A branding constellation relaibility study - CORE
109
BRANDING CONSTELLATIONS AS RELIABLE PREDICTORS OF BRAND EXTENSIONS A BRANDING CONSTELLATION RELIABILITY CASE STUDY Student name : Ing. H. van ‘t Ende University : Open University in The Netherlands Course : Thesis B9131B Student number : 836.729.534 Study : Management Graduation Theme : Branding (number 31) Examiner : Dr. W.E. Jurg Second reviewer : Dr. J.M.C. Schijns Date : 2013, August 28 31 BOVAG Breakdown Service BOVAG Car Assurances Brand Name Lobbying Members Director Divisions
-
Upload
khangminh22 -
Category
Documents
-
view
0 -
download
0
Transcript of A branding constellation relaibility study - CORE

Branding constellations as reliable predictors of brand extensions.
BRANDING CONSTELLATIONS
AS RELIABLE PREDICTORS OF BRAND EXTENSIONS
A BRANDING CONSTELLATION RELIABILITY CASE STUDY
Student name : Ing. H. van ‘t Ende University : Open University in The Netherlands Course : Thesis B9131B Student number : 836.729.534 Study : Management Graduation Theme : Branding (number 31) Examiner : Dr. W.E. Jurg Second reviewer : Dr. J.M.C. Schijns Date : 2013, August 28
31
BOVAG Breakdown Service
BOVAG Car Assurances
Brand Name
Lobbying Members Director Divisions

Branding constellations as reliable predictors of brand extensions
A branding constellation reliability case study 2

Branding constellations as reliable predictors of brand extensions
A branding constellation reliability case study 3
BRANDING CONSTELLATIONS AS RELIABLE PREDICTORS OF BRAND EXTENSIONS
A BRANDING CONSTELLATION RELIABILITY CASE STUDY

Branding constellations as reliable predictors of brand extensions
A branding constellation reliability case study 4
Branding constellations as reliable predictors of brand extensions
A branding constellation reliability case study 5
Summary
Branding Theme The identification of problems is a crucial phase in marketing research on brands. Although the available literature agrees on its importance, this theme has not received much attention in this literature. The Open University’s Management faculty in The Netherlands offers students the opportunity to study the usefulness of branding constellations within the Branding Theme (hereafter referred to as the Theme), covering reliability, validity, and relevance. Branding constellations are applications of systems constellations to identify branding opportunities (Jurg, 2008). In general, studies within the Theme are set up as stacking comparable cases, based on Miles and Huberman’s (1984) and Yin’s (2009) methodologies: each student performs a case study using similar measurements with leeway for uniqueness as it evolves. The core issue within the Theme at the start of this thesis is the reliability of branding constellations, based on five different measurements: precision reliability, bilateral relationship test-retest reliability, perceived bilateral relationship reliability, introspective reliability, and consensus reliability. These measurements are expressed in scores on ordinal bipolar five-point scales from -2 to +2, based on Jurg (2010). This case study covers two BOVAG branding constellations. It is the 31st thesis within the Theme. BOVAG is a branch association for motorists founded in 1930. In the past eighty years BOVAG obtained the status of a quality mark for Dutch motorists and consumers in general. The leeway of this thesis is an improved consensus reliability measurement involving the attendees rather than the branders, who filled out questionnaires directly after the two branding constellations. Branding constellations The innovative assumption in branding constellations is that branders set up the key elements of a branding system (indicated by symbols as “B” for Brand Name) in such a way that blanks standing for these elements (named stand-ins) are capable of bringing to the surface the subconscious relationships between these elements in the branders’ minds (Jurg, 2010). This helps these branders to identify their branding problems, based on an improved understanding of the key elements and the positive and negative feedback loops between them. This indicates that branding constellations adopt a holistic perspective. The choice of these elements is based on a combination of bodily experiences, feelings and intentions as well as free associations (spontaneous outbursts) experienced by the brander, indicating an emotional approach. The power of the synthesis of the the holistic perspective and the emotional approach is that the emotional approach turns the holistic perspective into something that can be felt, And, at the same time, it allows branders to decide on the key branding elements and to maintain an overview. Case study This case study is a second-person study as the BOVAG brand team members (hereafter referred to as branders) concerned are colleagues of the researcher: the marketing manager and the spokesman. The branding question of these two branders is whether the BOVAG brand might be extended by introducing products for Dutch consumers, named BOVAG Breakdown Service (Dutch: pechhulp) and BOVAG Car Assurance (Dutch: autoverzekering).

Branding constellations as reliable predictors of brand extensions
A branding constellation reliability case study 6
February 26, 2010, two branding constellations were conducted to identify the opportunities to extend the BOVAG brand to the Dutch consumer market. These two constellations took place at BOVAG’s house of mobility, in the same room, and were conducted by the same facilitator. The first branding constellation by the marketing manager had an external perspective and the second one by the spokesman had an internal perspective. Both branding constellations contained the BOVAG brand name and the two brand extensions. Research problem The objective of this case study is to contribute to the Theme by applying the five standardised reliability measurements to the case study by stacking these reliability measurements and by improving the sixth consensus reliability measurement. This means that this case study covers three research questions: 1. How reliable are the branding constellations of this BOVAG case study with regard to
precision reliability, bilateral relationship test-retest reliability, perceived bilateral relationship reliability, and introspective reliability?
2. How do these BOVAG case study reliability findings relate to the previous findings within the Theme?
3. How could the consensus reliability measurement be improved? Reliability findings All Theme measurements are rated on an ordinal bipolar five-point scale from -2 to +2. 1. The precision reliability of the two BOVAG branding constellations is ambivalent
(-0.15). This indicates that in general, the statements by the branding elements’ stand-ins in the constellations can hardly be falsified.
2. The bilateral relationship test-retest reliability is very high (+1.3), which signifies that the relationships between two stand-ins were very similar for the same branding elements in the two succeeding BOVAG branding constellations.
3. The perceived bilateral relationship reliability is moderately high (+0.7), which signifies that the relationships between the stand-ins in the BOVAG branding constellations are very similar to the perceived relationships by the two BOVAG branders.
4. The introspective reliability is moderately high (+0.5), indicating that the precise statements of the stand-ins moderately match with reality as perceived by the researcher employed by BOVAG.
Overall, the BOVAG branding constellations are moderately reliable (+0.8). Stacking comparable cases The stacking reliability of the BOVAG case study is also rated on an ordinal bipolar five-point scale from -2 to +2. 1. The stacking precision reliability is moderately high as the BOVAG score (-0.2) is 0.7
below the average Theme score (+0.5). 2. The stacking bilateral relationship test-retest reliability is very high because the
BOVAG score (+1.3) is only 0.1 points lower than the Theme average of (+1.4). 3. The stacking perceived bilateral relationship reliability is very high since the BOVAG
score (+0.7) is only 0.1 points higher than the average Theme score (+0.6). 4. The stacking introspective reliability is very high for the BOVAG score (+0.5) is equal
to the average Theme score (+0.5).
Branding constellations as reliable predictors of brand extensions
A branding constellation reliability case study 7
Thus, the BOVAG findings are very similar to the ones found within the Theme before, except with regard to precision reliability for which they are moderately similar. Improvement of consensus reliability measurement Both Jongsma (2011) and Roossien (2012) restricted their consensus measurement to branders who have their own concerns and biases. This thesis improves the consensus measurement by focusing on the perceptions of the attendees. In addition, the propositions were formulated before the branding constellations rather than afterwards as Jongsma did. More specifically, the improvement covers two measurements: 1. A normal distribution test based on the attendees’ scores on eighteen BOVAG
branding propositions, formulated before the workshop such as “Brand Name (B) contributes positively to the branding system”. When these propositions scores on the perceptions regarding these branding elements in the branding constellations are distributed around a real value, this signifies that branding constellations are reliable, based on Multon (2010).
2. A one-sample t-test to indicate whether or not attendees’ scores are significantly sufficient or insufficient (higher or lower than the 5.5. sufficiency norm, respectively) with regard to the eight propositions concerning the importance and valuation (positive contribution) of the two brand extensions. This then indicates the degree of intersubjective agreement among the attendees and thus the reliability of branding constellations in testing brand extensions, based on Maso & Smaling (1998).
The normal distribution test establishes that three of the eighteen propositions are retained to be normally distributed. This signifies that these three propositions scores on the perceptions regarding these branding elements in the branding constellations are reliable as they are distributed around a real value. These three propositions are based on the first (external) branding constellation. These propositions are: 1. Brand Name contributes positively to the branding system 2. BOVAG Car Assurance is important in the current branding system 3. BOVAG Car Assurance contributes positively to the branding system. The one-sample t-test demonstrates significant insufficiency scores on the importance and valuation (positive contribution) of BOVAG Breakdown Service as the attendees’ scores are significantly lower than the 5.5 sufficiency norm in both branding constellations. And, the findings show a significant sufficiency for BOVAG Car Assurance as the attendees’ scores are significantly higher than the 5.5 sufficiency norm on the importance and valuation of BOVAG Car Assurance in both branding constellations, except for the importance of BOVAG Car Assurance in the first (external) branding constellation.

Branding constellations as reliable predictors of brand extensions
A branding constellation reliability case study 8
Implications Theoretical implications for the Theme are: 1. The standardised reliability findings of the BOVAG case study are in line with
previous findings within the Theme. It seems that theoretical saturation is reached here and that the focus of the Theme should be changed to other reliability measurements, and to relevance and validity.
2. The normal distribution test based on the attendees’ scores on branding propositions formulated before the branding constellation workshop should be studied further to allow a more definitive conclusion about the reliability measurement of the distribution of these propositions around a real value.
3. The one-sample t-test seems a reliable, valid, and relevant measurement to test brand extensions and should be studied further. The name might be changed in predictive validity and explicitly be studied as an instrument to test brand extensions.

Branding constellations as reliable predictors of brand extensions
A branding constellation reliability case study 9
Preface
In 1997 I started studying ‘Organisation & Strategy’ at the Open University in The Netherlands, because of my interest in new organisational theory. In May of 1998, I obtained my first course certificate ‘Organisation Diagnosis’. When I reached the Master stage, I realised that obtaining a Master’s degree was becoming reality. This inspired me to complete the whole study. I quickly chose systems constellations as a subject for my graduation paper. This subject interested me profoundly because of my background in consultancy and my personal experience with systems constellations. I would like to thank Dr. Wim Jurg from the Open University for letting me be a member of the Theme and for his critical, constructive and everlasting positive feedback during the writing process. I would also like to thank Dr. Jos Schijns for being second reviewer. I extend special thanks to the BOVAG branders Drs. Paul de Waal, and Dylan Weggemans for making time and providing me with a wealth of information about the BOVAG brand. Further thanks go out to Frans Kragten, Peter Niesink, and Leo Steijn. These three men motivated me to complete this thesis. And thanks go out to Drs. Liza Bruggeling for reviewing the text on the use of correct UK English. Last, but absolutely not least, I thank my wife Frederike, our children Willemijn, Emma and Marijke and my parents Gerrit and Willy, who supported me with completing this study. I dedicate this thesis to them. When counting the pages, they exceed the 45 norm. However, based on an average of 400 words per page and excluding the extensive discussion asked for by the Theme coordinator, the big pictures, tables, and figures due to the qualitative approach, this thesis consists of about 45 pages of text as it contains approximately 18.000 words. The extensive discussion could have been put in the appendices to reduce the number of pages in the main text, but my personal experience was that reading the discussions of the previous students was very valuable and supported the quality of this thesis. Thus, by adding the extensive discussion to the main text of the thesis I aim to pass on the discussion within the Theme to future students. I hope you enjoy reading this thesis. Ing. Hendri van ‘t Ende Ermelo, August 28, 2013.

Branding constellations as reliable predictors of brand extensions
A branding constellation reliability case study 10
Table of contents
Summary ................................................................................................................................................. 5 Preface .................................................................................................................................................... 9 Table of contents ................................................................................................................................... 10
1 Introduction ................................................................................................................................... 13
1.1 Context ................................................................................................................................. 13 1.2 Research problem ................................................................................................................ 13
1.2.1 Research objective ......................................................................................................... 13 1.2.2 Research questions ........................................................................................................ 14
1.3 Research outline ................................................................................................................... 14
2 Literature study ............................................................................................................................. 15
2.1 Branding Theme ................................................................................................................... 15 2.1.1 Developments within Branding Theme ........................................................................... 16 2.1.2 Reliability measurement definitions within Branding Theme .......................................... 19
2.2 Marketing research and problem identification ..................................................................... 19 2.3 Brand issues ......................................................................................................................... 20
2.3.1 Brands ............................................................................................................................ 20 2.3.2 Branding ......................................................................................................................... 21 2.3.3 Modelling ........................................................................................................................ 22 2.3.4 Brand extensions ............................................................................................................ 22
3 Case study ................................................................................................................................... 25
3.1 BOVAG association .............................................................................................................. 25 3.2 BOVAG organisation ............................................................................................................ 26 3.3 BOVAG brand ....................................................................................................................... 27 3.4 BOVAG brand situation ........................................................................................................ 28 3.5 BOVAG branding constellations ........................................................................................... 29
3.5.1 Branding constellation workshop structure ..................................................................... 30 3.5.2 Workshop realisation ...................................................................................................... 30
4 Data design .................................................................................................................................. 35
4.1 Methodology ......................................................................................................................... 35 4.1.1 Questionnaires................................................................................................................ 35 4.1.2 Transcriptions ................................................................................................................. 35
4.2 Reliability measurements of branding constellations ............................................................ 36 4.2.1 Precision reliability .......................................................................................................... 36 4.2.2 Bilateral relationship test-retest reliability ....................................................................... 37 4.2.3 Perceived bilateral relationship reliability ........................................................................ 39 4.2.4 Introspective reliability .................................................................................................... 40 4.2.5 Overview of reliability measurements ............................................................................. 41
4.3 Stacking Comparable Cases ................................................................................................ 42 4.4 Consensus reliability ............................................................................................................. 42
4.4.1 Consensus measurement Jongsma (2011) .................................................................... 42 4.4.2 Consensus measurement Roossien (2012) ................................................................... 44 4.4.3 Suggested improvement consensus measurement........................................................ 44

Branding constellations as reliable predictors of brand extensions
A branding constellation reliability case study 11
5 Findings ........................................................................................................................................ 47 5.1 Reliability findings of branding constellations ....................................................................... 47
5.1.1 Precision reliability .......................................................................................................... 47 5.1.2 Bilateral relationship test-retest reliability ....................................................................... 49 5.1.3 Perceived bilateral relationship reliability ........................................................................ 52 5.1.4 Introspective reliability .................................................................................................... 57 5.1.5 Overview reliability measurements ................................................................................. 59
5.2 Stacking findings comparable cases .................................................................................... 59 5.2.1 Stacking precision reliability ............................................................................................ 59 5.2.2 Stacking bilateral relationship test-retest reliability ......................................................... 60 5.2.3 Stacking perceived bilateral relationship reliability ......................................................... 61 5.2.4 Stacking introspective reliability ...................................................................................... 62 5.2.5 Overview of stacking compared cases ........................................................................... 63
5.3 Findings on consensus reliability measurement ................................................................... 64 5.3.1 Frequency histograms of first (external) branding constellation ..................................... 64 5.3.2 Frequency histograms of second (internal) branding constellation ................................ 66 5.3.3 Normality plots of first (external) branding constellation ................................................. 68 5.3.4 Normality plots of second (internal) branding constellation ............................................ 70 5.3.5 Shapiro-Wilkinson tests .................................................................................................. 72 5.3.6 Overview of normality tests ............................................................................................. 73 5.3.7 One-sample t-test ........................................................................................................... 74
6 Evaluation ..................................................................................................................................... 77
6.1 Conclusion ............................................................................................................................ 77 6.1.1 Theoretical conclusion .................................................................................................... 77 6.1.2 Practical conclusion ........................................................................................................ 78
6.2 Discussion on construct validity ............................................................................................ 79 6.2.1 Discussion on construct validity of precision reliability ................................................... 79 6.2.2 Discussion on construct validity of bilateral relationship test-retest reliability ................. 80 6.2.3 Discussion on construct validity of perceived bilateral relationship reliability ................. 81 6.2.4 Discussion on construct validity of introspective reliability.............................................. 82 6.2.5 Discussion on construct validity of stacking.................................................................... 83 6.2.6 Discussion on construct validity of branding constellations ............................................ 84 6.2.7 Discussion on construct validity of model of Martinez and Pina (2010).......................... 85
6.3 Discussion construct validity of improved consensus reliability measurements ................... 86 6.3.1 Discussion on construct validity of normal distribution tests ........................................... 86 6.3.2 Discussion on construct validity of t-tests ....................................................................... 87
6.4 Reliability .............................................................................................................................. 91 6.4.1 Reliability of case study design....................................................................................... 91 6.4.2 Reliability of preparing data collection ............................................................................ 92 6.4.3 Reliability of evidence collection ..................................................................................... 92 6.4.4 Reliability of evidence analysis ....................................................................................... 92 6.4.5 Reliability of study report ................................................................................................ 93
6.5 Implications ........................................................................................................................... 93 6.5.1 Theme implications ......................................................................................................... 93 6.5.2 BOVAG implications ....................................................................................................... 94
6.6 Reflections of researcher ...................................................................................................... 95 6.6.1 Theme reflection ............................................................................................................. 95 6.6.2 Personal reflection .......................................................................................................... 96
References ............................................................................................................................................ 99
Bibliography ...................................................................................................................................... 99 Tables overview .............................................................................................................................. 103 Figures overview ............................................................................................................................. 105 Appendix overview .......................................................................................................................... 106 Table of contents DATA-DVD ......................................................................................................... 107

Branding constellations as reliable predictors of brand extensions
A branding constellation reliability case study 12

Branding constellations as reliable predictors of brand extensions
A branding constellation reliability case study 13
1 Introduction
The objective of this thesis is to contribute to the Branding Theme by studying whether branding constellations are reliable in identifying branding problems. Section 1.1 starts with a short context overview and section 1.2 explains the research problem. Chapter 1 closes with a description of the research outline in section 1.3.
1.1 Context
The Open University’s Management Faculty in The Netherlands offers students the opportunity to study the usefulness of branding constellations to identify branding problems within the Branding Theme, hereafter called Theme. The Master theses on branding constellations are set up as multiple case studies, stacking comparable cases with leeway for uniqueness as it emerges, based on Miles and Huberman (1984: 28) and Yin (2009: 46-53). Recently, the core issue within the Theme has been the reliability of branding constellations, based on six standard measurements named precision reliability, bilateral relationship test-retest reliability, perceived bilateral relationship reliability, introspective reliability, and consensus reliability.
1.2 Research problem
This section describes the research problem. Subsection 1.2.1 contains the research objective. Subsection 1.2.2 addresses the research questions.
1.2.1 Research objective The general objective of this Master thesis, further called thesis, is to gain a more comprehensive view on the reliability of branding constellations as part of the Theme, a research community studying the usefulness of branding constellations. - First, by applying the standardised reliability measurements to a case study as part
of the Theme’s multiple case study methodology. In this thesis the selected case study is, a branding opportunity of the branch association BOVAG: the Association of Automobile traders and Garage holders (in Dutch; BOnd Van Automobielhandelaren en Garagehouders).
- Second, by comparing these case study reliability findings to the current Theme findings (named stacking).
- Third, by improving the consensus reliability measurement within the Theme as developed by Jongsma (2011, number 25), and Roossien (2012, number 27). The main improvement is involving the attendees’ perceptions of the constellations rather than just the branders.

Branding constellations as reliable predictors of brand extensions
A branding constellation reliability case study 14
1.2.2 Research questions The research questions are based on the research objective of this thesis and follow the process that Miles and Huberman (1984: 33-38) describe. The leeway of of this thesis is an improved reliability measurement involving the attendees by filling out workshop questionnaires directly after the branding constellations. This case study thus covers two standard theoretical research questions within the Theme (1 and 2) and one related to the research question for the leeway (3). The research questions are: 1. How reliable are the branding constellations of this BOVAG case study with regard to
precision reliability, bilateral relationship test-retest reliability, perceived bilateral relationship reliability, and introspective reliability?
2. How do these BOVAG case study reliability findings relate to the previous findings within the Theme?
3. How could the consensus reliability measurement be improved?
1.3 Research outline
This first chapter introduces the case study research objective and the research problem. Chapter 2 describes the Theme, the constellation procedure, and the theoretical embedding of the Theme and the brand extensions. Chapter 3 describes the case company and its branding opportunity. Chapter 4 explains how the case study is designed to answer the research questions. Chapter 5 presents the case study findings on reliability including the findings of the improved measurement, and the findings to the predecessors within the Theme. Chapter 6 evaluates the thesis’ findings. This chapter introduced the Theme and the context of the case study. The next chapter details the literature study.

Branding constellations as reliable predictors of brand extensions
A branding constellation reliability case study 15
2 Literature study
This chapter presents the background literature of the case study, where references are made both to the Branding Theme literature and the brand extension literature. It starts with a description of the Branding Theme in section 2.1, which forms the framework for this case study. Section 2.2 looks into market research and problem identification and section 2.3 looks into brands, branding, and modelling of brand extension strategies.
2.1 Branding Theme
The Branding Theme originated in 2002 as the then Dean of the School of Management at The Open University in the Netherlands, Prof. Dr. Herman van den Bosch, asked then Drs. Wim Jurg to start a research group on branding constellations parallel to his own PhD-thesis on the perceived usefulness of branding constellations. The Theme is set up following Miles and Huberman (1984: 28) and Yin (2009: 46-53) by stacking comparable cases. Each researcher (student) studies a case in line with the research opportunities offered by this case and stacks it to the comparable cases of previous students within the Theme. Branding constellations are a new application of systems constellations employed to identify branding opportunities (Jurg, 2010: 25-26). The innovative assumption of branding constellations is that people who neither know the brander nor his problem (named stand-ins), set up by a brander as personified representations of elements of a branding system, are able to bring the implicit relationships between these elements in the minds of the brander to the surface. Jurg (2010: 72) argues that branding constellations differ from other problem identification techniques in their combination of a holistic perspective and an emotional approach. A holistic perspective focuses on the elements and relationships emerging from the whole rather than decomposing problems into a few basic elements that form the core of the problem (the latter is classified as the reductionist perspective). An emotional approach includes bodily experiences, feelings, and intentions as well as spontaneous verbal “outbursts” based on these emotions rather than a logical verbalisation and an encouragement to employ grounded arguments (a rational approach). The comparison to other problem identification techniques is displayed in table 2.1. Table 2.1 Positioning of systems constellations to other problem identification techniques
Approach/Perspective Holistic perspective Reductionist perspective
Emotional approach Branding
constellations Brainstorming, psychodrama,
projections, and ZMET
Rational approach Cognitive mapping
and SSM Lateral marketing.

Branding constellations as reliable predictors of brand extensions
A branding constellation reliability case study 16
The definitions in table 2.1 are detailed in Jurg (2010: 57-72), below an overview:
- Brainstorming is a creative session producing a checklist of ideas that serve as leads to problem solutions to be evaluated and further processed later on.
- Psychodrama is an emotional technique where people are asked to create and act out brand scenarios in order to portray some part of a real or imagined situation.
- Projections –also called projective techniques- in qualitative marketing consumer research involve the presentation of ambiguous emotional stimuli and asking respondents to make sense of them.
- The Zaltman Metaphor Elicitation Technique (ZMET) is a research tool that employs visual and sensory images to assist in understanding the meaning of brands to consumers because people think in image, and metaphors.
- Cognitive mapping is a graphical representation of a particular branding problem that allows for deeper and more integrative understanding.
- The Soft Systems Methodology (SSM) employs the systems methaphor to identify soft problems as a particular way of expressing problem owners’ thoughts on a problematic situation.
- Lateral marketing consists of introducing a new branding element inside a logical sequence of branding elements to allow the brain to make new connections and to develop new products.
2.1.1 Developments within Branding Theme Jurg finished his dissertation “The perceived usefulness of Branding Constellations” and defended it successfully in 2010. He now bears the title doctor. Van Reij (2010) performed a case survey as promoted by Yin’s (2009: 109-138) idea about analysing case study evidence (doing a secondary analysis across cases). Van Reij (2010) worked on the theme reliability measurements with the purpose to increase the consistency of the measurements by standardising the precision measurement and the bilateral relationship test-retest measurement. Van Reij involved all previous case studies in her study. Since Van Reij, the Theme’s case study protocol measurements were drastically improved in line with Yin’s recommendations. Since Van Reij, the graduate students in the Theme are using her uniform case study protocol. At the start of this thesis the focus is on the reliability of branding constellations. Currently, the emphasis is shifted on relevance. The Theme focuses on comparative case studies. Three kinds of comparative case studies are distinguished: first-person, second-person, and third-person based on Bradbury and Bergmann Lichtenstein (2000: 551-564). A first-person case study is a case study in which the usefulness of a branding constellation is studied on a branding problem that is the student’s responsibility as a brander. The first-person case study is primary research. In primary research the students collect their own data. This kind of study was performed by Gomersbach (2004), Davidse (2005), De Velde Harsenhorst (2006), De Heij (2006), Holwerda (2006), Ten Have (2007), Vertregt (2007), and Karel (2009).

Branding constellations as reliable predictors of brand extensions
A branding constellation reliability case study 17
A second-person case study is a case study in which the usefulness of a branding constellation is studied on a branding problem of a brander who is an acquaintance, a client, or a colleague of the student. Thus, the Theme student is familiar with the brander and the branding problem before the study. The second-person case study is also a primary study. This kind of study was performed by Van Geel (2004), Mathijssen (2005), Halters (2008), Meines (2011), and Roossien (2012). A third-person case study is a case study in which the usefulness of branding constellations is studied whilst there is no former relationship with the branders. This study generally focuses on secondary data and on the falsification of a hypothesis regarding branding constellations, for instance: 1. Branding constellations are metaphors (Van Zwienen, 2005) 2. Branding constellations are a form of lateral marketing (Van Mechelen, 2005) 3. Branding constellations fit the Soft Systems Methodology (Simons, 2005) 4. Branding constellations are a brainstorming technique (Harrewijn, 2006) 5. Branding constellations are a form of action research (Labots, 2006) 6. Branding constellations require emotional intelligence (Stroo, 2006) 7. Quantum theory might explain the working of branding constellations (Blootens,
2006) 8. Relationships between stand-ins correlate with their distances and angles (the
sociometrics hypotheses by Schuurman, 2006) 9. Branders employing branding constellations score similar on the MBTI personality
test than regular branders (Claus, 2008).
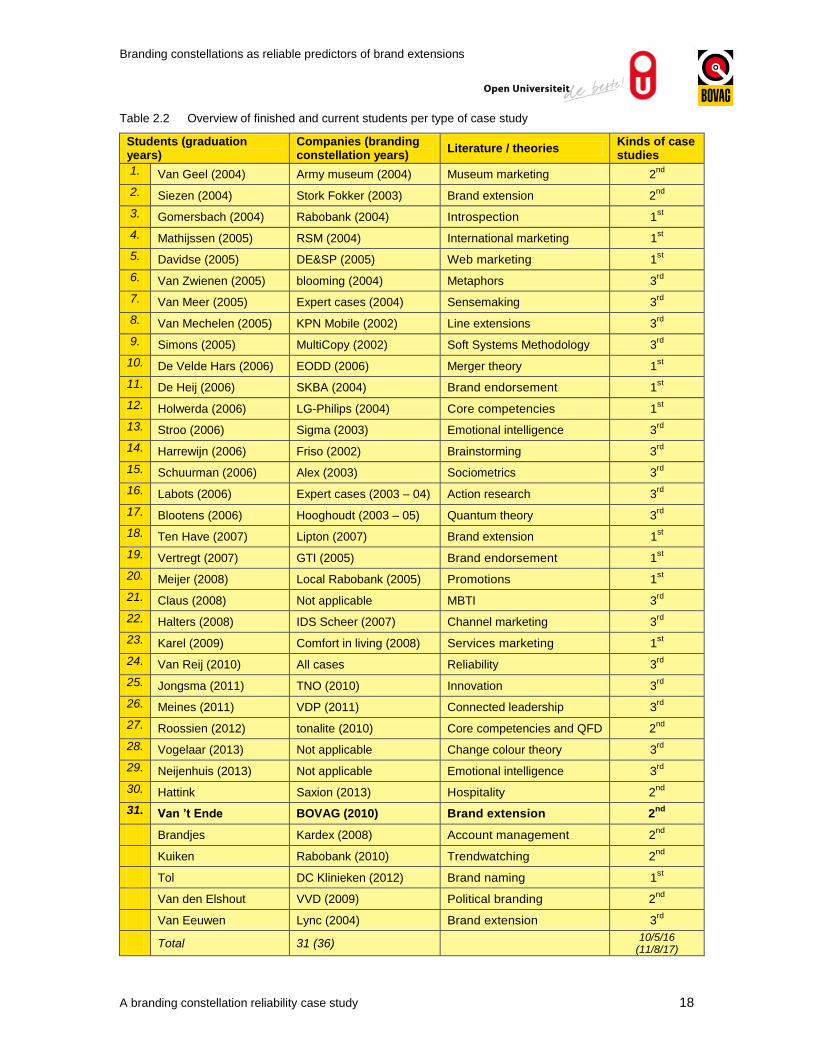
All hypotheses could not be falsified, except for the quantum theory and the sociometrics hypotheses. Blootens (2006: 6) concludes that quantum theory might be useful as a metaphor rather than as a description of reality fitting branding constellations. Schuurman (2006) concludes that the relationships between stand-ins do not linearly correlate with their mutual distances and angles. Lately, new variations of systems constellations were introduced with the Theme by Jongsma (2011) and Meines (2011): innovation constellations and intervention constellations, respectively; the application of systems constellations on innovations and organisational interventions. Table 2.2 shows that till now, thirty students finished their master thesis within the Theme. Ten students finished a first-person case study. Four students finished a second-person case study within the Theme. Third-person case studies are conducted most often (sixteen times). This study (number 31) can be categorised as a second-person case study. Eleven studies included theory building.
Branding constellations as reliable predictors of brand extensions
A branding constellation reliability case study 18
Table 2.2 Overview of finished and current students per type of case study
Students (graduation years)
Companies (branding constellation years)
Literature / theories Kinds of case studies
1. Van Geel (2004) Army museum (2004) Museum marketing 2nd
2. Siezen (2004) Stork Fokker (2003) Brand extension 2nd
3. Gomersbach (2004) Rabobank (2004) Introspection 1st
4. Mathijssen (2005) RSM (2004) International marketing 1st
5. Davidse (2005) DE&SP (2005) Web marketing 1st
6. Van Zwienen (2005) blooming (2004) Metaphors 3rd
7. Van Meer (2005) Expert cases (2004) Sensemaking 3rd
8. Van Mechelen (2005) KPN Mobile (2002) Line extensions 3rd
9. Simons (2005) MultiCopy (2002) Soft Systems Methodology 3rd
10. De Velde Hars (2006) EODD (2006) Merger theory 1st
11. De Heij (2006) SKBA (2004) Brand endorsement 1st
12. Holwerda (2006) LG-Philips (2004) Core competencies 1st
13. Stroo (2006) Sigma (2003) Emotional intelligence 3rd
14. Harrewijn (2006) Friso (2002) Brainstorming 3rd
15. Schuurman (2006) Alex (2003) Sociometrics 3rd
16. Labots (2006) Expert cases (2003 – 04) Action research 3rd
17. Blootens (2006) Hooghoudt (2003 – 05) Quantum theory 3rd
18. Ten Have (2007) Lipton (2007) Brand extension 1st
19. Vertregt (2007) GTI (2005) Brand endorsement 1st
20. Meijer (2008) Local Rabobank (2005) Promotions 1st
21. Claus (2008) Not applicable MBTI 3rd
22. Halters (2008) IDS Scheer (2007) Channel marketing 3rd
23. Karel (2009) Comfort in living (2008) Services marketing 1st
24. Van Reij (2010) All cases Reliability 3rd
25. Jongsma (2011) TNO (2010) Innovation 3rd
26. Meines (2011) VDP (2011) Connected leadership 3rd
27. Roossien (2012) tonalite (2010) Core competencies and QFD 2nd
28. Vogelaar (2013) Not applicable Change colour theory 3rd
29. Neijenhuis (2013) Not applicable Emotional intelligence 3rd
30. Hattink Saxion (2013) Hospitality 2nd
31. Van ’t Ende BOVAG (2010) Brand extension 2nd
Brandjes Kardex (2008) Account management 2nd
Kuiken Rabobank (2010) Trendwatching 2nd
Tol DC Klinieken (2012) Brand naming 1st
Van den Elshout VVD (2009) Political branding 2nd
Van Eeuwen Lync (2004) Brand extension 3rd
Total 31 (36) 10/5/16
(11/8/17)
Branding constellations as reliable predictors of brand extensions
A branding constellation reliability case study 19
Table 2.2 shows that finished second-person case studies are underrepresented. Second-person case studies within the Theme seem a troublesome category (Roossien, 2012: 90). In a second-person case study the researcher is, for example, employed by the company where the research takes place. Being employed to the company, enablers and preconditions are available to follow the process and analyse the reliability of branding constellations over a longer period of time. This could also be a pitfall for students of the second-person studies. Table 2.2 shows that there are five second-person students who did not finish their thesis yet. This thesis is also a second-person case study, the challenge for this case study was to execute a second-person study and contribute to the Theme by improving the consensus reliability measurement.
2.1.2 Reliability measurement definitions within Branding Theme Within the Theme five more or less standardised reliability measurements are employed according to Roossien (2012: 7). 1. Precision reliability studies the testability of the statements by the stand-ins of the
branding elements in the branding constellations 2. Bilateral relationship test-retest reliability examines on the similarity of the
relationships between two stand-ins for the same branding elements in two different branding constellations
3. Perceived bilateral relationship reliability looks at the similarity of the relationships between the stand-ins of the branding elements in the branding constellations and the perceptions of these relationships by branders before the branding constellations
4. Introspective reliability regards whether the precise statements of the stand-ins of the branding elements in the branding constellations match with reality as perceived by the researcher employed by the case company
5. Consensus reliability measures the inter subjective agreement of branders regarding the bilateral relationships of the core branding elements.
2.2 Marketing research and problem identification
Marketing research is indicated as an inquiry to obtain valuable information regarding a marketing problem (Gibson, 1998: 5). The conceptualisation of the American Marketing Association (also known as AMA) is presented in table 2.3. Table 2.3 Conceptualisation of marketing research (AMA website, May 11, 2013)
Conceptualisation of marketing research
Marketing research is the systematic gathering, recording, and analysis of data about issues relating to marketing products and services.
Following this definition, four issues can be addressed in marketing research: 1. Identify and define marketing opportunities and problems 2. Generate, refine, and evaluate marketing actions 3. Monitor marketing performance 4. Improve understanding of marketing as a process.

Branding constellations as reliable predictors of brand extensions
A branding constellation reliability case study 20
The focus of the Theme is on this first phase of identifying and defining marketing opportunities and problems, and specifically on branding opportunities and problems. Yadav & Korukonda (1985: 60) see problem identification as a process of “designing problems” and problem definition as a process of “discovering problems”. Rowley (1999: 290) states that problem identification is about “dealing with a kind of problem” and problem definition is about “handling the nature of the problem”. However, in general, the terms problem identification and problem definition seem to be used interchangeably in marketing literature (Jurg, 2010: 19). In this thesis the term “identification” is employed. The difference between problems and opportunities is psychological rather than logical: while problems are perceived as negative gaps, opportunities are experienced as positive challenges (Gibson, 1998: 5). As scientific literature generally addresses problems rather than opportunities, the term “opportunity” is used in this report as it is thought to fit marketing idea better. Branding opportunities are situations in which branders perceive gaps between “what is” and “what might, could or should be” (Gibson, 1998: 7-10). An opportunity always exists for some brander. No branding opportunity exists independent of a brander. A branding opportunity is a situation in which marketers want to change the “present state” into the “goal state” but do not know how. In a literature study, Butler (1995: 5) concluded that opportunity identification is considered the most important stage in the marketing research process but also that it attracts more interest in general management fields rather than in marketing. Although marketers know that marketing research should start with a proper identification of the opportunity and that its success depends on the quality of that identification, most identification processes are rather ad hoc and do not follow a systematic procedure. But unless these opportunities are well identified, it is unlikely that proper solutions will be found (Gibson, 1998: 5-10). Selecting the core opportunity to work on seems a simple operation but marketing research often tackles only the easy, salient opportunities and does not pay enough attention to the opportunities that lie beneath the surface. Poor identification of opportunities exposes marketing research to a range of undesirable consequences, including incorrect research designs, inappropriate or needlessly expensive data collection and assembly of incorrect or irrelevant data.
2.3 Brand issues
This section starts with a description of brands in section 2.3.1. Section 2.3.2 looks into the branding concept. Section 2.3.3 covers modelling and section 2.3.4 brand extensions.
2.3.1 Brands The importance of brands is well acknowledged, for instance, the value for the organisation of the (since 2000) number one global brand Coca-Cola was estimated at 70 million dollars in 2010 by Interbrand (2010). Besides the top 100 of Interbrand, there is the list of Millward Brown (2011) the BrandZ Top 100 Most Valuable Global Brands 2011. In this list, Apple is in 2011 the most valuable with a brand value of 153 million dollars.

Branding constellations as reliable predictors of brand extensions
A branding constellation reliability case study 21
The brand conceptualisation of the American Marketing Association (also known as AMA) is presented in table 2.4. Table 2.4 Conceptualisation of brand by AMA (AMA website, May 11, 2013)
Conceptualisation of brand by AMA (2013)
Name, term, design, symbol, or any other feature that identifies one seller's good or service as distinct from those of other sellers.
However, few marketing authors follow this AMA definition and there appears to be a definitional fallacy (Hanby, 1999: 10). Table 2.5 presents six categories of conceptualisations found in an exploratory review by Jurg (2010: 35). Table 2.5 Six conceptualisations of brand by Jurg (2010)
Six conceptualisations of brand by Jurg (2010)
1. Identification of a product or service
2. Icon of a culture
3. Trust object in the customers’ mind
4. Clear promise to consumers
5. Network of associations in the consumer’s mind
6. Dissipative, self-organising system.
However, there is little disagreement whether something is a brand, because brands are implicitly culture phenomena, according to Jurg (2010: 35). Within the Theme, brands are defined as self-organising systems that need energy from the environment to stay alive, based on Jurg (2010: 36). Brands are legally owned by companies, but sociologically and psychologically, they are owned by consumers.
2.3.2 Branding Similar to marketing which is derived from market, branding is derived from brand according to Jurg (2010: 36). Table 2.6 presents the branding definition categorization from exploratory literature review by Jurg (2010: 37). Table 2.6 Five conceptualisations of branding by Jurg (2010)
Five conceptualisations of branding by Jurg (2010)
1. Operations that contribute positively to the branding system
2. Improving the unique position in the customers’ mind
3. Strategic process that manages the presentation and influences the perception of the brand
4. Labelling a product through brand elements e.g. brand name, logo or symbol
5. Device to identify and differentiate a producer’s offering.
Most conceptualisation categories of “branding” found in Jurg’s exploratory review can be linked to the conceptualisation categories of “brand” as presented in table 2.5. The Theme defines branding as conducting operations that make a positive contribution to the branding system, based on Jurg (2010: 37). A positive contribution refers to marketing programme decisions made to improve the unique brand position in the consumers’ minds in order to increase the brand’s value.

Branding constellations as reliable predictors of brand extensions
A branding constellation reliability case study 22
2.3.3 Modelling Branding opportunities are dynamic and complex situations characterized by the fact that multiple causes and effects are far apart in space and time (Gosling and Mintzberg, 2003: 54). One of the basic issues of the systems approach to branding is the identification of core branding elements. Although branders are generally well able to list a large number of factors and relationships in a certain area, they appear to have considerable difficulties in deciding on their relative importance and their relationships. It is often helpful to develop a simplified representation or a model of these kinds of situations in order to make specific judgments (Daniels et al., 1994: 22). Graham and Jahani (1977: 51,53) describe modelling as the creation of simplified abstractions of reality that capture the critical or key features of the situation and a model as a set of related systems elements in which some can be manipulated.
2.3.4 Brand extensions Most attention in the brand programme generally goes to brand extensions (Jurg, 2010: 45). Brand extensions have been the core of strategic marketing efforts since the origin of brands, increasing both the visibility and vitality of the brand according to Jurg. Table 2.7 Conceptualisation of brand extensions (Jurg, 2010: 45)
Conceptualisation of brand extensions by Jurg (2010)
The application of the brand name in another product class such as Harley Davison perfume.
If organisations want to get more benefits from the brand knowledge in their current markets they can follow the strategy of brand extensions (Aaker and Keller, 1990: 27-41). A key question for those who are responsible for the corporate brand is “How we can get sure that a potential brand extension will be positive for the parent brand?”. Brands are one of the most important assets for organisations, and therefore, branders must be alert for inadequate strategies that erode brand assets. One of these potentially risky strategies involves the launching of unsuitable brand extensions that erode extended brand benefits and associations (Martinez and Chernatony, 2004: 41). One of the most recent models for brand extension strategies, in the western market situation, is developed by Martinez and Pina (2010). In appendix 4 a summary of this article can be found and the complete article is on the DATA-DVD (map 4). Martinez and Pina developed a model to analyse the effect of brand extension strategy on the brand image, see figure 2.1. Other models in line with this model can be found on the DATA-DVD (map 4) and the search words to find this specific article in the scientific databases are in appendix 3.

Branding constellations as reliable predictors of brand extensions
A branding constellation reliability case study 23
Figure 2.1: Model to analyse the effect of brand extension strategy on brand image (Martinez and Pina, 2010: 1185)
The pillar of the model is that the support from parent brand to extension often leads to a change in associations of the brand image. A lot of key features might affect this feedback process. This feedback process can increase the memory and strength of brand associations and thus improve the position of the brand, but dilution of the current beliefs is also likely. Dilution can take place even though the extension is not related to negative information (Martinez and Pina, 2003: 432-444). Branders have to realise the complex reality of reciprocal relations and effect between the brand image of the parent brand and the brand extensions. And they will do right to made a model like figure 2.1 for their own organisation and case. A good brand model for the specific organisation is very valuable. This chapter set the theoretical framework and baselines for the case study. This case study is described in chapter 3.

Branding constellations as reliable predictors of brand extensions
A branding constellation reliability case study 24

Branding constellations as reliable predictors of brand extensions
A branding constellation reliability case study 25
3 Case study
The general objective of this thesis is to get a more comprehensive view on the reliability of branding constellations. Chapter 2 presented the branding literature. Chapter 3 describes this case study. Section 3.1 describes the BOVAG association. Section 3.2 covers the BOVAG organisation and in section 3.3 the BOVAG brand is the central subject. In section 3.4 the brand situation is described. Section 3.5 describes the BOVAG branding constellations.
3.1 BOVAG association
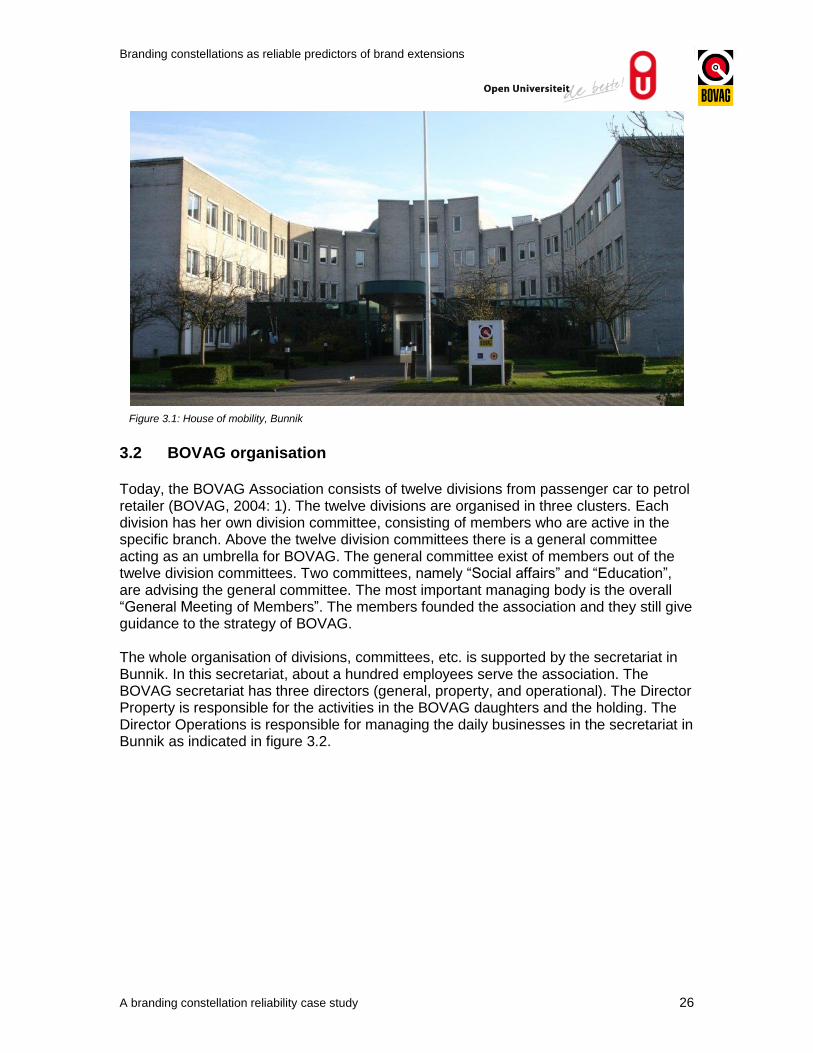
May 6, 1930, the BOVAG association is founded (BOVAG statutes). Forty garage keepers gathered in a pub in Utrecht. They decided to join their forces in a branch association with the name BOVAG, meaning “Association Of Automobile traders and Garage holders”. Within one year the BOVAG had more than 750 members and there were various other kinds of organisations who wanted to become a member for example petrol stations, car rental, driving schools, bike shops, and truck organisations. It became an association for all kinds of organisations related to the mobility sector. Today, BOVAG represents some 11.000 business operators from the overall mobility sector (BOVAG, 2004: 1). These include passenger car and truck dealers, independent repairers, bicycle, motorcycle, caravan, camper and folding trailer companies, trailer businesses, engine rebuilders, car rental firms an car washing companies, driving schools, and petrol retailers. The members together generate turnover of more than 49 billion euro and employ some 84.000 staff. This sector organisation acts as a platform as well a news and information collection and dissemination centre. BOVAG lobbies, organises quality assurances, and advises it divisions. In addition, BOVAG is an employers’ organisation active in the field of employment conditions policy, employment opportunities, working conditions, and education. Furthermore, BOVAG functions as a network organisation providing a joint purchase of goods for the members. Thinking as a “network” is for an association a natural way of organising things. A good example of this is the house of mobility in Bunnik. This is the place where members can meet each other. But also other branch related organisations can use the meeting rooms and the facilities to develop new business relations.
Branding constellations as reliable predictors of brand extensions
A branding constellation reliability case study 26
Figure 3.1: House of mobility, Bunnik
3.2 BOVAG organisation
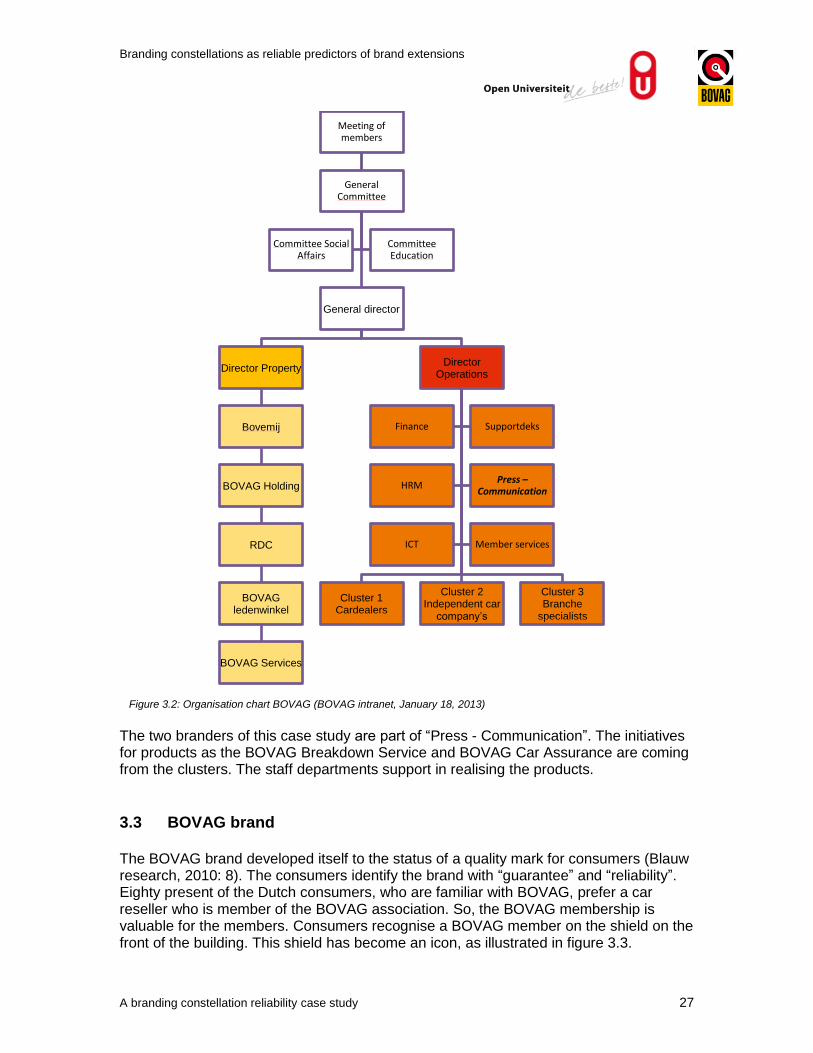
Today, the BOVAG Association consists of twelve divisions from passenger car to petrol retailer (BOVAG, 2004: 1). The twelve divisions are organised in three clusters. Each division has her own division committee, consisting of members who are active in the specific branch. Above the twelve division committees there is a general committee acting as an umbrella for BOVAG. The general committee exist of members out of the twelve division committees. Two committees, namely “Social affairs” and “Education”, are advising the general committee. The most important managing body is the overall “General Meeting of Members”. The members founded the association and they still give guidance to the strategy of BOVAG. The whole organisation of divisions, committees, etc. is supported by the secretariat in Bunnik. In this secretariat, about a hundred employees serve the association. The BOVAG secretariat has three directors (general, property, and operational). The Director Property is responsible for the activities in the BOVAG daughters and the holding. The Director Operations is responsible for managing the daily businesses in the secretariat in Bunnik as indicated in figure 3.2.
Branding constellations as reliable predictors of brand extensions
A branding constellation reliability case study 27
Figure 3.2: Organisation chart BOVAG (BOVAG intranet, January 18, 2013)
The two branders of this case study are part of “Press - Communication”. The initiatives for products as the BOVAG Breakdown Service and BOVAG Car Assurance are coming from the clusters. The staff departments support in realising the products.
3.3 BOVAG brand
The BOVAG brand developed itself to the status of a quality mark for consumers (Blauw research, 2010: 8). The consumers identify the brand with “guarantee” and “reliability”. Eighty present of the Dutch consumers, who are familiar with BOVAG, prefer a car reseller who is member of the BOVAG association. So, the BOVAG membership is valuable for the members. Consumers recognise a BOVAG member on the shield on the front of the building. This shield has become an icon, as illustrated in figure 3.3.
Meeting of members
General Committee
General director
Director Property
Bovemij
BOVAG Holding
RDC
BOVAG ledenwinkel
BOVAG Services
Director Operations
Cluster 1 Cardealers
Cluster 2 Independent car
company’s
Cluster 3 Branche
specialists
Finance Supportdeks
HRM Press –
Communication
ICT Member services
Committee Social Affairs
Committee Education

Branding constellations as reliable predictors of brand extensions
A branding constellation reliability case study 28
Figure 3.3: Example of the BOVAG shield on the front of a building The BOVAG brand is the second quality mark in the Netherlands, which people have on top of mind. “Kema Keur” takes the first place (Heliview research, 2007: 13). Special of this situation is, that BOVAG is not a quality mark that is officially approved by a board of accreditation, but the quality mark is created by the branch association with a form of control.
3.4 BOVAG brand situation
Since many years, Dutch consumers know the BOVAG brand (Blauw research, 2010: 8). Fifty eight per cent of the Dutch population, between sixteen and eighty, are familiar with BOVAG. They associate the logo with guarantee, reliability, and in the buying process of a car more than eighty per cent prefer a seller with the shield on the front. But also when a car needs a repair or maintenance, consumers prefer a BOVAG logo on the frontage. Seven facts to understand the principles off BOVAG branding opportunities: 1. More than halve off the Dutch consumers know the brand BOVAG 2. The brand is associated with stable values as guarantee, reliability, safety on the
road, quality (quality mark) 3. 11.000 entrepreneurs with stores, showrooms etc. spread over the whole country 4. 6.000 members have the facilities of a car company 5. A daughter company is selling insurances to consumers 6. The service “BOVAG Guarantee” is very successfully sold by members to customers
who buy a car 7. The general committee exist of mostly successful entrepreneurs, who naturally want
to act. The facts above led to a situation where the BOVAG committee sees opportunities to enter the consumer market with BOVAG-services and -products with the intention that more consumers buy at the companies of the members and so the members earn more money. The basic idea is to complete the “circle of mobility”, after the purchase of a car with BOVAG guarantee the consumer needs a car assurance. And although the aftersales, APK-checks, and regular maintenance it is possible that a consumer get a breakdown on the way. An extra service in case of breakdown completes the circle.
Branding constellations as reliable predictors of brand extensions
A branding constellation reliability case study 29
The two main services, besides guarantee, which were recently developed and launched: 1. “BOVAG Breakdown Service” is executed by the 6.000 car members who are joined
together in a service, based on the fact that each car company has the possibility to service consumers with car problems
2. “BOVAG Car Assurance” is already sold by a daughter with another name; so BOVAG Car Assurance is an extra label for an existing insurance service.
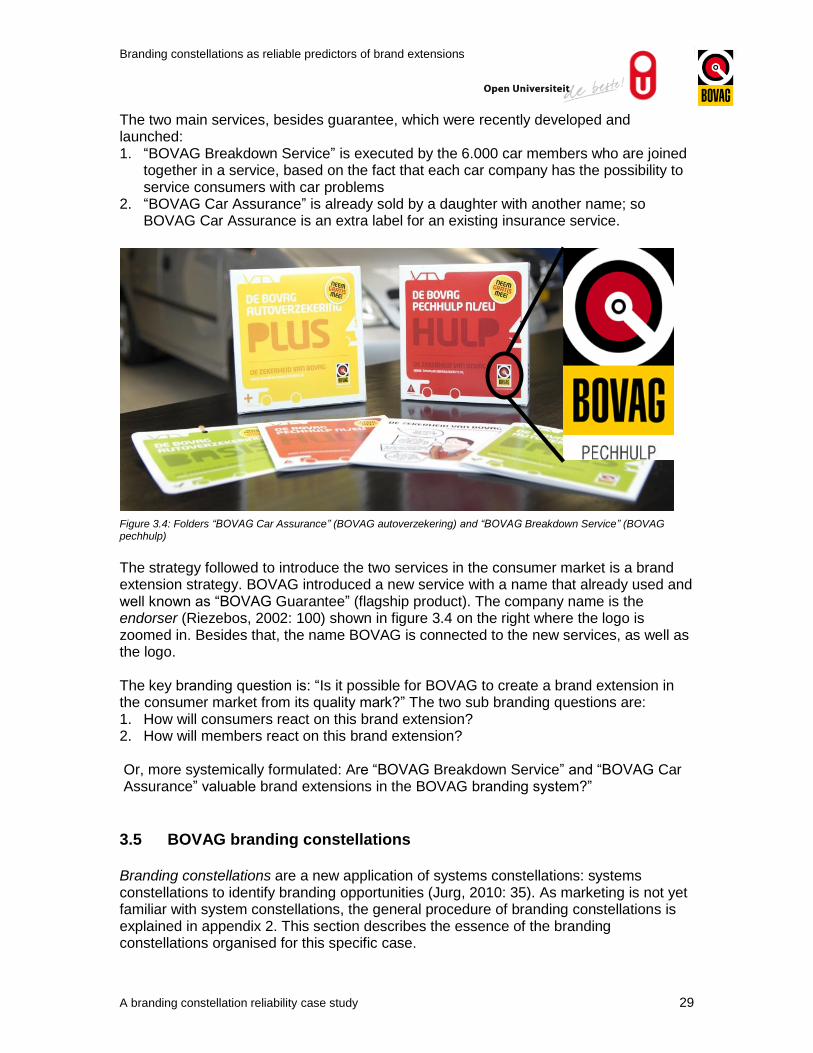
Figure 3.4: Folders “BOVAG Car Assurance” (BOVAG autoverzekering) and “BOVAG Breakdown Service” (BOVAG pechhulp)
The strategy followed to introduce the two services in the consumer market is a brand extension strategy. BOVAG introduced a new service with a name that already used and well known as “BOVAG Guarantee” (flagship product). The company name is the endorser (Riezebos, 2002: 100) shown in figure 3.4 on the right where the logo is zoomed in. Besides that, the name BOVAG is connected to the new services, as well as the logo. The key branding question is: “Is it possible for BOVAG to create a brand extension in the consumer market from its quality mark?” The two sub branding questions are: 1. How will consumers react on this brand extension? 2. How will members react on this brand extension? Or, more systemically formulated: Are “BOVAG Breakdown Service” and “BOVAG Car Assurance” valuable brand extensions in the BOVAG branding system?”
3.5 BOVAG branding constellations
Branding constellations are a new application of systems constellations: systems constellations to identify branding opportunities (Jurg, 2010: 35). As marketing is not yet familiar with system constellations, the general procedure of branding constellations is explained in appendix 2. This section describes the essence of the branding constellations organised for this specific case.

Branding constellations as reliable predictors of brand extensions
A branding constellation reliability case study 30
3.5.1 Branding constellation workshop structure February 18, 2010, BOVAG’s marketing and communication manager (further called marketing manager), the facilitator and the researcher had a dialogue on the branding opportunities prior to the branding constellations (see appendix 1 the preparation document for this dialogue). The information collected in this meeting was employed to develop and prepare the workshop. February 26, 2010, two consecutive branding constellations took place in the home of mobility at Bunnik. Two branding constellations were conducted successively in the same room with the same group of people of about 50 persons and facilitated by the same facilitator. The first branding constellation had an external perspective and the second branding constellation had an internal perspective. Table 3.1 presents the branding constellation workshop programme. Table 3.1 Branding constellation workshop programme
Time Programme
15.00 – 15.30 Arrival, coffee/tea
15.30 – 15.40 Introduction
15.45 – 16.45 Branding constellation one, fill out questionnaire
16.45 – 17.00 Break with coffee, tea, and soft drinks
17.00 – 18.00 Branding constellation two, fill out questionnaire
18.00 – 18.30 Bread, coffee, tea, and leave
18.30 – 18.45 Short interview with the marketing manager BOVAG.
The audience was placed in a U-form. In the open space, the branding elements were positioned by the branders. The audience did not have any background information about the brand or the branding opportunities.
3.5.2 Workshop realisation Both branding constellations started with the positioning of Brand Name by the marketing manager and the spokesman, respectively, an older man with grey hair in a grey suite. This might indicate that the two branders feel that their BOVAG brand is old and colourless. In both constellations, however, Brand Name mostly played a subordinate role; opposite to Quality Mark, which was represented by a rather small, middle-aged, and well-dressed lady, who was very clear in her communication. She attracted more attention than Brand Name and formed the centre in the constellation where she was positioned. In both branding constellations the brand extensions BOVAG Breakdown Service (in Dutch: pechhulp) and BOVAG Car Assurance (in Dutch: autoverzekering) were set up. In the first branding constellation, Breakdown Service was positioned at the outside of the configuration and almost completely ignored. In the second (internal) constellation he was repositioned at least five times by the facilitator to find a position where he felt well and was appreciated by the other branding elements. But nowhere the right position in the constellation could be found and the other stand-ins kept ignoring him never the less. BOVAG Car Assurance on the contrary was warmheartedly welcomed by the other stand-ins. In both branding constellations the others liked her, were smiling to her and most of them had a positive relationship with her. She triggered a lot of positive energy.

Branding constellations as reliable predictors of brand extensions
A branding constellation reliability case study 31
The first branding constellation by the marketing manager had an external perspective. The following branding elements, in alphabetical order, were setup: BOVAG Breakdown Service, BOVAG Car Assurance, Brand Name, Car Dealers, Consumers, Independent Car Repairers, Lobbying, and Quality Mark. The first (projection) positions of the extensions in the first (external) branding constellation set up by the marketing manager are presented in figure 3.5.
Figure 3.5: Projection positions of the brand extensions in the first (external) branding constellation set up by the marketing manager
In the projection phase (the initial positioning of the branding elements by the brander) of the first branding constellation both brand extensions were positioned rather close together, indicating that the marketing manager had the impression that both brand extensions needed a similar positioning. The vision phase positions of the brand extensions in the first (external) branding constellation set up by the marketing manager is presented in figure 3.6.
BOVAG Breakdown Service
BOVAG Car Assurances
Brand Name
Car Dealers
Independent Car Repairers
Lobbying Consumers

Branding constellations as reliable predictors of brand extensions
A branding constellation reliability case study 32
Figure 3.6: Vision phase positions of the brand extensions in the first (external) branding constellation set up by the marketing manager
In the vision phase, the final stage of the branding constellation, the BOVAG Car Assurance was interested in other elements and vice versa, while BOVAG Breakdown Service had a fractious attitude. He was making snarky comments en was frustratingly stubborn. Further, especially consumers and BOVAG Car Assurance had a fine relationship. The second branding constellation by the spokesman had an internal perspective. The next elements, in alphabetical order, were positioned: ANWB1, BOVAG Breakdown Service, BOVAG Car Assurance, Brand Name, Clients, Committee, Director, Divisions, Lobbying, and Members. The first (projection) position of BOVAG Breakdown Service in the second (internal) branding constellation set up by the BOVAG spokesman is illustrated by figure 3.7.
1 ANWB is a consumer association with about 4 million members (ANWB website, feiten en cijfers, August
23, 2013). ANWB and BOVAG regularly joined forces in their lobbying, otherwise both association compete each other with the same products. For example the ANWB have also a car assurance and one of their core products is a breakdown service.
BOVAG Breakdown Service
BOVAG Car Assurances
Brand Name Car Dealers Independent Car Repairers
Lobbying
Quality Mark
Consumers

Branding constellations as reliable predictors of brand extensions
A branding constellation reliability case study 33
Figure 3.7: Projection position of Breakdown Service in the second (internal) branding constellation set up by the spokesman
In the projection phase of the second (internal) branding constellation by the spokesman the extensions were setup at totally different places than in the first (external) branding constellation. BOVAG Breakdown Service was positioned in the centre, which caused a lot of verbal and nonverbal negativism from the other elements. The positioning of BOVAG Car Assurance is presented in figure 3.8. In the meanwhile Brand Name was repositioned at the end of the room and became the “target” of the branding constellation where all other elements were focused upon.
. Figure 3.8: Projection positions of BOVAG Car Assurance in the second (internal) branding constellation set up by the spokesman
BOVAG Car Assurance
Clients
Lobbying
Members Director Divisions
Committee
BOVAG Breakdown Service
Clients Lobbying Members Director
Brand Name
Divisions
Committee

Branding constellations as reliable predictors of brand extensions
A branding constellation reliability case study 34
BOVAG Car Assurance was repositioned in line with the other stand-ins, but in the peak of the configuration (see figure 3.8). The vision phase of the second branding constellation is presented in figure 3.9.
Figure 3.9: Final positions of the brand extensions in the second (internal) branding constellation set up by the spokesman At the end of the vision phase of the internal second branding constellation, BOVAG Breakdown Service was positioned at the border of the configuration, while BOVAG Car Assurance ended as an integral part of the configuration. The pictures above show that the brand extension BOVAG Car Assurance was represented by a young female dressed in a white blouse with blond hair. This element was loaded with young, frank, happy energy, while most other elements were at last 15 years older than her wearing dark cloths, except for Lobbying who wore a (dark) red shirt. Almost all elements indicated that the expansion with this element provided more energy to the configuration. For Quality Mark, the core of the branding system is formed by BOVAG Car Assurance and Consumer. A preliminary branding constellation conclusion could be that BOVAG Car Assurance is a valuable extension, both from an external and an internal perspective. The pictures above show that the brand extension BOVAG Breakdown Service is represented by a young male with a provoking energy. This element is loaded with a stubborn and irritating attitude, condescending, and a negative energy. The other stand-ins generally had a neutral or negative relationship with him. Lobbying (a typical association part) was really annoyed with him. A preliminary branding constellation interpretation could be that the BOVAG Breakdown Service extension does not add more value to the system. Even further, it could cause a negative feedback to the branding system according to the branding constellation. A remarkable last comment in the second branding constellation of the element Brand Name was that the BOVAG Breakdown Service must be removed from the system. His quote “it looks like a train that derails when he is in the system”. The whole videos of the branding constellations can be found on DATA-DVD (map 1). The design of how data was collected and interpreted is described in the next chapter, Chapter 4.
BOVAG Car Assurance
BOVAG Breakdown
Service

Branding constellations as reliable predictors of brand extensions
A branding constellation reliability case study 35
4 Data design
Chapter 4 presents the data design. Section 4.1 describes the use of two important methods in the branding constellations. Section 4.2 describes the reliability measurements covering the first research question. Section 4.3 covers the second research question by describing the data analysis about stacking of the comparable cases. Section 4.4 contains the leeway of this case study namely research question 3.
4.1 Methodology
Subsection 4.1.1 explains the design of the questionnaires. Subsection 4.1.2 describes the branding constellation transcriptions.
4.1.1 Questionnaires Immediately after the branding constellations the branders and all other attendees were asked to complete a questionnaire. This form can be found in appendix 5. The questionnaires of both constellations were similar. They contained nine questions about propositions to get insight in how the attendees perceived the findings of the branding constellations regarding the two brand extensions. The questions were focused on the importance and valuation of specific elements in the branding system: Brand Name, Quality Mark, BOVAG Breakdown Service, and BOVAG Car Assurance. The questions could be scored on a ten-point scale from “absolutely not” to “absolutely yes”. The answers of the attendees and the branders were analysed per branding constellation to find out if there is consensus. First, a frequency account was performed (how many answers form each category). Second, a histogram was made to present the variation in the answers. The assumption is that if the histogram has a normal distribution that there is consensus. This assumption was tested statistically. In addition, the first (external) branding constellation was statistically analysed on mean differences with the second (internal) branding constellation. If the outcomes matched regarding the two brand extensions, than the reliability of the branding constellations is considered high.
4.1.2 Transcriptions The researcher, in the presence of the facilitator, transcribed the two branding constellations. Non-verbal communication, postures and movements were reproduced in writing in the transcripts when they appeared different from the verbal statements. The two branding constellations were held on the 26th of February 2010 and were transcribed on the 28th up to the 29th of April 2010. The transcripts can be found on the DATA-DVD (map 2).

Branding constellations as reliable predictors of brand extensions
A branding constellation reliability case study 36
4.2 Reliability measurements of branding constellations
This section explains the design of this case study to answer the first research question as described in chapter 1.2.2: “How reliable are the branding constellations of this BOVAG case study regarding precision reliability, bilateral relationship test-retest reliability, perceived bilateral relationship reliability, and introspective reliability?”. Within the Theme, all these measurements were carried out before and standardised. Subsection 4.2.1 explains the design of the precision reliability measurement, subsection 4.2.2 goes into the design of the bilateral relationship test-rest reliability, subsection 4.2.3 addresses the perceived bilateral relationship reliability, subsection 4.2.4 contains the introspective reliability and finally subsection 4.2.5 contains an overview of the reliability measurements.
4.2.1 Precision reliability The Theme conceptualises precision reliability based on Peter (1997: 394). Peter refers to precision as an approach of reliability. The precision reliability of branding constellations is defined within the Theme as the degree of which the statements of the stand-ins in the branding constellations can be tested (Van Reij, 2010: 34). This measurement focuses on the reliability of the branding constellation by measuring its falsification/verification opportunities. Van Reij (2010: 37) summarised the Theme efforts into a measurement including detailed excel instructions, which are used for transcriptions and measurements. These can be found on the DATA-DVD (map 2). The transcriptions of the branding constellations were imported in the excel file after which the measurements were carried out using the instructions. Not all statements were suitable for measuring. Table 4.1 presents a legend of the not applicable statements for precision measurements based on Van Reij (2010: 33). Table 4.1 Legend of not applicable statements for precision measurements (Van Reij, 2010: 33)
Statements by the stand-ins that were not taken into account
1. Incomplete sentences, single words, or stop gaps
2. Not understandable statements shown as [ ]
3. Repeated statements by the facilitator due to not understandable statements according to blanks and/or stand-ins
4. Non-verbal actions
5. Comments by the camera people
6. Thank you-statements by the facilitator and the brander.
The above explained method led to an excel file in which all statements of the stand-ins of the branding elements during the branding constellations that did not qualify as a not-applicable statement, were scored for their precision (see DATA-DVD, map 2). Next, the Theme coordinator and the current Theme students reviewed the files. The statements that were taken into account were judged to what degree statements of the stand-ins had the possibility of allowing verification/falsification on a five-point scale. Table 4.2 presents the precision scores. High scores on precision mean that many statements of stand-ins can be falsified on a five-point scale (-2 to +2).

Branding constellations as reliable predictors of brand extensions
A branding constellation reliability case study 37
Table 4.2 Legend of precision reliability scores (Roossien, 2012: 27)
Scores Interpretations
+2 Statement of a stand-in of a brand element is directly measurable and therefore can be verified or falsified
+1 Statement of a stand-in of a brand element can be operationalised employing definitions that might be found in literature
+0 Statement of a stand-in of a brand element cannot be operationalised employing definitions that might be found in literature
-1 Statement of a stand-in of a brand element is multi-interpretable
-2 Statement of a stand-in of a brand element is in contradiction with another statement made by this stand-in.
Further specific instructions regarding the standardised precision measurement are presented in the excel file tab “manual” (see DATA-DVD, map 2). The tab “total precision score” in this excel file presents the precision reliability. Where a row “weighted average” of the mentioned tabs is given, the totalised precision scores are divided by the number of elements involved. The standardised excel file contains a standard legend for interpreting the findings presented in table 4.3. Table 4.3 Legend total precision reliability scores (Roossien, 2012: 27)
Scores Interpretations
+1.2 – +2.0 The precision reliability score is very high
+0.4 – +1.2 The precision reliability score is moderately high
-0.4 – +0.4 The precision reliability score is ambivalent
-1.2 – -0.4 The precision reliability score is moderately low
-2.0 – -1.2 The precision reliability score is very low.
Notably, the precision reliability was measured on both branding constellations separately.
4.2.2 Bilateral relationship test-retest reliability The bilateral relationship test-retest reliability measurement focused on the reliability of the branding constellations by comparing the relationship of two stand-ins of identical branding elements in the two branding constellations. Hereto the standardised measurements by Van Reij (2010: 36) are employed. The transcriptions of the branding constellations were imported in the excel file after which the measurement could be carried out using the instructions in the standardised excel file on the DATA-DVD (map 2). Not all statements were suitable for measuring. Table 4.4 presents a legend of the not applicable statements, based on Van Reij (2010: 33).

Branding constellations as reliable predictors of brand extensions
A branding constellation reliability case study 38
Table 4.4 Legend of not applicable statements for bilateral relationship test-retest reliability (Van Reij, 2010: 33)
Statements by the stand-ins that were not taken into account
1. Statements of a stand-in in second person, for example: "he has a connection with him"
2. Incomplete sentence, single words, or stopgaps are not taken into account
3. Not understandable statements are shown as [ ]. Repeated statements by the facilitator due to not understandable statements are not taken into account
4. Nonverbal interpretations are not taken into account
5. Statements/ comments by the camera people are not taken into account, except the comments regarding checks (these are underlined)
6. Statements like; thank you by the facilitator, branders, and attendees are not taken into account.
The statements that were taken into account were employed to measure the bilateral relationships between all combinations of branding elements, as indicated by the stand-in statements in the two branding constellations. Table 4.5 presents the relationship scores on a five point scale (-2 to +2). Table 4.5 Legend of bilateral relationship test-retest reliability (Roossien, 2012: 28)
Scores Interpretations
+2 The statement of the stand-in of a branding element in a branding constellation indicates a very positive relationship with the stand-in of another branding element in this branding constellation
+1 The statement of the stand-in of a branding element in a branding constellation indicates a positive relationship with the stand-in of another branding element in this branding constellation
0 The statement of the stand-in of a branding element in a branding constellation indicates a neutral relationship with the stand-in of another element in this branding constellation
-1 The statement of the stand-in of a branding element in a branding constellation indicates a negative relationship with the stand-in of another element in this branding constellation
-2 The statement of the stand-in of a branding element in a branding constellation indicates a very negative relationship with the stand-in of another element in this branding constellation.
The standardised excel file calculated the degree of accordance of the relationships between the two constellations. The mean scores of the relationships are presented in a matrix on the DATA-DVD (map 2). Table 4.6 presents the legend to analyse the comparison of the bilateral relationships of the elements between two different constellations, where table 4.7 presents the classification of differences between two constellations. The legends are conform Roossien (2012: 29), except that “strong” is replaced by “high” and “weak” by “low”. Table 4.6 Legend of total bilateral relationship test-retest reliability scores for elements (Roossien, 2012:
29)
Scores Interpretations
+1.2 – +2.0 The similarity in the relationship between two stand-ins of branding elements in two different branding constellations is very high
+0.4 – +1.2 The similarity in the relationship between two stand-ins of elements in two different constellations is moderately high
-0.4 – +0.4 The similarity in the relationship between two stand-ins of elements in two different constellations is ambivalent
-1.2 – -0.4 The similarity in the relationship between two stand-ins of elements in two different constellations is moderately low
-2.0 – -1.2 The similarity in the relationship between two stand-ins of elements in two different constellations is very low.
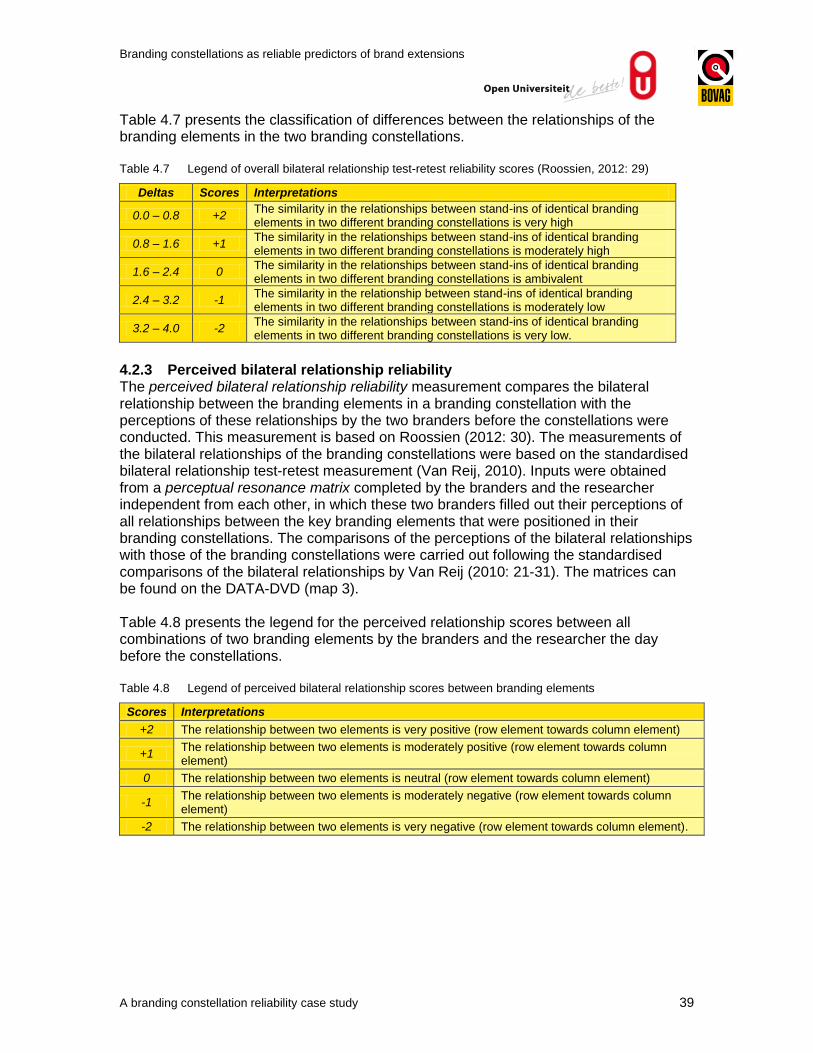
Branding constellations as reliable predictors of brand extensions
A branding constellation reliability case study 39
Table 4.7 presents the classification of differences between the relationships of the branding elements in the two branding constellations. Table 4.7 Legend of overall bilateral relationship test-retest reliability scores (Roossien, 2012: 29)
Deltas Scores Interpretations
0.0 – 0.8 +2 The similarity in the relationships between stand-ins of identical branding elements in two different branding constellations is very high
0.8 – 1.6 +1 The similarity in the relationships between stand-ins of identical branding elements in two different branding constellations is moderately high
1.6 – 2.4 0 The similarity in the relationships between stand-ins of identical branding elements in two different branding constellations is ambivalent
2.4 – 3.2 -1 The similarity in the relationship between stand-ins of identical branding elements in two different branding constellations is moderately low
3.2 – 4.0 -2 The similarity in the relationships between stand-ins of identical branding elements in two different branding constellations is very low.
4.2.3 Perceived bilateral relationship reliability The perceived bilateral relationship reliability measurement compares the bilateral relationship between the branding elements in a branding constellation with the perceptions of these relationships by the two branders before the constellations were conducted. This measurement is based on Roossien (2012: 30). The measurements of the bilateral relationships of the branding constellations were based on the standardised bilateral relationship test-retest measurement (Van Reij, 2010). Inputs were obtained from a perceptual resonance matrix completed by the branders and the researcher independent from each other, in which these two branders filled out their perceptions of all relationships between the key branding elements that were positioned in their branding constellations. The comparisons of the perceptions of the bilateral relationships with those of the branding constellations were carried out following the standardised comparisons of the bilateral relationships by Van Reij (2010: 21-31). The matrices can be found on the DATA-DVD (map 3). Table 4.8 presents the legend for the perceived relationship scores between all combinations of two branding elements by the branders and the researcher the day before the constellations. Table 4.8 Legend of perceived bilateral relationship scores between branding elements
Scores Interpretations
+2 The relationship between two elements is very positive (row element towards column element)
+1 The relationship between two elements is moderately positive (row element towards column element)
0 The relationship between two elements is neutral (row element towards column element)
-1 The relationship between two elements is moderately negative (row element towards column element)
-2 The relationship between two elements is very negative (row element towards column element).

Branding constellations as reliable predictors of brand extensions
A branding constellation reliability case study 40
The standardised excel file calculated the degree of accordance of the relationships between the external and internal branding constellations and the resonance matrices filled out by the marketing manager and the spokesman, respectively. Table 4.9 presents the legend to analyse the comparison of the bilateral relationships of the elements between the branding constellations and the resonance matrices. The legends are conform Roossien (2012: 29), except that “strong” is replaced by “high” and “weak” by “low”. Table 4.9 Legend total perceived bilateral relationship reliability scores (Roossien, 2012: 29)
Deltas Scores Interpretations
0.0 – 0.8 +2 The similarity in the relationship between stand-ins in the branding constellation and their relationship in the resonance matrix is very high
0.8 – 1.6 +1 The similarity in the relationship between stand-ins in the branding constellation and their relationship in the resonance matrix is moderately high
1.6 – 2.4 0 The similarity in the relationship between stand-ins in the branding constellation and their relationship in the resonance matrix is ambivalent
2.4 – 3.2 -1 The similarity in the relationship between stand-ins in the branding constellation and their relationship in the resonance matrix is moderately low
3.2 – 4.0 -2 The similarity in the relationship between stand-ins in the branding constellation and their relationship in the resonance matrix is very low.
Table 4.10 presents the classifications of differences between the relationships of the branding elements in the branding constellations and the resonance matrices Table 4.10 Legend of overall perceived bilateral relationship reliability scores
Deltas Scores Interpretations
0.0 – 0.8 +2 The similarity is very high
0.8 – 1.6 +1 The similarity is moderately high
1.6 – 2.4 0 The similarity is ambivalent
2.4 – 3.2 -1 The similarity is moderately low
3.2 – 4.0 -2 The similarity is very low.
4.2.4 Introspective reliability Within the Theme the introspective reliability is defined as the degree to which the statements of the stand-ins in the two branding constellations match with the reality perceptions of the researcher (Roossien, 2012: 31). In order to examine introspective reliability of the branding constellations, first the precise statements were selected by means of the excel models of Van Reij (2010: 37). Second, the researcher reflected on the truth (the representation of reality; based on Carson, Gilmore, Perry, & Gronhaug, 2001: 16) of the falsifiable statements, given available hard or soft information. Finally, the excel models of Roossien (2012) were employed to calculate scores for introspective reliability comparable with the approach for precision reliability. The transcriptions of the branding constellations were imported in the excel files after which the measurements were carried out. Only the precise statements were scored. Table 4.11 presents the scoring legend for the introspective reliability measurement of the Theme according Roossien (2012: 32).

Branding constellations as reliable predictors of brand extensions
A branding constellation reliability case study 41
Table 4.11 Legend of total introspective reliability scores (after Roossien 2012: 32)
Scores Interpretations
+2 A precise statement of a stand-in of a branding element in the branding constellation is accordance with reality according to the researcher based on hard information
+1 A precise statement of a stand-in of a branding element in the branding constellation is in accordance with reality according to the researcher based on soft information
0 The researcher does not know whether a precise statement of a stand-in of a branding element in the branding constellation is in accordance with reality
-1 A precise statement of a stand-in of a branding element in the branding constellation is moderately in discordance with reality according to the researcher based on soft information
-2 A precise statement of a stand-in of a branding element in the branding constellation is fully in discordance with reality according to the researcher based on hard information.
The legend for interpreting the findings can be found in table 4.12. Table 4.12 Legend of overall total introspective reliability scores (Roossien, 2012: 33)
Scores Interpretations
+1.2 – +2.0 The introspective reliability is very high
+0.4 – +1.2 The introspective reliability is moderately high
-0.4 – +0.4 The introspective reliability is ambivalent
-1.2 – -0.4 The introspective reliability is moderately low
-2.0 – -1.2 The introspective reliability is very low.
4.2.5 Overview of reliability measurements Table 4.13 gives an overview of the reliability measurements which are used to investigate research question 1. Table 4.13 Overview of reliability measurements for the first research question
Sections Reliability measurements
4.1.1 Precision reliability
4.1.2 Bilateral relationship test-retest reliability
4.1.3 Perceived bilateral relationship reliability
4.1.4 Introspective reliability
Overall Unweighted average.
Each reliability measurement led to a specific judgement on the reliability of the branding constellations. Table 4.14 presents a legend for the overall reliability score of the branding constellations. The interpretations follow the standard interpretation of Jurg (2010: 99). Table 4.14 Legend overall reliability scores (Roossien, 2012: 34)
Scores Interpretations
+1.2 – +2.0 Branding constellations are very reliable
+0.4 – +1.2 Branding constellations are moderately reliable
-0.4 – +0.4 Branding constellations are neutral or ambivalent on reliability
-1.2 – -0.4 Branding constellations are moderately unreliable
-2.0 – -1.2 Branding constellations are very unreliable.

Branding constellations as reliable predictors of brand extensions
A branding constellation reliability case study 42
4.3 Stacking Comparable Cases
This subsection deals with the methodology of research question 2 (chapter 1.2.2): “How do these BOVAG case study reliability findings relate to the previous findings within the Theme?”. The reliability findings, gathered by applying the data design explained in chapter 4.1, are compared to the reliability findings of predecessors. The stacking of these findings built upon the stacking of the original studies, rather than the studies of the predecessors as Jongsma (2011), Meines (2011), and Roossien (2012) did. The differences between the reliability findings of this case study and the average scores of the stacked comparable are scored on a five-point scale, as presented in table 4.15. Table 4.15 Legend stacking reliability scores (Roossien, 2012: 34)
Scores Interpretations
+1.2 – +2.0 Branding constellations are very reliable
+0.4 – +1.2 Branding constellations are moderately reliable
-0.4 – +0.4 Branding constellations are neutral or ambivalent on reliability
-1.2 – -0.4 Branding constellations are moderately unreliable
-2.0 – -1.2 Branding constellations are very unreliable.
4.4 Consensus reliability
This subsection deals with the methodology of research question 3 (chapter 1.2.2): “How could the consensus reliability measurement be improved?”. Section 4.4.1 describes how Jongsma (2011) completed his consensus measurement. In 4.4.2 the consensus measurement of Roossien (2012) is clarified. Finally, in 4.4.3 the leeway of this thesis is explained by how the consensus measurement might be improved by involving the attendees.
4.4.1 Consensus measurement Jongsma (2011) Jongsma (2011: 29) defined the research question as “How did the consensus among innovation team members develop after the innovation constellation?”. Jongsma conceptualised consensus as “intersubjective agreement”, based on Maso & Smaling (1998: 69). Jongsma (2011: 30) operationalised the consensus reliability definition in his case study by asking an innovation team of TNO about their opinions on five propositions before and after the innovation constellation workshop. The five members of this innovation team were individually asked to score their perceptions regarding these five propositions on an ordinal bipolar five-point scale from -2 to +2 based on Jurg (2010: 95-96).

Branding constellations as reliable predictors of brand extensions
A branding constellation reliability case study 43
Jongsma (2011: 30) defined the following two hypotheses for his study:
H0 Consensus concerning the propositions within the team does not differ before and after the innovation constellation workshop
H1 Consensus concerning the propositions within the team differs before and after the innovation constellation workshop.
To be able to measure the development of consensus, Jongsma (2011: 31) introduced an indicator of consensus. This is the mean variance of the opinions of the team members on a certain proposition. The increase or decrease was measured on three moments in time: before the constellation workshop, six weeks after the constellation workshop, and after the presentation of the findings of the constellations by the facilitator. These indicators of consensus on the three mentioned points of time were calculated and analysed using the variances of the indicators. To support this analysis with a statistical test, Jongsma choose the F-test and compared the between group mean square value and the within group mean square value. The outcomes were also presented in a graph, displayed in figure 4.1.
Proposition 1 In the first phase, innovation should be connected to TK-Naming
Proposition 2 In the first phase, innovation should be marketed as a product rather than a service and with the help of TNO-Funding
Proposition 3 In the first phase, innovation should be offered to Grandparents in Department-Stores
Proposition 4 In the second phase innovation should be developed with the help of families with children through social media as a service
Proposition 5 In the third phase, innovation might be further developed to a Garden-Wellness-Measurements application.
Figure 4.1: Variance of the opinions as the indicator of consensus (y-as) of 5 members of the innovation team regarding 5 propositions on three points in a time period (x-as), (Jongsma, 2011: 46)
Jongsma concluded that the consensus within the team increased significantly after the presentation by the facilitator. And after the respondents scored their perceptions on the five propositions, Jongsma performed an F-test (see table 4.16) and based on these outcomes he one-sidedly rejected the hypothesis H0.
0,000,200,400,600,801,001,201,401,60
Proposition 1
Proposition 2
Proposition 3
Proposition 4
Proposition 5
Time
Variance
Branding constellations as reliable predictors of brand extensions
A branding constellation reliability case study 44
Table 4.16 Legend stacking scores
Hypothesis F critical (2.12) one sided alpha 0.05 F value Hypothesis has to be
Consensus is similar 3.88 4.6 Rejected
Table 4.16 shows that the calculated F value exceeds the critical F-value. This means that the ‘between group mean square value’ is significantly higher than the ‘within group mean square value’, indicating that there is less than 5% chance that the hypothesis is wrongly rejected. Therefore, the null-hypothesis was rejected. Jongsma concluded that the consensus within the innovation team increased significantly after, or due to the presentation by the facilitator. The original text of Jongsma can be read in appendix 6.
4.4.2 Consensus measurement Roossien (2012) The operationalisation of the consensus reliability of Roossien (2012: 33) concerns a measurement of the development of consensus based on the comparison of the resonance matrices by two members of the tonalite brand team on their own branding constellation, the director and the project manager, before and after the branding constellation workshop (9 months later to be exact). Input for this measurement was obtained from the resonance matrices in which these brand team members were asked to fill out their perceptions of all relationships between the key branding elements that were positioned in their branding constellations. These resonance matrices were also employed in the bilateral relationship test-rest reliability and the perceived bilateral relationship reliability, making this reliability in line with the other reliability measurements. The resonance matrices were compared similarly to the standardised bilateral relationship test-retest reliability measurements by Van Reij (2010), leading to a quantification of the intersubjective agreement between key elements before and after the branding constellation. Roossien concluded that the consensus development reliability is ambivalent (-0.1), indicating that the consensus between the director and the project manager regarding the bilateral branding element relationships before and after the branding constellations is very similar. The original text of Roossien can be read in appendix 7.
4.4.3 Suggested improvement consensus measurement Both Jongsma (2011) and Roossien (2012) restricted their consensus measurement to the branders who were familiar with the case and who had their own concerns and biases. This thesis intends to improve the consensus measurement by focusing on the perceptions of the attendees. By asking the attendees to score a number of propositions right after the branding constellations, the degree of similarity between their perceptions was measured. The procedure followed was that right after the constellations the attendees filled out the same questionnaire (see appendix 5) based on propositions following Jongsma (2011), with the difference that Jongsma formulated the propositions based on the branding constellation findings, while in this study they were formulated independently from the workshop.

Branding constellations as reliable predictors of brand extensions
A branding constellation reliability case study 45
The focus of this thesis is on the propositions regarding the perceptions of the attendees of the Brand Name and the two brand extensions to be able to compare the findings with the theoretical model of Martinez. Based on Fishbein and Ajzen (1975: 59), a difference is made between the importance and the valuations (positive contributions) of the perceptions. The nine propositions are per constellation the same so both branding constellations could be compared (see appendix 5). The six core propositions are: 1. Brand Name (N) is important in the current branding system 2. Brand Name (N) contributes positively to the branding system 3. BOVAG Breakdown Service (H) is important in the current branding system 4. BOVAG Breakdown Service (H) contributes positively to the branding system 5. BOVAG Car Assurance (V) is important in the current branding system 6. BOVAG Car Assurance (V) contributes positively to the branding system. These propositions were scored by the attendees on a ten-point scale from very positive (10) to very negative (1), based on Jurg (2010: 94). The scores of the attendees were analysed per question on the proposition and per branding constellation to find out if there is consensus among them.
The first leeway for measuring the consensus reliability is to test whether the scores on the propositions are normally distributed around a “real” value, based on Multon (2010: 629). The more these scores depart from a normal distribution, the more attenuated the perceptions. The more these scores are normally distributed, the higher the perceptual consensus among the attendees; the more the scores on the propositions by the attendees are shaped around a real value, the more reliable the branding constellation. Whether the scores of the attendees and the branders per proposition are normally distributed is analysed by Field (2009: 133-148): 1. Histograms: with a frequency histograms, based on the score sets of this case and a
uniform normal distribution, a judgement can be made on the shape is normally distributed. The judgment is normally distributed if the frequencies are descending from the modus; the judgment is moderately normally distributed if the frequencies are descending from the modus, except for one score; the judgment is not normally distributed if the frequencies are descending from the modus, except for two or more scores.
2. Plots: P–P plots (Probability–Probability plots) illustrate how closely two data sets agree; set 1 covers the normal distribution data set and set 2 contains the score sets of this case study. The judgment is considered to be normally distributed if the set 2 dots touch the normal distribution line of set 1; the judgment is considered to be moderately normally distributed if the set 2 dots touch the normal distribution line of set 1, except for one point; the judgment is considered to be not normally distributed if two or more set 2 dots do not touch the normal distribution line of set 1.
3. Shapiro-Wilkinson tests: if the significant value of the Shapiro-Wilkinson test is greater than or equal to 0.05, than the data are normally distributed. If it is below 0.05, the data significantly deviate from a normal distribution.

Branding constellations as reliable predictors of brand extensions
A branding constellation reliability case study 46
The second leeway for measuring the consensus reliability is to test whether the scores on the eight propositions, concerning the two brand extensions, are significantly positive or negative. The one-sample t-test is used to test what the deviation is from the 5.5 sufficiency norm, the discrimination between sufficient and insufficient. When the scores are significantly lower than the 5.5 sufficiency norm, the conclusion is that the scores are insufficient, indicating that the attendants agree that it is not a wise decision to implement the brand extension based on the branding constellation. Opposite, when the scores are significantly higher than the 5.5 sufficiency norm, the conclusion is that the scores are sufficient, indicating that the attendants agree that is a wise decision to implement the brand extension based on the branding constellation. This chapter presented the data design of this case study. The next chapter presents the findings from the case study following the methodology as presented in this chapter.

Branding constellations as reliable predictors of brand extensions
A branding constellation reliability case study 47
5 Findings
Chapter 5 analyses the reliability of the branding constellations of BOVAG. Section 5.1 covers the first research question “How reliable are the findings of the two different branding constellations to identify the branding problem of the case study?”. The next section 5.2 covers the second research question “How do these case study findings harmonize and differ with the branding constellation reliability findings of previous case studies?”. And section 5.3 covers the leeway, research question 3.
5.1 Reliability findings of branding constellations
This section answers the first research question “How reliable are the branding constellations of this BOVAG case study?” regarding precision reliability, bilateral relationship test-retest reliability, perceived bilateral relationship reliability and introspective reliability? Subsection 5.1.1 till 5.1.4 respectively presents the reliability findings. Finally, subsection 5.1.5 presents an overview of the reliability measurements.
5.1.1 Precision reliability The precision reliability of the constellation is the first reliability measurement. The element with the highest mean precision score is mentioned first, followed by the second highest average precision score, and so on. The calculations are based on the standardised calculations of the Theme initiated by Van Reij (2010) and improved by Roossien (2012). The average precision of each stand-in of a branding element is calculated by dividing the sum of the scores by the number of scored statements presented in the same row. The average precision of the branding constellation is an unweighted average of the average precision of the stand-ins of the elements of that branding constellation. The completed standardised precision excel files of the both constellations can be found on the Data DVD. Table 5.1 presents the findings of the precision measurement of the first (external) constellation. Table 5.1 Findings of precision reliability measurements on first (external) branding constellation (scale -2
to +2)
Frequencies scores
Branding elements Average precision
scores +2 1 0 -1 -2
Numbers of statements
scored
Numbers of statements
Brand Name +0.31 1 6 2 4 0 13 22
BOVAG Car Assurance +0.25 0 4 2 2 0 8 11
Quality Mark +0.23 0 7 2 4 0 13 13
Independent Car Repairers +0.11 0 3 4 2 0 9 10
Lobbying -0.14 0 2 2 3 0 7 9
Car Dealers -0.33 0 2 0 4 0 6 8
Customers -0.63 0 1 1 6 0 8 13
BOVAG Breakdown Service -1.00 0 0 0 7 0 7 7
Average -0.15 1 25 13 32 0 71 93
The average precision reliability of the first (external) branding constellation is ambivalent (-0.15).

Branding constellations as reliable predictors of brand extensions
A branding constellation reliability case study 48
Table 5.2 shows the three most and least precise elements from the second (internal) branding constellation. Table 5.2 Most and least precise branding elements in internal second branding constellation
Ranks Most precise branding elements Least precise branding elements
1. Brand Name BOVAG Breakdown Service
2. BOVAG Car Assurance Customers
3. Quality Mark Car Dealers.
The stand-ins for the elements Brand Name, BOVAG Car Assurance, and Quality Mark are the most precise and the stand-in for the element BOVAG Breakdown Service is least precise. Table 5.3 presents the precision reliability findings of the second (internal) constellation. Table 5.3 Findings of precision reliability measurements on second (internal) branding constellation (scale
-2 to +2)
Frequencies scores
Branding elements Average precision
scores +2 +1 0 -1 -2
Number of statements
scored
Number of statements
Committee +0.33 0 4 0 2 0 6 13
Lobbying +0.29 0 3 3 1 0 7 15
Director +0.18 0 3 7 1 0 11 19
Members +0.00 0 6 1 6 0 13 22
BOVAG Car Assurance +0.00 0 0 1 0 0 1 2
Brand Name -0.05 1 5 5 8 0 19 23
BOVAG Breakdown Service -0.21 1 3 3 6 1 14 18
Clients -0.44 0 2 1 6 0 9 16
Divisions -0.50 0 0 2 2 0 4 5
ANWB -1.00 0 0 0 1 0 1 2
Average -0.14 2 26 23 33 1 85 135
The average precision reliability of the second (internal) branding constellation is also ambivalent (-0.14). Table 5.4 shows the three most and least precise elements from the second (internal) branding constellation. Table 5.4 Most and least precise branding elements in second (internal) branding constellation
Ranks Most precise branding elements Least precise branding elements
1. Committee ANWB
2. Lobbying Divisions
3. Director Clients.
The stand-in for the element Committee was the most precise and the stand-in for the element ANWB was least precise. It should however be noted that there is only one statement scored by the ANWB stand-in.

Branding constellations as reliable predictors of brand extensions
A branding constellation reliability case study 49
Table 5.5 combines the precision reliability findings of the first (external) and second (internal) branding constellations. Table 5.5 Overview precision reliability scores per branding constellation
Branding
constellations
Mean precision
Times scored
2
Times scored
1
Times scored
0
Times scored
-1
Times scored
-2
Sum of
scores
Numbers of
statements scored
First (external) -0.15 1 25 13 32 0 71 93
Second (internal)
-0.14 2 26 23 33 1 85 135
Mean / Sum -0.15* 3 51 36 65 1 156 228
* Mean precision and not a sum
Thus, the precision reliability of the two branding constellations is ambivalent (-0.15). The scores of both constellations were very similar: only the number of 0-scores in the first (external) branding constellation was substantially lower than in the second (internal) one (13 versus 23 times).
5.1.2 Bilateral relationship test-retest reliability The bilateral relationship test-retest reliability was the second reliability measurement. The scoring of statements by stand-ins on their bilateral relationship, led to a calculation of the bilateral relationships of both branding constellations. The completed standardised bilateral relationship excel files of the both constellations can be found on the DATA-DVD (map 2). As described in Chapter 4.2.2, the bilateral relationships of the same elements in both constellations are compared. The following four branding elements appeared in both constellations: BOVAG Breakdown Service, BOVAG Car Assurance, Brand Name, and Lobbying. In the first (external) branding constellation there was an element customers and in the second (internal) constellation the element clients. Although, there was a similarity between these two elements, there were too many differences to treat them as similar. The main difference was that consumers include all Dutch consumers who could buy a BOVAG product and clients cover the consumers who are already clients from a BOVAG member. The bilateral relationships between the four similar branding elements are presented in table 5.6 and table 5.7; the first (external) and the second (internal) constellation, respectively.

Branding constellations as reliable predictors of brand extensions
A branding constellation reliability case study 50
Table 5.6 Bilateral relationships scores in first (external) branding constellation (scale -2 to +2)
Branding elements
Lo
bbyin
g
BO
VA
G C
ar
Assu
ran
ce
Bra
nd
Nam
e
BO
VA
G B
rea
kd
ow
n
Se
rvic
e
Ave
rage
of
row
s
BOVAG Breakdown Service +1.0 +1.3 0.0 +0.8
Brand Name +1.5 0.0 0.0 +0.5
BOVAG Car Assurance +1.0 -1.0 -1.0 -0.3
Lobbying 0.0 +1.0 -2.0 -0.3
Average of columns +1.2 +0.4 0.0 -1.0 +0.2
Table 5.6 shows that overall the bilateral relationships are ambivalent. Most positive towards the other elements was BOVAG Breakdown Service (+0.8), followed by Brand Name (+0.5); most negative were BOVAG Care Assurance and Lobbying. Most valued was Lobbying (+1.2) and least valued BOVAG Breakdown Service (-1.0). The relationship between Lobbying and BOVAG Breakdown Service was perceived negatively by Lobbying, while it was perceived as moderately positive by BOVAG Breakdown Service in the first (external) constellation. In general, BOVAG Breakdown Service had a more positive perspective on his relationships with the other elements than vice versa. Brand Name and Lobbying had a mutual positive relationship. BOVAG Car Assurance was not so positive about the relationship with Brand Name. Brand Name was ambivalent about his relationship with the two brand extensions and the brand extensions BOVAG Care Assurance was negative about the relationship with Brand Name and BOVAG Breakdown Service was ambivalent about the relationship with Brand Name. Table 5.7 presents the bilateral relationships of the second (internal) constellation of the same elements set up in both branding constellations. Table 5.7 Bilateral relationships scores in second (internal) branding constellation (scale -2 to +2)
Branding elements
Bra
nd
Nam
e
BO
VA
G C
ar
Assu
ran
ce
Lo
bbyin
g
BO
VA
G B
rea
kd
ow
n
Se
rvic
e
Ave
rage
of
row
s
Brand Name 0.0 +1.0 -0.3 +0.2
BOVAG Car Assurance 0.0 0.0 0.0 0.0
Lobbying +1.0 0.0 -1.0 0.0
BOVAG Breakdown Service 0.0 +0.7 -1.0 -0.1
Average of columns +0.3 +0.2 0.0 -0.4 0.0

Branding constellations as reliable predictors of brand extensions
A branding constellation reliability case study 51
Table 5.7 shows again that overall the relationships are ambivalent. Most positive towards the other elements was Brand Name (+0.2) and most negative BOVAG Breakdown Service (-0.1). Most valued was Brand Name (+0.3) and least valued BOVAG Breakdown Service (-0.4). Again, there was a negative relationship between the elements BOVAG Breakdown Service and Lobbying. But in this constellation BOVAG Breakdown Service perceived the relationship also negatively. However, the differences are rather limited. BOVAG Car Assurance perceived a neutral relationship with all elements in this constellation. Brand Name and Lobbying had again a mutual positive relationship. Brand Name was again ambivalent about his relationship with the brand extensions and the brand extensions were also ambivalent about their relationships with Brand Name. Table 5.8 presents the comparisons between the bilateral relationships of the same elements of the first (external) and second (internal) branding constellations, employing the legend of table 4.7 in comparing the relationships. Table 5.8 Similarity scores of bilateral relationships of the same branding elements in the branding
constellations (scale -2 to +2)
Branding elements
BO
VA
G C
ar
Assu
ran
ce
Bra
nd
Nam
e
BO
VA
G B
rea
kd
ow
n
Se
rvic
e
Lo
bbyin
g
Ave
rage
of
row
s
Brand Name +2 +2 +2 +2.0
Lobbying +2 +2 +1 +1.3
BOVAG Breakdown Service +2 +2 -1 +1.0
BOVAG Car Assurance +1 +1 +1 +1.0
Average of columns +2.0 +1.7 +1.3 +0.7 +1.3
Thus, the average bilateral relationship test-retest reliability is very high (+1.3), meaning that the relationships between two stand-ins for the same branding elements in the two consecutive branding constellations were very similar. Most similar were the relationships with the other elements perceived by Brand Name (+2.0) and least similar were the relationships with the other elements perceived by the brand extensions (+1.0). Most similar were the relationships by the other elements with BOVAG Car Assurance (+2.0) and least similar were the relationships by the other elements with Lobbying (+0.7). Seven bilateral relationships were very similar (+2), while four bilateral relationships were moderately high (+1). The similarity of the bilateral relationship between BOVAG Breakdown Service and Lobbying in the two constellations was moderately low (-1). Brand Name scored for al relationships very high on similarity. The BOVAG Breakdown Service scored also very high in similarity in his relationship with Brand Name, while BOVAG Car Assurance scored moderately high in similarity on the relationship with Brand Name in the two branding constellations.

Branding constellations as reliable predictors of brand extensions
A branding constellation reliability case study 52
5.1.3 Perceived bilateral relationship reliability The perceived bilateral relationship measurement was the third reliability measurement. For this measurement each brander denoted their perceptions of the bilateral relationships of the branding elements before the workshop by completing a perceptual resonance matrix with the branders’ perceptions of the relationships of the branding elements set up in the first (external) constellation and second (internal) constellation, respectively. The matrix is similar to one employed for the bilateral relationship test-retest. The completed propositions questionnaires can be found on the DATA-DVD (map 5). Table 5.10 presents the perceived relationships of the marketing manager who set up the (first) external constellation. The researcher and the spokesman also filled out their perceptions of the relationships between the branding elements displayed the first (external) constellation. These scores can also be found on the DATA-DVD (map 5). Table 5.10 Perceptions of bilateral relationships scores by marketing manager (scale -2 to +2)
Branding elements
Bra
nd
Nam
e
Qu
alit
y M
ark
Con
sum
ers
Lo
bbyin
g
Ind
epe
nd
en
t C
ar
Rep
air
ers
BO
VA
G C
ar
Assu
ran
ce
BO
VA
G B
rea
kd
ow
n
Se
rvic
e
Car
Dea
lers
Ave
rage
of
row
s
Independent Car Repairers 2.0 2.0 +2.0 2.0 1.0 1.0 +1.0 +1.6
Brand Name 2.0 +1.0 2.0 1.0 1.0 1.0 +1.0 +1.3
BOVAG Breakdown Service 2.0 1.0 +2.0 -1.0 1.0 2.0 0.0 +1.0
BOVAG Car Assurance 2.0 2.0 +2.0 -1.0 1.0 1.0 -1.0 +0.9
Quality Mark 2.0 +2.0 2.0 1.0 1.0 -1.0 -1.0 +0.9
Car Dealers 2.0 1.0 +1.0 2.0 -1.0 -1.0 1.0 +0.7
Consumers 1.0 2.0 0.0 1.0 0.0 1.0 -1.0 +0.6
Lobbying 2.0 2.0 -1.0 1.0 -1.0 -2.0 +2.0 +0.4
Average of columns +1.9 +1.7 +1.3 +0.9 +0.7 +0.4 +0.3 +0.1 +0.9
Table 5.10 shows that the bilateral relationships between the branding elements perceived before the workshop by the marketing manager and the ones displayed in the first (external) branding constellation are moderately positive (+0.9). Independent Car Repairers was most positive about the other branding elements (+1.6), followed by Brand Name (+1.3). The least positive was Lobbying (+0.4). Overall, the elements most valued Brand Name (+1.9) and Quality Mark (+1.7). The lowest score was found for the relationships with Car Dealers (+0.1), the extensions BOVAG Breakdown Service (+0.3), and BOVAG Car Assurance (+0.4).

Branding constellations as reliable predictors of brand extensions
A branding constellation reliability case study 53
Table 5.11 presents the bilateral relationships in the first (external) constellation. Table 5.11 Bilateral relationships scores in the first (external) constellation (scale -2 to +2)
Branding elements
Lo
bbyin
g
Ca
r d
ea
lers
Qu
alit
y M
ark
BO
VA
G C
ar
Assu
ran
ce
Co
nsum
ers
Bra
nd
Nam
e
BO
VA
G B
rea
kd
ow
n
Se
rvic
e
Ind
epe
nd
en
t C
ar
Re
pa
ire
rs
Ave
rage
of
row
s
Consumers +1.0 +0.5 +1.5 +1.0 +0.3 +2.0 0.0 +0.9
Car dealers +2.0 0.0 0.0 0.0 +1.0 0.0 +1.0 +0.6
BOVAG Breakdown Service +1.0 0.0 0.0 +1.3 +1.0 0.0 +0.5 +0.5
Brand Name +1.5 +1.0 +2.0 0.0 0.0 0.0 -2.0 +0.4
Independent Car Repairers +1.0 +1.5 0.0 0.0 +2.0 -2.0 0.0
+0.4
Lobbying +2.0 +1.0 0.0 0.0 +1.0 -2.0 0.0 +0.3
Quality Mark -0.5 -1.0 +1.0 +1.7 +0.8 0.0 -0.6 +0.2
BOVAG Car Assurance +1.0 +1.5 +1.0 -1.0 -1.0 -1.0 -1.0 -0.1
Average of columns +1.0 +0.8 +0.8 +0.5 +0.5 0.0 -0.1 -0.3 +0.4
Table 5.11 shows that the bilateral relationships between the branding elements in the first (external) constellation are moderately positive (+0.4). Most positive about the other elements was Consumers (+0.9) and most negative was BOVAG Car Assurance (-0.1). Most positively valued by the other elements was Lobbying (+1.0) and most negatively BOVAG Breakdown Service (-0.1). Brand Name was perceived as neutral by the other elements (0.0). The bilateral relationships by the other elements with BOVAG Car Assurance were moderately positive (+0.5). Table 5.12 presents the scores of the similarity between the bilateral relationships of the elements in the perceptions of the relationships between the elements in the perceptual resonance matrix and in the first (external) branding constellation by employing the legend of table 4.9.

Branding constellations as reliable predictors of brand extensions
A branding constellation reliability case study 54
Table 5.12 Similarity scores between perceptions of bilateral relationships and the first (external) constellation by marketing manager (scale -2 to +2)
Branding elements
Ca
r D
ea
lers
BO
VA
G B
rea
kd
ow
n
Se
rvic
e
BO
VA
G C
ar
Assu
ran
ce
Qu
alit
y M
ark
Co
nsum
ers
Lo
bbyin
g
Ind
epe
nd
en
t C
ar
Re
pa
ire
rs
Bra
nd
Nam
e
Ave
rage
of
row
s
Consumers +1.0 +1.0 +1.0 +2.0
+1.0 +1.0 +2.0 +1.3
Lobbying +2.0 +2.0 +1.0 +1.0 +1.0 +1.0 +1.0 +1.3
BOVAG Breakdown Service +2.0 +2.0 +1.0 +1.0 0.0 +2.0 0.0 +1.1
Brand name +2.0 +1.0 +1.0 +2.0 +1.0 +2.0 -1.0 +1.1
Car Dealers +1.0 +1.0 +1.0 +1.0 +2.0 0.0 +1.0 +1.0
Quality Mark +2.0 +1.0 +2.0 +2.0 -1.0 0.0 +1.0 +1.0
Independent Car Repairers +2.0 +1.0 +1.0 0.0 +2.0 +1.0
-2.0 +0.7
BOVAG Car Assurance -1.0 +2.0 +1.0 -1.0 0.0 0.0 -1.0 0.0
Average of columns +1.4 +1.3 +1.3 +1.1 +1.0 +0.7 +0.4 +0.3 +0.9
Table 5.12 shows that the perceived bilateral relationship reliability of the first (external) branding constellation is moderately high (+0.9). This indicates that the perceptions of the bilateral relationships by the marketing manager and the bilateral relationships scores of the first (external) constellation were moderately similar. The highest similarity was for the relationships with Car Dealers (+1.4) and the two extensions (both +1.3). The lowest similarity between the perceptions and the constellation had the relationship of all elements with Brand Name (+0.3). In the perception of the marketing manager the relationships with Brand Name were very positive, while in the constellation these relationships were neutral. Table 5.13 presents the perceived relationships of the spokesman who set up the second (internal) branding constellation before the constellation. Unfortunately, he did not score Brand Name. These scores can also be found in DATA-DVD (map 2).

Branding constellations as reliable predictors of brand extensions
A branding constellation reliability case study 55
Table 5.13 Perceptions of the bilateral relationships by the spokesman (scale -2 to +2)
Branding elements
Me
mb
ers
Clie
nts
Dir
ecto
r
Div
isio
ns
Lo
bbyin
g
Co
mm
itte
e
BO
VA
G B
rea
kd
ow
n
Se
rvic
e
AN
WB
Bra
nd
Nam
e
Ave
rage
of
row
s
Director +2.0 +1.0 +2.0 +2.0 +1.0 +1.0 0.0 - +1.3
Members +2.0 +2.0 +1.0 +2.0 +2.0 +1.0 -1.0 - +1.3
Committee +2.0 +1.0 +1.0 +2.0 +1.0 +1.0 -1.0 - +1.0
Divisions +2.0 +2.0 0.0 +2.0 +1.0 +1.0 -1.0 - +1.0
Lobbying +1.0 0.0 +2.0 +1.0 +1.0 0.0 0.0 - +0.7
Clients +1.0 0.0 0.0 0.0 0.0 +1.0 0.0 - +0.3
BOVAG Breakdown Service +1.0 +2.0 0.0 0.0 0.0 0.0 -2.0 - +0.1
ANWB +1.0 -1.0 +1.0 0.0 -1.0 0.0 -2.0 - -0.3
Brand Name - - - - - - - - -
Average of columns +1.4 +1.0 +0.9 +0.9 +0.9 +0.7 +0.4 -0.7 - +0.7
* The spokesman did not fill out the element Brand Name
Table 5.13 shows that the perceived bilateral relationships between the branding elements by the spokesman in the second (internal) branding constellation are moderately positive (+0.7). The highest score he attributed to the relationships of Directors and Members with the other elements (+1.3); the lowest score to the ANWB (-0.3). Most valued was in his perception Members (+1.4); least valued ANWB (-0.7). Table 5.14 presents the bilateral relationships in the second (internal) constellation. Table 5.14 Bilateral relationships scores in the second (internal) constellation by the spokesman (scale -2 to +2)
Branding elements
Bra
nd
Nam
e
Clie
nts
Dir
ecto
r
Me
mb
ers
Lo
bbyin
g
AN
WB
Div
isio
ns
BO
VA
G B
rea
kd
ow
n
Se
rvic
e
Com
mitte
e
Ave
rage
of
row
s
Brand Name +1.0 +1.0 +1.0 +1.0 0.0 0.0 -0.3 -2.0 +0.2
Lobbying +1.0 0.0 +1.0 +1.8 0.0 -1.0 -1.0 -1.0 +0.1
Director +2.0 +2.0 +0.7 +0.5 -1.0 -1.7 -1.8 -1.0 0.0
Divisions +1.0 -1.0 +1.0 0.0 0.0 0.0 0.0 -1.0 0.0
Clients 0.0 +1.3 -1.0 -1.0 0.0 0.0 -1.0 0.0 -0.2
BOVAG Breakdown Service 0.0 -0.3 -1.0 -1.0 -1.0 0.0 -1.0 -0.7 -0.6
Members -1.0 -1.0 -1.0 +1.5 -1.0 -1.0 -1.3 -1.0 -0.7
Committee -1.0 +1.0 -1.0 -1.5 -1.5 0.0 -1.0 -1.5 -0.8
ANWB -1.0 -1.0 -1.0 -1.0 -1.0 -1.0 -1.0 -1.0 -1.0
Average of columns +0.1 +0.1 0.0 -0.1 -0.2 -0.3 -0.8 -1.0 -1.0 -0.3

Branding constellations as reliable predictors of brand extensions
A branding constellation reliability case study 56
Table 5.14 shows that the bilateral relationships between the branding elements in the second (internal) constellation are ambivalent (-0.3). Most positive was Brand Name (+0.2) and most negative was ANWB (-1.0). Most positively valued by the other elements was Brand Name (+0.1) and most negatively BOVAG Breakdown Service and Committee (-1.0). Table 5.15 presents the scores of the similarity between the bilateral relationships of the elements in the perceptions of the relationships in the perceptual resonance matrix and in the second (internal) constellation by employing the legend of table 4.9. Table 5.15 Similarity scores between the perceptions of the bilateral relationships and the second (internal)
branding constellation by the spokesman (scale -2 to +2)
Branding elements
AN
WB
Lo
bbyin
g
Clie
nts
Com
mitte
e
Dir
ecto
r
BO
VA
G B
rea
kd
ow
n
Se
rvic
e
Div
isio
ns
Me
mb
ers
Bra
nd
Nam
e*
Ave
rage
of
row
s
Clients +2.0 +1.0 +2.0 +1.0 0.0 +2.0 0.0 - +1.1
ANWB +2.0 +2.0 +1.0 0.0 +1.0 +1.0 0.0 - +1.0
Lobbying +2.0 +2.0 0.0 +1.0 +1.0 0.0 +1.0 - +1.0
BOVAG Breakdown Service 0.0 +1.0 0.0 +2.0 +1.0 +1.0 0.0 - +0.7
Divisions +1.0 0.0 -1.0 0.0 +1.0 +1.0 0.0 - +0.3
Director +1.0 +1.0 +1.0 0.0 -1.0 -2.0 +1.0 - +0.1
Members +2.0 +2.0 -1.0 -1.0 -1.0 0.0 0.0
- +0.1
Committee +1.0 -1.0 +2.0 0.0 -1.0 -1.0 -2.0 - -0.3
Brand Name* - - - - - - - - -
Average of columns +1.3 +0.9 +0.7 +0.6 +0.4 +0.1 +0.1 0.0 - +0.5
* The spokesman did not fill out the element Brand Name
Table 5.15 shows that the perceived bilateral relationship reliability of the second (internal) branding constellation is moderately high (+0.5). This indicates that the perceptions of the bilateral relationships by the spokesman and the bilateral relationships scores of the second (internal) constellation were moderately similar. The highest similarity was for the relationships with ANWB (+1.3). For BOVAG Breakdown Service the similarity is ambivalent (+0.1). The lowest similarity between the perceptions and the constellation had the relationship of all elements with Members (+0.0). In the perception of the spokesman the relationships with BOVAG Breakdown Services by the other branding elements were positive (+0.7); in the branding constellation these relationships were ambivalent. Table 5.16 shows the unweighted average of similarity of the two constellations. Table 5.16 Unweighted average of similarity of the constellations
Branding constellation Similarity
External (first) +0.9
Internal (second) +0.5
Average +0.7

Branding constellations as reliable predictors of brand extensions
A branding constellation reliability case study 57
Thus, the average perceived bilateral relationship reliability is moderately high (+0.7), meaning that the relationships between the elements in the constellation compared to the perceptions of these relationships by the branders are moderately strong.
5.1.4 Introspective reliability The introspective measurement is the fourth reliability measurement. Because this Thesis is set up as a second-person case study and the internal involvement of the researcher is high, the statements of the stand-ins could be tested on their “truth”. The findings of these introspective reliability measurements are on the DATA-DVD (map 5) as part of the excel sheets used by the precision measurement. The introspective reliability findings for the external branding constellation are presented in table 5.17. Table 5.17 Introspective reliability scores of the first (external) constellation (scale -2 to +2)
Frequency scores
Branding elements Average
introspective scores
2 1 0 -1 -2 Numbers of statements
scored
Numbers of statements
Lobbying +0.9 0 6 1 0 0 7 9
BOVAG Car Assurance +0.8 1 2 0 1 0 4 11
BOVAG Breakdown Service +0.7 3 0 3 1 0 7 7
Brand Name +0.6 0 3 2 0 0 5 22
Customers +0.6 0 3 2 0 0 5 13
Car Dealers +0.5 1 2 0 0 1 4 8
Quality Mark +0.4 0 5 5 1 0 11 13
Independent Car Repairers +0.2 0 3 1 2 0 6 10
Average +0.6 5 24 14 5 1 49 93
The weighted average score for introspective reliability of the first (external) constellation is moderately high (+0.6), indicating that overall the researcher was positive about the truth of the statements of the stand-ins of the branding elements. The most and least true branding elements in the perception of the researcher are presented in table 5.18. Table 5.18 Most and least true branding elements (stand-ins) in the external branding constellation; top 3
Ranks Most true branding elements Least true branding elements
1. Lobbying Car Dealers
2. BOVAG Car Assurance Quality Mark
3. BOVAG Breakdown Service Independent Car Repairers.
Element Lobbying and the two extensions are the branding elements with the highest introspective scores. This indicates that their statements were most true according to the researcher. Brand Names scored in the middle. The introspective reliability findings for the second (internal) constellation are presented in table 5.19.

Branding constellations as reliable predictors of brand extensions
A branding constellation reliability case study 58
Table 5.19 Introspective reliability scors of the second (internal) branding constellation (scale -2 to +2)
Frequency scores
Branding elements Average
introspective scores
2 1 0 -1 -2 Numbers of statements
scored
Numbers of statements
Lobbying +0.6 0 3 2 0 0 5 15
Director +0.6 0 6 0 0 0 10 19
Brand Name +0.5 1 6 6 1 0 14 23
Members +0.4 0 4 6 0 0 10 22
Committee +0.4 0 3 1 1 0 5 13
BOVAG Breakdown Service +0.3 1 2 5 1 0 9 18
Divisions +0.3 0 1 3 0 0 4 5
Clients +0.2 0 2 2 1 0 5 16
BOVAG Car Assurance +0.0 0 0 1 0 0 1 2
ANWB +0.0 0 0 0 0 0 0 2
Average +0.3 2 27 26 4 0 63 135
The weighted average score for introspective reliability of the first (external) constellation is ambivalent (+0.3), indicating that overall the researcher was ambivalent about the truth of the statements of the stand-ins of the branding elements. The most and least true branding elements are presented in table 5.20. Table 5.20 Most and least true branding elements (stand-ins) in the internal branding constellation; top 3
Rank Most true branding elements Least true branding elements
1. Lobbying ANWB
2. Director BOVAG Car Assurance
3. Brand Name Clients.
Again, Lobbying has the highest introspective score. Other branding elements with a high score are Director and Brand Name. For the least true element scores it is important to notice that the number of statements is very low. ANWB and BOVAG Car Assurance both have two statements. The findings from the introspective reliability measurements are summarised in table 5.21. Table 5.21 Overview introspective reliability scores per branding constellation
Branding constellations Similarity
External (first) +0.6
Internal (second) +0.3
Average +0.5
The introspective reliability is moderately high (+0.5), indicating that the researcher perceives them as moderately true, employing the legend in table 4.12. The difference of 0.3 between the external and second (internal) constellation indicates that the similarity of the researcher’s perceptions regarding the truth of the statements by the elements is very high, using legend of table 4.9.

Branding constellations as reliable predictors of brand extensions
A branding constellation reliability case study 59
Thus, the average introspective reliability is moderately high (0.5), meaning that the precise statements of the stand-ins of the branding elements moderately match with reality as perceived by the researcher (at this moment employed by the case company).
5.1.5 Overview reliability measurements An overview of the findings on the reliability measurements answering research question one, is presented in table 5.22. The consensus reliability measurement is not presented in this overview because it is the leeway of this Thesis and is very different form the earlier measurements within the Theme (see subsection 4.4). Table 5.22 Overview of the findings on the reliability of the constellation; scale -2 to +2
Sections Reliability measurements First
(external) Second
(internal)
Average
of rows
5.1.1 Precision reliability -0.2 -0.1 -0.2
5.1.2 Bilateral relationship test-retest reliability +1.3 +1.3
5.1.3 Perceived bilateral relationship reliability +1.0 +1.3 +1.2
5.1.4 Introspective reliability +0.9 +0.5 +0.7
Average of columns +0.8 +0.8 +0.8
Table 5.22 illustrates that the average reliability scores of the first (external) branding constellation and of the second (internal) constellation are both +0.8. Most positive scores the perceived bilateral relationship reliability and most negative the precision reliability. Overall, according to the legend of table 4.14 the conclusion is that branding constellations are moderately reliable (between 0.4 and 1.2).
5.2 Stacking findings comparable cases
This section answers the second research question “How do these case study findings harmonize and differ with the branding constellation reliability findings of previous case studies?” regarding precision reliability, bilateral relationship test-retest reliability, perceived bilateral relationship reliability and introspective reliability? Subsection 5.2.1 till subsection 5.2.4 respectively presents the findings of stacking the comparable cases. Finally, subsection 5.2.5 presents an overview.
5.2.1 Stacking precision reliability Van Reij (2010) presented an overview of the findings of the standardised precision measurements of predecessors in the Theme. Table 5.23 presents this overview completed with the findings of this case study. The case study with the highest mean precision score is mentioned first, followed by the second highest mean precision score, and so on.

Branding constellations as reliable predictors of brand extensions
A branding constellation reliability case study 60
Table 5.23 Overview of precision reliability measurements within Theme (scale -2 to +2)
Numbers Student Company and year of constellations
Mean scores
1. Van Geel (2004) Army museum – 2004 +0.9
23. Karel (2008) Comfort in Living – 2008 +0.8
18. Ten Have (2007) Lipton – 2007 +0.7
4. Mathijssen (2005) RSM – 2004 +0.6
6. Van Zwienen (2005) blooming – 2004 +0.6
22. Halters (2008) IDS Scheer – 2007 +0.6
5. Davidse (2005) DE&SP – 2005 +0.5
10. De Velde Harsenhorst (2006) EODD – 2004 +0.5
19. Vertregt (2007) GTI – 2005 +0.5
20. Meijer (2008) Rabobank – 2005 +0.5
26. Meines (2011) VDP – 2011 +0.5
2. Siezen (2004) Stork Fokker – 2003 +0.4
3. Gomersbach (2004) Rabobank – 2004 +0.4
11. De Heij (2006) SKBA – 2004 +0.4
27. Roossien (2012) tonalite – 2010 +0.4
12. Holwerda (2006) Phillips – LG – 2004 +0.3
25. Jongsma (2011) TNO – 2010 +0.3
31. Van ’t Ende (2013) BOVAG – 2010 -0.2
Average +0.5
The stacking precision reliability of this case study (-0.2) is below average (+0.5), indicating a moderately low score on the stacking precision reliability of this case study (-1) by employing table 4.3 as legend.
5.2.2 Stacking bilateral relationship test-retest reliability Van Reij (2010: 39) presented an overview of the findings of the standardised bilateral relationship test-retest reliability measurements of predecessors in the Theme. Table 5.24 presents this overview completed with the findings of this case study.

Branding constellations as reliable predictors of brand extensions
A branding constellation reliability case study 61
Table 5.24 Overview of bilateral relationship test-retest reliability Theme measurements (scale -2 to +2)
Nr. Student Brand Brander Faci- litator
Stand- ins
Time Room Nr. of ele-ments
Overall scores
25. Jongsma TNO Different Same Same Different Same 2 +2.0
17. Blootens Hooghoudt Same Same Different Different Same 4 +1.9
26-3. Meines VDP 1-3 Different Same Same Different Same 3 +1.7
26-4. Meines DUO 1-2 Different Same Same Different Same 5 +1.7
27-2. Roossien Tonalite Different Different Different Same Different 7 +1.6
10. De Velde H. EODD Different Different Different Different Similar 9 +1.6
23. Karel Comfort i L Different Different Different Same Different 9 +1.6
15. Schuurman Alex Different Same Different Different Similar 5 +1.6
18. Ten Have Lipton Different Same Same Different Same 8 +1.6
27-1. Roossien Tonalite Different Different Different Same Different 7 +1.3
26-1. Meines VDP 1-2 Different Same Same Different Same 3 +1.3
26-2. Meines VDP 2-3 Different Same Same Different Same 3 +1.3
31. Van ‘t Ende BOVAG Differ. Same Differ. Differ. Same 4 +1.3
22. Halters IDS Sch. Different Different Different Same Similar 9 +1.2
1.* Van Geel Army mus. Same Same Same Different Same 3 +1.2
8.* Simons MultiCopy Same Same Different Different Different 3 -0.3
Ave-rage
5.3 +1.4
*= This measurement was not standardised by Van Reij (2010)
The stacking bilateral relationship test-retest reliability is very high (+2) as the score of this case study +1.3 and the average Theme score is +1.4 (delta +0.1), based on table 4.7.
5.2.3 Stacking perceived bilateral relationship reliability Jongsma (2011: 44) started with an overview of the findings of the perceived bilateral relationship reliability measurements of predecessors in the Theme. Roossien (2012: 68) completed this list with his findings. Table 5.25 presents this overview completed with the findings of this case study.

Branding constellations as reliable predictors of brand extensions
A branding constellation reliability case study 62
Table 5.25 Overview of perceived bilateral relationship reliability measurements within Theme (scale -2 to +2)
Nr. Student Company Mean scores
1. Van Geel (2004) Army museum – 2004 +1.7
25. Jongsma (2011) TNO – 2010 +0.9
5.* Davidse (2005) DE&SP – 2005 +0.8
31. Van ‘t Ende (2013) BOVAG – 2010 +0.7
10.* De Velde Harsenhorst (2006) EODD – 2004 +0.4
11.* De Heij (2006) SKBA – 2004 +0.4
27. Roossien (2012) tonalite – 2010 +0.4
4.* Mathijssen (2005) RSM – 2004 +0.2
23.* Karel (2008) Comfort in Living – 2008 +0.2
18.* Ten Have (2007) Lipton – 2007 0.0
Average +0.6
*= The measurement was not standardised by Van Reij (2010)
The stacking perceived bilateral relationship reliability is very high (+2) as the perceived bilateral relationship reliability score of this case study +0.7 while the average Theme score is +0.6 (delta +0.1), based on the legend in table 4.9.
5.2.4 Stacking introspective reliability The most recent stacking findings are from Roossien (2012: 69). Therefore, table 5.26 is based on Roossien.

Branding constellations as reliable predictors of brand extensions
A branding constellation reliability case study 63
Table 5.26 Overview of introspective reliability measurements within Theme (scale -2 to +2)
Numbers Student Company Function brander Mean scores
11-2.* De Heij SKBA Student +1.1
23-1. Karel Comfort in Living Student +1.0
5.* Davidse DE&SP Student +0.8
11-1.* De Heij SKBA Student +0.8
12.* Holwerda LG-Philips Student +0.8
18-1.* Ten Have Lipton Student +0.7
10-1.* De Velde Harsenhorst EODD Student +0.6
10-2.* De Velde Harsenhorst EODD Director +0.6
19. Vertregt GTI Student +0.6
31. Van ’t Ende BOVAG Marketing manager +0.6
27-2. Roossien tonalite Systems designer +0.5
4-1.* Mathijssen RSM Marketing manager +0.5
27-1. Roossien tonalite Director +0.4
27-4. Roossien tonalite Systems analyst +0.4
20. Meijer Rabo Student +0.4
31. Van ’t Ende BOVAG Spokesman +0.3
27-3. Roossien tonalite Project manager +0.3
23-1. Karel Comfort in Living Director +0.3
5.* Davidse DE&SP Student +0.2
4-2.* Mathijssen RSM Student +0.2
18.* Ten Have Lipton Logistics manager +0.2
Average +0.5
*= The measurement was not standardised by Van Reij (2010)
The stacking introspective reliability is very high (+2) as the average introspective reliability of these constellations is +0.5 and the average Theme score is also +0.5, according to the legend in table 4.12.
5.2.5 Overview of stacking compared cases An overview of the findings regarding the stacking of comparable cases, which answers research question two, are presented in table 5.27 However, the consensus reliability measurement is not presented in this overview because it is the leeway of this Thesis and is therefore formulated as the third research question (see subsection 5.3). Table 5.27 Overview of findings regarding the stacking of comparable cases (scale -2 to +2)
Sections Reliability measurements Stacking reliability scores
5.2.1 Precision reliability -1
5.2.2 Bilateral relationship test-retest reliability +2
5.2.3 Perceived bilateral relationship reliability +2
5.2.4 Introspective reliability +2
Average +1.3
According to the legend of table 4.15, the conclusion is that branding constellations are very reliable (>1.2).
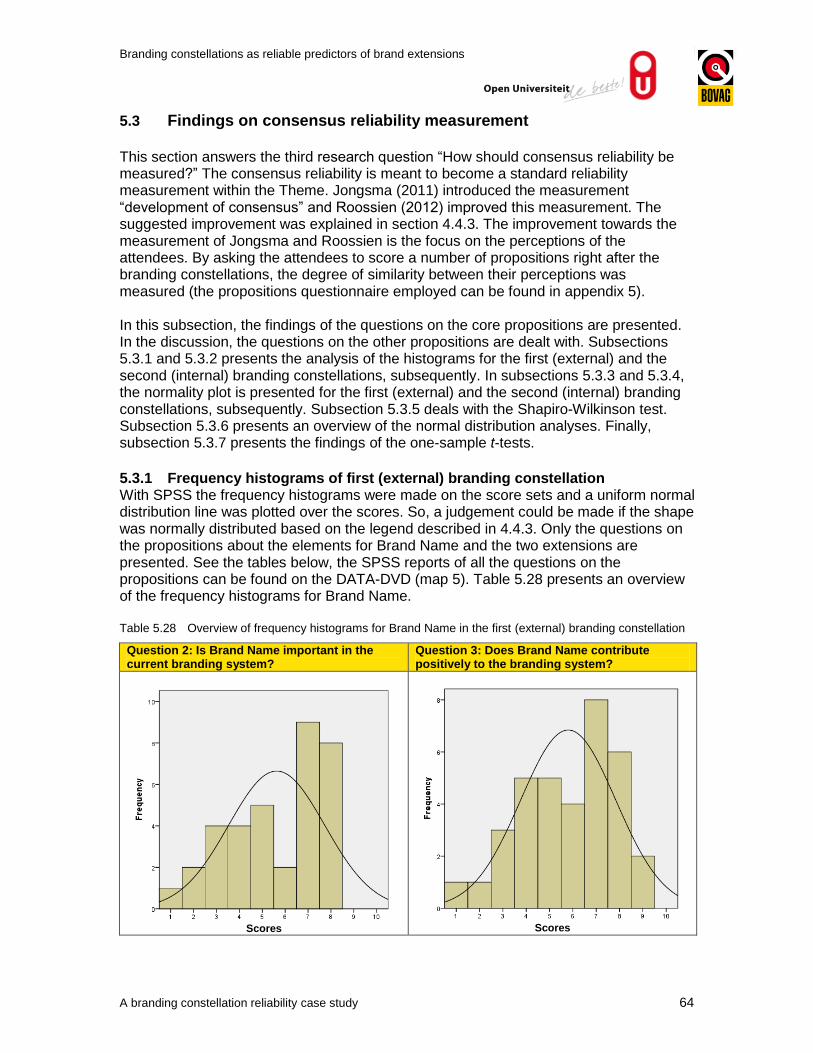
Branding constellations as reliable predictors of brand extensions
A branding constellation reliability case study 64
5.3 Findings on consensus reliability measurement
This section answers the third research question “How should consensus reliability be measured?” The consensus reliability is meant to become a standard reliability measurement within the Theme. Jongsma (2011) introduced the measurement “development of consensus” and Roossien (2012) improved this measurement. The suggested improvement was explained in section 4.4.3. The improvement towards the measurement of Jongsma and Roossien is the focus on the perceptions of the attendees. By asking the attendees to score a number of propositions right after the branding constellations, the degree of similarity between their perceptions was measured (the propositions questionnaire employed can be found in appendix 5). In this subsection, the findings of the questions on the core propositions are presented. In the discussion, the questions on the other propositions are dealt with. Subsections 5.3.1 and 5.3.2 presents the analysis of the histograms for the first (external) and the second (internal) branding constellations, subsequently. In subsections 5.3.3 and 5.3.4, the normality plot is presented for the first (external) and the second (internal) branding constellations, subsequently. Subsection 5.3.5 deals with the Shapiro-Wilkinson test. Subsection 5.3.6 presents an overview of the normal distribution analyses. Finally, subsection 5.3.7 presents the findings of the one-sample t-tests.
5.3.1 Frequency histograms of first (external) branding constellation With SPSS the frequency histograms were made on the score sets and a uniform normal distribution line was plotted over the scores. So, a judgement could be made if the shape was normally distributed based on the legend described in 4.4.3. Only the questions on the propositions about the elements for Brand Name and the two extensions are presented. See the tables below, the SPSS reports of all the questions on the propositions can be found on the DATA-DVD (map 5). Table 5.28 presents an overview of the frequency histograms for Brand Name. Table 5.28 Overview of frequency histograms for Brand Name in the first (external) branding constellation
Question 2: Is Brand Name important in the current branding system?
Question 3: Does Brand Name contribute positively to the branding system?
Scores
Scores

Branding constellations as reliable predictors of brand extensions
A branding constellation reliability case study 65
Based on table 5.28, the importance and valuation (positive contribution) scores on the Brand Name are not normally distributed as e.g. the “3”-score does not to have a lower frequency than the “4”-score and the “5”-score has a higher frequency than the “6”-score. Table 5.29 presents an overview of the frequency histograms for BOVAG Breakdown Service. Table 5.29 Overview of frequency histograms for BOVAG Breakdown Service in the first (external)
branding constellation
Question 6: Is BOVAG Breakdown Service important in the current branding system?
Question 7: Does BOVAG Breakdown Service contribute positively to the branding system?
Scores
Scores
Based on table 5.29, the perception and valuation scores on BOVAG Breakdown Service are not normally distributed as e.g. the “2”-score does not have a lower frequency than the “2”-score and the “3”-score does not have a lower frequency than the “4”-score. Table 5.30 presents an overview of the frequency histograms for BOVAG Car Assurance.

Branding constellations as reliable predictors of brand extensions
A branding constellation reliability case study 66
Table 5.30 Overview of frequency histograms for BOVAG Car Assurance in the first (external) branding constellation
Question 8: Is BOVAG Car Assurance important in the current branding system?
Question 9: Does BOVAG Car Assurance contribute positively to the branding system?
Scores
Scores
Based on table 5.30, the importance and valuation scores on BOVAG Car Assurance are not normally distributed as e.g. the “2”-score does not have a lower frequency than the “3”-score and the “9”-score has a higher frequency than the “8”-score.
5.3.2 Frequency histograms of second (internal) branding constellation With SPSS the frequency histograms were made on the score sets and a uniform normal distribution line was plotted over the scores. So, a first visual judgement could be made on the shape was normally distributed. All SPSS reports can be found on the DATA-DVD (map 5). Table 5.31 presents an overview of the frequency histograms for Brand Name. Table 5.31 Overview of frequency histograms for Brand Name in the second (internal) branding
constellation
Question 2: Is Brand Name important in the current branding system?
Question 3: Does Brand Name contribute positively to the branding system?
Scores
Scores

Branding constellations as reliable predictors of brand extensions
A branding constellation reliability case study 67
Based on table 5.31, the scores on the importance of the Brand Name are not normally distributed as e.g. the “4”-score has a higher frequency than the “5”-score and the “10”-score has a higher frequency than the “9”-score. The scores on the valuation (positive contribution) of the Brand Name are also not normally distributed as e.g. the “3”-score has a higher frequency than the “4”-score and the “6”-score has a higher frequency than the “7”-score. Table 5.32 presents an overview of the frequency histograms for BOVAG Breakdown Service. Table 5.32 Overview of frequency histograms for BOVAG Breakdown Service in the second (internal)
branding constellation
Question 6: Is BOVAG Breakdown Service important in the current branding system?
Question 7: Does BOVAG Breakdown Service contribute positively to the branding system?
Scores
Scores
Based on table 5.32, the importance and valuation scores on the BOVAG Breakdown Service are not normally distributed as e.g. the “4”-score has a higher frequency than the “5”-score and the “10”-score has a higher frequency than the “9”-score. Table 5.33 presents an overview of the frequency histograms for BOVAG Car Assurance.

Branding constellations as reliable predictors of brand extensions
A branding constellation reliability case study 68
Table 5.33 Overview of frequency histograms for BOVAG Car Assurance in the second (internal) branding constellation
Question 8: Is BOVAG Car Assurance important in the current branding system?
Question 9: Does BOVAG Car Assurance contribute positively to the branding system?
Scores
Scores
Based on table 5.33, the importance scores on the BOVAG Car Assurance are not normally distributed as e.g. the “2”-score has a higher frequency than the “3”-score and the “5”-score has a higher frequency than the “6”-score. The valuation scores on the BOVAG Car Assurance are moderately normally distributed: if the frequency of the “4”-score would be in between the frequencies of the “3”-score and the “5”-score, the frequencies are descending from the modus.
5.3.3 Normality plots of first (external) branding constellation With SPSS the P–P plots (probability–probability plot) were made of the score sets. The P-P plot shows how closely two data sets agree, the basic line was the normal distribution data set (set 1) and the score sets of this case study (set 2) were plotted on this line. See the tables below (all SPSS reports are on the DATA-DVD, map 5). The normal distribution judgement was based on the legend described in 4.4.3. Table 5.34 presents an overview of the P-P Plots for Brand Name in the first (external) branding constellation.

Branding constellations as reliable predictors of brand extensions
A branding constellation reliability case study 69
Table 5.34 Overview of P-P plots for Brand Name in the first (external) branding constellation
Question 2: Is Brand Name important in the current branding system?
Question 3: Does Brand Name contribute positively to the branding system?
Based on table 5.34, the importance and valuation scores on Brand Name are not normally distributed as more than 2 dots do not touch the normal distributed line. Table 5.35 presents an overview of the P-P Plots for BOVAG Breakdown Service in the first (external) branding constellation. Table 5.35 Overview of P-P plots for BOVAG Breakdown Service in the first (external) branding
constellation
Question 6: Is BOVAG Breakdown Service important in the current branding system?
Question 7: Does BOVAG Breakdown Service contribute positively to the branding system?

Branding constellations as reliable predictors of brand extensions
A branding constellation reliability case study 70
Based on table 5.35, the scores on the importance and valuation of BOVAG Breakdown Service are not normally distributed as more than 2 dots do not touch the normal distribution line. Table 5.36 presents an overview of the P-P Plots for BOVAG Car Assurance in the first (external) branding constellation. Table 5.36 Overview of P-P plots for BOVAG Car Assurance in the first (external) branding constellation
Question 8: Is BOVAG Car Assurance important in the current branding system?
Question 9: Does BOVAG Car Assurance contribute positively to the branding system?
Based on table 5.36, the scores of the importance and valuation propositions on BOVAG Car Assurance are not normally distributed as more than 2 dots do not touch the normal distribution line.
5.3.4 Normality plots of second (internal) branding constellation With SPSS the P–P plots (probability–probability plot) were made of the score sets. The P-P plot shows how closely two data sets agree, the basic line was the normal distribution data set and the score sets of this case study were plotted on this line. The SPSS reports are on the DATA-DVD (map 5). Table 5.37 presents an overview of the P-P Plots for Brand Name in the second (internal) branding constellation.

Branding constellations as reliable predictors of brand extensions
A branding constellation reliability case study 71
Table 5.37 Overview of P-P plots for Brand Name in the second (internal) branding constellation
Question 2: Is Brand Name important in the current branding system?
Question 3: Does Brand Name contribute positively to the branding system?
Based on table 5.37, the scores of the importance and valuation propositions on the Brand Name are not normally distributed as more than 2 dots do not touch the normal distribution line. Table 5.38 presents the overview of the P-P Plots for BOVAG Breakdown Service in the second (internal) branding constellation. Table 5.38 Overview of P-P plots for BOVAG Breakdown Service in the second (internal) branding
constellation
Question 6: Is BOVAG Breakdown Service important in the current branding system?
Question 7: Does BOVAG Breakdown Service contribute positively to the branding system?
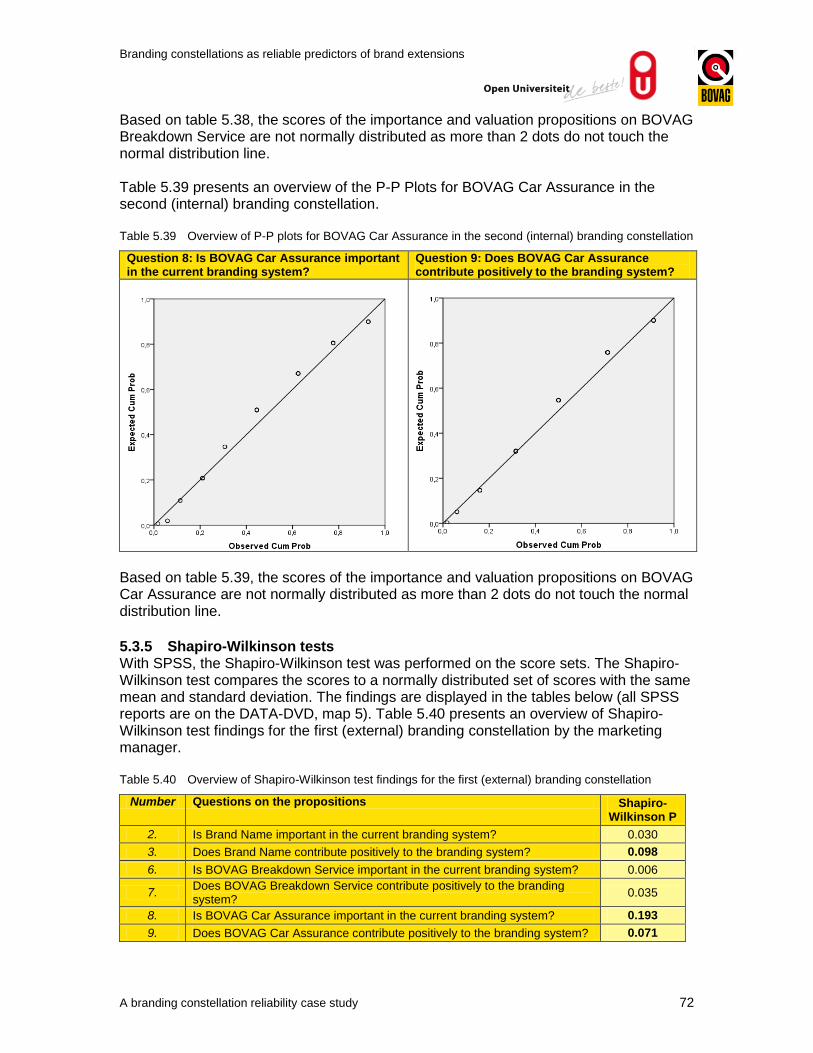
Branding constellations as reliable predictors of brand extensions
A branding constellation reliability case study 72
Based on table 5.38, the scores of the importance and valuation propositions on BOVAG Breakdown Service are not normally distributed as more than 2 dots do not touch the normal distribution line. Table 5.39 presents an overview of the P-P Plots for BOVAG Car Assurance in the second (internal) branding constellation. Table 5.39 Overview of P-P plots for BOVAG Car Assurance in the second (internal) branding constellation
Question 8: Is BOVAG Car Assurance important in the current branding system?
Question 9: Does BOVAG Car Assurance contribute positively to the branding system?
Based on table 5.39, the scores of the importance and valuation propositions on BOVAG Car Assurance are not normally distributed as more than 2 dots do not touch the normal distribution line.
5.3.5 Shapiro-Wilkinson tests With SPSS, the Shapiro-Wilkinson test was performed on the score sets. The Shapiro-Wilkinson test compares the scores to a normally distributed set of scores with the same mean and standard deviation. The findings are displayed in the tables below (all SPSS reports are on the DATA-DVD, map 5). Table 5.40 presents an overview of Shapiro-Wilkinson test findings for the first (external) branding constellation by the marketing manager. Table 5.40 Overview of Shapiro-Wilkinson test findings for the first (external) branding constellation
Number Questions on the propositions Shapiro-Wilkinson P
2. Is Brand Name important in the current branding system? 0.030
3. Does Brand Name contribute positively to the branding system? 0.098
6. Is BOVAG Breakdown Service important in the current branding system? 0.006
7. Does BOVAG Breakdown Service contribute positively to the branding system?
0.035
8. Is BOVAG Car Assurance important in the current branding system? 0.193
9. Does BOVAG Car Assurance contribute positively to the branding system? 0.071

Branding constellations as reliable predictors of brand extensions
A branding constellation reliability case study 73
Based on table 5.40, employing the Shapiro-Wilkinson test, it turns out that it can be retained that the scores on proposition 3, proposition 8, and proposition 9 are normally distributed. Table 5.41 presents an overview of Shapiro-Wilkinson test findings for the second (internal) branding constellation by the spokesman. Table 5.41 Overview of Shapiro-Wilkinson test findings for the second (internal) branding constellation
Number Questions on the propositions Shapiro-Wilkinson P
2. Is Brand Name important in the current branding system? 0.000
3. Does Brand Name contribute positively to the branding system? 0.050
6. Is BOVAG Breakdown Service important in the current branding system? 0.017
7. Does BOVAG Breakdown Service contribute positively to the branding system?
0.009
8. Is BOVAG Car Assurance important in the current branding system? 0.015
9. Does BOVAG Car Assurance contribute positively to the branding system? 0.020
Based on table 5.41, employing the Shapiro-Wilkinson test, it turns out that it can be rejected that one of the scores on the propositions is normally distributed.
5.3.6 Overview of normality tests Two overviews regarding the findings of the normality tests on the first (external) and the second (internal) branding constellation, performed to judge whether the scores are normally distributed, are presented in table 5.42 and 5.43. The overview of all questions can be found in appendix 8. Table 5.42 Overview tests of normal distribution first (external) constellation
Number Questions on the propositions
His
tog
ram
te
sts
Plo
t te
sts
Sh
ap
iro
-Wilk
ins
on
tes
ts
2. Is Brand Name important in the current branding system? No No 0.03
3. Does Brand Name contribute positively to the branding system? No No 0.098
6. Is BOVAG Breakdown Service important in the current branding system?
No No 0.006
7. Does BOVAG Breakdown Service contribute positively to the branding system?
No No 0.035
8. Is BOVAG Car Assurance important in the current branding system? No No 0.193
9. Does BOVAG Car Assurance contribute positively to the branding system?
No No 0.071
Table 5.42 shows that the histogram and the plot tests do not discriminate as the Shapiro-Wilkinson test does. As the Shapiro-Wilkinson test is the only validated test, it can be concluded that the answers of the questions 3, 8, and 9 are retained as normally distributed, because the Shapiro-Wilkinson P is greater than 0.05.
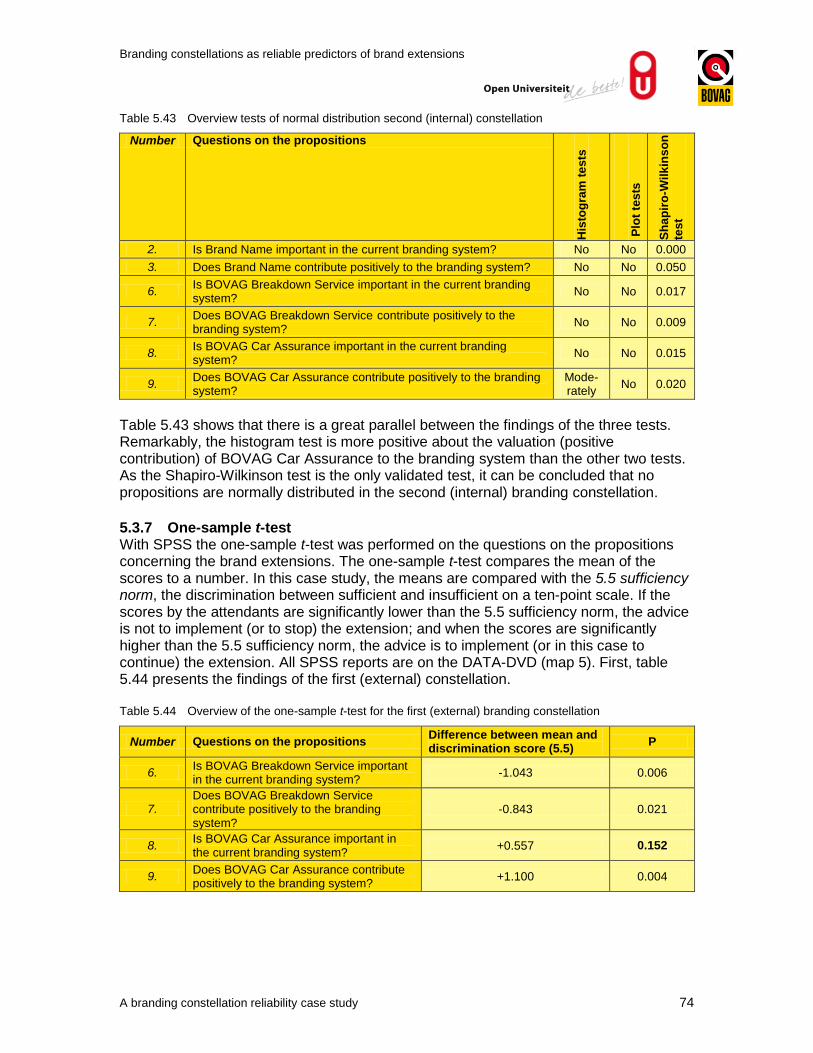
Branding constellations as reliable predictors of brand extensions
A branding constellation reliability case study 74
Table 5.43 Overview tests of normal distribution second (internal) constellation
Number Questions on the propositions
His
tog
ram
te
sts
Plo
t te
sts
Sh
ap
iro
-Wilk
ins
on
tes
t
2. Is Brand Name important in the current branding system? No No 0.000
3. Does Brand Name contribute positively to the branding system? No No 0.050
6. Is BOVAG Breakdown Service important in the current branding system?
No No 0.017
7. Does BOVAG Breakdown Service contribute positively to the branding system?
No No 0.009
8. Is BOVAG Car Assurance important in the current branding system?
No No 0.015
9. Does BOVAG Car Assurance contribute positively to the branding system?
Mode-rately
No 0.020
Table 5.43 shows that there is a great parallel between the findings of the three tests. Remarkably, the histogram test is more positive about the valuation (positive contribution) of BOVAG Car Assurance to the branding system than the other two tests. As the Shapiro-Wilkinson test is the only validated test, it can be concluded that no propositions are normally distributed in the second (internal) branding constellation.
5.3.7 One-sample t-test With SPSS the one-sample t-test was performed on the questions on the propositions concerning the brand extensions. The one-sample t-test compares the mean of the scores to a number. In this case study, the means are compared with the 5.5 sufficiency norm, the discrimination between sufficient and insufficient on a ten-point scale. If the scores by the attendants are significantly lower than the 5.5 sufficiency norm, the advice is not to implement (or to stop) the extension; and when the scores are significantly higher than the 5.5 sufficiency norm, the advice is to implement (or in this case to continue) the extension. All SPSS reports are on the DATA-DVD (map 5). First, table 5.44 presents the findings of the first (external) constellation. Table 5.44 Overview of the one-sample t-test for the first (external) branding constellation
Number Questions on the propositions Difference between mean and discrimination score (5.5)
P
6. Is BOVAG Breakdown Service important in the current branding system?
-1.043 0.006
7. Does BOVAG Breakdown Service contribute positively to the branding system?
-0.843 0.021
8. Is BOVAG Car Assurance important in the current branding system?
+0.557 0.152
9. Does BOVAG Car Assurance contribute positively to the branding system?
+1.100 0.004

Branding constellations as reliable predictors of brand extensions
A branding constellation reliability case study 75
Based on table 5.44, employing the one-sample t-test, it turns out that the importance and valuation (positive contribution) propositions concerning BOVAG Breakdown Services score significantly lower than the 5.5 sufficiency norm. The importance and valuation propositions concerning the BOVAG Car Assurance score higher than the 5.5 sufficiency norm. However, only the valuation propositions scores significantly higher, while the importance proposition does not. In table 5.45 the findings of the second (internal) constellation are presented. Table 5.45 Overview of the one-sample t-test for the second (internal) branding constellation
Number Questions on the propositions Difference between mean and discrimination score (5.5)
P
6. Is BOVAG Breakdown Service important in the current branding system?
-2.333 0.000
7. Does BOVAG Breakdown Service contribute positively to the branding system?
-2.556 0.000
8. Is BOVAG Car Assurance important in the current branding system?
+1.444 0.010
9. Does BOVAG Car Assurance contribute positively to the branding system?
+1.444 0.010
Based on table 5.45, employing the one-sample t-test, it turns out that the importance and valuation (positive contribution) propositions concerning BOVAG Breakdown Services score significantly lower than 5.5. The importance and valuation propositions concerning the BOVAG Car Assurance score significantly higher than 5.5. Thus, based on the one-sample t-test the advice based on the second (internal) branding constellation is not to implement (or stop) the BOVAG Breakdown Service and to implement (or continue) the BOVAG Car Assurance. This chapter presented the findings of this case study. The next chapter presents the evaluation of this case study and the Theme in general.

Branding constellations as reliable predictors of brand extensions
A branding constellation reliability case study 76

Branding constellations as reliable predictors of brand extensions
A branding constellation reliability case study 77
6 Evaluation
This chapter starts with the conclusion in section 6.1; there after the case study’s construct validity is discussed in section 6.2. Section 6.3 discusses the validity about the leeway of this thesis. Then, in subsection 6.4 the reliability is discussed, where after in section 6.5 the relevancy is discussed. Section 6.6 describes the theoretical and practical implications for the Theme and BOVAG, respectively. A personal reflection closes this chapter and this thesis in 6.6.
6.1 Conclusion
The conclusion is what is finally stated, based on the available information (Van Zanten, 2006: 78). The Thesis covers three theoretical research questions (1.1.2) and two practical branding questions concerning the case company (3.4). These questions are answered in subsection 6.1.1 for the theoretical research questions and in 6.1.2 for the practical branding questions.
6.1.1 Theoretical conclusion This subsection discusses the theoretical conclusions based the available information The three research questions are: 1. How reliable are the branding constellations of this BOVAG case study with regard to
precision reliability, bilateral relationship test-retest reliability, perceived bilateral relationship reliability, and introspective reliability?
2. How do these BOVAG case study reliability findings relate to the previous findings within the Theme?
3. How could the consensus reliability measurement be improved? Question 1: How reliable are the branding constellations? The reliability of the branding constellations of this BOVAG case study was tested by four standardised reliability measurements. The precision reliability, bilateral relationship test-retest reliability, perceived bilateral relationship reliability, and introspective reliability. The bilateral relationship test-retest reliability measurement and the perceived bilateral relationship reliability score very high (+1.3 and +1.2, respectively), while the precision reliability scores ambivalent (-0.2). The introspective reliability scores moderately high (+0.7). Overall, the conclusion is that branding constellations are moderately reliable. Question 2: How do the findings relate to previous findings? The precision reliability scores low when compared with the measurements of antecedents (-1), while the other three measurements all score very high on the similarity of the findings with the predecessors (+2). Overall, the reliability findings on the branding constellations are themselves very reliable (+1.3).

Branding constellations as reliable predictors of brand extensions
A branding constellation reliability case study 78
Question 3: How could the consensus reliability measurement be improved? The procedure of the improved consensus reliability is the following. 1. Consensus reliability is measured by involving the attendees and employing their
perceptions instead of those of the branders. In this case study, about forty attendees were present at the branding constellation workshop.
2. The attendees fill out a propositions questionnaire after each branding constellation on predetermined propositions. In this case study, too many propositions (eighteen) were formulated. Therefore, only the findings of the eight core propositions are dealt with in the main text. The importance and valuation (positive contribution) propositions seem fit to test brand extensions in future Theme studies.
3. The propositions scores are analysed with the Cronbach’s Alpha test to check the consistency of the propositions questionnaire. In this case study, the Alpha’s of the questionnaires in both constellation are high, indicating a reliable set of propositions.
4. The propositions scores are tested on their normal distribution as indication of consensus among the attendees based on a common (real) value. In this case study three of the eighteen propositions scores are normally distributed.
5. A histogram test and a plot test are performed on the propositions to illustrate the normal distribution of the propositions scores. However, the legend described in section 4.4.3 needs improvement by anchoring it in methodological literature.
6. A Shapiro-Wilkinson test is performed to test whether the distribution of the propositions scores is normally distributed or not. In this case study, three of the eighteen propositions tested were normally distributed.
7. A one-sample t-test is performed to test if the scores on eight propositions concerning the two brand extensions, are significantly positively or negatively deviating from 5.5 sufficiency norm). The attendees in this case study score significantly higher than the 5.5 sufficiency norm on the importance and valuation of BOVAG Car Assurance in both branding constellations, except for the importance of BOVAG Car Assurance in the first (external) branding constellation. The attendees score significantly lower than the 5.5 sufficiency norm in both branding constellations on BOVAG Breakdown Service.
6.1.2 Practical conclusion This subsection discusses the practical conclusions based on the gathered information, and insights to be able to answer the branding question:
Are “BOVAG Breakdown Service” and “BOVAG Car Assurance” valuable extensions to the BOVAG branding system?”
BOVAG Breakdown Service is not an extension that fits the BOVAG branding system, while BOVAG Car Assurance is an important and valuable BOVAG brand extension.
Branding constellations as reliable predictors of brand extensions
A branding constellation reliability case study 79
6.2 Discussion on construct validity
Construct validity is defined by Yin (2009: 40) as “establishing correct operational measures for the concepts being studied”. As chapter 1.2.1 mentions, this case study investigated the reliability of the branding constellations of this case study by distinguishing four sub reliability concepts described in the research question 1 and a fifth one in research question 3. This subsection first discusses the construct validity of the case study concerning these five reliability measurements: precision reliability, bilateral relationship test-retest reliability, perceived bilateral relationship reliability, introspective reliability, and consensus reliability. The construct validity of these reliability measurements is discussed hereafter. Subsection 6.2.1 discusses the precision reliability, subsection 6.2.2 the bilateral relationship test-retest reliability, subsection 6.2.3 the perceived bilateral relationship reliability, subsection 6.2.4 the introspective reliability, and subsection 6.2.5 the consensus reliability. Subsection 6.2.6 discusses the construct validity of the branding constellations. Since the Theme is fundamentally a multiple case study and the stacking of the findings is core of the Theme, the discussion is predominantly based on the discussion of the predecessors Jongsma (2011, number 25), Meines (2011, number 26), and Roossien (2012, 27) as Theme students Vogelaar (2012, number 28), Neijenhuis (2013, number 29), and Hattink (2013, number 30) did not perform a case study. In subsection 6.2.7 the stacking will be discussed.
6.2.1 Discussion on construct validity of precision reliability This subsection discusses the construct validity of the precision measurement of this case study, which is predominantly based on the discussion of the predecessors Jongsma (2011, number 25), Meines (2011, number 26), and Roossien (2012, number 27). First, Jurg (2010: 83) defines precision in his dissertation in two components: 1. Verification: Degree to which the statements of the stand-ins provide verifiable,
and/or falsifiable information in the perceived of the respondents: the information can be checked, or can conflict with possible observations.
2. Unambiguity: Degree to which the statements of the stand-ins provide unambiguous information in the perceived of the respondents: statements that do not permit, or invite alternative interpretations.
These two components are integrated in the legend of the Theme (subsection 4.2.1). However, Jurg (2010: 182) argues that verification and ambiguity seem to form a paradox. Thus, it does not seem right to integrate these two components in one measurement. In this case study the main focus has been on the verification part of this definition, whilst the ambiguity part is limited to the -2 score. Second, it can be discussed if clearly can be determined whether a statement “can be operationalised using definitions that might be found in literature”. A term as “might be” cannot be expected to lead to reliable measurements. Thus, the insights and knowledge of the literature by the researcher influences this measurement. Thus, not only the precision of the constellation is measured, but also the insights and knowledge of the literature by the researcher.

Branding constellations as reliable predictors of brand extensions
A branding constellation reliability case study 80
Third, the construct validity of the precision measurement can be influenced by the development in a branding constellation. For instance, an as contrary scored statement might be really in contradiction with other statements, but regarding the rolling of the time and regarding the knowledge that the systemic character implies that a statement addressed to a certain other system element might become invalid as soon as the system further develops, the final precision score can easily be misinterpreted. Fourth, the choice within the Theme to calculate the average precision unweightedly, biases the measurement. The precision outcome in the standardised calculation is equally influenced by an element with 40 statements scored and by an element with only one statement scored such as by ANWB in the second (internal) branding constellation. The precision calculation also is influenced by the number of statements that were taken into account. The absolute number of statements is doubtful due to the interpretation of when a sentence or more sentences can be noted as one statement or divided into more statements. Thus, it can be discussed whether every statement is equally important for the interpretation of the precision of a constellation or not, leading to the question whether or not a calculated average presents a responsible precision score of the constellation. Fifth, it is not clear what it means if a stand-in has a high or low precision score. Does for example a high score indicate that the stand-in is a good stand-in and will be a reliable stand-in in future branding constellations? This should be studied by a future Theme student. Sixth, a remark which is often made about the precision is that the outcome is influenced by the relationships with other stand-ins. Within the Theme this is not tested. For future students this may also be an interesting research question. To conclude, the construct validity of the precision measurement to produce relevant theoretical and practical knowledge can be called ambivalent.
6.2.2 Discussion on construct validity of bilateral relationship test-retest reliability
This subsection discusses the construct validity of the bilateral relationship test-retest reliability, which is based on the discussion of the predecessors Karel (2009, number 23), Halters (2011, number 26), Jongsma (2011, number 25), Meines (2011, number 26) and, Roossien (2012, number 27). First, the sequential character of the branding constellations leads to discussion as for an optimal test-retest all variables should be the same. This is practically impossible. Even if everything is the same, time is not. Thus, the second branding constellation is influenced by the experience of the first (external) constellation because the attendees have seen a development of relationships and will subconsciously expect the same patterns. These subconscious expectations also apply for the stand-ins of the branding elements set up. The meaning of a conducted test-retest measurement, therefore, is limited.
Branding constellations as reliable predictors of brand extensions
A branding constellation reliability case study 81
Second, in these branding constellations only four branding elements were the same in the two branding constellations and the perspective of both constellations was different. So, the four elements were confronted with different elements in the two constellations. Further, the four elements had worked together in the first (external) constellation and created a relationship with each other. This relationship will surely have influenced the developments of their relationships in the second (internal) constellation. Thus, stand-ins of branding elements in the second (internal) constellation will easily have demonstrated unintentional similar behaviour as in the first (external) constellation. To conclude, the construct validity of the bilateral relationship test-retest reliability seems ambivalent.
6.2.3 Discussion on construct validity of perceived bilateral relationship reliability
This subsection discusses the construct validity of perceived bilateral relationship reliability and is based on the discussion of the predecessors Jongsma (2011, number 25), Meines (2011, number 26), and Roossien (2012, number 27). First, the perceived bilateral relationship reliability scores are easily influenced by “political” concerns of branders. Branders who fill out the propositions questionnaires are easily tended to admit to their wishful thinking in filling out these questionnaires. And in their wishful thinking, they will probably not express scores that might negatively influence their own position or reached results by them or their department. For the future, it would be better to involve attendees on this measurement too. Second, it can be discussed if the Theme assumption is valid as to what extend the subconscious image of the branders is expressed in the branding constellations. A mean score of +0.6 within the Theme seems to indicate that the subconscious image did not get represented one-to-one in the branding constellation or that the answers of the branders on the resonance matrices are invalid. In this case, in the first (external) branding constellation 55% of the predicted relations were scored the same by the branders as revealed by the branding constellations. In the second (internal) constellation 67% scored the same (see DATA-DVD, map 5). The researcher also filled out the matrices also and compared the similarity with the branders. The percentages of equality of the outcomes were substantially lower as displayed in the DATA-DVD (map 5). So, future students have to pay more attention to explaining the differences between the prediction matrices and the branding constellation findings. Third, it can be discussed whether or not the relationships between the branding constellation and the prediction can be compared. In both constellations were elements predicted which were not setup. And in the second (internal) constellation in the predictions the BOVAG Car Assurance was not brought in as an element, but was set up in the constellation and took one of the most important positions. Fourth, it can be discussed whether people are capable of predicting 180 relationships independent of each other. In addition, it can be questioned if a specific relationship between two elements can be seen apart from the rest of the system. For example, in the perceived relationship matrix on the first (external) constellation the branders did not fill out that the extensions would do differently within the branding system.

Branding constellations as reliable predictors of brand extensions
A branding constellation reliability case study 82
Fifth, in the branding constellation, there was a big difference between the two brand extensions. This leads to a low score, while in hindsight the branders agree with the findings of the branding constellations. Another example is that in the first (external) constellation the perception of the marketing manager is that the relationships with Brand Name by the other branding elements are very positive, while in the constellation these relationships were neutral. There is a strong chance that being employed by BOVAG had influenced his predictions. However, the valuable information leads to low scores on the perceived bilateral relationship reliability. To conclude, the construct validity of the perceived bilateral relationship reliability seems ambivalent too.
6.2.4 Discussion on construct validity of introspective reliability This subsection discusses the construct validity of the introspective reliability measurement and is predominantly based on the discussion of the predecessor Karel (2010, number 23), and Roossien (2012, number 27). First, it is assumed that the introspective reliability represents “the” truth. However, “the” truth changes constantly, even the intervention of the constellation itself will change reality. In addition, it can be discussed if the perception of the researcher represents the truth. The researcher cannot oversee the whole organisation of the case company. The truth of the researcher will be constructed on a lot of assumptions based on personal experiences. This might be reduced by searching a resource for every statement. Or following Yin (2009: 85-86), making the researcher search for objective falsifications/verifications by employing evidence from documentation, archival records, interviews, direct observations, participant observations, and/or physical artefacts. Within this case a falsification is conducted by employing a secondary study of Blauw Research (2008, 2009, 2010, and 2012) on the BOVAG brand and a secondary study by Interbrand (2011). These studies can be found on the DATA-DVD (map 6). It is strange that in the past this triangulation reliability measurement was unsuccessful (Halters, 2009). A first verification is based on the research of Blauw (2008). BOVAG brand is most known by people older than 50. The image of BOVAG is “quietness, reliable, grey, and a little bit old fashioned”. The person, who was chosen as Brand Name in both constellations, seems to represent this image very well, see figure 6.1.
Figure 6.1: Element Brand Name
A second verification on BOVAG Breakdown Service is found by analysing the Interbrand (2011) study. The Interbrand advice about BOVAG Breakdown Service is to end this product or to look for an alliance with a company like ANWB. Historically seen, Breakdown Service was not a success in the past. In 1968, a national wide system introduced for alerts of Breakdown Service companies, which was a failure (see historical analysis in appendix 11). In 1989, Breakdown Service companies unite in an association named the VBS, independent from BOVAG.

Branding constellations as reliable predictors of brand extensions
A branding constellation reliability case study 83
The advice by Interbrand (2011) about BOVAG Car Assurance is to orientate if Car Assurance really fits the product portfolio, and if so, than find out if there are enough resources to make a difference in the assurance market. Furthermore, Interbrand advised to esteem what the added value of BOVAG Car Assurance is for the BOVAG brand. A third verification on BOVAG Car Assurance is found by analysing the BOVAG brand history. Successful brand extensions of the past are the best predictors if new extensions will succeed. Historically seen, assurances are products where BOVAG has been successful in the past. The greatest BOVAG brand extension, with national impact till now, arose in the late 1950s as the Association of Traffic Safety and 50 BOVAG-members from Rotterdam started the voluntarily safety check. At a later moment BOVAG asked all members to cooperate with these checks: the roots for the mandatory APK-check (1985); for consumers in The Netherlands till today very important for traffic safety as well as for BOVAG members and non-members a very important moment for business revenues and enhanced customer contacts. In 1963, the “Bovemij” was founded (see historical analyse appendix 11). Bovemij is an assurance company founded for the members of BOVAG, but 50 years later Bovemij also sells consumers’ assurance- and funding-products. At this moment Bovemij has about 350 employees and Bovemij’s revenues after tax are 27.5 million euros. In the 1970s, BOVAG Guarantee was introduced to ensure that members could always keep their guarantee obligations the Bovemij organisation is founded and an official mediation process was arranged. Till today BOVAG Guarantee is national term and every day members perceive the effect of the BOVAG brand on their revenue. Thus, the tentative falsification and verification attempts do not challenge the branding constellation findings. BOVAG Car Assurance as a new element brings energy to the branding system and BOVAG Breakdown Service is a disturbing element. To conclude, the construct validity of the introspective reliability seems limited, but the truth of the brand extension findings in the branding constellations seems high if triangularly measured in a more proper way.
6.2.5 Discussion on construct validity of stacking This subsection discusses the construct validity of the stacking reliability of this case study within the Theme and is based on the discussion of Jongsma (2011, number 25), Meines (2011, number 26), and Roossien (2012, number 27). Because the case studies within the Theme are set up following Miles and Huberman (1994) and Yin (2009) as stacking comparable cases, the findings of the case study have to be presented as stackable findings. The reliability findings of the stacked measurements should be comparable in order to produce a finding on the stacking reliability. First, with this research a 31st case study is added to the data collection of the Theme. Besides this is leading to the growth of the data collection it also enlarge the Theme’s external validity, because more and more case studies get executed at the same way. This enlarges the stacking possibilities.
Branding constellations as reliable predictors of brand extensions
A branding constellation reliability case study 84
Further, a 31st case study leads a step further into the research design and the theoretical development of the Theme. And the more the method will be accepted as a fully and useful methodology to unravel branding systems. Second, the question is of the findings of stacking not kept artificial high through the scale which is used within the Theme. Does a difference of 4 ever appear? An advice is to modify the scale for the next three Theme students and evaluate if there arise another view on the findings. Third, the precision reliability and bilateral relationship test-retest reliability are standardised within the Theme. This means that the case study findings are stacked with previous case study findings in a similar way, and thus the information derived from the data seems construct valid. This seems a valid methodology for the standardised measurements. However, the point is that within the Theme the findings of the standardised measurement get more value if the findings could be compared with other sources from outside the constellation procedure. It is highly recommended for future Theme students to develop standardise triangulation measurement or a methodology to compare the different measurements in line with the comparisons described in 6.2.4. Fourth, in these branding constellations there were a lot of emotional expressions and non-verbal communication moments. These were noted in the remarks column of the transcriptions of Van Reij. Together with the Theme coordinator, the non-verbal actions were interpreted but in none of the measurements the interpretations could be used. The focus on the stacking seems to prevent the Theme form employing important information. For future Theme students these remarks are an opportunity to improve the measurements within the Theme. Fifth, the reliability measurements within the Theme are treated isolated and there is a lack of coherence. Finally, the naming of “reliability of the reliability measurements” causes confusion and complicates understanding. It is recommended to change terms. To conclude, the construct validity of stacking is ambivalent.
6.2.6 Discussion on construct validity of branding constellations This subsection discusses the construct validity of the branding constellations as they were conducted, and is based on the discussion of the predecessors Jongsma (2011, number 25), Meines (2011, number 26), and Roossien (2012, number 27). First, two branding constellations were conducted after each other with the same facilitator and the same attendees in the same room. The possibility that the second (internal) constellation is influenced by the first (external) branding constellation is great e.g. the same stand-ins were chosen for Brand Name and the two brand extensions. It was clear that the branders were influenced, as a remark from the spokesman was “So for B I take this person again”.

Branding constellations as reliable predictors of brand extensions
A branding constellation reliability case study 85
Second, some stand-ins did not have experience with branding constellations and started personal dialogues with other stand-ins in the constellations or did not talk about their own feelings but interpreted the feelings of others. Especially, the stand-in who represented BOVAG Breakdown Service made a lot off remarks about the feelings of other stand-ins and asked them things. So, it seems that the stand-ins should have some experience with constellations to be a valuable stand-in. Third, it was remarkable that in the second (internal) constellation the two brand extensions got a place at the outside. The internal elements were very busy with reacting on each other and noticed that two extensions were added but they did not get much attention. In the first (external) constellation there was a lot of interaction between the standing system and the two extensions. The explanation could be that BOVAG is an internally orientated organisation. To get things done, there must put a lot of effort in the internal processes and coalitions. To conclude, the construct validity of the branding constellations is ambivalent.
6.2.7 Discussion on construct validity of model of Martinez and Pina (2010) The theoretical basis of brand extensions in this thesis is the brand extension model of Martinez and Pina (2010). Hereto, some remarks have to be made. First, looking at the model of Martinez and Pina (2010) in subsection 2.3.4, the conclusion that BOVAG Car Assurance fits the branding system fine and BOVAG Breakdown Service does not, seems logical. For example, the first hypothesis of the model concerns the effect of “brand familiarity” on the brand extension attitude. As described in 6.2.4, within the assurance market BOVAG is very successful with sub brand Bovemij. Also the core values of BOVAG as “reliability and guarantee” are values which are in line with “assurance” instead of “breakdown and bad luck” the values associated with BOVAG Breakdown Service. Second, a systematic comparison between branding constellations and the brand extension model of Martinez and Pina (2010). Future students should pay more attention to a systematic comparison between the theoretical model and the findings of the branding constellations. To conclude, the construct validity of the model is unclear.

Branding constellations as reliable predictors of brand extensions
A branding constellation reliability case study 86
6.3 Discussion construct validity of improved consensus reliability measurements
Construct validity is defined by Yin (2009: 40) as “establishing correct operational measures for the concepts being studied”. As chapter 1.2.1 mentions, the leeway of this this case study is to improve the consensus reliability measurement within the Theme as developed by Jongsma (2011, number 25) and Roossien (2012, number 27). The main improvement involves including the perceptions of the attendees of the branding constellations instead of the branders. The construct validity of the improved consensus reliability measurements is discussed in subsection 6.3.1 regarding the normal distribution tests, and in subsection 6.3.2 concerning the t-tests.
6.3.1 Discussion on construct validity of normal distribution tests The measurement improvement is based on the concept of the interobserver reliability which is employed to assess the degree to which different raters make consistent estimates of the same phenomenon (Multon, 2010: 627). First, however, Multon argues that the difficulty here is that there is no “best” approach for calculating this reliability. Each approach has its own assumptions and implications as well as its own strengths and weaknesses. Second, it should be noted that no connection was made to the interrater reliability measurements employed at the start of the Theme by Van Geel (2004, number 1), Gomersbach (2004, number 2), Siezen (2004, number 3), Davidse (2005, number 5), and Holwerda (2006, number 12). Their theses are on the DATA-DVD (map 8). Third, the judgement of normality based on the use of histograms is based on the assumption that the shape of the propositions scores is normally distributed. The histogram legend states that the judgment is normally distributed if the frequencies are descending from the modus; the judgment is moderately normally distributed if the frequencies are descending from the modus, except for one score; the judgment is not normally distributed if the frequencies are descending from the modus, except for two or more scores. This methodology of judgement is not based on method logical or statistical theory and the question is if the interpretations were valid because a lack of theoretical support. However, the findings are in line with the findings of the validated Shapiro-Wilkinson-test. Fourth, the judgement of normality based on the P–P plots (rather than e.g. Q-plots) is based on a comparison between the normal distribution data set (set 1): the score sets of this case study (set 2). And if it is not better to use another plot-test (Q-plot).The judgment is normally distributed if the set 2 dots touch the normal distribution line of set 1; the judgment is moderately normally distributed if the set 2 dots touch the normal distribution line of set 1, except for one point; the judgment is not normally distributed if two or more set 2 dots do not touch the normal distribution line of set 1. This methodology of judgement is also not based on methodological or statistical theory and the question is if the interpretations were valid because a lack of theoretical support. However, the findings are in line with the findings of the validated Shapiro-Wilkinson-test.

Branding constellations as reliable predictors of brand extensions
A branding constellation reliability case study 87
Fifth, the judgment of normality based on the Shapiro-Wilkinson test involves that the data are normally distributed if the significant value of the Shapiro-Wilkinson test is greater than or equal than 0.05. If it is below 0.05, the data significantly deviate from a normal distribution. This is a clear way of judgement and validity is no discussion. However, the number of scores is limited to about forty. Theoretically this is sufficient (Field, 2009 144-148), but practically it can be discussed if Shapiro-Wilkinson tests are useful for future students as generally the number of attendees in branding constellations is limited to about 20. To conclude, the construct validity of the improved consensus reliability measurement regarding the normal distribution tests seems to need further improvement.
6.3.2 Discussion on construct validity of t-tests The one-sample t-tests were performed according the statistical theory. But there are also a few points that have to be made on the validity of the conducted t-tests. First, the findings about normal distribution proved that most of the propositions were not normally distributed. Despite of this lack of normal distribution a parametric test, the one-sample t-test, is performed. For the future, a non-parametric test seems to be more appropriate; for example, the one-sample Wilcoxon signed rank test. Second, the scale on the propositions questionnaires are numbers from 1 to 10, the scale is ordinal. In the test, the scale is employed as a quasi-interval scale and arithmetic means and other arithmetic values were calculated. Although this is common sense in scientific studies, statistically it is not justified with an ordinal scale to work out arithmetic means and other arithmetic values (Buijs, 1990: 8). Third, the timing of the questionnaires by both predecessors, Jongsma (2011) and Roossien (2012), was discussed in their thesis. In both cases the time between the branding constellations and filling out the questionnaires to check if the degree of consensus had changed, was too long. In this case immediately after each branding constellation the attendees were asked to fill out the proposition questionnaire. By this approach the constellations were top of mind by the respondents and this led to a high response percentage and qualitatively valuable answers, arguments, and advices. The assumption is, how lesser the shift of opinions the better for the validity of the observations (Miles & Huberman, 1984: 118,126,188). To check the validity of these workshop findings, the day after the branding constellations the attendees received an email in which they were asked to answer two questions: 1. BOVAG Car Assurance fits / doesn’t fit the BOVAG brand, because… 2. BOVAG Breakdown Service fits / doesn’t fit the BOVAG brand, because….

Branding constellations as reliable predictors of brand extensions
A branding constellation reliability case study 88
This check idea was based on Jurg (2010: 179), who reported that the attendees were more positive directly after the branding constellations then they were back in their own environment. All answers in the email propositions questionnaire were scored by the attendees on a five-point scale from very positive (+2) to very negative (-2) to prevent the attendees to repeat their ten-point scores in the propositions questionnaires filled out directly after the constellations. The legend of on the fit consensus scores is displayed in table 6.1. Table 6.1 Legend fit consensus scores per brand extension
Scores Interpretations
+2 The brand extension fits the BOVAG brand fine
+1 The brand extension fits the BOVAG brand moderately
0 It is unclear, whether the brand extension fits the BOVAG brand
-1 The brand extension does not fit the BOVAG brand moderately
-2 The brand extension does not fit the BOVAG brand at all.
The score-reasons mentioned by the attendees can be found on the DATA-DVD (map 5). In this thesis, however, the reasons are no input for a measurement but were used in the discussions, conclusions, and reflections. This is an important point of discussion. The attendees scored both branding questions for the first (external) and second (internal) constellation as reported in section 5.3. The findings are displayed in table 6.2. Table 6.2 Attendees’ workshop scores right after the branding constellations (scale +1 to +10)
Number Question
Average workshop scores on first (external) branding constellation
Average workshop scores on second (internal) branding constellation
6. Is BOVAG Breakdown Service important in the current branding system?
+4.3 +3.2
7. Does BOVAG Breakdown Service contribute positively to the branding system?
+4.7 +3.0
8. Is BOVAG Car Assurance important in the current branding system?
+5.7 +6.9
9. Does BOVAG Car Assurance contribute positively to the branding system?
+6.5 +7.6
Table 6.2 shows that the attendees right after the branding constellations were not very positive about the BOVAG Breakdown Service contrary to BOVAG Car Assurance. Remarkable is that in the second (internal) constellation the differences between the scores is much higher than in the first (external) constellation, which might refer to a difference between the acceptance in the BOVAG organisation and the market. However, it might also have to do with the development of the two branding constellations. The fit-scores on the email send the day after the branding constellation workshop are displayed in table 6.3.

Branding constellations as reliable predictors of brand extensions
A branding constellation reliability case study 89
Table 6.3 Attendees’ email fit-scores the day after the branding constellation workshop (scale -2 to +2)
Number Question Average email fit-scores on first (external) branding constellation
Average email fit-scores on second (internal) branding constellation
1. Is BOVAG Breakdown Service important in the current branding system?
-0.4 -1.1
2. Is BOVAG Car Assurance important in the current branding system?
+0.5 +1.0
Table 6.3 shows that the attendees had the same perception about the brand extensions, knowing the branding questions. In the email also asked for an overall score for the extension on the scale of -2 to +2. BOVAG Car Assurance scored +0.6 and BOVAG Breakdown Service Scored -1.4. Two points of attention here are that the score scales are different and that the importance and valuation are combined to “fit” to avoid asking attendees the same questions. Fourth, the attendees can be divided in observers and stand-ins, and can be compared to the branders’ scores per proposition and per branding constellation to find out if these findings match. This analysis is conducted and the findings shows that there is no normal distribution, so no consensus (see DATA-DVD map 5). Main findings in the first (external) constellation are:
The branders scored on or nearby the modus (plus or minus 1). Except for the question if BOVAG Breakdown Service is important for the system. The branders are much more positive than the attendees. Maybe logical, as the branders were part of the implementation team which introduced this extension.
Both branders did not score once a same value. This is remarkable, they work closely together but there seems be differences how they think about the elements.
The stand-ins for Quality Mark, BOVAG Car Assurance, and BOVAG Breakdown Service were more positive about their added value to the system then the modus. Brand Name was more negative about his added value in relation to the modus.
The stand-in for BOVAG Car Assurance was very positive about BOVAG Breakdown Service. She was more than five points more positive in relation with the modus. She was even more positive over BOVAG Breakdown Service than over her own added value.
The stand-ins scored Brand Name more negatively than the modus and they scored Quality Mark more positively than the modus.

Branding constellations as reliable predictors of brand extensions
A branding constellation reliability case study 90
Main findings in the second (internal) constellation:
The branders scored on or nearby the modus (plus or minus 1), except for the positive contribution of Brand Name and BOVAG Car Assurance on which they scored more negatively (minus 2 related to the modus).
The branders scored six propositions with the same value. It looks like both branders had a common view on the internal system or did not put too much effort in distinguishing their perceptions on these six propositions.
Brand Name had a more positive score for himself than the modus. Also BOVAG Car Assurance had a more positive picture of herself than the modus score. She was this time negative about BOVAG Breakdown Service, in line with the scores of the attendees.
BOVAG Breakdown Service was a little more positive about himself than the modus. Furthermore, he was very positive about BOVAG Car Assurance (more than the modus).
Clients had a very realistic picture of herself. She scored exactly on the modus.
The stand-ins scored more positive about Brand Name than the modus and varied more about the added value of both extensions.
Fifth, the attitude theory of Fishbein and Ajzen (1975: 59) asks for a test on the product of importance and valuation. Therefore, the scores of questions 2 and 3 were multiplied, of questions 6 and 7, and of questions 8 and 9 for both constellations. This re-test led to the same findings (DATA-DVD map 5). Sixth, the one-sample t-test shows that BOVAG Breakdown Service is the brand extension to stop and the BOVAG Car Assurance is the brand extension to continue. To check these findings an independent t-test is performed on the propositions scores right after the brandings constellations to see if the means of the two brand extensions differ from each other. The findings are displayed in table 6.4. Table 6.4 Overview findings independent t-test (scale 1: 10)
Constellation Mean differences
Mean BOVAG
Breakdown Services
Mean BOVAG Car Assurance
First (extern) Question 6 and 8 direct after constellation?
+4.46 +6,06
First (extern) Question 7 and 9 direct after constellation?
+4.66 +6.60
Second (intern) Question 6 and 8 direct after constellation?
+3.17 +6,94
Second (intern) Question 7 and 9 direct after constellation
+2,94 +6,94
Table 6.4 shows that there is a clear difference in mean between the attendees’ scores for BOVAG Breakdown Service and BOVAG Car Assurance. The attendees are significantly more positive about the extension BOVAG Car Assurance Finally, a one-sample t-test was performed on the e-mail fit-scores. The findings are displayed in table 6.5. The means of the extensions were compared to 0. All SPSS reports can be found on the DATA-DVD (map 5).

Branding constellations as reliable predictors of brand extensions
A branding constellation reliability case study 91
Table 6.5 Overview findings one-sample t-test because of the send email (scale -2: +2)
Constellation Brand extension Mean Sig.-factor
First (extern) BOVAG Breakdown Service -0.370 0.046
First (extern) BOVAG Car Assurance +0.450 0.033
Second (intern) BOVAG Breakdown Service -1.150 0.000
Second (intern) BOVAG Car Assurance +1.000 0.010
Table 6.5 shows again that the fit-scores also indicate that there is a clear difference between the attendees’ scores for the BOVAG Breakdown Service and BOVAG Car Assurance. BOVAG Breakdown Service scored significantly lower than 0, while BOVAG Car Assurance scored significantly higher than 0. Thus, the validity of the normal distribution consensus reliability is moderately positive, while the validity of the performed t-test is very high.
6.4 Reliability
According Yin (2009: 40) reliability is demonstrating that the operations of a study, such as data collection procedures, can be repeated with the same findings. Yin describes the following phases of a case study research: 1. Design the case study. Choose a general approach and which design will be used.
Questions are for example is it a multiple or single case study and how quality will be judged.
2. Preparing for performing the data collection. A standardised case study protocol is essential for a single study but even more for a multiple study to make it possible to stack the case studies.
3. Collecting evidence. Choose the sources of evidence Yin (2009: 86) and use the three principles of data collection (multiple sources of evidence, create a case study database, and maintain a chain of evidence).
4. Analysing the evidence. Use the correct analytic tools and be sure the researcher is familiar with the analytic tools.
5. Reporting the studies. An illustrative structure and standardised procedures will help by making the report and stacking the findings if the case study is part of a multi case study.
Subsection 6.4.1 discusses the design of the case study. In subsection 6.4.2 the preparing of data collection is discussed and in subsection 6.4.3 the collection of evidence is reviewed. Subsection 6.4.4 examines the methods of analysing the evidence. Finally, subsection 6.4.5 regards the reporting.
6.4.1 Reliability of case study design The case study design covers the general approach and the design employed according to Yin (2003: 40). Questions are for example is it a multiple or single case study and how quality will be judged. The Theme is set up as a multiple case study. The quality within the Theme is underpinned by rigorously employing with the scientific theories of Yin (2009) and Miles and Huberman (1994).

Branding constellations as reliable predictors of brand extensions
A branding constellation reliability case study 92
However, in 2013, Yin and Miles & Huberman updated their books. Yin presented a fifth edition of “Case Study Research“ (ISBN 13: 9781452242569) and Miles & Huberman a third edition of “Qualitative Data Analysis” (ISBN 13: 9 781452257877); a clear signal that both theories are still contemporary. For future Theme students it is recommended to employ these updates.
6.4.2 Reliability of preparing data collection The preparing of the data collection is according to Yin (2003: 40) a case of preparing the researchers with an intensive training and a standardised case study protocol should be developed and refined to stack the case studies. A standardised case study protocol is essential for a multiple study to make a useful stacking possible. Preparing the researchers is mainly done by the Open University. As all students who start their thesis are in the Masters phase of a scientific study. The Theme follows a standardised case study protocol with standardised reliability measurements. The development and refinement of the case study protocol is conducted within the Theme by asking student to study the most recent Theme theses and especially focus on the discussions as these are intended to cover the opportunities for further development and refinements.
6.4.3 Reliability of evidence collection Data for case studies should come from many sources of evidence according to Yin (2003: 40). Therefore the Theme has developed and refined several different measurements of reliability. And within the Theme other researchers are asked to review the standardised measurements when they are performed. However there is always some subjectivity about the interpretation of the scales, especially where the researcher scores a “+1”, and other Theme students denote it might have been a “+2”.
6.4.4 Reliability of evidence analysis The reliability of evidence analysing is about employing the correct analytic tools and to make sure the researcher is familiar with the analytic tools according to Yin (2009: 40). Analysing the evidence of a case study is one of the least developed and most difficult aspects of doing case studies according to Yin (2009: 109). The discussion on the validity of the measurement is extended to discuss the correctness of the analytic tools. To make new researchers familiar with the analytic tools, they are asked to review the analyses of their current predecessors. Furthermore, drawing conclusions is within the Theme also an interactive process with the coordinator and fellow Theme students. Especially, the Theme coordinator is a guide in the process of drawing conclusions. This is a process of testing the meanings that are emerging from the data. Applying statistics seems a hard way of analysing, but sometimes raises questions about which statistic technique has to be used. In this case, the choice was between the Shapiro-Wilkinson test and the Kolmogorov-Smirnov. The Shapiro-Wilkinson test is chosen because this test is more appropriate for small sample sizes (< 50 samples).

Branding constellations as reliable predictors of brand extensions
A branding constellation reliability case study 93
Furthermore, in this case the Cronbach’s Alpha test is used to check the consistency of the propositions questionnaire. The Alpha must be 0.7 or higher to be reliable (Field, 2009: 675). The Cronbach’s Alpha for the first (external) constellation is 0.991. The Cronbach’s Alpha for the second (internal) constellation is 0.988. This indicates that the 9 questions account for a reliable questionnaire.
6.4.5 Reliability of study report An illustrative structure and standardised procedures will help by making the report and stacking the findings if the case study is part of a multi case study according to Yin (2009: 49). Reporting a case study means bringing its results and findings to closure (Yin, 2009: 141). Yin advises to use a structure and to follow certain procedures such as having the report reviewed by informed persons. Both are already common within the Theme. There is a report structure and the reports are all reviewed by the Theme coordinator and Theme students. And were necessary predecessors were asked to review parts, where their own thesis is interpreted. In this case for example Jongsma was asked to review the text in subsection 4.4.1 and Roossien was asked to review the text of subsection 4.4.2. The overall conclusion is that studies on branding constellations and the developed procedures, and methodologies within the Theme are highly reliable. The methodology and procedures are mature (almost free of errors) and they can easily be repeated.
6.5 Implications
Based on the insights and ideas, derived during the whole research process and the insights derived because of the discussions about validity and reliability, some implications are formulated; in sub section 6.5.1 for the Theme and in sub section 6.5.2 for BOVAG.
6.5.1 Theme implications The four most important Theme implications are described below. Implication 1: Further improvement of the consensus measurement This study presents important insights about the usability of the consensus measurement within the Theme. There is further research necessary whether the normal distribution tests based on the scores of the attendees on predetermined branding propositions to allow for a more definitive conclusion about the reliability measurement of the distribution of these propositions around a real value. Implication 2: Further development of a predictive validity measurement The one-sample t-test seems a reliable test to predict the success of brand extensions. Further development of a prediction reliability measurement bases on the t-test is recommended. This thesis gives a first start the development of a predictive validity measurement (e.g. Robson, 2002: 103), indicating how well branding constellation predict brand extensions.

Branding constellations as reliable predictors of brand extensions
A branding constellation reliability case study 94
Implication 3: Further research on relevance and validity of branding constellations within the Theme According Jurg (2010: 78) there are four dimensions of perceived usefulness: relevance, validity, reliability, and precision. The participating branders and marketing experts in the study of Jurg are very positive about the relevance of branding constellations, moderately positive about their validity, and have their doubts about their reliability and precision. Within the Theme for each dimension measurements were developed and tested since 2004. The last five years the focus in the Theme is on reliability and precision. A lot of time is spend to develop and improve reliability measurements. The question is if more “reliability” research will made the constellation methodology more reliable than it already is. It seems more fertile to focus on the two dimensions of the usefulness of banding constellations that were valued most: relevance and validity. So, direct future studies more on the development and improvement of the dimensions relevance and validity. Implication 4: Further research on quality marks During this research it became clear that there is no scientific research done after quality marks in relation with brand extension or other brand strategies. There is a little research done what the effects are on consumer behaviour if quality mark stamps are on products. But these quality marks were directly related to the products. So a recommendation, for future Theme students of strategic marketing students, is to perform further research about the effects of quality marks in relation with strategic marketing questions (see also 6.6.2).
6.5.2 BOVAG implications The most important BOVAG implications are described below. Implication 1: Stop the BOVAG Breakdown Service extension The relationships with BOVAG Breakdown Service are not positive (he encountered resistance from members, confused consumers, and diluted the parent brand). The diluting from the parent brand was also a conclusion of a research done by BLAUW (2009: 7). The advice to stop with BOVAG Breakdown Service was also the outcome of the independent research company Interbrand (2011: 44, 45) a year after the branding constellations. Thus, start a project to implement the consequences of these findings. Implication 2: Take up a brand strategy inclusive an extension strategy At this moment the twelve BOVAG divisions could launch division products as a BOVAG brand extension or line extension. The perspective of these launches is often short term and focused on the product functionality. The effects on the parent brand are insufficiently taken into account. According to Martinez (2010: 1198), a brand is one of the most important assets for companies and maybe for a branch organization with a quality mark a brand may even be more important. Thus, the BOVAG marketing manager must be alert for inadequate strategies that erode the brand assets. One of these potentially risky strategies involves launching unsuitable brand- or line- extensions that erode extended brand benefits and associations.

Branding constellations as reliable predictors of brand extensions
A branding constellation reliability case study 95
Implication 3: Employ branding constellations as predictions for future brand extensions The reliability of branding constellations to predict the usefulness of extensions seems very high. The one-sample t-test shows this and it is theoretical underlined with the model of Martinez, and in the practical way by the research of Interbrand one year later with comparable findings. With a high confidence branding constellations can be employed as reliable predictor of brand extensions. Thus, when there is a plan for introduction of an extension it will good to perform a branding constellation in line with the branding constellations studied in this thesis. It is better to invest little time and money before the introduction of an extension then spend lots of time and money afterwards to make up for the negative effects on the parent brand. Implication 4: Distinguish between quality mark and brand BOVAG is a quality mark and also a “consumer” brand. The differences are not clear for consumers. So the recommendation is to start a project to distinguish between the quality mark and the brand explicitly.
6.6 Reflections of researcher
This section presents a brief reflection on the study of branding constellations, quality marks, and brand extensions. Section 6.6.1 starts with a Theme reflection and section 6.6.2 presents a personal reflection by the researcher.
6.6.1 Theme reflection In this subsection I will share my Theme reflection. First, a second-person study might be a troublesome category for Theme students. Given the fact that the second-person studies already were underweighted within the Theme and the runtime seems longer. It looks like the researchers cannot easily take distance from the case. This was also an experience of myself. Second, in the external branding constellation a second facilitator was introduced to get some movement in the system. This did not work well as the branders did not develop new insights from his interventions and the elements got more or less a little out of the “flow”. Third, the room where the constellation took place was so large that sharp video and audio material was hard to made with regular camcorders. The distance to microphones of the camcorders made it difficult to transcribe the conversations. Sometimes I had to listen twice or thrice times to hear what was said. Also the light in the room was too weak for sharp video material. The pictures in the Thesis are snapshots from the video, and so they are all a little hazy. Fourth, some stand-ins had no experience with constellations. At some moment the stand-ins must be reminded what the rules are in the constellations. It is questionable if inexperienced stand-ins must take part of commercially conducted branding constellations. The correction they needed from the facilitator seemed to distract the other stand-ins.

Branding constellations as reliable predictors of brand extensions
A branding constellation reliability case study 96
Fifth, the sessions with the facilitator where we work out the transcriptions were very helpful. The experience of the facilitator is necessary to see all little details in the branding constellations. Doing the transcriptions together, for sure enhanced the quality of the findings. Sixth, I performed a triangulation measurement with a historical analysis of BOVAG and a study on the research reports of external brand company’s (BLAUW research and Interbrand). The triangulation reliability measurement is supposed to support a finding by showing that independent measure of it agree with it, or, at least, do not contradict it (Miles & Huberman, 1984: 234). And according Van Zanten (2006: 30) when the different methods gives consistent findings then confirmed this the reliability of the measurement. But at some moment in time I decided that the triangulation measurement would not be a part of the findings. This was very pity, because a lot of time spend to both studies. But the studies gives me a lot of insight and supported me in the interpretations. Although it feels as lost time, later it turned out as welcome extra insight and knowledge which was used at different ways. Because I found consistent findings from the other research findings, I am convicted that branding constellations are reliable. Seventh, the literature study is now done from the perspective of brand extensions but initially the intention was to employ the theoretical perspective of quality marks. But there was no scientific literature available and I still keep searching and contacting a lot of people. This cost me a lot of time. I advise future Theme students to choose a subject covered by the literature. Finally, my laptop crashed at a moment. I had made copies on an external disk, but these were more than a month old. After that moment I used cloud services to synchronise the Thesis to a several workstations. Maybe an opportunity for the Open University to service the back-up process.
6.6.2 Personal reflection In this subsection I will share my personal learning points with others with a short reflection. The first two learning points are about adapting my ambitions. This was my personal theme in the process of realising this thesis. The first thing I learned at the start of the Thesis process was that it would be less romantically then the picture I created for myself in the past years. I had a big picture what I would like to study about what online presence can do for your Brand. I remember the first conversations with Wim Jurg, his first message was: narrow, narrow, and again narrow your research question. So my big global picture became a small specific question. This was a very important lesson, if you want perform a good study project, you have to be very specific. The second thing I learned is that as I committed myself to a case study in the Theme, I had to fit in with the unwritten and developing boundaries of the Theme. This meant that I partly had to give up all my own ideas of content I want to research. I had to research a field of study which was not my first idea, but was related to my own ideas. In the first period I had to accustom myself to the new situation.

Branding constellations as reliable predictors of brand extensions
A branding constellation reliability case study 97
When the examiner asked me if it would be a problem for me to write this thesis in English I realised that foreign languages are not my best skills. But optimistically, I consented with the request. I saw an opportunity that during the process of writing the thesis I also could improve my English (to kill two birds with one stone). I learned a lot, but the use of English in this thesis has its limitations and may have caused the reader some annoyance. I offer my apologies. When the examiner asked for the planning, my planning was to finish the thesis within a year. At that moment I worked as a self-employed professional so I could plan my own time. But a few unforeseen occurrences made that I could not stick to my planning. Add up with a few content challenges in the thesis, made the journey longer than planned. But not less interesting. In my search to find literature about quality marks I did not find a scientific article (see appendix 9). Only popular and commercial articles could be found (see DATA-DVD, map 4). In some books about branding a little bit could be found. For example dr. R. Riezebos (2002: 119) wrote a few pages about quality marks. And online, on www.keurmerk.nl, Riezebos was quoted. So, my ambition was to create theory and relevant content about quality marks. On my twitter account a tweeted for more than a year about quality marks, talked to a lot of people who are responsible for the marketing of a quality mark, and organised in cooperation with the consultancy organisation Berenschot a Quality Mark Seminar for branch associations with a quality mark. And I wrote an article about the further of quality marks in cooperation with a consultant of Berenschot (see appendix 10). I succeeded in my ambition to create content about quality marks, and I learned unimaginable a lot of the do’s en don’ts about quality marks and the struggles of branch organisations with their second degree quality mark. I had met a lot of interesting people and enlarge my network. But in retrospect I lost myself in the process. To get an impression of the activities see table 6.6. Table 6.6 Activities employed for searching or creating content of Quality Marks
Number Activities When
1. Organise a seminar with Berenschot about quality marks. Spoke with al lot off representatives of quality marks in Holland. BOVAG contributed also to this Seminar.
Oct 2010
2. Write the article “wat is de toekomst van uw keurmerk?” (what is the future of your quality mark?) and published the article in a periodical for branch organisations (appendix 10)
March 2011
3. Interviewed several consultants and advisors in the field of branch organisations and used the snowball method to find more articles and advisors.
Oct 2010 till Oct 2012
4. Read a lot of books about branding strategies and searched for paragraphs about quality marks. And also used here the snowball method on the literature list.
April 2010 till Febr 2011
5. Read a thesis which is never finished with the subject “fair trade marks”. The reason was that the student could not find articles.
Dec 2010
6. Read all the news about quality marks on the internet and put a lot of tweet on a twitter account “hendri_ende”. This results in a few new contacts and discussions whit experts about quality marks.
Oct 2010 till now

Branding constellations as reliable predictors of brand extensions
A branding constellation reliability case study 98
The runtime of more than 3 years results in many adjustments because new insights had to be added and led sometimes to renew a part of the Thesis. The long runtime is the main cause that made it difficult to plan the thesis process and led to a substantial exceeding of the 600 hours the Open University estimates for this course. At a moment I stopped registering the actual hours because it was clear that I would exceed the 600 hours by far. Table 6.7 presents an overview of the estimated time spent on the case study. At least it is more than 800 hours. Table 6.7 Overview of the time spent on the case study
Tasks Planned hours Actual hours
Preparations, make research plan 30 15
Literature study 80 105
Preparing branding constellations, questionnaires e.g. 20 19
Organisation branding constellation(s) 10 9
Analysis of video footage (including transcription) 80 39
Writing a first thesis draw 150 200
Feedback to fellow students and participate to constellations 30 28
Completing the thesis 150 250
Finalisation research (review feedback, layout, presentation) 50 175
Total 600 840
Thus, the process of realising this Thesis cost a lot more time than I ever had imagined. And if some had told me before that the runtime would be over the 3 years, I would laugh so hard…But beside all the things I learned about writing a thesis, doing research, meet a lot of interesting people, the BOVAG, Quality Marks and Brand Extensions etc. And another important thing I learned a lot about myself and further that life is what happens to you while you're busy writing your Thesis.
Branding constellations as reliable predictors of brand extensions
A branding constellation reliability case study 99
References
Bibliography
Articles 1. Aaker, D.A. and Keller, K.L. (1990), Consumer Evaluations of Brand Extensions,
Journal of Marketing, 54 (1), page 27-41. 2. Aardema, H. (2010), Innovatiekans voor volksvertegenwoordigers en mensen om
hen heen, Kluwer, Alphen aan den Rijn. 3. Baarda, Dr. D.B. (1990) en Goede de, Dr. M.P.M., Basisboek Methoden en
Technieken, Stenfert Kroese Uitgevers, Leiden 4. BOVAG (2005), BOVAG 75 jaar, Een terugblik op 75 jaar BOVAG-historie,
Langfords Publications, Amsterdam 5. BOVAG (2004), Association for business operators in the mobility sector, brochure 6. Bradbury, H. and Bergmann Lichtenstein, B.M. (2000), Relationality in
Organizational Research: Exploring the Space Between, Organization Science, 11 (5), page 551-564.
7. Buijs, Drs. A. (1990), Statistiek om mee te werken, Stenfert Kroese Uitgevers, Leiden
8. Butler, P. (1995), From Analysis to Decision, Marketing Intelligence and Planning, 12 (2), page 4-16.
9. Carson, D., Gilmore, A., Perry, C., & Gronhaug, K. (2001), Qualitative Market Research. London: Sage.
10. Daniels, K., Johnson, G. and de Chernatony, L. (1994), Differences in Managerial Cognitions of Competition, British Journal of Management, special issue, (2), 21/29.
11. Dijksterhuis, A. (2009), Het slimme onbewuste, denken met gevoel, Uitgeverij Bert Bakker, Amsterdam
12. Field, A. (2009), Discovering statistics using SPSS – Third edition, Sage Publications, Inc., Thousand Oaks, California
13. Fishbein, M., and Ajzen, I. (1975), Belief, Attitude, Intention, and Behavior: An Introduction to Theory and Research, Addison-Wesley Publishing Company, London
14. Franke, U. (2003), The river never looks back – Historical and Practical Foundations of Bert Hellinger’s Family Constellations, Carl-Auer-Systeme Verlag, Heidelberg
15. Franzen, G. and Berg van den, M. (2001), Strategisch management van merken, Kluwer, Alphen aan den Rijn
16. Franzen, G. and Bouwman, M. (1999), De mentale wereld van merken, Samson, Alphen aan den Rijn
17. Gibson, L. and Lawrence D. (1998), Defining marketing problems, Marketing Research, 10 (1), page 4-12.
18. Gibson, L. and Lawrence D. (2000), Quo vadis, marketing research? Marketing Research, 12 (1), page 36-41
19. Gminder, C.U. (2006), Nachhaltigkeitstrategien systemisch umsetzen – Eine qualitative Exploration der Organisationaufstellung als Managementmethode, Deutscher Universitäts-Verslag/GWV Fachverlage GmbH, Wiesbaden
20. Gosling, J., and Mintzberg, H., (2003), The Five Minds of a Manager, Harvard Business Review, 81 (1), page 54-63.
21. Graham, R., and Jahani, M. (1977), People, Problems and Planning: a Systems Approach to Problem Identification, Interfaces, 8 (1), page 50-55.

Branding constellations as reliable predictors of brand extensions
A branding constellation reliability case study 100
22. Hanby, T. (1999), Brands - dead or alive?, Journal of the Market Research Society, 41 (1), page 7-18.
23. Huizinga, H. (2000), Merken, Samson, Alphen aan den Rijn 24. Keller, K.L.(2001), Editorial - Brand research imperatives, Journal of Brand
Management, 9 (1), page 4-6. . 25. Kotler, P. (1994), Marketing Management: analysis, planning, implementation and
control, 8th edition, Prentice-Hall inc. A Simon & Schuster Company, New Jersey 26. Labots, H.G. (1964), 25 jaar Mr A.F.H. Jansen en de BOVAG, Bunnik 27. Lapin, L. (1995), Statistics for Modern Business, The Dryden Press, Harcourt Brace
College Publishers 28. Martinez, E. and de Chernatony, L. (2004), The effect of brand extension strategies
upon brand image, The Journal of Consumer Marketing, 21 (1), page 39-50. 29. Martinez, E. and Pina, J.M. (2010), Consumer responses to brand extensions: a
comprehensive model, European Journal of Marketing, 44 (7/8), page 1182-1205. 30. Martinez, E. and Pina, J.M. (2003), The negative impact of brand extensions on
parent brand image, Journal of Product & Brand management, 12 (6/7), page 432-448.
31. Maso, I. and Smaling, A. (1998), Kwalitatief onderzoek: theorie en praktijk, Boom Lemma Uitgevers, Den Haag
32. Miles, Matthew B. and Huberman, A. Michael (1994), Qualitative Data Analysis, an expanded sourcebook. Sage Publications, Inc., Thousand Oaks, California
33. Multon, K.D. (2010), Inter-rater Reliability (inter-observer), Encyclopedia of Research Design, Sage Publications, Thousand Oaks CA, Volume 2, page 627-629.
34. Olson, J.M. (1993), Book review essays on Eagly & Chaiken’s, The psychology of attitudes, Psychological Inquiry, 4 (4), page 358-378.
35. Razali, N.M. and Wah, Y.B. (2011), Power comparisons of Shapiro-Wilk, Kolmogorov-Smirnov, Liliefors and Anderson-Darling tests, Journal of Statistical Modeling and Analytics, 2 (1), page 21-33,
36. Riezebos, R. (2002), Merkenmanagement, Wolters-Noordhoff bv, Groningen 37. Riezebos, R., van der Schee, J. (1999), Het keurmerk gekeurd: keurmerken en
certificaten als merkenbouwinstrument. Tijdschrift voor Marketing Volume 33, No. 2, pp. 49 – 51.
38. Robson, C. (2002), Real World Research: A Resource for Social Scientists and Practitioner-Researchers, John Wiley and Sons Ltd (Blackwell), Oxford
39. Rowley, J. (1999), Towards a consumer perspective on information behaviour research, Information Services and Use, 19 (4), page 289-298
40. Stam, J.J. (1998), bringing the roots of organizations to light, Anchorpoint, article number 972, volume 12, month july
41. Stam, J.J. (> 2000), Inleidend artikel familieopstellingen, website hellingerinstituut 42. Velde van der, M., Jansen, P. & Anderson, N. (2004), Guide to management
research methods, Blackwell Publishing Ltd., Oxford 43. Verschuren, P. (1994), De probleemopstelling voor een onderzoek, 5e druk,
Uitgeverij Het Spectrum B.V., Utrecht 44. Yadav, S.B. and Korukonda, A (1985), Management of Type III Error in Problem
Identification, Interfaces, 15, page 55-61. 45. Yakimova, R. and Beverland, M. (2005), The brand-supportive firm - An exploration
of organisational drivers of brand updating, Journal of Brand Management, 12 (6), page 445-460
46. Yin, Robert K. (2009), Case Study Research, Design and Methods, fourth edition, Sage Publications, Inc.,Thousand Oaks, California.

Branding constellations as reliable predictors of brand extensions
A branding constellation reliability case study 101
47. Zanten van, W. (2006). Academische vaardigheden 6: onderzoek faseren en probleemstellen. Heerlen: Open Universiteit Nederland
Branding constellation articles 1. Bloemer, M., Doorewaard, H. and Jurg, W.E., (2003), Het Merk en zijn Marketeer op
de Sofa 2. Bloemer, M., Doorewaard, H. and Jurg, W.E., (2006), Validity of Branding
Constellations, EMAC. 3. Jurg , W.E. (2013), Branding Theme Definition list, Data-DVD (map 4) 4. Jurg, W.E., (2003), SEBI – Systemic Exploration of Branding Issues, EMAC. 5. Bloemer M. and Jurg, W.E., (2007), Improving Predictability Using Branding
Constellations, Submitted EMAC paper. 6. Jurg, W.E., (2003), Systemische Erforschung von branding issues, Praxis der
Systemaufstellung, 1, 79/83 7. Jurg, W.E., Bloemer, J., Doorewaard, H., Peelen E. and Simons R.E.A., Systems
constellations, a better way to identify branding opportunities, (2008), Journal of Brand Management, 15 (4), 239/57
8. Jurg, W.E., Bloemer, J., and Simons, R.E.A., (2007), Ga eens buiten de geijkte onderzoekslijnen kleuren – MOA jaarboek.
9. Jurg, W.E., Thoelke, J., Integrating the inner and outer world in market research 10. Jurg, W.E., Peelen, E. and Roossien, H. (2013) et al, Embracing the Elephant Dissertations 1. Jurg, W.E. (2010), Unravelling Branding Systems, The perceived usefulness of
Branding Constellations, Open Universiteit Nederland, Uitgeverij Het Noorderlicht 2. Vorst van der R. (2004), Branding, a systems theoretic perspective, Radboud
Universiteit Nijmegen, Amsterdam Brand research 1. Blauw research (May 2005), 0-meting bekendheid en imago BOVAG, een
onderzoek onder consumenten van 16 t/m 80 jaar naar de bekendheid en het imago van BOVAG, Rotterdam
2. Blauw research (Januari 2006), Effect-meting bekendheid en imago BOVAG, een onderzoek onder consumenten van 16 t/m 80 jaar naar de bekendheid en het imago van BOVAG, Rotterdam
3. Blauw research (Januari 2007), Effect-meting tv-campagne BOVAG, een onderzoek onder consumenten van 16 t/m 80 jaar naar de bekendheid en het imago van BOVAG, Rotterdam
4. Blauw research (Januari 2008), Effect-meting tv-campagne BOVAG, een onderzoek onder consumenten van 16 t/m 80 jaar naar de bekendheid en het imago van BOVAG (3e effectmeting), Rotterdam
5. Blauw research (Januari 2009), Campagne Tracker BOVAG, een onderzoek naar de bekendheid en het imago van BOVAG (4e effectmeting), Rotterdam
6. Blauw research (April 2010), Campagne Tracker BOVAG, een onderzoek naar de bekendheid en het imago van BOVAG Campagne 2010 (5e effectmeting), Rotterdam
7. Heliview research (September 2007), Keurmerk Monitor 2007 Consumenten, Breda 8. Interbrand (Augustus 2011), Evalueren hoe belangrijk het merk voor BOVAG is,
onderzoek naar licensing en productaanbod, Amsterdam

Branding constellations as reliable predictors of brand extensions
A branding constellation reliability case study 102
Thesis 1. Elshout, M. van den (pending), Concept Changing lanes VVD, Open Universiteit
Nederland. 2. Halters, P. (2009), Trust is a Belief in Reliability, Open Universiteit Nederland. 3. Have ten, M. (2007), The reliability of Branding Constellations, Open Universiteit
Nederland. 4. Jongsma, K. (2011), Where is the innovation system?, Open Universiteit Nederland. 5. Karel, J.O. (2009), Identifying a New Opportunity, Open Universiteit Nederland. 6. Mechelen van, M. (2005), A Brand Extension Case Study, Open Universiteit
Nederland. 7. Meines, H. (2011), Verbindend leiderschap binnen een veranderende overheid,
Open Universiteit Nederland. 8. Reij van, C.C.A.J.M. (2010), Increasing consistency, Open Universiteit Nederland. 9. Roossien, H. (2012), Core competencies as branding opportunities, Open
Universiteit Nederland Websites 1. intranet.bovag.nl 2. www.anwb.nl 3. www.agreestat.com
4. www.allesoverinternalbranding.nl5. www.brandextension.org 6. www.bovag.nl 7. www.bovagautoverzekering.nl 8. www.bovagbeleidsinfo.nl 9. www.bovagpechhulp.nl 10. www.brandingconstellations.com 11. www.channelweb.com 12. www.eurib.org 13. www.hellingerinstituut.nl 14. www.interbrand.com 15. www.jstor.org 16. www.keurmerk.nl 17. www.marketingpower.com (AMA-website) 18. www.merkopstellingen.nl 19. www.millwardbrown.com 20. www.qualitative-research.net 21. www.rva.nl 22. www.sage-ereference.com 23. www.scribd.com 24. www.vbs-berging.nl 25. www.wimjurg.eu

Branding constellations as reliable predictors of brand extensions
A branding constellation reliability case study 103
Tables overview
Table 2.1 Positioning of systems constellations to other problem identification techniques ................... 15 Table 2.2 Overview of finished and current students per type of case study ......................................... 18 Table 2.3 Conceptualisation of marketing research (AMA website, May 11, 2013) ............................... 19 Table 2.4 Conceptualisation of brand by AMA (AMA website, May 11, 2013) ....................................... 21 Table 2.5 Six conceptualisations of brand by Jurg (2010) ...................................................................... 21 Table 2.6 Five conceptualisations of branding by Jurg (2010) ............................................................... 21 Table 2.7 Conceptualisation of brand extensions (Jurg, 2010: 45) ........................................................ 22
Table 3.1 Branding constellation workshop programme ........................................................................ 30 Table 4.1 Legend of not applicable statements for precision measurements (Van Reij, 2010: 33) ........ 36 Table 4.2 Legend of precision reliability scores (Roossien, 2012: 27) ................................................... 37 Table 4.3 Legend total precision reliability scores (Roossien, 2012: 27) ................................................ 37 Table 4.4 Legend of not applicable statements for bilateral relationship test-retest reliability (Van Reij,
2010: 33) ................................................................................................................................ 38 Table 4.5 Legend of bilateral relationship test-retest reliability (Roossien, 2012: 28) ............................ 38 Table 4.6 Legend of total bilateral relationship test-retest reliability scores for elements (Roossien,
2012: 29) ................................................................................................................................ 38 Table 4.7 Legend of overall bilateral relationship test-retest reliability scores (Roossien, 2012: 29) ..... 39 Table 4.8 Legend of perceived bilateral relationship scores between branding elements ...................... 39 Table 4.9 Legend total perceived bilateral relationship reliability scores (Roossien, 2012: 29) .............. 40 Table 4.10 Legend of overall perceived bilateral relationship reliability scores ........................................ 40 Table 4.11 Legend of total introspective reliability scores (after Roossien 2012: 32) ............................... 41 Table 4.12 Legend of overall total introspective reliability scores (Roossien, 2012: 33) .......................... 41 Table 4.13 Overview of reliability measurements for the first research question ..................................... 41 Table 4.14 Legend overall reliability scores (Roossien, 2012: 34) ........................................................... 41 Table 4.15 Legend stacking reliability scores (Roossien, 2012: 34)......................................................... 42 Table 4.16 Legend stacking scores.......................................................................................................... 44
Table 5.1 Findings of precision reliability measurements on first (external) branding constellation (scale
-2 to +2) .................................................................................................................................. 47 Table 5.2 Most and least precise branding elements in internal second branding constellation ............ 48 Table 5.3 Findings of precision reliability measurements on second (internal) branding constellation
(scale -2 to +2) ....................................................................................................................... 48 Table 5.4 Most and least precise branding elements in second (internal) branding constellation .......... 48 Table 5.5 Overview precision reliability scores per branding constellation............................................. 49 Table 5.6 Bilateral relationships scores in first (external) branding constellation (scale -2 to +2) .......... 50 Table 5.7 Bilateral relationships scores in second (internal) branding constellation (scale -2 to +2) ...... 50 Table 5.8 Similarity scores of bilateral relationships of the same branding elements in the branding
constellations (scale -2 to +2) ................................................................................................ 51 Table 5.10 Perceptions of bilateral relationships scores by marketing manager (scale -2 to +2) ............. 52 Table 5.11 Bilateral relationships scores in the first (external) constellation (scale -2 to +2) ................... 53 Table 5.12 Similarity scores between perceptions of bilateral relationships and the first (external)
constellation by marketing manager (scale -2 to +2) .............................................................. 54 Table 5.13 Perceptions of the bilateral relationships by the spokesman (scale -2 to +2) ......................... 55 Table 5.14 Bilateral relationships scores in the second (internal) constellation by the spokesman (scale -
2 to +2) ................................................................................................................................... 55 Table 5.15 Similarity scores between the perceptions of the bilateral relationships and the second
(internal) branding constellation by the spokesman (scale -2 to +2) ...................................... 56 Table 5.16 Unweighted average of similarity of the constellations ........................................................... 56 Table 5.17 Introspective reliability scores of the first (external) constellation (scale -2 to +2) .................. 57 Table 5.18 Most and least true branding elements (stand-ins) in the external branding constellation; top 3
............................................................................................................................................... 57 Table 5.19 Introspective reliability scors of the second (internal) branding constellation (scale -2 to +2) 58 Table 5.20 Most and least true branding elements (stand-ins) in the internal branding constellation; top 3
............................................................................................................................................... 58 Table 5.21 Overview introspective reliability scores per branding constellation ....................................... 58 Table 5.22 Overview of the findings on the reliability of the constellation; scale -2 to +2 ......................... 59

Branding constellations as reliable predictors of brand extensions
A branding constellation reliability case study 104
Table 5.23 Overview of precision reliability measurements within Theme (scale -2 to +2) ...................... 60 Table 5.24 Overview of bilateral relationship test-retest reliability Theme measurements (scale -2 to +2) ..
............................................................................................................................................... 61 Table 5.25 Overview of perceived bilateral relationship reliability measurements within Theme (scale -2
to +2) ...................................................................................................................................... 62 Table 5.26 Overview of introspective reliability measurements within Theme (scale -2 to +2)................. 63 Table 5.27 Overview of findings regarding the stacking of comparable cases (scale -2 to +2) ................ 63 Table 5.28 Overview of frequency histograms for Brand Name in the first (external) branding
constellation ........................................................................................................................... 64 Table 5.29 Overview of frequency histograms for BOVAG Breakdown Service in the first (external)
branding constellation ............................................................................................................ 65 Table 5.30 Overview of frequency histograms for BOVAG Car Assurance in the first (external) branding
constellation ........................................................................................................................... 66 Table 5.31 Overview of frequency histograms for Brand Name in the second (internal) branding
constellation ........................................................................................................................... 66 Table 5.32 Overview of frequency histograms for BOVAG Breakdown Service in the second (internal)
branding constellation ............................................................................................................ 67 Table 5.33 Overview of frequency histograms for BOVAG Car Assurance in the second (internal)
branding constellation ............................................................................................................ 68 Table 5.34 Overview of P-P plots for Brand Name in the first (external) branding constellation .............. 69 Table 5.35 Overview of P-P plots for BOVAG Breakdown Service in the first (external) branding
constellation ........................................................................................................................... 69 Table 5.36 Overview of P-P plots for BOVAG Car Assurance in the first (external) branding constellation .
............................................................................................................................................... 70 Table 5.37 Overview of P-P plots for Brand Name in the second (internal) branding constellation ......... 71 Table 5.38 Overview of P-P plots for BOVAG Breakdown Service in the second (internal) branding
constellation ........................................................................................................................... 71 Table 5.39 Overview of P-P plots for BOVAG Car Assurance in the second (internal) branding
constellation ........................................................................................................................... 72 Table 5.40 Overview of Shapiro-Wilkinson test findings for the first (external) branding constellation ..... 72 Table 5.41 Overview of Shapiro-Wilkinson test findings for the second (internal) branding constellation 73 Table 5.42 Overview tests of normal distribution first (external) constellation .......................................... 73 Table 5.43 Overview tests of normal distribution second (internal) constellation ..................................... 74 Table 5.44 Overview of the one-sample t-test for the first (external) branding constellation .................... 74 Table 5.45 Overview of the one-sample t-test for the second (internal) branding constellation ............... 75
Table 6.1 Legend fit consensus scores per brand extension ................................................................. 88 Table 6.2 Attendees’ workshop scores right after the branding constellations (scale +1 to +10) ........... 88 Table 6.3 Attendees’ email fit-scores the day after the branding constellation workshop (scale -2 to +2) .
............................................................................................................................................... 89 Table 6.4 Overview findings independent t-test (scale 1: 10) ................................................................. 90 Table 6.5 Overview findings one-sample t-test because of the send email (scale -2: +2) ...................... 91 Table 6.6 Activities employed for searching or creating content of Quality Marks ................................. 97 Table 6.7 Overview of the time spent on the case study ........................................................................ 98

Branding constellations as reliable predictors of brand extensions
A branding constellation reliability case study 105
Figures overview
Figure Name
Figure 2.1 Model to analyse the effect of brand extension strategy on brand image (Martinez and Pina, 2010: 1185)
Figure 3.1 House of mobility, Bunnik
Figure 3.2 Organisation chart BOVAG (BOVAG intranet, January 18, 2013)
Figure 3.3 Example of the BOVAG shield on the front of a building
Figure 3.4 Folders “BOVAG Car Assurance” (BOVAG autoverzekering) and “BOVAG Breakdown Service” (BOVAG pechhulp)
Figure 3.5 Projection positions of the brand extensions in the first (external) branding constellation set up by the marketing manager
Figure 3.6 Vision phase positions of the brand extensions in the first (external) branding constellation set up by the marketing manager
Figure 3.7 Projection position of Breakdown Service in the second (internal) branding constellation set up by the spokesman
Figure 3.8 Projection positions of BOVAG Car Assurance in the second (internal) branding constellation set up by the spokesman
Figure 3.9 Final positions of the brand extensions in the second (internal) branding constellation set up by the spokesman
Figure 4.1 Variance of the opinions as the indicator of consensus (y-as) of 5 members of the innovation team regarding 5 propositions on three points in a time period (x-as), (Jongsma, 2011: 46)
Figure 6.1 Element Brand Name.

Branding constellations as reliable predictors of brand extensions
A branding constellation reliability case study 106
Appendix overview
In the document “Appendices” the next appendix could be found.
Appendix Name Page
Appendix notes 5
1 Voorbereiding Merkopstellingen 7
2 Algemene procedure merkopsteling 11
3 Literatuuronderzoek brand extensions 13
4 Samenvatting van het artikel 19
5 Vragenlijsten direct na de opstelling 21
6 Complete tekst Jongsma 23
7 Complete tekst Roossien 25
8 Compelte overzicht van alle vragen normal verdeeld 27
9 Literatuuronderzoek quality mark 29
10 Artikeltekst “De toekomst van uw keurmerk” 31
11 Historische analyse 35
12 Results of attitude theory of Fishbein and Ajzen 41
13 DATA-DVD 43

Branding constellations as reliable predictors of brand extensions
A branding constellation reliability case study 107
Table of contents DATA-DVD
The DATA-DVD can be found as the last appendix in the document “Appendices”. Map name Sub map / Files
1. Video material Merkopstelling 1 26 februari 2010
Merkopstelling 2 26 februari 2010
Nabespreking merkopstellingen 26 januari 2010
Nabespreking 23 maart 2010
2. Transcriptions Transcription precisiontest branding constellation interne opstelling BOVAG 26 februari 2010
Transcription precisiontest branding constellation externe opstelling BOVAG 26 februari 2010
Transcription bilateral test-retest branding constellation interne opstelling BOVAG 26 februari 2010
Transcription bilateral test-retest branding constellation externe opstelling BOVAG 26 februari 2010
Transcription branding constellations old method
Transcription branding constellations evaluatiefase BOVAG 26 februari 2010
3. Forms and templates
Vragenformulier merkopstelling
Verschilanalyse voorspellingsmatrix_nav analyse
ORIGINEEL Standardised bilateral test-retest measurement
4. Literature Background
Brand Extension literature study
Inter Rater Reliability
Internal Branding
Quality Mark literature study
5. Analyses Attendees
Prediction matrices
SPSS outcomes
6. External research (empty)
BLAUW (2008) rapportage 3e effectmeting BOVAG
BLAUW (2009) rapportage 4e effectmeting BOVAG
BLAUW (2010) rapportage 5e effectmeting BOVAG
BLAUW (2012) rapportage onderzoek naar de bekendheid en het imago van BOVAG
Heliview research (2007) Keurmerk Monitor Consumenten
INTERBRAND (2011) rapportage hoe belangrijk het merk voor BOVAG is
7. Historical analyse
30 jaar BOVAG
BOVAG 50 jaar jong
Wat is BOVAG personeelsgids
8. Theses predecessors
01. Van Geel (2004)
02. Siezen (2004)
03. Gomersbach (2004)
05. Davidse (2005)
12. Holwerda (2006)
22. Halters (2008)
23. Karel (2009)
24. Van Reij (2010)
25. Jongsma (2011)
26. Meines (2011)
27. Roossien (2012)
28. Vogelaar (2013)
29. Neijenhuis (2013)
Thesis not finished or ongoing
9. Thesis Hendri van ’t Ende
Presentation
Appendices Hendri van t Ende (2010) , A Branding Constellation Reliability Study
Thesis Hendri van t Ende (2010), A Branding Constellation Reliability Study
Branding constellations as reliable predictors of brand extensions
A branding constellation reliability case study 108

Branding constellations as reliable predictors of brand extensions
A branding constellation reliability case study 109
Live is what happens to you while you're busy writing your Thesis