CONSTELLATION ARRAY: A NEW SENSORY STRUCTURE IN SCORPIONS (ARACHNIDA: SCORPIONES)
Upload
khangminh22Category
view
3download
0
to) 0
I
'�¾.&.
I
U) -E
7
4,
& �,
+
mc
C 0
so =

INANCIAL HIGHLIGHTS
p
Common Stock Data Earnings per share
Earnings per share before special costs included in operations and cumulative effect of change in accnunting principle
Earnings per share before cumulative effect of change
effect of change
A in accounting principle$ 82
9 $ 91
$ 345
s 345
$ 8,134 S 7.296 4,869 4,482 1,075 1,161
$14,078 S 12,939 $ 3,844 S 3,174 $ 1,850 $ 830 $ 239 $ 350
Common Stock Market Price and Book value Per Share
$50
$4O
$30
$20
so 1 997 1999 1999 2000 2001
Book Value per Share M Market Price per Share
(762)%
(73.6)%
11.5% 8.6%
(74) % 8.8%
21.%
122.9% (31.7)%
Return on Average Common Equity
14t
12%
10%
8%
4%
2%
0 197 1998 1999 2000 200
Reportrd SExclerinSpecIalCostsand
Nonrecurrcn ltems
Income before cumulative ini accounting princip
Cumulative effect of chaor! Net income Assets
Merchant energy busines Regulated utility business Other businesscs and .. t
Iloal assets Total common equity Nonregulated capital ,spe Regulated capital expendl
Earnings and Dividends Declared* Per Share of Common Stock
$300
$250
-1
1997 1998 1999
Earnings per Share Reported Earnings per Share- -Sefore Sper
and Nonrecurrng Ihems
DIviNends Declared per Share
In January 2002, the Board c
2001 2000 (In mion, , except per shnr gmointsj
% Change
$ 2.60 $ 2.43
( irte Itse
iditures ure$
been r..lafid to confirm witI tAe c..r..nt ja' ..
LI 2000 2001
IC1osts
Directors announced it will increase the
01

e '71 Fi

11W Gpith a long history in Central Maryland, Constellation Energy XGroup has repeatedly demonstrated the strength and flexibility
to prosper in diverse market conditions.
Our strength is rooted in industry knowledge, experience, and in valuable assets that
include a premier gas and electric utility and a diverse portfolio of power plants.
Ourflexibility comes from a strong balance sheet, proven commercial skills, and
strong decision-making abilities that allow us to adjust rapidly to evolving market
conditions. This agility propels us forward as we act quickly to capitalize on the
opportunities of the marketplace.
Together, strength and flexibility are the formula for our success.
But strength and flexibility have another advantage: they are the perfect platform
for growth. As our industry continues to change, we have the generation assets and
the marketing expertise to capitalize. As the economy gains forward momentum, we
are perfectly positioned to build upon the solid foundation that is our company.
Such is the success of Constellation Energy Group.

Mh
0
Mh 0 1
0 c

4 / TO OUR FELLOW SHAREHOLDERS
No doubt, 2001 was a tough year for our company, as it was for the entire energy industry. The
combination of many factors, including the dramatic decline in power pri ces, the collapse ofEnron, and the
dynamics of the California market, led us to make similarly dramatic changes in our strategy and our organization.
In 2001, we canceled our plans to separate, terminated our relationship with Goldman Sachs, and brought on a
new CEO. We also moved to control costs, streamline our organization, and intensify our focus on risk management.
As the year ended, we were already seeing the positive results of our decisive actions, and we are pleased to convey our
confidence that we have emergedfrom a difficult year stronger than ever.
Ours has been an industry in transition for nearly a decade.
Much of the upheaval experienced in the past year may be an
inevitable and necessary step in the evolution from a regulated
to a competitive market. This transformation has caused
volatility and uncertainty around many factors that affect our
company's profitability. While we wholeheartedly endorse the
industry's migration to a freely competitive market, we are
focused on maintaining our strength and flexibility, both
strategically and financially, and managing risk vigilantly while
positioning our company for the future. Thus, that is the
theme of this annual report.
Financial Highlights
Our 2001 earnings from operations were $2.60 per share
compared to $2.43 per share in 2000. In the fourth quarter,
however, we reported a series of special costs that together
equal approximately $533 million, or a total earnings per share
impact of $2.08. We also recorded a cumulative effect of an
accounting principle change in the first quarter that increased
earnings per share by $.05. This resulted in reported earnings
for the calendar year of $.57 per share.
The special costs recognized in the fourth quarter (see
pages 22-23 in the Financial section) are the result of rigorous
analysis coupled with an aggressive strategy to monetize our
non-core assets, improve our balance sheet, and rationalize our
cost structure. With these actions, we want to assure you that
we are clearly focused on our core business of energy.
Dividend Policy Changes
Going forward, we are committed and determined to improve
our results. Achieving a competitive total return on your
investment is our goal. Since deciding not to separate into two
companies, we recognized that we needed to change our
dividend policy that became effective last year in April.
On January 30, we announced that we would increase our
annual dividend from $.48 to $.96 per share beginning with

the next quarterly payment date of April 1, 2002. The
dividend is a meaningful contributor to our goal of providing
superior return to our shareholders.
Focus on the Fundamentals
One of the most important strategic decisions we made last year was deciding not to separate our merchant from our retail energy services business. This significant choice was partly
driven by the capital markets, which had shifted dramatically and no longer awarded a cost-of-capital advantage to merchant generation companies. We also recognized that in times of economic uncertainty, it's wise to build from a base of scale
and stability and that there is strength in a portfolio of
businesses that balances earnings growth and cash flow. The collapse of Enron and the steady decline in the value
of all merchant energy companies have demonstrated that our courageous decision not to separate was, in fact, the
right decision.
Since canceling separation, we have moved quickly to
realign the management team and streamline our organization. We have established three operating units and put the right
people with the right skills in charge to manage them.
In addition, we have created a new staff role of Chief Risk
Officer, who is focused on defining and managing all key risks across the company It was particularly gratifying that our prudent business practices allowed us to avoid any material Enron-related losses. This new position strengthens our ability to continue to manage risk responsiblyý
The strategic and organizational decisions of 2001 provide
real clarity to our direction. We are focused on being a leader
in the wholesale merchant energy business and providing
premier utility and energy-related services in Maryland and the surrounding region.
In pursuing these strategies, we are guided by the core values that are fundamental to the successful operation of Constellation Energy Group. This is a company that has a

6/
186 -year history of dealing fairly with its customers, of
maintaining the highest level of integrity, and of living tIp to its
responsibility to its shareholders, communities, and employees.
A Solid Platform for Growth
A Strong Base of Generation Assets
We believe that the strongest energy businesses have physical
assets to complement their merchant capabilities. Our strength
in generation, including our expanding influence in the nuclear
world, is a true core competency. In 2001, we started the year
by winning the Edison Award, our industry's most prestigious
honor, for our pioneering work in nuclear license renewal. We
ended the year with the purchase of Nine Mile Point Nuclear
Station. In the summer, we brought on line 1,100 megawatts
of new gas-fired generation. We also have under construction
an additional 2,900 megawatts in key parts of the country.
As of year-end 2001, our Generation Group owned
and operated about 9,200 megawatts of power. With
2,900 megawatts under construction, it will have more
than 12,000 megawatts by the end of 2003 when all the
plants will be completed.
Leveraging Our Assets
Our power marketing, long-term power contract origination,
and risk management business leverages off of the strength of
our generation assets and is a vital part of our company's
success. Since its inception five years ago, this operation has
generated strong earnings growth for Constellation. Much of
this growth has been driven by serving electric distribution
companies that have elected to outsource their wholesale
supply. Constellation is now a key player in the Northeast, the
Mid-Atlantic, and Texas-three regions that have meaningfully
deregulated their retail energy markets. We plan to continue to
grow our load-serving market positions in these regions.
We built the risk management and long-term power
contract origination business with the help of our advisor,
Goldman Sachs. One of the strategic decisions made in 2001
was the termination of the power business services agreement
with Goldman. This allows us to benefit from 100% of the
profits and provides us with strategic and operating control
of this business, which is critically linked to our fleet of
generation assets.
Reliable Delivery and Returns
Our regulated utility, Baltimore Gas and Electric Company
(BGE), balances our portfolio of energy businesses. BGE holds
a solid franchise in an economically healthy region that has
successfully deregulated the electric and gas supply. As an
energy-delivery company, BGE provides very predictable
earnings and generates high cash flow with a low risk profile.
BGE's 186-year heritage of serving Central Maryland is
unique in our industry. Today, BGE delivers energy to more
than 1.1 million electric and 600,000 gas customers. As
always, its primary focus is on reliability, safety, and achieving
operational excellence.
Toward that end, the utility embraced a new initiative in
2001 to comprehensively review and re-engineer key business
processes. Now implementing the more than 200 recommen-
This is a long-term business, and Constellation Energy Group has proven that the same strength and
flexibility that have sustained this company for more than 186 years will help us withstand virtually
any challenge the future may bring.

U
/7
Maintaining the Balance
2002 Sources of Net Income
Consellaion nerg ropGonserbaatinedproh of busc Distsributiod nd 54%glae-tafsol
provide tio d epndbe, earning .. bowt alancd stong ahffow
with a moderte level of risk.
more detail in the Financial section of this report. We believe
these actions will prove critical to ensuring the strength of the
company's baance sheer in the future.
VIlewe have a lot ofwrk ahead, our stuccess is ultimately
in our own hands. 'With employees focused on crisp execution
of ot r strategy, we indeed are in control of our own destiny.
This is a long-term business, and Constellation Fnergy Group
has proven that the same strength and flexibility that have
sustained this company foi more than 186 years will help us
withstand virtually any challenge the future may h fling.
That's cause for credit and applause for the maiy dedicated
employees who helped us weather a turbulent 2001
Before closing, we want to thank and bid farewell to five
long term board members who announced their retirement as
of December 31, 2001: H. Furlong Baldwin, J. Owcn Cole,
Dan A. Coluss, Jerome W Gecide, and George L. Russell, J,
All five combiued have given 80 years of service to this
company and provided impeccable leadership and guidance
through the deregulation of Maryland's gas and electric
industry and the formation of our merchant energy business.
datons that came OUt of the process, BGP, has created the
blueprint for substantially improving business processes. functions, and activities while providing customers with more
emflcienr, effective, and hassle-free service.
A Company With Staying Power
The California sittation combined with Enron's collapse and a
slower pace of deregulation indicate thar a lot is changing in our world Yet, Constellation Energy is operating fdro a
position of strength with a very solid balance sheet. We have
taken a series ofdecisive actions, all ofwhich are discussed in
Sincerly,
Mayo A. Shattuck III
]'resid.nt cý
CYhef Execitive O .cer
(hstan H. Poindexter Chauirman of the Board
March 25, 2002
0 1

U8 / AT A GLANCE
Constellation Energy Group owns energy-related businesses, including a North American wholsesale power marketing and merchant generation business, and the Baltimore Gas and Electric Company (BGE), a regulated energy delivery
company in Central Mary/and. In 2001, combined revenues totaled $3.9 billion.
Merchant Energy
Our mnerhant energy business is two main part: Generation and Marketing
CosteMtlation Generation Group: Owns and operates our fleet of power plants and geneiates tie megawatts (MW) that we sell
into rhe wholesale market.
Key Facts
Generating Capacity 2003 Fuel Mix (thousands of MWs) (MV/s of Capacity)
14 2
6 4 2
2000 2001 2002 2003
Constellation Generation Group
owns and operates 9,200 MWs
as of year-end 2001; by yearend
2003, it will own and operate
more than 12,000 MWs.
0)Other 4%
Constellation Generation Group
manages a diverse portfoiho of
plants that maintains a balanced
fuel mix and geographic and
dispatch diversity
2001 Highlights
" Acquired Nine Mile Point Nuclear Station in
November resulting in the ownership ofan additional
1,550 megawatts
"* Brought on line more than 1,100 megawatts of natural
gas fired peaking plants at four sires (West Virginia,
Virginia, Illinois, and Pennsylvania)
"* Owned and operated 9,200 megawatts of generation, with
an annualiced capacity output of47,300 gigawatt houns
"* Had under construction four new plants in Florida,
fllinois, Texas, and California that combined will add
nearly 2,900 megawatts by the end of 2003
Constellation Power Sourcet Oversees our power marketing, onigination, and risk management operations and is responsible for selling every wholesale megawatL hour Constellation Generation Group produces and managing all the associated market hedgeable risk.
Key Facts
"* Sewes wholesale custome uns, nchlding distribution
utilities, co-eps, municipalities, and other large, load
serving companies that operate in dei egulated energy markets, providing capacity, energy, and related products
and services
"* Serves significant volumes of the wholesale peak load in the Northeast, Mid Atlantic, and 'hxas
"* Enhances out generation assets by providing access to
national marikets, market infrastructulne, real-time market intelligence, risk management and arbitrage opportu
nities, and transmission and rransportation expermise
2001 Highlights
" Expanded irs toad serving business in Texas by completing
a straregic alliance with HNP Enterprises, Inc., for
managing the lexas power resource needs of its two
subsidiaies, I-as New Mexico Power Company and
First Choice Power
"* Expanded its total load-serving business in the Northeast, Mid-Atantrc, and Texas to an expected peak of moie than
14,000 megawatts in 2002
"* Signed long-term power sales contracts with California
Department of \Wi'ater Resources and Florida's Seminole
Electric Cooperative and Florida Power & Light to sell
power from two of Otu plants under construction the
High Desert plant in Southern California and the
Oleander plant near Cocoa, Florida
2 3

L
/9
"* Our merohant enePrg business curently owns 9,200 megawatts of generating Capacity nabonwide and focuses on sensing wholesale customers (distribution utilities, co-ops, municipalities and other large, load-sening companies) that operate in deregulated energy markets, including the Northeast and Mid-Atlantic regions, and Texas. It is also expanding Uts reach in Florida, Illinois, Texas, and California with four power plants under construction in those states.
"* Our regulated energy delivery business, BOE, delivers energy throughout its 2,300-square-oile electnc and "X square-mile gas service territory in Central Maryland and is a member of the PJM Interconnection, which sprves the Pennsylvania, New Jersey, Maryland region.
"* Our other retail energy services businesses include Constellation Energy Source, which provides customized energy solutions exclusively to commercial and industrial customers, and BSE Home Products & Services, which provides home products, commercial building systems, and residential and commercial elctno and gas retail meaketing
Regulated Energy Delivery
Baltimore Gas and Electric Company (BGE): Deliv,,s energy to more than 1. 1 million electric customers and 600,000 gas
customers throughout Central Maryland.
Key Facts 2001 Highlights
ElRotric Transmission actdDisdibuiton * Reported its best year ever for average interruptions per
0 Operates in the PJM Interconnection and maintains Customer, beating by 15% its previous all-rime-best
nearly 21,500 circuit miles of distribution lines and reliability record set in 2000
altmost 1,300 cihcuit miles of transmission lines in a l oacked in wholesale power supply contracts wvith 2 ,300-square mile service territory Constellation Power Source and Allegheny Energy Supply
Natural Gas Distribution
Stores and delivers natural gas through two peak shaving plants, 10 gate stations, and nearly 6,000 miles of gas main
in an over 800-square-mile service territory; natural gas
suppliers include Columbia Gas Transmission Corporation,
Trarscontinental Ga. Pipeline Corporation, aud Dominion
Transmission
Company, J1C, ensuring it can meet its obligation as
provider of last resort through the end of the transition to
customer fhoice in 2006
Embarked on a new initiative-Achieving Operational
Excellenec to enhance financial and operational
performance while increasing customer satisfaction,
reliability and productivity, and reducing costs

10 / THE FORMULA FOR SUCCESS
Together, strength and flexibility are the formula for our success.
In an industry buffeted by unpredictable forces, ranging from regulatory uncertainty to the bankruptcy of
industry "leaders" such as PG&E and Enron, success can be measured by the ability to withstand powerful forces and
prosper under challenging conditions. It can also be measured in a commitment to values that have stood the test of
time.' service excellence, reliability, integrity, respect for the environment, and involvement in the community.
On these pages are some of our 2001 success stories.
They include the expansion of our power generation fleet and a continued focus on risk management and
customized approaches to supply the needs of wholesale energy customers. They also include significant reliability
improvements and business milestones achieved by our utility operations, as well as some of our notable
accomplishments in community outreach and environmental stewardship.
From the momentum gained fom last year, we expect our strength and flexibility to bring us even greater success
in 2002 and beyond.
U- a] l l I I P-= 0]
Supplier of Choice
In deregulated energy markets like New Englands, customers can choose their electric supplier
Those not making a choice receive a fixed-rate energy supply, or standard offer service, from their
utiliýy To meet that obligation, electric distribution utilities have turned to companies like
Constellation Power Source, our origination and risk management business.
Last September, the Maine Public Utilities Commission chose Constellation Power Source to
provide the standard-ofler-service energy supply to 550,000 residential and small-business
customers in the state. The three-year contract runs through February of 2005 and fits nicely
with our overall stratcg¢ to be a key player in the national merchant energy market.
Constellation Power Source manages risk for large, load-serving customers (such as nstellation Power Source is a malor utilities and municipalities), including their exposure to volatile energy prices. Balanced by
ctric supplier in Maine. owned or controlled generation assets, it designs the wholesale products and services
necessary for the emerging competitive marketplace.
Focusing on deregulated regions, Constellation Power Source has gained a major foothold in key markets, including:
"* The Northeast, where contracts like the one in Maine hase made it one of the major regional suppliers;
"* Maryland, where it won the competitively bid contract to supply 90% of BGE's standard-offer-service electric load from
July 1, 2003, through June 30, 200 6-an extension of its current contract to serve 100% of BGE's standard offer service
through June 30, 2003; and
"* Texas, where it forged a special alliance with TNP Enterprises, Inc., for managing the Texas power resource needs of its two
subsidiaries, Texas-New Mexico Power Company and First Choice Power.
Through transactions like these, we have built a strong platform for growth. u
Co ele

/11
Powering Success
Constellation Energy' balanced portcolio ofpower plants
provides us with the flexibility to meet our wholesale customers'
energy needs. With plants located strategically across the country,
our portfolio includes a balanced mix of nuclear, coal, natural
gas, and renewable plants that have diverse dispatch capabilities.
Balanced Growth
In 2001, the power behind Constellation's merchant energy
business continued to grow. In the fall, Constellation completed
the acquisition of the Nine Mile Point Nuclear Station in New
York State. Also, last summer we added more than 1,100
megawatts, bringing on-line four new gas-fired peaking plants in
strategic markets from Illinois to Virginia and Pennsylvania.
We are continuing our balanced growth trend with four
gas-fired power plants currently under construction in
Nine Mile Point Nuclear Station in Oswego County, New York, is the largest addition to our merchant fleet.
IE.uL'.
California, Texas, Florida and Illinois that are scheduled to come
on-line, adding another 2,900 megawatts to our competitive
generation portfolio by the end of 2003.
Strong Operations
The flexibility in our growing portfolio is enhanced by strong
performances at our existing power plants.
Our Calvert Cliffs plant had its second-best year ever in terms
of power production and continued to rank among the best in
worker safety. Plus, two of the plant's four new steam generators
arrived last year. Workers will replace the steam generators in
2002 (Unit 1) and 2003 (Unit 2) and make other major upgrades
that will help the plant continue to safely generate clean electricity
for many years to come.
On the fossil fuel side, our nine Baltimore-based plants
produced 14.7 million-megawatt-hours in 2001-a 2% increase
over 2000. While maintaining one of the lowest forced outage
rates in their history, these plants also implemented a number of
process improvement programs to reduce costs and be
more competitive.
Nuclear: A Banner Year
The momentum created by the historic
license renewal of our Calvert Cliffs
Nuclear Power Plant in 2000 carried over
into 2001. In the spring, we received our
industry's highest honor-the Edison
Electric Institute's Edison Award. This
prestigious award recognized our
pioneering work as the first commercial
nuclear plant in the country to be
authorized to operate for an additional
20 years by the U.S. Nuclear Regulatory Constellation Ener
Commission. EEl's Edison Awar
Our standing as an industry leader in winner in 2001
safety and performance made a difference in our purchase of
Nine Mile Point. Niagara Mohawk Power Corporation-one
of the sellers-and the New York Public Service Commission
cited our reputation for performance, safety, and environ
mental stewardship as major reasons why Constellation
won the bid. 0
rgy, d

BGE Keeps on Delivering
Solid, predictable revenue for shareholders ... Significant improvements in reliability ... Smart and profitable growth ... BGE had quite a year.
A Strong Year for Reliability
Delivering reliable electric service to more than 1.1
million customers in Central Maryland is no small feat.
In 2001, BGE made significant strides with its reliability
initiatives, reporting its best year ever for average inter
ruptions per customer. In fact, it improved upon its
previous all-time best record set in 2000 by 15%.
Fewer outages can mean happier customers. That's
why BGE has made significant investments over the
past seven years to improve the reliability of its electric
delivery system. Customers have enjoyed the results,
witnessing steady reductions in the number of service
interruptions experienced.
In addition to instituting a comprehensive preven
tative maintenance program, BGE has also installed
innovative information technology that improves service
and reduces costs. This year, BGE's new
7w
ATLAS and Outage Management systems will be up
and running. By deploying advanced information
technology in the operation of its electric and gas
distribution networks, BGE will deliver improved
relaibility and save millions of dollars in
operating costs.
Operational Excellence is the Future
When BGE's Gas Division signed its 600,000th gas
customer in 2001, there was reason to celebrate.
Achieving this major milestone was not just about
growth; it represented the company's commitment to
growing smartly and profitably.
That commitment is the foundation for a new
initiative BGE embraced in 2001-Achieving
Operational Excellence (AOE). Aimed at improving
productivity while reducing and
controlling costs, AOE has become the
blueprint for making BGE a leader in
energy delivery.
After a comprehensive and concerted
effort to review and re-engineer key
business processes in 2001, BGE has now
•: begun to implement the more than 200
recommendations that came out of the
process. Combined, the recommendations
promise to substantially improve business
processes, functions and activities while
providing customers with more efficient,
effective, and hassle-free service. .
I Alert! >0'11 get hurt. Get some help,
do not, do not, do not touch!
service TV spots teaching children to
downed wires garnered numerous
including an Emmy. .

/13
Serving the Communities Where We Work Despite a year of national turmoil and uncertainty, Constellation Energy and its employees remain constant in their commitment to the community Below are some of the ways we responded to those in need in 2001:
"* We continued our regional leadership in supporting the United Ways of Maryland, increasing our donation for the fourth consecutive year with a combined pledge of almost $2.5 million.
"• We again rolled up our sleeves to donate more than 4,000 units of blood, a 46% employee participation rate that is the highest among private-sector employers in the Maryland region. It's no surprise that for more than 40 years the American Red Cross has relied on our employees for much of our region's needed blood supply.
"* We translated our grief over the September 11 th attacks into support for its heroes. In addition to a corporate donation to United Way of New York City's September 11 th Fund, employees also gave victims their money, time, and blood.
"* We volunteered hundreds of hours and raised thousands of dollars to support charities such as Special Olympics and the March of Dimes, and local initiatives including community shelters and literacy programs.
"* We contributed corporately almost $4.7 million to community-strengthening initiatives that have proven to have a positive impact on education, economic development, and the environment in the areas where we operate. l
Protecting the Environment
Recognizedfor our environmental stewardship, Constellation
Energy bridges the gap between protecting natural resources
and creating a better quality of life for customers. Here are
some notable accomplishments that will have a positive,
long-lasting effect on the environment:
"* Constellation Energy received the 2001 WasteWise
Partner of the Year Award-the U.S. Environmental
Protection Agency's highest honor for its voluntary
program to reduce municipal solid waste. We were cited for our innovative and cost-effective new programs to prevent waste, increase recycling, and boost expenditures
on recycled-content products.
"* Constellation Generation's Safe Harbor hydroelectric
plant in Pennsylvania, of which we have two-thirds
ownership, received that state's Governor's Environmental
Excellence Award. Recognized for its river-borne debris
removal program, the plant uses a floating harvester to
collect trash and refuse in the Susquehanna River, a tributary of the Chesapeake Bay, and brings it to shore for
sorting and recycling.
"* Constellation Generation's Brandon Shores power plant
significantly reduced its air emissions. Located outside of
Baltimore, it is the
company's largest coal
burning facility. Last
year, it completed the
installation of two
selective catalytic
reduction (SCR)
reactors. SCRs work
like the catalytic
converter in your
car to reduce
nitrogen oxide
(NOx)
emissions known Located in the Chesapeake Bay
to contribute to the Critical Area, our Spring Gardens na gas facility won Baltimore's 2001 Ma
formation of Business Recognition Award for our
ground-level ozone reforestation and clean-up efforts.
or smog. Brandon
Shores is now capable of achieving a 90% NOx reduction
and ranks as one of the country's cleanest coal-burning
plants of its size. *
tural yor's site

14 / A CONVERSATION WITH MAYO A. SHATTUCK III
In October 2001, Constellation Energy Groups Board of Directors elected Mayo A. Shattuck III President and
Chief Executive Officer, Not your everyday utility CEO, Shattuck came to Constellation with a unique and
powerful background of success in fields vital to the changing energy business-capital markets, trading, investment
banking, and corporate finance.
He joined the company after leaving his position as Chairman of Deutsche Banc Alex. Brown, the successor
company to the nations oldest investment bank, Alex. Brown 6- Sons, where he had been President. Earlier in his
career at Alex. Brown, he headed the firm's Technology Group, which managed several landmark initial public
offerings including Microsoft, AOL, Sun Microsystems, and Oracle.
Shattuck says that his priority has always been, and always will be, creating shareholder value. In the following
question and answer session, he articulates how his vision and unique skills will make that priority a reality at
Constellation Energy Group.
R or I I i
You're the company's first
CEO who has been hired
firom the outside. What
perspective do you bring
that's important in today's
energy marketplace?
I really feel fortunate to be
following in a long line of
leaders who have helped
transform and steward
this great company for
almost two centuries. Chris Poindcxtei
has managed the company through its most challenging deregu
latory years, and this management team is particularly grateful to
have his ongoing guidance as Chairman and as an influential
industry leader in the many trade and regulatory issues we face.
I assumed my new role at Constellation Energy during a
time of great upheaval for this industrx. In effect, we are
experiencing the collapse of a speculative bubble. Bubbles are
created when financial markets allow too much capital to flow
to specific industries or ideas without sufficient pickup in
demand to meet the new level of supply.
It isn't difficult to find evidence of this in the power
industry: the collapse of Enron and subsequent rating
agencies' actions; an expected oversupply in generation
capacity; efforts across the industry to cut new generation
spending and turbine orders, and to sell non-core assets; and
finally, a retrenchment in expectations for earnings growth.
I've seen similar bubbles and, over the years, I've learned
that, regardless of the industry, a management team needs to
focus on its strengths and intensify the focus on managing risk
to successfully navigate through a transition period like the one
we are experiencing.
,.

/15
In my first several months on the job, we've taken steps to
address the weaknesses that have hindered our performance in
the past. We have reorganized the management structure and
reinvigorated the organization to focus on execution and our
ability to manage risk in a prudent and responsible way.
We now have a Chief Risk Officer as a part of our executive
management team. Why did you create that position?
Success in today's energy market is all about managing risk, a
task that has become vastly more complex over the past several
years. Volatility in fuel costs and power prices, congestion in
transmission, illiquidity in financial markets, and many other
factors all contribute to a much more dynamic business model.
We have to be smart in how we define and manage risk.
That's why I elevated the position of Chief Risk Officer to a
The benefits of
Constellation's more stable
businesses-like our utility
and our generating plants
are that their solid cash
flow and earnings balance
the growth potential of
our new origination
business.
In effect, our decision
not to separate helped
preserve a portfolio of businesses that, when
married together, create a nice balance between stability and
growth. That allows us to be competitive on multiple fronts
going forward.
rMayor ht u hkIIIcorporate level, much the way I've managed risk at large financial institutions in the past.
The Chief Risk Officer reports directly to me and is responsible for defining our risk from a corporate portfolio standpoint. He bridges all business lines in an independent fashion and systematically identifies the risks that each part of our business faces daily so we can proactively make decisions about what we want to pursue. He also makes sure we're continually and vigilantly assessing the credit risk of the many counterparties with which we deal.
One of the reasons given for not separating is the importance of having a strong balance sheet. How has that helped set us apart from the pack today? Creditworthiness is a critical element of our strategic position. To grow and take advantage of opportunities, it's important to have balanced sources of net income and a strong balance sheet.
The failure of deregulation in California and then the collapse
ofEnron have had a dramatic impact on the industry. What
makes Constellation Energy different from the rest of the sector?
First, Constellation Energy is not even close to Enron in terms of the type of business we run and the way in which we behave. The best energy businesses have physical assets to complement their merchant capabilities and they maintain strong customer relationships. That's what our company has and plans to preserve. In short, we have real assets, real customers, and a real business that has staying power.
We take the issue of disclosure very seriously. We have worked hard to ensure we provide our shareholders with the information they need to understand our financials and the factors that could affect our earnings results. It used to be that the weather was the main source of quarterly earnings variability. Today there are many other factors. Our goal is to keep our shareholders informed while we build a business that is viable over the very long term.
continued on next page

16/
It's also important to understand that Maryland is not
California in terms of deregulation. Since implementing
electric customer choice in July 2000, Maryland has been
spared the problems associated with deregulation in California.
Today all BGE customers have a choice as to their energy
commodity suppliers. As the provider of last resort, BGE
locked in wholesale power supply contracts in 2001 with
Constellation Power Source and Allegheny Energy Supply
Company, LILC. These contracts ensure the utility can mieet its
obligation to provide power through June 2006 at rates and
terms set by the Maryland public Service Commission's
1999 Restructuring Order.
What makes certain regions more attractive than others for
our business?
Our merchant energy business is focused on the national
wholesale market. It serves customers-including distribution
utilities, co-ops, municipalities, and other large, load-serving
companies-that operate in regions that have meaningfully
deregulated their retail energy markets.
That is why we have built a significant presence in the
Northeast and Mid-Atlantic regions, and Texas. Over the next
two years, we plan to continue to grow our load-serving
market positions in these regions and expand beyond as we
bring on plants in Florida, Texas, Illinois, and California.
What kind ofgrowth do you see for our company?
We have set a long-term goal of growing earnings per share from
organic sources at 10% a year, and we have a solid plan to achieve
that. About 30% of our earnings still come from our regulated
energy delivers business, while our competitive wholesale
merchant ccrnerg business contributes nearly 70%. If we combine
the share price appreciation, which should result from our
earnings growth, with our new 3% dividend yield, xxwc hope to
achieve an overall total shareholder return of 13% or more.
What challenges do we face in meeting our growth targets?
The most important thing we have to do is execute well. We
also must be ever more vigilant about making sure we have the
best competitive cost structure in the industry. And wxc must
leverage our human capital. Providing we do those things and
improve the valuation of the company, we will be in control of
our owvn destiny.
Are mergers and acquisi- r tions a part of our future?
Are you planning on
building or acquiring
more power plants to
continue to strengthen
your generating asset
poroolio?
Our strategy is to grow
the merchant energy
business, so we are
focused on merchant
energy-related assets
that support our
customer-focused origination business. We evaluate all
opportunities against a strict set of criteria. We are only looking
lor acquisitions that provide strong return to our shareholders.
Constellation Energy Group has been a leader in the nuclear
industry. What role will nuclear play in the company's future?
Nuclear generation remains one of our core competencies and
an important part of our balanced portfolio of generating
assets. We will continue to maintain a commitment to excel
lence at our two nuclear stations, which comprise more than
.3,200 megawatts oF our total 9,200-megawatt portfolio.
"Toward that end, our Calvert Cliffs plant is replacing its
four steam generators. Once the project is complete, the plant can continue to safely generate clean electricity for many years
to come.
In addition, we arc embarking on a long-term performance
improvement plan at our Nine Mile Point plant and initiating
a license renewal effort. Our goal is to take this asset to the
next level in terms of safety, reliability, capacity factors,
and productivity.
How does the future look for Constellation Energy Group?
This company has some very bright prospects. I believe that it
is wsell-positioned to emerge from this period of uncertainty as
a strong company with solid building blocks for growth. Our
core strengths-high quality assets, the right people to operate
them, and a strong balance sheetv-will be the platform for
that growth. m

/17
Contents
O perating Statistics .............................
Selected Financial D ata ..........................
Management's Discussion and Analysis ..............
Report of M anagement ..........................
Report of Independent Accountants .................
Consolidated Statements of Income .................
Consolidated Statements of Comprehensive Income .....
Consolidated Balance Sheets ......................
Consolidated Statements of Cash Flows ..............
18
20
21
48
48
49
49
50
52
Consolidated Statements of
Common Shareholders' Equity ...................
Consolidated Statements of Capitalization ............
Consolidated Statements of Income Taxes ............
Notes to Consolidated Financial Statements ...........
Board of D irectors ..............................
Executive Team ................................
Five-Year Statistical Summary .....................
Shareholder Information .........................
fin n~~r~ ilep r*YForward Looking Statements We make statements in this report that are considered forward looking statements within the meaning of the Securities Exchange Act of 1934. Sometimes these statements will contain words such as "believes," "expects," "intends," "plans," and other similar words. These statements are not guarantees of our future performance and are subject to risks, uncertainties, and other important factors that could cause our actual performance or achievements to be materially different from those we project. These risks, uncertainties, and factors include, but are not limited to:
* the timing and extent of changes in commodity prices for energy including coal, natural gas, oil, and electricity,
* the timing and extent of deregulation of, and competition in, the energy markets in North America, and the rules and regulations adopted on a transitional basis in those markets,
"* the conditions of the capital markets generally, which are affected by interest rates and general economic conditions, as well as Constellation Energy and BGE's ability to maintain their current credit ratings,
"* the effectiveness of Constellation Energy's risk management policies and procedures and the ability of our counterparties to satisfy their financial commitments,
* the liquidity and competitiveness of wholesale markets for energy commodities,
* operational factors affecting the start-up or ongoing commercial operations of our generating facilities (including nuclear facilities) and BGE's transmission and distribution facilities, including catastrophic weather related damages, unscheduled outages or repairs, unanticipated changes in fuel costs or availability, unavailability of gas transportation or electric transmission services, workforce issues,
terrorism, liabilities associated with catastrophic events, and other events beyond our control,
M the inability of BGE to recover all its costs associated with providing electric retail customers service during the electric rate freeze period,
"* the effect of weather and general economic and business conditions on energy supply, demand, and prices,
"* regulator), or legislative developments that affect demand for energy, or increase costs, including costs related to nuclear power plants, safety, or environmental compliance,
"* the actual outcome of uncertainties associated with assumptions and estimates using judgment when applying critical accounting policies anid preparing financial statements, including factors that are estimated in applying mark-to-market accounting, such as variable contract quantities and the value of mark-to-market assets and liabilities determined using models,
"* cost and other effects of legal and administrative proceedings that may not be covered by insurance, including environmental liabilities, or the outcome of pending appeals regarding the Maryland Public Service Commission's (Maryland PSC) orders on electric deregulation, and the transfer of BGE's generation assets to affiliates, and
"* operation of our generation assets in a deregulated market without the benefit of a fuel rate adjustment clause.
Given these uncertainties, you should not place undue reliance on these forward looking statements. Please see the other sections of this report and our other periodic reports filed with the SEC for more information on these factors. These forward looking statements represent our estimates and assumptions only as of the date of this report.
Changes may occur after that date, and we do not assume responsibility to update these forward looking statements.
Constellation Energy Group, Inc. and Subsidiaries
53
54
56
57
88
90
92
93

18 / OPERATING STATISTICS
2001 2000* 1999 1998 1997
Merchant Energy Mark-to-Market Energy Assets (In millions) $2,218.2 $2,522.4 $373.4 $133.0 $ 9.4 Mark-to-Market Energy Liabilities (In millions) 1,799.8 1,994.5 225.1 99.0 8.6
Revenues (In millions) Standard Offer Service Revenue from BGE $1,269.0 $ 691.0 $ - $ $ Other Generation Revenue 314.1 171.9 124.3 129.4 108.1 Mark-to-Market Energy Revenues 175.8 151.5 147.7 47.5 2.6 Other Revenue 6.6 11.3 5.3 6.7 2.3
Total Revenue $1,765.5 $1,025.7 $277.3 $183.6 $113.0
Generated (In millions)-MWH 37.4 18.8 1.3 1.3 1.2
Regulated Utility Electric Operating Statistics
Revenues (In millions) Residential $ 885.3 $ 922.6 $ 975.2 $ 948.6 $ 932.5 Commercial 903.0 926.2 939.3 912.9 892.6 Industrial 218.1 203.6 204.3 211.5 211.9
System Sales 2,006.4 2,052.4 2,118.8 2,073.0 2,037.0 Interchange and Other Sales - 53.8 112.1 120.8 132.7 Other 33.6 29.0 29.1 27.0 22.3
Total $2,040.0 $2,135.2 $2,260.0 $2,220.8 $2,192.0
Sales (hi thousands)-MW H Residential 11,714 11,675 11,349 10,965 10,806 Commercial 14,147 14,042 13,565 13,219 12,718 Industrial 4,445 4,476 4,350 4,583 4,575 System Sales 30,306 30,193 29,264 28,767 28,099 Interchange and Other Sales - 2,064 4,785 5,454 6,224
Total 30,306 32,257 34,049 34,221 34,323
Customers (In thousands) Residential 1,040.5 1,033.4 1,021.4 1,009.1 1,001.0 Commercial 110.9 108.9 107.7 106.5 105.9 Industrial 5.0 5.0 4.7 4.6 4.5
Total 1,156.4 1,147.3 1,133.8 1,120.2 1,111.4
Average Use per Residential Customer-KWH Average Rate per KWH (System Sales)--€
Residential Commercial Industrial
11,257
7.56 6.38 4.91
11,297
7.90 6.60 4.55
11,111
8.59 6.92 4.70
Operating statistics do not reflect rhe elimination of intercompany transactions. 'Operating statistics reflect generation finction as part of regulated electric operations through Jnnc 30, 2000.
10,866 10,794
8.65 6.91 4.62
8.63 7.02 4.63
continued on next page
Constellation Energ)i Group, Inc. and Subsidiaries
OPERATING STATISTICS /19
2001 2000 1999 1998 1997
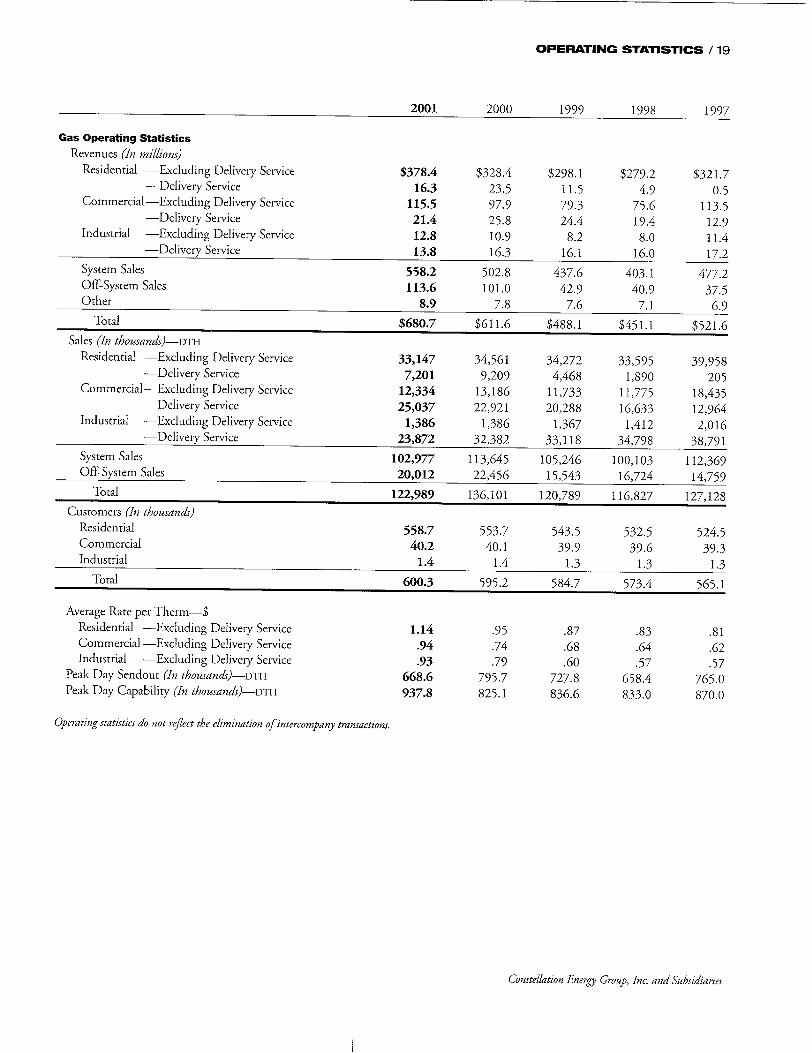
Gas Operating Statistics Revenues (In millions)
Residential -Excluding Delivery Service $378.4 $328.4 $298.1 $279.2 $321.7 -Delivery Service 16.3 23.5 11.5 4.9 0.5
Commercial--Excluding Delivery Service 115.5 97.9 79.3 75.6 113.5 -Delivery Service 21.4 25.8 24.4 19.4 12.9
Industrial -Excluding Delivery Service 12.8 10.9 8.2 8.0 11.4 -Delivery Service 13.8 16.3 16.1 16.0 17.2
System Sales 558.2 502.8 437.6 403.1 477.2 Off-System Sales 113.6 101.0 42.9 40.9 37.5 Other 8.9 7.8 7.6 7.1 6.9
Total $680.7 $611.6 $488.1 $451.1 $521.6 Sales (In thousands)-DTH
Residential -Excluding Delivery Service 33,147 34,561 34,272 33,595 39,958 -Delivery Service 7,201 9,209 4,468 1,890 205
Commercial--Excluding Delivery Service 12,334 13,186 11,733 11,775 18,435 -Delivery Service 25,037 22,921 20,288 16,633 12,964
Industrial -Excluding Delivery Service 1,386 1,386 1,367 1,412 2,016 -Delivery Service 23,872 32,382 33,118 34,798 38,791
System Sales 102,977 113,645 105,246 100,103 112,369 Off-System Sales 20,012 22,456 15,543 16,724 14,759
Total 122,989 136,101 120,789 116,827 127,128
Customers (In thousands) Residential 558.7 553.7 543.5 532.5 524.5 Commercial 40.2 40.1 39.9 39.6 39.3 Industrial 1.4 1.4 1.3 1.3 1.3
Total 600.3 595.2 584.7 573.4 565.1
Average Rate per Therm-$ Residential -Excluding Delivery Service 1.14 .95 .87 .83 .81 Commercial--Excluding Delivery Service .94 .74 .68 .64 .62 Industrial -Excluding Delivery Service .93 .79 .60 .57 .57
Peak Day Sendout (In thousands)-DTH 668.6 795.7 727.8 658.4 765.0 Peak Day Capability (In thousands)-DTH 937.8 825.1 836.6 833.0 870.0
Operating statistics do not reflect the elimination of intercompany transactions.
Constellation Energy Group, hIt. and Subsidiaries

20 / SELECTED FINANCIAL DATA
2001
Summary of Operations
Total Revenues Total Expenses
Income From Operations Other Income (Expense)
Income Before Fixed Charges and Income Taxes
Fixed Charges
Income Before Income Taxes Tnrcnle Ts~es
$3,928.3 3,570.5
357.8 1.3
359.1 238.8
120.3 37.9
2000 1999 1998 (Dollar amounts in millions, except per share amounts)
$3,852.5 3,009.9
842.6 4.2
846.8 271.4
575.4 230.1
$3,840.9 3,081.0
759.9 7.9
767.8 255.0
512.8 186.4
$3,386.4 2,647.9
738.5 5.7
744.2 260.6
483.6 177.7
Income Before Extraordinary Item and Cumulative Effect
of Change in Accounting Principle 82.4 345.3 326.4 305.9 254.1
Extraordinary Loss, Net of Income Taxes - - (66.3) -
Cumulative Effect of Change in Accounting Principle,
Net of Income Taxes 8.5 -...
Net Income $ 90.9 $ 345.3 $ 260.1 $ 305.9 $ 254.1
Earnings Per Common Share and
Earnings Per Common Share Assuming Dilution Before
Extraordinary Item and Cumulative Effect of Change
in Accounting Principle $ .52 $2.30 $2.18 $2.06 $1.72
Extraordinary Loss - - (.44) -
Cumulative Effect of Change in Accounting Principle .05 ....
Earnings Per Common Share and
Earnings Per Common Share-Assuming Dilution $ .57 $2.30 $1.74 $2.06 $1.72
Dividends Declared Per Common Share $ .48 $1.68 $1.68 $1.67 $1.63
Summary of Financial Condition
Total Assets $14,077.6 $12,939.3 $9,745.1 $9,434.1 $8,900.0
Short-Term Borrowings $ 975.0 $ 243.6 $ 371.5 $ - $ 316.1
Current Portion of Long-Term Debt $ 1,406.7 $ 906.6 $ 808.3 $ 541.7 $ 271.9
Capitalization Long-Term Debt $ 2,712.5 $ 3,159.3 $2,575.4 $3,128.1 $2,988.9
Redeemable Preference Stock - - - - 90.0
Preference Stock Not Subject to Mandatory
Redemption 190.0 190.0 190.0 190.0 210.0
Common Shareholders' Equity 3,843.6 3,174.0 3,017.5 2,995.9 2,876.4
Total Capitalization $ 6,746.1 $ 6,523.3 $5,782.9 $6,314.0 $6,165.3
Financial Statistics at Year End
Ratio of Earnings to Fixed Charges 1.18 2.78
Book Value Per Share of Common Stock $23.48 $21.09
Certain prior-year amounts have been reclassified to conform with the current year's presentation.
2.87 $20.17
2.60 $20.08
2.35 $19.47
Constellation Energy Group, Inc. and Subsidiaries
1997
$3,307.6 2,584.0
723.6 (52.8)
670.8 258.7
412.1 158.0

MANAGEMENT'S DISCUSSION AND ANALYSIS / 21 OF FINANCIAL CONDITION AND RESULTS OF OPERATIONS
Introduction
Constellation Energy Group, Inc. (Constellation Energy) is a North American energy company that conducts its business through various subsidiaries including a merchant energy business and Baltimore Gas and Electric Company (BGE). Our merchant energy business generates and markets wholesale electricity in North America. BGE is an electric and gas public utility company with a service territory that covers the City of Baltimore and all or part of ten counties in central Maryland. We describe our operating segments in Note 3 on page 66.
References in this report to "we" and "our" are to Constellation Energy and its subsidiaries, collectively. References in this report to the "utility business" are to BGE.
Effective July 1, 2000, electric generation was deregulated in Maryland. Also, on July 1, 2000, BGE transferred all of its generation assets and related liabilities at book value to our merchant energy business. As a result, the financial results of the electric generation portion of our business are included in the merchant energy business beginning July 1, 2000. Prior to July 1, 2000, the financial results of electric generation were included in BGE's regulated electric business. We discuss the deregulation of electric generation in the Business Environment section on page 25.
Our merchant energy business includes: "* fossil, nuclear, and hydroelectric generating facilities,
interests in domestic power projects, and nuclear consulting services, and
"* power marketing, origination transactions, and risk management services.
BGE is a regulated electric and gas public transmission and distribution utility company.
Our other nonregulated businesses include: "* energy products and services, "* home products, commercial building systems, and
residential and commercial electric and gas retail marketing,
"* a general partnership, in which BGE is a partner, that provides cooling services for commercial customers in Baltimore,
"* financial investments, "* real estate and senior-living facilities, and "* interests in Latin American power generation and
distribution projects and investments. In this discussion and analysis, we explain the general
financial condition and the results of operations for Constellation Energy including:
"* what factors affect our businesses, "* what our earnings and costs were in the years presented, "* why earnings and costs changed between years, "* where our earnings came from, "* how all of this affects our overall financial condition, "* what our expenditures for capital projects were for 1999
through 2001, and what we expect them to be through 2003, and
"* where we expect to get cash for future capital expenditures.
As you read this discussion and analysis, refer to our Consolidated Statements of Income on page 49, which present the results of our operations for 2001, 2000, and 1999. We analyze and explain the differences between periods in the specific line items of the Consolidated Statements of Income.
Also, this discussion and analysis is based on the operation of the electric generation portion of our utility business under rate regulation through June 30, 2000. Our regulated electric business changed as we transferred our electric generation assets and related liabilities to our merchant energy business, and we entered into retail customer choice for electric generation effective July 1, 2000. Accordingly, the results of operations and financial condition described in this discussion and analysis are not necessarily indicative of future performance.
Critical Accounting Policies Our discussion and analysis of financial condition and results of operations are based on our consolidated financial statements that were prepared in accordance with accounting principles generally accepted in the United States of America. Management makes estimates and assumptions when preparing financial statements. These estimates and assumptions affect various matters, including:
"* our reported amounts of assets and liabilities in our Consolidated Balance Sheets at the dates of the financial statements,
"* our disclosure of contingent assets and liabilities at the dates of the financial statements, and
"* our reported amounts of revenues and expenses in our Consolidated Statements of Income during the reporting periods.
These estimates involve judgments with respect to, among other things, future economic factors that are difficult to predict and are beyond management's control. As a result, actual amounts could differ from these estimates.
The Securities and Exchange Commission (SEC) recently issued disclosure guidance for accounting policies that management believes are most "critical." The SEC defines these critical accounting policies as those that are both most important to the portrayal of a company's financial condition and results and require management's most difficult, subjective, or complex judgment, often as a result of the need to make estimates about the effect of matters that are inherently uncertain and may change in subsequent periods.
Management believes the following accounting policies require us to use more significant judgments and estimates in preparing our financial statements and could represent critical accounting policies as defined by the SEC. We discuss our significant accounting policies, including those that do not require management to make difficult, subjective, or complex judgments or estimates, in Note 1 on page 57.
Constellation Energy Group, Inc. and Subsidiaries

22 /
Revenue Recognition/Mark-to-Market Method
of Accounting
Our subsidiary, Constellation Ptsxcr Source, uses the isark-tomarket method of atconirting to account for a portion of its
power marketing activities. We record all other revenues in the
period earned for services rendered, commodities or products
delivered, or contracts settled.
Posw er marketing activities include sesw t origination transact
rions arid risk mianagcnemnit activities using contracts for cericigs.
other etiergy- related commodities, and related derivative
contracts. \Vc use trIe tisark-to-market method of accotutiing
for portions of Constellation Posswer Source's activities as
required by HITF 98-10, Aciounting ifr Oonmoacts huro/lrd M
h'nergy, 7J-auing (iand Risk Malagoaemeno Acitviues. Under thie
mark-to-is arker method of accounisitin, we record the fair s alue
of commodity arid derivative contracts as mark-to-tisarket
encrgv assets arsd liabilities at the time of contract execution.
We record reserves to reflect uncertainmties associated with
certain estimates inherent in trIe ictermitnation of faitr value.
NMark-to-r-sarket etsergy revenues include:
"* the fair value of new transactions at origination,
" umsealized gains anid losses from changes in the fair value
of open positions,
"* net gains antd losses from realized transactions, atid
"* chanmes its reserves.
Wec record the chaiges in mark-to-isiarket energs assets ndi
liabilities oti a net basis in "Nonregulated revetnmes" in our
Consolidated Statetments of Income. Mark-to-market emncirgy
assets and liabilities are comprised of a combinatiti of enCrig
arid ccrtgm-rclatcid derivative atsd tion-derivative contracts.
While some of these contracts represent coimmtoditics or instru
tients For which prices are available from external sOurrces, other
commodities amid certain contracts are not activcxl traded and
arc valued using modeling techniques to deternmins expected
future market prices, contract quantities, or both. The market
prices used to determine fair value reflect maniageicictis best estimate cosiderimig variorms factors, includitg closimg exchaige
amid over-the-counter quotations, time valtie, arid volatility
factors. However, it is possible that future market pmices could
vaty f[tiol those tised in. recording mark-to-tmarkct energy assets
arid liabilities, and such variations could be material.
Certain power marketing atid risk managetient transactions
entered into under master agreements atid other airangements
provide ourt imerchant energy business wxith a right of setoff in
the event of bankruptcy or default by the coiniterparty. We
report such transactions net in the balance sheets in accordasc
with FASB Interpretation No. 39, Offietting ofAmoonts ReLited
to Certai/n C lrooas. \W'c discuss the impact of tiark-to-market accounting ons outu
financial results in the Results of Operaios--fercisiot Poem p
Bzsiness section oti page 30.
Evaluation of Assets for Impairment and Other Than
Temporary Decline in Value
We arc required to evaluate certain assets that have long lives
(generating property and equipment and real estate) to determine if they arc impaired if certain conditions exist. We
determine if long-lived assets are impaired by comparing their tIndiscounted expected future cash flosws to their carrYing
amotint in ouir accounting records. We would record an
impairment loss if the undiscounted expected future cash flows
[tom an asset were less than the carrying amount of the asset.
Additionally, we evaluate our equit, -method investments to
detertmine svhether they have experienced a loss in value that is
considered other than a temporary decline in value.
We use our best estimates in making these evaluations and
consider various factors, including forward price curves for
energi, fuel costs, and operating costs. However, actual future
market prices and project costs could vary from those used in
our impairment evaluations, and the impact of such variations
could be material.
Events of 2001
In the past year, the utility' industry and energy markets experi
eticed significant changes as a result of the slowing of the U.S.
economy, the significant declines in both the short-term and
long-term market prices of electricity in certain regions, the
events in California, the financial collapse of Enron Corporation (Enron), as well as the effects of the September 11, 2001 terrorist attacks, antd the threat of additional attacks. We address
certain of these issues in the Business Lnvromnoent section on page 25.
In response to our changing business environment, sse
canceled our separation plans and terminated our power business services agreement wvith Goldman Sachs & Co. (Goldmian Sachs) on October 26, 2001. We believe that
mraintainng our current corporate structure provides a better
platform of size, strength, and stability from which to execute
our strategies. As a result of the significant declines in market
prices of electricity, we terniminated all planned development
projects not currently under construction. Separately, wxc initiated efforts to reduce costs in order to
become more comnpetitive and to sell certain non-core assets in
order to focus mianageicssnts attention arid our capital resources
ots our core energy businesses. We discuss our initiatives in more detail in this section. '"e continue to examine plans to
achieve our stiategies, arid to Futher strengthen our balance
sheet amid enhance our liqtiidimr.
Contract Termination Related Costs
We announced the termination of our power business services
agreisemit swith Goldman Sachs. We paid Goldman Sachs a
total of S355 million, representing S196 million to terminate
the poswer business services agreement svith our power
(Consterllationo I: eyy Iro sup., Inc .id ,bsidiaries

/ 23
marketing operation and $159 million previously recognized as a payable for services rendered under the agreement. We issued commercial paper and borrowed under our existing bank lines to fund this payment. In the fourth quarter of 2001, we recognized expenses of approximately $224.8 million pre-tax, or $139.6 million after-tax, related to the termination of the contract with Goldman Sachs. Goldman Sachs also will not make an equity investment in our merchant energy business as previously announced. We discuss the termination of our power business services agreement with Goldman Sachs in Note 2 on page 65.
Sale of Guatemalan Operations On November 8, 2001, we sold our Guatemalan power plant operations to an affiliate of Duke Energy International, L.L.C., the international business unit of Duke Energy. Through this sale, Duke Energy acquired Grupo Generador de Guatemala y Cia., S.C.A., which owns two generating plants at Esquintla and Lake Amatitlan in Guatemala. The combined capacity of the plants is 167 megawatts.
We decided to sell our Guatemalan operations to focus our efforts on our core energy businesses. As a result of this transaction, we are no longer committed to making significant future capital investments in this non-core operation. We recorded a pre-tax loss of $43.3 million, or $28.1 million after-tax, in the fourth quarter of 2001, resulting from this sale. We discuss this sale in Note 2 on page 65.
Workforce Reduction Programs In the fourth quarter of 2001, we undertook several measures to reduce our workforce through both voluntary and involuntary means. The purpose of these programs was to reduce our operating costs to become more competitive. As part of this initiative, several companies including our merchant energy business and BGE announced Voluntary Special Early Retirement Programs (VSERP) to provide enhanced retirement benefits to certain eligible participants that elect to retire in 2002 and other involuntary severance programs.
As a result, we recorded $105.7 million pre-tax, or $64.1 million after-tax, of expenses related to these programs during the fourth quarter of 2001. BGE recorded $57.0 million of the pre-tax amount as expense relating to its electric and gas businesses. BGE also recorded $19.5 million on its balance sheet as a regulatory asset of its gas business. We will continue costcutting measures to remain competitive in our business environment and expect to record approximately $35 million of additional expense in 2002 related to the programs implemented to date. As a result of our workforce reduction efforts to date, we expect annual cost savings of approximately $72 million.
We also expect that a significant number of retiring employees covered by our qualified, basic pension plan will elect to receive their pension benefit in the form of a lump-sum payment in 2002. These lump-sum payments may exceed annual plan service
cost and interest expense that could trigger a settlement loss in 2002 estimated to be approximately $20 million.
We discuss our early retirement and severance programs in more detail in Note 2 on page 64, Note 6 on page 71, and Note 7 on page 72.
Impairment Losses and Other Costs In the fourth quarter of 2001, our merchant energy business recorded impairments of $46.9 million pre-tax, or $30.5 million after-tax, primarily due to the termination of all planned development projects not currently under construction, including projects in Texas, California, Florida, and Massachusetts and due to a decline in value of an investment in a power project in Michigan. We decided to terminate our development projects due to the expected excess generation capacity in most domestic markets and the significant decline in the forward market prices of electricity. The impairments include costs associated with four turbines no longer expected to be placed in service.
In the fourth quarter of 2001, our other nonregulated businesses recorded $107.3 million pre-tax, or $69.7 million after-tax, in impairments of certain non-core assets as follows:
0 We decided to sell six real estate projects without further development and our senior-living facilities and accelerate the exit strategies for two other real estate projects that we will continue to hold and own over the next several years.
a We decided to accelerate the exit strategy for the investment in a distribution company in Panama.
m There was an other than temporary decline in value in our equity method Bolivian investment due to a deterioration in our investment's position in the Bolivian capacity market.
In addition, our financial investments business recorded a $4.6 million pre-tax, or $2.8 million after-tax, reduction of its investment in an aircraft due to the decline in value of used airplanes as a result of the September 11, 2001 terrorist attacks and the general downturn in the aviation industry.
We discuss these special costs further in Note 2 on page 65.
Acquisition of Nine Mile Point On November 7, 2001, we completed our purchase of the Nine Mile Point Nuclear Station (Nine Mile Point) located in Scriba, New York. Nine Mile Point Nuclear Station, LLC, a subsidiary of Constellation Nuclear, purchased 100 percent of Nine Mile Point Unit 1 and 82 percent of Unit 2 for cash of $382.7 million including settlement costs and a sellers' note of $388.1 million to be repaid over five years with an interest rate of 11.0%. This note may be prepaid at any time without penalty. The sellers also transferred approximately $442 million in decommissioning funds. As a result of this purchase, we own 1,550 megawatts of Nine Mile Point's 1,757 megawatts of total generating capacity.
Constellation Energy Group, Inc. and Subsidiaries
24 /
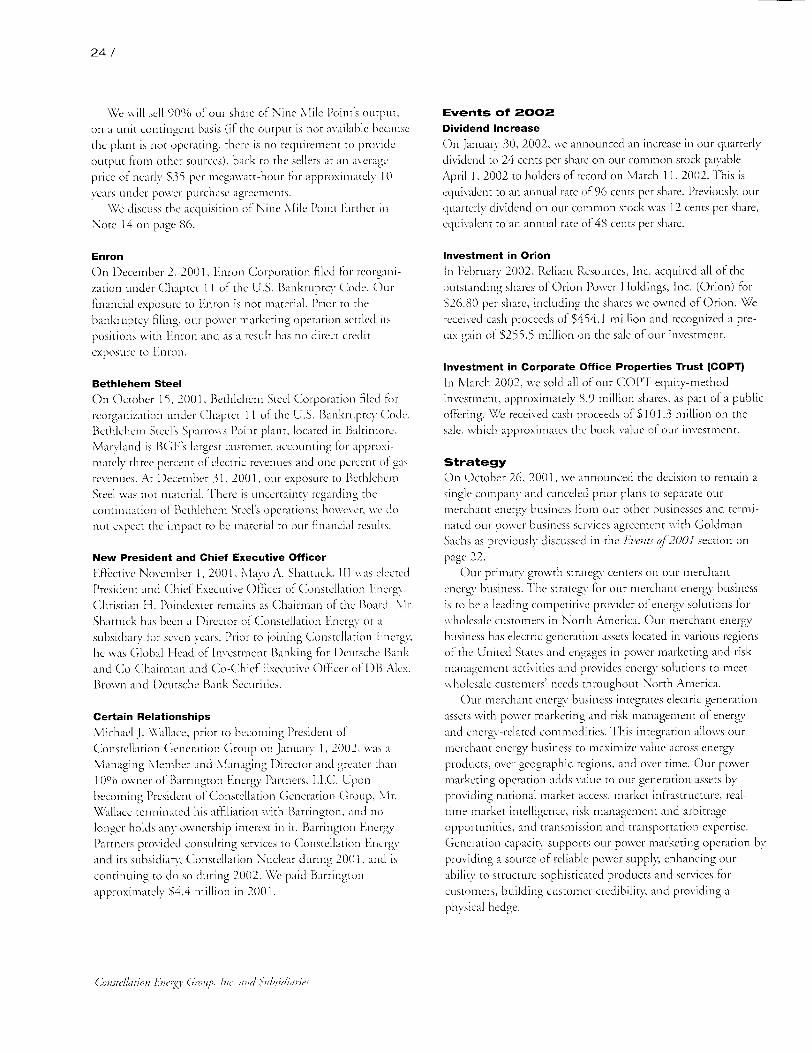
We Will sell 90"0 of our share of Nine Mile I)oint's Output, On a Unit contingent basis (if the output is not available because the plant is not operating, there is no requirement to provide ocitpuit Fbon other sources), back to the sellers at an average price of nearly S35 per megawaxt-xhotir for approxinately 10 )ears under poxxwer purchase agreements.
\WC discuss the acqtiisition of Nine Mile Point fiurther int Note 14 on page 86.
Enron On December 2, 2001, 1nron Corporation filed foi ieorganization under Chapter 1 of the U.S. Bankruiptcy Code. Our
financial expostire to Enron is not material. Ptriorx to the bankrciptcy filing, otir poxxer marketing operation settled its
positions x.with F niron and as a result has no direct credit
exposure to 1nrxon.
Bethlehem Steel
On October 15, 2001, Bethlehcm Steel C;orporation filed For reorganization under Chapter II of the U.S. Bankruptcy Code. Bethlehem Steel's Sparrowss Point plant, located in Baltimore, Slaartland is BGF's largest customer, accountining ft approximnately three percent of electric reventies and one percent of gas
revenuces. At December 31, 2001, otir exposure to Bethlehem Steel was not material. There is tincertainty regarding the coixtiixciation of Bethlehem Steel's operations: hossever, xx c do not expect the impact to be material to our financial iesults.
New President and Chief Executive Officer
Efffective Novsenbcr 1, 2001, Mayo A. Shatttick, Ill I Ias elected
President and Chief Fxecutive Officer of Constellation Encrgi. Christian 11. Poindexter remains as Chairman of the Board. Sr. Shattuck has been a Director of Constellation Fncrig or a subsidiarv fior seven teats. Prior to joining Constellation tici gx he was Global Head of Investment Banking for Deutsche BIank and (co- Chairman and Co- Chief Executixe OfficCr Of DB M"e×. Brown and Deutsche Bank Secuiiries.
Certain Relationships
Michael J. Watllace, prior to becotxing President of
Conxstellation Generation Grotip on Janiuar 1, 2002, xas a Managing Metmber and Managing Director and greater thaan 100 Oit ox.Ixer of Barrington Entrgg Partiners, I I.C. Upon becoxinig President of Constellation Ccneration Group, Mr. \Xlallace tetiinated his affiliation xwith Barrington, and no lonxtger holds any ossnership interest in it. Barrington Energx Partners prosided coixsulting scrvicCs to Constellation Enietrgy and its stibsidiary, Constellation Nuclear during 2001, and is coixtitxciinxg to do six during 2002. 55c paid Barrixgton
approxiimxately S4.4 million it 2001.
Events of 2002 Dividend Increase
On Janiuars 30, 2002, xxe announced an increase itt otir Cquarterly
dividend to 24 cents per share ont ocir comx1txxntx stock payable
April 1, 2002 to holders of record on March 11, 2002. This is
equivalent to an annual rate of96 cents per share. Prevxiouslxt our
quarterly dividend on outi cxmtxor tx stock xras 12 cents per share,
equivalent to an anixital rate of 48 cents per share.
Investment in Orion
[ix Februarx 2002, Reliant Resources, Inc. acquiired all of the
ocutstanding shares of Orion Posser Holdings, Inc. (Orion) for
S26.80 per share, inxcliiding the shares xxe owned of Orion. We
received cash proceeds of $454.1 million and recognized a pre
tax gain of S255.5 million on the sale of our investment.
Investment in Corporate Office Properties Trust (COPT)
In N larch 2002, xxe sold all Of` our COPTI equity -ixetod
inxvestment, approxitxately" 8.9 million shares, as part of a putblic
offering. Wxe receixved cash proceeds of S 101.3 million on the
sale, wIhich approximates the book value Of tx11r ixvestmetnt.
Strategy
On October 26, 2001, xwe anixounced the decision to remain a
single company and canceled prior plans to separate our
Merchant energý' business froix our other bistinesses and termi
nated cx1i power bxcsiness services agreement ws ith Goldman
Sachs as previoiuslx, discussed in the vevnts of 2001 section on
page 22.
Our primary grcswth istrateg, centers on ocir nxerchant
exergv! business. The strategy fcor our merchant ener© bisiness
is to be a leading competitive providcer ofenertgx solutions for
wxholesale customers in North America. Otit merchant energ,
butsiixess has electric generation assets located in various regions
of the United States and engages in pxoer marketing and risk
management activities and provides ctcxrg" solcttions to meet
xw holesale customers' needs throcighocit North America.
OcIr merchant enertg business integrates electric generation
assets with power marketing and risk management of energv
and energy-related commodities. Tix s integration allows our
ierichant energy bfsiness tx maxinitzc value across energx
products, over geographic regions, and over timne. Our power marketing operation adds valcte to outr generation assets blx
proxiding national market access, market intfrastructure, realtiixe market intelligence, risk management and arbitrage
oppoitunities, and transmission and transportation expertise.
Generation capacity sutpports oir power marketing operation byx
proxiding a source of reliable poxwer supply, enhancing our
abilitys to structure sophisticated products and services for
cuistoxters, building Ccscustoxet crecdibility, and providing a
phxysical hedge.
Consts/llytion ttnol't Group, olo. J0td . bsidtiain It
/ 25
Currently, our merchant energy business controls over 11,500 megawatts of generation including the 1,550 megawatts of the nuclear generating capacity at Nine Mile Point and the 1,100 megawatts of natural gas-fired peaking capacity that commenced operations in the Mid-Atlantic and Mid-West regions during mid-summer 2001. We also have approximately 2,900 megawatts of natural gas-fired peaking and combined cycle production facilities under construction in Texas, California, Florida, and Illinois.
To achieve our strategic objectives, we expect to continue to support our power marketing and risk management operations with generation assets that have diversified geographic, fuel, and dispatch characteristics. We also expect to use a disciplined growth strategy through originating transactions with wholesale customers and by acquiring and developing additional generating facilities when necessary to support our power marketing operation.
Our merchant energy business will focus on long term, high-value sales of energy, capacity, and related products to distribution companies and other wholesale purchasers, primarily in the regional markets in which end user electricity rates have been deregulated and thereby separated from the cost of generation supply. These markets include the Northeast region, the Mid-Atlantic region, and Texas.
The growth of BGE and our retail energy services businesses is expected through focused and disciplined expansion.
Customer choice, regulatory change, and energy market conditions significantly impact our business. In response, we regularly evaluate our strategies with these goals in mind: to improve our competitive position, to anticipate and adapt to business environment and regulatory changes, and to maintain a strong balance sheet and an investment-grade credit quality.
In the fourth quarter of 2001, we undertook a number of initiatives to reduce our costs towards competitive levels and to ensure that our management and capital resources are focused on our core energy businesses. This included the implementation of workforce reduction programs, efforts to reduce capital spending for planned development projects not currently under construction, and to accelerate our exit strategy for certain noncore assets.
We also might consider one or more of the following strategies:
"* the complete or partial separation of BGE's transmission function from its distribution function,
"* mergers or acquisitions of utility or non-utility businesses or assets, and
"* sale of assets or one or more businesses.
Business Environment
With the shift toward customer choice, competition, and the growth of our merchant energy business, various factors will affect our financial results in the future. We discuss these various factors in the Forward Looking Statements section on page 17.
In this section, we discuss in more detail several factors that affect our businesses.
Electric Competition
We are facing competition in the sale of electricity in wholesale power markets and to retail customers.
Maryland
On April 8, 1999, Maryland enacted the Electric Customer Choice and Competition Act of 1999 (the Act) and accompanying tax legislation that significantly restructured Maryland's electric utility industry and modified the industry's tax structure.
In the Restructuring Order discussed below, the Maryland PSC addressed the major provisions of the Act. The accompanying tax legislation is discussed in detail in Note 5 on page 69.
On November 10, 1999, the Maryland PSC issued a Restructuring Order that resolved the major issues surrounding electric restructuring, accelerated the timetable for customer choice, and addressed the major provisions of the Act. The Restructuring Order also resolved the electric restructuring proceeding (transition costs, customer price protections, and unbundled rates for electric services) and a petition filed in September 1998 by the Office of People's Counsel (OPC) to lower our electric base rates. The major provisions of the Restructuring Order are discussed in Note 5 on page 69.
As a result of the deregulation of electric generation, the following occurred effective July 1, 2000:
"* All customers can choose their electric energy supplier. BGE will provide a standard offer service for customers that do not select an alternative supplier. In either case, BGE will continue to deliver electricity to all customers in areas traditionally served by BGE.
"* BGE reduced residential base rates by approximately 6.5%, on average about $54 million a year. These rates will not change before July 2006.
"* BGE transferred, at book value, its nuclear generating assets, its nuclear decommissioning trust fund, and related liabilities to Calvert Cliffs Nuclear Power Plant, Inc. In addition, BGE transferred, at book value, its fossil generating assets and related liabilities and its partial ownership interest in two coal plants and a hydroelectric plant located in Pennsylvania to Constellation Power Source Generation. In total, these generating assets represent about 6,240 megawatts of generation capacity with a total net book value at June 30, 2000 of approximately $2.4 billion.
Constellation Energy Group, Inc. and Subsidiaries
26/
SBG assigned approximately S47 million to Calvert C lif. Nuclear Po[er Plant, Inc. and S231 million to
Constellation Power Source Generation of tax-exempt debt related to the transferred assets.
"* Constellation Power Source Generation issued approximately $366 million in unsecured promissoryv notes to BL(E. All of these notes have been repaid by Constellation Power Source Generation. The proceeds werC used to scrveic the current maturities of certain BGE long-term debt.
"* BGE transferred equity associated with the generating assets to Calvert Cliffs Nuclear Power Plant, Inc. and Constellation Power Source GcnCration.
"* The fossil fuel and nuclear Foel inventories, materials and
supplies, and certain purchased power contracts of BG F were also assumed by these subsidiaries.
Fffe•ctive JUly 1, 2000, BGC provides standard offer service
to customers at fixed rates over various time periods during the transition period (JulI , 2000 to June 30, 2006) for those customces that do not choose an alternate supplier. In addition,
the electric Ftiel rate wvas discontintred effective July 1, 2000. Pursuant to the Resrtructuiring Order, Constellation Power
Source provides BGE swith the energy and capacity required to
meet its standard offer service obligations for the first three Years of the transition period (July 1, 2000 to June 30, 2003).
In August 2001, following a competitive bidding process, BC;E entered into contracts with Constellation Power Source it)
provide 90Q% and Alleghcny Energy Supplyv Companyr 11C to provide the remaining 10% of the energy and capacity required for BGF to meet its standard offer service requirements for the
final three years July 1, 2003 to June 30, 2006) of rhe transition period. BGE awarded these contracts primarily based
on price and access to the PJM region. The amount BGC" pavs For energy and capacity does not exceed the standard offcr service rates received from customers. Over the transition period, the standard offer service rate that BC;E receives from its
customers increases. This is offset by a corresponding decrease in the competitive transition charge BGC receives.
Constellation Power Source obtains the energy and capacity
to supply BCE's standard offer service obligations from nonrcg ulared affiliates that osvri Calvert Cliffs Nuclear Power Plant (Calvert Cliffs) and BGC ''s former fossil plants, supplemented with energy and capacity purchased from the wholesale market if necessary.
Other ,States
Several states, other than Maryland, have supported complete
deregulation of thc electric industry. Other states that were considering deregulation have slowed their plans or postponed consideration. \While our power marketing operation may be affected bs the slow down in deregulation, the Federal Energy Regolators Commission (FPRC) initiatives regarding the formation of larger Regional Transmission Organizations could provide outr merchant energy business other opportunitits as
discussed in the FI-RC Regulation -Regional Transnission Organizations section on page 28.
Our merchant energy business has S296.4 million invested in operating posver projects of which our ownership percentage represents 146 megawatts of electricity that are sold to Pacific
Gas & Electric (PGE) and to Southern California Edison (SCE) in California under power purchase agreements as discussed in the Califjnia Power Purchase Agreements section on page 32. Ouri merchant energy business was not paid in full for its sales from these plants to the two utilities from November 2000 throtigh early April 2001. At December 31, 2001, our portion if the amount due for unpaid power sales frorn these utilities was approximately S45 million. We recorded reserves of approx
imately 20% of this amotunt. These projects entered into agreements ssith PGE and SCE
that provide for five-year fixed-price payments averaging $53.70 per megasvatt-hour plus the stated capacity payments in the
original Interim Standard Offer No. 4 (504) contracts. These agreements also provide for the payment of all past due aniounts plus interest. As of the date of this report, sse have received 528 million related to the $45 million of unpaid power
sales, of which 100% of the SCE outstanding balance was paid. We expect to collect the remaining outstanding balance from pGC svithin the next year.
However, as a result of ongoing litigation before the FERC regarding sales into the spot markets of the California
Independent System Operator (ISO) and Power Exchange, we may be required to pay refunds of berween $3 and $4 million
for transactions that we entered into with these entities for the period betwveen October 2000 and June 2001. While the process at FERC is ongoing, FERC has indicated that we will
have the ability to reduce the potential refund amount in order to recover outstanding receivables sse are owed. FERC also has indicated that it svill consider adjustments to the refund amount to the extent we can demonstrate that its refund methodology resulted in an overall revenue shortfall for our transactions in these markets during the refund period.
The situation ssith PGE and SCE has not had a material
impact on our financial results. However, we cannot provide
any assurance that the events in California still not have a material, adverse inmpact on our financial results, or that any legislative, regulatory, or other solution enacted in California will permit tIs to recover any past losses or will not have a
negative effect on our business opportunities in California. We are currently leasing and supervising the construction of
the High Desert project, a 750 megawatt generating facility in California. The High Desert project uses an off-balance sheet financing structure through a special-purpose entit' (SPE) that currently qualifies as an operating lease. The project is scheduled
For completion in the summer of 2003. We signed a contract to
sell all of the plant's output to the California Department of "W ater Resources on a unit contingent basis. The contract has a term of eight years and three months.
Constellatior kP'niy, ( toip, to. anid Subsiuhries
/ 27
In February 2002, the FASB proposed a new accounting interpretation that potentially would impact the accounting for, but not the cash flows associated with, our High Desert operating lease and the related SPE. Under the proposed interpretation, we may be required to consolidate the SPE in our Consolidated Balance Sheets. We would have recorded approximately $221 million of development, construction, and capitalized financing costs as an asset and the related financial obligations as a liability in our Consolidated Balance Sheets had we consolidated this project at December 31, 2001.
We discuss our High Desert project in more detail in the Capital Resources section on page 43.
In February 2002, the California Department of Water Resources filed a claim with the FERC that all long-term contracts for power supply that the California Department of Water Resources entered into in the first quarter of 2001, which includes the contracts related to our High Desert project, were not just and reasonable. The California Department of Water Resources is requesting the FERC to terminate the contracts entirely or, at least, modify the prices to terms that the FERC considers just and reasonable. Currently, we are discussing the renegotiations of our contracts with the California Department of Water Resources. We cannot estimate the timing or impact of the FERC proceedings or the renegotiations of our contracts.
Gas Competition Currently, no regulation exists for the wholesale price of natural gas as a commodity, and the regulation of interstate transmission at the federal level has been reduced. All BGE gas customers have the option to purchase gas from other suppliers.
Market Risks The decline in both short-term and long-term market prices of electricity has had, and is expected to continue to have, a significant, negative impact on our financial results in certain regions in which we operate or expect to operate. In addition, significant uncertainties exist in the competitive energy marketplace.
We discuss our market risks in detail on page 44.
Regulation by the Maryland PSC In addition to electric restructuring which was discussed earlier, regulation by the Maryland PSC influences BGE's businesses.
Under traditional rate regulation that continues after July 1, 2000 for BGE's electric transmission and distribution, and gas businesses, the Maryland PSC determines the rates we can charge our customers. Prior to July 1, 2000, BGE's regulated
electric rates consisted primarily of a "base rate" and a "fuel rate." Effective July 1, 2000, BGE discontinued its electric fuel rate and unbundled its rates to show separate components for delivery service, competitive transition charges, standard offer services (generation), transmission, universal service, and taxes. The rates for BGE's regulated gas business continue to consist of a "base rate" and a "fuel rate."
Base Rate The base rate is the rate the Maryland PSC allows BGE to charge its customers for the cost of providing them service, plus a profit. BGE has both an electric base rate and a gas base rate. Higher electric base rates apply during the summer when the demand for electricity is higher. Gas base rates are not affected by seasonal changes,
BGE may ask the Maryland PSC to increase base rates from time to time. The Maryland PSC historically has allowed BGE to increase base rates to recover increased utility plant asset and higher operating costs, plus a profit, beginning at the time of replacement. Generally, rate increases improve our utility earnings because they allow us to collect more revenue. However, rate increases are normally granted based on historical data, and those increases may not always keep pace with increasing costs. Other parties may petition the Maryland PSC to decrease base rates.
On June 19, 2000, the Maryland PSC authorized a $6.4 million annual increase in our gas base rates effective June 22, 2000.
As a result of the Restructuring Order, BGE's residential electric base rates are frozen until 2006. Electric delivery service rates are frozen until 2004 for commercial and industrial customers. The generation and transmission components of rates are frozen for different time periods depending on the service options selected by those customers.
Fuel Rate Through June 30, 2000, we charged our electric customers separately for the fuel we used to generate electricity (nuclear fuel, coal, gas, or oil) and for the net cost of purchases and sales of electricity. We charged the actual cost of these items to the customer with no profit to us. If these fuel costs went up, the Maryland PSC generally permitted us to increase the fuel rate.
Under the Restructuring Order, BGE's electric fuel rate was frozen until July 1, 2000, at which time the fuel rate clause was discontinued. We deferred the difference between our actual costs of fuel and energy and what we collected from customers under the fuel rate through June 30, 2000.
In September 2000, the Maryland PSC approved the collection of the $54.6 million accumulated difference between our actual costs of fuel and energy and the amounts collected from customers that were deferred under the electric fuel rate clause through June 30, 2000. We collected this accumulated difference from customers over the twelve-month period ended October 2001. Effective July 1, 2000, our earnings are affected by the changes in the cost of fuel and energy.
We charge our gas customers separately for the natural gas they purchase from us. The price we charge for the natural gas is based on a market-based rates incentive mechanism approved by the Maryland PSC. We discuss market-based rates in more detail in the Gas Cost Adjustments section on page 39 and in Note 1 on page 58.
Constellation Eneigy Group, Inc. and Subsidiaries

28 /
FERC Regulation-Regional Transmission Organizations
In December 1999, FL-PC issued Order 2000, amending its
regulations Under the Federal Poswer Act to advance the
formation of Regional transmission Organizations (RPOs).
On July 12, 2001, FERC provisionally granted [I'O status
to PJMl and ordered it to engage in mediation with the New
York ISO and the New England ISO to create a business plan
to form one Northeast 13TO, using I)JNIl as a platform. After
further hearings by' FFRC, it announced that it is rc-evaluatirrg
its Order regarding a Northeast RtO. In the meantirsic, P 1 I is
exploring opporturnities to expand into other regions.
'le creatiorn of large 1;TOs could benefit our mcrchaist
energ' buisiness by allowing easier access to transmission and a
uniform rare across various regions.
In addition, PJNI is required to subrsit a filing by July I,
2002 addressing implementation of a uniform transmission rare
bl January 1, 2003. A uniform rate could expose B3(F to
higher transmission rates.
B(;E, jointly with other PJ3Ž transmission owners, requested
rehearing and clarification from FF RCU on its July 12, 2001
order iegar ding certain incentive rates, interconnection proce
dures, and allocations of interconnection costs. F[PC has not
set issued anr order oin this request.
Weather
Merchant Energy Business
W\eather conditions in the different regions of North America
influernce the financial results of onirs merchant energy business.
Weather conditions cals affect the sufpply of arid deisrarid foi
electricity and ficels, arsd changes in energy suppy anid demand
rsasy impact the price of these eihergs' commodities in both the
spot market arsd the forward market. I spically, demand foi electricitr arid its price are higher in the surmsser arsd the wixntcr,
when xweather is more extreme. Similarly, the demand fsr and
price of natural gas and oil are higher in the winter. Horscxcri,
all regions of North America typically do not experience
cxtictse weather conditions at the saise time. 'We discuss out
market risk in detail oti pagc 45.
BGE
Weathcr affccts the demand for elcctricito arid gas for our
regulated busirsesses. Veryx hot suIsisser s arid very cold wirsters
increase dersand. Mild weather reduces dermsand. Residential sales for otri regulatedl businesses are impacted more by wcathcl than commercial and indrrstrial sales, whicls are mostly arffccred
by business needs for electriciry arid gas.
However, the M ar vland PSC allows LIS to record a ismonthlyl
adjusmseist to our regulated gas business revenues to eliminate
the effect of abnorsal weather patterns. We discuss hiss filrdlCr
in the Weather 'or'ralizauior section o(i page 39.
"We mneasurc re x weather's effect using "degree days." Th'
rseasure of degree days for a given day is the difference between
the average daily actual temperature arsd a baseline tcsipcrariurc
of 65 degrces. Cooling degree days resrilt wsher the arverage daily
actual temperature exceeds the 65 degree baseline. Heating degree days result xxhen the average daily actual temperature is less than the baseline.
During the cooling season, hotter xw'eather is measured by More cooling degree days and results in greater demand for electricitx to operate cooling systems. During the heatinu season, colder weather is measured byv more heating degree days and results in greater demand For electricity and gas to operate heatring sstems.
We show the number of cooling and heating degree days in 2001 and 2000, the percentage change in the number of degree days friom the prior year, and the number of degree days in a "n year as represented by the 30-year average in the
following table.
Cooling degree days Percentage change frons prior year Heating dcgrec days
Percentage ch ange fin ' prior year
2001
787 6.9%
4,514
(8.5)%
2000
736 (12.9).% 4,936
7.79,
30-year Average
839
4,725
Other Factors
Other factors, aside from -weather, impact the demand for
electricity arsd gas in our regulated businesses. These factors
isclude rie "isusnuber of custoisers" arsd "Usage per customser"
during a gixen period. We use these terms later in our discis
sions of regulated electric arid gas operations. In those sections, we discuss how these arid other factors affected electric arsd gas
sales dIuring the periods presented.
The rnumrsber of customisers in a given period is affected by
new hoise and apartment constriuctiors and by the number of
businesses in otir sertsice tennitoy ' der the Restiructiuring
Order, BGE's electric customers can become dceixerY service
Cuistoiiers only arid can purchase their electricity from other
souircs. We wilt collect a delivery seu' rce charge to recover the
fixed costs for the service we provide. The remaining electric
Cistoiessei Will receive standard offer service from BGEF at the
fixed rates provided bxv the Restrurcturingc Order. Usage per
CUstonsei refers to all other iterss impacting customer sales that
cannot be measured separately. These Factors include the strength
of the ecornom'y in our service territory. When the economy is
healthy and expanding, custoissers tend to coissusse more
electricity arid gas. Conversely, during an econormic doxwsrtrend,
Our customers tend to corrnssue less electricity arsd gas.
Environmental and Legal Matters
YOu wx'ill find details of our environmental and legal matters in
Note 11 o5i page 79) arid in our most recent Annual Report on
Form 10 -K. Souse of the information is about costs that niay be
material to our financial resutlts.
Accounting Standards Adopted and Issued
We discuss recently adopted ansd issuced accounting standards in
Note I on page 63.
(Conartel//ratiotn -i or (Ctt,, hIc. t•ndbsidiaries

/ 29
Results of Operations
In this section, we discuss our earnings and the factors affecting
them. We begin with a general overview, then separately discuss
net income for our operating segments. Changes in fixed
charges and income taxes are discussed in the aggregate for all
segments in the Consolidated Nonoperating Income and Expenses
section on page 41.
Overview
Net Income 2001 2000 1999
(in millions) Net Income Before Special Costs
Included in Operations:
Merchant energy $291.2 $213.6 $ 66.6 Regulated electric 84.5 106.5 270.0 Regulated gas 38.3 30.6 33.0 Other nonregulated 3.2 13.8 2.2
Net Income Before Special Costs Included in Operations 417.2 364.5 371.8
Special Costs Included in Operations:
Contract termination related costs (139.6)
Loss on sale of Guatemalan operations (28.1)
Workforce reduction costs (64.1) (4.2) Impairments of domestic
power projects (30.5) - (14.2) Impairments of real estate,
senior-living, and international investments (69.7) - (10.3)
Reduction of financial investments (2.8) - (16.0)
Deregulation transition cost - (15.0)
Hurricane Floyd - - (4.9)
Net Income Before Extraordinary
Item and Cumulative Effect of Change in Accounting Principle 82.4 345.3 326.4
Extraordinary Loss - - (66.3) Cumulative Effect of Change
in Accounting Principle 8.5 -
Net Income $ 90.9 $345.3 $260.1
Net income for theperiodspresented reflect a significant shifi fom the regulated electric business to the merchant energy business as a result of the transfer ofBGEs electric generation assets to nonregulated subsidiaries on July 1, 2000. We discuss this in more detail in Note 5 on page 69.
2001 Our total net income for 2001 decreased $254.4 million, or $1.73 per share, compared to 2000 mostly because of the following special costs in operations:
"* Our merchant energy business recorded expenses of $139.6 million after-tax, or $.87 per share, related to the termination of our power marketing operation's power business services agreement with Goldman Sachs.
"* Our Latin American operation recognized a $28.1 million after-tax, or $.17 per share, loss on the sale of the Guatemalan power plant operations.
"* We recorded costs of $64.1 million after-tax, or $.40 per share, associated with our corporate-wide workforce reduction program.
"* Our merchant energy business recorded impairments that total $30.5 million after-tax, or $.19 per share, primarily due to the termination of certain planned development projects and due to a decline in value of an investment in a power project.
"* Our other nonregulated businesses recorded $69.7 million after-tax, or $.43 per share, impairments of certain real estate projects, senior-living facilities, and international assets. This was a result of our decision to sell certain noncore assets and accelerate the exit strategies on other assets that we will continue to hold and own over the next several years, as well as an other than temporary decline in the value of our equity method Bolivian investment.
"* Our financial investments business recorded a $2.8 million after-tax, or $.02 per share, reduction of its investment in an aircraft due to the decline in value of used airplanes as a result of the September 11, 2001 terrorist attacks and the general downturn in the aviation industry.
These decreases were partially offset by the following: "* Our merchant energy business recorded in 2000 an
expense of $15.0 million after-tax, or $.10 per share, for a deregulation transition cost to Goldman Sachs.
"* BGE recorded an expense of $4.2 million after-tax, or $.03 per share, for its employees that elected to participate in a targeted VSERP in 2000 that had a negative impact in that year.
"* We recorded an $8.5 million after-tax, or $.05 per share, gain for the cumulative effect of adopting Statement of Financial Accounting Standard (SPAS) No. 133, Accounting for Derivative Instruments and Hedging Activities, as amended, in the first quarter of 2001.
"* Net income before special costs increased $. 17 per share compared to 2000 as discussed in more detail below.
Net income before special costs was $417.2 million, or $2.60 per share, in 2001 compared to $364.5 million, or $2.43 per share, in 2000. Net income before special costs were higher compared to 2000 mostly because BGE recorded $75.0 million pre-tax, or approximately $.30 per share, of amortization expense for the reduction of our generating plants associated
Constellation Energy Group, Inc. and Subsidiaries

30 /
svith the Restructrit ing Order in 2000 that had a negative impact in that year. [n addition, we had higher earnings from out regulated gas business in 2001 mosth' because of increases in the sharing mechanism under otit gas cost adjustment clauses and the increase in our base rates. These increases wete offset bs the impact ofa 6.5Qt6 annual electric residential rate reduction that was effectiVe July 1, 2000, and decreases in earnings fiom our other notnrcgulsated businesses.
Net income before special costs from our other nonrcgulated businesses decreased primarily due to declining equits values and lower gains on sales oF cquity securities in our financial invrestments business.
2000
Our 2000 total net income increased $85.2 million, or S.56 per share, compared to 1999 mostly because wse recorded an extraordinart charge of S66.3 million after-tax, or $.44 per share, associated ws ith the deregulation of the electric generation portion of our business inl 1999. In addition, we recorded several special costs in 1999 that had a negative impact in that Year as follows:
"* Our regulated electric business recorded S4.9 million aftertax, or S.03 per share, of expenses related to Hurricane Floyd.
"* Our generation operation recorded impairments of certain power projects of 'S14.2 million after-tax, or S.)9 per share.
"* Our Latin American operation recorded a $4.5 million after-tax, or -.03 per share, impairment of an investment in a power project.
"* Our financial investments business recorded a S 16.0 million after-tax, or S. 11 per share, reduction of a financial investment.
"* Our real estate and senior-living fhcilities business recorded a S5.8 million after-tax, or 5.04 per share, impairment of certain senior-living facilities.
These were partially offset by the following special costs in operations recorded in 2000:
"* S 15.0 million after-tax deregulation transition cost in June 2000 to (Goldman Sachs incurred by our power marketing operation to provide BGE's standard offer service requirements, and
"* S4.2 million after-tax expense during the first and second
quarters of 2000 for BGE employees that elected to partiipate in a targeted VSERP
Net income before special costs was 5364.5 million, or S2.43 per share, in 2000 compared to $371.8 million, or S2.48 per share, in 1999. Net income before special costs included in operations decreased mostly because we recognized $29.9 million, or $18.1 million after-tax, of the 6.5% annul, residential rate reduction that was effective July 1, 2000, and we had higher interest costs in 2000 compared to 1999. We also recognized $5.7 million after-tax, or 5.04 per share, for cotntribttions to the universal service Fund relating to the implementation
of the deregul ation of electric generation, starting July 1, 2000. 1hese decreases were offset partially by higher earnings in our merchant energy and our other nonregulated businesses.
In 2000, net income from our merchant energy business before special costs increased compared to 1999 because of higher earnings in both our power marketing and generation operations.
In 2000, net income from our other nonregulated businesses increased mostly because of higher earnings in out financial investitments operation.
In the following sections, we discuss our net income, Including the special costs, by business segment in greater detail.
Merchant Energy Business
Our merchant energy business is exposed to various market iisks as discussed further on page 45.
We record the financial impacts ofthese market risks in earnings in different periods depending upon which portion of our merchant energy business they' affect.
"* We record changes in the value of contracts in our power marketing operation that are subject to mark- to- market accounting in earnings in the period in svhich the change occurs.
"* Prior to the settlement of the anticipated transaction being hedged, we record changes in the value of contracts designated as cash flow hedges of our generation operations in other comprehensive income to the extent that the hedges are effective. We record the effective portion of hedges in earnings in the period the settlement ofthe hedged transaction occurs. We record the ineffective portion of such hedges, if any, in earnings in the period in which the change occurs.
SMark-to-market accounting requires us to make estimates and assumptions using judgment in determining the fair value of ouir contracts and in recording revenues from those contracts. We discuss the effects of mark-to-market accounting on our revenues in the Mark-to-Market ineigy Revenues section on page 32. W-c discuss mark-to-market accounting and the accouInting policies for the merchant energy business further in tihe C"tiecal Accounting Policies section on page 22 and in Note 1 on page 58.
As discussed in the Business Fnjironanent-Elece'ic Competin ion section on page 25, our merchant energy business ssvas significantly impacted by the July 1, 2000 implementation of customer choice in Maryland. At that time, BGE's generating assets became part of our nonregulated merchant energy business, and Constellation Power Source began selling to BGE the energy and capacity, required to meet its standard offer service obligations for the first three years (July 1, 2000 to June
30, 2003) of the transition period. In August 2001, BGE entered into a contract with Constellation Power Source to
provide 90% of the energy and capacity required for BGE to meet its standard offer service requirements for the final three years (July 1, 2003 to June 30, 2006) of the transition period.
(oisrelktibon hn)trKz (;,up, /0. and Subsidiaries
/ 31
In addition, effective July 1, 2000, the merchant energy business revenues include 90% of the competitive transition charges (CTC revenues) BGE collects from its customers and the portion of BGE's revenues providing for nuclear decommissioning costs.
Net Income 2001 2000 1999
(In millions)
Revenues $1,765.5 $1,025.7 $277.3 Operating expenses 1,082.3 586.8 151.5 Workforce reduction costs 46.0 -Contract termination related costs 224.8 Impairment losses and other costs 46.9 - 21.4 Depreciation and amortization 174.9 83.6 7.5 Taxes other than income taxes 49.4 24.6 Income from Operations $ 141.2 $ 330.7 $ 96.9
Net Income $ 93.1 $ 198.6 $ 52.4
Net Income Before Special Costs Included in Operations $ 291.2 $ 213.6 $ 66.6 Workforce reduction costs (28.0) -Contract termination
related costs (139.6) Deregulation transition cost - (15.0) Impairment of power projects (30.5) - (14.2)
Net Income $ 93.1 $ 198.6 $ 52.4
Above amounts include inter'company transactions eliminated in our Consolidated Financial Statements. Note 3 on page 67provides a reconciliation of operating
results by segment to our Consolidated Financial Statements.
Revenues Merchant energy revenues increased $739.8 million during 2001 compared to 2000 mostly due to:
* supplying BGE's standard offer service requirements for a full year in 2001 as compared to six months in 2000,
* higher revenues from other sales of generation, including new peaking facilities and Nine Mile Point, and
m higher mark-to-market energy revenues. Merchant energy revenues increased $748.4 million during
2000 compared to 1999 mostly due to: * providing BGE's standard offer service requirements
effective July 1, 2000, and * higher revenues from our generation and power marketing
operations. We discuss the revenues from our generation and power
marketing operations below.
Revenues fom BGE Standard Offer Service Our merchant energy business provided BGE's standard offer service requirements for a full year in 2001 as compared to six months in 2000. As a result, merchant energy revenues increased $578.0 million in 2001, including CTC and decommissioning revenues that increased $74.4 million.
Merchant energy revenues increased $691.0 million, including $110.0 million of CTC and decommissioning revenues, in 2000 compared to 1999 related to providing BGE's standard offer service requirements effective July 1, 2000.
Other Generation Revenues Other generation revenues increased $142.2 million in 2001 as compared to 2000 primarily due to the construction of new power plants and the acquisition of Nine Mile Point, as well as additional sales from our existing facilities. Revenues from peaking facilities that commenced operations during midsummer 2001 totaled $83.6 million, and revenues from Nine Mile Point, which we acquired in November 2001, totaled $55.2 million.
Additionally, sales of power from our Baltimore plants in excess of that required to serve BGE's standard offer service requirements increased $51.2 million. Our generation operation also recognized a $9.5 million gain on the sale of a project under development in the PJM region in March 2001.
These increases were partially offset by the following: "* Revenues associated with the California power purchase
agreements decreased $22.0 million. We discuss the California power purchase agreements on page 32.
"* In April 2000, our generation operation terminated an operating arrangement and sold certain subsidiaries of Constellation Operating Services Inc. (COSI) to Orion. COSI ended its exclusive arrangement with Orion to operate Orion's facilities, and Orion purchased from COSI the four subsidiary companies formed to operate power plants owned by Orion. Our generation operation recognized a $13.3 million gain on this sale in 2000 which had a positive impact on that year, and we also had lower revenues during 2001 compared to 2000 due to the sale of these subsidiaries.
Other generation revenues increased $47.6 million during 2000 compared to 1999 mostly because of the following:
"* sales of power from our Baltimore plants in excess of that required to serve BGE's standard offer requirements totaled $40.7 million, and
"* our generation operation recognized a $13.3 million gain on the termination of an operating arrangement and the sale of certain subsidiaries of COSI as discussed above.
These increases were partially offset by a decrease of $14.9 million in revenues associated with our California power purchase agreements. We discuss the California power purchase agreements on page 32.
The significant decline in the long-term prices of electricity since early 2001 has affected, and may continue to affect, our facilities that have not entered into contracts for the sale of their generation.
Under the Restructuring Order, larger industrial customers have available standard offer service until June 30, 2002. Beginning in July 2002, approximately 1,000 megawatts of
Constellation Energy Group, Inc. and Subsidiaries

32 /
industrial customer load 55ill move from BGCFs standard offer service to market-based rates. As a result, our merchant encrgy business will have an increasing amount of generating capacity that will be sold at wholesale market iates and thus be subject to future changes in wholesale electricity prices. Refet to the Buttsiness bun'iro'net section on page 25 for fiurther discussion.
Ca/iGioln/a Poe'r Pun iase Ap'eements Our generation operation has $296.4 million invested in 1,I operating projects of sshich our ownership percentage represenits 146 megawatts of electricirs' that are sold in California to PG 1: and SCY' under power purchase agreements called S04 agrccmcnts.
Undet these agieements, the projects supplx elCCtticits' to
these utilities at variable rates. Revenues from these projects were S22.1 million in 2001 compared to 544.1 million in 2000. Revenues decieased because of lower power prices in California during thc second half of 2001. While encrgy rates Were higher during the first half of 2001, the higher rates seie offset bs ieserves established for our exposure in C(alifornia dluring that period.
As presiously discussed in the [usiwss /ei on omtct COth/Ž r Satate section on page 26, the projccts entered into agreements ws'ith PGFC and SC(E that provide for five-year fixed-price payments averaging S53.70 per gaws'atr-hout plus the stated capacity payments in the original S04 contracts. \Xc expect the revenues fhom these projects to be lower in 2002 compared to 2001.
WX e also describe these projects in Note 11 on page 83.
.farck-to- /arckne'i /'ac , Revenues Nark-to-market cncrgy resventues include net gains anid losses
from Constellation Power Source origination and risk management activities ftr which the mark-to-market method of atccounting is required by Eierging Issues TIask Force Issue 98-10, Acc'oouuug fin' Contracts Ihvo/ied in b)ucry li'ading and Risk ilanagement Acti4iti/s. We discuss the mark-to-market method of acconinting and Constellation Powei Sourice's activities in nuore detail in the (itica/Accountig Policies section on page 22 and in Note I on page 58.
As a result Of the nature of its operations and the use of mark-to-market accounting fior certain activities, Constellation Power Source's revenlnues annd earnings Will fluctuate. \'C c,iuot
predict these fluctuations, but the impact on Our rcvcuiles and earninigs could be material. We discuss our market risk in moir detail oni page 44. ['hc primary Factors that cause fluctuatiots ili (I1t ri'esenues and earnings arc:
"* the number, size, and profitability of ness' transactions, "* the inagnitude and volatilitr ofI changes in commodiit
prices and interest rates, and "* the tuinuber and size of Outi open comnmodity and
deriisattie positions.
Mark-to-market energ" revenues were as follows:
New originatiui transactiions Risk management actisitis
Realized Un realized
"Iotal risk mainagemenit activities
"l6tal
2001 2000
$227.0 S158.8
1999
$141.5
19.7 (57.7() 22.2 (70.9) 49.- (16.0)
(51.2) (7.3) $175.8 S151.5
6.2 5147.7
Revenues Front new origination ti-ansactions represent the
initial unrealized fair value of new wholesale energy transactions
at the time of contract execution. Risk management revenues
represent both realized and unrealized gains and losses from
changes in the vsaloe of our entire portfolio. We discuss the
changes in origination and risk management revenues belows.
Constellation Posswer Source's mark-to-market ireventies are
influenced bys our focus on serving the full electric cnergy and
capacity requirements of-electric utility customers- Providing
utilities' full enertg and capacity requirements requires greater
ownership of or contractual access to power generating facilities,
as opposed to merely standard products obtainable in liquid
irading markets.
In order to enable us to serve such customers, during 2000
and 2001, see obtained access to physical power by entering
into a portfolio of tolling arrangements and other physical
delivery cienrig contracts. lolling arrangements are contracts
which provide tIs the right, but not the obligation, to purchase
posver at a price linked to the variable cost of production,
including fuel. This inventory of energy supply somewhat
exceeded the ecrerg demands from existing transactions and
provides resources to enable us to close additional transactions.
The relationship of the realized portion of revenue to total
mark-to-market enerig res enue in the table above reflects the
nattuie of the origination transactions which Constellation
Power Source has executed. A significant portion of these
contracts provided for Constellation Power Source to serve
customersI energy requirements at fixed prices that svere loswer
in the early' Y'eais of the contracts but that are expected to
provide increased margins and cash flows over the remaining
terms of the contracts. We discuss the settlement terms of our
contracts on the next page.
Mark-to-market energy revenues increased $24.3 million
during 2001 compared to 2000 mostly because of higher
resenues from new origination transactions, partially offset bs
net losses from risk management activities. Yhe increase in
origination revenue reflects primarily new full-requirements load
sening transaction volumes, primarily in New England and
lcexas Which wvere enabled by the portfolio of physical supply
arrangements discussed above. The increase in net losses fiom
risk management activities is primarily due to decreases in both
fuiture posswer prices and price volatility during 2001 and costs of
Co.lstellwioil /onr o (;)oup1, ho. ,Ok/ Sobsi'iabut'
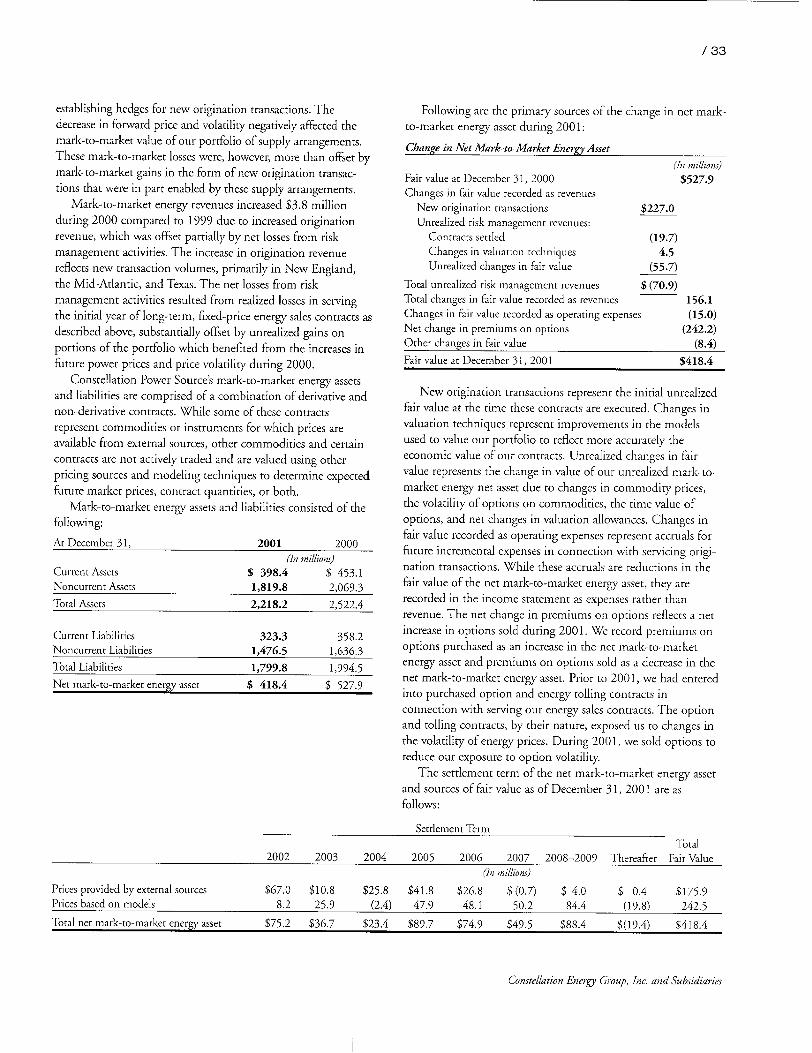
/ 33
establishing hedges for new origination transactions. The decrease in forward price and volatility negatively affected the mark-to-market value of our portfolio of supply arrangements. These mark-to-market losses were, however, more than offset by mark-to-market gains in the form of new origination transactions that were in part enabled by these supply arrangements.
Mark-to-market energy revenues increased $3.8 million during 2000 compared to 1999 due to increased origination revenue, which was offset partially by net losses from risk management activities. The increase in origination revenue reflects new transaction volumes, primarily in New England, the Mid-Atlantic, and Texas. The net losses from risk management activities resulted from realized losses in serving the initial year of long-term, fixed-price energy sales contracts as described above, substantially offset by unrealized gains on portions of the portfolio which benefited from the increases in future power prices and price volatility during 2000.
Constellation Power Source's mark-to-market energy assets and liabilities are comprised of a combination of derivative and non-derivative contracts. While some of these contracts represent commodities or instruments for which prices are available from external sources, other commodities and certain contracts are not actively traded and are valued using other pricing sources and modeling techniques to determine expected future market prices, contract quantities, or both.
Mark-to-market energy assets and liabilities consisted of the following:
At December 31, 2001 2000
(In millions)
$ 398.4 $ 453.1 1,819.8 2,069.3
2,218.2 2,522.4
Current Assets Noncurrent Assets
Total Assets
Current Liabilities Noncurrent Liabilities
Total Liabilities
Net mark-to-market energy asset
323.3 1,476.5
1,799.8
$ 418.4
358.2 1,636.3
1,994.5
$ 527.9
Following are the primary sources of the change in net markto-market energy asset during 2001:
Change in Net Mark-to-Market Energy Asset
(In millions) Fair value at December 31, 2000 $527.9 Changes in fair value recorded as revenues
New origination transactions $227.0 Unrealized risk management revenues:
Contracts settled (19.7) Changes in valuation techniques 4.5 Unrealized changes in fair value (55.7)
Total unrealized risk management revenues $ (70.9) Total changes in fair value recorded as revenues 156.1 Changes in fair value recorded as operating expenses (15.0) Net change in premiums on options (242.2) Other changes in fair value (8.4) Fair value at December 31, 2001 $418.4
New origination transactions represent the initial unrealized fair value at the time these contracts are executed. Changes in valuation techniques represent improvements in the models used to value our portfolio to reflect more accurately the economic value of our contracts. Unrealized changes in fair value represents the change in value of our unrealized mark-tomarket energy net asset due to changes in commodity prices, the volatility of options on commodities, the time value of options, and net changes in valuation allowances. Changes in fair value recorded as operating expenses represent accruals for future incremental expenses in connection with servicing origination transactions. While these accruals are reductions in the fair value of the net mark-to-market energy asset, they are recorded in the income statement as expenses rather than revenue. The net change in premiums on options reflects a net increase in options sold during 2001. We record premiums on options purchased as an increase in the net mark-to-market energy asset and premiums on options sold as a decrease in the net mark-to-market energy asset. Prior to 2001, we had entered into purchased option and energy tolling contracts in connection with serving our energy sales contracts. The option and tolling contracts, by their nature, exposed us to changes in the volatility of energy prices. During 2001, we sold options to reduce our exposure to option volatility.
The settlement term of the net mark-to-market energy asset and sources of fair value as of December 31, 2001 are as follows:
Settlement Term Total
2002 2003 2004 2005 2006 2007 2008-2009 Thereafter Fair Value (In millions)
Prices provided by external sources $67.0 $10.8 $25.8 $41.8 $26.8 $ (0.7) $ 4.0 5 0.4 $175.9 Prices based on models 8.2 25.9 (2.4) 47.9 48.1 50.2 84.4 (19.8) 242.5 Total net mark-to-market energy asset $75.2 $36.7 $23.4 $89.7 $74.9 $49.5 $88.4 $(19.4) $418.4
Constellation Energy Group, Inc. and Subsidiaries

34 /
Constellation Poower Source manages its risk on a portfolio
basis based upon the delivery period of its contracts and the
individual components of the risks within each contract. Acc-ridinglv, wve record and manage the energv purchase and sale obligations under our contracts in separate components
based upon the commodity (e.g., electricity or gas), tbe product
(e.g., electricity foto delivery dciiring peak or off-peak hours), the delivery location (c.,., bx region), the risk profile (e.g., forward
or option), and the delivery period (e.g., by month and 'eat). Consistent With our risk management practices, wc have presented the information in tre table on the previous page
based upon the abilit' to obtain reliable prices fror components of the risks in our contracts fiom external sources rather than
on a co ti ract-bY-contract basis. Thus, the portion of long-teirm contracts that is valued using external price sources is classified in the same caption as other sbortcr-tert i transactions that setle
in the same period. This prcsentation is consistent xwith how we
manage our risk, and sxe believe it provides the best indication of the basis for the valuation Of our portfolio. Since we manage
our risk on a portfolio basis rather than contract-by-contract, it is not practicable to determine separately the portion of longterm contracts that is included in each valuation category. We describe the corninodities, products, and delivery periods included in each valuation categor' in detail below.
The amounts Fior which fair value is determined cising prices
provided by external sources represent the portion of forwatd, ssvap, and Option contracts for which price quotations are
available through brokers or over-thecoou titer transactions. The term for Which such price inftormation is available varies by commioclity, regicion, and product. l]hle fair values included in this categiorv are the Icilowing portions of our contracts:
* toorxard purchases and sales of electricity cduring peak
hours for delivery terms Of fiur to six years, dcepending
upon the region, "* forward puriciases and sales oflectricity clduinig off-peak
hours for delivers terms of two to f•rur years, depend]cing
uipon the region,
"* options for the purchase and sale of electricity fr clclieiVey
terms Of LfP to two y'ears, "* forward Purchases and sales of elcctric capacity for dclives)
terms of up to two years, "* forx'ard ptIrchases and sales Of natural gas and oil fci
delixvery' terms cOf tIp to foour years, and "* options for the purchase and sale of natural gas and oil for
delivery terms of tip to tso Yiears.
The rcmaindcet of the net mark-ro-iiarket energy asset is
valuced using models. The portion of contracts for which such techniques are used includes standard products foir Which external prices arc not available and custoiizecd products which
arc valued using modeling techniques to determine expected future market prices, contract quantities, or both.
Modeling techniques include estimating the present vahlIe of
cash flows based upon cindctlying contractual terms and itcot-
porate, where appropriate, option pricing models and statistical sitiiulation procedures. Inputs to the models include observable
market prices, estimated market prices in the absence of quoted Market prices, the risk-free market discount rate, volatility
factors, estimated correlation of energy commodity prices, contractural volumes, and estimated volumes for requirements
contracts. Additionallyx we incorporate counterparts-specific credit quality and factors for market price uncertaintv and other risks ill Our 'valuation. The Inputs and factors used to determine firi salcue reflect managenieents best estimates.
The electricity, fuel, and other energy contracts held by
C(onstellation Powcre Source have varying terms to maturity, ranging from contracts for delivery the next hour to contracts with terms of ten years or more. Because an active, liquid
electricity futures market comparable to that for other commodities has not developed, the majority of contracts used
in the powser marketing business are direct contracts berveen market participants and are not exchange-traded or financially
settling contracts that readily can be liquidated in their entirer' through-i an exchange or other market mechanism. ConsequenCtl's Constellation Piower Source and other market participants generally realize the value of these contracts as cash
flows bccome due or payable under the terms of the contracts rather than througi selling or liquidating the contracts
themnselves. C(onsistenit With our tisk management practices, the amounts
s]iown in the table on the previous page as being valued using prices from external sources include the portion of long-term
contracts for which wvc can obtain reliable prices from external
sources. The remaining portions of these long-term contracts are shown in the table as being valued using models. In order to realize the entire value of a long-term contract in a single trans
action, wVe would need to sell or assign the entire contract. If xxwe
were to sell or assign any' of ocir log-terni contracts in their entirete;, xc masY not realize the entire value reflected in the table. Howcver, based upon the nature of the power marketing business, we expect to realize the value of these contracts, as xwell
as any contracts xxe may enter into in the future to manage our risk, over time as the contracts and related hedges settle in accordance xxwith their terms. We do not expect to realize the
value of these contracts and related hedges by selling or
assigning the contracts themselves in total. 'Ihe fair valuces it) the table represent expected future cash
fioiss based on the level of forward prices and volatility factors as of December 31, 2001. These aiioitints do not represent the
contractual maturities and could change significantly as a result
of fcuture changes in these factors. Additionally, because the depth and liquidity of the poixer mnarkets varies substantially between regions and time periods, the prices used to determine
f'air value could be affected signiificaltitly by the volune of transactions executed. Constellation Powx'er Source's management
uses its best estimates to determine the fair value of commodir,
and derivative contracts it holds and sells. These estimates
C on'stlLtiooo /W''vc' (Group, hon. and 'Subsidiari'o,

/ 35
consider various factors including closing exchange and overthe-counter price quotations, time value, volatility factors, and credit exposure. However, it is possible that future market prices could vary from those used in recording mark-to-market energy assets and liabilities, and such variations could be material.
Operating Expenses Merchant energy operating expenses increased $495.5 million during 2001 compared to 2000 mostly because of the following:
"* Fuel and purchased energy costs increased $291.5 million and operations and maintenance costs increased $236.7 million. These increases reflect a full year's operation of the generation plants that were transferred from BGE effective July 1, 2000, as well as, the added operations of the new peaking facilities and Nine Mile Point. The fuel cost increase also reflects higher fuel prices for generating electricity. Coal prices increased during 2001, and we expect to incur additional costs in the future to operate our coal generating facilities due to higher prices.
"* Power marketing operating expenses associated with the growth of the operation increased $31.6 million.
These increased costs were partially offset by lower fees earned by Goldman Sachs at our power marketing operation due to the termination of the power business services agreement in October 2001. The Goldman Sachs fees were $28.9 million in 2001, $81.3 million in 2000, and $31.8 million in 1999. The amount of fees for 2000 includes the $24.0 million, or $. 10 per share, deregulation transition cost as discussed below. These fees will not be incurred in the future due to the termination of the power business services agreement with Goldman Sachs. In addition, COSI had lower operating expenses due to the sale of certain subsidiaries to Orion, as previously discussed.
Operating expenses increased $435.3 million in 2000 compared to 1999 mostly because of three factors:
"* an increase of $191.6 million in fuel costs and $157.2 million in operations and maintenance costs associated with the generation plants that were transferred from BGE effective July 1, 2000,
"* an increase in Goldman Sachs fees of $49.5 million, including the $24.0 million deregulation transition cost incurred by our power marketing operation to provide BGE's standard offer service requirements, and
"* a $6.2 million increase in power marketing operating expenses associated with the growth of the operation.
In light of the events of September 11, 2001, we have taken additional security measures at our nuclear facilities. While we anticipate continuing to incur additional security related costs at our nuclear facilities, we do not expect that these costs will be material. However, the Nuclear Regulatory Commission (NRC) currently is evaluating additional security measures that may be required at nuclear facilities. At this time, we cannot determine
the impact on our financial results of any additional security measures that may be required by the NRC.
Extended Nuclear Outages Our merchant energy business will experience extended outages at Calvert Cliffs to replace the steam generators during the 2002 refueling outage for Unit 1 and during the 2003 refueling outage for Unit 2. As a result of the extended outages, we expect lower annual revenues and higher annual operating costs for each extended outage.
Workforce Reduction Costs, Contract Termination Related Costs, and Impairment Losses and Other Costs As previously discussed in the Events of 2001 section on page 22, our merchant energy business recognized the following:
* $46.0 million, or $.17 per share, of expenses associated with our workforce reduction efforts,
* $224.8 million, or $.87 per share, of expenses related to the termination of the power business services agreement with Goldman Sachs,
M a $40.8 million, or $.16 per share, impairment of certain planned development projects that were terminated, and
* a $6.1 million, or $.03 per share, loss on the impairment of a power project.
As a result of our workforce reduction efforts, our merchant energy business expects to generate annual savings of approximately $24 million.
In 1999, our generation operation recorded a $21.4 million, or $.09 per share, write-off of two geothermal power projects, which had a negative impact in that year.
We discuss these workforce reduction costs, contract termination related costs, and impairment losses and other costs further in Note 2 on page 64.
Depreciation and Amortization Expense Merchant energy depreciation and amortization expense increased $91.3 million in 2001 compared to 2000 mostly because 2001 includes a full year of expenses associated with the generation plants that were transferred from BGE effective July 1, 2000. Additionally, 2001 expenses include depreciation and amortization associated with the new peaking facilities and Nine Mile Point.
Merchant energy depreciation and amortization expense increased $76.1 million in 2000 compared to 1999 mostly because of $73.8 million of expenses associated with the generation plants that were transferred from BGE effective July 1, 2000.
Taxes Other than Income Taxes Merchant energy taxes other than income taxes increased in 2001 and 2000 compared to their respective prior year mostly because of taxes other than income taxes associated with the generation plants that were transferred from BGE effective July 1, 2000.
Constellation Energy Group, Inc. and Subsidiaries
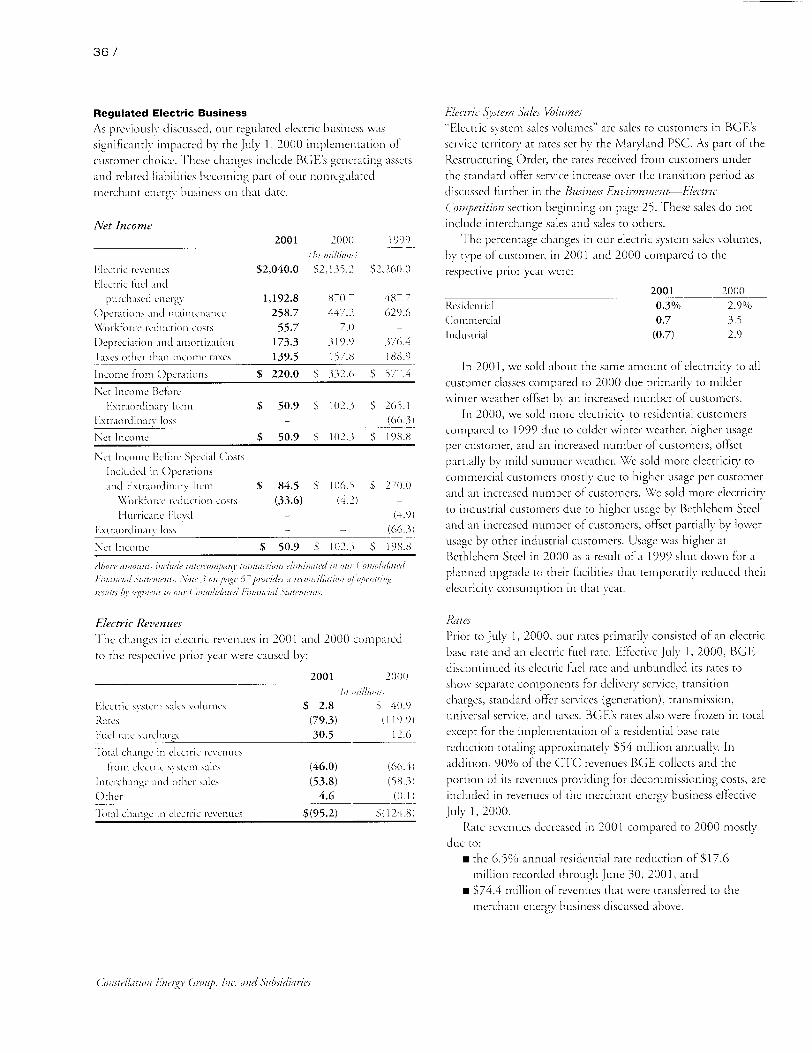
Regulated Electric Business
As previously discussed, our regulated electric business %%as significantly impacted by the JuilV 1, 2000 imnplemettation of
cnstotmer choice. T'hese ch anges include BG'-s generating assets and related liabilities becoming part of oUr nonregulatecd merchant enetgx' business nn that date.
Net Income 2001 2000 1999
(/n mill/wl.;
Ilectric reveuos $2,040.0 S2,135.2 5$2,l0.0 Ilectric fidl and
purchased c ni t 'g y 1,192.8 8 70. 7 48 7.7
Operations and maintenancc 258.7 44.2 029 .6
\Xrorkftocc ieduction costs 55.7 7.0 Depreciation arid ainortization 173.3 311)( 376.4
I-axes other than income taxes 139.5 157.8 (88-9
Income fioat Operations $ 220.0 S 332.0 S 577A
Net Incotnte Beti'oit
I xtlaolditaryii Itoen $ 50.9 S 102. S 2>5.1
Ixtiaottliiiarv loss (- 06.3
Net Incoaie $ 50.9 $ 02. S 198 .8
Net Incomtie Icolre Special Costs I nIcluded in OperatiotLs and 1xtiaordiiiarl \ Itett $ 84.5 S 106.> S 2-0.0
Xork-foice lc•.llctiol costs (33.6) (0) H urK icaiiC lax - (.4 .9
-xtlraordiraryai loss - - (66.3)
Net Incoine $ 50.9 S 102.3 S 1)8.8 ,Aborcaout , imm itidektk in2to'omipanr onnsacmon, elpw);af'ed• oýl• ou. Con.,ohz•tble
ii tal : 1/ , :ii .atut' V. .\) ti'. /on 6- aroit •e a ze ,t lif atit ot 'o/i titi
Electric Revenues TIhe changes in electric reetnuies in 2001 and 2000 compared to the respective prior year were caused bhv:
2001 200(
Ilcctric s\stcnt sales sal limes
Rates 1Ftuel rate surchaigc
'I tal chalige in olecic t rvoeto tin's
froin clectric sxstcun sales
Interchatge and other sales
Other
"Iital chaige it) electric te'Veili'S
$ 2.8 (79.3) 30.5
(46.0) (53.8)
4.6
$(95.2)
In tllio/nit
S 40.9 tl!9.91
12.6
(5 8.3) (0.1)
5)124.8)
E/ectnic Sy'stern S¾/ees Volumes "Electric system sales volumes" arc sales to customers in BGE's
service territory at rates set bv the Maryland PSC. As part of the
Restructuring Order, the rates received from customers under
the standard offer service increase over the transition period as
discussed further in the lisiness Fttirooeot--£/ecWri
(Competitio section beginning on page 25. These sales do not
include interchange sales and sales to others. Tlhe pcrcentage changes in our electric system sales voltimes,
by type of customer, in 2001 and 2000 compared to the
respective prior year were:
Residcential C(otnxiercial Industrial
2001 0.3% 0.7 (0.7)
2000 2.9% 3.5 2.9
In 2001, .ve sold ahout the same amount of electricity to all customer classes compared to 2000 due primarily to milder xvinter weather offset by an increased nuimher ofcttstomers.
In 2000, we sold more clectricitY to residential customers compared to 1999 due to colder winter weather, higher usage per customer, and an increased number of customers, offset partially by mild summer wveather. We sold more electricity to commercial ccistomers mosdy due to higher usage per customer and an increased number of customers. We sold more electricity to industrial customers due to lhigher usage by Bethlehem Steel
and an increased n[umber of customers, offset partially by lower Ucsage by other industrial customers. Usage xwas higher at Bethlehem Steel in 2000 as a result of a 1999 shut dosvn for a planned upgrade to their facilities that temporarily reduced their electricity consumption in that Year.
ater•
Prior to July 1, 2000, our rates primarily consisted of an electric
base rate and an electric fuiel rate. Effective Jctly 1, 2000, BGE
discontintued its electric fciel rate and unbundled its rates to
show separate components For delivery service, transition
charges, standard offer services (generation), transmission,
universal service, and tcaxes. BGC! s rates also were frozen in total
except for the implementation of a residential base rate
reduction totaling approximately S54 million annually. In
addition, 90%ta of the CTC revenues BGE- collects and the
portion of its revenues providing for decommissioning costs, are
included in revetzcis of the merchant energy business effectiVe
JuIly 1, 2000. Rate teventies idecreaseCd in 2001 compared to 2000 mostly
due to:
"* the 6.5%A} annual residential rate reduction of-$17.6
million recorded thtotigh June 30, 2001, and "* S74.4 million of revenuces that were transferred to the
merchant encrig, business discussed above.
36/
I
(.l~cb:Lt,/tion lP)Ieroy (,)remp, Ine. atd Subsidiaries

/ 37
These decreases were partially offset by the increase in the standard offer service rate that BGE charges its customers and other net impacts of the rate restructuring discussed above.
Rate revenues decreased in 2000 compared to 1999 mostly because of the $29.9 million decrease caused by the 6.5% annual residential rate reduction, and the $110.0 million transfer of revenues to the merchant energy business. This was offset partially by higher fuel rate revenues during the first half of 2000.
Fuel Rate Surcharge In September 2000, the Maryland PSC approved the collection of the $54.6 million accumulated difference between our actual costs of fuel and energy and the amounts collected from customers that were deferred under the electric fuel rate clause through June 30, 2000. We discuss this further in the Electric Fuel Rate Clause section below.
Interchange and Other Sales "Interchange and other sales" are sales in the PJM energy market and to others. PJM is a RTO/ISO that also operates a regional power pool with members that include many wholesale market participants, as well as BGE and other utility companies. Prior to the implementation of customer choice, BGE sold energy to PJM members and to others after it had satisfied the demand for electricity in its own system.
Effective July 1, 2000, BGE no longer engages in interchange sales, and these activities are included in our merchant energy business, which resulted in a decrease in interchange and other sales for 2001 and 2000 compared to their respective prior year. In addition, BGE had lower interchange and other sales during the first half of 2000 when increased demand for system sales reduced the amount of energy BGE had available for off-system sales.
Electric Fuel and Purchased Energy Expenses
2001 2000 1999
(In millions)
Actual costs $1,150.5 $868.0 $558.0 Net recovery (deferral)
of costs under electric fuel rate clause 42.3 2.7 (70.3)
Total electric fuel and purchased energy expenses $1,192.8 $870.7 $487.7
Actual Costs As discussed in the Business Environment Electric Competition section on page 25, effective July 1, 2000, BGE transferred its generating assets to, and began purchasing substantially all of the energy and capacity required to provide electricity to standard offer service customers from, the merchant energy business.
Our actual costs of fuel and purchased energy increased in 2001 compared to 2000 mostly because of the deregulation of electric generation. The higher amount BGE paid for purchased energy from our merchant energy business is offset by the absence of $206.4 million in 2001 and $191.6 million in 2000 in fuel costs, and lower operations and maintenance, depreciation, taxes, and other costs at BGE as a result of no longer owning and operating the transferred electric generation plants.
Prior to July 1, 2000, BGE's purchased fuel and energy costs only included actual costs of fuel to generate electricity (nuclear fuel, coal, gas, or oil) and electricity we bought from others.
Electric Fuel Rate Clause Prior to July 1, 2000, we deferred (included as an asset or liability on the Consolidated Balance Sheets and excluded from the Consolidated Statements of Income) the difference between our actual costs of fuel and energy and what we collected from customers under the fuel rate in a given period. Effective July 1, 2000, the fuel rate clause was discontinued under the terms of the Restructuring Order. In September 2000, the Maryland PSC approved the collection of the $54.6 million accumulated difference between our actual costs of fuel and energy and the amounts collected from customers that were deferred under the electric fuel rate clause through June 30, 2000. We collected this accumulated difference from customers over the twelve-month period ended October 2001.
Electric Operations and Maintenance Expenses Regulated electric operations and maintenance expenses decreased $188.5 million during 2001 compared to 2000 mostly because effective July 1, 2000, costs of $194.7 million were no longer incurred by this business segment. These costs were associated with the electric generation assets that were transferred to the merchant energy business.
Regulated electric operations and maintenance expenses decreased $182.4 million during 2000 compared to 1999 mostly because effective July 1, 2000, $157.2 million of costs were no longer incurred by this business segment. These costs were associated with the electric generation assets that were transferred to the merchant energy business. In addition, 1999 operations and maintenance expenses included costs for system restoration activities related to Hurricane Floyd and a major winter ice storm, and costs associated with the preparation for the year 2000 (Y2K). These costs had a negative impact in that year.
Constellation Energy Group, hIn. and Subsidiaries

38/
Workforce Reduction Costs In 2001, BGE's electric business recognized $55.7 million, or
S.21 per share, of expenses associated with our workforce reduction efforts. As a result of our worklforce reduction eflotrts, our regulated electric business expects to generate annual
savings of approximately S36 million. In 2000, B(GEI's electric business recognized $7.0 million, or S.03 per share, of expenses for employees that elected to participate in a targeted VSERP, that had a negative impact in that year. We discuss these programs further in Note 2 on page 64.
Electric Depreciation and Amortization Expense Regulated electric depreciation and amortization expense decreased $146.6 million during 2001 compared to 2000 mostly due to:
* the absence of $75.0 million of amortization expense recorded in 2000 associated with the $150 million reduction of our generating plants provided for in the
Restructuring Order, and * $75.1 million of expenses associated with the transfer of
the generation assets to the merchant energy buIsiness effective July 1, 2000.
Regulated electric depreciation and amortization expense decreased $56.5 million during 2000 compared to 1999 mostls because of the absence of $73.8 million of depreciation and amortization expense associated with the transfer of the generation assets. This decrease was offset partially' by more electiic plant in service and higher amortization associated with regulatory assets.
Electric Taxes Other Than Income Taxes Regulated electric taxes other than income taxes decreased S18.3 million during 2001 compared to 2000 mostly due to the absence of taxes other than income taxes associated wvith the generation assets that were transferred to the merchant eneroy business eflective JuIy 1, 2000 partially offset by feNser tax credits.
Regulated electric taxes other than income taxes decreased $31.1 million during 2000 compared to 1999. This sxas mostly due to trso factors:
" regilated electric taxes other than income taxes reflect the absence of $23.8 million of taxes other than income taxes associated wxith the generation assets that swere transferred to the merchant energy business effective July 1, 2000, and
"* comprehensive changes to the tax laws. The comprehensive tax law changes are discussed further in
Note 5 on page 69.
Regulated Gas Business Net Income
(as revenlues
Gas purchased for resale Operations and maintenance W'orkforce reduction costs Depreciation and amortization "tlxes other than income taxes
Income from Operations
2001 2000 (Zn inllions)
$680.7 $611.6 401.3 350.6 104.3 100.6
1999
$488.1 233.8
97.7
1.3 47.7 46.2 44.9
34.3 34.8 34.5
$ 91.8 S 79.4 S 77.2
Net Income $ 37.5 S 30.6 S 33.0
Net Income Before Special Costs Included in Operations $ 38.3 $ 30.6 $ 33.0
Workforce reduction costs (0.8) -
Net Income $ 37.5 $ 30.6 $ 33.0
Abow' amounts incude interompaio, t0 hnsaction' eliiinated in oner Consolidired t noam'al Srareme'nr A ,on 3 on page 6- pro'idi a reoonci/iation of op/ewthr
on/ult / y segment to our Consolidated tinaml Sten'n.
Net 1ncome from our regulated gas business increased during 2001 compared to 2000 mostly due to the sharing mechanism under our gas cost adjustment clauses and the increase in our base rates.
Net income from the regulated gas business decreased during 2000 compared to 1999 mostly due to a slight increase in operations and maintenance and depreciation expenses partially offset by an increase in our base rates.
All BGE customers have the option to purchase gas from
other suppliers. To date, customer choice has not had a material effect on our, or B3GE's, financial results.
Gas Revenues The changes in gas revenues in 2001 respective prior year xsere caused by':
Gas system sales volumnes Base rates Weather normalization
Gas cost adjustInents
Iota1 change in gas rexvenucs
fiom gas system sales Off-system sales Other
Iltal change in gas rcevrtues
and 2000 compared to the
2001
$(3.4)
3.3 11.9 43.6
55.4 12.5
1.2
$69.1
2000 Ini millions)
$ 34.5 2.7
(26.7) 54.7
65.2 58.1
0.2
$123.5
Consteotrion Fnergi, Croup, Inc. and Subsidiaries

/ 39
Gas System Sales Volumes The percentage changes in our gas system sales volumes, by type of customer, in 2001 and 2000 compared to the respective prior year were:
2001
Residential
Commercial Industrial
(7.8)%
3.5 (25.2)
2000
13.0%
12.8
(2.1)
We sold less gas to residential customers during 2001 compared to 2000 mostly due to milder winter weather and lower usage per customer partially offset by an increased number of customers. We sold more gas to commercial customers mostly due to higher usage per customer. We sold less gas to industrial customers mostly because of lower usage by Bethlehem Steel and other industrial customers due to their switching to lower cost alternative fuel sources and lower business needs related to the general downturn in the economy partially offset by an increased number of customers.
We sold more gas to residential and commercial customers during 2000 compared to 1999 due to higher usage per customer, colder weather, and an increased number of customers. We sold less gas to industrial customers mostly because of lower usage by Bethlehem Steel and other industrial customers partially offset by an increased number of customers.
Base Rates Base rate revenues increased during 2001 and 2000 compared to the respective prior year mostly because the Maryland PSC authorized a $6.4 million annual increase in our base rates effective June 22, 2000.
Weather Normalization The Maryland PSC allows us to record a monthly adjustment to our gas revenues to eliminate the effect of abnormal weather patterns on our gas system sales volumes. This means our monthly gas revenues are based on weather that is considered "normal" for the month and, therefore, are not affected by actual weather conditions.
Gas Cost Adjustments We charge our gas customers for the natural gas they purchase from us using gas cost adjustment clauses set by the Maryland PSC as described in Note 1 on page 58. However, under market-based rates, our actual cost of gas is compared to a market index (a measure of the market price of gas in a given period). The difference between our actual cost and the market index is shared equally between shareholders and customers. The shareholders' portion increased $3.6 million during 2001 compared to 2000. Effective November 2001, the Maryland PSC approved an order that modifies certain provisions of the
market-based rates incentive mechanism. These provisions require that BGE secure fixed-price contracts for at least 10%, but not more than 20%, of forecasted system supply requirements for the November through March period. These fixed price contracts are not subject to sharing under the marketbased rates incentive mechanism. We do not expect these changes to have a material impact on our financial results.
Delivery service customers, including Bethlehem Steel, are not subject to the gas cost adjustment clauses because we are not selling gas to them. We charge these customers fees to recover the fixed costs for the transportation service we provide. These fees are the same as the base rate charged for gas sales and are included in gas system sales volumes.
Gas cost adjustment revenues increased during 2001 compared to 2000 mostly because the gas we sold to nondelivery service customers was at a higher price partially offset by less gas sold. In the first half of 2001, the revenue increase reflects the significant increase in natural gas prices.
Gas cost adjustment revenues increased during 2000 compared to 1999 mostly because we sold more gas at a higher price. The revenue increase reflects the significant increase in natural gas prices.
Off-System Sales Off-system gas sales are low-margin direct sales of gas to wholesale suppliers of natural gas outside our service territory. Off-system gas sales, which occur after we have satisfied our customers' demand, are not subject to gas cost adjustments. The Maryland PSC approved an arrangement for part of the margin from off-system sales to benefit customers (through reduced costs) and the remainder to be retained by BGE (which benefits shareholders).
Revenues from off-system gas sales increased during 2001 compared to 2000 mostly because the gas we sold off-system was at a higher price partially offset by less gas sold. In the first half of 2001, the revenue increase reflects the significant increase in natural gas prices.
Revenues from off-system gas sales increased during 2000 compared to 1999 mostly because we sold more gas off-system at significantly higher prices.
Gas Purchased For Resale Expenses Actual costs include the cost of gas purchased for resale to our customers and for off-system sales. Actual costs do not include the cost of gas purchased by delivery service customers.
Our gas costs increased during 2001 compared to 2000 mostly because gas we purchased was at a higher price partially offset by less gas purchased for both system and off-system sales. Our gas costs increased during 2000 compared to 1999 mostly because we bought more gas for both system and off-system sales, and all of the gas purchased was at a higher price due to the significant increase in natural gas prices during 2000.
Constellation Energy Group, Inc. and Subsidiaries

40 /
Other Gas Operating Expenses Other gas operating expenses were about the same during 20001 and 2000 compared to the respective prior year.
As a result of our workforce reduction efforts, our regulated gas business expects to generate annual savings of approximately $12 million. The cost of these programs was deferred as a regulatory asset. See Note 6 oin page 71.
Other Nonregulated Businesses
Net Income
RCVCI1 LlLS
Operating txpenses \\'torkforcC reducltion costs Impairment losses and other costs Depreciation antd amortization
Taxes othei than income taxes
$S
2001 2000
602.1 S713.3 510.7 588.8
2.7 155.2 23.2
3.4
199)
$8481 771 .5
20.3 21.)) 4.3 3.9
(Loss) Income from Operations $ (93.1) S 99.9 S 9.1
Net (Loss) Income Before C.uritilarvc F1 f'fect of C(hange in Accounting PrinIcipic $ (99.1) S 13.8 S24. I-)
CUmulativs Effect of Change in Accounting Principle 8.5
Net (L0oss) Income $ (90.6) S 13.8 S(214.1)
Net Income Before Special Costs Included in Operations $ 3,2 S 13.8 S 2.2
WXo'rkfoicc reduction costs (1.7)
Loss orn sale of" Cuarcnalan operations (28.1)
Impairment of real estate, senior -living, and interiatioial irissrncrits (69.7) (I 0J3)
Reduction of financial inlvestrnenit (2.8) - (16.0)
Net (Loss) Incone Befoire C turulatiVC
I ffcct of Chairec ill Accountirig Principle (99.1) 13.8 (24.1)
Curimulatie IffcCt of-Chasgi in Accoutnting Principle 8.5
Net (ILoss) Income $ (90.6) 1 13.8 S(24.1)
A4bor ,r otv s a rorti in , itt e c'toioMpi I a ll,14 0 1m's /timi liutr, m r1a (.itisolilatt ,
I'mor;tl Strornent. None -3 or psige 67 p6 v/ifrtd m 1ohiatie of ot'oreoi
results nn s)••ota ot or Consoldatd to! ,,ircoits.
Net income from our other nonregulatcd businesses decreased during 2001 compared to 2000 mostly because Of the following items:
"* Our 1Latin American operations recorded a loss of S28.1 million after-tax, or S. 17 per share, on the sale of our
G;uatemalan operations. "* \We recorded S69.7 million after-tax, or S.43 per share, in
impairments of certain non-core assets. WAce decided to sell six real estate projects without afurther development and all
of our senior-living facilities in 2002 and accelerate the exit strategies for two other real estate projects that we will continue to hold and own over the next several years. WA-e also decided to accelerate the exit strategy for the investment in a distribution company in Panama and expect to complete the sale by mid-to-late 2003. Finallt; there was an other than temporary decline in value in our equity method Bolivian investment duo to a deterioration in our investment's position in the Bolivian capacity market.
* Our financial investments business recorded a S2.8 million after-tax, or S.02 per share, redtiction of its investment in an aircraft due to the decline in value of used airplanes as a result of the September 11, 2001 terrorist attacks and the general downturn in the aviation industry.
Wc discuss these special costs further in Note 2 on page 65. In addition, our financial investments business had lower
earnings due to declining equity values and lower gains on sales of equity securities, partially offset by aso S8.5 million after-tax, or 5.05 per share, gain for the cumulative effect of adopting SFAS No. 133 in the first quarter of 2001. The gains on sales of securities includc a S9.0 million after-tax gain on the sale of one million shares of the Orion investment in 2001 and a S9.5 million after-tax gain on the sale of two million shares of our Orion investment in 2000.
Net income from our other nonregulated businesses Increased during 2000 compared to 1999 mostly because of better market perforimance of certain of our financial investmCents including the sale of certain equity securities. In addition, in 1999, we reduced the values of a financial investment, our investment in an electric generating company in Bolivia, antd certain senior-living facilities, Which had negative impacts in that year, as discussed in more detail in Note 2 on page 66. These increases were offset partially by loswer earnings from our
,atim American operation primarily duc to increased operating expenses in Guatermala in 2000.
As previously discussed in the Events of'2001 section, ste decided to sell certain non-core assets and accelerate the exit strategies on other assets that we will continue to hold and own over the next several years. TI hese assets include approximately 1,300 acres of land holdings in various stages of development located in seven sites in the central Maryland region, an operating waste wvater treatment plant located in Anne Arundel County, Marxland, all of our 18 senior-living facilities, and certain international powser projects. While our intent is to dispose of these assets, market conditions and other events beyond ourt control maY affect the actual sale of these assets. In addition, a future decline in the fair value of these assets could result in additional losses.
Our remaining projects are partially or substantially developed. Our strategy is to hold and in some cases further develop these projects to increase their value. However, if we wx ere to sell these projects in the current market, we may have losses that could be material, although the amount of the losses is hard to predict.
C oistelri/tot fnct) (uroup, hic ar! Subsidiaries

/41
Consolidated Nonoperating Income and Expenses
Fixed Charges Total fixed charges decreased $32.6 million during 2001 compared to 2000 mostly because of lower interest rates and higher capitalized interest associated with our construction of new generating facilities. These decreases were offset partially by a higher average level of debt outstanding.
Fixed charges increased $16.4 million during 2000 compared to 1999 mostly because we had more debt outstanding.
Income Taxes The differences in income taxes result from a combination of the changes in income and the effective tax rate. We include an analysis of the changes in the effective tax rate in our Consolidated Statements of Income Taxes on page 56.
Financial Condition
Cash Flows
Cash provided by operations was $573.3 million in 2001 compared to $850.9 million in 2000 and $679.0 million in 1999.
Cash used in investing activities was $1,472.7 million in 2001 compared to $1,106.5 million in 2000 and $615.1 million in 1999. The increase in 2001 compared to 2000 was mostly due to increased purchases of property, plant and equipment and other capital expenditures including $382.7 million relating to the net cash paid for the acquisition of Nine Mile Point. The increase in 2000 compared to 1999 was mostly due to substantial increases in our merchant energy capital expenditures to support our construction program.
Cash provided by financing activities was $789.1 million in 2001 compared to $345.6 million in 2000 and cash used in financing activities of $144.9 million in 1999. The increase in 2001 compared to 2000 was mostly due to increased proceeds from the issuance of common stock, an increase in proceeds from the net issuance of short-term borrowings, and a $130.0 million decrease in common stock dividends paid. These items were partially offset by the issuance of less long-term debt and higher repayments of our long-term debt. The increase in 2000 compared to 1999 was mostly because we issued more longterm debt and common stock. This was offset partially by an increase in net maturities of short-term borrowings, and we repaid more long-term debt.
Security Ratings
Independent credit-rating agencies rate Constellation Energy's and BGE's fixed-income securities. The ratings indicate the agencies' assessment of each company's ability to pay interest, distributions, dividends, and principal on these securities. These ratings affect how much it will cost each company to sell these securities. The better the rating, the lower the cost of the securities to each company when they sell them. The factors that credit rating agencies consider in establishing Constellation Energy's and BGE's credit ratings include cash flows, liquidity, and the amount of debt as a component of total capitalization.
All three rating agencies recently completed reviews of Constellation Energy's and BGE's ratings. FitchRatings affirmed
its ratings of Constellation Energy. Standard & Poors Rating Group downgraded Constellation Energy's commercial paper from A-1 to A-2 and senior unsecured debt from A- to BBB+. In addition, Moody's Investors Service downgraded Constellation Energy's commercial paper from P-1 to P-2 and senior unsecured debt from A3 to Baal. All Constellation Energy ratings have stable outlooks.
Moody's Investors Service and FitchRatings recently affirmed the ratings of BGE. Standard & Poors Rating Group downgraded BGE commercial paper from A-1 to A-2, senior unsecured debt from A to BBB+, mortgage bonds from AA- to A, and Trust Originated Preferred Securities and Preference Stock from A- to BBB. All BGE ratings have stable outlooks.
At the date of this report, our credit ratings were as follows:
Standard & Poors Rating Group
Constellation Energy Commercial Paper Senior Unsecured Debt
BGE Commercial Paper Mortgage Bonds Senior Unsecured Debt Trust Originated Preferred
Securities and Preference Stock
A-2 BBB+
A-2 A
BBB+
BBB
Moody's Investors Service
P-2 Baa I
P-1 Al A2
Baa 1
FitchRatings
F-2
A
F-1 A+ A
A-
Available Sources of Funding
As previously discussed in the Events of2001 section, we decided to sell certain non-core assets to focus on our core strategies. We expect to use the proceeds from these sales to reduce our debt and fund our merchant energy business. We continuously monitor our liquidity requirements and believe that our facilities and access to the capital markets provide sufficient liquidity to meet our business requirements. We discuss our available sources of funding in more detail on the next page.
Constellation Energy Group, Inc. and Subsidiaries

42 /
Constellation Energy Constellation Energy has a commercial paper program wx here it can issue short-term notes to fund its subsidiaries. To support its commercial paper program, Constellation Energy maintains two 364-day revolving credit agreements totaling $2.9 billion maturing in June 2002, as well as a S188.5 million miiltie-yar revolving credit facility. Twvo of these facilities can also issue letters of credit. As of December 31, 2001, Constellation Energy had S246 million in outstanding letters of credit and £955 million of outstanding commercial paper which results in approximately $1.8 billion of unused credit facilities. Constellation Energv also has access to interim lines of credit as
required from time to time to support its outstanding commercial paper. We expect to refinance the majority of our outstanding short-term debt during the first half of 2002 xx ith long-term debt.
BGE BGE maintains S 168.0 million in annual committed bank lines
of credit and has S75.0 million in bank revolving credit agreements to support the commercial paper program. As of December 31, 200 1, BGE had no outstanding commercial paper, which results in $243.0 million in unused credit facilities. 13GE also has access to interim lines of credit as required from time to time to support its outstanding commercial paper
and maintains a program to sell receivables tip to $25 million.
Other Nonregulated Businesses BGE Home Products & Services maintains a program to sell receivables rip to S50 million. ComfortLink has a revolving credit agreement totaling, £50 million to provide liquidits for
short-term financial needs. If we can get a reasonable value for our remaining real estate
projects and other investmenrs, additional cash may be obtained
by selling them. Our ability to sell or liquidate assets will depend on market conditions, and we cannot give assurances that these sales or liquidations could be made.
Capital Resources Our business iequires a great deal of capital. Our actual consolidated capital requirements for the years 1999 through 2001, along with the estimated annual amounts for the years 2002 through 2003, are shown in the table below.
We will continue to have cash requirements for: "* sorking capital needs including the payments of interest.
distributions, arid dividends, "* capital expenditures, and "* the retirement of debt arid redemption of preference stock. Capital requirements for 2002 through 2003 include
estimates of spending for existing and anticipated projects. We continuously review and modifx those estimates.
Actual requirements may vats from the estimates included in
the table below because of a number of factors including: "* regulation, legislation, and competition, "* BGE load requirements, "* environmental protection standards, "* the type and number of projects selected for construction
or acquisition, "* the effect of market conditions on those projects, "* the cost and availability of capital, and "* the availability of cash from operations. Our estimates are also subject to additional factors. Please see
the Forward Looking .Statements section on page 17. Effective July 1, 2000, we transferred all of BGE's generation
assets to nonregulated subsidiaries of Constellation Energy. The discussion and table for capital requirements below include
these generation assets as part of the utiliry's regulated electric busiisess through June 30, 2000. After that date, the capital requirements are included in the merchant energy business.
1999 2000 2001 2002 2003 (hi mi/lions)
Nonregulated Capital Requirements: Merchant Energy
Construction program S 86 £ Steans generators
Nine NMlile Print acquisition IEisvironmental controls
Coistiisuing requirements (including nuclear fuel) 7
"['tal Merclhant Fnergs capital requirements 163
Other Nonregulated capital requiremenits 115
Total Nonregulated capital requirements 2
Utility Capital Requirements: Regulated electric
(Generation (including isuiclear fucl)
Steams generators hisvironmiental coistols
"Transmission and distributions
"Total regulaterd electric 3 Regulated gas
"[otal Utility capital requirements
Total capital requirements
537 S 697 21 53
4 771 45 89
S152 91
S6I'
69 16
96* 205 243 199
699 1,815 555 280
131 35 39 34
278 830 1,850 594 314
117 34 31
85
67 69
73 13 1F
187
290 60
180
180
59
1714
174 56
174
174 56
436 350 239 230 230
S714 S1,180 $2,089 S824 $544
7,tfit rice /iy 1, 2000, inchedes $4 .6 nalion for / eiec't goienutoni and nucleia?
e/brniermy) part ofB;EI• iegidared elecuric bisiness.
Consce/lation l'orr) (Griup, Inc. and Subseiaries

/43
Capital Requirements Merchant Energy Business Our merchant energy business will require additional funding for constructing planned power projects and growing its power marketing operation. These capital requirements include:
n Construction expenditures for approximately 2,900 megawatts of natural gas-fired peaking and combined cycle production facilities in various regions of North America under construction.
m Cost for replacing the steam generators at Calvert Cliffs. In March 2000, we received a license extension from the NRC that extends Calvert Cliffs' operating licenses to 2034 for Unit I and 2036 for Unit 2. Replacement of the steam generators will allow us to operate these units through our operating license periods. We expect the steam generator replacement to occur during the 2002 refueling outage for Unit 1 and during the 2003 refueling outage for Unit 2.
m Construction expenditures for improvements to generating plants, including costs of complying with Environmental Protection Agency (EPA), Maryland and Pennsylvania nitrogen oxides emissions (NOx) regulations. We discuss the NOx regulations and timing of expenditures in Note 11 on page 79.
The above table does not include the financing for the High Desert 750 megawatt gas-fired generation project in California, which is under an operating lease with a term through February 2006. As an operating lease, we do not record any assets or debt associated with the project in our Consolidated Balance Sheets. We are leasing the project and supervising its construction.
Under the terms of the lease, we are required to make payments that represent all or a portion of the lease balance if one of the following events occurs: termination of construction prior to completion or our default under the lease.
Under certain circumstances, we may be required to either post cash collateral equal to the outstanding lease balance or we may elect to purchase the property for the outstanding lease balance. At any time during the term of the lease we have the right to pay off the lease and acquire the asset from the lessor. At December 31, 2001, the outstanding lease balance plus other committed expenses was $271.2 million.
At the conclusion of the lease term in 2006, we have the following options:
m renew the lease upon approval of the lessors, n elect to purchase the property for a price equal to the lease
balance at the end of the term, or E request the lessor to sell the property. If we request the lessor to sell the property, we guarantee the
sale proceeds up to approximately 83% of the lease balance. The lease balance at the end of the term is currently estimated to be $600 million, which represents the estimated cost of the
project; however, this may vary based on the ultimate cost of construction and interest incurred during the construction period.
Regulated Electric and Gas Regulated electric and gas construction expenditures primarily include new business construction needs and improvements to existing facilities.
Funding for Capital Requirements Merchant Energy Business Funding for the expansion of our merchant energy business is expected from internally generated funds, commercial paper issuances, issuances of long-term debt and equity, leases, and other financing instruments issued by Constellation Energy and its subsidiaries. Specifically related to the Nine Mile Point acquisition, approximately one-half of the purchase price was paid in November 2001, and the remainder is being financed through the sellers in a note to be repaid over five years with an interest rate of 11.0%. This note may be prepaid at any time without penalty. We closed the transaction using existing credit facilities. In addition, we also used existing credit facilities to pay Goldman Sachs a total of $355 million. This represented $196.7 million to terminate the power business services agreement with our power marketing operation and $159 million previously recognized as a payable for services rendered.
The projects that our merchant energy business develops typically require substantial capital investment. Most of the projects recently constructed or currently under construction are funded through corporate borrowings by Constellation Energy. Certain other projects in which we have an interest are financed primarily with non-recourse debt that is repaid from the project's cash flows. This debt is collateralized by interests in the physical assets, major project contracts and agreements, cash accounts and, in some cases, the ownership interest in that project.
Longer term, we expect to fund our growth and operating objectives primarily with internally generated funds supplemented, if necessary, by a mixture of debt and equity with an overall goal of maintaining an investment grade credit profile.
BGE Funding for utility capital expenditures is expected from internally generated funds. During 2002 and 2003, we expect our regulated utility business to provide at least 140% of the cash needed to meet the capital requirements for its operations, excluding cash needed to retire debt. If necessary, additional funding may be obtained from commercial paper issuances, available capacity under credit facilities, the issuance of longterm debt, trust securities, or preference stock, and/or from time to time equity contributions from Constellation Energy.
Constellation Energy Group, Inc. and Subsidiaries

44 /
Other Nonregulated Businesses Funding for our other nonregulated businesses is expected fiom internally generated funds, commercial paper issuances, issuances of long-term debt of Constellation Enert, and sales
of assets. BGE Home Products & Services can continue to fund capital requirements through sales of receivables. ComfortLink has a revolving credit agreement totaling $50 million to provide liquidit' for short-term financial needs.
Out ability' to sell or liquidate assets will depend on market conditions, and we cannot give assurances that these sales or liquidations could be made. We discuss our remaining real estate projects and market conditions in the Other A/oreglhoto'/d Bosinesses section beginning on page 40.
Committed Amounts Our total contractual and contingent obligations as of December 31, 2001 are shown in the following table:
Pa'•rnents/Expiration
Less than One- Four- Over one year three years five years rte Years iotal
( }ntracttual Ob/t,,zatow•
Short-itir itri in"i Nonrcgulatmd hog-crin Icbt
B(t F h'g-wf[1 debt
B( ]t ptci'tcinic stiotk
720.
i,19.
Fue i iil) /ttnStt/lJ 2// /)n 3 I
Nrluch.ii capacityi andi encrgy I (,..I
Oplrai ntg leases 9). I ('japitalaUld loan comnitments 81.5
'161al colmmacualoliaon
,bt/iwt /2 ()i b/~5git /u
I tcit/s tt tcr/dii Guarantccs, net
[blal contingctIt obligations
total obligaxion,
2ýi5.k
-27.8
673.-1
S3,3,18.7
169.8 •1 11.0
130.0]
330.0
31.S•
63-)
0.8
-156.8
5l11.8
60.0) 51. Ic'S t7S.0
1 -.7 98.
98. • 176. 5
],ý)6.8 0,016.i2,6-5.3 I t. 1i . 1,207.8
0.2
38.
38.6
S1,205.0
666.1 666.1
236. 1
S 1.802.9
),158
1,368 )
A tmoutis are ill, det/'t fit a,,licab/b' peJuots in ow. capi( lito ai/ nts tabi, on p/1 -12.
G ( , ,atnlai t ' 111 th e it,,i/i at' is ,o, net t/ lit/ilie itt , I itt] / 1),,vewbe- -31. 2001 ill our (.lisolmi~ztd B•alilwt Vwtes.
While we included our contingent obligations in the table
above, we do not expect to fund the full amounts Under the letteis of credit and goaarantees.
L ease payments rundet the High Desert operating lease are reflected in the table above. The lease balance at the end of the lease term is currently estimated to be $600 million. This amoIunt is included as a guarantee in the table above.
The table above does not include the fixed payment portions of our mark-to-market energy assets and liabilities. \We discuss the expected settlement terms of these contracts in the Allr'/'-tMarketr lnerog, Rei'entes section on page 33.
Liquidity Provisions
VWe have certain agreements that contain provisions that would require additional collateral upon significant decreases in the
Senior Unsecured Debt credit ratings of Constellation Energy.
Decreases in Constellation Energy's credit ratings would not
trigger an early payment on any of oUr credit facilities.
However, if Constellation Energy's credit ratings were to fall
three or more rating levels from our present rating to a level
below investment grade, we would have collateral obligations of
S470 million under our current contractual obligations related
it Our power marketing operation. In mans' cases, customers of
our power marketing operation rely on the creditworthiness of
Constellation Enerogs' A decline below investment grade by
Constellation Energs would negatively impact the business
prospects of that operation.
The credit facilities of Constellation Energy and BG(E have
limited material adverse change clauses that only consider a
material change in financial condition and are not directly
affected by decreases in credit ratings. If these clauses are
violated, the lending institutions can decline making nesw
advances or issuing new letters of credit, but cannot accelerate
existing amounts outstanding. The credit facilities of
Constellation Energy contain a provision requiring
Constellation Energy to maintain a ratio of debt to capital
ization equal to or less than 0.65. The long-term debt
indentures of Constellation Energs and B1GE do not contain
material adverse change clauses or financial covenants.
Constellation Nuclear guarantees the $388 million sellers'
note to finance the acquisition of Nine Mile Point. This guarantee contains provisions that iequire Constellation Nuclear
to maintain a net wvorth of at least $500 million and a ratio of
current assets to current liabilities of at least 1. 1. Constellation
IEnergv is required to provide adequate support to Constellation Nuclear to meet these provisions. In addition, Constellation
Enerng provides credit support to Calvert Cliffs and Nine Mile
Point to ensure these plants have funds to meet expenses and
obligations to safely operate and maintain the plants.
We discuss our short-term borrosings in Note 8 on page 75, long-term ldebt in Note 9 on page 75, lease requirements in
Note 10 on page 77, and commitments and guarantees in
Note 11 on page 78.
Market Risk We are exposed to various market risks, including changes in
interest rates, certain commodity prices, credit risk, and equiit
prices. In manage our market risk, xxe may enter into various
derivative instiuments including swaps, forward contracts,
fiutures contracts, and options. We discuss our market risk
fuirther in Note I on page 59. In this section, x\e discuss our current market risk and the related use of derivative instruiments.
CG(st//lot0i t//;1 (Group. Inc. ,2d2 bsidiariet
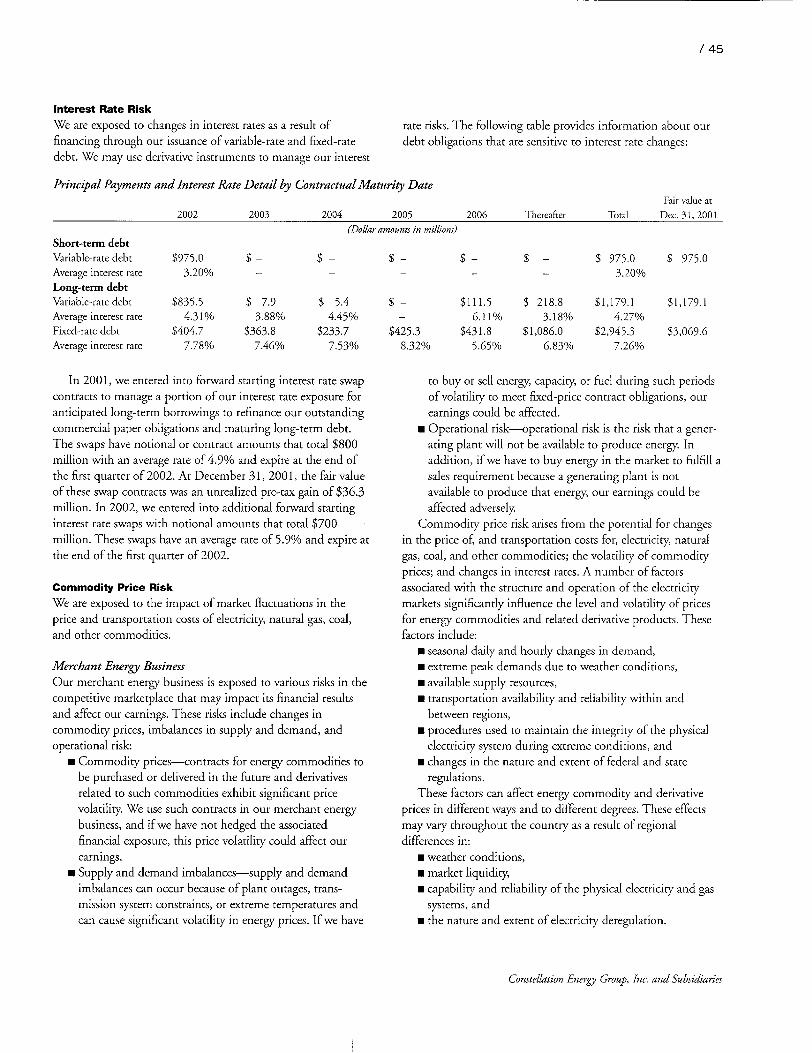
/ 45
Interest Rate Risk We are exposed to changes in interest rates as a result of financing through our issuance of variable-rate and fixed-rate debt. We may use derivative instruments to manage our interest
rate risks. The following table provides information about our debt obligations that are sensitive to interest rate changes:
Principal Payments and Interest Rate Detail by Contractual Maturity Date
2002 2003 2004 2005 2006 ThereafterFair value at
Total Dec. 31, 2001(Dollar amounts in millions)
Short-term debt Variable-rate debt Average interest rate Long-term debt Variable-rate debt Average interest rate Fixed-rate debt Average interest rate
$975.0 3.20%
$835.5 4.31%
$404.7 7.78%
$ $
$ 7.9 3.88%
$363.8 7.46%
$ -$
$ 5.4 4.45%
$233.7 7.53%
$425.3 8.32%
$111.5 6.11%
$431.8 5.65%
$ 218.8 3.18%
$1,086.0 6.83%
$ 975.0 3.20%
$1,179.1 4.27%
$2,945.3 7.26%
$ 975.0
$1,179.1
$3,069.6
In 2001, we entered into forward starting interest rate swap contracts to manage a portion of our interest rate exposure for anticipated long-term borrowings to refinance our outstanding commercial paper obligations and maturing long-term debt. The swaps have notional or contract amounts that total $800 million with an average rate of 4.9% and expire at the end of the first quarter of 2002. At December 31, 2001, the fair value of these swap contracts was an unrealized pre-tax gain of $36.3 million. In 2002, we entered into additional forward starting interest rate swaps with notional amounts that total $700 million. These swaps have an average rate of 5.9% and expire at the end of the first quarter of 2002.
Commodity Price Risk We are exposed to the impact of market fluctuations in the price and transportation costs of electricity, natural gas, coal, and other commodities.
Merchant Energy Business Our merchant energy business is exposed to various risks in the competitive marketplace that may impact its financial results and affect our earnings. These risks include changes in commodity prices, imbalances in supply and demand, and operational risk:
"* Commodity prices-contracts for energy commodities to be purchased or delivered in the future and derivatives related to such commodities exhibit significant price volatility. We use such contracts in our merchant energy business, and if we have not hedged the associated financial exposure, this price volatility could affect our earnings.
"* Supply and demand imbalances-supply and demand imbalances can occur because of plant outages, transmission system constraints, or extreme temperatures and can cause significant volatility in energy prices. If we have
to buy or sell energy, capacity, or fuel during such periods of volatility to meet fixed-price contract obligations, our earnings could be affected.
m Operational risk-operational risk is the risk that a generating plant will not be available to produce energy. In addition, if we have to buy energy in the market to fulfill a sales requirement because a generating plant is not available to produce that energy, our earnings could be affected adversely.
Commodity price risk arises from the potential for changes in the price of, and transportation costs for, electricity, natural gas, coal, and other commodities; the volatility of commodity prices; and changes in interest rates. A number of factors associated with the structure and operation of the electricity markets significantly influence the level and volatility of prices for energy commodities and related derivative products. These factors include:
"* seasonal daily and hourly changes in demand, "* extreme peak demands due to weather conditions, "* available supply resources, "* transportation availability and reliability within and
between regions, "* procedures used to maintain the integrity of the physical
electricity system during extreme conditions, and "* changes in the nature and extent of federal and state
regulations. These factors can affect energy commodity and derivative
prices in different ways and to different degrees. These effects may vary throughout the country as a result of regional differences in:
"* weather conditions, "* market liquidity, "* capability and reliability of the physical electricity and gas
systems, and "* the nature and extent of electricity deregulation.
Constellation Energy Group, Inc. and Subsidiaries

46 /
Powe; 'cAarkeriog Our power marketing operation is exposed to market risk as a result of the number and size of unhedged positions it holds. The power marketing operation manages market risk on a portfolio basis, subject to established risk management policies. In order to manage market risk, the power marketing operation uses a variety of derivative and non-derivative instruments, including:
"* forward contracts, which commit us to purchase or sell energy commodities in the future;
"* futures contracts, which are exchange- traded standardized comnmitments to purchase or sell a commodity or financial instrument, or to make a cash settlement, at a specific price and future date;
"* swap agreements, which require payments to or From counterparties based upon the differential between two prices for a predetermined contractual (notional) quantity; and
"* option contracts, which convex the right to bUtV or sell a conmmodity, financial instrument, or index at a predetermined price.
While some of these contracts represent commodities or instruments for which prices are available from external sources, other commodities and certain contracts are not actively traded and are valued using other pricing sources and modeling techniques to determine expected future market prices, contract quantities, or both. Constellation Power Source's managemeni uses its best estimates to determine the fair value of commodIty and derivative contracts it holds and sells. These estimates consider v ariotis factors including closing exchange and over
the-counter price quotations, time value, volatility factors, and credit exposure. However, it is likely that future market prices could vary from those used in recording mark-to-market energy assets and liabilities, and such variations could be material.
Constellation Power Source uses various methods, including a value at risk model, to measure its exposure to market risk fromn its energy trading portfolio. Value at risk is a statistical model that attempts to predict risk of loss based on historical market price volatilityx Constellation Power Source calculates value at risk using a variance/covariance technique that models option positions using a linear approximation of their value. Additionally, Constellation Power Source estimates variances and correlation using historical commodirv price changes oser the most recent rolling three-month period. Constellation Power Source's value at risk calculation includes all mark-tomarket energy assets and liabilities, including contracts For energy commodities and derivatives that result in physical settlement and contracts that require cash settlement.
The value at risk amount represents the potential pre-tax loss in the fair value of mark-to-market energy assets and liabilities over a one-day holding period with a 99.6% confidence level. Using this confidence level, Constellation Power Source would expect a one-day change in fair value greater than or equal to the daily value at risk at least once per year. Constellation Power Source's value at risk was S 18.0 million as of December 31, 2001, $13.7 million as of December 31, 2000, and $7.2
million as of December 31, 1999. 1-he average, high, and low value at risk for the year ended December 31, 2001 were $18.0 million, S68.9 million, and S8.7 million, respectively. The high value at risk amount for the year represents certain hedge contracts entered into in anticipation of closing an offsetting transaction. When the offsetting transaction closed within several days, the value at risk amount returned to a level more representative of the average for the year.
Due to the inherent limitations of statistical measures such as value at risk, the relative inmsaturity of the competitive market for electricity and related derivatives, arid the seasonality of changes in market prices, the value at risk calculation may not reflect the full extent of our commodity, price risk exposure. Additionally, actual changes in the value of options may differ fiots the value at risk calculated using a linear approximation inherent in our calculation method. As a result, actual changes in the fair value of mark-to-market energy assets and liabilities could differ from the calculated value at risk, and such changes could have a material impact on our financial results.
CGenena tion
For 2002, we expect to use the majority of the generating capacity controlled by our merchant energy business to provide standard offer service to BGE or to be sold back to the sellers of Nine Mile Point to service their load requirements. However, beginning in July 2002, we expect approximately' 1,000 negasvatts of industrial customer load will imsove from BGE's standard offer service to miarket-based rates. Going forward, our merchant energy business will supply 100% of the standard offer service to BGE through June 30, 2003 and 90% from July 1, 2003 through June 30, 2006.
As a result of declines in BGE's standard offer service load arid the additional 2,900 nsegawvatts of natural gas-fired peaking arsd combined cycle production facilities under construction, our generation operation has a substantial amount of generating capacity that is subject to future changes in wholesale electricity prices and has futel requirements that are subject to future changes in coal, natural gas, and oil prices. Our power generation facilities purchase fuel under contracts or on the spot market. Fuel prices may be volatile and the price that can be obtained from power sales may not change at the same rate as changes in fuel costs. Additionally; if one or more of our gener-
Consteldation E:)! Group, Io. and S"ubsidiaries

/ 47
ating facilities is not able to produce electricity when required due to operational factors, we may have to forego sales opportunities or fulfill fixed-price sale commitments through the operation of other more costly generating facilities or through the purchase of energy in the wholesale market at higher prices.
As part of its overall portfolio, our power marketing operation manages the commodity price risk of our electric generation facilities including power sales, fuel purchases, emission credits, weather risk, and the market risk of outages. In order to manage this risk, our merchant energy business may enter into fixed-price derivative or non-derivative contracts to hedge the variability in future cash flows from forecasted sales of electricity and purchases of fuel. The objectives for entering into such hedges include:
m fixing the price for a portion of anticipated future electricity sales at a level that provides an acceptable return on our electric generation operations, and
* fixing the price of a portion of anticipated fuel purchases for the operation of our power plants.
The portion of forecasted transactions hedged may vary based upon management's assessment of market, weather, operational, and other factors.
Our merchant energy business has hedged more than 85% of our expected energy output and fuel purchases for 2002. The amount hedged is more than 75% for 2003.
Regulated Electric Business Under the Restructuring Order, effective July 1, 2000, BGE's residential rates are frozen for a six-year period, and its commercial and industrial rates are frozen for four to six years. BGE entered into standard offer service arrangements with Constellation Power Source and Allegheny Energy Supply Company to provide the energy and capacity required to meet its standard offer service obligations through June 30, 2006.
Regulated Gas Business Our regulated gas business may enter into gas futures, options, and swaps to hedge its price risk under our market-based rate incentive mechanism and our off-system gas sales program. We discuss this further in Note 1 on page 59. At December 31, 2001 and 2000, our exposure to commodity price risk for our regulated gas business was not material.
Credit Risk We are exposed to credit risk, primarily through Constellation Power Source. Credit risk is the loss that may result from a counterparty's nonperformance. Constellation Power Source uses credit policies to manage its credit risk, including utilizing an established credit approval process, monitoring counterparty
limits, employing credit mitigation measures such as margin, collateral, or prepayment arrangements, and using master netting agreements. Constellation Power Source measures credit risk as the replacement cost for open energy commodity and derivative positions plus amounts owed from counterparties for settled transactions. The replacement cost of open positions represents unrealized gains, net of any unrealized losses, where we have a legally enforceable right of setoff.
As of December 31, 2001, approximately 85% of Constellation Power Source's mark-to-market energy assets consisted of contracts with counterparties rated investment grade by the major credit rating agencies, 5% of these assets consisted of contracts with counterparties rated below investment grade, and 10% of these assets consisted of contracts with governmental authorities which are not rated but which Constellation Power Source assesses are equivalent to investment grade based upon its internal credit ratings.
Due to the possibility of extreme volatility in the prices of energy commodities and derivatives, the market value of contractual positions with individual counterparties could exceed established credit limits or collateral provided by those counterparties. If such a counterparty were then to fail to perform its obligations under its contract (for example, fail to deliver the electricity the power marketing operation had contracted for), we could sustain a loss that could have a material impact on our financial results.
Our merchant energy business sells electricity under longterm power purchase agreements to two California investor-owned utilities that were downgraded by rating agencies to below investment grade. We discuss the credit and other exposures under these agreements in the Business Environment-Other States section on page 26.
Equity Price Risk We are exposed to price fluctuations in equity markets primarily through our financial investments business, our pension plan assets, and our nuclear decommissioning trust funds. We are required by the NRC to maintain an externally funded trust for the costs of decommissioning our nuclear power plants. We discuss our nuclear decommissioning trust funds in more detail in Note 1 on page 62.
A hypothetical 10% decrease in equity prices would result in an approximate $80 million reduction in the fair value of our financial investments that are classified as trading or availablefor-sale securities, excluding our investment in Orion. In 2001, the value of our pension plan assets decreased by $42.7 million due to declines in the markets in which plan assets are invested. We describe our financial investments in more detail in Note 4 on page 68, and our pension plans in Note 7 on page 72.
Constellation Energy Group, Inc. and Subsidiaries
48 / REPORT OF MANAGEMENT
The managcmcnt of the Company is responsible for the infoi
marion and representations in the C ompanx s financial
statements. ohe ('ompany prepares the financial statcments in
accordance xwith accounting principles generally accepted in the
United States of America based upon available facts and
circumstances and managcmcntrs best estimates and judigmen ts
of known conditions. ['he C ompany maintains an accotLinting syNstem and ielated
system of` internal controls designed to provide reasonable assnirance that the financial records are accurate and that the Company's assets are protected. The Company's staff of internal auditors, which reports directly to the Chief -xecctitcix Officer. conducts pertiodic reviews to maintain the effcctivenCss of internal control procednies. PricewaterhouseC'oopers II, independent accotintants, aeldit the financial statements and express their opinion oti them. Thcy perform their atidit in
accordance wxith atiditing standards gcncrally accepted in the United States of Amnerica.
The Audit Committee of the Board of Directors, xwhich consists of three outside Directors, meets periodically with maiagement, internal auditors, and PricewaterhouseCoopers
ITIP to reviewv the activities of each in discharging their responsibilities. The internal atidit staff and PricexsaterhouseCoopers LITP have free access to the Avudit Comiiittee.
'ý7 ý" ,,httik II
jlayo A. Shatttick Ill
lPresic/ent acnd
ChiVef Fiecurice Offiter,
A
E. Follin Smith
Senior Vice President 6, C/TiefFinancial Officer
REPORT OF INDEPENDENT ACCOUNTANTS
7/t ite S/taor/ol0cels of ( Constr/lation hnetgji (f;ioup, lit.
In our opinion, the accompanrying consolidated balance sheets
and the ielated consolidated statements of inicome, compii-ip
henisive income, cash flows, common shareholders' equity,
capital ization, and income taxes present fairly, in all material respects, the financial position of Constellation Eincts' C troop,
Inc. and Subsidiaiies ("the ( onipan) ') at Deceiiber 31, 2001
and 2000, and the results of their operations arid theii cash
flows for each of the three yeais in the period ended Decemibir
31, 2001 in confornity wx ith accounting principles geniei ally
accepted in the United States of`Anerica. TIhese financial
statements are the rcsponsibility of trle Company's
maianagenient; oir responsibility is to express an opinion oii
these financial statements based on our audits. \N'c coiidceied
odir auitdits of these statements in accordance with auditing
standards enerialls accepted in the United States of Ainerica,
which require that we plan arid perform the audit to obtain
reasonable assurance about whether the financial statemeints ate
fiee of material misstatement. An audit includes exatmining, on
a test basis, evidence stipportinig the amounts and disclosures in
the binancial statements, assessing the accoun tinig principles
used arid significant estimates made by management, and evaluating the overall financial statement presentation. \Ve believe
that our audits provide a reasonable basis for our opinion.
As discussed in Note 1 to the consolidated financial state
ments, the Company changed its method of accounting for
derivative arid hedging activities pursuant to Statement of
Financial Accounting Standards No. 133, Accounting Jor Derivati've Itittnuents and Hedging Activities, as amended by
Statement of Financial Accounting Standards No. 138,
Accounntigfbr Certain Derivative hJstruments and Certain Hedgoig Activities (an amendment oJ'FAl B Statelnent No. 133).
PricewaterhouseCoopers IT P
Baltimore, Maryland
January 21, 2002
(o/nste/liition Enolit, (trou2, hic. andfi bc soidniuries

CONSOLIDATED STATEMENTS OF INCOME / 49
Year Ended December 31, 2001 2000 19 (In millions, except per share amounts)
Revenues Nonregulated revenues Regulated electric revenues Regulated gas revenues
$1,214.4 2,039.6
674.3
$1,114.0 2,134.7
603.8
)99
$1,105.6 2,258.8
476.5
Total revenues 3,928.3 3,852.5 3,840.9 Expenses
Operating expenses 2,392.2 2,311.4 2,339.6 Workforce reduction costs 105.7 7.0 Contract termination related costs 224.8 -Impairment losses and other costs 202.1 - 64.3 Depreciation and amortization 419.1 470.0 449.8 Taxes other than income taxes 226.6 221.5 227.3 Total expenses 3,570.5 3,009.9 3,081.0
Income from Operations 357.8 842.6 759.9 Other Income 1.3 4.2 7.9 Income Before Fixed Charges and Income Taxes 359.1 846.8 767.8 Fixed Charges
Interest expense 283.2 282.4 248.0 Interest capitalized and allowance for borrowed funds used during construction (57.6) (24.2) (6.5) BGE preference stock dividends 13.2 13.2 13.5
Total fixed charges 238.8 271.4 255.0 Income Before Income Taxes 120.3 575.4 512.8 Income Taxes 37.9 230.1 186.4
Income Before Extraordinary Item and Cumulative Effect of Change in Accounting Principle 82.4 345.3 326.4
Extraordinary Loss, Net of Income Taxes of $30.4 (see Note 5) - - (66.3) Cumulative Effect of Change in Accounting Principle,
Net of Income Taxes of $5.6 (see Note 1) 8.5 -
Net Income $ 90.9 $ 345.3 $ 260.1 Earnings Applicable to Common Stock $ 90.9 $ 345.3 $ 260.1
Average Shares of Common Stock Outstanding 160.7 150.0 149.6 Earnings Per Common Share and Earnings Per Common Share-Assuming
Dilution Before Extraordinary Item and Cumulative Effect of Change in Accounting Principle $ .52 $2.30 $2.18
Extraordinary Loss - - (.44) Cumulative Effect of Change in Accounting Principle .05 -
Earnings Per Common Share and Earnings Per Common Share-Assuming Dilution $ .57 $2.30 $1.74
CONSOLIDATED STATEMENTS OF COMPREHENSIVE INCOME
Year Ended December 31, 2001 2000 1999
(In millions) Net Income $ 90.9 $345.3 $260.1 Other comprehensive income, net of taxes
Financial securities 124.5 18.6 3.9 Hedging instruments 102.6 -Minimum pension liability (44.7) -
Comprehensive Income Before Cumulative Effect of Change in Accounting Principle 273.3 363.9 264.0 Cumulative Effect of Change in Accounting Principle, Net of Income Taxes of $22.6 (35.5) -Comprehensive Income $237.8 $363.9 $264.0
See Notes to Consolidated Financial Statements. Certain prior-year amounts have been reclassified to conform with the current year'presentation.
Constellation Energy Group, Inc. and Subsidiaries

50 / CONSOLIDATED BALANCE SHEETS
At December-3 ], 2001 2000 (h7 minionts)
Assets
Current Assets
Cash and cash equivalents $ 72.4 $ 182.7
Accounts receixvable (net of allowance for unCollectibcIs
of $22.8 and $21.3, respectively) 738.9 792.6
Trading securities 178.2 189.3
Mark-to-market energy assets 398.4 453.1
Fuel stocks 108.0 78.2
Materials and supplies 196.3 151.3
prepaid taxes other than income taxes 93.4 73.5
Other 74.6 52.8
"lotal current assets 1,860.2 1,973.5
Investments and Other Assets
Real estate projects and insestments 210.7 290.3
Investments in power projects 499.1 510.6
Investment in Orion Power Holdings, Inc. 442.5 192.0
Financial investments 60.7 161.0
Nuclear decommissioning trust fuinds 683.5 228.7
Net pension asset - 93.2
Mark-to-market energy assets 1,819.8 2,069.3
Other 207.4 123.0
"lotal investments and other assets 3,923.7 3,668.1
Property, Plant and Equipment
Regulated propertr, plant and equipment
Plant in servicc 4,862.4 4,780.3
Construction wxork in progress 81.8 75.3
Plant held for future usc 4.5 4.5
Total regulated property, plant and equipment 4,948.7 4,860.1
Nonregutlared generation property, plant and equipneut 6,551.1 5,286.8
Other nonregtUlated propertx, plant and equipment 192.9 147.0
Nuclear fitcl (net of amortization) 169.5 128.3
Accumttlated depreciation (4,161.8) (3,756.7)
Net propert", plant and equipment 7,700.4 6,665.5
Deferred Charges
Regulatory assets (net) 463.8 514.9
Other 129.5 117.3
Total deferred charges 593.3 632.2
Total Assets $14,077.6 S12,939.3
See Vores to (,onsolidated Financia/ Statements.
(C'ertaion 36iortearo nownts ha/'e been rteclassifien' to con/won w2'it!) te /to Iesr presentatio .n
(Consrel/tiot konr/y' r (;roui, Inc. a2l2 bsidiaries

CONSOLIDATED BALANCE SHEETS / 51
At December 31, 2001 2000
(In millions) Liabilities and Capitalization
Current Liabilities Short-term borrowings $ 975.0 $ 243.6 Current portion of long-term debt 1,406.7 906.6 Accounts payable 534.4 750.0 Mark-to-market energy liabilities 323.3 358.2 Dividends declared 23.0 66.5 Other 297.1 250.8 Total current liabilities 3,559.5 2,575.7
Deferred Credits and Other Liabilities
Deferred income taxes Mark-to-market energy liabilities
Net pension liability Postretirement and postemployment benefits
Deferred investment tax credits
Other
1,431.0
1,476.5
173.3
330.9
93.4 266.9
3,772.0Total deferred credits and other liabilities
Capitalization
Long-term debt BGE preference stock not subject to mandatory redemption Common shareholders' equity
Total capitalization
1,353.2 1,636.3
265.2
101.4
484.2
3,840.3
2,712.5
190.0
3,843.6
6,746.1
3,159.3 190.0
3,174.0
6,523.3
Commitments, Guarantees, and Contingencies (see Note 11)
Total Liabilities and Capitalization $14,077.6 $12,939.3
See Notes to Consolidated Financial Statements.
Certain prior-year amounts have been reclassified to conform with the current year' presentation.
Constellation Energy Group, Inc. and Subsidiaries

52 / CONSOLIDATED STATEMENTS OF CASH FLOWS
Year Ended December 31, 2001 2000 1999 (In nlillions)
Cash Flows From Operating Activities Net income $ 90.9 S 345.3 $ 260.1 Adjustments to reconcile to net cash prov ided by operating activities
Cumulative effect of change in accounting principle (8.5)
F xtraordinary loss - - 66.3 Depreciation and amortization 468.9 524.8 505.9 Deferred income taxes (26.5) 42.1 13.0 Investment tax credit adjustments (8.1) (8.4) (8.6) Deferred fuel costs 37.6 2.8 (61.1) Accrued pension and postemployment benefits 55.3 27.9 36.1 Gain on sale of investments (40.7) (64.1) ILoss (gain) on sale of subsidiaries and plant assets 43.3 (13.3)
Deregulation transition cost - 24.0 Wor kforce reduction costs 105.7 7.0 Contract termination related costs 26.2 Impairment losses and other costs 158.7 64.3 Equityi in earnings of affiliates and joint venttires (net) 2.0 (5.3) (7.6) Changes in mark-to-market energy assets and liabilities 109.5 (379.6) (114.3) Changes in other current assets (57.7) (230.7) (216.4) Changes in other current liabilities (218.8) 406.2 121.0 Other (164.5) 172.2 20.3
Net cash provided by operating activities 573.3 850.9 679.0
Cash Flows From Investing Activities Purchases of property, plant and equipment and other capiral expenditures (1,318.3) (1,079.0) (616.5) Acquisition of Nine Mile Point (382.7) Sale of (investment in) Orion 26.2 (101.5) (97.7) Contributions to nuclear decommissioning trust ftinds (22.0) (13.2) (17.6) Purchases of marketable equity securities (33.2) (80.8) (27.3) Sales of marketable equity securities 132.6 110.2 34.9 Proceeds from the sale of property' plant, and equipment 112.0 20.8 Other investments 12.7 37.0 109.1
Net cash used in investing activities (1,472.7) (1,106.5) (615.1)
Cash Flows From Financing Activities Net issuance (maturitv) of short-term borrowvings 731.4 (127.9) 371.5 Proceeds from issuance otf
Long-term debt 1,175.2 1,374.0 302.8 Common stock 504.4 35.9 9.6
Repayment of long-term debt (1,510.2) (697.0) (584.4) Redemption of preference stock (7.0) Common stock dividends paid (120.7) (250.7) (251.1) Other 9.0 11.3 13.7
Net cash provided by (used in) financing activities 789.1 345.6 (144.9)
Net (Decrease) Increase in Cash and Cash Equivalents (110.3) 90.0 (81.0)
Cash and Cash Equivalents at Beginning of Year 182.7 92.7 173.7
Cash and Cash Equivalents at End of Year $ 72.4 S 182.7 S 92.7
Other Cash Flow Information: C ash paid during the year for:
Interest (net of amouints capitalized) $ 238.3 S 268.2 $ 245.3 Income taxes $ 101.5 S 184.7 $ 165.6
Non-Cash Transaction: In connection with our purchase of Nine Mile Point, the fair vdtie of the net assets purchased was S770.8 million. We paid S382.7 million in cash, including settlement costs, and ircurred a sellers' note of $388.1 million as discussed further in Note 14 on page 86.
5;; .Votes to Consolidaed f'Tna Stateients (ertain prior-rter aoounts hao'e been recbsstfieea to coniJrm ruith !)ie ourrent isca presentation.
Corstel/atton r ra gr (roip, -.and .tebsidiaries
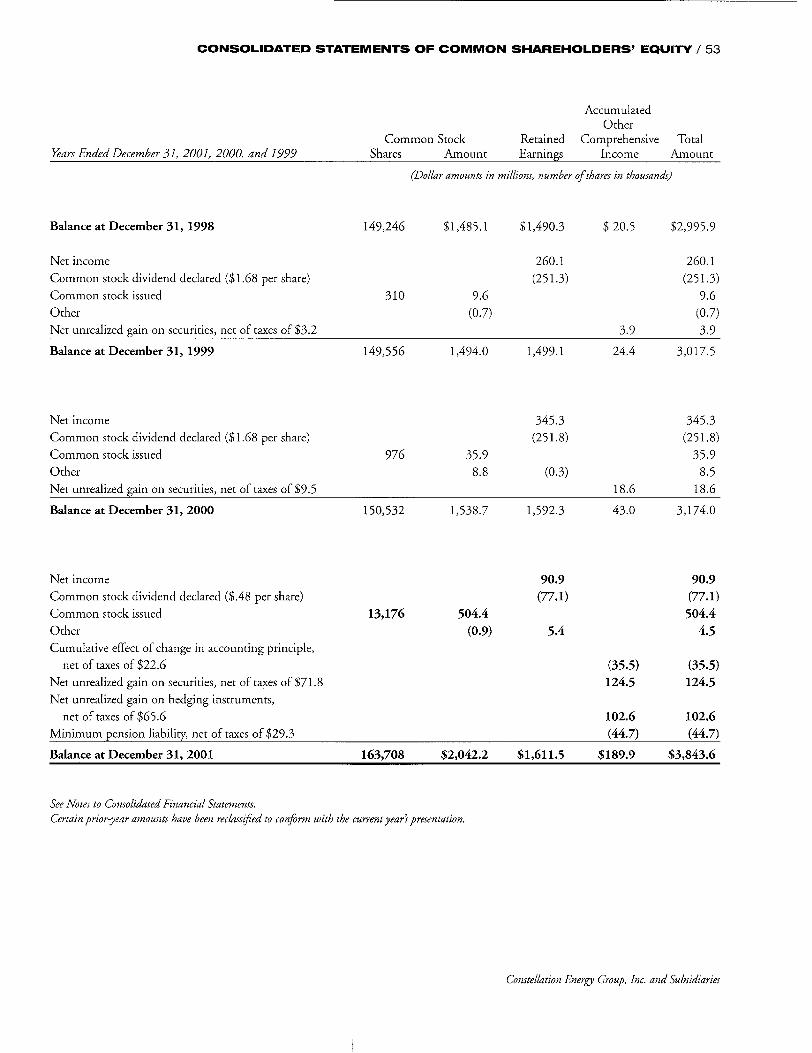
CONSOLIDATED STATEMENTS OF COMMON SHAREHOLDERS' EQUITY / 53
Common Stock
Accumulated Other
Retained Comprehensive TotalYears Ended December 31, 2001, 2000, and 1999 Shares Amount Earnings Income Amount
(Dollar amounts in millions, number of shares in thousands)
Balance at December 31, 1998 149,246 $1,485.1 $1,490.3 $ 20.5 $2,995.9
Net income 260.1 260.1
Common stock dividend declared ($1.68 per share) (251.3) (251.3)
Common stock issued 310 9.6 9.6
Other (0.7) (0.7)
Net unrealized gain on securities, net of taxes of $3.2 3.9 3.9
Balance at December 31, 1999 149,556 1,494.0 1,499.1 24.4 3,017.5
Net income 345.3 345.3
Common stock dividend declared ($1.68 per share) (251.8) (251.8)
Common stock issued 976 35.9 35.9
Other 8.8 (0.3) 8.5
Net unrealized gain on securities, net of taxes of $9.5 18.6 18.6
Balance at December 31, 2000 150,532 1,538.7 1,592.3 43.0 3,174.0
Net income 90.9 90.9 Common stock dividend declared ($.48 per share) (77.1) (77.1)
Common stock issued 13,176 504.4 504.4
Other (0.9) 5.4 4.5
Cumulative effect of change in accounting principle,
net of taxes of $22.6 (35.5) (35.5)
Net unrealized gain on securities, net of taxes of $71.8 124.5 124.5
Net unrealized gain on hedging instruments,
net of taxes of $65.6 102.6 102.6 Minimum pension liability, net of taxes of $29.3 (44.7) (44.7)
Balance at December 31, 2001 163,708 $2,042.2 $1,611.5 $189.9 $3,843.6
See Notes to Consolidated Financial Statements. Certain prior-year amounts have been reclassified to conform with the current years presentation.
Constellation Energy Group, Inc. and Subsidiaries

54 / CONSOLIDATED STATEMENTS OF CAPITALIZATION
At December 31,
Long-Term Debt Long-term debt of Constellation Energy
7',% Notes, due April 1, 2005
Floating rate notes, due April 4, 2003 Extendible notes, due June 21, 2010 Floating rate reset notes, due March 15, 2002 Floating rate notes, due January 17, 2002
"Total long-term debt of Constellation Energy
Long-term debt of nonregulated businesses "Tax-exempt debt transferred from BGE effective July 1, 2000
pollution control loan, due July 1, 2011 Port facilities loan, due June 1, 2013 Adjustable rate pollution control loan, due July 1, 2014 5.55% Pollution control revenue refunding loan, duc July 15, 2014 Economic development loan, due December 1, 2018 6.00% Pollution control revenue refunding loan, duc April 1, 2024 Floating rate pollution control loan, due June 1, 2027 5 00% nstallment series, due July 15, 2002
District Cooling facilities loan, due December 1, 2031 Ioans cunder revolving credit agreements
1 1% Installment note, due November 7, 2006 Mortgage and construction loans
Floating rate mortgage notes and construction loans, due through 2005 Other mortgage notes ranging from 4.25') to 9.65i% due March 15, 2009 to November 1, 2033
Unsecured notes
"Total long-term debt of nonregulated businesses First Refunding Mortgage Bonds of BGE
8%1% Series, due August 15, 2001 T1/.0 Series, due July 1, 2002
6,/% Series, due February 15, 2003 6 00 Series, due July 1, 2003 5,00 Series, due April 15, 2004 Remarketed floating rate series, due September 1, 2006 70/% Series, due January 15, 2007 6/0o Series, due March 15, 2008
00% Series, due March 1, 2023 75 % Series, due April 15, 2023
"[btal First Refunding Mortgage Bonds of BGE
Other long-term debt of BGE 5.25% Notes, due December 15, 2006 Floating rate reset notes, due February 5, 2002 Floating rate reset notes, due October 19, 2001 Medium-term notes, Series B Medium-term notes, Series C Medium-term notes, Series D Medium-tcrm notes, Series E Medicim-terii 1tutes, Series G Mediuim-term notes, Series H 6.75% Remarketable or redeemable securities, due December 15, 2012 "Total other long-term debt of BGE
BGE obligated mandatorily redeemable trust preferred securities of subsidiary trust holding solely I 716%o deferrable interest subordinated debentuies due June 30, 2038
Unamortized discount and premium Current portion of long-term debt
2001 2000
(In 0/oflons)
$ 300.0 $ 300.0 - 200.0
300.0 - 200.0
635.0 _
935.0 1,000.0
36.0 48.0 20.0 47.0 35.0 75.0
8.8 6.7
25.0 46.0
388.1
13.8 19.7
769.1
124.0 124.8 124.9 125.0 111.5 123.5 124.9
98.1 84.0
1,040.7
300.0 200.0
23.1 25.5 68.0
200.0 140.0
173.0 1,129.6
36.0 48.0 20.0 47.0 35.0 75.0
8.8 7.6
34.0
51.3 20.3
287.0
670.0
122.2 124.0 124.8 124.9 125.0 111.5 123.5 124.9 109.9 84.0
1,174.7
200.0 23.1 25.5
128.0 200.0 200.0
27.0 173.0
976.6
250.0 250.0 (5.2) (5.4)
(1,406.7) (906.6)
$2,712.5 $3,159.3
continued on next page
Total long-term debt
ee \ Aotes to (.onsolidnted Financial Statements.
(on>stel/ation 1her)' G;roup, Inc. and Subsidiaries

CONSOLIDATED STATEMENTS OF CAPITALIZATION / 55
At December 31, 2001 2000
(In millions)
BGE Preference Stock Cumulative preference stock not subject to mandatory redemption, 6,500,000 shares authorized
7.125%, 1993 Series, 400,000 shares outstanding, not callable prior to July 1, 2003 $ 40.0 $ 40.0 6.97%, 1993 Series, 500,000 shares outstanding, not callable prior to October 1, 2003 50.0 50.0 6.70%, 1993 Series, 400,000 shares outstanding, not callable prior to January 1, 2004 40.0 40.0 6.99%, 1995 Series, 600,000 shares outstanding, not callable prior to October 1, 2005 60.0 60.0
Total preference stock not subject to mandatory redemption 190.0 190.0
Common Shareholders' Equity Common stock without par value, 250,000,000 shares authorized; 163,707,950 and
150,531,716 shares issued and outstanding at December 31, 2001 and 2000, respectively. (At December 31, 2001 11,797,976 shares were reserved for the Shareholder Investment Plan and 6,000,000 were reserved for the long-term incentive plans.) 2,042.2 1,538.7
Retained earnings 1,611.5 1,592.3 Accumulated other comprehensive income 189.9 43.0
Total common shareholders' equity 3,843.6 3,174.0
Total Capitalization $6,746.1 $6,523.3
See Notes to Consolidated Financial Statements. Certain prior-year amounts have been reclassified to conform with the current year's presentation.
Constellation Energy Group, Inc. and Subsidiaries

56 / CONSOLIDATED STATEMENTS OF INCOME TAXES
Year Fo•ded December 3 1, 2001 2000 1999
(Dollar ao•toi s," ini nzil/ions)
Income Taxes Current
Federal $45.5 $148.2 S176.3 State 27.0 48.2 5.7
Current taxes charged to expense 72.5 196.4 182.0 Deferred
Federal (22.4) 53.9 5.8 State (4.1) (11.8) 7.2
Deferred taxes charged to expense (26.5) 42.1 13.0 Investment tax credit adjustments (8.1) (8.4) (8.6)
Income taxes per Consolidated Statements of Income $37.9 $230.1 $186.4
Reconciliation of Income Taxes Computed at Statutory Federal Rate to Total Income Taxes
Income before income taxes (excluding BGE preference stock dividends) $133.5 $588.6 $526.3 Statutory federal income tax rate 35% 35% 35%
Income taxes computed at statutory federal rate 46.7 206.0 184.2 Increases (decreases) in income taxes due to
Depreciation differences not normalized on regulatcd activities 5.6 12.6 15.3 Allowsance for equity funds used during construction (1.1) (0.9) (2.2) Amortization of deferred investment tax credits (8.1) (8.4) (8.6) Tax credits flowed through to income (13.4) (6.5) (3.2) Amortization of deferred tax rate differential on regulated activities (2.1) (2.9) (3.0) State income taxes, net of federal income tax benefit 13.5 31.7 8.2 Other (3.2) (1.5) (4.3)
lotal income taxes $ 37.9 $230.1 S186.4
Effective income tax rate 2 8.4 % 39.1% 35.4%
At Decemnber 31, 2001 2000 (Dollar amounts in mi/lions)
Deferred Income Taxes Deferred tax liabilities
Net property, plant and equipment $1,156.0 S1,135.5 Income taxes recoverable through future rates 31.4 32.8 Deferred termination and postemployment costs 7.0 13.6 Deferred Fuel costs 11.7 24.9 Fowser marketing and risk management activities 776.4 819.4 Deferred electric generation-related regulatory assets 87.1 93.7 Financial investments and hedging instruments 153.9 42.6 Other 140.9 135.6 "Ibtal deferred tax liabilities 2,364.4 2,298.1
Deferred tax assets Accrued pension and postemployment beneft costs 132.7 76.5 Deferred investment taex credits 35.1 35.5 Nuclear decommissioning liability 32.1 28.2 Power marketing and risk rnanagernent actis ities 549.1 638.2 Reduction of investments 82.3 29.8 Other 102.1 136.7 "Total deferred tax assets 933.4 944.9
Deferred tax liabilirt, net $1,431.0 S1,353.2
See AVotes to Conssolidated Fliancia/ 5 tate•zents. ('ertant Prior- tYoar atlounits haze been recla-ssifed to cotformn withe ti cturreyt er' presentation.
Consre/laLtoo 1e'ne?-, Group, Inc'. and Subsidiaries

NOTES TO CONSOLIDATED FINANCIAL STATEMENTS / 57
Note 1. Significant Accounting Policies
Nature of Our Business Constellation Energy Group, Inc. (Constellation Energy) is a North American energy company that conducts its business through various subsidiaries including a merchant energy business and Baltimore Gas and Electric Company (BGE). Our merchant energy business generates and markets wholesale electricity in North America. BGE is an electric and gas public transmission and distribution utility company with a service territory that covers the City of Baltimore and all or part of ten counties in central Maryland. We describe our operating segments in Note 3 on page 66.
References in this report to "we" and "our" are to Constellation Energy and its subsidiaries, collectively. Reference in this report to the "utility business" is to BGE.
Consolidation Policy We use three different accounting methods to report our investments in our subsidiaries or other companies: consolidation, the equity method, and the cost method.
Consolidation We use consolidation when we own a majority of the voting stock of the subsidiary. This means the accounts of our subsidiaries are combined with our accounts. We eliminate intercompany balances and transactions when we consolidate these accounts.
The Equity Method We usually use the equity method to report investments, corporate joint ventures, partnerships, and affiliated companies (including power projects) where we hold a 20% to 50% voting interest. Under the equity method, we report:
"* our interest in the entity as an investment in our Consolidated Balance Sheets, and
"* our percentage share of the earnings from the entity in our Consolidated Statements of Income.
The only time we do not use this method is if we can exercise control over the operations and policies of the company. If we have control, accounting rules require us to use consolidation.
The Cost Method We usually use the cost method if we hold less than a 20% voting interest in an investment. Under the cost method, we report our investment at cost in our Consolidated Balance
Sheets. The only time we do not use this method is when we can exercise significant influence over the operations and policies of the company. If we have significant influence, accounting rules require us to use the equity method.
Regulation of Utility Business The Maryland Public Service Commission (Maryland PSC) provides the final determination of the rates we charge our customers for our regulated businesses. Generally, we use the same accounting policies and practices used by nonregulated companies for financial reporting under accounting principles generally accepted in the United States of America. However, sometimes the Maryland PSC orders an accounting treatment different from that used by nonregulated companies to determine the rates we charge our customers. When this happens, we must defer (include as an asset or liability in our Consolidated Balance Sheets and exclude from our Consolidated Statements of Income) certain utility expenses and income as regulatory assets and liabilities. We have recorded these regulatory assets and liabilities in our Consolidated Balance Sheets in accordance with Statement of Financial Accounting Standards (SPAS) No. 71, Accounting for the Effects of Certain Types of Regulation. We summarize and discuss our regulatory assets and liabilities further in Note 6 on page 71.
In 1997, the Financial Accounting Standards Board (FASB) through its Emerging Issues Task Force (EITF) issued EITF 97-4, Deregulation of the Pricing of Electricity,-Issues Related to the Application of FASB Statements No. 71 and 101. The EITF concluded that a company should cease to apply SPAS No. 71 when either legislation is passed or a regulatory body issues an order that contains sufficient detail to determine how the transition plan will affect the deregulated portion of the business. Additionally, a company would continue to recognize regulatory assets and liabilities in the Consolidated Balance Sheets to the extent that the transition plan provides for their recovery.
On November 10, 1999, the Maryland PSC issued a Restructuring Order that we believe provided sufficient details of the transition plan to competition for BGE's electric generation business to require BGE to discontinue the application of SIAS No. 71 for that portion of its business. Accordingly, in the fourth quarter of 1999, we adopted the provisions of SFAS No. 101, Regulated Enterprises-Accounting for the Discontinuation of FASB Statement No. 71 and EITF 97-4 for BGE's electric generation business. BGE's transmission and distribution business continues to meet the requirements of SFAS No. 71, as that business remains regulated. We discuss this further in Note 5 on page 70.
Constellation Energy Group, Inc. and Subsidiaries

58 /
Revenues
Nonregulated Businesses Our subsidiary, Constellation Power Source, uses the mark-to
market method of accounting, as discussed below, to account
for a portion of its power marketing activitics. We record all
other nonregulatcd rcvcnucs in the period earrned fCor services
rendered, commodities or products delivered, or contracts
settled. Equirs in earnings from our investments in poser
projects is included in revenues.
Power marketing activities include news origination transactions and risk management activities using contracts for cnerys;
other energy-related commodities, and related derivative
contracts. We use the mark-to-market method of accountiln, tor
portions of Constellation Power Source's activities as required by EI> F 98-10, Accountingfbr Contraicts Involved in Eniergy /7'kding and Risk 1Ianagerment Activities. Under the mark-to-market
method of accounting, we record the fair value of commodits
and derivative contracts as mark-to-market energy assets and
liabilities at the time of contract execution. We record reservees
to reflect uncertain ties associated svith certain estimates in heretn
in the determination of fair value. Mark-to-market energy
revenues include:
"* the fair value of nesw transactions at origination,
"* unrealized gains and losses from changes in the fair valre
of open positions,
"* net gains and losses from realized transactions, and
"* changes in reserves. We record the changes in mark-to-market energy' assets and
liabilities on a net basis in "Nonregulated revenues" irn our
Consolidated Statements of Income. Mark-to-market energy
assets arid liabilities are comprised of a combination of eneigs
and energ'-related derivative and non-clerivative contracts.
While some of these contracts represent commodities or instru
ments for which prices are available from external sources, other
commodities and certain contracts are not actively traded and
arc valued using modeling techniques to determine expected
fiture market prices, contract quantities, or both. The markei
prices used to determine fair value reflect management's best
estimate considering variours factors, including closing exchangr
and over-the-counter quotations, time value, aind volatility
factors. However, it is possible that future market prices could
vary from those used in recording mark-to-market energy assets
and liabilities, arid such variations could be material.
Certain pousser marketing and risk management transactions
cntcred into under master agreements and other arrangements
provide our merchant energy business sswith a right of setoff in
the event of bankruptcy or default by the counterparty. We report such transactions net in the balance sheets in accordance
isith FASB Interpretation No. 39, Offietring ofAmounts Re/kitd
to Certain f'onmrcts.
Regulated Utility WVe record utilits' revenues svhen we provide service to customiers.
Fuel and Purchased Energy Costs
We incur costs for: "* the fuel we use to generate elecrricitr; "* purchases of electricitY from others, and "* natural gas that we resell. These costs are included in "Operating expenses" in our
Consolidated Statements of Income. We discuss each of these separately below.
Fuel Used to Generate Electricity and Purchases of Electricity From Others Effective July 1, 2000, these costs are recorded as incurred. Historically and until July 1, 2000, ie were allowed to recover our costs of electric fuel under the electric fuel rate clause set by the NMaryland PSC. Under the electric fuel rate clause, we charged our electric custormers for:
"* the fuel We use to generate electricirv (nuclear frel, coal, gas, or oil), and
"* the iset cost of purchases arid sales of electricit>. We charged the actual costs of these items to customers with
no profit to us. To do this, we had to keep track of ihat we spent arid what we collected front customers under the fuel rate in a given period. Usually these two amounts were not the same because there was a difference between the time we spent the muoney and the time we collected it from our customers.
Under the electric fuel rate clause, we deferred the difference bertween our actual costs of fuel arid energy arid what we collected from customers under the fuel rate irs a given period. We either billed or refunded our customers that difference ini the future. As a restrlt of the Restructuring Order, the fuel rate was discontinued cffcctive Jrlsy 1, 2000. We discuss this further iii Note 6 on page 71.
Natural Gas We charge our gas customers for the natural gas they purchase frons us using "gas cost adjustment clauses" set by the Maryland PSC. These clauses operate similarly to the electric fuel rate clause described earlier in this note. Hosswever, the Maryland PSC approved a modification of the gas cost adjustment clauses to provide a market-based rates incentive mechanism. Under mnarket-based rates, our actual cost of gas is compared to a market index (a measure of the market price of gas in a given period). The difference between our actual cost and the market index is shared equally beriseen shareholders and customers. Effective November 2001, the Maryland PSC approved an order that modifies certain provisions of the market-based rates incentive mechanism. These provisions require that BGE secure
Cons/nretiodn ler),g Grouip, [nc. and .Sbsidiaries

/ 59
fixed-price contracts for at least 10%, but not more than 20%, of forecasted system supply requirements for the November through March period. These fixed price contracts are not subject to sharing under the market-based rates incentive mechanism.
Risk Management We are exposed to market risk, including changes in interest rates and the impact of market fluctuations in the price and transportation costs of electricity, natural gas, and other commodities as discussed further in Note 12 on page 83. We use interest rate swaps to manage our interest rate exposures associated with new debt issuances. These swaps are designated as cash-flow hedges under SFAS No. 133, Accountingfor Derivative Instruments and Hedging Activities, as discussed later in this note, with our gains recorded in "Other current assets" in our Consolidated Balance Sheets and "Accumulated other comprehensive income," in our Consolidated Statements of Common Shareholders' Equity and Consolidated Statements of Capitalization, in anticipation of planned financing transactions. Any gain or loss on the hedges will be reclassified from "Accumulated other comprehensive income" into "Interest expense" and be included in earnings during the periods in which the interest payments being hedged occur.
Our merchant energy and regulated gas businesses use derivative and non-derivative instruments to manage changes in their respective commodity prices as discussed in more detail below.
Merchant Energy Business The power marketing operation manages market risk on a portfolio basis, subject to established risk management policies. The power marketing operation uses a variety of derivative and non-derivative instruments, including:
M forward contracts, which commit us to purchase or sell energy commodities in the future;
m futures contracts, which are exchange-traded standardized commitments to purchase or sell a commodity or financial instrument, or to make a cash settlement, at a specific price and future date;
m swap agreements, which require payments to or from counterparties based upon the differential between two prices for a predetermined contractual (notional) quantity; and
m option contracts, which convey the right to buy or sell a commodity, financial instrument, or index at a predetermined price.
As part of its overall portfolio, the power marketing operation manages the commodity price risk of our electric generation facilities, including power sales, fuel purchases, emission credits, weather risk, and the market risk of outages. In order to manage this risk, we may enter into fixed-price derivative or non-derivative contracts to hedge the variability in future cash flows from forecasted sales of electricity and
purchases of fuel. The objectives for entering into such hedges include:
m fixing the price for a portion of anticipated future electricity sales at a level that provides an acceptable return on our electric generation operations, and
0 fixing the price of a portion of anticipated fuel purchases for the operation of our power plants.
The portion of forecasted transactions hedged may vary based upon management's assessment of market, weather, operational, and other factors.
Under the provisions of SEAS No. 133, we record gains and losses on derivative contracts designated as cash-flow hedges of firm commitments or anticipated transactions in "Accumulated other comprehensive income" in our Consolidated Statements of Common Shareholders' Equity and Consolidated Statements of Capitalization prior to the settlement of the anticipated hedged physical transaction. We reclassify these gains or losses into earnings upon settlement of the underlying hedged transaction. We record derivatives used for hedging activities from our merchant energy business in "Other assets," and in "Other deferred credits and other liabilities," in our Consolidated Balance Sheets.
Regulated Electric Business Under the Restructuring Order, effective July 1, 2000, BGE's residential rates are frozen for a six-year period, and its commercial and industrial rates are frozen for four to six years. BGE entered into standard offer service arrangements with Constellation Power Source and Allegheny Energy Supply Company to provide the energy and capacity required to meet its standard offer service obligations through June 30, 2006.
Regulated Gas Business We use basis swaps in the winter months (November through March) to hedge our price risk associated with natural gas purchases under our market-based rates incentive mechanism. We also use fixed-to-floating and floating-to-fixed swaps to hedge our price risk associated with our off-system gas sales.
The fixed portion represents a specific dollar amount that we will pay or receive, and the floating portion represents a fluctuating amount based on a published index that we will receive or pay. Our regulated gas business internal guidelines do not permit the use of swap agreements for any purpose other than to hedge price risk.
BGE's off-system gas sales activities represent trading activities under EITF 98-10. Accordingly, we use mark-to-market accounting to record these transactions. The trading activities relating to our off-system gas sales were not material at December 31, 2001 and 2000.
We defer, as unrealized gains or losses, the changes in fair value of the swap agreements under the market-based rates incentive mechanism and the customers' portion of off-system
Constellation Energy Group, Inc. and Subsidiaries
60 /
gas sales in our Consolidated Balance Sheets. When amounts are paid tinder the agreements, we report the payments as gas costs in our Consolidated Statements of Income. "Xe report the changes in fair value for the shareholders' portion of off-svstem gas sales in earnings as a component of gas costs.
Credit Risk Credit risk is the loss that may result from counterparty nonperformance. Wre are exposed to credit risk, primarily through Constellation Poswer Source. Constellation Power Source uses credit policies to manage its credit risk, including utilizing an established credit approval process, monitoring counterparty limits, employing credit mitigation meastres such as margin,
collateral or prepayment arrangements, and using master netting agreements. Constellation Power Source measures credit risk as the replacement cost fir open energy commodity and derivative positions plus amounts owed from counterparties for settled transactions. The replacement cost of open positions represents unrealized gains, net of any unrealized losses, where wc have a legally enforceable right ofsetoff.
Due to the possibility of extreme volatility in the prices of energy commodities and derivatives, the market value of contractual positions wvith individual counterparries could exceed established credit limits or collateral provided by those counterparties. If such a counterparty were then to fail to perform its obligations under its contract (for example, fail to deliver the clectricitv the posw er marketing operation had contracted for), We could sustain a loss that could have a material impact on our financial results.
Electric and gas utilities, cooperatives, and energy marketers comprise the majority of cotinterparties underlying our assets From power marketing and risk management activities. We held cash collateral from counterparties totaling $3.5 million as of December 31, 2001 and $103.3 million as of December 31, 2000. These amounts are included in "Other deferred credits and other liabilities" in our Consolidated Balance Sheets.
Taxes We summarize our income taxes in our Consolidated Statements of Income Taxes on page 56. As you read this section, it may be helpful to refer to those statements.
Income Tax Expense We have two categories of income taxes in our Consolidated Statements of Income Taxes-current and deferred. We desci be each of these belosw:
"* current income tax expense consists solely of regular tax less applicable tax credits, and
"* deferred income tax expense is equal to the changes in the net deferred income tax liability, excluding amounts charged or credited to accumulated other comprehensise income. Our deferred income tax expense is increased or reduced for changes to the "Income taxes recoverable
through future rates (net)" regulatory asset (described later in this note) during the year.
Investment Tax Credits We have deferred the investment tax credit associated with our regulated utility business and assets previously held by our regulated utility business in our Consolidated Balance Sheets. The investment tax credit is amortized evenly to income over the life of each property. We reduce income tax expense in our Consolidated Statements of Income for the investment tax credit and other tax credits associated with our nonregulated businesses, other than leveraged leases.
Deferred Income Tax Assets and Liabilities We must report some of our revenues and expenses differently for our financial statements than for income tax return purposes. The tax effects of the differences in these items are reported as deferred income tax assets or liabilities in our Consolidated Balance Sheets. We measure the deferred income tax assets and liabilities using income tax rates that are currently in effect.
A portion of our total deferred income tax liability relates to our regulated utilirs business, but has not been reflected in the rates we charge our customers. We refer to this portion of the liability as "Inconme taxes recoverable through future rates (net)." We have recorded that portion of the net liability as a regnilator
asset in our Consolidated Balance Sheets. We discuss this further in Note 6 on page 71.
State and Local Taxes As discussed in Note 5 on page 69, tax legislation has made comprehensive changes to the state and local taxation of electric and gas utilities. State and local income taxes are included in "Income taxes" in our Consolidated Statements of Income.
Through December 31, 1999, xe paid Maryland public service company franchise tax on our uitility revenue from sales in Maryland instead of state income tax. We include the franchise tax in "Thaxes other than income taxes" in our Consolidated Statements of Income.
Cash and Cash Equivalents All highly liquid investments with original maturities of three months or less are considered cash equivalents.
At December 31, 2000, S 112.5 million of the cash balance included in our Consolidated Balance Sheets was restricted tinder certain collateral arrangements for our power marketing operation.
Inventory
We record our fuel stocks and materials and supplies at the lower of cost or market. We determine cost using the average cost method.
Constrhltion c ekog, (;roup. Inc. and ol bsidiaries

/ 61
Real Estate Projects and Investments
In Note 4 on page 68, we summarize the real estate projects and
investments that are in our Consolidated Balance Sheets. The projects and investments primarily consist of:
m approximately 1,600 acres of land holdings in various
stages of development located at 11 sites in the central Maryland region,
m a 4,500 unit mixed-use planned unit development located in Anne Arundel County, Maryland of which 1,300
residential units and 11 acres for commercial development remain,
* an operating waste water treatment plant located in Anne Arundel County, Maryland, and
s an equity interest in Corporate Office Properties Trust, a real estate investment trust.
The costs incurred to acquire and develop properties are
included as part of the cost of the properties.
Financial Investments and Trading Securities In Note 4 on page 68, we summarize the financial investments
that are in our Consolidated Balance Sheets.
SFAS No. 115, Accountingfor Certain Investments in Debt and Equity Securities, applies particular requirements to some of
our investments in debt and equity securities. We report those investments at fair value, and we use either specific identifi
cation or average cost to determine their cost for computing
realized gains or losses. We classify these investments as either
trading securities or available-for-sale securities, which we
describe separately below. We report investments that are not
covered by SFAS No. 115 at their cost.
Trading Securities Our other nonregulated businesses classify some of their investments in marketable equity securities and financial limited
partnerships as trading securities. We include any unrealized gains or losses on these securities in "Nonregulated revenues" in
our Consolidated Statements of Income.
Available-for-Sale Securities We classify our investments in the nuclear decommissioning
trust funds as available-for-sale securities. We describe the nuclear decommissioning trusts and the reserves under the
heading "Nuclear Decommissioning" later in this note. In addition, our other nonregulated businesses classify some
of their investments in marketable equity securities as available
for-sale securities, including the investment in Orion Power Holdings, Inc. (Orion) effective June 1, 2001. We discuss the
accounting for the investment in Orion in more detail in Note
4 on page 68. We include any unrealized gains or losses on our available
for-sale securities in "Accumulated other comprehensive income" in our Consolidated Statements of Common Shareholders'
Equity and Consolidated Statements of Capitalization.
Evaluation of Assets for Impairment and Other Than Temporary Decline in Value
SFAS No. 121, Accounting for the Impairment ofLong-Lived
Assets andfor Long-Lived Assets to Be Disposed Of, requires us to
evaluate certain assets that have long lives (generating property and equipment and real estate) to determine if they are impaired if certain conditions exist. We determine if long-lived
assets are impaired by comparing their undiscounted expected
future cash flows to their carrying amount in our accounting records. We would record an impairment loss if the undis
counted expected future cash flows from an asset were less than
the carrying amount of the asset. Additionally, we evaluate our equity-method investments to determine whether they have
experienced a loss in value that is considered other than a
temporary decline in value. We use our best estimates in making these evaluations and
consider various factors, including forward price curves for
energy, fuel costs, and operating costs. However, actual future
market prices and project costs could vary from those used in
our impairment evaluations, and the impact of such variations
could be material.
Property, Plant and Equipment, Depreciation,
Amortization, and Decommissioning We report our property, plant and equipment at its original
cost, unless impaired under the provisions of SFAS No. 121. Our original costs include: m material and labor, m contractor costs, and * construction overhead costs and financing costs (where
applicable). We own an undivided interest in the Keystone and
Conemaugh electric generating plants in Western Pennsylvania, as well as in the transmission line that transports the plants'
output to the joint owners' service territories. Our ownership interests in these plants are 20.99% in Keystone and 10.56% in
Conemaugh. These ownership interests represented a net investment of $150 million at December 31, 2001 and $143 million at December 31, 2000.
The "Nonregulated generation property, plant and
equipment" in our Consolidated Balance Sheets includes
nonregulated generation construction work in progress of $1,158.6 million at December 31, 2001 and $908.7 million at
December 31, 2000. When we retire or dispose of property, plant and equipment,
we remove the asset's cost from our Consolidated Balance
Sheets. We charge this cost to accumulated depreciation for
assets that were depreciated under the composite, straight-line method. This includes regulated utility property, plant and
equipment and nonregulated generating assets previously owned
by the regulated utility. For all other assets, we remove the accumulated depreciation and amortization amounts from our
Consolidated Balance Sheets and record any gain or loss in our Consolidated Statements of Income.
Constellation Energy Group, Inc. and Subsidiaries

62 /
"The costs of maintenance and certain replacements are charged to "Operating expenses" in our Consolidated Statements of Income as incurred.
Depreciation Expense We compute depreciation for our generating, electric transmission and distribution, and gas facilities over the estimated useful lives of depreciable property using either the:
"* composite, straight-line rates (approved by the Maryland PSC for our regulated utility business) applied to the average investment in classes of depreciable property based on an average rate of approximately three percent per year, or
"* units of production method. Other assets are depreciated using the straight-line method
and the following estimated useful lives:
Asset Estimated Useful Ivises Building and improvements 20- 50 sears Transportation equipment 5 - 15 years Office equipment and computer software 3 - 20 years
Amortization Expense Amortization is an accounting process of reducing an amount in our Consolidated Balance Sheets evenly over a period of time that approximates the useful life of the related item. When we reduce amounts in our Consolidated Balance Sheets, we increase amortization expense in our Consolidated Statements of Income. An amount is considered fully amortized when it has been reduced to zero.
Nuclear Fuel We amortize nuclear fuel based on the energy produced over the life of the fuel including the quarterly fees we pay to the Department of Energy for the future disposal of spent nuclear fuel. These fees are based on the kilowatt-hours of electricity sold. We report the amortization expense for nuclear fuel in "Operating expenses" in our Consolidated Statements of Income.
Nuclear Decommissioning We record an expense and a reserve for the costs expected to be incurred in the friture to decommission the radioactive portion of Calvert Cliffs based on a sinking fund methodology. '[he accumulated decommissioning reserve is recorded in "Accumulated depreciation" in our Consolidated Balance Sheets. The total reserve was $304.6 million at December 31, 2001 and $275.4 million at December 31, 2000. Our contributions to the nuclear decommissioning trust funds were $22.0 million for 2001, $13.2 million for 2000, and $17.6 million for 1999.
Under the Maryland PSC's order deregulating electric generation, BGE's customers must pay a total of $520 million in
1993 dollars, adjusted for inflation, to decommission Calvert Cliffs. BGE is collecting this amount on behalf of and passing it to Calvert Cliffs Nuclear Power Plant, Inc. Calvert Cliffs Nuclear Power Plant, Inc. is responsible for any difference between this a.mount and the actual costs to decommission the plant.
We recorded a reserve for the costs expected to be incurred in the future to decommission the radioactive portion of Nine Mile Point under the discounted future cash flows methodologs. The total reserve was S224.4 million at December 31, 2001. We have determined that the decommissioning trust funds established for Nine Mile Point are adequately funded to cover the future costs to decommission the radioactive portions of the plant and as such, no contributions were made to the trust funds during the year ended December 31, 2001.
In accordance with Nuclear Regulator' Commission (NRC) regulations, we maintain external decommissioning trusts to fund the costs expected to be incurred to decommission Calvert Cliffs and Nine Mile Point. The assets in the trusts are reported in "Nuclear decommissioning trust funds" in our Consolidated Balance Sheets. The NRC requires utilities to provide financial assurance that theyv will accumulate sufficient Finds to pay for the cost of nuclear decommissioning based upon either a generic NRC formula or a facility-specific decommissioning cost estimate. We use the facility-specific cost estimate for funding these costs and providing the required financial assurance.
We classify the investments in the nuclear decommissioning trust funds as available- for-sale securities, and we report these investments at fair value in our Consolidated Balance Sheets as previously discussed in this note.
As owners of Calvert Cliffs Nuclear Power Plant, we are required, along with other domestic utilities, by the Energy Policy Act of 1992 to make contributions to a fund for decommissioning and decontaminating the Department of Energy's uranium enrichment facilities. The contributions are generally payable over 15 years with escalation for inflation and are based upon the proportionate amount of uranium enriched by the Department of Energy for each utility' We amortize the deferred costs of decommissioning and decontaminating the Department of Energy's uranium enrichment facilities. The previous owners retained the obligation for Nine Mile Point.
Capitalized Interest and Allowance
for Funds Used During Construction
Capitalized Interest With the issuance of the Restructuring Order, we ceased accruing AFC (discussed on the next page) for electric generation-related construction projects.
Our nonregulated businesses capitalize interest costs under SFAS No. 34, Capitalizing Interest Costs, for costs incurred to finance our power plant construction projects and real estate developed for internal use.
Constellation Energy Group, inc. and S'bsidiaries

/ 63
Allowance for Funds Used During Construction (AFC) We finance regulated utility construction projects with borrowed funds and equity funds. We are allowed by the Maryland PSC to record the costs of these funds as part of the cost of construction projects in our Consolidated Balance Sheets. We do this through the AFC, which we calculate using a rate authorized by the Maryland PSC. We bill our customers for the AFC plus a return after the utility property is placed in service.
The AFC rates are 9.4% for electric plant, 8.6% for gas plant, and 9.2% for common plant. We compound AFC annually.
Long-Term Debt We defer all costs related to the issuance of long-term debt. These costs include underwriters' commissions, discounts or premiums, other costs such as legal, accounting, and regulatory fees, and printing costs. We amortize these costs to expense over the life of the debt.
When we incur gains or losses on debt that we retire prior to maturity in our regulated utility business, we amortize those gains or losses over the remaining original life of the debt.
Use of Accounting Estimates Management makes estimates and assumptions when preparing financial statements under accounting principles generally accepted in the United States of America. These estimates and assumptions affect various matters, including:
"* our reported amounts of assets and liabilities in our Consolidated Balance Sheets at the dates of the financial statements,
"* our disclosure of contingent assets and liabilities at the dates of the financial statements, and
"* our reported amounts of revenues and expenses in our Consolidated Statements of Income during the reporting periods.
These estimates involve judgments with respect to, among other things, future economic factors that are difficult to predict and are beyond management's control. As a result, actual amounts could differ from these estimates.
Reclassifications We have reclassified certain prior-year amounts for comparative purposes. These reclassifications did not affect consolidated net income for the years presented.
Accounting Standards Adopted On January 1, 2001, we adopted SFAS No. 133, as amended by SPAS No. 138, Accounting for Certain Derivative Instruments and Certain Hedging Activities.
These statements require that we recognize all derivatives on the balance sheet at fair value. Changes in the value of derivatives that are not hedges must be recorded in earnings.
We use derivatives in connection with our power marketing
and risk management activities and to hedge the risk of variations in future cash flows from forecasted purchases and sales of electricity and gas in our electric generation operations as more fully described in the Risk Management section on page 59. Under SFAS No. 133, changes in the value of derivatives designated as hedges that are effective in offsetting the variability in cash flows of forecasted transactions are recognized in other comprehensive income until the forecasted transactions occur. The ineffective portion of changes in fair value of derivatives used as cash-flow hedges is immediately recognized in earnings.
In accordance with the transition provisions of SPAS No. 133, we recorded the following at January 1, 2001:
"* an $8.5 million after-tax cumulative effect adjustment that increased earnings, and
"* a $35.5 million after-tax cumulative effect adjustment that reduced other comprehensive income.
The cumulative effect adjustment recorded in earnings represents the fair value as of January 1, 2001 of a warrant for 705,900 shares of common stock of Orion. The warrant had an exercise price of $10 per share and was received in conjunction with our investment in Orion. As part of the sale of Orion to Reliant Resources, Inc., we received cash equal to the difference between Reliant's purchase price of $26.80 per share and the exercise price multiplied by the number of shares subject to the warrant.
The cumulative effect adjustment recorded in other comprehensive income represents certain forward sales of electricity that we designated as cash-flow hedges of forecasted transactions primarily through our merchant energy business.
Recently Issued Accounting Standards In 2001, the FASB issued SPAS No. 141, Business Combinations, SEAS No. 142, Goodwill and Other Intangible Assets, SFAS No. 143, Accounting for Obligations Associated with the Retirement of Long-Lived Assets, and SEAS No. 144, Accounting for the Impairment or Disposal of Long-Lived Assets.
SEAS No. 141 requires all business combinations to be accounted for under the purchase method. Use of the poolingof-interests method is prohibited for business combinations initiated after June 30, 2001. This statement also establishes criteria for the separate recognition of intangible assets acquired in a business combination. We do not expect the adoption of this statement to have a material impact on our financial results.
SEAS No. 142 requires that goodwill no longer be amortized to earnings, but instead be subject to periodic testing for impairment. This statement is effective for fiscal years beginning after December 15, 2001, with earlier application permitted only in specified circumstances. We do not expect the adoption of this statement to have a material impact on our financial results.
SPAS No. 143 provides the accounting requirements for asset retirement obligations associated with tangible long-lived assets. This statement is effective for fiscal years beginning after June 15, 2002, and early adoption is permitted. Currently, we
Constellation Energy Group, Inc. and Subsidiaries

64 /
are evaluating this statement and have not determined its
impact on outt financial results. hoxwever, it could be riaterial.
SEAS No. 144 replaces FASB Statement No. 121,
Acrountingjor tie lmpaioi-ent of'Long-Lived Assets andfor LoigLived Aaets to Be Disposed Of SEAS No. 144 addresses financial
reporting for the imipairmenit or disposal of long-lived assets.
['his statement is cffectivc for- fiscal ears beginning after
lDccember 15, 2001, and interim periods xvithin those fiscal Years, xwith early application encouraged. We do riot expect the adoption of this statemient to have a iiaterial imipact oti our financial results. However, we expect to reclassiff our seniorliving facilities busiiess as a discontinued operation in the first quarter of 2002 as required under this standard.
Note 2. Contract Termination, Workforce Reduction, and Other Special Costs
2001 Events
lPre- \ICtr "Iax lax
rIn oi//miort.
Workforce reduction costs:
oluntar-V termination bench fits -\'1PP
Settlement mcd ctMtailmcnt Ih atrges
lnvolointar severance accrual
lotal woikfiorcc recuction costs
Contiact tcrininationi related costs
Imiipairment losses and other costs:
ILoss oil sale o (Guaterialanr operatiorn
Impairments of" real estate, scrior-lixing,
arid international irIsesctlmerits
CanccllatLioi of domestic posscr projects
Reduoction of fitnancial iocestmcnt
Iota1 impairment losses and other costs
"IOtal special costs
Workforce Reduction Costs Voluntary Special Early Retirement Programn In the fourth quarter of 2001, suC undertook reduce Oar" vworkfolrcc through both votiltari means. The purpose of these programs was to operating costs to become mcore comipetitive. \locintary Special Farly Retiremienit Prograiis employrecs of Ctnstellatioi Fnergy and certai first group Of these programs offered enhance benefits to ermployees age 55 or older with 10 setsice. [he second group of these programs eartI retirement benefits to eniployees age 50 mtore years of service.
Since etnployees elctiiig to participate in VSERP had toi make their elections bx the en cost of that prograni was reflected in 2001. T in the above table reflects the portion of the L program charged to expense for the 507 etmp to participate. BGb recorded 53 .9 miillion o
C(moostelain /o /on rtr (Group, fr. and/ Suibdiaries
16 7.1 16.3
S 12.5 9.9
BLGF also recorded S 13.7 million on its balance sheet as a regulatory asset related to its gas business as discussed itt Note 6 oin page 71.
Settlement and Curtailment Charges In connection xvith the age 55 or older VSERP, a significant ritimber of the participants in our nonqualified pension plans
19.3 11.- are retiring. As a result, we recognized a settlement loss of
105.7 6-4.1 approxitiiately SI10.5 tiillion and a curtailment loss of approxi
ritately S5.8 mnillion for those plans in accordance wvith SEAS
224.8 139.6 No. 88, Emp/oeraAccornirgjor Settlerments and Curtailmets of Defined Benefit Pernion Plans and for Ierrmirzaitior Benefits. BGE recorded S6.6 million of this arnount. Additional details on the
43.3 28.1 VNSEPP and their iupact on ourr pension and postretiremenit
benefit plans arc discussed in Note 7 on page 72.
46.9
69.7 30.5 Involuntary Severance Accrual
4.6 2.8 1'ihe x'oluhtary programs were designed, offered, and timed to
202.1 131.1 riiirnirize the nurmber of employees xwho wx'ill be involuntarily severed under our overall workforce reduction plan. Our
S532.6 S33-.8 Workforce reduction plan identified 435 jobs to be eliminated
oser and aboxe position reductions expected to be satisfied
througlh the age 55 and over VSER P and was specific as to coripan'y, organizational unit, and position. However, the
s- VSERP rutcttiber ofcriiployces that xwill elect to Voluntarily retire under
sexeral iicasurrcs ti the age 50 to 54 VSER P and how marxv will thereafter be
and inVohlcitarl V ivoliunarily severed Is Unknown until aftcr the election period
reduce our ofthe VSFRP ends in February 2002.
Wc offered several In accordance with EI1FF 94-3, Labi/ity Recognitionjir
(NSERP) to (Certain l'mplo/,ee YFrrination Benrifita and Other Costs to Evit an
n subsidiaries. Ihe Activitr' (inc/rrdirig (Certain Costs hwuIred inn a Resaructuring), the
d early r ciriric't C'iopany recognized a liability of S25.1 million at Deceniber
or smore sears oif 31, 2001 for the targeted niumiiiber of irsolhitary teriinations
offercd crihanced that will result ifi no eiployees elect the age 50 to 54 VSERP to 54 wth'20 or The S 19.3 mnillion in the table above represents involuntary'
sexverance charged to expense in 2001 in connection wxith our
the ag,e 35 or older xorkforce reduction prograris. BGE recorded S12.5 million of
cd of 2(001, the this aniount. BGE also recorded 55.8 million on its balance
Ile 570.1 m1'illionri sheet as a regulatory asset related to its gas business as discussed
otal cost of that in Note 6 on page 71. We xvill record an's additional cost in
loyccs that elected excess of the 2001 involintary' severance accrual fror those
fthis arioult. eligible participants that elect the 50 to 54 VSERP in 2002.

/ 65
Contract Termination Related Costs
On October 26, 2001, we announced the decision to remain a single company and canceled prior plans to separate our merchant energy business from our remaining businesses.
We also announced the termination of our power business services agreement with Goldman Sachs. We paid Goldman Sachs a total of $355 million, representing $196.7 million to terminate the power business services agreement with our power marketing operation and $159 million previously recognized as a payable for services rendered under the agreement. Goldman Sachs also will not make an equity investment in our merchant energy business as previously announced.
In addition, we terminated a software agreement we had whereby Goldman Sachs would provide maintenance, support, and minor upgrades to our risk management and trading system. We recognized $17.6 million in expense in the fourth quarter of 2001 representing the unamortized prepaid costs related to this agreement. Finally, we incurred approximately $10.5 million in employee-related expenses and advisory costs from investment bankers and legal counsel. In total, we recognized expenses of approximately $224.8 million in the fourth quarter of 2001 relating to the termination of our relationship with Goldman Sachs and our decision not to separate.
Impairment Losses and Other Costs Sale of Guatemalan Operation On November 8, 2001, we sold our Guatemalan power plant operations to an affiliate of Duke Energy International, LLC, the international business unit of Duke Energy. Through this sale, Duke Energy acquired Grupo Generador de Guatemala y Cia., S.C.A., which owns two generating plants at Esquintla and Lake Amatitlan in Guatemala. The combined capacity of the plants is 167 megawatts. We decided to sell our Guatemalan operations to focus our efforts on our core energy businesses. As a result of this transaction, we are no longer committed to making significant future capital investments in a non-core operation. We recorded a $43.3 million loss on this sale.
Impairments of Real Estate, Senior-Living, and Other International Investments In the fourth quarter of 2001, our other nonregulated businesses recorded $107.3 million in impairments of certain real estate projects, senior-living facilities, and international assets to reflect the fair value of these investments. These investments represent non-core assets with a book value of approximately $140.6 million after these impairments. As part of our focus on capital and cash requirements and on our core energy businesses, the following occurred:
n We decided to sell six real estate projects without further development and all of our 18 senior-living facilities in 2002 and accelerate the exit strategies for two other real
estate projects that we will continue to hold and own over the next several years. The real estate projects include approximately 1,300 acres of land holdings in various stages of development located in seven sites in the central Maryland region and an operating waste water treatment plant located in Anne Arundel County, Maryland.
m We decided to accelerate the exit strategy for our interest in a Panamanian electric distribution company. As a noncore asset, management has decided to reduce the cost and risk of holding this asset indefinitely and intends to dispose of this asset. We believe a sale of this investment can be completed by mid-to-late 2003.
m We incurred an other than temporary decline in our equity method investment in the Bolivian Generating Group, which owns an interest in an electric generation concession in Bolivia. This decline in value resulted from a deterioration of our investment's position in the dispatch curve of its capacity market. As a result, we recorded the impairment in accordance with the provisions of Accounting Principles Board Opinion No. 18, The Equity Method ofAccountingfor Investments in Common Stock.
The impairments of our real estate, senior-living facilities, and Panama investments were recorded in accordance with the provisions of SFAS No. 121. These impairments resulted from our change from an intent to hold to an intent to sell certain of these non-core assets in 2002, and our decision to limit future costs and risks by accelerating the exit strategies for certain assets that cannot be sold by the end of 2002. Previously, our strategy for these investments was to hold them until we could obtain reasonable value. Under that strategy, the expected cash flows were greater than our investment and no impairment was recognized.
Impairment of Domestic Power Projects In the fourth quarter of 2001, our merchant energy business recorded impairments of $46.9 million primarily due to $40.8 million in impairments under SFAS No. 121 associated with the termination of our planned development projects in Texas, California, Florida, and Massachusetts that are not currently under construction. The impairments include amounts paid for the purchase of four turbines related to these development projects. We decided to terminate our development projects due to the expected excess generation capacity in most domestic markets and the significant decline in the forward market prices of electricity. In accordance with the provisions of APB No. 18, we recognized $6.1 million for an other than temporary decline in the value of our investment in a waste burning power plant in Michigan where operating cash flows are not sufficient to pay existing debt service and we are not likely to recover our equity interest in this investment.
Constellation Energy Group, Inc. and Subsidiaries

66 /
Reduction of Financial Investment
Our financial investments business recorded a S4.6 million
reduction of its investment in a leased aircraft due to the other
than teitporary decline in the estimated residual value Of used
airplanes as a result of the September 11, 2001 terrorist attacks
and the general doxw nturn in the aviation industrs. Th is
investment is accounted for as a leveraged lease under SEAS No
13, Accountiogfor Leases.
2000 Events
In 2000, BCE offered a targeted \"SERP to employees ages 55
or older with 10 or more years of service in targeted positions
that elected to retire on June 1, 2000 to reduce our operating
costs to become more competitive. BGE recorded approxi
marelyS $10.0 million pre-tax for employees that elected to
participate in the program. Of this amount, BGE recorded
approximately $3.0 million on its balance sheet as a ICgulatori
asset of its gas business. BGE is amortizing this regulatory asset
over a 5-year period as provided by the Jtne 2000 Maryland
PSC gas base rate order as discussed in Note 6 on page -1. The
remaining $7.0 million, or S4.2 million after-tax, related to
BGE's electric business and was charged to expense.
1999 Events
Our generation operation recorded a 521.4 million pre-tax, or
$14.2 million after-tax, impairment of two geothermal power
projects. These impairments occurred because the expected
future cash flows from the projects are less than the investment
in the projects. For the first project, this resulted from the
inability to restructure certain project agreements. For the
second project, we experienced a declining water temperature of the geothermal resource used by one of the plants for
production. Our Larin American operation recorded a $71 million pre
tax, or S4.5 million after-tax, impairment to reflect the fair Value of our invesmuent in a generating company in Bolivia as a
tesult ofCour international exit strateg, at that time to focus on
our core businesses.
Our financial investments exchanged its shares of common stock in Capital Re, an insurance company, for common stock
of ACE. Limited (ACE) as part of a business combination whereby ACE acquired all of the outstanding capital stock of
Capital Re. As a result, our financial investments operation wx rote-down its 594.2 million investment in Capital Re stock by
$26.2 million pre-tax, or 516.0 million after-tax, to reflect the closing price of the business combination.
Our real estate and senior-living facilities operations entered
into an agreement to sell all but one of its senior-living facilities to Sunrise Assisted ILiving, Inc. Under the terms of the agreement, Sunrise was to acquire twelve of our existing seniorliving facilities, three facilities under construction, and several sites under development for $72.2 million in cash and $16.0 million in debt assumption. We could not reach an agreement
on financing issues that subsequently arose, and the agreement was terminated in November 1999. Hoxxsever, our real estate
and senior-living operations recorded a $9.6 million pre-tax, or S5.8 million after-tax, impairment related to the proposed sale
of these facilities.
Note 3. Information by Operating Segment
Our reportable operating segments are--\lerchant Fnerg',
Regulated Electric, and Regulated Gas: * Our noinreglated merchant eneigs business in North
America: * provides power marketing, origination transactions, and
risk management services, * develops, osw ns, and operates generating facilitics and/or
powver projects in North America, and * provides nuclear consulting services.
"* Our regulated electric business purchases, distributes, and
sells electricity in Maryland. * Our rcgilated gas business purchases, transports, and sells
natural gas in Marvland. We have restated certain prior-period information For cornpar
ative purposes based on our reportable operating segments. Effective July 1, 2000, the financial results of the electric
generation portion oF outr business are included in the merchant
energy business segment. Prior to that date, the financial results
of electric generation are included in our regulated electric business.
Out remaining nonregulated businesses: "* provide energy products and services,
"* sell and service electric and gas appliances, and heating and
air conditioning systems, engage in home improvements,
and sell electricity and natural gas throtigh mass marketing
efforts,
"* provide cooling services,
"* engage in financial investments,
"* develop, own, and manage real estate and senior-living
facilities, and
"* own interests in ILatin American power generation and
distribution projects and investments.
These reportable segments are strategic businesses based
principalls upon regulations, products, and services that require
different rechnologs and marketing strategies. We evaluate the
performance of these segments based on net income. \Ve
account for intersegment revenues using market prices. A
summary of information by operating segment is shown on the
next page.
Constel/ation hoo gy (rouip, 1nc. and Subsidiaries

Merchant Energy
Business
Regulated Electric
Business
Regulated Gas
Business
Other Nonregulated
Businesses
Unallocated Corporate Items and
Eliminations Consolidated
(In millions)
2001 Unaffiliated revenues $ 614.3 $2,039.6 $ 674.3 $ 600.1 $ - $3,928.3 Intersegment revenues 1,151.2 0.4 6.4 2.0 (1,160.0)
Total revenues 1,765.5 2,040.0 680.7 602.1 (1,160.0) 3,928.3 Depreciation and amortization 174.9 173.3 47.7 23.2 - 419.1 Fixed charges 25.8 135.8 28.5 48.7 - 238.8 Income tax expense (benefit) 25.2 36.8 25.7 (49.8) - 37.9 Cumulative effect of change in accounting principle - - - 8.5 - 8.5 Net income (loss) (a) 93.1 50.9 37.5 (90.6) - 90.9 Segment assets 8,134.3 3,764.9 1,104.2 1,314.0 (239.8) 14,077.6 Capital expenditures 1,815.0 180.3 58.7 35.0 - 2,089.0
2000 Unaffiliated revenues $ 421.1 $2,134.7 $ 603.8 $ 692.9 $ - $3,852.5 Intersegment revenues 604.6 0.5 7.8 20.4 (633.3)
Total revenues 1,025.7 2,135.2 611.6 713.3 (633.3) 3,852.5 Depreciation and amortization 83.6 319.9 46.2 20.3 470.0 Equity in income of equity-method investees (b) - 2.4 - - 2.4 Fixed charges 18.3 168.4 27.3 65.8 (8.4) 271.4 Income tax expense 118.5 72.2 21.9 17.5 230.1 Net income (c) 198.6 102.3 30.6 13.8 345.3 Segment assets 7,295.5 3,392.3 1,089.9 1,491.5 (329.9) 12,939.3 Capital expenditures 699.0 290.3 59.7 131.5 1,180.5
1999 Unaffiliated revenues $ 277.3 $2,258.8 $ 476.5 $ 828.3 $ $3,840.9 Intersegment revenues - 1.2 11.6 20.1 (32.9) Total revenues 277.3 2,260.0 488.1 848.4 (32.9) 3,840.9 Depreciation and amortization 7.5 376.4 44.9 21.0 449.8Equity in income of equity-method investees (b) Fixed charges Income tax expense (benefit) Extraordinary loss Net income (loss) (d) Segment assets Capital expenditures
29.2
52.4 1,259.0
163.0
5.1 174.2 149.2 66.3
198.8 6,312.6
366.8
26.1 18.1
33.0 915.3
69.2
56.1 (10.1)
(24.1) 1,239.7
115.2
5.1 (1.4) 255.0
186.4 - 66.3 - 260.1
18.5 9,745.1 - 714.2
(a) Our merchant energy business, our regulated electric business, our regulated gas business, and our other nonregulated businesses recognized $198. 1 million, $33.6 million, $0.8 million, and $102.3 million, respectively for workforce reduction costs, contract termination related costs, and impairment losses and other costs as described more fully in Note 2.
(b) Our merchant energy business records its equity in the income ofequity method investees in unaffiliated revenues. (c) Our regulated electric business recorded expense of $4.2 million related to employees that elected to participate in a Voluntary Special Early Retirement Program. In
addition, our merchant energy business recorded a $15.0 million deregulation transition cost incurred by our power marketing operation. (d) Our regulated electric business recorded expense of $4 9 million related to Hurricane Flayd. Our merchant energy business recorded $14.2 million for the
impairment oftwo geothermal power plants. Our Latin American operation recorded $4.5 million fir the impairment to refct the fair value ofour investment in a power project in Bolivia. Our financial investments operation recorded $16. 0 million for the reduction ofits investment in Capital Re stock to relect the market value ofthis investment. Our real estate and senior-living ficilities operation recorded $5.8 million for the impairment of certain senior-living facilities.
Constellation Energy Group, Inc. and Subsidiaries
/ 67

68 /
Note 4. Investments
Real Estate Projects and Investments
Real estate projects anrd investrents held by Constellation Real
Estate Group (CREG), consist of the following:
2001 2000
/ In io/ s)
Properties under devrelopment Operating Properties
(net Of accuimulated depreciation)
Ecquity interest in real estate insestients
Total real estate projects and investnents
$100.5 S165.1
0.9 109.3
$210.7
12.7
112.5 S290.3
See Note 2 on page 65 for a discussion of impairments
in 2001.
Power Projects
Investments in power projects held by our merchant energy,
business consist of the follosing:
At December 31, 2001 2000 ([n milions)
Squiit MCLICIod $480.3 S488t.o
Cost Method 10.7 10.8
"Notal poswer projects $491.0 $499-2
Our percentage voting interest in power projects accounted
for under the equity method ranges from 16% to 50%. EquiP y
in earnings of these power projects wvere $24.2 million in 2001,
S50.2 million in 2000, and $49.7 million in 1999.
Our power projects accounted for under the equity method
include investments of $296.4 million in 2001 and S297.9
million in 2000 that sell electricity in California under posw er
purchase agreements called "Interim Standard Offer No. 4"
agreements. \'e discuss these projects further in Note 11 on
page 83.
Our Latin American operation held power projects of
$8.1 million at December 31 2001 and SI 1.4 million at
December 31, 2000.
See Note 2 on page 65 for a discussion of impairments
recorded in 2001.
Orion and Financial Investments
Financial investments consist of the following:
At D1ccembe r31, 2001 2000 (hl millions)
Orion Marketable equ1Oity securlities Financial limitled partnerships I eseraged leases
$442.5 20.2 25.8 14.7
S192.0
I 05.9 3 2.7
22.4
Investments Classified as Available-for-Sale
We classih, the following in'estments as available-for-sale:
"* nuclear deconsmmissioning trust funds,
"* our other nonregulated businesses' marketable equiry
securities (shown above), and
"* Orion.
This means we do not expect to hold them to matrcrity, and
we do not consider them trading securities.
Effective June 1, 2001, we changed our accounting for the
insestmsent in Orion from the equity method to the cost
method. This change rescltecd from no longer having significant
influence as required under equitiy method accounting due to a
reduction in our ownership percentage. Our ownership
percentage decreased due to Orion's issuance of 13 million
shares of common stock that were sold in a public offering and
due to our sale of one million shares as part of the offering. At
December 31, 2001, the unrealized gain on our investment in
Orion was S244.0 million. In addition, at December 31, 2001,
we owned a warrant for 705,900 shares of common stock in
Orion with a fair market value of S 11.8 million. These warrants
are accounted for under SFAS No. 133 as discussed in Note I
on page 63.
We show the fair values, gross unrealized gains and losses,
and armortized cost bases for all of our available-for-sale
securities, in the following tables. We use specific identification
to determine cost in computing realized gains and losses, except
we use average cost basis for our investment in Orion.
At Decembet 31, 2001
Marketable cquitiii secriities
( orporate debt and U.S. Gosersnieist agecy
State municipal bonds
Amortized Unocalizcd Unrcalizcd 1:air (Cost Basis (Gains l05sscs Value
(In mil/ions)
$773.9 $270.6 $(00.3) $1,034.2
47.7 1.5 - 49.2 38.4 3.3 (0.2) 41,5
"[otals $860.0 $275.4 $S10.5) $1,124.9
Amortized Unrealized Unealizedi Fiir
\t I)cccniber 31, 2000 Cost Basis Gainls IonesCS ValLeC
(h] illions)
Nlarketable equity secutrities SV1I.8 8689 S(2.2) $238.5
Corporate debt and
U.S. Gosvernment agency 26.1 0.1 (0.1) 26.1
State municipal bonds 61.3 2.3 (0.4) 63.2
"I6tals 8259.2 S71.3 S(2.7) S327.8
In addition to the above securities, the nuclear decommis
sioning trust funds included $7.7 million at December 3 1,
2001 and S6.8 million at December 31, 2000 of cash and cash
equivalents.
Conste/kluion Eneagt, Group, I nc. aond Subsidiaries
"Iotal financial inscstmeiits $503.2 $353.0
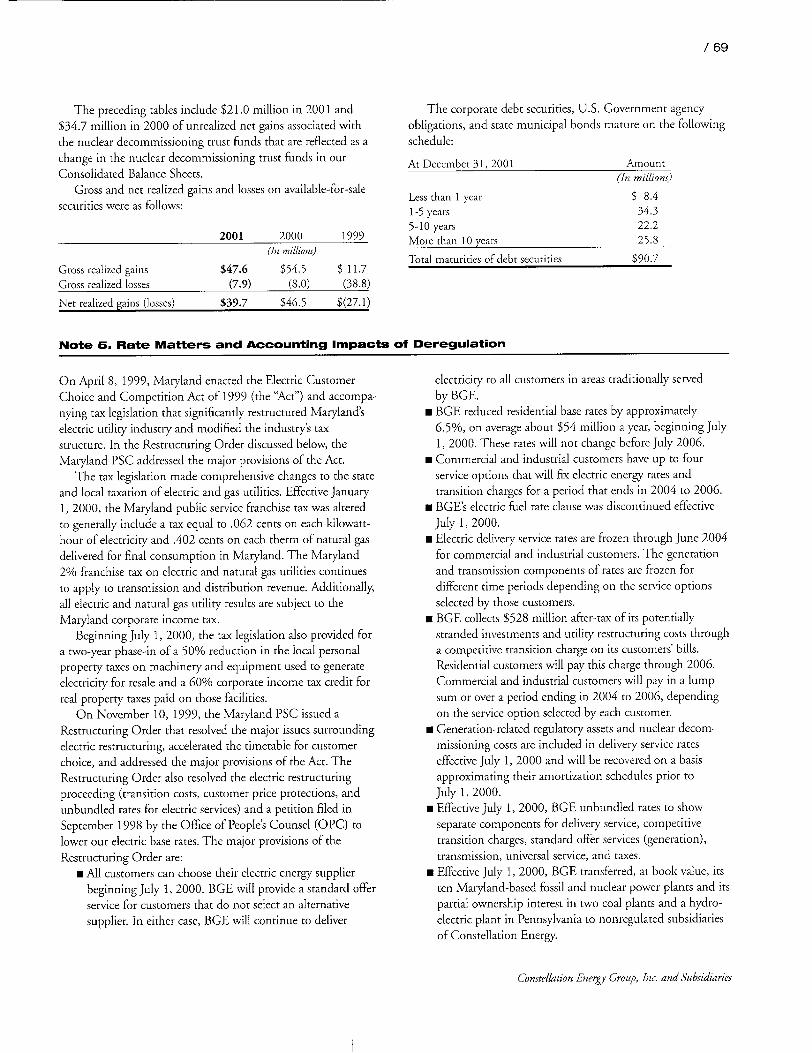
/ 69
The preceding tables include $21.0 million in 2001 and $34.7 million in 2000 of unrealized net gains associated with
the nuclear decommissioning trust funds that are reflected as a
change in the nuclear decommissioning trust funds in our
Consolidated Balance Sheets. Gross and net realized gains and losses on available-for-sale
securities were as follows:
2001 2000 1999 (In millions)
Gross realized gains $47.6 $54.5 $ 11.7 Gross realized losses (7.9) (8.0) (38.8)
Net realized gains (losses) $39.7 $46.5 $(27.1)
The corporate debt securities, U.S. Government agency obligations, and state municipal bonds mature on the following schedule:
At December 31, 2001 Amnount (In millions)
Less than 1 year $ 8.4 1-5 years 34.3 5-10 years 22.2 More than 10 years 25.8
Total maturities of debt securities $90.7
Note 5. Rate Matters and Accounting Impacts of Deregulation
On April 8, 1999, Maryland enacted the Electric Customer
Choice and Competition Act of 1999 (the "Act") and accompanying tax legislation that significantly restructured Maryland's
electric utility industry and modified the industry's tax structure. In the Restructuring Order discussed below, the Maryland PSC addressed the major provisions of the Act.
The tax legislation made comprehensive changes to the state
and local taxation of electric and gas utilities. Effective January 1, 2000, the Maryland public service franchise tax was altered
to generally include a tax equal to .062 cents on each kilowatthour of electricity and .402 cents on each therm of natural gas
delivered for final consumption in Maryland. The Maryland
2% franchise tax on electric and natural gas utilities continues
to apply to transmission and distribution revenue. Additionally, all electric and natural gas utility results are subject to the Maryland corporate income tax.
Beginning July 1, 2000, the tax legislation also provided for
a two-year phase-in of a 50% reduction in the local personal property taxes on machinery and equipment used to generate
electricity for resale and a 60% corporate income tax credit for real property taxes paid on those facilities.
On November 10, 1999, the Maryland PSC issued a
Restructuring Order that resolved the major issues surrounding electric restructuring, accelerated the timetable for customer
choice, and addressed the major provisions of the Act. The
Restructuring Order also resolved the electric restructuring proceeding (transition costs, customer price protections, and
unbundled rates for electric services) and a petition filed in
September 1998 by the Office of People's Counsel (OPC) to
lower our electric base rates. The major provisions of the
Restructuring Order are: m All customers can choose their electric energy supplier
beginning July 1, 2000. BGE will provide a standard offer
service for customers that do not select an alternative supplier. In either case, BGE will continue to deliver
electricity to all customers in areas traditionally served
by BGE. "* BGE reduced residential base rates by approximately
6.5%, on average about $54 million a year, beginning July 1, 2000. These rates will not change before July 2006.
"* Commercial and industrial customers have up to four service options that will fix electric energy rates and transition charges for a period that ends in 2004 to 2006.
"* BGE's electric fuel rate clause was discontinued effective July 1, 2000.
"* Electric delivery service rates are frozen through June 2004
for commercial and industrial customers. The generation and transmission components of rates are frozen for
different time periods depending on the service options selected by those customers.
"* BGE collects $528 million after-tax of its potentially stranded investments and utility restructuring costs through a competitive transition charge on its customers' bills. Residential customers will pay this charge through 2006. Commercial and industrial customers will pay in a lump
sum or over a period ending in 2004 to 2006, depending
on the service option selected by each customer. "* Generation-related regulatory assets and nuclear decom
missioning costs are included in delivery service rates effective July 1, 2000 and will be recovered on a basis
approximating their amortization schedules prior to July 1, 2000.
"* Effective July 1, 2000, BGE unbundled rates to show separate components for delivery service, competitive transition charges, standard offer services (generation),
transmission, universal service, and taxes.
"* Effective July 1, 2000, BGE transferred, at book value, its
ten Maryland-based fossil and nuclear power plants and its partial ownership interest in two coal plants and a hydroelectric plant in Pennsylvania to nonregulated subsidiaries of Constellation Energy.
Constellation Energy Group, Inc. and Subsidiaries
70 /
"* B(I: redlucedl its generation assets bh S150 million pie a\ doring the period IlyI 1, 1999 -one 30, 2000 to mitiiii e a portion of1 B3(1s poteniiallY stranded inscstmlnis.
"* U1livetrsal s(iXI\rce Is Ilrig provided Fi r llrs iow-hCOinC cust[omIe rs w5 ithotit increasing their bills. B(.)- will provide its share ofa statcwidc hUnd totaling S334 million annisllk.
As discussed ill Note I on page 17, ITI1 9"--i cquircs that a company should cease appising SFAS No. -I xxlen eihici legislation is passed oF a reguIlatoiy bock isseiCs an ordci that contains siffhcieiit detail to eleterminc how the transition pl ii Will affect the eriiegulated portion of the shILsIsS. Additiorialls, a company \wold cone nue to ireco'glniZe ieeiltatoir asseis and liabilities in the Consolidated Balance Sheets to tie cxieni that the transition plan providess for their recoxeisr
We believe that the Resreetoring (3Order provided1 sotf'hclnt details of-the transition plan to competition oir B(13(1s Clec ic generation business to require B(GF to discontinue the application of S' AS No. 7 ftiFr that portion ofits business. Accodtirlgh',, in the foUrth i ltn cr Otiif 1999, Wc adopted ithe provisions oFSFAS< No. 101 and 111 97-4 For Ri 3(1 csectic generation busirsess.
SFAS No. 10)1 ireq(Ltires the elimination tf the effects ot iate
regulation that have •cen recognizedi as irCgiaiorsy ascts and liabilities Pirsuant to SFAS No. 71. However, 1F1I 97-4 requires that regolatory assets and liabilities that wil lIle recOvsered in the regeulaeed portion ofthe huisirress COtiliIitieu it) hc classified as iregolators assets and liabilities. [lhe RestiicttiriiMg Order provided foi tre creation oiia single, tess generation-related regualatorV asset to be recoveriel thmuoh BG1I's rieglated transmission and distribution liisiness. Wxe discuss this foiither in Note 6 on page 7.
Peirstiant to SiFAS No. 101 , the book value of propcrtri, plint arid eequipment maty not be adjusted unless those assets are impaired uerleii the prioisions of S LAS No. 121. Thle pioccs We Used in evaleiatintg anld Measoririg rriipaiitenCIlt Ullcer the provisions of SI:AS No. 121 involved Iwo steps. First, We compared the net book valere ofeach generating planr to the estimated tindiscoiiteCd fel tuire niet operating cash fioxxs ftom that plant. An electric gencrating plant was cerrixie l rii ed when its undiisCtLitCee fortore net opcratiig cash Howss were less than its nest book valere. Second, we computed the fair saloe of each plant that is dererilined to be impaired based oin the present valme of that plant's estinated f"tture Icte oit peatiig cash flows discountedrLt using an iIteiest rate that cotnsiders lic riisk of operating that facility in a competitive eniviroiieilet. Ti the
extent that the tier book Vsaloe of each impaired electric generation plant exceeded its fair valoe, wc reduced its book valere.
Ureder the ResriCturruituiIg Order, B1(iF will recover S528 million after-tax oi)its potentially stranded irsestments aird
tility restrictir ring costs rhiriosigh lthe COIlpletitive transitiori ciar ge crompoeriert of its cstIosLer rates beginning Jeily 1, 2000. Ihis rcco\erv mostli relates to the siranded costs associated
s%,ill the CallVert C liffs NcIClear iPower Plant, whose book value Was solisuatiallv higher than its estimated fair value. Ftsowcver, "( allrr Cliffs was not consideered impaired under the provisionis o'SiFAS No. 121 since its estimated fttUre ririeliscouined cash flows exceeded its book valuie. Acoilinugh', B(;E did not record an) riiapaili-mct related to Calvert Cliffs. However, B(E1 recognized ater-tax impairrmcnti losses totaling S 115.8 million associated ssiti cerrain of its foissil plants elrder the pLovisioeis Of SPFAS No. 121.
B(11 had contracts to puichase electric capacity and encrtg' that btcanic erneetIrlorIic 1i1liion the 'clCeegoLlatiolr of electric gener
ntion. Tlhceefore, B(11 recordeld a $3-4.2 million after-tax charge haseed on the tiet prese nit Valee oc the excess of estimated contract _Osts over the mliarkct-ehasc 's enCVieLlCS to recover these costs over
tile remaining terms of the contracts. I el addition, BGE had dc icrred certain cnererg conscr\s ,tion expenditures that w eould riot lie recoescred rthough its tiansmliission and distribhItion busiriess Iueler rile' RCstiurerurriritg Ordler. Accordinglye , BGE recorded a
$10.3 million after-tax charge to eliminate the regulatory asset presViously cstablislicdl for these dcfcrred cxpenditures.
,r\t D)ecember 31, 1999, the roial charge for B(;-'s electric airing plants that \xerc impaired, losses on uneconomic
purchased capacity and eiergx contracts, and deferreed energy roiseCIrVataoll expenlditures was approximatelY $ 160.3 milliOnl
after-tax. 13(11- recordecd approxitiiatel' S94.0 million of the $ 160.3
million oni its balance slicer. This cornsisted of S 150.0 million rgtillatory a.sse t Of its regel ated transmission and distrihuterion Ibursiress, net o appiroximately S56.0 million of associated deeferred income taxes. The regrulatory asset was amortized as it 55a1s IICceVCreed ft'tins ratepacirs throIgh June 30, 22000. This accomplishiedl (ie S150 million reeledctioni of its generation plallts reeuireed bV the RCstreruiCtring Order.
B(;11 recorded atr aitetr-tax, extraordinair charge against earnitgs foIr -approxiimarey 66.3 million related to the remainingi portion of the $160.3 million described above that was riOt rccos\ercde under the Restrecturing Order.
onsr!tel//tron 1)1• m p (heoe ,, I . ,t s t S! ,sidiarict 1

/71
Note 6. Regulatory Assets (net)
As discussed in Note 1 on page 57, the Maryland PSC provides the final determination of the rates we charge our customers for our regulated businesses. Generally, we use the same accounting policies and practices used by nonregulated companies for financial reporting under accounting principles generally accepted in the United States of America. However, sometimes the Maryland PSC orders an accounting treatment different from that used by nonregulated companies to determine the rates we charge our customers. When this happens, we must defer certain utility expenses and income in our Consolidated Balance Sheets as regulatory assets and liabilities. We then record them in our Consolidated Statements of Income (using amortization) when we include them in the rates we charge our customers.
We summarize regulatory assets and liabilities in the following table, and we discuss each of them separately below.
At December 31, 2001 2000 (In millions)
Electric generation-related regulatory asset $249.0 $267.8 Income taxes recoverable through future rates (net) 95.6 101.2 Deferred postretirement and
postemployment benefit costs 35.5 38.7 Deferred environmental costs 26.0 28.8 Deferred fuel costs (net) 33.5 71.1 Workforce reduction costs 21.6 2.8 Other (net) 2.6 4.5
Total reaulatory assets (net) $463.8 $514.9
Electric Generation-Related Regulatory Asset
With the issuance of the Restructuring Order, BGE no longer
met the requirements for the application of SIAS No. 71 for
the electric generation portion of its business. In accordance with SFAS No. 101 and EITF 97-4, all individual generation
related regulatory assets and liabilities must be eliminated from
our balance sheet unless these regulatory assets and liabilities
will be recovered in the regulated portion of the business.
Pursuant to the Restructuring Order, BGE wrote-off all of its
individual, generation-related regulatory assets and liabilities.
BGE established a single, new generation-related regulatory
asset for amounts to be collected through its regulated trans
mission and distribution business. The new regulatory asset is
being amortized on a basis that approximates the pre-existing individual regulatory asset amortization schedules.
Income Taxes Recoverable Through Future Rates (net)
As described in Note 1 on page 60, income taxes recoverable
through future rates are the portion of our net deferred income
tax liability that is applicable to our regulated utility business,
but has not been reflected in the rates we charge our customers.
These income taxes represent the tax effect of temporary differ
ences in depreciation and the allowance for equity funds used
during construction, offset by differences in deferred tax rates
and deferred taxes on deferred investment tax credits. We amortize these amounts as the temporary differences reverse.
Deferred Postretirement and Postemployment Benefit Costs
Deferred postretirement and postemployment benefit costs are the costs we recorded under SFAS No. 106 (for postretirement benefits) and No. 112 (for postemployment benefits) in excess of the costs we included in the rates we charge our customers. We began amortizing these costs over a 15-year period in 1998. We discuss these costs further in Note 7 on page 72.
Deferred Environmental Costs
Deferred environmental costs are the estimated costs of investigating and cleaning up contaminated sites we own. We discuss this further in Note 11 on page 80. We are amortizing $21.6 million of these costs (the amount we had incurred through October 1995) and $6.4 million of these costs (the amount we incurred from November 1995 through June 2000) over 10year periods in accordance with the Maryland PSC's orders.
Deferred Fuel Costs
As described in Note 1 on page 58, deferred fuel costs are the difference between our actual costs of electric fuel, net purchases and sales of electricity, and natural gas, and our fuel rate revenues collected from customers. We reduce deferred fuel costs as we collect them from or refund them to our customers.
We show our deferred fuel costs in the following table.
At December 31, 2001 2000 (In millions)
Electric $ - $42.3 Gas 33.5 28.8
Deferred fuel costs (net) $33.5 $71.1
Under the terms of the Restructuring Order, BGE's electric fuel rate clause was discontinued effective July 1, 2000. In September 2000, the Maryland PSC approved the collection of the $54.6 million accumulated difference between our actual costs of fuel and energy and the amounts collected from customers that were deferred under the electric fuel rate clause through June 30, 2000. We collected this accumulated difference from customers over the twelve-month period ending October 2001.
Workforce Reduction Costs
The portions of the workforce reduction costs associated with the VSERP and involuntary severance programs we announced in 2001 and 2000 that relate to BGE's gas business are deferred as regulatory assets in accordance with the Maryland PSC's orders in prior rate cases. These costs are amortized over 5-year periods. See Note 2 on page 64 and Note 7 on page 72.
Constellation Energy Group, Inc. and Subsidiaries

72 /
Note 7. Pension, Postretirement, Other Postemployment, and Employee Savings Plan Benefits
\X/e of-fcr pension, postretircment, othet postemploy 'tecnt, and etmployce saxhiigs plan bencfits. \\c describe each of these separtatclh below. Nine Mile Point offers its osw n pension, postretirement, other postemployment, and employcc saxvings plan benefits to its employees. The bexnefits for Nine MilI Point arc included in the tables beginning on the next page.
Pension Benefits \'c sponsor sexcirai dcfined benefit pension plans Cot (1,11 emploxyces. Thcsc inllude the basic, qualified plan that niost employees participate in and scxeeral iots1 oFalified plaits that are available only to certain employees. A defined benefit plan specifies the amTIount of benefits a plan participant is to receive using itiforltiatioti abont the participant. Employces( do not conrtribuhe to thcse plans. Genetrallsx we calcolate the bcehfits Under these plans based on agc, seats tf serice, and pay.
Sometinses xxe antiend the plans rctrtactixchlx. TIhese retroactite plan amentdmsents require its to recalcnlate bheicIts related to participants' past scrxvice. \Nc amoti izc thel c hatg in the benefit costs fitom these plan amendments on a straight-litie basis oxer the axcragt remaining service period of-activc eniployecs.
\Wc Cind the plans bs conttibuting at least the iniMium amssouCnt r Cqcjired under Internal RexVCIL-C SeLVicC regulatiois. "Xc calcnlate the amount of'tiding using an actuarial method called the proelcteld lsit credit cost imethod. The asscts isi all of the plans at I)eccmber 3 1, 2001 xxeterc mostly marlketahlC equity arid fixed iticotix securities.
In 1999, xc eisade the Iolloxx itig atscndnien ts: " cligiblc participants were allowed to choose bhetxccii ati
enhanced setsiots of the cotrtent benefit forolUla and a iexw pesion ecquilv plan (pITl)) foimola. PensiotI bhenefits fot eligible ceisploycees hired after December 31, 1999 atc based on a PIT' formula, and
"* pension and sutrsior bencnts wcre increased fisr parricipants %hi rctired prior to Janoary' 1, 1994 and lot their sotrvising spocises.
The finaicial impacts of the aiendt'nents are iticloded iii the tables beginnitng on the next page.
Postretirement Benefits We sponsor dcfinecd benefit postictirecnicit health carc and life6C i1ISI~ai ce plaits that cox er substantially all ofCont etisploxees. (cneralls; Wx c alctilatt the bcheifits under these plans based on age, yats ofsetsice, and penisitn heisefit lexels. Wec do sot fimd these plans.
For nearly all of the health care plans, retirees ILakIc cotiributions to coxei i portios (f the plan costs.
Contribhutions ftor tIsIplox ecs xw ho retire after Junc 30, 1992 are calcolared based on age arid Years of setsice. ['lie atiItunt of rctiice coistribuhiotis increases based on expected Increases tn medical costs. Fot the life insuranct plan, iretires (do not imake contributioiss to cover a portion of the plan costs.
ffectie Jasntitar 1, 19933, we adoptcd SI AS No. 106, tI7,q, Iff/ol, 11 oo,•tig Jot Powosot)- nr Benefits Otier 1lkini S'nsioizs. The adoptioi (of that statement caused:
transiton bligation, which we are amortizing oer 20
Yeaes, arid
* ats iticrease iII anistlial postrctirerisenit benefit costs. For outr tsotsregilfatecd businesses, we expense all postec
ticiemctit benefit costs. For otin regulated utility bhisitsess, we accotietd f•cr the incicase in annual post cri tcttment bettefit costs Under tvrxxo Mart xland PSC rate orders:
"* its as April 1993 rate order, the Mars I' sd PSC allowed us to expense one-half-atd deftr, as a regilatort asset (see Note 6 on page -1), the ostcr halofthe incicase in annual post Lrciremsent lbeiehit costs related to oIs regulatecd electric arid gas bstistiesses, aisd
"* its a NOenslber I 995 rate order, the Nat and liSC allowed us to expense all of thc inictease in annuts al poste
eticimst betichst costs related to our regulated gas bluSsiness. Bcaiiiting in 1998, the Matyland PSC actrlsoriied LIs ts: "* expense a.l lif the increase in annual tosretircntenscit sCseefit
costs related tos oU rcgulated elcetric business, and * aititreZ te tcrgculatory asset for postretirctenisit belheft
costs related t0 our tcgcil~atcdl electric atnd gas busitiesses tser 15 sears.
VSERP Its 2001, ocur Board of Directors approccd sxveral \0slcItar 'i Fctit-cssci{ protgratis fitr Constellation 1 Iset g" anscd ýzcrtains subsidiarics. The first grcsl) of- these programi-s offeted einhanced ear Ietirement bcticlts to employees age 55 or ilder with 10 o0 morc sears of serVicC. Tlhc seconcd gitoiup iOf these progratis of fered enhanced carly' rcriretsetst benefits to enployees age 50 to 54 with 20 or tiore cars of sertice.
Sitce e sployeecs electing to participate in the age 55 oti older VSERP had toi make their elections bli the cud of 200(1, the cost of that program was reflected its 2001 . The total cost of that pli ogram was approximatcly 583.8 million (863.5 million in pctssion tertssination bcnefits, S18.5 isillion in posutetirenscnt bcnefit costs, and S 1 .8 tiillion in education and outplacectsnt assistance costs). Of this aroictIst, BGFt recorded approxitsatey $1 3.7 million on its balance sheet as a rcgcilatory asset of its gas busitness. This amocitir Will bc amortized oxer a 5-ycar period as pto\ idecl for in prior Marxyland PSCI rate orders.
Co'witelbiimho-) 6b'wup (v~,> hzc-m,l*ub}sidiarics

/ 73
In connection with the retirement of a significant number of the participants in the nonqualified pension plans we recognized a settlement loss of approximately $10.5 million and a curtailment loss of approximately $5.8 million for those plans in accordance with SFAS No. 88.
Since the age 50 to 54 programs allow employees to make their elections beginning in January through February 2002, the cost of that program will be reflected in 2002.
We recorded a $133.0 million additional minimum pension liability adjustment as a result of the combination of decreases in the fair value of plan assets due to a declining equity market in 2001 and an increased pension liability primarily due to the VSERP We charged $59.0 million of this adjustment to an intangible asset included in "Other deferred charges" in our Consolidated Balance Sheets. The remaining $74.0 million, or $44.7 million after-tax, of this adjustment was included in "Accumulated other comprehensive income" in our Consolidated Statements of Common Shareholders' Equity and Consolidated Statements of Capitalization.
In 2000, we offered a targeted VSERP to provide enhanced early retirement benefits to certain eligible participants in targeted jobs at BGE that elected to retire on June 1, 2000. BGE recorded approximately $10.0 million ($7.6 million for pension termination benefits and $2.4 million for postretirement benefit costs) for employees that elected to participate in the program. Of this amount, BGE recorded approximately $3.0 million on its balance sheet as a regulatory asset of its gas business. We amortize this regulatory asset over a 5-year period. The remaining $7.0 million related to BGE's electric business was charged to expense.
The cost of the 2001 and 2000 voluntary retirement programs and the settlement or curtailment losses are not included in the tables of net periodic pension and postretirement benefit costs.
Obligations, Assets, and Funded Status We show the change in the benefit obligations, plan assets, and funded status of the pension and postretirement benefit plans including the effect of the Nine Mile Point acquisition, in the following tables.
Pension Postretirement Benefits Benefits
2001 2000 2001 2000 (In millions)
Change in benefit obligation Benefit obligation
at January 1 $1, Service cost Interest cost Plan participants'
contributions Actuarial loss Plan amendments VSERP charge Curtailment Settlement Nine Mile Point acquisition
045.1 25.8 76.1
42.6
63.5 9.7
(23.0) 91.8
$1,016.7 25.4 73.1
0.8 6.7 7.6
$375.9 8.4
29.2
3.0 49.1
18.5
15.0
$358.7 7.7
26.6
2.8 40.9
(41.1) 2.4
Benefits paid (72.4) (85.2) (23.9) (22.1)
Benefit obligation at December 31 $1,259.2 $1,045.1 $475.2 $375.9
Pension Postretirement Benefits Benefits
2001 2000 2001 2000 (In millions)
Change in plan assets Fair value of plan assets
at January 1 $1,030.1 $1,084.9 $ - $Actual return on
plan assets (42.7) 3.7 -Employer contribution 39.4 26.7 20.9 19.3 Plan participants'
contributions - - 3.0 2.8 Benefits paid (72.4) (85.2) (23.9) (22.1)
Fair value of plan assets at December 31 $ 954.4 $1,030.1 $ - $
Pension Postretirement Benefits Benefits
2001 2000 2001 2000 (In m/illions)
Funded Status Funded Status at
December 31 $(304.8) $(15.0) $(475.2) $(375.9) Unrecognized net
actuarial loss 207.8 49.2 107.8 61.4 Unrecognized prior
service cost 56.7 59.2 (0.4) (0.4) Unrecognized
transition obligation - - 86.9 94.8 Unamortized net asset from
adoption of SFAS No. 87 - (0.2) -
Pension liability adjustment (133.0) - -
(Accrued) prepaid benefit cost $(173.3) $93.2 $(280.9) $(220.1)
Constellation Eneigy Group, Inc. and Subsidiaries

74 /
Net Periodic Benefit Cost
We show the components of net periodic pension benefit cost
in the following table:
Near 1 nded D[ec m ber 31, 2001 2000 1999 1ii yj/llio) /
Components of net periodic
pension benefit cost Scricc cost Inter est cost EIxpected rctlrin on plan assets krirortiitriirm i)f trransitiotn obli"gtioto Z,,
Amnorti/atiorn of pIrion sert ice Cost
Recoirnized n[et actuarril loss Amnout capitatiZied as Coi/i ttCtiotl Cr
$25.8 76.1
(87.5) (0.2) 6.5 2.8
S25.,i
73.1
(83.6) (0.2)
1.6
S26.1 65.3
F76.6)
((1.2)
2.1
ost (2.5) (3.I) i-.2)
Net periodic penision fienefit cost $21.0 $0. .1i S23.0
\Vc show the components of net periodic postretirement beneht cost in the following table:
Y'ear 1 indcd [DccCrfbCer 31,
Components of net periodic postretirement benefit cost
Service cos[
Initerexs cost
Amoritization i transitis n obligationri
,CcogmriZcd ri Ct acatiMri loss ,nirnottnt capitaliZed as construction cost
Net periodic postretireicmir bncifit cost
2001 2000 ,1'In C//, ,
$ 8.4 29.2 7.9 3.3
(14.5)
$34.3
S 7. 26.0,
.9
3.1 (10.8)
$34.ýý
8 8.6
1.9 (9. 4
S3 6.5
Assumptions
Vei made the assumptions below to calculate our pension and
postretirement berefit obligations.
At 1)ccember 31,
Discoict rate t pccted r icrturii oil
plait assets
Rate Ior ct) rliipi.rlsi trl
increase
[)~lisionl Bcnc fitIS
2001 2000
7.25% -. 50"
I)Ost ciciicll ci Bene~fits
2001 2000
7.250, 7.-
9.00 9.00 N/A N/,\
4.00 4.00 4,00 ,.0)0
Ve assorined the health care inflation rates to be:
"* in 2001, 5.7% [it)r Nledicare-eligible retirees and 9 .5(6 for
retirees not covered by N Medicare, and "* iin 2002, 11 .0% -For both Medicare-eligible retirees and
retirees not coxered by Medicare.
After 2002, We assuired inflation rates xvill decrease to 7.())
in 2003, 6.5' i*i 2004, 6.0% inl 2005, and 5.5,o annually aftcr
2005.
A one-percent increase in the health care inflation rate from the assumed rates xVould increase the accuminilated
postretirement iernefit obligation by approximately S0(n3.8
million as of December 31, 2001 and wVonld increase the combined service and interest costs of the postretircmcnt benefit cost by approximately S5.9 million annuallv.
A one-percent decrease iII the heahlt care inflation rate fionr the asstrmed rates would decrease the acctrmuilated postr ctirement benefit obligation by approximatefly 5 1 .1 million as of [December 31, 200 1 and w ould decrease the combined ser\vice and interest costs of the postiretirement benefit cot by appr oximately S4.7 million anrually.
Other Postemployment Benefits V e proside the following postcmployment bcnefits:
"* health and life insurance benefits to eligible employees xho arc fournd to be disabled Under our Disability
Insurance Plan, and "* income replacement pa yments for cmploYees forrnd to be
disabled before November 1995 (pay rients fir employees Found to be disabled after that (late arc paid by an insurance company, and the cost is paid by emrployees).
The liability for these benefits totaled $48.7 million as of I December 31, 2001 and Sr46. million as of December 31, 2000.
1Effective December 31, 1993, we adopted SFAS No. 112, tinpl/oy v' Accootringfor Postmppo),ment i•4ofits. \Xc deferred, as a regulatory asset (see Note 6 on page 71 ), the postemployment benefit liability attri rbtable to our regulated UtilitY business as of Decemriber 31, 1993, consistent with the Maryland PSC's orders for postrctir emcnt berefits (described earlier in this note).
WV began to amortize the regralatory asset ox cr 15 years beginning in 1998. The \Iarylandr PS( authorized LIs to reflect this change in otr regrlaecd electric and gas base rates to recover the higher costs in 1998.
VWe assumcd the discornt i rate frr other posteroplox rent benefits to be 5.0')o inr 2001 and 5.5( in 2000.
Employee Savings Plan Benefits
We, along with several of our subsidiaries, sponsor defined contribution savings plans that are offered to all eligible employees of Constellation Einergy and certain employees of our surbsidiaries. The Sa rings Plans are qualified 4011(k) plans Under the Internal Rcveritie Code. In a defined contribution plan, the benefits a participant is to receive result from regular contributions to a participant account. Matching contributions to participant accounts are made under these plans. Niatching contributions to these plans were:
"* S12.2 million in 2001, "* $10.8 million in 2000, and "* $10.4 million in 1999.
Conste/llaton crrn•n' rop, hnie. andc ub cdiaries

/ 75
Note B. Short-Term Borrowings
Our short-term borrowings may include bank loans,
commercial paper, and bank lines of credit. Short-term
borrowings mature within one year from the date of issuance.
We pay commitment fees to banks for providing us lines of
credit. When we borrow under the lines of credit, we pay
market interest rates.
Constellation Energy
In anticipation of separating our merchant energy business from
our other businesses and to fund working capital requirements
and capital expenditures, in June 2001, Constellation Energy
arranged a $2.5 billion, 364-day revolving credit facility.
However, since we canceled prior plans to separate, we used this
facility primarily to fund capital expenditures, and working
capital requirements, including commercial paper support, for
the merchant energy business. In June 2001, Constellation Energy also arranged a $380
million, 364-day revolving credit facility to be used primarily to
support letters of credit and for other short-term financing
needs, including commercial paper support. Constellation
Energy also has an existing $188.5 million, multi-year revolving
credit facility available for short-term and long-term needs,
including support for the issuance of letters of credit.
Constellation Energy had committed bank lines of credit as
described above of $3.1 billion at December 31, 2001 and
$565.0 million at December 31, 2000 for short-term financial
needs, including support for the issuance of letters of credit.
These agreements also support Constellation Energy's
commercial paper program. Letters of credit issued under all of
our facilities totaled $245.8 million at December 31, 2001 and
$297.2 million at December 31, 2000. Constellation Energy
had cornmercial paper outstanding of $954.9 million at
December 31, 2001 and $198.7 million at December 31, 2000.
The weighted-average effective interest rates for
Constellation Energy's commercial paper were 3.73% for the
year ended December 31, 2001 and 6.31% for 2000.
BGE
BGE had no commercial paper outstanding at December 31,
2001 and $32.1 million at December 31, 2000.
At December 31, 2001, BGE had unused committed bank
lines of credit totaling $243.0 million supporting the
commercial paper program compared to $218.0 million at
December 31, 2000. BGE has a $25 million revolving credit
agreement that is available through 2003. At December 31,
2001 and 2000, BGE did not have any borrowings under the
revolving credit agreement. This agreement also supports BGE's
commercial paper program.
The weighted-average effective interest rates for BGE's
commercial paper were 2.53% for the year ended December
31, 2001 and 6.36% for 2000.
Other Nonregulated Businesses
Our other nonregulated businesses had short-term borrowings
outstanding of $20.1 million at December 31, 2001 and $12.8
million at December 31, 2000. The weighted-average effective
interest rates for our other nonregulated businesses' short-term
borrowings were 4.20% for the year ended December 31, 2001
and 8.59% for 2000.
Note 9. Long-Term Debt
Long-term debt matures in one year or more from the date of
issuance. We summarize our long-term debt in the
Consolidated Statements of Capitalization. As you read this
section, it may be helpful to refer to those statements.
Constellation Energy
On January 17, 2001, we issued $400.0 million of
Mandatorily Redeemable Floating Rate Notes that matured on
January 17, 2002.
On April 11, 2001, we issued $235.0 million of
Mandatorily Redeemable Floating Rate Notes that matured on
January 17, 2002.
In 2001, we redeemed several Notes that totaled $700.0
million prior to their maturity for a purchase price equal to
100% of their principal amount, plus accrued interest.
BGE BGE's First Refunding Mortgage Bonds
BGE's first refunding mortgage bonds are secured by a
mortgage lien on all of its assets. The generating assets BGE
transferred to subsidiaries of Constellation Energy also remain
subject to the lien of BGE's mortgage, along with the stock of
Safe Harbor Water Power Corporation and Constellation
Enterprises, Inc.
BGE is required to make an annual sinking fund payment
each August 1 to the mortgage trustee. The amount of the
payment is equal to 1% of the highest principal amount of
bonds outstanding during the preceding 12 months. The
trustee uses these funds to retire bonds from any series through
repurchases or calls for early redemption. However, the trustee
cannot call the following bonds for early redemption:
"* 7X% Series, due 2002 w 5X% Series, due 2004
"* 6Y2% Series, due 2003 n 7X% Series, due 2007
"* 6X,% Series, due 2003 m 67%!o Series, due 2008
Constellation Energy Group, Inc. and Subsidiaries

76 /
Holders of the Remarketed Floating Rate Series cie Seprember 1, 2006 have the option to require B(F 110 re purchase their bonds at face value on September I of each year. B, I'S is reCuirr ed to repurchase and retire at par als lv bords tChat are not remarketed or purchased by the rensarketriog eCnrt. B(E also has the option to redeem all or some of tdcse bonds at fiace valoe each September 1.
BGE's Other Long-7erm Debt On MaV 11, 2001, 13GF issued $200.0 million of" toating Rare Reset Notes that maritaured on [cbhruarsv 5, 2002.
Also on Mlav 11, 2001, B1Gb redeemed $200.0 million of Floating Rare Notes.
On iDecember 11, 2001, ,Gb issered S300.0 muillion 5.2aa Notes, dre I)ecerisher I 5, 2006.
Oin 111Y 1, 2000, BG E transferred S278.0 million of taxexempt debt to our metichant cncrgý bhusiness rclated io the transferred assets. Ar [)ecember 31, 2001, B3( rerimatis cOllittgentis liable for tile S26.5 aillior oursranding balance of this
debt. Or I)rcember 201 2000, B(;E. issercd S17/3.0 million of
6.75%15 Remarketablic and Redeemable Securi rties (RO.\RS) cluC I)ccceiher L5, 2012. [he ROARS contain an option tsr the tinderwriteto tt remarket the ROARS os I)ccembcr Ia, 2002 If the undcerwrirtes do riot elect to remarkct the ROARS oil that date, then B(FI must reclecm the ROARS ar 1 00%1o of the principal amounerit O(1 1)ecember 15, 2002.
W'e show the cigihrted-average interest rates and tris ty dates for BlE1's fixed-rate meclium-term notes otetsanldich ngat D)ecember 31, 2001 in the following table.
We geltehd-.\sc rage Ilsterest [(are
11 C 1)
6.98 0.66.66 6.08
2100(2 206
2((04-1006 2006-2012
2O08
Soie of'the medilLtts-term noiltes irrlder a "pet option." "ihese pett optieors allos rise Sold(ers to sell their notes back tre B[Cb oil the putt opttion dates at a [irice Cee.rLal to Io"0( of rtie prinsCipal ames0uLst. [lie feollowing is a summary of tiCdii~tt-tCtll) trotes witis put opeiols.
Series i1 Notcs P)rincipal PLIu (p014iol l[ttc.
6.75', clue 2012 S60.0 Juer 2002 mid 2(007 6.7- ,, due 2(012 $25.0 lt,, i,. 200 ,4 111 1in
BP; Obligated Mandatorily Redeemable 7I'ust Preferred Securities ()n itJune 15, 1998, 13(Gt (Capital Itiust I ('ltcst), a Delaware businiess trust established bl i3(,1' , issUed I0,000,000 TItsr Originaecd Preferred Secerities (T1OPtS) fo-r S250 million (525 ll[Ltcidations amotulesent pI prteferred secrirty) With a distriibutionr ratre of ', 16%0(.
T lhe 'Ilest ursed the nct proceeds fItoM the isstar.ncc of rhe common securities and the preferrted securities to purrchase a series oef-.16( 1 )eferrable Interest Sueordiiratcd )ebcntetres cir Jiuec 330, 2038 (debenrtCres) (torn BGb iri rise aggregate principal aillounit of 25.7 tiiillio(n \w iti tlise same term is the I'OPrS. "[he IIut e usR 11sct redeem tire IOPtrS at S25 per preferred securitn ph us acrcrued burt ettipaid distributions when rhe debentures are iltid at rssaturrity' or Upon any earlier redemption. 8Gb(; has the
option to redceetis the debentures at an 's time on or( after JcIrse 15, 2003 or at am' time whenr certain tax or othcr es'entts occur.
The interest paid on rhe debentures, which tthe TIrerstill rUse to make distributions OI tic TO)PrS, is included ict <'Interest expensc" n eiort C(oensolidated Statements of Income and is cfeducctiblie for income tax purposes.
GbE feully and uncondintonally gtarantees the IOPrS based on its vatrioies obligatiotis relating to the triuest agreement, incienrures, debentures, and the preferred sccurit> giluaraniee agreement.
"ThSe dcbentures are the on1 y assets Of the KTrtst. TI'he 'Ittsr is wholly rrwned bh BGE becasers it oss IS all the comnsmon securities of the 'liuist that have geineral oting power.
For the pa yment of'dividcends and in the event oF liquidation of[ B[CE, the debentures are tranked prior to prefercnce stock and c(Ilmlon stock.
Other Nonregulated Businesses Revolving Credit Agreement ( etisortI Link has a S50 million ernsceured revolvintsg credit agreemenst that rssarrreCS Septeiber 26, 2002. Under the tcrms of'thie a.greetsenet, Comfolrtiisk has the option to obtain loanls at vantrios rates fsrt terms elp to nrine months. CornfortLrinsk pays a facilitY fee ors risee total amount osf the commiitient. Uidier this agr eementt, Coenfortelirk had eourtstandinig S46.0 million at I)Cccmber 31, 2001 and S34.0 nsillion at I)ecember 31, 2000.
On D~eeember 18, 2001, C( •forurJink entered into a S25.0 million loan agreement with the M artland Energy Financinit .dminsistrations INlEFA). 'T'lie terms of the loan exactly match the rertlas of'variable rate, tax exempt bonds cre I)ecembcr 1, 203 1 issued by NIlF1A f(r( ComF'e rtriink to finance the cost ofI btildlingse a chilled water distribierieoni s stIC1a. I[h istnterest rate Oi
6.73{!{o, duc 20 12 Iuric 200(}- aliot 2007S25.0
(.bonstellwio•l Fnol'U} (/?•vlip, /hzc. ::I.',:~gz'
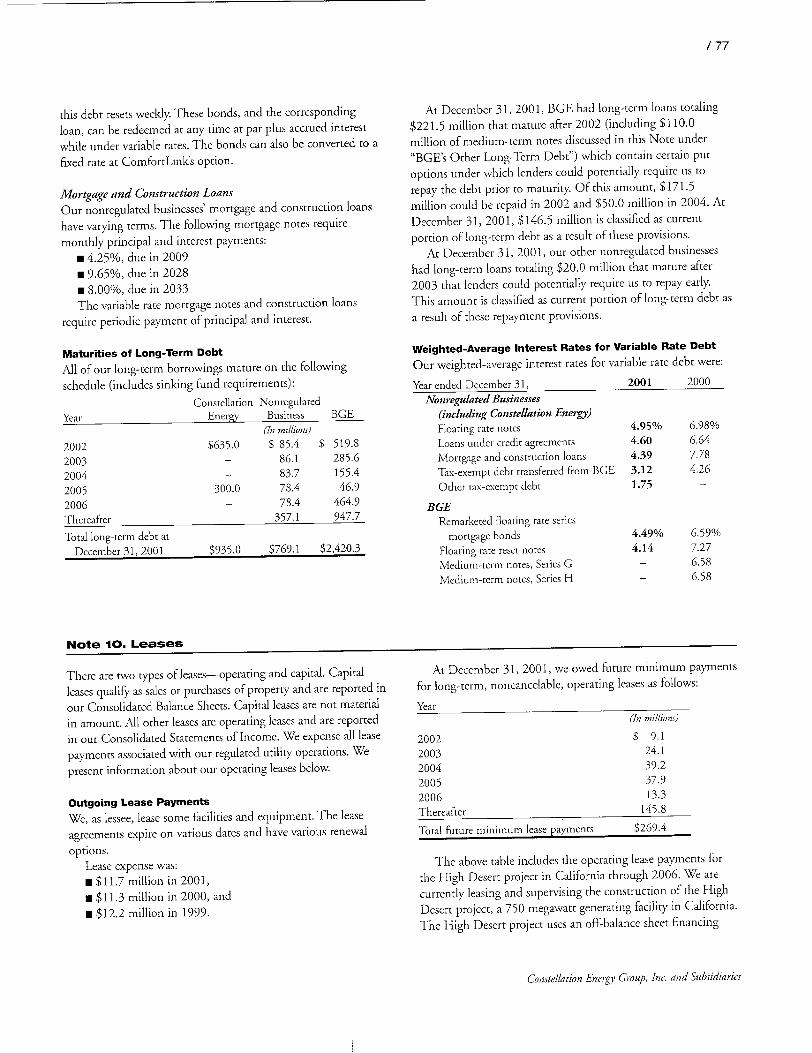
/ 77
this debt resets weekly. These bonds, and the corresponding loan, can be redeemed at any time at par plus accrued interest
while under variable rates. The bonds can also be converted to
fixed rate at ComfortLink's option.
Mortgage and Construction Loans
Our nonregulated businesses' mortgage and construction loans
have varying terms. The following mortgage notes require
monthly principal and interest payments: "* 4.25%, due in 2009 "* 9.65%, due in 2028 "* 8.00%, due in 2033 The variable rate mortgage notes and construction loans
require periodic payment of principal and interest.
Maturities of Long-Term Debt
All of our long-term borrowings mature on the following
schedule (includes sinking fund requirements): Constellation Nonregulated
Year Energy Business BGE (In millions)
2002 $635.0 $ 85.4 $ 519.8
2003 - 86.1 285.6
2004 - 83.7 155.4
2005 300.0 78.4 46.9 2006 - 78.4 464.9 Thereafter - 357.1 947.7
Total long-term debt at December 31, 2001 $935.0 $769.1 $2,420.3
At December 31, 2001, BGE had long-term loans totaling $221.5 million that mature after 2002 (including $110.0
million of medium-term notes discussed in this Note under
"BGE's Other Long-Term Debt") which contain certain put
options under which lenders could potentially require us to
repay the debt prior to maturity. Of this amount, $171.5
million could be repaid in 2002 and $50.0 million in 2004. At
December 31, 2001, $146.5 million is classified as current
portion of long-term debt as a result of these provisions.
At December 31, 2001, our other nonregulated businesses
had long-term loans totaling $20.0 million that mature after
2003 that lenders could potentially require us to repay early.
This amount is classified as current portion of long-term debt as
a result of these repayment provisions.
Weighted-Average Interest Rates for Variable Rate Debt
Our weighted-average interest rates for variable rate debt were:
Year ended December 31, 2001 2000
Nonregulated Businesses
(including Constellation Energy)
Floating rate notes 4.95% 6.98%
Loans under credit agreements 4.60 6.64
Mortgage and construction loans 4.39 7.78
Tax-exempt debt transferred from BGE 3.12 4.26
Other tax-exempt debt 1.75
BGE
Remarketed Roating rate series mortgage bonds
Floating rate reset notes Medium-term notes, Series G Medium-term notes, Series H
4.49% 4.14
6.59% 7.27 6.58 6.58
Note 10. Leases
There are two types of leases--operating and capital. Capital
leases qualify as sales or purchases of property and are reported in
our Consolidated Balance Sheets. Capital leases are not material
in amount. All other leases are operating leases and are reported
in our Consolidated Statements of Income. We expense all lease
payments associated with our regulated utility operations. We
present information about our operating leases below.
Outgoing Lease Payments
We, as lessee, lease some facilities and equipment. The lease
agreements expire on various dates and have various renewal
options. Lease expense was: * $11.7 million in 2001,
* $11.3 million in 2000, and
* $12.2 million in 1999.
At December 31, 2001, we owed future minimum payments for long-term, noncancelable, operating leases as follows:
Year (In millios)
2002 $ 9.1
2003 24.1
2004 39.2
2005 37.9
2006 13.3
Thereafter 145.8
Total future minimum lease payments $269.4
The above table includes the operating lease payments for
the High Desert project in California through 2006. We are
currently leasing and supervising the construction of the High
Desert project, a 750 megawatt generating facility in California.
The High Desert project uses an off-balance sheet financing
Constellation Enegy Group, Inc. and Subsidiaries
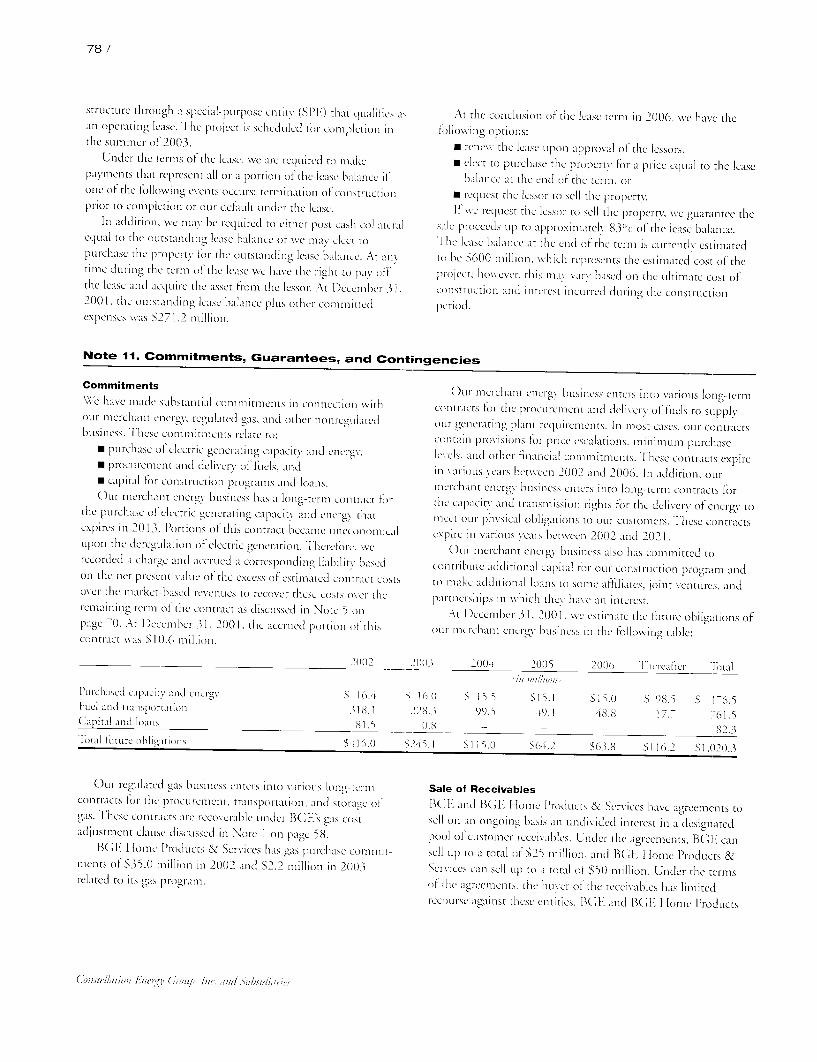
78 /
structcIre throtigh a special-pnrpose entity (SPil) that dldualifics a, an operating lease. The project is schcdllc ht tfor ntmplCtioi ill the slimmer of 2003.
Under the terms of-the lease, we arc rtccired to itike payments that represent all or a potiion oftthe lease i)lantcc if one of the followiting events occtirs: termtnation o( coilsFtrictitO prior to completion OF Otit defalt ditnWder the lease.
Itt addition. Wtc Ma\i be reqcirted to Cithet post cash collateral eqCtial tO the otLtstanding lease balance ot we may dcct to puIrchase the property f[It the odutstandiig icasc balancc. Alt a(t tille cititng the tc tIll of the lease we has C the right to pat off the lease and acititre the asset ftI1 tihe lessor. Alt icccUllbc 31, 2001, the ontstandinig Icase htlatICC plls othet cI(l ill i cCI expenIses ttas S27 1 .2 million.
At tlhe concluitotl Of the lcase telill ill 2006, wc have the ftllowitig OptiOtlS:
"* ICHcvc the lcisc upoll approval Of the lessors, " clcect to purchait tse tlc protpertt for a price equal to the lease
balaice at the Cod OF the tCtlM, O(
" requicst the lessor to sell the p[I-ttflrt I(wfe retueICst the lessor to sell the piOpfrt ts, WC guarantee the
sile proceeds op to approximatels' 83% of'tile lease balance. I'he lease balance at the end oft the tetItll is CLn cltlhs estimated to bic 600 million, which trepresetils the estimated cost of the projcct; hlowtver, this may \a5 i based otl the ultinlate cost of construction and intcicst incliced i.ring the construction period.
Note 11. Commitments, Guarantees, and Contingencies
Commitments WeZ have made suibstanitial commitmecnts [it conneictionl with
o(tr Meichait nIItIg tMc rgtlateC (1as .ttlcl OIther it (t1ICplatcd buisinIess. "lhCsc comllitlenIts i elatte t0:
"* ptirchasc of clcctiic genciating capacity aind cncrgy, " proctircment and deliscrt of' ficls. and "* capital ((It construiction programis and loans. (Xir merchant irerg.' iLisitlness has a lotg-tetrill COitiact lot
the purchase of clctric gentrating capactt and ctlert that expires itt 21013. Portios otf this contiract bcCamC uItc'toiottital iOtltI tile dcregulation ofclectric geetrattion. ITlet cftt., wc
recorded a charge and accttdiccl a corresponding liabitlit based oni the net present valdi tf tich excess of cstiiated contract costs ot cr the marketi-bascd ICVCiltiLCS tOI cCOt'Cr tilese costs OVCt tile rellainittg term of the cOIltr act as discissecd ill Note 5 oil
page 70. At l)ccctttbClt 31, 2())1, tile accruned po dOl of tiis contract was S 10.6 millionl.
()Mi itlecrchailt c g [itisiticselicss t r5 stintov tariotis loltg term toiltracts f(I titc proI( rctcttlit anti delivsrct of feils to supplh out "Ciecrating Plant irc(Itliilletlts. Ill 11(ost cases, ttor coiltracts
cottla f1 Proisiotis t fii Price CsCalttiots, Miitmll [ldi1 ' p tirchase lI els, and other Financial cotimittnlcits. These contracts expire i1 vatrdis Scars between 2002 and 2006. Ih additioll, (ttr mrcrilanlt crietr gtYt busit ss Clnttrs itnto lottg-tm cont tracts -or the capacity and transmission righits for the citlitcrs of encrt to tleCCt OLI physical obligationts ito ottr cdIstotlmeis. These contracts Cxpirc ill vatitoIs y ears betwetei 2002 and 2021. Ourt merchant cnriew bulsiness also has coimmitted to
conttibltt additional Capital ftt oldi contstruction program and to malkc additional loans to some affiliates, Joint venritores, and partnerships ill which theit have all ittCst.
At December 31, 2001, wse estitlatc the itLittite obligations of outr teillrticht t e gyn (is bitsincss itt the lt'olOtIng table:
100.4 _f005 S/In mil/,'ou.
2006 I'hcteaftftci lottal
Fe iiucl tranispoitatiot Capital andi loatis
"I'tal [-Uturc obligationis
S 16.0
ISi].0
ot regulatedi gas husiness entets into variots lotg-tcrit contracts for the procoricielent, transportation, and stotage of gas. I'host contracts are recoverable Under BGEC's gas cost adjustment clausc discussecd in Note I on page 58.
BGYI Home Prodtlcts & Setviccs has gas pucIchase contiltments of'S35.0 million ill 2002 and 12.2 million in 2003 related to its gas protgant.
S 16.0 5 1t.5 SI I S 11.0) S 98.5 S 176.5
i. .3 99.5 0).1 >8.8 1 .7 -7 61.5 0.8 - 82.3
S2. i. I S11 5.0 SO.( 2 >63.8 S1 16.2 SI, (20.3
Sale of Receivables
B(;l: and Bi" Home ltrOdUct> & Services have agrcements to sell on an ongoing basis an oundiied interest in a designated pool ofcostomeCr tccisVables. Under the agreements, BGE can sel op to a total oFS25 amillion, and B(CI Home Pioducts & Setvices can sell op to a total of $50 million. Under the terms of thc aýgiccilcnts , the bhitei of the iccenvables has limited rcOuirsc against these entities. BIl f and BGi( H omc Prodticts
(0012 No03

/ 79
& Services have recorded reserves for credit losses. At December
31, 2001, BGE had sold $8.1 million and BGE Home
Products & Services had sold $42.5 million of receivables under
these agreements.
Guarantees At December 31, 2001, Constellation Energy issued guarantees
in an amount up to $1,682.4 million related to credit facilities
and contractual performance of certain of its nonregulated
subsidiaries, including $600 million relating to the High Desert
project. The actual subsidiary liabilities related to these
guarantees totaled $369.9 million at December 31, 2001.
At December 31, 2001, Constellation Nuclear guaranteed
the $388.1 million sellers' note that financed the acquisition of
Nine Mile Point. This guarantee contains covenant provisions
that require Constellation Nuclear to maintain a net worth of at
least $500 million and a ratio of current assets to current liabil
ities of at least 1.1.
At December 31, 2001, our merchant energy business had
other guaranteed outstanding loans and letters of credit of
certain power projects totaling $26.7 million.
At December 31, 2001, our other nonregulated businesses
had guaranteed outstanding loans and letters of credit of real
estate projects totaling $15.9 million.
BGE guarantees two-thirds of certain debt of Safe Harbor
Water Power Corporation. At December 31, 2001, Safe Harbor
Water Power Corporation had outstanding debt of $20 million.
The maximum amount of BGE's guarantee is $13.3 million.
Additionally at December 31, 2001, BGE guaranteed the
TOPrS of $250.0 million as discussed in Note 9 on page 76.
We assess the risk of loss from these guarantees to be minimal.
Environmental Matters
We are subject to regulation by various federal, state, and local
authorities with regard to:
"* air quality, "* water quality, "* chemical and waste management and disposal, and
"* other environmental matters. The development (involving site selection, environmental
assessments, and permitting), construction, acquisition, and
operation of electric generating, transmission, and distribution
facilities are subject to extensive federal, state, and local environ
mental and land use laws and regulations. From the beginning
phases of siting and developing, to the ongoing operation of
existing or new electric generating, transmission, and distri
bution facilities, our activities involve compliance with diverse
laws and regulations that address emissions and impacts to air
and water, special, protected, and cultural resources (such as
wetlands, endangered species, and archeological/historical
resources), chemical and waste handling, and noise impacts.
Our activities require complex and often lengthy processes to obtain approvals, permits, or licenses for new, existing, or
modified facilities. Additionally, the use and handling of various
chemicals or hazardous materials (including wastes) requires
preparation of release prevention plans and emergency response
procedures. As new laws or regulations are promulgated, we
assess their applicability and implement the necessary modifica
tions to our facilities or their operation, as required.
We discuss the significant matters below.
Clean Air Act
The Clean Air Act affects both existing generating facilities and
new projects. The Clean Air Act and many state laws require
significant reductions in S02 (sulfur dioxide) and NOx
(nitrogen oxide) emissions that result from burning fossil fuels.
The Clean Air Act also contains other provisions that could
materially affect some of our projects. Various provisions may
require permits, inspections, or installation of additional
pollution control technology. Certain of these provisions are
described in more detail below. Since our generation portfolio is
diverse, both in the mix of fuels used to generate electricity, as
well as in the age of various facilities, the Clean Air Act require
ments have different impacts in terms of compliance costs for
each of our projects. Many of these compliance costs may be
substantial, as described in more detail below. In addition, the
Clean Air Act contains many enforcement tools, ranging from
broad investigatory powers to civil, criminal, and administrative
penalties and citizen suits. These enforcement provisions also
include enhanced monitoring, recordkeeping, and reporting
requirements for both existing and new facilities.
The Clean Air Act creates a marketable commodity called an
SO2 "allowance." All non-exempt facilities over 25 megawatts
that emit SO2 must obtain allowances in order to operate after
1999. Each allowance gives the owner the right to emit one ton
of S02. All non-exempt existing facilities have been allocated
allowances based on a facility's past production and the
statutory emission reduction goals. If additional allowances are
needed for new facilities, they can be purchased from facilities
having excess allowances or from S02 allowance banks. Our
projects comply with the S02 allowance caps through the
purchase of allowances, use of emission control devices, or by
qualifying for exemptions. We believe that the additional costs
of obtaining allowances needed for future generation projects
should not materially affect our ability to build, acquire, and
operate them.
The Clean Air Act also requires states to impose annual
operating permit fees. These fees are based on the tons of pollu
tants emitted from a generating facility and vary based on the
type of facility. For example, fees will typically be greater for
coal-fired plants than for natural gas-fired plants. Our portfolio
includes coal-fired plants and gas-fired plants, as well as plants
Conusellation Energy Group, Inc. and Subsidiaries

,-)Npqwd aq oi npyum an can mp Amy uynr ppoun"y LIO PaSUýj ý61-11 PLIUSLIVId u0p:w
IVjpaLUaJ Pa-unbai )III PalnuUqns ýý,\ 'aJOLLI!IlVý1 U! pam--)0I 'al!S 511,)[11") AqK1S DIP P"0JU PLIV 1V LIO!11-11
-jLL1UAUa)Jn4 SLIVId tiolim. IMpaLU:)J )UaLU3fdU-I! 01 STI pa.1111ba.1 IMP (".[oI\,) 'Llauluanmr..1 aLP,10 uiaunirdo(I ay qq" upio waSum v PAs m% '966 1 i3quians(I wq
III '.m] Fa) ).\OLLI,).l 01 5110pT alCl!Sý0d gAu-\ýa!.\aJ SaptIl-NI! aIPS 3SO111 -' -a.\LJ! X[f. 'ISVd -)If) Lu Pa.1111DU JO U0!IV,1!IS _111LIMU SUM 'Xý) a-JaLIM Salls Fla.%aý,40 LJOWIrMp 5"UqpJ0W DJV a" WqV
,V(I"ýq at.p ýq panýS! LIYYMG JO POWN V UO PSN S! )JP1LnJS,) S!LIJ -ýi,)DqS amwrq porpFamK) mo no hMqq r
sr pap.lo,)ai a-wal am SILRIOUIV IJULP iaLign-I UqPW C75 0 IPnW su aq NITIOD TQ0pqQ-[d W 13LUYPOJ Flaw U TDPSWjj0 jmýj ImNj Amp asayjoatio m siýo,) duUI"I,)aI(j!SS0d ý[(IULIOsva-f )III jo amqs NC11 I imxmD inn my DIMUPSD 'UrD q .N\
SauS aS,-)Lpjo l1v
ýIsa) (Inural') -)III almunsa iottur.) ý\ -siatpo.ýq pairiodo pur P011.ý\O Sal!s I-Iml-1,0JO dIIUPaj:)
,-)LP 01 I--)a(k-)J LPj,\\,6.frd alysuoR)i ý11r!]LIal0d V. paJ--)p!SL1o:) XV a" IMP 01 PYPOLI aAPq SIPUPOU alms FJOAaS PWJ NhIA OqL
1-0dý'G 'I'"
mmyphy aq pinoD amnq ny q suoynpai sd vsnoquAK Imopq pmepurw !wv yy% unu wupywoo ino wymmU, AIR mInNuoml Fdpyd v AtiopywD aMxyp uoyrD
jo sa-)inos wrypips ar oxamotl Alurld iamod pa.ty-laly liSs0:1 Aojiv,ý YK asmNmal m uyatcIptou ino qjnpiod
lary asimlp ino)o 1111sal V ýý,r -aUIjI 51LP IV 11.%%OLIý11.111 Su U0 IOD010-1d 010.ý'ýq aIII j0SI,)ajjaaJUUJ!JIII aLP put! aIISS! ;!III UO aLjI .1 11 pay XI la,ý IOU
Im.1 If,), seq anq SMUIS ]3QUI-1 aLP .ý(j paU-JýS' sv,ýý lamial't olo.ý,\j
-)Lff. -amclap LIDIVILI JO nqns ay aq m Dmipmu Quim" luciold pup suopswia sel asnoqumA d"NAY vqmpty ammy
-IV!iaIVLU OCI f-)IIIa)a.-)1IV!jCfUIa)J0 ]Sa)atl'jý -Siapo(l po-ty-imn IF 4Uv pina" pm ME ul patay aq oi pDnom
am -- ,Ftly WpI -Looj qmvwywddv.Qj paynbai Dq l1no:) a-)LIv!Idwoý) Alurid pa.ly-ICOD Ulay SUOIýS!Ufa -ýJu-)JDUI 10.11LIa-)
01 P,)P!--),)p SpLI aLj'lý AIUVId [-)aJ4-IVa) LLI0.y 'RIVIIII10d JIV ýII0pJVZVLj r '.611DJaUl JO SLI 0! SS! ILI;) jO SIDVd Uu 111JUaLl
-)IIqIIdaLJJ alrnlv.ýa nI vdA aLP S.-)JHIba.I Y)ýý.uV UMIý) ail.j. .Upqpy inn ouTn" vIcInu onuq Av u! pps;DYN ,rý" vd-A a`-PY pairiapmv aq pp(v sonypuacixo ImQo
PaULIFId -I0/pUU 'pa.1-11INH acl plzlaý sapIruad pur S)sa) IV.uo!I!ppr FlialMU IVLP a,ýý AU0!I--)V ;)D-1110ý Mau May Ly AqWS XV SMISIS JqpUV VdA oy ivy IMIU03 SLIOVTSIWý
1P qMj ly UO PSUH W-HUY OLP q U0YV =j0 LIM ay oq Inn pu way jo AV my aDunmov on aq urD maip 'Sa!i! -Ipy inn isquOr paly sipis pa)vjai-ma!-%ai a-)inoS,\\,-m .ýIIV Llaa(l
IOU AINII -ILIVId gLIj)S!Xa LIP JO U0!IV--)y!p0LL1 10ýULI atp uodn )LIaUld!f1ba lainia) LJ0!uIII0dJ!V jMJMI!ppV jo uyqpBq Dy w!nbvi UVD SpJVpm1S Lions Imawd ul
.SpiVpurlýý a:)uvuIJoj.M'j " nS,\ýaN ýO LI0!IV..)!I(JLjV JU!]LI, Iod )U! L !
Ia-unhai LIVId LIOý]V)UaUlajdUl! aIVIS PLIV UVal:) III!.\\ )NIV!JdUJa) NIIUI.Ialafý 01 SI UO!JULLI.InJUý S!Lljý -110f)DU
JaLli-Ily ýLIV saj.vi aqyj a- oi Qqn" mr pup jUl )III 01 POPLIOCIS01 a.ýVLJ a,\\ AILIV[d IV0--)-aIýVA% Mjnýl,ýSUUad
]a,\v)II .1110jo oml oI ýIsanbai U0nMLIJnJLu '.IaN\aIJVLI )n(I 'iVju-U!S ul'-)s oSF alljý %)Jaltu)lrýj UI SILIVjdiaugJr,,\\ pur WMI:) 'ý,)JOLJS LIOPIIVJýl .1110 01 apVUi SU0!IV-)yjp0LU 01 g)LIjIUIa-1 ucTmwqq lownhi VAI oy na."mi Viowtisaxq povici q
SUNI 1()()E LIJ -S]UaUI3.I!nbai .ý%ai.ýaj a:)-mos \kau si,)ý,, .1p,-, LmDr) Opy"UPUMA woutunnuV-1-1011 pur Lionviopaiap
,-)LfIjo suol)rlo!,ý "itugallp Sams unytIos Pur UUBI\ -p!jý Lu smvjdia.ý\od paj!4-jro--),jo -jaq1UnLJ V ISU!VgVS]HIS
p,1jy a.\VLl 5amIS IMa.%as pIIV ý,ý&,j aLP 'SJVAý OMI 1Wd ly JWO 'U0!I[jUI ýIaIVUu\aIddV ILU)dS a,%Vll ),%\
t ()t)-c , t ( iaquia,)a(l Liginall-1.1 -tI0!IjuU ()()ý ýjaIVL[uX0JddV ISO--) II!,N\ SJUV]d a'ý,-)Ljl It! p,-)paaLl IUaU-I(Iu1baaLP IVLP aIVtU!IS,-1 ý,\\ -a[IIJ ýVd] nI u]VusJHd pauSS! 1,,U0!IVIug)aJ VniU,\I.ýSULJa(j lx%-)Ui 01 ý()()E
.&I wouivQnho u0junpal myssym QFMY or qmNAwiqj Lu JmY DU0146)[ 01-11JO siaLIM0 aLIJ, -alni oi iurnsind
pan"! quopqnhvi pup;6rlV =w oi jMZ.Kqn Nq wouicly-Ib UO!Dnpal LJO!SS!Ula 'gLuIjUISLu am a" MqPq J,-)Uoqx, inn IV pur
PIFINP )AULI SaJa-JS LI0pLmJH )III )\,7 -ILIau-1jSa2\U1 FiVND Irtiopplop Ouppro vpMVI guy,; pup man qwq
ýOaýJV U0!IIQw qIIINUM&W-A Pup MAY LY POPM)l o.op Typp DFI, xAlA ay wpun swatuapnba-i uopmpai
\Oý\j oi i,),ýqns ).it,, L10pV.IaUagJ aLp jO ýuvj ýf Aa-I1Ijjpuad\,) lm!dm
10 ILMAWU nuirs xp onnK Inn Ipm pup YtioproaW VIKI Dy ),-),-)LLI .ýppa.TJV,ýUUI SIUVId paJy-IVOý) JAW)LI in0jOaLLIOS 'Ja.ýa.ý\OLI
'0AnV1I!LI! ';!III -faPun \ON Y) Iag).m.] jUd!-)Lnjd Va-1V SILIUld ia.%ýod p;).i.q-IV.o,) ýq IagJpnq
\ON '!,)III ]a,-)UI 01 ILIa!,)yj-,ISSj0-1)Ua-) I1I,-)LUajduu o) Salvpý' sDpnhj qn-I jAA DIL pumYsImy PU"RIJ11q, QPPLIT
ýIV15 LIDVaRy IagJpTI(I LI0!1NjLU,) \ON V PnV 'i, Tual(laý' tl-,1110.1111 .ýVjýf Lllaý4 sU1I-I Ll:)!LINý -LIOSUas X10/a UV SaLISýJ(Iuvs,-) ,-)pj "qH vy Spy wyo &mwV latIozojo mumod m
ol V!quilljoý)jo ay pur ýalrls tuaVorl 11 2upnbm spu r pony ("H) hunIV mqwuqj
Fwa""'nWA DY '806t '-j daclor)() LJO 'sLI0!IVpL1aUIMWa-I QrtoM) umumamV imdsunqýuoq) ny jo ilnui v qT
'LIOSIý,IS aLI0/.0JaU1UIIISaIII -imptip siapoci V!JISupLu May SU0!I:)I1p,1I -)pulNI! SLI0!IVpLI,-)LLILUa)aJ
asIltl'i ApJVpLIVIS Imapal IUaJJ1I,) pt.10,6(j 0g) IMP ýLIOIY)npa.l KIM; NON lVLI0TI!ppP PapUaUiU.I0-),-)J SVLj 'SaIVIS U.Ialsu-ýj
JILIV 11"1qXCNjY LC ay Way SlYDY0 &MqnhJ qU IV0q pUV )IVISY) p,-)ýOdUla-) 'dual") JUaUiY1;,ýSSA,' )i0dSLIUijaLI0Z() xjjý
'SISOý) Ju0 aSUa.DLII ]at] 01) Sa,ýj aLl]. -SU0!SS!U1,) s5al IVJ AýVLJ
yauglond pup Mlos sr If')TIs
/02

/81
to remedy the contamination are estimated to total $47 million.
We have recorded these costs as a liability on our Consolidated
Balance Sheets and have deferred these costs, net of accumu
lated amortization and amounts we recovered from insurance
companies, as a regulatory asset. Because of the results of studies
at these sites, it is reasonably possible that these additional costs
could exceed the amount we recognized by approximately $14
million. We discuss this further in Note 6 on page 71. Through
December 31, 2001, we have spent approximately $37 million
for remediation at this site. We do not expect the cleanup costs of the remaining sites to
have a material effect on our financial results.
Litigation In the normal course of business, we are involved in various
legal proceedings. We discuss the significant matters below.
California
Baldwin Associates, Inc. v. Gray Davis, Governor of California
and 22 other defendants (including Constellation Power
Development, Inc., a subsidiary of Constellation Power, Inc.)
This class action lawsuit was filed on October 5, 2001 in the
Superior Court, County of San Francisco. The action seeks
damages of $43 billion, recession and reformation of approxi
mately 38 long-term power purchase contracts, and an
injunction against improper spending by the state of California.
Constellation Power Development, Inc. is named as a defendant
but does not have a power purchase agreement with the State of
California. However, our High Desert Power Project does have
a power purchase agreement with the California Department of
Water Resources. We believe this case is without merit.
However, we cannot predict the timing, or outcome, of it or its
possible effect on our financial results.
Employment Discrimination
Miller, et. al v. Baltimore Gas and Electric Company, et at - This
action was filed on September 20, 2000 in the U.S. District
Court for the District of Maryland. Besides BGE, Constellation
Energy Group, Constellation Nuclear, and Calvert Cliffs Nuclear
Power Plant are also named defendants. The action seeks class
certification for approximately 150 past and present employees
and alleges racial discrimination at Calvert Cliffs Nuclear Power
Plant. The amount of damages is unspecified, however the plain
tiffs seek back and front pay, along with compensatory and
punitive damages. The Court scheduled a briefing process for
the motion to certify the case as a class action suit for the
beginning of 2003. We believe this case is without merit.
However, we cannot predict the timing, or outcome, of it or its
possible effect on our, or BGE's, financial results.
Asbestos
Since 1993, BGE has been involved in several actions
concerning asbestos. The actions are based upon the theory of
"premises liability," alleging that BGE knew of and exposed individuals to an asbestos hazard. The actions relate to two types of claims.
The first type is direct claims by individuals exposed to
asbestos. BGE is involved in these claims with approximately 70 other defendants. Approximately 545 individuals that were never employees of BGE each claim $6 million in damages ($2
million compensatory and $4 million punitive). These claims were filed in the Circuit Court for Baltimore City, Maryland in
the summer of 1993. BGE does not know the specific facts necessary to estimate its potential liability for these claims. The specific facts BGE does not know include:
"* the identity of BGE's facilities at which the plaintiffs allegedly worked as contractors,
"* the names of the plaintiff's employers, and "* the date on which the exposure allegedly occurred. To date, 36 of these cases were settled for amounts that were
not significant. The second type is claims by one manufacturer-Pittsburgh
Corning Corp. (PCC)-against BGE and approximately eight others, as third-party defendants. On April 17, 2000, PCC declared bankruptcy, and BGE does not expect PCC to prosecute these claims.
These claims relate to approximately 1,500 individual plain
tiffs and were filed in the Circuit Court for Baltimore City,
Maryland in the fall of 1993. To date, about 375 cases have
been resolved, all without any payment by BGE. BGE does not know the specific facts necessary to estimate its potential liability for these claims. The specific facts we do not know include:
"* the identity of BGE facilities containing asbestos manufactured by the manufacturer,
"* the relationship (if any) of each of the individual plaintiffs to BGE,
"* the settlement amounts for any individual plaintiffs who are shown to have had a relationship to BGE, and
"* the dates on which/places at which the exposure allegedly occurred.
Until the relevant facts for both types of claims are determined, BGE is unable to estimate what its liability, if any, might be. Although insurance and hold harmless agreements
from contractors who employed the plaintiffs may cover a portion of any awards in the actions, the potential liability could be material.
Asset Transfer Order
On July 6, 2000, the Mid-Atlantic Power Supply Association (MAPSA) and Shell Energy LLC filed, in the Circuit Court for Baltimore City, a petition for review and a delay of the
Maryland PSC's order approving the transfer of BGE's generation assets issued on June 19, 2000. The Court denied MAPSA's request for a delay on August 4, 2000, and after a
hearing on the petition on August 23, 2000 issued an order on
Constellation Fnergy Group, Inc. and Subsidiaries
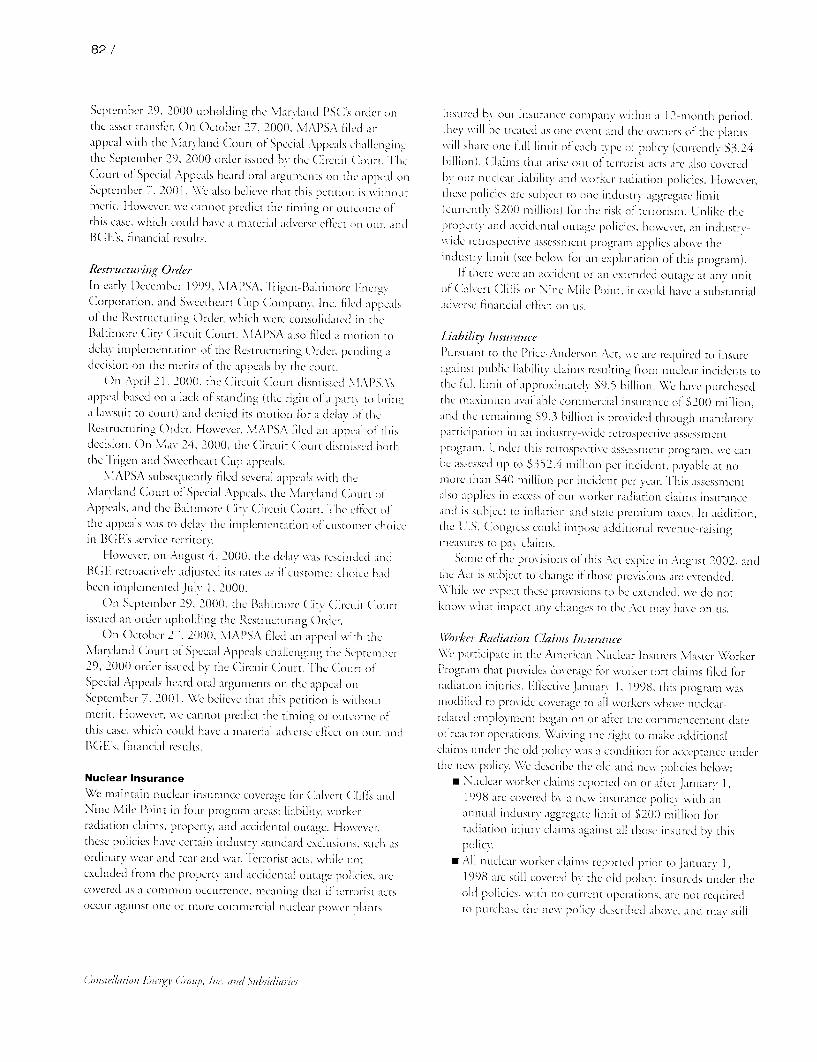
82 /
September 29, 2000( upholding he Maryland PSC's order on the asset transfer. On October 2 7, 2000, MAPSA filed an appeal with the [aIryland Cunrt ofSpecial Appeals challengzig the September 29, 2000 order issued be the Circuit (ocurt. I fie Court of Special Appeals heard oral arguments on the appcal on September 7, 2001. \Ne also believe that this peition Is withoui meriti. ossevcr, WCe cannot predict the timting or ourconiC Of' ihis case, which could have a material advcrsc effect on our, and B(-'.1s, financial results.
Restructuring Order In earls Decembei 1999, NIAPSA, ITrigen -altimorc I -ierg Corporation, and Sweetheart ('tIp (ompany, Inc. filed appeals of the Restrucrctucriing Ordrct, which were consolidated in the Baltimoie City (Crircttit Cocrrt. NIAPSA also filed a motion (o delay implemcntition cIf the RCstructuring Or cerde, pcrding a decision oin the merits of the appeals byx the coccrt.
On April 21, 2000, the (Cit iccurt Cocii dismissed M,\I S\'s
appeal based on a lack oFstanding (the right otia part>i to brin a lawsuit to coirt) and denied its motion fin a dclaiv of the Restructctring Order. Howevcs, NlAPSA filed an appeal of tis decision. On Nlav 24, 2000, the Cirrcuit Court dismissed both the Ilrigen and S\ "eethcart C(up appeals.
MAPSA scibsecquCently filed several appeals with the NMtar vland cicourt cit Special Appeals, the N lar land ('ocirt 01' Appeals, and the Baltimore Cits Circcuit C(octr. The K cct Of' the appeals was to delay the implemeritation of cCIstomc r cllicrice In BGE's servicc territort.
HlosVCser, Ocu Acgust 4, 2000, the clc'ay was resciicdecd and B( 1 retioactively adjUStcd its rates as ii customer chCoice had been impleileitecd Jily 1, 2000.
On SeptcCiiber 29, 1000, the Blalthmore LCity C uit Court issuecd an oirder Ipholdiig the Resncictcturng )Ordcr.
On ()cictcr 27, 2000, Xl,-\PSA filed an appeal with the Staryland Court ofSpecial Appeals challenging the Scptccr1Ibe 29, 2000 order isscecd by the C(ircorit CocIrt. TI'le ( Curit 0'
Special Appeals heard oral arIgcMents Oi the appeal oii Septcmber -, 200(1. \V 5C beliesve that this petition is %%ithocit tierit. However, weC cannot predict the timing uOr ocItcorIe Of' this case, which could have a material adverse cAicct ri our, ard BG1's, financial csults.
Nuclear Insurance "We maiitiin nuclcar iIraceriicc' cc Oeragc (cit C alxCrt (Cillfs ald Nine Mile Point in fOin progrinai, areas: liability, workcer radiation claims, properttx.i anrld acciderital outage. Howeser, these policies have certain iridListIry standard exclusions, such is oidinary wear and tecart a x ar. d Trorist acts, x hile not excluded from the propeirty and accidental outage policies, arc cover-ed as a coonrnntl occuirrence, nearnirig tliat if ttrrorist acts occuIr against oinc more commercial ricclear powesr plants
riscIreCd by oir minscianice cOcrpairix V Within a 12-ronith peIiod, theylic will bc treatecd as oic event and the o% ricr xS cf the plants will share oric 6.l! liriit Of each tspc cOF pOIlicy' (cirI rentl SB3.24 billion). Claims that arise out ofr terririsi acts are also covered 1i cir V II nuclear Iiability and workcer radiaioni policies. However, Ithisc policies are sutiicct co oic inclustrt aggregatc linirt (currcii cu S200 million) focm the risk otcitrorisnm. Unlike the lropcrte n ard acciderital otitagc policies, howevei , an ihdLlcstrx. wide retrospectiveC assissment piograni applies above the induxstir liriiit (sec belio fcir an explariatior cf this program).
If there were an accident or an extended ocitage at MINi ciri1t if Calvert Cliff's oi Nine Mile Point, it could haVe a sulbstauntial Adclrsx finOaricial effect Oin cis.
Liability hisurance Pittr xScatrt tcrt[e Price-Andersor Act, \%C are cectilired to itistire againrist public liability claims rLSclhing 11ciii nuIclecar incidents to
the fullt limit ofuapproximatcly S9.5 billion. Se have e picIihasecd the maximni available coMiMercial insIiracC ofi S200 Million, ancd the reiiarining S9.3 billion is p-o\idcd thloughi i mandatory Participation iii an i noticistirx-w tIde retrospectivc asscssxiierit program. Undier this rctrospccti\-c assescmerit prograrii xwc cani be assessed tip to S3S2.4 million pei incident, payable at no more than SS40 million per incidleit pc+ Year. This assessment lo api plies in excess oit cio ixrkci rad ia tion claims intixsrarice
aid iS sxcbjcCt to inifiation and state p rcmiuin taxes. In a dditior, the U.S. SCo cngress could iroposc additiocnal ausii iiicastuics to pas cv Claims.
Some of the provisions oi cthis Act expire in AScguist 2002, and the Act is subject to chaige ifthose provisions are exteidecd. 55hile we expect these provisions to bc extended, wc do not kLois what inpact any changes to the Act Mai ha\s Oli c Is.
Worker Radiation Claims Insurance We participate in the Strictican Nuclcar ITusur~erS .\Maste+r SN crkcr Program that piovides (dxcirage for worer tort claims filed for radiation injuries. Idffcctive Jairar y 1, 1998, chixs pi ogram was rmodified to provide covciage to all workers ws-hosce ritclcairclaited employicnr began on oi after the commenceiecnt date oFc recio opeiations, Wa5iving trie right to make additionial laiims under the old polic"v xxas a condition cfir acceptance Linder
thre ness piolic.\. Wc describe the old and ness policies below: " N\uclear woikcr claimIs reported oi oi- aifter Janiariir 1,
1998 are covcrcd bl% a ricw inuicirance policsy with an annuial induIstri aggregiate limit OF i200 2111iilliont] r radiation inijurt claims against all those insurcd by this polico-.
"* All nicrclcar worket claims reportced ptior to Januari cr 1998 arc still covei cd by the old polic>- Inxsurccls under the Old policies, With ii0 curtcii opeirationis, are riot recquired to pirchase the nsw policsy dcxcscibcd above, and may still
(.cnistc'l/aion 1 oKi (")_0l1/,, hI. awc Sitsidt res

/ 83
make claims against the old policies through 2007. If
radiation injury claims under these old policies exceed the
policy reserves, all policyholders could be retroactively
assessed, with our share being up to $6.3 million.
The sellers of Nine Mile Point retain the liabilities for
existing and potential claims that occurred prior to November
7, 2001. In addition, the Long Island Power Authority, which
continues to own 18 percent of Unit 2 at Nine Mile Point, is
obligated to assume its pro rata share of any liabilities for retro
spective premiums and other premiums assessments. If claims
under these policies exceed the coverage limits, the provisions of
the Price-Anderson Act would apply.
Property Insurance
Our policies provide $500 million in primary and an additional
$2.25 billion in excess coverage for property damage, deconta
mination, and premature decommissioning liability for Calvert
Cliffs or Nine Mile Point. If accidents at any insured plants
cause a shortfall of funds at the industry mutual insurance
company, all policyholders could be assessed, with our share
being up to $56.2 million.
Accidental Outage Insurance
Our policies provide indemnification on a weekly basis resulting
from an accidental outage of a nuclear unit. Initial coverage
begins after a 12-week deductible period and continues at
100% of the weekly indemnity limit for 52 weeks and 80% of
the weekly indemnity limit for the next 110 weeks. Our
coverage is up to $490.0 million per unit at Calvert Cliffs,
$335.4 million for Unit I of Nine Mile Point, and $412.6
million for Unit 2 of Nine Mile Point. This amount can be
reduced by up to $98.0 million per unit at Calvert Cliffs and
$82.5 million for Nine Mile Point if an outage at either plant is
caused by a single insured physical damage loss.
California Power Purchase Agreements
Our merchant energy business has $296.4 million invested in
operating power projects of which our ownership percentage
represents 146 megawatts of electricity that are sold to Pacific
Gas & Electric (PGE) and to Southern California Edison
(SCE) in California under power purchase agreements. Our
merchant energy business was not paid in full for its sales from
these plants to the two utilities from November 2000 through
early April 2001. At December 31, 2001, our portion of the
amount due for unpaid power sales from these utilities was
approximately $45 million. We recorded reserves of approxi
mately 20% of this amount.
These projects entered into agreements with PGE and SCE
that provide for five-year fixed-price payments averaging $53.70
per megawatt-hour plus the stated capacity payments in the
original Interim Standard Offer No. 4 (S04) contracts. These
agreements also provide for the payment of all past due
amounts plus interest, which the projects expect to collect
within the next two years. The SCE agreement to pay these past
due amounts is contingent on SCE making certain payments to
other creditors.
As a result of ongoing litigation before the FERC regarding
sales into the spot markets of the California Independent
System Operator and Power Exchange, we may be required to
pay refunds of between $3 and $4 million for transactions that
we entered into with these entities for the period between
October 2000 and June 2001. While the process at FERC is
ongoing, FERC has indicated that we will have the ability to
reduce the potential refund amount in order to recover
outstanding receivables we are owed. FERC also has indicated
that it will consider adjustments to the refund amount to the
extent we can demonstrate that its refund methodology resulted
in an overall revenue shortfall for our transactions in these
markets during the refund period.
Note 12. Risk Management Activities and Fair Value of Financial Instruments
Risk Management Activities
In 2001, we entered into forward starting interest rate swap
contracts to manage a portion of our interest rate exposure for
anticipated long-term borrowings to refinance our outstanding
commercial paper obligations and maturing long-term debt. The
swaps have notional or contract amounts that total $800 million
with an average rate of 4.9% and expire in the first quarter of
2002. The notional amounts of the contracts do not represent
amounts that are exchanged by the parties and are not a measure
of our exposure to market or credit risks. The notional amounts
are used in the determination of the cash settlements under the
contracts. At December 31, 2001, the fair value of these swaps
was an unrealized pre-tax gain of $36.3 million.
At December 31, 2001, these swaps were designated as cash
flow hedges under SEAS No. 133. We recorded this unrealized
gain in "Other current assets" in our Consolidated Balance
Sheets and "Accumulated other comprehensive income," net of
associated deferred income tax effects, in our Consolidated
Statements of Common Shareholders' Equity and Consolidated
Statements of Capitalization. Any gain or loss on the hedges will
be reclassified from "Accumulated other comprehensive income"
into "Interest expense" and be included in earnings during the
periods in which the interest payments being hedged occur.
In 2002, we entered into additional forward starting interest
rate swaps with notional amounts that total $700 million.
These swaps have an average rate of 5.9% and expire in the first
quarter of 2002.
Constellation Energy Group, Inc. and Subsidiaries

84 /
Our powsr etrthttkettng oprraitott rtanages the commodits price risk of ottt electric t l cneration operations as pal t of' its overall porttolio. [n order to manage this risk, ottr mcrChanlt eCtIer sbLISitness -atlNt cltter into fixCd-price dcrvarti\c oir t1c derivative contracts to he~dge the v.riability in) fiuluecs l ow
Irot) forecastcd sales oftelectricit t i attd pUillhases or fttel as discttssetd Ill Note 1 oil page 59.
At I )ceelthr 31, 2001, oUr mirchant enct,,g btstness had designaeti certtait ftixtd-pricc te rward tlectricitit sale otit ,t ts cash-flow hetdges ofIti ccasted sales Of elcctrticittv tfr the ytats 2002 tlhtotigh 2010 tinder SFi\5 No. 13.3.
,At 1)Ceeelher 31, 2001, ottt lerchant cncrg, buis 1intss recorded ielt Utitrealited pre-tax gains ofi 76.5 milliot tn thlst hedges, net oftassociatet deferrledi Income tax difetts, ill "X tt'tMUl[ttetd other comprehensive ilncome." WXe expect to
reclassiftv $5.7 million of-nct pre rax 1gttins on cash-flow hedges ftom "Accumulated other comprehensive incot itme" t tito earttittgt titir itlg rhe next tsvslve motrhs based otl the market prices at December 31, 2001. f iowcvcr. the actual amount reclassified Intt earlings coUld Vatt\ fro-0 tlt [ tle aotltttls recorded at
DIecetilbhe 31 , 200 1 cilte to lIt'ttit'C citlltges ill ttarket prices. i[t 2001, there xwas no hedege tntfeeticxness recog iztdtt it1 earttitcgs.
A I)ecember 3 1, 2000, otr tenCi-Ciant cncrgi bhtsitess recorded cci ceft ree r-tax ltedge losses otf 58.3 milliontt in "-Other deferred charges" in our Consolidati l Balarce Sheets fir the eixed-pitee fottward electrticits sale contracts dcesigtattd as a hedlge oF ftrecasted sales ofCleciricitv. We C rclassitftei these dceerred hiecdge losses, sict of associated deferred income tax Cf'fCCtiS, to "ACCLtitltteaCd oither cotstptehettsisC ittet"tte -tlupoit the adoption ofitSFAS No. 133, it the tirst quttarter of 2)00I.
Fair Value of Financial Instruments "lThi ftr salte Cal t of i a tcil itts tr ett ites teprt esenil s tCI t oeut at Which tile itstr itent iciIould bc exchandcl it a ctrctnt t'an.iaction betwheet willing pattics, other cthat ill a fitccd salt or liquidation. Significatlt dife terttes ce nt occur between the ftir VA.tLIC MtidL M'l'v Io HOLIFItl Or"fil'la.lldal illS~tlllMMUS that4 M.IC
recorded at histoitcal amo. tts. \X •c tSc the ftllowixtg tttetltods anid assuiiptlors ForI estirl~tingp Ffir VaIlIe discIosure-s t'()r fi nanc-ial ili~st rt m-llts:
* Cash a<td cash citialenIts. tet Icoeittirts recixablc, otlcr CtLnrtCit <issets, certalll CeitrICrtL liabilities, short-tell borrowitngs, current portion oflttg-term debt, a<td certaiti dceferrd credits arid oItt r liabilities: because Of t IleI shiotrrterIIt1 Iitttrcite, the <lltiIt tS repoittd iI our CiosoindIa teed Balance Sheets approximate •fair vaIlue,
* illcstments and other assets where itx was practicablc to estittlate fýtir VaIltC: the fCiir valuce is based or qcittIcd market prices where available, and
0 fitt long-term debt: the failr xahitr is tasecd oil quoted market prices wtiere asailatle or bt el iscouttintt Iig Ierte<aillitg C a~s h f• icw s a t c irI r 'e ttn m a rk e t ra te s .
\XX e cisows the carrying <tittOLttS and fti a tlues Of f titancial issrrlMeits included in otir (Consolidated Balance Shiters itt the Itllisitg tale, att s eeeseritbe some of thle itettts scparately later ill t[its section.
A l • ) c itsit r 3 1 ,
Jr csmlCiuts itd ochile tSSits felr wich ie is:
PzimcziabIc to
estiliate fuir slc $1
I sest11irmtic t al eIt
h~xcd-ratc lorig-ter)
diet 2 ',itri I c -i r tc loir g -te rl t
(l -,t 1
2001 2000 ý,Zlvyirl ]a;il (Carrm i g F;Iir <Iotlrlt V t . Van tiC
Ic n r N 'cci' ; Cs' ci } i s r /I
,144.9 S1,144.9 S 3-49.8 S 349.8
25.8 N/A 32.7 N /A
,945.3 3,069.6 2,-34. 1 2, 81 i.9
,179.1 1,179.1 1,331.8 1 3-31.8
It sas ,(ot practicable to estimatt tite fa li VaiLe Of itnvestmertts field by oitr itotregtluatCed bBIsintesses ill sexecral ftlltatcia] p rtrierships thiat ittyvest ill tio tpublic debt and eqiuity secti ies. T 'his is bec~acse the timiitg <tild arttottntt of-cassit flowst fiom these invtestmenits arc difficcult to Predict. WX eeport these ittvestmrtents at their original cost 11 Oitr (ionsolidated Balance Sheets. lhe inxvestttmetlts ill fittancial partleirtships totaled S25.8 iillion at I)ecetber 31 , 2001 and 53).7 millicn at IFecebrth
31 , 2000, reptresentitg otwnershitp in terests tip no I 11 it. The total assets otall of ttese partterships totaled $5.4 billion at I[)cctber 31, 2000 (which is the latest information available).
Citarantees
It ',as not practicable ti ciererrmttie ithe F~ttr Vaute Of crrtaiirn loant gct"i iratees of" (tonstellation Eniergy and its sttbsidiaries. (ionstellation 'nr gtar ,tianteed ctttstandiig edebt Of S,.) ttmilliont c I)ecmber t 31, 2001 and $341.0 million <it December 31, 2000.
Our merchant cieneg business giuaranteed oitstanditg debt totaling $414.8 million at IDeciethr 31, 2001 atid S33.6 million at: December 31, 2000.
O0t tOther ttisttregtIUkCed buIstinesses guarantecd itttstardict debt totaling SI15.9 million at I'eccnbtr 31, 2001 acid SI6(.5 million at December 31, 2000.
B(G 1, gtarartteed oscitanrditeiing debt of 8263.3 tiilliot at I )eccember 31 , 2001 attd 2000.
\XXc do not anticipate that wxc sill need to f'tind these "guarantees.
(,il.ýrc/atiom tli) , ') (,rollp, Inc. i md ,lbsidi, wit's

/ 85
Note 13. Stock-Based Compensation
As permitted by SFAS No. 123, Accountingfor Stock-Based Compensation, we measure our stock-based compensation in
accordance with Accounting Principles Board Opinion (APB)
No. 25, Accountingfor Stock Issued to Employees, and related
interpretations. Under our existing long-term incentive plans, we can issue
awards that include stock options and performance-based restricted stock to officers and key employees. Under the plans,
we can issue up to a total of 6,000,000 shares for these awards.
Stock Options In May 2000, our Board of Directors approved the issuance of
nonqualified stock options. Options have been granted at prices
not less than the market value of the stock at the date of grant,
generally become exercisable ratably over a three-year period
beginning one year from the date of grant, and expire ten years
from the date of grant. In accordance with APB No. 25, no compensation expense is recognized for the stock option
awards. Summarized information for our stock option awards is as follows:
2001 Weighted
Average Exercise
2000 Weighted
Average Exercise
Shares Price Shares Price
(In thousands, except per share amounts)
Outstanding, beginning of year 2,420 $34.65 - $ Granted 1,015 25.08 2,462 34.64
Exercised (512) (34.25) -Cancelled/
Expired (277) (37.74) (42) (34.25)
Outstanding, end of year 2,646 $30.73 2,420 $34.65
Exercisable, end of year 235 $34.25 -
Weighted-average fair value per share of options granted $ 9.27 $ 5.60
The following table summarizes information about stock
options outstanding at December 31, 2001 (shares in thousands):
Plan Year
2001 2000
Exercise
Prices
$25.08
$34.25
Number Outstanding
1,015 1,631
Weighted-Average Remaining Contractual Number
Life Exercisable
9.9 8.4 235
Performance-Based Restricted Stock Awards In addition, we issue common stock based on meeting certain
performance and service goals over a three to five year period.
This stock vests to participants at various times ranging from
three to five years or less. In accordance with APB No. 25, we
recognize compensation expense for our restricted stock awards
using the variable accounting method. In 2001, due to non
attainment of performance criteria, we recorded a credit to
compensation expense of $10.1 million. We recorded compen
sation expense of $16.3 million for 2000 and $10.5 million for
1999. Summarized share information for our restricted stock
awards is as follows:
2001 2000 1999
(In thousands, except per share amounts)
Outstanding, beginning of year 377 323 350 Granted 87 353 358 Released to participants - (277) (362) Cancelled (29) (22) (23)
Available for grant, end of year 435 377 323
Weighted-average fair value restricted stock granted $35.24 $32.89 $28.61
Pro-forma Information
Disclosure of pro-forma information regarding net income and earnings per share is required under SFAS No. 123, which uses
the fair value method. The fair values of our stock-based awards
were estimated as of the date of grant using the Black-Scholes
option pricing model based on the following weighted-average assumptions:
Risk-free interest rate Expected life (in years) Expected market price
volatility factors Expected dividend yields
2001
4.79% 5.0
2000
6.37% 10.0
41.3% 21.0% 1.8% 5.7%
Had compensation cost for these plans been recognized under the fair value method, net income and basic and diluted earnings per share amounts would have been as follows:
Pro-forma net income Pro-forma earnings per share:
Basic Diluted
2001 (In millions, except per share amounts)
$87.2
$ .54 $ .54
The effect of applying SFAS No. 123 to our stock-based
awards results in net income and earnings per share that are not materially different from amounts reported for the year ended
December 31, 2000.
Constellation Energy Group, Inc. and Subsidiaries

86 /
Note 14. Acquisition of Nine Mile Point
On November 7, 2001, we completed our purchase of Nine Mile Point located in Scriba, New York. Nine Mile Point consists of two boiling-water reactors. Unit 1 is a 609-megaw att reactor that entered service in 1969. Unit 2 is a 1,148-megawatu reactor that began operation in 1988.
Nine Mile Point Nuclear Station, LI-C, a subsidiary of Constellation Nuclear, purchased 100 percent of Nine Mile Point Unit 1 and 82 percent of Unit 2. Approximately one-half of the purchase price, or S380 million, in addition to settlement costs of S2.7 million, was paid at closing. The remainder is being financed through the sellers in a note to be repaid over five years with an interest rate of 11.0%. This note may be prepaid at any' time without penaltn The sellers also transferred to us approximately $442 million in decommissioning finds. As a result of this purchase, we own 1,550 megawatts of Nine Mile Point's 1,757 megawatts of total generating capacity.
Niagara Mohawk Power Corporation was the sole owner of Nine Mile Point Unit 1. The co-owners of Unit 2 who sold their interests are: Niagara Mohawk (41 percent), New York State Electric and Gas (18 percent), Rochester Gas & Electric Corporation (14 percent), and Central Hudson Gas & Electric Corporation (9 percent). The Long Island Power Authority will continue to own 18 percent of Unit 2.
We will sell 90 percent of our share of Nine Mile Point's output back to the sellers at an average price of nearly $35 per megawvatt-hour for approximately 10 Years under power purchase agreements. The contracts for the output are on a unit contingent basis (if the output is not available becauise the plant is not operating, there is no requirement to provide output from other sources).
Nine Mile Point Net Assets Acquired At Novxember 7, 2001
C urrent Assets Nuclear Decommissioning Trust Fund Net Properoy, Plant and Equipment Intangible Assets (details below)
lotal Assets Acquired
Current Liabilities Deterred Credits and Other Liabilities
Net Assets Acquired Note to Sellers
'Intal cash paid
(In millions)
$135.4 441.7 292.6
38.7
908.4
16.9
120.7
70.8
388.1
S382.7
"Phe intangible assets acquired consist of the following:
Description Art
SOperating procedures and manuals Permits and licenses Software
"Iotal intangible assets
\WeightedAverage
nfouint Useful Life Mil/ion) (In years) 23.4 10 12.9 27 2.4 5
S38.7
In 2002, Niagara Mohawk, or its successor, will provide funds equal to the net pension obligation of Nine Mile Point employees following a more precise estimate of this obligation. Refer to Note 7 on page 72 for additional information.
Constellation ieorg), Group, Inc. and Sbsidiaries

/ 87
Note 15. Quarterly Financial Data (Unaudited)
Our quarterly financial information has not been audited but, in management's opinion, includes all adjustments necessary for a fair
presentation. Our business is seasonal in nature with the peak sales periods generally occurring during the summer and winter months.
Accordingly, comparisons among quarters of a year may not represent overall trends and changes in operations.
2001 Quarterly Data Earnings Earnings
Income Applicable Per Share of from to Common Common
Revenue Operations Stock Stock
(In millions, except per-share amounts)
Quarter Ended
March 31 $1,147.1 $235.0 $111.8 $0.74
June 30 843.2 171.0 75.6 0.46
September 30 1,036.1 317.5 163.6 1.00 December 31 901.9 (365.7) (260.1) (1.59)
Year Ended
December 31 $3,928.3 $357.8 $ 90.9 $0.57
Our first quarter results include a $8.5 million after-tax gain
for the cumulative effect of adopting SFAS No. 133.
Our fourth quarter results include workforce reduction costs,
contract termination related costs, and impairment losses and
other costs totaling $334.8 million after-tax. For details, refer to
Note 2 on page 64.
2000 Quarterly Data Earnings Earnings
Income Applicable Per Share of from to Common Common
Revenue Operations Stock Stock
(In millions, except per-share amounts)
Quarter Ended March 31 $ 994.0 $184.6 $ 72.1 $0.48
June 30 866.6 132.1 39.6 0.26
September 30 968.6 313.4 147.5 0.98
December 31 1,023.3 212.5 86.1 0.57
Year Ended December 31 $3,852.5 $842.6 $345.3 $2.30
Our first quarter results include a $2.5 million after-tax expense for BGE employees that elected to participate in a
targeted VSERP as discussed in more detail in Note 2 on page 66.
Our second quarter results include: " a $15.0 million after-tax deregulation transition cost to
Goldman Sachs incurred by our power marketing
operation to provide BGE's standard offer service requirements, and
"* a $1.7 million after-tax expense for the VSERP as
discussed in more detail in Note 2 on page 66.
The sum of the quarterly earnings per share amounts may not equal the total for the year due to the effects of rounding and dilution as a
result of issuing common shares during the year
Certain prior-year amounts have been reclassified to conform with the current year's presentation.
Constellation Energy Group, Inc. and Subsidiaries

88 / BOARD OF DIRECTORS
Christian H. Poindexter
Chair7nan,
Constellation Eners), Group
Board of Directors Age 63
Director since 1988'
Frank P. Bramble, Sr. (C/ef] xecutive L7A,
Allied Irish Banks, p. .c.
and Chairman,
Al/Nrst Financial, Inc, Age 53
Director since 2002
Roger W Gale
Senior Advisor; PA
Consu/ting
Age 55
Director since 1995"
Charles R. Larson Admniral, United States Aatp' (Retired)
Age 65
Director since 1998'
Mayo A. Shattuck III President and
Chief Executive Office;
Constellation Energy Group
Age 47
Director since 1994"
Beverly B. Byron
Former C(onpress0woman,
U.S. House of Rep re.,entatiusss
Age 69
Director since 1993'
Dr. Freeman A. Hrabowski III President, LUniversi t, of Maryland Baltimor, COount',
Age 51
Director since 1994*
Robert J. Lawless Chairman, President and
Chief Executive Offices;
McCormick & Comnpanr; hIn.
Age 55
Director since 2001
Douglas L. Becker
Chairnan and Chief
Executive Officer, Slvan 1 earning Systems, Inc.
Age 36
Director since 1998'
Edward A. Crooke
Retired Vice Chairman,
(.onstellation knei)e Group Age 63
Director since 1988'
Edward J. Kelly III President and Chiefxvecutive
Office; Mlercantile Bankshares
Corporation Age 48
Director since 2001
Michael D. Sullivan
Chairman, Life Source, Inc.
Age 62
Director since 1992*
James T. Brady Managing Director
Mid-Atlantic of Ballantrae
International, Lid Age 61
Director since 1998-*
James R. Curtiss, Esq.
Partnes; Winston & Strawn
Age 48
Director since 1994'
Nancy Lampton
Chairman and Chief
AXecutive Offices; American
Life and Accident Insurance
Comnpan, of Kentuck;
Age 59
Director since 1994*
PForserly a [3(;C1- L)iresss; has elected to the Constelation .siso-,y (ro iq, Board o/ Directors in Ap/il 1999 at thejrnarion oftrhe holding conpany
Ioorsers/' ,a Director ol's ,sduidiasy, is , elected to the (.o01st, iatios Inera (;roup Board o]'Directoss in Xar 1999.
c'onste/litson Ess•ery, Group, Ini. and Subsidiaries

Committees of the Board
Executive Committee
Christian H. Poindexter, Chairperson
Mayo A. Shattuck III
Frank P. Bramble, Sr.
Edward A. Crooke
Edward J. Kelly III
Robert J. Lawless
Audit Committee
James T. Brady, Chairperson
Freeman A. Hrabowski III
Nancy Lampton
Committee on Management
Michael D. Sullivan, Chairperson
Douglas L. Becker
Frank P Bramble, Sr.
Edward J. Kelly III
Robert J. Lawless
Committee on Nuclear Power
James R. Curtiss, Chairperson
Beverly B. Byron
Adm. Charles R. Larson (Ret.)
Roger W Gale
Constellation Energy Group, Inc. and Subsidiaries

90 / EXECUTIVE TEAM
Constellation Energy's executive team is diverse in experience, background, and point of view. Those who are
steeped in the knowledge and experience of Constellation work side-by-side with those who have been recruited for
their expertise gained around the world. Together they combine the right mix of energy industry tradition and
competitive business savvy necessary for today's changing energy landscape.
p
ýA ý Christian H. Poindexter Chairman of the Board
63, joined BGE* in 1967; served as Project Engineer during Calvert Cliffs Nuclear Power Plant's construction; was Chief Nuclear Engineer 1974-76; became Treasurer-Assistant Secretary in 1978 and Vice PresidentEngineering and Construction in 1980; named President and CEO of Constellation Holdings, Inc., in 1985; elected BGE Vice Chairman in 1989 and Chairman, President, CEO in 1993.
Frank 0. Heintz President and Chief Evecutive Officer BGE
58, joined BGE* in 1996 as Vice President, assuming leadership of its Gas Division in 1997; elected Executive Vice President, BGE Utilit, Operations Group in 1998. Prior to this he served 13 years as Chairman, Mlaryland Public Service Commission.
Mayo A. Shattuck III President and Chief(Executive Officer
47, joined Constellation Energy in 2001. Prior to this be was Chairman, DB Alex. Brown, and CEO--Private Client and Asset Management Group, Americas, and Global Head-Private Banking Division. In 1991, he was elected President and COO of Alex. Brown, Inc., which merged with Bankers Trust in 1997; served as Bankers Trust Vice Chairman until it merged with Deutsche Bank in 1999; scrxed as Co-Head of Global Investment Banking for Deutsche Bank, and Co-Chairman and Co-CEO of DB Alex. Brown and Deutsche Bank Securities until 2001.
Michael J. Wallace President, Constelation Generation Group
54, joined Constellation Energy in 2002.
Prior to this he was co-founder and Managing Director, Barrington Energy Partners, LLC, an energy industry strategic consulting firm. Previously he served as Senior Vice President
and Chief Nuclear Officer, Unicom/ComEd of Illinois.
Thomas V. Brooks President, Constellation Power Source
39, joined Constellation Energy in 2001 as Vice President, Business Development & Strategy Prior to this, he was Vice President, Goldman Sachs working with Constellation to develop its power marketing business; previously served as director, Enron Capital & Trade Resources, joining them when they bought AERX, Inc., a company he helped
found that specialized in emissions credit trading.
Thomas E Brady Vice President, Corporate Strategy
& Development
52, also Chairman of BGE HOME, Constellation Energy Source, and our other nonregulared businesses. Joined BGE* in 1969; became Assistant Treasurer-Assistant Secretary in
1983; elected Vice President, Accounting & Economics in 1988; Vice President, Customer
Service & Accounting in 1991; Vice President Customer Senice & Distribution in 1993; Vice President Retail Services 1998; and assumed current position in 1999.
Constellation Fnergy, Group, tic. and Subsidiaries

E. Follin Smith Senior Vice President and Chief Financial Officer 42, joined Constellation Energy in 2001. Prior to this she was Senior Vice President and CFO of Armstrong Holdings, Inc.
Previously, she spent 15 years with General Motors (GM), starting in the New York Treasurer's Office; other positions included Treasurer-GM of Canada Limited; Vice President of Finance for GMAC; Assistant Treasurer for GM; and CFO for GM's Delphi Chassis Systems division.
John R. Collins Vice President and Chief Risk Officer
44, joined BGE- in 1988; named Assistant Treasurer and Director of Financial Management in 1995; joined Constellation Power Source at its formation in 1997, serving as its senior financial officer; became Managing Director-Finance and Treasurer, Constellation Power Source Holdings in 2000.
Paul J. Allen Vice President, Corporate Affairs
50, joined Constellation Energy in 2001. Prior to this he was Senior Vice President and Group Head-Ogilvy Public Relations, managing its energy and environment practice. Previously he served as senior staff member at Natural Resources Defense Council; Press Secretary for U.S. Senator Christopher Dodd; and National Public Radio's Editor of "Morning Edition" and then Foreign News Editor.
Diane L. Featherstone Vice President, Management Consulting 5 Auditing
48, joined BGE* in 1976; in 1992 was named Manager, Staff Services; elected President and CEO, Constellation Energy Source in 1997; was named to her current position in 2001.
David A. Brune VIice President, General Counsel and Secretas3
61, joined BGE- in 1976; named General Counsel in 1984; elected CFO, Vice President-Finance & Accounting and Corporate Secretary in 1997 and took over his current position in 2001.
7.%:
Elaine W Johnston
Vice President, Human Resources
60, joined BGE* in 1987; named Manager, Constellation Enterprises"' HR Services in 1998 and Managing Director- Human Resources & Administration, Constellation Power Source Holdings in January 200 1.
On April30, 1999, Constellation Energ), Group, Inc. became the holding company for Baltimore Gas and Electic Compan) (BGE) and its subsidiaries. - Constellation Encenprises was previously owned by BGE and was the holding company for BGEs nowregulated businesses.
Constellation Energy Group, Inc. and Subsidiaries
/ 91

92 / FIVE-YEAR STATISTICAL SUMMARY
2001
Common Stock Data Quarterly Earnings Per Share
First Quarter Second Quarter Third Quarter Fourth Quarter
lotal
$0.74 0.46 1.00
(1.59)
$0.57 S2 3O Z1. VA 31./Zl
2000
$0.48 0.26 0.98 0.57
1999
$0.55 0.45 0.91
(0.18) Q 1 7X
1998
SO50 0.39 1.08 0.09
1997
$0.43 0.05 1.11 0.12
Earnings Per Share Before Special Costs Included in Operations and Nonrecurring Items
Dividends Dividends Declared Per Share Dividends Paid Per Share Dix idend Payout Ratio
Reported Excluding special costs and nonrecurring charges
Market Prices High Lowx Close
Capital Structure I.ong-Jerm Debt Short-Term Borrowings BGE Preference Stock Common Shareholders' Equiry
$2.60
$0.48 0.78
84.2%
18.5%
$50.14
20.90
26.55
45.1%
10.7
2.1
42.1
S2.43
$1.68 1.68
S2.48 $2.20 S2.28
$1.68 1.68
S1.67 $1.63 1.66 1.62
73.0% 96.6% 81.1% 94.8% 69.1% 67.7o 75.9% 71.5%
S52.06 27.06 45.06
52.9% 3.2 2.5
41.4
831.50 24.69 29.00
48.6% 5.4 2.7
43.3
$35.25 29.25 30.88
S34.31 24.75 34.13
53.5% 4 8.3% -4. 7
2.8 4.4 43.7 42.6
ie smm oa the quarter!l, earnings per share aomounts maj', not equal the to'afir tA year dae to the effects o/frounding aid changes in the ai'erag'e nuoiber oJ Žhares outstanding throughout the year
7The quartely earnings per s/are amounts inchlade certam one-itne a/'unst)utents as shown in Note 15 on page 87 to the C(nsooidated Financial Staretnents.
Constel/ation Ioeto•i, Group, Inc. andt Shbsidiaries

SHAREHOLDER INFORMATION / 93
Common Stock Dividends and Price Ranges
2001
First Quarter Second Quarter Third Quarter Fourth Quarter
Total
Dividend Declared
$0.12 0.12 0.12 0.12
$0.48
Price High Low
$44.65 $34.69 50.14 40.10 43.80 22.85 28.21 20.90
Dividend Declared
First Quarter Second Quarter Third Quarter Fourth Quarter
Total
$0.42 0.42 0.42 0.42
$1.68
2000
Price High Low
$33.81 $27.06 35.69 31.25 52.06 32.06 50.50 37.88
Dividend Policy The common stock is entitled to dividends when and as declared by the Board of Directors. There are no limitations in any indenture or other agreements on payment of dividends.
Dividends have been paid on the common stock continuously since 1910. Future dividends depend upon future earnings, the financial condition of the company, and other factors.
Dividend Increase On January 30, 2002, the Board of Directors announced it will increase the dividend to 96 cents per share (24 cents quarterly). The company had been paying an annual rate of 48 cents per share (12 cents quarterly), which was established April 3, 2001.
Common Stock DMdend Dates Record dates are normally on the 10th of March, June, September, and December. Quarterly dividends are customarily mailed to each shareholder on or about the 1st of April, July, October, and January.
Stock Trading Constellation Energy Group's common stock, which is traded under the ticker symbol CEG, is listed on the New York, Chicago, and Pacific stock exchanges, and has unlisted trading privileges on the Boston, Cincinnati, and Philadelphia exchanges. As of December 31, 2001, there were 54,285 common shareholders of record.
Annual Meeting The annual meeting of shareholders will be held at 10 a.m. on Friday, May 24,2002, in the 2nd Floor Conference Room of the Gas and Electric Building, located at 39 W Lexington Street, Baltimore, Maryland 21201.
Form 10-K Upon written request, the company will furnish, without charge, a copy of its and BGE's Annual Report on Form 10-K, including financial statements. Requests should be addressed to Constellation Energy Group, Inc., Shareholder Services, P.O. Box 1642, Baltimore, MD 21203-1642.
Auditors PricewaterhouseCoopers LLP
Executive Offices 250 W Pratt Street Baltimore, Maryland 21201 Mail: PO. Box 1475, Baltimore, Maryland 21203-1475
Shareholder Investment Plan Constellation Energy Group's Shareholder Investment Plan provides common shareholders an easy and economical way to acquire additional shares of common stock. The plan allows shareholders to reinvest all or part of their common stock dividends; purchase additional shares of common stock; deposit the common stock they hold into the plan; and request a transfer or sale of shares held in their accounts.
Stock Transfer Agents and Registrars Transfer Agent and Registrar:
Constellation Energy Group, Inc. Baltimore, Maryland
Co-Transfer Agent and Registrar: Continental StockTransfer and Trust Company 8th Floor
17 Battery Place South New York, NY 10004
Shareholder Assistance and Inquiries If you need assistance with lost or stolen stock certificates or dividend checks, name changes, address changes, stock transfers, the Shareholder Investment Plan, or other matters, you may visit our Web site at www.constellationenergy.com or contact our shareholder service representatives as follows:
By telephone (Monday-Friday, 8 a.m. - 4:45 p.m. EST):
Baltimore Metropolitan Area Within Maryland Outside Maryland
By U.S. mail: Constellation Energy Group, Inc. Shareholder Services P.O. Box 1642 Baltimore, MD 21203-1642
In person or by overnight delivery: Constellation Energy Group, Inc. Shareholder Services, Room 800 39 W Lexington Street Baltimore, MD 21201
410-783-5920 1-800-492-2861 1-800-258-0499

Constellation Energy Group
250 W. Pratt Street Baltimore, Maryland 21201
www.constellationenergy.com
mf I
Copyright © 2022 FDOKUMEN