CONSTELLATION ARRAY: A NEW SENSORY STRUCTURE IN SCORPIONS (ARACHNIDA: SCORPIONES)
Upload
khangminh22Category
view
0download
0

PhD THESIS
Presented at
UNIVERSITÉ DU QUÉBEC À CHICOUTIMI
IN PARTIAL FULFILLMENT OF REQUIREMENTS FOR
THE DEGREE OF DOCTOR OF PHILOSOPHY IN ENGINEERING
BY
Pierre, TCHAKOUA TAKOUTSING
A NEW APPROACH FOR ELECTRIC MODELING OF VERTICAL AXIS WIND
TURBINE ROTORS IN VIEW TO THE CONSTRUCTION OF A GLOBAL
ELECTRIC MODEL FOR THE WIND ENERGY CONVERSION SYSTEM
Québec, Canada
© Pierre Tchakoua, 2018

THÈSE DE DOCTORAT
Présentée
À L’UNIVERSITÉ DU QUÉBEC À CHICOUTIMI
COMME EXIGENCE PARTIELLE DE L’OBTENTION DU GRADE
DE DOCTEUR EN PHILOSOHIE EN INGÉNIERIE
PAR
Pierre, TCHAKOUA TAKOUTSING
NOUVELLE APPROCHE DE MODÉLISATION ÉLECTRIQUE DES ROTORS
D’ÉOLIENNES À AXE VERTICAL EN VUE DE LA CONSTRUCTION D’UN
MODÈLE ÉLECTRIQUE GLOBAL DE LA CHAINE DE CONVERSION
ÉOLIENNE
Québec, Canada
© Pierre Tchakoua, 2018

i
Abstract
The combine effects of climate changes, the continue and considerable increase of
energy demand in the world, the instability of fossil fuel prices as well as the energetic
dependence of some countries who are not fuel producers leads to important development of
renewable energies. More again, the energy bill in its dizzying rise causes the prices increase
for raw materials, goods and even basic necessities. It is therefore imperative to go in for
diversification of energy sources on the one hand and means to produce energy at a relatively
low cost on the other hand.
This thesis proposes a novel approach for aerodynamic modelling of Darrieus type
vertical axes wind turbines (VAWTs). Indeed, it is a contribution to the build-up of a global
electric model for vertical axis wind turbine conversion system with a view to improve
monitoring, diagnosis and maintenance.
The goal of this research work is double: firstly, to propose an innovative approach
for aerodynamic modelling of VAWTs and secondly, based on this approach, to build a new
equivalent electric model for the study, analysis and aerodynamic optimisation of Darrieus
type VAWTs. More broadly, this work aims to contribute to the development of new tools,
techniques and methods to improve the design, optimization, diagnosis, prognosis and
monitoring of Darrieus VAWTs to better ensure their maintenance. The purpose is to provide
the scientific community and the wind turbine industry with new tools that can ameliorate
the reliability and thus increase performance and efficiency of Darrieus type VAWTs.
An equivalent electric circuit model for three-blade DT-VAWT rotors was builded.
The new model that we named the Tchakoua model is based on a recently developed

ii
approach for modelling DT-VAWT rotors using the equivalent electrical circuit analogy.
The proposed model was built from the mechanical description given by the Paraschivoiu
double-multiple streamtube model and was based on an analogy between mechanical and
electrical circuits. Thus, the rotating blades and the blades’ mechanical coupling to the
shaft are modelled using the mechanical-electrical analogy, and the wind flow is modelled
as a source of electric current.
Model simulations were conducted using MATLAB for a three-bladed rotor
architecture, characterized by a NACA0012 profile, an average Reynolds number of
40,000 for the blade and a tip speed ratio of 5. The results obtained show strong agreement
with findings from both aerodynamic and computational fluid dynamics (CFD) models in
the literature.
Keywords: Renewable energy, wind turbine; Darrieus turbines; vertical axis wind
turbine; condition monitoring, diagnosis, maintenance, modelling; electric circuit model;
aerodynamic characteristics; performance analysis; Tchakoua model

iii
RÉSUMÉ
Les effets conjugués du réchauffement climatique, l’augmentation considérable et
continue de la demande énergétique mondiale, la volatilité des prix des énergies fossiles, la
dépendance énergétique de certains pays non producteurs de pétrole, font que les énergies
renouvelables bénéficient actuellement d’un essor très important. De plus, la facture
énergétique dans sa hausse vertigineuse entraîne les matières premières, les biens de
consommation et même les produits de première nécessité. Il est donc impératif de réfléchir
à la diversification des sources d’énergie d’une part et aux moyens de produire de l’énergie
à un coup relativement bas d’autre part.
Cette thèse propose un modèle électrique équivalent pour les rotors d’éoliennes à axes
vertical. Elle constitue une contribution à la construction d’un modèle électrique global de la
chaine de conversion éolienne.
L’objectif de cette recherche est d’une part de proposer une nouvelle approche de
modélisation des éoliennes à axe vertical; et d’autre part d’élaborer, sur la base de cette
approche, un nouveau modèle pour l’étude, l’analyse et l’optimisation aérodynamique des
éoliennes à axe vertical de type Darrieus. De façon plus large, ce travail vise à contribuer au
développement de nouveaux outils, techniques et méthodes devant permettre d’améliorer la
conception, l’optimisation, le diagnostic, le pronostic et la surveillance des éoliennes à axe
vertical de type Darrieus afin de mieux assurer leur maintenance. La finalité étant de mettre
à la disposition de la communauté scientifique et de l’industrie de l’éolienne de nouveaux
outils pouvant permettre d’accroître la performance aérodynamique ainsi que le rendement
énergétique des éoliennes à axe vertical de type Darrieus.

iv
Un modèle électrique équivaut pour rotor d’éolienne de type Darrius tri-pales a été
développé. Ce nouveau modèle que nous avons nommé le ‘Tchakoua model’ est basé sur une
nouvelle approche de modélisation des rotors d’éoliennes à axe vertical utilisant des circuits
électriques équivalents. Le modèle a été construit sur la base de description à double disque
actuateur à multiple tubes de vent faite par Paraschivoiu et est basé sur l’analogie circuits
mécaniques et circuits électriques appliquée à l’aérodynamique. Ainsi, les pales et le
couplage mécanique à l’arbre lent sont modélisées en utilisant l’analogie mécanique-
électrique tandis que l’écoulement de vent est modélisé comme source de courant.
Les simulations ont été effectuées avec le logiciel MATLAB pour un rotor tripal
caractérisé par un profil NACA0012, un nombre de Reynold moyen de 40000 et une vitesse
spécifique de 5. Une validation croisée de ces résultats avec les données issues des modèles
aérodynamiques ou même des modèles numériques de dynamique des fluides montre de
bonnes concordances.
Mots clés : Énergie éolienne, éolienne de Darrieus, éolienne à axe vertical, surveillance,
diagnostic, maintenance, modélisation, circuit électrique équivalent, caractéristiques
aérodynamiques, Tchakoua Model

v
Dedication
To those who gave me life.
To my dear wife.
To my children.

vi
Acknowledgements
This work has been carried out in the Renewable energy and Energy Efficiency
Laboratory, School of Engineering, at University of Québec in Abitibi-Témiscamingue with
the financial support Natural Sciences and Engineering Research Council of Canada
(NSERC). The School of engineering of the University of Quebec in Abitibi for providing a
sound environment for the project and the NSERC for it financial support are gratefully
acknowledged for financial, materiel and infrastructural support.
I hereby express my gratitude to all those who contributed in any way to the successful
completion of this work. I am grateful to my thesis director Professor Fouad Slaoui
(UQAC/UQAT) for the opportunity I was given to work on an interesting topic, my co-
directors Professor Mohand Ouhrouche (UQAC) who have both been very instrumental in
various parts of the project. Their technical advices and encouragements were invaluable.
Thank you for allowing me in the harmonious and rich environment of your research groups
and your professional networks.
I would like to express gratitude to my examiner Professors Issouf Fofana, Nahi
Kandil and Mamadou Doumbia for accepting to evaluate this work and for providing
guidance, encouragement, valuable suggestions and constructive advice on this thesis.
I really appreciate Dr Francois Nzokou, Dr Aimé Sylvain Fotso Talla, for providing
valuable comments and suggestions.
I would also like to thank Professor Ernesto Benini, Gabriel Ekemb, Tommy-Andy
Theubou, Ayang Albert for good collaboration. Thanks for countless hours, early runs to the
laboratories and sleepless nights going through everything, from Matlab codes, data analysis,
report writing and even correspondence with various Editors. I indeed learned a lot from you.

vii
My gratitude also goes to my friends Donald Poirier and Mark Hislop, my beloved
sister Marie Pascale Makougoum, my dear brothers Fokou Francis and Mukam Emmanuel,
my uncles Anselme Tchamssik and Ngatsing Emmanuel, my aunts Chantal Majomo,
Honorine Mache, my sister inlaw Jougne Larrissa, my late friend and brother Wilfried Yopa,
not forgetting my parents in law, Fotsing Camille and Madjou Colette. You were all
invaluable supports. Thank you for encouraging me when I felt like quitting. Although some
of you were weakened by sickness or going trough difficult moments, you still loved and
encouraged me even when I spent months without communicating with you.
My ultimate gratitude goes to my parents, Takoutsing Joseph and Mayo Francoise.
You always told me not to forget that education is the most robust key to open the doors of
professional and personal accomplishment. Both of you are the key of this success. It is
because you taught me virtues of hardworking and perseverance, finally, I can accomplish
this work.
My most heartfelt acknowledgement must go to my sweetheart Magakou Fotsing
Merline Romance for her endless patience, love and support. Romy, may you find here an
expression of my love.
Finally, to my son Tchakoua Nenda Fresnel Betz and daughter Tchakoua Maya
Yopaela Kline, thank you for your love, which made this work so joyful. Both of you are
inexhaustible sources of hope and determination.
Pierre Tchakoua Takoutsing

viii
Table des matières Abstract .................................................................................................................................... i
RÉSUMÉ .............................................................................................................................. iii
Dedication ............................................................................................................................... v
Acknowledgements ................................................................................................................ vi
LIST OF TABLES ................................................................................................................. xi
LIST OF FIGURES ............................................................................................................. xii
LIST OF ABREVIATIONS ................................................................................................. xv
Chapter I GENERAL INTRODUCTION ..................................................................... 1
1.1. INTRODUCTION.................................................................................................... 2
1.2. THESIS motivations ................................................................................................ 3
4.3.1. Socio-economic motivations .................................................................................... 3
4.3.2. Scientific motivations : problem statement .............................................................. 6
1.3. Thesis GENERAL objectives and scope .................................................................. 9
1.4. Specific objectives and link between chapters ......................................................... 9
1.5. thesis Limitations ................................................................................................... 10
1.6. CREDITS ............................................................................................................... 11
References ............................................................................................................................. 11
Chapter II LITERATURE REVIEW ........................................................................... 13
Wind Turbine Condition Monitoring: State-of-the-Art Review, New Trends, and Future Challenges ............................................................................................................... 14
Introduction ............................................................................................................ 16
Concepts and Definitions ....................................................................................... 21
Review of Concepts and Methods for WTCM ...................................................... 25
New Trends and Future Challenges in Wind Turbine CONDITION MONITORING SYSTEMS (WTCMS) ............................................................................ 46
Conclusions ............................................................................................................ 52
Acknowledgments ................................................................................................................ 53
Author Contributions ............................................................................................................ 53
Nomenclature ........................................................................................................................ 54
Conflicts of Interest .............................................................................................................. 55
References ............................................................................................................................. 55

ix
Chapter III PROPOSING A NEW APPROACH FOR WIND TURBINES AERODYNAMICS MODELLING WITH APPLICATION TO DARRIEUS TYPE VERTICAL AXIS WIND TURBINES .......................................................... 72
3.1. Introduction ............................................................................................................ 75
3.2. Theory: Working Principle of Darrieus-Type Vertical-Axis Wind Turbines (VAWTs) ........................................................................................................................... 81
3.3. Method and Model Construction ........................................................................... 85
3.4. Results and Discussion ......................................................................................... 105
3.5. Conclusions .......................................................................................................... 114
Acknowledgments .............................................................................................................. 115
Author Contributions .......................................................................................................... 115
Conflicts of Interest ............................................................................................................ 116
References ........................................................................................................................... 116
Chapter IV ELECTRIC CIRCUIT MODEL FOR THE AERODYNAMIC PERFORMANCE ANALYSIS OF A THREE-BLADE DARRIEUS-TYPE VERTICAL AXIS WIND TURBINE ....................................................................... 125
4.1 INTRODUCTION .............................................................................................. 128
4.2 CONTEXT AND METHOD ............................................................................. 129
4.2.1. Context ................................................................................................................. 129
4.2.2. Method: The Mechanical-Electrical Analogy Approach ..................................... 132
4.3 MODEL CONSTRUCTION ............................................................................. 136
4.3.3. Theoretical Background ....................................................................................... 136
4.3.4. Wind Flow as a Current Source ........................................................................... 137
4.3.5. Electric Circuit Model for a Single Blade ............................................................ 139
4.3.6. Electric Circuit Model for the Blades’ Mechanical Coupling to the Shaft .......... 144
4.4 RESULTS AND DISCUSSION ........................................................................ 147
4.4.1. Electric Circuit Model for Three-Blade DT-VAWT Rotors: The Tchakoua Model 147
4.4.2. Simulation Results ............................................................................................... 150
4.5 CONCLUSIONS ................................................................................................ 156
Reference ............................................................................................................................ 158
Chapter V CONCLUSION AND RECOMMENDATIONS ................................. 163

x
5.1. Conclusion............................................................................................................ 164
5.2. RECOMMENDATIONS ..................................................................................... 165

xi
LIST OF TABLES
Table II-1 Overview of possible failures and monitoring techniques for various WTs components and subsystems. OA: oil analysis; AE: acoustic emission; SM: strain measurement; VI: visual inspection; SPM: shock pulse method; and OM: operation and maintenance. ................................................................. 44
Table III-1 Features, advantages and shortcoming of different aerodynamic models for vertical-axis wind turbine (VAWT) rotors. .................................................... 79
Table III-2 System analogy used in developing the new model. ...................................... 87
Table III-3 Blade’s simulation characteristics. ............................................................. 106
Table IV-1 System analogy used for developing the new model. .................................. 134
Table IV-2 Blade simulation characteristics. ................................................................ 150

xii
LIST OF FIGURES
Figure I-1 Share of renewable energy in global power generation in 2016 [1]. .................. 2
Figure I-2 Overview of the Cap d'Ours wind turbine. ......................................................... 5
Figure I-3 Percentage of failures in a Swedish wind farm [19]. .......................................... 7
Figure I-4 Capital expenditures for onshore wind project [20] ........................................... 8
Figure II-1 Wind energy world market forecast for 2013–2017 [1]. Reprinted/Reproduced with permission from [1]. Copyright 2013, Global Wind Energy Council (GWEC). ....................................................................................................... 16
Figure II-2 The “bathtub” curve illustrating the reliability of technical systems. ............. 18
Figure II-3 Number of incidents per wind turbine (WT) per operational year; WTs are categorized by rated power [12]. Reprinted/Reproduced with permission from [12]. Copyright 2008, American Society of Mechanical Engineers. ... 18
Figure II-4 Share of the main components of the total number of failures [13]. Reprinted/Reproduced with permission from [13]. Copyright 2007, Springer Science + Business Media. ............................................................................ 19
Figure II-5 Failure rates and downtime from two large surveys of European WTs over 13 years [13]. Reprinted/Reproduced with permission from [13]. Copyright 2007, Springer Science + Business Media. ................................................... 20
Figure II-6 Costs associated with traditional maintenance strategies [30]. ...................... 22
Figure II-7 Overview of condition-monitoring (CM) and maintenance processes for WTs. .............................................................................................................. 24
Figure II-8 Typical main components of a utility-scale WT [51]. ................................... 26
Figure II-9 Function model for monitoring of a wind-energy conversion system (WECS) [53]. BCU: boundary controlling unstable; and RMS: root mean square. Reprinted/Reproduced with permission from [53]. Copyright 2008, Blekinge Institute of Technology. ................................................................................ 27
Figure II-10 Typical development of a mechanical failure. ............................................... 28
Figure II-11 Principle of the pulse-echo technique used for the investigation of WT blades [100,103]. GFRP: glass fiber reinforced plastic. Reprinted/Reproduced with permission from [100]. Copyright 2008, Kaunas University of Technology. ....................................................................................................................... 36
Figure II-12 Overview of wind turbine condition monitoring (WTCM) based on supervisory control and data acquisition (SCADA) data analysis. FIS: fuzzy interference system. ....................................................................................... 43
Figure III-1 Curved, three-blade, Darrieus-type VAWT. ................................................. 81
Figure III-2 Velocity and force components for a Darrieus-type VAWT (DTVAWT). ... 82

xiii
Figure III-3 Top view of a three-blade VAWT showing the velocity components relative to the blade. ................................................................................................... 88
Figure III-4 Definition of angles and velocities. ............................................................... 90
Figure III-5 Angle of attack as function of the rotational angle. ....................................... 92
Figure III-6 Double-multiple multi-streamtube model. ..................................................... 94
Figure III-7 Wind flow equivalent electrical model. ......................................................... 94
Figure III-8 Aerodynamic coefficients acting on a Darrieus WT blade element [71]. ..... 95
Figure III-9 Lift and drag coefficients variations as a function of the angle of attack for a NACA0012 blade profile. ............................................................................. 96
Figure III-10 Discretization of the blade into n elements. ................................................. 99
Figure III-11 Equivalent electrical diagram for the lift force applied to a blade element. ..................................................................................................................... 101
Figure III-12 Equivalent electrical diagram for the drag force applied to a blade element. ..................................................................................................................... 101
Figure III-13 Electric equivalent circuit for a blade that is subject to a wind flow. ........ 104
Figure III-14 The torque produced by the blade reactive impedance. ............................. 106
Figure III-15 Normal and tangential coefficient variations as functions of the angle of attack. .......................................................................................................... 107
Figure III-16 Lift, drag and normal resistance variations as functions of the angle of attack. .......................................................................................................... 108
Figure III-17 Reactive element variations as functions of the angle of attack. ................ 108
Figure III-18 Lift and drag coefficient variations as functions of rotational angle. ......... 109
Figure III-19 Normal and tangential coefficient variations as functions of rotational angle. ..................................................................................................................... 110
Figure III-20 Lift, drag and normal resistance variations as functions of rotational angle. ..................................................................................................................... 111
Figure III-21 Lift, drag and normal admittance variations as functions of rotational angle. ..................................................................................................................... 112
Figure III-22 Cross validation of normal force variations as functions of rotational angle. ..................................................................................................................... 113
Figure III-23 Cross validation of tangential force variations as functions of rotational angle. ........................................................................................................... 113
Figure IV-1 “Cap d’Ours”, a curved, three-blade, Darrieus-type VAWT. ...................... 130
Figure IV-2 Schematic of a curved, three-blade DT-VAWT. ......................................... 136
Figure IV-3 Velocity and force components for a DT-VAWT. ...................................... 137
Figure IV-4 Double-multiple multi-streamtube model. ................................................... 138

xiv
Figure IV-5 Electric circuit model for wind flow. ........................................................... 139
Figure IV-6 Aerodynamic coefficients acting on a Darrieus wind turbine blade element [36]. ............................................................................................................. 140
Figure IV-7 Electric circuit model for a single blade. ..................................................... 142
Figure IV-8 Lift, drag and normal resistance variations as functions of the angle of attack. ..................................................................................................................... 142
Figure IV-9 Lift, drag and tangential reactance variations as functions of the angle of attack. .......................................................................................................... 143
Figure IV-10 Equivalent diagram for a single blade coupled to the shaft. ....................... 144
Figure IV-11 Rotor coupling of three blades modelled as an electric transformer. ......... 146
Figure IV-12 Equivalent electric diagram for a three-blade DT-VAWT. ........................ 147
Figure IV-13 Incident current variations as functions of the rotational angle. ................. 151
Figure IV-14 Variations of the blade total resistance as a function of the rotational angle. ..................................................................................................................... 152
Figure IV-15 Variations of the blade reactance as a function of the rotational angle. ..... 152
Figure IV-16 Normal voltage variations of the blade as a function of the rotational angle. ..................................................................................................................... 154
Figure IV-17 Tangential voltage variations of the blades as a function of the rotational angle. ........................................................................................................... 155
Figure IV-18 Power produced by the blades as a function of the rotational angle. ......... 156

xv
LIST OF ABREVIATIONS
Area of a blade element (m2)
Chord of the blade (m)
Equivalent or total coefficient
Lift coefficient
Drag coefficient
Normal coefficient
Tangential coefficient
Normal force (N)
Tangential force (N)
Lift force (N)
Drag force (N)
Half of rotor’s height (m)
Instantaneous current that represents the incident wind flow (A* = N/m2)
Current at the primary side of the transformer (A*= N/m2)
Current at the secondary side of the transformer (A*= N/m2)
Number of blades
Relative dynamic pressure flow (N/m2)
Local radius of the blade (m)
Drag resistance (Ω* = m2)
Lift resistance (Ω* = m2)
Resistance to wind flow (Ω* = m2)
Reynolds number (Ω* = m2)
Rotor radius (m)
eA
c
eqC
LC
DC
NC
TC
NF
TF
LF
DF
H
( )wi t
TI
SI
bN
q
r
DR
LR
WR
eR
R

xvi
Apparent power produced by the blade (VA* = N2/m3)
Total apparent power produced by the rotor (VA* = N2/m3)
Blade torque (N.m)
Rotor torque (N.m)
Kinematic viscosity of air (m)
Total voltage across the blade (V* = N.m)
Normal voltage across the blade (V* = N.m)
Tangential voltage across the blade (V* = N.m)
Tangential voltage across the blade (V* = N.m)
Incoming wind speed (m/s)
Linear velocity of the blade (m/s)
Relative wind speed seen by the blade (m/s)
Incident wind on the wind turbine rotor (m/s) (relative wind speed seen by the
blade when aligning the blade motion with the negative real axis)
Blade shift position
Lift reactance (Ω* = m2)
Drag reactance (Ω* = m2)
Local height of the blade from H (m)
Drag impedance (Ω* = m2)
Total impedance of the blade (Ω* = m2)
Normal impedance of the blade (Ω* = m2)
Tangential impedance of the blade (Ω* = m2)
Lift impedance (Ω* = m2)
Angle of attack or angle of the wind with respect to the X axis (deg)
BS
TS
BT
RT
51.45 10v
R SV V
NV
T BV V
T BV V
0W
bW
rW
rbW
bx
LX
DX
z
DZ
BZ
N BZ R
T BZ X
LZ
xvii
Pitch angle of the blade (deg)
Angle of the relative wind speed (deg)
Angle of the blade relative to the vertical axis (deg)
Azimuthal angle of the blade (deg)
Blade tip speed ratio
Fluid density (kg/m3)
Modulus of the instantaneous current (A* = N/m2)
ω Rotational speed of the rotor (rad/s)
CFD Computational fluid dynamics
DT-VAWTs Darrieus-type vertical axis wind turbines
OM Operations and maintenance
SCADA Supervisory control and data acquisition
VAWTs Vertical axis wind turbines
WECS Wind energy conversion system
WTCM Wind turbine condition monitoring
b

1
Chapter I
GENERAL INTRODUCTION
This chapter discusses the background of the work covered in this thesis, the
challenges it tackled, its targeted objectives and an overview of its resulting scientific
contributions.

2
1.1. INTRODUCTION
Electric energy is essential for the economic development in all countries of the
world. It relative importance increases with technical progress, industrialization and the need
for comfort in modern societies. The estimated share of renewable energy in global power
generation (including hydropower) reached 24.5% in 2016 [1]. Indeed, in a world context
marked by global climate warming, considerable and continuing increase in world energy
demand, volatility of fossil fuel prices, energy dependency of certain non-oil producing
countries, etc., renewable energies are growing steadily.
Figure I-1 Share of renewable energy in global power generation in 2016 [1].
Figure I-1 shows the structure of electricity generation and that of renewable
electricity production in the world in 2016. As it can be seen, apart from hydroelectricity,
wind energy sector represents the first renewable energy source. This tendency will be
consolidated further for, with an average growth of 28% per year over the last 10 years,
because wind energy is the most expanding renewable energy source in terms of installed
capacity. In addition, according to GWEC (Global Wind Energy Council) forecasts, wind
energy production could reach 2110 GW in 2030, which would then represent about 20% of
the world's electricity consumption and could create up to 2.4 million new jobs [2], [3].

3
1.2. THESIS MOTIVATIONS
In recent years, there has been a renewed interest in vertical axis wind turbines
(VAWTs). Indeed, VAWTs have several advantages compared to horizontal axis wind
turbines (HAWTs). Among other advantages, VAWTs are insensitive to the wind speed and,
consequently, do not require any orientation system with respect to wind direction [4], [5].
They are also less noisy than HAWTs, which make them more suitable for installation in
urban environments. For these wind turbines, the gearbox and the generator can be placed at
ground level, which makes maintenance easier and, as a result, reduces operating costs [6].
Also, VAWTs have greater resistance to strong winds. Finally, the wind speed slow down
for VAWTs is lesser compare to that of HAWTs, therefore, VAWTs can be installed close
to each other in a wind farm [7] . However, VAWTs have a major flaw that explains why
they are not used on a large scale: their yield is much lower than that of HAWTs [8].
Socio-economic motivations
The reputation of wind industry amongst populations and communities in Quebec
province is not of it best. Here are some of the reasons often mentioned:
- Wind energy is often more expensive than hydroelectricity produced by Hydro-
Québec;
- Wind farms are important sources of noise pollution;
- The aesthetic aspect; indeed, the integration of wind turbines into the landscape and
the appreciation of their appearance are major criteria in the acceptance of this mode
of energy production;
- WTs contribute to the decimation of birds and bats populations.

4
Yet Quebec's wind energy potential is enormous and estimated between 8000 and
12000MW [9]. Moreover, the economic impact of wind energy production on communities
is not negligible. In fact, in addition to the royalties paid, the wind sector provides many good
jobs and therefore significantly contribute to stimulate local economy.
So as to make the most of this huge potential, the Québec government intends to
encourage the production of electric power by private companies as well as cogeneration
with the Hydro Québec network. In addition, it’s about for Quebec, on one hand to continue
to offer electricity at the lowest price in North America and, on the other hand, to have
supplementary energy sources in order to overcome significant increase in energy demand
observed during peak consumption (during episodes of extreme cold for example). Achieving
these objectives and at the same time responding to community concerns require the
implementation of reliable and low-cost technologies as well as the development of local
expertise in the design, construction and maintenance of wind turbines.
Québec's new energy strategy forecasts a significant increase of the installed wind
power by 2030 [9]. Wind turbines could be used for power compensation in long electric
transmission lines. In addition, hybrid energy systems including wind turbines could be used
to power villages, industrial projects or mines in the Far North of the province. It is in this
perspective that the Cap d'Ours wind turbine was developed.
a) Brief presentation of the Cap d'Ours wind turbine
The ‘Cap d'Ours’ wind turbine is a 200-kW vertical axis wind turbine that was built
by the Dermond company in 2004. It operated for about two years, producing electrical
energy in a satisfactory quantity. ‘Cap d'Ours’ wind turbine is installed on a site located not
far (a few hundred meters) from the main campus of UQAT in Rouyn-Noranda. The design
5
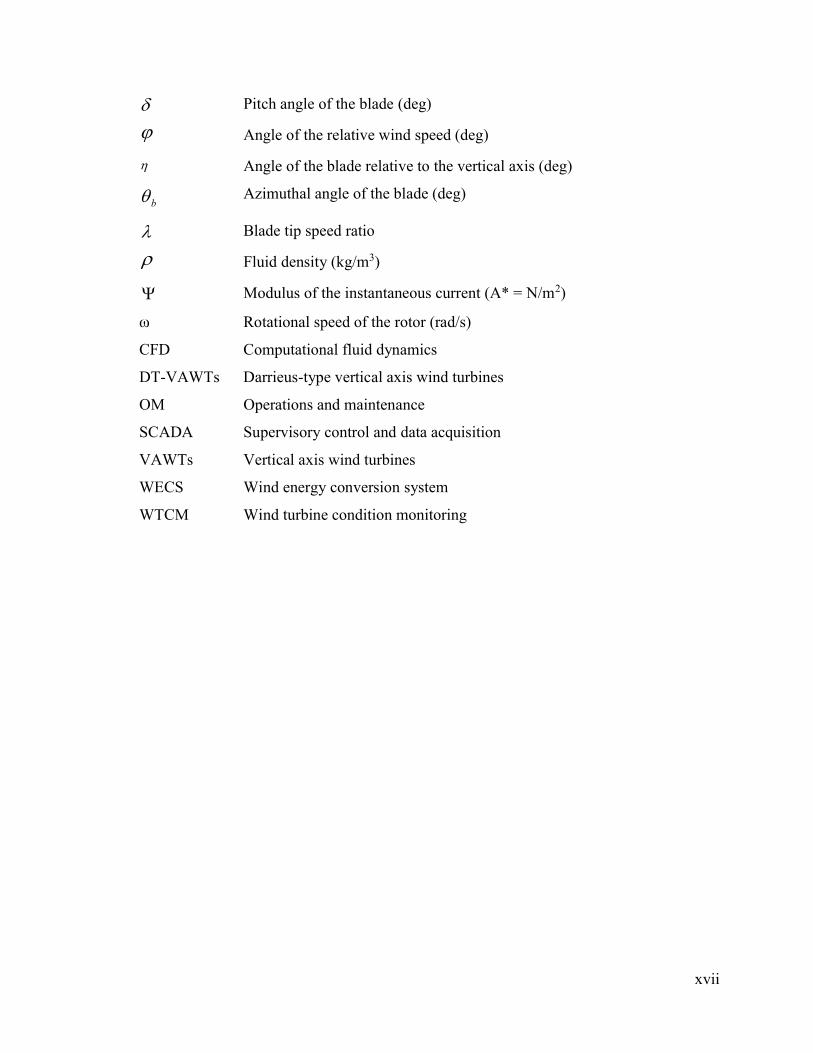
and construction of this wind turbine with special features was carried out as part of an
innovative project. The Dermond company foresaw then to produce 12 of the wind turbine
per year. These wind turbines where expected to be used, among other things, to supply the
isolated communities of Nunavik with electricity.
In 2005, ‘Cap d'Ours’ wind turbine stopped operating and since then, it has never
been restarted. It should be noted that the ‘Cap d'Ours’ wind turbine has been for many years
at the mercy of bad weather and vandals. During this period, many equipment’s of the
structure were vandalized (destroyed and/or taken away) by looters. The wind turbine has
lost several parts among its important equipment’s. In addition, lack of maintenance and
climatic hazards have contributed to weakening some aspects of its metal structure.
Figure I-2 Overview of the Cap d'Ours wind turbine.

6
Designed to withstand wind speeds greater than 220 km/h, the Cap d'Ours wind
turbine turns out to be an ideal prototype for Canada's Far North, where winds are particularly
strong [10]. Blais Industries, which is a Rouyn-Noranda-based company is owner of the Cap
d'Ours wind turbine since the bankruptcy of the Dermond company in 2007. Recently Blais
Industries agreed to put the impressive structure at the disposal of UQAT researchers. The
company intends to use this wind turbine as a prototype for the development of wind turbine
technology more appropriate for installation in Far North mining sites. To help achieve this
goal, the UQAT School of Engineering is conducing various research projects that will
contribute to optimize the structure, as well as reduce noise and vibrations during operation.
Scientific motivations : problem statement
In recent years, many research works have been conducted on the improvement of
aerodynamic performance of VAWs. However, very few researchers dedicate their work to
solve the problem of the lack of a more conducive rotor model for the conceptual
optimization, the monitoring as well as the diagnosis and maintenance of Darrieus wind
turbine rotors. This despite the growth of installed wind power worldwide and the renewed
interest in VAWTs pose the thorny problem of research and staff training in the areas of
optimization, diagnosis and maintenance of the wind turbines.
Wind turbines are equipment that can experience many hazards during their useful
life. They are designed to work for a period of about 20 years [11], [12], [13]. Like all other
mechanical systems, wind turbines are subject to many defects at the beginning and at the
end of their life. In Canada, the wind energy industry very often practices reactive
maintenance (repair when it breaks) [14]; the preventive maintenance is then limited to the
instructions of the maintenance manual of the wind turbine manufacturer. Meanwhile, the

7
development of preventive maintenance strategies, as well as more efficient methods of
diagnosis and troubleshooting, could significantly reduce the shortfall associated with
maintenance operations of wind turbines; that is 10 to 20% of the revenues generated by the
total production of the wind turbine during its lifetime [15]. Indeed, the application of a
maintenance strategy that wisely combines preventive and reactive maintenance would
certainly improve the reliability, availability and maintainability of wind turbines while
reducing maintenance costs [16], [17].
Wind turbines are exposed to very harsh and variable climatic conditions, including:
a binding weather alternating calm, violent winds, tropical heat, lightning, Siberian cold, rain,
hail and snow. These extreme and variable conditions increase the mechanical stress on the
structure of the wind turbine; thus, causing vibrations, risks of torsional resonances,
numerous failures, and sometimes even the complete breakage of the wind turbine [18].
Figure I-3 Percentage of failures in a Swedish wind farm [19].

8
To these defects, can be added failures such as the deterioration of the sensors, the
loss of efficiency of the actuators which control the blades, the short circuits of the WT
windings, etc. The unfortunate consequences are, of course, the frequent shutdowns of
production, the rapid aging of production equipment and the high cost of maintenance, all of
which increases operating expenses. Figure I-3 shows the failure distribution of wind turbines
with a nominal power greater than 490 kW between 2000 and 2004 in Sweden [19]. Theses
statistics show that in a wind farm, electric system components are those who suffer more
regularly from defects meanwhile, 13.4% of faults occurs on blades. On the other hand, rotor
is one of the most expensive part of the wind turbine. Figure I-4 illustrates the breakdown of
capital expenditure for onshore wind project [20], the component percentages are
highlighted. It comes that rotor can represent up to 20% of the investment in a wind turbine.
It is therefore essential to maintain rotors including blades, bearings and shaft as faultless as
possible. This will reduce the maintenance downtimes and therefore ameliorate both
reliability of energy production and profitability of the project.
Figure I-4 Capital expenditures for onshore wind project [20]

9
It's becoming imperative for wind industry to develop appropriates advanced
predictive maintenance methods that will quickly identify potential failures on rotors and
correct them before complete part deterioration. A global electric model for the entire wind
energy conversion system can be of great utility for achieve this goal.
1.3. THESIS GENERAL OBJECTIVES AND SCOPE
Considering all social, economic and scientific motivations mentioned above, we have
chosen, within the framework of this doctoral thesis, to work on: contribution to the modeling
and diagnosis of a vertical axis aerogenerator for maintenance.
In general, this work aims to contribute to the development of new tools, techniques
and methods to improve the design, optimization, diagnosis, prognosis and monitoring of
Darrieus vertical axis wind turbines to better ensure their maintenance. The goal is to enrich
the scientific community and the wind turbine industry with new tools that can help to
increase the aerodynamic performance and energy efficiency of Darrieus type AVEs. The
development of an equivalent electric rotor model will therefore be the focus of our work.
This model will be use in future research work to propose new methods for optimization,
diagnosis and maintenance of wind turbines.
1.4. SPECIFIC OBJECTIVES AND LINK BETWEEN CHAPTERS
Achieving the general objective goes through several specific objectives. More
specifically, this research work aims to:
1- Propose a new approach to modeling WTs rotors;

10
2- Develop, based on this approach, a new model for the study, analysis and
aerodynamic optimization of Darrieus type VAWTs.
The thesis is subdivided into five chapters. Chapter I is a general introduction to the
work. As well, it discusses the challenges tackle by this work. The motivations, objectives
and limitations of the work. Chapter II is a review of WT condition monitoring techniques.
State of the art, trends as well as challenges are addressed. It aimed to highlight the strengths
and weaknesses of the different methods according to corresponding the state of the art. This
allowed us to determine the need to develop an equivalent model of roto wind turbine that
could improve the detection of defects occurring on the rotor. Chapter III establishes the
foundations of a theoretical as well as the physical and mathematical concepts of an
equivalent electric model capable of simulating the aerodynamic behavior of wind turbine
rotors. The equivalent electric model for a single blade has thus been developed. Simulations
and cross-validation were performed in MATLAB. Subsequently, using the validated model
of a single blade, we perform in chapter IV the modulization of the mechanical link between
the blades and the slow shaft of the rotor. Association all, we obtain the electric equivalent
model of the whole three blades rotor for a Darrius type VAWT. Finally, chapter V conclude
the thesis and gives some recommendations for future research works in continuity to this
thesis.
1.5. THESIS LIMITATIONS
Once the scope of the project is defined, some limitation arises in order to fulfill the scope of
the project. These limitations are as fallows:
- The model will be developed in the linear regime;

11
- The wind will be considered continuous and constant;
- The rotor mechanical coupling of three blades to the shaft is ideal.
1.6. CREDITS
The main part of this thesis consists of three chapters that where written in 'paper'
style in order to favour publication of the results and ideas presented in this thesis. Chapters
two, three and four are published in the journal Energies. All papers have been written by the
author of this thesis, and all ideas presented are genuinely his. Supervisor of this thesis Fouad
Slaoui Hasnaoui and cosupervisors Mohand Ouhrouche guided and helped the author to stay
focused on the objectives of the study throughout the core of this thesis. René wamkeue,
Gabriel Ekemb, Ernesto Benini and Tommy Andy Tameghe participated by assisting the
author in results analysis and interpretation.
References
[1] Observ'ER, «La production d’électricité d’origine renouvelable dans le monde,» Collection chiffres et statistiques. Neuvième inventaire-Edition, 2007.
[2] «Renewables 2012 Global Status Report,» 2012.
[3] «Small Wind World Report 2012,» 2012.
[4] S. Shamsoddin et F. Porté-Agel, «Large Eddy Simulation of Vertical Axis Wind Turbine Wakes,» Energies, vol. 7, n° %12, pp. 890-912, 2014.
[5] F. Scheurich, «Modelling the aerodynamics of vertical-axis wind turbines,» 2011.
[6] F. Scheurich et R. E. Brown, «Modelling the aerodynamics of vertical-axis wind turbines in unsteady wind conditions,» Wind Energy, vol. 16, n° %11, pp. 91-107, 2013.
[7] M. R. Castelli, G. Grandi et E. Benini, «Numerical Analysis of the Performance of the DU91-W2-250 Airfoil for Straight-Bladed Vertical-Axis Wind Turbine Application,» chez World Academy of Science, Engineering and Technology, 2012.

12
[8] R. Lanzafame, S. Mauro et M. Messina, «2D CFD Modeling of H-Darrieus Wind Turbines using a Transition Turbulence Model,» Energy Procedia, vol. 45, pp. 131-140, 2014.
[9] G. Lafrance, «Oui aux renouvelables alternatifs,» Mémoire déposé dans le cadre de la Commission sur les enjeux énergétiques du Québec, 2013.
[10] G. Westerholm, «The wind energy frontier: Urban retail markets,» Refocus, vol. 5, n° %14, pp. 42-45, 2004.
[11] E. Echavarria, B. Hahn, G. J. W. et T. Tomiyama, «Reliability of Wind Turbine Technology Through Time,» Journal of Solar Energy Engineering, vol. 130, p. 31005, August 2008.
[12] B. Hahn, «RELIABILITY ASSESSMENT OF WIND TURBINES IN GERMANY,» In Proceedings Europeen Wind Energy Conference, Nice, France, pp. 1-5, March 1999.
[13] B. Hahn, M. Durstewitz et K. Rohrig, «Reliability of Wind Turbines,» Wind Energy, pp. 329-332, 2007.
[14] B. Steve et Golbeck, «Maintenance d'éoliennes et surveillance d'état,» 2014. [En ligne]. Available: http://windsksolutions.com. [Accès le Juin 2013].
[15] C. A. Walford, Wind turbine reliability: understanding and minimizing wind turbine operation and maintenance costs, United States. Department of Energy, 2006.
[16] E. Byon, L. Ntaimo et Y. Ding, «Optimal maintenance strategies for wind turbine systems under stochastic weather conditions,» Reliability, IEEE Transactions on, vol. 59, pp. 393-404, 2010.
[17] R. F. Orsagh, H. Lee, M. Watson, C. S. Byington et J. Power, «Advance Vibration Monitoring for Wind turbine Health Management».
[18] Y. Amirat, M. Benbouzid, S. Member, B. Bensaker et R. Wamkeue, «Condition Monitoring and Fault Diagnosis in Wind Energy Conversion Systems: A Review,» Electric Machines \& Drives Conference, 2007. IEMDC'07. IEEE International. Proceeding, vol. 2, pp. 1434-1439, 2007.
[19] J. Ribrant, «Reliability performance and maintenance - A survey of failures in wind power systems,» 2005/2006.
[20] C. Moné, A. Smith et B. M. a. M. Hand, «2013 Cost of Wind Energy,» National Renewable Energy Laboratory: Golden CO, 2015.

13
Chapter II
LITERATURE REVIEW
Article published in Energies, April 2014
doi: 10.3390/en7042595

14
WIND TURBINE CONDITIWIND TURBINE CONDITION MONITORING: STATEON MONITORING: STATE--
OFOF--THETHE--ART REVIEW, NART REVIEW, NEW TRENDS, AND FUTUREW TRENDS, AND FUTURE E
CHALLENGESCHALLENGES
Pierre Tchakoua, René Wamkeue, Mohand Ouhrouche, Fouad Slaoui-Hasnaoui, Tommy
Andy Tameghe and Gabriel Ekemb
Résumé
Avec la forte croissance de l’énergie éolienne, la réduction des coûts d'exploitation et
de maintenance ainsi que l'amélioration de la fiabilité sont devenues les principales priorités
dans les stratégies de développement de projets éoliens. En plus du développement de
modèles d’éoliennes plus évolués afin d’assurer une plus grande continuité dans la
production d’énergie électrique, l'application de techniques de surveillance fiables et moins
onéreuses est une approche efficace pour l’atteinte de ces objectifs. Cet article planche sur la
revue et la classification des différentes méthodes et des techniques de surveillance
d’éoliennes et ceci en mettant l'accent sur les nouvelles tendances et les défis à venir. Après
avoir mis en lumière les principales techniques de surveillance, de diagnostic et de
maintenance utilisées dans l’industrie éolienne, une description des relations entre ces
différents concepts et les théories connexes a été effectuée ainsi que l’examinassions des
nouvelles tendances et des défis futurs. Ce travail de recherche permet de mettre en exergue
les forces et les faiblesses de l'industrie éolienne d'aujourd'hui et de définir les priorités de
recherche qui permettront à l'industrie de relever les défis de l'évolution technologique et de
la croissance du marché dans l'industrie éolienne.

15
Abstract
As the demand for wind energy continues to grow at exponential rates, reducing
operation and maintenance (OM) costs and improving reliability have become top priorities
in wind turbine (WT) maintenance strategies. In addition to the development of more highly
evolved WT designs intended to improve availability, the application of reliable and cost-
effective condition-monitoring (CM) techniques offers an efficient approach to achieve this
goal. This paper provides a general review and classification of wind turbine condition
monitoring (WTCM) methods and techniques with a focus on trends and future challenges.
After highlighting the relevant CM, diagnosis, and maintenance analysis, this work outlines
the relationship between these concepts and related theories and examines new trends and
future challenges in the WTCM industry. Interesting insights from this research are used to
point out strengths and weaknesses in today’s WTCM industry and define research priorities
needed for the industry to meet the challenges in wind industry technological evolution and
market growth.

16
INTRODUCTION
Energy conversion and efficiency improvement have become a worldwide priority to
secure an energy supply and address the challenges of climate change, greenhouse gas
emission reduction, biodiversity protection, and renewable technology development. In
2011, renewable sources accounted for nearly 50% of the estimated globally added electric
capacity evaluated at 208 GW [1]. Among all renewable energy sources, wind energy is the
fastest-growing sector in terms of installed capacity. As shown in Figure II-1, the cumulative
installed wind power capacity reached 283 GW in 2011, which represents nearly 3% of global
electricity production. Furthermore, the contribution of wind power to the world total
generation capacity is expected to reach 8% by 2018 [1–3].
Figure II-1 Wind energy world market forecast for 2013–2017 [1]. Reprinted/Reproduced with permission
from [1]. Copyright 2013, Global Wind Energy Council (GWEC).
Wind turbines (WTs) are unmanned, remote power plants. Unlike conventional power
stations, WTs are exposed to highly variable and harsh weather conditions, including calm
to severe winds, tropical heat, lightning, arctic cold, hail, and snow. Due to these external
variations, WTs undergo constantly changing loads, which result in highly variable
17
operational conditions that lead to intense mechanical stress [4]. Consequently, the
operational unavailability of WTs reaches 3% of the lifetime of a WT. Moreover, operation
and maintenance (OM) costs can account for 10%–20% of the total cost of energy (COE) for
a wind project, and this percentage can reach 35% for a WT at the end of life. A preventive-
centered maintenance strategy that avoids machine shutdown can considerably reduce these
costs [5–7]. Therefore, WTs require a high degree of maintenance to provide a safe, cost-
effective, and reliable power output with acceptable equipment life. The state-of-the-art
method for determining the maintenance strategy in the WT industry is reliability-centered
maintenance (RCM), which consists of preventive maintenance based on performance and/or
parameter monitoring and subsequent actions. In this strategy, condition-monitoring (CM) is
used to determine the optimum point between corrective and scheduled maintenance
strategies [8–11]. The recurrent and commonly used condition-monitoring techniques
(CMTs) are: (i) vibration/acoustic-controlled and OM techniques for the turbine; and (ii)
optical strain gauges for the blades.
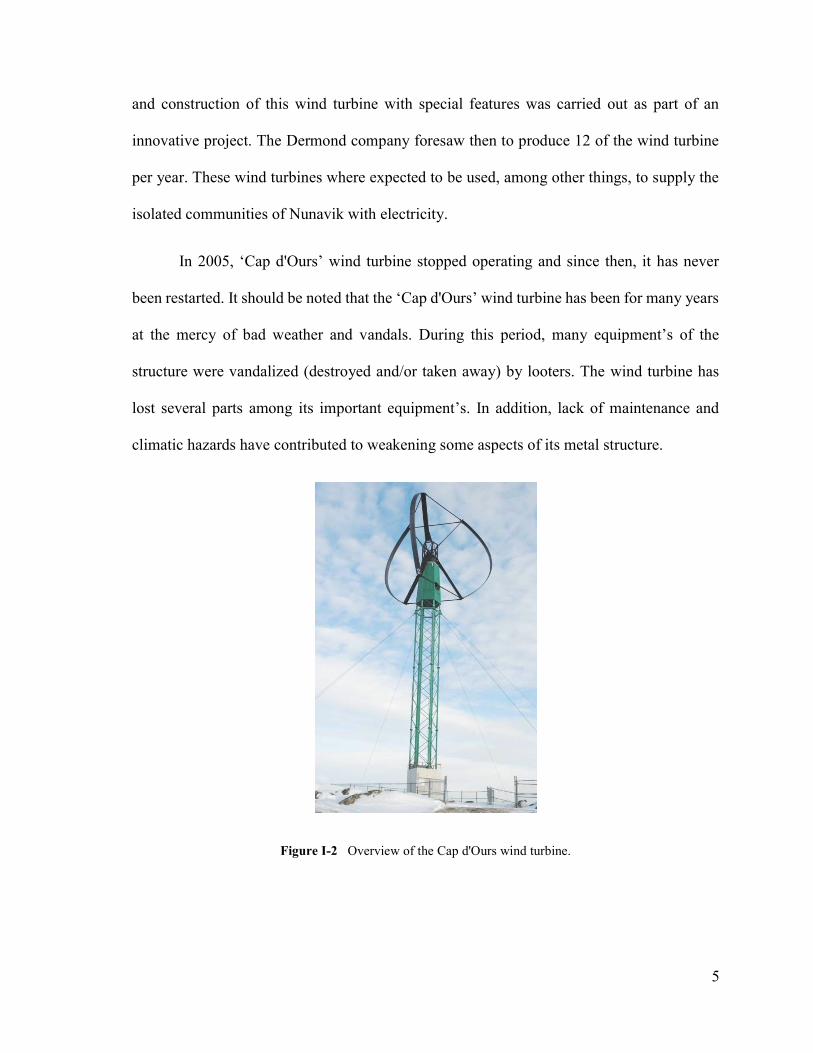
The WTs are typically designed to operate for a period of 20 years [12,13]. As with
other mechanical systems, time-based maintenance assumes that the failure behavior of WTs
is predictable. Fundamentally, three failure patterns describe the failure characteristics of WT
mechanical systems [14].
The bathtub curve shown in Figure II-2 illustrates the hypothetical failure rate versus
time in a mechanical system [15–18], where β ˂ 1 represents a decreasing failure rate, β = 1
represents a constant failure rate, and β ˃ 1 represents an increasing failure rate.

18
Figure II-2 The “bathtub” curve illustrating the reliability of technical systems.
Guo et al. [19] developed a three-parameter Weibull failure rate function for WTs,
and their results corroborate the bathtub curve. Echavarria et al. [12] published results of a
remarkable 15-year research study on the frequency of failures versus increasing operational
age for various WT power ratings (Figure II-3).
Figure II-3 Number of incidents per wind turbine (WT) per operational year; WTs are categorized by rated
power [12]. Reprinted/Reproduced with permission from [12]. Copyright 2008, American Society of Mechanical Engineers.
The frequency of failures in WTs also varies with the scale and type. Spinato et al.
[18,20] carried out a failure analysis based on onshore WT types, as specified in the
Schleswig Holstein Landwirtschaftskammer (LWK) database. The work displayed a general

19
trend of an increasing failure rate with turbine size. Because turbine capacity continues to
grow, we can assume that it will be difficult to decrease the initial failure rate. Several
research studies considered the distribution of WT failures in the main components
[13,20,21]. Haln et al. [13] reported a survey of 1500 WTs over 15 years and found that five
component groups, i.e., electrical system, control system, hydraulic system, sensors, and
rotor blades, are responsible for 67% of failures in WTs, as shown by the pie chart in Figure
II-4.
Figure II-4 Share of the main components of the total number of failures [13]. Reprinted/Reproduced with
permission from [13]. Copyright 2007, Springer Science + Business Media.
To establish the impact of component failure on WT reliability, research centered on
the availability of WTs was presented in [8,22–25]. The results published by Fischer et al.
[8] indicated that 75% of the annual downtime is caused by only 15% of the failures in WTs.
This result corroborates the conclusions of Haln et al. [13], regarding the average failure rate
and average downtime per component. The results of this study are also in agreement with
the conclusions of Crabtree et al. [24], regarding the comparison of failure rates and
downtime for different WT subassemblies based on surveys of European wind-energy
conversion systems (WECSs). The chart in Figure II-5 summarizes the failure rate and

20
downtime of different WT subassemblies. The reliability and downtime data of the Egmond
aan Zee wind farm in Germany also produced similar results, i.e., the gearbox failure rate is
low, but the downtime and resultant costs are high. As a result, the percentage of electricity
production lost due to gearbox downtime is the highest of all subassemblies [24].
A statistical analysis of WT faults demonstrates that their reliability and availability
depend on multiple factors, i.e., age, size, weather, wind speed, and subassembly failure rates.
However, applying efficient CMTs can greatly increase the reliability of WTs.
Figure II-5 Failure rates and downtime from two large surveys of European WTs over 13 years [13]. Reprinted/Reproduced with permission from [13]. Copyright 2007, Springer Science + Business Media.
In the literatures, few articles have provided a review of wind turbine condition
monitoring (WTCM) and/or fault diagnosis [7,21,26–29]. The goal of this paper is to provide
a review of methods and techniques for WTCM with a classification of: (i) intrusive and
nonintrusive techniques; and (ii) destructive techniques and non-destructive techniques. This
work also focuses on trends and future challenges in the WTCM industry. The paper is
organized as follows: Section 2 is dedicated to CM-related concepts and definitions and
outlines the relationships among CM, fault diagnosis, and fault prognostic and maintenance

21
strategies; Section 3 presents a review of techniques and methods used in WECSs and CM,
subdividing them into subsystem techniques and overall system techniques as well as
destructive and non-destructive techniques; Section 4 discusses the new trends and future
challenges that will enable the industry to address the WT challenges of the future, including
reducing operational costs and improving reliability; finally, Section 5 provides conclusions
to the work.
CONCEPTS AND DEFINITIONS
2.2.1. Maintenance Approaches
As in most industries, maintenance approaches in the WT industry can be widely
classified into three main groups [30,31]:
- Reactive or corrective maintenance (run to failure);
- Preventive maintenance (time-based);
- Predictive maintenance (condition-based).
The COE estimation for a WECS is given by Equation (1) [6,32–35], where ICC is
the initial capital investment cost; FRC is the annual fixed charge rate; E is the annual energy
production in kW h; and OM is the annual OM cost:
ICC FCR OMCOE
E
(1)
where ICC and FCR are fixed parameters; and OM is a variable parameter that can
affect the COE during the lifetime of the project. Therefore, the profit from wind energy is
highly dependent on the ability to control and reduce this variable cost. The OM cost of
equipment will notably depend on the maintenance strategy adopted by the user.
22
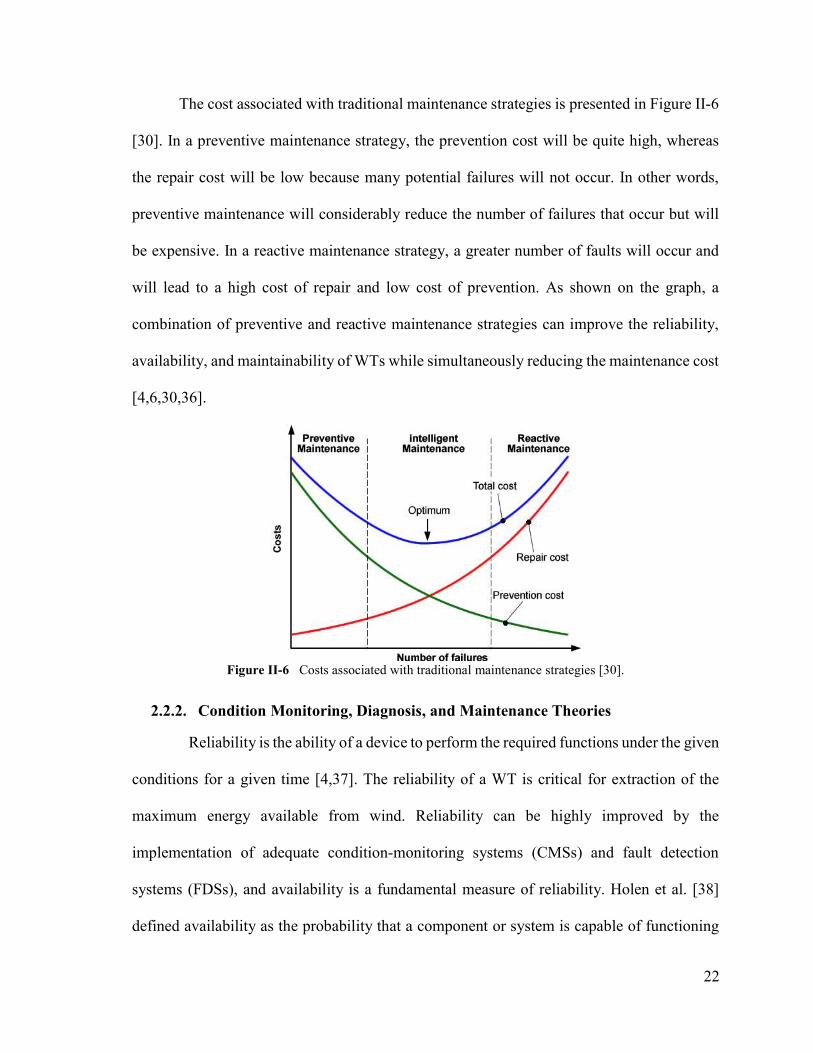
The cost associated with traditional maintenance strategies is presented in Figure II-6
[30]. In a preventive maintenance strategy, the prevention cost will be quite high, whereas
the repair cost will be low because many potential failures will not occur. In other words,
preventive maintenance will considerably reduce the number of failures that occur but will
be expensive. In a reactive maintenance strategy, a greater number of faults will occur and
will lead to a high cost of repair and low cost of prevention. As shown on the graph, a
combination of preventive and reactive maintenance strategies can improve the reliability,
availability, and maintainability of WTs while simultaneously reducing the maintenance cost
[4,6,30,36].
Figure II-6 Costs associated with traditional maintenance strategies [30].
2.2.2. Condition Monitoring, Diagnosis, and Maintenance Theories
Reliability is the ability of a device to perform the required functions under the given
conditions for a given time [4,37]. The reliability of a WT is critical for extraction of the
maximum energy available from wind. Reliability can be highly improved by the
implementation of adequate condition-monitoring systems (CMSs) and fault detection
systems (FDSs), and availability is a fundamental measure of reliability. Holen et al. [38]
defined availability as the probability that a component or system is capable of functioning

23
at time t, given by Equation (2), where MTTF is the mean time to failure and MTTR is the
mean time to recovery:
MTTFA
MTTF MTTR
(2)
A CMS is a tool used to ensure and measure the reliability of any running system
[39]. Wiggelinkhuizen et al. [40] suggested that for WECSs, significant changes are
indicative of a developing failure. The continuous component states (i.e., WT health) are
evaluated using a collection of techniques, i.e., vibration analysis (VA), acoustics, oil
analysis (OA), strain measurement (SM), and thermography [27]. Data are sampled at regular
time intervals using sensors and measurement systems. Using data processing and analyses,
CMSs can determine the states of the key WECS components. By processing the data history,
faults can be detected (diagnosis) or predicted (prognostic) and the appropriate maintenance
strategy can be chosen.
Maintenance includes any actions appropriate for retaining equipment in or restoring
it to a given condition [31]. Maintenance is required to ensure that the components continue
to perform the functions for which they were designed. The basic objectives of the
maintenance activity are to: (i) deploy the minimum resources required; (ii) ensure system
reliability; and (iii) recover from breakdowns [41]. The applied maintenance strategy can be
preventive if a predicted failure is avoided or corrective when a detected failure is repaired
[42].
A description of and models for CMSs can be found in [27,39,43,44]. This description
can be combined with concepts definitions provided in [14,31,45–48], which address
maintenance techniques and methods. The diagram relating technical concepts and words
used in the domain of WTCM and fault diagnosis emerges from the aforementioned

24
combination. As shown in Figure II-7, CM is performed in three main steps: data acquisition
using sensors, signal processing using various data processing techniques, and feature
extraction via the retrieval of parameters that will aid in establishing the current status of the
monitored equipment. Using both: (i) current information sources; and (ii) information on
the system’s past status obtained from stored data, the system’s present state is obtained via
online monitoring such that a fault can be detected or predicted. After a fault is diagnosed,
corrective maintenance is carried out. Two approaches to corrective maintenance can be
distinguished, i.e., palliative maintenance, which consists of provisional solutions to failures,
and curative maintenance for standing solutions to failures. If a fault is predicted, preventive
maintenance is carried out before the fault can occur. In this case, four different approaches
can be used: time-based or scheduled maintenance, current-state based or conditional
maintenance, parameter-projection-based or forecasting maintenance, and status-based or
proactive maintenance.
Figure II-7 Overview of condition-monitoring (CM) and maintenance processes for WTs.

25
REVIEW OF CONCEPTS AND METHODS FOR WTCM
According to the Swedish standard SS-EN 13306 [49], monitoring can be defined as
an activity performed either manually or automatically that is intended to observe the actual
state of an item. The key function of a successful CMS should be to provide a reliable
indication of the presence of a fault within the WECS and to indicate the location and severity
of the situation [25]. For this purpose, a CMS is required for early warning sign detection.
CM is based on data acquisition and signals processing and can be implemented using various
approaches with different levels of technology [46].
A complete CMS is composed of many subsystems, each monitoring a particular
component of the wind generator [50]. Due to the considerable level of overlap between
functions of different subsystems, certain CM subsystems will monitor many components of
the WT. The approach proposed in this review differentiates CMTs applied on WT
subsystems from CMTs applied on the overall WT system.
2.3.1. Wind Turbines Subsystems or Intrusive Condition Monitoring Techniques
The subsystem-level CM of WTs is based on subcomponents related to local
parameters [27,28,51] and enables the acquisition of information on specific components and
thus the precise localization of eventual failures. The typical main components of a utility-
scale WT are presented in Figure II-8, and an example of a function model for the monitoring
of a WECS based on the subsystem approach is presented in Figure II-9.

26
Figure II-8 Typical main components of a utility-scale WT [51].
Subsystem CM can be classified into two main subcategories, namely, those based
on destructive test (DT) and those based on non-destructive test (NDT) [52].
Subsystem CM based on DT uses:
- VA;
- OA;
- SM;
- Electrical effects;
- Shock pulse method;
- Physical condition of materials;
- Self-diagnosis sensors;
- Other techniques.
- Subsystem CM based on NDT uses:
- Ultrasonic testing techniques (UTTs);
- Visual inspection (VI);
- Acoustic emission;

27
- Thermography;
- Performance monitoring;
- Radiographic inspection.
Figure II-9 Function model for monitoring of a wind-energy conversion system (WECS) [53]. BCU: boundary
controlling unstable; and RMS: root mean square. Reprinted/Reproduced with permission from [53]. Copyright 2008, Blekinge Institute of Technology.
2.3.2. Subsystem Condition Monitoring Techniques Based on Destructive Techniques
As stated in [54], a DT is “a form of mechanical test (primarily destructive) of
materials whereby certain specific characteristics of the material can be evaluated
quantitatively”. DTs are generally realized more easily and yield additional data that are
easier to interpret than those from NDTs [55,56]. As applied to WECSs, DTs are dynamic or
static and can provide useful information related to the material’s design considerations,
equipment performance, structural health, and useful life.

28
a) Voltage Analysis (VA)
VA is the most well-known technology for rotating equipment CM. As shown in
Figure II-10, VA is the most efficient technology for early prediction and detection of failures
in mechanical equipment [32]. Applied sensor technology is selected by considering the
frequency range and operating conditions [57]. Position transducers, velocity sensors,
accelerometers, and spectral emission energy sensors are used for low-, middle-, high-, and
very-high-frequency ranges, respectively. Fast Fourier transformation is the signal
processing technique commonly used in VA to convert a time-domain signal into a
frequency-domain signal [58].
Figure II-10 Typical development of a mechanical failure.
As a subsystem monitoring technique, VA is applied to such WT components as
shafts, bearings, gearboxes, and blades. In WTs or wind farms, CM via the VA’s extreme
false alarm levels can provide information on the incorrectness of vibration signals from the
recording process (e.g., in the case of a faulty sensor). To minimize the risk of anomalies,
which is increased in a wind farm due to the greater number of WTs, Jablosky et al. [59]
developed an algorithm for the automatic validation of vibration signals in the distributed

29
monitoring system of a wind farm. Based on amplitude validation, the vibration data are
validated via an original implementation of Parseval’s theorem, in addition to the novel idea
of a so-called “N-point” rule, which is a simple yet powerful in automatic signal error
detection.
The WTCM techniques with VA are standardized in ISO10816 [60], which define
the positioning and use of sensors. VA methods are easy to implement in existing equipment
and have a high level of interpretation, making it easy to locate the exact faulty component.
Nevertheless, this approach implies the use of additional hardware and software, which
increases the production costs. Additionally, it is difficult to use sensors to detect low-
frequency faults [28].
b) Oil Analysis (OA)
Oil debris monitoring has been proven as a viable CMT for the early detection and
tracking of damage in bearing and gear elements in WT gearboxes [61]. Indeed, 80% of
gearbox problems can be attributed to the bearings, which subsequently lead to damage to
the gearing [62].
In most cases, oil is pumped through the component in a closed-loop system, and
metal debris from cracked gearbox wheels or bearings is caught by a filter. The amount and
type of metal debris can indicate the health of the component. OA has three main purposes
[61]: (i) to monitor the lubricant; condition and reveal whether the system fluid is healthy
and fit for further service or requires a change; (ii) to ensure the oil quality (e.g.,
contamination by parts, moisture); and (iii) to safeguard the components involved (part
characterization). Six main tests are generally employed in the OA process: [57,63–65]:
- Viscosity analysis;
30
- Oxidation analysis;
- Water content or acid content analysis;
- Particle count analysis;
- Machine wear analysis;
- Temperature.
OA techniques can be divided into two categories: real-time continuous monitoring
and offline oil sample analysis [66]. These processes are typically executed off line by taking
samples. However, online real-time oil debris monitoring may be desirable for applications
in which failure modes develop rapidly or when accessibility is limited. In this case, it is
advisable to install several sensors in the gearbox lubrication loop to analyze different
characteristics. This approach will increase the reliability and accuracy of the analyses
[53,64].
The technology for on-line detection can be broadly divided into three subcategories
depending on the sensing techniques applied [4]: electromagnetic sensing, flow or pressure-
drop sensing, and optical debris sensing. In terms of cost, size, accuracy, and development,
suitable oil monitoring technologies are online ferrography, selective fluorescence
spectroscopy, scattering measurements, Fourier transform infrared (IR) spectroscopy, photo
acoustic spectroscopy, and solid-state viscometry [62,64]. Du and Zhe [67] developed a high-
throughout, high-sensitivity inductive sensor for the detection of micro-scale metallic debris
in nonconductive lubrication oil. The device is able to detect and differentiate ferrous and
non-ferrous metallic debris in lubrication oil with high efficiency.
Although OA is the only method for detecting cracks in the internal gearbox, this
approach has two main limitations. First, it cannot detect failures outside the gearbox, and

31
second, use of this equipment for online monitoring is highly expensive. For these reasons,
offline monitoring of oil samples is often used [28,68].
c) Temperature Measurement (TM)
Monitoring the temperature of the observed component is one of the most common
methods of CM [56]. TM aids in detecting the presence of any potential failure related to
temperature changes in the equipment. In the wind energy industry, TM is applied on such
components as bearings, fluids (oil), and generator windings, among others [53,69]. Optical
pyrometers, resistant thermometers, and thermocouples are a subset of the sensors used in
TM [70]. Unlike thermography, TM provides information on the ongoing deterioration
process in the component from excessive mechanical friction due to faulty bearings and
gears, insufficient lubricant properties, and loose or bad electrical connections [53].
TM is reliable because every piece of equipment has a limited operational
temperature. However, temperature develops slowly and is not sufficient for early and precise
fault detection [71]. Additionally, the measured temperature can also be influenced by the
surroundings. Therefore, TM is rarely used alone but often as a secondary source of
information. In this case, the primary source could be vibration monitoring [32,71].
d) Structural Monitoring (SM)
SM is a renowned technique for structural health monitoring (SHM) and is becoming
increasingly important in the WT industry, where it is applied to blades and towers; SM is
commonly used in laboratory settings for blade lifetime testing [16,51,72,73]. Measurements
are gathered with sensors, i.e., so-called metal foil strain gauges, and the finite element
method is commonly used to process the acquired data [73,74]. Strain gauges can be placed
randomly on the blade, and the distribution varies according to the number of transducers.

32
However, strain gauges are not robust over the long term, and more robust sensors might
offer an interesting application area [51,57].
Currently, certain WT manufacturers incorporate fiber-optic sensors into the blades
to reduce connections with the data logger and permit little to no weakening of the signal
over a considerable distance. With the latest fiber optic sensing technologies, monitoring of
stresses on the blades during rotation is easier and more accurate [27,75–77]. Kreuzer [73],
Bang et al. [74] and Schroeder et al. [78] investigated the development of a high-speed-fiber
Bragg-grating-based sensor array system for strain-based deflection shape estimation of WT
structures.
e) Optical Fiber Monitoring (OFM)
OFM is growing as a reliable and cost-effective technique for WT SHM [71]. A
network of sensors can be embedded in the blade structure to enable the measurement of five
parameters that are critical to SHM. The five parameters include: (i) SM for monitoring the
blade loading and vibration level; (ii) TM for likely over-heating; (iii) acceleration
measurement for monitoring the pitch angle and rotor position; (iv) crack detection
measurements; and (v) lightning detection for measuring the front steepness, maximum
current, and specific energy [79–82].
The optical fibers must be mounted on the surface or embedded into the body of the
monitored WT components. Therefore, OFM is complicated and expensive in real-world
applications compared with other CM and fault detection methods [83,84]. However, due to
technological progress, it is expected that the cost of OFM for WT SHM will decrease
considerably in the future.

33
2.3.3. Subsystem Condition Monitoring Techniques Based on Non-Destructive Techniques (NDTs)
Malhotra et al. [54] defined NDT as “an examination, test, or evaluation performed
on any type of test object without changing or altering it in any way”. This is often done in
order to determine the absence or presence of conditions or discontinuities that may have an
effect on the usefulness or serviceability of the monitored object. NDTs may also be
conducted to measure other tested object characteristics, i.e., size, dimension,
configuration, or structures, including alloy content, hardness, and grain size.
Nevertheless, these approaches are largely applied to localized areas. Thus, NDT
technologies require more accurate prior knowledge of probable damage locations as well as
the use of dedicated sensors [56].
a) Visual Inspection (VI)
Based on human sensory capabilities, VI or observation is undoubtedly one of the
oldest CMT and can serve as a supplement to other CMTs. VI includes the detection of
sounds emitted by a functioning system, touch (temperature and vibration checking), and VI
(e.g., deformation and aspects). This approach is generally used to monitor such components
as rotor blades, nacelles, slip rings, yaw drives, bearings, generators, and transformers
[53,85].
In several cases, VI is of great importance in identifying a problem that was not
identified by other CMTs. Such cases may include loose parts, connections, terminals, and
components; visibly worn or broken parts; excessive temperatures that reflect through the
structure or housing, oil leakages, corrosion, chattering gears, or hot bearing housings [85–
87]. Nevertheless, VI is limited to the identification of damages that are visible on the surface
34
of a structure. Moreover, VI is labor intensive and highly subjective because the results
depend on the experience and judgment of the inspector [88].
Today, the industry is implementing remote VI technologies to inspect gearboxes,
WT blades, and other critical components [89]. AIT Inc. has developed a video boroscope or
videoscope used to inspect the interior areas that are not accessible and can be efficient in
revealing hairline cracks, corrosion, pitting, rubbing, and other defects [85]. Moreover, the
AutoCopter™ Corporation [87] has developed a flying remote VI device that enables
inspection of WTs, thus increasing reliability and the number of daily inspections while
eliminating the risk of personal injury.
b) Acoustic Emission (AE)
AE phenomena are based on the release of energy in the form of transitory elastic
waves within a material via a dynamic deformation process [90]. Typically, sources of AE
within a material are [91,92] crack initiation and propagation, breaking of fibers, and matrix
cracking and fretting between surfaces at de-bonds or de-laminations. Unlike VA, AE can
detect failures characterized by high-frequency vibrations ranging from 50 kHz to 1 MHz
[93]. Piezoelectric transducers and optic fiber displacement sensors are often employed in
this approach [94]. The most commonly measured AE parameters for diagnosis are
amplitude, root mean square (RMS) value, energy, kurtosis, crest factor, counts, and events
[95].
This method is typically applied for fault detection in gearboxes, bearings, shafts, and
blades, and its advantages include a large frequency range and a relatively high signal-to-
noise ratio. The main drawback of AE is its cost. Furthermore, only a few types of faults
occur in the high-frequency range. Another limitation of AE is the attenuation of the signal

35
during propagation. Therefore, an AE sensor must be located as close to its source as possible
[96], which may pose a practical constraint in applying AE to certain wind machines.
Research was carried on the combined use of AE and VA data [97–99]. Soua et al.
[99] presented the results of a combined vibration and AE monitoring effort that was
performed over a continuous period of five years on an operating WT. Good results were
obtained for the detection of defects, most notably in the gearbox, using special digital
processing techniques, such as similarity analysis. Tan et al. [96] carried out a comparative
experimental study on the diagnostic and prognostic capabilities of AE, VA, and
spectrometric OA for spur gears and observed that based on the analysis of RMS levels, only
the AE technique was more sensitive in detecting and monitoring faults than either the
vibration or spectrometric OA.
c) Ultrasonic Testing Techniques (UTTs)
UTTs are extensively used by the wind energy industry for structural evaluation of
WT towers and blades [27,92]. This method relies on elastic wave propagation and reflection
within the material. Three different techniques can be used for this investigation: pulse-echo
(Figure II-11), through transmission, and pitch-catch [100,101]. Laser interferometric
sensors, air-coupled transducers, electromagnetic acoustic transducers, or contact transducers
are a subset of the sensors that can be used as the scanning sensor for acoustic wave field
imaging, which is another UTT [72,102].

36
Figure II-11 Principle of the pulse-echo technique used for the investigation of WT blades [100,103]. GFRP: glass fiber reinforced plastic. Reprinted/Reproduced with permission from [100]. Copyright 2008, Kaunas University of Technology.
Implementation of UTTs implies one or more of the following measurements: time
of flight or delay, path length, frequency, phase angle, amplitude, acoustic impedance, and
angle of wave deflection [104]. Thus, signal-processing algorithms, including such time-
frequency techniques as the Wigner-Ville distribution, Hilbert-Huang transform, and wavelet
transform [100,105], can be used to extract additional information on internal defects.
Ultrasonic testing via wave propagation characteristics allows for the estimation of
the location and nature of the detected failure. This approach provides a quick, reliable, and
effective method for determining the material properties of the principal turbine components
[106]. Ultrasound scanning allows personnel to see below the surface and check the laminate
for dry glass fibers and de-lamination [107]. Unlike other NDT techniques (i.e.,
thermographic techniques), acoustic techniques are not as affected by temperature or air
humidity [108].
d) Thermography Analysis (TA)

37
TA provides a wide range of diagnostic and monitoring applications in different
equipment and machines, i.e., bearings, gear boxes, conveyor systems, drivers, motors, and
electric generators. IR thermography is recognized as one of the most versatile and effective
CM tools for use in the WT industry for control and diagnoses of electric parts and
mechanical equipment [109,110]. This method is based on the fact that all working
components emit heat and when a component in the system starts to malfunction, its
temperature increases beyond the normal values [56]. IR temperature transmitters and high-
resolution IR cameras are the sensors applied in TA, and results are typically interpreted
visually [27,111].
Today, TA is primarily used for periodical manual inspection and can be used as a
local or global technique because it is possible to assess the damage at the component or
system level, depending on the resolution of the camera. However, TA is not appropriate for
early fault detection because temperature develops slowly, as mentioned earlier [111,112].
Another important difficulty with TA for WTCM is that monitoring should be performed
offline [111]. However, cameras and diagnostic software that are suitable for on-line process
monitoring are currently entering the market [57].
e) Radiographic Inspection
Radiography (both film and digital) uses the well-known effects of an X-ray source
on one side of a specimen and an X-ray-sensitive receptor on the other side. Although this
method does provide useful information on the structural condition of the WT component
under inspection, radiographic imaging using X-rays is rarely used in WECS industry [27].
The technique is highly efficient in detecting crack and de-lamination in the blade/rotor and
tower structures.

38
f) Other Non-Destructive Wind Turbine Condition Monitoring Techniques
Other techniques are not widespread but are also used in the maintenance of WTs. In
many cases, their performance is heavily influenced by the costs or excessive specialization,
making them impractical in some situations. Examples are SMs in blades, voltage and current
analysis, shock pulse methods, and magnetic flux leakage.
2.3.4. Wind Turbine Global System or Nonintrusive Condition Monitoring Techniques
Conventional subsystems CMTs (i.e., vibration, lubrication oil, and generator current
signal analysis) require the deployment of a variety of sensors and computationally intensive
analysis techniques [113]. The use of additional sensors and equipment increases costs and
hardware complexity of the WECS. Furthermore, sensors and equipment are inevitably
subject to failure, causing additional problems with system reliability and additional OM
costs [114]. For these reasons, it is of interest to develop overall CMTs. These techniques are
nonintrusive, low cost, and reliable.
Unlike subsystem CMTs, global systems CMTs enable the extraction of fault features
with low calculation time from direct or indirect drives and fixed- or variable-speed WTs. In
addition, these techniques can all be used in online and thus increase the WT reliability while
reducing the downtime and OM costs [113–115]. Certain overall WTCM approaches include
performance monitoring, power curve analyses, electrical signature, and supervisory control
and data acquisition (SCADA) system data analysis.
a) Performance Monitoring or the Process Parameter Technique
In WT performance monitoring, parameter readings of the capacity factors of the
plant, power, wind velocity, rotor speed, and blade angle are compared with the values in
operator manuals or manufacturer performance specifications to determine whether the

39
system is performing at optimum efficiency. The relationships among power, wind velocity,
rotor speed, and blade angle can be used for safeguarding purposes, and an alarm is generated
in the case of large deviations. The detection margins are large to prevent false alarms
[51,53]. Today, more intelligent usage of the signals based on parameter estimation and
trending is not a common practice in the WT industry [51].
b) Power Signal Analysis
Power quality is a high-interest area for WTCM because quality could degrade as a
result of wind speed turbulence and switching events. From a global viewpoint, the
mechanical power (torque times speed) measured on the WT drive shaft and the total three-
phase electrical power measured from the terminals of the generator are the input and output
of a WT system, respectively. Both energy flows are disturbed by WT abnormalities caused
by mechanical or electrical faults [115]. Significant variations in the WT drive train torque
are generally signs of abnormalities. Faults in the drive train cause either a torsional
oscillation or shift in the T
ratio. By monitoring this ratio, certain fault conditions can be
detected. For example, torque oscillations can be detected in a blade or rotor imbalance
condition in the WT [71,116].
Peak power output, reactive power, voltage fluctuations, and harmonics greatly
influence the power quality [117–120]. As an example, for a healthy WT, the output current
is assumed to be sinusoidal:
(3)
Where 1 is the pulsation for a healthy WT.
1( ) a cos(ω )Hi t t

40
A failure will cause a vibration in the shaft rotation at a certain frequency that can be
detected using vibration sensors. The new shaft rotating speed is given by [121,122]:
(4)
2 is the pulsation in the broken down WT that is due to the vibration caused by the failure.
Therefore, the instantaneous phase for a faulty WT can be obtained:
1 2
0
( ) ( ) sin( )t
F Ft t dt t t (5)
The current for the faulty WT can then be written as:
(6)
If we assume c ω , thus γ 1 . As a result, 2cos γ sin(ω ) 1t and
2 2sin γ sin(ω ) γ sin(ω )t t.
We will finally obtain:
(7)
where ( )Hi t and ( )Fi t are the instantaneous currents for healthy and faulty WT,
respectively; 1 is the angular shaft rotation speed for a healthy WT; 2 is the angular shaft
rotation speed generated by the fault; F is the shaft rotation speed for a faulty WT; a is the
amplitude of the instantaneous current for a healthy WT; c is the amplitude of the current due
to the WT fault; and = c/. a, c and are constants values. Frequency demodulation is used
for feature extraction from Equation (7).
1 2ω ( ) ω ccos(ω )F t t
1 2 1 2 1 2( ) a cos ω γ sin(ω ) a cos ω cos γ sin(ω ) a sin ω sin γ sin(ω )Fi t t t t t t t
1 1 2 1 1 2 1 2
γ γ( ) a cos ω aγsin ω sin(ω ) cos(ω ) cos (ω ω ) cos (ω ω )
2 2F
a ai t t t t a t t t

41
A mechanical failure can also lead to amplitude modulation of the output current. For
a three-phase generator, the stator current ik(t) (k = 1,2,3) can be described in a discrete form
as [121,123]:
(8)
where 0,...., 1n N is the sample index (N being the total number of received
samples); and k = 2k/3 is the phase parameter. The angular frequency is equal to 2f/Fe,
where f and Fe are the supply and sampling frequencies, respectively. The amplitude ak(n)
is related to the fault as follows:
- For a healthy WT, ak(n) is constant and there is no amplitude modulation;
- For a faulty WT, ak(n) is time variant and the current signal is modulated in amplitude.
- Amplitude demodulation can be used for feature extraction using various techniques,
such as the Concordia transform or Hilbert transform.
Wakui and Yokoyama [124] developed a sensorless wind-speed performance-
monitoring method for stand-alone vertical-axis WTs using numerical analyses in a dynamic
simulation model. Yang et al. [113,125,126] and Watson et al. [122] proposed a wind turbine
condition monitoring technique (WTCMT) that uses the generator output power and
rotational speed to derive a fault detection signal. The technique is based on a detection
algorithm using a continuous-wavelet-transform-based adaptive filter to track the energy in
the prescribed time-varying fault-related frequency bands in the power signal. A probabilistic
model of the power curve based on copulas was developed by Gill et al. [127], for CM
purposes. Copula analysis is likely to be useful in WTCM, particularly in early recognition
of incipient faults, such as blade degradation, yaw, and pitch errors.
c) WTCM Based on Signature Analysis (SA)
( ) ( ) cos(ω )k k ki n a n n

42
SA is a simpler but more inclusive WTCM technique. Intensive research efforts have
been focused on the use of SA to predict or detect electrical and mechanical faults in WECSs.
Different signals can be detected (i.e., voltages, power, currents, or stray flux), and SA can
be used to detect various faults (i.e., broken rotor bars, bearing failures, air gap eccentricity,
and unbalanced rotors and blades) [50,128]. Yazidi et al. [129] proposed a monitoring system
for WTs with double-fed induction generators based on stator and rotor current signatures.
Different tests were performed in this work, and relevant results were obtained. The proposed
CMS was efficient for detection of rotor and stator asymmetry in a double-fed induction
machine connected to a back-to-back converter. A similar investigation was carried out by
Douglas et al. [130].
Yang et al. [131] proposed a CMT based on both electrical and mechanical signatures.
In addition to its versatile function, i.e., its ability to detect both mechanical and electrical
faults, this technique removes the negative influence of variable wind in the machine CM.
This work also investigated the possibility of detecting a WT mechanical fault (e.g., rotor
imbalance fault and drive train mechanical fault) via power signal analysis.
d) Wind Turbine Condition Monitoring Based on SCADA Data Analysis
In most modern WTs, SCADA systems are now common. The WTCM using SCADA
data analysis is cost effective (data collection and sensor networks already in place) and
reliable because it relies on the interpretation of SCADA data [132]. The SCADA system
collects information extensively from key WT subassemblies using sensors fitted to the WT,
i.e., anemometers, thermocouples, and switches. The operational data reflect either turbine
status or measurements of signals, such as wind speed and direction, temperatures, currents,
or pressures. This information can effectively reflect the real-time condition of a WECS, and
by analyzing SCADA data, the relationship between different signals can be observed and

43
the health of WT components deduced [133]. Neural networks and fuzzy logic are other
examples of the common tools for data analysis. An overview of WTCM based on SCADA
data analysis is presented in Figure II-12.
Figure II-12 Overview of wind turbine condition monitoring (WTCM) based on supervisory control and
data acquisition (SCADA) data analysis. FIS: fuzzy interference system.
Several recent studies on SCADA data for WECS CM can be found in the literatures
[132,134–137]. A wind turbine condition monitoring system (WTCMS) based on SCADA
using normal behavior models and fuzzy logic was presented in [135]. This CMS is designed
to detect trends and patterns in SCADA data and predict possible failures. Another recent
research study by Li et al. [136] focused on improving the fuzzy synthetic condition
assessment of a WT generator system. The results indicated that the evaluation of dynamic
limits and deterioration degree functions for the characteristic variables for WECSs could be
improved by analyzing SCADA data with the improved fuzzy synthetic model.
However, the WT SCADA system does not collect all of the information necessary
to conduct a full CM of a WT because it was not initially designed for CM purposes.

44
Furthermore, although SCADA techniques are widely applied to WT, the data rate of once
every 5–10 min is too slow for most rotating machine fault diagnoses [116,131,133]. Another
concern is that the values of SCADA data vary over wide ranges under varying operational
conditions, and it is difficult to detect an incipient fault from raw SCADA data without an
appropriate data analysis tool [137].
This section provides a status update on different methods and techniques used for
WTCM. Table II-1 presents an overview on the state of the art for WTCMSs, including
possible failures and corresponding monitoring techniques for various WT components and
subsystems. The following section focuses on new trends in WTCM with respect to the wind
industry’s evolution, and implications for challenges in the research area will be discussed
based on these tendencies.
Table II-1 Overview of possible failures and monitoring techniques for various WTs components and subsystems. OA: oil analysis; AE: acoustic emission; SM: strain measurement; VI: visual inspection; SPM: shock pulse method; and OM: operation and maintenance.
WT subsystems
Components Possible failures Component or subsystem
monitoring
Rotor
Blades Deterioration, cracking, and
adjustment error
Ultrasound, and active
thermography
Torque, AM, SM, and VI Bearings
Spalling, wear, defect of bearing shells and
rolling element
Vibration, OA, AE, shock
pulse methods, and
performance monitoring
Shaft Fatigue, and crack
formation Vibration
Drive train
Main shaft bearing
Wear, and high vibration
Vibration, SPM,
temperature, and AE
Torque, power signal analysis, thermography,
AE, and performance monitoring
Mechanical brake
Locking position Temperature

45
Gearbox
Wearing, fatigue, oil leakage, insufficient
lubrication, braking in teeth, displacement, and eccentricity of
toothed wheels
Temperature, vibration,
SPM, particles in oil, and AE
Generator
Wearing, electrical, problems, slip rigs,
winding damage, rotor asymmetries, bar
break, overheating, and over speed
Generated effect, temperature, vibration, SPM, OM, torque,
power signal analysis, electrical effects, process parameters,
performance monitoring, and thermography
Auxiliary systems
Yaw system Yaw motor problem,
brake locked, and gear problem
Motor current
Pitch system Pitch motor problem OM Hydraulic
system Pump motor problems,
and oil leakage OM, process parameter, performance monitoring
Sensors Broken, and wrong
indication Thermography
Electrical system
Control system
Short circuit, component fault, and
bad connection
Current consumption,
and temperature
Thermography, and VI Power
electronics
Short circuit, component fault, and
bad connection
Current consumption,
and temperature
High Voltage Contamination, and
arcs Arc guard,
temperature
Tower
Nacelle Fire, and yaw error Smoke, heat,
flame detection Vibration, shock pulse
method, SM, and VI Tower
Crack formation, fatigue, vibration,
and foundation weakness
-
System transformer
Problem with contamination,
breakers, disconnectors, and
isolators
Thermography

46
NEW TRENDS AND FUTURE CHALLENGES IN WIND TURBINE CONDITION MONITORING SYSTEMS (WTCMS)
The state-of-the-art maintenance strategy in the wind machine industry is defined by
the implementation of on-line continuous CMS. The authors of [133,138] conducted
respective surveys of: (i) commercially available CMSs for WT; and (ii) commercially
available SCADA data analysis tools for WT health monitoring. The survey in [138]
elaborated on the methods used by 20 suppliers and concluded that nearly all of them focus
on the same subassemblies, i.e., blades, main bearings, gearbox internals, gearbox bearings,
and generator bearings.
Furthermore, VM, OM, and fiber optic monitoring are the most frequently used
monitoring techniques. The study in [133] addressed 17 SCADA data analysis tools for
WTCM. Among the 17 products, three were developed by WT manufacturers, two by
renewable energy consultancies, up to nine by industrial software companies, two by an
electrical equipment provider, and only one by a WT operating company.
2.4.1. New Trends in Wind Turbine Condition Monitoring Systems
The current trend in the wind energy industry is the use of larger WTs in remote
locations, which are increasingly situated offshore for optimal wind conditions. Both the size
and location factors have led to maintenance challenges that are unique compared with those
of traditional power generation systems [66]. To cope with this reality, WTCMS
manufacturers must improve the existing monitoring techniques and/or develop more
appropriate techniques. The future goal in CMS is to continue to minimize the efforts
required from operators through the use of intelligent software algorithms and automated
analysis.

47
The WT industry is moving toward intelligent machine health management (IMHM),
which is a fourth-generation maintenance strategy. The final objective is to provide WECSs
that are capable of understanding and making decisions without human intervention. This
goal implies the use of intelligent condition-based maintenance systems based on RCM
mechanisms. Thus, the following tendencies can be mentioned with respect to the new
tendencies in the WTCM industry [52].
e) Toward Smart Monitoring
The purpose of this effort is to develop a CMS that is self-contained. Such systems
could be operated by trained personnel but would not require specialists for the interpretation
of results because a smart monitoring system will be able to perform classification and
prediction operations [139]. Therefore, the number of turbines that a technician is able to
oversee might double. Moreover, smart WTCMSs will integrate built-in hardware auto-
diagnostics that continuously check all sensors, cabling, and electronics for any faults, signal
interruption, shorts, or power failures. Any malfunctions trigger an alarm. Indeed, false
warnings and false alarms occur on a regular basis with actual CMSs [119,140–143]. The
use of smart monitoring will aid in avoiding such situations.
Automation of CM and diagnostic systems will also be an important development as
WT operators acquire a larger number of turbines and manual inspection of data becomes
impractical. Furthermore, it is essential that methods for reliable, automatic diagnosis are
developed with consideration of multiple signals to improve detection and increase operator
confidence in alarm signals [25,138].
f) Necessity of Remote and E-Monitoring

48
Considering: (i) the tendency toward the use of offshore WTs; and (ii) the fact that
wind parks are geographically dispersed and often located in remote areas, cost
considerations make it necessary to re-evaluate the traditional monitoring setup. Thus,
remote CM of WECSs is gaining popularity in the industry and can be implemented as either
standalone or networked systems. Remote CM involves monitoring the condition of a
component at a location far away from the immediate vicinity of the component in question.
E-monitoring and CM using the Internet improves remote monitoring by providing
worldwide remote capabilities. Because browsers reside on many platforms, internet-based
CMSs can be accessed by multiple users working on any type of operating system [144–
146]. In short, wireless technologies will help to optimize the cost and efficiency of
WTCMSs.
g) In-Service SHM
Given the increased size of modern turbines and their growing cost and fabrication
sophistication, i.e., high-tech, complex, and constructed with composite materials, SHM is
becoming increasingly important to both operators and insurers [143]. The necessity for
continuous in-service SHM is a reality because these complex structures are fragile. For
example, if any blade fails, the rotor can become unbalanced and might lead to the destruction
of the entire WT [147]. Therefore, it is important to acquire early indications of structural or
mechanical problems that will allow operators to better plan for maintenance, possible
operation of the machine in a de-rated condition rather than taking the turbine off-line, or, in
the case of an emergency, shutdown of the machine to avoid further damage.
The development of real-time, remote, wireless, and smart SHM is playing an
increasingly important role. Such monitoring systems designed for the continuous
assessment of structural performance and safety should be comprehensive and include

49
functions for self-diagnostics and management of the SHM system [88,148,149]. Similar
SHM techniques are already used in certain industries, such as aeronautics, where they are
applied for the SHM of aircraft composite structures [150,151]. Additionally, there is a
tendency to require ambient energy harvesting for powering wireless sensors [152,153].
However, a major limitation in the field of energy harvesting is the fact that the energy
generated by harvesting devices is far too small to directly power most electronics. Therefore,
(i) efficient, innovative, and adapted methods of storing electric energy; and (ii) more energy-
efficient sensors are the key technologies that will allow energy harvesting to become a
source of power for electronics and wireless sensors [154–156].
Two different approaches are emerging in the field of WTSHM. The first and more
practical approach is the development of appropriate non-contact and remote NDT/inspecting
technologies for in-service WTSHM because non-contact and remote NDTs have
overwhelming advantages in terms of on-line testing and inspection. The second approach
consists of equipping the WT with a SHM system consisting of a network of sensors, data
acquisition units, and an on-site server installed in the WT maintenance room. The sensors
(accelerometers, displacement transducers, and temperature sensors) are placed at different
levels inside and outside the steel tower and on the foundation of the WT. In this last case,
microchip path antennas are increasingly used for sensing, ambient energy harvesting, and
data transmission [157–160].
h) Integration and Interaction of Monitoring and Control Systems
Today’s standard CMSs essentially still operate in stand-alone mode, i.e.,
independent of the WT controller. The CMSs are increasingly integrated with control
functions and included in maintenance concepts [161]. The full integration of CM
capabilities within the WT control system is beneficial with regard to three different aspects:

50
(i) cost benefits; (ii) technical benefits; and (iii) quality benefits. An overview of the benefits
of controller-integrated CMSs was presented in [162,163] and can be summarized as follows:
Cost benefits:
- Lower hardware costs due to industrial mass production and fewer components;
- Lower installation and cabling costs due to integration in the existing control cabinet
and communication with the main controller via bus systems;
- Fewer required parts because no additional voltage transformers, communication
modules, uninterruptible power supply (UPS), or similar devices are needed;
- Reduced analysis because fewer false alarms occur.
Technical benefits:
- No measurement if interference signals are present;
- Higher-quality raw data for analysis;
- Fewer false alarms;
- Reduced scatter leads to improved fault detection;
- Integration of further signals (e.g., temperature, pressure, and current) enables
integrated signal/system monitoring.
Quality benefits:
- Reliable hardware from established industrial suppliers;
- Mass production with high-quality standards.
i) Estimation of the Remaining Component Life Service
The limited accessibility of offshore wind farms requires new maintenance and repair
strategies. In fact, offshore wind farms are likely to be unreachable for several months out of
a year, especially if sited in the North Sea and polar regions [164,165]. Thus, maintenance

51
and repair activities must be carried out during seasons in which the turbines are accessible.
Components that are likely to fail during periods of inaccessibility must be replaced. This
approach is referred to as a “condition-dependent and predictive maintenance and repair
strategy” [38,166]. Such a strategy requires comprehensive knowledge of the actual
condition and the remaining lifetime of the turbine components. Such knowledge can be
provided by CMSs. For those components, a count of their lifetime fatigue load can provide
information on the condition and remaining lifetime. However, current CMSs are not able to
assure that a given component will not fail, nor can they prevent a failure.
2.4.2. Future Research Challenges in WTCMTs
Although CM technologies face various challenges in WT applications, they are still
necessary and valuable. As with any technology, there is room for improvement such that
these systems can be better utilized to benefit the wind industry. Based on the provided
discussion on new trends in WTCM, selected key points that must be addressed by further
research are listed as follows:
- Determine the most cost-effective measurement or monitoring strategy.
- Automate the “experts” in data interpretation to automate actionable recommendations.
- Develop reliable and accurate prognostic techniques.
- Improve the use of SCADA system data (normally only stored at 10-min intervals) to
provide a more reliable, flexible, and efficient tool for automatic WT monitoring and
control [133].
- Develop smart, wireless, and energy-efficient sensors that will offer opportunities for
placing sensors in difficult-to-reach locations, electrically noisy environments, and
mobile applications in which wires cannot be installed.
52
- Focus on providing the newest and industry-proven signal processing algorithms for
extracting the key features of a signal to predict machine component health.
- Combine numerical simulation analysis with testing, inspecting, and monitoring
technologies. The finite element method is one such interesting tool that has
traditionally been used in the development of WT blades, primarily to investigate the
global behavior in terms of eigenfrequencies, tip deflections, and global stress/strain
levels [167]. An advantage of using the finite element method is that complex load
cases that represent actual wind conditions can be analyzed once the model is set up
and calibrated. Moreover, this method will considerably reduce the cost of testing,
inspecting, and monitoring for WTs, especially SHM.
- Develop innovative, adapted, and efficient methods of harvesting and storing electric
energy for autonomous and wireless sensors.
Other technological advances that must be developed in WTCMs include
advancements in diagnostic and prognostic software, acceptance of communication
protocols, and developments in maintenance software applications and computer networking
technologies [146]. Although these future research areas may appear challenging to address,
they also represent great opportunities for CM to boost the success of the wind industry by
reducing the COE and increasing its competitiveness.
CONCLUSIONS
WT technology has greatly advanced in a relatively short time span. Among the
technologies successfully transferred from applications in other industries, CMSs enable
early detection and diagnosis of potential component failures and serve as a platform for
implementing CM practices.
53
This paper performed an inventory and classification of WTCMTs and has
highlighted the fact that a combination of preventive and reactive maintenance strategies can
improve reliability, availability, and maintainability of WTs while reducing maintenance
costs. An overview of CM and the maintenance process in the WT industry enabled the
presentation of a global diagram linking the various concepts, and a comprehensive review
of WTCM techniques and methods was carried out.
For new trends in WTCM, the wind energy industry’s tendency to use larger WTs in
remote locations implies the need for remote, intelligent, and integrated CMSs. In particular,
efforts should be directed toward improving the capacity of CMSs for failure prognostics and
determination of remaining equipment life. Finally, this work addressed certain important
and challenging areas of research that should be explored for the industry to better cope with
the major innovations that are likely to occur in the WTCM industry.
Acknowledgments
The authors would like to thank the Natural Science and Engineering Research
Council of Canada (NSERC) for financially supporting this research. Authors’ gratefulness
also goes to the editor and four anonymous reviewers for their valuable comments and
suggestions that appreciably improved the quality of this paper.
Author Contributions
Pierre Tchakoua Takoutsing is the main author of this work. This paper provides a
further elaboration of some of the results associated to his Ph.D. dissertation. René Wamkeue
and Mohand Ouhrouche have supervised the Ph.D. work and thus have supported Pierre
Tchakoua Takoutsing’s research in terms of both scientific and technical expertise. Fouad
Slaoui-Hasnaoui, Tommy Andy Tameghe and Gabriel Ekemb participated in designing the

54
structure of the contributions to fit them into a review of concepts and methods for WTCM.
All authors have been involved in the manuscript preparation.
Nomenclature
WT Wind turbine
RCM Reliability-centered maintenance
CM Condition monitoring
OM: Operation and maintenance
WTCM Wind turbine condition monitoring
WTCMS Wind turbine condition-monitoring system
WECS Wind energy conversion system
COE Cost of energy
CMS Condition-monitoring system
CMT Condition-monitoring technique
FDS Fault detection system
DT Destructive test
NDT Non-destructive tests
VA Vibration analysis
OA Oil analysis
TM Temperature monitoring
SM Strain measurement
OFM Optical-fiber monitoring
SHM Structural health monitoring
VI Visual inspection
AE Acoustic emission
UTT Ultrasonic testing techniques
TA Thermography analysis
SCADA Supervisory control and data acquisition

55
SA Signature analysis
Conflicts of Interest
The authors declare no conflict of interest.
References
1. Fried, L.; Sawyer, S.; Shukla, S.; Qiao, L; Global Wind Report 2012—Annual Market
Update; Global Wind Energy Council (GWEC), http://www. gwec. net, 2013.
2. Zhang, P. Small Wind World Report 2012; World Wind Energy Association (WWEA):
Bonn, Germany, 2012.
3. Renewables 2012: Global Status Report; REN21: Paris, France, 2012.
4. Ribrant, J. Reliability Performance and Maintenance—A Survey of Failures in Wind
Power Systems. Master’s Thesis, School of Electrical Engineeringm, KTH Royal
Institute of Technology, Stockholm, Sweden, 2005–2006.
5. Hines, V.; Ogilvie, A.; Bond, C. Continuous Reliability Enhancement for Wind (CREW)
Database: Wind Turbine Reliability Benchmark Report; Sandia National Laboratories:
Albuquerque, N.M., USA, 2013.
6. Walford, C.A. Wind Turbine Reliability: Understanding and Minimizing Wind Turbine
Operation and Maintenance Costs; Sandia Report No. SAND2006-1100; Sandia
National Laboratories: Albuquerque, N.M., USA, 2006.
7. Tchakoua, P.; Wamkeue, R.; Tameghe, T.A.; Ekemb, G. A Review of Concepts and
Methods for Wind Turbines Condition Monitoring. In Proceedings of the 2013 World
Congress on Computer and Information Technology (WCCIT), Sousse, Tunisia, 22–
24 June 2013; pp. 1–9.
8. Fischer, K.; Besnard, F.; Bertling, L. Reliability-centered maintenance for wind
turbines based on statistical analysis and practical experience. IEEE Trans. Energy
Convers. 2012, 27, 184–195.
9. McMillan, D.; Ault, G. Condition monitoring benefit for onshore wind turbines:
Sensitivity to operational parameters. IET Renew. Power Gener. 2008, 2, 60–72.
10. Amayri, A.; Tian, Z.; Jin, T. Condition Based Maintenance of Wind Turbine Systems
Considering Different Turbine Types. In Proceedings of the 2011 International
56
Conference on Quality, Reliability, Risk, Maintenance, and Safety Engineering
(ICQR2MSE), Xi’an, Shannxi, China, 17–19 June 2011; pp. 596–600.
11. Besnard, F.; Bertling, L. An approach for condition-based maintenance optimization
applied to wind turbine blades. IEEE Trans. Sustain. Energy 2010, 1, 77–83.
12. Echavarria, E.; Hahn, B.; van Bussel, G.J.; Tomiyama, T. Reliability of wind turbine
technology through time. J. Sol. Energy Eng. 2008, 130, doi:10.1115/1.2936235.
13. Hahn, B.; Durstewitz, M.; Rohrig, K. Reliability of Wind Turbines. In Wind Energy;
Springer: Berlin/Heidelberg, Germany, 2007; pp. 329–332.
14. Ahmad, R.; Kamaruddin, S. An overview of time-based and condition-based
maintenance in industrial application. Comput. Ind. Eng. 2012, 63, 135–149.
15. Andrawus, J.A.; Watson, J.; Kishk, M. Wind turbine maintenance optimisation:
Principles of quantitative maintenance optimisation. Wind Eng. 2007, 31, 101–110.
16. Andrawus, J.A. Maintenance Optimisation for Wind Turbines. Ph.D. Thesis, Robert
Gordon University, Aberdeen, UK, April 2008.
17. Hahn, B. Reliability Assessment of Wind Turbines in Germany. In Proceedings of the
1999 Europeen Wind Energy Conference, Nice, France, 1–5 March 1999.
18. Tavner, P.J.; Xiang, J.; Spinato, F. Reliability analysis for wind turbines. Wind
Energy 2007, 10, 1–18.
19. Guo, H.; Watson, S.; Tavner, P.; Xiang, J. Reliability analysis for wind turbines with
incomplete failure data collected from after the date of initial installation. Reliab. Eng.
Syst. Saf. 2009, 94, 1057–1063.
20. Spinato, F.; Tavner, P.J.; van Bussel, G.J.W.; Koutoulakos, E. Reliability of wind
turbine subassemblies. IET Renew. Power Gener. 2008, 3, 387–401.
21. Amirat, Y.; Benbouzid, M.E.H.; Member, S.; Bensaker, B.; Wamkeue, R. Condition
Monitoring and Fault Diagnosis in Wind Energy Conversion Systems: A Review. In
Proceedings of the IEEE International Electric Machines & Drives Conference,
IEMDC '07, Antalya, Turkey,
3–5 May 2007;Volume 2, pp. 1434–1439.
22. Ribrant, J.; Bertling, L. Survey of Failures in Wind Power Systems with Focus on
Swedish Wind Power Plants during 1997–2005. In Proceedings of the 2007 IEEE

57
Power Engineering Society General Meeting, Tampa, FL, USA, 24–28 June 2007; pp.
1–8.
23. Villa, L.F.; Renones, A.; Pera, J.R.; de Miguel, L.J. Statistical fault diagnosis based on
vibration analysis for gear test-bench under non-stationary conditions of speed and
load. Mech. Syst. Signal Process. 2012, 29, 436–446.
24. Crabtree, C.J.; Feng, Y.; Tavner, P.J. Detecting Incipient Wind Turbine Gearbox Failure:
A Signal Analysis Method for On-line Condition Monotoring. In Proceedings of
European Wind Energy Conference (EWEC 2010), Warsaw, Poland, 20–23 April
2010; pp. 154–156.
25. Crabtree, C.J. Condition Monitoring Techniques for Wind Turbines. Ph.D. Thesis,
Durham University, Durham, UK, February 2011.
26. Aziz, M.A.; Noura, H.; Fardoun, A. General Review of Fault Diagnostic in Wind
Turbines. In Proceedings of the 2010 18th Mediterranean Conference on Control &
Automation (MED), Marrakech, Morocco, 23–25 June 2010; pp. 1302–1307.
27. García, F.P.; Tobias, A.M.; Pinar, J.M.; Papaelias, M. Condition monitoring of wind
turbines: Techniques and methods. Renew. Energy 2012, 46, 169–178.
28. Hameed, Z.; Hong, Y.S.; Cho, Y.M.; Ahn, S.H.; Song, C.K. Condition monitoring and
fault detection of wind turbines and related algorithms: A review. Renew. Sustain.
Energy Rev. 2009, 13, 1–39.
29. Lu, B.; Li, Y.; Wu, X.; Yang, Z. A Review of Recent Advances in Wind Turbine
Condition Monitoring and Fault Diagnosis. In Proceedings of the IEEE Power
Electronics and Machines in Wind Applications, PEMWA 2009, Lincoln, NE, USA,
24–26 June 2009; pp. 1–7.
30. Orsagh, R.F.; Lee, H.; Watson, M.; Byington, C.S.; Power, J. Advance Vibration
Monitoring for Wind turbine Health Management; Impact Technologies, LLC:
Rochester, NY, USA, 2006.
31. Dhillon, B.S. Engineering Maintenance: A Modern Approach; CRC Press: Boca Raton,
FL., USA, 2002.
32. Madsen, B.N. Condition Monitoring of Wind Turbines by Electric Signature
Analysis. Master’s Thesis, Technical University of Denemark, Copenhagen, Denmark,
October 2011.
58
33. Wang, L.; Yeh, T.-H.; Lee, W.-J.; Chen, Z. Benefit evaluation of wind turbine
generators in wind farms using capacity-factor analysis and economic-cost methods.
IEEE Trans. Power Syst. 2009, 24, 692–704.
34. Al-Ahmar, E.; Hachemi, M.E.; Turri, S. Wind energy conversion systems fault
diagnosis using wavelet analysis. Int. Rev. Electr. Eng. 2008, 3, 646–652.
35. De Oliveria, W.S.; Fernandes, A.J. Cost-effectiveness analysis for wind energy
projects. Int. J. Energy Sci. 2012, 2, 15–21.
36. Byon, E.; Ntaimo, L.; Ding, Y. Optimal maintenance strategies for wind turbine
systems under stochastic weather conditions. IEEE Trans. Reliab. 2010, 59, 393–404.
37. Blischke, W.R.; Karim, M.R.; Prabhakar Murthy, D.N. Warranty Data Collection and
Analysis; Springer: London, UK, 2011.
38. Nilsson, J.; Bertling, L. Maintenance management of wind power systems using
condition monitoring systems—Life cycle cost analysis for two case studies. IEEE
Trans. Energy Convers. 2007, 22, 223–229.
39. Hameed, Z.; Ahn, S.H.; Cho, Y.M. Practical aspects of a condition monitoring system
for a wind turbine with emphasis on its design, system architecture, testing and
installation. Renew. Energy 2010, 35, 879–884.
40. Wiggelinkhuizen, E.J.; Verbruggen, T.W.; Braam, H.; Rademakers, L.W.M.M.; Xiang,
J.; Watson, S.; Giebel, G.; Norton, E.; Tipluica, M.C.; MacLean, A.; et al. CONMOW:
Condition Monitoring for Offshore Wind Farms. In Proceedings of the European Wind
Energy Conference (EWEC2007), Milan, Itlay, 7–10 May 2007.
41. Renewable Energy Technologies: Cost Analysis Series; The International Renewable
Energy Agency (IRENA): Abu Dhabi, United Arab Emirates, 2012; Volume 1.
42. Arunraj, N.S.; Maiti, J. Risk-based maintenance—Techniques and applications. J.
Hazard. Mater. 2007, 142, 653–661.
43. Sheng, C.; Li, Z.; Qin, L.; Guo, Z.; Zhang, Y. Recent progress on mechanical condition
monitoring and fault diagnosis. Procedia Eng. 2011, 15, 142–146.
44. Jardine, A.K.S.; Lin, D.; Banjevic, D. A review on machinery diagnostics and
prognostics implementing condition-based maintenance. Mech. Syst. Signal Process.
2006, 20, 1483–1510.

59
45. Utne, I.B.; Brurok, T.; Rodseth, H. A structured approach to improved condition
monitoring. J. Loss Prev. Process Ind. 2012, 25, 148–188.
46. Bengsston, M. On Condition Based Maintenance ant Its Implimentation in Industrial
Settings. Ph.D. Thesis, Mälardalen University, Västerås, Sweden, 2007.
47. Bengtsson, M.; Olsson, E.; Funk, P.; Jackson, M. Technical Design of Condition Based
Maintenance System—A Case Study using Sound Analysis and Case-Based Reasoning.
In Proceedings of the 8th Congress on Maintenance and Reliability Conference,
MARCON 2004, Knoxville, TN., USA, 2-5 May 2004.
48. Simeón, E.A.; Álvares, A.J. An Expert System for Fault Diagnostics in Condition
Based Maintenance. ABCM Symp. Ser. Mechatron. 2010, 4, 304–313.
49. Maintenance Terminology; SS-EN 13306; Swedish Standards Institute: Stockholm,
Sweden, 2011.
50. Popa, L.M.; Jensen, B.-B.; Ritchie, E.; Boldea, I. Condition Monitoring of Wind
Generators. In Proceedings of the 38th IAS Annual Meeting, Conference Record of
the Industry Applications Conference, Salt Lake City, UT, USA, 12–16 October 2003;
Volume 3, pp. 1839–1846.
51. Verbruggen, T. Wind Turbine Operation & Maintenance based on Condition
Monitoring WT-Ω; ECN-C--03-047; Energieonderzoek Centrum Nederland (ECN):
Petten, The Netherlands, 2003.
52. Tchakoua, P.; Wamkeue, R.; Slaoui-Hasnaoui, F.; Tameghe, T.A.; Ekemb, G. New
Trends and Future Challenges for Wind Turbines Condition. In Proceedings of the 2013
International Conference on Control Automation and Information Sciences (ICCAIS),
Nha Trang, Vietnam, 25–28 November 2013; pp. 238–245.
53. Saeed, A. Online Condition Monitoring System for Wind Turbine. Master’s Thesis,
Blekinge Institute of Technology, Karlskrona, Sweden, 2008.
54. Malhotra, V.M.; Carino, N.J. Handbook on Nondestructive Testing of Concrete; CRC
Press: Boca Raton, FL., USA, 2004.
55. Gamidi, S.H. Non Destructive Testing of Structures. Master’s Thesis, Indian Institute of
Technology, Bombay, Libya, November 2009.
56. Hellier, C.J. Handbook of Nondestructive Evaluation; McGraw-Hill Professional
Publishing: New York, NY., USA, 2003.

60
57. Elforjani, M.A. Condition Monitoring of Slow Speed Rotating Machinery Using
Acoustic Emission Technology. Ph.D. Thesis, Cranfield University, Cranfield, UK,
June 2010.
58. Khan, M.M.; Iqbal, M.T.; Khan, F. Reliability and Condition Monitoring of a Wind
Turbine. In Proceedings of the 2005 Canadian Conference on Electrical and Computer
Engineering, Saskatoon, SK,Canada, 1–4 May 2005; pp. 1978–1981.
59. Jablonsky, A.; Barszcz, T.; Bielecka, M. Automatic validation of vibration signals in
wind farm distributed monitoring systems. Measurement 2011, 44, 1954–1967.
60. Mechanical Vibration—Evaluation of Machine Vibration by Measurements on Non-
Rotating Parts—Part 1: General Guidelines; ISO 10816-1:1995; International
Organization for Standardization (ISO): Geneva, Switzerland, 1995.
61. Barrett, M.P.; Stover, J. Understanding Oil Analysis: How it Can Improve the
Reliability of Wind Turbine Gearboxes. Gear Technology 2013, 104-111.
62. Dupuis, R. Application of Oil Debris Monitoring For Wind Turbine Gearbox
Prognostics and Health Management. In Proceedings of the Annual Conference of the
Prognostics and Health Management Society 2010, Portland, OR, USA, 10–16 October
2010.
63. Goncalves, A.C.; Campos, J.B. Predictive maintenance of a reducer with contaminated
oil under an excentrical load through vibration and oil analysis. J. Braz. Soc. Mech. Sci.
Eng. 2011, 33, 1–7.
64. Hamilton, A.; Quail, F. Detailed state of the art review for the different on-line/in-line
oil analysis techniques in context of wind turbine gearboxes. J. Tribol. 2011, 133,
doi:10.1115/1.4004903.
65. Walford, C.; Roberts, D. Condition Monitoring of Wind Turbines: Technology
Overview, Seeded-Fault Testing, and Cost-Benefit Analysis; Technical Report
1010149; Global Energy Concepts, LLC: Kirkland, WA, USA, 2006.
66. Sheng, S.; Veers, P. Wind Turbine Drivetrain Condition Monitoring—An Overview;
Mechanical Failures Prevention Group: Applied Systems Health Management
Conference 2011, Virginia Beach, VA, USA, 10–12 May 2011.
67. Du, L.; Zhe, J. A high throughput inductive pulse sensor for online oil debris
monitoring. Tribol. Int. 2011, 44, 175–179.

61
68. Hasan, I.; Rahaman, M.I. Intelligent Diagnostics and Predictive Maintenance Sensor
System for Electrical Fault Diagnosis of Wind Turbine System. In Proceedings of the
Global Engineering, Science and Technology Conference 2012, Dhaka, Bangladesh,
28–29 December 2012.
69. Park, J.-Y.; Lee, J.-K.; Oh, K.-Y.; Lee, J.-S.; Kim, B.-J. Design of Simulator for 3MW
Wind Turbine and its Condition Monitoring System. In Proceedings of the International
MultiConference of Engineers and Computer Scientists, IMECS 2010, Kowloon, Hong
Kong, 17–19 March 2010; Volume II, pp. 930–933.
70. Jayaswal, P.; Wadhwani, A.; Mulchandani, K. Machine fault signature analysis. Int. J.
Rotat. Mach. 2008, 2008, doi:10.1155/2008/583982.
71. Gong, X. Online Nonintrusive Condition Monitoring and Fault Detection for Wind
Turbines. Ph.D. Thesis, Department of Electrical Engineering, University of Nebraska–
Lincoln, Lincoln, NE, USA, August 2012.
72. Ciang, C.C.; Lee, J.-R.; Bang, H.-J. Structural health monitoring for a wind turbine
system: A review of damage detection methods. Meas. Sci. Technol. 2008, 19,
doi:10.1088/0957-0233/
19/12/122001.
73. Kreuzer, M. Strain Measurement with Fiber Bragg Grating Sensors; S2338–1.0 e;
HBM GmbH: Darmstadt, Germany, 2006.
74. Bang, H.-J.; Kim, H.-I.; Lee, K.-S. Measurement of strain and bending deflection of a
wind turbine tower using arrayed FBG sensors. Int. J. Precis. Eng. Manuf. 2012, 13,
2121–2126.
75. Lee, J.M.; Hwang, Y. A novel online rotor condition monitoring system using fiber
Bragg grating (FBG) sensors and a rotary optical coupler. Meas. Sci. Technol. 2008,
19, doi:10.1088/0957-0233/19/6/065303.
76. Kang, L.-H.; Kim, D.-K.; Han, J.-H. Estimation of dynamic structural displacements
using fiber Bragg grating strain sensors. J. Sound Vib. 2007, 305, 534–542.
77. Turner, A.; Graver, T.W. Structural monitoring of wind turbine blades using fiber optic
Bragg grating strain sensors. Exp. Mech. Emerg. Energy Syst. Mater. 2011, 5, 149–154.

62
78. Schroeder, K.; Ecke, W.; Apitz, J.; Lembke, E.; Lenschow, G. A fibre Bragg grating
sensor system monitors operational load in a wind turbine rotor blade. Meas. Sci.
Technol. 2006, 17, doi:10.1088/0957-0233/17/5/S39.
79. Kramer, S.G.; Leon, F.P.; Appert, B. Fiber Optic Sensor Network for Lightning Impact
Localization and Classification in Wind Turbines. In Proceedings of the 2006 IEEE
International Conference on Multisensor Fusion and Integration for Intelligent
Systems, Heidelberg, Germany, 3–6 September 2006; pp. 173–178.
80. Rademakers, L.W.M.M.; Vebruggen, T.W.; van der Werff, P.A.; Korterink, H.;
Richon, D.; Rey, P.; Lancon, F. Fiber Optic Blade Monitoring. In Proceedings of the
European Wind Energy Conference, London, UK, 22–25 November 2004; pp. 22–25.
81. Eum, S.; Kageyama, K.; Murayama, H.; Uzawa, K.; Ohsawa, I.; Kanai, M.; Igawa, H.
Process/Health Monitoring for Wind Turbine Blade by Using FBG Sensors with
Multiplexing Techniques. In Proceedings of the 19th International Society for Optics
and Photonics, Perth, Australia, 14–18 April 2008; Volume 7004,
doi:10.1117/12.786240.
82. Shin, C.; Chen, B.; Cheng, J.; Liaw, S. Impact response of a wind turbine blade
measured by distributed FBG sensors. Mater. Manuf. Process. 2010, 25, 268–271.
83. Guemes, A.; Fernandez-Lopez, A.; Soller, B. Optical fiber distributed sensing-physical
principles and applications. Struct. Health Monit. 2010, 9, 233–245.
84. Merzbacher, C.; Kersey, A.; Friebele, E. Fiber optic sensors in concrete structures: A
review. Smart Mater. Struct. 1996, 5, doi:10.1088/0964-1726/5/2/008.
85. Moragues Pons, J. Practical Experiments on the Efficiency of the Remote Presence:
Remote Inspection in an Offshore Wind Turbine. Master’s Thesis, Norwegian
University of Science and Technology, Trondheim, Norway, 21 June 2012.
86. Sheppard, R.; Puskar, F.; Waldhart, C. SS: Offshore Wind Energy Special Session:
Inspection Guidance for Offshore Wind Turbine Facilities. In Proceedings of the
Offshore Technology Conference, Houston, TA, USA, 3–6 May 2010.
87. Effren, D. Automated Turbine Inspection; AutoCopter™ Corporation: Charlotte, NC,
USA, 2011.

63
88. Smarsly, K.; Law, K.H. Advanced Structural Health Monitoring Based on Multi-Agent
Technology. In Computation for Humanity: Information Technology to Advance Society;
Taylor & Francis Group: Boca Raton, FL, USA, 2012.
89. McGugan, M.; Larsen, G.C.; Sorensen, B.F.; Borum, K.K.; Engelhardt, J.
Fundamentals for Remote Condition Monitoring of Offshore Wind Turbines;
Danmarks Tekniske Universitet, Risø Nationallaboratoriet for Bæredygtig Energi,
2008.
90. Balageas, D.; Fritzen, C.-P.; Güemes, A. Structural Health Monitoring; ISTE Ltd:
London, United Kingdom, 2006.
91. Schubel, P.; Crossley, R.; Boateng, E.; Hutchinson, J. Review of structural health and
cure monitoring techniques for large wind turbine blades. Renew. Energy 2013, 51,
113–123.
92. Hyers, R.; McGowan, J.; Sullivan, K.; Manwell, J.; Syrett, B. Condition monitoring
and prognosis of utility scale wind turbines. Energy Mater. 2006, 1, 187–203.
93. Watson, M.; Sheldon, J.; Amin, S.; Lee, H.; Byington, C.; Begin, M. A Comprehensive
High Frequency Vibration Monitoring System for Incipient Fault Detection and
Isolation of Gears, Bearings and Shafts/Couplings in Turbine Engines and Accessories.
In Proceedings of the ASME Turbo Expo 2007: Power for Land, Sea, and Air, Montreal,
QC, Canada, 14–17 May 2007; Volume 5, pp. 885–894.
94. Lading, L.; McGugan, M.; Sendrup, P.; Rheinlander, J.; Rusborg, J. Fundamentals for
Remote Structural Health Monitoring of Wind Turbine Blades-A Preproject, Annex
B: Sensors and Non-Destructive Testing Methods for Damage Detection in Wind
Turbine Blades; Riso National Laboratory: Roskilde, Denmark, 2002.
95. Mba, D.; Rao, R.B. Development of acoustic emission technology for condition
monitoring and diagnosis of rotating machines; bearings, pumps, gearboxes, engines
and rotating structures. Shock Vib. Dig. 2006, 38, 3–16.
96. Tan, C.K.; Irving, P.; Mba, D. A comparative experimental study on the diagnostic and
prognostic capabilities of acoustics emission, vibration and spectrometric oil analysis for
spur gears. Mech. Syst. Signal Process. 2007, 21, 208–233.
97. Loutas, T.; Kalaitzoglou, J.; Sotiriades, G.; Kostopoulos, V. The Combined Use Of
Vibration, Acoustic Emission And Oil Debris Sensor Monitored Data Coming From

64
Rotating Machinery For The Development Of A Robust Health Monitoring System.
Availble online: http://maritime-conferences.com/asranet2010-
conference/asranet2008/53%20Kostopoulos,%20V.pdf (accessed on 22 February 2011).
98. Loutas, T.; Sotiriades, G.; Kalaitzoglou, I.; Kostopoulos, V. Condition monitoring
of a single-stage gearbox with artificially induced gear cracks utilizing on-line
vibration and acoustic emission measurements. Appl. Acoust. 2009, 70, 1148–1159.
99. Soua, S.; Lieshout, P.V.; Perera, A.; Gan, T.-H.; Bridge, B. Determination of the
combined vibrational and acoustic emission signature of a wind turbine gearbox and
generator shaft in service as a pre-requisite for effective condition monitoring. Renew.
Energy 2013, 51, 175–181.
100. Raisutis, R.; Jasiuniene, E.; Sliteris, R.; Vladisauskas, A. The review of non-destructive
testing techniques suitable for inspection of the wind turbine blades. Ultrasound 2008,
63, 26–30.
101. Rose, J.L. Ultrasonic guided waves in structural health monitoring. Key Eng. Mater.
2004, 270, 14–21.
102. Lee, J.-R.; Takatsubo, J.; Toyama, N.; Kang, D.-H. Health monitoring of complex
curved structures using an ultrasonic wavefield propagation imaging system. Meas. Sci.
Technol. 2007, 18, doi:10.1088/0957-0233/18/12/017.
103. Jasiuniene, E.; Raisutis, R.; Sliteris, R.; Voleisis, A.; Jakas, M. Ultrasonic NDT of wind
turbine blades using contact pulse-echo immersion testing with moving water
container. Ultrasound 2008, 63, 28–32.
104. Giurgiutiu, V.; Cuc, A. Embedded non-destructive evaluation for structural health
monitoring, damage detection, and failure prevention. Shock Vib. Dig. 2005, 37, 83–
105.
105. Tsai, C.-S.; Hsieh, C.-T.; Huang, S.-J. Enhancement of damage-detection of wind
turbine blades via CWT-based approaches. IEEE Trans. Energy Convers. 2006, 21,
776–781.
106. Drewry, M.A.; Georgiou, G.A. A review of NDT techniques for wind turbines. Insight-
Non-Destr. Test. Cond. Monit. 2007, 49, 137–141.
107. Cheng, L.; Tian, G.Y. Comparison of nondestructive testing methods on detection of
delaminations in composites. J. Sens. 2012, 2012, doi:org/10.1155/2012/408437.

65
108. Jüngert, A. Damage Detection in Wind Turbine Blades Using Two Different Acoustic
Techniques. In Proceedings of the 7th fib Ph.D. Symposium, Stuttgart, Germany, 11–
13 September 2008.
109. Beattie, A.G.; Rumsey, M. Non-Destructive Evaluation of Wind Turbine Blades Using
an Infrared Camera; SAND98-2824C; Sandia National Laboratory: Albuquerque,
NM, USA, 1998.
110. Liu, W.; Tang, B.; Jiang, Y. Status and problems of wind turbine structural health
monitoring techniques in China. Renew. Energy 2010, 35, 1414–1418.
111. Bodil, A.; Mats, D.; Magnus, U. Feasibility Study of Thermal Condition Monitoring
and Condition Based Maintenance in Wind Turbines; Elforsk Report 11:19;
ELFORSK: Stockholm, Sweden, 2011.
112. Ge, Z.; Du, X.; Yang, L.; Yang, Y.; Li, Y.; Jin, Y. Performance monitoring of direct
air-cooled power generating unit with infrared thermography. Appl. Therm. Eng. 2011,
31, 418–424.
113. Yang, W.; Tavner, P.J.; Crabtree, C.J.; Wilkinson, M. Cost-effective condition
monitoring for wind turbines. IEEE Trans. Ind. Electron. 2010, 57, 263–271.
114. Yang, W.; Jiang, J.; Tavner, P.; Crabtree, C. Monitoring Wind Turbine Condition by
the Approach of Empirical Mode Decomposition. In Proceedings of the International
Conference on Electrical Machines and Systems, ICEMS 2008, Wuhan, Hubei,
China, 17–20 October 2008; pp. 736–740.
115. Yang, W.; Tavner, P.; Crabtree, C.; Wilkinson, M. Research on a Simple, Cheap but
Globally Effective Condition Monitoring Technique for Wind Turbines. In
Proceedings of the 18th International Conference on Electrical Machines, ICEM
2008, Vilamoura, Portugal, 6–9 September 2008; pp. 1–5.
116. Wilkinson, M.R.; Spinato, F.; Tavner, P.J. Condition Monitoring of Generators &
Other Subassemblies in Wind Turbine Drive Trains. In Proceedings of the IEEE
International Symposium on Diagnostics for Electric Machines, Power Electronics and
Drives, SDEMPED 2007, Cracow, Poland, 6–8 September 2007; pp. 388–392.
117. Costinas, S.; Diaconescu, I.; Fagarasanu, I. Wind Power Plant Condition Monitoring.
In Proceedings of the 3rd WSEAS Int. Conf. on Energy Planning, Energy Saving,

66
Environmental Education (EPESE '09), Canary Islands, Spain, 1–3 July 2009; pp. 71–
76.
118. Fuchs, E.; Masoum, M.A.S. Power Quality in Power Systems and Electrical Machines;
Elsevier Academic Press: Burlington, MA., USA, 2008.
119. Yang, W.; Tavner, P.J.; Crabtree, C.J. An Intelligent Approach to the Condition
Monitoring of Large Scale Wind Turbines. In Proceedings of the European Wind
Energy Conference and Exhibition (EWEC2009), Marseille, France, 16–19 March
2009.
120. Cook, K. A Power Quality Monitoring System for a 20 kW Ocean Turbine. Master’s
Thesis, Florida Atlantic University, Dania Beach, FL, USA, August 2010.
121. Qiao, W. Recovery Act: Online Nonintrusive Condition Monitoring and Fault
Detection for Wind Turbines; Award Number DE-EE0001366; University of
Nebraska–Lincoln, Lincoln, NE, USA, 2012.
122. Watson, S.J.; Xiang, B.J.; Yang, W.; Tavner, P.J.; Crabtree, C.J. Condition monitoring
of the power output of wind turbine generators using wavelets. IEEE Trans. Energy
Convers. 2010, 25, 715–721.
123. Amirat, Y.; Choqueuse, V.; Benbouzid, M. Condition Monitoring of Wind Turbines
Based on Amplitude Demodulation. In Proceedings of the 2010 IEEE Energy
Conversion Congress and Exposition (ECCE), Atlanta, GA, USA, 12–16 September
2010; pp. 2417–2421.
124. Wakui, T.; Yokoyama, R. Wind speed sensorless performance monitoring based on
operating behavior for stand-alone vertical axis wind turbine. Renew. Energy 2013, 53,
49–59.
125. Yang, W.X.; Tavner, P.J.; Crabtree, C.J. Bivariate empirical mode decomposition and
its contribution to wind turbine condition monitoring. J. Sound Vib. 2011, 330, 3766–
3782.
126. Yang, W.X.; Tavner, P.J.; Court, R. An online technique for condition monitoring the
induction generators used in wind and marine turbines. Mech. Syst. Signal Process.
2012, 38, 103–112.
127. Gill, S.; Stephen, B.; Galloway, S. Wind turbine condition assessment through power
curve copula modeling. IEEE Trans. Sustain. Energy 2012, 3, 94–101.

67
128. Yazidi, A.; Henao, H.; Capolino, G.; Artioli, M.; Filippetti, F.; Casadei, D. Flux
Signature Analysis: An Alternative Method for the Fault Diagnosis of Induction
Machines. In Proceedings of the 2005 IEEE Russia Power Tech, St. Petersburg, Russia,
27–30 June 2005; pp. 1–6.
129. Yazidi, A.; Capolino, G.; Filippetti, F.; Casadei, D. A New Monitoring System for
Wind Turbines with Doubly-Fed Induction Generators. In Proceedings of the IEEE
Mediterranean Electrotechnical Conference, MELECON 2006, Malaga, Spain, 16–19
May 2006; pp. 1142–1145.
130. Douglas, H.; Pillay, P.; Barendse, P. The Detection of Interturn Stator Faults in Doubly-
Fed Induction Generators. In Proceedings of the Conference Record of the 2005
Industry Applications Conference, Fourtieth IAS Annual Meeting, Kowloon, Hong Kong,
2–6 October 2005; Volume 2, pp. 1097–1102.
131. Yang, W.; Tavner, P.; Wilkinson, M. Wind Turbine Condition Monitoring and Fault
Diagnosis Using Both Mechanical and Electrical Signatures. In Proceedings of the
IEEE/ASME International Conference on Advanced Intelligent Mechatronics, AIM 2008,
Xian, Shannxi, China, 2–5 July 2008; pp. 1296–1301.
132. Butler, S.; O’Connor, F.; Farren, D.; Ringwood, J.V. A Feasibility Study into
Prognostics for the Main Bearing of A Wind Turbine. In Proceedings of the 2012 IEEE
International Conference on Control Applications (CCA), Dubrovnik, Croatia, 3–5
October 2012; pp. 1092–1097.
133. Chen, B. Survey of Commercially Available SCADA Data Analysis Tools for Wind
Turbine Health Monitoring; School of Engineering and Computing Sciences, Durham
University: Durham, UK, 2010.
134. Schlechtingen, M.; Santos, I.F. Condition Monitoring with Ordinary Wind Turbine
SCADA Data—A Neuro-Fuzzy Approach. In Proceedings of the European Wind
Energy Association (EWEA) Offshore 2011, Amsterdam, The Netherlands, 29
November–1 December 2011.
135. Schlechtingen, M.; Santos, I.F.; Achiche, S. Wind turbine condition monitoring based
on SCADA data using normal behavior models: Part 1: System description. Appl. Soft
Comput. 2013, 13, 259–270.

68
136. Li, H.; Hu, Y.; Yang, C.; Chen, Z.; Ji, H.; Zhao, B. An improved fuzzy synthetic
condition assessment of a wind turbine generator system. Int. J. Electr. Power Energy Syst.
2013, 45, 468–476.
137. Yang, W.X.; Court, R.; Jiang, J.S. Wind turbine condition monitoring by the approach
of SCADA data analysis. Renew. Energy 2013, 53, 365–376.
138. Crabtree, C.J. Survey of Commercially Available Condition Monitoring Systems for Wind
Turbines; Durham University: Durham, UK, 2010.
139. Wang, W. An intelligent system for machinery condition monitoring. IEEE Trans.
Fuzzy Syst. 2008, 16, 110–122.
140. Amirat, Y.; Choqueuse, V.; Benbouzid, M. Wind Turbines Condition Monitoring and
Fault Diagnosis Using Generator Current Amplitude Demodulation. In Proceedings
of the 2010 IEEE International Energy Conference and Exhibition (EnergyCon),
Manama, Bahrain,
18–22 December 2010; pp. 310–315.
141. Zimroz, R.; Urbanek, J.; Barszcz, T.; Bartelmus, W.; Millioz, F.; Martin, N.
Measurement of instantaneous shaft speed by advanced vibration signal processing-
application to wind turbine gearbox. Metrol. Meas. Syst. 2011, 18, 701–712.
142. Ye, X.; Yan, Y.; Osadciw, L.A. Learning Decision Rules by Particle Swarm
Optimization (PSO) for Wind Turbine Fault Diagnosis. In Proceedings of the Annual
Conference of the Prognostics and Health Management Society 2010, Portland, OR,
USA, 10–16 October 2010.
143. Boyle, D.; Magno, M.; O’Flynn, B.; Brunelli, D.; Popovici, E.; Benini, L. Towards
Persistent Structural Health Monitoring through Sustainable Wireless Sensor
Networks. In Proceedings of the 2011 Seventh International Conference on Intelligent
Sensors, Sensor Networks and Information Processing (ISSNIP), Adelaide, SA,
Australia, 6–9 December 2011; pp. 323–328.
144. Christensen, J.J.; Andersson, C.; Gutt, S. Remote Condition Monitoring of Vestas
Turbines. In Proceedings of the of European Wind Energy Conference and Exhibition
(EWEC2009), Marseille, France, 16–19 March 2009.

69
145. Miguelanez, E.; Lane, D. Predictive Diagnosis for Offshore Wind Turbines Using
Holistic Condition Monitoring. In Proceedings of the OCEANS 2010, Seattle, WA,
USA, 20–23 September 2010; pp. 1–7.
146. Higgs, P.A.; Parkin, R.; Jackson, M.; Al-Habaibeh, A.; Zorriassatine, F.; Coy, J. A
Survey on Condition Monitoring Systems in Industry. In Proceedings of the ASME 7th
Biennial Conference on Engineering Systems Design and Analysis, Manchester, UK,
19–22 July 2004; Volume 3, pp. 163–178.
147. Yang, B.; Sun, D. Testing, inspecting and monitoring technologies for wind turbine blades:
A survey. Renew. Sustain. Energy Rev. 2013, 22, 515–526.
148. Lynch, J.P.; Loh, K.J. A summary review of wireless sensors and sensor networks for
structural health monitoring. Shock Vib. Dig. 2006, 38, 91–130.
149. Smarsly, K.; Law, K.H.; Hartmann, D. Implementing a Multiagent-Based Self-
Managing Structural Health Monitoring System on a Wind Turbine. In Proceedings of
the 2011 NSF Engineering Research and Innovation Conference, Atlanta, GA, USA,
4–7 January 2011.
150. Diamanti, K.; Soutis, C. Structural health monitoring techniques for aircraft composite
structures. Prog. Aerosp. Sci. 2010, 46, 342–352.
151. Giurgiutiu, V.; Zagrai, A.; Bao, J.J. Piezoelectric wafer embedded active sensors for
aging aircraft structural health monitoring. Struct. Health Monit. 2002, 1, 41–61.
152. Seah, W.K.; Eu, Z.A.; Tan, H.-P. Wireless Sensor Networks Powered by Ambient
Energy Harvesting (WSN-HEAP)-Survey and Challenges. In Proceedings of the 1st
International Conference on Wireless Communication, Vehicular Technology,
Information Theory and Aerospace & Electronic Systems Technology, Wireless
VITAE 2009, Aalborg, Denmark, 17–20 May 2009; pp. 1–5.
153. Eu, Z.A.; Tan, H.-P.; Seah, W.K. Design and performance analysis of MAC schemes
for wireless sensor networks powered by ambient energy harvesting. Ad Hoc Netw.
2011, 9, 300–323.
154. Fu, T.S.; Ghosh, A.; Johnson, E.A.; Krishnamachari, B. Energy-efficient deployment
strategies in structural health monitoring using wireless sensor networks. Struct.
Control Health Monit. 2013, 20, 971–986.

70
155. Park, G.; Rosing, T.; Todd, M.D.; Farrar, C.R.; Hodgkiss, W. Energy harvesting for
structural health monitoring sensor networks. J. Infrastruct. Syst. 2008, 14, 64–79.
156. Ling, Q.; Tian, Z.; Yin, Y.; Li, Y. Localized structural health monitoring using energy-
efficient wireless sensor networks. IEEE Sens. J. 2009, 9, 1596–1604.
157. Daliri, A.; Galehdar, A.; Rowe, W.S.; Ghorbani, K.; John, S. Utilising microstrip patch
antenna strain sensors for structural health monitoring. J. Intell. Mater. Syst. Struct.
2012, 23, 169–182.
158. Daliri, A.; Galehdar, A.; John, S.; Rowe, W.; Ghorbani, K. Circular Microstrip Patch
Antenna Strain Sensor for Wireless Structural Health Monitoring. In Proceedings of
the World Congress on Engineering, WCE 2010, London, UK, 30 June–2 July 2010;
Volume II, pp. 1173–1178.
159. Daliri, A.; Galehdar, A.; John, S.; Rowe, W.S.T.; Ghorbani, K. Slotted Circular
Microstrip Patch Antenna Application in Strain Based Structural Health
Monitoring. In Proceedings of the AIAC14 Fourteenth Australian International
Aerospace Congress, Melbourne, Australia, 28 February–3 March 2011.
160. Taylor, S.G.; Farinholt, K.M.; Flynn, E.B.; Figueiredo, E.; Mascarenas, D.L.; Moro, E.A.;
Park, G.; Todd, M.D.; Farrar, C.R. A mobile-agent-based wireless sensing network for
structural monitoring applications. Meas. Sci. Technol. 2009, 20, doi:10.1088/0957-
0233/20/4/045201.
161. Park, J.-Y.; Kim, B.-J.; Lee, J.-K. Development of Condition Monitoring System with
Control Functions for Wind Turbines. World Acad. Sci. Eng. Technol. 2011, 5, 269–
274.
162. Isko, V.; Mykhaylyshyn, V.; Moroz, I.; Ivanchenko, O.; Rasmussen, P. Remote Wind
Turbine Generator Condition Monitoring with Mita-Teknik’s WP4086 System. In
Proceedings of the 2010 European Wind Energy Conference (EWEC) & Exhibition,
Warsaw, Poland, 20–23 April 2010.
163. Koutroulis, E.; Kalaitzakis, K. Development of an integrated data-acquisition system
for renewable energy sources systems monitoring. Renew. Energy 2003, 28, 139–152.
164. Feuchtwang, J.; Infield, D. The Offshore Access Problem and Turbine Availability-
Probabilistic Modelling of Expected Delays to Repairs. In Procedings of the European
71
Offshore Wind (EOW) Conference & Exhibition, Stockholm, Sweden, 14–16
September 2009.
165. Karyotakis, A. On the Optimisation of Operation and Maintenance Strategies for
Offshore Wind Farms. Ph.D. Thesis, University College London (UCL), London, UK,
2011.
166. Byon, E.; Ding, Y. Season-dependent condition-based maintenance for a wind turbine
using a partially observed Markov decision process. IEEE Trans. Power Syst. 2010, 25,
1823–1834.
167. Jensen, F.M.; Falzon, B.; Ankersen, J.; Stang, H. Structural testing and numerical
simulation of a 34 m composite wind turbine blade. Compos. Struct. 2006, 76, 52–61.
© 2014 by the authors; licensee MDPI, Basel, Switzerland. This article is an open access
article distributed under the terms and conditions of the Creative Commons Attribution
license (http://creativecommons.org/licenses/by/3.0/).

72
Chapter III
PROPOSING A NEW APPROACH FOR WIND
TURBINES AERODYNAMICS MODELLING
WITH APPLICATION TO DARRIEUS TYPE
VERTICAL AXIS WIND TURBINES
Article published in Energies, September 2015
doi: 10.3390/en81010684
73
A New Approach for Modeling Darrieus-Type Vertical Axis Wind Turbine Rotors Using Electrical Equivalent Circuit Analogy: Basis of Theoretical Formulations and Model Development
Pierre Tchakoua, René Wamkeue, Mohand Ouhrouche, Tommy Andy Tameghe and
Gabriel Ekemb
Résumé
Les modèles sont essentiels dans le processus de conception en ingénierie car ils
peuvent être utilisés aussi bien pour l'optimisation des paramètres de conception que pour la
prédiction des performances. Ainsi, les modèles peuvent considérablement réduire les coûts
de conception, de développement et d'optimisation. Cet article propose un nouveau modèle
électrique équivalent pour les rotors d’éoliennes à axe vertical type Darrieus. Le modèle
proposé a été construit à partir de la description mécanique donnée par le modèle à double
disques et multiples tubes de vents donnés par Paraschivoiu et repose sur l'analogie entre
circuits mécaniques et électriques. Ce travail présente les concepts physiques et les
fondements théoriques sur lesquels est basé le développement du nouveau modèle. Après
avoir présenté le principe de fonctionnement des éoliennes à axe vertical type Darrieus, les
différentes étapes de développement du nouveau modèle sont graduellement présentées. À
des fins d'évaluation, les caractéristiques aérodynamiques des pales et celles des composants
électriques correspondants sont simulées et comparées.

74
Abstract
Models are crucial in the engineering design process because they can be used for
both the optimization of design parameters and the prediction of performance. Thus, models
can significantly reduce design, development and optimization costs. This paper proposes a
novel equivalent electrical model for Darrieus-type vertical axis wind turbines (DTVAWTs).
The proposed model was built from the mechanical description given by the Paraschivoiu
double-multiple streamtube model and is based on the analogy between mechanical and
electrical circuits. This work addresses the physical concepts and theoretical formulations
underpinning the development of the model. After highlighting the working principle of the
DTVAWT, the step-by-step development of the model is presented. For assessment
purposes, simulations of aerodynamic characteristics and those of corresponding electrical
components are performed and compared.

75
3.1. INTRODUCTION
The aerodynamic characteristics of vertical-axis wind turbines (VAWTs) are
somewhat more complex than those of horizontal-axis configurations. Thus, industrial and
academic research has primarily focused on horizontal-axis turbines over the past several
decades. As a result, VAWTs are still relatively poorly understood [1].
3.1.1 The Growing Interest for Vertical-Axis Wind Turbines (VAWTs)
VAWTs have various advantages over horizontal-axis wind turbines (HAWTs). The
main advantage is their omni-directionality; a VAWT can operate using wind incident from
any direction and therefore does not require a yaw control system. Moreover, a VAWT
gearbox and generator can be placed at ground level, making maintenance easier and
reducing construction costs [1–3]. Finally, VAWTs are noiseless and do not slow wind down
as much as HAWTs do, making VAWTs less detrimental to humans and birds. As a result,
VAWTs can be placed close together in a wind farm [4]. These advantages make VAWTs
better suited to local production of clean electric power in industrial and residential areas [5];
furthermore, these benefits have led to a renewed interest in VAWTs for small- and medium-
scale power generation. For all of these reasons, VAWTs have experienced renewed interest
in recent years [6–8]. Several universities and research institutions have conducted extensive
research and developed numerous designs based on several aerodynamic computational
models [3,6].
Being able to numerically predict wind turbine performance offers a tremendous
benefit over classic experimental techniques; the major benefit is that computational studies
are more economical than are such costly experiments. Various wind turbine computational
models exist, each with their own strengths and weaknesses, which attempt to accurately

76
predict the performance of VAWTs [9]. These models are all based on the simple idea of
being able to determine the relative velocity and, in turn, the tangential force component of
the individual blades at various azimuthal locations [10].
3.1.2 The Necessity of a New Modeling Approach for Darrieus-Type Vertical-Axis Wind Turbines (VAWTs)
VAWTs are becoming ever more important in wind power generation thanks to their
compactness and adaptability for domestic installations. However, it is well known that
VAWTs have poor efficiency, especially compared to HAWTs. To improve the performance
of VAWTs, industries and researchers are attempting to optimize the design of the rotors
[11]. Thus, models are crucial because they can be used for parameter optimization,
performance prediction before fabrication, condition monitoring and fault detection and
prediction [12–14]. Various models can be found for VAWT simulation in the literature [15–
22]. These models can be broadly classified into four categories: momentum models, vortex
models, cascade models and computational fluid dynamic (CFD) models. Based on [17,23–
30], a quick literature survey was performed on most used models. Table 1 presents the
relevant features as well as the advantages and shortcoming for each model category. Table
1 shows that aerodynamic models remain unable to meet the demands of various applications,
although the streamtube and vortex models have seen significant improvement. Meanwhile,
CFD solutions remain computationally very expensive and are basically prohibitive for the
routine engineering analyses of the local interaction mechanisms of wind turbines.
Furthermore, none of the models with high reliability and accuracy can be efficiently coupled
with models of the other mechanical and electrical parts of the wind turbine to form a global
model for the wind energy conversion system (WECS).

77
The goal of this research is to establish the bases for the construction of a new model
for Darrieus-type vertical axis wind turbines (DTVAWTs). This model is likely to be more
user friendly for the electrical engineering community in particular. This is of great
importance especially because wind energy is multidisciplinary domain with increasing
resources from the field of electrical engineering. In addition, it will be possible to link the
model to other mechanical and electrical part models to form a global model for the WECS.
Such a global model will help users understand the effects of various aerodynamic
phenomena and other structural faults on other blade components as well as the overall
performance of the WECS. Finally, the new model is of great versatility and may therefore
permit the study of various effects and phenomena, including dynamic stall effects, flow
curvature effects, pitching circulation, added mass effects, interference among blades, and
vibration effects.
The proposed model is an equivalent model based on the analogy between mechanical
and electrical circuits. Our initial motivation is that the use of electrical circuit elements to
model physical devices and systems has a long history of success. Additionally, knowledge
of analogies and construction of an analogue model for a given system allows the study of a
system in an environment other than that for which it is intended [31–33], thereby facilitating
the study of specific phenomena of the system. Moreover, a model based on electrical
components is accessible and quickly understood by researchers from almost all engineering
fields. This last argument is of great importance because research and development in the
wind turbine industry requires a variety of competencies from different fields of engineering.
Furthermore, the equivalent electrical model can take advantage of existing resources by
simultaneously capitalizing on their strengths and minimizing their respective drawbacks. In
addition, such a model can be a good tool for the simulation of wind turbine rotor operation

78
in the case of physical damage or structural faults on one or more blades. Finally, because
electric and other dynamic models for other parts of the wind turbine have been developed
[34–41], this new model can be easily linked to existing models to obtain an overall wind
turbine model.
This paper proposes a new approach for modeling Darrieus-type VAWT rotors using
the electrical-mechanical analogy. This new model is likely to be more appropriate for the
design, performance prediction and optimization of Darrieus rotors. Mechanical fault
diagnosis and prognosis is also an important aspect because the model can be use to simulate
the rotor’s behavior for the case of a mechanical fault on one or more of the blades as well
as on rotor-shaft coupling elements. This paper focuses on providing a proof-of-concept
demonstration of the new model. Section 2 presents the working principle of Darrieus-type
VAWTs. In Section 3, the basis of the mechanical-electrical analogy approach is discussed.
Theoretical concepts underpinning the new model and the step-by-step development process
are also described in this section. The results are presented and discussed in Section 4;
simulations of aerodynamic characteristics and those of corresponding electrical components
are presented for a single blade and for various parameters of the new model. Finally, Section
5 concludes the paper and gives prospects for future research work.

79
Table III-1 Features, advantages and shortcoming of different aerodynamic models for vertical-axis wind turbine (VAWT) rotors.
Model Main features Advantages Shortcomings
Momentum or blade element
model
- Combines momentum theory with blade element theory.
- Uses the calculation of flow velocity through the turbine by equating the streamwise aerodynamic force on the blades with the rate of change of momentum of air.
- Momentum models include the single streamtube model, multiple streamtube model and Double-multiple streamtube model.
- Can predict the overall performance of a lightly loaded wind turbine. It is thus useful for overall design.
- Very fast computational prediction. - Can provide a good correlation between
the performance prediction and the experimental data (double-multiple streamtube model).
- Invalid for large tip speed ratios and for high rotor solidities.
- Does not provide any information as to the shape of the near wake, which is important when considering the placement of struts and other structures close to the turbine blades.
- The effect of perpendicular perturbations in blade element momentum (BEM) methods can only be added as a correction.
- Cannot predict wind velocity variations across the rotor.
- Some convergence problems (double-multiple streamtube model).
Vortex model
- Potential flow models based on the calculation of the velocity field about the turbine through the influence of vorticity in the wake of the blades.
- Vortex models include the free-wake vortex model and fixed-wake momentum theory.
- Can include the dynamic stall effect, pitching circulation and added mass effect.
- Capable of providing information about the wake structure near the turbine because the velocity normal to the airflow is neglected.
- High-precision prediction capabilities. - Can be used for highly loaded rotors at
large tip speed ratios. - Naturally addresses perturbations both
parallel and perpendicular to the streamwise velocity.
- Computationally too expensive. - Relies on significant simplifications (such as
the potential flow being assumed in the wake, and the effect of viscosity in the blade aerodynamics is included through empirical force coefficients).
- Convergence problems in some cases. - Computational accuracy greatly dependent on
the potential flow model used in computations.

80
Table III-1 . Cont.
Model Main features Advantages Shortcomings
Cascade model
- Consists in equidistantly placing the blades one behind another on a plane, the width of which is the circumference of the rotor.
- The aerodynamic characteristics of each element of the blade are independently obtained using the local Reynolds number.
- Can predict the overall values of both low and high solidity turbines quite well.
- Highly precise computation with no iterative convergence even at high tip speed ratios and high solidities.
- Incorporates the effect of the local Reynolds number variation at different azimuth angles, zero-lift-drag coefficients, finite aspect ratios and flow curvature effect in the calculation process.
- Dynamic stall and flow curvature with blade pitching can be considered.
- Achieves smooth convergence even at high tip speed ratios and high solidity VAWT with quite reasonable accuracy.
- Reasonable computation time.
Computational fluid dynamics
(CFD) model
- CFD simulation of VAWT is performed by solving the Unsteady Reynolds Averaged Navier Stokes (URANS) equation.
- According to the discrete principle, CFD models can be generally classified into three branches: the Finite Difference Method (FDM), the Finite Element Method (FEM) and the Finite Volume Method (FVM).
- Provides a more precise aerodynamic prediction for VAWTs (reliability and accuracy).
- Can visualize the flow near airfoils in detail.
- Can accelerate the design process and reduce the overall cost of design.
- Effective solutions for the analysis of local flow fields around blades, particularly for dynamic stall and wake flow.
- Attractive solution for performance optimization
- Computationally intensive. - Basically prohibitive for the routine
engineering analyses of wind turbines.
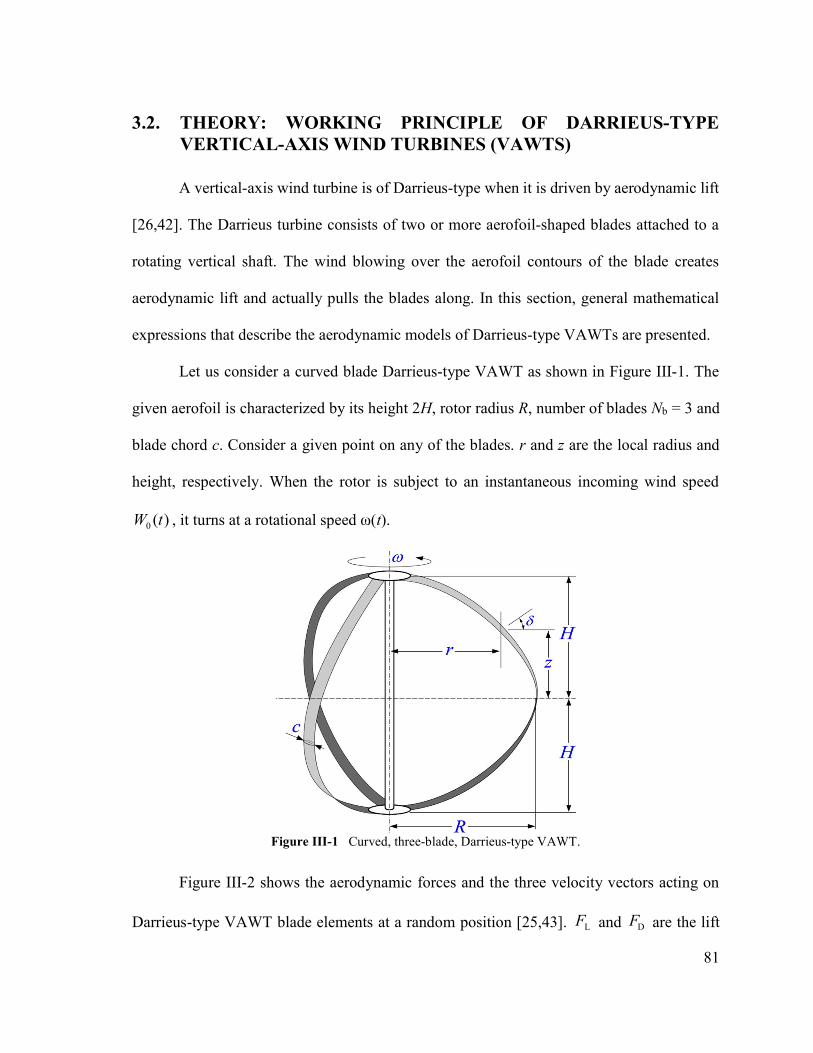
81
3.2. THEORY: WORKING PRINCIPLE OF DARRIEUS-TYPE VERTICAL-AXIS WIND TURBINES (VAWTS)
A vertical-axis wind turbine is of Darrieus-type when it is driven by aerodynamic lift
[26,42]. The Darrieus turbine consists of two or more aerofoil-shaped blades attached to a
rotating vertical shaft. The wind blowing over the aerofoil contours of the blade creates
aerodynamic lift and actually pulls the blades along. In this section, general mathematical
expressions that describe the aerodynamic models of Darrieus-type VAWTs are presented.
Let us consider a curved blade Darrieus-type VAWT as shown in Figure III-1. The
given aerofoil is characterized by its height 2H, rotor radius R, number of blades Nb = 3 and
blade chord c. Consider a given point on any of the blades. r and z are the local radius and
height, respectively. When the rotor is subject to an instantaneous incoming wind speed
0 ( )W t , it turns at a rotational speed ω(t).
Figure III-1 Curved, three-blade, Darrieus-type VAWT.
Figure III-2 shows the aerodynamic forces and the three velocity vectors acting on
Darrieus-type VAWT blade elements at a random position [25,43]. LF and DF are the lift

82
and drag force, respectively. As the blade rotates, the local angle of attack α varies with the
relative velocity rW . The incoming wind speed 0W and the rotational velocity of the blade ω
govern the orientation and magnitude of rW [23,42]. In turn, the forces LF and DF acting on
the blade vary. The magnitude and orientation of the lift and drag forces as well as the
resultant force vary. The resultant force can be decomposed into a normal force NF and a
tangential force TF .
The tangential force component then drives the rotation of the wind turbine and
produces the torque necessary to generate electricity [24].
Figure III-2 Velocity and force components for a Darrieus-type VAWT (DTVAWT).
Elementary normal and tangential forces applied to a blade element are, respectively,
given by [44]:
2N N
1d ρ d
2 cos δ
cF C W z
(1)

83
2T T
1d ρ d
2 cosδ
cF C W z
(2)
where δ is the pitch angle of the blade, defined as 1δ tan
2
H
z
; c is the blade chord
(m); and NC and TC are the normal and tangential force coefficients, respectively, which
are given by:
N L Dcosφ sinφC C C , T L Dsinφ cosφC C C (3)
where LC and DC are the blade lift and drag coefficients, respectively. These
coefficients are related to the blade profile and are obtained from empirical data and made
available by the blade manufacturer. LC and DC are experimentally determined and depend
on the incidence angle α and the Reynolds number ωe
R cR
W [45]. The lift and drag
coefficients are given by the following relations [42]:
L2ρ
2
xRC
l W
(4)
D2ρ
2
zRC
l W
(5)
If we assume that the relative dynamic pressure flow q and the blade element area eA
can be expressed as 21ρ
2q W and deA c z , then [46]:
NNd
cos δeC qA
F (6)
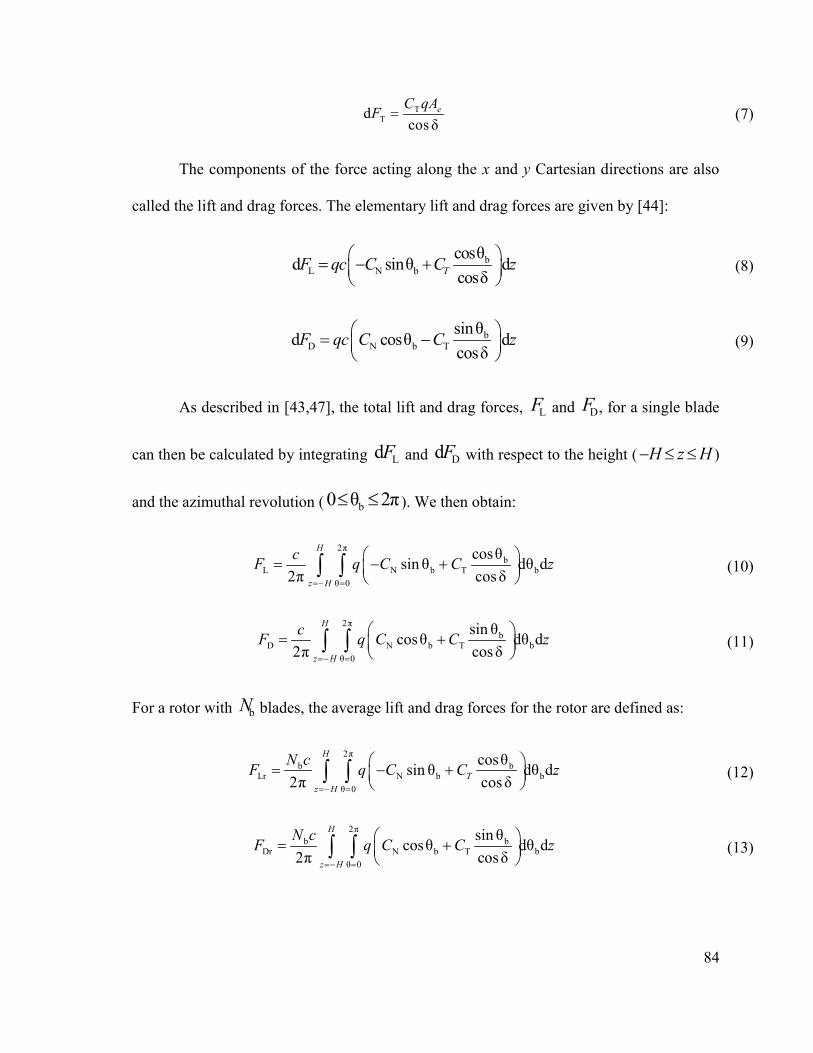
84
TTd
cos δeC qA
F (7)
The components of the force acting along the x and y Cartesian directions are also
called the lift and drag forces. The elementary lift and drag forces are given by [44]:
bL N b
cosθd sinθ d
cosδTF qc C C z
(8)
bD N b T
sinθd cosθ d
cosδF qc C C z
(9)
As described in [43,47], the total lift and drag forces, LF and DF , for a single blade
can then be calculated by integrating LdF and DdF with respect to the height ( H z H )
and the azimuthal revolution ( b0 θ 2π ). We then obtain:
2πb
L N b T b
θ 0
cosθsin θ dθ d
2π cos δ
H
z H
cF q C C z
(10)
2πb
D N b T b
θ 0
sin θcosθ dθ d
2π cos δ
H
z H
cF q C C z
(11)
For a rotor with bN blades, the average lift and drag forces for the rotor are defined as:
2πb b
Lr N b b
θ 0
cosθsin θ dθ d
2π cos δ
H
T
z H
N cF q C C z
(12)
2πb b
Dr N b T b
θ 0
sin θcosθ dθ d
2π cosδ
H
z H
N cF q C C z
(13)

85
The torque of the Darrieus rotor is produced solely by the tangential component of
the applied force [23,43,48]. Thus, from the elementary tangential force of the rotor, we can
obtain the elementary torque of the rotor at a given position. For a blade element of length
d / cosδz , we obtain:
TBd d
cos δ
C qrcT z (14)
The torque varies as a function of the azimuthal angle and the rotor height [48]. The
total torque can then be obtained by successively integrating the elementary torque with
respect to the variables θ and z. For a rotor with bN blades, we have:
2π
R b B
0
ωdθ d
2π cos δ
xHT
b
z xH
qC rcT N T z
(15)
The average power generated by the rotor shaft is defined as:
2π
R b
0
ωω dθ d
2π cos δ
xHT
z xH
qC rNcP T z
(16)
The power coefficient of the rotor can then be obtained as:
2π
p b3max 0
81 1 ωdθ d
64 2π ρ cos δ
xHT
z xH
qC rP NcC z
P V RH
(17)
3.3. METHOD AND MODEL CONSTRUCTION
Based on the aerodynamic model described in the precedent section, this section is
devoted to the presentation of the building process of an equivalent electrical model. Our
methodology is based on the complex plane representation of various model subassemblies
and an analogy between electrical and mechanical systems.

86
3.3.1. The Mechanical-Electrical Analogy Approach
The main value of analogies lies in the way in which mathematics unifies these
diverse fields of engineering into one subject. Tools developed for solving problems in one
field can be used to solve problems in another. This is an important concept because some
fields, particularly electrical engineering, have developed rich sets of problem-solving tools
that are fully applicable to other engineering fields [49]. There are simple and straightforward
analogies between electrical and mechanical systems. Furthermore, analogies between
mechanical systems and electrical and fluid systems are effective and are in common use.
Two valid techniques of modeling mechanical systems with electrical systems or
drawing analogies between the two types of systems can found in the literature, with each
method having its own advantages and disadvantages [50–54]. The first technique is
intuitive; in this technique, current corresponds to velocity (both are motion), and voltage
corresponds to force (both provide a “push”). The second technique is the through/across
analogy, which uses voltage as an analogy for velocity and current as an analogy for force.
The two schools of thought for modeling mechanical systems with electrical systems are
presented in Table 2 [49]. Both are valid. However, the through/across analogy results in a
counterintuitive definition of impedance [49,51,52,55]. The analogy for impedance that is
universally applied is the one from the intuitive analogy listed in the corresponding section
of Table II-1. For this reason, the intuitive analogy will be used in the present study.

87
Table III-2 System analogy used in developing the new model.
Topology-Preserving Set (book’s Analogy)
Intuitive Analogy Set
Intuitive Stretch
Topology Change
Description Trans Mech Rot
Mech Electrical Thermal Fluid Trans Mech Rot Mech Description
“through”
variable 𝑓 (force)
𝜏
(torque)
𝑖
(current)
𝜙 (heat
flux) q (flow) 𝑣 (velocity)
ω (angular
velocity) Motion
“across”
variable 𝑣 (velocity)
ω
(angular
velocity)
ν
(voltage) T, θ p (pressure) 𝑓 (force) 𝜏 (torque)
Push
(force)
Dissipative
element 𝑣 =
𝟏
𝑩 𝑓 ω =
𝟏
𝑩𝒓𝜏 𝑣 = 𝑖𝑹 𝜃 = ϕ𝑹 𝑝 = 𝑞𝑹
𝑓 = 𝑣𝑩
𝜏 = ω𝑩𝒓
Dissipative
element
Dissipation 𝑓𝟏
𝑩=
𝑣
𝟏/𝑩
𝜏𝟏
𝑩
=ω
𝟏/𝑩
𝑖 𝑹
= 𝑣 /𝑹 N/A
𝑞 𝑹
= 𝑝 /𝑹
𝑣 𝑹
= 𝑓 /𝑹
𝜔 𝑩𝒓
= 𝜏 /𝑩𝒓 Dissipation
Through-
variable
storage
element
𝑣 =𝟏
𝑲
𝑑𝑓
𝑑𝑡
or ∫ 𝑣𝑑𝑡 =𝟏
𝑲𝑓
ω
=𝟏
𝑲𝒓
𝑑𝜏
𝑑𝑡
or
∫ 𝜔𝑑𝑡 =𝟏
𝑲𝒓𝜏
𝑣 = 𝑳𝑑𝑖
𝑑𝑡 N/A 𝑝 = 𝑰
𝑑𝑞
𝑑𝑡
𝑓 = 𝑴𝑑𝑣
𝑑𝑡
(one end
must be
“grounded”)
𝜏 = 𝑱𝑑ω
𝑑𝑡
(one end
must be
“grounded”)
Motion
storage
element
Energy 𝐸 = 𝟏
𝑲𝑓
𝐸
=𝟏
𝑲𝒓𝜏
𝐸
= ½𝑳𝑖 𝐸 = ½𝑰𝑞 𝐸 = ½𝑴𝑣 𝐸 = ½𝑱ω Energy
Impedance Standard definition is at
right
𝑉(𝑠)
= 𝐼(𝑠)𝑳𝒔
𝑃(𝑠)
= 𝑄(𝑠)𝑰𝒔
𝐹(𝑠)
= 𝑉(𝑠)𝑴𝒔
𝑇(𝑠)
= Ω(𝑠)𝑱𝒔 Impedance
Across
variable
storage
element
𝑓 = 𝑴𝑑𝑣
𝑑𝑡
(one end
must be
“grounded”)
𝜏 = 𝑱𝑑𝜔
𝑑𝑡 𝑖 = 𝑪
𝑑𝑣
𝑑𝑡
ϕ = 𝑪𝑑θ
𝑑𝑡
(one end
must be
“grounded”)
𝑞 = 𝑪𝑑𝑝
𝑑𝑡
(one end
usually
“grounded”)
𝑣 =𝟏
𝑲
𝑑𝑓
𝑑𝑡
or ∫ 𝑣𝑑𝑡 =𝟏
𝑲𝑓
ω =𝟏
𝑲𝒓
𝑑𝜏
𝑑𝑡
or ∫ ω𝑑𝑡 =𝟏
𝑲𝒓𝜏
Push
(force)
storage
element
Energy 𝐸 = ½𝑴𝑣 𝐸
= ½𝑱ω
𝐸
= ½𝑪𝑣
𝐸 = 𝑪𝑇
(not
analogous)
𝐸 = ½𝑪𝑝 𝐸 = 𝟏
𝑲𝑓 𝐸 =
𝟏
𝑲𝒓𝜏 Energy
Impedance
The standard definition
of mechanical
impedance is the one on
the right, based on the
intuitive analogy
𝑉(𝑠)
= 𝐼(𝑠)𝑰
𝒔𝑪
Θ(𝑠)
= Φ(𝑠)𝟏
𝒔𝑪
𝑃(𝑠)
= 𝑄(𝑠)𝟏
𝒔𝑪
𝐹(𝑠)
= 𝑉(𝑠)𝑲
𝒔
𝑇(𝑠)
= Ω(𝑠)𝑲𝒓
𝒔
Impedance

88
3.3.2. Wind Flow as an Electric Current Source
The analogy between air flow and electrical current is mathematically accurate; the
momentum of a section of a gas, also called inertance, is directly analogous to electrical
inductance. The compliance of a transmission vessel (hose or pipe) is directly analogous to
electrical capacitance [56–59]. In this section, we will model the wind flow across the rotor
as an electric current source.
Figure III-3 shows the top view of a three-blade VAWT and the different velocity
components. Considering one of the blades, its shift position bx is characterized by the rotor
radius R and the angular position bθ . Thus, the complex representation of the blade shift
position bx can be written as follows [60–62]:
bθb
jx Re (18)
Figure III-3 Top view of a three-blade VAWT showing the velocity components relative to the blade.

89
The linear velocity of the blade bW can be obtained by deriving its position with
respect to time. We then have [63]:
bθbb b
d( )θ
djx
W j Ret
(19)
where bθ =ω is the rotational speed and 0W is the incoming wind and represents wind
from any direction. The relative wind seen by the blades at any moment is given by
[61,64,65]:
bθr 0 b 0 ω jW W W W j Re
(20)
As explained in [61], the angle definitions are counter-clockwise; hence, α and φ are
negative for the directions of rW and bW (Figure III-4). Therefore, if we consider the blade
reference frame, the angle of the relative wind is obtained by rotating rW by an angle bθjje ,
thereby aligning the blade motion with the negative real axis. The relative flow velocity for
a blade in its own reference frame can then be defined as:
b bθ θrb r 0 ωj jW W je W je R (21)
The algebraic expression can be written as follows:
rb 0 b 0 bω sinθ cosθW R W j W (22)

90
Figure III-4 Definition of angles and velocities.
The Paraschivoiu model [43] assumes that the direction of the flow does not change.
Therefore, the angle of the blade relative to the vertical axis η is taken into consideration
when expressing the relative wind velocity seen by the blade. Hence, from Equation (22), the
relative wind seen by the blade element, and that corresponding to the streamtube i, can be
expressed as follows:
rb 0 b 0 bω sinθ cosθ cosηi i i i iW R W j W (23)
where η is the angle of the blade relative to the vertical axis and is equal to zero for straight
blade VAWTs ( η 0 and cos η 1 ). If the parabola shape of the blade is approximated as:
2
1r z
R H
(24)
then the angle of the blade relative to the vertical axes can be defined as [43,66]:
1 1 1
η tan tan2 2 1
H
z r R
(25)
The angle of the relative wind is the argument of rbW [9,47]. Because 0W is
considered to be real, we can write:

91
1 1b b
bb
0
cos θ cos η cos θ cos ηφ tan tan
λ sin θωsin θ
i i i ii
i iii
i
R
W
(26)
where 0
ωλ
R
W is the blade tip speed ratio.
Considering the pitch angle δ, the angle of attack α is obtained through summation of the
pitch angle and that of the relative wind [23]; specifically:
α φ δ (27)
Finally, the wind’s angle of attack relative to a streamtube i can be written as follows:
1 b
b
cos θ cos ηα tan δ
λ sin θi
ii
(28)
For a given blade element situated at a height z and corresponding to a given
streamtube, η and δ are constant. The angle of attack (AoA) will therefore vary with the angle
of the relative wind speed, that is, with the rotational angle of the blade. Figure III-5 shows
the variation of the angle of attack as a function of the rotational angle of the blade for
different values of the tip speed ratio λ. The results are in accordance with those obtained in
[67] and show that small tip speed ratios lead to large incidence variations during a
revolution.

92
Figure III-5 Angle of attack as function of the rotational angle.
Additionally, the absolute value of the relative velocity is the modulus of the complex
algebraic definition in Equation (22). Therefore, it can be written in accordance with the
definition in [68]:
2
2 2
rb 0 b b0
ωsin θ cos θ cos η
RW W
W
(29)
Broadly speaking, the incident wind at the wind turbine rotor can be written as a complex
number:
(φ δ)rb rb e jW W (30)
As stated in [56–59], an analogy can be made between the wind flow in a streamtube
and an electric current. Equation (30) is similar to the complex expression of a sinusoidal
current generator. Moreover, if the incident wind flow is assumed to be an electric current,
0 100 200 300 400 500 600 700 800-50
-40
-30
-20
-10
0
10
20
30
40
50
Rotational angle in degrees
Win
d in
cide
nt a
ngle
in d
egre
es
Vsp = 1.5
Vsp = 2Vsp = 2.5
Vsp = 3

93
then the wind relative dynamic pressure flow 2rb
1ρ
2q W (where q is given in 3N/m and the
fluid density ρ is given in 3kg/m ), which is the energy acquired by the wind due to its velocity,
can be considered as an electric energy source. Referring to our system analogy table, this
will be a current source. The wind relative dynamic pressure flow can therefore be written as
a complex number:
2 2 2(φ δ) 2(φ δ)w rb rb rb
1 1 1ρ ρ e ρ
2 2 2j jI q W W W e
2
2 22 2(φ δ)w 0 b b
0
1 ωρ sin θ cosθ cos η e
2jR
I WW
(31)
Finally, the instantaneous expression of the current source that represents the relative wind
seen by the blade is as follows:
w ( ) cos ω 2α 2αi t t (32)
where 2
2 220 b b
0
1 ωρ sin θ cosθ cos η
2
RW
W
and 1 b
b
cos θ cos ηα tan δ
λ sin θi
. ψ
is the modulus of the current flow and varies with the rotational angle of the blade.
As shown in Figure III-6, in the double-multiple multi-streamtube models, the
incoming wind speed in the upstream u
0W disk is different than that in the downstream disk
d0W [69]. Thus, the modulus of the corresponding current in the downwind disk is slightly
lower than that in the upwind disk ( d u ). We can therefore incorporate this into the
current source definition. The new current definition is Equation (33), and the electric current
source analogy for wind flow can be represented as shown in Figure III-7:

94
u
w d
sin ω 2α for π / 2 θ π / 2( )
sin ω 2α for 3π / 2 θ π / 2
ti t
t
(33)
Figure III-6 Double-multiple multi-streamtube model.
Finally, the wind flow in our model is represented as follows:
Figure III-7 Wind flow equivalent electrical model.
3.3.3. Single-Blade Electrical Equivalent Circuit (Normal, Tangential, Lift and Drag Coefficients)
The aerodynamic force coefficients acting on a cross-sectional blade element of a
Darrieus wind turbine are shown in Figure III-8 [70]. The directions of the lift and drag
coefficients as well as their normal and tangential components are illustrated.
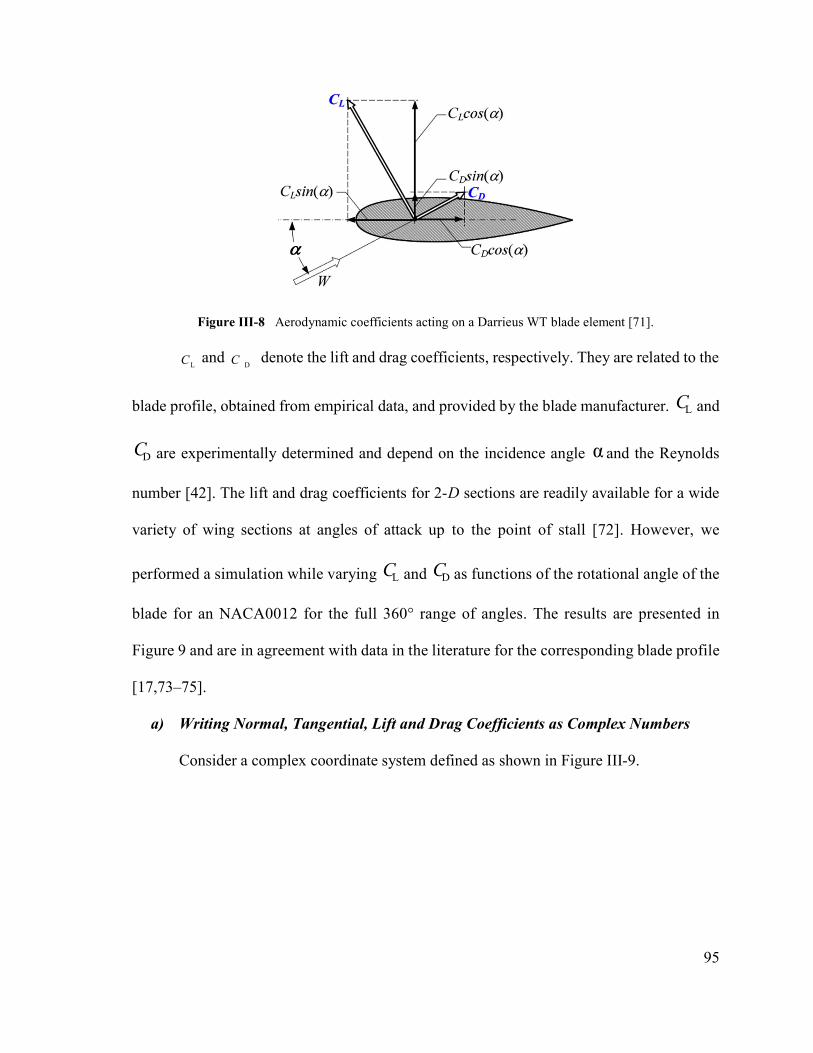
95
Figure III-8 Aerodynamic coefficients acting on a Darrieus WT blade element [71].
LC and DC denote the lift and drag coefficients, respectively. They are related to the
blade profile, obtained from empirical data, and provided by the blade manufacturer. LC and
DC are experimentally determined and depend on the incidence angle α and the Reynolds
number [42]. The lift and drag coefficients for 2-D sections are readily available for a wide
variety of wing sections at angles of attack up to the point of stall [72]. However, we
performed a simulation while varying LC and DC as functions of the rotational angle of the
blade for an NACA0012 for the full 360° range of angles. The results are presented in
Figure 9 and are in agreement with data in the literature for the corresponding blade profile
[17,73–75].
a) Writing Normal, Tangential, Lift and Drag Coefficients as Complex Numbers
Consider a complex coordinate system defined as shown in Figure III-9.

96
Figure III-9 Lift and drag coefficients variations as a function of the angle of attack for a NACA0012 blade
profile.
The vertical axis is assumed to be real, and the horizontal axis is assumed to be
imaginary. In this new complex coordinate system, the lift and drag coefficients can be
written as complex numbers:
LL
DD
φ
πφ
2
CC
CC
(34)
Using the signs of their imaginary components, LC can be regarded as an inductive
coefficient with absolute value LC and angle α, and DC can be seen as a capacitive coefficient
with absolute value DC and angle π
φ2
. We can therefore write:
φL LL
Lπ
φ2 D DD
D
cosφ sinφeπ π
cos φ sin φe 2 2
j
j
C jCCC
C jCC C
(35)
-200 -150 -100 -50 0 50 100 150 200-1.5
-1
-0.5
0
0.5
1
1.5
2
Angle of attack in degrees
Lift
and
Dra
g C
oeff
icie
nts
Lift Coef
Drag Coef

97
which then becomes:
L L L
D DD
cosφ sin φ
sin φ cosφ
C C jC
C jCC
(36)
The total or equivalent complex coefficients can be obtained by including the lift and
drag coefficients:
eq L D L L D Dcosφ sinφ sinφ cosφC C C C jC C jC (37)
Grouping real and imaginary components, we obtain:
eq L D L Dcosφ sinφ sinφ cosφC C C j C C (38)
The tangential force coefficient TC is basically the difference between the tangential
components of the lift and drag forces. Similarly, the normal force coefficient NC is the
difference between the normal components of the lift and drag forces [25,43,76]. Thus, in
the complex plane, NC is real, and
TC is imaginary. From Equation (38):
eq N TC C jC (39)
where:
N L D
L DT
cos φ sin φ
sin φ cos φ
C C C
C CC
(40)
The tangential coefficient characterizes the force tangential to the blade. To consider the
influence of η on TC , this letter is multiplied by
1κ
cosη , namely, the coefficient of the
blade tilt relative to the vertical axis; κ 1 for straight-blade VAWTs [43]. Hence, the new

98
definitions of the normal and tangential coefficients that can be applied to any VAWT blade
configurations are:
L DL DN
L DL DT
cos φ sin φcos φ sin φ
sin φ cos φκ sin φ cos φ
cos η cos η
C CC CC
C CC CC
(41)
The lift and drag coefficients become:
L LL
DD D
sin φcosφ
cos η
cosφsin φ
cos η
C jCC
C C jC
(42)
b) Normal, Tangential, Lift and Drag Impedances
The blade is divided into n elements, as shown in Figure III-10. Each blade element
corresponds to a given streamtube. These blade elements will experience varying flow
characteristics because they may have, depending on the design, different radii, angles of
relative wind speed, pitch angles, angles relative to the vertical axis, local heights, etc. Our
approach is to calculate the characteristics for each blade element. The overall performance
of the blade will then be obtained by the discrete addition of the n blade element
characteristics along the span of the blade.
Each moving body in the air is subjected to a resisting force that tends to oppose this
movement.
This resistance is a function of the air properties but also depends on the characteristics of
the body itself (surface, shape, weight, etc.).
Kirchhoff’s first law for air circuits states that the quantity of air leaving a junction must
equal the quantity of air entering the junction. Kirchhoff’s second law states that the sum of

99
the pressure drops around any closed path must be equal to zero. Pressure differences and
head losses are analogous to voltage, electrical current is analogous to volumetric airflow
rate and electrical resistance is analogous to airflow resistance [59,77–80]. This approach
provides a useful framework when developing an equivalent electrical circuit for a blade.
Figure III-10 Discretization of the blade into n elements.
To develop our new model, and in accordance with our mechanical-electrical
analogy presented in Table III-1, the blade resistance will not represent a force; rather, it will
represent the capacity of the blade to oppose the wind flow.
Thus, the blade element resistance can be defined as [57,81–84]:
Bi i iR C A (43)
where:
- iR is the aerodynamic resistance of the blade element;
- BiC is the equivalent aerodynamic coefficient of the blade;
- iA is the cord surface of the blade.

100
This aerodynamic resistance of the blade element can be decomposed into two
components: a horizontal component (in the direction of the flow), which constitutes the drag
aerodynamic resistance, and a component perpendicular to the plate, directed upwards, which
is called the lift aerodynamic resistance [45].
Based on [57,58,70,85], various impedances of a blade element, because we are using
a complex coordinate system, the elementary equivalent impedance of a blade element is
obtained by multiplying the corresponding elementary complex coefficient by the elementary
surface. Thus, we can write:
L L L L
sinφcosφ
cosηi
i i i i i i i i ii
Z AC c z C jc z C (44)
From Equation (44), we can write:
L L Li i iZ R jX (45)
with:
LL
LL
cosφ
sinφ
cosη
i i i ii
ii i ii
i
c z CR
c z CX
(46)
where LiR and LiX are the resistive and inductive components of the elementary lift
impedance, respectively. Because LiC varies with the angle of attack α, LiR and LiX
correspond to a variable resistor ( L αi iR f ) and a variable inductor ( L αi iX f ),
respectively. The equivalent electrical diagram for the lift impedance of a blade element is
as shown in Figure III-11.

101
Figure III-11 Equivalent electrical diagram for the lift force applied to a blade element.
Identically, the elementary drag impedance is:
D D D D
cosφsinφ
cosηi
ii i i i i i i i i
i
Z AC c z C jc z C (47)
From Equation (47), we can write:
D D Di i iZ R jX (48)
with:
DD
DD
sinφ
cosφ
cosη
i i i ii
ii i ii
i
c z CR
c z CX
(49)
where DiR and DiX are the resistive and inductive components of the elementary drag
impedance, respectively. Because DiC varies with the angle of attack α, DiR and DiX will
correspond to a variable resistor ( D αi iR f ) and a variable capacitor ( D αi iX f ),
respectively. The equivalent electrical diagram for the drag impedance of a blade element is
as shown in Figure III-12.
Figure III-12 Equivalent electrical diagram for the drag force applied to a blade element.

102
c) Total Impedance and Equivalent Electrical Circuit of a Single Blade
From the preceding section, the lift coefficient of the blade produces inductive
impedance, and the drag coefficient is responsible for the creation of capacitive impedance.
As suggested by the Aynsley resistance approach in [59], the total impedance for a blade
element is obtained by adding the elementary lift and drag impedances. We have the
following development:
B B L L L Di ii i i i i iZ A C A C C Z Z (50)
that is:
B L Di i iZ Z Z (51)
We can then write:
B L D L D
sin φ cos φcos φ sin φ
cos η cos ηi i
i i i i i i i i i i ii i
Z c z C C jc z C C
(52)
Finally:
TB N cosη
ii i i i i i
i
CZ c z C jc z (53)
From Equation (53), we can write:
B N Ti i iZ Z Z (54)
where:

103
L DL DN
L DL DT
cos φ sin φ
sin φ cos φ
cos η cos η
i i i ii ii i
i ii ii i ii
i i
C CR RZ R
C CjX j X XZ
(55)
Equations (54) and (55) show that the real component of the total elementary
impedance is resistive and is generated by the normal coefficient. In the same vein, the
imaginary component of the total elementary impedance is reactive and is produced by the
tangential coefficient. This is in accordance with the definitions of the normal and tangential
coefficients and forces found in the literature [86].
The total impedance of the entire blade is obtained by the addition of n discrete
elementary impedances over the full height of the rotor [87]:
B B1 1
n n
i i ii i
Z Z R jX
(56)
Specifically:
TB N
1 1
L D L D1 1
cos η
sin φ cos φ cos φ sin φ
cos η cos η
n ni
i i i i ii i i
n ni i
i i i i i i i i i ii i i i
CZ c z C j c z
c z C C j c z C C
(57)
We can then write:
B L D L D1 1 1 1
sin φ cos φcos φ sin φ
cos η cos η
n n n ni i
i i i i i i i i i i i i i ii i i ii i
Z c z C c z C j c z C c z C
(58)
If we consider:

104
L1
LD
1D
LL
1D
D1
cosφ
sin φ
sin φ
cosη
cosφ
cosη
n
i i i ii
n
i i i ii
ni
i i ii i
ni
i i ii i
c z C
Rc z C
R
Xc z C
X
c z C
(59)
We can write:
B B B N TZ R jX Z jZ (60)
where:
N B L D
B L DT
Z R R R
X X XZ
(61)
For a given blade element, the equivalent electrical components are subject to the
same wind flow. Thus, the equivalent electrical components of a blade are considered
connected in series. Therefore, the electric equivalent circuit for a blade that is subject to a
wind flow is as shown in Figure III-13.
Figure III-13 Electric equivalent circuit for a blade that is subject to a wind flow.

105
3.4. RESULTS AND DISCUSSION
This section presents the obtained equivalent electrical model for a single blade. The
simulation results for different elements of the model are also given. The simulations were
conducted using data for NACA0012 that can be obtained from different sources in the
literature [88–90] with Reynolds numbers ranging from 500,000 to approximately 750,000.
Our selection was motivated by the fact that the NACA0012 blade profile is one of the most
studied and commonly used as a rotor blade aerofoil section [89]. Finally, the simulation
results were assessed using other results that can be found in the literature [91].
3.4.1. The Electrical Equivalent Model of a Single Blade
The wind flow through the blade (the current flow through the circuit) will produce
lift and drag forces (lift and drag voltage) on the one hand and normal and tangential forces
(normal and tangential voltage) on the other hand. The normal and tangential voltages
produced by the blade can be expressed as follows:
0 B
N wN B
π /2BT wT B
2αe
2α, 2α π2αe
2
i
i
RZ IV R
XZ IV X
(62)
Following the laws of electrical circuit analyses, the total voltage across a blade can be
obtained by the algebraic sum of the lift and drag voltages. We can then write:
B w B w N T N TV I Z I Z jZ V V (63)
Nevertheless, the torque delivered by the blade is produced only by the tangential
component of the force. Therefore, only the tangential voltage will create the power in the
corresponding electric circuit. Finally, the electric circuit corresponding to a single blade is

106
obtained. Figure III-14 shows the equivalent electric model of a single blade with voltage
produce across reactive impedance that stand for blades torque.
Figure III-14 The torque produced by the blade reactive impedance.
3.4.2. Simulations
The simulation characteristics of the rotor were taken from [42] and are presented in
Table III-3.
Table III-3 Blade’s simulation characteristics.
Parameter Value/spécification
Number of blades 1
Aerofoil section NACA0012
Average blade Reynolds number 40,000
Aerofoil chord length 9.14 cm
Rotor tip speed 45.7 cm/s
Tip speed ratio 5
Chord-to-radius ratio 0.15

107
a) Variations of Coefficients and Equivalent Electric Components with the Angle of Attack
As discussed in Section 4.2, the blade’s lift and drag coefficients vary with the angle
of attack of the wind, as shown in Figure III-9. These coefficients can then be used to plot
the normal and tangential coefficients as a function of angle of attack using Equation (3).
Furthermore, Figure 5 shows that the angle of attack changes as the blade rotates. Therefore,
because the normal and tangential coefficients are obtained using lift and drag, as well as the
lift and drag coefficients, the normal and tangential coefficients will vary according the blade
position. The variations of the normal and tangential coefficients as functions of the angle of
attack can be observed in Figure III-15. The obtained results agree with those in [43].
Figure III-15 Normal and tangential coefficient variations as functions of the angle of attack.
Using the relations in Equations (59) and (61), we can then find the variations in the
various equivalent electrical components according to the angle of attack. The forms of the
BR and BX curves follow those of the normal and tangential coefficients. The variations of
-200 -150 -100 -50 0 50 100 150 200-2
-1.5
-1
-0.5
0
0.5
1
1.5
2
Angle of attack in degrees
Nor
mal
and
Tan
gent
iel c
oeff
icie
nts
Normal Coef
Tangential Coef

108
the values of electric components with the blade angle of attack are plotted on Figure III-16
and Figure III-17.
Figure III-16 Lift, drag and normal resistance variations as functions of the angle of attack.
Figure III-17 Reactive element variations as functions of the angle of attack.
-200 -150 -100 -50 0 50 100 150 200-1
-0.8
-0.6
-0.4
-0.2
0
0.2
0.4
0.6
0.8
1
Angle of attack in degrees
RL,
RD
and
RB
in m
2
R-Lift
R-Drad
R-Blade
-200 -150 -100 -50 0 50 100 150 200-0.4
-0.3
-0.2
-0.1
0
0.1
0.2
0.3
0.4
Angle of attack in degrees
XL,
XD
and
XB
in m
2
X-Lift
X-Drag
X-Blade

109
b) Variations of Coefficients and Equivalent Electric Components with the Rotational Angle of the Blade
The angle of attack gradually changes as the wind turbine rotor rotates. Figure 6
shows that the angle of attack varies as a function of the rotational angle of the blade; for a
tip speed ratio of 1.5, the angle of attack broadly varies between −45° and 45° during a
complete rotation of the turbine. Figure III-15, Figure III-16 and Figure III-17 show that only
parts of the various curves, that is, for angles of attack between −50° and 50° are involved in
the fluctuations of the respective coefficients and electric elements during a complete
rotation of the blade. Figure III-18 and Figure III-19 simulate the variations of the
coefficients as well as the equivalent electrical components according to the blade rotational
angle. Our obtained results are consistent with what can be found in the relevant literature in
[71].
Figure III-18 Lift and drag coefficient variations as functions of rotational angle.
0 100 200 300 400 500 600 700 800-1.5
-1
-0.5
0
0.5
1
1.5
Rotational angle in degrees
m2
C-Lift
C-Drad

110
Figure III-19 Normal and tangential coefficient variations as functions of rotational angle.
The value of the lift coefficient is almost equal to that drag coefficient, in absolute
value, during the rotation of the blade. Meanwhile, the blade’s natural resistance as it moves
through the air is nearly equivalent to the surface that opposes the blade weight by generating
drag. Indeed, although the lift coefficient values alternate from positive to negative, the drag
coefficient always remains positive.
The normal and tangential coefficients are non-linear combinations of the lift and
drag coefficients. Both are alternative values, and the normal coefficient is much more
important. The pressure of air on the surface of the blade varies widely. We can deduce that
the surface of the blade that is exposed to the wind pressure varies as the blade rotate. During
a complete tour, it is equal to zero for the rotational angles π/2 and 3π/2. The tangential
coefficient, responsible for the tangential force and thus of the power produced by the blade,
is lower and alternate between positive and negative quantities.
0 100 200 300 400 500 600 700 800-1.5
-1
-0.5
0
0.5
1
1.5
Rotational angle in degrees
m2
C-Nor
C-Tang

111
We can now plot the variations of various equivalent electrical components with the
rotational angle of the blade. The total resistance BR is obtained by algebraic addition of the
lift and drag resistances LR and DR . Similarly, the total reactance BX results from the
algebraic addition of the lift inductive admittance and drag capacitive admittance. Figure
III-20 and Figure III-21 show that the forms of the BR and BX curves follow those of NC
and TC , respectively. This finding is further evidence that the simulation results obtained using
the developed model are in agreement with those obtained using existing BEM models.
Figure III-20 Lift, drag and normal resistance variations as functions of rotational angle.
0 100 200 300 400 500 600 700 800-0.8
-0.6
-0.4
-0.2
0
0.2
0.4
0.6
0.8
Rotational angle in degrees
m2
R-Lift
R-Drad
R-Blade

112
Figure III-21 Lift, drag and normal admittance variations as functions of rotational angle.
c) Cross Validation and Comparative Analysis
Finally, to perform the cross-validation simulation, the results of the normal and
tangential forces obtained with equivalent electric model (EEM) were compared with those
obtained using DMSTM. The simulation results of the normal and tangential forces using the
EEM model and DMSTM of DTVAWTs are superimposed. The obtained results are shown
in Figure III-22 and Figure III-23.
0 100 200 300 400 500 600 700 800-0.05
0
0.05
0.1
0.15
0.2
0.25
0.3
0.35
Rotational angle in degrees
m2
X-Lift
X-Drad
X-Blade

113
Figure III-22 Cross validation of normal force variations as functions of rotational angle.
Figure III-23 Cross validation of tangential force variations as functions of rotational angle.
0 100 200 300 400 500 600 700 800-300
-200
-100
0
100
200
300
Rotational angle in degrees
m2
Fn-eem
Fn-dmstm
0 100 200 300 400 500 600 700 800-20
-15
-10
-5
0
5
10
15
20
25
30
Rotational angle in degrees
m2
Ft-eem
Ft-dmstm

114
Figures 22 and 23 show that EEM produces satisfactory results as these results are in
agreement with the results obtained in [43,92] for a single blade. Indeed, even though a slight
distortion between the EEM and DMSTM normal forces can be observed on Figure 22.
Figure 23 clearly shows that the EEM and DMSTM tangential forces strongly overlap.
3.5. CONCLUSIONS
A new approach for modeling Darrieus-type VAWT rotors using the electric-
mechanic analogy was presented. This paper provides a proof-of-concept demonstration of
the approach and attests to the feasibility of such a model through both step-by-step
demonstrations of the theoretical and practical concepts that underpin the new model and
simulations and cross validation of a single blade model. The obtained simulation results tie
in with the findings of the Paraschivoiu double-multiple streamtube model found in the
literature.
An equivalent electrical model for Darrieus-type VAWTs was proven to be viable.
We intend in our future work to finalize the model building process and address the electrical
modeling of the blades’ mechanical coupling to the shaft to generate an EEM for the full
three-blade DTVAWT rotor. A comparative study of the results of the new model and those
of existing models will then conducted.
The model that will emerge from this new approach is likely to be more appropriate
for the design, performance prediction and optimization of Darrieus rotors. Mechanical fault
diagnosis and prognosis is also an important aspect because the model could be used to
simulate the rotor’s behavior in the case of mechanical faults in one or more of the blades as

115
well as in rotor-shaft coupling elements. The model will also enable the simulation of turbine
operation in the case of mechanical faults in one or more elements of the rotor.
Although further work must be conducted to build an EEM for the entire VAWT
turbine, the findings of this study are encouraging and have practical applications for the
determination and understanding of the aerodynamic factors that influence the performance
of Darrieus-type VAWTs under different operating conditions.
In future works, the results of the EEM for DTVAWTs will be considered for
extension to other types of wind turbines, including horizontal axis and Savonious types.
Additionally, the EEM of rotors may be used to study the influence of wind flow turbulence
on turbine vibrations. Transitional (starting) and permanent sate functioning of VAWTs may
also be examined. We will also use the model to simulate the behavior of a Darrieus WT in
the case of a structural break in one or more blades. Finally, as a long-term goal, the EEM of
the rotor will be linked to existing models of other electrical and mechanical parts to obtain
a global model of a Darrieus WECS.
Acknowledgments
The authors would like to thank the Natural Science and Engineering Research
Council of Canada (NSERC) for financially supporting this research. Authors’ gratefulness
also goes to the editor and four anonymous reviewers for their valuable comments and
suggestions that appreciably improved the quality of this paper.
Author Contributions
Pierre Tchakoua is the main author of this work. This paper provides a further
elaboration on some of the results from his Ph.D. dissertation. René Wamkeue and Mohand

116
Ouhrouche supervised the project and thus supported Pierre Tchakoua’s research in terms of
both scientific and technical expertise. Tommy Andy Tameghe and Gabriel Ekemb
participated in results analysis and interpretation. The manuscript is written by Pierre
Tchakoua and revised and commented by René Wamkeue and Mohand Ouhrouche.
Conflicts of Interest
The authors declare no conflict of interest.
References
1. Scheurich, F.; Brown, R.E. Modelling the aerodynamics of vertical-axis wind turbines
in unsteady wind conditions. Wind Energy 2013, 16, 91–107.
2. Howell, R.; Qin, N.; Edwards, J.; Durrani, N. Wind tunnel and numerical study of a
small vertical axis wind turbine. Renew. Energy 2010, 35, 412–422.
3. Eriksson, S.; Bernhoff, H.; Leijon, M. Evaluation of different turbine concepts for wind
power. Renew. Sustain. Energy Rev. 2008, 12, 1419–1434.
4. Castelli, M.R.; Grandi, G.; Benini, E. Numerical analysis of the performance of the DU91-
W2-250 airfoil for straight-bladed vertical-axis wind turbine application. World Acad.
Sci. Eng. Technol. 2012, 6, 742–747.
5. Ferreira, C.S.; Bussel, G.; Kuik, G.V. 2D CFD Simulation of Dynamic Stall on a
Vertical Axis Wind Turbine: Verification and Validation with PIV Measurements. In
Proceedings of the 45th AIAA Aerospace Sciences Meeting and Exhibit, Reno, NV,
USA, 8–11 January 2007; pp. 1–11.
6. Tjiu, W.; Marnoto, T.; Mat, S.; Ruslan, M.H.; Sopian, K. Darrieus vertical axis wind
turbine for power generation I: Assessment of Darrieus VAWT configurations. Renew.
Energy 2015, 75, 50–67.
7. Tjiu, W.; Marnoto, T.; Mat, S.; Ruslan, M.H.; Sopian, K. Darrieus vertical axis wind
turbine for power generation II: Challenges in HAWT and the opportunity of multi-
megawatt Darrieus VAWT development. Renew. Energy 2015, 75, 560–571.
8. Bianchini, A.; Ferrara, G.; Ferrari, L. Design guidelines for H-Darrieus wind turbines:
Optimization of the annual energy yield. Energy Convers. Manag. 2015, 89, 690–707.

117
9. Dixon, K.R. The Near Wake Structure of a Vertical Axis Wind Turbine Including the
Development of a 3D Unsteady Free-Wake Panel Method for VAWTs. Master’s Thesis,
Delft University of Technology, Delft, The Netherlands, 2008.
10. Carrigan, T.J.; Dennis, B.H.; Han, Z.X.; Wang, B.P. Aerodynamic shape optimization
of a vertical-axis wind turbine using differential evolution. ISRN Renew. Energy 2011,
2012, 1–16.
11. Lanzafame, R.; Mauro, S.; Messina, M. 2D CFD modeling of H-Darrieus wind turbines
using a transition turbulence model. Energy Procedia 2014, 45, 131–140.
12. Tchakoua, P.; Wamkeue, R.; Tameghe, T.A.; Ekemb, G. A Review of Concepts and
Methods for Wind Turbines Condition Monitoring. In Proceedings of the 2013 World
Congress on Computer and Information Technology (WCCIT), Sousse, Tunisia, 22–24
June 2013; pp. 1–9.
13. Tchakoua, P.; Wamkeue, R.; Ouhrouche, M.; Slaoui-Hasnaoui, F.; Tameghe, T.;
Ekemb, G. Wind turbine condition monitoring: State-of-the-art review, new trends, and
future challenges. Energies 2014, 7, 2595–2630.
14. Tchakoua, P.; Wamkeue, R.; Slaoui-Hasnaoui, F.; Tameghe, T.A.; Ekemb, G. New
Trends and Future Challenges for Wind Turbines Condition Monitoring. In Proceeding
of the 2013 International Conference on Control, Automation and Information Sciences
(ICCAIS), Nha Trang, Vietnam, 25–28 November 2013; pp. 238–245.
15. Chen, Y.; Lian, Y. Numerical investigation of vortex dynamics in an H-rotor vertical
axis wind turbine. Eng. Appl. Comp. Fluid Mech. 2015, 9, 21–32.
16. Jin, X.; Zhao, G.; Gao, K.; Ju, W. Darrieus vertical axis wind turbine: Basic research
methods. Renew. Sustain. Energy Rev. 2015, 42, 212–225.
17. Paraschivoiu, I. Double-multiple streamtube model for Darrieus in turbines. Wind
Turbine Dyn. 1981, 1, 19–25.
18. Mohamed, M.H. Performance investigation of H-rotor Darrieus turbine with new airfoil
shapes. Energy 2012, 47, 522–530.
19. Masson, C.; Leclerc, C.; Paraschivoiu, I. Appropriate dynamic-stall models for
performance predictions of VAWTs with NLF blades. Int. J. Rotat. Mach. 1998, 4, 129–
139.

118
20. Dyachuk, E.; Goude, A. Simulating dynamic stall effects for vertical Axis wind turbines
applying a double multiple Streamtube model. Energies 2015, 8, 1353–1372.
21. Dai, Y.M.; Gardiner, N.; Sutton, R.; Dyson, P.K. Hydrodynamic analysis models for the
design of Darrieus-type vertical-axis marine current turbines. Proc. Inst. Mech. Eng. M J.
Eng. Marit. Environ. 2011, 225, 295–307.
22. Hall, T.J. Numerical Simulation of a Cross Flow Marine Hydrokinetic Turbine. Ph.D.
Thesis, University of Washington, Seattle, WA, USA, 2012.
23. Islam, M.; Ting, D.S.K.; Fartaj, A. Aerodynamic models for Darrieus-type straight-
bladed vertical axis wind turbines. Renew. Sustain. Energy Rev. 2008, 12, 1087–1109.
24. Beri, H.; Yao, Y. Double multiple Streamtube model and numerical analysis of
vertical axis wind turbine. Energy Power Eng. 2011, 3, 262–270.
25. Zhang, L.X.; Liang, Y.B.; Liu, X.H.; Jiao, Q.F.; Guo, J. Aerodynamic performance
prediction of straight-bladed vertical axis wind turbine based on CFD. Adv. Mech.
Eng. 2015, 5, doi:10.1155/2013/905379.
26. Bhutta, M.M.A.; Hayat, N.; Farooq, A.U.; Ali, Z.; Jamil, S.R.; Hussain, Z. Vertical axis
wind turbine—A review of various configurations and design techniques. Renew.
Sustain. Energy Rev. 2012, 16, 1926–1939.
27. Edwards, J. The Influence of Aerodynamic Stall on the Performance of Vertical Axis Wind
Turbines. Ph.D. Thesis, University of Sheffield, Sheffield, UK, 2012.
28. Alaimo, A.; Esposito, A.; Messineo, A.; Orlando, C.; Tumino, D. 3D CFD analysis of a
vertical axis wind turbine. Energies 2015, 8, 3013–3033.
29. Verkinderen, E.; Imam, B. A simplified dynamic model for mast design of H-Darrieus
vertical axis wind turbines (VAWTs). Eng. Struct. 2015, 100, 564–576.
30. Chowdhury, A.M.; Akimoto, H.; Hara, Y. Comparative CFD analysis of vertical axis
wind turbine in upright and tilted configuration. Renew. Energy 2016, 85, 327–337.
31. Tilmans, H.A.C. Equivalent circuit representation of electromechanical transducers: I.
Lumped-parameter systems. J. Micromech. Microeng. 1996, 6, 157–176.
32. Mason, W. An electromechanical representation of a piezoelectric crystal used as a
transducer. Proc. Inst. Radio Eng. 1935, 23, 1252–1263.
33. Tilmans, H.A.C. Equivalent circuit representation of electromechanical transducers: II.
Distributed-parameter systems. J. Micromech. Microeng. 1997, 7, 285–309.

119
34. Barakati, S.M. Modeling and Controller Design of a Wind Energy Conversion System
Including a Matrix Converter. Ph.D. Thesis, University of Waterloo, Waterloo, ON,
Canada, 2008.
35. Kim, H.; Kim, S.; Ko, H. Modeling and control of PMSG-based variable-speed wind
turbine. Electr. Power Syst. Res. 2010, 80, 46–52.
36. Borowy, B.S.; Salameh, Z.M. Dynamic response of a stand-alone wind energy
conversion system with battery energy storage to a wind gust. IEEE Trans. Energy
Conver. 1997, 12, 73–78.
37. Delarue, P.; Bouscayrol, A.; Tounzi, A.; Guillaud, X.; Lancigu, G. Modelling, control
and simulation of an overall wind energy conversion system. Renew. Energy 2003, 28,
1169–1185.
38. Slootweg, J.G.; de Haan, S.W.H.; Polinder, H.; Kling, W.L. General model for
representing variable speed wind turbines in power system dynamics simulations. IEEE
Trans. Power Syst. 2003, 18, 144–151.
39. Junyent-Ferré, A.; Gomis-Bellmunt, O.; Sumper, A.; Sala, M.; Mata, M. Modeling and
control of the doubly fed induction generator wind turbine. Simul. Model. Pract. Theory
2010, 18, 1365–1381.
40. Bolik, S.M. Modelling and Analysis of Variable Speed Wind Turbines with Induction
Generator during Grid Fault. Ph.D. Thesis, Aalborg University: Aalborg, Danmark,
2004.
41. Perdana, A. Dynamic Models of Wind Turbines; Chalmers University of Technology:
Göteborg, Sweden, 2008.
42. Scheurich, F.; Fletcher, T.M.; Brown, R.E. Simulating the aerodynamic performance
and wake dynamics of a vertical-axis wind turbine. Wind Energy 2011, 14, 159–177.
43. Paraschivoiu, I. Wind Turbine Design: With Emphasis on Darrieus Concept;
Polytechnic International Press: Montréal, QC, Canada, 2002.
44. Claessens, M. The Design and Testing of Airfoils for Application in Small Vertical Axis
Wind Turbines. Master’s Thesis, Delft University of Technology, Delft, The
Netherlands, 2006.
45. Ajedegba, J.O.; Naterer, G.; Rosen, M.; Tsang, E. Effects of Blade Configurations on
Flow Distribution and Power Output of a Zephyr Vertical Axis Wind Turbine. In

120
Proceedings of the 3rd IASME/WSEAS International Conference on Energy &
Environment, Stevens Point, WI, USA, 23 February 2008; pp. 480–486.
46. Camporeale, S.M.; Magi, V. Streamtube model for analysis of vertical axis variable
pitch turbine for marine currents energy conversion. Energy Convers. Manag. 2000, 41,
1811–1827.
47. Scheurich, F. Modelling the Aerodynamics of Vertical-Axis Wind Turbines. Ph.D.
Thesis, University of Glasgow, Glasgow, UK, 2011.
48. Chandramouli, S.; Premsai, T.; Prithviraj, P.; Mugundhan, V.; Velamati, R.K.
Numerical analysis of effect of pitch angle on a small scale vertical axis wind turbine.
Int. J. Renew. Energy Res. 2014, 4, 929–935.
49. Lewis, J.W. Modeling Engineering Systems: PC-Based Techniques and Design Tools;
LLH Technology Publishing: Eagle Rock, VA, USA, 1994.
50. Hogan, N.; Breedveld, P. The physical basis of analogies in network models of physical
system dynamics. Simul. Ser. 1999, 31, 96–104.
51. Firestone, F.A. A new analogy between mechanical and electrical systems. J. Acoust.
Soc. Am. 1933, 4, 249–267.
52. Olson, H.F. Dynamical Analogies; D. Van Nostrand Company, Inc.: Princeton, NJ,
USA, 1959.
53. Firestone, F.A. The mobility method of computing the vibration of linear mechanical
and acoustical systems: Mechanical-electrical analogies. J. Appl. Phys. 1938, 9, 373–
387.
54. Calvo, J.A.; Alvarez-Caldas, C.; San, J.L. Analysis of Dynamic Systems Using Bond.
Graph. Method through SIMULINK; INTECH Open Access Publisher: Rijeka, Croatia,
2011.
55. Bishop, R.H. Mechatronics: An Introduction; CRC Press: Boca Raton, FL, USA, 2005.
56. Van Gilder, J.W.; Schmidt, R.R. Airflow Uniformity through Perforated Tiles in a
Raised-Floor Data Center. In Proceedings of the ASME 2005 Pacific Rim Technical
Conference and Exhibition on Integration and Packaging of MEMS, NEMS, and
Electronic Systems collocated with the ASME 2005 Heat Transfer Summer Conference,
San Francisco, CA, USA, 17–22 July 2005; pp. 493–501.

121
57. Pugh, L.G.C.E. The influence of wind resistance in running and walking and the
mechanical efficiency of work against horizontal or vertical forces. J. Physiol. 1971,
213, 255–276.
58. Herrmann, F.; Schmid, G.B. Analogy between mechanics and electricity. Eur. J. Phys.
1985, 6, 16–21.
59. Aynsley, R.M. A resistance approach to analysis of natural ventilation airflow networks.
J. Wind Eng. Ind. Aerodyn. 1997, 67, 711–719.
60. Deglaire, P. Analytical Aerodynamic Simulation Tools for Vertical Axis Wind
Turbines. Ph.D. Thesis, Acta Universitatis Upsaliensis, Uppsala, Sweden, 2010.
61. Goude, A. Fluid Mechanics of Vertical Axis Turbines: Simulations and Model
Development. Ph.D. Thesis, Uppsala University, Uppsala, Sweden, 2012.
62. Dyachuk, E.; Goude, A.; Bernhoff, H. Dynamic stall modeling for the conditions of
vertical Axis wind turbines. AIAA J. 2014, 52, 72–81.
63. Wilson, R.E.; Walker, S.N.; Lissaman, P.B.S. Aerodynamics of the Darrieus rotor. J.
Aircr. 1976, 13, 1023–1024.
64. Goude, A.; Lundin, S.; Leijon, M. A Parameter Study of the Influence of Struts on the
Performance of a Vertical-Axis Marine Current Turbine. In Proceedings of the 8th
European Wave and Tidal Energy Conference (EWTEC09), Uppsala, Sweden, 7–10
September 2009; pp. 477–483.
65. Wekesa, D.W.; Wang, C.; Wei, Y.; Danao, A.M. Influence of operating conditions on
unsteady wind performance of vertical axis wind turbines operating within a fluctuating
free-stream: A numerical study. J. Wind Eng. Ind. Aerodyn. 2014, 135, 76–89.
66. Shires, A. Development and evaluation of an aerodynamic model for a novel vertical
axis wind turbine concept. Energies 2013, 6, 2501–2520.
67. Antheaume, S.; Maître, T.; Achard, J. Hydraulic Darrieus turbines efficiency for free
fluid flow conditions versus power farms conditions. Renew. Energy 2008, 33, 2186–
2198.
68. Butbul, J.; MacPhee, D.; Beyene, A. The impact of inertial forces on morphing wind
turbine blade in vertical axis configuration. Energy Convers. Manag. 2015, 91, 54–62.
69. Jamati, F. Étude Numérique d’une Éolienne Hybride Asynchrone. Ph.D. Thesis,
Polytechnique Montréal, Montréal, QC, Canada, 2011.

122
70. Batista, N.C.; Melìcio, R.; Matias, J.C.O.; Catalao, J.P.S. Self-Start Performance
Evaluation in Darrieus-Type Vertical Axis Wind Turbines: Methodology and
Computational Tool Applied to Symmetrical Airfoils. In Proceedings of the
International Conference on Renewable Energies and Power Quality (ICREPQ’11), Las
Palmas de Gran Canaria, Spain, 13–15 April 2011.
71. Patel, M.V.; Chaudhari, M.H. Performance Prediction of H-Type Darrieus Turbine by
Single Stream Tube Model for Hydro Dynamic Application. Int. J. Eng. Res. Technol.
2013, 2.
72. Abbott, I.H.; Von Doenhoff, A.E. Theory of Wing Sections, Including a Summary of
Airfoil Data; Courier Corporation: North Chelmsford, MA, USA, 1959.
73. Evans, J.; Nahon, M. Dynamics modeling and performance evaluation of an autonomous
underwater vehicle. Ocean Eng. 2004, 31, 1835–1858.
74. Wu, J.; Lu, X.; Denny, A.G.; Fan, M.; Wu, J. Post-stall flow control on an airfoil by
local unsteady forcing. J. Fluid Mech. 1998, 371, 21–58.
75. Castelli, M.R.; Fedrigo, A.; Benini, E. Effect of dynamic stall, finite aspect ratio and
streamtube expansion on VAWT performance prediction using the BE-M model. Int. J.
Eng. Phys. Sci. 2012, 6, 237–249.
76. Tala, H.; Patel, H.; Sapra, R.R.; Gharte, J.R. Simulations of small scale straight blade
Darrieus wind turbine using latest CAE techniques to get optimum power output. Int. J.
Adv. Found. Res. Sci. Eng. 2014, 1, 37–53.
77. Hartman, H.L.; Mutmansky, J.M.; Ramani, R.V.; Wang, Y. Mine Ventilation and Air
Conditioning; John Wiley & Sons: San Francisco, CA, USA, 2012.
78. Aynsley, R. Indoor wind speed coefficients for estimating summer comfort. Int. J. Vent.
2006, 5, 3–12.
79. McPherson, M.J. Ventilation network analysis. In Subsurface Ventilation and
Environmental Engineering; Springer: Amsterdam, The Netherlands, 1993; pp. 209–
240.
80. Acuña, E.I.; Lowndes, I.S. A review of primary mine ventilation system optimization.
Interfaces 2014, 44, 163–175.

123
81. Sheldon, J.C.; Burrows, F.M. The dispersal effectiveness of the achene—Pappus units
of selected Compositae in steady winds with convection. New Phytol. 1973, 72, 665–
675.
82. Toussaint, H.M.; de Groot, G.; Savelberg, H.H.; Vervoorn, K.; Hollander, A.P.;
van Ingen Schenau, G.J. Active drag related to velocity in male and female swimmers.
J. Biomech. 1988, 21, 435–438.
83. Cresswell, L.G. The relation of oxygen intake and speed in competition cycling and
comparative observations on the bicycle ergometer. J. Physiol. 1974, 241, 795–808.
84. Martin, J.C.; Milliken, D.L.; Cobb, J.E.; McFadden, K.L.; Coggan, A.R. Validation of
a mathematical model for road cycling power. J. Appl. Biomech. 1998, 14, 276–291.
85. Kiyoto, H.; Tosha, K. Effect of Peened Surface Characteristics on Flow Resistance. In
Proceedings of the 10th International Conference on Shot Peening, Tokyo, Japan, 15–18
September 2008; pp. 535–540.
86. Crawford, C. Advanced Engineering Models for Wind Turbines with Application to the
Design of a Coning Rotor Concept. Ph.D. Thesis, University of Cambridge, Cambridge,
UK, 2007.
87. Mohammadi-Amin, M.; Ghadiri, B.; Abdalla, M.M.; Haddadpour, H.; de Breuker,
R. Continuous-time state-space unsteady aerodynamic modeling based on boundary
element method. Eng. Anal. Bound. Elem. 2012, 36, 789–798.
88. Sheldahl, R.E.; Klimas, P.C. Aerodynamic Characteristics of Seven Symmetrical Airfoil
Sections through 180-Degree Angle of attack for Use in Aerodynamic Analysis of
Vertical Axis Wind Turbines; Technical Report for Sandia National Laboratories:
Albuquerque, NM, USA, 1981.
89. Critzos, C.C.; Heyson, H.H.; Boswinkle, R.W. Aerodynamic Characteristics of NACA
0012 Airfoil Section at Angles of Attack from 0 Degree to 180 Degree; Technical Report
for National Advisory Committee for Aeronautics, Langley Aeronautical Lab: Langley
Field, VA, USA, 1955.
90. Miley, S.J. A Catalog of Low Reynolds Number Airfoil Data for Wind Turbine
Applications; Technical Rockwell International Corp: Golden, CO, USA, 1982.

124
91. Timmer, W.A. Aerodynamic Characteristics of Wind Turbine Blade Airfoils at High
Angles-of-Attack. In Proceedings of the 3rd EWEA Conference-Torque 2010: The
Science of making Torque from Wind, Heraklion, Greece, 28–30 June 2010.
92. Rathi, D. Performance Prediction and Dynamic Model Analysis of Vertical Axis Wind
Turbine Blades with Aerodynamically Varied Blade Pitch. Master’s Thesis, NC State
University, Raleigh, NC, USA, 2012.
© 2015 by the authors; licensee MDPI, Basel, Switzerland. This article is an open access
article distributed under the terms and conditions of the Creative Commons Attribution
license (http://creativecommons.org/licenses/by/4.0/).

125
Chapter IV
ELECTRIC CIRCUIT MODEL FOR THE
AERODYNAMIC PERFORMANCE ANALYSIS
OF A THREE-BLADE DARRIEUS-TYPE
VERTICAL AXIS WIND TURBINE
Article published in Energies, Octobre 2016
doi: 10.3390/en9100820

126
Electric Circuit Model for the Aerodynamic Performance
Analysis of a Three-Blade Darrieus-Type Vertical Axis
Wind Turbine: The Tchakoua Model
Pierre Tchakoua, René Wamkeue, Mohand Ouhrouche, Ernesto Benini and Gabriel Ekemb
Résumé
L'aérodynamique complexe et instable des éoliennes à axe vertical pose d’importants
défis aux outils de simulation. D’importants efforts de recherche ont récemment porté sur le
développement de nouvelles méthodes d'analyse et d'optimisation de la performance
aérodynamique des éoliennes a axe vertical. Cet article présente un modèle à base de circuit
électrique pour les rotors d'éoliennes à axe vertical de type Darrieus. Le nouveau modèle
baptisé ‘Tchakoua model’ est basé sur la description mécanique donnée par le modèle à
double disque et multiples tubes de vent de Paraschivoiu et utilise l’analogie mécanique
électrique. Des simulations du modèle ont été effectuées avec MATLAB pour une
architecture de rotor à trois pales, caractérisée par un profil NACA0012, un nombre moyen
de Reynolds de 40 000 pour la pale et une vitesse spécifique de 5. Les résultats obtenus
montrent une forte concordance à la fois avec les simulations de modèles aérodynamiques et
ceux de modèles de dynamique des fluides issues de la littérature.

127
Abstract
The complex and unsteady aerodynamics of vertical axis wind turbines (VAWTs)
pose significant challenges for simulation tools. Recently, significant research efforts have
focused on the development of new methods for analysing and optimising the aerodynamic
performance of VAWTs. This paper presents an electric circuit model for Darrieus-type
vertical axis wind turbine (DT-VAWT) rotors. The novel Tchakoua model is based on the
mechanical description given by the Paraschivoiu double-multiple streamtube model using a
mechanical-electrical analogy. Model simulations were conducted using MATLAB for a
three-bladed rotor architecture, characterized by a NACA0012 profile, an average Reynolds
number of 40,000 for the blade and a tip speed ratio of 5. The results obtained show strong
agreement with findings from both aerodynamic and computational fluid dynamics (CFD)
models in the literature.

128
4.1 INTRODUCTION
Darrieus-type vertical axis wind turbines (DT-VAWTs) are nonlinear systems that
operate in turbulent environments. Therefore, it is difficult to accurately characterize their
aerodynamic rotor behaviour across a wide range of operating conditions using physically
meaningful models. Commonly used models are either derived from wind turbine data and
are presented in a “black box” format or are computationally expensive. Indeed, most of these
models lack both conciseness and intelligibility and are therefore prohibitive for the routine
engineering analyses of the local interaction mechanisms of wind turbines. Furthermore,
none of the models with high reliability and accuracy can be efficiently coupled with models
of the other mechanical and electrical parts of the wind turbine to form a global model for
the wind energy conversion system (WECS).
Models are of central importance in many scientific contexts and are one of the
principal instruments of modern science. Scientists spend considerable time building, testing,
comparing and revising models, and many scientific publications are dedicated to
introducing, applying and interpreting these valuable tools. The use of electrical circuit
elements to model physical devices and systems has a long and successful history.
Additionally, understanding analogies and constructing an analogue model for a given
system allows the system to be studied in an environment other than that for which it is
intended [1–3], thereby facilitating the study of specific system phenomena. Moreover, a
model based on electrical components is accessible and quickly understood by researchers
from almost all engineering fields. This wide understanding is of great importance because
research and development in the wind turbine industry requires competencies from several
different fields of engineering. Furthermore, the equivalent electrical model can take
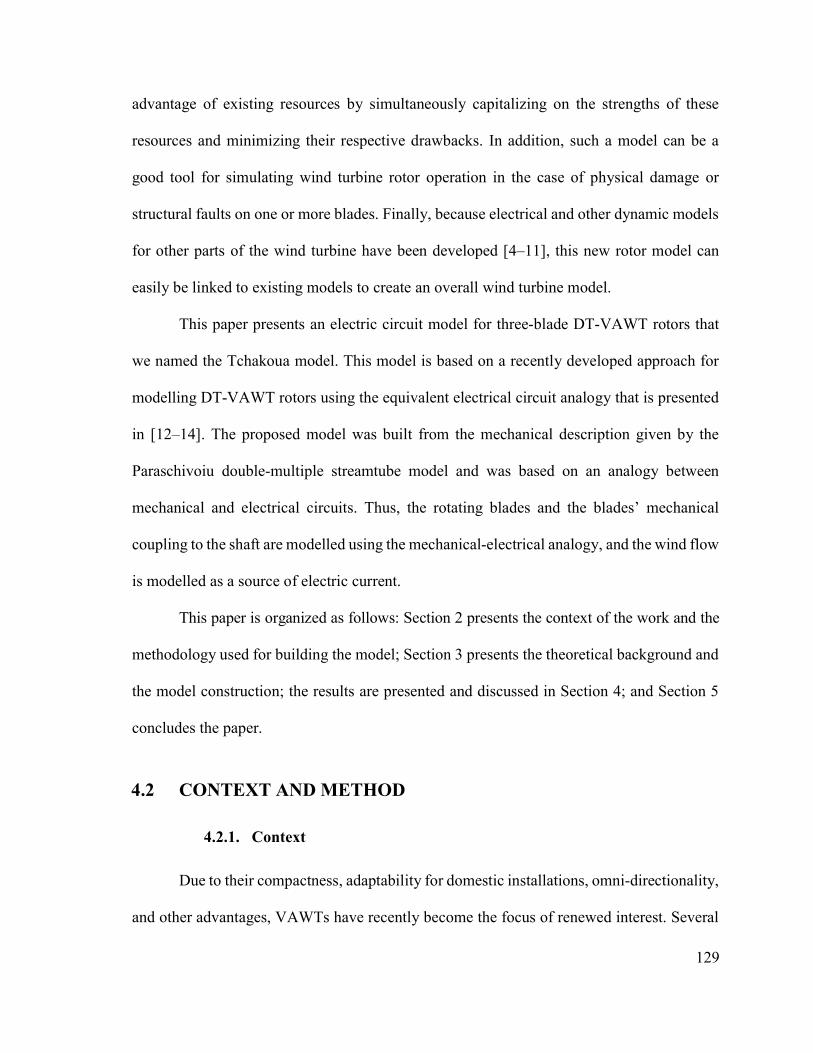
129
advantage of existing resources by simultaneously capitalizing on the strengths of these
resources and minimizing their respective drawbacks. In addition, such a model can be a
good tool for simulating wind turbine rotor operation in the case of physical damage or
structural faults on one or more blades. Finally, because electrical and other dynamic models
for other parts of the wind turbine have been developed [4–11], this new rotor model can
easily be linked to existing models to create an overall wind turbine model.
This paper presents an electric circuit model for three-blade DT-VAWT rotors that
we named the Tchakoua model. This model is based on a recently developed approach for
modelling DT-VAWT rotors using the equivalent electrical circuit analogy that is presented
in [12–14]. The proposed model was built from the mechanical description given by the
Paraschivoiu double-multiple streamtube model and was based on an analogy between
mechanical and electrical circuits. Thus, the rotating blades and the blades’ mechanical
coupling to the shaft are modelled using the mechanical-electrical analogy, and the wind flow
is modelled as a source of electric current.
This paper is organized as follows: Section 2 presents the context of the work and the
methodology used for building the model; Section 3 presents the theoretical background and
the model construction; the results are presented and discussed in Section 4; and Section 5
concludes the paper.
4.2 CONTEXT AND METHOD
4.2.1. Context
Due to their compactness, adaptability for domestic installations, omni-directionality,
and other advantages, VAWTs have recently become the focus of renewed interest. Several

130
universities and research institutions have conducted extensive research and developed
numerous designs based on aerodynamic computational models [15–17]. For example, the
on-going studies at the University of Québec at Abiti-Témiscamingue could construct a new
model that is more appropriate for the design and further conceptual analysis focusing on
operational optimization, condition monitoring, and fault prediction and detection of DT-
VAWT rotors. Figure IV-1 shows the “Cap d’Ours” three-blade VAWT that serves as a
teaching and research tool at the University of Québec at Abitibi-Témiscamingue.
Figure IV-1 “Cap d’Ours”, a curved, three-blade, Darrieus-type VAWT.
Several advances have been made in the understanding and modelling of wind turbine
aerodynamics. Various models for VAWT aerodynamic simulation can be found in the
literature. These models can be broadly classified into four categories: momentum models,
vortex models, cascade models and computational fluid dynamic (CFD) models. A literature
survey on the most used models was conducted in [12,14]. Aerodynamics are still unable to

131
meet the demands of various applications, although the streamtube and vortex models have
seen significant improvements. However, as with all knowledge, our understanding of
aerodynamics is not absolute and can be viewed as tentative, approximate, and always subject
to revision. For instance, CFD solutions remain very computationally expensive and are
prohibitive for routine engineering analyses of the local interaction mechanisms of wind
turbines. Furthermore, none of the models with high reliability and accuracy can be
efficiently coupled with the models of the other mechanical and electrical parts of the wind
turbine to create a global model for the wind energy conversion system (WECS).
To overcome these problems, this paper presents a DT-VAWT model that is built
using electric components. The Tchakoua model is a circuit-based model that is
advantageous because it allows an electrical engineer to visualize and understand the working
principles and the aerodynamics underlying the VAWT rotor functions and behaviour in a
connected circuit better than a black box or a complex equation. Indeed, wind energy is a
multidisciplinary domain with increasing research in the field of electrical engineering.
Furthermore, the Tchakoua model could be linked to existing electric models of other
mechanical and electrical parts of a wind turbine to form a global model for the WECS. Such
a global circuit-based model for WECS will help users to understand the effects of various
parameters on the aerodynamic blade forces and the effects of rotor structural faults on the
overall WECS performance. According to [18–20], this model will contribute to constructing
a global model that can be used to develop or improve the overall condition monitoring
technique for WECS. Overall WTCM approaches include performance monitoring, power
curve analysis, electrical signature, and supervisory control and data acquisition (SCADA)
system data analysis. Compared to subsystem condition monitoring techniques, global

132
system condition monitoring techniques are nonintrusive, low cost and reliable; global
monitoring techniques can be used in online monitoring to reduce downtime and OM costs
[21–23]. Finally, the new model is very versatile and may therefore permit the study of
various effects and phenomena, including dynamic stall effects, flow curvature effects,
pitching circulation, added mass effects, interference among blades, and vibration effects.
4.2.2. Method: The Mechanical-Electrical Analogy Approach
Analogies are of greatest use in electromechanical systems when there is a connection
between mechanical and electrical parts, especially when the system includes transducers
between different energy domains, such as WECS.
Mechanical-electrical analogies are used to represent the function of a mechanical
system as an equivalent electrical system by drawing analogies between mechanical and
electrical parameters. The main value of analogies lies in the way in which mathematics
unifies these diverse fields of engineering into one subject. Tools previously developed for
solving problems in one field can be used to solve problems in another field. This is an
important concept because some fields, particularly electrical engineering, have developed
rich sets of problem-solving tools that are fully applicable to other engineering fields [24];
for example, there are simple and straightforward analogies between electrical and
mechanical systems. Furthermore, analogies between mechanical systems and electrical or
fluid systems are effective and commonly used.
Two valid techniques for modelling mechanical systems with electrical systems or
for drawing analogies between the two types of systems can be found in the literature, and
each method has its own advantages and disadvantages [25–28]. The first technique is
intuitive; in this technique, current corresponds to velocity (both consist of motion), and

133
voltage corresponds to force (both provide a “push”). The second technique is the
through/across analogy that uses voltage as an analogy for velocity and current as an analogy
for force. The two schools of thought for modelling mechanical systems with electrical
systems are presented in Table 1. Although both are valid, the through/across analogy results
in a counterintuitive definition of impedance [24,29,30]. The universally applied analogy for
impedance is that from the intuitive analogy listed in the corresponding section of Table IV-1.
Therefore, the intuitive analogy is used in the present study.

134
Table IV-1 System analogy used for developing the new model.
Topology-Preserving Set (Book’s Analogy)
Intuitive Analogy Set
⟸⟹
Intuitive Stretch
⟸⟹
Topology Change
Description Trans Mech Rot Mech Electrical Thermal Fluid Trans Mech Rot Mech Description
“Through”
variable 𝑓 (force) 𝜏 (torque) 𝑖 (current)
𝜙 (heat
flux) q (flow) 𝑣 (velocity)
ω (angular
velocity) Motion
“Across”
variable 𝑣 (velocity)
ω (angular
velocity) ν (voltage) T, θ p (pressure) 𝑓 (force) 𝜏 (torque) Push (force)
Dissipative
element 𝑣 =
𝟏
𝑩 𝑓 ω =
𝟏
𝑩𝒓𝜏 𝑣 = 𝑖𝑹 𝜃 = 𝜙𝑹 𝑝 = 𝑞𝑹 𝑓 = 𝑣𝑩 𝜏 = ω𝑩𝒓
Dissipative
element
Dissipation 𝑓𝟏
𝑩=
𝑣
𝟏/𝑩 𝜏
𝟏
𝑩=
ω
𝟏/𝑩 𝑖 𝑹 = 𝑣 /𝑹 N/A
𝑞 𝑹
= 𝑝 /𝑹
𝑣 𝑹
= 𝑓 /𝑹
𝜔 𝑩𝒓
= 𝜏 /𝑩𝒓 Dissipation
Through-
variable
storage
element
𝑣 =𝟏
𝑲 or
∫ 𝑣𝑑𝑡 =𝟏
𝑲𝑓
ω =𝟏
𝑲𝒓 or
∫ 𝜔𝑑𝑡 =𝟏
𝑲𝒓𝜏
𝑣 = 𝑳𝑑𝑖
𝑑𝑡 N/A 𝑝 = 𝑰
𝑑𝑞
𝑑𝑡
𝑓 = 𝑴
(one end
must be
“grounded”)
𝜏 = 𝑱
(one end
must be
“grounded”)
Motion
storage
element

135
Energy 𝐸 = 𝟏
𝑲𝑓 𝐸 =
𝟏
𝑲𝒓𝜏 𝐸 = ½𝑳𝑖 𝐸 = ½𝑰𝑞 𝐸 = ½𝑴𝑣 𝐸 = ½𝑱ω Energy
Impedance Standard definition is shown to the
right 𝑉(𝑠) = 𝐼(𝑠)𝑳𝒔
𝑃(𝑠)
= 𝑄(𝑠)𝑰𝒔
𝐹(𝑠)
= 𝑉(𝑠)𝑴𝒔
𝑇(𝑠)
= Ω(𝑠)𝑱𝒔 Impedance
Across-
variable
storage
element
𝑓 = 𝑴 (one
end must be
“grounded”)
𝜏 = 𝑱𝑑𝜔
𝑑𝑡 𝑖 = 𝑪
𝑑𝑣
𝑑𝑡
ϕ = 𝑪
(one end
must be
“grounded”)
𝑞 =
𝑪 (one
end is
usually
“grounded”)
𝑣 =𝟏
𝑲 or
∫ 𝑣𝑑𝑡 =𝟏
𝑲𝑓
ω =𝟏
𝑲𝒓
or ∫ ω𝑑𝑡 =
𝟏
𝑲𝒓𝜏
Push (force)
storage
element
Energy 𝐸 = ½𝑴𝑣 𝐸 = ½𝑱ω 𝐸 = ½𝑪𝑣
𝐸 = 𝑪𝑇
(not
analogous)
𝐸 = ½𝑪𝑝 𝐸 = 𝟏
𝑲𝑓 𝐸 =
𝟏
𝑲𝒓𝜏 Energy
Impedance
The standard definition of mechanical
impedance is the one on the right,
based on the intuitive analogy
𝑉(𝑠)
= 𝐼(𝑠)𝟏
𝒔𝑪
Θ(𝑠)
= Φ(𝑠)𝟏
𝒔𝑪
𝑃(𝑠)
= 𝑄(𝑠)𝟏
𝒔𝑪
𝐹(𝑠)
= 𝑉(𝑠)𝑲
𝒔
𝑇(𝑠)
= Ω(𝑠)𝑲𝒓
𝒔
Impedance

136
4.3 MODEL CONSTRUCTION
Theoretical Background
DT-VAWTs are lift-based machines, i.e., their driving torque is mainly generated
by the lift force, and they consist of two or more aerofoil-shaped blades attached to a rotating
vertical shaft. The interaction between the wind and the rotating blades creates a system of
lift and drag forces over the blades themselves. The instantaneous resultant of these forces is
dominated by the lift effect that is responsible for the aerodynamically generated mechanical
torque. If we consider a Darrieus-type VAWT, as shown in Figure IV-2, the aerofoil blade is
characterized by the height 2H, the rotor radius R, the number of blades Nb = 3 and the blade
chord c. For a given point on any of the blades, r and z are the local radius and height,
respectively. When the rotor is subject to an instantaneous incoming wind speed W0(t), it
turns at a rotational speed ω(t).
Figure IV-2 Schematic of a curved, three-blade DT-VAWT.
Figure IV-3 shows the aerodynamic forces and the three velocity vectors acting on
DT-VAWT blade elements at a random position [31,32]. FL and FD are the lift and drag force,

137
respectively. As the blade rotates, the local angle of attack α varies with the relative velocity
Wr. The incoming wind speed W0 and the rotational velocity of the blade ω govern the
orientation and magnitude of Wr [33,34]. In turn, the forces FL and FD acting on the blade
vary. The magnitude and orientation of the lift and drag forces vary along with the resultant
force. The resultant force can be decomposed into a normal force FN and a tangential force
FT. The tangential force component drives the rotation of the wind turbine and produces the
torque necessary to generate electricity [35].
Figure IV-3 Velocity and force components for a DT-VAWT.
A new approach for modelling DT-VAWT rotors using the electric-mechanic analogy
was presented in [12–14]. These works provide a proof-of-concept demonstration of the
approach and verify the feasibility of such a model through step-by-step demonstrations of
the theoretical and practical concepts that underpin the new model as well as simulations and
cross-validation of a single-blade model.
Wind Flow as a Current Source
As stated in [12,14], an analogy can be made between the wind flow in a streamtube
and an electric current. If the incident wind flow is assumed to be an electric current, then

138
the wind’s relative dynamic pressure flow can be defined as 21
2 rbq W (where q is given in
𝑁/𝑚 and the fluid density ρ is given in kg/m3), which is the energy of the wind due to its
velocity, that can be considered an electric energy source. Thus, the instantaneous expression
of the current source that represents the relative wind seen by the blade is as follows:
sin 2 for / 2 / 2( )
sin 2 for 3 / 2 / 2
u
w d
ti t
t
(1)
where 2
2 220
0
1sin cos cos
2 b b
RW
W
and 1 cos costan
sinb
i b
.
is the modulus of the current flow that varies with the rotational angle of the blade.
For the Double-multiple multi-streamtube model shown in Figure IV-4, the modulus of the
corresponding current in the downwind disk is slightly lower than that in the upwind disk,
that is ( d u ).
Figure IV-4 Double-multiple multi-streamtube model.

139
As described in [12,14], the airflow in a streamtube can be compared to wind flow on
a thin flat disc that is parallel to the airstream. In such conditions, the resistance to the airflow
due to air friction on both sides of the plate is minimal, and the wind driving pressure
difference from one point of the streamtube to another is approximately zero. Thus, the
resistance to wind flow is zero, meaning that the electric resistance parallel to the current
source tends to infinity such that the total current produced by the current generator flows in
the blade. The improved equivalent electric model for wind flow in a double-multiple multi-
streamtube model is shown in Figure IV-5.
Figure IV-5 Electric circuit model for wind flow.
Electric Circuit Model for a Single Blade
The aerodynamic force coefficients acting on a cross-sectional blade element of a
Darrieus wind turbine are shown in Figure IV-6. The directions of the lift and drag
coefficients as well as their normal and tangential components are illustrated in this figure.
The effort variable is voltage, while the flow variable is electrical current. The ratio of voltage
to current is the electrical resistance (Ohm’s law). The ratio of the effort variable to the flow
variable in other domains is also described as resistance. Oscillating voltages and currents
with a phase difference between them provide the concept of electrical impedance.
Impedance can be considered an extension to the concept of resistance: resistance is

140
associated with energy dissipation, while impedance encompasses both energy storage and
energy dissipation.
Figure IV-6 Aerodynamic coefficients acting on a Darrieus wind turbine blade element [36].
We consider a complex coordinate system as shown in Figure 6, where the vertical
axis is assumed to be real and the horizontal axis is assumed to be imaginary. Then, the lift
and drag coefficients can be written as follows:
sincos
cos
cossin
cos
L LL
DD D
C jCC
C C jC
(2)
The total impedance for a blade element is obtained by adding the elementary lift and
drag impedances. We can then write:
B B B N TZ R jX Z jZ (3)
where

141
N B L D
B L DT
Z R R R
X X XZ
(4)
and
L1
LD
1D
LL
1D
D1
cosφ
sin φ
sin φ
cosη
cosφ
cosη
n
i i i ii
n
i i i ii
ni
i i ii i
ni
i i ii i
c z C
Rc z C
R
Xc z C
X
c z C
(5)
where LiR and LiX are the resistive and inductive components of the lift impedance,
respectively, while DiR and DiX are the resistive and inductive components of the
elementary drag impedance, respectively. Because LiC varies with the angle of attack α, LiR
and LiX correspond to a variable resistor ( L αi iR f ) and a variable inductor (
L αi iX f ), respectively. Similarly, because DiC varies with the angle of attack α, DiR and
DiX correspond to a variable resistor ( D αi iR f ) and a variable capacitor ( D αi iX f ),
respectively.
Figure IV-7 shows the enhanced equivalent electric model of a single blade. The
normal and tangential voltages produced by the blade can be expressed as follows:
0 B
N wN B
π /2BT wT B
2αe
2α, 2α π2αe
2
i
i
RZ IV R
XZ IV X
(6)

142
Figure IV-7 Electric circuit model for a single blade.
The variation of the lift, drag and normal resistances as well as those of the lift, drag
and tangential reactances are shown in Figure IV-8 and Figure IV-9, respectively [14]. These
resistances and reactances are obtained considering a blade element; therefore, they are given
per unit of blade height.
Figure IV-8 Lift, drag and normal resistance variations as functions of the angle of attack.
-180 -135 -90 -45 0 45 90 135 180-1
-0.8
-0.6
-0.4
-0.2
0
0.2
0.4
0.6
0.8
1
Angle of attack in degrees
RL,
RD
and
RB
in m
2
R-Lift
R-DragR-Blade

143
Figure IV-9 Lift, drag and tangential reactance variations as functions of the angle of attack.
Following the laws of electrical circuit analysis, the branch with WR can be
assumed to be an open circuit, and the total voltage across a blade can be obtained from the
algebraic sum of the lift and drag voltages. We can then write:
B w B w N T N TV I Z I Z jZ V V (7)
When the blade is turning, the elementary work (or elementary amount of mechanical
energy) is produced when an elementary force is exerted on an elementary linear distance
rd covered by the blade. Furthermore, because the torque varies with the azimuth angle of
the blade, the torque produced by a blade element is obtained by integrating with respect to
the rotational angle. Then, the total torque produced by the entire blade for a complete
revolution of the turbine is obtained by adding n discrete elementary torques over the full
height of the rotor:
22
01 1 10
1
2 2
n n ni
B Bi Bi i Bii i i
rT T X d r X d
. (8)
-180 -135 -90 -45 0 45 90 135 180-0.4
-0.3
-0.2
-0.1
0
0.1
0.2
0.3
0.4
Angle of attack in degrees
XL,
XD
and
XB
in m
2
X-Lift
X-DragX-Blade

144
The final expression of the total torque is then obtained;
2
01
sin cos1
2 cos cos
ni i
B i i i Li Dii i i
T rc z C C d
. (9)
Electric Circuit Model for the Blades’ Mechanical Coupling to the Shaft
The wind turbine shaft is connected to the centre of the rotor; this shaft supports the
rotor (hub and blades) and transmits the rotary motion and torque moments of the rotor to the
gearbox and/or generator. When the rotor spins, the shaft spins as well. In this way, the rotor
transfers its rotational mechanical energy to the shaft and then to an electrical generator on
the other end. If we assume that the rotor’s mechanical coupling to the shaft is ideal, then it
would be electrically equivalent to an ideal transformer. Figure IV-10 shows the equivalent
electric diagram for a single blade coupled to the shaft.
Figure IV-10 Equivalent diagram for a single blade coupled to the shaft.
At this stage of the WECS (shaft), we no longer consider fluid mechanics; instead,
we address translation and/or rotation mechanics. Assuming an ideal autotransformer, the
voltage at the primary side is equal to that at the secondary side, i.e., Si TiV V . The current

145
produced by the source corresponds to the relative wind seen by the blades at any moment.
That is, for each blade:
2
2 22 2( )0
0
1sin cos cos
2j
B w b b
RI I V e
V
(10)
2jBI e
(11)
where 2
2 220
0
1sin cos cos
2 b b
RW
W
and
1 cos costan
sinb
i b
.
We can then obtain:
2α 2B
iTV X e . (12)
Because the mechanical coupling of a single blade I to the shaft can be modelled as an ideal
autotransformer, we can then write:
Ti Si
Ti Si
V V
I I
(13)
Assuming that the rotor mechanical coupling of three blades to the shaft is ideal, this coupling
can be electrically modelled as multiple ideal primary transformers, as shown in Figure
IV-11.

146
Figure IV-11 Rotor coupling of three blades modelled as an electric transformer.
The windings of the corresponding transformer are made so that the following is true:
31 2
1 2 3
TT T R
R
VV V V
a a a a (14)
Because we have 1 2 3 Ra a a a , we can write:
1 2 3R T T TV V V V
(15)
The voltage at the secondary of the transformer can be obtained by vector addition of
the three primary voltages because 1TV
, 2TV
and 2TV
have variable moduli and phases while
the phase difference from one blade to another remains constant. At any instant, the three
voltages behave as if in an unbalanced three-phase system.
As suggested in the intuitive analogy, the rotational speed of the shaft ω is analogous
to the electrical current. Finally, the rotational speed of the shaft can be assumed to be
equivalent to the electric current at the secondary of the transformer, i.e., IS = ω. We can
therefore write the following relations:

147
1 2 3
1 2 3 3
S S S S
S S S
I I I I
I I I
(16)
4.4 RESULTS AND DISCUSSION
4.4.1. Electric Circuit Model for Three-Blade DT-VAWT Rotors: The Tchakoua
Model
We can now construct the equivalent electric model for the whole three-blade turbine.
The equivalent circuits for various blades are brought together and are coupled based on the
developments presented in Section 3. Figure IV-12 presents the Tchakoua model, which is
the global equivalent electric model for a three-blade DT-VAWT.
Figure IV-12 Equivalent electric diagram for a three-blade DT-VAWT.

148
Because the rotor has three blades, the angle between two blades is . If we assume
a constant wind flow, then the blades are subject to the same current vector with their
respective phase delays. Assuming that the rotor turns in the forward rotational direction, we
can write:
1 2 3B B BI I I ; 2 1
2arg arg
3B BI I
and 3 1
2arg arg
3B BI I
.
Then, the following matrix can be obtained:
1
2
3
1 1
2 2
33
0 0
Im 0 0
0 0
BB B
B B B
BB B
ZV I
V Z I
IV Z
(17)
Considering the operator 𝑎 = 1∠120, we have 2
2 1B BI a I and 3 1B BI a I . Thus,
the voltage vectors for the three-blade rotor can be written as follows:
1
2
3
1
22 1
3
0 0 1
Im 0 0
0 0
BB
B B B
B B
ZV
V Z a I
aV Z
(18)
*11 11
* 2 *2 2 2 2 1
*3 3 33
1SB BB
B B S B S
B B BS
IV VS
S V I V a I
S aV VI
(19)
Following Figure 4, the apparent power representing the contribution of the whole
rotor to the shaft power can be obtained by adding the power produced by the three blades
separately:
2
3

149
* *1 1 1( )T T S B B B SS V I V V V I
(20)
Finally:
1 2 3
22T B B B SS Z Z a Z a I (21)
The voltage produced by a sectional element of a single blade varies with its azimuth
position and relative radius and height. The curved blade is discretized into n blade elements,
as suggested in [14], and the average power produced by a blade element for a complete
revolution of the turbine is obtained by integrating the elementary power with respect to θ.
2
0
1( ) ( )
2BS s t d t
(22)
For different blades, the blades elements at the same high will produce the same
power. We can then write:
2
1 2 3 0
1
2B B B B D L bS S S S r X X d
(23)
That is:
2
2 2 2200
0
1 1sin cos cos
2 2B D L b b b
RS r X X W d
W
.
We the obtain:
2
2 2 220 0
0
1. sin cos cos
2 2 i iB D L b b b
r RS W X X d
W
(24)
(25)

150
Finally, the total average power produced by sectional element of the rotor is obtained
by adding the power from each of the three blades.
2
2 2 220 0
0
33 . sin cos cos
2 2 i iT B D L b b b
r RS S W X X d
W
(26)
4.4.2. Simulation Results
This section presents the results of the Tchakoua model for a three-blade DT-VAWT.
The simulations were performed in MATLAB using data for NACA0012 that was obtained
from different literature sources [37–39] with Reynolds numbers ranging from 500,000 to
approximately 750,000. We choose the NACA0012 blade profile because it is one of the
most studied and most commonly used profiles [39] Finally, the simulation results were
assessed using results from the literature [40].
The simulation characteristics of the rotor were taken from [34] and are presented in
Table IV-2.
Table IV-2 Blade simulation characteristics.
Number of Blades 3
Aerofoil section NACA0012
Blade’s average
Reynolds number 40,000
Aerofoil chord length 9.14 cm
Rotor tip speed 45.7 cm/s
Tip speed ratio 5
Chord-to-radius ratio 0.15

151
a) Simulation Results for Current Sources
Figure IV-13 shows the current variations for each blade. These variations are similar
to those of AOA as a function of the rotational angle of the blade. In addition, the incident
current for a given blade is at a maximum when its AOA is at a maximum; similarly, the
incident current is minimal or zero when the AOA is minimal or zero. Furthermore, the
incident currents appear similar to the alternating current of a symmetric three-phase power
supply system with the same frequency and voltage amplitudes relative to a common
reference but with a phase difference that is one-third of the period.
Figure IV-13 Incident current variations as functions of the rotational angle.
b) Variations of the Resistances and Reactances in the Model
The total normal and resistive components of the blade impedance Rb and the total
tangential and reactive components of the blade impedance Xb are plotted using the relations
in Equations (4) and (5). Figure IV-14 and Figure IV-15 show the variations of Rb and Xb for
the three blades as functions of the rotational angle.
0 45 90 135 180 225 270 315 360 400-50
-40
-30
-20
-10
0
10
20
30
40
50
Rotational angle in degrees
Inci
dent
cur
rent
in N
/m2
Ib1
Ib2
Ib3

152
Figure IV-14 Variations of the blade total resistance as a function of the rotational angle.
Figure IV-15 Variations of the blade reactance as a function of the rotational angle.
For a given blade, the resistance is zero when the blade rotational angle corresponds
to wind incident angle equal to zero, that is a shortly before and for B1. At these
positions, the blade is parallel to the wind flow streamtubes, and the incident angle is
therefore zero. In addition, the blade’s B1 resistance is at a maximum when corresponding
0 45 90 135 180 225 270 315 360 400-3
-2
-1
0
1
2
3x 10
8
Rotational angle in degrees
Res
ista
nce
in m
2
Rb1
Rb2Rb3
0 45 90 135 180 225 270 315 360 400-0.01
0
0.01
0.02
0.03
0.04
0.05
0.06
0.07
0.08
Rotational angle in degrees
Rea
ctiv
e im
peda
nce
in m
2
Xb1
Xb2
Xb3
2
3
2

153
wind incident angle is minims, which corresponds to a position close to 190° from the
reference point for these blade positions, the blades are perpendicular to the wind flow
streamtubes, and the incident angle is at its maximum. Furthermore, the resistances vary
between positive and negative quantities. According to our model inspired from double-
multiple multi-streamtube models, the resistance of the blade to the wind flow is considered
to be positive in the upwind disk and negative in the downwind disk.
The reactance of B1 is minimal when it is at and . At these positions, the
blade is parallel to the wind flow streamtubes, and the incident angle is therefore zero; thus,
the contribution of the wind to the torque production is negligible. Starting from , the
blade reactance continues to increase reaching two maximums respectively at 160° and 220°.
At between 160° and 220°, a valley appears that is caused by dynamic stall, which occurs
when an aerofoil, operating in unsteady flow, overcomes the static stall angle. For a VAWT
with a fixed blade geometry in unsteady flow and a given induction factor, the angle of attack
is a function of the azimuth angle; for λ < 5, the angle of attack can overcome the static stall
angle, causing dynamic stall. During dynamic stall, large leading edge separated vortices are
formed, delaying lift loss until they are convected over the surface results in a rapid decrease
in lift.
c) Variations of the Normal and Tangential Voltages
Figure IV-16 and Figure IV-17 plot the normal and tangential voltage variations as
functions of the blade position, respectively.
The normal voltage produced by the blade during a complete rotation varies from
zero to a minimal value. All the normal voltages are negative quantities at any instant of
2
3
2
2

154
blade rotation because they stem from the drag coefficient and constitute obstructions to the
blade rotation, meaning that they are negative contributions to the torque production. During
a complete rotation of the reference blade, there are two minimums at rotational angles for
which the angle of attack is zero at 190° and 350°. The negative value of the resistance
matches the contribution of this impedance element in the blade movement and thus in the
torque production.
Figure IV-16 Normal voltage variations of the blade as a function of the rotational angle.
The tangential voltage produced by the blade during a complete rotation varies
following an alternative and 2π periodic signal. During a complete rotation of the blade, the
tangential voltage is equal to zero at and ; these points are also inflexion points that
correspond to angles for which the tangential impedance is zero. Similar to the tangential
impedance, a valley occurs between 160° and 220° due to dynamic stall. The total voltage
produced by the rotor is obtained by adding the voltages produced by the blades. As shown
0 45 90 135 180 225 270 315 360 400-14
-12
-10
-8
-6
-4
-2
0
2x 10
9
Rotational angle in degrees
Nor
mal
Vol
tage
in N
Vn1
Vn2Vn3
2
2
3

155
in Figure 17, the total voltage is an alternative and periodic signal is not equal to zero
because at any moment, the blade voltage is an unbalanced three-phase system. The effect of
dynamic stall can also be observed for the total voltage at and every after this point.
Figure IV-17 Tangential voltage variations of the blades as a function of the rotational angle.
d) Power Variations Produced as a Function of the Rotational Angle
The power produced by individual blades and the total power produced by the whole
rotor are plotted in Figure IV-18. These results agree with findings in [32,35,41-43]. The
power produced by each blade is always positive and is a variable and periodic quantity with
a period of π. The power produced by a blade varies similar to the reactance with negative
reactance producing positive power. A phase difference of exists between the powers of
the three blades. The total power for the rotor is always a positive quantity; is variable and
periodic with a period of . The results obtained show strong agreement with results from
both aerodynamic and CFD models in the literature.
2
3
2
2
3
0 45 90 135 180 225 270 315 360 400-3
-2
-1
0
1
2
3
Rotational angle in degrees
Tan
gent
ial V
olta
ge in
N
Vt1
Vt2Vt3
Vs
2
3
2
3

156
Figure IV-18 Power produced by the blades as a function of the rotational angle.
The normal and tangential voltages are both periodic values that undergo important
variations during rotor rotation. The total tangential voltage produces the total torque.
4.5 CONCLUSIONS
In this paper, an electric circuit model for a three-blade DT-VAWT rotor is proposed.
The new Tchakoua model is based on a new approach for modelling DT-VAWT rotors using
the mechanical-electrical analogy. Indeed, the construction of this novel model is further to
the proof-of-concept demonstration of the relevancy of modelling VAWTs rotors using
electrical equivalent circuit analogy that was performed in previous research work. The
model is based on an analogy with the double multiple streamtube model and was obtained
by combining the equivalent electrical models for the wind, the three blades and the
mechanical coupling. For validation, simulations were conducted using MATLAB for a
three-bladed rotor. Results obtained for models outputs such as voltages and power are
0 45 90 135 180 225 270 315 360 400-50
0
50
100
150
200
250
300
Rotational angle in degrees
Pow
er in
N2 /m
2
Sb1
Sb2
Sb3
St

157
consistent with findings of the Paraschivoiu double-multiple streamtube model as well as
Frank Scheurich among others.
The Tchakoua model is more appropriate for the design, performance prediction and
optimization of Darrieus rotors. Mechanical fault diagnosis and prognosis are also important
because the model can be used to simulate rotor behaviour in the event of mechanical faults
in one or more of the blades or in the rotor-shaft coupling elements. The model can also
simulate turbine operation in the event of mechanical faults in one or more rotor elements.
The simulations were conducted in MATLAB, and the results show high accuracy with the
Paraschivoiu model as well as other results in the literature.
Despite the very simple design philosophy of VAWTs, their aerodynamics presents
several challenges. The main feature of VAWTs is that the effective angle of attack “seen”
by the blades undergoes a very large variation that in moderate to low tip speed conditions
drives the blades into stall for both negative and the positive angles of attack. In future works,
we intend to implement the Tchakoua model in simulation tools such as MATLAB Simulik
or P-SPICE to study the effects of varying angles of attack within the post-stall region on
flow unsteadiness and dynamic stall phenomena. The model could be extended to other types
of wind turbines including horizontal axis wind turbines, Savonious-type VAWTs and hybrid
Darrius-Savonius VAWTs. Additionally, the Tchakoua model will be used to study the
influence of wind flow turbulence on turbine vibrations. Transitional (starting) and
permanent sate functioning of VAWTs may also be examined. Finally, we intend to use the
model to study the impact of structural faults in one or more blades on a DT-VAWT. As a
long-term goal, the Tchakoua model will be linked to existing models of other electrical and
mechanical wind turbine parts to obtain a global Darrieus-type WECS model.

158
Acknowledgments: The authors would like to thank the Natural Science and
Engineering Research Council of Canada (NSERC) for financially supporting this research.
The authors are also grateful to the editor and the four anonymous reviewers for their valuable
comments and suggestions that improved the quality of this paper.
Author Contributions: Pierre Tchakoua is the main author of this work. This paper
further elaborates on some of the results from his Ph.D. dissertation. René Wamkeue and
Mohand Ouhrouche supervised the project and supported Pierre Tchakoua’s research in
terms of both scientific and technical expertise. Gabriel Ekemb and Ernesto Benini assisted
in the results analysis and interpretation. The manuscript was written by Pierre Tchakoua and
was reviewed and revised by René Wamkeue, Mohand Ouhrouche and Ernesto Benini.
Conflicts of Interest: The authors declare no conflicts of interest.
Reference
1. Tilmans, H.A. Equivalent circuit representation of electromechanical transducers: I.
Lumped-parameter systems. J. Micromech. Microeng. 1996, 6, 157–176.
2. Mason, W. An electromechanical representation of a piezoelectric crystal used as a
transducer. Proc. Inst. Radio Eng. 1935, 23, 1252–1263.
3. Tilmans, H.A. Equivalent circuit representation of electromechanical transducers: II.
Distributed-parameter systems. J. Micromech. Microeng. 1997, 7, 285–309.
4. Barakati, S.M. Modeling and Controller Design of a Wind Energy Conversion System
Including a Matrix Converter. Ph.D. Thesis, University of Waterloo, Waterloo, ON,
Canada, 2008.
5. Kim, H.-W.; Kim, S.-S.; Ko, H.-S. Modeling and control of PMSG-based variable-speed
wind turbine. Electr. Power Syst. Res. 2010, 80, 46–52.

159
6. Borowy, B.S.; Salameh, Z.M. Dynamic response of a stand-alone wind energy
conversion system with battery energy storage to a wind gust. IEEE Trans. Energy
Conve. 1997, 12, 73–78.
7. Delarue, P.; Bouscayrol, A.; Tounzi, A.; Guillaud, X.; Lancigu, G. Modelling, control
and simulation of an overall wind energy conversion system. Renew. Energy 2003, 28,
1169–1185.
8. Slootweg, J.; Haan, S.D.; Polinder, H.; Kling, W. General model for representing
variable speed wind turbines in power system dynamics simulations. IEEE Trans. Power
Syst. 2003, 18, 144–151.
9. Junyent-Ferré, A.; Gomis-Bellmunt, O.; Sumper, A.; Sala, M.; Mata, M. Modeling and
control of the doubly fed induction generator wind turbine. Simul. Model. Pract. Theory
2010, 18, 1365–1381.
10. Bolik, S.M. Modelling and Analysis of variable Speed Wind Turbines with induction
Generator during Grid Fault; Aalborg Universitet: Aalborg, Denmark, 2004.
11. Perdana, A. Dynamic Models of Wind Turbines; Chalmers University of Technology:
Göteborg, Sweden, 2008.
12. Tchakoua, P.; Ouhrouche, M.; Tameghe, T.A.; Ekemb, G.; Wamkeue, R.; Slaoui-
Hasnaoui, F. Basis of theoretical formulations for new approach for modelling darrieus-
type vertical axis wind turbine rotors using electrical equivalent circuit analogy. In
proceedings of the 2015 IEEE 3rd International Renewable and Sustainable Energy
Conference, Marrakech & Ouarzazate, Morocco, 10–13 December 2015; pp. 1–7.
13. Tchakoua, P.; Ouhrouche, M.; Tameghe, T.A.; Ekemb, G.; Wamkeue, R.; Slaoui-
Hasnaoui, F. Development of equivalent electric circuit model for darrieus-type
vertical axis wind turbine rotor using mechanic-electric analogy approach. In
proceeding of the 2015 IEEE 3rd International Renewable and Sustainable Energy
Conference, Marrakech & Ouarzazate, Morocco, 10–13 December 2015; pp. 1–8.
14. Tchakoua, P.; Wamkeue, R.; Ouhrouche, M.; Tameghe, T.A.; Ekemb, G. A new
approach for modeling Darrieus-type vertical axis wind turbine rotors using electrical

160
equivalent circuit analogy: Basis of theoretical formulations and model development.
Energies 2015, 8, 10684–10717.
15. Eriksson, S.; Bernhoff, H.; Leijon, M. Evaluation of different turbine concepts for wind
power. Renew. Sustain. Energy Rev. 2008, 12, 1419–1434.
16. Tjiu, W.; Marnoto, T.; Mat, S.; Ruslan, M.H.; Sopian, K. Darrieus vertical axis wind
turbine for power generation I: Assessment of Darrieus VAWT configurations. Renew.
Energy 2015, 75, 50–67.
17. Bedon, G.; Castelli, M.R.; Benini, E. Optimal spanwise chord and thickness distribution
for a Troposkien Darrieus wind turbine. J. Wind Eng. Ind. Aerodyn. 2014, 125, 13–21.
18. Tchakoua, P.; Wamkeue, R.; Tameghe, T.A.; Ekemb, G. A review of concepts and
methods for wind turbines condition monitoring. In Proceedings of the 2013 IEEE World
Congress on Computer and Information Technology (WCCIT), Sousse, Tunisia, 22–24
June 2013; pp 1–9.
19. Tchakoua, P.; Wamkeue, R.; Slaoui-Hasnaoui, F.; Tameghe, T.A.; Ekemb, G. New
trends and future challenges for wind turbines condition monitoring. In Proceeding of
the 2013 IEEE International Conference on Control, Automation and Information
Sciences (ICCAIS), Nha Trang, Vietnam, 25–28 November 2013; pp. 238–245.
20. Tchakoua, P.; Wamkeue, R.; Ouhrouche, M.; Slaoui-Hasnaoui, F.; Tameghe, T.A.;
Ekemb, G. Wind turbine condition monitoring: State-of-the-art review, new trends, and
future challenges. Energies 2014, 7, 2595–2630.
21. Yang, W.; Tavner, P.J.; Crabtree, C.J.; Wilkinson, M. Cost-effective condition
monitoring for wind turbines. IEEE Trans. Ind. Electron. 2010, 57, 263–271.
22. Yang, W.; Jiang, J.; Tavner, P.; Crabtree, C. Monitoring wind turbine condition by the
approach of Empirical Mode Decomposition. In Proceedings of the 2008 International
Conference on Electrical Machines and Systems (ICEMS), Wuhan, China, 17–20
October 2008; pp 736–740.
23. Yang, W.; Tavner, P.; Crabtree, C.; Wilkinson, M. Research on a simple, cheap but
globally effective condition monitoring technique for wind turbines. In Proceedings of

161
the 2008 International Conference on Electrical Machines and Systems (ICEMS),
Wuhan, China, 17–20 October 2008; pp 1–5.
24. Lewis, J.W. Modeling Engineering Systems: PC-Based Techniques and Design Tools;
High Text Publications: San Diego, CA, USA, 1994.
25. Hogan, N.; Breedveld, P. The physical basis of analogies in network models of physical
system dynamics. Simul. Ser. 1999, 31, 96–104.
26. Olson, H.F. Dynamical Analogies; Van Nostrand: Princeton, NJ, USA, 1958.
27. Firestone, F. The mobility method of computing the vibration of linear mechanical and
acoustical systems: mechanical-electrical analogies. J. Appl. Phys. 1938, 9, 373–387.
28. Calvo, J.A.; Alvarez-Caldas, C.; San, J.L. Analysis of Dynamic Systems Using Bond
Graph Method through SIMULINK; INTECH Open Access Publisher: Rijeka, Croatia,
2011.
29. Firestone, F. A new analogy between mechanical and electrical systems. J. Acoust. Soc.
Am. 1933, 4, 249–267.
30. Bishop, R.H. Mechatronics: An Introduction; CRC Press: Boca Raton, FL, USA, 2005.
31. Zhang, L.; Liang, Y.; Liu, X.; Jiao, Q.; Guo, J. Aerodynamic performance prediction of
straight-bladed vertical axis wind turbine based on CFD. Adv. Mech. Eng. 2013, 5,
doi:10.1155/2013/905379.
32. Paraschivoiu, I. Wind Turbine Design: With Emphasis on Darrieus Concept; Presses
Inter Polytechnique: Montreal, QC, Canada, 2002.
33. Islam, M.; Ting, D.S.-K.; Fartaj, A. Aerodynamic models for Darrieus-type straight-
bladed vertical axis wind turbines. Renew. Sustain. Energy Rev. 2008, 12, 1087–1109.
34. Scheurich, F.; Fletcher, T.M.; Brown, R.E. Simulating the aerodynamic performance
and wake dynamics of a vertical-axis wind turbine. Wind Energy 2011, 14, 159–177.
35. Beri, H.; Yao, Y. Double multiple streamtube model and numerical analysis of vertical
axis wind turbine. Energy Power Eng. 2011, 3, 262–270.

162
36. Claessens, M.C. The Design and Testing of Airfoils for Application in Small Vertical
Axis Wind Turbines. Master’s Thesis, Delft University of Technology, Delft, The
Netherlands, 2006.
37. Sheldahl, R.E.; Klimas, P.C. Aerodynamic Characteristics of seven Symmetrical Airfoil
Sections through 180-Degree Angle of Attack for Use in Aerodynamic Analysis of
Vertical Axis Wind Turbines; Technical Report; Sandia National Labs: Albuquerque,
NM, USA, 1981.
38. Critzos, C.C.; Heyson, H.H.; Boswinkle, R.W. Aerodynamic Characteristics of NACA
0012 Airfoil Section at Angles of Attack from 0 to 180 Degrees; National Advisory
Committee for Aeronautics: Washington, DC, USA, 1955.
39. Miley, S.J. A Catalog of Low Reynolds Number Airfoil Data for Wind Turbine
Applications; National Technical Information Service: Alexandria, VA, USA, 1982.
40. Timmer, W. Aerodynamic Characteristics of Wind Turbine Blade Airfoils at High
Angles-of-Attack; European Wind Energy Association: Brussels, Belgium, 2010.
41. Li, S.; Li, Y. Numerical study on the performance effect of solidity on the straight-bladed
vertical axis wind turbine. In Proceedings of the 2010 Asia-Pacific Power and Energy
Engineering Conference (APPEEC), Chengdu, China, 28–31 March 2010; pp 1–4.
42. Attia, E.; Saber, H.; Gamal, H.E. Analysis of straight bladed vertical axis wind turbine.
Int. J. Eng. Res. Technol. 2015, 4, doi:10.1007/s11630-014-0712-8.
43. Scheurich, F.; Brown, R.E. Modelling the aerodynamics of vertical-axis wind turbines
in unsteady wind conditions. Wind Energy 2013, 16, 91–107.
© 2016 by the authors. Submitted for possible open access publication
under the
terms and conditions of the Creative Commons Attribution (CC-BY) license
(http://creativecommons.org/licenses/by/4.0/).

163
Chapter V
CONCLUSION AND RECOMMENDATIONS

164
5.1. Conclusion
The aerodynamic characteristics of vertical-axis wind turbines are somewhat more
complex compared to those of horizontal-axis configurations and are partially responsible
for the fact that industrial and academic research has focused primarily on horizontal-axis
turbines in the past decades. This has had the result that vertical-axis wind turbines are still
relatively poorly understood compared to horizontal-axis wind turbines. However, vertical-
axis wind turbines are becoming ever more important in wind power generation thanks to
their compactness and adaptability for domestic installations. Furthermore, it is well known
that VAWTs have poor efficiency, especially compared to HAWTs.
The blades are governing the turbine’s efficiency and their power output is primarily
given by their design. The challenges in vertical axis wind turbines have not yet been all
mastered. The accurate modelling of the aerodynamics of vertical-axis wind turbines poses
a significant challenge as past experiences showed that good rotor modelling for accurate
condition monitoring has not reached a matured and reliable state of the art. The cyclic
motion of the turbine induces large variations in the angle of attack on the blades of the rotor
that result in significant unsteadiness in the blade aerodynamic loading and can manifest as
dynamic stall. In addition, aerodynamic interactions occur between the turbine blades and
the wake that is generated by the rotor.
Commencing this research, an inventory and classification of WTCMTs highlighted
the fact that a combination of preventive and reactive maintenance strategies can improve
reliability, availability, and maintainability of WTs while reducing maintenance costs. Also,
a quick literature survey was performed on most used models and presented the relevant
features as well as the advantages and shortcoming for each model category.

165
The object of the current PhD thesis was to contribute to the development of new
tools, techniques and methods to improve the design, optimization, diagnosis, prognosis and
monitoring of Darrieus vertical axis wind turbines to better ensure their maintenance.
A new approach for modeling Darrieus-type VAWT rotors using the electric-
mechanic analogy was presented based on double multiple streamtube model. A proof-of-
concept demonstration of the approach attested the feasibility of such a model through both
step-by-step demonstrations of the theoretical and practical concepts that underpin the new
model and simulations and cross validation of a single blade.
Then, an electric circuit model for a three-blade DT-VAWT rotor was developed. The
so called Tchakoua model was obtained by combining the equivalent electrical models for
the wind, the three blades and the mechanical coupling. For validation, simulations were for
single blade using MATLAB and cross validation was done with findings of existing models.
Various simulations for the VAWT three-bladed rotor were also perform in MATLAB.
Outputs variables such as voltages and power are consistent with findings of the Paraschivoiu
double-multiple streamtube model as well as Frank Scheurich among others.
5.2. RECOMMENDATIONS
The new model built in this thesis could be more suitable for the supervision and
diagnosis of AVEs for better maintenance. However, as any new model, this model can be
improved and upgrade to make it more realistic. Because not all the objectives of the project
were fulfilled, some future work is necessary to be done:
Upgrade the model by improving wind modeling. Indeed, the current modulization
considers wind flow to be of constant direction and intensity which is far from reality.
An improved wind model would consider the different turbulences in the wind flow.

166
Use the new model to study the effects of varying angle of attack in the aerodynamic
stall region and the instability generated.
Use the model to study the impact of structural faults on one or more blades on the
quality of wind turbine electrical production.
Build default models for VAWTs rotors including for cases of mass imbalance and
blades aerodynamic asymmetry.
Finally, as a long-term goal, the model will be assembled with existing electrical
models of other electrical and mechanical parts of VAWTs to build a global
equivalent electrical model of the wind-energy conversion system. This global model
will open the way for the study of certain phenomena from a macroscopic point of
view. It would also be interesting to extend this modeling approach and apply it to
other types of wind turbines such as horizontal axis wind turbines, Savonious wind
turbines and Darrieus Savonius hybrid wind turbines.

167
Appendix A
The research work done in this PhD thesis has already broth to the publication of the
following papers.
Conference papers
TCHAKOUA, Pierre, WAMKEUE, René, TAMEGHE, Tommy Andy, Gabriel Ekenb. A review of concepts and methods for wind turbines condition monitoring. In :Computer and Information Technology (WCCIT), 2013 World Congress on. IEEE, 2013. p. 1-9.
TCHAKOUA, Pierre, WAMKEUE, René, Fouad, Slaoui-Hasnaoui, F., Tameghe, T. A., & Ekemb, G., New trends and future challenges for wind turbines condition monitoring. In :Control, Automation and Information Sciences (ICCAIS), 2013 International Conference on. IEEE, 2013. p. 238-245.
TCHAKOUA, Pierre, WAMKEUE, René, SLAOUI-HASNAOUI, Fouad, et al. Basis of Theoretical Formulations for New Approach for Modelling Darrieus-Type Vertical Axis Wind Turbine Rotors using Electrical Equivalent Circuit Analogy. In : 2015 3rd International Renewable and Sustainable Energy Conference (IRSEC). 10-13 Décembre 2015 Marrakech, Morocco.
TCHAKOUA, Pierre, WAMKEUE, René, SLAOUI-HASNAOUI, Fouad, et al. Development of Equivalent Electric Circuit Model for Darrieus-Type Vertical Axis Wind Turbine Rotor using Mechanic - Electric Analogy Approach. In : 2015 3rd International Renewable and Sustainable Energy Conference (IRSEC). 10-13 Décembre 2015 Marrakech, Morocco.
Tchakoua, P.; Wamkeue, R.; Ouhrouche, M.; Tameghe, T.A.; Ekemb, G. An Electric Circuit Model for Darrieus-Type Vertical Axis Wind Turbine Rotors: The Tchakoua Model . In : 2016 4th International Renewable and Sustainable Energy Conference (IRSEC). 14-17 November 2016 Marrakech, Morocco
Journal papers
TCHAKOUA, Pierre, WAMKEUE, René, OUHROUCHE, Mohand, Slaoui-Hasnaoui, F., Tameghe, T. A., & Ekemb, G., Wind turbine condition monitorage:

168
State-of-the-art review, new trends, and future challenges. Energies, 2014, vol. 7, no 4, p. 2595-2630.
Tchakoua, P.; Wamkeue, R.; Ouhrouche, M.; Tameghe, T.A.; Ekemb, G. A New Approach for Modeling Darrieus-Type Vertical Axis Wind Turbine Rotors Using Electrical Equivalent Circuit Analogy: Basis of Theoretical Formulations and Model Development. Energies 2015, 8, 10684-10717.
Tchakoua, P.; Wamkeue, R.; Ouhrouche, M.; Benini, E.; Ekemb, G. Electric Circuit Model for the Aerodynamic Performance Analysis of a Three-Blade Darrieus-Type Vertical Axis Wind Turbine: The Tchakoua Model. Energies 2016, 9, 820.
Book chapter
Tchakoua, P., Wamkeue, R., Ouhrouche, M., Slaoui-Hasnaoui, F., Tameghe, T. A., & Ekemb, G., “Wind turbine condition monitoring: State-of-the-art review, new trends, and future challenges” dans “Wind Ressource and Future Enwergy Security: Enviromental, Social, and Econimic Issues”, Edited by Muyiwa Adaramola, Apple Academic Press 2015, pp. 283 – 330
Copyright © 2022 FDOKUMEN