Q2 2021 MARKET REPORTS - Lee & Associates
111
LEE-ASSOCIATES.COM/RESEARCH
-
Upload
khangminh22 -
Category
Documents
-
view
2 -
download
0
Transcript of Q2 2021 MARKET REPORTS - Lee & Associates
LEE-ASSOCIATES.COM/RESEARCH

Q2 2021 MARKET REPORTS
LOCAL EXPERTISE INTERNATIONAL REACHWith offices in 65+ markets across North America and a strategic international alliance with Gerald Eve, Lee & Associates has the ability to deliver first-class services to our clients both locally and internationally.
FEATURED MARKET REPORTS THE LEE ADVANTAGEEvery Lee & Associates office delivers world-class service to an array of regional, national, and international clients - from small businesses and local investors to major corporate users and institutional investors. Our professionals combine the latest technology, resources, and market intelligence with their experience, expertise, and commitment to superior service to optimize client results.
WHAT SETS US APART? Since 1979, Lee & Associates has reimagined the way that commercial real estate companies should be structured. Each Lee & Associates office is owned and operated by its professionals. As shareholders of the company, this separates us from our competition and creates one common goal; to provide seamless, consistent execution and value-driven market-to-market services to our clients.
SERVICES TO MEET THE NEEDS OF OUR CLIENTSLee & Associates’ offices offer a broad array of real estate services tailored to meet the needs of the company’s clients in each of the markets it operates, including commercial real estate brokerage, integrated services, and construction services.
With specialty practice groups in each of these disciplines, our professionals regularly collaborate to make sure they are providing their clients with the most advanced, up-to-date market technology and information.

Q2 2021
E-COMMERCE GROWS AND SETS INDUSTRIAL RECORDSThere are a number of records being toppled in the nation’s industrial real estate market, which is consumed by demand for logistics solutions. Net absorption set a record in the second quarter with 134.7 million SF, and record mid-year tenant growth totaled 208.7 million SF, just shy of the net absorption total for all of 2020. More than 200 million SF is set to be delivered in the second half, bringing the total of new product this year to 342.9 million SF, 12% more than the previous record in 2019. Sales volume has hit an all-time high. Although Q2’s totals still are incomplete, assets valued at more than $20 billion were traded in Q1 and a record $44 billion in property changed hands in Q4 of last year, 9% more than the previous record in Q3 2019. Unsurprisingly, with all other real estate classes under stress, investor demand is red hot for large industrial properties and portfolio deals. Meanwhile, the profile of tenants leasing space continues to broaden and span a variety of segments and business types. Amazon continues to lead the nation along with other e-commerce, third-party logistics providers such as Outsource Logistics, FedEx and DHL, and home improvement retailers.
Aiming to boost its logistics strength on the East Coast, e-commerce home furnishings merchant Wayfair selected a site near I-95 in suburban Baltimore for a 1.2-million-SF mid-Atlantic distribution hub. The facility will allow Wayfair’s products to reach one third of the U.S. population from Miami to Canada in one overnight drive. As industrial users aim to bolster their last-mile logistics networks throughout the nation, several secondary markets, such as Phoenix, Memphis and Reno are witnessing net absorption rates in excess of 5%. With strong consumer spending on home improvement goods, it’s not surprising that a durable goods manufacturer made the list of active lessees. Milwaukee-based Briggs & Stratton, a longtime maker of small gas engines, leased 566,000 SF of a 1.l4-million-SF manufacturing campus in Sherrill, a town in central New York.
Several of the nation’s largest regional and local distribution centers, including Phoenix, Houston, Philadelphia and Baltimore, are posting volume consistent with prior-year highs and, in the case of California’s Inland Empire and Seattle, exceeding prior-year highs. Low vacancy and strong demand is driving rent growth which accelerated modestly in the first quarter and, growing at slightly more than 4% annually, outperforming all other property types.
Lee’s analysis predicts rents will grow at an annual pace of from 3.1% to 3.7% per year for the next three years. But most markets will experience a deceleration in rent growth. Several southern markets, including Orlando, Miami, Jacksonville and Fort Lauderdale, should defy the national deceleration trend. Orlando is projected to be the national leader in rent growth at 5.2% per year.
INDUSTRIAL OVERVIEW
LOWEST VACANCY RATE
ON, Toronto 1.3%
BC, Vancouver 1.5%
CA, Los Angeles 2.3%
CA, Inland Empire 2.8%
CA, Orange County 2.8%
U.S. Index 5.1%
HIGHEST MARKET RENT / SF ANNUAL
CA, Orange County $15.21
CA, East Bay $15.08
NY, New York $15.03
NY, Long Island $14.95
CA, Los Angeles $14.45
U.S. Index $12.08 PSF
HIGHEST MARKET SALE PRICE / SF
CA, Orange County $280
BC, Vancouver $279
CA, San Diego $270
CA, Los Angeles $251
CA, East Bay $243
U.S. Index $217 PSF
MOST SF UNDER CONSTRUCTION
TX, Dallas-Fort Worth 39,176,768
CA, Inland Empire 27,082,173
GA, Atlanta 25,240,013
AZ, Phoenix 23,009,621
PA, Philadelphia 22,188,417
U.S. Index 409,628,674 SF
LARGEST INVENTORY BY SF
IL, Chicago 1,316,116,578
TX, Dallas-Fort Worth 1,007,614,590
CA, Los Angeles 942,601,835
ON, Toronto 847,552,704
NY, New York 835,921,242
U.S. Index 17,347,801,392 SF
LOWEST MARKET CAP RATE
BC, Vancouver 4.0%
CA, Los Angeles 4.4%
CA, Inland Empire 4.5%
CA, Orange County 4.5%
ON, Toronto 4.5%
U.S. Index 5.0%
FEATURED REPORTS• AZ, Phoenix• BC, Vancouver• CA, East Bay• CA, Inland Empire East• CA, Inland Empire West• CA, LA - North• CA, LA - South Bay - Port Markets• CA, North San Diego• CA, Orange County• CA, Stockton / Central Valley• FL, Fort Myers• FL, Naples• FL, South Florida• GA, Atlanta• IL, Chicago• MA, Boston• MD, Greater Baltimore• MI, Detroit• NC, Durham• NC, Raleigh• NJ, Northern & Central• NV, Reno• OH, Cincinnati• OH, Cleveland• OH, Columbus• PA, Philadelphia Region• SC, Charleston• SC, Greenville / Spartanburg• TN, Nashville• TX, Dallas / Fort Worth• TX, Houston• WI, Madison
Q2 2021
MARKET VACANCY RATE
MARKETRENT / SF
MARKET SALE PRICE / SF
SF UNDER CONSTRUCTION INVENTORY SF MARKET CAP
RATE
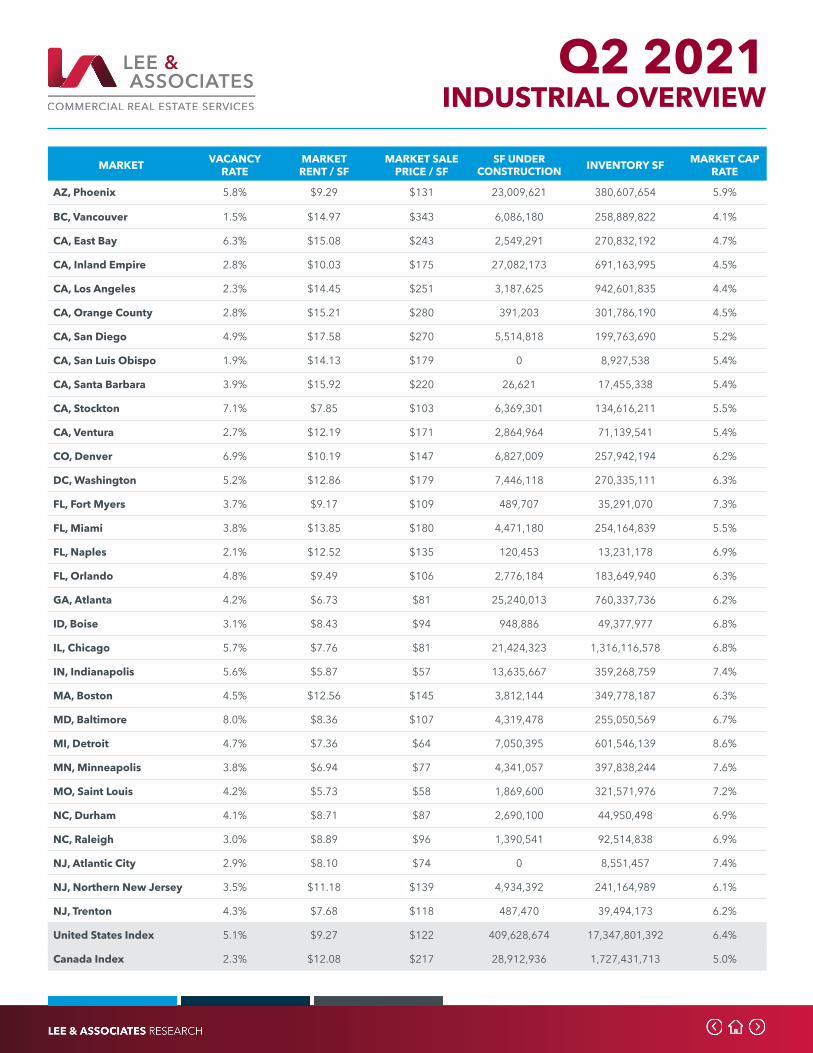
AZ, Phoenix 5.8% $9.29 $131 23,009,621 380,607,654 5.9%
BC, Vancouver 1.5% $14.97 $343 6,086,180 258,889,822 4.1%
CA, East Bay 6.3% $15.08 $243 2,549,291 270,832,192 4.7%
CA, Inland Empire 2.8% $10.03 $175 27,082,173 691,163,995 4.5%
CA, Los Angeles 2.3% $14.45 $251 3,187,625 942,601,835 4.4%
CA, Orange County 2.8% $15.21 $280 391,203 301,786,190 4.5%
CA, San Diego 4.9% $17.58 $270 5,514,818 199,763,690 5.2%
CA, San Luis Obispo 1.9% $14.13 $179 0 8,927,538 5.4%
CA, Santa Barbara 3.9% $15.92 $220 26,621 17,455,338 5.4%
CA, Stockton 7.1% $7.85 $103 6,369,301 134,616,211 5.5%
CA, Ventura 2.7% $12.19 $171 2,864,964 71,139,541 5.4%
CO, Denver 6.9% $10.19 $147 6,827,009 257,942,194 6.2%
DC, Washington 5.2% $12.86 $179 7,446,118 270,335,111 6.3%
FL, Fort Myers 3.7% $9.17 $109 489,707 35,291,070 7.3%
FL, Miami 3.8% $13.85 $180 4,471,180 254,164,839 5.5%
FL, Naples 2.1% $12.52 $135 120,453 13,231,178 6.9%
FL, Orlando 4.8% $9.49 $106 2,776,184 183,649,940 6.3%
GA, Atlanta 4.2% $6.73 $81 25,240,013 760,337,736 6.2%
ID, Boise 3.1% $8.43 $94 948,886 49,377,977 6.8%
IL, Chicago 5.7% $7.76 $81 21,424,323 1,316,116,578 6.8%
IN, Indianapolis 5.6% $5.87 $57 13,635,667 359,268,759 7.4%
MA, Boston 4.5% $12.56 $145 3,812,144 349,778,187 6.3%
MD, Baltimore 8.0% $8.36 $107 4,319,478 255,050,569 6.7%
MI, Detroit 4.7% $7.36 $64 7,050,395 601,546,139 8.6%
MN, Minneapolis 3.8% $6.94 $77 4,341,057 397,838,244 7.6%
MO, Saint Louis 4.2% $5.73 $58 1,869,600 321,571,976 7.2%
NC, Durham 4.1% $8.71 $87 2,690,100 44,950,498 6.9%
NC, Raleigh 3.0% $8.89 $96 1,390,541 92,514,838 6.9%
NJ, Atlantic City 2.9% $8.10 $74 0 8,551,457 7.4%
NJ, Northern New Jersey 3.5% $11.18 $139 4,934,392 241,164,989 6.1%
NJ, Trenton 4.3% $7.68 $118 487,470 39,494,173 6.2%
United States Index 5.1% $9.27 $122 409,628,674 17,347,801,392 6.4%
Canada Index 2.3% $12.08 $217 28,912,936 1,727,431,713 5.0%
INDUSTRIAL OVERVIEW

Q2 2021
MARKET VACANCY RATE
MARKETRENT / SF
MARKET SALE PRICE / SF
SF UNDER CONSTRUCTION INVENTORY SF MARKET CAP
RATE
NJ, Vineland 7.8% $5.32 $56 0 17,276,974 7.1%
NV, Reno 3.8% $7.46 $102 5,847,456 103,803,842 5.5%
NY, Long Island 4.4% $14.95 $180 1,118,412 176,583,221 7.0%
NY, New York 4.2% $15.03 $211 14,787,656 835,921,242 5.4%
OH, Cincinnati 5.9% $5.50 $56 5,332,850 337,815,234 7.4%
OH, Cleveland 4.9% $5.25 $42 1,133,500 352,650,091 8.8%
OH, Columbus 5.7% $5.68 $61 6,768,052 322,141,512 6.7%
ON, Toronto 1.3% $10.18 $190 13,988,993 847,552,704 4.5%
PA, Harrisburg 7.6% $6.25 $80 800,000 106,061,968 6.0%
PA, Lehigh Valley 4.7% $6.73 $96 8,833,651 146,003,175 5.9%
PA, Philadelphia 4.4% $8.20 $89 22,188,417 565,656,021 6.6%
SC, Charleston 4.9% $7.69 $86 7,128,922 88,830,422 6.7%
SC, Greenville 5.2% $4.99 $49 1,093,560 136,030,612 7.9%
SC, Spartanburg 8.7% $4.61 $53 1,859,900 99,710,891 7.6%
TN, Nashville 3.4% $8.48 $83 13,488,224 246,461,645 6.1%
TX, Dallas-Fort Worth 6.3% $7.17 $87 39,176,768 1,007,614,590 5.9%
TX, Houston 8.5% $7.57 $88 15,406,087 703,040,450 6.5%
WA, Seattle 5.3% $11.55 $200 10,789,148 335,600,483 4.9%
WI, Madison 3.7% $6.36 $61 742,670 70,023,326 7.4%
United States Index 5.1% $9.27 $122 409,628,674 17,347,801,392 6.4%
Canada Index 2.3% $12.08 $217 28,912,936 1,727,431,713 5.0%
INDUSTRIAL OVERVIEW
Q2 2021 PHOENIX, AZ
INDUSTRIAL MARKET OVERVIEWCHRIS MCCHESNEY, Research Director
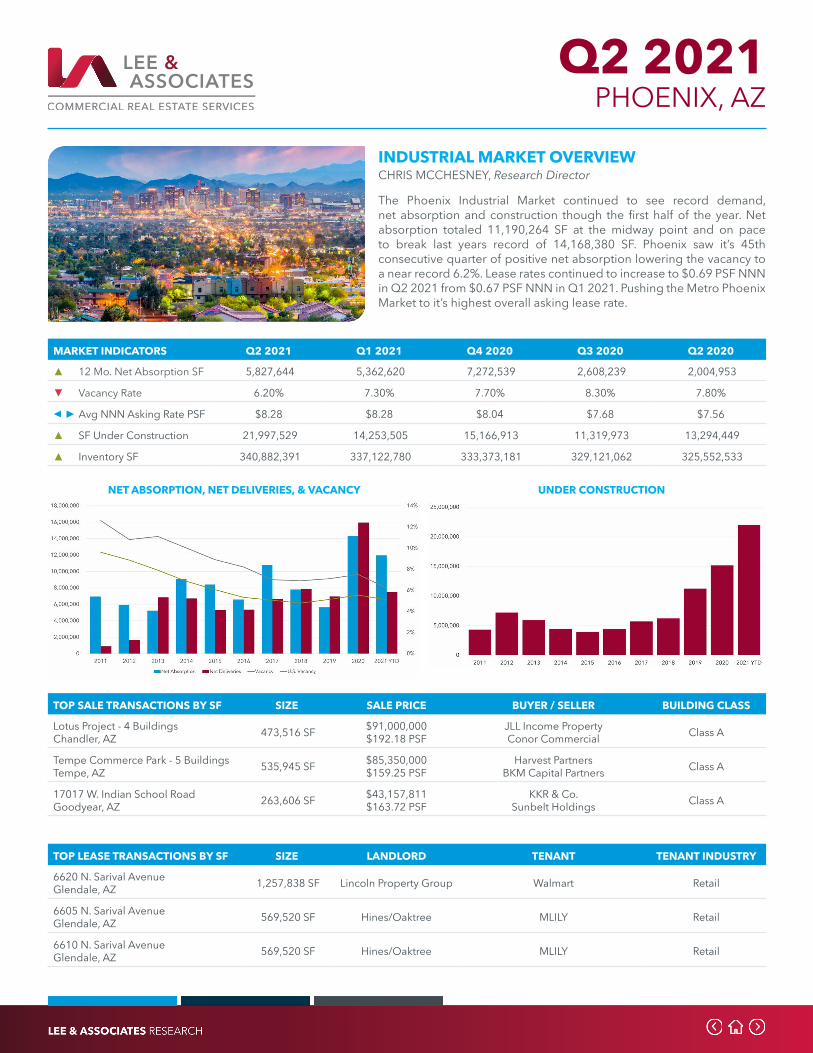
The Phoenix Industrial Market continued to see record demand, net absorption and construction though the first half of the year. Net absorption totaled 11,190,264 SF at the midway point and on pace to break last years record of 14,168,380 SF. Phoenix saw it’s 45th consecutive quarter of positive net absorption lowering the vacancy to a near record 6.2%. Lease rates continued to increase to $0.69 PSF NNN in Q2 2021 from $0.67 PSF NNN in Q1 2021. Pushing the Metro Phoenix Market to it’s highest overall asking lease rate.
MARKET INDICATORS Q2 2021 Q1 2021 Q4 2020 Q3 2020 Q2 2020
▲ 12 Mo. Net Absorption SF 5,827,644 5,362,620 7,272,539 2,608,239 2,004,953
▼ Vacancy Rate 6.20% 7.30% 7.70% 8.30% 7.80%
◀ ► Avg NNN Asking Rate PSF $8.28 $8.28 $8.04 $7.68 $7.56
▲ SF Under Construction 21,997,529 14,253,505 15,166,913 11,319,973 13,294,449
▲ Inventory SF 340,882,391 337,122,780 333,373,181 329,121,062 325,552,533
NET ABSORPTION, NET DELIVERIES, & VACANCY UNDER CONSTRUCTION
TOP LEASE TRANSACTIONS BY SF SIZE LANDLORD TENANT TENANT INDUSTRY
6620 N. Sarival AvenueGlendale, AZ 1,257,838 SF Lincoln Property Group Walmart Retail
6605 N. Sarival AvenueGlendale, AZ 569,520 SF Hines/Oaktree MLILY Retail
6610 N. Sarival AvenueGlendale, AZ 569,520 SF Hines/Oaktree MLILY Retail
TOP SALE TRANSACTIONS BY SF SIZE SALE PRICE BUYER / SELLER BUILDING CLASS
Lotus Project - 4 BuildingsChandler, AZ 473,516 SF $91,000,000
$192.18 PSFJLL Income PropertyConor Commercial Class A
Tempe Commerce Park - 5 BuildingsTempe, AZ 535,945 SF $85,350,000
$159.25 PSFHarvest Partners
BKM Capital Partners Class A
17017 W. Indian School RoadGoodyear, AZ 263,606 SF $43,157,811
$163.72 PSFKKR & Co.
Sunbelt Holdings Class A

Q2 2021 VANCOUVER, BC
INDUSTRIAL MARKET OVERVIEWMARIA FAYLOGA, Director of Research
Metro Vancouver’s Q2 2021 numbers are indicative of a thriving industrial market. Surpassing other major Canadian markets, avg industrial market rates have risen to $14.90 PSF - an 8.9% YoY increase. A new benchmark has been set this quarter with over 2.3 Million SF of industrial space leased. Amazon’s presence continues to impact market performance - the eCommerce giant has committed to another brand new 203,172 SF distribution centre in Delta. Amazon now has 5 new industrial facilities underway in the region. Metro Vancouver faces an industrial land crunch with only 2.0% of new inventory currently in the pipeline. In the future, there will be continued competition for available industrial options.
NET ABSORPTION, NET DELIVERIES, & VACANCY UNDER CONSTRUCTION
TOP LEASE TRANSACTIONS BY SF SIZE LANDLORD TENANT TENANT INDUSTRY
2965-188th StreetSurrey, BC 178,000 SF BentallGreenOak Undisclosed Undisclosed
7400 Vantage WayDelta, BC 203,172 SF Conwest Amazon e-Commerce
8576 River RoadDelta, BC 373,073 SF Wesgroup Lululemon Retailer
TOP SALE TRANSACTIONS BY SF SIZE SALE PRICE BUYER / SELLER BUILDING CLASS
8310 Prince Edward StreetVancouver, BC 421,844 SF $123,400,000
$293.00 PSFGreystone Managed Investments
Morguard Investments Ltd Class C
100 Forester StreetNorth Vancouver, BC 60,164 SF $95,590,000
$1,588.82 PSFERCO Worldwide
Superior Plus Class C
945-999 West 1st StreetNorth Vanvouver, BC 110,460 SF $44,000,000
$398.00 PSFVeramax Holding Ltd.
677466 BC Ltd Class C
MARKET INDICATORS Q2 2021 Q1 2021 Q4 2020 Q3 2020 Q2 2020
▲ 12 Mo. Net Absorption SF 5,028,680 3,487,093 1,905,441 2,950,544 2,014,421
▼ Vacancy Rate 1.55% 1.86% 2.2% 2.1% 2.0%
▲ Avg NNN Asking Rate PSF $14.91 $14.26 $13.99 $13.89 $13.64
▲ SF Under Construction 5,083,845 4,988,839 3,291,118 4,298,715 4,981,036
▲ Inventory SF 258,772,867 257,266,072 256,935,312 255,731,875 254,371,620
Q2 2021 EAST BAY, CA
INDUSTRIAL MARKET OVERVIEWCHRIS SCHOFIELD, SIOR, Principal
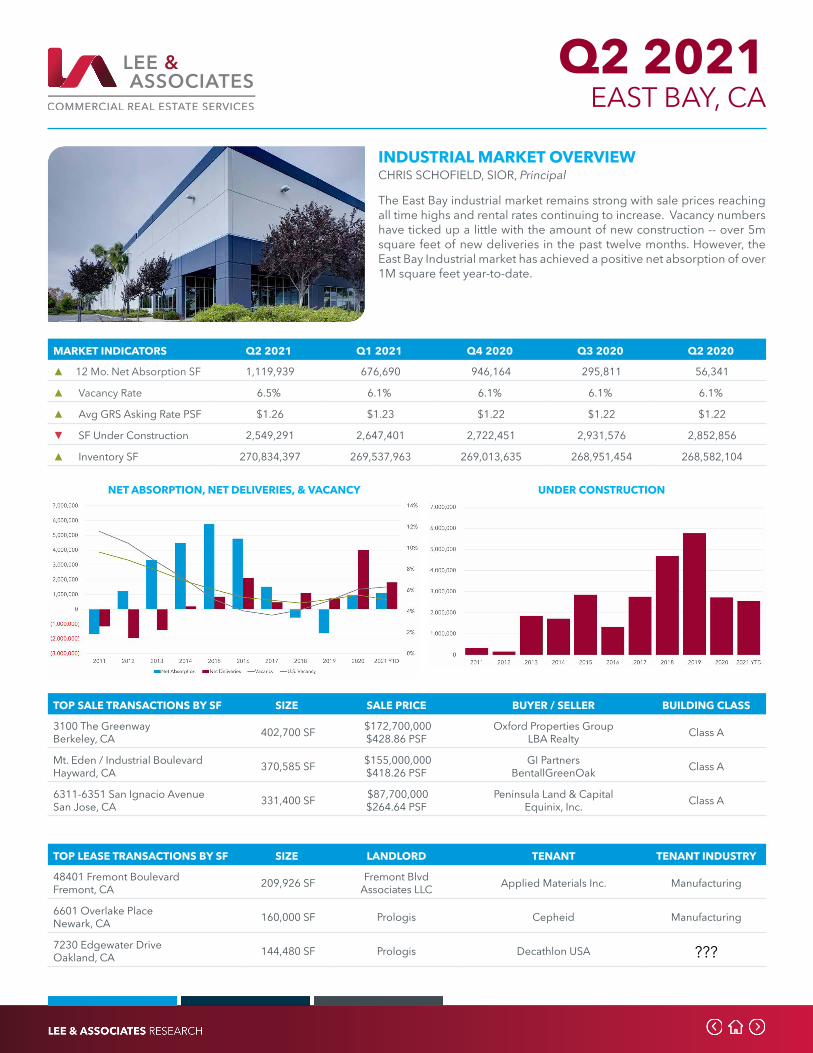
The East Bay industrial market remains strong with sale prices reaching all time highs and rental rates continuing to increase. Vacancy numbers have ticked up a little with the amount of new construction -- over 5m square feet of new deliveries in the past twelve months. However, the East Bay Industrial market has achieved a positive net absorption of over 1M square feet year-to-date.
MARKET INDICATORS Q2 2021 Q1 2021 Q4 2020 Q3 2020 Q2 2020
▲ 12 Mo. Net Absorption SF 1,119,939 676,690 946,164 295,811 56,341
▲ Vacancy Rate 6.5% 6.1% 6.1% 6.1% 6.1%
▲ Avg GRS Asking Rate PSF $1.26 $1.23 $1.22 $1.22 $1.22
▼ SF Under Construction 2,549,291 2,647,401 2,722,451 2,931,576 2,852,856
▲ Inventory SF 270,834,397 269,537,963 269,013,635 268,951,454 268,582,104
NET ABSORPTION, NET DELIVERIES, & VACANCY UNDER CONSTRUCTION
TOP LEASE TRANSACTIONS BY SF SIZE LANDLORD TENANT TENANT INDUSTRY
48401 Fremont BoulevardFremont, CA 209,926 SF Fremont Blvd
Associates LLC Applied Materials Inc. Manufacturing
6601 Overlake PlaceNewark, CA 160,000 SF Prologis Cepheid Manufacturing
7230 Edgewater DriveOakland, CA 144,480 SF Prologis Decathlon USA ???
TOP SALE TRANSACTIONS BY SF SIZE SALE PRICE BUYER / SELLER BUILDING CLASS
3100 The GreenwayBerkeley, CA 402,700 SF $172,700,000
$428.86 PSFOxford Properties Group
LBA Realty Class A
Mt. Eden / Industrial BoulevardHayward, CA 370,585 SF $155,000,000
$418.26 PSFGI Partners
BentallGreenOak Class A
6311-6351 San Ignacio AvenueSan Jose, CA 331,400 SF $87,700,000
$264.64 PSFPeninsula Land & Capital
Equinix, Inc. Class A
Q2 2021 INLAND EMPIRE EAST, CA
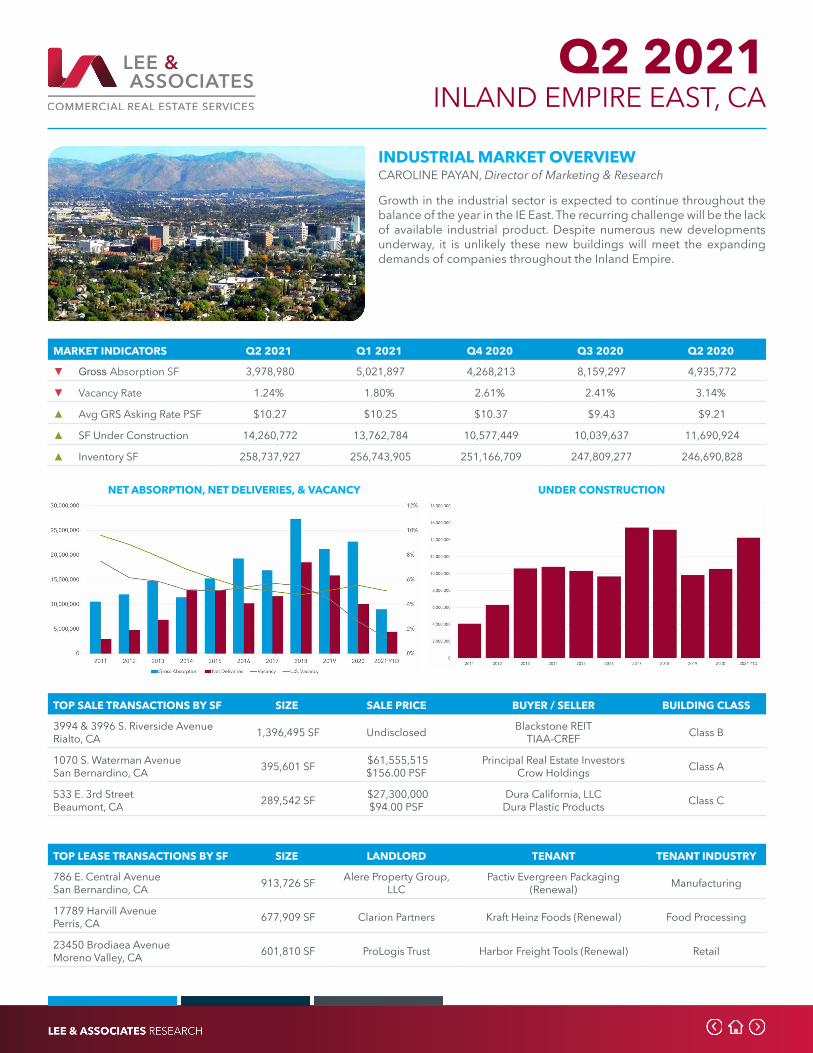
INDUSTRIAL MARKET OVERVIEWCAROLINE PAYAN, Director of Marketing & Research
Growth in the industrial sector is expected to continue throughout the balance of the year in the IE East. The recurring challenge will be the lack of available industrial product. Despite numerous new developments underway, it is unlikely these new buildings will meet the expanding demands of companies throughout the Inland Empire.
MARKET INDICATORS Q2 2021 Q1 2021 Q4 2020 Q3 2020 Q2 2020
▼ Gross Absorption SF 3,978,980 5,021,897 4,268,213 8,159,297 4,935,772
▼ Vacancy Rate 1.24% 1.80% 2.61% 2.41% 3.14%
▲ Avg GRS Asking Rate PSF $10.27 $10.25 $10.37 $9.43 $9.21
▲ SF Under Construction 14,260,772 13,762,784 10,577,449 10,039,637 11,690,924
▲ Inventory SF 258,737,927 256,743,905 251,166,709 247,809,277 246,690,828
NET ABSORPTION, NET DELIVERIES, & VACANCY UNDER CONSTRUCTION
TOP LEASE TRANSACTIONS BY SF SIZE LANDLORD TENANT TENANT INDUSTRY
786 E. Central AvenueSan Bernardino, CA 913,726 SF Alere Property Group,
LLCPactiv Evergreen Packaging
(Renewal) Manufacturing
17789 Harvill AvenuePerris, CA 677,909 SF Clarion Partners Kraft Heinz Foods (Renewal) Food Processing
23450 Brodiaea AvenueMoreno Valley, CA 601,810 SF ProLogis Trust Harbor Freight Tools (Renewal) Retail
TOP SALE TRANSACTIONS BY SF SIZE SALE PRICE BUYER / SELLER BUILDING CLASS
3994 & 3996 S. Riverside AvenueRialto, CA 1,396,495 SF Undisclosed Blackstone REIT
TIAA-CREF Class B
1070 S. Waterman AvenueSan Bernardino, CA 395,601 SF $61,555,515
$156.00 PSFPrincipal Real Estate Investors
Crow Holdings Class A
533 E. 3rd StreetBeaumont, CA 289,542 SF $27,300,000
$94.00 PSFDura California, LLC
Dura Plastic Products Class C
Q2 2021 INLAND EMPIRE WEST, CA
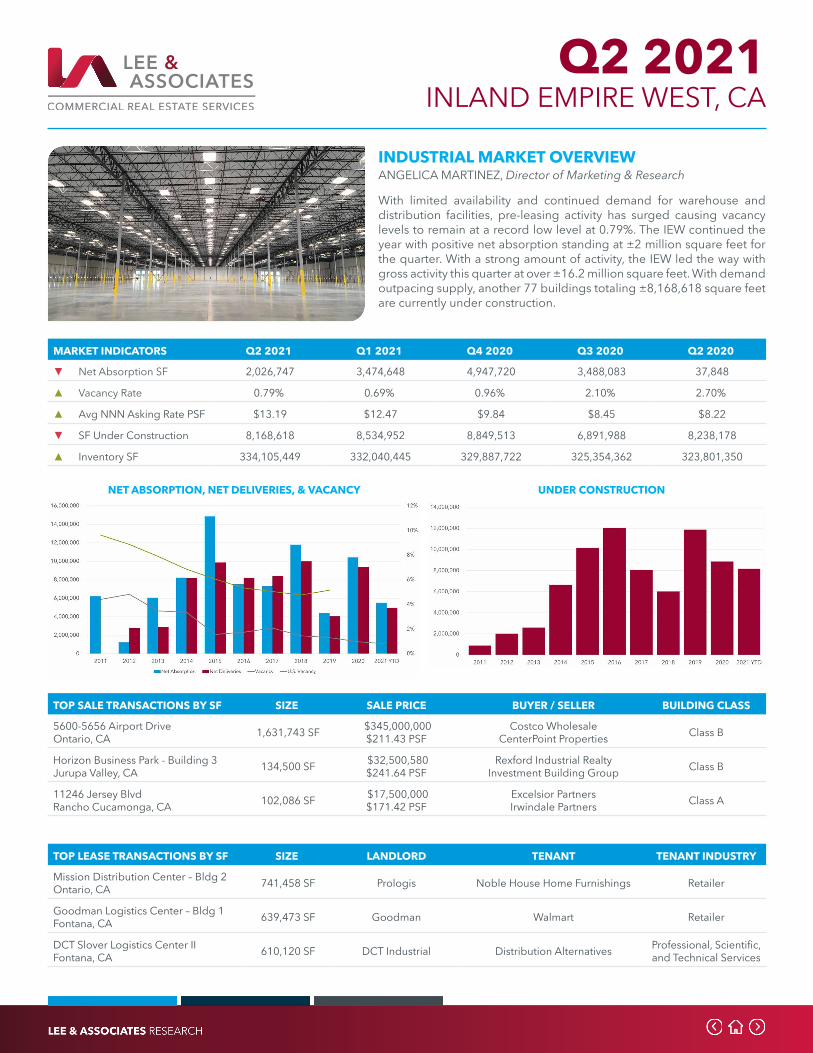
INDUSTRIAL MARKET OVERVIEWANGELICA MARTINEZ, Director of Marketing & Research
With limited availability and continued demand for warehouse and distribution facilities, pre-leasing activity has surged causing vacancy levels to remain at a record low level at 0.79%. The IEW continued the year with positive net absorption standing at ±2 million square feet for the quarter. With a strong amount of activity, the IEW led the way with gross activity this quarter at over ±16.2 million square feet. With demand outpacing supply, another 77 buildings totaling ±8,168,618 square feet are currently under construction.
MARKET INDICATORS Q2 2021 Q1 2021 Q4 2020 Q3 2020 Q2 2020
▼ Net Absorption SF 2,026,747 3,474,648 4,947,720 3,488,083 37,848
▲ Vacancy Rate 0.79% 0.69% 0.96% 2.10% 2.70%
▲ Avg NNN Asking Rate PSF $13.19 $12.47 $9.84 $8.45 $8.22
▼ SF Under Construction 8,168,618 8,534,952 8,849,513 6,891,988 8,238,178
▲ Inventory SF 334,105,449 332,040,445 329,887,722 325,354,362 323,801,350
NET ABSORPTION, NET DELIVERIES, & VACANCY UNDER CONSTRUCTION
TOP LEASE TRANSACTIONS BY SF SIZE LANDLORD TENANT TENANT INDUSTRY
Mission Distribution Center – Bldg 2Ontario, CA 741,458 SF Prologis Noble House Home Furnishings Retailer
Goodman Logistics Center – Bldg 1Fontana, CA 639,473 SF Goodman Walmart Retailer
DCT Slover Logistics Center IIFontana, CA 610,120 SF DCT Industrial Distribution Alternatives Professional, Scientific,
and Technical Services
TOP SALE TRANSACTIONS BY SF SIZE SALE PRICE BUYER / SELLER BUILDING CLASS
5600-5656 Airport DriveOntario, CA 1,631,743 SF $345,000,000
$211.43 PSFCostco Wholesale
CenterPoint Properties Class B
Horizon Business Park - Building 3Jurupa Valley, CA 134,500 SF $32,500,580
$241.64 PSFRexford Industrial Realty
Investment Building Group Class B
11246 Jersey BlvdRancho Cucamonga, CA 102,086 SF $17,500,000
$171.42 PSFExcelsior PartnersIrwindale Partners Class A
Q2 2021 LA - NORTH, CA
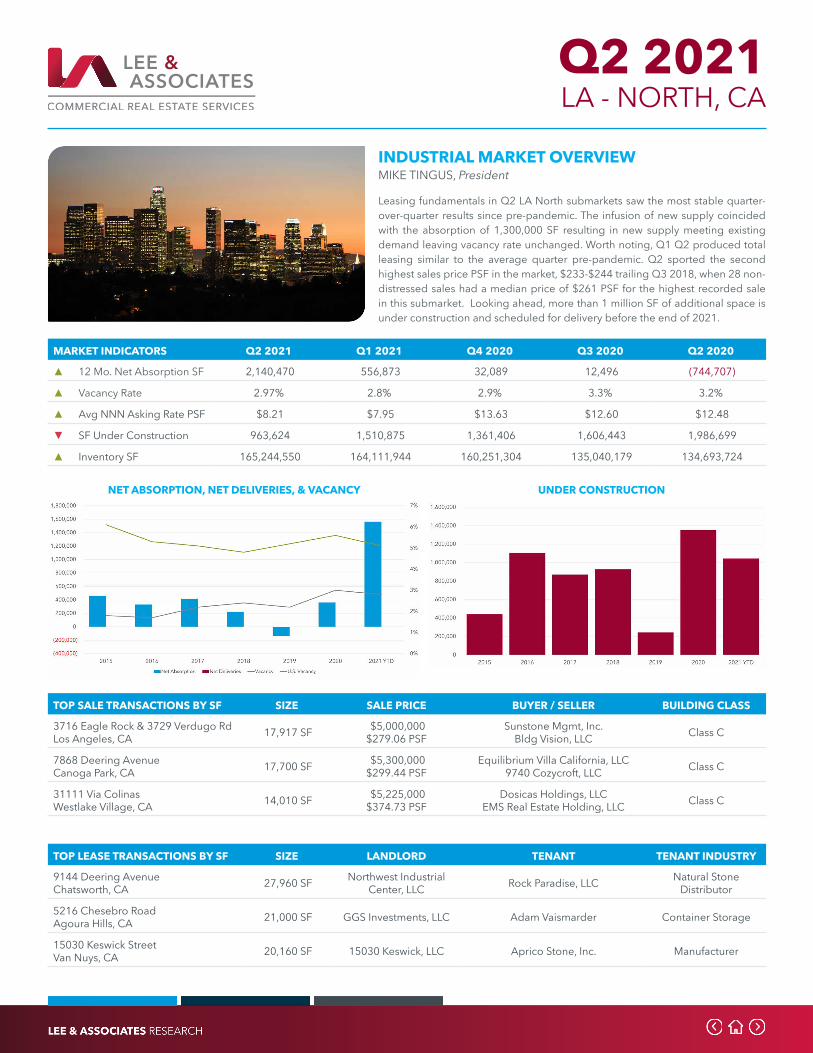
INDUSTRIAL MARKET OVERVIEWMIKE TINGUS, President
Leasing fundamentals in Q2 LA North submarkets saw the most stable quarter-over-quarter results since pre-pandemic. The infusion of new supply coincided with the absorption of 1,300,000 SF resulting in new supply meeting existing demand leaving vacancy rate unchanged. Worth noting, Q1 Q2 produced total leasing similar to the average quarter pre-pandemic. Q2 sported the second highest sales price PSF in the market, $233-$244 trailing Q3 2018, when 28 non-distressed sales had a median price of $261 PSF for the highest recorded sale in this submarket. Looking ahead, more than 1 million SF of additional space is under construction and scheduled for delivery before the end of 2021.
NET ABSORPTION, NET DELIVERIES, & VACANCY UNDER CONSTRUCTION
TOP LEASE TRANSACTIONS BY SF SIZE LANDLORD TENANT TENANT INDUSTRY
9144 Deering AvenueChatsworth, CA 27,960 SF Northwest Industrial
Center, LLC Rock Paradise, LLC Natural StoneDistributor
5216 Chesebro RoadAgoura Hills, CA 21,000 SF GGS Investments, LLC Adam Vaismarder Container Storage
15030 Keswick StreetVan Nuys, CA 20,160 SF 15030 Keswick, LLC Aprico Stone, Inc. Manufacturer
TOP SALE TRANSACTIONS BY SF SIZE SALE PRICE BUYER / SELLER BUILDING CLASS
3716 Eagle Rock & 3729 Verdugo RdLos Angeles, CA 17,917 SF $5,000,000
$279.06 PSFSunstone Mgmt, Inc.
Bldg Vision, LLC Class C
7868 Deering AvenueCanoga Park, CA 17,700 SF $5,300,000
$299.44 PSFEquilibrium Villa California, LLC
9740 Cozycroft, LLC Class C
31111 Via ColinasWestlake Village, CA 14,010 SF $5,225,000
$374.73 PSFDosicas Holdings, LLC
EMS Real Estate Holding, LLC Class C
MARKET INDICATORS Q2 2021 Q1 2021 Q4 2020 Q3 2020 Q2 2020
▲ 12 Mo. Net Absorption SF 2,140,470 556,873 32,089 12,496 (744,707)
▲ Vacancy Rate 2.97% 2.8% 2.9% 3.3% 3.2%
▲ Avg NNN Asking Rate PSF $8.21 $7.95 $13.63 $12.60 $12.48
▼ SF Under Construction 963,624 1,510,875 1,361,406 1,606,443 1,986,699
▲ Inventory SF 165,244,550 164,111,944 160,251,304 135,040,179 134,693,724
Q2 2021 LA - SOUTH BAY - PORT MARKETS, CA
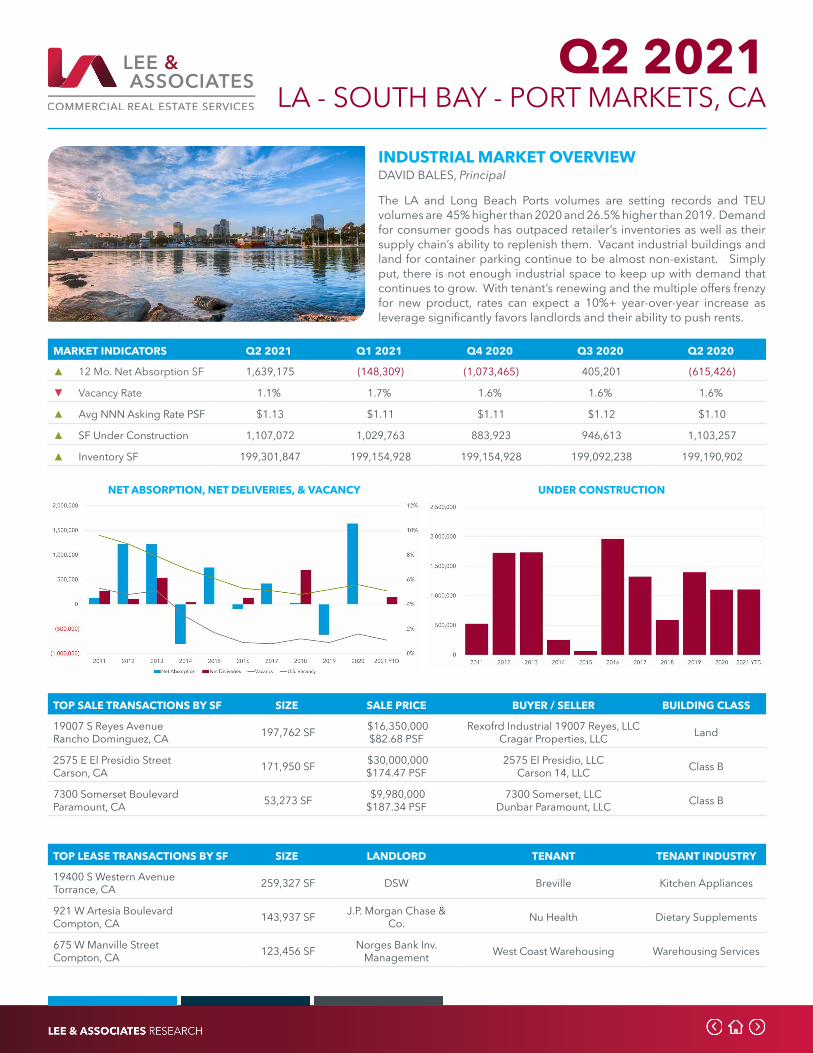
INDUSTRIAL MARKET OVERVIEWDAVID BALES, Principal
The LA and Long Beach Ports volumes are setting records and TEU volumes are 45% higher than 2020 and 26.5% higher than 2019. Demand for consumer goods has outpaced retailer’s inventories as well as their supply chain’s ability to replenish them. Vacant industrial buildings and land for container parking continue to be almost non-existant. Simply put, there is not enough industrial space to keep up with demand that continues to grow. With tenant’s renewing and the multiple offers frenzy for new product, rates can expect a 10%+ year-over-year increase as leverage significantly favors landlords and their ability to push rents.
NET ABSORPTION, NET DELIVERIES, & VACANCY UNDER CONSTRUCTION
TOP LEASE TRANSACTIONS BY SF SIZE LANDLORD TENANT TENANT INDUSTRY
19400 S Western AvenueTorrance, CA 259,327 SF DSW Breville Kitchen Appliances
921 W Artesia BoulevardCompton, CA 143,937 SF J.P. Morgan Chase &
Co. Nu Health Dietary Supplements
675 W Manville StreetCompton, CA 123,456 SF Norges Bank Inv.
Management West Coast Warehousing Warehousing Services
TOP SALE TRANSACTIONS BY SF SIZE SALE PRICE BUYER / SELLER BUILDING CLASS
19007 S Reyes AvenueRancho Dominguez, CA 197,762 SF $16,350,000
$82.68 PSFRexofrd Industrial 19007 Reyes, LLC
Cragar Properties, LLC Land
2575 E El Presidio StreetCarson, CA 171,950 SF $30,000,000
$174.47 PSF2575 El Presidio, LLC
Carson 14, LLC Class B
7300 Somerset BoulevardParamount, CA 53,273 SF $9,980,000
$187.34 PSF7300 Somerset, LLC
Dunbar Paramount, LLC Class B
MARKET INDICATORS Q2 2021 Q1 2021 Q4 2020 Q3 2020 Q2 2020
▲ 12 Mo. Net Absorption SF 1,639,175 (148,309) (1,073,465) 405,201 (615,426)
▼ Vacancy Rate 1.1% 1.7% 1.6% 1.6% 1.6%
▲ Avg NNN Asking Rate PSF $1.13 $1.11 $1.11 $1.12 $1.10
▲ SF Under Construction 1,107,072 1,029,763 883,923 946,613 1,103,257
▲ Inventory SF 199,301,847 199,154,928 199,154,928 199,092,238 199,190,902
Q2 2021 NORTH SAN DIEGO, CA
INDUSTRIAL MARKET OVERVIEWTIM GOSSELIN, Vice President
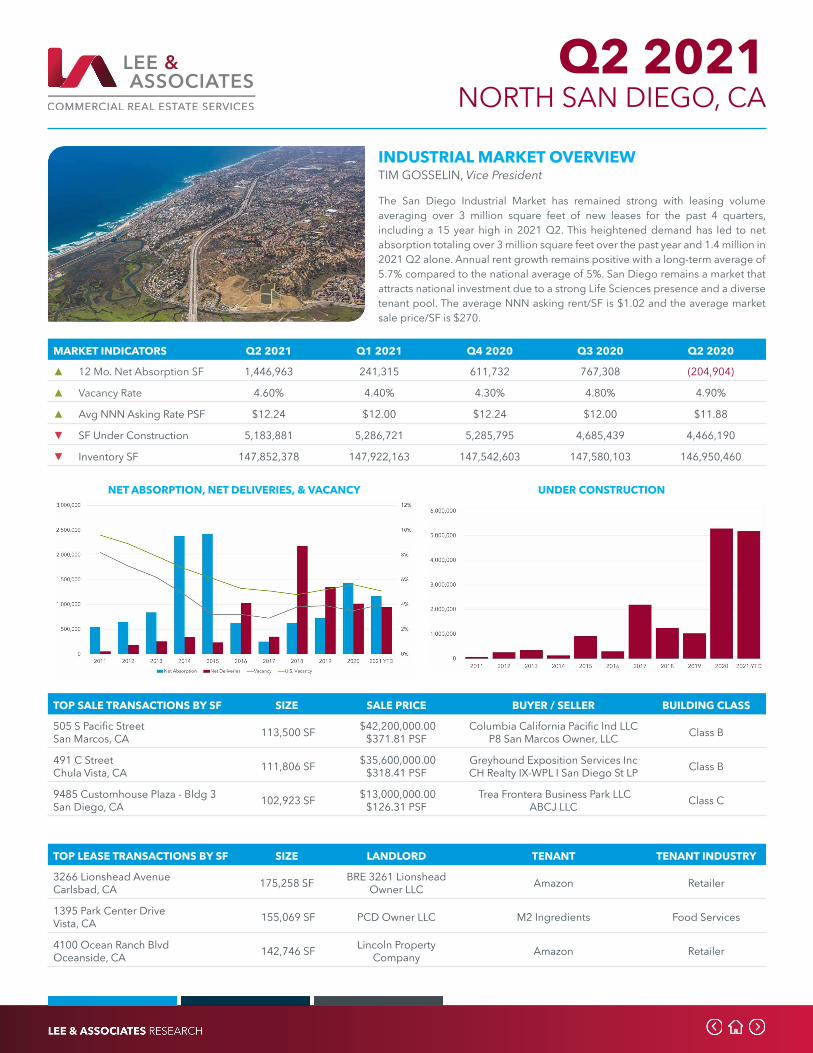
The San Diego Industrial Market has remained strong with leasing volume averaging over 3 million square feet of new leases for the past 4 quarters, including a 15 year high in 2021 Q2. This heightened demand has led to net absorption totaling over 3 million square feet over the past year and 1.4 million in 2021 Q2 alone. Annual rent growth remains positive with a long-term average of 5.7% compared to the national average of 5%. San Diego remains a market that attracts national investment due to a strong Life Sciences presence and a diverse tenant pool. The average NNN asking rent/SF is $1.02 and the average market sale price/SF is $270.
NET ABSORPTION, NET DELIVERIES, & VACANCY UNDER CONSTRUCTION
TOP LEASE TRANSACTIONS BY SF SIZE LANDLORD TENANT TENANT INDUSTRY
3266 Lionshead AvenueCarlsbad, CA 175,258 SF BRE 3261 Lionshead
Owner LLC Amazon Retailer
1395 Park Center DriveVista, CA 155,069 SF PCD Owner LLC M2 Ingredients Food Services
4100 Ocean Ranch BlvdOceanside, CA 142,746 SF Lincoln Property
Company Amazon Retailer
TOP SALE TRANSACTIONS BY SF SIZE SALE PRICE BUYER / SELLER BUILDING CLASS
505 S Pacific StreetSan Marcos, CA 113,500 SF $42,200,000.00
$371.81 PSFColumbia California Pacific Ind LLC
P8 San Marcos Owner, LLC Class B
491 C StreetChula Vista, CA 111,806 SF $35,600,000.00
$318.41 PSFGreyhound Exposition Services IncCH Realty IX-WPL I San Diego St LP Class B
9485 Customhouse Plaza - Bldg 3San Diego, CA 102,923 SF $13,000,000.00
$126.31 PSF Trea Frontera Business Park LLC
ABCJ LLC Class C
MARKET INDICATORS Q2 2021 Q1 2021 Q4 2020 Q3 2020 Q2 2020
▲ 12 Mo. Net Absorption SF 1,446,963 241,315 611,732 767,308 (204,904)
▲ Vacancy Rate 4.60% 4.40% 4.30% 4.80% 4.90%
▲ Avg NNN Asking Rate PSF $12.24 $12.00 $12.24 $12.00 $11.88
▼ SF Under Construction 5,183,881 5,286,721 5,285,795 4,685,439 4,466,190
▼ Inventory SF 147,852,378 147,922,163 147,542,603 147,580,103 146,950,460
Q2 2021 ORANGE COUNTY, CA
INDUSTRIAL MARKET OVERVIEWJACK HALEY, Principal
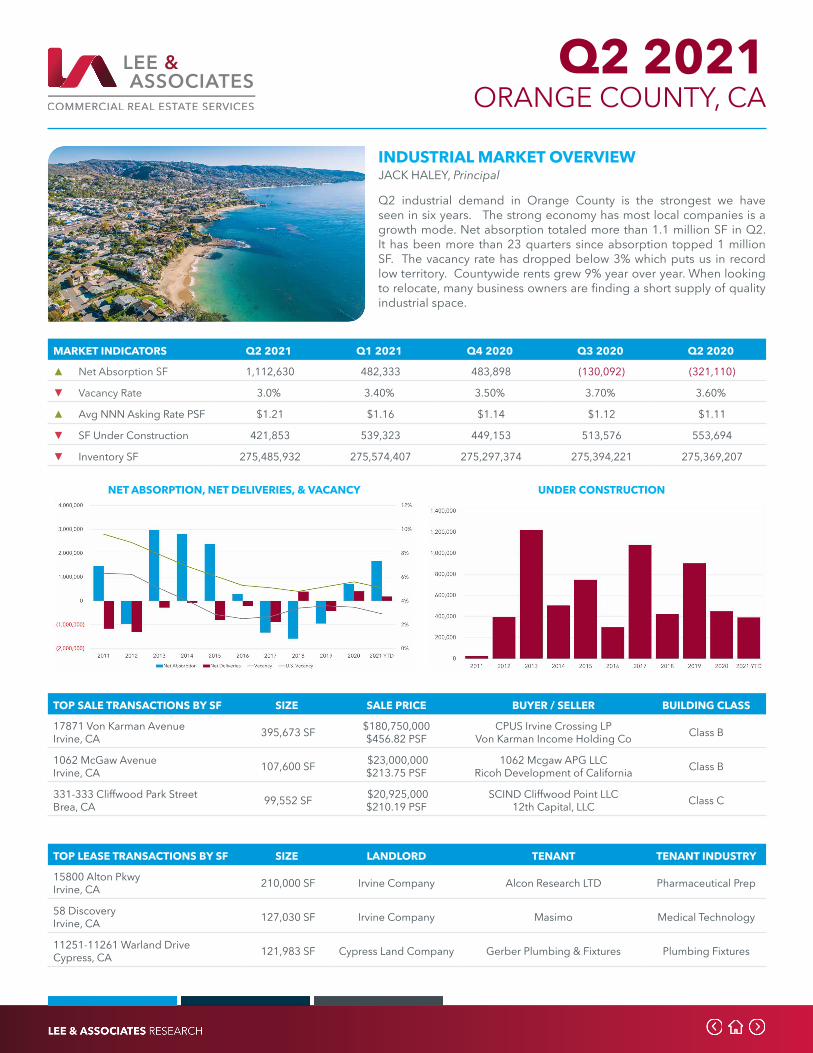
Q2 industrial demand in Orange County is the strongest we have seen in six years. The strong economy has most local companies is a growth mode. Net absorption totaled more than 1.1 million SF in Q2. It has been more than 23 quarters since absorption topped 1 million SF. The vacancy rate has dropped below 3% which puts us in record low territory. Countywide rents grew 9% year over year. When looking to relocate, many business owners are finding a short supply of quality industrial space.
NET ABSORPTION, NET DELIVERIES, & VACANCY UNDER CONSTRUCTION
TOP LEASE TRANSACTIONS BY SF SIZE LANDLORD TENANT TENANT INDUSTRY
15800 Alton PkwyIrvine, CA 210,000 SF Irvine Company Alcon Research LTD Pharmaceutical Prep
58 DiscoveryIrvine, CA 127,030 SF Irvine Company Masimo Medical Technology
11251-11261 Warland DriveCypress, CA 121,983 SF Cypress Land Company Gerber Plumbing & Fixtures Plumbing Fixtures
TOP SALE TRANSACTIONS BY SF SIZE SALE PRICE BUYER / SELLER BUILDING CLASS
17871 Von Karman AvenueIrvine, CA 395,673 SF $180,750,000
$456.82 PSFCPUS Irvine Crossing LP
Von Karman Income Holding Co Class B
1062 McGaw AvenueIrvine, CA 107,600 SF $23,000,000
$213.75 PSF1062 Mcgaw APG LLC
Ricoh Development of California Class B
331-333 Cliffwood Park StreetBrea, CA 99,552 SF $20,925,000
$210.19 PSFSCIND Cliffwood Point LLC
12th Capital, LLC Class C
MARKET INDICATORS Q2 2021 Q1 2021 Q4 2020 Q3 2020 Q2 2020
▲ Net Absorption SF 1,112,630 482,333 483,898 (130,092) (321,110)
▼ Vacancy Rate 3.0% 3.40% 3.50% 3.70% 3.60%
▲ Avg NNN Asking Rate PSF $1.21 $1.16 $1.14 $1.12 $1.11
▼ SF Under Construction 421,853 539,323 449,153 513,576 553,694
▼ Inventory SF 275,485,932 275,574,407 275,297,374 275,394,221 275,369,207
Q2 2021 STOCKTON / CENTRAL VALLEY, CA
INDUSTRIAL MARKET OVERVIEWJIM MARTIN, SIOR, Senior Vice President
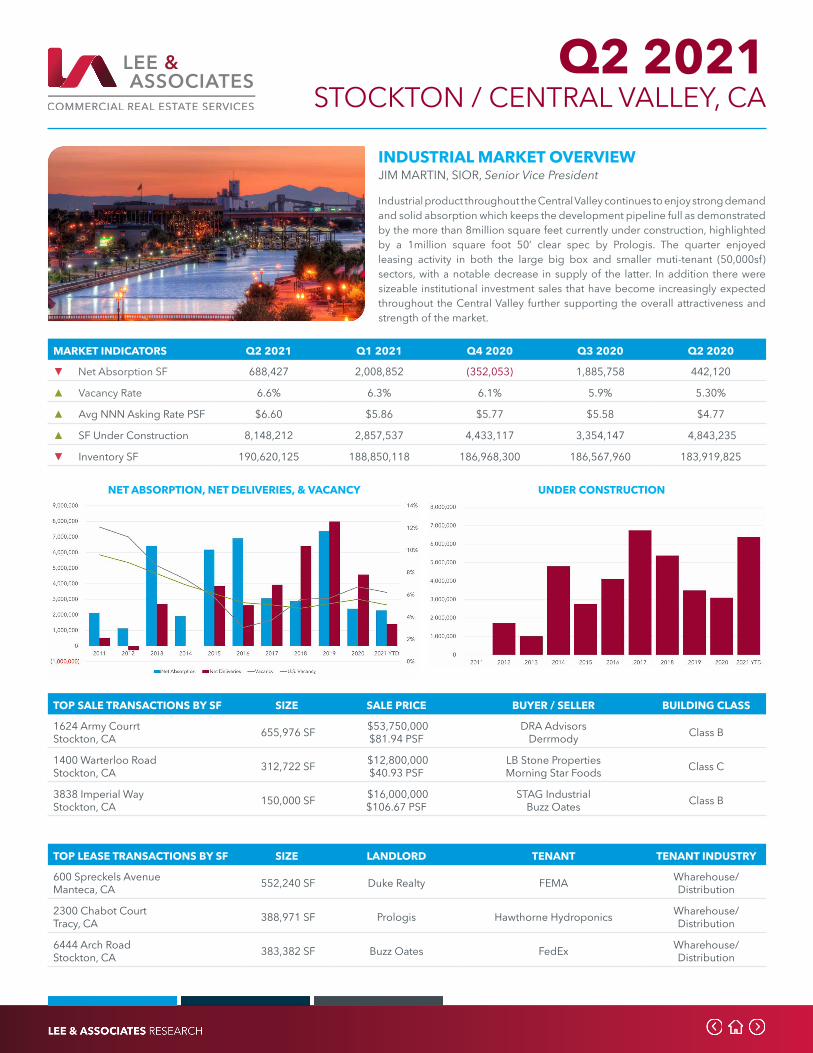
Industrial product throughout the Central Valley continues to enjoy strong demand and solid absorption which keeps the development pipeline full as demonstrated by the more than 8million square feet currently under construction, highlighted by a 1million square foot 50’ clear spec by Prologis. The quarter enjoyed leasing activity in both the large big box and smaller muti-tenant (50,000sf) sectors, with a notable decrease in supply of the latter. In addition there were sizeable institutional investment sales that have become increasingly expected throughout the Central Valley further supporting the overall attractiveness and strength of the market.
NET ABSORPTION, NET DELIVERIES, & VACANCY UNDER CONSTRUCTION
TOP LEASE TRANSACTIONS BY SF SIZE LANDLORD TENANT TENANT INDUSTRY
600 Spreckels AvenueManteca, CA 552,240 SF Duke Realty FEMA Wharehouse/
Distribution
2300 Chabot CourtTracy, CA 388,971 SF Prologis Hawthorne Hydroponics Wharehouse/
Distribution
6444 Arch RoadStockton, CA 383,382 SF Buzz Oates FedEx Wharehouse/
Distribution
TOP SALE TRANSACTIONS BY SF SIZE SALE PRICE BUYER / SELLER BUILDING CLASS
1624 Army CourrtStockton, CA 655,976 SF $53,750,000
$81.94 PSFDRA Advisors
Derrmody Class B
1400 Warterloo RoadStockton, CA 312,722 SF $12,800,000
$40.93 PSFLB Stone PropertiesMorning Star Foods Class C
3838 Imperial WayStockton, CA 150,000 SF $16,000,000
$106.67 PSFSTAG Industrial
Buzz Oates Class B
MARKET INDICATORS Q2 2021 Q1 2021 Q4 2020 Q3 2020 Q2 2020
▼ Net Absorption SF 688,427 2,008,852 (352,053) 1,885,758 442,120
▲ Vacancy Rate 6.6% 6.3% 6.1% 5.9% 5.30%
▲ Avg NNN Asking Rate PSF $6.60 $5.86 $5.77 $5.58 $4.77
▲ SF Under Construction 8,148,212 2,857,537 4,433,117 3,354,147 4,843,235
▼ Inventory SF 190,620,125 188,850,118 186,968,300 186,567,960 183,919,825
Q2 2021 FORT MYERS, FL
INDUSTRIAL MARKET OVERVIEWCLAIRE SEARLS, Director of Research
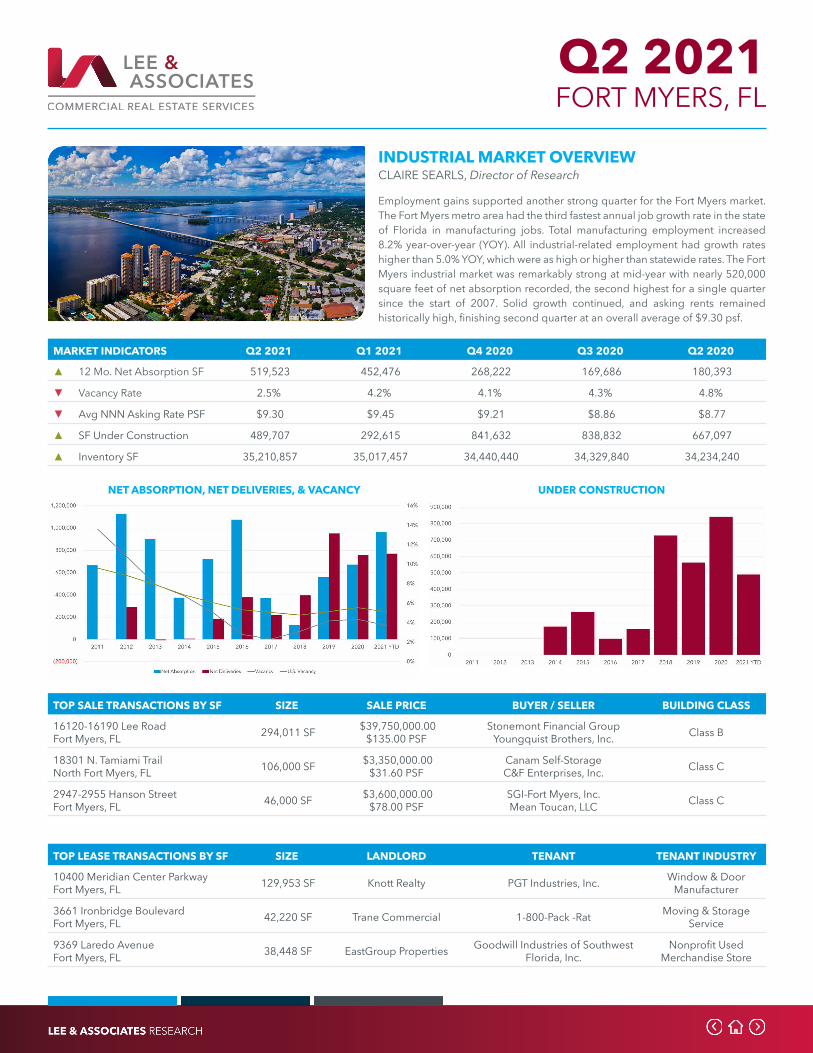
Employment gains supported another strong quarter for the Fort Myers market. The Fort Myers metro area had the third fastest annual job growth rate in the state of Florida in manufacturing jobs. Total manufacturing employment increased 8.2% year-over-year (YOY). All industrial-related employment had growth rates higher than 5.0% YOY, which were as high or higher than statewide rates. The Fort Myers industrial market was remarkably strong at mid-year with nearly 520,000 square feet of net absorption recorded, the second highest for a single quarter since the start of 2007. Solid growth continued, and asking rents remained historically high, finishing second quarter at an overall average of $9.30 psf.
NET ABSORPTION, NET DELIVERIES, & VACANCY UNDER CONSTRUCTION
TOP LEASE TRANSACTIONS BY SF SIZE LANDLORD TENANT TENANT INDUSTRY
10400 Meridian Center ParkwayFort Myers, FL 129,953 SF Knott Realty PGT Industries, Inc. Window & Door
Manufacturer
3661 Ironbridge BoulevardFort Myers, FL 42,220 SF Trane Commercial 1-800-Pack -Rat Moving & Storage
Service
9369 Laredo AvenueFort Myers, FL 38,448 SF EastGroup Properties Goodwill Industries of Southwest
Florida, Inc.Nonprofit Used
Merchandise Store
TOP SALE TRANSACTIONS BY SF SIZE SALE PRICE BUYER / SELLER BUILDING CLASS
16120-16190 Lee RoadFort Myers, FL 294,011 SF $39,750,000.00
$135.00 PSFStonemont Financial Group
Youngquist Brothers, Inc. Class B
18301 N. Tamiami Trail North Fort Myers, FL 106,000 SF $3,350,000.00
$31.60 PSFCanam Self-StorageC&F Enterprises, Inc. Class C
2947-2955 Hanson StreetFort Myers, FL 46,000 SF $3,600,000.00
$78.00 PSFSGI-Fort Myers, Inc.Mean Toucan, LLC Class C
MARKET INDICATORS Q2 2021 Q1 2021 Q4 2020 Q3 2020 Q2 2020
▲ 12 Mo. Net Absorption SF 519,523 452,476 268,222 169,686 180,393
▼ Vacancy Rate 2.5% 4.2% 4.1% 4.3% 4.8%
▼ Avg NNN Asking Rate PSF $9.30 $9.45 $9.21 $8.86 $8.77
▲ SF Under Construction 489,707 292,615 841,632 838,832 667,097
▲ Inventory SF 35,210,857 35,017,457 34,440,440 34,329,840 34,234,240
Q2 2021 NAPLES, FL
INDUSTRIAL MARKET OVERVIEWCLAIRE SEARLS, Director of Research
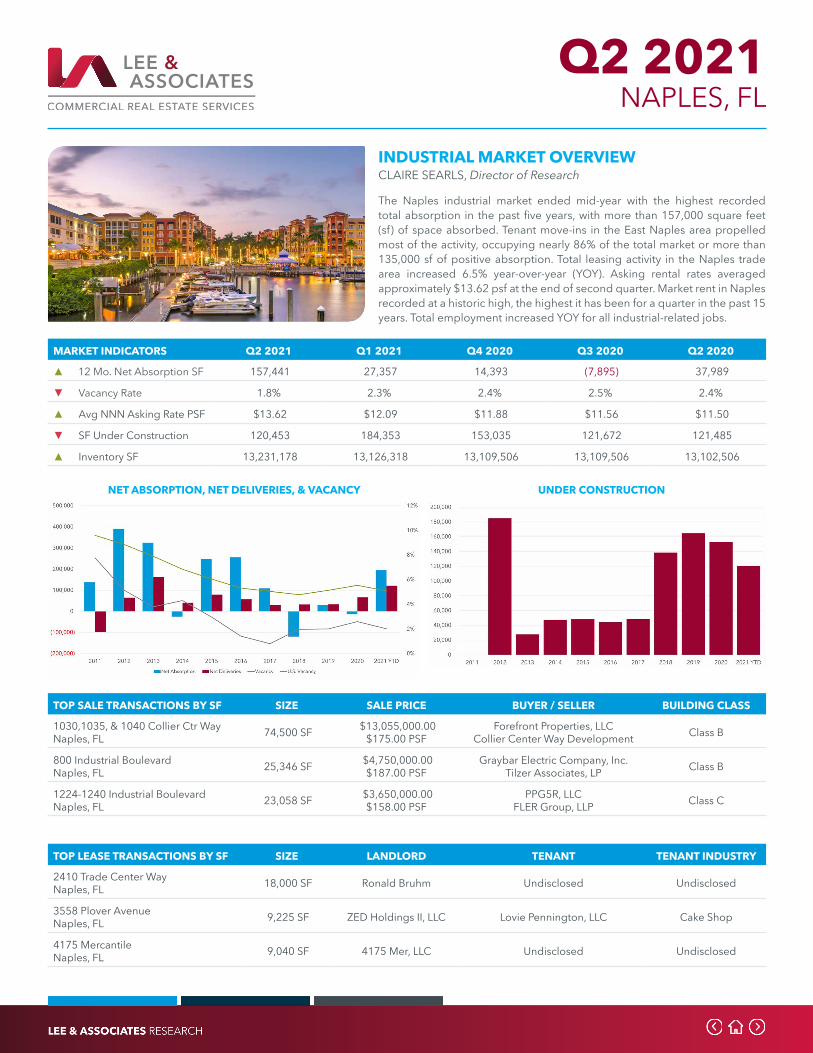
The Naples industrial market ended mid-year with the highest recorded total absorption in the past five years, with more than 157,000 square feet (sf) of space absorbed. Tenant move-ins in the East Naples area propelled most of the activity, occupying nearly 86% of the total market or more than 135,000 sf of positive absorption. Total leasing activity in the Naples trade area increased 6.5% year-over-year (YOY). Asking rental rates averaged approximately $13.62 psf at the end of second quarter. Market rent in Naples recorded at a historic high, the highest it has been for a quarter in the past 15 years. Total employment increased YOY for all industrial-related jobs.
NET ABSORPTION, NET DELIVERIES, & VACANCY UNDER CONSTRUCTION
TOP LEASE TRANSACTIONS BY SF SIZE LANDLORD TENANT TENANT INDUSTRY
2410 Trade Center WayNaples, FL 18,000 SF Ronald Bruhm Undisclosed Undisclosed
3558 Plover AvenueNaples, FL 9,225 SF ZED Holdings II, LLC Lovie Pennington, LLC Cake Shop
4175 MercantileNaples, FL 9,040 SF 4175 Mer, LLC Undisclosed Undisclosed
TOP SALE TRANSACTIONS BY SF SIZE SALE PRICE BUYER / SELLER BUILDING CLASS
1030,1035, & 1040 Collier Ctr WayNaples, FL 74,500 SF $13,055,000.00
$175.00 PSFForefront Properties, LLC
Collier Center Way Development Class B
800 Industrial BoulevardNaples, FL 25,346 SF $4,750,000.00
$187.00 PSFGraybar Electric Company, Inc.
Tilzer Associates, LP Class B
1224-1240 Industrial BoulevardNaples, FL 23,058 SF $3,650,000.00
$158.00 PSFPPG5R, LLC
FLER Group, LLP Class C
MARKET INDICATORS Q2 2021 Q1 2021 Q4 2020 Q3 2020 Q2 2020
▲ 12 Mo. Net Absorption SF 157,441 27,357 14,393 (7,895) 37,989
▼ Vacancy Rate 1.8% 2.3% 2.4% 2.5% 2.4%
▲ Avg NNN Asking Rate PSF $13.62 $12.09 $11.88 $11.56 $11.50
▼ SF Under Construction 120,453 184,353 153,035 121,672 121,485
▲ Inventory SF 13,231,178 13,126,318 13,109,506 13,109,506 13,102,506
Q2 2021 SOUTH FLORIDA, FL
INDUSTRIAL MARKET OVERVIEWWILLIAM DOMSKY, Principal
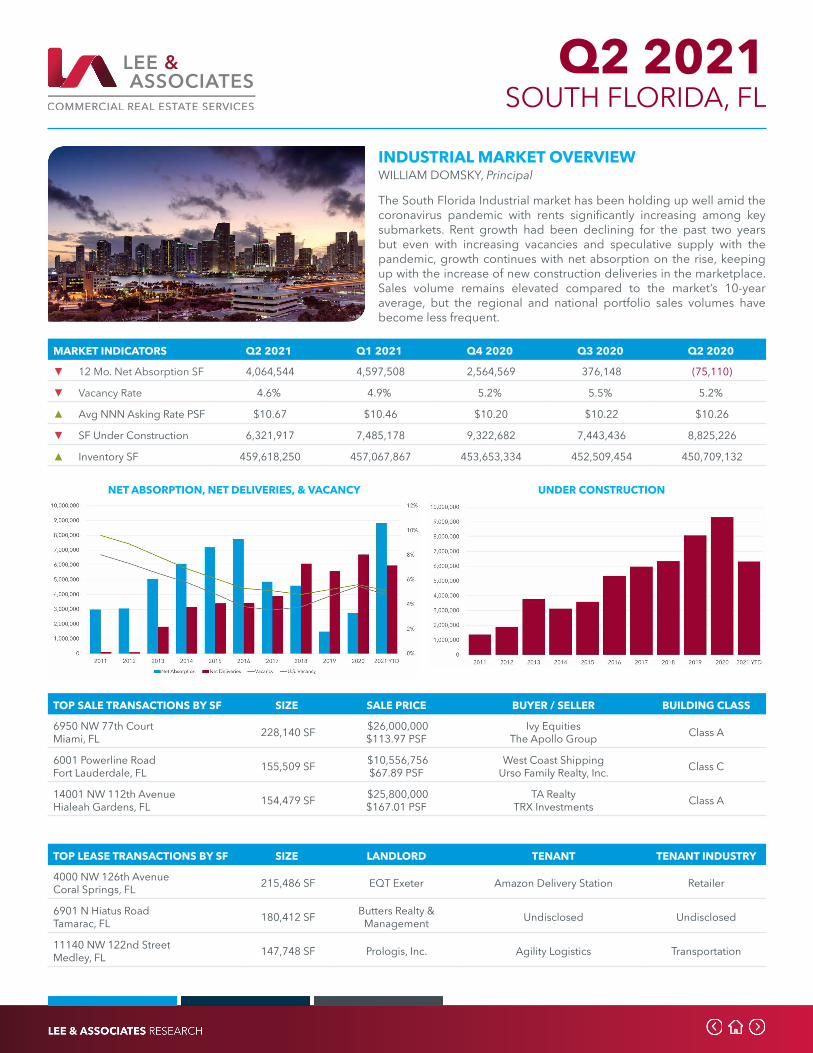
The South Florida Industrial market has been holding up well amid the coronavirus pandemic with rents significantly increasing among key submarkets. Rent growth had been declining for the past two years but even with increasing vacancies and speculative supply with the pandemic, growth continues with net absorption on the rise, keeping up with the increase of new construction deliveries in the marketplace. Sales volume remains elevated compared to the market’s 10-year average, but the regional and national portfolio sales volumes have become less frequent.
NET ABSORPTION, NET DELIVERIES, & VACANCY UNDER CONSTRUCTION
TOP LEASE TRANSACTIONS BY SF SIZE LANDLORD TENANT TENANT INDUSTRY
4000 NW 126th AvenueCoral Springs, FL 215,486 SF EQT Exeter Amazon Delivery Station Retailer
6901 N Hiatus RoadTamarac, FL 180,412 SF Butters Realty &
Management Undisclosed Undisclosed
11140 NW 122nd StreetMedley, FL 147,748 SF Prologis, Inc. Agility Logistics Transportation
TOP SALE TRANSACTIONS BY SF SIZE SALE PRICE BUYER / SELLER BUILDING CLASS
6950 NW 77th CourtMiami, FL 228,140 SF $26,000,000
$113.97 PSFIvy Equities
The Apollo Group Class A
6001 Powerline RoadFort Lauderdale, FL 155,509 SF $10,556,756
$67.89 PSFWest Coast Shipping
Urso Family Realty, Inc. Class C
14001 NW 112th AvenueHialeah Gardens, FL 154,479 SF $25,800,000
$167.01 PSFTA Realty
TRX Investments Class A
MARKET INDICATORS Q2 2021 Q1 2021 Q4 2020 Q3 2020 Q2 2020
▼ 12 Mo. Net Absorption SF 4,064,544 4,597,508 2,564,569 376,148 (75,110)
▼ Vacancy Rate 4.6% 4.9% 5.2% 5.5% 5.2%
▲ Avg NNN Asking Rate PSF $10.67 $10.46 $10.20 $10.22 $10.26
▼ SF Under Construction 6,321,917 7,485,178 9,322,682 7,443,436 8,825,226
▲ Inventory SF 459,618,250 457,067,867 453,653,334 452,509,454 450,709,132
Q2 2021 ATLANTA, GA
INDUSTRIAL MARKET OVERVIEWWILLIE CANDLER, Research Associate
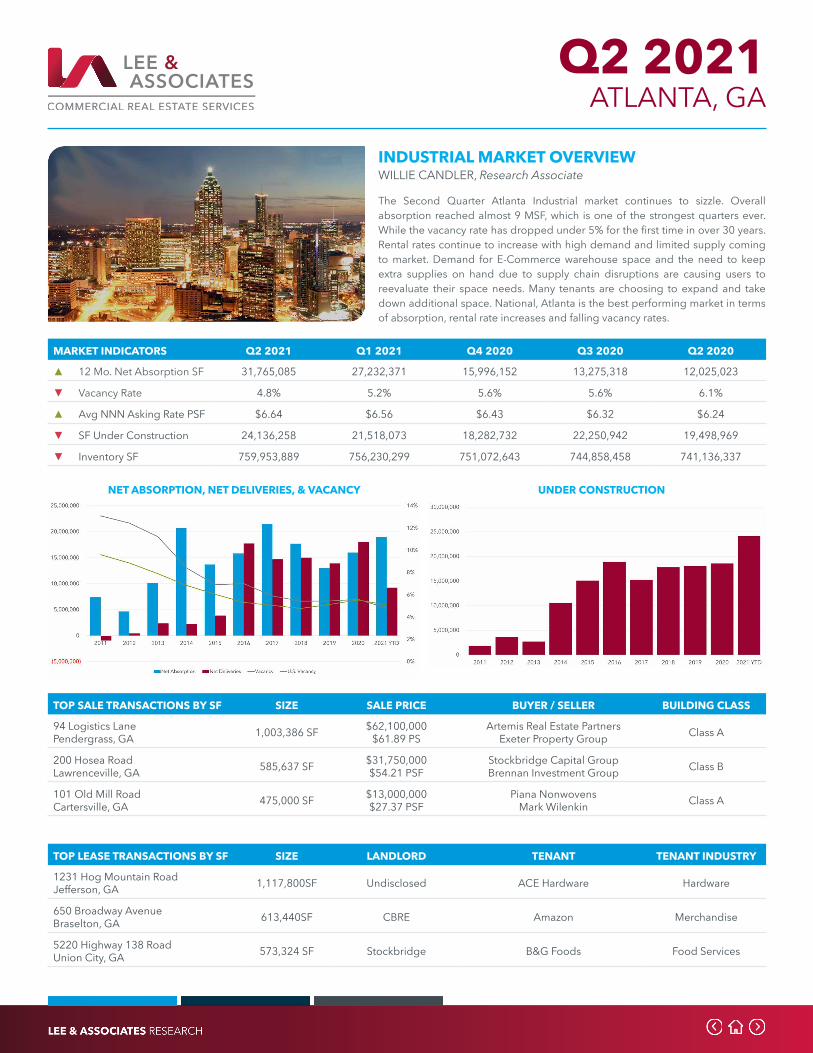
The Second Quarter Atlanta Industrial market continues to sizzle. Overall absorption reached almost 9 MSF, which is one of the strongest quarters ever. While the vacancy rate has dropped under 5% for the first time in over 30 years. Rental rates continue to increase with high demand and limited supply coming to market. Demand for E-Commerce warehouse space and the need to keep extra supplies on hand due to supply chain disruptions are causing users to reevaluate their space needs. Many tenants are choosing to expand and take down additional space. National, Atlanta is the best performing market in terms of absorption, rental rate increases and falling vacancy rates.
NET ABSORPTION, NET DELIVERIES, & VACANCY UNDER CONSTRUCTION
TOP LEASE TRANSACTIONS BY SF SIZE LANDLORD TENANT TENANT INDUSTRY
1231 Hog Mountain RoadJefferson, GA 1,117,800SF Undisclosed ACE Hardware Hardware
650 Broadway AvenueBraselton, GA 613,440SF CBRE Amazon Merchandise
5220 Highway 138 RoadUnion City, GA 573,324 SF Stockbridge B&G Foods Food Services
TOP SALE TRANSACTIONS BY SF SIZE SALE PRICE BUYER / SELLER BUILDING CLASS
94 Logistics LanePendergrass, GA 1,003,386 SF $62,100,000
$61.89 PSArtemis Real Estate Partners
Exeter Property Group Class A
200 Hosea RoadLawrenceville, GA 585,637 SF $31,750,000
$54.21 PSFStockbridge Capital GroupBrennan Investment Group Class B
101 Old Mill RoadCartersville, GA 475,000 SF $13,000,000
$27.37 PSFPiana Nonwovens
Mark Wilenkin Class A
MARKET INDICATORS Q2 2021 Q1 2021 Q4 2020 Q3 2020 Q2 2020
▲ 12 Mo. Net Absorption SF 31,765,085 27,232,371 15,996,152 13,275,318 12,025,023
▼ Vacancy Rate 4.8% 5.2% 5.6% 5.6% 6.1%
▲ Avg NNN Asking Rate PSF $6.64 $6.56 $6.43 $6.32 $6.24
▼ SF Under Construction 24,136,258 21,518,073 18,282,732 22,250,942 19,498,969
▼ Inventory SF 759,953,889 756,230,299 751,072,643 744,858,458 741,136,337
Q2 2021 CHICAGO, IL
INDUSTRIAL MARKET OVERVIEWDIANA PEREZ, Director of Research
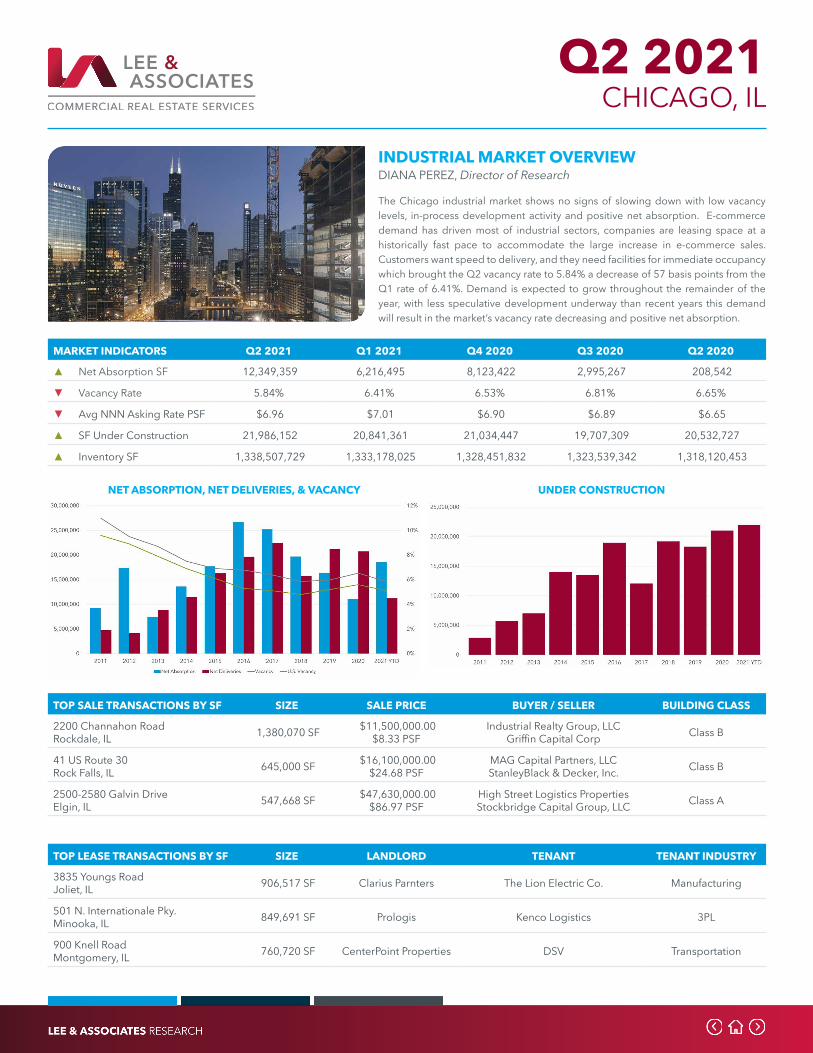
The Chicago industrial market shows no signs of slowing down with low vacancy levels, in-process development activity and positive net absorption. E-commerce demand has driven most of industrial sectors, companies are leasing space at a historically fast pace to accommodate the large increase in e-commerce sales. Customers want speed to delivery, and they need facilities for immediate occupancy which brought the Q2 vacancy rate to 5.84% a decrease of 57 basis points from the Q1 rate of 6.41%. Demand is expected to grow throughout the remainder of the year, with less speculative development underway than recent years this demand will result in the market’s vacancy rate decreasing and positive net absorption.
NET ABSORPTION, NET DELIVERIES, & VACANCY UNDER CONSTRUCTION
TOP LEASE TRANSACTIONS BY SF SIZE LANDLORD TENANT TENANT INDUSTRY
3835 Youngs RoadJoliet, IL 906,517 SF Clarius Parnters The Lion Electric Co. Manufacturing
501 N. Internationale Pky.Minooka, IL 849,691 SF Prologis Kenco Logistics 3PL
900 Knell RoadMontgomery, IL 760,720 SF CenterPoint Properties DSV Transportation
TOP SALE TRANSACTIONS BY SF SIZE SALE PRICE BUYER / SELLER BUILDING CLASS
2200 Channahon RoadRockdale, IL 1,380,070 SF $11,500,000.00
$8.33 PSFIndustrial Realty Group, LLC
Griffin Capital Corp Class B
41 US Route 30Rock Falls, IL 645,000 SF $16,100,000.00
$24.68 PSFMAG Capital Partners, LLCStanleyBlack & Decker, Inc. Class B
2500-2580 Galvin DriveElgin, IL 547,668 SF $47,630,000.00
$86.97 PSFHigh Street Logistics PropertiesStockbridge Capital Group, LLC Class A
MARKET INDICATORS Q2 2021 Q1 2021 Q4 2020 Q3 2020 Q2 2020
▲ Net Absorption SF 12,349,359 6,216,495 8,123,422 2,995,267 208,542
▼ Vacancy Rate 5.84% 6.41% 6.53% 6.81% 6.65%
▼ Avg NNN Asking Rate PSF $6.96 $7.01 $6.90 $6.89 $6.65
▲ SF Under Construction 21,986,152 20,841,361 21,034,447 19,707,309 20,532,727
▲ Inventory SF 1,338,507,729 1,333,178,025 1,328,451,832 1,323,539,342 1,318,120,453
Q2 2021 BOSTON, MA
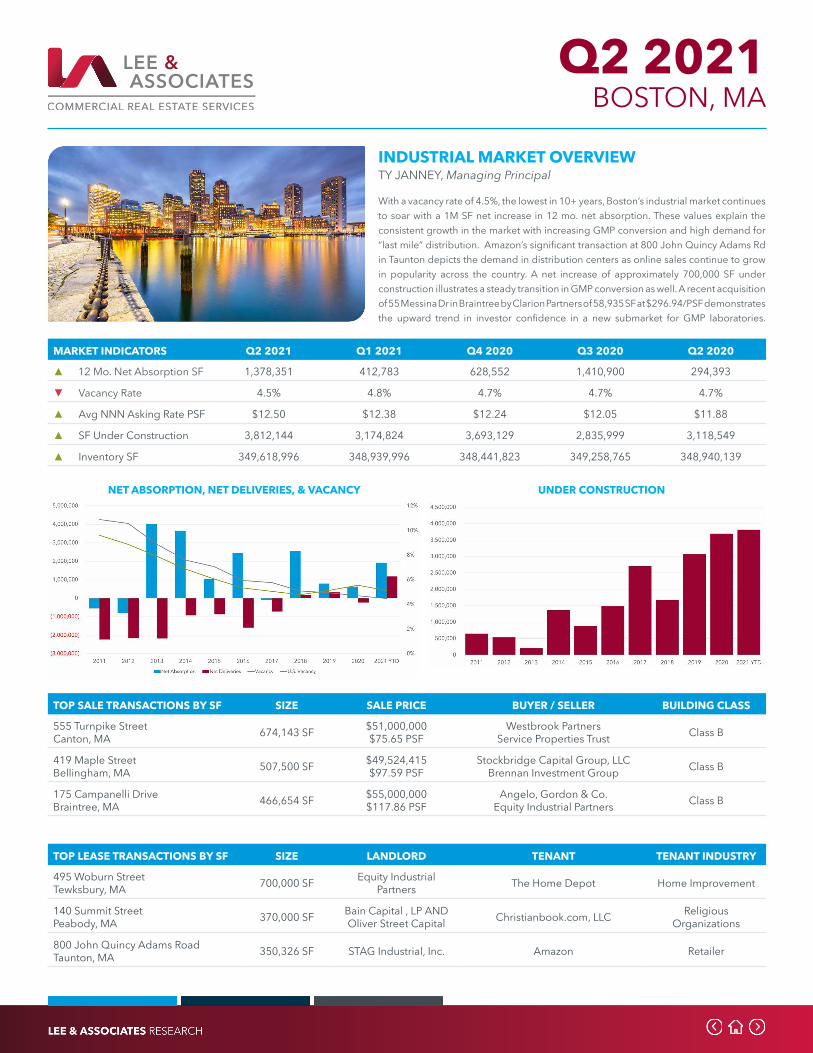
INDUSTRIAL MARKET OVERVIEWTY JANNEY, Managing Principal
With a vacancy rate of 4.5%, the lowest in 10+ years, Boston’s industrial market continues to soar with a 1M SF net increase in 12 mo. net absorption. These values explain the consistent growth in the market with increasing GMP conversion and high demand for “last mile” distribution. Amazon’s significant transaction at 800 John Quincy Adams Rd in Taunton depicts the demand in distribution centers as online sales continue to grow in popularity across the country. A net increase of approximately 700,000 SF under construction illustrates a steady transition in GMP conversion as well. A recent acquisition of 55 Messina Dr in Braintree by Clarion Partners of 58,935 SF at $296.94/PSF demonstrates the upward trend in investor confidence in a new submarket for GMP laboratories.
NET ABSORPTION, NET DELIVERIES, & VACANCY UNDER CONSTRUCTION
TOP LEASE TRANSACTIONS BY SF SIZE LANDLORD TENANT TENANT INDUSTRY
495 Woburn StreetTewksbury, MA 700,000 SF Equity Industrial
Partners The Home Depot Home Improvement
140 Summit StreetPeabody, MA 370,000 SF Bain Capital , LP AND
Oliver Street Capital Christianbook.com, LLC ReligiousOrganizations
800 John Quincy Adams RoadTaunton, MA 350,326 SF STAG Industrial, Inc. Amazon Retailer
TOP SALE TRANSACTIONS BY SF SIZE SALE PRICE BUYER / SELLER BUILDING CLASS
555 Turnpike StreetCanton, MA 674,143 SF $51,000,000
$75.65 PSFWestbrook Partners
Service Properties Trust Class B
419 Maple StreetBellingham, MA 507,500 SF $49,524,415
$97.59 PSFStockbridge Capital Group, LLC
Brennan Investment Group Class B
175 Campanelli DriveBraintree, MA 466,654 SF $55,000,000
$117.86 PSFAngelo, Gordon & Co.
Equity Industrial Partners Class B
MARKET INDICATORS Q2 2021 Q1 2021 Q4 2020 Q3 2020 Q2 2020
▲ 12 Mo. Net Absorption SF 1,378,351 412,783 628,552 1,410,900 294,393
▼ Vacancy Rate 4.5% 4.8% 4.7% 4.7% 4.7%
▲ Avg NNN Asking Rate PSF $12.50 $12.38 $12.24 $12.05 $11.88
▲ SF Under Construction 3,812,144 3,174,824 3,693,129 2,835,999 3,118,549
▲ Inventory SF 349,618,996 348,939,996 348,441,823 349,258,765 348,940,139
Q2 2021 GREATER BALTIMORE, MD
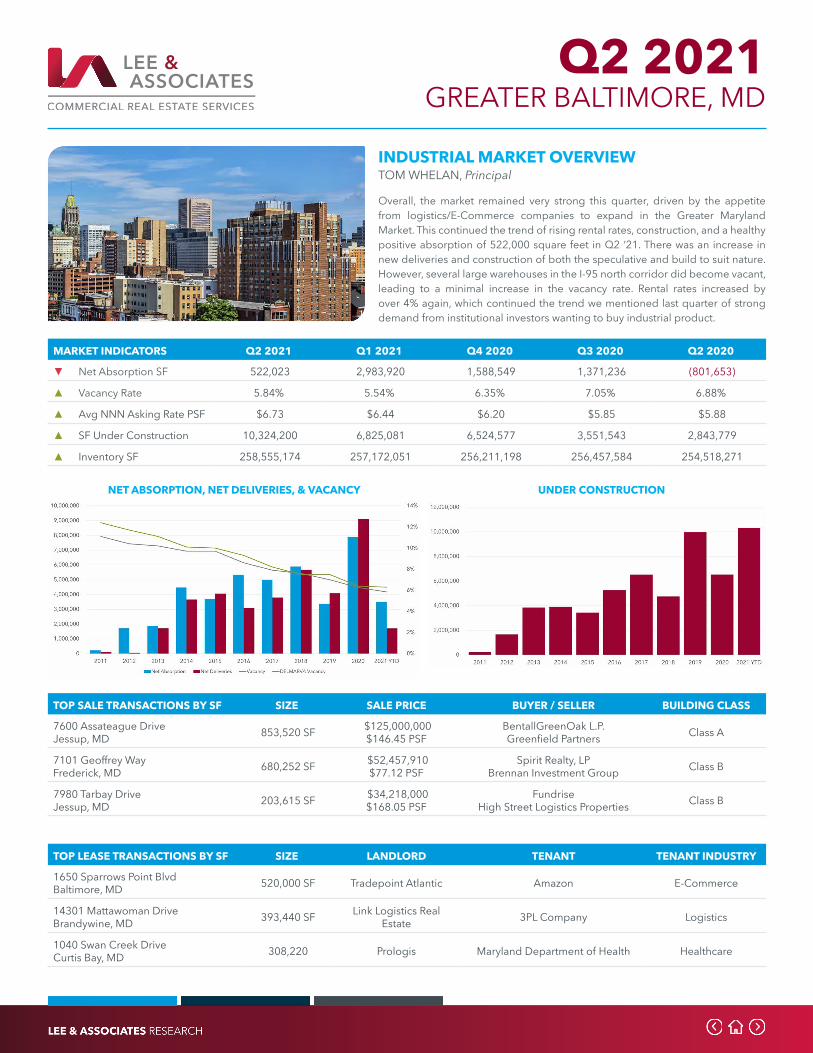
INDUSTRIAL MARKET OVERVIEWTOM WHELAN, Principal
Overall, the market remained very strong this quarter, driven by the appetite from logistics/E-Commerce companies to expand in the Greater Maryland Market. This continued the trend of rising rental rates, construction, and a healthy positive absorption of 522,000 square feet in Q2 ‘21. There was an increase in new deliveries and construction of both the speculative and build to suit nature. However, several large warehouses in the I-95 north corridor did become vacant, leading to a minimal increase in the vacancy rate. Rental rates increased by over 4% again, which continued the trend we mentioned last quarter of strong demand from institutional investors wanting to buy industrial product.
NET ABSORPTION, NET DELIVERIES, & VACANCY UNDER CONSTRUCTION
TOP LEASE TRANSACTIONS BY SF SIZE LANDLORD TENANT TENANT INDUSTRY
1650 Sparrows Point BlvdBaltimore, MD 520,000 SF Tradepoint Atlantic Amazon E-Commerce
14301 Mattawoman DriveBrandywine, MD 393,440 SF Link Logistics Real
Estate 3PL Company Logistics
1040 Swan Creek DriveCurtis Bay, MD 308,220 Prologis Maryland Department of Health Healthcare
TOP SALE TRANSACTIONS BY SF SIZE SALE PRICE BUYER / SELLER BUILDING CLASS
7600 Assateague DriveJessup, MD 853,520 SF $125,000,000
$146.45 PSFBentallGreenOak L.P.Greenfield Partners Class A
7101 Geoffrey WayFrederick, MD 680,252 SF $52,457,910
$77.12 PSFSpirit Realty, LP
Brennan Investment Group Class B
7980 Tarbay DriveJessup, MD 203,615 SF $34,218,000
$168.05 PSFFundrise
High Street Logistics Properties Class B
MARKET INDICATORS Q2 2021 Q1 2021 Q4 2020 Q3 2020 Q2 2020
▼ Net Absorption SF 522,023 2,983,920 1,588,549 1,371,236 (801,653)
▲ Vacancy Rate 5.84% 5.54% 6.35% 7.05% 6.88%
▲ Avg NNN Asking Rate PSF $6.73 $6.44 $6.20 $5.85 $5.88
▲ SF Under Construction 10,324,200 6,825,081 6,524,577 3,551,543 2,843,779
▲ Inventory SF 258,555,174 257,172,051 256,211,198 256,457,584 254,518,271

Q2 2021 DETROIT, MI
INDUSTRIAL MARKET OVERVIEWJON SAVOY, CCIM, SIOR, President
The Detroit Industrial Market currently hosts a 4.7% vacancy rate. New construction has nearly doubled, reaching 7,000,000 SF, a 200% increase since the second quarter of 2020. In June of 2021, Kansas City-based NorthPoint Development, LLC announced plans for a 1,000,000 SF industrial park in Shelby Township. In June of 2021, New York-based Ashley Capital, LLC, recently announced plans to develop the Livonia West Commerce Center, a 300,000 SF speculative development. The Flint Development Group, another Kansas City-based developer is under construction on a 713,796 SF building in Pontiac, as well as a 711,000 SF building on the former Ford Auto Plant site in Wixom.
NET ABSORPTION, NET DELIVERIES, & VACANCY UNDER CONSTRUCTION
TOP LEASE TRANSACTIONS BY SF SIZE LANDLORD TENANT TENANT INDUSTRY
20495 Pennsylvania Rd., Bldg #1Brownstown, MI 493,264 SF Ashley Capital, LLC Hollingsworth, LLC Logistics
1430 E. 10 Mile Rd., Bldg #3Hazel Park, MI 445,432 SF Ashley Capital, LLC Maryville Engineering Company,
Inc. Manufacturing
36501 Van Born RoadRomulus, MI 228,671 SF Ashley Capital, LLC Hodges Bonded Warehouse, Inc. Logistics
TOP SALE TRANSACTIONS BY SF SIZE SALE PRICE BUYER / SELLER BUILDING CLASS
6000 Wyoming StreetDetroit, MI 366,103 SF $39,795,000
$108.70 PSFW.P. Carey, Inc.
US Realty Advisors, LLC Class B
5100 S. Haggerty RoadCanton, MI 248,000 SF Undisclosed Undisclosed
United States Steel Corp. Class C
5260 S. Haggerty RoadCanton, MI 195,000 SF Undisclosed Undisclosed
United States Steel Corp/ Class C
MARKET INDICATORS Q2 2021 Q1 2021 Q4 2020 Q3 2020 Q2 2020
▼ 12 Mo. Net Absorption SF 1,193,616 1,558,719 (1,341,791) 1,320,848 2,701,245
▲ Vacancy Rate 4.7% 4.4% 4.4% 4.1% 4.1%
▲ Avg NNN Asking Rate PSF $7.34 $7.16 $7.07 $6.96 $6.90
▲ SF Under Construction 7,050,395 6,793,197 7,410,603 6,782,514 4,909,173
▲ Inventory SF 601,389,259 599,555,205 597,558,552 596,981,180 596,779,021
Q2 2021 DURHAM, NC
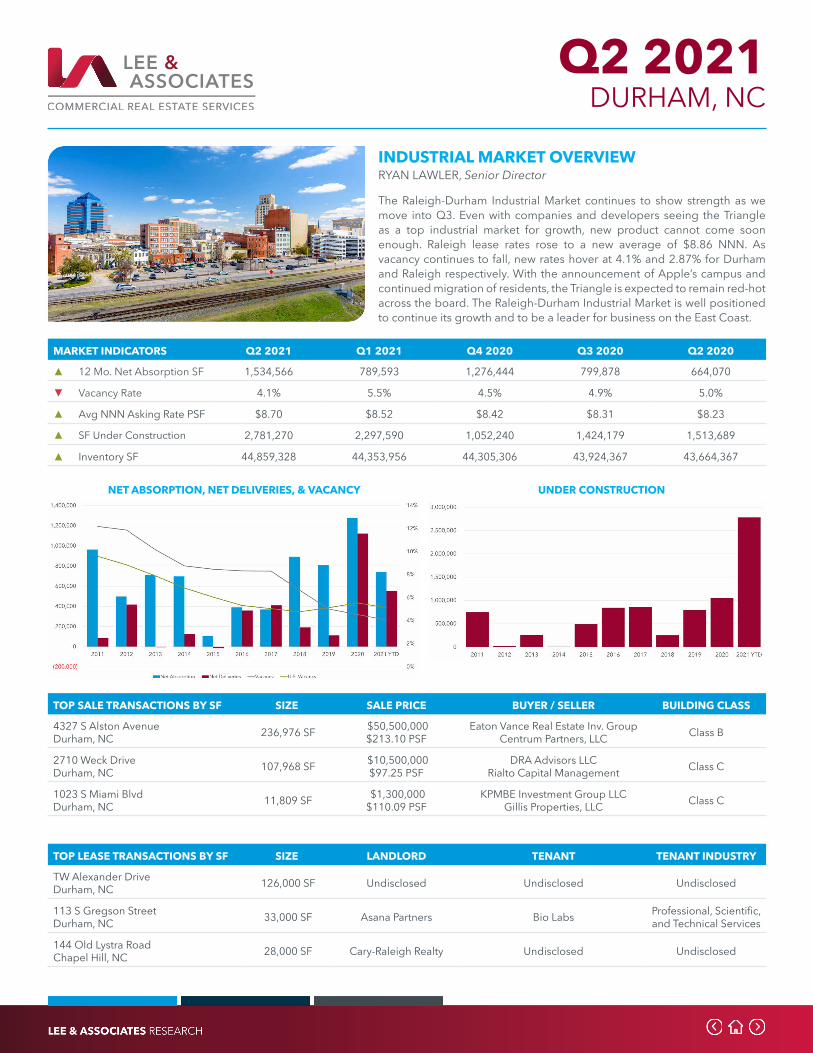
INDUSTRIAL MARKET OVERVIEWRYAN LAWLER, Senior Director
The Raleigh-Durham Industrial Market continues to show strength as we move into Q3. Even with companies and developers seeing the Triangle as a top industrial market for growth, new product cannot come soon enough. Raleigh lease rates rose to a new average of $8.86 NNN. As vacancy continues to fall, new rates hover at 4.1% and 2.87% for Durham and Raleigh respectively. With the announcement of Apple’s campus and continued migration of residents, the Triangle is expected to remain red-hot across the board. The Raleigh-Durham Industrial Market is well positioned to continue its growth and to be a leader for business on the East Coast.
NET ABSORPTION, NET DELIVERIES, & VACANCY UNDER CONSTRUCTION
TOP LEASE TRANSACTIONS BY SF SIZE LANDLORD TENANT TENANT INDUSTRY
TW Alexander DriveDurham, NC 126,000 SF Undisclosed Undisclosed Undisclosed
113 S Gregson StreetDurham, NC 33,000 SF Asana Partners Bio Labs Professional, Scientific,
and Technical Services
144 Old Lystra RoadChapel Hill, NC 28,000 SF Cary-Raleigh Realty Undisclosed Undisclosed
TOP SALE TRANSACTIONS BY SF SIZE SALE PRICE BUYER / SELLER BUILDING CLASS
4327 S Alston AvenueDurham, NC 236,976 SF $50,500,000
$213.10 PSFEaton Vance Real Estate Inv. Group
Centrum Partners, LLC Class B
2710 Weck DriveDurham, NC 107,968 SF $10,500,000
$97.25 PSFDRA Advisors LLC
Rialto Capital Management Class C
1023 S Miami BlvdDurham, NC 11,809 SF $1,300,000
$110.09 PSFKPMBE Investment Group LLC
Gillis Properties, LLC Class C
MARKET INDICATORS Q2 2021 Q1 2021 Q4 2020 Q3 2020 Q2 2020
▲ 12 Mo. Net Absorption SF 1,534,566 789,593 1,276,444 799,878 664,070
▼ Vacancy Rate 4.1% 5.5% 4.5% 4.9% 5.0%
▲ Avg NNN Asking Rate PSF $8.70 $8.52 $8.42 $8.31 $8.23
▲ SF Under Construction 2,781,270 2,297,590 1,052,240 1,424,179 1,513,689
▲ Inventory SF 44,859,328 44,353,956 44,305,306 43,924,367 43,664,367

Q2 2021 RALEIGH, NC
INDUSTRIAL MARKET OVERVIEWRYAN LAWLER, Senior Director
The Raleigh-Durham Industrial Market continues to show strength as we move into Q3. Even with companies and developers seeing the Triangle as a top industrial market for growth, new product cannot come soon enough. Raleigh lease rates rose to a new average of $8.86 NNN. As vacancy continues to fall, new rates hover at 4.1% and 2.87% for Durham and Raleigh respectively. With the announcement of Apple’s campus and continued migration of residents, the Triangle is expected to remain red-hot across the board. The Raleigh-Durham Industrial Market is well positioned to continue its growth and to be a leader for business on the East Coast.
NET ABSORPTION, NET DELIVERIES, & VACANCY UNDER CONSTRUCTION
TOP LEASE TRANSACTIONS BY SF SIZE LANDLORD TENANT TENANT INDUSTRY
2201 S Wilmington StreetRaleigh, NC 169,352 SF LM Real Estate Partners BlueSky Resource Solutions Administrative and
Support Services
Freedom Drive & New Bern AvenueRaleigh, NC 129,000 SF AI Neyer Amazon Retailer
9301 Globe Center DriveMorrisville, NC 111,128 SF UBS Financial Services
Inc. Park Communications Manufacturing
TOP SALE TRANSACTIONS BY SF SIZE SALE PRICE BUYER / SELLER BUILDING CLASS
1053 Shotwell RoadClayton, NC 343,414 SF $33,980,000
$99.01 PSFSIF CDC Freezer LLCCrown Raleigh IV, LLC Class B
390 Spectrum DriveKnightdale, NC 204,220 SF $705,000
$3.45 PSFHodge Road Building 7 LLC
Richardson Jerry A & James E Class A
1200 Innovation AvenueMorrisville, NC 175,951 SF $24,370,000
$138.48 PSFAsb Raleigh Woodlake LP
Duke Realty, LP Class A
MARKET INDICATORS Q2 2021 Q1 2021 Q4 2020 Q3 2020 Q2 2020
▲ 12 Mo. Net Absorption SF 3,826,768 3,025,306 2,679,481 2,539,462 293,615
▼ Vacancy Rate 2.87% 3.49% 3.39% 3.83% 3.50%
▲ Avg NNN Asking Rate PSF $8.86 $8.69 $8.59 $8.48 $8.39
▲ SF Under Construction 1,139,741 801,595 737,739 822,104 3,590,131
▲ Inventory SF 92,480,433 92,439,733 92,464,405 91,915,405 89,111,486
Q2 2021 NORTHERN & CENTRAL, NJ
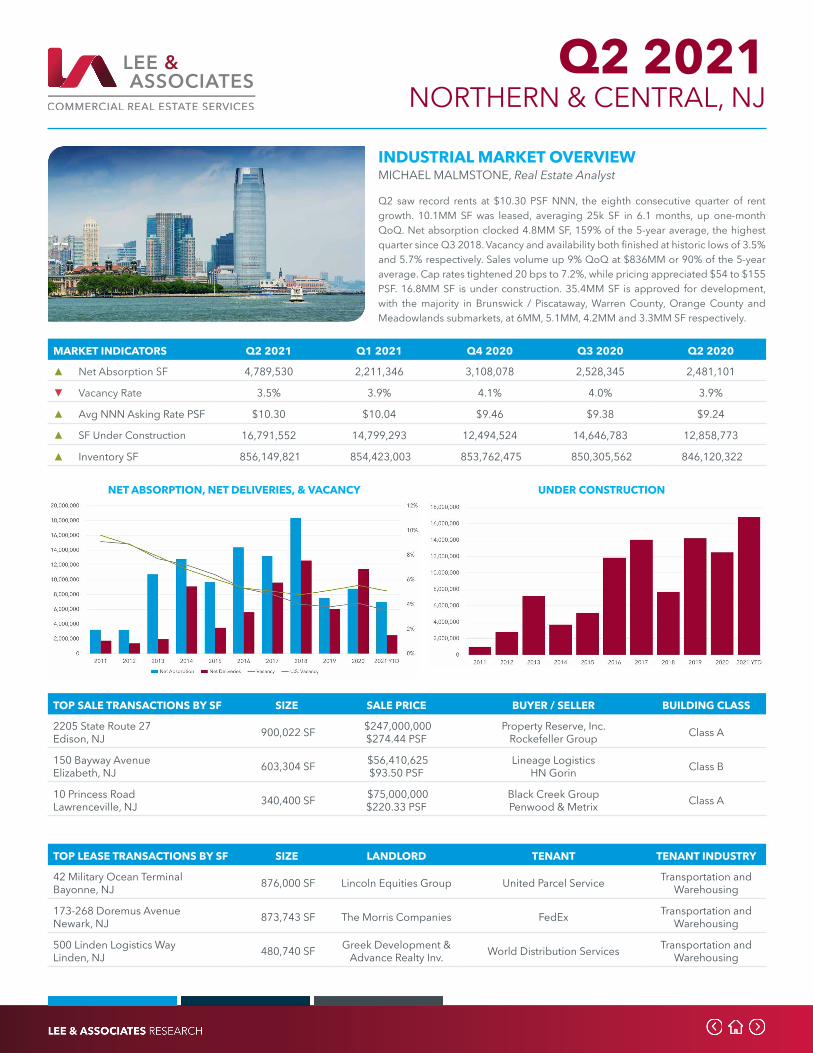
INDUSTRIAL MARKET OVERVIEWMICHAEL MALMSTONE, Real Estate Analyst
Q2 saw record rents at $10.30 PSF NNN, the eighth consecutive quarter of rent growth. 10.1MM SF was leased, averaging 25k SF in 6.1 months, up one-month QoQ. Net absorption clocked 4.8MM SF, 159% of the 5-year average, the highest quarter since Q3 2018. Vacancy and availability both finished at historic lows of 3.5% and 5.7% respectively. Sales volume up 9% QoQ at $836MM or 90% of the 5-year average. Cap rates tightened 20 bps to 7.2%, while pricing appreciated $54 to $155 PSF. 16.8MM SF is under construction. 35.4MM SF is approved for development, with the majority in Brunswick / Piscataway, Warren County, Orange County and Meadowlands submarkets, at 6MM, 5.1MM, 4.2MM and 3.3MM SF respectively.
NET ABSORPTION, NET DELIVERIES, & VACANCY UNDER CONSTRUCTION
TOP LEASE TRANSACTIONS BY SF SIZE LANDLORD TENANT TENANT INDUSTRY
42 Military Ocean TerminalBayonne, NJ 876,000 SF Lincoln Equities Group United Parcel Service Transportation and
Warehousing
173-268 Doremus AvenueNewark, NJ 873,743 SF The Morris Companies FedEx Transportation and
Warehousing
500 Linden Logistics WayLinden, NJ 480,740 SF Greek Development &
Advance Realty Inv. World Distribution Services Transportation and Warehousing
TOP SALE TRANSACTIONS BY SF SIZE SALE PRICE BUYER / SELLER BUILDING CLASS
2205 State Route 27Edison, NJ 900,022 SF $247,000,000
$274.44 PSFProperty Reserve, Inc.
Rockefeller Group Class A
150 Bayway AvenueElizabeth, NJ 603,304 SF $56,410,625
$93.50 PSFLineage Logistics
HN Gorin Class B
10 Princess RoadLawrenceville, NJ 340,400 SF $75,000,000
$220.33 PSFBlack Creek GroupPenwood & Metrix Class A
MARKET INDICATORS Q2 2021 Q1 2021 Q4 2020 Q3 2020 Q2 2020
▲ Net Absorption SF 4,789,530 2,211,346 3,108,078 2,528,345 2,481,101
▼ Vacancy Rate 3.5% 3.9% 4.1% 4.0% 3.9%
▲ Avg NNN Asking Rate PSF $10.30 $10.04 $9.46 $9.38 $9.24
▲ SF Under Construction 16,791,552 14,799,293 12,494,524 14,646,783 12,858,773
▲ Inventory SF 856,149,821 854,423,003 853,762,475 850,305,562 846,120,322

Q2 2021 RENO, NV
INDUSTRIAL MARKET OVERVIEWLYLE CHAMBERLAIN, President
It seems that each quarter, the vacancy in Norther Nevada continues to drop. Well below the national average, this continues to put pressure on rents in the area, although those too, especially when looking at the large Logistics market in the area, are below average. This combination continues to keep demand solid in the area. While there will be much of the “Under Construction” delivered in the next few quarters, I expect the vacancy will still stay low, and the interest in the Sales market will be, again, hot. The Price per Square Foot price continues to rise as the Cap rates drop. With local available land dwindling, this trend should continue.
NET ABSORPTION, NET DELIVERIES, & VACANCY UNDER CONSTRUCTION
TOP LEASE TRANSACTIONS BY SF SIZE LANDLORD TENANT TENANT INDUSTRY
N VirginiaReno, NV 795,726 SF North Point
Development Chewy Manufacturing
6125 EchoReno, NV 286,487 SF Becknell Development Undisclosed Undisclosed
9560 N VirginiaReno, NV 196,220 SF Panattoni Bender Warehousing Services
TOP SALE TRANSACTIONS BY SF SIZE SALE PRICE BUYER / SELLER BUILDING CLASS
901-909 E Glendale Ave ( Portfolio)Sparks, NV 448,000 SF $28,888,240
$64.48 PSFBlackstone Real Estate Income Trust
LBA Realty Class B
1101-1165 E Glendale Ave ( Portfolio)Sparks, NV 405,225 SF $29,894,355
$73.77 PSFBlackstone Real Estate Income Trust,
LBA Realty Class C
960-990 E Greg St (Part of Portfolio)Sparks, NV 299,200 SF $21,457,921
$71.72 PSFBlackstone Real Estate Income Trust
LBA Realty Class B
MARKET INDICATORS Q2 2021 Q1 2021 Q4 2020 Q3 2020 Q2 2020
▼ 12 Mo. Net Absorption SF 4,485,742 5,096,009 1,936,234 5,996,166 5,761,323
▼ Vacancy Rate 3.8% 4.6% 7.1% 6.9% 6.5%
▲ Avg NNN Asking Rate PSF $7.45 $7.39 $7.33 $7.26 $7.20
▲ SF Under Construction 3,530,762 3,504,102 3,687,318 1,658,507 2,817,263
◀ ► Inventory SF 103,804,601 103,804,601 103,399,145 103,167,367 102,016,869
Q2 2021 CINCINNATI, OH
INDUSTRIAL MARKET OVERVIEWGARY FISHER, Vice President
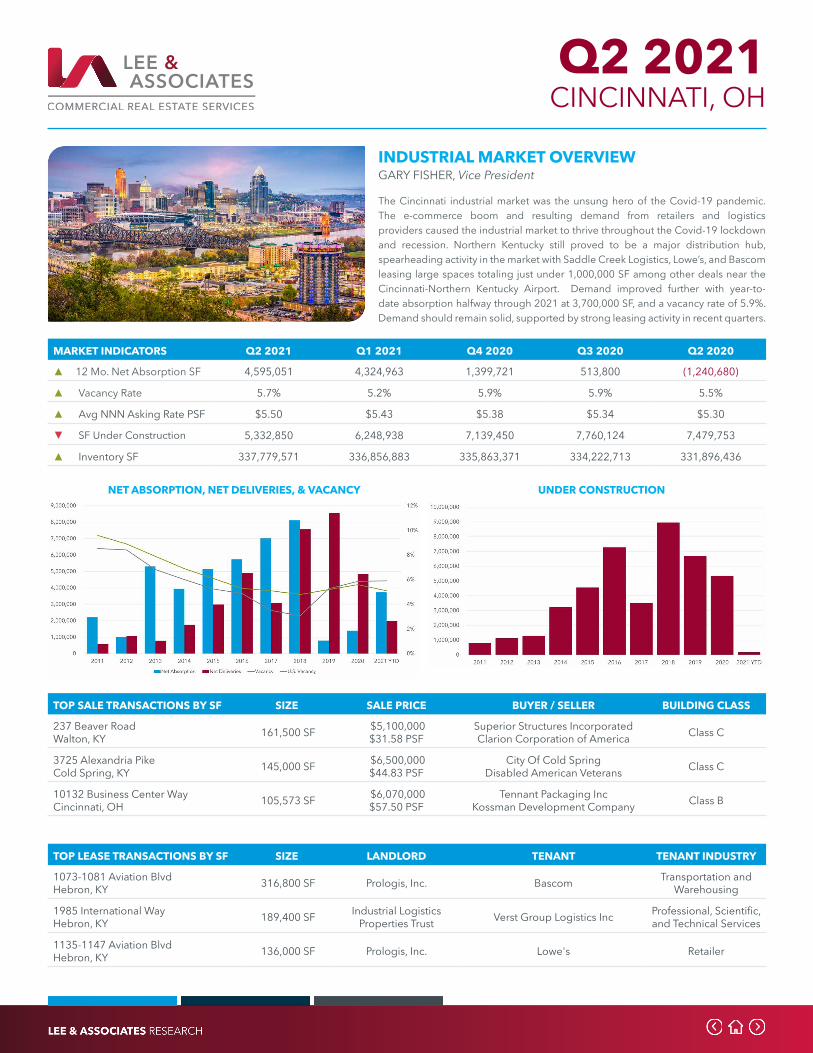
The Cincinnati industrial market was the unsung hero of the Covid-19 pandemic. The e-commerce boom and resulting demand from retailers and logistics providers caused the industrial market to thrive throughout the Covid-19 lockdown and recession. Northern Kentucky still proved to be a major distribution hub, spearheading activity in the market with Saddle Creek Logistics, Lowe’s, and Bascom leasing large spaces totaling just under 1,000,000 SF among other deals near the Cincinnati-Northern Kentucky Airport. Demand improved further with year-to-date absorption halfway through 2021 at 3,700,000 SF, and a vacancy rate of 5.9%. Demand should remain solid, supported by strong leasing activity in recent quarters.
NET ABSORPTION, NET DELIVERIES, & VACANCY UNDER CONSTRUCTION
TOP LEASE TRANSACTIONS BY SF SIZE LANDLORD TENANT TENANT INDUSTRY
1073-1081 Aviation BlvdHebron, KY 316,800 SF Prologis, Inc. Bascom Transportation and
Warehousing
1985 International WayHebron, KY 189,400 SF Industrial Logistics
Properties Trust Verst Group Logistics Inc Professional, Scientific, and Technical Services
1135-1147 Aviation BlvdHebron, KY 136,000 SF Prologis, Inc. Lowe's Retailer
TOP SALE TRANSACTIONS BY SF SIZE SALE PRICE BUYER / SELLER BUILDING CLASS
237 Beaver RoadWalton, KY 161,500 SF $5,100,000
$31.58 PSFSuperior Structures IncorporatedClarion Corporation of America Class C
3725 Alexandria PikeCold Spring, KY 145,000 SF $6,500,000
$44.83 PSFCity Of Cold Spring
Disabled American Veterans Class C
10132 Business Center WayCincinnati, OH 105,573 SF $6,070,000
$57.50 PSFTennant Packaging Inc
Kossman Development Company Class B
MARKET INDICATORS Q2 2021 Q1 2021 Q4 2020 Q3 2020 Q2 2020
▲ 12 Mo. Net Absorption SF 4,595,051 4,324,963 1,399,721 513,800 (1,240,680)
▲ Vacancy Rate 5.7% 5.2% 5.9% 5.9% 5.5%
▲ Avg NNN Asking Rate PSF $5.50 $5.43 $5.38 $5.34 $5.30
▼ SF Under Construction 5,332,850 6,248,938 7,139,450 7,760,124 7,479,753
▲ Inventory SF 337,779,571 336,856,883 335,863,371 334,222,713 331,896,436

Q2 2021 CLEVELAND, OH
INDUSTRIAL MARKET OVERVIEWCONNOR KROUSE, Associate
Cleveland’s Industrial Market has proven resilient amid the pandemic. With the increase of consumers shopping from home, e-commerce has been a driving force in Cleveland’s Industrial Market. E-Commerce has driven leasing activity to all-time highs as Tenants seek to expand their distribution networks to fulfill a surge of online orders. Although demand for logistics space remains high, it is offset by offset by weakness in Manufacturing. With the recent reduction in export growth and labor shortages, the Manufacturing sector faces difficulties. While the development pipeline is limited, it will help keep vacancies (4.9%) modest over the upcoming quarters.
NET ABSORPTION, NET DELIVERIES, & VACANCY UNDER CONSTRUCTION
TOP LEASE TRANSACTIONS BY SF SIZE LANDLORD TENANT TENANT INDUSTRY
6880 Lake Abram DriveMiddleburg Heights, OH 71,305 SF 54 Chevy Lake Abram
LLC ADC Trucking Transportation
5638-5744 Transportation Blvd.Garfield Heights, OH 62,652 SF ICP LLC Innoplast and Thermoprene Manufacturing
12400 Plaza DriveParma, OH 39,657 SF PARMA-PLAZA DRIVE Stevens Delivery Systems Transportation
TOP SALE TRANSACTIONS BY SF SIZE SALE PRICE BUYER / SELLER BUILDING CLASS
10801 Madison AvenueCleveland, OH 168,750 SF $30,800,000
$182.52 PSF10801 Madison LLC
10801 Madison Avenue Owner, LLC Class A
37200 Research DriveEastlake, OH 105,557 SF $6,000,000
$56.84 PSFTenCLE37200Research LLC
Research Dr Eastlake OH LLC Class B
945 N. Industrial PkwyBrunswick, OH 50,289 SF $5,650,000
$112.35 PSFAcarthur LLC, Trason CO Springs Trason FL
Industrial Parkway Partners Class B
MARKET INDICATORS Q2 2021 Q1 2021 Q4 2020 Q3 2020 Q2 2020
▲ 12 Mo. Net Absorption SF 814,000 90,482 1,399,721 513,800 (1,240,680)
▲ Vacancy Rate 4.9% 4.6% 5.9% 5.9% 5.5%
▲ Avg NNN Asking Rate PSF $4.45 $4.41 $5.38 $5.34 $5.30
▲ SF Under Construction 4,030,000 2,910,000 7,139,450 7,760,124 7,479,753
▲ Inventory SF 288,000,000 287,000,000 335,863,371 334,222,713 331,896,436

Q2 2021 COLUMBUS, OH
INDUSTRIAL MARKET OVERVIEWMIKE SPENCER, SIOR, Principal / Broker
Occupiers are currently in a “wait period” for new product to be delivered. Project commencements will help offset some of the demand later in the year, but the market is experiencing high demand this summer. We are seeing bidding wars for space - a first for even the most veteran brokers of Central Ohio. The demand is anticipated to continue through the end of the year. Buildings are being leased before they reach substantial completion. Rental rates continue to see upward pressure - as land pricing and construction materials trend higher.
NET ABSORPTION, NET DELIVERIES, & VACANCY UNDER CONSTRUCTION
TOP LEASE TRANSACTIONS BY SF SIZE LANDLORD TENANT TENANT INDUSTRY
Jackson Pike SR 104Commercial Point, OH 1,022,000 SF VanTrust Bath & Body Works Retail
4077 Airbase RoadColumbus, OH 742,140 SF CT Realty TJX Companies Retail
5999 Bixby RoadCanal Winchester, OH 436,079 SF Hillwood / NorthPoint Covetrus Pet Care
TOP SALE TRANSACTIONS BY SF SIZE SALE PRICE BUYER / SELLER BUILDING CLASS
1566 Rail Court SColumbus, OH 357,504 SF $31,500,000
$88.11 PSFInd Log Prop Trust
Duke / CRAA Class A
510 Sunbury RoadColumbus, OH 296,372 SF $60,000,000
$202.45 PSFMiramar CapitalMontwards, LLC Class A
4400 Hamilton RoadGroveport, OH 569,584 SF $27,000,000
$47.40 PSFWP Carey
Ind Comm Properties Class B
MARKET INDICATORS Q2 2021 Q1 2021 Q4 2020 Q3 2020 Q2 2020
▼ 12 Mo. Net Absorption SF 2,884,639 5,016,330 2,408,168 3,415,040 2,743,083
▲ Vacancy Rate 5.60% 4.90% 5.90% 6.70% 5.60%
▲ Avg NNN Asking Rate PSF $4.41 $4.36 $4.27 $4.23 $4.22
▲ SF Under Construction 8,874,087 6,634,928 7,376,930 8,637,370 9,491,411
▲ Inventory SF 320,621,510 318,273,909 311,597,034 307,199,412 303,367,196
Q2 2021 PHILADELPHIA REGION, PA
INDUSTRIAL MARKET OVERVIEWJOTH WHITE, Research Analyst
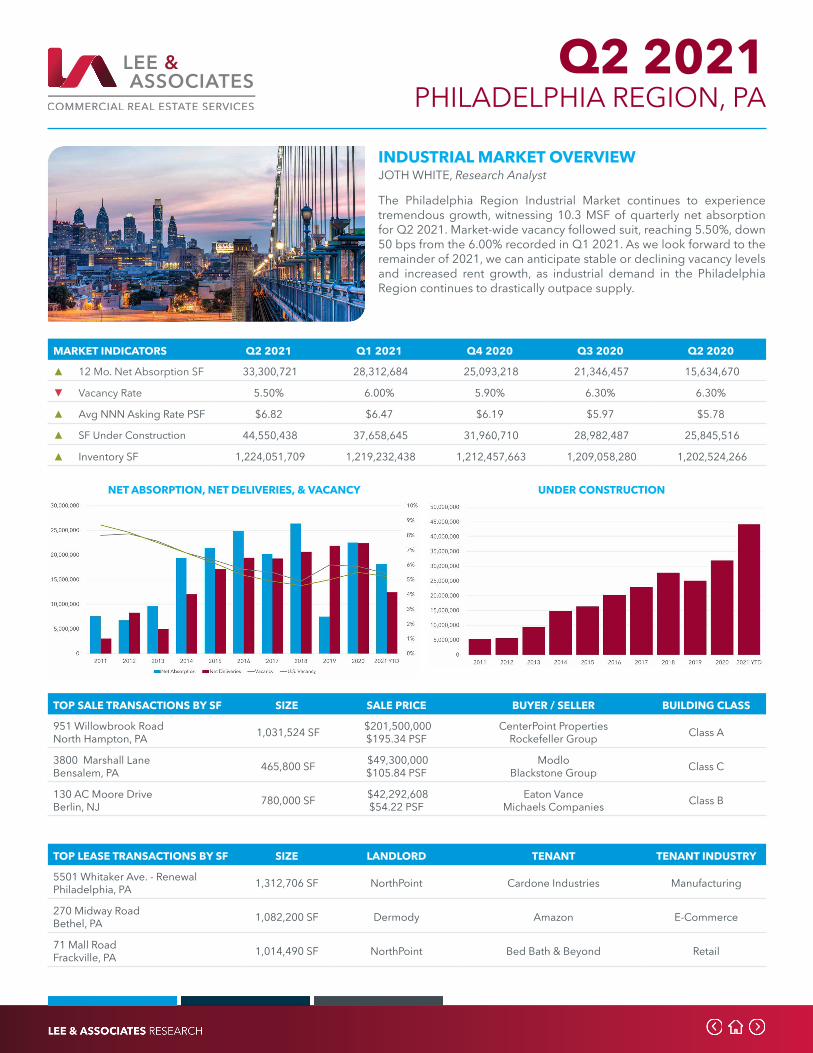
The Philadelphia Region Industrial Market continues to experience tremendous growth, witnessing 10.3 MSF of quarterly net absorption for Q2 2021. Market-wide vacancy followed suit, reaching 5.50%, down 50 bps from the 6.00% recorded in Q1 2021. As we look forward to the remainder of 2021, we can anticipate stable or declining vacancy levels and increased rent growth, as industrial demand in the Philadelphia Region continues to drastically outpace supply.
NET ABSORPTION, NET DELIVERIES, & VACANCY UNDER CONSTRUCTION
TOP LEASE TRANSACTIONS BY SF SIZE LANDLORD TENANT TENANT INDUSTRY
5501 Whitaker Ave. - RenewalPhiladelphia, PA 1,312,706 SF NorthPoint Cardone Industries Manufacturing
270 Midway RoadBethel, PA 1,082,200 SF Dermody Amazon E-Commerce
71 Mall RoadFrackville, PA 1,014,490 SF NorthPoint Bed Bath & Beyond Retail
TOP SALE TRANSACTIONS BY SF SIZE SALE PRICE BUYER / SELLER BUILDING CLASS
951 Willowbrook RoadNorth Hampton, PA 1,031,524 SF $201,500,000
$195.34 PSFCenterPoint Properties
Rockefeller Group Class A
3800 Marshall LaneBensalem, PA 465,800 SF $49,300,000
$105.84 PSFModlo
Blackstone Group Class C
130 AC Moore DriveBerlin, NJ 780,000 SF $42,292,608
$54.22 PSFEaton Vance
Michaels Companies Class B
MARKET INDICATORS Q2 2021 Q1 2021 Q4 2020 Q3 2020 Q2 2020
▲ 12 Mo. Net Absorption SF 33,300,721 28,312,684 25,093,218 21,346,457 15,634,670
▼ Vacancy Rate 5.50% 6.00% 5.90% 6.30% 6.30%
▲ Avg NNN Asking Rate PSF $6.82 $6.47 $6.19 $5.97 $5.78
▲ SF Under Construction 44,550,438 37,658,645 31,960,710 28,982,487 25,845,516
▲ Inventory SF 1,224,051,709 1,219,232,438 1,212,457,663 1,209,058,280 1,202,524,266
Q2 2021 CHARLESTON, SC
INDUSTRIAL MARKET OVERVIEWCLARKE ATTAWAY, Associate
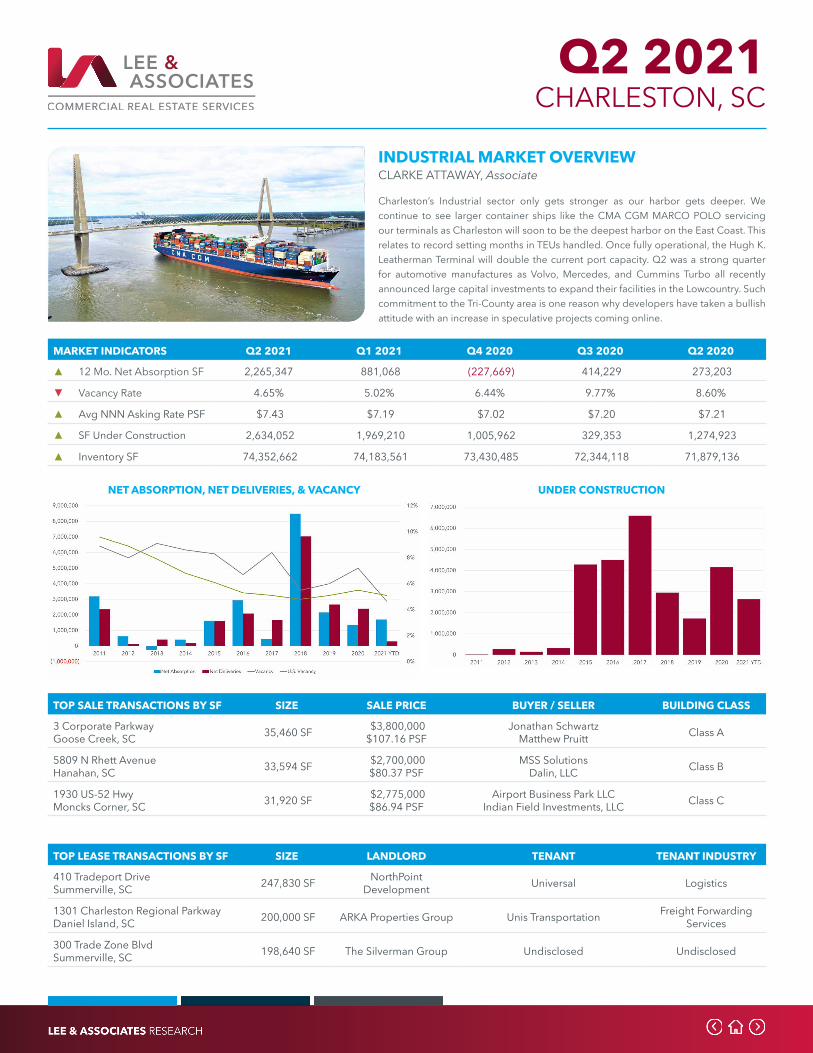
Charleston’s Industrial sector only gets stronger as our harbor gets deeper. We continue to see larger container ships like the CMA CGM MARCO POLO servicing our terminals as Charleston will soon to be the deepest harbor on the East Coast. This relates to record setting months in TEUs handled. Once fully operational, the Hugh K. Leatherman Terminal will double the current port capacity. Q2 was a strong quarter for automotive manufactures as Volvo, Mercedes, and Cummins Turbo all recently announced large capital investments to expand their facilities in the Lowcountry. Such commitment to the Tri-County area is one reason why developers have taken a bullish attitude with an increase in speculative projects coming online.
NET ABSORPTION, NET DELIVERIES, & VACANCY UNDER CONSTRUCTION
TOP LEASE TRANSACTIONS BY SF SIZE LANDLORD TENANT TENANT INDUSTRY
410 Tradeport DriveSummerville, SC 247,830 SF NorthPoint
Development Universal Logistics
1301 Charleston Regional ParkwayDaniel Island, SC 200,000 SF ARKA Properties Group Unis Transportation Freight Forwarding
Services
300 Trade Zone BlvdSummerville, SC 198,640 SF The Silverman Group Undisclosed Undisclosed
TOP SALE TRANSACTIONS BY SF SIZE SALE PRICE BUYER / SELLER BUILDING CLASS
3 Corporate ParkwayGoose Creek, SC 35,460 SF $3,800,000
$107.16 PSFJonathan Schwartz
Matthew Pruitt Class A
5809 N Rhett AvenueHanahan, SC 33,594 SF $2,700,000
$80.37 PSFMSS Solutions
Dalin, LLC Class B
1930 US-52 HwyMoncks Corner, SC 31,920 SF $2,775,000
$86.94 PSFAirport Business Park LLC
Indian Field Investments, LLC Class C
MARKET INDICATORS Q2 2021 Q1 2021 Q4 2020 Q3 2020 Q2 2020
▲ 12 Mo. Net Absorption SF 2,265,347 881,068 (227,669) 414,229 273,203
▼ Vacancy Rate 4.65% 5.02% 6.44% 9.77% 8.60%
▲ Avg NNN Asking Rate PSF $7.43 $7.19 $7.02 $7.20 $7.21
▲ SF Under Construction 2,634,052 1,969,210 1,005,962 329,353 1,274,923
▲ Inventory SF 74,352,662 74,183,561 73,430,485 72,344,118 71,879,136
Q2 2021 GREENVILLE / SPARTANBURG, SC
INDUSTRIAL MARKET OVERVIEWRANDALL BENTLEY, CCIM, SIOR, President
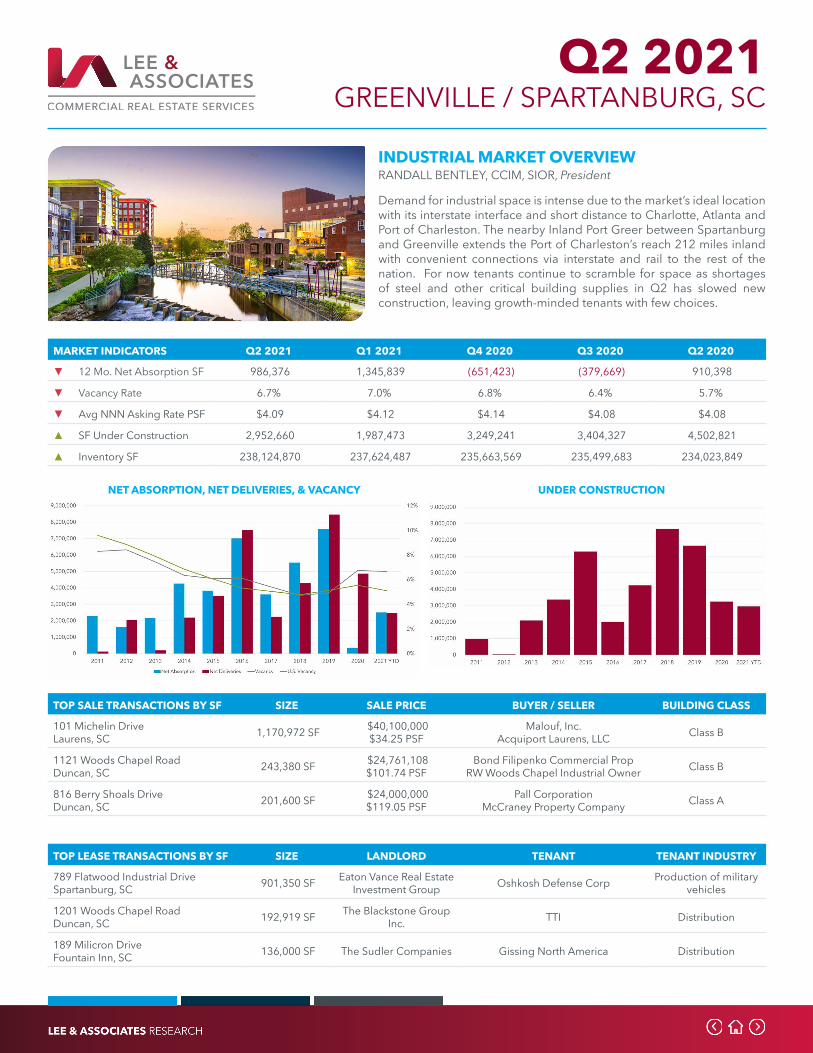
Demand for industrial space is intense due to the market’s ideal location with its interstate interface and short distance to Charlotte, Atlanta and Port of Charleston. The nearby Inland Port Greer between Spartanburg and Greenville extends the Port of Charleston’s reach 212 miles inland with convenient connections via interstate and rail to the rest of the nation. For now tenants continue to scramble for space as shortages of steel and other critical building supplies in Q2 has slowed new construction, leaving growth-minded tenants with few choices.
NET ABSORPTION, NET DELIVERIES, & VACANCY UNDER CONSTRUCTION
TOP LEASE TRANSACTIONS BY SF SIZE LANDLORD TENANT TENANT INDUSTRY
789 Flatwood Industrial DriveSpartanburg, SC 901,350 SF Eaton Vance Real Estate
Investment Group Oshkosh Defense Corp Production of military vehicles
1201 Woods Chapel RoadDuncan, SC 192,919 SF The Blackstone Group
Inc. TTI Distribution
189 Milicron DriveFountain Inn, SC 136,000 SF The Sudler Companies Gissing North America Distribution
TOP SALE TRANSACTIONS BY SF SIZE SALE PRICE BUYER / SELLER BUILDING CLASS
101 Michelin DriveLaurens, SC 1,170,972 SF $40,100,000
$34.25 PSFMalouf, Inc.
Acquiport Laurens, LLC Class B
1121 Woods Chapel RoadDuncan, SC 243,380 SF $24,761,108
$101.74 PSFBond Filipenko Commercial Prop
RW Woods Chapel Industrial Owner Class B
816 Berry Shoals DriveDuncan, SC 201,600 SF $24,000,000
$119.05 PSFPall Corporation
McCraney Property Company Class A
MARKET INDICATORS Q2 2021 Q1 2021 Q4 2020 Q3 2020 Q2 2020
▼ 12 Mo. Net Absorption SF 986,376 1,345,839 (651,423) (379,669) 910,398
▼ Vacancy Rate 6.7% 7.0% 6.8% 6.4% 5.7%
▼ Avg NNN Asking Rate PSF $4.09 $4.12 $4.14 $4.08 $4.08
▲ SF Under Construction 2,952,660 1,987,473 3,249,241 3,404,327 4,502,821
▲ Inventory SF 238,124,870 237,624,487 235,663,569 235,499,683 234,023,849
Q2 2021 NASHVILLE, TN
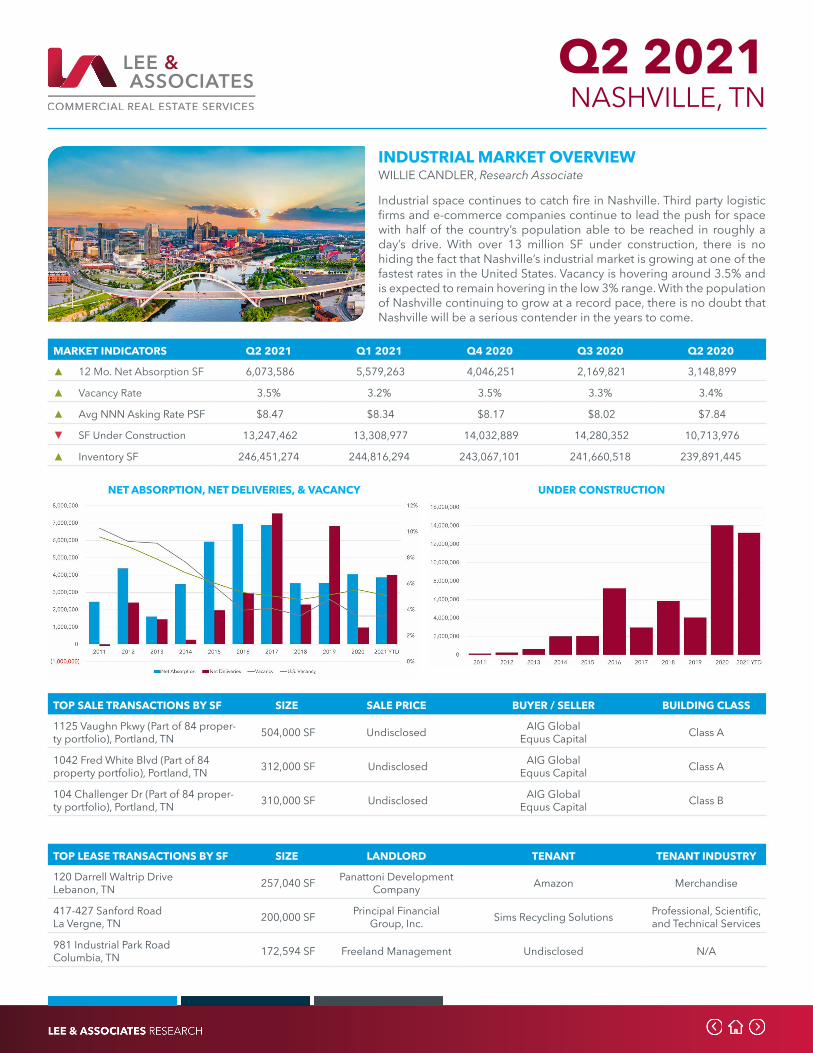
INDUSTRIAL MARKET OVERVIEWWILLIE CANDLER, Research Associate
Industrial space continues to catch fire in Nashville. Third party logistic firms and e-commerce companies continue to lead the push for space with half of the country’s population able to be reached in roughly a day’s drive. With over 13 million SF under construction, there is no hiding the fact that Nashville’s industrial market is growing at one of the fastest rates in the United States. Vacancy is hovering around 3.5% and is expected to remain hovering in the low 3% range. With the population of Nashville continuing to grow at a record pace, there is no doubt that Nashville will be a serious contender in the years to come.
NET ABSORPTION, NET DELIVERIES, & VACANCY UNDER CONSTRUCTION
TOP LEASE TRANSACTIONS BY SF SIZE LANDLORD TENANT TENANT INDUSTRY
120 Darrell Waltrip DriveLebanon, TN 257,040 SF Panattoni Development
Company Amazon Merchandise
417-427 Sanford RoadLa Vergne, TN 200,000 SF Principal Financial
Group, Inc. Sims Recycling Solutions Professional, Scientific, and Technical Services
981 Industrial Park RoadColumbia, TN 172,594 SF Freeland Management Undisclosed N/A
TOP SALE TRANSACTIONS BY SF SIZE SALE PRICE BUYER / SELLER BUILDING CLASS
1125 Vaughn Pkwy (Part of 84 proper-ty portfolio), Portland, TN 504,000 SF Undisclosed AIG Global
Equus Capital Class A
1042 Fred White Blvd (Part of 84 property portfolio), Portland, TN 312,000 SF Undisclosed AIG Global
Equus Capital Class A
104 Challenger Dr (Part of 84 proper-ty portfolio), Portland, TN 310,000 SF Undisclosed AIG Global
Equus Capital Class B
MARKET INDICATORS Q2 2021 Q1 2021 Q4 2020 Q3 2020 Q2 2020
▲ 12 Mo. Net Absorption SF 6,073,586 5,579,263 4,046,251 2,169,821 3,148,899
▲ Vacancy Rate 3.5% 3.2% 3.5% 3.3% 3.4%
▲ Avg NNN Asking Rate PSF $8.47 $8.34 $8.17 $8.02 $7.84
▼ SF Under Construction 13,247,462 13,308,977 14,032,889 14,280,352 10,713,976
▲ Inventory SF 246,451,274 244,816,294 243,067,101 241,660,518 239,891,445

Q2 2021 DALLAS / FORT WORTH, TX
INDUSTRIAL MARKET OVERVIEWCHRIS WOOL, Associate
The Dallas-Fort-Worth Industrial Market has continued to build upon the positive momentum of 2020. Developers in the region have done an excellent job attempting to keep up with this unprecedented demand by creating, on average, more than 20 million SF of net new space annually, since 2015. Over the past year alone, developers have produced over 27.6 million SF of inventory to keep up with the demand within this booming market. The region continues to be an ideal landing spot for larger corporate tenants, and with nearly 40 million SF under construction within the Metroplex, there don’t seem to be any signs of that national trend slowing soon.
NET ABSORPTION, NET DELIVERIES, & VACANCY UNDER CONSTRUCTION
TOP LEASE TRANSACTIONS BY SF SIZE LANDLORD TENANT TENANT INDUSTRY
300 Austin BlvdRed Oak, TX 852,500 SF Arlington Capital
Partners Qarbon Aerospace Manufacturing
3701 Litsey RoadFort Worth, TX 810,908 SF AIL Investment, L.P. Henry Schein Inc. Wholesaler
7343 Grady Niblo RoadDallas, TX 630,000 SF TA Realty Niagara Bottling LLC Wholesaler
TOP SALE TRANSACTIONS BY SF SIZE SALE PRICE BUYER / SELLER BUILDING CLASS
1851 NE Loop 820Fort Worth, TX 1,023,488 SF Undisclosed Realty Income Corporation
Hunt Southwest Real Estate Class A
300 Austin BlvdRed Oak, TX 852,500 SF Undisclosed Arlington Capital Partners
Triumph Group Class B
8600 S Central ExpyDallas, TX 305,000 SF $10,675,000
$35.00 PSFUndisclosedUndisclosed Class C
MARKET INDICATORS Q2 2021 Q1 2021 Q4 2020 Q3 2020 Q2 2020
▲ 12 Mo. Net Absorption SF 29,691,487 25,691,112 22,618,982 27,472,938 26,719,067
▼ Vacancy Rate 6.3% 6.7% 7.1% 6.8% 6.7%
▲ Avg NNN Asking Rate PSF $7.17 $7.01 $6.92 $6.83 $6.76
▲ SF Under Construction 37,306,438 29,759,045 31,699,320 29,726,335 28,874,616
▲ Inventory SF 1,007,352,030 1,001,091,759 993,796,812 985,535,430 979,046,356
Q2 2021 HOUSTON, TX
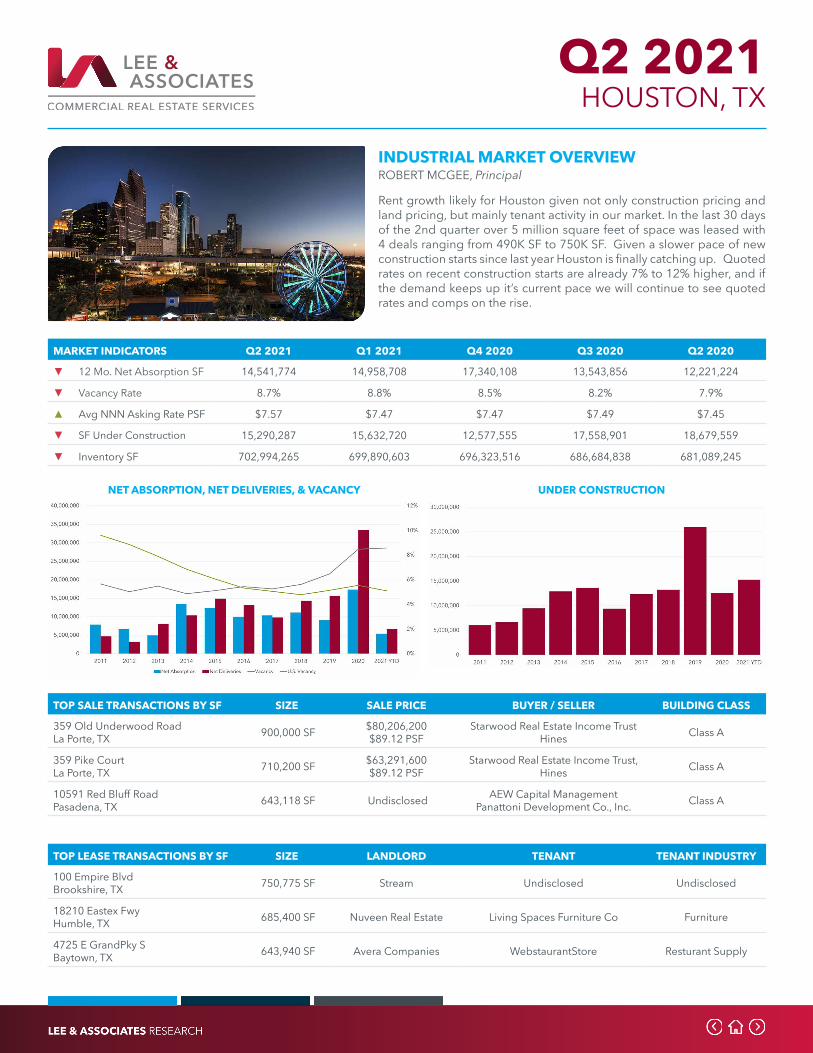
INDUSTRIAL MARKET OVERVIEWROBERT MCGEE, Principal
Rent growth likely for Houston given not only construction pricing and land pricing, but mainly tenant activity in our market. In the last 30 days of the 2nd quarter over 5 million square feet of space was leased with 4 deals ranging from 490K SF to 750K SF. Given a slower pace of new construction starts since last year Houston is finally catching up. Quoted rates on recent construction starts are already 7% to 12% higher, and if the demand keeps up it’s current pace we will continue to see quoted rates and comps on the rise.
NET ABSORPTION, NET DELIVERIES, & VACANCY UNDER CONSTRUCTION
TOP LEASE TRANSACTIONS BY SF SIZE LANDLORD TENANT TENANT INDUSTRY
100 Empire BlvdBrookshire, TX 750,775 SF Stream Undisclosed Undisclosed
18210 Eastex FwyHumble, TX 685,400 SF Nuveen Real Estate Living Spaces Furniture Co Furniture
4725 E GrandPky SBaytown, TX 643,940 SF Avera Companies WebstaurantStore Resturant Supply
TOP SALE TRANSACTIONS BY SF SIZE SALE PRICE BUYER / SELLER BUILDING CLASS
359 Old Underwood RoadLa Porte, TX 900,000 SF $80,206,200
$89.12 PSFStarwood Real Estate Income Trust
Hines Class A
359 Pike CourtLa Porte, TX 710,200 SF $63,291,600
$89.12 PSFStarwood Real Estate Income Trust,
Hines Class A
10591 Red Bluff RoadPasadena, TX 643,118 SF Undisclosed AEW Capital Management
Panattoni Development Co., Inc. Class A
MARKET INDICATORS Q2 2021 Q1 2021 Q4 2020 Q3 2020 Q2 2020
▼ 12 Mo. Net Absorption SF 14,541,774 14,958,708 17,340,108 13,543,856 12,221,224
▼ Vacancy Rate 8.7% 8.8% 8.5% 8.2% 7.9%
▲ Avg NNN Asking Rate PSF $7.57 $7.47 $7.47 $7.49 $7.45
▼ SF Under Construction 15,290,287 15,632,720 12,577,555 17,558,901 18,679,559
▼ Inventory SF 702,994,265 699,890,603 696,323,516 686,684,838 681,089,245
Q2 2021 MADISON, WI
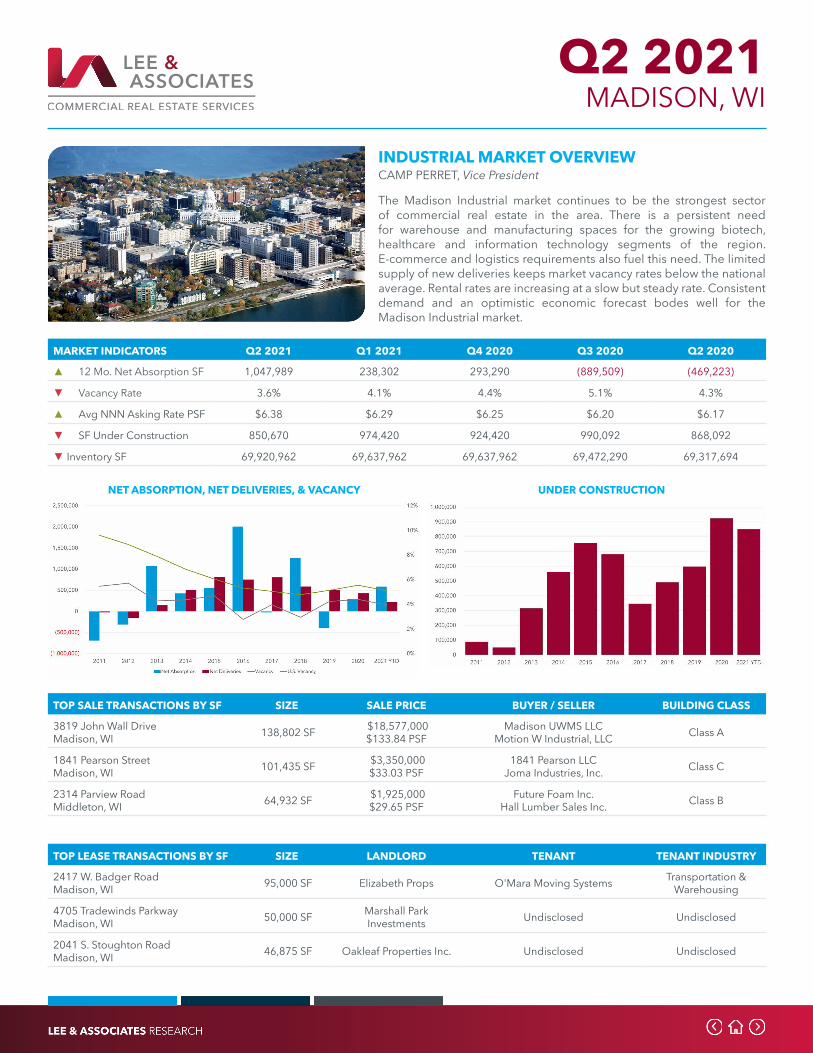
INDUSTRIAL MARKET OVERVIEWCAMP PERRET, Vice President
The Madison Industrial market continues to be the strongest sector of commercial real estate in the area. There is a persistent need for warehouse and manufacturing spaces for the growing biotech, healthcare and information technology segments of the region. E-commerce and logistics requirements also fuel this need. The limited supply of new deliveries keeps market vacancy rates below the national average. Rental rates are increasing at a slow but steady rate. Consistent demand and an optimistic economic forecast bodes well for the Madison Industrial market.
NET ABSORPTION, NET DELIVERIES, & VACANCY UNDER CONSTRUCTION
TOP LEASE TRANSACTIONS BY SF SIZE LANDLORD TENANT TENANT INDUSTRY
2417 W. Badger RoadMadison, WI 95,000 SF Elizabeth Props O'Mara Moving Systems Transportation &
Warehousing
4705 Tradewinds ParkwayMadison, WI 50,000 SF Marshall Park
Investments Undisclosed Undisclosed
2041 S. Stoughton RoadMadison, WI 46,875 SF Oakleaf Properties Inc. Undisclosed Undisclosed
TOP SALE TRANSACTIONS BY SF SIZE SALE PRICE BUYER / SELLER BUILDING CLASS
3819 John Wall DriveMadison, WI 138,802 SF $18,577,000
$133.84 PSFMadison UWMS LLC
Motion W Industrial, LLC Class A
1841 Pearson StreetMadison, WI 101,435 SF $3,350,000
$33.03 PSF1841 Pearson LLC
Joma Industries, Inc. Class C
2314 Parview RoadMiddleton, WI 64,932 SF $1,925,000
$29.65 PSFFuture Foam Inc.
Hall Lumber Sales Inc. Class B
MARKET INDICATORS Q2 2021 Q1 2021 Q4 2020 Q3 2020 Q2 2020
▲ 12 Mo. Net Absorption SF 1,047,989 238,302 293,290 (889,509) (469,223)
▼ Vacancy Rate 3.6% 4.1% 4.4% 5.1% 4.3%
▲ Avg NNN Asking Rate PSF $6.38 $6.29 $6.25 $6.20 $6.17
▼ SF Under Construction 850,670 974,420 924,420 990,092 868,092
▼ Inventory SF 69,920,962 69,637,962 69,637,962 69,472,290 69,317,694
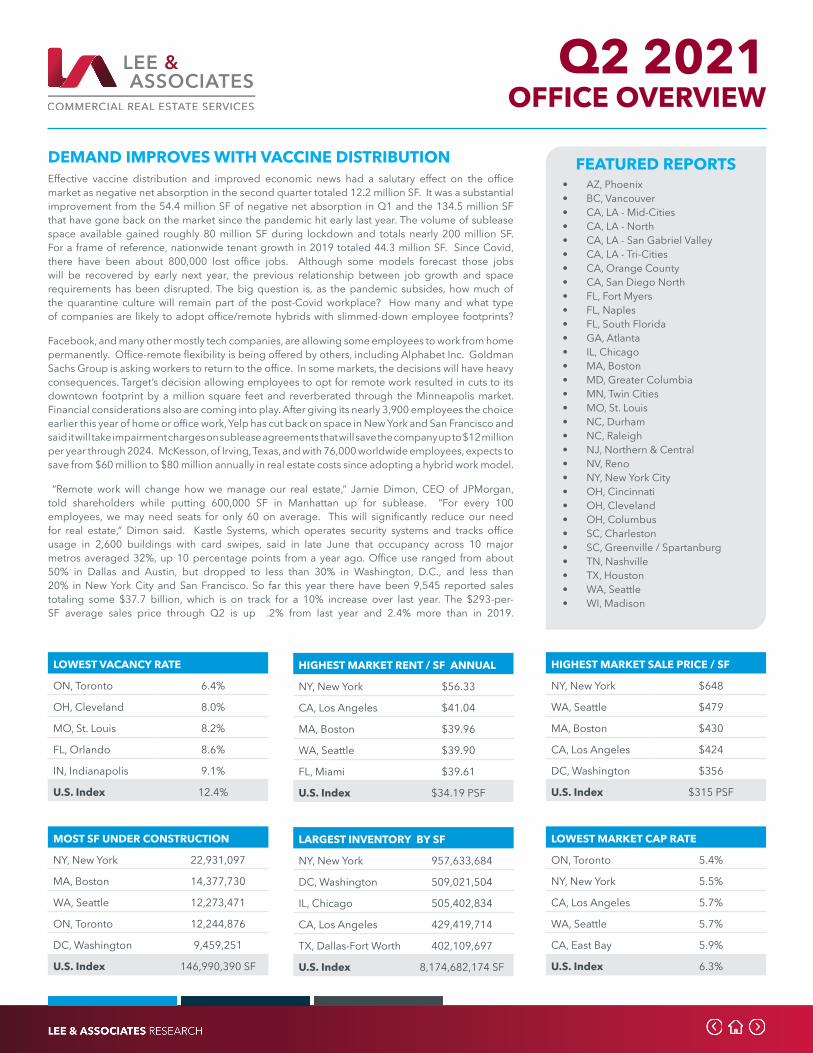
Q2 2021 OFFICE OVERVIEW
FEATURED REPORTS• AZ, Phoenix• BC, Vancouver• CA, LA - Mid-Cities• CA, LA - North• CA, LA - San Gabriel Valley• CA, LA - Tri-Cities• CA, Orange County• CA, San Diego North• FL, Fort Myers• FL, Naples• FL, South Florida• GA, Atlanta• IL, Chicago• MA, Boston• MD, Greater Columbia• MN, Twin Cities• MO, St. Louis• NC, Durham• NC, Raleigh• NJ, Northern & Central• NV, Reno• NY, New York City• OH, Cincinnati• OH, Cleveland• OH, Columbus• SC, Charleston• SC, Greenville / Spartanburg• TN, Nashville• TX, Houston• WA, Seattle • WI, Madison
DEMAND IMPROVES WITH VACCINE DISTRIBUTIONEffective vaccine distribution and improved economic news had a salutary effect on the office market as negative net absorption in the second quarter totaled 12.2 million SF. It was a substantial improvement from the 54.4 million SF of negative net absorption in Q1 and the 134.5 million SF that have gone back on the market since the pandemic hit early last year. The volume of sublease space available gained roughly 80 million SF during lockdown and totals nearly 200 million SF. For a frame of reference, nationwide tenant growth in 2019 totaled 44.3 million SF. Since Covid, there have been about 800,000 lost office jobs. Although some models forecast those jobs will be recovered by early next year, the previous relationship between job growth and space requirements has been disrupted. The big question is, as the pandemic subsides, how much of the quarantine culture will remain part of the post-Covid workplace? How many and what type of companies are likely to adopt office/remote hybrids with slimmed-down employee footprints?
Facebook, and many other mostly tech companies, are allowing some employees to work from home permanently. Office-remote flexibility is being offered by others, including Alphabet Inc. Goldman Sachs Group is asking workers to return to the office. In some markets, the decisions will have heavy consequences. Target’s decision allowing employees to opt for remote work resulted in cuts to its downtown footprint by a million square feet and reverberated through the Minneapolis market. Financial considerations also are coming into play. After giving its nearly 3,900 employees the choice earlier this year of home or office work, Yelp has cut back on space in New York and San Francisco and said it will take impairment charges on sublease agreements that will save the company up to $12 million per year through 2024. McKesson, of Irving, Texas, and with 76,000 worldwide employees, expects to save from $60 million to $80 million annually in real estate costs since adopting a hybrid work model.
“Remote work will change how we manage our real estate,” Jamie Dimon, CEO of JPMorgan, told shareholders while putting 600,000 SF in Manhattan up for sublease. “For every 100 employees, we may need seats for only 60 on average. This will significantly reduce our need for real estate,” Dimon said. Kastle Systems, which operates security systems and tracks office usage in 2,600 buildings with card swipes, said in late June that occupancy across 10 major metros averaged 32%, up 10 percentage points from a year ago. Office use ranged from about 50% in Dallas and Austin, but dropped to less than 30% in Washington, D.C., and less than 20% in New York City and San Francisco. So far this year there have been 9,545 reported sales totaling some $37.7 billion, which is on track for a 10% increase over last year. The $293-per-SF average sales price through Q2 is up .2% from last year and 2.4% more than in 2019.
LOWEST VACANCY RATE
ON, Toronto 6.4%
OH, Cleveland 8.0%
MO, St. Louis 8.2%
FL, Orlando 8.6%
IN, Indianapolis 9.1%
U.S. Index 12.4%
HIGHEST MARKET RENT / SF ANNUAL
NY, New York $56.33
CA, Los Angeles $41.04
MA, Boston $39.96
WA, Seattle $39.90
FL, Miami $39.61
U.S. Index $34.19 PSF
HIGHEST MARKET SALE PRICE / SF
NY, New York $648
WA, Seattle $479
MA, Boston $430
CA, Los Angeles $424
DC, Washington $356
U.S. Index $315 PSF
MOST SF UNDER CONSTRUCTION
NY, New York 22,931,097
MA, Boston 14,377,730
WA, Seattle 12,273,471
ON, Toronto 12,244,876
DC, Washington 9,459,251
U.S. Index 146,990,390 SF
LARGEST INVENTORY BY SF
NY, New York 957,633,684
DC, Washington 509,021,504
IL, Chicago 505,402,834
CA, Los Angeles 429,419,714
TX, Dallas-Fort Worth 402,109,697
U.S. Index 8,174,682,174 SF
LOWEST MARKET CAP RATE
ON, Toronto 5.4%
NY, New York 5.5%
CA, Los Angeles 5.7%
WA, Seattle 5.7%
CA, East Bay 5.9%
U.S. Index 6.3%
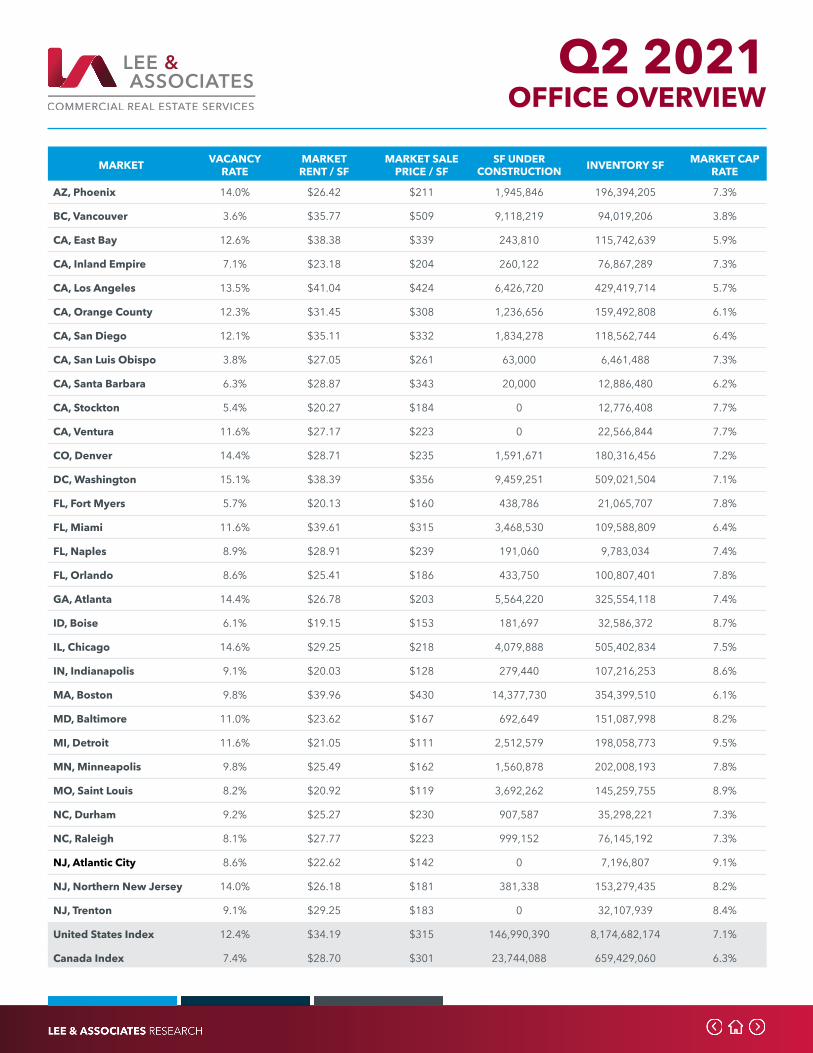
Q2 2021
MARKET VACANCY RATE
MARKETRENT / SF
MARKET SALE PRICE / SF
SF UNDER CONSTRUCTION INVENTORY SF MARKET CAP
RATE
AZ, Phoenix 14.0% $26.42 $211 1,945,846 196,394,205 7.3%
BC, Vancouver 3.6% $35.77 $509 9,118,219 94,019,206 3.8%
CA, East Bay 12.6% $38.38 $339 243,810 115,742,639 5.9%
CA, Inland Empire 7.1% $23.18 $204 260,122 76,867,289 7.3%
CA, Los Angeles 13.5% $41.04 $424 6,426,720 429,419,714 5.7%
CA, Orange County 12.3% $31.45 $308 1,236,656 159,492,808 6.1%
CA, San Diego 12.1% $35.11 $332 1,834,278 118,562,744 6.4%
CA, San Luis Obispo 3.8% $27.05 $261 63,000 6,461,488 7.3%
CA, Santa Barbara 6.3% $28.87 $343 20,000 12,886,480 6.2%
CA, Stockton 5.4% $20.27 $184 0 12,776,408 7.7%
CA, Ventura 11.6% $27.17 $223 0 22,566,844 7.7%
CO, Denver 14.4% $28.71 $235 1,591,671 180,316,456 7.2%
DC, Washington 15.1% $38.39 $356 9,459,251 509,021,504 7.1%
FL, Fort Myers 5.7% $20.13 $160 438,786 21,065,707 7.8%
FL, Miami 11.6% $39.61 $315 3,468,530 109,588,809 6.4%
FL, Naples 8.9% $28.91 $239 191,060 9,783,034 7.4%
FL, Orlando 8.6% $25.41 $186 433,750 100,807,401 7.8%
GA, Atlanta 14.4% $26.78 $203 5,564,220 325,554,118 7.4%
ID, Boise 6.1% $19.15 $153 181,697 32,586,372 8.7%
IL, Chicago 14.6% $29.25 $218 4,079,888 505,402,834 7.5%
IN, Indianapolis 9.1% $20.03 $128 279,440 107,216,253 8.6%
MA, Boston 9.8% $39.96 $430 14,377,730 354,399,510 6.1%
MD, Baltimore 11.0% $23.62 $167 692,649 151,087,998 8.2%
MI, Detroit 11.6% $21.05 $111 2,512,579 198,058,773 9.5%
MN, Minneapolis 9.8% $25.49 $162 1,560,878 202,008,193 7.8%
MO, Saint Louis 8.2% $20.92 $119 3,692,262 145,259,755 8.9%
NC, Durham 9.2% $25.27 $230 907,587 35,298,221 7.3%
NC, Raleigh 8.1% $27.77 $223 999,152 76,145,192 7.3%
NJ, Atlantic City 8.6% $22.62 $142 0 7,196,807 9.1%
NJ, Northern New Jersey 14.0% $26.18 $181 381,338 153,279,435 8.2%
NJ, Trenton 9.1% $29.25 $183 0 32,107,939 8.4%
United States Index 12.4% $34.19 $315 146,990,390 8,174,682,174 7.1%
Canada Index 7.4% $28.70 $301 23,744,088 659,429,060 6.3%
OFFICE OVERVIEW

Q2 2021
MARKET VACANCY RATE
MARKETRENT / SF
MARKET SALE PRICE / SF
SF UNDER CONSTRUCTION INVENTORY SF MARKET CAP
RATE
NJ, Vineland 6.4% $18.17 $114 0 2,510,242 9.0%
NV, Reno 9.3% $22.77 $182 237,021 16,836,771 8.1%
NY, Long Island 8.4% $29.24 $202 142,602 97,997,734 7.9%
NY, New York 11.8% $56.33 $648 22,931,097 957,633,684 5.5%
OH, Cincinnati 10.1% $19.78 $106 840,271 104,932,750 9.5%
OH, Cleveland 8.0% $19.37 $100 175,000 106,559,597 10.1%
OH, Columbus 9.5% $21.29 $112 1,173,073 112,055,581 8.9%
ON, Toronto 6.4% $31.72 $349 12,244,876 280,126,551 5.4%
PA, Harrisburg 8.1% $17.79 $131 419,990 35,960,094 9.3%
PA, Lehigh Valley 9.4% $19.89 $117 756,169 30,080,203 9.6%
PA, Philadelphia 10.3% $26.77 $191 3,702,594 321,916,571 8.0%
SC, Charleston 8.3% $27.87 $195 606,512 32,880,764 8.1%
SC, Greenville 8.7% $19.88 $152 755,159 33,815,978 8.1%
SC, Spartanburg 8.0% $18.24 $125 3,200 7,565,046 9.3%
TN, Nashville 10.1% $28.54 $220 3,203,681 98,632,793 7.3%
TX, Dallas-Fort Worth 18.0% $27.84 $213 7,103,059 402,109,697 7.2%
TX, Houston 18.9% $28.55 $209 5,706,140 340,590,218 7.9%
WA, Seattle 9.7% $39.90 $479 12,273,471 218,183,035 5.7%
WI, Madison 5.8% $21.63 $140 167,676 36,373,070 8.9%
United States Index 12.4% $34.19 $315 146,990,390 8,174,682,174 7.1%
Canada Index 7.4% $28.70 $301 23,744,088 659,429,060 6.3%
OFFICE OVERVIEW

Q2 2021
OFFICE MARKET OVERVIEWCHRIS MCCHESNEY, Research Director
Following an impressive run of 21 consecutive quarters of positive net absorption, the Phoenix Office Market ended Q2 2021 posting -107,902 square feet of net absorption, making it the fourth consecutive quarter of negative absorption. While many office tenants are adapting to the challenges faced due to the pandemic, they continue to reevaluate their office needs.
PHOENIX, AZ
NET ABSORPTION, NET DELIVERIES, & VACANCY UNDER CONSTRUCTION
TOP LEASE TRANSACTIONS BY SF SIZE LANDLORD TENANT TENANT INDUSTRY
500 E. Rio Salado PkwyTempe, AZ 372,741 SF State Farm Ins. Carvana Auto Sales
1201 S. 7th AvenuePhoenix, AZ 71,000 SF Cornerstone Connections AZ Healthcare
4300 E. Camelback RoadPhoenix, AZ 60,000 SF Red Development Sendoso Software
TOP SALE TRANSACTIONS BY SF SIZE SALE PRICE BUYER / SELLER BUILDING CLASS
1715 N. McQueen RoadGilbert, AZ 120,294 SF $43,100,000
$358.29 PSFSilver Creek Development
SunCap Property Group Class A
1201 S. Alma School RoadMesa, AZ 311,132 SF $39,500,000
$126.96 PSFCamco Investment Group
Barkar Pacific Group Class A
1840 & 1910 S. Stapley DriveMesa, AZ 180,083 SF $37,000,000
$205.46 PSFCypress Office Properties
Buchanan Street Class A
MARKET INDICATORS Q2 2021 Q1 2021 Q4 2020 Q3 2020 Q2 2020
▲ 12 Mo. Net Absorption SF (107,902) (550,501) (269,254) (14,638) 599,629
▲ Vacancy Rate 18.0% 17.70% 16.30% 15.90% 15.80%
▲ Avg NNN Asking Rate PSF $25.43 $25.10 $25.33 $25.95 $25.78
▲ SF Under Construction 1,634,906 1,499,170 2,843,236 2,687,238 2,607,295
▲ Inventory SF 108,341,871 107,579,770 106,138,519 105,779,308 104,924,565
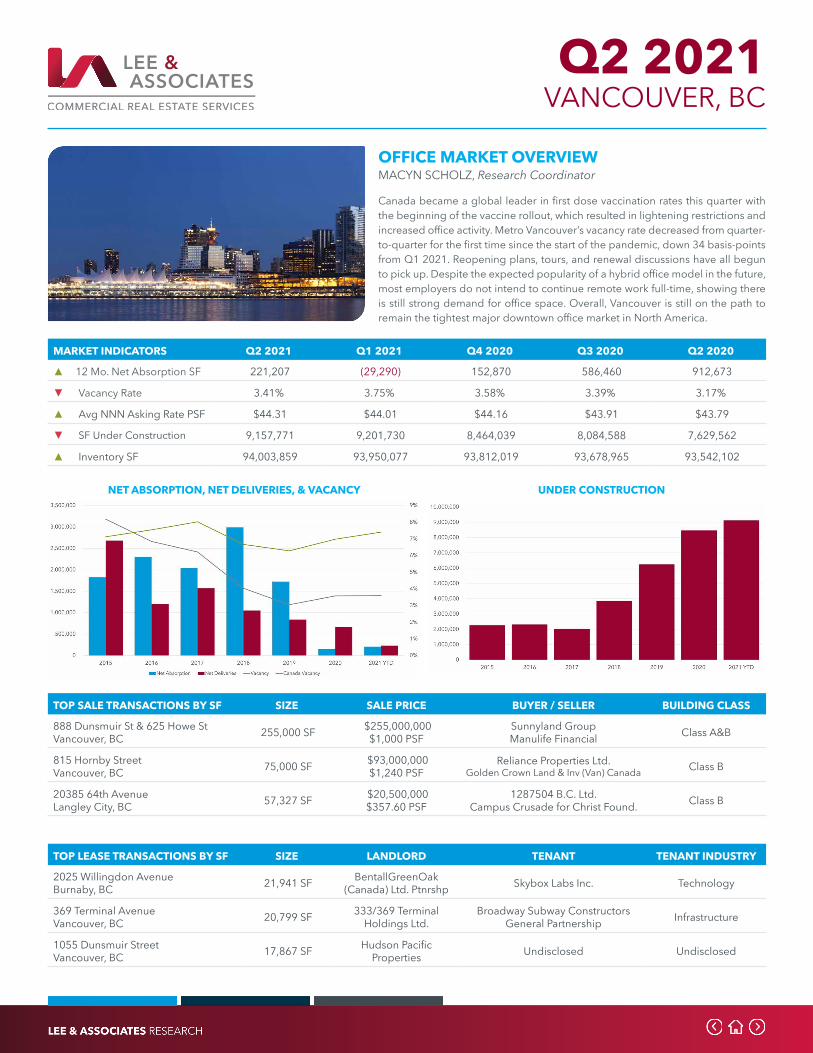
Q2 2021
OFFICE MARKET OVERVIEWMACYN SCHOLZ, Research Coordinator
Canada became a global leader in first dose vaccination rates this quarter with the beginning of the vaccine rollout, which resulted in lightening restrictions and increased office activity. Metro Vancouver’s vacancy rate decreased from quarter-to-quarter for the first time since the start of the pandemic, down 34 basis-points from Q1 2021. Reopening plans, tours, and renewal discussions have all begun to pick up. Despite the expected popularity of a hybrid office model in the future, most employers do not intend to continue remote work full-time, showing there is still strong demand for office space. Overall, Vancouver is still on the path to remain the tightest major downtown office market in North America.
VANCOUVER, BC
NET ABSORPTION, NET DELIVERIES, & VACANCY UNDER CONSTRUCTION
TOP LEASE TRANSACTIONS BY SF SIZE LANDLORD TENANT TENANT INDUSTRY
2025 Willingdon AvenueBurnaby, BC 21,941 SF BentallGreenOak
(Canada) Ltd. Ptnrshp Skybox Labs Inc. Technology
369 Terminal AvenueVancouver, BC 20,799 SF 333/369 Terminal
Holdings Ltd.Broadway Subway Constructors
General Partnership Infrastructure
1055 Dunsmuir StreetVancouver, BC 17,867 SF Hudson Pacific
Properties Undisclosed Undisclosed
TOP SALE TRANSACTIONS BY SF SIZE SALE PRICE BUYER / SELLER BUILDING CLASS
888 Dunsmuir St & 625 Howe StVancouver, BC 255,000 SF $255,000,000
$1,000 PSFSunnyland GroupManulife Financial Class A&B
815 Hornby StreetVancouver, BC 75,000 SF $93,000,000
$1,240 PSFReliance Properties Ltd.
Golden Crown Land & Inv (Van) Canada Class B
20385 64th AvenueLangley City, BC 57,327 SF $20,500,000
$357.60 PSF1287504 B.C. Ltd.
Campus Crusade for Christ Found. Class B
MARKET INDICATORS Q2 2021 Q1 2021 Q4 2020 Q3 2020 Q2 2020
▲ 12 Mo. Net Absorption SF 221,207 (29,290) 152,870 586,460 912,673
▼ Vacancy Rate 3.41% 3.75% 3.58% 3.39% 3.17%
▲ Avg NNN Asking Rate PSF $44.31 $44.01 $44.16 $43.91 $43.79
▼ SF Under Construction 9,157,771 9,201,730 8,464,039 8,084,588 7,629,562
▲ Inventory SF 94,003,859 93,950,077 93,812,019 93,678,965 93,542,102
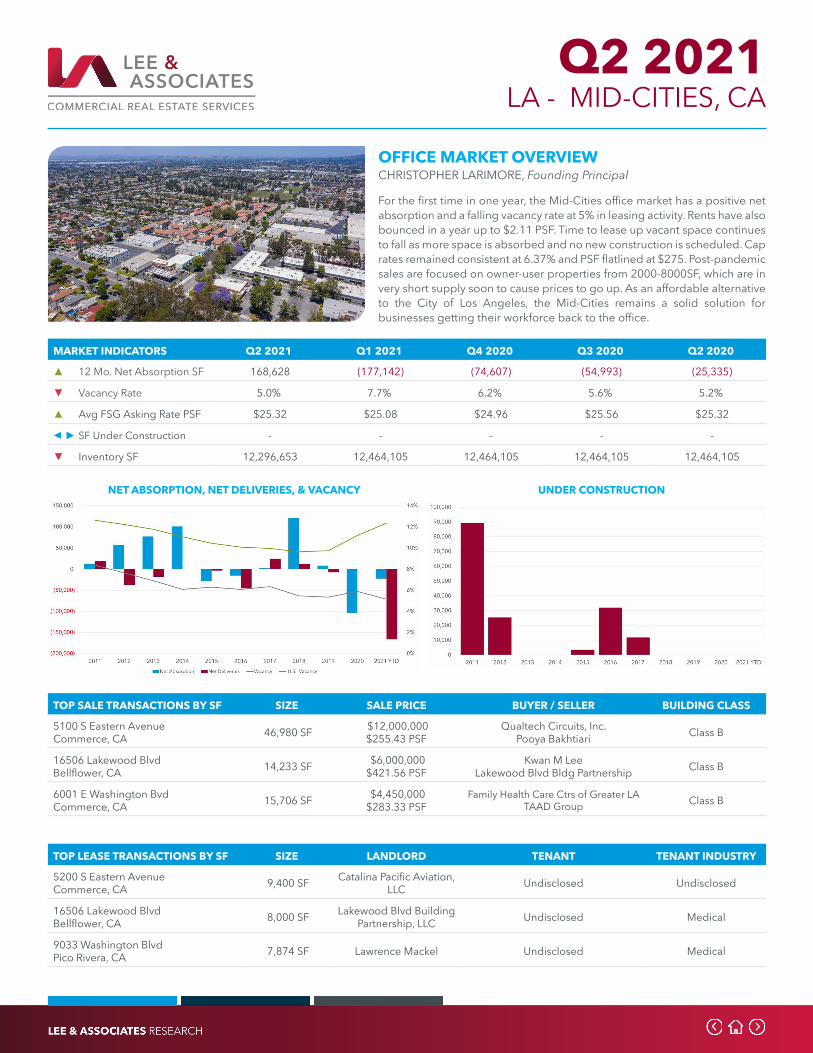
Q2 2021
OFFICE MARKET OVERVIEWCHRISTOPHER LARIMORE, Founding Principal
For the first time in one year, the Mid-Cities office market has a positive net absorption and a falling vacancy rate at 5% in leasing activity. Rents have also bounced in a year up to $2.11 PSF. Time to lease up vacant space continues to fall as more space is absorbed and no new construction is scheduled. Cap rates remained consistent at 6.37% and PSF flatlined at $275. Post-pandemic sales are focused on owner-user properties from 2000-8000SF, which are in very short supply soon to cause prices to go up. As an affordable alternative to the City of Los Angeles, the Mid-Cities remains a solid solution for businesses getting their workforce back to the office.
LA - MID-CITIES, CA
NET ABSORPTION, NET DELIVERIES, & VACANCY UNDER CONSTRUCTION
TOP LEASE TRANSACTIONS BY SF SIZE LANDLORD TENANT TENANT INDUSTRY
5200 S Eastern AvenueCommerce, CA 9,400 SF Catalina Pacific Aviation,
LLC Undisclosed Undisclosed
16506 Lakewood BlvdBellflower, CA 8,000 SF Lakewood Blvd Building
Partnership, LLC Undisclosed Medical
9033 Washington BlvdPico Rivera, CA 7,874 SF Lawrence Mackel Undisclosed Medical
TOP SALE TRANSACTIONS BY SF SIZE SALE PRICE BUYER / SELLER BUILDING CLASS
5100 S Eastern AvenueCommerce, CA 46,980 SF $12,000,000
$255.43 PSFQualtech Circuits, Inc.
Pooya Bakhtiari Class B
16506 Lakewood BlvdBellflower, CA 14,233 SF $6,000,000
$421.56 PSFKwan M Lee
Lakewood Blvd Bldg Partnership Class B
6001 E Washington BvdCommerce, CA 15,706 SF $4,450,000
$283.33 PSFFamily Health Care Ctrs of Greater LA
TAAD Group Class B
MARKET INDICATORS Q2 2021 Q1 2021 Q4 2020 Q3 2020 Q2 2020
▲ 12 Mo. Net Absorption SF 168,628 (177,142) (74,607) (54,993) (25,335)
▼ Vacancy Rate 5.0% 7.7% 6.2% 5.6% 5.2%
▲ Avg FSG Asking Rate PSF $25.32 $25.08 $24.96 $25.56 $25.32
◀ ► SF Under Construction - - - - -
▼ Inventory SF 12,296,653 12,464,105 12,464,105 12,464,105 12,464,105
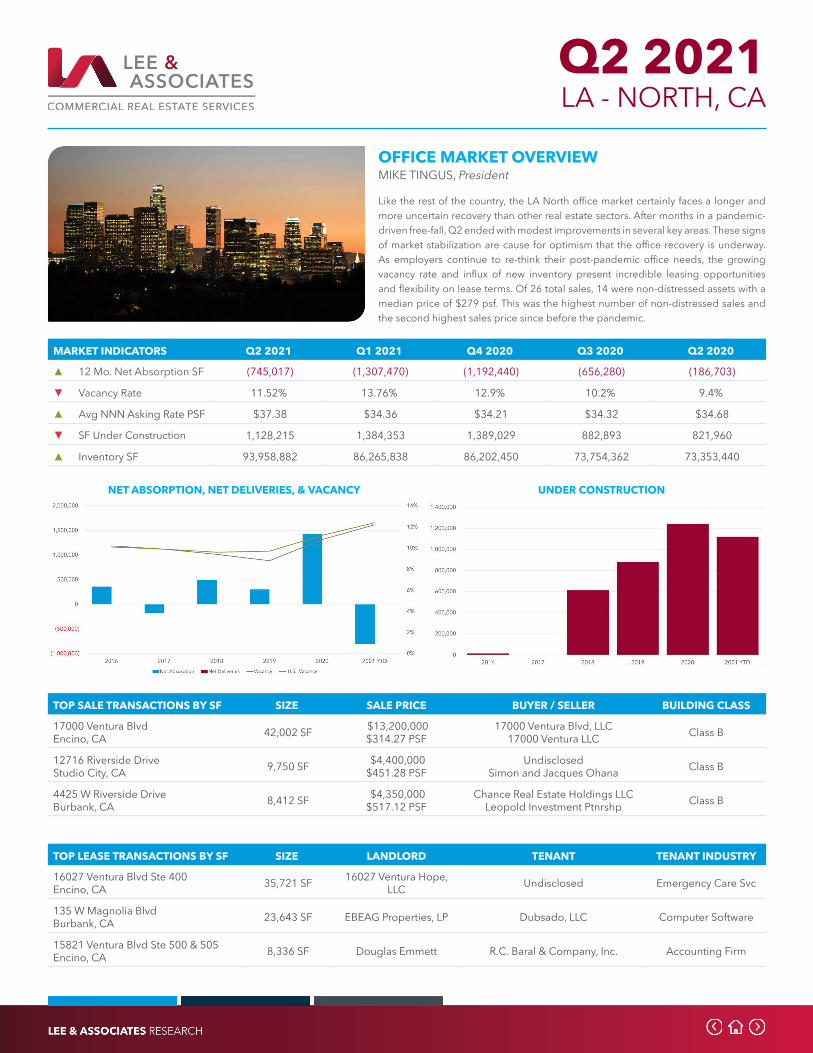
Q2 2021
OFFICE MARKET OVERVIEWMIKE TINGUS, President
Like the rest of the country, the LA North office market certainly faces a longer and more uncertain recovery than other real estate sectors. After months in a pandemic-driven free-fall, Q2 ended with modest improvements in several key areas. These signs of market stabilization are cause for optimism that the office recovery is underway. As employers continue to re-think their post-pandemic office needs, the growing vacancy rate and influx of new inventory present incredible leasing opportunities and flexibility on lease terms. Of 26 total sales, 14 were non-distressed assets with a median price of $279 psf. This was the highest number of non-distressed sales and the second highest sales price since before the pandemic.
LA - NORTH, CA
NET ABSORPTION, NET DELIVERIES, & VACANCY UNDER CONSTRUCTION
TOP LEASE TRANSACTIONS BY SF SIZE LANDLORD TENANT TENANT INDUSTRY
16027 Ventura Blvd Ste 400Encino, CA 35,721 SF 16027 Ventura Hope,
LLC Undisclosed Emergency Care Svc
135 W Magnolia BlvdBurbank, CA 23,643 SF EBEAG Properties, LP Dubsado, LLC Computer Software
15821 Ventura Blvd Ste 500 & 505Encino, CA 8,336 SF Douglas Emmett R.C. Baral & Company, Inc. Accounting Firm
TOP SALE TRANSACTIONS BY SF SIZE SALE PRICE BUYER / SELLER BUILDING CLASS
17000 Ventura BlvdEncino, CA 42,002 SF $13,200,000
$314.27 PSF17000 Ventura Blvd, LLC
17000 Ventura LLC Class B
12716 Riverside DriveStudio City, CA 9,750 SF $4,400,000
$451.28 PSFUndisclosed
Simon and Jacques Ohana Class B
4425 W Riverside DriveBurbank, CA 8,412 SF $4,350,000
$517.12 PSFChance Real Estate Holdings LLC
Leopold Investment Ptnrshp Class B
MARKET INDICATORS Q2 2021 Q1 2021 Q4 2020 Q3 2020 Q2 2020
▲ 12 Mo. Net Absorption SF (745,017) (1,307,470) (1,192,440) (656,280) (186,703)
▼ Vacancy Rate 11.52% 13.76% 12.9% 10.2% 9.4%
▲ Avg NNN Asking Rate PSF $37.38 $34.36 $34.21 $34.32 $34.68
▼ SF Under Construction 1,128,215 1,384,353 1,389,029 882,893 821,960
▲ Inventory SF 93,958,882 86,265,838 86,202,450 73,754,362 73,353,440
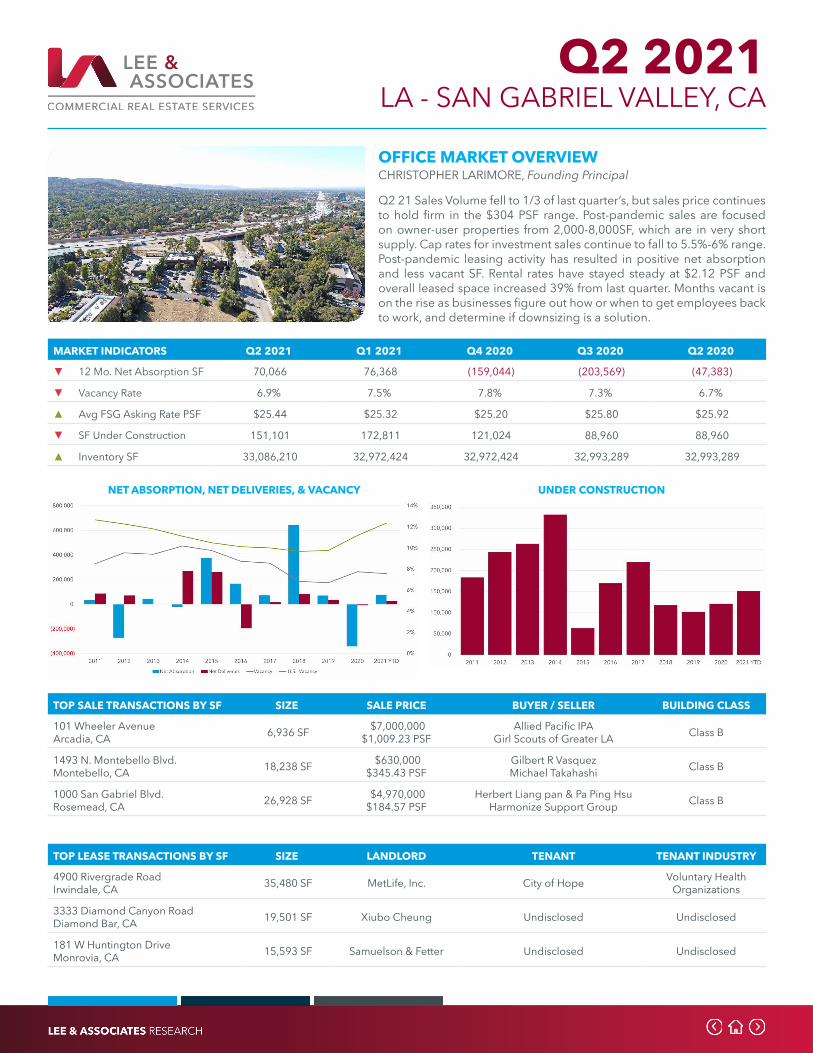
Q2 2021
OFFICE MARKET OVERVIEWCHRISTOPHER LARIMORE, Founding Principal
Q2 21 Sales Volume fell to 1/3 of last quarter’s, but sales price continues to hold firm in the $304 PSF range. Post-pandemic sales are focused on owner-user properties from 2,000-8,000SF, which are in very short supply. Cap rates for investment sales continue to fall to 5.5%-6% range. Post-pandemic leasing activity has resulted in positive net absorption and less vacant SF. Rental rates have stayed steady at $2.12 PSF and overall leased space increased 39% from last quarter. Months vacant is on the rise as businesses figure out how or when to get employees back to work, and determine if downsizing is a solution.
LA - SAN GABRIEL VALLEY, CA
NET ABSORPTION, NET DELIVERIES, & VACANCY UNDER CONSTRUCTION
TOP LEASE TRANSACTIONS BY SF SIZE LANDLORD TENANT TENANT INDUSTRY
4900 Rivergrade RoadIrwindale, CA 35,480 SF MetLife, Inc. City of Hope Voluntary Health
Organizations
3333 Diamond Canyon RoadDiamond Bar, CA 19,501 SF Xiubo Cheung Undisclosed Undisclosed
181 W Huntington DriveMonrovia, CA 15,593 SF Samuelson & Fetter Undisclosed Undisclosed
TOP SALE TRANSACTIONS BY SF SIZE SALE PRICE BUYER / SELLER BUILDING CLASS
101 Wheeler AvenueArcadia, CA 6,936 SF $7,000,000
$1,009.23 PSFAllied Pacific IPA
Girl Scouts of Greater LA Class B
1493 N. Montebello Blvd.Montebello, CA 18,238 SF $630,000
$345.43 PSFGilbert R VasquezMichael Takahashi Class B
1000 San Gabriel Blvd.Rosemead, CA 26,928 SF $4,970,000
$184.57 PSFHerbert Liang pan & Pa Ping Hsu
Harmonize Support Group Class B
MARKET INDICATORS Q2 2021 Q1 2021 Q4 2020 Q3 2020 Q2 2020
▼ 12 Mo. Net Absorption SF 70,066 76,368 (159,044) (203,569) (47,383)
▼ Vacancy Rate 6.9% 7.5% 7.8% 7.3% 6.7%
▲ Avg FSG Asking Rate PSF $25.44 $25.32 $25.20 $25.80 $25.92
▼ SF Under Construction 151,101 172,811 121,024 88,960 88,960
▲ Inventory SF 33,086,210 32,972,424 32,972,424 32,993,289 32,993,289
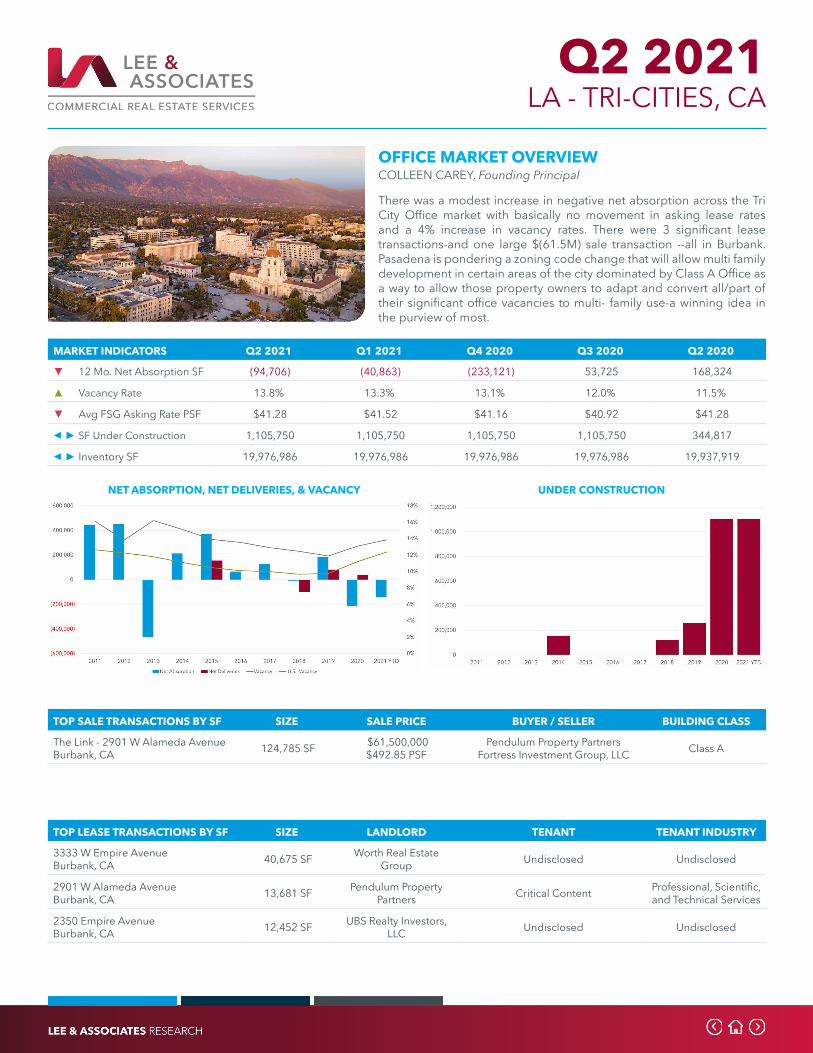
Q2 2021
OFFICE MARKET OVERVIEWCOLLEEN CAREY, Founding Principal
There was a modest increase in negative net absorption across the Tri City Office market with basically no movement in asking lease rates and a 4% increase in vacancy rates. There were 3 significant lease transactions-and one large $(61.5M) sale transaction --all in Burbank. Pasadena is pondering a zoning code change that will allow multi family development in certain areas of the city dominated by Class A Office as a way to allow those property owners to adapt and convert all/part of their significant office vacancies to multi- family use-a winning idea in the purview of most.
LA - TRI-CITIES, CA
NET ABSORPTION, NET DELIVERIES, & VACANCY UNDER CONSTRUCTION
TOP LEASE TRANSACTIONS BY SF SIZE LANDLORD TENANT TENANT INDUSTRY
3333 W Empire AvenueBurbank, CA 40,675 SF Worth Real Estate
Group Undisclosed Undisclosed
2901 W Alameda AvenueBurbank, CA 13,681 SF Pendulum Property
Partners Critical Content Professional, Scientific, and Technical Services
2350 Empire AvenueBurbank, CA 12,452 SF UBS Realty Investors,
LLC Undisclosed Undisclosed
TOP SALE TRANSACTIONS BY SF SIZE SALE PRICE BUYER / SELLER BUILDING CLASS
The Link - 2901 W Alameda AvenueBurbank, CA 124,785 SF $61,500,000
$492.85 PSFPendulum Property Partners
Fortress Investment Group, LLC Class A
MARKET INDICATORS Q2 2021 Q1 2021 Q4 2020 Q3 2020 Q2 2020
▼ 12 Mo. Net Absorption SF (94,706) (40,863) (233,121) 53,725 168,324
▲ Vacancy Rate 13.8% 13.3% 13.1% 12.0% 11.5%
▼ Avg FSG Asking Rate PSF $41.28 $41.52 $41.16 $40.92 $41.28
◀ ► SF Under Construction 1,105,750 1,105,750 1,105,750 1,105,750 344,817
◀ ► Inventory SF 19,976,986 19,976,986 19,976,986 19,976,986 19,937,919
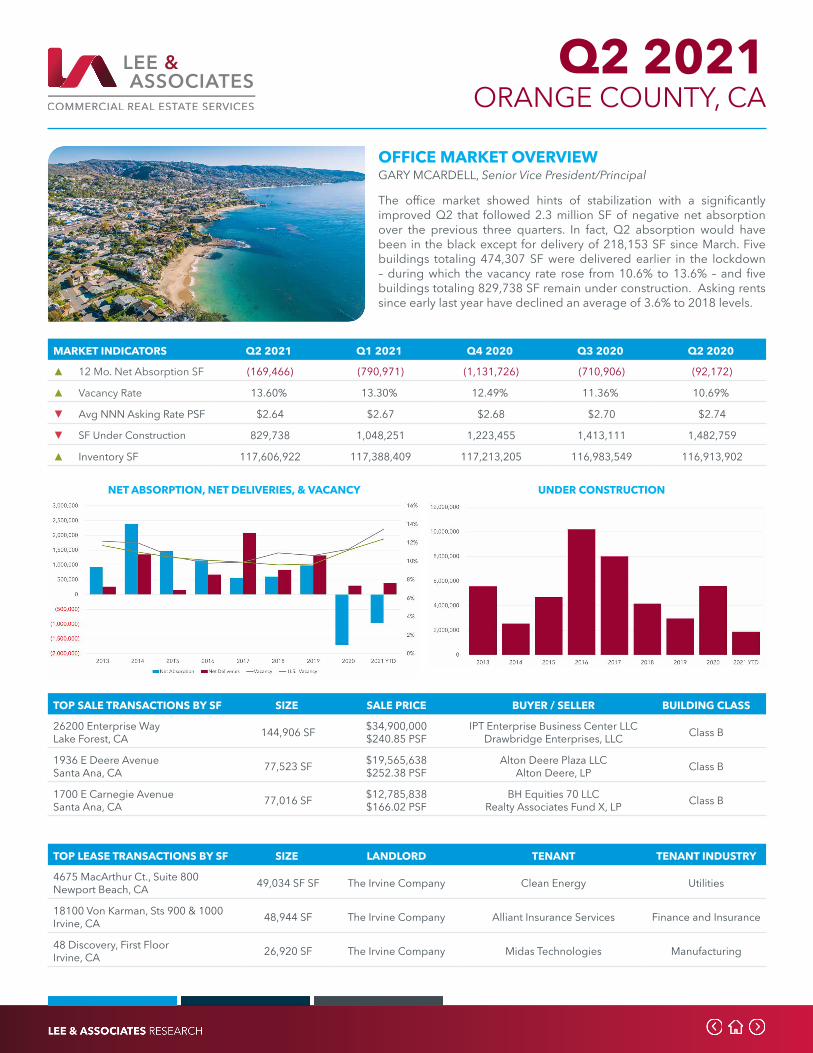
Q2 2021
OFFICE MARKET OVERVIEWGARY MCARDELL, Senior Vice President/Principal
The office market showed hints of stabilization with a significantly improved Q2 that followed 2.3 million SF of negative net absorption over the previous three quarters. In fact, Q2 absorption would have been in the black except for delivery of 218,153 SF since March. Five buildings totaling 474,307 SF were delivered earlier in the lockdown – during which the vacancy rate rose from 10.6% to 13.6% – and five buildings totaling 829,738 SF remain under construction. Asking rents since early last year have declined an average of 3.6% to 2018 levels.
ORANGE COUNTY, CA
NET ABSORPTION, NET DELIVERIES, & VACANCY UNDER CONSTRUCTION
TOP LEASE TRANSACTIONS BY SF SIZE LANDLORD TENANT TENANT INDUSTRY
4675 MacArthur Ct., Suite 800Newport Beach, CA 49,034 SF SF The Irvine Company Clean Energy Utilities
18100 Von Karman, Sts 900 & 1000Irvine, CA 48,944 SF The Irvine Company Alliant Insurance Services Finance and Insurance
48 Discovery, First FloorIrvine, CA 26,920 SF The Irvine Company Midas Technologies Manufacturing
TOP SALE TRANSACTIONS BY SF SIZE SALE PRICE BUYER / SELLER BUILDING CLASS
26200 Enterprise WayLake Forest, CA 144,906 SF $34,900,000
$240.85 PSFIPT Enterprise Business Center LLC
Drawbridge Enterprises, LLC Class B
1936 E Deere AvenueSanta Ana, CA 77,523 SF $19,565,638
$252.38 PSFAlton Deere Plaza LLC
Alton Deere, LP Class B
1700 E Carnegie AvenueSanta Ana, CA 77,016 SF $12,785,838
$166.02 PSFBH Equities 70 LLC
Realty Associates Fund X, LP Class B
MARKET INDICATORS Q2 2021 Q1 2021 Q4 2020 Q3 2020 Q2 2020
▲ 12 Mo. Net Absorption SF (169,466) (790,971) (1,131,726) (710,906) (92,172)
▲ Vacancy Rate 13.60% 13.30% 12.49% 11.36% 10.69%
▼ Avg NNN Asking Rate PSF $2.64 $2.67 $2.68 $2.70 $2.74
▼ SF Under Construction 829,738 1,048,251 1,223,455 1,413,111 1,482,759
▲ Inventory SF 117,606,922 117,388,409 117,213,205 116,983,549 116,913,902
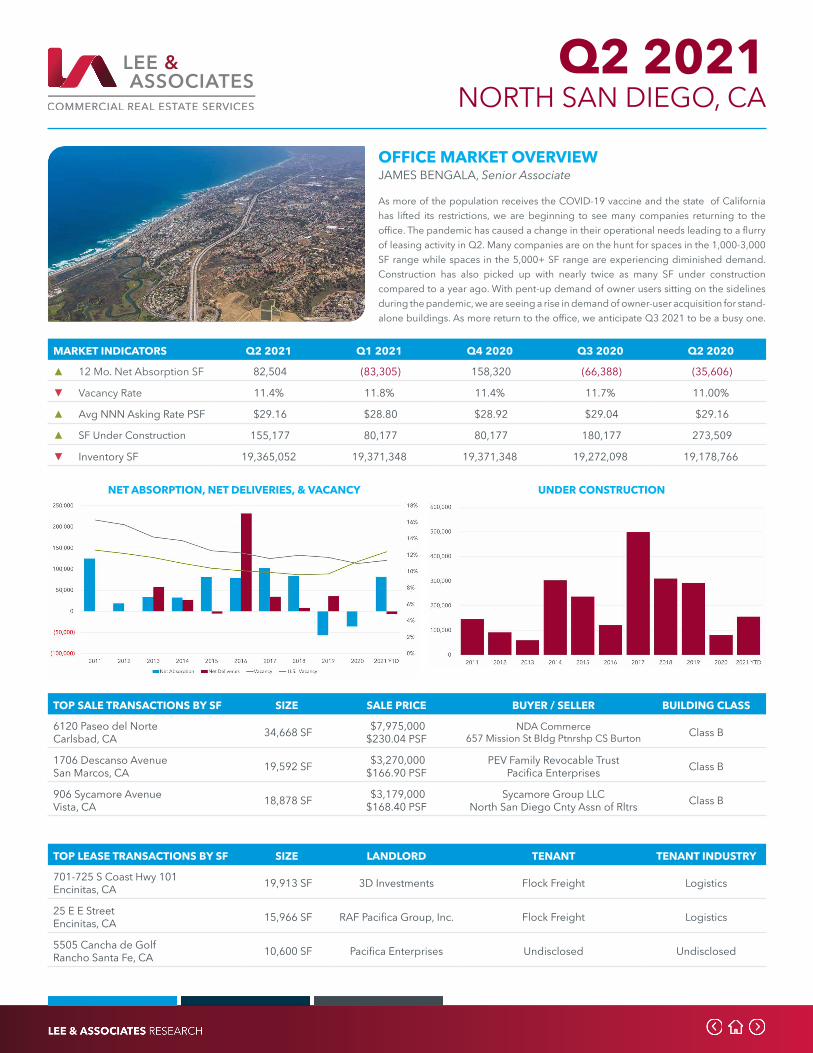
Q2 2021
OFFICE MARKET OVERVIEWJAMES BENGALA, Senior Associate
As more of the population receives the COVID-19 vaccine and the state of California has lifted its restrictions, we are beginning to see many companies returning to the office. The pandemic has caused a change in their operational needs leading to a flurry of leasing activity in Q2. Many companies are on the hunt for spaces in the 1,000-3,000 SF range while spaces in the 5,000+ SF range are experiencing diminished demand. Construction has also picked up with nearly twice as many SF under construction compared to a year ago. With pent-up demand of owner users sitting on the sidelines during the pandemic, we are seeing a rise in demand of owner-user acquisition for stand-alone buildings. As more return to the office, we anticipate Q3 2021 to be a busy one.
NORTH SAN DIEGO, CA
NET ABSORPTION, NET DELIVERIES, & VACANCY UNDER CONSTRUCTION
TOP LEASE TRANSACTIONS BY SF SIZE LANDLORD TENANT TENANT INDUSTRY
701-725 S Coast Hwy 101Encinitas, CA 19,913 SF 3D Investments Flock Freight Logistics
25 E E StreetEncinitas, CA 15,966 SF RAF Pacifica Group, Inc. Flock Freight Logistics
5505 Cancha de GolfRancho Santa Fe, CA 10,600 SF Pacifica Enterprises Undisclosed Undisclosed
TOP SALE TRANSACTIONS BY SF SIZE SALE PRICE BUYER / SELLER BUILDING CLASS
6120 Paseo del NorteCarlsbad, CA 34,668 SF $7,975,000
$230.04 PSFNDA Commerce
657 Mission St Bldg Ptnrshp CS Burton Class B
1706 Descanso AvenueSan Marcos, CA 19,592 SF $3,270,000
$166.90 PSFPEV Family Revocable Trust
Pacifica Enterprises Class B
906 Sycamore AvenueVista, CA 18,878 SF $3,179,000
$168.40 PSFSycamore Group LLC
North San Diego Cnty Assn of Rltrs Class B
MARKET INDICATORS Q2 2021 Q1 2021 Q4 2020 Q3 2020 Q2 2020
▲ 12 Mo. Net Absorption SF 82,504 (83,305) 158,320 (66,388) (35,606)
▼ Vacancy Rate 11.4% 11.8% 11.4% 11.7% 11.00%
▲ Avg NNN Asking Rate PSF $29.16 $28.80 $28.92 $29.04 $29.16
▲ SF Under Construction 155,177 80,177 80,177 180,177 273,509
▼ Inventory SF 19,365,052 19,371,348 19,371,348 19,272,098 19,178,766

Q2 2021
OFFICE MARKET OVERVIEWCLAIRE SEARLS, Director of Research
The office market in Fort Myers ended second quarter with positive absorption and strong leasing activity. Overall asking rent for Class A space increased to approximately $18.14 PSF, a $2.41 PSF increase from this time last year. The Cape-Coral/Fort Myers MSA added 800 jobs in the Financial Activities industry for a 6.1% increase year-over-year (YOY). This addition to office-using employment was a metro area growth rate higher than YOY statewide growth. One of the largest leases for the quarter was more than 10,000 sf leased to Foundation Risk Partners in the South Fort Myers submarket.
FORT MYERS, FL
NET ABSORPTION, NET DELIVERIES, & VACANCY UNDER CONSTRUCTION
TOP LEASE TRANSACTIONS BY SF SIZE LANDLORD TENANT TENANT INDUSTRY
11215 Metro ParkwayFort Myers, FL 10,400 SF Chico's FAS, Inc. Foundation Risk Partners Insurance
13250 University Center BoulevardFort Myers, FL 9,100 SF Fowler-White Merrill Lynch Financial Advisors
12501 World Plaza LaneFort Myers, FL 8,100 SF Mega Realty
Investments, LLC MJC Acquisitions, LLC Business Services
TOP SALE TRANSACTIONS BY SF SIZE SALE PRICE BUYER / SELLER BUILDING CLASS
38,40,42 & 44 Barkley CircleFort Myers, FL 20,724 SF $3,200,000
$154.00 PSFMimercy, LLC
Habana Properties, LP Class C
15050 Elderberry LaneFort Myers, FL 12,390 SF $2,250,000
$182.00 PSFAt Home Rentals, LLC
New York Towers Liberty House Corp Class B
9520 Bonita Beach RoadBonita Springs, FL 10,405 SF $1,950,000
$187.00 PSFMPG Bonita 2, LLC
Havacamp, Inc. Class B
MARKET INDICATORS Q2 2021 Q1 2021 Q4 2020 Q3 2020 Q2 2020
▲ 12 Mo. Net Absorption SF 194,695 71,491 191,674 202,424 209,089
▼ Vacancy Rate 5.7% 6.2% 6.3% 6.7% 6.0%
▲ Avg NNN Asking Rate PSF $15.04 $14.69 $14.58 $14.36 $14.31
▲ SF Under Construction 438,786 325,800 248,000 286,000 262,500
▲ Inventory SF 21,065,707 21,040,207 21,032,707 20,972,707 20,927,707

Q2 2021
OFFICE MARKET OVERVIEWCLAIRE SEARLS, Director of Research
The office market in Naples ended second quarter with positive absorption and solid leasing activity. Leasing velocity for Class A office space increased year-over-year. Overall asking rent for Class A space also increased at midyear to approximately $24 PSF. Office-using employment increased across three major industries, which included a 17.9% increase in Professional and Business Services, 8.3% increase in Information and a 6.0% increase in Financial Services. One of the largest leases for the quarter was nearly 15,000 sf to Ametek at 3520 Kraft Road, which was previously headquarters to ACI Worldwide.
NAPLES, FL
NET ABSORPTION, NET DELIVERIES, & VACANCY UNDER CONSTRUCTION
TOP LEASE TRANSACTIONS BY SF SIZE LANDLORD TENANT TENANT INDUSTRY
3520 Kraft RoadNaples, FL 14,275 SF Kraft Office Center, LLC Ametek Motors and
Generators
1100 5th Avenue SNaples, FL 8,905 SF 1100 5th Ave LLC Adaptive Computing Computer
Programming
1100 5th Avenue SNaples, FL 6,236 SF 1100 5th Ave LLC DUAL North America, Inc. Finance and Insurance
TOP SALE TRANSACTIONS BY SF SIZE SALE PRICE BUYER / SELLER BUILDING CLASS
3696 Enterprise AvenueNaples, FL 22,432 SF $5,850,000
$261.00 PSFLUR Florida, LLC
BCB Homes Class B
180 9th Street SouthNaples, FL 18,051 SF $5,400,000
$299.00 PSF180 9th Street South LLC
Interbeaute, LLC Class A
809 Walkerbilt RoadNaples, FL 12,000 SF $3,200,000
$267.00 PSFPhelan Family Brands
Walkerbilt, LLC Class B
MARKET INDICATORS Q2 2021 Q1 2021 Q4 2020 Q3 2020 Q2 2020
▲ 12 Mo. Net Absorption SF 117,160 (26,180) 167,656 143,517 208,367
▼ Vacancy Rate 9.4% 10.4% 10.4% 10.5% 9.4%
▲ Avg NNN Asking Rate PSF $22.56 $22.04 $21.76 $21.68 $21.62
▼ SF Under Construction 191,060 223,192 309,934 275,809 133,397
▲ Inventory SF 9,783,034 9,740,902 9,649,637 9,651,968 9,651,968
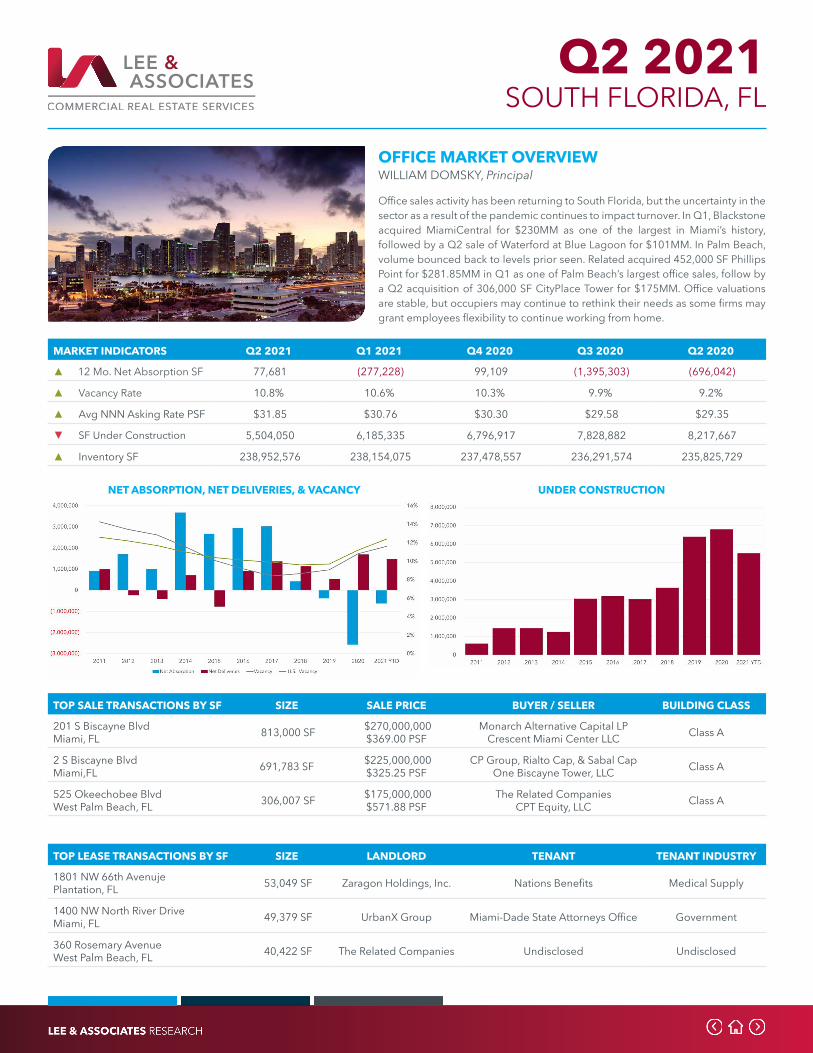
Q2 2021
OFFICE MARKET OVERVIEWWILLIAM DOMSKY, Principal
Office sales activity has been returning to South Florida, but the uncertainty in the sector as a result of the pandemic continues to impact turnover. In Q1, Blackstone acquired MiamiCentral for $230MM as one of the largest in Miami’s history, followed by a Q2 sale of Waterford at Blue Lagoon for $101MM. In Palm Beach, volume bounced back to levels prior seen. Related acquired 452,000 SF Phillips Point for $281.85MM in Q1 as one of Palm Beach’s largest office sales, follow by a Q2 acquisition of 306,000 SF CityPlace Tower for $175MM. Office valuations are stable, but occupiers may continue to rethink their needs as some firms may grant employees flexibility to continue working from home.
SOUTH FLORIDA, FL
NET ABSORPTION, NET DELIVERIES, & VACANCY UNDER CONSTRUCTION
TOP LEASE TRANSACTIONS BY SF SIZE LANDLORD TENANT TENANT INDUSTRY
1801 NW 66th AvenujePlantation, FL 53,049 SF Zaragon Holdings, Inc. Nations Benefits Medical Supply
1400 NW North River DriveMiami, FL 49,379 SF UrbanX Group Miami-Dade State Attorneys Office Government
360 Rosemary AvenueWest Palm Beach, FL 40,422 SF The Related Companies Undisclosed Undisclosed
TOP SALE TRANSACTIONS BY SF SIZE SALE PRICE BUYER / SELLER BUILDING CLASS
201 S Biscayne BlvdMiami, FL 813,000 SF $270,000,000
$369.00 PSFMonarch Alternative Capital LP
Crescent Miami Center LLC Class A
2 S Biscayne BlvdMiami,FL 691,783 SF $225,000,000
$325.25 PSFCP Group, Rialto Cap, & Sabal Cap
One Biscayne Tower, LLC Class A
525 Okeechobee BlvdWest Palm Beach, FL 306,007 SF $175,000,000
$571.88 PSFThe Related Companies
CPT Equity, LLC Class A
MARKET INDICATORS Q2 2021 Q1 2021 Q4 2020 Q3 2020 Q2 2020
▲ 12 Mo. Net Absorption SF 77,681 (277,228) 99,109 (1,395,303) (696,042)
▲ Vacancy Rate 10.8% 10.6% 10.3% 9.9% 9.2%
▲ Avg NNN Asking Rate PSF $31.85 $30.76 $30.30 $29.58 $29.35
▼ SF Under Construction 5,504,050 6,185,335 6,796,917 7,828,882 8,217,667
▲ Inventory SF 238,952,576 238,154,075 237,478,557 236,291,574 235,825,729
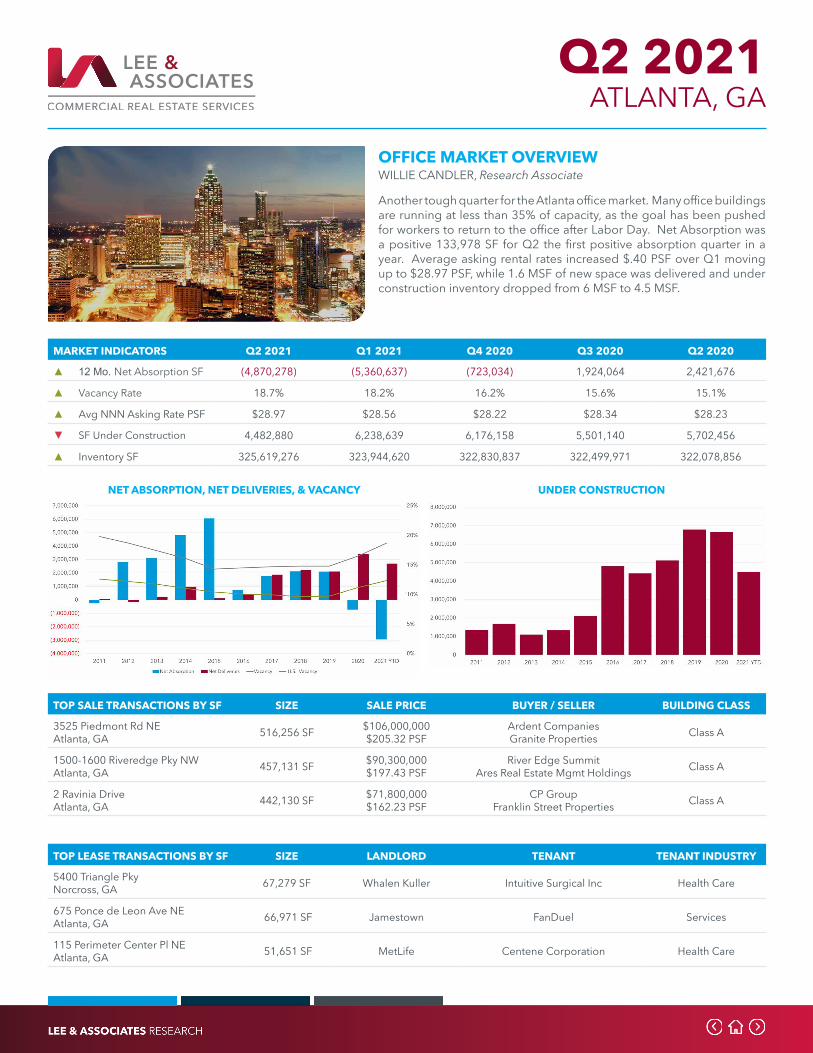
Q2 2021
OFFICE MARKET OVERVIEWWILLIE CANDLER, Research Associate
Another tough quarter for the Atlanta office market. Many office buildings are running at less than 35% of capacity, as the goal has been pushed for workers to return to the office after Labor Day. Net Absorption was a positive 133,978 SF for Q2 the first positive absorption quarter in a year. Average asking rental rates increased $.40 PSF over Q1 moving up to $28.97 PSF, while 1.6 MSF of new space was delivered and under construction inventory dropped from 6 MSF to 4.5 MSF.
ATLANTA, GA
NET ABSORPTION, NET DELIVERIES, & VACANCY UNDER CONSTRUCTION
TOP LEASE TRANSACTIONS BY SF SIZE LANDLORD TENANT TENANT INDUSTRY
5400 Triangle PkyNorcross, GA 67,279 SF Whalen Kuller Intuitive Surgical Inc Health Care
675 Ponce de Leon Ave NEAtlanta, GA 66,971 SF Jamestown FanDuel Services
115 Perimeter Center Pl NEAtlanta, GA 51,651 SF MetLife Centene Corporation Health Care
TOP SALE TRANSACTIONS BY SF SIZE SALE PRICE BUYER / SELLER BUILDING CLASS
3525 Piedmont Rd NEAtlanta, GA 516,256 SF $106,000,000
$205.32 PSFArdent CompaniesGranite Properties Class A
1500-1600 Riveredge Pky NWAtlanta, GA 457,131 SF $90,300,000
$197.43 PSFRiver Edge Summit
Ares Real Estate Mgmt Holdings Class A
2 Ravinia DriveAtlanta, GA 442,130 SF $71,800,000
$162.23 PSFCP Group
Franklin Street Properties Class A
MARKET INDICATORS Q2 2021 Q1 2021 Q4 2020 Q3 2020 Q2 2020
▲ 12 Mo. Net Absorption SF (4,870,278) (5,360,637) (723,034) 1,924,064 2,421,676
▲ Vacancy Rate 18.7% 18.2% 16.2% 15.6% 15.1%
▲ Avg NNN Asking Rate PSF $28.97 $28.56 $28.22 $28.34 $28.23
▼ SF Under Construction 4,482,880 6,238,639 6,176,158 5,501,140 5,702,456
▲ Inventory SF 325,619,276 323,944,620 322,830,837 322,499,971 322,078,856
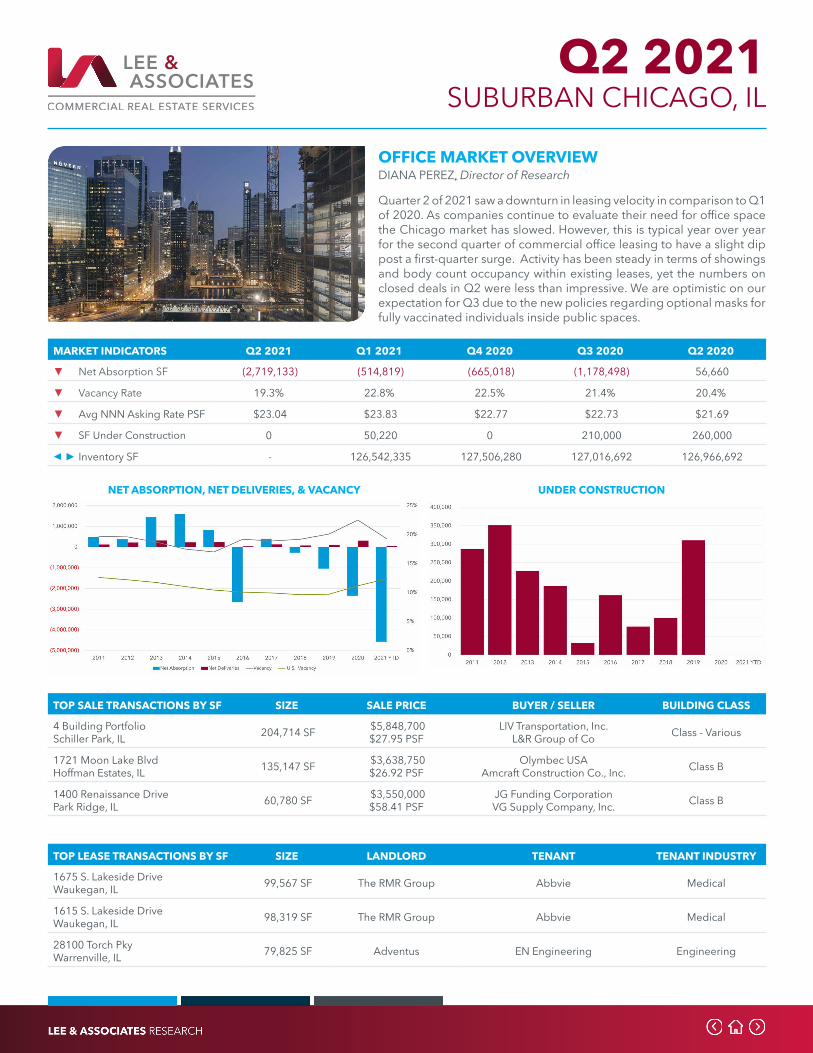
Q2 2021
OFFICE MARKET OVERVIEWDIANA PEREZ, Director of Research
Quarter 2 of 2021 saw a downturn in leasing velocity in comparison to Q1 of 2020. As companies continue to evaluate their need for office space the Chicago market has slowed. However, this is typical year over year for the second quarter of commercial office leasing to have a slight dip post a first-quarter surge. Activity has been steady in terms of showings and body count occupancy within existing leases, yet the numbers on closed deals in Q2 were less than impressive. We are optimistic on our expectation for Q3 due to the new policies regarding optional masks for fully vaccinated individuals inside public spaces.
SUBURBAN CHICAGO, IL
NET ABSORPTION, NET DELIVERIES, & VACANCY UNDER CONSTRUCTION
TOP LEASE TRANSACTIONS BY SF SIZE LANDLORD TENANT TENANT INDUSTRY
1675 S. Lakeside DriveWaukegan, IL 99,567 SF The RMR Group Abbvie Medical
1615 S. Lakeside DriveWaukegan, IL 98,319 SF The RMR Group Abbvie Medical
28100 Torch PkyWarrenville, IL 79,825 SF Adventus EN Engineering Engineering
TOP SALE TRANSACTIONS BY SF SIZE SALE PRICE BUYER / SELLER BUILDING CLASS
4 Building PortfolioSchiller Park, IL 204,714 SF $5,848,700
$27.95 PSFLIV Transportation, Inc.
L&R Group of Co Class - Various
1721 Moon Lake BlvdHoffman Estates, IL 135,147 SF $3,638,750
$26.92 PSFOlymbec USA
Amcraft Construction Co., Inc. Class B
1400 Renaissance DrivePark Ridge, IL 60,780 SF $3,550,000
$58.41 PSFJG Funding CorporationVG Supply Company, Inc. Class B
MARKET INDICATORS Q2 2021 Q1 2021 Q4 2020 Q3 2020 Q2 2020
▼ Net Absorption SF (2,719,133) (514,819) (665,018) (1,178,498) 56,660
▼ Vacancy Rate 19.3% 22.8% 22.5% 21.4% 20.4%
▼ Avg NNN Asking Rate PSF $23.04 $23.83 $22.77 $22.73 $21.69
▼ SF Under Construction 0 50,220 0 210,000 260,000
◀ ► Inventory SF - 126,542,335 127,506,280 127,016,692 126,966,692
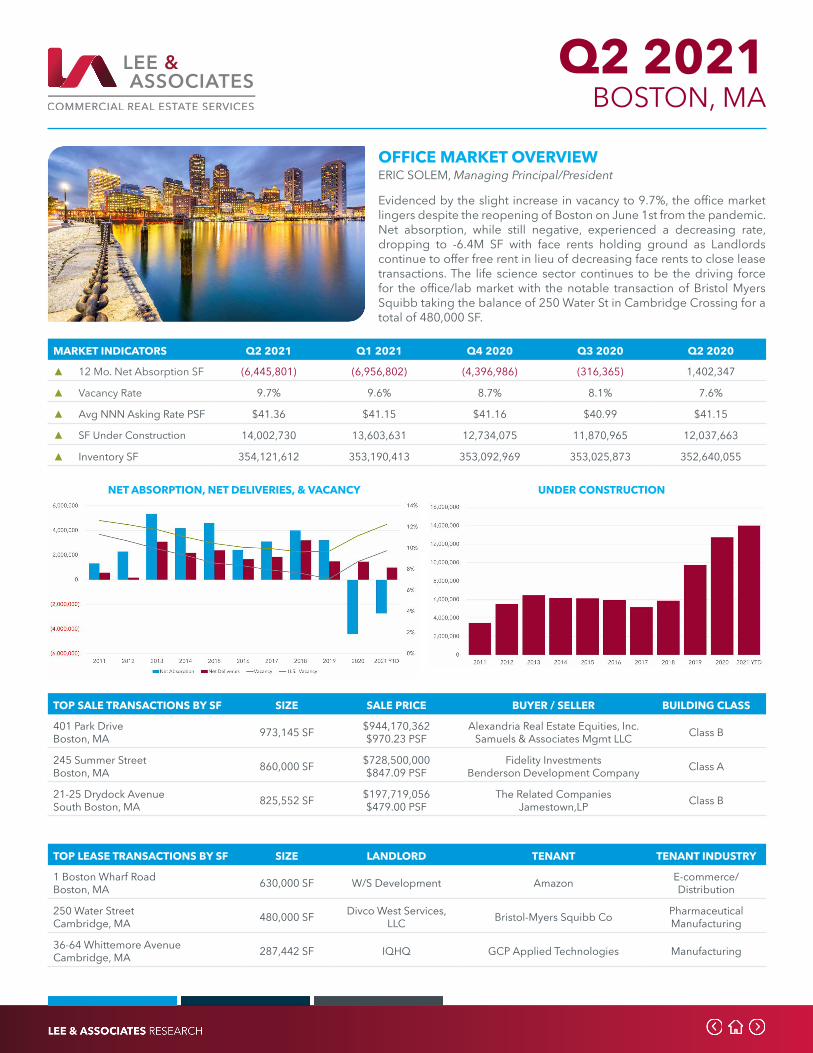
Q2 2021
OFFICE MARKET OVERVIEWERIC SOLEM, Managing Principal/President
Evidenced by the slight increase in vacancy to 9.7%, the office market lingers despite the reopening of Boston on June 1st from the pandemic. Net absorption, while still negative, experienced a decreasing rate, dropping to -6.4M SF with face rents holding ground as Landlords continue to offer free rent in lieu of decreasing face rents to close lease transactions. The life science sector continues to be the driving force for the office/lab market with the notable transaction of Bristol Myers Squibb taking the balance of 250 Water St in Cambridge Crossing for a total of 480,000 SF.
BOSTON, MA
NET ABSORPTION, NET DELIVERIES, & VACANCY UNDER CONSTRUCTION
TOP LEASE TRANSACTIONS BY SF SIZE LANDLORD TENANT TENANT INDUSTRY
1 Boston Wharf RoadBoston, MA 630,000 SF W/S Development Amazon E-commerce/
Distribution
250 Water StreetCambridge, MA 480,000 SF Divco West Services,
LLC Bristol-Myers Squibb Co PharmaceuticalManufacturing
36-64 Whittemore AvenueCambridge, MA 287,442 SF IQHQ GCP Applied Technologies Manufacturing
TOP SALE TRANSACTIONS BY SF SIZE SALE PRICE BUYER / SELLER BUILDING CLASS
401 Park DriveBoston, MA 973,145 SF $944,170,362
$970.23 PSFAlexandria Real Estate Equities, Inc.
Samuels & Associates Mgmt LLC Class B
245 Summer StreetBoston, MA 860,000 SF $728,500,000
$847.09 PSFFidelity Investments
Benderson Development Company Class A
21-25 Drydock AvenueSouth Boston, MA 825,552 SF $197,719,056
$479.00 PSFThe Related Companies
Jamestown,LP Class B
MARKET INDICATORS Q2 2021 Q1 2021 Q4 2020 Q3 2020 Q2 2020
▲ 12 Mo. Net Absorption SF (6,445,801) (6,956,802) (4,396,986) (316,365) 1,402,347
▲ Vacancy Rate 9.7% 9.6% 8.7% 8.1% 7.6%
▲ Avg NNN Asking Rate PSF $41.36 $41.15 $41.16 $40.99 $41.15
▲ SF Under Construction 14,002,730 13,603,631 12,734,075 11,870,965 12,037,663
▲ Inventory SF 354,121,612 353,190,413 353,092,969 353,025,873 352,640,055

Q2 2021
OFFICE MARKET OVERVIEWBILL HARRISON, Senior Vice President
This Quarter’s report covers the Greater Columbia Office Market. It is fair to say that the positive trend continues, with Net absorption improving to a positive 201,055 SF number verses 54,617 in Q 1. Vacancy rates remain stable at 12.6% and the same can be said for asking rental rates. It appears that much of the sub-lease space flooding the market earlier in the year has been removed. Large tech and health services tenants call the area home. Many of which are targeting Labor Day or sooner as a full or hybrid return to the office. Due to its location near the Federal Government this Submarket is also driven by defense and government-related tenants.
GREATER COLUMBIA, MD
NET ABSORPTION, NET DELIVERIES, & VACANCY UNDER CONSTRUCTION
TOP LEASE TRANSACTIONS BY SF SIZE LANDLORD TENANT TENANT INDUSTRY
10960 Grantchester WayColumbia, MD 23,525 SF Howard Hughes Government Contractor Defense
14502 Greenview DriveLaurel, MD 15,561 SF Berman Enterprises Undisclosed Undisclosed
6750 Alexander Bell DriveColumbia, MD 14,943 SF COPT Sealing Tech Engineering
TOP SALE TRANSACTIONS BY SF SIZE SALE PRICE BUYER / SELLER BUILDING CLASS
13922 Baltimore Ave, Units 4&5Laurel, MD 6,342 SF $1,650,000
$260.17 PSFUndisclosed
3502 Kenilworth Ave, LLC Class B
8860 Columbia Pky, Unit 314Columbia, MD 3,289 SF $841,847
$255.96 PSFColumbia Aesthetic Plastic Surgery
Coath Investments Class A
14333 Laurel Bowie RoadLaurel, MD 1,000 SF $195,000
$195.00 PSCaring Hands, LLC
Dr. Bhaumak Class B
MARKET INDICATORS Q2 2021 Q1 2021 Q4 2020 Q3 2020 Q2 2020
▲ Net Absorption SF 201,055 54,617 (183,332) (243,871) (228,005)
▲ Vacancy Rate 12.6% 12.5% 12.8% 12.0% 11.3%
▲ Avg NNN Asking Rate PSF $25.56 $25.50 $25.31 $25.42 $25.66
▼ SF Under Construction 115,980 378,980 378,980 263,000 263,000
▲ Inventory SF 22,833,970 22,570,970 22,570,970 22,570,970 22,690,040
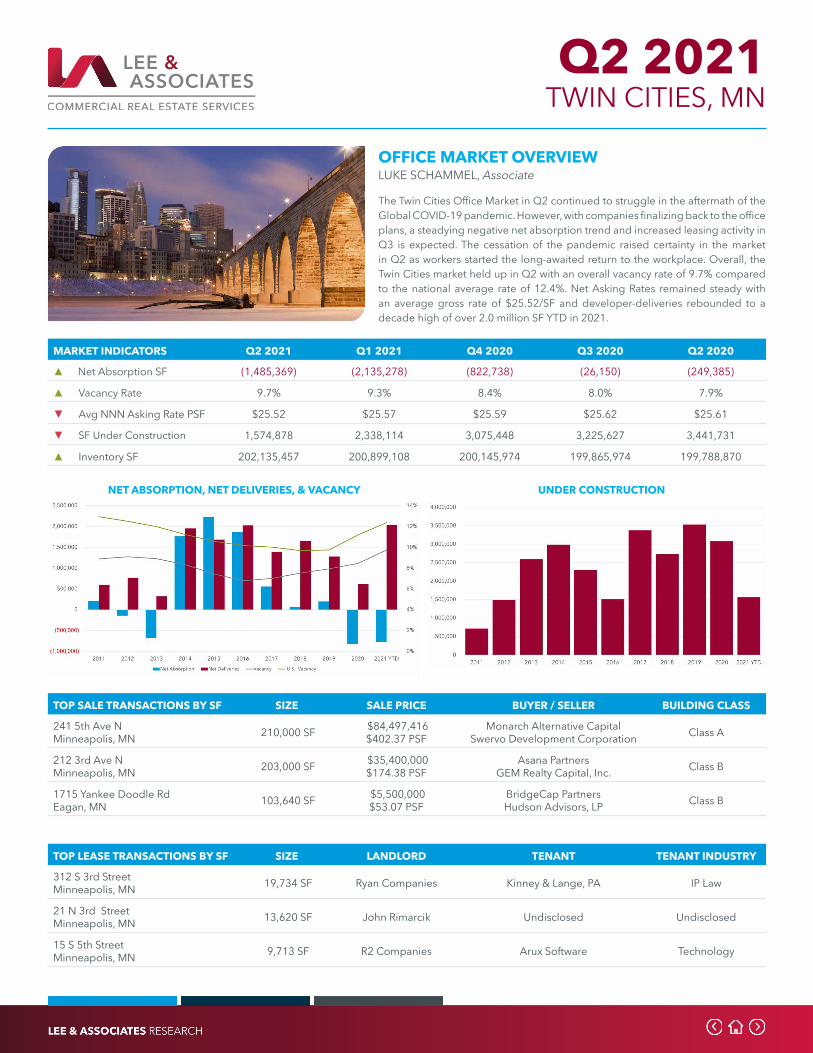
Q2 2021
OFFICE MARKET OVERVIEWLUKE SCHAMMEL, Associate
The Twin Cities Office Market in Q2 continued to struggle in the aftermath of the Global COVID-19 pandemic. However, with companies finalizing back to the office plans, a steadying negative net absorption trend and increased leasing activity in Q3 is expected. The cessation of the pandemic raised certainty in the market in Q2 as workers started the long-awaited return to the workplace. Overall, the Twin Cities market held up in Q2 with an overall vacancy rate of 9.7% compared to the national average rate of 12.4%. Net Asking Rates remained steady with an average gross rate of $25.52/SF and developer-deliveries rebounded to a decade high of over 2.0 million SF YTD in 2021.
TWIN CITIES, MN
NET ABSORPTION, NET DELIVERIES, & VACANCY UNDER CONSTRUCTION
TOP LEASE TRANSACTIONS BY SF SIZE LANDLORD TENANT TENANT INDUSTRY
312 S 3rd StreetMinneapolis, MN 19,734 SF Ryan Companies Kinney & Lange, PA IP Law
21 N 3rd StreetMinneapolis, MN 13,620 SF John Rimarcik Undisclosed Undisclosed
15 S 5th StreetMinneapolis, MN 9,713 SF R2 Companies Arux Software Technology
TOP SALE TRANSACTIONS BY SF SIZE SALE PRICE BUYER / SELLER BUILDING CLASS
241 5th Ave NMinneapolis, MN 210,000 SF $84,497,416
$402.37 PSFMonarch Alternative Capital
Swervo Development Corporation Class A
212 3rd Ave NMinneapolis, MN 203,000 SF $35,400,000
$174.38 PSFAsana Partners
GEM Realty Capital, Inc. Class B
1715 Yankee Doodle RdEagan, MN 103,640 SF $5,500,000
$53.07 PSFBridgeCap PartnersHudson Advisors, LP Class B
MARKET INDICATORS Q2 2021 Q1 2021 Q4 2020 Q3 2020 Q2 2020
▲ Net Absorption SF (1,485,369) (2,135,278) (822,738) (26,150) (249,385)
▲ Vacancy Rate 9.7% 9.3% 8.4% 8.0% 7.9%
▼ Avg NNN Asking Rate PSF $25.52 $25.57 $25.59 $25.62 $25.61
▼ SF Under Construction 1,574,878 2,338,114 3,075,448 3,225,627 3,441,731
▲ Inventory SF 202,135,457 200,899,108 200,145,974 199,865,974 199,788,870
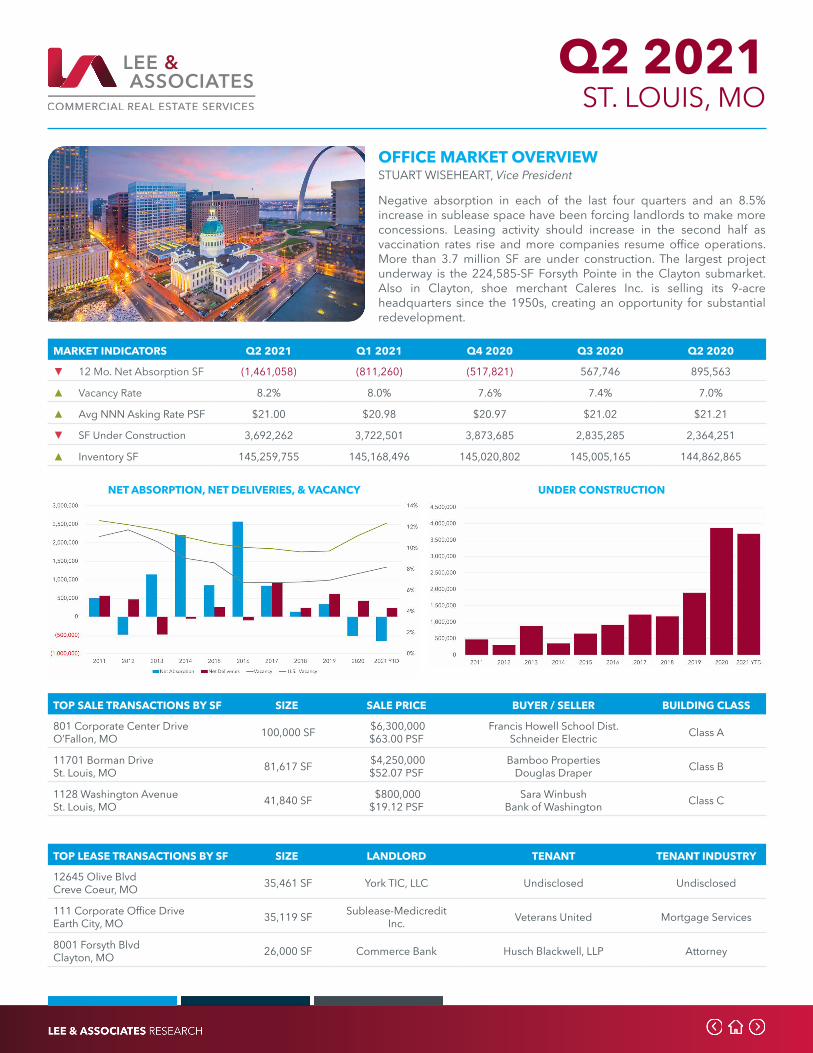
Q2 2021
OFFICE MARKET OVERVIEWSTUART WISEHEART, Vice President
Negative absorption in each of the last four quarters and an 8.5% increase in sublease space have been forcing landlords to make more concessions. Leasing activity should increase in the second half as vaccination rates rise and more companies resume office operations. More than 3.7 million SF are under construction. The largest project underway is the 224,585-SF Forsyth Pointe in the Clayton submarket. Also in Clayton, shoe merchant Caleres Inc. is selling its 9-acre headquarters since the 1950s, creating an opportunity for substantial redevelopment.
ST. LOUIS, MO
NET ABSORPTION, NET DELIVERIES, & VACANCY UNDER CONSTRUCTION
TOP LEASE TRANSACTIONS BY SF SIZE LANDLORD TENANT TENANT INDUSTRY
12645 Olive BlvdCreve Coeur, MO 35,461 SF York TIC, LLC Undisclosed Undisclosed
111 Corporate Office DriveEarth City, MO 35,119 SF Sublease-Medicredit
Inc. Veterans United Mortgage Services
8001 Forsyth BlvdClayton, MO 26,000 SF Commerce Bank Husch Blackwell, LLP Attorney
TOP SALE TRANSACTIONS BY SF SIZE SALE PRICE BUYER / SELLER BUILDING CLASS
801 Corporate Center DriveO’Fallon, MO 100,000 SF $6,300,000
$63.00 PSFFrancis Howell School Dist.
Schneider Electric Class A
11701 Borman DriveSt. Louis, MO 81,617 SF $4,250,000
$52.07 PSFBamboo Properties
Douglas Draper Class B
1128 Washington AvenueSt. Louis, MO 41,840 SF $800,000
$19.12 PSFSara Winbush
Bank of Washington Class C
MARKET INDICATORS Q2 2021 Q1 2021 Q4 2020 Q3 2020 Q2 2020
▼ 12 Mo. Net Absorption SF (1,461,058) (811,260) (517,821) 567,746 895,563
▲ Vacancy Rate 8.2% 8.0% 7.6% 7.4% 7.0%
▲ Avg NNN Asking Rate PSF $21.00 $20.98 $20.97 $21.02 $21.21
▼ SF Under Construction 3,692,262 3,722,501 3,873,685 2,835,285 2,364,251
▲ Inventory SF 145,259,755 145,168,496 145,020,802 145,005,165 144,862,865
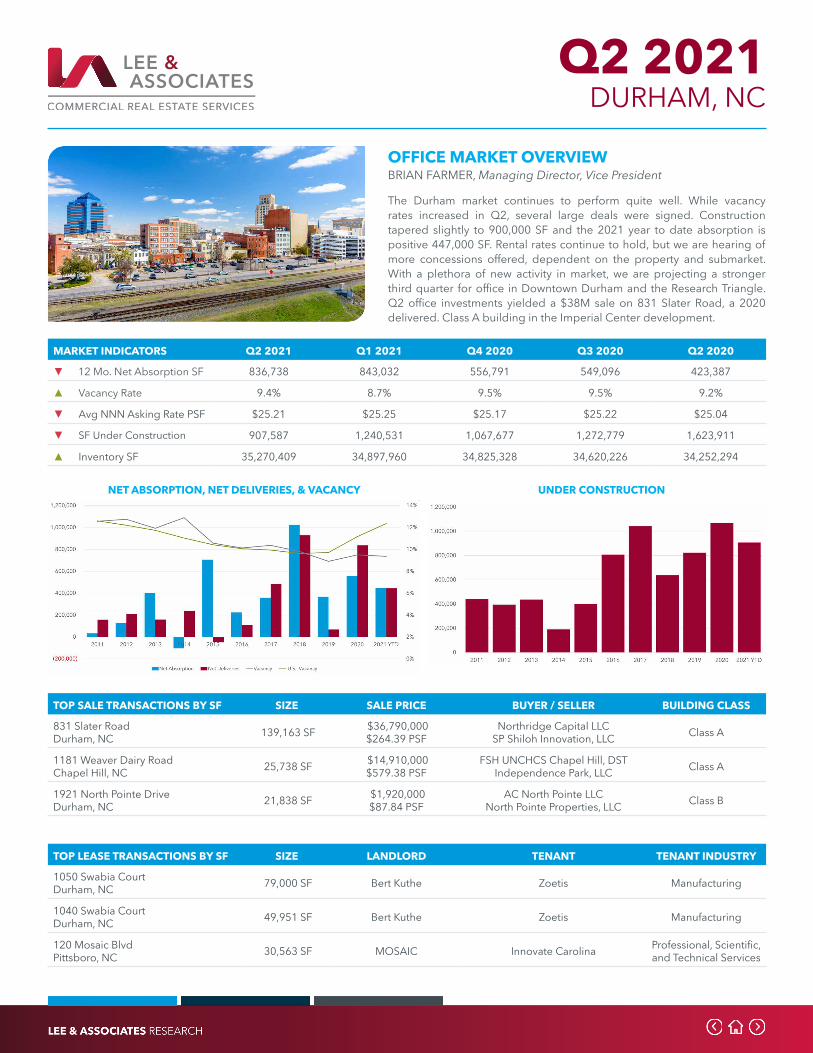
Q2 2021
OFFICE MARKET OVERVIEWBRIAN FARMER, Managing Director, Vice President
The Durham market continues to perform quite well. While vacancy rates increased in Q2, several large deals were signed. Construction tapered slightly to 900,000 SF and the 2021 year to date absorption is positive 447,000 SF. Rental rates continue to hold, but we are hearing of more concessions offered, dependent on the property and submarket. With a plethora of new activity in market, we are projecting a stronger third quarter for office in Downtown Durham and the Research Triangle. Q2 office investments yielded a $38M sale on 831 Slater Road, a 2020 delivered. Class A building in the Imperial Center development.
DURHAM, NC
NET ABSORPTION, NET DELIVERIES, & VACANCY UNDER CONSTRUCTION
TOP LEASE TRANSACTIONS BY SF SIZE LANDLORD TENANT TENANT INDUSTRY
1050 Swabia CourtDurham, NC 79,000 SF Bert Kuthe Zoetis Manufacturing
1040 Swabia CourtDurham, NC 49,951 SF Bert Kuthe Zoetis Manufacturing
120 Mosaic BlvdPittsboro, NC 30,563 SF MOSAIC Innovate Carolina Professional, Scientific,
and Technical Services
TOP SALE TRANSACTIONS BY SF SIZE SALE PRICE BUYER / SELLER BUILDING CLASS
831 Slater RoadDurham, NC 139,163 SF $36,790,000
$264.39 PSFNorthridge Capital LLC
SP Shiloh Innovation, LLC Class A
1181 Weaver Dairy RoadChapel Hill, NC 25,738 SF $14,910,000
$579.38 PSFFSH UNCHCS Chapel Hill, DST
Independence Park, LLC Class A
1921 North Pointe DriveDurham, NC 21,838 SF $1,920,000
$87.84 PSFAC North Pointe LLC
North Pointe Properties, LLC Class B
MARKET INDICATORS Q2 2021 Q1 2021 Q4 2020 Q3 2020 Q2 2020
▼ 12 Mo. Net Absorption SF 836,738 843,032 556,791 549,096 423,387
▲ Vacancy Rate 9.4% 8.7% 9.5% 9.5% 9.2%
▼ Avg NNN Asking Rate PSF $25.21 $25.25 $25.17 $25.22 $25.04
▼ SF Under Construction 907,587 1,240,531 1,067,677 1,272,779 1,623,911
▲ Inventory SF 35,270,409 34,897,960 34,825,328 34,620,226 34,252,294

Q2 2021
OFFICE MARKET OVERVIEWBRIAN FARMER, Managing Director, Vice President
The Raleigh market continues to perform quite well. Rental rates climbed again in Q2 and construction has tapered slightly to just under 1M SF. Sublease listings continue to increase, but the pace has slowed substantially. Our firm is continuing to see tenants renewing current office suites rather than moving to new and larger developments. Though over 600,000 SF of Class-A office was delivered in Q2, there was nearly the same amount of positive absorption, holding vacancy rates constant. The largest lease deal was the life science company Invitae who has taken an entire adaptive re-use project called ‘The Stitch’ consisting of 250,000 SF.
RALEIGH, NC
NET ABSORPTION, NET DELIVERIES, & VACANCY UNDER CONSTRUCTION
TOP LEASE TRANSACTIONS BY SF SIZE LANDLORD TENANT TENANT INDUSTRY
1001 Airport BlvdMorrisville, NC 250,000 SF Equator Capital
Management Invitae Corporation Health Care and Social Assistance
1200 Crescent Green DriveCary, NC 75,168 SF Grupo Haddad US Undisclosed Undisclosed
1101 Shiloh Glenn DriveMorrisville, NC 75,015 SF DRA Advisors LLC Azzur Cleanrooms On Demand
Raleigh Services
TOP SALE TRANSACTIONS BY SF SIZE SALE PRICE BUYER / SELLER BUILDING CLASS
1201 Edwards Mill RoadRaleigh, NC 114,547 SF $27,750,000
$242.26 PSF1201 Edwards Mill Road, LLC
Orgin-Trinity Holdings, LLC Class A
2710 Wycliff RoadRaleigh, NC 87,980 SF $9,130,000
$130.73 PSFCPGJRC Wycliff Road LLC
Martin Marietta Materials, Inc. Class C
2700 Wycliff RoadRaleigh, NC 87,000 SF $8,470,000
$97.40 PSFCPGJRC Wycliff Road LLC
Martin Marietta Materials, LLC Class C
MARKET INDICATORS Q2 2021 Q1 2021 Q4 2020 Q3 2020 Q2 2020
▲ 12 Mo. Net Absorption SF 618,751 (216,278) (95,639) (45,036) 369,253
◀ ► Vacancy Rate 7.8% 7.8% 7.2% 6.5% 5.9%
▲ Avg NNN Asking Rate PSF $27.76 $27.67 $27.56 $27.58 $27.46
▼ SF Under Construction 999,152 1,694,394 2,070,316 2,478,376 2,715,970
▲ Inventory SF 76,141,963 75,440,721 74,880,187 74,298,365 73,910,230
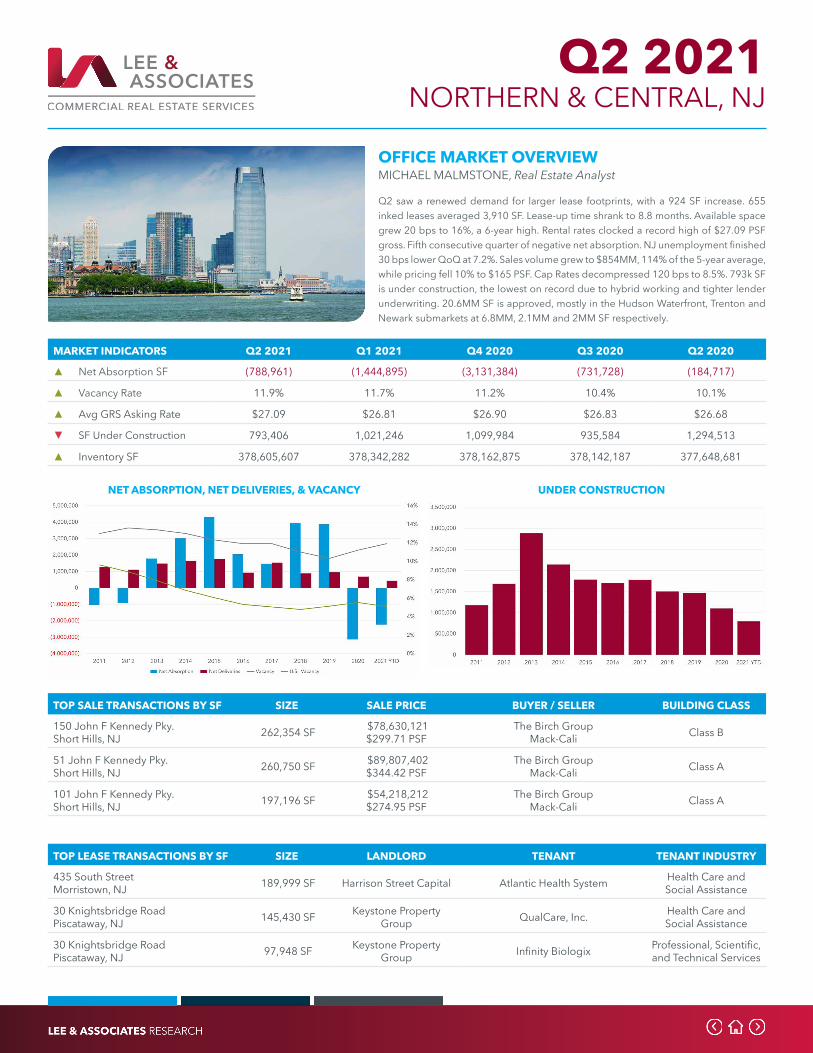
Q2 2021
OFFICE MARKET OVERVIEWMICHAEL MALMSTONE, Real Estate Analyst
Q2 saw a renewed demand for larger lease footprints, with a 924 SF increase. 655 inked leases averaged 3,910 SF. Lease-up time shrank to 8.8 months. Available space grew 20 bps to 16%, a 6-year high. Rental rates clocked a record high of $27.09 PSF gross. Fifth consecutive quarter of negative net absorption. NJ unemployment finished 30 bps lower QoQ at 7.2%. Sales volume grew to $854MM, 114% of the 5-year average, while pricing fell 10% to $165 PSF. Cap Rates decompressed 120 bps to 8.5%. 793k SF is under construction, the lowest on record due to hybrid working and tighter lender underwriting. 20.6MM SF is approved, mostly in the Hudson Waterfront, Trenton and Newark submarkets at 6.8MM, 2.1MM and 2MM SF respectively.
NORTHERN & CENTRAL, NJ
NET ABSORPTION, NET DELIVERIES, & VACANCY UNDER CONSTRUCTION
TOP LEASE TRANSACTIONS BY SF SIZE LANDLORD TENANT TENANT INDUSTRY
435 South StreetMorristown, NJ 189,999 SF Harrison Street Capital Atlantic Health System Health Care and
Social Assistance
30 Knightsbridge RoadPiscataway, NJ 145,430 SF Keystone Property
Group QualCare, Inc. Health Care and Social Assistance
30 Knightsbridge RoadPiscataway, NJ 97,948 SF Keystone Property
Group Infinity Biologix Professional, Scientific, and Technical Services
TOP SALE TRANSACTIONS BY SF SIZE SALE PRICE BUYER / SELLER BUILDING CLASS
150 John F Kennedy Pky.Short Hills, NJ 262,354 SF $78,630,121
$299.71 PSFThe Birch Group
Mack-Cali Class B
51 John F Kennedy Pky.Short Hills, NJ 260,750 SF $89,807,402
$344.42 PSFThe Birch Group
Mack-Cali Class A
101 John F Kennedy Pky.Short Hills, NJ 197,196 SF $54,218,212
$274.95 PSFThe Birch Group
Mack-Cali Class A
MARKET INDICATORS Q2 2021 Q1 2021 Q4 2020 Q3 2020 Q2 2020
▲ Net Absorption SF (788,961) (1,444,895) (3,131,384) (731,728) (184,717)
▲ Vacancy Rate 11.9% 11.7% 11.2% 10.4% 10.1%
▲ Avg GRS Asking Rate $27.09 $26.81 $26.90 $26.83 $26.68
▼ SF Under Construction 793,406 1,021,246 1,099,984 935,584 1,294,513
▲ Inventory SF 378,605,607 378,342,282 378,162,875 378,142,187 377,648,681

Q2 2021
OFFICE MARKET OVERVIEWLYLE CHAMBERLAIN, President
As the Pandemic restrictions are lifted, and people go back to their offices, we are going to start to have a better idea as to if the habits created (stay at home offices and workers) will have lasting effect. This, combined with a significant amount of product under construction will have a big impact on the Office market here. I expect the new construction to attract tenants, even at the “higher than market” rents they will need, but this will be at the direct cost to the existing product, both in rent pressure (downwards) and vacancy. This will be an ongoing discussion as the new product comes to market.
RENO, NV
NET ABSORPTION, NET DELIVERIES, & VACANCY UNDER CONSTRUCTION
TOP LEASE TRANSACTIONS BY SF SIZE LANDLORD TENANT TENANT INDUSTRY
9850 Double RReno, NV 28,856 SF Incline Capital Group Harley Davidson Retailer
9670 GatewayReno,NV 17,227 SF Helio Power Ridgeline Inc Prof, Science & Tech
Services
7900 RancharrahReno, NV 8,651 SF Reno Land Dev Co Kimeley-Horn & Associates Services
TOP SALE TRANSACTIONS BY SF SIZE SALE PRICE BUYER / SELLER BUILDING CLASS
245 E Liberty StreetReno, NV 72,864 SF $6,400,000
$87.83 PSFFAEC fbo 24 Lofts, LLC
Stewart A & Kim I Colton Class B
1000 Sandhill RoadReno, NV 52,100 SF $6,600,000
$126.68 PSFStem Express
Benjamin F Garfinkle Rvcble Trust Class B
5560 Kietzke Ln (Multi-Property Sale)Reno, NV 21,500 SF $11,509,796
$535.34 PSFRemedy Medical Properties
Urology Nevada Class B
MARKET INDICATORS Q2 2021 Q1 2021 Q4 2020 Q3 2020 Q2 2020
▲ 12 Mo. Net Absorption SF (37,261) (227,106) (185,982) (245,517) (96,318)
◀ ► Vacancy Rate 9.4% 9.4% 9.5% 9.7% 8.9%
▲ Avg NNN Asking Rate $22.72 $22.55 $22.48 $22.11 $22.31
▼ SF Under Construction 237,021 252,659 37,408 36,151 33,013
▲ Inventory SF 16,840,563 16,824,925 16,824,925 16,804,412 16,791,912

Q2 2021 OFFICE MARKET OVERVIEWKENNETH SALZMAN, SIOR, Executive Managing Director, Principal
New York City is slowly recovering from the negative impact caused by the Covid-19 pandemic. The number of firms offering their offices for sublease increased 30%, resulting in 27.1 M SF of space being returned to the market during 2Q21 and leasing activity remained sluggish, pushing vacancy to 11.7% of available inventory. Average rents contracted 3.7%. Many believe the market has bottomed and some firms are taking advantage of large concession packages. By the end of 2Q21, nearly 73% of people 18+ have received at least one vaccination shot. While private-sector office usage throughout the quarter remained below 25%, businesses are actively announcing their return to office strategies. According to the US BLS, unemployment rates in Manhattan are more than 50% lower than the 15.2% high in 2020, however unemployment remains 200 bps greater the national average (7.5% vs. 5.5%). There is optimism the market will stabilize the 2nd half of the year.
NEW YORK CITY, NY
NET ABSORPTION, NET DELIVERIES, & VACANCY UNDER CONSTRUCTION
TOP LEASE TRANSACTIONS BY SF SIZE LANDLORD TENANT TENANT INDUSTRY
200 Vesey StreetNew York, NY 302,525 SF Brookfield Properties U.S. Securities Exchange
Commission Public Administration
11 Penn PlazaNew York, NY 155,724 SF Vornado Realty Trust SPARC Group Retailer
40 Worth StreetNew York, NY 122,310 SF GFP Real Estate Legal Services of New York Professional, Scientific,
and Technical Services
TOP SALE TRANSACTIONS BY SF SIZE SALE PRICE BUYER / SELLER BUILDING CLASS
11 East 26th StreetNew York, NY 264,660 SF $32,900,000
$888 PSF11 MSNA1 LLC
11-13 E 26 St Holding Corporation Class B
325 Hudson StreetNew York, NY 223,000 SF $135,000,000
$605 PSFDivco West
Jamestown, LP Class B
524 BroadwayNew York, NY 180,000 SF $234,720,000
$1,304 PSFNorthwood InvestorsTahl Property Equities Class B
MARKET INDICATORS Q2 2021 Q1 2021 Q4 2020 Q3 2020 Q2 2020
▼ 12 Mo. Net Absorption SF (27,144,753) (22,311,709) (13,278,266) (2,724,222) 3,316,676
▲ Vacancy Rate 11.7% 11.1% 10.0% 9.2% 8.4%
▼ Avg Asking Rate $56.36 $56.85 $57.12 $57.67 $58.62
▼ SF Under Construction 22,931,097 23,286,448 21,069,194 21,851,895 24,385,092
▲ Inventory SF 956,869,992 956,004,603 954,890,401 954,158,316 951,416,187
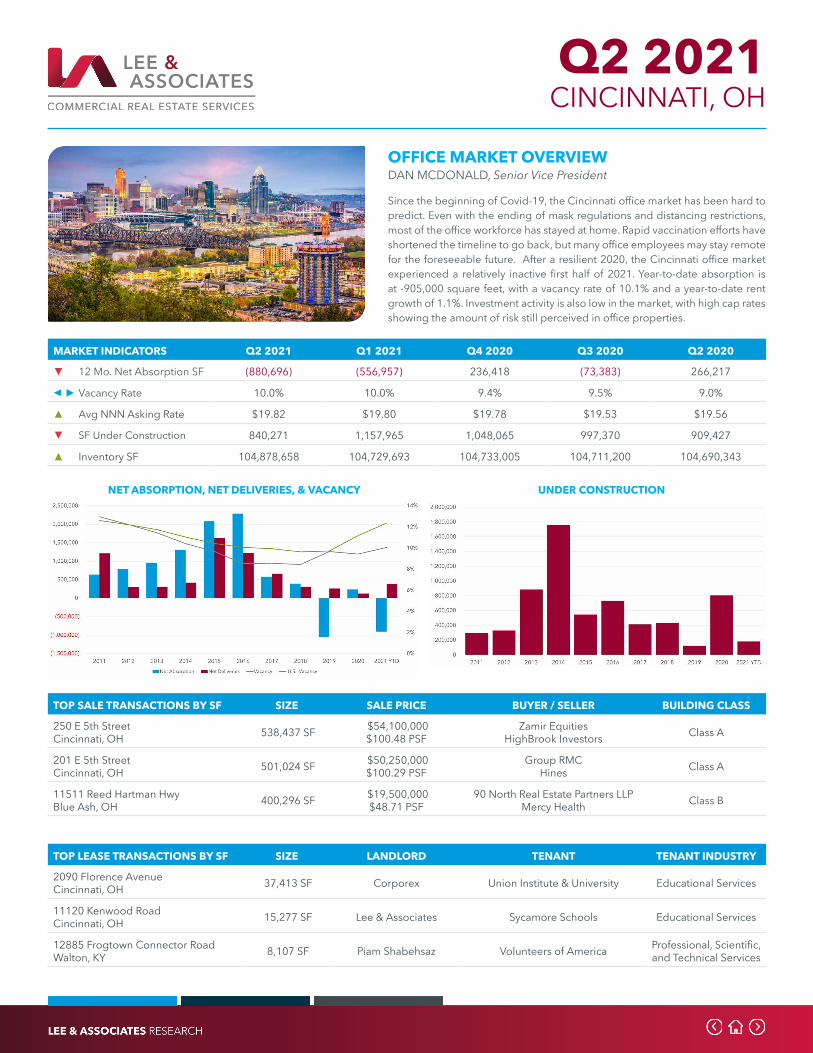
Q2 2021
OFFICE MARKET OVERVIEWDAN MCDONALD, Senior Vice President
Since the beginning of Covid-19, the Cincinnati office market has been hard to predict. Even with the ending of mask regulations and distancing restrictions, most of the office workforce has stayed at home. Rapid vaccination efforts have shortened the timeline to go back, but many office employees may stay remote for the foreseeable future. After a resilient 2020, the Cincinnati office market experienced a relatively inactive first half of 2021. Year-to-date absorption is at -905,000 square feet, with a vacancy rate of 10.1% and a year-to-date rent growth of 1.1%. Investment activity is also low in the market, with high cap rates showing the amount of risk still perceived in office properties.
CINCINNATI, OH
NET ABSORPTION, NET DELIVERIES, & VACANCY UNDER CONSTRUCTION
TOP LEASE TRANSACTIONS BY SF SIZE LANDLORD TENANT TENANT INDUSTRY
2090 Florence AvenueCincinnati, OH 37,413 SF Corporex Union Institute & University Educational Services
11120 Kenwood RoadCincinnati, OH 15,277 SF Lee & Associates Sycamore Schools Educational Services
12885 Frogtown Connector RoadWalton, KY 8,107 SF Piam Shabehsaz Volunteers of America Professional, Scientific,
and Technical Services
TOP SALE TRANSACTIONS BY SF SIZE SALE PRICE BUYER / SELLER BUILDING CLASS
250 E 5th StreetCincinnati, OH 538,437 SF $54,100,000
$100.48 PSFZamir Equities
HighBrook Investors Class A
201 E 5th StreetCincinnati, OH 501,024 SF $50,250,000
$100.29 PSFGroup RMC
Hines Class A
11511 Reed Hartman HwyBlue Ash, OH 400,296 SF $19,500,000
$48.71 PSF90 North Real Estate Partners LLP
Mercy Health Class B
MARKET INDICATORS Q2 2021 Q1 2021 Q4 2020 Q3 2020 Q2 2020
▼ 12 Mo. Net Absorption SF (880,696) (556,957) 236,418 (73,383) 266,217
◀ ► Vacancy Rate 10.0% 10.0% 9.4% 9.5% 9.0%
▲ Avg NNN Asking Rate $19.82 $19.80 $19.78 $19.53 $19.56
▼ SF Under Construction 840,271 1,157,965 1,048,065 997,370 909,427
▲ Inventory SF 104,878,658 104,729,693 104,733,005 104,711,200 104,690,343
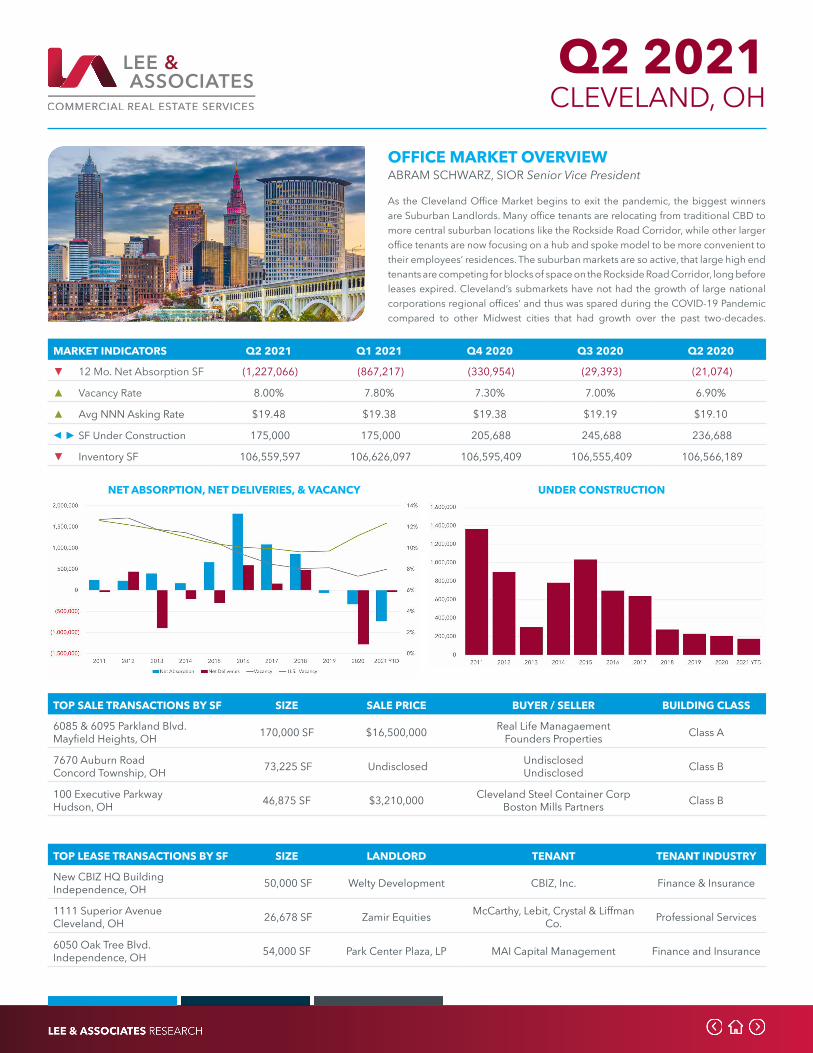
Q2 2021
OFFICE MARKET OVERVIEWABRAM SCHWARZ, SIOR Senior Vice President
As the Cleveland Office Market begins to exit the pandemic, the biggest winners are Suburban Landlords. Many office tenants are relocating from traditional CBD to more central suburban locations like the Rockside Road Corridor, while other larger office tenants are now focusing on a hub and spoke model to be more convenient to their employees’ residences. The suburban markets are so active, that large high end tenants are competing for blocks of space on the Rockside Road Corridor, long before leases expired. Cleveland’s submarkets have not had the growth of large national corporations regional offices’ and thus was spared during the COVID-19 Pandemic compared to other Midwest cities that had growth over the past two-decades.
CLEVELAND, OH
NET ABSORPTION, NET DELIVERIES, & VACANCY UNDER CONSTRUCTION
TOP LEASE TRANSACTIONS BY SF SIZE LANDLORD TENANT TENANT INDUSTRY
New CBIZ HQ BuildingIndependence, OH 50,000 SF Welty Development CBIZ, Inc. Finance & Insurance
1111 Superior AvenueCleveland, OH 26,678 SF Zamir Equities McCarthy, Lebit, Crystal & Liffman
Co. Professional Services
6050 Oak Tree Blvd.Independence, OH 54,000 SF Park Center Plaza, LP MAI Capital Management Finance and Insurance
TOP SALE TRANSACTIONS BY SF SIZE SALE PRICE BUYER / SELLER BUILDING CLASS
6085 & 6095 Parkland Blvd.Mayfield Heights, OH 170,000 SF $16,500,000 Real Life Managaement
Founders Properties Class A
7670 Auburn RoadConcord Township, OH 73,225 SF Undisclosed Undisclosed
Undisclosed Class B
100 Executive ParkwayHudson, OH 46,875 SF $3,210,000 Cleveland Steel Container Corp
Boston Mills Partners Class B
MARKET INDICATORS Q2 2021 Q1 2021 Q4 2020 Q3 2020 Q2 2020
▼ 12 Mo. Net Absorption SF (1,227,066) (867,217) (330,954) (29,393) (21,074)
▲ Vacancy Rate 8.00% 7.80% 7.30% 7.00% 6.90%
▲ Avg NNN Asking Rate $19.48 $19.38 $19.38 $19.19 $19.10
◀ ► SF Under Construction 175,000 175,000 205,688 245,688 236,688
▼ Inventory SF 106,559,597 106,626,097 106,595,409 106,555,409 106,566,189

Q2 2021
OFFICE MARKET OVERVIEWALEX KUNIEGA, Senior Associate
The Columbus office market recorded a third straight quarter of negative net absorption while an increase in sublease space has driven the vacancy rate to above 9%. The second quarter saw the largest office sale in Columbus history with CoverMyMeds selling the first of their two-building headquarters for $120MM to Qatar First Bank. Construction remains active with the Arlington Gateway project underway and various other developments around the city ongoing. BMW Financial Services preleased the first building in the Grandview Crossing development, taking up 120,000 SF total.
COLUMBUS, OH
NET ABSORPTION, NET DELIVERIES, & VACANCY UNDER CONSTRUCTION
TOP LEASE TRANSACTIONS BY SF SIZE LANDLORD TENANT TENANT INDUSTRY
1400 City View DriveColumbus, OH 120,000 SF Thrive Companies BMW Financial Auto Financing
1325 W. Lane AvenueColumbus, OH 33,874 SF Continental Real Estate Northwestern Mututal Financial Services
1325 W. Lane AvenueColumbus, OH 19,889 SF Continental Real Estate First Merchants Bank Banking
TOP SALE TRANSACTIONS BY SF SIZE SALE PRICE BUYER / SELLER BUILDING CLASS
1440 Granville RoadNewark, OH 325,779 SF $2,300,000
$7.06 PSFNewark City Schools
Aniketos Capitol Management Class C
910 John StreetColumbus, OH 218,000 SF $120,000,000
$550.46 PSFQatar First BankCoverMyMeds Class A
6480 Busch BoulevardColumbus, OH 111,778 SF $3,000,000
$26.84 PSFWupek PropertiesGrubb Properties Class B
MARKET INDICATORS Q2 2021 Q1 2021 Q4 2020 Q3 2020 Q2 2020
▼ 12 Mo. Net Absorption SF (1,271,498) (1,080,932) (786,146) 38,328 (390,887)
▲ Vacancy Rate 9.4% 8.9% 8.4% 7.8% 7.8%
▲ Avg NNN Asking Rate $21.20 $21.18 $21.05 $21.10 $21.11
▼ SF Under Construction 1,195,073 1,391,316 1,217,812 1,018,837 841,665
▲ Inventory SF 112,117,976 111,921,733 111,887,752 111,742,592 111,468,826
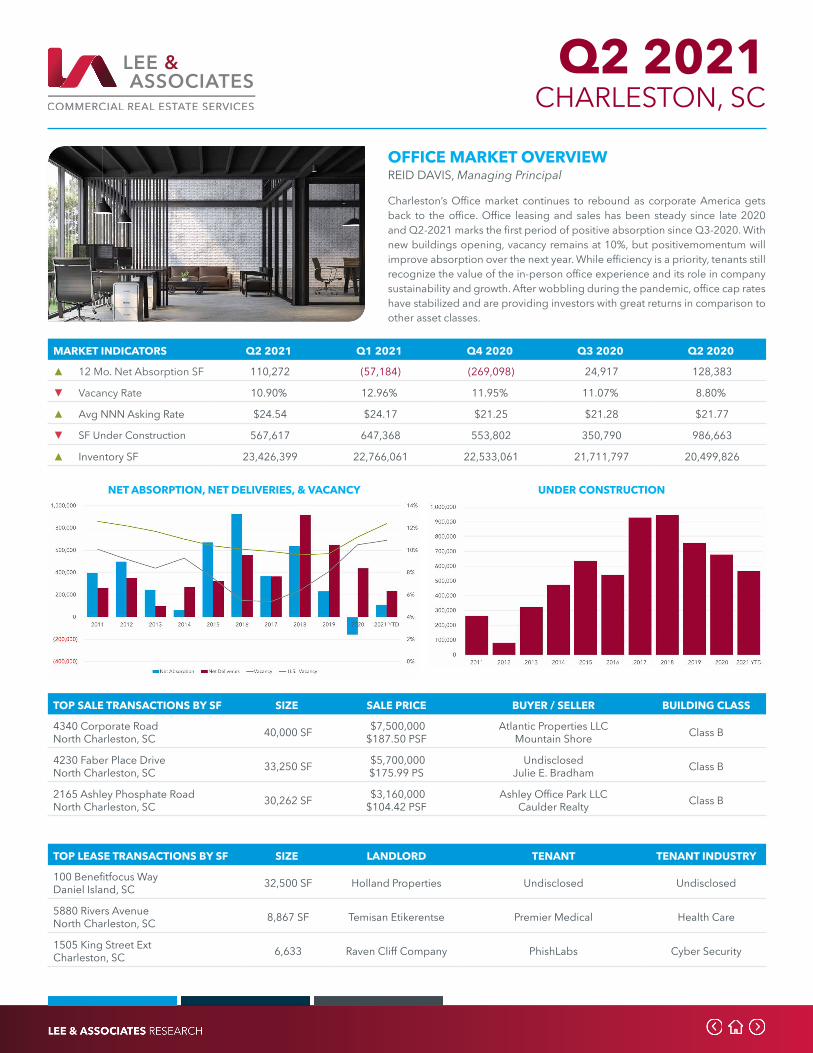
Q2 2021
OFFICE MARKET OVERVIEWREID DAVIS, Managing Principal
Charleston’s Office market continues to rebound as corporate America gets back to the office. Office leasing and sales has been steady since late 2020 and Q2-2021 marks the first period of positive absorption since Q3-2020. With new buildings opening, vacancy remains at 10%, but positivemomentum will improve absorption over the next year. While efficiency is a priority, tenants still recognize the value of the in-person office experience and its role in company sustainability and growth. After wobbling during the pandemic, office cap rates have stabilized and are providing investors with great returns in comparison to other asset classes.
CHARLESTON, SC
NET ABSORPTION, NET DELIVERIES, & VACANCY UNDER CONSTRUCTION
TOP LEASE TRANSACTIONS BY SF SIZE LANDLORD TENANT TENANT INDUSTRY
100 Benefitfocus WayDaniel Island, SC 32,500 SF Holland Properties Undisclosed Undisclosed
5880 Rivers AvenueNorth Charleston, SC 8,867 SF Temisan Etikerentse Premier Medical Health Care
1505 King Street ExtCharleston, SC 6,633 Raven Cliff Company PhishLabs Cyber Security
TOP SALE TRANSACTIONS BY SF SIZE SALE PRICE BUYER / SELLER BUILDING CLASS
4340 Corporate RoadNorth Charleston, SC 40,000 SF $7,500,000
$187.50 PSFAtlantic Properties LLC
Mountain Shore Class B
4230 Faber Place DriveNorth Charleston, SC 33,250 SF $5,700,000
$175.99 PSUndisclosed
Julie E. Bradham Class B
2165 Ashley Phosphate RoadNorth Charleston, SC 30,262 SF $3,160,000
$104.42 PSFAshley Office Park LLC
Caulder Realty Class B
MARKET INDICATORS Q2 2021 Q1 2021 Q4 2020 Q3 2020 Q2 2020
▲ 12 Mo. Net Absorption SF 110,272 (57,184) (269,098) 24,917 128,383
▼ Vacancy Rate 10.90% 12.96% 11.95% 11.07% 8.80%
▲ Avg NNN Asking Rate $24.54 $24.17 $21.25 $21.28 $21.77
▼ SF Under Construction 567,617 647,368 553,802 350,790 986,663
▲ Inventory SF 23,426,399 22,766,061 22,533,061 21,711,797 20,499,826

Q2 2021
OFFICE MARKET OVERVIEWDARATH MACKIE, Associate Broker
The Greenville/Spartanburg office market continued to strengthen in Q2 with greater demand for buyable office product versus shorter term leasing options we have been experiencing in the 3 previous quarters. Available inventory remained constant this quarter while the overall vacancy at 8.4% was slightly increased from the previous quarter but still remains well below both the national average and Greenville’s historical average. As predicted, rental rates are continuing to see a slight decline again this quarter at $18.57/SF on average but are expected to flatten in Q3 and increase slightly in Q4 as demand increases.
GREENVILLE / SPARTANBURG, SC
NET ABSORPTION, NET DELIVERIES, & VACANCY UNDER CONSTRUCTION
TOP LEASE TRANSACTIONS BY SF SIZE LANDLORD TENANT TENANT INDUSTRY
300 Executive Center DriveGreenville, SC 9,649 SF Two Greenville Park Lp Total Quality Logistics LLC Transportation and
warehousing
24 Cleveland StreetGreenville, SC 8,100 SF Bannister and Stalvey
Properties Pintail and Fox Commercial Real Estate
818 E Main Street Spartanburg, SC 7,200 SF Neuburger
Management Inc Winyah Community Hospice Care Healthcare
TOP SALE TRANSACTIONS BY SF SIZE SALE PRICE BUYER / SELLER BUILDING CLASS
40 W. Broad StreetGreenville, SC 65,076 SF $16,600,000
$255.09 PSF40 West Broad Jv Partners LLC
Broad Street Hospitality LLC Class A
850 Wade Hampton Blvd.Greenville, SC 21,690 SF $900,000
$41.49 PSFRfh Advisors Eight Fifty LLC
Doit Holdings, LLC Class C
110 W North StreetGreenville, SC 19,014 SF $4,122,000
$216.79 PSFTruliant Federal Credit Union
Npbn Partnership SC Class B
MARKET INDICATORS Q2 2021 Q1 2021 Q4 2020 Q3 2020 Q2 2020
▼ 12 Mo. Net Absorption SF (109,549) (15,791) (157,612) (482,190) (185,890)
▲ Vacancy Rate 8.4% 8.1% 8.0% 7.3% 6.1%
▼ Avg NNN Asking Rate $18.57 $18.86 $18.97 $18.54 $18.52
▲ SF Under Construction 758,359 755,159 242,504 423,647 441,009
◀ ► Inventory SF 41,636,706 41,636,706 41,618,861 41,434,861 41,422,313

Q2 2021
OFFICE MARKET OVERVIEWWILLIE CANDLER, Research Associate
Nashville, similar to the rest of the county, is experiencing a decline in leasing activity for office space. Vacancy has risen to 10.2% and with the uncertainty of the economy; however, expansions announced by Amazon and Oracle will bring several thousand new employees into Downtown over the next several years. Amazon has started construction on a second tower and Oracle has a 10 year building horizon for their new campus. Boosting not only worker traffic, but also bringing additional businesses providing services to them. Nashville is posed to become a regional powerhouse in the southeast.
NASHVILLE, TN
NET ABSORPTION, NET DELIVERIES, & VACANCY UNDER CONSTRUCTION
TOP LEASE TRANSACTIONS BY SF SIZE LANDLORD TENANT TENANT INDUSTRY
315 Deaderick StreetNashville, TN 138,000 SF Shorenstein Properties
LLC UBS Financial Services
201 Platform Way SNashville, TN 105,000 SF Southwest Value
Partners Enterprises Pinnacle Financial Partners Financial Services
200 Powell PlaceBrentwood, TN 50,000 SF Crestview Funds American Addiction Centers Addiction Treatment
TOP SALE TRANSACTIONS BY SF SIZE SALE PRICE BUYER / SELLER BUILDING CLASS
1 Lifeway PlzNashville, TN 279,770 SF $95,000,000
$339.56 PSFRubicon Equities/ Meritage Group
LifeWay Christian Resources Class A
2 Vantage WayNashville, TN 111,090 SF $16,500,000
$148.53 PSFThe Sason Organization
TPG Capital Class C
490 MetroPlex DriveNashville, TN 111,090 SF $6,000,000
$70.91 PSFOakPoint Real EstateHCA Healthcare Inc. Class C
MARKET INDICATORS Q2 2021 Q1 2021 Q4 2020 Q3 2020 Q2 2020
▲ 12 Mo. Net Absorption SF 48,271 (1,309,489) (769,849) (472,560) (33,425)
▲ Vacancy Rate 10.2% 10.0% 8.8% 8.3% 7.3%
▼ Avg NNN Asking Rate $28.48 $28.50 $28.60 $28.45 $28.56
▼ SF Under Construction 3,193,681 3,410,361 3,390,304 3,495,812 4,565,336
▲ Inventory SF 98,633,783 97,255,980 97,099,648 96,829,276 95,582,761
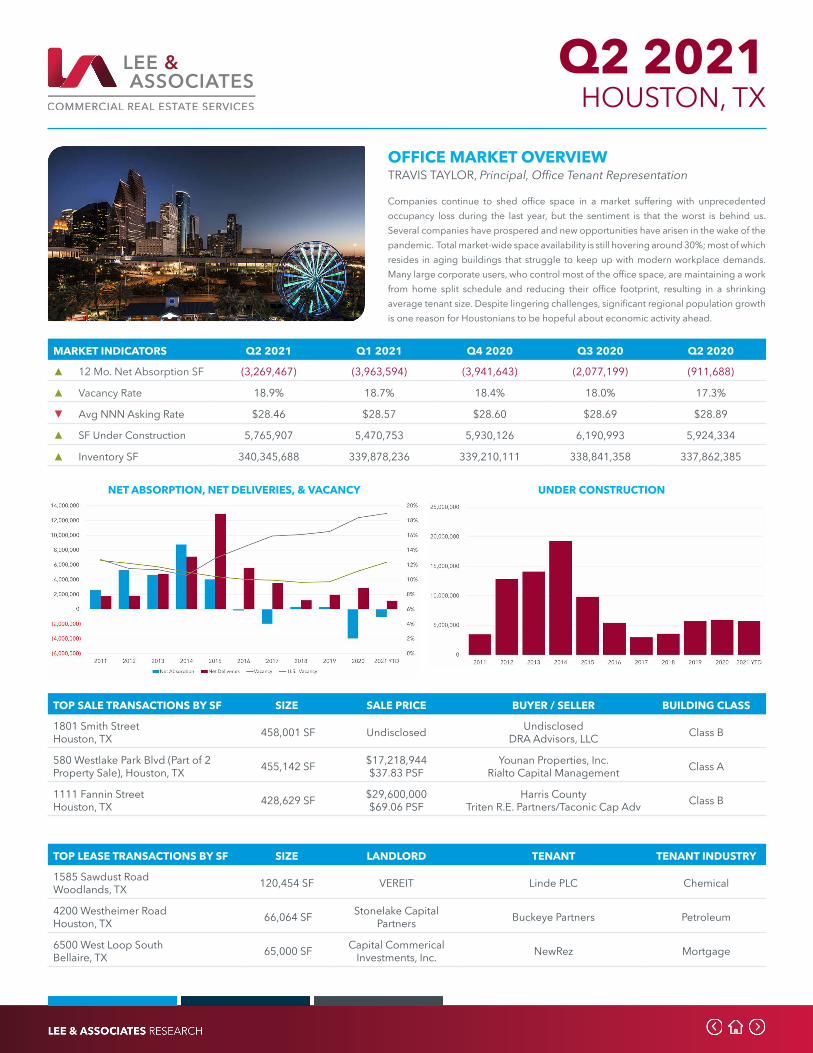
Q2 2021
OFFICE MARKET OVERVIEWTRAVIS TAYLOR, Principal, Office Tenant Representation
Companies continue to shed office space in a market suffering with unprecedented occupancy loss during the last year, but the sentiment is that the worst is behind us. Several companies have prospered and new opportunities have arisen in the wake of the pandemic. Total market-wide space availability is still hovering around 30%; most of which resides in aging buildings that struggle to keep up with modern workplace demands. Many large corporate users, who control most of the office space, are maintaining a work from home split schedule and reducing their office footprint, resulting in a shrinking average tenant size. Despite lingering challenges, significant regional population growth is one reason for Houstonians to be hopeful about economic activity ahead.
HOUSTON, TX
NET ABSORPTION, NET DELIVERIES, & VACANCY UNDER CONSTRUCTION
TOP LEASE TRANSACTIONS BY SF SIZE LANDLORD TENANT TENANT INDUSTRY
1585 Sawdust RoadWoodlands, TX 120,454 SF VEREIT Linde PLC Chemical
4200 Westheimer RoadHouston, TX 66,064 SF Stonelake Capital
Partners Buckeye Partners Petroleum
6500 West Loop SouthBellaire, TX 65,000 SF Capital Commerical
Investments, Inc. NewRez Mortgage
TOP SALE TRANSACTIONS BY SF SIZE SALE PRICE BUYER / SELLER BUILDING CLASS
1801 Smith StreetHouston, TX 458,001 SF Undisclosed Undisclosed
DRA Advisors, LLC Class B
580 Westlake Park Blvd (Part of 2 Property Sale), Houston, TX 455,142 SF $17,218,944
$37.83 PSFYounan Properties, Inc.
Rialto Capital Management Class A
1111 Fannin StreetHouston, TX 428,629 SF $29,600,000
$69.06 PSFHarris County
Triten R.E. Partners/Taconic Cap Adv Class B
MARKET INDICATORS Q2 2021 Q1 2021 Q4 2020 Q3 2020 Q2 2020
▲ 12 Mo. Net Absorption SF (3,269,467) (3,963,594) (3,941,643) (2,077,199) (911,688)
▲ Vacancy Rate 18.9% 18.7% 18.4% 18.0% 17.3%
▼ Avg NNN Asking Rate $28.46 $28.57 $28.60 $28.69 $28.89
▲ SF Under Construction 5,765,907 5,470,753 5,930,126 6,190,993 5,924,334
▲ Inventory SF 340,345,688 339,878,236 339,210,111 338,841,358 337,862,385
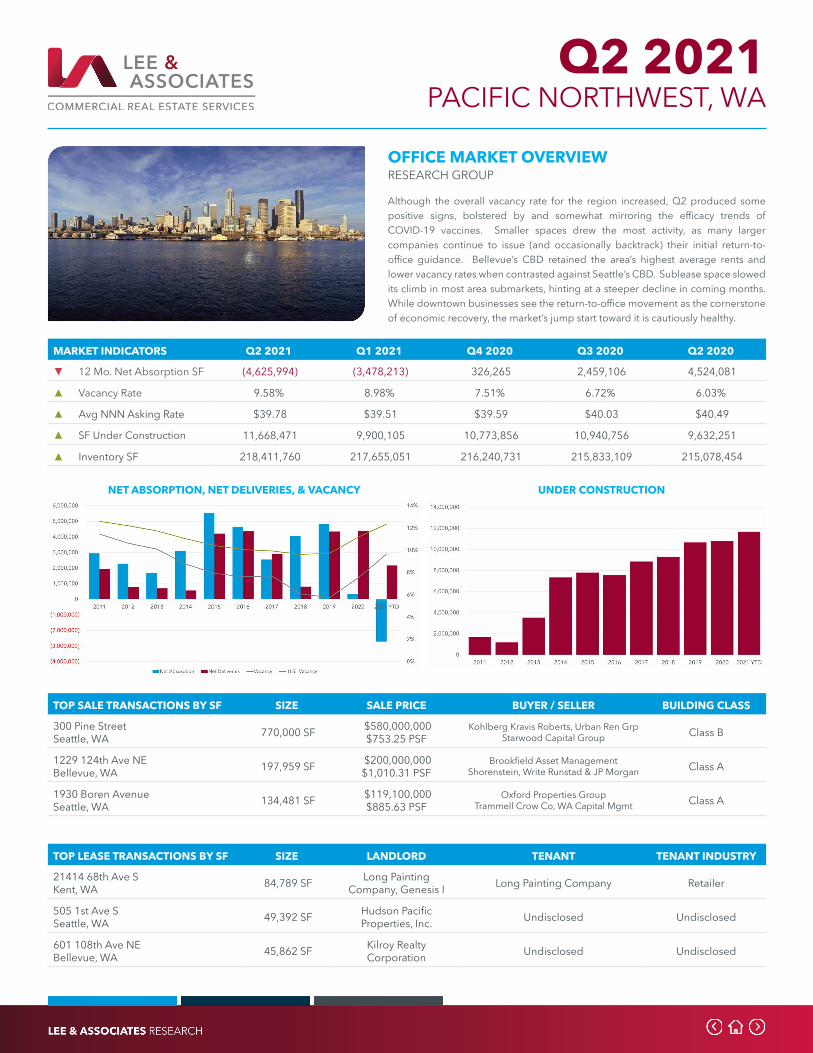
Q2 2021
OFFICE MARKET OVERVIEWRESEARCH GROUP
Although the overall vacancy rate for the region increased, Q2 produced some positive signs, bolstered by and somewhat mirroring the efficacy trends of COVID-19 vaccines. Smaller spaces drew the most activity, as many larger companies continue to issue (and occasionally backtrack) their initial return-to-office guidance. Bellevue’s CBD retained the area’s highest average rents and lower vacancy rates when contrasted against Seattle’s CBD. Sublease space slowed its climb in most area submarkets, hinting at a steeper decline in coming months. While downtown businesses see the return-to-office movement as the cornerstone of economic recovery, the market’s jump start toward it is cautiously healthy.
PACIFIC NORTHWEST, WA
NET ABSORPTION, NET DELIVERIES, & VACANCY UNDER CONSTRUCTION
TOP LEASE TRANSACTIONS BY SF SIZE LANDLORD TENANT TENANT INDUSTRY
21414 68th Ave SKent, WA 84,789 SF Long Painting
Company, Genesis I Long Painting Company Retailer
505 1st Ave SSeattle, WA 49,392 SF Hudson Pacific
Properties, Inc. Undisclosed Undisclosed
601 108th Ave NEBellevue, WA 45,862 SF Kilroy Realty
Corporation Undisclosed Undisclosed
TOP SALE TRANSACTIONS BY SF SIZE SALE PRICE BUYER / SELLER BUILDING CLASS
300 Pine StreetSeattle, WA 770,000 SF $580,000,000
$753.25 PSFKohlberg Kravis Roberts, Urban Ren Grp
Starwood Capital Group Class B
1229 124th Ave NEBellevue, WA 197,959 SF $200,000,000
$1,010.31 PSFBrookfield Asset Management
Shorenstein, Write Runstad & JP Morgan Class A
1930 Boren AvenueSeattle, WA 134,481 SF $119,100,000
$885.63 PSFOxford Properties Group
Trammell Crow Co, WA Capital Mgmt Class A
MARKET INDICATORS Q2 2021 Q1 2021 Q4 2020 Q3 2020 Q2 2020
▼ 12 Mo. Net Absorption SF (4,625,994) (3,478,213) 326,265 2,459,106 4,524,081
▲ Vacancy Rate 9.58% 8.98% 7.51% 6.72% 6.03%
▲ Avg NNN Asking Rate $39.78 $39.51 $39.59 $40.03 $40.49
▲ SF Under Construction 11,668,471 9,900,105 10,773,856 10,940,756 9,632,251
▲ Inventory SF 218,411,760 217,655,051 216,240,731 215,833,109 215,078,454
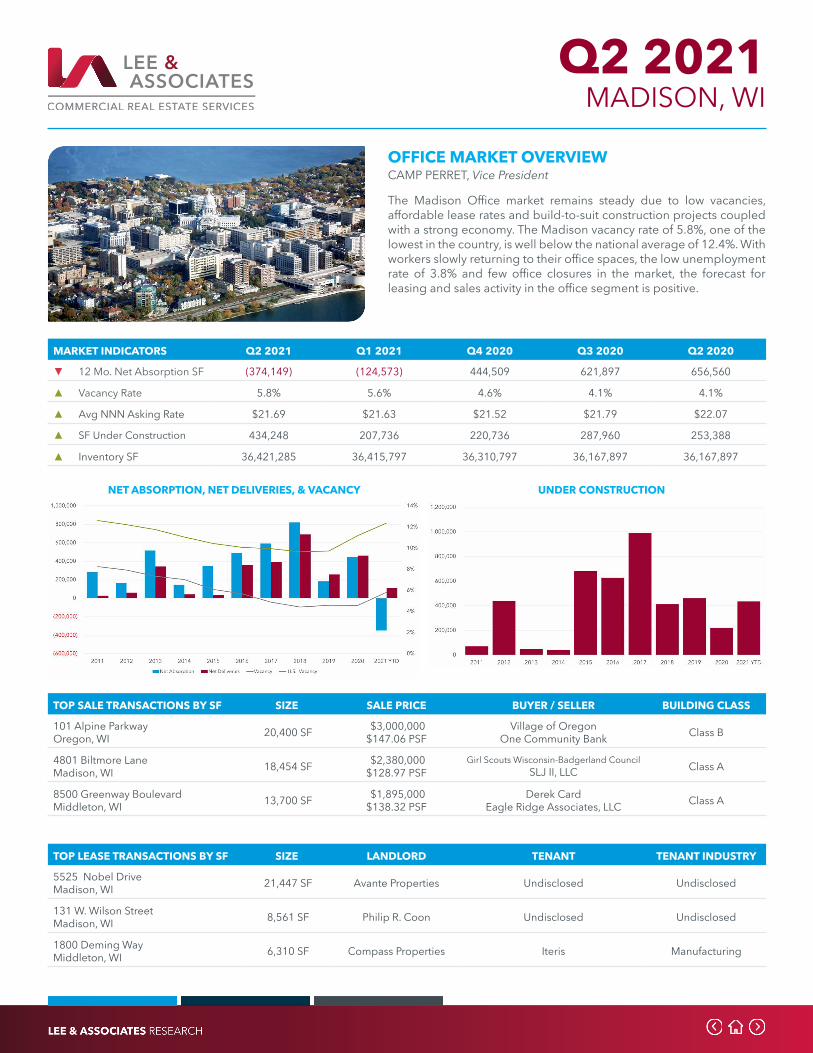
Q2 2021
OFFICE MARKET OVERVIEWCAMP PERRET, Vice President
The Madison Office market remains steady due to low vacancies, affordable lease rates and build-to-suit construction projects coupled with a strong economy. The Madison vacancy rate of 5.8%, one of the lowest in the country, is well below the national average of 12.4%. With workers slowly returning to their office spaces, the low unemployment rate of 3.8% and few office closures in the market, the forecast for leasing and sales activity in the office segment is positive.
MADISON, WI
NET ABSORPTION, NET DELIVERIES, & VACANCY UNDER CONSTRUCTION
TOP LEASE TRANSACTIONS BY SF SIZE LANDLORD TENANT TENANT INDUSTRY
5525 Nobel DriveMadison, WI 21,447 SF Avante Properties Undisclosed Undisclosed
131 W. Wilson StreetMadison, WI 8,561 SF Philip R. Coon Undisclosed Undisclosed
1800 Deming WayMiddleton, WI 6,310 SF Compass Properties Iteris Manufacturing
TOP SALE TRANSACTIONS BY SF SIZE SALE PRICE BUYER / SELLER BUILDING CLASS
101 Alpine ParkwayOregon, WI 20,400 SF $3,000,000
$147.06 PSFVillage of Oregon
One Community Bank Class B
4801 Biltmore LaneMadison, WI 18,454 SF $2,380,000
$128.97 PSFGirl Scouts Wisconsin-Badgerland Council
SLJ II, LLC Class A
8500 Greenway BoulevardMiddleton, WI 13,700 SF $1,895,000
$138.32 PSFDerek Card
Eagle Ridge Associates, LLC Class A
MARKET INDICATORS Q2 2021 Q1 2021 Q4 2020 Q3 2020 Q2 2020
▼ 12 Mo. Net Absorption SF (374,149) (124,573) 444,509 621,897 656,560
▲ Vacancy Rate 5.8% 5.6% 4.6% 4.1% 4.1%
▲ Avg NNN Asking Rate $21.69 $21.63 $21.52 $21.79 $22.07
▲ SF Under Construction 434,248 207,736 220,736 287,960 253,388
▲ Inventory SF 36,421,285 36,415,797 36,310,797 36,167,897 36,167,897
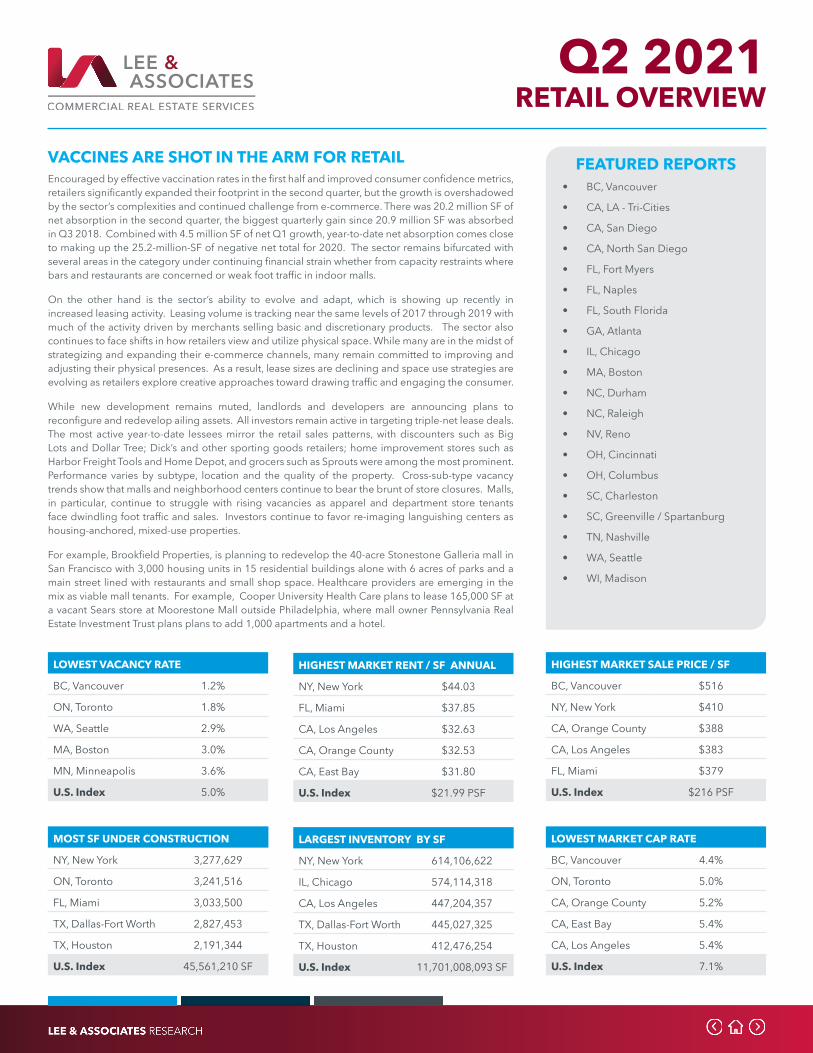
Q2 2021 RETAIL OVERVIEW
FEATURED REPORTS• BC, Vancouver
• CA, LA - Tri-Cities
• CA, San Diego
• CA, North San Diego
• FL, Fort Myers
• FL, Naples
• FL, South Florida
• GA, Atlanta
• IL, Chicago
• MA, Boston
• NC, Durham
• NC, Raleigh
• NV, Reno
• OH, Cincinnati
• OH, Columbus
• SC, Charleston
• SC, Greenville / Spartanburg
• TN, Nashville
• WA, Seattle
• WI, Madison
VACCINES ARE SHOT IN THE ARM FOR RETAILEncouraged by effective vaccination rates in the first half and improved consumer confidence metrics, retailers significantly expanded their footprint in the second quarter, but the growth is overshadowed by the sector’s complexities and continued challenge from e-commerce. There was 20.2 million SF of net absorption in the second quarter, the biggest quarterly gain since 20.9 million SF was absorbed in Q3 2018. Combined with 4.5 million SF of net Q1 growth, year-to-date net absorption comes close to making up the 25.2-million-SF of negative net total for 2020. The sector remains bifurcated with several areas in the category under continuing financial strain whether from capacity restraints where bars and restaurants are concerned or weak foot traffic in indoor malls.
On the other hand is the sector’s ability to evolve and adapt, which is showing up recently in increased leasing activity. Leasing volume is tracking near the same levels of 2017 through 2019 with much of the activity driven by merchants selling basic and discretionary products. The sector also continues to face shifts in how retailers view and utilize physical space. While many are in the midst of strategizing and expanding their e-commerce channels, many remain committed to improving and adjusting their physical presences. As a result, lease sizes are declining and space use strategies are evolving as retailers explore creative approaches toward drawing traffic and engaging the consumer.
While new development remains muted, landlords and developers are announcing plans to reconfigure and redevelop ailing assets. All investors remain active in targeting triple-net lease deals. The most active year-to-date lessees mirror the retail sales patterns, with discounters such as Big Lots and Dollar Tree; Dick’s and other sporting goods retailers; home improvement stores such as Harbor Freight Tools and Home Depot, and grocers such as Sprouts were among the most prominent. Performance varies by subtype, location and the quality of the property. Cross-sub-type vacancy trends show that malls and neighborhood centers continue to bear the brunt of store closures. Malls, in particular, continue to struggle with rising vacancies as apparel and department store tenants face dwindling foot traffic and sales. Investors continue to favor re-imaging languishing centers as housing-anchored, mixed-use properties.
For example, Brookfield Properties, is planning to redevelop the 40-acre Stonestone Galleria mall in San Francisco with 3,000 housing units in 15 residential buildings alone with 6 acres of parks and a main street lined with restaurants and small shop space. Healthcare providers are emerging in the mix as viable mall tenants. For example, Cooper University Health Care plans to lease 165,000 SF at a vacant Sears store at Moorestone Mall outside Philadelphia, where mall owner Pennsylvania Real Estate Investment Trust plans plans to add 1,000 apartments and a hotel.
LOWEST VACANCY RATE
BC, Vancouver 1.2%
ON, Toronto 1.8%
WA, Seattle 2.9%
MA, Boston 3.0%
MN, Minneapolis 3.6%
U.S. Index 5.0%
HIGHEST MARKET RENT / SF ANNUAL
NY, New York $44.03
FL, Miami $37.85
CA, Los Angeles $32.63
CA, Orange County $32.53
CA, East Bay $31.80
U.S. Index $21.99 PSF
HIGHEST MARKET SALE PRICE / SF
BC, Vancouver $516
NY, New York $410
CA, Orange County $388
CA, Los Angeles $383
FL, Miami $379
U.S. Index $216 PSF
MOST SF UNDER CONSTRUCTION
NY, New York 3,277,629
ON, Toronto 3,241,516
FL, Miami 3,033,500
TX, Dallas-Fort Worth 2,827,453
TX, Houston 2,191,344
U.S. Index 45,561,210 SF
LARGEST INVENTORY BY SF
NY, New York 614,106,622
IL, Chicago 574,114,318
CA, Los Angeles 447,204,357
TX, Dallas-Fort Worth 445,027,325
TX, Houston 412,476,254
U.S. Index 11,701,008,093 SF
LOWEST MARKET CAP RATE
BC, Vancouver 4.4%
ON, Toronto 5.0%
CA, Orange County 5.2%
CA, East Bay 5.4%
CA, Los Angeles 5.4%
U.S. Index 7.1%

Q2 2021
MARKET VACANCY RATE
MARKETRENT / SF
MARKET SALE PRICE / SF
SF UNDER CONSTRUCTION INVENTORY SF MARKET CAP
RATE
AZ, Phoenix 7.6% $19.71 $200 735,218 235,818,076 7.0%
BC, Vancouver 1.2% $25.50 $516 846,799 122,783,023 4.4%
CA, East Bay 5.2% $31.80 $332 176,216 124,081,238 5.4%
CA, Inland Empire 7.5% $22.71 $249 809,002 197,987,678 6.2%
CA, Los Angeles 5.5% $32.63 $383 1,573,630 447,204,357 5.4%
CA, Orange County 4.5% $32.53 $388 122,666 144,319,762 5.2%
CA, San Diego 5.4% $30.63 $345 686,130 139,053,673 5.6%
CA, San Luis Obispo 4.1% $24.63 $266 218,912 15,239,650 6.1%
CA, Santa Barbara 4.9% $27.05 $357 0 24,989,543 6.0%
CA, Stockton 4.2% $18.99 $177 26,766 31,014,868 7.2%
CA, Ventura 5.9% $25.47 $275 60,926 41,195,507 6.0%
CO, Denver 5.1% $23.08 $230 1,091,266 159,638,544 6.5%
DC, Washington 5.1% $29.53 $303 1,844,440 265,083,534 6.5%
FL, Fort Myers 4.4% $17.91 $193 293,448 48,397,181 6.9%
FL, Miami 4.1% $37.85 $379 3,033,500 137,373,952 5.7%
FL, Naples 5.0% $24.04 $260 174,252 23,485,721 6.0%
FL, Orlando 4.6% $23.35 $205 933,755 148,308,221 7.1%
GA, Atlanta 5.2% $18.44 $175 2,089,050 361,547,840 7.4%
ID, Boise 3.8% $14.81 $188 423,348 41,603,442 6.7%
IL, Chicago 6.1% $19.21 $178 869,736 574,114,318 7.5%
IN, Indianapolis 4.5% $16.47 $139 247,509 129,382,306 8.1%
MA, Boston 3.0% $23.99 $241 879,018 242,349,204 6.4%
MD, Baltimore 5.8% $21.96 $180 289,881 143,827,936 7.5%
MI, Detroit 5.5% $16.58 $115 518,021 261,176,446 8.1%
MN, Minneapolis 3.6% $17.76 $162 157,641 202,734,398 7.3%
MO, Saint Louis 5.0% $14.93 $136 325,510 173,932,415 8.2%
NC, Durham 3.8% $20.03 $213 312,664 27,267,514 8.5%
NC, Raleigh 3.1% $21.75 $205 636,108 74,701,917 7.0%
NJ, Atlantic City 5.6% $15.36 $111 98,216 17,745,462 8.5%
NJ, Northern New Jersey 4.9% $22.47 $192 488,059 133,186,478 7.2%
NJ, Trenton 5.4% $19.90 $196 52,309 21,446,474 7.8%
United States Index 5.0% $21.99 $216 45,561,210 11,701,008,093 7.1%
Canada Index 2.3% $21.99 $328 6,739,138 740,317,187 5.4%
RETAIL OVERVIEW
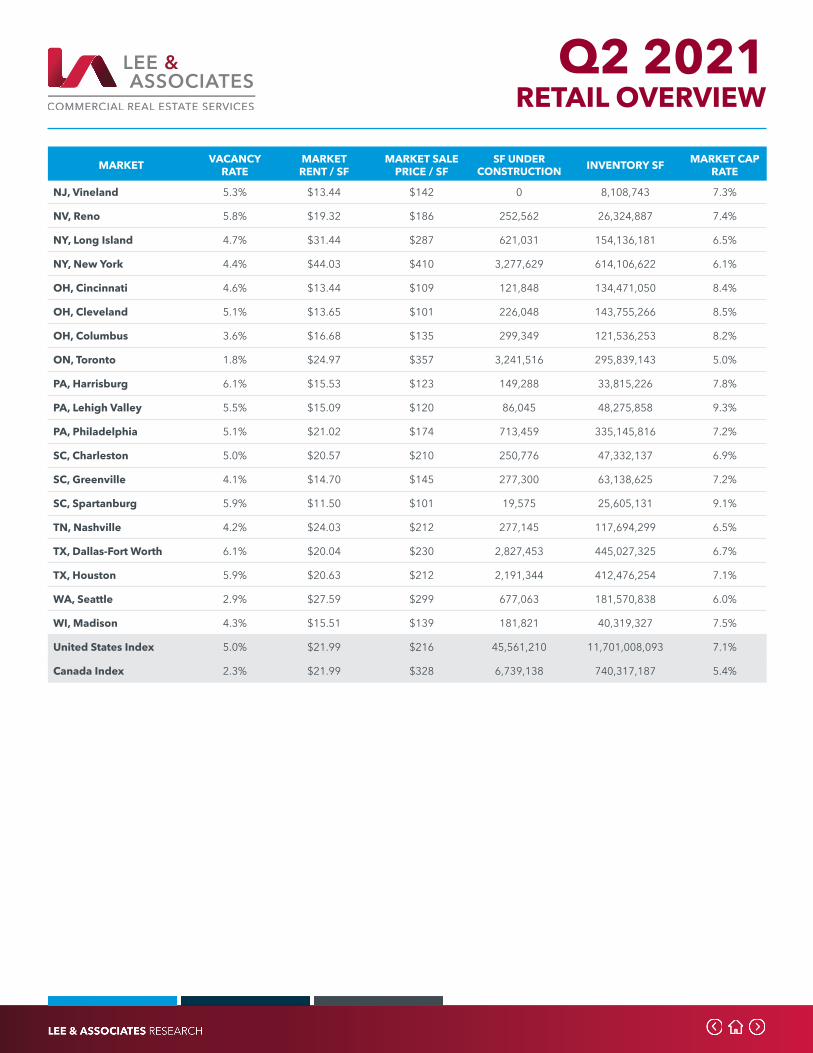
Q2 2021
MARKET VACANCY RATE
MARKETRENT / SF
MARKET SALE PRICE / SF
SF UNDER CONSTRUCTION INVENTORY SF MARKET CAP
RATE
NJ, Vineland 5.3% $13.44 $142 0 8,108,743 7.3%
NV, Reno 5.8% $19.32 $186 252,562 26,324,887 7.4%
NY, Long Island 4.7% $31.44 $287 621,031 154,136,181 6.5%
NY, New York 4.4% $44.03 $410 3,277,629 614,106,622 6.1%
OH, Cincinnati 4.6% $13.44 $109 121,848 134,471,050 8.4%
OH, Cleveland 5.1% $13.65 $101 226,048 143,755,266 8.5%
OH, Columbus 3.6% $16.68 $135 299,349 121,536,253 8.2%
ON, Toronto 1.8% $24.97 $357 3,241,516 295,839,143 5.0%
PA, Harrisburg 6.1% $15.53 $123 149,288 33,815,226 7.8%
PA, Lehigh Valley 5.5% $15.09 $120 86,045 48,275,858 9.3%
PA, Philadelphia 5.1% $21.02 $174 713,459 335,145,816 7.2%
SC, Charleston 5.0% $20.57 $210 250,776 47,332,137 6.9%
SC, Greenville 4.1% $14.70 $145 277,300 63,138,625 7.2%
SC, Spartanburg 5.9% $11.50 $101 19,575 25,605,131 9.1%
TN, Nashville 4.2% $24.03 $212 277,145 117,694,299 6.5%
TX, Dallas-Fort Worth 6.1% $20.04 $230 2,827,453 445,027,325 6.7%
TX, Houston 5.9% $20.63 $212 2,191,344 412,476,254 7.1%
WA, Seattle 2.9% $27.59 $299 677,063 181,570,838 6.0%
WI, Madison 4.3% $15.51 $139 181,821 40,319,327 7.5%
United States Index 5.0% $21.99 $216 45,561,210 11,701,008,093 7.1%
Canada Index 2.3% $21.99 $328 6,739,138 740,317,187 5.4%
RETAIL OVERVIEW
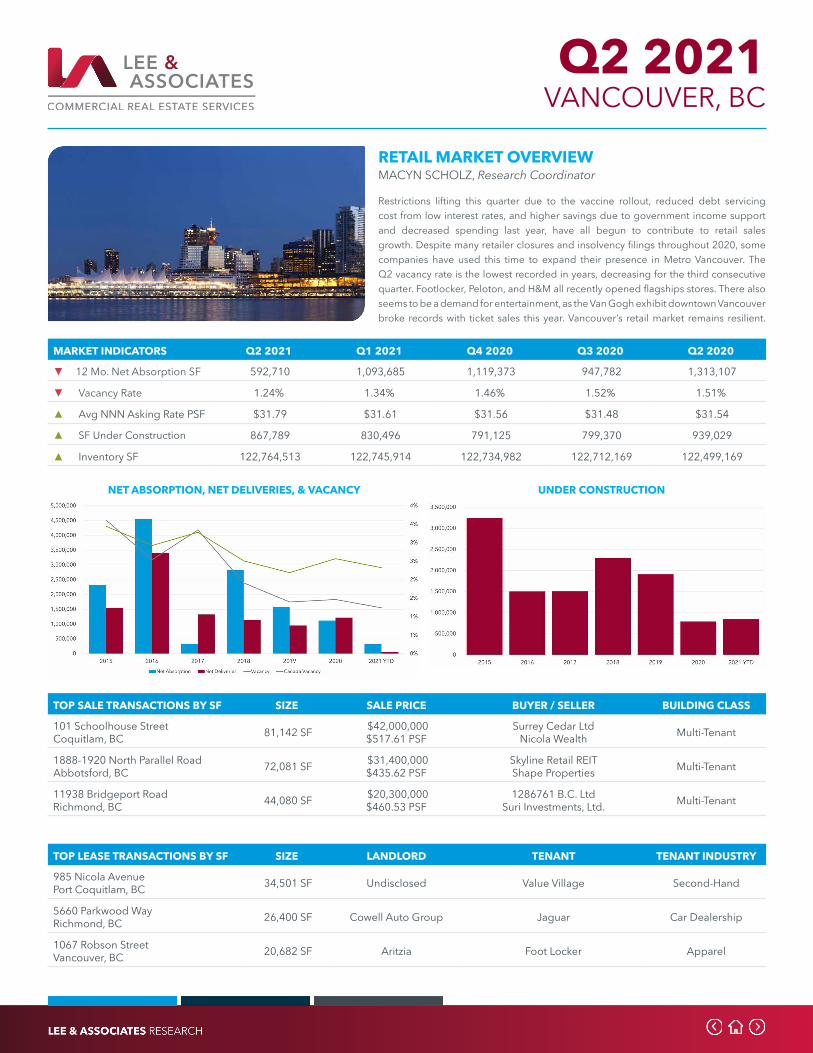
Q2 2021
RETAIL MARKET OVERVIEWMACYN SCHOLZ, Research Coordinator
Restrictions lifting this quarter due to the vaccine rollout, reduced debt servicing cost from low interest rates, and higher savings due to government income support and decreased spending last year, have all begun to contribute to retail sales growth. Despite many retailer closures and insolvency filings throughout 2020, some companies have used this time to expand their presence in Metro Vancouver. The Q2 vacancy rate is the lowest recorded in years, decreasing for the third consecutive quarter. Footlocker, Peloton, and H&M all recently opened flagships stores. There also seems to be a demand for entertainment, as the Van Gogh exhibit downtown Vancouver broke records with ticket sales this year. Vancouver’s retail market remains resilient.
VANCOUVER, BC
NET ABSORPTION, NET DELIVERIES, & VACANCY UNDER CONSTRUCTION
TOP LEASE TRANSACTIONS BY SF SIZE LANDLORD TENANT TENANT INDUSTRY
985 Nicola AvenuePort Coquitlam, BC 34,501 SF Undisclosed Value Village Second-Hand
5660 Parkwood WayRichmond, BC 26,400 SF Cowell Auto Group Jaguar Car Dealership
1067 Robson StreetVancouver, BC 20,682 SF Aritzia Foot Locker Apparel
TOP SALE TRANSACTIONS BY SF SIZE SALE PRICE BUYER / SELLER BUILDING CLASS
101 Schoolhouse StreetCoquitlam, BC 81,142 SF $42,000,000
$517.61 PSFSurrey Cedar Ltd
Nicola Wealth Multi-Tenant
1888-1920 North Parallel RoadAbbotsford, BC 72,081 SF $31,400,000
$435.62 PSFSkyline Retail REITShape Properties Multi-Tenant
11938 Bridgeport RoadRichmond, BC 44,080 SF $20,300,000
$460.53 PSF1286761 B.C. Ltd
Suri Investments, Ltd. Multi-Tenant
MARKET INDICATORS Q2 2021 Q1 2021 Q4 2020 Q3 2020 Q2 2020
▼ 12 Mo. Net Absorption SF 592,710 1,093,685 1,119,373 947,782 1,313,107
▼ Vacancy Rate 1.24% 1.34% 1.46% 1.52% 1.51%
▲ Avg NNN Asking Rate PSF $31.79 $31.61 $31.56 $31.48 $31.54
▲ SF Under Construction 867,789 830,496 791,125 799,370 939,029
▲ Inventory SF 122,764,513 122,745,914 122,734,982 122,712,169 122,499,169

Q2 2021
RETAIL MARKET OVERVIEWJODI SHOEMAKE, Founding Principal
Vacancy rates continued to increase for the second consecutive quarter of 2021, indicating the retail market in the Tri-Cites of Los Angeles is still in recovery mode. However, transaction activity has increased and experts agree bricks and mortar retail deals will continue as customers have the need to experience retail in person. Private investors, high net worth individuals and non-traded REITs are the primary deal makers, with institutional capital waiting on the sidelines.
LA - TRI-CITIES, CA
NET ABSORPTION, NET DELIVERIES, & VACANCY UNDER CONSTRUCTION
TOP LEASE TRANSACTIONS BY SF SIZE LANDLORD TENANT TENANT INDUSTRY
128-146 S Brand Blvd.Glendale, CA 5,758 SF CETTG Glendale, LLC LA Fitness Health Clubs
440-458 E Colorado Blvd.Pasadena, CA 5,600 SF Charlotte Wagner Undisclosed Undisclosed
45 N San Gabriel Blvd.Pasadena, CA 5,292 SF Takashi Cheng Culinary Cloud 8 Commercial Kitchen
TOP SALE TRANSACTIONS BY SF SIZE SALE PRICE BUYER / SELLER TENANCY TYPE
820 N Central AvenueGlendale, CA 7,336 SF $9,000,000
$1,226.83 PSFParagon Real Estate Advisors
Bissias Dalkas & Riordan Enterprises Multi-Tenant
24 N Marengo AvenuePasadena, CA 6,788 SF $3,900,000
$574.54 PSFMt Partners Marengo, LLC
BPN Properties, LLC Multi-Tenant
2200-2218 Honolulu AvenueGlendale, CA 11,659 SF $3,650,000
$313.06 PSFUndisclosed
Jeffers Living Trust Multi-Tenant
MARKET INDICATORS Q2 2021 Q1 2021 Q4 2020 Q3 2020 Q2 2020
▼ 12 Mo. Net Absorption SF (64,469) (28,058) 66,726 (88,189) (52,011)
▲ Vacancy Rate 5.1% 4.9% 4.4% 4.7% 4.4%
◀ ► Avg NNN Asking Rate PSF $36.72 $36.72 $37.80 $38.28 $36.84
◀ ► SF Under Construction 30,000 30,000 135,000 135,000 135,000
◀ ► Inventory SF 26,342,791 26,342,791 26,219,372 26,219,372 26,223,652
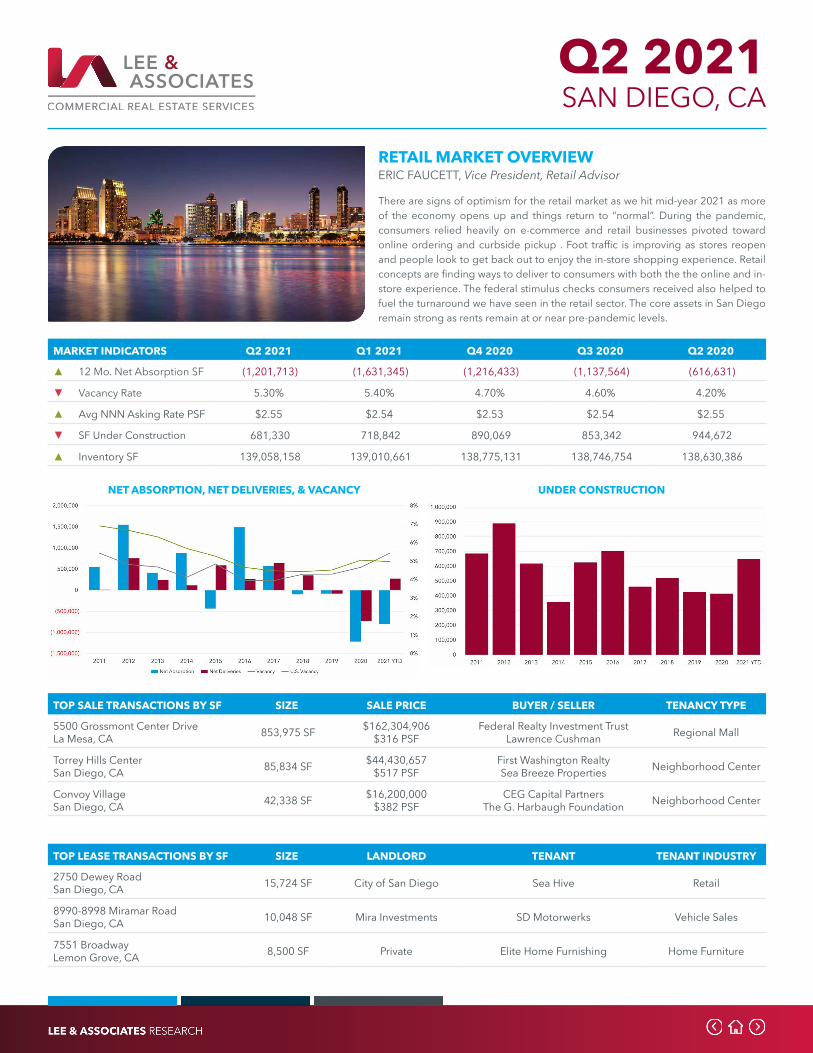
Q2 2021
RETAIL MARKET OVERVIEWERIC FAUCETT, Vice President, Retail Advisor
There are signs of optimism for the retail market as we hit mid-year 2021 as more of the economy opens up and things return to “normal”. During the pandemic, consumers relied heavily on e-commerce and retail businesses pivoted toward online ordering and curbside pickup . Foot traffic is improving as stores reopen and people look to get back out to enjoy the in-store shopping experience. Retail concepts are finding ways to deliver to consumers with both the the online and in-store experience. The federal stimulus checks consumers received also helped to fuel the turnaround we have seen in the retail sector. The core assets in San Diego remain strong as rents remain at or near pre-pandemic levels.
SAN DIEGO, CA
NET ABSORPTION, NET DELIVERIES, & VACANCY UNDER CONSTRUCTION
TOP LEASE TRANSACTIONS BY SF SIZE LANDLORD TENANT TENANT INDUSTRY
2750 Dewey RoadSan Diego, CA 15,724 SF City of San Diego Sea Hive Retail
8990-8998 Miramar RoadSan Diego, CA 10,048 SF Mira Investments SD Motorwerks Vehicle Sales
7551 BroadwayLemon Grove, CA 8,500 SF Private Elite Home Furnishing Home Furniture
TOP SALE TRANSACTIONS BY SF SIZE SALE PRICE BUYER / SELLER TENANCY TYPE
5500 Grossmont Center DriveLa Mesa, CA 853,975 SF $162,304,906
$316 PSFFederal Realty Investment Trust
Lawrence Cushman Regional Mall
Torrey Hills CenterSan Diego, CA 85,834 SF $44,430,657
$517 PSFFirst Washington RealtySea Breeze Properties Neighborhood Center
Convoy VillageSan Diego, CA 42,338 SF $16,200,000
$382 PSFCEG Capital Partners
The G. Harbaugh Foundation Neighborhood Center
MARKET INDICATORS Q2 2021 Q1 2021 Q4 2020 Q3 2020 Q2 2020
▲ 12 Mo. Net Absorption SF (1,201,713) (1,631,345) (1,216,433) (1,137,564) (616,631)
▼ Vacancy Rate 5.30% 5.40% 4.70% 4.60% 4.20%
▲ Avg NNN Asking Rate PSF $2.55 $2.54 $2.53 $2.54 $2.55
▼ SF Under Construction 681,330 718,842 890,069 853,342 944,672
▲ Inventory SF 139,058,158 139,010,661 138,775,131 138,746,754 138,630,386
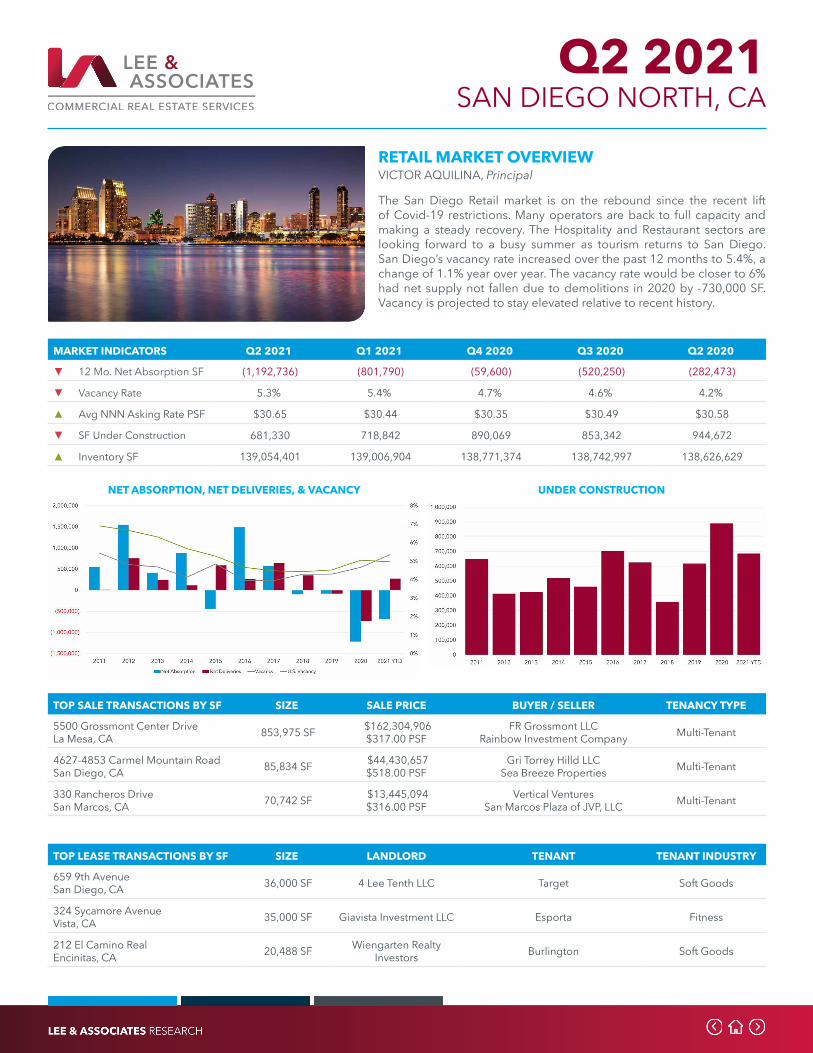
Q2 2021
RETAIL MARKET OVERVIEWVICTOR AQUILINA, Principal
The San Diego Retail market is on the rebound since the recent lift of Covid-19 restrictions. Many operators are back to full capacity and making a steady recovery. The Hospitality and Restaurant sectors are looking forward to a busy summer as tourism returns to San Diego. San Diego’s vacancy rate increased over the past 12 months to 5.4%, a change of 1.1% year over year. The vacancy rate would be closer to 6% had net supply not fallen due to demolitions in 2020 by -730,000 SF. Vacancy is projected to stay elevated relative to recent history.
SAN DIEGO NORTH, CA
NET ABSORPTION, NET DELIVERIES, & VACANCY UNDER CONSTRUCTION
TOP LEASE TRANSACTIONS BY SF SIZE LANDLORD TENANT TENANT INDUSTRY
659 9th AvenueSan Diego, CA 36,000 SF 4 Lee Tenth LLC Target Soft Goods
324 Sycamore AvenueVista, CA 35,000 SF Giavista Investment LLC Esporta Fitness
212 El Camino RealEncinitas, CA 20,488 SF Wiengarten Realty
Investors Burlington Soft Goods
TOP SALE TRANSACTIONS BY SF SIZE SALE PRICE BUYER / SELLER TENANCY TYPE
5500 Grossmont Center DriveLa Mesa, CA 853,975 SF $162,304,906
$317.00 PSFFR Grossmont LLC
Rainbow Investment Company Multi-Tenant
4627-4853 Carmel Mountain RoadSan Diego, CA 85,834 SF $44,430,657
$518.00 PSFGri Torrey Hilld LLC
Sea Breeze Properties Multi-Tenant
330 Rancheros DriveSan Marcos, CA 70,742 SF $13,445,094
$316.00 PSFVertical Ventures
San Marcos Plaza of JVP, LLC Multi-Tenant
MARKET INDICATORS Q2 2021 Q1 2021 Q4 2020 Q3 2020 Q2 2020
▼ 12 Mo. Net Absorption SF (1,192,736) (801,790) (59,600) (520,250) (282,473)
▼ Vacancy Rate 5.3% 5.4% 4.7% 4.6% 4.2%
▲ Avg NNN Asking Rate PSF $30.65 $30.44 $30.35 $30.49 $30.58
▼ SF Under Construction 681,330 718,842 890,069 853,342 944,672
▲ Inventory SF 139,054,401 139,006,904 138,771,374 138,742,997 138,626,629

Q2 2021
RETAIL MARKET OVERVIEWCLAIRE SEARLS, Director of Research
Market fundamentals supported a positive quarter for the Fort Myers retail sector. Total net absorption was positive at the end of second quarter with the largest lease for the year being a home furnishings superstore. The City of Fort Myers was the only submarket that recorded a giveback of space, totaling -40,181 square feet. The Consumer Confidence Index® improved in June (127.3, up from 120.0 in May 2021), which may be a good indication for the months ahead. The total retail space leased in Lee County increased by approximately 50.37% in the first six months of 2021 when compared to the first six months of last year.
FORT MYERS, FL
NET ABSORPTION, NET DELIVERIES, & VACANCY UNDER CONSTRUCTION
TOP LEASE TRANSACTIONS BY SF SIZE LANDLORD TENANT TENANT INDUSTRY
10000-10020 Gulf Center DriveFort Myers, FL 99,825 SF Davidson Kempner
Capital Management At Home Home FurnishingMerchant Wholesaler
14380 S. Tamiami TrailFort Myers, FL 12,000 SF Weinberg Capital
Group 4 Wheel Parts Automotive Parts
6900 Daniels ParkwayFort Myers, FL 11,316 SF Stiles Corporation Hope Chest Resale Retailer
TOP SALE TRANSACTIONS BY SF SIZE SALE PRICE BUYER / SELLER TENANCY TYPE
3300-3360 Bonita Beach RoadBonita Springs, FL 281,394 SF $48,500,000
$172.00 PSFBrixmor Property Group
AmCap Incorporated Multi-Tenant
2336 Surfside BoulevardCape Coral, FL 117,566 SF $7,000,000
$60.00 PSFUndisclosed
Tabani Group, Inc. Multi-Tenant
28441 S. Tamiami TrailBonita Springs, FL 34,446 SF $5,000,000
$145.00 PSFEE Properties Bonita, LLC
Amos Financial, LLC Multi-Tenant
MARKET INDICATORS Q2 2021 Q1 2021 Q4 2020 Q3 2020 Q2 2020
▲ 12 Mo. Net Absorption SF 966,543 648,539 286,640 44,024 99,437
▼ Vacancy Rate 4.4% 4.8% 5.3% 5.5% 5.8%
▲ Avg NNN Asking Rate PSF $17.93 $17.77 $17.72 $17.65 $17.60
▼ SF Under Construction 293,448 370,643 252,683 288,845 320,836
▲ Inventory SF 48,394,378 48,301,683 48,292,656 48,171,869 48,098,155

Q2 2021
RETAIL MARKET OVERVIEWCLAIRE SEARLS, Director of Research
The Naples retail market ended midyear with positive absorption. Leasing velocity increased significantly over last year showing a rebound for the local retail centers. The Consumer Confidence Index® improved in June (127.3, up from 120.0 in May 2021), which may be a good indication for market fundamentals in the months ahead. New retail development continued with one of the significant projects for the market being at the corner of Immokalee Road and Collier Boulevard named The Pointe at Founders Square. The development will bring quality space and several new restaurants.
NAPLES, FL
NET ABSORPTION, NET DELIVERIES, & VACANCY UNDER CONSTRUCTION
TOP LEASE TRANSACTIONS BY SF SIZE LANDLORD TENANT TENANT INDUSTRY
4911 Rattlesnake Hammock RoadNaples, FL 16,368 SF Cohen Real Estate Undisclosed Undisclosed
445 5th AvenueNaples, FL 13,990 SF Cava Investments, LLC Undisclosed Undisclosed
1034 Pine Ridge RoadNaples, FL 6,637 SF BBG, Inc. Floors N More Direct Flooring Retailer
TOP SALE TRANSACTIONS BY SF SIZE SALE PRICE BUYER / SELLER TENANCY TYPE
2157-2159 Pine Ridge RoadNaples, FL 109,978 SF $18,000,000
$164.00 PSFAgree Realty Corporation
NCH Single-Tenant
7211 Vanderbilt Beach RoadNaples, FL 34,723 SF $12,000,000
$346.00 PSFIII Star Investments, Inc.George Vukobratovich Multi-Tenant
2320 Vanderbilt Beach RoadNaples, FL 26,858 SF $5,550,000
$207.00 PSF Undisclosed Single-Tenant
MARKET INDICATORS Q2 2021 Q1 2021 Q4 2020 Q3 2020 Q2 2020
▲ 12 Mo. Net Absorption SF 89,513 (136,220) (27,037) 128,689 2,781
▼ Vacancy Rate 5.1% 6.1% 5.9% 5.5% 5.3%
▲ Avg NNN Asking Rate PSF $24.07 $23.86 $23.82 $23.75 $23.69
▼ SF Under Construction 174,252 244,950 324,751 205,738 192,238
▼ Inventory SF 23,485,721 23,548,597 23,461,400 23,459,504 23,449,004

Q2 2021
RETAIL MARKET OVERVIEWVICTOR PASTOR, Principal
Market rents on Shopping centers affected by the pandemic are slightly lower by about 5% reflecting the myriad of closings and increased vacancy. Compounding the situation for landlords is the glut of retail development coming online that slowed during 2020. All the data suggests this is a temporary situation until the retail development returns to historical levels. Landlords are feeling pressure to fill vacancies at a discount to sell before cap rates react to a looming interest rate environment.
SOUTH FLORIDA, FL
NET ABSORPTION, NET DELIVERIES, & VACANCY UNDER CONSTRUCTION
TOP LEASE TRANSACTIONS BY SF SIZE LANDLORD TENANT TENANT INDUSTRY
3660-4060 W Hillsboro BlvdDeerfield Beach, FL 32,368 SF Weingarten Realty
Investors Deerfield Beach Cinemas Theaters
1225-1265 Washington AvenueMiami Beach, FL 30,050 SF Pix Realty Undisclosed Undisclosed
12700 SW 128th StreetMiami, FL 27,821 SF Adrian Builders Inc. Undisclosed Undisclosed
TOP SALE TRANSACTIONS BY SF SIZE SALE PRICE BUYER / SELLER TENANCY TYPE
3400-3570 N Andrews AvenueOakland Park, FL 133,000 SF $19,596,262
$147.34 PSFHudson Capital Grp & Amera Realty Svcs
SELA, LLC Multi-Tenant
630-650 Royal Palm Beach BlvdRoyal Palm Beach, FL 98,515 SF $10,000,000
$101.51 PSFIberic Malls Group
Royal Palm Beach Shopping Plaza Multi-Tenant
4803-4963 S State Road 7Fort Lauderdale, FL 74,300 SF $12,800,000
$172.27 PSFEl-Ad National Properties
Saber Grivvin Two LLC Multi-Tenant
MARKET INDICATORS Q2 2021 Q1 2021 Q4 2020 Q3 2020 Q2 2020
▲ 12 Mo. Net Absorption SF 1,294,196 441,003 3,402 (439,641) (997,816)
▼ Vacancy Rate 4.4% 4.6% 4.8% 4.7% 4.4%
▲ Avg NNN Asking Rate PSF $30.00 $29.65 $29.05 $28.75 $28.70
▼ SF Under Construction 4,044,142 4,066,702 3,871,941 4,019,527 4,221,918
▲ Inventory SF 326,958,380 326,497,481 326,297,918 325,989,603 325,497,782

Q2 2021
RETAIL MARKET OVERVIEWWILLIE CANDLER, Research Associate
Atlanta Retail market has held up considerably well over the past year considering having to battle the pandemic, with a vacancy rate that has remained relatively unchanged compared to before the pandemic. While leasing activity has slowed and has not bounced back to pre-pandemic numbers, landlords are confident that they will get back to early 2020 levels. After two negative net absorption quarters, retail bounced back into positive absorption numbers and is only expected to keep increasing in the rest of 2021. The outlook on the rest of 2021 and 2022 remains positive for retail as numbers seem to be on the upward climb.
ATLANTA, GA
NET ABSORPTION, NET DELIVERIES, & VACANCY UNDER CONSTRUCTION
TOP LEASE TRANSACTIONS BY SF SIZE LANDLORD TENANT TENANT INDUSTRY
1690 Northeast ExpyAtlanta, GA 80,000 SF Habersham Properties Floor & Décor Outlets-America Floor Covering
1295 Iris DriveConyers, GA 58,000 SF Tri-Land Holdings Academy Sports Sporting Goods
8020 Mall PkyLithonia, GA 50,000 SF Undisclosed SeaQuest Educational Services
TOP SALE TRANSACTIONS BY SF SIZE SALE PRICE BUYER / SELLER TENANCY TYPE
2100 Pleasant Hill RoadDuluth, GA 563,367 SF $23,000,000
$40.83 PSFGwinnett Cnty Planning and Dev.
Moonbeam Leasing & Mgmt Multi-Tenant
4000 Venture DriveDuluth, GA 156,263 SF $38,040,000
$243.44 PSFSFG STPK LM Duluth
TPA Group Multi-Tenant
3753 Austell Rd SWAustell, GA 145,360 SF $8,940,000
$8.94 PSFT.L.M. Realty Group
Heritage Hills Shopping Center Multi-Tenant
MARKET INDICATORS Q2 2021 Q1 2021 Q4 2020 Q3 2020 Q2 2020
▲ 12 Mo. Net Absorption SF 1,007,087 (183,260) (403,380) (456,990) 608,865
▼ Vacancy Rate 5.2% 5.3% 5.4% 5.5% 5.2%
▲ Avg NNN Asking Rate PSF $18.47 $18.23 $17.93 $17.73 $17.66
▼ SF Under Construction 2,035,512 2,257,139 2,326,821 2,437,721 1,721,393
▲ Inventory SF 361,580,737 361,196,935 360,998,232 360,933,088 360,598,587

Q2 2021
RETAIL MARKET OVERVIEWRYAN REBOT, Research Analyst
The Chicago retail market recorded decreased vacancy during the second quarter of 2021. Improving from the previous quarter’s 6.13 percent, vacancy dropped to 6.08 percent. Net absorption totaled 561,359 square feet in the second quarter. From the 992,584 square feet measured in the quarter prior, net absorption fell by 431,225 square feet. Average rental rates continued to increase to $19.22 per square foot per year; a difference of $0.31 per square foot. A total of 22 retail buildings were delivered in the second quarter. Rising from the previous quarter’s 211,985 square feet, the second quarter added 475,811 square feet of retail space to the market. Currently, there are 54 buildings under construction, totaling 869,164 square feet.
CHICAGO, IL
NET ABSORPTION, NET DELIVERIES, & VACANCY UNDER CONSTRUCTION
TOP LEASE TRANSACTIONS BY SF SIZE LANDLORD TENANT TENANT INDUSTRY
2750-2782 E. 79th AvenueMerrillville, IL 144,028 SF Schottenstein Property
Group Dick’s Sporting Goods Sporting Good Stores
1021 Butterfield RoadDowners Grove, IL 122,532 SF Broadstone Real Estate Steinhafels Furniture Stores
7061 W. 159th StreetTinley Park, IL 70,601 SF American Midwest Bank Floor & Décor Floor Covering Stores
TOP SALE TRANSACTIONS BY SF SIZE SALE PRICE BUYER / SELLER TENANCY TYPE
1800-2124 S. Randall RoadAlgonquin, IL 380,039 SF $20,527,275
$54.01 PSFRed Mountain Retail Group, Inc.
Greystone Servicing Corporation Multi-Tenant
1900-1916 Dempster StreetEvanston, IL 101,948 SF $17,130,987
$168.04 PSFBon Aviv Investments
Valli Produce Multi-Tenant
1830 E. Roosevelt RoadWheaton, IL 40,266 SF $17,036,824
$423.11 PSFCubeSmart, LP
ROC, Inc. Single-Tenant
MARKET INDICATORS Q2 2021 Q1 2021 Q4 2020 Q3 2020 Q2 2020
▼ Net Absorption SF 561,359 992,584 971,634 40,820 23,170
▼ Vacancy Rate 6.08% 6.13% 6.03% 6.43% 6.30%
▲ Avg NNN Asking Rate PSF $19.22 $18.91 $16.37 $18.93 $19.06
▼ SF Under Construction 869,164 931,644 877,436 1,412,291 1,157,265
▲ Inventory SF 574,000,757 572,087,837 570,672,298 567,118,947 565,441,008
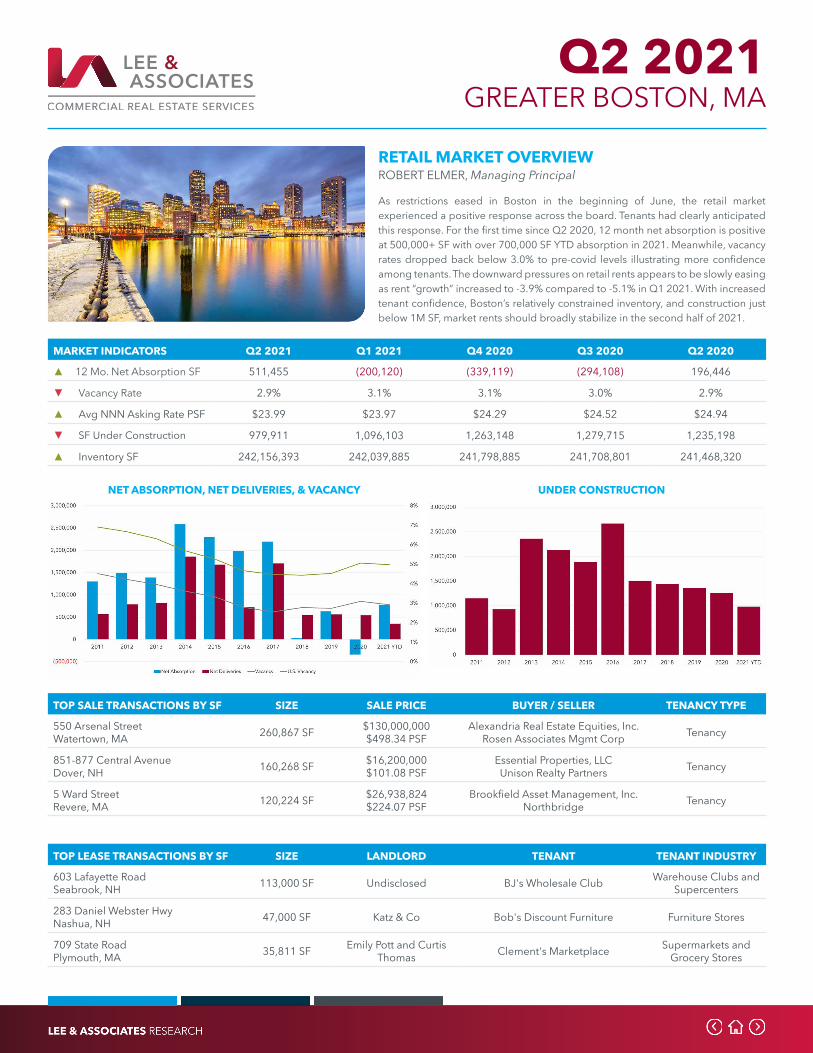
Q2 2021
RETAIL MARKET OVERVIEWROBERT ELMER, Managing Principal
As restrictions eased in Boston in the beginning of June, the retail market experienced a positive response across the board. Tenants had clearly anticipated this response. For the first time since Q2 2020, 12 month net absorption is positive at 500,000+ SF with over 700,000 SF YTD absorption in 2021. Meanwhile, vacancy rates dropped back below 3.0% to pre-covid levels illustrating more confidence among tenants. The downward pressures on retail rents appears to be slowly easing as rent “growth” increased to -3.9% compared to -5.1% in Q1 2021. With increased tenant confidence, Boston’s relatively constrained inventory, and construction just below 1M SF, market rents should broadly stabilize in the second half of 2021.
GREATER BOSTON, MA
NET ABSORPTION, NET DELIVERIES, & VACANCY UNDER CONSTRUCTION
TOP LEASE TRANSACTIONS BY SF SIZE LANDLORD TENANT TENANT INDUSTRY
603 Lafayette RoadSeabrook, NH 113,000 SF Undisclosed BJ's Wholesale Club Warehouse Clubs and
Supercenters
283 Daniel Webster HwyNashua, NH 47,000 SF Katz & Co Bob's Discount Furniture Furniture Stores
709 State RoadPlymouth, MA 35,811 SF Emily Pott and Curtis
Thomas Clement's Marketplace Supermarkets and Grocery Stores
TOP SALE TRANSACTIONS BY SF SIZE SALE PRICE BUYER / SELLER TENANCY TYPE
550 Arsenal StreetWatertown, MA 260,867 SF $130,000,000
$498.34 PSFAlexandria Real Estate Equities, Inc.
Rosen Associates Mgmt Corp Tenancy
851-877 Central AvenueDover, NH 160,268 SF $16,200,000
$101.08 PSFEssential Properties, LLCUnison Realty Partners Tenancy
5 Ward StreetRevere, MA 120,224 SF $26,938,824
$224.07 PSFBrookfield Asset Management, Inc.
Northbridge Tenancy
MARKET INDICATORS Q2 2021 Q1 2021 Q4 2020 Q3 2020 Q2 2020
▲ 12 Mo. Net Absorption SF 511,455 (200,120) (339,119) (294,108) 196,446
▼ Vacancy Rate 2.9% 3.1% 3.1% 3.0% 2.9%
▲ Avg NNN Asking Rate PSF $23.99 $23.97 $24.29 $24.52 $24.94
▼ SF Under Construction 979,911 1,096,103 1,263,148 1,279,715 1,235,198
▲ Inventory SF 242,156,393 242,039,885 241,798,885 241,708,801 241,468,320
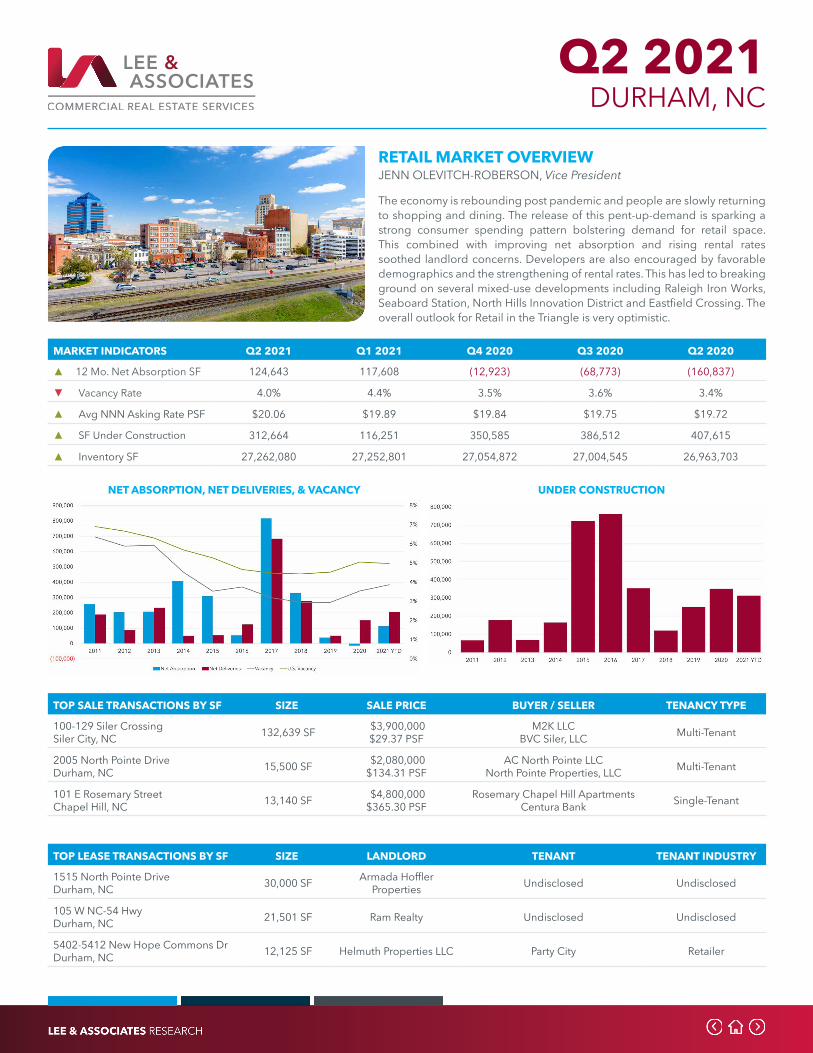
Q2 2021
RETAIL MARKET OVERVIEWJENN OLEVITCH-ROBERSON, Vice President
The economy is rebounding post pandemic and people are slowly returning to shopping and dining. The release of this pent-up-demand is sparking a strong consumer spending pattern bolstering demand for retail space. This combined with improving net absorption and rising rental rates soothed landlord concerns. Developers are also encouraged by favorable demographics and the strengthening of rental rates. This has led to breaking ground on several mixed-use developments including Raleigh Iron Works, Seaboard Station, North Hills Innovation District and Eastfield Crossing. The overall outlook for Retail in the Triangle is very optimistic.
DURHAM, NC
NET ABSORPTION, NET DELIVERIES, & VACANCY UNDER CONSTRUCTION
TOP LEASE TRANSACTIONS BY SF SIZE LANDLORD TENANT TENANT INDUSTRY
1515 North Pointe DriveDurham, NC 30,000 SF Armada Hoffler
Properties Undisclosed Undisclosed
105 W NC-54 HwyDurham, NC 21,501 SF Ram Realty Undisclosed Undisclosed
5402-5412 New Hope Commons DrDurham, NC 12,125 SF Helmuth Properties LLC Party City Retailer
TOP SALE TRANSACTIONS BY SF SIZE SALE PRICE BUYER / SELLER TENANCY TYPE
100-129 Siler CrossingSiler City, NC 132,639 SF $3,900,000
$29.37 PSFM2K LLC
BVC Siler, LLC Multi-Tenant
2005 North Pointe DriveDurham, NC 15,500 SF $2,080,000
$134.31 PSFAC North Pointe LLC
North Pointe Properties, LLC Multi-Tenant
101 E Rosemary StreetChapel Hill, NC 13,140 SF $4,800,000
$365.30 PSFRosemary Chapel Hill Apartments
Centura Bank Single-Tenant
MARKET INDICATORS Q2 2021 Q1 2021 Q4 2020 Q3 2020 Q2 2020
▲ 12 Mo. Net Absorption SF 124,643 117,608 (12,923) (68,773) (160,837)
▼ Vacancy Rate 4.0% 4.4% 3.5% 3.6% 3.4%
▲ Avg NNN Asking Rate PSF $20.06 $19.89 $19.84 $19.75 $19.72
▲ SF Under Construction 312,664 116,251 350,585 386,512 407,615
▲ Inventory SF 27,262,080 27,252,801 27,054,872 27,004,545 26,963,703

Q2 2021
RETAIL MARKET OVERVIEWJENN OLEVITCH-ROBERSON, Vice President
The economy is rebounding post pandemic and people are slowly returning to shopping and dining. The release of this pent-up-demand is sparking a strong consumer spending pattern bolstering demand for retail space. This combined with improving net absorption and rising rental rates soothed landlord concerns. Developers are also encouraged by favorable demographics and the strengthening of rental rates. This has led to breaking ground on several mixed-use developments including Raleigh Iron Works, Seaboard Station, North Hills Innovation District and Eastfield Crossing. The overall outlook for Retail in the Triangle is very optimistic.
RALEIGH, NC
NET ABSORPTION, NET DELIVERIES, & VACANCY UNDER CONSTRUCTION
TOP LEASE TRANSACTIONS BY SF SIZE LANDLORD TENANT TENANT INDUSTRY
4721 Capital BlvdRaleigh, NC 22,877 SF Undisclosed Undisclosed Undisclosed
6129 Glenwood AvenueRaleigh, NC 12,500 SF Cushman & Wakefield -
Thalhimer Undisclosed Undisclosed
401-435 Woodburn RoadRaleigh, NC 10,436 SF Regency Centers
Corporation Barnes & Noble Retailer
TOP SALE TRANSACTIONS BY SF SIZE SALE PRICE BUYER / SELLER TENANCY TYPE
1021 Pine Plaza DriveApex, NC 64,327 SF $12,250,000
$190.50 PSFTarakhan Holdings, LLC
CRP-Apex II, LLC Single-Tenant
122-126 Glenwood AvenueRaleigh, NC 16,800 SF $5,100,000
$303.57 PSFNP Loden Glenwood LLC
Tarlton Properties, LLC Multi-Tenant
535 S White StreetWake Forest, NC 16,200 SF $1,250,000
$77.16 PSFWake Forest Adaptive Re-Use LLC
Casron, LLC Multi-Tenant
MARKET INDICATORS Q2 2021 Q1 2021 Q4 2020 Q3 2020 Q2 2020
▲ 12 Mo. Net Absorption SF 154,968 7,586 (252,745) 327,834 987,036
▼ Vacancy Rate 3.1% 3.3% 3.4% 3.1% 2.6%
▲ Avg NNN Asking Rate PSF $21.83 $21.24 $21.19 $20.82 $20.37
▼ SF Under Construction 636,108 749,763 737,029 563,206 637,129
▲ Inventory SF 74,674,431 74,540,410 74,458,035 74,320,482 74,144,028

Q2 2021
RETAIL MARKET OVERVIEWLYLE CHAMBERLAIN, CCIM. President
While population growth and jobs continue to rise in the area, the Retail market continues to “come back”. Although this has not translated yet into real rental rate growth, it is stabilizing a market which needed it. A couple of new projects will be coming on the market in the near future. The rise in rents these will command, will be absorbed in those projects, but will not immediately cause the existing centers to raise their rates with them. This should happen, however, as demand should remain strong. I look for a stronger “Sales” market as the relative cap rates should attract capital and the market itself stabilizes.
RENO, NV
NET ABSORPTION, NET DELIVERIES, & VACANCY UNDER CONSTRUCTION
TOP LEASE TRANSACTIONS BY SF SIZE LANDLORD TENANT TENANT INDUSTRY
1315 Scheels DriveSparks, NV 30,000 SF Gerrity Group Crunch Fitness Fitness
6407 S VirginiaReno, NV 20,000 SF Jim Kaplan Undisclosed Undisclosed
662 E PraterSparks, NV 19,370 SF John D Lawton Salvation Army Retailer
TOP SALE TRANSACTIONS BY SF SIZE SALE PRICE BUYER / SELLER TENANCY TYPE
2450 Oddie Blvd (Multi-Prop Sale)Sparks, NV 225,000 SF Undisclosed Foothill Partners Inc.
Renown Health Single-Tenant
5150 Mae Anne AvenueReno, NV 94,385 SF $9,525,000
$100.92 PSFArnold SchlesingerCRG Investments Multi-Tenant
2580 S Kietzke LaneReno, NV 74,124 SF $6,500,000
$87.69 PSFPaul Blanco Good Car Company
Scandinavian Designs Single-Tenant
MARKET INDICATORS Q2 2021 Q1 2021 Q4 2020 Q3 2020 Q2 2020
▲ 12 Mo. Net Absorption SF (27,618) (156,747) (53,707) (139,843) 104,525
◀ ► Vacancy Rate 6.0% 6.0% 6.3% 6.2% 5.6%
▲ Avg NNN Asking Rate PSF $19.35 $19.19 $19.09 $19.06 $19.04
▼ SF Under Construction 293,562 305,570 204,094 57,736 72,923
▲ Inventory SF 26,327,599 26,251,975 26,246,544 26,241,382 26,239,615
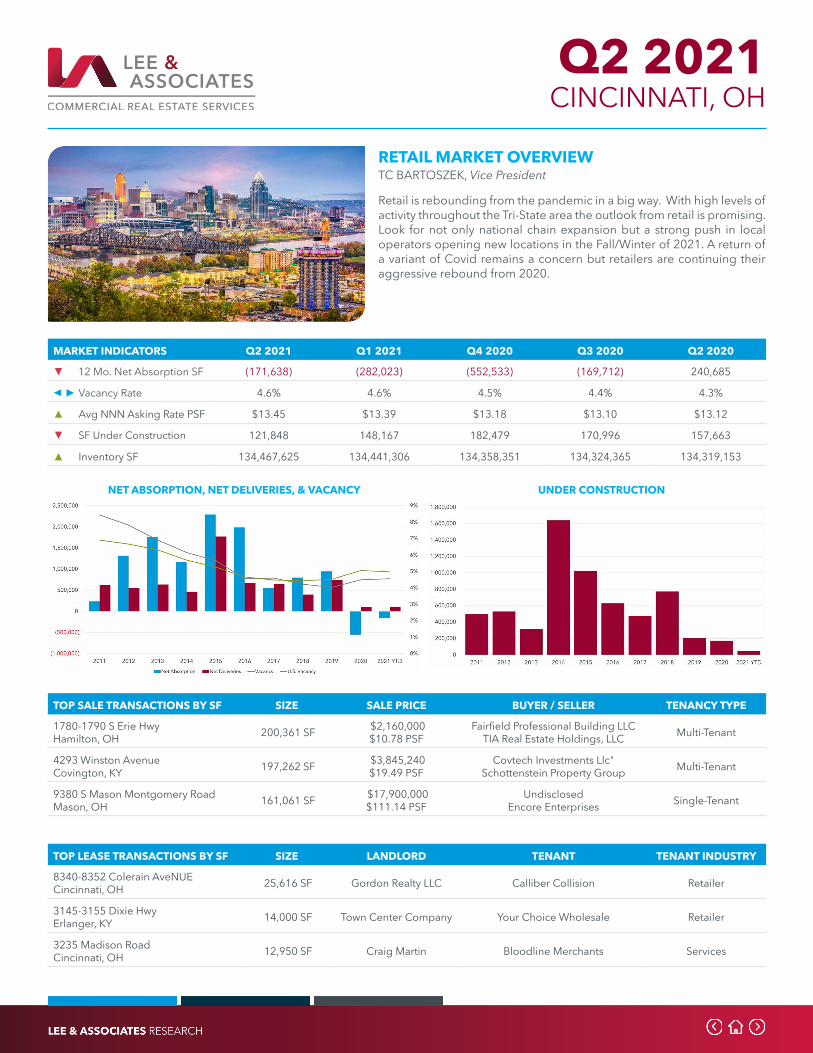
Q2 2021
RETAIL MARKET OVERVIEWTC BARTOSZEK, Vice President
Retail is rebounding from the pandemic in a big way. With high levels of activity throughout the Tri-State area the outlook from retail is promising. Look for not only national chain expansion but a strong push in local operators opening new locations in the Fall/Winter of 2021. A return of a variant of Covid remains a concern but retailers are continuing their aggressive rebound from 2020.
CINCINNATI, OH
NET ABSORPTION, NET DELIVERIES, & VACANCY UNDER CONSTRUCTION
TOP LEASE TRANSACTIONS BY SF SIZE LANDLORD TENANT TENANT INDUSTRY
8340-8352 Colerain AveNUECincinnati, OH 25,616 SF Gordon Realty LLC Calliber Collision Retailer
3145-3155 Dixie HwyErlanger, KY 14,000 SF Town Center Company Your Choice Wholesale Retailer
3235 Madison RoadCincinnati, OH 12,950 SF Craig Martin Bloodline Merchants Services
TOP SALE TRANSACTIONS BY SF SIZE SALE PRICE BUYER / SELLER TENANCY TYPE
1780-1790 S Erie HwyHamilton, OH 200,361 SF $2,160,000
$10.78 PSFFairfield Professional Building LLC
TIA Real Estate Holdings, LLC Multi-Tenant
4293 Winston AvenueCovington, KY 197,262 SF $3,845,240
$19.49 PSFCovtech Investments Llc"
Schottenstein Property Group Multi-Tenant
9380 S Mason Montgomery RoadMason, OH 161,061 SF $17,900,000
$111.14 PSFUndisclosed
Encore Enterprises Single-Tenant
MARKET INDICATORS Q2 2021 Q1 2021 Q4 2020 Q3 2020 Q2 2020
▼ 12 Mo. Net Absorption SF (171,638) (282,023) (552,533) (169,712) 240,685
◀ ► Vacancy Rate 4.6% 4.6% 4.5% 4.4% 4.3%
▲ Avg NNN Asking Rate PSF $13.45 $13.39 $13.18 $13.10 $13.12
▼ SF Under Construction 121,848 148,167 182,479 170,996 157,663
▲ Inventory SF 134,467,625 134,441,306 134,358,351 134,324,365 134,319,153
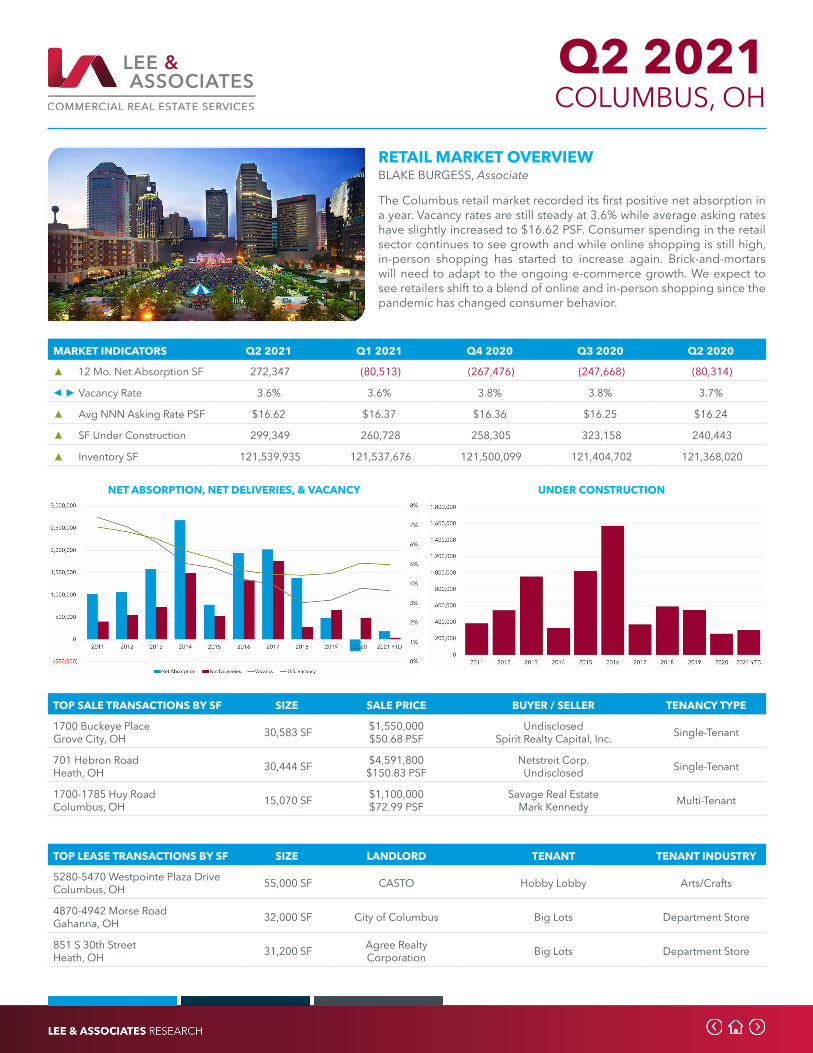
Q2 2021
RETAIL MARKET OVERVIEWBLAKE BURGESS, Associate
The Columbus retail market recorded its first positive net absorption in a year. Vacancy rates are still steady at 3.6% while average asking rates have slightly increased to $16.62 PSF. Consumer spending in the retail sector continues to see growth and while online shopping is still high, in-person shopping has started to increase again. Brick-and-mortars will need to adapt to the ongoing e-commerce growth. We expect to see retailers shift to a blend of online and in-person shopping since the pandemic has changed consumer behavior.
COLUMBUS, OH
NET ABSORPTION, NET DELIVERIES, & VACANCY UNDER CONSTRUCTION
TOP LEASE TRANSACTIONS BY SF SIZE LANDLORD TENANT TENANT INDUSTRY
5280-5470 Westpointe Plaza DriveColumbus, OH 55,000 SF CASTO Hobby Lobby Arts/Crafts
4870-4942 Morse RoadGahanna, OH 32,000 SF City of Columbus Big Lots Department Store
851 S 30th StreetHeath, OH 31,200 SF Agree Realty
Corporation Big Lots Department Store
TOP SALE TRANSACTIONS BY SF SIZE SALE PRICE BUYER / SELLER TENANCY TYPE
1700 Buckeye PlaceGrove City, OH 30,583 SF $1,550,000
$50.68 PSFUndisclosed
Spirit Realty Capital, Inc. Single-Tenant
701 Hebron RoadHeath, OH 30,444 SF $4,591,800
$150.83 PSFNetstreit Corp.
Undisclosed Single-Tenant
1700-1785 Huy RoadColumbus, OH 15,070 SF $1,100,000
$72.99 PSFSavage Real Estate
Mark Kennedy Multi-Tenant
MARKET INDICATORS Q2 2021 Q1 2021 Q4 2020 Q3 2020 Q2 2020
▲ 12 Mo. Net Absorption SF 272,347 (80,513) (267,476) (247,668) (80,314)
◀ ► Vacancy Rate 3.6% 3.6% 3.8% 3.8% 3.7%
▲ Avg NNN Asking Rate PSF $16.62 $16.37 $16.36 $16.25 $16.24
▲ SF Under Construction 299,349 260,728 258,305 323,158 240,443
▲ Inventory SF 121,539,935 121,537,676 121,500,099 121,404,702 121,368,020

Q2 2021
RETAIL MARKET OVERVIEWCORI NUTTALL, Associate
Charleston’s retail market continues to steadily recover from the effects of Covid-19. Vacancies spiked in 2020 and the market experienced several consecutive quarters of negative absorption, resulting in a 12-month increase from 3.4% to 5.2% for the Charleston metro area. Still, retailers have found opportunities to backfill vacancies at favorable terms as a result of tenant closures during the pandemic. Residents and tourists alike in Charleston have returned in large part back to pre-pandemic habits, frequenting restaurants, bars, shops, and service retail centers. The region continues to attract new jobs, and the population growth rate remains steady as people flock from major cities to the Southeast.
CHARLESTON, SC
NET ABSORPTION, NET DELIVERIES, & VACANCY UNDER CONSTRUCTION
TOP LEASE TRANSACTIONS BY SF SIZE LANDLORD TENANT TENANT INDUSTRY
211 King StreetCharleston, SC 30,000 SF The Beach Company Target Department Stores
Dorchester RoadNorth Charleston, SC 22,000 SF Cameron Management Ross Dress for Less Family Clothes Stores
Dorchester RoadCharleston, SC 22,000 SF Cameron Management HomeGoods Home Furnishing
Stores
TOP SALE TRANSACTIONS BY SF SIZE SALE PRICE BUYER / SELLER TENANCY TYPE
7800 Rivers AvenueNorth Charleston, SC 65,000 SF $7,600,000
$116,92 PSFUndisclosed
BVA Promenade LLC Multi-Tenant
100 Old Trolley RoadSummerville, SC 11,070 SF $1,100,000
$99.37 PSFImpact Property Management
K&B LLC Multi-Tenant
492 King StreetCharleston, SC 5,995 SF $6,800,000
$1,134.28 PSFCasaMigs Realty LLCInter Tech Group, Inc. Single-Tenant
MARKET INDICATORS Q2 2021 Q1 2021 Q4 2020 Q3 2020 Q2 2020
▼ 12 Mo. Net Absorption SF 61,353 155,088 (157,384) (510,756) (211,862)
▲ Vacancy Rate 5.13% 5.00% 5.40% 4.97% 3.87%
▼ Avg NNN Asking Rate PSF $22.82 $22.93 $23.26 $23.61 $24.32
▼ SF Under Construction 258,326 285,404 236,468 398,884 393,874
▲ Inventory SF 47,294,257 46,774,021 46,770,083 46,601,548 46,577,488
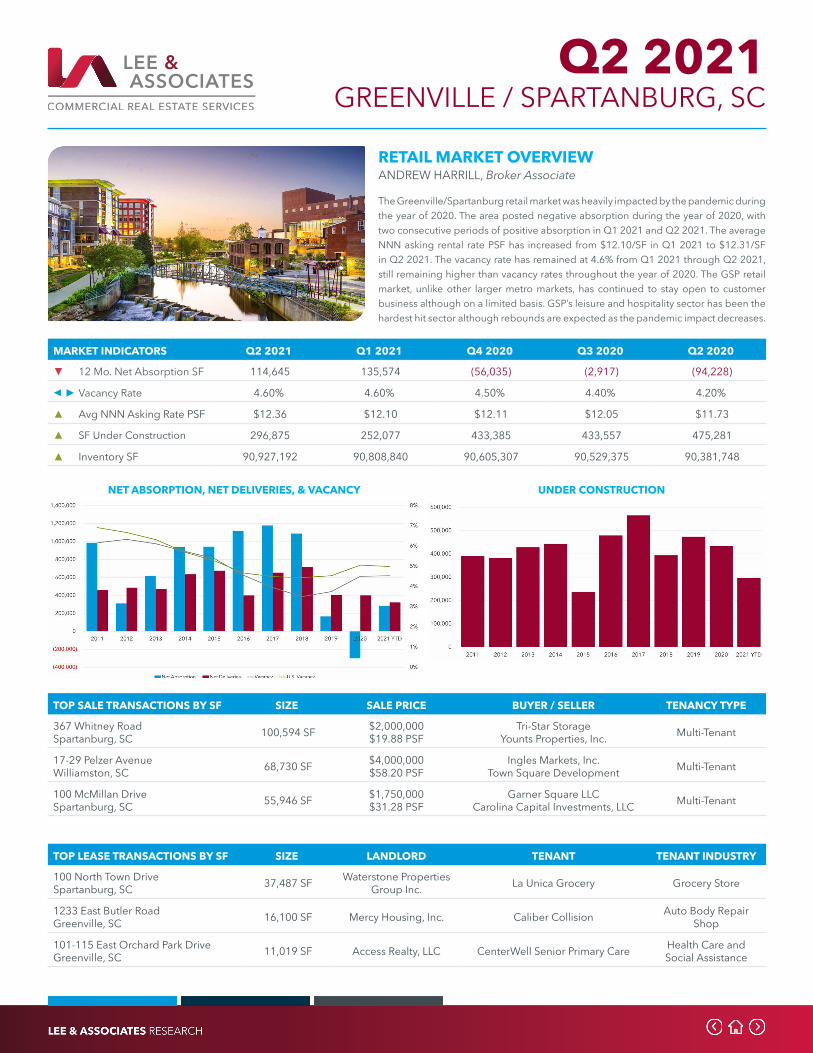
Q2 2021
RETAIL MARKET OVERVIEWANDREW HARRILL, Broker Associate
The Greenville/Spartanburg retail market was heavily impacted by the pandemic during the year of 2020. The area posted negative absorption during the year of 2020, with two consecutive periods of positive absorption in Q1 2021 and Q2 2021. The average NNN asking rental rate PSF has increased from $12.10/SF in Q1 2021 to $12.31/SF in Q2 2021. The vacancy rate has remained at 4.6% from Q1 2021 through Q2 2021, still remaining higher than vacancy rates throughout the year of 2020. The GSP retail market, unlike other larger metro markets, has continued to stay open to customer business although on a limited basis. GSP’s leisure and hospitality sector has been the hardest hit sector although rebounds are expected as the pandemic impact decreases.
GREENVILLE / SPARTANBURG, SC
NET ABSORPTION, NET DELIVERIES, & VACANCY UNDER CONSTRUCTION
TOP LEASE TRANSACTIONS BY SF SIZE LANDLORD TENANT TENANT INDUSTRY
100 North Town DriveSpartanburg, SC 37,487 SF Waterstone Properties
Group Inc. La Unica Grocery Grocery Store
1233 East Butler RoadGreenville, SC 16,100 SF Mercy Housing, Inc. Caliber Collision Auto Body Repair
Shop
101-115 East Orchard Park DriveGreenville, SC 11,019 SF Access Realty, LLC CenterWell Senior Primary Care Health Care and
Social Assistance
TOP SALE TRANSACTIONS BY SF SIZE SALE PRICE BUYER / SELLER TENANCY TYPE
367 Whitney RoadSpartanburg, SC 100,594 SF $2,000,000
$19.88 PSFTri-Star Storage
Younts Properties, Inc. Multi-Tenant
17-29 Pelzer AvenueWilliamston, SC 68,730 SF $4,000,000
$58.20 PSFIngles Markets, Inc.
Town Square Development Multi-Tenant
100 McMillan DriveSpartanburg, SC 55,946 SF $1,750,000
$31.28 PSFGarner Square LLC
Carolina Capital Investments, LLC Multi-Tenant
MARKET INDICATORS Q2 2021 Q1 2021 Q4 2020 Q3 2020 Q2 2020
▼ 12 Mo. Net Absorption SF 114,645 135,574 (56,035) (2,917) (94,228)
◀ ► Vacancy Rate 4.60% 4.60% 4.50% 4.40% 4.20%
▲ Avg NNN Asking Rate PSF $12.36 $12.10 $12.11 $12.05 $11.73
▲ SF Under Construction 296,875 252,077 433,385 433,557 475,281
▲ Inventory SF 90,927,192 90,808,840 90,605,307 90,529,375 90,381,748
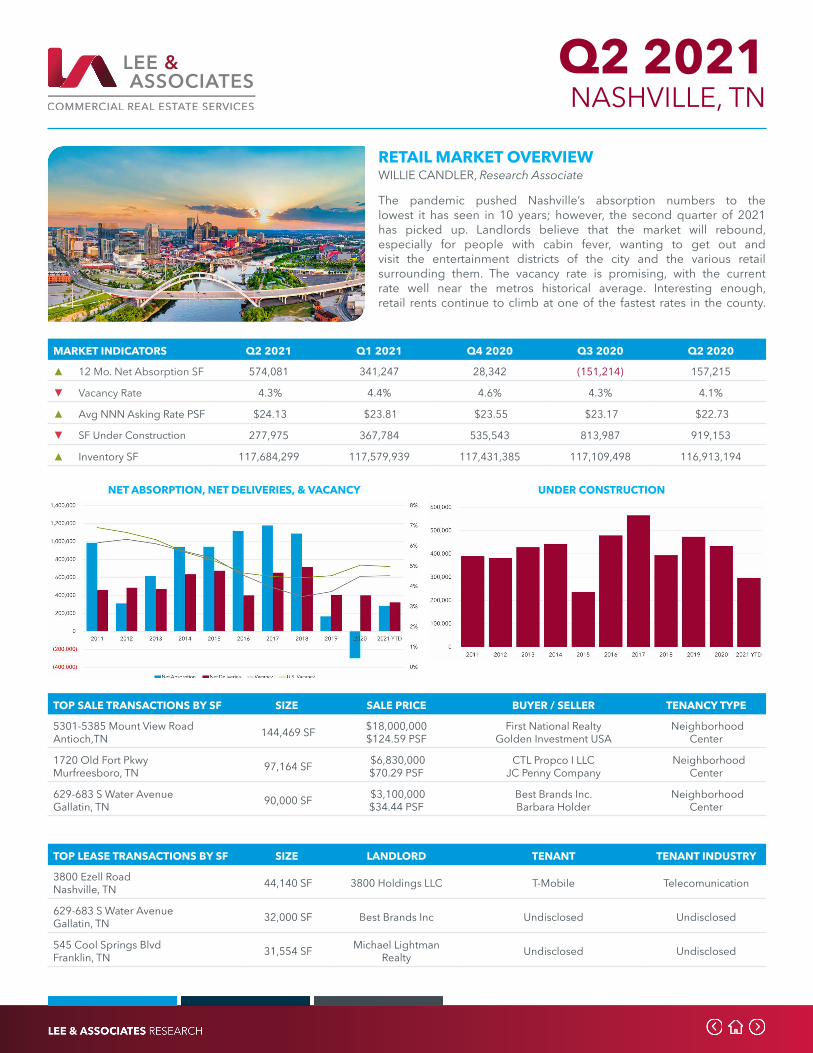
Q2 2021
RETAIL MARKET OVERVIEWWILLIE CANDLER, Research Associate
The pandemic pushed Nashville’s absorption numbers to the lowest it has seen in 10 years; however, the second quarter of 2021 has picked up. Landlords believe that the market will rebound, especially for people with cabin fever, wanting to get out and visit the entertainment districts of the city and the various retail surrounding them. The vacancy rate is promising, with the current rate well near the metros historical average. Interesting enough, retail rents continue to climb at one of the fastest rates in the county.
NASHVILLE, TN
NET ABSORPTION, NET DELIVERIES, & VACANCY UNDER CONSTRUCTION
TOP LEASE TRANSACTIONS BY SF SIZE LANDLORD TENANT TENANT INDUSTRY
3800 Ezell RoadNashville, TN 44,140 SF 3800 Holdings LLC T-Mobile Telecomunication
629-683 S Water AvenueGallatin, TN 32,000 SF Best Brands Inc Undisclosed Undisclosed
545 Cool Springs BlvdFranklin, TN 31,554 SF Michael Lightman
Realty Undisclosed Undisclosed
TOP SALE TRANSACTIONS BY SF SIZE SALE PRICE BUYER / SELLER TENANCY TYPE
5301-5385 Mount View RoadAntioch,TN 144,469 SF $18,000,000
$124.59 PSFFirst National Realty
Golden Investment USA Neighborhood
Center
1720 Old Fort PkwyMurfreesboro, TN 97,164 SF $6,830,000
$70.29 PSFCTL Propco I LLC
JC Penny Company Neighborhood
Center
629-683 S Water AvenueGallatin, TN 90,000 SF $3,100,000
$34.44 PSFBest Brands Inc.Barbara Holder
Neighborhood Center
MARKET INDICATORS Q2 2021 Q1 2021 Q4 2020 Q3 2020 Q2 2020
▲ 12 Mo. Net Absorption SF 574,081 341,247 28,342 (151,214) 157,215
▼ Vacancy Rate 4.3% 4.4% 4.6% 4.3% 4.1%
▲ Avg NNN Asking Rate PSF $24.13 $23.81 $23.55 $23.17 $22.73
▼ SF Under Construction 277,975 367,784 535,543 813,987 919,153
▲ Inventory SF 117,684,299 117,579,939 117,431,385 117,109,498 116,913,194
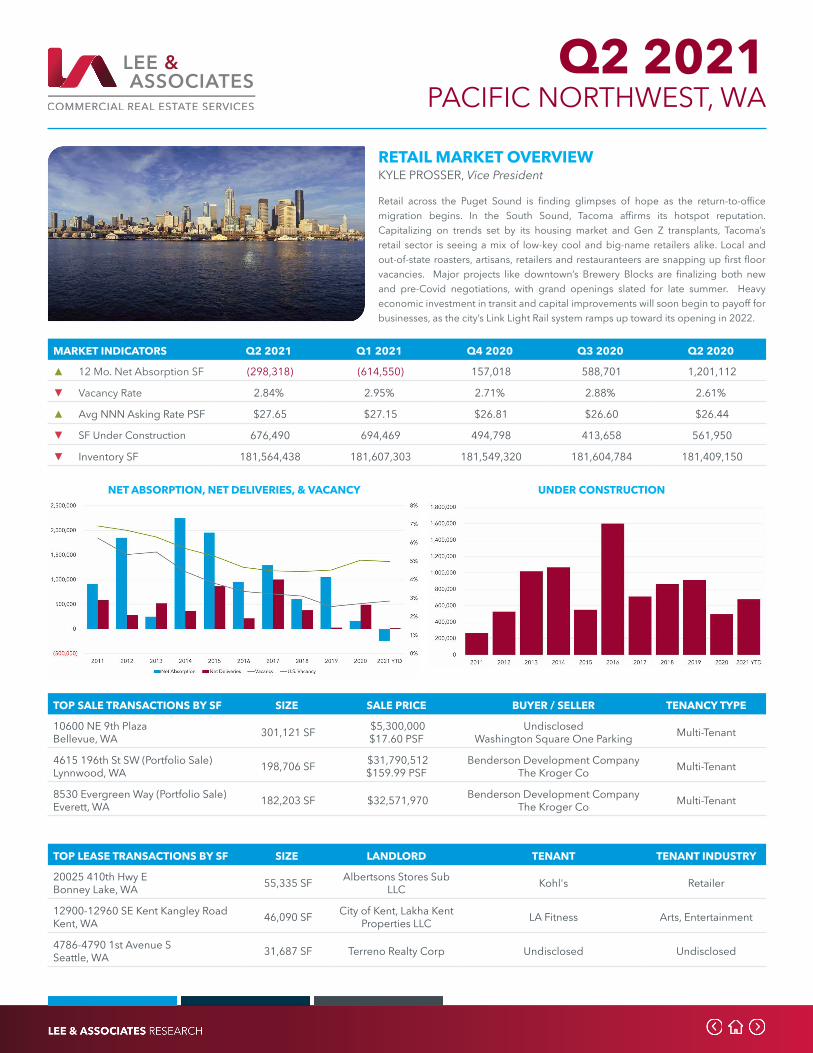
Q2 2021
RETAIL MARKET OVERVIEWKYLE PROSSER, Vice President
Retail across the Puget Sound is finding glimpses of hope as the return-to-office migration begins. In the South Sound, Tacoma affirms its hotspot reputation. Capitalizing on trends set by its housing market and Gen Z transplants, Tacoma’s retail sector is seeing a mix of low-key cool and big-name retailers alike. Local and out-of-state roasters, artisans, retailers and restauranteers are snapping up first floor vacancies. Major projects like downtown’s Brewery Blocks are finalizing both new and pre-Covid negotiations, with grand openings slated for late summer. Heavy economic investment in transit and capital improvements will soon begin to payoff for businesses, as the city’s Link Light Rail system ramps up toward its opening in 2022.
PACIFIC NORTHWEST, WA
NET ABSORPTION, NET DELIVERIES, & VACANCY UNDER CONSTRUCTION
TOP LEASE TRANSACTIONS BY SF SIZE LANDLORD TENANT TENANT INDUSTRY
20025 410th Hwy EBonney Lake, WA 55,335 SF Albertsons Stores Sub
LLC Kohl's Retailer
12900-12960 SE Kent Kangley RoadKent, WA 46,090 SF City of Kent, Lakha Kent
Properties LLC LA Fitness Arts, Entertainment
4786-4790 1st Avenue SSeattle, WA 31,687 SF Terreno Realty Corp Undisclosed Undisclosed
TOP SALE TRANSACTIONS BY SF SIZE SALE PRICE BUYER / SELLER TENANCY TYPE
10600 NE 9th PlazaBellevue, WA 301,121 SF $5,300,000
$17.60 PSFUndisclosed
Washington Square One Parking Multi-Tenant
4615 196th St SW (Portfolio Sale)Lynnwood, WA 198,706 SF $31,790,512
$159.99 PSFBenderson Development Company
The Kroger Co Multi-Tenant
8530 Evergreen Way (Portfolio Sale)Everett, WA 182,203 SF $32,571,970 Benderson Development Company
The Kroger Co Multi-Tenant
MARKET INDICATORS Q2 2021 Q1 2021 Q4 2020 Q3 2020 Q2 2020
▲ 12 Mo. Net Absorption SF (298,318) (614,550) 157,018 588,701 1,201,112
▼ Vacancy Rate 2.84% 2.95% 2.71% 2.88% 2.61%
▲ Avg NNN Asking Rate PSF $27.65 $27.15 $26.81 $26.60 $26.44
▼ SF Under Construction 676,490 694,469 494,798 413,658 561,950
▼ Inventory SF 181,564,438 181,607,303 181,549,320 181,604,784 181,409,150
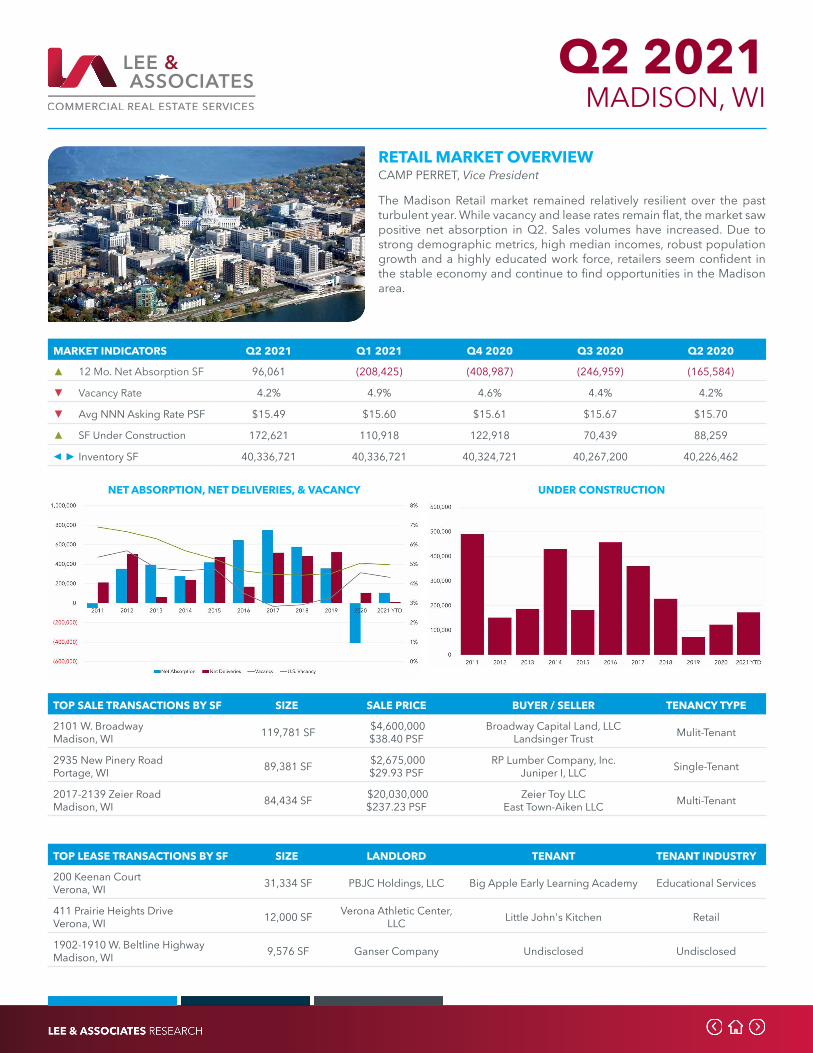
Q2 2021
RETAIL MARKET OVERVIEWCAMP PERRET, Vice President
The Madison Retail market remained relatively resilient over the past turbulent year. While vacancy and lease rates remain flat, the market saw positive net absorption in Q2. Sales volumes have increased. Due to strong demographic metrics, high median incomes, robust population growth and a highly educated work force, retailers seem confident in the stable economy and continue to find opportunities in the Madison area.
MADISON, WI
NET ABSORPTION, NET DELIVERIES, & VACANCY UNDER CONSTRUCTION
TOP LEASE TRANSACTIONS BY SF SIZE LANDLORD TENANT TENANT INDUSTRY
200 Keenan CourtVerona, WI 31,334 SF PBJC Holdings, LLC Big Apple Early Learning Academy Educational Services
411 Prairie Heights DriveVerona, WI 12,000 SF Verona Athletic Center,
LLC Little John's Kitchen Retail
1902-1910 W. Beltline HighwayMadison, WI 9,576 SF Ganser Company Undisclosed Undisclosed
TOP SALE TRANSACTIONS BY SF SIZE SALE PRICE BUYER / SELLER TENANCY TYPE
2101 W. BroadwayMadison, WI 119,781 SF $4,600,000
$38.40 PSFBroadway Capital Land, LLC
Landsinger Trust Mulit-Tenant
2935 New Pinery RoadPortage, WI 89,381 SF $2,675,000
$29.93 PSFRP Lumber Company, Inc.
Juniper I, LLC Single-Tenant
2017-2139 Zeier RoadMadison, WI 84,434 SF $20,030,000
$237.23 PSFZeier Toy LLC
East Town-Aiken LLC Multi-Tenant
MARKET INDICATORS Q2 2021 Q1 2021 Q4 2020 Q3 2020 Q2 2020
▲ 12 Mo. Net Absorption SF 96,061 (208,425) (408,987) (246,959) (165,584)
▼ Vacancy Rate 4.2% 4.9% 4.6% 4.4% 4.2%
▼ Avg NNN Asking Rate PSF $15.49 $15.60 $15.61 $15.67 $15.70
▲ SF Under Construction 172,621 110,918 122,918 70,439 88,259
◀ ► Inventory SF 40,336,721 40,336,721 40,324,721 40,267,200 40,226,462

Q2 2021
DEMAND SOARS AS INFECTIONS FALL The nation’s multifamily market posted a second straight quarterly record for net absorption along with strong first-half rent growth in every major metro and across suburban and downtown properties. Net absorption in the first half was 417,736 units, more than the total for any year in the last decade, and tenants responded to plunging second-quarter Covid infection rates by renting 331,067 units, a three-month total that is greater than any year except for 2018 and 2020.
Investors also have regained confidence in the sector with sales volumes reverting to the norm. Deal volume in the first half totaled $70.5 billion for an average price per unit of $171,222, a year-over-year price gain of 6.4%. Buyers especially were drawn toward properties in the fast-growing Sunbelt states and metros like Dallas-Fort Worth, Atlanta and Phoenix with bidding wars in many markets. Deal volume in Phoenix is nearly double normal sales activity and well above typical levels in Atlanta, Austin and Dallas/Fort Worth. Conversely, transaction activity remains tepid in New York, Washington, D.C., Los Angles and the Bay Area even as demand and rent growth continues to improve.
Nationwide, rents rose nearly 7% in the first half of the year and there are more than a dozen metros with gains in the teens and more, led by a 21.2% jump in effective rents in Tampa in the last 12 months followed by Palm Beach, 20.3%; Phoenix, 19.9%; Las Vegas, 19.1%; Atlanta, 17.6% and Jacksonville, 17%. Demand outpaced new supply while construction starts have fallen to their lowest levels since 2017. Construction got underway in the first half of about 140,000 units compared to some 200,000 apartments started in 2020. About 580,000 units currently are underway. As a percent of inventory, Nashville, Miami, Austin, Salt Lake City and Charleston lead all markets in units in the pipeline with at least 6% of inventory underway.
Slowing construction is significant in some markets. In Dallas/Fort Worth construction activity is down roughly 17,000 units compared to a year ago. Construction also is off in other high-demand markets like Houston, Portland, Oregon, Orlando and Atlanta. There is a notable shift in the size of the units being built. Apartments are getting bigger. In a survey by RENTCafe, 36% of U.S. cities, apartments underway are larger, on average, than those built in the previous five years.
Smaller units are more profitable for landlords, but more people are working from home and looking for added space. Also, older millennials have reached the typical home-buying age, but many are stymied by prices beyond reach. Instead they’re looking to rent larger apartments.
MULTIFAMILY OVERVIEW
LOWEST VACANCY RATE
BC, Vancouver 1.3%
ON, Toronto 1.9%
CA, Inland Empire 1.9%
CA, Orange County 2.8%
CA, San Diego 3.3%
U.S. Index 5.3%
HIGHEST MARKET RENT / UNIT
NY, New York $2,791
MA, Boston $2,439
CA, Orange County $2,282
CA, East Bay $2,277
CA, San Diego $2,035
U.S. Index $1,482
HIGHEST 12 MO. SALES VOLUME
GA, Atlanta $10,933,152,221
AZ. Phoenix $10,587,485,574
CA, Los Angeles $8,395,059,329
CO, Denver $6,909,863,849
DC, Washington $6,464,376,419
U.S. Index $140,460,345,050
MOST UNITS UNDER CONSTRUCTION
NY, New York 53,783
DC, Washington 31,741
CA, Los Angeles 25,848
TX, Dallas-Fort Worth 24,108
WA, Seattle 21,976
U.S. Index 582,531
LARGEST INVENTORY BY UNITS
NY, New York 1,432,517
CA, Los Angeles 979,040
TX, Dallas-Fort Worth 775,639
TX, Houston 639,840
DC, Washington 526,351
U.S. Index 17,664,776
LOWEST MARKET CAP RATE
BC, Vancouver 2.5%
ON, Toronto 3.7%
CA, Orange County 3.9%
WA, Seattle 4.2%
CA, San Diego 4.2%
U.S. Index 5.4%
FEATURED REPORTS• CA, LA - Los Angeles• CA, LA - San Gabriel Valley• CA, LA - Tri-Cities• CA, North San Diego• FL, Fort Myers• FL, Naples• FL, South Florida• IN, Indianapolis• NC, Durham• NC, Raleigh• NV, Reno• OH, Cincinnati• WA, Seattle
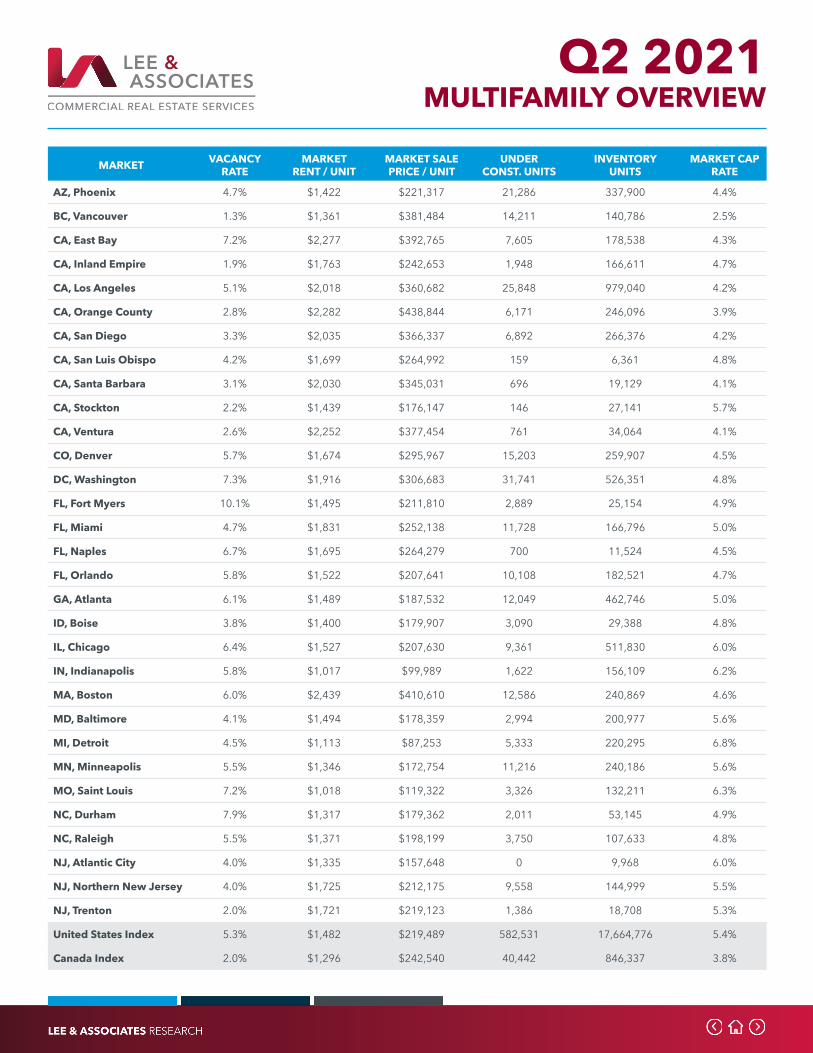
Q2 2021
MARKET VACANCY RATE
MARKETRENT / UNIT
MARKET SALE PRICE / UNIT
UNDER CONST. UNITS
INVENTORY UNITS
MARKET CAP RATE
AZ, Phoenix 4.7% $1,422 $221,317 21,286 337,900 4.4%
BC, Vancouver 1.3% $1,361 $381,484 14,211 140,786 2.5%
CA, East Bay 7.2% $2,277 $392,765 7,605 178,538 4.3%
CA, Inland Empire 1.9% $1,763 $242,653 1,948 166,611 4.7%
CA, Los Angeles 5.1% $2,018 $360,682 25,848 979,040 4.2%
CA, Orange County 2.8% $2,282 $438,844 6,171 246,096 3.9%
CA, San Diego 3.3% $2,035 $366,337 6,892 266,376 4.2%
CA, San Luis Obispo 4.2% $1,699 $264,992 159 6,361 4.8%
CA, Santa Barbara 3.1% $2,030 $345,031 696 19,129 4.1%
CA, Stockton 2.2% $1,439 $176,147 146 27,141 5.7%
CA, Ventura 2.6% $2,252 $377,454 761 34,064 4.1%
CO, Denver 5.7% $1,674 $295,967 15,203 259,907 4.5%
DC, Washington 7.3% $1,916 $306,683 31,741 526,351 4.8%
FL, Fort Myers 10.1% $1,495 $211,810 2,889 25,154 4.9%
FL, Miami 4.7% $1,831 $252,138 11,728 166,796 5.0%
FL, Naples 6.7% $1,695 $264,279 700 11,524 4.5%
FL, Orlando 5.8% $1,522 $207,641 10,108 182,521 4.7%
GA, Atlanta 6.1% $1,489 $187,532 12,049 462,746 5.0%
ID, Boise 3.8% $1,400 $179,907 3,090 29,388 4.8%
IL, Chicago 6.4% $1,527 $207,630 9,361 511,830 6.0%
IN, Indianapolis 5.8% $1,017 $99,989 1,622 156,109 6.2%
MA, Boston 6.0% $2,439 $410,610 12,586 240,869 4.6%
MD, Baltimore 4.1% $1,494 $178,359 2,994 200,977 5.6%
MI, Detroit 4.5% $1,113 $87,253 5,333 220,295 6.8%
MN, Minneapolis 5.5% $1,346 $172,754 11,216 240,186 5.6%
MO, Saint Louis 7.2% $1,018 $119,322 3,326 132,211 6.3%
NC, Durham 7.9% $1,317 $179,362 2,011 53,145 4.9%
NC, Raleigh 5.5% $1,371 $198,199 3,750 107,633 4.8%
NJ, Atlantic City 4.0% $1,335 $157,648 0 9,968 6.0%
NJ, Northern New Jersey 4.0% $1,725 $212,175 9,558 144,999 5.5%
NJ, Trenton 2.0% $1,721 $219,123 1,386 18,708 5.3%
United States Index 5.3% $1,482 $219,489 582,531 17,664,776 5.4%
Canada Index 2.0% $1,296 $242,540 40,442 846,337 3.8%
MULTIFAMILY OVERVIEW
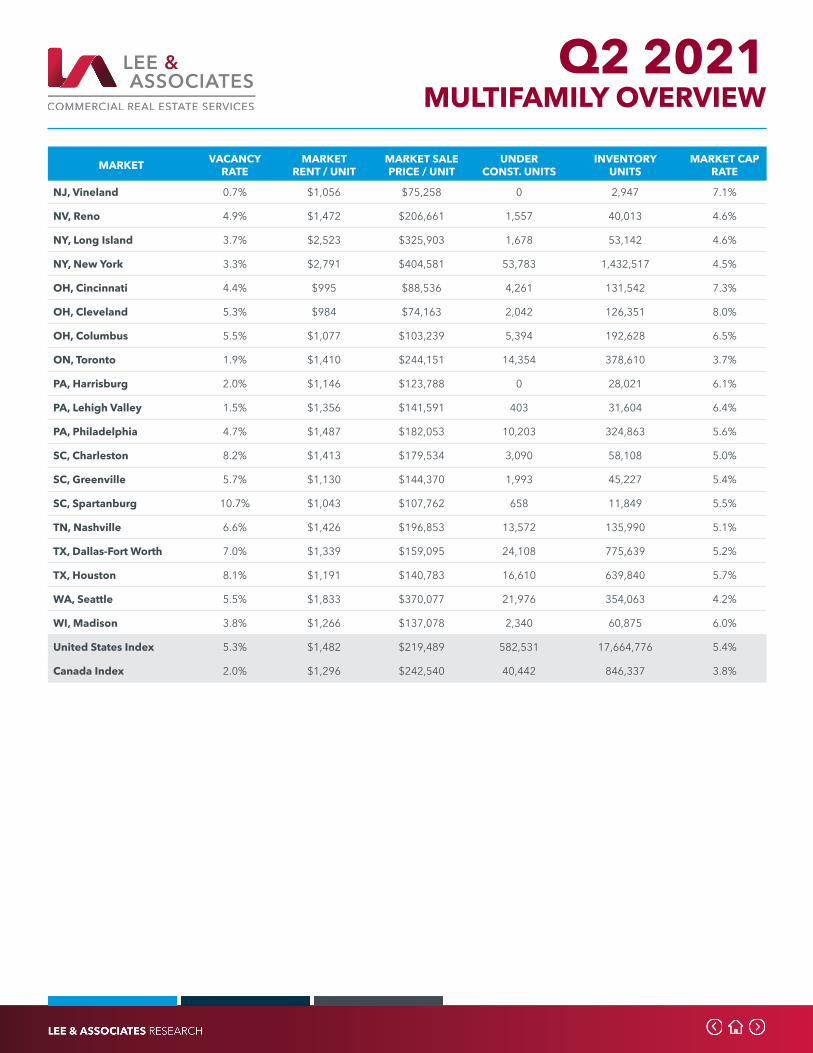
Q2 2021
MARKET VACANCY RATE
MARKETRENT / UNIT
MARKET SALE PRICE / UNIT
UNDER CONST. UNITS
INVENTORY UNITS
MARKET CAP RATE
NJ, Vineland 0.7% $1,056 $75,258 0 2,947 7.1%
NV, Reno 4.9% $1,472 $206,661 1,557 40,013 4.6%
NY, Long Island 3.7% $2,523 $325,903 1,678 53,142 4.6%
NY, New York 3.3% $2,791 $404,581 53,783 1,432,517 4.5%
OH, Cincinnati 4.4% $995 $88,536 4,261 131,542 7.3%
OH, Cleveland 5.3% $984 $74,163 2,042 126,351 8.0%
OH, Columbus 5.5% $1,077 $103,239 5,394 192,628 6.5%
ON, Toronto 1.9% $1,410 $244,151 14,354 378,610 3.7%
PA, Harrisburg 2.0% $1,146 $123,788 0 28,021 6.1%
PA, Lehigh Valley 1.5% $1,356 $141,591 403 31,604 6.4%
PA, Philadelphia 4.7% $1,487 $182,053 10,203 324,863 5.6%
SC, Charleston 8.2% $1,413 $179,534 3,090 58,108 5.0%
SC, Greenville 5.7% $1,130 $144,370 1,993 45,227 5.4%
SC, Spartanburg 10.7% $1,043 $107,762 658 11,849 5.5%
TN, Nashville 6.6% $1,426 $196,853 13,572 135,990 5.1%
TX, Dallas-Fort Worth 7.0% $1,339 $159,095 24,108 775,639 5.2%
TX, Houston 8.1% $1,191 $140,783 16,610 639,840 5.7%
WA, Seattle 5.5% $1,833 $370,077 21,976 354,063 4.2%
WI, Madison 3.8% $1,266 $137,078 2,340 60,875 6.0%
United States Index 5.3% $1,482 $219,489 582,531 17,664,776 5.4%
Canada Index 2.0% $1,296 $242,540 40,442 846,337 3.8%
MULTIFAMILY OVERVIEW
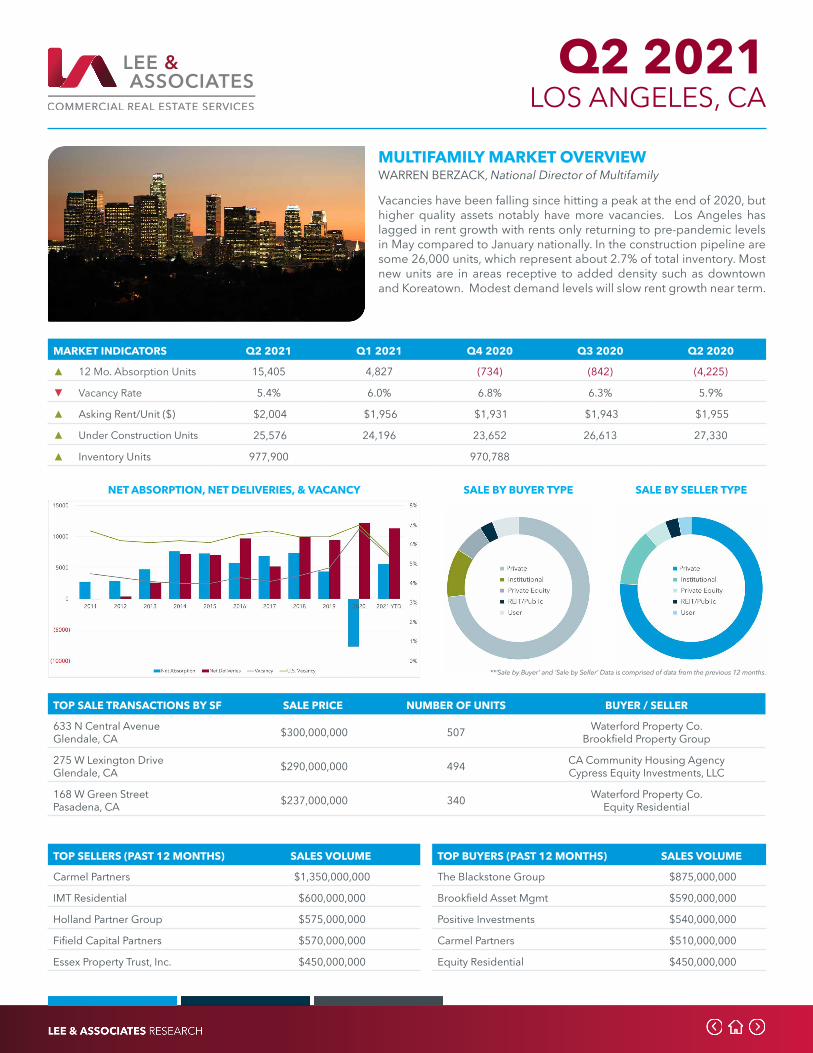
Q2 2021 LOS ANGELES, CA
MULTIFAMILY MARKET OVERVIEWWARREN BERZACK, National Director of Multifamily
Vacancies have been falling since hitting a peak at the end of 2020, but higher quality assets notably have more vacancies. Los Angeles has lagged in rent growth with rents only returning to pre-pandemic levels in May compared to January nationally. In the construction pipeline are some 26,000 units, which represent about 2.7% of total inventory. Most new units are in areas receptive to added density such as downtown and Koreatown. Modest demand levels will slow rent growth near term.
TOP SALE TRANSACTIONS BY SF SALE PRICE NUMBER OF UNITS BUYER / SELLER
633 N Central AvenueGlendale, CA $300,000,000 507 Waterford Property Co.
Brookfield Property Group
275 W Lexington DriveGlendale, CA $290,000,000 494 CA Community Housing Agency
Cypress Equity Investments, LLC
168 W Green StreetPasadena, CA $237,000,000 340 Waterford Property Co.
Equity Residential
SALE BY BUYER TYPE SALE BY SELLER TYPE
TOP SELLERS (PAST 12 MONTHS) SALES VOLUME
Carmel Partners $1,350,000,000
IMT Residential $600,000,000
Holland Partner Group $575,000,000
Fifield Capital Partners $570,000,000
Essex Property Trust, Inc. $450,000,000
NET ABSORPTION, NET DELIVERIES, & VACANCY
**’Sale by Buyer’ and ‘Sale by Seller’ Data is comprised of data from the previous 12 months.
TOP BUYERS (PAST 12 MONTHS) SALES VOLUME
The Blackstone Group $875,000,000
Brookfield Asset Mgmt $590,000,000
Positive Investments $540,000,000
Carmel Partners $510,000,000
Equity Residential $450,000,000
MARKET INDICATORS Q2 2021 Q1 2021 Q4 2020 Q3 2020 Q2 2020
▲ 12 Mo. Absorption Units 15,405 4,827 (734) (842) (4,225)
▼ Vacancy Rate 5.4% 6.0% 6.8% 6.3% 5.9%
▲ Asking Rent/Unit ($) $2,004 $1,956 $1,931 $1,943 $1,955
▲ Under Construction Units 25,576 24,196 23,652 26,613 27,330
▲ Inventory Units 977,900 970,788
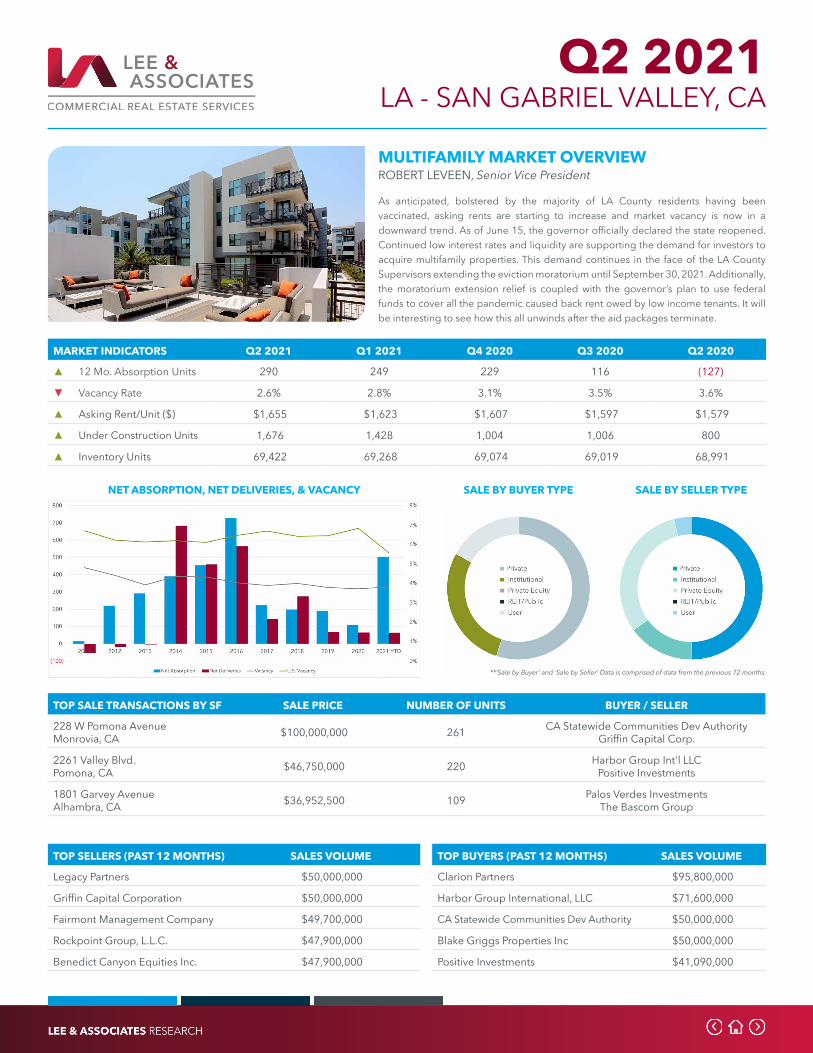
Q2 2021 LA - SAN GABRIEL VALLEY, CA
MULTIFAMILY MARKET OVERVIEWROBERT LEVEEN, Senior Vice President
As anticipated, bolstered by the majority of LA County residents having been vaccinated, asking rents are starting to increase and market vacancy is now in a downward trend. As of June 15, the governor officially declared the state reopened. Continued low interest rates and liquidity are supporting the demand for investors to acquire multifamily properties. This demand continues in the face of the LA County Supervisors extending the eviction moratorium until September 30, 2021. Additionally, the moratorium extension relief is coupled with the governor’s plan to use federal funds to cover all the pandemic caused back rent owed by low income tenants. It will be interesting to see how this all unwinds after the aid packages terminate.
TOP SALE TRANSACTIONS BY SF SALE PRICE NUMBER OF UNITS BUYER / SELLER
228 W Pomona AvenueMonrovia, CA $100,000,000 261 CA Statewide Communities Dev Authority
Griffin Capital Corp.
2261 Valley Blvd.Pomona, CA $46,750,000 220 Harbor Group Int'l LLC
Positive Investments
1801 Garvey AvenueAlhambra, CA $36,952,500 109 Palos Verdes Investments
The Bascom Group
SALE BY BUYER TYPE SALE BY SELLER TYPE
TOP SELLERS (PAST 12 MONTHS) SALES VOLUME
Legacy Partners $50,000,000
Griffin Capital Corporation $50,000,000
Fairmont Management Company $49,700,000
Rockpoint Group, L.L.C. $47,900,000
Benedict Canyon Equities Inc. $47,900,000
NET ABSORPTION, NET DELIVERIES, & VACANCY
**’Sale by Buyer’ and ‘Sale by Seller’ Data is comprised of data from the previous 12 months.
TOP BUYERS (PAST 12 MONTHS) SALES VOLUME
Clarion Partners $95,800,000
Harbor Group International, LLC $71,600,000
CA Statewide Communities Dev Authority $50,000,000
Blake Griggs Properties Inc $50,000,000
Positive Investments $41,090,000
MARKET INDICATORS Q2 2021 Q1 2021 Q4 2020 Q3 2020 Q2 2020
▲ 12 Mo. Absorption Units 290 249 229 116 (127)
▼ Vacancy Rate 2.6% 2.8% 3.1% 3.5% 3.6%
▲ Asking Rent/Unit ($) $1,655 $1,623 $1,607 $1,597 $1,579
▲ Under Construction Units 1,676 1,428 1,004 1,006 800
▲ Inventory Units 69,422 69,268 69,074 69,019 68,991
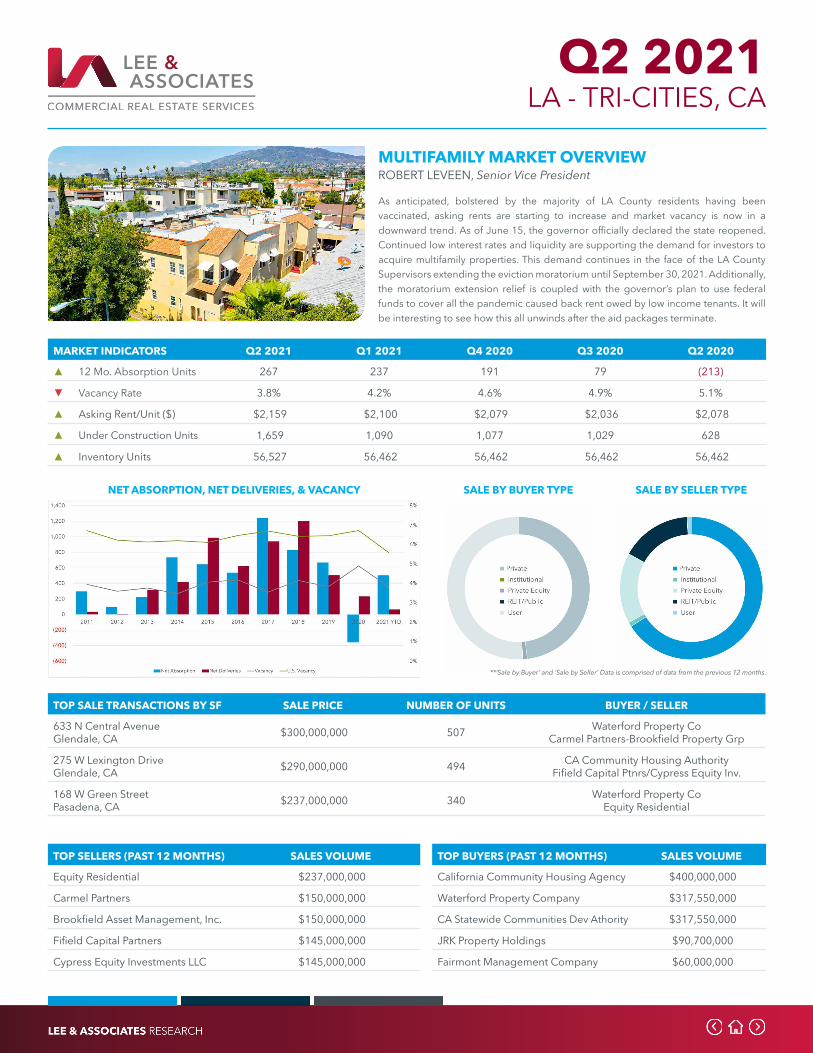
Q2 2021 LA - TRI-CITIES, CA
MULTIFAMILY MARKET OVERVIEWROBERT LEVEEN, Senior Vice President
As anticipated, bolstered by the majority of LA County residents having been vaccinated, asking rents are starting to increase and market vacancy is now in a downward trend. As of June 15, the governor officially declared the state reopened. Continued low interest rates and liquidity are supporting the demand for investors to acquire multifamily properties. This demand continues in the face of the LA County Supervisors extending the eviction moratorium until September 30, 2021. Additionally, the moratorium extension relief is coupled with the governor’s plan to use federal funds to cover all the pandemic caused back rent owed by low income tenants. It will be interesting to see how this all unwinds after the aid packages terminate.
TOP SALE TRANSACTIONS BY SF SALE PRICE NUMBER OF UNITS BUYER / SELLER
633 N Central AvenueGlendale, CA $300,000,000 507 Waterford Property Co
Carmel Partners-Brookfield Property Grp
275 W Lexington DriveGlendale, CA $290,000,000 494 CA Community Housing Authority
Fifield Capital Ptnrs/Cypress Equity Inv.
168 W Green StreetPasadena, CA $237,000,000 340 Waterford Property Co
Equity Residential
SALE BY BUYER TYPE SALE BY SELLER TYPE
TOP SELLERS (PAST 12 MONTHS) SALES VOLUME
Equity Residential $237,000,000
Carmel Partners $150,000,000
Brookfield Asset Management, Inc. $150,000,000
Fifield Capital Partners $145,000,000
Cypress Equity Investments LLC $145,000,000
NET ABSORPTION, NET DELIVERIES, & VACANCY
**’Sale by Buyer’ and ‘Sale by Seller’ Data is comprised of data from the previous 12 months.
TOP BUYERS (PAST 12 MONTHS) SALES VOLUME
California Community Housing Agency $400,000,000
Waterford Property Company $317,550,000
CA Statewide Communities Dev Athority $317,550,000
JRK Property Holdings $90,700,000
Fairmont Management Company $60,000,000
MARKET INDICATORS Q2 2021 Q1 2021 Q4 2020 Q3 2020 Q2 2020
▲ 12 Mo. Absorption Units 267 237 191 79 (213)
▼ Vacancy Rate 3.8% 4.2% 4.6% 4.9% 5.1%
▲ Asking Rent/Unit ($) $2,159 $2,100 $2,079 $2,036 $2,078
▲ Under Construction Units 1,659 1,090 1,077 1,029 628
▲ Inventory Units 56,527 56,462 56,462 56,462 56,462
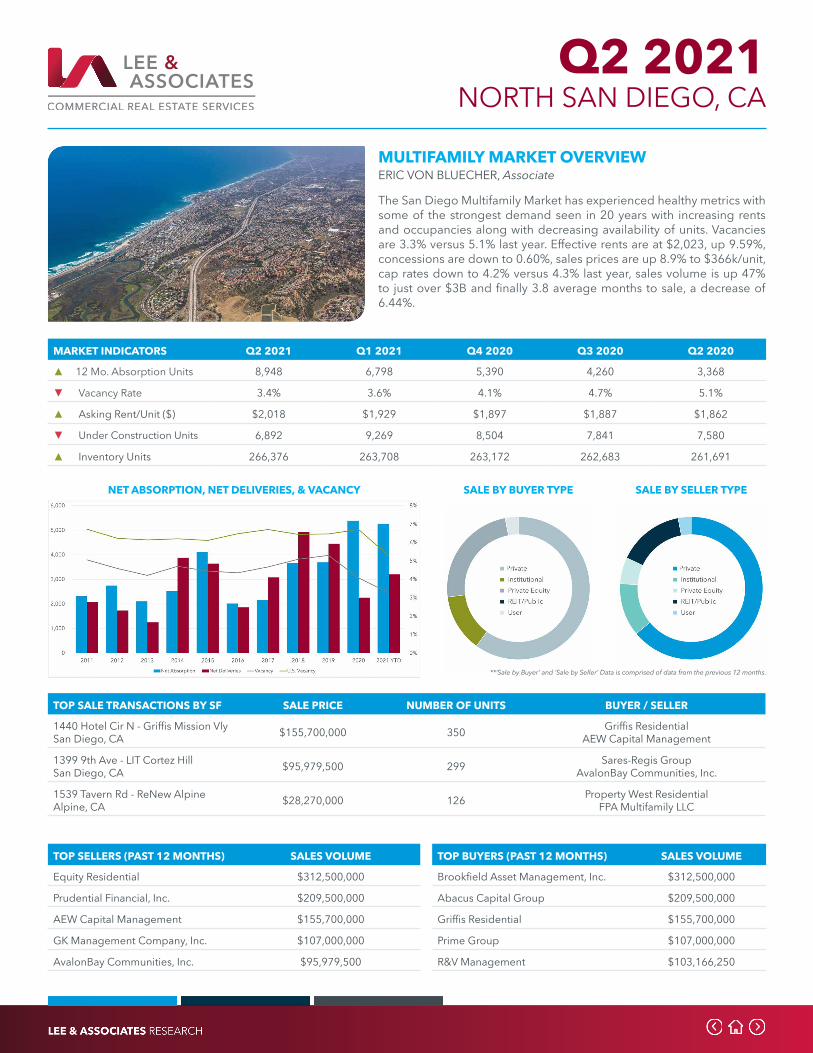
Q2 2021 NORTH SAN DIEGO, CA
MULTIFAMILY MARKET OVERVIEWERIC VON BLUECHER, Associate
The San Diego Multifamily Market has experienced healthy metrics with some of the strongest demand seen in 20 years with increasing rents and occupancies along with decreasing availability of units. Vacancies are 3.3% versus 5.1% last year. Effective rents are at $2,023, up 9.59%, concessions are down to 0.60%, sales prices are up 8.9% to $366k/unit, cap rates down to 4.2% versus 4.3% last year, sales volume is up 47% to just over $3B and finally 3.8 average months to sale, a decrease of 6.44%.
TOP SALE TRANSACTIONS BY SF SALE PRICE NUMBER OF UNITS BUYER / SELLER
1440 Hotel Cir N - Griffis Mission VlySan Diego, CA $155,700,000 350 Griffis Residential
AEW Capital Management
1399 9th Ave - LIT Cortez HillSan Diego, CA $95,979,500 299 Sares-Regis Group
AvalonBay Communities, Inc.
1539 Tavern Rd - ReNew AlpineAlpine, CA $28,270,000 126 Property West Residential
FPA Multifamily LLC
SALE BY BUYER TYPE SALE BY SELLER TYPE
TOP SELLERS (PAST 12 MONTHS) SALES VOLUME
Equity Residential $312,500,000
Prudential Financial, Inc. $209,500,000
AEW Capital Management $155,700,000
GK Management Company, Inc. $107,000,000
AvalonBay Communities, Inc. $95,979,500
NET ABSORPTION, NET DELIVERIES, & VACANCY
**’Sale by Buyer’ and ‘Sale by Seller’ Data is comprised of data from the previous 12 months.
TOP BUYERS (PAST 12 MONTHS) SALES VOLUME
Brookfield Asset Management, Inc. $312,500,000
Abacus Capital Group $209,500,000
Griffis Residential $155,700,000
Prime Group $107,000,000
R&V Management $103,166,250
MARKET INDICATORS Q2 2021 Q1 2021 Q4 2020 Q3 2020 Q2 2020
▲ 12 Mo. Absorption Units 8,948 6,798 5,390 4,260 3,368
▼ Vacancy Rate 3.4% 3.6% 4.1% 4.7% 5.1%
▲ Asking Rent/Unit ($) $2,018 $1,929 $1,897 $1,887 $1,862
▼ Under Construction Units 6,892 9,269 8,504 7,841 7,580
▲ Inventory Units 266,376 263,708 263,172 262,683 261,691
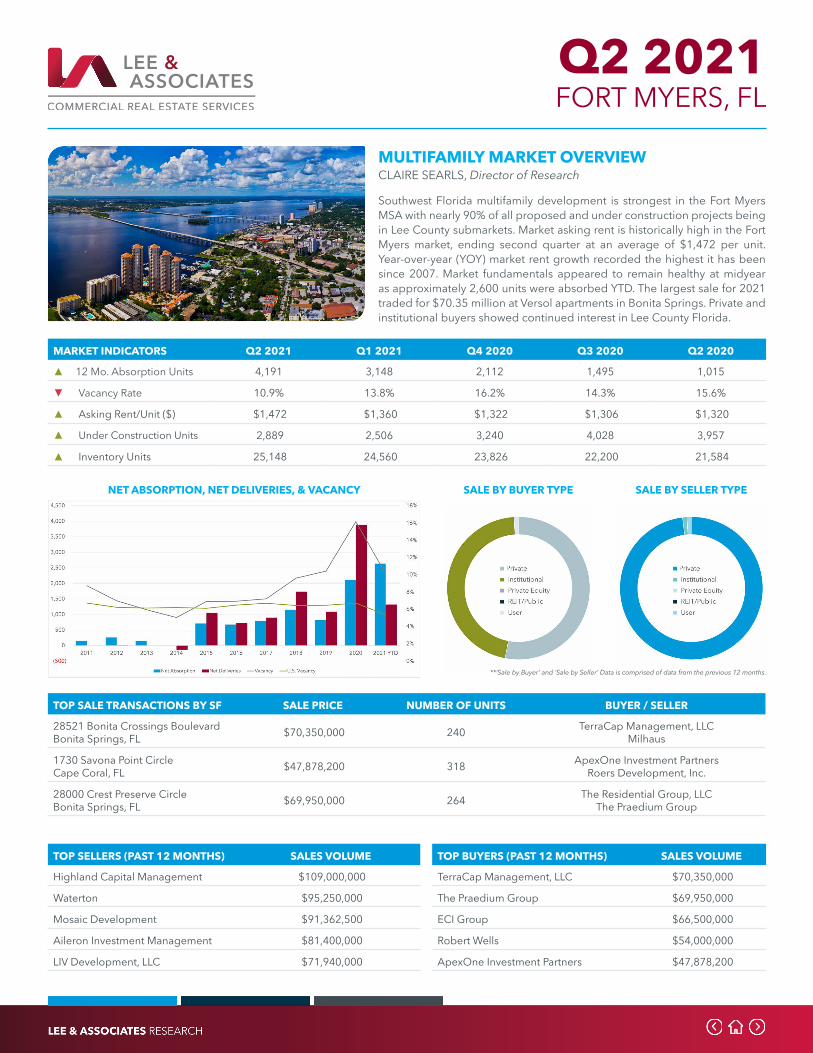
Q2 2021 FORT MYERS, FL
MULTIFAMILY MARKET OVERVIEWCLAIRE SEARLS, Director of Research
Southwest Florida multifamily development is strongest in the Fort Myers MSA with nearly 90% of all proposed and under construction projects being in Lee County submarkets. Market asking rent is historically high in the Fort Myers market, ending second quarter at an average of $1,472 per unit. Year-over-year (YOY) market rent growth recorded the highest it has been since 2007. Market fundamentals appeared to remain healthy at midyear as approximately 2,600 units were absorbed YTD. The largest sale for 2021 traded for $70.35 million at Versol apartments in Bonita Springs. Private and institutional buyers showed continued interest in Lee County Florida.
TOP SALE TRANSACTIONS BY SF SALE PRICE NUMBER OF UNITS BUYER / SELLER
28521 Bonita Crossings BoulevardBonita Springs, FL $70,350,000 240 TerraCap Management, LLC
Milhaus
1730 Savona Point CircleCape Coral, FL $47,878,200 318 ApexOne Investment Partners
Roers Development, Inc.
28000 Crest Preserve CircleBonita Springs, FL $69,950,000 264 The Residential Group, LLC
The Praedium Group
SALE BY BUYER TYPE SALE BY SELLER TYPE
TOP SELLERS (PAST 12 MONTHS) SALES VOLUME
Highland Capital Management $109,000,000
Waterton $95,250,000
Mosaic Development $91,362,500
Aileron Investment Management $81,400,000
LIV Development, LLC $71,940,000
NET ABSORPTION, NET DELIVERIES, & VACANCY
**’Sale by Buyer’ and ‘Sale by Seller’ Data is comprised of data from the previous 12 months.
TOP BUYERS (PAST 12 MONTHS) SALES VOLUME
TerraCap Management, LLC $70,350,000
The Praedium Group $69,950,000
ECI Group $66,500,000
Robert Wells $54,000,000
ApexOne Investment Partners $47,878,200
MARKET INDICATORS Q2 2021 Q1 2021 Q4 2020 Q3 2020 Q2 2020
▲ 12 Mo. Absorption Units 4,191 3,148 2,112 1,495 1,015
▼ Vacancy Rate 10.9% 13.8% 16.2% 14.3% 15.6%
▲ Asking Rent/Unit ($) $1,472 $1,360 $1,322 $1,306 $1,320
▲ Under Construction Units 2,889 2,506 3,240 4,028 3,957
▲ Inventory Units 25,148 24,560 23,826 22,200 21,584
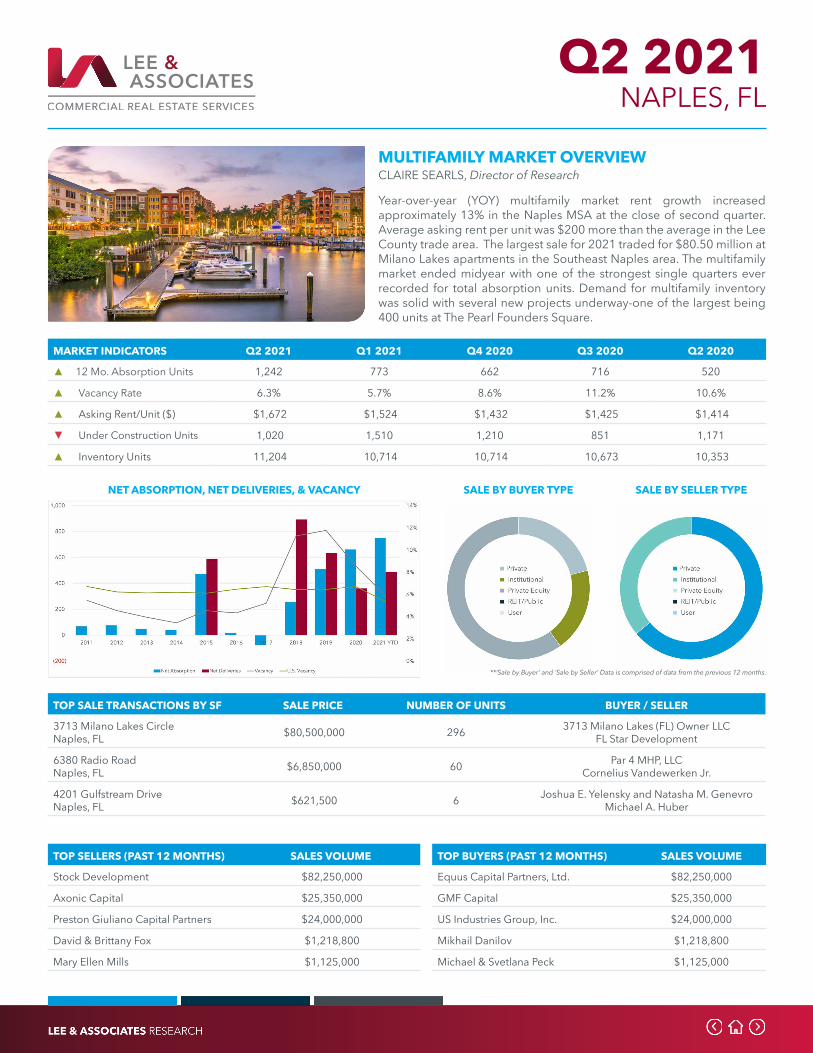
Q2 2021 NAPLES, FL
MULTIFAMILY MARKET OVERVIEWCLAIRE SEARLS, Director of Research
Year-over-year (YOY) multifamily market rent growth increased approximately 13% in the Naples MSA at the close of second quarter. Average asking rent per unit was $200 more than the average in the Lee County trade area. The largest sale for 2021 traded for $80.50 million at Milano Lakes apartments in the Southeast Naples area. The multifamily market ended midyear with one of the strongest single quarters ever recorded for total absorption units. Demand for multifamily inventory was solid with several new projects underway-one of the largest being 400 units at The Pearl Founders Square.
TOP SALE TRANSACTIONS BY SF SALE PRICE NUMBER OF UNITS BUYER / SELLER
3713 Milano Lakes CircleNaples, FL $80,500,000 296 3713 Milano Lakes (FL) Owner LLC
FL Star Development
6380 Radio RoadNaples, FL $6,850,000 60 Par 4 MHP, LLC
Cornelius Vandewerken Jr.
4201 Gulfstream DriveNaples, FL $621,500 6 Joshua E. Yelensky and Natasha M. Genevro
Michael A. Huber
SALE BY BUYER TYPE SALE BY SELLER TYPE
TOP SELLERS (PAST 12 MONTHS) SALES VOLUME
Stock Development $82,250,000
Axonic Capital $25,350,000
Preston Giuliano Capital Partners $24,000,000
David & Brittany Fox $1,218,800
Mary Ellen Mills $1,125,000
NET ABSORPTION, NET DELIVERIES, & VACANCY
**’Sale by Buyer’ and ‘Sale by Seller’ Data is comprised of data from the previous 12 months.
TOP BUYERS (PAST 12 MONTHS) SALES VOLUME
Equus Capital Partners, Ltd. $82,250,000
GMF Capital $25,350,000
US Industries Group, Inc. $24,000,000
Mikhail Danilov $1,218,800
Michael & Svetlana Peck $1,125,000
MARKET INDICATORS Q2 2021 Q1 2021 Q4 2020 Q3 2020 Q2 2020
▲ 12 Mo. Absorption Units 1,242 773 662 716 520
▲ Vacancy Rate 6.3% 5.7% 8.6% 11.2% 10.6%
▲ Asking Rent/Unit ($) $1,672 $1,524 $1,432 $1,425 $1,414
▼ Under Construction Units 1,020 1,510 1,210 851 1,171
▲ Inventory Units 11,204 10,714 10,714 10,673 10,353

Q2 2021 SOUTH FLORIDA, FL
MULTIFAMILY MARKET OVERVIEWPATRICK MONTELUS, Senior Vice President
With the challenges presented in 2020 leading into 2021 in the rearview mirror, the South Florida Multifamily market continues to see massive growth and aggressive acquisitions. South Florida’s reputation as being a homing beacon for investors held firm, as both the multifamily and economic market proved resilient. With a persistent positive year-over-year population growth, the recent pandemic has accelerated this phenomenon, creating low vacancy and scarce unit availability resulting in higher rents. The confluence of events coupled with an influx of new investors with advantageous debt options looking to redeploy capital from other markets is culminating in compressed cap rates among the available inventory.
TOP SALE TRANSACTIONS BY SF SALE PRICE NUMBER OF UNITS BUYER / SELLER
10170 SW 7th StreetPembroke Pines, FL $222,650,000 700 Apartment Income REIT
Harbor Group International, LLC
68 SE 6th StreetMiami, FL $65,000,000 81 Fortune International Realty & KAR Properties
Swire Properties, Inc.
1919 SE 10th AvenueFort Lauderdale, FL $100,000,000 310 Cardone Capital
Wood Partners
SALE BY BUYER TYPE SALE BY SELLER TYPE
TOP SELLERS (PAST 12 MONTHS) SALES VOLUME
Wood Partners $229,775,000
Starwood Capital Group $225,000,000
Harbor Group International, LLC $222,650,000
Prudential Financial, Inc. $215,175,000
Estate Investments Group $179,920,000
NET ABSORPTION, NET DELIVERIES, & VACANCY
**’Sale by Buyer’ and ‘Sale by Seller’ Data is comprised of data from the previous 12 months.
TOP BUYERS (PAST 12 MONTHS) SALES VOLUME
Sterling Equities $341,975,000
Cardone Capital $299,000,000
Cortland $231,550,000
Apartment Income REIT $222,650,000
Pantzer Properties $191,365,000
MARKET INDICATORS Q2 2021 Q1 2021 Q4 2020 Q3 2020 Q2 2020
▲ 12 Mo. Absorption Units 8,850 8,180 5,726 3,437 454
▼ Vacancy Rate 4.3% 5.5% 6.6% 6.9% 6.7%
▲ Asking Rent/Unit ($) $1,735 $1,639 $1,595 $1,573 $1,564
▲ Under Construction Units 27,504 25,918 25,505 27,867 29,604
▲ Inventory Units 500,507 497,310 494,109 489,708 485,179
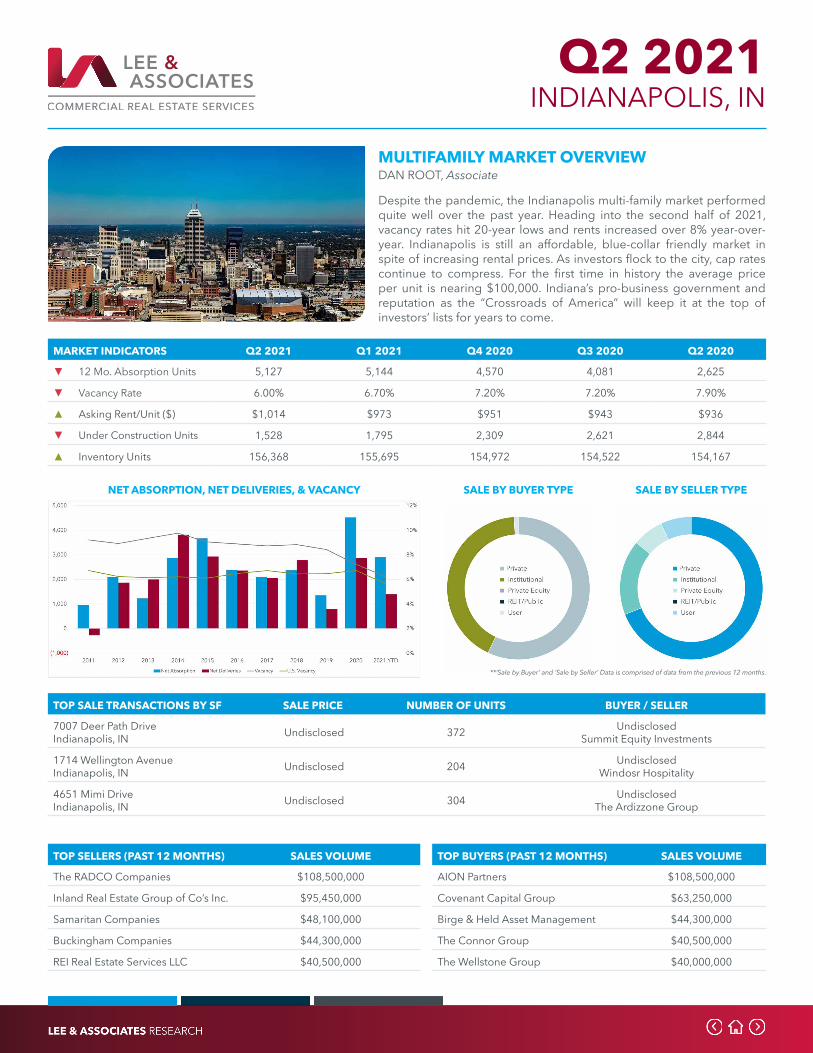
Q2 2021 INDIANAPOLIS, IN
MULTIFAMILY MARKET OVERVIEWDAN ROOT, Associate
Despite the pandemic, the Indianapolis multi-family market performed quite well over the past year. Heading into the second half of 2021, vacancy rates hit 20-year lows and rents increased over 8% year-over-year. Indianapolis is still an affordable, blue-collar friendly market in spite of increasing rental prices. As investors flock to the city, cap rates continue to compress. For the first time in history the average price per unit is nearing $100,000. Indiana’s pro-business government and reputation as the “Crossroads of America” will keep it at the top of investors’ lists for years to come.
TOP SALE TRANSACTIONS BY SF SALE PRICE NUMBER OF UNITS BUYER / SELLER
7007 Deer Path DriveIndianapolis, IN Undisclosed 372 Undisclosed
Summit Equity Investments
1714 Wellington AvenueIndianapolis, IN Undisclosed 204 Undisclosed
Windosr Hospitality
4651 Mimi DriveIndianapolis, IN Undisclosed 304 Undisclosed
The Ardizzone Group
SALE BY BUYER TYPE SALE BY SELLER TYPE
TOP SELLERS (PAST 12 MONTHS) SALES VOLUME
The RADCO Companies $108,500,000
Inland Real Estate Group of Co’s Inc. $95,450,000
Samaritan Companies $48,100,000
Buckingham Companies $44,300,000
REI Real Estate Services LLC $40,500,000
NET ABSORPTION, NET DELIVERIES, & VACANCY
**’Sale by Buyer’ and ‘Sale by Seller’ Data is comprised of data from the previous 12 months.
TOP BUYERS (PAST 12 MONTHS) SALES VOLUME
AION Partners $108,500,000
Covenant Capital Group $63,250,000
Birge & Held Asset Management $44,300,000
The Connor Group $40,500,000
The Wellstone Group $40,000,000
MARKET INDICATORS Q2 2021 Q1 2021 Q4 2020 Q3 2020 Q2 2020
▼ 12 Mo. Absorption Units 5,127 5,144 4,570 4,081 2,625
▼ Vacancy Rate 6.00% 6.70% 7.20% 7.20% 7.90%
▲ Asking Rent/Unit ($) $1,014 $973 $951 $943 $936
▼ Under Construction Units 1,528 1,795 2,309 2,621 2,844
▲ Inventory Units 156,368 155,695 154,972 154,522 154,167

Q2 2021 DURHAM, NC
MULTIFAMILY MARKET OVERVIEWDAN KOELLER, Director of Entitlements, Broker
The Raleigh-Durham/Triangle area and its surrounding submarkets continue to be a highly sought-after area for multifamily investors and developers. We continue to see an increase in out-of-state institutional funds seeking to deploy assets here. We are also starting to see the COVID-19 rebound effect on the multifamily sector with decreasing vacancy rates and increasing absorption rates. The Triangle’s strong population growth continues to benefit our market, particularly with the recent announcements of tech giants like Amazon, Apple, and Google coming into our region. Investors continue with their aggressive approach to secure land, while being creative in tying up and closing multifamily opportunities in the area.
TOP SALE TRANSACTIONS BY SF SALE PRICE NUMBER OF UNITS BUYER / SELLER
4230 Garrett RoadDurham, NC $52,150,000 500 Friedlam Partners LLC
Audubon
605 W Chapel Hill StreetDurham, NC $77,000,000 340 Exeter Property Group
Bell Partners
2335 Broad StreetDurham, NC $64,500,000 320 Greystar Real Estate Partners
McCann Realty Partners, LLC
SALE BY BUYER TYPE SALE BY SELLER TYPE
TOP SELLERS (PAST 12 MONTHS) SALES VOLUME
Terwilliger Pappas $109,300,000
Alliance Residential Company $87,210,000
Bell Partners, Inc. $77,000,000
Carroll $59,500,000
Audubon $52,150,000
NET ABSORPTION, NET DELIVERIES, & VACANCY
**’Sale by Buyer’ and ‘Sale by Seller’ Data is comprised of data from the previous 12 months.
TOP BUYERS (PAST 12 MONTHS) SALES VOLUME
Cortland $87,210,000
Duck Pond Realty Management $80,200,000
EQT AB $77,000,000
Greystar Real Estate Partners $64,500,000
Priderock Capital Partners, LLC $59,500,000
MARKET INDICATORS Q2 2021 Q1 2021 Q4 2020 Q3 2020 Q2 2020
▲ 12 Mo. Absorption Units 1,924 1,361 1,026 1,214 1,105
▼ Vacancy Rate 8.3% 9.2% 9.5% 8.5% 9.9%
▲ Asking Rent/Unit ($) $1,306 $1,218 $1,185 $1,185 $1,191
▲ Under Construction Units 1,466 1,085 1,361 1,984 1,463
◀ ► Inventory Units 53,145 53,145 52,876 52,253 51,958

Q2 2021 RALEIGH, NC
MULTIFAMILY MARKET OVERVIEWDAN KOELLER, Director of Entitlements, Broker
The Raleigh-Durham/Triangle area and its surrounding submarkets continue to be a highly sought-after area for multifamily investors and developers. We continue to see an increase in out-of-state institutional funds seeking to deploy assets here. We are also starting to see the COVID-19 rebound effect on the multifamily sector with decreasing vacancy rates and increasing absorption rates. The Triangle’s strong population growth continues to benefit our market, particularly with the recent announcements of tech giants like Amazon, Apple, and Google coming into our region. Investors continue with their aggressive approach to secure land, while being creative in tying up and closing multifamily opportunities in the area.
TOP SALE TRANSACTIONS BY SF SALE PRICE NUMBER OF UNITS BUYER / SELLER
6615 The Lakes DriveRaleigh, NC $82,650,000 600 Bridge Investment Group
WCP North Ridge, LLC
430 Allister DriveRaleigh, NC $120,000,000 434 TA Realty
Heitman
4722 Dansey DriveRaleigh, NC $48,700,000 356 Friedlam Partners LLC
Bridge Investment Group
SALE BY BUYER TYPE SALE BY SELLER TYPE
TOP SELLERS (PAST 12 MONTHS) SALES VOLUME
Banner Real Estate Group $113,750,000
Magnolia Capital $110,000,000
Taurus Investment Holdings, LLC $104,000,000
Duck Pond Realty Management $102,690,000
Gamma Real Estate $100,775,000
NET ABSORPTION, NET DELIVERIES, & VACANCY
**’Sale by Buyer’ and ‘Sale by Seller’ Data is comprised of data from the previous 12 months.
TOP BUYERS (PAST 12 MONTHS) SALES VOLUME
The Blackstone Group Inc. $170,750,000
Cortland $128,600,000
Morgan Stanley Services Group Inc. $124,550,000
TA Realty $120,000,000
Bluerock $100,775,000
MARKET INDICATORS Q2 2021 Q1 2021 Q4 2020 Q3 2020 Q2 2020
▲ 12 Mo. Absorption Units 4,919 4,862 3,858 3,646 3,103
▼ Vacancy Rate 5.9% 7.0% 8.2% 7.8% 7.2%
▲ Asking Rent/Unit ($) $1,354 $1,227 $1,186 $1,188 $1,186
▼ Under Construction Units 3,750 4,160 4,338 4,029 5,873
▲ Inventory Units 107,718 107,308 107,001 105,959 103,920
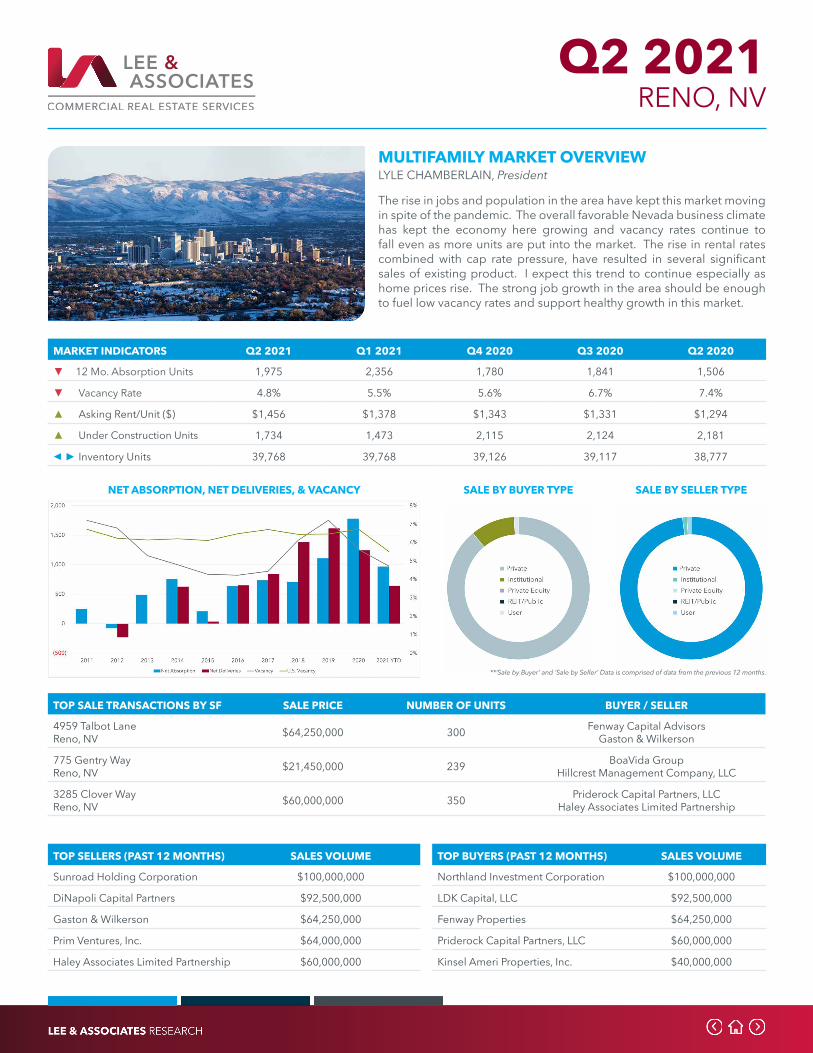
Q2 2021 RENO, NV
MULTIFAMILY MARKET OVERVIEWLYLE CHAMBERLAIN, President
The rise in jobs and population in the area have kept this market moving in spite of the pandemic. The overall favorable Nevada business climate has kept the economy here growing and vacancy rates continue to fall even as more units are put into the market. The rise in rental rates combined with cap rate pressure, have resulted in several significant sales of existing product. I expect this trend to continue especially as home prices rise. The strong job growth in the area should be enough to fuel low vacancy rates and support healthy growth in this market.
TOP SALE TRANSACTIONS BY SF SALE PRICE NUMBER OF UNITS BUYER / SELLER
4959 Talbot LaneReno, NV $64,250,000 300 Fenway Capital Advisors
Gaston & Wilkerson
775 Gentry WayReno, NV $21,450,000 239 BoaVida Group
Hillcrest Management Company, LLC
3285 Clover WayReno, NV $60,000,000 350 Priderock Capital Partners, LLC
Haley Associates Limited Partnership
SALE BY BUYER TYPE SALE BY SELLER TYPE
TOP SELLERS (PAST 12 MONTHS) SALES VOLUME
Sunroad Holding Corporation $100,000,000
DiNapoli Capital Partners $92,500,000
Gaston & Wilkerson $64,250,000
Prim Ventures, Inc. $64,000,000
Haley Associates Limited Partnership $60,000,000
NET ABSORPTION, NET DELIVERIES, & VACANCY
**’Sale by Buyer’ and ‘Sale by Seller’ Data is comprised of data from the previous 12 months.
TOP BUYERS (PAST 12 MONTHS) SALES VOLUME
Northland Investment Corporation $100,000,000
LDK Capital, LLC $92,500,000
Fenway Properties $64,250,000
Priderock Capital Partners, LLC $60,000,000
Kinsel Ameri Properties, Inc. $40,000,000
MARKET INDICATORS Q2 2021 Q1 2021 Q4 2020 Q3 2020 Q2 2020
▼ 12 Mo. Absorption Units 1,975 2,356 1,780 1,841 1,506
▼ Vacancy Rate 4.8% 5.5% 5.6% 6.7% 7.4%
▲ Asking Rent/Unit ($) $1,456 $1,378 $1,343 $1,331 $1,294
▲ Under Construction Units 1,734 1,473 2,115 2,124 2,181
◀ ► Inventory Units 39,768 39,768 39,126 39,117 38,777

Q2 2021 CINCINNATI, OH
MULTIFAMILY MARKET OVERVIEWGEORGE FLYNN, Managing Principal, Brokerage Services
Cincinnati’s apartment market remains on rock-solid footing, with strong demand and slowing development activity driving vacancy to record lows and rent growth to record highs. Another wave of new supply is likely to slow the downward trend in vacancy, and with surging home prices keeping more and more households in the renter pool. Renters continue to favor more spacious units, driving rents for the most coveted three-bedroom units up almost 8% above early 2020 levels. Studio units are making a comeback as vaccine deployment fuels a return to the office, with rents for studio units, many of which are located in urban properties, are now about 2.5% above pre-crisis levels.
TOP SALE TRANSACTIONS BY SF SALE PRICE NUMBER OF UNITS BUYER / SELLER
1400 Sherwood DriveFairfield, OH $42,500,000 492 Zidans Management Group, Inc.
Pepper Pike Capital Partners
1235 Chesterdale DriveSpringdale, OH $21,000,000 379 TWG Development
Hunters Glen Ltd Partnership
8000 Preakness DriveFlorence, KY $28,150,000 200 PLK Communities
Spyglass Capital Partners, LLC
SALE BY BUYER TYPE SALE BY SELLER TYPE
TOP SELLERS (PAST 12 MONTHS) SALES VOLUME
Pearl Companies $43,318,252
Pepper Pike Capital Partners $42,500,000
The Chetrit Group $8,154,546
Dickman Realty $7,750,000
Venture Real Estate Co. $5,240,000
NET ABSORPTION, NET DELIVERIES, & VACANCY
**’Sale by Buyer’ and ‘Sale by Seller’ Data is comprised of data from the previous 12 months.
TOP BUYERS (PAST 12 MONTHS) SALES VOLUME
Great Lakes Capital $43,318,252
Zidans Management Group, Inc. $42,500,000
TREA The Real Estate Alternative, LTD $7,750,000
Harbor Group International, LLC $4,077,272
Image Capital, LLC $4,077,272
MARKET INDICATORS Q2 2021 Q1 2021 Q4 2020 Q3 2020 Q2 2020
▲ 12 Mo. Absorption Units 3,219 3,097 2,240 1,698 1,287
▼ Vacancy Rate 4.5% 5.1% 5.8% 6.0% 6.3%
▲ Asking Rent/Unit ($) $993 $969 $952 $950 $947
▼ Under Construction Units 4,261 4,294 2,791 2,644 2,505
▲ Inventory Units 131,521 131,488 131,302 130,936 130,596

Q2 2021 PACIFIC NORTHWEST, WA
MULTIFAMILY MARKET OVERVIEWCANDICE CHEVAILLIER, CCIM, Principal
The most remarkable element of Q2 for the Seattle MSA was how quickly recovery from the pandemic has begun with a surge in rental demand. 12 month absorption in Q2 more than doubled over Q1. Vacancy rates dropped by 13% and asking rents began to climb. We are expecting absorption to remain strong and vacancy to continue to tighten. Then will come long-awaited rent growth. Apartments in our region missed a year of rent increases due to regulation while expenses continued to climb. But values held, and average cap rates actually dropped. We expect rents to continue to grow, allowing for improved cashflows, which will continue to attract strong investor demand.
TOP SALE TRANSACTIONS BY SF SALE PRICE NUMBER OF UNITS BUYER / SELLER
8935 160th Avenue NERedmond, WA $97,700,000 222 Acacia Capital Corporation
AvalonBay Communities, Inc.
12655 120th Avenue NEKirkland, WA $88,300,000 202 Bell Partners, Inc.
Trinsic Residential Group
2 W Casino RoadEverett, WA $38,600,000 217 Lincoln Avenue Capital
DH & G Properties, LLC
SALE BY BUYER TYPE SALE BY SELLER TYPE
TOP SELLERS (PAST 12 MONTHS) SALES VOLUME
Kennedy Wilson Properties $366,000,000
Carmel Partners $279,100,000
TruAmerica Multifamily, Inc. $223,800,000
Mill Creek Residential Trust LLC $197,325,000
Su Development $170,000,000
NET ABSORPTION, NET DELIVERIES, & VACANCY
**’Sale by Buyer’ and ‘Sale by Seller’ Data is comprised of data from the previous 12 months.
TOP BUYERS (PAST 12 MONTHS) SALES VOLUME
OMERS $320,000,000
Deutsche Bank AG $279,100,000
Greystar Real Estate Partners $236,164,000
The Blackstone Group Inc. $223,800,000
MG Properties Group $191,000,000
MARKET INDICATORS Q2 2021 Q1 2021 Q4 2020 Q3 2020 Q2 2020
▲ 12 Mo. Absorption Units 10,824 4,315 2,309 3,416 6,196
▼ Vacancy Rate 5.9% 6.7% 7.3% 7.1% 6.2%
▲ Asking Rent/Unit ($) $1,822 $1,718 $1,673 $1,693 $1,726
▼ Under Construction Units 21,971 23,782 24,099 23,226 24,571
▲ Inventory Units 354,158 350,843 348,484 347,269 344,332

The information and details contained herein have been obtained from third-party sources believed to be reliable, however, Lee & Associates has not independently verified its accuracy. Lee & Associates makes no representations, guarantees, or express or implied warranties of any kind regarding the accuracy or completeness of the information and details provided herein, including but not limited to, the implied warranty of suitability and fitness for a particular purpose. Interested parties should perform their own due diligence regarding the accuracy of the information.The information provided herein, including any sale or lease terms, is being provided subject to errors, omissions, changes of price or conditions, prior sale or lease, and withdrawal without notice. Third-party data sources: CoStar Group, Inc., The Economist, U.S. Bureau of Economic Analysis, U.S. Bureau of Labor Statistics, Congressional Budget Office, European Central Bank, GlobeSt.com, CoStar Property, and Lee & Associates Proprietary Data. ©© Copyright 2021 Lee & Associates all rights reserved. Third-party Image sources: sorbis/shutterstock.com, shutterstock.com, pixabay.com, istock.com