
Q2-FY22-Results-Presentation.pdf - Aarti Industries
25
AARTI INDUSTRIES LIMITED November 1, 2021 To, Listing/ Compliance Department BSE LTD. Phiroze Jeejeebhoy Towers, Dalal Street, Mumbai -400 001. BSE CODE -524208 To, Listing/Compliance Department National Stock Exchange of India Limited "Exchange Plaza", Plot No. C/1, G Block Sandra - Kurla Complex, Sandra (E), Mumbai - 400 051. NSE CODE:AARTIIND Dear Sir/Madam, Ref: Regulation 30(6) of the SEBI (LODR) Regulations, 2015 Please find enclosed herewith the Q2 FY22 Results Presentation of the Company for your records. Kindly take the same on record. Thanking You, Yours faithfully, FOR AARTI INDUSTRIES LIMITED RAJ SARRAF COMPANY SECRETARY ICSI M. NO. A15526 Encl. As above. www.aart i-industries.com I CIN: L24110GJ1984PLC007301 Admin. Office : 71, Udyog Kshetra, 2nd Floor, Mulund Goregaon Li nk Road, Mulund (W), Mumbai - 400080, INDIA. T : 022-67976666, F : 022-2565 3234 I E : info@aart i-industries.com Regd. Office: Plot No. 801, 801/23, lllrd Phase, GIDC Vapi-396195, Dist- Valsad. INDIA. T: 0260-2400366.
-
Upload
khangminh22 -
Category
Documents
-
view
1 -
download
0
Transcript of Q2-FY22-Results-Presentation.pdf - Aarti Industries
AARTI INDUSTRIES LIMITED
November 1, 2021
To, Listing/ Compliance Department BSE LTD. Phiroze Jeejeebhoy Towers, Dalal Street, Mumbai -400 001.
BSE CODE -524208
To, Listing/Compliance Department National Stock Exchange of India Limited "Exchange Plaza", Plot No. C/1, G Block Sandra - Kurla Complex, Sandra (E), Mumbai - 400 051. NSE CODE:AARTIIND
Dear Sir/Madam,
Ref: Regulation 30(6) of the SEBI (LODR) Regulations, 2015
Please find enclosed herewith the Q2 FY22 Results Presentation of the Company for your records.
Kindly take the same on record.
Thanking You,
Yours faithfully, FOR AARTI INDUSTRIES LIMITED
RAJ SARRAF COMPANY SECRETARY ICSI M. NO. A15526
Encl. As above.
www.aarti-industries.com I CIN: L24110GJ1984PLC007301 Admin. Office : 71, Udyog Kshetra, 2nd Floor, Mulund Goregaon Link Road, Mulund (W), Mumbai - 400080, INDIA.
T : 022-67976666, F : 022-2565 3234 I E : [email protected] Regd. Office: Plot No. 801, 801/23, lllrd Phase, GIDC Vapi-396195, Dist- Valsad. INDIA. T: 0260-2400366.

AARTI INDUSTRIES LIMITED
Q2 FY22 Results Presentation
1st November 2021

Disclaimer
2
AARTI INDUSTRIES LIMITED may, from time to time, make written and oral forward lookingstatements, in addition to statements contained in the company's filings with BSE Limited [BSE] andNational Stock Exchange of India Limited [NSE], and our reports to shareholders. The company doesnot undertake to update any forward-looking statements that may be made from time to time by or onbehalf of the AARTI INDUSTRIES LIMITED.
All information contained in this presentation has been prepared solely by AARTI INDUSTRIESLIMITED. AARTI INDUSTRIES LIMITED does not accept any liability whatsoever for any loss,howsoever, arising from any use or reliance on this presentation or its contents or otherwise arising inconnection therewith.

Agenda
02 Q2 FY21-22 Financial Results
03 Growth Opportunity & Strategy
01 Company Overview
3

About AIL
4
Speciality Chemicals,
83%
Pharma, 17%
654 699
965 977 982
FY17 FY18 FY19 FY20 FY21
EBITDA (Rs cr)
3,163
3,806
4,706 4,6215,023
FY17 FY18 FY19 FY20 FY21
Revenue (Rs cr)
Key MetricsOverview
Key Financials
A leading Speciality Chemicals company in Benzene based
derivatives with integrated operations and high level of cost
optimization.
Pharma operations spanning APIs, intermediates and Xanthene
derivatives
Established by first generation technocrats in 1984
Strong R&D capabilities – 4 R&D facilities; dedicated pool of about
400+ engineers & scientists; IPRs for developing customized
products.
Plants located in western India with proximity to ports: 15 for
Speciality chemicals; 5 for Pharma (2 USFDA and 3 WHO/GMP)
Revenue split - Segmental and Geographical – FY21
20Manufacturing Plants
7,000+Employees
200+Products
400+Global Customers
700+Domestic
Customers
16Zero Liquid Discharge
Plants
Domestic, 56%
North America,
9%
Europe, 12%
China, 6%
Japan, 3%
ROW, 13%

Q2 FY22 Highlights
Major Highlights
● Topline increase due to increase in RM prices, Fuel and Logistics Costs. Absolute growth in
EBITDA reflects the ability to pass-on the price increase to the customer.
● Recorded the highest ever Topline and Bottomline.
● Efforts taken to pass on a substantial part of Fuel and Logistics costs to the customer.
● QIP of Rs 1,200 crore raised in June 2021, assisted in reduction of debt and corresponding
borrowing costs.
● Key projects such as Project of Long Term Contracts, Pharma Expansion nearing the final stages
and expected to commercialised in H2 FY22.
● Discontinuation of MEIS and non inclusion of Chemical & Pharma products under RotDep Scheme
impacts the sector negatively
● Macro factors indicate positive traction to continue in near to mid term.
5

Chairman’s Message
“Maintaining our growth trajectory, we have once again recorded the highest ever revenue and profitability
in our operating history. We evaluate EBITDA as the key monitorable for the business and on this
parameter we have delivered 22% growth on YoY basis.
Based on the milestones achieved in the first half of FY22, we remain well-positioned to meet our growth
guidance. We are further encouraged by our recent achievements that come in the backdrop of a highly
volatile operating environment during this entire period – marked by significant shifts in raw material
prices, coal availability, supply chain disruptions, competitive pressures as well as constantly changing
dynamics in our end-user markets.
We are seeing improving demand shifts across key customer segments both in international markets and
within the expanding Indian chemicals ecosystem. We believe the current visibility – for India as an
increasingly significant global chemicals supply destination and for players such as Aarti that are
recognized as partners of choice by leading innovator companies – is likely to remain robust over the long
term.
On the operational front, we are witnessing progressively higher utilization of recently commissioned
facilities and we remain in line for the launch of our second and third long‐term customer contracts, NCB
expansion and pharma capacity enhancement for both APIs and intermediates. These enhancements
provide us the confidence of meeting our growth guidance for FY24. We are also aggressively pursuing
the previously shared business plan and revenue targets for the rest of the current decade, supported by
a well-capitalized balance sheet.”
Commenting on the performance for Q2 FY22, Mr. Rajendra Gogri – Chairman & MD at Aarti
Industries Limited said:
6

Agenda
02 Q2 FY21-22 Financial Results
03 Growth Opportunity & Strategy
01 Company Overview
7

Q2 FY22 P&L - Consolidated
ParticularsQ2
FY22
Q2
FY21
Y-o-Y
(%)
Q1
FY22
Q-o-Q
(%)
H1
FY22
H1
FY21
Y-o-Y
(%)(Rs. Crore)
Gross Income from
Operations1,762 1,330 32.4% 1,503 17.2% 3,265 2,366 38.0%
Exports 751 603 24.5% 634 18.5% 1,384 1,091 26.8%
% of Total Income 42.6% 45.3% 42.2% 42.4% 46.1%
EBITDA 310 254 21.8% 314 -1.3% 624 436 42.9%
EBITDA Margin (%) 17.6% 19.1% 20.9% 19.1% 18.4%
EBIT 239 199 19.8% 245 -2.7% 484 329 47.0%
EBIT Margin (%) 13.5% 15.0% 16.3% 14.8% 13.9%
PAT 176 140 25.6% 165 6.8% 341 222 53.5%
PAT Margin (%) 10.0% 10.5% 11.0% 10.4% 9.4%
EPS (Rs.) 4.86 8.05 4.55 9.41 12.75
▪ Sustained revenue growth driven by
volume expansion and 74% contribution
from value-added products
▪ Gross margins returned to normalized
levels
▪ Domestic demand for discretionary
products has returned to pre-covid
levels, while for exports markets the
same are recovering gradually
▪ Pharma segment revenues at record
levels
▪ Finance charges lower based on lower
cost of funds.
▪ Capex in Q2FY22: Rs 317 crore; 6M
aggregate capex of Rs. 620 crore – in
line with guidance of Rs. 1,200-1,500
crs for FY22.
*EPS are prebonus EPS and hence not comparable8

140
176
Q2 FY21 Q2 FY22
Q2 FY22 Highlights (Consolidated)
9
Revenues EBIDTA
1330
1762
Q2 FY21 Q2 FY22
PAT
254
310
Q2 FY21 Q2 FY22
Key Highlights:
Re-iterated guidance of over 25% growth for FY22.
Strong momentum in H1, driven by rising demand across various products.
Higher contribution from domestic demand as the local manufacturing ecosystem continues to progress.
Amount in INR (Cr)

Quarterly EBITDA & PAT (Consolidated)
EBITDA & EBITDA %
PAT
140
165
136
165176
Q2 FY21 Q3 FY21 Q4 FY21 Q1 FY22 Q2 FY22
254 285 260 314 310
19.1
21.7
19.320.9
17.6
Q2 FY21 Q3 FY21 Q4 FY21 Q1 FY22 Q2 FY22
Amount in INR (Cr)
10

Speciality Chemical - Revenue & EBIT
11
Speciality Chemicals - Revenue
Speciality Chemicals EBIT & EBIT %
1,089 1,065 1,0911,228
1,483
Q2 FY21 Q3 FY21 Q4 FY21 Q1 FY22 Q2 FY22
188224 206
232 242
17.3
21.018.9 18.9
16.3
Q2 FY21 Q3 FY21 Q4 FY21 Q1 FY22 Q2 FY22
EBIT EBIT %
Amount in INR (Cr)
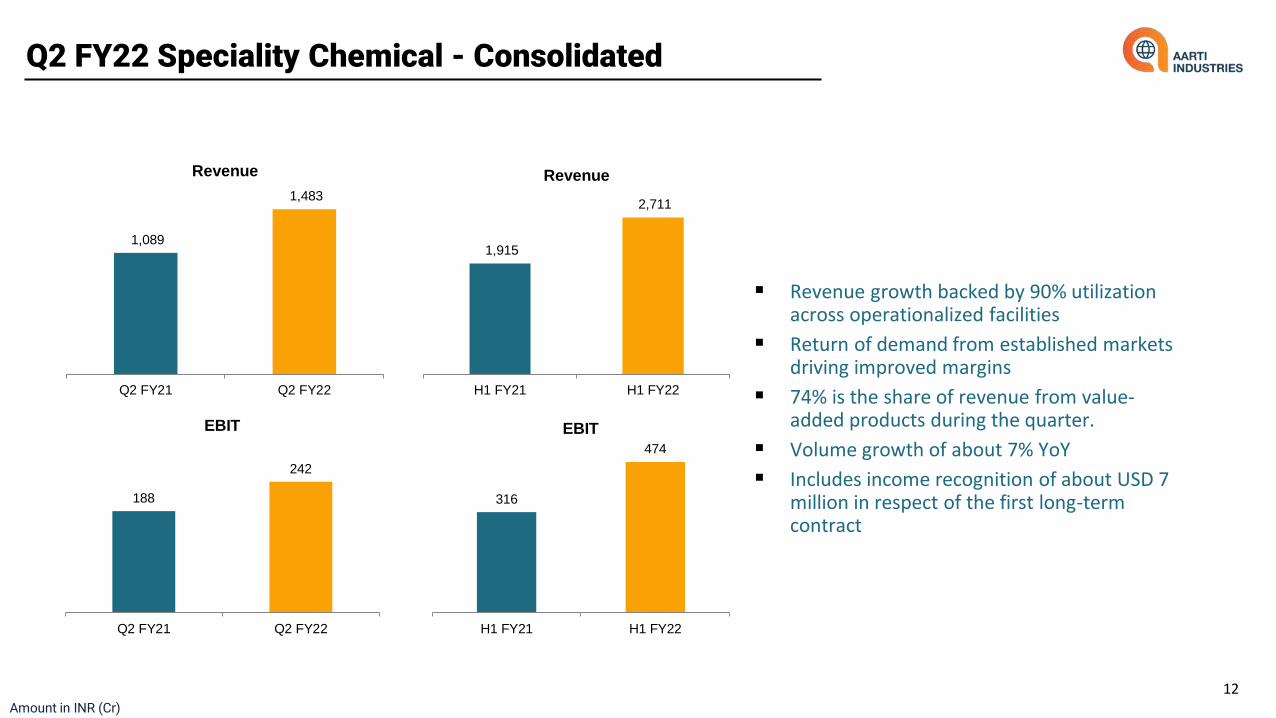
Q2 FY22 Speciality Chemical - Consolidated
12Amount in INR (Cr)
Revenue growth backed by 90% utilization across operationalized facilities
Return of demand from established markets driving improved margins
74% is the share of revenue from value-added products during the quarter.
Volume growth of about 7% YoY
Includes income recognition of about USD 7 million in respect of the first long-term contract
188
242
Q2 FY21 Q2 FY22
EBIT
1,089
1,483
Q2 FY21 Q2 FY22
Revenue
316
474
H1 FY21 H1 FY22
EBIT
1,915
2,711
H1 FY21 H1 FY22
Revenue

Pharma - Revenue & EBIT
13Amount in INR (Cr)
Pharma - Revenue
Pharma EBIT & EBIT %
241246
256
276 278
Q2 FY21 Q3 FY21 Q4 FY21 Q1 FY22 Q2 FY22
58 55 51 5241
24.1 22.4
20.0 18.8
14.7
Q2 FY21 Q3 FY21 Q4 FY21 Q1 FY22 Q2 FY22
EBIT EBIT %

Q2 FY22 Pharma - Consolidated
14Amount in INR (Cr)
Higher costs, passed on to the customer resulting into increased topline.
Lower sales towards the end of the quarter resulting into higher inventory and reduced conversion into profits
Trial runs at the new expanded block at Intermediate facility impacted the EBIT.
Revenue growth is expected to sustain as additional capacities for API’s and intermediates are operationalized
58
41
Q2 FY21 Q2 FY22
EBIT
241
278
Q2 FY21 Q2 FY22
Revenue
10594
H1 FY21 H1 FY22
EBIT
451
554
H1 FY21 H1 FY22
Revenue

Revenue Performance - Consolidated
15Amount in INR (Cr)
3,163 3,806
4,705 4,621 5,023
3,265
1,523 1,596
1,977 1,966
2,186
1,384
FY17 FY18 FY19 FY20 FY21 H1 FY22
Revenue Export
426
556
726 756872
554
FY17 FY18 FY19 FY20 FY21 H1 FY22
Pharmaceuticals
CAGR: 19%
2,5692,985
3,979 3,8654,151
2,711
FY17 FY18 FY19 FY20 FY21 H1 FY22
Speciality Chemicals
CAGR: 13%
Operating revenues have grown on the back of strong volume growth in key business segments and better product mix. Top line is also a function of variations in raw material prices linked to crude oil.
Deep engagement with global customers in Speciality Chemicals and Pharma. In addition, some part of domestic revenues are indirect exports.
CAGR: 12%

EBIT Performance - Consolidated
16Amount in INR (Cr)
615663
932 952 957
568
FY17 FY18 FY19 FY20 FY21 H1 FY22
EBITHigher growth relative to revenue highlights value addition delivered by AIL
4879
113137
205
94
FY17 FY18 FY19 FY20 FY21 H1 FY22
Pharmaceuticals
566 581
819 814 753
474
FY17 FY18 FY19 FY20 FY21 H1 FY22
Speciality Chemicals
CAGR: 12%
CAGR: 44%CAGR: 7%

Financials - Consolidated
17
316 333
492536 524
FY17 FY18 FY19 FY20 FY21
1.11.3
0.90.7 0.8
2.4
2.9
1.71.9
2.5
FY17 FY18 FY19 FY20 FY21
D/E Net Debt/EBITDA
Robust Revenue Growth Strong EBITDA Growth Strong PAT Growth
Strong Return Ratios Debt Profile
3,163
3,806
4,705 4,6215,023
FY17 FY18 FY19 FY20 FY21
INR (Cr)
20%17%
20%
17%
14%
22%19%
24% 23%
18%
24%
22% 23%
19%
16%
FY17 FY18 FY19 FY20 FY21
ROCE ROCE (exc CWIP) ROE
530 615794
1,1531,311
573448 422
530
1,431
FY17 FY18 FY19 FY20 FY21
Capex Capex CapitalizedINR (Cr)
654 699
965 977 982
FY17 FY18 FY19 FY20 FY21
INR (Cr) INR (Cr)
EBITDA =Profit before Tax + Interest Expense + Depreciation – Other Income; EBIT = EBITDA-Depreciation; Capital Employed= Net Worth + LT Debt+ ST debt+ current maturity of long term debt- cash; Capital Employed adj for CWIP= Capital Employed -CWIP;ROCE= EBIT/(Average of Capital employed of current & previous year ); ROCE (exc CWIP) = EBIT/(Average of Capital employed adj for CWIP of current & previous year); ROE = Net Income/Average of Net Worth of current & previous year; D/E = Total Debt/ TotalEquity; Net Debt/EBITDA = (Gross Debt- cash)/ EBITDA
FY17-20 CAGR: 13% FY17-20 CAGR: 14% FY17-20 CAGR: 19%
CWIP of 1,298 Crs as of Mar’211,040 Crs of Capex capitalized in H2 FY21
Return ratios declined in FY21 due to rear ended capitalization and impact of Covid
Significant Capex Undertaken

Global Player in Benzene based Derivatives with Integrated Operations
• Strong/Leadership position in key products and processes
• Integrated operations across product chain of Benzene and Toluene
• Ability to effectively use co-products and generate value-added products
Well Diversified Across Multiple Dimensions
• Diversification provides significant de-risking
• Multi-product, multi-customer, multi-geographies & multi- end-user industry
Key Strengths
Pharma – Significant growth with diversification
• API & Intermediate market (domestic & exports) expected to witness strong growth
• Xanthine Derivatives are expected to continue the growth momentum
Strong Return Profile despite Significant Capex
• Expanded capacities and diversified into new products while maintaining return profile
• New capacities are still ramping up providing operating leverage
Well placed to benefit from Industry Tailwinds
• Significant opportunity for exports arising from environmental related shutdowns in China
• Structural drivers in places for a robust domestic demand growth
Strong Focus on R&D and Process Innovation
• Focus on downstream products through processes like high value chlorination, hydrogenation, etc
Thrust on Sustainability
• Significant capex done in SH&E, which provide long term benefits
• Continuous efforts to enhance on ESG Initiatives.

Agenda
02 Q2 FY21-22 Financial Results
03 Growth Opportunity & Strategy
01 Company Overview
19

Major Projects: FY19 - FY23
20
Operationalised by FY21
Operationalized Phase 2 Unit at Dahej
SEZ for agrochemical intermediates
Expansion cum Asset
Upgradation for Acid Unit at
Vapi
Operationalized Phase 1 Unit at Dahej SEZ for
agrochemical intermediates & Speciality Chemical
Unit for 2nd Long Term Contract at Dahej SEZ
Unit for 3rd Long Term Contract at Jhagadia
NCB Capacity Expansion at Vapi
Set up New Research &
Technology Centre at Navi
Mumbai
USFDA Capacities Expansion
underway:
API unit at Tarapur, & Intermediates
unit at Vapi
Operationalised New Chlorination
Unit at Jhagadia.
Expansion, Asset
Restoration,
Sustainability initiatives etc.
Capex (FY22-FY23): ~ Rs 1500 crs
To be Completed by FY23

Future Growth Projects: FY22-24 (Driven by R&D & Innovation)
21
Highlights● Adding new chemistries and Value added
products
● 40+ products for Chemicals
● 50+ products for Pharma
● EBIDTA margin ~ 25% - 30%
● Capex of about
● Rs 2500 – 3000 crs for Chemical
● Rs 350 – 500 crs for Pharma
● Site development work to commence on 100+ acre land at Jhagadia. Also acquired over 120 acres land at Atali, Gujarat.
● Environmental Clearances obtained / in process.
● Construction from FY22 – FY24.
● Will drive the growth from FY25 and beyond.
Growth Initiatives under way
Manufacturing Outsourcing / Strategic Alliances
Newer range of Value Added products & Other Speciality Chemicals
Custom Manufacturing Opportunities
Introducing Chloro Toulenes Value Chain:
(Range of products)
Expansion & Introduction of new range of Pharma APIs & Intermediates
Setting up Universal Multipurpose Plants (UMPP)

Growth Estimates
FY21 Snapshot
FY24 Growth(over FY21)
FY27 Growth(over FY21)
Turnover: 5000 crs
EBIT: 750 crs
PAT: 523 crs
Turnover: 1.7x -2.0x
EBIT: 1.7x - 2.0x
PAT: 1.7x – 2.0x
Turnover: 2.5x-3.5x
EBIT: 3x - 4x
PAT: 3x - 4x
- Capex for FY 22-24: ~ Rs 4,500-5,000 Cr
- Existing Products: ~ Rs 1500 Cr, New Products: Rs 3,000-3,500 Cr
Expecting Robust Growth fuelled with aggressive Capex Investment
22

Contact Us
23
For further information please log on to www.aarti-industries.com or contact:
Mr. Chetan Gandhi / Mr. Raj Sarraf
Aarti Industries Limited
Tel: +91 22 6797 6666
Email: [email protected]
Shiv Muttoo / Shruti Joshi
CDR India
Tel: +91 98335 57572 / +91 75065 67349
Email: [email protected] / [email protected]
THANK YOU