Voting rights exercised during Q2 of FY 2017-18 by UTI Retirement ...
Upload
khangminh22Category
view
1download
0
Q2 2017Interim ReportJanuary–June
Solid business performance continues Encouraging order intake with new customer wins in allbusinesses, especially in Sweden
Healthy profitability driven by Technology Services andModernization
Automation programme and targeted investments insoftware businesses support further profit improvement

Interim Report 2/2017 2
© 2017Tieto Corporation
Key figures for the second quarterIT services• Sales growth totalled 1.0%, sales in local currencies up by 2.5%• Adjusted operating profit amounted to EUR 33.0 (32.4) million, 9.3% (9.3) of sales
The Group• Sales growth totalled 1.2%, sales in local currencies up by 2.8%• Adjusted operating profit amounted to EUR 35.6 (35.8) million, 9.2% (9.4) of sales• Order intake (Total Contract Value) at EUR 371 (326) million – book-to-bill 1.0 (0.9)
M&A impact visible in the tables on page 8.
4–6/2017 4–6/2016 1–6/2017 1–6/2016
Net sales, EUR million 385.5 381.0 778.7 748.5
Change, % 1.2 4.7 4.0 2.6
Change in local currencies, % 2.8 5.9 4.8 3.6
Operating profit (EBITA), EUR million 32.0 35.7 57.6 67.3
Operating margin (EBITA), % 8.3 9.4 7.4 9.0Operating profit (EBIT), EUR million 1) 28.2 32.3 50.1 60.6Operating margin (EBIT), % 1) 7.3 8.5 6.4 8.1
Adjusted 1) 2) operating profit (EBIT), EUR million 35.6 35.8 71.0 67.3
Adjusted 1) 2) operating margin (EBIT), % 9.2 9.4 9.1 9.0
Profit after taxes, EUR million 21.0 24.2 36.7 45.7
EPS, EUR 0.28 0.33 0.50 0.62
Net cash flow from operations, EUR million -6.1 -13.7 73.6 33.2
Return on equity, 12-month rolling, % 23.6 26.2 23.6 26.2
Return on capital employed, 12-month rolling, % 21.0 25.9 21.0 25.9
Capital expenditure, EUR million 21.0 11.8 30.3 21.2
Interest-bearing net debt, EUR million 164.6 103.3 164.6 103.3
Net debt/EBITDA 0.9 0.5 0.9 0.5
Book-to-bill 1.0 0.9 1.0 0.9
Order backlog 1 817 1 757 1 817 1 757
Personnel on 30 June 13 754 13 381 13 754 13 381
1) the second quarter includes EUR 1.0 (0.7) million and the first half EUR 2.1 (1.4) million in amortization of acquisition-relatedintangible assets2) adjusted for restructuring costs, capital gains/losses, goodwill impairment charges and other items (see page 15)
Full-year outlook for 2017 unchangedTieto expects its adjusted1) full-year operating profit (EBIT) to increase from the previous year’s level (EUR 152.2 millionin 2016).
1) adjusted for restructuring costs, capital gains/losses, goodwill impairment charges and other items

Interim Report 2/2017 3
© 2017Tieto Corporation
CEO’s commentComment regarding the interim report by Kimmo Alkio, President and CEO:“We had another solid quarter with good underlying growth in all the service lines. Our adjusted profit was healthy at 9%level while growth and profitability were somewhat affected by negative currency impacts and the shorter quarter.Highlights in the second quarter included several important customer wins across all key markets, especially in Sweden.I am pleased to see that we are actively contributing to the digitalization of Nordic society – across all our markets.
We continue to foresee exciting business and innovation opportunities through co-innovation with our customers. Wemaintain our total investment level with an increased focus on software-centric industry solutions – and foresee strongopportunities particularly in the financial services, healthcare and welfare, and energy sectors. These investments willalso support our competitiveness and performance objectives in the second half of this year.
We are participating in a number of exciting initiatives to leverage the use of data in an intelligent way to improvewellbeing and the quality of everyday life through personalized predictive healthcare and social inclusion. Tieto willcontinue to focus on attractive opportunities to participate in the creation of new data-centric ecosystems.”
IT market development• In the near term, the new EU General Data Protection Regulation, taking effect in May 2018, will have an impact on
IT markets. This regulation is opening up new opportunities, such as for Tieto’s security and application services.• Customers’ competitive landscape is changing as new technology-based companies are entering the market, in
some cases from outside clients’ own industry.
In 2017, the Nordic market is anticipated to grow by 2–3%. Digitalization of customers’ business – with a twofold agendaof growing revenue through innovation and reducing costs by improved efficiency – continues to drive IT market growth.Emerging services (consisting primarily of new services, such as cloud and security services, analytics and industry-specific software) are expected to experience double-digit growth and the decline in traditional services (traditionalapplication and infrastructure services) will continue. Sweden is expected to be the fastest-growing of Tieto’s coremarkets. Growth is driven by continued initiatives to improve user experience as well as outsourcing and cloudtransformation. In Finland, the economic outlook has improved, which gradually also supports the IT services market.
Customers’ competitive landscape is changing fast with new technology-based companies entering the market, insome cases from outside clients’ own industry. This trend, visible across all industries, is calling for an active innovationagenda for current actors to remain competitive. Currently, this has the greatest impact on the financial services andretail sectors.
Reflecting the accelerated need for customers to quickly roll out new services, the trend involves moving applicationlifecycle management to solutions supporting automated end-to-end development and maintenance. These solutionsenable faster-paced innovation and reduce the cost and time required for the process to launch new products andservices.
Infrastructure cloud services become a vital underpinning for digital transformation to enable scale and dynamicaccess to global resources. It is estimated that currently around 20–25% of global infrastructure services arerepresented by cloud, predominantly private cloud. While most organizations use cloud services to some extent,significantly fewer than 20% are currently cloud mature. Total infrastructure cloud market is expected to annually growby 15–20%. This comprises• public cloud adoption – expected market growth 25–30%• private/enterprise cloud – expected growth 10–15%.
Future cloud market growth will extensively be driven by multi-cloud solutions integrating public cloud, private cloudand traditional technologies for customers to enable cost-efficient business innovation and agility. Tieto’s focus andgrowth since 2014 have mainly been based on its private cloud offerings. Tieto has expanded its cloud portfolio toinclude public cloud services through OneCloud launched earlier this year. OneCloud is a multi-cloud solutionseamlessly orchestrating workloads across private and public clouds.
Technologies such as the cloud, software robotics, artificial intelligence and blockchain will enable a new data-centricecosystem where individuals are provided with personalized, predictive experiences. Artificial intelligence and machinelearning are outcomes of the need to master the exponentially growing amount of data.
Co-creation with partners and customers is becoming more important in order to provide customers with best-of-breed technologies. This trend is accelerated by increasing openness, as open APIs (application programming interface)and open data make collaborative innovation possible.
In IT spending, emerging services are gaining ground while traditional services, such as infrastructure services, areseen as a source of cost reductions. Going forward, IT service providers will continue their investments in servicedelivery standardization, automation and productivity improvements.

Interim Report 2/2017 4
© 2017Tieto Corporation
Industry sector drivers
• In the financial services sector, there is still a rather high level of activity with several large transformationprogrammes ongoing or planned. However, many programmes are divided into smaller projects to better controlperformance and costs. The market is currently capability driven, as many of the larger programmes are managedby customers and require a broad range of competences across markets. Many new smaller players (Fintech) arestill entering the market, continuing to challenge traditional IT service providers. Regulatory changes such as PSD2(Payment Services Directive) and GDPR (General Data Protection Regulation) are creating new opportunities forTieto within Financial Services, but also pose a degree of uncertainty in customer transformation projects. Interest inbusiness process outsourcing and software as a service delivered on secure cloud platforms continues to grow withthe market being driven by a combination of digital transformation, core system renewal and regulation.
• In the public sector, the digitalization of services and processes will continue with a focus on cost reductions andcitizen-centric services. There is also healthy demand for solutions such as digitalized learning and planning for theeducation segment. Demand for cloud services has remained strong in Sweden. In Finland, Tieto is activelyparticipating in the Government development programme in order to facilitate digitalization in the public sector.
• In the healthcare and welfare sector, the digitalization trend will continue to support easier and faster access tohealthcare for citizens and compensate for the anticipated shortage of care workers. There are large developmentprojects planned across all Nordic markets and the prevailing trend is to move towards integrated healthcare andwelfare systems supporting seamless care. In Finland, it is anticipated that the ongoing healthcare and welfarereform will provide growth opportunities in the coming years. The first proposals are being submitted during thesummer while during the current year, customers will focus on smaller modernization activities.
• In the manufacturing, forest and paper sector, the strong digitalization trend continues and clients are seeking newbusiness and service models to ensure steady revenues and to improve service experience. At the same time, coreprocess renewals to deploy cloud-enabled ERP solutions are ongoing. Preventive maintenance continues to drivedigitalization in the manufacturing sector and customer experience is a strong driver. In the case of wood andproduction equipment, there is increased interest in digital twins of assets, using data from sensors installed torepresent their current status. The market for consulting and business transformation is active and there is gooddemand for a Hackathon type of an approach to innovation.
• In the retail and logistics sector, enterprises are investing in more advanced solutions to be able to provide a unifiedcustomer experience in all interaction across different touchpoints, including brick and mortar. In addition toconsultancy and implementation capabilities to renew eCommerce platforms, demand for improving mobile tools forservice personnel has remained good. Along with the omnichannel transformation, enterprises need to tightlyintegrate their customer interface solutions with their core supply chain solutions and seamless mobile payments. Inaddition, B2B enterprises are expanding from transactional digital services to enhanced user experience.
• In the energy utility sector, differentiation is increasingly based on improved customer interaction. In the Nordiccountries, common electricity hubs will provide new opportunities towards the year end; for example, Norway isstarting to create its national hub during 2017. As a result, there is interest in investing in customer experiencemanagement and modern software-based systems as well as building new ecosystems. In the oil & gas market,investment levels have remained low and the focus in the entire industry is still on lower cost.
• The media sector is continuing to undergo a huge change with increased deployment of digital services. Advertisingis one of the main sources for revenue and related solutions are being renewed. While there are opportunitiesrelated to renewal and automation of sales processes, price pressure is high, as many companies need to reducecosts.
• In the telecom sector, demand for IT services is driven by modernization of existing legacy systems as wellas transformation towards new platforms that create additional business value. Customers are increasingly utilizingagile development methodologies to quickly launch and manage new services. The regulatory requirements in theEU are creating a positive business environment for service providers.

Interim Report 2/2017 5
© 2017Tieto Corporation
Strategy implementationIn its strategy, launched in 2016, Tieto aims to address its customers’ dual agenda: to run their existing businessesefficiently while innovating new services. Tieto will enhance its competitiveness and growth through three strategicchoices:• Services to accelerate customer value• Nordic leadership and international expansion• Active participation in open ecosystems and co-innovation.
Focusing on Nordic enterprises and the public sector, Tieto seeks to grow by further increasing its market share inthe Nordics. Growth will also be supported by international expansion of selected industry solutions that have proven tobe effective in current markets.
Tieto continues to drive shareholder returns above industry average. Positive financial development and attractivedividend policy are expected to continue while the company has increased its investments to support innovation andgrowth.
Growth businesses
Tieto is seeking to grow faster than the market in the long term. The company aims to accelerate customer value withend-to-end industry solutions and active modernization of customers’ technology landscapes. Additionally, new data-driven businesses help Tieto and its customers to capture the opportunities provided by the data-driven economy.
Tieto drives scale and repeatability through investments in software businesses, including start-up businesses withstrong growth potential. Industry solutions based on leading industry-specific software products, system integrationcapabilities and partnerships form the basis for Tieto’s differentiation.
Growth will be based on a strong solution foundation built on a dynamic portfolio with selected high-growth industrysolutions and high-growth services. The company has increased investments mainly in the following high-growthbusinesses during the past two years:• Selected high-growth industry solutions with annual sales of around EUR 320 million in 2016
• Lifecare (Healthcare and welfare)• Case management (Public sector)• Banking solutions (Financial services)• Payments (Financial services)
• Data-Driven Businesses – started in July 2016 and reported within selected industry solutions• Selected high-growth services with annual sales of around EUR 160 million in 2016
• Cloud services• Customer Experience Management• Security Services.
In the first half of 2017, sales of the high-growth businesses amounted to around EUR 260 million and the increasetotalled 10%, comprising growth of 8% in the selected industry solutions and 13% in selected high-growth services.
Tieto’s start-ups, Security Services and Customer Experience Management, were the strongest growing businesses.Security Services has continued to drive scale and posted growth of 30% in the first half of 2017. Awareness of cyberthreats is increasing and continues to accelerate demand for security services. Additionally, the EU General DataProtection Regulation will start to provide new opportunities. Customer Experience Management (CEM) posted growthof 27% in the first half. The development of omnichannel capabilities as well as agile customer-driven solutionsenhancing personalized user experiences based on data and intelligence has continued. In the second quarter, thefocus has been on the development of next-generation customer experience solution built on new microservicesarchitecture combining business knowledge, design, software development and rapid deployment. The solution istargeted at omnichannel marketing, sales and service. Cloud services posted growth of 10%. There is strong interest inshifting from current service environments to Tieto’s OneCloud solution. The solution, launched in late 2016, is adynamic solution that enables customers to efficiently manage multiple cloud services through one platform.
In Tieto’s Data-Driven Businesses, a number of cases have already advanced into the commercialization phase.Tieto has signed several agreements for solutions, such as Intelligent Building, Industrial Equipment, IntelligentWellbeing and Data Lake and good momentum is expected to continue. In addition, the number of cases in theinnovation or incubation stage is currently well above ten and is continuing to grow. In the next phase, the focus will beon acceleration and scale.
Performance drivers 2017
Tieto will continue its actions to drive competitiveness and to enable continued investments in innovation and growth. InIT services, Tieto aims to grow faster than the market during the year. In 2016, Tieto completed the acquisition of Emric,the Nordic market leader in software and services for credit processing, which will also affect sales in 2017. Emric’sannual sales amount to around EUR 20 million, of which around EUR 7 million was visible in 2016.

Interim Report 2/2017 6
© 2017Tieto Corporation
In addition to sales growth, IT services’ performance is affected by• offering development• recruitments in new service areas and related competence development• automation and industrialization in service deliveries• salary inflation.
Tieto increased its investments in high-growth businesses in 2016, which has resulted in a slight negative carry overeffect in the first half of 2017 while automation is expected to support second-half profit improvement.
The company will continue to renew and strengthen its service and solution portfolio in promising growth areasduring the year with a special focus on high-growth industry solutions. Offering development costs in 2017 areanticipated to remain at the 2016 level (EUR 75 million in 2016) and close to 5% of Group sales. In the first half, offeringdevelopment costs were up by around EUR 2 million.
Tieto has continued to recruit new competences. In the first half of the year, net recruitments for IT servicesamounted to over 100. As part of its long-term renewal and the need to increase productivity and price competitiveness,Tieto initiated actions to optimize its productivity and cost structure globally in January 2017. Redundanciesimplemented during the first half amounted to around 450. The company expects that the actions altogether will result inannualized gross savings of close to EUR 40 million. It is estimated that around EUR 20 million in savings will affect thecost base for 2017, of which close to EUR 5 million materialized in the second quarter and around EUR 15 million isexpected to materialize in the second half. Around half of the total redundancies are expected to affect the TechnologyServices and Modernization service line.
Salary inflation is anticipated to amount to around EUR 20 million in 2017.In 2017 overall, Tieto’s restructuring needs will be based on automation, other productivity improvements and the
need to align the company’s competence base with market demand. Tieto currently estimates that its full-yearrestructuring costs in 2017 will represent 1–2% of Group sales.
Capital expenditure (CAPEX) is anticipated to remain below 4% of Group sales.
Financial performance in April–JuneSecond-quarter net sales increased by 1.2% to EUR 385.5 (381.0) million, growth of 2.8% in local currencies. Growthwas affected by the number of working days, down by two days compared with the corresponding quarter of 2016 due tothe timing of Easter. In IT services, net sales were up by 1.0%, in local currencies up by 2.5%. In Product DevelopmentServices, sales in local currencies increased by 6.3%. Acquisitions added EUR 5 million in sales, affecting IndustrySolutions. Currency fluctuations had a negative impact of EUR 6 million on sales, mainly due to the weaker SwedishKrona.
Second-quarter operating profit (EBIT) amounted to EUR 28.2 (32.3) million, representing a margin of 7.3% (8.5).Operating profit was strained by restructuring costs related to the automation and efficiency improvement programmeinitiated in January 2017. Adjusted1) operating profit stood at EUR 35.6 (35.8) million, or 9.2% (9.4) of net sales. Furtherdetails on second-quarter adjustments are available in a table on page 15.
Operating profit was affected by the number of working days. Additionally, the impact of the negative currency effectamounted to EUR 1.5 million. The efficiency improvement programme had a positive impact of close to EUR 5 million onthe cost base during the quarter while profitability was affected by salary inflation of around EUR 4 million. Offeringdevelopment costs were maintained at the previous year’s level.
Depreciation and amortization amounted to EUR 13.6 (13.1) million, including EUR 1.0 (0.7) million in amortization ofacquisition-related intangible assets. Net financial expenses stood at EUR 0.6 (1.6) million in the second quarter. Netinterest expenses were EUR 0.5 (0.4) million and net gains from foreign exchange transactions EUR 0.2 (loss 1.0)million. Other financial income and expenses amounted to EUR -0.3 (-0.2) million.
Earnings per share (EPS) totalled EUR 0.28 (0.33). Adjusted1) earnings per share amounted to EUR 0.36 (0.37).
1) adjusted for restructuring costs, capital gains/losses, goodwill impairment charges and other items
Interim Report 2/2017 7
© 2017Tieto Corporation
Financial performance by service line
EUR million
Customersales
4–6/2017
Customersales
4–6/2016Change,
%
Operatingprofit
4–6/2017
Operatingprofit
4–6/2016
Technology Services and Modernization 194 196 -1 20.5 20.9
Business Consulting and Implementation 38 37 2 2.6 1.2
Industry Solutions 122 117 4 9.3 11.1
Product Development Services 31 31 3 2.4 3.3
Support Functions and Global Management -6.6 -4.2
Total 386 381 1 28.2 32.3
Operating margin by service line
%
Operatingmargin
4–6/2017
Operatingmargin
4–6/2016
Adjusted1)
operatingmargin
4–6/2017
Adjusted1)
operatingmargin
4–6/2016
Technology Services and Modernization 10.5 10.6 11.9 10.8
Business Consulting and Implementation 7.0 3.3 4.0 3.3
Industry Solutions 7.6 9.5 9.0 10.9
Product Development Services 7.6 10.7 8.3 11.1
Total 7.3 8.5 9.2 9.4
1) adjusted for restructuring costs, capital gains/losses, goodwill impairment charges and other items
For a comprehensive set of service line and industry group figures, see the tables section.
In Technology Services and Modernization, sales in local currencies were up slightly despite negative currency effectsand the lower number of working days. In line with the market trend, sales of traditional services were slightly down whilesales for Application Services were growing. Cloud services’ sales continued to grow and in the first half, cloud saleswere up by 10% and security services by 30%. Service standardization and automation continues, reflecting the shiftfrom traditional services to emerging services. The measures to ensure continued competitiveness contributed to theoperating margin. The third-quarter adjusted operating margin is expected to be strong at the level of the correspondingquarter of 2016.
In Business Consulting and Implementation, sales growth in local currencies was 3%, driven by good performance inCustomer Experience Management with growth of over 20% and increased demand in consulting. The lower number ofworking days had a negative impact on growth and profit. Adjusted operating profit improved slightly due to the higherutilization rate and lower offering development investments. Improvement was curbed by several agreements with lowmargins. Third-quarter adjusted operating margin is expected to clearly improve from the previous year’s low level.
In Industry Solutions, favourable business performance continued in most businesses. Financial Services, specificallythe payments area, experienced challenges as some licence sales were postponed to the second half. Additionally, thetransition to a new product family in Payments impacts on growth and requires higher mid-term investments. Theacquisition of Emric contributed to growth. Organically, growth was strongest in the Public, Healthcare and Welfaresegment, up by 5%. Adjusted operating profit was down from the previous year’s level due to an increase in investmentsin growth businesses. The investments comprise an increase of around EUR 2 million in offering development costs,including new data-driven businesses, and recruitments during the past year. The second half is expected to see a year-on-year improvement in adjusted operating margin due to licence sales growth contributing to a business mix with ahigher than average margin in Industry Solutions. Additionally, it is anticipated that the execution of the efficiencyprogramme started in January will support performance.
In Product Development Services (PDS), sales growth in local currencies was 6%. Growth was attributable to strongvolume development with the largest key customers. Development remained strong, especially in the Radio area, inwhich Tieto has increased its resources in offshore locations to meet demand. Operating margin excluding the negativeworking day impact remained at the strong level of the corresponding quarter in 2016. In the third quarter, adjustedoperating margin is anticipated to be seasonally weaker, at the previous year’s level.
Interim Report 2/2017 8
© 2017Tieto Corporation
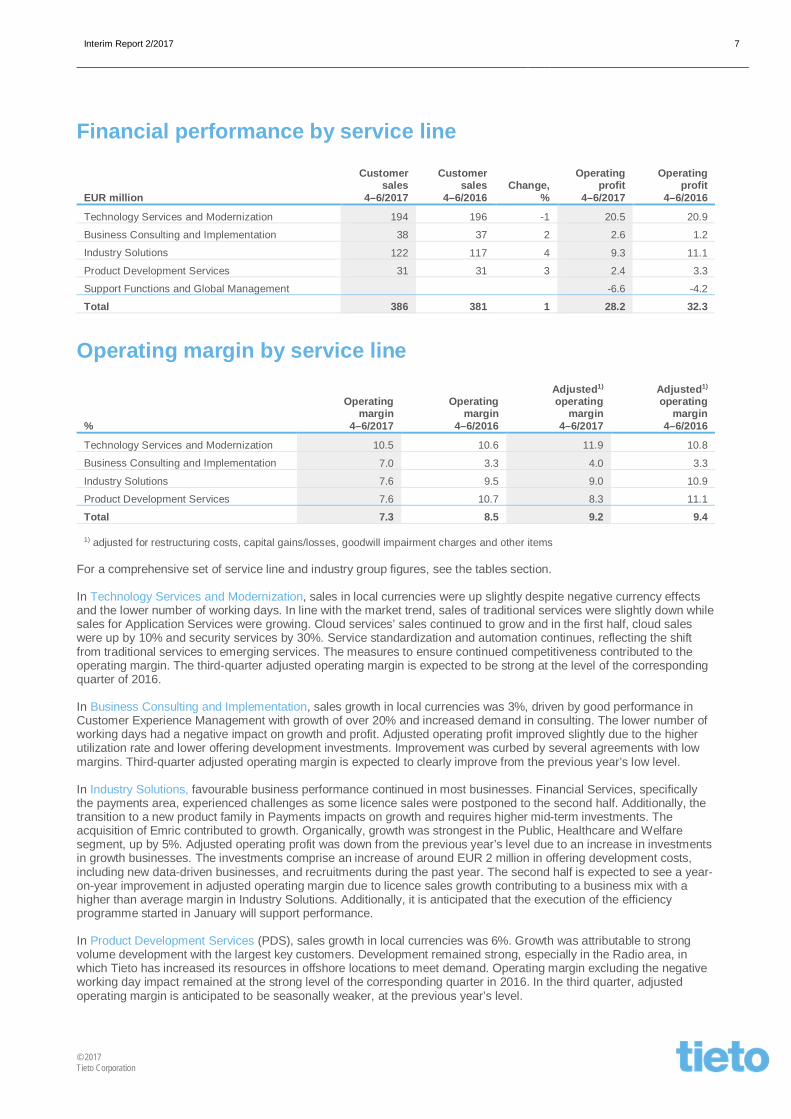
Customer sales by industry groupEUR million
Customer sales4–6/2017
Customer sales4–6/2016 Change, %
Financial Services 97 93 4
Public, Healthcare and Welfare 127 120 5
Industrial and Consumer Services 132 138 -5
IT services 355 350 1Product Development Services 31 31 3
Total 386 381 1
In Financial Services, the acquisition of Emric and projects driving IT efficiency and digital services, especially in Finland,contributed to growth of 6% in local currencies. Growth was curbed by challenges in Industry Solutions in the paymentsarea, where some licence sales were postponed to the second half of the year. Investments to support transition to anew product family in the payments solution are in place.
In Public, Healthcare and Welfare, sales in local currencies were up by 7%. Growth was healthy across all businesslogics with Finland and Norway being the strongest markets. Growth was also supported by good licence sales inIndustry Solutions. The market is active with several digitalization initiatives and transition projects in infrastructureservices.
In Industrial and Consumer Services, sales were down due to expiring contracts, price erosion and a lower number ofworking days, while new contracts are expected to contribute to growth in the second half. In energy utilities, gooddemand in the billing area continued due to regulatory changes and investment in digitalized customer services. IndustryConsulting and Customer Experience Management saw strong demand.
M&A impact in April–JuneIn IT services, second-quarter organic growth in local currencies was 1.1%. At Group level, second-quarter sales in localcurrencies were organically up by 1.6%. Acquisitions added EUR 5 million in sales, affecting Industry Solutions.
M&A impact by service line
Growth, %(in local currencies)
4–6/2017
Organic growth, %(in local currencies)
4–6/2017
Technology Services and Modernization 0.4 0.4
Business Consulting and Implementation 3.1 3.1
Industry Solutions 5.9 1.8
IT services 2.5 1.1
Product Development Services 6.3 6.3
Total 2.8 1.6

Interim Report 2/2017 9
© 2017Tieto Corporation
M&A impact by industry groupGrowth, %
(in local currencies)4–6/2017
Organic growth, %(in local currencies)
4–6/2017
Financial Services 5.6 0.9
Public, Healthcare and Welfare 7.3 7.3
Industrial and Consumer Services -3.2 -3.5
IT services 2.5 1.1
Product Development Services 6.3 6.3
Total 2.8 1.6
Financial performance in January–JuneFirst-half net sales increased by 4.0% to EUR 778.7 (748.5) million, growth of 4.8% in local currencies. In IT services,net sales were up by 3.9%, in local currencies up by 4.5%. In Product Development Services, sales increased by 6.1%,in local currencies up by 8.7%. Acquisitions added EUR 10 million in sales, affecting Industry Solutions. Currencyfluctuations had a negative impact of EUR 6 million on sales, mainly due to the weaker Swedish Krona.
First-half operating profit (EBIT) amounted to EUR 50.1 (60.6) million, representing a margin of 6.4% (8.1). Operatingprofit was strained by restructuring costs related to the automation and efficiency improvement programme initiated inJanuary 2017. Adjusted1) operating profit stood at EUR 71.0 (67.3) million, or 9.1% (9.0) of net sales. Further details onadjustments are available in a table on page 15.
The efficiency improvement programme had an impact of around EUR 5 million on the cost base during the first half,whereas improvement was curbed by salary inflation of around EUR 8 million and a EUR 2 million increase in offeringdevelopment.
Depreciation and amortization amounted to EUR 27.3 (26.4) million, including EUR 2.1 (1.4) million in amortization ofacquisition-related intangible assets. Net financial expenses stood at EUR 1.6 (2.2) million in the first half. Net interestexpenses were EUR 1.0 (1.0) million and net losses from foreign exchange transactions EUR 0.0 (0.8) million. Otherfinancial income and expenses amounted to EUR -0.6 (-0.4) million.
Earnings per share (EPS) totalled EUR 0.50 (0.62). Adjusted1) earnings per share amounted to EUR 0.72 (0.69).
1) adjusted for restructuring costs, capital gains/losses, goodwill impairment charges and other items
Financial performance by service line
EUR million
Customersales
1–6/2017
Customersales
1–6/2016Change,
%
Operatingprofit
1–6/2017
Operatingprofit
1–6/2016
Technology Services and Modernization 392 386 2 35.0 38.6
Business Consulting and Implementation 77 72 7 4.8 2.3
Industry Solutions 247 231 7 15.6 22.6
Product Development Services 63 60 6 6.6 5.9
Support Functions and Global Management -11.9 -8.8
Total 779 748 4 50.1 60.6

Interim Report 2/2017 10
© 2017Tieto Corporation
Operating margin by service line
%
Operatingmargin
1–6/2017
Operatingmargin
1–6/2016
Adjusted1)
operatingmargin
1–6/2017
Adjusted1)
operatingmargin
1–6/2016
Technology Services and Modernization 8.9 10.0 11.4 10.5
Business Consulting and Implementation 6.3 3.2 5.6 3.5
Industry Solutions 6.3 9.8 8.5 10.6
Product Development Services 10.4 9.9 10.9 9.8
Total 6.4 8.1 9.1 9.0
1) adjusted for restructuring costs, capital gains/losses, goodwill impairment charges and other items
Customer sales by industry groupEUR million
Customer sales1–6/2017
Customer sales1–6/2016 Change, %
Financial Services 193 181 6
Public, Healthcare and Welfare 254 238 7
Industrial and Consumer Services 270 270 0
IT services 716 689 4Product Development Services 63 60 6
Total 779 748 4
M&A impact by service line
Growth, %(in local currencies)
1–6/2017
Organic growth, %(in local currencies)
1–6/2017
Technology Services and Modernization 2.4 2.4
Business Consulting and Implementation 8.0 8.0
Industry Solutions 7.1 2.8
IT services 4.5 3.1
Product Development Services 8.7 8.7
Total 4.8 3.5
M&A impact by industry groupGrowth, %
(in local currencies)1–6/2017
Organic growth, %(in local currencies)
1–6/2017
Financial Services 6.8 1.9
Public, Healthcare and Welfare 7.6 7.6
Industrial and Consumer Services 0.3 0.0
IT services 4.5 3.1
Product Development Services 8.7 8.7
Total 4.8 3.5

Interim Report 2/2017 11
© 2017Tieto Corporation
Cash flow, financing and investmentsSecond-quarter net cash flow from operations amounted to EUR -6.1 (-13.7) million, including the increase of EUR 36.0(47.3) million in net working capital. The second quarter is seasonally weaker and the main contributors to the increasein net working capital were changes in advance payments due to timing of customer agreements and payments forpersonnel-related accruals (bonuses and restructuring). Payments for restructuring amounted to EUR 7.4 (6.5) million.
First-half net cash flow from operations amounted to EUR 73.6 (33.2) million, including the decrease of EUR 11.2(increase 29.5) million in net working capital.
Tax payments were EUR 12.5 (22.6 including a EUR 6.0 million payment based on the transfer pricing audit for taxyears 2009–2013 in Finland) million in the first half.
First-half capital expenditure totalled EUR 30.3 (21.2) million, of which paid EUR 26.2 (21.3) million. Capitalexpenditure represented 3.9% (2.8) of net sales and was mainly related to data centres. Capital expenditure in thesecond half is expected to be below the level of the corresponding period of 2016 and in the full-year to remain below4% of Group sales. Net payments for acquisitions totalled EUR 0.4 (1.8) million.
The equity ratio was 40.6% (42.2). Gearing increased to 39.8% (24.7). Interest-bearing net debt totalled EUR 164.6(103.3) million, including EUR 215.6 (197.9) million in interest-bearing debt, EUR 4.8 (6.1) million in finance leaseliabilities, EUR 4.2 (7.1) million in finance lease receivables, EUR 0.5 (0.4) million in other interest-bearing receivablesand EUR 51.3 (93.2) million in cash and cash equivalents.
The EUR 100 million bond matures in May 2019 and it carries a coupon of fixed annual interest of 2.875%. Interest-bearing long-term loans amounted to EUR 103.7 million at the end of June. Interest-bearing short-term loans amountedto EUR 116.7 million, mainly related to commercial paper issues and joint venture cash pool balances. In the secondquarter, Tieto prolonged the maturity of its syndicated revolving credit facility of EUR 150 million by one year. The creditfacility maturing in May 2021 was not in use at the end of June.
In June, Tieto signed an EUR 85 million financing agreement with the European Investment Bank for Tieto’s plannedresearch, development, innovation and infrastructure investments. The loan was extended under the European Fund forStrategic Investments (EFSI). The agreement is a committed credit facility where Tieto has a possibility to withdrawfunding for up to nine years.
Order backlogTotal Contract Value (TCV) amounted to EUR 371 (325) million in the second quarter. Second-quarter book-to-bill stoodat 1.0 (0.9). The total value, including the part beyond the notice period, is included in the TCV.
In the first half, Total Contract Value (TCV) amounted to EUR 760 (652) million. First-half book-to-bill stood at 1.0(0.9).
The order backlog amounted to EUR 1 817 (1 757) million. Of the backlog, 33% (34) is expected to be invoicedduring the current year.
Major agreements in January–JuneDuring the first six months, Tieto signed a number of new agreements with customers across all the industry groups.However, according to the terms and conditions of these agreements, Tieto is not able to disclose most of the contracts.
In January, a collaboration group of Norwegian municipalities (DGI) selected Tieto as its supplier of a new deliveryplatform for the six owner municipalities. The main objective of the agreement is to create the foundation to meet futureneeds by digitalizing citizen services, streamlining processes, and ensuring round-the-clock administration and flexibleaccess for citizens. The agreement has a value of approximately EUR 22 million over four years with an option for anadditional four years.
In January, Tieto signed an agreement to digitalize Region Blekinge’s document and case management system witha new cloud-based service, Public 360°. The digitalization will result in faster, more efficient and more flexibleinformation management and will pave the way for Region Blekinge’s integration into the Blekinge County Council in2019.
In January, Tieto took over the full responsibility for the next development phase of the eCommerce and omnichanneloperations solution of Granngården, a major retail chain in Sweden. With this new solution, Granngården aims to developtheir customer experience and to lay the basis for online revenue growth and seamless omnichannel experience.
In February, Tieto signed an outsourcing agreement with the municipality of Järfälla in the Stockholm region. Thepurpose is to provide future-proof application and IT services that will ensure a smooth digital transition and makeeveryday life for citizens easier. The contract is initially for four years, including two extension options for a total period ofup to eight years, with a value of approximately EUR 14 million.

Interim Report 2/2017 12
© 2017Tieto Corporation
In February, Tieto signed a four-year deal with Swedish engineering and consultancy firm ÅF to modernize thecompany’s IT infrastructure around the world. The contract extends Tieto’s strategic partnership with ÅF and will help thefirm pursue its aggressive growth targets with the help of cutting-edge cloud services and workplace solutions. Tieto willupgrade ÅF's IT infrastructure in offices across six different service areas, including Server and Storage through TietoOneCloud.
In February, the Finnish Prime Minister’s Office, Government ICT Centre (Valtori) and Tieto signed an agreement todigitalize case and document management within the ministries and governmental agencies in Finland. The assignmentis one of the most significant digitalization projects in the country, supporting the nationwide transformation of centralgovernment administration. The agreement with Tieto is valid to the year 2020 and is intended to enable a gradualtransition toward digital management of everything from case and document processes to electronic archiving.
In February, Tieto signed a three-year contract with SCA, Europe's largest private forest owner, to handle SAPApplication Lifecycle Management Services, whereby Tieto will be responsible for application management anddevelopment. The aim is to help SCA follow industry best practices and at the same time ensure business continuity andlower application maintenance costs.
In March, Apoteket Group, a state-owned pharmaceuticals retailer in Sweden, extended their current ApplicationService Management contract with Tieto for an additional period of three years. The agreement provides Apoteket with acost-effective solution combined with high availability to applications. The contract has an estimated value of EUR 4million.
In March, Tieto signed an outsourcing agreement with Folksam, an insurance company in Sweden. Folksam andTieto continue to develop their partnership with this outsourcing agreement under which Tieto takes over theresponsibility for Folksam’s IT operations in Östersund, Sweden. Based on the agreement, Folksam IT operations’employees in Östersund will be offered employment at Tieto. This will further strengthen Tieto's position in the Swedishmarket and will add valuable expertise in application management and consulting services.
In March, HSB and Tieto concluded a new three-year agreement on infrastructure services with an estimatedcontract value of EUR 7.8 million. HSB, the largest Swedish housing cooperative, was looking for an IT partner to helpthe organization build a coordinated IT infrastructure for its affiliated regional associations. Tieto’s solution, based onSPOC Service Desk, OneCloud services, network services, application operations and customized infrastructureservices, facilitates collaboration based on flexible standards while achieving a 30% reduction in costs for IT operationsin a pay-as-you-use model.
In March, Tieto signed a five-year contract with Outokumpu whereby Tieto will supply Outokumpu with nextgeneration infrastructure services. Tieto provides Outokumpu with multi-cloud capabilities based on its OneCloudsolution, a combination of public and private cloud capacity platforms with a unified service experience. With Tieto’ssolution, Outokumpu enhances its competitiveness by improving operational efficiency through global standardizationand decreased time-to-market.
In April, the energy company Vattenfall selected Tieto to deliver its Tieto Smart Utility for Vattenfall Distribution andVattenfall Retail in Sweden based on two separate procurement processes. The new system will increase efficiency bydigitalizing and automating the customer’s core business processes, such as sales, customer services, work flowmanagement and billing.
In April, Turku Energia, one of Finland's largest energy companies, selected the Tieto Smart Utility cloud servicesolution to support its energy retail and distribution businesses and its district heating, steam and cooling businesses.Tieto's Smart Utility will increase efficiency by digitalizing and automating the client’s key processes and enablingseamless connection with the datahub, a forthcoming centralized information exchange solution for energy companies.
In May, the Finnish Transport Safety Agency, Trafi, signed a framework agreement to purchase information systemservices from Tieto. Tieto's experts will develop and maintain Trafi's information systems for road traffic, maritime,boating and information services. The contract period is valid from 2017 to 2021.
In May, Tieto and Fora, a service company that offers administrative solutions for collective insurance agreementsand fees for parties on the labour market, signed an agreement extension on cloud and capacity services. The extendedagreement continues to entail flexible and secure cloud solutions with high availability for both infrastructure capacityand business-critical ERP systems. The solutions will help Fora strengthen continuity in operations as well as improve ITprocesses, resulting in reduced costs and increased flexibility.
In May, Tieto signed an outsourcing agreement with Inwido AB, Europe's largest supplier of windows and a leadingdoor supplier, to deliver service desk, end user and infrastructure services. The contract is for five years and has a totalvalue of EUR 6 million. The first signed agreement covers Sweden and several global services.
In June, Tieto signed an agreement with Lecta, one of the leading manufacturers and distributors of specialty papersfor labels and flexible packaging, coated paper for publishing and other high value-added print media, to deliver theimplementation of Tieto’s paper solution template, integrating SAP with TIPS, Tieto’s Mill Execution System product.During 2016 and the beginning of 2017, Tieto successfully completed a blueprint for streamlining and harmonizingLecta’s business processes based on Tieto’s industry-specific Paper Solution Template. Tieto will by April 2018implement the defined processes in SAP to create a common template for seven paper mills and support the rolloutprocess. This will further strengthen Tieto's position as a preferred partner utilizing IT to drive and enable businesschange and to address the fast-changing market requirements.
In June, Tieto signed an agreement with Qliro, a Nordic company within the FinTech industry, specialising ineCommerce payments, consumer financing and savings accounts, to deliver a digital service for savings accounts.Emric, acquired by Tieto in September 2016, will deliver the underlying system (Emric’s Managed Services solution) for

Interim Report 2/2017 13
© 2017Tieto Corporation
the entire deposit value chain from automated customer registration to administration. The solution includes the coresystem that comprises not only a digital self-service platform, verification through BankID, and accounting, but alsostaffing for general administration. The agreement has a term of three years.
In June, Tieto signed an agreement with international media group Modern Times Group (MTG) to standardize,integrate and modernise MTG's IT infrastructure by delivering data centre, end-user, service desk, security and networkservices. The contract is for three years
In June, Södertälje municipality chose Tieto as its supplier of end-user IT services and the underlying infrastructurewhich will take the municipality´s digitalization to the next level. Tieto will also provide the customer with serviceintegration and management (SIAM) solutions to develop the municipality’s IT services and coordinate suppliers. Thecontract is for five years with an option for additional four years, and is worth approximately SEK 140 million. As part ofthe deal, Tieto will deliver end-user services such as IT workplaces, service desk, e-mail and printing services, as wellas infrastructure including networks, internet connections, security services and an integration platform.
In June, Tieto signed a three-year contract with Mutual Pension Insurance Company Ilmarinen to digitalize andrenew insurance services and processes. Tieto is delivering competences for insurance consulting, designthinking, service design, application and front-end development, testing and a SAFe framework.
In June, Tieto signed an agreement with Keva and Varma, two large Finnish pension providers, to deliver a newpension payment system. The three-year renewal project will create a platform for automated and modern payments.DevOps methods and automated solutions are used for system development. The new pension payment system willreplace the current aging systems and will connect seamlessly to tax authorities, banks and the public pension system.Modern technologies and modularity will enable flexible developments in the future, allowing the system to adapt to newregulations in a cost-efficient way.
In June 2017, Tieto signed an agreement with Stockholm County Council to provide application managementservices. The four-year contract with an option to extend by three more years has a total value of EUR 17 million.
PersonnelThe number of full-time employees amounted to 13 754 (13 381) at the end of June. The number of full-time employeesin the global delivery centres totalled 6 733 (6 321), or 49.0% (47.2) of all personnel.
In the first half, the number of full-time employees was down by a net amount of over 100. In IT services, the numberof employees decreased by around 300, including around 450 redundancies and over 100 recruitments (net).Additionally, new outsourcing agreements added over 30 employees. Product Development Services recruited close to200 employees, mainly in offshore locations.
The 12-month rolling employee turnover stood at 11.4% (9.8) at the end of June.Salary inflation is expected to remain at around 3% on average in 2017. In offshore countries, salary inflation is
clearly above the average. In Finland, Tieto reached an agreement on the national Competitiveness Pact, effective 13January 2017. Based on the agreement, annual working time will increase by around two working days in Finland.
SharesThe number of Tieto shares amounted to 74 109 252 at the end of June. On 30 June, Tieto’s holding amounted to a totalof 386 127 own shares, representing 0.5% of the total number of shares and voting rights.
Additional information regarding shares and shareholders is available at www.tieto.com/investors/shares.
Near-term risks and uncertaintiesConsolidated net sales and profitability are sensitive to volatility in exchange rates, especially that of the Swedish Kronaand Norwegian Krona. Sales to Sweden and Norway represent close to half of the Group’s sales. Further details onmanagement of currency risks are provided in the Financial Statements and on currency impacts atwww.tieto.com/currency-impact.
Tieto’s ambition to drive customer transformation also poses a risk of lower prices in existing services while it is alsoanticipated to expand the company’s sales opportunities. At the same time, new disruptive technologies, such as cloudcomputing, drive customer demand towards standardized and less labour-intensive solutions. These changes mightresult in the need for continuous restructuring and the need to recruit new competences. That may lead to temporarilyoverlapping personnel costs and uncertainty among personnel.

Interim Report 2/2017 14
© 2017Tieto Corporation
The new EU General Data Protection Regulation will take effect in May 2018. The new GDPR-based requirementsresult in an increase in offering development costs for Tieto’s software-based solutions while based on several customeragreements Tieto is entitled to invoice its customers for additional development work. Additionally, the new regulation isopening up new opportunities, such as for Tieto’s security and application services.
The company’s development is relatively sensitive to changes in the demand from large customers as Tieto’s top 10customers currently account for 31% of its net sales, with Product Development Services having the highest customerconcentration in the company. However, the share has decreased by several percentage points during the past years.
Typical risks faced by the IT service industry relate to the development and implementation of new technologies andsoftware. In Tieto’s case these relate to both own software development and implementation of third-party software forservice delivery. Furthermore, additional technology licence fees, the quality of deliveries and related project overrunsand penalties pose potential risks.
Economic growth might be affected by uncertainty related to the general political situation. The direct impact on Tietois anticipated to be marginal, but slower growth in Europe might indirectly lead to weakness in the IT services market aswell. The share of sales in the USA and Russia is less than 1%.
Companies around the world are facing new risks arising from tax audits. Should the macroeconomic environmentremain weak, some countries may introduce new regulation. Additionally, changes in the tax authorities’interpretations could have unfavourable impacts on taxpayers.
Full-year outlook for 2017 unchangedTieto expects its adjusted1) full-year operating profit (EBIT) to increase from the previous year’s level (EUR 152.2 millionin 2016).
1) adjusted for restructuring costs, capital gains/losses, goodwill impairment charges and other items
AuditingThe figures in this report are unaudited.
Financial calendar 201724 October Interim report 3/2017 (8.00 am EET)
Accounting policies 2017The interim report has been prepared in accordance with International Accounting Standard (IAS) 34, Interim FinancialReporting, as adopted by the EU. The accounting policies adopted are consistent with those used in the annual financialstatements for the year ended on 31 December 2016. The standards, amendments and interpretations which areeffective 1 January 2017 are not material to the Group.
The Group’s assessment of the impact of the new standards IFRS 9 ‘Financial Instruments’, IFRS 15 ‘Revenue fromContracts with Customers’ and IFRS 16 ‘Leases’ are described in the annual financial statements for the year ended on31 December 2016.
Interim Report 2/2017 15
© 2017Tieto Corporation
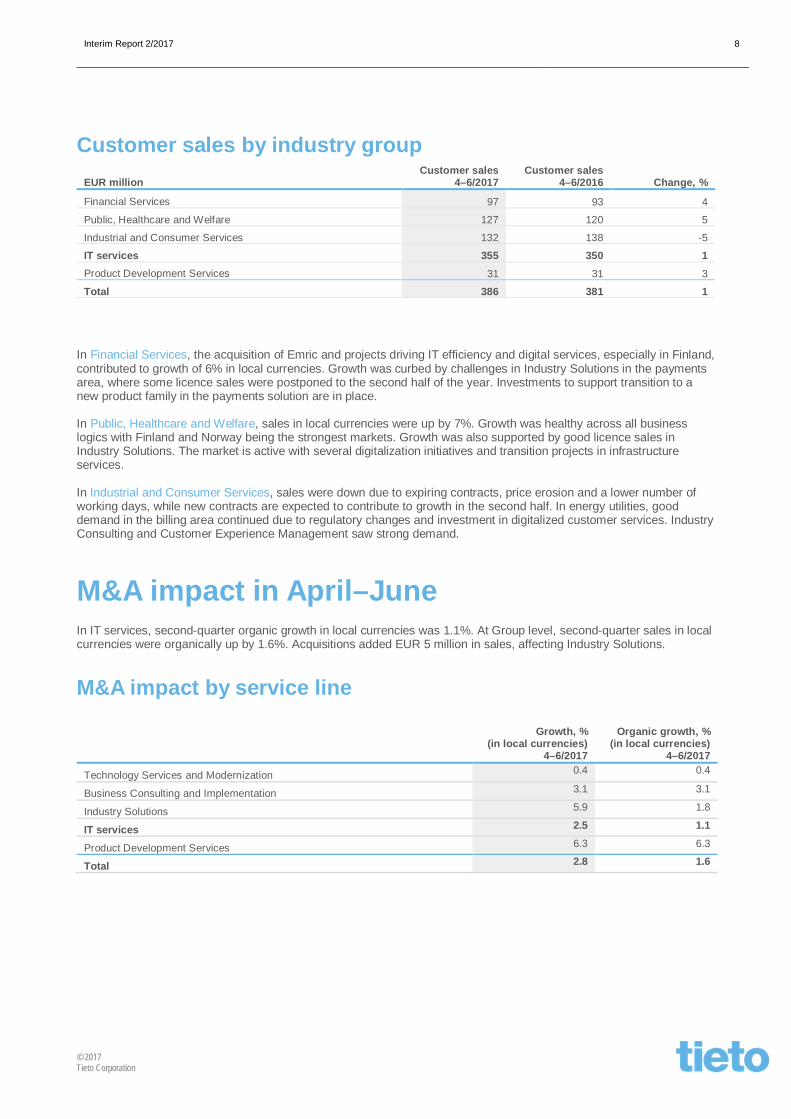
Reported alternative performance measuresTieto uses “Adjusted operating profit (EBIT)” as an alternative performance measure to better reflect its operationalbusiness performance and to enhance comparability between financial periods. This alternative performance measure isreported in addition to, but not as a substitute for, the performance measures reported in accordance to IFRS. Adjusteditems include restructuring costs, capital gains/losses, goodwill impairment charges and other items.
Adjusted operating profit (EBIT)
EUR million20174–6
20164–6
20171–3
20171–6
20161–6
20161–12
Operating profit (EBIT) 28.2 32.3 21.9 50.1 60.6 140.8
+ restructuring costs 5.3 2.2 13.5 18.7 5.4 14.8
+ capital losses - 0.2 - - 0.2 0.2
+/- M&A related items 0.0 - 0.0 0.1 - -1.9
+/- other 2.1 *) 1.1 **) - 2.1 *) 1.1 **) -1.7 **) ***)
Adjusted operating profit (EBIT) 35.6 35.8 35.4 71.0 67.3 152.2
*) In Sweden, one defined benefit pension plan was closed and a new contribution pension plan was established.Consequently, net costs of EUR 1.1 million have been recognized. EUR 1.0 million in write-offs related to obsolete assetsreplaced by new technologies are also included.
**) Value added tax correction from previous years EUR -1.1 million in Russia.
***) In Finland, around 250 active employees have been included in the defined benefit pension plans. Based on negotiationswith the insurance company, Tieto closed its defined benefit plan for future pension accrual. As a consequence, a settlementgain of EUR 4.6 million has been recognized in personnel expenses in December 2016. More information is available in theAnnual Report 2016. “Other items” also includes EUR 1.5 million in one-off write-offs related to obsolete assets replaced bynew technologies.

Interim Report 2/2017 16
© 2017Tieto Corporation
Key figures20174–6
20164–6
20171–3
20171–6
20161–6
20161–12
Earnings per share, EURBasic 0.28 0.33 0.21 0.50 0.62 1.46Diluted 0.28 0.33 0.21 0.50 0.62 1.46
Equity per share, EUR 5.60 5.67 5.44 5.60 5.67 6.62
Return on equity, 12-month rolling, % 23.6 26.2 25.3 23.6 26.2 22.1Return on capital employed, 12-month rolling, % 21.0 25.9 25.8 21.0 25.9 21.6Equity ratio, % 40.6 42.2 39.2 40.6 42.2 47.3Interest-bearing net debt, EUR million 164.6 103.3 38.0 164.6 103.3 109.7Gearing, % 39.8 24.7 9.5 39.8 24.7 22.5Capital expenditure, EUR million 21.0 11.8 9.3 30.3 21.2 61.6Acquisitions, EUR million - - - - - 37.6

Interim Report 2/2017 17
© 2017Tieto Corporation
Number of shares2017
4–6 2017
1–32017
1–6 2016
1–620161–12
Outstanding shares, end of periodBasic 73 723 125 73 723 125 73 723 125 73 697 570 73 697 570Diluted 73 723 125 73 723 125 73 723 125 73 697 570 73 697 570
Outstanding shares, averageBasic 73 723 125 73 720 853 73 721 995 73 622 887 73 660 433Diluted 73 723 125 73 720 853 73 721 995 73 659 489 73 678 634
Company's possession of its own sharesEnd of period 386 127 386 127 386 127 411 682 411 682Average 386 127 388 399 387 257 431 634 421 604

Interim Report 2/2017 18
© 2017Tieto Corporation
Income statement, EUR million
20174–6
20164–6
20171–6
20161–6
Change%
20161–12
Net sales 385.5 381.0 778.7 748.5 4 1 492.6Other operating income 4.3 2.8 7.4 7.0 6 19.8Employee benefit expenses -223.9 -213.8 -463.7 -427.8 8 -827.1Depreciation, amortization and impairment charges -13.6 -13.1 -27.3 -26.4 3 -53.9
Other operating expenses -124.8 -125.5 -246.4 -242.0 2 -493.8Share of profit from investments accounted for using the equity method 0.7 0.9 1.4 1.3 8 3.2Operating profit (EBIT) 28.2 32.3 50.1 60.6 -17 140.8Interest and other financial income 0.4 0.5 0.8 1.2 -33 2.1Interest and other financial expenses -1.2 -1.1 -2.4 -2.6 -8 -5.0Net exchange gains/losses 0.2 -1.0 -0,0 -0.8 -100 -1.1
Profit before taxes 27.6 30.7 48.5 58.4 -17 136.8Income taxes -6.6 -6.5 -11.8 -12.7 -7 -29.6Net profit for the period 21.0 24.2 36.7 45.7 -20 107.2
Net profit for the period attributable toShareholders of the Parent company 21.0 24.2 36.7 45.7 -20 107.2
Non-controlling interest - 0.0 - 0.0 - 0.021.0 24.2 36.7 45.7 -20 107.2
Earnings per share attributable to the shareholders of theParent company, EURBasic 0.28 0.33 0.50 0.62 -19 1.46Diluted 0.28 0.33 0.50 0.62 -19 1.46
Statement of comprehensive income, EUR millionNet profit for the period 21.0 24.2 36.7 45.7 -20 107.2
Items that may be reclassified subsequently to profit or lossTranslation differences -10.5 -3.2 -10.0 -4.4 - -2.1Cash flow hedges (net of tax) - 0.0 - -0.2 - -0.2Other changes - -0.4 - -0.4 - -
Items that will not be reclassified subsequently to profit or lossActuarial gain/loss on post-employment benefit obligations(net of tax) 1.1 -4.2 -1.5 -7.6 - -2.1
Total comprehensive income 11.6 16.4 25.2 33.1 -24 102.8
Total comprehensive income attributable toShareholders of the Parent company 11.6 16.4 25.2 33.1 -24 102.8Non-controlling interest - 0.0 - 0.0 - 0.0
11.6 16.4 25.2 33.1 -24 102.8

Interim Report 2/2017 19
© 2017Tieto Corporation
Balance sheet, EUR million2017
30 Jun2016
30 JunChange
%2016
31 Dec
Goodwill 405.0 383.5 6 409.7
Other intangible assets 50.5 39.5 28 52.3
Property, plant and equipment 97.1 79.0 23 94.0
Investments accounted for using the equity method 14.4 14.6 -1 16.5
Deferred tax assets 28.8 31.7 -9 29.9
Finance lease receivables 1.1 3.6 -69 2.2
Other interest-bearing receivables 0.5 0.0 - 0.0
Available-for-sale financial assets 0.7 0.7 0 0.7
Total non-current assets 598.1 552.6 8 605.3
Trade and other receivables 396.7 384.2 3 390.3
Pension benefit assets 6.0 2.0 200 7.4
Finance lease receivables 3.1 3.5 -11 3.5
Other interest-bearing receivables 0.0 0.4 -100 0.3
Current income tax receivables 16.1 12.8 26 11.0
Cash and cash equivalents 51.3 93.2 -45 56.7
Total current assets 473.2 496.1 -5 469.2
Total assets 1 071.3 1 048.7 2 1 074.5
Share capital, share issue premiums and other reserves 119.8 120.4 0 120.0
Retained earnings 293.4 297.3 -1 368.1
Parent shareholders' equity 413.2 417.7 -1 488.1
Non-controlling interest - - - -
Total equity 413.2 417.7 -1 488.1
Loans 103.7 104.4 -1 103.8
Deferred tax liabilities 33.9 27.2 25 34.9
Provisions 5.1 6.6 -23 5.4
Pension obligations 13.8 20.3 -32 13.9
Other non-current liabilities 0.8 0.5 60 0.2
Total non-current liabilities 157.3 159.0 -1 158.2
Trade and other payables 360.7 350.4 3 344.6
Current income tax liabilities 7.4 9.9 -25 3.5
Provisions 16.0 12.1 32 11.5
Loans 116.7 99.6 17 68.6
Total current liabilities 500.8 472.0 6 428.2
Total equity and liabilities 1 071.3 1 048.7 2 1 074.5

Interim Report 2/2017 20
© 2017Tieto Corporation
Net working capital in the balance sheet, EUR million
201730 Jun
201630 Jun
Change%
201731 Mar
201631 Dec
Accounts receivable 265.3 265.8 0 263.7 282.4
Other working capital receivables 131.5 117.8 12 130.9 107.9
Working capital receivables included in assets 396.8 383.6 3 394.6 390.3
Accounts payable 98.2 88.8 11 95.9 96.3
Personnel related accruals 151.3 144.9 4 159.0 137.6
Provisions 21.1 18.7 13 24.1 16.9
Other working capital liabilities 105.0 111.0 -5 125.3 100.3
Working capital liabilities included in liabilities 375.6 363.4 3 404.3 351.1
Net working capital in the balance sheet 21.2 20.2 5 -9.7 39.2

Interim Report 2/2017 21
© 2017Tieto Corporation
Cash flow, EUR million
20174–6
20164–6
20171–3
20171–6
20161–6
20161–12
Cash flow from operationsNet profit 21.0 24.2 15.7 36.7 45.7 107.2
Adjustments
Depreciation, amortization and impairment charges 13.6 13.1 13.7 27.3 26.4 53.9
Share-based payments 0.6 -0.2 0.4 1.0 0.5 1.3
Profit/loss on sale of fixed assets and shares -0.1 0.1 0.0 -0.1 0.1 0.1Share of profit from investments accounted for using the equity method -0.7 -0.9 -0.7 -1.4 -1.3 -3.2
Other adjustments 0.0 -2.6 -0.5 -0.5 -2.0 -7.7
Net financial expenses 0.6 1.6 1.0 1.6 2.2 4.0
Income taxes 6.6 6.5 5.2 11.8 12.7 29.6
Change in net working capital -36.0 -47.3 47.2 11.2 -29.5 -51.6
Cash generated from operations 5.6 -5.5 82.0 87.6 54.8 133.6
Net financial expenses paid -5.6 -2.0 0.6 -5.0 -2.8 -2.6Dividends received from investments accounted for using the equity method - - 3.5 3.5 3.8 3.8
Income taxes paid -6.1 -6.2 -6.4 -12.5 -22.6 -37.6
Net cash flow from operations -6.1 -13.7 79.7 73.6 33.2 97.2
Cash flow from investing activitiesAcquisition of Group companies and business operations,net of cash acquired - -0.4 -0.4 -0.4 -1.8 -32.3
Capital expenditures -16.9 -11.9 -9.3 -26.2 -21.3 -61.7Disposal of Group companies and business operations,net of cash disposed - - - - - 0.0
Sales of fixed assets 0.2 0.0 0.0 0.2 0.0 0.1
Change in loan receivables 1.3 0.4 0.1 1.4 1.1 2.5
Net cash used in investing activities -15.4 -11.9 -9.6 -25.0 -22.0 -91.4
Cash flow from financing activitiesDividends paid -101.0 -99.3 - -101.0 -99.3 -99.3
Exercise of stock options - 0.8 - - 0.8 0.8
Payments of finance lease liabilities -0.3 -0.3 -0.3 -0.6 -0.6 -1.3
Change in interest-bearing liabilities 95.3 72.9 -51.4 43.9 26.5 -4.4
Net cash used in financing activities -6.0 -25.9 -51.7 -57.7 -72.6 -104.2
Change in cash and cash equivalents -27.5 -51.5 18.4 -9.1 -61.4 -98.4
Cash and cash equivalents at the beginning of period 76.9 144.6 56.7 56.7 156.2 156.2
Foreign exchange differences 1.9 0.1 1.8 3.7 -1.6 -1.1
Change in cash and cash equivalents -27.5 -51.5 18.4 -9.1 -61.4 -98.4
Cash and cash equivalents at the end of period 51.3 93.2 76.9 51.3 93.2 56.7

Interim Report 2/2017 22
© 2017Tieto Corporation
Statement of changes in shareholders' equity, EUR million
Parent shareholders' equity
Non-control-linginter-est
Totalequity
Sharecapi-
tal
Shareissue
premi-umsand
otherre-
ser-ves
Shareissue
basedon
stockoptions
Ownshares
Trans-lationdiffer-ences
Cashflow
hedges
In-vest-
edunre-strict-
edequity
re-serve
Re-tainedearn-ings Total
At 31 Dec 2015 76.6 44.6 0.0 -11.6 -49.2 0.2 12.1 410.1 482.8 0.1 482.9
ComprehensiveincomeNet profit for the period 45.7 45.7 0.0 45.7Other comprehensiveincomeActuarial loss on post-employment benefitobligations (net of tax) -7.6 -7.6 -7.6
Translation difference -0.8 -3.8 0.2 -4.4 -4.4Cash flow hedges(net of tax) -0.2 -0.2 -0.2
Other changes -0.4 -0.4 -0.4Total comprehensiveincome -0.8 -3.8 -0.2 37.9 33.1 0.0 33.1
Transactions withownersShare-based paymentsrecognized againstequity 0.4 0.4 0.4
Dividend -99.4 -99.4 -99.4Share subscriptionsbased onstock options 0.0 0.7 0.7 0.7
Non-controlling interest 0.1 0.1 -0.1 0.0Total transactionswith owners 0.0 0.0 0.0 0.7 -98.9 -98.2 -0.1 -98.3
Impact oninvestmentsaccounted for usingthe equity method 0.0 0.0 0.0
At 30 Jun 2016 76.6 43.8 0.0 -11.6 -53.0 0.0 12.8 349.1 417.7 0.0 417.7

Interim Report 2/2017 23
© 2017Tieto Corporation
Parent shareholders' equity
Non-control-linginter-est
Totalequity
Sharecapi-
tal
Shareissue
premi-umsand
otherre-
ser-ves
Shareissue
basedon
stockoptions
Ownshares
Trans-lationdiffer-ences
Cashflow
hedges
In-vest-
edunre-strict-
edequity
re-serve
Re-tainedearn-ings Total
At 31 Dec 2016 76.6 43.4 0.0 -11.6 -52.3 - 12.8 419.2 488.1 - 488.1
ComprehensiveincomeNet profit for the period 36.7 36.7 - 36.7Other comprehensiveincomeActuarial loss on post-employment benefitobligations (net of tax) -1.5 -1.5 -1.5
Translation difference -0.2 -13.6 3.8 -10.0 -10.0Cash flow hedges(net of tax) - -Total comprehensiveincome -0.2 -13.6 - 39.0 25.2 - 25.2
Transactions withownersShare-based paymentsrecognized againstequity 0.9 0.9 0.9
Dividend -101.0 -101.0 -101.0
Non-controlling interest - -Total transactionswith owners 0.0 0.0 0.0 0.0 -100.1 -100.1 - -100.1
Impact oninvestmentsaccounted for usingthe equity method 0.0 0.0 0.0
At 30 Jun 2017 76.6 43.2 0.0 -11.6 -65.9 - 12.8 358.1 413.2 - 413.2

Interim Report 2/2017 24
© 2017Tieto Corporation
Segment informationCustomer sales by service line, EUR million
2017 2016 Change 2017 2016 Change 20164–6 4–6 % 1–6 1–6 % 1–12
Technology Services and Modernization 194 196 -1 392 386 2 762
Business Consulting and Implementation 38 37 2 77 72 7 139
Industry Solutions 122 117 4 247 231 7 475
Product Development Services 31 31 3 63 60 6 117
Group total 386 381 1 779 748 4 1 493
No internal sales occur between service lines as in the management accounting, revenue and costs are booked directly to the respectivecustomer projects in the service lines.
Customer sales by country, EUR million
2017 2016 Change 2017 2016 Change Share 2016 Share4–6 4–6 % 1–6 1–6 % % 1–12 %
Finland 172 173 -1 345 339 2 44 674 45Sweden 148 146 1 299 286 4 38 566 38
Norway 41 39 4 84 77 10 11 159 11
Other 26 23 12 51 47 9 7 94 6
Group total 386 381 1 779 748 4 100 1 493 100
In Finland, IT services sales decreased with 0.6% during the second quarter and grew by 1.8% in the six-month period.
In Sweden, growth in local currencies was 5.4% during the second quarter and 7.5% in the six-month period. IT services grew in localcurrencies by 5.8% during the second quarter and 7.6% in the six-month period.
In Norway, growth in local currencies was 4.3% during the second quarter and 7.3% during the six-month period.
Customer sales by industry group, EUR million
2017 2016 Change 2017 2016 Change 20164–6 4–6 % 1–6 1–6 % 1–12
Financial Services 97 93 4 193 181 6 370
Public, Healthcare and Welfare 127 120 5 254 238 7 479
Industrial and Consumer Services 132 138 -5 270 270 0 527
Product Development Services 31 31 3 63 60 6 117
Group total 386 381 1 779 748 4 1 493
Customer sales to the telecom sector were EUR 119 (121) million during January–June.
Revenues derived from any single external customer during January–June 2017 or 2016 did not exceed the 10% level of the total net salesof the Group.

Interim Report 2/2017 25
© 2017Tieto Corporation
Operating profit (EBIT) by service line, EUR million
2017 2016 Change 2017 2016 Change 2016
4–6 4–6 % 1–6 1–6 % 1–12
Technology Services and Modernization 20.5 20.9 -1.9 35.0 38.6 -9.4 89.0
Business Consulting and Implementation 2.6 1.2 118.2 4.8 2.3 110.7 4.1
Industry Solutions 9.3 11.1 -16.2 15.6 22.6 -31.0 55.2
Product Development Services 2.4 3.3 -26.9 6.6 5.9 11.7 10.9
Support Functions and Global Management -6.6 -4.2 -58.8 -11.9 -8.8 -35.3 -18.5
Operating profit (EBIT) 28.2 32.3 -12.7 50.1 60.6 -17.3 140.8
Operating margin (EBIT) by service line, %
2017 2016 Change 2017 2016 Change 2016
4–6 4–6 pp 1–6 1–6 pp 1–12
Technology Services and Modernization 10.5 10.6 -0.1 8.9 10.0 -1.1 11.7
Business Consulting and Implementation 7.0 3.3 3.7 6.3 3.2 3.1 3.0
Industry Solutions 7.6 9.5 -1.9 6.3 9.8 -3.5 11.6
Product Development Services 7.6 10.7 -3.1 10.4 9.9 0.5 9.3
Operating margin (EBIT) 7.3 8.5 -1.2 6.4 8.1 -1.7 9.4
Adjusted operating profit (EBIT) by service line, EUR million
2017 2016 Change 2017 2016 Change 20164–6 4–6 % 1–6 1–6 % 1–12
Technology Services and Modernization 23.1 21.3 8.7 44.6 40.6 9.8 92.4
Business Consulting and Implementation 1.5 1.2 24.3 4.3 2.5 71.2 1.7
Industry Solutions 11.0 12.8 -14.2 20.9 24.5 -14.8 59.2
Product Development Services 2.6 3.4 -23.2 6.9 5.8 19.0 11.1
Support Functions and Global Management -2.6 -2.8 7.9 -5.8 -6.2 7.1 -12.2
Adjusted operating profit (EBIT) 35.6 35.8 -0.6 71.0 67.3 5.5 152.2
Adjusted operating margin (EBIT) by service line, %
2017 2016 Change 2017 2016 Change 20164–6 4–6 pp 1–6 1–6 pp 1–12
Technology Services and Modernization 11.9 10.8 1.1 11.4 10.5 0.9 12.1
Business Consulting and Implementation 4.0 3.3 0.7 5.6 3.5 2.1 1.2
Industry Solutions 9.0 10.9 -1.9 8.5 10.6 -2.2 12.5
Product Development Services 8.3 11.1 -2.8 10.9 9.8 1.2 9.4
Adjusted operating margin (EBIT) 9.2 9.4 -0.2 9.1 9.0 0.1 10.2

Interim Report 2/2017 26
© 2017Tieto Corporation
Personnel by service line
End of period Average2017 Change Share 2016 2016 2017 2016
1–6 % % 1–6 1–12 1–6 1–6
Technology Services and Modernization 6 096 -1 44 6 170 6 338 6 196 6 020
Business Consulting and Implementation 1 381 1 10 1 364 1 376 1 401 1 352
Industry Solutions 4 022 7 29 3 742 4 024 4 016 3 711
Product Development Services 1 388 18 10 1 178 1 243 1 330 1 222
Service lines total 12 886 3 94 12 454 12 981 12 942 12 305Industry groups 253 -12 2 288 260 257 279
Support Functions and Global Management 614 -4 4 639 635 622 645
Group total 13 754 3 100 13 381 13 876 13 821 13 229
Personnel by country
End of period Average2017 Change Share 2016 2016 2017 20161–6 % % 1–6 1–12 1–6 1–6
Finland 3 369 -6 24 3 594 3 552 3 449 3 595
Sweden 2 706 7 20 2 535 2 698 2 710 2 517
India 2 489 3 18 2 419 2 503 2 488 2 319
Czech Republic 2 233 6 16 2 117 2 247 2 246 2 068
Latvia 630 -5 5 663 649 634 670
Norway 601 2 4 591 636 616 601
Poland 460 25 3 368 413 441 393
China 385 44 3 267 305 346 264
Estonia 286 10 2 259 280 292 235
Austria 134 3 1 129 138 135 125
Lithuania 94 -18 1 114 99 97 117
Other 367 13 3 325 357 367 326
Group total 13 754 3 100 13 381 13 876 13 821 13 229Onshore countries 7 021 -1 51 7 060 7 233 7 121 7 048
Offshore countries 6 733 7 49 6 321 6 643 6 700 6 181
Group total 13 754 3 100 13 381 13 876 13 821 13 229

Interim Report 2/2017 27
© 2017Tieto Corporation
Non-current assets by country, EUR million
2017 2016 Change 2016
30 Jun 30 Jun % 31 Dec
Finland 90.4 77.2 17 85.9
Sweden 37.9 24.1 57 39.3
Norway 13.6 12.8 6 15.4
Other 5.7 4.4 29 5.7
Total non-current assets 147.6 118.5 25 146.4
Goodwill is allocated to the Cash Generating Units, which include several countries and therefore goodwill is not included in the countryspecific non-current assets shown above.

Interim Report 2/2017 28
© 2017Tieto Corporation
Depreciation by service line, EUR million
2017 2016 Change 2017 2016 Change 20164–6 4–6 % 1–6 1–6 % 1–12
Technology Services and Modernization 8.1 8.7 -7 16.5 17.7 -7 35.2
Business Consulting and Implementation 0.0 0.0 20 0.0 0.0 109 0.1
Industry Solutions 0.2 0.2 2 0.5 0.4 37 0.8
Product Development Services 0.0 0.0 -20 0.1 0.0 - 0.0
Support Functions and Global Management 1.4 0.8 69 2.7 1.7 58 3.7
Group total 9.7 9.8 0 19.8 19.8 0 39.8
Amortization on allocated intangible assets from acquisitions by service line, EUR million
2017 2016 Change 2017 2016 Change 20164–6 4–6 % 1–6 1–6 % 1–12
Technology Services and Modernization - - - - - - -
Business Consulting and Implementation 0.1 0.1 -2 0.2 0.2 -1 0.4
Industry Solutions 0.9 0.6 57 1.9 1.2 59 2.8
Product Development Services - - - - - - -
Support Functions and Global Management - - - - - - -
Group total 1.0 0.7 48 2.1 1.4 50 3.3
Amortization on other intangible assets by service line, EUR million
2017 2016 Change 2017 2016 Change 20164–6 4–6 % 1–6 1–6 % 1–12
Technology Services and Modernization 2.1 2.2 -3 4.3 4.4 -2 8.9
Business Consulting and Implementation - - - - - - 0.1
Industry Solutions 0.1 - - 0.3 0.1 406 0.2
Product Development Services - - - - - - 0.0
Support Functions and Global Management 0.5 0.4 43 0.8 0.8 2 1.6
Group total 2.8 2.6 8 5.4 5.3 4 10.8

Interim Report 2/2017 29
© 2017Tieto Corporation
Commitments and contingencies, EUR million
201730 Jun
201631 Dec
For Tieto obligations
Guarantees
Performance guarantees 1.3 4.0
Lease guarantees 8.8 8.9
Other 1.3 1.5
Other Tieto obligations
Rent commitments due in one year 39.1 39.7
Rent commitments due in 1–5 years 91.7 95.3
Rent commitments due after 5 years 27.6 31.4
Operating lease commitments due in one year 8.0 8.3
Operating lease commitments due in 1–5 years 8.4 8.1
Operating lease commitments due after 5 years 0.4 0.6
Commitments to purchase assets 14.6 6.2
Other 2.0 -
On behalf of joint ventures - -
On behalf of others
Guarantees 0.1 0.1

Interim Report 2/2017 30
© 2017Tieto Corporation
Derivatives, EUR million
Notional amounts of derivatives
Includes the gross amount of all notional values for contracts that have not yet been settled or closed. The amount of notional valueoutstanding is not necessarily a measure or indication of market risk, as the exposure of certain contracts may be offset by othercontracts.
201730 Jun
201631 Dec
Foreign exchange forward contracts 211.7 198.7
Electricity price futures contracts 0.4 0.5
Fair values of derivatives
The net fair values of derivative financial instruments at the balance sheet date2017
30 Jun2016
31 Dec
Foreign exchange forward contracts -0.3 1.2
Electricity price futures contracts 0.0 0.1
Derivatives are used for economic hedging purposes only.
Gross positive fair values of derivatives2017
30 Jun2016
31 Dec
Foreign exchange forward contracts 1.3 2.3
Electricity price futures contracts 0.0 0.1
Gross negative fair values of derivatives2017
30 Jun2016
31 Dec
Foreign exchange forward contracts -1.6 -1.1
Electricity price futures contracts 0.0 0.0
Foreign exchange derivatives' fair values are calculated according to FX and interest rates on the closing date.

Interim Report 2/2017 31
© 2017Tieto Corporation
Fair value measurement of financial assets and liabilities
EUR million
30 Jun 2017 Level 1 Level 2 Level 3 Total
Financial assets at fair value through profit or loss
Derivatives - 1.3 - 1.3
Available-for-sale investments - - 0.7 -
Financial liabilities at fair value through profit or loss
Derivatives - -1.6 - -1.6
EUR million
31 Dec 2016 Level 1 Level 2 Level 3 Total
Financial assets at fair value through profit or loss
Derivatives - 2.4 - 2.4
Available-for-sale investments - - 0.7 0.7
Financial liabilities at fair value through profit or loss
Derivatives - -1.1 - -1.1
Available-for-sale investments' fair value measurement is based on their initial value. The fair market value cannot be reliably estimated,due to lack of proper market for the assets.

Interim Report 2/2017 32
© 2017Tieto Corporation
Quarterly figures
Key figures
20174–6
20171–3
201610–12
20167–9
20164–6
20161–3
Earnings per share, EURBasic 0.28 0.21 0.46 0.37 0.33 0.29Diluted 0.28 0.21 0.46 0.37 0.33 0.29
Equity per share, EUR 5.60 5.44 6.62 6.05 5.67 5.46Return on equity, 12-month rolling, % 23.6 25.3 22.1 24.4 26.2 25.7Return on capital employed,12-month rolling, % 21.0 25.8 21.6 22.6 25.9 27.2Equity ratio, % 40.6 39.2 47.3 44.4 42.2 38.9Interest-bearing net debt, EUR million 164.6 38.0 109.7 136.4 103.3 -21.3Gearing, % 39.8 9.5 22.5 30.6 24.7 -5.3Capital expenditure, EUR million 21.0 9.3 24.4 16.0 11.8 9.4Acquisitions, EUR million - - 0.3 37.3 - -
Income statement, EUR million
20174–6
20171–3
201610–12
20167–9
20164–6
20161–3
Net sales 385.5 393.2 403.6 340.5 381.0 367.5Other operating income 4.3 3.1 7.6 5.2 2.8 4.2Employee benefit expenses -223.9 -239.8 -216.2 -183.1 -213.8 -214.0Depreciation, amortization and impairment charges -13.6 -13.7 -13.9 -13.6 -13.1 -13.3Other operating expenses -124.8 -121.6 -137.1 -114.7 -125.5 -116.5Share of profit from investments accounted for using theequity method 0.7 0.7 1.1 0.8 0.9 0.4Operating profit (EBIT) 28.2 21.9 45.1 35.1 32.3 28.3Financial income and expenses -0.6 -1.0 -0.8 -1.0 -1.6 -0.6Profit before taxes 27.6 20.9 44.3 34.1 30.7 27.7Income taxes -6.6 -5.2 -10.1 -6.8 -6.5 -6.2Net profit for the period 21.0 15.7 34.2 27.3 24.2 21.5

Interim Report 2/2017 33
© 2017Tieto Corporation
Balance sheet, EUR million
201730 Jun
201731 Mar
201631 Dec
201630 Sep
201630 Jun
201631 Mar
Goodwill 405.0 409.5 409.7 414.0 383.5 385.2
Other intangible assets 50.5 47.3 52.3 50.0 39.5 40.1
Property, plant and equipment 97.1 94.1 94.0 79.7 79.0 79.9
Investments accounted for using the equity method 14.4 13.8 16.5 15.4 14.6 13.7
Other non-current assets 31.1 32.2 32.8 37.1 36.0 37.1
Total non-current assets 598.1 596.9 605.3 596.2 552.6 556.0
Trade receivables and other current assets 421.9 417.4 412.5 389.6 402.9 403.9
Cash and cash equivalents 51.3 76.9 56.7 71.7 93.2 144.6
Total current assets 473.2 494.3 469.2 461.3 496.1 548.5
Total assets 1 071.3 1 091.2 1 074.5 1 057.5 1 048.7 1 104.5
Total equity 413.2 401.1 488.1 446.2 417.7 401.7
Non-current loans 103.7 104.0 103.8 104.1 104.4 104.7
Other non-current liabilities 53.6 55.3 54.4 56.4 54.6 53.0
Total non-current liabilities 157.3 159.3 158.2 160.5 159.0 157.7
Trade payables and other current liabilities 368.1 495.8 348.1 330.9 360.3 500.3
Provisions 16.0 18.3 11.5 9.1 12.1 18.2
Current loans 116.7 16.7 68.6 110.8 99.6 26.6
Total current liabilities 500.8 530.8 428.2 450.8 472.0 545.1
Total equity and liabilities 1 071.3 1 091.2 1 074.5 1 057.5 1 048.7 1 104.5

Interim Report 2/2017 34
© 2017Tieto Corporation
Cash flow, EUR million
20174–6
20171–3
201610–12
20167–9
20164–6
20161–3
Cash flow from operations
Net profit 21.0 15.7 34.2 27.3 24.2 21.5
Adjustments 20.6 19.1 19.4 20.0 17.6 21.0
Change in net working capital -36.0 47.2 4.4 -26.5 -47.3 17.8
Cash generated from operations 5.6 82.0 58.0 20.8 -5.5 60.3
Net financial expenses paid -5.6 0.6 1.1 -0.9 -2.0 -0.8Dividends received from investments accounted for usingthe equity method - 3.5 - - - 3.8
Income taxes paid -6.1 -6.4 -8.9 -6.1 -6.2 -16.4
Net cash flow from operations -6.1 79.7 50.2 13.8 -13.7 46.9
Net cash used in investing activities -15.4 -9.6 -23.6 -45.8 -11.9 -10.1
Net cash used in financing activities -6.0 -51.7 -42.5 10.9 -25.9 -46.7
Change in cash and cash equivalents -27.5 18.4 -15.9 -21.1 -51.5 -9.9
Cash and cash equivalents at the beginning of period 76.9 56.7 71.7 93.2 144.6 156.2
Foreign exchange differences 1.9 1.8 0.9 -0.4 0.1 -1.7
Change in cash and cash equivalents -27.5 18.4 -15.9 -21.1 -51.5 -9.9
Cash and cash equivalents at the end of period 51.3 76.9 56.7 71.7 93.2 144.6

Interim Report 2/2017 35
© 2017Tieto Corporation
Quarterly figures by segments
Customer sales by service line, EUR million
20174–6
20171–3
201610–12
20167–9
20164–6
20161–3
Technology Services and Modernization 194 198 197 179 196 190
Business Consulting and Implementation 38 39 38 30 37 35
Industry Solutions 122 125 138 106 117 113
Product Development Services 31 32 31 26 31 29
Group total 386 393 404 341 381 367
Customer sales by industry group, EUR million
20174–6
20171–3
201610–12
20167–9
20164–6
20161–3
Financial Services 97 96 101 88 93 88
Public, Healthcare and Welfare 127 128 135 106 120 118
Industrial and Consumer Services 132 138 137 121 138 132
Product Development Services 31 32 31 26 31 29
Group total 386 393 404 341 381 367

Interim Report 2/2017 36
© 2017Tieto Corporation
Operating profit (EBIT) by service line, EUR million
20174–6
20171–3
201610–12
20167–9
20164–6
20161–3
Technology Services and Modernization 20.5 14.5 26.2 24.2 20.9 17.7
Business Consulting and Implementation 2.6 2.2 2.0 -0.2 1.2 1.1
Industry Solutions 9.3 6.3 19.7 13.0 11.1 11.5
Product Development Services 2.4 4.2 3.3 1.7 3.3 2.6
Support Functions and Global Management -6.6 -5.3 -6.2 -3.5 -4.2 -4.6
Operating profit (EBIT) 28.2 21.9 45.1 35.1 32.3 28.3
Operating margin (EBIT) by service line, %
20174–6
20171–3
201610–12
20167–9
20164–6
20161–3
Technology Services and Modernization 10.5 7.3 13.3 13.5 10.6 9.4
Business Consulting and Implementation 7.0 5.7 5.3 -0.6 3.3 3.2
Industry Solutions 7.6 5.0 14.3 12.3 9.5 10.1
Product Development Services 7.6 13.1 10.6 6.4 10.7 9.0
Operating margin (EBIT) 7.3 5.6 11.2 10.3 8.5 7.7
Adjusted operating profit (EBIT) by service line, EUR million
20174–6
20171–3
201610–12
20167–9
20164–6
20161–3
Technology Services and Modernization 23.1 21.5 27.7 24.0 21.3 19.4
Business Consulting and Implementation 1.5 2.8 0.7 -1.5 1.2 1.3
Industry Solutions 11.0 9.9 21.5 13.2 12.8 11.7
Product Development Services 2.6 4.3 3.5 1.7 3.4 2.4
Support Functions and Global Management -2.6 -3.1 -4.0 -2.0 -2.8 -3.4
Adjusted operating profit (EBIT) 35.6 35.4 49.5 35.4 35.8 31.5
Adjusted operating margin (EBIT) by service line, %
20174–6
20171–3
201610–12
20167–9
20164–6
20161–3
Technology Services and Modernization 11.9 10.9 14.1 13.4 10.8 10.2
Business Consulting and Implementation 4.0 7.1 1.8 -4.9 3.3 3.7
Industry Solutions 9.0 8.0 15.5 12.5 10.9 10.4
Product Development Services 8.3 13.6 11.3 6.5 11.1 8.4
Adjusted operating margin (EBIT) 9.2 9.0 12.3 10.4 9.4 8.6

Interim Report 2/2017 37
© 2017Tieto Corporation
Major shareholders on 30 June 2017Shares %
1 Cevian Capital *) 11 066 684 14.9
2 Solidium Oy 7 415 418 10.0
3 Silchester International Investors LLP **) 7 401 027 10.0
4 Swedbank Robur fonder 1 860 655 2.5
5 Ilmarinen Mutual Pension Insurance Co. 1 682 598 2.3
6 Elo Pension Co. 838 648 1.1
7 The State Pension fund 773 000 1.0
8 Svenska litteratursällskapet i Finland r.f. 541 345 0.7
9 OP-Finland Small Firms Fund 450 736 0.6
10 Tieto Oyj 386 127 0.5
Top 10 shareholders total 32 416 238 43.7
- of which nominee registered 20 328 366 27.4
Nominee registered other 14 465 350 19.5
Others 27 227 664 36.7
Total 74 109 252 100.0
Based on the ownership records of Euroclear Finland Oy and Euroclear Sweden AB.
*) Based on the ownership records of Euroclear Finland Oy, Cevian Capital's holding on 31 March 2017 was 11 066 684 shares,representing 14.9 % of the shares and voting rights.
**) On 23 June 2015, Silchester International Investors LLP announced that its holding in Tieto Corporation was 7 401 027 shares, whichrepresents 10.0% of the shares and voting rights.
For further information, please contact:
Lasse Heinonen, CFO, tel. +358 2072 66329, +358 50 393 4950, lasse.heinonen (at) tieto.comTanja Lounevirta, Head of Investor Relations, tel. +358 2072 71725, +358 50 321 7510, tanja.lounevirta (at) tieto.com

Interim Report 2/2017 38
© 2017Tieto Corporation
A teleconference for analysts and media will be held on Friday 21 July 2017 at 10.00 am EET (9.00 am CET, 8.00 amUK time). Analysts and media are also welcome to participate in the conference at Tieto’s office in Espoo, address:Keilalahdentie 2-4.
Kimmo Alkio, President and CEO, and Lasse Heinonen, CFO, will present the results online in English. Thepresentation can be followed on Tieto's website, for which attendees need Adobe Flash plugin version 10.1.0 ornewer. The teleconference details can be found below.
Teleconference numbersFinland: +358 (0)9 7479 0361Sweden: +46 (0)8 5033 6574UK: +44 (0)330 336 9105US: +1 719 457 1036Conference code: 4404154
To ensure that you are connected to the conference call, please dial in a few minutes before the start of the press andanalyst conference. The teleconference is recorded and it will be available on demand later during the day.
Tieto publishes its financial information in English and Finnish.
TIETO CORPORATION
DISTRIBUTIONNASDAQ HelsinkiPrincipal Media
Tieto aims to capture the significant opportunities of the data-driven world and turn them into lifelong value for people,business and society. We aim to be customers’ first choice for business renewal by combining our software and servicescapabilities with a strong drive for co-innovation and ecosystems.
Headquartered in Finland, Tieto has over 13 000 experts in close to 20 countries. Tieto’s turnover is approximately EUR1.5 billion and shares listed on NASDAQ in Helsinki and Stockholm. www.tieto.com.
Tieto CorporationBusiness ID: 0101138-5
Keilahdentie 2-4PO Box 2FI-02101 ESPOO, FINLANDTel +358 207 2010Registered office: Espoo
E-mail: ir (at) tieto.comwww.tieto.com
Copyright © 2022 FDOKUMEN