ASX Announcement – Metcash Limited FY22 Full Year Results
95
METCASH LIMITED ABN 32 112 073 480 1 THOMAS HOLT DRIVE MACQUARIE PARK NSW 2113 AUSTRALIA PO BOX 557 MACQUARIE PARK NSW 1670 AUSTRALIA PHONE: 02 9741 3000 FAX: 02 9741 3399 WEB: www.metcash.com 27 June 2022 Market Announcements Office Australian Securities Exchange Limited 20 Bridge Street Sydney NSW 2000 Dear Sir/Madam METCASH LIMITED - FY22 FULL YEAR RESULTS AND FINANCIAL REPORT In accordance with ASX Listing Rule 4.3A, please find attached the following documents for release to the market: (a) Announcement – Metcash Limited FY22 Full Year Results (b) Appendix 4E and Financial Report (including the Directors’ Report and Independent Auditor’s Report) of Metcash Limited and its controlled entities for the year ended 30 April 2022. Yours faithfully Julie Hutton Company Secretary
-
Upload
khangminh22 -
Category
Documents
-
view
2 -
download
0
Transcript of ASX Announcement – Metcash Limited FY22 Full Year Results

METCASH LIMITED ABN 32 112 073 480
1 THOMAS HOLT DRIVE MACQUARIE PARK NSW 2113 AUSTRALIA
PO BOX 557 MACQUARIE PARK NSW 1670 AUSTRALIA
PHONE: 02 9741 3000 FAX: 02 9741 3399 WEB: www.metcash.com
27 June 2022 Market Announcements Office Australian Securities Exchange Limited 20 Bridge Street Sydney NSW 2000 Dear Sir/Madam METCASH LIMITED - FY22 FULL YEAR RESULTS AND FINANCIAL REPORT In accordance with ASX Listing Rule 4.3A, please find attached the following documents for release to the market: (a) Announcement – Metcash Limited FY22 Full Year Results (b) Appendix 4E and Financial Report (including the Directors’ Report and Independent
Auditor’s Report) of Metcash Limited and its controlled entities for the year ended 30 April 2022.
Yours faithfully
Julie Hutton Company Secretary

1
27 June 2022
ASX Announcement – Metcash Limited FY22 Full Year Results
Metcash Limited (ASX:MTS) today released its financial results for the full year ended 30 April 2022.
Highlights
• Continued growth on exceptional FY21 results despite significant external challenges
• Strong sales and earnings in all Pillars underpinned by sustained shift in consumer behaviour and success of
MFuture initiatives
• Group revenue up 5.9% to $15.2bn, and including charge-through1 by 6.4% to $17.4bn (2yr +17.2%)
• Group underlying EBIT up 17.7% to $472.3m (2yr +41.0%)
• Underlying profit after tax up 18.6% to $299.6m2 (2yr +50.7%)
• Statutory profit after tax up 2.7% to $245.4m
• Underlying earnings per share up 23.5% to 30.5 cents (2yr +39.9%)
• Strong operating cashflow of $432.3m (cash realisation ratio 90.9%)
• Significant return to shareholders – dividends and buy-back ~$400m
• Total dividends for FY22 up ~23% to 21.5 cents per share (2yr +72.0%)
• Strategic acquisitions delivered accretive returns
• Balance sheet strength with financing flexibility
• Further improvement in ESG credentials
• Long term supply agreements with Australian United Retailers (Foodworks) and Drakes Supermarkets in QLD
• Strong sales momentum has continued into FY23
Commentary
Group CEO, Doug Jones said: “I am pleased to be presenting Metcash’s FY22 results, my first as Group CEO. The results are outstanding, another record year, and represent continued progress on the exceptional performance in FY21.
“At the outset I would like to thank Jeff Adams for his stewardship of the Company and his assistance in my transition into the Group CEO role earlier this year.
“Record sales growth led to a significant increase in underlying earnings and returns to shareholders.
“The FY22 results were underpinned by the success of our MFuture initiatives designed to further improve the competitiveness of our retail network, continuation of the local neighbourhood shopping trend and the success of recent strategic acquisitions.
Metcash Limited ABN 32 112 073 480
1 Thomas Holt Drive
Macquarie Park
NSW 2113 Australia

2
“The number of external challenges increased in the second half and our supply chain and retail operations, both our own and those of our retail partners, exhibited significant resilience and flexibility. There were more lockdowns due to the Omicron COVID variant, major supply chain challenges, flooding in South Australia, New South Wales and Queensland which resulted in supply route disruptions, and towards the end of the financial year challenges related to Russia’s invasion of Ukraine and lockdowns in China.
“A strategic investment in inventory, the flexibility of our operations and the outstanding efforts of our people helped our retailers to keep their shelves stocked and continue serving their local communities through these challenges. A testament to our people and independent retailers is that our focus on keeping shelves stocked did not materially hinder the continued successful execution of our MFuture initiatives.
“Our retail networks in Food, Hardware and Liquor all continued to perform well, further strengthening the health of our independent retail networks. On a two-year basis, like-for-like (LfL) sales increased ~15% in the IGA retail network, ~28% across Hardware’s IHG and Total Tools retail networks and ~24% in the IBA Liquor network. Importantly, retailers are increasingly reinvesting in their stores, further improving the quality of their network primarily through the various store upgrade programs we support.
“We also further strengthened relationships with our independent retailers and were pleased to recently announce long term agreements to continue supplying Foodworks stores and Drakes Supermarkets in Queensland.
“Good progress has been made on a wide range of digital initiatives, including progressing the rollout of new eCommerce platforms in the Food and Liquor networks. In Food, we now have ~190 stores using our IGA Shop Online platform, and sales through our leading platforms in IHG and Total Tools now represent ~6% of total network sales in Hardware.
“Project Horizon, our technology transformation program aimed at resetting our core technology and making it easier to do business with us, has continued to progress with transition to a new core financial system successfully completed in the year.
“Our range of ESG projects has expanded substantially reflecting the inclusion of sustainability as a core component of Metcash’s vision. Pleasingly, this has been reflected in a further improvement in our ESG credentials with our DJSI ranking improving to 21 and the 69th percentile.
“The Group’s significant lift in earnings and strong financial position led to a ~23% increase in total dividends for FY22, representing a 72% increase on a two-year basis.
“Importantly, sales momentum has continued into FY23 with Group sales up ~9% in the first seven weeks of the year and growth in all pillars, partly buoyed by the impact of inflation.
“While remaining focused on managing the supply change challenges, we are also helping shoppers manage the impact of inflation by providing better value options through a wider range of products at competitive prices.
“Going forward, our robust business model is supporting our pillars to manage well through the ongoing challenges, and we remain well positioned with a strong balance sheet and financial flexibility to continue progressing our MFuture plans,” Mr Jones said.
Results Overview
Group reported revenue, which excludes charge-through sales1, increased 5.9% to $15.2bn (FY21: $14.3bn). Including charge-through sales1, Group revenue increased 6.4% to $17.4bn (FY21: $16.4bn), with significant underlying growth in each pillar, building on the exceptional sales performance in the prior corresponding year.

3
Group underlying EBIT increased 17.7% to $472.3m reflecting the robust sales performance and the success of recent strategic acquisitions, partly offset by increased costs related to COVID and supply chain challenges. On a two-year basis, Group underlying EBIT increased 41.0%.
The Food pillar continued to perform well delivering EBIT growth of 4.1%, or ~17% after adjusting for the adverse impact of 7-Eleven3, a decline in the contribution from the resolution of onerous lease obligations and there being no tobacco excise increase in FY22.
In Hardware, EBIT increased a substantial 40.7% reflecting earnings growth in both IHG and Total Tools, buoyed by elevated residential construction activity and the increased contribution from majority-owned company and joint venture stores in IHG and Total Tools.
In Liquor, EBIT increased 9.8% reflecting the continued robust demand in the retail network and a recovery in on-premise sales following the easing of COVID-related trading restrictions.
Group underlying profit after tax2 increased 18.6% to $299.6m, and statutory profit after tax increased 2.7% to $245.4m. Underlying earnings per share increased 23.5% to 30.5 cents reflecting the increase in profit after tax and the accretive benefit of the Company’s $200m share buy back completed in August last year.
Group operating cashflow was $432.3m (FY21: $475.5m) with the cash realisation ratio ~91%, in line with our historical guidance. The operating cashflow in FY22 has been achieved after an increase in working capital, including a strategic investment in inventory to keep our retailers adequately stocked through the supply chain challenges experienced in the year, and the impact of ‘significant items’.
The Group ended the financial year with net debt of $189.0m (FY21: net cash $124.6m) reflecting the impact of ~$400m of shareholder distributions including the share buy back and an increase in dividends paid, as well as the strategic investment in inventory.
The Group’s significant lift in earnings and strong financial position led to a ~23% increase in total dividends for FY22 to 21.5 cents per share, fully franked. This represents a ~72% increase in total dividends on a two year basis.
Review of Trading Results
Food
Total Food sales (including charge-through1) increased 1.4% to $9.5bn, or 2.0% on a normalised basis4 (+13.4% 2yr normalised4). Excluding tobacco, total Food sales (including charge-through1) increased 5.4% or 3.8% on a normalised4 basis (+11.9% 2yr normalised4).
Supermarkets sales increased 3.9% or 1.9% on a normalised4 basis (+13.8% 2yr normalised4). Like for Like (LfL) sales5 in the IGA network increased 2.9% (+14.6% 2yr basis) with continued support from shoppers rediscovering the convenience of local neighbourhood shopping and the improved competitiveness of the network. This has been underpinned by the success of our MFuture initiatives including the Network of the Future and Diamond Store Accelerator programs.
The strongest sales growth (ex tobacco) was in states less impacted by COVID-related restrictions (Western Australia and Queensland).
The business went to extraordinary lengths to keep its retailers’ shelves adequately stocked through significant supply chain and operational disruptions, as well as elevated and unpredictable demand. Initiatives such as a strategic investment in inventory, operating 7-day shift patterns in large distribution centres, re-routing supply points around logistics blockages, re-deploying staff to support our logistics operations and working closely with our suppliers, government and industry all helped support the strong performance of our IGA network.
Sales momentum in Supermarkets accelerated in the fourth quarter of FY22 increasing 13.8% or 5.8% normalised4 (+9.6% ex tobacco normalised4). LfL sales5 in the IGA network increased 6.3% (normalised) in the same period, reflecting market share gains and the impact of inflation.
4
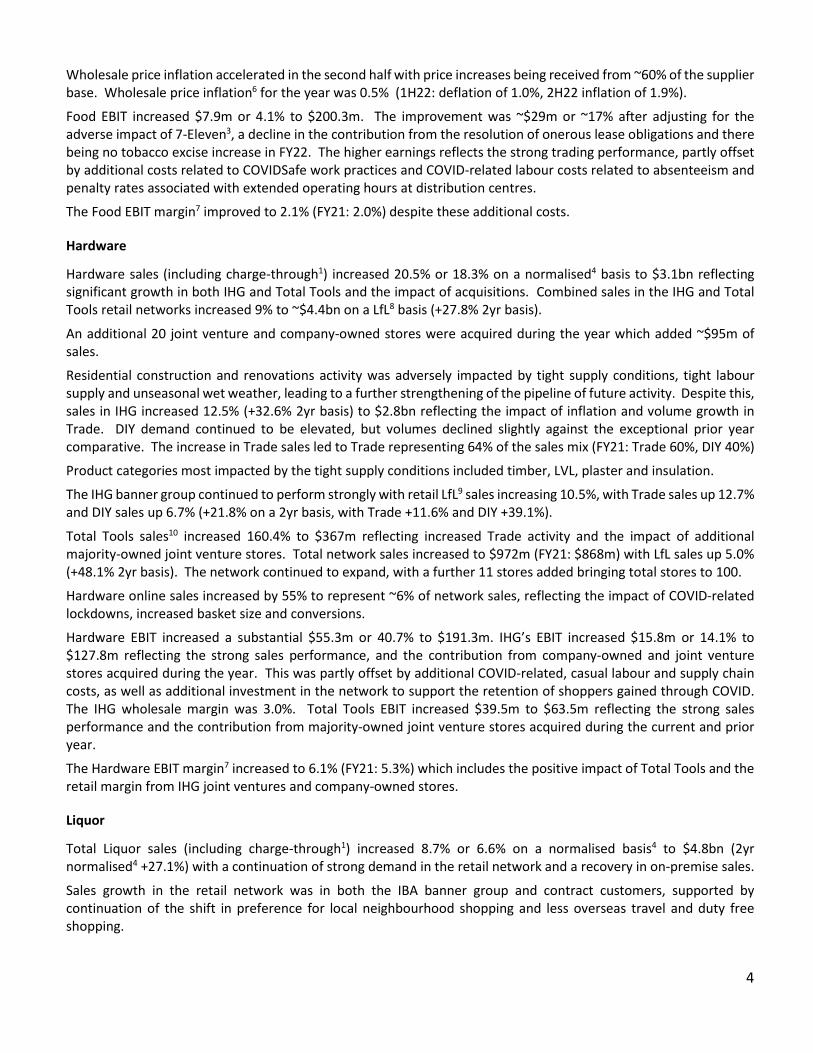
Wholesale price inflation accelerated in the second half with price increases being received from ~60% of the supplier base. Wholesale price inflation6 for the year was 0.5% (1H22: deflation of 1.0%, 2H22 inflation of 1.9%).
Food EBIT increased $7.9m or 4.1% to $200.3m. The improvement was ~$29m or ~17% after adjusting for the adverse impact of 7-Eleven3, a decline in the contribution from the resolution of onerous lease obligations and there being no tobacco excise increase in FY22. The higher earnings reflects the strong trading performance, partly offset by additional costs related to COVIDSafe work practices and COVID-related labour costs related to absenteeism and penalty rates associated with extended operating hours at distribution centres.
The Food EBIT margin7 improved to 2.1% (FY21: 2.0%) despite these additional costs.
Hardware
Hardware sales (including charge-through1) increased 20.5% or 18.3% on a normalised4 basis to $3.1bn reflecting significant growth in both IHG and Total Tools and the impact of acquisitions. Combined sales in the IHG and Total Tools retail networks increased 9% to ~$4.4bn on a LfL8 basis (+27.8% 2yr basis).
An additional 20 joint venture and company-owned stores were acquired during the year which added ~$95m of sales.
Residential construction and renovations activity was adversely impacted by tight supply conditions, tight labour supply and unseasonal wet weather, leading to a further strengthening of the pipeline of future activity. Despite this, sales in IHG increased 12.5% (+32.6% 2yr basis) to $2.8bn reflecting the impact of inflation and volume growth in Trade. DIY demand continued to be elevated, but volumes declined slightly against the exceptional prior year comparative. The increase in Trade sales led to Trade representing 64% of the sales mix (FY21: Trade 60%, DIY 40%)
Product categories most impacted by the tight supply conditions included timber, LVL, plaster and insulation.
The IHG banner group continued to perform strongly with retail LfL9 sales increasing 10.5%, with Trade sales up 12.7% and DIY sales up 6.7% (+21.8% on a 2yr basis, with Trade +11.6% and DIY +39.1%).
Total Tools sales10 increased 160.4% to $367m reflecting increased Trade activity and the impact of additional majority-owned joint venture stores. Total network sales increased to $972m (FY21: $868m) with LfL sales up 5.0% (+48.1% 2yr basis). The network continued to expand, with a further 11 stores added bringing total stores to 100.
Hardware online sales increased by 55% to represent ~6% of network sales, reflecting the impact of COVID-related lockdowns, increased basket size and conversions.
Hardware EBIT increased a substantial $55.3m or 40.7% to $191.3m. IHG’s EBIT increased $15.8m or 14.1% to $127.8m reflecting the strong sales performance, and the contribution from company-owned and joint venture stores acquired during the year. This was partly offset by additional COVID-related, casual labour and supply chain costs, as well as additional investment in the network to support the retention of shoppers gained through COVID. The IHG wholesale margin was 3.0%. Total Tools EBIT increased $39.5m to $63.5m reflecting the strong sales performance and the contribution from majority-owned joint venture stores acquired during the current and prior year.
The Hardware EBIT margin7 increased to 6.1% (FY21: 5.3%) which includes the positive impact of Total Tools and the retail margin from IHG joint ventures and company-owned stores.
Liquor
Total Liquor sales (including charge-through1) increased 8.7% or 6.6% on a normalised basis4 to $4.8bn (2yr normalised4 +27.1%) with a continuation of strong demand in the retail network and a recovery in on-premise sales.
Sales growth in the retail network was in both the IBA banner group and contract customers, supported by continuation of the shift in preference for local neighbourhood shopping and less overseas travel and duty free shopping.

5
Wholesale sales to the IBA banner group increased 4.4% (+28.1% 2yr basis) with all brands performing well, particularly the Bottle-O, Cellarbrations and IGA Liquor. RTDs, spirits and wine continued to be the strongest growth categories. Retail LfL sales11 in the IBA banner group increased 2.5% (+24.0% 2yr basis).
Sales to on-premise customers continued to recover with the easing of COVID-related restrictions, increasing 30% compared with the prior corresponding year.
Sales growth across states was strongest in Western Australia, which has been least impacted by COVID-related restrictions.
Liquor EBIT increased $8.7m or 9.8% to $97.4m reflecting the contribution from the increase in sales volumes, which more than offset an increased weighting of the on-premise channel in the sales mix, as well as higher costs associated with the impact of COVIDSafe work practices, COVID-related costs associated with absenteeism, and higher freight costs related to route disruptions and increased fuel costs. The EBIT margin7 for Liquor was in line with the prior comparative period at 2.0% despite the additional costs.
Financial Position
Group operating cashflow was $432.3m (FY21: $475.5m) with a cash realisation ratio of ~91%, in line with our historical guidance. The operating cashflow in FY22 has been achieved after an increase in working capital, including a strategic investment in inventory to keep our retailers adequately stocked through the supply chain challenges experienced in the year, and the adverse impact of ‘significant items’.
The Group had net investing outflows12 of $223.8m, including capital expenditure of $121.7m (~50% growth), and acquisitions of businesses of $114.8m. The business acquisitions were predominantly in the Hardware pillar and included the purchase of an additional 15% stake in Total Tools Holdings which increased Metcash’s holding to 85%, and the addition of a further 15 Total Tools joint venture stores.
The Group ended the financial year with net debt of $189.0m (FY21: net cash $124.6m) reflecting the impact of the ~$400m of shareholder distributions from the share buy back and increase in dividends paid, as well as the strategic investment in inventory.
Dividends
The Board has determined to pay a final dividend of 11.0 cents per share, bringing total dividends for FY22 to 21.5 cents per share, an increase of 22.9% on the prior corresponding year (+72% 2yr basis). The increase in FY22 reflects the Groups higher earnings and strong financial position.
Outlook
Group
Strong sales momentum has continued in all pillars in the first seven weeks of FY23 supported by the increased preference for local neighbourhood shopping and the improved competitiveness of our independent retail networks.
While elevated inflation has continued into 1H23, there is uncertainty over the level of inflation going forward, as well as how the impact of inflation and other cost of living increases may impact consumer behaviour in the retail networks of our pillars, and Metcash.
We are continuing to work closely with our suppliers and retailers to help shoppers manage the impact of inflation by providing better value options through offering a wider range of products at competitive prices.
Supply chain challenges, increased DC labour and COVID-related costs are continuing and may remain a reality for all pillars over FY23. Underpinned by the flexibility of our operating model and dedication of our teams, all pillars are

6
continuing to manage well through the current challenges and remain focused on progressing their MFuture initiatives to further improve the competitiveness of our retail networks.
Sales update – first 7 weeks of FY23
Total Group sales increased 8.6% with growth reported in all pillars.
In Food, total sales increased 5.0% (+7.7% ex tobacco) compared with the prior corresponding period reflecting strong demand in both the Supermarkets and Convenience businesses. Supermarkets sales increased 4.5% (+7.4% ex tobacco) with continuation of the increased momentum experienced in Q4 FY22 and higher wholesale price inflation.
In Hardware, total sales increased 19.8% compared with the prior corresponding period, representing continued strong demand in IHG and Total Tools and the impact of higher inflation. IHG sales increased 10.4%. Strong demand and global supply chain challenges are continuing to place pressure on the availability of some product categories, and there continues to be a solid pipeline of residential construction and renovations activity.
In Liquor, total sales increased 8.6% compared with the prior corresponding period reflecting continuation of strong demand across retail stores and a recovery in on-premise sales. Wholesale sales to the IBA retail banner group increased 2.7%.
This announcement is authorised by a Committee of the Board of Directors of Metcash Limited.
ends
For further information:
Steve Ashe Merrin Hodge
Head of Corporate Affairs and Investor Relations Investor Relations Manager
Metcash Limited Metcash Limited
Mob: +61 (0)408 164 011 Mob: +61 (0)429 235 104
1 Direct sales from suppliers to retailers, invoiced through Metcash 2 Underlying profit after tax excludes significant items: put option valuation and business acquisition costs of $27.6m, Project
Horizon implementation costs of $22.0m, and other costs of $4.6m (all post tax) 3 The previous east coast supply agreement with 7-Eleven concluded on 17 August 2020. To enable comparison, sales in the
comparative period have been adjusted to exclude sales to 7-Eleven 4 Normalised sales have been adjusted to exclude the impact of the 53rd trading week, and in the Food pillar, also sales to
Drakes and 7-Eleven in the relevant sales period as appropriate 5 Based on scan data from 1,173 IGA stores 6 Excludes tobacco and produce 7 EBIT margin: EBIT/Total revenue (including charge-through) 8 Includes a combination of scan sales and estimates based on wholesale data 9 Based on a sample of 323 network stores that provide scan data (representing >70% sales) 10 Total Tools sales include exclusive brand sales, franchisee fees, joint venture and company-owned store sales and other
services 11 Based on scan data from 480 stores 12 The payment for acquisition of non-controlling interest of $59.4m relating to the 15% step acquisition of Total Tools
Holdings is presented as part of ‘Cash flows from financing activities’ in the Statement of Cash Flows in the Statutory Financial Report

This Appendix 4E should be read in conjunction with the Metcash Financial Report for the year ended 30 April 2022.
Metcash Limited | Appendix 4E
METCASH GROUP METCASH LIMITED (ABN 32 112 073 480) AND ITS CONTROLLED ENTITIES
APPENDIX 4E FOR THE YEAR ENDED 30 APRIL 2022 RESULTS FOR ANNOUNCEMENT TO THE MARKET
FY22
$m
FY21
$m
Variance
$m
Variance
%
Sales revenue 15,164.8 14,315.3 849.5 5.9
Underlying earnings before interest, tax, depreciation and
amortisation (EBITDA)
648.2 565.1 83.1 14.7
Depreciation and amortisation (175.9) (163.7) (12.2) (7.5)
Underlying earnings before interest and tax (‘EBIT’) 472.3 401.4 70.9 17.7
Net finance costs (48.5) (42.6) (5.9) (13.8)
Underlying profit before tax 423.8 358.8 65.0 18.1
Tax expense on underlying profit (122.5) (103.7) (18.8) (18.1)
Non-controlling interests (1.7) (2.4) (0.7) (29.2)
Underlying profit after tax (‘UPAT’) (i) 299.6 252.7 46.9 18.6
Significant items (65.6) (17.0) (48.6) (285.9)
Tax benefit attributable to significant items 11.4 3.3 8.1 245.5
Net profit for the year attributable to members 245.4 239.0 6.4 2.7
Underlying earnings per share (cents) (ii) 30.5 24.7 5.8 23.5
Reported earnings per share (cents) 25.0 23.4 1.6 6.8
(i) UPAT is defined as reported profit after tax attributable to equity holders of the parent, excluding significant items identified in
Note 3.3 of Metcash’s FY22 Financial Report.
(ii) Underlying earnings per share (EPS) is calculated by dividing UPAT by the weighted average number of ordinary shares outstanding during the year.
EXPLANATORY NOTE ON RESULTS
Group reported revenue, which excludes charge-through sales1, increased 5.9% to $15.2 billion (FY21: $14.3 billion).
Including charge-through sales1, Group revenue increased 6.4% to $17.4 billion (FY21: $16.4 billion), with significant
underlying growth in each pillar, building on the exceptional sales performance in the prior corresponding year.
Group underlying EBIT increased 17.7% to $472.3 million reflecting the robust sales performance and the success of recent
strategic acquisitions, partly offset by increased costs related to COVID and supply chain challenges. On a two-year basis,
Group underlying EBIT increased 41.0%.
The Food pillar continued to perform well delivering EBIT growth of 4.1%, or ~17% after adjusting for the adverse impact of
7-Eleven2, a decline in the contribution from the resolution of onerous lease obligations and there being no tobacco excise
increase in FY22.
In Hardware, EBIT increased a substantial 40.7% reflecting earnings growth in both IHG and Total Tools, buoyed by elevated
residential construction activity and the increased contribution from majority-owned company and joint venture stores in
IHG and Total Tools.
In Liquor, EBIT increased 9.8% reflecting the continued robust demand in the retail network and a recovery in on-premise
sales following the easing of COVID-related trading restrictions.
Group underlying profit after tax3 increased 18.6% to $299.6 million, and statutory profit after tax increased 2.7% to $245.4
million. Underlying earnings per share increased 23.5% to 30.5 cents reflecting the increase in profit after tax and the
accretive benefit of the Company’s $200 million share buyback completed in August last year.

APPENDIX 4E (CONTINUED) FOR THE YEAR ENDED 30 APRIL 2022
This Appendix 4E should be read in conjunction with the Metcash Financial Report for the year ended 30 April 2022.
Metcash Limited | Appendix 4E
DIVIDENDS ON ORDINARY SHARES
On 27 June 2022, the Board determined to pay a fully franked FY22 final dividend of 11.0 cents per share, sourced from the
profit reserve established by Metcash Limited (Parent Company), with a record date of 13 July 2022 and payable in cash on
10 August 2022. The Dividend Reinvestment Plan remains suspended with effect from 26 June 2017.
OTHER DISCLOSURES
Net tangible assets4 backing
At 30 April 2022, the net tangible assets was 30.2 cents per share (FY21: 55.0 cents per share).
Entities where control has been gained or lost
In FY22, Total Tools acquired ownership interests of between 51% and 60% in fifteen Total Tools independent retail stores for
$37.5 million. Accordingly, Metcash holds an effective ownership interest of between 43% and 51% in these ‘JV Stores’.
Other than the above, there were no changes in control that were material to the Group. Refer Note 6.1 of Metcash’s FY22
Financial Report for further details.
Subsequent events
In May 2022, Metcash announced that it entered into an agreement with Australian United Retailers Limited (AUR) to supply
its national network of supermarkets and convenience stores, including its FoodWorks bannered supermarkets, for a further
five-year period, commencing 1 July 2022. In addition, the Group also announced that it extended the term of its agreement
to supply Drakes Supermarkets stores in Queensland for a further five years, up to 3 June 2029.
On 27 June 2022, Metcash announced that it has signed a long-term lease agreement with the Goodman Group for the
construction and leasing of a new ‘best in class’ wholesale Distribution Centre (DC) at Truganina, Victoria. The new ~115,000m²
DC, which will replace Metcash’s existing ~90,000m² DC at Laverton, is expected to help further improve the competitiveness
of our independent retailers in Victoria through delivery of greater efficiencies and by providing access to a wider range of
products. It is also expected to benefit local suppliers by providing an efficient route to market through access to Metcash’s
extensive distribution network. Construction of the DC is scheduled to commence in the first half of FY23, with completion
expected mid-2024.
Other than matters disclosed in this report, there were no events that have occurred after the end of the financial year that
would materially affect the reported results or would require disclosure in this report.
STATEMENT OF COMPLIANCE
This report is based on the consolidated financial report of Metcash Limited and its controlled entities which has been audited
by Ernst & Young. The financial report was lodged with the ASX on 27 June 2022.
Metcash Limited has a formally constituted audit committee.
On behalf of the Board
Doug Jones
Director
Sydney, 27 June 2022
1 Direct sales from suppliers to retailers, invoiced through Metcash.
2 The previous east coast supply agreement with 7-Eleven concluded on 17 August 2020. To enable comparison, sales in the comparative period have been
adjusted to exclude sales to 7-Eleven.
3 Underlying profit after tax excludes significant items: put option valuation and business acquisition costs of $27.6 million, Project Horizon implementation
costs of $22.0 million and other costs of $4.6 million (all post tax). 4 The calculation of the net tangible assets per share includes the right-of-use assets and lease liabilities.
DIRECTORS’ REPORT
1
Met
cash
Fin
anci
al R
epo
rt 2
022
FINANCIAL REPORT 2022
Metcash Limited (ABN 32 112 073 480) and its controlled entities
Supporting local

DIRECTORS’ REPORT
2
Met
cash
Fin
anci
al R
epo
rt 2
022
Met
cash
Fin
anci
al R
epo
rt 2
022
Met
cash
Fin
anci
al R
epo
rt 2
022
Your Directors submit their report of Metcash Limited (the ‘Company’) and its controlled entities (together the ‘Group’ or ‘Metcash’) for
the financial year ended 30 April 2022 (‘FY22’).
OPERATING AND FINANCIAL REVIEW
METCASH’S BUSINESS MODEL
Metcash is Australia’s leading wholesaler and distributor, supplying and supporting an extensive network of independent retailers which
form part of our bannered network and several other unbannered businesses across the food, liquor and hardware pillars. Metcash’s
retail customers operate some of Australia’s leading independent brands including: IGA, Foodland, Mitre 10, Home Hardware, Total
Tools, Cellarbrations, IGA Liquor and the Bottle-O. We help them to be the ‘Best Store in their Town’ by providing merchandising,
operational and marketing support.
Metcash operates a low-cost distribution model that enables independent retailers to compete against the vertically integrated retail
chains and other competitors. The Group’s core competencies include: procurement, logistics, marketing, retail development and retail
operational support. Metcash operates major distribution centres in all the mainland states of Australia which are complemented by a
number of smaller warehouses and a portfolio of corporate and joint venture stores.
The Group employs over 8,000 people and indirectly supports employment in the independent retail network.
STRATEGIC OBJECTIVES
Metcash’s purpose is ‘Championing successful independents’. Metcash’s vision includes:
− supporting independent retailers to be the best store in town;
− being passionate about independents;
− being a favourite place to work;
− being a business partner of choice for suppliers and independents;
− supporting thriving communities; and
− creating a sustainable future.
The strategic vision is underpinned by a number of programs and initiatives across the three pillars (Food, Liquor and Hardware) aimed
at supporting our independent retailers. These include store upgrade programs, new store formats and brand clarity, expanding private
label brands, core ranging and pricing, marketing support, accelerating eCommerce and system enhancements as well as training and
development programs for independent retailers.
The Group commenced the MFuture program at the beginning of FY20. This five-year program spans all pillars and support functions and
adopts a balanced approach to revenue growth and cost savings. The program has a strong focus on accelerating successful current
initiatives, following the shopper into new growth areas, improving the Group’s infrastructure to enable simpler and cheaper processes
and ensuring a sustainable cost base into the future. The program aims to deliver competitive and successful independent retail
networks across all pillars and match store formats to customers shopping missions.
KEY DEVELOPMENTS
Increase in ownership of Total Tools Holdings Pty Ltd (‘Total Tools’) and acquisition of Total Tools independent retail stores (‘JV Stores’)
In June 2021, Metcash acquired an additional 15% interest in Total Tools, increasing its ownership from 70% to 85%. Cash consideration
of $59.4 million was paid to the minority shareholders. Total Tools is the franchisor to the largest professional tools network in Australia
with 100 bannered stores across Australia as at 30 April 2022, and it is complementary to Metcash’s Independent Hardware Group.
During the year, Total Tools also acquired ownership interests of between 51% and 60% in fifteen Total Tools JV Stores for $37.5 million.
Put and call option arrangements exist which enable Metcash to acquire 100% of these businesses during the first quarter of FY25 and
FY26.
Further details are set out in note 6.1 of the financial report.
COVID-19 pandemic
The Group continues to be subject to COVID-19 related volatility and uncertainty in its trading environment and operations, as well as
from the dynamic economic landscape. In FY22, the Group recognised a $3.0 million impairment charge (FY21: $0.5 million reversal)
primarily in relation to certain inventory items that were impacted by COVID-19 related demand factors. As at balance date, total
provisions for COVID-19 impairments are $8.7 million (FY21: $10.7 million) as detailed in note 3.3 of the financial report.
DIRECTORS’ REPORT
3
Met
cash
Fin
anci
al R
epo
rt 2
022
Project Horizon implementation costs
In FY21, Metcash launched Project Horizon, aimed at driving further efficiencies through simplification, as well as growth through making
it easier to do business with Metcash. In addition to these aims, the first stage of this program will also include a focus on the Group’s
technical infrastructure consolidation and replacement, process efficiency foundations and better alignment of the Group’s
infrastructure across the pillars through the development of a single operating system across the Group. Metcash has delivered the first
component, with the core finance module having gone live in November 2021. The remaining components of the first stage are expected
to be progressively delivered through to completion, which is anticipated to occur by the end of calendar year 2023. In FY22, which was
the first full year of the project, the Group incurred $46.9 million (FY21: $17.3 million) of capital expenditure and $31.4 million (FY21: $7.9
million) of expenses on the project. The project expenses included resource costs, accelerated amortisation of legacy software assets
and incremental software licence and maintenance costs. These costs are separately disclosed within significant items in the Statement
of Comprehensive Income to enable a better understanding of the Group’s results.
Capital management initiatives
The Group completed an off-market buyback of 56,821,219 ordinary shares (or 5.6% of total shares in issue) for $200.0 million in August
2021. The ordinary shares were bought back at $3.52 per share, which represented a 14% discount to the Metcash market price of $4.10
(being the volume weighted average price of Metcash ordinary shares on the ASX over the five trading days up to and including 13 August
2021). The buyback comprised a fully franked dividend of $2.67 per share ($151.7 million) and a capital component of $0.85 per share
($48.3 million). These amounts, along with $0.4 million of transaction costs, were debited to the Company’s profit reserve and share
capital account, respectively. The shares bought back were subsequently cancelled.
Changes in key management personnel (KMP)
Doug Jones joined Metcash on 1 February 2022 and was appointed as Group Chief Executive Officer (CEO) and Executive Director on
11 March 2022. Jeff Adams remains in place as the retiring Group CEO to support Doug until Jeff’s retirement in October 2022.
Margaret Haseltine joined the Metcash Board as a Non-executive Director on 3 May 2021. Ms Haseltine joined the People & Culture
Committee and Nomination Committees from her appointment date.
Tonianne Dwyer retired from the Board on 30 June 2021.
Details of Directors’ experience and qualifications are included within this report.
Dividend declaration
The Board has determined to pay a fully franked final FY22 dividend of 11.0 cents per share, which together with the interim dividend of
10.5 cents per share, represent a full year dividend payout ratio of ~70% of underlying profit after tax.
KEY FINANCIAL MEASURES
Warehouse earnings
Metcash’s operations are designed to allow significant volumes to be distributed through its warehouse infrastructure at a relatively fixed
cost base. The ability to leverage volumes through the warehouse is a key driver of profitability for both Metcash and the independent
retail network.
In addition to warehouse revenue, earnings are impacted by product category mix and the proportion of the Group’s products bought by
the network. Warehouse revenue and related margins are driven by competitive pricing, promotional activities and the level of supplier
support through volumetric and other rebates.
Metcash also operates a portfolio of corporate and joint venture retail stores, predominantly in the Hardware pillar.
Metcash has a number of key programs in place to drive sales and margins, including through pricing and promotion, product range,
retail operational standards and consumer alignment.
Cost of doing business
The Group’s profitability depends on the efficiency and effectiveness of its operating model. This is achieved by optimising the Group’s
cost of doing business (‘CODB’) which comprises the various costs of operating the distribution centres, retail stores and the
administrative support functions. During FY22, the efficiency of the supply chain was impacted by global supply chain factors, COVID-19
Safe work practices which were implemented to align with local health regulations as well as significant weather events in Queensland,
New South Wales and South Australia.
The MFuture program includes initiatives aimed at both revenue growth and ensuring the Group has a sustainable cost base.

DIRECTORS’ REPORT
4
Met
cash
Fin
anci
al R
epo
rt 2
022
Met
cash
Fin
anci
al R
epo
rt 2
022
Met
cash
Fin
anci
al R
epo
rt 2
022
Funds employed and return on capital
The Group’s funds employed is primarily influenced by the seasonal working capital cycle. The Group has longer term capital
investments predominantly in relation to its supply chain capabilities, including warehouse automation technologies and software
development. In a number of instances, the Group invests alongside the independent retail network, mainly in the form of equity
participation or short-term loans.
The Board’s intention is to continue to invest in the business for future growth while maintaining a strong financial position and
otherwise to assess returning surplus capital to shareholders.
Impact of the 53rd trading week in FY22
The current financial year represents a 53-week trading period (from 26 April 2021 to 1 May 2022) as compared to a 52-week trading
period in the previous financial year (from 27 April 2020 to 25 April 2021). Section 5 of this report provides an overview of the Group’s
financial performance.
Non-IFRS Information
The directors report contains IFRS and non-IFRS financial information. IFRS financial information is financial information that is
presented in accordance with all relevant accounting standards. Non-IFRS financial information is financial information that is not
defined or specified under any relevant accounting standards and may not be directly comparable with other companies’ information.
Non-IFRS measures are used by management to assess and monitor business performance at the Group and segment level and should
be considered in addition to, and not as a substitute for, IFRS information. Non-IFRS information is not subject to audit or review.
Impact of new IFRIC agenda decision on key financial measures
In April 2021, IFRIC published an agenda decision in relation to the accounting treatment of configuration and customisation costs
related to Software-as-a-Service (‘SaaS’) arrangements. The Group has considered the final agenda decision and has clarified its
accounting policy for costs incurred in implementing cloud-based arrangements. That is, costs relating to configuration and
customisation are only capitalised if the implementation activities create an intangible asset that the Group controls in accordance
with the requirements of AASB 138 Intangible Assets. Costs that do not result in intangible assets should be expensed as incurred. The
exception is where they are paid to the suppliers of the cloud-based arrangement to significantly customise the cloud-based software
for the Group. In this case, the costs are recorded as a prepayment for services and amortised over the expected renewable term of
the arrangement.
The change in accounting policy has been applied retrospectively and there was no material impact on the Group’s FY22 financial report.
Climate change and sustainability disclosure
Metcash aligns with the Taskforce for Climate-Related Financial Disclosures and full information on our climate response can be
obtained in the ‘Our Planet’ section of the Sustainability Report. The management of climate-related risks and opportunities at Metcash
is overseen by the ESG Council through the Climate Change Risk Register. These various risks are combined and represented in an overall
Climate Risk category in the Group Risk Profile. At the time of writing, the ISSB (Exposure Draft 2) is undergoing industry consultation,
therefore the full scope of the draft and standards are yet to be finalised. However, based on the current draft recommendations,
Metcash has disclosed information related to greenhouse gas emissions and targets, transition risks, physical risks, climate-related
opportunities and climate metrics tied to management performance and remuneration.

DIRECTORS’ REPORT
5
Met
cash
Fin
anci
al R
epo
rt 2
022
REVIEW OF FINANCIAL RESULTS
Group overview
FY22
$m FY21
$m
Sales revenue 15,164.8 14,315.3
Food 200.3 192.4
Hardware 191.3 136.0
Liquor 97.4 88.7
Corporate (16.7) (15.7)
Underlying earnings before interest and tax (‘EBIT’) 472.3 401.4
Net finance costs (48.5) (42.6)
Underlying profit before tax 423.8 358.8
Tax expense on underlying profit (122.5) (103.7)
Non-controlling interests (1.7) (2.4)
Underlying profit after tax (‘UPAT’) (a) 299.6 252.7
Significant items (65.6) (17.0)
Tax benefit attributable to significant items 11.4 3.3
Net profit for the year attributable to members 245.4 239.0
Underlying earnings per share (cents) (b) 30.5 24.7
Reported earnings per share (cents) 25.0 23.4
(a) UPAT is defined as reported profit after tax attributable to equity holders of the parent, excluding significant items identified in note 3.3 of the financial report.
(b) Underlying earnings per share (EPS) is calculated by dividing UPAT by the weighted average number of ordinary shares outstanding during the year.
Group reported revenue, which excludes charge-through sales1, increased 5.9% to $15.2 billion (FY21: $14.3 billion). Including charge-
through sales1, Group revenue increased 6.4% to $17.4 billion (FY21: $16.4 billion), with significant underlying growth in each pillar,
building on the exceptional sales performance in the prior corresponding year.
Group underlying EBIT increased 17.7% to $472.3 million reflecting the robust sales performance and the success of recent strategic
acquisitions, partly offset by increased costs related to COVID and supply chain challenges. On a two-year basis, Group underlying EBIT
increased 41.0%.
The Food pillar continued to perform well delivering EBIT growth of 4.1%, or ~17% after adjusting for the adverse impact of 7-Eleven2, a
decline in the contribution from the resolution of onerous lease obligations and there being no tobacco excise increase in FY22.
In Hardware, EBIT increased a substantial 40.7% reflecting earnings growth in both IHG and Total Tools, buoyed by elevated residential
construction activity and the increased contribution from majority-owned company and joint venture stores in IHG and Total Tools.
In Liquor, EBIT increased 9.8% reflecting the continued robust demand in the retail network and a recovery in on-premise sales following
the easing of COVID-related trading restrictions.
Group underlying profit after tax3 increased 18.6% to $299.6 million, and statutory profit after tax increased 2.7% to $245.4 million.
Underlying earnings per share increased 23.5% to 30.5 cents reflecting the increase in profit after tax and the accretive benefit of the
Company’s $200 million share buyback completed in August last year.
Segment results
Segment revenue (a) Segment underlying EBIT
FY22 $m
FY21 $m
FY22 $m
FY21 $m
Food 8,379.3 8,316.3 200.3 192.4
Hardware 2,033.1 1,624.7 191.3 136.0
Liquor 4,752.4 4,374.3 97.4 88.7
Corporate — — (16.7) (15.7)
Metcash Group 15,164.8 14,315.3 472.3 401.4
(a) Segment revenue excludes gross charge-through sales to customers of $2.241 billion (FY21: $2.046 billion). Refer note 3.2.

DIRECTORS’ REPORT
6
Met
cash
Fin
anci
al R
epo
rt 2
022
Met
cash
Fin
anci
al R
epo
rt 2
022
Met
cash
Fin
anci
al R
epo
rt 2
022
Food
Total Food sales (including charge-through1) increased 1.4% to $9.5 billion, or 2.0% on a normalised4 basis (+13.4% 2 year normalised4).
Excluding tobacco, total Food sales (including charge-through1) increased 5.4% or 3.8% on a normalised4 basis (+11.9% 2-year
normalised4).
Supermarkets sales increased 3.9% or 1.9% on a normalised4 basis (+13.8% 2yr normalised4). Like for Like (LfL) sales5 in the IGA network
increased 2.9% (+14.6% 2-year basis) with continued support from shoppers rediscovering the convenience of local neighbourhood
shopping and the improved competitiveness of the network. This has been underpinned by the success of our MFuture initiatives
including the Network of the Future and Diamond Store Accelerator programs.
The strongest sales growth (ex tobacco) was in states less impacted by COVID-related restrictions (Western Australia and Queensland).
The business went to extraordinary lengths to keep its retailers’ shelves adequately stocked through significant supply chain and
operational disruptions, as well as elevated and unpredictable demand. Initiatives such as a strategic investment in inventory, operating
7-day shift patterns in large distribution centres, re-routing supply points around logistics blockages, re-deploying staff to support our
logistics operations and working closely with our suppliers, government and industry all helped support the strong performance of our
IGA network.
Sales momentum in Supermarkets accelerated in the fourth quarter of FY22 increasing 13.8% or 6.8% normalised4 (+9.6% ex tobacco
normalised4). LfL sales5 in the IGA network increased 6.3% (normalised4) in the same period, reflecting market share gains and the
impact of inflation.
Wholesale price inflation6 accelerated in the second half with price increases being received from ~60% of the supplier base. Wholesale
price inflation for the year was 0.5% (1H22: deflation of 1.0%, 2H22 inflation of 1.9%).
Food EBIT increased $7.9 million or 4.1% to $200.3 million. The improvement was ~$29 million or ~17% after adjusting for the adverse
impact of 7-Eleven2, a decline in the contribution from the resolution of onerous lease obligations and there being no tobacco excise
increase in FY22. The higher earnings reflects the strong trading performance, partly offset by additional costs related to COVIDSafe work
practices and COVID-related labour costs related to absenteeism and penalty rates associated with extended operating hours at
distribution centres.
The Food EBIT margin7 improved to 2.1% (FY21: 2.0%) despite these additional costs.
Hardware
Hardware sales (including charge-through1) increased 20.5% or 18.3% on a normalised4 basis to $3.1 billion reflecting significant growth
in both IHG and Total Tools and the impact of acquisitions. Combined sales in the IHG and Total Tools retail networks increased 9% to
~$4.4 billion on a LfL8 basis (+27.8% 2-year basis).
An additional 20 joint venture and company-owned stores were acquired during the year which added ~$95 million of sales.
Residential construction and renovations activity was adversely impacted by tight supply conditions, tight labour supply and unseasonal
wet weather, leading to a further strengthening of the pipeline of future activity. Despite this, sales in IHG increased 12.5% (+32.6% 2-year
basis) to $2.8 billion reflecting the impact of inflation and volume growth in Trade. DIY demand continued to be elevated, but volumes
declined slightly against the exceptional prior year comparative. The increase in Trade sales led to Trade representing 64% of the sales
mix (FY21: Trade 60%, DIY 40%).
Product categories most impacted by the tight supply conditions included timber, LVL, plaster and insulation.
The IHG banner group continued to perform strongly with retail LfL9 sales increasing 10.5%, with Trade sales up 12.7% and DIY sales up
6.7% (+21.8% on a 2-year basis, with Trade +11.6% and DIY +39.1%).
Total Tools sales10 increased 160.4% to $367 million reflecting increased Trade activity and the impact of additional majority-owned joint
venture stores. Total network sales increased to $972 million (FY21: $868 million) with LfL sales up 5.0% (+48.1% 2-year basis). The
network continued to expand, with a further 11 stores added bringing total stores to 100.
Hardware online sales increased by 55% to represent ~6% of network sales, reflecting the impact of COVID-related lockdowns, increased
basket size and conversions.
Hardware EBIT increased a substantial $55.3 million or 40.7% to $191.3 million. IHG’s EBIT increased $15.8 million or 14.1% to $127.8
million reflecting the strong sales performance, and the contribution from company-owned and joint venture stores acquired during the
year. This was partly offset by additional COVID-related, casual labour and supply chain costs, as well as additional investment in the
network to support the retention of shoppers gained through COVID. The IHG wholesale margin was 3.0%. Total Tools EBIT increased
$39.5 million to $63.5 million reflecting the strong sales performance and the contribution from majority-owned joint venture stores
acquired during the current and prior year.
The Hardware EBIT margin7 increased to 6.1% (FY21: 5.3%) which includes the positive impact of Total Tools and the retail margin from
IHG joint ventures and company-owned stores.

DIRECTORS’ REPORT
7
Met
cash
Fin
anci
al R
epo
rt 2
022
Liquor
Total Liquor sales (including charge-through1) increased 8.7% or 6.6% on a normalised4 basis to $4.8 billion (2-year normalised4 +27.1%)
with a continuation of strong demand in the retail network and a recovery in on-premise sales.
Sales growth in the retail network was in both the IBA banner group and contract customers, supported by continuation of the shift in
preference for local neighbourhood shopping and less overseas travel and duty free shopping.
Wholesale sales to the IBA banner group increased 4.4% (+28.1% 2-year basis) with all brands performing well, particularly the Bottle-O,
Cellarbrations and IGA Liquor. RTDs, spirits and wine continued to be the strongest growth categories. Retail LfL sales11 in the IBA
banner group increased 2.5% (+24.0% 2-year basis).
Sales to on-premise customers continued to recover with the easing of COVID-related restrictions, increasing 31% compared with the
prior corresponding year.
Sales growth across states was strongest in Western Australia, which has been least impacted by COVID-related restrictions.
Liquor EBIT increased $8.7 million or 9.8% to $97.4 million reflecting the contribution from the increase in sales volumes, which more
than offset an increased weighting of the on-premise channel in the sales mix, as well as higher costs associated with the impact of
COVIDSafe work practices, COVID-related costs associated with absenteeism, and higher freight costs related to route disruptions and
increased fuel costs. The EBIT margin7 for Liquor was in line with the prior comparative period at 2.0% despite the additional costs.
Finance costs and tax
Net finance costs increased during the year driven by higher debt utilisation reflecting the impact of the share buy back and an increase
in dividends paid. Tax expense of $122.5 million on underlying profit represents an effective tax rate of 28.9% (FY21: 28.9%).
Significant items
Significant items categories were consistent with the half-year and included Project Horizon implementation costs of $31.4 million (FY21:
$7.9 million), Total Tools put option valuation and business acquisition costs of $27.6 million (FY21: $6.1 million), costs related to the
MFuture program of $3.6 million (FY21: $3.5 million), and COVID-19 allowance for impairment losses of $3.0 million (FY21: reversal $0.5
million).
Refer note 3.3 of the financial report for further information.
Cash flows
FY22
$m FY21
$m
Operating cash flows 432.3 475.5
Investing cash flows, net (a) (223.8) (216.0)
Payments for lease liabilities, net and other financing activities (123.2) (86.8)
85.3 172.7
Payment for off-market buyback of shares, including costs (200.4) —
Proceeds from equity raising, net of share issue costs — 13.5
Dividends paid to the owners of the parent (198.5) (148.3)
(398.9) (134.8)
(Increase)/decrease in net debt (313.6) 37.9
(a) This includes the payment for acquisition of non-controlling interest of $59.4 million relating to the 15% step acquisition of Total Tools Holdings which is
presented as part of ‘cash flows from financing activities’ in the Statement of Cash Flows.
Group operating cash flows were $432.3 million (FY21: $475.5 million), reflecting a strong cash realisation ratio of 91% (FY21: 114%),
which was achieved notwithstanding the increase in significant items expense. Favourable management of inventory levels and
customer collections over the final weeks helped offset the investment in net working capital that arose as a result of shortening
payment times for our smaller suppliers and ongoing investment in inventory to protect the network from supply constraints.
The Group had net investing outflows of $223.8 million, including capital expenditure of $121.7 million (including $46.9 million on Project
Horizon), acquisitions of businesses of $55.4 million and acquisition of non-controlling interest of $59.4 million representing payments for
an additional 15% interest in Total Tools, increasing the Group’s ownership from 70% to 85%. The acquisitions of businesses were also
predominantly in the Hardware pillar and included an investment in 15 Total Tools ‘JV Stores’.
The Group paid $198.5 million (FY21: $148.3 million) in dividends during the current financial year and successfully completed an off-
market buyback of $200 million, equating to $399m of shareholder distributions. Total dividends paid in FY22 was 20.0 cents per share
(FY21: 14.5 cents per share).
DIRECTORS’ REPORT
8
Met
cash
Fin
anci
al R
epo
rt 2
022
Met
cash
Fin
anci
al R
epo
rt 2
022
Met
cash
Fin
anci
al R
epo
rt 2
022
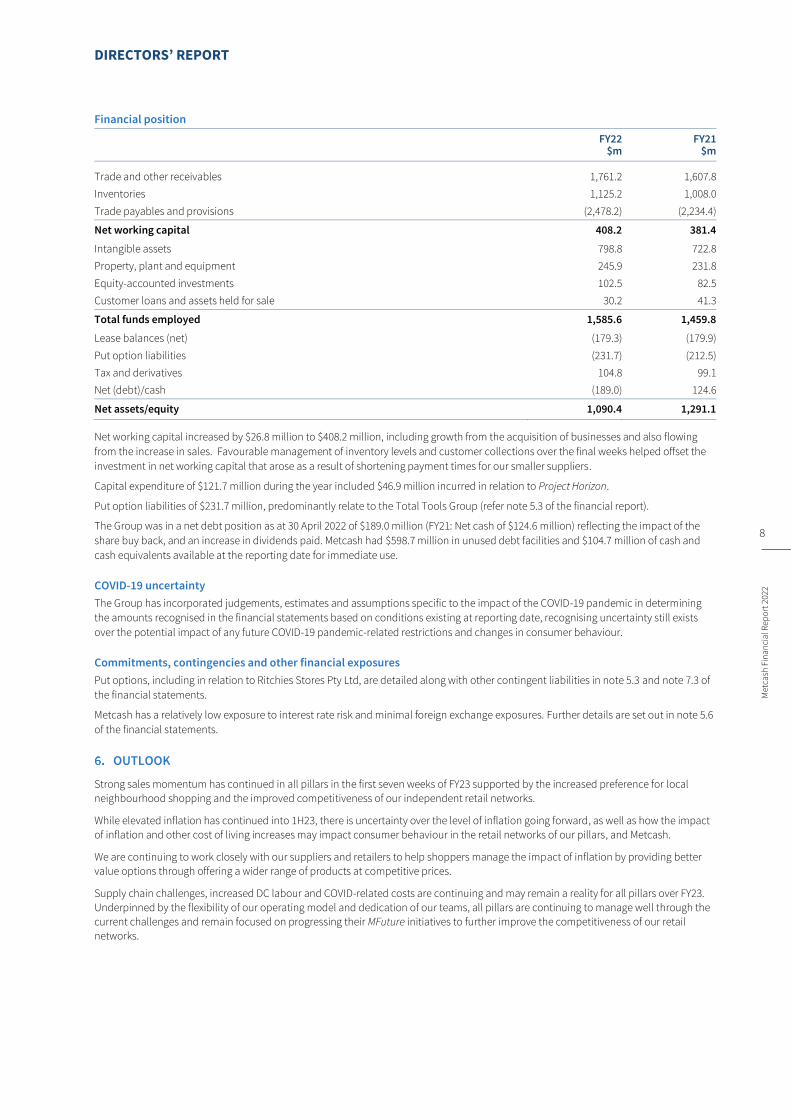
Financial position
FY22
$m FY21
$m
Trade and other receivables 1,761.2 1,607.8
Inventories 1,125.2 1,008.0
Trade payables and provisions (2,478.2) (2,234.4)
Net working capital 408.2 381.4
Intangible assets 798.8 722.8
Property, plant and equipment 245.9 231.8
Equity-accounted investments 102.5 82.5
Customer loans and assets held for sale 30.2 41.3
Total funds employed 1,585.6 1,459.8
Lease balances (net) (179.3) (179.9)
Put option liabilities (231.7) (212.5)
Tax and derivatives 104.8 99.1
Net (debt)/cash (189.0) 124.6
Net assets/equity 1,090.4 1,291.1
Net working capital increased by $26.8 million to $408.2 million, including growth from the acquisition of businesses and also flowing
from the increase in sales. Favourable management of inventory levels and customer collections over the final weeks helped offset the
investment in net working capital that arose as a result of shortening payment times for our smaller suppliers.
Capital expenditure of $121.7 million during the year included $46.9 million incurred in relation to Project Horizon.
Put option liabilities of $231.7 million, predominantly relate to the Total Tools Group (refer note 5.3 of the financial report).
The Group was in a net debt position as at 30 April 2022 of $189.0 million (FY21: Net cash of $124.6 million) reflecting the impact of the
share buy back, and an increase in dividends paid. Metcash had $598.7 million in unused debt facilities and $104.7 million of cash and
cash equivalents available at the reporting date for immediate use.
COVID-19 uncertainty
The Group has incorporated judgements, estimates and assumptions specific to the impact of the COVID-19 pandemic in determining
the amounts recognised in the financial statements based on conditions existing at reporting date, recognising uncertainty still exists
over the potential impact of any future COVID-19 pandemic-related restrictions and changes in consumer behaviour.
Commitments, contingencies and other financial exposures
Put options, including in relation to Ritchies Stores Pty Ltd, are detailed along with other contingent liabilities in note 5.3 and note 7.3 of
the financial statements.
Metcash has a relatively low exposure to interest rate risk and minimal foreign exchange exposures. Further details are set out in note 5.6
of the financial statements.
OUTLOOK
Strong sales momentum has continued in all pillars in the first seven weeks of FY23 supported by the increased preference for local
neighbourhood shopping and the improved competitiveness of our independent retail networks.
While elevated inflation has continued into 1H23, there is uncertainty over the level of inflation going forward, as well as how the impact
of inflation and other cost of living increases may impact consumer behaviour in the retail networks of our pillars, and Metcash.
We are continuing to work closely with our suppliers and retailers to help shoppers manage the impact of inflation by providing better
value options through offering a wider range of products at competitive prices.
Supply chain challenges, increased DC labour and COVID-related costs are continuing and may remain a reality for all pillars over FY23.
Underpinned by the flexibility of our operating model and dedication of our teams, all pillars are continuing to manage well through the
current challenges and remain focused on progressing their MFuture initiatives to further improve the competitiveness of our retail
networks.

DIRECTORS’ REPORT
9
Met
cash
Fin
anci
al R
epo
rt 2
022
MATERIAL BUSINESS RISKS
The following section outlines the material business risks that may impact on the Group achieving its strategic objectives and business
operations, including the mitigating factors put in place to address those risks. The material risks are not set out in any particular order
and exclude many general risks that could have a material effect on most businesses in Australia under normal operating conditions.
Strategy and disruption risks
Consumer behaviour and preferences continue to change and are influenced by factors such as economic conditions, digital and
technological development and disruption, healthy living trends and increasing choices in both online and in-store retail options. These
changes may impact Metcash’s sales mix and earnings. Metcash’s strategy puts customers and consumers first, with ongoing focus on
our shopper-led range, e-commerce and loyalty, store quality and overall perception of value at checkout.
Metcash is accelerating its investment in digital, expanding our capability and improving our delivery of digital solutions to our retailers
and shoppers. This is being achieved through investment in our online stores, such as the upgraded IGA Online Shop, new and enhanced
IBA bannered online stores, and the continued success of the Mitre10 and Total Tools online platforms.
In executing its strategy, there is a risk that Metcash may experience project execution issues or may not realise the full benefits of
projects that underpin its strategic plan. There is also a risk that projects may experience scope, time or cost variability or overruns.
Metcash’s business operations and strategic priorities are subject to ongoing review and development. Management regularly reviews
plans against market changes and, where necessary, modifies its approach.
COVID-19 risks
The COVID-19 pandemic has continued to impact Metcash and our people. Lockdowns, travel restrictions, and the arrival of the Delta
and Omicron variants led to a number of operational complexities, including high levels of employee absenteeism due to infection or
isolation, and broader disruption to our supply chain. Whilst there were challenges, we continued to serve our independent retailers
across all of our Pillars, and importantly ensured continuity of supply of critical food and grocery products to our retailers, supporting
local communities across Australia.
Going forward, the Group’s operations and those of our customers and suppliers may continue to be impacted by COVID-19 through any
continuation of restrictions such as social distancing, quarantines, travel restrictions, work stoppages, health authority actions,
lockdowns or other related measures. Any of these factors may impact our operational and financial performance.
Competition risks
Any increase in competitive activity from new or existing competitors (including in the form of a new market entrant with a wholesale or
other disruptive business model, where suppliers sell directly to the Group’s customers, where customers form their own buying groups
to collectively negotiate and purchase directly from suppliers or where indirect competitors change their business models to compete
directly with the Group) may have a detrimental effect on the Group’s operations, particularly if Metcash fails to respond effectively to
that competitive activity or its response is delayed (for example, as a result of the time required to engage with the Group’s independent
retail network in order to implement an initiative). Increased competition may also adversely impact Metcash’s long-term performance
and profitability.
Key brands risk
Metcash’s success in generating profits and increasing its market share is based on the success of the key brands it owns or licences.
Reliance on key brands makes Metcash vulnerable to brand damage from negative publicity, product tampering or recalls, unauthorised
use of its brands or ineffective brand management by Metcash or its licensees, increasing the risk of asset write downs.
Macroeconomic and Geopolitical risk
General macroeconomic conditions and factors including inflation, low levels of unemployment, monetary policy and variability in
interest rates, changes in governments and their approach to fiscal policy, variability in energy and input costs, and changes in consumer
purchasing behaviour may adversely impact our customers as well as Metcash’s earnings, cost of doing business and profitability. We
seek to manage these risks through maintaining vigilance over our cost structure and delivering on our strategy to grow earnings and
profitability.
Further, geopolitical tensions and actions of nation states, including trade wars, territorial disputes, incursions, and war may adversely
impact Metcash’s operations and supply chain, resulting in delay or unavailability of certain products or inputs, increased cost of doing
business and subsequent impact on profitability. We seek to manage these risks through forecasting and planning to maintain adequate
levels of supply, as well as understanding alternative avenues of supply.
Operational and compliance risks
As Australia’s leading wholesaler, Metcash is reliant upon the success of its suppliers and retailers. Metcash continues to invest in
programs to improve the health of the independent retail network and improving Metcash’s infrastructure to make it simpler to do
business. These programs aim to strengthen Metcash as the business partner of choice for both its suppliers and retailers. As with any
significant change, there is a risk that these transformation programs fail to deliver the expected benefits. Metcash has strengthened its
governance frameworks to manage these change programs through the establishment of dedicated project teams to ensure projects are
delivered and risks are addressed in a timely manner.

DIRECTORS’ REPORT
10
Met
cash
Fin
anci
al R
epo
rt 2
022
Met
cash
Fin
anci
al R
epo
rt 2
022
Met
cash
Fin
anci
al R
epo
rt 2
022
Metcash’s operations require compliance with various regulatory requirements including work health and safety, food and product
safety, environmental regulations, workplace industrial relations, public liability, privacy and security, financial and legal. Any regulatory
breach could have a material negative impact on the wellbeing, reputation or financial results of Metcash or its stakeholders. The
Group’s internal processes are regularly assessed and tested as part of risk and assurance programs addressing areas including; safety,
security, sustainability, chain of responsibility, quality and food safety. Metcash maintains a strong ‘safety-first’ culture and has
established standards and ‘Chain of Responsibility’ policies to identify and manage risk.
Disruption to, or inefficiency or failure within Metcash’s supply chain, product sourcing ability, or of key support systems could impact
the Group’s ability to deliver on its objectives, its operational capability and financial performance. Metcash’s strategic planning process
and ongoing monitoring of operations ensure its supply chain and support systems are able to scale appropriately to respond to its
business needs.
Property and facilities risk
Metcash leases facilities for the wholesale distribution of grocery, fresh produce, liquor, hardware and other fast-moving consumer
goods. Damage to or destruction of these facilities could result in the loss or reduction of distribution capability and hence adversely
impact Metcash’s financial results. While Metcash has in place insurances that it considers are sufficient for a business of its type and size,
Metcash will be required to pay for the loss on any event up to the deductible and self-insurance retention.
Financial risks
Metcash’s ability to reduce its cost of doing business is critical to support independent retailers in remaining competitive in the
continued challenging environment. Competitive trading conditions and broader adverse economic conditions can increase the credit
risk associated with the Group’s activities. Metcash’s strategy is to support successful independents through appropriate credit
management processes.
Funding and liquidity risk continue to be relevant to the Group due to the need to adequately fund business operations, growth
initiatives and absorb potential loss events that may arise. Inability to adequately fund the Group’s business operations and growth
plans may lead to difficulty in executing the Group’s strategy. Metcash maintains a prudent approach towards capital management,
which includes optimising working capital, targeted capital expenditure, capital and asset recycling and careful consideration of its
dividend policy.
In addition, banking and debt facilities are maintained with sufficient tenure, diversity and headroom to fund business operations.
However, these is a risk that the Group may be unable to refinance or renew its banking and debt facilities following expiry, or will only be
able to refinance or renew those facilities on terms that are less favourable to the Group than existing terms. Further, if Metcash failed to
meet any of the covenants on its debt facilities there is a risk that the Group may be required to repay outstanding debt on notice or take
other actions to remedy the breach. Any requirement to repay outstanding debt on notice, or inability to refinance banking facilities or
obtain capital or financing generally, on favourable terms or at all, may have a material adverse effect on the Group’s financial
performance and position.
The Group’s financial risk management framework is discussed in further detail in note 5.6 of the financial statements.
Trading and customer risks
Metcash’s ability to operate efficiently is critical to support independent retailers in remaining competitive. A disruption to the business
could result in an increased cost to serve retailers and inability to meet customers’ requirements.
Tobacco sales represent a significant proportion of the products Metcash supplies to its independent retailers. Following the
cessation of the legislated annual increase in customs and excise duty in 2020, Metcash implemented mitigation strategies to
support earnings performance following this impact. Metcash continues to achieve gains from price increases on tobacco stock
sales, which are commonly linked to the consumer price index.
In our Food pillar, Metcash services a number of large customers known as Multiple Store Owners (MSOs). These customers own and/or
operate more than one independent retail store, and in some cases can own and/or operate a sizeable number of stores (examples of
larger MSOs include Ritchies Stores Pty Ltd (Ritchies) and Romeo Retail Group). In addition, Metcash Food is a supplier to a number of
contract customers, one of which is Australian United Retailers (AUR), which operates the Foodworks bannered network. In May 2022,
Metcash entered into an agreement to supply AUR for a further five years commencing 1 July 2022. Metcash also extended the term of its
agreement to supply Drakes Supermarket stores in Queensland for a further five years, to 3 June 2029. If any one or more MSOs or AUR
were to materially reduce or cease to source their inventory from Metcash for any reason (including vertically integrating their supply
chain, establishing an alternative buying group, purchasing from another source, entering into a supply agreement with a competitor or
closure of stores due to insolvency or poor performance), this would adversely impact Metcash’s long-term performance and
profitability.
In addition, there are certain large contract customers in the Liquor business whose contracts are renewed on a regular basis. If one or
more of these contract customers decided not to renew their supply contract this too could adversely impact Metcash’s long-term
performance and profitability. Further, the Liquor business also has a number of large suppliers and if one or more of these suppliers
decided to no longer conduct business with Metcash, this too could adversely impact Metcash’s long-term performance and profitability.
DIRECTORS’ REPORT
11
Met
cash
Fin
anci
al R
epo
rt 2
022
Technology and cyber security risks
Metcash relies on a number of complex information technology systems to support its warehousing and distribution, supply chain,
customer service, marketing and finance operations. A severe disruption to the information technology systems may significantly impact
the operations and value of Metcash. Metcash is embarking on a business transformation program called Project Horizon which will
replace end-of-life technology, reducing operational risk and onerous maintenance costs.
With expanding information privacy and security regulations, and an increasingly hostile cyber environment, Metcash recognises
information privacy and cyber security as an increasing risk. Any impact on the availability, integrity or confidentiality of data could result
in a breach of privacy and security regulations and/or impact Metcash’s commercially sensitive information, which could expose Metcash
to penalties (including financial penalties), and could adversely affect Metcash’s operating and financial position or cause reputational
harm.
Social responsibility, environment and climate change risks
Metcash is committed to ‘Championing successful independents’ and a key element of this is underpinned by ensuring its operations are
conducted in a socially responsible manner.
Metcash has a moderate exposure to environmental risks. Metcash’s operations could be impacted by natural disasters, extreme
weather events or other catastrophic events which could materially disrupt its operations and supply chain. There is also a risk that, with
time, the frequency and intensity of natural disasters and extreme weather events may increase if anthropogenic climate change
accelerates or worsens.
Metcash is conscious of the impact its operations may have on the environment given the breadth of our operations across Australia.
Although Metcash is only a moderate emitter of carbon emissions relative to its peers, we have set a science-based target to reduce our
carbon emissions by 42% by 2030. In addition, Metcash seeks to reduce its environmental impact through programs and initiatives that
manage its energy consumption and waste.
Metcash previously conducted a climate change risk assessment, which considered the physical and transitional risks of climate change
on the Group’s operations. The main drivers of physical climate change risk for Metcash are the potential increase in frequency and
severity of acute climate change events, such as bushfires, drought, floods, extreme storms and cyclones. The assessment concluded
that the highest inherent rated risk is likely to be an increase in insurance premiums year on year. Other lower rated inherent rated risks
include: damage to facilities and equipment, a temporary increase in costs to service our retailers during these events, a temporary
disruption to our supply chain and distribution network, reduced availability and quality of fresh products, a decrease in the availability
of timber products due to the impact of bushfires. Regarding transitional risks, the assessment found there are medium level transition
risks, including potential reputational damage should Metcash not meet stakeholder expectations on climate management, and
additional compliance costs should government introduce new greenhouse gas emission regulations or laws. For further information on
how we manage environmental risks please refer to our most recent Sustainability Report available on our website.
Metcash has a low to moderate exposure to social risks. Our business and our people are driven by our purpose of ‘Championing
successful independents’, and Metcash is proud to support independent retailers who are at the heart of local communities across
Australia. At the core of our Purpose and Vision are our Values – we believe that independence is worth fighting for; in treating our
people, retailers and suppliers the way we like to be treated; and in giving back to the communities where we live and work.
Metcash contributes to our local communities through the IGA Community Chest Program, disaster relief, and through our partnership
with Foodbank. In addition, Metcash maintains an unwavering commitment to supporting remote communities through its partnership
with The Arnhem Land Progress Aboriginal Corporation (ALPA) and the Outback Stores in the Northern Territory, to deliver improved
affordability of food supply and the best possible outcomes for those communities.
Metcash meets the threshold for reporting under the Modern Slavery Act 2018 (Cth) with our most recent statement available at
modernslaveryregister.gov.au and our Anti-Slavery Policy is available on our website. Metcash is taking steps to continually improve its
exposure to modern slavery risks in its supply chain. Further, under recent amendments to the Security of Critical Infrastructure Act 2018
(Cth), Metcash has been declared a ‘critical food and grocery asset’, which will require it to implement certain measures to meet
compliance with the Act. For further information on how we manage social risks please refer to our Sustainability Report.
Work health and safety risk
While a strong emphasis is placed on the implementation of work health and safety standards, the risk of injury or fatality remains
possible. The occurrence of such events may have an adverse effect on the safety of our people and the productivity, operations and
reputation of Metcash.
Metcash is focused on the safety of its staff and customers. The Group’s safety processes have been reviewed in light of COVID-19 and,
where appropriate, additional processes and procedures have been implemented.
People and culture risks
The increasing competitive landscape and low levels of unemployment continues to place pressure on the competition for talent and
labour capacity and the ability to efficiently operate our business. The ability to attract and retain talent with the necessary skills and
capabilities to operate in a challenging market whilst being able to effect transformation is critical to Metcash’s success. Similarly, the
ability to attract and retain employees to meet our labour capacity needs is crucial for our operational capability and efficiency. Metcash
competes in labour markets to attract and retain its employees and management team. The competitive nature of these labour markets
may result in the loss of key employees and/or labour capacity which may make it more difficult and costly to attract or retain

DIRECTORS’ REPORT
12
Met
cash
Fin
anci
al R
epo
rt 2
022
Met
cash
Fin
anci
al R
epo
rt 2
022
Met
cash
Fin
anci
al R
epo
rt 2
022
employees. If Metcash is unable to attract and retain employees, this may adversely affect the Group’s operations and overall financial
performance.
Interruptions at Metcash’s workplaces arising from industrial disputes, work stoppages and accidents may result in production losses
and delays. Renegotiation of collective agreements may increase Metcash’s operating costs and may involve disputes.
Metcash is committed to being a favourite place to work by unlocking the potential of its people through empowerment and ensuring
the Group’s cultural values align with their values. Integrity is the foundation of the ethical values and standards of behaviour set for all
employees through the Group’s Code of Conduct.
Metcash invests in its people through training and development opportunities, by promoting diversity and workplace flexibility and
maintaining succession planning. The short and long-term incentive schemes align the Group’s remuneration structure to shareholders’
interests.
End of the Operating and Financial Review
1 Direct sales from suppliers to retailers, invoiced through Metcash. 2 The previous east coast supply agreement with 7-Eleven concluded on 17 August 2020. To enable comparison, sales in the comparative period have been adjusted
to exclude sales to 7-Eleven. 3 Underlying profit after tax excludes significant items: put option valuation and business acquisition costs of $27.6 million, Project Horizon implementation costs of
$22.0 million, and other costs of $4.6 million (all post tax). 4 Normalised sales have been adjusted to exclude the impact of the 53rd trading week, and in the Food pillar, also sales to Drakes and 7-Eleven in the relevant sales
period as appropriate. 5 Based on scan data from 1,173 IGA stores. 6 Excludes tobacco and produce. 7 EBIT margin: EBIT/Total revenue (including charge-through). 8 Includes a combination of scan sales and estimates based on wholesale data. 9 Based on a sample of 323 network stores that provide scan data (representing >70% sales). 10 Total Tools sales include exclusive brand sales, franchisee fees, joint venture and company-owned store sales and other services. 11 Based on scan data from 480 stores.

DIRECTORS’ REPORT
13
Met
cash
Fin
anci
al R
epo
rt 2
022
BOARD INFORMATION
The Directors in office during the financial year and up to the date of this report are as follows.
ROBERT A MURRAY (MA Hons, Economics (Cantab))
Independent Non-executive Chair
Robert (Rob) is the Chair of the Metcash Limited Board of Directors
and is also the Chair of the Nomination Committee and a member of
the People and Culture Committee. Rob was appointed to the Board
on 29 April 2015 and was appointed Chair on 27 August 2015.
Rob has extensive experience in FMCG. He has held positions with
industry leaders, having been CEO of both Lion Nathan and Nestle
Oceania, and he therefore brings with him a deep understanding
of consumers and their requirements as well as the issues faced by
those supplying the industry.
As a former director of Dick Smith Holdings Limited (2014 to 2016),
Super Retail Group Limited (2013 to 2015) and Linfox Logistics,
Rob also has experience in the logistics, electronics, automotive,
leisure and sports industries.
Rob is a non-executive director of Southern Cross Media Group
Limited (since 2014, and Chair since August 2020), Advisory
Chairman of Hawkes Brewing Company (since August 2019) and
is a board member of the not- for- profit charity, the Bestest
Foundation.
DOUG JONES (BComm, Accounting, Tax, Auditing, Information
Systems, CA(SA))
Group Chief Executive Officer, Executive Director
Doug is an experienced executive with extensive wholesale, retail
and eCommerce experience. Doug spent 14 years with the
Johannesburg Stock Exchange-listed Massmart group which is
majority-owned by Walmart Inc. It has leading market positions in
wholesale food, liquor, home improvement and general
merchandise.
Before joining Metcash Doug was CEO and Senior Vice President of
Massmart Wholesale, which includes ‘big box’ format food, liquor,
and general merchandise stores serving retail, commercial and
wholesale customers; cash and carry stores; buying groups that
service wholesale and independent retail customers; and a
number of eCommerce platforms.
Doug is a qualified Chartered Accountant and has previously held
senior finance positions in Makro SA, Amalgamated Beverages
Industries Limited and The South African Breweries, all in
Johannesburg, CocaCola Enterprises in Canada, and Deloitte in
both Canada and South Africa.
MURRAY P JORDAN (MPA and MAICD)
Independent Non-executive Director
Murray has been a member of the Board since 23 February 2016.
He is also a member of the Audit, Risk and Compliance
Committee, the People and Culture Committee and the
Nomination Committee.
Murray has extensive experience in the independent retail sector,
bringing unique insight and perspective to the Board regarding the
challenges faced by independent retailers and the valuable role
they play in the community. Murray was previously Managing
Director of New Zealand business Foodstuffs North Island Limited,
a co-operative wholesale company, supplying independently
owned and operated businesses in the supermarkets, food service
and liquor sectors. He has also held key management positions in
property development and investment.
Murray is a non-executive director of Metlifecare Pty Limited, Asia
Pacific Village Holdings Pty Limited and Asia Pacific Village Group
Pty Limited (each since November 2020), Stevenson Group Limited
(since July 2016) and Chorus Limited (since September 2015), each
a New Zealand company. He is also a trustee of the Starship
Foundation in New Zealand that raises funds for the National
Children’s Hospital, a trustee of the Foodstuffs member protection
and co-operative perpetuation trusts (since January 2019), a
trustee of the Southern Cross Health Trust (since August 2019), a
director of the Southern Cross Medical Care Society (since January
2020) and a former director of Sky City Entertainment Group
Limited (NZ) 2016-2021).
HELEN NASH (BA Hons, GAICD)
Independent Non-executive Director
Helen was appointed to the Board on 23 October 2015. She is the
Chair of the People and Culture Committee (since August 2019)
and is also a member of the Nomination Committee.
Helen has more than 20 years executive experience across three
diverse industries: consumer packaged goods, media and quick
service restaurants.
Helen brings rounded commercial and consumer focused
experience to her role. She initially trained in the UK as a Certified
Management Accountant. 18 years in brands and marketing allow
her to bring a strong consumer lens to the Board. She gained
extensive strategic, operational and general management
experience in her role of Chief Operating Officer at McDonalds
Australia, overseeing business and corporate strategy, store
operations including all company and franchised stores,
marketing, menus, research and development and
information technology.
Helen is a non-executive director of Southern Cross Media Group
Limited (since April 2015) and Inghams Group Limited (since May
2017), and a former non-executive director of Blackmores Limited
(2013 to 2019).

DIRECTORS’ REPORT
14
Met
cash
Fin
anci
al R
epo
rt 2
022
Met
cash
Fin
anci
al R
epo
rt 2
022
Met
cash
Fin
anci
al R
epo
rt 2
022
PETER BIRTLES (BSc (Hons), FCA, MAICD)
Independent Non-executive Director
Peter was appointed to the Board on 1 August 2019. He is Chair of
the Audit, Risk and Compliance Committee (since July 2020) and a
member of the Nomination Committee.
Peter has over 30 years’ experience in retail and consumer goods
industries, including 18 years with Super Retail Group Limited
where he was Managing Director and Chief Executive Officer from
2006 to early 2019, and therefore brings a strong FMCG lens to
his role.
Peter's executive career also includes extensive experience in
accounting and finance having previously held the position of
Chief Financial Officer of Super Retail Group Limited, as well as
other senior financial roles during his 12 years with The Boots
Company in the UK and Australia.
Peter is Chair and non-executive director of Universal Store
Holdings Limited (since October 2020), GWA Group Limited (since
2010), and also a director of APG & Co Pty Limited and Apparel
Group Pty Limited (both since July 2019), as well as Good360
Australia Ltd (since August 2019). Peter was formerly a non-
executive director of Auto Guru Limited (2015 to 2019).
CHRISTINE HOLMAN (MBA, PG Dip Mgt, GAICD)
Independent Non-executive Director
Christine was appointed to the Board on 14 September 2020 and
is a member of the Audit, Risk and Compliance Committee and the
Nomination Committee.
From her previous executive capacity, as both CFO & Commercial
Director of Telstra Broadcast Services, Christine brings a deep
understanding of legacy and emerging technologies and digital
transformations. During her time in private investment
management, Christine assisted management and the Board of
investee companies on strategy development, mergers &
acquisitions, leading due diligence teams, managing large
complex commercial negotiations and developing growth
opportunities.
Christine is a non-executive director of Collins Foods Limited
(since December 2019) and CSR Limited (since October 2016).
She is also a director of The McGrath Foundation (since July 2020),
T20 Cricket World Cup (since January 2018), National Intermodal
Corporation Limited (since August 2018), The State Library of New
South Wales Foundation (since February 2017) and The Bradman
Foundation (since December 2016). Christine is a former non-
executive director of Blackmores Limited (2019 to 2021) and
Wisetech Global Limited (2018 to 2019).
MARGARET HASELTINE (BA, FAICD)
Independent Non-executive Director
Margaret (Margie) has more than 30 years of experience across
supply chains and logistics, customer interface in the FMCG sector,
change management and governance. Her executive career
includes 20 years at Mars Inc. including five years as Chief
Executive Officer of Food in Australia.
Margie is a non-executive director of Tyesoon Limited (since
February 2022), Bapcor Limited (since 2016, and Chair since
February 2021) and Real Pet Food Company Pty Ltd (since March
2022). She is a Fellow of the Australian Institute of Company
Directors.
Margie was formerly a non-executive director of Southern
Hospitality Development Corp (2015 to 2019), Bagtrans (2016 to
2021) and Newcastle Permanent Building Society (2018 to 2022).
Former Director
JEFFERY ADAMS was an Executive Director until 10 March 2022.
TONIANNE DWYER was a Non-Executive Director until 30 June
2021.
Company Secretary
JULIE S HUTTON (B Asian Studies (Viet), LLB, LLM, GAICD)
Julie was previously a partner at law firm Baker & McKenzie where
she specialised in mergers & acquisitions, private equity and
corporate restructures. Julie is a Graduate of the Australian
Institute of Company Directors and was formerly a Non-executive
Director of AVCAL, a national association which represents the
private equity and venture capital industries in Australia.
Indemnification and insurance of Directors and Officers
Under the Constitution of the Company, the Company indemnifies
(to the full extent permitted by law) current and former Directors
and Company Secretaries and such other current and former
officers as the Board may determine from time to time against all
losses and liabilities incurred as an officer of Metcash or its related
companies. The Company may enter into a deed indemnifying
such officers on these terms. The Company enters into such deeds
with each of its Directors and Company Secretaries from time
to time.
During the financial year, the Company has paid, or agreed to pay,
a premium in respect of a contract of insurance insuring officers
(and any persons who are officers in the future) against certain
liabilities incurred in that capacity. Disclosure of the total amount
of the premiums and the nature of the liabilities in respect of such
insurance is prohibited by the contract of insurance.
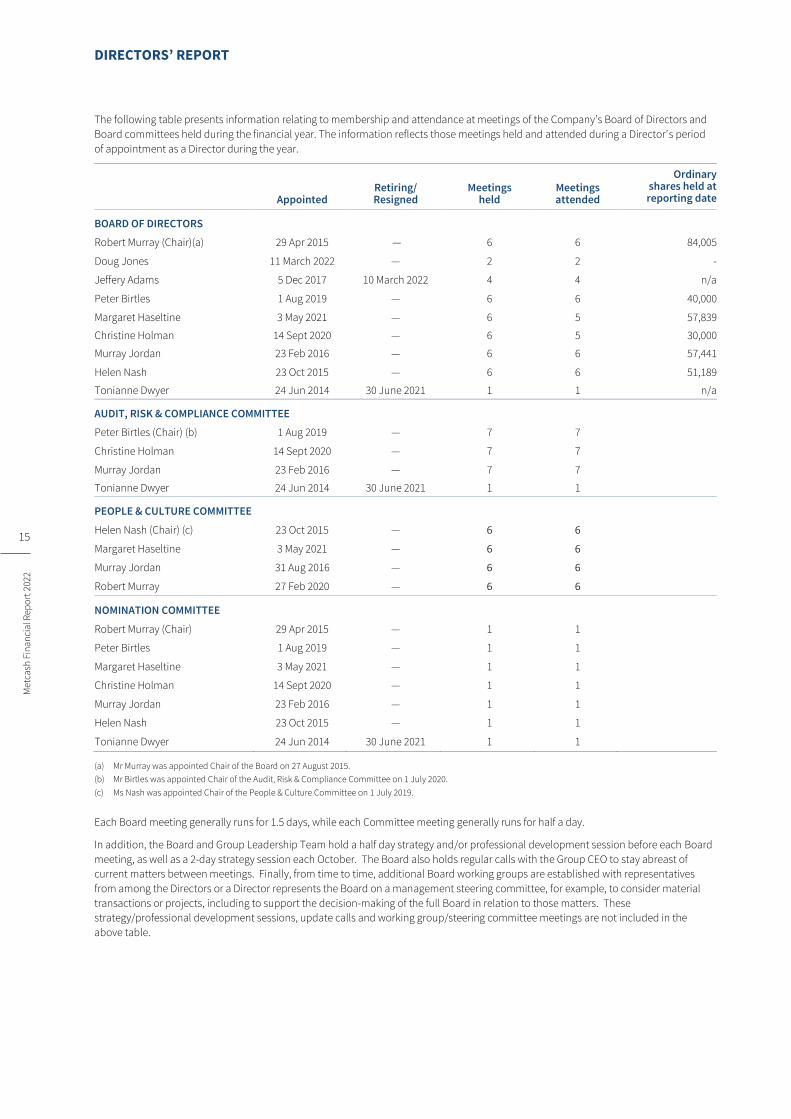
DIRECTORS’ REPORT
15
Met
cash
Fin
anci
al R
epo
rt 2
022
The following table presents information relating to membership and attendance at meetings of the Company’s Board of Directors and
Board committees held during the financial year. The information reflects those meetings held and attended during a Director’s period
of appointment as a Director during the year.
Appointed Retiring/ Resigned
Meetings held
Meetings attended
Ordinary shares held at reporting date
BOARD OF DIRECTORS
Robert Murray (Chair)(a) 29 Apr 2015 — 6 6 84,005
Doug Jones 11 March 2022 — 2 2 -
Jeffery Adams 5 Dec 2017 10 March 2022 4 4 n/a
Peter Birtles 1 Aug 2019 — 6 6 40,000
Margaret Haseltine 3 May 2021 — 6 5 57,839
Christine Holman 14 Sept 2020 — 6 5 30,000
Murray Jordan 23 Feb 2016 — 6 6 57,441
Helen Nash 23 Oct 2015 — 6 6 51,189
Tonianne Dwyer 24 Jun 2014 30 June 2021 1 1 n/a
AUDIT, RISK & COMPLIANCE COMMITTEE
Peter Birtles (Chair) (b) 1 Aug 2019 — 7 7
Christine Holman 14 Sept 2020 — 7 7
Murray Jordan 23 Feb 2016 — 7 7
Tonianne Dwyer 24 Jun 2014 30 June 2021 1 1
PEOPLE & CULTURE COMMITTEE
Helen Nash (Chair) (c) 23 Oct 2015 — 6 6
Margaret Haseltine 3 May 2021 — 6 6
Murray Jordan 31 Aug 2016 — 6 6
Robert Murray 27 Feb 2020 — 6 6
NOMINATION COMMITTEE
Robert Murray (Chair) 29 Apr 2015 — 1 1
Peter Birtles 1 Aug 2019 — 1 1
Margaret Haseltine 3 May 2021 — 1 1
Christine Holman 14 Sept 2020 — 1 1
Murray Jordan 23 Feb 2016 — 1 1
Helen Nash 23 Oct 2015 — 1 1
Tonianne Dwyer 24 Jun 2014 30 June 2021 1 1
(a) Mr Murray was appointed Chair of the Board on 27 August 2015.
(b) Mr Birtles was appointed Chair of the Audit, Risk & Compliance Committee on 1 July 2020.
(c) Ms Nash was appointed Chair of the People & Culture Committee on 1 July 2019.
Each Board meeting generally runs for 1.5 days, while each Committee meeting generally runs for half a day.
In addition, the Board and Group Leadership Team hold a half day strategy and/or professional development session before each Board
meeting, as well as a 2-day strategy session each October. The Board also holds regular calls with the Group CEO to stay abreast of
current matters between meetings. Finally, from time to time, additional Board working groups are established with representatives
from among the Directors or a Director represents the Board on a management steering committee, for example, to consider material
transactions or projects, including to support the decision-making of the full Board in relation to those matters. These
strategy/professional development sessions, update calls and working group/steering committee meetings are not included in the
above table.
DIRECTORS’ REPORT
16
Met
cash
Fin
anci
al R
epo
rt 2
022
Met
cash
Fin
anci
al R
epo
rt 2
022
Met
cash
Fin
anci
al R
epo
rt 2
022
REMUNERATION REPORT On behalf of the Board and the People and Culture Committee, I am pleased to present our Remuneration Report for the year ended 30 April 2022
HELEN NASH
Chair, People and Culture Committee
Record sales growth has led to a significant uplift in underlying
earnings and returns to shareholders. Our strong performance over
this financial year could not have been possible without the continued
dedication and commitment of our people. We are proud of how our
leaders, team members, retailers, suppliers, members and customers
have pulled together during another year of COVID-19 restrictions,
elevated demand, and significant supply chain challenges caused by
close contact requirements, infection rates and other factors. Our
people have worked exceptionally hard over the past year to ensure
the best possible support for our retailers and their communities.
The health and wellbeing of our people has continued to be a critical
priority for us. We have worked alongside government agencies and
followed their health teams’ advice, enacted Public Health Orders, and
consulted our team members broadly on our COVID-19 Vaccination
Policy. We have continued to actively support our team members over
the last year, not only through ongoing recognition, but also by
investing in strong preventative health and safety measures and
wellbeing programs.
Our remuneration framework
At Metcash, we are passionate about Championing Successful
Independents, attracting, motivating, and retaining key talent who
drive sustainable company performance while embodying our
Purpose, Vision and Values. Our executive pay comprises Fixed Pay,
Short-Term Incentive (‘STI’) and Long-Term Incentive (‘LTI’)
components and is designed to ensure that executives have a
significant proportion of remuneration at risk, which is payable on the
delivery of positive outcomes for shareholders. No significant changes
were made to our executive remuneration structure in FY22.
We undertake an annual, detailed market benchmarking review of our
director fees and executive pay, comparing fixed and variable rewards
with data sourced through Aon in their capacity as an independent
specialist remuneration data provider. Each Metcash position is
benchmarked against similar roles in our peer group, which includes
ASX listed organisations in a similar industry, both larger and smaller
than Metcash, and across measures of market capitalisation, revenue,
assets and complexity. Our target position against our peer group is
the 50th percentile, however our framework enables the recognition of
deeply experienced, high performing individuals.
Last year, we also took the opportunity to have KPMG review our
practices in setting executive performance objectives, including the
weightings given to financial and non-financial objectives and the
performance ranges used for target setting, (including the
appropriateness of minima and maxima) and also in how the
mechanics of the STI pool and the multipliers used for performance
outcomes operate. KPMG assessed Metcash practices against a group
of 21 comparator companies and found that Metcash practices were
not only broadly consistent with the market but were also best
practice in a number of key dimensions.
All that said, we took an opportunity to reframe the “Our People”
section of our executive scorecards as “Our Future”, focused on
Environment, Social and Governance (‘ESG’) priorities. The current ESG
metrics are reported in more detail in the main body of this Report.
Next year, we will be increasing the weighting on the ESG priorities to
30% of executive scorecards.
Our performance and outcomes
Our FY22 results are outstanding, with another record year,
representing continued progress on the exceptional performance in
FY21. Our Pillars continued to respond proactively to the significant
challenges associated with COVID-19 and in parallel maintained focus
on executing our MFuture plans to further improve the
competitiveness of our independent retail networks, including actively
enabling the Horizon Program.
We have worked hard to retain new and returning shoppers and are
delighted at our record sales performance again this year. Group
revenue (excluding charge through sales) increased 5.9% to $15.2
billion. Including charge through sales, Group revenue increased 6.4%
to $17.4 billion with strong sales growth in all Pillars. The uplift in sales,
together with our strong focus on costs led to EBIT increasing a
significant 17.7% to $472.3 million, despite the pressure of operating
under COVID-19 resource challenges. Underlying net profit after tax
increased 18.6% to $299.6 million and was $245.4 million on a
statutory basis. Underlying earnings per share increased 23.4% to 30.5
cents. Furthermore, we will distribute $408 million to shareholders in
dividends and share buy-backs in relation to the FY22 year.
In addition to the standout financial performance, there was ongoing
improvement in the Company’s ESG credentials as outlined in the
Company’s FY22 results presentation, with further detail to be
provided in this year’s Sustainability Report.
As part of the Aon pay benchmarking review, some changes to KMP
remuneration occurred in FY22.
No changes were made to the Group CEO’s remuneration in FY22. This
has resulted in the retiring Group CEO having had one change to his
remuneration over his five-year tenure, with that increase applying to
his variable remuneration only (STI and LTI opportunity) last year to
give even stronger alignment in his pay mix to market practice and
increase further the ‘at risk’ component of his total remuneration. His
total remuneration remains below his peer group benchmark.

DIRECTORS’ REPORT
17
Met
cash
Fin
anci
al R
epo
rt 2
022
Our recently appointed new Group CEO commenced in his role on a
slightly lower total remuneration than his predecessor. We retained
the higher weighting to variable pay in keeping with current practice in
our peer group and to maintain alignment with shareholder interests
from the very start of his tenure. As is frequently the case at Group CEO
level, in joining Metcash, our new Group CEO forfeited on-foot STI and
LTI with his previous employer and Metcash put in place a buy-out
grant to cover a portion of that forfeiture. A $1.2 million buy-out grant
was issued as performance rights, with 50% vesting to each of a one-
and two-year performance period, subject to the achievement of
Earnings Before Tax and Interest (EBIT) targets, tenure hurdles
and behavioural expectations.
Given the increase last year to the CEO Food’s remuneration, taking
him to slightly below his peer group benchmark, no further increase
was applied in FY22. However, given the business importance of the
ongoing transformation agenda in the Food business, the Board
recognised the criticality of the CEO Food during a period of transition
from one Group CEO to the next. Consequently, a retention plan was
put in place in October 2021, comprising both financial and
developmental components. A $1.0 million retention grant
incentivises the CEO Food to remain at Metcash for at least three years.
The grant was issued as performance rights and partially vests at the
end of each of the three years in the performance period, with a heavy
weighting of 50% unavailable until the end of the third year. The
performance metrics comprise the achievement of EBIT targets, tenure
hurdles and behavioural expectations.
As foreshadowed last year, a modest increase was awarded to each of
the Group CFO and the CEOs of Liquor and Hardware, representing the
first increases since their appointments.
Also, as foreshadowed last year, most Metcash Board fees remained
below peer group medians and a modest increase of 2.5% took some
slightly closer to and others slightly above the FY22 market medians
with a range of 90% to 108%.
These remuneration adjustments ensure we remain competitive
against our peer group from a reward perspective. In a tightening
talent market, where wage inflation is likely to be a reality, further
increases in Board fees and KMP salaries may be necessary in FY23 to
ensure ongoing alignment to the market.
STI outcomes for KMP are based on pool and scorecard results and
ranged from 73% to 85% of maximum, reflecting another outstanding
performance in which market share gains and improved shareholder
returns were sustained.
Our FY20 LTI vested at 100% reflecting an excellent Return on Funds
Employed (ROFE) outcome of 28.2%, representing an average of the
ROFE in each of the three financial years in the performance period
and an absolute total shareholder return (aTSR) of 25.5%, representing
growth of 89.1% in our share price and dividends over the three-year
performance period ended 30 April 2022.
For non-KMP team members, we have also rewarded performance in
keeping with our ‘pay for performance’ principles, with our exceptional
performers consistently receiving higher merit increases and incentive
payments. To maintain our outstanding record of paying equitably, we
again ensured those sitting lower in our salary bands, our more junior
team members, and those whose pay was lower than their colleagues
of a different gender received higher increases.
I am very pleased to advise that Metcash has again been awarded an
Employer of Choice citation by the Workplace Gender Equality Agency.
This recognises our deep commitment to gender pay parity and
gender equality in the workforce. This is the fourth time we have
received this citation. Metcash also received awards for its learning
and development offerings.
In summary, I believe our remuneration framework and outcomes for
the year deliver a balanced and equitable outcome for all
stakeholders.
Following positive feedback about the changes we made to this
Report, we have retained its structure and high level of disclosure. I
trust you continue to find the Report informative.
HELEN NASH
Chair, People and Culture Committee
GROUP REVENUE
GROUP EBIT
UPAT
INCREASE FROM FY21
INCREASE FROM FY21
INCREASE FROM FY21
$15.2 billion $472.3 million $299.6 million
5.9%
TOTAL SHAREHOLDER RETURN
IMPROVEMENT IN TOTAL RECORDABLE INJURY FREQUENCY RATE (TRIFR)
GENDER EQUALITY
32.9% EMPLOYER OF CHOICE
FOR THE 12 MONTHS TO 30 APRIL 2022
AWARDED BY THE WORKPLACE GENDER EQUALITY AGENCY
DIVIDENDS PER SHARE
IMPROVEMENT IN SURVEY RESULTS FROM FY21
EMPLOYEE ENGAGEMENT
3.5%
NPAT
17.7% 18.6% 2.7% INCREASE FROM FY21
$245.4 million 21.5 cents
22.9% INCREASE FROM FY21
SAFETY
0.4%
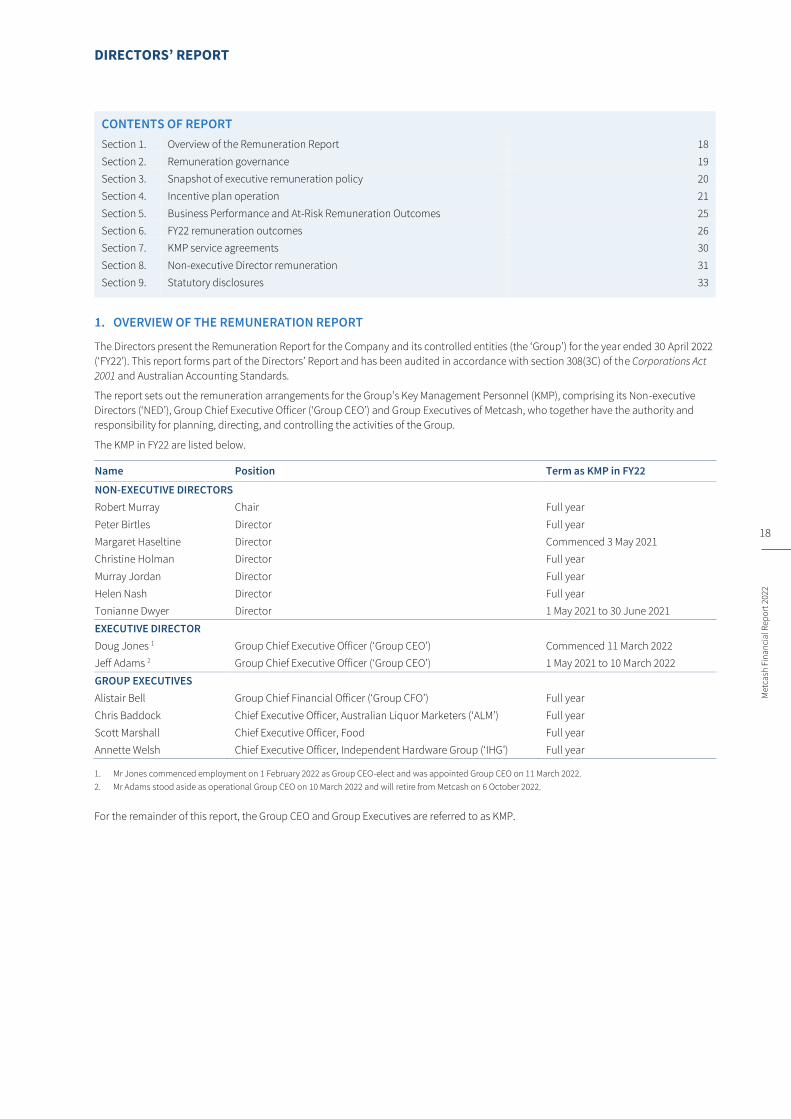
DIRECTORS’ REPORT
18
Met
cash
Fin
anci
al R
epo
rt 2
022
Met
cash
Fin
anci
al R
epo
rt 2
022
Met
cash
Fin
anci
al R
epo
rt 2
022
CONTENTS OF REPORT
Section 1. Overview of the Remuneration Report 18
Section 2. Remuneration governance 19
Section 3. Snapshot of executive remuneration policy 20
Section 4. Incentive plan operation 21
Section 5. Business Performance and At-Risk Remuneration Outcomes 25
Section 6. FY22 remuneration outcomes 26
Section 7. KMP service agreements 30
Section 8. Non-executive Director remuneration 31
Section 9. Statutory disclosures 33
OVERVIEW OF THE REMUNERATION REPORT
The Directors present the Remuneration Report for the Company and its controlled entities (the ‘Group’) for the year ended 30 April 2022
(‘FY22’). This report forms part of the Directors’ Report and has been audited in accordance with section 308(3C) of the Corporations Act
2001 and Australian Accounting Standards.
The report sets out the remuneration arrangements for the Group’s Key Management Personnel (KMP), comprising its Non-executive
Directors (‘NED’), Group Chief Executive Officer (‘Group CEO’) and Group Executives of Metcash, who together have the authority and
responsibility for planning, directing, and controlling the activities of the Group.
The KMP in FY22 are listed below.
Name Position Term as KMP in FY22
NON-EXECUTIVE DIRECTORS
Robert Murray Chair Full year
Peter Birtles Director Full year
Margaret Haseltine Director Commenced 3 May 2021
Christine Holman Director Full year
Murray Jordan Director Full year
Helen Nash Director Full year
Tonianne Dwyer Director 1 May 2021 to 30 June 2021
EXECUTIVE DIRECTOR
Doug Jones 1 Group Chief Executive Officer (‘Group CEO’) Commenced 11 March 2022
Jeff Adams 2 Group Chief Executive Officer (‘Group CEO’) 1 May 2021 to 10 March 2022
GROUP EXECUTIVES
Alistair Bell Group Chief Financial Officer (‘Group CFO’) Full year
Chris Baddock Chief Executive Officer, Australian Liquor Marketers (‘ALM’) Full year
Scott Marshall Chief Executive Officer, Food Full year
Annette Welsh Chief Executive Officer, Independent Hardware Group (‘IHG’) Full year
1. Mr Jones commenced employment on 1 February 2022 as Group CEO-elect and was appointed Group CEO on 11 March 2022.
2. Mr Adams stood aside as operational Group CEO on 10 March 2022 and will retire from Metcash on 6 October 2022.
For the remainder of this report, the Group CEO and Group Executives are referred to as KMP.

DIRECTORS’ REPORT
19
Met
cash
Fin
anci
al R
epo
rt 2
022
REMUNERATION GOVERNANCE
The following diagram illustrates Metcash’s remuneration governance framework.
The People & Culture Committee engage and consider advice from independent remuneration consultants where appropriate in relation
to remuneration matters and Non-executive Director fees. During the year, no remuneration recommendations as defined in section 9B
of the Corporations Act 2001 were provided.
BOARD The Board is responsible for overseeing and approving recommendations from the People and Culture Committee and Audit,
Risk and Compliance Committee. The Board ultimately approve the remuneration outcomes for the Group CEO and other KMP.
PEOPLE AND CULTURE
COMMITTEE (‘P&CC’)
The P&CC is the key governing body
in respect of remuneration matters.
In addition to Non-executive Director
and executive remuneration, the
P&CC oversee major people‑related
programs such as culture and
diversity, equity and inclusion. The
P&CC make recommendations to the
Board based on its review of proposals
received from management.
MANAGEMENT
Provides information relevant to
people and remuneration decisions
and makes recommendations to the
P&CC. Undertakes work as directed
by the P&CC including obtaining
information from external advisers
to assist the Committee with
decision making.
AUDIT, RISK
AND COMPLIANCE
COMMITTEE (‘ARCC’)
The ARCC support the
P&CC by reviewing the
Group’s financial results
which form the basis for
STI and LTI awards and
providing advice relating to
material risk and accounting
issues that may affect the
Board’s deliberations in
determining STI and LTI
award outcomes.
EXTERNAL ADVISERS
The Committee may commission external
advisers to provide information and/or
recommendations on remuneration. If
recommendations are sought in respect
of KMP remuneration, interaction with
external advisers is governed by protocol,
which ensures the Committee can obtain
independent advice. The Committee
Chair appoints and engages directly with
external advisers on KMP remuneration
matters. Further, remuneration
recommendations obtained from external
advisers are used as a guide, rather than
as a substitute for the Committee’s
thorough consideration of the relevant
matters. The Committee consider the
recommendations, along with other
relevant factors, in making remuneration
decisions. Both the Committee and the
Board are satisfied that the existing
protocols ensure that remuneration
recommendations obtained from external
advisers are free from undue influence
from the KMP to whom the remuneration
recommendations apply.
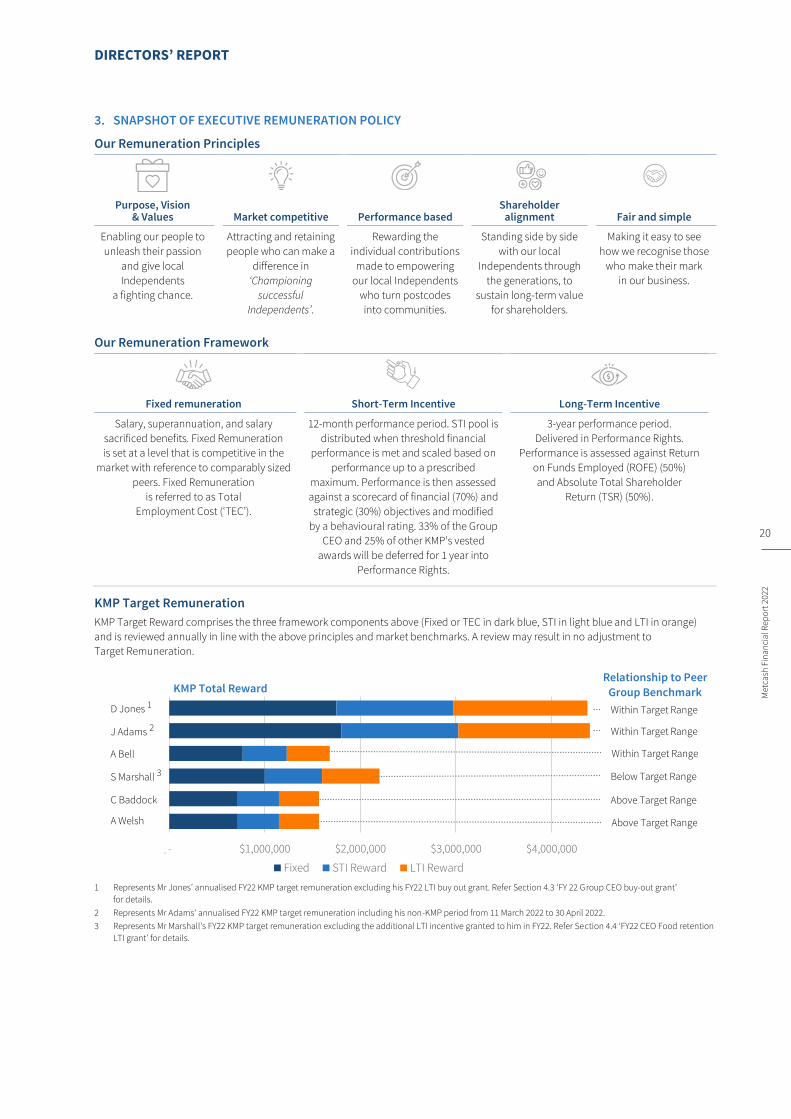
DIRECTORS’ REPORT
20
Met
cash
Fin
anci
al R
epo
rt 2
022
Met
cash
Fin
anci
al R
epo
rt 2
022
Met
cash
Fin
anci
al R
epo
rt 2
022
SNAPSHOT OF EXECUTIVE REMUNERATION POLICY
Our Remuneration Principles
Purpose, Vision & Values Market competitive Performance based
Shareholder alignment Fair and simple
Enabling our people to
unleash their passion
and give local
Independents
a fighting chance.
Attracting and retaining
people who can make a
difference in
‘Championing
successful
Independents’.
Rewarding the
individual contributions
made to empowering
our local Independents
who turn postcodes
into communities.
Standing side by side
with our local
Independents through
the generations, to
sustain long-term value
for shareholders.
Making it easy to see
how we recognise those
who make their mark
in our business.
Our Remuneration Framework
Fixed remuneration Short-Term Incentive Long-Term Incentive
Salary, superannuation, and salary
sacrificed benefits. Fixed Remuneration
is set at a level that is competitive in the
market with reference to comparably sized
peers. Fixed Remuneration
is referred to as Total
Employment Cost (‘TEC’).
12-month performance period. STI pool is
distributed when threshold financial
performance is met and scaled based on
performance up to a prescribed
maximum. Performance is then assessed
against a scorecard of financial (70%) and
strategic (30%) objectives and modified
by a behavioural rating. 33% of the Group
CEO and 25% of other KMP’s vested
awards will be deferred for 1 year into
Performance Rights.
3-year performance period.
Delivered in Performance Rights.
Performance is assessed against Return
on Funds Employed (ROFE) (50%)
and Absolute Total Shareholder
Return (TSR) (50%).
KMP Target Remuneration
KMP Target Reward comprises the three framework components above (Fixed or TEC in dark blue, STI in light blue and LTI in orange)
and is reviewed annually in line with the above principles and market benchmarks. A review may result in no adjustment to
Target Remuneration.
1 Represents Mr Jones’ annualised FY22 KMP target remuneration excluding his FY22 LTI buy out grant. Refer Section 4.3 ‘FY 22 Group CEO buy-out grant’
for details.
2 Represents Mr Adams' annualised FY22 KMP target remuneration including his non-KMP period from 11 March 2022 to 30 April 2022.
3 Represents Mr Marshall's FY22 KMP target remuneration excluding the additional LTI incentive granted to him in FY22. Refer Section 4.4 ‘FY22 CEO Food retention
LTI grant’ for details.
$- $1,000,000 $2,000,000 $3,000,000 $4,000,000
Fixed STI Reward LTI Reward
Within Target Range
KMP Total Reward
Within Target Range
Below Target Range
Above Target Range
Above Target Range
Relationship to Peer
Group Benchmark
J Adams 2
A Bell
S Marshall 3
C Baddock
A Welsh
D Jones 1
Within Target Range

DIRECTORS’ REPORT
21
Met
cash
Fin
anci
al R
epo
rt 2
022
INCENTIVE PLAN OPERATION
‘At-risk’ STI plan
The ‘at-risk’ STI plan provides executives the opportunity to earn an incentive that is contingent upon performance against a
combination of agreed financial and non-financial performance targets, which are set by the Board in consultation with the Group CEO
at the start of each financial year. The operation of the plan was reviewed by KMPG in FY22 and was confirmed as being broadly aligned
to market practice and best practice in its key components.
Feature Description
Delivery Delivered in a combination of cash and deferred equity (33% for the Group CEO and 25% for other KMP).
Deferred equity comprises performance rights that convert into fully paid ordinary shares in Metcash, which only
become unrestricted at the end of the deferral period.
Performance
period
1 May each year to 30 April the following year.
Eligibility The Group CEO and all other KMP participate in the STI plan.
The Group CEO and Group CFO participate in the Group STI pool. The Pillar CEOs participate in their respective
Pillar STI pools which are determined by a combination of their respective pillar EBIT and the consolidated
Group EBIT.
Performance
measures
STI awards are paid out of the Group and Pillar STI pools. STI pools are only released for distribution when the
threshold Group or Pillar underlying EBIT budget result, as applicable, is achieved. The STI pools are generally
made available for distribution on the following basis:
Achievement Distribution of STI pool
Below threshold 95% of budget EBIT 0% - no pool is available for distribution
Threshold 95% of budget EBIT 50% of the respective STI pools
Budget or ‘Target’ EBIT 100% of the respective STI pools
Over-achievement 105% of budget EBIT 150% of the respective STI pools
Once an STI pool is released for distribution and scaled as noted above, a participant’s individual STI award is
determined based on individual performance and behaviours. An individual’s overall performance rating is equally
weighted between their scorecard results and Metcash behaviours. Individual performance and behavioural outcomes
act as a multiplier against the pool reward by a factor of 0% to 150%. Individual results are also scaled so that the
collective individual participants’ results are distributed in a manner consistent with a normal distribution curve.
The STI Balanced Scorecard performance measures vary for each KMP based on the budgets and strategies for
their respective pillars. KPMG also reviewed the mechanics of Metcash’s scorecards, which were found to be in
keeping with the broader market and best practice in the key components.
Balanced Scorecard
Financial & Value Creation Objectives (70%) Measure
Group Target
Group Outcome Threshold Target Stretch
Deliver Financial Results
Sales revenue1 $16.0 billion $17.4 billion - 2.5% Budget + 2.5%
UPAT2 $252.4 million $299.6 million - 5.0% Budget + 5.0%
EBIT2 $410.6 million $472.3 million - 5.0% Budget + 5.0%
ROFE 25% 31% - 50bps Budget + 50bps
Cash conversion 96% 91% - 1000bps Budget + 1000bps
Project Horizon3 95% of stretch targets
90% of stretch targets
- 5.0% Budget + 5.0%
Strategic Objectives (30%) Measure Group Target
Our Future (ESG priorities) Safety (TRIFR)4 Improvement of 5% on FY21 result
Engagement Improvement of 5% on FY21 result
Our Business Business metrics5 95% of stretch targets
1 Sales revenue (including charge-through sales).
2 Analyst consensus for FY22 at time of setting the FY22 budget was UPAT of $238.0 million and EBIT of $382.9 million which is supportive of the stretch nature of these earnings targets.
3 These comprise quality and timing of the deliverables, cost of the program and value of the benefits realised.
4 Total Recordable Injury Frequency Rate
5 Examples of business metrics include Team Score (target = maintain FY21 result), Loyalty Programs (target = 12% uplift on FY21), Cost Management (target = achieve approved budget) and IBA Store Count (target =10% uplift on FY21 result).

DIRECTORS’ REPORT
22
Met
cash
Fin
anci
al R
epo
rt 2
022
Met
cash
Fin
anci
al R
epo
rt 2
022
Met
cash
Fin
anci
al R
epo
rt 2
022
Feature Description
Behavioural ratings act to modify performance against scorecard objectives and can result in an increase for
exceptional behaviour, a decrease for unacceptable behaviour or no change for successful behaviours in the overall
performance rating.
Our Metcash Behaviours are:
Accountability Continuous
Improvement Team Work
Think Customer
I am open and honest,
accepting responsibility
and delivering on
promises. I act with
integrity.
I learn from success and
failure and seek out a
better way and
collaborate with others to
reach the best outcome.
I am responsible for the
strength and diversity of
my team, and I own my
development. I build a
strong culture.
I understand and
anticipate my customer /
retailer / supplier /
shopper needs and drive
innovation for mutual
benefit.
The maximum reward is only paid on achievement of ‘stretch’ outcomes, which include:
− Maximum achievement against Group and/or pillar EBIT financial performance hurdles, as applicable
(‘STI pool’);
− Maximum achievement in overall individual performance results against all financial and all non-financial
measures contained in the individual’s Balanced Scorecard; and
− An exceptional or successful rating against Metcash’s behaviours framework.
Target setting Challenging performance targets are set against each performance measure following a rigorous budget setting
process that considers many factors including market conditions. This process includes draft budgets being initially
prepared by leadership teams, followed by Pillar CEO and CFO reviews. Once these reviews are complete, including
the Pillar CEO and CFO being confident in them, these draft budgets are thoroughly reviewed and challenged by
the Group CEO and Group CFO. Following satisfaction at this level, each Pillar presents the draft budgets to the
Board over a two-day process during which they are challenged on all matters to ensure the Board is comfortable
that the budgets are sufficiently challenging and achievable.
STI
opportunities
The STI opportunities as a percentage of TEC for KMP are outlined below:
Position Below threshold
% of TEC Threshold
% of TEC Target
% of TEC Maximum
% of TEC
Group CEO (D Jones) 0% 17.5% 70.0% 157.5%
Other KMPs 0% 15.0% 60.0% 135.0%
The Group CEO’s pay mix reflects peer group practice for Group CEOs and is therefore different to other KMP.
Deferred vesting
criteria
The deferred performance rights are conditional and only vest if the executive remains employed by the Company
up to and including 15 April of the year following the performance period. Shares are issued to participants by
25 April and are then restricted from trading until the annual results release which typically occurs in late June.
Valuing deferred
awards
The number of performance rights issued to participants is calculated by dividing 33% (Group CEO) and 25% (other
KMP) of the STI award dollar value by the volume weighted average price (VWAP) of Metcash ordinary shares over
the 20 trading days prior to the end of the performance period which ends on 30 April.
Board discretion The Board may exercise discretion to adjust the STI pool to more appropriately reflect the performance of the
Group or a specific Pillar. The Board also retain discretion to adjust vesting outcomes in any circumstances to
ensure they are appropriate.
Clawback KMP STI awards are subject to clawback for cause or material misstatement of the Group’s financial statements.
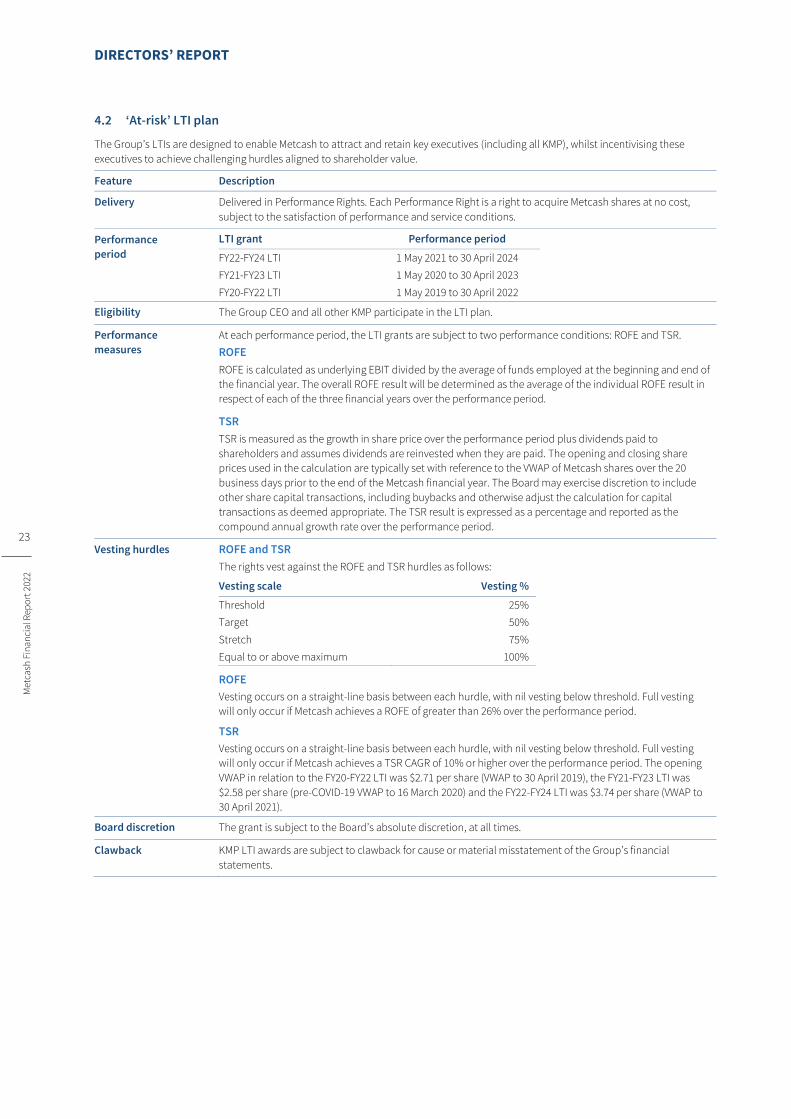
DIRECTORS’ REPORT
23
Met
cash
Fin
anci
al R
epo
rt 2
022
‘At-risk’ LTI plan
The Group’s LTIs are designed to enable Metcash to attract and retain key executives (including all KMP), whilst incentivising these
executives to achieve challenging hurdles aligned to shareholder value.
Feature Description
Delivery Delivered in Performance Rights. Each Performance Right is a right to acquire Metcash shares at no cost,
subject to the satisfaction of performance and service conditions.
Performance
period
LTI grant Performance period
FY22-FY24 LTI 1 May 2021 to 30 April 2024
FY21-FY23 LTI 1 May 2020 to 30 April 2023
FY20-FY22 LTI 1 May 2019 to 30 April 2022
Eligibility The Group CEO and all other KMP participate in the LTI plan.
Performance
measures
At each performance period, the LTI grants are subject to two performance conditions: ROFE and TSR.
ROFE
ROFE is calculated as underlying EBIT divided by the average of funds employed at the beginning and end of
the financial year. The overall ROFE result will be determined as the average of the individual ROFE result in
respect of each of the three financial years over the performance period.
TSR
TSR is measured as the growth in share price over the performance period plus dividends paid to
shareholders and assumes dividends are reinvested when they are paid. The opening and closing share
prices used in the calculation are typically set with reference to the VWAP of Metcash shares over the 20
business days prior to the end of the Metcash financial year. The Board may exercise discretion to include
other share capital transactions, including buybacks and otherwise adjust the calculation for capital
transactions as deemed appropriate. The TSR result is expressed as a percentage and reported as the
compound annual growth rate over the performance period.
Vesting hurdles ROFE and TSR
The rights vest against the ROFE and TSR hurdles as follows:
Vesting scale Vesting %
Threshold 25%
Target 50%
Stretch 75%
Equal to or above maximum 100%
ROFE
Vesting occurs on a straight-line basis between each hurdle, with nil vesting below threshold. Full vesting
will only occur if Metcash achieves a ROFE of greater than 26% over the performance period.
TSR
Vesting occurs on a straight-line basis between each hurdle, with nil vesting below threshold. Full vesting
will only occur if Metcash achieves a TSR CAGR of 10% or higher over the performance period. The opening
VWAP in relation to the FY20-FY22 LTI was $2.71 per share (VWAP to 30 April 2019), the FY21-FY23 LTI was
$2.58 per share (pre-COVID-19 VWAP to 16 March 2020) and the FY22-FY24 LTI was $3.74 per share (VWAP to
30 April 2021).
Board discretion The grant is subject to the Board’s absolute discretion, at all times.
Clawback KMP LTI awards are subject to clawback for cause or material misstatement of the Group’s financial
statements.

DIRECTORS’ REPORT
24
Met
cash
Fin
anci
al R
epo
rt 2
022
Met
cash
Fin
anci
al R
epo
rt 2
022
Met
cash
Fin
anci
al R
epo
rt 2
022
FY22 Group CEO buy-out grant
Feature Description
Delivery Delivered in Performance Rights. Each Performance Right is a right to acquire Metcash shares at no cost,
subject to the satisfaction of performance and service conditions.
Performance
period
LTI grant Performance period
Tranche 1 1 February 2022 to 31 January 2023
Tranche 2 1 February 2022 to 31 January 2024
Eligibility Group CEO
Performance
measures
To secure Mr Jones’ appointment, Mr Jones’ on-foot executive incentives with his previous employer required
a buyout. This grant, which represented only a portion of his on-foot incentives, is subject to two
performance conditions:
− a service condition and;
− a Group underlying EBIT performance hurdle for each tranche, as set out in section 6 below. The EBIT
hurdles align to the Group’s annual budget and STI metrics.
In addition, Mr Jones’ ongoing performance and behaviours must be deemed as acceptable over each
performance period by the Board.
Vesting hurdles Vesting occurs when all the performance measures have been satisfied. Failure to achieve any of the
two performance conditions will result in nil vesting. Each tranche is tested separately and operates
independently.
Board discretion The grant is subject to the Board’s absolute discretion, at all times.
Clawback The grant is subject to clawback for cause or material misstatement of the Group’s financial statements.
FY22 CEO Food retention LTI grant
Feature Description
Delivery Delivered in Performance Rights. Each Performance Right is a right to acquire Metcash shares at no cost,
subject to the satisfaction of performance and service conditions.
Performance
period
LTI grant Performance period
Tranche 1 1 October 2021 to 30 September 2022
Tranche 2 1 October 2021 to 30 September 2023
Tranche 3 1 October 2021 to 30 September 2024
Eligibility CEO Food
Performance
measures
This is a retention incentive issued to Mr Marshall and is subject to two performance conditions:
− a service condition and;
− a Food underlying EBIT performance hurdle for each tranche, as set out in section 6 below. The EBIT
hurdles align to the Group’s annual budget and STI metrics.
In addition, Mr Marshall’s ongoing performance and behaviours must be deemed as acceptable over each
performance period by the Board.
Vesting hurdles Vesting occurs when all the performance measures have been satisfied. Failure to achieve any of the
two performance conditions will result in nil vesting. Each tranche is tested separately and operates
independently.
Board discretion The grant is subject to the Board’s absolute discretion, at all times.
Clawback The grant is subject to clawback for cause or material misstatement of the Group’s financial statements.
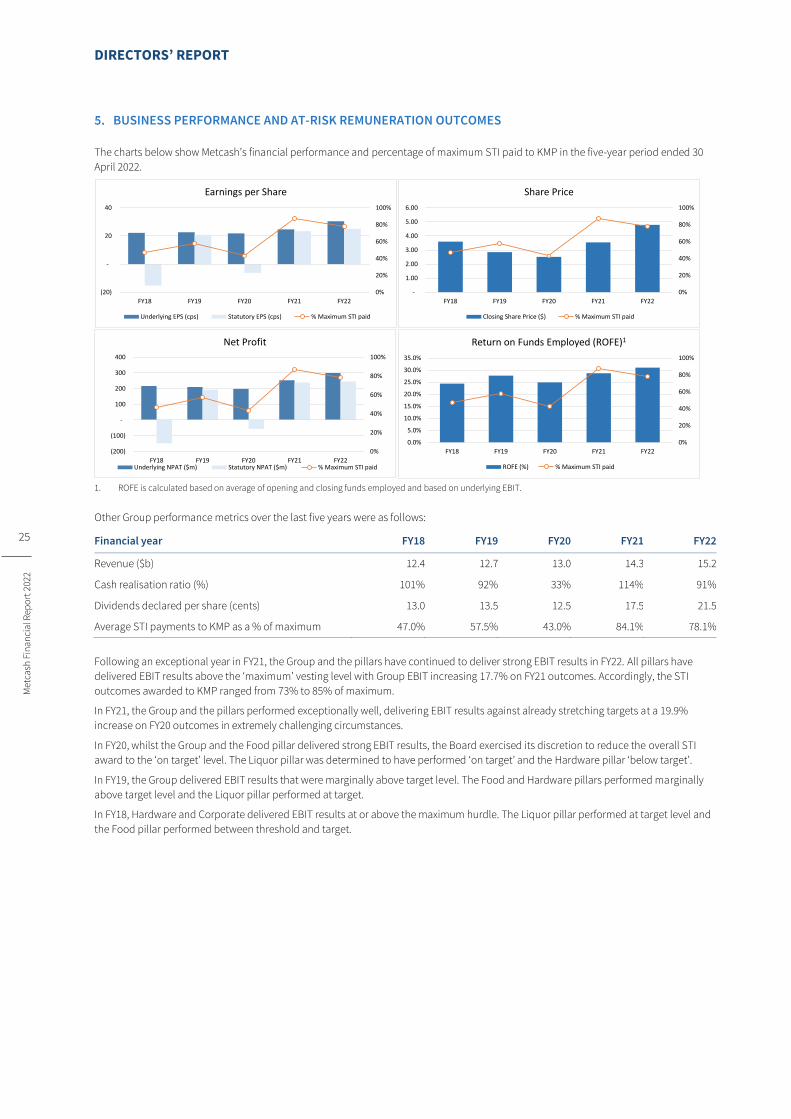
DIRECTORS’ REPORT
25
Met
cash
Fin
anci
al R
epo
rt 2
022
BUSINESS PERFORMANCE AND AT-RISK REMUNERATION OUTCOMES
The charts below show Metcash’s financial performance and percentage of maximum STI paid to KMP in the five-year period ended 30
April 2022.
1. ROFE is calculated based on average of opening and closing funds employed and based on underlying EBIT.
Other Group performance metrics over the last five years were as follows:
Financial year FY18 FY19 FY20 FY21 FY22
Revenue ($b) 12.4 12.7 13.0 14.3 15.2
Cash realisation ratio (%) 101% 92% 33% 114% 91%
Dividends declared per share (cents) 13.0 13.5 12.5 17.5 21.5
Average STI payments to KMP as a % of maximum 47.0% 57.5% 43.0% 84.1% 78.1%
Following an exceptional year in FY21, the Group and the pillars have continued to deliver strong EBIT results in FY22. All pillars have
delivered EBIT results above the ‘maximum’ vesting level with Group EBIT increasing 17.7% on FY21 outcomes. Accordingly, the STI
outcomes awarded to KMP ranged from 73% to 85% of maximum.
In FY21, the Group and the pillars performed exceptionally well, delivering EBIT results against already stretching targets at a 19.9%
increase on FY20 outcomes in extremely challenging circumstances.
In FY20, whilst the Group and the Food pillar delivered strong EBIT results, the Board exercised its discretion to reduce the overall STI
award to the ‘on target’ level. The Liquor pillar was determined to have performed ‘on target’ and the Hardware pillar ‘below target’.
In FY19, the Group delivered EBIT results that were marginally above target level. The Food and Hardware pillars performed marginally
above target level and the Liquor pillar performed at target.
In FY18, Hardware and Corporate delivered EBIT results at or above the maximum hurdle. The Liquor pillar performed at target level and
the Food pillar performed between threshold and target.
0%
20%
40%
60%
80%
100%
(20)
-
20
40
FY18 FY19 FY20 FY21 FY22
Earnings per Share
Underlying EPS (cps) Statutory EPS (cps) % Maximum STI paid
0%
20%
40%
60%
80%
100%
-
1.00
2.00
3.00
4.00
5.00
6.00
FY18 FY19 FY20 FY21 FY22
Share Price
Closing Share Price ($) % Maximum STI paid
0%
20%
40%
60%
80%
100%
(200)
(100)
-
100
200
300
400
FY18 FY19 FY20 FY21 FY22
Net Profit
Underlying NPAT ($m) Statutory NPAT ($m) % Maximum STI paid
0%
20%
40%
60%
80%
100%
0.0%
5.0%
10.0%
15.0%
20.0%
25.0%
30.0%
35.0%
FY18 FY19 FY20 FY21 FY22
Return on Funds Employed (ROFE)1
ROFE (%) % Maximum STI paid

DIRECTORS’ REPORT
26
Met
cash
Fin
anci
al R
epo
rt 2
022
Met
cash
Fin
anci
al R
epo
rt 2
022
Met
cash
Fin
anci
al R
epo
rt 2
022
FY22 REMUNERATION OUTCOMES
Actual FY22 KMP remuneration
The table below reflects actual cash payments made or due to KMP in respect of performance during FY22. The table does not comply
with IFRS requirements. The required statutory disclosures are shown in section 9 of this report:
KMP
Total employment
cost $
FY22 STI cash1
$
FY21 STI deferred2
$ LTI3
$ Total
$
D Jones4 249,375 194,006 - - 443,381
J Adams (retiring)5 1,548,000 1,164,644 794,351 2,059,038 5,566,033
A Bell 768,750 570,797 86,640 - 1,426,187
C Baddock 717,500 605,391 202,388 720,666 2,245,945
S Marshall 1,000,000 860,625 288,182 918,840 3,067,647
A Welsh 717,500 593,282 213,413 180,178 1,704,373
1 Represents the cash component of the FY22 STI reward amount of 67% (Group CEO) and 75% (other KMP) payable in cash in July 2022. The deferred equity
component of the FY22 STI reward of 33% (Group CEO) and 25% (other KMP) is not presented above because the reward is conditional upon the executive being
employed by the Company on 15 April 2023. Shares are issued to participants by 25 April 2023 and are then restricted from trading until the close of 26 June 2023.
2 Represents the deferred equity component of the FY21 STI reward of 33% (Group CEO) and 25% (other KMP) which were deferred as equity. The KMPs have
subsequently met the continuity of employment service condition. Accordingly, the performance rights have vested and the shares were issued to the KMPs in
April 2022. The shares are restricted from trading until the close of 27 June 2022. The amounts presented above are based on the number of rights vested
multiplied by the VWAP of Metcash shares over the 20 business days ending 30 April 2021 of $3.74 per share.
3 The FY20-FY22 LTI will vest during FY22 at 100%, subject only to the KMP remaining in employment until 15 August 2022. The amounts presented above are based
on the number of rights that will vest multiplied by the VWAP of Metcash shares over the 20 business days until 30 April 2022 of $4.65 per share.
4 Mr Jones commenced employment on 1 February 2022 as Group CEO-elect and was appointed Group CEO on 11 March 2022, with a fixed remuneration of
$1,750,000. The amounts disclosed above reflect Mr Jones’ total fixed remuneration and actual STI award for the period from 11 March 2022 to 30 April 2022 as
KMP. In addition, Mr Jones received total fixed remuneration of $188,125 and FY22 STI cash award of $144,553 as non-KMP relating to the period from 1 February
2022 to 10 March 2022.
5 Mr Adams stood aside as operational Group CEO on 10 March 2022 and will retire from Metcash on 6 October 2022. The amounts disclosed above reflect Mr
Adams’ total fixed remuneration and actual STI and LTI award for the period from 1 May 2021 to 10 March 2022 as KMP. In addition, Mr Adams received total
actual FY22 remuneration of $441,593 as non-KMP relating to the period from 11 March 2022 to 30 April 2022. In line with Metcash’s good leavers policy, the Board
exercised its discretion not to issue performance rights in relation to 33% of Mr Adams’ FY22 STI reward which was deferred to and will be payable in cash on the
date of his retirement and retain (on a pro-rata basis) 100,354 and 192,048 of his FY21-FY23 and FY22-FY24 LTI performance rights, respectively, which will be
tested in accordance with existing performance conditions.
FY22 STI outcomes
Metcash’s performance in FY22 exceeded expectations driven by the exceptional performance of our executive team.
Performance against each financial STI measure comfortably exceeded ‘stretch’ targets, allowing each STI pool to be funded to its
maximum level.
As outlined on the following page, these financial results combined with KMP exceeding expectations against their overall individual
objectives resulted in STI outcomes ranging from 73% to 85% of maximum. Across the KMP, performance against a number of targets,
mainly non-financial targets, while being solid, were below target in the balanced scorecard which adversely affected their overall STI
reward.
The Board view these FY22 STI outcomes as an appropriate recognition of the KMP’s performance. This outcome also recognises that
FY22 performance was reflected in strong outcomes for shareholders, customers and the broader workforce (who were also eligible for
maximum bonus payments in FY22).

DIRECTORS’ REPORT
27
Met
cash
Fin
anci
al R
epo
rt 2
022
The FY22 STI outcomes against each of the KMPs Balanced Scorecards are summarised below:
Balanced Scorecard Outcomes D Jones
Group CEO
J Adams (retiring)
Group CEO A Bell
Group CFO C Baddock
CEO ALM S Marshall CEO Food
A Welsh CEO IHG
FINANCIAL & VALUE CREATION OBJECTIVES (70%)
Sales revenue1 Stretch Stretch Stretch Stretch Stretch Stretch
UPAT Stretch Stretch Stretch N/A N/A N/A
EBIT Stretch Stretch Stretch Stretch Stretch Stretch
ROFE Stretch Stretch Stretch Stretch Stretch Stretch
Cash Conversion Below target Below target Below target N/A N/A N/A
Working Capital N/A N/A N/A Stretch Stretch Target
Project Horizon Delivery Target Below target Below target Below target Target Below target
STRATEGIC OBJECTIVES (30%)
Our Future (ESG priorities)
Strong & Positive Culture Below target Below target Below target Target Target Stretch
Safety Below target Below target Below target Stretch Below target Target
Our Business
Improve Pillar Metrics Above target Above target N/A Target Stretch Above target
Finance Initiatives N/A N/A Above target N/A N/A N/A
Behaviours Exceptional Strong Strong Strong Exceptional Strong
Overall rating Above target Above target Above target Above target Stretch Above target
STI % of maximum awarded 75% 73% 73% 83% 85% 82%
1. Sales revenue (including charge-through sales).
The table below reflects the KMP’s FY22 STI outcomes when compared against target and maximum potential STI:
KMP
Target potential STI
$
Maximum potential STI
$
STI awarded %
of maximum
STI cash1
$
STI deferred2
$
Total STI awarded
$
Maximum STI forfeited
$
D Jones3 171,165 385,120 73.3% 194,066 95,555 289,561 95,559
J Adams (retiring)4 1,053,500 2,370,375 73.3% 1,164,644 573,631 1,738,275 632,100
A Bell 461,250 1,037,813 73.3% 570,797 190,266 761,063 276,750
C Baddock 430,500 968,625 83.3% 605,391 201,797 807,188 161,437
S Marshall 600,000 1,350,000 85.0% 860,625 286,875 1,147,500 202,500
A Welsh 430,500 968,625 81.7% 593,282 197,762 791,044 177,582
1. The cash component of the FY22 STI reward of 67% (Group CEO) and 75% (other KMP) is payable in cash in July 2022.
2. The deferred equity component of the FY22 STI reward of 33% (Group CEO) and 25% (other KMP) is deferred and released through the issue of Metcash
performance rights, conditional upon the executive being employed by the Company on 15 April 2023. Shares are issued to participants by 25 April 2023 and are
then restricted from trading until the close of 26 June 2023.
3. Mr Jones commenced employment on 1 February 2022 as Group CEO-elect and was appointed as Group CEO on 11 March 2022 with a fixed remuneration of
$1,750,000. The amounts disclosed above reflect Mr Jones’ STI award for the period from 11 March 2022 to 30 April 2022 as KMP. In addition, Mr Jones received an
STI award of $215,752 as non-KMP relating to the period from 1 February 2022 to 10 March 2022.
4. Mr Adams stood aside as operational Group CEO on 10 March 2022 and will retire from Metcash on 6 October 2022. The amounts disclosed above reflect Mr
Adams’ STI award for the period from 1 May 2021 to 10 March 2022 as KMP. In line with Metcash’s good leavers policy, the Board exercised its discretion not to
issue performance rights in relation to 33% of Mr Adams’ FY22 STI reward which was deferred to and will be payable in cash on the date of his retirement.
Accordingly, Mr Adams received an STI cash award of $282,975 as non-KMP relating to the period from 11 March 2022 to 30 April 2022.
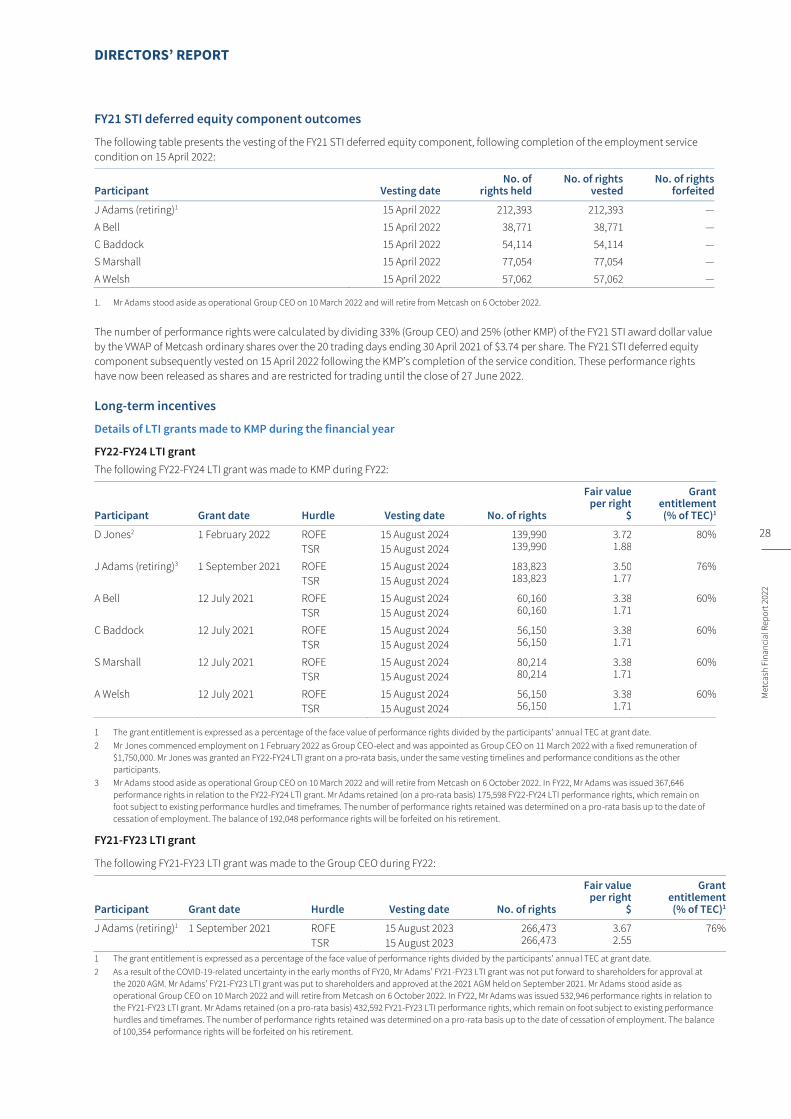
DIRECTORS’ REPORT
28
Met
cash
Fin
anci
al R
epo
rt 2
022
Met
cash
Fin
anci
al R
epo
rt 2
022
Met
cash
Fin
anci
al R
epo
rt 2
022
FY21 STI deferred equity component outcomes
The following table presents the vesting of the FY21 STI deferred equity component, following completion of the employment service
condition on 15 April 2022:
Participant Vesting date No. of
rights held No. of rights
vested No. of rights
forfeited
J Adams (retiring)1 15 April 2022 212,393 212,393 —
A Bell 15 April 2022 38,771 38,771 —
C Baddock 15 April 2022 54,114 54,114 —
S Marshall 15 April 2022 77,054 77,054 —
A Welsh 15 April 2022 57,062 57,062 —
1. Mr Adams stood aside as operational Group CEO on 10 March 2022 and will retire from Metcash on 6 October 2022.
The number of performance rights were calculated by dividing 33% (Group CEO) and 25% (other KMP) of the FY21 STI award dollar value
by the VWAP of Metcash ordinary shares over the 20 trading days ending 30 April 2021 of $3.74 per share. The FY21 STI deferred equity
component subsequently vested on 15 April 2022 following the KMP’s completion of the service condition. These performance rights
have now been released as shares and are restricted for trading until the close of 27 June 2022.
Long-term incentives
Details of LTI grants made to KMP during the financial year
FY22-FY24 LTI grant
The following FY22-FY24 LTI grant was made to KMP during FY22:
Participant Grant date Hurdle Vesting date No. of rights
Fair value per right
$
Grant entitlement (% of TEC)1
D Jones2 1 February 2022 ROFE
TSR
15 August 2024
15 August 2024
139,990 139,990
3.72 1.88
80%
J Adams (retiring)3 1 September 2021 ROFE
TSR
15 August 2024
15 August 2024
183,823 183,823
3.50 1.77
76%
A Bell 12 July 2021 ROFE
TSR
15 August 2024
15 August 2024
60,160 60,160
3.38 1.71
60%
C Baddock 12 July 2021 ROFE
TSR
15 August 2024
15 August 2024
56,150 56,150
3.38 1.71
60%
S Marshall 12 July 2021 ROFE
TSR
15 August 2024
15 August 2024
80,214 80,214
3.38 1.71
60%
A Welsh 12 July 2021 ROFE
TSR
15 August 2024
15 August 2024
56,150 56,150
3.38 1.71
60%
1 The grant entitlement is expressed as a percentage of the face value of performance rights divided by the participants’ annua l TEC at grant date.
2 Mr Jones commenced employment on 1 February 2022 as Group CEO-elect and was appointed as Group CEO on 11 March 2022 with a fixed remuneration of
$1,750,000. Mr Jones was granted an FY22-FY24 LTI grant on a pro-rata basis, under the same vesting timelines and performance conditions as the other
participants.
3 Mr Adams stood aside as operational Group CEO on 10 March 2022 and will retire from Metcash on 6 October 2022. In FY22, Mr Adams was issued 367,646
performance rights in relation to the FY22-FY24 LTI grant. Mr Adams retained (on a pro-rata basis) 175,598 FY22-FY24 LTI performance rights, which remain on
foot subject to existing performance hurdles and timeframes. The number of performance rights retained was determined on a pro-rata basis up to the date of
cessation of employment. The balance of 192,048 performance rights will be forfeited on his retirement.
FY21-FY23 LTI grant
The following FY21-FY23 LTI grant was made to the Group CEO during FY22:
Participant Grant date Hurdle Vesting date No. of rights
Fair value per right
$
Grant entitlement (% of TEC)1
J Adams (retiring)1 1 September 2021 ROFE
TSR
15 August 2023
15 August 2023
266,473 266,473
3.67 2.55
76%
1 The grant entitlement is expressed as a percentage of the face value of performance rights divided by the participants’ annua l TEC at grant date.
2 As a result of the COVID-19-related uncertainty in the early months of FY20, Mr Adams’ FY21-FY23 LTI grant was not put forward to shareholders for approval at
the 2020 AGM. Mr Adams’ FY21-FY23 LTI grant was put to shareholders and approved at the 2021 AGM held on September 2021. Mr Adams stood aside as
operational Group CEO on 10 March 2022 and will retire from Metcash on 6 October 2022. In FY22, Mr Adams was issued 532,946 performance rights in relation to
the FY21-FY23 LTI grant. Mr Adams retained (on a pro-rata basis) 432,592 FY21-FY23 LTI performance rights, which remain on foot subject to existing performance
hurdles and timeframes. The number of performance rights retained was determined on a pro-rata basis up to the date of cessation of employment. The balance
of 100,354 performance rights will be forfeited on his retirement.
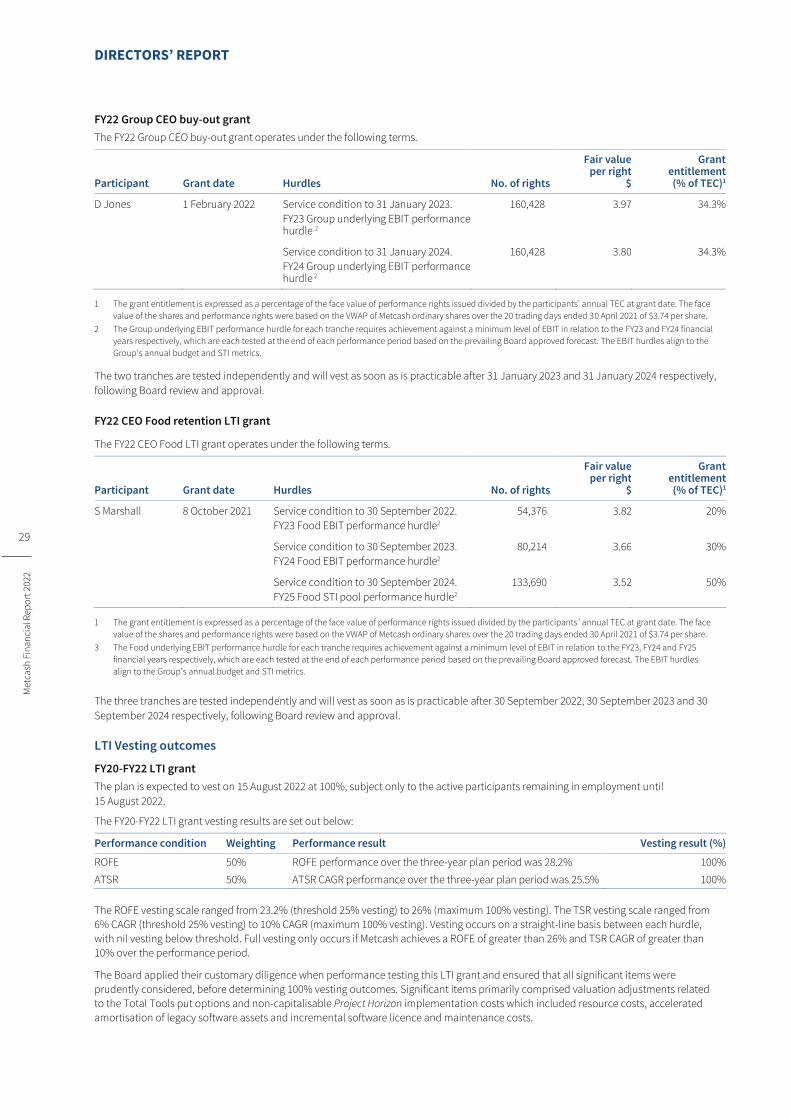
DIRECTORS’ REPORT
29
Met
cash
Fin
anci
al R
epo
rt 2
022
FY22 Group CEO buy-out grant
The FY22 Group CEO buy-out grant operates under the following terms.
Participant Grant date Hurdles No. of rights
Fair value per right
$
Grant entitlement (% of TEC)1
D Jones 1 February 2022 Service condition to 31 January 2023.
FY23 Group underlying EBIT performance hurdle 2
160,428 3.97 34.3%
Service condition to 31 January 2024.
FY24 Group underlying EBIT performance hurdle 2
160,428 3.80 34.3%
1 The grant entitlement is expressed as a percentage of the face value of performance rights issued divided by the participants’ annual TEC at grant date. The face
value of the shares and performance rights were based on the VWAP of Metcash ordinary shares over the 20 trading days ended 30 April 2021 of $3.74 per share.
2 The Group underlying EBIT performance hurdle for each tranche requires achievement against a minimum level of EBIT in relation to the FY23 and FY24 financial
years respectively, which are each tested at the end of each performance period based on the prevailing Board approved forecast. The EBIT hurdles align to the
Group’s annual budget and STI metrics.
The two tranches are tested independently and will vest as soon as is practicable after 31 January 2023 and 31 January 2024 respectively,
following Board review and approval.
FY22 CEO Food retention LTI grant
The FY22 CEO Food LTI grant operates under the following terms.
Participant Grant date Hurdles No. of rights
Fair value per right
$
Grant entitlement (% of TEC)1
S Marshall 8 October 2021 Service condition to 30 September 2022.
FY23 Food EBIT performance hurdle2
54,376 3.82 20%
Service condition to 30 September 2023.
FY24 Food EBIT performance hurdle2
80,214 3.66 30%
Service condition to 30 September 2024.
FY25 Food STI pool performance hurdle2
133,690 3.52 50%
1 The grant entitlement is expressed as a percentage of the face value of performance rights issued divided by the participants ’ annual TEC at grant date. The face
value of the shares and performance rights were based on the VWAP of Metcash ordinary shares over the 20 trading days ended 30 April 2021 of $3.74 per share.
3 The Food underlying EBIT performance hurdle for each tranche requires achievement against a minimum level of EBIT in relation to the FY23, FY24 and FY25
financial years respectively, which are each tested at the end of each performance period based on the prevailing Board approved forecast. The EBIT hurdles
align to the Group’s annual budget and STI metrics.
The three tranches are tested independently and will vest as soon as is practicable after 30 September 2022, 30 September 2023 and 30
September 2024 respectively, following Board review and approval.
LTI Vesting outcomes
FY20-FY22 LTI grant
The plan is expected to vest on 15 August 2022 at 100%, subject only to the active participants remaining in employment until
15 August 2022.
The FY20-FY22 LTI grant vesting results are set out below:
Performance condition Weighting Performance result Vesting result (%)
ROFE 50% ROFE performance over the three-year plan period was 28.2% 100%
ATSR 50% ATSR CAGR performance over the three-year plan period was 25.5% 100%
The ROFE vesting scale ranged from 23.2% (threshold 25% vesting) to 26% (maximum 100% vesting). The TSR vesting scale ranged from
6% CAGR (threshold 25% vesting) to 10% CAGR (maximum 100% vesting). Vesting occurs on a straight-line basis between each hurdle,
with nil vesting below threshold. Full vesting only occurs if Metcash achieves a ROFE of greater than 26% and TSR CAGR of greater than
10% over the performance period.
The Board applied their customary diligence when performance testing this LTI grant and ensured that all significant items were
prudently considered, before determining 100% vesting outcomes. Significant items primarily comprised valuation adjustments related
to the Total Tools put options and non-capitalisable Project Horizon implementation costs which included resource costs, accelerated
amortisation of legacy software assets and incremental software licence and maintenance costs.

DIRECTORS’ REPORT
30
Met
cash
Fin
anci
al R
epo
rt 2
022
Met
cash
Fin
anci
al R
epo
rt 2
022
Met
cash
Fin
anci
al R
epo
rt 2
022
Participant Hurdle No. of
rights held No. of rights
expected to vest No. of rights
expected to be forfeited
J Adams (retiring) ROFE
ATSR
221,402 221,402
221,402 221,402
- -
C Baddock ROFE
ATSR
77,491 77,491
77,491 77,491
- -
S Marshall ROFE
ATSR
98,800 98,800
98,800 98,800
- -
A Welsh ROFE
ATSR
19,374
19,374
19,374
19,374
- -
FY21-FY23 LTI grant
The ATSR component is currently performing at the maximum level on the vesting scale. This interim performance assessment is based
on a VWAP of $4.65 per share, measured across the 20 business days to 30 April 2022. In FY22, the Group provided for the ROFE
component based on the maximum level of performance.
FY22-FY24 LTI grant
The ATSR component is currently performing at the maximum level on the vesting scale. This interim performance assessment is based
on a VWAP of $4.65 per share, measured across the 20 business days to 30 April 2022. In FY22, the Group provided for the ROFE
component based on the maximum level of performance.
Remuneration mix
The chart below outlines the FY22 remuneration mix for KMP at the end of the year including the deferral of the 33% (Group CEO) and
25% (other KMP) of STI ‘at risk’ equity component. Each remuneration component is shown as a percentage of total remuneration
measured at Target and at Maximum earnings opportunity. LTI values have been measured at grant date, based on the face value of
incentives granted in FY22.
The KMP remuneration weighting as a percentage of TEC during FY22 was as follows:
1. Represents Mr Jones’ annualised FY22 KMP remuneration excluding his FY22 LTI buy out grant. Refer Section 4.3 ‘FY 22 Group CEO buy-out grant’ for details.
2. Represents Mr Adams' annualised FY22 KMP remuneration including his non-KMP period from 11 March 2022 to 30 April 2022.
3. Represents Mr Marshall's FY22 KMP remuneration excluding the additional LTI incentive granted to him in FY22. Refer Section 4.4 ‘FY22 CEO Food retention LTI
grant’ for details.
KMP SERVICE AGREEMENTS
Name Agreement term Executive notice Metcash notice Redundancy
D Jones Four years (based on 482 visa limitations)1 12 months 12 months 12 months
A Bell Ongoing unless notice given 12 months 12 months 12 months
C Baddock Ongoing unless notice given 12 months 12 months 12 months
S Marshall Ongoing unless notice given 12 months 12 months 12 months
A Welsh Ongoing unless notice given 12 months 12 months 12 months
1. Mr Jones’ visa expires in November 2025.
In the event of cessation of employment, a KMP’s unvested performance rights will ordinarily lapse, however, this is subject to Board
discretion which may be exercised in circumstances such as death, disability, retirement, redundancy or special circumstances.
In some circumstances on termination of employment, the Group may require individuals to enter into non-compete arrangements with
the Group. These arrangements may require a payment to the individual.
30%
30%
34%
34%
34%
34%
31%
31%
34%
34%
34%
34%
15%
16%
12%
12%
12%
12%
24%
23%
20%
20%
20%
20%
D Jones
J Adams
A Bell
C Baddock
S Marshall
A Welsh
Maximum
TEC STI cash STI deferred equity LTI
0
40%
41%
45%
45%
45%
45%
19%
19%
20%
20%
20%
20%
9%
9%
8%
8%
8%
8%
32%
31%
27%
27%
27%
27%
D Jones
J Adams
A Bell
C Baddock
S Marshall
A Welsh
Target
TEC STI cash STI deferred equity LTI
1
2
3

DIRECTORS’ REPORT
31
Met
cash
Fin
anci
al R
epo
rt 2
022
Minimum shareholding guidelines
Minimum shareholding guidelines have been implemented for all KMP commencing as of the effective date specified below or upon the
date of appointment as KMP, whichever occurs later.
Position Value Time to achieve Effective date
Group CEO 1 x TEC 5 years 1 May 2018
Other KMP 0.5 x TEC 5 years 1 May 2019
8. NON-EXECUTIVE DIRECTOR REMUNERATION
Remuneration policy
The objectives of Metcash’s policy regarding Non-executive Director fees are:
− To preserve the independence of Non-executive Directors by not including any performance-related element; and
− To be market competitive with regard to Non-executive Director fees in comparable ASX-listed companies and to the time and
professional commitment in discharging the responsibilities of the role.
All Non-executive Directors are paid a fixed annual fee. In addition, Committee fees are paid to recognise the additional responsibilities
associated with participating on a Board Committee. The fixed fee to the Board Chair is to remunerate the Chair for all responsibilities,
including participating on any Board Committees.
To align individual interests with shareholders’ interests, Non-executive Directors are encouraged to hold Metcash shares. Non-executive
Directors fund their own share purchases and must comply with Metcash’s share trading policy.
Aggregate fee limit
Non-executive Director fees are limited to a maximum aggregate amount approved by shareholders. The current limit of $2,000,000 was
approved in 2021.
Minimum shareholding guidelines
Minimum shareholding guidelines have been implemented for all Non-executive Directors of one year’s base fees to be accumulated in
five years from the effective date of 1 May 2019 or upon their date of appointment as a Non-executive Director, whichever occurs later.
Non-executive Director fee structure
Consistent with all executive remuneration practices in Metcash, extensive annual independent data benchmarking is undertaken on
Board fees. Averaged over the last 4 years, the Board fees have increased by 3% per annum and this results in Metcash sitting below the
market benchmark of our peer group. In FY22, an increase in fees of 2.5% was made, which moves the position to between 95% and
112% of the market benchmark.
FY22
$1 FY21
$1,2
BOARD
Chair 462,761 451,474
Non-executive Director 156,832 153,007
COMMITTEE
Audit, Risk & Compliance
Chair 37,472 36,558
Member 16,856 16,444
People & Culture
Chair 37,472 36,558
Member 16,856 16,444
Nomination
Chair — —
Member — —
1. Per annum fees as at the end of the financial year, including superannuation.
2. The increase in per annum fees was effective 1 May 2020 except for the Chairman of the Board which was effective 1 December 2020.

DIRECTORS’ REPORT
32
Met
cash
Fin
anci
al R
epo
rt 2
022
Met
cash
Fin
anci
al R
epo
rt 2
022
Met
cash
Fin
anci
al R
epo
rt 2
022
Non-executive Director remuneration
Name Financial
year Fees
$ Superannuation
$ Total
$
R Murray FY22 439,505 23,256 462,761 FY21 417,352 21,581 438,933
P Birtles FY22 176,775 17,530 194,305 FY21 170,057 16,155 186,212
M Haseltine1 FY22 158,018 15,670 173,688
FY21 - - -
C Holman FY22 158,018 15,670 173,688
FY21 90,271 8,576 98,847
M Jordan FY22 173,353 17,190 190,543
FY21 169,767 16,128 185,895
H Nash FY22 185,472 8,832 194,304
FY21 181,211 8,354 189,565
T Dwyer (retired)2 FY22 26,436 2,511 28,947 FY21 160,873 15,283 176,156
Total FY22 1,317,577 100,659 1,418,236 FY21 1,189,531 86,077 1,275,608
1. Ms Haseltine was appointed a Non-executive Director on 3 May 2021.
2. Ms Dwyer retired as a Non-executive Director on 30 June 2021.
Non-executive Director shareholdings
Name Balance at 1 May 2021
Acquired during the year
Other adjustments
Balance at 30 April 2022
Balance at report date
DIRECTORS
R Murray 84,005 - - 84,005 84,005
P Birtles 40,000 - - 40,000 40,000
M Haseltine1 - 57,839 - 57,839 57,839
C Holman 30,000 - - 30,000 30,000
M Jordan 57,441 - - 57,441 57,441
H Nash 51,189 - - 51,189 51,189
T Dwyer (retired)2 60,000 - (60,000) - -
322,635 57,839 (60,000) 320,474 320,474
1. Ms Haseltine was appointed a Non-executive Director on 3 May 2021.
2. Ms Dwyer retired as a Non-executive Director on 30 June 2021.

DIRECTORS’ REPORT
33
Met
cash
Fin
anci
al R
epo
rt 2
022
9. STATUTORY DISCLOSURES
Fixed and ‘at-risk’ remuneration
Fixed
remuneration STI
cash1 STI
deferred 2, 3 Super-
annuation Leave4
LTI (share-based
payments) Total Performance-
related
KMP Year $ $ $ $ $ $ $ %
D Jones5 FY22 244,897 194,006 47,777 4,478 43,888 179,536 714,582 59.0%
FY21 — — — — — — — —
J Adams (retiring)6
FY22 1,548,000 1,164,644 970,806 — 55,385 1,625,793 5,364,628 70.1%
FY21 1,800,000 1,612,774 697,176 — 69,099 1,385,992 5,565,041 66.4%
A Bell7 FY22 745,494 570,797 138,453 23,256 51,145 86,649 1,615,794 49.3%
FY21 290,113 259,923 43,320 8,642 35,208 47,614 684,820 51.2%
C Baddock FY22 694,244 605,391 202,092 23,256 3,638 309,496 1,838,117 60.8%
FY21 678,419 607,163 185,194 21,581 (8,106) 280,130 1,764,381 60.8%
S Marshall8 FY22 976,744 860,625 287,529 23,256 51,889 731,521 2,931,564 64.1%
FY21 949,253 864,547 251,191 21,581 29,275 570,642 2,686,489 62.8%
A Welsh FY22 694,244 593,282 205,588 23,256 40,574 247,426 1,804,370 58.0%
FY21 678,419 640,238 130,360 21,581 22,340 212,481 1,705,419 57.6%
B Soller (retired)9
FY22 — — — — — — — —
FY21 548,940 379,354 170,326 13,067 167,528 502,350 1,781,565 59.1%
Total FY22 4,903,623 3,988,745 1,852,245 97,502 246,519 3,180,421 14,269,055 63.2%
FY21 4,945,144 4,363,999 1,477,567 86,452 315,344 2,999,209 14,187,715 62.3%
1 The cash component of the FY22 STI reward of 67% (Group CEO) and 75% (other KMP) is payable in cash in July 2022. The cash component of the FY21 STI
reward of 67% (Group CEO) and 75% (other KMP) was paid in cash in July 2021.
2 The deferred equity component of the FY22 STI reward of 33% (Group CEO) and 25% (other KMP) is deferred and released through the issue of Metcash
performance rights, conditional upon the executive being employed by the Company on 15 April 2023. Shares are issued to participants by 25 April 2023 and are
then restricted from trading until the close of 26 June 2023. The fair value of the deferred share component is amortised over the two-year performance period.
3 The deferred equity component of the FY21 STI reward of 33% (Group CEO) and 25% (other KMP) vested during the year. Shares were issued to participants in
April 2022 and are restricted from trading until the close of 27 June 2022. The fair value of the deferred share component is amortised over the two-year
performance period.
4 Includes changes in annual and long service leave entitlements.
5 Mr Jones commenced employment on 1 February 2022 as Group CEO-elect and was appointed as Group CEO on 11 March 2022, with fixed remuneration of
$1,750,000. The amounts disclosed above reflect Mr Jones’ remuneration for the period from 11 March 2022 to 30 April 2022 as KMP. In addition, Mr Jones
received total remuneration of $502,049 as non-KMP relating to the period from 1 February 2022 to 10 March 2022. Mr Jones’ LTI also included his FY22 Group
CEO buy-out grant as set out in Section 4.3.
6 Mr Adams stood aside as operational Group CEO on 10 March 2022 and will retire from Metcash on 6 October 2022. The amounts disclosed above reflect Mr
Adams’ remuneration relating to the period from 1 May 2021 to 10 March 2022 as KMP. In addition, Mr Adams received (a) total remuneration of $799,037 as non-
KMP relating to the period from 11 March 2022 to 30 April 2022 and (b) is expected to receive total remuneration of $1,825,556 as non-KMP relating to the period 1
May 2022 to 6 October 2022. The terms of Mr Adams’ employment prohibit him from accepting employment at a competitor company for 12 months following his
cessation of employment on 6 October 2022. In line with Metcash’s good leavers policy, the Board exercised its discretion not to issue performance rights in
relation to 33% of Mr Adams’ FY22 STI reward which was deferred to and will be payable in cash on the date of his retirement and retain 432,592 and 175,598 of
his FY21-FY23 and FY22-FY24 LTI performance rights, respectively, which will be tested in accordance with existing performance conditions.
7 Mr Bell commenced employment on 1 September 2020 and was appointed as Group CFO on 7 December 2020, with fixed remuneration of $750,000. The
amounts disclosed in FY21 above reflect Mr Bell’s remuneration for the period from 7 December 2020 to 30 April 2021 as KMP.
8 Mr Marshall’s LTI includes his FY22 CEO Food retention LTI grant as set out in Section 4.4.
9 Mr Soller retired as Group CFO on 7 December 2020.

DIRECTORS’ REPORT
34
Met
cash
Fin
anci
al R
epo
rt 2
022
Met
cash
Fin
anci
al R
epo
rt 2
022
Met
cash
Fin
anci
al R
epo
rt 2
022
KMP performance rights holdings
Name Balance at 1 May 2021 Granted
Vested/ Exercised1 Forfeited
Balance at 30 April 2022
Balance at report date
D Jones2 — 600,836 — — 600,836 600,836
J Adams (retiring)3 810,902 1,112,985 (543,681) (36,810) 1,343,396 1,343,396
A Bell 155,020 159,091 (38,771) — 275,340 275,340
C Baddock 317,772 166,414 (54,114) — 430,072 430,072
S Marshall 587,672 504,862 (241,317) (18,251) 832,966 832,966
A Welsh 241,980 169,362 (93,460) (4,044) 313,838 313,838
Total 2,113,346 2,713,550 (971,343) (59,105) 3,796,448 3,796,448
1 As foreshadowed in the FY21 financial report, a total of 531,949 performance rights from the FY19-FY21 LTI plan partially vested on 15 August 2021. The vested
shares were acquired on market and allocated to the participants on 15 August 2021. In addition, a total of 439,394 performance rights were granted to the KMPs
and have then subsequently vested in relation to the deferred component of the FY21 STI plan.
2 Mr Jones commenced employment on 1 February 2022 as Group CEO-elect and was appointed as Group CEO on 11 March 2022.
3 As set out in section 6, 442,804 performance rights held by Mr Adams in relation to the FY20-22 LTI plan are expected to vest on 15 August 2022. Mr Adams
retained (on a pro-rata basis) 432,592 and 175,598 of his FY21-FY23 and FY22-FY24 LTI performance rights, respectively, which will be tested in accordance with
existing performance conditions. The number of rights retained was determined on a pro-rata basis up to the date of Mr Adams’ retirement on 6 October 2022.
The balance of the performance rights in relation to the FY21-FY23 and FY22-FY24 LTI plans will be forfeited on his retirement.
KMP shareholdings
Name Balance at 1 May 2021
Acquired during the year1
Sold during the year
Other adjustments2
Balance at 30 April 2022
Balance at report date
D Jones3 — — — — — —
J Adams (retiring) 547,858 543,681 — (1,091,539) — —
A Bell — 38,771 — — 38,771 38,771
C Baddock 286,516 54,114 (143,258) — 197,372 197,372
S Marshall 387,369 241,317 (387,369) — 241,317 241,317
A Welsh 72,209 93,460 — — 165,669 165,669
Total 1,293,952 971,343 (530,627) (1,091,539) 1,173,756 1,173,756
1 Includes vesting of shares in relation to Metcash deferred STI and LTI plans.
2 Reflects changes in KMP composition following retirement or resignation.
3 Mr Jones commenced employment on 1 February 2022 as Group CEO-elect and was appointed as Group CEO on 11 March 2022.
This concludes the Remuneration Report.

DIRECTORS’ REPORT
35
Met
cash
Fin
anci
al R
epo
rt 2
022
OTHER DISCLOSURES
Unissued shares under share options and performance rights
At the date of this report, there were 7,609,890 performance rights (7,609,890 at the reporting date). There were no share options on issue
at the reporting date or at the date of this report. Refer to note 7.1 of the financial statements for further details regarding performance
rights.
Shares issued as a result of options and performance rights
During the year, a total of 1,374,136 shares and 621,872 shares were acquired on market in relation to the vesting of the FY19-FY21 LTI
grant and FY21 STI deferred equity component, respectively, and these shares were issued to employees and executives. There were no
other shares issued to employees or executives during or since the end of the financial year in respect of the exercise of options or
performance rights.
Indemnification of Auditors
Pursuant to the terms of engagement the Company has with its auditors, EY Australia, the Company has agreed to indemnify EY Australia
to the extent permitted by law and professional regulations, against any losses, liabilities, costs or expenses incurred by EY Australia
where they arise out of or occur in relation to any negligent, wrongful or wilful act or omission by the Company. No payment has been
made to EY Australia by the Company pursuant to this indemnity, either during or since the end of the financial year.
Non-audit services
Details of the non-audit services undertaken by, and amounts paid to the Company’s auditor, EY Australia are detailed in note 7.2 of the
financial statements.
The Directors are satisfied that the provision of non-audit services is compatible with the general standard of independence for auditors
imposed by the Corporations Act 2001. The nature and scope of each type of non-audit service provided means that auditor
independence was not compromised.
The auditor’s independence declaration for the year ended 30 April 2022 has been received and is included on page 81.
Subsequent events
In May 2022, Metcash announced that it entered into an agreement with Australian United Retailers Limited (AUR) to supply its national
network of supermarkets and convenience stores, including its FoodWorks bannered supermarkets, for a further five-year period,
commencing 1 July 2022. In addition, the Group also announced that it extended the term of its agreement to supply Drakes
Supermarkets stores in Queensland for a further five years, up to 3 June 2029.
On 27 June 2022, Metcash announced that it has signed a long-term lease agreement with the Goodman Group for the construction and
leasing of a new ‘best in class’ wholesale Distribution Centre (DC) at Truganina, Victoria. The new ~115,000m² DC, which will replace
Metcash’s existing ~90,000m² DC at Laverton, is expected to help further improve the competitiveness of our independent retailers in
Victoria through delivery of greater efficiencies and by providing access to a wider range of products. It is also expected to benefit local
suppliers by providing an efficient route to market through access to Metcash’s extensive distribution network. Construction of the DC is
scheduled to commence in the first half of FY23, with completion expected mid-2024.
Other than matters disclosed in this report, there were no events that have occurred after the end of the financial year that would
materially affect the reported results or would require disclosure in this report.
Rounding
The amounts contained in this report and in the financial statements have been rounded to the nearest $100,000 (where rounding is
applicable) under the option available to the Company under ASIC Corporations Instrument 2016/191. The Company is an entity to
which the legislative instrument applies.
Signed in accordance with a resolution of the Directors.
DOUG JONES
Director
Sydney, 27 June 2022

TABLE OF CONTENTS
36
Met
cash
Fin
anci
al R
epo
rt 2
022
Met
cash
Fin
anci
al R
epo
rt 2
022
Met
cash
Fin
anci
al R
epo
rt 2
022
FINANCIAL STATEMENTS
Statement of Comprehensive Income 37
Statement of Financial Position 38
Statement of Changes in Equity 39
Statement of Cash Flows 40
NOTES TO THE FINANCIAL STATEMENTS
NOTE 1. CORPORATE INFORMATION 41 NOTE 2. BASIS OF PREPARATION AND ACCOUNTING POLICIES
2.1 Basis of preparation 41
2.2 Significant accounting policies 41
2.3 Significant accounting judgements, estimates and assumptions 42 NOTE 3. GROUP PERFORMANCE
3.1 Segment information 43
3.2 Sales revenue 43
3.3 Other income and expenses 44
3.4 Income taxes 46
3.5 Earnings per share 47 NOTE 4. ASSETS AND LIABILITIES
4.1 Trade receivables and loans 48
4.2 Right-of-use assets, lease receivables and lease liabilities 50
4.3 Inventories 53
4.4 Equity-accounted investments 53
4.5 Property, plant, and equipment 54
4.6 Intangible assets 55
4.7 Impairment of non-financial assets 56
4.8 Provisions 58 NOTE 5. CAPITAL STRUCTURE, FINANCING AND RISK MANAGEMENT
5.1 Reconciliation of cash flows from operating activities 59
5.2 Interest-bearing borrowings 59
5.3 Put options and other financial liabilities 60
5.4 Contributed equity and reserves 62
5.5 Dividends 63
5.6 Financial risk management 63
5.7 Capital management 66 NOTE 6. GROUP STRUCTURE
6.1 Business combinations and acquisition of additional interest in associate and subsidiaries 67
6.2 Parent entity information 68
6.3 Related party disclosures 69
NOTE 7. OTHER DISCLOSURES
7.1 Share-based payments 70
7.2 Auditors remuneration 73
7.3 Commitments and contingent liabilities 73
7.4 Subsequent events 74
APPENDICES
Appendix A New or amended Accounting Standards and Interpretation 75
Appendix B Information on subsidiaries 76
Appendix C Equity-accounted investments 79
Directors’ Declaration 80
Auditor’s Independence Declaration 81
Independent Auditor’s Report 82

STATEMENT OF COMPREHENSIVE INCOME
FOR THE YEAR ENDED 30 APRIL 2022
37
Met
cash
Fin
anci
al R
epo
rt 2
022
Notes FY22
$m FY21
$m
Sales revenue 3.1, 3.2 15,164.8 14,315.3
Cost of sales (13,482.3) (12,834.0)
Gross profit 1,682.5 1,481.3
Other income 3.3 23.8 24.0
Share of profit from equity-accounted investments 4.4 19.2 20.1
Employee benefit expenses 3.3 (823.4) (727.2)
Depreciation and amortisation 3.3 (175.9) (163.7)
Lease expenses 3.3 (67.7) (69.2)
Provisions for impairment, net of reversals 3.3 (41.0) (42.9)
Other expenses (145.2) (121.0)
Finance costs, net 3.3 (48.5) (42.6)
Significant items 3.3 (65.6) (17.0)
Profit before income tax 358.2 341.8
Income tax expense 3.4 (111.1) (100.4)
Net profit for the year 247.1 241.4
Other comprehensive loss for the year, net of tax — (1.8)
Total comprehensive income for the year 247.1 239.6
Net profit for the year is attributable to:
Equity holders of the parent 245.4 239.0
Non-controlling interests 1.7 2.4
247.1 241.4
Total comprehensive income for the year is attributable to:
Equity holders of the parent 245.4 237.2
Non-controlling interests 1.7 2.4
247.1 239.6
Earnings per share attributable to the ordinary equity holders of the company:
Basic earnings per share (cents) 3.5 25.0 23.4
Diluted earnings per share (cents) 3.5 24.9 23.3
The above Statement of Comprehensive Income should be read in conjunction with the accompanying notes.
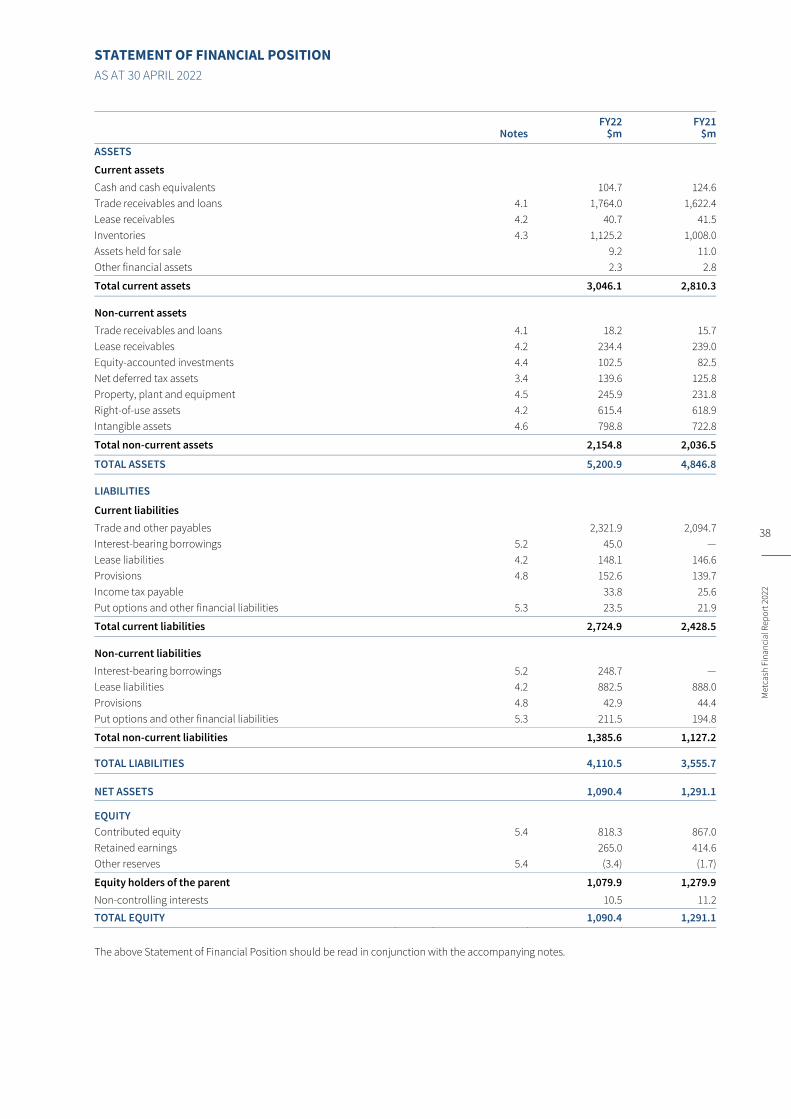
STATEMENT OF FINANCIAL POSITION
AS AT 30 APRIL 2022
38
Met
cash
Fin
anci
al R
epo
rt 2
022
Met
cash
Fin
anci
al R
epo
rt 2
022
Met
cash
Fin
anci
al R
epo
rt 2
022
Notes FY22
$m FY21
$m
ASSETS
Current assets
Cash and cash equivalents 104.7 124.6
Trade receivables and loans 4.1 1,764.0 1,622.4
Lease receivables 4.2 40.7 41.5
Inventories 4.3 1,125.2 1,008.0
Assets held for sale 9.2 11.0
Other financial assets 2.3 2.8
Total current assets 3,046.1 2,810.3
Non-current assets
Trade receivables and loans 4.1 18.2 15.7
Lease receivables 4.2 234.4 239.0
Equity-accounted investments 4.4 102.5 82.5
Net deferred tax assets 3.4 139.6 125.8
Property, plant and equipment 4.5 245.9 231.8
Right-of-use assets 4.2 615.4 618.9
Intangible assets 4.6 798.8 722.8
Total non-current assets 2,154.8 2,036.5
TOTAL ASSETS 5,200.9 4,846.8
LIABILITIES
Current liabilities
Trade and other payables 2,321.9 2,094.7
Interest-bearing borrowings 5.2 45.0 —
Lease liabilities 4.2 148.1 146.6
Provisions 4.8 152.6 139.7
Income tax payable 33.8 25.6
Put options and other financial liabilities 5.3 23.5 21.9
Total current liabilities 2,724.9 2,428.5
Non-current liabilities
Interest-bearing borrowings 5.2 248.7 —
Lease liabilities 4.2 882.5 888.0
Provisions 4.8 42.9 44.4
Put options and other financial liabilities 5.3 211.5 194.8
Total non-current liabilities 1,385.6 1,127.2
TOTAL LIABILITIES 4,110.5 3,555.7
NET ASSETS 1,090.4 1,291.1
EQUITY
Contributed equity 5.4 818.3 867.0
Retained earnings 265.0 414.6
Other reserves 5.4 (3.4) (1.7)
Equity holders of the parent 1,079.9 1,279.9
Non-controlling interests 10.5 11.2
TOTAL EQUITY 1,090.4 1,291.1
The above Statement of Financial Position should be read in conjunction with the accompanying notes.

STATEMENT OF CHANGES IN EQUITY FOR THE YEAR ENDED 30 APRIL 2022
39
Met
cash
Fin
anci
al R
epo
rt 2
022
Contributed
equity Retained earnings
Other reserves
Equity holders
of the parent
Non-controlling
interests Total
equity
Notes $m $m $m $m $m $m
At 1 May 2021 867.0 414.6 (1.7) 1,279.9 11.2 1,291.1
Total comprehensive income, net of tax
— 245.4 — 245.4 1.7 247.1
Transactions with owners
Dividends paid 5.5 — (198.5) — (198.5) (2.4) (200.9)
Recognition of put option liabilities 6.1 — (44.8) — (44.8) — (44.8)
Share buyback and related costs 5.4 (48.7) (151.7) — (200.4) — (200.4)
Shares issued to employees 7.1 — — (9.4) (9.4) — (9.4)
Share-based payments expense — — 7.7 7.7 — 7.7
At 30 April 2022 818.3 265.0 (3.4) 1,079.9 10.5 1,090.4
At 1 May 2020
853.5 505.5 (2.3) 1,356.7 14.9 1,371.6
Total comprehensive income/(loss), net of tax
— 239.0 (1.8) 237.2 2.4 239.6
Transactions with owners
Dividends paid 5.5 — (148.3) — (148.3) (1.4) (149.7)
Recognition of put option liabilities — (172.6) — (172.6) (4.7) (177.3)
Share of associate’s adjustment on initial adoption of AASB 16 Leases
— (9.0) — (9.0) — (9.0)
Proceeds from equity raising, net of costs 5.4 13.5 — — 13.5 — 13.5
Shares issued to employees 7.1 — — (6.3) (6.3) — (6.3)
Share-based payments expense — — 8.7 8.7 — 8.7
At 30 April 2021 867.0 414.6 (1.7) 1,279.9 11.2 1,291.1
The above Statement of Changes in Equity should be read in conjunction with the accompanying notes.

STATEMENT OF CASH FLOWS FOR THE YEAR ENDED 30 APRIL 2022
40
Met
cash
Fin
anci
al R
epo
rt 2
022
Met
cash
Fin
anci
al R
epo
rt 2
022
Met
cash
Fin
anci
al R
epo
rt 2
022
Notes FY22
$m FY21
$m
CASH FLOWS FROM OPERATING ACTIVITIES
Receipts from customers 18,796.9 17,845.6
Payments to suppliers and employees (18,210.9) (17,256.7)
Financing component of lease payments, net 4.2 (34.3) (30.3)
Interest paid, net (12.3) (10.2)
Dividends received 9.9 6.0
Income tax paid, net of tax refunds (117.0) (78.9)
Net cash generated from operating activities 5.1 432.3 475.5
CASH FLOWS FROM INVESTING ACTIVITIES
Proceeds from sale of assets 2.4 0.6
Payments for acquisition of assets (121.7) (85.6)
Payments for acquisition of subsidiaries, net of cash acquired 6.1 (44.4) (141.8)
Payments for acquisition of additional interest in associate 6.1 (11.0) (1.3)
Receipts from subleases, excluding the financing component 4.2 42.7 44.3
Loans repaid by other entities, net 10.3 12.1
Net cash used in investing activities (121.7) (171.7)
CASH FLOWS FROM FINANCING ACTIVITIES
Proceeds from borrowings 6,789.1 3,568.0
Repayments of borrowings (6,495.4) (3,758.9)
Payments for lease liabilities, excluding the financing component 4.2 (149.4) (122.0)
Payment for off-market buyback of shares, including costs 5.4 (200.4) —
Proceeds from equity raising, net of costs 5.4 — 13.5
Payments for on-market purchase of shares (8.3) (5.2)
Payments for acquisition of non-controlling interests 6.1 (59.4) —
Payment of dividends to owners of the parent 5.5 (198.5) (148.3)
Payment of dividends to non-controlling interests (8.2) (1.4)
Net cash used in financing activities (330.5) (454.3)
Net decrease in cash and cash equivalents
(19.9) (150.5)
Add: opening cash and cash equivalents 124.6 275.1
Cash and cash equivalents at the end of the year 104.7 124.6
The above Statement of Cash Flows should be read in conjunction with the accompanying notes.
NOTES TO THE FINANCIAL STATEMENTS
FOR THE YEAR ENDED 30 APRIL 2022
41
Met
cash
Fin
anci
al R
epo
rt 2
022
CORPORATE INFORMATION
The financial statements of Metcash Limited (the ‘Company’) and its controlled entities (together the ‘Group’) for the year ended 30 April
2022 were authorised for issue in accordance with a resolution of the Directors on 27 June 2022.
Metcash Limited is a for-profit company limited by ordinary shares incorporated and domiciled in Australia whose shares are publicly
traded on the Australian Securities Exchange. The nature of the operations and principal activities of the Group are described in the
Directors’ Report. The registered office of the Company is 1 Thomas Holt Drive, Macquarie Park NSW 2113.
BASIS OF PREPARATION AND ACCOUNTING POLICIES
Basis of preparation
The financial statements are a general-purpose financial report that has been prepared in accordance with the requirements of the
Corporations Act 2001 and Australian Accounting Standards and other authoritative pronouncements of the Australian Accounting
Standards Board.
The financial statements have been prepared using the historical cost basis except for derivative financial instruments and share-based
payments which are measured at fair value.
The financial statements are presented in Australian dollars and all values are rounded to the nearest $100,000 unless otherwise stated
under the option available to the Company under ASIC Corporations Instrument 2016/191. The Company is an entity to which the
legislative instrument applies.
The current financial year comprises a 53-week period that commenced on 26 April 2021 and ended on 1 May 2022. The prior financial
year comprised a 52-week period that commenced on 27 April 2020 and ended on 25 April 2021.
The financial statements comply with Australian Accounting Standards. The financial statements also comply with International
Financial Reporting Standards (IFRS) as issued by the International Accounting Standards Board (IASB).
The accounting policies adopted are consistent with those of the previous period. Refer Appendix A for new or amended Accounting
Standards and Interpretations.
Certain comparative information was amended in these financial statements to conform to the current year presentation. These
amendments do not impact the Group’s financial results and do not have any significant impact on the Group’s balance sheet.
Significant accounting policies
2.2.1 Basis of consolidation
Controlled entities
The financial statements comprise the consolidated financial statements of Metcash Limited and its controlled entities for the year
ended 30 April 2022. Refer Appendix B for a list of controlled entities.
Controlled entities are all those entities over which the Group is exposed to, or has rights to, variable returns from its involvement with
the entity and has the ability to affect those returns through its power over the entity.
Consolidation procedures
Controlled entities are consolidated from the date on which control is transferred to the Group and cease to be consolidated from the
date on which control is transferred out of the Group.
In preparing the consolidated financial statements, all intercompany balances and transactions have been eliminated in full.
Non-controlling interests are allocated their share of total comprehensive income and are presented as a separate category
within equity.
The financial statements of controlled entities are prepared for the same reporting period as the parent entity, using consistent
accounting policies. For those controlled entities with non-coterminous year-ends, management accounts for the relevant period to
the Group’s reporting date have been consolidated. In the opinion of the Directors, the expense of providing additional coterminous
statutory accounts, together with consequential delay in producing the Group’s financial statements, would outweigh any benefit
to shareholders.
Separate financial statements
Investments in entities controlled by Metcash Limited are accounted for at cost in the separate financial statements of the parent entity
less any impairment charges. Dividends received from controlled entities are recorded as income in the separate financial statements of
the parent entity, and do not impact the recorded cost of the investment unless the dividends effectively represent a return of capital.

NOTES TO THE FINANCIAL STATEMENTS
FOR THE YEAR ENDED 30 APRIL 2022 CONTINUED
42
Met
cash
Fin
anci
al R
epo
rt 2
022
Met
cash
Fin
anci
al R
epo
rt 2
022
Met
cash
Fin
anci
al R
epo
rt 2
022
Significant accounting judgements, estimates and assumptions
The Group has incorporated judgements, estimates and assumptions specific to the impact of the COVID-19 pandemic in determining
the amounts recognised in the financial statements based on conditions existing at balance date, recognising uncertainty still exists over
the potential impact of any future COVID-19 pandemic-related restrictions and changes in consumer behaviour.
2.3.1 Significant accounting judgements
In the process of applying the Group’s accounting policies, the following judgements were made, apart from those involving estimations,
which have a significant effect on the amounts recognised in the financial statements.
Note Areas Judgements
Note 3.2 Sales revenue - Charge-through sales – In addition to warehouse purchases, customers
purchase goods through the Group’s charge-through platform and have
these goods delivered directly to them from suppliers. The Group earns
a margin on these sales for providing procurement, cross-docking and
settlement services. The Group also bears credit risk on the receivables
from these sales with limited recourse to suppliers.
- The Group determined that it is an agent in these contracts as it does
not control the goods before they are being transferred to customers.
Note 4.2 Leases - Determination of lease term of contracts with renewal options.
Note 4.3 Inventories - Supplier income – The recognition and measurement of supplier
income requires the use of judgement, due to a high degree of variability
and complexity in arrangements with suppliers, and due to timing
differences between stock purchases and the provision of promotional
services.
Note 6.1 Business combinations - Determining the existence of control, joint control or significant
influence over the Group’s acquisitions. Where the Group exercises
significant influence or joint control, the acquisitions are accounted for
as joint arrangements (note 4.4); and where the Group exercises control,
the acquisitions are accounted for as business combinations.
- Determining the acquisition date fair value of assets acquired and
liabilities assumed on acquisition of controlled entities.
2.3.2 Significant accounting estimates
The carrying amounts of certain assets and liabilities are often determined based on estimates and assumptions of future events. The
key estimates and assumptions that have a significant risk of causing a material adjustment to the carrying amounts of certain assets
and liabilities within the next annual reporting period are:
Note Areas Estimates
Note 4.1 Trade receivables and loans Allowance for impairment loss
Note 4.4 Equity-accounted investments Assessment of recoverable amount
Note 4.7 Impairment of non-financial assets Assessment of recoverable amount
Note 4.2 and 4.8 Provisions Property provisions, restructuring
Note 5.3 Put option liabilities Determining put option consideration including Total Tools and Ritchies

NOTES TO THE FINANCIAL STATEMENTS
FOR THE YEAR ENDED 30 APRIL 2022 CONTINUED
43
Met
cash
Fin
anci
al R
epo
rt 2
022
GROUP PERFORMANCE
Segment information
The Group has identified its operating segments based on the internal reports that are reviewed and used by the Chief Executive Officer
(the chief operating decision maker) in assessing performance and in determining the allocation of resources. Discrete financial
information about these operating segments is reported on at least a monthly basis.
The information reported to the CEO is aggregated based on product types and the overall economic characteristics of industries in
which the Group operates. The Group’s reportable segments are therefore as follows:
− Food activities comprise the distribution of a range of products and services to independent supermarket and convenience retail
outlets.
− Hardware activities comprise the distribution of hardware products to independent retail outlets and the operation of company
owned retail stores.
− Liquor activities comprise the distribution of liquor products to independent retail outlets and hotels.
The Group operates predominantly in Australia. The Group has operations in New Zealand that represent less than 5% of revenue,
results and assets of the Group. The Group does not have a single customer which represents greater than 10% of the Group’s revenue.
Sales between segments are based on similar terms and conditions to those in place with third party customers and are eliminated from
the results below.
Segment results
Segment revenue Segment results
FY22 $m
FY21 $m
FY22 $m
FY21 $m
Food 8,379.3 8,316.3 200.3 192.4
Hardware 2,033.1 1,624.7 191.3 136.0
Liquor 4,752.4 4,374.3 97.4 88.7
Segment total 15,164.8 14,315.3 489.0 417.1
Corporate (16.7) (15.7)
Group underlying earnings before interest and tax (‘EBIT’) 472.3 401.4
Finance costs, net (Note 3.3) (48.5) (42.6)
Significant items (Note 3.3) (65.6) (17.0)
Profit before income tax 358.2 341.8
Sales revenue
Sale of goods
The Group’s revenue principally arises from the sale of goods within its wholesale distribution and retail operations. Sales revenue is
recognised when the Group has delivered goods to its customers, and it is probable that consideration will be collected in exchange.
Revenue is measured based on the consideration expected to be received, net of volumetric and other trade rebates.
Charge-through sales
The Group operates a charge-through platform whereby goods are delivered directly to the Group’s customers by suppliers. The Group
retains the credit risk associated with these transactions; however, the Group does not bear any material inventory risk or exercise any
material discretion in establishing prices. Charge-through transactions are therefore reported on an agency or net ‘commission’ basis
with the gross sale value included in trade receivables and the gross purchase cost included in trade payables. Gross charge-through
sales to customers during the year were $2.241 billion (FY21: $2.046 billion).

NOTES TO THE FINANCIAL STATEMENTS
FOR THE YEAR ENDED 30 APRIL 2022 CONTINUED
44
Met
cash
Fin
anci
al R
epo
rt 2
022
Met
cash
Fin
anci
al R
epo
rt 2
022
Met
cash
Fin
anci
al R
epo
rt 2
022
Other income and expenses
FY22
$m FY21
$m
(I) OTHER INCOME
Lease income – rent 8.1 7.1
Lease income – outgoings recoveries 15.4 16.3
Net gain from disposal of plant and equipment 0.3 0.6
23.8 24.0
(II) EMPLOYEE BENEFIT EXPENSES
Salaries and wages, incentives, and on-costs 763.3 673.1
Superannuation expense 52.7 45.4
Share-based payments expense 7.4 8.7
823.4 727.2
(III) DEPRECIATION AND AMORTISATION
Depreciation of right-of-use assets 117.0 106.8
Depreciation of property, plant and equipment 34.8 29.5
Amortisation of software 19.5 22.8
Amortisation of other intangible assets 4.6 4.6
175.9 163.7
(IV) LEASE EXPENSES
Property rent 5.2 3.9
Property outgoings 56.5 54.7
Equipment and other leases 6.0 10.6
67.7 69.2
(V) PROVISIONS FOR IMPAIRMENT, NET OF REVERSALS
Trade receivables and loans 10.3 14.1
Inventories 31.7 31.2
Property provisions (0.1) (6.8)
Other impairments (net) (0.9) 4.4
41.0 42.9
(VI) FINANCE COSTS, NET
Interest expense 11.0 9.8
Transaction fees in relation to customer charge cards (Note 4.1) 2.5 2.0
Deferred borrowing costs 1.6 1.7
Finance component of lease payments, net 34.3 30.3
Finance costs from discounting of liabilities 2.9 2.7
Interest income (3.8) (3.9)
48.5 42.6
SIGNIFICANT ACCOUNTING POLICIES
Finance costs
Finance costs directly attributable to the acquisition, construction or production of an asset that necessarily takes a substantial
period of time to get ready for its intended use or sale are capitalised as part of the cost of the asset. All other finance costs are
expensed in the period they occur. Borrowing costs consist of interest and other costs that an entity incurs in connection with the
borrowing of funds.
Certain provisions are measured at their discounted value. During each period the provision is increased by an amount that is equal
to the provision multiplied by the discount rate. This increment, including any change in the value of the provision as a result of a
change in discount rate, is treated as a finance cost.
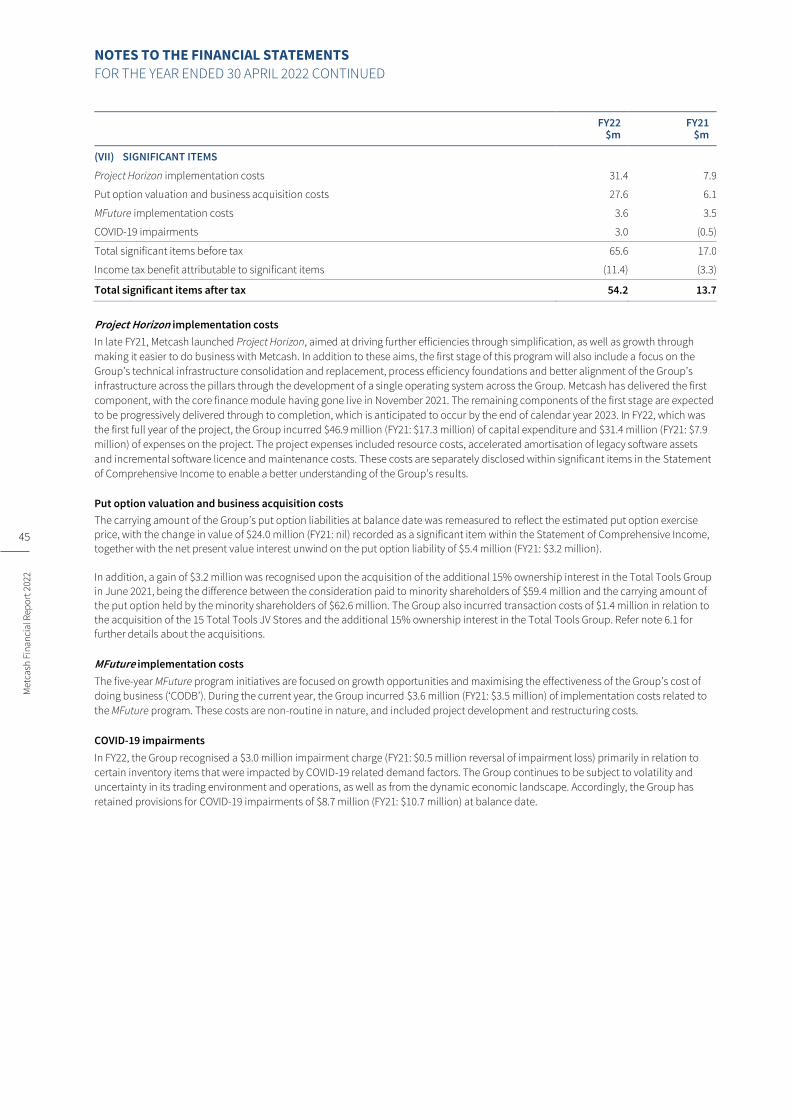
NOTES TO THE FINANCIAL STATEMENTS
FOR THE YEAR ENDED 30 APRIL 2022 CONTINUED
45
Met
cash
Fin
anci
al R
epo
rt 2
022
FY22 $m
FY21 $m
(VII) SIGNIFICANT ITEMS
Project Horizon implementation costs 31.4 7.9
Put option valuation and business acquisition costs 27.6 6.1
MFuture implementation costs 3.6 3.5
COVID-19 impairments 3.0 (0.5)
Total significant items before tax 65.6 17.0
Income tax benefit attributable to significant items (11.4) (3.3)
Total significant items after tax 54.2 13.7
Project Horizon implementation costs
In late FY21, Metcash launched Project Horizon, aimed at driving further efficiencies through simplification, as well as growth through
making it easier to do business with Metcash. In addition to these aims, the first stage of this program will also include a focus on the
Group’s technical infrastructure consolidation and replacement, process efficiency foundations and better alignment of the Group’s
infrastructure across the pillars through the development of a single operating system across the Group. Metcash has delivered the first
component, with the core finance module having gone live in November 2021. The remaining components of the first stage are expected
to be progressively delivered through to completion, which is anticipated to occur by the end of calendar year 2023. In FY22, which was
the first full year of the project, the Group incurred $46.9 million (FY21: $17.3 million) of capital expenditure and $31.4 million (FY21: $7.9
million) of expenses on the project. The project expenses included resource costs, accelerated amortisation of legacy software assets
and incremental software licence and maintenance costs. These costs are separately disclosed within significant items in the Statement
of Comprehensive Income to enable a better understanding of the Group’s results.
Put option valuation and business acquisition costs
The carrying amount of the Group’s put option liabilities at balance date was remeasured to reflect the estimated put option exercise
price, with the change in value of $24.0 million (FY21: nil) recorded as a significant item within the Statement of Comprehensive Income,
together with the net present value interest unwind on the put option liability of $5.4 million (FY21: $3.2 million).
In addition, a gain of $3.2 million was recognised upon the acquisition of the additional 15% ownership interest in the Total Tools Group
in June 2021, being the difference between the consideration paid to minority shareholders of $59.4 million and the carrying amount of
the put option held by the minority shareholders of $62.6 million. The Group also incurred transaction costs of $1.4 million in relation to
the acquisition of the 15 Total Tools JV Stores and the additional 15% ownership interest in the Total Tools Group. Refer note 6.1 for
further details about the acquisitions.
MFuture implementation costs
The five-year MFuture program initiatives are focused on growth opportunities and maximising the effectiveness of the Group’s cost of
doing business (‘CODB’). During the current year, the Group incurred $3.6 million (FY21: $3.5 million) of implementation costs related to
the MFuture program. These costs are non-routine in nature, and included project development and restructuring costs.
COVID-19 impairments
In FY22, the Group recognised a $3.0 million impairment charge (FY21: $0.5 million reversal of impairment loss) primarily in relation to
certain inventory items that were impacted by COVID-19 related demand factors. The Group continues to be subject to volatility and
uncertainty in its trading environment and operations, as well as from the dynamic economic landscape. Accordingly, the Group has
retained provisions for COVID-19 impairments of $8.7 million (FY21: $10.7 million) at balance date.

NOTES TO THE FINANCIAL STATEMENTS
FOR THE YEAR ENDED 30 APRIL 2022 CONTINUED
46
Met
cash
Fin
anci
al R
epo
rt 2
022
Met
cash
Fin
anci
al R
epo
rt 2
022
Met
cash
Fin
anci
al R
epo
rt 2
022
Income Taxes
FY22
$m FY21
$m
MAJOR COMPONENTS OF INCOME TAX EXPENSE
Current income tax charge 120.7 102.4
Adjustments in respect of income tax of previous years 0.3 0.3
Deferred income tax relating to origination and reversal of temporary differences (9.9) (2.3)
Total income tax expense 111.1 100.4
RECONCILIATION OF INCOME TAX EXPENSE
Profit before income tax 358.2 341.8
At the Group’s statutory income tax rate of 30% (FY21: 30%) 107.4 102.5
Other assessable/(non-assessable) amounts – net 3.4 (2.4)
Adjustments in respect of income tax of previous years 0.3 0.3
Income tax expense 111.1 100.4
COMPONENTS OF NET DEFERRED TAX ASSETS
Provisions 137.8 131.1
Accelerated depreciation for accounting purposes 18.2 16.5
Other 16.4 12.3
Intangible assets (32.8) (34.1)
139.6 125.8
MOVEMENTS IN NET DEFERRED TAX ASSETS
Opening balance 125.8 120.0
Credited to net profit for the year 12.7 2.3
Tax benefit associated with share issue/buyback costs 0.1 (0.2)
Adjustments related to business combinations 1.0 3.7
Closing balance 139.6 125.8
The Group has unrecognised gross capital losses of $19.5 million (FY21: $19.5 million) that are available indefinitely for offset against
future capital gains.
Tax consolidation
Metcash Limited and its 100% owned Australian resident subsidiaries formed a tax consolidated group with effect from 1 July 2005.
Metcash Limited is the head entity of the tax consolidated group. Members of the group have entered into a tax sharing arrangement in
order to allocate income tax expense to the wholly owned subsidiaries on a modified standalone basis. In addition, the agreement
provides for the allocation of income tax liabilities between the entities should the head entity default on its tax payment obligations.
Tax effect accounting by members of the tax consolidated group
Members of the tax consolidated group have entered into a tax funding agreement. The tax funding agreement provides for the
allocation of current taxes to members of the tax consolidated group in accordance with a group allocation method using modified
standalone tax calculations as the basis for allocation. Deferred taxes of members of the tax consolidated group are measured and
recognised in accordance with the principles of AASB 112 Income Taxes.
Under the tax funding agreement, funding is based upon the amounts allocated and recognised by the member entities. Accordingly,
funding results in an increase/decrease in the subsidiaries’ intercompany accounts with the tax consolidated group head entity, Metcash
Limited.

NOTES TO THE FINANCIAL STATEMENTS
FOR THE YEAR ENDED 30 APRIL 2022 CONTINUED
47
Met
cash
Fin
anci
al R
epo
rt 2
022
SIGNIFICANT ACCOUNTING POLICIES
Current tax assets and liabilities for the current and prior periods are measured at the amount expected to be recovered from or paid
to the taxation authority. The tax rates and tax laws used to compute the amount are those that are enacted or substantively enacted
by the relevant reporting date.
Deferred tax assets are recognised for all deductible temporary differences, carry-forward unused tax assets and unused tax losses, to
the extent that it is probable that taxable profit will be available against which the deductible temporary differences, and the carry-
forward of unused tax assets and unused tax losses can be utilised:
− except where the deferred income tax asset relating to the deductible temporary difference arises from the initial recognition of an
asset or liability in a transaction that is not a business combination and, at the time of the transaction, affects neither the
accounting nor taxable profit or loss; and
− in respect of deductible temporary differences associated with investments in subsidiaries, associates and interests in joint
ventures, deferred tax assets are only recognised to the extent that it is probable that the temporary differences will reverse in the
foreseeable future and taxable profit will be available against which the temporary differences can be utilised.
The carrying amount of deferred tax assets is reviewed at each reporting date and reduced to the extent that it is no longer probable
that sufficient taxable profit will be available to allow all or part of the deferred income tax asset to be utilised.
Earnings per share
The following reflects the earnings data used in the basic and diluted earnings per share (EPS) computations:
FY22 $m
FY21 $m
EARNINGS USED IN CALCULATING BASIC AND DILUTED EPS
Net profit attributable to ordinary equity holders of Metcash Limited 245.4 239.0
The following reflects the share data used in the basic and diluted EPS computations:
FY22 Number
FY21 Number
Weighted average number of ordinary shares used in calculating basic EPS 982,848,334 1,021,936,877
Effect of dilutive securities 3,369,269 3,228,702
Weighted average number of ordinary shares used in calculating diluted EPS 986,217,603 1,025,165,579
At the reporting date, 7,609,890 performance rights (FY21: 6,496,163) were outstanding, of which 4,240,621 (FY21: 3,267,461) were not
included in the calculation of diluted EPS as they are not dilutive for the periods presented. Refer note 7.1 for more details about
performance rights.
SIGNIFICANT ACCOUNTING POLICIES
Basic earnings per share is calculated as net profit attributable to members of the parent, adjusted to exclude any costs of servicing
equity (other than dividends) divided by the weighted average number of ordinary shares, adjusted for any bonus element.
Diluted earnings per share are calculated as net profit attributable to members of the parent, adjusted for:
− costs of servicing equity (other than dividends);
− the after-tax effect of dividends and interest associated with dilutive potential ordinary shares that have been recognised as
expenses; and
− other non-discretionary changes in revenues or expenses during the period that would result from the dilution of potential
ordinary shares, divided by the weighted average number of ordinary shares and dilutive potential ordinary shares, adjusted for
any bonus element.
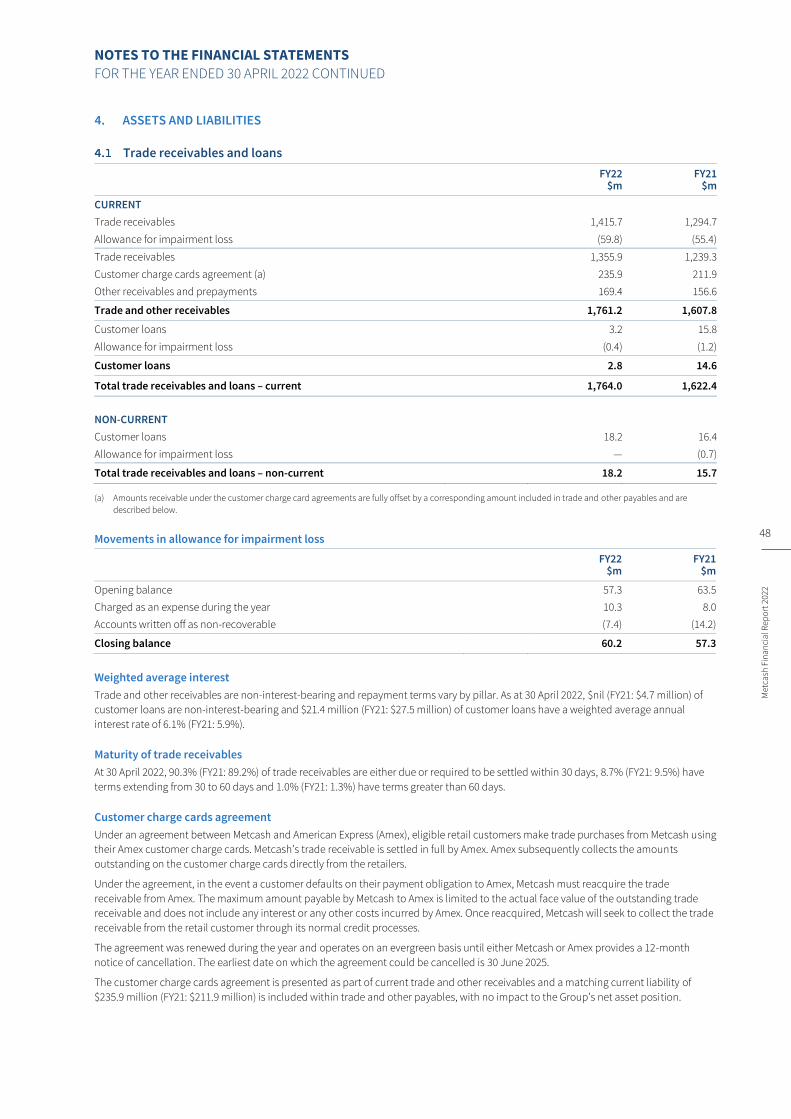
NOTES TO THE FINANCIAL STATEMENTS
FOR THE YEAR ENDED 30 APRIL 2022 CONTINUED
48
Met
cash
Fin
anci
al R
epo
rt 2
022
Met
cash
Fin
anci
al R
epo
rt 2
022
Met
cash
Fin
anci
al R
epo
rt 2
022
ASSETS AND LIABILITIES
Trade receivables and loans
FY22
$m FY21
$m
CURRENT
Trade receivables 1,415.7 1,294.7
Allowance for impairment loss (59.8) (55.4)
Trade receivables 1,355.9 1,239.3
Customer charge cards agreement (a) 235.9 211.9
Other receivables and prepayments 169.4 156.6
Trade and other receivables 1,761.2 1,607.8
Customer loans 3.2 15.8
Allowance for impairment loss (0.4) (1.2)
Customer loans 2.8 14.6
Total trade receivables and loans – current 1,764.0 1,622.4
NON-CURRENT
Customer loans 18.2 16.4
Allowance for impairment loss — (0.7)
Total trade receivables and loans – non-current 18.2 15.7
(a) Amounts receivable under the customer charge card agreements are fully offset by a corresponding amount included in trade and other payables and are
described below.
Movements in allowance for impairment loss
FY22
$m FY21
$m
Opening balance 57.3 63.5
Charged as an expense during the year 10.3 8.0
Accounts written off as non-recoverable (7.4) (14.2)
Closing balance 60.2 57.3
Weighted average interest
Trade and other receivables are non-interest-bearing and repayment terms vary by pillar. As at 30 April 2022, $nil (FY21: $4.7 million) of
customer loans are non-interest-bearing and $21.4 million (FY21: $27.5 million) of customer loans have a weighted average annual
interest rate of 6.1% (FY21: 5.9%).
Maturity of trade receivables
At 30 April 2022, 90.3% (FY21: 89.2%) of trade receivables are either due or required to be settled within 30 days, 8.7% (FY21: 9.5%) have
terms extending from 30 to 60 days and 1.0% (FY21: 1.3%) have terms greater than 60 days.
Customer charge cards agreement
Under an agreement between Metcash and American Express (Amex), eligible retail customers make trade purchases from Metcash using
their Amex customer charge cards. Metcash’s trade receivable is settled in full by Amex. Amex subsequently collects the amounts
outstanding on the customer charge cards directly from the retailers.
Under the agreement, in the event a customer defaults on their payment obligation to Amex, Metcash must reacquire the trade
receivable from Amex. The maximum amount payable by Metcash to Amex is limited to the actual face value of the outstanding trade
receivable and does not include any interest or any other costs incurred by Amex. Once reacquired, Metcash will seek to collect the trade
receivable from the retail customer through its normal credit processes.
The agreement was renewed during the year and operates on an evergreen basis until either Metcash or Amex provides a 12-month
notice of cancellation. The earliest date on which the agreement could be cancelled is 30 June 2025.
The customer charge cards agreement is presented as part of current trade and other receivables and a matching current liability of
$235.9 million (FY21: $211.9 million) is included within trade and other payables, with no impact to the Group’s net asset position.

NOTES TO THE FINANCIAL STATEMENTS
FOR THE YEAR ENDED 30 APRIL 2022 CONTINUED
49
Met
cash
Fin
anci
al R
epo
rt 2
022
Customer loan security
The Group has access to security against most customer loans in the event of default. Security held may include bank and personal
guarantees, fixed and floating charges and security over property and other assets. Due to the large number and the varied nature of
security held, their fair value cannot be practicably estimated. The fair value of the security against a loan is determined when the loan is
not deemed to be recoverable and an allowance for impairment loss is raised to cover any deficit in recoverability.
Ageing of unimpaired trade receivables and loans
Trade receivables (a) Customer loans Other receivables and prepayments
Days overdue $m % $m % $m %
AT 30 APRIL 2022
Neither past due nor impaired 1,463.8 91.9% 19.9 95% 169.4 100.0%
Less than 30 days 122.5 7.7% 0.1 1% — —
Between 30 and 60 days 4.0 0.3% — — — —
Between 60 and 90 days 1.5 0.1% 0.3 1% — —
Between 90 and 120 days — — — — — —
More than 120 days — — 0.7 3% — —
Total 1,591.8 100.0% 21.0 100.0% 169.4 100.0%
AT 30 APRIL 2021
Neither past due nor impaired 1,389.5 95.7% 23.4 77.2% 156.6 100.0%
Less than 30 days 58.0 4.0% 0.2 0.7% — —
Between 30 and 60 days 3.7 0.3% 0.4 1.3% — —
Between 60 and 90 days — — 0.3 1.0% — —
Between 90 and 120 days — — 0.5 1.7% — —
More than 120 days — — 5.5 18.1% — —
Total 1,451.2 100.0% 30.3 100.0% 156.6 100.0%
(a) The ageing profile of trade receivables includes amounts receivable under the customer charge cards agreement.
The Group expects that the unimpaired trade receivables and loans presented above are fully recoverable.
SIGNIFICANT ACCOUNTING POLICIES
Trade receivables Trade receivables are measured at the transaction price determined under the ‘Sales Revenue’ significant accounting policy (Note
3.2).
Allowance for impairment loss The Group recognises an allowance for impairment loss based on expected credit losses (ECL) for its trade and other receivables. The
Group has established a provision rate matrix, under the simplified approach in calculating ECL, that is based on its historical credit
loss experience, adjusted for forward-looking factors specific to a group of debtors and the economic environment.
SIGNIFICANT ACCOUNTING ESTIMATES
Allowance for impairment loss The Group uses a provision rate matrix to calculate ECLs for receivables. The provision rates are initially based on the Group’s
historical observed default rates. The Group will calibrate the matrix to adjust the historical credit loss experience with forward-
looking information (e.g., any known changes in market conditions with reference to the most recent gross domestic product data). At
every reporting date, the historical observed default rates are updated and changes in the forward-looking estimates are analysed.
The assessment of the correlation between historical observed default rates, forecast economic conditions and ECLs is a significant
estimate. The amount of ECLs is sensitive to changes in circumstances and of forecast economic conditions. The Group’s historical
credit loss experience and forecast of economic conditions may also not be representative of customer’s actual default in the future.

NOTES TO THE FINANCIAL STATEMENTS
FOR THE YEAR ENDED 30 APRIL 2022 CONTINUED
50
Met
cash
Fin
anci
al R
epo
rt 2
022
Met
cash
Fin
anci
al R
epo
rt 2
022
Met
cash
Fin
anci
al R
epo
rt 2
022
Right-of-use assets, lease receivables and lease liabilities
Right-of-use assets (a)
Leasehold properties
$m
Motor vehicles and
equipment $m
Total $m
Lease receivables
(b)(c) $m
Lease liabilities
$m
As at 1 May 2021 565.7 53.2 618.9 280.5 (1,034.6)
New and modified leases 78.2 3.3 81.5 9.0 (88.9)
Additions through business combinations 18.1 — 18.1 — (18.1)
Leases exited (1.0) — (1.0) (1.3) 6.3
Lease remeasurements 13.5 0.6 14.1 25.2 (44.7)
Impairments, net 1.4 (0.6) 0.8 4.4 —
Depreciation (101.0) (16.0) (117.0) — —
Cash (receipts)/payments — — — (56.3) 197.3
Financing component of lease receipts/(payments) — — — 13.6 (47.9)
As at 30 April 2022 574.9 40.5 615.4 275.1 (1,030.6)
Current — — — 40.7 (148.1)
Non-current 574.9 40.5 615.4 234.4 (882.5)
As at 1 May 2020 452.4 33.0 485.4 292.7 (886.1)
New and modified leases 165.5 34.4 199.9 11.4 (211.0)
Additions through business combinations 36.5 — 36.5 2.9 (39.5)
Leases exited — — — (1.3) 1.1
Lease remeasurements 3.8 — 3.8 16.9 (21.1)
Impairments, net (0.4) — (0.4) 2.7 —
Depreciation (92.6) (14.2) (106.8) — —
Reclassifications 0.5 — 0.5 (0.5) —
Cash (receipts)/payments — — — (57.6) 165.6
Financing component of lease receipts/(payments) — — — 13.3 (43.6)
As at 30 April 2021 565.7 53.2 618.9 280.5 (1,034.6)
Current — — — 41.5 (146.6)
Non-current 565.7 53.2 618.9 239.0 (888.0)
(a) The cost and accumulated depreciation and impairment of the right-of-use assets are presented below:
Right-of-use assets
Leasehold properties
$m
Motor vehicles and
equipment $m
Total $m
Cost 856.5 85.5 942.0
Accumulated depreciation and impairment (281.6) (45.0) (326.6)
As at 30 April 2022 574.9 40.5 615.4
Cost 765.2 89.9 855.1
Accumulated depreciation and impairment (199.5) (36.7) (236.2)
As at 30 April 2021 565.7 53.2 618.9
(b) As at 30 April 2022, lease receivables include a gross carrying amount of $290.5 million (FY21: $299.3 million) and allowance for
impairment losses of $15.4 million (FY21: $18.8 million).

NOTES TO THE FINANCIAL STATEMENTS
FOR THE YEAR ENDED 30 APRIL 2022 CONTINUED
51
Met
cash
Fin
anci
al R
epo
rt 2
022
(c) The future minimum rentals receivable under non-cancellable finance leases are as follows:
(d) The future minimum rentals receivable under non-cancellable operating leases are as follows:
(e) Lease cash receipts and payments are presented in the following lines of the statement of cash flows:
(f) In FY22, the Group recognised rent expense of $11.2 million (FY21: $14.5 million) from short-term leases and variable lease payments.
(g) Extension options are included in a number of lease contracts across the Group. These options are negotiated by management to
provide flexibility in managing the leased-asset portfolio and align with the Group’s business needs. The extension options are
exercisable only by the Group and not by the lessors. The present value of lease payments to be made under these options that are
considered reasonably certain to be exercised have been included in the lease liability balance at 30 April 2022. The undiscounted
potential future payments at current rental rates under options that are not considered reasonably certain to be exercised is
approximately $2.0 billion, which includes potential lease payments within the next five years of approximately $286.4 million.
FY22
$m FY21
$m
Within one year 53.6 55.1
After one year but not more than five years 203.4 171.7
More than five years 94.9 139.6
351.9 366.4
Unearned finance income (61.4) (67.1)
Impairment of receivables (15.4) (18.8)
275.1 280.5
FY22
$m FY21
$m
Within one year 2.2 2.1
After one year but not more than five years 7.6 5.8
More than five years 4.6 6.8
14.4 14.7
FY22
$m FY21
$m
Receipts from subleases, excluding the financing component 42.7 44.3
Payment for lease liabilities, excluding the financing component (149.4) (122.0)
Financing component of lease payments, net (34.3) (30.3)
Net cash payments (141.0) (108.0)
NOTES TO THE FINANCIAL STATEMENTS
FOR THE YEAR ENDED 30 APRIL 2022 CONTINUED
52
Met
cash
Fin
anci
al R
epo
rt 2
022
Met
cash
Fin
anci
al R
epo
rt 2
022
Met
cash
Fin
anci
al R
epo
rt 2
022
SIGNIFICANT ACCOUNTING POLICIES
Group as a lessee
Right-of-use assets The Group recognises right-of-use assets at the commencement of a lease (i.e., the date the underlying asset is available for use). The
initial measurement of right-of-use assets includes the amount of lease liabilities recognised, initial direct costs incurred, and lease
payments made at or before the commencement date, less any lease incentives received. Right-of-use assets are subsequently
measured at cost, less any accumulated depreciation and impairment losses, and adjusted for any remeasurement of lease liabilities.
Unless the Group is reasonably certain to obtain ownership of the leased asset at the end of the lease term, the right-of-use assets are
depreciated on a straight-line basis over the shorter of its estimated useful life and the lease term. Right-of-use assets are subject to
impairment assessments under AASB 136 Impairment of Assets.
Depreciation Depreciation is provided on a straight-line basis on all right-of-use assets. Major depreciation periods are:
FY22 FY21
Leasehold properties 1-30 years 1-30 years
Motor vehicles and equipment 4-5 years 4-5 years
Useful lives are reassessed on an annual basis and adjustments, where applicable, are made on a prospective basis.
Lease liabilities At the commencement of a lease, the Group recognises lease liabilities measured at the present value of lease payments to be made
over the lease term. The lease payments include fixed payments (including in-substance fixed payments) less any lease incentives
receivable and amounts expected to be paid under residual value guarantees. The lease payments also include renewal periods
where the Group is reasonably certain to exercise the renewal option. Outgoings and other variable lease payments that do not
depend on an index or a rate are recognised as incurred.
In calculating the present value of lease payments, the Group uses the incremental borrowing rate at the lease commencement date
if the interest rate implicit in the lease is not readily determinable. After the commencement date, the amount of lease liabilities is
increased to reflect the accretion of interest and reduced for the lease payments made. In addition, the carrying amount of lease
liabilities is remeasured if there is a change in the lease term, a change in the in-substance fixed lease payments or a change in the
assessment to purchase the underlying asset.
Group as a lessor
Lease receivables The Group enters into back-to-back lease agreements with independent retailers where the terms of the lease transfer substantially
all the risks and rewards of ownership to the sublessee and these are classified as a finance lease.
Amounts due from finance leases are recognised as lease receivables at the amount of the Group’s net investment in the lease. Lease
receivables are subsequently remeasured if there is a change in the lease term. Finance lease income is allocated to reporting periods
so as to reflect a constant periodic rate of return on the Group’s net investment outstanding in respect of the leases.
All other leases are classified as operating leases. Rental income from operating leases is recognised on a straight-line basis over the
term of the relevant lease.
Short-term leases and leases of low-value assets The Group applies a recognition exemption to leases that have a lease term of 12 months or less from the commencement date and
do not contain a purchase option. It also applies a recognition exemption to leases that are considered of low value. Lease payments
and rental income from short-term and low-value leases are recognised on a straight-line basis over the lease term.
SIGNIFICANT ACCOUNTING JUDGEMENT
Determination of lease term of contracts with renewal options The Group determines the lease term as the non-cancellable term of the lease, together with any periods covered by an option to
extend the lease if it is reasonably certain to be exercised, or any periods covered by an option to terminate the lease, if it is
reasonably certain not to be exercised.
After initial recognition, the Group reassesses the lease term if there is a significant event or change in circumstances that is within its
control and affects its ability to exercise (or not to exercise) the option to renew.
SIGNIFICANT ACCOUNTING ESTIMATES
Property provisions
The Group recognises provisions for rental agreements on acquisition. In measuring these provisions, assumptions are made about future retail sales, rental costs and in determining the appropriate discount rate to be used in the cash flow calculations.
The Group has recognised a provision in accordance with the accounting policy described above. The Group assesses obligations on property make-good, restructuring and other costs. These estimates are determined using assumptions on property-related costs, redundancy and other closure or restructure costs.

NOTES TO THE FINANCIAL STATEMENTS
FOR THE YEAR ENDED 30 APRIL 2022 CONTINUED
53
Met
cash
Fin
anci
al R
epo
rt 2
022
Inventories
SIGNIFICANT ACCOUNTING POLICIES
Inventory cost is measured at purchase price, net of trade rebates and discounts received, and including costs incurred in bringing the
inventory to its present location and condition. Trade rebates include non-volumetric supplier income, which is systematically
allocated against inventory cost using estimates based on expected purchase patterns and earn rates.
Inventories are valued at the lower of cost or net realisable value. Net realisable value is the estimated selling price in the ordinary
course of business, net of estimated costs necessary to make the sale.
Equity-accounted investments
Nature and extent
Appendix C contains key information about the nature and extent of the Group’s equity-accounted investments.
Share of investees’ financial information
The following table illustrates the summarised financial information (proportionate share) of the Group’s equity-accounted investments.
At the reporting date, the Group’s share of unrecognised gains or losses is not material.
Refer note 7.3 for details of the Group’s contingent liabilities in relation to equity-accounted investments.
SIGNIFICANT ACCOUNTING POLICIES
The Group’s investments in joint ventures and associates are accounted for using the equity method. Associates are those entities
over which the Group exercises significant influence, but not control or joint control, over the financial and operating policies. A joint
venture is an arrangement in which the Group has joint control, whereby the Group has rights to the net assets of the joint venture.
Joint control is the contractually agreed sharing of control of an arrangement, which exists only when decisions about the relevant
activities require unanimous consent of the parties sharing control.
Equity-accounted investments are carried in the statement of financial position at cost plus post-acquisition changes in the Group’s
share of net assets of the investee, less any impairment in value.
For those associates and joint ventures with non-coterminous year ends, management accounts for the relevant period to the
Group’s reporting date have been equity-accounted. In the opinion of the Directors, the expense of providing additional coterminous
statutory accounts, together with consequential delay in producing the Group’s financial statements, would outweigh any benefit to
shareholders.
SIGNIFICANT ACCOUNTING ESTIMATES
Impairment of equity-accounted investments The Group assesses the recoverable amount of its equity-accounted investments when objective evidence of impairment is identified
under AASB 136 Impairment of Assets. In assessing the recoverable amount, assumptions are made about the growth prospects of the
investment and in determining the discount rate used to calculate the net present value of future cash flows when a discounted cash
flow model is used.
FY22
$m FY21
$m
Inventories 1,125.2 1,008.0
FY22 $m
FY21 $m
Current assets 110.9 96.7
Non-current assets 278.5 232.2
Total assets 389.4 328.9
Current liabilities 151.2 133.7
Non-current liabilities 157.0 136.7
Total liabilities 308.2 270.4
Net assets 81.2 58.5
Revenue 822.1 751.5
Profit before income tax 27.4 28.7
Income tax expense (8.2) (8.6)
Net profit for the year 19.2 20.1
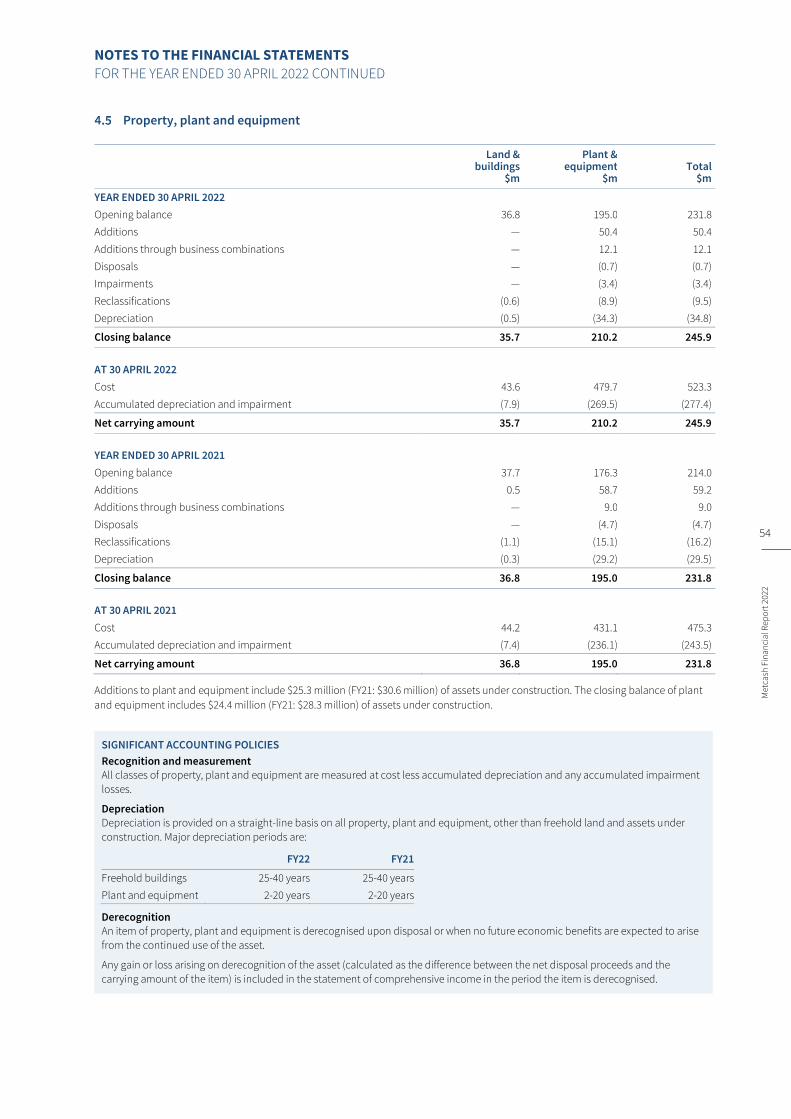
NOTES TO THE FINANCIAL STATEMENTS
FOR THE YEAR ENDED 30 APRIL 2022 CONTINUED
54
Met
cash
Fin
anci
al R
epo
rt 2
022
Met
cash
Fin
anci
al R
epo
rt 2
022
Met
cash
Fin
anci
al R
epo
rt 2
022
Property, plant and equipment
Land & buildings
$m
Plant & equipment
$m Total
$m
YEAR ENDED 30 APRIL 2022
Opening balance 36.8 195.0 231.8
Additions — 50.4 50.4
Additions through business combinations — 12.1 12.1
Disposals — (0.7) (0.7)
Impairments — (3.4) (3.4)
Reclassifications (0.6) (8.9) (9.5)
Depreciation (0.5) (34.3) (34.8)
Closing balance 35.7 210.2 245.9
AT 30 APRIL 2022
Cost 43.6 479.7 523.3
Accumulated depreciation and impairment (7.9) (269.5) (277.4)
Net carrying amount 35.7 210.2 245.9
YEAR ENDED 30 APRIL 2021
Opening balance 37.7 176.3 214.0
Additions 0.5 58.7 59.2
Additions through business combinations — 9.0 9.0
Disposals — (4.7) (4.7)
Reclassifications (1.1) (15.1) (16.2)
Depreciation (0.3) (29.2) (29.5)
Closing balance 36.8 195.0 231.8
AT 30 APRIL 2021
Cost 44.2 431.1 475.3
Accumulated depreciation and impairment (7.4) (236.1) (243.5)
Net carrying amount 36.8 195.0 231.8
Additions to plant and equipment include $25.3 million (FY21: $30.6 million) of assets under construction. The closing balance of plant
and equipment includes $24.4 million (FY21: $28.3 million) of assets under construction.
SIGNIFICANT ACCOUNTING POLICIES
Recognition and measurement All classes of property, plant and equipment are measured at cost less accumulated depreciation and any accumulated impairment
losses.
Depreciation Depreciation is provided on a straight-line basis on all property, plant and equipment, other than freehold land and assets under
construction. Major depreciation periods are:
FY22 FY21
Freehold buildings 25-40 years 25-40 years
Plant and equipment 2-20 years 2-20 years
Derecognition An item of property, plant and equipment is derecognised upon disposal or when no future economic benefits are expected to arise
from the continued use of the asset.
Any gain or loss arising on derecognition of the asset (calculated as the difference between the net disposal proceeds and the
carrying amount of the item) is included in the statement of comprehensive income in the period the item is derecognised.
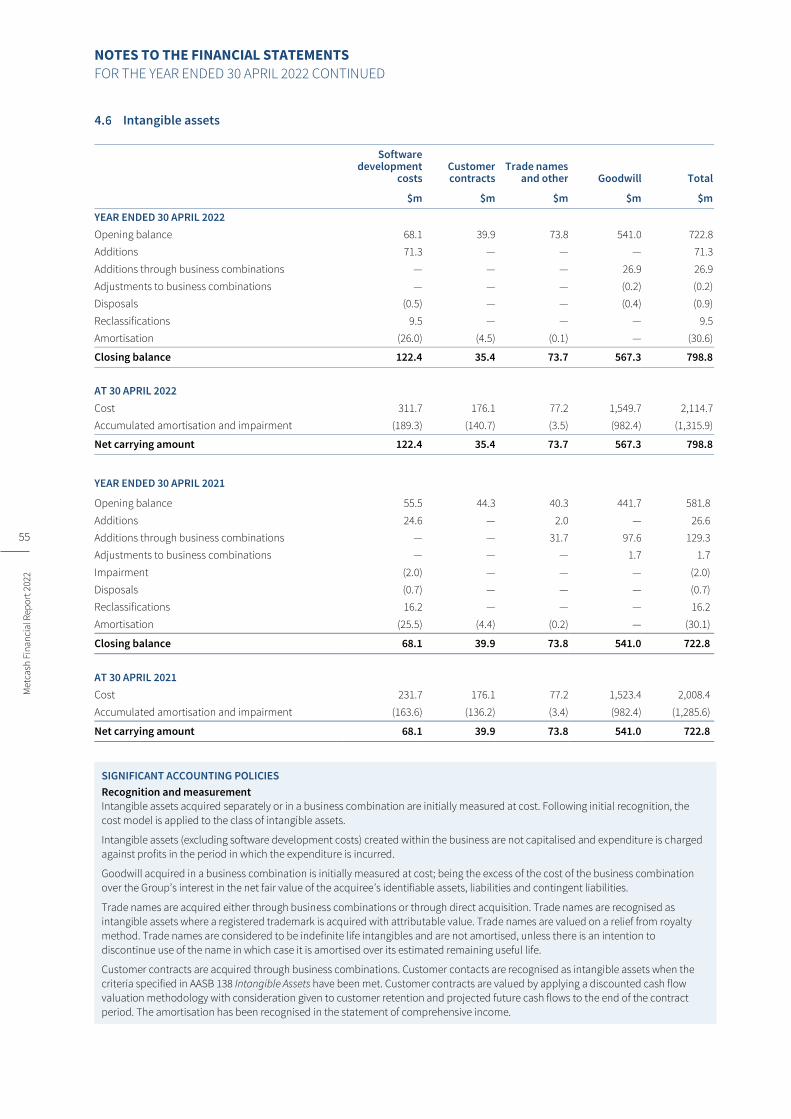
NOTES TO THE FINANCIAL STATEMENTS
FOR THE YEAR ENDED 30 APRIL 2022 CONTINUED
55
Met
cash
Fin
anci
al R
epo
rt 2
022
Intangible assets
Software
development costs
Customer contracts
Trade names and other Goodwill Total
$m $m $m $m $m
YEAR ENDED 30 APRIL 2022
Opening balance 68.1 39.9 73.8 541.0 722.8
Additions 71.3 — — — 71.3
Additions through business combinations — — — 26.9 26.9
Adjustments to business combinations — — — (0.2) (0.2)
Disposals (0.5) — — (0.4) (0.9)
Reclassifications 9.5 — — — 9.5
Amortisation (26.0) (4.5) (0.1) — (30.6)
Closing balance 122.4 35.4 73.7 567.3 798.8
AT 30 APRIL 2022
Cost 311.7 176.1 77.2 1,549.7 2,114.7
Accumulated amortisation and impairment (189.3) (140.7) (3.5) (982.4) (1,315.9)
Net carrying amount 122.4 35.4 73.7 567.3 798.8
YEAR ENDED 30 APRIL 2021
Opening balance 55.5 44.3 40.3 441.7 581.8
Additions 24.6 — 2.0 — 26.6
Additions through business combinations — — 31.7 97.6 129.3
Adjustments to business combinations — — — 1.7 1.7
Impairment (2.0) — — — (2.0)
Disposals (0.7) — — — (0.7)
Reclassifications 16.2 — — — 16.2
Amortisation (25.5) (4.4) (0.2) — (30.1)
Closing balance 68.1 39.9 73.8 541.0 722.8
AT 30 APRIL 2021
Cost 231.7 176.1 77.2 1,523.4 2,008.4
Accumulated amortisation and impairment (163.6) (136.2) (3.4) (982.4) (1,285.6)
Net carrying amount 68.1 39.9 73.8 541.0 722.8
SIGNIFICANT ACCOUNTING POLICIES
Recognition and measurement Intangible assets acquired separately or in a business combination are initially measured at cost. Following initial recognition, the
cost model is applied to the class of intangible assets.
Intangible assets (excluding software development costs) created within the business are not capitalised and expenditure is charged
against profits in the period in which the expenditure is incurred.
Goodwill acquired in a business combination is initially measured at cost; being the excess of the cost of the business combination
over the Group’s interest in the net fair value of the acquiree’s identifiable assets, liabilities and contingent liabilities.
Trade names are acquired either through business combinations or through direct acquisition. Trade names are recognised as
intangible assets where a registered trademark is acquired with attributable value. Trade names are valued on a relief from royalty
method. Trade names are considered to be indefinite life intangibles and are not amortised, unless there is an intention to
discontinue use of the name in which case it is amortised over its estimated remaining useful life.
Customer contracts are acquired through business combinations. Customer contacts are recognised as intangible assets when the
criteria specified in AASB 138 Intangible Assets have been met. Customer contracts are valued by applying a discounted cash flow
valuation methodology with consideration given to customer retention and projected future cash flows to the end of the contract
period. The amortisation has been recognised in the statement of comprehensive income.
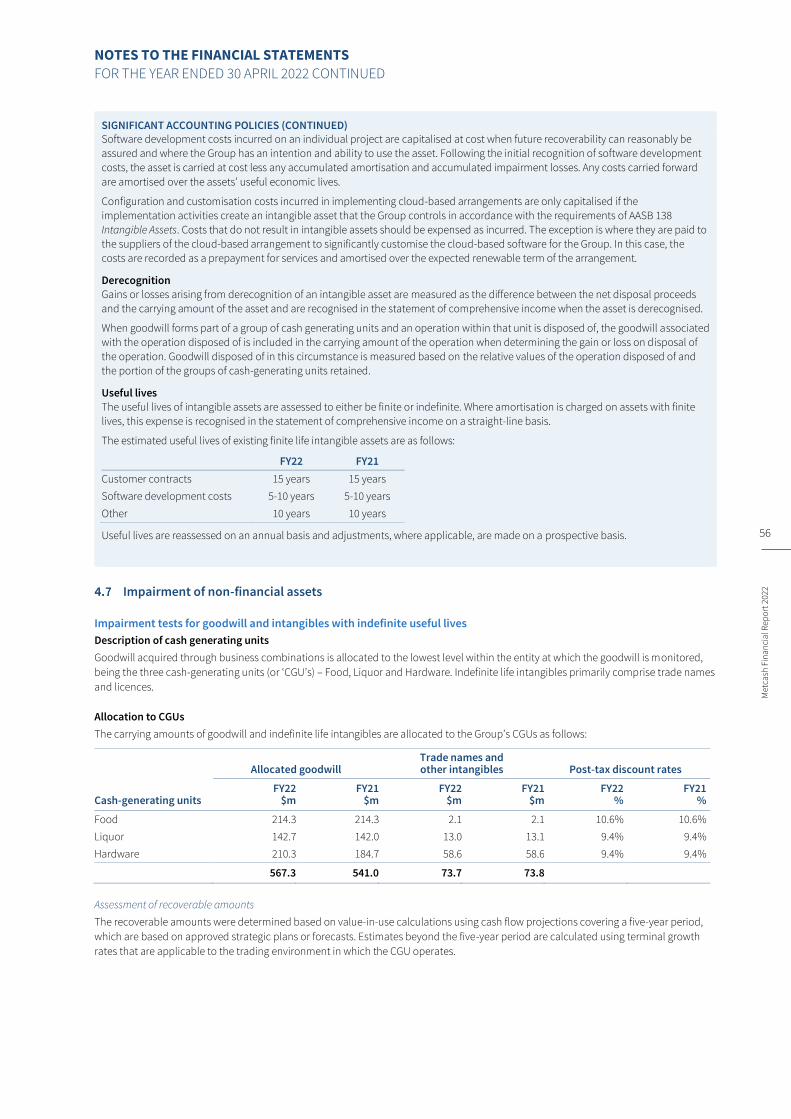
NOTES TO THE FINANCIAL STATEMENTS
FOR THE YEAR ENDED 30 APRIL 2022 CONTINUED
56
Met
cash
Fin
anci
al R
epo
rt 2
022
Met
cash
Fin
anci
al R
epo
rt 2
022
Met
cash
Fin
anci
al R
epo
rt 2
022
SIGNIFICANT ACCOUNTING POLICIES (CONTINUED) Software development costs incurred on an individual project are capitalised at cost when future recoverability can reasonably be
assured and where the Group has an intention and ability to use the asset. Following the initial recognition of software development
costs, the asset is carried at cost less any accumulated amortisation and accumulated impairment losses. Any costs carried forward
are amortised over the assets’ useful economic lives.
Configuration and customisation costs incurred in implementing cloud-based arrangements are only capitalised if the
implementation activities create an intangible asset that the Group controls in accordance with the requirements of AASB 138
Intangible Assets. Costs that do not result in intangible assets should be expensed as incurred. The exception is where they are paid to
the suppliers of the cloud-based arrangement to significantly customise the cloud-based software for the Group. In this case, the
costs are recorded as a prepayment for services and amortised over the expected renewable term of the arrangement.
Derecognition Gains or losses arising from derecognition of an intangible asset are measured as the difference between the net disposal proceeds
and the carrying amount of the asset and are recognised in the statement of comprehensive income when the asset is derecognised.
When goodwill forms part of a group of cash generating units and an operation within that unit is disposed of, the goodwill associated
with the operation disposed of is included in the carrying amount of the operation when determining the gain or loss on disposal of
the operation. Goodwill disposed of in this circumstance is measured based on the relative values of the operation disposed of and
the portion of the groups of cash-generating units retained.
Useful lives The useful lives of intangible assets are assessed to either be finite or indefinite. Where amortisation is charged on assets with finite
lives, this expense is recognised in the statement of comprehensive income on a straight-line basis.
The estimated useful lives of existing finite life intangible assets are as follows:
FY22 FY21
Customer contracts 15 years 15 years
Software development costs 5-10 years 5-10 years
Other 10 years 10 years
Useful lives are reassessed on an annual basis and adjustments, where applicable, are made on a prospective basis.
Impairment of non-financial assets
Impairment tests for goodwill and intangibles with indefinite useful lives
Description of cash generating units
Goodwill acquired through business combinations is allocated to the lowest level within the entity at which the goodwill is monitored,
being the three cash-generating units (or ‘CGU’s) – Food, Liquor and Hardware. Indefinite life intangibles primarily comprise trade names
and licences.
Allocation to CGUs
The carrying amounts of goodwill and indefinite life intangibles are allocated to the Group’s CGUs as follows:
Allocated goodwill Trade names and other intangibles Post-tax discount rates
Cash-generating units FY22
$m FY21
$m FY22
$m FY21
$m FY22
% FY21
%
Food 214.3 214.3 2.1 2.1 10.6% 10.6%
Liquor 142.7 142.0 13.0 13.1 9.4% 9.4%
Hardware 210.3 184.7 58.6 58.6 9.4% 9.4%
567.3 541.0 73.7 73.8
Assessment of recoverable amounts
The recoverable amounts were determined based on value-in-use calculations using cash flow projections covering a five-year period,
which are based on approved strategic plans or forecasts. Estimates beyond the five-year period are calculated using terminal growth
rates that are applicable to the trading environment in which the CGU operates.
NOTES TO THE FINANCIAL STATEMENTS
FOR THE YEAR ENDED 30 APRIL 2022 CONTINUED
57
Met
cash
Fin
anci
al R
epo
rt 2
022
Key assumptions used in assessment
The valuations used to support the carrying amounts of intangible assets are based on forward looking key assumptions that are, by
nature, uncertain. The nature and basis of the key assumptions used to estimate future cash flows and the discount rates used in the
projections, when determining the recoverable amount of each CGU, are set out below and in the table above:
− Operating cash flows – Operating cash flow projections are extracted from the most recent approved strategic plans or forecasts that
relate to the existing asset base. For each CGU, the cash flow projections for a five-year period have been determined based on
expectations of future performance. Key assumptions in the cash flows include sales volume growth, costs of sales and costs of doing
business. These assumptions are based on expectations of market demand and operational performance.
Cash flow projections are based on risk-adjusted forecasts allowing for estimated changes in the business, the competitive trading
environment, legislation and economic growth whilst noting that uncertainties remain over the potential impact of any future COVID-
19 related restrictions and changes to consumer behaviour. Other uncertainties surrounding macroeconomic indicators such as
unemployment and GDP growth create future uncertainty over the Group’s operating cash flows.
− Discount rates – Discount rates are based on the weighted average cost of capital (‘WACC’) for the Group adjusted for an asset-
specific risk premium assigned to each CGU. The asset-specific risk premium is determined based on risk embedded within the cash
flow projections and other factors specific to the industries in which the CGUs operate.
The calculation of WACC is market-driven and key inputs include target capital structure, equity beta, market risk premium, risk-free
rate of return and debt risk premium. Pre-tax equivalents of the adopted discount rates are derived iteratively and differ based on the
timing and extent of tax cash flows. Pre-tax rates were 15.1% (FY21: 15.1%) for Food, 13.4% (FY21: 13.4%) for Liquor and 13.4% (FY21:
13.4%) for Hardware.
− Terminal growth rates – Cash flows beyond the projection period are extrapolated indefinitely using estimated long-term growth
rates applicable to the trading environment in which the CGUs operate. A terminal growth rate of 1.5% was applied to all CGUs.
Results of assessment
Based on the FY22 assessment, no impairment of goodwill was identified in any of the Group’s CGUs.
Sensitivity to changes in key assumptions
At the assessment date, no reasonably likely change in key assumptions would cause the carrying amount of any CGU to exceed its
recoverable amount.
SIGNIFICANT ACCOUNTING POLICIES
At each reporting date, the Group assesses whether there is any indication that the value of a non-financial asset may be impaired.
Goodwill and indefinite life intangible assets are tested for impairment at least annually and more frequently if events or changes in
circumstances indicate that the carrying value may be impaired.
Where an indicator of impairment exists, the Group makes a formal estimate of recoverable amount. Where the carrying amount of a
non-financial asset exceeds its recoverable amount the asset is considered impaired and is written down to its recoverable amount.
Recoverable amount is the greater of fair value less costs to sell and value in use. It is determined for an individual asset, unless the
asset’s value in use cannot be estimated to be close to its fair value less costs to sell and it does not generate cash inflows that are
largely independent of those from other assets or groups of assets. In this case, the recoverable amount is determined for the CGU to
which the asset belongs.
When the carrying amount of an asset or CGU exceeds its recoverable amount, the asset is considered impaired and is written down
to its recoverable amount. In assessing value in use, the estimated pre-tax future cash flows are discounted to their present value
using a pre-tax discount rate that reflects current market assessments of the time value of money and the risks specific to the asset.
Impairment losses are recognised in the Statement of Comprehensive Income.
SIGNIFICANT ACCOUNTING ESTIMATES
Impairment of goodwill The Group determines whether goodwill is impaired on an annual basis. This requires an estimation of the recoverable amount of the
CGUs to which the goodwill is allocated.

NOTES TO THE FINANCIAL STATEMENTS
FOR THE YEAR ENDED 30 APRIL 2022 CONTINUED
58
Met
cash
Fin
anci
al R
epo
rt 2
022
Met
cash
Fin
anci
al R
epo
rt 2
022
Met
cash
Fin
anci
al R
epo
rt 2
022
Provisions
Employee
entitlements $m
Property provisions
$m Total
$m
30 APRIL 2022
Current 144.0 8.6 152.6
Non-current 12.3 30.6 42.9
156.3 39.2 195.5
30 APRIL 2021
Current 128.2 11.5 139.7
Non-current 11.2 33.2 44.4
139.4 44.7 184.1
Movements in property provisions
FY22
$m FY21
$m
Opening balance 44.7 58.1
Charged as an expense/(reversals) during the year, net 1.6 (6.8)
Utilised during the year, net (9.0) (9.3)
Finance cost discount rate adjustment 1.9 2.7
Closing balance 39.2 44.7
SIGNIFICANT ACCOUNTING POLICIES
Employee Entitlements
Wages, salaries, incentives, annual leave and sick leave Liabilities for wages and salaries, including non-monetary benefits, incentives, annual leave and accumulating sick leave, are
recognised in provisions in respect of employees’ services up to the reporting date. They are measured at the amounts expected to
be paid when the liabilities are settled. Liabilities due to be settled within 12 months of the reporting date are classified as current
liabilities. Liabilities for non-accumulating sick leave are recognised when the leave is taken and are measured at the rates paid
or payable.
Long service leave The liability for long service leave is recognised in the provision for employee benefits and measured as the present value of expected
future payments to be made in respect of services provided by employees up to the reporting date. Consideration is given to expected
future wage and salary levels, experience of employee departures, and periods of service. Expected future payments at the reporting
date are discounted using market yields on high-quality corporate bonds with terms to maturity that match as closely as possible, the
estimated future cash outflows.
Property Provisions Provisions are recognised when the Group has a present obligation (legal or constructive) as a result of a past event, it is probable that
an outflow of resources embodying economic benefits will be required to settle the obligation and a reliable estimate can be made of
the amount of the obligation.
Property provisions include the value of certain retail store lease obligations recognised as part of the acquisition of Franklins in FY12.
The provision is initially recognised at the acquisition date fair value and subsequently utilised to settle lease obligations. The
provision related to an individual lease is derecognised when the Group has met or otherwise extinguished its obligations in full under
that lease.
Provisions are also recognised for obligations such as guarantees, property make-good and other costs. Depending on the nature of
these obligations, they are expected to be settled over the term of the lease, at the conclusion of the lease or otherwise when the
obligation vests.
If the effect of the time value of money is material, provisions are measured at the net present value of the expected future cash
outflows using a current pre-tax rate that reflects the risks specific to the liability. During each period the provision is increased by an
amount that is equal to the provision multiplied by the discount rate. This increment, including any change in the value of the
provision as a result of a change in discount rate, is treated as a finance cost.

NOTES TO THE FINANCIAL STATEMENTS
FOR THE YEAR ENDED 30 APRIL 2022 CONTINUED
59
Met
cash
Fin
anci
al R
epo
rt 2
022
SIGNIFICANT ACCOUNTING ESTIMATES
Property provisions The Group recognises provisions for rental agreements on acquisition. In measuring these provisions, assumptions are made about
future retail sales, rental costs and in determining the appropriate discount rate to be used in the cash flow calculations.
The Group assesses obligations on property make-good, restructuring and other costs. These estimates are determined using
assumptions on property-related costs, redundancy and other closure or restructure costs.
CAPITAL STRUCTURE, FINANCING AND RISK MANAGEMENT
Reconciliation of cash flows from operating activities
FY22
$m FY21
$m
Net profit for the year 247.1 241.4
ADJUSTMENTS FOR:
Depreciation and amortisation 175.9 163.7
Provisions for impairment, net of reversals 41.0 42.9
Share of profit from equity-accounted investments (19.2) (20.1)
Movements in put option liabilities 30.5 3.2
Share-based payments expense 7.4 8.7
Net gain from disposal of property, plant and equipment (0.3) (0.6)
Other adjustments 17.8 10.8
CHANGES IN ASSETS AND LIABILITIES:
Increase in trade and other receivables (154.3) (30.7)
(Increase)/decrease in inventories (122.3) 37.6
(Decrease)/ increase in tax balances (6.0) 21.5
Increase/(decrease) in payables and provisions 214.7 (2.9)
Cash flows from operating activities 432.3 475.5
Interest-bearing borrowings
FY22
$m FY21
$m
CURRENT
Bank loans – working capital 45.0 —
45.0 —
NON-CURRENT
Bank loans – syndicated 200.0 —
Bank loans – bilateral 51.5 —
Deferred borrowing costs (2.8) —
248.7 —
Financial covenants
See note 5.6 for details of the Group’s core borrowing facilities. The core borrowings of the Group must comply with two primary
covenants which apply to the syndicated, bilateral and working capital bank facilities. They include a Fixed Charges Cover Ratio and a
Senior Leverage Ratio. There were no defaults or breaches on the Group’s core borrowings in FY22 and FY21.
Weighted average interest
The weighted average effective interest rate on the syndicated, bilateral and working capital loans was 1.7% (FY21: 1.9%) over the
financial year. These rates exclude line fees on unutilised facility balances.

NOTES TO THE FINANCIAL STATEMENTS
FOR THE YEAR ENDED 30 APRIL 2022 CONTINUED
60
Met
cash
Fin
anci
al R
epo
rt 2
022
Met
cash
Fin
anci
al R
epo
rt 2
022
Met
cash
Fin
anci
al R
epo
rt 2
022
SIGNIFICANT ACCOUNTING POLICIES
All loans and borrowings are initially recognised at the fair value of the consideration received net of issue costs associated with
the borrowing.
After initial recognition, interest-bearing borrowings are subsequently measured at amortised cost using the effective
interest method.
Gains and losses are recognised in profit or loss when the liabilities are derecognised.
Put options and other financial liabilities
Put option liabilities
$m
Other financial liabilities
$m Total
$m
30 APRIL 2022
Current 21.1 2.4 23.5
Non-current 210.6 0.9 211.5
231.7 3.3 235.0
30 APRIL 2021
Current 17.7 4.2 21.9
Non-current 194.8 — 194.8
212.5 4.2 216.7
Put option liabilities
Total Tools Group put options
The Group has a put option with Total Tools Holdings Pty Ltd (Total Tools), which is the parent entity in the Total Tools Group,
comprising the franchisor operations, 8 company-owned stores and ownership interests in 27 Total Tools independent retail stores
(JV stores).
In June 2021, Metcash acquired an additional 15% interest in Total Tools increasing its ownership from 70% to 85%. The remaining
shareholders in Total Tools have the right to put their 15% ownership interest to Metcash, via a put option, exercisable between
1 November 2023 and 31 January 2024. Metcash has the right to acquire the remaining 15% equity interest via a call option, exercisable
at any time from 1 November 2023. The exercise price of the put option is based on a multiple of the Total Tools Group EBITDA over the
12-month period ending on 29 October 2023, adjusted for a number of items, including net debt and working capital and was valued at
$79.3 million at balance date.
In addition, Total Tools has ownership of between 51% and 60% in 27 Total Tools JV stores, including the 15 JV stores acquired in FY22
(refer note 6.1). Accordingly, at balance date, Metcash holds an effective ownership interest of between 43% and 51% in these JV Stores.
The Total Tools JV Store put option agreements allow individual minority shareholders to sell their remaining equity interests in the
27 JV Stores to Total Tools, subject to the satisfaction of certain criteria, exercisable between May 2024 and July 2024 (13 stores, valued
at $80.1 million) and between May 2025 and July 2025 (14 stores, valued at $51.2 million). Metcash has the right to acquire the remaining
equity interests via call options, exercisable at any time. The exercise price of the put options are based on a multiple of the respective
store’s EBITDA over the 12-month period immediately prior to the respective exercise dates, adjusted for a number of items, including
net debt and working capital.
In accordance with AASB 10 Consolidated Financial Statements, the Group has recognised financial liabilities for the Total Tools put
option and the JV Store put options, has derecognised the non-controlling interests in Total Tools and the JV Stores and has ceased
accounting for the non-controlling interests. Accordingly, the Statement of Comprehensive Income includes 100% of the net profit of
Total Tools and includes 100% of the net profits of the JV Stores.
The above put option liabilities are remeasured at each reporting date at the estimated put option exercise price, with any change in
value recorded as a significant item within the Statement of Comprehensive Income, together with the net present value interest unwind
on the put option liability.
At balance date, the carrying amount of the Total Tools Group put option liabilities is $210.6 million (FY21: $194.8 million). Refer note 3.3
of the financial report for details in relation to the put option valuation adjustments recognised during the period.
Other put options
The Group has also recognised a liability of $21.1 million (FY21: $17.7 million) in respect of an additional three put options written over
non-controlling interests in non-wholly owned subsidiaries within the Hardware pillar. These put option arrangements allow minority
shareholders to sell their equity interests to Metcash, subject to specific terms and conditions. These put options are measured at the
present value of the redemption amount under the option.

NOTES TO THE FINANCIAL STATEMENTS
FOR THE YEAR ENDED 30 APRIL 2022 CONTINUED
61
Met
cash
Fin
anci
al R
epo
rt 2
022
Contingent put option liabilities
Ritchies Stores Pty Ltd (Ritchies) put option
The Group has a put option with Ritchies Stores Pty Ltd (Ritchies). Metcash has a 28.9% (FY21: 26.4%) ownership interest in Ritchies,
which is recognised as an equity-accounted investment on the Group’s balance sheet. The remaining shareholders in Ritchies have the
right to put their 71.1% (FY21: 73.6%) ownership interests to Metcash, via put option, subject to a margin related annual financial hurdle
(‘hurdle’) being achieved.
The put option can be exercised collectively by all shareholders during a prescribed period following the approval of Ritchies’ annual
audited financial report (‘group put option’ representing the remaining 71.1% shareholding) or in certain circumstances by individual
minority shareholders within a prescribed period (‘small shareholder put option’).
Should the hurdle be achieved, and the shareholders elect to exercise any put option, the purchase consideration payable by Metcash is
based on a multiple of the prior year reported earnings, normalised for certain adjustments.
Whilst the financial hurdle was achieved in respect of Ritchies’ 2021 financial year, the group put option was not exercised in relation to
that year. Metcash estimates that the group put option consideration payable to Ritchies shareholders in respect of the 2021 financial
year would have been between $310 million and $320 million.
During FY22, eight small shareholders holding an aggregate of 13,750 shares (or 2.5% stake in Ritchies) exercised their option under the
‘small shareholder put option’ in relation to Ritchies’ 2021 financial year, bringing Metcash’s share in Ritchies to 28.9%.
If any put options were to be exercised in future years, the exercise price will be determined with reference to Ritchies’ results for that
financial year and the consideration payable would reflect those results.
The put option agreement terminates when Metcash ceases to hold shares in Ritchies or if Ritchies lists on the ASX.
The Ritchies put option is recognised at a fair value of nil.
Other put options
In addition, the Group has put and call option agreements with two Total Tools independent retail stores without acquiring any present
ownership interest (‘non-owned stores’). These options are exercisable between May 2024 and July 2024 if certain operating
performance conditions are met and with an exercise price determined using a multiple of EBITDA. These put options are recognised at
their fair values of nil.
SIGNIFICANT ACCOUNTING POLICIES Arrangements within certain business combinations entitle the non-controlling interests to require the Group to acquire their
shareholding via exercise of a put option, subject to specific terms and conditions. Where such an arrangement is deemed to be part
of the business combination, a financial liability is recognised on the acquisition date measured at the present value of the
redemption amount under the arrangement. The initial recognition of the put option liability is charged directly to retained earnings
and the non-controlling interest is derecognised.
The put option liability is subsequently remeasured at each reporting date at the estimated put option exercise price, with any
change in value recorded within the Statement of Comprehensive Income, together with the net present value interest unwind on the
put option liability.
SIGNIFICANT ACCOUNTING ESTIMATE
The valuations used to determine the carrying amount of put option liabilities are based on forward looking key assumptions that are,
by nature, uncertain. This requires an estimation of future earnings and cash flows which includes assumptions in relation to sales
volume growth, cost of sales and costs of doing business.

NOTES TO THE FINANCIAL STATEMENTS
FOR THE YEAR ENDED 30 APRIL 2022 CONTINUED
62
Met
cash
Fin
anci
al R
epo
rt 2
022
Met
cash
Fin
anci
al R
epo
rt 2
022
Met
cash
Fin
anci
al R
epo
rt 2
022
Contributed equity and reserves
Contributed equity
FY22 FY21
Number of shares $m Number of shares $m
At 1 May 1,022,362,821 867.0 1,016,399,606 853.5
Share buyback and related costs, net of tax (56,821,219) (48.7) — —
Issued under equity raising, net of share issue costs — — 5,963,215 13.5
At 30 April 965,541,602 818.3 1,022,362,821 867.0
Fully paid ordinary shares carry one vote per share and carry the right to dividends. Shares have no par value.
In August 2021, the Group completed an off-market buyback of 56,821,219 ordinary shares (or 5.6% of total shares in issue) for $200.0
million. The ordinary shares were bought back at $3.52 per share, which represented a 14% discount to Metcash market price of $4.10
(being the volume weighted average price of Metcash ordinary shares on the ASX over the five trading days up to and including 13 August
2021). The buyback comprised a fully franked dividend of $2.67 per share ($151.7 million) and a capital component of $0.85 per share
($48.3 million). These amounts, along with $0.4 million of transaction costs, were debited to the Company’s profit reserve and share
capital account, respectively. The shares bought back were subsequently cancelled.
In May 2020, Metcash issued 5,963,215 shares under its Share Purchase Plan (‘SPP’) at $2.28 per share which raised $13.5 million of
equity, net of transaction costs.
Other reserves
Share-based
payments reserve Foreign currency
translation reserve Cash flow hedge
reserve Total
other reserves
$m $m $m $m
At 1 May 2020 2.6 (5.0) 0.1 (2.3)
Total comprehensive income, net of tax — (0.3) (1.5) (1.8)
Shares issued to employees (6.3) — — (6.3)
Share-based payments expense 8.7 — — 8.7
At 30 April 2021 5.0 (5.3) (1.4) (1.7)
Movement in fair value of derivatives — — 0.9 0.9
Movement in foreign currency valuations — (0.9) — (0.9)
Total comprehensive (loss)/income, net of tax — (0.9) 0.9 —
Shares issued to employees (9.4) — — (9.4)
Share-based payments expense 7.7 — — 7.7
At 30 April 2022 3.3 (6.2) (0.5) (3.4)
SIGNIFICANT ACCOUNTING POLICIES
Share-based payments reserve The share-based payments reserve is used to record the value of equity benefits provided to executives as part of their remuneration.
Once a performance right has lapsed the Group no longer has any obligation to convert these performance rights into share capital.
The amount transferred to retained earnings represents the value of share-based payments previously recognised as an expense that
have subsequently lapsed.
Foreign currency translation reserve The foreign currency translation reserve is used to record exchange differences arising from the translation of the financial statements
of foreign subsidiaries. It is also used to record the effect of hedging net investments in foreign operations.
Cash flow hedge reserve The cash flow hedge reserve records the portion of the unrealised gain or loss on a hedging instrument in a cash flow hedge that is
determined to be an effective hedge.

NOTES TO THE FINANCIAL STATEMENTS
FOR THE YEAR ENDED 30 APRIL 2022 CONTINUED
63
Met
cash
Fin
anci
al R
epo
rt 2
022
Dividends
FY22
$m FY21
$m
DIVIDENDS PAID ON ORDINARY SHARES DURING THE YEAR
Final fully franked dividend for FY21: 9.5c (FY20: 6.5c) 97.1 66.5
Interim fully franked dividend for FY22: 10.5c (FY21: 8.0c) 101.4 81.8
198.5 148.3
DIVIDENDS DETERMINED (NOT RECOGNISED AS A LIABILITY AS AT 30 APRIL)
Final fully franked dividend for FY22: 11.0c (FY21: 9.5c) 106.2 97.1
On 27 June 2022, the Board determined to pay a fully franked FY22 final dividend of 11.0 cents per share, sourced from the profit reserve
established by Metcash Limited (Parent Company), with a record date of 13 July 2022 and payable in cash on 10 August 2022. The
Dividend Reinvestment Plan remains suspended with effect from 26 June 2017.
Franking credit balance of Metcash Limited
FY22
$m FY21
$m
Franking account balance as at the end of the financial year at 30% (FY21: 30%) 156.2 216.8
Franking credits that will arise from the payment of income tax payable at the reporting date 23.9 16.5
Franking credits on dividends determined but not distributed to shareholders during the year (45.5) (41.6)
134.6 191.7
Financial risk management
Objectives and policies
The Group’s principal financial instruments comprise bank loans and overdrafts, leases, cash and short-term deposits and derivatives.
The main purpose of these instruments is to finance the Group’s operations. The Group also has various other financial assets and
liabilities such as trade receivables and payables, which arise directly from its operations.
The main risks arising from the Group’s financial instruments are liquidity risk, interest rate risk, credit risk and foreign exchange risk. The
Board reviews and agrees policies for managing each of these risks and they are detailed below. The objective of the Group’s risk
management policy is to support delivery of the Group’s financial targets while protecting future financial security.
Liquidity risk and funding management
Liquidity risk is the risk that the Group will be unable to meet its payment obligations when they fall due under normal and extreme
circumstances. To limit this risk, the Group manages assets with liquidity in mind, and monitors future cash flows and liquidity on a daily
basis. The Group’s primary sources of debt funding are syndicated, bilateral and working capital facilities, of which 33.6% (FY21: 1.2%)
has been utilised at 30 April 2022. The Group monitors forecasts of liquidity reserves on the basis of expected cash flow.
Available credit facilities
At the reporting date, the Group had the following unused credit facilities available for its immediate use:
Total facilities
$m
Debt usage
$m
Guarantees & other usage
$m
Facilities available
$m
AT 30 APRIL 2022
Syndicated facilities 525.0 200.0 — 325.0
Working capital, including guarantees 250.0 45.0 6.3 198.7
Bilateral loans 126.5 51.5 — 75.0
901.5 296.5 6.3 598.7
AT 30 APRIL 2021
Syndicated facilities 675.0 — — 675.0
Working capital, including guarantees 230.0 — 10.7 219.3
905.0 — 10.7 894.3

NOTES TO THE FINANCIAL STATEMENTS
FOR THE YEAR ENDED 30 APRIL 2022 CONTINUED
64
Met
cash
Fin
anci
al R
epo
rt 2
022
Met
cash
Fin
anci
al R
epo
rt 2
022
Met
cash
Fin
anci
al R
epo
rt 2
022
Syndicated facilities
Syndicated bank loans are senior unsecured revolving facilities. The facilities are due to expire in May 2024 ($100.0 million), September
2024 ($125.0 million), September 2025 ($100.0 million) and May 2026 ($200.0 million). Interest is payable on the facilities based on BBSY
plus a margin. The applicable margin is dependent upon an escalation matrix linked to the Senior Leverage Ratio achieved. These bank
loans are subject to certain financial undertakings as detailed in note 5.2.
Working capital
Working capital bank loans are represented by four unsecured revolving facilities totalling $250.0 million. These facilities mature in
September 2022 ($55.0 million), February 2023 ($75.0 million) and July 2023 ($120.0 million). Interest payable on any loans drawn under
these facilities is based on BBSY or the RBA cash rate plus a margin. These bank loans are subject to certain financial undertakings as
detailed in note 5.2.
Bilateral loans
Bilateral bank loans are represented by three unsecured revolving facilities totalling $126.5 million. These facilities mature in June 2024
($26.5 million), June 2025 ($50.0 million) and December 2028 ($50.0 million). Interest payable on any loans drawn under these facilities is
based on BBSY plus a margin. These bank loans are subject to certain financial undertakings as detailed in note 5.2.
Maturity analysis of financial liabilities based on contracted date
The following table reflects the gross contracted values of financial liabilities categorised by their contracted dates of settlement.
Gross settled derivatives comprise forward exchange contracts that are used to hedge anticipated purchase commitments. Under the
terms of these agreements, the settlements at expiry include both a cash payment and receipt.
1 year or less
$m 1 – 5 years
$m
More than 5 years
$m Total
$m
AS AT 30 APRIL 2022
Trade and other payables 2,321.9 — — 2,321.9
Bank loans 50.0 209.6 51.5 311.1
Financial guarantee contracts 0.5 0.9 — 1.4
Other financial liabilities 1.9 — — 1.9
Put options written over non-controlling interests 21.1 224.4 — 245.5
Lease liabilities 193.4 637.3 437.3 1,268.0
Derivative liabilities – gross settled:
— Inflows 4.9 — — 4.9
— Outflows (4.9) — — (4.9)
Net maturity 2,588.8 1,072.2 488.8 4,149.8
AS AT 30 APRIL 2021
Trade and other payables 2,094.7 — — 2,094.7
Financial guarantee contracts 0.4 — — 0.4
Other financial liabilities 3.8 — — 3.8
Put options written over non-controlling interests 17.4 191.6 — 209.0
Lease liabilities 189.9 526.1 570.0 1,286.0
Derivative liabilities – gross settled:
— Inflows 30.4 — — 30.4
— Outflows (30.4) — — (30.4)
Net maturity 2,306.2 717.7 570.0 3,593.9
Interest rate risk
The Group’s exposure to the risk of changes in market interest rates relates primarily to the Group’s bank debt obligations with a floating
interest rate.
The Group’s treasury policy provides percentage ranges across yearly periods for the interest rate hedging of net debt. Core debt is
defined as the minimum level of drawn debt which is expected to occur over the year. At 30 April 2022, Metcash has $296.5 million (FY21:
nil) bank debt obligations and has not entered into interest rate swap contracts (FY21: nil).

NOTES TO THE FINANCIAL STATEMENTS
FOR THE YEAR ENDED 30 APRIL 2022 CONTINUED
65
Met
cash
Fin
anci
al R
epo
rt 2
022
At the reporting date, the Group had the following mix of financial assets and liabilities exposed to Australian variable interest rate risk
that, except as indicated, are not designated in cash flow hedges:
FY22
$m FY21
$m
FINANCIAL ASSETS
Cash and cash equivalents 104.7 124.6
FINANCIAL LIABILITIES
Bank loans – syndicated (200.0) —
Bank loans – working capital (45.0) —
Bank loans – bilateral (51.5) —
Net exposure (191.8) —
Sensitivity analysis
As the Group’s treasury policy requires core debt to be appropriately hedged, there are no reasonably likely changes in interest rates that
are expected to have a material impact on the Group’s net profit after tax and other comprehensive income.
Credit risk
Credit risk is the risk that a counterparty will not meet its obligations under a financial instrument or customer contract, leading to a
financial loss. The Group is exposed to credit risk from its operating activities (primarily trade receivables) and from its financing
activities, including deposits with banks and financial institutions, foreign exchange transactions and other financial instruments.
Trade receivables and loans
The Group trades with a large number of customers and it is Group policy that all customers who wish to trade on credit terms are
subject to credit verification procedures. In addition, where a loan has been provided, the Group will obtain security over certain assets
of the customer wherever possible.
Receivables and loans are monitored on an ongoing basis and a formal review of all balances occurs every six months to measure
impairment losses. As identified in note 4.1, the current level of impairment provision represents 3.3% (FY21: 3.4%) of the Group’s
receivables and loans.
Lease receivables
The Group is exposed to credit risk on ‘back-to-back’ arrangements contained within its property leases where Metcash has subleased
properties to retailers. The Group regularly reviews material lease arrangements on an ongoing basis and a formal review of all leases
occurs every six months to measure impairment losses. Refer note 4.2 for further details.
Others
There are no other significant concentrations of credit risk within the Group.
Foreign exchange risk
The Group is exposed to foreign exchange fluctuations on transactions and balances in respect of its operations in New Zealand.
This operation represents less than 5% of the Group’s total sales revenue and total profit after tax.
In addition, the Group undertakes some foreign currency transactions when purchasing goods and services. The Group enters into
forward foreign exchange contracts to manage the risk associated with anticipated purchase commitments denominated in foreign
currencies.
The amount of foreign exchange cover is based on anticipated future purchases in light of current conditions in foreign markets,
commitments from customers and experience.

NOTES TO THE FINANCIAL STATEMENTS
FOR THE YEAR ENDED 30 APRIL 2022 CONTINUED
66
Met
cash
Fin
anci
al R
epo
rt 2
022
Met
cash
Fin
anci
al R
epo
rt 2
022
Met
cash
Fin
anci
al R
epo
rt 2
022
SIGNIFICANT ACCOUNTING POLICIES
Derivative financial instruments are initially recognised at fair value on the date at which a derivative contract is entered into and are
subsequently remeasured to fair value.
The fair value of derivative contracts is determined by reference to market values for similar instruments. Derivatives are carried as
assets when their fair value is positive and as liabilities when their fair value is negative. Any gains or losses arising from changes in the
fair value of derivatives, except for those that qualify as cash flow hedges, are taken directly to the Statement of Comprehensive
Income for the year.
Instruments that meet the strict criteria for hedge accounting are classified as:
− fair value hedges, when they hedge the exposure to changes in the fair value of a recognised asset or liability; or
− cash flow hedges, when they hedge the exposure to variability in cash flows that is attributable either to a particular risk
associated with a recognised asset or liability or to a forecast transaction.
Fair value hedges The change in the fair value of the hedged item attributable to the risk hedged is recorded as part of the carrying value of the hedged
item and is also recognised in the Statement of Comprehensive Income as finance costs. If the hedged item is derecognised, the
unamortised fair value is recognised immediately in the Statement of Comprehensive Income.
When an unrecognised firm commitment is designated as a hedged item, the subsequent cumulative change in the fair value of the
firm commitment attributable to the hedged risk is recognised as an asset or liability with a corresponding gain or loss recognised in
the Statement of Comprehensive Income.
Cash flow hedges The effective portion of the gain or loss on the hedging instrument is recognised in other comprehensive income and carried forward
to the cash flow hedge reserve, while any ineffective portion is recognised immediately in the Statement of Comprehensive Income as
finance costs.
Amounts recognised as other comprehensive income are transferred to profit or loss when the hedged transaction affects profit or
loss, such as when the hedged financial income or financial expense is recognised or when a forecast sale occurs. When the hedged
item is the cost of a non-financial asset or non-financial liability, the amounts recognised as other comprehensive income are
transferred to the initial carrying amount of the non-financial asset or liability.
If the forecast transaction or firm commitment is no longer expected to occur, the cumulative gain or loss previously recognised in
equity is transferred to the Statement of Comprehensive Income. If the hedging instrument expires or is sold, terminated or exercised
without replacement or rollover, or if its designation as a hedge is revoked, any cumulative gain or loss previously recognised in other
comprehensive income remains in other comprehensive income until the forecast transaction or firm commitment affects the
Statement of Comprehensive Income.
Current versus non-current classification Derivative instruments are classified as current or non-current or separated into current and non-current portions based on an
assessment of the facts and circumstances including the underlying contracted cash flows.
Capital management
For the purpose of the Group’s capital management, capital includes all accounts classified as equity on the Statement of Financial
Position. The Board’s intention is to continue to invest in the business for future growth while maintaining a strong financial position
and otherwise to assess returning surplus capital to shareholders.
On 27 June 2022, the Board determined to pay a fully franked FY22 final dividend of 11.0 cents per share. The FY22 final dividend
represents a full year dividend payout ratio of ~70% of underlying profit after tax.
The Board and management set out to maintain appropriate Statement of Financial Position ratios. Certain Statement of Financial
Position ratios are also imposed under the Group’s banking facilities (refer to note 5.2).
Management monitor capital through the debt leverage ratio (net debt / underlying EBITDA - depreciation of ROU assets). The FY22 debt
leverage ratio was 0.36x, which reflects a low gearing position.
No changes were made to the overall objectives, policies or processes for managing capital during the year.
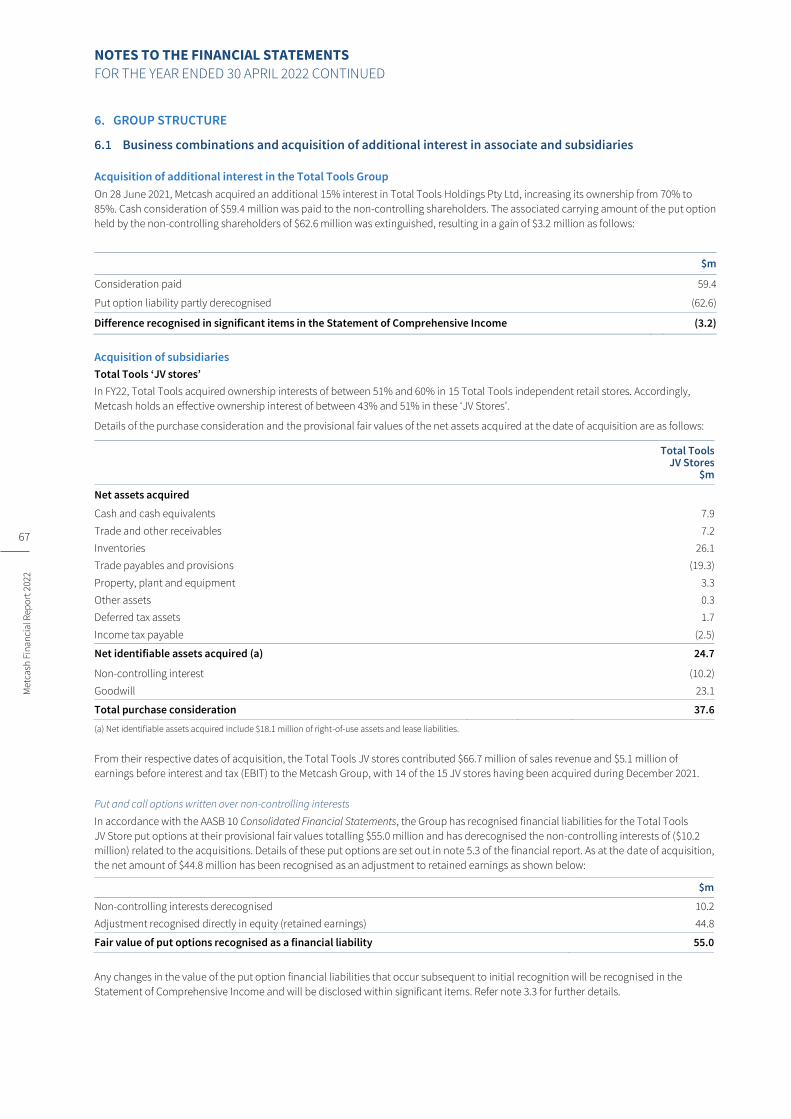
NOTES TO THE FINANCIAL STATEMENTS
FOR THE YEAR ENDED 30 APRIL 2022 CONTINUED
67
Met
cash
Fin
anci
al R
epo
rt 2
022
GROUP STRUCTURE
Business combinations and acquisition of additional interest in associate and subsidiaries
Acquisition of additional interest in the Total Tools Group
On 28 June 2021, Metcash acquired an additional 15% interest in Total Tools Holdings Pty Ltd, increasing its ownership from 70% to
85%. Cash consideration of $59.4 million was paid to the non-controlling shareholders. The associated carrying amount of the put option
held by the non-controlling shareholders of $62.6 million was extinguished, resulting in a gain of $3.2 million as follows:
$m
Consideration paid 59.4
Put option liability partly derecognised (62.6)
Difference recognised in significant items in the Statement of Comprehensive Income (3.2)
Acquisition of subsidiaries
Total Tools ‘JV stores’
In FY22, Total Tools acquired ownership interests of between 51% and 60% in 15 Total Tools independent retail stores. Accordingly,
Metcash holds an effective ownership interest of between 43% and 51% in these ‘JV Stores’.
Details of the purchase consideration and the provisional fair values of the net assets acquired at the date of acquisition are as follows:
Total Tools JV Stores
$m
Net assets acquired
Cash and cash equivalents 7.9
Trade and other receivables 7.2
Inventories 26.1
Trade payables and provisions (19.3)
Property, plant and equipment 3.3
Other assets 0.3
Deferred tax assets 1.7
Income tax payable (2.5)
Net identifiable assets acquired (a) 24.7
Non-controlling interest (10.2)
Goodwill 23.1
Total purchase consideration 37.6
(a) Net identifiable assets acquired include $18.1 million of right-of-use assets and lease liabilities.
From their respective dates of acquisition, the Total Tools JV stores contributed $66.7 million of sales revenue and $5.1 million of
earnings before interest and tax (EBIT) to the Metcash Group, with 14 of the 15 JV stores having been acquired during December 2021.
Put and call options written over non-controlling interests
In accordance with the AASB 10 Consolidated Financial Statements, the Group has recognised financial liabilities for the Total Tools
JV Store put options at their provisional fair values totalling $55.0 million and has derecognised the non-controlling interests of ($10.2
million) related to the acquisitions. Details of these put options are set out in note 5.3 of the financial report. As at the date of acquisition,
the net amount of $44.8 million has been recognised as an adjustment to retained earnings as shown below:
$m
Non-controlling interests derecognised 10.2
Adjustment recognised directly in equity (retained earnings) 44.8
Fair value of put options recognised as a financial liability 55.0
Any changes in the value of the put option financial liabilities that occur subsequent to initial recognition will be recognised in the
Statement of Comprehensive Income and will be disclosed within significant items. Refer note 3.3 for further details.
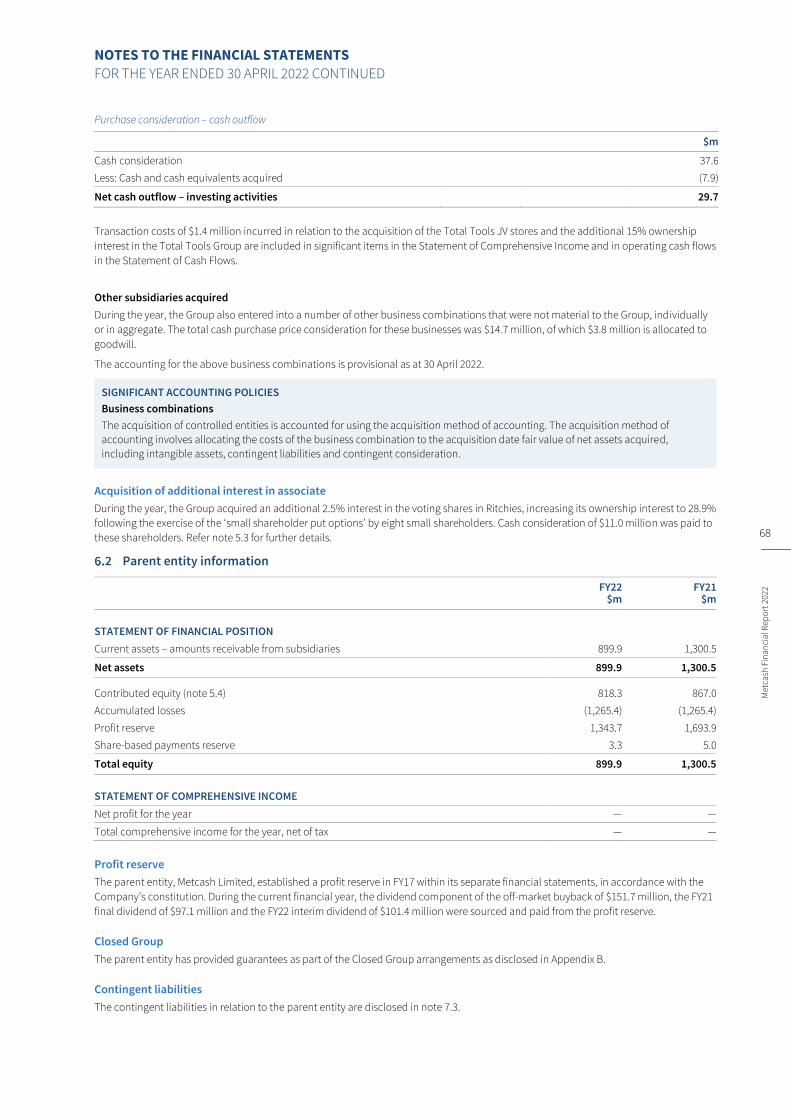
NOTES TO THE FINANCIAL STATEMENTS
FOR THE YEAR ENDED 30 APRIL 2022 CONTINUED
68
Met
cash
Fin
anci
al R
epo
rt 2
022
Met
cash
Fin
anci
al R
epo
rt 2
022
Met
cash
Fin
anci
al R
epo
rt 2
022
Purchase consideration – cash outflow
$m
Cash consideration 37.6
Less: Cash and cash equivalents acquired (7.9)
Net cash outflow – investing activities 29.7
Transaction costs of $1.4 million incurred in relation to the acquisition of the Total Tools JV stores and the additional 15% ownership
interest in the Total Tools Group are included in significant items in the Statement of Comprehensive Income and in operating cash flows
in the Statement of Cash Flows.
Other subsidiaries acquired
During the year, the Group also entered into a number of other business combinations that were not material to the Group, individually
or in aggregate. The total cash purchase price consideration for these businesses was $14.7 million, of which $3.8 million is allocated to
goodwill.
The accounting for the above business combinations is provisional as at 30 April 2022.
SIGNIFICANT ACCOUNTING POLICIES
Business combinations
The acquisition of controlled entities is accounted for using the acquisition method of accounting. The acquisition method of
accounting involves allocating the costs of the business combination to the acquisition date fair value of net assets acquired,
including intangible assets, contingent liabilities and contingent consideration.
Acquisition of additional interest in associate
During the year, the Group acquired an additional 2.5% interest in the voting shares in Ritchies, increasing its ownership interest to 28.9%
following the exercise of the ‘small shareholder put options’ by eight small shareholders. Cash consideration of $11.0 million was paid to
these shareholders. Refer note 5.3 for further details.
Parent entity information
FY22
$m FY21
$m
STATEMENT OF FINANCIAL POSITION
Current assets – amounts receivable from subsidiaries 899.9 1,300.5
Net assets 899.9 1,300.5
Contributed equity (note 5.4) 818.3 867.0
Accumulated losses (1,265.4) (1,265.4)
Profit reserve 1,343.7 1,693.9
Share-based payments reserve 3.3 5.0
Total equity 899.9 1,300.5
STATEMENT OF COMPREHENSIVE INCOME
Net profit for the year — —
Total comprehensive income for the year, net of tax — —
Profit reserve
The parent entity, Metcash Limited, established a profit reserve in FY17 within its separate financial statements, in accordance with the
Company’s constitution. During the current financial year, the dividend component of the off-market buyback of $151.7 million, the FY21
final dividend of $97.1 million and the FY22 interim dividend of $101.4 million were sourced and paid from the profit reserve.
Closed Group
The parent entity has provided guarantees as part of the Closed Group arrangements as disclosed in Appendix B.
Contingent liabilities
The contingent liabilities in relation to the parent entity are disclosed in note 7.3.

NOTES TO THE FINANCIAL STATEMENTS
FOR THE YEAR ENDED 30 APRIL 2022 CONTINUED
69
Met
cash
Fin
anci
al R
epo
rt 2
022
Related party disclosures
A list of the Group’s subsidiaries is included in Appendix B and a list of equity-accounted investments is included in Appendix C.
Material transactions and balances with related parties – Group
FY22
$ FY21
$
TRANSACTIONS WITH RELATED PARTIES – EQUITY-ACCOUNTED INVESTMENTS
Sales revenue 1,332,521,928 1,318,698,814
Lease and other charges 996,955 1,217,712
Dividends received 9,827,925 6,048,119
Interest income from lease receivables 2,451,681 2,479,047
BALANCES WITH RELATED PARTIES – EQUITY-ACCOUNTED INVESTMENTS
Trade receivables – gross 110,084,284 121,262,314
Provision for impairment loss — (148,148)
110,084,284 121,114,166
Lease receivables – gross 48,694,583 52,661,428
Provision for impairment loss — —
48,694,583 52,661,428
Parent entity
Details of the parent entity are set out in note 6.2.
Compensation of key management personnel of the Group
FY22
$ FY21
$
Short-term 12,062,190 11,976,242
Long-term 246,519 315,344
Post-employment 198,161 172,528
Share-based payments 3,180,421 2,999,209
15,687,291 15,463,323
Other transactions with key management personnel
− Mr Rob Murray is a director of Southern Cross Media Group Limited and Advisory Chairman of Hawkes Brewing Company.
− Ms Helen Nash is a director of Inghams Group Limited and Southern Cross Media Group Limited.
− Mr Peter Birtles is a director of GWA Group Limited.
− Ms Christine Holman is a director of CSR Limited, McGrath Foundation and Collins Food Group Pty Ltd.
− Ms Margaret Haseltine is a director of Real Pet Food Company Pty Ltd.
Metcash has business relationships with the above entities, including supply and purchase of trading goods and services. All transactions
with the above entities are conducted on an arm’s length basis in the ordinary course of business.

NOTES TO THE FINANCIAL STATEMENTS
FOR THE YEAR ENDED 30 APRIL 2022 CONTINUED
70
Met
cash
Fin
anci
al R
epo
rt 2
022
Met
cash
Fin
anci
al R
epo
rt 2
022
Met
cash
Fin
anci
al R
epo
rt 2
022
OTHER DISCLOSURES
Share-based payments
Description of share-based payment arrangements
In FY22, the Group had the following share-based incentive schemes for employees:
Scheme name Description
SHORT-TERM INCENTIVES (STI SCHEMES)
FY22 at-risk STI plan
– deferred component The FY22 at-risk STI plan included a 33% (Group CEO) and 25% (other KMP and senior executives)
deferred component which will be released through the issue of performance rights conditional upon
the executives remaining employed by the Company until 15 April 2023.
FY21 at-risk STI plan
– deferred component The FY21 at-risk STI plan included a 33% (Group CEO) and 25% (other KMP and senior executives)
deferred component which was released through the issue of performance rights to executives who
remained employed by the Company until 15 April 2022.
LONG-TERM INCENTIVES (LTI SCHEMES)
FY22-FY24 LTI grant This grant was issued to KMP and senior executives during FY22 and is subject to two performance
conditions: Return on Funds Employed (‘ROFE’) and Total Shareholder Returns (‘TSR’) over a three-year
period from 1 May 2021 to 30 April 2024.
FY21-FY23 LTI grant This grant was issued to KMP and senior executives during FY21 and is subject to two performance
conditions: Return on Funds Employed (‘ROFE’) and Total Shareholder Returns (‘TSR’) over a three-year
period from 1 May 2020 to 30 April 2023.
FY20-FY22 LTI grant This grant was issued to KMP and senior executives during FY20 and is subject to two performance
conditions: Return on Funds Employed (‘ROFE’) and Total Shareholder Returns (‘TSR’) over a three-year
period from 1 May 2019 to 30 April 2022.
FY22 Group CEO buy-out grant This grant was issued to the Group CEO during FY22 and is subject to two performance conditions:
Service condition and a forecast achievement of a minimum Group underlying EBIT hurdle over two
annual performance periods that are measured between 1 February 2022 and 31 January 2024. The
EBIT hurdles align to the Group’s annual budget and STI metrics. In addition, the Group CEO’s ongoing
performance and behaviours must be deemed as acceptable over each performance period by the
Board.
FY22 CEO Food retention LTI grant
This grant was issued to the CEO Food during FY22 and is subject to two performance conditions:
Service condition and a forecast achievement of a minimum Food underlying EBIT hurdle over three
annual performance periods that are measured between 1 October 2021 and 30 September 2024. The
EBIT hurdles align to the Food pillar’s annual budget and STI metrics. In addition, the CEO Food’s
ongoing performance and behaviours must be deemed as acceptable over each performance period by
the Board.
Project Horizon LTI plan
This grant was issued to employees dedicated to Project Horizon during FY22 and is subject to two
performance conditions: Service condition and performance conditions such as quality and timing of
the deliverables, cost of the program and value of the benefits realised.
The STI schemes (deferred component) and LTI schemes are also subject to service conditions, usually from grant date to the date of the
allocation of shares.
The FY20-FY22 LTI is expected to vest at 100%. These vested performance rights will be converted to shares and allocated to the
participants under the rights plan on 15 August 2022.
As foreshadowed in FY21, the FY19-FY21 LTI plan partially vested on 15 August 2021 at 90% which was equivalent to 1,686,728
performance rights. Each performance right entitled the participant to one Metcash share. Metcash acquired 1,374,136 shares on market
and allocated these to the participants on 15 August 2021. The balance relating to good leavers was settled in cash.

NOTES TO THE FINANCIAL STATEMENTS
FOR THE YEAR ENDED 30 APRIL 2022 CONTINUED
71
Met
cash
Fin
anci
al R
epo
rt 2
022
Measurement of fair values
FY22 at-risk STI plan – deferred component
The 33% (Group CEO) and 25% (other KMP and senior executives) components of the FY22 at-risk STI plan will be deferred and released
through the issue of Metcash performance rights conditional upon the executive remaining employed by the Company until 15 April
2023. The number of performance rights will be calculated by dividing 33% (Group CEO) and 25% (other KMP and senior executives)
of the STI award dollar value by the volume-weighted average price (VWAP) of Metcash ordinary shares over the 20 trading days ended
30 April 2022 of $4.65 per share. The FY22 expense for the FY22 at-risk STI plan – deferred component has been based on an estimate of
the fair value of the performance rights. The fair value per grant will be determined in accordance with AASB 2 Share-based payments at
grant date.
FY21 at-risk STI plan – deferred component
The 33% (Group CEO) and 25% (other KMP and senior executives) components of the FY21 at-risk STI plan was deferred and released
through the issue of Metcash performance rights conditional upon the executive remaining employed by the Company until 15 April
2022. The number of performance rights was calculated by dividing 33% (Group CEO) and 25% (other KMP and senior executives) of the
STI award dollar value by the volume-weighted average price (VWAP) of Metcash ordinary shares over the 20 trading days ended 30 April
2021 of $3.74 per share. The fair value per grant was determined in accordance with AASB 2 Share-based payments at grant date.
Performance rights
The weighted average inputs to the valuation of the STI deferred component and LTI performance rights valued at grant date using the
Black-Scholes option pricing model are as follows:
At-risk STI deferred
FY21
LTI FY22–FY24
(ROFE)
LTI FY21–FY23
(ROFE)
LTI FY20–FY22
(ROFE)
FY22 Group CEO buy-out
grant
FY22 CEO Food retention LTI grant
Project Horizon LTI plan
Dividend yield 4.5% 4.5% 4.2% 4.8% 4.5% 4.5% 4.5%
Risk free rate 0.1% 0.1% 0.1% 1.0% 0.1% 0.1% 0.1%
Expected volatility 35% 35% 37% 31% 35% 35% 35%
Days to vesting 274 1,095 895 1,121 546 357 1,094
Share price at grant date 3.97 3.98 3.62 2.81 4.01 4.00 3.92
Fair value at grant date 3.73 3.44 3.28 2.66 3.89 3.62 3.44
The weighted average inputs to the valuation of performance rights valued at grant date by an external specialist using the Monte Carlo
option pricing model are as follows:
LTI FY22–FY24
(TSR)
LTI FY21–FY23
(TSR)
LTI FY20–FY22
(TSR)
Dividend yield 4.5% 4.2% 4.8%
Risk free rate 0.1% 0.1% 1.0%
Expected volatility 35% 37% 31%
Days to vesting 1,095 895 1,121
Share price at grant date 3.98 3.62 2.81
Fair value at grant date 1.74 2.30 1.23
Service and non-market performance conditions attached to the grants were not taken into account in measuring fair value. Market
performance conditions associated with the grants have been reflected in the fair value measurement. Expected volatility is based on an
evaluation of the historical volatility of Metcash’s share price, particularly over the historical period commensurate with the expected
term. Performance rights are only exercisable on their vesting date.

NOTES TO THE FINANCIAL STATEMENTS
FOR THE YEAR ENDED 30 APRIL 2022 CONTINUED
72
Met
cash
Fin
anci
al R
epo
rt 2
022
Met
cash
Fin
anci
al R
epo
rt 2
022
Met
cash
Fin
anci
al R
epo
rt 2
022
SIGNIFICANT ACCOUNTING POLICIES
Share-based payment transactions The Group provides a portion of senior executive and key employee remuneration as equity-settled share-based payments, in the
form of performance rights.
The value of the performance rights issued is determined on the date which both the employee and the Group understand and agree
to the share-based payment terms and conditions (grant date). The value at grant date is based upon the fair value of a similar
arrangement between the Group and an independent third party and is determined using an appropriate valuation model. The fair
value does not consider the impact of service or performance conditions, other than conditions linked to the share price of Metcash
Limited (market conditions).
The fair value of performance rights is recognised as an expense, together with a corresponding increase in the share-based
payments reserve within equity, over the period between the grant date and the date on which the employee becomes fully entitled
to the award (vesting date). This expense is recognised cumulatively by estimating the number of performance rights expected to
vest. This estimate is formed based on the best available information at the reporting date. No adjustment is made for the likelihood
of market conditions being met as the effect of these conditions is included in the determination of fair value at grant date. Where the
performance rights are cancelled, any expense not yet recognised for the award is recognised immediately.
The dilutive effect, if any, of outstanding performance rights are reflected as additional share dilution in the computation of earnings
per share.
Reconciliation of outstanding performance rights
The following table illustrates the movement in the number of performance rights during the year:
FY22
Number FY21
Number
Outstanding at the beginning of the year 6,496,163 6,370,539
Granted during the year 4,349,521 3,022,580
Vested/exercised during the year (2,347,360) (2,098,672)
Expired/forfeited during the year (888,234) (798,284)
Outstanding at the end of the year 7,609,890 6,496,163
The outstanding balance of performance rights as at 30 April 2022 is represented by:
Scheme name Vesting date Total outstanding
(number) Exercisable
(number) Remaining
contractual life
LTI FY22 – FY24 15 August 2024 2,143,700 — 2 years 4 months
LTI FY21 – FY23 15 August 2023 2,590,366 — 1 year 4 months
LTI FY20 – FY221 15 August 2022 2,004,471 — 4 months
FY22 Group CEO buy-out grant
As soon as practicable2 320,856 — 9 months to 1 year and 9 months
FY22 CEO Food retention LTI grant
As soon as practicable3 267,380 — 5 months to 2 years and 5 months
Project Horizon LTI plan 15 August 2024 251,031 — 2 years 4 months
Others 15 August 2022 32,086 — 4 months
Total outstanding at the reporting date 7,609,890
1. The FY20-FY22 LTI performance rights plan is expected to vest on 15 August 2022 at 100% subject only to the employees remaining in employment until 15
August 2022. These vested performance rights will be converted to shares and allocated to the participants under the Rights Plan on 15 August 2022.
2. This LTI comprises two tranches which will be tested independently and will vest as soon as is practicable after 31 January 2023 and 31 January 2024
respectively, following Board review and approval.
3. This LTI comprises three tranches which will be tested independently and will vest as soon as is practicable after 30 September 2022, 30 September 2023 and 30
September 2024 respectively, following Board review and approval.
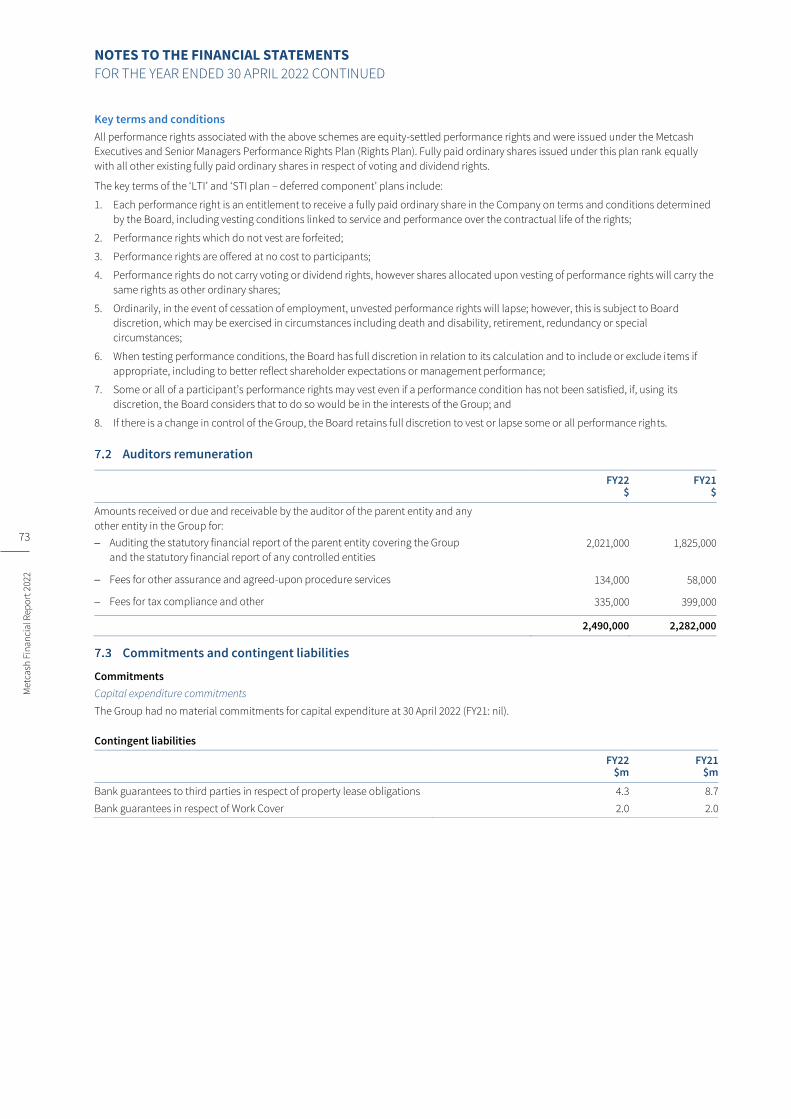
NOTES TO THE FINANCIAL STATEMENTS
FOR THE YEAR ENDED 30 APRIL 2022 CONTINUED
73
Met
cash
Fin
anci
al R
epo
rt 2
022
Key terms and conditions
All performance rights associated with the above schemes are equity-settled performance rights and were issued under the Metcash
Executives and Senior Managers Performance Rights Plan (Rights Plan). Fully paid ordinary shares issued under this plan rank equally
with all other existing fully paid ordinary shares in respect of voting and dividend rights.
The key terms of the ‘LTI’ and ‘STI plan – deferred component’ plans include:
1. Each performance right is an entitlement to receive a fully paid ordinary share in the Company on terms and conditions determined
by the Board, including vesting conditions linked to service and performance over the contractual life of the rights;
2. Performance rights which do not vest are forfeited;
3. Performance rights are offered at no cost to participants;
4. Performance rights do not carry voting or dividend rights, however shares allocated upon vesting of performance rights will carry the
same rights as other ordinary shares;
5. Ordinarily, in the event of cessation of employment, unvested performance rights will lapse; however, this is subject to Board
discretion, which may be exercised in circumstances including death and disability, retirement, redundancy or special
circumstances;
6. When testing performance conditions, the Board has full discretion in relation to its calculation and to include or exclude items if
appropriate, including to better reflect shareholder expectations or management performance;
7. Some or all of a participant’s performance rights may vest even if a performance condition has not been satisfied, if, using its
discretion, the Board considers that to do so would be in the interests of the Group; and
8. If there is a change in control of the Group, the Board retains full discretion to vest or lapse some or all performance rights.
Auditors remuneration
FY22 $
FY21 $
Amounts received or due and receivable by the auditor of the parent entity and any
other entity in the Group for:
− Auditing the statutory financial report of the parent entity covering the Group
and the statutory financial report of any controlled entities
2,021,000 1,825,000
− Fees for other assurance and agreed-upon procedure services 134,000 58,000
− Fees for tax compliance and other 335,000 399,000
2,490,000 2,282,000
Commitments and contingent liabilities
Commitments
Capital expenditure commitments
The Group had no material commitments for capital expenditure at 30 April 2022 (FY21: nil).
Contingent liabilities
FY22 $m
FY21 $m
Bank guarantees to third parties in respect of property lease obligations 4.3 8.7
Bank guarantees in respect of Work Cover 2.0 2.0
NOTES TO THE FINANCIAL STATEMENTS
FOR THE YEAR ENDED 30 APRIL 2022 CONTINUED
74
Met
cash
Fin
anci
al R
epo
rt 2
022
Met
cash
Fin
anci
al R
epo
rt 2
022
Met
cash
Fin
anci
al R
epo
rt 2
022
Financial guarantee contracts
The Group has granted a financial guarantee contract relating to the bank loan of a joint venture, Adcome Pty Ltd. Under the contract,
the bank has the right to require Metcash to repay the debt under certain prescribed circumstances of default. The estimate of the
maximum amount payable in respect of the guarantee, if exercised, is $40.0 million (FY21: $37.2 million).
Had the guarantee been exercised at 30 April 2022, the amount payable would have been $31.2 million (FY21: $35.2 million). The fair
value of the financial guarantee contract at the reporting date was $1.4 million (FY21: $0.4 million) and is recognised as a financial
liability.
Put options
Put options, including in relation to Ritchies Stores Pty Ltd, are detailed along with other contingent liabilities in note 5.3 of the
financial statements.
Subsequent events
In May 2022, Metcash announced that it entered into an agreement with Australian United Retailers Limited (AUR) to supply its national
network of supermarkets and convenience stores, including its FoodWorks bannered supermarkets, for a further five-year period,
commencing 1 July 2022. In addition, the Group also announced that it extended the term of its agreement to supply Drakes
Supermarkets stores in Queensland for a further five years, up to 3 June 2029.
On 27 June 2022, Metcash announced that it has signed a long-term lease agreement with the Goodman Group for the construction and
leasing of a new ‘best in class’ wholesale Distribution Centre (DC) at Truganina, Victoria. The new ~115,000m² DC, which will replace
Metcash’s existing ~90,000m² DC at Laverton, is expected to help further improve the competitiveness of our independent retailers in
Victoria through delivery of greater efficiencies and by providing access to a wider range of products. It is also expected to benefit local
suppliers by providing an efficient route to market through access to Metcash’s extensive distribution network. Construction of the DC is
scheduled to commence in the first half of FY23, with completion expected mid-2024.
Other than matters disclosed in this report, there were no events that have occurred after the end of the financial year that would
materially affect the reported results or would require disclosure in this report.

NOTES TO THE FINANCIAL STATEMENTS
FOR THE YEAR ENDED 30 APRIL 2022 CONTINUED
75
Met
cash
Fin
anci
al R
epo
rt 2
022
APPENDIX A – NEW OR AMENDED ACCOUNTING STANDARDS AND INTERPRETATIONS
(a) New or amended Accounting Standards and Interpretations
Several other amendments and interpretations apply for the first time in FY22, but do not have an impact on the financial report of the
Group. These are as follows:
− AASB 2019-3 Amendments to AASB 7, AASB 9 and AASB 139 Interest Rate Benchmark Reform on Hedge Accounting
− AASB 2021-3 Amendments to AASs – COVID-19-Related Rent Concessions beyond 30 June 2021
(b) Australian Accounting Standards issued but not yet effective
A number of new accounting standards (including amendments and interpretations) have been issued but were not effective as at
30 April 2022. The following are the pronouncements that the Group has elected not to early adopt in these financial statements:
− Amendments to AASB 101: Classification of Liabilities as Current or Non-current
− Amendments to AASB 3: Reference to Conceptual Framework
− Amendments to AASB 9: Fees in the ’10 per cent’ test for derecognition of financial liabilities
− Amendments to AASB 108: Definition of Accounting Estimates
− Amendments to AASB 1 and AASB Practice Statement 2: Disclosure of Accounting Policies
− Amendments to AASB 116: Property, Plant and Equipment: Proceeds before Intended Use
− Amendments to AASB 137: Onerous Contracts – Costs of Fulfilling a Contract
The above standards are not expected to have a significant impact on the Group’s financial statements in the year of their initial
application.
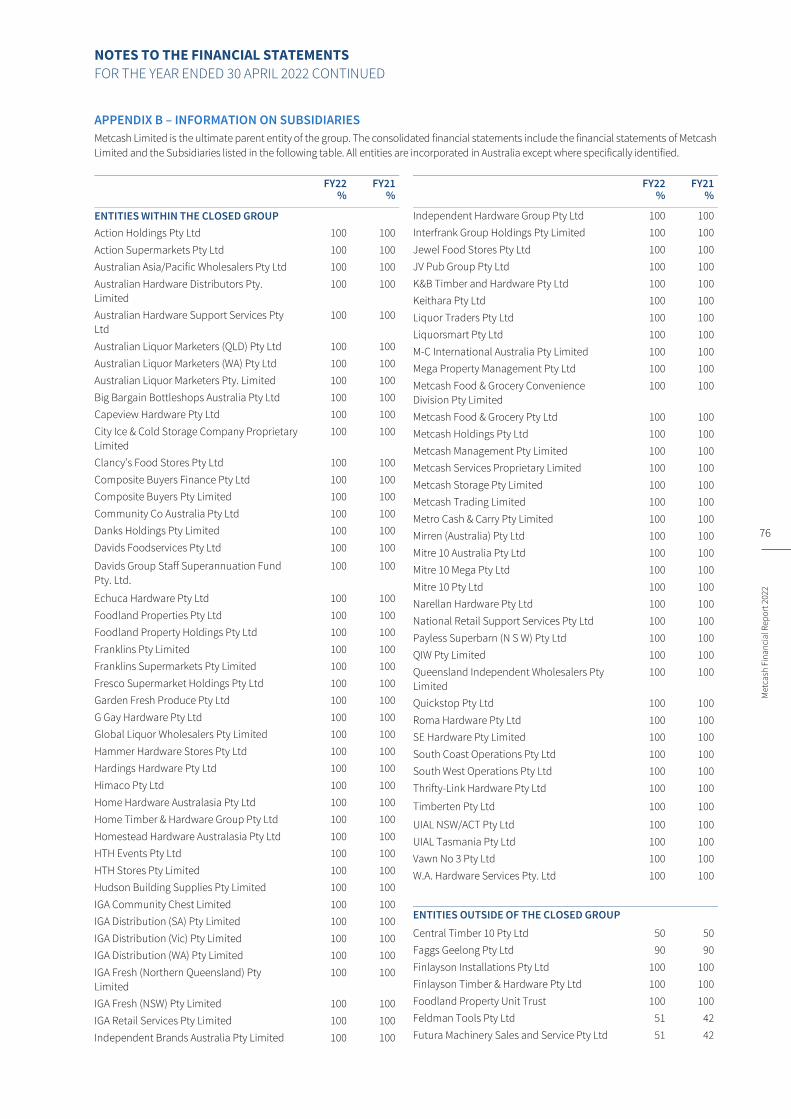
NOTES TO THE FINANCIAL STATEMENTS
FOR THE YEAR ENDED 30 APRIL 2022 CONTINUED
76
Met
cash
Fin
anci
al R
epo
rt 2
022
Met
cash
Fin
anci
al R
epo
rt 2
022
Met
cash
Fin
anci
al R
epo
rt 2
022
APPENDIX B – INFORMATION ON SUBSIDIARIES
Metcash Limited is the ultimate parent entity of the group. The consolidated financial statements include the financial statements of Metcash
Limited and the Subsidiaries listed in the following table. All entities are incorporated in Australia except where specifically identified.
FY22
% FY21
%
ENTITIES WITHIN THE CLOSED GROUP
Action Holdings Pty Ltd 100 100
Action Supermarkets Pty Ltd 100 100
Australian Asia/Pacific Wholesalers Pty Ltd 100 100
Australian Hardware Distributors Pty.
Limited
100 100
Australian Hardware Support Services Pty
Ltd
100 100
Australian Liquor Marketers (QLD) Pty Ltd 100 100
Australian Liquor Marketers (WA) Pty Ltd 100 100
Australian Liquor Marketers Pty. Limited 100 100
Big Bargain Bottleshops Australia Pty Ltd 100 100
Capeview Hardware Pty Ltd 100 100
City Ice & Cold Storage Company Proprietary
Limited
100 100
Clancy’s Food Stores Pty Ltd 100 100
Composite Buyers Finance Pty Ltd 100 100
Composite Buyers Pty Limited 100 100
Community Co Australia Pty Ltd 100 100
Danks Holdings Pty Limited 100 100
Davids Foodservices Pty Ltd 100 100
Davids Group Staff Superannuation Fund
Pty. Ltd.
100 100
Echuca Hardware Pty Ltd 100 100
Foodland Properties Pty Ltd 100 100
Foodland Property Holdings Pty Ltd 100 100
Franklins Pty Limited 100 100
Franklins Supermarkets Pty Limited 100 100
Fresco Supermarket Holdings Pty Ltd 100 100
Garden Fresh Produce Pty Ltd 100 100
G Gay Hardware Pty Ltd 100 100
Global Liquor Wholesalers Pty Limited 100 100
Hammer Hardware Stores Pty Ltd 100 100
Hardings Hardware Pty Ltd 100 100
Himaco Pty Ltd 100 100
Home Hardware Australasia Pty Ltd 100 100
Home Timber & Hardware Group Pty Ltd 100 100
Homestead Hardware Australasia Pty Ltd 100 100
HTH Events Pty Ltd 100 100
HTH Stores Pty Limited 100 100
Hudson Building Supplies Pty Limited 100 100
IGA Community Chest Limited 100 100
IGA Distribution (SA) Pty Limited 100 100
IGA Distribution (Vic) Pty Limited 100 100
IGA Distribution (WA) Pty Limited 100 100
IGA Fresh (Northern Queensland) Pty
Limited
100 100
IGA Fresh (NSW) Pty Limited 100 100
IGA Retail Services Pty Limited 100 100
Independent Brands Australia Pty Limited 100 100
FY22
% FY21
%
Independent Hardware Group Pty Ltd 100 100
Interfrank Group Holdings Pty Limited 100 100
Jewel Food Stores Pty Ltd 100 100
JV Pub Group Pty Ltd 100 100
K&B Timber and Hardware Pty Ltd 100 100
Keithara Pty Ltd 100 100
Liquor Traders Pty Ltd 100 100
Liquorsmart Pty Ltd 100 100
M-C International Australia Pty Limited 100 100
Mega Property Management Pty Ltd 100 100
Metcash Food & Grocery Convenience
Division Pty Limited
100 100
Metcash Food & Grocery Pty Ltd 100 100
Metcash Holdings Pty Ltd 100 100
Metcash Management Pty Limited 100 100
Metcash Services Proprietary Limited 100 100
Metcash Storage Pty Limited 100 100
Metcash Trading Limited 100 100
Metro Cash & Carry Pty Limited 100 100
Mirren (Australia) Pty Ltd 100 100
Mitre 10 Australia Pty Ltd 100 100
Mitre 10 Mega Pty Ltd 100 100
Mitre 10 Pty Ltd 100 100
Narellan Hardware Pty Ltd 100 100
National Retail Support Services Pty Ltd 100 100
Payless Superbarn (N S W) Pty Ltd 100 100
QIW Pty Limited 100 100
Queensland Independent Wholesalers Pty
Limited
100 100
Quickstop Pty Ltd 100 100
Roma Hardware Pty Ltd 100 100
SE Hardware Pty Limited 100 100
South Coast Operations Pty Ltd 100 100
South West Operations Pty Ltd 100 100
Thrifty-Link Hardware Pty Ltd 100 100
Timberten Pty Ltd 100 100
UIAL NSW/ACT Pty Ltd 100 100
UIAL Tasmania Pty Ltd 100 100
Vawn No 3 Pty Ltd 100 100
W.A. Hardware Services Pty. Ltd 100 100
ENTITIES OUTSIDE OF THE CLOSED GROUP
Central Timber 10 Pty Ltd 50 50
Faggs Geelong Pty Ltd 90 90
Finlayson Installations Pty Ltd 100 100
Finlayson Timber & Hardware Pty Ltd 100 100
Foodland Property Unit Trust 100 100
Feldman Tools Pty Ltd 51 42
Futura Machinery Sales and Service Pty Ltd 51 42

NOTES TO THE FINANCIAL STATEMENTS
FOR THE YEAR ENDED 30 APRIL 2022 CONTINUED
77
Met
cash
Fin
anci
al R
epo
rt 2
022
FY22
% FY21
%
Gympie Property Investment Pty Ltd 84.7 84.7
Hardware Property Trust 100 100
IGA Retail Network Limited 50 50
Metoz Holding Limited (incorporated in
South Africa) (In liquidation)
100 100
Mitre 10 Mega Property Trust 100 100
Napier Liquor Merchants Limited
(incorporated in New Zealand)
100 -
NFRF Developments Pty Ltd 51 51
Northern Hardware Group Pty Ltd 84.7 84.7
Nu Fruit Pty. Ltd. 51 51
Produce Traders Trust 100 100
Rainbow Unit Trust 100 100
Rainfresh Vic Pty Ltd 51 51
Retail Merchandise Services Pty Limited 100 100
Sunshine Hardware Pty Ltd 84.7 84.7
Tasman Liquor Company Limited
(incorporated in New Zealand)
100 100
Tasmania Hardware Pty Ltd 80 80
Timber and Hardware Exchange Pty Ltd 68.4 68.4
Total Tools (Importing) Pty Ltd 85 70
Total Tools Commercial Pty Ltd 85 70
Total Tools Holdings Pty Ltd 85 70
Total Tools Industrial Pty. Limited 85 70
Total Tools Licensing Pty Ltd 85 70
Total Tools Moorabbin Store Pty Ltd 85 70
Total Tools New Zealand Limited 85 70
Total Tools Online Pty Ltd 85 70
Total Tools Stores Pty Ltd 85 70
FY22
% FY21
%
TT Brookvale Pty Ltd 85 70
Total Tools Fyshwick Pty Ltd1 43.4 35.7
Toolshack Pty Ltd1 43.4 35.7
TT Brooklyn Pty Ltd1 43.4 35.7
TT Darwin Pty Ltd1 43.4 35.7
TT Geelong Pty Ltd1 43.4 35.7
TT Melton Pty Ltd1 43.4 35.7
TT South Melbourne Pty Ltd1 43.4 35.7
TT Adelaide West Pty Ltd 51 42
TT Mackay Pty Ltd 51 42
TT Albury Pty Ltd1 43.4 —
Total Tools Wagga Wagga Pty Ltd1 43.4 —
TT Traralgon Pty Ltd 51 —
TT Ferntree Gully Pty Ltd 51 —
TT Kilsyth Pty Ltd 51 —
TT Dandenong Pty Ltd 51 —
TT Narre Warren Pty Ltd 51 —
TT Mitcham Pty Ltd 51 —
MOTS Support Services Pty Ltd 85 —
Phar Management Pty Ltd1 43.4 —
Alltools (Pakenham) Pty Ltd 51 —
Four Of Six Pty Ltd 51 —
Midland Tools Pty Ltd 51 —
Virginia Tools Pty Ltd 51 —
Cado Tools Pty Ltd 51 —
Total Tools Preston Pty Ltd 51 —
Wimbledon Unit Trust 100 100
1. The Group has an indirect ownership of 43.4% in these entities via its interest in Total Tools Holdings Pty Ltd. While the Group has beneficial ownership of less
than 50% of these entities, the Group has control over key operating and financial decisions in these entities. Accordingly, these entities are accounted for as
controlled entities.
Entities within the closed group as at 30 April 2022
Certain controlled entities of Metcash Limited, collectively referred to as the ‘Closed Group’, are party to a Deed of Cross Guarantee
which meets the requirements of ASIC Corporations (Wholly-owned Companies) Instrument 2016/785 (Instrument). Pursuant to the
Instrument, entities within the Closed Group that have lodged an opt-in notice with ASIC within the requisite time limits are granted relief
from standalone financial reporting and audit requirements of the Corporations Act 2001. Under the Deed of Cross Guarantee, the entities
within the Closed Group, including Metcash Limited, have guaranteed to pay any outstanding debts or claims in the event of a winding
up of any other entity within the Closed Group.

NOTES TO THE FINANCIAL STATEMENTS
FOR THE YEAR ENDED 30 APRIL 2022 CONTINUED
78
Met
cash
Fin
anci
al R
epo
rt 2
022
Met
cash
Fin
anci
al R
epo
rt 2
022
Met
cash
Fin
anci
al R
epo
rt 2
022
Summary Statement of Comprehensive Income of the Closed Group
FY22 $m
FY21 $m
Distributions from subsidiaries outside the Closed Group 10.6 4.6
Other net income 322.9 302.7
Significant items (53.8) (17.0)
Profit before income tax 279.7 290.3
Income tax expense (85.6) (88.6)
Net profit for the year 194.1 201.7
Summary Statement of Financial Position of the Closed Group
FY22
$m FY21
$m
ASSETS Cash and cash equivalents 46.7 76.7
Trade receivables and loans 1,643.0 1,519.3 Lease receivables 40.3 41.1 Amounts due from related parties 13.1 —
Inventories 947.5 874.7 Other current assets 8.0 12.0
Total current assets 2,698.6 2,523.8
Investments 325.1 318.1 Lease receivables 232.2 236.8
Property, plant and equipment 193.7 191.3 Net deferred tax assets 124.3 114.5 Intangible assets and goodwill 604.8 562.1
Right-of-use assets 531.5 551.2 Other non-current assets 18.2 15.7
Total non-current assets 2,029.8 1,989.7
Total assets 4,728.4 4,513.5
LIABILITIES Trade and other payables 2,146.2 1,940.5 Lease liabilities 128.0 129.9
Interest-bearing borrowings 45.0 — Income tax payable 25.5 22.3 Provisions 134.4 126.7
Put options and other financial liabilities 21.7 20.8
Total current liabilities 2,500.8 2,240.2
Interest-bearing borrowings 248.7 —
Lease liabilities 812.4 831.3 Amounts due to related parties — 22.7 Provisions 39.8 41.7
Put options and other financial liabilities 80.2 124.6
Total non-current liabilities 1,181.1 1,020.3
Total liabilities 3,681.9 3,260.5
Net assets 1,046.5 1,253.0
EQUITY Contributed and other equity, opening balance 867.0 853.5 Share buyback and related costs (48.7) —
Equity raised, net of costs — 13.5
Contributed and other equity, closing balance 818.3 867.0
Retained earnings, opening balance 387.7 456.7 Net profit for the year 194.1 201.7 Dividends paid (198.5) (148.3)
Share buyback and related costs (151.7) — Recognition of put option liability — (113.4) Share of associate’s adjustment on initial adoption of AASB 16 Leases — (9.0)
Retained earnings, closing balance 231.6 387.7
Other reserves (3.4) (1.7)
Total equity 1,046.5 1,253.0

NOTES TO THE FINANCIAL STATEMENTS
FOR THE YEAR ENDED 30 APRIL 2022 CONTINUED
79
Met
cash
Fin
anci
al R
epo
rt 2
022
APPENDIX C – EQUITY-ACCOUNTED INVESTMENTS
Equity-accounted investments of the Group represent both associates and joint ventures and are structured through equity participation
in separate legal entities. Metcash invests capital to support the independent retail network, strengthen relationships and fund growth.
Relationships with co-investors are governed by contractual agreements which allow the Group to exercise either significant influence or
joint control over these entities. Where the Group exercises joint control, key operating decisions are agreed unanimously, regardless of
ownership interest.
The principal place of business for all of the Group’s equity-accounted investments is Australia, with the exception of Metcash Export
Services Pty Ltd, which primarily deals with customers in China.
The following table presents key information about the Group’s interests in associates and joint ventures.
Investee Principal activities Reporting date FY22
% FY21
%
ASSOCIATES
Ritchies Stores Proprietary Limited Grocery retailing 30 June 28.9 26.4
Dramet Holdings Pty Ltd Grocery retailing 30 June 26.0 26.0
Metcash Export Services Pty Ltd Grocery retailing 30 April 15.0 15.0
JOINT VENTURES
Adcome Pty Ltd Grocery retailing 30 April 45.0 45.0
BMS Retail Group Holdings Pty Ltd Grocery retailing 30 June 49.0 49.0
Waltock Pty Ltd Hardware retailing 30 June 49.0 49.0
LA United Pty Limited1 Liquor wholesaling 30 June 75.3 75.3
Liquor Alliance Proprietary Limited1 Liquor wholesaling 30 June 66.7 66.7
1. The Group has a direct ownership of 26.0% in LA United Pty Ltd, an indirect ownership of 49.3% via its interest in Liquor All iance Pty Ltd. While the Group has
beneficial ownership of more than 50% of the entity, key operating and financial decisions require the unanimous consent of other joint venture partners.
Accordingly, LA United Pty Ltd and Liquor Alliance Pty Ltd are accounted for as joint arrangements.

DIRECTORS’ DECLARATION
80
Met
cash
Fin
anci
al R
epo
rt 2
022
Met
cash
Fin
anci
al R
epo
rt 2
022
Met
cash
Fin
anci
al R
epo
rt 2
022
In accordance with a resolution of the directors of Metcash Limited, I state that:
1. In the opinion of the directors:
a. The financial statements, notes and the additional disclosures included in the directors’ report designated as audited, of
Metcash Limited are in accordance with the Corporations Act 2001, including:
i. Giving a true and fair view of the consolidated entity’s financial position as at 30 April 2022 and of its performance for the
year ended on that date; and
ii. Complying with Accounting Standards (including the Australian Accounting Interpretations) and Corporations Regulations
2001;
b. The financial statements and notes also comply with International Financial Reporting Standards as disclosed in Section 2; and
c. There are reasonable grounds to believe that the Company will be able to pay its debts as and when they become due and
payable.
2. This declaration has been made after receiving the declarations required to be made to the directors in accordance with section
295A of the Corporations Act 2001 for the financial year ended 30 April 2022.
3. In the opinion of the directors, as at the date of this declaration, there are reasonable grounds to believe that the members of the
Closed Group identified in Appendix B will be able to meet any obligation or liabilities to which they are or may become subject to,
by virtue of the Deed of Cross Guarantee.
On behalf of the Board
DOUG JONES
Director
Sydney, 27 June 2022

A member firm of Ernst & Young Global Limited Liability limited by a scheme approved under Professional Standards Legislation
81
Ernst & Young 200 George Street Sydney NSW 2000 Australia GPO Box 2646 Sydney NSW 2001
Tel: +61 2 9248 5555 Fax: +61 2 9248 5959 ey.com/au
Met
cash
Fin
anci
al R
epo
rt 2
022
Auditor’s Independence Declaration to the Directors of Metcash Limited
As lead auditor for the audit of the financial report of Metcash Limited for the financial year ended 30 April 2022, I declare to the best of my knowledge and belief, there have been:
(a) No contraventions of the auditor independence requirements of the Corporations Act 2001 in relation to the audit;
(b) No contraventions of any applicable code of professional conduct in relation to the audit; and
(c) No non-audit services provided that contravene any applicable code of professional conduct in relation to the audit
This declaration is in respect of Metcash Limited and the entities it controlled during the financial year.
Ernst & Young
CHRISTOPHER GEORGE
Partner 27 June 2022

A member firm of Ernst & Young Global Limited Liability limited by a scheme approved under Professional Standards Legislation
82
Ernst & Young 200 George Street Sydney NSW 2000 Australia GPO Box 2646 Sydney NSW 2001
Tel: +61 2 9248 5555 Fax: +61 2 9248 5959 ey.com/au
Met
cash
Fin
anci
al R
epo
rt 2
022
Met
cash
Fin
anci
al R
epo
rt 2
022
Met
cash
Fin
anci
al R
epo
rt 2
022
Independent auditor’s report to the members of Metcash Limited
Report on the audit of the Financial Report
Opinion We have audited the financial report of Metcash Limited (the Company) and its subsidiaries (collectively the Group), which comprises the consolidated statement of financial position as at 30 April 2022, the consolidated statement of comprehensive income, consolidated statement of changes in equity and consolidated statement of cash flows for the year then ended, notes to the financial statements, including a summary of significant accounting policies, and the directors’ declaration.
In our opinion, the accompanying financial report of the Group is in accordance with the Corporations Act 2001, including:
a. Giving a true and fair view of the consolidated financial position of the Group as at 30 April 2022 and of its consolidated financial performance for the year ended on that date; and
b. Complying with Australian Accounting Standards and the Corporations Regulations 2001.
Basis for opinion We conducted our audit in accordance with Australian Auditing Standards. Our responsibilities under those standards are further described in the Auditor’s responsibilities for the audit of the financial report section of our report. We are independent of the Group in accordance with the auditor independence requirements of the Corporations Act 2001 and the ethical requirements of the Accounting Professional and Ethical Standards Board’s APES 110 Code of Ethics for Professional Accountants (including Independence Standards) (the Code) that are relevant to our audit of the financial report in Australia. We have also fulfilled our other ethical responsibilities in accordance with the Code.
We believe that the audit evidence we have obtained is sufficient and appropriate to provide a basis for our opinion.
Key audit matters Key audit matters are those matters that, in our professional judgment, were of most significance in our audit of the financial report of the current year. These matters were addressed in the context of our audit of the financial report as a whole, and in forming our opinion thereon, but we do not provide a separate opinion on these matters. For each matter below, our description of how our audit addressed the matter is provided in that context.
We have fulfilled the responsibilities described in the Auditor’s responsibilities for the audit of the financial report section of our report, including in relation to these matters. Accordingly, our audit included the performance of procedures designed to respond to our assessment of the risks of material misstatement of the financial report. The results of our audit procedures, including the procedures performed to address the matters below, provide the basis for our audit opinion on the accompanying financial report.

A member firm of Ernst & Young Global Limited Liability limited by a scheme approved under Professional Standards Legislation
83
Met
cash
Fin
anci
al R
epo
rt 2
022
Impairment assessment for goodwill and other intangible assets
Why significant How our audit addressed the key audit matter
At 30 April 2022 the Group’s consolidated statement of financial position includes goodwill and other intangible assets with a carrying value $798.8 million, representing 15.4% of total assets. The Group recognised $26.9 million, in goodwill and other intangible assets arising from business acquisitions during the year.
The directors have assessed goodwill and other intangible assets for impairment. As disclosed within Note 4.7 to the financial statements, the assessment of the impairment of the Group’s goodwill and other intangible assets incorporated significant judgments and estimates, based upon conditions existing as at 30 April 2022, specifically concerning factors such as forecast cashflows, discounts rates and terminal growth rates.
The estimates and assumptions relate to the sustainability of future performance, market and economic conditions. Significant assumptions used in the impairment testing referred to above are inherently subjective.
The disclosures in the financial report provide important information about the assumptions made in the impairment testing and the market conditions at 30 April 2022.
Accordingly, we considered the impairment testing of goodwill and other intangible assets and the related disclosures in the financial report to be a key audit matter.
Our audit procedures included the following:
► Assessed the Group’s determination of the cash generating units (CGUs) used in the impairment model, based on our understanding of the nature of the Group’s business and the economic environment in which the segments operate. We also considered internal reporting of the Group’s results to assess how earnings and goodwill are monitored and reported
► Assessed the Group’s allocation of additional goodwill arising from business combinations to CGUs used in the impairment model
► Assessed the cash flow forecasts, assumptions and estimates used by the Group, as outlined in Note 4.7 to the financial statements, by considering the reliability of the Group’s historical cash flow forecasts, our knowledge of the business and corroborating data with external information where possible
► Evaluated the appropriateness of discount and terminal growth rates applied with involvement from our valuation specialists
► Tested the mathematical accuracy of the impairment testing models including the consistency of relevant data with latest Board approved forecasts
► Performed sensitivity analysis on key assumptions including discount rates, terminal growth rates and EBIT forecasts for each of the Group’s CGUs
► Assessed the adequacy of the financial report disclosures contained in Note 4.7.

A member firm of Ernst & Young Global Limited Liability limited by a scheme approved under Professional Standards Legislation
84
Met
cash
Fin
anci
al R
epo
rt 2
022
Met
cash
Fin
anci
al R
epo
rt 2
022
Met
cash
Fin
anci
al R
epo
rt 2
022
Accounting for Rebates
Why significant How our audit addressed the key audit matter
Note 4.3 of the financial report outlines the Group’s accounting policy relating to supplier rebates, or supplier income as they are referred to in the financial report.
The Group receives rebates and other similar incentives from suppliers which are determined based upon a number of measures which can include volumes of inventory purchased, sold, and the performance of promotional activities.
We considered this to be a key audit matter as supplier rebates contributed significantly to the Group’s results, there are a large number of specific agreements in place and some of the arrangements require judgment to be applied in determining the timing of rebate recognition and the appropriate classification within the financial statements based upon the terms of the agreement.
Our audit procedures included the following:
► Evaluated the Group’s processes and design of controls relating to the recognition and valuation of rebate amounts recognised and classified within the consolidated statement of comprehensive income
► Assessed the operating effectiveness of relevant controls in place relating to the recognition and measurement of purchase-volume based, and non purchase-volume based rebates
► Selected a sample of supplier rebates including non purchase-volume based rebates received and recorded as receivable at year-end and assessed whether the income was correctly calculated and recognised in the correct period
► Considered the Group’s assessment of the value of rebates associated with inventory on hand at year end that were deducted from the carrying value of inventory
► Considered the impact of supplier claims during and subsequent to year end on amounts recognised
► Inquired of the Group as to the existence of any non-standard agreements or side arrangements.
Information other than the financial report and auditor’s report thereon The directors are responsible for the other information. The other information comprises the information included in the Group’s 2022 Annual Report other than the financial report and our auditor’s report thereon. We obtained the directors’ report that is to be included in the Annual Report, prior to the date of this auditor’s report, and we expect to obtain the remaining sections of the Annual Report after the date of this auditor’s report.
Our opinion on the financial report does not cover the other information and we do not and will not express any form of assurance conclusion thereon, with the exception of the Remuneration Report and our related assurance opinion.
In connection with our audit of the financial report, our responsibility is to read the other information and, in doing so, consider whether the other information is materially inconsistent with the financial report or our knowledge obtained in the audit or otherwise appears to be materially misstated.
If, based on the work we have performed on the other information obtained prior to the date of this auditor’s report, we conclude that there is a material misstatement of this other information, we are required to report that fact. We have nothing to report in this regard.

A member firm of Ernst & Young Global Limited Liability limited by a scheme approved under Professional Standards Legislation
85
Met
cash
Fin
anci
al R
epo
rt 2
022
Responsibilities of the directors for the financial report The directors of the Company are responsible for the preparation of the financial report that gives a true and fair view in accordance with Australian Accounting Standards and the Corporations Act 2001 and for such internal control as the directors determine is necessary to enable the preparation of the financial report that gives a true and fair view and is free from material misstatement, whether due to fraud or error.
In preparing the financial report, the directors are responsible for assessing the Group’s ability to continue as a going concern, disclosing, as applicable, matters relating to going concern and using the going concern basis of accounting unless the directors either intend to liquidate the Group or to cease operations, or have no realistic alternative but to do so.
Auditor’s responsibilities for the audit of the financial report Our objectives are to obtain reasonable assurance about whether the financial report as a whole is free from material misstatement, whether due to fraud or error, and to issue an auditor’s report that includes our opinion. Reasonable assurance is a high level of assurance, but is not a guarantee that an audit conducted in accordance with the Australian Auditing Standards will always detect a material misstatement when it exists. Misstatements can arise from fraud or error and are considered material if, individually or in the aggregate, they could reasonably be expected to influence the economic decisions of users taken on the basis of this financial report.
As part of an audit in accordance with the Australian Auditing Standards, we exercise professional judgment and maintain professional scepticism throughout the audit. We also:
► Identify and assess the risks of material misstatement of the financial report, whether due to fraud or error, design and perform audit procedures responsive to those risks, and obtain audit evidence that is sufficient and appropriate to provide a basis for our opinion. The risk of not detecting a material misstatement resulting from fraud is higher than for one resulting from error, as fraud may involve collusion, forgery, intentional omissions, misrepresentations, or the override of internal control.
► Obtain an understanding of internal control relevant to the audit in order to design audit procedures that are appropriate in the circumstances, but not for the purpose of expressing an opinion on the effectiveness of the Group’s internal control.
► Evaluate the appropriateness of accounting policies used and the reasonableness of accounting estimates and related disclosures made by the directors.
► Conclude on the appropriateness of the directors’ use of the going concern basis of accounting and, based on the audit evidence obtained, whether a material uncertainty exists related to events or conditions that may cast significant doubt on the Group’s ability to continue as a going concern. If we conclude that a material uncertainty exists, we are required to draw attention in our auditor’s report to the related disclosures in the financial report or, if such disclosures are inadequate, to modify our opinion. Our conclusions are based on the audit evidence obtained up to the date of our auditor’s report. However, future events or conditions may cause the Group to cease to continue as a going concern.
► Evaluate the overall presentation, structure and content of the financial report, including the disclosures, and whether the financial report represents the underlying transactions and events in a manner that achieves fair presentation.
► Obtain sufficient appropriate audit evidence regarding the financial information of the entities or business activities within the Group to express an opinion on the financial report. We are responsible for the direction, supervision and performance of the Group audit. We remain solely responsible for our audit opinion.
We communicate with the directors regarding, among other matters, the planned scope and timing of the audit and significant audit findings, including any significant deficiencies in internal control that we identify during our audit.

A member firm of Ernst & Young Global Limited Liability limited by a scheme approved under Professional Standards Legislation
86
Met
cash
Fin
anci
al R
epo
rt 2
022
Met
cash
Fin
anci
al R
epo
rt 2
022
Met
cash
Fin
anci
al R
epo
rt 2
022
We also provide the directors with a statement that we have complied with relevant ethical requirements regarding independence, and to communicate with them all relationships and other matters that may reasonably be thought to bear on our independence, and where applicable, actions taken to eliminate threats or safeguards applied.
From the matters communicated to the directors, we determine those matters that were of most significance in the audit of the financial report of the current year and are therefore the key audit matters. We describe these matters in our auditor’s report unless law or regulation precludes public disclosure about the matter or when, in extremely rare circumstances, we determine that a matter should not be communicated in our report because the adverse consequences of doing so would reasonably be expected to outweigh the public interest benefits of such communication.
Report on the audit of the Remuneration Report
Opinion on the Remuneration Report We have audited the Remuneration Report included in pages 18 to 34 of the Directors’ report for the year ended 30 April 2022.
In our opinion, the Remuneration Report of Metcash Limited for the year ended 30 April 2022, complies with section 300A of the Corporations Act 2001.
Responsibilities The directors of the Company are responsible for the preparation and presentation of the Remuneration Report in accordance with section 300A of the Corporations Act 2001. Our responsibility is to express an opinion on the Remuneration Report, based on our audit conducted in accordance with Australian Auditing Standards.
Ernst & Young
Christopher George Partner Sydney 27 June 2022