ASX release - Transurban
251
ASX release 18 August 2022 Classification Transurban Group Transurban International Limited ABN 90 121 746 825 Transurban Holdings Limited ABN 86 098 143 429 Transurban Holding Trust ABN 30 169 362 255 ARSN 098 807 419 [email protected] www.transurban.com Level 31 Tower Five, Collins Square 727 Collins Street Docklands Victoria 3008 Australia Telephone +613 8656 8900 Facsimile +613 8656 8585 Transurban Appendix 4E and FY22 Corporate Report In accordance with ASX Listing Rules, please see attached Transurban’s Appendix 4E and Corporate Report for the year ended 30 June 2022. The following year end reporting documents will be released separately: • Transurban FY22 results and FY23 distribution guidance release • Transurban FY22 investor presentation • FY22 Corporate Governance Statement • Appendix 4G Transurban will provide a market briefing at 9:45am (AEST) today, 18 August 2022. The market briefing will be webcast via the Transurban website at transurban.com. Investor enquiries Hannah Higgins Head of Investor Relations +61 419 246 502 Media enquiries Josie Brophy Manager, Media and Communications +61 437 165 424 This announcement is authorised by the Board of Transurban Group.
-
Upload
khangminh22 -
Category
Documents
-
view
4 -
download
0
Transcript of ASX release - Transurban

ASX release 18 August 2022
Classification Transurban Group
Transurban International Limited
ABN 90 121 746 825
Transurban Holdings Limited
ABN 86 098 143 429
Transurban Holding Trust
ABN 30 169 362 255
ARSN 098 807 419
www.transurban.com
Level 31
Tower Five, Collins Square
727 Collins Street
Docklands
Victoria 3008 Australia
Telephone +613 8656 8900
Facsimile +613 8656 8585
Transurban Appendix 4E and FY22 Corporate Report
In accordance with ASX Listing Rules, please see attached Transurban’s Appendix 4E and Corporate Report for
the year ended 30 June 2022.
The following year end reporting documents will be released separately:
• Transurban FY22 results and FY23 distribution guidance release
• Transurban FY22 investor presentation
• FY22 Corporate Governance Statement
• Appendix 4G
Transurban will provide a market briefing at 9:45am (AEST) today, 18 August 2022. The market briefing will be
webcast via the Transurban website at transurban.com.
Investor enquiries
Hannah Higgins
Head of Investor Relations
+61 419 246 502
Media enquiries
Josie Brophy
Manager, Media and Communications
+61 437 165 424
This announcement is authorised by the Board of Transurban Group.

Transurban GroupAppendix 4E Year ended 30 June 2022(Previous corresponding period being the year ended 30 June 2021)The Transurban Group (the Group) comprises the following entities:
Transurban Holdings Limited (ABN 86 098 143 429) Transurban Holding Trust (ARSN 098 807 419) Transurban International Limited (ABN 90 121 746 825)
Results for announcement to the market1
Statutory results from continuing operations2022
$MRevenue from ordinary activities increase of 18.0% to $3,406
Profit after tax from ordinary activities increase of 106.0% to $16Profit after tax from ordinary activities attributable to security holders of the Group increase of 107.8% to $19
Profit attributable to security holders of the Group increase of 107.8% to $19
Statutory results including discontinued operations2022
$MProfit after tax from ordinary activities decrease of 99.5% to $16
Profit after tax from ordinary activities attributable to security holders of the Group decrease of 99.4% to $19
Profit attributable to security holders of the Group decrease of 99.4% to $19
Proportional results
2022
$MToll revenue increase of 5.7% to $2,626Earnings before depreciation, amortisation, net finance costs and income taxes (EBITDA) increase of 4.9% to $1,900EBITDA excluding significant items increase of 3.5% to $1,900Free cash increase of 19.8% to $1,531
The accompanying ASX Release and FY22 Corporate Report that follow provide further commentary of the results and provide a definition of Proportional results, Significant items and Free Cash.
Distributions and dividends
Year ended 30 June 2022Amount per
security (cents)
Franked amount for dividend
component (%) Record date Payment dateFinal distribution/dividend 26.0 8.347 30 June 2022 23 August 2022
Interim distribution/dividend 15.0 Not Applicable 31 December 2021 22 February 2022
Final distribution/dividend (prior year) 21.5 5.724 30 June 2021 23 August 2021
Distribution Reinvestment Plan
Under the Distribution Reinvestment Plan (DRP), security holders may receive additional stapled securities in substitution for some or all cash distributions in respect of their stapled securities. The last date for the receipt of an election notice for participation in the DRP was 1 July 2022 and the participation rate was 6.46%. No discount has been applied when determining the price at which stapled securities will be issued under the DRP for the current period distribution.
Net tangible asset backing2022 2021
Net tangible asset backing per stapled security² $4.81 $3.90
1. Figures used for calculating percentage movements are based on whole numbers.2. Net tangible assets used as the basis for this calculation include: concession intangible assets relating to the operational assets of the Group, lease right of use assets and lease liabilities.

AuditThis Appendix 4E is based on the consolidated financial statements of the Group which have been audited by the Group’s auditors, PricewaterhouseCoopers (PwC). A copy of PwC’s unqualified audit report can be found in the FY22 Corporate Report that follows.
Other informationDisclosure requirements of ASX Listing Rule 4.3A not contained in this Appendix 4E are included in the attached FY22 Corporate Report and accompanying ASX Release.

2022Corporate Report for the year ended
30 June 2022

222
3.78
$4M
2ND3.09
7
road injury crash index—below target of 4.25 or less
towards social investment programs
More than
paid in distributions to security holders
highest-rated motorway infrastructure company—Global Real Estate Sustainability Benchmark for Infrastructure (2021)
contractor recordable injury frequency rate—below target of 4.20 or less
40:40:20progressed gender balance across our workforce, in line with our target —40% men, 40% women, 20% any gender/non-binary
major infrastructure projects in development or delivery
Our year in numbers
How we created value for our stakeholders
$1.2B
Governance and risk
Financial statements
Security holder information
Sustainability supplement
Business performance
Remuneration report
Directors’ report
Introduction and overview
Corporate Report for the year ended 30 June 2022

Who we areWe are a leading global toll road developer and operator with 21 assets and seven development projects across five regions.
Our purposeTo strengthen communities through transport.
Our strategyBy understanding what matters to our stakeholders, we create road transport solutions that make us a partner of choice.
Our investment propositionWe balance growth in distributions and investment to create long-term value.
3
Governance and risk
Financial statements
Security holder information
Sustainability supplement
Business performance
Remuneration report
Directors’ report
Corporate Report for the year ended 30 June 2022
Introduction and overview

ContentsLetter from the Chair and CEO 6
About this report 8
Working with our stakeholders 12
About Transurban 15
Our roads and projects 16
Executive Committee 18
Business strategy 20
Global trends 22
Governance 75
Board of Directors 80
Risk management 82
Introduction and overview
Business performance
Remuneration report
Governance and risk
Directors’ report
Project updates 25
Customers 29
Communities 35
Our people 45
Government and Industry 51
Business partners and suppliers 57
Investors 65
For the best viewing experience, download this report
Governance and risk
Financial statements
Security holder information
Sustainability supplement
Business performance
Remuneration report
Directors’ report
Introduction and overview
Corporate Report for the year ended 30 June 2022

Glossary 244
10-year history 246
Key contacts 247
Financial statements
Sustainability supplement
Security holder information
—Reporting suite—
FY22 Corporate Report1—(this report)
The holistic performance of Transurban in FY22 including our Financial Statements and Sustainability Supplement.
FY22 Results Presentation
Management presentation of financial and non-financial results, including non-statutory analysis.
FY22 Climate Change Disclosure2
Our response to the Task Force on Climate-related Financial Disclosures’ (TCFD) recommendations.
FY22 Sustainability Data2
Our progress against the UN Sustainable Development Goals and other sustainability performance data.
Corporate Governance Statement
Statement made in accordance with the ASX Corporate Governance Council’s Corporate Governance Principles and Recommendations (4th Edition).
Tax Transparency Report
Overview of our corporate structure, approach to tax and tax position for FY21 —available late August 2022.
Modern Slavery Statement
Overview of how we identify, manage and mitigate the specific risks of modern slavery in our operations and supply—available late 2022.
All available on our website transurban.com
1 We have integrated some of our Sustainability Supplement into our FY22 Corporate Report. This approach provides additional information on our non-financial performance (including environmental, social and governance performance) and our progress in achieving our Sustainability Strategy
2 Previously incorporated in our Sustainability Supplement
Acknowledgment of CountryTransurban acknowledges the Traditional Owners of the lands across Australia—in particular where we own and operate toll roads—and we pay respect to Elders past, present and emerging.
As caretakers and custodians of transportation in urban communities we have a deep respect for Indigenous communities and culture and seek to celebrate pride in Country through engagement with, and providing opportunities for, Aboriginal and Torres Strait Islander peoples. We also celebrate connection to Country through artwork and design elements in our infrastructure.
To achieve our purpose—to strengthen communities through transport—we will continue to foster positive and sustainable relationships with all communities, while progressing our efforts to contribute to Australia’s reconciliation journey.
Governance and risk
Financial statements
Security holder information
Sustainability supplement
Business performance
Remuneration report
Directors’ report
Corporate Report for the year ended 30 June 2022
Introduction and overview

6
Letter from the Chair and CEO
From left: CEO Scott Charlton and Chair Lindsay Maxsted
A major highlight was our acquisition, as part of the Sydney Transport Partners consortium, of the remaining 49% of WestConnex from the NSW Government to take Transurban’s total ownership interest to 50%.
Once complete, WestConnex will form a 70 kilometre network, providing efficient and safer travel between industrial and freight hubs as well as catering for Sydney’s growing western suburbs. With close to 40 years1 remaining on its concession life, cash flows generated from WestConnex will underpin distributions to our security holders for decades to come.
We would like to take this opportunity to thank our security holders for their backing of the $4.2 billion equity raising in FY22, which underpinned the acquisition of this world-class asset, which is not only transformational for Sydney, but for Transurban as well.
Another milestone was the start of tunnelling on our West Gate Tunnel Project in Melbourne after Transurban, the Victorian Government and the D&C subcontractor
reached an agreement on revised project delivery terms, including a new completion date of late 2025. While the delay and additional cost has been disappointing, this project is critical for the efficient and safe movement of people and goods in Melbourne by providing an alternative to the often heavily congested West Gate Bridge, as well as adding more than 18 kilometres of new traffic lanes on the West Gate Freeway. It is expected to create more than 6,000 jobs and generate around $11 billion in economic benefits for the State of Victoria. It remains a financially attractive investment for Transurban and will be another valuable project for security holders for years to come.
FY22 financial results While traffic was impacted by government
restrictions particularly in our key markets of Sydney and Melbourne in the first half of FY22, we were pleased to see traffic volumes grow as the year progressed. In the final quarter of FY22, average daily traffic exceeded FY19 by 5.8%. Compared to FY21,
traffic numbers for the full year were down slightly overall, declining by 0.5%.
The key financial metrics of the period ended 30 June 2022 included a 5.7% increase in proportional toll revenue to $2,626 million and 3.5% growth in proportional EBITDA to $1,900 million. Free Cash inclusive of Capital Releases increased by 19.8%, which supported our full-year distribution of 41 cents per security. We were pleased to pay more than $1.2 billion in distributions to security holders during the year.
The return of traffic to our roads once government restrictions lifted throughout the year reflects the value that our customers continue to see in terms of travel-time savings, reliability and safety in our assets, which are crucial transport corridors in areas where population, employment and economies are expected to grow.
These are first-class assets and, along with our pipeline of developments and opportunities, we are confident in our ability to continue delivering value not only for investors, but for all our stakeholders. Our balance sheet is in a robust position, which can support near and longer-term growth opportunities. Combined with the positive trend in traffic performance and project delivery, we have a meaningful base for generating cash flow.
Macro-economic environmentWhile rising inflation is impacting
economies globally, almost 70% of our roads have toll escalations of CPI or greater. This provides inflation protection in this environment.
Our debt is also hedged to provide protection against near-term interest rate increases. Around 98% of our existing debt book is fully hedged and during FY22 we refinanced more than $3.4 billion of debt at better interest rates on average to give us lower exposure to current market rates and volatility.
Listening to our stakeholdersOver the past year, we embarked on an
extensive exercise to test our understanding of our stakeholders’ views. We heard from more than 4,000 community members and 100 business partners. We interviewed investors, government partners and employees, and analysed thousands of pieces of customer feedback.
This is something we do every few years to understand, anticipate and address what is important to our stakeholders so that we can confidently deliver on our strategy:
FY22 has again been a year of significant milestones for Transurban.
Governance and risk
Financial statements
Security holder information
Sustainability supplement
Business performance
Remuneration report
Introduction and overview
Directors’ report
Corporate Report for the year ended 30 June 2022

7
The need for climate action was put sharply into focus this year with major flooding in Queensland and NSW. Natural disasters such as these highlight the importance of resilience in both our operations and the design and construction of our assets. We will continue to work to better understand the financial implications that climate change may present for our operations and assets. Our progress is reported in our FY22 Climate Change Disclosure, which is available on our website.
Recognising that sustainability is part of everyday business for Transurban, this year we have integrated more of our previous standalone Sustainability Supplement into this report. This approach endeavours to present the most holistic view of our performance.
Our approach to sustainability is guided by our ongoing commitment to the United Nations (UN) Global Compact and the UN Sustainable Development Goals (UN SDGs). We have identified the UN SDGs that are most relevant to our business, and we report annually on how we are contributing to these global goals. Our achievements for FY22 are available in our Insights hub on our website.
FY23 outlookAs the world continues to adapt the way
in which they move about, and with domestic and international travel returning, we feel confident that customers will continue to see value in using our assets.
In FY23, we also look forward to progressing our development projects, in particular in Sydney. Civil works are complete on the final stage of WestConnex—the M4-M5 Link—and the project is expected to open to traffic in 2023. Project developments such as this, position us well for growth in the coming year.
The Board has also issued guidance that it expects the FY23 distribution to be 53.0 cps representing approximately 30% growth on FY22. This will be subject to the Group’s distribution policy (page 73), traffic performance and macroeconomic factors, and timing of distributions from subsidiaries.3
While FY22 again presented uncertainties, the team at Transurban maintained its focus on delivering for all our stakeholders. The Board would like to take this opportunity to thank all employees for their hard work and dedication in achieving so many milestones during the year.
“By understanding what matters to our stakeholders, we create road transport solutions that make us a partner of choice”.
These solutions come in many forms—from multi-billion-dollar infrastructure projects such as extending our Express Lanes in the US to create faster and more efficient travel choices, to enhancing technologies and rewards programs for our customers and supporting community organisations.
Safety plays a critical role in many of our transport solutions. Our efforts begin right from the outset of our asset design and span our business from operations to research and education programs such as improving child car seat safety. We track our on-road performance using a Road Injury Crash Index (RICI)—the number of serious injury crashes per 100 million vehicle kilometres travelled on our roads. In FY22, pleasingly we achieved a RICI of 3.78, 11% lower than our target RICI of no more than 4.25.
Our solutions also respond to the urgent and very real need to reduce greenhouse gas (GHG) emissions and to minimise our environmental impacts.
ESG initiativesDuring FY22, we continued to make
significant progress on a number of Environment, Social and Governance (ESG) initiatives that reinforce our sustainable business practices as well as our commitment to reduce our GHG emissions. We have committed to net zero emissions by 2050 from our operations, supply chains and major project developments and have also set targets for significant reductions by 2030 (see page 37).
Our transition to renewable energy sources in FY22 led to a 46% reduction in GHG emissions compared to the previous year and we are now sourcing two thirds of our electricity from renewable sources.
While our customers’ GHG emissions are not formally within our control, we recognise their impact on the environment and continue to educate our customers about efficient driving to reduce GHG emissions and fuel use. Further, by choosing our roads over alternate stop-start routes, drivers can save an average of 27% in GHG emissions.2 During the year, we also launched initiatives to encourage the take up of electric vehicles (EVs). This included a campaign to support Australia’s COVID-19 vaccine rollout by offering vaccinated customers the opportunity to win an EV.
We also thank our security holders for your ongoing support of Transurban and commend this report to you as an excellent summary of our performance in FY22.
Lindsay Maxsted Chair and Independent Non-executive Director
Scott Charlton Chief Executive Officer and Executive Director
Chair’s messageThis year’s Corporate Report
marks my final as Chair of Transurban as I have announced my retirement at the conclusion of this year’s Annual General Meeting (AGM) in October.
Transurban is an exceptional business and I am extremely proud of our achievements since joining the Board in 2008 and becoming Chair in 2010.
In that time, Transurban has realised many milestones from our entry into the Queensland market to the creation of 85 kilometres of Express Lanes in the US, to the successful partnership that acquired Sydney’s WestConnex network.
Achievements such as these are the result of a talented and committed team that is steadfastly focused on creating long-term value for our investors and other stakeholder groups.
I would like to take this opportunity to thank my fellow Board members as well as the broader Transurban team for their commitment and dedication to the ongoing success of Transurban.
I look forward to speaking with you further at my final Transurban AGM on 20 October 2022.
1 Remaining concession life as at 30 June 2022 for each concession on a non-revenue weighted basis with each concession expiring in December 2060
2 Transurban internal calculation based on vehicle type, distance travelled and COPERT emission modelling tool
3 Distributions to be determined by relevant Board discretion at the time
Governance and risk
Financial statements
Security holder information
Sustainability supplement
Business performance
Remuneration report
Directors’ report
Introduction and overview
Corporate Report for the year ended 30 June 2022

8
Compliance statementOur FY22 Corporate Report includes
key disclosures under Australian legislation.
Our Directors’ Report page 91 and Financial Statements page 120 have been prepared in accordance with the Corporations Act 2001 (Cth).
Our Financial Statements have also been prepared in accordance with Australian Accounting Standards. The basis of preparation of our Financial Statements is provided on page 129.
PricewaterhouseCoopers has conducted an independent audit of the Financial Statements and Remuneration Report. Auditor’s Independence Declaration is available on page 119. Detailed information on the audit is available on pages 216 to 225.
The sustainability data methodology used in this report is available in the Sustainability Supplement section of this report, including a KPMG-issued limited assurance statement on page 239.
Select non-financial data points within this report are estimates, informed by part-year data and previous-year trend analysis.
The remaining information in this report has been reviewed internally.
This report contains certain forward-looking statements. See page 245 for a notice regarding these statements.
Thank you for reading Transurban’s FY22 Corporate Report. These pages explain both the structure of this report and our approach to integrating the United Nations Sustainable Development Goals (UN SDGs) into the reporting frameworks that guide us.
About this report
Scope and contentOur FY22 Corporate Report provides an
overview of Transurban’s operations and performance during the financial year (1 July 2021 to 30 June 2022). The report covers our financial and non-financial performance and details how we create value for our six key stakeholder groups:
• investors
• customers
• communities
• our people
• business partners and suppliers
• government and industry.
Integrated approachOur reporting approach is guided by two
initiatives that drive integrated, accessible, measurable, and comparable reporting:
• Global Reporting Initiative (GRI) that establishes standardised sustainability impact reporting across industries and sectors
• International Integrated ReportingFramework (IIRF) that provides a clear, concise and comparable format for integrated reporting across strategy, governance, performance and prospects.
This report is also informed by recommendations from: the Task Force on Climate-related Financial Disclosures (TCFD); the Sustainability Accounting Standards Board (SASB); and the UN SDGs.
Our approach to sustainabilityThis year, we have integrated some
of our Sustainability Supplement into this report. This approach provides additional information on our non-financial performance, including environmental, social and governance (ESG), and progress in achieving our Sustainability Strategy.
Transurban’s Sustainability Strategy—centred around four pillars (people, planet, places and partnerships)—is aligned with the UN SGDs most relevant to us and our stakeholders, and is supported by objectives, targets and indicators. This strategy guides us in identifying, understanding and responding to social and environmental issues in support of Transurban’s purpose —to strengthen communities through transport. Our strategy helps us create real and lasting benefits for all our stakeholders.
Responsibility for this strategy and its associated work program is embedded right across our business. Our specialist Sustainability team drives this process, including by providing strategic advice and reporting on progress, trends and emerging themes to our Board and Executive Committee.
A standalone response to the TCFD and detailed sustainability data tables are available in our Insights Hub, insights.transurban.com
Governance and risk
Financial statements
Security holder information
Sustainability supplement
Business performance
Remuneration report
Introduction and overview
Directors’ report
Corporate Report for the year ended 30 June 2022

9
Figure 1: Material issues and alignment with stakeholders and reporting frameworks
Frameworks
Corporate sustainability
Global sustainability
Investor frameworks
Material issues in FY22Stakeholder groups1
GRI indicators
UN SDGs
SASB sector
TCFD relevance
Road safetyOur roads, research, and community safety initiatives
Customers; Community 416
3
9
CustomersCustomer satisfaction, hardship support, data privacy and cybersecurity Customers 418
11
Local communitiesCommunity engagement, social investment and creating community spaces Community 413
11
EnvironmentClimate change, energy and carbon, air quality, materials and biodiversity
Community; Investors 301, 302, 305
7
12
13
Health and safetyOur employees, contractors and workplaces
Our people; Business partners and suppliers 403
3
Wellbeing and diversitySupporting diversity, inclusiveness and fair work practices Our people 401, 405
5
8
Supply chainProcurement practices, shared value and human rights including Modern Slavery
Government and industry; Business partners and suppliers 204, 412
17
Our businessFinancial performance, road effectiveness, economic impact, job creation and response to COVID-19 pandemic
Investors; Government and industry 201, 203
8
9
GovernanceStrategy and risk management, legal and regulatory compliance and ethical business practices
Investors; Our people 205, 206
17
1 ‘Stakeholder groups’ refer to the main stakeholders where this issue is most relevant, but in many cases these issues overlap several or all stakeholder groups’ interests
Reporting what matters
For more than a decade, we have evaluated and prioritised topics that we believe are material to our business for inclusion in our reporting suite. A material issue is one that is significant for Transurban in terms of impact (actual or potential economic, environmental, and social impact) or influence (level of interest and potential to influence stakeholder decisions).
Materiality reviewWe have used both stakeholder feedback
and reporting guidelines to determine the non-financial topics included in this report.
Our business strategy—by understanding what matters to our stakeholders, we create road transport solutions that make us a partner of choice—is central to our reporting. Our stakeholder engagement activities, key issues identified and our responses to stakeholder issues are available on pages 12 to 13.
Sustainability frameworks used include: GRI and SASB standards on pages 226 to 238; TCFD recommendations; and UN SDGs.
Detailed risk management summaries are included on pages 85 to 88.
Figure 1 summarises FY22’s highest-priority topics identified from the above materiality reviews, including how these topics address issues raised by various stakeholders and frameworks.
The issues we have determined as the most material are generally covered within the relevant stakeholder section in this report. Topics deemed less significant are reported in the GRI Index (page 226).
Governance and risk
Financial statements
Security holder information
Sustainability supplement
Business performance
Remuneration report
Directors’ report
Introduction and overview
Corporate Report for the year ended 30 June 2022

10
RecognitionsGlobal Real Estate Sustainability Benchmark—Infrastructure (2021) Highest-rated listed infrastructure company, 2nd-highest-rated motorway infrastructure company globally
Dow Jones Sustainability Index (2021)Member of DJSI World Index, equal 3rd-highest-rated transport company globally
CDP (2021)Climate Change ‘Management’ level (B rating)
MSCI AAA ESG rating since 2015
FTSE4GoodMember of Global Index since 2004
Workplace Gender Equality Agency (Australia) Employer of Choice Citation since 2015
EquileapRated the 8th-best company globally and 2nd in Australia for gender equality
Support the Goals5-star-rated company for action on the UN SDGs
AffiliationsGRIUsed for our sustainability reporting since 2006
TCFDAll recommendations addressed
United Nations Global CompactParticipant since 2009
Infrastructure Sustainability (IS) and Envision major project ratings8 rated projects to date and 4 project ratings underway
SASBImplementing reporting recommendations
Science Based Targets initiative (SBTi)Validated greenhouse gas emission reduction targets
Business for Societal Impact (B4SI) Measuring and verifying the social impact of our community investment
Find our sustainability performance data, including comprehensive UN SDG progress in our Insights Hub, insights.transurban.com
FY22 UN SDG Progress Report Transurban is committed to the UN SDGs,
which directly inform our Sustainability Strategy.
This report details Transurban’s FY22 progress against the nine UN SDGs that are particularly relevant to Transurban and the associated targets and indicators that apply to our business. We believe more can be done to contribute to the UN SDG targets above and beyond the official indicator set. For this reason, we also list our own, Transurban-specific, indicators and targets
UN SDG Relevance to Transurban
Key FY22 initiatives and highlights
Key FY22 performance metrics (FY18-22 trend/target status)1
Performance metric comments
Progress to goal
Ensuring the safety, health and wellbeing of our people and safety of road users is vital to our ongoing success
• Outperformed Road Injury Crash Index (RICI) target
• 91% of travel on our roads deemed to be four-star or better by Australian Road Research Board
• NeuRA research on motorcycle fuel tank and seating posture injury risks
• Continued mental health wellbeing program
• RICI; 3.78 (target ≤ 4.25)
• Road user fatalities; 3
• Road Safety Action Plan completion rate; 89%
Performance against RICI continues to improve over time with outperformance in FY22
l
We believe diversity in all its forms—including gender diversity—helps our business perform better
• Rated 2nd (Australia) and 8th (globally) for gender equality by Equileap
• Workplace Gender Equality Agency Employer of Choice for Gender Equality citation 2021–23
• Improved Board gender diversity
• Board diversity; 73%M/27%F l
• Executive diversity; 44%M/56%F
• Direct employee diversity; 57%M/43%F2
Board diversity improved in FY22 with appointment of two new female directors (20% in FY21 to 27% in FY22)
l
Figure 3: FY22 UN SDG performance summary
79.3%
Target met 23/29
Improving 3/29
10.3%
Declining 3/29
10.3%
Figure 2: Summary of FY18-22 progress for UN SDG targets
and summarise our performance against these.
A summary of our FY22 performance for each of the nine UN SDGs that are particularly relevant to Transurban, and trends towards 29 applicable targets— official and Transurban-specific—are provided in Figure 2 and Figure 3.
1 FY18-22 performance metrics trend: N/A = no data or trend not applicable; a= target met; l = no change; l = improving; l = declining (not all targets are included in Key FY22 performance metrics)
2 Non-binary represents 0.06% of our direct employees
Governance and risk
Financial statements
Security holder information
Sustainability supplement
Business performance
Remuneration report
Introduction and overview
Directors’ report
Corporate Report for the year ended 30 June 2022

11
UN SDG Relevance to Transurban
Key FY22 initiatives and highlights
Key FY22 performance metrics (FY18-22 trend/target status)1
Performance metric comments
Progress to goal
Meeting our energy needs mainly from renewable sources is dramatically reducing our direct greenhouse gas emissions
• Renewable energy supply started from Coopers Gap Wind Farm (QLD) in January and Bango Wind Farm (NSW) in June 2022
• Renewable energy supply arrangements now in place for all Australian markets and under investigation for US
• Proportion of energy purchased from renewables; 56% (N/A)
• Installed renewable energy capacity; 231kW (N/A)
• Energy-efficiency savings to date; 8.3% l
Significant improvements for FY22 as supply from renewable energy sources becomes dominant
Substantial progress made towards energy-efficiency target
l
We can help under-represented groups participate in and benefit from economic growth. Our roads are critical in moving people and goods within and around the urban areas where we operate—helping economies function and grow
• Gender pay gap maintained at ≤1%
• Enhanced parental leave policy
• Released FY21 Modern Slavery Statement (December 2021)
• Completed our second (Innovate) Reconciliation Action Plan
• Gender pay gap; ≤1%
• Employee recordable injuries; 0
• Contractor Recordable Injury Frequency Rate (RIFR); 3.09 (target ≤ 4.2)
• Reconciliation Action Plan; 100% actions complete
Targets met l
Our core business is providing and operating road infrastructure and we are committed to making it more sustainable and resilient to future climatic conditions
• Rated or committed to rating the sustainability performance of 12 projects, worth approximately $25B to date
• Scope 1 and 2 absolute emissions; 106,392 tCO2e l
• Scope 1 and 2 emissions per $M revenue; 45.8 tCO2e
• Scope 3 emissions from purchased goods and services per million VKT; 32.9 tCO2e l
• Scope 3 emissions from capital projects per $M capex; 138.5 tCO2e l
Scope 1 and 2 absolute emissions decreased significantly as we transitioned to mainly renewable energy use
l
Operating responsibly—socially and environmentally—will help us continue to be a partner of choice for governments and respected by communities and our customers
• More than USD45M provided to date to support public transit initiatives in Northern Virginia
• More than 1,475 kilometres of cycle/pedestrian paths delivered or maintained to date
• Provided community grants to support those affected by COVID-19 pandemic and flooding
• Compliance with air quality indicators for tunnel emissions; 100%
Target met l
Our projects and maintenance activities use significant amounts of materials. Efforts to reduce use and favour low carbon materials will lower our indirect greenhouse gas (GHG) emissions and help conserve resources
• Set waste management targets for the business
• Continuing to use and promote lower-carbon materials
• Continuing to support social enterprises throughout COVID-19 pandemic
• > $130M Indigenous procurement spend to date (Australia) across more than 100 suppliers (N/A)
• USD976M spend to date on disadvantaged business enterprises (DBEs) and small, women and minority-owned (SWaM) businesses in the US (N/A)
Australian Indigenous procurement growing through major projects and direct procurement
l
We need to understand and prepare for the transition to a low-carbon environment and the physical impacts of climate change
• CDP Supplier Engagement Leader
• Climate risk assessments progressed for assets
• Work underway to identify financial impacts of climate change
• Existing assets assessed for climate risk; 100%
• Major projects under construction assessed for climate change risk; 50%; 2/4 projects l
Climate change risk assessments for FredEx and Project NEXT projects delayed to FY23
l
Partnering with other organisations committed to the UN SDGs and the opportunities and challenges they represent is vital to achieve greater impact sooner
• Key partnerships in FY22 with NeuRA, Kidsafe (road safety); The Smith Family, The Salvation Army, Northern Virginia Family Services (community); MECLA (materials); Landcare (biodiversity)
• No metrics for this SDG N/A l
1 FY18-22 performance metrics trend: N/A = no data or trend not applicable; a= target met; l = no change; l = improving; l = declining (not all targets are included in Key FY22 performance metrics)
2 Non-binary represents 0.06% of our direct employees
Governance and risk
Financial statements
Security holder information
Sustainability supplement
Business performance
Remuneration report
Directors’ report
Introduction and overview
Corporate Report for the year ended 30 June 2022

12
Working with our stakeholders
Customers Communities Our people
How
we
enga
ged • Ongoing customer listening program;
customer research panel; qualitative and quantitative research.
• Customer channels: app; website; phone; social media; retail outlets.
• Digital, print and outdoor advertising; phone and SMS; newsletters; social media.
• Surveys: community, business partner and supplier; corporate trust and mobility trends.
• Events; community liaison groups; information sessions; site tours.
• Digital, print and outdoor advertising; newsletters; social media; letter drops, door knocking; phone and SMS; media coverage.
• Partnerships; grant programs; school and grassroots activities.
• All-employee listening program and pulse-check surveys.
• All-employee meetings (virtual, in-person, hybrid).
• Internal communication channels: intranet; instant message; email; signage.
• Quarterly/annual awards and recognition programs.
• People leader forums.
• Belonging and wellbeing events.
Wha
t we
hear
d • Value of toll road travel: on-road experiences (such as signage, congestion); road incident alerts; fees and charges.
• Interacting with us: interaction convenience and ease; cybersecurity, data protection and privacy; infringement processes.
• Rewards and support: enhanced rewards program; competitions; support for vulnerable customers.
• Processes and governance: transparency in project design, decisions and delivery; and project operations benefits and impacts; listening to, and responding to, stakeholders including post-construction.
• Road works and construction: notification of disruption; planning of works and minimising impacts of construction on residents and the environment.
• Environmental and social performance: GHG emissions and air quality; supporting vulnerable communities and people; family violence support; driver safety and education.
• Health, safety, and wellbeing: diversity, inclusion and respect in the workplace.
• Career paths: skills and capability development; ongoing career opportunities.
• Workforce engagement: key talent retention and attraction; flexible working access; connection and collaboration.
How
we
resp
onde
d • Value of toll road travel: education on avoiding fees and charges; new tools to inform travel decisions and improve value certainty; added roads to our GoToll app.
• Interacting with us: delivered improved digital platform experiences and functionality; used data and analytics to identify pain points; continued focus on cybersecurity capability.
• Rewards and support: expanded Linkt Customer Rewards program; customer competitions; expanded Linkt Assist program; supported customers experiencing hardship via new partnership program.
• Processes and governance: developed a Social Licence Framework to maximise impact and stakeholder benefit; enhanced sharing of road safety research, education and outcomes; engaged communities on project developments and current works’ impacts.
• Road works and construction: engaged communities on project development and works’ impacts; adhered to robust guidelines and regulations for environmental management.
• Environmental and social performance: provided additional community grants to ease pandemic (NSW, VIC, NA) and flood (QLD) impacts; continued partnerships (including NeuRA, Kidsafe, The Smith Family, The Salvation Army, Northern Virginia Family Services, 9/11 Pentagon Memorial Fund, and La fondation les petits trésors); expanded public art/education programs (Canal to Creek, CityLink Kids, West Gate Kids); hosted open days, events and competitions.
• Health, safety, and wellbeing: mandatory Health, Safety and Environment Action Plans for all teams; delivered Belonging and Wellbeing program with mental wellbeing focus; ran Respect at Work program, including mandatory sexual harassment prevention learning module.
• Career paths: provided on-demand access to 7,000+ online learning programs; maintained career resource hub and activity program.
• Workforce engagement: supported flexible working, including via collaborative technologies; conducted annual pay reviews to maintain pay equity gap of less than 1% and to account for Australian superannuation guarantee increases; refreshed parental leave policy.
Governance and risk
Financial statements
Security holder information
Sustainability supplement
Business performance
Remuneration report
Introduction and overview
Directors’ report
Corporate Report for the year ended 30 June 2022

13
Government and industry Business partners and suppliers Investors
• State/federal government and agency inquiry submissions.
• Industry partnerships, memberships, and event participation.
• Partnering on shared issues (for example, road safety).
• Official and regulator meetings; research and business updates; MP engagement on initiatives, grants and competitions; asset milestones and event attendance.
• Major long-term partner shared-objective setting; pipeline and future works’ scope engagement; supplier working groups/workshops.
• Dedicated relationship managers.
• Engagement on disadvantaged group employment barriers.
• Decarbonisation and climate change mitigation actions.
• Institutional and retail investor engagement; one-on-one meetings; twice-yearly surveys.
• Results briefings (half and full year); hybrid annual Investor Day event; virtual Annual General Meeting (AGM); quarterly traffic releases; investor centre website; digital Investor Day Hub.
• West Gate Tunnel Project tour.
• Proxy adviser and ESG engagement.
• WestConnex capital raising engagement.
How
we engaged
• Future-ready infrastructure: innovative and sustainable transport solutions and population growth alignment; electric vehicle (EV) uptake/education; road-user charging.
• Environmental initiatives: emissions-reduction targets; sustainable construction practices.
• Data-led economic insights: urban mobility trends.
• Community support: road safety; supporting vulnerable communities including COVID-19 pandemic and flood impacts and responses.
• Sustainability: supply chain engagement; decarbonisation performance; social procurement.
• Industry leadership: major project learnings; supply chain risks (modern slavery, conflict-zone disruptions).
• Partner engagement: long-term pipeline visibility; supplier confidence; relationship quality.
• Performance: distribution growth; project and asset performance; current and emerging risks, including broader economic conditions; ESG performance and initiatives.
• Strategy and future: development opportunities; capital management; long-term value creation; long-term mobility trends.
• Governance: organisational capability including Executive Committee and Board.
What w
e heard
• Future-ready infrastructure: progressed seven major infrastructure projects with governments; provided data to and attended public hearings on NSW Parliament Inquiry into Road Tolling Regimes; worked with government and industry to advance trials on connected transport technology and EVs.
• Environmental initiatives: renewable energy agreements; ventilation optimisation; energy-efficient lighting; sustainable construction initiatives.
• Data-led economic insights: shared research insights on mobility trends, economic activity and sustainability initiatives.
• Community support: consulted with government on Transurban Road Safety Centre research; delivered customer hardship initiatives; supported Australian Government vaccine rollout via competition incentives.
• Sustainability: continued our Sustainable Procurement Program and supplier engagement activities.
• Industry leadership: worked with suppliers and multi-stakeholder organisations to advance our Modern Slavery Act 2018 (Cth) response and reporting.
• Partner engagement: implemented shared-value initiatives with key suppliers; halved payment terms for flood-impacted QLD small businesses; worked with suppliers to deliver on expected work pipeline.
• Performance: distribution growth supported by improvement in Free Cash; maintained a strong balance sheet; asset quality/diversification; demonstrated inflation benefit with near-term interest rate protection through inflation-linked toll escalation and debt hedging profile; maintained ESG leadership status and continued progress in key ESG areas.
• Strategy and future: executed strategic initiatives and created longer-term value for security holders; increased WestConnex proportional ownership to 50% with strategically aligned partners; ensured balance sheet capacity to fund existing near-term growth opportunities.
• Governance: continued focus on strengthening leadership capability; formal leadership programs; embedded Executive Committee and operating model.
How
we responded
We conducted a listening exercise across all stakeholder groups in Australia and North America to align our future direction with their needs.
Read more on page 36
Governance and risk
Financial statements
Security holder information
Sustainability supplement
Business performance
Remuneration report
Directors’ report
Introduction and overview
Corporate Report for the year ended 30 June 2022

14
Figure 4: FY22 proportional toll revenue by market
48.1%Sydney
27.5%Melbourne
17.2%Brisbane
7.2%North America
Governance and risk
Financial statements
Security holder information
Sustainability supplement
Business performance
Remuneration report
Directors’ report
Introduction and overview
Corporate Report for the year ended 30 June 2022

15
For us, this is about much more than laying asphalt and building tunnels. By understanding what matters to our stakeholders, we create road transport solutions that make us a partner of choice.
Transurban’s roads connect key industry, freight, employment and community centres and keep cities moving safely and efficiently.
Since opening CityLink in Melbourne in 1999, our company has grown to include 21 toll roads in Australia, the United States and Canada, with more on the way. We have 6 million customers in Australia and 3.7 million customers in North America.
During the past two decades we have established a strong track record of partnering with governments to successfully deliver and manage key road infrastructure. We have seven major infrastructure projects in development or delivery in Australia and North America. These projects are designed to solve critical congestion issues and improve city connectivity, community liveability and economic growth.
We have also built a reputation for bringing innovative solutions to our operations, using technology to improve safety and increase the efficiency of our own roads and cities’
As one of the world’s largest toll road developers and operators, our business is to get people where they want to go as quickly and safely as possible.
About Transurban
wider transport networks. And our efforts are paying off: external research has found our roads are twice as safe as like roads.1
Our purpose is to strengthen communities through transport and we aim to achieve this in many different ways. From our 24/7 traffic control room operators to the transport planners who forecast where congestion hot spots could be in a decade’s time, we are focused on making travel easier now and in the future.
As a leading global toll road owner and operator, listed on the Australian Securities Exchange (ASX), Transurban represents one of the most significant infrastructure investment opportunities available to investors.
We have more than 3,600 people2 working across Australia and North America, as well as more than 5,000 subcontractors through the delivery of major projects. We foster an engaged and diverse workforce that prides itself on making a significant and lasting contribution to the cities and communities in which we operate.
We also continuously challenge ourselves in how we respond to social and environmental issues—and we invest in
21assets in operation
7major infrastructure projects in development
2Mtrips daily across our roads
1 Monash University Accident Research Centre (MUARC), 2021
2 Direct workforce includes direct employees (which include casual, fixed term and permanent employees (excluding leave of absence and non-executive directors)) and temporary workers and workers contracted through our partner organisations
3 Total workforce includes direct workforce and sub-contractors working on major infrastructure projects
4 No assurance can be given that these potential opportunities will eventuate on the timetable outlined or at all, or that Transurban will be able to participate in them. Transurban’s ability to participate in any future projects or acquisitions will be subject to, among other things, applicable government processes and the receipt of relevant regulatory approvals
5 On a calendar year basis6 Rozelle Interchange is being delivered and funded by
Transport for NSW7 Transurban is not a sponsor of the Olympic Games,
any Olympic Committees or teams
Region Projects in delivery and potential opportunities4 Expected delivery5Next 5 years 5+ years
Sydney WestConnex M4–M5 Link 2023Rozelle Interchange6 2024M7–M12 integration and delivery Early developmentWestern Harbour Tunnel and Sydney Harbour Tunnel potential monetisation lM6 potential monetisation lBeaches Link potential monetisation l
Melbourne West Gate Tunnel Project 2025North East Link potential monetisation l
Brisbane Gateway Motorway widening lLogan Motorway widening lBroader road enhancements including in relation to Brisbane 20327 l
North America
Fredericksburg Extension 2023495 Northern Extension 2025Maryland Express Lanes—Phase 1 Early development lCapital Beltway Accord lExpress Lanes enhancements and/or extensions lFuture traditional toll road and Express Lanes acquisition opportunities l lMaryland Express Lanes Project future phases lFuture opportunities in Quebec l
Figure 5: Opportunity and delivery pipeline
both to create social inclusion and manage our environmental impacts. Our Social Licence Framework helps us identify the initiatives, investments and partnerships that will have the greatest social, economic and environmental benefits for the regions we operate in (read more on page 43).
Success for us means achieving our purpose and creating value for all our stakeholders.
9.7Mcustomers globally
9,000+total workforce3
1996listed on the ASX
Governance and risk
Financial statements
Security holder information
Sustainability supplement
Business performance
Remuneration report
Directors’ report
Introduction and overview
Corporate Report for the year ended 30 June 2022

16
Ownership (as at 30 June 2022)
Length in kilometres
Concession end
Melbourne, Victoria
AU S TR A LI AAU S TR A LI A
V I C T O R I AV I C T O R I A
DOMAIN DOMAIN TUNNELTUNNEL
WEST GATE WEST GATE BRIDGEBRIDGE
BOLTE BOLTE BRIDGEBRIDGE
Essendon Essendon AirportAirport
Swanson Swanson DockDock
Webb DockWebb Dock
Melbourne Melbourne AirportAirport
BURNLEY TUNNELBURNLEY TUNNEL
CityLink CityLink Western Link Western Link M2M2
CityLink CityLink Southern Link Southern Link
M1M1
West Gate West Gate Tunnel ProjectTunnel Project
MELBOURNE CBD
N E W SO U T H W A LE SN E W SO U T H W A LE S
AU S TR A LI AAU S TR A LI A
Moorebank Moorebank Intermodal TerminalIntermodal Terminal
Sydney AirportSydney Airport
M7M7
M4M4
M5 WestM5 West
M5 EastM5 East
M8M8
Lane Cove Lane Cove TunnelTunnel
NorthConnexNorthConnex
M2M2
Military Road Military Road E-rampE-ramp
Eastern Eastern DistributorDistributor
Cross Cross City City TunnelTunnel
M4–M5 LinkM4–M5 Link
Rozelle Rozelle InterchangeInterchange
SYDNEY CBD
SYDNEY SYDNEY HARBOUR HARBOUR
BRIDGEBRIDGE
M7M7
M2M2
SYDNEY SYDNEY HARBOUR HARBOUR TUNNELTUNNEL
Port BotanyPort Botany
Our roads and projects
1 Transurban manages incident response on about 45 kilometres of road on the following roads including: CityLink; Monash Freeway; Domain and Burnley tunnels; Bolte Bridge; Tullamarine Freeway; West Gate Bridge; and some sections of the West Gate Freeway
2 M5 West will form part of the WestConnex M5 concession once the current concession expires in December 2026. During that period Transurban’s proportional ownership will be 50% based on its current ownership proportion in WestConnex
3 Transurban’s proportional ownership of WestConnex, through its equity investment in STP JV, increased from 25.5% to 50% on 29 October 2021
4 Rozelle Interchange is being delivered and funded by Transport for NSW5 Rozelle Interchange is a complex design consisting predominantly of ramps. The length of
lane kilometres is about equivalent to a five-kilometre motorway with two lanes in each direction
Sydney, New South Wales
M5 West2 100% 22 km 2026
M2 100% 21 km 2048
Lane Cove Tunnel 100% 3.8 km 2048
Cross City Tunnel 100% 2.1 km 2035
Eastern Distributor 75.1% 6 km 2048
M7 50% 40 km 2048
M43 50% 14 km 2060
M83 50% 11 km 2060
M5 East3 50% 10 km 2060
NorthConnex 50% 9 km 2048
Projects
M4–M5 Link 50% 7.5 km 2060
Rozelle Interchange4 50% 5 km5 2060
CityLink1 100% 22 km 2045
Projects
West Gate Tunnel Project 100% 17 km 2045
Governance and risk
Financial statements
Security holder information
Sustainability supplement
Business performance
Remuneration report
Introduction and overview
Directors’ report
Corporate Report for the year ended 30 June 2022

17
Brisbane Brisbane AirportAirport
AU S TR A LI AAU S TR A LI A
AirportlinkM7AirportlinkM7
INNER CITY INNER CITY BYPASSBYPASS
FREDERICKSBURGFREDERICKSBURG
FREDERICKFREDERICK
SIR LEO HIELSCHER SIR LEO HIELSCHER BRIDGESBRIDGES
Legacy WayLegacy Way
Clem7Clem7
Port of Port of BrisbaneBrisbane
Australia Australia Trade CoastTrade Coast
Logan Logan MotorwayMotorway
95 Express 95 Express LanesLanes
395 Express 395 Express LanesLanes
495 Express 495 Express LanesLanes
Capital Beltway Capital Beltway AccordAccord
Gateway Gateway Motorway Motorway
Go Between Go Between BridgeBridge
Q U EEN SL A N D
BRISBANE CBD
M A RY L A N DM A RY L A N D
V I R G I N I AV I R G I N I A
WASHINGTON DC
495 Express Lanes 495 Express Lanes Northern ExtensionNorthern Extension
Fredericksburg Fredericksburg ExtensionExtension
Maryland Express Maryland Express Lanes Project— Lanes Project— Phase 1 SouthPhase 1 South
Maryland Express Maryland Express Lanes Project— Lanes Project—
Phase 1 NorthPhase 1 North
Ronald Reagan Washington Ronald Reagan Washington National AirportNational Airport
NO RTH A M E R IC ANO RTH A M E R IC A
A25 A25
Montréal Montréal Saint-Hubert Saint-Hubert
Longueuil AirportLongueuil Airport
Montréal Gateway Terminals Montréal Gateway Terminals Partnership Partnership (Port of Montréal)(Port of Montréal)
Termont Montréal Termont Montréal (Port of Montréal)(Port of Montréal)
DOWNTOWN
LOUIS-HIPPOLYTE LOUIS-HIPPOLYTE LA FONTAINE TUNNELLA FONTAINE TUNNEL
CHAMPLAIN BRIDGECHAMPLAIN BRIDGE
VICTORIA BRIDGEVICTORIA BRIDGEVILLE-MARIE TUNNELVILLE-MARIE TUNNEL
JACQUES-CARTIER JACQUES-CARTIER BRIDGEBRIDGE
OLIVIER-OLIVIER-CHARBONNEAU CHARBONNEAU BRIDGEBRIDGE
Q U ÉB ECQ U ÉB EC
NO RTH A M E R IC ANO RTH A M E R IC A
1 Along with the roads listed here, Transurban Queensland also manages operations, maintenance and incident response along Brisbane’s Inner City Bypass and provides tolling services on the Toowoomba Bypass on behalf of the Department of Transport and Main Roads
2 The 95 Express Lanes concession includes the 395 Express Lanes and the Fredericksburg Extension (under construction)
3 The 495 Express Lanes concession includes the 495 Express Lanes Northern Extension project (under construction)
4 Also known as the New American Legion Bridge I-270 Traffic Relief Plan
Brisbane1, Queensland
95 Express Lanes2 50% 50 km 2087
495 Express Lanes3 50% 22 km 2087
395 Express Lanes 50% 13 km 2087
Projects
Fredericksburg Extension 50% 16 km 2087
495 Express Lanes Northern Extension 50% 3.2 km 2087
Maryland Express Lanes Project—Phase 14 60 km
Capital Beltway Accord 4.2 km
Logan Motorway 62.5% 39.5 km 2051
Gateway Motorway 62.5% 23.1 km 2051
Clem7 62.5% 6.8 km 2051
AirportlinkM7 62.5% 6.7 km 2053
Legacy Way 62.5% 5.7 km 2065
Go Between Bridge 62.5% 0.3 km 2063
A25 100% 7.2 km 2042
Montreal, Quebec
Virginia and Maryland, Greater Washington Area
Governance and risk
Financial statements
Security holder information
Sustainability supplement
Business performance
Remuneration report
Directors’ report
Introduction and overview
Corporate Report for the year ended 30 June 2022

18
Pierce Coffee BSc President, North America
Pierce has been an integral part of Transurban since 2009. She oversees Transurban’s business in the United States and Canada, where she is responsible for the development, financing, construction, and operations of major toll road infrastructure.
Prior to her Executive Committee appointment, Pierce served as Vice President of Customer Experience and Operations, where she was responsible for end-to-end customer experience and operations across the growing Express Lanes in the US—including road operations, maintenance, dynamic pricing, account management and product development. She has held public affairs, communications, and marketing leadership roles in North America and Australia, during which she established the first customer marketing function in both markets. She currently serves on the Eno Transportation Board of Advisors and has been recognised as one of Virginia Business’ most influential transportation leaders.
Scott Charlton BSc, MBA Chief Executive Officer
Scott joined Transurban as Chief Executive Officer and Executive Director in 2012. Scott has led Transurban through significant growth during his tenure as CEO, expanding its position in existing markets and leading its entry into new markets.
Scott joined Transurban from Lendlease, where he held positions as Group COO and Group Director of Operations. Previously Scott held several senior positions across a range of infrastructure entities and financial institutions, including as CFO of Leighton Holdings Limited and Managing Director of Deutsche Bank in Australia and Hong Kong.
Scott is Deputy Chair of Infrastructure Partnerships Australia and is a member of the Monash Industry Council of Advisers, the Business Council of Australia and Roads Australia.
Michelle Jablko LLB(Hons), BEc(Hons) Chief Financial Officer
Michelle joined Transurban in 2021 as Chief Financial Officer. Michelle’s portfolio includes the group finance, treasury, tax, legal, audit, corporate affairs, investor relations and sustainability functions.
Prior to joining Transurban, Michelle was CFO at ANZ Bank for just under five years. That followed more than 15 years of experience in investment banking with UBS and Greenhill Australia as a Managing Director working across a vast array of industries, providing advice on mergers and acquisitions, capital management, funding, and investor relations. Early in her career, Michelle was a lawyer with Allens where she focused on mergers and acquisitions, tax and banking and finance law.
Henry Byrne BCom, LLB Group Executive, Victoria and Strategy
Henry was appointed Group Executive Victoria and Strategy in February 2020 with responsibility for the Victorian market and Strategy group, including strategic initiatives and traffic forecasting and analysis. He joined Transurban in 2007 and was appointed to the Executive Committee in 2017 as Group Executive Corporate Affairs. He has worked across most aspects of the business having held senior roles in commercial and operations, corporate affairs and investor relations.
Henry is a Non-executive Director for the Committee for Melbourne and a member of the Research Advisory Board for the Australian National University’s Institute for Infrastructure in Society.
Executive Committee
Governance and risk
Financial statements
Security holder information
Sustainability supplement
Business performance
Remuneration report
Introduction and overview
Directors’ report
Corporate Report for the year ended 30 June 2022

19
Andrew Head BA Group Executive, WestConnex
Andrew joined Transurban in 2003 and was appointed Chief Executive Officer—WestConnex (now known as Group Executive, WestConnex) in September 2018. Andrew is responsible for delivering Australia’s largest road infrastructure project, WestConnex, comprising multiple road-and-tunnel construction projects. Prior to his current role, Andrew held various roles on the Executive Committee including Group General Manager NSW, Group Strategy, and Group Development.
Before joining Transurban, Andrew held roles at PricewaterhouseCoopers and worked in the NSW Government. Andrew is Treasurer and a Director of Roads Australia.
Suzette Corr BCom, MBA Group Executive, People and Culture
Suzette joined Transurban in 2018 as Group Executive, People and Culture. She has responsibility for talent and leadership, organisational culture and development, diversity and inclusion, performance and remuneration, HR services and systems, and workplace relations.
Prior to Transurban, Suzette held Group General Manager roles at ANZ for Talent and Culture, Australia Division HR, Institutional and International Division HR, and as a Director of publicly listed AMMB Holdings Ltd Malaysia. Her earlier career was in consulting at EY, and she brings substantial experience dealing with a diverse and international workforce.
Michele Huey BCom, MBA Group Executive, NSW
Michele joined Transurban in 2015 as Group Executive, Strategy, and was appointed to the role of Group Executive, NSW Business Operations in 2017. Michele is responsible for the NSW market (excluding WestConnex).
Before joining Transurban, Michele was the Group Head of Procurement and Group Head of Transformation at Lendlease Corporation, and a Principal at Booz & Company (now part of PricewaterhouseCoopers) where she worked with international and national organisations across the oil and gas, resources, industrial and financial services sectors on strategy development, operational improvement programs, and organisation transformations.
Simon Moorfield BSc Group Executive, Customer and Technology
Simon joined Transurban in October 2020 and in his role as Group Executive, Customer and Technology he has responsibility for the product development and service proposition for our Linkt customers, as well as global technology strategy and delivery.
Before joining Transurban, Simon held several executive and CIO positions in companies including AGL, Commonwealth Bank and GE. Simon has an extensive background in transformations, mergers and acquisitions and customer engagement platforms.
Hugh Wehby BEc (Hons) Group Executive, Partners, Delivery and Risk
Hugh joined Transurban in October 2020 and in his role as Group Executive, Partners, Delivery and Risk he has responsibility for our strategic partnerships with investment partners, major project delivery, new project opportunity development, risk, and health, safety and environment.
Before joining Transurban, Hugh held various roles at Sydney Airport including Chief Operating Officer and Chief Financial Officer, and previously worked at Macquarie Group across investment banking and asset management. Hugh is also a Director and Chair of the Finance and Properties Committee at Northcott, a not-for-profit disability services provider.
Sue Johnson BBus, BSc Group Executive, Queensland
Sue joined Transurban in 2001 and has held several executive roles in two decades with the business. In early 2018, Sue was appointed Group Executive, Queensland where she oversees the development, financing, construction and operations of our South East Queensland roads. In her previous role as Group Executive, Customer and Human Resources, Sue transformed Transurban’s global customer-service approach.
Sue sits on the Committee for Brisbane Advisory Panel and the Queensland Government’s Innovation Advisory Council.
Governance and risk
Financial statements
Security holder information
Sustainability supplement
Business performance
Remuneration report
Directors’ report
Introduction and overview
Corporate Report for the year ended 30 June 2022

Our purposeTo strengthen
communities through transport
Our strategyBy understanding what matters
to our stakeholders, we create road transport solutions that make us
a partner of choice
Our busin
ess s
trate
gy d
rives
val
ue fo
r st
akeh
olde
rs
Our busin
ess s
trate
gy d
rives
val
ue fo
r st
akeh
olde
rs
20
Governance and risk
Financial statements
Security holder information
Sustainability supplement
Business performance
Remuneration report
Directors’ report
Introduction and overview
Corporate Report for the year ended 30 June 2022

Our strategy in action
21
The value we create for our stakeholders
Customers
The millions of people and businesses that use our roads.
More productive and liveable cities through:
• safer roads enabling efficient journeys
• faster and more reliable travel times
• choice, convenience, transparency and value for customers in the routes they take and the ways they interact with us.
Government and industry
The government partners, and the transport and business community we are active in.
Innovative and efficient transport infrastructure to cater for growing urban populations through:
• capital input freeing up government balance sheets
• potential to fast-track project delivery and provide economic, social and other benefits earlier
• private sector expertise in innovative design, construction and operations
• capturing data and sharing insights.
Communities
The communities in which we operate.
Better connected and more sustainable communities through:
• safe, effective roads that support private transport
• improved productivity and easier access to goods and services through transport connections
• reduced through-traffic in local neighbourhoods
• job creation through construction projects and flow-on employment opportunities
• improved amenities and partnerships informed by community engagement.
Business partners and suppliers
The organisations providing goods and services we rely on to deliver for our customers.
Better community and environmental outcomes through influence in our extensive supply chain through:
• long-term relationships with lasting economic benefits in employment, goods and services procurement
• shared systems that contribute to better oversight and risk management
• opportunities for innovation and enhanced sustainability performance.
Our people
Our workforce and subcontractors supporting our projects and operations.
Highly capable workforce through:
• focus on safety, employee wellbeing and diversity
• job creation and skills development
• talent development.
Investors
The institutional, superannuation, retail and debt investors that provide us with the capital to deliver long-term, responsible growth.
Sustainable investment proposition through:
• balanced distribution growth and long-term value creation
• disciplined approach to future opportunities
• leading ESG performance.
Governance and risk
Financial statements
Security holder information
Sustainability supplement
Business performance
Remuneration report
Directors’ report
Introduction and overview
Corporate Report for the year ended 30 June 2022

22
Developing trends and advances in the infrastructure and transportation sector present new opportunities but also potential disruptions. We keep a close watch on the external factors that may impact our business’ operations.
Global trends
Confidence is returning to our cities. International borders have reopened, airports are bustling and traffic is nearing pre-pandemic levels as most of the world emerges from almost two years of restrictions.
While new issues—from supply chain bottlenecks to rising costs—are testing governments and communities, some of the familiar challenges facing our cities have also resurfaced.
Pre-pandemic, many of our cities faced the prospect of congestion on both roads and public transport, reducing productivity and quality of life. Now, as traffic has returned, so have the traditional rush hours.
External surveys commissioned by Transurban since July 2020 have consistently found respondents have an increasing preference for private vehicle travel over public transport. In our January 2022 survey, an average of 16% more people, across Sydney, Melbourne and Brisbane and 7% more people in the Greater Washington Area said they intended to use private vehicles every day post-pandemic, compared to pre-pandemic. Ongoing concerns over personal health and safety are contributing to that shift. If the trend continues, road networks are likely to face further pressure.
At the same time, many cities also have a significant backlog of transport projects and face the added prospect of a shortage in skilled labour. In Australia, skilled visa numbers have been declining for the past five years, contributing to a labour shortage that has been exacerbated by pandemic-related border closures1. With multiple city-shaping construction projects underway and many more planned or in development, addressing this issue will be vital to maintain the delivery of much-needed infrastructure projects.
Meanwhile, keeping our cities moving efficiently to avoid a return to the peak-hour crushes of the past will require some innovative thinking.
Flexible work arrangements that have been so prominent during the pandemic provide an opportunity to manage demand on transport networks, by shifting commuters away from traditional peak hours. In Australia, the NSW Government has also flagged the potential to change long-standing school hours as another option to help manage congestion. Our traffic data shows that even small shifts in travel behaviour can have a big impact on congestion and help transport networks operate most effectively.
At Transurban we have offered flexible work arrangements for some years, including investing in technology to allow our employees to work remotely. We encourage employees to consider options such as flexible workday start and finish times.
However, we recognise that flexible work as a way of addressing mobility constraints requires a coordinated approach between public and private sectors. In response, we have promoted a ‘Beat the peak traffic’ campaign, inviting drivers to shift their travel patterns—and potentially save up to 1.5 hours travel time a week. This campaign capitalised on the new flexibility many workplaces have retained since pandemic-related restrictions have eased.
Transport costs On the back of two years of disruptions
across multiple sectors, geo-political factors including the Russia-Ukraine War and climate-change related floods and droughts have led to rising costs for consumers across the globe.
The average amount a customer spends on tolls remains a small proportion of typical household expenditure,2 and on average, our Australian customers spend $6.70 per week on tolls, with 81% spending less than $10 per week.3 The majority of our Express Lanes customers in the US spend less than USD8 on each toll.
Our July 2022 research into mobility trends found that while 63% of Australian respondents were concerned about fuel prices, other transport costs such as public transport (9%) and tolls (8%) were less concerning.
However, we recognise that a proportion of our customers are frequent toll road users.
We are undertaking detailed analysis to better understand spending patterns of frequent users from economically vulnerable areas and also offer our Linkt Assist (Australia) and First Time Forgiveness (US) to those customers who need support.
We also recognise the impacts on our commercial customers and will continue to work with them on a case-by-case basis.
Funding future road infrastructure
The rising cost of fuel has led to several governments temporarily cutting fuel excise. The Australian Federal Government has halved fuel excise to 22.1 cents a litre for the six months leading to 28 September 2022. In March 2022, the Maryland Government in the US suspended fuel excise for one month.
Net fuel excise in Australia has been declining in real terms for decades due to more fuel-efficient and zero emissions vehicles (ZEVs) and the gap between revenue collected and funding needed to build and maintain transport infrastructure is ever widening. The current fuel excise regime also presents equity issues. As the world works to decarbonise its transport systems by encouraging the adoption of ZEVs,4 drivers with older and less fuel-efficient vehicles will inevitably pay more in fuel excise.
1 The Age (2022) ‘We’ve got a crisis. We need workers’: Big business urges election winner to boost migration. Accessed 30 June 2022
2 Australian Bureau of Statistics and internal Transurban analysis
3 Australian customers traveling in a private vehicle ( July 2021 to June 2022)
4 Per kilometre travelled compared to drivers of fuel-efficient vehicles or ZEVs
Governance and risk
Financial statements
Security holder information
Sustainability supplement
Business performance
Remuneration report
Introduction and overview
Directors’ report
Corporate Report for the year ended 30 June 2022

23
While the push to reduce transport emissions is critical, it also points to the inadequacy of the current system.
Transurban has long advocated for a fairer, sustainable funding model that meets future infrastructure needs and prepares for the inevitable transition to ZEVs. Such a model would be based on road usage. Some governments are exploring user-based charging through real-world trials and in Australia, the Victorian Government has introduced a road usage charge for electric vehicles and plug-in hybrids.
In July 2021, we commissioned research to gauge the community’s understanding and attitudes towards a road usage charge and found that after comparing both models, 50% of respondents preferred such a charge, compared to 32% who preferred the current funding model.1
However, we also found that most people had little or no understanding of the funding challenge facing governments with 81% of respondents across Victoria, NSW and Queensland claiming to know a little, or nothing at all about road funding.1 This points to the need for further education about the issue.
Vehicle technology transforming travel
The future of transport is expected to involve safer and more sustainable mobility options that provide convenience and personalised transport choices.
Most vehicle manufacturers are working on the transition to electric as well as connected and autonomous vehicles (CAVs). These vehicles will, via ever-more-advanced sensors, data management and artificial intelligence, increasingly perform independently of their operators and in tandem with surrounding vehicles. As well as improving efficiency and travel times, and reducing transport emissions, given human error is estimated to contribute to 90% of vehicle crashes, CAVs are expected to make road travel safer.
Freight operators are expected to transition their fleets to CAVs faster than other industries. The benefits CAVs deliver are potentially most valuable to freight operators, particularly for point-to-point journeys on tollways and other high-functioning roads.
We are staying on top of these trends through continual research and development (including running pilot programs) as well as through partnerships with relevant technology providers.
Addressing climate change
The impacts of climate change are already being felt around the world. As a road operator with assets across three countries and both hemispheres, and an average concession of more than 28 years, climate change will affect the way that we operate
—Highlight—
Urban mobility trends research
Since the start of the pandemic, we’ve surveyed thousands of people in cities across Australia and North America to track the impact of COVID-19 on how we live, work and move around cities, through lockdowns, reopening and recovery.
Our research found people increasingly prefer private vehicles over public transport, leading us to explore associated topics including: using flexible work to manage peak network demand; and road-funding reform to help prepare the road network for higher future demand.
We have now published five Urban Mobility Trends industry reports, including two during FY22 and the latest in August 2022.
Urban Mobility Trends: Road Funding Reform (August 2021)
This report looked ahead to a post-pandemic future, and a critical issue Australia needs to solve to ensure its road infrastructure keeps pace with future demand: road funding. This research investigated people’s understanding of Australia’s existing road-funding system and attitudes towards road-user charging reform.
Read report on transurban.com/mobility-report-fy21
Urban Mobility Trends from COVID-19 (February 2022)
This report checked back in on mobility trends observed during the first three surveys, to see how attitudes and expectations may have shifted as we emerged from two years of intermittent disruption and began to return to a form of normalcy. It covered transport mode preferences, online shopping habits and flexible work patterns.
Read report on transurban.com/mobility-report-1h22
Latest reportOur latest Urban Mobility Trends Industry
Report, published in August 2022, asks people about their current and future travel behaviours, their working arrangements, what influences their transport choices, the transport challenges in their communities and their views on transport infrastructure.
Read more on our Insights Hub, insights.transurban.com
our business into the future. It is also incumbent on us, as an industry leader, to set the highest sustainability standards for our operations. We have set ambitious emission reduction targets and are delivering programs to meet these targets, recognising the risks—threats and opportunities—that climate change presents. We are also preparing our assets to tolerate extreme weather events. Our response aligns with the Task Force on Climate-related Financial Disclosures’ (TFCD) recommendations.
Read more in our FY22 Climate Change Disclosure on transurban.com/ccd22
1 Transurban’s Urban Mobility Trends: Road Funding Reform, August 2021
Governance and risk
Financial statements
Security holder information
Sustainability supplement
Business performance
Remuneration report
Directors’ report
Introduction and overview
Corporate Report for the year ended 30 June 2022

24
Business performance
Governance and risk
Financial statements
Security holder information
Sustainability supplement
Remuneration report
Introduction and overview
Directors’ report
Business performance
Corporate Report for the year ended 30 June 2022

25
Once completed, the West Gate Tunnel Project will deliver a vital alternative to the heavily congested West Gate Bridge and provide new links to Melbourne’s port, CityLink and the city.
The project includes 18 kilometres of new lanes on the West Gate Freeway, widening from eight to 12 lanes and easing traffic congestion for the 200,000 motorists who use it daily. More than 70% of widening works are now complete and 80% of the project’s new and improved noise walls have been installed. The project is currently completing its IS ‘Design’ rating.
Two tunnel boring machines—the biggest of their kind in the southern hemisphere—are now digging the twin tunnels beneath Melbourne’s inner west. The tunnels are expected to remove around 9,000 trucks from local roads a day by providing a direct route from the port to the industrial areas of Melbourne’s west.
Tunnelling began in early 2022, after Transurban, the Victorian Government and the design and construction (D&C) subcontractor reached an agreement on revised project delivery terms, including a new completion date of late 2025. As part of the agreement, the D&C contract total cost was increased by $3.4 billion, with Transurban and the Victorian Government
each contributing $1.7 billion. The D&C subcontractor withdrew its claim for additional construction costs (see B2 on page 128 for more information).
The tunnels connect to a new bridge and ramps being built over the Maribyrnong River—the first steel support beams were lifted into place in May 2022. The bridge will connect the new tunnels with an elevated roadway above Footscray Road, where a state-of-the-art launching gantry has so far enabled the construction of more than 700 metres of the new two-kilometre, six-lane elevated road that will connect to CityLink, and improve links between the city centre and Melbourne’s northern and western suburbs.
In collaboration with our partners, we engaged with 4,000 community members this financial year to discuss both construction impacts and project benefits. With children back in classrooms in 2022, we also visited 22 schools in Melbourne’s western suburbs as part of our West Gate Kids Schools Engagement Program, conducting hands-on activities to help kids learn about how infrastructure is built.
See how this project fits into our portfolio (pages 16 to 17)
1 Victoria State Government: Western Distributor Business Case (2015)
2 Victorian Government West Gate Tunnel Project website
33M worker hours
~$11Bestimated economic benefits for the State of Victoria1
~6,000construction jobs created, including up to 400 regional jobs
Up to
20 minsexpected travel-time savings per trip2
>14kmnew and upgraded walking and cycling paths
~9hanew parks and wetlands
Project update
Melbourne
westgatetunnelproject.vic.gov.au
West Gate Tunnel Project
Governance and risk
Financial statements
Security holder information
Sustainability supplement
Remuneration report
Introduction and overview
Directors’ report
Business performance
Corporate Report for the year ended 30 June 2022

26
SydneyProject update Future project
1 Parramatta to Sydney Airport once project is completed. WestConnex Updated Strategic Business Case, November 2015
2 National Institute of Water and Atmospheric Research 2021
3 Transurban economic analysis
WestConnex is one of the world’s largest road infrastructure projects and, once complete, will connect Sydney’s west and southwest suburbs with the city centre, airport and Port Botany via a 33-kilometre traffic-light-free motorway.
We are nearing completion for the next critical stage of the project, the M4–M5 Link which is being delivered by Transurban. The project is currently finalising its IS ‘As Built’ rating.
The M4–M5 Link civil works were completed in FY22, and the project is on track to open to traffic in Q3 2023. When opened, these 7.5-kilometre tunnels are expected to reduce travel times and improve travel reliability by allowing motorists to bypass up to 52 sets of traffic lights between western Sydney and the city centre.
The tunnels have the capacity to carry up to 100,000 vehicles a day, significantly reducing traffic and heavy vehicles on congested surface streets. Moving traffic underground also helps improve liveability in local communities: the first stage of the project, the M4 Tunnels corridor, has delivered air quality improvements of 10 to 15% since opening in 20192.
Safety improvements have also been significant. Since WestConnex’s M8 tunnels opened, smoother traffic flow has reduced serious crashes on the neighbouring M5 East by 40%.
Rozelle Interchange (delivered by the NSW Government) connects to the M4–M5 Link and is scheduled to open in late 2023.
In 2018 Transurban and its co-investors in Sydney Transport Partners (STP) acquired a 51% stake in WestConnex from the NSW Government. In October 2021, STP acquired the remaining 49% equity stake from the NSW Government for $11.1 billion, taking STP’s total ownership interest to 100%. Transurban owns 50% of STP.
Transurban, alongside its strategically aligned partners, has operational control of WestConnex. We opened the M4 in 2019 and the M8 in 2020.
90%project completion
~40,000 workers
>10,000workers involved in M4–M5 Link, with more than 40% from Western Sydney
Up to
40 minstotal travel-time savings Parramatta to Sydney Airport1
52 traffic lights bypassed
23kmnew and upgraded cycle and shared paths
18haopen space
300+WestConnex Community Grants awarded, benefitting ~155,000 people
26kmmotorway, adding +one lane in each direction
1,600jobs at the peak of construction
4Mhours in travel time to be saved per year3
2023proposed construction commencement
The M7–M12 integration and delivery project will cater for Sydney’s growing western suburbs and planned second international airport, which is expected to begin operations in 2026.
With our Westlink M7 partners, we submitted an Unsolicited Proposal to the NSW Government for the project. The proposal, to widen the M7 and connect it with the planned M12 motorway, progressed to the third stage of the NSW Government’s Unsolicited Proposals Process in FY22. Subject to Government approval and final documentation, construction is anticipated to start in early 2023, with the project anticipated to take around three years.
Sections of the M7 are already operating at capacity and will likely face further pressure when the government-delivered M12, which provides direct access to the Western Sydney International Airport, opens in late 2025.
Our M7 widening proposal includes: funding and construction of an additional 26-kilometre lane in each direction; building the M7–M12 Interchange; and building connecting roads between Elizabeth Drive and the new M12.
These enhancements are expected to save road users more than four million hours of travel time per year,3 as well as reducing stop-start traffic. Our delivery approach includes local community partnerships designed to boost both jobs and the economy during construction and beyond.
M7–M12 integration and deliveryWestConnex
westconnex.com.au
See how this project fits into our portfolio (pages 16 to 17)
Governance and risk
Financial statements
Security holder information
Sustainability supplement
Business performance
Remuneration report
Introduction and overview
Directors’ report
Corporate Report for the year ended 30 June 2022

27
A ground-breaking ceremony in March 2022 marked the official start of construction on the 495 Northern Extension project —known as Project NEXT. This project will extend our 495 Express Lanes from Virginia towards the Maryland border with new connections at the Dulles Toll Road and George Washington Memorial Parkway.
The four-kilometre extension is expected to reduce peak travel times by up to 25 minutes3 and improve connectivity to key economic hubs including Tysons and Dulles Corridor. This project is also preparing the lanes for the Capital Beltway Accord—the rebuild of the ageing American Legion Bridge and extension of the Express Lanes north across the Potomac River into Maryland.
The project will facilitate a new bus service connecting Virginia and Maryland, supported by a commitment of $2.2 million in annual public transit investment from toll revenues.
New bicycle and pedestrian connections will be built along the project’s corridor. The project also includes commitments for major stream restoration works. The project is working towards its Silver Envision rating.
The project is a public-private partnership between the Commonwealth of Virginia and Transurban and is expected to open to traffic in 2025.
~6,300jobs during construction2
USD880Meconomic boost—estimated through construction and project delivery3
20%reduction expected in accidents along the I-4954
50%time saving during peak commuting times4,5
6.4kmcycle and pedestrian connections
16kmextension of 95 Express Lanes
1M+project work hours completed
+955,000 m3
earth moved
66%more capacity during peak times1
~9,000jobs2
USD1Beconomic boost—estimated through construction and project delivery
The Fredericksburg Extension project—known as FredEx—continues to progress with major milestones, including the rebuild of a second overpass and a series of steel beam lifts for fly-over ramps completed.
The project involves extending the 95 Express Lanes by 16 kilometres and, when complete, will create the longest reversible Express Lanes system in North America, spanning approximately 80 kilometres from Washington DC to Fredericksburg, Virginia. The project is working towards its Silver Envision rating.
FredEx is expected to deliver 66% more capacity during peak travel times,1 relieving congestion in one of the worst traffic hotspots in the US, and more reliable and faster travel times for the many workers in the region, including 28,000 Quantico Marine Base employees. Buses and carpools will travel for free.
Working collaboratively, Transurban, the Commonwealth of Virginia and the D&C subcontractor reached an agreement on a new targeted completion date of late 2023. This allows for the mitigation of construction challenges posed by the presence of highly plastic clay in the corridor soil.
Fredericksburg Extension 495 Northern Extension
Project updates
Greater Washington Area
495northernextension.orgexpresslanes.com/projects/fredericksburg-extension
See how this project fits into our portfolio (pages 16 to 17)
See how this project fits into our portfolio (pages 16 to 17)
1 FredEx Level 2 Study. Virginia Department of Transport
2 Estimated number of jobs expected from the economic development of the project
3 Virginia Department of Transport
4 I-495 Express Lanes Northern Extension, Location and Design Public Hearing. Virginia Department of Transport. 5 October 2020
5 For those who choose the Express Lanes
Governance and risk
Financial statements
Security holder information
Sustainability supplement
Remuneration report
Introduction and overview
Directors’ report
Business performance
Corporate Report for the year ended 30 June 2022

28
New and enhanced ramps to the 95 and 395 Express Lanes will give customers better access to the growing economic hubs along the Express Lanes corridor, offering improved travel choice and more reliable travel times.
The Commonwealth of Virginia has approved the conversion of ramps at Seminary Road (395) and Opitz Boulevard (95), which will improve access to the 62.8-kilometre Express Lanes corridor.
The 395 Seminary Road Ramp Project involves converting an existing high occupancy vehicle (HOV) lane ramp onto the 395 Express Lanes into an express lane ramp. It is expected to be converted later this year.
The 95 Express Lanes Opitz Boulevard Ramp Project will construct a new reversible ramp between the 95 Express Lanes and an expanded Opitz Boulevard bridge, servicing one of the fastest growing counties in Virginia. Construction of this USD70 million project is scheduled to begin first half of FY23. It is expected to open in 2024.
~96km/haverage speed on HOT lanes in 20451
~24km/hfaster travel on general-purpose lanes in 20451
USD12.6Beconomic boost—estimated through construction and project delivery2
43,400job-years2,3
8 MOUs signed with local organisations4
The Maryland Express Lanes Project—Phase 1 proposes to add high-occupancy toll (HOT) lanes to approximately 60 kilometres of highway linking Maryland’s inner Washington DC suburbs with Maryland’s northern suburbs.
The proposal is intended to address some of the region’s worst congestion, extending the benefits of the Virginia Express Lanes to Maryland and Virginia motorists.
The final step of the environmental review process (NEPA Record of Decision) remains under evaluation by federal and state parties, and we are currently working with Maryland Department of Transportation (MDOT) on an updated project timeline.
The process to select D&C subcontrator(s) to continue to advance early development and design work is underway.
The rebuild and expansion of the American Legion Bridge is expected to be completed within Phase 1 South, the first segment of the project to be delivered. Virginia and Maryland are currently progressing agreements for this Accord (see right).
When complete, the project is expected to improve speeds for both the neighbouring general-purpose lanes and the new toll lanes. The lanes are expected to reduce delays by 13% during the morning peak and 38% in the afternoon peak.1 A new bicycle/pedestrian crossing between Maryland and Virginia are also expected to form part of the project.
1 I-495 and I-270 Managed Lanes Study: Final Environmental Impact Statement
2 Economic analysis by George Mason University, 2022
3 43,400 job-years of employment (one job lasting for one year)
4 Memorandums of Understanding (MOUs) to assist in developing training, education and workforce development programs and increase inclusion of disadvantaged businesses working on the project
Capital Beltway AccordThe proposed Capital Beltway Accord
is expected to be a bi-state (Virginia and Maryland government) agreement to:
• add two express lanes in each direction across the Potomac River
• replace the ageing American Legion Bridge with upgraded general-purpose lanes.
The rebuild and expansion of the American Legion Bridge expected to be completed within Maryland Express Lanes Project—Phase 1.
Agreements between both state governments are in progress.
The project team has engaged with our stakeholders early to understand their needs and has attended more than 30 stakeholder events in the area. They have joined eight local chambers of commerce and held 50 briefings with state and local elected officials.
Community feedback will inform the design and solutions to minimise the construction impacts for road users, the local community and businesses, as well as the environment.
95/395 Express Lanes—enhancements
See how this project fits into our portfolio (pages 16 to 17)
Project updates
Maryland Express Lanes—Phase 1
Greater Washington Area
Governance and risk
Financial statements
Security holder information
Sustainability supplement
Business performance
Remuneration report
Introduction and overview
Directors’ report
Corporate Report for the year ended 30 June 2022

29
See how our strategy creates value for our customers (pages 20 to 21)
UN SDGs relevant to this section
road injury crash index below target of <4.25
3.78hours saved by
customers every workday
323,000customers
3.7 million North America, 6 million Australia
9.7M
CustomersOur customers make around two million trips on our roads every day—saving around 323,000 hours in travel time every workday by taking our roads instead of the alternate routes.
While government-imposed COVID-19 pandemic restrictions, particularly in Sydney and Melbourne, during the first half of FY22 significantly impacted traffic volumes, we’ve seen traffic volumes grow as the year progressed.
This year, we continued to increase our customer account numbers for all our retail brands: Linkt in Australia; Express Lanes and GoToll in the US; and A25 in Canada. We now have more than 9.7 million customers, an increase of almost 10% since FY20.
As well as investing in high-quality and safe roads, we also use technology to ensure our customers’ experiences off the road are as easy and seamless as possible. More than 96% of our Australian customers use our digital apps and website to manage their toll road travel.
Governance and risk
Financial statements
Security holder information
Sustainability supplement
Remuneration report
Introduction and overview
Directors’ report
Business performance
Corporate Report for the year ended 30 June 2022

303030
Our Australian 24/7 incident response teams manage around 1,000 incidents a week. Safe management of incidents can include lane closures or reduced speed-limits. Planned road works can also impact travel times.
Until this year, we only shared live information about travel disruptions via the Linkt website and our Twitter accounts—but both options required customers to proactively check for information.
Through external research of our Australian customers, we found they wanted early and live notifications of potential delays:
• 67% of customers wanted to be notified about incidents occurring on our roads
• 87% considered ‘time delay’ the most useful information we could provide
• 40% wanted to choose which roads to be notified about.
Customers choose our roads for reliable and faster travel times, so information about live-traffic conditions is important to ensure we meet their expectations.
On alert: how we keep our customers moving
Understanding what matters to our customers
In March 2022, we implemented road incident notification functionality within the Linkt app, allowing customers to request notifications for specific roads, road sections, and times.
When an incident occurs, customers are notified about the location, delay type and if incident response crews are on the scene. This feature means customers can choose our roads with confidence and receive the value they expect: a quicker, safer and more reliable journey.
Governance and risk
Financial statements
Security holder information
Sustainability supplement
Remuneration report
Introduction and overview
Directors’ report
Business performance
Corporate Report for the year ended 30 June 2022
—Case study—
Financial statements

31
We invest in industry-leading safety and traffic management technologies that smooth traffic flow, ease congestion and ensure road users have the safest possible experiences on our roads. Our 24/7 road monitoring and incident response further enhance the safety and reliability of our roads.
On-road experience
In July 2020, a toll was applied to Sydney’s M5 East when the neighbouring M8 opened. A one-way trip using the 5.5-kilometre road used to take up to 18 minutes. The same trip now takes around eight to nine minutes during peak traffic times and average travel speeds along the existing M5 corridor have improved by almost 60%.
In FY22, traffic continued to be impacted by government-mandated restrictions related to COVID-19, however in most markets traffic recovered in line with the easing of restrictions.
By April 2022, traffic on CityLink in Melbourne was trending towards pre-pandemic levels.
In response, we launched a ‘Beat the peak traffic’ campaign, inviting drivers to shift their travel patterns—and potentially save up to 1.5 hours travel time a week. This campaign capitalised on the new flexibility many workplaces have retained post-restrictions, including on workday start and finish times.
Average daily traffic (# vehicles)
Average workday travel-time savings
(# hours)Sydney 802,000 168,000
Melbourne 648,000 62,000
Brisbane 418,000 74,000
North America 140,000 19,000
Figure 6: Annualised benefits for each region
Beat the peak: find out the best times to travel in Melbourne, transurban.com/beatthepeak
Governance and risk
Financial statements
Security holder information
Sustainability supplement
Remuneration report
Introduction and overview
Directors’ report
Business performance
Corporate Report for the year ended 30 June 2022

32
Our approachTransurban’s Road Safety Strategy is
based on the best-practice Safe System Approach that recognises road safety as a shared responsibility—including the individuals and businesses who use the roads and those building and managing road networks. We are aligned with World Health Organisation (WHO) targets and UN SDGs to address road safety risks.
We champion road safety by:
• implementing targeted and evidence-led safety initiatives
• using proven and innovative technology to reduce incident risk
• providing 24/7 monitoring and incident-response services
• supporting and conducting ongoing research into diverse road safety issues
• delivering tailored community education programs.
Road safety is a part of our Social Licence Framework. Read more on page 43
Eyes on the roadOur extensive roadside technology
capabilities—including control-room observations, CCTV and road sensors—ensure we can quickly identify and respond to incidents, helping keep our roads safer for all our customers.
In Brisbane, we’re continuing to consolidate our four traffic control rooms into one state-of-the-art traffic control centre. This centre will ultimately monitor our entire 81-kilometres of roads, tunnels and bridges. In FY22, the Legacy Way tunnel was brought into this centralised control centre, which will use artificial intelligence technology to automatically identify incidents and congestion, and alert operators.
In Melbourne, work commenced in June 2022 on a major makeover for the Burnley Tunnel. Works will improve traffic flow and include installing Australian-first and state-of-the-art pacemaker lighting to encourage drivers to maintain a consistent and safe speed.
Road safetyWe’re always working towards our ultimate
target of zero fatalities and life-changing injury crashes on our roads.
We track our performance using a Road Injury Crash Index (RICI)—the number of serious injury crashes per 100 million vehicle kilometres travelled (VKT) on our roads. In FY22, we achieved a RICI of 3.78, 11% lower than our target RICI of no more than 4.25 (Figure 7).
During the government-mandated COVID-19 travel restrictions in the first half of FY22, traffic numbers on our roads fell—and so did crash numbers, from 286 in FY21 to 246 in FY22.
We continued to identify and implement initiatives to reduce common crash types on our roads (see below). Most crashes on our roads result in no injury to the occupants involved.
Pandemic-related restrictions on travel also contributed to declining rates of rear-end crashes—the most common crash type on our roads—owing to reduced congestion.
Over the past three years, improved data insights and a range of interventions have been introduced to address rear-end crashes at hot spots, including speed management using variable speed limit signs and advanced congestion warning. These measures have contributed to a reduction in rear-end crashes, down from 50% in FY20 to 40% in FY22.
Our road safety performance has been independently assessed in line with the International Road Assessment Program (iRAP) and by the Australian Road Research Board, who found 91% of travel on our roads to be four-star or better, exceeding the national road safety target of 90% for national highways.
Research from the Monash University Accident Research Centre (MUARC) has also found that our roads in Australia are up to twice as safe—and have significantly fewer injury crashes—than like roads.4
We’re making every journey a safer one. Watch our campaign, transurban.com/roadsafety
Our safety performanceThe three most common crash types on our roads are:3
40%of crashes
Rear-endAssociated with congestion and driver distraction
16%of crashes
Out of controlAssociated with speed and usually single car
10%of crashes
Merging/side swipeAssociated with late exiting, inattention around trucks, and merging with on-road traffic
Read more on our Insights Hub, insights.transurban.com
1 In Australia2 FY22 maintenance cash spend on controlled entities
at 100%3 Incident types on Transurban roads in FY22.
Based on sample data taken from across our markets4 Monash University Accident Research Centre (MUARC),
2021
FY18 FY19 FY20 FY22FY21
4.82 4.71
3.70
4.293.78
Figure 7: RICI performance FY18–FY22
21 assets in operation
330+kilometres of roads
5,000+CCTV cameras on our roads1
~1,000incidents managed per week1
$97Minvested in maintenance2
Our operations
Governance and risk
Financial statements
Security holder information
Sustainability supplement
Business performance
Remuneration report
Introduction and overview
Directors’ report
Corporate Report for the year ended 30 June 2022

33
1 NTI NTARC Major Accident Investigation Report, 2021
Read more on our Insights Hub, insights.transurban.com
In the US, our dynamically tolled 95 and 395 Express Lanes have horizontal and vertical gates, used to open or close entry points, depending on what direction traffic is flowing. We have launched a pilot to evaluate alternate flagging systems on the gates, to influence safer driver behaviour and reduce gate strikes. Early results have shown a reduction in strikes and we have plans to expand the pilot.
Read more about our safety approach with our people page 49 and our contractors page 64.
Road safety research
Research helps us understand complex safety issues and enables us to test technology and other solutions under controlled conditions to ensure they will be effective.
We continued our partnership with Neuroscience Research Australia (NeuRA), with research conducted at the Transurban Road Safety Centre in Sydney. NeuRA scientists use a crash sled capable of reaching speeds up to 64 kilometres per hour to understand road safety injury risks.
FY22 NeuRA research has included:
• Motorcycle fuel tank trials: measuring motorcyclist pelvic injuries to understand how fuel tank and rider positioning contribute to these injuries.
• Seating posture injury risks for young and older adults and children: preparing for autonomous vehicles, where vehicle occupants may adopt non-standard seating positions to help us understand future safety system requirements.
• Optimising safety for rear-seat occupants of all ages: exploring rear-door properties and risks; rear-seat video screen risks; and seat-size variations and optimisations to understand and improve rear-seat passenger safety.
To help raise awareness and reduce crash risks for children, in FY22, we ran:
• Car Seat Blitz (Australia) in partnership with Kidsafe, supporting free child car seat checks across our markets. Read more on page 44.
transurban.com/checkmyride
• Driving Willpower (US) campaign, targeting child car safety, including the correct fitting of child car seats.
drivingwillpower.com
UN SDGs relevant to this section
—Case study—
The future is now: preventing crashes before they happen
Technology and accurate and real-time data mean we can constantly explore ways to improve safety on our roads by proactively identifying trends and patterns.
Working with a road intelligence company, we can access data sourced directly—and anonymously—from connected vehicles’ GPS systems. This allows us to see where drivers have reacted in unusual ways, such as suddenly braking or swerving.
In Melbourne, data showed an issue with last-minute merging near the final CityLink exit before the Domain Tunnel. After line marking and directional signage were improved, rear-end crashes on the approach to the Domain Tunnel dropped by 75%, and lane side-swipes reduced by 66%, between August 2021 and April 2022 compared to the previous nine months. The new marking and signage are giving drivers clearer and more advanced warning of the exit before the tunnel. No serious or minor injuries have been recorded since the measures were installed.
In Sydney, we used in-car data to track swerving and sudden braking on the notoriously congested Pennant Hills Road (that provides an alternative route to the nearby NorthConnex tunnel). Data shows a 50% reduction in near misses on Pennant Hills Road in the 12 months since the tunnel opened, verifying that safety benefits are flowing to the wider road network following the opening of NorthConnex.
We’re also using this technology to assess off-ramp safety performance in Sydney and variable message signage efficacy in addressing merging risks on our Brisbane roads.
More than 78% of fatal crashes involving a truck and a car, the car was the at-fault party.1 In partnership with the Queensland Trucking Association, we have worked to raise awareness of truck blind spots
Governance and risk
Financial statements
Security holder information
Sustainability supplement
Remuneration report
Introduction and overview
Directors’ report
Business performance
Corporate Report for the year ended 30 June 2022

34
Our 9.7 million customers engage with us by managing their toll payments, planning their journeys—and even when they’re buying fuel.
Customer experience
Our Australian customers take an average of 5.7 trips per month and those travelling in a private vehicle spend $6.70 per week on tolls, with 81% spending less than $10 per week. The majority of our Express Lanes customers in the US spend less than USD8 on each toll, with around 7 out of 10 customers spending less than USD20 per month.
We gather feedback from our ongoing Voice of Customer (VoC) listening program and use these customer suggestions and insights to improve customer experience, and identify and address emerging issues.
Service ratingsWe also track customers’ account
management and service-related complaints to ensure we are delivering excellent service. This year in Australia, the number of complaints recorded per million trips fell by 12.54%. We also saw a reduction in customer service-related complaints (18%) and account management complaints (29%), indicating enhanced customer experiences.
Our customers trust us to protect their personal and financial information. We remain vigilant in our cybersecurity measures and programs to keep pace with the changing risk environment, including refreshed customer identification and privacy training.
Making it easyMore than 96% of our Australian
customers prefer to interact with us via digital tools—in FY22, our Australian Linkt and LinktGO apps were downloaded almost 500,000 times.
In April 2022, our LinktGO app hit a record net promoter score (NPS) of +49. NPS is a measure of participant advocacy, and the app averages 38, demonstrating customer satisfaction and loyalty. We continually invest in activities that improve the functionality of our digital channels and this year focused on delivering new personalised features in response to customer feedback.
Our digital tools, such as Trip Compare which is available in Victoria and NSW, help customers make informed choices about the best route to take. Over 185,000 trip calculations were made in FY22 using the app. Occasional toll road users have the option to manage their travel on the go using our LinktGO app. More than 5.2 million trips have been taken using LinktGO to date. In the US, our GoToll payment app offers a similar pay-as-you-go option.
We’re also upgrading our core customer account and billing systems to leading cloud-based platforms, which will make it even easier for Linkt customers to pay for tolls and manage their accounts. This approach will also simplify our products and fees.
During FY22 in Australia, we ran a pilot to see if new technology could help increase automated recognition of non-standard licence plates.
The technology improved automated recognition rates to 98% and reduced manual image processing by 50%. We will seek to implement this new technology in FY23.
Adding valueWith fuel prices rising around the world,
we have encouraged our Australian customers to take advantage of a four cents per litre2 fuel discount at participating Shell Coles Express offered through our Linkt Customer Rewards program. This discount can be combined with other offers to save up to 18 cents per litre.2,3
In May 2022, we launched a month-long campaign promoting a limited saving of up to 22 cents per litre2,3,4 at participating Shell Coles Express when combined with other offers. All up, our fuel discount program has saved our customers more than $3 million since its 2019 launch.
We also launched an education campaign to give customers tips on how to save fuel and, in turn, greenhouse gas (GHG) emissions, by driving economically. In May 2022 we worked with GOFAR who ran a promotion for our Linkt customers to win a device to measure the fuel efficiency of their driving. Read more on page 39.
Showing we careIn FY22, we increased our support
for people facing financial hardship by extending our support for the One Stop One Story Hub pilot program in Australia. The pilot, led by charitable organisation Thriving Communities Partnership, focused on supporting people impacted by family and domestic violence, which has increased during the pandemic.
This hub allows customers to access hardship support for multiple essential services via a single point of contact. The hub extends the value of our existing Linkt Assist support service by connecting customers with other corporate programs and community support services, making it easier for them to get the help they need. More than 500 customers accessed the service during the pilot and we will be continuing the partnership in FY23.
We continued to support our North American customers with hardship and first-time forgiveness requests.
Service ratings1
50.6Minbound interactions
96%interactions are digital
48.7Mdigital sessions (80% of these accessed via mobile)
4.3 out of 5customer satisfaction rating for call centre
1 Australian customer data, does not include North America
2 See offer terms for full conditions3 Offers are subject to change from time to time.
See Coles Express terms for conditions4 The “Spend $20 in-store and save 14c per litre” was a
limited time offer from 30 March to 25 May 2022 and not valid in ACT or Queanbeyan NSW stores.
Governance and risk
Financial statements
Security holder information
Sustainability supplement
Business performance
Remuneration report
Introduction and overview
Directors’ report
Corporate Report for the year ended 30 June 2022

3535
See how our strategy creates value for our communities (pages 20 to 21)
UN SDGs relevant to this section
$4Maverage GHG emission savings for customers
using our roads1
27%
community interactions
More than
12,000towards social
investment programsCommunitiesTo achieve our purpose, we must listen to and learn from our neighbours—people living and working near our roads or projects, and the communities our roads help to connect—and respond to them in meaningful ways.
Strengthening communities is also one of the three focus areas of our revised Social Licence Framework (page 43) that helps us identify the initiatives, investments and partnerships that will have the greatest social, economic and environmental benefits for local communities and our customers.
In FY22, our communities continued to experience the challenges of the COVID-19 pandemic compounded by, in Queensland and NSW, extreme weather events including floods. Alongside our annual community grants program, this year we supported flood-affected communities in Brisbane and those most affected by pandemic-related restrictions in Melbourne and Sydney. In the Greater Washington Area, we expanded our grant programs to support those along our new construction corridors and raised funds to support existing partnerships with Northern Virginia Family Services and the 9/11 Pentagon Memorial Fund.
Between August 2021 and March 2022, we conducted a major listening project, asking community members and other key stakeholder groups for their views on Transurban (see page 36). Project findings are helping us determine the effectiveness of our approaches to supporting our stakeholders.
More than
1 Transurban internal calculation based on vehicle type, distance travelled and COPERT emission modelling tool. Read more in our Insights Hub
Governance and risk
Financial statements
Security holder information
Sustainability supplement
Remuneration report
Introduction and overview
Directors’ report
Business performance
Corporate Report for the year ended 30 June 2022

3636
Understanding what matters to our communities
This year we conducted our second extensive stakeholder listening program. The first program was undertaken five years ago with stakeholder listening informing new customer offerings including Linkt Assist, LinktGO, Trip Compare and a rewards program, as well as new social investment guidelines.
Our second, multi-phase perception study, completed in May 2022, is helping us understand current performance sentiment and will inform our future strategic direction. This study was extended to include North American stakeholders.
Study activities included, in Australia:
• 71 deep-dive stakeholder interviews
• 68 documents analysed, including Voice of Customer (VoC) and other surveys
• 112 responses to our business partner and supplier survey
• 4,000+ responses to our community engagement survey.
And in North America:
• 2 focus groups
• 17 deep-dive stakeholder interviews
• +80 surveys distributed.
The timing of our second study aligned with the launch of our Social Licence Framework, designed to ensure our activities support the three areas that matter most to our stakeholders:
• empowering customers
• championing road safety
• strengthening communities.
Early findings across all our markets indicate that, overall, Transurban has a sound standing with community members and stakeholders. Our operational business performance is considered ‘gold standard’. Our communities and other stakeholders also recognise the excellence of our employees.
Several opportunities for improvement were also identified.
Overall, stakeholders agreed Transurban’s social licence focus areas are appropriate and relevant for the business. However, early findings suggest they want to see more evidence of our current performance and have low awareness of initiatives we are delivering within each social licence area.
Specifically, two focus areas are resonating well with stakeholders: ‘championing road safety’ and ‘strengthening communities’. The third area, ‘empowering customers’ resonated less, suggesting lower stakeholder awareness of our overall customer engagement efforts and performance.
Read more on page 42
Our initial survey review has identified some themes that, when addressed, will help to consolidate our social licence, enhance our competitive edge and support our growth agenda, including:
• Relationship building, including creating more opportunities for our stakeholders to engage and collaborate with us.
• Value awareness and visibility, including enhancing our community engagement post-construction and ensuring communities are getting long-term benefits from our local activities.
• Leading on transport issues, including using our influence to drive holistic and sustainable transport network solutions.
• Increasing focus on sustainability, including ensuring we continue to make meaningful and tangible contributions to creating a sustainable future.
When all analysis is complete, we will share the findings across our business, and with our stakeholders and collaborate to develop a strategy for addressing stakeholder feedback.
The perceptions and experiences of our communities and other stakeholders play a critical role in our success. We need to understand, anticipate and address what is important to them, so that we can deliver on our purpose and strategy.
Listening and learning
Left: Our listening project findings indicate stakeholders have low awareness of the community initiatives we deliver, for example, new playgrounds and open spaces
Governance and risk
Financial statements
Security holder information
Sustainability supplement
Remuneration report
Introduction and overview
Directors’ report
Business performance
Corporate Report for the year ended 30 June 2022
—Case study—

37
Our targets are:
Net zero emissions by 2050Scope 1, 2 and 3
50% reduction in Scope 1 and 2 emissions by 2030 (Figure 9)
55% reduction in Scope 3 carbon intensityof our major projects by 2030
22% reduction in Scope 3 carbon intensity of purchased goods and services by 2030
10% energy-efficiency savings by 2023from a 2013 baseline (Figure 8)
The impacts of climate change are being felt around the world, and it is critical we set high sustainability standards for every facet of our business—from the design and construction of our roads to our daily operations—to minimise our impacts on the environment.
Minimising our impacts
We have a detailed decarbonisation strategy to help us achieve both interim and long-term targets to reduce Scope 1 (fuel), Scope 2 (electricity) and Scope 3 (supply chain and major projects) GHG emissions and energy use.
We have delivered 8% energy-efficiency savings, putting us on track to meet our target of 10% energy-efficiency savings by the end of 2023 (Figure 8).
Figure 8: Progress to 10% energy-efficiency savings by 2023 (2013 baseline)
-0.20
-0.15
-0.10
-0.05
0.00
-4%
-8%
-4%
Electricity represents 92% of Transurban’s total Scope 1 and 2 energy use, with most used to power our lighting, tunnel ventilation systems and traffic management centres.
These efficiencies have come from improvement initiatives such as upgrading to more efficient LED lighting and optimising tunnel ventilation systems in response to updated traffic profiles.
Our 2030 interim targets have been externally validated by the Science Based Targets initiative, in line with climate science.
Complete In progress Potential opportunities
Ener
gy sa
ving
s
0%
-8%
-16%
-4%
-12%
-20%
-2%
-10%
-18%
-6%
-14%
Governance and risk
Financial statements
Security holder information
Sustainability supplement
Remuneration report
Introduction and overview
Directors’ report
Business performance
Corporate Report for the year ended 30 June 2022

38
0
50,000
100,000
150,000
200,000
250,000
FY18 FY19 FY20 FY30FY21FY16 FY17 FY22 FY23 FY24 FY25 FY26 FY27 FY28 FY29
As part of our efforts to meet our Scope 3 reduction targets, we have introduced GHG reporting for our major suppliers. Supplier progress is monitored through their participation in CDP Supply Chain reporting, providing greater transparency and confidence that we can achieve our 2030 targets. We also continue to work with our delivery partners on major projects to reduce projects’ impact on the environment and increase their use of low-carbon construction materials.
In FY22, GHG intensity across Scope 3 emissions sources continued to be a focus and supplier engagement with our CDP supply chain program reached 70%. Further supply chain engagement information can be found on page 62.
Towards our net zero target
In addition to working with our supply chain to reduce Scope 3 emissions, our next steps towards our net zero target include setting contractor targets for fuel efficiency and transitioning contractor operations, maintenance and incident response vehicles to zero-emission vehicles by 2030.
We are continuing our lighting upgrade and ventilation optimisation programs and investigating renewable energy opportunities for our North American assets.
Our renewable energy use will increase as new renewable electricity contracts mature and we transition to renewables in the US.
To increase the visibility of our commitment and progress to net zero, we embraced the opportunity to volunteer for the Clean Energy Regulator’s pilot of the Corporate Emissions Reduction Transparency (CERT) reporting scheme. We provided information about progress towards our net zero commitment and science-based GHG emission reduction targets, GHG emission data (Scope 1 and 2) and renewable energy use for FY21. The Regulator released the FY21 pilot year report in July 2022 ahead of the start of the official program for FY22 reporting onwards later this year.
Progress towards 2030 interim GHG reduction targets
Our business has grown significantly since 2019, but we remain on track to meet our 2030 GHG reduction target (Figure 9). The delivery of key energy-efficiency projects and increased use of renewable electricity in FY22 led to a 46% reduction in GHG emissions compared to the previous year, with FY22 Scope 1 and 2 GHG emissions 13% below 2019 levels. As of June 2022, two-thirds of our electricity needs were being sourced from renewables. This is enough renewable electricity to power 30,000 homes.
By market, our electricity mix comprises:
• Sydney: 80% renewable since July 2021 (excluding NorthConnex)
• Brisbane: 80% renewable since January 2022
• Melbourne: CityLink 50% renewable since January 2022, anticipated to increase to 100% from January 2024
• Greater Washington Area: 0% renewable (grid only, with renewable energy options being explored)
• Montreal: grid electricity comprising around 99% renewables.
Figure 10: FY22 GHG inventory FY201 FY211 FY221
tCO2-e tCO2-e tCO2-e
Total Scope 1 & 2 136,955 196,341 106,392
Scope 1 4,213 4,598 5,046
Scope 2 (market-based) 132,742 191,743 101,346
(Renewables emissions savings) 3,753 6,343 87,930
Scope 2 (location-based) 136,495 198,086 189,275
Scope 3 634,213 428,367 412,593
Purchased goods and services 161,607 168,785 173,982
Capital goods (major projects) 405,348 218,335 201,944
Investments (non-managed assets) 46,547 14,481 12,394
Upstream fuel and energy related activities 17,058 24,240 20,695
Waste 2,241 2,416 2,544
Business travel 1,412 109 1,034
Total Scope 1 & 2 & 3 774,383 624,708 518,985
Customer travel emissions 1,156,130 1,227,450 1,184,369
Figure 9: Scope 1 and 2 GHG emissions forecast
1 Transurban Group total, excluding non-managed assets
Transurban Scope 1 and 2 BAU forecast Reduction pathway SBTi target
Emis
sion
s (tC
O2e)
Governance and risk
Financial statements
Security holder information
Sustainability supplement
Business performance
Remuneration report
Introduction and overview
Directors’ report
Corporate Report for the year ended 30 June 2022

39
Managing our water and waste
Responsibly managing groundwater and stormwater at our assets—and ensuring we release clean water back into creeks and waterways—is fundamental to minimising our environmental impacts.
We are developing a water strategy to standardise our approach to water consumption and promote beneficial reuse of water across our Australian assets. Water analyses were conducted for each operational asset across our Australian markets to identify water use trends. These analyses informed opportunities to reduce water consumption and for potable water replacement across various assets, which will be further investigated and reviewed for implementation over the coming years. The strategy has also considered water-saving initiatives implemented on our recent major projects.
The strategy aligns with UN SDG 6 (Access to water and sanitation), an important, but not material UN SDG for Transurban and benchmarks water savings in line with the Infrastructure Sustainability Rating scheme.
Read more in our Insights Hub, insights.transurban.com
Air quality We are vigilant about maintaining high
air-quality standards within our tunnels and, in turn, local communities. Our roads and tunnels are designed to reduce the impact of vehicle emissions as much as possible and we monitor and report on air-quality levels to ensure compliance with strict air quality regulations. Generally, air quality in our tunnels is well within the annual limits set by environmental agencies.
We monitor in-tunnel conditions, ventilation outlet emissions, and ambient air quality around tunnel portals. For tunnel projects, we also monitor air quality around project sites to understand local conditions. This helps us understand local air quality changes once a tunnel opens. We regularly publish air-quality data from our road projects and tunnels publicly on our customer website, linkt.com.au.
See our air quality data in our Insights Hub, insights.transurban.com
Customer vehicle emissionsBy choosing our roads over alternate
routes, drivers are saving an average of 27% in GHG emissions.2 Vehicle emissions are a significant contributor to GHG emissions. Customer emissions are not formally within our control—or included in our indirect Scope 3 targets—but we are determined to help our customers drive more sustainably and reduce their impact on the environment.
We implemented a series of educational campaigns to show customers how they can drive more economically and reduce GHG emissions and fuel use using eco-driving techniques.
Eco-driving skills can also have a multiplier effect. While we operate less than 1% of the total urban roads in our markets, if we can empower our customers to use eco-driving techniques on our roads, they’re likely to apply them across the broader road network, reducing overall network emissions.
In February 2022, we also released our Eco-driving Trial Industry Report that outlined the findings of a trial (run in partnership with technology business GOFAR), using an in-vehicle device to monitor driving behaviour. Travelling almost 740,000 kilometres, trial participants achieved a 5.5% reduction in fuel and GHG emissions. The trial showed small changes to the way you drive can have a significant impact on the environment and fuel consumption. As a follow-up to the trial, in May 2022 we worked with GOFAR who ran a promotion for Linkt customers to win one of 200 GOFAR devices.
Read our eco-driving report at transurban.com/ecodriving
Acknowledging the significant role that electric vehicles (EVs) will play in tackling GHG emissions, we have developed initiatives to raise awareness of their benefits and to dispel consumer concerns such as the availability of charging stations.
In June 2022, we launched an EV experience program, where customers are test driving a Nissan LEAF for up to 10 days and documenting their experiences to dispel myths and promote the benefits of owning an EV. The program is running initially in Victoria and finishes in December 2022.
We also gave away two EVs as main prizes in competitions encouraging Linkt customers to get vaccinated against COVID-19. Read more on page 52.
We are transitioning parts of our own fleet to hybrids, and ultimately, EVs. In FY22, we purchased our first EV which is used by our HSE team in the US. We also purchased six plug-in hybrid electric vehicles for our Brisbane and Sydney operations teams.
Our incident response teams in Melbourne have been equipped with batteries and chargers to address EV incidents. In Montreal, we are collaborating with the Government of Quebec to exempt registered EVs from paying tolls on the A25. This program will be in place until 2024.
Read more about our sustainability initiatives with our business partners and suppliers (page 62)
1 Unless required by government regulations to be disposed to landfill
2 Transurban internal calculation based on vehicle type, distance travelled and COPERT emission modelling tool. Read more in our Insights Hub
Waste managementIn late FY22, we set targets to divert waste from landfill for major projects and operating assets in Australia.
In FY23, we will be adding targets for minor capex works and Transurban-controlled offices.
Major projects
95% construction and demolition waste diverted from landfill
95% spoil waste diverted from landfill1
Assets
80% operational and maintenance waste diverted from landfill by 2025
Governance and risk
Financial statements
Security holder information
Sustainability supplement
Remuneration report
Introduction and overview
Directors’ report
Business performance
Corporate Report for the year ended 30 June 2022

4040
“I love the artwork in the Kingsgrove underpasses. The improved lighting and the new vibrancy of the tunnels means I feel safer using them as well.”Verity—Kingsgrove, NSW
As well as supporting local communities, we also need to consider how our assets can contribute to local ecology. In FY22, working with Landcare Australia, we assessed the landscaping around our first asset, CityLink, to create a biodiversity masterplan. Plan actions include indigenous species selection and community engagement to help us improve CityLink’s long-term environmental, community and operational performance.
We also added some new colour to the elevated section of CityLink’s pillars in Flemington with a mural project. A local artist created these striking works as part of a Moonee Valley Council initiative. We also invited Melbourne’s community to help us name two new pedestrian bridges being built as part of the West Gate Tunnel Project, with finalists to be announced in early FY23.
In NSW, the Canal to Creek public art program continued to generate value for communities. This program comprises more than 20 public art works (including playgrounds, murals and interactive light installations) each exploring connections between people and place. The program also includes an educational portal designed to engage high school students with the artworks and the artists’ intentions.
In FY22, we launched the first Canal to Creek Prize, a visual art competition for students in Years 7 to 10, attracting more than 200 entries from more than 70 schools. The winning artworks are now displayed at the WestConnex Motorway Control Centre.
We also commissioned three new artworks through the Inner West Council’s Perfect Match program. This initiative brings artists, residents, business owners and community together to collaboratively create street artworks, while also deterring unwanted tagging.
All three works are now featured in the Canal to Creek portal with supporting education materials. Since it launched in FY21, 9,000 students from more than 60 countries have accessed the public art program portal.
View the artwork on canaltocreek.com
Parks, cycling and pedestrian paths, playgrounds and public art are lasting ways that we contribute to more liveable local communities and active mobility.
More than roads
Greenspace34 hectares of parkland operated, maintained or delivered by Transurban
Community spacesFive social spaces, including playgrounds and barbecue areas delivered or maintained by Transurban
Cycle and pedestrian paths1,475+ kilometres of walking and bike paths delivered or maintained by Transurban
Public transport35 public transport routes use our roads
Road art25 artworks installed along our roads
Governance and risk
Financial statements
Security holder information
Sustainability supplement
Business performance
Remuneration report
Introduction and overview
Directors’ report
Corporate Report for the year ended 30 June 2022

4141
Major infrastructure projects can be disruptive to build—which is why we are vigilant about managing our impacts on local communities.
Community engagement
We have teams dedicated to engaging with the community through lengthy construction periods; however, we are also mindful that being a good neighbour does not end at project completion and it is equally important to engage with communities over the long term.
In FY22, our teams had around 12,000 interactions with community members, including around 6,000 in the US, through activities ranging from community meetings, events and visits.
In Sydney, our teams recorded more than 3,900 engagements with the community surrounding our roads and the WestConnex project.
The WestConnex team continued its micro-engagement consultation, interacting through face-to-face engagement, community notifications and social and traditional media. We also continue to track community sentiment towards the project and positive sentiment remains high at 60%. Only 14% feel negatively towards the project. A strong majority has agreed that WestConnex is making travel around Sydney
easier and faster and that the project is good for the city overall.
In Melbourne, more than 700 people attended our community open day for the West Gate Tunnel Project where they could find out more about the project from our engineers and other team members as well as enjoying family-friendly activities. Attendees also had the opportunity to learn about what it’s like to work inside one of our huge tunnel boring machines.
In Queensland, we continue to actively engage with our neighbours, the local residents and businesses who live and work along our 81 kilometres of roads and tunnels, ensuring they are kept well informed of any maintenance projects and activities that may impact them.
In North America, we continued targeted engagement and investments with local communities, including alongside our project corridors. In FY22, this included community consultation around construction on Project NEXT (495 Northern Extension) and establishing dedicated communication channels for project inquiries.
We remain focused on increasing public education and awareness of the Maryland Express Lanes Project—Phase 1 and the benefits it will deliver. With the Maryland Department of Transportation, we have provided project briefings to homeowner associations and elected officials, and have participated in numerous community events.
Left: We engage with communities before, during and after project delivery, including by sharing information at dedicated centres such as the West Gate Tunnel Project open day
Looking out for our neighboursIn FY22, our teams had 12,050 interactions with the community.
2,182 Sydney
3,325 Melbourne
543 Brisbane
6,000 North America
What do we mean by interaction?Community interactions include all enquiries, meetings, complaints and compliments, and any consultation events.
Governance and risk
Financial statements
Security holder information
Sustainability supplement
Remuneration report
Introduction and overview
Directors’ report
Business performance
Corporate Report for the year ended 30 June 2022

42
Our social investment
FY22
Strengthening comm
unities
Strengthening comm
unities
Empo
wering customers
Empo
wering customers
Championing road
safe
ty
Championing road
safe
ty
invested in targeted programs and partnerships,
including road safety
$4MMore than
time donated through employee volunteering
$90KMore than
Governance and risk
Financial statements
Security holder information
Sustainability supplement
Remuneration report
Introduction and overview
Directors’ report
Business performance
Corporate Report for the year ended 30 June 2022

43
Guided by our Social Licence Framework, we target our community support to areas we believe are best aligned with our business and will have the greatest impact.
Our grants program
$700K+total grants awarded to local community organisations and initiatives
50,000+people directly benefitted from our financial, material and other support
$485Kawarded to 19 Victorian, NSW and Queensland community organisations
USD117.5Kdonated in Greater Washington Area and CAD50K donated in Quebec to support local organisations and initiatives
Communities impacted by COVID-19-related restrictions
$150Kdonated to 16 Victorian and NSW organisations to support communities most affected by COVID-19-related restrictions
20,000+people directly benefitted, through improved food security, mental health and wellbeing and education opportunities
Flood relief funding
$94,500emergency relief funding donated to 20+ Queensland community organisations after March 2022 major flooding event
$4,500raised by Transurban employees through a matched giving program
6,000+people directly benefitted from flood recovery and food security support
Community fundraising
$2.3Mraised for charity via Bridge to Brisbane and Run for the Kids fun runs
USD100Kdonated to the Northern Virginia community via Drive to Donate
~$20,000donated via our Community Rewards Program
Education and training
4,200+students in education and STEM programs
190+scholarships and internships funded
6employment, education and work experience programs supported
Strengthening communitiesEmpowering customers
Championing road safety
Driver training
5driver training programs across three cities, including new ARTIE partnership (QLD)
300+participants, 50+ found jobs thanks to their new driver licences
100%surveyed participants feel more independent and more socially connected
Road safety research and action
3 new NeuRA road safety research reports released
119 crash tests performed at the Transurban Road Safety Centre
2,000+ child car seats checked and fixed
Customer support
44customers supported by Linkt Assist 360
500+people accessed hardship support via the One Stop One Story Hub
13,000+customers experiencing hardship supported through the Linkt Assist program
5road safety projects progressed with NeuRA
9journal articles published and conference presentations delivered
Ensuring customers have all the information and support they need to manage their travel and accounts, and in ways that make their lives easier.
Ensuring our roads are the safest they can be and investing in partnerships and research to continually lead and share advancements in road safety.
Investing in initiatives and partnerships that minimise our impact and enhance liveability, including the environment, local amenities, and social and financial inclusion.
Governance and risk
Financial statements
Security holder information
Sustainability supplement
Remuneration report
Introduction and overview
Directors’ report
Business performance
Corporate Report for the year ended 30 June 2022

—Case study—
Improving car seat fittings
44
NeuRA’s Transurban Road Safety Centre research shows more than 50% of child car seats are incorrectly fitted, putting children at risk of serious injuries in a crash. A correctly fitted child car seat can reduce the risk of injury in an accident by up to 70%. This is why we are continuing to build on our partnership with Australian not-for-profit organisation Kidsafe.
In May 2022, to coincide with National Road Safety Week in Australia, we joined Kidsafe in a car seat blitz and supported more than 600 free car seat checks and fittings at 12 locations such as shopping and community centres across Melbourne, Brisbane and Sydney. Approximately 90% of checked car seats had at least one fault in the way they were fitted.
In FY22, we also provided more than 1,600 car seat fittings for Brisbane and Logan families in need through our Kidsafe Queensland partnership. Established in FY21, this partnership has already provided more than 5,000 car seat fittings in total.
We also ran a webinar with industry experts from Kidsafe, NeuRA and our road safety team sharing advice on keeping children safe in vehicles. Our Driving Willpower (US) campaign also shared advice on correct child car seat fitting.
Watch our webinar, transurban.com/news/child- seat-safety-webinar
Action for reconciliationOur Reconciliation Action Plan (RAP)
is focused on creating meaningful and long-term connections with Indigenous communities to help inform our actions and ensure we contribute to Australia’s reconciliation journey. After consulting with Indigenous communities, we completed an Engagement Strategy and Guidelines, which contain a set of principles for future engagement. These are helping us to identify key themes and opportunities for future reconciliation as we prepare to develop our next RAP.
Read more about how we support reconciliation with our people (page 47) and our suppliers (page 60).
In FY22, we launched a driving school in Queensland to give Indigenous young people access to a safe vehicle and trained instructor to help them complete their required 100 hours of supervised driving. We partnered with Former Origin Greats (FOGS) Achieving Results Through Indigenous Education (ARTIE) Academy to launch the Transurban ARTIE #1 Driving School. The driving school is a Queensland
Kidsafe partnership highlights
600+free car seats checked during the program
~90%of checked car seats had at least one fault in how they were fitted
97% surveyed after fitting had a better understanding of what to look for when they’re checking their car seats
1,600+car seats fitted in Brisbane in FY22 through our partnership with Kidsafe Queensland
Transurban ARTIE #1 Driving School is a Queensland first
first and each year will provide more than 900 free driving hours to around 80 students in South East Queensland. More than 500 Indigenous students are expected to benefit from the driving school over five years.
We partner with Indigenous support service KARI in NSW on a similar program. The WestConnex Indigenous Driver Program provides access to a car and free professional driving lessons for disadvantaged Aboriginal and Torres Strait
Islander young people in Western Sydney. Since the program commenced in 2018, more than 400 young people have gained their learner or provisional licence, and 94 young people have gained employment as a result of having a licence.
Read more about our driver training programs at transurban.com/drivertraining
Governance and risk
Financial statements
Security holder information
Sustainability supplement
Business performance
Remuneration report
Introduction and overview
Directors’ report
Corporate Report for the year ended 30 June 2022

45
See how our strategy creates value for our people (pages 20 to 21)
UN SDGs relevant to this section
years WGEA Employer of Choice citation
9
people in total workforce1
9,000+people in direct
workforce1
3,600+
Our peopleWe owe our success to our talented and diverse team who facilitate the lasting contribution Transurban makes to the communities in which we operate.
We have more than 3,600 people1 working across Australia and North America. However, our major infrastructure projects rely on a much larger workforce. Our total workforce comprises more than 9,000 people1.
Like most businesses, the past year has been unpredictable as we continued to contend with the impacts of COVID-19. Current low unemployment rates and a downturn in skilled migration have created a competitive talent market, and this is providing new challenges as we look to attract and retain our workforce.
Maintaining an engaged workforce is fundamental to meeting this challenge and we do this by focusing on creating a culture that truly reflects our values of integrity, collaboration, accountability, ingenuity, and respect.
of employees are proud to work for Transurban
82%
1 Direct workforce includes direct employees (which include casual, fixed term and permanent employees (excluding leave of absence and non-executive directors)) and temporary workers and workers contracted through our partner organisations. Total workforce includes direct workforce and sub-contractors working on major infrastructure projects
Governance and risk
Financial statements
Security holder information
Sustainability supplement
Remuneration report
Introduction and overview
Directors’ report
Business performance
Corporate Report for the year ended 30 June 2022

4646
Understanding what matters to our people
From the outset of the pandemic, we acted to support and retain our workforce, ensuring we remained well positioned to realise future opportunities. We achieved this and more, growing our direct employees (plus contract workers directly engaged by Transurban) by more than 7% between 2020 and 2022.
The two years of disruption had a significant impact on our people, evidenced through increased utilisation of our Employee Assistance Program (EAP) on issues relating to mental health and wellbeing. Our Voice annual employee opinion survey feedback also indicated people were missing the opportunity to connect and collaborate in person.
The challenges faced by our employees working through the pandemic during FY22 were not unique to Transurban. As in FY21, we continued our focus and support on maintaining good mental health including the delivery of resilience-building programs and initiatives.
Programs and initiatives we offered to help develop resilience during this challenging time included:
• a month-long mental wellbeing program including an afternoon dedicated to rest, reflect and reset
• mental wellbeing education delivered by The Resilience Project
• people leader forums, including dedicated resilience workshop
• an online resources hub.
In February 2022, we rolled out Headspace subscriptions across the business, offering one-year free memberships to this leading mindfulness app. More than 550 employees have enrolled and active utilisation rates are higher than Headspace’s corporate benchmark.
Our ongoing focus on resilience has equipped our people with tools designed to support their wellbeing, with 91% of employees surveyed in Our Voice reporting that their manager supports their wellbeing—well above global benchmarks.
With our hybrid working environment well established, we continue to create opportunities for bringing people together. We support all our employees with tools and strategies to manage hybrid work, including running a people leader forum on fostering team connection in a hybrid context. We continue to encourage our people to connect and collaborate in person, while also taking advantage of our established flexible work practices.
Sustaining a resilient workforceOur people have shown remarkable resilience through the past two years, and they continue to adapt to the impacts of the pandemic.
Governance and risk
Financial statements
Security holder information
Sustainability supplement
Remuneration report
Introduction and overview
Directors’ report
Business performance
Corporate Report for the year ended 30 June 2022
—Case study—

47
To effectively understand and support our stakeholders, our workforce must reflect our customer base and the communities we serve.
Diversity, equity and inclusion
Understanding how people feel about their work and workplace is key to creating an engaging employee experience. We conduct an annual employee opinion survey, Our Voice, to gather feedback around engagement, confidence in leadership, our customer focus, commitment to diversity and inclusion, and more. We also conduct regular ‘pulse’ surveys to check in and understand how our people are managing during key periods.
Results continue to be above global benchmarks on belonging, with 85% of Our Voice respondents agreeing that people from all backgrounds have equal opportunities to succeed at Transurban, and 86% agreeing all types of diversity are valued. Our Voice also revealed 95% of people agree gender-based and sexual harassment are not tolerated at Transurban.
We continue to evolve our policies and educate our people to ensure a respectful, safe and inclusive workplace. Initiatives rolled out in FY22 included:
• mandatory training on sexual harassment prevention for all employees
• new uncapped leave for domestic violence victims
• hiring manager training with a focus on identifying and mitigating for unconscious bias when recruiting.
Across Australia and North America, we recognised International Women’s Day (IWD), with more than 500 employees participating in a virtual workshop exploring bias and the impact it can have on diversity, key decisions, and inclusion. Our President North America, Pierce Coffee, was interviewed by the US Chamber of Commerce Foundation on how Transurban is ensuring equity in our workforce as part of their IWD forum.
Pierce Coffee on equity in the transport industry
Our targeted efforts towards gender equity across the business have been recognised through the Workplace Gender Equality Agency (WGEA) Employer of Choice citation, which we have held for nine consecutive years1. We were also ranked second in Australia and eighth globally by Equileap, which assessed more than 4,000 companies globally on criteria including gender balance, the gender pay gap, paid parental leave and anti-sexual harassment policies.
Our gender pay gap is reviewed annually and continues to be less than or equal to 1%. This year we achieved our target of 40:40:20—40% men, 40% women, 20% any gender/non-binary balance across our direct workforce.2 We recognise there is always more to be done and we have strategies in place to enable us to continue this focus (for example, providing unconscious bias training for hiring managers as mentioned above).
Suzette Corr on women who break the bias
Our Reconciliation Action Plan (RAP) is focused on creating meaningful and long-term connections with Indigenous communities to help inform our actions. We engage our employees in cultural learning opportunities to increase understanding and appreciation of Aboriginal and Torres Strait Islander cultures, histories, knowledge and rights. Read more on page 44.
Our North American Diversity, Equity, Inclusion and Wellness plan continued during FY22, with focus on increased representation and greater transparency, as well as equipping employees with tools to support inclusion. Activities undertaken included celebrating Black History Month, as well as enhancements to our parental leave policy.
Our Voice survey revealed
91%agree their direct manager genuinely supports their wellbeing
95%agree gender-based and sexual harassment is not tolerated
86%agree we value all types of diversity
87%agree they have the flexibility needed to manage work and other commitments
85%agree people from all backgrounds have equal opportunities to succeed
FY18
FY19
FY22
FY21
FY20
1,862
1,793
1,567
1,652
1,925
1 WGEA Employer of Choice citations are awarded for two year periods and our current Transurban Limited WGEA citation is for the period 2021–2023
2 Direct workforce includes direct employees (which include casual, fixed term and permanent employees (excluding leave of absence and non-executive directors)) and temporary workers and workers contracted through our partner organisations
3 Includes direct employees (casual, fixed term and permanent employees (excluding leave of absence and non-executive directors)) as well as temporary workers
4 Non-binary represents 0.06% of our direct employees
Figure 13: Direct employee gender4
Male Female
Direct employees
57% 43%
Executive Committee (excluding CEO)
44% 56%
Board (including CEO)
73% 27%
Figure 14: Employee numbers over time3
Governance and risk
Financial statements
Security holder information
Sustainability supplement
Remuneration report
Introduction and overview
Directors’ report
Business performance
Corporate Report for the year ended 30 June 2022

48
1 Parental leave after adoption is also available
“I was pretty fortunate as my parental leave coincided with my
other daughter’s first term of prep and my son’s first term of kinder. So not only did I get to spend time with our youngest, I also got to drop my older children off and pick them up
for these milestone school days.” David Counsell,
Head of Network Maintenance and Environment in Queensland
—Case study—
The positive impact of parental leave
Families come in all shapes and sizes. Recognising this, we’ve made it easier for all carers to manage their family commitments while also continuing to thrive at work.
In October 2021 we made changes to help new parents at Transurban. We identified that, by providing primary and secondary carers’ leave, we were unintentionally perpetuating stereotypical gender norms about who typically adopts the carer role in families.
By removing this distinction, we made it easier for parents to manage and share their parenting responsibilities in ways that best suit them.
This means that, up to 24 months after their child’s birth,1 eligible parents in all our markets can access 16 weeks of paid and 36 weeks unpaid parental leave, regardless of when their partner is taking parental leave. This is in addition to any government-funded leave.
During the 12 months ending March 2022, 36% more men took the opportunity to take parental leave than in the 12 months ending March 2021.
Matthew Putterman, father of two and Transurban’s Manager Pricing and Data Analytics in the Greater Washington Area, took advantage of our parental leave offering.
“It really was so valuable to have this time to help support your new child and your growing family. I was able to be present for so many fun milestones.”
David Counsell, Head of Network Maintenance and Environment in Queensland took up parental leave to care for his daughter Chloe.
“I was pretty fortunate as my parental leave coincided with my other daughter’s first term of prep and my son’s first term of kinder. So not only did I get to spend time with our youngest, I also got to drop my older children off and pick them up for these milestone school days.”
Our values
CollaborationIntegrity RespectIngenuityAccountability
Governance and risk
Financial statements
Security holder information
Sustainability supplement
Business performance
Remuneration report
Introduction and overview
Directors’ report
Corporate Report for the year ended 30 June 2022
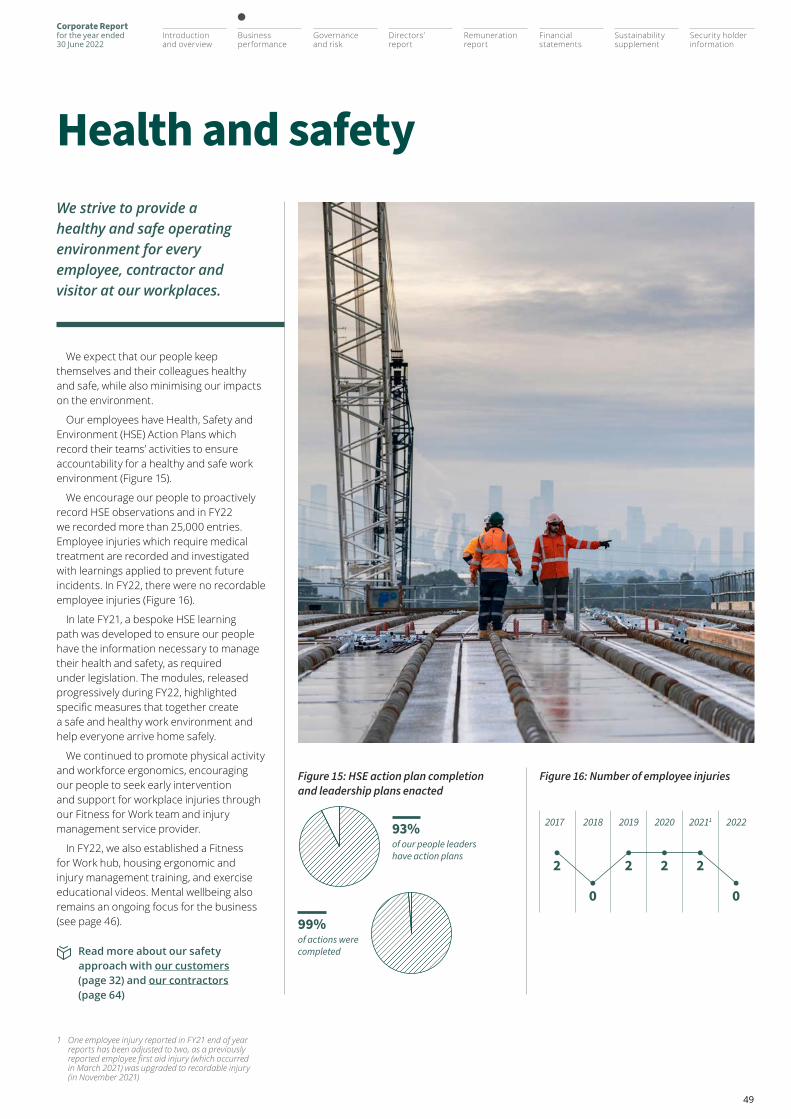
49
We expect that our people keep themselves and their colleagues healthy and safe, while also minimising our impacts on the environment.
Our employees have Health, Safety and Environment (HSE) Action Plans which record their teams’ activities to ensure accountability for a healthy and safe work environment (Figure 15).
We encourage our people to proactively record HSE observations and in FY22 we recorded more than 25,000 entries. Employee injuries which require medical treatment are recorded and investigated with learnings applied to prevent future incidents. In FY22, there were no recordable employee injuries (Figure 16).
In late FY21, a bespoke HSE learning path was developed to ensure our people have the information necessary to manage their health and safety, as required under legislation. The modules, released progressively during FY22, highlighted specific measures that together create a safe and healthy work environment and help everyone arrive home safely.
We continued to promote physical activity and workforce ergonomics, encouraging our people to seek early intervention and support for workplace injuries through our Fitness for Work team and injury management service provider.
In FY22, we also established a Fitness for Work hub, housing ergonomic and injury management training, and exercise educational videos. Mental wellbeing also remains an ongoing focus for the business (see page 46).
Read more about our safety approach with our customers (page 32) and our contractors (page 64)
We strive to provide a healthy and safe operating environment for every employee, contractor and visitor at our workplaces.
Health and safety
2017 2018 2019 2020 20211 2022
2 22
0
2
0
93%of our people leaders have action plans
99%of actions were completed
1 One employee injury reported in FY21 end of year reports has been adjusted to two, as a previously reported employee first aid injury (which occurred in March 2021) was upgraded to recordable injury (in November 2021)
Figure 15: HSE action plan completion and leadership plans enacted
Figure 16: Number of employee injuries
Governance and risk
Financial statements
Security holder information
Sustainability supplement
Remuneration report
Introduction and overview
Directors’ report
Business performance
Corporate Report for the year ended 30 June 2022

50
Building our workforce’s leadership and broader capability remains a priority, particularly in the context of tightening labour markets across Australia and North America.
Building future capability
We have a comprehensive, refreshed suite of development programs across all levels of leadership to continually build the capability needed to lead the organisation and deliver on our strategy.
Following the successful launch of our Foundation Leadership and Business Leadership programs in FY21, we progressed more cohorts through these programs in FY22, targeting first-time and mid-to-senior people leaders, among others. These programs are designed to develop skills aligned to Transurban’s leadership capabilities and help strengthen leadership networks across business units. Together, these initiatives contributed to improved Our Voice performance, with positive leadership sentiment at 73% in our FY22 survey.
We continue to invest in developing our female talent, with a second cohort of our Maximising Leadership Potential program launched in FY22. First piloted in FY21, the program aims to build our pipeline of female talent and includes executive mentoring of participants and learning experiences over a five-month period. The program uniquely includes learning sessions for the participant’s people leader, equipping them to support both their participant and female talent across their wider team.
As part of this suite of programs, we are also equipping our most senior leaders to enable the organisation to deliver on future growth opportunities. In FY22, we continued the Strategic Leadership Program, launched in FY21 with the Stanford Graduate School of Business Executive Education.
The objective of this year’s program was to develop the capability of our most senior leaders to shape and pursue our strategic growth ambitions. This program is designed to enhance the leadership capabilities and opportunities that will deliver the greatest strategic value to Transurban.
We also continued our focus on strengthening leadership capability, including initiatives such as regular people leader forums (to support point-in-time leadership priorities) and continuing to leverage our online learning platform—which has seen a 6% increase in use, compared to FY21. We also made further investments in our formal leadership programs, increasing the hours invested in these programs by 31%, compared to FY21.
Developing a strong pipeline of talent is vital. In FY22, we expanded our rotational Graduate Program to include several core technical disciplines (Engineering, Technology and Corporate Finance). With 46% female participation, our graduate program aims to build a pipeline of versatile graduates with broad business and leadership skills. Our undergraduate internship and mentoring programs provide career-enhancing opportunities to female talent, Aboriginal and Torres Strait Islander peoples, and asylum seeker and refugee students. These programs focus primarily on STEM disciplines.
We are building the capabilities our business will need in the future. In FY22, we trained more than 300 people in Agile methodologies and honed our innovation practices, including establishing an Enterprise Squad program. The squad model provides a unique development opportunity, and also drives innovation by bringing diverse, skilled people together. Squad members are now using Agile methodologies to tackle some of Transurban’s biggest challenges and opportunities.
Social connection Aligned with our purpose, our employees
recognise the importance of supporting the communities in which we operate. We offer paid volunteering leave to all our employees, but in FY22 pandemic impacts meant staff volunteering activities were virtual, such as writing gift messages to accompany Christmas vouchers. When pandemic restrictions eased in early 2022, in-person volunteering resumed, including supporting Landcare’s environmental initiatives and Kidsafe’s car seat fittings (read more on page 44).
Our engineers supported STEM programs across Australian schools by participating in Experience It! workshops, in partnership with Engineers Australia. These workshops encourage female high school students to participate in STEM-related subjects. Employees also attended Engineers Australia’s Autumn School of Engineering, spending time sharing their professional experience with students.
In North America we participated in volunteering activities as part of International Volunteer Day. In the US we joined our long-standing partner, Northern Virginia Family Services to deliver services around the local area. In Quebec, we helped paint sensory rooms for children with autism at a local hospital with our partner organisation La fondation les petits trésors.
Communities in Australia endured catastrophic flooding in early 2022. We worked with local community partners and other charitable organisations to provide immediate support where it was needed most (read more on page 42). Transurban also matched employee donations, of $4,500, committing a total $94,500 to the flood relief and recovery efforts.
Governance and risk
Financial statements
Security holder information
Sustainability supplement
Business performance
Remuneration report
Introduction and overview
Directors’ report
Corporate Report for the year ended 30 June 2022

51
UN SDGs relevant to this section
infrastructure projects in delivery
or development
assets
721
kilometres of road330
Government and industryOur long-term partnerships with governments in Australia, the US and Canada are key to achieving transport solutions that keep cities moving efficiently.
With more than 330 kilometres of road, 10 tunnels and five major bridges, we have a proven track record of delivering and operating diverse assets in partnership with all levels of government.
Despite the ongoing challenges presented by the pandemic, including skills shortages and restrictions on construction activity in early FY22, we have seven major infrastructure projects in delivery or development which will improve connectivity in our cities.
While population growth has slowed in Australia, the reopening of international borders is expected to see growth rebound faster than projected1 putting already-stretched transport networks under renewed pressure.
Each of our markets has a significant backlog of transport projects, and private sector partnerships will help governments both fund and accelerate the delivery of this critical infrastructure.
1 Australian Government Centre for Population, 2022-23 Budget: Australia’s Future Population. Accessed 30 June 2022
More than See how our strategy creates value for government and industry (pages 20 to 21)
Governance and risk
Financial statements
Security holder information
Sustainability supplement
Remuneration report
Introduction and overview
Directors’ report
Business performance
Corporate Report for the year ended 30 June 2022

5252
State governments had created road maps that specified the levels of single and double-dose vaccinations required in their populations before restrictions could be lifted safely.
In July 2021, the Australian Federal Government held a major roundtable meeting and called on businesses to work in partnership with it to accelerate vaccine uptake.
Recognising the importance of increasing vaccination uptake to create safer communities and free up movement, we devised a campaign that incentivised our customers to get vaccinated. And with around six million Linkt customers we recognised we could offer significant support.
Our Your Shot to Win competition encouraged Linkt customers to get fully vaccinated for the chance to win prizes including EVs, free toll road travel for a year and toll credits. Offering EVs as the major prize supported our ambitions to increase public awareness of the benefits of EVs and their role in reducing GHG emissions. Read more on page 39.
Competition details were shared with Federal and State members of Parliament and industry partners so they could help increase community awareness through their own constituent and member communication channels.
In November 2021, Queensland vaccination rates were behind other states, so we launched a Queensland-specific competition, Queensland, It’s Your Shot to Win, that attracted 45,000 entries.
Once first-dose vaccination levels had reached the required levels to allow restrictions to be eased, governments’ focus shifted to promoting booster shots.
In February 2022, we launched an additional incentive campaign, Boost Your Shot to Win, encouraging our customers to receive a booster shot for another chance to win an EV, and to thank Linkt customers for getting vaccinated.
Recognising the challenges faced by small businesses to keep goods and services moving during the pandemic, we extended the eligibility criteria for Boost Your Shot to Win to include our small business Commercial Linkt customers.
All up, these competitions attracted more than 417,000 entries and our research found nearly a quarter of Australians had entered a competition as a reward for being vaccinated.
In 2021, the Australian Federal Government—like many governments around the world—embarked on a major campaign to vaccinate and protect its population from COVID-19, while also paving the way for ending significant restrictions on movement and travel.
Supporting Australia’s vaccine roll out
Understanding what matters to governments and industry
—Case study—
Governance and risk
Financial statements
Security holder information
Sustainability supplement
Remuneration report
Introduction and overview
Directors’ report
Business performance
Corporate Report for the year ended 30 June 2022

53
Transurban continues to work with governments to understand where we can contribute. This includes major projects, such as M7–M12 integration and delivery to support the growth of Western Sydney, as well as initiatives using data and smart motorway technologies to make our existing roads more efficient.
In the US, we are working with the Virginia and Maryland governments to rebuild the ageing American Legion Bridge and better connect communities, support economic growth and provide safer and more efficient travel across a growing region.
In Canada, we shared our expertise in the Mobility Forum organised by local mayors in Quebec. The forum gathered stakeholders from the transport industry to discuss existing congestion issues, economic impacts and potential solutions to increase mobility in the region.
In Australia, FY22 saw Transurban—as part of the Sydney Transport Partners consortium—successfully awarded the remaining 49% ownership of WestConnex, Australia’s largest single road infrastructure project. Read more on page 66.
Transurban has managed WestConnex since 2018, including operating the M4 and M8 and taking over operations of the M5 East. The WestConnex network continues to transform travel across Sydney.
One in five Australians call Sydney home, and 40% of Sydney’s population is expected to live within five kilometres of WestConnex in 2031. WestConnex draws vehicles from across the city by providing a critical connection between Sydney’s west and south-west and the central city, as well as a corridor to the airport and port.
With close to 47 million trips taken on WestConnex in FY22, drivers are enjoying significantly improved travel times, journey reliability, safety and connectivity.
Congestion relief and increasing transport options are two of the ways we support governments to achieve their goals for more efficient transport networks.
Progressing transport agendas
The then Prime Minister Scott Morrison joined NSW Premier Dominic Perrottet on site at WestConnex in November 2021 to thank workers and celebrate the project’s final tunnel breakthrough.
Construction of the remainder of WestConnex is largely completed, with remaining work continuing on the M4–M5 Link (delivered by Transurban) and the associated Rozelle Interchange (delivered by Transport for NSW).
At the peak of construction in mid-2021, female participation on the WestConnex M4–M5 Link Tunnels project was at 21%―almost double the national average of 12% for females working in the construction industry.1
This project is a key component of the NSW Government’s integrated transport plan to ease congestion and connect communities in Sydney.
In Victoria, tunnelling began on the West Gate Tunnel Project in early 2022, after Transurban, the Victorian Government and the D&C subcontractor reached an agreement on revised project delivery terms (see B2 on page 128 for more information).
Around 30% of the twin tunnels have been excavated, and above the ground, more than 700 metres of new elevated road has been installed above Footscray Road and widening works along the West Gate Freeway are more than 70% complete.
“WestConnex is a game changer for our city and state” NSW Premier Dominic Perrottet
NSW Premier Dominic Perrottet and NSW Minister for Metropolitan Roads Natalie Ward, with WestConnex Project Director Terry Chapman at the project site
1 M4–M5 Link Sustainability Review, February 2022
Governance and risk
Financial statements
Security holder information
Sustainability supplement
Remuneration report
Introduction and overview
Directors’ report
Business performance
Corporate Report for the year ended 30 June 2022

54
Continuing investment in public transport
In FY22, we continued to invest in Virginia’s public transit services, making our annual contribution of USD15 million to the Northern Virginia Transportation Commission’s (NVTC) Commuter Choice program. This program supports the region’s economy, increases mobility options and reduces congestion and emissions.
Since 2019, we have invested more than USD45 million in regional transit improvements from 395 Express Lanes toll revenues. We will continue to do this annually for the life of this multi-decade concession. Our contributions are improving transit services along the I-395/I-95 corridor by helping fund: new or expanded bus services; commuter parking lot expansions; commuter incentive programs; and bike-share network expansions.
Our latest USD15 million contribution will support projects between Alexandria and Spotsylvania County, including the DASH bus service, Fredericksburg Regional Transit and OmniRide, along with the Fairfax County bus service and new park-and-ride options in Prince William and Spotsylvania counties.
Sharing our insights
Around two million trips are made on our Australian and North American roads every day, and every trip made contributes to the productivity and liveability of our cities.
Technology and data help to make every one of these trips as safe and efficient as possible. We’re now sharing our data—along with our regular Mobility Trends research—with governments and industry partners via our new Insights Hub. This tool provides insights on mobility and trends relevant to the transport sector and reveals how people are moving around cities, now and into the future.
Read more on our Insights Hub, insights.transurban.com
We have also committed USD2.2 million per year following the opening of the 495 Northern Extension (Project NEXT) to support a new cross-state bus route between Virginia and Maryland— a service that does not exist today.
“The future of transportation requires collaboration across multimodal owners to invest in networks that move more people through a breadth of travel choices,” said Amanda Baxter, Transurban’s Senior Vice President Virginia Market and Operations.
“Our annual transit contribution is part of our commitment to bettering the communities we serve, and we are fortunate to see tangible investments being made through the strong stewardship of Virginia’s Department of Transport and NVTC.” Amanda Baxter, Transurban’s Senior Vice President Virginia Market and Operations
Governance and risk
Financial statements
Security holder information
Sustainability supplement
Remuneration report
Introduction and overview
Directors’ report
Business performance
Corporate Report for the year ended 30 June 2022

55
One of the key ways we contribute is via Transurban representation on boards, including Infrastructure Partnerships Australia, Roads Australia, the Committee for Melbourne, the Queensland Infrastructure Association and the Advisory Committee for Committee for Brisbane, along with the Eno Center for Transportation in the US.
We’re also partnering with governments and industry as part of the Australian National University’s Institute for Infrastructure in Society, which is undertaking Australia’s largest study on engagement and infrastructure delivery.
In FY22, we hosted the Australian Parliament’s Joint Standing Committee on Road Safety at the Transurban Road Safety Centre at Neuroscience Research Australia (NeuRA) in Sydney. Committee members learnt about this centre’s life-saving road safety research. The visit informed the Committee’s inquiry into measures that can be taken to reduce trauma and deaths on Australian roads. We also contributed a submission to the NSW inquiry into mobile speed camera enforcement programs and provided expertise alongside industry partner Roads Australia at a hearing on this issue.
With action on climate change at the forefront for most governments, we shared our progress in decarbonising our business by participating in the inquiry into Renewable Energy in Victoria and Victoria’s emissions reduction target for 2035. With renewable energy agreements now signed in all Australian markets, we continue to keep governments and our industry partners updated as we progressively switch our assets over to renewable energy.
In North America, we are partnering with The Climate Board—an organisation bringing industry leaders together to tackle climate change mitigation and resilience challenges. The Climate Board members have ready access to critical research, collective expertise and best practices to aid with progressing actionable climate change solutions.
And with Queensland’s population booming and Brisbane 20321 on the horizon, Transurban has provided submissions and feedback on several long-term transport strategies for the state, including the government’s State Infrastructure Strategy. We also worked with Queensland MPs to support flood-affected Brisbane communities with targeted grants. Read more on page 43.
“It’s great to see Transurban investing in partnerships with the research industry and working with government to deliver the outcomes Australians expect on our roads.”Australian Parliament’s Joint Standing Committee on Road Safety Chair Hon Darren Chester
Contributing to policy developmentAs one of the world’s largest toll road operators, Transurban can provide valuable insights on ways to make roads safer, more sustainable and more efficient. We work with both governments and industry partners, sharing our insights and contributing to policy discussions that will help shape how people move around cities for years to come.
The Australian Parliament’s Joint Standing Committee on Road Safety visited the Transurban Road Safety Centre at NeuRA
1 Transurban is not a sponsor of the Olympic Games, any Olympic Committees or teams
Governance and risk
Financial statements
Security holder information
Sustainability supplement
Remuneration report
Introduction and overview
Directors’ report
Business performance
Corporate Report for the year ended 30 June 2022

56
NSW inquiry into road tolling regimes
Following our comprehensive submission to the NSW Government’s Inquiry into Road Tolling Regimes in FY21, Transurban welcomed the opportunity to speak before the inquiry this year.
In two appearances before the inquiry’s parliamentary committee, our NSW executives Michele Huey and Andrew Head shared detailed information about the benefits of toll roads, the value of public-private partnerships, and provided data on the time and cost savings available to customers using our roads.
As part of the inquiry process, we indicated that we are open to considering a range of initiatives to improve our customers’ on and off-road experience in Sydney, including:
• potential tolling reform for pricing consistency
• decision-point signage to give motorists choice
• consolidated toll notices to reduce customer charges
• a tunnel ventilation optimisation trial to support the NSW Government’s net zero commitment.
We are looking forward to further discussion with the NSW Government and other stakeholders during FY23 about Sydney’s toll roads, and how the Sydney road network can be even more equitable and efficient.
Future transport funding Transurban has long advocated for a fairer
and more sustainable transport funding model to replace the current system based on diminishing revenue from fuel excise.
In the US, we are partnering with the Eastern Transportation Coalition to provide insights into how a road funding system based on user charging could operate along the east coast.
With internal combustion vehicle fuel efficiency and electric vehicle adoption projected to increase significantly, federal and state government leaders have prioritised trialling road usage charge programs as a viable replacement to a traditional fuel excise. Under these programs, drivers pay for their road use based on the distances they travel, rather than fuel consumed.
In FY22, nearly 200 drivers were recruited from the Greater Washington Area for a three-month study to assess how road user charging systems could work with toll roads, and how these systems could incorporate a congestion charge and cordon pricing. The next program phase launched in late FY22.
The US trial follows our Melbourne Road Usage Study in 2016, the first real-world test of a user-pays system in Australia.
Political contributions
Our Political Contributions Policy precludes us from making any direct donations to political parties. However, it does allow participation in public policy dialogues and events on issues that may impact our business.
In Australia, we engage with political representatives through multiple avenues, including our membership of business forums associated with both sides of politics. In FY22, we spent $74,717 participating in events relevant to our business.
A similar bipartisan approach is taken in the United States, resulting in USD132,500 spent in FY22. In Canada, contributions are prohibited and accordingly none were made. All contributions are disclosed in line with relevant government and regulatory requirements.
Read our Political Contributions Policy, transurban.com/corporate-governance
Our road usage charge study is helping governments gather the insights they need to evaluate more sustainable and equitable tools to fund transport in the region.
Governance and risk
Financial statements
Security holder information
Sustainability supplement
Remuneration report
Introduction and overview
Directors’ report
Business performance
Corporate Report for the year ended 30 June 2022

57
UN SDGs relevant to this section
contractor RIFR (below target
of ≤4.20)
annual managed spend
direct suppliers
3.09
~$2B1,600+
Business partners and suppliersWith more than 1,600 direct suppliers and partners across a broad range of sectors, we are in an ideal position to lead industry innovation and best practice in every aspect of our business.
Encompassing design, construction, operations and maintenance, our diverse suppliers and partners range from multinational contractors to small local businesses and social enterprises. Our buying power and our innovative practices create value for our business partners and suppliers through:
• supporting small businesses by expediting payments, including during periods of financial duress, such as the recent Queensland floods and COVID-19 pandemic
• generating more sustainable solutions by collaborating with suppliers on sustainability performance, including tracking greenhouse gas (GHG) emissions, and trialling and transitioning to recycled, renewable and low-emission materials
• driving integrity and accountability by establishing data capture, risk management and performance monitoring processes that contribute to ethical and sustainable supply chain practices.
See how our strategy creates value for our business partners and suppliers (pages 20 to 21)
Governance and risk
Financial statements
Security holder information
Sustainability supplement
Remuneration report
Introduction and overview
Directors’ report
Business performance
Corporate Report for the year ended 30 June 2022

5858
Our contractors must have comprehensive, industry-leading safety procedures in place for workers entering live-traffic environments, including delineation of the works area from the live environment, personal protective equipment (PPE), signage and other measures. Our Active Client contractor management approach (read more on page 64) also means we monitor and conduct assurances on these procedures.
However, even with meticulous safety measures in place, our contractors reported dangerous driving behaviour—such as motorists driving or speeding through closed lanes—was making the environment unsafe for road workers.
We heard what our stakeholders were telling us: unsafe driving practices were increasing workers’ risk. Our response included engagement with the traffic management industry, government transport and road safety agencies and our own contractors.
For example, to support our operations and maintenance partners in protecting their workers, we hosted an Incident Response and Maintenance Safety Forum with our NSW operations and maintenance service provider partners. The forum enabled our partners to discuss safety issues, share lessons learned and collaborate on solutions—consolidating knowledge and experience across all partners to enhance overall safety performance.
We are also a member of Roads Australia’s Road Worker Safety Working Group, that aims to improve the standard and professionalism for those who work in the industry. The group is currently developing a guide for best practice work zone safety, and we are contributing to this guide by sharing our data and experience. In FY22, we also participated in a work zone safety panel at Roads Australia’s Annual Transport Summit where we discussed the challenges of separating workers from traffic in work zones, as well as the opportunities for improved standards and innovation.
Nationally, three out of four workplace fatalities involve a vehicle. We continue to support our NSW incident response and maintenance contractor Ventia to increase its workforce’s road-safety awareness while driving vehicles at work. We commissioned accredited safety training experts, Youthsafe, to develop and deliver a tailored safety program to Ventia’s road workers. The program helps workers identify critical road safety issues when they’re behind the wheel or working near vehicles. Workers are invited to reflect on their own experiences and develop strategies to improve their own, and their workplaces’, safety performance.
Three sessions have been delivered to date, to around 130 contractors and employees. Feedback has been positive and Ventia is now rolling the training out to its workers on non-Transurban owned assets. We are exploring delivering this program across all our NSW assets and our other Australian markets.
In the US, we worked with our contractor on the Fredericksburg Extension project, on a driver awareness around work zones campaign. Many drivers are returning to the roads since the start of the pandemic and the campaign reminded our customers and other road users about driver awareness, road rules and fineable offences.
Work in live traffic is a necessary part of operating and maintaining safe roads and we do all we can to protect workers on our roads.
Keeping road workers safe
Understanding what matters to our business partners and suppliers
—Case study—
Governance and risk
Financial statements
Security holder information
Sustainability supplement
Remuneration report
Introduction and overview
Directors’ report
Business performance
Corporate Report for the year ended 30 June 2022

59
Buying betterOur Sustainable Procurement Program directs more spending towards community social, economic and environmental wellbeing. For example, the program is helping deliver local community benefits by creating jobs, including for disadvantaged groups.
Sustainable supply chainIn FY22, we continued progress towards
achieving net zero GHG emissions in our supply chain and projects by 2050 (read more on page 38). We engaged with our suppliers on reducing their environmental impact through using low-carbon materials, reducing energy use and transitioning to renewable energy.
We assess our suppliers’ efforts in taking practical action towards the United Nations Sustainable Development Goals (UN SDGs) via Support the Goals, an international agency that rates and recognises businesses’ UN SDG efforts. So far, around 25% of our top suppliers have taken action on the UN SDGs. We will continue using our influence and buying power to drive more sustainable supply chain outcomes.
Supporting small business cashflow
During FY22, we spent more than $71 million with 664 Australian small businesses1 that supply us with goods and services ranging from personal protective equipment (PPE) to office supplies.
We know reliable and on-time cashflows help small businesses grow and support their people. We’ve signed the Business Council of Australia’s (BCA) Supplier Payment Code, including agreeing to pay eligible Australian small businesses on time and within 30 days.
In the first half of FY22, we paid 98% of Australian small businesses within 30 days of invoicing. Recognising the impact of the floods, we halved our payment terms between March and 30 June 2022 to support our Queensland-based small business suppliers.
Labour and supply chain challenges
In Australia, skilled visa availability has been declining for the past five years, contributing to a labour shortage further exacerbated by two years of pandemic-related border closures.2 With multiple city-shaping construction projects underway and many more planned, this national skilled labour shortage risk is impeding overall capacity to deliver critically needed infrastructure projects.
In response to capacity constraints and demand in the market, we are exploring opportunities for more flexible project delivery models that may relieve a portion of current labour constraints. For example, splitting project scope/works packages to attract a broader range of contractors, including Tier 2 and 3 suppliers. This approach creates opportunities for smaller operations to build capacity and capability.
We’re also building industry capacity through our projects. For example, on the West Gate Tunnel Project, our resourcing aligns with the Victorian Industry Participation Policy (VIPP), promoting access to local small to medium enterprises (SMEs) to supply this major project.
To date, 46% of our delivery partners are categorised as SMEs. We’re also delivering on the Victorian Government’s Major Project Skills Guarantee, with apprentices working 12.3% of our labour hours—2.3% more than the 10% minimum requirement. This ensures young Victorians develop valuable skills, benefitting directly from the project.
1 Entities with an annual turnover of less than $10 million 2 The Age (2022), ‘We’ve got a crisis. We need workers’: Big business urges election winner to boost migration.
Accessed 30 June 2022 3 WestConnex concession includes M4–M5 Link and Rozelle Interchange (both currently under construction)4 495 Express Lanes concession includes the 495 Express Lanes Northern Extension Project (currently under construction)5 95 Express Lanes concession includes the Fredericksburg Extension (currently under construction)
Investment partnership Members AssetsSydney Transport Partners Transurban, AustralianSuper,
Canada Pension Plan Investment Board (CPP Investments), Tawreed Investments Ltd and Caisse de dépôt et placement du Québec
WestConnex,3 currently comprising of M4, M8, M5 East
Airport Motorway Pty Limited Transurban, IFM Investors and UniSuper
Eastern Distributor
North West Roads Group Transurban, CPP Investments and QIC Limited
M7, NorthConnex
Transurban Chesapeake Transurban, AustralianSuper, CPP Investments and UniSuper
495 Express Lanes,4 95 Express Lanes,5 395 Express Lanes
Transurban Queensland Transurban, AustralianSuper, Tawreed Investments Ltd
AirportlinkM7, Clem7, Gateway Motorway, Go Between Bridge, Legacy Way, Logan Motorway
Investment partnersWe have seven investment partners across
15 assets. Our investment partners operate or own infrastructure assets in more than 35 countries and have more than $1.6 trillion in collective funds under management or net assets. Partners include leading global pension funds and infrastructure investors.
The direct asset funding our investment partners provide enables us to access new markets and assets with less reliance on the Transurban balance sheet.
Our expertise as a global toll road operator, coupled with our project delivery capability, attracts quality investment partners. In FY22, the Sydney Transport Partners (STP) consortium strengthened its commitment to the Sydney market by acquiring the remaining 49% share in WestConnex, for $11.1 billion. Read more on page 66.
Governance and risk
Financial statements
Security holder information
Sustainability supplement
Remuneration report
Introduction and overview
Directors’ report
Business performance
Corporate Report for the year ended 30 June 2022

60
With Ventia, our NSW road operations and maintenance provider and Muru Mittigar, an Aboriginal (Dhaurg) not-for-profit organisation, we established an Aboriginal and Torres Strait Islander skill development and long-term employment program. Now, two Aboriginal and Torres Strait Islander apprentices are working on the M2 Motorway and studying for their qualifications. To date, we have spent more than $130 million with Aboriginal and Torres Strait Islander businesses through our major projects, and we continue to explore ways we can enhance our engagement and partnerships.
In North America, we and our partners, Macquarie Capital, continued our Maryland Express Lanes Project—Phase 1 local workforce development activities. These included: engagement with women/veteran/minority-owned and small businesses; union and local contractor involvement; and partnerships with community organisations and educational institutions.
Our Sustainable Procurement Program includes social procurement practices which to direct our purchasing power to support small and under-represented businesses, including businesses owned by, or supporting: women; people with disabilities; the long-term unemployed; and social enterprises (businesses that create jobs for disadvantaged groups).
In Australia, we are a member of Social Traders, an organisation that connects businesses with certified social enterprises. We also have a dedicated Sustainable Procurement Manager who supports our teams in developing social procurement partnerships that deliver shared-value outcomes. In FY22, our program expanded to include new partnerships.
In Brisbane, we dressed our new Mental Health First Aiders in TradeMutt’s PPE shirts, featuring colourful and vibrant designs intended to serve as conversation starters and connect our people with their newly minted mental health first aiders. TradeMutt are a social impact workwear brand that contributes shirt sale proceeds to TIACS, a free text, chat and call-back service staffed by mental health clinicians.
We also partnered with Multicap, a disability employment and skills-development service, and Q-Free Australia, our image processing and review service provider, to create job opportunities for Multicap participants. Q-Free monitors vehicles without tags on our Brisbane
roads—taking photos of licence plates and processing the images using auto recognition to identify the customer. These photos need to be regularly reviewed for quality assurance, and Multicap’s team is now undertaking this important task. This initiative is enabling people with disabilities to gain skills, training and employment experience in a technology-based industry with support from our partners.
Our decade-long partnership with Ability Works, a Melbourne-based social enterprise employing people with disabilities and members of the community facing significant employment barriers, was recognised at the 2021 Asia-Pacific Shared Value Awards. We were finalists in the Best Shared Value Idea Collaboration of the Year (early stage) category, for our ongoing shared value partnership with Ability Works, our supplier Aurecon, Apricot Consulting and RMIT University. Ability Works delivers our mail-house and tag processing services.
We also continued working with Apricot Consulting and their academic partners (RMIT and The University of Melbourne) to help us develop and grow our social enterprise and other shared-value partnerships.
In Australia, we support Aboriginal and Torres Strait Islander peoples with commitments for employment, training and development as well as spending with accredited businesses.
Our social procurement approach enhances the competitiveness of the businesses we buy from. By creating jobs for disadvantaged people, our approach also delivers value to the communities these businesses operate in.
Social procurement
To date, we have spent more than $130 million with Aboriginal and Torres Strait Islander businesses on our major projects.
Governance and risk
Financial statements
Security holder information
Sustainability supplement
Remuneration report
Introduction and overview
Directors’ report
Business performance
Corporate Report for the year ended 30 June 2022

61
We also have specific targets on our other projects in the Greater Washington Area for both Disadvantaged Business Enterprises (DBE) and Small Women and Minority (SWaM) owned businesses, with a combined goal of USD116 million on the Fredericksburg Extension an increase of almost 10% and USD110 million on the 495 Extension Project. Both projects currently have contracted USD146 million to DBEs and SWaMs.
In Melbourne, our West Gate Tunnel Project spent more than $7 million across 46 Aboriginal and Torres Strait Islander businesses, and more than $6 million on social enterprises, with 45 engaged to provide goods and services.1
In Sydney, the WestConnex M4–M5 Link Project has now spent more than $62 million with accredited Aboriginal and Torres Strait Islander businesses, including recruitment.
NorthConnex, in Sydney, which opened in FY21, continues to support employment of Aboriginal and Torres Strait Islander peoples through our procurement of incident response and maintenance services for the next five years.
In Brisbane, we began investigating opportunities to expand both direct and indirect opportunities with Aboriginal and Torres Strait Islander, and other, social enterprises. We are reviewing the existing market and researching Queensland demographics to identify opportunities that will maximise value (for participants, local communities and our own sustainability targets) and also to identify challenges we will need to address to progress this action.
Read about our sustainable procurement with Aboriginal and Torres Strait Islander suppliers in our Reconciliation Action Plan transurban.com/rap
—Highlight—
Addressing modern slavery risks
We continue to work with suppliers to identify and address any possible exposures to human rights risks and exploitation in our supply chains. We submitted our second Modern Slavery Statement to the Australian Federal Government in December 2021, again outlining how we work to identify, manage, and mitigate the specific risks of modern slavery in our operations and supply chains.
We did not identify any instances of modern slavery in our operations or supply chains in FY21, and we remain vigilant in monitoring slavery risks. We participate in regular forums, with both suppliers and other industry leaders to share learnings and knowledge on mitigating these risks.
Further, we maintain an independent whistleblower hotline for those wanting to raise issues, including modern slavery issues.
Our next Modern Slavery Statement will be submitted to the Australian Government by December 2022.
Read our FY21 Modern Slavery Statement, transurban.com/modern-slavery-fy21
1 Social procurement information as reported by the West Gate Tunnel Project D&C subcontractor, CPB Contractors Pty Ltd and John Holland Pty Ltd
In Australia, Ability Works delivers our important mail-house and tag processing services
Governance and risk
Financial statements
Security holder information
Sustainability supplement
Remuneration report
Introduction and overview
Directors’ report
Business performance
Corporate Report for the year ended 30 June 2022

62
Our major infrastructure projects remain the most resource intensive-area of our business—so they are also our biggest opportunity for reducing our environmental impacts. Our design and construction projects also serve as springboards for innovation, enabling the development of more sustainable materials and delivery methods.
Environmental leadership
Engaging our suppliers We are engaging with our suppliers on
GHG reduction and climate risk management through CDP Supply Chain reporting. Last year we engaged with our top 50 suppliers (by spend) to support them in establishing CDP reporting processes. This group represents 66% of our emissions from purchased goods and services so getting suppliers on board and having oversight of their progress is important to our success. So far:
• 35% of disclosing suppliers’ total energy consumption is sourced from renewable energy
• 25 of our top 50 suppliers reported having active GHG reduction targets in place.
Decarbonising constructionRethinking the way we plan, design,
construct and operate assets to reduce their whole-of-life impact is fundamental to achieving our Scope 3 GHG emission reduction targets for our supply chain and projects (see page 38). This means
continuing to work with our contractors and suppliers on low-carbon and circular-materials strategies while also reducing direct fuel consumption and waste and increasing renewable energy use. Project specifications and materials changes we’ve implemented with our partners to date have reduced GHG emissions by about 644,000 tCO2e across nine projects.1
The production of many road construction materials (including concrete, steel and asphalt) currently relies heavily on fossil fuels. For example, production of cement—an ingredient used in concrete—accounts for about 8% of all global GHG emissions.2 To meet our emission reduction targets, we are working with our contractors, government and industry partners to increase the use of low-carbon concrete and other materials.
Out of 271,000 m3 concrete poured on the M4–M5 Link project, we replaced 32% of cement with fly ash (a power-generation waste material) and other supplementary cementitous materials (SCM). This reduced emissions associated with cement production, diverted 35,000 tonnes of waste from landfill and far exceeded the project’s 5% SCM target.
One of the key areas of focus in our journey to net zero is addressing indirect (Scope 3) GHG emissions from materials. In FY22, we continued our role as a founding partner with the Materials Embodied Carbon Leaders Alliance (MECLA). More than 150 industry representatives and government agencies participate in MECLA, which aims to drive reductions in embodied carbon in the building and construction industry. MECLA also aims to achieve a one million tonne carbon emission reduction by 2030.
We participate in two of the organisation’s eight working groups, focused on identifying:
• ways to create demand for low/zero embodied carbon materials
• opportunities to reduce emissions associated with cement and concrete.
M4–M5 Link project highlights:
100% usable spoil reused/recycled (target 80%)
97%construction and demolition waste reused/recycled (target 80%)
63%of 665,137 kl water used during construction was reused, recycled or reclaimed (target 15%)
32%cement replacement material used in concrete (target 5%)
21%forecasted construction phase emission reduction (via GreenPower and carbon offset certificate procurement)3
1 IS Design and As Built ratings from Transurban major projects2 Beyond Zero Emissions, Zero Carbon Industry Plan: Rethinking Cement (2017). Accessed 30 June 20223 Acciona Samsung Bouygues Joint Venture (ASBJV)
Governance and risk
Financial statements
Security holder information
Sustainability supplement
Remuneration report
Introduction and overview
Directors’ report
Business performance
Corporate Report for the year ended 30 June 2022

63
Decarbonising operationsTo support our Scope 3 targets, we are
increasingly including contractual supplier requirements for the provision of low-carbon products and services, for example: switching to renewable energy and/or setting science-based GHG emission reduction targets. We also encourage suppliers under existing contracts to adopt similar low-carbon strategies.
Currently, diesel Truck Mounted Attenuator (TMA) trucks are responsible for at least 30% of Scope 1 (fuel) emissions from Ventia’s operations on our NSW roads, due to idling during traffic management activities. To reduce these GHG emissions, Ventia has ordered an Electric TMA—an Australian first—that is expected to be operating on Sydney’s M2 Motorway in mid 2023.
As part of a pavement trial on the M2 Motorway in NSW, recycled tyres were applied as crumb rubber asphalt. In road construction, crumb rubber is predominantly truck and car tyres, which is combined with aggregates in the dry manufacturing process before adding bitumen to produce crumb rubber asphalt. The trial content made up around 2% of the total asphalt, and it is estimated that approximately 563 equivalent passenger car tyres were recycled.
The Infrastructure Sustainability Council (ISC) manages and advocates the use of its Infrastructure Sustainability (IS) rating scheme to improve sustainability outcomes over the lifecycle of infrastructure assets in Australia and New Zealand. Version 1.2 of their Design and As Built rating tool has three rating levels—‘Commended’ (25–49 points), ‘Excellent’ (50–74 points) and ‘Leading’ (>75 points).
We have committed to achieving at least Excellent IS ratings for the design and construction phases of all our major Australian projects. We set targets and monitor project management, procurement, environmental impact, community wellbeing, stakeholder engagement, and innovation performance throughout delivery to ensure IS ratings are met. We are continuing to work on achieving our first operations IS rating, for the M2 in Sydney.
In North America, Transurban’s major project procurement process invites contractors and service providers to include sustainable development principles in proposals and solutions. From planning and preliminary engineering, design, construction and operation, all suppliers are required to provide solutions that mitigate risks and generate social and environmental benefits for both the communities where we operate and globally.
For example, for major projects, contractors are required to achieve an Envision rating from the Institute for Sustainable Infrastructure—the North American equivalent to the ISC. Under Envision, five levels of achievement are possible—Verified, Bronze, Silver, Gold and Platinum. To ensure all new major projects contribute to our emission reduction targets, we are enhancing our project specifications to help reduce direct fuel consumption and increase renewable energy and low-carbon material use. We are working to achieve an Envision Silver rating (rating tool Version 3) for the Fredericksburg Extension project’s design and construction, and have set an Envision Silver rating requirement for the 495 Express Lanes Northern Extension project.
Our proposal for the Maryland Express Lanes Project—Phase 1 aims to achieve the Envision Platinum, including via significant above-regulation community and environmental programs and initiatives.
Read more about our sustainability initiatives in our community (page 37)
Achieving project sustainability ratings
To support our Scope 3 targets, we are increasingly including requirements for the provision of low-carbon products and services in our contracts.
Governance and risk
Financial statements
Security holder information
Sustainability supplement
Remuneration report
Introduction and overview
Directors’ report
Business performance
Corporate Report for the year ended 30 June 2022

64
Contractor safetyMillions of construction hours are worked on our major projects each year. We work closely with our supply chain partners to identify and mitigate potential health, safety and environment (HSE) risks and hazards.
FY22 was our first full year working under an enhanced HSE Contract Management Framework, with HSE analytics integrated into our risk reporting and analysis. This approach, designed to improve our overall understanding, identification and management of hazards, risks, incidents and near misses, has delivered improved contractor HSE performance.
This year 427 employees who interface and engage with contract management completed training on the new framework. The training enhanced understanding of our contractor oversight approach, Active Client. Under the Active Client approach:
• our contractors are responsible for identifying and managing HSE risks associated with delivering their works
• we are responsible for monitoring and conducting assurance activities to confirm works are being performed in accordance with contractor’s stated processes.
The Active Client approach underpins our engagement with our contractors to enhance HSE performance. We conduct regular joint HSE walks and site visits with our contractors to understand and discuss their key risks and the associated controls in place to manage the risk. We also have well-established processes to respond to outcomes of incident investigations and communicate lessons learnt across our regions. In the US, bilingual (English and Spanish) functionality has been added to our Authority to Access (ATA) permit process.
In FY22, we enhanced our ATA system to ensure those accessing our operating assets to perform work have the appropriate safety awareness. Now, every person seeking access must successfully complete an online Transurban Asset Induction before being granted an ATA, and every person must sign in when attending the relevant asset.
During FY22 we also developed an enhanced Contractor Assurance Procedure and a Contractor Performance Verification checklist, and have made these tools available in our health, safety and environment management system. These tools provide additional support for our people when conducting contractor HSE performance assurances for high-risk and other activities performed by contractors.
In North America we completed multiple HSE audits to assure contractor compliance with regulatory and contract requirements. Audited parties included our largest technology contractor, largest maintenance contractor, facilities contractor, and the joint venture contractor responsible for design and construction of the Fredericksburg Extension. In addition, Transurban hosts a quarterly Northern Virginia Safety Forum to engage our construction and operations partners in the region to foster continual improvement and share best practices for the protection of our workers.
In FY22 we recorded a contractor recordable injury frequency rate (RIFR) of 3.09 per million work hours (Figure 17). This result was under our target of no more than 4.20 and lower than the FY21 RIFR, 3.75.1 It also includes a contractor recordable injury-free month achieved across all operations and projects in June 2022.2
Recordable injuries include lost-time injuries, where a person loses one or more full shifts from work, and medical treatment injuries where medical treatment (other than first aid) is required.
Read more about our safety approach with our customers (page 32) and our people (page 49)
16.5M contractor hours worked on projects and operations
~6,150subcontractors completed online HSE induction
Figure 17: Contractor RIFR
1 FY21 Contractor RIFR reported at 3.90 in end of year reporting materials. Following an assurance process on WestConnex, additional contractor hours were recovered lowering the FY21 Contractor RIFR to 3.75
2 Zero contractor fatalities in FY22
FY18
FY19
FY22
FY211
FY20
5.03
3.66
3.60
3.75
3.09
Governance and risk
Financial statements
Security holder information
Sustainability supplement
Remuneration report
Introduction and overview
Directors’ report
Business performance
Corporate Report for the year ended 30 June 2022

65
UN SDGs relevant to this section
distributions to security holders
$1.2B
highest-rated motorway infrastructure company—
Global Real Estate Sustainability Benchmark
for Infrastructure (2021)
2ND
$4.2Bequity raising
successfully completed with strong support
from security holders
InvestorsWe understand that, for our business to deliver value over the long term, we need to balance the needs of all stakeholder groups. For investors, our focus is on balancing growth in distributions and investment to create long-term security holder value.
In this section we report on our financial performance, capital management activity and strategy, and the financial outlook for our business in FY22.
Figure 18: Group Average Daily Traffic by year (FY00–FY22)
See how our strategy creates value for our investors (pages 20 to 21)
FY00 FY01 FY02 FY03 FY04 FY05 FY06 FY07 FY08 FY09 FY10 FY11 FY12 FY13 FY14 FY15 FY16 FY17 FY18 FY19 FY20 FY21 FY22
0.50
1.00
1.50
2.00
2.50
Governance and risk
Financial statements
Security holder information
Sustainability supplement
Remuneration report
Introduction and overview
Directors’ report
Business performance
Corporate Report for the year ended 30 June 2022

6666
When complete, WestConnex will comprise a ~70-kilometre network linking Sydney’s west with the Sydney CBD, Sydney Airport and Port Botany. Around 40% of Sydney’s population is expected to live within five kilometres of WestConnex by 20311.
In FY22, Transurban, with its Sydney Transport Partners (STP) consortium members—AustralianSuper, Tawreed and a new partner, the Caisse de depot et placement du Quebec (CDPQ)—were successful in acquiring the remaining 49% equity stake in WestConnex from the NSW Government. This acquisition increased STP’s total ownership of WestConnex to 100%. Transurban owns 50% of STP.
WestConnex is expected to deliver long-term value due to benefits including its long remaining concession life, traffic resilience, and defined pricing escalation mechanism. WestConnex benefits from the structural growth drivers of Sydney by providing a critical connection linking the population and employment centres in Sydney’s west and southwest to key economic centres. WestConnex provides critical connections for the commercial road transport industry, with 80% of the greater Sydney freight task undertaken by road and is well positioned to benefit from new government projects expected to be required to support expected future population growth.
WestConnex has close to 40 years concession life remaining.2 The additional ownership in WestConnex, including the extension to the M5 West concession from 2026, extends Transurban’s weighted average concession life to approximately 30 years.3
The strong fundamentals of WestConnex along with the upside potential of Greater Sydney economic growth and future infrastructure is expected to support long-term Group Free Cash generation and distributions for security holders. The FY22 distribution included an additional amount of 2.7 cents per security as a result of the additional ownership in WestConnex, providing an offset to short-term dilution from the transaction.
Through the NSW Government’s bid process, the stake was acquired for $11.1 billion, including stamp duty, alongside our co-investors. Transurban’s contribution to the acquisition was funded through a combination of new equity and existing corporate liquidity with most coming from a fully underwritten $3.97 billion pro rata accelerated renounceable rights offer to eligible security holders. This offer structure was identified as the best way to recognise the support of our existing security holders, many of whom are long-term investors.
The entitlement offer was well supported with 93% of entitlements available to
eligible institutional investors taken up. All eligible retail security holders were also invited to participate in the entitlement offer.
The offer price of $13.00 per security represented an 8.3% discount to Transurban’s closing price of $14.18 on 17 September 2021.
WestConnex is one of the largest road infrastructure projects in the world and a key component of the NSW Government’s integrated transport plan to ease congestion and connect communities.
WestConnex acquisition
Understanding what matters to our investors
—Case study—
1 In 2031, based on Deloitte Access Economics estimates and Transurban’s own internal estimates and assessments2 Remaining concession life as at 30 June 2022 for each concession on a non-revenue weighted basis with each concession expiring in December 20603 Pro-forma remaining concession life as at 30 June 2022 with each concession weighted based on the contribution to Transurban’s total proportional
revenue for FY22 in each concession’s respective region as reported in Transurban’s audited financial statements
“We feel privileged to take Sydney Transport Partners’ holding in this critical asset to 100%. This transaction is expected to support Free Cash growth and distributions for Transurban security holders for the life of the concession” Scott Charlton, Transurban CEO
Governance and risk
Financial statements
Security holder information
Sustainability supplement
Remuneration report
Introduction and overview
Directors’ report
Business performance
Corporate Report for the year ended 30 June 2022

67
Large vehicle traffic has remained resilient across FY22 in all markets with steady freight demand and e-commerce movements remaining elevated.
Delivering for investors
Transurban distributed $1,259 million2 to security holders in relation to FY22. In parallel, we progressed our pipeline of projects in development across Australia and North America, and invested in strategic opportunities with the potential to further grow the pipeline. Through FY22, Transurban has continued to actively manage its balance sheet, providing optionality to pursue near and longer-term growth opportunities. Positive trends in traffic performance and project delivery, together with the strength of the Group’s balance sheet, provides a meaningful base for Free Cash growth over the medium to longer term.
How we measure financial performance
Free Cash FlowFree Cash is the primary measure used to
assess the cash performance of the Group and generally represents the cash available for distribution to security holders. Free Cash is calculated in note B10 of the Group Financial Statements.
Proportional EBITDAWe consider proportional earnings before
interest, tax, depreciation and amortisation (EBITDA) to be the best measure of underlying business performance. Proportional EBITDA aggregates the results from each asset multiplied by Transurban’s percentage ownership as well as the contribution from central Group functions. Proportional EBITDA reflects the contribution from individual assets to the Group’s operating performance and focuses on
elements of the result that management can influence to drive improvements in earnings.
Note B4 to the Group Financial Statements presents further detail on the proportional results for the Group, including reconciliations to the statutory result.
Traffic performance during FY22
Group traffic was supported by improvement in airport and CBD activity, continued demand for leisure travel, and commissioning of new assets.1 This contributed to the Group’s 4Q22 performance exceeding 2019 levels, despite COVID-19 impacts and severe weather events earlier in the period.
This was further supported by use of private transport and increased mobility and travel. For example, the performance of airport-exposed corridors improved in line with returning passenger volumes on both domestic and international routes.
Leading global toll road developer and operatorUsing a data-driven approach to facilitate safer and faster journeys for more than 2 million trips each day
21 assets in five markets with average concession life of nearly 30 years Averaging more than 28 years in concession life over the last decade through disciplined investments with seven development projects in progress
Balance sheet strength supports growth opportunities Robust balance sheet provides optionality to pursue near and longer-term growth opportunities
Inflation benefit with near-term interest rate protectionEmbedded CPI escalation across 68% of revenue, together with debt hedging profile, is expected to provide a net benefit in a near-term rising interest rate environment
Positioned for long-term growth opportunitiesCreating innovative transport solutions in partnership with governments and strategic partners, supported by investment in technology and data capabilities
1 M8 and M5 East opened/commenced tolling on 5 July 2020. NorthConnex opened on 31 October 2020
2 Final distribution will be paid on 23 August 2022
Our investment proposition
Balancing growth in distributions and investment to create long-term value
Governance and risk
Financial statements
Security holder information
Sustainability supplement
Remuneration report
Introduction and overview
Directors’ report
Business performance
Corporate Report for the year ended 30 June 2022

68
Key metricsThe below table is a summary of key financial measures which we consider the best representation of underlying business performance
FY22 financial performance highlights
Average daily traffic (millions)
Proportional toll revenue ($ millions)
Proportional EBITDA (excl. significant items) ($ millions)
Financial metrics FY22 FY22 vs. FY21Proportional toll revenue $ millions 2,626 5.7%
Proportional EBITDA (exc. significant items) $ millions 1,900 3.5%
Statutory revenue $ millions 3,406 18.0%
Statutory NPAT $ millions 16 (99.5%)
Statutory cash flow from operating activities $ millions 982 9.2%
Free Cash (incl. Capital Releases) $ millions 1,531 19.8%
Gross distributions $ millions 1,259 26.0%
Distributions per security cps 41 12.3%
FY22 FY21Capital Releases $ millions 355 278
Proportional drawn debt $ millions 23,574 20,763
Proportional development capex $ millions 882 1,157
Ratios and ratesProportional Group EBITDA margin % 68.8
Corporate debt rating (S&P/Moody’s/Fitch) rating BBB+/Baa1/A-
Distribution Free Cash flow coverage % 122
Corporate SICR x 3.3
Gearing % 34.2
Weighted average cost of debt
AUD debt % 3.9
USD debt % 3.6
CAD debt % 5.0
2.02.2
2.0 2.0 2.0
FY18 FY19 FY20 FY22FY21
2,6262,340
2,581 2,492 2,486
FY18 FY19 FY20 FY22FY21
68.8%74.9% 75.4% 72.3% 70.3%
1,9001,7962,016
1,888 1,836
FY18 FY19 FY20 FY22FY21
EBITDA MARGIN (%)
Governance and risk
Financial statements
Security holder information
Sustainability supplement
Remuneration report
Introduction and overview
Directors’ report
Business performance
Corporate Report for the year ended 30 June 2022

69
Waterfall chart
1,000 94
(12)
21 12 103
1,176
1,531
16
(27)
1,259
(83)(13)
65
FY21 Free Cashexcluding
Capital Releases
EBITDA100% owned
entities
Distributionsnon-100% owned
entities
Maintenanceand other
movements
Net finance costs100% owned
entities
Workingcapital
FY22 Free Cashexcluding
Capital Releases
FY22distribution
FY22 Free Cash
17.6%
North AmericaBrisbane CorporateMelbourneSydney
Key drivers
EBITDA from 100%-owned assetsThe decrease in EBITDA from 100%-owned
assets primarily reflected a year-on-year decrease in traffic in Sydney combined with an incremental increase in the cost base, with the prior year comparatively less impacted by government-mandated COVID-19 restrictions.
EBITDA from 100%-owned assets is also impacted by the partial divestment of Transurban Chesapeake, with the Free Cash contribution from these assets now captured within the distributions from non-100% owned assets.
While traffic was broadly flat compared to FY21, proportional toll revenue increased 5.7% year on year, driven by inflation-linked toll escalations across Transurban’s Australian markets and the A25 in Canada.
Overall growth in costs was due to annual escalations, investments in new or enhanced capability, accounting-related changes and new assets, partially offset by divestments.
Distributions from non-100% owned assets
There was an increase in distributions from non-100% owned assets with Transurban Chesapeake paying its first post-divestment distribution and incremental distributions resulting from the increased ownership in WestConnex. This was partly offset by reduced distributions from the Eastern Distributor, due to traffic impacts, increased tax payments and debt amortisation payments.
Maintenance and other movements
There was a small favourable movement due to the deconsolidation of Transurban Chesapeake assets from Group reporting.
Net finance costs from 100% owned assets
Net finance costs declined due to the reduction in interest paid associated with Transurban Chesapeake following the partial divestment.
Working CapitalThe favourable movement in working
capital compared to FY21 was primarily timing related.
Capital ReleasesCapital Releases in FY22 comprised $255
million from WestConnex and $100 million from NorthConnex, compared to $278 million from WestConnex in FY21.
Operating performance
Figure 19: Free cash flow reconciliation
Governance and risk
Financial statements
Security holder information
Sustainability supplement
Remuneration report
Introduction and overview
Directors’ report
Business performance
Corporate Report for the year ended 30 June 2022

70
FY22 performance2
• Average Daily Traffic decreased by 13.9%, compared to FY21 with traffic performance improving throughout the second half of FY22 following COVID-19 disruptions and heavy rainfall events
• Car traffic was down by 14.9%, while large vehicle traffic decreased by 3.4% compared to FY21
• Proportional toll revenue decreased by 1.1% to $1,264 million, including new assets3
• Proportional EBITDA margin decreased to 77.2% (from 80.9% in FY21), with FY21 including liquidated damages received for the delayed opening of NorthConnex.
Portfolio summaryM2Lane Cove TunnelCross City TunnelEastern DistributorM7NorthConnexM4
M8/M5 East M5 WestM4-M5 Link—under constructionRozelle Interchange—under construction
Sydney
802
663
931814
761
FY18 FY19 FY20 FY22FY21
1,264
9441,042 1,072
1,278
FY18 FY19 FY20 FY22FY21
763856 879
1,033 976
80.7% 82.0% 82.0% 80.9% 77.2%
FY18 FY19 FY20 FY22FY21
Average daily traffic (‘000) Proportional toll revenue ($ millions) Proportional EBITDA ($ millions)1
Market performance
FY22 performance2 • CityLink traffic increased by 14.6% compared to FY21. Southern Link traffic increased by 11.5%,
and Western Link improved by 18.5% benefitting, in part, from increased airport-related travel
• Car traffic increased by 18.4% and large vehicle traffic increased by 4.6%, heavy commercial vehicles increased by 0.7% and light commercial vehicles increased by 7.6%
• Toll revenue increased by 17.3% to $722 million driven by traffic growth and contracted toll price escalation
• EBITDA margin increased to 82.2% (from 81.6% in FY21) reflecting traffic recovery in 2H22 and additional movement restrictions in FY21, compared to FY22.
Portfolio summaryCityLinkWest Gate Tunnel—under construction
Melbourne
648
824 851750
566
FY18 FY19 FY20 FY22FY21
722780 813
747
616
FY18 FY19 FY20 FY22FY21
594688 716
634502
82.2%88.2% 88.0%81.6%84.8%
FY18 FY19 FY20 FY22FY21
Average daily traffic (‘000) Toll revenue ($ millions) EBITDA ($ millions)
EBITDA MARGIN (%)
EBITDA MARGIN (%)
1 Excluding contributions from NorthConnex and additional proportional ownership of WestConnex, underlying EBITDA margin would be 77.7%2 All figures are proportional. Percentage changes are based on prior comparative period unless otherwise stated3 New assets include contributions from NorthConnex and additional ownership of WestConnex
Governance and risk
Financial statements
Security holder information
Sustainability supplement
Remuneration report
Introduction and overview
Directors’ report
Business performance
Corporate Report for the year ended 30 June 2022

71
Market performance
1 All figures are proportional. Percentage changes are based on prior comparative period unless otherwise stated2 Excluding the impacts of the partial divestment of Transurban Chesapeake, underlying EBITDA margin would be 54.3%
FY22 performance1
• Traffic on the Express Lanes increased by 31.3% compared to FY21. 95 Express Lanes benefitted from ongoing discretionary and leisure travel. Traffic on 495 Express Lanes remains below pre-pandemic levels with subdued commuter-related travel
• A25 traffic increased by 9.7% due to the easing of COVID-19 associated restrictions on movements in the prior year and construction activity in the local area. Car traffic increased by 10.6% and large vehicle traffic increased by 2.9%
• Proportional toll revenue increased by 13.2% to $189 million, or 60.5% to $269 million on a like-for-like basis, excluding the partial divestment of Transurban Chesapeake assets
• Proportional EBITDA margin increased to 63.1%2 (from 42.7% in FY21), due to the partial divestment of Transurban Chesapeake and seasonality.
Portfolio summary95 Express Lanes—GWA395 Express Lanes—GWA495 Express Lanes—GWAA25—MontrealFredericksburg Extension—GWA, under construction495 Express Lanes Northern Extension—GWA, in developmentCapital Beltway Accord—GWA, progressing with government
FY22 performance1
• Average daily traffic increased by 2.8% compared to FY21. Growth was broad-based with increases in both car and commercial traffic
• Car traffic increased by 2.0% with growth in both workday and weekend discretionary travel across most assets. Large vehicle traffic increased by 5.0%
• Proportional toll revenue increased by 6.1% to $451 million
• Proportional EBITDA margin decreased to 71.0% (from 73.9% in FY21), due to higher maintenance costs in the second half of FY22 compared to FY21.
Portfolio summaryGateway Motorway Logan MotorwayAirportlinkM7 Clem7Legacy WayGo Between Bridge
Brisbane
North America
418403 405 383407
FY18 FY19 FY20 FY22FY21
451393 402 394
425
FY18 FY19 FY20 FY22FY21
320279 293 286
314
71.0%71.0% 73.1% 72.6% 73.9%
FY18 FY19 FY20 FY22FY21
140144 147132
115
FY18 FY19 FY20 FY22FY21
189223
324
279
167
FY18 FY19 FY20 FY22FY21
63.1%58.6%
65.0%
55.3%
42.7%
120130
210
154
72
FY18 FY19 FY20 FY22FY21
Average daily traffic (‘000)
Average daily traffic (‘000)
Proportional toll revenue ($ millions)
Proportional toll revenue ($ millions)
Proportional EBITDA ($ millions)
Proportional EBITDA ($ millions)
EBITDA MARGIN (%)
EBITDA MARGIN (%)
Governance and risk
Financial statements
Security holder information
Sustainability supplement
Remuneration report
Introduction and overview
Directors’ report
Business performance
Corporate Report for the year ended 30 June 2022

72
Capital managementThe underlying strength of the Group’s
cashflows support security holder distributions and allows efficient funding of opportunities through a combination of debt and equity funding.
Sydney Transport Partners completed the acquisition of the remaining 49% share in WestConnex from the NSW Government in October 2021. Transurban funded its share by $1.4 billion of available corporate liquidity and $4.22 billion in new equity including a $3.97 billion fully underwritten pro-rata renounceable entitlement offer.
Transurban’s approach to capital management supports our investment proposition: to balance growth in distributions to investors and investments to create long-term value.
Capital management
215
1,297
1,8761,611 1,652
866
1,700
1,332 1,239
570
2,552
2,297
952
2,596
2,114
569 993
1,848
1,259
5,394
1,317
1,836
1,234
FY23 FY24 FY25 FY26 FY27 FY28 FY29 FY30 FY31 FY32 FY33–37 FY38–42 FY43+
Figure 21: Group debt maturity profile ($ millions)2,3
1 Proportional drawn debt inclusive of issued letters of credit. CAD, CHF, EUR, NOK and USD debt converted at the hedged rate where cross currency swaps are in place. USD debt is converted at the spot exchange rate (0.6884 at 30 June 2022) where no cross currency swaps are in place. CAD debt is converted at the spot exchange rate (0.8885 at 30 June 2022) where no cross currency swaps are in place
2 The full value of debt facilities is shown. Debt is shown in the financial year in which is matures
3 Debt values are shown in AUD as at 30 June 2022. CAD, EUR, NOK and USD debt converted at the hedged rate where cross currency swaps are in place. USD debt is converted at the spot exchange rate (0.6884 at 30 June 2022) where no cross currency swaps are in place. CAD debt is converted at the spot exchange rate (0.8885 at 30 June 2022)
NOK NOTES
CHF EUR NOTES
CAD NOTES
AUDPRIVATEPLACEMENT
AMTN
BANK DEBT
LETTERS OF CREDIT
GOVERNMENT DEBT
USD NOTES(REG S)
USD NOTES(PABs)
USD NOTES(144a)
US PRIVATEPLACEMENT
Figure 20: Group proportional debt diversity1
Debt overviewTransurban refinanced $3.4 billion of
debt across bank and debt capital markets (excluding letters of credit and undrawn borrowing facilities) to support funding initiatives and the delivery of projects across the business. In doing so, the Group’s weighted average cost of AUD debt decreased to 3.9%. The average tenor decreased to 7.1 years, however this would have been 6.7 years absent any refinancing activities.
As at 30 June 2022 the Group’s gearing level was relatively stable at 34.2% and FFO/Debt decreased slightly to 9.1%.
Prudent management of the debt book remains core to the funding strategy, with a focus on growing the diversity of funding sources while reducing funding and liquidity risk.
Funding growthTransurban is well capitalised to fund the
near-term pipeline of growth projects with capex profile expected to broadly align with the timing of Capital Releases. Timing and amount of Capital Releases remain uncertain and subject to a variety of factors, including
the relevant asset’s performance, debt capital market and broader macroeconomic conditions over the near term.
Transurban is proactive in maintaining a robust balance sheet to ensure sufficient capacity to cover near-term liquidity requirements, retaining access to a diverse range of funding markets, as well as additional funding sources such as Capital Releases.
DistributionA distribution totalling 26.0 cents per
stapled security will be paid on 23 August 2022 for the six months ended 30 June 2022. This will be made up of a 24.0 cents partly franked distribution from Transurban Holding Trust and controlled entities and a 2.0 cent fully franked dividend from Transurban Holdings Limited and controlled entities. This takes the total FY22 distribution to 41.0 cents per stapled security, of which 2.0 cents is fully franked.
This distribution includes 2.7 cents per security in Capital Releases resulting from the increased stake in WestConnex which has been used to minimise the dilutive impact of the transaction, with total FY22 Free Cash (including Capital Releases) coverage of 122%.
Corporate Non-Recourse
Governance and risk
Financial statements
Security holder information
Sustainability supplement
Remuneration report
Introduction and overview
Directors’ report
Business performance
Corporate Report for the year ended 30 June 2022

73
While traffic performance has shown resilience in the context of weather-related impacts, we recognise there is likely to be fluctuations around long-term growth trendlines and will continue to monitor and analyse changing mobility trends. This includes people’s workplace arrangements, the acceleration of online shopping and the preference for private-vehicle travel over public transport.
In the current macro environment of rising inflation and interest rates, the business is well positioned with almost 70% of our assets having embedded inflation-linked toll escalation, which provides a built-in buffer in an inflationary environment. As at 30 June 2022, around 98% of our debt book is fully hedged which gives us very low exposure to near-term interest rate increases.
The combination of inbuilt inflation protection and a balance sheet structured on conservative views around interest rates positions us well for growth throughout the cycle.
We have optionality to pursue near and longer-term growth opportunities in our core markets which, coupled with our long-term investment horizon, will enable the company to continue to take a disciplined approach in growing the portfolio to create long-term value while balancing growth in distributions to security holders.
FY23 distribution expected to be 53.0 cps representing approximately 30% growth on FY22. This will be subject to the Group’s distribution policy as outlined below, traffic performance and macroeconomic factors, and timing of distributions from subsidiaries.1
Distribution policy1
Distribution is expected to be in line with Free Cash excluding Capital Releases, with the following exception.
As previously stated, the acquisition of an additional 24.5% interest in WestConnex,2 Transurban is likely to use a portion of the additional WestConnex Capital Releases3 received in the two years following the transaction to minimise dilution in Free Cash per security associated with the equity raising.
Traffic growth is expected to be supported by new assets and long-term structural trends including population, employment and economic growth.
Outlook
Figure 22: Projects under development or delivery
1 Distributions to be determined by relevant Board discretion at the time
2 Transurban’s proportional ownership in WestConnex through its equity investment in STP JV increased from 25.5% to 50% on 29 October 2021
3 Additional releases received due to Transurban’s higher equity interest in WestConnex. Timing and amount of Capital Releases remain uncertain and subject to a variety of factors, including the relevant asset’s performance, debt capital market and broader macroeconomic conditions
SydneyM4–M5 LinkRozelle Interchange2
M7–M12 Integration and Delivery
MelbourneWest Gate Tunnel Project
Greater Washington Area495 Express Lanes Northern Extension95 Express Lanes Maryland Express Lanes Project—Phase 1 Capital Beltway AccordFredericksburg Extension
Governance and risk
Financial statements
Security holder information
Sustainability supplement
Remuneration report
Introduction and overview
Directors’ report
Business performance
Corporate Report for the year ended 30 June 2022

74
Governance and risk
Financial statements
Security holder information
Sustainability supplement
Business performance
Remuneration report
Introduction and overview
Directors’ report
Governance and risk
Corporate Report for the year ended 30 June 2022

75
Governance
IntroductionTransurban’s governance framework plays
a critical role in helping the business deliver on its strategy.
It provides the structure through which business objectives are set, performance is monitored and risks are managed. It includes a framework for decision making across the business and provides guidance on the standards of behaviour expected of Transurban’s people.
Transurban’s governance framework, including our statement of compliance with the 4th edition of the ASX Corporate Governance Council’s Corporate Governance Principles and Recommendations, is detailed in our 2022 Corporate Governance Statement. Our Corporate Governance Statement and key governance documents are available on our website.
Role of the BoardThe Board is accountable to security
holders for the performance of Transurban. The Board’s primary roles are to demonstrate leadership and provide overall strategic guidance for Transurban and effective oversight of management in implementing Transurban’s strategic objectives and instilling its values. To assist it in discharging these responsibilities, the Board has established Committees to give detailed consideration to key issues.
The Board has also delegated responsibility for the day-to-day management of Transurban to the Chief Executive Officer (CEO), and through the CEO to other Senior Executives. The CEO is accountable to the Board for the exercise of this delegation with the support of Senior Executives.
The Board regularly reviews the charters and key policies that underpin Transurban’s corporate governance practices to ensure they remain appropriate, reflect high standards of governance and meet regulatory requirements.
Board structure and composition
The Board is structured to ensure that it is comprised of individuals with appropriate skills, knowledge, experience, independence and diversity to develop and support Transurban’s strategy and enable it to discharge its responsibilities and add value.
The Board utilises a skills matrix in succession planning and to assist in assessing the range of skills, knowledge, experience and diversity on the Board, and to identify particular competencies and perspectives that will enhance the Board’s effectiveness and add value. Enhanced disclosure of the Board’s collective skills and experience is set out in the matrix on page 77, and Directors’ biographies are set out on pages 80 to 81.
During the year the Board reviewed the interests, positions and relationships of the Non-executive Directors and considers each of them to be independent.
Board meetingsThe Board meets as often as necessary to
discharge its responsibilities. This requires Board members to attend at least eight scheduled meetings each year, the Annual General Meeting (AGM), Committee meetings and unscheduled meetings as required. The Board also meets with Transurban’s Executive Committee for strategy sessions.
Board meetings are typically held in each of our regions over the course of the year. In addition to these meetings, Directors also attend regional activities, including briefings, asset or project site visits and presentations, and opportunities for employee and stakeholder engagement. These activities are an important element of the Board’s induction and ongoing educational activities and enable Directors to obtain the required deep understanding of our operations within each region. As COVID-19-related government restrictions eased during FY22, members of the Board visited Transurban’s assets, offices and project sites in NSW, Victoria, Queensland, and the Greater Washington Area. The Board has welcomed the resumption of its usual schedule of in-person meetings and activities across each of Transurban’s markets as travel restrictions ease.
Performance of the Board, Committees and individual Directors
The Board undertakes an annual assessment of its performance, including its performance against the requirements of the Board Charter, the performance of individual Committees and the performance of individual Directors.
During the reporting period and through to the date of this report, the Board undertook an internally facilitated Board performance and effectiveness review, which included each Director providing feedback by way of a questionnaire. Further, one-on-one meetings were held between the Chair and each Director to obtain and provide additional feedback. The outcomes of the review were discussed with the Board and relevant actions were agreed.
Transurban is committed to good governance, transparency and accountability. The Board1 believes this is essential for the long-term performance and sustainability of our business, and to protect and enhance the interests of security holders and other stakeholders.
Read more at transurban.com/corporate-governance
1 The Boards of Transurban Holdings Limited, Transurban International Limited and Transurban Infrastructure Management Limited as responsible entity for Transurban Holding Trust (together, Transurban) have common directors and meet concurrently, and are collectively referred to as the Board
Financial statements
Security holder information
Sustainability supplement
Business performance
Remuneration report
Introduction and overview
Directors’ report
Governance and risk
Corporate Report for the year ended 30 June 2022

76
Key strategic, governance and oversight activities for the year included:
Health, safety, environment (HSE) and road safety
Ongoing commitment and oversight of Transurban’s HSE and Road Safety Plan. The plan is centred on Transurban’s long term vision to achieve a future with zero life changing injuries for employees, contractors and customers, and minimising our impact on the environment. Over the year there has been oversight of health and wellbeing initiatives, the HSE learning framework, the ongoing embedding of contractor management principles, and a focus on improvement in environmental management. This oversight also included Transurban’s efforts to reduce serious injury crashes on all of its road assets.
Customer, community and social licence
Oversight of customer initiatives and expanded hardship programs providing ongoing support for customers and other members of the community, including through the Linkt Assist (Australia) and First Time Forgiveness (North America) programs, holistic support for vulnerable customers needing additional support beyond assistance with tolling debt (Australia), and participation in a ground-breaking service ‘One Stop One Story Hub’ enabling victim-survivors of family violence to access hardship support from a range of companies through a single referral (Australia). Oversight of Transurban’s Social Licence Framework, and the focus areas intended to address key social and environmental issues and opportunities relevant to our core business and meet the evolving expectations of our stakeholders.
People, culture and remuneration governance
Investing in strategic leadership and talent development to deliver the Group’s strategy in line with Transurban’s purpose and culture; supporting the ongoing wellbeing and productivity of our workforce including leveraging established flexible work options to support transitioning back into the workplace; and focusing on creating a diverse, inclusive and equitable workplace in which everybody belongs, can contribute and succeed. Oversight of Transurban’s response to the first strike received on its Remuneration Report at the 2021 AGM, (see this year’s Remuneration Report on page 95 for further information).
SustainabilityReviewing the key findings of the
Intergovernmental Panel on Climate Change’s Sixth Assessment Report to assess the ongoing relevance and adequacy of Transurban’s climate change management framework. Examining the ratings for current climate change threats and opportunities taking into account current controls, progress and future focus areas. Monitoring progress towards our 2050 net zero and 2030 interim greenhouse gas emission reduction targets.
Oversight of COVID-19 impactsOversight of, and exercise of its
stewardship responsibilities in relation to, Transurban’s continued response to COVID-19 impacts including: health and safety; customers; employee wellbeing; operations; projects; assets; finance; treasury; capital and liquidity matters; and risk management.
Delivery of major projects, asset management and performance
Ongoing oversight of the performance of Transurban’s infrastructure assets, and delivery of major projects including: WestConnex M4-M5 Link in Sydney; the Fredericksburg Extension and 495 Express Lanes Northern Extension in North America; and the West Gate Tunnel Project in Melbourne, which included oversight of the process to resolve the dispute between the parties and approval of the revised terms for
the delivery of the project.
Oversight and approval of emerging opportunities
Oversight and approval of the acquisition by Sydney Transport Partners of the remaining 49% interest in WestConnex from the NSW Government in Sydney, and continuing to oversee and assess emerging opportunities including: M7–M12 integration and delivery in Sydney; Capital Beltway Accord and Maryland Express Lanes Project —Phase 1 in North America; and other asset enhancements in the regions in which Transurban operates.
Capital managementOversight and approval of a $4.22 billion
equity raising, including a $250 million placement to AustralianSuper and a $3.97 billion fully underwritten, pro-rata renounceable entitlement offer, to fund Transurban’s contribution to Sydney Transport Partners’ acquisition of the remaining interest in WestConnex. Oversight and approval of raising over $7.7 billion in debt facilities (bank debt and capital market issuances), comprising refinancing activity across the Transurban Group, funding of a $0.5 billion capital release for WestConnex and the funding of a $0.2 billion capital release for NorthConnex.
Strategy and riskTogether with management, setting the
strategic direction of the business including: approving the annual financial budget and monitoring corporate performance; engaging in scheduled Board strategy sessions; ongoing integration of risk management with our HSE and business resilience activities, including oversight of technology risk; reviewing the Risk Appetite Statement (including for financial and non-financial risks) and reviewing the Enterprise Risk Management Framework to further enhance the identification, assessment and management of material business risks.
Board succession planningDuring the year, the Board welcomed three
new Non-executive Directors, Patricia Cross, Craig Drummond and Marina Go, and farewelled two Non-executive Directors, Neil Chatfield and Samantha Mostyn, who retired at the conclusion of the 2021 AGM. As previously announced, Lindsay Maxsted will retire at the conclusion of this year’s AGM and the Board has appointed Craig Drummond as Chair of Transurban effective from the conclusion of the 2022 AGM. These appointments and retirements are the result of a coordinated and orderly succession planning process for Board renewal.
During the year, the Board provided strategic guidance and effective oversight of management in its implementation of Transurban’s strategy.
Transurban Board FY22 areas of focus
Financial statements
Security holder information
Sustainability supplement
Business performance
Remuneration report
Introduction and overview
Directors’ report
Governance and risk
Corporate Report for the year ended 30 June 2022

77
Board skills and experienceThe skills matrix below presents the key skills and experience that the Board considers necessary having regard to Transurban’s strategic objectives, core capabilities and the emerging business and governance issues relevant to Transurban. Having completed a period of Board renewal, the Board is satisfied that it collectively possesses an appropriate breadth and depth of skills and experience to provide effective leadership to Transurban.
Skills/experience Description
Leadership Board, CEO and/or senior leadership experience in major organisations, enterprises or listed companies in Australia or overseas, and managing through periods of rapid change.
Strategic and commercial acumen
An ability to define strategic objectives and constructively question business plans and implement strategy using commercial judgement.
Health, safety and environment
Experience in health, safety and environmental matters (HSE), policies and strategies, including implementing HSE systems in organisations of significant size.
Risk management An understanding of financial and non-financial risk management, including operational, conduct, compliance, environmental, technological and governance risk.
Financing/ capital management
Experience in complex financing and/or capital management including economic drivers and global business perspectives.
Project development, project management and delivery
Experience in all aspects of major infrastructure projects, including project engineering.
Industry specific knowledge and expertise
Specific experience, knowledge and expertise gained across the broader infrastructure and transport industries, including global experience.
Customer experience Knowledge of, or experience in, organisations and operations managing large retail customer bases.
Government and stakeholder relations, public policy and community engagement
Experience in government and regulatory policy matters (including public policy discourse), multiple stakeholder relations and community engagement.
Governance, compliance and sustainability
Commitment to, and knowledge of, governance and sustainability issues (including the legal, compliance and regulatory environment applicable to transport infrastructure and climate change).
People, culture and remuneration
Experience in people matters including culture, morale, management development, succession and remuneration (including incentive programs and the legislative framework governing remuneration).
Technology An understanding of, or experience in, organisations of a significant size having a major technology focus, including new technologies and digital disruption, digital customer management, and cybersecurity.
Financial acumen Financial knowledge, accounting or related financial management qualifications and experience, including understanding the financial statements of organisations of significant size and complexity and the ability to probe the adequacies of financial and related risk controls.
Deep expertise Competent Capable
Financial statements
Security holder information
Sustainability supplement
Business performance
Remuneration report
Introduction and overview
Directors’ report
Governance and risk
Corporate Report for the year ended 30 June 2022

78
Board Committees The Board has established three standing Committees, each operating under a separate Charter which sets out its responsibilities.
Audit and Risk Committee
Responsibilities:
To assist the Board in fulfilling its corporate governance and oversight responsibilities relating to the integrity of Transurban’s financial reporting, the effectiveness of Transurban’s systems of financial risk management and internal controls, internal and external audit functions, Transurban’s risk profile and risk policy, and the effectiveness of Transurban’s risk management framework (for both financial and non-financial risks) and supporting risk management systems and culture.
Areas of focus during FY22 included:
• Reviewing and recommending to the Board significant accounting and financial reporting disclosures including in relation to: the Group’s equity issuance and equity injection to fund Sydney Transport Partners’ acquisition of the remaining interest in WestConnex; the status of major projects, including the West Gate Tunnel Project and the revised terms for the delivery of the project; and the impact of uncertainties related to COVID-19, near-term interest rates and inflation on accounting, audit and risk-related matters.
• Oversight of the assurance and disclosure processes for the Transurban Corporate Report incorporating the financial statements and Remuneration Report; and disclosures relating to the recommendations of the Taskforce on Climate-related Financial Disclosures (TCFD).
• Oversight of risk management activities including: annual review of the Risk Appetite Statement, Risk Management Policy and Enterprise Risk Management Framework; implementation of key risk control assurance activities and initiatives across the business; deep dives into the risk management activities for each business unit; continued development of risk management performance analytics and development of enhanced risk reporting and visualisation techniques; oversight of climate related risks, including reviewing the findings of the Intergovernmental Panel on Climate Change’s Sixth Assessment Report; and annual review of key policies including the Whistleblower Policy.
• Oversight of cybersecurity and technology risks, the development and implementation of the Cyber Uplift and Resilience Program, ongoing third party and supply chain cybersecurity reviews, and disaster recovery and data protection capabilities and initiatives.
• Oversight of taxation matters, including tax governance and tax risk management.
• Oversight of the rotation of the external auditor, culminating in the Board’s appointment of a new lead audit engagement partner for FY23.
• Oversight of the Sustainable Procurement Program and reviewing and recommending to the Board the FY21 Modern Slavery Statement.
• Approval of, and delivery and oversight of, the FY22 Internal Audit Plan.
Nomination Committee
Responsibilities:
To assist the Board in fulfilling its responsibilities relating to the composition and performance of the Board, Board appointments, and succession planning.
Areas of focus during FY22 included:
• Ongoing Board succession planning, utilising the Board skills matrix, culminating in the appointment of three new Non-executive Directors following the retirement of two long-standing Non-executive Directors at the end of the 2021 AGM.
• Ongoing Chair succession planning, culminating in the Board’s appointment of a new Chair.
• Oversight of the induction of new Non-executive Directors.
• Oversight of the process for the annual review of Board, Board Committee and Director performance.
• Review and recommendation of annual Director re-election and election.
• Review and recommendation to the Board on the appointment of a new North American Advisory Board member.
Remuneration, People and Culture Committee
Responsibilities:
To assist the Board in fulfilling its responsibilities in relation to people, remuneration and culture related matters and disclosures, including: oversight of policies and programs to develop the capability of our people and support Transurban’s desired culture; alignment of the remuneration framework with Transurban’s purpose, strategy and culture; the remuneration of the Chair and other Non-executive Directors; and performance and remuneration of, and incentives for, the CEO and Senior Executives.
Areas of focus during FY22 included:
• Supporting the Board in its oversight of Transurban’s culture, including: reviewing and making recommendations to the Board on key policies to drive desired cultural outcomes such as the Code of Conduct; monitoring workplace relations, workplace equity and employee engagement trends and considering implications for Transurban’s culture.
• Ongoing oversight of Executive development, succession, and management programs to optimise the contributions of Transurban’s people.
• Extensive stakeholder listening and engagement to understand feedback on our remuneration structures and responding to that feedback and the first strike received on our Remuneration Report at the 2021 AGM.
• Reviewing CEO and Senior Executive fixed, performance-based and equity-based remuneration, including ongoing review of appropriate performance measures.
• Review and enhancement of Transurban’s remuneration framework to ensure that the framework continues to effectively support Transurban’s business strategy and desired culture.
• Oversight of Transurban’s diversity and inclusion practices, programs and initiatives to support and assist with improving diversity and inclusion at all levels of the business: this includes our response to the Australian Human Rights Commission Respect@Work report, and an update of our Diversity and Inclusion Policy and measurable objectives.
Read more in the Remuneration Report on pages 95 to 119
Financial statements
Security holder information
Sustainability supplement
Business performance
Remuneration report
Introduction and overview
Directors’ report
Governance and risk
Corporate Report for the year ended 30 June 2022

79
North American Advisory Board
In 2019, the Board established a North American Advisory Board (Advisory Board), which operates in an advisory capacity to the Board. The purpose of the Advisory Board is to capture the wisdom of individuals with deep experience and relationships in the North American region in order to contribute to Transurban’s strategic thinking and the development of executive leadership.
The Advisory Board members’ knowledge and experience complements that of North American senior management, providing Transurban with a broad perspective and awareness of the local markets in which it operates and the clients, customers and communities it serves. During FY22 the Board and Senior Executives engaged with the Advisory Board on specific matters related to the North American region. The Advisory Board has been particularly valuable whilst COVID-19-related government restrictions have limited travel to and from North America. In FY22 the Advisory Board met with the Transurban Board both in person in Washington DC and remotely via video conference and provided useful insights on: Transurban’s assets and projects; potential development opportunities in North America; the local market conditions and changes in the political landscape; as well as macroeconomic and geopolitical matters relevant to Transurban’s business operations. In FY22, the Board approved the appointment of a new member to the Advisory Board.
The current members of the North American Advisory Board are Françoise Bertrand, Laurie Mahon and Matt Rose, and details of their skills and experience are available at transurban.com/board
Governance policiesTransurban has a number of governance
policies to guide how it does business, including:
• Code of Conduct―articulates the behaviour expected of Transurban’s Directors and employees, who are expected to align their actions with the code and Transurban’s values whenever they are representing Transurban.
• Continuous Disclosure Policy―establishes our procedure for compliance with Transurban’s continuous disclosure obligations and provides guidance for the identification of material information and timely disclosure of Transurban’s activities to the market.
• Dealing in Securities Policy―prohibits Transurban’s Directors, employees, contractors and their related parties from dealing in Transurban securities if they are in possession of price-sensitive information and provides for open periods during which Directors and employees may trade, subject to any required approvals being obtained.
• Ethical Business Practices Policy―defines the standard required from employees and third parties when working with Transurban, and confirms Transurban’s commitment to a sound culture of compliance and ethical behaviour.
• Health, Safety and Environment Policy―provides Transurban’s commitment to a healthy and safe work environment for all employees, contractors and third parties and to minimise impacts to our environment.
• Human Rights Policy―sets out how Transurban respects and supports internationally-recognised human rights.
• Political Donations Policy―sets out Transurban’s policies that govern contributions to political parties.
• Risk Management Policy and Enterprise Risk Management Framework―provides guidance and direction on the management of risk in Transurban and states Transurban’s commitment to the effective management of risk.
• Supplier Sustainability Code of Practice—outlines our minimum standards and leadership expectations which encourage suppliers to go beyond legal compliance in order to advance social and environmental responsibility.
• Sustainability Policy―contains our commitment to achieve net zero greenhouse gas emissions by 2050 and describes how we are bringing relevant UN Sustainable Development Goals to life in Transurban.
• Whistleblower Policy―encourages and supports people in freely raising concerns over matters they may have witnessed, or if they know about any suspected or actual misconduct or improper state of affairs in relation to Transurban without fear of intimidation, disadvantage or reprisal.
Corporate Governance Statement
For detailed information on the corporate governance framework and main governance practices, policies and charters of Transurban Group for the year ended 30 June 2022, including details of the Group’s compliance with the 4th edition of the ASX Corporate Governance Council’s Corporate Governance Principles and Recommendations, refer to the Group’s 2022 Corporate Governance Statement on the Transurban website.
Read more at transurban.com/corporate-governance
Financial statements
Security holder information
Sustainability supplement
Business performance
Remuneration report
Introduction and overview
Directors’ report
Governance and risk
Corporate Report for the year ended 30 June 2022

80
Lindsay Maxsted DipBus, FCA, FAICD—Age 68Chair and independent Non-executive Director since August 2010 and March 2008 (respectively)Chair of the Nomination Committee
Skills and experience
Lindsay is the Managing Director of Align Capital Pty Ltd, the Co-Chair of Tanarra Restructuring Partners Pty Ltd
and Chair of the Grattan Institute.
Lindsay was previously Chair (2011–2020) and a Non-executive Director of Westpac Banking Corporation (2008–2020), a Non-executive Director of BHP Group Limited and BHP Group Plc (2011–2020) and a partner of KPMG Australia where he was CEO of that firm from 2001 to 2007. His principal area of practice prior to this was in the corporate recovery field managing a number of Australia’s largest insolvency/workout/turnaround engagements.
Scott CharltonBSc, MBA—Age 58Chief Executive Officer and Executive Director since July 2012
Skills and experience
Scott joined Transurban as Chief Executive Officer and Executive Director in 2012. Scott has led Transurban
through significant growth during his tenure as CEO, expanding its position in existing markets and leading its entry into new markets.
Scott joined Transurban from Lendlease, where he held positions as Group COO and Group Director of Operations. Previously, Scott held several senior positions across a range of infrastructure entities and financial institutions, including as CFO of Leighton Holdings Limited and Managing Director of Deutsche Bank in Australia and Hong Kong.
Scott is Deputy Chair of Infrastructure Partnerships Australia and is a member of the Monash Industry Council of Advisers, the Business Council of Australia and Roads Australia.
Board of Directors Patricia CrossBSc (Hons), FAICD—Age 63Independent Non-executive Director since July 2021Member of the Remuneration, People and Culture Committee and the Nomination Committee
Skills and experience
Patricia has extensive international experience as both an executive and Non-executive Director across
a wide range of financial services and other industries. She has expertise in capital markets, risk management, corporate governance, treasury and international affairs.
Patricia is currently the Chair of OFX Group Limited (since 2022), a Guardian of the Future Fund’s Board of Guardians (since 2021) and an Ambassador for the Australian Indigenous Education Foundation (since 2008).
She was previously Chair of the Commonwealth Superannuation Corporation (since 2014–2021), a Non-executive Director of Aviva plc (2013–2022), Macquarie Group Limited (2013–2018), National Australia Bank Limited (2005–2013), Qantas Airways Limited (2004–2013), and Wesfarmers Limited (2003–2010). Patricia also held several honorary government positions including as a founding member of the Financial Sector Advisory Council and as a member of the Panel of Experts to the Australian Financial Centre Forum.
As an executive, Patricia lived and worked in seven different countries holding a number of senior leadership positions with Chase Manhattan Bank and Chase Investment Bank, Banque Nationale de Paris, and National Australia Bank Limited.
Craig DrummondBCom, FCA, SF Fin—Age 61Independent Non-executive Director since July 2021Member of the Audit and Risk Committee and the Nomination Committee
Skills and experience
Craig has over 30 years’ experience in financial and regulated service industries. He has extensive experience
across all facets of company management, including equity and debt capital markets, risk management and business strategy.
Craig is currently a Non-executive Director of the Australian Foundation Investment Company Limited (since 2021), a member of the Financial Regulator Assessment Authority, President of the Geelong Football Club and a Governor of The Ian Potter Foundation.
He previously held a number of senior leadership positions including Chief Executive Officer of Medibank (2016–2021), Group Executive Finance and Strategy of National Australia Bank Limited and Chief Executive Officer and Country Head of Bank of America Merrill Lynch (Australia).
Earlier in his career, Craig held various roles at JBWere, including COO, CEO and Executive Chairman of Goldman Sachs JBWere.
Mark Birrell AMBEc, LLB, HonLLD, FAICD—Age 64Independent Non-executive Director since May 2018Member of the Audit and Risk Committee and the Nomination Committee
Skills and experience
Mark is an experienced Director with credentials spanning the private and public sectors. He has deep
industry knowledge in the fields of transport, infrastructure and the law.
Mark is Chairman of Post Super Pty Ltd (since 2013) and Deputy President of the Australian Chamber of Commerce and Industry (since 2021).
His previous roles include Chair of Regis Healthcare Limited (2014–2018), Infrastructure Australia, the Port of Melbourne Corporation, Evans & Peck Limited, and Deputy Chair of Australia Post. He brings extensive legal experience and was National Leader of the Infrastructure Group at Minter Ellison.
With a significant public policy background, Mark was the founding Chair of Infrastructure Partnerships Australia, the nation’s peak infrastructure sector body (2005–2013), and served as a Cabinet Minister in Victoria and Leader of the Government in the Upper House (1992–1999).
Terence BowenBAcc, FCPA, MAICD—Age 55Independent Non-executive Director since February 2020Chair of the Audit and Risk Committee and member of the Nomination Committee
Skills and experience
Terry has over 25 years of extensive financial, strategic and operational experience across a range of sectors
within some of Australia’s leading companies.
Terry is currently Chair of the Operations Group at BGH Capital, and a Non-executive Director of BHP Group Limited and BHP Group Plc (since 2017), Navitas Pty Ltd and the West Coast Eagles Football Club. He previously served as Managing Partner and Head of the Operations Group at BGH Capital and prior to this served as an Executive Director and Finance Director of Wesfarmers Limited (2009–2017), Finance Director of Coles and Managing Director of Wesfarmers Industrial and Safety. Terry was formerly the CFO of Jetstar Airways, and before this held senior finance roles with Tubemakers of Australia Limited.
He is a former Chair of the West Australian Opera Company Incorporated and a former Non-executive Director of the Western Australian Institute of Medical Research Pty Ltd, Gresham Partners Holdings Limited and Gresham Partners Group Limited.
Financial statements
Security holder information
Sustainability supplement
Business performance
Remuneration report
Introduction and overview
Directors’ report
Governance and risk
Corporate Report for the year ended 30 June 2022

81
Marina GoBA, MBA, MAICD—Age 56Independent Non-executive Director since December 2021Member of the Nomination Committee
Skills and experience
Marina has worked in executive roles across a range of listed and private companies and in non-
executive director roles across a diverse range of sectors. Her executive career included over 25 years’ experience in branding, marketing, digital technologies and change leadership in the media industry.
Marina is Chair of Adore Beauty Group (since November 2021 and a Non-executive Director since 2020), and a Non-executive Director of Energy Australia (since 2017), 7-Eleven (since 2018) and Autosports Group (since 2016). She is also Chair of Netball Australia (since 2021), and a member of the UNSW Business Advisory Council and the ANU Centre for Asian-Australian Leadership Advisory Board.
She was previously Chair of Ovarian Cancer Australia, The Walkley Foundation and Wests Tigers Rugby League Football Club, and a Non-executive Director of Booktopia Group Limited (2020–2022) and Pro-Pac Packaging Limited (2018–2021).
Marina was previously Country Chief Executive Officer for The Hearst Corporation and held a variety of senior leadership positions across multi-media businesses, including Fairfax, Bauer Media, EMAP Australia and Private Media.
Timothy ReedBCom (Hons), MBA, MAICD—Age 52Independent Non-executive Director since November 2020Member of the Remuneration, People and Culture Committee and the Nomination Committee
Skills and experience
Tim has over 30 years’ experience in technology, marketing, strategy and business development gained
from various roles held in Asia, Europe, the USA and Australia.
Tim is currently the President of the Business Council of Australia and co-Managing Director of Potentia, a private equity firm focused on technology businesses.
He was formerly the CEO of MYOB (2008–2019) and before this held a range of other senior management roles during his 16-year career with the business. Prior to joining MYOB, Tim also held senior management roles in sales, marketing, product management and business development with software and technology businesses in Silicon Valley.
Peter ScottBE (Hons), MEngSc, Hon FIEAust, MICE—Age 68Independent Non-executive Director since March 2016Member of the Audit and Risk Committee and the Nomination Committee
Skills and experience
Peter has over 20 years’ senior business experience in publicly listed companies and a breadth of expertise in the
engineering and finance sectors.
He was formerly the CEO of MLC and head of National Australia Bank’s Wealth Management Division and held several senior positions with Lendlease.
He was previously Chair and a Non-executive Director of Perpetual Limited, Chair and a Non-executive Director of Perpetual Equity Investment Company Limited and a Non-executive Director of Stockland Corporation Limited.
His pro-bono activities include being Chair of Igniting Change Limited, a not-for-profit organisation, and a Fellow of the Senate of the University of Sydney. He is currently a Non-executive Director of Centuria Heathcare Limited.
Robert Whitfield AMBCom, Grad Dip Banking, Grad Dip Fin, AMP, SF Fin, FAICD—Age 57Independent Non-executive Director since November 2020Chair of the Remuneration, People and Culture Committee and member of the Audit and
Risk Committee and the Nomination Committee
Skills and experience
Rob has extensive financial, risk and capital markets
experience in senior management roles across the public and private sectors.
Rob is currently a Non-executive Director of the Commonwealth Bank of Australia (since 2017) and GPT Group (since 2020).
He previously served as Chair and Director of New South Wales Treasury Corporation, Secretary of NSW Treasury, Secretary of NSW Industrial Relations, and as Deputy Chair of the Australian Financial Markets Association. Prior to this, Rob had a 30-year executive career with Westpac Banking Corporation where he held a number of senior leadership positions including CEO of the Institutional Bank, Chief Risk Officer and Group Treasurer.
Jane WilsonMBBS, MBA, FAICD—Age 64Independent Non-executive Director since January 2017Member of the Remuneration, People and Culture Committee and the Nomination Committee
Skills and experience
Jane has over 20 years’ experience as an independent director of public companies, government-owned
corporations and not-for-profit organisations following an executive career in finance, banking and medicine.
Jane is a Non-executive Director of Sonic Healthcare Limited (since 2010) and Costa Group Holdings Limited (since 2019). She is also Co-Chair of the Australian Government Advisory Board on Technology and Healthcare Competitiveness and a Director of Rugby Australia (since 2021).
She was previously a Guardian of the Future Fund (2015–2021), the Deputy Chancellor of the University of Queensland, and a Non-executive Director of the General Sir John Monash Foundation, Opal Aged Care Limited and the Winston Churchill Memorial Trust.
Financial statements
Security holder information
Sustainability supplement
Business performance
Remuneration report
Introduction and overview
Directors’ report
Governance and risk
Corporate Report for the year ended 30 June 2022

82
Continuous activityQuarterly activityAnnual activity
Review material andemerging risks
Internal AuditUpdate audit plan based on key risks and themes
Business ResilienceProvide assurance of resilience capability and preparedness
Reporting on learnings from exercises and incidents
Review ERM effectiveness and approve changes
Review and updateRisk Appetite
Risk and Compliancestatus reporting
Review key business, strategic and emerging risks
Annual review of business compliance
Consider emerging threats and catastrophic risks
Exercise and test business response
Review ERM effectivenessand approve changes
Review and updateRisk Appetite
Validate key risks andcompliance requirements
Review key risks and treatments
Consolidate and review key business and operational risks
Internal Audit plan review and update to reflect any emerging risks
Exercise and test response to disruption risks
Validate preventative controls
Set risk objectives andpriorities in Business Plan
Update risks in line with objectives
Validate key risks andcompliance requirements
Review key risks and treatments
Formal review ofRisk Registers
Audit Reports issued including assessmentsof controls and management actions to enhance the control environment
Identification of risks that could disrupt the safe and continuous operations of our assets or critical business processes
Set risk objectives andpriorities in Business Plan
Update risks in line with objectives
Markets and Business units
Projects, Development Proposals and Acquisition
Executive Committee
ARC/Board
Markets and Business units
Projects, Development Proposals and Acquisition
Executive Committee
ARC/Board
Proactive risk management is embedded into our strategic activities and decision-making processes, as well as our daily operations to ensure we deliver upon Transurban’s strategic objectives, as well as continue to create and maintain stakeholder value.
Our Enterprise Risk Management (ERM) Framework is a fundamental tool, providing governing principles and guidance to ensure the early identification of risks and proactive implementation of strategies to mitigate or effectively deal with risks should they occur. Overseen by the Board and the Audit and
Risk Committee (ARC), actively managed by the CEO and Executive Committee along with senior managers, the ERM Framework also provides a structured approach so that key risks and issues are escalated appropriately, ensuring we respond to those with the potential to materially impact our business.
Our Risk Appetite Statement, which covers both financial and non-financial measures, outlines the level of risk that we are prepared to either accept, tolerate, or avoid in the pursuit of our business strategy. It is critical in guiding our attitudes and behaviours towards risk and is reviewed by the Board
An integrated, proactive, practical approach to identifying and managing risks is essential for an organisation’s resilience, sustainability, and social licence. By anticipating and understanding the current and future uncertainties associated with our operating environment, we can mitigate threats and pursue business opportunities to benefit all of our stakeholders.
annually. To ensure we are operating within our risk appetite thresholds we have linked our Risk Appetite Statement to Key Risk Indicators (KRIs) and Key Performance Indicators (KPIs). Using these KRIs and KPIs, we can measure our business and risk management performance against financial and non-financial risk metrics. Performance is tracked and presented to the Board to provide early insights into our risk exposures.
Across the business, teams regularly review the operating environment and their business activities to identify risks with the potential to impact Transurban or our stakeholders. Proactive strategies and contingency plans are then developed and implemented to manage risk exposure. Regular assessment of the risks determines the ongoing effectiveness of the management strategy which can be enhanced where necessary.
Risk management
Figure 23: Enterprise Risk Management Framework in action
Financial statements
Security holder information
Sustainability supplement
Business performance
Remuneration report
Introduction and overview
Directors’ report
Governance and risk
Corporate Report for the year ended 30 June 2022

83
A business-wide integrated approach and practice
The ERM Framework is integrated with related processes and policies (including the Code of Conduct, Ethical Business Practices, Compliance Framework, Health, Safety and Environment, Internal Audit, Tax, Treasury, Procurement, Business Resilience, and Insurance) to ensure a business-wide view of our risks and enable us to understand and address their potential consequences.
To further support the maturity of risk across the business, a key pillar underpinning Transurban’s FY22 Risk Strategy is the integration of risk information and insights into core management processes. We have linked our Risk Management, Incident, Operational, Compliance, Privacy, Resilience and HSE data and invested in data analytics to enable us to understand our internal and external risk landscape, and test our strategic decision making. This has allowed us to:
• holistically consider risk and uncertainty
• more effectively use forward-looking risk visualisation to support better decision-making
• capitalise on opportunities
• identify opportunities to create lasting value.
This risk integration has enabled our ERM approach to extend beyond a stand-alone process and provides the Board and the Executive Committee with greater confidence that management strategies, plans and performance reporting are robust. This has enabled risk learnings and insights to be shared and cascaded amongst teams. Additionally, the combination of risk integration with monitoring emerging risks has enhanced strategic planning through increased emphasis on data analytics, scenario analysis and stress testing to anticipate risk, monitor the validity of strategic assumptions and assess the impact of alternative approaches on projected performance.
Measuring the effectiveness of our risk management activities
We have multiple assurance activities to assess the value and success of our ERM activities. The overall effectiveness of our ERM requires clear expectations and consistent application of controls across the business. So this can happen, the ERM
Framework is linked to our assurance and governance processes—with outcomes from our risk processes used to define areas of focus for Internal Audit. These audits provide independent assurance to ARC, supporting them to fulfil their responsibility for overseeing the organisation’s risks and controls, and support management to maintain an effective risk and control environment.
To support broader Internal Audit assurance activities we utilise a co-sourced operating model, comprising an external independent Internal Audit Service Provider (EY), and an internal team led by the Head of Internal Audit. This approach enables balance, independence, external subject matter expertise and internal knowledge. Internal Audit operates under a plan approved annually by ARC and has full access to all functions, records, property, and personnel of Transurban Group. Internal Audit administratively reports to the Company Secretary and has a direct reporting line to the Chair of ARC. The results of Internal Audit activities are reported to ARC.
We assess our risk culture annually, with questions posed in the Our Voice employee survey. The purpose of these questions is to assess the current understanding of risk,
the level of risk management practice within the business, and understand the propensity of employees and the business to take considered risk.
Additionally, the Board requests that Internal Audit undertakes an annual review of our ERM Framework. This review is to satisfy the Board that the Framework continues to be sound and aligned to the ASX Corporate Governance Council’s Corporate Governance Principles and Recommendations. The review involves:
• gap analysis of Transurban’s risk management approach alignment to ASX Corporate Governance Council’s Corporate Governance Principles and Recommendations
• examining alignment to the ISO 31000:2018
• assessment of our ERM Framework against other leading practice frameworks.
The detailed results from both our employee survey and ERM review are used to identify business areas requiring focused risk support and capability development activities. Results and feedback also form the basis for future risk management training, education and ERM Framework improvement activities.
Risk assurance process
Reporting and insights
Business data capture
Figure 24: Integrating business data with our risk assurance process
Financial statements
Security holder information
Sustainability supplement
Business performance
Remuneration report
Introduction and overview
Directors’ report
Governance and risk
Corporate Report for the year ended 30 June 2022

8484
Adverseweather
COVID-19absenteeism
Geopolitical/economic
megatrends
Supply chainshortages
Third partyfailure
Higherprices
Third partyinsolvency
Global risk pressures that have the potential to impact our business
We place a focus on monitoring national and global events to identify emerging threats to our business. We also implement early warning mechanisms to determine if threats are impacting on our business activities.
Over the last 12 months, there has been significant global disruption associated with the impact of COVID-19 and geopolitical instability. These include global supply-chain shortages and resource shortages (see page 59).
To understand the impact of these emerging threats, we applied risk visualisation. We use data analytics to
model potential global supply chain pressures and disruption scenarios. Through this analysis we identified that these threats could potentially impact multiple areas of our business.
Undertaking visualisation of the interconnectivity of these risks against our business activities, we were able to identify several risk responses to reduce the threat pressure, such as sourcing alternative local suppliers to minimise the impact of supply chain shortages on the business.
Read more about global trends influencing our sector (page 22)
In an increasingly interconnected global operating environment, it is more important than ever to understand and visualise the organisation’s risk landscape to ensure operational resilience.
Monitoring emerging risks
Understanding what matters to our stakeholders
Financial statements
Security holder information
Sustainability supplement
Business performance
Remuneration report
Introduction and overview
Directors’ report
Governance and risk
Corporate Report for the year ended 30 June 2022
—Case study—

85
Key risks—Opportunities and threats1
Opportunity Change in opportunity within FY222
Example management responses
New business opportunities in our target markets
Opportunities to further grow the business and enhance existing assets and operations or pursue acquisition or investment opportunities of other non-Transurban assets.
Reflects continuing focus on development opportunities in target markets
• Demonstrate leadership in sustainability, climate risk, road safety and emerging technologies
• Focus on the right opportunities aligned to our business strategy
• Continue to build relationships with partners and other stakeholders
• Demonstrate core capabilities and delivery credibility
• Maintain leading understanding of the transport needs of our markets and develop solutions based on this understanding
• Market scanning and review of non-Transurban assets
• Further collaboration with existing and new investment partners targeting emerging opportunities
• Develop new service offerings utilising existing capabilities.
Harness technology and services to develop new projects and offerings
Transurban’s technology footprint and mobile app platforms present the opportunity to respond to customer opportunities within the market or establish differentiators against our competitors.
Implementation of upgrades to our core customer account and billing systems
• Customer listening programs, monitoring emerging risks and emerging technology review to identify trends
• Technology road map, including identification of suitable technology partners and solutions
• Strategic initiatives to test and pilot technology adaptations
• Implementation of digital tools, such as Trip Compare
• Community and customer engagement
• Cloud and digital architecture strategy
• Future development and expansion of LinktGO and GoToll
• Continued investment in channel optimisation and digital offerings including apps and features.
Sustainability initiatives to enhance road user and community experience
Opportunity to further pursue sustainability projects to enhance social and environmental outcomes for communities and social licence credentials.
Continued focus on sustainability opportunities and associated technologies
• Customer Hardship Program and Financial Inclusion Action Plan
• Managed motorway risks such as pre-peak-hour speed limit reductions to lower risk of rear-end crashes
• Transurban Road Safety Centre at Neuroscience Research Australia (NeuRA) research program
• Membership with Social Traders to identify opportunities to increase direct and indirect spend with certified social enterprises
• Infrastructure Sustainability ratings for road assets
• Research and pilots of new technologies to reduce environmental impacts of construction materials as well as other initiatives to move toward carbon neutrality
• Sustainability Strategy aligned to the nine UN Sustainable Development Goals most relevant to our business
• Sustainable procurement program which also addresses modern slavery risks.
1 Transurban’s exposure to financial risks and the policies we have in place for managing that risk can be found in the Derivatives and Financial Risk Management notes—see note B15. This section discusses our hedging policies, credit risk, interest rate risk and liquidity and funding policies
Transurban considers the impacts of climate change as a potential contributing factor to many of our threats and opportunities. For more information on our climate change management strategies and our consideration of transition and physical risks refer to climate change risk management on page 89 of this report and our Sustainability Supplement
2 Directional arrows are a general assessment only of the risk change over the year, detailed risk reviews are undertaken regularly to ensure alignment with our risk appetite statement as outlined in “Risk management” on page 82
Up
Down
Neutral
Financial statements
Security holder information
Sustainability supplement
Business performance
Remuneration report
Introduction and overview
Directors’ report
Governance and risk
Corporate Report for the year ended 30 June 2022

86
Key risks—Opportunities and threats1
Threat Change in threat within FY222
Example management responses
Unfavourable changes in the market or to operating conditions
Key assumptions relating to the operating environment (including potential disruption events) and/or budget forecasts may prove to be incorrect.
Continued potential for changes in government response to COVID variants
• Revised traffic models to reflect dynamic external environment in light of COVID-19
• Scenario analysis reflecting further COVID-19 future outlook uncertainties and other potential disruption events
• Strategic and emerging risks and mitigations identified and managed as part of the overall Risk Management Framework
• Ongoing regional and asset traffic analysis supplemented by third party data and/or review
• Consideration of extreme and future weather events or land use changes.
Delivering our major projects to meet agreed outcomes
Contractor performance or behaviour could lead to a failure to deliver projects on time and within budget resulting in reputational issues which could impact on future opportunities.
Settlement deed on WGTP completed
• Due diligence throughout procurement and tender processes
• Project Steering groups, Internal Audit Program and Program reviews
• Enterprise Risk Management Framework incorporating project risk reviews
• Ongoing focus on relationship with current and potential suppliers including senior executive engagement with major contractors.
Maintaining our social licence to operate
Failure to live the Transurban values when engaging with our stakeholders or failure to satisfactorily meet their needs could result in a loss of trust in our business, with implications for our reputation and business operations.
Decrease reflects positive traction with customer hardship and engagement activities
• Expanded efforts to support Australian customers experiencing social and financial hardship for a range of reasons
• Proactive activities to enhance our social licence to operate
• Program of activities that engage stakeholders on local and global social issues
• Proactive engagement with governments on tolling reform (including response to NSW Tolling inquiry)
• Transparent communication of fees and charges including fee free options
• Development of tools and campaigns to help customers make informed choices
• Continuous listening through Community Trust benchmark and ‘Voice of Customer’ program to identify issues and trends
• Internal workforce initiatives such as ‘respect in the workplace’ to continue to drive diversity, appropriate behaviours and a safe workplace.
Customer and road safety
Failure to effectively manage road infrastructure and response to incidents could impact customer and road safety.
Positive customer and road safety performance for FY22. HSE remains a focus for FY23 with implementation of revised HSE and Road Safety Strategy
• Australian Road Research Board assessment of the Australian network to determine International/Australian Road/Assessment Program safety ratings
• Monash University Accident Research Centre analysis of serious injury crashes on Australian roads
• Road Safety Action Plans and Community of Practice
• Continued focus on emergency response capabilities and delivery of emergency management exercises
• Transurban Road Safety Centre at NeuRA research program
• Scenario analysis of weather events and their impact on road safety.
Cybersecurity and information protection
Failure to appropriately manage, govern and protect customer and company data and systems from cyber threats, resulting in information or data loss and operational disruption.
Increase reflects global geopolitical uplift in cyber threat landscape
• Implementation and operation of a Cybersecurity Framework aligned to industry standards to protect against cyber-attacks and disruption
• Review and management of cyber risks and threats, and provided regular reporting on key cyber risks and cyber control metrics to the Board, executive and management
• Funding of a cyber program in order to maintain security posture within risk appetite over time supported by training and awareness campaigns.
Board role renewals
Failure to effectively manage Board/Chair transitions could impact on market confidence.
Risk raised reflecting FY22 Board change and Chair transition plan
• Transition plan development and implementation
• CEO and Board engagement.
Up
Down
Neutral
1 Transurban’s exposure to financial risks and the policies we have in place for managing that risk can be found in the Derivatives and Financial Risk Management notes—see note B15. This section discusses our hedging policies, credit risk, interest rate risk and liquidity and funding policies
Transurban considers the impacts of climate change as a potential contributing factor to many of our threats and opportunities. For more information on our climate change management strategies and our consideration of transition and physical risks refer to climate change risk management on page 89 of this report and our Sustainability Supplement
2 Directional arrows are a general assessment only of the risk change over the year, detailed risk reviews are undertaken regularly to ensure alignment with our risk appetite statement as outlined in “Risk management” on page 82
Financial statements
Security holder information
Sustainability supplement
Business performance
Remuneration report
Introduction and overview
Directors’ report
Governance and risk
Corporate Report for the year ended 30 June 2022

87
Key risks—Opportunities and threats1
Threat Change in threat within FY222
Example management responses
Maintaining the safety and wellbeing of employees and contractors
Due to the nature of some of our work activities, employees, workers and other stakeholders could be exposed to harm or suffer wellbeing issues if business controls fail to be adequate. Mental wellbeing of employees could be impacted given COVID-19.
Positive safety and wellbeing performance for FY22. HSE remains a focus for the business with a refreshed strategy for FY23
• Safety reporting and management systems that enable detailed analytics
• Contractor management and engagement to ensure implementation of Transurban minimum requirements
• Ongoing development and implementation of the Transurban HSE culture including delivery of mental health and wellbeing initiatives and support services
• HSE training and awareness including practical exercises
• Proactive HSE observation and HSE Action Plan activities linked to employee performance KPIs
• Regular internal and external HSE reviews of our HSE frameworks and management system.
Dependency on third parties and critical suppliers
Loss of a key strategic supplier due to liquidation, legal action, buyout/takeover. Likewise, availability, performance issues or inflation pressures could lead to a disruption in supply of a critical service/ capabilities to Transurban or impact on development or operational costs.
Increase reflects global supply chain challenges and geopolitical environment
• Due diligence throughout procurement processes
• Environmental scans and proactive industry engagement
• Supplier and Contractor Management Framework which includes requirements for Supplier Performance Management
• Ongoing delivery of Sustainable Procurement Program including acting in accordance with the Modern Slavery Act 2018 (Cth) requirements, potential climate change obligations and collaboration with suppliers to respond to potential risks within our supply chain
• Considerations of alternative risk sharing concepts including sharing of risk for supply impacts and cost escalations
• Explore opportunities for engaging a broader range of contractors, through project-specific procurement packaging
• Research of infrastructure delivery within Australian market
• Review of new industry procurement and contractual packages.
Inability to attract and retain the workforce capability required by the organisation for critical roles
An inability to attract best talent as well as ensure that we retain the key critical people necessary to drive and grow the business could lead to the unavailability of critical key roles or capabilities. This combined with the impact of COVID-19 on critical or overseas resources/support requirements could impact on the availability of operational resources to support projects, bids and development opportunities.
Increase reflects active competition for key talent
• Strategically prioritising talent growth and development opportunities
• Workforce planning
• Regular talent reviews and succession planning
• Employee engagement, belonging and wellbeing initiatives
• Strategic sourcing for agreed roles
• Tactical strategies including resourcing, retention, performance and remuneration to support acquisition and retention of critical skills
• Key industry partnerships/memberships.
Treasury management of debt, liquidity, and balance sheet
Volatility in interest rates, hedging and refinancing could impact financial exposure and funding for new projects.
• Rating protections through Transurban’s predictable cash flow from established concessions, which are supported by embedded toll escalations and hedging policies
• Regular reporting of funding activities, performance against key metrics, compliance, operational issues/breaches
• Annual review and approval of the Treasury Frameworks, Treasury Policy and Charter by the Board
• Capital Strategy and annual review of the Funding Plan
• Monthly reporting of compliance against debt
• Stress testing of debt exposure based on market assumptions
• Disciplined approach to opportunities
• Effective management of costs, debt and balance sheet.
Up
Down
Neutral
1 Transurban’s exposure to financial risks and the policies we have in place for managing that risk can be found in the Derivatives and Financial Risk Management notes—see note B15. This section discusses our hedging policies, credit risk, interest rate risk and liquidity and funding policies
Transurban considers the impacts of climate change as a potential contributing factor to many of our threats and opportunities. For more information on our climate change management strategies and our consideration of transition and physical risks refer to climate change risk management on page 89 of this report and our Sustainability Supplement
2 Directional arrows are a general assessment only of the risk change over the year, detailed risk reviews are undertaken regularly to ensure alignment with our risk appetite statement as outlined in “Risk management” on page 82
Financial statements
Security holder information
Sustainability supplement
Business performance
Remuneration report
Introduction and overview
Directors’ report
Governance and risk
Corporate Report for the year ended 30 June 2022

88
Key risks—Opportunities and threats1
Threat Change in threat within FY222
Example management responses
Failure of technical infrastructure or an inability to respond effectively to a disruption
Failure to adequately maintain our infrastructure or failure to respond effectively to an emerging failure, incident or disruption, including preparing for potential changes to the operating environment, could lead to impacts on asset lifecycle planning, breaches of concession, possible safety risks and/or reputational damage.
Less COVID restrictions on access combined with enhanced response training, including testing of climate change adaptation plans
• Transurban’s asset management and operations system and their associated processes
• Supplier and Contractor Management Framework outlines requirement for regular audits, inspections and quality assurance assessments of contractors and sub-contractors
• Asset reviews and Internal Audit Program Scenario analysis of future weather events and/or changes in the operating environment on system/asset reliability and asset lifecycle planning
• Business Continuity Plan and Incident Management and Emergency Strategy Teams in place
• Annual desktop exercises and field exercises with emergency services to coordinate response
• Annual update and review of all corporate emergency procedures.
Changes in government policies or regulatory interpretations
A change in government policy and/or expectations could impact on the ability to deliver the business strategy.
• Contributions to policy discussions through submissions to government inquiries and draft strategies
• Engagement with all levels of government—political and bureaucratic— to understand policy positions (and their potential implications)
• Monitoring potential changes to stakeholder and government policies, including alignment to TCFD recommendations and transition to net zero
• Compliance management system enhancement in place and automatic notification and escalation of compliance actions and regulatory changes
• Compliance working group continues to oversee and report to Board on compliance activities.
Potential impacts of emerging recession
A potential recession could impact on business confidence leading to reduced economic activity, increased unemployment which (when combined with an increased cost of living) could lead to reduced revenue.
Increase reflects global economic challenges
• Ongoing review of external trends and performance
• Early identification of pressure points and action if changes identified. Responses include: – Review of cost base – Stress testing and scenario analysis – Implement early changes to spend plans
• Ongoing approach to financing activities.
1 Transurban’s exposure to financial risks and the policies we have in place for managing that risk can be found in the Derivatives and Financial Risk Management notes—see note B15. This section discusses our hedging policies, credit risk, interest rate risk and liquidity and funding policies
Transurban considers the impacts of climate change as a potential contributing factor to many of our threats and opportunities. For more information on our climate change management strategies and our consideration of transition and physical risks refer to climate change risk management on page 89 of this report and our Sustainability Supplement
2 Directional arrows are a general assessment only of the risk change over the year, detailed risk reviews are undertaken regularly to ensure alignment with our risk appetite statement as outlined in “Risk management” on page 82
Up
Down
Neutral
Financial statements
Security holder information
Sustainability supplement
Business performance
Remuneration report
Introduction and overview
Directors’ report
Governance and risk
Corporate Report for the year ended 30 June 2022

89
Our Climate Change Framework (Figure 25) is a business-wide strategy that supports two priority areas: the transition to net zero, and ensuring our infrastructure and operations are resilient under potential future conditions. The Framework applies to our Australian and North American operations and responds to our strategic climate-related risk themes including four strategic climate-related threats and two strategic climate-related opportunities.
Our Climate Change Framework positions us well to respond to climate-related threats and opportunities, and we continue to evolve our understanding of the ramifications arising from climate change. FY22 has seen us advance the implementation of the Framework with significant progress achieved in our two priority areas. In FY22, 56% of our electricity needs were met from renewable energy. Since June 2022 this has increased to two-thirds as we continue our transition to renewables.
Climate change will influence our business and operations into the future. We are committed to transition our business to net zero greenhouse gas (GHG) emissions by 2050 and are implementing broader business resilience and adaptation measures across our assets and major construction and development projects.
Climate change risk management
Figure 25: Our Climate Change Framework
Resilient infrastructure and operations
Energy
Energy efficiency upgrades
Onsite renewables
Renewable energy agreements
Low-carbon supply chain
Low-carbon materials
Circular economy
Partnerships and
engagement
Customer emissions
Customer engagement on fuel and emissions reduction
Support the uptake of
zero-emissions vehicles
Roadside regeneration
Improve vegetation and
biodiversity within our
alignments
Green infrastructure
Climate risk integration
Embed relevant climate projections
and associated risks (threats and
opportunities) within processes
and systems
Asset and business
adaptation
Scenario analysis
Asset-specific Climate Risk
and Adaptation Management
Plans including adaptation pathways
TCFD alignment
Climate risk impact assessments
Integration with financial systems,
processes and reporting
Ongoing review, monitoring and
reporting
Transition to Net Zero
Training and capacity building
Governance
Twice-yearly updates provided to the ARC, Transurban Board and subsidiary Boards
on climate-related aspects
Climate-related risk oversight by the Transurban Board’s ARC
Committee provide additional oversight and guidance on business-wide
implementation of the Framework
Financial statements
Security holder information
Sustainability supplement
Business performance
Remuneration report
Introduction and overview
Directors’ report
Governance and risk
Corporate Report for the year ended 30 June 2022

90
We have now entered into renewable energy agreements across all Australian markets. Our understanding of physical climate change risks has also evolved as we gained experience through reflecting on flooding events in Queensland and New South Wales in February and March 2022, and conducted a desktop emergency management exercise for Sydney’s M2 Motorway (see case study). This has improved our confidence in the likely success of planned and proposed adaptation measures.
Our governance arrangements, climate-related risk procedures and supply chain engagement were enhanced over FY22. Our Climate Change Risk and Adaptation Guideline standardises the approach to preparing asset-specific Climate Risk and Adaptation Management Plans (CRAMPs), ensuring consistency across markets and enhancing efficiency. This is in line with the Enterprise Risk Management (ERM) Framework (see page 82), which is used to manage the threats and opportunities relating to climate change across our business and operations and is an integral part of our decision-making process. We prepared CRAMPs for two Queensland assets as this market has higher overall levels of climate-related risks compared to other markets where we operate. The experience of preparing the CRAMPs has highlighted the importance of understanding the resilience of adjacent road networks and feeders into our assets and has also moved us closer to being able to estimate potential financial impacts. At this stage, we have identified potential climate-related material impacts for the business, and plan to quantify the associated potential financial impacts from FY23.
FY22 saw us survey our major suppliers (top 50 suppliers by spend, excluding major projects) through the CDP supplier engagement process to better understand their progress in transitioning to a low carbon economy and the climate-related risks they face by geographic location. Of our 50 top suppliers, 25 reported having active GHG reduction targets, with most either having, or committed to, setting science-based GHG emission reduction targets. Some appear to understand the key transition and physical risks for their operations. Examples of transition risks cited included carbon pricing ( Japan), changes to environmental regulation ( Japan and Europe) and enhanced reporting and reputational risk (Europe). Physical risks identified included extreme weather events (most geographies), rising temperatures ( Japan), severity and frequency of extreme events (India) and bushfires (Australia). We will continue to work with our supply chain to evolve our appreciation of climate-related risks, their management approaches and impact on our operations and projects.
As detailed in our FY22 Climate Change Disclosure, we continue to address all eleven recommendations of the Task Force on Climate-related Financial Disclosures (TCFD). The recommendations aim to enhance financial disclosure of climate-related risks and subsequent impacts on business models and operations and cover the themes of governance, strategy, risk management, and metrics and targets. We considered the Intergovernmental Panel on Climate Change’s (IPCC) sixth assessment report and the TCFD’s revised October 2021 guidelines in developing our FY22 Climate Change Disclosure and addressing the TCFD recommendations.
—Case study—
Preparing for a changing climate
To ensure our climate change risk management and resilience activities are effective, we need to understand how current and future climate-related events will impact our infrastructure and our people. In FY22 we ran an exercise to test extreme weather event impacts on one of our roads.
To test the efficacy of our newly developed M2 CRAMP, we ran an operational resilience exercise. The exercise was designed to test our proposed integrated response to an extreme heat event. The scenario tested our proposed responses to:
• bushfire and electrical storm hazards
• significant community impacts
• concurrent/related motorway and wider-road-network incidents.
The exercise included our NSW Market Incident Management Team (IMT) and our Emergency Strategy Team (EST) and tested how effectively we would respond to the threat scenario. This included considering and addressing Transurban, customers and community impacts; prioritising the safety of people; assessing our ability to continue to operate critical services; and protecting our reputation.
Exercise outcomes and learnings, and our real-world experiences from the March 2022 Brisbane floods are now being used to:
• inform relevant climate change risk and adaptation assessments
• enhance our adaptation plan approach
• identify opportunities to enhance our asset resilience in each market
• identify opportunities to support our local stakeholders as part of broader community responses.
Flood impacted suburban roads in Brisbane, Australia (February 2022). Image via Alex Cimbal/Shutterstock
Financial statements
Security holder information
Sustainability supplement
Business performance
Remuneration report
Introduction and overview
Directors’ report
Governance and risk
Corporate Report for the year ended 30 June 2022

91
Directors’ report
Governance and risk
Financial statements
Security holder information
Sustainability supplement
Business performance
Remuneration report
Introduction and overview
Directors’ report
Corporate Report for the year ended 30 June 2022

92
The controlled entities of THL include the other members of the stapled group, being TIL and THT.
The Directors’ Report has been prepared in accordance with the requirements of the Corporations Act 2001 (Cth) with the following information forming part of this Directors’ Report:
• Operating and financial review (see to right)
• Remuneration Report on pages 95 to 118
• Directors’ declaration on page 215
• Auditor's independence declaration on page 119.
Principal activities The principal activities of the Group during
the year were the building and operation of toll roads in Sydney, Melbourne and Brisbane, in Australia, as well as in the Greater Washington Area and Montreal in North America. There has been no significant change in the nature of these activities during the year.
Operating and financial reviewA review of the Group’s operations and
the results of those operations during the year, including likely developments in future financial years and risk management, are on pages 20 to 90 of this Corporate Report. Other than the information included in the operating and financial review and throughout this report, information on other likely developments, business strategies and prospects for future financial years has not been included as it would be likely to result in unreasonable prejudice to the Group.
Details of the results of the Group’s operations are in the Financial Statements (pages 120 to 225)
Directors’ detailsThe Boards of THL, TIML and TIL have
common Directors. The names of Directors who served during or since the end of FY22 are below. All Directors held their positions for the duration of FY22 unless otherwise stated.
• Lindsay Maxsted (Chairman)
• Scott Charlton (Chief Executive Officer)
• Mark Birrell
• Terence Bowen
• Patricia Cross
• Craig Drummond
• Marina Go(appointed 1 December 2021)
• Timothy Reed
• Peter Scott
• Robert Whitfield
• Jane Wilson
• Neil Chatfield(retired 21 October 2021)
• Samantha Mostyn(retired 21 October 2021)
Details of each Director’s appointment, qualifications, experience and special responsibilities, together with their recent directorships, are set out in their biographies.
Director biographies are on pages 80 to 81
Company Secretary Fiona Last is the Company Secretary of
THL, TIML and TIL. Julie Galligan was also a Company Secretary of THL, TIML and TIL until 29 October 2021.
Fiona Last LLB (Hons), BCom, FGIA
Fiona joined Transurban as Company Secretary in January 2020. Fiona is an experienced corporate lawyer and governance adviser with over 20 years relevant professional experience. Prior to joining Transurban, Fiona was Company Secretary at Treasury Wine Estates, and a Senior Corporate Lawyer at National Australia Bank. Prior to her in-house roles, Fiona worked as a corporate lawyer for legal firms in Australia, Asia and the United Kingdom.
Directors’ report The Directors of Transurban Holdings Limited (‘the Company’ or ‘THL’) and its controlled entities, Transurban International Limited and its controlled entities (‘TIL’) and Transurban Infrastructure Management Limited (‘TIML’), as responsible entity of Transurban Holding Trust and its controlled entities (‘THT’) (‘Transurban’, ‘Transurban Group’ or ‘the Group’) present their Directors’ Report on the Transurban Group for the financial year ended 30 June 2022 (‘FY22’).
Governance and risk
Financial statements
Security holder information
Sustainability supplement
Business performance
Remuneration report
Introduction and overview
Directors’ report
Corporate Report for the year ended 30 June 2022

93
Directors’ meeting attendance The Boards of THL, TIML and TIL have common Directors and meetings are held concurrently. The number of meetings of the Board and each
Board Committee held during FY22, and the number of meetings attended by each Director, are set out below. The below table excludes the attendance of those Directors who attended Board Committee meetings of which they are not a member, other than the Chair of the Board whose attendance at all Committee meetings is included below.
Board of Directors
Audit and Risk Committee
Remuneration, People and
Culture Committee
Nomination Committee
Board Sub-Committee1
Attended Held* Attended Held* Attended Held* Attended Held* Attended Held*
Lindsay Maxsted (Chairman) 13 13 6 8 4 4 10 10
Scott Charlton (CEO) 13 13 10 10
Mark Birrell 13 13 7 7 4 4
Terence Bowen 13 13 7 7 4 4 5 5
Patricia Cross 13 13 5 5 4 4
Craig Drummond 13 13 5 5 4 4
Marina Go2 7 7 3 3
Timothy Reed 13 13 5 5 4 4
Peter Scott 13 13 7 7 4 4 5 5
Robert Whitfield 13 13 5 5 5 5 4 4 5 5
Jane Wilson 123 13 8 8 4 4
Neil Chatfield4 5 5 3 3 3 3 1 1
Samantha Mostyn4 5 5 3 3 1 1
DistributionsThe Board determined a distribution of
26.0 cents per stapled security for the six months ended 30 June 2022 with a payment date of 23 August 2022. This takes the total distribution for FY22 to 41.0 cents per stapled security, of which 2.0 cents is fully franked. Further details of FY22 distributions are provided in note B10 to the Financial Statements.
* Number of meetings held during the year at which the Director was a member of the Board or respective Committee. Details of current Committee membership are set out on pages 80 to 811 A number of Board Sub-Committees were formed during the year for special purposes, including due diligence processes undertaken in connection with the equity raising for the acquisition
of the remaining interest in WestConnex2 M Go was appointed as a director effective 1 December 20213 Reflects an unscheduled Board meeting where J Wilson was unable to attend due to a prior commitment4 N Chatfield and S Mostyn retired from the Board on 21 October 2021
Significant changes in the state of affairs
The financial position and performance of the Group was particularly affected by the following matters during the reporting period:
• Impact of COVID-19
• Group equity issuance and equity injection to Sydney Transport Partners joint venture
• Final agreement reached on revised terms for the delivery of the West Gate Tunnel Project.
Further information is provided in note B2 on page 128 of the Financial Statements.
Events subsequent to the end of the financial year
Other than as disclosed in the financial statements, there has not arisen in the interval between the end of the financial year and the date of this report any matter or circumstance that has significantly affected, or may significantly affect, the Group’s operations, the results of those operations, or Group’s state of affairs, in the future years.
Governance and risk
Financial statements
Security holder information
Sustainability supplement
Business performance
Remuneration report
Introduction and overview
Directors’ report
Corporate Report for the year ended 30 June 2022

94
Indemnification and insurance of Directors and officers
The Constitutions of the Group provide that the Group will indemnify each officer (including each Director) of the Group, on a full indemnity basis and to the extent permitted by law, against any liabilities incurred by them in their capacity as an officer of any member of the Group. Each officer is also indemnified against reasonable costs (whether legal or otherwise) incurred in relation to relevant proceedings in which the officer is involved because the officer is or was an officer.
The Group has entered into Deeds of Indemnity, Insurance and Access with each of its Directors and officers.
The Group has arranged to pay a premium for a directors and officers liability insurance policy to indemnify Directors and officers in accordance with the terms and conditions of the policy. This policy is subject to a confidentiality clause which prohibits disclosure of the nature of the liability covered, the name of the insurer, the limit of liability and the premium paid for this policy.
During FY22 and as at the date of this Directors’ Report, no indemnity in favour of a current or former Director or officer of the Group or in favour of PwC, the external auditor, has been called on.
Environmental regulation The Group’s operations are subject
to environmental regulation under both Commonwealth and State legislation. The Group is committed to achieving a high standard of environmental performance. The Sustainability Strategy—available on our website transurban.com—outlines our objectives, while our risk management processes provide regular monitoring of environmental exposure and compliance with environmental regulations.
Based on the results of enquiries made, the Board is not aware of any significant breaches during the reporting period.
Proceedings on behalf of the Company
No proceedings have been brought or intervened in on behalf of the Company, nor any application made under section 237 of the Corporations Act 2001 (Cth).
Non-audit services and auditor independence
PwC was appointed as the Group’s external auditor on 12 October 2001 and continues in office in accordance with section 327 of the Corporations Act 2001 (Cth). The Group has an External Auditor Independence Policy that is intended to support the independence of the external auditor by regulating the provision of services by the external auditor. The external auditor will not be engaged to perform any service that may impair or be perceived to impair the external auditor’s judgement or independence.
The Board has considered the position and, in accordance with advice received from the Audit and Risk Committee (ARC), is satisfied that the provision of the non-audit services during the reporting period is compatible with the general standard of independence for auditors imposed by the Corporations Act 2001 (Cth). The Directors are satisfied that the provision of non-audit services by PwC did not compromise the auditor independence requirements of the Corporations Act 2001 (Cth) for the following reasons:
• The Audit and Risk Committee reviewed the non-audit services to ensure they did not impact the impartiality and objectivity of the auditor.
• None of the services undermined the general principles relating to auditor independence as set out in APES 110 Code of Ethics for Professional Accountants, including reviewing orauditing the auditor’s own work, acting in a management or a decision making capacity for the Group, acting as advocate for the Group or jointly sharing economic risk and rewards.
Details of the amounts paid for non-audit services are provided in note B34 to the Financial Statements on page 187.
The Group’s external auditor, PwC, has provided an independence declaration in accordance with section 307C of the Corporations Act 2001 (Cth), which is set out on page 216 and forms part of this Directors’ Report.
Rounding of amountsThe Group has applied the Australian
Securities and Investments Commission (‘ASIC’) Corporations (Rounding in Financial/Directors’ reports) Instrument 2016/191 to this report, and amounts in the Financial Statements have been rounded to the nearest million dollars, unless stated otherwise.
This Directors’ Report is made in accordance with a resolution of the Board of Directors and is signed for and on behalf of the Directors:
Lindsay Maxsted Director
Scott Charlton Director
Melbourne18 August 2022
Governance and risk
Financial statements
Security holder information
Sustainability supplement
Business performance
Remuneration report
Introduction and overview
Directors’ report
Corporate Report for the year ended 30 June 2022

95
Remuneration report
Corporate Report for the year ended 30 June 2022
Governance and risk
Financial statements
Security holder information
Sustainability supplement
Business performance
Introduction and overview
Directors’ report
Remuneration report

96
Dear security holder
On behalf of the Board, I am pleased to present Transurban’s Remuneration Report for the year ended 30 June 2022, my first as Chair of the Remuneration, People and Culture Committee.
This was another year impacted by COVID-19 uncertainty however Transurban’s leaders have navigated this well. They have remained focused on driving strong financial performance while supporting all of our stakeholders.
During the period, significant progress has been made on our Social Licence focus areas of championing road safety, empowering customers and strengthening communities. This has been achieved through a number of initiatives including a customer campaign to support Australia’s COVID-19 vaccine rollout and targeted assistance for communities impacted by natural disasters and COVID-19. Priority continues to be given to the safety of our roads and operations as well as the health and wellbeing our people. There has also been a focus on employee attraction and retention strategies given the significant increase in competition for key talent.
Financial PerformanceOverall Group financial performance for
FY22 improved compared to FY21. Revenue increased over the previous year, leading to distributions for security holders growing by 12.3% per security, despite traffic being down 0.5%.
Transurban is well positioned for future distribution growth as traffic improves and our embedded inflation protection translates into revenue. Management also continues to progress numerous development opportunities and prudently manage the balance sheet.
In addition, during this period, the Group successfully closed the WestConnex bid which increased proportional ownership to 50% alongside strategically aligned partners and extended the Group’s weighted average concession life to approximately 30 years.
However, Earnings Before Interest, Tax, Depreciation and Amortisation (EBITDA) and Free Cash Flow (FCF) per security remain below pre-COVID levels. The Board recognises the impact of this on security holders and has taken this into account by exercising downward discretion on the FY22 Short Term Incentive (STI) outcome (see page 106).
The Board was concerned to receive Transurban’s first strike against its Remuneration Report at the 2021 Annual General Meeting (AGM). Over the past 12 months the Board has focused on understanding the concerns of stakeholders and we would like to thank those who took the time to speak with us. There was a diversity of views expressed in relation to Executive remuneration.
In response to the feedback provided, the Board has sought to balance the interests of stakeholders while maintaining appropriate performance-based remuneration with sufficient leverage to motivate, incentivise and retain the executive talent required to deliver our business strategy.
As a result, further refinements have been made to our remuneration approach in addition to those already approved as part of our ongoing review of Transurban’s remuneration practices. These changes are detailed on page 100 and include:
FY22
• Short Term Incentive (STI) Plan: Group performance measures to apply to 100% of the target STI pool; introduction of additional non-financial measures as a discretionary downward moderator
• Long Term Incentive (LTI) Plan: increasing the performance period from three to four years with FY22 as a transition year
FY23
• STI Plan: replacing the existing performance measures of Proportional EBITDA, Proportional Net Cost and Health, Safety and Environment (HSE) with a new Group Performance Scorecard to assess the overall Group performance, including Financials (Proportional EBITDA and Proportional Net Cost), HSE, Customer and Delivery, and Sustainability, Reputation and Leadership
• LTI Plan: the reintroduction of the FCF measure in addition to relative Total Shareholder return (TSR)
FY24
• LTI Plan: change of grant allocation methodology to full-face value (previously face value discounted for distributions and/or dividends foregone throughout the performance period)
A specific concern raised in FY21 related to the STI outcomes for Executives not appearing to reflect the ongoing West Gate Tunnel Project (WGTP) dispute. In its review of FY21 STI outcomes, the Board had regard to this issue and considered it appropriate for the WGTP issues to be formally resolved and final settlement conditions known before making material adjustments to Executive STI outcomes.
The WGTP situation was difficult, however a resolution was reached in FY22. While the final settlement was in the interests of all stakeholders, the Board has considered the impact to security holders and applied appropriate Executive accountability to FY22 STI outcomes.
Introduction from the Chair of the Remuneration, People and Culture Committee
Corporate Report for the year ended 30 June 2022
Governance and risk
Financial statements
Security holder information
Sustainability supplement
Business performance
Introduction and overview
Directors’ report
Remuneration report

97
Short Term Incentive FY22 performance
Proportional EBITDA contributed $1,869 million for the period. The Board recognised that government mandated COVID-19 restrictions created uncertainty throughout the year. At the time the EBITDA measures were set, restrictions were in place and the nature and length of these restrictions were unknown. A set of principles were developed for expected weekly impacts of these restrictions. These were incorporated into the Board’s assessment of Group performance. The resulting outcome for Proportional EBITDA was 58%.
Proportional Net Cost performed well against budget through a number of initiatives, however the Board has exercised its discretion to reduce the outcome to 90% reflecting that some cost savings were not attributable to Management efforts.
Group HSE performance was strong for the period reflecting the Group’s ongoing focus and investment in our safety culture. This includes targeted activities in relation to the safety of our people, our contractors and our roads. The FY22 outcome for HSE was 130.5%.
The overall FY22 STI outcome is 85.3%, including Board discretion to reduce the Proportional Net Cost STI outcome (refer to page 105 for further details). This aligns STI outcomes with the experience of security holders, given FCF (excluding Capital Releases) was 8.5% and EBITDA was 5.8% below pre-COVID levels (FY19).
Executive STI outcomes
In assessing the performance of the CEO and Executive KMP, the Board has considered all factors that have contributed to the overall Group result, including WGTP accountability as outlined.
In summary:
• The CEO received a final STI outcome of 28% of maximum opportunity (43% of target opportunity), adjusted to reflect individual accountability for the WGTP outcome
• Other Executive KMP received between 40% and 59% of maximum opportunity (60% to 88% of target opportunity), reflecting individual performance outcomes adjusted to reflect individual accountability for the WGTP outcome
Long Term Incentive During FY22, the FY19 LTI plan vested,
FY20 and FY21 plans were on foot and grants were made under the FY22 LTI plan.
FY19 LTI plan vesting
The FY19 LTI plan (performance period 1 July 2018 to 30 June 2021) vested on 20 August 2021 at 42.8%, entirely derived from TSR.
Vesting outlook for FY20 LTI plan
The FY20 LTI plan (performance period 1 July 2019 to 30 June 2022) is scheduled to vest in August 2022 (after the date of this report). Reduced traffic across all regions due to government mandated COVID-19 restrictions has significantly impacted the FCF component of this plan, with calculations indicating that 35.7% of awards will vest for eligible participants. As for the FY19 LTI plan, this result will be derived entirely from relative TSR, with a zero outcome for FCF.
SummaryIn summary, the Group has performed
well during another COVID-19 impacted year, with Management balancing the needs and expectations of Transurban’s broad range of stakeholders. This has included investing in the business, progressing key projects and strategic investment opportunities and delivering strong financial outcomes.
The material exception is the additional cost of investment which is crystallised with the settlement of the WGTP dispute and, as stated earlier, this has been specifically addressed in relation to Executive remuneration. The WGTP is a critical infrastructure project for Melbourne, providing a vital alternative to the West Gate Bridge, which carries over 200,000 vehicles per day and regularly experiences significant congestion. Notwithstanding the impacts of the settlement, the WGTP remains a financially attractive investment for Transurban and a valuable project for security holders. With the dispute now resolved, it is pleasing to have this key project moving forward.
We have appreciated and listened carefully to the feedback provided following the strike against the FY21 remuneration report. The Board will continue to review the overall Group performance each year and looks forward to continuing to work with our security holders.
Robert Whitfield Chair, Remuneration, People and Culture Committee
This report has been prepared and audited in accordance with section 300A of the Corporations Act 2001 (Corporations Act)
A tiered approach has been taken to reflect individual Executive contribution to the original bid and the dispute resolution process, reflecting the various levels of involvement and authority. This has been applied to Key Management Personnel (KMP) as follows:
Tier DefinitionSTI
Impact
1 The CEO, having the highest level of involvement and authority in both the original bid and dispute resolution process
Impacted KMP: S Charlton
-50%
2 Executives who were in an executive role at the time of the original bid and/or involved in the dispute resolution process
Impacted KMP: H Byrne, M Huey, S Johnson, H Wehby
-20%
3 Other current Executives not involved in the original bid or dispute resolution process
Impacted KMP: M Jablko, S Moorfield
-10%
This percentage STI reduction is reflected in the FY22 STI outcomes for all Executive KMP as provided in this report on page 106.
Remuneration outcomes in FY22The FY22 remuneration outcomes
are outlined below and, in the Board’s opinion, fairly reflect individual and Group performance taking into consideration market conditions and security holder experience.
Fixed remuneration Fixed annual remuneration reviews were
conducted, with adjustments being made to the FY22 fixed remuneration of three Executive KMP, effective 1 July 2021. These were made in recognition of the individual skills, experience and performance that each bring to their roles, as well as with reference to ASX30 benchmarking. Consideration was also given to internal and gender relativities for like roles in this process. Details can be found in the Executive KMP remuneration table on page 117.
CEO fixed remuneration has not increased since 1 July 2018 and Chairman and Non-executive Director fees have not increased since 1 January 2018.
Corporate Report for the year ended 30 June 2022
Governance and risk
Financial statements
Security holder information
Sustainability supplement
Business performance
Introduction and overview
Directors’ report
Remuneration report

98
The following lists the Group’s KMP during FY22. All KMP held their positions for the duration of FY22 unless otherwise stated.
Current Non-executive Directors Lindsay Maxsted, Chair
Mark Birrell
Terence Bowen
Patricia Cross (from 1 July 2021)
Craig Drummond (from 1 July 2021)
Marina Go (from 1 December 2021)
Timothy Reed
Peter Scott
Robert Whitfield
Jane Wilson
Former Non-executive DirectorsNeil Chatfield (until 21 October 2021)
Samantha Mostyn (until 21 October 2021)
Current Executive KMPExecutive Director and Chief Executive Officer (CEO) Scott Charlton
Chief Financial Officer Michelle Jablko
Group Executive Customer and Technology Simon Moorfield
Group Executive New South Wales Michele Huey
Group Executive Partners, Delivery and Risk Hugh Wehby
Group Executive Queensland Sue Johnson
Group Executive Victoria and Strategy Henry Byrne
This report covers the KMP of Transurban who have the authority and responsibility for planning, directing and controlling the activities of the Group either directly or indirectly. This includes both Executive KMP as well as Non-executive Directors.
Who is covered by the report
Corporate Report for the year ended 30 June 2022
Governance and risk
Financial statements
Security holder information
Sustainability supplement
Business performance
Introduction and overview
Directors’ report
Remuneration report

99
Our remuneration governance framework at a glance1
Board
Sets and oversees the implementation of the Remuneration Policy.
Remuneration, People and Culture Committee
Assists the Board in fulfilling its responsibilities in relation to the remuneration of the Chairman and other Non-executive Directors, performance and remuneration of, and incentives for, the CEO and Senior Executives, remuneration strategies, practices and disclosures, and management programs to develop the capability of Transurban’s workforce and align to the Group’s purpose, strategy and culture.
The Committee may request additional information from Management or external advisors where required. The Committee uses a range of inputs when assessing performance and outcomes of Executive KMP, including both what and how results have been achieved. Detailed performance assessments as well as audited financial results, external remuneration benchmarking and an overarching view to the organisation’s values and risk profile are taken into account. The Committee and the Board review relevant information and exercise discretion, and may adjust remuneration outcomes, including application of malus and claw back.
1 Refer to Governance and Risk section of the Corporate Report on page 74 for details of Transurban’s Governance Framework
Management
Provide management information on financial, customer and risk matters which may impact remuneration.
The CEO and the Group Executive, People and Culture attend Committee meetings, however they do not participate in formal decision making or in discussions involving their own remuneration.
External Advisors
The Committee may seek and consider advice from independent remuneration consultants where appropriate.
Protocols are in place for the independent engagement of remuneration consultants and the provision of remuneration recommendations.
During FY22, remuneration consultants only provided benchmark data and insights on market practices to the Committee. No remuneration recommendations relating to KMP were provided by consultants.
Corporate Report for the year ended 30 June 2022
Governance and risk
Financial statements
Security holder information
Sustainability supplement
Business performance
Introduction and overview
Directors’ report
Remuneration report

100
2021 strikeTransurban’s security holders signaled
concerns with our Remuneration Report, delivering a first strike at the 2021 AGM with 74.26% voting in favour of the FY21 Remuneration Report and 25.74% voting against. In response, the Board gathered and carefully considered feedback over the course of FY22, as a further review of the executive remuneration framework was undertaken. Specifically, this included:
• reviewing feedback from security holders and proxy advisors immediately prior to and during the 2021 AGM; and
• holding additional meetings with security holders and proxy advisors following the 2021 AGM to seek further feedback and clarification as required.
The Board has considered the interests of security holders as well as the need to ensure the Group has appropriate performance-based remuneration which can successfully attract, motivate and retain executive talent required to deliver our business strategy.
Prior to the strike, the Board approved a number of changes to the remuneration framework during FY21 to strengthen the alignment of short-term results and long-term value creation with reward outcomes and to address concerns raised by security holders. Stakeholder feedback in FY22 was generally supportive of our current remuneration framework and changes are outlined on page 101.
The following table summarises the concerns raised at our 2021 AGM, and our responses to those concerns.
Topic Board responseAppropriateness of FY21 executive short-term incentive outcomes (including CEO) given status of WGTP
FY21 was a strong year for Transurban with a number of major achievements, including the addition of three assets, sale of 50% of Transurban’s interest in Transurban Chesapeake and overall strong management of the balance sheet in the COVID-19 environment. The Board determined that bonuses in the range of 93% to 117% of target were appropriate for Executive KMP in FY21. The Board had regard to the WGTP dispute but considered it appropriate to wait until the dispute was formally resolved before making material adjustments to Executive STI outcomes. The Board acknowledges that the view of some security holders was they would have preferred for this to have been incorporated into the FY21 STI outcomes rather than FY22.
Following the WGTP dispute settlement announcement in December 2021, the Board considered the impact of the settlement conditions and determined the appropriate impact to FY22 STI outcomes for Executive KMP, as outlined on page 106.
Positive feedback for extension of LTI performance period to 4 years
Transurban began transitioning to a four-year LTI performance period with the FY22 LTI grant and will fully implement a four-year LTI performance period with the FY23 LTI grant.
There was also consistent support from security holders and proxy advisors for the reintroduction of a FCF measure to the LTI Plan in addition to the relative TSR measure. FCF and TSR measures will apply to LTI grants from FY23.
Impact of strike on CEO succession planning
The strike does not impact CEO succession planning.
Whether any of the five proxy advisors in the Australian market recommended against the Remuneration Report or the LTI grant to the CEO, and if so, what concerns were raised and whether these concerns were shared by any of Transurban’s major security holders in the form of a material protest vote.
Three proxy advisors recommended against the adoption of the FY21 Remuneration Report. Their main concern, which was shared by some of Transurban’s major security holders, was that the FY21 STI outcomes were considered too high given the COVID-19 environment and the status of the WGTP dispute. As explained above, the Board has factored the WGTP settlement into the FY22 STI outcomes for Executive KMP.
One proxy advisor raised concerns about the use of discounted face value (to account for non-payment of distributions) for LTI allocations which Transurban will discontinue for FY24 LTI grants.
None of the proxy advisors recommended against the CEO LTI grant and were generally supportive of many aspects of Transurban’s remuneration approach and outcomes.
Where does this protest rank when compared with other Transurban remuneration protest votes over the years?
The protest vote received on the FY21 Remuneration Report (25.74%) was the highest protest vote in relation to any remuneration resolution at Transurban over the last 10 years, with the majority of remuneration resolutions over that time receiving support above 90%.
Remuneration Framework Review
Corporate Report for the year ended 30 June 2022
Governance and risk
Financial statements
Security holder information
Sustainability supplement
Business performance
Introduction and overview
Directors’ report
Remuneration report

101
Changes to remuneration frameworkDuring FY21, the Remuneration, People and Culture Committee undertook a detailed review of Transurban’s remuneration
framework. Following the 2021 AGM, a further review was undertaken in response to concerns raised by security holders.
The table below provides a summary of changes both already made and also being proposed to the remuneration framework.
Remuneration Component Feature Previously FY22 FY23Remuneration Benchmarking Peer Group ASX 10 to 30 ASX 1 to 30 No further change
Short Term Incentive
Pool Funding 50% Group and 50% Individual performance
100% Group performance No further change
Changes to strengthen the alignment of Group results with individual outcomes
Formula: (Individual STI outcome % + [Individual STI outcome % x Group performance %]) ÷ 2
Formula: (Individual STI outcome % x Group performance %)
No further change
Performance measures to determine STI pool outcome
• Proportional EBITDA (20%)
• Proportional Net Costs (20%)
• HSE (10%)
• Individual Performance (50%)
• Proportional EBITDA (40%)
• Proportional Net Costs (40%)
• Health, Safety and Environment (20%)
Introduction of a Group Performance Scorecard1 to determine Group performance for the STI pool with the following categories:
• Financials (55%) – Proportional EBITDA (40%) – Proportional Net Costs (15%)
• HSE (15%)
• Customer and Delivery (15%)
• Sustainability, Reputation and Leadership (15%)
The result from the Group Performance Scorecard will impact 100% of the STI Pool and therefore individual outcomes for Executive KMP.
Non-financial measures provide the Board with further context in assessing Group performance
NA Introduction of additional non-financial measures in the areas of Customer, Leadership and Environmental Sustainability; to be used as a discretionary moderator to adjust the STI pool down if Transurban does not meet expectations in these areas
Incorporation of these measures into a Group Performance Scorecard to determine Group performance
Long Term Incentive
Performance period Three-year performance period
Introduction of a four-year performance period, with transitional arrangement for the FY22 award with 50% subject to a three-year performance period and 50% subject to a four-year performance period
Four-year performance period
1 Detail to be provided in the FY23 Remuneration Report
Corporate Report for the year ended 30 June 2022
Governance and risk
Financial statements
Security holder information
Sustainability supplement
Business performance
Introduction and overview
Directors’ report
Remuneration report

102
Our purpose To strengthen communities through transport
Our strategy By understanding what matters to our stakeholders, we create road transport solutions that make us a partner of choice
Remuneration strategy
A total remuneration framework designed to attract, motivate and retain the most skilled, experienced and capable senior executives by rewarding them for delivering on our business strategy and creating long-term, sustainable value for stakeholders
Governance The Board holds discretion with regard to the setting of targets and hurdles, as well as decisions regarding performance and remuneration outcomes; this includes taking into account any relevant significant items
Minimum security holding requirements for Group CEO and KMP (equal in value to fixed remuneration excluding superannuation; five-year period to accumulate)
Strict protocols for engaging independent remuneration consultants and advisors
Remuneration principles
Aligns the interests of our people with stakeholders, particularly security holders and partners, and importantly considers the impact on the community
Attracts, motivates and retains the best talent with capabilities that enable our competitive value proposition
Balances financial and non-financial performance which aligns to our purpose, values and risk appetite
Pays fairly and appropriately for operational performance and long-term value creation
Remuneration policy, including components and delivery mechanisms
Fixed remunerationSalary including statutory superannuation
Short Term Incentive (STI)Target performance, defined by a combination of group and individual Key Performance Indicators (KPIs), could achieve a 100% of STI target, with the potential, based on over-achievement of group and individual KPIs, to earn a maximum of 150% of STI target
Annual incentive awarded 50% in cash and 50% as two-year deferred Transurban securities
Long Term Incentive (LTI) Long-term business performance measures determine opportunity for vesting of security grants
Performance Rights with a four-year performance period, with transitional arrangements for FY22 LTI Plan
Purpose Fixed component
Designed to provide market competitive remuneration to attract and retain the best talent in Australia and internationally for Transurban’s current and future priorities, taking into consideration roles and experience
Key role accountabilities, size and complexity are weighed up against individual responsibilities, knowledge, skills and experience to determine the appropriate level of fixed remuneration
Current year performanceDesigned as a lever to deliver our strategic and operational priorities, with a level of outperformance that reflects our values and supports our purpose
Rewards for strong collective and individual contributions to overall performance of Transurban and where deferral applies provides an additional retention incentive and enables clawback optionality
Long-term sustainable performanceDesigned to focus on the achievement of sustainable longer-term value creation; the performance period better reflects security holder expectations and enables the application of malus and clawback
Our executive remuneration approach Our remuneration policy and strategy are designed to support and reinforce our business strategy and sustainable long-term growth with consideration being given to the interests of all our stakeholders. The remuneration components that are at risk require the successful execution of that strategy in both the short and long term. Our strategic drivers are reflected in our STI and LTI performance measures so that business performance, security holder outcomes and senior executive remuneration are directly aligned. The Remuneration Report is presented to security holders annually showing how the Board has applied the Remuneration Framework.
Corporate Report for the year ended 30 June 2022
Governance and risk
Financial statements
Security holder information
Sustainability supplement
Business performance
Introduction and overview
Directors’ report
Remuneration report

103
�����
���������������������
Year 1 Year 2 Year 3 Year 4
LTI
STI
TEC4
Full LTI award vests at the end of year four subject to above performance outcomes and service arrangements
Base salary andsuperannuation
Securities deferred for two years following the performance periodSubject to two-year service requirement and Board discretionCash
50% of award based on relative TSR—performance measured at the end of year four
50% of award based on FCF growth—performance measured at the end of year four
100%
50% 50%
50%
50%
Overview of executive remuneration framework1,2,3
Executive KMP remuneration
Remuneration mixThe remuneration mix is designed to
achieve a balanced reward for achievement of short-term objectives and the creation of long-term sustainable value. The amount of remuneration received by Executive KMP each year depends on the achievement of business and individual performance.
Fixed remuneration (TEC4) was set with reference to the market median, using the ASX30 companies as the primary reference. Remuneration packages (including TEC levels) are reviewed by the Remuneration, People and Culture Committee taking into consideration an individual’s role, experience and performance, as well as relevant comparative market data provided by remuneration consultants. TEC levels are also reviewed after a change in role.
Remuneration mix for Executive KMPThe following diagrams show the minimum, target and maximum total
remuneration opportunity for CEO and other Executive KMP. Each component is determined as a percentage of the total remuneration package. Base salary and superannuation received by each Executive KMP are disclosed on page 117.
Minimum: consists of TEC which is comprised of base salary and statutory superannuation.
Target: consists of TEC, target STI (cash and deferred components) which totals 100% of TEC for the CEO and 67% of TEC for other Executive KMP and target LTI (face value of 147% of TEC for the CEO and 80% for other Executive KMP). The potential impact of future security price movements is not included in the value of deferred STI awards or LTI awards.
Maximum: consists of TEC, maximum STI (cash and deferred components) which totals 150% of TEC for the CEO and 100.5% for other Executive KMP and maximum LTI (face value of 147% of TEC for the CEO and 80% for other Executive KMP). The potential impact of future security price movements is not included in the value of deferred STI awards or LTI awards.
The maximum opportunity represented below is the most that could be awarded to Executive KMP. It does not reflect any intention to award that amount.
1 The FY21 Plan (performance period 1 July 2020 to 30 June 2023) and the FY22 Plan (two performance periods, 50% of LTI grants with 1 July 2021 to 30 June 2024 and 50% with 1 July 2021 to 30 June 2025) both have relative TSR as a single performance measure.
2 The Board has approved the re-introduction of FCF as a second performance measure for the FY23 LTI Plan
3 Effective FY22 the performance period was increased from three years to four years with the FY22 LTI Plan being a transitional plan
4 Total Employment Cost (TEC)—includes base salary and statutory superannuation
100%
41%
36% 28%
�����������������
������
�������
32%
18% 18%
13.5% 13.5%
Fixed remuneration Variable STI —cash Variable STI —deferred Variable LTI
Other Executive KMP
100%
29%
25%
14.5%
19%
14.5%
19%
42%
37%
�����������������
������
�������
Fixed remuneration Variable STI —cash Variable STI —deferred Variable LTI
CEO
$2.3m
$9.13m
$7.98m
Corporate Report for the year ended 30 June 2022
Governance and risk
Financial statements
Security holder information
Sustainability supplement
Business performance
Introduction and overview
Directors’ report
Remuneration report

104
Our business performanceFinancial highlights for FY22
Group financial performance for FY22 has improved over FY21 notwithstanding the uncertainty during the year from government-mandated COVID-19 restrictions as well as ongoing public health concerns across the community. Traffic was down only 0.5% due to the resilience of commercial traffic and contributions from new assets, in addition to travel patterns returning to normal. In addition, Revenue, EBITDA and FCF have all increased over the previous year,
leading to growth in distributions for security holders of 12.3% per security. Headline costs were up on FY21 by 10.9% ($85million) driven largely by accounting impacts, investment in new capabilities to support the growth of the business and higher insurance premiums.
The balance sheet has remained strong with liquidity, debt covenants and credit ratings all remaining robust. Significant forward planning over the past few years has provided protection from rising interest rates with over 98% of the debt book hedged
and a weighted average maturity of 7.1 years. In addition, the balance sheet currently supports corporate liquidity of $3.9 billion and expected future capital releases (FY23 – FY25) in excess of $1.9 billion to enable future growth.
Overview of Group performanceThe following table shows the Group’s
performance over the past five financial years.
Five-year performance FY18 FY19 FY20 FY21 FY22
Proportional EBITDA excluding significant items only $M 1,796 2,016 1,888 1,836 1,900
Proportional Net Costs1 $M 406 450 475 483 546
Free Cash per security Cents 56.8 57.13 54.04 46.75 49.96
Distribution paid per security Cents 56.0 59.0 47.0 36.5 41.0
Security price at 30 June2 $ 11.97 14.74 14.13 14.23 14.38
TSR at 30 June % 6.4 30.9 (1.0) 3.4 4.9
Market capitalisation $b 26.63 39.43 38.65 38.96 44.16
Transurban’s Five Year TSR Performance against ASX Indices
The graph right shows Transurban’s TSR performance over a 5 year period against ASX indices.
Further details of our Group performance are provided in the Business Performance section on pages 24 to 73.
1 Proportional Net Costs as determined for the purposes of STI outcomes, excludes significant items, specific major development and legal project spend, transaction and integration costs and the incremental impact of unbudgeted new assets.
2 The opening security price in FY18 was $11.853 The FY19 FCF of 57.1 cents per security included 4.6 cents per security relating to a capital release from the NorthWestern Roads Group and 6.7 cents per security from a capital release from
Transurban Queensland. Excluding these capital releases, the FY19 FCF was 45.8 cents per security4 The FY20 FCF of 54.0 cents per security included 5.9 cents per security relating to capital releases from Lane Cove Tunnel, 2.7 cents per security from NorthWestern Roads Group, 1.9 cents
per security from Hills M2 and 1.2 cents per security from Transurban Queensland. Excluding these capital releases, the FY20 FCF was 42.3 cents per security5 The FY21 FCF of 46.7 cents per security included 10.1 cents per security relating to a capital release from WestConnex. Excluding this capital release, the FY21 FCF was 36.6 cents per security6 The FY22 FCF of 49.9 cents per security included 8.4 cents per security relating to a capital release from WestConnex and 3.2 cents per security from NorthWestern Roads Group. Excluding
these capital releases, the FY22 FCF was 38.3 cents per security.
0.6
0.7
0.8
0.9
1.0
1.1
1.2
1.3
1.4
1.5
30/06/2230/06/2130/06/2030/06/1930/06/18
Transurban ASX50 Index ASX200 Index
Corporate Report for the year ended 30 June 2022
Governance and risk
Financial statements
Security holder information
Sustainability supplement
Business performance
Introduction and overview
Directors’ report
Remuneration report

105
Executive KMP remuneration outcomesSTI outcomes
STI awards are determined with reference to an assessment of performance against individual KPIs and Group performance measures.
When the Board and the Remuneration, People and Culture Committee consider the performance against each element, several factors are considered that may result in the exercise of Board discretion for the benefit or detriment of the executives. For example:
• prevailing external business and economic factors beyond the control of the business and which may impact performance
• unforeseen factors that may not have been known at the beginning of the performance period, but which are relevant to performance over the performance period
• whether budgetary assumptions that were made when setting performance targets remain appropriate and whether conditions are potentially better or worse when compared with those assumptions
• the degree of difficulty and complexity associated with achieving the targets, as related to both the internal and external environment.
In assessing whether to exercise discretion for any of these factors, the Board will have regard for the interests of all stakeholders including security holders.
Transurban’s strategic priorities are cascaded via the CEO’s KPIs to other executives, along with other functional measures. The Board assessed the Group’s and CEO’s performance as follows (KPIs that are commercially sensitive have been excluded).
FY22 Group measures outcomesProportional EBITDA contributed $1,869
million for the period versus a target $1,951 million. At the time the EBITDA measures were set, government mandated COVID-19 restrictions were in place and the nature and length of these restrictions were unknown. It was acknowledged that the associated impact on EBITDA was outside of Management’s control. In response to the uncertainty, a set of principles were developed to estimate the expected weekly revenue impacts of these restrictions, which were provided to the ASX as part of the FY21 investor materials. The target EBITDA has incorporated these principles. The additional impacts to EBITDA were ongoing COVID-19 related government directives, the Omicron wave and extended traffic recovery profiles over the year, resulting in an outcome of 58%.
Proportional Net Costs were $546 million for the period versus target of $605 million. This was driven by a combination of active management initiatives and benefits from prevailing market conditions. Active cost management initiatives include:
• direct negotiation with vendors to reduce costs across technology and insurance;
• deferral or cancellation of consulting and marketing spend;
• renegotiation of electricity contracts at historically low energy prices; and
• management of ventilation systems electricity consumption.
Benefits to Net Costs partially due to prevailing market conditions include lower than expected employee expenses, lower debt collection costs and COVID-19 related cost reductions of travel, entertainment and facilities. This resulted in an outcome of 150% on which the Board exercised its discretion and reduced the outcome to 90%. This was to reflect the benefit of some cost savings not being directly attributable to management efforts.
Group HSE performance was strong for the period reflecting the Group’s ongoing focus and investment in our safety culture. This includes targeted activities in relation to the safety of our people, our contractors and our roads. The FY22 outcome for HSE was 130.5%.
The overall FY22 STI outcome is 85.3%, including Board discretion to reduce the Proportional Net Cost STI outcome. This aligns STI outcomes with the experience of security holders, given FCF (excluding Capital Releases) was 8.5% and EBITDA was 5.8% below pre-COVID levels (FY19).
FY22 Group measures outcomes
Measure Target Performance Outcome % STI Outcome % Commentary
Proportional EBITDA (40%) $1,951M $1,869M 58% 23.2%Excluding significant items, specific major development and legal project spend, transaction and integration costs and the incremental impact of unbudgeted new assets.Proportional Net Costs (40%) $605M $546M 90% 36.0%
HSE (20%) 130.5% 26.1%
Overall performance/Group outcome 85.3%
Corporate Report for the year ended 30 June 2022
Governance and risk
Financial statements
Security holder information
Sustainability supplement
Business performance
Introduction and overview
Directors’ report
Remuneration report

106
Numerous development opportunities continue to progress and the balance sheet remains strong, providing certainty and the ability to support future growth. Customer satisfaction increased as did trust scores, and there has been a continued focus on managing costs, HSE and supporting workforce productivity and wellbeing.
The Board assessed the CEO’s performance against his KPIs and determined an individual result of 100% to which the Group outcome of 85.3% was applied. After also applying a material adjustment to reflect Executive accountability in relation to the WGTP
Following another complex year, the Board assessed the CEO’s FY22 performance outcome with respect to the Group’s overall performance and taking into account the CEO’s performance against his KPIs. A key factor this year related to the WGTP dispute. This was a difficult situation with settlement being reached in December 2021, in the interests of all stakeholders. Other considerations included the successful bid for WestConnex which increased proportional ownership to 50% alongside strategically aligned partners and extended the Group’s weighted average concession life to approximately 30 years.
STI Outcome
Impact of WGTP
STI awarded ($)
STI Cash ($)
STI Deferred
equity2 ($)
STI as a % of maximum opportunity
STI as a % of target
opportunityCurrent Executive KMP
S Charlton 1,962,000 (50%) 981,000 = 490,500 + 490,500 28% 43%
H Byrne 465,750 (20%) 372,600 = 186,300 + 186,300 45% 68%
M Huey 535,625 (20%) 428,500 = 214,250 + 214,250 52% 78%
M Jablko 729,222 (10%) 656,300 = 328,150 + 328,150 45% 68%
S Johnson 409,875 (20%) 327,900 = 163,950 + 163,950 40% 60%
S Moorfield 558,667 (10%) 502,800 = 251,400 + 251,400 59% 88%
H Wehby 553,250 (20%) 442,600 = 221,300 + 221,300 40% 60%
FY22 CEO Performance
Priority PerformanceStrategy and Development • 495 Northern Extension project reached financial close and outperformed against approval base-case
• Approval of M7–M12 integration and delivery to progress to the third stage of the NSW Government’s Unsolicited Proposals Process
• Successful launch of ‘connected vehicle’ prototype as part of road user charging project
• Additional value derived from NeuRA partnership with federal/state governments and communities
Customer and Delivery • WGTP dispute settlement reached in the best interest of all stakeholders
• Successful WestConnex bid, increasing proportional ownership to 50%
• Successful customer offerings including vaccine uptake support and the electric vehicle competition across markets; above target performance in reputation and customer sentiment measures
People and Leadership • Increase in talent and leadership bench strength following Executive Committee appointments in FY21 and further senior management appointments in FY22
• Awarded WGEA EOCGE citation for 9th consecutive year; ranked 2nd in Australia and 8th globally in Equileap’s FY22 Gender Equality Global Report
Operations • Asset Management and Operations Program delivering significant operational efficiencies and improvements across markets
• Strong HSE performance with zero employee recordable injuries, contractor Recordable Injury Frequency Rate (RIFR) of 3.09 (FY21: 3.751) and Road Injury Crash Index (RICI) of 3.78 (FY21: 4.29)
Financials • Balance sheet well positioned, including strong liquidity levels, debt covenants and credit ratings through COVID-19 related traffic disruptions
• Strong cost management driven partly by management actions (e.g. negotiated lower vendor costs, reduced consulting and marketing spend) and partly by external factors (e.g. COVID-19 related cost reductions)
settlement, the CEO’s final performance outcome was 43% of target, representing 28% of maximum opportunity. The Board considers this result to be aligned with the experience and expectations of security holders and other stakeholders.
FY22 Executive KMP STI outcomesThe STI performance outcomes and
awards for the CEO and Executive KMP, which include the application of individual Executive accountability impacts in relation to the WGTP dispute (as detailed on page 97), are provided in the following table.
1 FY21 Contractor RIFR reported at 3.90 in end of year reporting materials. Following an assurance process on WestConnex, additional contractor hours were recovered lowering the FY21 Contractor RIFR to 3.75
2 Securities are subject to a two-year restriction period following the end of the performance year. Securities will be granted in October 2022
Corporate Report for the year ended 30 June 2022
Governance and risk
Financial statements
Security holder information
Sustainability supplement
Business performance
Introduction and overview
Directors’ report
Remuneration report

107
Vested 42.8%
FY20 Plan4
FY19 Plan
FY21 Plan3
FY22 Plan3
FY23 Plan4
1 July2018
30 June2026
1 July2019
1 July2020
1 July2021
1 July2022
30 June2023
30 June2024
30 June2025
Base 59.0 cents/Target 5.5–7.5%
Compared to select ASX150
Base 38.3 cents/Target 14–18%
Compared to select ASX150
Compared to select ASX150
Compared to select ASX150
Current on-foot LTI plans and associated performance parameters
LTI outcomes Value of FY19 LTI plan performance awards vested and lapsed in FY22
The FY19 LTI plan performance awards, which were granted on 22 August 2018 and 19 October 2018 for the CEO, and covered the performance period from 1 July 2018 to 30 June 2021, vested on 20 August 2021. The overall vesting outcome of the performance tests was as follows:
Test type Result of test% of
units vestTSR Transurban ranked
10th highest out of 29 companies (67.8 percentile)
85.6%
FCF (3.1%) compound annual growth rate in FCF per security over the performance period. Target range was 5.5% to 7.5% FCF growth per security
0.0%
Overall vesting 42.8%
Free Cash Flow measure
The target range for the FCF measure in the LTI plans considers forecast financial performance over the three years in which the award is measured. This three-year forecast reflects near-term FCF growth generated by the business together with planned activities that deliver value over the longer term.
The Free Cash growth per security target over the performance period of the FY19 LTI plan achieved an outcome of 0%. This was due to the significant impact of COVID-19 pandemic restrictions over more than 16 months of the three-year performance period.
Value of FY20 LTI plan performance awards to vest/lapse in FY23
The FY20 LTI plan (1 July 2019 to 30 June 2022) is scheduled to vest in August 2022. Reduced traffic and toll revenue across all regions due to the COVID-19 pandemic have continued to significantly impact the FCF component of this plan, with calculations indicating that 35.7% of awards will vest for eligible participants, derived entirely from relative TSR.
Details of vesting for each Executive KMP will be included in next year’s Remuneration Report.
LTI grantsPerformance awards granted in FY22
The Board approved to extend the performance period from three years to four years for LTI plans commencing 1 July 2021. To support the transition to a four-year performance period, the Board approved that the FY22 LTI plan will consist of two tranches. Tranche 1 (50% of awards granted) has a three-year performance period (1 July 2021 to 30 June 2024) and Tranche 2 (50% of awards granted) has a four-year performance period (1 July 2021 to 30 June 2025).
As a result of the ongoing economic uncertainty relating to COVID-19, the Board decided to continue to test performance relative to TSR hurdles only, with no FCF hurdles applying to the FY22 LTI Plan.
Looking ahead - performance awards to be granted in FY23
For LTI awards commencing 1 July 2022, the Board approved the reintroduction of FCF as the second performance hurdle. The FY23 LTI Plan will have a four-year performance period, with 50% subject to relative TSR and 50% subject to FCF (excluding Capital Releases)1 per security growth rate.
The FY23 LTI Performance awards for the FCF tranche will have a compound annual growth rate (CAGR)2 range of between 14% and 18%. The CAGR in FCF1 per security will be calculated from a base of FY22 FCF1, being 38.3 cents per security. The target growth range is considered to be appropriately challenging for Management, taking into account the budget and forecast estimates of the Group over the four-year plan period. It should be noted that there are a number of potential sources of uncertainty such as unforeseen changes in traffic patterns, as well as macro-economic factors and potential new growth opportunities.
Should Management achieve these outcomes and deliver growth in FCF1 in line with the target range, the Board considers the outcomes for Management and security holders would be strongly aligned.
1 References to FCF in relation to FY23 LTI Plan exclude Capital Releases2 The FCF per security target range is calculated by adding each of the FCF budget and forecasts over the four-year
performance period, and determining the CAGR required to achieve the 4-year aggregate FCF3 Single performance measure of Relative TSR for the FY21 and FY22 plans4 FCF Target: compound annual growth rate range
FCF Performance TSR Performance
Corporate Report for the year ended 30 June 2022
Governance and risk
Financial statements
Security holder information
Sustainability supplement
Business performance
Introduction and overview
Directors’ report
Remuneration report

108
Current Executive KMP TEC Cash STI Total Cash
Value of deferred STI
vested during the year1
Value of LTI vested during
the year1
Total Actual Remuneration
received during the
year
Value of Forfeited / Lapsed LTI
during year1, 2
S Charlton 2,300,000 490,500 2,790,500 1,051,570 1,886,488 5,728,558 2,521,174
H Byrne 815,000 186,300 1,001,300 199,038 252,202 1,452,540 337,053
M Huey 794,015 214,250 1,008,265 126,126 290,149 1,424,540 387,755
M Jablko 1,450,000 328,150 1,778,150 – 934,321 2,712,471 –
S Johnson 815,000 163,950 978,950 203,710 312,474 1,495,134 417,578
S Moorfield 846,720 251,400 1,098,120 – 70,941 1,169,061 –
H Wehby 1,100,000 221,300 1,321,300 – 120,808 1,442,108 –
1 The point in time value of securities based on the share price at the date of vesting/lapse multiplied by the number of securities2 The forfeited / lapsed LTI values relate to 57.2% of the performance awards which lapsed in August 2021 due to the performance hurdles not being met
Remuneration received in FY22 This table sets out the actual remuneration realised by Executive KMP during FY22. This is a voluntary disclosure and is not prepared in
accordance with Australian Accounting Standards. The value Executive KMP actually receive depends on Transurban’s security price and whether equity vests. The statutory remuneration tables (prepared in accordance with the Australian Accounting Standards) can be found on pages 114 to 118.
Corporate Report for the year ended 30 June 2022
Governance and risk
Financial statements
Security holder information
Sustainability supplement
Business performance
Introduction and overview
Directors’ report
Remuneration report

109
How variable remuneration is structuredShort Term Incentive (STI)—how does it work?
Description Eligible permanent employees, including the CEO and other Executive KMP, participate in the annual STI plan, which puts a proportion of remuneration ‘at risk’ subject to meeting specific pre-determined Group and individual performance measures linked to Group objectives.
Performance period The performance period is the financial year preceding the payment date.
Opportunity For ‘at-target’ performance, the CEO has the opportunity to receive an STI payment of 100% of TEC and all other Executive KMP have the opportunity to receive 67% of TEC. The minimum STI outcome is 0% (if targets are not met) and the maximum is capped at 150% of the ‘at-target’ STI opportunity, which is only awarded for exceptional performance.
Payment and deferral
STI awards for the CEO and other Executive KMP are delivered 50% in cash and 50% is deferred into Transurban stapled securities for two years following the performance year. The deferred securities are subject to service conditions (refer to Cessation of Employment section below) and participate in dividends and/or distributions paid during the deferral period. The number of deferred securities allocated is determined by dividing the amount to be deferred by a 10-day Volume Weighted Average Price (VWAP) of Transurban securities over the 10 business days immediately preceding the STI deferred plan offer.
Annual pool The Board determines the total STI pool to be distributed. The total pool will not exceed 125% of the aggregate STI target opportunity for all participants. The pool is allocated to individuals based on individual and Group performance in accordance with the following formula: (Individual STI outcome % x Group outcome %). This approach is designed such that higher performing employees receive a greater portion of the Group STI outcome than those who do not perform as well and aligns individual performance with overall Group performance.
Performance measures
Individual measures (KPIs) are unique to the individual’s area of accountability. Individuals have a clear line of sight to KPIs and are able to directly affect outcomes through their own actions. These measures are aligned to security holder returns and value creation.
Group measures comprise the following three components:
• Proportional EBITDA* (40%): is one of the primary measures the Board uses to assess the operating performance of the Group. It reflects the contribution from individual assets to the Group’s operating performance and focuses on elements of the result that management can influence to drive improvements in short term earnings. This measure provides a better reflection of theperformance of the Group’s assets than statutory EBITDA.
• Proportional Net Costs** (40%): reflects management’s ability to influence the expenditure of the business. Strong cost management throughout the business drives an increase in proportional EBITDA and FCF and ultimately security holder value.
• HSE (20%): measures focus on improving the Group’s HSE culture and reducing workplace injuries for employees and contractors, as well as customer safety. The HSE measure is a combination of two lead indicators and four lag indicators.
The ‘Lead’ HSE KPI (Leadership) focuses on enhancing HSE culture, behaviours and accountability at Transurban. Employees are assessed against a five-scale rating according to their HSE KPI and this result is then aggregated across the Group and averaged to provide a Group score.
The ‘Lag’ KPIs focus on recordable incidents, planning and tracking, including injury rates, crash rates and road safety action planning.
In assessing the performance of the Group, the Board also references additional non-financial measures in determining the final Group STI pool.
Definitions
* Proportional EBITDA is the aggregation of EBITDA from each asset multiplied by the Group’s percentage ownership, as well as any contribution from Group functions. Proportional EBITDA figures used to assess performance are included in note B4 of the audited financial statements.
** Proportional Net Costs is the aggregation of total costs less fee and other revenues from each asset multiplied by the Group’s percentage ownership, as well as any contribution from Group functions.From FY23, the STI performance measures will be replaced with a Group Performance Scorecard which include KPIs in the following categories:
• Financials• HSE • Customer and Delivery• Sustainability, Reputation and Leadership
Corporate Report for the year ended 30 June 2022
Governance and risk
Financial statements
Security holder information
Sustainability supplement
Business performance
Introduction and overview
Directors’ report
Remuneration report

110
Performance measures (continued)
Financials (Proportional EBITDA and Proportional Net Costs)
The Board utilises the annual budget as the primary input to determine appropriate financial targets. When approving the budget, the Board reviews the core principles and assumptions underpinning the budget. Specifically, for Proportional EBITDA, the budget incorporates base business growth derived from network-wide traffic performance, price growth and impacts of inflation and adjusts for events such as construction and project completion and the impact of acquisitions. Directly controllable initiatives including road safety, lane availability, operational efficiencies and the impact of development activity are also incorporated.
Once the budget has been finalised, the Board determines the STI targets to ensure that sufficient stretch is incorporated Consideration is given to the quantifiable risks and opportunities that can influence the Group’s financial performance. In some instances, the Board may deem it appropriate to exclude significant items.
The targets use a constant currency for operations within North America.
HSE
The Board reviews HSE targets each year with a view to continuously improving the HSE culture and performance of the Group.
Individual KPIs
Individual targets as set out in KPIs include consideration as to role-related accountabilities and responsibilities in the context of business strategic priorities. Executive KPIs consist of similar categories to those of the CEO (as disclosed on page 106) of this report) and reflect the individual’s role and areas of responsibility.
Vesting The Board assesses performance against Group measures and the results of key elements are independently validated. The Board confirms final outcomes for individual and Group performance and has discretion to adjust the performance conditions and outcomes.
These methods for assessing performance are used because they provide the Board with discretion as to assessment of conditions and outcomes, with the use of an independent overlay where considered appropriate.
Cessation of employment
If employment ceases before performance is assessed, generally there is no entitlement to receive any STI award. If employment ceases due to resignation before the end of the two-year restriction period, any unvested deferred securities will lapse, unless the plan rules provide otherwise or the Board otherwise resolves.
Clawback Grants prior to FY21: Fraudulent or dishonest behaviour will result in the forfeiture or clawback of any unvested awards. Further, at the discretion of the Board, awards are subject to forfeiture or clawback where there is a financial misstatement circumstance or the allocation of awards was made in error, on the basis of a misrepresentation or an omission, or on the basis of facts or circumstances that were later proven to be untrue or inaccurate (applicable to both STI and LTI plans).
FY21 and future grants: In December 2019 Transurban adopted new Equity Incentive Plan Rules. Under the new Equity Plan Rules, in addition to the above, the Board has discretion to clawback vested securities or repay cash proceeds from the sale of vested securities. Circumstances for clawback have also been expanded to include: breach of duties or obligation to the Group, acts which have a negative impact on Transurban’s reputation, vesting is not justified or supportable and the possibility of an employee who departed as a “good leaver” but then behaves inappropriately.
Long Term Incentive (LTI)—how does it work?
Description Participation in the LTI plan is offered to the CEO and other Executive KMP and a very limited number of other employees nominated by the CEO and approved by the Board.
Instrument Grants are made in the form of performance awards at no cost to the recipient. Each performance award is an entitlement to receive a Transurban stapled security, or at the Board’s discretion, an equivalent cash payment, on terms and conditions determined by the Board, subject to the achievement of vesting conditions. Performance awards do not carry dividend, distribution or voting entitlements prior to vesting.
Performance period
Grants prior to FY22 have a three-year performance period commencing on 1 July in the year the grants are made. For example, the FY21 grant has a performance period commencing 1 July 2020 and ending 30 June 2023.
The FY22 grant transitioned to a four-year performance period, consisting of two tranches. Tranche 1 (50% of awards granted) have a three-year performance period (1 July 2021 to 30 June 2024) and Tranche 2 (50% of awards granted) have a four-year performance period (1 July 2021 to 30 June 2025).
FY23 and future grants will revert to a single award over the new four-year performance period.
Opportunity The CEO’s opportunity is 147% of TEC and the opportunity for all other Executive KMP is 80% of TEC. The minimum vesting outcome an individual can receive is 0% of the award (if the performance measures are not achieved) and the maximum vesting outcome an individual can receive is capped at 100% of the award (if performance measures are achieved).
Performance measures
Two performance measures are ordinarily used to determine the number of awards that will vest at the end of the performance period; relative Total Shareholder Return (TSR) against a bespoke comparator group and FCF (each with an equal 50% weighting).
The FY22 Plan (with the two performance periods, 1 July 2021 to 30 June 2024 and 1 July 2021 to 30 June 2025) have Relative TSR as a single performance measure. The Board decided that FCF was not a suitable measure for the FY22 Plan due to the challenges associated with predicting traffic and toll revenues and therefore the ability to accurately forecast FCF for the performance periods within the COVID-19 pandemic environment.
From FY23, FCF will be reinstated as a second performance measure for the LTI Plan.
Short Term Incentive (STI)—how does it work? (continued)
Corporate Report for the year ended 30 June 2022
Governance and risk
Financial statements
Security holder information
Sustainability supplement
Business performance
Introduction and overview
Directors’ report
Remuneration report

111
Targets Relative TSR is measured against a bespoke comparator group comprising companies in the transport, utilities, real estate, construction and infrastructure Global Industry Classification standards sectors of the ASX150. The companies in this group for grants made during FY22 were:
Abacus Property Group, AGL Energy Limited, Auckland International Airport Limited, APA Group, Atlas Arteria, Aurizon Holdings Limited, AusNet Services Limited, BWP Trust, Charter Hall Group, Charter Hall Long, Chorus Limited, Cromwell Property Group, Dexus, Goodman Group, GPT Group, Growthpoint Properties Australia, Lendlease Group, Mirvac Group, National Storage REIT, Origin Energy Limited, Qantas Airways Limited, Qube Holdings Limited, Scentre Group, Shopping Centres Australasia Property Group, Spark Infrastructure Group, Spark New Zealand Limited, Stockland, Sydney Airport, Telstra Corporation Limited, TPG Telecom Limited, Transurban Group, Vicinity Centres.
Changes to the comparator group in FY22 are as follows:• Excluded (moved out of ASX150): Charter Hall Retail and Waypoint • Excluded (delisted): Vocus Group Limited (on 23 July 2021); AusNet Services Limited (on 16 February 2022); Spark Infrastructure
Group (on 23 December 2021); Sydney Airport (on 10 March 2022)• Included (moved into ASX150): Auckland International Airport Limited• Included (change in GICS Industry Classification): Origin Energy Limited
FCF1 per security targets are set by the Board utilising the annual budget and forecasts as the primary inputs (consistent with the approach taken for STI measures of Proportional EBITDA and Proportional Net Costs). Once the budget and forecast has been finalised, the Board determines the FCF targets by analysing the cash flow outcomes, ensuring sufficient stretch is incorporated.
The actual FCF outcomes are reviewed in detail against targets to consider key reasons for variance and assess whether any adjustments should be made in determining management’s performance. The Board may adjust where a decision has been made, in the interests of the Transurban Group and its security holders that differs from the original budgeted assumptions. This may include factors such as significant equity raisings to fund growth opportunities or changes to the timing or quantum of anticipated capital releases.
Factors that may cause FCF growth to fluctuate from year to year include activities that are intended to generate long-term value for the business but may negatively impact FCF growth in the near term. The Group is currently in a significant development phase with seven major projects to be delivered in Australia and North America (see page 15 for the project pipeline).
The FCF calculation is included in note B10 of the audited financial statements.
Why are these per-formance measures used?
TSR is a relative, external, market-based performance measure against those companies with which the Group competes for capital. It provides a direct link between executive reward and security holder return. TSR measures total return on investment of a security, taking into account both capital appreciation and distributed and/or dividend income that was reinvested on a pre-tax basis.
Growth in FCF per security reflects the Group’s continued focus on maximising available free cash. The Group seeks to consistently grow its distributions year on year and to align security holder distributions with FCF per security.
Allocation Face value allocation methodology (discounted for distributions and/or dividends foregone throughout the performance period). For each grant cycle, the allocation calculations are performed on 1 July of the first performance year using a valuation determined by an independent third party.
This methodology is an alternative to paying dividend equivalent payments on LTI plans. The performance awards are subject to performance hurdles and are forfeited and lapse if performance hurdles are not achieved. Participants only receive performance awards which vest at the end of the performance period.
Transurban will adopt a full-face value allocation methodology for the FY24 LTI grants.
Vesting Following the end of the performance period, the performance measures are tested, and the Board assesses the LTI outcome.
TSR component
The Group uses an independent report that sets out the Group’s TSR growth and that of each company in the bespoke comparator group. A VWAP of securities for the 20 trading days up to and including the testing date is used to calculate TSR.The level of TSR growth achieved by the Group is given a percentile ranking in relation to the Group’s performance compared to the performance of other companies in the comparator group (the highest-ranking company is ranked at the 100th percentile). The TSR performance is tested at the end of the performance period, and this ranking determines the extent to which performance awards subject to this component vest.Following testing, any awards that do not vest lapse, and any awards that vest are automatically exercised into Transurban stapled securities or settled in cash at the discretion of the Board. No price is payable on exercise.
TSR vesting schedule
The TSR component of performance awards vest on a straight-line basis in accordance with the following table:
The Group’s relative TSR ranking in the comparator group % of performance awards that vest
At or below the 50th percentile Zero
Above the 50th percentile but below the 75th percentile Straight line vesting between 50 and 100
At or above the 75th percentile 100
Long Term Incentive (LTI)—how does it work? (continued)
1 References to FCF in relation to FY23 LTI Plan exclude Capital Releases
Corporate Report for the year ended 30 June 2022
Governance and risk
Financial statements
Security holder information
Sustainability supplement
Business performance
Introduction and overview
Directors’ report
Remuneration report

112
1 References to FCF in relation to FY23 LTI Plan exclude Capital Releases2 The FCF (excluding Capital Releases) per security target range is calculated by adding each of the FCF (excluding Capital Releases) budget and forecasts over the four-year performance
period, and determining the CAGR required to achieve the 4-year aggregate FCF (excluding Capital Releases)3 Payment in lieu of the notice period may be provided (based on the executive’s fixed remuneration). The Group may also terminate at any time without notice for serious misconduct
Minimum security holding
The Board has endorsed minimum security holding guidelines for Non-executive Directors, the CEO and Executive KMP. The guidelines recommend that Non-executive Directors, the CEO and Executive KMP build and maintain a minimum security holding of Transurban stapled securities equal to 100% of their fixed remuneration or base fees (excluding superannuation). The minimum stapled security holding can be accumulated over a five-year period.
As at the date of this report, all KMP have either achieved and maintained their minimum security holding or, for those new to the Group, are on track to meet the five-year accumulation period.
Service Agreements
The remuneration and other terms of employment for the CEO and other Executive KMP are formalised in service agreements that have no specified term. Under these agreements, the CEO and other Executive KMP are eligible to participate in STI and LTI plans. The notice periods in place for FY22 are outlined below:
Period of notice to terminate by
the Executive KMP
Period of notice to
terminate by the Group3
CEO 6 months 12 months
Other Executive KMP 3 months 6 months
Other Executive KMP – commencing post 6 October 2020 6 months 6 months
Vesting (continued)
FCF component
The Group’s FCF1 per security percentage growth rate is calculated over the four-year performance period.2 The FCF per security component of performance awards granted will vest based on the Group’s compound annual growth targets translated into annual FCF (excluding Capital Releases) per security over the four-year performance period.
The Board uses its discretion to determine whether the performance awards are settled in Transurban stapled securities or a cash payment of equivalent value.
Following testing, any awards that do not vest, lapse and any awards that vest are automatically exercised into Transurban stapled securities or settled in cash at the discretion of the Board. No price is payable on exercise.
FCF vesting schedule
The FCF component of performance awards vest on a straight-line basis in accordance with the following table:
FCF per security over the performance period % of performance awards that vest
Below minimum threshold Zero
Between minimum threshold and maximum target Straight line vesting between 50 and 100
At or above maximum target 100
The method of assessing the performance measure set out above is the most appropriate for the type of performance measure used.
Cessation of employment
If employment ceases due to resignation before the performance measures are tested, generally there is no entitlement to unvested performance awards and any unvested awards will lapse, unless the plan rules provide otherwise, or the Board otherwise resolves.
Clawback Same treatment as per STI.
Long Term Incentive (LTI)—how does it work? (continued)
Corporate Report for the year ended 30 June 2022
Governance and risk
Financial statements
Security holder information
Sustainability supplement
Business performance
Introduction and overview
Directors’ report
Remuneration report

113
Non-executive Director remunerationRemuneration policy
The following diagram sets out the key objectives of the Group’s Non-executive Director remuneration policy and how they are achieved through the Group’s remuneration framework:
Remuneration arrangementsMaximum aggregate remuneration
The aggregate remuneration that may be paid to Non-executive Directors in any year is capped at a level approved by security holders. Security holders at the 2016 Annual General Meeting approved the current aggregate fee pool of $3,000,000 per year (inclusive of superannuation contributions).
Non-executive Director fees
The Remuneration, People and Culture Committee regularly reviews Non-executive Director fees and such reviews include periodic benchmarking against other publicly listed entities of a similar size and complexity to Transurban.
A review of Non-executive Director fees (base Director and Committee fees) was undertaken during FY22. The Remuneration, People and Culture Committee recommended, and the Board subsequently resolved that Non-executive Director fees remain unchanged for the 2022 calendar year. The last increase in NED fees was 1 January 2018.
Current Director and Committee fees (per annum) are set out below:
Board feesChair $600,000
Member $205,000
Committee feesAudit and Risk Committee
Chair $50,000
Member $25,000
Remuneration, People and Culture Committee
Chair $45,000
Member $20,000
There are no fees for membership of the Nomination Committee.
The Chair of the Board does not receive any additional fees for Committee responsibilities.
The Chair of each Committee only receives the Chair fee (and not a member fee).
Non-executive Directors are permitted to be paid additional fees for special duties or exertions. No such fees were paid during FY22. Non-executive Directors are also entitled to be reimbursed for all business-related expenses, including travel, as may be incurred in the discharge of their duties.
Non-executive Directors are not entitled to any retirement benefits other than statutory superannuation contributions.
Non-executive Director related party information
All Non-executive Director related party relationships are based on normal commercial arms’ length terms. None of the Non-executive Directors were, or are, involved in any procurement of these products and services.
The Group is not required to make the following disclosures but for transparency reasons notes the following relationships and transactions.
Director Related party Services providedS Mostyn (former Director)
During the period Samantha Mostyn was a Director of Transurban, she was Chair and a Non-executive Director of Citigroup Pty Limited.
During FY22 Transurban received some carry over fees from activities in FY21 when Citigroup was a Joint Lead Manager on a Corporate 144A issuance. Citigroup also participates in a corporate working capital facility to Transurban, all on normal commercial terms.
R Whitfield Robert Whitfield is a Non-executive Director of Commonwealth Bank of Australia (CBA)
During FY22 CBA provided transactional banking products and services to Transurban on arms-length commercial terms. CBA also participates as a lender in numerous debt facilities and acts as the agent for certain debt facilities, all on arms-length commercial terms.
J Wilson Dr Jane Wilson is a non-executive director of Sonic Healthcare Limited.
Sonic HealthPlus (backed by Sonic Healthcare) provides employment medical services to Transurban on normal commercial terms.
M Go Marina Go is a non-executive director of Energy Australia
During FY22, Energy Australia was one of Transurban’s energy providers. This relationship is on normal commercial terms.
Securing and retaining talented, qualified DirectorsDirector fee levels are set with regards to: the responsibilities and risks attached to the role, the time commitment and workload expected, the Director’s experience and expertise, and market benchmark data.
Preserving independence and impartialityDirector remuneration consists of base (Director) fees and Committee fees. No element of Director remuneration is ‘at risk’ (i.e. fees are not based on the performance of the Group or individual Directors).
Aligning Director and security holder interestsDirectors are encouraged to hold Transurban securities and the Board has endorsed minimum security holding guidelines for Directors.
Corporate Report for the year ended 30 June 2022
Governance and risk
Financial statements
Security holder information
Sustainability supplement
Business performance
Introduction and overview
Directors’ report
Remuneration report

114
Dealing in securitiesIn accordance with the Group’s Dealing in Securities Policy,
Directors, members of the Executive Committee and their related parties must not enter into hedging arrangements in relation to Transurban stapled securities. In addition, employees who have equity awards under the Group equity plan must not hedge against those equity awards. Directors and employees are also prohibited from entering into margin lending arrangements using Transurban stapled securities as security.
Securities held by Executive KMP as at 30 June 2022
Balance at start of year
Changes during year
Balance at end of year1,2
Current Executive KMP
S Charlton 350,000 282,104 632,104
H Byrne 34,802 34,848 69,650
M Huey 193,332 72,090 265,422
M Jablko – 67,169 67,169
S Johnson 122,816 (16,303) 106,513
S Moorfield – 5,100 5,100
H Wehby – 8,685 8,685
1 Balance at the date of this Report is the same as the balance at the end of FY222 As at 30 June 2022, all of Scott Charlton’s securities were held nominally
LTI performance awards granted in FY22 Eligible Executive KMP received LTI performance awards with a grant
date of 4 October 2021, except for the CEO with a grant date of 28 October 2021. The FY22 LTI Plan consists of two tranches of LTI awards as the Group transitioned from a three-year performance period to a four-year performance period. Awards granted in Tranche 1 (50% of the LTI award) may vest subject to achieving the TSR vesting schedule over the performance period from 1 July 2021 through to 30 June 2024 and awards granted in tranche 2 (50% of the LTI award) may vest subject to achieving the TSR vesting schedule over the performance period from 1 July 2021 through to 30 June 2025.
Statutory tables
The relevant values of the grants are as follows:
Fair Value of awards at
grant date Security price at
grant date
Face Value5 of
awards at allocation
dateTranche Grant dateRelative
TSR3FCF per
security4
Tranche 1 4 Oct 2021 $6.56 NA $14.27 $13.34
Tranche 2 4 Oct 2021 $6.86 NA $14.27 $12.91
Tranche 1 28 Oct 2021 $5.51 NA $13.68 $13.34
Tranche 2 28 Oct 2021 $5.89 NA $13.68 $12.91
3 Fair value in accordance with AASB 2 – share-based payments treatment of market conditions.
4 The FY22 LTI grant has just the one TSR performance measure. 5 Security price as at 1 July 2021 (allocation date) discounted for distributions and
dividends forgone throughout the two performance periods.
The following table shows the number of LTI awards granted to Executive KMP during FY22:
Number of performance
awards granted7
Maximum (fair value)
value8 of grant ($)
Maximum (face value)
value9 of grant ($)
Current Executive KMP
S Charlton6 257,671 1,469,527 3,524,939
H Byrne 49,690 333,542 709,076
M Huey 49,690 333,542 709,076
M Jablko 88,406 593,421 1,261,554
S Johnson 49,690 333,542 709,076
S Moorfield 51,825 347,873 739,543
H Wehby 67,067 450,184 957,046
6 Scott Charlton was granted 257,671 performance awards as part of his 2022 remuneration package as approved at the 2021 Annual General Meeting, under ASX Listing Rule 10.14
7 The minimum value of the grant, if the applicable performance measures are not met, is zero
8 Maximum value of the grant has been calculated based on a fair value approach as at the grant date. The fair value considers the probability that the Executive KMP may not derive value from the LTI award, along with other factors, including difficulty of achieving performance hurdles and anticipated security price volatility
9 Maximum value of the grant based on security price at grant date The maximum LTI opportunity for each Executive KMP is the face value of the award (i.e. the value the Executive KMP would receive if all of their performance awards vested, based on Transurban’s security price at the time the award was granted)
Corporate Report for the year ended 30 June 2022
Governance and risk
Financial statements
Security holder information
Sustainability supplement
Business performance
Introduction and overview
Directors’ report
Remuneration report

115
Summary of Executive KMP allocated, vested or lapsed equity
Type of equity1,2Allocation date
Grant date
Vesting date
Balance at start of year
Granted during
year Vested
in FY226
% of total
Vested
Lapsed/ forfeited
in FY22
% Lapsed/forfeited
in FY22
Balance at end
of year7
Fair value of equity
($)8,9
Current Executive KMP
S Charlton
Performance awards 1 Jul 2018 19 Oct 2018 Aug 2021 316,870 – (135,621) 42.8 (181,249) 57.2 – 2,170,560
Performance awards 1 Jul 2019 17 Oct 2019 Aug 2022 257,502 – – – – – 257,502 2,508,069
Performance awards 1 Jul 2020 22 Oct 2020 Aug 2023 254,594 – – – – – 254,594 1,682,866
Performance awards 1 Jul 2021 28 Oct 2021 Aug 2024 – 126,725 – – – – 128,836 703,324
Performance awards 1 Jul 2021 28 Oct 2021 Aug 2025 – 130,946 – – – – 128,835 777,819
Total performance awards 828,966 257,671 (135,621) 42.8 (181,249) 57.2 769,767 7,831,022
Deferred securities 11 Oct 2019 2 Sep 2019 Aug 2021 79,006 – (79,006) 100 – – - 1,180,475
Deferred securities 15 Oct 2020 2 Sep 2020 Aug 2022 42,660 – – – – – 42,660 575,000
Deferred securities 15 Oct 2021 4 Oct 2021 Aug 2023 – 95,967 – – – – 95,967 1,343,200
Total deferred securities 121,666 95,967 (79,006) 100 – – 138,627 3,098,675
H Byrne
Performance awards 1 Jul 2018 22 Aug 2018 Aug 2021 42,362 – (18,131) 42.8 (24,231) 57.2 – 314,961
Performance awards 1 Jul 2019 17 Oct 2019 Aug 2022 37,179 – – – – – 37,179 362,123
Performance awards 1 Jul 2020 22 Oct 2020 Aug 2023 43,675 – – – – – 43,675 288,692
Performance awards 1 Jul 2021 4 Oct 2021 Aug 2024 – 24,438 – – – – 24,438 160,313
Performance awards 1 Jul 2021 4 Oct 2021 Aug 2025 – 25,252 – – – – 25,252 173,229
Total performance awards 123,216 49,690 (18,131) 42.8 (24,231) 57.2 130,544 1,299,318
Deferred securities 11 Oct 2019 2 Sep 2019 Aug 2021 14,954 – (14,954) 100 – – – 223,430
Deferred securities 15 Oct 2020 2 Sep 2020 Aug 2022 10,967 – – – – – 10,967 147,810
Deferred securities 15 Oct 2021 4 Oct 2021 Aug 2023 – 18,241 – – – – 18,241 255,310
Total deferred securities 25,921 18,241 (14,954) 100 – – 29,208 626,550
M Huey
Performance awards 1 Jul 2018 22 Aug 2018 Aug 2021 48,735 – (20,859) 42.8 (27,876) 57.2 – 362,345
Performance awards 1 Jul 2019 17 Oct 2019 Aug 2022 42,773 – – – – – 42,773 416,609
Performance awards 1 Jul 2020 22 Oct 2020 Aug 2023 43,675 – – – – – 43,675 288,692
Performance awards 1 Jul 2021 4 Oct 2021 Aug 2024 – 24,438 – – – – 24,438 160,313
Performance awards 1 Jul 2021 4 Oct 2021 Aug 2025 – 25,252 – – – – 25,252 173,229
Total performance awards 135,183 49,690 (20,859) 42.8 (27,876) 57.2 136,138 1,401,188
Deferred securities 11 Oct 2019 2 Sep 2019 Aug 2021 9,476 – (9,476) 100 – – – 141,580
Deferred securities 15 Oct 2020 2 Sep 2020 Aug 2022 12,570 – – – – – 12,570 169,425
Deferred securities 15 Oct 2021 4 Oct 2021 Aug 2023 – 20,268 – – – – 20,268 283,675
Total deferred securities 22,046 20,268 (9,476) 100 – – 32,838 594,680
M Jablko3
Performance awards 12 Apr 2021 29 Mar 2021 29 Mar 2022 67,169 – (67,169) 100 – – – 826,589
Performance awards 12 Apr 2021 29 Mar 2021 29 Mar 2023 67,169 – – – – – 67,169 826,589
Performance awards 1 Jul 2021 4 Oct 2021 Aug 2024 – 43,479 – – – – 43,479 285,222
Performance awards 1 Jul 2021 4 Oct 2021 Aug 2025 – 44,927 – – – – 44,927 308,199
Total performance awards 134,338 88,406 (67,169) 100 – – 155,575 2,246,599
Deferred securities 15 Oct 2021 4 Oct 2021 Aug 2023 – 8,352 – – – 8,352 116,890
Total deferred securities – 8,352 – – – 8,352 116,890
Footnote references appear on page 116.
Corporate Report for the year ended 30 June 2022
Governance and risk
Financial statements
Security holder information
Sustainability supplement
Business performance
Introduction and overview
Directors’ report
Remuneration report

116
1 Additional information regarding the prior year incentive awards that are on foot, can be found in the Remuneration Report of the relevant year in which the grant was made2 Performance awards granted prior to December 2019 expire 7 years from the date of allocation and Performance awards granted after December 2019 have an expiry of 15 years from the
date of allocation. Deferred securities do not have an expiry date3 Michelle Jablko was granted 134,338 performance awards as a one-off grant in recognition of her giving up equity awards with her former employer to join Transurban. This was not a
sign-on award and only represented a portion of the value of unvested STI equity Michelle forfeited on resignation from her former employer, with no consideration for any unvested LTI. The one-off grant is subject to Michelle’s continued employment with Transurban and will vest in two equal tranches of 67,169 awards on the first and second anniversary of her commencement with Transurban. Each performance award is an entitlement to receive one fully paid Transurban security on vesting. The fair value was calculated using a Black-Scholes framework to model Transurban’s security price. On the grant date, each performance award had a market value of $12.95. The first tranche of performance awards vested in full on 29 March 2022
4 Simon Moorfield was granted 51,205 performance awards under the FY21 LTI Plan and 10,200 performance awards as a one-off grant in recognition of him giving up equity awards with his former employer to join Transurban. This was not a sign-on award and only represented a portion of the value of unvested STI equity Simon forfeited on resignation from his former employer, with no consideration for any unvested LTI. The one-off grant is subject to Simon’s continued employment with Transurban and will vest in two equal tranches of 5,100 awards on the first and second anniversaries of his commencement with Transurban. Each performance award is an entitlement to receive one fully paid Transurban security on vesting. The fair value was calculated using a Black-Scholes framework to model Transurban’s security price. On the grant date, each performance award had a market value of $14.22. The first tranche of performance awards vested in full on 5 October 2021
5 Hugh Wehby was granted 66,266 performance awards under the FY21 LTI Plan and 17,370 performance awards as a one-off grant in recognition of him giving up deferred awards with his former employer to join Transurban. This was not a sign-on award and only represented a portion of the value of unvested STI equity Hugh forfeited on resignation from his former employer, with no consideration for any unvested LTI. The one-off grant is subject to Hugh’s continued employment with Transurban and will vest in two equal tranches of 8,685 awards on the first and second anniversaries of his commencement with Transurban. Each performance award is an entitlement to receive one fully paid Transurban security on vesting. The fair value was calculated using a Black-Scholes framework to model Transurban’s security price. On the grant date, each performance award had a market value of $13.88. The first tranche of performance awards vested in full on 19 October 2021
6 Performance awards granted in FY19 vested during FY22 on 20 August 2021 at the end of the three-year performance period in accordance with performance outcomes (market value at vesting was $13.91). Performance awards that vest are automatically exercised. Securities granted as FY19 deferred STI awards vested during FY22 on 11 August 2021 at the end of the two-year restriction period. Vesting date and exercise date are the same
7 No closely related parties of Executive KMP held any performance awards or deferred securities during FY228 Fair value at grant date for performance awards. Deferred securities represent the fair value of the STI deferred component9 In accordance with the requirements of AASB 2 Share-based Payment, the fair value of performance awards as at their date of grant has been independently determined. The fair value of
the performance awards with a TSR performance measure has been valued applying a Monte Carlo simulation (using a Black-Scholes framework) to model Transurban’s security price and the TSR performance against the comparator group’s TSR performance. The fair value of performance awards with a FCF performance measure (grants made prior to October 2020) has been determined by reference to Transurban’s security price at the grant date discounted for dividends and distributions forgone throughout the performance period. The amount included is not related to or indicative of the benefit (if any) that individual executives may ultimately realise should these equity instruments vest
Type of equity1,2Allocation date
Grant date
Vesting date
Balance at start of year
Granted during
year Vested
in FY226
% of total
Vested
Lapsed/ forfeited
in FY22
% Lapsed/forfeited
in FY22
Balance at end
of year7
Fair value of equity
($)8,9
Current Executive KMP
S Johnson
Performance awards 1 Jul 2018 22 Aug 2018 Aug 2021 52,484 – (22,464) 42.8 (30,020) 57.2 – 390,219
Performance awards 1 Jul 2019 17 Oct 2019 Aug 2022 44,357 – – – – – 44,357 432,037
Performance awards 1 Jul 2020 22 Oct 2020 Aug 2023 43,856 – – – – – 43,856 289,888
Performance awards 1 Jul 2021 4 Oct 2021 Aug 2024 – 24,438 – – – – 24,438 160,313
Performance awards 1 Jul 2021 4 Oct 2021 Aug 2025 – 25,252 – – – – 25,252 173,229
Total performance awards 140,697 49,690 (22,464) 42.8 (30,020) 57.2 137,903 1,445,686
Deferred securities 11 Oct 2019 2 Sep 2019 Aug 2021 15,305 – (15,305) 100 – – 228,675
Deferred securities 15 Oct 2020 2 Sep 2020 Aug 2022 16,657 – – – – 16,657 224,505
Deferred securities 15 Oct 2021 1 Sep 2021 Aug 2023 – 20,352 – – – 20,352 284,850
Total deferred securities 31,962 20,352 (15,305) 100 - - 37,009 738,030
S Moorfield4
Performance awards 1 Jul 2020 22 Oct 2020 Aug 2023 51,205 – – – – – 51,205 338,465
Performance awards 26 Oct 2020 5 Oct 2020 5 Oct 21 5,100 – (5,100) 100 – – – 68,916
Performance awards 26 Oct 2020 5 Oct 2020 5 Oct 22 5,100 – – – – – 5,100 68,916
Performance awards 1 Jul 2021 4 Oct 2021 Aug 2024 – 25,488 – – – – 25,488 167,201
Performance awards 1 Jul 2021 4 Oct 2021 Aug 2025 – 26,337 – – – – 26,337 180,672
Total performance awards 61,405 51,825 (5,100) 100 – – 108,130 824,170
Deferred securities 15 Oct 2021 1 Sep 2021 Aug 2023 – 14,010 – – – – 14,010 196,090
Total deferred securities – 14,010 – – – – 14,010 196,090
H Wehby5
Performance awards 19 Oct 2020 22 Oct 2020 Aug 2023 66,266 – – – – 66,266 438,018
Performance awards 26 Oct 2020 19 Oct 2020 19 Oct 21 8,685 – (8,685) 100 – – 114,554
Performance awards 26 Oct 2020 19 Oct 2020 19 Oct 22 8,685 – – – – 8,685 114,554
Performance awards 1 Jul 2021 4 Oct 2021 Aug 2024 – 32,984 – – – 32,984 216,375
Performance awards 1 Jul 2021 4 Oct 2021 Aug 2025 – 34,083 – – – 34,083 233,809
Total performance awards 83,636 67,067 (8,685) 100 – 142,018 1,117,310
Deferred securities 15 Oct 2021 1 Sep 2021 Aug 2023 – 17,187 – – – 17,187 240,555
Total deferred securities – 17,187 – – – 17,187 240,555
Summary of Executive KMP allocated, vested or lapsed equity (continued)
Corporate Report for the year ended 30 June 2022
Governance and risk
Financial statements
Security holder information
Sustainability supplement
Business performance
Introduction and overview
Directors’ report
Remuneration report

117
Executive KMP remuneration
Short-term employee benefits
Post-employment
benefitsLong-term
benefits Share-based benefits8, 9
Cash salary and fees4 Cash STI5
Non-monetary benefits6
Superannua-tion
Long service leave
Deferred STI7
LTI Awards Total
Current Executive KMP
S Charlton
2022 2,276,432 490,500 6,466 23,568 44,291 802,900 702,072 4,346,228
2021 2,278,306 1,343,200 6,466 21,694 44,125 1,032,892 787,301 5,513,984
H Byrne
2022 791,432 186,300 4,103 23,568 38,855 196,473 150,060 1,390,792
2021 703,306 255,310 4,103 21,694 13,476 208,850 126,347 1,333,086
M Huey
2022 770,447 214,250 3,932 23,568 41,710 222,450 144,827 1,421,184
2021 703,306 283,675 3,932 21,694 26,558 198,227 134,244 1,371,636
M Jablko1
2022 1,426,432 328,150 2,975 23,568 – 148,347 1,325,260 3,254,732
2021 372,601 116,890 766 5,424 – 38,963 356,250 890,894
S Johnson
2022 791,432 163,950 4,080 23,568 (7,301) 224,435 143,790 1,343,954
2021 706,306 284,850 4,080 21,694 10,340 246,010 135,139 1,408,419
S Moorfield2
2022 823,152 251,400 2,267 23,568 – 149,163 264,027 1,513,578
2021 605,093 196,090 1,671 16,271 – 65,363 86,006 970,494
H Wehby3
2022 1,076,432 221,300 2,597 23,568 – 153,952 365,120 1,842,969
2021 759,715 240,555 1,815 16,271 – 80,185 146,457 1,244,998
Total
2022 7,955,760 1,855,850 26,420 164,976 117,555 1,897,720 3,095,156 15,113,437
2021 6,128,633 2,720,570 22,833 124,742 94,499 1,870,490 1,771,744 12,733,511
1 2021: Michelle Jablko commenced as a KMP on 29 March 2021 and the period of reporting is from that date2 2021: Simon Moorfield commenced as a KMP on 5 October 2020 and the period of reporting is from that date3 2021: Hugh Wehby commenced as a KMP on 19 October 2020 and the period of reporting is from that date4 Cash salary and fees does not include unpaid leave taken during the year5 The amount represents the cash STI payment to the Executive KMP for FY22, which will be paid in September 2022. FY21: cash component of STI paid in September 20216 Non-monetary benefits include Group employee insurance7 A component of STI award is deferred into Transurban stapled securities. In accordance with accounting standards, the deferred component is recognised over the three-year service period 8 In accordance with the requirements of the accounting standards, remuneration includes a proportion of the fair value of equity compensation granted or outstanding during the year (i.e.
performance awards under the LTI plan). The fair value of the awards is determined as at the grant date and is progressively allocated over the performance period. The amount included, as remuneration may be different to the benefit (if any) that the KMP may ultimately realise should the awards vest. The fair value of performance awards with a TSR performance measure has been determined by applying a Monte Carlo simulation (using a Black-Scholes framework) to model Transurban’s security price and the TSR performance against the comparator group performance. The fair value of performance awards with a FCF performance measure has been determined by reference to Transurban’s security price at the grant date discounted for dividends and distributions forgone throughout the performance period. As the FCF performance measure is a non-market performance condition, amounts recognised are adjusted based on the best available estimate of the number of equity instruments expected to vest
9 The value for share-based benefits for Michelle Jablko, Simon Moorfield and Hugh Wehby include their one-off grants of performance awards as detailed on pages 115 to 116
Corporate Report for the year ended 30 June 2022
Governance and risk
Financial statements
Security holder information
Sustainability supplement
Business performance
Introduction and overview
Directors’ report
Remuneration report

118
Remuneration paid to Non-executive Directors
Short-term benefits
Post-employment
benefitsFees Superannuation1 Total
Current Non-executive Directors
L Maxsted2022 576,432 23,568 600,0002021 578,306 21,694 600,000
M Birrell2022 209,091 20,909 230,0002021 210,046 19,954 230,000
T Bowen2022 224,874 22,487 247,3612021 206,241 19,593 225,834
P Cross2
2022 202,686 20,269 222,955
C Drummond2
2022 206,767 20,677 227,443
M Go3
2022 108,712 10,871 119,583
T Reed4
2022 202,686 20,269 222,9552021 124,810 11,857 136,667
P Scott2022 209,091 20,909 230,0002021 210,046 19,954 230,000
R Whitfield5
2022 239,866 23,068 262,9342021 124,810 11,857 136,667
J Wilson2022 204,545 20,455 225,0002021 205,479 19,521 225,000
Former Non-executive Directors6
N Chatfield 2022 77,824 7,389 85,2132021 268,277 0 268,277
S Mostyn2022 70,346 7,035 77,381 2021 228,311 21,689 250,000
Total2022 2,532,920 217,904 2,750,8247
2021 2,156,326 146,119 2,302,445
1 Superannuation contributions made on behalf of Non-executive Directors to satisfy Transurban’s obligations under applicable superannuation guarantee legislation. Excludes Australian Taxation Office approved exemptions
2 Patricia Cross and Craig Drummond commenced as Non-executive Directors on 1 July 2021 and the period reported is from that date
3 Marina Go commenced as a Non-executive Director on 1 December 2021 and the period reported is from that date
4 2021: Tim Reed commenced as a Non-executive Director on 1 November 2020 and the period reported is from that date
5 2021: Rob Whitfield commenced as a Non-executive Director on 1 November 2020 and the period reported is from that date
6 Neil Chatfield and Samantha Mostyn ceased to be Non-executive Directors on 21 October 2021 and their remuneration reported is until that date
7 The current maximum aggregate amount approved by security holders to be paid as remuneration to Non-executive Directors is $3,000,000 per year, inclusive of superannuation contributions. The total remuneration paid to Non-executive Directors in FY22 represents approximately 92% (FY21: approximately 77%) of this approved maximum aggregate amount
Securities held by Non-executive Directors as at 30 June 2022 and at the date of this Report
Balance at start of year
Changes during year
Balance at end of year8,9
Current Non-executive Directors
L Maxsted 90,307 10,035 100,342
M Birrell 12,263 2,737 15,000
T Bowen 40,221 4,470 44,691
P Cross 30,896 3,433 34,329
C Drummond – 40,451 40,451
M Go 3,400 7,938 11,338
T Reed – 22,500 22,500
P Scott 31,307 4,394 35,701
R Whitfield 10,000 16,112 26,112
J Wilson 20,000 2,223 22,223
Former Non-executive Directors
N Chatfield 65,867 – N/A
S Mostyn 28,196 – N/A
8 Balance at the date of this Report is the same as the balance at the end of FY229 As at 30 June 2022, all of the securities held by Lindsay Maxsted, Mark Birrell, Terence
Bowen, Patricia Cross and Peter Scott were held nominally, and 7,900 of the securities held by Marina Go were held nominally
Corporate Report for the year ended 30 June 2022
Governance and risk
Financial statements
Security holder information
Sustainability supplement
Business performance
Introduction and overview
Directors’ report
Remuneration report

119
Auditor’s Independence Declaration
PricewaterhouseCoopers, ABN 52 780 433 757 2 Riverside Quay, SOUTHBANK VIC 3006, GPO Box 1331, MELBOURNE VIC 3001T: 61 3 8603 1000, F: 61 3 8603 1999, www.pwc.com.au
Liability limited by a scheme approved under Professional Standards Legislation.
Auditor’s Independence Declaration
As lead auditor for the audit of Transurban Holdings Limited, Transurban Holding Trust and Transurban International Limited for the year ended 30 June 2022, I declare that to the best of my knowledge and belief, there have been:
(a) no contraventions of the auditor independence requirements of the Corporations Act 2001 inrelation to the audit; and
(b) no contraventions of any applicable code of professional conduct in relation to the audit.
This declaration is in respect of Transurban Holdings Limited, Transurban Holding Trust and Transurban International Limited and the entities they controlled during the period.
Marcus Laithwaite Melbourne Partner PricewaterhouseCoopers
18 August 2022
Corporate Report for the year ended 30 June 2022
Governance and risk
Financial statements
Security holder information
Sustainability supplement
Business performance
Introduction and overview
Directors’ report
Remuneration report
Page 8 reference destination: Audit information (RR)
PricewaterhouseCoopers, ABN 52 780 433 757 2 Riverside Quay, SOUTHBANK VIC 3006, GPO Box 1331, MELBOURNE VIC 3001 T: 61 3 8603 1000, F: 61 3 8603 1999, www.pwc.com.au
Liability limited by a scheme approved under Professional Standards Legislation.

120
Financial statements
Governance and risk
Security holder information
Sustainability supplement
Business performance
Remuneration report
Introduction and overview
Directors’ report
Financial statements
Corporate Report for the year ended 30 June 2022

121
Contents122 Section A: Group financial statements
Consolidated statement of comprehensive income
Consolidated balance sheet
Consolidated statement of changes in equity
Consolidated statement of cash flows
128 Section B: Notes to the Group financial statements
Basis of preparation and significant changes
B1Corporate information
B2Summary of significant changes in the current reporting period
B3Basis of preparation
Operating performance
B4Segment information
B5Revenue
B6Significant items
B7Income tax
B8Working capital
Security holder outcomes
B9Earnings per stapled security
B10Dividends/distributions and free cash
Capital and borrowings
B11Contributed equity
B12Reserves
B13Net finance costs
B14Borrowings
B15Derivatives and financial risk management
Concession summary
B16Goodwill
B17Other intangible assets
B18Concession financial asset
B19Maintenance provision
B20Construction obligation liability
B21Other liabilities― concession and State loan liabilities
Group structure
B22Principles of consolidation
B23Material subsidiaries
B24Business combinations and changes in ownership interests
B25Equity accounted investments
B26Non-controlling interests―other
B27Deed of cross and intra-group guarantees
Items not recognised
B28Contingencies
B29Commitments
B30Subsequent events
Other
B31Leases
B32Related party transactions
B33Key management personnel compensation
B34Remuneration of auditors
B35Parent entity disclosures
189 Section C: Transurban Holding Trust (THT) and Transurban International Limited (TIL) financial statements
Consolidated statements of comprehensive income
Consolidated balance sheets
Consolidated statements of changes in equity
Consolidated statements of cash flows
198 Section D: Notes to the THT and TIL financial statements
215 Section E: Signed reports
Directors’ declaration
Independent auditor’s report to the stapled security holders
121
Governance and risk
Security holder information
Sustainability supplement
Business performance
Introduction and overview
Directors’ report
Corporate Report for the year ended 30 June 2022
Remuneration report
Financial statements

122
Section A: Group financial statements for the year ended 30 June 2022
Section A: Group financial statementsTransurban Holdings LimitedConsolidated statement of comprehensive income for the year ended 30 June 2022
2022 2021
Note $M $M
Continuing operations
Revenue B5 3,406 2,886
Expenses
Employee benefits expense (315) (280)
Road operating costs (343) (328)
Construction costs (911) (480)
Transaction and integration costs (13) (5)
Corporate and other expenses (143) (102)
Total expenses (1,725) (1,195)
Earnings before depreciation, amortisation, net finance costs, equity accounted investments and income taxes 1,681 1,691
Amortisation (996) (1,017)
Depreciation (111) (123)
Total depreciation and amortisation (1,107) (1,140)
Net finance costs B13 (466) (870)
Share of loss of equity accounted investments B25 (368) (161)
Loss before income tax (260) (480)
Income tax benefit B7 276 193
Profit/(loss) for the year from continuing operations 16 (287)
Discontinued operations
Profit for the year from discontinued operations B24 — 3,559
Profit for the year from continuing and discontinued operations 16 3,272
Profit/(loss) attributable to:
Ordinary security holders of the stapled group
— Attributable to Transurban Holdings Limited (THL) (641) (356)
— Attributable to THT/TIL 660 3,659
Profit attributable to ordinary security holders of the stapled group B9 19 3,303
Non-controlling interests—other B26 (3) (31)
Profit for the year 16 3,272
Other comprehensive income
Gains reclassified on disposal of subsidiary, net of tax — (198)
Items that may be reclassified to profit and loss in the future
Changes in the fair value of cash flow hedges, net of tax 698 149
Changes in the fair value of cost of hedging, net of tax 9 4
Share of other comprehensive income of equity accounted investments, net of tax B25 245 74
Exchange differences on translation of North American operations, net of tax 188 97
Other comprehensive income for the year, net of tax 1,140 126
Total comprehensive income for the year 1,156 3,398
Total comprehensive income/(loss) for the year is attributable to:
Ordinary security holders of the stapled group
— Attributable to THL (442) (327)
— Attributable to THT/TIL 1,519 3,761
Non-controlling interests—other 79 (36)
Total comprehensive income for the year 1,156 3,398 Cents Cents
Earnings from continuing operations per security attributable to ordinary security holders of the stapled group B9 0.6 (9.4)
Earnings per security attributable to ordinary security holders of the stapled group B9 0.6 120.6
Section A: Group financial statements for the year ended 30 June 2022
The above consolidated statement of comprehensive income should be read in conjunction with the accompanying notes.122
Governance and risk
Security holder information
Sustainability supplement
Business performance
Introduction and overview
Directors’ report
Corporate Report for the year ended 30 June 2022
Remuneration report
Financial statements

123
Section A: Group financial statements for the year ended 30 June 2022
Transurban Holdings LimitedConsolidated balance sheet as at 30 June 2022
2022 2021
Note $M $M
Assets
Current assets
Cash and cash equivalents B8 2,020 4,285
Current tax assets 10 —
Trade and other receivables B8 347 572
Derivative financial instruments B15 22 —
Total current assets 2,399 4,857
Non-current assets
Equity accounted investments B25 10,524 5,751
Trade and other receivables 3 194
Financial assets at amortised cost B32 1,997 1,353
Derivative financial instruments B15 1,012 145
Property, plant and equipment 557 567
Concession financial asset B18 339 330
Deferred tax assets B7 915 831
Goodwill B16 466 466
Other intangible assets B17 20,753 21,177
Total non-current assets 36,566 30,814
Total assets 38,965 35,671
Liabilities
Current liabilities
Trade and other payables B8 463 397
Current tax liabilities 6 182
Borrowings B14 1,063 750
Derivative financial instruments B15 50 2
Maintenance provision B19 147 144
Distribution provision B10 837 627
Other provisions 79 83
Construction obligation liability B20 432 579
Other liabilities 417 300
Total current liabilities 3,494 3,064
Non-current liabilities
Borrowings B14 16,580 17,081
Derivative financial instruments B15 176 697
Deferred tax liabilities B7 1,832 1,794
Maintenance provision B19 981 934
Other provisions 7 7
Construction obligation liability B20 364 646
Other liabilities 303 312
Total non-current liabilities 20,243 21,471
Total liabilities 23,737 24,535
Net assets 15,228 11,136
Equity
Contributed equity B11 3,939 2,929
Reserves B12 (258) (457)
Accumulated losses (4,936) (4,234)
Equity attributable to other members of the stapled group (THT/TIL) 15,676 12,097
Equity attributable to security holders of the stapled group 14,421 10,335
Non-controlling interests—other B26 807 801
Total equity 15,228 11,136
Section A: Group financial statements for the year ended 30 June 2022
The above consolidated balance sheet should be read in conjunction with the accompanying notes.123
Governance and risk
Security holder information
Sustainability supplement
Business performance
Introduction and overview
Directors’ report
Corporate Report for the year ended 30 June 2022
Remuneration report
Financial statements

124
Section A: Group financial statements for the year ended 30 June 2022
Transurban Holdings LimitedConsolidated statement of changes in equity for the year ended 30 June 2022
Attributable to security holders of the stapled group
Number of securities
Contributed equity Reserves
Accumulated losses
Equity attributable
to other members—
THT & TIL Total
Non-controlling interests—
otherTotal
equity
M $M $M $M $M $M $M $M
Balance at 1 July 2021 2,738 2,929 (457) (4,234) 12,097 10,335 801 11,136
Comprehensive income/(loss)
Profit/(loss) for the year — — — (641) 660 19 (3) 16
Other comprehensive income — — 199 — 859 1,058 82 1,140
Total comprehensive income/(loss) — — 199 (641) 1,519 1,077 79 1,156 Transactions with owners in their capacity as owners:
Contributions of equity, net of transaction costs1 325 983 — — 3,168 4,151 — 4,151
Employee performance awards issued2 1 2 — — 8 10 — 10
Distributions provided for or paid3 — — — (61) (1,198) (1,259) — (1,259)
Distribution reinvestment plan4 7 25 — — 82 107 — 107
Distributions to non-controlling interests5 — — — — — — (73) (73)
333 1,010 — (61) 2,060 3,009 (73) 2,936
Balance at 30 June 2022 3,071 3,939 (258) (4,936) 15,676 14,421 807 15,228
1. On 13 October 2021, the Group successfully completed the fully underwritten institutional and retail components of its pro-rata accelerated renounceable 1 for 9 entitlement offer. The institutional component raised gross proceeds of $2,898 million at an issue price of $13.00 per security. The retail component raised gross proceeds of $1,068 million at an issue price of $13.00 per security. A further $250 million was raised through a placement to AustralianSuper at an issue price of $13.07 per security. The total gross proceeds of $4,216 million ($4,150 million net of costs and tax) were used to fund the Group’s contribution to the acquisition of the remaining 49% equity stake in WestConnex through Sydney Transport Partners Joint Venture (STP JV), which completed on 29 October 2021.
2. It is the Group's policy that a portion of all Short Term Incentives issued to the CEO and other executives are deferred for a period of 2 years. In addition to the Short Term Incentives, stapled securities (including units in the Trust) were issued to senior executives and other employees under the Group's Long Term Incentive share based payment plans. These securities are held by the employees but will only vest in accordance with the terms of the plans.
3. Refer to Note B10 for further details of dividends and distributions provided for or paid.
4. Under the Distribution Reinvestment Plan (DRP), holders of stapled securities may elect to have all or part of their distribution entitlements satisfied by the issue of new stapled securities rather than by cash. The DRP applied for the final distribution for FY21 and the interim distribution for FY22, paid in August 2021 and February 2022, respectively. The DRP applies for the final FY22 distribution.
5. Distributions and dividends were paid during the year to the non-controlling interest partners in Transurban Queensland.
Section A: Group financial statements for the year ended 30 June 2022
The above consolidated statement of changes in equity should be read in conjunction with the accompanying notes.124
Governance and risk
Security holder information
Sustainability supplement
Business performance
Introduction and overview
Directors’ report
Corporate Report for the year ended 30 June 2022
Remuneration report
Financial statements

125
Section A: Group financial statements for the year ended 30 June 2022
Transurban Holdings LimitedConsolidated statement of changes in equity for the year ended 30 June 2021
Attributable to security holders of the stapled group
Number of securities
Contributed equity Reserves
Accumulated losses
Equity attributable
to other members—
THT & TIL Total
Non-controlling interests—
otherTotal
equity
M $M $M $M $M $M $M $M
Balance at 1 July 2020 2,735 2,919 (491) (3,851) 9,281 7,858 927 8,785
Comprehensive (loss)/income
Profit/(loss) for the year — — — (356) 3,659 3,303 (31) 3,272
Other comprehensive income/(loss) — — 29 — 102 131 (5) 126
Total comprehensive income/(loss) — — 29 (356) 3,761 3,434 (36) 3,398 Transactions with owners in their capacity as owners:
Employee performance awards issued1 1 2 (1) — 5 6 — 6
Distributions provided for or paid2 — — — (27) (972) (999) — (999)
Distribution reinvestment plan3 2 8 — — 22 30 — 30
Distributions to non-controlling interests4 — — — — — — (90) (90)
Transactions with non-controlling interests—other5 — — 6 — — 6 — 6
3 10 5 (27) (945) (957) (90) (1,047)
Balance at 30 June 2021 2,738 2,929 (457) (4,234) 12,097 10,335 801 11,136
1. It is the Group's policy that a portion of all Short Term Incentives issued to the CEO and other executives are deferred for a period of 2 years. In addition to the Short Term Incentives, stapled securities (including units in the Trust) were issued to senior executives and other employees under the Group's Long Term Incentive share based payment plans. These securities are held by the employees but will only vest in accordance with the terms of the plans.
2. Refer to Note B10 for further details of dividends and distributions provided for or paid.
3. Under the Distribution Reinvestment Plan (DRP), holders of stapled securities may elect to have all or part of their distribution entitlements satisfied by the issue of new stapled securities rather than by cash. The DRP applied for the final distribution for FY20 and the interim distribution for FY21, paid in August 2020 and February 2021, respectively.
4. Distributions and dividends were paid during the year to the non-controlling interest partners in the Eastern Distributor, Transurban Queensland and the M5 West.
5. Stamp duty adjustment relating to the acquisition of the remaining 34.62% interest of M5 West on 30 October 2019.
Section A: Group financial statements for the year ended 30 June 2022
The above consolidated statement of changes in equity should be read in conjunction with the accompanying notes.125
Governance and risk
Security holder information
Sustainability supplement
Business performance
Introduction and overview
Directors’ report
Corporate Report for the year ended 30 June 2022
Remuneration report
Financial statements

126
Section A: Group financial statements for the year ended 30 June 2022
Transurban Holdings LimitedConsolidated statement of cash flows for the year ended 30 June 2022
2022 2021
Note $M $M
Cash flows from operating activities
Receipts from customers 2,540 2,529
Payments to suppliers and employees (952) (883)
Payments for maintenance of intangible assets (97) (88)
Transaction and integration costs (13) (30)
Other cash receipts 220 166
Interest received 13 13
Interest paid (700) (800)
Income taxes paid (29) (14)
Net cash inflow from operating activities (a) 982 893
Cash flows from investing activities
Payments for financial assets at amortised cost (716) (29)
Repayment of financial assets at amortised cost 215 61
Capital contribution to equity accounted investments (5,132) (115)
Payments for intangible assets (517) (926)
Payments for property, plant and equipment (96) (119)
Distributions received from equity accounted investments 492 446
Proceeds from disposal of subsidiaries, net of cash disposed B24 — 2,343
Income taxes paid related to the disposal of subsidiaries B24 (178) —
Net cash (outflow)/inflow from investing activities (5,932) 1,661
Cash flows from financing activities
Proceeds from equity issues of stapled securities (net of costs) 4,143 —
Proceeds from borrowings (net of costs) (b) 811 2,864
Net proceeds from loan facilities (b) 165 74
Principal repayment of leases B31 (10) (10)
Repayment of borrowings (b) (1,443) (2,596)
Dividends and distributions paid to the Group's security holders B10 (942) (818)
Distributions paid to non-controlling interests B10 (73) (90)
Net cash inflow/(outflow) from financing activities 2,651 (576)
Net (decrease)/increase in cash and cash equivalents (2,299) 1,978
Cash and cash equivalents at the beginning of the year 4,285 2,349
Effects of exchange rate changes on cash and cash equivalents 34 (42)
Cash and cash equivalents at end of the year B8 2,020 4,285
Refer to Note B24 for cash flows from discontinued operations.
(a) Reconciliation of profit/(loss) after income tax to net cash inflow from operating activities
Profit for the year from continuing and discontinued operations 16 3,272
Depreciation and amortisation 1,107 1,161
Gain on disposal of interest in Transurban Chesapeake (TC) — (3,751)
Non-cash employee benefit expense—share based payments 8 6
Non-cash net finance (income)/costs (238) 241
Share of loss of equity accounted investments B25 368 161
Non-cash road operating costs—Power Purchase Agreements1 B15 (14) —
Change in operating assets and liabilities:
Increase in trade and other receivables (11) (66)
Increase in concession and promissory note liability 7 32
Increase in operating creditors and accruals 24 11
Decrease in other operating provisions (30) (8)
Movement in deferred and current taxes (305) (227)
Increase in maintenance provision 50 61
Net cash inflow from operating activities 982 893
1. Relates to fair value movements in the Group's 'contract for difference' derivative financial instruments relating to its Power Purchase Agreements, which are recorded on the balance sheet at their fair values with movements recorded in the profit and loss (refer to Note B15).
Section A: Group financial statements for the year ended 30 June 2022
The above consolidated statement of cash flows should be read in conjunction with the accompanying notes.126
Governance and risk
Security holder information
Sustainability supplement
Business performance
Introduction and overview
Directors’ report
Corporate Report for the year ended 30 June 2022
Remuneration report
Financial statements

127
Section A: Group financial statements for the year ended 30 June 2022
Transurban Holdings LimitedConsolidated statement of cash flows for the year ended 30 June 2022 (continued)
(b) Reconciliation of liabilities arising from financing activities
Borrowings current
Borrowings non-current
Debt principal
related derivatives
(included in assets /
liabilities)1
Other Loan Facilities
(included in other
liabilities)
Total debt related
financial instruments
$M $M $M $M $M
Balance at 1 July 2021 750 17,081 (856) 81 17,056
Proceeds from borrowings (net of costs) 68 743 — — 811
Repayment of borrowings (783) (660) — — (1,443)
Proceeds from other loan facilities — — — 281 281
Repayment of other loan facilities — — — (116) (116)
Total cash flows (715) 83 — 165 (467)
Non-cash changes
Foreign exchange movements 32 393 (552) — (127)
Transfer 996 (996) — — —
Amortisation of borrowing costs — 19 — — 19
West Gate Tunnel settlement adjustments2 — — — (39) (39)
Total non-cash changes 1,028 (584) (552) (39) (147)
Balance at 30 June 2022 1,063 16,580 (1,408) 207 16,442
1. Total derivatives balance as at 30 June 2022 is an asset of $808 million. The difference in carrying value to the table above relates to interest rate swap contracts, forward exchange contracts, the interest portion of cross-currency interest rate swap contracts and credit valuation and debit valuation adjustments which are excluded from the balances above as they do not relate to financing activities.
2. The net amount of $39 million predominantly relates to advance payments initially funded by the State of Victoria and paid by Transurban to the West Gate Tunnel Design & Construct (D&C) Subcontractor in the prior year which were offset against the State Loan during the current financial year, as part of the West Gate Tunnel settlement finalised on 23 March 2022 (refer to Note B8).
Borrowings current
Borrowings non-current
Debt principal
related derivatives
(included in assets /
liabilities)1
Other Loan Facilities
(included in other
liabilities)
Total debt related
financial instruments
$M $M $M $M $M
Balance at 1 July 2020 1,553 19,525 (1,436) 7 19,649
Proceeds from borrowings (net of costs) 400 2,403 61 — 2,864
Repayment of borrowings (1,993) (490) (113) — (2,596)
Proceeds from other loan facilities — — — 120 120
Repayment of other loan facilities — — — (46) (46)
Total cash flows (1,593) 1,913 (52) 74 342
Non-cash changes
Disposals through loss of control of subsidiary2 — (2,598) — — (2,598)
Foreign exchange movements 40 (1,047) 632 — (375)
Transfer 750 (750) — — —
Capitalised interest — 21 — — 21
Amortisation of borrowing costs — 26 — — 26
Non substantial modification gain — (9) — — (9)
Total non-cash changes 790 (4,357) 632 — (2,935)
Balance at 30 June 2021 750 17,081 (856) 81 17,056
1. Total derivatives balance as at 30 June 2021 is a liability of $554 million. The difference in carrying value to the table above relates to interest rate swap contracts, forward exchange contracts, the interest portion of cross-currency interest rate swap contracts and credit valuation and debit valuation adjustments which are excluded from the balances above as they do not relate to financing activities.
2. Relates to the deconsolidation of the Group's ownership interest in TC upon divestment of 50% ownership interest (refer to Note B24).
Section A: Group financial statements for the year ended 30 June 2022
The above consolidated statement of cash flows should be read in conjunction with the accompanying notes.127
Governance and risk
Security holder information
Sustainability supplement
Business performance
Introduction and overview
Directors’ report
Corporate Report for the year ended 30 June 2022
Remuneration report
Financial statements

Pages 25 & 53 reference destination: See Financial Statements B2
128
Section B: Notes to the Group financial statements for the year ended 30 June 2022
Section B: Notes to the Group financial statements
Basis of preparation and significant changes
B1 Corporate informationTransurban Holdings Limited (the Company, the Parent or THL) is a Company incorporated in Australia and limited by shares that are publicly traded on the Australian Securities Exchange. These financial statements have been prepared as a consolidation of the financial statements of THL and its controlled entities (Transurban, Transurban Holdings Limited Group, Transurban Group or the Group). The controlled entities of THL include the other members of the stapled group being Transurban Infrastructure Management Limited (TIML) as the responsible entity of Transurban Holding Trust and its controlled entities (THT) and Transurban International Limited and its controlled entities (TIL). The equity securities of THL, TIL and THT are stapled and cannot be traded separately. The Group is a for-profit entity. Entities within the Group are domiciled and incorporated in Australia, the United States of America and Canada.
The consolidated financial statements of the Transurban Group for the year ended 30 June 2022 were authorised for issue in accordance with a resolution of the Directors on 18 August 2022. Directors have the power to amend and reissue the financial statements.
B2 Summary of significant changes in the current reporting periodThe financial position and performance of the Group was particularly affected by the following transactions and events during the reporting period:
Coronavirus global pandemic (COVID-19)COVID-19 has continued to impact the Group’s operating performance, particularly traffic volumes and consequently toll revenue. In Sydney, impacts were as a result of comparatively more severe government mandated restrictions on movement in the first half of the reporting period compared to the prior period. In Melbourne, government mandated restrictions applied for part of the reporting period, however, the restrictions were less severe compared to the prior period. Traffic improved in the second half of the financial year. In the last quarter of FY22, traffic exceeded pre-pandemic levels. Traffic in each of Transurban’s markets continues to be sensitive to government responses to COVID-19, to behavioural aspects related to COVID-19 and to economic conditions. Despite the impact on traffic volumes and toll revenue, the Group's operations, liquidity and financial position have not been significantly impacted by COVID-19 in the current reporting period.
The Group's concession assets have remained fully operational and investment into networks and major development projects has continued. The Group also successfully raised $1,789 million of debt inclusive of new facilities across bank and debt capital markets during the year ended 30 June 2022 to fund future capital requirements, refinance existing debt and for general corporate purposes.
Group equity issuance and equity injection to Sydney Transport Partners Joint Venture (STP JV)
On 13 October 2021, the Group successfully completed the fully underwritten institutional and retail components of its pro-rata accelerated renounceable 1 for 9 entitlement offer. The institutional component raised gross proceeds of $2,898 million at an issue price of $13.00 per security. The retail component raised gross proceeds of $1,068 million at an issue price of $13.00 per security. A further $250 million was raised through a placement to AustralianSuper at an issue price of $13.07 per security. The total gross proceeds of $4,216 million ($4,150 million net of costs and tax) were used to fund the Group’s contribution to the acquisition of the remaining 49% equity stake in WestConnex by the STP JV, which was completed on 29 October 2021.
To fund the acquisition, the Group contributed $4,856 million of equity to the STP JV and also issued shareholder loan notes with a face value of $699 million. The Group’s equity interest in STP JV remains at 50%. The Group’s proportional equity interest in WestConnex through its equity investment in STP JV increased from 25.5% to 50% on 29 October 2021. Refer to Note B25 for further information.
Final agreement reached on revised terms for the delivery of the West Gate Tunnel Project
On 16 December 2021, the Group reached agreement with the State of Victoria (the State) and the D&C Subcontractor on revised terms for the delivery of the West Gate Tunnel Project, including a new expected completion date of late 2025. The parties finalised binding detailed documentation for the settlement on 23 March 2022. The total cost of the D&C Subcontract has been increased by $3,440 million (Contract Sum Adjustment), with Transurban and the State each contributing $1,720 million. Transurban is expected to incur additional net project related costs of approximately $300 million including the Group's share of site activation and insurance costs as well as Transurban's direct project management costs. Transurban's future revenues will be impacted due to the later completion date in late 2025. There have been no changes to concession rights or tolling arrangements as a result of the settlement. The D&C Subcontractor has provided releases of historic claims that would have otherwise impacted construction costs and time. Transurban has also provided equivalent releases to the State.
Transurban's share of the Contract Sum Adjustment is being accounted for as capital expenditure (increasing the concession intangible asset as the expenditure is incurred) and does not impact Free Cash. Refer to Note B29.
Section B: Notes to the Group financial statements for the year ended 30 June 2022
128
Governance and risk
Security holder information
Sustainability supplement
Business performance
Introduction and overview
Directors’ report
Corporate Report for the year ended 30 June 2022
Remuneration report
Financial statements

Page 8 reference destination: Basis of preparation of our FS
129
Section B: Notes to the Group financial statements for the year ended 30 June 2022
B3 Basis of preparationThe Group financial statements are general purpose financial statements which:
• Have been prepared in accordance with the Corporations Act 2001, Australian Accounting Standards (AAS) and other authoritative pronouncements of the Australian Accounting Standards Board (AASB);
• Have adopted all accounting policies in accordance with AASs and, where a standard permits a choice in accounting policy, the policy adopted by the Group has been disclosed in these financial statements;
• Have applied the option under ASIC Corporations (Stapled Group Reports) Instrument 2015/838 to present the consolidated financial statements in one section (Section A) and all other reporting group members in a separate section (Section C);
• Comply with International Financial Reporting Standards (IFRS) as issued by the International Accounting Standards Board (IASB);
• Have been prepared under the historical cost convention, as modified by the revaluation of other financial assets and liabilities (including derivative financial instruments);
• Are presented in Australian dollars, which is the Group's functional and presentation currency;
• Have been rounded to the nearest million dollars, unless otherwise stated, in accordance with ASIC Corporations (Rounding in Financial/Director's Reports) Instrument 2016/191; and
• Have restated the presentation of comparative amounts, where applicable, to conform to the current period presentation.
Going concern
The financial statements have been prepared on a going concern basis, which assumes the continuity of normal operations, in particular over the next 12 months from the financial statements release date of 18 August 2022. In determining the appropriateness of the going concern basis of preparation, the Directors have considered the uncertainties related to COVID-19 impacts on traffic, near-term interest rates and inflation on the Group’s liquidity and operations.
The Group has assessed cash flow forecasts and its ability to fund THL's net current liability position as at 30 June 2022 of $1,095 million (2021: net current asset position of $1,793 million). Scenario analysis was undertaken, which includes judgement, of reasonably possible changes in traffic volume, near-term interest rates and inflation. This analysis indicates that the Group is expected to be able to continue to operate within available liquidity levels and the terms of its debt facilities, and to fund THL's net current liability position as at 30 June 2022, for the 12 months from the date of this report.
The Group has also forecast that it does not expect to breach any financial covenants within the 12 months from the date of this report. Financial covenant forecasts utilised the same underlying cash flow forecasts as those used in the going concern assessment. Corporate and non-recourse debt financial covenants are calculated on a trailing 12 month basis.
Furthermore, the Directors have also taken the following matters into consideration in forming the view that the Group is a going concern:
• The Group has cash and cash equivalents of $2,020 million as at 30 June 2022;
• The Group has available a total of $2,727 million of undrawn general purpose borrowing facilities across a number of financial providers with a maturity beyond 12 months. Additionally, the Group has a further $63 million of undrawn borrowing facilities to provide funding for the Group's capital projects;
• The Group is expected to have the ability to fund THL's net current liability position through the generation of free cash and the use of undrawn facilities in the 12 months from the date of this report; and
• Payment of future dividends and distributions remains at the discretion of the Board.
Section B: Notes to the Group financial statements for the year ended 30 June 2022
129
Governance and risk
Security holder information
Sustainability supplement
Business performance
Introduction and overview
Directors’ report
Corporate Report for the year ended 30 June 2022
Remuneration report
Financial statements

130
Section B: Notes to the Group financial statements for the year ended 30 June 2022
B3 Basis of preparation (continued)
Foreign currency translation
Transactions and balances
Foreign currency transactions are translated into the functional currency using the exchange rates prevailing at the dates of the transactions. Foreign exchange gains and losses resulting from the settlement of such transactions and from the translation at year end exchange rates of monetary assets and liabilities denominated in foreign currencies are recognised in the profit and loss, except when they are deferred in equity as qualifying cash flow hedges and qualifying net investment hedges or are attributable to part of the net investment in a foreign operation.
Non-monetary items that are measured at fair value in a foreign currency are translated using the exchange rates at the date when the fair value was determined. Translation differences on assets and liabilities carried at fair value are reported as part of the fair value gain or loss. For example, translation differences on non-monetary assets and liabilities such as equities held at fair value through profit and loss are recognised in the profit and loss as part of the fair value gain or loss and translation differences on non-monetary assets such as equities classified as available-for-sale financial assets are recognised in the fair value reserve in equity.
Foreign operations
The results and financial position of all of the Group entities that have a functional currency different from the presentation currency are translated into the presentation currency as follows:
• assets and liabilities are translated at the closing rate at the reporting date;
• income and expenses are translated at average exchange rates throughout the course of the reporting period (unless this is not a reasonable approximation of the cumulative effect of the rates prevailing on the transaction dates, in which case income and expenses are translated at the dates of the transactions); and
• all resulting exchange differences are recognised in other comprehensive income.
On consolidation, exchange differences arising from the translation of any net investment in foreign entities and of borrowings and other financial instruments designated as hedges of such investments, are taken to other comprehensive income.
Section B: Notes to the Group financial statements for the year ended 30 June 2022
130
Governance and risk
Security holder information
Sustainability supplement
Business performance
Introduction and overview
Directors’ report
Corporate Report for the year ended 30 June 2022
Remuneration report
Financial statements

131
Section B: Notes to the Group financial statements for the year ended 30 June 2022
B3 Basis of preparation (continued)
New and amended standards and interpretations
The Group has adopted the following new and amended accounting standards and interpretations which became effective for the annual reporting period commencing 1 July 2021. The Group’s assessment of the impact of these new and amended standards and interpretations is set out below.
Reference Description and impact on the GroupAASB 2020-8Amendments to Australian Accounting Standards—Interest Rate Benchmark Reform—Phase 2
This standard amends AASB 9 Financial Instruments, AASB 16 Leases and AASB 7 Financial Instruments: Disclosures, providing certain relief for hedge accounting and changes to contractual cash flows of financial instruments (including lease liabilities) due to the reform of inter-bank offered rates. The relief enables hedge accounting to continue for certain hedges that might otherwise need to be discontinued once an alternative benchmark interest rate is available. It also allows the recalculation of the carrying amount of a financial instrument using an updated effective interest rate to reflect the change to the benchmark rate for the purpose of discounting the revised contractual cash flows.
Application of this standard has not materially impacted the Group.
AASB 2021-3Amendments to Australian Accounting Standards—COVID-19 Related Rent Concessions beyond 30 June 2021
AASB 2021-3 extends the date of the practical expedient provided to lessees in AASB 2020-4 Amendments to Australian Accounting standards—COVID-19 Related Rent Concessions from 30 June 2021 to 30 June 2022. The practical expedient allows lessees to recognise any change in lease payments (now due before 30 June 2022) arising from a COVID-19 related rent concession directly in the profit and loss and not have to assess whether it is lease modification.
Application of this standard has not materially impacted the Group.
Section B: Notes to the Group financial statements for the year ended 30 June 2022
131
Governance and risk
Security holder information
Sustainability supplement
Business performance
Introduction and overview
Directors’ report
Corporate Report for the year ended 30 June 2022
Remuneration report
Financial statements

132
Section B: Notes to the Group financial statements for the year ended 30 June 2022
B3 Basis of preparation (continued)
New and amended accounting standards and interpretations issued but not yet effective
Certain new and amended accounting standards and interpretations have been published but are not mandatory for the year ended 30 June 2022. The Group's assessment of the impact of these new and amended accounting standards and interpretations is set out below.
AASB 2020-1Amendments to Australian Accounting Standards—Classification of Liabilities as Current or Non-current
AASB 2020-6Amendments to Australian Accounting Standards—Classification of Liabilities as Current or Non-current—Deferral of Effective Date
AASB 2020-1 amends AASB 101 Presentation of Financial Statements to clarify requirements for the presentation of liabilities in the statement of financial position as current or non-current.
AASB 2020-6 defers the application date of AASB 2020-1 by one year.
Application of the amendments is not expected to materially impact the Group.
1 January 2023 1 July 2023
AASB 2020-3Amendments to Australian Accounting Standards—Annual improvements 2018–2020 and Other Amendments
The following small amendments were made to accounting standards:
• Annual Improvements 2018-2020 Cycle make minor amendments to AASB 1 First-time Adoption of International Financial Reporting Standards, AASB 9 Financial Instruments and the Illustrative Examples accompanying AASB 16 Leases to clarify the wording or correct minor consequences, oversights or conflicts between requirements in the Standards;
• Amendments to AASB 3 Business Combinations update a reference in AASB 3 to the Conceptual Framework for Financial Reporting without changing the accounting requirements for business combinations;
• Amendments to AASB 116 Property, Plant and Equipment require an entity to recognise the sales proceeds from selling items produced while preparing property, plant and equipment for its intended use and the related cost in the profit and loss, instead of deducting the amounts received from the cost of the asset; and
• Amendments to AASB 137 Provisions, Contingent Liabilities and Contingent Assets clarify which costs a company includes when assessing whether a contract will be onerous.
Application of the above amendments is prospective following the application date by the Group and is not expected to materially impact the Group.
1 January 2022 1 July 2022
AASB 2021-2Amendments to Australian Accounting Standards—Disclosure of Accounting Policies and Definition of Accounting Estimates
The standard amends AASB 7 Financial Instruments: Disclosures, AASB 101 Presentation of Financial Statements, AASB 108 Accounting Policies, Changes in Accounting Estimates and Errors, AASB 134 Interim Financial Reporting and AASB Practice Statement 2 Making Materiality Judgements to:
• improve accounting policy disclosures so that they provide more useful information to investors and other primary users of the financial statements; and
• distinguish changes in accounting estimates from changes in accounting policies.
Application of the amendments is not expected to materially impact the Group.
1 January 2023 1 July 2023
AASB 2021-5Amendments to Australian Accounting Standards—Deferred Tax related to Assets and Liabilities arising from a Single Transaction
AASB 2021-5 has made amendments to AASB 1 First-time Adoption of Australian Accounting Standards and AASB 112 Income Taxes which require companies in specified circumstances to recognise deferred tax on transactions that, on initial recognition, give rise to equal amounts of taxable and deductible temporary differences.
Transactions that are expected to be captured by the amendments include leases where the entity is a lessee and decommissioning obligations.
Application of the amendments is not expected to materially impact the Group as the Group has already recognised deferred tax on lease arrangements where the Group is a lessee and there are no other transactions expected to be captured within the amendments.
1 January 2023 1 July 2023
Reference Description and impact on the GroupApplication of the standard
Application by the Group
AASB 2014-10Amendments to Australian Accounting Standards—Sale or Contribution of Assets between an Investor and its Associate or Joint Venture
AASB 2021-7Amendments to Australian Accounting Standards—Effective Date of Amendments to AASB 10 and AASB 128 and Editorial Corrections
The AASB has made limited scope amendments to AASB 10 Consolidated Financial Statements and AASB 128 Investments in Associates and Joint Ventures. The amendments clarify the accounting treatment for sale or contribution of assets between an investor and its associates or joint ventures. They confirm that the accounting treatment depends on whether the non-monetary assets sold or contributed to an associate or joint venture constitute a ‘business’ (as defined in AASB 3 Business Combinations). Where the non-monetary assets constitute a business, the investor will recognise the full gain or loss on the sale or contribution of assets. If the assets do not meet the definition of a business, the gain or loss is recognised by the investor only to the extent of the other investor’s interest in the associate or joint venture.
AASB 2021-7 mainly defers application date of AASB 2024-10 so that the amendments are required to be applied for annual reporting periods beginning on or after 1 January 2025 instead of 1 January 2022.
Application of the amendments is prospective and is not expected to materially impact the Group.
1 January 2025 1 July 2025
Section B: Notes to the Group financial statements for the year ended 30 June 2022
132
Governance and risk
Security holder information
Sustainability supplement
Business performance
Introduction and overview
Directors’ report
Corporate Report for the year ended 30 June 2022
Remuneration report
Financial statements

133
Section B: Notes to the Group financial statements for the year ended 30 June 2022
B3 Basis of preparation (continued)
Key accounting estimates and judgements
Estimates and judgements are regularly made by management and are based on historical experience and other factors, including expectations of future events that may have a financial impact on the Group and that are believed to be reasonable under the circumstances.
The estimates and assumptions that have the most significant risk of causing a material adjustment to the carrying amount of assets and liabilities are as follows:
• Provision for income taxes and utilisation of tax losses; Note B7
• Fair value of derivatives and other financial instruments; Note B15
• Recoverability of goodwill, other intangibles assets and equity accounted investments; Note B16, Note B17 and Note B25
• Determination of CityLink and West Gate Tunnel cash generating unit; Note B17
• Provision for maintenance expenditure; Note B19
• Measurement of construction obligation liability; Note B20
• Measurement of promissory notes and concession notes; Note B21
• Assessment of control of STP JV; Note B25
• Assessment of control of TC; and Note B25
• Contingencies Note B28
KEY ESTIMATE AND JUDGEMENT
The Group has made a number of estimates and judgements as at 30 June 2022 as a result of the uncertainty relating to the impacts of COVID-19, near-term interest rates and inflation. These estimates and judgements are included in the notes to the financial statements as applicable.
KEY ESTIMATE AND JUDGEMENT
The Group continues to progress its assessment of the potential financial impacts of climate change and the transition to a low carbon economy. To date this assessment has been qualitative. The Group has also considered the potential financial reporting implications of the climate-related risks (threats and opportunities) identified at the date of this report.
Consistent with the Group's strategic climate-related risk themes, while transition threats and opportunities have been identified, the focus of the assessment has been on acute and chronic physical risks (threats and opportunities) which may be more impactful over time. Physical climate-related threats include increased incidence of severe weather events such as extended rainfall and higher temperatures which may disrupt operations and increase operating and maintenance costs. Our assessment has indicated that climate change may have a financial impact on the Group particularly over the long-term. Certain assets and liabilities (in particular service concession intangible assets and maintenance provisions) are supported by cash flows that extend into the medium and long-term. With respect to the carrying amount of concession intangible assets, climate impacts on future cash flows are not expected to be significant enough to erode the excess in recoverable amount due to the existing headroom over carrying amount (which is also reducing over time through amortisation).As the Group continues to progress its assessment of the potential financial impacts of climate change and the transition to a low carbon economy, the identification of additional risks (threats and opportunities), the detailed development of the Group's response, and changes to the Group's climate change strategy may impact the Group's significant judgements and key estimates and result in material changes to financial results and the carrying amounts of certain assets and liabilities in future reporting periods.
Section B: Notes to the Group financial statements for the year ended 30 June 2022
133
Governance and risk
Security holder information
Sustainability supplement
Business performance
Introduction and overview
Directors’ report
Corporate Report for the year ended 30 June 2022
Remuneration report
Financial statements

134
Section B: Notes to the Group financial statements for the year ended 30 June 2022
Operating performance
B4 Segment informationIn the segment information provided to the Transurban Group Executive Committee (certain members of which act as the chief operating decision maker), segments are defined by the geographical region in which the Group operates being Melbourne, Sydney, Brisbane and North America. The Group's corporate function is not an operating segment under the requirements of AASB 8 Operating Segments as its revenue generating activities are only incidental to the business.
The Executive Committee assesses the performance of the region based on a measure of proportional earnings before depreciation, amortisation, net finance costs and income taxes (Proportional EBITDA). This reflects the contribution of each region in the Group in the proportion of Transurban's equity ownership.
Significant items are those items where their nature is sufficiently significant to the financial statements and not in the ordinary course of business. Refer to Note B6 for further details.
The diagram below shows the assets included in each geographical region, together with the ownership interests held by the Group as at 30 June 2022:
1. Westlink M7 and NorthConnex form the NorthWestern Roads Group (NWRG).
2. The M4, M8/M5 East and M4-M5 Link together form WestConnex. The M8/M5 East includes the M8, the M5 East and will include the M5 West from December 2026. From 29 October 2021, the Group's proportional equity interest in WestConnex increased from 25.5% to 50% through its equity investment in the STP JV.
3. The 95 Express Lanes concession is inclusive of the 395 Express Lanes and the Fredericksburg Extension.
4. The 495 Express Lanes concession is inclusive of the 495 Express Lanes Northern Extension Project and the Capital Beltway Accord Project.
5. 495 Express Lanes and 95 Express Lanes are part of TC. Transurban Group's ownership reduced from 100% to 50% from 1 April 2021.
6. Accelerate Maryland Partners LLC (AM Partners) role is to be the Maryland Department of Transport’s long-term partner to build, finance and operate new Express Lanes in Maryland, USA.
Section B: Notes to the Group financial statements for the year ended 30 June 2022
134
Governance and risk
Security holder information
Sustainability supplement
Business performance
Introduction and overview
Directors’ report
Corporate Report for the year ended 30 June 2022
Remuneration report
Financial statements

135
Section B: Notes to the Group financial statements for the year ended 30 June 2022
B4 Segment information (continued)
Segment information—proportional income statement
2022
$M
Note Melbourne Sydney BrisbaneNorth
AmericaCorporate and other Total
Toll revenue 722 1,264 451 189 — 2,626
Other revenue 22 46 3 36 29 136
Total proportional revenue 744 1,310 454 225 29 2,762
Proportional EBITDA 594 976 320 120 (110) 1,900
2021
$M
Note Melbourne Sydney BrisbaneNorth
America¹Corporate and other Total
Toll revenue 616 1,278 425 167 — 2,486
Other revenue 24 49 3 21 30 127
Total proportional revenue 640 1,327 428 188 30 2,613
Underlying proportional EBITDA 502 1,033 314 72 (85) 1,836
Significant items B6 — (6) — (18) — (24)
Proportional EBITDA 502 1,027 314 54 (85) 1,812
1. Proportional segment information includes the results of discontinued operations, being TC, which includes the 95 Express Lanes and 495 Express Lanes assets which are included at proportional ownership, being 100% for the period to 31 March 2021 and 50% from 1 April 2021 to 30 June 2021.
Reconciliation of segment information to statutory financial information
The proportional results presented above are different from the statutory financial results of the Group due to the proportional presentation of each asset’s contribution to each geographical region and adjustments.
Segment revenue
Revenue from external customers comprises toll, service and fee revenues earned on toll roads. Segment revenue reconciles to total statutory revenue as follows:
2022 2021Note $M $M
Total segment revenue (proportional) 2,762 2,613
Add:
Revenue attributable to non-controlling interests 304 291
Construction revenue from road development activities 911 567
Other revenue from discontinued operations1 — 6
Intragroup elimination2 58 32
Less:
Proportional revenue of non-100% owned equity accounted assets (600) (432)
Toll revenue receipts relating to the A25 concession financial asset3 (14) (13)
Other revenue receipts relating to the A25 concession financial asset3 (15) (14)
Revenue attributable to discontinued operations1 — (164)
Total statutory revenue from continuing operations B5 3,406 2,886
1. Statutory financial information classifies the results of TC as discontinued operations in the prior comparative period. FY21 other revenue from discontinued operations represents intragroup revenue recognised in relation to arrangements between continuing and discontinued operations that is eliminated for segment purposes.
2. Statutory revenue recognised in relation to arrangements with the equity accounted investments that are eliminated for segment purposes.
3. The Executive Committee members acting as the chief operating decision maker assesses the performance of the Group using proportional results that include A25 income streams relating to availability payments and guaranteed toll income which are classified as revenue within the proportional results. These revenues form part of the ordinary activities of the A25 and are reflective of its underlying performance. For statutory accounting purposes, these income streams offset the related concession financial asset receivable recorded on acquisition of the A25 (refer to Note B18).
Section B: Notes to the Group financial statements for the year ended 30 June 2022
135
Governance and risk
Security holder information
Sustainability supplement
Business performance
Introduction and overview
Directors’ report
Corporate Report for the year ended 30 June 2022
Remuneration report
Financial statements

136
Section B: Notes to the Group financial statements for the year ended 30 June 2022
B4 Segment information (continued)
Proportional EBITDA
Proportional EBITDA reconciles to loss before income tax as follows:
2022 2021$M $M
Proportional EBITDA 1,900 1,812
Add: EBITDA attributable to non-controlling interests 215 214
Add: Intragroup elimination1 8 9
Less: Proportional EBITDA (excluding significant items) of non-100% owned equity accounted assets (413) (330)
Add: Significant items incurred by equity accounted assets2 — 1
Less: Toll and other revenue receipts relating to the A25 concession financial asset3 (29) (27)
Add: EBITDA from discontinued operations net of transaction costs on disposal4 — 12
Statutory earnings before depreciation, amortisation, net finance costs, equity accounted investments and income taxes from continuing operations 1,681 1,691
Statutory depreciation and amortisation from continuing operations (1,107) (1,140)
Statutory net finance costs from continuing operations (466) (870)
Share of loss from equity accounted investments (368) (161)
Loss before income tax from continuing operations (260) (480)
1. Statutory EBITDA recognised in relation to arrangements with equity accounted investments that are eliminated for segment purposes. For statutory purposes an offsetting adjustment is recognised within the share of loss from equity accounted investments.
2. Refer to Note B6 for further information.
3. The Executive Committee members acting as the chief operating decision maker assesses the performance of the Group using proportional results that include A25 income streams relating to availability payments and guaranteed toll income which are classified as revenue within the proportional results. These revenues form part of the ordinary activities of the A25 and are reflective of its underlying performance. For statutory accounting purposes, these income streams offset the related concession financial asset receivable recorded on acquisition of the A25 (refer to Note B18).
4. Statutory results classify the results of TC as discontinued operations in the prior comparative period. FY21 proportional EBITDA includes $18 million transaction costs on disposal of TC which are included within the statutory gain on disposal and not within statutory EBITDA.
B5 Revenue
2022 2021$M $M
Toll revenue 2,324 2,266
Construction revenue 911 480
Other revenue 171 140
Total revenue from continuing operations 3,406 2,886
The Group’s principal revenue generating activities, being the service concession arrangements, are accounted for in accordance with AASB Interpretation 12 Service Concession Arrangements (IFRIC 12) and AASB 15 Revenue from Contracts with Customers. Those accounting pronouncements specify that operations and maintenance services and construction services provided under the Group’s service concession arrangements are two distinct types of services.
The Group’s service concession arrangements fall into two types of models, the intangible asset model and the financial asset model as discussed below.
Service concession arrangements—intangible asset model
The revenue streams covered by this model are Toll revenue and Construction revenue. Revenue recognition principles for these revenue streams are discussed below:
Revenue type Recognition
Toll revenue The customer of the operations and maintenance services is the user of the infrastructure. Each use made of the toll road by users is considered a performance obligation. The related revenue is recognised at the point in time that the individual service is provided and the amount is determined to be recoverable by the Group. Total toll revenue is net of any revenue share arrangements that the Group has triggered during the reporting period.
Construction revenue The customer with respect to construction services is the concession grantor. Construction services are accounted for as one performance obligation and revenue is recognised in line with the progress of construction services provided over time. The progress of construction is measured by reference to costs incurred to date. Revenue is measured at fair value by reference to the stand-alone selling price.
Section B: Notes to the Group financial statements for the year ended 30 June 2022
136
Governance and risk
Security holder information
Sustainability supplement
Business performance
Introduction and overview
Directors’ report
Corporate Report for the year ended 30 June 2022
Remuneration report
Financial statements

137
Section B: Notes to the Group financial statements for the year ended 30 June 2022
B5 Revenue (continued)
Service concession arrangements—financial asset model
The Group’s accounting policy for service concession arrangements under the financial asset model is consistent with that disclosed in Note B18. As at 30 June 2022, the Group’s concession financial asset only relates to A25.
Revenue sharing
Toll revenue for the year ended 30 June 2022 is recognised net of revenue share of $24 million (2021: $24 million) to the grantor of A25, Ministry of Transport of Quebec (MTQ).
Other revenue
Other revenue includes management fee revenue, roaming fee revenue and advertising revenue and is recognised at the point in time the service is provided. Additionally, other revenue includes tolling services provided to third parties for which revenue is recognised over the period the service is provided. It also includes compensation received from third parties for a loss of toll revenue due to delays with construction completion, which is recognised when it is reasonably assured it will be collected.
Interest income―receivables
Interest income (refer to Note B13) from receivables and bank deposits is recognised using the effective interest method.
B6 Significant itemsSignificant items are items where their nature is sufficiently significant to the financial statements and not in the ordinary course of business. There were no items classified as significant items for the year ended 30 June 2022. For the year ended 30 June 2021, total statutory significant items were $5,120 million gain before tax ($3,722 million gain after tax), total proportional significant items were $24 million loss before tax ($24 million loss after tax).
Significant items for the year ended 30 June 2021 included $5 million relating to the integration costs of the acquired A25 and M5 West included within total expenses (statutory and proportional), $1 million relating to the integration of WestConnex acquired by the STP JV included within statutory share of loss of equity accounted investments and proportional total expenses, $18 million relating to the transaction costs on disposal of controlling interest in TC included within statutory profit from discontinued operations and proportional total expenses, and $5,144 million relating to the gain on disposal of controlling interest in TC included in the statutory profit from discontinued operations. The income tax expense associated with these significant items was $1,398 million for the year ended 30 June 2021.
Section B: Notes to the Group financial statements for the year ended 30 June 2022
137
Governance and risk
Security holder information
Sustainability supplement
Business performance
Introduction and overview
Directors’ report
Corporate Report for the year ended 30 June 2022
Remuneration report
Financial statements

138
Section B: Notes to the Group financial statements for the year ended 30 June 2022
B7 Income tax
Income tax expense/(benefit)
2022 2021$M $M
Current tax (39) 627
Deferred tax (226) 551
(Over)/under provision in prior years (11) 3
(276) 1,181
Income tax benefit attributable to continuing operations (276) (193)
Income tax expense attributable to discontinued operations — 1,374
(276) 1,181
Deferred income tax benefit included in income tax (benefit)/expense comprises:
Increase in deferred tax assets (61) (72)
(Decrease)/increase in deferred tax liabilities (165) 623
(226) 551
Reconciliation of income tax expense/(benefit) to prima facie tax payable
2022 2021$M $M
Loss before income tax from continuing operations (260) (480)
Profit before income tax from discontinued operations (Note B24) — 4,933
(Loss)/profit before income tax (260) 4,453
Tax at the Australian tax rate of 30% (2021: 30%) (78) 1,336
Tax effect of amounts which are not deductible/(taxable) in calculating taxable income:
Trust income not subject to tax (251) (131)
Equity accounted results 100 35
Tax rate differential 3 (195)
(Non-assessable)/non-deductible interest (25) 12
Non-deductible depreciation 10 34
Prior year tax losses recognised (25) (5)
(Over)/under provision in prior years (11) 3
Gain on disposal of controlling interest in TC — 47
Foreign exchange (3) 34
Other items 4 11
Income tax expense/(benefit) (276) 1,181
Tax expense/(income) relating to items of other comprehensive income and equity
Cash flow hedges 194 32
Foreign currency translation (26) 2
Cost of hedging 4 2
Other equity transactions (7) —
165 36
Current tax assets and liabilities
As at 30 June 2022 the current tax assets and liabilities of the Group relate to income tax receivable for the Transurban DRIVe Holdings LLC (DRIVe) and Transurban (USA) Holdings Inc (TUSAH) tax consolidated groups, and income tax payable for the Airport Motorway Pty Limited (AML) tax consolidated group and TU Cardinal Secondary Holdings Ltd as a standalone entity.
Prior year tax losses recognised
During the year ended 30 June 2022, the Group undertook a review of its unbooked tax losses in conjunction with updated forecast financial information of the relevant entities in the Group. As a result, the Group has determined it is probable that future taxable profit will be available to utilise previously unbooked tax losses in the TIL Australia tax consolidated group. Accordingly, an additional deferred tax asset of $25 million has been recognised as at 30 June 2022.
Section B: Notes to the Group financial statements for the year ended 30 June 2022
138
Governance and risk
Security holder information
Sustainability supplement
Business performance
Introduction and overview
Directors’ report
Corporate Report for the year ended 30 June 2022
Remuneration report
Financial statements

139
Section B: Notes to the Group financial statements for the year ended 30 June 2022
B7 Income tax (continued)
Deferred tax assets and liabilities
Assets Liabilities2022 2021 2022 2021
$M $M $M $M
The balance comprises temporary differences attributable to:
Provisions 489 441 (15) (16)
Current and prior year losses 738 630 — —
Fixed assets/intangibles 543 529 (1,536) (1,627)
Concession fees and promissory notes — — (274) (342)
Derivatives and foreign exchange 237 253 (288) (90)
Lease liabilities 7 5 — —
Equity accounted investments — — (846) (764)
Other 27 18 1 —
Tax assets/(liabilities) 2,041 1,876 (2,958) (2,839)
Set-off of tax (1,126) (1,045) 1,126 1,045
Net tax assets/(liabilities) 915 831 (1,832) (1,794)
Movements:
Opening balance at 1 July 1,876 2,502 (2,839) (2,633)
Credited to profit or loss 61 72 165 141
Credited/(charged) to equity 11 (106) (176) 70
Disposed through other comprehensive income1 — (13) — —
Disposed through profit or loss1 — (96) — 326
Acquired1 — — — (764)
Foreign exchange movements 7 (54) (87) 23
Transfer from deferred tax assets/liabilities 8 (8) (8) 8
Current year losses recognised/(prior year losses utilised) and under/(over) provision in prior years 78 (421) (13) (10)
Closing balance at 30 June 2,041 1,876 (2,958) (2,839)
Deferred tax assets/(liabilities) to be recovered/(paid) after more than 12 months 2,041 1,876 (2,958) (2,839)
1. Relates to the net impact of the deconsolidation of the Group’s ownership interest in TC and recognition of an equity accounted investment in TC upon divestment of a 50% ownership interest (refer to Note B24).
The Group has reviewed its deferred tax assets with reference to the potential impact of reductions in traffic due to COVID-19, near-term interest rates and inflation on forecast taxable profits. Management have determined that it is probable that future taxable profits will be available to utilise against deferred tax assets recognised as at 30 June 2022.
The Group has no unrecognised tax losses as at 30 June 2022 (2021: $23 million tax effected).
Accounting policy
The income tax expense/(benefit) for the period is the tax payable or benefit on the current period's taxable income based on the applicable income tax rate for each jurisdiction, adjusted by changes in deferred tax assets and liabilities attributable to temporary differences and to unused tax losses.
The current income tax expense is calculated on the basis of the tax laws enacted or substantively enacted at the end of the reporting period in the countries where the Group operates and generates taxable income. Management periodically evaluate positions taken in tax returns with respect to situations in which applicable tax regulation is subject to interpretation. They establish provisions where appropriate on the basis of amounts expected to be paid to the tax authorities.
The Transurban Group comprises two corporate entities (THL and TIL) and a trust (THT). THT operates as a flow-through trust, and is not liable to pay tax itself. Instead, security holders pay tax on the distributions they receive from the trust at their individual marginal tax rates. The Group is structured in this way because the initial heavy capital investment and associated debt funding required for infrastructure investments results in accounting losses being generated in the initial years which would otherwise prevent a company from paying dividends. The trust enables distributions to be made to security holders throughout the life of the asset.
Section B: Notes to the Group financial statements for the year ended 30 June 2022
139
Governance and risk
Security holder information
Sustainability supplement
Business performance
Introduction and overview
Directors’ report
Corporate Report for the year ended 30 June 2022
Remuneration report
Financial statements

140
Section B: Notes to the Group financial statements for the year ended 30 June 2022
B7 Income tax (continued)
Accounting policy (continued)
Deferred income tax is provided in full, using the liability method, on temporary differences arising between the tax bases of assets and liabilities and their carrying amounts in the consolidated financial statements. However, deferred income tax is not accounted for if it arises from the initial recognition of an asset or liability in a transaction other than a business combination that at the time of the transaction affects neither accounting nor taxable profit and loss. Deferred income tax is determined using tax rates (and laws) that have been enacted or substantially enacted by the reporting date and are expected to apply when the related deferred income tax asset is realised or the deferred income tax liability is settled.
Deferred tax assets are recognised for deductible temporary differences and unused tax losses only if it is probable that future taxable amounts will be available to utilise those temporary differences and losses. Deferred tax assets and liabilities are not recognised for temporary differences between the carrying amount and tax bases of investments in subsidiaries where the Group is able to control the timing of the reversal of the temporary differences and it is probable that the differences will not reverse in the foreseeable future.
Deferred tax assets and liabilities are offset when there is a legally enforceable right to offset current tax assets and liabilities and when the deferred tax balances relate to the same taxation authority. Current tax assets and tax liabilities are offset where the entity has a legally enforceable right to offset and intends either to settle on a net basis, or to realise the asset and settle the liability simultaneously.
Current and deferred tax is recognised in the profit and loss, except to the extent that it relates to items recognised in other comprehensive income or directly in equity.
Investment allowances
Companies within the Group may be entitled to claim special tax deductions for investments in qualifying assets (investment allowances). The Group accounts for such allowances as tax credits, which means that the allowance reduces income tax payable and current tax expense. A deferred tax asset is recognised for unclaimed tax credits that are carried forward as tax losses.
Tax consolidation legislation
The Transurban Group has adopted the Australian tax consolidation legislation for THL and its wholly-owned Australian entities from 1 July 2005.
All entities within the Australian tax consolidated groups continue to account for their own current and deferred tax amounts. These tax amounts are measured as if each entity in the tax consolidation group is a separate taxpayer within the tax consolidated group.
The tax consolidated groups within the Group are summarised as follows:
1. Entity is classified as a partnership for tax purposes.
2. There are no tax consolidated groups under THT.
3. TC is treated as a partnership for US tax purposes and owns all of the membership interests in both 495 Express Lanes and 95 Express Lanes. Taxable income and losses of TC, inclusive of 495 Express Lanes and 95 Express Lanes, flow to the partners of TC for inclusion in their respective US tax returns. The DRIVe and TUSAH tax consolidated groups collectively own 50% of the membership interests in TC.
4. AM Partners is treated as a partnership for US tax purposes and owns all of the membership interests in Maryland Express Lanes. Taxable income and losses of AM Partners flow to the partners of AM Partners for inclusion in their respective US tax returns. The TUSAH tax consolidated group own 60% of the membership interests in AM Partners.
Section B: Notes to the Group financial statements for the year ended 30 June 2022
140
Governance and risk
Security holder information
Sustainability supplement
Business performance
Introduction and overview
Directors’ report
Corporate Report for the year ended 30 June 2022
Remuneration report
Financial statements

141
Section B: Notes to the Group financial statements for the year ended 30 June 2022
B7 Income tax (continued)
THL tax consolidated group
The entities in the THL tax consolidated group entered into a tax sharing agreement (TSA) effective from 29 April 2009, with amendments executed on 30 June 2020 to cover various administrative changes in tax legislation.
The entities in the THL tax consolidated group have also entered into a tax funding agreement (TFA) effective from 1 July 2008, with amendments executed on 30 June 2020 to cover various administrative changes in tax legislation. Under the TFA the wholly-owned entities fully compensate THL for any current tax payable assumed and are compensated by THL for any current tax receivable and deferred tax assets relating to tax losses. The funding amounts are determined by reference to the amounts recognised in the wholly-owned entities’ financial statements.
The amount receivable/payable under the TFA is calculated at the end of the financial year for each wholly-owned entity. THL determines and communicates the amount payable/receivable to each wholly-owned entity along with the method of calculation and any other information deemed necessary.
Transurban Queensland tax consolidated group
The entities in the Transurban Queensland Holdings 1 Pty Ltd (TQH1) tax consolidated group entered into a TSA effective from 2 July 2014. The entities in the TQH1 tax consolidated group have also entered into a TFA effective from 2 July 2014. APL Hold Co Pty Ltd (AirportlinkM7) and its controlled entities entered the TQH1 tax consolidated group effective from 23 November 2015.
Under the TFA the wholly-owned entities fully compensate TQH1 for any current tax payable assumed and are compensated by TQH1 for any current tax receivable and deferred tax assets relating to tax losses. The funding amounts are determined by reference to the amounts recognised in the wholly-owned entities financial statements.
The amount receivable/payable under the TFA is calculated at the end of the financial year for each wholly-owned entity. TQH1 determines and communicates the amount payable/receivable to each wholly-owned entity along with the method of calculation and any other information deemed necessary.
Airport Motorway tax consolidated group
The entities in the Airport Motorway Holdings (AMH) tax consolidated group entered into a TSA and TFA effective from 2 July 2009, with amendments executed on 23 May 2022 to cover various administrative changes in the tax legislation.
Under the TFA the wholly-owned entities fully compensate AMH for any current tax payable assumed and are compensated by AMH for any current tax receivable and deferred tax assets relating to tax losses. The funding amounts are determined by reference to the amounts recognised in the wholly-owned entities financial statements.
The amount receivable/payable under the TFA is calculated at the end of the financial year for each wholly-owned entity. AMH determines and communicates the amount payable/receivable to each wholly-owned entity along with the method of calculation and any other information deemed necessary.
TIL Australia tax consolidated group
The entities in the TIL Australia tax consolidated group have entered into a TSA effective from 1 July 2018. The entities in the TIL Australia tax consolidated group have also entered into a TFA effective from 1 July 2018.
Under the TFA the wholly-owned entities fully compensate TIL for any current tax payable assumed and are compensated by TIL for any current tax receivable and deferred tax assets relating to tax losses. The funding amounts are determined by reference to the amounts recognised in the wholly-owned entities financial statements.
The amount receivable/payable under the TFA is calculated at the end of the financial year for each wholly-owned entity. TIL determines and communicates the amount payable / receivable to each wholly-owned entity along with the method of calculation and any other information deemed necessary.
Transurban DRIVe tax group
Transurban DRIVe Holdings LLC (TDH) is the head company of the DRIVe tax group. The DRIVe tax group is consolidated for US tax purposes in the sense that the 100% subsidiaries of TDH have elected to be treated as disregarded entities for US tax purposes. This treatment means that those entities are ignored for US tax purposes and that TDH, as head entity, carries any tax liability or benefits arising in the group. The DRIVe tax group owns membership interests in the TC partnership and includes its share of the TC partnerships’ profits or losses in its US tax return.
Section B: Notes to the Group financial statements for the year ended 30 June 2022
141
Governance and risk
Security holder information
Sustainability supplement
Business performance
Introduction and overview
Directors’ report
Corporate Report for the year ended 30 June 2022
Remuneration report
Financial statements

142
Section B: Notes to the Group financial statements for the year ended 30 June 2022
B7 Income tax (continued)
Transurban (USA) Holdings tax consolidated group
Transurban (USA) Holdings Inc (TUSAH) is the head company of the TUSAH tax consolidated group. The TUSAH tax consolidated group contains the entities that are responsible for employment and providing services to the Group’s North America operations. The TUSAH tax consolidated group owns membership interests in TC and AM Partners partnerships and includes its share of the TC and AMP partnerships’ profits or losses in its US tax return.
Concession A25 LP
Concession A25 LP (A25 LP) is treated as a partnership for tax purposes and is the main operating entity of the A25 Group. The partners of A25 LP include their share of A25 LP’s profits or losses in their individual Canadian tax returns.
All entities within the Canadian operations are standalone entities for tax purposes.
Goods and Services Tax (GST)
Revenues, expenses and assets are recognised net of the amount of associated GST, unless the GST incurred is not recoverable from the taxation authority. In this case it is recognised as part of the cost of acquisition of the asset or as part of the expense.
Receivables and payables are stated inclusive of the amount of GST receivable or payable. The net amount of GST recoverable from, or payable to, the taxation authority is included within other receivables or other payables in the balance sheet.
Cash flows are presented on a gross basis. The GST components of cash flows arising from investing or financing activities which are recoverable from, or payable to the taxation authority, are presented as operating cash flows.
KEY ESTIMATE AND JUDGEMENT
The Group is subject to income taxes in Australia, the United States and Canada. Significant judgement is required in determining the provision for income taxes. There are various transactions and calculations undertaken during the ordinary course of business for which the ultimate tax determination is uncertain. The Group recognises liabilities for tax audit issues based on whether it is anticipated that additional taxes will be due. Where the final tax outcome of these matters is different from the amounts that were initially recorded, such differences will impact the current and deferred tax assets and liabilities in the period in which such determination is made.The Group has recognised deferred tax assets relating to carried forward tax losses to the extent there are sufficient taxable temporary differences relating to the same taxation authority against which the unused tax losses can be utilised.
The utilisation of tax losses also depends on the ability of the Group to satisfy certain tests at the time the losses are recouped, including:
• In the United States, all tax losses relate to periods post 30 June 2018, and are generally carried forward indefinitely, subject to an 80 per cent utilisation limit on taxable income in any given year; and
• In Canada tax losses generally expire after a 20 year period.
During the year ended 30 June 2022, management have reviewed forecast taxable profits for the TIL Australia tax consolidated group and have recognised deferred tax assets in relation to previously unbooked tax losses. The change in the TIL Australia tax loss utilisation profile has arisen due to new cross-staple interest bearing loans established as a result of the Group equity issuance completed in October 2021.Management have reviewed forecast taxable profits including the potential impact of reductions in traffic due to COVID-19, near-term interest rates and inflation and have recognised deferred tax assets in relation to tax losses.
Section B: Notes to the Group financial statements for the year ended 30 June 2022
142
Governance and risk
Security holder information
Sustainability supplement
Business performance
Introduction and overview
Directors’ report
Corporate Report for the year ended 30 June 2022
Remuneration report
Financial statements

143
Section B: Notes to the Group financial statements for the year ended 30 June 2022
B8 Working capitalThe Group’s working capital balances are summarised as follows:
2022 2021Note $M $M
Current assets
Cash and cash equivalents 2,020 4,285
Trade and other receivables
Prepayments 36 283
Trade receivables 169 145
Other receivables 112 116
Concession financial asset B18 30 28
347 572
Current liabilities
Trade and other payables (463) (397)
(463) (397)
Net working capital 1,904 4,460
Cash and cash equivalents
For the purpose of presentation in the consolidated statement of cash flows, cash and cash equivalents includes cash on hand, deposits held at call with financial institutions, other short-term, highly liquid investments with original maturities of three months or less that are readily convertible to known amounts of cash and which are subject to an insignificant risk of changes in value. Bank overdrafts are shown within borrowings in current liabilities. All cash balances are interest bearing.
The amount shown in cash and cash equivalents includes $95 million not available for general use as at 30 June 2022 (2021: $87 million) of which $28 million (2021: $24 million) belongs to TIL. This comprises amounts required to be held in a construction account, maintenance and funding reserves and prepaid tolls.
Prepayments
From time to time the Group makes advance payments to its D&C subcontractors, not necessarily stipulated in the D&C subcontract itself, to facilitate the progression of its construction projects. Included within current and non-current prepayments as at 30 June 2021 were advance payments of $253 million and $190 million, respectively to the West Gate Tunnel Project D&C Subcontractor.
During the financial year, the advance payments have been utilised to pay for certified West Gate Tunnel Project works and partially settle the State Loan liability, as part of the settlement finalised on 23 March 2022 with the State of Victoria and D&C Subcontractor on revised terms for the delivery of the West Gate Tunnel Project.
Trade receivables
Trade receivables are recognised initially at the amount of consideration that is unconditional unless they contain significant financing components in which case they are recognised at fair value. The Group holds the trade receivables with the objective to collect the contractual cash flows and therefore measures them subsequently at amortised cost using the effective interest method. Trade receivables are generally due for settlement no more than 30 days from revenue recognition.
The Group applies the AASB 9 simplified approach to measuring expected credit losses which uses a lifetime of expected loss allowance for all trade receivables. The expected loss rates are based on the payment profiles of toll revenue over historical periods and the corresponding historical credit losses experienced. The historical loss rates are adjusted to reflect current and forward-looking information on macroeconomic factors affecting the ability of customers to settle the receivables.
As at 30 June 2022, the expected loss rates incorporate forward-looking information about the economic uncertainty relating to the impacts of COVID-19, near-term interest rates and inflation. Such forward-looking information reflects management’s estimate based on the information available as at 30 June 2022.
Section B: Notes to the Group financial statements for the year ended 30 June 2022
143
Governance and risk
Security holder information
Sustainability supplement
Business performance
Introduction and overview
Directors’ report
Corporate Report for the year ended 30 June 2022
Remuneration report
Financial statements

144
Section B: Notes to the Group financial statements for the year ended 30 June 2022
B8 Working capital (continued)
Trade receivables (continued)
The loss allowance for the trade receivables as at 30 June 2022 and 30 June 2021 was determined as follows:
2022
CurrentUp to 90 days
past dueMore than 90 days past due Total
Expected loss rate 2% 4% 65% NA¹
Gross carrying amount ($M) 132 28 35 195
Loss allowance ($M) (2) (1) (23) (26)
2021
CurrentUp to 90 days
past due
More than 90 days past
due Total
Expected loss rate 2% 4% 67% NA¹
Gross carrying amount ($M) 117 22 27 166
Loss allowance ($M) (2) (1) (18) (21)
1. NA―Not applicable.
The closing loss allowances for trade receivables reconciles to the opening loss allowance as follows:
2022 2021$M $M
Opening loss allowance 21 18
Increase in loss allowance recognised in the profit and loss during the year 6 5
Receivables written off during the year as uncollectible (1) (2)
Closing loss allowance 26 21
Trade receivables are written off when there is no reasonable expectation of recovery. Indicators that there is no reasonable expectation of recovery include the failure of a debtor to engage in a repayment plan with the Group, and a failure to make contractual payments for an extended period.
Other financial assets at amortised cost
The Group classifies its financial assets at amortised cost only if both of the following criteria are met:
• the asset is held within a business model whose objective is to collect the contractual cash flows; and
• the contractual terms give rise to cash flows that are solely payments of principal and interest.
Other financial assets at amortised cost include concession financial assets, other receivables and loan receivables at call recorded within trade and other receivables.
As at 30 June 2022, having assessed the impact from the economic uncertainty relating to COVID-19, near-term interest rates and inflation, management do not consider there to be evidence of a significant increase in credit risk since the initial recognition of these balances. This is mainly due to there being no significant change in the nature of or the collectability of these balances. The loss allowance for other financial assets continues to be limited to 12 months of expected losses. These balances continue to have low credit risk as they have a low risk of default and the issuer has a strong capacity to meet its contractual cash flow obligations in the near-term. The loss allowance for other financial assets is $nil (2021: $nil).
Section B: Notes to the Group financial statements for the year ended 30 June 2022
144
Governance and risk
Security holder information
Sustainability supplement
Business performance
Introduction and overview
Directors’ report
Corporate Report for the year ended 30 June 2022
Remuneration report
Financial statements

145
Section B: Notes to the Group financial statements for the year ended 30 June 2022
Security holder outcomes
B9 Earnings per stapled security
Reconciliation of earnings used in calculating earnings per security
2022 2021Profit/(loss) attributable to ordinary security holders of the stapled group ($M)
Continuing operations 19 (256)
Discontinued operations — 3,559
Total 19 3,303
Weighted average number of securities (M) 2,991 2,737
Basic and diluted earnings per security attributable to the ordinary security holders of the stapled group (cents)
Continuing operations 0.6 (9.4)
Discontinued operations — 130.0
Total 0.6 120.6
B10 Dividends/distributions and free cash
Total Paid in cashSettled in securities
CentsDate paid/
payable$M $M $M
Dividends/distributions payable by the Group
Declared 20 June 20221
Franked THL 61 — — 2.0
Partly franked THT 737 — — 24.0
798 — — 26.0 23 August 2022
Dividends/distributions paid by the Group
2022
Declared 3 December 20211
Franked THL — — — —
Unfranked THT 461 450 11 15.0
461 450 11 15.0 22 February 2022
Declared 24 June 20212
Franked THL 27 23 4 1.0
Partly franked THT 561 469 92 20.5
588 492 96 21.5 23 August 2021
Total 1,049 942 107 36.5
2021
Declared 23 December 20202
Franked THL — — — —
Unfranked THT 411 392 19 15.0
411 392 19 15.0 16 February 2021
Declared 22 June 2020
Franked THL — — — —
Unfranked THT 437 426 11 16.0
437 426 11 16.0 14 August 2020
Total 848 818 30 31.0
1. Total declared FY22 was $1,259 million.
2. Total declared FY21 was $999 million.
Section B: Notes to the Group financial statements for the year ended 30 June 2022
145
Governance and risk
Security holder information
Sustainability supplement
Business performance
Introduction and overview
Directors’ report
Corporate Report for the year ended 30 June 2022
Remuneration report
Financial statements

146
Section B: Notes to the Group financial statements for the year ended 30 June 2022
B10 Dividends/distributions and free cash (continued)
Distribution policy and free cash calculation
The Group typically aligns distributions with free cash generated. The distributions declared during FY22 are 122% covered by FY22 free cash (including capital releases). The Group calculates free cash as follows:
2022 2021$M $M
Cash flows from operating activities 982 893
Add back transaction and integration costs1 13 30
Add back payments for maintenance of intangible assets 97 88
Less debt amortisation of 100% owned assets2 (14) (10)
Less cash flow from operating activities related to non-100% owned entities (369) (376)
Less allowance for maintenance of intangible assets for 100% owned assets3,4 (60) (78)
Adjust for distributions and interest received from non-100% owned entities
M1 Eastern Distributor distributions — 54
Transurban Queensland distributions and shareholder loan note payments 186 165
NWRG distributions and shareholder loan note payments 267 170
STP JV distributions and shareholder loan note payments 364 342
TC distributions 65 —
Free cash5 1,531 1,278
Weighted average securities on issue (millions)6 3,071 2,737
Free cash per security (cents)—weighted average securities 49.9 46.7
1. For the year ended 30 June 2022, transaction and integration costs comprise transaction costs relating to the Group's acquisition of an additional proportional equity interest in WestConnex through its equity investment in STP JV of 24.5%. For the year ended 30 June 2021, transaction and integration costs related to the Group's disposal of 50% of its interest in TC and integration costs paid in relation to M5 West.
2. From the date of the initial WestConnex acquisition in 2018, debt amortisation from M5 West has been added back to this figure due to the M5 West concession arrangement being transferred to the WestConnex ownership consortium at the end of the current M5 West concession agreement in 2026. Debt amortisation of 100% owned assets has been adjusted by $90 million (2021: $85 million).
3. The prior comparative period includes allowance for maintenance of intangible assets classified within discontinued operations.
4. Includes tag purchases.
5. Free cash for the year ended 30 June 2022 includes $255 million (2021: $278 million) capital release from STP JV and $100 million (2021 $nil) capital release from NWRG. In the absence of these capital releases, the free cash per security was 38.3 cents.
6. The weighting applied to securities is based on their eligibility for distributions during the year and consequently can be different to weighted average securities calculated in Note B9 Earnings per stapled security.
Franking credits
2022 2021$M $M
Franking credits available for subsequent periods based on a tax rate of 30% (2021: 30%) 131 115
Franking credits available for subsequent periods relate to Airport Motorway Holdings Pty Ltd $103 million (2021: $75 million) and Transurban Holdings Limited $28 million (2021: $40 million).
Distribution provision
A provision for distribution is recognised for any distribution declared and authorised on or before the end of the reporting period, but not distributed by the end of the reporting period. These distributions are provided for once they are approved by the Board, are announced to equity holders and are no longer at the discretion of the entity.
Section B: Notes to the Group financial statements for the year ended 30 June 2022
146
Governance and risk
Security holder information
Sustainability supplement
Business performance
Introduction and overview
Directors’ report
Corporate Report for the year ended 30 June 2022
Remuneration report
Financial statements

147
Section B: Notes to the Group financial statements for the year ended 30 June 2022
B10 Dividends/distributions and free cash (continued)
Distribution provision (continued)
Movements in distribution provision
Movements in the distribution provision during the financial year are set out below:
Distribution to security
holders
Distributions to non-controlling interest—other Total
$M $M $M
Balance at 1 July 2021 588 39 627
Additional provision recognised 1,259 73 1,332
Amounts paid (942) (73) (1,015)
Amounts reinvested (107) — (107)
Balance at 30 June 2022 798 39 837
Balance at 1 July 2020 437 39 476
Additional provision recognised 999 90 1,089
Amounts paid (818) (90) (908)
Amounts reinvested (30) — (30)
Balance at 30 June 2021 588 39 627
Section B: Notes to the Group financial statements for the year ended 30 June 2022
147
Governance and risk
Security holder information
Sustainability supplement
Business performance
Introduction and overview
Directors’ report
Corporate Report for the year ended 30 June 2022
Remuneration report
Financial statements

148
Section B: Notes to the Group financial statements for the year ended 30 June 2022
Capital and borrowings
B11 Contributed equity
2022 2021$M $M
Fully paid stapled securities 3,939 2,929
Stapled securities
Stapled securities are classified as equity and entitle the holder to participate in distributions and share in the proceeds upon winding up of the Group in proportion to the number of securities held. Every holder of a stapled security present at a meeting, in person or by proxy, is entitled to one vote. The issued units of the Group are made up of a parcel of stapled securities, each parcel comprising one share in THL, one unit in THT and one share in TIL. The individual securities comprising a parcel of stapled securities cannot be traded separately.
Other contributed equity units attributable to security holders of the Group relating to THT and TIL of $19,354 million and $1,030 million respectively (2021: $16,527 million and $599 million respectively) is included within non-controlling interests that relate to THT and TIL. Refer to Note B22.
B12 Reserves
Cash flow hedges
Cost of hedging
Share based payments
Foreign currency
translation
Transactions with non-
controlling interests Total
$M $M $M $M $M $M
Balance at 1 July 2021 (163) 4 1 (1) (298) (457)
Revaluation―gross 367 5 — (87) — 285
Deferred tax (111) (1) — 26 — (86)
Balance at 30 June 2022 93 8 1 (62) (298) (258)
Balance at 1 July 2020 (236) — 2 47 (304) (491)
Revaluation―gross 104 6 (1) (11) — 98
Deferred tax (31) (2) — 3 — (30)
Transactions with non-controlling interests — — — — 6 6
Gains reclassified on disposal of subsidiary, net of tax — — — (40) — (40)
Balance at 30 June 2021 (163) 4 1 (1) (298) (457)
Nature of reserves Purpose of reserves
Cash flow hedges Used to record gains or losses on cash flow hedging instruments (to the extent these are part of an effective hedge relationship), which are used by the Group to mitigate the risk of movements in exchange rates and interest rates. Amounts are reclassified to the profit and loss when the transaction to which the hedge is linked (such as the recognition of interest expense) affects the profit and loss. Amounts accumulated in the cash flow hedges reserve are reclassified to the profit and loss if hedge accounting is discontinued or when a subsidiary to which the reserve relates to is disposed of.
Cost of hedging Used to record changes in the fair value of our hedging instruments attributable to movements in currency basis spread (where these elements are excluded from the designated hedge relationship). Amounts accumulated in the cost of hedging reserve are reclassified to the profit and loss if hedge accounting is discontinued.
Share based payments Used to recognise the grant date fair value of securities issued to employees and deferred securities granted to employees but not yet vested.
Foreign currency translation
Exchange differences, including gains or losses relating to the effective component of net investment hedges, arising on translation of the United States and Canadian operations of the Group are recognised in this reserve. The cumulative amount is reclassified to profit or loss when the net investment is disposed of.
Transactions with non-controlling interests
The Group uses the economic entity approach when accounting for transactions with non-controlling interests.
Section B: Notes to the Group financial statements for the year ended 30 June 2022
148
Governance and risk
Security holder information
Sustainability supplement
Business performance
Introduction and overview
Directors’ report
Corporate Report for the year ended 30 June 2022
Remuneration report
Financial statements

149
Section B: Notes to the Group financial statements for the year ended 30 June 2022
B13 Net finance costs
2022 2021Note $M $M
Finance income
Income from concession financial asset B18 23 23
Interest income on financial assets at amortised cost 37 19
Interest income on bank deposits held at amortised cost 11 8
Net unrealised remeasurement gain attributable to derivative financial instruments 153 —
Unwind of discount and remeasurement of financial assets at amortised cost 117 16
Unwind of discount and remeasurement of liabilities—promissory and concession notes 2 —
Movement in impairment provisions on financial assets at amortised cost — 3
Total finance income 343 69
Finance costs
Interest and finance charges paid/payable (727) (758)
Net unrealised remeasurement loss attributable to derivative financial instruments — (54)
Unwind of discount and remeasurement of liabilities—maintenance provision (33) (34)
Unwind of discount and remeasurement of liabilities—construction obligation liability B20 (22) (41)
Unwind of discount and remeasurement of liabilities—promissory and concession notes — (23)
Unwind of discount and remeasurement of liabilities—lease liabilities B31 (6) (6)
Unwind of discount and remeasurement of liabilities—other liabilities (3) (6)
Movement in impairment provisions on financial assets at amortised cost (1) —
Net foreign exchange losses (17) (17)
Total finance costs (809) (939)
Net finance costs from continuing operations (466) (870)
Borrowing costs capitalised to assets under construction
In addition to the net finance costs from continuing operations (shown above) that are included in the profit and loss, $69 million (2021: $55 million) of financing costs have been capitalised and included in the carrying value of assets under construction.
Unrealised remeasurement gain attributable to derivative financial instruments
The Group uses derivative financial instruments in the normal course of business to hedge exposures to fluctuations in interest rates and foreign exchange rates in accordance with the Group’s financial risk management policies. Excluding borrowings held in foreign currencies that hedge the Group’s investment in US and Canadian operations, the Group has entered into cross-currency interest rate swaps that hedge 100% of its economic exposure to borrowings raised in foreign currencies. The cross-currency interest rate swap contracts hedge the risk of unfavourable foreign exchange rate movements on borrowings denominated in foreign currencies. Under the swap contracts, the Group receives foreign currency at fixed rates and pays AUD at fixed rates.
At the end of each reporting period the Group remeasures the cross-currency interest rate swap contracts at fair value and applies hedge accounting. The periodic remeasurement of the cross-currency interest rate swap contracts to fair value includes an element of foreign currency basis spread. For those cross-currency interest rate swap contracts that designate the entire fair value of the cross-currency interest swap contract as the hedging instrument (including the foreign currency basis spread component), this can result in ineffectiveness in the hedging relationship that is recognised in the profit and loss.
During the year ended 30 June 2022 the Group observed an upward shift in the AUD basis curve relative to other foreign currencies, which resulted in a change in the fair value of these cross-currency interest rate swaps as outlined at Note B15. While the Group has removed the cash flow risk of unfavourable exchange rate movements through the use of these swaps, hedge accounting ineffectiveness is one of the primary drivers of the net unrealised remeasurement gain attributable to these derivative financial instruments for the year ended 30 June 2022.
The balance of the unrealised remeasurement gain for the reporting period relates to changes in the fair value of interest rate swap contracts that do not qualify for hedge accounting. The Group observed an increase in the interest rate curve during the period, which resulted in a change in the fair value of these interest rate swap contracts.
Unwind of discount and remeasurement of financial assets at amortised cost
The movement in the unwind of discount and remeasurement of financial assets at amortised cost is primarily due to the revision of the estimated repayment cash flows on the shareholder loan notes (SLNs) with STP JV and NWRG during the financial year, which had the effect of bringing forward the repayment of the SLNs (refer to Note B32).
Unwind of discount and remeasurement of construction obligation liability
The movement in the unwind of discount and remeasurement of the construction obligation liability has been influenced by the change in the expected completion date of the West Gate Tunnel Project and the timing of CityLink funding source payments (refer to Note B20).
Section B: Notes to the Group financial statements for the year ended 30 June 2022
149
Governance and risk
Security holder information
Sustainability supplement
Business performance
Introduction and overview
Directors’ report
Corporate Report for the year ended 30 June 2022
Remuneration report
Financial statements

150
Section B: Notes to the Group financial statements for the year ended 30 June 2022
B14 Borrowings
2022 2021$M $M
Current
Capital markets debt 304 250
US private placement 224 216
Term debt 535 284
Total current borrowings 1,063 750
Non-current
Capital markets debt 10,963 11,088
US private placement 2,827 2,828
Term debt 2,534 2,884
Shareholder loan notes 256 281
Total non-current borrowings 16,580 17,081
Total borrowings 17,643 17,831
Accounting policy
Borrowings are initially recognised at fair value, net of transaction costs incurred. Borrowings are subsequently measured at amortised cost. Any difference between the proceeds (net of transaction costs) and the redemption amount is recognised in the profit and loss over the period of the borrowings using the effective interest method. Fees paid on the establishment of loan facilities are recognised as transaction costs of the loan to the extent that it is probable that some or all of the facility will be drawn down. In this case, the fee is deferred until the draw down occurs. To the extent there is no evidence that it is probable that some or all of the facility will be drawn down, the fee is capitalised as a prepayment for liquidity services and amortised over the period of the facility to which it relates.
Borrowings are removed from the balance sheet when the obligation specified in the contract is discharged, cancelled or expired. The difference between the carrying amount of a financial liability that has been extinguished or transferred to another party and the consideration paid, including any non-cash assets transferred or liabilities assumed, is recognised in the profit and loss as finance income or finance costs. Borrowings are classified as current liabilities unless the Group has an unconditional right to defer settlement of the liability for at least 12 months after the reporting period.
Borrowing costs are recognised as expenses in the period in which they are incurred, except to the extent to which they relate to the construction of qualifying assets, in which case specifically identifiable borrowing costs are capitalised into the cost of the asset. Borrowing costs include interest on short-term and long-term borrowings.
Costs incurred in connection with the arrangement of borrowings are capitalised and amortised over the effective period of the funding.
Section B: Notes to the Group financial statements for the year ended 30 June 2022
150
Governance and risk
Security holder information
Sustainability supplement
Business performance
Introduction and overview
Directors’ report
Corporate Report for the year ended 30 June 2022
Remuneration report
Financial statements

151
Section B: Notes to the Group financial statements for the year ended 30 June 2022
B14 Borrowings (continued)
Financing arrangements and credit facilities
During the reporting period Transurban executed a number of financing activities including:
August 2021
• Transurban reached financial close on two letter of credit facilities, US$93 million ($135 million) and US$6 million ($9 million) both with a 2-year tenor.
September 2021
• Transurban Queensland repaid its $250 million Medium Term Note (MTN) which was due for maturity in December 2021.
• Transurban reached financial close on a letter of credit facility, comprising Facility A $82 million with a tenor of 2 years and Facility B $125 million with a tenor of 5 months. Facility B was cancelled in October 2021, following financial close of WestConnex.
November 2021
• Transurban repaid US$162 million ($227 million) in US private placement notes at their maturity in November 2021.
December 2021
• Transurban reached financial close on three letter of credit facilities of US$215 million ($312 million) with a tenor of 3 years, US$198 million ($287 million) with a tenor of 4.5 years and US$150 million ($218 million) with a tenor of 2.5 years.
February 2022
• Eastern Distributor reached financial close on a $434 million bank debt facility with a tenor of 8.8 years.
April 2022
• Transurban reached financial close on a $825 million syndicated bank facility with a tenor of 5 years.
May 2022
• Transurban Queensland reached financial close on a $150 million syndicated capex facility and a $35 million working capital facility. Both facilities have a tenor of 3 years.
• M5 West reached financial close on a $345 million bank debt facility with a tenor of 3.1 years.
Section B: Notes to the Group financial statements for the year ended 30 June 2022
151
Governance and risk
Security holder information
Sustainability supplement
Business performance
Introduction and overview
Directors’ report
Corporate Report for the year ended 30 June 2022
Remuneration report
Financial statements

152
Section B: Notes to the Group financial statements for the year ended 30 June 2022
B14 Borrowings (continued)
Financing arrangements and credit facilities (continued)
Credit facilities are provided as part of the overall debt funding structure of the Group. The drawn component of each facility is shown below:
Carrying valueMaturity 2022 2021
$M $M
Working capital facilities
AUD 2,650m facility Apr 20272 — —
Capital markets debt
EMTN EUR 600m Sep 2024 910 950
EMTN EUR 500m Aug 2025 758 791
US 144A USD 550m Feb 2026 799 731
US 144A USD 550m Mar 2027 799 731
EMTN NOK 750m Jul 2027 110 116
EMTN EUR 500m Mar 2028 758 791
EMTN CAD 650m Nov 2028 732 698
EMTN EUR 600m May 2029 910 950
EMTN EUR 750m Apr 2030 1,138 1,187
US 144A USD 900m Mar 2031 1,307 1,197
EMTN EUR 350m Jul 2034 531 554
Net capitalised borrowing costs (65) (69)
US private placement
Nov 2006—Tranche C USD 121m (plus accreted interest)1 Nov 2021 — 216
Nov 2006—Tranche D USD 50m (plus accreted interest) Nov 2026 98 89
Total corporate debt, net of capitalised borrowing costs 8,785 8,932
Non-recourse debt
Capital markets debt
Transurban Queensland Finance—Domestic bond AUD 250m1 Dec 2021 — 250
Transurban Queensland Finance—EMTN CHF 200m Jun 2023 304 288
Transurban Queensland Finance—Domestic bond AUD 200m Oct 2023 200 200
Transurban Queensland Finance—Domestic bond AUD 200m Dec 2024 200 200
Transurban Queensland Finance—EMTN CHF 200m Dec 2025 304 288
Transurban Queensland Finance—EMTN CHF 175m Nov 2026 266 253
Transurban Queensland Finance—EMTN Reg S USD 500m Apr 2028 726 665
Transurban Queensland Finance—Domestic bond AUD 300m Aug 2031 300 300
Transurban Queensland Finance—EMTN CHF 190m Nov 2031 289 274
Net capitalised borrowing costs (9) (7)
1. These facilities were repaid during FY22.
2. Maturity date shown is final maturity date. Tranche B ($825 million) matures in November 2024, Tranche C ($1,000 million) matures in November 2023 and Tranche D ($825 million) matures in April 2027.
Section B: Notes to the Group financial statements for the year ended 30 June 2022
152
Governance and risk
Security holder information
Sustainability supplement
Business performance
Introduction and overview
Directors’ report
Corporate Report for the year ended 30 June 2022
Remuneration report
Financial statements

153
Section B: Notes to the Group financial statements for the year ended 30 June 2022
B14 Borrowings (continued)
Financing arrangements and credit facilities (continued)Carrying value
Maturity 2022 2021$M $M
Non-recourse debt (continued)
US private placement
Transurban Cardinal Holdings—Nov 2018 CAD 200m Feb 2023 225 215
Transurban Queensland Finance—Sep 2015—Tranche A USD 155m Sep 2025 225 206
Transurban Queensland Finance—Dec 2016—Tranche A USD 130m Dec 2026 189 173
Transurban Queensland Finance—Dec 2016—Tranche D AUD 35m Dec 2026 35 35
Transurban Queensland Finance—Sep 2015—Tranche B USD 230m Sep 2027 334 306
Transurban Queensland Finance—Dec 2016—Tranche B USD 225m Dec 2028 327 299
Transurban Queensland Finance—May 2019—Tranche A AUD 30m May 2029 30 30
Transurban Queensland Finance—May 2019—Tranche C USD 144m May 2029 209 191
Transurban Queensland Finance—Sep 2015—Tranche C USD 256m Sep 2030 372 341
Transurban Queensland Finance—Sep 2015—Tranche D AUD 70m Sep 2030 70 70
Transurban Queensland Finance—May 2019—Tranche D USD 245m May 2031 356 326
Transurban Queensland Finance—Dec 2016—Tranche C USD 78m Dec 2031 113 104
Transurban Queensland Finance—Dec 2016—Tranche E AUD 75m Dec 2031 75 75
Transurban Queensland Finance—May 2019—Tranche B AUD 40m May 2034 40 40
Transurban Queensland Finance—May 2019—Tranche E USD 180m May 2034 261 239
Transurban Queensland Finance—Jan 2017—Tranche F AUD 100m Jan 2035 100 100
Net capitalised borrowing costs (8) (11)
Term debt
Airport Motorway Trust—Term debt AUD 226m1 Mar 2022 — 166
M5 West—Term Debt AUD 180m2 Dec 2022 — 137
Concession A25 LP—Term debt CAD 383m2 Feb 2023 390 385
M5 West—Term Debt AUD 96m Mar 2023 73 —
Airport Motorway Trust—Term debt AUD 302m1,2 Jan 2024 — 290
M5 West—Term Debt AUD 106m2 Mar 2024 106 —
Lane Cove Tunnel Trust—Term debt AUD 326m Oct 2024 326 326
Transurban Queensland Finance—Capex facility AUD 150m1 Apr 2025 33 7
Transurban Queensland Finance—Working capital facility AUD 35m1 Apr 2025 — —
Lane Cove Tunnel Trust—Term debt AUD 60m May 2025 60 60
M5 West—Term debt AUD 275m1 Jun 2025 — 275
M5 West—Term debt AUD 143m Jun 2025 143 —
Cross City Tunnel Trust—Term debt AUD 282m Mar 2026 282 282
Lane Cove Tunnel Trust—Term debt AUD 200m May 2028 200 200
Transurban Queensland Finance—Term debt AUD 200m Apr 2030 200 200
Hills Motorway Trust—Term debt AUD 475m Apr 2030 475 475
Airport Motorway Trust—Term debt AUD 434m2 Dec 2030 412 —
Lane Cove Tunnel Trust—Term debt AUD 40m May 2031 40 40
Hills Motorway Trust—Term debt AUD 340m Apr 2035 340 340
Net capitalised borrowing costs (11) (15)
Shareholder loan notes
Loan from Transurban Queensland consortium partners—AUD 281m3 Dec 2048 256 281
Total non-recourse debt, net of capitalised borrowing costs 8,858 8,899
Total borrowings 17,643 17,831
1. These facilities were refinanced during FY22.
2. These facilities require principal repayments throughout their life, with $73 million due within one year of 30 June 2022 (2021: $118 million), classified as current borrowings.
3. A portion of the shareholder loan notes were repaid during FY22.
Section B: Notes to the Group financial statements for the year ended 30 June 2022
153
Governance and risk
Security holder information
Sustainability supplement
Business performance
Introduction and overview
Directors’ report
Corporate Report for the year ended 30 June 2022
Remuneration report
Financial statements

154
Section B: Notes to the Group financial statements for the year ended 30 June 2022
B14 Borrowings (continued)
Working capital facilities
• The Group's corporate facilities are secured by first ranking charges granted by Transurban Finance Company Pty Ltd, Transurban Finance Trust, Transurban Holdings Limited, Transurban Holding Trust, Transurban International Limited and Transurban Limited; and
• The Transurban Queensland Finance facility is secured against the respective rights of Transurban Queensland Holdings 1 Pty Limited, Transurban Queensland Holdings 2 Pty Limited, Transurban Queensland Invest Trust and their assets.
Capital markets debt
• The Group has a corporate secured EMTN programme with a limit of US$10 billion. Under the program the Group may from time to time issue notes denominated in any currency. These facilities are secured by first ranking charges granted by Transurban Finance Company Pty Ltd, Transurban Finance Trust, Transurban Holdings Limited, Transurban Holding Trust, Transurban International Limited and Transurban Limited;
• The Group's corporate US 144A notes are secured by first ranking charges granted by Transurban Finance Company Pty Ltd, Transurban Finance Trust, Transurban Holdings Limited, Transurban Holding Trust, Transurban International Limited and Transurban Limited;
• The Transurban Queensland Finance domestic bonds are secured against the respective rights of Transurban Queensland Holdings 1 Pty Limited, Transurban Queensland Holdings 2 Pty Limited, Transurban Queensland Invest Trust and their assets; and
• A Transurban Queensland Finance EMTN program was established in March 2016 with a program limit of US$2 billion. Under the programme, Transurban Queensland Finance may from time to time issue notes denominated in any currency. These notes are secured against the respective rights of Transurban Queensland Holdings 1 Pty Limited, Transurban Queensland Holdings 2 Pty Limited, Transurban Queensland Invest Trust and their assets.
US private placement
• The Group's corporate US private placement facilities are secured by first ranking charges granted by Transurban Finance Company Pty Ltd, Transurban Finance Trust, Transurban Holdings Limited, Transurban Holding Trust, Transurban International Limited and Transurban Limited;
• The Transurban Queensland Finance US private placement facilities are secured against the respective rights of Transurban Queensland Holdings 1 Pty Limited, Transurban Queensland Holdings 2 Pty Limited, Transurban Queensland Invest Trust and their assets; and
• The Cardinal Hold Co Canadian private placement facilities are secured against the rights of Transurban Cardinal Holdings Ltd.
Term debt
• The Airport Motorway facility is secured against the respective rights of Airport Motorway Pty Limited, the Airport Motorway Trust and their assets;
• The Hills Motorway Trust facilities are secured against the respective rights of Hills Motorway Limited, Hills Motorway Trust and their assets;
• The Lane Cove Tunnel facility is secured against the respective rights of LCT-MRE Pty Limited, LCT-MRE Trust and their assets;
• The Cross City Tunnel facility is secured against the respective rights of Transurban CCT Pty Limited, Transurban CCT Trust and their assets;
• The M5 West facility is secured against the respective rights of Interlink Roads Pty Limited and their assets;
• The Transurban Queensland Finance facilities are secured against the respective rights of Transurban Queensland Holdings 1 Pty Limited, Transurban Queensland Holdings 2 Pty Limited, Transurban Queensland Invest Trust and their assets; and
• The A25 facility is secured against the respective rights of Concession A25 Funding Limited and Concession A25, L.P. and their assets.
Shareholder loan notes
• The loans to Transurban Queensland from the acquisition consortium partners are unsecured.
Section B: Notes to the Group financial statements for the year ended 30 June 2022
154
Governance and risk
Security holder information
Sustainability supplement
Business performance
Introduction and overview
Directors’ report
Corporate Report for the year ended 30 June 2022
Remuneration report
Financial statements

155
Section B: Notes to the Group financial statements for the year ended 30 June 2022
B14 Borrowings (continued)
Letters of credit and corporate credit facilities
2022 2021$M $M
MaturityFacility
amountAmount
issuedFacility
amountAmount
issued
Letter of credit facility Nov 2022 55 24 55 43
Letter of credit facility Dec 2022 4 4 118 118
General credit facility Dec 2022 6 5 6 5
Letter of credit facilities2 Dec 2022 150 42 154 98
Letter of credit facility Feb 2023 13 13 13 13
Letter of credit facilities1 Aug 2023 226 218 — —
Letter of credit facility1 Jun 2024 71 71 — —
Letter of credit facility1 Dec 2024 218 132 199 117
Working capital facility3 Apr 2025 12 12 3 3
Letter of credit facility1 Jun 2026 109 109 — —
Total 864 630 548 397
1. These facilities were amended or refinanced during FY22.
2. This included an LC facility of $4 million as at 30 June 2021 which was cancelled in FY22.
3. Transurban Queensland $3 million LC was refinanced in FY22. The $12 million drawn amount reflects the letters of credit issued as part of a working capital facility.
There are no claims against any of the issued letters of credit and therefore no liability is recorded as at 30 June 2022 (2021: $nil).
Covenants
A number of the Group's consolidated borrowings include financial covenants, which are listed below. There have been no breaches of any of these covenants during the year.
The Group monitors covenants by applying forecast cash flows to ensure ongoing compliance with its obligations. This allows capital management and management action decisions to be made at the asset level (including distributions) should actual cash flows not perform to budget.
Corporate and non-recourse debt covenants are calculated on a trailing 12 month basis. A trailing 12 month metric also enables management action to be taken swiftly to mitigate the risks of any covenants breaches.
Corporate debt
Covenant Covenant breach threshold
Senior Interest Coverage Ratio Less than 1.25 times
Group Market Capitalisation Gearing must not exceed 60%1
CityLink Interest Coverage Ratio Less than 1.1 times
1. Based on the balance sheet as at 30 June 2022, the Group’s average closing security price over 20 consecutive business days would need to be below $5.74 (2021: $3.83) per security to trigger this clause.
Non-recourse debt
Covenant Covenant breach threshold
A25 Interest Coverage Ratio Less than 1.05 times
M5 West Debt Service Cover Ratio Less than 1.10 times
Airport Motorway Trust Interest Coverage Ratio Less than 1.10 times
Hills Motorway Trust Debt Service Coverage Ratio Less than 1.10 times
Lane Cove Tunnel Trust Interest Coverage Ratio Less than 1.15 times
Cross City Tunnel Trust Interest Coverage Ratio Less than 1.10 times
Transurban Queensland Finance Interest Coverage Ratio Less than 1.20 times
Transurban Cardinal Holdings Senior Debt Service Coverage Ratio Less than 1.30 times
Section B: Notes to the Group financial statements for the year ended 30 June 2022
155
Governance and risk
Security holder information
Sustainability supplement
Business performance
Introduction and overview
Directors’ report
Corporate Report for the year ended 30 June 2022
Remuneration report
Financial statements

156
Section B: Notes to the Group financial statements for the year ended 30 June 2022
B15 Derivatives and financial risk management
Derivatives
2022 2021$M $M
Current Non-current Current Non-current
Assets
Interest rate swap contracts — 264 — 28
Cross-currency interest rate swap contracts 22 734 — 117
Power purchase agreements — 14 — —
Total derivative financial instrument assets 22 1,012 — 145
Liabilities
Interest rate swap contracts 50 — 2 213
Cross-currency interest rate swap contracts — 176 — 484
Total derivative financial instrument liabilities 50 176 2 697
Accounting policy
Initial recognition and subsequent measurement
Derivatives are initially recognised at fair value on the date a derivative contract is entered into and are subsequently remeasured at fair value at the end of each reporting period. The accounting for subsequent changes in fair value depends on whether the derivative is designated as a hedging instrument, and if so, the nature of the item being hedged. The Group designates certain derivatives as either:
• hedges of the fair value of recognised assets or liabilities or a firm commitment (fair value hedges);
• hedges of a particular risk associated with the cash flows of recognised assets and liabilities and highly probable forecast transactions (cash flow hedges); or
• hedges of a net investment in a foreign operation (net investment hedges).
At the inception of the hedging transaction the Group documents the relationship between the hedging instruments and hedged items, as well as its risk management objective and strategy for undertaking various hedge transactions. The Group also documents its assessment, both at hedge inception and on an ongoing basis, of whether the derivatives that are used in hedging transactions have been and will continue to be highly effective in offsetting changes in fair values or cash flows of hedged items.
The fair values of various derivative financial instruments used for hedging purposes are disclosed in this note. The entire fair value of a hedging derivative is classified as a non-current asset or liability when the remaining maturity of the hedged item is more than 12 months.
Cash flow hedges
The effective portion of changes in the fair value of derivatives that are designated and qualify as cash flow hedges is recognised in other comprehensive income and accumulated in reserves in equity. The gain or loss relating to the ineffective portion is recognised immediately in the profit and loss.
Amounts accumulated in equity are reclassified to the profit and loss in the periods when the hedged item affects the profit and loss.
When a hedging instrument expires or is sold or terminated, or when a hedge no longer meets the criteria for hedge accounting, any cumulative gain or loss existing in equity at that time remains in equity and is recognised when the forecast transaction is ultimately recognised in the profit and loss. When a forecast transaction is no longer expected to occur, the cumulative gain or loss that was reported in equity is immediately transferred to the profit and loss.
The Group excludes currency basis spread from its cash flow hedge relationships where the designated hedging instrument is a cross-currency interest rate swap entered into on or after 1 July 2020. Changes in currency basis spread on swaps entered into from 1 July 2020 are recognised through other comprehensive income in a separate cost of hedging reserve (refer to Note B12).
Net investment hedges
Hedges of net investments in foreign operations are accounted for similarly to cash flow hedges.
Any gain or loss on the hedging instrument relating to the effective portion of the hedge is recognised in other comprehensive income and accumulated in reserves in equity. The gain or loss relating to the ineffective portion is recognised immediately in the profit and loss.
Gains and losses accumulated in equity are included in the profit and loss when the foreign operation is partially disposed or sold.
Derivatives that do not qualify for hedge accounting
Certain derivative instruments do not qualify for hedge accounting. Changes in the fair value of any derivative instrument that does not qualify for hedge accounting are recognised immediately in the profit and loss.
Section B: Notes to the Group financial statements for the year ended 30 June 2022
156
Governance and risk
Security holder information
Sustainability supplement
Business performance
Introduction and overview
Directors’ report
Corporate Report for the year ended 30 June 2022
Remuneration report
Financial statements

157
Section B: Notes to the Group financial statements for the year ended 30 June 2022
B15 Derivatives and financial risk management (continued)
Hedging strategy and instruments used by the Group
The Group uses derivative financial instruments in the normal course of business in order to hedge exposures to fluctuations in interest rates and foreign exchange rates in accordance with the Group’s financial risk management policies. The Group’s policies allow derivative transactions to be undertaken for the purpose of reducing risk and do not permit speculative trading. The instruments used by the Group are as follows:
Interest rate swap contracts—cash flow hedges
The Group uses interest rate swap contracts to manage the Group’s exposure to variable interest rates related to borrowings. Interest rate swap contracts currently in place cover 100% (2021: 100%) of the variable debt held by the Group (excluding working capital facilities).
Forward exchange contracts—cash flow hedges
The Group currently uses forward exchange contracts to protect against exchange rate movements between the AUD and foreign currencies. The Group has hedged a portion of its USD and CAD interest commitments. The fair value of forward exchange contracts held is not material to the Group in the current year.
Cross-currency interest rate swap contracts—cash flow hedges
The Group has entered into cross-currency interest rate swap contracts to remove the risk of unfavourable exchange rate movements on borrowings held in foreign currencies. Under these contracts, the Group receives foreign currency at fixed rates and pays AUD at a fixed rate.
Offsetting financial assets and financial liabilities
Currently there is no right or basis to present any financial assets or financial liabilities on a net basis, and as such no financial assets or financial liabilities have been presented on a net basis in the Group's balance sheet at the end of the financial year.
Hedge of net investment in foreign entity
Transurban's investment in its US and Canadian based assets (TC in the US, A25 in Canada) act as a natural hedge against the exposure to foreign currency movements for a portion of the Group’s USD denominated borrowings and CAD denominated borrowings. Exchange differences arising on the revaluation of these borrowings are recognised in the profit and loss in the separate financial statements of the relevant subsidiaries. In the Group financial statements these exchange differences are recognised in the foreign currency translation reserve in equity and will be transferred to the profit and loss when the Group disposes of its interest in either the US or Canadian based assets.
As at 30 June 2022, the Group has deferred $83 million in losses (2021: $15 million in losses) related to exchange differences on the revaluation of financial instruments and $19 million in gains (2021: $12 million in gains) related to exchange differences on the net assets of its US and Canadian assets.
Power Purchase Agreements
As at 30 June 2022, the Group has entered into four Power Purchase Agreements (PPAs); three Financial PPAs and one Retail PPA. The three Financial PPAs are operational with the Retail PPA set to commence in January 2024.
The Financial PPAs with the Sapphire Wind Farm and Bango Wind Farm are both for 9 years and 9 months, support the NSW and WestConnex operations (excluding WestConnex M4-M5 Link) and expire in December 2030. The Bango Wind Farm became operational on 8 June 2022 and on 2 June 2022, the Bango Wind Farm PPA was amended and expanded to include NCX and M5 West operations from July 2022 onwards.
The Financial PPA with the Coopers Gap Wind Farm is for 4 years and 6 months, became operational on 1 January 2022 and supports Transurban Queensland's operations expiring in June 2026.
The Financial PPAs operate as a contract for difference (CfD) derivative which is a derivative financial instrument and are recorded on the balance sheet at fair value with movements recorded in the profit and loss.
On 23 December 2021, the Group entered into a Retail PPA to supply renewable energy from January 2024 to December 2030 to support its Victorian operations. The Retail PPA contract type differs to the Financial PPA contract type in that it does not contain a CfD derivative.
Financial risk management
The Group’s activities expose it to a variety of financial risks: market risk (including currency risk and interest rate risk), credit risk and liquidity risk. The financial risk management function is carried out centrally under the policies approved by the Board. The Group reviews operations actively to identify and monitor all financial risks and to mitigate these risks through the use of hedging instruments where appropriate. The Board is kept informed in a timely manner of any material exposures to financial risks.
The Group continuously monitors risk exposures over time through reviewing cash flow sensitivities, market analysis and ongoing communication within the Group. When measuring financial risk, the Group considers the positive and negative exposures, existing hedges and the ability to offset exposures.
Section B: Notes to the Group financial statements for the year ended 30 June 2022
157
Governance and risk
Security holder information
Sustainability supplement
Business performance
Introduction and overview
Directors’ report
Corporate Report for the year ended 30 June 2022
Remuneration report
Financial statements

158
Section B: Notes to the Group financial statements for the year ended 30 June 2022
B15 Derivatives and financial risk management (continued)
Market risk
Foreign exchange risk
The Group operates internationally and is exposed to foreign exchange risk when future transactions and recognised assets and liabilities are denominated in a currency that is not the entity’s functional currency.
Foreign currency exposures are viewed as either investment exposures or operating exposures. The Group generally manages exposures from investments in foreign assets using foreign currency debt. The Group’s policy is to ensure that, at any time, all known material operating exposures for the following twelve months are hedged using hedging instruments or are offset by drawing on foreign currency funds.
The Group uses hedging instruments such as cross-currency swaps, as well as natural hedges such as foreign currency-denominated operating exposures and foreign currency borrowings, to manage these exposures.
The effects of the foreign currency related hedging instruments on the Group’s financial position and performance are as follows:
2022 2021
$M $M
Net investment in foreign operation—USD1
Carrying amount 726 880
USD carrying amount 500 662
Hedge ratio 1:1 1:1
Increase in carrying amount of loan as a result of foreign currency movements 62 9
Increase in value of hedged item used to determine hedge effectiveness 255 27
Net investment in foreign operation—CAD
Carrying amount 638 583
CAD carrying amount 567 544
Hedge ratio 1:1 1:1
Increase in carrying amount of loan as a result of foreign currency movements 34 5
Increase in value of hedged item used to determine hedge effectiveness 30 4
2022 2021
$M $M
Cross-currency interest rate swaps
Carrying amount 580 (367)
Notional amount 11,320 11,320
Maturity datesJune 2023 to
July 2034June 2023 to
July 2034
Hedge ratio 1:1 1:1
Increase/(decrease) in discounted value of outstanding hedging instruments since inception 775 (663)
(Decrease)/increase in value of hedged item used to determine hedge effectiveness (782) 719
1. During the prior comparative period, the Group divested 50% of its equity interest in TC, which resulted in the discontinuation of the previous net investment hedge of the US assets. From the date of the change in control of TC on 31 March 2021, the Group has designated a new net investment hedge of its equity accounted investment in the US assets.
Section B: Notes to the Group financial statements for the year ended 30 June 2022
158
Governance and risk
Security holder information
Sustainability supplement
Business performance
Introduction and overview
Directors’ report
Corporate Report for the year ended 30 June 2022
Remuneration report
Financial statements

159
Section B: Notes to the Group financial statements for the year ended 30 June 2022
B15 Derivatives and financial risk management (continued)
Market risk (continued)
Foreign exchange risk (continued)
Maturity profile—notional value of cross-currency interest rate swaps are as follows:
2022 Less than 12 months 1–5 years Over 5 years
Total notional amount$M
Cross-currency interest rate swaps (AUD:USD)3 — 952 2,758 3,710
Average AUD-USD exchange rate — 0.74 0.74 NA¹
Average fixed interest rate2 — 5.4% 4.5% NA¹
Cross-currency interest rate swaps (AUD:EUR)4 — 1,100 2,200 3,300
Average AUD-EUR exchange rate — 0.71 0.61 NA¹
Average fixed interest rate2 — 5.3% 4.3% NA¹
Cross-currency interest rate swaps (AUD:CHF)5 200 375 190 765
Average AUD-CHF exchange rate 0.72 0.74 0.71 NA¹
Average fixed interest rate2 4.6% 4.5% 3.3% NA¹
Cross-currency interest rate swaps (AUD:NOK)6 — — 750 750
Average AUD-NOK exchange rate — — 6.42 NA¹
Average fixed interest rate2 — — 4.5% NA¹
2021
$M
Cross-currency interest rate swaps (AUD:USD)3 — 205 3,505 3,710
Average AUD-USD exchange rate — 0.75 0.74 NA¹
Average fixed interest rate2 — 5.5% 4.7% NA¹
Cross-currency interest rate swaps (AUD:EUR)4 — 1,100 2,200 3,300
Average AUD-EUR exchange rate — 0.71 0.61 NA¹
Average fixed interest rate2 — 5.3% 4.3% NA¹
Cross-currency interest rate swaps (AUD:CHF)5 — 400 365 765
Average AUD-CHF exchange rate — 0.73 0.73 NA¹
Average fixed interest rate2 — 4.5% 3.9% NA¹
Cross-currency interest rate swaps (AUD:NOK)6 — — 750 750
Average AUD-NOK exchange rate — — 6.42 NA¹
Average fixed interest rate2 — — 4.5% NA¹
1. NA―Not applicable.
2. Based on average fixed rate of cross-currency swap contracts, which does not include any margins that may be applicable on the hedged debt instrument.
3. Balances are presented in USD currency.
4. Balances are presented in EUR currency.
5. Balances are presented in CHF currency.
6. Balances are presented in NOK currency.
Effectiveness of hedging relationships designated are as follows:
2022
Hedge (gains)/losses recognised in other
comprehensive income
Hedge ineffectiveness (gains)/losses
recognised in profit and loss
Line item in profit and loss that includes
hedge ineffectiveness
Amount reclassified from other
comprehensive income to profit and
lossLine item in profit and
loss for reclassification$M
Foreign currency risk
Cross-currency interest rate swaps (861) (86) Net finance costs — Net finance costs
Net investment in foreign operation 81 3 Net finance costs — Net finance costs
2021
$M
Foreign currency risk
Cross-currency interest rate swaps 521 97 Net finance costs 5 Net finance costs
Net investment in foreign operation 31 — Net finance costs (44) Profit for the year from
discontinued operations
Section B: Notes to the Group financial statements for the year ended 30 June 2022
159
Governance and risk
Security holder information
Sustainability supplement
Business performance
Introduction and overview
Directors’ report
Corporate Report for the year ended 30 June 2022
Remuneration report
Financial statements

160
Section B: Notes to the Group financial statements for the year ended 30 June 2022
B15 Derivatives and financial risk management (continued)
Market risk (continued)
Foreign exchange risk (continued)
Exposure to foreign currency risk at the reporting date, denominated in the currency in which the risk arises are as follows:
2022 Local 2021 Local$M $M
USD EUR CAD CHF NOK USD EUR CAD CHF NOK
Cash and cash equivalents 2 — 1 — — 8 — 5 — —
Trade payables 2 — — — — 2 — — — —
Net investment in foreign operation 2,073 — 567 — — 2,057 — 544 — —
Borrowings (4,210) (3,300) (650) (765) (750) (4,373) (3,300) (650) (765) (750)
Foreign exchange forwards 1 — 12 — — 10 — 20 — —
Cross-currency interest rate swaps 3,710 3,300 — 765 750 3,710 3,300 — 765 750
Net exposure 1,578 — (70) — — 1,414 — (81) — —
Sensitivity to exchange rate movements based on the translation of financial instruments held at the end of the period is as follows:
2022 2021$M $M
Movement in post-tax
profit
Increase/(decrease) in
equity
Movement in post-tax
profit
Increase/(decrease) in
equity
AUD/USD
+ 10 cents — (219) (1) (226)
– 10 cents 1 293 1 295
AUD/EUR
+ 5 cents — (193) — (43)
– 5 cents — 303 — 50
AUD/CAD
+ 10 cents¹ (7) (1) (7) (1)
– 10 cents¹ 8 1 9 2
AUD/CHF
+ 10 cents — (9) — (7)
– 10 cents — 12 — 9
AUD/NOK
+ 50 cents — — — (1)
– 50 cents — — — 1
1. Movement in post-tax profit relates to the ineffective portion of the net investment hedge in Canadian operations where the gain or loss is recognised in the profit and loss.
The Group revalues its foreign currency denominated borrowings each period using market spot rates and, where these borrowings have been appropriately hedged, defers these movements in the cash flow hedge reserve in equity. The volatility in the cash flow hedge reserve is caused mainly by fair value movements of the cross-currency interest rate swaps, which are affected by changes in forward Australian dollar/foreign currency exchange rates.
Section B: Notes to the Group financial statements for the year ended 30 June 2022
160
Governance and risk
Security holder information
Sustainability supplement
Business performance
Introduction and overview
Directors’ report
Corporate Report for the year ended 30 June 2022
Remuneration report
Financial statements

161
Section B: Notes to the Group financial statements for the year ended 30 June 2022
B15 Derivatives and financial risk management (continued)
Market risk (continued)
Interest rate risk
The Group’s main exposure to interest rate risk arises from our borrowings and cash and cash equivalents. The Group manages the interest rate risk on our borrowings by entering into fixed rate debt facilities or by using interest rate swaps to convert floating rate debt to fixed interest rates.
The Group’s policy is to hedge the interest rate exposure on drawn debt to between 80% and 100%, and to ensure compliance with any covenant requirements of our funding facilities. As at 30 June 2022, 100% (2021: 100%) of the Group’s interest rate exposure on variable rate borrowings was hedged (excluding working capital facilities).
The effects of the interest rate related hedging instruments on the Group’s financial position and performance are as follows:
2022 2021
$M $M
Interest rate swaps
Carrying amount 263 (74)
Notional amount1 3,225 3,359
Maturity dates
August 2022 to January
2035
February 2022 to January
2035
Hedge ratio 1:1 1:1
Increase/(decrease) in fair value of outstanding hedging instruments since inception 356 (158)
(Decrease)/increase in value of hedged item used to determine hedge effectiveness (361) 161
1. The notional amounts disclosed in the table above exclude $408 million (2021: $393 million) relating to interest rate swaps which are not hedge accounted. These notional amounts are however included in the net exposure to interest rate risk table. The notional amounts above also include $407 million (2021: $407 million) of forward starting swaps which are hedging the same underlying interest rate exposures and therefore not included in the net exposure to interest rate risk table. The notional amount of interest rate swaps hedging floating rate interest rate exposures relating to fixed-for-floating cross-currency swaps is also excluded (2022: $nil; 2021: $nil).
Maturity profile―notional value of interest rate swaps are as follows:
2022 Less than 12 months 1–5 years Over 5 years
Total nominal amount$M
Interest rate swaps 455 1,143 1,627 3,225
Average fixed interest rate1 2.9% 1.8% 1.9% —
2021
$M
Interest rate swaps 166 1,978 1,215 3,359
Average fixed interest rate1 2.3% 1.7% 1.8% —
1. Based on average fixed rate of interest rate swap contracts, which does not include any margins that may be applicable on the hedged debt instrument.
Effectiveness of hedging relationships designated are as follows:
2022
Hedge gains recognised in other
comprehensive income
Hedge ineffectiveness losses/(gains)
recognised in profit and loss
Line item in profit and loss that includes
hedge ineffectiveness
Amount reclassified from other
comprehensive income to profit and
lossLine item in profit and
loss for reclassification$M
Interest rate risk (333) — Net finance costs (4) Net finance costs
2021$M
Interest rate risk (203) — Net finance costs — Net finance costs
Section B: Notes to the Group financial statements for the year ended 30 June 2022
161
Governance and risk
Security holder information
Sustainability supplement
Business performance
Introduction and overview
Directors’ report
Corporate Report for the year ended 30 June 2022
Remuneration report
Financial statements

162
Section B: Notes to the Group financial statements for the year ended 30 June 2022
B15 Derivatives and financial risk management (continued)
Market risk (continued)
Interest rate risk (continued)
As at the reporting date, the Group had the following cash balances, variable rate borrowings and interest rate swap contracts outstanding:
2022 2021$M $M
Cash and cash equivalents 2,020 4,285
Floating rate borrowings (3,241) (3,343)
Interest rate swaps (notional principal amount) 3,226 3,345
Net exposure to interest rate risk 2,005 4,287
Sensitivity to interest rate movements based on variable rate cash balances, variable rate borrowings and interest rate swap contracts is as follows:
Movement in post-tax profit2022 2021
$M $M
Interest rates +100bps 20 43
Interest rates –100bps (20) (43)
Credit risk
Credit risk refers to the risk that a counterparty will default on its contractual obligations, resulting in financial loss. The Group has no significant concentrations of credit risk from operating activities, and has policies in place to ensure that transactions are made with commercial customers with an appropriate credit history. However, as an operator of large infrastructure assets, the Group is exposed to credit risk with its financial counterparties through entering into financial transactions in the ordinary course of business. These include funds held on deposit, cash investments and the market value of derivative transactions.
The Group assesses the credit strength of potential financial counterparties using objective ratings provided by multiple independent rating agencies. The Board approved policies ensure that higher limits are granted to higher rated counterparties. The Group also seeks to mitigate its total credit exposure to counterparties by only dealing with credit worthy entities, limiting the exposure to any one counterparty, minimising the size of the exposure where possible through netting offsetting exposures, diversifying exposures across counterparties, closely monitoring changes in total credit exposures and changes in credit status, and taking mitigating action when necessary.
Credit exposures and compliance with internal credit limits are monitored daily. An International Swaps and Derivatives Association (ISDA) agreement must be in place between the Transurban dealing entity and the counterparty prior to executing any derivatives and netting provisions are included.
Liquidity risk
The Group maintains sufficient cash and undrawn facilities to maintain short term flexibility and enable the Group to meet financial commitments in a timely manner. The Group assesses liquidity over the short term (up to 12 months) and medium term (1 to 5 years) by maintaining accurate forecasts of operating expenses, committed capital expenditure, debt maturities and payments to security holders. Long term liquidity requirements are reviewed as part of the annual strategic planning process.
Short term liquidity is managed by maintaining a strategic level of liquidity at the corporate level of the Group. This reserve is based on the Group’s forecast annual operating costs and certain risk exposure scenarios as maintained by the Group’s strategic risk register, and is maintained as cash and undrawn facilities. Forecasting is performed frequently to ensure the strategic liquidity reserve is being maintained to adequate levels. Medium term liquidity forecasting is maintained on a rolling five year horizon.
Existing cash reserves are sufficient to cover periods of negative cash flows, however some subsidiary assets adopted a conservative position on paying distributions to retain sufficient asset level liquidity.
Transurban Finance Company Pty Ltd, Transurban’s corporate borrowing entity is currently forecast to maintain all required liquidity buffers for the Group as required under the Group’s Treasury Policy.
Financing arrangements
The Group has access to the following undrawn borrowing facilities at the end of the reporting period:
2022 2021
$M $M
Floating rate
Expiring beyond one year 2,790 2,853
2,790 2,853
As at 30 June 2022, the Group has letter of credit facilities and general credit facilities in place with an undrawn capacity of $234 million (2021: $151 million). The facilities are committed for the duration of the facility and the undrawn portion cannot be withdrawn by the lenders.
Section B: Notes to the Group financial statements for the year ended 30 June 2022
162
Governance and risk
Security holder information
Sustainability supplement
Business performance
Introduction and overview
Directors’ report
Corporate Report for the year ended 30 June 2022
Remuneration report
Financial statements

163
Section B: Notes to the Group financial statements for the year ended 30 June 2022
B15 Derivatives and financial risk management (continued)
Liquidity risk (continued)
Contractual maturities of financial liabilities
The amounts disclosed in the following table are the contractual undiscounted cash flows of the Group’s financial liabilities.
2022 1 year or less
Over 1 to 2 years
Over 2 to 3 years
Over 3 to 4 years
Over 4 to 5 years
Over 5 years
Total contractual
cash flowsCarrying amount$M
Trade payables 463 — — — — — 463 463
Borrowings 1,434 893 2,105 2,866 1,827 11,572 20,697 17,643
Interest rate swaps1,2 (14) (49) (37) (32) (28) (101) (261) (214)
Cross-currency interest rate swaps1,3 196 186 186 150 118 318 1,154 (580)
Power purchase agreements (3) (3) (2) (6) (5) 4 (15) (14)
Concession and promissory notes — — — — — 629 629 140
Lease liabilities 17 17 19 19 20 68 160 131
Other liabilities 213 4 4 5 5 130 361 260
Total 2,306 1,048 2,275 3,002 1,937 12,620 23,188 17,829
2021 1 year or less
Over 1 to 2 years
Over 2 to 3 years
Over 3 to 4 years
Over 4 to 5 years
Over 5 years
Total contractual
cash flowsCarrying amount$M
Trade payables 397 — — — — — 397 397
Borrowings 1,015 1,483 1,108 2,135 2,716 12,790 21,247 17,831
Interest rate swaps1,2 66 48 32 19 9 26 200 187
Cross-currency interest rate swaps1,3 210 209 198 198 163 474 1,452 367
Concession and promissory notes — — — — — 601 601 133
Lease liabilities 16 16 17 19 19 87 174 141
Other liabilities 86 4 4 5 5 139 243 133
Total 1,790 1,760 1,359 2,376 2,912 14,117 24,314 19,189
1. The carrying value of the interest rate and cross-currency interest rate swaps are presented on a net basis. The gross position is disclosed in the first table of Note B15.
2. Cash flows have been estimated using forward interest rates at the end of the reporting period.
3. Cash flows have been estimated using spot translation rates at the end of the reporting period.
Capital management
The Group's objectives when managing capital are to safeguard its ability to continue as a going concern and to maintain an optimal capital structure to reduce the cost of capital, so that it can continue to provide returns to security holders and benefits for other stakeholders.
Fair value measurements
The carrying amount of the Group’s financial assets and liabilities approximate their fair value. With current borrowings, this is due to the interest payable being close to current market rates or the borrowings are of a short-term nature. The fair values of non-current borrowings are determined based on discounted cash flows using a current borrowing rate. They are classified as level 2 fair values in the fair value hierarchy due to the use of observable inputs.
Fair value is categorised within the fair value hierarchy based on the lowest level of input that is significant to the fair value measurement as a whole:
• Level 1—quoted prices (unadjusted) in active markets for identical assets or liabilities;
• Level 2—inputs other than quoted prices included within level 1 that are observable for the asset or liability, either directly (as prices) or indirectly (derived from prices); and
• Level 3—inputs for the asset or liability that are not based on observable market data (unobservable inputs).
All of the Group’s financial instruments measured, recognised and disclosed at fair value are valued using market observable inputs (level 2), except for the Financial PPAs (level 3).
Section B: Notes to the Group financial statements for the year ended 30 June 2022
163
Governance and risk
Security holder information
Sustainability supplement
Business performance
Introduction and overview
Directors’ report
Corporate Report for the year ended 30 June 2022
Remuneration report
Financial statements

164
Section B: Notes to the Group financial statements for the year ended 30 June 2022
B15 Derivatives and financial risk management (continued)
Fair value measurements (continued)
The Financial PPAs include CfD derivatives which are measured as level 3 financial instruments. This is because the electricity forward spot prices cannot be forecasted (using observable market data) for the duration of the contracts.
The valuation technique applied to the CfDs for the Financial PPAs uses an electricity price forecasting model and inputs consistent with those outlined in the ‘Key estimate and judgement’ below.
The following table presents the changes in level 3 instruments for the year ended 30 June 2022:
Level 3 Instruments
$M
Opening balance at 1 July 2021 —
Gains recognised in the profit and loss1 14
Closing balance at 30 June 2022 14
1. Comprises unrealised gains recognised in the profit and loss (road operating costs) attributable to balances held at the end of the reporting period.
There were no transfers between levels during the period and there has been no change in the valuation techniques applied for level 2 instruments.
KEY ESTIMATE AND JUDGEMENT
The fair value of financial instruments that are not traded in an active market is determined using valuation techniques. The Group uses its judgement to select a variety of methods and makes assumptions that are mainly based on market conditions existing at each reporting date. The fair value of both cross-currency interest rate swaps and interest rate swaps is calculated as the present value of the estimated future cash flows. The fair value of forward exchange contracts is determined using forward exchange market rates at the end of the reporting period. The fair value of CfDs relating to Financial PPAs is determined using an electricity price forecasting model and inputs used include forecast electricity volumes, the electricity forward spot price, the contract period, the discount rate and the net position of the long-term generation certificates.
Section B: Notes to the Group financial statements for the year ended 30 June 2022
164
Governance and risk
Security holder information
Sustainability supplement
Business performance
Introduction and overview
Directors’ report
Corporate Report for the year ended 30 June 2022
Remuneration report
Financial statements

165
Section B: Notes to the Group financial statements for the year ended 30 June 2022
Concession summaryThe table below summarises the key balance sheet items of the Group’s concession assets by geographical region:
2022
Melbourne Sydney BrisbaneNorth
AmericaCarrying amount$M
Equity accounted investment carrying amount — 7,487 — 3,037 10,524
Service concession intangible assets carrying amount 2,663 5,426 7,319 1,224 16,632
Concession financial asset (current and non-current) — — — 369 369
Assets under construction1 4,009 — — — 4,009
Other intangibles2 52 — — — 52
Goodwill 1 260 205 — 466
Maintenance provision (current and non-current) (170) (265) (658) (35) (1,128)
Construction obligation liability (current and non-current) (796) — — — (796)
2021
Melbourne Sydney BrisbaneNorth
AmericaCarrying amount$M
Equity accounted investment carrying amount — 3,037 — 2,714 5,751
Service concession intangible assets carrying amount 2,780 5,867 7,557 1,223 17,427
Concession financial asset (current and non-current) — — — 358 358
Assets under construction1 3,672 — — 2 3,674
Goodwill 1 260 205 — 466
Maintenance provision (current and non-current) (171) (256) (620) (31) (1,078)
Construction obligation liability (current and non-current) (1,225) — — — (1,225)
1. Assets under construction are included within other intangible assets in the consolidated balance sheet.
2. Relates to rights associated with the agreement with the High-Quality Bulla spoil disposal site entered in June 2021. Funding has been provided to complete the site activation works on a rights reserved basis to enable the site to be available for the receipt and storage of project spoil in relation to the West Gate Tunnel Project. The amount capitalised represents the Group's share of funding the site activation works.
KEY ESTIMATE AND JUDGEMENT
The Group makes certain assumptions in calculating the recoverable amount of its goodwill (Note B16), other intangible assets (Note B17) and equity accounted investments (Note B25). These include assumptions around expected traffic flows (including COVID-19 impacts) and forecast operational costs.
In performing the recoverable amount calculations for goodwill, the Group has applied the assumptions noted in Note B16. Management do not consider that any reasonably possible change in the assumptions will result in the carrying amount of a cash generating unit to which goodwill has been allocated exceeding its recoverable amount. Except for the A25 (refer to Note B17) and TC (refer to Note B25), management does not consider that reasonably possible changes in key assumptions would result in the recoverable amount being lower than the carrying amount of a service concession intangible asset or an equity accounted investment.
Section B: Notes to the Group financial statements for the year ended 30 June 2022
165
Governance and risk
Security holder information
Sustainability supplement
Business performance
Introduction and overview
Directors’ report
Corporate Report for the year ended 30 June 2022
Remuneration report
Financial statements

166
Section B: Notes to the Group financial statements for the year ended 30 June 2022
B16 Goodwill2022 2021
$M $M
Cost 466 466
Carrying amount 466 466
Goodwill primarily relates to the Group's Sydney Network cash generating unit (CGU) and Brisbane Network CGU and has arisen from the acquisition of Hills Motorway Group, Tollaust Pty Limited and the Sydney Roads Group in Sydney and the Queensland Motorways Group in Brisbane.
Impairment testing of goodwill
The Group assesses whether there is an indication of impairment at each reporting period and tests goodwill for impairment on an annual basis, regardless of whether an indicator of impairment exists.
Impairment testing is undertaken by calculating the recoverable amount, which is the greater of fair value less costs to sell and value in use. For the purpose of assessing impairment, assets are grouped at the lowest levels for which there are separately identifiable cash inflows which are largely independent of the cash inflows from other assets or groups of assets (CGU).
Where the carrying amount of an intangible asset exceeds its recoverable amount, the asset is considered impaired and is written down to its recoverable amount through the profit and loss. The decrement in the carrying amount is recognised as an expense in the profit and loss in the reporting period in which the impairment occurs.
The recoverable amount of the Group’s CGUs has been determined based on value-in-use calculations.
The following table sets out the key assumptions on which management have based their cash flow projections. The calculations use four-year cash flow projections based on financial plans reviewed by the Board which include management’s estimate of the impact to cash flows from inflation and to traffic volumes related to COVID-19. Management estimate a recovery in traffic volumes in the short to medium-term associated with the transition to a post COVID-19 environment and increased economic activity. Cash flows beyond this period are modelled using a consistent set of long-term assumptions up to the end of the applicable concession period:
Melbourne Sydney Brisbane
2022 2021 2022 2021 2022 2021
Long term consumer price index (CPI) (% annual growth) 2.5% 2.5% 2.5% 2.5% 2.5% 2.5%
Long term average weekly earnings (% annual growth) 3.5% 3.5% 3.5% 3.5% 3.5% 3.5%
Pre-tax discount rate (%) 8.2% 8.2% 8.2% 8.2% 8.2% 8.2%
Management have determined the values assigned to each of the below key assumptions as follows:
Assumption Approach used to determine values
Traffic volume Forecasts are developed based on historical trends and the Group's long term forecasting models, inclusive of some expectation of industry changes. Short and medium-term forecasting models incorporate management's estimate of the recovery from COVID-19 impacts. In developing these forecasts, management utilised external observable data to benchmark current traffic performance against an estimated improvement in traffic profiles. The improvement in traffic reflects the transition to a post COVID-19 environment coupled with increased economic activity.
Long term CPI (% annual growth) Based on independent external forecasts.
Long term average weekly earnings (% annual growth) Based on independent external forecasts.
Pre-tax discount rate Discount rates consider specific risks relating to the CGU. In performing the value-in-use calculations for each CGU, the Group has applied pre-tax discount rates to discount the forecast pre-tax cash flows. The pre-tax discount rates are disclosed in the table above. Discount rates factor in the risk associated with possible variations in the forecast impact to traffic volumes due to COVID-19.
The impairment testing indicates the recoverable amount of each Group CGU to which goodwill has been allocated exceeds its carrying amount (after allocating goodwill). Therefore, there is no goodwill that is impaired as at 30 June 2022.
Sensitivity analysis has been performed within each of the CGU valuation models to which goodwill has been allocated to determine whether it is feasible that the recoverable amount of the CGU could fall below its net carrying amount (after allocating goodwill) under reasonably possible scenarios of shifts in key assumptions. The results from the sensitivity analysis show that the recoverable amount of the CGU did not fall below its carrying amount (after allocating goodwill) under any of the sensitivity scenarios.
Section B: Notes to the Group financial statements for the year ended 30 June 2022
166
Governance and risk
Security holder information
Sustainability supplement
Business performance
Introduction and overview
Directors’ report
Corporate Report for the year ended 30 June 2022
Remuneration report
Financial statements

167
Section B: Notes to the Group financial statements for the year ended 30 June 2022
B17 Other intangible assets
2022 Concession assets
Assets under construction1
Other intangibles Total$M
Cost 25,165 4,384 181 29,730
Accumulated amortisation (8,533) (375) (69) (8,977)
Net carrying amount 16,632 4,009 112 20,753
2021 Concession assets
Assets under construction1
Other intangibles Total$M
Cost 25,093 3,924 130 29,147
Accumulated amortisation (7,666) (250) (54) (7,970)
Net carrying amount 17,427 3,674 76 21,177
Movement in other intangible assets
Concession assets
Assets under construction1
Other intangibles Total
$M $M $M $M
Net carrying amount at 1 July 2021 17,427 3,674 76 21,177
Additions — 464 51 515
Foreign exchange movements and other adjustments 61 (4) — 57
Amortisation charge (856) (125) (15) (996)
Net carrying amount at 30 June 2022 16,632 4,009 112 20,753
Net carrying amount at 1 July 2020 21,490 4,352 98 25,940
Additions — 158 16 174
Disposals through loss of control of subsidiary2 (2,899) (634) — (3,533)
Foreign exchange movements (304) (62) — (366)
Transfers 15 (15) — —
Amortisation charge (875) (125) (38) (1,038)
Net carrying amount at 30 June 2021 17,427 3,674 76 21,177
1. The amortisation charge recorded in assets under construction relates to the component of the West Gate Tunnel Project asset under construction which is related to CityLink funding contributions for which funding sources began to be received from 1 July 2019.
2. Relates to the deconsolidation of the Group’s ownership interest in TC upon divestment of a 50% ownership interest (refer to Note B24).
Concession assets represent the Group's rights to operate roads under Service Concession Arrangements. Service Concession Arrangements are accounted for in accordance with AASB Interpretation 12 Service Concession Arrangements (IFRIC 12), which establishes a framework for classification of the assets based on an intangible asset model and a financial asset model (bifurcated arrangements can also exist). Assets under construction are accounted for as contract assets in accordance with AASB 15 Revenue from Contracts with Customers until they are available for use. The Group classifies assets under construction based on whether the consideration provides rights to an intangible asset or a financial asset.
Intangible asset model
Concession assets that do not meet the criteria of the financial asset model are classified as intangible assets and are amortised on a straight-line basis over the term of the concession arrangement.
Transurban has the right to toll the concession assets for the concession period. Extensions to the concession period have been granted for a number of individual concessions as a result of road development projects and improvements. At the end of the concession period, all concession assets are to be returned to the respective government. The remaining terms of the right to operate period are reflected below:
2022 2021
Years Years
Melbourne—Victorian State Government 23 24
Sydney—New South Wales State Government1 4–26 5–27
Brisbane—Queensland State Government and Brisbane City Council 29–43 30–44
North America—MTQ 20 21
1. The concession end date for M5 West is December 2026 at which point it will form part of the WestConnex M5 concession.
Section B: Notes to the Group financial statements for the year ended 30 June 2022
167
Governance and risk
Security holder information
Sustainability supplement
Business performance
Introduction and overview
Directors’ report
Corporate Report for the year ended 30 June 2022
Remuneration report
Financial statements

168
Section B: Notes to the Group financial statements for the year ended 30 June 2022
B17 Other intangible assets (continued)
Indicators of impairment
At each reporting period the Group assesses whether there is an indication of impairment for each of the Group’s service concession intangible assets. Where an indicator of impairment is identified, impairment testing is performed.
COVID-19 related government restrictions have adversely affected traffic volumes and consequently toll revenue in the year ended 30 June 2022. Expected COVID-19 impacts were factored into the Group's budget for the year ended 30 June 2022. While there was some deterioration in traffic performance against budget, this was not significant enough to erode the excess in recoverable amount. This is mainly due to the length of the remaining term of these service concession arrangements, with the majority of the recoverable amount generated beyond the near-term period impacted by COVID-19. Given this, management have concluded that there are no indicators of impairment for the Group's service concession intangible assets as at 30 June 2022.
The key assumptions on which management have based their cash flow estimates used for the Group's impairment indicator assessments are traffic volumes, long-term CPI and the discount rate. For the A25, management have also considered the realisation of asset enhancement opportunities. As part of the impairment indicator assessments, sensitivity analysis has been performed which considers reasonably possible changes in these key assumptions for each of the Group's service concession intangible assets. Except for the A25, the Group's service concession intangible assets were not sensitive to reasonably possible changes in key assumptions. The recoverable amount for the A25 as at 30 June 2022 (based on fair value less costs of disposal) exceeds the carrying amount by 20% (30 June 2022 carrying amount: $1,224 million). As at 30 June 2022, the A25 concession intangible asset is sensitive and may be impaired if there are reasonably possible changes in the key assumption relating to the realisation of asset enhancement opportunities. There has not been a material change to long-term assumptions through to 30 June 2022. Accordingly, and given the A25’s reducing carrying amount through amortisation, management conclude there is no impairment as at 30 June 2022.
KEY ESTIMATE AND JUDGEMENT
For the purpose of impairment testing under AASB 136, for the Victorian operating segment, management have determined that the lowest level where there is an identifiable group of assets, that has separately identifiable cash inflows that are largely independent from other assets or group of assets, is the combined service concession intangible assets of CityLink and West Gate Tunnel (CGU). Any identified indicator of impairment would require impairment testing at this CGU level. For a majority of the Group's remaining concession intangible assets, impairment testing has been identified at the individual service concession intangible asset level.
Impairment testing is undertaken by calculating the recoverable amount, based on the higher of fair value less costs of disposal and value-in-use, estimated using discounted cash flows. The calculation requires the use of assumptions regarding traffic flows, discount rates, growth rates and other factors affecting operating activities of the CGU.Management have concluded that there are no indicators of impairment for the service concession intangible assets of the CityLink and West Gate Tunnel CGU as at 30 June 2022.
Assets under construction
Assets under construction as at 30 June 2022 include the construction of the West Gate Tunnel Project in Melbourne.
Construction costs relating to completed works are transferred to the service concession intangible asset upon final completion of the project.
For the purposes of impairment testing, these balances are classified as contract assets and subject to the impairment requirements in AASB 9 Financial Instruments. Applying the expected credit loss model to the Group’s assets under construction resulted in a $nil loss allowance being recorded (2021: $nil). The expected credit loss model as at 30 June 2022 includes consideration of the impacts from the economic uncertainty relating to COVID-19, near-term interest rates and inflation which are limited due to the financial strength of the Group’s government counterparties.
Management considers the carrying amount of assets under construction to be appropriate as at 30 June 2022. Refer to Note B2 for details on the final settlement reached during the reporting period with the State of Victoria and the D&C Subcontractor on revised terms for the delivery of the West Gate Tunnel Project.
Section B: Notes to the Group financial statements for the year ended 30 June 2022
168
Governance and risk
Security holder information
Sustainability supplement
Business performance
Introduction and overview
Directors’ report
Corporate Report for the year ended 30 June 2022
Remuneration report
Financial statements

169
Section B: Notes to the Group financial statements for the year ended 30 June 2022
B18 Concession financial assetThe Group’s concession financial asset only relates to A25 as at 30 June 2022 and 30 June 2021.
Note 2022 2021
$M $M
Opening carrying value 358 358
Additional finance income recognised B13 23 23
Cash received (29) (27)
Foreign exchange movements and other adjustments 17 4
Closing carrying value 369 358
Including:
Current asset B8 30 28
Non-current asset 339 330
Total concession financial asset 369 358
The financial asset model within IFRIC 12 applies to service concession arrangements whereby the Group has an unconditional contractual right to receive cash or another financial asset as the consideration for the construction services provided to the grantor of the concession. The unconditional contractual right to receive cash or another financial asset arises under two scenarios:
• the respective government authority guarantees to pay the Group specified amounts throughout the term of the concession arrangement (such as availability payments) provided certain asset operating conditions are met; or
• the respective government authority guarantees to pay the Group any shortfall between amounts received from users of the asset and an amount specified within the concession agreement (guaranteed toll revenue arrangements).
For amounts received under these arrangements the traffic risk is not borne by the Group. The portion of concession arrangements accounted for under the financial asset model in IFRIC 12 are presented as a financial receivable within the Group’s consolidated balance sheet. The Group classifies its concession financial asset at amortised cost as the objective of the Group’s business model is to collect the contractual cash flows and the contractual terms give rise to cash flows that are solely payments of principal and interest.
As at 30 June 2022, having assessed the impacts from the economic uncertainty relating to COVID-19, near-term interest rates and inflation, management do not consider there to be evidence of a significant increase in credit risk since the initial recognition of these balances. This is mainly due to there being no significant change in the nature of or the collectability of these balances. The loss allowance for this concession financial asset continues to be limited to 12 months of expected losses. These balances continue to have low credit risk as they have a low risk of default and the government counterparty has a strong capacity to meet its contractual cash flow obligations in the near-term. Applying the expected credit loss model to the Group’s concession financial asset at amortised cost resulted in a $nil loss allowance being recorded (2021: $nil).
The fair value of the receivable is determined at the inception of the service concession arrangement based on the discounted present value of cash flows to be received over the concession life. A portion of the receivable is recognised with corresponding revenue recorded for construction services based on the progress of the construction services provided in each period. Post completion of construction services, interest income is recorded to recognise the unwind of discounted future cash flows, while also increasing the receivable balance. Amounts received from the respective government authority are offset against the financial asset receivable.
The concession asset of the A25 asset in Canada is accounted for using a bifurcated model, being:
• Financial asset model for the income streams of an unconditional contractual right to receive cash from MTQ, including the availability payments and the minimum guaranteed toll income; and
• Intangible asset model for the remaining income streams (refer to Note B17).
Section B: Notes to the Group financial statements for the year ended 30 June 2022
169
Governance and risk
Security holder information
Sustainability supplement
Business performance
Introduction and overview
Directors’ report
Corporate Report for the year ended 30 June 2022
Remuneration report
Financial statements

170
Section B: Notes to the Group financial statements for the year ended 30 June 2022
B19 Maintenance provision
Movement in maintenance provision
Current Non-current
$M $M
Carrying value at 1 July 2021 144 934
Additional provision recognised — 121
Amounts paid/utilised (105) —
Unwinding of discount — 33
Transfer 108 (108)
Foreign exchange movements — 1
Carrying value at 30 June 2022 147 981
Current Non-current
$M $M
Carrying value at 1 July 2020 104 1,102
Additional provision recognised — 117
Amounts paid/utilised (90) —
Unwinding of discount — 35
Transfer 138 (138)
Disposals through loss of control of subsidiary1 (6) (166)
Foreign exchange movements (2) (16)
Carrying value at 30 June 2021 144 934
1. Relates to the deconsolidation of the Group’s ownership interest in TC upon divestment of a 50% ownership interest (refer to Note B24).
KEY ESTIMATE AND JUDGEMENT
As part of its obligations under the service concession arrangements, the Group assumes responsibility for the maintenance and repair of installations of the publicly owned roads it operates (including associated tolling equipment and systems). The Group records a provision for its present obligation to maintain the roads held under concession deeds. The Group periodically reassesses the estimate of its present obligation, which includes consideration of the results of routine inspections performed over the condition of the roads it operates. Any incremental maintenance and repair activities identified through this process are assessed for whether they are the sole responsibility of the Group or whether they are the responsibility of other parties. To the extent the Group believes other parties are responsible for the maintenance or repair or remediation, the Group may initiate claims on those parties. These assessments inform the timing and extent of planned future maintenance activities, notwithstanding the provision recorded at period end continues to capture the Group’s maintenance and repair obligations under the concession deeds.
The provision is included in the financial statements at the present value of expected future payments. The calculations to discount these amounts to their present value are based on the estimated timing and profile of expenditure occurring on the roads.
Section B: Notes to the Group financial statements for the year ended 30 June 2022
170
Governance and risk
Security holder information
Sustainability supplement
Business performance
Introduction and overview
Directors’ report
Corporate Report for the year ended 30 June 2022
Remuneration report
Financial statements

171
Section B: Notes to the Group financial statements for the year ended 30 June 2022
B20 Construction obligation liability
West Gate Tunnel Project
The West Gate Tunnel Project is being funded by tolling income from the CityLink Concession Deed and the receipt of future tolling income from the West Gate Tunnel Project. The CityLink Concession Deed was amended in April 2019, requiring the recognition of an incremental asset within other intangible assets and a corresponding liability. The liability represents the Group’s obligation to complete construction of the West Gate Tunnel Project, attributable to the remaining CityLink funding sources payments. The liability will reduce as payments are made in connection with the CityLink funding sources.
The estimated nominal value of the remaining funding sources payments attributable to CityLink is $840 million as at 30 June 2022 (2021: $1,291 million) with $840 million due within five years (2021: $1,291 million due within five years).
Current Non-current
West Gate Tunnel Project
West Gate Tunnel Project Total
$M $M $M
Carrying value at 1 July 2021 579 646 1,225
Amounts paid/utilised (451) — (451)
Unwinding of discount — 22 22
Transfer 304 (304) —
Carrying value at 30 June 2022 432 364 796
Carrying value at 1 July 2020 767 822 1,589
Amounts paid/utilised (405) — (405)
Unwinding of discount — 41 41
Transfer 217 (217) —
Carrying value at 30 June 2021 579 646 1,225
KEY ESTIMATE AND JUDGEMENT
The Group has a construction liability for the West Gate Tunnel Project attributable to the CityLink funding sources payments from the CityLink Concession Deed Amendments. The construction liability is measured at the present value of the remaining CityLink funding sources payments. Assumptions are made in determining the timing and profile, based on the expected cash flows to be paid through completion of construction of the West Gate Tunnel Project, which are discounted to their present value.
The current balance represents the payments the Group expects to be made within 12 months from the reporting date, with the non-current portion being the present value of payments beyond 12 months from the reporting date.
Section B: Notes to the Group financial statements for the year ended 30 June 2022
171
Governance and risk
Security holder information
Sustainability supplement
Business performance
Introduction and overview
Directors’ report
Corporate Report for the year ended 30 June 2022
Remuneration report
Financial statements

172
Section B: Notes to the Group financial statements for the year ended 30 June 2022
B21 Other liabilities—concession and State loan liabilities2022 2021
$M $M
M1 Eastern Distributor concession notes 60 56
M2 Motorway promissory notes 80 77
State loans 209 82
M1 Eastern Distributor
The Eastern Distributor project deed between Airport Motorway Pty Limited, Airport Motorway Trust and Transport for New South Wales (TfNSW) provides for annual concession fees of $15 million during the construction phase and for the first 24 years after completion of construction of the M1 Eastern Distributor. Until a certain threshold return is achieved, payments of concession fees due under the Project Deed will be satisfied by means of the issue of non-interest bearing concession notes.
The face value of concession notes on issue as at 30 June 2022 is $375 million (2021: $360 million).
M2 Motorway
The Hills Motorway Trust has entered into leases with TfNSW. Annual lease liabilities under these leases total $13 million (2021: $12 million), indexed annually to the CPI over the estimated period that the M2 Motorway will be used. Until such time as a threshold return is achieved, payments under these leases can be made at any time at the discretion of the trustee of the Hills Motorway, by means of the issue of non-interest bearing promissory notes to TfNSW.
The face value of promissory notes on issue as at 30 June 2022 is $254 million (2021: $241 million).
State loans
Transurban WGT Co entered into loan agreements with the State of Victoria for the purpose of funding amounts owed by each party under the West Gate Tunnel Project D&C Subcontract, and also for funding advance payments to the West Gate Tunnel Project D&C Subcontractor. Loans are made between the parties on a short-term basis and are non-interest bearing.
The value of the State loans payable to the State as at 30 June 2022 is $209 million (2021: $82 million).
KEY ESTIMATE AND JUDGEMENT
Concession and promissory notesThe Group has non-interest bearing long term debt, represented by promissory notes and concession notes payable to TfNSW, measured at the present value of expected future payments. The calculations to discount these notes to their present value are based on the estimated timing and profile of the repayments. Assumptions are made in determining the timing and profile, based on expected available equity cash flows of the Group's CGUs. A discount rate is used to value the promissory notes and concession notes to their present value, which is determined through reference to other facilities in the market with similar characteristics. A discount rate of 7.50% (2021: 7.50%) has been used for notes issued during the reporting period, which recognises the subordinated nature of these notes.
Section B: Notes to the Group financial statements for the year ended 30 June 2022
172
Governance and risk
Security holder information
Sustainability supplement
Business performance
Introduction and overview
Directors’ report
Corporate Report for the year ended 30 June 2022
Remuneration report
Financial statements

173
Section B: Notes to the Group financial statements for the year ended 30 June 2022
Group structure
B22 Principles of consolidation
Subsidiaries
Subsidiaries are fully consolidated from the date the Group gains control of the subsidiary and are de-consolidated from the date that control ceases.
In preparing the consolidated financial statements of the Group, all inter-entity transactions and balances have been eliminated.
The accounting policies adopted by the individual entities comprising the Group are consistent with the Parent company.
Non-controlling interests
Non-controlling interests consist of two components:
• Non-controlling interest—other: external non-controlling interests relating to the results and equity of Transurban Queensland and Eastern Distributor subsidiaries are shown separately in the Group financial statements; and
• Non-controlling interests that relate to THT and TIL are presented separately, and relate to equity holders of the stapled group.
Associates and joint ventures
Associates are entities in which the Group has significant influence, but not control or joint control, over the financial and operating policies. The Group currently has an interest in one associate being Bluedot. A joint venture is an arrangement in which the Group has joint control, whereby the Group has rights to the net assets of the arrangement, rather than rights to its assets and obligations for its liabilities. The Group’s investments in joint ventures during the reporting period comprise STP JV, NWRG, TC, and Accelerate Maryland Partners LLC.
Interests in the associate and the joint ventures are accounted for using the equity method. They are initially recognised at cost, which includes transaction costs. Subsequent to initial recognition, the consolidated financial statements include the Group’s share of the profit and loss and other comprehensive income of equity accounted investees, until the date on which significant influence or joint control ceases. When the Group’s cumulative share of losses in an associate or joint venture exceeds its investment in the asset, the Group does not recognise any further losses from this point. Distributions received from the entities listed above reduce the carrying amount of the investment.
B23 Material subsidiariesThe Group’s material subsidiaries as at 30 June 2022 are outlined in the Group structure diagram below.
Section B: Notes to the Group financial statements for the year ended 30 June 2022
173
Governance and risk
Security holder information
Sustainability supplement
Business performance
Introduction and overview
Directors’ report
Corporate Report for the year ended 30 June 2022
Remuneration report
Financial statements

174
Section B: Notes to the Group financial statements for the year ended 30 June 2022
B24 Business combinations and changes in ownership interests
Business combinations
Accounting policy
Business combinations are accounted for using the acquisition method. The consideration transferred for the acquisition of a subsidiary comprises the fair values of the assets transferred, the liabilities incurred and the equity interests issued by the Group. The consideration transferred also includes the fair value of any contingent consideration arrangement and the fair value of any pre-existing equity interest in the subsidiary. Acquisition-related costs are expensed as incurred. Identifiable assets acquired and liabilities and contingent liabilities assumed in a business combination are, with limited exceptions, measured initially at their fair values at the acquisition date. On an acquisition-by-acquisition basis, the Group recognises any non-controlling interest in the acquiree either at fair value or at the non-controlling interest's proportionate share of the acquiree's net identifiable assets.
The excess of the consideration transferred, the amount of any non-controlling interest in the acquiree and the acquisition date fair value of any previous equity interest in the acquiree over the fair value of the Group's share of the net identifiable assets acquired is recorded as goodwill. If those amounts are less than the fair value of the net identifiable assets of the subsidiary acquired and the measurement of all amounts has been reviewed, the difference is recognised directly in the profit and loss as a gain on bargain purchase.
Where settlement of any part of cash consideration is deferred, the amounts payable in the future are discounted to their present value as at the date of obtaining control. The discount rate used is the entity's incremental borrowing rate, being the rate at which a similar borrowing could be obtained from an independent financier under comparable terms and conditions.
Contingent consideration is classified either as equity or a financial liability. Amounts classified as a financial liability are subsequently remeasured to fair value with changes in fair value recognised in the profit and loss.
Changes in ownership interests in controlled subsidiaries
Discontinued operations—Accounting policy
A discontinued operation is a component of the Group’s business that represents a separate major line of business or geographical area of operations that has ceased or been disposed of or is held for sale. When an operation is classified as a discontinued operation, the comparative statement of comprehensive income is restated as if the operation had been discontinued from the start of the comparative period.
Year ended 30 June 2021 changes in ownership interests
Sale of 50% interest in Transurban Chesapeake
On 17 December 2020 the Group announced that it had entered into an agreement to divest 50% of its equity interest in TC to AustralianSuper (25%), CPP Investments (15%) and UniSuper (10%). TC is part of the North American segment and includes the concessions for the 495 Express Lanes and 95 Express Lanes.
The sale was completed on 31 March 2021 via disposal of the Group’s controlling interest in TC.
The Group's investment in TC is equity accounted from 31 March 2021 and the Group’s 50% share of the equity accounted investment’s net profit after tax has been recorded as part of the Group’s continuing operations.
As TC represents the majority of the Group’s North American revenue and assets, the Group has classified its previous interest in TC as a discontinued operation up to the date of disposal. Financial information disclosed in relation to discontinued operations includes consolidation adjustments, net finance costs and income tax benefit (current tax and taxable temporary differences) that are recorded outside of the legal entities which form the TC Group, as they are directly related to the performance of the disposal group and the accounting for the transaction upon financial close.
Section B: Notes to the Group financial statements for the year ended 30 June 2022
174
Governance and risk
Security holder information
Sustainability supplement
Business performance
Introduction and overview
Directors’ report
Corporate Report for the year ended 30 June 2022
Remuneration report
Financial statements

175
Section B: Notes to the Group financial statements for the year ended 30 June 2022
B24 Business combinations and changes in ownership interests (continued)
Changes in ownership interests in controlled subsidiaries (continued)
Year ended 30 June 2021 changes in ownership interests (continued)
Sale of 50% interest in Transurban Chesapeake (continued)
Reconciliation of gain recognised on the disposal of 100% interest in TC
Note 2021
$M
Consideration on disposal
Cash consideration on disposal 2,706
Cash and cash equivalents disposed (369)
Realised forward FX contracts1 6
Total inflow of cash on disposal 2,343
Fair value of contingent consideration2 —
Fair value of 50% equity accounted investment in TC B25 2,706
Total consideration on disposal 5,049
(Assets)/liabilities at disposal date
Assets classified as held for sale (excluding cash disposed) (3,557)
Liabilities classified as held for sale 3,467
Carrying amount of net assets disposed (90)
Reclassification of reserves on disposal (net of income tax)3 185
Transaction costs on disposal (18)
Gain on disposal 5,126
Income tax expense (1,400)
Gain on disposal after income tax 3,726
1. Includes fair value gains recognised in association with forward FX contracts to fix the Australian dollar value of the majority of the net U.S. dollar proceeds from the divestment of 50% of the Group's interest in TC.
2. The earn-out receivable by the Group will be based on a cumulative revenue target trigger and subject to the achievement of minimum EBITDA thresholds. Upon meeting those triggers, an earn-out up to the earn-out cap will be paid between FY24 and FY26. The contingent consideration is recorded at the end of each reporting period at its fair value based upon the same assumptions underlying revenue and EBITDA as outlined in note B16. The fair value of contingent consideration is assessed as being nil at 31 March 2021, 30 June 2021 and 30 June 2022.
3. Includes foreign currency translation reserve $207 million less cash flow hedge reserve $22 million.
The assets and liabilities classified as held for sale associated with the TC Group as at sale completion date on 31 March 2021 were as follows:
31 March 2021
$M
Assets
Cash and cash equivalents 369
Trade and other receivables 12
Property, plant and equipment 12
Concession intangible assets 3,533
Total assets 3,926
Liabilities
Trade and other payables 116
Borrowings 2,598
Derivative financial instruments 59
Maintenance provision 172
Deferred tax liabilities 230
Other provisions 7
Other liabilities 285
Total liabilities 3,467
Net assets 459
Net assets associated with the TC Group within TIL as at 31 March 2021 were $487 million, which excludes adjustments recorded to other intangible assets upon consolidation of the THL Group, which were derecognised upon disposal.
Section B: Notes to the Group financial statements for the year ended 30 June 2022
175
Governance and risk
Security holder information
Sustainability supplement
Business performance
Introduction and overview
Directors’ report
Corporate Report for the year ended 30 June 2022
Remuneration report
Financial statements

176
Section B: Notes to the Group financial statements for the year ended 30 June 2022
B24 Business combinations and changes in ownership interests (continued)
Changes in ownership interests in controlled subsidiaries (continued)
Year ended 30 June 2021 changes in ownership interests (continued)
Sale of 50% interest in Transurban Chesapeake (continued)
Discontinued operations
The contribution of discontinued operations included within the Group’s consolidated statement of comprehensive income and consolidated statement of cash flows for the nine months ended 31 March 2021 is detailed below:
Income statement—Discontinued operations2021
$M
Toll revenue 77
Construction revenue 87
Total revenue 164
Total expenses1 (158)
Earnings before depreciation, amortisation, net finance costs and income taxes 6
Total amortisation and depreciation (21)
Net finance costs (178)
Loss before gain on disposal and income tax (193)
Gain on disposal2 5,126
Profit before income tax 4,933
Income tax benefit from discontinued operations 26
Income tax expense on gain on disposal (1,400)
Profit for the period3 3,559
Profit/(loss) attributable to:
Ordinary security holders of the stapled group
– Attributable to THL 42
– Attributable to THT/TIL 3,517
Profit attributable to ordinary security holders of the stapled group 3,559
Other comprehensive income
Changes in the fair value of cash flow hedges, net of tax 13
Exchange differences on translation of operations, net of tax (91)
Gains reclassified on disposal of subsidiary, net of tax4 (198)
Other comprehensive loss for the period, net of tax (276)
Total comprehensive income for the period 3,283
Total comprehensive income/(loss) for the period is attributable to:
Ordinary security holders of the stapled group
– Attributable to THL —
– Attributable to THT/TIL 3,283
Total comprehensive income attributable to ordinary security holders of the stapled group 3,283
1. Includes construction costs of $87 million.
2. Includes fair value gains of $6 million recognised in association with forward foreign exchange contracts to fix the Australian dollar value of the majority of the net U.S. dollar proceeds from the divestment of 50% of the Group's interest in TC.
3. Profit/(loss) of TIL for the year ended 30 June 2021 includes finance costs of $150 million (tax-effected: $146 million) relating to related party payables and loans that were settled on receipt of the proceeds of the transaction. Profit/(loss) of TIL for the year ended 30 June 2021 excludes fair value losses of $6 million (tax-effected: $4 million), which is recorded within a wholly owned subsidiary of THL.
4. Includes $13 million reversed against deferred tax assets.
In addition to net finance costs included in the profit and loss from discontinued operations, $12 million of financing costs for the nine months ended 31 March 2021 were capitalised by TC and included in the carrying amount of assets under construction.
Section B: Notes to the Group financial statements for the year ended 30 June 2022
176
Governance and risk
Security holder information
Sustainability supplement
Business performance
Introduction and overview
Directors’ report
Corporate Report for the year ended 30 June 2022
Remuneration report
Financial statements

177
Section B: Notes to the Group financial statements for the year ended 30 June 2022
B24 Business combinations and changes in ownership interests (continued)
Changes in ownership interests in controlled subsidiaries (continued)
Year ended 30 June 2021 changes in ownership interests (continued)
Sale of 50% interest in Transurban Chesapeake (continued)
Cash flows—Discontinued operations
20222 20213
$M $M
Net operating cash flows — (56)
Net investing cash flows (178) 2,229
Net financing cash flows — —
Effects of exchange rate changes on cash and cash equivalents — (49)
Net increase/(decrease) in cash and cash equivalents from discontinued operations1 (178) 2,124
1. The net movement in cash and cash equivalents from discontinued operations for TIL for the year ended 30 June 2021 is a $33 million outflow, after adjusting for the net financing cash flow impact from related party payables and borrowings that were settled on receipt of the proceeds from the transaction.
2. Cash flows from discontinued operations for the year ended 30 June 2022 relate to income tax paid in connection with the Group's divestment of 50% of its equity interest in TC.
3. Cash flows from discontinued operations include cash flows of TC for the 9 months ended 31 March 2021 and cash flows of the Transurban Group incurred in connection with the Group's divestment of 50% of its equity interest in TC.
B25 Equity accounted investments
Joint Ventures
STP JV (50% ownership interest)
The Group has a 50% ownership interest in the STP JV. The STP JV partners comprise of Transurban (50%), AustralianSuper (20.5%), CPP Investments (10.5%), Caisse de depot et placement du Quebec (CDPQ) (10%) and Tawreed (9%).
During the period, the STP JV increased its ownership interest in WestConnex from 51% to 100%. To fund this acquisition, the Group contributed $4,856 million of equity to the STP JV and also issued shareholder loan notes with a face value of $699 million. WestConnex has long-dated concessions through to 2060 and includes 33 kilometres of new or improved motorway linking Sydney’s west and southwest with the CBD, and the corridor to Sydney Airport and Port Botany.
The following entities are part of the STP JV Group:
• STP Project Trust;
• STP Asset Trust;
• STP PT Pty Ltd; and
• STP AT Pty Ltd.
KEY ESTIMATE AND JUDGEMENT
The Group’s assessment that it does not control the STP JV has been made by considering the terms of the Investment Agreement signed by the JV partners and the ongoing compliance with the Investor Agreement. This Agreement requires a supermajority vote of at least 91.5% of all investors for the decisions on the significant relevant activities made by the STP JV. Therefore, noting this and other factors, the Group has concluded that it, together with other STP JV partners, jointly controls the STP JV and its controlled entities.
NWRG (50% ownership interest)
The Group has a 50% ownership interest in NWRG (including NorthWestern Roads Group Pty Ltd, NorthWestern Roads Group Trust and NorthConnex State Works Contractor Pty Limited), which holds 100% of the Westlink M7 Group and the NorthConnex Group. Westlink M7 holds the concession to design, construct, finance and operate the Westlink M7 Motorway in Sydney for a period of 43 years from the date of operation (16 December 2005) until June 2048, and NorthConnex holds the concession to design, construct, finance and operate the NorthConnex Tunnel in Sydney until 2048.
The following entities are a part of the Westlink Group:
• WSO Co Pty Limited (the operator of the Motorway);
• Westlink Motorway Limited (the nominee manager of the Westlink Motorway Partnership);
• WSO Finance Pty Limited (the financier of the Motorway); and
• Westlink Motorway Partnership (was responsible for the construction of the Motorway).
The following entities are part of the NorthConnex Group:
• NorthConnex Company Pty Limited (the operator of the Tunnel); and
• NorthConnex Finance Pty Limited (the financier of the Tunnel).
Section B: Notes to the Group financial statements for the year ended 30 June 2022
177
Governance and risk
Security holder information
Sustainability supplement
Business performance
Introduction and overview
Directors’ report
Corporate Report for the year ended 30 June 2022
Remuneration report
Financial statements

178
Section B: Notes to the Group financial statements for the year ended 30 June 2022
B25 Equity accounted investments (continued)
Joint Ventures (continued)
TC (50% ownership interest)
Effective 31 March 2021, the Group has a 50% ownership interest in TC.
The following entities are part of TC:
• Transurban Chesapeake LLC;
• Capital Beltway Express LLC (the operator of the Capital Beltway Express Lanes); and
• 95 Express Lanes LLC (the operator of the 95 Express Lanes).
On 30 April 2022, TC and Branch-Flatiron Joint Venture (BFJV), the D&C Subcontractor on the Fredericksburg Extension project, reached agreement regarding claims related to certain geological soil conditions encountered during construction, including a new Scheduled Service Commencement Date of 15 December 2023. The total cost of the D&C Subcontract has increased by US$102 million ($150 million), of which US$30 million ($44 million) has been offset against provisional payments made previously to BFJV. The Group's proportional contribution to the adjustment to the D&C Subcontract price is included within Note B29.
KEY ESTIMATE AND JUDGEMENT
The Group’s assessment that it does not control TC has been made by considering the terms of the Purchase Agreement signed by the TC partners, which requires a supermajority vote of at least 77.5% of all shareholders for decisions on significant relevant activities. Considering this, and among other factors, the Group has concluded that it, together with the other TC partners, jointly controls TC and its controlled entities.
AM Partners (60% ownership interest)
The Group has a 60% ownership interest in AM Partners, whose role is to be the Maryland Department of Transport’s long-term partner to build, finance and operate new Express Lanes in Maryland, USA. Management have assessed that the Group does not control AM Partners considering the ownership and operating agreements, which require unanimous approval by all shareholders for all relevant decisions.
Associate
Bluedot (4.2% ownership interest)
Bluedot is an advanced location services technology company. The Group leverages Bluedot’s location services technology for the Group’s LinktGo application which allows the use of a smartphone’s GPS and other sensors to identify when a driver has entered and exited a toll road. Bluedot’s technology continues to be used by the Group as at 30 June 2022.
The carrying value of the Bluedot equity accounted investment is $nil (2021: $nil). Accordingly, summarised financial information, including cumulative losses not recognised, is not disclosed.
Set out below is the reconciliation of the carrying value of equity accounted investments:
STP JV NWRG TC Other5 Total
2022 2021 2022 2021 2022 2021 2022 2021 2022 2021
$M $M $M $M $M $M $M $M $M $M
Opening carrying value at 1 July 2,774 3,061 263 374 2,714 — — — 5,751 3,435
Acquisition — — — — — 2,706 — — — 2,706
Group's share of loss1,2 (308) (140) — — (60) (21) — — (368) (161)
Group’s share of other comprehensive income/(loss) 216 75 — — 29 (1) — — 245 74
Distributions received (342) (335) (85) (111) (65) — — — (492) (446)
Foreign exchange movements — — — — 255 28 1 — 256 28
Capital contributions3 4,970 113 — — 139 2 23 — 5,132 115
Fair value adjustment on issuance of shareholder loan notes and TC loan receivable4 (1) — — — 1 — — — — —
Closing carrying value at 30 June 7,309 2,774 178 263 3,013 2,714 24 — 10,524 5,751
Cumulative losses not recognised2,5 — — 119 123 — — — — 119 123
1. The Group’s share of STP JV losses includes losses from STP Project Trust of $150 million (2021: $11 million) and STP Asset Trust of $158 million (2021: $129 million).
2. The Group’s share of profits from the investment in the NWRG are currently not recognised until such time as cumulative losses have been fully utilised. Accordingly, any potential deferred tax liability relating to the difference between the accounting base of the investment and the tax base of the investment has not been brought to account as at 30 June 2022. Cumulative losses not recognised above are disclosed at 100%.
3. Capital contributions for AM Partners includes $6 million (2021: $nil) of costs capitalised as part of the cost of the equity accounted investment.
4. During the year, interest bearing loans issued to STP JV and TC were recorded at fair value on initial recognition and subsequently measured at amortised cost using the effective interest method. The difference between the nominal value of the loans and the fair value was treated as a contribution to the equity accounted investment in STP JV and TC.
5. Other equity accounted investments includes AM Partners.
Section B: Notes to the Group financial statements for the year ended 30 June 2022
178
Governance and risk
Security holder information
Sustainability supplement
Business performance
Introduction and overview
Directors’ report
Corporate Report for the year ended 30 June 2022
Remuneration report
Financial statements

179
Section B: Notes to the Group financial statements for the year ended 30 June 2022
B25 Equity accounted investments (continued)
Summarised financial information of equity accounted investments
Set out below is the summarised financial information for those joint ventures and associates that are material to the Group. The summarised financial information presented below is on a 100 per cent basis for each equity accounted investment.
Summarised balance sheet―100%
STP JV NWRG TC Other3 Total
2022 2021 2022 2021 2022 2021² 2022 2021 2022 2021$M $M $M $M $M $M $M $M $M $M
Cash and cash equivalents 716 940 129 133 483 366 — — 1,328 1,439
Other current assets 28 58 93 239 18 9 — — 139 306
Non-current assets 22,367 22,096 3,036 3,195 9,549 8,561 129 — 35,081 33,852
Current financial liabilities (1,496) 7 (1) (1) — — — — (1,497) 6
Other current liabilities (166) (223) (63) (128) (178) (145) (100) — (507) (496)
Non-current financial liabilities (11,364) (10,759) (3,411) (3,451) (3,616) (3,188) — — (18,391) (17,398)
Other non-current liabilities (67) (42) (108) (86) (232) (176) — — (407) (304)
Net assets/(liabilities) 10,018 12,077 (325) (99) 6,024 5,427 29 — 15,746 17,405
Summarised statement of comprehensive income—100%
Revenue 510 534 518 544 229 49 — — 1,257 1,127
Construction revenue 298 514 — 39 261 47 — — 559 600
Depreciation and amortisation (499) (498) (110) (100) (124) (29) — — (733) (627)
Other expenses (151) (141) (134) (107) (121) (30) — — (406) (278)
Construction costs (298) (514) — (39) (261) (47) — — (559) (600)
Net finance costs¹ (513) (449) (210) (183) (106) (31) — — (829) (663)
Income tax benefit/(expense) (58) (21) (60) 20 — — — — (118) (1)
Profit/(loss) (711) (575) 4 174 (122) (41) — — (829) (442)
Other comprehensive income/(loss) 566 297 14 4 61 (2) — — 641 299
Total comprehensive income/(loss) (145) (278) 18 178 (61) (43) — — (188) (143)
The following table reconciles the above summarised financial information presented on a 100 per cent basis to the proportional amounts recognised by the Group:
Ownership interest 50% 50% 50% 50% 50% 50% 60% 60%
Proportional total comprehensive income/(loss) (92) (65) 9 89 (79) (13) — — (162) 11
Amortisation of fair value uplift and other adjustments — — — — 48 (9) — — 48 (9)
Group's share of comprehensive income/(loss) (92) (65) 9 89 (31) (22) — — (114) 2
Profits not recognised (excluding other comprehensive income) — — (2) (87) — — — — (2) (87)
Group's recognised share of total comprehensive loss (92) (65) — — (31) (22) — — (123) (87)
1. STP JV includes net finance costs of $181 million (2021: $31 million of income) that are not recorded at the WestConnex level of the corporate structure, and are only incurred by the STP JV partners. The Group has a 50% equity interest in STP JV. Aside from some inconsequential items, the Group's proportional equity interest in the remaining STP JV comprehensive income is 50%, reflective of Transurban's proportional ownership interest in WestConnex.
2. The summarised statement of comprehensive income is presented from the date of divestment of 50% share in TC on 31 March 2021.
3. Other equity accounted investments includes AM Partners.
Indicators of impairment
At each reporting period the Group assesses whether there is an indication of impairment. Where an indicator of impairment is identified, impairment testing is performed using the same approach as the Group’s annual goodwill impairment testing. There were no indicators of impairment as at 30 June 2022.
The key assumptions on which management have based their cash flow estimates used for the Group’s impairment indicator assessments are traffic volumes, long-term CPI and the discount rate. As part of the impairment indicator assessments, sensitivity analysis has been performed which considers reasonably possible changes in these key assumptions for each of the Group’s equity accounted investments. Except for TC, the Group’s equity accounted investments were not sensitive to reasonably possible changes in key assumptions. The recoverable amount of TC exceeds the carrying amount by 15% (carrying amount $3,013 million as at 30 June 2022). The TC equity accounted investment was acquired in March 2021 as part of the divestment of TC (refer to Note B24) and due to the recent acquisition, the equity accounted investment could be impaired if there were a reasonably possible change in key assumptions relating to the discount rate or long-term CPI. However, there has not been a material change to long-term assumptions and accordingly, there is no impairment as at 30 June 2022.
Section B: Notes to the Group financial statements for the year ended 30 June 2022
179
Governance and risk
Security holder information
Sustainability supplement
Business performance
Introduction and overview
Directors’ report
Corporate Report for the year ended 30 June 2022
Remuneration report
Financial statements

180
Section B: Notes to the Group financial statements for the year ended 30 June 2022
B25 Equity accounted investments (continued)
Financing arrangements and credit facilities
During the reporting period, equity accounted investments executed a number of financing activities including:
February 2022
• 95 Express Lanes (TC) reached financial close on the issuance of US$638 million ($889 million) of Private Activity Bonds (PABs) refinancing its existing PABs series. The final maturity date is 2048.
March 2022
• Capital Beltway Express (TC) reached financial close on the Northern Extension Project (NEXT) and the refinancing of existing debt facilities. Debt raised included US$841 million ($1,157 million) of Bond Anticipation Notes (BANs), which were subsequently redeemed in June 2022, US$299 million ($412 million) of PABs with final maturity in 2057, US$1,053 million ($1,449 million) in new facilities under the Transportation Infrastructure Finance and Innovation Act (TIFIA) with maturities in 2047 and 2060 and a US$49 million ($67 million) facility with Virginia Transportation Infrastructure Bank (VTIB), with maturity in 2060.
April 2022
• WestConnex (STP JV) reached financial close on a $540 million bank facility with a tenor of 2 years.
June 2022
• NorthConnex (NWRG) reached financial close on a $202 million bank debt facility with a tenor of 5 years.
• Capital Beltway Express redeemed US$841 million ($1,217 million) of BANs via a drawdown against the TIFIA facility established in March 2022.
August 2022
• WestConnex (STP JV) reached financial close to raise $1,700 million of bank debt facilities with tenor of 4 and 7 years. The proceeds from the raising were used to fully refinance $1,499 million of existing bank debt facilities, as well as partially repay the $540 million bank debt facility established in April 2022.
B26 Non-controlling interests—otherSet out below is the summarised financial information for each material subsidiary (refer to Note B23) that has non-controlling interests (NCI) that are material and external to the Group and the total external NCI. The amounts disclosed are before intercompany eliminations.
Transurban Queensland Airport Motorway Total NCI
37.50% 37.50% 24.90% 24.90%
2022 2021 2022 2021 2022 2021
$M $M $M $M $M $M
Summarised balance sheet
Current assets 188 415 29 18 217 433
Non-current assets 8,958 8,705 1,382 1,413 10,340 10,118
Current liabilities (537) (479) (222) (375) (759) (854)
Non-current liabilities (6,669) (6,687) (863) (773) (7,532) (7,460)
Net assets 1,940 1,954 326 283 2,266 2,237
Carrying amount of NCI 726 733 81 68 807 801
Summarised statement of comprehensive income
Revenue 726 684 126 140 852 824
Expenses (745) (776) (105) (126) (850) (902)
Profit/(loss) for the year (19) (92) 21 14 2 (78)
Other comprehensive income/(loss) 202 (17) 26 7 228 (10)
Total comprehensive income/(loss) 183 (109) 47 21 230 (88)
Profit/(loss) allocated to NCI (8) (33) 5 2 (3) (31)
Other comprehensive income/(loss) allocated to NCI 76 (6) 6 1 82 (5)
Summarised cash flows
Cash flows from operating activities 239 211 58 86 297 297
Cash flows from investing activities (18) (85) — — (18) (85)
Cash flows from financing activities (485) 127 (46) (103) (531) 24
Net (decreases)/increases in cash and cash equivalents (264) 253 12 (17) (252) 236
Section B: Notes to the Group financial statements for the year ended 30 June 2022
180
Governance and risk
Security holder information
Sustainability supplement
Business performance
Introduction and overview
Directors’ report
Corporate Report for the year ended 30 June 2022
Remuneration report
Financial statements

181
Section B: Notes to the Group financial statements for the year ended 30 June 2022
B27 Deed of cross and intra-group guarantees
Deed of cross guarantee
Transurban Holdings Limited, Transurban Limited, Tollaust Pty Limited, Roam Tolling Pty Limited, Sydney Roads Limited, Sydney Roads Management Limited, Statewide Roads Limited, M4 Holdings No. 1 Pty Limited, M5 Holdings Pty Limited, Devome Pty Limited, Transurban Funding Pty Limited, Transurban STP AHT Pty Limited, Transurban STP AT Pty Limited, Transurban STP Project Hold Co Pty Limited, Transurban STP Project Co Pty Limited, Transurban Sun Holdings Pty Ltd and Transurban Operations Pty Ltd are party to a deed of cross guarantee under which each company guarantees the debts of the others. By entering into the deed, the wholly-owned entities have been relieved from the requirement to prepare a financial report and Directors’ report under Instrument 2016/785 issued by the Australian Securities and Investments Commission. The companies represent a 'closed group' for the purposes of the Instrument, and as there are no other parties to the deed of cross guarantee that are controlled by THL, they also represent the 'extended closed group’.
Set out below is the summary financial information of the closed group.
2022 2021
$M $M
Summarised statement of comprehensive income
Revenue 440 462
Operating costs (413) (341)
Depreciation and amortisation expense (112) (144)
Net finance costs (390) (304)
Loss before income tax (475) (327)
Income tax benefit 181 133
Loss for the year (294) (194)
Total comprehensive loss for the year (294) (194)
Section B: Notes to the Group financial statements for the year ended 30 June 2022
181
Governance and risk
Security holder information
Sustainability supplement
Business performance
Introduction and overview
Directors’ report
Corporate Report for the year ended 30 June 2022
Remuneration report
Financial statements

182
Section B: Notes to the Group financial statements for the year ended 30 June 2022
B27 Deed of cross and intra-group guarantees (continued)
Deed of cross guarantee (continued)2022 2021
$M $M
Summarised movements in accumulated losses
Accumulated losses at the beginning of the year (961) (758)
Retained earnings of entities that joined the ‘closed group’ — 18
Loss for the year (294) (194)
Dividends provided for or paid (61) (27)
Accumulated losses at the end of the year (1,316) (961)
Summarised balance sheet
Current assets
Cash and cash equivalents 1,017 2,793
Trade and other receivables 916 968
Total current assets 1,933 3,761
Non-current assets
Other financial assets 7,365 6,472
Equity accounted investments 2,434 901
Property, plant and equipment 416 438
Intangible assets 127 142
Deferred tax assets 601 518
Total non-current assets 10,943 8,471
Total assets 12,876 12,232
Current liabilities
Trade and other payables 983 1,273
Provisions 107 77
Total current liabilities 1,090 1,350
Non-current liabilities
Payables 9,141 8,903
Deferred tax liabilities 17 5
Provisions 5 5
Total non-current liabilities 9,163 8,913
Total liabilities 10,253 10,263
Net assets 2,623 1,969
Equity
Contributed equity 3,938 2,929
Other reserves 1 1
Accumulated losses (1,316) (961)
Total equity 2,623 1,969
Intra-group guarantees
As at 30 June 2022, the Transurban Group comprising Transurban Holdings Limited, Transurban Holding Trust and Transurban International Limited, was traded and quoted on the ASX as one triple stapled security. Under the stapling arrangement, each entity is able to provide direct and/or indirect support to each other entity and its controlled entities within the Group on a continual basis.
Expected credit loss
As at 30 June 2022, having assessed the impacts from the economic uncertainty relating to COVID-19, near-term interest rates and inflation, management do not consider there to be evidence of a significant increase in credit risk since the initial recognition of the financial assets at amortised cost in the closed group. This is mainly due to there being no significant change in the nature of or the collectability of these balances. The loss allowance for these financial assets at amortised cost continues to be limited to 12 months of expected losses. These balances continue to have low credit risk as they have a low risk of default and the counterparties have a strong capacity to meet their contractual cash flow obligations in the near-term. As at 30 June 2022 the loss allowance was $9 million (2021: $10 million), reflecting management's updated estimate of the collectability of these balances.
Section B: Notes to the Group financial statements for the year ended 30 June 2022
182
Governance and risk
Security holder information
Sustainability supplement
Business performance
Introduction and overview
Directors’ report
Corporate Report for the year ended 30 June 2022
Remuneration report
Financial statements

183
Section B: Notes to the Group financial statements for the year ended 30 June 2022
Items not recognised
B28 ContingenciesContingent assets are possible recoveries whose existence will only be confirmed by uncertain future events not wholly within the control of the Group. Contingent assets are not recognised on the balance sheet unless they are virtually certain but are disclosed if the inflow of economic resources is probable. Contingent liabilities are possible obligations whose existence will only be confirmed by uncertain future events and present obligations where the transfer of economic resources is not probable or cannot be reliably estimated. Contingent liabilities are not recognised on the balance sheet unless they are probable but are disclosed if the outflow of economic resource is possible.
The Group (including its equity accounted investments) is exposed to direct and indirect construction risk including through its third party contractors. Construction risk includes exposure to claims made on the Group (including its equity accounted investments) and claims that the Group (including its equity accounted investments) may pass through or initiate on others. From time to time it is possible payments may be made that are in excess of, or separate to, D&C subcontracted amounts to facilitate the continued progression of the project. Contingent assets and liabilities may exist in respect of actual or potential claims and commercial payments and recoveries arising from overseeing construction projects. Disclosures are made for these matters in accordance with accounting standards, or other legal disclosure obligations. This may be applicable for a number of projects overseen by Transurban and the Group’s equity accounted investments. As at 30 June 2022 any possible payment or possible claim settlement cannot be reliably estimated and/or is not considered probable of being made.
KEY ESTIMATE AND JUDGEMENT
The Group has a number of existing claims that it has brought against other parties with respect to the Group’s obligations under its contractual arrangements. As at 30 June 2022 these claims are not considered probable and cannot be reliably estimated.
Additionally, the Group (including its equity accounted investments) has received claims in connection with its construction projects. Many of these claims have been passed through. In other instances, the Group has initiated claims on others. In overseeing construction projects, from time to time payments may be made in excess of contracted amounts to facilitate their continued progression.
Further, as at 30 June 2022, there continues to be a risk from claims linked to COVID-19, with claims activity observed across the construction industry owing to the impact of COVID-19 on construction schedules.
The Group (including its equity accounted investments) assess each claim that they are party to for the purposes of preparing financial statements in accordance with the accounting standards. Contingent assets and liabilities may exist in respect of actual or potential claims and commercial payments and recoveries arising from these matters. Disclosures are made for these matters in accordance with accounting standards, or other legal disclosure obligations.
As at 30 June 2022 any possible payments relating to actual or potential future claims or possible commercial payments to third parties in excess of, or separate to the amounts stipulated in the D&C subcontracts or other contracts, cannot be reliably estimated and/or is not considered probable of being made.
Parent entity
The Parent entity does not have any contingent liabilities at reporting date.
B29 CommitmentsThe Group’s capital commitments as at 30 June 2022 are $1,428 million (2021: $177 million) and relate primarily to the West Gate Tunnel Project.
On 23 March 2022, the Group finalised the settlement with the State of Victoria and the D&C Subcontractor on revised terms for the delivery of the West Gate Tunnel Project, including a new expected completion date of late 2025. The total cost of the D&C Subcontract has increased by $3,440 million, with Transurban and the State each contributing $1,720 million. Transurban's share is being accounted for as capital expenditure (increasing the concession intangible asset as the expenditure is incurred).
Share of commitments related to equity accounted investments
STP JV50%
AM Partners
60%TC
50% Total
2022 2021 2022 2021 2022 2021 2022 2021$M $M $M $M $M $M $M $M
Capital commitments (at Group’s effective ownership interest) 86 118 60 — 746 644 892 762
The Group’s share of commitments relating to equity accounted investments as at 30 June 2022 primarily relate to WestConnex M4-M5 Link in STP JV, Fredericksburg Extension and the 495 Express Lanes Northern Extension in TC and Maryland Express Lanes in AM Partners (2021: WestConnex M4-M5 Link in STP JV and Fredericksburg Extension in TC).
B30 Subsequent eventsOther than as disclosed elsewhere in this report, there has not arisen in the interval between the end of the financial year and the date of this report any matter or circumstance that has significantly affected, or may significantly affect, the Group’s operations, the results of those operations, or Group’s state of affairs, in the future years.
Section B: Notes to the Group financial statements for the year ended 30 June 2022
183
Governance and risk
Security holder information
Sustainability supplement
Business performance
Introduction and overview
Directors’ report
Corporate Report for the year ended 30 June 2022
Remuneration report
Financial statements

184
Section B: Notes to the Group financial statements for the year ended 30 June 2022
Other
B31 Leases
Leases as a lessee
The Group leases various office buildings. Rental contracts are typically made for fixed periods of 3 to 12 years but may have extension options. The majority of extension options held are exercisable only by the Group and not by the respective lessor. In determining the lease term, management consider all facts and circumstances that create an economic incentive to exercise an extension option.
Right-of-use Asset
The Group’s right-of use assets relate to leased office buildings and are included in property, plant and equipment on the Group’s consolidated balance sheet. Right-of-use assets have finite lives, are depreciated on a straight-line basis and are carried at cost less accumulated depreciation.
The net carrying amount of right-of-use assets is presented below:
Office buildings2022 2021
$M $M
Carrying amount at 1 July 124 139
Depreciation charge for the year (16) (16)
Foreign exchange movements — 1
Carrying amount at 30 June 108 124
Lease liability
Lease liabilities are included in other liabilities on the Group’s consolidated balance sheet.
2022 2021$M $M
Current (17) (12)
Non-Current (114) (129)
Total lease liability (131) (141)
Refer to Note B15 for contractual maturities for lease liabilities.
Refer to Note B13 for interest expense on lease liabilities (included in finance costs).
Reconciliation of lease liabilities arising from financing activities
Lease liabilities2022 2021
$M $M
Balance at 1 July 141 152
Interest paid on leases (6) (7)
Principal repayment of leases (10) (10)
Total cash flows (16) (17)
Non-cash changes
Unwinding of discount 6 6
Total non-cash changes 6 6
Balance at 30 June 131 141
The total cash outflow for leases in the year ended 30 June 2022 was $16 million (2021: $17 million). The Group presents lease payments as ‘principal repayments of leases’ in ‘cash flows from financing activities’ and the finance cost as ‘interest paid’ in ‘cash flows from operating activities’ within the consolidated statement of cash flows.
The Group's commitments related to leases not yet commenced as at 30 June 2022 are $30 million (2021: $nil).
Section B: Notes to the Group financial statements for the year ended 30 June 2022
184
Governance and risk
Security holder information
Sustainability supplement
Business performance
Introduction and overview
Directors’ report
Corporate Report for the year ended 30 June 2022
Remuneration report
Financial statements

185
Section B: Notes to the Group financial statements for the year ended 30 June 2022
B32 Related party transactions
Joint ventures2022 2021
$'000 $'000
Transactions with related parties
Other revenue 120,926 90,282
Finance income 155,818 34,878
276,744 125,160
Outstanding balances with related parties
Financial assets at amortised cost
NorthConnex shareholder loan notes 606,104 724,240
STP JV shareholder loan notes 1,388,564 627,450
TC loan receivable 1,889 1,728
Other liabilities
NWRG payable for acquisition of customer base (50,268) (51,018)
TC other liabilities (7,074) (6,556)
Other assets
NorthConnex shareholder loan note interest receivable 5 9
STP JV shareholder loan note interest receivable 5,153 4,119
NWRG other (payables)/receivables (172) 3,565
STP JV other receivables 2,789 2,843
TC other receivables 36,988 66,693
1,983,978 1,373,073
Section B: Notes to the Group financial statements for the year ended 30 June 2022
185
Governance and risk
Security holder information
Sustainability supplement
Business performance
Introduction and overview
Directors’ report
Corporate Report for the year ended 30 June 2022
Remuneration report
Financial statements

186
Section B: Notes to the Group financial statements for the year ended 30 June 2022
B32 Related party transactions (continued)
Transactions with related parties
Other revenue
Other revenue relates to tolling and management services provided to related parties.
Interest income
Interest income relates to the interest recorded on financial assets at amortised costs as noted below.
Financial assets at amortised cost
Debt financial assets carried at amortised cost relate to TC loan receivable and NorthConnex and STP JV shareholder loan notes. The Group intends to hold the assets to maturity and to collect contractual cash flows and these cash flows consist solely of payments of principal and interest on the principal amount outstanding. The SLNs are not classified as an investment for equity accounting purposes, and therefore have not been affected by equity accounting losses from the associate. The NorthConnex and STP JV SLNs are denominated in AUD. The TC loan receivable is denominated in USD.
The movement of the NorthConnex and STP JV SLNs and TC loan receivable is set out below:
NorthConnex STP JV TC Total2022 2021 2022 2021 2022 2021 2022 2021
$'000 $'000 $'000 $'000 $'000 $'000 $'000 $'000
Opening balance at 1 July 724,240 705,583 627,450 646,497 1,728 — 1,353,418 1,352,080
SLNs and loan issued — 27,168 699,214 — 16,535 1,728 715,749 28,896
SLNs and loan repaid (181,654) (59,350) (17,058) (1,732) (16,707) — (215,419) (61,082)
Fair value adjustment on issuance of SLNs issued and TC loan receivable1 — — 672 — (1,406) — (734) —
Capitalisation of accrued interest 3,045 3,102 22,818 10,954 — — 25,863 14,056
Unwind of discount and remeasurement of SLNs2 60,310 47,536 57,093 (31,166) — — 117,403 16,370
Change in expected credit losses 163 201 (1,625) 2,897 — — (1,462) 3,098
Foreign exchange movements and other adjustments — — — — 1,739 — 1,739 —
Closing balance at 30 June 606,104 724,240 1,388,564 627,450 1,889 1,728 1,996,557 1,353,418
1. During the year, interest bearing facilities with STP JV and TC were issued. The loans were recorded at fair value on initial recognition and the difference between the nominal value of the loans and the fair value was treated as a contribution to the equity accounted investment in STP JV and TC, respectively.
2. Includes adjustments from updating the expected timing of cash repayments from the SLNs.
Accounting policy
The Group measures the SLNs and loan receivable at fair value on initial recognition and subsequently they are measured at amortised cost using the effective interest method. Any difference between the nominal value of the SLNs and loan receivable, and their fair value at initial recognition is treated as a contribution to the relevant equity accounted investment.
The SLNs and loan receivable are presented within non-current financial assets in the consolidated balance sheet.
NorthConnex shareholder loan notes
The NorthConnex SLNs consist of an interest-bearing SLN facility with a fixed rate of 5.9% and a maturity date of June 2048 and one non-interest bearing facility with a maturity date of June 2048. As at 30 June 2022, the repayment profile for these SLNs have been updated to reflect an uplift in forecast toll revenue due to an increase in CPI assumptions in the short-term which has brought forward the SLN repayments.
The nominal value of the NorthConnex SLNs as at 30 June 2022 is $777,358 thousand (2021: $955,967 thousand).
STP JV shareholder loan notes
The STP JV SLNs earn interest at a rate equivalent to the weighted average of the interest rate applicable to WestConnex’s senior secured debt plus a margin. The agreement includes a mechanism to capitalise interest should funds not be available to settle accrued interest. The SLNs have a maturity date of September 2028. As at 30 June 2022, the repayment profile for these SLNs has been updated to reflect higher interest rate assumptions and repayments. The nominal value of the STP JV SLNs as at 30 June 2022 is $1,426,350 thousand (2021: $721,376 thousand).
TC loan receivable
The TC loan receivable consists of an interest-bearing facility with a fixed rate of 0.13% and a maturity date of December 2023. The nominal value of the TC loan receivable as at 30 June 2022 is US$1,300 thousand ($1,889 thousand) (2021: US$1,300 thousand ($1,728 thousand)).
Expected credit loss
As at 30 June 2022, having assessed the impacts from the economic uncertainty relating to COVID-19, near-term interest rates and inflation, management do not consider there to be evidence of a significant increase in credit risk since the initial recognition of these balances. This is mainly due to there being no significant change in the nature of or the collectability of these balances. The loss allowance for these financial assets at amortised cost continues to be limited to 12 months of expected losses. These balances continue to have low credit risk as they have a low risk of default and the counterparties have a strong capacity to meet their contractual cash flow obligations in the near-term. As at 30 June 2022 loss allowance was $3,802 thousand (2021: $2,340 thousand), reflecting management's updated estimate of the collectability of these balances.
Section B: Notes to the Group financial statements for the year ended 30 June 2022
186
Governance and risk
Security holder information
Sustainability supplement
Business performance
Introduction and overview
Directors’ report
Corporate Report for the year ended 30 June 2022
Remuneration report
Financial statements

Page 94 reference destination: Note B34 to the FS
187
Section B: Notes to the Group financial statements for the year ended 30 June 2022
B33 Key management personnel compensation2022 2021
$ $
Short-term employee benefits 12,370,950 12,001,338
Post-employment benefits 382,880 295,482
Termination benefits — —
Long-term benefits (long service leave) 117,555 40,904
Share based payments 3,095,156 1,185,109
Deferred short term incentives 1,897,720 1,784,925 17,864,261 15,307,758
Detailed remuneration disclosures including the key management personnel are made in the remuneration report in the Directors' report.
B34 Remuneration of auditorsDuring the year the following fees were paid or payable for services provided by the auditor of the Group and its related practices.
(a) Amounts received or due and receivable by PricewaterhouseCoopers Australia
2022 2021
$ $
Services performed by PricewaterhouseCoopers Australia
Audit and other assurance services
Audit and review of financial reports 3,508,142 2,983,374
Other assurance services 389,267 783,000
3,897,409 3,766,374
Other consulting services 600,000 —
Total remuneration of PricewaterhouseCoopers Australia 4,497,409 3,766,374
(b) Amounts received or due and receivable by network firms of PricewaterhouseCoopers Australia
2022 2021$ $
Services performed by other PricewaterhouseCoopers network firms
Audit and other assurance services
Audit and review of financial reports 197,441 559,216
Total remuneration for other PricewaterhouseCoopers network firms 197,441 559,216
Total auditors remuneration 4,694,850 4,325,590
Section B: Notes to the Group financial statements for the year ended 30 June 2022
187
Governance and risk
Security holder information
Sustainability supplement
Business performance
Introduction and overview
Directors’ report
Corporate Report for the year ended 30 June 2022
Remuneration report
Financial statements

188
Section B: Notes to the Group financial statements for the year ended 30 June 2022
B35 Parent entity disclosuresThe financial information for the Parent entity, Transurban Holdings Limited, has been prepared on the same basis as the consolidated financial statements, except as set out below.
Investments in subsidiaries, associates and joint ventures
Investments in subsidiaries, associates and joint ventures are accounted for at cost in the Parent entity financial statements of Transurban Holdings Limited. Dividends received from associates are recognised in the Parent entity's profit and loss, rather than being deducted from the carrying amount of these investments.
Tax consolidation legislation
In addition to its own current and deferred tax amounts, Transurban Holdings Limited also recognises the current tax liabilities (or assets) and the deferred tax assets arising from unused tax losses and unused tax credits assumed from controlled entities in the tax consolidated group.
Assets or liabilities arising under tax funding agreements with the tax consolidated entities are recognised as amounts receivable from or payable to other entities in the Group. Any difference between the amounts assumed and amounts receivable or payable under the tax funding agreement are recognised as a contribution to (or distribution from) wholly owned tax consolidated entities.
Summary financial information
The individual financial statements for the Parent entity report the following aggregate amounts:
2022 2021$M $M
Balance sheet
Current assets 1,289 1,181
Total assets 10,727 7,913
Current liabilities 5,617 3,663
Total liabilities 6,409 4,522
Net assets 4,318 3,391
Shareholders' equity
Contributed equity 3,939 2,929
Reserves 1 1
Retained earnings 378 461
Total equity 4,318 3,391
(Loss)/profit for the year (22) 49
Total comprehensive (loss)/income (22) 49
Expected credit loss
As at 30 June 2022, having assessed the impacts from the economic uncertainty relating to COVID-19, near-term interest rates and inflation, management do not consider there to be evidence of a significant increase in credit risk since the initial recognition of the financial assets at amortised cost in the Parent entity. This is mainly due to there being no significant change in the nature of or the collectability of these balances. The loss allowance for these financial assets at amortised cost continues to be limited to 12 months of expected losses. These balances continue to have low credit risk as they have a low risk of default and the counterparties have a strong capacity to meet their contractual cash flow obligations in the near-term. As at 30 June 2022 the loss allowance was $8 million (2021: $8 million), reflecting management's updated estimate of the collectability of these balances.
Guarantees entered into by the Parent entity
There are cross guarantees given by Transurban Holdings Limited, Transurban Limited, Tollaust Pty Limited, Roam Tolling Pty Limited, Sydney Roads Limited, Sydney Roads Management Limited, Statewide Roads Limited, M4 Holdings No 1 Pty Limited, M5 Holdings Pty Limited, Devome Pty Limited, Transurban Funding Pty Limited, Transurban STP AHT Pty Limited, Transurban STP AT Pty Limited, Transurban STP Project Hold Co Pty Limited, Transurban STP Project Co Pty Limited, Transurban Sun Holdings Pty Ltd and Transurban Operations Pty Ltd as described in Note B27.
Section B: Notes to the Group financial statements for the year ended 30 June 2022
188
Governance and risk
Security holder information
Sustainability supplement
Business performance
Introduction and overview
Directors’ report
Corporate Report for the year ended 30 June 2022
Remuneration report
Financial statements

189
Section C: THT and TIL financial statements for the year ended 30 June 2022
Section C: Transurban Holding Trust (THT) and Transurban International Limited (TIL) financial statements
THT—ARSN 098 807 419 and TIL—ABN 90 121 746 825Consolidated statements of comprehensive income
Consolidated balance sheets
Consolidated statements of changes in equity
Consolidated statements of cash flows
Section C: THT and TIL financial statements for the year ended 30 June 2022
189
Governance and risk
Security holder information
Sustainability supplement
Business performance
Introduction and overview
Directors’ report
Corporate Report for the year ended 30 June 2022
Remuneration report
Financial statements

190
Section C: THT and TIL financial statements for the year ended 30 June 2022
Transurban Holding Trust and Transurban International LimitedConsolidated statements of comprehensive income for the year ended 30 June 2022
Transurban Holding TrustTransurban International
LimitedNote 2022 2021 2022 2021
$M $M $M $M
Continuing operations
Revenue D4 996 900 98 71
Expenses
Employee benefits expense — — (32) (36)
Road operating costs — — (30) (26)
Construction costs (48) (122) — —
Corporate and other expenses (10) (11) (16) (17)
Total expenses (58) (133) (78) (79)
Earnings/(loss) before depreciation and amortisation, net finance costs, equity accounted investments and income taxes 938 767 20 (8)
Amortisation (328) (327) (58) (57)
Depreciation — — (6) (5)
Total depreciation and amortisation (328) (327) (64) (62)
Net finance income/(costs) D9 251 (44) 22 (25)
Share of losses of equity accounted investments D15 (118) (96) (60) (21)
Profit/(loss) before income tax 743 300 (82) (116)
Income tax (expense)/benefit (5) 16 49 8
Profit/(loss) for the year 738 316 (33) (108)
Discontinued operations
Profit for the year from discontinued operations — — — 3,454
Profit/(loss) for the year from continuing and discontinued operations 738 316 (33) 3,346
Profit/(loss) is attributable to:
Ordinary security holders of TIL — — (33) 3,346
Ordinary unit holders of THT 737 347 — —
Non-controlling interests D16 1 (31) — —
Profit/(loss) for the year 738 316 (33) 3,346
Other comprehensive income
Gains reclassified on disposal of subsidiary, net of tax D8 — — — (166)
Items that may be reclassified to profit and loss in the future
Changes in the fair value of cash flow hedges, net of tax 442 61 — 15
Changes in the fair value of cost of hedging, net of tax 5 — — —
Share of other comprehensive income/(loss) from equity accounted investments, net of tax D15 224 77 29 (1)
Exchange differences on translation of North American operations, net of tax — — 249 119
Other comprehensive income/(loss) for the year, net of tax 671 138 278 (33)
Total comprehensive income for the year 1,409 454 245 3,313
Total comprehensive income/(loss) for the year is attributable to:
Ordinary security holders of TIL — — 245 3,313
Ordinary unit holders of THT 1,326 490 — —
Non-controlling interests—other 83 (36) — —
Total comprehensive income for the year 1,409 454 245 3,313
Cents Cents Cents CentsEarnings from continuing operations per security attributable to ordinary security holders of the stapled group D7 24.6 12.7 (1.1) (4.0) Earnings per security attributable to ordinary security holders of the stapled group D7 24.6 12.7 (1.1) 122.2
Section C: THT and TIL financial statements for the year ended 30 June 2022
The above consolidated statements of comprehensive income should be read in conjunction with the accompanying notes.190
Governance and risk
Security holder information
Sustainability supplement
Business performance
Introduction and overview
Directors’ report
Corporate Report for the year ended 30 June 2022
Remuneration report
Financial statements

191
Section C: THT and TIL financial statements for the year ended 30 June 2022
Transurban Holding Trust and Transurban International LimitedConsolidated balance sheets as at 30 June 2022
Transurban Holding TrustTransurban International
LimitedNote 2022 2021 2022 2021
$M $M $M $M
Assets
Current assets
Cash and cash equivalents 116 116 307 560
Related party receivables1 D18 709 961 46 72
Trade and other receivables 14 10 76 51
Derivative financial instruments D11 22 — — —
Current tax assets — — 10 —
Concession notes D18 136 — — —
Total current assets 997 1,087 439 683
Non-current assets
Equity accounted investments D15 5,265 2,149 3,037 2,714
Derivative financial instruments D11 688 44 — —
Related party receivables D18 8,513 9,064 440 —
Concession notes D18 1,006 855 — —
Concession financial asset — — 339 330
Financial assets at amortised cost D18 665 627 2 2
Property, plant and equipment — — 32 28
Deferred tax assets D5 111 67 33 —
Other intangible assets D12 8,986 9,314 1,224 1,225
Total non-current assets 25,234 22,120 5,107 4,299
Total assets 26,231 23,207 5,546 4,982
Liabilities
Current liabilities
Related party payables1 D18 315 490 21 19
Trade and other payables 74 64 27 22
Current tax liabilities — — 1 168
Borrowings D10 351 441 614 4
Maintenance provision — — 2 4
Distribution provision D6 776 600 — —
Derivative financial instruments D11 — 2 49 —
Construction obligation liability 51 60 — —
Other liabilities — — 33 38
Total current liabilities 1,567 1,657 747 255
Non–current liabilities
Maintenance provision — — 33 27
Deferred tax liabilities D5 141 6 1,099 1,031
Related party payables D18 3,795 3,693 451 421
Borrowings D10 7,316 7,166 — 594
Derivative financial instruments D11 — 208 — 113
Construction obligation liability 33 66 — —
Other liabilities 80 77 6 7
Total non–current liabilities 11,365 11,216 1,589 2,193
Total liabilities 12,932 12,873 2,336 2,448
Net assets 13,299 10,334 3,210 2,534
Equity
Contributed equity — — 1,030 599
Issued units 19,354 16,527 — —
Reserves D8 498 (91) 22 (256)
(Accumulated losses)/retained earnings (7,286) (6,825) 2,158 2,191
Non-controlling interests D16 733 723 — —
Total equity 13,299 10,334 3,210 2,534
1. Receivables from and payables to joint ventures have been classified as related party receivables and payables, with comparative amounts restated for consistency.
Section C: THT and TIL financial statements for the year ended 30 June 2022
The above consolidated balance sheets should be read in conjunction with the accompanying notes. 191
Governance and risk
Security holder information
Sustainability supplement
Business performance
Introduction and overview
Directors’ report
Corporate Report for the year ended 30 June 2022
Remuneration report
Financial statements

192
Section C: THT and TIL financial statements for the year ended 30 June 2022
Transurban Holding Trust and Transurban International LimitedConsolidated statements of changes in equity for the year ended 30 June 2022
THT
Attributable to security holders of Transurban Holding Trust
No of units Issued units ReservesAccumulated
losses
Non- controlling
interests Total
M $M $M $M $M $M
Balance at 1 July 2021 2,738 16,527 (91) (6,825) 723 10,334
Comprehensive income/(loss)
Profit for the year — — — 737 1 738
Other comprehensive income — — 589 — 82 671
Total comprehensive income — — 589 737 83 1,409
Transactions with owners in their capacity as owners
Contributions of equity, net of transaction costs1 325 2,749 — — — 2,749
Employee performance awards issued 1 7 — — — 7
Distributions provided for or paid — — — (1,198) — (1,198)
Distribution reinvestment plan 7 71 — — — 71
Distributions to non-controlling interests — — — — (73) (73)
333 2,827 — (1,198) (73) 1,556
Balance at 30 June 2022 3,071 19,354 498 (7,286) 733 13,299
Balance at 1 July 2020 2,735 16,504 (234) (6,200) 831 10,901
Comprehensive income
Profit/(loss) for the year — — — 347 (31) 316
Other comprehensive income/(loss) — — 143 — (5) 138
Total comprehensive income/(loss) — — 143 347 (36) 454
Transactions with owners in their capacity as owners
Employee performance awards issued 1 4 — — — 4
Distributions provided for or paid — — — (972) — (972)
Distribution reinvestment plan 2 19 — — — 19
Distributions to non-controlling interests — — — — (72) (72)
3 23 — (972) (72) (1,021)
Balance at 30 June 2021 2,738 16,527 (91) (6,825) 723 10,334
1. Refer to the Group’s consolidated statement of changes in equity for further information.
Section C: THT and TIL financial statements for the year ended 30 June 2022
The above consolidated statements of changes in equity should be read in conjunction with the accompanying notes.192
Governance and risk
Security holder information
Sustainability supplement
Business performance
Introduction and overview
Directors’ report
Corporate Report for the year ended 30 June 2022
Remuneration report
Financial statements

193
Section C: THT and TIL financial statements for the year ended 30 June 2022
Transurban Holding Trust and Transurban International LimitedConsolidated statements of changes in equity for the year ended 30 June 2022 (continued)
TIL
Attributable to security holders of Transurban International Limited
No. of securities
Contributed equity Reserves
Retained earnings/
(Accumulated losses) Total equity
M $M $M $M $M
Balance at 1 July 2021 2,738 599 (256) 2,191 2,534
Comprehensive income/(loss)
Loss for the year — — — (33) (33)
Other comprehensive income — — 278 — 278
Total comprehensive income/(loss) — — 278 (33) 245
Transactions with owners in their capacity as owners
Contributions of equity, net of transaction costs1 325 419 — — 419
Employee performance awards issued 1 1 — — 1
Distribution reinvestment plan 7 11 — — 11
333 431 — — 431
Balance at 30 June 2022 3,071 1,030 22 2,158 3,210
Balance at 1 July 2020 2,735 595 (223) (1,155) (783)
Comprehensive income/(loss)
Profit for the year — — — 3,346 3,346
Other comprehensive loss — — (33) — (33)
Total comprehensive income/(loss) — — (33) 3,346 3,313
Transactions with owners in their capacity as owners
Employee performance awards issued 1 1 — — 1
Distribution reinvestment plan 2 3 — — 3
3 4 — — 4
Balance at 30 June 2021 2,738 599 (256) 2,191 2,534
1. Refer to the Group’s consolidated statement of changes in equity for further information.
Section C: THT and TIL financial statements for the year ended 30 June 2022
The above consolidated statements of changes in equity should be read in conjunction with the accompanying notes.193
Governance and risk
Security holder information
Sustainability supplement
Business performance
Introduction and overview
Directors’ report
Corporate Report for the year ended 30 June 2022
Remuneration report
Financial statements

194
Section C: THT and TIL financial statements for the year ended 30 June 2022
Transurban Holding Trust and Transurban International LimitedConsolidated statements of cash flows for the year ended 30 June 2022
Transurban Holding TrustTransurban International
Limited
Note2022 2021 2022 2021
$M $M $M $M
Cash flows from operating activities
Receipts from customers 944 776 85 138
Payments to suppliers and employees (43) (45) (91) (112)
Payments for maintenance of intangible assets — — (6) (10)
Transaction costs — — (1) (18)
Other cash receipts — 1 78 28
Interest received 233 198 — —
Interest paid (433) (486) (47) (135)
Income taxes paid — — — (10)
Net cash inflow/(outflow) from operating activities (a) 701 444 18 (119)
Cash flows from investing activities
Proceeds from sale of property, plant and equipment — — — 49
Payments for property, plant and equipment — — (7) (24)
Payments for intangible assets (39) (124) — (104)
Payments for financial assets at amortised cost — — (17) (2)
Capital contribution to equity accounted investments (3,373) (113) (162) (2)
Receipts from concession notes — 88 — —
Distributions received from equity accounted investments 363 364 65 —
Proceeds from disposal of subsidiaries, net of cash disposed — — — 2,337
Repayment of financial assets at amortised cost 9 2 17 —
Income taxes paid related to the disposal of subsidiaries — — (178) —
Net cash (outflow)/inflow from investing activities (3,040) 217 (282) 2,254
Cash flows from financing activities
Loans (to)/from related parties (b) (5,232) (3,326) (416) 40
Repayment of loans from/(to) related parties (b) 6,082 3,230 (8) (2,161)
Proceeds from equity issues of stapled securities (net of costs) 2,749 — 416 —
Proceeds from borrowings (net of costs) (b) 474 1,240 — —
Principal repayment of leases — — (1) (1)
Repayment of borrowings (b) (742) (927) (14) (10)
Dividends and distributions paid to the Group's security holders (919) (818) — —
Distributions paid to non-controlling interests (73) (72) — —
Net cash inflow/(outflow) from financing activities 2,339 (673) (23) (2,132)
Net increase/(decrease) in cash and cash equivalents — (12) (287) 3
Cash and cash equivalents at the beginning of the year 116 128 560 599
Effects of exchange rate changes on cash and cash equivalents — — 34 (42)
Cash and cash equivalents at end of year 116 116 307 560
Refer to Note B24 for cash flows from discontinued operations.
Section C: THT and TIL financial statements for the year ended 30 June 2022
The above consolidated statements of cash flows should be read in conjunction with the accompanying notes.194
Governance and risk
Security holder information
Sustainability supplement
Business performance
Introduction and overview
Directors’ report
Corporate Report for the year ended 30 June 2022
Remuneration report
Financial statements

195
Section C: THT and TIL financial statements for the year ended 30 June 2022
Transurban Holding Trust and Transurban International LimitedConsolidated statements of cash flows for the year ended 30 June 2022 (continued)
(a) Reconciliation of profit after income tax to net cash inflow from operating activities
Transurban Holding TrustTransurban International
Limited2022 2021 2022 2021
$M $M $M $M
Profit/(loss) for the year from continuing and discontinued operations 738 316 (33) 3,346
Depreciation and amortisation 328 327 64 83
Gain on disposal of interest in TC — — — (3,687)
Non-cash net finance (income)/costs (137) 1 (47) 154
Capitalised interest income (221) (159) — —
Non-cash net income on concession notes (284) (115) — —
Share of losses from equity accounted investments 118 96 60 21
Change in operating assets and liabilities:
(Increase)/decrease in trade and other receivables (4) — 26 (35)
Increase/(decrease) in related party operating loans 66 (43) — (2)
Increase/(decrease) in operating creditors and accruals 2 3 (4) 28
Decrease in other operating provisions — — (4) —
Increase/(decrease) in deferred and current taxes 92 1 (48) (47)
Increase in maintenance provision — — 4 20
Increase in other liabilities 3 17 — —
Net cash inflow/(outflow) from operating activities 701 444 18 (119)
Section C: THT and TIL financial statements for the year ended 30 June 2022
The above consolidated statements of cash flows should be read in conjunction with the accompanying notes.195
Governance and risk
Security holder information
Sustainability supplement
Business performance
Introduction and overview
Directors’ report
Corporate Report for the year ended 30 June 2022
Remuneration report
Financial statements

196
Section C: THT and TIL financial statements for the year ended 30 June 2022
Transurban Holding Trust and Transurban International LimitedConsolidated statements of cash flows for the year ended 30 June 2022 (continued)
(b) Reconciliation of liabilities arising from financing activities
THT
Borrowings current
Borrowings non-current
Debt principal related
derivatives (included in
assets / liabilities)1
Total debt related
financial instruments
Net related party
receivables2
$M $M $M $M $M
Balance at 1 July 2021 441 7,166 (205) 7,402 (5,835)
Proceeds from borrowings (net of costs) 68 405 1 474 —
Repayment of borrowings (462) (279) (1) (742) —
Loans to related parties — — — — (5,232)
Repayment of loans from related parties — — — — 6,082
Total cash flows (394) 126 — (268) 850
Non-cash changes
Transfer 304 (304) — — —
Capitalised interest — — — — (206)
Amortisation of borrowing costs — 6 — 6 —
Intercompany non-cash settlements — — — — 24
Provision for impairment of intercompany loans — — — — (2)
Foreign exchange movements — 322 (405) (83) (6)
Total non-cash changes 304 24 (405) (77) (190)
Balance at 30 June 2022 351 7,316 (610) 7,057 (5,175)
1. Total derivatives balance as at 30 June 2022 is an asset of $710 million. The difference in carrying value to the table above relates to interest rate swap contracts, forward exchange contracts, the interest portion of cross-currency interest rate swap contracts and credit valuation and debit valuation adjustments which are excluded from the balances above as they do not relate to financing activities.
2. Total net related party receivables balance as at 30 June 2022 is an asset of $5,112 million. The difference in carrying value to the table above relates to intercompany accruals balances which are excluded from the balances above as they do not relate to financing activities.
Borrowings current
Borrowings non-current
Debt principal related
derivatives (included in
assets / liabilities)1
Total debt related
financial instruments
Net related party
receivables2
$M $M $M $M $M
Balance at 1 July 2020 320 7,279 (518) 7,081 (5,487)
Proceeds from borrowings (net of costs) — 1,240 — 1,240 —
Repayment of borrowings (300) (627) — (927) —
Loans to related parties — — — — (3,326)
Repayment of loans from related parties — — — — 3,230
Total cash flows (300) 613 — 313 (96)
Non-cash changes
Transfer 421 (421) — — —
Capitalised interest — — — — (175)
Amortisation of borrowing costs — 15 — 15 —
Intercompany non-cash settlements — — — — (71)
Provision for impairment of intercompany loans — — — — (18)
Foreign exchange movements — (320) 313 (7) 12
Total non-cash changes 421 (726) 313 8 (252)
Balance at 30 June 2021 441 7,166 (205) 7,402 (5,835)
1. Total derivatives balance as at 30 June 2021 is a liability of $166 million. The difference in carrying value to the table above relates to interest rate swap contracts, forward exchange contracts, the interest portion of cross-currency interest rate swap contracts and credit valuation and debit valuation adjustments which are excluded from the balances above as they do not relate to financing activities.
2. Total net related party receivables balance as at 30 June 2021 is an asset of $5,842 million. The difference in carrying value to the table above relates to intercompany accruals balances which are excluded from the balances above as they do not relate to financing activities.
Section C: THT and TIL financial statements for the year ended 30 June 2022
The above consolidated statements of cash flows should be read in conjunction with the accompanying notes.196
Governance and risk
Security holder information
Sustainability supplement
Business performance
Introduction and overview
Directors’ report
Corporate Report for the year ended 30 June 2022
Remuneration report
Financial statements

197
Section C: THT and TIL financial statements for the year ended 30 June 2022
Transurban Holding Trust and Transurban International LimitedConsolidated statements of cash flows for the year ended 30 June 2022 (continued)
(b) Reconciliation of liabilities arising from financing activities (continued)
TIL
Borrowings current
Borrowings non-current
Total borrowings
Net related party
payables1
$M $M $M $M
Balance at 1 July 2021 4 594 598 418
Repayment of borrowings (4) (10) (14) —
Loans to related parties — — — (416)
Repayment of loans to related parties — — — (8)
Total cash flows (4) (10) (14) (424)
Non-cash changes
Transfer 594 (594) — —
Capitalised interest — — — 17
Intercompany non-cash settlements — — — (12)
Amortisation of borrowing costs — 1 1 —
Foreign exchange movements 20 9 29 11
Total non-cash changes 614 (584) 30 16
Balance at 30 June 2022 614 — 614 10
1. Total net related party receivables balance as at 30 June 2022 is an asset of $14 million. The difference in carrying value to the table above relates to intercompany accruals balances which are excluded from the balances above as they do not relate to financing activities.
Borrowings current
Borrowings non-current
Total borrowings
Net related party
payables2
$M $M $M $M
Balance at 1 July 2020 4 3,459 3,463 2,549
Repayment of borrowings (4) (6) (10) —
Loans from related parties — — — 43
Loans to related parties — — — (3)
Repayment of loans to related parties — — — (2,161)
Total cash flows (4) (6) (10) (2,121)
Non-cash changes
Disposals through loss of control of subsidiary1 — (2,600) (2,600) 10
Transfer 4 (4) — —
Capitalised interest — 21 21 84
Intercompany non-cash settlements — — — (8)
Amortisation of borrowing costs — 7 7 —
Non substantial modification gain — (9) (9) —
Foreign exchange movements — (274) (274) (96)
Total non-cash changes 4 (2,859) (2,855) (10)
Balance at 30 June 2021 4 594 598 418
1. Relates to the deconsolidation of the Group’s ownership interest in TC upon divestment of a 50% ownership interest (refer to Note B24).
2. Total net related party payables balance as at 30 June 2021 is a liability of $368 million. The difference in carrying value to the table above relates to intercompany accruals balances which are excluded from the balances above as they do not relate to financing activities.
Section C: THT and TIL financial statements for the year ended 30 June 2022
The above consolidated statements of cash flows should be read in conjunction with the accompanying notes.197
Governance and risk
Security holder information
Sustainability supplement
Business performance
Introduction and overview
Directors’ report
Corporate Report for the year ended 30 June 2022
Remuneration report
Financial statements

198
Section D: Notes to the THT and TIL financial statements for the year ended 30 June 2022
Section D: Notes to the THT and TIL financial statements
Basis of preparation and significant changes
D1Summary of significant changes in the current reporting period
D2Basis of preparation
Operating performance
D3Segment information
D4Revenue
D5Income tax
Security holder outcomes
D6Distributions
D7Earnings per stapled security
Capital and borrowings
D8Reserves
D9Net finance income/(costs)
D10Borrowings
D11Derivatives and financial risk management
Concession summary
D12Other intangible assets
D13Concession financial asset
D14Other liabilities—concession liabilities
Group structure
D15Equity accounted investments
D16Non-controlling interests—other
D17Deed of cross and intra-group guarantees
Other
D18Related party transactions
D19Parent entity disclosures
Section D: Notes to the THT and TIL financial statements for the year ended 30 June 2022
198
Governance and risk
Security holder information
Sustainability supplement
Business performance
Introduction and overview
Directors’ report
Corporate Report for the year ended 30 June 2022
Remuneration report
Financial statements

199
Section D: Notes to the THT and TIL financial statements for the year ended 30 June 2022
Basis of preparation and significant changes
D1 Summary of significant changes in the current reporting periodRefer to Note B2 for significant changes in the current reporting period.
D2 Basis of preparationThe Transurban Holding Trust Group consists of Transurban Holding Trust and the entities it controls (THT) and the Transurban International Limited Group consists of Transurban International Limited and the entities it controls (TIL). THT and TIL form part of the stapled Transurban Group.
THT is registered as a managed investment scheme under Chapter 5C of the Corporations Act 2001, and as a result requires a responsible entity. The responsible entity of THT is Transurban Infrastructure Management Limited (TIML). TIML is responsible for performing all functions that are required under the Corporations Act 2001 of a responsible entity.
The Transurban Holding Trust was established on 15 November 2001 and has no termination date. The Trust was registered as a managed investment scheme by the Australian Securities and Investments Commission on 28 November 2001.
THT is a Trust registered and domiciled in Australia.
TIL is a public company limited by shares and incorporated in Australia.
Going concern
The financial statements have been prepared on a going concern basis, which assumes the continuity of normal operations, in particular over the next 12 months from the financial statement release date on 18 August 2022. In determining the appropriateness of the going concern basis of preparation, the Directors have considered the uncertainties related to COVID-19 impacts on traffic, near-term interest rates and inflation on THT and TIL's liquidity and operations.
Refer to Note B2 for details of the impact of COVID-19 on the current reporting period.
THT and TIL have assessed cash flow forecasts and the ability of THT and TIL to fund their net current liability positions as at 30 June 2022 of $570 million and $308 million, respectively. Excluding related party payables, THT and TIL are in a net current liability position of $255 million and $287 million, respectively. Scenario analysis was undertaken, which includes judgement, of reasonably possible changes in traffic volume, near-term interest rates and inflation. This analysis indicates that THT and TIL are expected to be able to continue to operate within available liquidity levels and the terms of available debt facilities, and to fund their net current liability positions as at 30 June 2022 for the 12 months from the date of this report.
THT and TIL have also forecast that they do not expect to breach any financial covenants within the 12 months from the date of this report. Financial covenant forecasts utilised the same underlying cash flow forecasts as those used in the going concern assessment. Non-recourse debt financial covenants are calculated on a trailing 12-month basis.
The Directors have also taken the following matters into consideration in forming the view that THT and TIL are a going concern:
• THT and TIL have generated positive cash inflows from operating activities of $701 million and $18 million, respectively for the year ended 30 June 2022;
• THT and TIL expect to refinance or repay with available cash all borrowing facilities classified as a current liability as at 30 June 2022. Under the stapled arrangement, each entity is able to provide direct and/or indirect support to each other entity and its controlled entities within the Transurban Group; and
• Payment of future distributions remains at the discretion of the Board.
Refer to Note B2 for further information on the basis of preparation for the Transurban Group.
Section D: Notes to the THT and TIL financial statements for the year ended 30 June 2022
199
Governance and risk
Security holder information
Sustainability supplement
Business performance
Introduction and overview
Directors’ report
Corporate Report for the year ended 30 June 2022
Remuneration report
Financial statements

200
Section D: Notes to the THT and TIL financial statements for the year ended 30 June 2022
Operating performance
D3 Segment informationRefer to Note B4 for further information around the structure of the segments for the Transurban Group.
THT operating segments
Management have determined that THT has one operating segment.
THT operations involve the leasing of assets and the provision of funding to the Transurban Group or associates of the Transurban Group. All revenues and expenses are directly attributable to these activities. The management structure and internal reporting of THT are based on this one operating segment.
TIL operating segments
Management have determined that TIL has one operating segment.
TIL’s operations involve the development, operation and maintenance of toll roads in North America. All revenues and expenses are directly attributable to these activities. The management structure and internal reporting of TIL are based on this one operating segment.
Reconciliation of segment information to statutory financial information
Segment information for North America as disclosed in the Transurban Group segment note (Note B4) is reconciled to the TIL statutory financial information below.
Segment revenue
Revenue from external customers is through toll and service and fee revenues earned on toll roads. Segment revenue reconciles to total statutory revenue as follows:
TIL Note2022 2021
$M $M
Total segment revenue (proportional) 225 188
Add:
Construction revenue from road development activities — 87
Other revenue from discontinued operations1 — 6
Intragroup elimination2 17 5
Less:
Proportional revenue of non-100% owned equity accounted assets (115) (24)
Toll revenue receipts relating to the A25 concession financial asset3 (14) (13)
Other revenue receipts relating to the A25 concession financial asset3 (15) (14)
Revenue attributable to discontinued operations1 — (164)
Total statutory revenue from continuing operations D4 98 71
1. Statutory financial information classifies the results of TC as discontinued operations in the prior comparative period. FY21 other revenue from discontinued operations represents intragroup revenue recognised in relation to arrangements between continuing and discontinued operations that is eliminated for segment purposes.
2. Statutory revenue recognised in relation to arrangements with the equity accounted investments that are eliminated for segment purposes.
3. The Executive Committee members acting as the chief operating decision maker assesses the performance of TIL using proportional results that include A25 income streams relating to availability payments and guaranteed toll income which are classified as revenue within the proportional results. These revenues form part of the ordinary activities of the A25 asset and are reflective of its underlying performance. For statutory accounting purposes, these income streams offset the related concession financial asset receivable recorded on acquisition of the A25 (refer to Note B18).
Proportional EBITDA
Proportional EBITDA reconciles to (loss)/profit before income tax as follows:
TIL2022 2021
$M $M
Proportional EBITDA 120 54
Less: EBITDA attributable to TIL corporate activities (disclosed in corporate and other)1 (17) (37)
Less: Toll and other revenue receipts relating to the A25 concession financial asset (29) (27)
Less: Proportional EBITDA of non-100% owned equity accounted investments (54) (10)
Add: EBITDA from discontinued operations net of transaction costs on disposal2 — 12
Statutory earnings/(loss) before depreciation, amortisation, net finance costs, equity accounted investments and income taxes from continuing operations 20 (8)
Statutory depreciation and amortisation from continuing operations (64) (62)
Statutory net finance income/(costs) from continuing operations 22 (25)
Share of loss from equity accounted investments, inclusive of impairments from continuing operations (60) (21)
Loss before income tax from continuing operations (82) (116)
1. Relates primarily to development activities.
2. Statutory financial information classifies the results of TC as discontinued operations in the prior comparative period. FY21 proportional EBITDA includes $18 million transaction costs on disposal of TC which are included within the statutory gain on disposal and not within statutory EBITDA.
Section D: Notes to the THT and TIL financial statements for the year ended 30 June 2022
200
Governance and risk
Security holder information
Sustainability supplement
Business performance
Introduction and overview
Directors’ report
Corporate Report for the year ended 30 June 2022
Remuneration report
Financial statements

201
Section D: Notes to the THT and TIL financial statements for the year ended 30 June 2022
D4 Revenue
THT TIL2022 2021 2022 2021
$M $M $M $M
Toll revenue — — 62 54
Rental income 902 734 — —
Construction revenue 48 122 — —
Other revenue 3 3 36 17
Concession fees 43 41 — —
Total revenue from continuing operations 996 900 98 71
For toll revenue, construction revenue and other revenue accounting policies, refer to Note B5.
Revenue type Recognition
Rental income The rental income revenue stream relates to lease payments received from operating leases on the property held by THT. This income is recognised in accordance with the terms of the lease contract.
Concession fees Other income from concession fees relates to the CityLink concession notes. Pursuant to the Agreement for the Melbourne CityLink Concession Deed (the Concession Deed), CityLink Melbourne Limited (CityLink) (a member of the Transurban Group), is required to pay annual concession fees for the duration of CityLink's concession period. Until a certain threshold rate of return on the project is achieved, the payment of concession fees due under the Concession Deed can be satisfied by means of non-interest bearing concession notes.
Following agreements reached with the State of Victoria, the Group paid a total of $765 million to the State to have all current concession notes issued by the State assigned to Transurban Holding Trust, and the State directed CityLink to pay future concession notes to Transurban Holding Trust. Accordingly, CityLink continues to issue notes semi-annually to Transurban Holding Trust, and Transurban Holding Trust recognises concession note income from the issue of these notes, at the present value of expected future repayments.
D5 Income tax
Deferred tax assets and liabilities—TIL
Asset Liability2022 2021 2022 2021
$M $M $M $M
The balance comprises temporary difference attributable to:
Accrued expenses 1 — — —
Provisions 12 11 — —
Current and prior year losses 82 28 — —
Fixed assets/intangibles 8 7 (350) (344)
Derivatives and foreign exchange 21 31 — —
Equity accounted investments — — (846) (764)
Other 6 — — —
Tax assets/(liabilities) 130 77 (1,196) (1,108)
Set off of tax (97) (77) 97 77
Net tax assets/(liabilities) 33 — (1,099) (1,031)
Movements:
Opening balance at 1 July 77 665 (1,108) (700)
Credited/(charged) to profit or loss 17 — (8) (3)
Credited/(charged) to equity 2 (8) — (2)
Disposed through other comprehensive income1 — (13) — —
Disposed through profit or loss1 — (96) — 326
Acquired1 — — — (764)
Foreign exchange movements 7 (54) (87) 23
Transfer from deferred tax assets/liabilities — (11) — 11
Current year losses recognised/(prior year losses utilised) and under/(over) provision in prior years 27 (406) 7 1
Closing balance at 30 June 130 77 (1,196) (1,108)
Deferred tax assets/(liabilities) to be recovered/(paid) after more than 12 months 130 77 (1,196) (1,108)
1. Relates to the net impact of the deconsolidation of the Group’s ownership interest in TC and recognition of an equity accounted investment in TC upon divestment of a 50% ownership interest (refer to Note B24).
Section D: Notes to the THT and TIL financial statements for the year ended 30 June 2022
201
Governance and risk
Security holder information
Sustainability supplement
Business performance
Introduction and overview
Directors’ report
Corporate Report for the year ended 30 June 2022
Remuneration report
Financial statements

202
Section D: Notes to the THT and TIL financial statements for the year ended 30 June 2022
Security holder outcomes
D6 DistributionsRefer to Note B10 of the Group financial statements for the dividends/distributions paid and payable by the Group.
Movements in distribution provision—THT
Distribution to security
holders
Distributions to non-
controlling interest in
subsidiaries Total
$M $M $M
Balance at 1 July 2021 561 39 600
Additional provision recognised 1,198 73 1,271
Amounts paid (919) (73) (992)
Amounts reinvested (103) — (103)
Balance at 30 June 2022 737 39 776
Balance at 1 July 2020 437 39 476
Additional provision recognised 972 72 1,044
Amounts paid (818) (72) (890)
Amounts reinvested (30) — (30)
Balance at 30 June 2021 561 39 600
D7 Earnings per stapled security
Reconciliation of earnings used in calculating earnings per security
THT TIL2022 2021 2022 2021
Profit/(loss) attributable to ordinary security holders ($M)
Continuing operations 737 347 (33) (108)
Discontinued operations — — — 3,454
Total 737 347 (33) 3,346
Weighted average number of securities (M) 2,991 2,737 2,991 2,737
Basic and diluted earnings per security attributable to the ordinary security holders (cents)
Continuing operations 24.6 12.7 (1.1) (4.0)
Discontinued operations — — — 126.2
Total 24.6 12.7 (1.1) 122.2
Section D: Notes to the THT and TIL financial statements for the year ended 30 June 2022
202
Governance and risk
Security holder information
Sustainability supplement
Business performance
Introduction and overview
Directors’ report
Corporate Report for the year ended 30 June 2022
Remuneration report
Financial statements

203
Section D: Notes to the THT and TIL financial statements for the year ended 30 June 2022
Capital and borrowings
D8 ReservesRefer to Note B12 for a description of the nature and purpose of each reserve.
THTCash flow
hedgesCost of
hedgingShare based
payments Total
$M $M $M $M
Balance at 1 July 2021 (96) 1 4 (91)
Revaluation—gross 414 5 — 419
Deferred tax (52) (2) — (54)
Share of other comprehensive income/(loss) of equity accounted investments, net of tax 227 (3) — 224
Balance at 30 June 2022 493 1 4 498
Balance at 1 July 2020 (238) — 4 (234)
Revaluation—gross 63 — — 63
Deferred tax 3 — — 3
Share of other comprehensive income of equity accounted investments, net of tax 76 1 — 77
Balance at 30 June 2021 (96) 1 4 (91)
TIL
Cash flow hedges
Share based payments
Foreign currency
translation
Transactions with non-
controlling interests Total
$M $M $M $M $M
Balance at 1 July 2021 (1) 1 (198) (58) (256)
Currency translation differences — — 249 — 249
Share of other comprehensive income of equity accounted investments 29 — — — 29
Balance at 30 June 2022 28 1 51 (58) 22
Balance at 1 July 2020 (24) 1 (142) (58) (223)
Revaluation—gross 20 — — — 20
Currency translation differences — — 124 — 124
Share of other comprehensive loss of equity accounted investments, net of tax (1) — — — (1)
(Gains)/losses reclassified on disposal of subsidiary, net of tax 9 — (175) — (166)
Deferred tax (5) — (5) — (10)
Balance at 30 June 2021 (1) 1 (198) (58) (256)
Section D: Notes to the THT and TIL financial statements for the year ended 30 June 2022
203
Governance and risk
Security holder information
Sustainability supplement
Business performance
Introduction and overview
Directors’ report
Corporate Report for the year ended 30 June 2022
Remuneration report
Financial statements

204
Section D: Notes to the THT and TIL financial statements for the year ended 30 June 2022
D9 Net finance income/(costs)
THT TIL2022 2021 2022 2021
$M $M $M $M
Finance income
Interest income from related parties 424 439 14 —
Unrealised remeasurement gain attributable to derivative financial instruments 20 — 67 42
Interest income on financial assets at amortised cost 20 15 1 —
Unwind of discount and remeasurement of financial assets at amortised cost 32 — 1 —
Unwind of discount and remeasurement of concession notes receivable 243 115 — —
Unwind of discount and remeasurement of liabilities―promissory notes 3 — — —
Income from concession financial asset — — 23 23
Movement in impairment provisions on related party receivables 2 13 — —
Net foreign exchange gains 6 — — —
Total finance income 750 582 106 65
Finance costs
Interest and finance charges paid/payable (494) (515) (61) (68)
Unrealised remeasurement loss attributable to derivative financial instruments — (48) — —
Unwind of discount and remeasurement of liabilities—maintenance provision — — (1) (1)
Unwind of discount and remeasurement of liabilities—promissory notes — (12) — —
Unwind of discount and remeasurement of liabilities—construction obligation liability (5) (7) — —
Unwind of discount and remeasurement of financial assets at amortised cost — (31) — —
Net foreign exchange losses — (13) (21) (21)
Movement in impairment provisions on related party receivables — — (1) —
Total finance costs (499) (626) (84) (90)
Net finance income/(costs) from continuing operations 251 (44) 22 (25)
Unwind of discount and remeasurement of concession notes receivable
Remeasurement of concession notes represents the discount unwind on these notes and the change in the payment profile of the concession notes.
Unrealised remeasurement gain attributable to derivative financial instruments
Refer to Note B13 for further information on the unrealised remeasurement gain attributable to derivative financial instruments.
D10 BorrowingsRefer to Note B14 for a description of each facility type.
THT TIL2022 2021 2022 2021
$M $M $M $M
Current
Capital markets debt 304 250 — —
US private placement — — 225 —
Term debt 47 191 389 4
Total current borrowings 351 441 614 4
Non-current
Capital markets debt 2,275 2,458 — —
US private placement 2,729 2,525 — 213
Term debt 2,312 2,183 — 381
Total non-current borrowings 7,316 7,166 — 594
Total borrowings 7,667 7,607 614 598
Section D: Notes to the THT and TIL financial statements for the year ended 30 June 2022
204
Governance and risk
Security holder information
Sustainability supplement
Business performance
Introduction and overview
Directors’ report
Corporate Report for the year ended 30 June 2022
Remuneration report
Financial statements

205
Section D: Notes to the THT and TIL financial statements for the year ended 30 June 2022
D11 Derivatives and financial risk managementThe instruments used by the Group are described in Note B15.
2022 2021
$M $M
Current Non-current Current Non-current
THT TIL THT TIL THT TIL THT TIL
Assets
Interest rate swap contracts — — 262 — — — 28 —
Cross currency interest rate swap contracts 22 — 426 — — — 16 —
Total derivative financial instrument assets 22 — 688 — — — 44 —
Liabilities
Interest rate swap contracts — 49 — — 2 — 77 113
Cross currency interest rate swap contracts — — — — — — 131 —
Total derivative financial instrument liabilities — 49 — — 2 — 208 113
Market risk
Foreign exchange risk
The effects of the foreign currency related hedging instruments on THT’s financial position and performance are as follows:
THT
2022 2021$M $M
Cross-currency interest rate swaps
Carrying amount 448 (115)
Notional amount 3,909 3,909
Hedge ratio 1:1 1:1
Increase/(decrease) in discounted value of outstanding hedging instruments since inception 615 (256)
(Decrease)/increase in value of hedged item used to determine hedge effectiveness (636) 275
Maturity profile—notional value of cross-currency interest rate swaps are as follows:
THT
2022Less than 12
months 1–5 years Over 5 years
Total nominal amount
$M
Cross-currency interest rate swaps (AUD:USD)3 — 285 1,858 2,143
Average AUD-USD exchange rate — 0.76 0.75 NA¹
Average fixed interest rate2 — 5.2% 4.9% NA¹
Cross-currency interest rate swaps (AUD:CHF)4 200 375 190 765
Average AUD-CHF exchange rate 0.72 0.74 0.71 NA¹
Average fixed interest rate2 4.6% 4.5% 3.3% NA¹
2021Less than 12
months 1–5 years Over 5 years
Total nominal amount
$M
Cross-currency interest rate swaps (AUD:USD)3 — 155 1,988 2,143
Average AUD-USD exchange rate — — — NA¹
Average fixed interest rate2 — 5.5% 4.9% NA¹
Cross-currency interest rate swaps (AUD:CHF)4 — 400 365 765
Average AUD-CHF exchange rate — — — NA¹
Average fixed interest rate2 — 4.5% 3.9% NA¹
1. NA—Not applicable.
2. Based on average fixed rate of cross currency swap contracts, which does not include any margins that may be applicable on the hedged debt instrument.
3. Balances are presented in USD currency.
4. Balances are presented in CHF currency.
Section D: Notes to the THT and TIL financial statements for the year ended 30 June 2022
205
Governance and risk
Security holder information
Sustainability supplement
Business performance
Introduction and overview
Directors’ report
Corporate Report for the year ended 30 June 2022
Remuneration report
Financial statements

206
Section D: Notes to the THT and TIL financial statements for the year ended 30 June 2022
D11 Derivatives and financial risk management (continued)
Market risk (continued)
Foreign exchange risk (continued)
Effectiveness of hedging relationships designated are as follows:
THT
2022$M
Hedge (gains)/losses recognised in other
comprehensive income
Hedge ineffectiveness
(gains)/losses recognised in profit
and loss
Line item in profit and loss that
includes hedge ineffectiveness
Amount reclassified from other
comprehensive income to profit and
loss
Line item in profit and loss for
reclassification
Foreign currency risk (543) (20) Net finance costs — Net finance costs
2021
$M
Foreign currency risk 371 48 Net finance costs — Net finance costs
Exposure to foreign currency risk at the reporting date, denominated in the currency in which the risk arises, was as follows:
THT THT TIL
2022 2021 2022 2021 2022 2021
USD USD CHF CHF AUD AUD
$M $M $M $M $M $M
Receivables 588 812 — — 449 1
Payables (553) (715) — — (28) (9)
Borrowings (2,143) (2,143) (765) (765) — —
Cross-currency interest rate swaps 2,143 2,143 765 765 — —
Net exposure 35 97 — — 421 (8)
Sensitivity to exchange rate movements based on the translation of financial instruments held at the end of the period is as follows:
THTMovement in
post-tax profitIncrease/(decrease)
in equity2022 2021 2022 2021
$M $M $M $M
AUD/USD
+ 10 cents (5) (11) (18) (51)
– 10 cents 6 14 25 67
AUD/CHF
+ 10 cents — — (9) (7)
– 10 cents — — 12 9
TILMovement in
post-tax profitIncrease/(decrease)
in equity2022 2021 2022 2021
$M $M $M $M
USD/AUD
+ 10 cents 13 — — —
– 10 cents (15) — — —
Section D: Notes to the THT and TIL financial statements for the year ended 30 June 2022
206
Governance and risk
Security holder information
Sustainability supplement
Business performance
Introduction and overview
Directors’ report
Corporate Report for the year ended 30 June 2022
Remuneration report
Financial statements

207
Section D: Notes to the THT and TIL financial statements for the year ended 30 June 2022
D11 Derivatives and financial risk management (continued)
Interest rate risk
Interest rate swap contracts in TIL do not qualify for hedge accounting. The effects of the interest rate related hedging instruments on THT’s financial position and performance are as follows:
THT
2022 2021$M $M
Interest rate swaps
Carrying amount 262 (51)
Notional amount1 2,903 2,947
Hedge ratio 1:1 1:1
Increase/(decrease) in fair value of outstanding hedging instruments 352 (108)
(Decrease)/increase in value of hedged item used to determine hedge effectiveness since inception (357) 112
Weighted average hedged rate for the year 100% 100%
1. The notional amounts above include $407 million (2021: $407 million) of forward starting swaps which are hedging the same underlying interest rate exposures and therefore not included in the net exposure to interest rate risk table.
Maturity profile—notional value of interest rate swaps are as follows:
THT
2022 Less than 12 months 1-5 years Over 5 years
Total notional amount$M
Interest rate swaps 408 868 1,627 2,903
Average fixed interest rate1 2.2% 1.5% 1.9% NA²
2021
$M
Interest rate swaps 166 1,566 1,215 2,947
Average fixed interest rate1 2.3% 1.4% 1.8% NA²
1. Based on average fixed rate of interest rate swap contracts, which does not include any margins that may be applicable on the hedged debt instrument.
Effectiveness of hedging relationships designated are as follows:
THT
2022
Hedge gains recognised in other
comprehensive income
Hedge ineffectiveness
losses/(gains) recognised in profit
and loss
Line item in profit and loss that
includes hedge ineffectiveness
Amount reclassified from other
comprehensive income to profit and
loss
Line item in profitand loss for
reclassification$M
Interest rate risk (313) — Net finance costs — Net finance costs
2021
$M
Interest rate risk (104) — Net finance costs — Net finance costs
THT and TIL are not materially impacted by movements in interest rates. As at the reporting date, THT and TIL had the following variable rate borrowings and interest rate swap contracts outstanding:
THT TIL2022 2021 2022 2021
$M $M $M $M
Cash and cash equivalents 116 116 307 560
Floating rate borrowings (2,528) (2,546) (390) (385)
Interest rate swaps (notional principal amount) 2,495 2,539 408 393
Net exposure to interest rate risk 83 109 325 568
Section D: Notes to the THT and TIL financial statements for the year ended 30 June 2022
207
Governance and risk
Security holder information
Sustainability supplement
Business performance
Introduction and overview
Directors’ report
Corporate Report for the year ended 30 June 2022
Remuneration report
Financial statements

208
Section D: Notes to the THT and TIL financial statements for the year ended 30 June 2022
D11 Derivatives and financial risk management (continued)
Interest rate risk (continued)
Sensitivity to interest rate movements based on variable rate obligations is as follows:
THT TIL2022 2021 2022 2021
$M $M $M $M
Interest rates +100bps 1 1 3 6
Interest rates –100bps (1) (1) (3) (6)
Liquidity risk
Contractual maturities of financial liabilities
The amounts disclosed in the following table are the contractual undiscounted cash flows of THT and TIL’s financial liabilities. For interest rate swaps, the cash flows have been estimated using forward interest rates applicable at the end of the reporting period. For further information refer to Note B15.
THT
2022 1 year or less
Over 1 to 2 years
Over 2 to 3 years
Over 3 to 4 years
Over 4 to 5 years
Over 5 years
Total contractual
cash flowsCarrying amount$M
Trade payables 74 — — — — — 74 74
Borrowings 588 542 842 1,089 761 5,690 9,512 7,667
Related party payables 134 134 1,044 1,675 164 1,400 4,551 4,110
Interest rate swaps1 (20) (53) (42) (37) (33) (133) (318) (262)
Cross-currency interest rate swaps1 47 36 36 29 19 49 216 (448)
Concession notes — — — — — 254 254 80
Total 823 659 1,880 2,756 911 7,260 14,289 11,221
2021 1 year or less
Over 1 to 2 years
Over 2 to 3 years
Over 3 to 4 years
Over 4 to 5 years
Over 5 years
Total contractual
cash flowsCarrying amount$M
Trade payables 64 — — — — — 64 64
Borrowings 587 533 758 835 980 5,919 9,612 7,607
Related party payables 350 127 127 1,077 1,632 1,373 4,686 4,183
Interest rate swaps1 39 28 17 7 — (38) 53 51
Cross-currency interest rate swaps1 59 58 48 48 40 103 356 115
Concession notes — — — — — 241 241 77
Total 1,099 746 950 1,967 2,652 7,598 15,012 12,097
1. The carrying value of the interest rate and cross-currency swaps are presented on a net basis. The gross position is disclosed in the first table of Note D11.
TIL
2022 1 year or less
Over 1 to 2 years
Over 2 to 3 years
Over 3 to 4 years
Over 4 to 5 years
Over 5 years
Total contractual
cash flowsCarrying amount$M
Trade payables 27 — — — — — 27 27
Borrowings 634 — — — — — 634 614
Related party payables 36 29 29 29 29 890 1,042 472
Interest rate swaps 5 6 6 6 5 30 58 49
Lease liabilities 1 1 1 1 1 — 5 6
Total 703 36 36 36 35 920 1,766 1,168
2021 1 year or less
Over 1 to 2 years
Over 2 to 3 years
Over 3 to 4 years
Over 4 to 5 years
Over 5 years
Total contractual
cash flowsCarrying amount$M
Trade payables 22 — — — — — 22 22
Borrowings 21 609 — — — — 630 598
Related party payables 34 27 27 27 27 818 960 440
Interest rate swaps 16 13 11 10 9 64 123 113
Lease liabilities 1 1 1 1 1 1 6 6
Total 94 650 39 38 37 883 1,741 1,179
Section D: Notes to the THT and TIL financial statements for the year ended 30 June 2022
208
Governance and risk
Security holder information
Sustainability supplement
Business performance
Introduction and overview
Directors’ report
Corporate Report for the year ended 30 June 2022
Remuneration report
Financial statements

209
Section D: Notes to the THT and TIL financial statements for the year ended 30 June 2022
Concession summaryRefer to the Concession summary section of the Group financial statements for the intangible assets, concession note and promissory note accounting policies.
D12 Other intangible assets
2022 Concession assets
Assets under construction Total$M
THT TIL THT TIL THT TIL
Cost 12,141 1,470 371 — 12,512 1,470
Accumulated amortisation (3,482) (246) (44) — (3,526) (246)
Net carrying amount 8,659 1,224 327 — 8,986 1,224
2021 Concession assets
Assets under construction Total$M
THT TIL THT TIL THT TIL
Cost 12,140 1,400 371 2 12,511 1,402
Accumulated amortisation (3,168) (177) (29) — (3,197) (177)
Net carrying amount 8,972 1,223 342 2 9,314 1,225
Movement in other intangible assets
Concession assets Assets under construction Total
THT TIL THT TIL THT TIL
$M $M $M $M $M $M
Opening balance at 1 July 2021 8,972 1,223 342 2 9,314 1,225
Foreign exchange movements and other adjustments — 59 — (2) — 57
Amortisation charge (313) (58) (15) — (328) (58)
Net carrying amount at 30 June 2022 8,659 1,224 327 — 8,986 1,224
Opening balance at 1 July 2020 9,281 4,504 355 629 9,636 5,133
Additions — — 5 87 5 87
Foreign exchange movements and other adjustments — (310) — (54) — (364)
Transfer 4 11 (4) (11) — —
Disposals through loss of control of subsidiary1 — (2,904) — (649) — (3,553)
Amortisation charge (313) (78) (14) — (327) (78)
Net carrying amount at 30 June 2021 8,972 1,223 342 2 9,314 1,225
1. Relates to the deconsolidation of the Group’s ownership interest in TC upon divestment of a 50% ownership interest (refer to Note B24).
D13 Concession financial assetTIL’s concession financial assets relate only to A25 as at 30 June 2022 and 30 June 2021. Refer to Note B18 for a reconciliation of movements in the A25 concession financial asset.
D14 Other liabilities—concession liabilitiesRefer to Note B21 for further information on these concession liabilities.
M2 Motorway (THT)
The face value of promissory notes on issue as at 30 June 2022 is $254 million (2021: $241 million). The net present value as at 30 June 2022 of the redemption payments relating to these promissory notes is $80 million (2021: $77 million).
Section D: Notes to the THT and TIL financial statements for the year ended 30 June 2022
209
Governance and risk
Security holder information
Sustainability supplement
Business performance
Introduction and overview
Directors’ report
Corporate Report for the year ended 30 June 2022
Remuneration report
Financial statements

210
Section D: Notes to the THT and TIL financial statements for the year ended 30 June 2022
Group structure
D15 Equity accounted investmentsSet out below is the summarised financial information for those joint ventures and associates that are material to the THT and TIL Group. The summarised financial information presented below is on a 100 per cent basis. Refer to Note B25 for the details of the STP JV, NWRG and TIL (TC and AM Partners) equity accounted investments.
Reconciliation of summarised financial information
Set out below is the reconciliation of the carrying value of equity accounted investments.
THTSTP JV
THT NorthWestern Roads
TrustTHT
Total TIL2022 2021 2022 2021 2022 2021 2022 2021
$M $M $M $M $M $M $M $M
Opening carrying value at 1 July 2,073 2,268 76 151 2,149 2,419 2,714 —
Acquisition — — — — — — — 2,706
Group’s share of profit/(loss) (158) (130) 40 34 (118) (96) (60) (21)
Group’s share of other comprehensive income/(loss) 216 75 8 2 224 77 29 (1)
Distributions received (278) (253) (85) (111) (363) (364) (65) —
Foreign exchange movements — — — — — — 256 28
Capital contributions1 3,373 113 — — 3,373 113 162 2
Fair value adjustment on issuance of shareholder loans — — — — — — 1 —
Closing carrying value at 30 June 5,226 2,073 39 76 5,265 2,149 3,037 2,714
1. Capital contributions for AM Partners includes $6 million (2021: $nil) of costs capitalised as part of the cost of the equity accounted investment.
Summarised balance sheet—100%
THT STP JV
THT North Western Roads
TrustTHT
Total TIL2022 2021 2022 2021 2022 2021 2022 2021¹
$M $M $M $M $M $M $M $M
Cash and cash equivalents 565 781 — — 565 781 483 366
Other current assets 426 420 — — 426 420 18 9
Non-current assets 16,903 16,322 2,003 2,088 18,906 18,410 9,678 8,561
Current financial liabilities (1,496) 8 (18) (17) (1,514) (9) — —
Other current liabilities (120) (130) (2) (5) (122) (135) (278) (145)
Non-current financial liabilities (8,581) (9,501) (1,997) (2,000) (10,578) (11,501) (3,616) (3,188)
Other non-current liabilities 9 9 — — 9 9 (232) (176)
Net assets/(liabilities) 7,706 7,909 (14) 66 7,692 7,975 6,053 5,427
Summarised statement of comprehensive income—100%
Revenue 293 320 153 141 446 461 229 49
Construction revenue 288 514 — — 288 514 261 47
Depreciation and amortisation (351) (350) (34) (34) (385) (384) (124) (29)
Other expenses (17) — (1) (1) (18) (1) (121) (30)
Construction costs (288) (514) — — (288) (514) (261) (47)
Net finance costs (316) (479) (38) (34) (354) (513) (106) (31)
Income tax expense — — (2) (4) (2) (4) — —
Profit/(loss) for the year (391) (509) 78 68 (313) (441) (122) (41)
Other comprehensive income/(loss) 566 297 15 4 581 301 61 (2)
Total comprehensive income/(loss) 175 (212) 93 72 268 (140) (61) (43)
The following table reconciles the above summarised financial information presented on a 100 per cent basis to the proportional amounts recognised by the Group:
Ownership interest 50% 50% 50% 50% 60% 60%
Proportional total comprehensive income/(loss) 58 (55) 48 36 106 (19) (79) (13)
Amortisation of fair value uplift and other adjustments — — — — — — 48 (9)
Group's share of comprehensive income/(loss) 58 (55) 48 36 106 (19) (31) (22)
1. The summarised statement of comprehensive income for TC is presented from the date of divestment of 50% share in TC on 31 March 2021.
Section D: Notes to the THT and TIL financial statements for the year ended 30 June 2022
210
Governance and risk
Security holder information
Sustainability supplement
Business performance
Introduction and overview
Directors’ report
Corporate Report for the year ended 30 June 2022
Remuneration report
Financial statements

211
Section D: Notes to the THT and TIL financial statements for the year ended 30 June 2022
D16 Non-controlling interests—otherSet out below is summarised financial information for each material subsidiary that has non-controlling interests that are material and external to THT and the total external NCI. The amounts disclosed for each subsidiary are before cross-staple eliminations.
THT
Transurban Queensland Invest Trust
Airport Motorway Trust Total NCI
37.50% 37.50% 24.90% 24.90%
2022 2021 2022 2021 2022 2021
$M $M $M $M $M $M
Summarised balance sheet
Current assets 302 65 51 190 353 255
Non-current assets 7,257 7,424 723 600 7,980 8,024
Current liabilities (359) (302) (205) (347) (564) (649)
Non-current liabilities (5,383) (5,376) (365) (266) (5,748) (5,642)
Net assets 1,817 1,811 204 177 2,021 1,988
Carrying amount of NCI 682 679 51 44 733 723
Summarised statement of comprehensive income
Revenue 392 359 10 14 402 373
Profit/(loss) for the year (1) (83) 5 1 4 (82)
Other comprehensive income/(loss) 202 (17) 28 7 230 (10)
Total comprehensive income/(loss) 201 (100) 33 8 234 (92)
Profit/(loss) allocated to NCI — (31) 1 — 1 (31)
Other comprehensive income/(loss) allocated to NCI 76 (6) 6 1 82 (5)
Summarised cash flows
Cash flows from operating activities 188 159 4 — 192 159
Cash flows from investing activities (1) (1) — — (1) (1)
Cash flows from financing activities (189) (186) — — (189) (186)
Net increase/(decrease) in cash and cash equivalents (2) (28) 4 — 2 (28)
D17 Deed of cross and intra-group guarantees
Deed of cross guarantee
Transurban International Limited, Transurban International Holdings Pty Ltd, Transurban Maple Holdings Pty Ltd, Transurban Maple Investments Pty Ltd, Transurban Technology Investments Holdings Pty Ltd and Transurban Technology Investments Pty Ltd are party to a deed of cross guarantee under which each company guarantees the debts of the others. By entering into the deed, the wholly-owned entities have been relieved from the requirement to prepare a financial report and Directors’ report under Instrument 2016/785 issued by the Australian Securities and Investments Commission. The companies represent a 'closed group' for the purposes of the Instrument, and as there are no other parties to the deed of cross guarantee that are controlled by TIL, they also represent the 'extended closed group’.
Set out below is the summary financial information of the closed group.
2022 2021$M $M
Summarised statement of comprehensive income
Revenue 3 1,657
Net finance costs (9) (169)
(Loss)/profit before income tax (6) 1,488
Income tax benefit/(expense) 30 (8)
Profit for the year from continuing operations 24 1,480
Loss for the year from discontinued operations — (6)
Profit for the year from continuing and discontinued operations 24 1,474
Total comprehensive income for the year 24 1,474
Section D: Notes to the THT and TIL financial statements for the year ended 30 June 2022
211
Governance and risk
Security holder information
Sustainability supplement
Business performance
Introduction and overview
Directors’ report
Corporate Report for the year ended 30 June 2022
Remuneration report
Financial statements

212
Section D: Notes to the THT and TIL financial statements for the year ended 30 June 2022
D17 Deed of cross and intra-group guarantees (continued)
Deed of cross guarantee (continued)
2022 2021$M $M
Summarised movements in retained earnings
Retained earnings at the beginning of the year 980 —
Accumulated losses of entities that joined the ‘closed group’ — (494)
Profit for the year 24 1,474
Retained earnings at the end of the year 1,004 980
Summarised balance sheet
Current assets
Trade and other receivables 8 2
Total current assets 8 2
Non-current assets
Other financial assets 2,371 1,785
Deferred tax assets 33 —
Total non-current assets 2,404 1,785
Total assets 2,412 1,787
Current liabilities
Total current liabilities — —
Non-current liabilities
Total non-current liabilities — —
Total liabilities — —
Net assets 2,412 1,787
Equity
Contributed equity 1,031 600
Other reserves 377 207
Retained earnings 1,004 980
Total equity 2,412 1,787
Intra–group guarantees
As at 30 June 2022, the Transurban Group comprises Transurban Holdings Limited, Transurban Holding Trust and Transurban International Limited, traded and quoted on the ASX as one triple stapled security. Under the stapling arrangement, each entity is able to provide direct and/or indirect support to each other entity and its controlled entities within the Group on a continual basis.
Expected credit loss
As at 30 June 2022, having assessed the impacts from the economic uncertainty relating to COVID-19, near-term interest rates and inflation, management do not consider there to be evidence of a significant increase in credit risk since the initial recognition of the financial assets at amortised cost in the closed group. This is mainly due to there being no significant change in the nature of or the collectability of these balances. The loss allowance for these financial assets at amortised cost continues to be limited to 12 months of expected losses. These balances continue to have low credit risk as they have a low risk of default and the counterparties have a strong capacity to meet their contractual cash flow obligations in the near-term. As at 30 June 2022 the loss allowance was $1 million (2021: $nil), reflecting management's updated estimate of the collectability of these balances.
Section D: Notes to the THT and TIL financial statements for the year ended 30 June 2022
212
Governance and risk
Security holder information
Sustainability supplement
Business performance
Introduction and overview
Directors’ report
Corporate Report for the year ended 30 June 2022
Remuneration report
Financial statements

213
Section D: Notes to the THT and TIL financial statements for the year ended 30 June 2022
Other
D18 Related party transactions
THT THL1 Joint ventures2022 2021 2022 2021
$'000 $'000 $'000 $'000Transactions with related parties
Rental income 902,420 734,259 — —
Concession fees 42,951 41,375 — —
Interest income 423,520 439,341 — —
Finance income/(cost) on financial assets at amortised cost — — 51,683 (15,750)
Interest and finance charges paid/payable (183,481) (203,237) — —
Other expenses (4,538) (4,669) — —
Outstanding balances with related parties
Current receivables 709,286 960,758 — —
Current concession notes 135,540 — — —
Non-current receivables 8,513,097 9,064,377 — —
Non-current financial assets at amortised cost — — 665,200 627,450
Non-current concession notes 1,005,550 854,768 — —
Current liabilities (315,405) (490,299) — —
Non-current liabilities (3,794,727) (3,693,005) — —
1. Transactions and outstanding balances between THT and THL.
Expected credit loss
As at 30 June 2022, having considered the impacts from the economic uncertainty relating to COVID-19, near-term interest rates and inflation, management do not consider there to be evidence of a significant increase in credit risk since the initial recognition of the financial assets at amortised cost by THT. This is mainly due to there being no significant change in the nature of or the collectability of these balances. The loss allowance for these financial assets at amortised cost continues to be limited to 12 months of expected losses. These balances continue to have low credit risk as they have a low risk of default and the counterparties have a strong capacity to meet their contractual cash flow obligations in the near-term. As at 30 June 2022 the loss allowance was $27 million (2021: $27 million), reflecting management’s updated estimate of the collectability of these balances.
TIL THL1 Joint ventures2022 2021 2022 2021
$'000 $'000 $'000 $'000Transactions with related parties
Revenue from services — — 24,798 7,989
Interest income 14,256 — — —
Interest expense (27,758) (36,145) — —
Other expenses (13,244) (11,700) — —
Outstanding balances with related parties
Current receivables 9,384 5,328 36,995 66,693
Non-current receivables 439,668 — — —
Non-current financial assets at amortised cost — — 1,889 1,728
Current liabilities (14,207) (12,068) (7,074) (6,556)
Non-current liabilities (451,131) (420,929) — —
1. Transactions and outstanding balances between TIL and THL.
Section D: Notes to the THT and TIL financial statements for the year ended 30 June 2022
213
Governance and risk
Security holder information
Sustainability supplement
Business performance
Introduction and overview
Directors’ report
Corporate Report for the year ended 30 June 2022
Remuneration report
Financial statements

214
Section D: Notes to the THT and TIL financial statements for the year ended 30 June 2022
D19 Parent entity disclosures
Summary financial information
The individual financial statements for the parent entities (THT and TIL) show the following aggregate amounts:
THT¹ TIL2022 2021 2022 2021
$M $M $M $MBalance sheet
Current assets 718 1,075 350 316
Total assets 19,680 16,758 1,493 928
Current liabilities 1,836 1,665 — —
Total liabilities 3,683 3,411 — —
Net assets 15,997 13,347 1,493 928
Shareholder's equity 19,354 16,527 1,030 599
Reserves 3 4 172 63
(Accumulated losses)/retained earnings (3,360) (3,184) 291 266
Total equity 15,997 13,347 1,493 928
Profit for the year 1,022 670 25 292
Exchange differences on translation of USD balances, net of tax — — 109 (54)
Total comprehensive income 1,022 670 134 238
1. Comparatives have been restated to disclose distributions received and recognised in FY21.
Expected credit loss
As at 30 June 2022, having considered the impacts from the economic uncertainty relating to COVID-19, near-term interest rates and inflation, management do not consider there to be evidence of a significant increase in credit risk since the initial recognition of the financial assets at amortised cost in each respective parent entity. This is mainly due to there being no significant change in the nature of or the collectability of these balances. The loss allowance for these financial assets at amortised cost continues to be limited to 12 months of expected losses. These balances continue to have low credit risk as they have a low risk of default and the counterparties have a strong capacity to meet their contractual cash flow obligations in the near-term. As at 30 June 2022 the loss allowance was $5 million for THT (2021: $8 million) and $2 million for TIL (2021: $1 million), reflecting management’s updated estimate of the collectability of these balances.
Guarantees entered into by the parent entity
There are cross guarantees given by Transurban International Limited, Transurban International Holdings Pty Ltd, Transurban Maple Holdings Pty Ltd, Transurban Maple Investments Pty Ltd, Transurban Technology Investments Holdings Pty Ltd and Transurban Technology Investments Pty Ltd as described in Note D17.
Section D: Notes to the THT and TIL financial statements for the year ended 30 June 2022
214
Governance and risk
Security holder information
Sustainability supplement
Business performance
Introduction and overview
Directors’ report
Corporate Report for the year ended 30 June 2022
Remuneration report
Financial statements

Pages 8 & 94 ref destination: Audit information / directors declaration (FS)
215
Section E: Directors’ declaration for the year ended 30 June 2022
Section E: Signed reports
Directors' DeclarationIn the opinion of the Directors of Transurban Holdings Limited, Transurban Infrastructure Management Limited (as the responsible entity of Transurban Holding Trust) and Transurban International Limited (collectively referred to as ‘the Directors’):
• the financial statements and notes of Transurban Holdings Limited and its controlled entities, including Transurban Holding Trust and itscontrolled entities and Transurban International Limited and its controlled entities set out on pages 120 to 214 are in accordance with theCorporations Act 2001, including:
– complying with Accounting Standards, the Corporations Regulations 2001 and other mandatory professional reporting requirements, and
– giving a true and fair view of the Transurban Holdings Limited Group's, Transurban Holding Trust Group’s and Transurban InternationalLimited Group’s financial position as at 30 June 2022 and of its performance for the year ended on that date, and
• there are reasonable grounds to believe that the Transurban Holdings Limited Group, Transurban Holding Trust Group and TransurbanInternational Limited Group will be able to pay their debts as and when they become due and payable, and
• at the date of this declaration, there are reasonable grounds to believe that the members of the Extended Closed Group identified in Notes B27and D17 will be able to meet any obligations or liabilities to which they are, or may become liable, subject by virtue of the deed of crossguarantee described in Notes B27 and D17.
Note B3 confirms that the financial statements also comply with International Financial Reporting Standards as issued by the International Accounting Standards Board.
The Directors have been given the declarations by the Chief Executive Officer and Chief Financial Officer required by section 295A of the Corporations Act 2001.
Lindsay MaxstedDirector
Scott CharltonDirector
Melbourne18 August 2022
Section E: Directors’ declaration for the year ended 30 June 2022
215
Governance and risk
Security holder information
Sustainability supplement
Business performance
Introduction and overview
Directors’ report
Corporate Report for the year ended 30 June 2022
Remuneration report
Financial statements

Page 92 ref destination: Auditors independence declaration P1
216
PricewaterhouseCoopers, ABN 52 780 433 757 2 Riverside Quay, SOUTHBANK VIC 3006, GPO Box 1331, MELBOURNE VIC 3001 T: 61 3 8603 1000, F: 61 3 8603 1999
Liability limited by a scheme approved under Professional Standards Legislation.
Independent auditor’s report To the stapled security holders of Transurban Holdings Limited, Transurban Holding Trust and Transurban International Limited
Report on the audit of the financial report
Our opinion In our opinion:
The accompanying financial reports of Transurban Holdings Limited (THL or the Company) and its controlled entities (together the Transurban Group or the Group), Transurban Holding Trust (the Trust) and its controlled entities (together THT) and Transurban International Limited (the International Company) and its controlled entities (together TIL) are in accordance with the Corporations Act 2001, including:
(a) giving a true and fair view of the Transurban Group, THT and TIL’s financial positions as at 30 June2022 and of their financial performance for the year then ended
(b) complying with Australian Accounting Standards and the Corporations Regulations 2001.
What we have audited The Transurban Group, THT and TIL financial reports (the financial report) comprise:
the consolidated balance sheets as at 30 June 2022 the consolidated statements of comprehensive income for the year then ended the consolidated statements of changes in equity for the year then ended the consolidated statements of cash flows for the year then ended the notes to the consolidated financial statements, which include significant accounting policies and
other explanatory information the directors’ declaration.
Basis for opinion We conducted our audit in accordance with Australian Auditing Standards. Our responsibilities under those standards are further described in the Auditor’s responsibilities for the audit of the financial report section of our report.
We believe that the audit evidence we have obtained is sufficient and appropriate to provide a basis for our opinion.
Independence We are independent of the Transurban Group, THT and TIL in accordance with the auditor independence requirements of the Corporations Act 2001 and the ethical requirements of the Accounting Professional & Ethical Standards Board’s APES 110 Code of Ethics for Professional Accountants (including Independence Standards) (the Code) that are relevant to our audit of the financial report in Australia. We have also fulfilled our other ethical responsibilities in accordance with the Code.
Governance and risk
Security holder information
Sustainability supplement
Business performance
Introduction and overview
Directors’ report
Corporate Report for the year ended 30 June 2022
Remuneration report
Financial statements

217
Our audit approach An audit is designed to provide reasonable assurance about whether the financial report is free from material misstatement. Misstatements may arise due to fraud or error. They are considered material if individually or in aggregate, they could reasonably be expected to influence the economic decisions of users taken on the basis of the financial report.
We tailored the scope of our audit to ensure that we performed enough work to be able to give an opinion on the financial report as a whole, taking into account the geographic and management structure of the Transurban Group, THT and TIL, their accounting processes and controls and the industry in which they operate.
Group Materiality
For the purpose of our audit we used overall Group materiality of $42 million, which representsapproximately 2.5% of the Group’s earnings before interest, tax, depreciation and amortisationexpenses (EBITDA).
We applied this threshold, together with qualitative considerations, to determine the scope of ouraudit and the nature, timing and extent of our audit procedures and to evaluate the effect ofmisstatements on the financial report as a whole.
We chose EBITDA as the benchmark because, in our view, it is the metric against which theperformance of the Transurban Group is most commonly measured and is a generally acceptedbenchmark in the infrastructure industry. We chose 2.5% based on our professional judgement,noting that it is within the common range relative to EBITDA benchmarks.
Audit Scope
Our audit focused on where the Group made subjective judgements; for example, significantaccounting estimates involving assumptions and inherently uncertain future events.
We conducted an audit of the financial report for each of the Transurban Group, THT and TIL,including substantive audit procedures in respect of the operation of each of the toll roadconcessions and equity accounted investments. Specific audit procedures were also performed forinterest, tax, depreciation and amortisation expenses.
Key audit matters Key audit matters are those matters that, in our professional judgement, were of most significance in our audit of the financial report for the current period. The key audit matters were addressed in the context of our audit of the financial report as a whole, and in forming our opinion thereon, and we do not provide a separate opinion on these matters. Further, any commentary on the outcomes of a particular audit procedure is made in that context. We communicated the key audit matters to the Audit and Risk Committee.
Governance and risk
Security holder information
Sustainability supplement
Business performance
Introduction and overview
Directors’ report
Corporate Report for the year ended 30 June 2022
Remuneration report
Financial statements

218
Recording of toll revenue
Group – Note B5 Toll revenue: $2,324m
THT Toll revenue – not applicable
TIL – Note D4 Toll Revenue: $62m
Key audit matter How our audit addressed the key audit matter The Transurban Group operates toll roads in 4 geographic segments: Melbourne, Sydney and Brisbane in Australia and North America. Each toll road records and recognises revenue through the use of technology, specifically, roadside equipment supported by tolling and billing systems.
Tolling equipment and systems are customised complex systems that are built with the purpose of correctly identifying vehicle type, calculating correct fare and linking the vehicle to the customer’s account for billing purposes or obtaining information from local transport authorities for vehicles that have not made a valid billing arrangement.
Every toll road operates under a different concession deed which governs the means by which customers are charged.
We considered this to be a key audit matter for the Group and TIL due to the large volume of transactions that were processed in the year, the unique nature of each toll road and the reliance on bespoke information technology systems and controls.
Our procedures included, amongst others:
Testing a selection of Information TechnologyGeneral Controls (ITGCs) supporting theintegrity of the tolling systems' operation,including access, operations and changemanagement controls.
Performing tests of the design and operation ofrelevant controls over revenue adjustments,write offs, image processing and exceptionreporting.
Performing testing of the review and approval oftoll price increases for each toll road during theyear.
Performing testing of manual journals andmanual adjustments to revenue.
Using data analytics to recalculate toll revenuefor each toll road in Australia and the A25 inCanada for the full 12 month period.
For all material contracts, obtaining anunderstanding of the key terms of thearrangements, term dates and performanceobligations in regard to Australian AccountingStandards.
Assessing the Group's identification ofperformance obligations and allocation of pricesto the performance obligations for a sample ofcontracts.
Governance and risk
Security holder information
Sustainability supplement
Business performance
Introduction and overview
Directors’ report
Corporate Report for the year ended 30 June 2022
Remuneration report
Financial statements

219
Borrowings Group – Note B14 Current borrowings: $1,063m Non-Current borrowings: $16,580m
THT – Note D10 Current borrowings: $351m Non-Current borrowings: $7,316m
TIL – Note D10 Current borrowings: $614m Non-Current borrowings - Nil
Key audit matter How our audit addressed the key audit matter Borrowings are an integral part of the Transurban Group’s business model as it is the key source of funds used by the business to fund new projects and upgrades to existing concession assets.
Each of the borrowing agreements has its own set of terms and conditions and therefore assessment of the treatment of the agreements and their impact on the financial statements is required.
We considered this to be a key audit matter for the Group, THT and TIL given the size of the borrowings balances, the number of borrowing agreements in place and the importance of the funding structure for continued growth.
Our procedures included, amongst others:
Obtaining confirmations from banks to confirm asample of borrowings.
Reading the most up-to-date borrowingagreements with the financiers to develop anunderstanding of the terms associated with thefacilities and the amount of facility available fordrawdown.
Where debt is regarded as non-current,considering the Group's assessment whetherthere is an unconditional right to defer paymentsuch that there were no repayments requiredwithin 12 months from the balance date.
Assessing the accounting treatment of capitalisedborrowing costs arising from new arrangementsand borrowing costs related to terminatedfacilities.
Performing tests of the design and operation ofrelevant controls over the treasury functionincluding board review of the funding plan andapproval of debt agreements and financialinstitutions used.
Governance and risk
Security holder information
Sustainability supplement
Business performance
Introduction and overview
Directors’ report
Corporate Report for the year ended 30 June 2022
Remuneration report
Financial statements

220
Service concession arrangementsGroup – Notes B17 – B21Concession assets: $16,632mAssets under construction: $4,009mConcession financial asset: $369mMaintenance provision: $1,128mConstruction obligation liability: $796mOther liabilities: $140m
THT – Notes D12, D14Concession assets: $8,659mAssets under construction: $327mConcession notes receivable: $1,142mConstruction obligation liability: $84mOther liabilities: $80m
TIL – Notes D12 – D13Concession assets: $1,224mConcession financial asset:$369mMaintenance provision: $35m
Key audit matter How our audit addressed the key audit matterEach of the concession assets in the Transurban Group’s portfolio represents a contractual right under a concession agreement to toll a road in return for the capital and expertise needed to build, maintain and operate the road.
Every concession asset is governed by its own concession agreement between the Group and theconcession grantor (typically the government or alocal transport authority of the region in which theconcession is granted). As a result, the TransurbanGroup is subject to a number of contractual obligations, some of which have a direct impact onthe financial statements. Whenever the Groupundertakes a new project to construct, acquire or upgrade the asset, its contractual arrangements withconcession grantors are altered either through a new concession agreement or an amendment of the existing concession agreement.
The right to receive future economic benefits isrecognised on the balance sheet as a concession asset. The asset is recognised at the cost ofconstruction or price paid at acquisition.
Assets under construction include the construction of the West Gate Tunnel. The Group is exposed to direct and indirect construction risk including through its third party contractors. Construction risk includesexposures to claims made on the Group and claimsthat the Group may pass through or initiate on others.
The concession agreements also contain clauses thatrequire the Transurban Group to make cash outflows in the future, resulting in the recognition of concession liabilities such as maintenance liabilities andconcession note liabilities.
We evaluated the concession agreements for each toll road to develop an understanding of the nature of the agreements with the concession grantors and assessed the accounting implications of the contractualarrangements.
Our procedures included, amongst others:
Considering the relevant obligations in theconcession agreements having regard to thecalculations in the models and correspondingbalance sheet line items.
Obtaining an understanding of the status ofongoing construction projects, including claimsmade on the Group and claims the Group maypass onto other parties.
Performing tests of the design and operation ofcontrols over a selection of the forecast andbudgeting processes impacting the models in theCOVID-19 environment.
Evaluating the impairment indicator assessment.
Involving valuation experts to assess theappropriateness of selected key assumptionsused within the models.
Assessing the appropriateness of keyassumptions such as discount rates and inflationrates used in determining maintenance liabilitiesand concession note liabilities.
Assessing the adequacy of the disclosures in thefinancial report in respect of contractualarrangements having regard to the requirementsof Australian Accounting Standards
Service concession arrangements Group – Notes B17 – B21 Concession assets: $16,632m Assets under construction: $4,009m Concession financial asset: $369m Maintenance provision: $1,128m Construction obligation liability: $796m Other liabilities: $140m
THT – Notes D12, D14 Concession assets: $8,659m Assets under construction: $327m Concession notes receivable: $1,142m Construction obligation liability: $84m Other liabilities: $80m
TIL – Notes D12 – D13 Concession assets: $1,224m Concession financial asset: $369m Maintenance provision: $35m
Key audit matter How our audit addressed the key audit matter Each of the concession assets in the Transurban Group’s portfolio represents a contractual right under a concession agreement to toll a road in return for the capital and expertise needed to build, maintain and operate the road.
Every concession asset is governed by its own concession agreement between the Group and the concession grantor (typically the government or a local transport authority of the region in which the concession is granted). As a result, the Transurban Group is subject to a number of contractual obligations, some of which have a direct impact on the financial statements. Whenever the Group undertakes a new project to construct, acquire or upgrade the asset, its contractual arrangements with concession grantors are altered either through a new concession agreement or an amendment of the existing concession agreement.
The right to receive future economic benefits is recognised on the balance sheet as a concession asset. The asset is recognised at the cost of construction or price paid at acquisition.
Assets under construction include the construction of the West Gate Tunnel. The Group is exposed to direct and indirect construction risk including through its third party contractors. Construction risk includes exposures to claims made on the Group and claims that the Group may pass through or initiate on others.
The concession agreements also contain clauses that require the Transurban Group to make cash outflows in the future, resulting in the recognition of concession liabilities such as maintenance liabilities and concession note liabilities.
We evaluated the concession agreements for each toll road to develop an understanding of the nature of the agreements with the concession grantors and assessed the accounting implications of the contractual arrangements.
Our procedures included, amongst others:
Considering the relevant obligations in theconcession agreements having regard to thecalculations in the models and correspondingbalance sheet line items.
Obtaining an understanding of the status ofongoing construction projects, including claimsmade on the Group and claims the Group maypass onto other parties.
Performing tests of the design and operation ofcontrols over a selection of the forecast andbudgeting processes impacting the models in theCOVID-19 environment.
Evaluating the impairment indicator assessment.
Involving valuation experts to assess theappropriateness of selected key assumptionsused within the models.
Assessing the appropriateness of keyassumptions such as discount rates and inflationrates used in determining maintenance liabilitiesand concession note liabilities.
Assessing the adequacy of the disclosures in thefinancial report in respect of contractualarrangements having regard to the requirementsof Australian Accounting Standards
Governance and risk
Security holder information
Sustainability supplement
Business performance
Introduction and overview
Directors’ report
Corporate Report for the year ended 30 June 2022
Remuneration report
Financial statements

221
Service concession arrangements (continued) Group – Notes B17 – B21 Concession assets: $16,632m Assets under construction: $4,009m Concession financial asset: $369m Maintenance provision: $1,128m Construction obligation liability: $796m Other liabilities: $140m
THT – Notes D12, D14 Concession assets: $8,659m Assets under construction: $327m Concession notes receivable: $1,142m Construction obligation liability: $84m Other liabilities: $80m
TIL – Notes D12 – D13 Concession assets: $1,224m Concession financial asset: $369m Maintenance provision: $35m
Key audit matter How our audit addressed the key audit matter
The concession assets’ recoverable amount and concession liabilities recognised are calculated by estimating the net present value of future cash flows of the concession agreements using discounted cash flow models (the models).
This area requires significant judgement by the Group due to a number of uncertain assumptions that impact the timing and quantum of future cash flows generated by the toll road, specifically assumptions such as traffic flows, discount rates and growth rates. As disclosed in note B17, the A25 asset’s recoverable amount is sensitive to reasonably possible changes in certain key assumptions.
We considered this to be a key audit matter for the Group, THT and TIL due to the complexity of the arrangements and judgement required to interpret the accounting requirements and calculate their impact on the financial statements.
With respect to the West Gate Tunnel project, weinspected key agreements for the revised termsfor the delivery of the project and considered theaccounting implications.
Governance and risk
Security holder information
Sustainability supplement
Business performance
Introduction and overview
Directors’ report
Corporate Report for the year ended 30 June 2022
Remuneration report
Financial statements

222
Income taxes
Group – Note B7 Income tax benefit: $276m Current tax assets: $10m Current tax liabilities: $6m Deferred tax assets: $915m Deferred tax liabilities: $1,832m
THT Income taxes – not applicable
TIL – Note D5 Income tax benefit: $49m Current tax assets: $10m Current tax liabilities: $1m Deferred tax assets: $33m Deferred tax liabilities: $1,099m
Key audit matter How our audit addressed the key audit matter The Transurban Group is subject to income taxes in Australia and North America. Judgement is required in determining the provision for income taxes, specifically those industry specific tax rules and provisions which require significant judgement and detailed understanding of the legislation and relevant case law.
Some of the tax provisions are subject to interpretation and therefore for some transactions the ultimate tax determination is uncertain.
Deferred tax assets relating to carried forward tax losses are recognised to the extent there are sufficient taxable profits relating to the same taxation authority against which the unused tax losses can be utilised. The assumptions supporting this position are dependent on future cash flows generated from the toll roads operating in each tax group. Future taxable profits will need to be generated in order to support the recognition of the deferred tax assets.
Due to the stapled structure of the Group, tax calculations are complex and require the Group to make judgements and assumptions. Furthermore, as described in Note B7, the Transurban Group consists of six different tax consolidated groups with their own Tax Sharing and Tax Funding agreements, each of which creates additional complexities in the calculations.
We considered this to be a key audit matter for the Group and TIL due to the accounting complexity of the calculations, judgmental nature and expertise required to estimate the tax positions recorded.
Our procedures included, amongst others:
Using Australian and US tax experts to gain anunderstanding of the current status of taxassessments and investigations and assessingthe impact of selected new tax laws andguidance on the tax balances recognised.
Reading recent rulings and selectedcorrespondence with local tax authorities, as wellas external advice provided to the Group and TILwhere relevant, to assess the associated taxprovisions.
Testing a sample of deferred and income taxcalculations for each tax group.
Assessing the key assumptions used to supportthe recognition of tax losses and their futureutilisation in light of COVID-19 impacts,specifically forecast taxable profits. The keyassumptions included judgements over forecasttraffic performance including the impacts ofCOVID-19.
Governance and risk
Security holder information
Sustainability supplement
Business performance
Introduction and overview
Directors’ report
Corporate Report for the year ended 30 June 2022
Remuneration report
Financial statements

223
Recoverability of equity accounted investments – Transurban Chesapeake (TC)
Group – Note B25 Equity accounted investment: $3,013m
THT Equity accounted investment – not applicable
TIL – Note D15 Equity accounted investment: $3,037m
Key audit matter How our audit addressed the key audit matter On 17 December 2020 Transurban entered into an agreement to divest 50% of its interest in its Transurban Chesapeake (TC) assets. The sale was completed on 31 March 2021 via disposal of the Group’s controlling interest in TC. As a result of the sale the Group recognises its retained 50% interest as an equity accounted for investment.
The Group makes certain assumptions in assessing impairment indicators for its investment. These include assumptions around traffic volumes, long-term CPI and the discount rate. As disclosed in note B25, the equity accounted investment in TC is sensitive to reasonably possible changes in certain key assumptions.
We considered this to be a key audit matter for the Group and TIL, due to the complexity and judgement involved in the impairment indicator assessment.
to be a key audit
matter for
Our procedures included, amongst others:
Performing tests of the design and operation ofcontrols over a selection of the forecast andbudgeting processes impacting the impairmentassessment in the COVID-19 environment.
Evaluating the impairment indicator assessmentconsidering the requirements under theAustralian Accounting Standards.
Involving valuation experts to assess theappropriateness of selected key assumptionsused within the impairment indicator assessment.
Governance and risk
Security holder information
Sustainability supplement
Business performance
Introduction and overview
Directors’ report
Corporate Report for the year ended 30 June 2022
Remuneration report
Financial statements

224
Other information The directors of Transurban Holdings Limited, Transurban Infrastructure Management Limited (as the responsible entity of Transurban Holding Trust) and Transurban International Limited (collectively referred to as “the directors”) are responsible for the other information. The other information comprises the information included in the Group’s Corporate Report for the year ended 30 June 2022, but does not include the financial report and our auditor’s report thereon. Prior to the date of this auditor's report, the other information we obtained included the FY22 Corporate Report, FY22 Results Presentation, FY22 Climate Change Disclosure, FY22 Sustainability Data, Corporate Governance Statement and Security Holder Information. We expect the remaining other information to be made available to us after the date of this auditor's report.
Our opinion on the financial report does not cover the other information and accordingly we do not express any form of assurance conclusion thereon.
In connection with our audit of the financial report, our responsibility is to read the other information and, in doing so, consider whether the other information is materially inconsistent with the financial report or our knowledge obtained in the audit, or otherwise appears to be materially misstated.
If, based on the work we have performed on the other information that we obtained prior to the date of this auditor’s report, we conclude that there is a material misstatement of this other information, we are required to report that fact. We have nothing to report in this regard.
When we read the other information not yet received, if we conclude that there is a material misstatement therein, we are required to communicate the matter to the directors and use our professional judgement to determine the appropriate action to take.
Responsibilities of the directors for the financial report The directors are responsible for the preparation of the financial report that gives a true and fair view in accordance with Australian Accounting Standards and the Corporations Act 2001 and for such internal control as the directors determine is necessary to enable the preparation of the financial report that gives a true and fair view and is free from material misstatement, whether due to fraud or error.
In preparing the financial report, the directors are responsible for assessing the ability of the Transurban Group, THT and TIL to continue as a going concern, disclosing, as applicable, matters related to going concern and using the going concern basis of accounting unless the directors either intend to liquidate the Transurban Group, THT or TIL or to cease operations, or have no realistic alternative but to do so.
Auditor’s responsibilities for the audit of the financial report Our objectives are to obtain reasonable assurance about whether the financial report as a whole is free from material misstatement, whether due to fraud or error, and to issue an auditor’s report that includes our opinion. Reasonable assurance is a high level of assurance, but is not a guarantee that an audit conducted in accordance with the Australian Auditing Standards will always detect a material misstatement when it exists. Misstatements can arise from fraud or error and are considered material if, individually or in the aggregate, they could reasonably be expected to influence the economic decisions of users taken on the basis of the financial report.
Governance and risk
Security holder information
Sustainability supplement
Business performance
Introduction and overview
Directors’ report
Corporate Report for the year ended 30 June 2022
Remuneration report
Financial statements

Page 92 reference destination: Results of the group’s operations are in the FS (last page)
225
A further description of our responsibilities for the audit of the financial report is located at the Auditing and Assurance Standards Board website at: https://www.auasb.gov.au/admin/file/content102/c3/ar1_2020.pdf. This description forms part of our auditor's report.
Report on the remuneration report
Our opinion on the remuneration report We have audited the remuneration report included in pages 95 to 118 of the Directors’ Report for the year ended 30 June 2022.
In our opinion, the remuneration report of Transurban Holdings Limited for the year ended 30 June 2022 complies with section 300A of the Corporations Act 2001.
Responsibilities The directors are responsible for the preparation and presentation of the remuneration report in accordance with section 300A of the Corporations Act 2001. Our responsibility is to express an opinion on the remuneration report, based on our audit conducted in accordance with Australian Auditing Standards.
PricewaterhouseCoopers
Marcus Laithwaite MelbournePartner 18 August 2022
Governance and risk
Security holder information
Sustainability supplement
Business performance
Introduction and overview
Directors’ report
Corporate Report for the year ended 30 June 2022
Remuneration report
Financial statements

226
Sustainability supplement
Governance and risk
Financial statements
Security holder information
Business performance
Remuneration report
Introduction and overview
Directors’ report
Sustainability supplement
Corporate Report for the year ended 30 June 2022

227
Transurban reports non-financial data with reference to the Global Reporting Initiative (GRI) Standards. The table below shows where content for each GRI indicator can be found within Transurban’s reporting suite or provides additional information. Where a metric is not applicable or not available, we have provided related commentary on the topic.
GRI Index
GRI Disclosure Location or response
General disclosures
102-1 Name of the organisation Transurban Limited
102-2 Activities, brands, products, and services FY22 Corporate Report/About Transurban
102-3 Location of headquarters Tower Five, Collins Square, 727 Collins Street, Docklands, Victoria Australia
102-4 Location of operations FY22 Corporate Report/About Transurban
102-5 Ownership and legal form FY22 Corporate Governance Statement
102-6 Markets served FY22 Corporate Report/About Transurban
102-7 Scale of the organisation FY22 Corporate Report/About Transurban
FY22 Corporate Report/Business performance/Financial statements
102-8 Information on employees and other workers FY22 Corporate Report/Our people
Insights Hub/Sustainability performance/Employees
102-9 Supply chain FY22 Corporate Report/Business partners and suppliers
102-10 Significant changes to the organisation and its supply chain
FY22 Corporate Report/About Transurban
FY22 Corporate Report/Letter from the Chair and CEO
FY22 Corporate Report/Business partners and suppliers
FY22 Results Presentation
102-11 Precautionary Principle or approach The Precautionary Principle relates to appropriate risk management for uncertain, complex, and large-scale risks such as climate change or the recent COVID-19 pandemic.
Transurban’s overall approach to risk is outlined in:
• FY22 Corporate Report/Risk management
• FY22 Climate Change Disclosures
• FY22 Corporate Governance Statement material risk disclosures
• Our Risk Management Policy.
102-12 External initiatives Transurban endorses several economic, environmental and social charters, principles or other initiatives including:
• United Nations Global Compact
• United Nations’ Sustainable Development Goals
• Infrastructure Sustainability ratings for major projects (Australia)
• Envision sustainability ratings for major projects (North America)
• ISO 20400—Sustainable procurement (guidance)
• ASX Council’s Corporate Governance Principles (4th edition).
Governance and risk
Financial statements
Security holder information
Business performance
Remuneration report
Introduction and overview
Directors’ report
Sustainability supplement
Corporate Report for the year ended 30 June 2022

228
GRI Disclosure Location or response
General disclosures
102-13 Membership of associations Key Australian memberships include:
• Committee for Economic Development of Australia
• Infrastructure Partnerships Australia
• Business Council of Australia
• Infrastructure Sustainability Council (ISC)
• Roads Australia
• Electric Vehicle Council
• Business Renewables Centre Australia
• Intelligent Transport Systems Australia
• Signatory member of UN Global Compact/Global Compact Network Australia
• ISC Modern Slavery Coalition pilot (road construction sector)
• National Road Safety Partnership Program
• Thriving Communities Partnership
• Social Traders
Key North American memberships include:
• The Association for the Improvement of American Infrastructure
• American Highway Users Alliance
• American Road and Transportation Builders Association
• International Bridge, Tunnel and Turnpike Association
• Intelligent Transportation Society of America
• Intelligent Transportation Society of Virginia
• Northern Virginia Transportation Alliance.
102-14 Statement from senior decision-maker FY22 Corporate Report/Letter from the Chair and CEO
102-15 Key impacts, risks, and opportunities FY22 Corporate Report/Business strategy
FY22 Corporate Report/Global Trends influencing our strategy
FY22 Corporate Report/Governance and risk
FY22 Corporate Governance Statement material risk disclosure
102-16 Values, principles, standards, and norms of behaviour
FY22 Corporate Governance Statement
Code of Conduct and Ethical Business Practices Policy
102-17 Mechanisms for advice and concerns about ethics FY22 Corporate Governance Statement
Whistleblower Policy
102-18 Governance structure FY22 Corporate Governance Statement
102-19 Delegating authority FY22 Corporate Governance Statement
102-20 Executive-level responsibility for economic, environmental, and social topics
The following executives were responsible for several key economic, environmental, and social matters in FY22:
• Sustainability Strategy, economic performance: Chief Financial Officer (Michelle Jablko)
• Health, safety, and environment: Group Executive Partners, Delivery and Risk (Hugh Wehby)
• Community: Group Executives of regional markets (Henry Byrne, Pierce Coffee, Andrew Head, Michele Huey, Sue Johnson)
• Customer: Group Executive Customer and Technology (Simon Moorfield)
• Diversity: Group Executive People and Culture (Suzette Corr).
102-21 Consulting stakeholders on economic, environmental, and social topics
FY22 Corporate Report/Business Strategy/Working with our stakeholders
102-22 Composition of the highest governance body and its committees
FY22 Corporate Governance Statement
102-23 Chair of the highest governance body FY22 Corporate Governance Statement
102-24 Nominating and selecting the highest governance body
FY22 Corporate Governance Statement
102-25 Conflicts of interest FY22 Corporate Governance Statement
Governance and risk
Financial statements
Security holder information
Business performance
Remuneration report
Introduction and overview
Directors’ report
Sustainability supplement
Corporate Report for the year ended 30 June 2022

229
GRI Disclosure Location or response
General disclosures
102-26 Role of highest governance body in setting purpose, values, and strategy
FY22 Corporate Governance Statement
FY22 Corporate Report/Governance and Risk
102-27 Collective knowledge of highest governance body (of economic, environmental and social topics)
FY22 Corporate Governance Statement
FY22 Corporate Report/Governance and Risk
102-28 Evaluating the highest governance body’s performance
FY22 Corporate Governance Statement
102-29 Identifying and managing economic, environmental, and social impacts
FY22 Corporate Governance Statement
FY22 Corporate Report/Governance and Risk
102-30 Effectiveness of risk management processes FY22 Corporate Governance Statement
FY22 Corporate Report/Governance and Risk
102-31 Review of economic, environmental, and social topics
FY22 Corporate Governance Statement
FY22 Corporate Report/Governance and Risk
102-32 Highest governance body’s role in sustainability reporting
The FY22 Corporate Report is reviewed and endorsed by Transurban’s Board.
102-33 Communicating critical concerns FY22 Corporate Governance Statement
Whistleblower Policy and Whistleblower Service
102-34 Nature and total number of critical concerns FY22 Corporate Governance Statement Material risk disclosure
102-35 Remuneration policies FY22 Remuneration Report
102-36 Process for determining remuneration FY22 Remuneration Report
102-37 Stakeholders’ involvement in remuneration FY22 Remuneration Report
102-38 Annual total compensation ratio FY22 Remuneration Report
CEO compensation: $7,981,000 Mean employee compensation: $187,620 Median employee compensation: $150,248 Median compensation ratio: 53
102-39 Percentage increase in annual total compensation ratio
FY21 ratio of 57, FY22 ratio of 53, decrease of 7%
102-40 List of stakeholder groups FY22 Corporate Report/Business Strategy/Working with our stakeholders
102-41 Collective bargaining agreements Insights Hub/Sustainability performance/Employees
102-42 Identifying and selecting stakeholders FY22 Corporate Report/Business Strategy/Working with our stakeholders
102-43 Approach to stakeholder engagement FY22 Corporate Report/Business Strategy/Working with our stakeholders
102-44 Key topics and concerns raised FY22 Corporate Report/Business Strategy/Working with our stakeholders
102-45 Entities included in the consolidated financial statements
FY22 Financial Statements
102-46 Defining report content and topic Boundaries FY22 Corporate Report/About this report
FY22 Sustainability Supplement/Material issues
102-47 List of material topics FY22 Sustainability Supplement/Material issues
102-48 Restatements of information FY22 Sustainability Supplement/Data methodology
102-49 Changes in reporting FY22 Sustainability Supplement/Material issues
102-50 Reporting period FY22 (1 July 2021 to 30 June 2022)
102-51 Date of most recent report The FY22 Corporate Report was released on 18 August 2021.
The previous FY21 Corporate Report was released on 9 August 2021.
102-52 Reporting cycle Transurban reports annually with a financial year ending 30 June.
102-53 Contact point for questions regarding the report [email protected]
FY22 Corporate Report/Key contacts (back inside cover)
102-54 Claims of reporting in accordance with the GRI Standards
FY22 Corporate Report/About this report
Governance and risk
Financial statements
Security holder information
Business performance
Remuneration report
Introduction and overview
Directors’ report
Sustainability supplement
Corporate Report for the year ended 30 June 2022

230
GRI Disclosure Location or response
General disclosures
102-55 GRI content index This table
102-56 External assurance FY22 Sustainability Supplement/Assurance statement
Management approach
103-1 Explanation of the material topic and its Boundary FY22 Sustainability Supplement/Material issues
FY22 Corporate Report/Business performance (refer to individual stakeholder sections for material issues relevant to each).
103-2 The management approach and its components FY22 Corporate Report/Business performance (refer to individual stakeholder sections for material issues relevant to each).
103-3 Evaluation of the management approach FY22 Corporate Report/Business performance (refer to individual stakeholder sections for material issues relevant to each).
Economic performance
201-1 Direct economic value generated and distributed FY22 Results Presentation
FY22 Corporate Report/Communities
201-2 Financial implications and other risks and opportunities due to climate change
FY22 Climate Change Disclosures
201-3 Defined benefit plan obligations and other retirement plans
Insights Hub/Sustainability performance/Employees
201-4 Financial assistance received from government No financial assistance is sought or received from government.
Transurban builds and manages infrastructure in many cases with upfront government co-investment, but this is a business relationship and is reflected in the contractual terms of the tolling concession granted to Transurban.
No financial assistance from government has been sought or received by Transurban from FY20 to FY22 relating to COVID-19 impacts on our direct business.
Market presence
202-1 Ratios of standard entry level wage by gender compared to local minimum wage
Refer to Insights Hub/Sustainability performance/Employees, for average entry level remuneration gender equity ratio.
202-2 Proportion of senior management hired from the local community
FY22 Corporate Report/Executive Committee biographies
Transurban’s business operates across several major urban centres, and our Executive Committee are all from and based in those regions.
Indirect economic impacts
203-1 Infrastructure investments and services supported FY22 Corporate Report/About Transurban
FY22 Corporate Report/Business Strategy
203-2 Significant indirect economic impacts FY22 Corporate Report/Government and Industry
FY22 Corporate Report/Business partners and suppliers
FY22 Corporate Report/Customers
Procurement practices
204-1 Proportion of spending on local suppliers Transurban operates in urban centres of Australia (Melbourne, Sydney, Brisbane), the United States (Virginia) and Canada (Montreal). The vast majority of Transurban’s supply chain spend is on suppliers and activities that are physically, locally based around our roads, projects, and offices in each respective city. Some spending relates to group-wide services or technology services that are shared across regions.
Anti-corruption
205-1 Operations assessed for risks related to corruption All of Transurban’s business is subject to anti-corruption policies and controls, and risk assessments on at least an annual basis.
205-2 Communication and training about anti-corruption policies and procedures
Training on anti-corruption policies and procedures are undertaken annually across the organisation and employee opinions about the effectiveness of controls are assessed via the ‘Our Voice’ survey. Training is supported by internal communication.
205-3 Confirmed incidents of corruption and actions taken None in FY22
Governance and risk
Financial statements
Security holder information
Business performance
Remuneration report
Introduction and overview
Directors’ report
Sustainability supplement
Corporate Report for the year ended 30 June 2022

231
GRI Disclosure Location or response
Anti-competitive behaviour
206-1 Legal actions for anti-competitive behaviour, anti-trust, and monopoly practices
None in FY22
Materials
301-1 Materials used by weight or volume Transurban is developing a Circular Materials Strategy that will improve our measurement of materials and waste and set group-wide targets. We currently monitor materials quantities on major projects on an individual basis, and are developing group-wide materials quantities totals.
Refer to FY22 Corporate Report/Business partners and suppliers, for case studies on materials quantities used in construction projects, including materials and embodied emissions reductions achieved.
301-2 Recycled input materials used Refer to FY22 Corporate Report/Business partners and suppliers, for case studies of recycled input materials including the use of reclaimed tyres on road surfaces.
301-3 Reclaimed products and their packaging materials Transurban’s only physical product is tolling tags which are provided to customers to enable toll road travel. Tags that are returned by customers and still function may be reused. Tags that no longer work are returned to our supplier where they are dismantled into their separate components for appropriate recycling or disposal.
Refer to Insights Hub/Sustainability performance/Environment, for data on customer tag collection and reuse/recycling.
Energy
302-1 Energy consumption within the organisation FY22 Corporate Report/Communities
Insights Hub/Sustainability performance/Environment
302-2 Energy consumption outside of the organisation Transurban reports on its supply chain outside of the organisation on the basis of Scope 3 emissions (see GRI305-3), but currently does not convert this into an energy basis.
302-3 Energy intensity Insights Hub/Sustainability performance/SDG Progress Report/SDG 7.3.1 Energy intensity
302-4 Reduction of energy consumption FY22 Corporate Report/Communities
Insights Hub/Sustainability performance/SDG Progress Report/SDG 7.3.1 Energy intensity
302-5 Reductions in energy requirements of products and services
By providing customers with safer, faster and more free-flowing travel choices on our roads, we estimate that on average our customers save 27% of their fuel usage driving on a Transurban toll road compared to the next best available alternative route.
Refer to FY22 Corporate Report/Communities for details on customer vehicle time and emissions savings.
Water and effluents
303-1 Interactions with water as a shared resource Transurban’s water use and impacts include:
• The use of potable or recycled water for our operations including offices, road cleaning and maintenance, fire control systems, and irrigation
• Management of stormwater and groundwater flows on our assets, including treatment and discharge
• Potential impacts of our assets and projects on adjacent waterways that may arise from construction, run-off or other activities.
303-2 Management of water discharge-related impacts The majority of Transurban’s water discharge impacts relate to stormwater from road drainage, and groundwater management in tunnels.
Stormwater is drained to control ponds and detention basins allow us to capture, treat for impurities in road run-off, and discharge appropriately.
Groundwater naturally flows into underground tunnels that are below the level of groundwater aquifers. This water is treated to an appropriate level before discharge to drains and waterways. On CityLink, treated groundwater is reinjected into the aquifer, a unique need on this asset.
303-3 Water withdrawal Insights Hub/Sustainability performance/Environment
303-4 Water discharge Insights Hub/Sustainability performance/Environment
303-5 Water consumption Insights Hub/Sustainability performance/Environment
Governance and risk
Financial statements
Security holder information
Business performance
Remuneration report
Introduction and overview
Directors’ report
Sustainability supplement
Corporate Report for the year ended 30 June 2022

232
GRI Disclosure Location or response
Biodiversity
304-1 Operational sites owned, leased, managed in, or adjacent to, protected areas and areas of high biodiversity value outside protected areas
Sections of the following motorways are located adjacent to areas of high biodiversity value (National Parks or nature reserves):
• Hills M2 (Sydney—Lane Cove National Park)
• Gateway Motorway (Brisbane—Karawatha Forest, Nudgee Waterhole Reserve, Belmont Hills Reserve, Stretton Wetland )
• Legacy Way (Brisbane—Mount Coot-Tha Forest/D’Aguilar National Park Reserve)
• Logan Motorway (Brisbane—Glider Forest Conservation Area, Sergeant Dan Stiller Memorial Reserve)
• A25 (Montreal—Rivière des Prairies sturgeon habitat).
304-2 Significant impacts of activities, products, and services on biodiversity
Transurban is in the process of developing a broader company-wide biodiversity strategy.
Biodiversity, flora and fauna management plans are maintained at the regional level consistent with local regulations and habitat.
In some areas, motorways pass through areas of fragmented natural habitat and have impacts on wildlife movement. This also leads to the potential for animals crossing motorways. Transurban maintains motorway fencing and fauna crossing availability to channel animals to safe crossing locations.
304-3 Habitats protected or restored Ongoing habitat restoration projects included partnering with Landcare Australia on the Power St Loop in Melbourne and M2 Motorscapes in Sydney.
Major projects also have a focus on protecting or enhancing local habitat where possible. The Logan Enhancement Project in Brisbane included a major “fauna bridge” and wildlife connectivity improvements.
304-4 IUCN Red List species and national conservation list species with habitats in areas affected by operations
Transurban’s A25 bridge in Montreal spans a river inhabited by sturgeon, which are present on the IUCN Red List with some species listed as endangered.
Emissions
305-1 Direct (Scope 1) GHG emissions Insights Hub/Sustainability performance/Environment
FY22 Corporate Report/Communities
305-2 Energy indirect (Scope 2) GHG emissions Insights Hub/Sustainability performance/Environment
FY22 Corporate Report/Communities
305-3 Other indirect (Scope 3) GHG emissions Insights Hub/Sustainability performance/Environment
FY22 Corporate Report/Communities
305-4 GHG emissions intensity Insights Hub/Sustainability performance/SDG Progress Report/SDG 9.4.1 CO2 emission per unit of value added
305-5 Reduction of GHG emissions FY22 Corporate Report/Communities
305-6 Emissions of ozone-depleting substances (ODS) Not applicable, Transurban does not produce emissions of ozone-depleting substances.
305-7 Nitrogen oxides (NOX), sulphur oxides (SOX), and other significant air emissions
Insights Hub/Sustainability performance/Environment
Effluents and waste
306-1 Water discharge by quality and destination Insights Hub/Sustainability performance/Environment
306-2 Waste by type and disposal method Insights Hub/Sustainability performance/Environment
306-3 Significant spills No significant spills in FY22
306-4 Transport of hazardous waste Hazardous waste on our operational assets may include chemicals and solvents, old lighting fixtures, drain trap sludge and liquid waste.
Waste is handled in accordance with laws and regulations in each region. Where required, hazardous waste transportation procedures are managed by specialist waste contractors.
Hazardous waste on major construction projects is managed by the construction contractor.
Transurban currently does not have an aggregated group-wide total for corporate reporting on hazardous waste quantities.
Governance and risk
Financial statements
Security holder information
Business performance
Remuneration report
Introduction and overview
Directors’ report
Sustainability supplement
Corporate Report for the year ended 30 June 2022

233
GRI Disclosure Location or response
Environmental compliance
307-1 Non-compliance with environmental laws and regulations
No significant non-compliance, fines or non-monetary sanctions in FY22.
Many of Transurban’s asset operating requirements have environmental regulations with performance targets, where Transurban must notify regulators of any incidents or exceedances, but no regulatory action is taken if Transurban reports and responds to the issue and there is no significant impact.
Supplier environmental assessment
308-1 New suppliers that were screened using environmental criteria
All suppliers are subject to Transurban’s Supplier Sustainability Code of Practice which includes environmental criteria.
Suppliers applying for tenders managed by our sourcing team are required to complete ‘returnable schedules’ which include questions regarding environmental performance of their goods and services.
308-2 Negative environmental impacts in the supply chain and actions taken
Refer to FY22 Corporate Report/Business partners and suppliers, for details of impact assessment and reduction in our supply chain.
Employment
401-1 New employee hires and employee turnover Insights Hub/Sustainability performance/Employees
401-2 Benefits provided to full-time employees that are not provided to temporary or part-time employees
Insights Hub/Sustainability performance/Employees
401-3 Parental leave Refer to Insights Hub/Sustainability performance/Employees, for leave and return to work statistics.
Employees taking Parental Leave are entitled to 16 weeks of paid leave and up to 36 weeks of unpaid leave.
In FY22 Transurban removed the distinction between primary and secondary carers in our Parental Leave Policy and extended the time employees can take their leave to 24 months after the birth or adoption of their child.
Labour/Management relations
402-1 Minimum notice periods regarding operational changes
As per enterprise agreements and standard practice, we notify employees as soon as practicable after a decision is made which impacts working arrangements or employment, allowing a period for consultation with employees who may be adversely affected. The notice period varies depending on the nature of the change, but generally provides a minimum consultation period of one week.
Occupational health and safety
403-1 Occupational health and safety management system FY22 Corporate Report/Our people
Transurban has an occupational health and safety (OHS) management system aligned with international management system standards ISO 45001.
403-2 Hazard identification, risk assessment, and incident investigation
FY22 Corporate Report/Our people
Transurban has an enterprise risk management framework, standards, procedures and systems to systematically conduct risk assessments, identify hazards and conduct incident investigations.
403-3 Occupational health services FY22 Corporate Report/Our people
Transurban promotes and supports worker health through our Belonging and Wellbeing program which focuses on four pillars: Mind, Body, Connected and Recognition in and outside of the workplace.
403-4 Worker participation, consultation, and communication on occupational health and safety
FY22 Corporate Report/Our people
Transurban has various methods and forums to enable worker participation, consultation and communication on occupational health and safety.
403-5 Worker training on occupational health and safety FY22 Corporate Report/Our people
Transurban has a group wide Health, Safety and Environment Induction for all employees and contractors. In addition, various OHS training is undertaken on specific work-related hazards, high risk activities, or hazardous situations.
403-6 Promotion of worker health FY22 Corporate Report/Our people
403-7 Prevention and mitigation of occupational health and safety impacts directly linked by business relationships
FY22 Corporate Report/Our people
FY22 Corporate Report/Business partners and suppliers
Governance and risk
Financial statements
Security holder information
Business performance
Remuneration report
Introduction and overview
Directors’ report
Sustainability supplement
Corporate Report for the year ended 30 June 2022

234
GRI Disclosure Location or response
Occupational health and safety
403-8 Workers covered by an occupational health and safety management system
Transurban has an OHS management system aligned to international management system standard ISO 45001, and is applicable to all employees and other workers under the management and control of Transurban.
403-9 Work-related injuries FY22 Corporate Report/Our people
403-10 Work-related ill health FY22 Corporate Report/Our people
Training and education
404-1 Average hours of training per year per employee Insights Hub/Sustainability performance/Employees
404-2 Programs for upgrading employee skills and transition assistance programs
FY22 Corporate Report/Our people
In the event that an employee’s role is made redundant and there is no alternative role, outplacement services are provided to the employee.
404-3 Percentage of employees receiving regular performance and career development reviews
100%
Diversity and equal opportunity
405-1 Diversity of governance bodies and employees FY22 Corporate Governance Statement
405-2 Ratio of basic salary and remuneration of women to men
Insights Hub/Sustainability performance/Employees
Non-discrimination
406-1 Incidents of discrimination and corrective actions taken
None in FY22
Freedom of association and collective bargaining
407-1 Operations and suppliers in which the right to freedom of association and collective bargaining may be at risk
None
Transurban operates in Australia, the United States and Canada, where freedom of association and collective bargaining are protected by law and fully supported by our employee and supply chain policies.
Child labour
408-1 Operations and suppliers at significant risk for incidents of child labour
Human Rights Policy
FY21 Modern Slavery Statement
Forced or compulsory labour
409-1 Operations and suppliers at significant risk for incidents of forced or compulsory labour
Human Rights Policy
FY21 Modern Slavery Statement
Security practices
410-1 Security personnel trained in human rights policies or procedures
Not applicable. Transurban does not employ security personnel on any significant basis.
Rights of indigenous peoples
411-1 Incidents of violations involving rights of indigenous peoples
None
Transurban has a Reconciliation Action Plan outlining how we work towards better outcomes for Indigenous people in our workforce, supply chain and community.
Human rights assessment
412-1 Operations that have been subject to human rights reviews or impact assessments
Human Rights Policy
FY21 Modern Slavery Statement
412-2 Employee training on human rights policies or procedures
Transurban provides compulsory training to all employees on human rights related issues and policies including Modern Slavery, Equal Opportunity and Anti-discrimination, and Ethical Business Practices.
412-3 Significant investment agreements and contracts that include human rights clauses or that underwent human rights screening
All suppliers are subject to Transurban’s Supplier Sustainability Code of Practice which include human rights requirements, including those relating to the Modern Slavery Act 2018 (Cth).
Governance and risk
Financial statements
Security holder information
Business performance
Remuneration report
Introduction and overview
Directors’ report
Sustainability supplement
Corporate Report for the year ended 30 June 2022

235
GRI Disclosure Location or response
Local communities
413-1 Operations with local community engagement, impact assessments, and development programs
FY22 Corporate Report/Communities
413-2 Operations with significant actual and potential negative impacts on local communities
FY22 Corporate Report/Communities
Supplier social assessment
414-1 New suppliers that were screened using social criteria
All suppliers are subject to Transurban’s Supplier Sustainability Code of Practice which includes social criteria.
Suppliers applying for tenders managed by our sourcing team are required to complete ‘returnable schedules’ which include questions regarding environmental performance of their goods and services.
414-2 Negative social impacts in the supply chain and actions taken
Contractors for all major projects have and implement procedures to record and manage community complaints.
Our independent external whistleblowing service is available for anyone to use, including employees, customers and members of our supply chain to raise issues including those related to fraud, conflicts of interest, bribery, corruption and modern slavery.
Public policy
415-1 Political contributions Under Transurban’s Political Contributions Policy, the Group is precluded from making any political donations. The policies permit participation in public policy dialogues on issues that may impact our business.
In Australia, engagement with political representatives takes place through multiple avenues, including through our membership of business forums associated with both sides of politics. During FY22, the Group spent $74,717 participating in events relevant with our business. A similar bipartisan approach is taken in the United States, resulting in USD132,500 being spent in FY22. Contributions in Quebec, Canada are prohibited and accordingly no contributions were made by the Group in Canada.
All payments are disclosed in line with relevant government and regulatory requirements.
Customer health and safety
416-1 Assessment of the health and safety impacts of product and service categories
FY22 Corporate Report/Customers/Road safety
Insights Hub/Sustainability performance/SDG Progress Report/SDG 7.3.1 Energy intensity/SDG 3 Health and Wellbeing
416-2 Incidents of non-compliance concerning the health and safety impacts of products and services
None in FY22
Marketing and labelling
417-1 Requirements for product and service information and labelling
Transurban’s only physical product is tolling tags which are provided to customers to enable toll road travel. Customers also have the option of tag-free accounts including mobile app accounts which avoid the need for a physical tag.
Refer to FY22 Corporate Report/Customers, for details on our customer communications and information resources made available to customers on their product and service options.
417-2 Incidents of non-compliance concerning product and service information and labelling
None in FY22
417-3 Incidents of non-compliance concerning marketing communications
None in FY22
Customer privacy
418-1 Substantiated complaints concerning breaches of customer privacy and losses of customer data
No material complaints or breaches in relation to privacy identified in FY22.
Socioeconomic compliance
419-1 Non-compliance with laws and regulations in the social and economic area
None in FY22
Governance and risk
Financial statements
Security holder information
Business performance
Remuneration report
Introduction and overview
Directors’ report
Sustainability supplement
Corporate Report for the year ended 30 June 2022

236
Transurban reports against the Sustainability Accounting Standards Board (SASB) sector standards as this framework is increasingly used by our investors and stakeholders. The majority of SASB metrics are topics that Transurban has reported in its Corporate Report or other communications for many years. This index consolidates that information into the SASB-specific requests.
SASB Index
The table below shows where content for each SASB indicator can be found within Transurban’s reporting suite or provides additional information.
Transurban’s officially listed SASB sector is Infrastructure Engineering & Construction Services (IF-EN) which reflects our business as an infrastructure operator.
In previous years we have also used the SASB Road Transportation (TR-RO) sector standard but are no longer using that standard since it is focused on logistics and delivery services not relevant to Transurban. We have provided commentary where Transurban’s preferred metrics for each topic differ from SASB.
Governance and risk
Financial statements
Security holder information
Business performance
Remuneration report
Introduction and overview
Directors’ report
Sustainability supplement
Corporate Report for the year ended 30 June 2022

237
SASB Disclosure Location or response
SASB Sector: Infrastructure—engineering and construction services
Topic: Environmental impacts of project development
IF-EN-160a.1 Number of incidents of non-compliance with environmental permits, standards, and regulations
No significant non-compliance, fines or non-monetary sanctions in FY22.
Many of Transurban’s asset operating requirements have environmental regulations with performance targets, where Transurban must notify regulators of any incidents or exceedances, but no regulatory action is taken if Transurban reports and responds to the issue and there is no significant impact.
IF-EN-160a.2 Discussion of processes to assess and manage environmental risks associated with project design, siting, and construction
Transurban’s major projects complete a public Environmental Impact Statement /assessment in the planning phase, which informs environmental management processes during development to address key risks that vary on individual projects depending on location, project type and local stakeholder needs. These processes are documented on each project’s public website.
Refer to FY22 Corporate Report/Project updates, for more details.
Transurban’s major projects are also independently assessed using the Infrastructure Sustainability Rating Tool in Australia, and the Envision rating tool in North America. These rating tools assess performance and improvements beyond industry standard environmental management practices, and Transurban sets contractually-required targets for major project contractors to achieve.
Refer to FY22 Corporate Report/Business partners and suppliers for more details.
Topic: Structural integrity and safety
IF-EN-250a.1 Amount of defect- and safety-related rework costs Transurban infrastructure is built by contractors that have responsibility within their contract for a defects and liability period after completion to resolve issues.
Transurban may incur initial costs to rectify defects to ensure the safety of the assets, but where possible may seek to recover those costs from its contractors if covered by these liability periods or pursuant to contractual rights.
IF-EN-250a.2 Total amount of monetary losses as a result of legal proceedings associated with defect- and safety-related incidents
None
Topic: Workforce health and safety
IF-EN-320a.1 (1) Total recordable incident rate (TRIR) and (2) fatality rate for (a) direct employees and (b) contract employees
(Transurban uses the metric “Recordable Injury Frequency Rate” (RIFR) which is recordable injuries per million work hours. SASB’s TRIR metric is recordable injuries per 200,000 work hours, making them directly convertible by a factor of five.)
Employee injuries: 0 recordable injuries.
Contractor RIFR: 3.09 recordable injuries per million work hours.
No employee or contractor fatalities.
Refer to FY22 Corporate Report/Our people, for details.
Topic: Lifecycle impacts of buildings and infrastructure
IF-EN-410a.1 Number of (1) commissioned projects certified to a third-party multi-attribute sustainability standard and (2) active projects seeking such certification
FY22 Corporate Report/Project updates
Transurban uses the Infrastructure Sustainability Rating or Envision Sustainability Rating on our major projects:
• 8 projects with Sustainability Ratings certified
• 4 projects with Sustainability Ratings in progress.
IF-EN-410a.2 Discussion of process to incorporate operational-phase energy and water efficiency considerations into project planning and design
The Infrastructure Sustainability Rating and Envision Sustainability Rating both include energy and water efficiency standards which require improvement of the initial “base case” project design to show measurable energy and water savings.
Achieving and measuring these efficiencies contributes to each project being able to meet its contractually required sustainability rating target.
Refer to FY22 Corporate Report/Business partners and suppliers, for details and other processes in place.
Governance and risk
Financial statements
Security holder information
Business performance
Remuneration report
Introduction and overview
Directors’ report
Sustainability supplement
Corporate Report for the year ended 30 June 2022

238
SASB Disclosure Location or response
SASB Sector: Infrastructure—engineering and construction services
Topic: Climate impacts of business mix
IF-EN-410b.1 Amount of backlog for (1) hydrocarbon related projects and (2) renewable energy projects
Metric not applicable, Transurban does not manage energy projects directly.
As an energy consumer, Transurban has commenced supply of renewable electricity via separate renewable energy agreements in New South Wales, Queensland and Victoria.
Transurban is a contracted customer and does not manage these renewable energy projects themselves.
IF-EN-410b.2 Amount of backlog cancellations associated with hydrocarbon-related projects
Metric not applicable, Transurban does not manage hydrocarbon-related projects.
IF-EN-410b.3 Amount of backlog for non-energy projects associated with climate change mitigation
Refer to FY22 Climate Change Disclosures, for details on our climate change risks and strategy for mitigation and adaptation.
Topic: Business ethics
IF-EN-510a.1 (1) Number of active projects and (2) backlog in countries that have the 20 lowest rankings in Transparency International’s Corruption Perception Index
None
Transurban manages road infrastructure in Australia, the US and Canada.
IF-EN-510a.2 Total amount of monetary losses as a result of legal proceedings associated with charges of (1) bribery or corruption and (2) anticompetitive practices4
None
IF-EN-510a.3 Description of policies and practices for prevention of (1) bribery and corruption, and (2) anti-competitive behaviour in the project bidding processes
Prevention of fraud, bribery, corruption and modern slavery are governed by our Ethical Business Practices Policy and Code of Conduct.
Transurban presents bids for infrastructure projects in each region in accordance with each government’s official process for competitive tender or market-led/unsolicited bids.
Transurban receives bids from construction contractor partners, who must also comply with our Ethical Business Practices Policy.
Activity metrics
IF-EN-000.A Number of active projects 7 major projects in development and delivery as at end of FY22.
FY22 Corporate Report/Our roads and projects
FY22 Corporate Report/Project updates
IF-EN-000.B Number of commissioned projects No major projects completed during FY22.
IF-EN-000.C Total backlog (committed project pipeline) FY22 Corporate Report/Project updates
Governance and risk
Financial statements
Security holder information
Business performance
Remuneration report
Introduction and overview
Directors’ report
Sustainability supplement
Corporate Report for the year ended 30 June 2022

239
��
�/:DN�cm�x� �#c)*cm�+c#�m,# -*+�cm.�c�0,01,#�2*#0�32��-,��/:D�4)31c)�3#4cm* c�*3m�32�*m.,+,m.,m��0,01,#�2*#0 �c22*)*c�,.�5*�-��/:D�6m�,#mc�*3mc)�7*0*�,.N�c�+#*8c�,�9m4)* -�;30+cm<�)*0*�,.�1<�4�c#cm�,,=�x))�#*4-� �#, ,#8,.=�>-,��/:D�mc0,�cm.�)343�c#,��#c.,0c#? �� ,.��m.,#�)*;,m ,�1<��-,�*m.,+,m.,m��0,01,#�2*#0 �32��-,��/:D�4)31c)�3#4cm* c�*3m=�7*c1*)*�<�)*0*�,.�1<�c� ;-,0,�c++#38,.��m.,#�/#32, *3mc)�@�cm.c#. �7,4* )c�*3m=��
�ABCEFEBCEBG�HIJIGEC�KLLMOPBQE�REFSOG�GS�GTE�UIOEQGSOL�SV�WOPBLMOXPB�YOSMF���ZSBQ[MLISB�\c ,.�3m��-,�,8*.,m;,�5,�31�c*m,.�2#30��-,�+#3;,.�#, �+,#23#0,.N�5,��c#,�m3��c5c#,�32�cm<�0c�,#*c)�0* �c�,0,m� �*m��-,�6m23#0c�*3m�@�1],;���3�x �#cm;,N�5-*;-�-c �1,,m�+#,+c#,.�1<�>#cm �#1cm�D#3�+�*m�c;;3#.cm;,�5*�-�:cmc4,0,m��#*�,#*c�23#��-,�<,c#�,m.,.�_�a�m,�bbb=��defghijklge�nopqrsk�kg�tuuohjesr�>-,�6m23#0c�*3m�@�1],;���3�x �#cm;,�c �+#, ,m�,.�*m��-,�>#cm �#1cm�D#3�+�vwbb�3#+3#c�,�y,+3#�N�@� �c*mc1*)*�<�zc�c�z35m)3c.N�cm.�vwbb�)*0c�,�z* ;)3 �#,�{|vwbb�3#+3#c�,�y,+3#�*m4�@�*�,}~�*m;)�., ���-,���c)*�c�*8,�;)c*0 �*m;)�.,.�*m��-,�@�#c�,4*;�;)*0c�,�#* ?�#,)c�,.�#, +3m ,�{>c1),���32��-,�vwbb�)*0c�,�z* ;)3 �#,~�cm.��-,�/#34#, ��35c#. �>vz�y,;300,m.c�*3m �{>c1),���32��-,�vwbb�)*0c�,�z* ;)3 �#,~��cm.��-,�@,),;�,.�@� �c*mc1*)*�<�zc�c�c �*m;)�.,.�*m��-,��c1),�1,)35���nr�rskr��noukjlejpl�lk���jkj� rghkr���j�or��gkj��usgr����hrre�gour��ju�riluulgeu�� �N�����b�,���gkj��usgr����hrre�gour��ju�riluulgeu���ijh�rk�pjur���� ��N_�����b�,��gkj��usgr����hrre�gour��ju�riluulgeu�� ��bN��_���b�,��gkj��rerh���sgeuoir��� �__N��_�Da���gkj��soukgirh�khj�r��riluulgeu�� �N���N_�����b�,��gkj��soukgirh�khj�r��riluulgeu�uj�r��rh��j�� bNb�����b�,� !"�riluulgeu��kgeeru�� $���23#�*�<7*m?�_���23#�7cm,�38,�>�mm,)����23#�#3 �*�<�>�mm,)�gj��leqoh��shju��le�r"��d%d�� _=$��*m]�#<�;#c -, �+,#�� �0*))*3m�?0��#c8,)),.��gkj��&i�g�rr�rsgh�jp�r�deqohlru��jpug�okr��� �{m*)~�%gekhjskgh�rsgh�jp�r�leqoh��fhr'ores��hjkr��d(�� _=��;3m�#c;�3#�*m]�#*, �+,#�0*))*3m�-3�# �
KPMG assurance statement
Page 8 reference destination: KPMG-issued limited assurance statement
Governance and risk
Financial statements
Security holder information
Business performance
Remuneration report
Introduction and overview
Directors’ report
Sustainability supplement
Corporate Report for the year ended 30 June 2022

240
\
�\
\�*4?J*4U\��J�\U�\?�J\�U�4�\��\J�*?4��\\ ��\�������������\����\��\ ���������\���� \����������\��\�������\���\!�"��������\#��$�%�\��\&������%�\'()+,\-./),./012\���\���%�����\��\���\3566\7�� �����\8� ������\#����9\�U�4�\��*\���:;<�4��\=�\%����%���\���\>��@\��\�%%�����%�\>���\&���������\#�������\��\&������%�\A����������\&#&A\BCCC\D#�������E9\!�\�%%�����%�\>���\���\#�������\>�\��F�G\H\����\���\ ��"��������\$��������\��\ ���\���\ ��"���\���\����������\��\������\�������\�������%�\����\>�\���\���\�>���\�"\���\��������\�������������\��\���\!�"��������\#��$�%�\��\&������%�I\>������\���\��\"����\��\�����K\H\%���������\����F���\��������\%�������\>���\���������\���\�������%�\ ��%������I\��>�F��\>�\��\���\�L ����\�\%��%������\��\�����\�""�%��F�����K\���\\H\�������\����\���\����������\����\ ������\���\� �� �����\@��>�����I\�@����\���\ ��"��������\%�� ����%���9\\M<NNU*O\��\P*�:J�<*J�\PJ*��*NJ�\Q��\�������\�������%�\%��%������\��\�����\��\���\�F����%�\��������\"���\ ��"������\���\"����>���\ ��%������G\H\��R������\>���\����F���\ ���������\���� \ ��������\��\����������\���\��������\%�������I\��F�����%�\����%����\���\�� ������\ ��%���\�"\���\!�"��������\#��$�%�\��\&������%�K\H\��F��>�\�"\����F���\��%����������\��%������\����F���\��%����������\���\�� ������\"����>��@�K\H\�������%��\ ��%������\�F��\���\!�"��������\#��$�%�\��\&������%�K\H\��������\!�"��������\#��$�%�\��\&������%�\��%@\��\����%�\��%����������\��\�\��� ��\�����K\H\�F��������\���\� �� ���������\�"\���\%�������\>���\��� �%�\��\���\!�"��������\#��$�%�\��\&������%�K\���\\\H\��F��>��\���\3566\7�� �����\8� ������\#����\��\���\��������\��\������\��\��\%���������\>���\���\�F�����\@��>�����\�"\�������%�\����������9\S�T\?�J\M?U��U*�\VJ�4�J�\W4N4?J�\X��<*U�:J\U��\YU?J*4U;\Y4��?U?JNJ�?\ ��\ ��%������\ ��"�����\��\�\�������\�������%�\����������\F���\��\������\���\������\"���I\���\���\����\��\�L����\����\"��\�\����������\�������%�\����������9\7����R������\���\��F��\�"\�������%�\��������\��\�\�������\�������%�\����������\��\�������������\��>��\����\���\�������%�\����\>����\��F�\����\��������\���\�\����������\�������%�\����������\����\ ��"�����9\\Z������������I\��%������\���������I\���\%���������\��������\�"I\����F�������\��\��\���\���������I\����\%����\����������\��\�L �%���\��\��"����%�\����F���\��%������\�"\���\[���%����\�"\ ���������\���� 9\\
KPMG assurance statement
Governance and risk
Financial statements
Security holder information
Business performance
Remuneration report
Introduction and overview
Directors’ report
Sustainability supplement
Corporate Report for the year ended 30 June 2022

241
g
�g
�'2gFQg\�'g�''� ���2g�2�F \g����g������g���g����g������� g!��g���g"���#����g�!g�����$����g%��$�g!��g���g�$�����g�!g���&� ��(g��g���$���#�g#��#)$����g��g���g*�!��+�����g,$�-�#�g��g.��$���#�g�� g+�/g���g��g�$����)�g!��g�������g�$�����0g1�g ��#)��+g��/g���$+�����g�!g����������)��/g!��g��/g��)���#�g��g����g������3g��g��/g������g�����g����g���g"���#����g�!g�����$����g%��$�3g��g!��g��/g�����g�$�����g����g����g!��g4��#�g��g4��g������� 0gg5���6272�\8'g 2'�F�'9:\;g<���(�+���g���g���������)�g!��=g>g ����+����(g����g���g#�������g��g�����������g��g+���g�����g��� �g�� g���g��� �g�!g����� � g$����?g>g��������(g�� g���������(g���g*�!��+�����g,$�-�#�g��g.��$���#�g��g�##�� ��#�g4���g���g#�������?g�� g>g�����)�����(g�������)g#�����)�g����g����)�g���g�����������g�� g������������g�!g���g*�!��+�����g,$�-�#�g��g.��$���#�g����g��g!���g!��+g+������)g+�������+���3g4������g $�g��g!��$ g��g�����0gg@� g�2'�F�'9:\;gA$�g����������)��/g��g��g���!��+g�g)�+��� g���$���#�g��(�(�+���g��g��)�����g��g���g*�!��+�����g,$�-�#�g��g.��$���#�g!��g���g����� g�� gBCgD$��gECEE3g�� g��g���$�g��g���$���#�g������g����g��#)$ ��g�$�g#��#)$����0g@� gG�H2�2�H2��2g��HgI��:\;gJF�\ F:g1�g��&�g#�+�)�� g4���g�$�g�� ���� ��#�g�� g�����g��)�&���g����#�)g��K$���+����g�!g���gLMNOgMPgRSTUVWgPMXgYXMPOWWUMZ[]gVVM_ZS[ZSWgUZV]_NUZagbZNOcOZNOZVOgdS[ZN[XNWeg���$� g�/g���g.$����)���gf��!�������)g�� g����#�)g,��� �� �g���� 3g�� g#�+�)�� g4���g���g���)�#��)�g ��K$���+����g �!g .$����)���g,��� �� g��g�$�)��/g������)g�g��g+�������g�g#�+��������&�g�/���+g�!gK$�)��/g#�����)0ggggg�f<%g�g.$($��gECEEggg
KPMG assurance statement
Governance and risk
Financial statements
Security holder information
Business performance
Remuneration report
Introduction and overview
Directors’ report
Sustainability supplement
Corporate Report for the year ended 30 June 2022

242
Security holder information
Governance and risk
Financial statements
Sustainability supplement
Business performance
Remuneration report
Introduction and overview
Directors’ report
Security holder information
Corporate Report for the year ended 30 June 2022

243
The security holder information set out below was applicable as at 11 July 2022.
Distribution of stapled securitiesThe total number of holders of stapled securities, which comprise one share in Transurban Holdings Limited, one share in Transurban International Limited and one unit in Transurban Holding Trust, was 132,602. The voting rights are one vote per stapled security. There were 3,070,714,782 stapled securities on issue.
The distribution of security holders was as follows:
Security groupingTotal
holdersStapled
securitiesPercentage of issued
stapled securities1–1,000 53,327 21,051,515 0.691,001–5,000 55,518 136,187,462 4.435,001–10,000 14,111 98,907,606 3.2210,001–100,000 9,368 196,414,273 6.40100,001 and over 278 2,618,153,926 85.26Total 132,602 3,070,714,782 100.00
There were 3,129 security holders holding less than a marketable parcel of $500 worth of stapled securities, based on the closing market price on 11 July 2022 of $14.18 per share.
Twenty largest holders of stapled securities
NameNumber of stapled
securities heldPercentage of issued
stapled securitiesHSBC CUSTODY NOMINEES (AUSTRALIA) LIMITED 1,052,138,850 34.26J P MORGAN NOMINEES AUSTRALIA PTY LIMITED 583,575,778 19.00BNP PARIBAS NOMINEES PTY LTD <AGENCY LENDING DRP A/C> 377,390,283 12.29CITICORP NOMINEES PTY LIMITED 206,035,198 6.71BNP PARIBAS NOMS PTY LTD <DRP> 82,720,050 2.69NATIONAL NOMINEES LIMITED 79,013,524 2.57AUSTRALIAN FOUNDATION INVESTMENT COMPANY LIMITED 26,013,322 0.85CUSTODIAL SERVICES LIMITED <BENEFICIARIES HOLDING A/C> 19,479,715 0.63HSBC CUSTODY NOMINEES (AUSTRALIA) LIMITED <NT-COMNWLTH SUPER CORP A/C> 16,831,771 0.55NETWEALTH INVESTMENTS LIMITED <WRAP SERVICES A/C> 14,228,724 0.46ARGO INVESTMENTS LIMITED 9,193,040 0.30BNP PARIBAS NOMINEES PTY LTD HUB24 CUSTODIAL SERV LTD <DRP A/C> 8,782,371 0.29CITICORP NOMINEES PTY LIMITED <COLONIAL FIRST STATE INV A/C> 7,449,795 0.24MILTON CORPORATION LIMITED 6,461,282 0.21MUTUAL TRUST PTY LTD 5,169,038 0.17AUSTRALIAN UNITED INVESTMENT COMPANY LIMITED 4,670,000 0.15NEWECONOMY COM AU NOMINEES PTY LIMITED <900 ACCOUNT> 4,433,971 0.14BNP PARIBAS NOMS (NZ) LTD <DRP> 4,192,000 0.14HSBC CUSTODY NOMINEES (AUSTRALIA) LIMITED 4,060,611 0.13HSBC CUSTODY NOMINEES (AUSTRALIA) LIMITED - A/C 2 3,549,312 0.12Total 2,515,388,635 81.92
Substantial security holdersAs at 11 July 2022, Transurban Group has four substantial security holders who, together with their associates, hold 5% or more of the voting rights in Transurban Group, as notified under the Corporations Act 2001 (Cth).
NameNumber of stapled
securities heldPercentage of issued
stapled securitiesUNISUPER LIMITED (BNP PARIBAS NOMINEES PTY LIMITED) 333,423,165 12.48%BLACKROCK GROUP 193,550,348 7.07%STATE STREET CORPORATION 192,580,819 6.27%THE VANGUARD GROUP 153,517,197 5.001%
Governance and risk
Financial statements
Sustainability supplement
Business performance
Remuneration report
Introduction and overview
Directors’ report
Security holder information
Corporate Report for the year ended 30 June 2022

244
Glossary95 95 Express Lanes395 395 Express Lanes495 495 Express Lanes1H/2H First or second half of a financial yearA25 A25 toll roadAASB Australian Accounting Standards BoardABN Australian Business NumberACN Australian Company NumberADT Average Daily Traffic. ADT is calculated by dividing
the total number of trips on each asset (transactions on CityLink) by the number of days in the period
AFSL Australian Financial Services LicenceAMTN Australian Medium Term NoteARC Audit and Risk CommitteeARSN Australian Registered Scheme NumberASIC Australian Securities and Investments CommissionASX Australian Securities ExchangeATO Australian Taxation OfficeAUD Australian DollarsAWE Average Weekly EarningsCAD Canadian DollarsCAPITAL RELEASES
Capital Releases refer to the injection of debt into Transurban assets, thereby releasing equity
CAVs Connected and Automated VehiclesCCT Cross City TunnelCHF Swiss FrancCOVID-19 Coronavirus-19CPI Consumer Price Index. Refers to Australian CPI
unless otherwise statedCPP INVESTMENTS
Canada Pension Plan Investments
CPS Cents per securityD&A Depreciation and AmortisationD&C Design and ConstructDC District of Columbia, United States of AmericaDJSI Dow Jones Sustainability IndexDOT Department of TransportEBITDA Earnings Before Interest, Tax, Depreciation and
AmortisationED Eastern DistributorEIS Environmental Impact StatementEMTN Euro Medium Term NoteEOI Expressions of interestERM Enterprise Risk ManagementESG Environmental, Social and GovernanceEUR EurosE-WAY M5 West retail tolling brandFFO Funds From OperationsFFO/DEBT Based on S&P methodology. FFO is calculated as
statutory EBITDA (where EBITDA equals revenue minus operating expenses, net of maintenance provision) plus distributions from investments; minus interest paid, tax paid, and stock compensation expense. Debt is calculated as statutory drawn debt net of cash, foreign currency hedging and other liquid investments. FFO/Debt calculation methodologies may be subject to adjustments in future periods
FIAP Financial Inclusion Action PlanFREDEX Fredericksburg Extension project – 95 Express Lanes FREE CASH/FCF Free Cash is the primary measure used to assess the
cash performance of the Group. It represents the cash available for distribution to security holders.
FREE CASH/FCF CONT.
Free Cash is calculated as cash flows from operating activities from 100% owned entities (adjusted to include the allowance for maintenance of intangible assets, exclude cash payments for maintenance of intangible assets and exclude transaction and integration costs related to acquisitions), plus Capital Releases from 100% owned entities, less debt amortisation of 100% owned entities, plus returns from non-100% owned entities
FX Foreign Exchange FY Financial year 1 July to 30 JuneGHG Greenhouse gasGLIDE Transurban’s tolling back-office systemGOFAR GOFAR is a mileage tracker device and appGOTOLL GoToll is a GPS mobile tolling appGRESB Global Real Estate Sustainability BenchmarkGRI Global Reporting InitiativeGROUP Transurban GroupGWA Greater Washington Area meaning northern
Virginia, Washington D.C., areas of Maryland and the surrounding metropolitan area
HCV Heavy Commercial VehicleHOT High Occupancy TollHOV High Occupancy VehicleHPFV High Productivity Freight VehicleHSE Health, Safety and EnvironmentICB Inner City BypassISC Infrastructure Sustainability CouncilKMP Key Management PersonnelKPI Key Performance IndicatorKRI Key Risk IndicatorLCT Lane Cove TunnelLCV Light Commercial VehicleLEP Logan Enhancement ProjectLINKT Transurban’s retail tolling brandLINKTGO LinktGO is a GPS mobile tolling appLTI Long Term IncentiveM2 Hills M2 motorwayM4 New M4M4-M5 M4-M5 LinkM5 WEST M5 West motorwayM7 Westlink M7M8 M8 motorway (previously the New M5)MD Maryland, United States of AmericaMDOT Maryland Department of TransportationMTQ Ministère des Transports du QuebecN.M Not meaningfulN/A Not applicableNA North AmericaNCX NorthConnexNEURA Neuroscience Research AustraliaNEXT Project NEXT – 495 Northern ExtensionNOK Norwegian KroneNPAT AND NPBT Net Profit After Tax and Net Profit Before TaxNSW New South Wales, AustraliaNWRG NorthWestern Roads Group O&M Operations and MaintenanceOTHER REVENUE Other revenue includes management fee revenue,
roaming fee revenue and advertising revenue and is recognised at the point in time the service is provided. Additionally, other revenue includes tolling services provided to third parties for which revenue is recognised over the period the service is provided. It also includes compensation received from third parties for a loss of toll revenue due to delays with construction completion, which is recognised when it is reasonably assured it will be collected
Governance and risk
Financial statements
Sustainability supplement
Business performance
Remuneration report
Introduction and overview
Directors’ report
Security holder information
Corporate Report for the year ended 30 June 2022

245
Forward-looking statements
This report contains certain forward-looking statements. The words “continue”, “expect”, “forecast”, “potential”, “estimated”, “projected”, “likely”, “anticipate” and other similar expressions are intended to identify forward-looking statements. Indications of, and guidance on, future earnings, financial position, distributions, capex requirements and performance are also forward-looking statements as are statements regarding plans, strategies and objectives of management and internal management estimates and assessments of traffic expectations and market outlook. These statements discuss future expectations concerning the results of asset and/or financial conditions or provide other forward-looking information. The forward-looking statements are based on the information available as at the date of this report and/or the date of Transurban’s planning processes or scenario analysis processes.
Such forward-looking statements are not guarantees of future performance and involve known and unknown risks, uncertainties and other factors, many of which are beyond the control of Transurban, its directors, officers, employees, agents and advisors, that may cause actual results to differ materially from those expressed or implied in such statements. There can be no assurance that actual outcomes will not differ materially from these statements, noting that information in this report is not intended to provide guidance in relation to the future performance of the Transurban Group. There are usually differences between forecast and actual results because events and actual circumstances frequently do not occur as forecast and their differences may be material.
Investors should not place undue reliance on forward-looking statements, particularly in light of the current economic climate and the uncertainty and disruption caused by the COVID-19 pandemic. None of the Transurban Group, its officers, employees or agents or any other person: (1) gives any representation, warranty or assurance that the occurrence of the events expressed or implied in any forward-looking statement will occur; and (2) have any responsibility to update or revise any forward-looking statement to reflect any change in the Transurban Group’s financial condition, status or affairs or any change in the events, conditions or circumstances on which a statement is based, except as required by Australian law.
OUR VOICE Internal staff engagement surveyPAB Private Activity BondPFAS Per and polyfluorinated alkyl substancesPP Private PlacementPPA Power Purchase AgreementPPP Public-Private PartnershipPROP/PROPORTIONAL RESULTS
The proportional results are the aggregation of the results from each asset multiplied by Transurban’s percentage ownership as well as the contribution from central Group functions. Proportional EBITDA is one of the primary measures used to assess the operating performance of Transurban, with an aim to maintain a focus on operating results and associated cash generation. The EBITDA calculation from the statutory accounts does not include the EBITDA contribution of M5 (until 18 September 2018), M7 and WCX and includes the non-controlling interests in TQ, M5 (from 18 September 2018) and ED
QC Quebec, CanadaQLD Queensland, AustraliaRAP Reconciliation Action PlanRICI Road Injury Crash Index. Serious road injury (an
individual transported from, or receives medical treatment, at scene) crashes per 100 million vehicle km travelled
RIFR Recordable Injury Frequency RateS&P Standard and Poor’sSAAS Software as a ServiceSASB Sustainability Accounting Standards BoardSBTI Science Based Target initiativeSENIOR EXECUTIVES
Executive Committee members
SEQ South East QueenslandSERVICE AND FEE REVENUE
Service and fee revenue includes customer administration charges and enforcement recoveries
SLN Shareholder Loan Note. An interest bearing shareholder loan
SPV Special Purpose VehicleSTATE WORKS CONTRIBUTION
The capital contribution for WestConnex Stage 3A to be provided by RMS
STEM Science, technology, engineering and mathematicsSTI Short Term IncentiveSTP/STP JV Sydney Transport Partners Joint VentureTAWREED Tawreed Investments Limited. A wholly owned
subsidiary of Abu Dhabi Investment AuthorityTCFD Task Force on Climate-related Financial DisclosuresTFNSW Transport for New South Wales is the government
agency responsible for transport infrastructure and transport services in New South Wales. Roads and Maritime Services (RMS) was dissolved in December 2019 with all functions transferring to TfNSW
THL Transurban Holdings Limited (ACN 098 143 429)THT Transurban Holding Trust (ARSN 098 807 419)TIFIA Transportation Infrastructure Finance and
Innovation Act TIL Transurban International Limited (ACN 121 746 825)TOLL REVENUE Toll revenue includes revenue from customers,
specifically tolls, service and fee revenueTOLLAUST Service provider including O&M and retail services
to NSW assetsTQ Transurban QueenslandTRANSURBAN CHESAPEAKE/TC
Transurban Chesapeake owns 100% of the entities that developed, built, financed and now operate and maintain the 95 Express Lanes (including the Fredericksburg Extension which is under construction), 395 Express Lanes and 495 Express Lanes (including the NEXT Extension which is under construction). Transurban has a 50% interest in Transurban Chesapeake
TRANSURBAN/TRANSURBAN GROUP
Comprising THL, THT and TIL and their controlled entities. The responsible entity of THT is Transurban Infrastructure Management Limited (ACN 098 147 678) (AFSL 246 585)
TSR Total Shareholder ReturnUN SDGS United Nations Sustainable Development GoalsUNDERLYING EBITDA
EBITDA excluding significant items
US United States of AmericaUSA United States of AmericaUSD US DollarsUSPP US Private Placement VA Virginia, United States of AmericaVDOT Virginia Department of TransportationVIC Victoria, AustraliaVTIB Virginia Transportation Infrastructure Bank WCX WestConnexWEIGHTED AVERAGE COST OF DEBT
Calculated using proportional drawn debt exclusive of issued letters of credit
WEIGHTED AVERAGE MATURITY
Calculated using proportional drawn debt exclusive of issued letters of credit
WGF West Gate FreewayWGT/WGTP West Gate Tunnel/West Gate Tunnel ProjectWHT Western Harbour TunnelZEVs Zero Emission Vehicles
Corporate Report for the year ended 30 June 2022
Governance and risk
Financial statements
Sustainability supplement
Business performance
Remuneration report
Introduction and overview
Directors’ report
Security holder information

246
10-year historyOperational metrics FY13 FY14 FY15 FY16 FY17 FY18 FY19 FY20 FY21 FY22Number of operational assets # 8 12 14 15 15 16 17 18 21 21Number of markets # 3 4 4 4 4 5 5 5 5 5Average daily traffic1
Group thousands 1,295 1,382 1,775 1,911 1,946 2,035 2,217 2,026 2,018 2,008Sydney thousands 477 543 581 622 644 663 814 761 931 802Melbourne thousands 780 793 816 820 813 824 851 750 566 648Brisbane thousands – – 303 383 394 403 405 383 407 418North America thousands 38 46 75 85 96 144 147 132 115 140
Proportional financialsProportional Toll Revenue3
Group $ millions 991 1,117 1,656 1,946 2,153 2,340 2,581 2,492 2,486 2,626Sydney $ millions 479 551 701 799 872 944 1,042 1,072 1,278 1,264Melbourne $ millions 496 535 615 660 687 780 813 747 616 722Brisbane $ millions – – 265 313 385 393 402 394 425 451North America $ millions 16 31 75 174 209 223 324 279 167 189
Proportional EBITDA (excl. significant items)Group $ millions 828 934 1,289 1,480 1,629 1,796 2,016 1,888 1,836 1,900Sydney $ millions 392 466 558 637 702 763 856 879 1,033 976Melbourne $ millions 441 483 523 564 594 688 716 634 502 594Brisbane $ millions – (6) 185 218 268 279 293 286 314 320North America $ millions (3) 4 33 86 116 130 210 154 72 120Corporate and other $ millions (2) (13) (10) (25) (51) (64) (59) (65) (85) (110)
Free Cash $ millions 443 572 768 926 1,220 1,215 1,527 1,476 1,278 1,531Proportional drawn debt $ millions 7,471 8,015 12,236 12,484 13,639 14,971 19,394 22,118 20,763 23,574Gross debt raised4 $ millions 1,507 2,122 7,814 4,707 4,518 5,865 15,112 7,968 10,016 6,715Equity raised $ millions 100 2,742 – 1,025 – 1,900 4,820 812 – 4,220
Ratios and ratesGroup EBITDA margin5 % 75.0 75.8 74.7 73.8 73.9 74.9 75.4 72.3 70.3 68.8FFO/Debt % – 6.6 7.9 8.0 8.5 8.9 8.7 7.0 9.46 9.1Corporate SICR x 2.5 2.9 3.5 4.3 3.9 4.9 4.1 3.8 2.8 3.3Gearing % 42.8 36.4 40.2 33.3 35.3 35.2 32.0 35.8 34.3 34.2Weighted average cost of debt
AUD % 6.6 6.3 5.3 5.2 4.9 4.9 4.6 4.4 4.1 3.9USD % 4.6 4.0 3.8 4.3 4.3 4.4 4.4 4.4 4.5 3.6CAD % – – – – – 5.8 4.9 5.0 5.0 5.0
Weighted average debt maturity7 years 9.7 7.5 7.8 8.7 9.0 8.6 8.3 8.4 7.7 7.1Weighted average concession length8 years 24.3 24.3 28.5 29.9 29.7 28.3 30.8 28.8 26.2 29.1
Corporate informationMarket capitalisation $ billions 10.02 14.01 17.80 24.41 24.32 26.63 39.43 38.65 38.96 44.16Total Shareholder Return % 25 17 32 35 4 6 31 (1) 3 4.9Gross distributions $ millions 456 594 764 901 1,055 1,174 1,577 1,284 999 1,259Distributions per security cps 31.0 35.0 40.0 45.5 51.5 56.0 59.0 47.0 36.5 41.0Securities on issue millions 1,482 1,896 1,914 2,036 2,052 2,225 2,675 2,735 2,738 3,071
Statutory financialsStatutory revenue $ millions 1,195 1,150 1,860 2,210 2,732 3,298 4,166 3,1692 2,8862 3,406Statutory NPAT $ millions 175 252 (373) 22 209 468 170 (153) 3,272 16Statutory cash flows from operating activities $ millions 411 521 304 910 837 1,053 1,197 1,131 893 982
1 CityLink traffic reported as average daily transactions (‘000)
2 Statutory results for FY20 and FY21 have been reclassified to present Transurban Chesapeake as discontinued operations in the current period. Refer to Note B24 Business combinations and changes in ownership interests within the Financial Statements for further information
3 Definition of Toll Revenue adjusted in FY16 (including restatement of FY15) to include fee revenue. Prior to this was disclosed as toll revenue only, and fee and other revenue
4 Calculated at 100% of the debt facility size. Non-AUD denominated debt converted at the hedged rate where cross currency swaps are in place
5 FY14 and FY15 EBITDA margins were restated in FY16. Not previously disclosed for FY12 to FY13
6 FY21 FFO/Debt previously reported as 8.9% has been restated due to an amendment S&P have made in their calculation methodology
7 FY18 to FY21 has been calculated using proportional drawn debt. FY12 to FY17 was calculated on the full value of available debt facilities. Prior to FY19, the previously reported tenor did not reflect the amortisation profile that occurs in the latter years of the USA asset debt facilities
8 Weighted using proportional Toll Revenue by asset
Governance and risk
Financial statements
Sustainability supplement
Business performance
Remuneration report
Introduction and overview
Directors’ report
Security holder information
Corporate Report for the year ended 30 June 2022

Key contactsRegistered office Level 31, Tower 5, Collins Square 727 Collins Street Docklands VIC Australia 3008
Phone: +61 3 8656 8900
Share registry Computershare Investor Services Pty Limited Yarra Falls 452 Johnston StreetAbbotsford VIC Australia 3067
Mailing address: GPO Box 2975 Melbourne VIC Australia 3001
Phone: 1300 360 146
Outside Australia: +61 3 9415 4315
Website: computershare.com.au
Investor Relations Team Email: [email protected]
General enquiries Email: [email protected]
Auditors PricewaterhouseCoopers 2 Riverside Quay Southbank VIC Australia 3006
Mailing address: GPO Box 1331 Melbourne VIC Australia 3001
Phone: +61 3 8603 1000
Whistleblower service Website: kpmgfaircall.kpmg.com.au/Transurban
Phone (toll free): 1800 500 965 (Australia) 1844 202 0966 (Greater Washington Area) 1800 241 9148 (Montreal—operated in English and French)
Mailing address: The FairCall Manager PO Box H67, Australia Square Sydney NSW Australia 1213
Find us
FeedbackWe welcome feedback on our Corporate Report, including on what worked well, and what we could do better. Share your thoughts here: [email protected]

transurban.comConstruction of the West Gate Tunnel is underway, including more than 700 metres of the new two-kilometre, six-lane elevated road (pictured). The tunnel will deliver a vital alternative to the heavily congested West Gate Bridge and provide new links to Melbourne’s port, CityLink and the city