
ASX RELEASE - New Hope Group
138
REGISTERED OFFICE P: PO Box 47, Ipswich, QLD Australia 4305 A: 3/22 Magnolia Drive, Brookwater, QLD Australia 4300 T: +61 7 3418 0500 F: +61 7 3418 0355 W: newhopegroup.com.au NEW HOPE CORPORATION LIMITED ABN: 38 010 653 844 The Company is pleased to announce the 2019 update of its Coal Resources and Coal Reserves, under the 2012 JORC Code. Key changes from the previous reporting period are: • New Acland – coal resource reduced by insitu depletion of 9.29Mt, entirely within the Measured Resource area; • Bengalla – coal resource reduced by insitu depletion of 11.27Mt entirely within the Measured Resource area; • Burton – a new coal resource has been declared for the Ellensfield South and Plumtree North areas; and • Inclusion of Table 1 information for relevant projects has been included as an appendix to this release. Coal Resources and Coal Reserves are stated as at 31 st May 2019. Production information for the financial year ended 31 July 2019 is available in the ‘Appendix 4E and Annual Financial Report’ released today. ASX RELEASE 2019 Coal Resources and Coal Reserves 17 September 2019
-
Upload
khangminh22 -
Category
Documents
-
view
3 -
download
0
Transcript of ASX RELEASE - New Hope Group
REGISTERED OFFICE P: PO Box 47, Ipswich, QLD Australia 4305 A: 3/22 Magnolia Drive, Brookwater, QLD Australia 4300 T: +61 7 3418 0500 F: +61 7 3418 0355 W: newhopegroup.com.au
NEW HOPE CORPORATION LIMITED ABN: 38 010 653 844
The Company is pleased to announce the 2019 update of its Coal Resources and Coal Reserves, under the 2012 JORC Code. Key changes from the previous reporting period are: • New Acland – coal resource reduced by insitu depletion of 9.29Mt, entirely within the
Measured Resource area; • Bengalla – coal resource reduced by insitu depletion of 11.27Mt entirely within the
Measured Resource area; • Burton – a new coal resource has been declared for the Ellensfield South and Plumtree
North areas; and • Inclusion of Table 1 information for relevant projects has been included as an appendix to
this release.
Coal Resources and Coal Reserves are stated as at 31st May 2019.
Production information for the financial year ended 31 July 2019 is available in the ‘Appendix 4E and Annual Financial Report’ released today.
ASX RELEASE
2019 Coal Resources and Coal Reserves 17 September 2019

REGISTERED OFFICE P: PO Box 47, Ipswich, QLD Australia 4305 A: 3/22 Magnolia Drive, Brookwater, QLD Australia 4300 T: +61 7 3418 0500 F: +61 7 3418 0355 W: newhopegroup.com.au
Coal Resources
COAL RESOURCES as at 31st May 2019 (MILLION TONNES) (COAL RESOURCES ARE INCLUSIVE OF THE RESERVES REPORTED BELOW) DEPOSIT STATUS INFERRED INDICATED MEASURED 2019 TOTAL 2018 TOTAL New Acland *1 Mine 23 189 285 497 506 Bengalla *2 Mine 116 141 154 411 422 Burton *3 Mine 8 11 13 32 - Lenton *4 Exploration 208 104 68 380 380 Yamala *5 Exploration 184 39 14 237 240 Elimatta * Exploration 73 105 108 286 286 Collingwood * Exploration 94 139 43 276 276 Taroom ** Exploration 126 149 158 433 433 Woori ** Exploration - - 84 84 84 Total 832 877 927 2,636 2,627† Reporting period 1/4/18 – 31/5/19
Notes on Resources: 1 Resources are re-quoted from 2018, less depletion of what was mined between the reporting periods. 2 Figures shown are 100% of total resources. New Hope Group Share is 80%. Resources are re-quoted from 2018,
less depletion of what was mined between the reporting periods. The Resource number includes 74 Mt of inferred Underground resource.
3 New Hope Group share is 90%. 4 New Hope Group share is 90%. 5 New Hope Group share is 70%. The inferred tonnage has changed due to an administrative error identified in
the 2018 annual report. * Denotes the Resource estimations that have been reviewed against and follow the 2012 JORC Code. ** This information was prepared and first disclosed under the JORC Code 2004. It has not been updated since to
be reported in accordance with the JORC Code 2012 on the basis that the information has not materially changed since it was last prepared. Exploration drilling on the Taroom and Woori tenements occurred in 2018 / 2019 and a new resource model will be prepared in due course.
† Total adjusted to exclude the Colton deposit. Totals may not add due to rounding JORC DECLARATION – COAL RESOURCES The estimates of coal resources herein have been prepared in accordance with the guidelines of the Australasian Code for Reporting of Exploration Results, Mineral Resources and Ore Reserves – The JORC Code. These resources are inclusive of the Reserves Statement and are as at 31/05/2019 unless otherwise stated. The resources for New Acland, Burton, Lenton, Yamala, Elimatta, Collingwood, Taroom and Woori have been re-quoted from the 2018 JORC reporting, less depletion for New Acland, and are based on information reviewed by Mr Sean Dixon, who is a full time employee of the company. The Bengalla Resources have been prepared by Mr Marko Seppanen (Geomine Pty Ltd) and are re-quoted from the 2018 JORC reporting, less depletion. Mr Dixon, and Mr Seppanen have sufficient experience which is relevant to the style of mineralisation and type of deposit under consideration and to the activity which they are undertaking to each qualify as a Competent Person as defined in the 2012 Edition of the ‘Australasian Code for Reporting of Exploration Results, Mineral Resources and Ore Reserves’ - The JORC Code. Mr Dixon and Mr Seppanen consent to the inclusion in the report of the matters based on their information in the form and context in which it appears.

REGISTERED OFFICE P: PO Box 47, Ipswich, QLD Australia 4305 A: 3/22 Magnolia Drive, Brookwater, QLD Australia 4300 T: +61 7 3418 0500 F: +61 7 3418 0355 W: newhopegroup.com.au
Coal Reserves
COAL RESERVES as at 31st May 2019 (MILLION TONNES) RECOVERABLE RESERVES MARKETABLE RESERVES 4 DEPOSIT STATUS PROBABLE PROVED TOTAL 2019 TOTAL 2018 PROBABLE PROVED TOTAL 2019 New Acland 1 Mine 125 245 370 381 68 133 201 Lenton 2 Exploration 12 23 35 35 7 14 21 Elimatta Exploration 29 96 125 125 17 66 83 Bengalla 3 Mine 87 132 218 229 68 110 178 Total 253 496 749 770 160 323 483 Notes on Reserves: 1 240Mt of Recoverable Reserves require additional approvals beyond Acland Stage 3.
The Reserves are based on those reported in 2017, less depletion. 2 Figures shown are 100% of total Reserves. New Hope share is 90%. 3 Figures shown are 100% of total Reserves. New Hope share is 80%.
The Reserves are based on those reported in 2018, less depletion. 4 Marketable Reserves are based on modelled wash plant yields based off reconciled data for the operating
mines, or simulated product yields for the exploration areas. Totals may not add due to rounding JORC DECLARATION – COAL RESERVES
The information in this Coal Reserves Statement that relates to coal reserves for New Acland, Lenton and Elimatta is based on information compiled by Mr Brett Domrow, who is a full time employee of the company. The Coal Reserves Statement for Bengalla has been prepared by Mr Chris Dutton (Bengalla Mining Company Pty Ltd). Mr Domrow, and Mr Dutton have sufficient experience which is relevant to the style of mineralisation and type of deposit under consideration and to the activity which they are undertaking to each qualify as a Competent person as defined in the 2012 Edition of the ‘Australasian Code for Reporting of Exploration Results, Mineral Resources and Ore Reserves’ – The JORC Code. Mr Domrow and Mr Dutton consent to the inclusion in the report of the matters based on their information in the form and context in which it appears.
(ends)
For more information, please contact: INVESTORS & ANALYSTS Robert Millner Chairman P: +61 2 9232 7166 Shane Stephan Managing Director P: +61 7 3418 0500 Libby Beath External Affairs Manager P: +61 499 016 674 MEDIA Libby Beath External Affairs Manager P: +61 7 3418 0522
M: +61 499 016 674

NEW ACLAND
JORC Reporting – Table 1 For Coal Resources and Reserves as at 2017
Section 1 Sampling Techniques and Data (Criteria in this section apply to all succeeding sections)
Criteria Commentary Sampling techniques New Hope Exploration (NHE) have a set of Field Operations Procedures which establish
the minimum requirements for each exploration task, including the best practices for the collection of geological data for use in resource models.
All staff are deemed competent by New Hope Group (NHG), and hold relevant qualifications and training competencies required to carry out these tasks.
Drilling campaigns at New Acland have taken on various forms, including chip drilling; and core drilling for coal quality, gas sampling and geotechnical analysis.
When drilling chip holes, for every metre drilled, the drill cuttings (chips) are laid out in individual piles representing that metre for the geologist to describe in their lithology logs.
Metre markers on the mast of the drill rig assist the Drill Crew to identify the sample boundaries.
It is standard practice for the Drill Crew to collect drill cuttings in a sieve and to place them in an orderly manner in the designated sample layout area.
The Exploration Geologist then logs the metre samples to identify and describe standard lithological characteristics. Lithological depths are later confirmed with geophysics, particularly for coaly units.
All core holes are logged and sampled directly from the core table in the field. Depths are measured using a tape measure per core run, with an understanding of the depth in the hole from Drillers measurements.
As per NHE procedures, standard coal quality core sampling parameters are defined to ensure consistency in sampling:
All coal in the drill hole is sampled, regardless of thickness; Any changes in coal brightness is sampled separately; All carbonaceous material is sampled, regardless of thickness; All stone bands are sampled separately, regardless of thickness, except large
interburdens (>50cm); All lithology changes within the stone bands are sampled separately; If the coal in one run is continued in the next run they are split into two samples to
ensure there is no risk in sample loss between core runs; Core loss in the middle of a sample is not allowed. Separate samples above and
below core loss are taken.
All coal quality samples are sent to ALS (ACIRL) at Richlands, Queensland, which is an accredited laboratory under the National Association of Testing Authorities (NATA). In compliance with NATA, all samples are prepared and analysed using methodologies stipulated in the Australian Standards.
Gas levels are below recordable detection limits at New Acland, and it is deemed that there are no problems with gas across the project. However, gas sampling has been conducted to determine emissions liability for fugitive greenhouse gas emissions reporting. This program was conducted within the guidelines of the ACARP report C20005 and was overseen by Ray Williams – a leading expert in coal seam gas and technical advisor to the ACARP report C20005. Samples of coal from selected locations in the coal sequence were placed into gas canisters, then sealed to ensure no gas could escape. These samples had a maximum thickness of 80cm. Q1 testing for lost gas was carried out on site. The samples were then immediately transported to the Brisbane GeoGas laboratory and analysed in accordance with the Q2 (desorbed gas) & Q3 (residual gas) testing procedures for gas sampling. GeoGas Brisbane is a NATA accredited laboratory.
Geotechnical sampling has been carried out under the advice of John Simmons of Sherwood Geotechnical – a leading expert in his field. Defect logging and samplings was carried out by representatives of GHD Pty Ltd from Brisbane, who also finalised the reporting for New Acland. Samples were (on average) 30cm in length, and were collected

NEW ACLAND
JORC Reporting – Table 1 For Coal Resources and Reserves as at 2017
Criteria Commentary from sandstone, siltstone, and interbedded sandstone/siltstone units, from overburden, interburden and basement materials. All samples were analysed at Trilab laboratories in Brisbane. Trilab, Brisbane, is a NATA accredited laboratory. Once the drilling of the hole is complete, downhole geophysical logging is carried out on all holes that intersect coal. As a minimum, dual density (long-spaced density & short-spaced density), gamma and caliper trace data is collected in each hole. Historically, the microdensity tool has also been used. In recent times, it has become standard to log all holes with the deviation tool. Sonic data is also acquired in some holes across the deposit. Where holes are drilled for geotechnical purposes, the acoustic scanner tool is also utilised. New Hope Group have the ability to log the hole with magnetic susceptibility and resistivity tools also, and a small number of holes have been tested with these tools.
Drilling techniques All holes drilled in coal are planned for vertical drilling, to intersect the stratified coal measures at a sub-perpendicular angle.
Holes are drilled using either air or water as a drilling medium. Muds are sometimes used to control water flow or hole stability.
Chip holes at New Acland vary in size and in the drill bit used. These holes are commonly used to define structure, coal seam continuity and lines of oxidation (LOX lines).
Most commonly, chip holes have been drilled with 114 mm PCD bits. Blade bits have also been used for chipping (with the same bit size). More recently chip holes have been drilled with 120mm diameter PCD bits.
Basalt is encountered in some areas of the New Acland deposit, and these intersections are commonly drilled with a hammer bit of 120mm.
The blast rig at New Acland is also used to delineate the base of basalt on the pit boundaries, and also for delineating faults. The hole size for the blast rig is 229mm, and a claw bit is used.
Coal quality samples are most commonly collected from holes with a core size diameter of 102mm (4-inches), as this size yields the required sample mass to carry out basic coal quality testing for the products at New Acland. 152mm (6-inch) holes have also been drilled across the deposit for more detailed coal quality investigations.
Grade control drilling; gas drilling; and geotechnical sampling has been conducted using HQ drilling (nominal core diameter of 63.5mm)
Drill Sample Recovery Core Depth and Sample Reconciliation data is recorded for recovered thicknesses, including sample recovery and core loss for each core run.
Coal seam depths and thickness are confirmed when the geophysical logging is completed.
Core loss and core expansion are accounted for in the field, by using observations in the core. For example, core recovery thickness discrepancies, broken core, crushed zones, swelling lithologies and groove marks caused by over-drilling are all indicators of these core states, and with careful data recording and confirmation with geophysics, can be assessed and appropriately logged to record an accurate geological interpretation of the downhole lithology.
The drilling supervisor is notified when core loss in coal greater than 5% or if substandard core is being presented to the geologist. The decision to re-drill the hole is discussed. If there are problems with core or sample recovery, the hole is not used in the geological model, this is a rare occurrence partly due to the geology (HGI of the deposit is low).
For representivity and sample recovery purposes, the full sample length measured on the core board is placed into the sample bags, without contaminating other samples or lithology units.
Drilling fluids and clays are cleaned off the core prior to recording lithological information
Separating adjacent samples is typically carried out using a paint scraper. If the core is a bit harder in one area, a hammer and bolster is used to break the core at this point.
In an attempt to avoid sample contamination, as much of the surrounding lithology is scraped off the samples before it is placed in the bag.
The core table is cleaned between runs to reduce the risk of sample contamination.
Logging When drilling chip holes, for every metre drilled, the drill cuttings (chips) are laid out in individual piles representing that metre for the geologist to describe in their lithology logs.

NEW ACLAND
JORC Reporting – Table 1 For Coal Resources and Reserves as at 2017
Criteria Commentary Geophysical logging is then performed in order to provide accurate depths for coal seam corrections.
For all core holes, core length measurements are taken for depth reconciliation purposes. The core depths and sample intervals are then marked on core boards, which sit alongside the core on the table. All samples are given unique NHE sample numbers, which are transcribed into the lithology logs as the geologist logs the core.
The core is photographed at 0.5m intervals at high resolution, prior to placing the core samples into sample bags to send to the laboratory. An overlap of the previous and following photographing area is included to allow core photo continuation and matching. These core photographs are utilised in data quality control, to establish core loss/expansion, to assist in core sample laboratory testing instructions, and as a permanent record of borehole lithology and the decisions made by the exploration geologist on the rig.
Geophysical logging is then performed to give accurate coal seam depths, and the lithology is reviewed against the geophysics to confirm that seam thickness recoveries are at an acceptable limit (>95%). All data collected in the field, including any photography, is saved electronically for future reference. All paperwork is stored in hardcopy borehole files at Head Office.
Downhole geophysical logging is carried out on all holes that intersect coal. As a minimum, dual density (long-spaced density & short-spaced density), gamma and caliper trace data is collected in each hole. Historically, the microdensity tool has also been used. In recent times, it has become standard to log all holes with the deviation tool. Sonic data is also acquired in some holes across the deposit. Where holes are drilled for geotechnical purposes, the acoustic scanner tool is also utilized. Where basalt has been intersected the magnetic susceptibility tool is utilized. In 2016 the Guarded Resistivity tool was introduced to the logging suite with data collected for the majority of holes. The Guarded Resistivity circuit was later incorporated into the dual density tool.
Sub-sampling techniques and sample preparation
Once the lithology and the defects in the core have been logged, the samples can be separated out using the intervals marked on the core boards, and placed into their corresponding sample bag. The criteria for identifying samples can be seen in the “Sampling Techniques” section, above.
Core is generally sampled immediately after drilling, once it reaches the surface.
To ensure that sample integrity is maintained, plastic sample bags are used.
NHE have developed a unique sample numbering system to prevent sample number duplication, which would result in exclusion from the geological model.
Sample numbers are printed on waterproof sample tags, which are stapled to the sample bag, facing outwards, so that it can be clearly identified.
To ensure that the sample is sealed off completely, the sample bag is twisted off and folded over itself before zip-tying it closed.
All coal quality samples are sent to ALS (ACIRL) at Richlands, Brisbane, which is an accredited laboratory under the National Association of Testing Authorities (NATA). In compliance with NATA, all samples are prepared and analysed using methodologies stipulated in the Australian Standards.
Coal quality analysis at New Acland is carried out in three stages: (1) Raw Coal Analysis; (2) Washability Analysis; and, (3) Clean Coal (Product) Analysis.
Following the Australia Standards, the laboratory representatively splits the samples into portions in order to perform the coal quality analysis required. For New Acland, one-eighth of the sample is used for Raw Analysis and the remaining seven-eighths reserved for Washability analysis, which is carried out after the Raw Analysis results are reported. Clean Coal Composite analysis is carried out on a cumulative cut point which targets an ash product, and is nominated based on the results of Washability analysis.
Quality of assay data and laboratory tests
All coal quality samples are sent to ALS (ACIRL) at Richlands, Brisbane, which is an accredited laboratory under the National Association of Testing Authorities (NATA) to perform analytical testing to the to the ISO 17025 and ISO 9001 Standards (Certificate number 15784-857). In compliance with NATA, all samples are prepared and analysed using methodologies stipulated in the Australian Standard AS4264.1-2009 for coal and coke sample preparation.

NEW ACLAND
JORC Reporting – Table 1 For Coal Resources and Reserves as at 2017
Criteria Commentary NATA accreditation involves regular external audits of the management, training and control procedures in the laboratory to ensure that the processes are documented, precise, accurate and validated. As such, the quality of testing is appropriate.
All testing is performed using well-recognised national or international processes (standards) which are considered appropriate for the testing and analysis of coal samples.
NHE own and operate their own fleet of geophysical logging trucks. All logging staff are appropriately licensed and hold relevant qualifications & training competencies to carry out the task, and are deemed competent by NHG.
NHE see a great advantage in having self-operated geophysical logging crews, as boreholes are logged immediately after drilling and data is readily available for geological interpretation.
NHE have drilled a calibration hole at New Acland, which allows the logging truck operators to ensure the tools are appropriately depth calibrated.
NHE have the ability to test the Dual Density tools against known density values (water tank & aluminium block). These tests are sent to DGRT Pty Ltd to verify against six known calibration curves developed by NHE, to ensure the tools are appropriately calibrated. The tools are adjusted if required.
Geophysical tools are serviced annually by DGRT Pty Ltd at Acacia Ridge in Brisbane, QLD. There are four main geophysics tools used for logging coal exploration holes:
Auslog A605 Dual Density Tool Sample interval 2cm; logging speed 4m/min; reading time 0.3sec. Density calibration is detailed above. Gamma is calibrated to a thorium source. Caliper is calibrated to readings of 50.8, 101.6, 152.4, 203.2 and 254mm using a standard gauge. NHE calibrate the caliper to point to point calibration, as opposed to a line of best fit.
Auslog A605FR Dual Density Tool Sample interval 0.05cm; logging speed 3.3m/min; reading time 0.3sec. Density calibration is detailed above. Gamma is calibrated to a thorium source. Caliper is calibrated to readings of 50.8, 101.6, 152.4, 203.2 and 254mm using a standard gauge. NHE calibrate the caliper to point to point calibration, as opposed to a line of best fit.
Auslog A698 Deviation Tool Sample interval 5cm; logging speed 6m/min; reading time 0.5sec. Factory calibration settings have been applied for this tool.
Auslog A799 Full Wave Sonic tool Sample interval 10cm; logging speed 4m/min; reading time 1.5sec. Factory calibration settings have been applied for this tool.
Verification of sampling and assaying
All lithology data is entered directly into LogCheck data entry software in the field, which has been designed specifically for coal exploration. LogCheck has been programmed with validation criteria to ensure all data loaded is clean of critical data entry errors. All validation tools and dictionaries are password protected.
The geophysical logs are loaded into LogCheck, and compared with the lithology observed by the geologist through the Graphic Editor module. Once the correlation between the coal seam observations in the lithology and the geophysics has been established, the lithology depths are adjusted to match the geophysical signatures. A copy of the original lithology log is stored in backup in case errors occur in the depth adjustment process.
The corrected field log is reviewed and validated by the Database and Modelling Geologist before being loaded into the database for seam correlation.
When all seam names have been confirmed as correct, sample summaries are generated from LogCheck, giving the sample number, sample depths and description of the sample against seam names, which provide the basis for laboratory coal quality instructions. Laboratory instructions are then provided on a seam-by-seam basis.
At the laboratory, all samples are registered into both Coal8 & LabSys – ALS’s own sample tracking software systems (approved by NATA). This registration is confirmed by Project Manager against the original client instructions, and each sample and its subsequent

NEW ACLAND
JORC Reporting – Table 1 For Coal Resources and Reserves as at 2017
Criteria Commentary children are affixed with a designated sticker containing all the sample details and a barcode.
Samples are analysed according to client procedures. As samples are analysed the barcode is used to log each result to that sample.
Results are quarantined and repeated if they do not meet the requirements of the appropriate Australian or ISO Standards. Controls are run with each batch of samples to ensure the testing apparatus is operating properly. Project Managers and Laboratory Managers/Supervisors approve these results. The use of twinned holes is not a typical practice in coal exploration for validating results.
Laboratory Project Managers collate and validate the data, looking for abnormalities in the results. The primary means of validation include looking for known trends in the data, by creating cross plots of the results on a seam by seam basis. Typical industry practices include the comparison of the following (for example):
Ash vs. Relative Density Volatile Matter vs. Ash Specific Energy vs. Volatile Matter Ash vs. Total Sulphur
The laboratory provides the results in a variety of formats:
1. Preliminary results templates, which provide all data for each stage of analysis in one Excel file, and is updated with data at the completion of each stage of analysis;
2. CSV templates of the final data in the correct format for loading directly into the geological database; and,
3. Final PDF reports that are deemed to be the final result for the coal quality analysis for each sample. These reports also list the sample instruction provided by the client, and the Australian Standard methodologies utilised in the analysis. These reports are signed off by the Laboratory Manager as being a true representation of analysis for those samples contained within the report.
All coal quality data obtained from the laboratory is entered into the geological database on completion of analysis for each hole, using standard load specifications, so as to reduce the risk of typographic errors, and minimise data handling. The coal quality models are built directly from the database. No changes are made to the results, unless verification checks confirm an anomalous result, which are edited individually to match the final laboratory result after an investigation is undertaken.
The geological database has built-in validation parameters to ensure all data is entered correctly.
The geological database has restricted access and is password protected.
All geological data is stored both electronically and in hardcopy, using New Hope Group practices outlined in Field Operations Procedure’s & Guidance Notes.
Hardcopy borehole files are stored in a secure fire-proof room at New Hope Group’s Head Office in Brookwater, Queensland.
Location of data points All location data at New Acland is collected using the AGD84 datum, and Australian Map Grid zone 56J projection.
All elevation data is recorded in Australian Height Datum (AHD)
All boreholes are planned and located using handheld GPS units. Because the accuracy of the handheld units averages 5-10m in the horizontal plane, all holes are then accurately surveyed at the completion of drilling, for the provision of coordinates to the geological model.
Surveys are carried out using RTK GPS which has a relative positional accuracy of approximately 50mm. Boreholes surveys are connected to the State Control Network to ensure absolute positional accuracy of approximately 100mm. Positional coordinates of Surveyed boreholes are then supplied to New Hope in the required project horizontal and vertical datum.
All borehole collars (locations) are surveyed by registered mine surveyors. Typically, New Acland’s mine surveyors collect this data, however, external contractors have been used also on MDL244, with Cottrell Cameron & Steen providing services over the last six years.

NEW ACLAND
JORC Reporting – Table 1 For Coal Resources and Reserves as at 2017
Criteria Commentary The topography surface used in the geological model was created through the acquisition of LiDAR data on a 50cm grid across the deposit.
Selected coal seam roof & floor elevations and base of basalt elevations are used as survey points from blast holes to assist with constraining the geological model in the Mining Lease areas.
Data spacing and distribution
On average, the core hole spacing at New Acland is 166m.
On average, the chip hole spacing at New Acland is 131m.
We are able to demonstrate, with a high degree of confidence, that the coal seams at New Acland are laterally continuous, through the collection of geophysical data across the deposit.
All resource estimations are limited to 50m offset against the New Acland mining tenure boundaries, and do not extrapolate beyond the granted tenure, however, New Hope Group also holds adjacent tenure which has been explored and indicates that the Acland sequence is continuous past the mining lease limits.
For fault delineation and base of basalt delineation programs, drill hole placement is reduced to 25m-50m along lines that are separated by an average spacing of 75m.
Coal quality samples are taken on a lithology basis, and combined for coal quality testing based on plies, and through confirmation in geophysical logs.
Orientation of data in relation to geological structure
The New Acland deposit has an overall dip of approximately 3-5o to the southwest.
Holes are drilled vertically to intersect the relatively flat-lying coal seam strata.
Minor drag-induced seam-steepening occurs around faults, and drillhole spacing across faults is reduced to ensure the seam behaviour is appropriately represented. Feedback from the New Acland mining operations, indicates these structures generally have limited effect on mining recovery.
Coal quality samples are taken on a seam-by-seam basis, in order to achieve an unbiased representation of the coal quality.
Geophysical deviation data is used to correct any deviation of the borehole from vertical, and allows true thickness to be represented in structural and coal quality models.
Sample security All samples are taken directly after they have been drilled and lithologically / geotechnically logged.
Samples are stored in a cool, dry, shady location if they are waiting to be dispatched to the ALS laboratory in line with industry standards.
Sample numbers are printed on unique NHE waterproof sample tags, which are stapled to the sample bag, facing outwards, so that it can be clearly identified.
Each sample is placed directly into the sample bag and is sealed off completely by twisting the sample bag and folding it over itself, before zip-tying it closed. This is to prevent moisture escaping, and the deterioration of coal properties.
Once the samples have been placed inside their corresponding plastic sample bags, they are placed inside large poly-weave sacks, which are then sealed and clearly labelled with New Hope’s specific information. Information about the samples in these poly-weave sacks is recorded on the “Core Depth and Reconciliation Sheet”, which is then scanned into the electronic document filing system, with the original hard copy stored in the appropriate hard-copy borehole file
Samples are then be placed in 44-gallon drums and dispatched as soon possible, usually within 24 hours of borehole completion.
The outside of the sample drums are clearly labelled with “New Hope Group” and the delivery address for the ALS laboratory. Also, the project name, hole number, number of poly-weave sacks in the drum, the drum number and the total number of drums for the hole.
If necessary, a drum liner is used to keep moisture out of the drums.
A core sample consignment note must be completed before the samples can be dispatched. The number of sample bags and drums is noted on this consignment note. A copy of the sample consignment note must remain with the sample drums when dispatched, and a copy is retained and an electronic copy is kept on file.
NEW ACLAND
JORC Reporting – Table 1 For Coal Resources and Reserves as at 2017
Criteria Commentary On arrival at the lab the samples are checked to ensure that all the samples have arrived as per the consignment note and a record of the samples received are filed electronically.
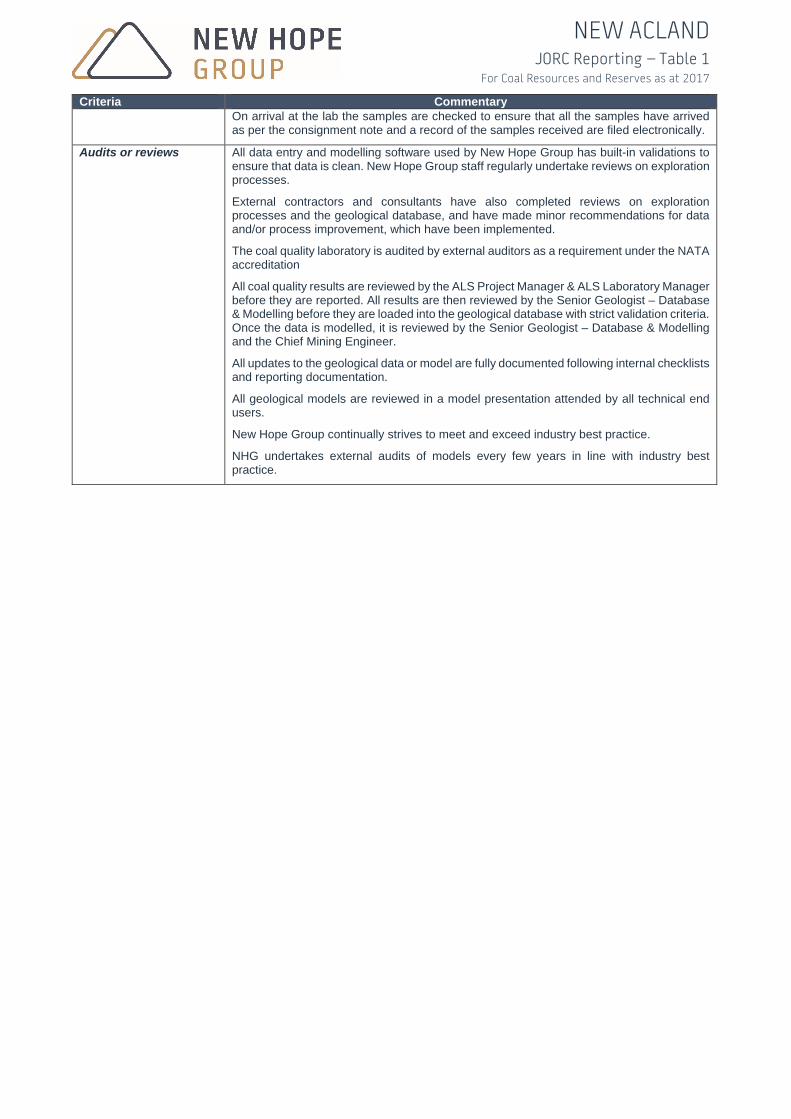
Audits or reviews All data entry and modelling software used by New Hope Group has built-in validations to ensure that data is clean. New Hope Group staff regularly undertake reviews on exploration processes.
External contractors and consultants have also completed reviews on exploration processes and the geological database, and have made minor recommendations for data and/or process improvement, which have been implemented.
The coal quality laboratory is audited by external auditors as a requirement under the NATA accreditation
All coal quality results are reviewed by the ALS Project Manager & ALS Laboratory Manager before they are reported. All results are then reviewed by the Senior Geologist – Database & Modelling before they are loaded into the geological database with strict validation criteria. Once the data is modelled, it is reviewed by the Senior Geologist – Database & Modelling and the Chief Mining Engineer.
All updates to the geological data or model are fully documented following internal checklists and reporting documentation.
All geological models are reviewed in a model presentation attended by all technical end users.
New Hope Group continually strives to meet and exceed industry best practice.
NHG undertakes external audits of models every few years in line with industry best practice.

NEW ACLAND
JORC Reporting – Table 1 For Coal Resources and Reserves as at 2017
Section 2 Reporting of Exploration Results (Criteria listed in the preceding section also apply to this section)
Criteria Commentary Mineral tenement and land tenure status
ML50170: Acland North
16km north of Oakey 100% ownership by New Acland Coal Pty Ltd, a subsidiary of New Hope Group Current mining operation Expiry: 30 September 2022
ML50216: Glen Roslyn
18km north of Oakey 100% ownership by New Acland Coal Pty Ltd, a subsidiary of New Hope Group Current mining operation Expiry: 31 December 2026
MLA50232: Manning Vale
18km north-west of Oakey 100% ownership Approval pending for continuation of mining the reserves in Manningvale and
Willeroo
MDL244: Acland
15km north of Oakey 100% ownership by New Acland Coal Pty Ltd, a subsidiary of New Hope Group Intensive exploration occurs on MDL244 in preparation for the approval of
ML50232 and subsequent mining activities that are expected to take place soon after grant.
Expiry: 30 September 2021
No Native Title objections have been lodged for the mining tenure at New Acland.
There are no overlapping tenure claimants for the New Acland project.
Exploration done by other parties
Exploration drilling at New Acland has been carried out since 1957. Several companies have drilled in the tenure in this time, including: Queensland Department of Mines; Exoil NL; CRA Exploration Pty Ltd; The Shell Company of Australia Limited; and, Shell Development Australia Pty Ltd. New Acland Coal acquired the tenure from Shell in 1999.
Underground mining occurred around the Acland area until as late at 1984. Statutory survey plans of the resulting underground mining structures have been obtained and digitised.
Aerial magnetic survey data acquired by Fugro (on behalf of GeoDiscovery) in 2006 which is used to aid basalt flow edge definition. Drilling programs have been carried out to confirm the basalt’s geometric profile from this survey. The polygon created showing the boundaries of the basalt at New Acland has been used in geological models, and is updated on an annual basis using drilling data from exploration campaigns.
Geology The New Acland deposit is a multi-thin seam coal deposit, located approximately 40km by sealed road from the City of Toowoomba, Queensland. Brisbane is approximately 200km by road from New Acland Mine.
New Acland is located in the northwest of the Clarence-Moreton Basin, and targets the coal resources of the Lower Walloon Coal Measures. These coal measures are laterally continuous across the Clarence-Moreton and Surat Basins, and were deposited during the Middle Jurassic period. They are stratigraphically equivalent to the Taroom Coal Measures, and conformably overlie the Lower Jurassic Marburg Formation, which is characterised by coarse quartzose sandstone. At New Acland, Cenozoic sediments unconformably overlie the coal sequence: intense volcanic activity during the Tertiary filled palaeochannels with basalt; and present-day natural drainage channels contain with Quaternary alluvial sediments.

NEW ACLAND
JORC Reporting – Table 1 For Coal Resources and Reserves as at 2017
Criteria Commentary The major coal-bearing unit in the New Acland deposit is referred to as the Acland Sequence. Two major coal seam sequences have been identified through exploration drilling. These are, in descending stratigraphic order:
Acland; and Balgowan.
Both sequences are characterised by multiple thin coal seams, separated by tuffaceous and/or claystone partings and sandstone and siltstone interburden material. The economically targeted seams are within the Acland Sequence, which typically comprises an average of 30m of alternating coal and interburden material. The overall seam dip is to the southwest with seams cropping out to the north and to the east.
Coal seam deterioration, siderite nodules, basalt flows, rare igneous intrusions and normal faulting are characteristic of the New Acland area.
Six coal seam groups are recognised in the Acland Sequence. In descending stratigraphic order the seam groups are A, B, C, D, E and F. The seam groups are 0.5m to 5m thick and are separated by laterally persistent interburdens. Each major seam group is then split into a number of seam “plies” – A0 to A8; B1 to B10; C1 to C8; D1 to D9; E1 to E8; F1 to F6, and can be mined as individual plies, or as bulk mining horizons, depending on the target product. The average total in-situ coal thickness of the Acland Sequence (A-F seams) is approximately 13m with the average thickness of individual seams being 25cm.
Thermal coal is the primary product at New Acland, and is mined from the Acland sequence. The majority of the mined coal is sold to export markets, with some coal sold to the domestic market.
Exploration has begun in the Balgowan sequence. In descending stratigraphic order, the seam names in this sequence are: M, N, O, P, Q, R, S. These seam groups are also separated by laterally persistent interburdens, and are split into a number of plies: M1-M2; N1-N5; O1-O4; P1-P5; Q1-Q5; R1-R5; S1-S6. The overall average in-situ coal thickness is 5.50m, with the average individual ply thickness of 18cm.
Drill hole information The drill holes used to define the resource at New Acland are displayed in Appendix 1
2389 chip holes have been included in the geological model, representing 76.8% of all modelled holes.
2235 (93.6%) of the chip holes intersected the Acland sequence; and of the 154 chip holes that don’t intersect part of the Acland sequence, 57 holes (2.6%) drilled through basalt only, 5 holes (0.2%) drilled through alluvium only, 3 holes (0.1%) intersected the Waipanna sequence, 65 holes (2.9%) were drilled to intersect the Balgowan sequence & 24 holes (1.1%) missed the Balgowan sub-crop and were drilled into the Marburg Sandstone.
722 core holes have been included in the geological model, representing the remaining 23.2% of all modelled holes.
712 (98.6%) of all core holes intersected the Acland sequence. Of the remaining 10 core holes, 7 targeted the Balgowan sequence, and 3 intersected basalt only.
All holes are drilled vertically and geophysically logged. Where holes have deviation data, this has been applied in the database and model.
Data aggregation methods
Due to the nature of the seams at New Acland, multiple samples are usually taken, and later combined for analysis on a seam-by-seam basis as determined from geophysical signatures.
For historically sampled data where multiple samples have been taken for the same seam, MineScape Software assigns a composite coal quality value which is weighted on thickness and RD.
Relationship between mineralisation widths and intercept lengths
Coal deposited in the Clarence-Moreton Basin is relatively flat and continuous over several hundreds of kilometres.
The coal measures at New Acland sub-crop to the north of the current operations; however, with a strike of approximately WNW to ESE, coal is known to exist to the south throughout the remainder of the mining tenure. Drillhole intercepts provide evidence for this.
The coal resources at New Acland are also known to extend past the mining tenure, however, resource estimates have been limited to the tenure held by New Acland Coal Pty Ltd.

NEW ACLAND
JORC Reporting – Table 1 For Coal Resources and Reserves as at 2017
Criteria Commentary Holes are drilled vertically to intersect the sub-horizontal seams (seam dip is an average of 3-5 degrees).
Geophysical deviation data is used to correct any deviation from vertical, and allows true thickness to be represented in geological and coal quality models.
Diagrams Drill hole location plan for holes used in the acl_jan17_db1 is attached in Appendix 1.
Balanced reporting All valid exploration data for the New Acland project has been collated and reported accordingly.
Some exploration holes have not been included in the geological model, for reasons including missing geophysical logs and historical sampling techniques where seams have been composited and rejected on the basis that the seam is being misrepresented in terms of coal quality results. However, sufficient coverage of drillholes, has allowed the New Acland deposit to be covered by a minimum of Inferred Resources, owing to the collection of valid drillhole data.
Other substantive exploration data
Airborne magnetics and gravity surveys were utilised to better understand the basalt extent across the area.
Otherwise no further exploration data was utilised in the resource estimation (i.e. seismic etc.).
Further work The current data is sufficient to be confident in the current resource estimation.
Further work will include:
1. Drilling as required for mining grade control and reserve definition.
Due to the application of Mining Lease 50232, New Hope Group deems that detailed plans for further exploration are of a sensitive nature.

NEW ACLAND
JORC Reporting – Table 1 For Coal Resources and Reserves as at 2017
Section 3 Estimation and Reporting of Mineral Resources (Criteria listed in section1, and where relevant in section 2, also apply to this section)
Criteria Commentary Database integrity Lithology logging and sampling is carried out in the field and data directly entered into
LogCheck software, which has look-up fields to display prescribed codes in password protected dictionaries for each field in the lithology, header and drilling tables. In-built validations in the software ensure that the data is collected correctly in the field.
Exploration Geologists place a backup of their original lithology files onto the New Hope Group network before adjusting their own drilling data to geophysics. This process allows the geologist to compare their lithology records, geophysics data and any available photography to apply verification to their field observations before passing their completed data package on to the Database & Modelling Geologists.
The Database & Modelling Geologists then reopen the data in LogCheck, and carry out validations on the data and check for record completeness. The data is exported for loading into ABB’s MineScape GDB database.
Coal quality data is validated by ALS under the conditions of their NATA accreditation. Further checks are completed by New Hope’s Database & Modelling Geologists, and are loaded into GDB which has strict validation criteria assigned in the project setup.
The GDB database contains automated validation processes which are activated during data loading and prevent invalid data from being loaded. This data gets stored in a temporary raw data table which displays error messages for any data that does not meet the validation criteria in GDB.
Once the data is loaded correctly, additional validations are performed either by viewing tabulated data and/or by plotting the data to a graphical format. In graphic formats, validation on interval depths and thicknesses, as well as correct seam naming can be confirmed and/or fixed.
Access to the GDB database is restricted to the Database & Modelling Geologists only. It is a password protected database. This is the database referenced in the geological models.
All Database & Modelling staff are deemed competent by New Hope Group (NHG), hold relevant qualifications and experience, and are trained in the necessary procedures to ensure the software is being used correctly.
External contractors and consultants have also completed reviews on exploration processes and the geological database, and have made minor recommendations for data and/or process improvement which have been implemented.
Site visits The estimator and competent person makes regular visits to the New Acland Mine, and assists in the supervision of exploration drilling programs. Data validation occurs on a regular basis through MineScape and GDB. The estimator and competent person are familiar with the geology of the deposit, having spent significant time working on the deposit within the Exploration department.
Geological interpretation
There are 3111 drill holes used in the geological model across the New Acland deposit, which have all intersected the resource to prove its existence. These are the primary data points for the resource estimations at New Acland.
Mining operations at the New Acland mine have continued since 2002, with the resource geological model used as the primary basis for detailed mine planning. Learnings from the mining process are routinely included in geological model updates as appropriate.
The amount of drilling carried out at New Acland has enabled interpretation of faults with throws of more than 5m across a large area of the New Acland deposit. Small-scale faulting is often difficult to discern with the borehole spacing as it stands. These smaller faults do not have a large impact on mining, and are often surveyed in-pit and included in subsequent model versions.
Aeromagnetic and gravity surveys have delineated basalt occurrences at New Acland. Drilling has subsequently enabled the depth of basalt to be modelled throughout the deposit.

NEW ACLAND
JORC Reporting – Table 1 For Coal Resources and Reserves as at 2017
Criteria Commentary The interpretation of basalt geometry has changed as a result of this drilling, and there is now more confidence in the extent to which the basalt has incised the coal measures.
Dimensions New Acland’s MDL244, which fully encompasses the New Acland deposit, is approximately 13km long and 10km wide, covering an area of approximately 9,981 hectares. 82% of the area is covered by coal resources reported in accordance with The 2012 JORC Code. Drilling in the remaining areas shows that the New Acland sequence does not extend into these regions, and additional exploration into the Balgowan sequence below has not yet been undertaken.
The coal resources at New Acland are also known to extend past the mining tenure, however, resource estimates have been limited to the tenure held by New Acland Coal Pty Ltd.
The coal measures strike at approximately WNW to ESE, which an average dip of 3-5o to the southwest.
The top of the Acland sequence varies from a minimum depth of 1.5m to a maximum of 132.9m across the New Acland deposit.
The base of the Acland sequence varies from a minimum depth of 8.2m to a maximum of 169.5m across the New Acland deposit.
The top of the Balgowan sequence varies from a minimum depth of 14.6m to a maximum of 188m across the New Acland deposit.
The base of the Balgowan sequence varies from a minimum depth of 30.4m to a maximum of 216.3m across the New Acland deposit.
The average base of weathering across the deposit is 15.04m.
Estimation and modelling techniques
The geological model used for resource estimation at New Acland is the acl_jan17_db1 model, which uses a grid spec containing 285 rows and 490 columns, with a grid cell size of 50m. The grid is 14.20km in length and 24.45m in width, and extends outside the boundaries of New Acland’s MDL244.
The model was generated using ABB’s Stratmodel module of the MineScape software, directly referencing data stored in the GDB database module.
A parting model is generated, meaning that any lithology codes within a seam that are not codes for coal are assigned to waste material. Parting is classified as any intersection greater than 10cm in thickness with an average raw ash >50%.
Interpolation of data points to grids occurs through Finite Element Method (FEM) interpolation for all thickness, surface (first order FEM) and trend surface assignment. FEM works by performing linear interpolations in two directions on the grid (i.e. in the x and y direction), and then resolving their compatibility once both results are completed. The result is that the data is honoured within each grid cell, and provides a more accurate representation than inverse distance, with the same rate of accuracy as the lease squares method.
To ensure the basalt unit was included in the geological model, a surface was created which combines the base of basalt the base of weathering and the base of heat affected clays beneath the basalt (BABCWE1701). This has been used as the upper limit of the geological model, and allows the coal measures to crop out against the basalt to reduce the risk of overestimating coal resources.
The BABCWE1701 surface is a continuous, non-conformable surface.
There are 103 individual elements (seam “plies”) modelled for the New Acland deposit, which includes all seam plies in the Waipanna (Z1-Z9), Acland (A0-F6) & Balgowan (M1-S6) sequences, and also the BABCWE1701 surface. The Waipanna & Balgowan seams are not included in resource estimations, but they have been intersected in some holes on MDL244.
All intervals are pinching, conformable units.
The Balgowan sequence has a unit relationship with the most continuous seam as the bottom of the Acland sequence (E8). This ensures that the interburden thickness between the Acland and Balgowan sequence remains consistent.
The lowest Balgowan seam – S6 – is the lower limit of the geological model.

NEW ACLAND
JORC Reporting – Table 1 For Coal Resources and Reserves as at 2017
Criteria Commentary There are 71 normal faults and 1 thrust fault modelled in the New Acland deposit. Once structural and coal quality modelling is complete, an expression surface is generated which reduces the yield within 5m of faults by 50% when reserves are generated.
The coal quality model is developed using an inverse distance interpolator.
Moisture Resources are calculated based on in-situ volume multiplied by relative density as reported on an air-dried basis, and no adjustments for moisture are applied.
Cut-off parameters Seams and parting material with a thickness of 10cm or more can be mined separately.
The combined yield of the cut points in a washability sample must be a minimum of 95% for inclusion in the coal quality model.
The seams at New Acland are washed even if the resulting yield achieve is as low as 25%; and sometimes lower.
Mining factors or assumptions
New Hope Group is actively mining the New Acland deposit in an open cut scenario, using techniques for thin seam extraction.
The truck and shovel configuration combined with a surface miner allows coal and parting material to be mined separately to a minimum thickness of 10cm.
Life of mine planning shows that this is not expected to change throughout the resource.
Metallurgical factors or assumptions
Coal mined from New Acland is fed through the CHPP to produce a clean coal product through the separation of coal and non-coal material by standard techniques such as jigging, dense medium cyclones and spiral circuits.
New Acland produces thermal coal, based on defined marketing specifications, which is primarily sold to export market, with a small amount sold to the domestic market.
Environmental factors or assumptions
The lagoon creek area was masked out and not included in the resource numbers.
The Acland Township area was masked out and not included in the resource numbers.
The bottle tree hill area was masked out and not included in the resource numbers.
No other limiting environmental factors are applied to the coal resources at New Acland.
Bulk Density Resources are calculated based on in-situ volume multiplied by relative density as reported on an air-dried basis, and no adjustments for moisture are applied.
Seam density is based on Relative Density results obtained from the laboratory, and are reported on an air-dried basis.
The density of roof and floor dilution material is also analysed on an air-dried basis at the laboratory.
Classification The New Acland deposit includes resources in Measured, Indicated & Inferred categories.
Points of Observation for all resource categories are generally based on core holes that have raw ash analysed for the seam group, core holes are also geophysically logged, and aid in the interpretation for structural continuity. Analysed samples provide evidence of coal quality, and allow the level of variability to be measured.
Measured resources are based on Points of Observation as 300m centres
Indicated resources are based on Points of Observation at 600m centres
Inferred resources are based on Points of Observation at 1200m centres
Audits or reviews A review of the geological model and its outputs has been conducted in-house by a range of technical staff, including the Senior Geologist – Database & Modelling, the Senior Mining Engineer, Chief Mining Engineer, Geology Manager, the New Acland Technical Services Group and the Competent Person.
External consultants have been used to investigate processes applied in the development of the acl_jan17_db1 model.
Validation of the geological database by external contractors has also occurred throughout this modelling period.
Discussion of relative accuracy/confidence
Geostatistical investigations through variogram and madogram construction show that the Acland deposit is highly variable in terms of coal quality, geostatistics was also undertaken on the wash plant feed data and compares to field/modellled data.

NEW ACLAND
JORC Reporting – Table 1 For Coal Resources and Reserves as at 2017
Criteria Commentary However, there is a high level of confidence in the structural continuity and coal quality of the New Acland deposit, as mining operations have successfully operated for over 13 years, and there are a large number of boreholes across the deposit to support these inferences.
Accuracy and confidence of Mineral Resource estimations have been accepted by the Competent Person.

NEW ACLAND
JORC Reporting – Table 1 For Coal Resources and Reserves as at 2017
Section 4 Estimation and Reporting of Ore Reserves (Criteria listed in section1, and where relevant in sections 2 and 3, also apply to this section)
Criteria Commentary Mineral Resource estimate for conversion to Ore Reserves
The JORC classified reserves statement for the Acland Project is based upon reconciled data and the latest Geological model which was developed in January 2017 (acl_jan17_db1 model). This model includes the most recent drilling information provided throughout the 2016 calendar year.
The Resource statement was prepared by Danique Bax the Senior Geologist – Database & Modelling for New Hope Group and her principal qualification is a Bachelor of Science (Geology) with Honours from the University of Queensland. Danique is a Member of The Australasian Institute of Mining & Metallurgy and Member (AusIMM), The Australian Institute of Geoscientists (AIG), and The Geological Society of Australia (GSA).
The Acland Reserves have been developed based on categorising the resource as Measured, Indicated or Inferred on a seam group basis, (i.e. A, B, C, D, E and F series seams). This resource categorisation is identified within the MineScape quality model, and has been included as a quality within the reserve. The quality value is named ‘rcat’, with a value of;
1- representing Inferred coal resources 2- representing Indicated coal resources, and 3- representing Measured coal resources
If the rcat quality value for a given seam for a particular mining block is not an integer, for example 2.3, then the resource has been portioned into the different categories based on its value. In this example it would mean that 70% would be identified as Indicated, and 30% being Measured.
The mining reserves have been developed from the categorised resources based on the following methodology;
Inferred Resource = No Reserves Indicated Resource = Probable Reserve Measured Resource = Proved Reserve
After developing batter blocks and generating solids over the mining area, the data is imported into XPAC. The relevant XPAC Command Modules have then been run over the model to produce the resource categorisations.
The JORC classified Resources are inclusive to the coal Reserves.
Site visits As New Acland Coal is an active minesite, site visits to Acland have been conducted at regular intervals by the competent person throughout the exploration and mining process. These site visits combined with reviewing the exploration drill holes and knowledge of the operational mine, have provided a good understanding that has been used to help define the mining reserves. This information has allowed for a good understanding of geological structures in the area, the composition of the coal resource, and the mining method used which relates to defining the modifying factors associated with converting insitu tonnes to rom reserves.
Study status This report is an update to the JORC Reserve Report from 2016 using a more recent Geological model completed in January 2017, along with updated coal pricing information. The report is also formatted in accordance with the criteria listed in Section 4 (p. 31) of the 2012 JORC code.
The study for the New Acland Coal operation involves the design and economic evaluation of a mine plan covering the current operational reserves as well as those reserves included within the remainder of the MDL. The status of the study is at a bankable feasibility level, with a definition phase technical document already completed. Detailed design work has progressed with a view to continue production into MLA50232 as soon as it is granted.
ML50170 and ML50216 encompass the current operational mine whilst MLA50232 contains additional reserves that mining will progress into, once it has been granted. MLA50232 is currently in the approval process with the relevant government authorities. The EA has been provided for the project, with the mining lease now going through the land court process,

NEW ACLAND
JORC Reporting – Table 1 For Coal Resources and Reserves as at 2017
Criteria Commentary dealing with the objections made to the lease. Granting of ML50232 is expected to occur at this stage during the end part of 2017 calendar year.
A project team is currently in the process of developing detailed designs for the execution phase ready for when the projects continuation plan is approved. This has included studies to understand the washing requirements for the coal, along with the transport logistics and associated capital costs of developing this area. This information has been considered in conjunction with a mine plan that was developed based on a similar set of reserves covering the life of the mine. Numerous studies have been undertaken over the project area over the past few years.
Cut-off parameters Revenue and cost assumptions have been apportioned to the mining resources to determine the areas of the resource that provide a positive cash flow. Full costs were used on the Stage 3 reserves, however do not take into consideration the additional infrastructure capital required to be spent on developing this area. The infrastructure capital has been accounted for however in the feasibility economic models.
The margin ranking analysis was undertaken within XPac over blanket reserve blocks 100x100m to determine the economic areas over range of coal price assumptions used.
Other points of interest related to reserve boundaries and cutoff are listed below:
There is in the order of just under 30Mt of reserve currently sterilised by Lagoon Creek which is currently not planned to be mined. An offset distance from the high-bank of the creek of 150m either side has been used to determine the pit crest location.
The area sterilised by the Oakey-Cooyar Road combined with appropriate offsets (100m from fence line to pit crest), has been excluded from the reserves, as this road is not currently planned to be diverted within the LOM Plan.
There is a 200m offset from the planned JORC reserve pit highwall to the Acland township area. Commitments have been made that the Acland township will not be mined, and as such, this area has been excluded from the reserves. Noting that it will be difficult for mining to encroach on the town to this degree at present due to sensitive receptors within the area. However it is envisaged that at some point in time, this reserve will be able to be mined.
Because the Acland resource consists of multiple seams, some level of analysis is required to determine the optimal floor horizon to mine to. The same unit operating costs, along with predicted revenue assumptions, as per those used in determining the extents of the pit boundaries were used to determine the optimal floor to mine to. This process was undertaken within XPac, identifying the floor horizon where the maximum cash flow for the block was achieved.
Mining factors or assumptions
The Acland deposit is currently being mined by the open cut mining method. Any further expansions in the project are planned to be mined by this same method. The deposit consists of multiple thin seams inter-banded by partings material. Currently dozers are used to help rip and stack the coal and parting plys, with smaller loaders being used to help facilitate the mining of the interburdens and coal to help minimise loss and dilution. A surface miner is also operating at Acland to mine the thin coal and parting sequence without the need of dozers to help separate the seams.
The high wall angles utilised by the design are an average of 50-55 degrees from topography to pit floor, which is based on current practice at the New Acland mine and the advice of geotechnical consultants. (45 degrees in weathered Zone down to the top of coal, and 65 degrees within the coal banded sequence)
With the Acland resource being made up of multiple thin seams, inter-banded by partings material, assumptions relating to loss and dilution play a critical role in the conversion of insitu resources to reserves, along with the economic viability of the mining operation. The modifying factors have been developed in conjunction with the model to calibrate it with historical production data. These factors have been adjusted to account for the new methods being developed to more accurately model the coal and thin partings within the resource model. New Hope Coal has an extensive history and been quite successful in mining thin seam deposits within the West Moreton and Acland mines.
The mining loss and dilution assumptions are applied to the resource using different ranges of A0-C3 and C4-F3 seam plys to represent the resource more realistically by adjusting it to match the geological structure of the reserve. The loss and dilution quantities are impacted by the parting and coal thicknesses, with set loss and dilution factors used on working sections. These have been determined based on model calibration and previous

NEW ACLAND
JORC Reporting – Table 1 For Coal Resources and Reserves as at 2017
Criteria Commentary reconciliations. The working section loss and dilution parameters applied to the insitu resources for the current set of Reserves are summarised below;
Default Loss and Dilution Parameters:
Range Parameter (cm)
A0-C3 Seams Working Section Loss 6.1
Working Section Dilution 8.0
C4-F3 Seams Working Section Loss 2.7
Working Section Dilution 4.6
Determination of Loss and Dilution:
If the parting thickness of a particular seam is 10cm, then the seam is mined in a working section inclusive of the seam above it. And as such;
Dilution = parting volume Loss = no loss
If the coal thickness is less than 10cm and is not included with the seam above it then the seam is not recoverable
Dilution = no dilution Loss = total coal volume
In all other occasions’ coal loss and dilution is given as per the values as displayed in the table above and is applied to each working section.
The loss and dilution parameters are applied to the insitu resources by way of an XPac XCM once the insitu tonnage has been reserved within MineScape direct from the geological model.
The feasibility study for Acland includes within the pit design and mining schedule both Measured, Indicated and Inferred resources. Although the inferred resources included within the mine plan is minimal (<3%).
Metallurgical factors or assumptions
The rom coal that is mined at Acland is currently being washed by a traditional coal handling preparation plant. Rom coal from MLA50232 in the future will be washed within the existing two washplants, as well as a potential third newly constructed washplant should the expansion plans be approved, and economics allow for expansion. Preliminary designs of this washplant have been completed based on the current quality information available. This washing process is standard across numerous existing coal mines, and what is proposed in this instance is not unique and is considered to be well tested technology.
All product coal produced from the plant is considered to be of a Thermal Coal quality. Coal at Acland is currently broken into two specifications of “Bronze” and “Gold” quality coal, which are based on ash and energy content. Bronze coal typically has a higher ash content and a corresponding lower energy output. Gold coal is a low ash/high energy coal type. These same product assumptions have been used within the development of the mining reserves and feasibility document.
The modifying factors as well as the washing assumptions have been calibrated based on the following key points around the method of the resource model development;
1. Coal seam lithology data is built up from the core hole data only, and not the geophysically logged open holes.
2. Instead of using a generic >10cm non-coal lithology thickness assumption in the model, each lithology has been given a default ash value and then adjusted to match actual sample data. If combined lithologies have a raw ash >50% and >10cm in thickness it is deemed to be parting within the stratigraphy model.
3. Domains have been used to remove coal out of the reserves where the seam parting thickness was >50% of the total coal thickness (representing deteriorated coal areas).
4. Crushed float/sink data, which makes up the majority of the quality data has been calibrated with pre-treated and sized washability data. The entire crushed float/sink database has been unified and simulated to create a set of washability data that is more aligned with pre-treated samples. With the use of this data, no

NEW ACLAND
JORC Reporting – Table 1 For Coal Resources and Reserves as at 2017
Criteria Commentary washplant efficiency assumptions have needed to be used in the reconciliation/calibration process.
The modifying factors applied to the mineable insitu resources are summarised below;
Mining Reserve Parameters applied using XCM:
Parameter Units A-C3 Coal C4-F3 Coal
Loss per working section cm 6.1 2.7
Dilution per working section cm 8.0 4.6
Dilution raw ash % 72 72
Minimum mining separation thickness cm 0.13 0.10
Cutpoint used t/m3 1.50 1.45, 1.55
Adjustment for product yield factor 1.000 1.000
Adjustment for product ash factor 1.000 1.000
The parameters outlined in the above table produce different coal quality outputs for each reserve area based on the modelled quality data. The Glen Roslyn resource had an average yield of 51.6%, while the Southern resource in MLA50232 and MDL244 reported an average yield of 54.2%.
Within the reserve area, previous underground workings have mined a section of the reserve, namely the C4-D4 seams. Within this area, these seams have been excluded from the model. NHG has experience mining through old underground workings and extracting the pillars that remain.
A review into the spatial variation of all coal quality parameters that are tested for over the deposit has been conducted. The results from this analysis show that there are no marked changes to any of the coal qualities that would be deleterious to the product coal. As further coal quality data is obtained for each of these quality parameters, further reviews will be undertaken.
Environmental The current operation at the New Acland mine provides strong evidence of New Hopes commitment to responsible environmental management. The rehabilitation process has been carried out under the current Environmental Authority and Plan of Operations. A draft EA has been provided, covering the southern resources for the New Acland Continuation Plan (NACP) as part of the ML Application process for MLA50232. There are a number of conditions and requirements included within the EA, and NHG will continue to deliver on these conditions as has been the case in the past.
The reserves located east of the Oakey Cooyar Road in MDL244 will be subject to Strategic Cropping Legislation (SCL) when it is reviewed for development. This will also be the case for the Sabine resources.
Infrastructure The New Acland mine already has a number of infrastructure assets in place to service the existing mine. This includes a workshop, CHPP facilities, train load out facility and administration buildings. New Hope Group is currently in the approval process for New Acland Stage 3, which involves mining reserves from MLA50232. The additional infrastructure of a rail loop moved from Jondaryan up onto the mining lease as well as upgrades to power, roads and environmental/sediment dams will be required should the MLA50232 be approved. The design work associated with this additional infrastructure is well progressed.
Costs The costs used for the estimation are the average unit costs that are currently being achieved by the existing operation. All off-site costs including transport costs have been based on current negotiations or existing quotes.
Capital costs have been derived from design studies previously undertaken. The latest Definition Stage study report utilised recent capital quotes derived from detailed design.
Revenue factors The revenue factors utilised to calculate the economic viability of the mining resources at Acland is based on New Hope Coals long term price forecast which has been influenced from Wood Mackenzie.
NEW ACLAND
JORC Reporting – Table 1 For Coal Resources and Reserves as at 2017
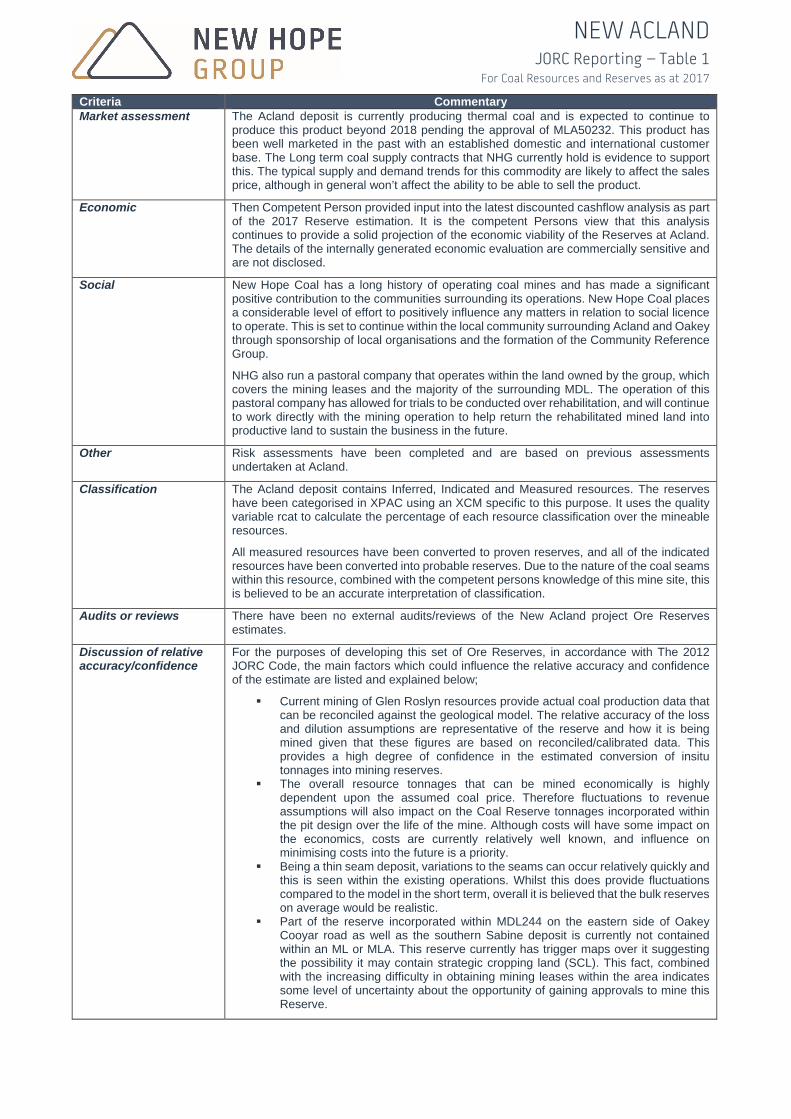
Criteria Commentary Market assessment The Acland deposit is currently producing thermal coal and is expected to continue to
produce this product beyond 2018 pending the approval of MLA50232. This product has been well marketed in the past with an established domestic and international customer base. The Long term coal supply contracts that NHG currently hold is evidence to support this. The typical supply and demand trends for this commodity are likely to affect the sales price, although in general won’t affect the ability to be able to sell the product.
Economic Then Competent Person provided input into the latest discounted cashflow analysis as part of the 2017 Reserve estimation. It is the competent Persons view that this analysis continues to provide a solid projection of the economic viability of the Reserves at Acland. The details of the internally generated economic evaluation are commercially sensitive and are not disclosed.
Social New Hope Coal has a long history of operating coal mines and has made a significant positive contribution to the communities surrounding its operations. New Hope Coal places a considerable level of effort to positively influence any matters in relation to social licence to operate. This is set to continue within the local community surrounding Acland and Oakey through sponsorship of local organisations and the formation of the Community Reference Group.
NHG also run a pastoral company that operates within the land owned by the group, which covers the mining leases and the majority of the surrounding MDL. The operation of this pastoral company has allowed for trials to be conducted over rehabilitation, and will continue to work directly with the mining operation to help return the rehabilitated mined land into productive land to sustain the business in the future.
Other Risk assessments have been completed and are based on previous assessments undertaken at Acland.
Classification The Acland deposit contains Inferred, Indicated and Measured resources. The reserves have been categorised in XPAC using an XCM specific to this purpose. It uses the quality variable rcat to calculate the percentage of each resource classification over the mineable resources.
All measured resources have been converted to proven reserves, and all of the indicated resources have been converted into probable reserves. Due to the nature of the coal seams within this resource, combined with the competent persons knowledge of this mine site, this is believed to be an accurate interpretation of classification.
Audits or reviews There have been no external audits/reviews of the New Acland project Ore Reserves estimates.
Discussion of relative accuracy/confidence
For the purposes of developing this set of Ore Reserves, in accordance with The 2012 JORC Code, the main factors which could influence the relative accuracy and confidence of the estimate are listed and explained below;
Current mining of Glen Roslyn resources provide actual coal production data that can be reconciled against the geological model. The relative accuracy of the loss and dilution assumptions are representative of the reserve and how it is being mined given that these figures are based on reconciled/calibrated data. This provides a high degree of confidence in the estimated conversion of insitu tonnages into mining reserves.
The overall resource tonnages that can be mined economically is highly dependent upon the assumed coal price. Therefore fluctuations to revenue assumptions will also impact on the Coal Reserve tonnages incorporated within the pit design over the life of the mine. Although costs will have some impact on the economics, costs are currently relatively well known, and influence on minimising costs into the future is a priority.
Being a thin seam deposit, variations to the seams can occur relatively quickly and this is seen within the existing operations. Whilst this does provide fluctuations compared to the model in the short term, overall it is believed that the bulk reserves on average would be realistic.
Part of the reserve incorporated within MDL244 on the eastern side of Oakey Cooyar road as well as the southern Sabine deposit is currently not contained within an ML or MLA. This reserve currently has trigger maps over it suggesting the possibility it may contain strategic cropping land (SCL). This fact, combined with the increasing difficulty in obtaining mining leases within the area indicates some level of uncertainty about the opportunity of gaining approvals to mine this Reserve.

NEW ACLAND
JORC Reporting – Table 1: Appendix 1 For Coal Resources and Reserves as at 2017

BENGALLA
JORC Reporting – Table 1 For Coal Resources and Reserves as at 2018
Section 1 Sampling Techniques and Data (Criteria in this section apply to all succeeding sections)
Criteria Commentary Sampling techniques New Hope Group (NHG) acquired 40% of the Bengalla Mining Company Pty Limited in
2016. A large volume of geological data for this project was transferred to NHG as part of this arrangement. As such, the geological and coal quality data acquired was essentially “legacy” data.
Several phases of exploration drilling have occurred at Bengalla. These include chip drilling, core drilling for coal quality analysis, as well as some core drilling for coal seam gas and for geotechnical sampling.
Based on examination of many of the lithological logs, the chip and core descriptions are usually complete and described in acceptable detail. This suggests that the drill samples have generally been collected in a reasonable manner. Some “Not Logged” intervals do exist, particularly for the older drill holes but these comprise a very low portion of the dataset.
Core photos are also available for most of the modern cored holes, and these show that core has generally been collected using sound drilling and handling techniques.
Most core photos also show the use of a tape measure for recording core run recoveries and for measuring sample intervals, as well as to provide a useful reference for the photos.
Most of the core photos show that core has been placed in core boxes for future storage. During a site visit some of these core boxes were observed in storage at the Bengalla core shed.
At the time of coring, it appears that for at least some cored holes the coal core has also been placed in the core boxes and then moved into sample bags at a later time. To reduce sample deterioration and to minimize the possibility of core handling issues, it is considered a better practice to sample the coal core directly off the core table and to sample bag it immediately. However, given such sample deterioration is much more significant for certain coking coal properties, and that Bengalla coal is considered to be predominantly thermal coal with some coking properties, this should not have a material impact.
Other than the above point, based on review of available sampling and analytical data for Bengalla cores, coal quality core sampling procedures appear to have followed satisfactory rigor in terms of the sample depth, thickness and core recovery management.
All major coal units appear to have been sampled for analysis, although some minor coaly units have been excluded from analysis
Stone bands have generally (but not always) been sampled separately; this is good practice, allowing some flexibility in product compositing later. This process is followed more consistently much better in the more modern post-2013 cored holes.
ARD has been analysed for many of the older cores and core recovery has usually been calculated and reported by the ACTEST lab.
Coal analysis reports have been generated from samples sent to the following laboratories: NSW Mines Department lab for the old cores, to ALS ACTEST lab Newcastle for the modern cores up to mid-2013, and to Bureau Veritas (BV) Brisbane Exploration Laboratory for the most recent cores. ALS and BV labs are understood to be accredited by National Association of Testing Authorities (NATA), and in compliance with NATA, all samples are believed to have been prepared and analysed using methodologies stipulated in the Australian Standards.
Seven gas holes were drilled at Bengalla in years 2010 and 2013, from which 210 gas samples were collected. This gas sampling appears to have followed standard gas sampling protocols with HQ core samples of coal taken and placed into gas canisters. Q1 testing for lost gas was carried out on site. The samples were then immediately transported to the Earthdata Thornton NSW laboratory for analysis.
Geotechnical samples were collected from several strategically located core holes. Samples were tested at both Trilab laboratories in Brisbane which is a NATA accredited laboratory.

BENGALLA
JORC Reporting – Table 1 For Coal Resources and Reserves as at 2018
Criteria Commentary Downhole geophysical logging has been carried out on most drill holes. In general, dual density (long-spaced density & short-spaced density), gamma and caliper trace data have been collected in each logged hole. Sonic data has also been acquired in some holes across the deposit. Acoustic scanner was also run on a small number of holes.
Most of the modern holes were also logged with the verticality tool. Some holes, particularly the older holes did not have verticality data and a small number had this data but it appears to be corrupt. For holes without verticality data it is generally assumed that they are vertical. While this affects the accuracy of the downhole seam positions, it is not expected to have any material impact on coal resource calculations.
Drilling techniques Nearly all exploration holes drilled at Bengalla were planned to be vertical holes, designed to intersect the horizontally stratified coal measures. Verticality data has been collected for most of the modern drill holes and this data confirms drill depths and deviation.
A small number of holes were drilled as angled geotechnical cored holes and verticality for some of these clearly shows their downhole deviation. For some of these holes, their verticality data appears corrupt and had to be excluded from the model e.g. 1201D. Further review of these data may be warranted.
Exploration holes are generally thought to have been drilled using either air or water as a drilling medium i.e. no evidence has been found to suggest mud drilling has been required.
Chip holes at Bengalla are primarily used to define coal seam thickness and continuity and also to help identify major geological structures.
Limit of Oxidation (LOX) drilling was used to define seam sub-crop positions for the lower mining sequence, however LOX has not yet been undertaken for the upper seams. This may have some impact on mine planning but is not expected to have a material impact on coal resources. LOX identification is supported by the Base of Weathering (BOW) routinely picked in all drill holes and further discussed in the Estimation and Modelling Techniques section.
There are a large number of geophysically logged Chip holes and these are used to support coal seam correlation and to demonstrate continuity between Points of Observation.
Typically chip holes are drilled using a rotary table rig with PCD, blade or hammer bits (as required) with nominal hole diameters of 100-120mm.
Coal quality samples appear to have most commonly been collected from holes with a core size (diameter) of 100mm, which has become an industry standard for open cut coal quality coring.
Gas and geotechnical sampling have been conducted using HQ “wireline” drilling (nominal core diameter of 63.5mm).
Drill Sample Recovery Standard coal industry practice is to validate the strata roof and floor positions against downhole geophysical detailed density logging. This has been done for most of the Bengalla cored and chip holes, particularly in the unmined (down-dip) area. However, most of the older cored holes have either poor or no geophysics therefore these have not been reliably depth adjusted. These holes are a minority and this is not expected to have any material impact on coal resources.
Core loss observations appear to have been made routinely by the exploration geologists at Bengalla. There are a significant number of holes with core losses however only a small number of seam intervals may be affected for each of these holes.
Re-drilling of cored holes that had significant core loss in the coal interval is quite common at Bengalla. This shows that there was a focus on identifying and managing core sample recovery. Typically, if an upper seam unit had core loss but lower seam units didn’t, a re-drill of just the upper seam unit would be drilled.
ARD and core (volume) Recovery have been reported for most of the ALS analysed samples.
Logging When drilling chip holes, for every metre drilled, the drill cuttings (chips) are generally laid out in individual piles representing one metre intervals for the geologist to examine and to describe in their lithology logs. It is understood that this method has been used for the Bengalla chip samples. This is supported by communication with BMC site personnel and by the detail available in lithological logs examined.

BENGALLA
JORC Reporting – Table 1 For Coal Resources and Reserves as at 2018
Criteria Commentary For cored hole data examined, accurate core length and depth measurements appear to have been taken. This is supported by a well catalogued core photo library. Core photos are generally of a high standard with photos in focus, tape measure used and clear mark ups of sample intervals and core depths.
The geologists generally appear to have examined the cored intervals in reasonable detail, and then have transcribed their observations into the lithology logs as the core was logged.
Cored intervals have been generally photographed before and after they have been transferred into core boxes. These core photographs are a useful record to help manage data quality control, to establish core loss/expansion, to assist in core sample laboratory testing instructions, and as a permanent record of borehole lithology.
Downhole geophysical logging has been carried out on most holes in Bengalla. Dual density (long-spaced density & short-spaced density), gamma and caliper trace data are available. The detailed density log generally appears to have been used to accurately correct seam roof and floor depths.
Most holes have also been logged with the deviation (verticality) tool. For holes without verticality (mostly older series holes) some seam depth errors will exist i.e. these holes are assumed to be vertically drilled. As an indication of this potential error, for a 100m deep drill hole that deviates 5o from vertical, the potential horizontal error is 8.7m, and the potential vertical error is approx. 0.76m. This is not considered likely to have any material impact on coal resource calculations.
Sonic (limited) data has also been acquired in most modern holes across the deposit. These logs may be useful in determining rock strength.
Neutron logs have also been acquired for some holes, but only pre-2013. Neutron logs are now rarely used for coal mine applications.
Acoustic Televiewer has also been run on some holes. Interpretation reports from Groundsearch are available for these.
Other miscellaneous logs such as Induction and Point Resistance-Self Potential logs were run for some holes.
Downhole geophysical logging services appear to have been performed predominantly (if not exclusively) by Groundsearch Australia Pty. Ltd. They are a well-established downhole logging company and their operational procedures and data quality are generally considered acceptable.
Due to ground conditions, a portion of holes were logged through steel (HWT) casing. Density for these logs may not be properly calibrated, but are generally well suited for coal seam identification purposes.
Sub-sampling techniques and sample preparation
The available lithology records show that the Bengalla cores appear to have been collected in accordance with acceptable coal industry practice. Lithological descriptions have been made and where relevant defects in the core have been logged.
For the modern cores, sample intervals generally appear to have been taken in a logical manner based on the coal brightness and presence of stone bands. These samples generally match seam ply intervals exactly and are therefore compatible.
For pre-2013 cores, ply samples were taken for raw analysis, but were often combined into seam composites before washability and clean coal testing. This meant that these composite samples are often incompatible with the coal plies in the structure model. This required a data management process to disaggregate the quality for the coal plies from the composites – this is discussed later herein.
There is some concern about the practice mentioned above where coal core has been boxed and then later sampled into bags. It is preferable to bag and seal the samples immediately after drilling and logging to help retain coal quality properties including in-situ moisture for accurate analysis. However, this concern is more significant for coals with coking properties, and given the coal at Bengalla is primarily considered a thermal coal properties, this is considered to be of low material significance. Notwithstanding the above, some further work (including potential sampling) to define seams with coking properties may be warranted.
It appears that 100mm diameter core has generally been sampled for coal quality. This core size allows collection of coal material with adequate dimensions for laboratory sample pre-treatment and is well suited to coal quality determination and is widely regarded as the

BENGALLA
JORC Reporting – Table 1 For Coal Resources and Reserves as at 2018
Criteria Commentary industry benchmark for open cut coal resource determination (although HQ and in particular PQ core are also considered acceptable by most industry professionals).
Size (length) of cored samples is generally satisfactory for the purpose of coal quality determination. Collection of separate samples for stone intervals adjacent to the coal units has been undertaken and is considered good practice, enabling flexibility in preparation of composite seam units for more detailed analysis (subject to comments above regarding sample aggregation).
Downhole geophysical data appears to have been routinely used to validate and “correct” the seam depth intervals.
Quality of assay data and laboratory tests
Coal quality core samples were sent to several laboratories over the years. The samples from old Department of Mineral Resources (DMR) cores are believed to have been tested at the Joint Coal Board government laboratory. The modern cores pre-2013 (up to 1451D) were sent to ALS ACTEST, and the more recent cores (post 2013) were sent to Bureau Veritas (BV).
Whilst the exact nature of coal testing procedures for the old cores is not known, it is believed that this was done at the NSW Joint Coal Board government laboratory. Although there were limited coal testing laboratories available at that time, this facility is believed to have been well regarded. Analytical procedures for these DMR samples are perhaps less refined compared with the modern labs, however they are believed to be sound and compatible in most respects to the modern labs.
Both ALS ACTEST and BV are NATA accredited laboratories. In compliance with NATA, it is believed that these samples were prepared and analysed using methodologies stipulated in the Australian Standards.
It is understood that these laboratories routinely undertake internal “round robin” testing between labs to ensure consistency of analytical results and procedures.
The available coal quality reports show that coal quality analysis at Bengalla was generally performed in three stages: (1) Raw Coal Analysis; (2) Washability Analysis; and, (3) Clean Coal (Product) Analysis.
There are some fundamental differences between the ALS ACTEST and the BV procedures. This change in labs and analytical and reporting procedures followed a review of sampling and testing procedures in 2013 by the RTCA/BMC.
Following the Australian Standards, there is evidence that the laboratories have split the samples into suitable quotients in order to perform the coal quality analysis required.
Core samples are crushed to -11.2mm rather than pre-treated and sized. This allows much more flexibility in the testing procedures, but is generally considered an inferior method for generating washability and clean coal analysis results to more accurately predict CHPP processing and product qualities. As a result the clean coal washability data from the crushed coal samples will tend to overstate the product Yield.
A series of large diameter (LD) cores were drilled in the 1990’s and although these did have sample pre-treatment, these holes now lie in the mined out area. Data from these LD holes was utilised by AB Mylec to generate their “unified” washability dataset.
Verification of sampling and assaying
For the Bengalla deposit, downhole geophysical logs have been routinely used to “depth adjust” the chip and core lithologies recorded by the geologist i.e. the coal seam roof and floor depths in the lithology logs are adjusted to match the geophysical signatures. This process also provides a good method for verification of coal seam thickness as well as correlation consistency.
Current practice observed is that coal seam names for Bengalla are generally consistently assigned by the geology team based on stratigraphic position and verified by geophysical signatures. This was not the case for some holes, particularly some of the pre-2013 drilling and the older government holes.
As part of the new bmc_1710_lom geological model build process a major review of coal seam and ply correlation was undertaken and the modelled coal plies (and associated qualities) are now more consistent across the deposit in the unmined (down-dip) area. In the up-dip area the data was not thoroughly reviewed as this mined out area was considered a lower priority.

BENGALLA
JORC Reporting – Table 1 For Coal Resources and Reserves as at 2018
Criteria Commentary The available lithology, geophysical and coal quality records and reports are located at BMC mine site and also on NHG I:\ drive where they are filed in a logical order by data type.
As part of the bmc_1710_lom model build the laboratory sample intervals have also been carefully matched to these LAS intervals by comparing GDB Sample Advice table with GDB Sedimentary Lithology table and adjusting where required.
A thorough review and validation of coal quality data was undertaken by McMahon Coal Quality Resources Quality Coal Consulting. Validation procedures undertaken included data trend analysis, review of quality data cross plots e.g. Ash vs. Relative Density, and statistical review. Various recommendations were made resulting in and many data edits to the coal quality data tables.
Coal quality data has been loaded into the GDB database as reported in lab reports, however the data has also been subject to a substantial degree of scrutiny and, validation.
A large number of samples were analysed as seam composites, and a large number of samples had missing analyses. To determine these missing values and to calculate ply based qualities for the composite intervals, an Ash based data regression procedure was agreed and adopted. This is discussed further in the modelling section.
The laboratory results are mostly available as MS Excel and CSV files, with some PDF files also available.
The current analytical procedures used and Standards followed to conduct these analyses are generally documented in, “RTCA Coal Sampling and Analysis NSW Version 2”.
A large amount of coal quality data was found in the GDB geological database Wybong, associated with the previous RTCA geological model bmc_1507_lom, however a large volume of additional data were also available in the laboratory reports and this was also loaded into the new GDB database Bengalla.
The final validated coal quality databases were exported into spreadsheets where the Ash based regression adjustments were applied. The adjusted data were then used to build the coal quality grid models.
The geological database also has built-in validation parameters to help ensure data is entered correctly and there are no obvious errors.
Available geological data is stored both electronically and in hardcopy, using New Hope Group standardized practices, and has restricted access. Hardcopy borehole files are stored in a secure fire-proof room at New Hope Group’s Head Office in Brookwater, Queensland. A large volume of hard copy geological data also exists at the Bengalla mine site Technical Service department.
Location of data points Drill hole collar locations for all modern Bengalla holes have been consistently collected using the MGA Zone 56 projection.
Collar elevation data for all modern holes is recorded in Australian Height Datum (AHD).
Modern borehole collar coordinates have been surveyed by BMC Bengalla Mine Surveyors.
Collar survey positions for the old cores are not accurately surveyed. These are based on historic collar survey methods and are considered approximate locations only. They are generally only included in the GDB database (and model) because they are the only holes in the far west of the deposit, and because their seam correlation generally looks reasonable. These collar positions should be further verified (if possible). It is anticipated that these old holes will eventually be replaced by future modern holes.
Whilst the survey position of the abovementioned old holes is not considered very accurate, their approximate position is not expected to have any material impact on estimation of coal resources.
A topographic surface (tops12) was adopted from the previous RTCA MineScape geology model and used in bmc_1710_lom model as the original topographic surface. Overall this surface looks reasonable, however there appear to be two linear features at the southern end of the data that may need review. This southern area is essentially outside the coal resources limits (apart from Inferred Resources) and therefore this is not likely to have any material impact on coal resources.
Data spacing and distribution
Based on the bmc_1710_lom model the average drill hole spacing for ALL holes in the main Bengalla resource area (that is yet to be mined) is approximately 156m.

BENGALLA
JORC Reporting – Table 1 For Coal Resources and Reserves as at 2018
Criteria Commentary In the area immediately behind the current highwall position (roughly the next ten mining strips) the drill hole spacing for ALL holes is considerably lower at approximately 94m. Beyond this (down-dip) the spacing increases to approximately 277m.
For cored holes only, the average spacing within the main resource area is approximately 307m. This cored hole spacing is 212m in the immediate highwall area, and 408m in the western down-dip area.
Through examination of lithological and geophysical data for drill hole seam intersections across the deposit, a high degree of confidence can be demonstrated for the broad lateral continuity of coal seams within the resource areas at Bengalla.
Some coal seams and plies appear to be more consistent than others and seam splitting is a common feature of the deposit. In particular the splitting of the Broonie seam lower plies have not yet been fully resolved. Seam splitting in some of the other seams e.g. Piercefield and Vaux, also becomes significant to the west of the deposit where further exploration drilling will be required to help with mine planning. However, seam splitting is not considered likely to materially impact coal resource estimation.
All resource estimations are limited to within the Bengalla tenure boundaries, and do not extrapolate beyond the granted tenure. Data available outside these boundaries indicates that the coal measures sequence is continuous throughout the region.
A number of faults have been included in the geology model. These faults are mostly normal faults with varying throws up to 50 metres e.g. Thornbro Fault. Some fault delineation drilling has been undertaken, however it is anticipated that additional drilling will be required for this purpose. Notwithstanding the above, for an open cut coal mine environment the discovery of additional faulting is unlikely to affect the resource categorization (unless major unexpected faulting is found). As a result this is unlikely to have any material impact on coal resources.
For the modern (post-2013) cored holes, quality samples are generally taken per coal ply and analysed for Raw, washability and clean coal properties per ply; this is ideal for ensuring consistency between the structure and quality model. However, for pre-2013 cores, coal quality samples were generally taken as coal plies, with raw analysis on the plies, but then often composited before washability and clean coal testing. This results in significant inconsistency between coal quality data points and effectively causes data gaps in the ply level qualities.
This practice of sample compositing is not uncommon in historic coal quality databases, however because this historic (pre-2013) quality data forms a major part of the dataset this issue needed to be addressed so that the data could be utilized in the ply level quality model.
The agreed solution was that a series of seam-based regression relationships were developed for many of the Ash related properties. These regressions were used to calculate the “missing” qualities. The modelling and validation processes have incorporated this regression-based approach which addresses the compositing issue. Whilst this approach does introduce some estimation error, it is not expected to have any material impact on the resource estimation. Furthermore, the process has been peer reviewed and found to be sound practice.
Orientation of data in relation to geological structure
The Bengalla deposit has an overall shallow dip of approximately 1-2o to the west. Some variations occur in dip direction including gentle dip reversal in the west. Local dips may also be steeper around areas of faulting.
Geological variations and seam-complexities will probably occur around faulted zones, and whilst the current drill hole spacing across faults may be too wide to accurately represent these areas, this is unlikely to have a significant material impact on overall resources. Additional closer spaced drilling to improve fault delineation is expected to occur over time and this will improve the geological model for mine planning purposes.
Holes are generally drilled vertically to intersect the relatively flat-lying coal seam strata and this is considered to provide the optimal sampling orientation strategy.
A small number of angled holes were drilled for geotechnical purposes. Although these holes contain useful data, the verticality data for some of these holes appear to be corrupt and therefore they cannot be included in the structure model. Further investigation of this erroneous verticality data should be considered to determine if it can be corrected. Exclusion of these data do not have a material impact on JORC resources.

BENGALLA
JORC Reporting – Table 1 For Coal Resources and Reserves as at 2018
Criteria Commentary Coal quality samples have been taken at a suitably regular spacing across the deposit and on a seam-by-seam basis, in order to achieve a reasonably unbiased representation of the coal quality. As is common in exploration projects of this nature, the lower (deeper) seams tend to be under-represented in the core sampling (as generally reflected in their resource status) and this is an area that could be addressed to firm up some of the deeper resources.
Geophysical verticality data is available for most drill holes. This data has generally been loaded into the GDB database used to build the bmc_1710_lom model and has been used to correct any deviation of the borehole from vertical. This is a significant improvement from the previous geology model where no verticality data had been loaded.
For a small percentage of current model holes, no verticality data is available (either not collected or corrupt data) and therefore the modelling process assumes these holes to be vertical. As a result, some minor depth and thickness errors are expected in the model around these holes, but this is not likely to have any significant material impact on resources. Current BMC practice is for drilling programs to routinely collect verticality data.
Sample security Many coal quality (and other) samples have been collected and dispatched to either ALS ACTEST or BV laboratories since 2006. It is understood that sample dispatch occurs through the BMC warehouse and no samples have been lost, damaged or affected in any other way through the routine sample transportation practices.
Core samples from current day and dating back to the 1991 Roxburgh cores are routinely stored at the BMC coreshed. Core disposal occurs on a priority basis after regulatory approval has been granted.
Drill chip samples are also stored in the coreshed but are regularly disposed of, again subject to approval.
BMC maintain a sample register on their computer server, but this is a work in progress. Ideally this should be completed and kept up to date with each new drilling program.
As part of the geological database and bmc_1710_lom model update, coal quality testing reports available for the Bengalla cores have been examined thoroughly. Apart from occasional lab typos and minor errors, the sample treatment instructions within these reports generally indicate that reasonable checks appear to have been in place for ensuring sample integrity at the NATA registered laboratories.
ARD has been determined for at least some samples which has then presumably been used for checking sample mass recoveries against the geologists sampling records.
Core photos are routinely collected for all new exploration holes. They are also available for most of the pre-2013 cored holes. These photos have been viewed in some detail and provide support for the apparent methodical collection and handling of core samples.
The issue already mentioned of coal core being boxed and then later sampled into bags for laboratory dispatch raises some concerns, but based on the available coal analysis reports, the samples generally appear to have arrived at the respective laboratories and have been satisfactorily processed.
Audits or reviews An audit of BMC geological data was completed by RTCA in April 2014. Refer report, “RTCA OBK Bengalla & Mt Pleasant Data Audit”. This report summarized the status of geological data on site at that time.
As part of the report for the previous RTCA geological model bmc_1507_lom, a model review was conducted by Encompass Mining. Refer to report, “APPENDIX 7 - Bengalla - High Level Geological Model Review - Nov 2015 Update – FINAL”. This review highlighted a number of issues with the geology model and some of these issues were addressed during completion of the final review report. A number of significant model issues were still unresolved at that time.
Since NHG became an owner in BMC, they have conducted various data reviews and audits on the Bengalla geological database and model. This has resulted in a number of improvements being included in the new bmc_1710_lom geological database and model.
McMahon Coal Quality Resources have undertaken a comprehensive review of the Bengalla coal quality database. This review has identified a significant number of data integrity issues which have now largely been addressed in the new geological model. Refer report, “J0319 - Bengalla Coal Review Summary Report 20180301”.
Geomine Pty. Ltd. generated a new MineScape geology model (bmc_1710_lom) in 2017/18. This model was based on the data exported from the previous RTCA MineScape
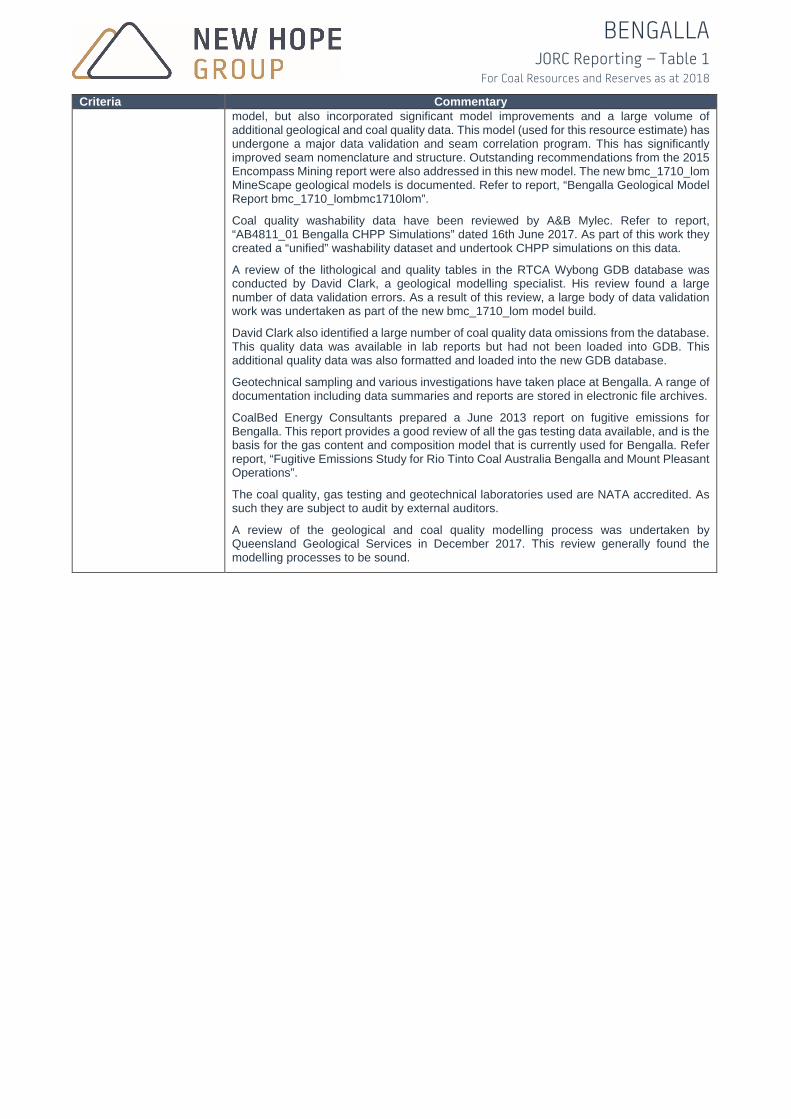
BENGALLA
JORC Reporting – Table 1 For Coal Resources and Reserves as at 2018
Criteria Commentary model, but also incorporated significant model improvements and a large volume of additional geological and coal quality data. This model (used for this resource estimate) has undergone a major data validation and seam correlation program. This has significantly improved seam nomenclature and structure. Outstanding recommendations from the 2015 Encompass Mining report were also addressed in this new model. The new bmc_1710_lom MineScape geological models is documented. Refer to report, “Bengalla Geological Model Report bmc_1710_lombmc1710lom”.
Coal quality washability data have been reviewed by A&B Mylec. Refer to report, “AB4811_01 Bengalla CHPP Simulations” dated 16th June 2017. As part of this work they created a “unified” washability dataset and undertook CHPP simulations on this data.
A review of the lithological and quality tables in the RTCA Wybong GDB database was conducted by David Clark, a geological modelling specialist. His review found a large number of data validation errors. As a result of this review, a large body of data validation work was undertaken as part of the new bmc_1710_lom model build.
David Clark also identified a large number of coal quality data omissions from the database. This quality data was available in lab reports but had not been loaded into GDB. This additional quality data was also formatted and loaded into the new GDB database.
Geotechnical sampling and various investigations have taken place at Bengalla. A range of documentation including data summaries and reports are stored in electronic file archives.
CoalBed Energy Consultants prepared a June 2013 report on fugitive emissions for Bengalla. This report provides a good review of all the gas testing data available, and is the basis for the gas content and composition model that is currently used for Bengalla. Refer report, “Fugitive Emissions Study for Rio Tinto Coal Australia Bengalla and Mount Pleasant Operations”.
The coal quality, gas testing and geotechnical laboratories used are NATA accredited. As such they are subject to audit by external auditors.
A review of the geological and coal quality modelling process was undertaken by Queensland Geological Services in December 2017. This review generally found the modelling processes to be sound.
BENGALLA
JORC Reporting – Table 1 For Coal Resources and Reserves as at 2018
Section 2 Reporting of Exploration Results (Criteria listed in the preceding section also apply to this section)
Criteria Commentary Mineral tenement and land tenure status
Bengalla Mining Company (BMC) is a joint venture with ownership of Wesfarmers 40%, New Hope Group 40%, Mitsui 10% and Taipower 10%. Bengalla received an initial 21-year development consent in 1996. The consent was renewed in March 2015 and extends mining through to 2039. The extraction limit approved from the mine is 15 Million tonnes per annum of run of mine coal.
The property is held under mining and exploration leases detailed in the Table 1.
Bengalla has development consent under the Environmental Planning & Assessment Act 1979 NSW (SSD 5170) and all other major NSW approvals and regulatory consents as well as approval under the Commonwealth Government environmental approval (under the Environment Protection and Biodiversity Conservation Act 1999 Cth) to mine until 2039 through ML1397 and ML1729. MACH Energy Australia Pty Limited holds a surface lease (ML1645) which overlays part of ML1729 for the purpose of locating infrastructure associate with their Mount Pleasant Project. There is an agreement between the holder of ML 1645 and Bengalla which provides for the removal of the Mount Pleasant infrastructure in stipulated circumstances, to allow for the mining of the coal within ML 1729.
Exploration done by other parties
Exploration drilling in the general Bengalla area has been carried out in the Bengalla area since the 1970’s, when the NSW Department of Mineral Resources drilled stratigraphic cored holes including the DM Clanricard and DM Ellis series.
In 1970/71 Armco (Australia) Pty. Ltd. drilled in Authorisation 330, west of Muswellbrook, looking for coking coal for their steelworks proposed for Jervis Bay.
From 1991 the Roxburgh Coal Consortium (managed by Costain Australia Limited) drilled exploration holes in Authorisation 438.
Most of the exploration drilling data in the current database was collected by BMC from 2005 up to the present. This data is generally regarded as reliable, including downhole geophysics for most holes and a good coverage of cored holes with coal quality analytical data.
While some drilling data from the earlier explorers has been included in the new geology model, some drill holes were excluded because they fall outside the lease area, or due to lack of reliable data.
The current seam nomenclature follows the general Hunter Valley coal seam sequence and seam hierarchy established by RTCA in the previous model, with minor modifications to reflect observations on seam and ply correlation.
Geology The Bengalla mine is located in the Hunter Coalfield in the northern part of the Sydney Basin. The Sydney Basin forms the southern part of the Bowen-Gunnedah-Sydney Basin, which occurs along the eastern margin of Australia. This basin contains numerous important coal producing intervals in the Permian stratigraphy.
In the Hunter Coalfield, the Permian sequences are displaced by a group of smaller thrust faults running parallel to subparallel to the Hunter-Mooki thrust and a series of northerly trending folds and associated faults are also developed. Two prominent folds occurring in the Hunter Coalfield are the Muswellbrook Anticline near Muswellbrook, and the Lochinvar Anticline southeast of Singleton.
Bengalla deposit lies on the western limb of the Muswellbrook Anticline. The dip of the bedding is steepest to the east of the Edderton seam sub-crop, ranging from 10 to 12 degrees. Towards the west, the dip of the strata becomes progressively shallower where it flattens out before dipping back to the east at approximately 4o, forming a very broad synclinal trough.
A number of faults have been identified within the mining lease. Some of these have been intersected in the mining highwall. These are nearly all normal faults, although the Wantana and Thornbro faults appear to change from reverse to normal faults near weathering (as seen in mining wall intersections).

BENGALLA
JORC Reporting – Table 1 For Coal Resources and Reserves as at 2018
Criteria Commentary Whilst low angle thrust faulting is known to occur at other mines located on the Muswellbrook Anticline, no evidence has been found for major thrust-related faulting within the Bengalla area.
The coal seams at Bengalla belong to the lower part of the Jerrys Plains Subgroup and the Vane Subgroup of the Late Permian Wittingham Coal Measures. The Wittingham Coal Measures sub-crop throughout the lease area and are overlain by the Watts Sandstone, which is in turn, overlain by the Newcastle Coal Measures.
The upper part of the Jerrys Plains Subgroup, the Watts Sandstone and the Newcastle Coal Measures all crop out to the west of the Bengalla tenements. The Greta Coal Measures occur at depths of at least 500m below the Wittingham Coal Measures and have not been investigated at Bengalla.
The Jerrys Plains Subgroup consists of coal seams ranging from the Whybrow seam down to the Bayswater seam. The upper part of this sequence is present to the west of the Bengalla leases and the seams cropping out in the leaseholds range from the Warkworth to the Bayswater seam. Sub-crops of the Vane Subgroup seams are concealed beneath alluvial deposits that flank the Hunter River. The preserved part of the Jerrys Plains Subgroup is up to 300m thick in the leasehold area.
At Bengalla, the Jerrys Plains Subgroup contains, in descending order, the Warkworth, Mount Arthur, Piercefield, Vaux, Broonie and Bayswater coal seams, with interburden typically composed of sandstone and siltstone. The Fairford Formation, a tuffaceous claystone, lies between the Mount Arthur 1 and Mount Arthur 2 seams.
The coal seams split and coalesce in several combinations and the presence of large, medium-coarse grained channel deposits have resulted in considerable lateral thickness variations in stratigraphy.
The Archerfield Sandstone underlies the Jerrys Plains Subgroup and separates it from the underlying Vane Subgroup. The Archerfield Sandstone developed as a nearshore sand and is characterised by bronze-colouration due to a high pyrite content.
The Vane Subgroup in this area is approximately 150 metres thick, containing strata similar to that of the Jerrys Plains Subgroup. Coal seams contained within the Foybrook Formation of this subgroup are the Wynn, Edderton, Clanricard, Bengalla, Edinglassie and Ramrod Creek.
Igneous rocks and heat-affected coal have been intersected in several drill holes within the Bengalla area. This igneous material is known to have low magnetic susceptibility. A ground magnetic survey and six angled holes were previously undertaken to intersect a suspected dyke. Dioritic rock was intersected in one of these holes.
Since that time, several igneous dykes have been identified and intersected in the mining highwall. Fortunately, there is no evidence of widespread silling of these dykes in the Bengalla area. The dykes are sub-vertical and less than 5m thick and have been included in the bmc_1710_lom geology model.
Drill hole information There are 2121 drill holes in the 2017/18 Bengalla GDB database, of which 1455 have been used in the MineScape structure model. Drill holes utilised in the model are displayed in Appendix 1.
The above holes include 155 quality cores with coal quality analyses in the Bengalla priority area, which were used to create the coal quality model.
A large number of drill holes were excluded from the geology model because they are too far outside of the Bengalla project area to be useful in modelling. A small number of other holes within the project were also excluded because they are considered unreliable e.g. old holes that do not have geophysics.
Except for a few angled geotechnical holes, all holes have been drilled vertically and most holes have been geophysically logged including down-hole verticality data. A small number of holes do not have verticality data e.g. old government cores, therefore these have been modelled as vertical holes. This will introduce some seam depth and thickness errors, but should not materially impact the coal resources.
Drill hole collars for all modern holes (since 2005) appear to have been surveyed accurately by qualified surveyors using MGA Zone 55 and AHD datum. Holes older than this have less reliable collar survey, however these holes are generally supported or replaced by modern holes. In the south west of the project these older holes are the only drilling available, and
BENGALLA
JORC Reporting – Table 1 For Coal Resources and Reserves as at 2018
Criteria Commentary the less reliable nature of this older data is generally reflected in the Inferred resource category that has been assigned.
Data aggregation methods
Because the coal quality cored holes have been collected over a long period there are differences in the coal quality sampling and analysis procedures used over time. These differences occur for various reasons including changes in exploration priorities, company budgets, personnel involved and also to some extent due to changes in technology and understanding. As a result, there are significant differences in the types of coal quality data collected and their reliability can be ranked (from best to worst) as follows:
1. Recent cores: 2013 onwards. Most reliable 2. Modern cores pre-2013 3. 1990’s coring (excluding pre-treated LD cores) 4. Old cores e.g. CLRD series, etc. Least reliable.
Recent cores from drill holes from 2013-2015 include holes 1454D-1593D. During 2013 the analytical laboratory testing regime changed significantly. The testing laboratory also changed from ACTEST (who had been testing since 2005) to Bureau Veritas. Subsequently, analytical procedures and reporting changed.
The other major change at this time was in core sampling and compositing methodology. Coal samples started to be analysed more as plies rather than as seam composite or parent samples. This improved ply sampling methodology from Raw through Washability to product coal testing is most evident in the latest cores from the Oct-Dec 2015 program. As a result, this recent data is greatly improved in terms of being directly representative of the coal plies, rather than composite seam intervals. This is of major significance because the structure and quality models are ply not composite seam models.
The disparity in the ply analysed quality data versus the composited data was seen as a major obstacle to creating a reliable coal ply quality model, however this was addressed through regression procedures.
The 155 key coal quality cored holes that fall within the remaining (unmined) Bengalla mining pit shell underwent detailed validation processes to ensure their data completeness and integrity. The other up-dip holes were deliberately left un-validated because they fall into the mined-out area. However, as was the case with structure model holes, selected holes within an overlap corridor of approximately 200m were included in the quality model.
Relationship between mineralisation widths and intercept lengths
Coal measures deposited in the Bengalla area are relatively flat and continuous over significant distances. This can generally be demonstrated using geophysically correlated drill hole intersections and mining highwall observations.
Exceptions to this continuity are around the faulted zones and in areas of seam splitting.
The seams generally dip gently from east to west on the eastern side of the deposit, and to then subtly from west to east on the eastern side of the deposit. Seams tend to sub-crop in the east where most of the seam sub-crops have now been mined out, however the upper seam (Bowfield and Warkworth) sub-crops are still being mined towards the west.
The coal resources at Bengalla are also known to extend beyond the lease boundaries, however, resource estimates have been limited to the tenements managed by BMC.
Most modern drill holes (since 2005) have verticality logging, however some holes do not and these are treated as vertical in the MineScape model. This will result in some degree of error in calculating true seam depths for these holes. However given the relatively small number of the affected holes, and due to the shallow seam dips, it is considered that these errors will not have any significant material impacts.
Diagrams Drill hole location plan for holes used in the bmc_1710_lom geology model is attached in Appendix 1.
Balanced reporting The Bengalla coal resources as at June 2018 have been calculated based on the newly created MineScape geology model bmc_1710_lom. All available exploration data for the Bengalla project was collated, validated and loaded to generate this model. This new geology model also includes a number of significant improvements that are documented in the report, “Bengalla Geological Model Report bmc1710lom”.
The geology model is effectively a series of interpolated data grids for seam roof and floor horizons as well as for a large number of coal quality parameters. These grids (not the original data) form the basis for calculation of coal resources.

BENGALLA
JORC Reporting – Table 1 For Coal Resources and Reserves as at 2018
Criteria Commentary A large number of drill holes were excluded from the geology model because they are too far outside of the Bengalla project area to be useful in modelling. A small number of other holes within the project were also excluded because they are considered unreliable e.g. old holes that do not have geophysics.
New exploration drilling data from late 2015 (11 cores and 29 chip holes) were included in the bmc_1710_lom geology model.
Other substantive exploration data
As mentioned previously, CoalBed Energy Consultants prepared a June 2013 report on fugitive emissions for Bengalla. This report provides a good review of all the gas testing data available, and is the basis for the gas content and composition model that is currently used for Bengalla. Refer to report, “Fugitive Emissions Study for Rio Tinto Coal Australia Bengalla and Mount Pleasant Operations”.
Some magnetometer data is available for the Bengalla area. Whilst this was briefly examined, the apparent low magnetic susceptibility of Bengalla intrusives makes it difficult to clearly define the known dykes from these images. The Mount Pleasant area to the north is thought to be significantly more affected by igneous rocks.
A series of large diameter quality cores were drilled at Bengalla in the early 1990’s. Coal seams were sampled in these cores and these samples were pre-treated to better represent the size distribution expected as a result of mining and CHPP processes. These LD cores now fall within the mined-out footprint at Bengalla and as such have not been fully validated. However, given they have been utilized in the CHPP simulated washability dataset it is recommended that these LD cores should be examined in more detail in the future.
Further work In recent months BMC have undertaken additional exploration drilling for both structure definition and coal quality. This new drilling data has missed the cut-off for the geology model but will be included in the next model.
It is understood that BMC will continue to conduct exploration drilling immediately ahead of the advancing operations to provide the most accurate geological data for mine planning. This will likely include occasional holes further down-dip to firm up resources.
There are a number of opportunities for extra drilling to improve the geological and coal quality understanding of the Bengalla area. These are discussed below.
Seam splitting is significant for some of the coal seams and it is recommended that further drilling and ply correlation work should be conducted to more accurately define these areas. In particular, the Broonie seams need further ply correlation work across the deposit. Also, the Piercefield and Vaux seams are subject to major seam splitting along the western side of the deposit and further drilling is recommended to understand and to control this splitting.
Further exploration drilling to more accurately delineate geological structures and faulting is recommended. In particular, areas where mining is proposed around the large faults in the south.
The LOX lines for the Bowfield and Warkworth seams are poorly defined. Additional LOX drilling for these seams should not significantly affect overall resources, would improve resource definition and would have a marked impact on mine planning for these areas.
Additional drilling in the western down-dip parts of the lease to improve confidence and to allow Indicated resources to be upgraded to Measured resources in these areas.
Consideration should be given to drilling a series of deeper holes down to the Edinglassie Seam to prove up the underground resources. Because a large part of this underground resource occurs under the mined-out area (that is now covered by spoil) this drilling may require some thought and extra preparation.
In addition, the existing deeper drill holes defining these underground resources should be validated to verify seam picks and ply naming and to ensure the integrity of the coal quality data tables. Note, these underground resources have been categorized as Inferred partly due to this requirement for data validation.
It is understood that some consideration has been given to assessing the potential coking properties of some seams. It is recommended that this work should be formalized in a technical report to help support marketable reserves estimation.
Some discussion has occurred around using alternative exploration methods such as seismic to supplement the drilling programs. This should be considered in more detail and evaluated, particularly for the underground resources.

BENGALLA
JORC Reporting – Table 1 For Coal Resources and Reserves as at 2018
Section 3 Estimation and Reporting of Mineral Resources (Criteria listed in section1, and where relevant in section 2, also apply to this section)
Criteria Commentary Database integrity In 2016, after NHG acquired RTCA’s equity in Bengalla, a preliminary review of the “legacy”
geological dataset was undertaken by NHG. This review indicated that there appeared to be some significant issues relating to data integrity in the bmc_1507_lom model.
A high-level data review had previously been undertaken for RTCA by Encompass Mining, November 2015. This earlier review had also identified a significant number of data issues and it appears that during the review process an attempt had been made (by RTCA) to address some of these issues.
An extract from this review is given below:
“There were initially a total of 11 major issues, 4 minor issues and 7 recommendations identified during the high level geological model review. The model was re-reviewed after the issues identified were addressed. After the model updates a total of 1 major issue, 0 minor issues and 6 recommendations were still unresolved.
These remaining outstanding issues are issues that will require substantial work to resolve but only have minimal impact on the current geological model. It is highly recommended that these 7 outstanding issues be resolved prior to the delivery of the next Bengalla LOM geological model in 2016.”
As part of a pre-model scoping exercise, a more detailed internal data review was conducted by NHG. This review found a large number of additional geological and coal quality database integrity issues.
In the current bmc_1710_lom model, which was used to generate the resources referred to in this statement, most of these issues have been partially or fully addressed. The steps taken are discussed below.
Essentially, a series of comprehensive data validation processes were implemented. The intent was to correct data errors to improve the reliability of the data and to populate missing data where required.
As agreed with BMC, in generating this model, priority was given to the current/future mining pit shell. Therefore, holes in areas that have already been mined out were generally not addressed for validation (including the Edinglassie EG2 underground seam) as these were outside the agreed priority area and (apart from lower seams) would not have added any significant value to the primary open cut model.
As a first step in understanding the nature of the Bengalla deposit and how the coal seams relate to one another across the deposit, a detailed seam correlation exercise was completed. Initially this was done using hard copy geophysical logs to track seam and ply correlation.
It was found that, overall the seam correlation was reasonable, particularly in the areas closest to the active mining high wall. However down-dip some significant correlation issues were observed and subsequently corrected. Furthermore, the Bowfield seams were identified stratigraphically above the Warkworth seams and added to the database.
The Broonie Seam at times displays irregular splitting. In particular, the lower coal plies BR2B-BR2A-BR3 can be poorly developed and discontinuous resulting in ply correlation challenges. In one area the splitting appears to be “Z-splitting”.
An attempt has been made to improve the correlation of the Broonie coal plies, however during the course of the structure model build it was agreed with BMC site personnel that to save time we should defer this detailed Broonie seam correlation to a later time. Whilst this issue is not expected to have a material impact on overall coal resources, it will have a significant impact on mine planning. It is recommended that this Broonie correlation work should be revisited ahead of the next structure model build.
Additional faults were added to the geology model including some large normal faults towards the south of the lease.

BENGALLA
JORC Reporting – Table 1 For Coal Resources and Reserves as at 2018
Criteria Commentary Although geophysical logs (LAS) had been loaded for many of the drill holes in the previous model, there were many holes that did not have any LAS data loaded into the Geophysics table of the GDB database. This meant that it was more difficult to view the logs in MineScape for detailed ply correlation work.
To fix this issue a large number of LAS files were loaded into GDB Bengalla database for bmc_1710_lom. Although other geophysical logs (such as Sonic and Neutron) were available, only the Gamma-Density-Caliper logs were loaded. These are the key logs required for seam interpretation and correlation. Due to LAS file inconsistencies and errors, this was found to be a very laborious process.
During this LAS load process a number of manual adjustments had to be made to the LAS files in order to get them to load properly. These included:
Ensuring correct Well name in the LAS header file (many had hole name but also other text and so could not be read)
Ensuring the LAS depths started at 0 metres (many started with negative depths) Ensuring “null” values in the LAS data files were set consistently to “-999.25” Scanning the data to ensure no unusual values e.g. negative Gamma values Some LAS file names were inconsistent or incorrect not matching the header data.
Furthermore, there had been no downhole verticality LAS data loaded for any Bengalla holes. To improve the accuracy of the structural model, this “vert” data has now been loaded into the new model database. Furthermore, the vert for some holes proved to be erroneous and had to be excluded e.g. 1201D, 1202D and 1203D. Others (1441D and 1510R) had spurious verticality data but these were resolved.
The previous GDB database for the bmc_1507_lom model was found to contain numerous lithological and seam depth errors. These were mostly minor, but some were significant. Most of these errors were routinely corrected as they were found.
Major omissions were identified in the coal quality data tables. This was a severe issue involving 75 drill holes that had some of their quality data loaded, but large amounts of data missing from the data tables (even though the data was generally available in laboratory reports) e.g. a hole may have had raw data loaded but not washability data. Missing quality data was sourced from original lab reports and loaded into the appropriate GDB tables.
Of the quality data that had been previously loaded into the database, a significant proportion was subject to many errors, ranging from minor to major. These errors were generally corrected in the new geology model and are summarized below:
Erroneous data in the GDB database tables was common and had to be checked against original lab reports and corrected.
Some quality values had been loaded into the wrong data field. These needed validation and corrections.
There are various data that can be indirectly derived from lab results through calculation. Calculated columns existed in the GDB database however some had not been generated.
Some of the existing calculated GDB fields seemed to have spurious values. These were confusing and not readily explained.
Missing quality parameters – i.e. where the data is available in a lab report but is missing from the database.
Laboratory instruction errors or inconsistencies. Lab analysis errors. This was a relatively minor concern in this database. Data
validation has helped to improve the data. Lab reporting issues e.g. typos, variations in reporting format such as moisture
basis, failure to validate certain types of analytical results, unresolved sample instruction errors.
Numbering inconsistencies for sample numbers were common. For many holes sample numbers in GDB were different from sample numbers in the original laboratory reports.
Some duplicate data had to be removed.
It was found that a large proportion of pre-2013 quality cores were analysed for washability and product testing as composite seam samples (rather than as coal plies). This meant that these quality data could not be readily assigned to the modelled seam plies. A process of Ash based data regressions were adopted to allow “disaggregation” of these seam composites into their respective coal ply qualities.

BENGALLA
JORC Reporting – Table 1 For Coal Resources and Reserves as at 2018
Criteria Commentary Practical yield data limitations. To better reflect the actual CHPP product yields the laboratory washability data can be “simulated” to reflect CHPP processes. Unified washability data from a previous study by A&B Mylec was available, however this data did not take into account the significant number of seam name and depth adjustments made during the creation of the new bmc_1710_lom model. This unified dataset was modified to reflect the latest seam names and intervals and was then simulated using NHG in-house procedure conducted by the NHG Senior Process Engineer.
Site visits This CP has visited the Bengalla mine site on several occasions. These trips have included pit visits where direct observations have been made of the exposed highwall showing coal seams, faulting and igneous dykes.
On one occasion the core shed was also inspected where many core boxes could be seen in storage.
During these visits a significant library of hard copy and digital geological and coal quality data was observed in the Technical Services office.
Geological interpretation
The Bengalla GDB database contains 2121 drill holes, of which 1455 have been used in the MineScape structure model. This includes 155 quality cores with coal quality analyses in the Bengalla priority area. These holes were used to create the coal quality model. It is considered that this dataset provides a good representation of drilling data across the deposit.
Many drill holes were excluded from the model either because they are too far outside of the Bengalla project area to be useful in modelling or because they are considered unreliable e.g. old holes that do not have geophysics. This results in a remaining dataset that is more accurate and reliable.
In total, there are over 70,000 named coal seam intersections recorded within the GDB Sedimentary Lithology table for Bengalla. All of the seam intersections within the unmined area have been thoroughly scrutinized, interpreted and correlated. This provides a high degree of confidence in the continuity of the coal seams across the deposit.
A series of east–west trending faults cross the deposit. These faults are primarily normal faults and some have large throws of up to 50m, particularly to the south. In the south and west, where borehole spacing increases, further drilling would improve fault definition.
Faults in the MineScape model are modelled based on drill hole fault intersections as well as pit observations and survey data for model guidance for some of the visible faults. Away from the current highwall the fault modelling is more subjective and there is lower confidence in their positions and throws. Even allowing for significant changes in faulting geometry, this is not considered likely to have a material impact on coal resources.
A series of igneous dykes cross the Bengalla lease area however there is no evidence to suggest that there are any associated igneous sills that affect the coal seams. Some magnetometer survey data is available and was also reviewed in this assessment. These intrusive units tend to have a low magnetic response and so it is possible that acidic sills might be present, but given the reasonable drilling coverage to date it is unlikely that they would be more than localized igneous “breakouts” from the dykes. Additional drilling to improve resource categorization and mine planning data will help to confirm this. In any case is not considered likely to have a material impact on coal resources.
The coal quality data used to generate the coal ply quality grids includes mostly actual lab results, but also a significant amount of data derived from regression relationships. This will potentially result in some errors associated with the derived data. However, given the regressions are based on real data, the general strength of the regression relationships, and due to the consistency of the coal seams across the deposit, these derived ply quality values are considered to be reasonably representative of the expected coal qualities. Some exceptions have been noted and these have been discussed in the bmc_1710_lom model report.
Dimensions The Bengalla deposit, as defined by the leases operated by BMC, has maximum dimensions of approximately 4.9km east-west and 4km north-south. The total lease area is approximately 1655 hectares.
100% of the Bengalla lease area (inside the constraints discussed below) is covered by coal resources reported in accordance with The 2012 JORC Code. This includes underground resources in the eastern up-dip area.

BENGALLA
JORC Reporting – Table 1 For Coal Resources and Reserves as at 2018
Criteria Commentary Coal seams at Bengalla are also known to extend beyond the mining tenure, however resource estimates have generally been limited to the tenure held by BMC.
Along the northern lease boundary resources are excluded in a 100m wide corridor to allowing for preservation of the Wybong Road “pillar” between Bengalla and the Mount Pleasant mine.
To the east the open cut coal seams have already been mined out, however the underground resources in the Edinglassie EG2 seam are limited to 100m from the eastern lease boundary.
To the southeast the resources are constrained by the Hunter River Flood Plain limit that was provided by BMC.
The mining pit shell boundary provided by the CP Reserves was also used as a guide the limit the Measured and Indicated resources in this southern area (which includes the project infrastructure). Inferred resources for some seams extend under this infrastructure on the basis that it is reasonably expected that this area could be mined late in the mine life.
To the southwest the 100m limit from the lease boundary also applies.
To the west the coal resources have been calculated right up to the western lease boundary; this is because it was considered that they would probably be mined to the boundary and even beyond this limit at some point in time.
The coal resources primarily occur within the Warkworth, Mount Arthur, Piercefield, Vaux, Broonie, Bayswater and Wynn seam groups, which comprise 95.6% of total Measured and Indicated resources. A further 4.4% of total Measured and Indicated resources are contained in the Edderton seam (not currently mined).
The Bengalla coal seams generally dip gently to the west, however they flatten out and begin to dip towards the east on the western side of the lease area.
The upper seams in the sequence (Bowfield) sub-crop towards the western lease boundary and the stratigraphically lowest seams (Ramrod Creek) do not crop within the lease area at all. Along the eastern (shallowest) edge of the lease the Ramrod Creek seams are intersected at around 100 metres depth and are at depths of around 350 metres along the western lease boundary.
Depth of weathering typically ranges from 5 to 40 metres and averages around 20 metres.
Estimation and modelling techniques
The bmc_1710_lom geological model has been produced using the stratmodel module in ABB MineScape (5.12) software. Geological, coal quality and geophysical data are stored in the MineScape GDB database, Bengalla. This model supersedes the bmc_1507_lom geological model that was produced by RTCA in late 2015.
The schema for the bmc_1710_lom model is bmc1710lom. A MineScape table model and grid model, both named bmc1710lom, were generated using this schema.
Two Conformable Sequences were defined in the schema. The weathered zone is defined by WEATH with Trend Surface Tops12 and Lowest Interval BOW. The fresh zone is defined by COAL with no trend surface and down to Lowest Interval RC3.
The modelling interpolator used was FEM for Thickness, Surface and Trend with Power/Order of 0, 1 and 0, respectively. Lithology has not been modelled. Apart from being used for fault guidance, pit survey data has not been included in the model.
Limits data has been included in the model. This data was adopted unchanged from the previous geology model bmc1507lom and is stored in design file limits_1612. These localized limits relate to the presence of igneous dykes. These limits have very little impact and should be reviewed when the next model is being generated based on any new drilling and pit mapping data.
The topography surface used in the bmc_1710_lom model is “Topo12”. This surface is the same as that used in the previous MineScape model bmc_1507_lom. This topo approximates the original topographic surface before mining commenced. It is used to help control the Base of Weathering (BOW) in areas where there is limited drill hole control. It is also used to truncate seams approaching subcrop.
In the model area there is generally less than 1m difference between the original topography surface (tops12) and the surveyed borehole collars, however there are a small number of holes where the difference is greater. These differences are either due to the accuracy of the tops12 surface, due to minor earthworks associated with mining, or due to collar survey

BENGALLA
JORC Reporting – Table 1 For Coal Resources and Reserves as at 2018
Criteria Commentary issues with old holes. This last issue is of some concern but is expected to affect very few holes and have no material impacts.
In the bmc_1710_lom model, the Base of Weathering (BOW) surface was modelled based on BOW lithology picks in the drill holes. This BOW was used to truncate the coal seams resulting in a weathered and a fresh sequence in the model.
An issue relating to limited occurrences of BOW having been logged in drill holes was identified by Encompass Mining, 2015. As part of the correlation and geological data review many holes had BOW picked or modified based on the original lithological data. This BOW work only includes holes in the key focus area i.e. not in mined out area (where most of the seams subcrop).
There remain a small number of BOW intersections that appear erroneous and should be verified as part of future drilling, however these are not expected to have any material impact on coal resources.
Elemental units are the fundamental components of a stratigraphic model. Elemental units can be either intervals or surfaces, and are used to create compound units when modelling parent intervals and splits.
Compound model intervals are the “parent” seams where seams are split into coal and parting plies. Compound units are composed of an upper and a lower interval (either an element or another previously defined compound unit).
The survey datum for Bengalla is MGA Zone 56 and Australian Height Datum (AHD).
No actual pit survey data has been included in bmc_1710_lom model, however some survey data for pit faults was used to position some of the faults modelled. In addition, the blast pattern toe data was used to help control the Wantana Fault. It is recommended that more consideration should be given to validation and inclusion of pit survey data in future model versions.
Some blast holes with geophysical logging have been entered into previous model versions. This data appears to be reasonable and has been retained in bmc_1710_lom, but it occurs in the mined out area and therefore has very limited impact.
Conformable sequences are stratigraphic “envelopes” defined for rock units with similar structural characteristics. A conformable sequence is defined by an upper and lower surface that bound a layer of units (elemental or compound). Units defined within a conformable sequence may not trend outside the boundaries of the conformable sequence. For bmc_1710_lom two conformable sequences were defined, one for the weathered material, and another for the fresh material.
The faults modelled in bmc_1710_lom are significantly different from those in the previous model. This is partly because of mining advance, partly because of the addition of new faults, and partly due to interpretation changes based on new and old fault data.
Faults modelled in the bmc_1710_lom model are located in the faults1612 design file, in the model_faults layer. There are eight faults modelled plus a further four near vertical dykes that have been modelled as vertical faults with zero throw.
Model faults at Bengalla are interpreted from various observations including: rapid changes in seam elevations between drill holes, missing or thin seams, sequence/interburden thickness anomalies, pit observations, and pit survey data provided by BMC.
All of the faults (except Keys Fault) are modelled across all seams from Bowfield down to Ramrod Creek. For the Keys Fault the fault throw only appears to affect the seams from Vaux down, therefore the upper part of the sequence (Piercefield and seams above) are not faulted. The results of this partial Keys faulting have been reviewed and verified by the BMC site technical team.
The Wantana Fault is interpreted as a reverse-normal fault, possibly a reactivated normal fault, however all other faults are modelled as normal faults. Fault throws vary from small to large. The largest faults are located at the southern end of the mine e.g. Thornbro, Roxburgh and Lumeah faults have fault throws of up to 30-50m.
The Wybong Fault is a new fault included in bmc_1710_lom at the northern end of the model area. This is a relatively small (<10m throws) normal fault dipping to the north.
BENGALLA
JORC Reporting – Table 1 For Coal Resources and Reserves as at 2018
Criteria Commentary The Thornbro Fault occurs at the southern end of the mine and has been intersected in the highwall and southern end wall. The fault starts in the current southern endwall as a small thrust and rapidly changes to a normal fault with approx. 10m throw.
Moisture Model grids have been generated for each seam for Moisture and Relative Density at both Air Dried and at Insitu basis (adjusted).
There has been no Moisture Holding Capacity testing work conducted for cored samples at Bengalla. As a result, the relationship between Inherent Moisture and Total Moisture was developed, as per ACARP report C10041. There is a wide range of data points in this IM-TM relationship, however on average the relationship works out as Total Moisture = Inherent Moisture + 4.7%. This has been adopted as the basis for determining (Total) Insitu Moisture.
Resources were calculated using the Insitu Density grids. See comments relating to correction of Insitu Moisture under Bulk density.
Resource estimates are reported as Insitu basis.
Cut-off parameters A review of Raw Ash data was completed for each of the Bengalla seams. In general, most seams have suitably low Raw Ash and/or Clean Coal Ash to warrant inclusion as resources, however there are a few exceptions.
A number of higher (>40%) Raw Ash instances occur and these are documented in the Resource checklist.
The Rider seam was rejected as a resource on the basis that it is too thin and has high Raw Ash of 40%+.
The Edderton ED1E and ED1C coal plies were also rejected as from resources. Whilst they are generally greater than 0.3m thickness, they have high Ash, are separated by partings and it is my understanding that they are never mined because their ROM Ash is too high. It would be prudent to review new drilling data to verify these coal plies do not improve down-dip.
While individual coal plies may be quite thin (0.2-0.3m), a minimum seam thickness constraint has not been applied to these resources. This is because for nearly all of the seams they are usually part of a parent seam group that is collectively thicker than 0.3m. Rider seam is an example of a single seam that was thin and rejected from resources largely on this basis.
Mining factors or assumptions
Bengalla is a large mining operation that has been run successfully for over 20 years. It utilizes a dragline and several truck-shovel fleets to remove burden and mine coal.
It is considered highly probable that a similar mining configuration will be utilized at Bengalla for the foreseeable future.
Some localized areas of seam splitting, particularly in the Broonie seams and in the western down-dip areas, may see individual coal plies thin and even pinch out. This is not considered a significant issue from a resources point of view because the MineScape resource calculations already take this into account through the very low resource tonnes that will be reported for these thinner coal areas. However, whilst this issue is not considered to have a material impact on coal resources, it may have some local impacts on mine planning.
To allow thinner coal and parting material to be mined in areas of thinner seams, mine scheduling of coal and parting operations will need to be to sufficiently flexible to allow sufficient time to maximize coal resource recovery employing the including use of smaller equipment where required.
It would be prudent to review new drilling data for the Broonie seams and other down-dip splitting areas to provide more accurate seam thickness and quality data for mine planning.
Apart from these splitting areas, it is recommended that exploration drilling and geological work to better define other areas (discussed above in Further Work) should also be completed prior to commencing detailed mine planning.
The Bengalla project infrastructure including office buildings, workshops and CHPP are located at the southern part of the lease area. In conjunction with the CP for Reserves, the mining pit shell finishes just north of this infrastructure area and has been used as a guide to limit both Measured and Indicated coal resources. However Inferred resources are

BENGALLA
JORC Reporting – Table 1 For Coal Resources and Reserves as at 2018
Criteria Commentary included in this area on the basis that it is reasonable to assume that some form of mining may take place late in the mine life.
Metallurgical factors or assumptions
The Bengalla mining operation includes a CHPP facility that processes the ROM coal feed to separate higher density material. If the feed Ash is sufficiently low, the CHPP has a Bypass option.
It is expected that most (if not all) of the future coal mined from Bengalla will require beneficiation through the CHPP to achieve their product coal specifications.
Based on the coal quality data examined, it is anticipated that Bengalla resources will be most suited to production of thermal coal to be sold to export markets.
Some of the coal seams have coking coal properties and this data should be reviewed to determine the potential for a semi-soft coking product. In particular, the Edderton, Piercefield and Wynn seams.
A large number of quality cores have had detailed float/sink testing. This data provides a strong basis for determining the expected product Ash and Yield for Bengalla coal. This data is stored in the GDB Washability table.
To provide better estimation for product Ash and Yield, the Washability data has been adjusted to match CHPP feed sizings and circuit efficiencies using a yield simulation process. Initially the Washability data was adjusted (or unified) by A&B Mylec to reflect CHPP sizings. Then the data was simulated by NHG’s Senior Process Engineer to match Bengalla CHPP settings. MineScape model grids were then created from this simulated data. Later adjustments were undertaken by the CP Reserves to allow for more detailed CHPP expected outcomes.
Environmental factors or assumptions
Bengalla has development consent under the Environmental Planning & Assessment Act 1979 NSW (SSD 5170) and all other major NSW approvals and regulatory consents as well as approval under the Commonwealth Government environmental approval (under the Environment Protection and Biodiversity Conservation Act 1999 Cth. Cth) to mine until 2039 through ML1397 and ML1729.
MACH Energy Australia Pty Limited holds a surface lease (ML1645) which overlays part of ML1729 for the purpose of locating infrastructure associate with their Mount Pleasant Project. There is an agreement between the holder of ML 1645 and Bengalla which provides for the removal of the Mount Pleasant infrastructure in stipulated circumstances, to allow for the mining of the coal within ML 1729.
The Hunter River runs to the southeast of the Bengalla lease. The Hunter River floodplain is the key limiting environmental factors that has been applied to the coal resources at Bengalla. A flood plain limit line was provided by BMC Technical Services and this line has been used to limit coal resources.
Existing project infrastructure includes a Coal Handling and Processing Plant, rail load-out facility, Maintenance workshops, Administration buildings, etc. The predicted remaining mine life is approximately 21 years to 2039.
Product coal is railed to Newcastle via the existing rail networks to the Port of Newcastle.
Bulk Density The coal quality data for the bmc_1710_lom geology model was compiled using the previous model database and loading missing data where required.
McMahon Coal Quality Resources reviewed the available moisture data and provided a method for estimate of in-situ moisture.
The average offset data between analysis moisture and in-situ moisture for the coal rank from ACARP Project C10041 research "Estimation of In-Situ and Product Total Moisture” was used.
Inherent Moisture was the only analytical moisture data available so the relationship between this and Total Moisture was used to estimate Total Moisture.
The spread in average moisture data was very large (1 to 10% offsets range from the C10041 report). The average number was +4.7% and this was used to calculate Total Moisture. Moisture holding capacity testing for future borecore programs is recommended.
This was then applied to the regression equations derived on a by-seam basis for analysis moisture against ash. What was produced is a regression table for each seam by-ash to predict in-situ moisture per below.

BENGALLA
JORC Reporting – Table 1 For Coal Resources and Reserves as at 2018
Criteria Commentary Insitu density was calculated from Relative Density and Insitu Moisture using the Preston Sanders equation.
Classification The Bengalla deposit includes resources in Measured, Indicated & Inferred categories. See Table 3 for a summary of resource descriptions by seam.
Points of Observation have been identified for each seam. These Points of Observation have been used to generate resource polygons in MineScape for calculation of Measured, Indicated and Inferred resources.
Each Point of Observation is based on a cored hole that has at least raw coal quality analysis for the relevant seam. These cored holes, as well as other non-cored holes are also generally geophysically logged, and provide confidence in seam continuity and correlation.
Measured resources are based on Points of Observation at 250m drilling centres.
Indicated resources are based on Points of Observation at 500m drilling centres.
Inferred resources are based on Points of Observation at 1000m drilling centres.
There is a moderately high level of confidence in the Measured and Indicated resources, and a lower level of resource confidence of Inferred resources.
A review of Raw Ash contours for each seam has been undertaken to confirm Raw coal quality is acceptable for resource definition. A number of high Ash occurrences have been identified, some have been excluded, and comments have been made as to their resource relevance.
The Rider seam is a single thin seam with limited but high Raw Ash analysis data. This seam has been rejected as a coal resource on this basis.
The ED1E and ED1C coal plies have also been rejected as resources because they are also high in Raw Ash. They are somewhat thicker but also have associated stone partings which would need to be separated and increase the expected ROM Ash. These coal plies are not mined. A more detailed examination of these coal units for potential lower Ash resource pockets may be warranted, particularly if new drilling data becomes available.
This classification system has also utilized the results from geostatistical data review conducted by McMahon Coal Quality Resources in 2018. It has also considered the findings of an earlier geostatistical study conducted by RTCA in 2014.
Audits or reviews Several experienced consultants have been engaged to review, assess and validate the available geological and coal quality data for Bengalla. A large body of work has been dedicated to improving the geological database and model from the previous versions.
This CP was directly involved in this process of creating the new geology model bmc_1710_lom and therefore has a detailed knowledge of the database and the modelling methods and limitations. Based on this knowledge he can confidently state that the models’ representation of the geology, structure and seam disposition in the Bengalla deposit is sound, significantly improved from the previous model, and well suited for JORC resource estimation.
A Geostatistical data review was completed by McMahon Coal Quality Resources, Refer to report, “J0319 - Bengalla Geostatistical Review - Raw Ash Outcomes, Summary Tables & Charts 20180417”. This work has been used to support some of the parameters used in this resource estimate.
A previous geostatistical study was also undertaken for RTCA by Geovariances in September 2014, “Bengalla Mining Company Drillhole Spacing Analysis Final Report RIO01007”.
A peer review of the Bengalla database and model build processes with regard to JORC reporting was conducted in December 2017 by QGESS Pty. Ltd. They conclude that, “The work undertaken by the New Hope Group geological team has established a solid foundation for accurate JORC reporting and to allow the onsite geology team to further develop short term mining models on an as required basis”.
The author acknowledges the work of various authors in the report, some of whom have been referenced and some have not.
Discussion of relative accuracy/confidence
There are varying degrees of confidence in the coal resources estimated for Bengalla. This is generally reflected in the variations in resource categories.

BENGALLA
JORC Reporting – Table 1 For Coal Resources and Reserves as at 2018
Criteria Commentary The Measured resources tend to be roughly concentrated closest to the current mining highwall position. Whilst Indicated resources occur over much of the western parts of the mining leases, some seams have less data available to the west and to the north.
The underground resources are constrained to the Edinglassie EG2 seam based primarily on seam thickness. Drill hole spacing for this seam tends to be smaller in the shallower eastern part of the lease, than in the deeper western area. Because the Edinglassie seam intersections have not been fully validated in the mined out eastern area, there is some degree of uncertainty relating to detailed seam integrity, however this is reflected in the Inferred resource category.
Overall, in a broad sense, there is a high level of confidence in the lateral continuity of all the coal seams, however there are some local variations in areas of seam splitting, faulting and upper seam sub-crops that need further exploration drilling to improve confidence prior to any detailed mine planning.
In particular, the Broonie seam correlation has not been fully resolved in the new geology model bmc_1710_lom and whilst this is not expected to have a material impact on resource calculations, it may impact on short to medium term mine planning and should be addressed through detailed correlation review.
The Piercefield and Vaux seams are subject to major seam splitting along the western side of the deposit and further drilling is recommended to understand and to control this splitting.
The coal quality of the Bengalla coals has been accepted in the market for many years now and it appears well suited for sale as an export thermal coal.
The calculation of these coal resources was generated from resource polygons based on Points of Observation (POO) with radii of influence set at 250m, 500m and 1000m, for Measured, Indicated and Inferred categories, respectively.
These radii of influence assumptions are largely based on the results of a geostatistical analysis by McMahon Coal Quality Resources, and on subsequent discussion with the Bengalla project team. Refer to report, “J0319 - Bengalla Geostatistical Review - Raw Ash Outcomes, Summary Tables & Charts 20180417”. The previous Geovariances 2014 report was also considered in these discussions.
These two geostatistical studies have significant technical differences in their approach, however they both report that some seams show more variance than others. This may be due to the variable nature of the thickness and quality of the Bengalla coal seams. As a result, the drill hole spacing/radii of influence recommendations for the three resource categories are potentially different for each seam, however this was thought to be too unnecessarily confusing.
This CP has adopted a simple scheme for drillhole radii of influence which weighs up both of these geostatistical reports and exercises practical judgement on the optimal radii. This has been discussed with peers and accepted as a reasonable and robust approach.

BENGALLA
JORC Reporting – Table 1 For Coal Resources and Reserves as at 2018
Section 4 Estimation and Reporting of Ore Reserves (Criteria listed in section1, and where relevant in sections 2 and 3, also apply to this section)
Criteria Commentary Mineral Resource estimate for conversion to Ore Reserves
Coal Resources have been estimated by Marko Seppannen – Principal Geologist, Geomine Pty. Ltd. Marko Seppanen is a Competent Person as defined by the JORC code 2012. The estimation of Coal Resources is detailed in the report titled “Bengalla – 2018 Statement of Resources for Bengalla mining Company” issued July 2018.
The reported Coal Resources are inclusive of the reported Coal Reserves as estimated by Mr Chris Dutton. Mr Dutton is a Competent Person, as defined by the JORC Code 2012, for the estimation of Coal Reserves.
Detailed strip designs have been applied to the updated Resource model to generate raw Reserve data. The raw Reserves are converted to run of mine (ROM) and marketable values after considering equipment selection, aggregation, loss and dilution and coal processing parameters.
Marketable Reserves have been calculated using the data from the bmc_1710_lom geological model, calibrated to align with historical product as quality and yields values.
Site visits The Reserves Competent Person works onsite at Bengalla mine and performs regular inspections of the mining operation.
Study status Bengalla is currently an operating mine. The reportable Ore Reserves for Bengalla are sourced from a robust life of mine plan which establishes technical feasibility, economic viability and considers all relevant modifying factors.
The Coal Reserves and Marketable Reserves have been estimated based on the historical performance of the mining and CHPP operations.
Cut-off parameters All mining blocks within the pit shell are economical tested within the scheduling database, showing positive cumulative profit margins at the basal seam. This process utilises historical unit cost rates, sustaining capital allowances and revenue price assumptions that align with the 2017 life of mine plan and 2018 annual operating plan.
Any mineable coal horizon with an overall air dried ash greater than 55.5% or float 1.60 cut point yield lower than 40% was converted to waste. This resulted in a 0.3% reduction in Coal Reserves.
Mining factors or assumptions
BMC utilises dragline, truck and shovel waste for movement, while coal is loaded using a combination of loaders and excavators with haulage to the run of mine (ROM) hopper undertaken using rear dump trucks. The operations are supported by additional equipment including dozers, graders and water carts.
All pit end walls have benched and battered designs based on the existing operation with allowances made for increasing depth of mining. The design provides for mining roadways and catch benches and design parameters are within Bengalla’s Slope Dump Management Plan guidelines. Default design parameters are shown in Table 1 below.

BENGALLA
JORC Reporting – Table 1 For Coal Resources and Reserves as at 2018
Criteria Commentary Table 1: bench width and batter angles
Working section or seam aggregation logic pre-determines what is defined as mineable coal by applying working section tests based on minimum practical coal thickness (typically between 30-40cm).
Any mineable coal horizon with an overall air dried ash greater than 55.5% or float 1.60 cut point yield lower than 40% was converted to waste. This resulted in a 0.3% reduction in Coal Reserves.
Coal loss and dilution factors are also applied and vary by the equipment type uncovering the various coal seams (i.e. excavator/truck versus dragline). Typical roof and floor coal loss thickness ranges from 2cm-15cm. Typical roof and floor waste dilution thickness ranges from 0cm-15cm.
Bulk mining loss factors for each seam are applied based on periodic reconciliations. Loss incurred due to faults and dykes are applied through the mapping of these geological structures within the mining limits. All coal is wasted within a 10 metre exclusion zone.
Bengalla has only very limited (2.1%) Inferred or unclassified coal within the final pit shell design. As per the JORC code these have been excluded from the reserves and would have minimum impact if excluded from current life of mine plans.
Metallurgical factors or assumptions
Raw coal will be washed in the onsite coal handling and processing plant (CHPP) at Bengalla. The CHPP utilises conventional washing processes that are consistent for the coal industry. The technology has been thoroughly tested at Bengalla.
Marketable Reserves are based on a combination of washing and bypassing of coal based on historical statistics.
Marketable Reserves have been calculated using the coal washability data from the bmc_1710_lom geological model, calibrated to align with historical product ash and yields results.
In seam dilution taken from sample testing of parting bands within the deposit have also been included in the product quality calculations.
Product coal calorific values are estimated from the product ash content regression relationship, developed from historical actuals.
Environmental In March 2015, the New South Wales government approved a development consent at Bengalla allowing for up to 15M tonnes per annum until 28 February 2039 (SSD-5170).
MACH Energy Australia Pty. Ltd. Holds a surface lease (ML1645) which overlays part of ML1729 for the purpose of location infrastructure associated with their Mount Pleasant Project. There is an agreement between the holder of ML1645 and Bengalla which provides
BENGALLA
JORC Reporting – Table 1 For Coal Resources and Reserves as at 2018
Criteria Commentary for the removal of the Mount Pleasant infrastructure in stipulated circumstances, to allow for the mining of the coal within ML1729 by Bengalla. Refer to Appendix 2 for further details.
Subsequent modifications to SSD-5170 have been approved to facilitate alterations to various component to the Bengalla project.
The re-instatement of Dry Creek as per the development consent SSD-5170 is likely to result in a waste dump shortfall as identified in the 2017 life of mine plan. Any height increases to existing Bengalla dumps or external dumping solutions will likely trigger the requirement for further development consent modifications. Due to the timing of this requirement (approximately 2035), further modification is attainable to abate any operational impacts.
The proportion of insitu waste rock with acid forming potential is low at Bengalla.
Rejects are co-disposed in amongst the mine’s overburden emplacement areas and is managed as per the requirements set out in Bengalla’s slope Dump Management Plan.
Infrastructure Infrastructure requirements necessary for the operation of Bengalla have been progressively developed since mining commenced. The current life of mine plan only requires sustaining capital to maintain the existing infrastructure.
Costs All operating unit cost rates and capital costs are based on historical Bengalla values and forecast cost fluctuations.
Revenue factors Revenue assumptions used the Bengalla Quarter 1 2017 plan $US prices (Newcastle 6000 NAR basis) to 2021 and then the Wood-McKenzie long term price forecasts as of November 2016 in $US per tonne, adjusting for energy and ash to match the Bengalla products.
The foreign exchange rates are assumed to be relatively flat over the mine life and are consistent with the recent Bengalla Coal Sales Company (BCSC) 2018 Marketing Plan, released November 2017.
Market assessment The global coal market is affected by multiple factors with consumption driven largely by economic development.
Bengalla product coals have been sold continuously since the mine began. This has been assumed to continue for the purposes of estimating Coal Reserves.
Economic The Competent Person provided input into the latest discounted cashflow analysis as part of the 2017 life of mine plan. It is competent Person view that this analysis continues to provide a solid projection of the economic viability of the Reserves at Bengalla. The details of the internally generated economic evaluation are commercially sensitive and is not disclosed.
Social There are two sites of European Cultural Heritage at Bengalla: Overdene and Bengalla Homesteads. Both sites are owned by Bengalla Mining company and are located outside the area of mineable Reserves.
Other Risk assessments have been completed and are based on previous assessments undertaken at Bengalla. No high risks were identified in the assessment.
Classification The Coal Reserves are classified as Proven or Probable Coal Reserves based on the JORC Code 2012. The basis for classification of Coal reserves is the coal Resource category polygons for each seam, in conjunction with the calculated cash margin and other modifying factors.
The Coal Reserves consist of approximately 62% Proved Reserves and 38% Probable Reserves.
The Competent Person is satisfied that the stated coal Reserve classification reflects the outcome of technical and economic studies.
Audits or reviews Optimal Mining Solutions Pty. Ltd. Have been engaged throughout the generation of the 2018 Coal Reserves to review and validate the processes used to determine the Coal Reserves. Since this was the first time the site XPAC database has been used for JORC reporting, detailed testing of the calculations within the scheduling database have been performed to verify each of the process steps. No significant errors were found during this process.
Discussion of relative accuracy/confidence
The Bengalla deposit is well understood. The Coal Reserves estimation techniques utilised at Bengalla are consistent with other open cut coal mines in the Hunter valley.

BENGALLA
JORC Reporting – Table 1 For Coal Resources and Reserves as at 2018
Criteria Commentary Historically, this process has provided actual production values within 5% for tonnage and grade. This result indicates a robust coal Reserve estimation process.

BENGALLA
JORC Reporting – Table 1: Appendix 1 For Coal Resources and Reserves as at 2018
Model sheets used and drill hole Model Flag
Model Flag “Y” = Black, “N” = Red; Model Sheet bmc_grids_17 (green)

BENGALLA
JORC Reporting – Table 1: Appendix 2 For Coal Resources and Reserves as at 2018
BURTON
JORC Reporting – Table 1 For Coal Resources as at 2019
Section 1 Sampling Techniques and Data (Criteria in this section apply to all succeeding sections)
Criteria Commentary Sampling techniques The Lenton Joint Venture (New Hope Group 90%, Formosa Plastics Group 10%) acquired
the Burton Coal Project from Peabody Energy Australia in November 2017. All of the geological (legacy) data for this project was transferred to Lenton Joint Venture (LJV) as part of this arrangement. New Hope Group (NHG) manage the geological and exploration activities for the LJV.
NHG generated a new geological model in 2018 (bur_1809) covering the Ellensfield South and Plumtree North deposits (ESPN). This Table 1 report only refers to coal resources, reported in accordance with The 2012 JORC Code, that have been estimated in these two deposits based on this geological model.
Additional drilling was carried out by New Hope Exploration (NHE) from December 2017 to June 2018. Therefore, the data set available is a combination of the legacy data and the new data.
NHE have a set of Field Operations Procedures which establish the minimum requirements for each exploration task, including the best practices for the collection of geological data for use in resource models.
All staff are assessed for competency by NHG, and hold relevant qualifications and training competencies required to carry out technical tasks relating to their roles.
Drilling campaigns at Burton have taken on various forms, including chip drilling; and core drilling for coal quality, and geotechnical analysis. Some gas testing is believed to have been undertaken in the past by previous owners, however no review has been undertaken by NHG. Nil gas drilling has been undertaken by NHE at Burton since acquisition of the project.
Commentary herein generally refers to current NHG practices, unless otherwise stated.
For the recent NHG open holes, the drill cuttings (chips) are laid out for every metre drilled for the Exploration Geologist to describe and record in their lithology logs.
Metre markers on the mast of the drill rig assist the Drill Crew to identify the sample boundaries.
It is standard practice for the Drill Crew to collect drill cuttings in a sieve and to place them in an orderly manner in the designated sample layout area.
The Exploration Geologist then logs the metre samples to identify and describe standard lithological characteristics. Lithological depths are later confirmed with geophysics, particularly for coaly units.
Review of available legacy data shows that similar practices were adopted by previous owners.
For the recent NHG holes, Limit of Oxidation (LOX) samples were taken every 0.25m and sent to ALS (ACIRL) at Richlands, Queensland, an accredited laboratory under the National Association of Testing Authorities (NATA). In compliance with NATA, all samples are prepared and analysed using methodologies stipulated in the Australian Standards.
Review of available legacy data shows that LOX sampling appears to have been coarser (i.e. 1m intervals), however, the available analysis results appear to indicate that base of weathering was placed conservatively. Recent interpretation by NHG has re-examined this historic LOX data and placed base of weathering (BHWE) in the GDB database in accordance with analytical results, rather than applying a nominal conservative boundary.
All core holes are logged and sampled directly from the core table in the field. Depths are measured using a tape measure per core run, with an understanding of the depth in the hole from Drillers measurements. Review of available legacy data shows that similar practices were adopted by previous owners, however, detailed ply sampling was not carried out. This has some impact on ply quality data available in the new MineScape model.
As per NHE procedures, standard coal quality core sampling parameters are defined to ensure consistency in sampling:

BURTON
JORC Reporting – Table 1 For Coal Resources as at 2019
Criteria Commentary All coal in the drill hole is sampled, regardless of thickness; All carbonaceous material is sampled, regardless of thickness; All intra seam stone bands are sampled separately, regardless of thickness,
except large interburdens (>50cm) where these are generally omitted from sampling;
If the coal in one run is continued in the next run they are split into two samples to ensure there is no risk in sample loss between core runs;
Core loss in the middle of a sample is not allowed. Separate samples above and below core loss are taken.
A review of the lithology logs from the legacy data reveals variable levels of confidence in sampling integrity.
For open/chip holes, particularly older holes, some have lithology records that appear to be coarsely logged, although some holes have additional detail available in scanned or hard copy files.
For the legacy quality core holes, sampling in the field was generally composited across the nominated seam interval rather than at a coal ply level.
All coal quality samples are sent to ALS (ACIRL) at Richlands, Queensland, which is an accredited laboratory under the National Association of Testing Authorities (NATA). In compliance with NATA, all samples are prepared and analysed using methodologies stipulated in the Australian Standards.
Review of available legacy coal quality data shows that coal quality samples were sent to SGS Mackay for slim core and LOX testing, to ACIRL Ipswich for slim core and carbonisation testing, and also to CCI for slim core analysis. All of these laboratories are understood to have been NATA accredited.
Geotechnical defect logging and sampling has been completed by both NHG staff, contract geologists, and representatives of Golder Associates, who also finalised the reporting for Burton. Samples were between 20-50cm in length, and were collected from sandstone, siltstone, and interbedded sandstone/siltstone units, from overburden, interburden and basement materials. All samples were analysed at Trilab laboratories in Brisbane. Trilab, Brisbane, is a NATA accredited laboratory.
Review of available legacy geotechnical information shows that samples were sent to Ullman & Nolan Geotechnic in Mackay for analysis, which is also NATA accredited.
Once the drilling of the hole is complete, downhole geophysical logging is carried out on all holes that intersect coal. As a minimum, dual density (long-spaced density & short-spaced density), gamma and caliper trace data is collected in each hole. Historically, the microdensity tool has also been used. In recent times, it has become standard to log all holes with the deviation tool. Sonic data is also acquired in some holes across the deposit. Where holes are drilled for geotechnical purposes, the acoustic scanner tool is also utilised.
Acoustic scanner interpretation of selected historic holes was undertaken by ASIMS.
Drilling techniques All holes drilled in coal are planned for vertical drilling. Holes are drilled using either air or water as a drilling medium.
Open/chip holes are commonly used to define structure, coal seam continuity and limit of oxidation (LOX). Drill bit types used for open holes include PCD, Blade and Hammer with diameters ranging from 114mm to 120mm.
Coal quality samples are most commonly collected from holes with a core size (diameter) of 4-inches or 63mm (HQ). Geotechnical sampling have been conducted using HQ drilling (nominal core diameter of 63.5mm).
The legacy dataset contains some large diameter (150mm) core holes drilled using air and water with a triple-tube barrel and tungsten core bit.
Review of available legacy data show that various drilling methods were utilised, including rotary chip and slim core. All slim core (HMLC) was carried out on air and water. Large diameter cores were drilled using a 150mm tungsten core bit. In addition, geotechnical holes appear to have been drilled using HQ diamond core bits.
Drill Sample Recovery Core Depth and Sample Reconciliation paperwork is available to keep a record of the drilled depths and recovered thicknesses for each core run, and is mandatory to complete. The

BURTON
JORC Reporting – Table 1 For Coal Resources as at 2019
Criteria Commentary Driller and Exploration Geologist consultation regularly about depth reconciliation as evidenced by DOR’s.
Coal seam depths are confirmed and depth corrected when the geophysical logging is completed.
Core loss and core expansion are accounted for in the field, by using observations in the core. For example, core recovery thickness discrepancies, broken core, crushed zones, swelling lithologies and groove marks caused by over-drilling are all indicators of these core states, and with careful data recording and confirmation with geophysics, are assessed and appropriately logged to record an accurate geological interpretation of the downhole lithology.
The drilling supervisor is notified when core loss greater than 5% occurs in coal or if substandard core is being presented to the geologist. Where required, the decision to re-drill the hole is discussed. If there are problems with core or sample recovery, the hole is not used in the geological model.
NHE routinely employ leading standards to ensure core sample recovery and representativeness. The sample length measured on the core board is placed into the sample bags, being separately carefully into individual ply or parting samples.
Drill core is cleaned of drilling fluids/clays (so that it can be examined clearly) prior to recording lithological information.
Separating adjacent samples is typically carried out using a paint scraper. If the core is a bit harder in one area, a hammer and bolster is used to break the core at this point.
Review of available legacy information indicates that similar sample recovery practices were observed by previous owners.
Legacy data forms used by the previous owner indicate that core loss > 5% triggered re-drilling of the hole.
Logging When drilling chip holes, for every metre drilled, the drill cuttings (chips) are laid out in individual piles representing that metre for the geologist to describe in their lithology logs. Geophysical logging is then utilised to provide accurate depths for coal seam corrections.
Core length measurements are taken carefully for depth reconciliation purposes. The core depths and sample intervals are then marked on core boards, which sit alongside the core on the table. All samples are given unique NHE sample numbers, which are transcribed into the lithology logs as the geologist logs the core.
Cored intervals are photographed at 0.5m intervals at high resolution, before placing this material into sample bags for laboratory dispatch. An overlap of the previous and following photographing area is included to allow core photo continuation and matching.
Core photographs are utilised in data quality control, to establish core loss/expansion, to assist in core sample laboratory testing instructions, for later reconciliation of coal depths and quality, and as a permanent record of borehole lithology and the decisions made by the exploration geologist on the rig.
Geophysical logging is then performed to give accurate coal seam depths, and the lithology is reviewed against the geophysics to confirm that seam thickness recoveries are at an acceptable limit. All data collected in the field including photographs are saved electronically for future reference. All paperwork is stored in hardcopy borehole files at NHG Corporate Office.
Downhole geophysical logging is carried out on all drill holes. As a minimum, dual density (long-spaced density & short-spaced density), gamma and caliper trace data are collected for each hole. Historically, the microdensity tool has also been used. In recent times, it has become standard to log all holes with the deviation tool and this is considered important for steeply dipping deposits like seen at ESPN. Sonic data is also acquired in some holes across the deposit. For holes drilled for geotechnical purposes, the acoustic scanner tool is also utilised.
NHE own and operate their own fleet of geophysical logging trucks. All logging staff are appropriately licensed for transportation and use of radiation sources for logging and hold relevant qualifications & training competencies to carry out the required tasks.
NHE have drilled a calibration hole at Burton, which allows the logging truck operators to ensure the tools are appropriately calibrated providing quality control for the logging results.
BURTON
JORC Reporting – Table 1 For Coal Resources as at 2019
Criteria Commentary Review of the legacy data set confirms that nearly all holes drilled by the previous owner have also been logged by a standard suite of down hole geophysical tools. This data has been thoroughly examined and utilized by NHG as part of the coal seam correlation and modelling exercise that was undertaken.
In general the legacy LAS data has been found to be of good quality and well suited for seam interpretation and correlation work. It provides good confidence for seam continuity between points of observation.
Sub-sampling techniques and sample preparation
Once the lithology and the defects in the core have been logged, the samples are separated out using the lithology and ply intervals marked on the core boards, and placed into their corresponding sample bags. The criteria for identifying samples can be seen in the “Sampling Techniques” section at the top of this table.
Core is sampled immediately after drilling, once it has been logged and photographed on the core table. This rapid sample preparation technique is considered important for retaining coal quality properties for accurate analysis.
To ensure that sample moisture and texture are maintained, the sample bags used are plastic.
NHE have developed a unique sample numbering system to prevent sample number duplication, which would result in exclusion from the geological model.
Sample numbers are printed on waterproof sample tags, which are stapled to the sample bag, facing outwards, so that it can be clearly identified.
To ensure that the sample is sealed off completely, the sample bag is twisted off and folded over itself before zip-tying it closed.
All coal quality samples are sent to ALS (ACIRL) at Richlands, Brisbane, which is an accredited laboratory under the National Association of Testing Authorities (NATA). In compliance with NATA, all samples are prepared and analysed using methodologies stipulated in the Australian Standards.
Coal quality analysis at Burton is carried out in multiple stages: (1) Drop Shatter; (2) Raw Coal Analysis (3) Fresh Floats Analysis at a density cut point of F1.375; (4) Sizing Properties Analysis; (5) Float/Sink Analysis; (6) Froth Flotation; (7) Product Composite Analysis; 8) Carbonisation testing of selected samples (as required).
Following the Australian Standards, the laboratory representatively splits the samples into portions in order to perform the coal quality analysis required. For Burton, one-eighth of the sample is used for Raw Analysis, another one-eighth is used for fresh floats, and the remaining three-quarters are reserved for sizing analyses, washability, and Clean Coal Composite analysis. Clean Coal Composites are carried out on a cumulative cut point which targets the ash product/s following the results of Washability testing.
Review of available legacy information indicates that in general similar sub-sampling techniques were observed by previous owners, however there are some fundamental differences observed in the way that ply sample intervals were determined.
The coal sampling by previous owners has tended to be as thicker seam-based samples rather than the thinner ply-based sampling method that has been adopted by NHG. This is of significance because the geological model is based on ply intervals rather than full seam intervals, therefore the historic sampling and subsequent coal quality analyses tend not to match the modelled ply intervals. This is of particular significance because some plies have coking properties and some do not.
Carbonisation testing has been conducted for some cores, both in the legacy dataset and the recent NHG cores.
Quality of assay data and laboratory tests
All coal quality samples are sent to ALS (ACIRL) at Richlands, Brisbane, which is an accredited laboratory under the National Association of Testing Authorities (NATA) to perform analytical testing to the to the ISO 17025 and ISO 9001 Standards (Certificate number 15784-857). In compliance with NATA, all samples are prepared and analysed using methodologies stipulated in the Australian Standard AS4264.1-2009 for coal and coke sample preparation.
NATA accreditation involves regular external audits of the management, training and control procedures in the laboratory to ensure that the processes are documented, precise, accurate and validated. This ensure that the standard of testing is appropriate.

BURTON
JORC Reporting – Table 1 For Coal Resources as at 2019
Criteria Commentary All testing is performed following appropriate Australian Standards for the testing of coal which are well accepted through the industry and considered acceptable for the analysis of coal samples.
Review of available legacy information indicates that the coal quality laboratories used by previous owners for coal analyses and for geotechnical analyses were also NATA accredited. This supports that the previous assay data has been subjected to appropriate rigor to ensure compliance with Australian Standards for coal and coke testing.
Geophysical tools are serviced annually by DGRT Pty Ltd at Acacia Ridge in Brisbane, QLD. There are four main geophysics tools for used for logging coal exploration holes:
Auslog A605 Dual Density Tool Sample interval 2cm; logging speed 4m/min; reading time 0.3sec. Density calibration is detailed above. Gamma is calibrated to a thorium source. Caliper is calibrated to readings of 50.8, 101.6, 152.4, 203.2 and 254mm using a standard gauge. NHE calibrate the caliper to point to point calibration, as opposed to a line of best fit.
Auslog A605FR Dual Density Tool Sample interval 0.05cm; logging speed 3.3m/min; reading time 0.3sec. Density calibration is detailed above. Gamma is calibrated to a thorium source. Caliper is calibrated to readings of 50.8, 101.6, 152.4, 203.2 and 254mm using a standard gauge. NHE calibrate the caliper to point to point calibration, as opposed to a line of best fit.
Auslog A698 Deviation Tool Sample interval 5cm; logging speed 6m/min; reading time 0.5sec. Factory calibration settings have been applied for this tool.
Auslog A799 Full Wave Sonic tool Sample interval 10cm; logging speed 4m/min; reading time 1.5sec. Factory calibration settings have been applied for this tool. Review of available legacy information indicates that similar logging techniques were observed by previous owners.
Verification of sampling and assaying
All lithology data is entered directly into LogCheck software in the field, which has been designed specifically for coal exploration data processing. LogCheck has inbuilt validation criteria to ensure all data loaded is clean of critical data entry errors. All validation tools and dictionaries are password protected.
The geophysical logs are loaded into LogCheck, and compared with the lithology intervals observed by the geologist through the Graphic Editor module. Coal seams and plies are depth corrected using the detailed geophysical logs. Backup copies of the original lithology logs are stored in case this data ever needs to be reviewed.
When all seam names have been confirmed as correct, sample summaries are generated from LogCheck, giving the sample number, sample depths and description of the sample against seam names, which provide the basis for laboratory coal quality instructions. Laboratory instructions are then provided on a seam-by-seam basis.
At the laboratory, all samples are registered into both Coal8 & LabSys – ALS’s own sample tracking software systems (approved by NATA). This registration is confirmed by Project Manager against the original client instructions, and each sample and its subsequent sub-samples are affixed with a designated sticker containing all the sample details and a barcode that can be scanned.
Samples are analysed according to client procedures. As samples are analysed the barcode is used to log each result to that sample.
Results are quarantined and repeated if they do not meet the requirements of the appropriate Australian or ISO Standards. Controls are run with each batch of samples to ensure the testing apparatus is operating properly. Project Managers and Laboratory Managers/Supervisors approve these results. The use of twinned holes is not a typical practice in coal exploration for validating results.
Laboratory supervisors collate and validate the data, looking for abnormalities in the results. In particular looking for data trends through cross plots of the results on a seam by seam basis. Typical industry practices include the comparison of the key qualities such as: Ash

BURTON
JORC Reporting – Table 1 For Coal Resources as at 2019
Criteria Commentary vs. Relative Density, Volatile Matter vs. Ash, Specific Energy vs. Volatile Matter, Ash vs. Total Sulphur.
The laboratory provides the results in a variety of formats, including:
Preliminary results templates - all data for each stage of analysis in one Excel file; updated with data at completion of each stage of analysis;
CSV templates of final data in the correct format for loading directly into the geological database; and,
Final PDF reports with the final analytical results for each sample. These include sample instructions provided by the client, and list the Australian Standards used. These are signed off by the Laboratory Manager to verify compliance with the standards.
All final coal quality data files from the laboratory are loaded into the geological database using standard GDB data load specifications, so as to reduce the risk of typographic errors, and minimise data handling. The coal quality models are built directly from the GDB database. No changes are made to the results, unless verification checks confirm an anomalous result, which are edited individually to match the final laboratory result.
The GDB geological database has built-in validation parameters to ensure all data is entered correctly. It also has restricted access and is password protected.
All geological data is stored both electronically and in hardcopy, using NHG practices outlined in Field Operations Procedure’s & Guidance Notes.
Hardcopy borehole files are stored in a secure fire-proof room at NHG Corporate Office.
Review of available legacy information indicates that in general similar procedures have been run for verification of sampling and assaying.
Location of data points All location data at Burton is collected using the AMG84 datum, and Australian Map Grid zone 55K projection. All elevation data is recorded in Australian Height Datum (AHD).
Based on review of available legacy data the previous project owners appear to have used this same datum as referenced in some of the reports read.
All boreholes are planned and drill sites are located using handheld GPS units. Once drilled, all holes are then accurately surveyed using differential GPS for the provision of coordinates to the geological model at an accuracy of less than 5cm.
All borehole collars (locations) are surveyed by registered contract surveyors. Cottrell Cameron & Steen surveyors (CCS) have provided surveying services over the last five years. CCS carry out surveys using RTK GPS which has a relative positional accuracy of approximately 50mm. Borehole surveys are connected to the State Control Network to ensure absolute positional accuracy of approximately 100mm.
The topography surface used in the geological model was derived from data acquired by the previous owner, Peabody.
Based on review of legacy documentation it is understood that the previous owners also undertook accurate survey of drill collars. Contract surveyors Pioneer Surveys Pty Ltd (Mackay) undertook some of this work.
Data spacing and distribution
The approximate drill hole spacing (chip and core) for the ESPN resource areas is approximately 60m. For cored holes only the spacing is approximately 170m. For chip holes only the spacing is approximately 85m.
The above spacing numbers include LOX drilling, so the effective drill spacing will be somewhat wider than these values.
NHG are able to demonstrate, with a high degree of confidence, that the coal seams and coal plies at Burton are laterally continuous, through seam correlation using geophysical data collected across the deposit.
Coal quality samples are taken on a ply-by-ply basis, and combined for coal quality testing based on seams, and through confirmation in geophysical logs. This helps to achieve an unbiased representation of the coal quality.
Due to the steep bedding dips in the model areas, the seam groups are drilled to a much wider data spacing for the stratigraphically lower seam units. Therefore the holes drilled in the shallower sub-crop regions have a closer drill spacing than the lower seams in the down-dip regions. This is reflected in the JORC resources categorisation.

BURTON
JORC Reporting – Table 1 For Coal Resources as at 2019
Criteria Commentary Orientation of data in relation to geological structure
The ESPN deposit has steep to moderately steep easterly dips becoming steeper from south to north i.e. dips are steeper in Ellensfield South (approximately 15-30o) and shallower in Plumtree North (approximately 10-20o).
Holes are generally drilled vertically intersecting the steep-dipping coal seam strata. Whilst it could be argued that some west-dipping angled holes might be of value for seam thickness and structure definition, it is considered that this would not make any material difference to the definition of JORC resources.
Both normal and reverse faulting are present in the Burton model area. A significant number of drill holes have been interpreted to intersect faults. Fault induced features such as seam or burden thinning or thickening have been used to interpret faulting, and where fault intersections have been recognized, these are also used to define the fault positions in the model.
It is considered highly likely that although there are already a significant number of faults defined in the model, considerably more as yet undefined faults probably exist. The current drill hole spacing does not permit reliable modelling of all the faults in the ESPN deposit and this is somewhat reflected in the resource categorization. Whilst this faulting may have a significant impact on coal mine planning and operations, is not likely to materially impact on coal resources.
Geophysical deviation (verticality) data is routinely collected and used to correct any deviation of the borehole from vertical. This allows true seam thickness and position to be represented in structural and coal quality models. This is particularly important for a steeply dipping deposit such as ESPN.
Sample security All samples are taken directly after they have been drilled and lithologically/geotechnically logged.
Sample numbers are printed on unique NHE waterproof sample tags, which are stapled to the sample bag, facing outwards, so that they can be clearly identified.
Each sample is placed directly into the sample bag and is sealed off completely by twisting the sample bag and folding it over itself, before zip-tying it closed. This is to prevent moisture escaping, and the deterioration of coal properties.
Once the samples have been placed inside their corresponding plastic sample bags, they are placed inside large poly-weave sacks, which are then sealed and clearly labelled with relevant NHG and sample details. Information about the samples in these poly-weave sacks is recorded on the “Core Depth and Reconciliation Sheet”, which is then scanned into the electronic document filing system, with the original hard copy stored in the appropriate hard-copy borehole file.
Samples are then be placed in closed 44-gallon drums and dispatched as soon possible, usually within 24 hours of borehole completion. Wherever possible, a drum liner is used to keep moisture out of the drums.
The outside of the sample drums are clearly labelled with “New Hope Group” and the delivery address for the ALS laboratory. Also, the project name, drill hole number, number of poly-weave sacks in the drum, the drum number and the total number of drums for the hole.
A core sample consignment note is completed before samples are dispatched. The number of sample bags and drums is noted on this consignment note. A copy of the sample consignment note must remain with the sample drums when dispatched, and a copy must be retained and sent to the Senior Database and Modelling Geologist. The copy should be stored on site in its relevant hard-copy borehole folder.
Samples are stored in a cool, dry, shady location if they are waiting to be dispatched to the laboratory. This is because coal quality samples may oxidise or coking properties could be affected if exposed to extreme weather conditions.
Geotechnical samples are treated similarly because they may also deteriorate on prolonged exposure to hot weather.
Audits or reviews All data entry and modelling software used by NHG has built-in validations to ensure that data is clean.
NHG staff regularly undertake reviews on exploration processes, seeking continuous improvement in all tasks.

BURTON
JORC Reporting – Table 1 For Coal Resources as at 2019
Criteria Commentary External contractors and consultants have also completed reviews on exploration processes and on the geological database, and have made recommendations for data and/or process improvement, which have generally been implemented.
The ALS coal quality laboratory is audited by external auditors as a requirement under the NATA accreditation.
All coal quality results are reviewed by the ALS Project Manager & ALS Laboratory Manager before they are reported. All results are then reviewed by the Senior Geologist – Database & Modelling before they are loaded into the geological database with strict validation criteria. Once the data is modelled, it is reviewed by the Senior Geologist – Database & Modelling and the Chief Mining Engineer.
NHG have engaged coal technology consultant David Hornsby from Minserve Pty. Ltd. to advise with coal quality procedures, determine analytical instructions and composites, and with interpretation of laboratory results.
Review of the legacy data shows that the previous owners engaged Gallagher Consulting Services Pty Ltd to advise with coal quality procedures, determine analytical instructions and composites, and with interpretation of laboratory results.
All updates to the geological data or model are fully documented following internal checklists and reporting documentation.
All geological models are reviewed in a model presentation attended by all technical end users where feedback is obtained.

BURTON
JORC Reporting – Table 1 For Coal Resources as at 2019
Section 2 Reporting of Exploration Results (Criteria listed in the preceding section also apply to this section)
Criteria Commentary Mineral tenement and land tenure status
The Lenton Joint Venture (LJV) is a tenancy in common agreement between New Lenton Coal Pty Ltd (NLC), a subsidiary of New Hope Corporation Limited, and Formosa Plastics Group (FPG), a subsidiary of MPC Lenton Pty Ltd. NLC has a 90% controlling interest with the remaining 10% held by FPG. ML70109: Burton
Ownership held by the Lenton Joint Venture. The ESPN deposit is 120 km southwest of Mackay, 53km west-northwest of Nebo,
33km south of Glenden. Exploration occurs on ML70109 in preparation for mining activities. ML70109 is held by LJV. Expiry: 31 December 2022
ML70260: Plumtree North East
Ownership held by the Lenton Joint Venture. The ESPN deposit is 120 km southwest of Mackay, 53km west-northwest of Nebo,
33km south of Glenden. Exploration occurs on ML70109 in preparation for mining activities. ML70260 is in the process of being transferred to LJV as part of the purchase
arrangements with Peabody Australia Coal. Expiry: 31 December 2022.
Exploration done by other parties
Between 1966 and 1990 Plumtree area was explored for coal by Utah Development Company, Queensland Department of Minerals and Energy (DME) and Diversified Mineral Resources NL and also for coal seam gas by Mitsubishi Gas Corporation Resources Ltd (MGC).
From the early 1990’s exploration drilling at Burton was carried out by RAG Australia Coal Pty Ltd and Portman Mining Ltd until 2004 when the Burton project was sold to Peabody Energy Australia Coal Pty Ltd.
Peabody continued to actively explore the Burton area until Lenton Joint Venture purchased the Burton projects from Peabody in November 2017. This has resulted in a large number of drill holes covering the area. A large part of the legacy data set was acquired during this period. Most of the exploration and data interpretation work during this period was completed by McElroy Bryan Geological Service, Sydney. This work appears to have been of a high standard.
Geophysical Technology Ltd conducted a detailed handheld magnetometer survey over Plumtree deposit for the previous owners in 2001. This survey defined the Plumtree Sill that affects the southern end of Plumtree North deposit.
A further magnetometer survey was conducted in the area to the north in 2003 by G-Tek Australia Pty. Ltd.
Based on legacy data review the previous owners conducted multiple seismic surveys in the Burton mine areas to the north of ESPN but none of these appear to cover the current ESPN resource area.
Geology The Burton deposit is located in the Bowen Basin approximately 120km west-south-west of Mackay, Queensland. The ESPN deposits occur immediately south of the Burton open cut pits which were mined by Peabody until early 2017. Peabody’s Burton Mine produced coking and thermal coal for the export market.
The ESPN deposits are located on the eastern limb of the Nebo Synclinorium and target the Rangal Coal Measures (RCM). In broad terms, these coal measures are laterally continuous across the Bowen Basin and have been mined at numerous locations including the Burton pits immediately north of the ESPN deposits.
BURTON
JORC Reporting – Table 1 For Coal Resources as at 2019
Criteria Commentary The RCM and the underlying Fort Cooper Coal Measures (FCCM) occur within the Late Permian Blackwater Group. The RCM are overlain by sediments of the Triassic Rewan Group, with Cenozoic cover unconformably overlying the coal sequence.
The RCM are comprised mainly of fine to medium grained sandstone, siltstone, mudstone and coal. They range from 120m to 150m thick and contain the Leichhardt and Vermont seams. These seams undergo significant splitting and coalescing along the strike of the deposit.
The FCCM comprise grey lithic sandstones, siltstones, mudstones and coal. The Girrah coal seam is a thick unit but has high inherent ash, interbedded carbonaceous mudstones, and multiple tuffaceous claystone bands.
Ellensfield is located in a structurally complex area. Numerous small scale reverse faults have been identified in cores and geophysical logs. A fault zone, comprising several large normal faults trending approximately east-west is present in the north of Ellensfield. The coal measure strata are steeply inclined at dips ranging from 15° to 30° to the east-northeast. Large normal faults (>10m displacement) have also been interpreted within Ellensfield.
Plumtree is also located in a structurally complex area, however bedding strike is south-southwest with shallower dip ranging from 10° to 17°. Several major reverse faults (>10m displacement) have been interpreted.
Teviot Creek runs between the Ellensfield South and Plumtree North deposits and separates these deposits.
Multiple thrust and normal faults occur throughout the deposit, and have been detected by both seismic and drilling data acquisition.
A number of coal plies are now recognised and modelled in the RCM in the ESPN deposits. In descending stratigraphic order these plies include: BR, LU, LL, V3U, V3MR, V3M4, V3M3, V3M2, V3M1, V3U, V3L, V1UL, and V1L. Girrah seam (GRH1) is also modelled below this RCM sequence.
The product make-up at Burton has been investigated to contain a split between coking and thermal coal from the RCM.
Drill hole information Drill holes used for the bur_1809 model, and to define coal resources are displayed in Appendix 1.
There are 1078 drill holes in the Burton MineScape GDB database of which 874 were used in the bur_1809 geological model. This incorporates the following:
776 chip holes 61 legacy coal quality core holes 37 recent NHE coal quality core holes
Nearly all of the modelled holes intersect at least one of the RCM coal seams. Due to the steep dips, the seam sub-crops occur in zones and drilling has tended to be concentrated along these crop zones. Furthermore these steep dips cause a rapid increase in seam depth to the east and as a result few drill holes intersect the full RCM seam sequence.
All holes are drilled vertically and are routinely geophysically logged with a standard logging suite including verticality. Where holes have deviation data, this has been applied in the database and model.
All data is stored in the MineScape GDB database.
Data aggregation methods
Due to the nature of the seams at Burton, multiple core samples are usually taken over the coal sequence, and later combined for analysis on a coal ply basis as determined from geophysical signatures.
For historically sampled data where multiple samples have been taken for the same seam, MineScape Software assigns a composite coal quality value which is weighted on thickness and in-situ RD.
The Stratmodel Resolved quality model procedure has been used in the current model. This work was completed by Danique Bax of RPMGlobal consultants, Brisbane.

BURTON
JORC Reporting – Table 1 For Coal Resources as at 2019
Criteria Commentary Relationship between mineralisation widths and intercept lengths
The coal measures in the ESPN deposits sub-crop along the west of the lease area and dip steeply towards the east. They have also have been disturbed by faulting, seam splitting, igneous intrusives and erosional features.
Both recent NHG and legacy drilling intersections and seismic surveys provide evidence for the continuation of coal both down-dip and along strike from the ESPN model areas.
The coal resources at ESPN are also believed to extend past the mining tenure, however, resource estimates have been limited to the tenure held by the Lenton Joint Venture.
Holes are drilled vertically to intersect the steeply-dipping seams (seam dip is an average of 15-25o) and geophysical verticality logs are used to correct any deviation from vertical. Detailed density logs are used to ensure accurate coal seam depth interpretation.
Core sample depths are routinely adjusted to match geophysically picked seam sample depths.
Diagrams Drill hole location plan for holes used in the bur_1809 model is attached in Appendix 1.
Balanced reporting Coal quality samples from recent exploration drilling by NHG (BUR series) have generally been collected at a seam ply interval level. This differs from much of the legacy dataset whish have generally been collected on a composite seam interval basis.
The above is of some significance because the new bur_1809 geological model upon which the coal resource statement is based is a coal ply rather than a coal seam model. This means that not all of the available coal quality data for some holes has been utilized for the coal quality model. The use of the MineScape Resolved quality model has helped to reduce this impact.
In broad terms, apart from regional data trends and localized anomalies, the coal seam and ply qualities are considered to be quite consistent for this deposit. Therefore this issue of ply versus seam sample analyses is not considered to be of material importance to JORC resources. It is however recommended that further validation work should be undertaken on the legacy dataset to improve the overall integrity of the coal quality database and its suitability for mine planning purposes.
A small number of exploration holes have not been included in the geological model. This may be for reasons including missing geophysical logs, historical sampling techniques (as mentioned above) or low data reliability. Notwithstanding the above, there is considered to be sufficient drill hole coverage over the ESPN deposit for the definition of coal resources.
Other substantive exploration data
Seismic data acquisition has occurred at Burton by both the previous owners and also more recently by NHG in 2018. A review of this data shows that it supports the continuation of coal resources across the deposit.
Small-scale carbonisation testing has been completed for a number of drill holes. This confirms that some of the coal plies have significant coking properties.
Although the Girrah Seam has not been considered a coal resource in this current statement, a number of holes (both legacy and recent) were drilled to intersect this seam.
Initial seam ply correlation work showed that notwithstanding significant local geological variations, the Girrah seam coal plies can be correlated across the available holes with reasonable confidence.
Two holes cored and sampled the Girrah seam. These samples were analysed for coal quality at ply and seam intervals. Resulting laboratory results support a thermal coal product for the Girrah seam.
Further work No further coal quality core holes are planned to be drilled for the Ellensfield South and Plumtree North areas.
Additional geotechnical drilling is being considered in the ESPN area once operations commence.
Further data validation work, particularly for the legacy coal quality data set is planned ahead of mining operations.
BURTON
JORC Reporting – Table 1 For Coal Resources as at 2019
Section 3 Estimation and Reporting of Mineral Resources (Criteria listed in section1, and where relevant in section 2, also apply to this section)
Criteria Commentary Database integrity Lithology logging and sampling is carried out in the field and data entered directly into
LogCheck software, which has look-up fields to display prescribed codes in password protected dictionaries for each field in the lithology, header and drilling tables. In-built validations in the software ensure that the data is collected correctly in the field.
Exploration Geologists place a backup of their original lithology files onto the NHG network before adjusting their own drilling data to geophysics. This process allows the geologist to compare their lithology records, geophysics data and any available photography to apply verification to their field observations before passing their completed data package on to the Database & Modelling Geologists.
The Database & Modelling Geologists then reopen the data in LogCheck, and carry out validations on the data and check for record completeness. The data is exported for loading into the MineScape GDB database.
Coal quality data is validated by ALS under the conditions of their NATA accreditation. Further checks are completed by New Hope’s Database & Modelling Geologists, and are loaded into GDB which has strict validation criteria assigned in the project setup.
The GDB database contains automated validation processes which are activated during data loading and prevent invalid data from being loaded. This data gets stored in a temporary raw data table which displays error messages for any data that does not meet the validation criteria in GDB.
Once the data is loaded correctly, additional validations are performed either by viewing tabulated data and/or by plotting the data to a graphical format. In graphical formats, validation on interval depths and thicknesses, as well as correct seam naming can be confirmed and/or fixed.
Access to the GDB database is restricted to the Database & Modelling Geologists only. It is a password protected database. This is the database that is referenced in the geological models.
All Database & Modelling staff are deemed competent by NHG, and hold relevant qualifications and experience, and are trained in the necessary procedures to ensure the software is being used correctly.
External contractors and consultants have also completed reviews on exploration processes and the geological database, and have made some recommendations for data and/or process improvement which have generally been implemented.
Site visits The Ellensfield South and Plumtree North model area is not yet being mined, however is a brownfields project adjacent to existing Burton mining pits. Exploration activity during 2017/18 has been the only recent activity taking place.
NHG have had an exploration and operations team on site at Burton since early 2018. A number of site visits have been conducted by various NHG personnel since that time.
The Competent Person has not visited the site specifically, however has extensive experience in the surrounding deposits which mine coal within the Rangal Coal Measures.
Geological interpretation
A model holes template has been used in GDB to select all holes that are to be included in the structure model. This template is called bur_1809_holes and includes all holes with a “model flag” = “M”. A spatial exclusion limit has also been used to limit data. This spatial limit is set to exclude data outside the Ellensfield South-Plumtree North pit areas.
The model holes dataset predominantly include holes with reasonable geophysical data, however a small percentage of holes without geophysical data have also been included.
The model area extends outside the mining pits to allow the data to be controlled up to and just beyond these boundaries. Outside this area the holes are incomplete and have not been validated in this model.

BURTON
JORC Reporting – Table 1 For Coal Resources as at 2019
Criteria Commentary The current GDB database was developed from the previous GDB database, Lenton, project Burton. This database was then updated with data from the following sources:
New NHG exploration drilling data from 2018 (35 quality cores, 2 geotechnical cores, 32 chip holes and 107 LOX holes)
Missing coal quality data load for many older holes (Wenjing Lin) Missing LAS density-gamma and verticality data for many older holes (Wenjing
Lin) New seam and ply names and depths from the correlation exercise Corrections to a number of lithology records.
The focus of the bur_1809 geology model was on the Ellensfield South and Plumtree North mining pits. Holes outside this model area were generally excluded. A small number of holes with less reliable data were also excluded within the mining pit footprints. The excluded holes are summarised below:
Holes north of the Ellensfield South pit area have not been reviewed Holes south of Plumtree North pit area have not been reviewed Two faulted holes were removed late in the modelling process to allow the seams
to project through the fault plane without pinching out - BD671 & BD687 Some abandoned holes.
NHG conducted a 2D seismic survey in 2018. Whilst this seismic data has not been specifically used in the bur_1809 model, it was examined and supports the continuity of the coal seams down-dip.
Dimensions The ESPN deposit is relatively small in dimensions. It has total strike length of approximately 4km i.e. Ellensfield South 1.4km long and Plumtree North approximately 2.4km long.
Due to its steeper seam dips Ellensfield South is narrower, approximately 400m wide, covering an area of approximately 66 hectares. All of this area is covered by coal resources reported in accordance with The 2012 JORC Code. Based on seismic data it is likely that the seams extend down-dip beyond the current resource limits.
Due to its shallower seam dips Plumtree North is wider, approximately 800m wide, covering an area of approximately 212 hectares. All of this area is covered by coal resources reported in accordance with The 2012 JORC Code. Based on seismic data it is likely that the seams extend down-dip beyond the current resource limits.
The coal resources at Burton are also believed to extend east past the mining tenure (ML70109), and a separate tenure (ML70260) has been granted in this eastern areas. However, resource estimates have been limited to ML70109.
The coal measures strike at approximately NNW to SSE in Ellensfield South, and approximately NNE-SSW in Plumtree North.
The average base of weathering across the deposit is 19m.
Estimation and modelling techniques
A geological model (bur_1809) was generated using the Stratmodel module in MineScape software. Model schema bur_1809 was used. Drill holes included in the model are described above. The structure grids were built using the grid sheet specification, bur_1809_10m and is summarised below:
Model Name (Schema): bur_1809 Bounding Coordinate, North: 7606800 Bounding Coordinate, South: 7602000 Bounding Coordinate, East: 623700 Bounding Coordinate, West: 621900 Grid Cell Size: 10m Rotation of Grid: 0.000 Roes in Grid: 571 Grid Length: 5700m Columns in Grid: 201 Grid Width: 2000m Total Area: 8.64km2

BURTON
JORC Reporting – Table 1 For Coal Resources as at 2019
Criteria Commentary The schema for the bur_1809 model is bur_1809. A MineScape table model and grid model, both named bur_1809, were generated using this schema. The model area only covers the Ellensfield South and Plumtree North mining pits.
There are 16 MineScape modelled elements in the bur_1809 model. These include 2 surface elements, BHQT (Base of Quaternary sediments) and BHWE (Base of Weathering). They also include the model intervals: BR, LU, LL, V3U, V3MR, V3M4, V3M3, V3M2, V3M1, V3L, V2 (Yarrabee Tuff), V1U, V1L, and GRH1 (Girrah). A quality model has been completed for all except the GRH1 seam.
There are also Compound (or parent seam) model intervals defined for these elemental intervals.
Two Conformable Sequences were defined in the schema. The weathered zone is defined by WEATH with Trend Surface Topo_2017 and Lowest Interval BHWE. The fresh zone is defined by COAL with no trend surface and down to Lowest Interval GRH1. All intervals are pinching conformable units.
The modelling interpolator used was FEM for Thickness, Surface and Trend with Power/Order of 0, 1 and 0, respectively. Lithology has not been modelled. No extra survey data has been included in the model for seam geometry enhancement.
Limits data has been included in the model to control the seams in areas of igneous intrusions. This data has been interpreted during the model build process and is stored in design file limits_1809. These limits relate primarily to the presence of igneous sills in the Leichhardt seam at the southern end of Plumtree North, however one limit also has been used to help control a fault. These limits should be reviewed when the next model is being generated, particularly if any new data becomes available.
It is considered unlikely that significant additional igneous intrusive units will be encountered within the mining footprint for the ESPN pits. However there is a possibility that some small intrusive bodies may project into the southern part of Plumtree North pit from the large sill at its southern end. These if present would most likely be dykes sourced from the sill. The intrusives intersected in BUR108 may be an example of such a dyke.
The V1 seam is affected by an igneous intrusion in holes BD219 and BD604 south of the PN pit shell. Whilst these holes do not affect coal resources, it suggests that there is also some scope for intrusions to occur in the Vermont seam intervals.
Some consideration has been given to the possibility of such intrusives in the definition of polygons for resource categorization.
There are 23 faults (both normal and reverse) modelled in the bur_1809 geological model. These faults all affect the full seam sequence from BR down to GRH1 seam.
In addition, there are believed to be many additional relatively small faults in the ESPN deposits that have not yet been modelled. Estimated positions for some of these potential faults have been drawn onto the layer possible_faults in design file faults_1809.
A large igneous sill with possible associated igneous dykes occurs at the southern end of Plumtree North. The geological review undertaken as part of this modelling exercise has confirmed the presence of this igneous sill. It intersects and affects the Leichhardt Seam in a series of drill holes at the south eastern part of Plumtree North. It appears to occur mostly outside the proposed mining pit outline but it does enter the pit along the southernmost highwall position and may affect the Leichhardt seam. The resource boundary polygon for the Leichhardt seam has been adjusted to reflect the presence of the intrusive sill.
The topographic surface used in the bur_1809 model is “Topo_2017”. This was used to help control the Base of Weathering in areas where there is limited drill hole control.
The survey datum for Burton is Australian Map Grid (AMG/AGD84) Zone 55 and Australian Height Datum (AHD). Available original field documentation does not appear to explicitly state the exact survey datum (i.e. AMG66 versus AMG84), however, review of maps within final drilling reports prepared by McElroy Bryan Geological Services show the datum as AMG84. No survey or blast hole data has been included in the model.
Moisture Resources are calculated based on in-situ volume multiplied by relative density as reported on an air-dried basis, and no adjustments for moisture are applied.
BURTON
JORC Reporting – Table 1 For Coal Resources as at 2019
Criteria Commentary Cut-off parameters As a general rule, minimum seam thickness is considered to be 10cm to be interpreted and
modelled. There may be rare exceptions to this where a very thin unit has been picked in order to provide better control in the geology structure model.
Separable stone parting thickness limit is generally considered to be 30cm, however there may be instances where thinner partings have been defined.
50% maximum Raw Ash cut off has been applied to cut off coal resources. This has restricted coal resources for the BR, V3MR, V3M1 and V3L seams.
Only fresh coal below the Base of Weathering (BHWE) have been included as resources.
The coal from the ESPN deposit is considered to be suitable for both coking and thermal coal products. Careful seam ply mining will be needed to separate these product types.
Mining factors or assumptions
The Burton deposit is only considered to include only open cut mining resources within the Rangal Coal Measures. Open cut mining methods using truck and shovel operations are anticipated.
The coal resources have been constrained to within ML70109 which is tenure securely held by the Lenton Joint Venture (LJV).
Site access will be from the existing Burton infrastructure.
Historically the coal seams at Burton were not normally split into different working sections during mining. This is reflected in the core sampling methodology which treated large composite samples rather than individual plies for analysis. However, the recent drilling results suggest that coal quality varies by ply across the deposit and it has been recognised that a number of coal plies can produce a coking product while others will yield a thermal coal product. A key challenge to mining is to identify where these new coal ply boundaries are located within the seams.
The recent NHG work has split up the Leichhardt and Vermont seams into additional coal plies with the aim to better understand the coal quality and to and identify selective mining opportunities. These new ply boundaries were picked based on geophysical signatures with a total of 11 different coal plies identified within the two seams (2 for Leichhardt and 9 for Vermont) plus the Burton Rider (BR) ply above the Leichhardt seam. This additional coal ply detail may provide opportunities to optimise product coal type and yield, in particular, the identification of the highest quality coking coal intervals will add maximum value to the business.
A more complex method for selectively mining these new coal plies is anticipated. This method will require the coking coal working sections to be identified on the basis of coal quality and for these working sections to be mined separately and accurately.
Due to the nature of the coal seams, the pit identification of these coal plies may be difficult, especially where they coalesce i.e. Ellensfield South and the northern part of Plumtree North. Notwithstanding the above, these plies can generally be picked from geophysical log signatures and with some geological pit familiarisation this should allow them to be separated to reasonable mining tolerances.
Given the number of interpreted faults in the Ellensfield South and Plumtree North areas, and some historic evidence of geotechnical instability experienced during mining of the Burton pits, appropriate methods for managing the geotechnical stability of the open-cut environment may need to be implemented for mining operations, which not an uncommon practice elsewhere in the Bowen Basin.
Although faulting is common in the ESPN deposits, no specific resource constraints have been applied to the modelled faults.
Metallurgical factors or assumptions
Preliminary washplant assumptions are based off the performance of the Rangal Coal Measures from operating mines in the Bowen Basin, as well as historical Burton wash plant data from the previously operating pits.
The ESPN deposits are located immediately south of the Burton Mine which produced coking and thermal coal for export market from the Rangal Coal Measures. The close proximity of this previous operation supports the assumption that coal products from Burton will be similar.
The coal from ESPN seams is considered to be suitable for both coking and thermal coal products.

BURTON
JORC Reporting – Table 1 For Coal Resources as at 2019
Criteria Commentary Environmental factors or assumptions
The ESPN deposits are a brownfield project on ML70109.
Whilst Inferred resources have been defined in the Teviot Creek area between the Ellensfield South and Plumtree North deposits, this area is a water course and further consideration may be required in terms of environmental approvals.
No other significant environmental constraints are known.
Bulk Density Resources are calculated based on in-situ volume multiplied by relative density as reported on an air-dried basis, and no adjustments for moisture are applied.
Seam density is based on Relative Density results obtained from the laboratory, and are reported on an air-dried basis.
The density of roof and floor dilution material is also analysed on an air-dried basis at the laboratory. This dilution data has not been used in seam thickness or density calculations.
Classification The ESPN deposits includes resources in Measured, Indicated & Inferred categories.
Points of Observation (POO) for all resource categories are based on core holes that have raw ash analysed for the seam group (as a minimum). Core holes are also geophysically logged, and aid in the interpretation for structural continuity. Analysed samples provide evidence of coal quality, and allow the level of variability to be measured. Core loss is also taken into account as a POO criterion.
These Points of Observation are supported by a large number of geophysically logged and validated chip holes. These chip holes significantly improve the confidence in seam correlation between the POO’s and help to confirm seam quality based on geological and geophysical logging.
Measured resources are based on Points of Observation at 200m centres
Indicated resources are based on Points of Observation at 300m centres
Inferred resources are based on Points of Observation at 500m centres
The above resource category definitions are considered to be reasonable limits for resource risk categorization in this deposit. The relatively low spacing for POO’s is considered justifiable to the steeply dipping strata in the deposit.
Only the Leichhardt and Vermont seams (including their various respective coal ply intervals) have been considered for resource definition. The BR seam is thin and high Ash and had no resources defined.
The Girrah seam is very thick and contains some thin bands of moderately good quality coal, however it has not been included as a coal resource as the limited available data suggests it may be of poor quality.
A conservative approach has been adopted to defining the resource polygons. This is to remove the “spotted dog” issue. Generally the eastern down-dip resource limit is defined as a line connecting the collars of the last line of drill holes i.e. resources don’t generally project beyond these collars.
Whilst a detailed geostatistical study has not been undertaken for this deposit, seam thickness and seam quality statistics were reviewed as part of the resource limit determination process.
There are many geophysically logged chip holes in the model supporting the POO’s to help demonstrate seam continuity.
The stratigraphically higher seams e.g. Leichhardt Seam are generally better represented in drill intersections than the deeper seams. This plays a significant factor in resource definition and this is reflected in the JORC categorization.
Another factor affecting the resource confidence is the methodology for seam sample compositing for the legacy cored holes. This has limited the number of ply based data points available for coal quality parameters. This has been partly addressed by use of the MineScape Resolved Quality model process but warrants further more detailed review in the future.
The northern resources limit for the Ellensfield South deposit has been defined as the old Ellensfield pit coal toe leaving a 20-25m wide buffer.

BURTON
JORC Reporting – Table 1 For Coal Resources as at 2019
Criteria Commentary Audits or reviews A review of the bur_1809 geological model and its outputs has been conducted in-house
by a range of technical staff, including the Senior Geologist – Database & Modelling, the Senior Mining Engineer, Chief Mining Engineer, and the Geology Manager/Competent Person.
Experienced database consultants were asked to validate and to load the legacy LAS data and coal quality data into the Burton Project in the Lenton GDB database. In addition, the new NHG exploration data was also loaded into the GDB database. This GDB legacy data was then subjected to the data validation and seam ply correlation work by the project team. This team comprised experienced NHG personnel and external contractors. This validation work has improved the data set significantly.
The bur_1809 geology model was generated in two parts by experienced external consultants – the structure model and the coal quality. This provides a further independent check of the database integrity.
Discussion of relative accuracy/confidence
A NHG review of the Burton geological data in early 2018 showed that whilst some good geological work had been undertaken by the previous owners, there were some data issues and errors as well as inconsistencies in coal seam correlations. In particular, the seam nomenclature in the legacy data was not considered sufficiently detailed to allow segregation of individual coal plies for determination of coking versus thermal product types. These issues were considered significant and had the potential to impact on the value of the coal resources.
To resolve the above issues, NHG initiated a program to review, validate and adjust the coal ply correlations. This work included a new exploration program, data validation, and subsequent geological model update. This new geology model bur_1809 forms the basis for this statement of coal resources.
As mentioned in this document, there are some opportunities to improve the geology model, however whilst these improvements are expected to make a tangible improvement for mine planning purposes, they are unlikely to have a material impact on coal resources.
There is a high level of confidence in the structural continuity and coal quality of the ESPN deposits. This is supported by its close proximity to neighbouring pits and operations which have successfully mined the Rangal Coal Measures as an export quality coal.
The confidence in coal seam continuity over the ESPN deposits is supported by the drill holes included in the geology model and also by the recent NHG seismic surveys.
Accuracy and confidence of Mineral Resource estimations have been accepted by the Competent Person.

BURTON
JORC Reporting – Table 1 For Coal Resources as at 2019
Section 4 Estimation and Reporting of Ore Reserves Reserves have not been quoted for Burton for the reporting period.

BURTON
JORC Reporting – Table 1: Appendix 1 For Coal Resources as at 2019

LENTON
JORC Reporting – Table 1 For Coal Resources and Reserves as at 2016
Section 1 Sampling Techniques and Data (Criteria in this section apply to all succeeding sections)
Criteria Commentary Sampling techniques New Hope Exploration (NHE) have a set of Field Operations Procedures which establish
the minimum requirements for each exploration task, including the best practices for the collection of geological data for use in resource models.
All staff are deemed competent by New Hope Group (NHG), and hold relevant qualifications and training competencies required to carry out these tasks.
Drilling campaigns at Lenton have taken on various forms, including chip drilling; and core drilling for coal quality, gas sampling and geotechnical analysis.
Commentary herein generally refers to current NHG practices, unless otherwise stated.
For the recent NHG open holes, the drill cuttings (chips) are laid out for every metre drilled for the Exploration Geologist to describe and record in their lithology logs.
Metre markers on the mast of the drill rig assist the Drill Crew to identify the sample boundaries.
It is standard practice for the Drill Crew to collect drill cuttings in a sieve and to place them in an orderly manner in the designated sample layout area.
The Exploration Geologist then logs the metre samples to identify and describe standard lithological characteristics. Lithological depths are later confirmed with geophysics, particularly for coaly units.
All core holes are logged and sampled directly from the core table in the field. Depths are measured using a tape measure per core run, with an understanding of the depth in the hole from Drillers measurements.
As per NHE procedures, standard coal quality core sampling parameters are defined to ensure consistency in sampling:
All coal in the drill hole is sampled, regardless of thickness; All carbonaceous material is sampled, regardless of thickness; All stone bands are sampled separately, regardless of thickness, except large
interburdens (>50cm); If the coal in one run is continued in the next run they are split into two samples to
ensure there is no risk in sample loss between core runs; Core loss in the middle of a sample is not allowed. Separate samples above and
below core loss are taken.
All coal quality samples are sent to ALS (ACIRL) at Richlands, Queensland, which is an accredited laboratory under the National Association of Testing Authorities (NATA). In compliance with NATA, all samples are prepared and analysed using methodologies stipulated in the Australian Standards. Gas sampling has been conducted regularly throughout exploration campaigns at Lenton. Samples of coal from selected locations in the coal sequence were placed into gas canisters, then sealing to ensure no gas could escape. These samples had a maximum thickness of 80cm. Q1 testing for lost gas was carried out on site. The samples were then immediately transported to the Mackay GeoGas laboratory and analysed in accordance with the Q2 (desorbed gas) & Q3 (residual gas) testing procedures for gas sampling. GeoGas Mackay is a NATA accredited laboratory. Geotechnical sampling has been carried out throughout various exploration campaigns at Lenton. Defect logging and samplings have been completed by both NHG staff & contract geologists, and by representatives of GHD Pty Ltd from Brisbane, who also finalised the reporting for Lenton. Samples were (on average) 30cm in length, and were collected from sandstone, siltstone, and interbedded sandstone/siltstone units, from overburden,

LENTON
JORC Reporting – Table 1 For Coal Resources and Reserves as at 2016
Criteria Commentary interburden and basement materials. All samples were analysed at Trilab laboratories in Brisbane. Trilab, Brisbane, is a NATA accredited laboratory. Once the drilling of the hole is complete, downhole geophysical logging is carried out on all holes that intersect coal. As a minimum, dual density (long-spaced density & short-spaced density), gamma and caliper trace data is collected in each hole. Historically, the microdensity tool has also been used. In recent times, it has become standard to log all holes with the deviation tool. Sonic data is also acquired in some holes across the deposit. Where holes are drilled for geotechnical purposes, the acoustic scanner tool is also utilised.
Drilling techniques All holes drilled in coal are planned for vertical drilling.
Holes are drilled using either air or water as a drilling medium.
Open/chip holes at Lenton vary in size and in the drill bit used. These holes are commonly used to define structure, coal seam continuity and lines of oxidation (LOX lines).
Most commonly, chips holes are drilled with PCD bits with 114mm diameter. Blade bits have also been used for chipping (with the same bit size). Some chip holes have 120mm diameters also.
Basalt is encountered in some areas of the Lenton deposit, and these intersections are commonly drilled with a hammer bit of 120mm.
Coal quality samples are most commonly collected from holes with a core size (diameter) of 4-inches or 63mm (HQ), as this size yields the required sample mass to carry out coal quality testing for the products at Lenton. 152mm (6-inch) holes have also been drilled across the deposit for more detailed coal quality investigations.
Gas drilling and geotechnical sampling have been conducted using HQ drilling (nominal core diameter of 63.5mm).
Drill Sample Recovery Core Depth and Sample Reconciliation is recorded noting drilled depths and recovered thicknesses for each core run.
Coal seam depths are confirmed when the geophysical logging is completed.
Core loss and core expansion are accounted for in the field, by using observations in the core. For example, core recovery thickness discrepancies, broken core, crushed zones, swelling lithologies and groove marks caused by over-drilling are all indicators of these core states, and with careful data recording and confirmation with geophysics, are assessed and appropriately logged to record an accurate geological interpretation of the downhole lithology.
The drilling supervisor is notified when core loss in coal is greater than 5% or if substandard core is being presented to the geologist. Coal intervals with unacceptable drill core recoveries are excluded from the model.
NHE routinely employ leading standards to ensure core sample recovery and representativeness. The sample length measured on the core board is placed into the sample bags, being separately carefully into individual ply or parting samples.
Drill core is cleaned of drilling fluids/clays (so that it can be examined clearly) prior to recording lithological information.
Separating adjacent samples is typically carried out using a paint scraper. If the core is a bit harder in one area, a hammer and bolster is used to break the core at this point.
Logging When drilling chip holes, for every metre drilled, the drill cuttings (chips) are laid out in individual piles representing that metre for the geologist to describe in their lithology logs. Geophysical logging is then performed in order to provide accurate depths for coal seam corrections.
Core length measurements are recorded for depth reconciliation purposes. The core depths and sample intervals are then marked on core boards, which sit alongside the core on the table. All samples are given unique NHE sample numbers, which are transcribed into the lithology logs as the geologist logs the core.
Cored intervals are photographed at 0.5m intervals at high resolution, prior to placing the core samples into sample bags for laboratory dispatch. An overlap of the previous and following photographing area is included to allow core photo continuation and matching.

LENTON
JORC Reporting – Table 1 For Coal Resources and Reserves as at 2016
Criteria Commentary Core photographs are utilised in data quality control, to establish core loss/expansion, to assist in core sample laboratory testing instructions, and as a permanent record of borehole lithology and the decisions made by the exploration geologist on the rig.
Geophysical logging is then performed to give accurate coal seam depths, and the lithology is reviewed against the geophysics to confirm that seam thickness recoveries are acceptable. All data collected in the field, including photographs, is saved electronically. All paperwork is stored in hardcopy borehole files at Corporate Office.
Downhole geophysical logging is carried out on all drill holes. As a minimum, dual density (long-spaced density & short-spaced density), gamma and caliper trace data is collected in each hole. Historically, the microdensity tool has also been used. In recent times, it has become standard to log all holes with the deviation tool. Sonic data is also acquired in some holes across the deposit. The acoustic scanner tool is used for geotechnical drillholes.
NHE own and operate their own fleet of geophysical logging trucks. All logging staff are appropriately licensed for transportation and use of radiation sources for logging and hold relevant qualifications & training competencies to carry out the required tasks.
NHE have drilled a calibration hole at Lenton, which allows the logging truck operators to ensure the tools are appropriately calibrated.
Sub-sampling techniques and sample preparation
Once the lithology and the defects in the core have been logged, the samples are separated out using the intervals marked on the core boards, and placed into their corresponding sample bag. The criteria for identifying samples can be seen in the “Sampling Techniques” section at the top of this table.
Core is sampled immediately after drilling, once it reaches the surface. This sample preparation technique is most important for retaining coal quality properties for accurate analysis.
To ensure that sample integrity is maintained, plastic sample bags are used.
NHE have developed a unique sample numbering system to prevent sample number duplication.
Sample numbers are printed on waterproof sample tags, which are stapled to the sample bag, facing outwards, so that it can be clearly identified.
To ensure that the sample is sealed off completely, the sample bag is twisted off and folded over itself before zip-tying it closed.
All coal quality samples are sent to ALS (ACIRL) at Richlands, Brisbane, which is an accredited laboratory under the National Association of Testing Authorities (NATA). In compliance with NATA, all samples are prepared and analysed using methodologies stipulated in the Australian Standards.
Coal quality analysis at Lenton is carried out in multiple stages: (1) Drop Shatter; (2) Raw Coal Analysis (3) Fresh Floats Analysis at a density cut point of F1.375; (4) Sizing Properties Analysis; (5) Float/Sink Analysis; (6) Froth Flotation; (7) Product Composite Analysis.
Following the Australia Standards, the laboratory representatively splits the samples into portions in order to perform the coal quality analysis required. For Lenton, one-eighth of the sample is used for Raw Analysis, another one-eighth is used for fresh floats, and the remaining three-quarters are reserved for sizing analyses, washability, and Clean Coal Composite analysis. Clean Coal Composites are carried out on a cumulative cut point which targets an ash product, and is nominated based on the results of Washability analysis.
Quality of assay data and laboratory tests
All coal quality samples are sent to ALS (ACIRL) at Richlands, Brisbane, which is an accredited laboratory under the National Association of Testing Authorities (NATA) to perform analytical testing to the to the ISO 17025 and ISO 9001 Standards (Certificate number 15784-857). In compliance with NATA, all samples are prepared and analysed using methodologies stipulated in the Australian Standard AS4264.1-2009 for coal and coke sample preparation.
NATA accreditation involves regular external audits of the management, training and control procedures in the laboratory to ensure that the processes are documented, precise, accurate and validated. As such, the quality of testing is appropriate.
All testing is performed using well-recognised national or international processes (standards) which are considered appropriate for the testing and analysis of coal samples.

LENTON
JORC Reporting – Table 1 For Coal Resources and Reserves as at 2016
Criteria Commentary Carbonisation testing has been conducted for some cores.
Geophysical tools are serviced annually by DGRT Pty Ltd at Acacia Ridge in Brisbane, QLD. There are four main geophysics tools for used for logging coal exploration holes:
Auslog A605 Dual Density Tool Sample interval 2cm; logging speed 4m/min; reading time 0.3sec. Density calibration is detailed above. Gamma is calibrated to a thorium source. Caliper is calibrated to readings of 50.8, 101.6, 152.4, 203.2 and 254mm using a standard gauge. NHE calibrate the caliper to point to point calibration, as opposed to a line of best fit.
Auslog A605FR Dual Density Tool Sample interval 0.05cm; logging speed 3.3m/min; reading time 0.3sec. Density calibration is detailed above. Gamma is calibrated to a thorium source. Caliper is calibrated to readings of 50.8, 101.6, 152.4, 203.2 and 254mm using a standard gauge. NHE calibrate the caliper to point to point calibration, as opposed to a line of best fit.
Auslog A698 Deviation Tool Sample interval 5cm; logging speed 6m/min; reading time 0.5sec. Factory calibration settings have been applied for this tool.
Auslog A799 Full Wave Sonic tool Sample interval 10cm; logging speed 4m/min; reading time 1.5sec. Factory calibration settings have been applied for this tool. Review of available legacy information indicates that similar logging techniques were observed by previous owners.
Verification of sampling and assaying
All lithology data is data is entered directly into LogCheck data entry software in the field, which has been designed specifically for coal exploration. LogCheck has been programmed with validation criteria to ensure all data loaded is clean of critical data entry errors. All validation tools and dictionaries are password protected.
The geophysical logs are loaded into LogCheck, and compared with the lithology observed by the geologist through the Graphic Editor module. Once the correlation between the coal seam observations in the lithology and the geophysics has been established, the lithology depths are adjusted to match the geophysical signatures. A copy of the original lithology log is stored in backup in case errors occur in the depth adjustment process.
When all seam names have been confirmed as correct, sample summaries are generated from LogCheck, giving the sample number, sample depths and description of the sample against seam names, which provide the basis for laboratory coal quality instructions. Laboratory instructions are then provided on a seam-by-seam basis.
At the laboratory, all samples are registered into both Coal8 & LabSys – ALS’s own sample tracking software systems (approved by NATA). This registration is confirmed by the Project Manager against the original client instructions, and each sample and it’s subsequent sub-samples are affixed with a designated sticker containing all the sample details and a barcode that is scanned.
Samples are analysed according to client procedures. As samples are analysed the barcode is used to log each result to that sample.
Results are quarantined and repeated if they do not meet the requirements of the appropriate Australian or ISO Standards. Controls are run with each batch of samples to ensure the testing apparatus is operating properly. Project Managers and Laboratory Managers/Supervisors approve these results. The use of twinned holes is not a typical practice in coal exploration for validating results.
Laboratory supervisors collate and validate the data, looking for abnormalities in the results. In particular looking for data trends through cross plots of the results on a seam by seam basis. Typical industry practices include the comparison of the key qualities such as: Ash vs. Relative Density, Volatile Matter vs. Ash, Specific Energy vs. Volatile Matter, Ash vs. Total Sulphur.
The laboratory provides the results in a variety of formats, including:
Preliminary results templates - all data for each stage of analysis in one Excel file; updated with data at completion of each stage of analysis;

LENTON
JORC Reporting – Table 1 For Coal Resources and Reserves as at 2016
Criteria Commentary CSV templates of final data in the correct format for loading directly into the
geological database; and, Final PDF reports with the final analytical results for each sample. These include
sample instructions provided by the client, and list the Australian Standards used. These are signed off by the Laboratory Manager to verify compliance with the standards.
All final coal quality data files from the laboratory are loaded into the geological database using standard GDB data load specifications, so as to reduce the risk of typographic errors, and minimise data handling. The coal quality models are built directly from the GDB database. No changes are made to the results, unless verification checks confirm an anomalous result, which are edited individually to match the final laboratory result.
The GDB geological database has built-in validation parameters to ensure all data is entered correctly. It also has restricted access and is password protected.
All geological data is stored both electronically and in hardcopy, using NHG practices outlined in Field Operations Procedure’s & Guidance Notes.
Hardcopy borehole files are stored in a secure fire-proof room at NHG Corporate Office.
Location of data points All location data at Lenton is collected using the AGD84 datum, and Australian Map Grid zone 55K projection. All elevation data is recorded in Australian Height Datum (AHD)
All boreholes are planned and drill sites are located using handheld GPS units. Once drilled, all holes are then accurately surveyed using differential GPS for the provision of coordinates to the geological model at an accuracy of less than 5cm.
Previously Moultrie Survey and JTH Surveys Pty Ltd (Jofe Graham-Jenkins) have provided surveying services to NHE at Lenton.
More recently Cottrell Cameron & Steen surveyors (CCS) have provided surveying services to NHE’s exploration sites over the last five years. CCS carry out surveys using RTK GPS which has a relative positional accuracy of approximately 50mm. Borehole surveys are connected to the State Control Network to ensure absolute positional accuracy of approximately 100mm.
The topography surface used in the geological model was created through the acquisition of LiDAR data on a 1m grid across the deposit, combined with SPOT survey points when the exploration tenure extended further than the LiDAR limits.
Selected coal seam roof elevations are used as survey points from 2D & 3D Seismic Surveys, to assist with constraining the geological model.
Data spacing and distribution
On average, the core hole spacing at Lenton is 146m. For open/chip holes, the average spacing is 122m.
NHG are able to demonstrate, with a high degree of confidence, that the coal seams at Lenton are laterally continuous, through the collection of geophysical data across the deposit.
For fault delineation programs, drill hole placement is reduced to 50m along lines that are separated by an average spacing of 50m.
Coal quality samples are taken on a ply-by-ply basis, and combined for coal quality testing based on seams, and through confirmation in geophysical logs.
Orientation of data in relation to geological structure
The Lenton deposit has an overall dip of approximately 15-25o to the north-north-west.
Holes are drilled vertically to intersect coal seam strata.
Drag-induced seam-steepening occurs around faults, and drill hole spacing across faults is reduced to ensure the seam behaviour is appropriately represented.
Coal quality samples are taken on a seam-by-seam basis, in order to achieve an unbiased representation of the coal quality.
Geophysical deviation (verticality) data is routinely collected and used to correct any deviation of the borehole from vertical, and allows true thickness to be represented in structural and coal quality models.
Sample security All samples are taken directly after they have been drilled and lithologically/geotechnically logged.

LENTON
JORC Reporting – Table 1 For Coal Resources and Reserves as at 2016
Criteria Commentary Sample numbers are printed on unique NHE waterproof sample tags, which are stapled to the sample bag, facing outwards, so that they can be clearly identified.
Each sample is placed directly into the sample bag and is sealed off completely by twisting the sample bag and folding it over itself, before zip-tying it closed. This is to prevent moisture escaping, and the deterioration of coal properties.
Once the samples have been placed inside their corresponding plastic sample bags, they are placed inside large poly-weave sacks, which are then sealed and clearly labelled with New Hope’s specific information. Information about the samples in these poly-weave sacks is recorded on the “Core Depth and Reconciliation Sheet”, which is then scanned into the electronic document filing system, with the original hard copy stored in the appropriate hard-copy borehole file
Samples are then be placed in closed 44-gallon drums and dispatched as soon possible, usually within 24 hours of borehole completion. Wherever possible, a drum liner is used to keep moisture out of the drums.
The outside of the sample drums are clearly labelled with “New Hope Group” and the delivery address for the ALS laboratory. Also, the project name, drill hole number, number of poly-weave sacks in the drum, the drum number and the total number of drums for the hole.
A core sample consignment note is completed before samples are dispatched. The number of sample bags and drums is noted on this consignment note. A copy of the sample consignment note must remain with the sample drums when dispatched, and a copy must be retained and sent to the Senior Database and Modelling Geologist. The copy should be stored on site in its relevant hard-copy borehole folder.
Samples are stored in a cool, dry, shady location if they are waiting to be dispatched to the laboratory. This is because coal quality samples may oxidise or coking properties could be affected if exposed to extreme weather conditions.
Geotechnical samples are treated similarly because they may also deteriorate on prolonged exposure to hot weather.
Audits or reviews All data entry and modelling software used by NHG has built-in validations to ensure that data is clean.
New Hope Group staff regularly undertake reviews on exploration processes, seeking continuous improvement in all tasks.
External contractors and consultants have also completed reviews on exploration processes and the geological database, and have made minor recommendations for data and/or process improvement, which have been implemented.
The coal quality laboratory is audited by external auditors as a requirement under the NATA accreditation scheme.
All coal quality results are reviewed by the ALS Project Manager & ALS Laboratory Manager before they are reported. All results are then reviewed by the Senior Geologist – Database & Modelling before they are loaded into the geological database with strict validation criteria. Once the data is modelled, it is reviewed by the Senior Geologist – Database & Modelling and the Chief Mining Engineer.
All updates to the geological data or model are fully documented following internal checklists and reporting documentation.
All geological models are reviewed in a model presentation attended by all technical end users where feedback is obtained.

LENTON
JORC Reporting – Table 1 For Coal Resources and Reserves as at 2016
Section 2 Reporting of Exploration Results (Criteria listed in the preceding section also apply to this section)
Criteria Commentary Mineral tenement and land tenure status
The Lenton Joint Venture (LJV) is a tenancy in common agreement between New Lenton Coal Pty Ltd (NLC), a subsidiary of New Hope Corporation Limited, and Formosa Plastics Group (FPG), a subsidiary of MPC Lenton Pty Ltd. NLC has a 90% controlling interest with the remaining 10% held by FPG. ML70337: Lenton
Ownership held by the Lenton Joint Venture 120km south west of Mackay Exploration occurs on ML70337 in preparation for mining activities. Expiry: 30 June 2023
MLA70456: Lenton
Ownership held by the Lenton Joint Venture 120km south west of Mackay The approvals process for this mining lease has been ongoing since 2011, and an
EIS application extension was submitted and approved by the department of Environment and Heritage Protection (DEHP).
EPC766: Lenton
Ownership held by the Lenton Joint Venture 120km south west of Mackay Restricted Areas (RA49) Isaac River – Condition 1 – Future Dam Site Exclusion of overlapping Mining Lease tenure for ML70337 & adjacent Burton
Mine Mining Lease. Co-development Agreement in place with Arrow Energy Expiry: 2 September 2021
EPC865: Lenton North
Ownership held by the Lenton Joint Venture 120km south west of Mackay Exclusion of overlapping Mining Lease tenure for ML70337 & adjacent Burton
Mine Mining Lease. Co-development Agreement in place with Arrow Energy Expiry: 7 June 2021
EPC1675: Lenton West
Ownership held by the Lenton Joint Venture 120km south west of Mackay Native Title Protection Conditions on 1 sub-block in the far west (distal to Mining
Lease/Application) Expiry: 30 May 2021
Exploration done by other parties
Exploration drilling at Lenton has been carried out since the early 1990’s. Several companies have drilled in the tenure in this time, including: Utah Development Company (UDC); Mitsubishi Gas Corporation Resources (MGCRA); Diversified Mineral Resources (DMR); and Burton Coal. New Hope Exploration was granted exploration tenure in 2002.
Seismic surveys were acquired by MGCRA in the early 1990’s.
Geology The Lenton deposit is located approximately 120km west-south-west of Mackay, Queensland; and immediately west of Peabody’s Burton Mine which produces coking and thermal coal for export market.
The Lenton project area is located on the western flank of the Nebo Synclinorium (whose eastern limb hosts the Burton Mine) and targets the Rangal Coal Measures (RCM). These coal measures are laterally continuous across the Bowen Basin, and were deposited during the Late Permian. Underlying the RCM are the Fort Cooper Coal Measures (FCCM). The RCM are overlain by sediments of the Triassic Rewan Group, with Cenozoic cover
LENTON
JORC Reporting – Table 1 For Coal Resources and Reserves as at 2016
Criteria Commentary unconformably overlying the coal sequence. Tertiary filled palaeochannels with basalt; and present-day natural drainage channels contain with Quaternary alluvial sediments.
The Lenton deposit is bound by the Burton anticline to the east and the Burton Thrust Fault to the west. The Burton Thrust Fault is a regionally extensive east-side-up fault that trends north-northwest with a vertical displacement of up to 600m. Multiple thrust and normal faults occur throughout the deposit, and have been detected by both seismic and drilling data acquisition.
The major coal-bearing unit in the Lenton deposit is the Rangal Coal Measures. This includes:
Burton Rider Seam Leichhardt Seam Vermont Seam
The RCM are characterised by thick seams of bright coal, separated by tuffaceous and/or claystone partings and sandstone and siltstone interburden material. The underlying Fort Cooper Coal Measures have also been intersected in drilling:
Girrah Seam
The FCCM are characterised by large intersections of interbanded approximately 50cm coal and stone bands. The economically targeted seams are within the RCM, which typically comprises an average of 50-60m of alternating coal and interburden material, with a total coal accumulation between 7-14m. The overall seam dip is to the north-north-west with seams cropping out to the south and to the east.
Thick coal seams, rare basalt flows, rare igneous intrusions, major thrust faulting and occasional normal faulting are characteristic of the Lenton area.
Six coal seam “plies” are recognised in the Rangal Coal Measures at Lenton. In descending stratigraphic order the seams are named BR, BLU, BLL, BV2, VU, VL.. The BR seam is separated from the remaining five seams by approximately 30m of interburden material consisting mainly of sandstone and siltstone. The remaining five seams are deposited contiguously, and mining scenarios have investigated extraction as individual plies, or as bulk mining horizons, depending on the target product. The average total in-situ coal thickness of the RCM is between 7-14m with the average thickness of individual seams being 1.5m.
The product make-up at Lenton has been investigated to contain a split between coking and thermal coal from the RCM.
Drill hole information Drill holes used for the len_jul15_dc1 model, and to define coal resources are displayed in Appendix 1. 355 chip holes have been included in the geological model, representing 77% of all modelled holes.
300 chip holes intersect the RCM sequence 34 chip holes intersect the Girrah seams only 21 holes do not intersect coal
106 core holes are in the geological model, representing the remaining 23% of all modelled holes.
98 core holes intersect the RCM sequence 7 core holes intersect the Girrah sequence
All holes are drilled vertically and are routinely geophysically logged. Where holes have deviation data, this has been applied in the database and model. All data is stored in the MineScape GDB database.
Data aggregation methods
Due to the nature of the seams at Lenton, multiple core samples are usually taken over the coal sequence, and later combined for analysis on a coal ply basis as determined from geophysical signatures.
For historically sampled data where multiple samples have been taken for the same seam, MineScape Software assigns a composite coal quality value which is weighted on thickness and in-situ RD.

LENTON
JORC Reporting – Table 1 For Coal Resources and Reserves as at 2016
Criteria Commentary Relationship between mineralisation widths and intercept lengths
The Rangal Coal Measures of the Bowen Basin is known to be continuous over several hundreds of kilometres.
The coal measures at Lenton sub-crop to the south of the lease area, and have been disturbed by faulting and folding. Drill hole intercepts and seismic surveys provide evidence for the continuation of coal through the northern areas of the Lenton exploration and mining tenure.
The coal resources at Lenton are also known to extend past the mining tenure, however, resource estimates have been limited to the tenure held by Lenton Coal Pty Ltd.
Holes are drilled vertically to intersect the sub-horizontal seams (seam dip is an average of 15-25o).
Geophysical deviation data is used to correct any deviation from vertical, and allows true thickness to be represented in geological and coal quality models.
Diagrams Drill hole location plan for holes used in the len_jul15_dc1 model is attached in Appendix 1.
Balanced reporting All valid exploration data for the Lenton project has been collated and reported accordingly.
Some exploration holes have not been included in the geological model, for reasons including missing geophysical logs and historical sampling techniques where seams have been composited and rejected on the basis that the seam is being misrepresented in terms of coal quality results. However, sufficient coverage of drillholes, as seen in Appendix 1, has allowed the Lenton deposit to be covered by a minimum of Inferred Resources, owing to the collection of valid drill hole data.
Other substantive exploration data
Multiple phases of 2D & 3D Seismic acquisition has occurred at Lenton over the history of exploration, supporting evidence for the continuation of coal resources across the tenure.
Small and pilot-scale coking tests have been completed throughout various exploration campaigns.
Further work No further coal quality core holes are planned to be drilled for the Lenton deposit.
Additional geotechnical drilling is being considered in the area once operations commence.
Further data validation work is planned ahead of mining operations.

LENTON
JORC Reporting – Table 1 For Coal Resources and Reserves as at 2016
Section 3 Estimation and Reporting of Mineral Resources (Criteria listed in section1, and where relevant in section 2, also apply to this section)
Criteria Commentary Database integrity Lithology logging and sampling is carried out in the field and data entered directly entered
into LogCheck software, which has look-up fields to display prescribed codes in password protected dictionaries for each field in the lithology, header and drilling tables. In-built validations in the software ensure that the data is collected correctly in the field. Exploration Geologists place a backup of their original lithology files onto the New Hope Group network before adjusting their own drilling data to geophysics. This process allows the geologist to compare their lithology records, geophysics data and any available photography to apply verification to their field observations before passing their completed data package on to the Database & Modelling Geologists. The Database & Modelling Geologists then reopen the data in LogCheck, and carry out validations on the data and check for record completeness. The data is exported for loading into the MineScape GDB database. Coal quality data is validated by ALS under the conditions of their NATA accreditation. Further checks are completed by New Hope’s Database & Modelling Geologists, and are loaded into GDB which has strict validation criteria assigned in the project setup. The GDB database contains automated validation processes which are activated during data loading and prevent invalid data from being loaded. This data gets stored in a temporary raw data table which displays error messages for any data that does not meet the validation criteria in GDB. Once the data is loaded correctly, additional validations are performed either by viewing tabulated data and/or by plotting the data to a graphical format. In graphic formats, validation on interval depths and thicknesses, as well as correct seam naming can be confirmed and/or fixed. Access to the GDB database is restricted to the Database & Modelling Geologists only. It is a password protected database. This is the database referenced in the geological models. All Database & Modelling staff are deemed competent by New Hope Group (NHG), and hold relevant qualifications and experience, and are trained in the necessary procedures to ensure the software is being used correctly. External contractors and consultants have also completed reviews on exploration processes and the geological database, and have made minor recommendations for data and/or process improvement which have been implemented.
Site visits The Lenton project site is currently a greenfield mining project with exploration activity the only activity taking place.
The Competent Person has not visited the site specifically, however has extensive experience in the surrounding deposits which mine coal within the Rangal Coal Measures.
Geological interpretation
A model holes template, named 0914_model_holes, has been used in GDB to select all holes to be included in the model.
The amount of drilling and seismic surveys carried out at Lenton has enabled interpretation of faults with throws of more than 5m across a large area of the Lenton deposit. Small-scale faulting is often difficult to discern with the borehole spacing as it stands.
For each exploration program, a set of intercept predictions are generated for the seams expected in the hole, and the exploration geologists use these confidently.
Dimensions Lenton’s EPC766, which fully encompasses the Lenton deposit, is approximately 9km long and 10km wide, covering an area of approximately 6690 hectares. Approximately 35% of the area is covered by coal resources reported in accordance with The 2012 JORC Code. Drilling in the remaining areas shows that the RCCM extend into these regions, however, initial exploration shows that the seams are intercepted at depths beyond the economic mining limits at this stage.

LENTON
JORC Reporting – Table 1 For Coal Resources and Reserves as at 2016
Criteria Commentary The coal resources at Lenton are also known to extend past the mining tenure, however, resource estimates have been limited to the tenure held by NLC. The coal measures strike at approximately ENE to WSW, which an average dip of 15-25o to the north-north-west. The top of the RCM sequence varies from a minimum depth of 9m to a maximum of 55m across the Lenton deposit. The base of the RCM sequence varies from a minimum depth of 13m to a maximum of 590m across the Lenton deposit. The average base of weathering across the deposit is 23m.
Estimation and modelling techniques
The geological model used for resource estimation at Lenton is the len_jul15_dc1 model, which uses a grid spec containing 195 rows and 322 columns, with a grid cell size of 50m. The grid is 9.70km in length and 16.05km in width, and covers ML70337 and associated EPC’s.
The model was generated using the Stratmodel module of the MineScape software, directly referencing data stored in the GDB database module.
The model created is a parting model, meaning that any lithology codes within a seam that are not codes for coal are assigned to waste material. Parting is classified as any intersection greater than 30cm in thickness.
Interpolation of data points to grids occurs through Planar interpolation for thickness, and Finite Element Method (FEM) interpolation for all surface (first order FEM) and trend surface assignment. Planar follows the last known trend when honouring a data point, and creates more straight lines rather than “natural” variation between points. FEM works by performing linear interpolations in two directions on the grid (i.e. in the x and y direction), and then resolving their compatibility once both results are completed. The result is that the data is honoured within each grid cell, and provides a more accurate representation than inverse distance, with the same rate of accuracy as the lease squares method.
To ensure the basalt unit was included in the geological model, a process was used to create a surface which combines the base of basalt and the base of weathering. This has been used as the upper limit of the geological model, and allows the coal measures to crop out against the basalt or weathering to reduce the risk of overestimating coal resources.
The combined base of weathering/base of basalt surface is a continuous, non-conformable surface.
There are 13 individual elements (seam “plies”) modelled for the Lenton deposit, which includes all seam plies in the Rangal Coal Measures (BR-VL3) & the three Girrah seam intersections of the Fort Cooper Coal Measures (GRH1-GHR3), and also the Base of Weathering (BHWE) surface. The Girrah seams are not included in resource estimations, but they have been intersected at Lenton.
All intervals are pinching, conformable units.
There are unit relationships between the BLU & the VU, as well as between VL2 & VL3 and VL & Girrah. This ensures that the interburden thickness between these units remains consistent when extrapolating trends.
The lowest Girrah seam – GRH1 – is the lower limit of the geological model.
Default extrapolation distances of 2000m have been applied to the model to ensure trends continue past the edge of the data, and do not edge effect issues.
There are 121 faults in the Lenton geological model. 111 (92%) are thrust faults and the remaining 10 (8%) are normal faults.
The coal quality model is developed using an inverse distance interpolator.
Moisture Resources are calculated based on in-situ volume multiplied by relative density as reported on an air-dried basis, and no adjustments for moisture are applied.
Cut-off parameters As a general rule, minimum seam thickness is considered to be 10cm to be interpreted and modelled. Parting material with a thickness of 30cm or more can be mined separately.
The combined yield of the cut points in a washability sample must be a minimum of 95% for inclusion in the coal quality model.

LENTON
JORC Reporting – Table 1 For Coal Resources and Reserves as at 2016
Criteria Commentary Coal seams at the Lenton deposit have been considered for both coking and thermal coal products.
Mining factors or assumptions
New Hope Group have evaluated the Lenton deposit to include both open cut and underground mining resources. Open cut mining methods involve the use of excavators and trucks; underground mining methods may include longwall construction. The current focus is on open cut mining.
All seams within the Rangal Coal Measures are planned for extraction in the open cut scenario.
ML70337 has been granted, with the Environmental Authority (EA) associated with ML70337 allowing for mining of up to 2.0 Million tonnes per annum (Mtpa) of product coal
The Lenton project is predominantly cut off economically by stripping ratio (further details are classified as commercially sensitive by New Hope Group)
As a Greenfield mining project, significant onsite infrastructure will be required to be constructed to support the Lenton Project.
Metallurgical factors or assumptions
Preliminary washplant assumptions are based off the performance of the Rangal Coal Measures from operating mines in the Bowen Basin, including various forms of materials handling, slurry pumping, beneficiation & waste handling.
The Lenton deposit is located immediately west of the Burton Mine which, under ownership of Peabody, produced coking and thermal coal for export market from the Rangal Coal Measures. The proximity of this mine leads to the interpretation that coal products from Lenton will be similar.
Coal seams at the Lenton deposit have been considered for both coking and thermal coal products.
Environmental factors or assumptions
No limiting environmental factors are applied to the coal resources at Lenton. See notes against the “Environmental” criteria of Section 4 for environmental considerations for Reserves.
Bulk Density Resources are calculated based on in-situ volume multiplied by relative density as reported on an air-dried basis, and no adjustments for moisture are applied.
Seam density is based on Relative Density results obtained from the laboratory, and are reported on an air-dried basis.
The density of roof and floor dilution material is also analysed on an air-dried basis at the laboratory.
Classification The Lenton deposit includes resources in Measured, Indicated & Inferred categories.
Points of Observation for all resource categories are based on core holes that have raw ash analysed for the seam group at a minimum. Core holes are also geophysically logged, and aid in the interpretation for structural continuity. Analysed samples provide evidence of coal quality, and allow the level of variability to be measured.
Measured resources are based on Points of Observation as 250m centres
Indicated resources are based on Points of Observation at 500m centres
Inferred resources are based on Points of Observation at 1000m centres
Audits or reviews A review of the geological model and its outputs has been conducted in-house by a range of technical staff, including the Senior Geologist – Database & Modelling, the Senior Mining Engineer, Chief Mining Engineer, and the Geology Manager/Competent Person.
External consultants have been used to investigate processes applied in the development of the len_jun15_dc1 model.
Validation of the geological database by external contractors has also occurred throughout this modelling period.
Discussion of relative accuracy/confidence
There is a high level of confidence in the structural continuity and coal quality of the Lenton deposit, owing to its proximity to neighbouring mining operations, the capability of the Rangal Coal Measures as an export quality coal, and the degree to which exploration through seismic surveys and drilling have intercepted the coal sequence across the deposit.

LENTON
JORC Reporting – Table 1 For Coal Resources and Reserves as at 2016
Criteria Commentary Accuracy and confidence of Mineral Resource estimations have been accepted by the Competent Person.

LENTON
JORC Reporting – Table 1 For Coal Resources and Reserves as at 2016
Section 4 Estimation and Reporting of Ore Reserves (Criteria listed in section1, and where relevant in sections 2 and 3, also apply to this section)
Criteria Commentary Mineral Resource estimate for conversion to Ore Reserves
The resource estimate utilised for coal reserves originates from the len_jul15_dc1 model.
The process for computer modelled reserves generation from the geological model followed the following steps:
100m x 100m base blocks generated in MineScape with vertical batters and reserved over resource area.
Insitu reserves data imported to XPAC with insitu to ROM conversion factors applied. Margin ranking completed to define pit boundary cut-off.
Cash margin positive blocks reimported back into MineScape for final pitshell design including; - 47 degree overall highwall batters - Allowance for 120m crest offset from the Isaac River as the Eastern pit limit - bounded to the South West by the Burton Thrust fault
Pit shell reserves re-imported into XPAC and insitu to ROM conversion factors applied. Resource Categorisation (rcat) quality is used to determine reportable ore reserves.
The JORC classified Resources for the New Lenton Project are inclusive of the identified coal Reserves in this report.
Site visits The Lenton project site is currently a Greenfield mining project with exploration activity the only activity taking place. The Competent Person (CP) responsible for this JORC Ore Reserves report has made a site visit and been present when exploration activity was being undertaken on the project. The outcome of the site visit by the CP was to gain an understanding of the local topography and observe the geological exploration drilling being undertaken for the project.
Study status The Lenton project is currently at the study level status of having a Pre-Feasibility Study (PFS) completed in 2011 for an Open Pit operation. ML70337 has been granted, with the Environmental Authority (EA) associated with ML70337 allowing for mining of up to 2.0 Million tonnes per annum (Mtpa) of product coal. The mine plan developed in the 2011 PFS includes a technically achievable and economically viable mine plan, inclusive of material Modifying Factors to convert insitu tonnes to Run of Mine (ROM) tonnes. A new release of an updated coal stratigraphical and quality geological model in 2016 has allowed for an updated set of Ore Reserves to be estimated based on the 2011 PFS modifying factors, new coal processing assumptions based on washability simulation data, and updated long term revenue forecasting for export coal price.
There are potential underground resources that exist in the Lenton project, however these resources have not been exposed to the PFS level of study required to convert Mineral Resources to Ore Reserves (JORC 2012). This Ore Reserves report is for Open Pit mineable coal reserves only.
Cut-off parameters The Lenton project is predominantly cut off economically by stripping ratio. The project is highly faulted, with many reverse faults in multiple repeat configuration present. A large fault exists, known as the ‘Burton Thrust Fault’ which cuts off the resource along the South-Western boundary of the project. The coal is thrust down some 500m in elevation, beyond the economics limits of extraction. Surface features such as the Isaac River cut off the resource in some areas along the Eastern boundary, with assumptions made including a 120m highwall crest offset from the Isaac River location. Seam crop lines exist to the Southern and Eastern extent of the deposit also. In the North East of the project area the Rangal seams are cut off by mining tenure, in these areas a 50m highwall crest offset is incorporated into the mine design. Mining full costs including capital depreciation and revenue assumptions are used to margin rank the project and define pit limits. These economic pit limits are based on cashflow = $0/t.
Mining factors or assumptions
The Lenton project is planned to be mined using open cut mining methods with the potential of future underground reserves beyond the economic limit of open pit mining. The assumptions used in the PFS to convert Mineral Resources to Ore Reserves are listed below:

LENTON
JORC Reporting – Table 1 For Coal Resources and Reserves as at 2016
Criteria Commentary Mining method: Open pit strip mining – block/terrace mining
Mining equipment: Excavator/Truck
High-wall overall slope angle: 47 degrees (60 deg benches + 10m berms)
Low-wall overall slope angle: 26 degrees (33 deg benches + 10m berms)
Minimum mining thickness: All seam plys mined
Mining loss in ROM coal: Nil – (Insitu=ROM)
Mining dilution in ROM coal: Nil – (Insitu=ROM)
Use of Inferred Resources in mine plan: 20% of mine plan is Inferred Resources
As a Greenfield mining project, significant onsite infrastructure will be required to be constructed to support the Lenton Project. These infrastructure items include;
Power supply and communication to site Pit dewatering Environmental Dams, Sediment Dams, Raw Water Dams, Tailings Dam Raw Water supply Flood protection levee banks Creek diversion Mine Industrial Area buildings and admin office Public road diversions and site access construction ROM pad 750tph CHPP (3.5Mtpa product) and product handling facility Rail loop infrastructure Train Load Out facility Staff accommodation facility
Onsite water and sewerage systems.
Metallurgical factors or assumptions
The coal processing method planned for the Lenton project encompasses traditional density separation techniques. This is well-tested technology used widely in the coal industry. The Coal Handling and Preparation Plant (CHPP) is planned as a two-stage beneficiation process for the coarse size range -31.5+1.4mm that allows the separation of the low density product by size at approximately 22mm in a primary and secondary DMC. The fines are planned to be processed by both Spirals or Reflux classifier for the -1.4+0.25mm fraction, and froth flotation for the -0.25mm fines fraction. The coal seams in the Lenton Project are planned to produce both a Coking coal product and a Thermal coal product.
For the seams that produce a primary coking product, namely the VL and BR, the CHPP will be producing two products at the one time - the primary coking product and the secondary thermal product. The remaining seams will be processed to produce a primary thermal product only.
There has been no bulk sample taken from the Lenton project site, however the same seams are being mined directly adjacent in a separate Mining Lease at the Burton Mine. The same seams are being processed on site and sold into the export coking and thermal coal market. Pilot scale carbonisation test work has been undertaken on core samples in an approved laboratory.
The coal quality for Lenton has been based on pre-treated sizing and washability data obtained from core samples. This information has then been used to carry out LIMN simulations that have provided estimates on product yield and ash for varying DMC cut points along with the type of products (coking and thermal) able to be achieved for each seam.
Environmental The Environmental Authority associated with ML70337, allows for mining of up to 2Mt per annum (Mtpa) of ROM coal. The EIS Terms of Reference was approved in June 2014 with the baseline studies now being completed (MLA70456). The EIS is planned for submission in 2018. Studies include dry and wet season flora and fauna surveys, soil surveys and background noise surveys. The site is predominantly cattle grazing country.
Infrastructure The Lenton project is located in an extensively mined region in Central Queensland with access to appropriate power, water and transport infrastructure to support the project. All infrastructure will need to be constructed at the beginning of the project, or in a staged approach suitable for a staged project ramp up schedule. The nearest existing rail is

LENTON
JORC Reporting – Table 1 For Coal Resources and Reserves as at 2016
Criteria Commentary approximately 40km to the south, with a proposed ‘Northern Missing Link’ planned to be constructed approximately 20km to the West of the project site.
There is currently no secured rail and port capacity for the Lenton project. Despite this however, there is spare capacity at Dalrymple Bay Coal Terminal (DBCT) which could be utilised on a short term basis. Longer term, discussions with the Port are ongoing and commitments will be determined based on timing of the project and port availability and/or expansion plans.
Costs The costs were sourced from the 2011 PFS completed for the Lenton project. Capital costs are included as a unit rate depreciation figure and are included in the costs estimate. The state royalty payable is calculated based on the current Qld Office of State Revenue guideline of a % based on revenue price.
Revenue factors As the Lenton project is not a currently operating site, the current downturn in the export coal market pricing does not affect the viability of the project longer term. Revenue assumptions used for the margin ranking of the Lenton project were based on long term price forecasts for both seaborne thermal coal and seaborne metallurgical coal.
The margin ranking process for Lenton has applied a discount to the HCC index price for the lower quality coking product at Lenton, and the thermal product price is energy adjusted on a Gross As Received (gar) basis to the thermal coal index energy value.
Market assessment The Lenton project will produce a mix of both semi soft coking/PCI coal and thermal coal products for the export market. The Rangal coal products from the Bowen Basin are well marketed on the export coal trade and the same seams are being mined currently in the directly adjacent Burton coal operation, owned by Peabody Energy Australia. The current coal prices are too low to justify commencing the Lenton project, and as such the project will remain on standby until the export coal market returns to favourable levels.
Economic Then Competent Person provided input into the latest discounted cashflow analysis as part of the 2016 Reserve estimation. It is the competent Persons view that this analysis continues to provide a solid projection of the economic viability of the Reserves at Lenton. The details of the internally generated economic evaluation are commercially sensitive and are not disclosed.
Social The Lenton Project is located in the Central Queensland coalfields on property owned by one single landowner. Relationships between NHG and the land owner have been good in the past and it is not seen to be an issue with the progression of mining at the Lenton project.
There are currently four registered native title claimants over the project area, with Cultural Heritage agreements being actively negotiated. Cultural Heritage agreements in the past were valid for exploration activities only, with nothing negotiated for mining related activities. Native title however has been extinguished over the Lenton project due to the land being held as freehold by the owner.
The surrounding community is heavily involved and reliant on the coal mining industry, and is believed will support the project from a social license to operate perspective. NHG operates coal mines in the state of Queensland, and has a good rapport with the state government and communities in which they operate.
Other Risk assessments have been completed and are based on previous assessments undertaken at Lenton.
Classification Within the defined mining area of the Lenton project, subject to economic strip ratio cut-off and geological and geographical pit cut-off features, the Ore Reserves have been converted as follows:
All Measures Resources > Proved Reserves All Indicated Resources > Probable Reserves
It is the Competent Persons’ understanding that this appropriately reflects their view of the Lenton project.
Audits or reviews There have been no external audits/reviews of the Lenton project Ore Reserves estimates.
Discussion of relative accuracy/confidence
For the purposes of developing this set of Ore Reserves, in accordance with The 2012 JORC Code, the main factors which could influence the relative accuracy and confidence of the estimate are listed and explained below;
The washability of the coal is simulated only and not reconciled against any actual

LENTON
JORC Reporting – Table 1 For Coal Resources and Reserves as at 2016
Criteria Commentary data as the site is a Greenfield mining project. The efficiency of the CHPP to beneficiate the resource as planned from simulated data will determine the economic pit limit extents of the mining boundary and hence the reportable Ore Reserve.
There is currently no loss and dilution included in the insitu to ROM coal tonnage conversion. Ideally the coal loss will be minimised by including additional dilution into the rom coal through the mining process. Therefore the Reserves quoted would go up with more dilution, with marketable Reserves remaining similar, so this is deemed to be an appropriate assumption at present.
The reportable Ore Reserve quantity is very sensitive to the assumed coal price. The revenue is also assumed to incur a quality penalty on the coking coal product stream. The Ore Reserve will differ if this assumption changes. Currently there is no Lenton coal in the market to test this, as it is a Greenfield mining project and assumptions have been made for the received coal price.
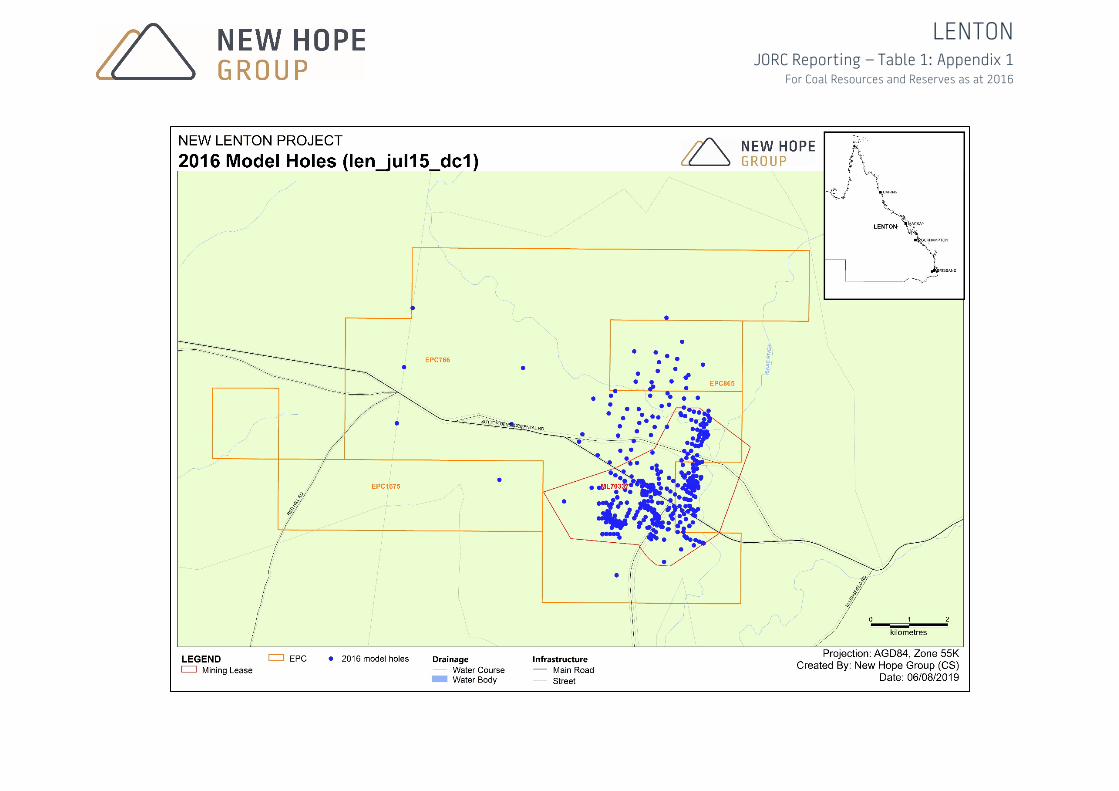
LENTON
JORC Reporting – Table 1: Appendix 1 For Coal Resources and Reserves as at 2016

YAMALA
JORC Reporting – Table 1 For Coal Resources as at 2014
Section 1 Sampling Techniques and Data (Criteria in this section apply to all succeeding sections)
Criteria Commentary Sampling techniques New Hope Exploration (NHE) have a set of field operations procedures which establish the
minimum requirements for each exploration task, including the best practices for the collection of geological data for use in resource models. All staff are deemed competent by New Hope Group (NHG), and hold relevant qualifications and training competencies required to carry out these tasks. NHE has conducted one campaign on the Yamala project, focussed on structural chip hole drilling and core drilling for coal quality analysis. The commentary within this table generally refers to current NHG practices, unless otherwise stated. Limited information is available on the methodology used in exploration campaigns prior to 2007, however much of the modern (post-2007) sampling is similar to that outlined below. For open/chip holes, the drill cuttings (chips) are laid out for every metre drilled for the Exploration Geologist to describe and record in their lithology logs.
Metre markers on the mast of the drill rig assist the crew to identify the sample boundaries.
It is standard practice for the driller offsider to collect drill cuttings in a sieve and to place them in an orderly manner in the designated sample layout area.
The Exploration Geologist then logs the metre samples to identify and describe standard lithological characteristics. Lithological depths are later confirmed with geophysics.
All core holes are logged and sampled directly from the core table in the field. Depths are measured using a tape measure per core run, with an understanding of the depth in the hole from Drillers measurements. As per NHE procedures, standard coal quality core sampling parameters are defined to ensure consistency in sampling:
All coal in the drill hole is sampled, regardless of thickness; All carbonaceous material is sampled, regardless of thickness; All intra seam stone bands are sampled separately, regardless of thickness,
except large interburdens (>50cm) where these are generally omitted from sampling;
If the coal in one run is continued in the next run they are split into two samples to ensure there is no risk in sample loss or contamination between core runs;
Core loss in the middle of a sample is not allowed. Separate samples above and below core loss are taken.
All coal quality samples are sent to ALS (ACIRL) at Richlands, Queensland, which is an accredited laboratory under the National Association of Testing Authorities (NATA). In compliance with NATA, all samples are prepared and analysed using methodologies stipulated in the Australian Standards. Once the drilling of the hole is complete, downhole geophysical logging is carried out on all holes that intersect coal. As a minimum, dual density (long-spaced density & short-spaced density), gamma and calliper trace data is collected in each hole. Historically, the microdensity tool has also been used. In recent times, it has become standard to log all holes with the deviation tool. Sonic data is also acquired in some holes across the deposit. Where holes are drilled for geotechnical purposes, the acoustic scanner tool is also utilised.
Drilling techniques All holes drilled in coal are planned for vertical drilling. Holes are drilled using either air or water as a drilling medium.

YAMALA
JORC Reporting – Table 1 For Coal Resources as at 2014
Criteria Commentary Coal quality samples are most commonly collected from holes with a core size (diameter) of 4-inches, producing core samples with a diameter of 102mm. This size yields the required sample mass to carry out basic coal quality testing. Historical core holes drilled by previous owner, Northern Energy Corporation Pty Ltd (NEC), are both 4-inch and PQ (85mm core diameter) size. Non-cored boreholes were drilled by rotary chip method using a 120mm PCD drill bit. These boreholes were used for structural delineation and coal seam continuity within the deposit. Boreholes were drilled to an average depth of 110m TVD across the Yamala deposit. LOX (Limit of Oxidation) drilling, 4-inch geotechnical, and gas sample drilling has also historically taken place at Yamala to feed into multiple studies regarding the deposit.
Drill Sample Recovery Core Depth and Sample Reconciliation is recorded noting drilled depths and recovered thicknesses for each core run. Coal seam depths are confirmed when the geophysical logging is completed. Core loss and core expansion are accounted for in the field, by using observations in the core. For example, core recovery thickness discrepancies, broken core, crushed zones, swelling lithologies and groove marks caused by over-drilling are all indicators of these core states, and with careful data recording and confirmation with geophysics, are assessed and appropriately logged to record an accurate geological interpretation of the downhole lithology. The drilling supervisor is notified when core loss in coal is greater than 5% or if substandard core is being presented to the geologist. Coal intervals with unacceptable drill core recoveries are excluded from the model. Where appropriate, additional holes are drilled to collected data over the loss zones. NHE implements industry best practices to ensure core sample recovery and representativeness. The sample length measured on the core board is placed into the sample bags, being separately carefully into individual ply or parting samples. Drill core is cleaned of drilling fluids/clays (so that it can be examined clearly) prior to recording lithological information. Separating adjacent samples is typically carried out using a paint scraper, with a hammer and bolster used if required.
Logging When drilling chip holes, for every metre drilled, the drill cuttings (chips) are laid out in individual piles representing that metre for the geologist to describe in their lithology logs. Geophysical logging is then utilised to provide accurate depths for coal seam corrections. Core length measurements are taken carefully for depth reconciliation purposes. The core depths and sample intervals are then marked on core boards, which sit alongside the core on the table. All samples are given unique NHE sample numbers, which are transcribed into the lithology logs as the geologist logs the core. Cored intervals are photographed at 0.5m intervals at high resolution, before placing this material into sample bags for laboratory dispatch. An overlap of the previous and following photographing area is included to allow core photo continuation and matching. Core photographs are utilised in data quality control, to establish core loss/expansion, to assist in core sample laboratory testing instructions, for later reconciliation of coal depths and quality, and as a permanent record of borehole lithology and the decisions made by the exploration geologist on the rig. Geophysical logging is then performed to give accurate coal seam depths, and the lithology is reviewed against the geophysics to confirm that seam thickness recoveries are at an acceptable limit. All data collected in the field including photographs are saved electronically for future reference. All paperwork is stored in hardcopy borehole files at NHG Corporate Office. Downhole geophysical logging is carried out on all drill holes. As a minimum, dual density (long-spaced density & short-spaced density), gamma and calliper trace data are collected for each hole. Historically, the microdensity tool has also been used. In recent times, it has

YAMALA
JORC Reporting – Table 1 For Coal Resources as at 2014
Criteria Commentary become standard to log all holes with the deviation tool and this is considered important for steeply dipping deposits like seen at ESPN. Sonic data is also acquired in some holes across the deposit. For holes drilled for geotechnical purposes, the acoustic scanner tool is also utilised. NHE own and operate their own fleet of geophysical logging trucks. All logging staff are appropriately licensed for transportation and use of radiation sources for logging and hold relevant qualifications & training competencies to carry out the required tasks. NHE have drilled a calibration hole at New Acland, which allows the logging truck operators to ensure the tools are appropriately calibrated. All geophysical tools were calibrated at New Acland prior to use at Yamala. Geophysical tools are serviced annually by DGRT Pty Ltd at Acacia Ridge in Brisbane, QLD. There are four main geophysics tools for used for logging coal exploration holes:
Auslog A605 Dual Density Tool - Sample interval 2cm; logging speed 4m/min; reading time 0.3sec. Density calibration is detailed above. Gamma is calibrated to a thorium source. Caliper is calibrated to readings of 50.8, 101.6, 152.4, 203.2 and 254mm using a standard gauge. NHE calibrate the caliper to point to point calibration, as opposed to a line of best fit.
Auslog A605FR Dual Density Tool - Sample interval 0.05cm; logging speed 3.3m/min; reading time 0.3sec. Density calibration is detailed above. Gamma is calibrated to a thorium source. Caliper is calibrated to readings of 50.8, 101.6, 152.4, 203.2 and 254mm using a standard gauge. NHE calibrate the caliper to point to point calibration, as opposed to a line of best fit.
Auslog A698 Deviation Tool - Sample interval 5cm; logging speed 6m/min; reading time 0.5sec. Factory calibration settings have been applied for this tool.
Auslog A799 Full Wave Sonic tool - Sample interval 10cm; logging speed 4m/min; reading time 1.5sec. Factory calibration settings have been applied for this tool.
Sub-sampling techniques and sample preparation
Once the lithology and the defects in the core have been logged, the samples are separated out using the lithology and ply intervals marked on the core boards, and placed into their corresponding sample bags. The criteria for identifying samples can be seen in the “Sampling Techniques” section at the top of this table.
Core is sampled immediately after drilling, once it has been logged and photographed on the core table. This rapid sample preparation technique is considered important for retaining coal quality properties for accurate analysis.
Plastic sample bags are used to ensure that sample moisture and texture are maintained.
NHE have developed a unique sample numbering system to prevent sample number duplication, which would result in exclusion from the geological model.
Sample numbers are printed on waterproof sample tags, which are stapled to the sample bag, facing outwards, so that it can be clearly identified.
To ensure that the sample is sealed off completely, the sample bag is twisted off and folded over itself before zip-tying it closed.
All coal quality samples are sent to ALS (ACIRL) at Richlands, Brisbane, which is an accredited laboratory under the National Association of Testing Authorities (NATA). In compliance with NATA, all samples are prepared and analysed using methodologies stipulated in the Australian Standards.
Coal quality analysis at Yamala is carried out in three stages: (1) Raw Coal Analysis; (2) Washability Analysis; and, (3) Clean Coal (Product) Analysis.
Following the Australia Standards, the laboratory representatively splits the samples into portions in order to perform the coal quality analysis required.
Clean Coal Composite analysis is carried out on a cumulative cut point which targets an ash product, and is nominated based on the results of Washability analysis.
Quality of assay data and laboratory tests
All coal quality samples are sent to ALS (ACIRL) at Richlands, Brisbane, which is an accredited laboratory under the National Association of Testing Authorities (NATA) to perform analytical testing to the to the ISO 17025 and ISO 9001 Standards (Certificate number 15784-857). In compliance with NATA, all samples are prepared and analysed
YAMALA
JORC Reporting – Table 1 For Coal Resources as at 2014
Criteria Commentary using methodologies stipulated in the Australian Standard AS4264.1-2009 for coal and coke sample preparation.
NATA accreditation involves regular external audits of the management, training and control procedures in the laboratory to ensure that the processes are documented, precise, accurate and validated. This ensure that the standard of testing is appropriate.
All testing is performed following appropriate Australian Standards for the testing of coal which are well accepted through the industry and considered acceptable for the analysis of coal samples.
Verification of sampling and assaying
All lithology data is entered directly into LogCheck software in the field, which has been designed specifically for coal exploration data processing. LogCheck has inbuilt validation criteria to ensure all data loaded is clean of critical data entry errors. All validation tools and dictionaries are password protected.
The geophysical logs are loaded into LogCheck, and compared with the lithology intervals observed by the geologist through the Graphic Editor module. Coal seams and plies are depth corrected using the detailed geophysical logs. Backup copies of the original lithology logs are stored in case this data ever needs to be reviewed.
When all seam names have been confirmed as correct, sample summaries are generated from LogCheck, giving the sample number, sample depths and description of the sample against seam names, which provide the basis for laboratory coal quality instructions. Laboratory instructions are then provided on a seam-by-seam basis.
At the laboratory, all samples are registered into both Coal8 & LabSys – ALS’s own sample tracking software systems (approved by NATA). This registration is confirmed by Project Manager against the original client instructions, and each sample and its subsequent sub-samples are affixed with a designated sticker containing all the sample details and a barcode that can be scanned.
Samples are analysed according to client procedures. As samples are analysed the barcode is used to log each result to that sample.
Results are quarantined and repeated if they do not meet the requirements of the appropriate Australian or ISO Standards. Controls are run with each batch of samples to ensure the testing apparatus is operating properly. Project Managers and Laboratory Managers/Supervisors approve these results. The use of twinned holes is not a typical practice in coal exploration for validating results.
Laboratory supervisors collate and validate the data, looking for abnormalities in the results. In particular looking for data trends through cross plots of the results on a seam by seam basis. Typical industry practices include the comparison of the key qualities such as: Ash vs. Relative Density, Volatile Matter vs. Ash, Specific Energy vs. Volatile Matter, Ash vs. Total Sulphur.
The laboratory provides the results in a variety of formats, including:
Preliminary results templates - all data for each stage of analysis in one Excel file; updated with data at completion of each stage of analysis;
CSV templates of final data in the correct format for loading directly into the geological database; and,
Final PDF reports with the final analytical results for each sample. These include sample instructions provided by the client, and list the Australian Standards used. These are signed off by the Laboratory Manager to verify compliance with the standards.
All final coal quality data files from the laboratory are loaded into the geological database using standard GDB data load specifications, so as to reduce the risk of typographic errors, and minimise data handling. The coal quality models are built directly from the GDB database. No changes are made to the results, unless verification checks confirm an anomalous result, which are edited individually to match the final laboratory result.
The GDB geological database has built-in validation parameters to ensure all data is entered correctly. It also has restricted access and is password protected.
All geological data is stored both electronically and in hardcopy, using NHG practices outlined in Field Operations Procedure’s & Guidance Notes.
Hardcopy borehole files are stored in a secure fire-proof room at NHG Corporate Office.

YAMALA
JORC Reporting – Table 1 For Coal Resources as at 2014
Criteria Commentary Location of data points All location data at Yamala is collected using the GDA94 datum, and Australian Map Grid
zone 55 projection. All elevation data is recorded in Australian Height Datum (AHD).
All boreholes are planned and drill sites are located using handheld GPS units. Once drilled, all holes are then accurately surveyed using differential GPS for the provision of coordinates to the geological model at an accuracy of less than 5cm.
All boreholes included in the geological model have been professionally surveyed.
Professional survey of boreholes drilled in the NHE 2013 drilling program was completed by Registered Surveyor Trevor Wolski of Cottrell Cameron & Steen (CCS) Surveying. Professional surveying for NEC was carried out by G. Nason of Murray Surveyors.
CCS carry out surveys using RTK GPS which has a relative positional accuracy of approximately 50mm. Borehole surveys are connected to the State Control Network to ensure absolute positional accuracy of approximately 100mm.
Data spacing and distribution
The spacing and distribution of data in the model is considered representative. A total of 120 boreholes were used in the geological model (77 core holes and 43 chip holes). These borehole locations are displayed in Appendix 1, Drill hole location plan.
Points of observation for resource estimation are as follows:
Measured = 250m Indicated = 500m Inferred = 1000m
Orientation of data in relation to geological structure
The Yamala deposit has an overall dip of approximately 3-5o to the west and the coal measures sub-crop to the east of the tenement area.
Holes are drilled vertically to intersect the relatively flat-lying coal seam strata.
Coal quality samples are taken on a seam-by-seam basis, in order to achieve an unbiased representation of the coal quality.
Geophysical deviation data is used to correct any deviation of the borehole from vertical, and allows true thickness to be represented in structural and coal quality models.
Sample security All samples are taken directly after they have been drilled and lithologically/geotechnically logged.
Sample numbers are printed on unique NHE waterproof sample tags, which are stapled to the sample bag, facing outwards, so that they can be clearly identified.
Each sample is placed directly into the sample bag and is sealed off completely by twisting the sample bag and folding it over itself, before zip-tying it closed. This is to prevent moisture escaping, and the deterioration of coal properties.
Once the samples have been placed inside their corresponding plastic sample bags, they are placed inside large poly-weave sacks, which are then sealed and clearly labelled with relevant NHG and sample details. Information about the samples in these poly-weave sacks is recorded on the “Core Depth and Reconciliation Sheet”, which is then scanned into the electronic document filing system, with the original hard copy stored in the appropriate hard-copy borehole file.
Samples are then be placed in closed 44-gallon drums and dispatched as soon possible, usually within 24 hours of borehole completion. Wherever possible, a drum liner is used to keep moisture out of the drums.
The outside of the sample drums are clearly labelled with “New Hope Group” and the delivery address for the ALS laboratory. Also, the project name, drill hole number, number of poly-weave sacks in the drum, the drum number and the total number of drums for the hole.
A core sample consignment note is completed before samples are dispatched. The number of sample bags and drums is noted on this consignment note. A copy of the sample consignment note must remain with the sample drums when dispatched, and a copy must be retained and sent to the Senior Database and Modelling Geologist. The copy should be stored on site in its relevant hard-copy borehole folder.
Sample security was ensured under a chain of custody between NHE personnel on site and ALS Laboratory in Richlands, Brisbane. Samples were transported by Followmonts Transportation in Emerald.

YAMALA
JORC Reporting – Table 1 For Coal Resources as at 2014
Criteria Commentary Samples are stored in a cool, dry, shady location if they are waiting to be dispatched to the laboratory. This is because coal quality samples may oxidise or coking properties could be affected if exposed to extreme weather conditions.
Geotechnical samples are treated similarly because they may also deteriorate on prolonged exposure to hot weather.
Audits or reviews All data entry and modelling software used by NHG has built-in validations to ensure that data is clean.
NHG staff regularly undertake reviews on exploration processes, seeking continuous improvement in all tasks.
External contractors and consultants have also completed reviews on exploration processes and on the geological database, and have made recommendations for data and/or process improvement, which have generally been implemented.
The Yamala database was audited in 2013 by ROM Resources, once NEC data was handed over to NHE. This audit highlighted a number of data errors and suggestions, which were rectified prior to establishing a new database for the 2013 exploration program data and resulting 2014 geological model.
The ALS coal quality laboratory is audited by external auditors as a requirement under the NATA accreditation.
All coal quality results are reviewed by the ALS Project Manager & ALS Laboratory Manager before they are reported. All results are then reviewed according to strict validation criteria, before they are loaded into the geological database. Once the data is modelled, it is reviewed by the Senior Geologist – Database & Modelling and the Chief Mining Engineer.
All updates to the geological data or model are fully documented following internal checklists and reporting documentation.
All geological models are reviewed in a model presentation attended by all technical end users where feedback is obtained.

YAMALA
JORC Reporting – Table 1 For Coal Resources as at 2014
Section 2 Reporting of Exploration Results (Criteria listed in the preceding section also apply to this section)
Criteria Commentary Mineral tenement and land tenure status
Note – this section has been updated in August 2019 to reflect tenure changes. There has been no impact to coal resources as a result of the changes. EPC927: Ensham (Yamala)
15km East of Emerald Joint venture ownership by Yamala Coal Pty Ltd (70%) and CHR Emerald Pty Ltd
(30%) 38 sub-blocks Expiry 27 April 2020
MDL3007: Yamala
15km East of Emerald Joint venture ownership by Yamala Coal Pty Ltd (70%) and CHR Emerald Pty Ltd
(30%) Expiry 31 May 2021 Restricted land in south-east corner for the proposed Mackenzie River Dam
Project The Yamala project area is adjacent to the Ensham mining operations. Overlapping petroleum tenure held by Denison Gas (Qld) Pty Ltd sits across the northern area of the project.
Exploration done by other parties
Exploration drilling at Yamala has been carried out since the 1980’s. A number of companies have drilled in the tenure since this time, including; Queensland Department of Mines, New Consolidated Gold Fields (A’SIA) Pty. Ltd, Geological Survey of QLD, Northern Energy Corporation Ltd., and New Hope Exploration.
An airborne geophysical survey was conducted by GPX Airborne in 2007. This fixed wing aeromagnetic and radiometric high resolution geophysical survey was undertaken for Northern Energy Corporation Ltd. across the entire Yamala project area. The results of which fed into a structural interpretation study by SRK in 2007 which determined fault locations and tertiary volcanics.
In 2008 a 2D mini-sosie seismic survey was conducted by Velseis on behalf of NEC. The interpretation was not obtained until 2014 which proved to be highly valuable for incorporation into the 2014 Yamala structural model.
Geology The Yamala project is located within the southern central Bowen Basin on the western flank of the Comet Ridge. The Rangal Coal Measures sub-crop within the project area for a strike of approximately 15km. The wider region plays host to many operational coal mines.
Both the Rangal and Burngrove coal measures have been intersected on the Yamala project. These coal measures belong to the Blackwater Group and were deposited during the Late Permian.
The stratigraphy of the project area includes:
Quaternary alluvial deposits comprised of poorly consolidated sands and clays. Remnants of Tertiary basalt flows have been identified to the south-western
portion of EPC927, where the coal seams are deeper and currently outside of the viable extraction threshold.
Triassic aged Rewan group, consisting of non-calcareous greenish-grey coloured siltstone and sandstone, interbedded with red mudstones.
Late Permian aged Rangal coal measures underlie the Triassic aged Rewan group. The Rangal coal measures are the stratigraphic equivalent of the Bandanna Formation and the Baralaba coal measures. Interburden consists of soft sediments being sandstones, claystones, siltstones and carbonaceous clays.
The Burngrove formation is beneath the Rangal coal measures and consists of

YAMALA
JORC Reporting – Table 1 For Coal Resources as at 2014
Criteria Commentary coal, mudstone, siltstone, sandstone and tuff.
The Rangal and Burngrove coal measures are contiguous across the project area. They dip at approximately 3°-5° to the west and sub-crop to the east.
The coal seams found within the Rangal coal measures on the project are:
Aries Seam Castor Seam Pollux Seam Orion Seam Pisces Seam
The coal seams found within the Burngrove coal measures on the project are:
Virgo Seam A number of lower seams exist, though these have not been intersected by current
exploration drilling as they are deeper than what is currently economically viable to extract
Drill hole information Drill holes used in the yam_jan14_hw1 model, and to define coal resources are displayed in Appendix 1. There are 243 holes in the Yamala MineScape GDB database of which 120 were used in the yam_jan14_hw1 geological model. This incorporates the following:
43 chip holes 77 core holes
Data aggregation methods
Depending on variation within coal plies or where samples are too long for sample bag sizes, multiple samples may be taken and later combined for analysis on a seam-by-seam basis as determined from geophysical signatures.
For historically sampled data where multiple samples have been taken for the same seam, MineScape Software assigns a composite coal quality value which is weighted on thickness and in-situ RD.
Relationship between mineralisation widths and intercept lengths
The coal measures across the Yamala project are contiguous and dip at a constant angle of 3-5° to the west of the tenement.
Boreholes have been planned and drilled to vertically intercept the coal measures across the deposit to best obtain accurate and representative chip, core, LOX, geotechnical and gas samples for analysis.
Diagrams Drill hole location plan for holes used in the yam_jan14_hw1 model is attached in Appendix 1.
Balanced reporting All available exploration data for the Yamala project has been collated and reported accordingly.
Some exploration holes have not been included in the geological model, for reasons including missing geophysical logs and historical sampling techniques where seams have been composited and rejected on the basis that the seam is being misrepresented in terms of coal quality results.
Other substantive exploration data
The interpreted fault data from the 2008 2D mini-sosie seismic survey was utilised for this model.
Further work There are a number of material mining risks that are poorly understood and require further work. These include, but are not limited to:
Detailed investigation into the roof and floor strength for the A2 seam Nature and significance of faulting and seam structure Coal quality variation including deleterious elements distribution Nature, type and volume of gases within and surrounding the A2 seam Spontaneous Combustion potential Limit of oxidation drilling for the open cut areas Large diameter cores for washability testing Update geostatistical study with new data to improve resource confidence.

YAMALA
JORC Reporting – Table 1 For Coal Resources as at 2014
Section 3 Estimation and Reporting of Mineral Resources (Criteria listed in section1, and where relevant in section 2, also apply to this section)
Criteria Commentary Database integrity Lithology logging and sampling is carried out in the field and data entered directly entered
into LogCheck software, which has look-up fields to display prescribed codes in password protected dictionaries for each field in the lithology, header and drilling tables. In-built validations in the software ensure that the data is collected correctly in the field.
Exploration Geologists place a backup of their original lithology files onto the NHG network before adjusting their own drilling data to geophysics. This process allows the geologist to compare their lithology records, geophysics data and any available photography to apply verification to their field observations before passing their completed data package on to the Database & Modelling Geologists.
The Database & Modelling Geologists then reopen the data in LogCheck, and carry out validations on the data and check for record completeness. The data is exported for loading into the GDB database.
Coal quality data is validated by ALS under the conditions of their NATA accreditation. Further checks are completed by New Hope’s Database & Modelling Geologists, and are loaded into GDB which has strict validation criteria assigned in the project setup.
The GDB database contains automated validation processes which are activated during data loading and prevent invalid data from being loaded. This data gets stored in a temporary raw data table which displays error messages for any data that does not meet the validation criteria in GDB.
Once the data is loaded correctly, additional validations are performed either by viewing tabulated data and/or by plotting the data to a graphical format. In graphic formats, validation on interval depths and thicknesses, as well as correct seam naming can be confirmed and/or fixed.
Access to the GDB database is restricted to the Database & Modelling Geologists only. It is a password protected database. This is the database referenced in the geological models.
All Database & Modelling staff are deemed competent by NHG, and hold relevant qualifications and experience, and are trained in the necessary procedures to ensure the software is being used correctly.
External contractors and consultants have also completed reviews on exploration processes and the geological database, and have made minor recommendations for data and/or process improvement which have been implemented.
Site visits Note – this section has been updated in August 2019 to reflect a change in Competent Person.
The Competent Person has not visited the site specifically, however has extensive experience in the surrounding deposits which mine coal within the Bowen Basin.
Geological interpretation
Confidence in the geological interpretation of the Yamala deposit is high. Regional geology, gravity & magnetic survey, 2D seismic interpretation and structural drilling have aided this level of confidence.
The incorporation of faults into the 2014 structural model has proven valuable in delineating the structure and resulting resources within the project area.
The mineral resource estimation was guided and controlled by all data attained through various exploration programs.
There are 120 boreholes used in the yam_jan14_hw1 model.
For each exploration program, a set of coal intercept predictions are generated for the seams expected in the hole, and the exploration geologists use these confidently.
Dimensions Resource estimation has been taken from the base of weathering (approximately 40m below topography) and is within the bounds of the Yamala tenements.

YAMALA
JORC Reporting – Table 1 For Coal Resources as at 2014
Criteria Commentary The Rangal coal measures sub-crop within the project area for a strike of approximately 15km, and dip at 3-5° to the west.
The bounding limits of the geological model are as follows (GDA94):
North: 7394475.355 South: 7370673.377 East: 649569.813 West: 634837.875 Grid cell size: 50m
Estimation and modelling techniques
The geological model used for resource estimation at Yamala is the yam_jan14_hw1 model, which was built on a 50x50m grid spacing.
The model was generated using the Stratmodel module of the MineScape software, directly referencing data stored in the GDB database module.
The model created is a parting model, meaning that any lithology codes within a seam that are not codes for coal are assigned to waste material. The minimum parting thickness is 10cm, i.e. any parting material more than 10cm thick is assigned as waste; if parting within a coal seam is less than 10cm, it is included in the resource calculations.
Interpolation of data points to grids occurs through Finite Element Method (FEM) interpolation for all thickness, surface (first order FEM) and trend surface assignment. FEM works by performing linear interpolations in two directions on the grid (i.e. in the x and y direction), and then resolving their compatibility once both results are completed. The result is that the data is honoured within each grid cell, and provides a more accurate representation than inverse distance, with the same rate of accuracy as the lease squares method.
To ensure only fresh coal material was included in the geological model, a surface layer was created from the base of weathering (BHWE) intersected in all modelled drill holes. This has been used as the upper limit of the geological model, and allows the coal measures to crop out against the base of weathering to reduce the risk of overestimating coal resources.
The BHWE surface is a continuous, non-conformable surface.
There are 20 individual elements (seam “plies”) modelled for the Yamala deposit, which includes all intersected coal seam plies in the Rangal and Burngrove sequences, Yarrabee Tuff, bases of weathering, Tertiary material, ground water level, and also the tops of both the Rangal and Burngrove formations.
All intervals are pinching, conformable units.
Because of the amount of data available for this model was deemed sufficient, no extrapolation distances have been applied.
There are 27 faults modelled in the Yamala model. These were derived from borehole intersection, seismic interpretation, regional geological interpretations, along with gravity-magnetic survey results.
The coal quality model is developed using an inverse distance interpolator.
The Yamala deposit is not currently being mined, therefore comparison of resources to actual production is not possible. The geological model and resulting resource estimation was reviewed by senior geological and mining peers, and the Competent Person.
Moisture Resources are calculated based on in-situ volume multiplied by relative density as reported on an air-dried basis, and no adjustments for moisture are applied.
Cut-off parameters Seams and parting material with a thickness of 10cm or more can be mined separately.
A number of controls have been applied to the coal quality model to ensure the data is representative of the coal seams:
If a sample is more than 4cm thicker than the seam, the sample is not deemed to be representative of the seam, and this sample is rejected from the coal quality model.
Where sampled sections extend outside of the seam boundaries, they were excluded from the coal quality model unless the lithology of the sample was a minimum of 25% coal.

YAMALA
JORC Reporting – Table 1 For Coal Resources as at 2014
Criteria Commentary Coal quality samples are rejected from the coal quality model if the total
thickness of the sample is less than 90% of the seam thickness
The combined yield of the cut points in a washability sample must be a minimum of 95% for inclusion in the coal quality model.
Mining factors or assumptions
A mine concept study was completed for the Yamala deposit in 2014, by New Hope personnel. This study evaluated a series of mining methods including:
Open cut truck and shovel Underground high wall mining Underground auger
A margin ranking analysis was conducted and three seams were identified as having open cut mining potential, in particular the A1, A2 and C1.
There is further potential for investigating alternative mining methods, such as bord and pillar, as there is an underground mine situated to the north of the project area (Ensham mine).
Material risks that are poorly understood and require further work, specifically for underground mining include:
Roof and floor strength for the A2 seam (which is the thickest and most suited to producing a viable working section, at approximately 1.8m thick)
Nature and significance of faulting and seam structure Coal quality variation and deleterious elements distribution down dip of the
potential open cut area Nature, type and volume of gases within and surrounding the A2 seam Spontaneous Combustion
Given that a concept level mining study has been conducted and there are neighbouring mines in similar stratigraphy, it is the competent person’s view that there are reasonable prospects for eventual economic extraction of the Yamala project.
Metallurgical factors or assumptions
Based on the current information available, the Yamala deposit is likely to produce a thermal product. Other products may be possible, however this potential is poorly understood.
A number of metallurgical scenarios for coal seam processing. were tested during the concept study:
1. Bypass A2, C1 and wash A1 2. Wash all seams 3. Bypass all seams 4. Bypass C1, Wash A1 and A2 5. Bypass A2, Wash A1 and C1
The study concluded that option 5 provided the highest value to the project.
Environmental factors or assumptions
No limiting environmental factors are applied to the coal resources of Yamala.
Bulk Density Resources are calculated based on in-situ volume multiplied by relative density as reported on an air-dried basis, and no adjustments for moisture are applied.
Seam density is based on Relative Density results obtained from the laboratory, and are reported on an air-dried basis.
The density of roof and floor dilution material is also analysed on an air-dried basis at the laboratory.
Classification The Yamala Deposit includes resources in Measured, Indicated and Inferred confidence categories.
Only material from the A2 seam has been included in the Measured and Indicated categories. The remainder of the coal seams have been included in the Inferred category, where sufficient supporting evidence is available.
Points of Observation for Measured and Indicated resources are based on core holes that have raw ash analysed for the seam group at a minimum. Core holes are also geophysically logged, and aid in the interpretation for structural continuity. Analysed samples provide evidence of coal quality, and allow the level of variability to be measured.

YAMALA
JORC Reporting – Table 1 For Coal Resources as at 2014
Criteria Commentary Measured resources are based on Points of Observation at 250m centres. Indicated resources are based on Points of Observation at 500m centres. Inferred resources are based on Points of Observation at 1000m centres.
There is a high level of confidence in the resources calculated in Measured & Indicated categories.
Points of Observation that do not abut or overlap have been downgraded in confidence. Although the continuity of the underlying coal measures is very highly likely, a conservative approach until proven has been taken.
Points of Observation for Inferred resources are based on core holes that have a minimum of raw ash analysis for the seam group, with the addition of core or chip holes that have been geophysically logged. Coal intersections that have been verified using geophysical logs logged holes show evidence of structural continuity, however the variability of coal quality is extrapolated from surrounding boreholes and is of low confidence.
Audits or reviews A review of the geological model and its outputs has been conducted in-house by a range of technical staff, including the Senior Geologist – Database & Modelling, the Senior Mining Engineer, Chief Mining Engineer and the Competent Person.
Discussion of relative accuracy/confidence
There is a high level of confidence in the structural continuity and coal quality of the Yamala deposit, as demonstrated by the categorisation of Measured and Indicated resources.
The level of confidence in the structural continuity of Inferred resources is also high, however, the lack of coal quality information and the relative thin nature of the seams other than the A1, A2 and C1 are the reasons for assigning a lower confidence category. A 2011 geostatistical study concluded that there was sufficient support for one domain for ash and thickness across the deposit. This study requires updating when additional information is available.
The accuracy and confidence of Mineral Resource estimations have been accepted by the Competent Person.

YAMALA
JORC Reporting – Table 1 For Coal Resources as at 2014
Section 4 Estimation and Reporting of Ore Reserves Reserves have not been quoted for Yamala for the reporting period.

Yamala
JORC Reporting – Table 1: Appendix 1 For Coal Resources as at 2014

Yamala
JORC Reporting – Table 1: Appendix 1 For Coal Resources as at 2014

ELIMATTA
JORC Reporting – Table 1 For Coal Resources and Reserves as at 2015
Section 1 Sampling Techniques and Data (Criteria in this section apply to all succeeding sections)
Criteria Commentary Sampling techniques New Hope Group (NHG) acquired the Elimatta exploration project as part of the acquisition
of Northern Energy Corporation Ltd. (NEC) in 2012. All of the geological data for this project was transferred to NHG as part of this arrangement. As such, the data is essentially “legacy” data.
Drilling campaigns at Elimatta have taken on various forms, including chip drilling, core drilling for coal quality analysis, as well as some core drilling for gas sampling and geotechnical testing.
Based on examination of the available legacy lithological logs, the chip and core descriptions reflect that the chip samples have been collected in 1 metre intervals and described in acceptable detail.
Available core photos illustrate that core has been collected using sound drilling and handling techniques.
Core photos show the use of a tape measure for recording core run recoveries and for measuring sample intervals.
Some of the core photos show that core has been placed in core boxes for future storage.
At the time of coring, it appears that for at least some cored holes the coal core has also been placed in the core boxes and then moved into sample bags at a later time. To reduce sample deterioration and to minimise the possibility of core handling issues, a better practice would have been to sample the coal core directly off the core table and bag it immediately. However, given such sample deterioration is much more significant for certain coking coal properties, and that the Elimatta coal is only considered suitable for thermal coal, this should not have any material impact.
Based on the review of available sampling and analytical data for Elimatta cores, coal quality core sampling procedures appear to have followed satisfactory rigor in terms of the sample depth, thickness and core recovery management.
All major coal units appear to have been sampled for analysis, although some minor coaly units have been excluded from analysis.
Stone bands have generally been sampled separately, which is good practice, allowing some flexibility in product compositing later.
Apparent Relative Density (ARD) has been analysed and there is some evidence to suggest that ARD has been used (at least for some holes) as a check to ensure core recovery has been adequate.
The available coal quality analytical reports have been generated from samples sent to Bureau Veritas (BV) Brisbane Exploration Laboratory and to Carbon Consulting International (CCI) for analysis. It is understood that these laboratories were accredited by National Association of Testing Authorities (NATA), and in compliance with NATA, all samples are believed to have been prepared and analysed using methodologies stipulated in the Australian Standards.
Twenty gas samples were collected from four HQ cored holes in Feb 2010 and were dispatched for gas analysis. This gas sampling appears to have followed standard gas sampling protocols with HQ core samples of coal taken and placed into gas canisters. These samples had a nominal thickness of 80cm. Q1 testing for lost gas was carried out on site. The samples were then immediately transported to the GeoGas Mackay laboratory and analysed in accordance with the Q2 (desorbed gas) & Q3 (residual gas) testing procedures for gas testing. GeoGas is a NATA accredited laboratory. Ref: Gas Content Testing Boreholes EL-GAS-01, EL-GAS-02, EL-GAS-03 & EL-GAS-04. Northern Energy Corporation Ltd. Geogas Mackay Report No.: 2010-696 / July, 2010.
Geotechnical sampling has been carried out with subsequent lab results reviewed and reported by Joseph Gough, Insite Geology Pty. Ltd. Defect logging and sample preparation were carried out by the field exploration geologist. Samples were tested at both Trilab

ELIMATTA
JORC Reporting – Table 1 For Coal Resources and Reserves as at 2015
Criteria Commentary laboratories in Brisbane and Strata Testing Services (STS), Newcastle. Both Trilab and STS are NATA accredited laboratories.
Down hole geophysical logging has been carried out on most drill holes. In general, dual density (long-spaced density & short-spaced density), gamma and caliper trace data have been collected in each logged hole. Although it has become an industry standard to log all holes with the deviation tool, unfortunately little or no verticality data appears to have been collected for the Elimatta project. While this affects the accuracy of the down hole seam positions, it is not expected to have any material impact on seam thickness or coal resource calculations. Sonic data has also been acquired in some holes across the deposit. Other forms of down hole geophysical data do not appear to have been collected e.g. acoustic scanner, magnetic susceptibility, resistivity, etc.
Drilling techniques Drill holes are generally thought to have been drilled using either air or water as a drilling medium.
Chip holes at Elimatta are primarily used to define coal seam thickness and continuity and also to help identify major geological structures. Although chip drilling is used to very broadly define seam sub-crop areas, Limit of Oxidation (LOX) drilling does not appear to have been undertaken to any significant extent. Robust chip holes are used to support Points of Observation i.e. where geophysical logging has been completed on the holes.
Typically chip holes are drilled using a rotary table rig with PCD, blade or hammer bits (as required) with nominal hole diameters of 100-120mm.
Some work also appears to have been completed during 2006 (P4000 series holes) using reverse circulation drilling to collect chip samples for a specific coal quality blending program.
Coal quality samples appear to have most commonly been collected from holes with a core size (diameter) of 100mm, which has become an industry standard for open cut coal quality coring.
Limited gas and geotechnical sampling have been conducted using HQ drilling (nominal core diameter of 63.5mm).
There is limited down hole deviation data with hole planned to be drilled as vertical holes, designed to intersect the relatively flat-lying Juandah Coal Measures.
Drill Sample Recovery For best practice, when drilling chip holes, for every metre drilled, the drill cuttings (chips) should generally be laid out in individual piles representing one metre intervals for the geologist to examine and to describe in their lithology logs. The available lithological logs suggest that this method has been used for the Elimatta project chip sampling.
For core holes, accurate core length and depth measurements have been taken.
The field geologists have examined the cored intervals in reasonable detail, and then have transcribed their observations into the lithology logs as the geologist logs the core.
Cored intervals have been photographed both on the core table and some have been transferred into core boxes and secondarily photographed. These core photographs are a useful record to help manage data quality control, to establish core loss/expansion, to compare with sample recovery methods, to assist in core sample laboratory testing instructions, and as a permanent record of borehole lithology. Core photos were taken at half-metre intervals while on the core table.
Down hole geophysical logging has been carried out on most holes in Elimatta. Dual density (long-spaced density & short-spaced density), gamma and caliper trace data are generally available. The detailed density log generally appears to have been used to accurately adjust seam roof and floor depths.
Although it is considered an industry standard to log all holes with the deviation (verticality) tool, this has generally not been undertaken at Elimatta, which means that there may be some seam depth errors, i.e. all holes are assumed to be vertically drilled, however this is unlikely to have a material impact on coal resources.
Geophysical sonic data has also been acquired in some holes across the deposit.
Down hole geophysical logging services have been performed predominantly (if not exclusively) by Geoscience Associates Australia Pty. Ltd. They are a well-established down hole logging company and their operational procedures and data quality are generally

ELIMATTA
JORC Reporting – Table 1 For Coal Resources and Reserves as at 2015
Criteria Commentary considered acceptable. Examination of a selection set of LAS header data indicates that the tools appear to have been calibrated.
Logging When drilling chip holes, for every metre drilled, the drill cuttings (chips) are generally laid out in individual piles representing one metre intervals for the geologist to examine and to describe in their lithology logs. The available lithological logs suggest that this method has been used for the Elimatta chip samples.
For cored hole data examined, accurate core length and depth measurements appear to have been taken.
The geologists generally appear to have examined the cored intervals in reasonable detail, and then have transcribed their observations into the lithology logs as the geologist logs the core.
Cored intervals have been photographed both on the core table (in some cases) and after they have been transferred into core boxes. These core photographs are a useful record to help manage data quality control, to establish core loss/expansion, to assist in core sample laboratory testing instructions, and as a permanent record of borehole lithology.
Downhole geophysical logging has been carried out on most holes in Elimatta. Dual density (long-spaced density & short-spaced density), gamma and caliper trace data are available. The detailed density log generally appears to have been used to accurately correct seam roof and floor depths.
Although it is considered an industry standard to log all holes with the deviation (verticality) tool, this has not been undertaken at Elimatta, which means that some depth error will be inherent in the seam depth data i.e. all holes are assumed to be vertically drilled. As an indication of this potential error, for a 100m deep drill hole that deviates 5o from vertical, the potential horizontal error is 8.7m, and the potential vertical error is approx. 0.76m. This is not considered likely to have any material impact on coal resource calculations.
Sonic (limited) data has also been acquired in some holes across the deposit.
Downhole geophysical logging services appear to have been performed predominantly (if not exclusively) by Geoscience Associates Australia Pty. Ltd. They are a well-established downhole logging company and their operational procedures and data quality are generally considered acceptable. Examination of some of the header data in some selected LAS files indicates that the tools have been calibrated.
Sub-sampling techniques and sample preparation
Lithology records show that the Elimatta project core samples appear to have been collected in accordance with acceptable coal industry practice.
Core samples were retained as uncut, cylindrical cores, cut at 1 metre intervals where required to be boxed.
Lithological descriptions have been detailed and relevant defects in the core have been logged. Core sample intervals generally appear to have been taken in a logical manner based on the coal brightness and presence of stone bands.
A typical size of 100mm diameter core has been sampled for coal quality across the project. This core size allows collection of coal material with adequate dimensions for laboratory sample pre-treatment and is well suited to coal quality determination. It is widely regarded as the industry benchmark for open cut coal resource determination, although HQ and in particular PQ core are also considered acceptable by most industry professionals.
Size (length) of cored samples is generally satisfactory for the purpose of coal quality determination. Collection of separate samples for stone intervals adjacent to the coal units has been undertaken and is considered good practice, enabling flexibility in preparation of composite seam units for more detailed analysis.
Downhole geophysical data appears to have been routinely used to validate and correct the seam depth intervals, and used along with core photography to validate core loss/expansion.
Quality of assay data and laboratory tests
Coal quality samples collected by Cockatoo Coal were sent to SGS Minerals Gladstone / Coal and Tech Services (CATS) and SGS Australia Pty Ltd., which were both NATA accredited laboratories. In compliance with NATA, it is understood that these samples were prepared and analysed using methodologies as stipulated in the Australian Standards.
Shell joint venture cores were 100mm diameter and were sent to various laboratories (as reported in the 2009 geological model report).

ELIMATTA
JORC Reporting – Table 1 For Coal Resources and Reserves as at 2015
Criteria Commentary The labs have advised previously that they routinely undertake internal “round robin” testing between labs to ensure consistency of analytical results and procedures.
Following the Australian Standards, there is evidence that the laboratories have split the samples into suitable quotients in order to perform the coal quality analyses required.
The available coal quality reports show that coal quality analysis at Elimatta was generally performed in three stages: (1) Raw Coal Analysis; (2) Washability Analysis; and, (3) Clean Coal (Product) Analysis.
However there are several product coal quality procedures represented in the Elimatta database:
• 2007 – Type A - Fully Pre-Treated and CCC at CF1.70. • 2007 – Type B – Crushed to -12.5mm and CCC at CF1.55. • 2008 – Type C – Crushed to -12.5mm and CCC at CF1.55. • 2009 – Coal Program - Fully Pre-Treated and CCC at CF1.65 (+2mm) and CF1.75
(-2.0+0.125mm). • 2011 – Coal Program – Fully Pre-Treated and CCC at nominated target ash.
Sample pre-treatment and sizing analysis has been undertaken on recent (post 2009) core samples. This is considered the best method for generating robust washability and clean coal analysis results required to accurately predict CHPP processing and product qualities. In any coal quality assessment, this more detailed data should be given preferential status.
Coal quality samples were sent to both Bureau Veritas (BV) and Carbon Consulting International (CCI), which were both NATA accredited laboratories. In compliance with NATA, it is believed that these samples were prepared and analysed using methodologies stipulated in the Australian Standards for coal testing.
Verification of sampling and assaying
For the Elimatta deposit, down hole geophysical logs appear have been routinely used to depth adjust the chip and core lithologies recorded by the geologist i.e. the coal seam roof and floor depths in the lithology logs are adjusted to match the geophysical signatures. This process also provides a good method for verification of coal seam thickness as well as correlation consistency.
Coal seam names for the Juandah Coal Measures within the Elimatta project appear to have been consistently assigned by the geology team based on seam hierarchy and stratigraphic position and verified by geophysical signatures.
The available lithology, geophysical and coal quality records and reports are located on the New Hope Group geological information secured network drive, where they are filed in a logical order.
A review of selected analytical data has shown that the seam depths and thicknesses have largely been corrected using LAS data and core photos. The laboratory sample intervals also generally match these LAS intervals (from short spaced density logs).
Coal quality data has been reviewed and various recommendations have been made by a coal quality consultant from A&B Mylec Pty Ltd.
For some of the cored holes with more detailed analyses available, A&B Mylec have provided clean coal composite “make up” weights advice for the preparation of product coal composite samples. It is understood that the relevant coal laboratories have used this advice to prepare their final stage composite samples.
Coal quality data validation procedures undertaken by various parties have included data trend analysis, review of coal quality data cross plots e.g. Ash vs. Relative Density, and also some statistical review.
The laboratory results are mostly available as MS Excel and CSV files, with some PDF files also available. Either within these files or in the NHG Coal Quality file directory the analytical procedures used and Standards followed to conduct these analyses are generally documented.
Coal quality data found in these laboratory reports have been entered into the geological databases. A number of holes were reviewed to verify that the database values match the laboratory reported values and this was found to be the case.
These coal quality databases have been used to build coal quality grid models. Other than the usual seam depth, thickness and seam correlation based naming edits, no modifications or adjustments appear to have been made to the analytical results. Where data validation
ELIMATTA
JORC Reporting – Table 1 For Coal Resources and Reserves as at 2015
Criteria Commentary checks identify an anomalous result, this data may be documented, or possibly even excluded if the modelling personnel decided it was erroneous or unreasonably biased the local data trends.
The geological database has built-in validation parameters to help ensure data is entered correctly and there are no obvious errors.
Available geological data is stored both electronically and in hardcopy, using New Hope Group standardised practices, and has restricted access. Hardcopy borehole files are stored in a secure fire-proof room at New Hope Group’s Corporate Office.
Location of data points Based on a brief review of available survey records, drill hole collar location data at Elimatta appears to have been consistently collected using the MGA94 Zone 55 projection. All elevation data is recorded in Australian Height Datum (AHD).
Borehole collar coordinates have been surveyed primarily by Murray & Associates Consulting Surveyors & Planners, however some earlier drill holes appear to have been surveyed by other survey contractors.
Digital Terrain Model (DTM) data from aerial photography was supplied by Cottrell, Cameron and Steen in early October 2009. This data was in DXF and DWG formats (“Elimatta Project 300909.dwg” and “Elimatta Project 300909.dxf”).
The Minserve 2010 Vulcan geology model topographic surface was derived from this DTM data. Layers with an “-N” suffix are non-contourable and were excluded from modelling. An area in the north-west corner of the topo grid is not covered by the new aerial data, so the available ALOS satellite imagery data was used. This less accurate section of the model is outside the EPC boundary. The DTM data is stored in a Vulcan design database called “elitopo_09.dgd.isis”. A triangulation model (topo.00t) was first created from the DTM data, and then a topo grid (topo.tpg) was created from the triangulation.
For the previous MineScape geology model, only the ALOS satellite data was used to create the topographic surface.
Data spacing and distribution
The average drill hole spacing within EPC650 is approximately 307m. In the main resource area (northern and central part of the EPC) the spacing averages 237m. On average, the spacing of cored holes within the main resource area is approximately 369m.
Through examination of cored seam intersections and geophysical data (for open and cored holes) across the deposit a reasonable degree of confidence can be demonstrated for the lateral continuity of coal seams within the resource areas at Elimatta.
All resource estimations are limited to the Elimatta EPC650 tenure boundaries (excluding a 50 metre wide buffer zone) and do not extrapolate beyond the granted tenure.
Historic drill hole data available outside EPC650 indicates that the Juandah Coal Measures sequence is continuous throughout the area, but coal resources appear to be best developed within EPC650.
Although some faults have been included in the 2010 Vulcan model, detailed drilling has not yet been undertaken for fault delineation, so it is anticipated that future closer spaced drilling will be required for this purpose. However, for an open cut coal resource, the discovery of additional faulting is unlikely to affect the resource categorisation.
Orientation of data in relation to geological structure
Within EPC650 the Elimatta deposit has an overall dip of approximately 1-2o to the south and southeast.
Holes are drilled vertically to intersect the relatively flat-lying coal seam strata and this is considered to provide the optimal sampling orientation strategy.
Geological variations and seam-complexities may occur around faulted zones, but the current drill hole spacing across faults is considered too wide to accurately represent these areas. Additional closer spaced drilling to improve fault delineation may occur at a later time, but this is unlikely to have a significant material impact on overall resources, particularly in the deeper seams.
Coal quality samples have been taken at a suitably regular spacing across the deposit and on a seam-by-seam basis, in order to achieve a reasonably unbiased representation of the coal quality. As is common in exploration projects of this nature, the lower (deeper) seams tend to be under-represented in the core sampling (as generally reflected in their resource status) and this is an area that could be addressed to potentially provide additional resources.

ELIMATTA
JORC Reporting – Table 1 For Coal Resources and Reserves as at 2015
Criteria Commentary Down hole verticality data has not been obtained to correct any deviation of the borehole from vertical. As a result, some depth and thickness errors are expected in the model, however, this is not likely to have a material impact on resources. Future drilling programs should include verticality data.
Sample security Many coal quality (and other) samples have been collected and dispatched to various laboratories, however no specific consignment information has been recorded in the legacy dataset obtained by New Hope Group during project acquisition.
There is some sample dispatch and register documentation available, but this seems only to cover some of the cored holes, rather than a comprehensive register.
There are a series of coal quality testing reports available for the Elimatta cores. The sample treatment instructions viewed for some of these reports indicate that some reasonable checks appear to have been in place for ensuring sample integrity at the NATA registered laboratories.
ARD has been determined for at least some samples which have then presumably been used for checking sample mass recoveries against the geologists sampling records.
Core photos are available and these support the methodical collection and handling of core samples.
Audits or reviews Various data reviews and audits have been completed by NHG technical staff and external consultants. Based on recommendations from these audits, some improvements have been made to the geological database.
In particular, a comprehensive data audit was completed in 2013 by Mary Nowland of ROM Resources.
Adam Stewart of Minserve generated a Vulcan geology model in 2010 based on the data exported from the previous NEC MineScape model. This Vulcan model forms the basis of this resource estimate and appears to have undertaken substantial data validation to improve seam structure and naming from the previous MineScape model. Adam also identified some concerns with the way in which sample intervals were treated, when they were loaded into the quality database, and many of these issues appear to have been resolved in Adam’s final Vulcan model.
The existing MineScape and Vulcan geological models were documented by NEC staff and the Minserve modeler, respectively.
Coal quality data has been reviewed and various recommendations have been made by a coal quality consultant of A&B Mylec Pty Ltd.
Coal quality advice from industry experts has clearly been sought during the previous work phases. For example, Chris Clarkson and A&B Mylec have provided technical advice on sample treatment, coal quality analysis and coal handling.
An insitu Moisture review was undertaken by Chris McMahon of McMahon Coal Quality Resources in 2015.
Geotechnical sample analysis data and specific geotechnical recommendations based on this data have been made by Insite Geology Pty. Ltd.
The coal quality, gas testing and geotechnical laboratories used are NATA accredited. As such they are subject to audit by external auditors.

ELIMATTA
JORC Reporting – Table 1 For Coal Resources and Reserves as at 2015
Section 2 Reporting of Exploration Results (Criteria listed in the preceding section also apply to this section)
Criteria Commentary Mineral tenement and land tenure status
NHG acquired the Elimatta exploration project as part of the acquisition of Northern Energy Corporation Ltd. in 2012. NHG’s subsidiary company, Taroom Coal Pty Ltd currently holds tenure over EPC650 Elimatta, as well as nearby EPC1171 Perret’s Road.
EPC650: Elimatta
Ownership held by Taroom Coal Pty Ltd. 35km west of Wandoan, Qld Expiry: 4 March 2021 MLA50254 over EPC650
EPC1171: Perret’s Road
Ownership held by Taroom Coal Pty Ltd. 35km west of Wandoan, Qld Expiry: 12 December 2019 MLA50270 over EPC1171
MLA50254: Elimatta
EIS submitted to Qld government in 2012 MLA50270: Elimatta Infrastructure
EIS submitted to Qld government in 2012 MLA50271: Elimatta Transport
S316 Application with consent from Glencore
Exploration done by other parties
Exploration drilling in the general Elimatta area has been carried out since 1974, when ATP563C was first granted to Brigalow Mines Pty. Ltd.
EPC157 and EPC450 were conditionally surrendered by Mount Isa Mines Limited (MIM) to allow amalgamation of tenure. Subsequently, EPC563 was granted to MIM in Nov 1994, then in Oct 1995 MIM lodged MDL applications over 123 sub blocks in the region, including the Elimatta deposit.
Most of the exploration drilling data in the current database was generated during 2007-2010 when tenure was held by Northern Energy Corporation Ltd. This data is generally regarded as reliable, including down hole geophysics for most holes and a good coverage of cored holes with coal quality analytical data.
Some additional cored holes were drilled by NEC in 2011 (after the Vulcan model was generated) and these have also been considered in this review of coal resources.
While some drilling data from the earlier explorers has been included in the model, many drill holes were excluded due to lack of down hole geophysical logs.
The current seam nomenclature follows the seam hierarchy established by Brigalow Mines Pty. Ltd. which is different from what is regarded as the standard seam nomenclature for this part of the Surat Basin.
Geology EPC650 Elimatta is located approximately 35km west of Wandoan and 55km south of Taroom, Queensland. The Leichardt Highway forms the main road access to the area.
The topography consists of low rolling hills, creek flats, and some deeper creeks with Horse Creek draining from SSW to NNE.
EPC650 is located adjacent to the Mimosa Syncline axis (on the western side) in the central northern Surat Basin. This is a major north-south trending feature in which the thickest basin sedimentation occurred.
Coal seams at Elimatta fall within the Juandah Coal Measures, part of the Walloon Sub Group, which is part of the Injune Creek Group.

ELIMATTA
JORC Reporting – Table 1 For Coal Resources and Reserves as at 2015
Criteria Commentary The Juandah Coal Measures overlie the Tangalooma Sandstone, and are in turn unconformably overlain by the Springbok Sandstone.
Deposition of the Juandah Coal Measures occurred during the late Middle Jurassic period in freshwater fluvial, lacustrine and paludal environments. Sediments comprise lithic and feldspathic labile sandstones, siltstone, mudstones and coal.
Forty individual coal seams have been correlated and modelled. The individual seams have been assigned to eight seam groups, based largely on the seam nomenclature system of an earlier tenure holder, Brigalow Mines Pty Ltd. In decreasing stratigraphic order, the seam groups are the T, UG, Y, A, B, BC, C and LG.
The Juandah Coal measures are overlain by a variable thickness of poorly consolidated alluvium, which is predominantly sandy but also contains gravelly and clayey material. The thickest alluvium is associated with Horse Creek, where it is up to 15 metres thick. Elsewhere, the alluvium thins to a veneer of soil on the ridges.
The Elimatta deposit is situated over the nose of a very broad, north-south trending anticline which plunges to the south. The coal seams dip to the south over most of the deposit, generally at less than one and a half degrees, although towards the east and west boundaries of the EPC the dips are to the east and west respectively. The upper seams in the sequence sub-crop towards the north.
There are several faults included in the Vulcan geology model, however these generally have throws of 10m or less. This is consistent with the understanding that coal deposits in the Surat Basin are typified by minimal structural disturbance, with flat dips and minimal faulting.
Drill hole information There are 317 drill holes in the 2010 Minserve Vulcan database, of which 268 have been used in the Vulcan structure model. This includes 124 cored holes, for which 108 have coal quality analyses. These holes were used to create the 2010 Minserve Vulcan model and consequently to define the resource at Elimatta.
Forty-nine drill holes were excluded from the geology model because they are considered unreliable or are too far outside the EPC to be useful in modelling. Most of the excluded holes are old holes that do not have geophysics.
All holes are considered to have been drilled vertically and most holes have been geophysically logged. However, as a rule, these holes do not have any verticality data and therefore have been modelled as vertical holes. This my introduce some seam depth errors, but should not have a material impact the coal resources.
Drill hole collars appear to have been surveyed accurately by qualified surveyors using MGA94 Zone 55 and AHD datum.
Data aggregation methods
Coal quality samples have been taken on both a working section basis (older holes) and also on a ply-by-ply basis, and combined as composites for coal quality testing based on seams, and through confirmation using geophysical logs. This results in some inconsistency between coal quality data points, but this is not uncommon in coal quality databases over multiple exploration drilling campaigns. In any case, the modelling and validation processes have addressed this issue to some extent and it is not expected to have any material impact on the estimation of coal resources.
Minserve have reported that although recent coal quality holes have been sampled into individual seams, many of the samples from earlier holes overlap the individual seam boundaries and include more than one seam. This has generally occurred where the seams are merged and the samples were selected to represent a likely working section. The data from these samples will be useful for modelling the qualities of the working sections, but often (due to inconsistency) must be excluded from the modelling dataset for the individual seams. The Vulcan database currently only contains samples that are valid for modelling qualities of the individual seams.
Yield was estimated from ROM ash, using ash yield relationships determined by A&B Mylec. Washed quality and simulated ash and yield grids may be a useful reference, but are generally based on a much smaller data set than the raw coal qualities. Apart from insitu ash and RD, all other qualities were modelled on an air-dried basis.
Relationship between mineralisation widths and intercept lengths
Coal measures deposited in the Surat Basin are relatively flat and continuous over significant distances, however have local variations at the individual ply level. Apart from some significant fault zones, the Elimatta coal seams can generally be demonstrated to be essentially continuous across the EPC650 area and beyond.
ELIMATTA
JORC Reporting – Table 1 For Coal Resources and Reserves as at 2015
Criteria Commentary Exceptions to this continuity are around the faulted zones, and also in areas where the coal seams sub-crop. Although the seams dip towards the south and southeast and tend to sub-crop to the north and northwest, there is quite a complicated pattern to the LOX lines generated in the geology model. This is due to a combination of a shallow dipping, multiple seam resource, plus some impacts from geological structures and variation in topography.
The coal resources at Elimatta are also known to extend beyond EPC650, however, resource estimates have been limited to within EPC650.
All drill holes are assumed to be vertical, but because geophysical deviation data is not available to correct any deviation from vertical, a small degree of error in calculating true seam depths and thicknesses are to be expected. However due to the very shallow seam dips, it is considered that these errors will not have any significant material impacts on coal resources.
Diagrams Drill hole location plan for holes used in the 2010 Vulcan model is attached in Appendix 1.
Balanced reporting Available exploration data for the Elimatta project were collated, validated and loaded to generate the 2010 Vulcan geology model. This model is effectively a series of interpolated data grids (25m x 25m) for seam roof and floor horizons as well as for selected coal quality parameters.
In 2014 Marko Seppanen of Geomine Pty Ltd generated a Vulcan Block Model which forms the basis of the coal resources reported for Elimatta.
Forty-nine drill holes were excluded from the geology model because they are considered unreliable or are too far outside the EPC to be useful in modelling. Most of the excluded holes are old holes that do not have geophysics. Notwithstanding the above, it is considered that sufficient drill hole coverage exists to complete resource estimation within EPC650.
Eleven additional coal quality cored holes were drilled in 2011. These post-date the 2010 Vulcan geology model, so are not included in the Vulcan model grids. These 2011 cored holes were however considered in the detailed data evaluation of the Elimatta resource and where relevant included as Points of Observation for estimation of coal resources. Whilst this is not ideal, it is considered a reasonable process to allow a more complete and reliable assessment of the coal resources based on all of the available data.
Other substantive exploration data
Some seismic line data exists for the Elimatta project area. Whilst this has been briefly examined, it has not been specifically utilised in the generation of the geology model or in resource estimation. However this data shows the broad outline of the regional sedimentary trough in which the coal measures occur continuously, and also that structure appears relatively benign in this area.
It is worth noting that there appears to be substantial amounts of gas associated with the coal seams at Elimatta. In particular, several exploration drill holes were abandoned due to high volumes of gas e.g. C6006, C6007 and C6008. This suggests there may be a need for gas risk management for future exploration drilling programs e.g. use of a Blow-Out Preventer and dampening mud fluid capability. It may also require further consideration with respect to more detailed assessment and management of potentially gassy conditions.
Further work There are a number of opportunities for improving the geological and coal quality understanding of the area:
Update geological model with the eleven additional coal quality holes, used as points of observation (refer Balanced reporting section).
The limit of oxidation (LOX) lines are complex, but are poorly defined. Although this should not significantly affect overall resources, it may have a marked impact on localised areas which are likely to occur around the initial “box-cut” mining blocks and barren zone areas. These should be addressed with targeted LOX line drilling and LOX sample analysis ahead of final mine plan development.
Further structural drilling, to more accurately delineate the geological structures, particularly in deeper seams.
Seam correlation review work is recommended for the C seam sequence.
Review the in-situ moisture calculation.

ELIMATTA
JORC Reporting – Table 1 For Coal Resources and Reserves as at 2015
Section 3 Estimation and Reporting of Mineral Resources (Criteria listed in section1, and where relevant in section 2, also apply to this section)
Criteria Commentary Database integrity There have been a number of quality control and validation processes applied to the
Elimatta datasets, and they have been scrutinised by various competent coal industry professionals. A range of recommendations have been made to investigate facets of the data and some significant data validation modifications have also been completed to improve data consistency and robustness.
Both the MineScape and Vulcan software contain rigorous data validation processes which are utilised during data loading to restrict invalid data entry.
Additional data validations have been undertaken by viewing tabulated data and graphical data outputs, such as geological cross sections and seam contour plans. In particular, during the generation of the 2010 Vulcan model, the data was subjected to a series of reasonably comprehensive validation processes resulting in a large number of corrections to interval depths, thicknesses, as well as edits to seam naming.
External contractors and consultants have also completed reviews and audited the geological and coal quality databases. In particular, a comprehensive data audit was completed in 2013 by Mary Nowland of ROM Resources.
Coal quality data have been reviewed and various recommendations were made by a leading coal quality consultant of A&B Mylec.
Site visits The Competent Person for NHG has not visited the Elimatta deposit specifically, however, has visited the nearby Taroom deposit and has worked elsewhere within the Surat Basin.
Geological interpretation
There are 317 drill holes loaded into the Vulcan Elimatta geology database, of which 49 holes have been excluded, leaving 268 holes that have been used in the geological model. These modelled drill holes include 108 coal quality cored holes that have been used to generate the coal quality grids.
A series of faults were inferred from variations in seam elevations between boreholes and included in the Vulcan model. As borehole spacing is roughly 300 metres over most of the deposit, interpreted fault locations should only be considered approximate. Similarly, it is usually not possible to determine the nature of the faults, although several borehole intersections indicate normal faulting, due to missing seams and thin interburden thicknesses, and this is more consistent with the expected nature of faulting in the Surat Basin.
In the north, three northwest–southeast trending faults form a graben. The throws on these faults are in the order of 10-20 metres. The geometry of these faults have a profound effect on the interpreted sub-crops for the upper seams, with fresh coal extending further to the north in the downthrown graben block. The nature of the westernmost of these faults is less certain as the upper seams in the holes on the western, up-thrown block have been eroded away. Although recent drilling has assisted in the geological interpretation of this area, the up-dip limits of the resource will remain poorly defined until closer spaced drilling is carried out to delineate the seam sub-crops.
There are a series of northeast–southwest trending faults cross the southern half of the deposit. These faults are mainly up-thrown to the southeast, with throws up to nine metres. As the borehole spacing increases to over 500 metres in some areas in the far south of the EPC, it is likely that the structural interpretation would change with further drilling and additional faults may be identified in this area.
Faults in the Vulcan model are modelled as being vertical and use digitised fault strings at a reference surface of the B2 seam roof. The digitised fault strings are in a layer called “FN_B2” in a Vulcan design file called “FAULTS”. This layer also contains dummy points which help to control the trend of the coal seams at the edges of the model. As additional drill holes become available, these dummy points should be removed.
A “barren” zone has been identified by previous workers (circa January 2010) in the northern part of the deposit where the A and B seams have thinned out or been removed due to weathering and erosion. Regional folding and/or faulting may have lifted this zone higher than the surrounding areas, hence causing the erosion.
ELIMATTA
JORC Reporting – Table 1 For Coal Resources and Reserves as at 2015
Criteria Commentary No intrusives or surface volcanics are known to have been identified during the exploration of EPC650.
Dimensions EPC650, which encompasses the Elimatta deposit, has maximum dimensions of approximately 7km long and 5km wide, covering an area of approximately 2774 hectares.
A 50 metre wide “buffer” exclusion zone was created inside the edge of the EPC650 boundary. The reported resources within EPC650 exclude this 50 metre buffer zone.
The coal resources at Elimatta are also known to extend past the mining tenure, however resource estimates have been limited to within the tenure held by New Hope Group.
The coal resources primarily occur within the A and B seam groups, which comprise 60% of total Measured and Indicated resources. A further 40.0% of total Measured and Indicated resources are contained in the C, Y and UG seam groups.
The Elimatta deposit is situated over the nose of a very broad, north-south trending anticline which plunges to the south. The coal seams dip to the south over most of the deposit, generally at 1-2o, although towards the east and west boundaries of the EPC the dips are to the east and west respectively. The upper seams in the sequence sub-crop in the north, resulting in complex coal seam lox line geometry.
The Elimatta coal sequence has a thickness of approximately 150m, from the T seam down to the LG seam group, thinning towards the sub-crops in the northern part of EPC650.
Depth of weathering ranges from 5 to 24 metres and averages 11.5 metres.
Estimation and modelling techniques
The Elimatta deposit was originally modelled using MineScape software by NEC. It was subsequently remodelled by Minserve using Vulcan software. A later revised MineScape model was also generated.
For the purposes of this work, the Minserve Vulcan model was used. This Vulcan project is called “eli”, for which data compilation, validation and modelling commenced in July 2009 and additional data was added throughout the remainder of 2009.
In December 2014, a new Vulcan block model was created using the Minserve grid model. This block model, called elimatta_harp_fresh has been used to generate the current coal resource estimate.
The Vulcan geological model uses a grid spec containing 321 rows and 249 columns, with a grid cell size of 25m. The grid is 8km in length and 6.2km in width, and extends outside the boundaries of EPC650.
Borehole data was initially supplied to Minserve by NEC as .CSV dumps from their Mincom database. A Vulcan borehole database was created with tables for Header and Lithology information based on NEC’s MineScape sheet structure. The Vulcan database was progressively updated as new borehole information became available. The final database is called “elidec09.elm.isis”. Down hole geophysical data is stored in a separate database called “elidec09_gp.eli.isis”.
The elidec09.elm.isis database has 317 holes. This includes an additional eight open holes, nine coal quality core holes, 13 geotechnical holes and 12 water monitoring bores, compared to the previous MineScape model.
The coal quality data for modelling was compiled by A&B Mylec and consists of vetted and composited data for each seam. A&B Mylec calculated insitu moisture using the model described in ACARP report C10042, which uses air dried moisture, ash (dry) and VM (daf). Insitu density was then calculated using the Preston-Sanders equation.
More recent coal quality holes were sampled as individual seams, but many of the samples from earlier holes overlap the individual seam boundaries and include more than one seam. This has generally occurred where the seams are merged and the samples were selected to represent a likely working section. The data from these samples will be useful for modelling the qualities of the working sections, but often must be excluded from the modelling dataset for the individual seams. The Vulcan database only contains samples that are valid for modelling qualities of the individual seams.
A coal type field (“COLTYP”) was created to classify the data supplied by A and B Mylec. Coal type codes are:
R = Raw Coal, C = Clean coal (crushed -12.5mm, CF1.55); P = Clean Coal (Pre-treated, F1.65 & F1.70);

ELIMATTA
JORC Reporting – Table 1 For Coal Resources and Reserves as at 2015
Criteria Commentary S = Simulation Output.
There are 40 coal seam intervals modelled for the Elimatta deposit. The individual seams have been assigned to eight seam groups. In decreasing stratigraphic order, the seam groups are the T, UG, Y, A, B, BC, C and LG.
The structural modelling process can be summarised as follows:
The Vulcan FixDHD function is used to interpolate missing seam information for holes where the seam has been eroded away or where the hole was not drilled deep enough to intersect a particular seam. Locations and thicknesses for the missing seams are estimated by analysing seam and mid-burden thicknesses in surrounding holes. The output from the FixDHD process is a mapfile (text file) for each seam with roof, floor and thickness data at each borehole location. An exclusion list (ELI_exclude.sel) is used to exclude holes that are considered unreliable. Few holes intersect the entire seam sequence and “short” holes that only intersect upper seams can cause poor results from FixDHD. To counteract this, four overlapping FixDHD passes were run, with each pass covering a different section of the total seam sequence.
Preliminary thickness and mid-burden grids were created for each seam from the FixDHD mapfiles. These grids were created using inverse distance squared interpolation.
A reference surface was created at the roof of the B2 seam. The B2 seam was selected as the reference surface because it has the most borehole intersections. Digitised fault strings and dummy points were used in addition to the FixDHD mapfile data. This surface is created by triangulation with a polynomial trend applied.
Roof and floor surfaces for the other seams are created by stacking the preliminary seam thickness and mid-burden grids from the reference surface.
The roof and floor grids are minimised so that they do not extend above the base of weathering. Thickness grids are recalculated by subtracting the floor from the roof.
The quality grids were created by inverse distance interpolation, power one, zero trending and zero smoothing, with an initial grid cell size of 100 metres. The grids were then converted to a 25 metre cell size to match the structural grids.
Moisture Vulcan model grids have been generated for each seam for Moisture and Relative Density at both Air Dried and at Insitu basis (adjusted).
Resources were calculated using the Insitu Moisture and Insitu Density grids. See comments relating to correction of Insitu Moisture under Bulk density.
Resource estimates are reported as Insitu Basis.
Cut-off parameters A review of Raw Ash contours was completed for each of the Elimatta seams. In general most seams have suitably low Raw Ash and/or Clean Coal Ash to warrant inclusion as resources.
A number of higher (>40%) Raw Ash instances occur and these are documented in the Resource checklist.
The T seam was rejected as a resource on the basis that it has only one Point of Observation (C7001) and that point has a cored T seam sample with Raw Ash of 49.6%.
Most of the lowest seams from the LG seam group have been excluded as coal resources due to lack of sufficient Points of Observation. Only the LG1 seam has had a small Inferred resource estimated.
Apart from the main resource seams, the coal seams at Elimatta tend to be thin and banded, however given NHG’s demonstrated capability with mining thin seams this is not considered to be a significant constraint.
A minimum seam thickness constraint has been applied to these resources. As a rule, 0.2m has been used as the minimum seam thickness, however in areas poorly controlled by drilling, a more conservative 0.3m minimum seam thickness has been used instead. The use of either 0.2m or 0.3m has no significant impact on coal resources.
Mining factors or assumptions
A&B Mylec suggest that development of working section mining methodologies will present a significant challenge, however New Hope Group are experienced in mining thin seam open cut operations, having operated the thin seam operation at New Acland mine since it was commissioned in 2002.

ELIMATTA
JORC Reporting – Table 1 For Coal Resources and Reserves as at 2015
Criteria Commentary It is considered reasonably probable that similar truck and shovel configuration could be utilised at Elimatta. This could allow coal and parting material to be mined separately to a minimum thickness of 10cm or even less.
Mine scheduling of coal and parting operations will need to be to sufficiently flexible to allow sufficient time to maximise coal resource recovery including use of smaller equipment where required.
Further geological definition of certain key areas should be completed prior to commencing detailed mine planning e.g. the complex LOX lines should be improved with further drilling. See also other comments under Further Work.
Metallurgical factors or assumptions
It is expected that coal mined from Elimatta will require beneficiation through a CHPP to produce a clean coal product.
Although no specific details are currently available for the exact nature of the beneficiation processes that may be adopted, work by A&B Mylec suggests that a thermal product at reasonable yields can be achieved.
Based on the coal quality data examined, it is anticipated that Elimatta resources will be most suited to production of thermal coal to be sold to export markets, although a small amount could be sold to the domestic market.
Environmental factors or assumptions
No limiting environmental factors have been applied to the coal resources at Elimatta. Refer to Section 4 Estimation and Reporting of Ore Reserves, for mining related environmental considerations.
There are no environmental conservation zones listed in the Queensland Government Interactive Resource and Tenure Maps database (IRTM) for the EPC650 area.
There is a Strategic Cropping Trigger Area over most of EPC650 which may need to be considered.
There is an active Application for Native Title by the Iman People that includes the EPC650 area. Tribunal Number QC1997/055.
An EIS has been prepared on behalf of Taroom Coal Pty Ltd for the Elimatta Project and was submitted to the Queensland Department of Natural Resources and Mines in 2012. The Project covers approximately 4,460 hectares, including Mining Lease applications 50254, 50271, 50270 and land underlying a 36 km long Rail and Services Corridor.
Key project infrastructure includes a Coal Handling and Processing Plant, rail load-out facility, a rail connection known as the West Surat Link, tailings storage facilities, spoil dumps, mining voids, site water management dams, the permanent diversion of a section of Horse Creek and an accommodation village. The predicted mine life is approximately 40 years including construction, operation, decommissioning and rehabilitation.
Product coal will be transported by train via the proposed West Surat Link, the planned Surat Basin Rail and existing rail networks to the Wiggins Island Coal Export Terminal near Gladstone.
Bulk Density The coal quality data for modelling was compiled by A&B Mylec and consists of vetted and composited data for each seam. A&B Mylec calculated insitu moisture using the model described in ACARP report C10042, which uses air dried moisture, ash (dry) and VM (daf). Insitu density was then calculated from Relative Density and Insitu Moisture using the Preston Sanders equation.
The Relative Density of roof and floor dilution samples has also been analysed for some sampled intervals.
Work undertaken by McMahon Coal Quality Resources, noted some discrepancies in calculated values for in-situ Moisture, which has been included in the Further work section.
Classification The Elimatta deposit includes resources in Measured, Indicated & Inferred categories.
Points of Observation have been identified for each seam. These Points of Observation have been used as a guide to generate resource polygons in Vulcan for calculation of Measured, Indicated and Inferred resources.
Each Point of Observation is based on a cored hole that has at least raw coal quality analysis for the relevant seam. These cored holes, as well as other non-cored holes are also generally geophysically logged, and provide confidence in seam continuity and correlation.

ELIMATTA
JORC Reporting – Table 1 For Coal Resources and Reserves as at 2015
Criteria Commentary Measured resources are based on Points of Observation at 300m drilling centres.
Indicated resources are based on Points of Observation at 600m drilling centres.
Inferred resources are based on Points of Observation at 1200m drilling centres.
There is a moderately high level of confidence in the Measured and Indicated resources, and a lower level of resource confidence of Inferred resources.
A review of Raw Ash contours for each seam has been undertaken to confirm Raw coal quality is acceptable for resource definition. A number of high Ash occurrences have been identified, some have been excluded, and comments have been made as to their resource relevance.
The T seam is a single thin seam and only has one Point of Observation with a relevant Raw Ash analysis value. This is drill hole C7001 with Raw Ash of 49.6%. Due to this single high Ash value, the T seam has been ruled out as a coal resource until such time as additional data becomes available to confirm coal quality is suitable.
Audits or reviews Several experienced consultants have been engaged to review and assess the available geological and coal quality data.
A review of the 2010 Elimatta Vulcan geological model and its outputs has been conducted. This model has included additional drilling data to that which was available in the previous MineScape model as well as substantial corrections made to the seam correlation and lithology data. It is considered suitable for the purpose of this resource assessment. Eleven additional coal quality cored holes were drilled in 2011 and were not included in the Vulcan model, however have been included in the detailed review and used in this coal resource estimation.
Work undertaken by McMahon Coal Quality Resources, noted some discrepancies in calculated values for in-situ Moisture which has been included in the Further work section.
A Geostatistical data review was completed by McMahon Coal Quality Resources in May 2015. This work has been used to support some of the parameters used in this resource estimate, in particular, distance between Points of Observation.
No other audits of the Elimatta resources are known to have been undertaken.
Discussion of relative accuracy/confidence
There are varying degrees of confidence in the coal resources estimated for the Elimatta EPC650 coal seams. This is reflected in the variations in resource categories between the seams. For example, the C seam is a major seam group, however has only had Indicated and Inferred resources defined. This is primarily due to the fact that the C seams are deeper stratigraphically and are therefore not as well delineated by exploration drilling. Each seam was considered individually and detailed documentation is available for the resource generation process.
Overall, in a broad sense, there is a high level of confidence in the lateral continuity of all the major coal seams in their respective resource areas, however there are some areas that need further exploration drilling to improve confidence prior to any detailed mine planning. Some such areas include: in the proximity to the main faults defined in the model, around the LOX lines, and in some of the thinner seams to confirm thickness continuity around resource boundaries.
In addition, instances of apparent C seam correlation mismatches were noted in several drill holes and these should be resolved through further detailed correlation review and may require targeted exploration drilling to verify.
The T and LG2 to LG8 seams have been excluded as coal resources because they have insufficient Points of Observation. Additional drilling in these seams may improve geological and coal quality confidence to allow these to be included as coal resources.
Due to the discrepancies found in calculation of Insitu Moisture and Insitu Density, the resources calculated having higher than 30 percent Raw Ash may be subject to a degree of error. However, given the average Raw Ash for the bulk of the Elimatta seams is well below 30%, and the fact that average Insitu Moisture-Insitu Density have been used in the calculations, this is not considered to be a significant source of error overall. Where the model density grids are used for calculation of resources and reserves for smaller areas, such as mining blocks, this may become more significant at a local scale.
In 2013, the reporting of coal resources was generated from resource polygons based on Points of Observation (POO) with radii of 250m, 500m and 1000m, for Measured, Indicated

ELIMATTA
JORC Reporting – Table 1 For Coal Resources and Reserves as at 2015
Criteria Commentary and Inferred categories, respectively. These POO radii have been increased in the 2015 estimation to 300m, 600m and 1200m, for Measured, Indicated and Inferred, respectively. This change is supported by the results of a geostatistical analysis by McMahon, Elimatta Geostatistical Review May 2015, described below.
This geostatistical study, which was conducted as part of a larger review of both Elimatta and the NHG New Acland mine deposit (also in the Surat Basin), confirmed that the variability of coal seam properties was generally much lower for the Elimatta seams than for New Acland. Furthermore, most Elimatta coal quality parameters reviewed did not vary significantly with modest increases in bore core (POO) spacing.
In particular, the study demonstrated that Product Ash and Product Yield predictions remained very similar with modest increases in spacing. Furthermore, the variability of key parameters would not be significantly impacted by a change in radii between Points of Observation to 300m, 600m and 1200m, respectively, which have subsequently been adopted for this resource estimation.
This increase in POO spacing has been reviewed both internally and externally by NHG and has been accepted as a reasonable approach.

ELIMATTA
JORC Reporting – Table 1 For Coal Resources and Reserves as at 2015
Section 4 Estimation and Reporting of Ore Reserves (Criteria listed in section1, and where relevant in sections 2 and 3, also apply to this section)
Criteria Commentary Mineral Resource estimate for conversion to Ore Reserves
The current Mineral Resource estimate reported for the Elimatta deposit is from July 2015.
The Elimatta Ore Reserves have been developed from the categorised Mineral Resources based on the following methodology as outlined in the JORC Code 2012 edition.
The mining reserves have been developed from the categorised resources based on the following methodology;
Inferred Resource = No Reserves Indicated Resource = Probable Reserve Measured Resource = Proved Reserve
The JORC classified Mineral Resources are inclusive of the reported Ore Reserves.
Site visits The Elimatta deposit is a greenfield mining project within the undeveloped Surat Basin. The Competent Person responsible for this Ore Reserves statement has not made a site visit to the Elimatta project personally, however a direct report of the Competent Person has made a site visit to the Elimatta project area. This direct report is a Chartered Professional (mining) with the Australasian Institute of Mining and Metallurgy.
Study status The level of study undertaken on the Elimatta deposit to date is Pre-Feasibility. This study was undertaken in 2013 and completed by a Chartered Professional and Registered Professional Engineer Queensland (Mining) for the Elimatta project. The Pre-Feasibility study was undertaken by the owner of the project New Hope Group. This study contained sufficient information to ascertain a viable mining method for the deposit and application of appropriate modifying factors. An economic evaluation has been completed for the project based on reasonable assumed revenues and cost assumptions. Detailed assessments of environmental and socio-economic impacts have been assessed as part of the Environmental Impact Study that has been lodged with the state government in 2012 as part of the Mining Lease Application process.
Cut-off parameters The basis of the cut-off grade for Elimatta is a margin rank of the deposit using assumed costs appropriate for the style of mining method, and future forecast revenues and foreign exchange rates. The margin rank is completed on reserved blocks from the geological model and converted to a mining model with appropriate modifying factors. The blocks are 100m x 100m in size, and the margin ranking is completed both laterally across the deposit and stratigraphically through the coal seam sequence within each mining block.
The waste stripping ratio and coal quality are the main driving factors of the cost assumptions and revenues generated in the margin ranking process. Capital costs for infrastructure and equipment are also included in the margin ranking exercise. The result of the exercise produces an economically viable mine plan layout based on positive margin coal areas, from which a mining schedule can be derived and infrastructure locations identified. These cost assumptions are outlined further in this report.
It should be noted that the forecast revenue price for Newcastle Index export thermal coal of US$85/t was used on the area of resource planned to be mined until 2030, and then a higher coal price of US$90/t was used beyond 2030 and in practically mineable areas not under out of pit mine dumps or diverted creeks. An AUD:USD exchange rate of $0.75 was used throughout the project life.
Mining factors or assumptions
The Elimatta project is planned to be operated as a truck and excavator operation in an open pit, strip mining orientation. The deposit consists of relatively shallow overburden and multiple seams and working sections separated by thin and thick bands of interburden. Trucks and wheel loaders are planned for all the coal and thin interburden extraction. New Hope Group operates similar operations in the Clarence-Moreton Basin in South East Queensland and is confident in its ability to mine the Elimatta deposit.
The early years of development of the project are driven by the need to develop a major creek diversion of Horse Creek, which runs directly through the entire mine area. There is a small section of permanent diversion that can be built initially, however the majority of the final diversion channel is built through mine waste dumps after the coal has been extracted along this diversion alignment. A Co-Development Agreement has also been developed

ELIMATTA
JORC Reporting – Table 1 For Coal Resources and Reserves as at 2015
Criteria Commentary between the coal lease tenure holder and the overlapping petroleum gas tenure holder, on how to manage the extraction of both resources appropriately.
Pit slopes used in the Pre-Feasibility study included an average overall batter of 50 degrees from pit crest to pit floor. Faults have been modelled for the deposit. It is not envisaged the highwall and endwall slopes will be too dissimilar to New Hope Groups’ current operating assets. Geotechnical advice will be sought for technical advice on boxcut and dump slope angles once state approval is given to mine the deposit and financial approval is given from the company to commence operations.
Mining assumptions made for the Elimatta project were based on New Hope Groups’ experience mining similar thin seam operations within its portfolio. It is envisaged that all coal working sections will require to be ripped and stacked into stockpiles on the bench by dozers, to be mined by front end loader. This is due to the thin nature of the seams and inefficiency of trying to mine the coal directly insitu from the ground.
The conversion of the geological model into a mining model occurs using appropriate modifying factors to create a Run of Mine (ROM) model. These factors are applied using a script in a XPAC database to the imported geological model data. The modifying factors are listed below;
Minimum separable interburden thickness (m): 0.15 Minimum mining thickness (m): 0.10 Working section loss (m): 0.05 Working section dilution (m): 0.075 Dilution material ash (% a.d.): 81.7% Dilution material relative density (g/cc): 2.40 Dry Ash Free energy of deposit average (kcal/kg): 7,739
The XPAC script applies the above modifying factors and creates ROM working sections based on the imported seam and interburden thicknesses.
If the parting thickness of a particular seam is ≤ 15cm, then the seam is mined in a working section inclusive of the seam above it. And as such;
Dilution = parting volume Loss = no loss
If the coal thickness is less than 10cm and is not included with the seam above it then the seam is not recoverable
Dilution = no dilution Loss = total coal volume
In all other occasions’ coal loss and dilution is given the default values as displayed in first list above.
The Pre-Feasibility mining study for Elimatta contains Mineral Resources from all categories; Measured, Indicated and Inferred. The majority of the mine plan area that is margin positive, is however classified Measured and Indicated Resources. Hence with this level of study, these Measured and Indicated Resources may be converted to Ore Reserves as outlined in the JORC Code 2012 edition.
Metallurgical factors or assumptions
All ROM coal from the Elimatta project is currently planned to be processed through an onsite CHPP. The plan is to utilise a dense medium plant with a fines recovery circuit to beneficiate the ROM coal into a thermal coal product targeting around 10% ash (a.d). This type of processing is common practice in the coal industry and what is proposed in not unique and is considered to be well tested technology.
ROM ash equations are typically employed when resource data density is insufficient to warrant the adoption of quality grids. In the case of Elimatta, fully pre-treated washability data density is low, hence the use of ROM ash equations is appropriate. Dilution data was sourced from the 2009 exploration stone sample pre-treatment and washability analysis. The process simulations used the approximate ash levels required to achieve the product target CVGAR specification of 5800 kcal/kg for each ply.
The simulation assumptions employed during the development of these equations were:
Dilution – 0.025m of roof and 0.050m of floor was attributed to each ply datapoint. Ply thickness – plies that were less than 0.15m thick were excluded. No coal ply loss was factored into the simulations.
ELIMATTA
JORC Reporting – Table 1 For Coal Resources and Reserves as at 2015
Criteria Commentary These formulae - see below, were applied to the relevant seam in a block working section and the quantities aggregated to determine product coal yield.
UG Seam: Yield % = -1.188 x ROM Ash% (ad) + 97.11
Y Seam: Yield % = -1.26 x ROM Ash% (ad) + 103.34
A Seam: Yield % = -1.31 x ROM Ash% (ad) + 103.83
B Seam: Yield % = -1.26 x ROM Ash% (ad) + 103.59
C Seam: Yield % = -1.23 x ROM Ash% (ad) + 102.81
The product ash % (a.d) below represents the weight average for the ply to achieve a product CVGAR specification of 5800 kcal/kg:
UG Seam: 9.6%
Y Seam: 9.3%
A Seam: 10.1%
B Seam: 10.1%
C Seam: 10.5%
The mining model will also apply some modifying factors to the CHPP’s ability in its efficiency in undertaking the ROM coal processing, namely;
CHPP efficiency factor (%): 94% Dilution removal factor (%): 94%
Environmental The Elimatta project is currently undergoing the state approval process for a MLA by which an Environmental Impact Study (EIS) has been completed on the project and submitted to the government in 2012. The Elimatta project requires the mining and permanent diversion of Horse Creek. Due to the limited space available on the MLA area, temporary diversions are required to be put in place while mining of the insitu creek alignment takes place. The permanent diversion is built through the waste dumps as part of the progressive rehabilitation plan for Elimatta. The remainder of the mine life will ensure maintenance and repair works can be completed over the life of mine and when completed, the diverted creek alignment will be self-sustaining.
Excavated waste consists of overburden and interburden extracted as part of the mining operation. Two out-of-pit dumps are required for the project, located in the South Western corner and in the Northern section of the MLA. Excavated waste will be disposed of in these out-of-pit dumps initially and then placed in the mining cavity left from pit excavations. In-pit dumping of excavated waste will occur after initial excavations in the pit become available for dumping. As waste is excavated from areas that are being actively mined, it is transported to and dumped into the previously mined pit for disposal. Excavated waste is not expected to be acid forming and will not require special handling prior to disposal.
Deposition of tailings will initially be deposited in out-of-pit TSFs and subsequently within an in-pit TSF. Mine tailings are likely to be non-acid forming and likely to have significant excess acid buffering capacity. The TSF dams will be capped as part of the rehabilitation program that will be ongoing as the mine progresses through the deposit. The water, air, noise and vibration impacts of the operation are dealt with in the completed EIS that has been submitted to the state government for assessment.
MLA 50254 meets the requirements for exemption under s99 of the Regional Planning Interests Act 2014 (RPI Act) for Strategic Cropping Areas (SCA). However the other two MLA’s for infrastructure and transport corridors in the Elimatta project, MLA 50270 and MLA 50271, are classified as Strategic Cropping Area’s and will require Regional Interests Development Approval (RIDA) in order to undertake resource activities.
Infrastructure Significant infrastructure requirements are needed to support not only this operation but also the Surat Basin in general. Initially a transport solution will be required to feasibly transport the product coal to ideally the Wiggins Island Coal Export Terminal (WICET) in Gladstone, Qld. The entire Surat Basin requires this in order to develop as a new coal basin in Queensland. Capital Expenditure for a project of this scale has not been incorporated into the Elimatta study, however a user pays cost per tonne has been assumed to utilise this infrastructure once built as an operational cost through the life of the project.
A second piece of transport infrastructure will be required known as the West Surat Link. This will be approximately a 35km long transport solution to transport the product coal from

ELIMATTA
JORC Reporting – Table 1 For Coal Resources and Reserves as at 2015
Criteria Commentary the Elimatta site to the Surat Basil transport corridor. The land in the project area is under MLA tenure status at present, with a major component of the freehold land under MLA has already been purchased and owned by subsidiary companies of New Hope Group. There remains some freehold land that needs to either be purchased or an agreement entered into with the landowner prior to mining commencing.
Labour is planned to be sourced from outside the local area by utilising a Fly-In-Fly-Out type project scenario, flying employees in and out of the township of Wandoan. An accommodation facility is planned to be built at the minesite, approximately 40kms West of Wandoan.
The Project’s external water supply will be secured by a connection to the water distribution pipeline network owned by SunWater Limited (SunWater). It is proposed that supply to the Project site will be via a dedicated pipeline alignment within the Rail and Services Corridor. Initially, the external water supply will be treated groundwater by-product resulting from dewatering operations associated with coal seam gas extraction. Once construction of the proposed Nathan Dam is complete, the external supply will instead be sourced from Nathan Dam.
Diesel generators will be utilised during the early construction stage until such time that a grid connection can be established. Generators will be replaced with a permanent grid connection to either the Wandoan or Wandoan South substations as soon as possible within the construction stage. Liaison with Ergon Energy Limited is underway regarding a connection to infrastructure in the Wandoan area to meet the Project’s operational demands.
Costs Capital costs in the Elimatta Pre-Feasibility study were a combination of equipment capital costs generated by New Hope Group and infrastructure costs as estimated by a third party consultancy. The equipment capital costs were based on the in-house financial modelling software XERAS, which contains a database of equipment upfront costs, major rebuild times and costs for rebuilds. The infrastructure costs assumptions were cross checked against New Hope Groups’ infrastructure cost assumptions for coal mining projects in Qld, and were deemed appropriate for the Elimatta project.
The operating costs for the Elimatta project were derived from New Hope Group in-house financial modelling database. The costs are based on hourly rates and built up from a mine schedule and equipment selection process. Unit rate costs are calculated for waste and coal production and checked for validity against New Hope Group operating assets and industry benchmarks. The XERAS financial model has been audited by an external consultant outside New Hope Group.
The capital costs for the project are included on a unit rate basis and added to the operating costs for the margin ranking of the Elimatta project.
Revenue factors The Elimatta revenue assumptions were based on producing an export thermal coal product to market. Revenue assumptions for JORC Ore Reserves reporting were a combination of industry analysts and New Hope Group marketing and Executive level staff. The revenues were not escalated and financial modelling completed on a real basis.
Market assessment New Hope Group is currently selling around 6Mt/a coal into the export thermal coal market and is planning on continuing to do so into the future. The Elimatta project is planned to market approximately 5Mt per annum of export thermal coal which is planned on being an expansion to the existing New Hope Group sales portfolio. The company holds long term sales contracts for its existing coal supply arrangements to Asian customers, and believes it will be able to successfully market the Elimatta product in the future.
All analyst reports are forecasting for future continual growth in the global thermal coal market as an energy source. With the increasing global demand for energy however, oversupply in the coal market has forced coal prices down quite low. In the future it is believed however that demand will eventually catch up to supply, and then we will see a rise in coal prices as the demand continues to grow.
Economic The Competent Person provided input into the latest discounted cashflow analysis as part of the 2015 Reserve estimation. It is the competent Persons view that this analysis continues to provide a solid projection of the economic viability of the Reserves at Elimatta. The details of the internally generated economic evaluation are commercially sensitive and are not disclosed.
Social The New Hope Group is an existing coal mining company based in Queensland and operating mines in Queensland. It has built significant reputation throughout the Darlings

ELIMATTA
JORC Reporting – Table 1 For Coal Resources and Reserves as at 2015
Criteria Commentary Downs and South-East Queensland for its stakeholder engagement and social license to operate. The Elimatta project is currently undergoing an EIS process for approval of the MLA for the project. New Hope Group currently owns freehold rights to some of the land parcels in the Elimatta project area, and is making a presence in the Wandoan and Taroom areas of the Surat Basin.
New Hope Group has also set up a subsidiary company called Elimatta Pastoral that will own and run the company owned properties and manage the future ongoing rehabilitation progress of the post mined land, similar to what happens at New Acland Mine with the Acland Pastoral company. The learnings from other New Hope Group operations will be incorporated into building the Elimatta project social license to operate, as the project moves through the state government approvals process phase.
Other Risk assessments have been completed and are based on previous assessments undertaken at Elimatta.
Classification The Elimatta project area contains Inferred, Indicated and Measured Mineral Resources. These have been categorised in XPAC using an XCM specific to this purpose.
In line with the JORC Code 2012 edition, all Measured Resources have been converted to Proven Reserves, and all of the Indicated Resources have been converted into Probable Reserves. As the competent person and author of this Elimatta JORC Ore Reserves report, it can be concluded that this classification accurately reflects the view of the Elimatta deposit.
Audits or reviews There have been no external audits/reviews of the Elimatta project Ore Reserves estimates.
Discussion of relative accuracy/confidence
The Pre-Feasibility study for the Elimatta project consists of a 17 year mine life project producing 5Mtpa product coal. Of this mine plan area, 95% of the coal is classified as JORC 2012 compliant Ore Reserves under this document. This is both Proven and Probable Ore Reserves. Most of the remaining 5% of coal is classified Inferred Mineral Resource in accordance with The 2012 JORC Code.
The quantity of economically viable coal tonnes at the Elimatta project is highly sensitive to the coal price and AUD:USD exchange rate. A small increase in the coal price will have an uplifting impact on the reportable Ore reserves. Long term coal pricing forecasts were used for the financial analysis and margin ranking of the project, however the future is always unknown with what will actually happen with supply/demand and technological advances of the industry.
It is felt the accuracy of the reported Ore Reserves for the Elimatta project is at a suitable level for this style of deposit. Given that it is a greenfield project in a new coal basin in Queensland, there is no ability to reconcile against production figures of this project or neighbouring projects. The reserving process and application of mining modifying factors is felt to be suitable for this style of deposit, as discussed in this report. This is turn gives the author of this report the confidence that there is suitable accuracy applied to the level of Ore Reserve estimate for the Elimatta project.

ELIMATTA
JORC Reporting – Table 1: Appendix 1 For Coal Resources and Reserves as at 2015
COLLINGWOOD
JORC Reporting – Table 1 For Coal Resources as at 2015
Section 1 Sampling Techniques and Data (Criteria in this section apply to all succeeding sections)
Criteria Commentary Sampling techniques New Hope Group (NHG) acquired the Collingwood exploration project from Cockatoo Coal
in December 2014. All of the geological data for this project was transferred to NHG as part of this arrangement. As such, the data is “legacy” data. No on-ground exploration activities have been carried out by NHG prior to this model.
Drilling campaigns at Collingwood have taken on various forms, including chip drilling, core drilling for coal quality analysis, as well as some core drilling for gas sampling and geotechnical testing.
Based on examination of the available legacy lithological logs, the chip and core descriptions reflect that the chip samples have been collected in 1 metre intervals and described in acceptable detail.
Based on the review of available sampling and analytical data for Collingwood cores, coal quality core sampling procedures appear to have followed satisfactory rigor in terms of the sample depth, thickness and core recovery management.
All major coal units appear to have been sampled for analysis, although some minor coal units, particularly those at depth, have been excluded from analysis.
Stone bands have generally been sampled separately, which is good practice, allowing some flexibility in product compositing later.
Roof and floor samples (15cm) have been taken for holes drilled by Cockatoo Coal.
The available coal quality analytical reports for holes drilled by Cockatoo Coal have been generated from samples sent to SGS Minerals Gladstone / Coal and Tech Services (CATS) SGS Australia Pty Ltd. It is understood that these laboratories were accredited by National Association of Testing Authorities (NATA), and in compliance with NATA, all samples are believed to have been prepared and analysed using methodologies stipulated in the Australian Standards.
There are six (6) large diameter coal quality core holes, for which sizing and washability data exist. Different laboratories were used in separate campaigns (SGS for 2011 and ALS for 2012) and differences in the results were noted, presumably due to different dry sizing instructions issued for each campaign.
Nine gas samples were collected from two HQ cored holes in Aug 2012 and were dispatched for gas analysis. Cockatoo Coal conducted a core sampling program that began on the 22nd August 2012 and concluded on the 25th August 2012. Core sampling targeted A, B, D, E and Y seams within the Taroom Coal Measures. Initial gas desorption measurements on-site were conducted by Cockatoo personnel using stainless steel canisters and gas desorption equipment supplied by GeoGAS. Following the conclusion of initial gas desorption measurements (Q1 lost gas determination), Q2 (measurable gas), Q3 (residual gas) gas desorption measurements and gas composition analysis were carried out by GeoGAS between the 6th and 7th September 2012 at the Mackay Laboratory. The material characterisation (i.e. proximate analyses and relative density analyses) were conducted by ALS Richlands. This gas sampling appears to have followed standard gas sampling protocols with HQ core samples of coal taken and placed into gas canisters. These samples had a nominal thickness of 80cm.
Geotechnical sampling has been carried out with subsequent lab results reviewed and reported by Tristan Cook, Geotechnical Engineer & Tim Summons Senior Engineering Geologist, Mining One Pty Ltd. Defect logging and sample preparation were carried out by the field exploration geologist. Samples were tested at both Trilab laboratories in Brisbane and ALS Global Environmental Division, Brisbane. Both Trilab and ALS are NATA accredited laboratories.
319 out of 388 holes have geophysical data. Downhole geophysical logging has been carried out on most drill holes. In general, dual density (long-spaced density & short-spaced density), gamma and caliper trace data have been collected in each logged hole. Although it has become an industry standard to log all holes with the deviation tool, only 152 holes have verticality data for the Collingwood project. This is not expected to have any material

COLLINGWOOD
JORC Reporting – Table 1 For Coal Resources as at 2015
Criteria Commentary impact on coal resource calculations. Sonic data has also been acquired in some holes across the deposit.
Regional 3D seismic survey has been gathered and utilised for structural reference.
Drilling techniques Open/chip holes at Collingwood are noted as being drilled by open hole hammer method with hole diameters of 96mm, 99mm, and 120mm.
Coal quality samples have most commonly been collected from holes with a core size (diameter) of 100mm, which has become an industry standard for open cut coal quality coring.
Mobil and Moonie Oil joint venture core holes were drilling at 63.5mm diameter (as reported in model report of 2009).
There are six (6) large diameter coal quality core holes, for which sizing and washability data exist. Different laboratories were used in separate campaigns (SGS for 2011 and ALS for 2012) and differences in the results were noted, presumably due to different dry sizing instructions issued for each campaign.
There are 152 holes with verticality data. All holes were planned as vertical holes, designed to intersect the horizontally stratified Taroom Coal Measures.
Drill Sample Recovery Standard coal industry practice is to validate the strata roof and floor positions against downhole geophysical detailed density logging. Recent auditing and legacy documentation has illustrated that geophysical borehole corrections were standard process.
Core depth and sample reconciliation records are readily available, showing that an attempt has been made to ensure seam depths are accurately measured and entered into the geological databases. Core recoveries are sometimes quite low, especially for CW series of holes, with re-drills common. It was stated in 2009 model report, under ownership of Anglo Coal, a core recovery of 95% was targeted but that 90% was acceptable. Where recovery was below 95% statistics were used to determine if there was any statistical variation within the seam.
The 2011 resource statement issued by Cockatoo Coal indicated that only drill holes with recovery of 95% or greater for the seams were included in the quality model and therefore used for resource estimation.
For the 2015 MineScape model, minimum sample recovery was defined as 90%.
Logging When drilling chip holes, for every metre drilled, the drill cuttings (chips) are generally laid out in individual piles representing one metre intervals for the geologist to examine and to describe in their lithology logs. The available lithological logs suggest that this method has been used for the Collingwood project chip sampling.
For core holes, accurate core length and depth measurements have been taken, and these have been reviewed by internal resource geologists and through third party audits.
The field geologists have examined the cored intervals in reasonable detail, and then have transcribed their observations into the lithology logs as the geologist logs the core.
Core photos are also available, and these illustrate that core has been collected using sound drilling and handling techniques.
Core photos show the use of a tape measure for recording core run recoveries and for measuring sample intervals.
Geological and geophysical logging of boreholes was carried out for the entire hole section.
Cored intervals have been photographed both on the core table and some have been transferred into core boxes and secondarily photographed. These core photographs are a useful record to help manage data quality control, to establish core loss/expansion, to compare with sample recovery methods, to assist in core sample laboratory testing instructions, and as a permanent record of borehole lithology. Core photos were taken at half-metre intervals whilst on the core table.
Photographic records of washed chip samples are displayed as wet samples for true colour and lithological determination.
319 holes have geophysical data. Downhole geophysical logging has been carried out on most holes across the Collingwood project. Dual density (long-spaced density & short-

COLLINGWOOD
JORC Reporting – Table 1 For Coal Resources as at 2015
Criteria Commentary spaced density), gamma and caliper trace data are available. The detailed density log has been used to accurately correct seam roof and floor depths.
Although it is considered an industry standard to log all holes with the deviation (verticality) tool, this has only been undertaken on 152 holes at Collingwood, which means that there may be some seam depth errors, i.e. all holes are assumed to be vertically drilled, however this is unlikely to have a material impact on coal resources.
Sonic geophysical data has been acquired for 211 holes across the deposit.
Downhole geophysical logging services have been performed predominantly (if not exclusively) by Weatherford Pty. Ltd. It is a well-established downhole logging company and their operational procedures and data quality are highly regarded in industry.
An audit of geophysical LAS file header data indicated that regular tool calibration procedures were in place.
Sub-sampling techniques and sample preparation
Lithology records show that the Collingwood project core samples appear to have been collected in accordance with acceptable coal industry practice.
Core samples were retained as uncut, cylindrical cores, cut at 1 metre intervals where required to be boxed.
Lithological descriptions have been detailed and relevant defects in the core have been logged. Core sample intervals generally appear to have been taken in a logical manner based on the coal brightness and presence of stone bands.
A typical core size of 100mm diameter has been sampled for coal quality across the project. This core size allows for collection of coal material with adequate dimensions for laboratory sample pre-treatment and is well suited to coal quality determination. It is widely regarded as the industry benchmark for open cut coal resource determination, although HQ and in particular PQ core are also considered acceptable by most industry professionals.
Mobil and Moonie Oil joint venture cores were 63.5mm diameter, as reported in the 2009 geological model report.
Size (length) of cored samples is generally satisfactory for the purpose of coal quality determination. Collection of separate samples for stone intervals adjacent to the coal units has been undertaken and is considered good practice, enabling flexibility in preparation of composite seam units for more detailed analysis.
Downhole geophysical data appears to have been routinely used to validate and correct the seam depth intervals, and used along with core photography to validate core loss/expansion.
Quality of assay data and laboratory tests
Coal quality samples collected by Cockatoo Coal were sent to SGS Minerals Gladstone / Coal and Tech Services (CATS) SGS Australia Pty Ltd., which where both NATA accredited laboratories. In compliance with NATA, it is understood that these samples were prepared and analysed using methodologies as stipulated in the Australian Standards.
Shell joint venture cores were 100mm diameter and were sent to various laboratories (as reported in the 2009 geological model report).
Mobil and Moonie Oil joint venture cores were 63.5mm diameter and were sent to ACIRL at Riverview (as reported in the 2009 geological model report, and also in laboratory reports that have been obtained from QDEX).
The labs have advised previously that they routinely undertake internal “round robin” testing between labs to ensure consistency of analytical results and procedures.
Coal quality reports show that coal quality analysis at Collingwood was performed in five stages: (1-3) Raw Coal Analysis; (4) Washability Analysis; and, (5) Clean Coal (Product) Analysis.
1 - ply (non-composite) lab analysis 2 - composite lab analysis 3 - composite calculated values
Following the Australian Standards, there is evidence that the laboratories have split the samples into suitable quotients in order to perform the coal quality analysis required.

COLLINGWOOD
JORC Reporting – Table 1 For Coal Resources as at 2015
Criteria Commentary Sample pre-treatment and sizing analysis has been undertaken on some core samples. This is considered the best method for generating robust washability and clean coal analysis results required to accurately predict CHPP processing and product qualities.
Verification of sampling and assaying
For the Collingwood deposit, downhole geophysical logs appear to have been routinely used to “depth adjust” the chip and core lithologies recorded by the geologist i.e. the coal seam roof and floor depths in the lithology logs are adjusted to match the geophysical signatures. This process also provides a good method for verification of coal seam thickness as well as correlation consistency.
Coal seam names for the Taroom Coal Measures within the Collingwood Project appear to have been consistently assigned by the geology team based on stratigraphic position and verified by geophysical signatures.
The available lithology, geophysical and coal quality records and reports are located on the New Hope Group geological information secured network drive “I-Drive” where they are filed in a logical order.
A review of selected analytical data has shown that the seam depths and thicknesses have largely been corrected using geophysical logs and core photography. The laboratory sample intervals also generally match these LAS intervals (from short spaced density logs).
Coal quality samples were taken as individual plies.
Coal quality data validation procedures, undertaken by Mal Blaik of JB Mining when constructing the geological model for Anglo Coal in 2009, have included data trend analysis, review of coal quality data cross plots e.g. Ash vs. Relative Density, and a statistical review. Similar analyses have been performed by David Clark when constructing the geological model in July 2015.
The laboratory results are mostly available for CW holes as MS Excel and CSV files, with some PDF files also available. Either within these files or in the NHG Coal Quality file directory, the analytical procedures used and standards followed to conduct these analyses are generally documented. There are many sample instructions for CW holes. However instructions for clean coal analyses conducted for Cockatoo Coal have not been located.
Coal quality data found in these laboratory reports have been entered into the geological databases. A visual check for washability and clean coal quality results was performed for all available reports to verify that the database values match the laboratory reported values and this was found to be the case. Data for raw coal quality has been compared and verified.
These coal quality databases have been used to build coal quality grid models. Other than the required seam depth, thickness and seam correlation based naming edits; no modifications appear to have been made to the analytical results. Where data validation checks identify an anomalous result, this data may have been excluded if modelling personnel felt it was sufficiently misleading or biased the local data trends.
The only data excluded from the 2015 model has been on the basis of core recovery. That is, seam composites with insufficient core recovery or with lower core recovery that composite for nearby hole have been omitted.
The geological database also has built-in validation parameters to help ensure data is entered correctly and there are no obvious errors.
Available geological data is securely stored both electronically and in hardcopy, using New Hope Group standardised practices, and has restricted access. Hardcopy borehole files are stored in a secure fire-proof room at New Hope Group’s Head Office in Brookwater, Queensland.
Location of data points Based on a brief review of available survey records, drill hole collar location data at Collingwood appears to been consistently represented using the MGA94 Zone 56S projection. Some holes have been transferred from AMG66 Zone 56S to match the project grid system. All elevation data is recorded in Australian Height Datum (AHD).
Borehole collar coordinates have been surveyed primarily by Downes Group however some earlier drill holes appear to have been surveyed by other surveying contractors.
Digital Terrain Model (DTM) data from aerial photography was supplied by Fugro in early October 2011. This data was supplied in Shape File formats.

COLLINGWOOD
JORC Reporting – Table 1 For Coal Resources as at 2015
Criteria Commentary The Cockatoo Coal 2014 MineScape geology model topographic surface was derived from this DTM data. And additional LiDAR data was used to create the topographic surface. This same topographical surface was used for the 2015 geological model.
Data spacing and distribution
The average chip hole spacing within the main resource area varies from 250 to 500m.
On average, the spacing of cored holes within the main resource area is approximately 500m.
Through examination of cored seam intersections and geophysical data (for open and cored holes) across the deposit a reasonable degree of confidence can be demonstrated for the lateral continuity of coal seams within the resource areas at Collingwood except for the E seams. These have not been logged consistently, do not appear to be very continuous, and have a wide range of sample raw ash values.
All resource estimations are limited to within the Collingwood EPC640 tenure boundary with a 50m exclusion buffer around the edge of the lease boundary.
No faults have been included in the geological models built in 2014 or 2015. Detailed drilling has not yet been undertaken for fault delineation, so it is anticipated that future closer spaced drilling will be required for this purpose. However, for an open cut coal environment the discovery of additional faulting is unlikely to affect the resource categorisation, unless major unexpected faulting is found. NHG currently undertake mining in a similar geological setting with no negative consequences to the resource.
Orientation of data in relation to geological structure
Within EPC640, the Collingwood deposit has an overall dip of approximately 1.5° to the south-west.
Holes were drilled vertically to intersect the relatively flat-lying coal seam strata and this is considered to provide the optimal sampling orientation strategy.
Coal quality samples have been taken at a suitably regular spacing across the deposit and on a seam-by-seam basis, in order to achieve a reasonably unbiased representation of the coal quality.
Limited available down hole deviation data has meant that no holes have been corrected from vertical. As a result, there may be some seam depth errors, i.e. all holes are assumed to be vertically drilled, however this is unlikely to have a material impact on coal resources.
Sample security Many coal quality (and other) samples have been collected and dispatched to various laboratories, however no specific consignment information has been recorded in the legacy dataset obtained by New Hope Group during project acquisition.
Intermittent sample dispatch documentation is available, but this is not comprehensive.
A series of coal quality testing reports are available for the Collingwood core samples. The sample treatment instructions viewed for these reports indicate that reasonable checks appear to have been in place for ensuring sample integrity at the NATA registered laboratories.
Core photos are available and these support the methodical collection and handling of core samples.
Audits or reviews A full due diligence was undertaken by NHG prior to purchase by NHG in 2014. Data reviews and audits have been completed by both NHG technical staff and external consultants. Based on recommendations from these audits, some improvements have been made to the geological database prior to modelling.
In particular, a comprehensive data audit was completed in 2015 by Wenjing Lin, titled ‘Collingwood Data Review’.
Cockatoo Coal generated a MineScape model in 2014 and this model was subsequently updated by David Clark in 2015. Although no new holes were included in this latest model there was some additional sample data that was recovered during the audit by Wenjing Lin. The origin of this data (i.e. the report name) has been identified in the comments field of the geological database sample advice table.
The latest MineScape model has been documented in detail in a model report compiled by David Clark.
Geotechnical sample analysis data and specific geotechnical recommendations based on this data have been made by Mining One Pty. Ltd.

COLLINGWOOD
JORC Reporting – Table 1 For Coal Resources as at 2015
Criteria Commentary The coal quality, gas testing and geotechnical laboratories used are NATA accredited. As such they are subject to audit by external auditors.

COLLINGWOOD
JORC Reporting – Table 1 For Coal Resources as at 2015
Section 2 Reporting of Exploration Results (Criteria listed in the preceding section also apply to this section)
Criteria Commentary Mineral tenement and land tenure status
North Surat Coal Pty Ltd, a subsidiary company of New Hope Group, currently holds tenure over EPC640 and EPC1322. EPC640: Collingwood
Ownership held by North Surat Coal Pty Ltd. 12km northeast of Wandoan, Qld. Expiry: 15 February 2023.
EPC1322: Collingwood South
Ownership held by North Surat Coal Pty Ltd. 5km northeast of Wandoan, Qld. No coal resources reported within EPC1322. Expiry 4 February 2019, renewal lodged 10 October 2018.
Mining Lease Applications MLA55015, MLA55012, and MLA 55016 over EPC640.
Exploration done by other parties
Exploration drilling in the general Collingwood area has been carried out since 1978, when ATP312C was first granted to Shell Pty. Ltd.
Boreholes within the project area have been drilled by the following parties:
Shell (Barakula) Mobil Moonie Pacific Oil & Gas Xstrata Santos QGC Cockatoo Coal Limited (CCL)
Most of the exploration drilling data in the current database was generated in 2011-2012 during which time tenure was held by CCL. This data is generally regarded as reliable, including downhole geophysics for most holes and a good coverage of cored holes with coal quality analytical data. While some drilling data from the earlier explorers has been included in the model, many drill holes were excluded due to lack of downhole geophysical logs.
Geology Collingwood is located approximately 400 kilometres (km) north-west of Brisbane and 320 km south-west of Rockhampton, between the Central Queensland towns of Taroom and Wandoan on the Leichhardt Highway. Wandoan and Taroom are approximately 12 km south-west and 40 km north-west of the project area respectively.
The area covered by EPC640: The landscape in the vicinity of Collingwood comprises gently undulating plains, with a dominant soil type classified as vertosols. The Collingwood site is located at an elevation of between 280 and 320m, Australian Height Datum (AHD). Vegetation has been extensively cleared by local landholders to allow for the sowing of improved pastures mostly for grazing.
Intermittent watercourses traverse the area, of which the most significant are Roche Creek, which flows in a westerly direction into Juandah Creek and then flows downstream to the Dawson River. Roche Creek forms part of the upper reaches of the Dawson River Catchment, a sub-basin of the larger Fitzroy River Catchment.
The topography of the Collingwood Project area shows considerable relief with variation of more than 100m from Roche Creek in the south to the north-east of EPC 640. Drillhole collar RLs vary from 252 to 352m. The form of the topography in the main deposit area is of a dip-slope to the north.
The Collingwood Deposit in EPC640 is located within the Taroom Coal Measures, the lower of two coal bearing units in the mid to upper Jurassic of the Walloon Subgroup of the southwesterly dipping eastern limb of the Taroom Trough (Mimosa Syncline) in the northeastern Surat Basin, Queensland, Australia.

COLLINGWOOD
JORC Reporting – Table 1 For Coal Resources as at 2015
Criteria Commentary The Taroom Coal Measures are overlain by the Tangalooma Sandstone, then the Juandah Coal Measures which form the uppermost unit of the Walloon Subgroup.
The Taroom Coal Measures are characterised by lithic, sub-labile medium grained sandstones grading upwards to interbedded sandstone, siltstone, mudstone, and coal.
Twenty-two individual coal seams have been correlated and modelled within the Collingwood Deposit. The individual seams have been assigned to seven seam groups. In decreasing stratigraphic order, the seam groups are the Y, X, A, B, C, D and E.
There are no faults included in the MineScape geological model, with drill hole spacing insufficient to adequately identify any major faults. This is consistent with the understanding that coal deposits in the Surat Basin are typified by minimal structural disturbance, with flat dips and minimal faulting.
Drill hole information Drill hole collars have been surveyed accurately by qualified surveyors using MGA94 Zone 56 and Australian Height Datum (AHD).
There are 306 drill holes in the MineScape geological database for the Collingwood Project, of which 216 have been used in the MineScape structural model. This includes 87 cored holes, for which 69 have coal quality analysis. These holes were used to create the 2015 MineScape model and consequently to define the resource at Collingwood.
Eighty-seven drill holes were excluded from the geology model because they were:
considered unreliable, or too far outside the EPC to be useful in modelling, or too close to other holes and so of no value to the model, e.g. pilot holes or re-drills.
Most of the excluded holes are legacy holes that do not have geophysics.
All holes included in the model are considered to have been drilled vertically and most holes have been geophysically logged. However, as a rule, these holes do not have any verticality data and therefore have been modelled as vertical holes. This may introduce some seam depth and thickness errors, but should not materially impact the coal resources this is based on similar deposits.
Data aggregation methods
Although recent coal quality holes have been sampled into individual plies, some of the samples from earlier holes overlap the individual seam boundaries and include more than one seam.
This is now less prevalent as some older sample data, which was previously combined into composites, has recently been recovered.
Samples that extend outside seam boundaries have been included in composites for the 2015 geological model, as they were for the previous Cockatoo Coal model.
Float 1.80 yield was estimated from raw ash, using ash yield relationships for the 2015 geological model. All qualities were modelled on an air dried basis. There was minimal clean coal data available for modelling.
Relationship between mineralisation widths and intercept lengths
Coal measures deposited in the Surat Basin are relatively flat and continuous over significant distances. The Collingwood project coal seams can generally be demonstrated (using geophysically correlated drill hole intersections) to be essentially continuous across the EPC640 area and beyond.
Exceptions to this continuity are in areas where the coal seams sub-crop, and if unexpected major faulting was to be determined through future exploration drilling. Although the seams dip towards the south and southeast and tend to sub-crop to the north and northwest. There is quite a complicated pattern to the LOX lines generated in the geology model. This is due to a combination of a shallow dipping, multiple seam resource, variable topography, plus some anticipated impacts from the geological structures.
The coal resources at Collingwood are also known to extend beyond EPC640, however, resource estimates have been limited to the bounds of EPC640.
All drill holes are assumed to be vertical, but because geophysical deviation data is not readily available to correct any deviation from vertical, there may be a small degree of error in true seam depths, however due to the very shallow seam dips, it is considered that this will not have any significant material impacts on coal resource estimates.
Diagrams Drill hole location plan for holes used in the Col_Aug15 model is attached in Appendix 1.

COLLINGWOOD
JORC Reporting – Table 1 For Coal Resources as at 2015
Criteria Commentary Balanced reporting Available exploration data for the Collingwood project has been collated, validated and
loaded to generate the 2015 MineScape geological model. This model is effectively a series of interpolated data grids for seam roof and floor horizons as well as for selected coal quality parameters. These grids are then used to calculate coal resources.
Seam thickness statistics comparing the original drill hole intersection data to the gridded data are listed in Table 3: Model Verification Summary for Grid Model. This table is a comparative measure of how closely the grid interpolations are to honoring the actual drill hole data.
Eighty-seven drill holes were excluded from the geological model because they are considered unreliable, too far outside EPC640 to be useful in modelling or close to other holes and containing no additional information which would be useful to model. Most of the excluded holes are old holes that do not have geophysics. Notwithstanding the above, it is considered and confirmed with geostatistics that sufficient drill hole coverage exists to complete resource estimation within EPC640.
Other substantive exploration data
Regional 3D seismic line data exists for the Collingwood project area. This has not been specifically utilised in the generation of the geological model or in resource estimation due in part to the shallow nature of the resource, however it confirmed the shallow dip of the geological sequence with no significant structural intercepts.
Further work As with every resource there are a number of opportunities for improving the geological and coal quality understanding of the area some of these are:
The LOX lines are complex, but are poorly defined. Although this should not significantly affect overall resources, it may have a marked impact on localised areas which are likely to occur around the initial “box-cut” mining blocks. These should be addressed with targeted LOX line drilling and LOX sample analysis ahead of final mine plan development. The “barren” zone should be targeted as part of this LOX drilling, this is not a high priority.
Further exploration and fault delineation drilling to more accurately define the geological structures and to fill in data “gaps” (particularly in deeper seams) is also recommended ahead of any detailed mine planning, however this should not have a significant impact on the overall coal resource again this is not a high priority.
As is common in exploration projects of this nature, the lower (deeper) seams tend to be under-represented in the core sampling (as generally reflected in their resource status) and this is an area that could be addressed to potentially add additional coal resources to the project area.
More detailed Washability analysis from large diameter core program(s) is highly recommended to assist further CHPP design studies.
COLLINGWOOD
JORC Reporting – Table 1 For Coal Resources as at 2015
Section 3 Estimation and Reporting of Mineral Resources (Criteria listed in section1, and where relevant in section 2, also apply to this section)
Criteria Commentary Database integrity There have been a number of quality control and validation processes applied to the
Collingwood dataset, and they have been scrutinised by various competent coal industry professionals. A range of recommendations have been made to investigate facets of the data and some significant data validation modifications have also been completed to improve data consistency and robustness.
The MineScape software contains rigorous data validation processes which are utilised during data loading to restrict invalid data entry.
Additional data validations have been undertaken by viewing tabulated data and graphical data outputs, such as geological cross sections and seam contour plans. In particular, during the generation of the 2015 MineScape model, the data was subjected to a series of reasonably comprehensive validation processes resulting in a large number of corrections to interval depths, thicknesses, as well as edits to seam naming.
External contractors and consultants have also completed reviews and audited the geological and coal quality databases. In particular, a comprehensive data audit was completed in 2015 by Wenjing Lin and a model audit was also completed at this time by David Clark.
Site visits The Competent Person for NHG has not visited the Collingwood deposit specifically, however, has visited the nearby Taroom deposit and has worked elsewhere within the Surat Basin.
Geological interpretation
There are 306 drill holes loaded into the MineScape Collingwood geological database (GDB), of which 90 holes have been excluded, leaving 216 holes that have been used in the geological model. These modelled drill holes include 69 coal quality cored holes that have been used to generate the coal quality grids.
Internal review and external auditing of the geological data resulted in a large volume of data validation to ensure the data used in the geological model was accurate.
The regional structure is relatively homogenous and only minor faulting was noted in historical exploration field notes.
No intrusive or surface volcanics are known to have been identified during the exploration of EPC640.
The geological resource estimation made for the Collingwood project is conservative.
Dimensions EPC640, which bounds the Collingwood deposit, has maximum dimensions of approximately 11km long and 6.5km wide, covering an area of approximately 5,709 hectares.
The coal resources at Collingwood are also known to extend past the mining tenure, however resource estimates have been limited to the within tenure held by New Hope Group.
The coal resources primarily occur within the A and B seam groups, which comprise approximately 90% of total Measured and Indicated resources.
The upper seams in the sequence sub-crop in the east, resulting in complex LOX line geometry.
The Taroom Coal Measures have a total vertical interval thickness of approximately 100m, from the Y seam down to the E seam group.
Depth of weathering ranges from 5 to 24 metres and averages 11.5 metres.
Estimation and modelling techniques
The model utilised for the estimation of coal resources was generated by David Clark in August 2015 (Col_Aug15) using MineScape software.
This geological model uses a grid spec containing 253 rows and 146 columns, with a grid cell size of 50m. The grid is 12.6km in length and 7.25km in width, and extends outside the boundaries of EPC640.

COLLINGWOOD
JORC Reporting – Table 1 For Coal Resources as at 2015
Criteria Commentary Borehole data was accessed directly from the MineScape GDB database that was constructed for NHG by Wenjing Lin. The coal quality data for modelling included coal types IR and CR, representing raw quality, and F1 and CN representing washed coal quality. More recent coal quality holes were sampled as individual seams, some of the samples from earlier holes overlap the individual seam boundaries and include more than one seam. This has generally occurred where the seams are merged and the samples were selected to represent a likely working section. Samples such as these that extend outside the seam boundaries have been included in this model.
There are 21 coal seam intervals modelled for the Collingwood deposit.
The structural modelling process can be summarised as follows:
The MineScape ‘Build Table Model’ function is used to interpolate missing seam information for holes where the seam has been eroded away or where the hole was not drilled deep enough to intersect a particular seam. Locations and thicknesses for the missing seams are estimated by analysing seam and mid-burden thicknesses in surrounding holes. The output from this process is a MineScape table file containing roof, floor and thickness for each seam at each borehole location. A selection template is used to limit the boreholes that are included in the model.
The MineScape ‘Build Grid Model’ function is then executed to produce a grid model containing roof and floor of all seams. These grids are created using Finite Element Method interpolation.
A reference surface is created at the roof of the B3B seam. The B3B seam was selected as the reference surface because it has the most borehole intersections. This surface is created using Finite Difference Method interpolation.
The quality model uses inverse distance interpolation, power two and search radius of 10km.
Moisture MineScape models have been generated for each seam for Moisture and Relative Density on an air dried basis.
Resources were calculated using the Air Dried Moisture Density grids. Resource estimates are reported on an air dried basis.
Cut-off parameters A review of Raw Ash contours was completed for each of the Collingwood project seams. In general, most seams have suitably low Raw Ash to warrant inclusion as resources.
A number of higher (>40%) Raw Ash instances occur for the lower E seams. The E seams were excluded from resource on the basis of relative lack of continuity, thin and highly variable raw ash,
The coal seams at Collingwood tend to be thin and banded however given the NHG’s demonstrated capability with mining thin seams this is not considered to be a significant constraint.
No minimum seam thickness constraint has been applied to these resources as NHG currently mine down to less than 10cm.
A maximum depth cut-off of 150m below topography was applied to these resources.
A buffer of 50m around the edge of the lease was excluded from the resources.
Mining factors or assumptions
While the development of working section mining methodologies will present a significant challenge, New Hope Group are experienced in mining thin seam open cut operations, having operated the thin seam operation at New Acland mine since it was commissioned in 2002.
It is considered reasonably probable that similar truck and shovel configuration could be utilised at Collingwood. This could allow coal and parting material to be mined separately to a minimum thickness of 10cm or even less.
Mine scheduling of coal and parting operations will need to be to sufficiently flexible to allow sufficient time to maximise coal resource recovery including use of smaller equipment where required.
Metallurgical factors or assumptions
It is expected that coal mined from Collingwood will require beneficiation through a CHPP to produce a clean coal product.

COLLINGWOOD
JORC Reporting – Table 1 For Coal Resources as at 2015
Criteria Commentary Environmental factors or assumptions
No limiting environmental factors are applied to the coal resources at Collingwood.
Areas of regional interest are listed across the EPC640 area which include Strategic Cropping Areas (SCA) and Priority Living Areas (PLA).
Much of the region has been cleared for previous agricultural and pastoral activities by landholders.
A full review of potential environmental impact has been conducted as part of the North Surat Project Concept Study, a study which includes EPC640: Collingwood.
Product coal will be transported by train via the proposed West Surat Link, the planned Surat Basin Rail and existing rail networks to the Wiggins Island Coal Export Terminal near Gladstone.
Bulk Density Resources are calculated based on in-situ volume multiplied by relative density as reported on an air-dried basis, and no adjustments for moisture are applied.
Seam density is based on Relative Density results obtained from the laboratory, and are reported on an air-dried basis.
The density of roof and floor dilution material is also analysed on an air-dried basis at the laboratory.
Classification The Collingwood deposit includes resources in Measured, Indicated & Inferred categories.
Points of Observation (POO) have been identified for each seam. These Points of Observation have been used to generate resource polygons in MineScape for calculation of Measured, Indicated and Inferred resources. Radii for the POO’s were decreased from the previous estimation based on a geostatistical investigation undertaken by McMahon Coal Quality Resources.
Each Point of Observation is based on a cored hole that has at least raw coal quality analysis for the relevant seam. These cored holes, as well as other non-cored holes are also generally geophysically logged, and provide confidence in seam continuity and correlation.
Measured resources are based on Points of Observation at 300m drilling centres.
Indicated resources are based on Points of Observation at 600m drilling centres.
Indicated resources are based on Points of Observation at 1200m drilling centres.
There is a moderately high level of confidence in the Measured and Indicated resources, and a slightly lower level of resource confidence of Inferred resources.
A review of Raw Ash contours for each seam has been undertaken to confirm Raw coal quality is acceptable for resource definition. A number of high Ash occurrences have been identified, but only in the E seams which are excluded from the resource.
The E seams are thin, logged inconsistently, with variable and occasionally high raw ash and relatively discontinuous. They have therefore been excluded from the resource.
Audits or reviews A full review of the data was undertaken during due diligence for NHG to purchase the project from CCL.
Several experienced consultants have been engaged to review and assess the available geological and coal quality data.
The 2015 MineScape model has implemented improvements recommended in an earlier review of the previous Cockatoo Coal model and includes some additional sample data. It is considered suitable for the purpose of this resource assessment.
Discussion of relative accuracy/confidence
Each seam was considered individually and detailed documentation is available for the resource generation process.
Additional data validations have been undertaken by viewing tabulated data and graphical data outputs, such as geological cross sections and seam contour plans. In particular, during the generation of the 2015 MineScape model, the data was subjected to a series of reasonably comprehensive validation processes resulting in a large number of corrections to interval depths, thicknesses, as well as edits to seam naming.
External contractors and consultants have also completed reviews and audited the geological and coal quality databases. In particular, a comprehensive data audit was

COLLINGWOOD
JORC Reporting – Table 1 For Coal Resources as at 2015
Criteria Commentary completed in 2015 by Wenjing Lin and a model audit was also completed at this time by David Clark.
Overall, in a broad sense, there is a high level of confidence in the lateral continuity of all the major coal seams in their respective resource areas, however there are some areas that need further exploration drilling to improve confidence prior to any detailed mine planning. Some such areas include: in the proximity to the main faults defined in the model, around the LOX lines, and in some of the thinner seams to confirm thickness continuity around resource boundaries.
In addition, instances of apparent D and E seam correlation mismatches were noted in several drill holes and these should be resolved through detailed correlation review and may require targeted exploration drilling to verify.
The coal quality of the Collingwood deposit appears well suited to production of an export thermal coal.

COLLINGWOOD
JORC Reporting – Table 1 For Coal Resources as at 2015
Section 4 Estimation and Reporting of Ore Reserves Reserves have not been quoted for Collingwood for the reporting period.

COLLINGWOOD
JORC Reporting – Table 1: Appendix 1 For Coal Resources as at 2015