FBU Annual Report 2021 - ASX
132
Building Momentum Fletcher Building Limited Annual Report 2021 For personal use only
-
Upload
khangminh22 -
Category
Documents
-
view
9 -
download
0
Transcript of FBU Annual Report 2021 - ASX

Building MomentumFletcher Building LimitedAnnual Report 2021
For
per
sona
l use
onl
y

When used in this annual report, references to the ‘Company’ are references to Fletcher Building Limited. References to ‘Fletcher Building’ or the ‘Group’ are to Fletcher Building Limited, together with its subsidiaries and its interests in associates and joint ventures. All references to financial years FY20 and FY21 in this annual report are to the financial year ended 30 June. References to $ and NZ$ are to New Zealand dollars unless otherwise stated.
In certain sections of this report the Group has chosen to present certain financial information exclusive of the impact of significant Items and/or the results of the legacy projects, consistent with previous market guidance. Where such information is presented, it is clearly described and marked with an appropriate footnote. This allows the readers of this report to better understand the underlying operations and performance of the Group.
Front cover image: Fletcher Steel's Marijune Cabiling scans steel coils for dispatch at Pacific Coil Coaters in Penrose, Auckland.
Nicola O'Sullivan inspects a section of managed fill now replanted at a historic Winstone Aggregates quarry site at Hunua. The site neighbours the quarry currently being mined for Greywacke, primarily for infrastructure such as roading and concrete.
For
per
sona
l use
onl
y

Contents
Welcome to our FY21 Annual Report, which describes our business operations, approach to doing business and performance for the year. As with our previous reports, we include commentary on our strategy, governance, environmental and social performance of our business as well as our financial results. We welcome questions, comments or suggestions about this report to [email protected].
This report and our previous reports and presentations are available at fletcherbuilding.com.
Throughout this annual report there are QR codes that you can scan with your mobile phone camera to view relevant video material.
Our Year02 We are Fletcher Building03 At a Glance04 Chair’s Report05 CEO’s Report06 Our Strategy08 Zero Injuries Every Day12 Embracing Innovation and
Disruption to Drive Future Growth18 Leadership in Sustainability22 Our People
Performance26 Group Performance 28 Group Overview30 Building Products32 Distribution34 Concrete36 Residential and Development 38 Construction 40 Australia
Governance42 Board and Executive Team45 Corporate Governance 56 Sustainability Materiality and Methodology57 Remuneration Report
Financial Report68 Trend Statement 69 Financial Statements 75 Notes to the Financial Statements117 Independent Auditor’s Report
Other Disclosures121 Statutory Disclosures128 Corporate Directory
This Annual Report is dated 18 August 2021 and is signed on behalf of the Board by:
Robert McDonaldDirector
Bruce HassallChair
Fletcher Building Limited Annual Report 2021 1
This is an interactive PDF designed to enhance your experience. The best way to view this report is with Adobe Acrobat Reader. To navigate this report, click content sections listed above to navigate to desired pages. You can also click the view contents page menu button on the top of any page to return here.
For
per
sona
l use
onl
y

We are Fletcher Building
New Zealand
Australia
We are driven through efforts to create a better more sustainable world. We want to be smart and innovative in all we do, making our customers' lives easier in the process.
Fletcher Building builds homes, buildings and infrastructure that creates communities, improves productivity, and contributes to the quality of life for people living and working in cities and regions across New Zealand, Australia and the South Pacific.
Our impact spans the full construction value chain. We operate businesses from resource extraction, product manufacture and distribution, through to property development and infrastructure construction.
Fletcher Building is dual listed on the NZX and ASX and operates through six divisions – Building Products, Distribution, Concrete, Residential and Development, Construction, and Australia.
‘Improving the world around us through smart thinking, simply delivered’ is our purpose.
Fletcher Building has operations in Papua New Guinea, Fiji, Samoa and American Samoa, Tonga, Vanuatu and the Solomon Islands.
South Pacific
Fletcher Building Limited Annual Report 20212
For
per
sona
l use
onl
y

At a Glance
30.0¢2020 nil
$305mNet earnings /
(loss) – reported:
2020 ($196m)
$8,120mRevenue
People in New Zealand, Australia and the South Pacific
2020 $7,309m
Leverage ratio (net debt/EBITDA)
2020 0.9x
$889mCash flows from
operating activities
$669mEBIT before
significant items (1)
2020 $160m
2020 $410m
37.0¢
0.2x
Earnings per share
2020 (23.5¢)
14,500+
Total dividend
2020 5.7
5.0Safety TRIFR (2)
2020 40
41Customer NPS (4)
2019(3) 71%
66%Employee engagement
2020 1,146,851 tCO2e
1,145,035tCO2e
Carbon emissions 2020 2.2%
8.2%EBIT margin before significant items (1)
(1) Measures before significant items are non-GAAP measure used by management to assess the performance of the Group and have been derived from Fletcher Building's financial statements for the year ended 30 June 2021.
(2) Total Recordable Injury Frequency Rate. Total number of recorded injuries per million hours worked. Does not include Restricted Work Injuries.(3) Note that the employee engagement survey did not take place as originally planned in March 2020 because of the COVID-19 crisis.(4) Net Promoter Score measures how satisfied our customers are with our business.
Fletcher Building Limited Annual Report 2021 3
For
per
sona
l use
onl
y

Chair’s Report
The Board continuously assesses Fletcher Building’s balance sheet position and investment opportunities in order to drive shareholder returns. In June 2021, the Company commenced an on-market share buyback of up to $300 million to deliver value to our shareholders. At 30 June 2021, we had acquired 3.1 million shares valued at $24 million.
Fletcher Building’s overall strategy takes into account a wide range of factors which include environmental, social and governance. We consider where we have a real impact and we align both our financial and non-financial targets to those areas. We also take into consideration the impact that broader societal changes will have on us and what we need to react to.
The Board continued its focus on driving the Fletcher Building strategy this year, together with financial and non-financial metric performance. We continued to prioritise our sustainability targets, for example our plans to reduce carbon 30% by 2030, and driving leadership and culture in the Protect safety programme through our Safety, Health, Environment and Sustainability Committee. We provided strong oversight on financials and risks via the Audit and Risk Committee. We’ve continued to evolve our remuneration structure, including reaching out to shareholders to hear their feedback, to ensure it is aligned with shareholder interests. The current structure and the changes we have made are outlined in the Remuneration Report.
Ongoing investment has been critical to future-proofing our businesses. The Board’s time and emphasis with management continues to focus on how to ensure we continue to drive operational performance and make value-enhancing growth investments. This is both an exciting and important transition for the Group to make.
In this regard, the Board recognises there are considerable opportunities; completing the turnarounds of our Australian and Construction businesses, innovating on disruption and adjacencies across all the businesses, driving decarbonisation, and accelerating e-commerce and digital activity.
We look forward to seeing tangible progress against all these over the coming year and into the future.
With a deeply experienced and capable executive team in place, the Group is well-positioned to deliver on its goals of ongoing performance and growth. Our people are central to achieving these goals and the Board acknowledges the hard work carried out by our skilled teams to deliver for our stakeholders. Coming out of a tough COVID-19 year in FY20, where some difficult decisions were made, it was pleasing to see the improvements being made by the business. We are focused on developing a culture of performance and growth for our people which includes providing training and development and driving our inclusion and diversity strategy.
This year’s Annual Shareholders' Meeting (ASM) will be held on 19 October 2021. I look forward to updating our shareholders personally and having the opportunity to answer any questions they may have.
In closing, on behalf of the Board, I want to convey my appreciation to the entire Fletcher Building team. Through their focus, commitment and hard work, Fletcher Building is well-positioned for ongoing performance and growth. We are dedicated to continuing to enhance shareholder value and we remain focused on achieving our aspiration to be the leader in New Zealand and Australian building products and solutions.
Bruce HassallChair
Dear Shareholders
Fletcher Building delivered a strong financial performance and ongoing operational improvements in FY21. The business largely enjoyed a more normal trading environment during the operating period with only minimal impacts from COVID-19 disruptions.
The Group’s return to profit was pleasing, with net earnings attributable to shareholders of $305 million, compared to a loss of $196 million in FY20 and strong cash flows from operating activities of $889 million compared to $410 million in FY20. These were material improvements on both the FY20 and FY19 years.
Having delivered a strong earnings and cash flow result, the Board has approved a final dividend for the year ended 30 June 2021 of 18.0 cents per share (unimputed and unfranked) to be paid on 17 September 2021. Combined with the 12 cents per share interim dividend, this brings the total dividend to 30.0 cents per share for the FY21 year.
Bruce Hassall, Chair
Fletcher Building Limited Annual Report 20214
For
per
sona
l use
onl
y

Firstly, in relation to safety, we remain resolutely focused on ensuring all our people get home safely, every day. An important step in achieving this goal is reducing serious injuries to zero across all our sites. With this goal in mind, in FY21 we delivered safety leadership training, risk containment and life-saving rules across our businesses. Pleasingly, 85% of our sites were injury-free and our Total Recordable Injury Frequency Rate (TRIFR) was 5.0, 12% lower than the prior year.
Secondly, a focus on carbon reduction forms one important element of our broader sustainability strategy. We have a Science Based Target in place to reduce our direct and indirect carbon emissions by 30% by 2030. In FY21 we made significant progress towards this goal, having achieved a reduction in emissions from our base FY18 levels. Our business unit roadmaps have been developed to plan in more detail where carbon reduction is possible and how we will achieve it. Through this planning, we have a line of sight to our targeted reduction of emissions by 2030 from initiatives across all our businesses.
Thirdly, our customers remain front and centre of what we do. We continually collect feedback and understand how we can constantly improve what we are doing to strengthen our customer relationships. Our goal is to build towards a ‘best in class’ net promoter score (NPS) of ≥ 55. Over the course of the financial year, we were pleased to see our NPS increase marginally from 40 to 41, despite a range of service disruptions due to COVID-19 along with broader industry supply chain constraints. Ongoing investments in technology, data, e-commerce and service enhancements, such as 'track and trace', will further amplify our ability to meet our customers’ current and future needs.
Finally, for our people, we know that strong engagement translates into our teams and people going above and beyond to deliver for our customers. It was disappointing to see engagement levels decline from 71% to 66% since FY19, however, this was in the context of a tough period for our people that included COVID-19 and the completion of significant corporate
restructuring activities. Having navigated these challenges, we are now positioned to sharpen our focus on raising engagement levels across the business.
Our growth aspirations continue to be supported by strategic investments, with net capital expenditure for FY21 of $212 million. This included $78 million towards the new landmark Winstone Wallboards plasterboard facility in Tauranga, which we expect to complete in 2023.
Notwithstanding the ongoing uncertainty around COVID-19, we believe that the economic trends in our key markets remain supportive for further growth. In New Zealand, the activity pipeline continues to look ‘stronger for longer’. With ongoing supply chain and labour constraints having the effect of smoothing the recent sharp rises in building consents over a longer period, this is likely to mean an extended period of solid building activity through FY22 and beyond.
Australia’s residential outlook also remains resilient, particularly across detached housing and renovations. This is likely to be offset by the apartments, commercial and key civil sectors stabilising at current levels.
More broadly, with the combination of a strong balance sheet, a sound strategy which we are delivering on and a favourable market outlook, I am confident that Fletcher Building is well-positioned to deliver future performance and growth.
The past year has been characterised by many challenges and disruptions associated with the global pandemic. I would like to acknowledge and thank our more than 14,500 people who have remained focused on supporting our customers, and each other, under difficult circumstances. Finally, I would also like to thank our shareholders, customers, and suppliers for their support. I look forward to providing further updates on our progress in FY22.
Ross TaylorCEO
Fletcher Building’s strong FY21 financial result reflects the significant work carried out over the past three years to reset and simplify the business. Having delivered on the first phase of our five-year strategy, we are confident we now have a sustainable base from which we can drive further operational improvements and growth.
FY21 saw increases across all our key financial metrics compared with both FY20 (heavily impacted by COVID-19) and FY19, which was a more normal operating year. Group revenue for the year was $8,120 million compared to $7,309 million in FY20, while EBIT before significant items was $669 million, compared to $160 million in FY20. Group EBIT margins lifted materially in FY21 to 8.2% and our return on funds employed (ROFE) increased to 18.6%.
The businesses generated strong cash flows from operating activities of $889 million, compared to $410 million in FY20. Our balance sheet remains strong with $1.6 billion liquidity and net debt of $173 million at year end.
In addition to our financial performance, we have also made good progress against our non-financial metrics which we also drive through our strategy.
CEO’s Report
Ross Taylor, CEO
Fletcher Building Limited Annual Report 2021 5
For
per
sona
l use
onl
y

Our StrategyMaximising momentum to drive growth
Over the past three years, Fletcher Building has refocused, stabilised and set-up the business for performance.
We’re confident that we have the right strategy to optimise our advantage and harness the growth trends anticipated in our key markets.
Our vision is to be the 'leader in New Zealand and Australian building products and solutions'.
'Improving the world around us through smart thinking, simply delivered', represents three key themes which shape how we operate as a group of businesses.
Firstly, our purpose recognises our commitment to make sure what we do is sustainable, and also makes things better wherever possible. Secondly, it highlights our
Ross Taylor, CEO
desire to adopt smart thinking in all we do - for example, by delivering our customers the best global ideas, or through innovating or disrupting how we have traditionally operated. Lastly, at the heart of it all is a real drive in our organisation to make our customers' lives easier.
Today, we are resilient and have strong momentum as we enter the next phase of our strategy, to deliver ongoing performance and growth.
Fletcher Construction’s Waikato 50 Project Director David Taylor, and Project Manager Kirsty McVicar
(winner of 2021 Women in Construction award).
Fletcher Building Limited Annual Report 20216
For
per
sona
l use
onl
y

Zero injuries every day
Our commitment to safety is at the heart of what we do. We believe all injuries are preventable and are committed to our responsibility to get our people home safely every day. We will never stop aspiring to create a safer workplace.
Market leading customer solutions and services
Delivering long-term value for our customers is how we will achieve our vision. We are continuing to invest in strengthening our customer-centric mindset, by actively listening to what our customers (and potential customers) are telling us, and anticipating their needs through advanced data and analytics. This will allow us to continue to meet our customers' current and future needs, and provide a seamless and positive experience.
Lowest delivered cost
We are always looking for ways to do things better and more efficiently to drive sustainable cost management. Our focus will be investing in initiatives that create real customer value and stopping those that don’t.
Economic performance of each business in industry top quartile
We plan to extend the advantage of our powerful heritage brands by arming all our businesses to perform to their full potential.
Having the fundamental elements of our business right will enable our efforts and resources to focus on growth, with the capability to make more strategic investments.
Leadership in innovation, sustainability and growth via disruption
We want to be the leader in bringing new ideas and trends from around the world to our people, our partners, and our customers. To do this we must not be afraid to disrupt the markets, the competition and, where necessary, ourselves. Our focus on sustainability will help drive our innovation by shaping how key resources are used in products and processes.
Anchored by our Values
Four values define how we work at Fletcher Building. Across the organisation, our people strive to constantly demonstrate these characteristics each day.
Our Strategy
To believe that all injuries are preventable and genuinely care about getting our people home safely, each and every day.
To innovate and grow by creating a workplace where everyone shares ideas and has a go.
To listen and understand our customers, know our competitors and provide our customers with products and services they value.
To use our diverse backgrounds and experience to create better results than ever expected.
Vision To be the leader in New Zealand and Australian building products and solutions
PurposeImproving the world around us through smart thinking, simply delivered
Strategic Goals
Zero injuries every day
Market leading customer solutions
and servicesLowest delivered cost
Economic performance of each business in industry
top quartile
Leadership in innovation,
sustainability, and growth via disruption
Our People
Focused on operational excellence
Global expertise – locally delivered
Obsession for customers
Strive for growth and innovation
Driven by purpose and values
Group Measures
Zero Serious Injuries NPS ≥ 55 Engagement ≥ 80% 30% Carbon Reduction
Growing Market Share EBIT Margin ≥ 10% Cash Conversion > 60% ROFE 15%
Our strategic goals are focused on achieving performance and growth
Fletcher Building Limited Annual Report 2021 7
For
per
sona
l use
onl
y

85%
37,000
of our sites were injury free
leader-led site safety walks took place
When it comes to keeping our people safe, our work is never done. However, we are pleased to see a marked improvement in safety performance and our people’s commitment to making ‘zero’ a reality. Wendi Croft, Chief Health and Safety Officer
Zero Injuries Every DayOur safety commitment
The Protect safety programme is focused on ensuring this belief is made real and built into all our rituals and practices which provide our people with the skills and the tools to proactively manage safety.
We have a strategic vision for our future and a realistic plan to get us there. We know that good safety is critical for our people and performance. It is simply good business.
Getting to ‘zero’Our current injury performance is improving, and when analysed over a five-year period we are recording a downward trend on serious injuries, dropping from an average of 25 per year down to 8 in FY21. That means,
Firstly, we knew we had to shift mindsets. To achieve zero, our people needed to personally connect with Protect and to believe that preventing all injuries - getting to ’zero’ - is possible. Along with the values, the executive and business leaders came together and identified four things that all our people can do every day to make a difference:
> Believe all injuries are preventable > Never walk past – speak up and
take action> Celebrate the good stuff > Care for each other.
Safety needed to be line-led, not policed by the safety team.
Leader site safety walks have been a foundation in resetting that attitude.
In the past year, leaders have completed over 37,000 leader walks, talking with our teams about the work that they do and supporting safety improvements. Our leaders have monthly scorecards and KPIs regularly reviewed, but it’s only when our leaders are out on site and engaged that we can truly foster a safety leadership culture.
Shift Mindsets
DevelopLeaders
The five fundamental pillars to our strategy
Our plan is to ensure every person who works for us or with us goes home safely each and every day. Fundamental to achieving this is to make Fletcher Building a place where all our people believe that all injuries can be prevented.
on average, 17 more people went home safely to their families in the past year, free from serious or life altering injuries. We think this is the strong start we are looking for, but our work on protecting our people and each other, is never done.
Our Total Recordable Injury Frequency Rate (TRIFR) was 5.0, a slight improvement from last year. At this rate, we are ahead of most of our peers in Australia and New Zealand. However, we know that the best companies in the world get below 3. We will continue to drive TRIFR down as we continue on our path toward preventing all injuries.
Our Protect strategyTo understand how safety performance can be improved, we turned to global experiences to draw on how the best in the world have optimised their safety culture to deliver zero injuries.
Fletcher Building Limited Annual Report 20218
For
per
sona
l use
onl
y

Getting in place the right organisational structures, systems, processes and plans will support our vision long term.
Our leaders are now supported by capable Environmental Health and Safety (EHS) teams which collaborate with them as trusted safety partners. We have committed to simplifying and decluttering our safety systems, including gathering our big data together and using business intelligence tools to gain insights into our performance.
We have included supporting our Protect safety programme as a key priority in our Remuneration Framework review for FY22, as outlined on pages 58 and 61.
Our frontline workers and teams are the foundation of our business. They are both the most vulnerable and the most experienced in the risks we are exposed to every day.
Together with our frontline teams, we agreed and established new Life Saving Rules – simple rules everyone can follow at work, that we all know can protect each other and save a mate's life. In the coming year, our Frontline Development Programme will be focused on enabling our people to speak up, challenge their risk perception and shift the way that they think about safety at work.
Managing our critical risks well - the areas of our operation that when mishandled can result in serious injury or death - is essential to get right.
We know that we need to be disciplined around our critical risks and that we need to sharpen our risk perception. Through our risk containment activities, teams physically seek out and contain exposed risks that could cause serious or fatal injuries. 2,242 risk containment sweeps have systematically identified and contained critical risks in FY21, and we have continued a downward trend in the number and severity of the injury related claims lodged across our businesses.
In the coming year and beyond, we will be implementing a full risk analysis and assurance process for our critical risks based on global best practice. This approach will enable us to focus in on a few critical controls, verify that they are in place and assess their effectiveness. This will give us confidence and visibility over the things that really matter to save a life.
Enable the Frontline
Manage Critical Risks
Drive Accountability
Our people are leading the way in developing personalised augmented reality experiences for site safety inductions. These easy step-by-step immersive tools provide a paper-free alternative to enhance contractors' risk awareness onsite.
Fletcher Building Limited Annual Report 2021 9
For
per
sona
l use
onl
y

FY17 FY18 FY19 FY20 FY21
6.9
5.1 5.2 5.75.0 (3)
33
21 21
8 8
FY17 FY18 FY19 FY20 FY21
Establishing an aspirational safety culture
Seeing leaders thinking differently about safety and our injury rates decrease gives us confidence we are heading in the right direction. We are achieving material change in how we run our businesses – from our fleet management to our inductions, from integrated risk solutions to simple innovation investments such as the 'Jonny Rail’ heightened scaffolding standard or tip alarms on heavy vehicles. We believe that our leadership focus and our strategy will help us deliver on our safety commitment of zero injuries every day.
Two years ago, when we embarked on this journey, only 42% of our people believed all injuries were preventable. That meant that most of our people expected to continue to experience harm at the same rate – that the injuries were just inevitable. This is unacceptable to us. We are seeing early signs that this belief is changing and more of our people are going home safely every day. It’s a good sign that our strategic focus is making a difference.
Learning from our near misses and from our people is essential. 6’4” Fletcher Living subcontractor ‘Jonny’ was the inspiration for the addition of another rail on all our scaffolding – putting our sites well above safety standards and ensuring everyone is safe.
Zero Injuries Every Day: Our safety commitmentContinued
Total Recordable Injury Frequency Rate (1)
Serious Injuries (2)
Further insights into our Protect safety programme
Watch Video
(1) Total recordable injury frequency rate. Measured by the total number of recordable injuries per million hours worked. TRIFR does not include restricted work injuries.
(2) Serious Injury includes immediate treatment as an in-patient at hospital for more than 24 hours or immediate treatment for a serious injury or illness as defined by Safe Work Australia.
(3) Subcontractor TRIFR for FY21 was 4.9.
Fletcher Building Limited Annual Report 202110
For
per
sona
l use
onl
y

Mental health pressure on the workforce is a reality across many industries, and the awareness of those impacts in the construction sector are well documented. Making Fletcher Building a place where our people thrive at work and know they are cared for by their teams, is a force our leadership is determined to get behind.
For several years we have provided programmes to equip our people to manage their mental health more proactively. With the arrival of COVID-19 and, unprecedented stress to all areas of our lives during this last year, the need to dial-up those efforts was evident.
Many of our operational sites continued in a highly sanitised, socially-distanced state and had added production pressure without the same comradery that drives site culture. At home, our people were often thrust into a reality of work life and personal life squeezed into close quarters.
Our Fletcher Building executive quickly initiated frank and open virtual conversations about the impact as we all adjusted to a ‘lockdown’ or altered operational environment. From there, our leaders began tailored efforts to bring people together regularly. Arming our workforce with mental health tools to cope was essential. In addition to the support provided by our long-standing Employee Assistance Programme (EAP) we increased a wellness focus through our dedicated employee hub app and a series of virtual resilience trainings, including a special session with TV psychologist Nigel Latta to put it all into perspective as a community.
Protect Our Mental Health: Skills to cope with a disrupted work and home life
Cas
e St
udy
Fletcher Construction and PlaceMakers have expanded partnerships with MATES in Construction activating initiatives to help improve mental health and prevent suicide across the industry. From left Lance Van Niekerk, Victoria McArthur (CEO MATES in Construction), Bruce McEwen and Slade McFarland.
Residents in the Australian state of Victoria in particular – where many of our Australian operations are based – found themselves in the grip of a highly disruptive 111 day lockdown during the winter months of 2020. Fletcher Building Australia accessed a programme of tailored support from our partnership with NZ-based Mentemia, specialists in digitally-delivered mental wellbeing to create the Protect Our Mental Health programme. This was led from the front, with the senior leadership team sharing their own, personal stories of mental health. More than 200 Protect Ambassadors were mobilised to help reach into the business and better connect our frontline workforce to tools and support. Mentemia’s purpose-developed app connecting with virtual workshops and a regular programme of podcasts and webinars led by a psychologist, generated impressive attendance. Informal online ‘coffee and chat’ catch ups drew a gathering, the largest of these attracted 70 people.
With more than 4,500 people spread across 250 sites, never before has our Australian national business been able to connect together so seamlessly. Leaders report back more conversations around mental health has increased the cohesiveness of teams, and the business was able to achieve better performance as a result.
In FY21 Fletcher Building established a partnership with MATES in Construction, in their mission to combat the enormous toll of death by suicide in the building and construction industry, a programme which will expand in FY22. Thanks to a grant from the PlaceMakers Foundation, PlaceMakers is now working with MATES in Construction to offer in-person support, information and training for staff across 70 stores and sites nationwide.
We led the Protect Our Mental Health initiative from the front – launching the programme to 250 of our people with a series of change stories from our leaders. Soon after we kicked off a series of workshops and webinars available to help our people through difficult times, supplemented by access to the handy Mentemia app. Dean Fradgley, CE Australia
Fletcher Building Limited Annual Report 2021 11
For
per
sona
l use
onl
y

Environmental Advisor, Cameron Russell using drone technology at Winstone Aggregates Hunua Quarry.
Embracing Innovation and Disruptionto Drive Future Growth
Driving business growth requires both discipline in our existing businesses and a willingness to embrace innovation and disruption to fuel future performance and growth.
Innovation at Fletcher Building involves the whole organisation and ranges from day-to-day performance improvements to disruptive change. It involves us applying agile process and experimentation techniques and partnering with leading global innovators and disruptors to bring new ideas to our businesses.
Driving growth through data and digital innovationOur business is increasingly shaped by the need to build for a sustainable future by embracing new products, technologies and processes which will meet the shifting expectations of our customers, and transforming our current ways of working to ensure that our operation delivers efficiently and safely, always.
As we respond to these opportunities, we are not ‘re-inventing the wheel’, rather we deliberately look to great innovators to determine what is relevant for our customers in Australia and New Zealand and develop these ideas for our local markets. We then use our scale to commercialise these new ideas quickly.
Core to all of our innovation ambitions is understanding our customer needs and behaviours. By leveraging our significant data assets, we are able to understand threats and opportunities in our markets and respond more quickly to address them.
Specifically, we are using data analytics and digital capabilities to simplify our customers’ experience and to scale our distribution model. One example of this is the digital tools we are developing for our customers allowing them to plan their work and manage their accounts to help them improve their business.
These tools improve our customers’ experience and also provide us with greater insight into our customers’ behaviours.
innovation pilots underway
people involved in innovation challenges to date
20
264
Fletcher Building Limited Annual Report 202112
For
per
sona
l use
onl
y

Cas
e St
udy
While digital capabilities are commonplace in many aspects of our lives, the trades industries have traditionally continued to rely on paper-based account management. However overseas trends show this is changing rapidly.
Our PlaceMakers team wanted to get ahead of the curve, be bold and disrupt the way we’ve always done things by enabling customers to connect anytime, anywhere. The ambition being, to put a PlaceMakers store ‘in the pocket’ of every New Zealand builder.
By adopting an agile delivery model and partnering with both onshore and offshore development capability, we are able to bring products to market. This helped us speed up the launch of the ‘Trade App’ in 2020, allowing customers to receive contactless service following the initial COVID-19 disruption in New Zealand. For the first time, trade customers could place, track and update their orders in a seamless mobile experience. A desktop and tablet friendly ‘Trade Portal’ quickly followed with additional features, along with a fully integrated, mobile-optimised consumer online store to complete the e-commerce capability.
Customer centric, digital solutions are now in-store with the launch of ‘Skip the Counter’ experience, reducing queues at the trade counter and allowing customers to drive in, scan and drive out.
No need to leave the worksitePlaceMakers e-tools (Trade App and Trade Portal) allow customers to view their specific product pricing, check stock availability and place orders for click-and-collect or for delivery to site. The ability to get the materials they need to complete their jobs is no longer constrained by opening hours, location or stock unavailability, they can manage all of this from wherever they are.
Customer uptake of PlaceMakers e-tools has been strong with 31% of trade customers now registered on the digital platform and digital sales growing to over 8% of total sales. It’s an encouraging result given that our international benchmarking for similar trades businesses indicates 5% total digital sales over five years is the standard.
Over the next 12-18-months PlaceMakers will continue to drive awareness of the benefits of a mobile-managed account, working with customers to understand their business' pain points and what’s possible with these new tools.
With the digital platform fundamentals now in place, customer experience improvements and new features are continuing to be developed and rolled out.
PlaceMakers has a roadmap of ongoing developments to deliver a personalised customer centric experience and new features which make builders’ lives even easier. From basic customer prompts such as, “Do you need screws with that?” to more customer-centric features such as the ability to ‘create a quote’ for their own customers. PlaceMakers is driven to become an integral part of our customers' world and make it even easier for them to do business.
Digital enablement for PlaceMakers trade customers
The new PlaceMakers.co.nz Trade App and portal and refreshed online store deliver a more convenient digital experience, connecting customers to shop and manage their trade business whenever they choose.
Our digital focus has centred around harnessing technologies that drive convenience and value for our customers. We are creating solutions that enable a seamless integration into their world, making it easier for them to do business with us. Bruce McEwen, CE Distribution
Fletcher Building Limited Annual Report 2021 13
For
per
sona
l use
onl
y

Our dedicated Innovation and Sustainability team is constantly looking to identify and evaluate global trends and new opportunities that can complement our existing businesses or disrupt the industry. In the past 12 months we’ve made significant progress in forging ahead on key areas where we can apply a disruptive lens to drive new product development, process efficiencies, sustainability and better customer outcomes.
Through our innovation programme, all Fletcher Building people are being encouraged to become ‘innovators’.
Embracing Innovation and Disruption to Drive Future GrowthContinued
Bringing the outside in
Our team has a systematic process to identify and quickly evaluate new product opportunities, process innovations, technologies, business models, and partnerships. Starting with broad but targeted global market eco-system scans, we identify a pipeline of potential innovations to address specific market opportunities.
The ideas that come out of the eco-system scans are prioritised and assessed against a set of criteria. With input from our business unit experts, we then select a number of key opportunities to pursue in more depth. We have completed six eco-scans and have generated exciting developments with 20 pilots and partnerships now in place such as Carbon Cure, a technology that lowers the carbon content of concrete; Marxiant, a 3D
product representation software; Partium, a digital object recognition technology, and Ligate, a 100% bio-based adhesive.
To drive an entrepreneurial mindset at all levels of the organisation, we have established our Innovation Capability Building Programme, with several hundred people participating in different types of innovation training, workshops, or collaborative programmes working on real innovation opportunities.
Fletcher Building Limited Annual Report 202114
For
per
sona
l use
onl
y

In our Fletcher Living developments our competitive advantage is that we control the master-planning, which also allows us to create the parks, play areas and other amenities that are the foundations of a vibrant community.
These valuable community resources also mean we can optimise the number of houses to be built, without residents missing out on that valuable outdoor living they love. We are also able to continue to deliver homes at all price points (generally in the $600,000 to $900,000 range) in desirable locations. Fletcher Living homeowners endorse this approach, and consistently report back favourably on the experience, with our net promoter score (NPS) in the excellent range (NPS +68 in FY21).
In the last year, we have continued to evolve our home offerings, commenced some work on understanding the future of sustainable housing, including a focus on a future of low-carbon houses, and incorporating trends in technology including electric vehicles and automation in the home. We responded quickly to the shift to work-from-home by adding facilities, such as study nooks to our design plans.
Over the last five years our land development strategy has grown to support a sophisticated approach to selecting the right land in the right location, then rezoning to share and create the
Building a base for smart expansion of Fletcher Living housing in New Zealand
ideal conditions for our Fletcher Living residential developments.
Our Clever Core offsite manufacturing is continuing to evolve. In its first calendar year of formal operation, we have expanded our range of design typologies to over 20 and we have successfully installed 97 new homes for Fletcher Living in the last year.
With the recent acquisition of world leading DfMA (Design for Manufacture & Assembly) software, Clever Core has increased the speed they are able to adapt their operation to new design typologies, translating concept designs to assembly-ready products faster and at a lower cost. In FY22, one in five new Fletcher Living homes will be delivered by Clever Core.
The evolution of our apartment offering continues, typically at a mid-market price range which holds growing appeal as Auckland becomes increasingly densified. Our focus on driving innovation in this type of housing grows and we are developing sites in suburbs such as Three Kings, Northcote and Panmure to deliver our distinctive community approach. Some of these apartments will include commitments to deliver KiwiBuild or other government programmes such as shared equity housing.
Fletcher Living’s One Central development in Christchurch,
winner of 2021 Te Ka-hui Whaihanga New Zealand
Institute of Architects Canterbury Awards
(Multi-Unit development).
Fletcher Living NPS
house typologies built by Clever Core
68
20+
Fletcher Building Limited Annual Report 2021 15
For
per
sona
l use
onl
y

Embracing Innovation and Disruption to Drive Future GrowthContinued
Focusing our core New Zealand businesses for growth
by investment such as the mobile extrusion plant and upgrading of manufacturing capability. These improvements have led to the development of new products and solutions enabling entry to new market segments.
In the past 18 months, Winstone Wallboards has seen strong growth in its Weatherline® Rigid Air Barrier product. With its distinctive purple colour it is noticeable across both commercial and residential sites. The system benefits are wide-ranging including moisture protection, early close-in providing temporary weather protection during construction, enhanced thermal efficiency and structural bracing elements.
Improving our capacity to innovate for growth is also important. Winstone Wallboards is a world-class business and our current Auckland plant is nearing end-of-life. The new plant at Tauriko, Bay of Plenty is set to open in 2023 and will bring significant economic benefit to the Tauranga region and around 100 new permanent jobs. It will enable exciting innovation opportunities, becoming a hub for new product development while improving energy, manufacturing and logistical efficiency. Importantly, it will provide the capacity to support long-term demand for and surety of supply of plasterboard in New Zealand. It will also be more environmentally friendly, allowing us to recycle used plasterboard and reduce carbon emissions by 10%.
In our NZ Core divisions, our programme of investments in modern manufacturing and supply chains is taking effect. These initiatives aim to deliver growth through increasing process efficiency, reducing cost of production and reducing our carbon impact of production. A variety of innovation initiatives are underway in our Building Products division. These include a wider range of cost-effective automation solutions, such as at Tasman Insulation which has resulted in 7% productivity improvement; and the acceleration of our new product innovation pipeline across our Products, Pipes and Steel businesses. Iplex has seen solid market share growth driven
GIB’s new Weatherline® Rigid Air Barrier product is being installed at Fletcher Living’s Waiata Shores development in South Auckland.
Fletcher Building Limited Annual Report 202116
For
per
sona
l use
onl
y

Case Study
Innovation delivering insights into customer trends
By applying innovation practices, including embracing Product Vitality measures, Australia have demonstrated they can continue to bring to market the latest and most desirable products customers want, sooner.
Scanning for, trialling and testing innovation is one thing, but making smart decisions to ensure longer-term effectiveness of innovative practices, products and services in our business requires a combination of data-led disciplines.
With market leading joinery and surfaces business Laminex Australia, we have sought to accelerate our growth in decorative sales over the past two years, by employing innovative strategies to capture customers’ attention. To lead the market, our product selection of roughly 9,000 individual products needs to always ‘hit the mark’ with bold options, popular ranges and great customer choice. To clearly assess product performance Laminex is using a range of analytics tools.
In the past year, Laminex has added the Product Vitality Index to their reporting KPIs to provide a view to help ensure their customers always have access to the newest, most durable, and desirable products.
The Product Vitality Index is a measure that describes 'new' product revenues as a percent of total revenues. By including the index into their monthly operational
evaluation process, they can better understand where they are at and where action is needed. This has led to dedicated focus on delivery of new product development projects and initiatives that respond to market needs, drive product leadership within the industry and deliver fresh new sources of business and revenue growth.
Consistent market and customer feedback indicates that over the last three to four years, Laminex has increased its level of innovation and product leadership. This has translated into a record number of product launches, particularly those targeted at new product categories and applications, which has led to increased consideration and use of our products. In the past six months alone, Laminex has launched three new brands, Haven Kitchens by Formica, Surround by Laminex and Fusion, with a total addressable market of over A$3 billion.
Following this process, Laminex are currently maintaining a Product Vitality of over 12%. The end result is a clearer forecast of future product pipeline that will land with our customer base. It’s a welcome part of the kit enabling Laminex to perform very well in market with margins in historic top quartile levels and sustainably low overhead costs.
Fletcher Building Limited Annual Report 2021 17
For
per
sona
l use
onl
y

Leadership in Sustainability
Our aspiration is to lead our markets with sustainable building materials, construction and distribution. We have been making steady progress to improve the sustainability of our products, and to innovate so that as our business thrives we also play our part in a sustainable future.
Be the leader in making sustainable building products
Reduce the environmental impact of our products
Gain sustainability product certifications
Transparent environmental, social and governance reporting
Improve environmental, social and governance reporting across our business
Careful management of
our resources and emissions
Reduce carbon emissions in line
with limiting climate change below 2oC
Partner with our supply chain to deliver sustainable outcomes
Improve environmental, social and governance
reporting within our supply chain
Support our people and our communities
Protect our people from harm
Improve diversity, equity and inclusion in our workplace
Provide world-class learning and development opportunities
Measure the impact and opportunities we provide in the communities where we build
Build healthy homes and deliver sustainable infrastructure
Meet a consistent sustainability standard for our construction projects
Understand what matters to our customers and lead in providing sustainable solutions
Innovate to sustainably grow revenue, margin and markets
Our sustainability strategy deepens our commitment to our people and customers.
We focus on the issues that are significant for our business and our stakeholders to form the core aims of our strategy, and we look for areas where we can make a meaningful difference. These are our
material sustainability issues. In this annual report we outline our performance on the most significant of these issues, which are improving our safety performance, reducing our greenhouse gas emissions and supporting our people.
Fletcher Building Limited Annual Report 202118
For
per
sona
l use
onl
y

FY20: 39%
FY21 waste diverted from landfill
FY20: 9
FY21 Environmental ProductDeclarations (EPDs)
Products with EPDs
46%
10Leading in sustainabilityAs a leading building products, construction, and distribution business we take our environmental responsibility seriously. We understand the need to address carbon emissions and mitigate the impacts of climate change. As part of that commitment we are the first construction materials company in Australasia to set a Science-Based Target (SBT) for carbon reduction – our ’30 by 30’ target to reduce our emissions by 30% by 2030. We were pleased to be recognised by the Carbon Disclosure Project (CDP) this year as the most improved business in New Zealand for our carbon reporting.
We are an active member of the Sustainable Business Council, the Sustainable Business Network, the New Zealand Green Building Council and the Infrastructure Sustainability Council of Australia.
Reducing our greenhouse gas (GHG) emissionsThe main sources of our GHG emissions are the fuels used to produce our products, known as process heat, emissions from the cement-making process, our electricity use and our emissions from transport.
We have taken steps to reduce our impact in all these areas – each of our business units has a Carbon Reduction Roadmap that identifies specific initiatives to meet our ’30 by 30’ target.
Process heat and cement We made substantial investment in reducing coal use for our cement operations at Golden Bay Cement this year and we are actively investigating solutions to minimise emissions from the cement-making process.
Our forward plans for further reductions across the business include the new Winstone Wallboards plant we plan to open in 2023, which will reduce emissions by 10% as well as increase recycled content in the product and be significantly more water efficient.
SUSTAINABLE DEVELOPMENT GOALSThe Sustainable Development Goals are a global set of goals adopted by New Zealand, Australia and all United Nations member states that support strategies to improve health and education, reduce inequality, and spur economic growth while tackling climate change and working to preserve our oceans and forests. Fletcher Building’s sustainability aims support these eight United Nations Sustainable Development Goals.
The essential Waikato-50 water initiative will increase Auckland water supplies by an additional 50 mega litres per day. The project was delivered in a little over a year instead of the three to four years it would normally take for a project of this size.
Fletcher Building Limited Annual Report 2021 19
For
per
sona
l use
onl
y

0
200,000
400,000
600,000
800,000
1,000,000
1,200,000
1,400,000
FY20FY19FY18 FY21
Emis
sion
s (t
CO
2e)
Green electricityThis year we continued to reduce electricity usage in our Australian businesses through energy efficiency programmes and site consolidation. We installed one of New Zealand’s largest rooftop solar energy systems at our Laminex manufacturing facility in Hamilton and it is providing 19% of the energy for the site on average and reducing greenhouse gas emissions for the site by around 3%. We also completed an initial assessment of solar options for our larger Australian sites.
Low carbon transportFrom the small to the large we are moving away from fossil fuel to power our vehicles. This includes a move to electric forklifts and tipper trucks in some of our operations, transitioning 20% of our construction fleet to hybrid by the end of next year, and investigating hydrogen and electric options for heavy vehicles across our business.
Our FY21 GHG emissionsCombined Scope 1 and 2 carbon emissions in FY21 were 1,145,035 tCO2e compared to 1,238,380 tCO2e, our FY18 baseline. Our emissions intensity - the tonnes emitted per million dollars of revenue - reduced by 6%.
Approximately half of the overall reduction was due to our project to reduce coal use at Golden Bay Cement by using end-of-life tyres and work in our Australian businesses on energy efficiency, including consolidation of some sites. The remainder was due to lower production volumes at Golden Bay Cement while we installed the end-of-life tyres facility.
Sustainable productsWe continue to increase the number of our products that hold Environmental Product Declarations (EPDs) and other sustainability certifications. EPDs assess the environmental impact of a product across the entire product lifecycle. EPDs provide a verifiable and transparent product assessment against an international standard. They empower our customers to make an informed choice about the environmental impact of the products they choose. We have published 10 EPDs in Australia and New Zealand and will complete a similar number over the next three years, which will meet our aim of holding sustainability certifications for all our major products.
A number of our products also hold other sustainability certifications such as Declare labels and Environmental Choice certifications which are recognised within green building standards such as Green Star and Homestar.
Reducing waste to landfill remains an area of focus for our business, and in particular reducing waste from construction and demolition activities, which is a significant component of landfilled waste in both New Zealand and Australia. In FY21 our waste to Class 1 landfills was 23,456 tonnes and diversion from landfill was 19,604 tonnes. This equates to 46% diversion from landfill and is a 7% improvement on last year.
We see reducing waste generation and applying ‘circular economy’ principles to use waste from one industry as a raw material input for another industry as key to overall waste reduction.
Combined Scope 1 & 2 emissions
Scope 1 emissions
Combined Scope 1 and 2 carbon emissions*
*Figures exclude International division.Scope 3 emissions for FY21 were 813,725 tCO2e.
We are the first building materials company in Australasia to publish a Science-Based Target (SBT) for carbon reduction – our ’30 by 30’ target.
Leadership in SustainabilityContinued
Our businesses are proud to provide civil works for the Waipipi Wind Farm on 980ha of coastal land between Patea and Waverley. The site is expected to deliver about 455 gigawatt hours of electricity each year—that’s enough to power about 65,000 homes.
Scope 2 emissions
Fletcher Building Limited Annual Report 202120
For
per
sona
l use
onl
y

Leading our markets in innovative practices to reduce carbon emissions, is not just making good on our commitment to a reduction of 30% emissions by 2030, it can be really good business. As we explore the opportunity to bring the best of global thinking to this part of the world, seeking opportunities to reduce business costs and increase process efficiencies, customer enhancements and product improvement are central.
Case Study
Sustainability as a springboard for growth
3.1m
At New Zealand’s only end-to-end cement plant Golden Bay Cement, we are now using end-of-life tyres in cement manufacturing which helps to solve a significant waste problem and improve the sustainability of this key building material.
Golden Bay Cement (GBC) is New Zealand’s only manufacturer of cement and is uniquely positioned to take advantage of innovations in the cement process to reduce the impact of manufacture. For 17 years GBC has used waste wood to help displace coal and reduce its emissions. This is one reason why cement from GBC already takes 20% less carbon to manufacture, per tonne, than imported cement. This performance is set to improve because in FY21 GBC implemented a process to help minimise waste across New Zealand as well as reducing carbon emissions from the plant, in partnership with the Waste Minimisation Fund. GBC now uses waste tyres at the end of their life as a fuel, replacing coal.
Tyres that would otherwise go to landfill are combusted as part of the cement making process. The process can consume up to 3.1 million waste tyres per year, half of New Zealand’s output, as
fuel to substitute 15% or more of the coal used to achieve the high temperatures that cement making requires. The tyres are transported to GBC by another Fletcher Building business, Winstone Aggregates, who backload shredded tyres from the processing plant in Auckland.
Because the tyres contain a proportion of natural rubber, this fuel source has lower carbon emissions than coal by around 13,000 tCO2e per annum. The steel in the tyres saves 5,000 tonnes of ironsand from being mined for use in cement. The high temperatures in the cement kiln mean that the tyres burn cleanly, with all the ash and steel content becoming part of the finished cement. At the same time it helps solve a major waste problem for New Zealand.
We are looking across all our concrete products to create new, sustainable products. We work with our customers to refine the concrete they need using
our Firth carbon calculator, and these customers can take advantage of Firth’s low carbon cement offer. We are also looking at the other raw materials used in concrete, and this year we started trials of recycled aggregate production at our Hunua Winstone Aggregates site.
tonnes of carbon reduced so far
9,000
tyres diverted from landfill per year
Fletcher Building Limited Annual Report 2021 21
For
per
sona
l use
onl
y

From project managers to cement truck drivers to environmental specialists, our business operates at its best when we embrace the scale, experience, and diversity of our people. Every day we are privileged to have more than 14,500 talented people band together and turn our purpose and vision into reality.
Our PeopleDeveloping a culture of performance and growth for our people
In return, Fletcher Building aims to offer our people an exceptional employee experience with a commitment to help them succeed personally and professionally. Our goal is to provide an inclusive, safe and healthy workplace, where teamwork is celebrated and where people are challenged to be bold and channel their inner innovator to help our business grow.
Providing our people with career growth is a priority. We are pleased that in FY21, nearly half of all open positions were filled by internal candidates, creating, in turn, new opportunities for people to join Fletcher Building.
Just as importantly, we have worked hard to ensure that our people, whatever their skillset and background, have access to the necessary development opportunities and experiences to build rewarding careers with Fletcher Building. This has seen us offer more than 166,000 hours of training, learning and development options for our people. We continue to be grateful for the
ongoing support of the Fletcher Building Employee Educational Fund who in FY21, invested more than $4.2 million in the development of our people.
Our most recent employee engagement score was 66%, down from 71% in FY19. Whilst this drop is disappointing, it is a huge motivator to make improvements across the Group to help our people feel more connected to Fletcher Building in the future.
Our key people traits To succeed, we need a range of talented people from diverse backgrounds with different perspectives and experiences. As part of our strategy, we have identified a handful of fundamental people traits and values that will be critical if we are to achieve our true potential.
Operational excellenceOperational excellence is about making sure we are delivering the basics well, all the time. This key trait ensures we are operating our businesses effectively and efficiently while building solid foundations to grow from.
22 Fletcher Building Limited Annual Report 2021
This starts with a culture where safety is always put first, no matter where in the business our people work and strengthening our belief that all injuries are preventable.
As part of our Protect programme, we launched The Safety Leadership Programme (SLP) which we highlight in the case study opposite.
Another particular focus of operational excellence in FY21 has been around pricing. We recognise that to achieve the margin expansion we want to deliver, we need to enhance our pricing discipline. To do this we have been building the capability of our people in this area. An applied learning framework encouraged teams to link their learning to their own market, including understanding pricing from a customer point of view and what creates value for them.
Feedback has been positive with our Stramit Australia teams commenting that having a common framework to talk about customer value is already positively changing conversations about pricing across teams.
The Fletcher Construction team working on the Ara Tu-hono – Pu-hoi to Warkworth project will extend
the four-lane Northern Motorway (SH1) 18.5km to just north of Warkworth. The project is a partnership
between Waka Kotahi NZ Transport Agency (NZTA) and the Northern Express Group (NX2).
Fletcher Building Limited Annual Report 202122
For
per
sona
l use
onl
y

In FY21 we created our own Safety Leadership Programme (SLP) to provide a purpose-built framework for leadership development to enhance safety across the organisation. SLP is our primary tool to upskill and empower our line leaders who are responsible for leading safety within their division, business unit and teams.
What makes this a truly unique programme is that SLP is facilitated by line managers, bringing credibility to the delivery as they are encouraged to tell their own stories to connect with their teams. The programme encourages people to talk openly about how they can personally contribute to a safer workplace, rather than putting the emphasis on compliance and legal obligations. In a practical sense, this means that our people will focus on their own safety and that of their colleagues, regardless of whether a supervisor is present or not.
SLP has become the gold standard for a truly authentic ‘by us, for us’ approach to developing a leadership vision, and a practical toolkit for our leaders to engage the hearts and minds of their people. The cascaded approach means no one is asked to lead differently until they have felt a difference in their own leader. The programme is supplemented by significant and ongoing coaching, which extends over a six-month period, providing participants with the chance to hone their skills in their own work sites.
The roll-out of the programme started with CEO, Ross Taylor leading the executive team through the programme, who in turn took their own leadership teams through it. We anticipate nearly 1,500 leaders will be engaged in the programme by January 2022.
Our people have told us that it has made a difference to have their own leaders facilitating workshops and genuinely leading these discussions. Participants say they were particularly impacted by the open, honest story telling which created an environment where they feel they have an important and relevant part to play.
As one of our senior managers commented: 'this isn’t a safety course that happens to be about leadership; it’s a leadership programme that happens to be about safety.'
78395%agree or strongly agree they will be a better safety leader after attending the SLP
safety leaders initiated their training through the SLP
Developing as safety leaders
Cas
e St
udy
Line managers, site supervisors and plant managers are re-emerging as confident safety leaders through our Safety Leadership Programme. At its heart is a shared vision of achieving 'zero injuries every day'.
Boldly driving a customer mindsetThree of our people traits are intrinsically linked; obsession for customers; global expertise, locally delivered; and striving for innovation and growth. Instilling these traits in our teams and growing them further is how we will stay ahead of our competitors.
We are orientating our business more towards our customers to meet their shifting needs, which requires using more data and analytics to understand them better and anticipate their needs. It also means encouraging our people to deliberately look outside of their own businesses and industries for innovations that improve the customer experience by embracing disruptive global trends.
Building an innovation mindset and culture is central to Fletcher Building achieving our goals. Over the past year, our people have had the opportunity to be involved in a range of different innovation activities.
One such example is the Fletcher Steel Innovation Challenge which engaged with more than 180 of our people and generated 400 new ideas and concepts. These ideas were narrowed down to 11 and are now included in Steel’s Innovation Roadmap for commercialisation.
Focusing on these traits is getting results. We have lifted our Net Promoter Score (NPS) by eight points to 41 over the last three years and we are determined to keep this trend moving upwards.
Driven by purpose and values How we do what we do is as important as what we achieve, and our values remain central to how we do business. We actively foster an inclusive workplace which encourages diversity of thought which we believe is the foundation for greater innovation.
Our Inclusion and Diversity strategy concentrates on three dimensions: fostering an inclusive culture; greater women representation; and more ethnicity in leadership.
People-led action groups have been amplified this year with two new groups being set up to promote and champion inclusion and diversity initiatives. Ta-tai, Fletcher Building’s Ma-ori Network Group and the Equality Network Group join our well-established Fletcher Building Pride Action Group, each sponsored by an executive team member and empowered to develop initiatives and events to raise awareness and ignite action.
While women hold more than 50% of our functional roles, we recognise that our industry is traditionally regarded as male dominated and that we have more work to do to ensure a more balanced gender mix across our operational roles. This is based on the belief that diverse backgrounds, perspectives and thinking contribute to building innovation, creativity and performance. With this in mind, we set a target in FY21 to increase the number of women in operational roles by 23 year-on-year, while also retaining or replacing the number of women we already employ. While not all our divisions achieved their targets, notably, our Concrete division increased the number of women in operational roles on their sites over the past year, and one in four leaders in our Residential and Development division is a woman. However, more broadly, we continue to build our understanding of how we can drive sustainable and meaningful change in this important area.
More about our Safety Leadership Programme
Watch Video
Fletcher Building Limited Annual Report 2021 23
For
per
sona
l use
onl
y

programme continues to connect participants with their culture and allow them to grow personally and professionally through new-found confidence and skills. Whakatupu plays a key role in helping us to create work environments where our indigenous people can bring their whole selves to work. Whakatupu is also about creating a legacy community within Fletcher Building so that alumni from the programme can call on the team for support throughout their Fletcher Building careers.
We also remain a principal sponsor of both the First Foundation and Tupu Toa. These organisations focus on development and work opportunities for indigenous youth and those from challenging backgrounds. Our support gives a ‘hand-up’ to those that may not have the same opportunities as others in our community. We continue to provide five First Foundation scholarships for tertiary education annually and expect to secure placements for the coming year's students across Fletcher Living, Construction and Concrete. We intend to offer 10 internships from Tupu Toa in FY22.
Creating possibilities for tomorrow's workforce
GirlBoss New Zealand:
Addressing the issue of gender pay parity remains another key priority. While our average female salary across the business is 96% of the average male salary, we now have action plans in place within all our divisions to close this gap.
Our people-led Equality Network, which aims to inspire, support and develop women in our business has also delivered valuable steps forward. In FY21 the network expanded to over 160 members and provided 93 women with professional development and networking opportunities through membership of the National Association of Women in Construction (NAWIC) and the NZ Women’s Infrastructure Network. In addition, the first cohort of 15 women went through an in-house mentoring programme designed and piloted by the Equality Network, which adds to development opportunities already available to our women through Global Women and our leadership development programmes.
This year 26 future leaders participated in our flagship Whakatupu Ma-ori Leadership wa-nanga ('to grow’) programme. This
Case Study
Our People: Developing a culture of performance and growth for our peopleContinued
Equally important as supporting women already in the industry is creating and sustaining a pipeline of young high school-aged women, keen to enter the building and construction industry.
In 2021, Fletcher Building teamed up with GirlBoss New Zealand to run two five-day programmes which introduced 28 female high school students to the possibilities of a career in the sector.
Participants went on site visits to see the latest Fletcher Building projects, learned about personal branding and networking, and took part in a Dragon’s Den-style challenge. They were mentored by senior leaders and then they presented back to a panel of executive ‘dragons’ at the end of the week.
More than 60 Fletcher Building employees took time to mentor the girls and demonstrate first-hand how rewarding a career in the industry can be.
The results of the programme were significant. As well as feeling more confident in themselves, the percentage of girls who stated that they were interested in a career in Science, Technology, Engineering, Mathematics (STEM) increased from 16 at the start of the programme to all 28 by the end.
Our suppliersWe also have a responsibility to those who work with us. We are committed to the highest standards of ethical behaviour in the conduct of our business and activities. We support and respect the protection of human rights and endeavour to make sure that Fletcher Building is not complicit in human rights abuses. In FY20 we published our Human Rights Policy and our Supplier Code of Conduct, outlining how we and our suppliers will ensure ethical treatment of people who work with us. This year, we focused on identifying areas with potential risk for forms of modern slavery in our supply chain, completed risk assessments to identify where to focus, and published our Modern Slavery Statement in March 2021.
View the Fletcher Building case study video, and learn more
about the GirlBoss partnership.
View Fletcher Steel's Kylie Henderson Whakatupu experience here.
Watch Video
Watch Video
Fletcher Building Limited Annual Report 202124
For
per
sona
l use
onl
y

Performance
Fletcher Building Limited Annual Report 2021 25
For
per
sona
l use
onl
y
Group Performance
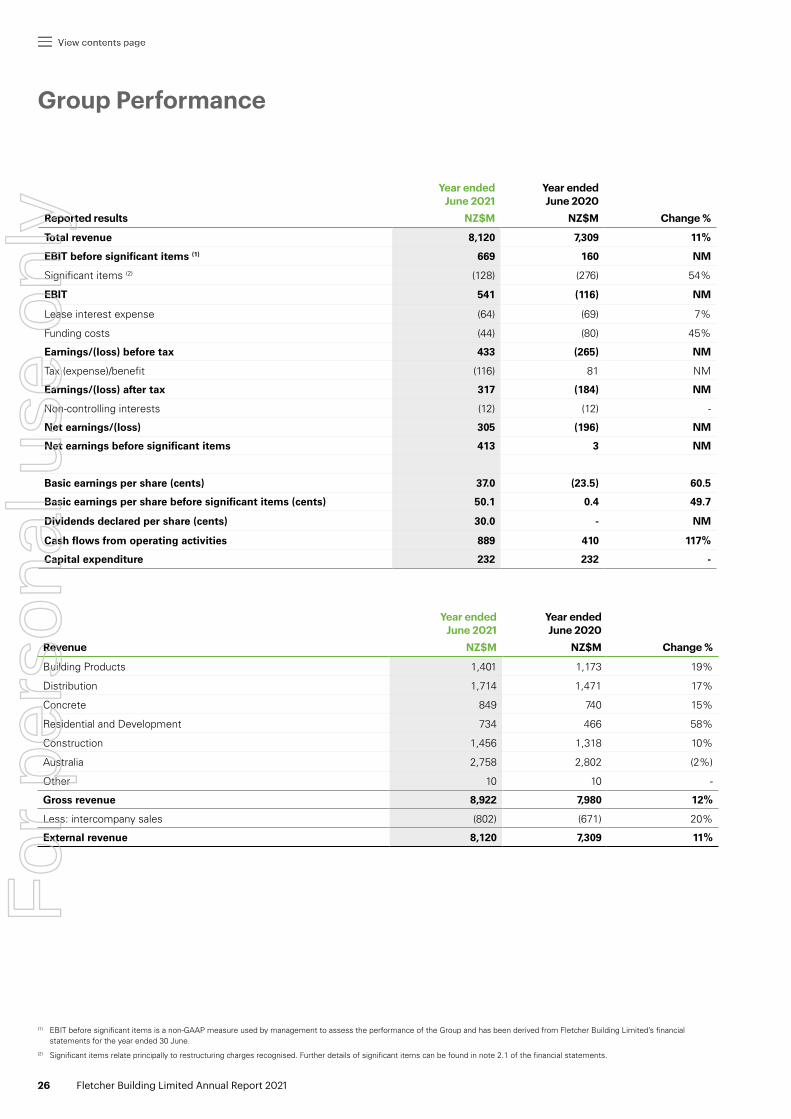
Reported results
Year endedJune 2021
NZ$M
Year endedJune 2020
NZ$M Change %
Total revenue 8,120 7,309 11%
EBIT before significant items (1) 669 160 NM
Significant items (2) (128) (276) 54%
EBIT 541 (116) NM
Lease interest expense (64) (69) 7%
Funding costs (44) (80) 45%
Earnings/(loss) before tax 433 (265) NM
Tax (expense)/benefit (116) 81 NM
Earnings/(loss) after tax 317 (184) NM
Non-controlling interests (12) (12) -
Net earnings/(loss) 305 (196) NM
Net earnings before significant items 413 3 NM
Basic earnings per share (cents) 37.0 (23.5) 60.5
Basic earnings per share before significant items (cents) 50.1 0.4 49.7
Dividends declared per share (cents) 30.0 - NM
Cash flows from operating activities 889 410 117%
Capital expenditure 232 232 -
Revenue
Year endedJune 2021
NZ$M
Year endedJune 2020
NZ$M Change %
Building Products 1,401 1,173 19%
Distribution 1,714 1,471 17%
Concrete 849 740 15%
Residential and Development 734 466 58%
Construction 1,456 1,318 10%
Australia 2,758 2,802 (2%)
Other 10 10 -
Gross revenue 8,922 7,980 12%
Less: intercompany sales (802) (671) 20%
External revenue 8,120 7,309 11%
(1) EBIT before significant items is a non-GAAP measure used by management to assess the performance of the Group and has been derived from Fletcher Building Limited’s financial statements for the year ended 30 June.
(2) Significant items relate principally to restructuring charges recognised. Further details of significant items can be found in note 2.1 of the financial statements.
Fletcher Building Limited Annual Report 202126
For
per
sona
l use
onl
y

$197m $127m
$31m $103m
EBIT EBIT before significant items(1)
Year ended 2021
NZ$M
Year ended2020
NZ$MChange
%
Year ended 2021
NZ$M
Year ended 2020
NZ$MChange
%
Building Products 188 68 176% 197 87 126%
Distribution 128 67 91% 127 85 49%
Concrete 117 61 92% 113 74 53%
Residential and Development 154 64 141% 154 65 137%
Construction 28 (160) NM 31 (147) NM
Australia (17) (133) NM 103 33 212%
Corporate (57) (83) 31% (56) (37) (51%)
Total 541 (116) NM 669 160 NM
Lease interest expense (64) (69) 7% (64) (69) 7%
Funding costs (44) (80) 45% (44) (80) 45%
Earnings/(loss) before tax 433 (265) NM 561 11 NM
Tax (expense)/benefit (116) 81 NM (136) 4 NM
Earnings/(loss) after tax 317 (184) NM 425 15 NM
Non-controlling interests (12) (12) - (12) (12) -
Net earnings/(loss) 305 (196) NM 413 3 NM
Building ProductsEBIT* 2021
DistributionEBIT* 2021
ConstructionEBIT* 2021
AustraliaEBIT* 2021
EBIT* 2020 $87m (p) 126%
$154mResidential and DevelopmentEBIT 2021
EBIT* 2020 $65m (p) 137%
EBIT* 2020 $85m (p) 49%
EBIT* 2020 $(147)m (p) NM EBIT* 2020 $33m (p) 212%
$113mConcreteEBIT* 2021
EBIT* 2020 $74m (p) 53%
* Before significant items.
(1) Measures before significant items are non-GAAP measures used by management to assess the performance of the Group and has been derived from Fletcher Building Limited’s financial statements for the year ended 30 June.
Fletcher Building Limited Annual Report 2021 27
For
per
sona
l use
onl
y

Group Overview
Whilst the uplift in the Group’s performance was partly due to the adverse impact of COVID-19 in the prior year, the result also reflected the Group’s progress in its strategy to drive performance and growth. In particular, programmes implemented over the past three years to improve operational performance and investments in targeted growth opportunities resulted in materially improved profitability. FY21 EBIT margin before significant items increased materially to 8.2%, with the Group continuing to target an earnings margin of around 10% in FY23.
In New Zealand, market activity levels for the core materials and distribution divisions (Building Products, Distribution and Concrete) remained robust throughout the year. Demand in the residential sector was strong, driven by both new housing and renovation activity, while the commercial and infrastructure sectors were broadly in line with the prior year. Markets were also characterised by global and local supply chain constraints, creating pressures on logistics channels and freight costs, and there were material increases in input costs in other areas – notably energy, steel and resin. In this environment, the New Zealand core divisions delivered strong performances. Gross revenue was 17% higher than the prior period, ahead of market activity as businesses achieved share gains in target segments. EBIT before significant items was $437 million, significantly ahead of revenue growth through a combination of operating leverage, efficiency benefits, and improved operational disciplines across the businesses. EBIT margins before significant items in these New Zealand core divisions lifted to 11% overall.
The Residential and Development division delivered EBIT before significant items of $154 million, compared to $65 million in the prior year. The Residential business continued to grow with house sales volumes of 836 units in FY21. Combined with year-on-year price growth of 8% in a supportive market environment, this resulted in Residential EBIT of $101 million. Clever Core continued to ramp up volumes to 97 units compared to 50 in the prior year. Land Development EBIT was $57 million, predominantly from the sale of two surplus Australian sites.
The Construction division reported gross revenue of $1,456 million and EBIT before significant items of $31 million. Earnings were underpinned by Brian Perry Civil and Higgins, which delivered a combined EBIT margin of 5.4%. The division continues to make good progress in reshaping its forward order book to deliver an improved risk profile and margins.
In Australia, market conditions were mixed. The residential sector proved resilient for detached housing and renovations, supported by low interest rates and the Government’s HomeBuilder grant. The commercial sector trended lower, and project activity in key civil sectors also slowed. In this environment the division delivered materially improved performance, driven by significant cost reductions and operational investments undertaken over the past three years. Gross revenue of $2,758 million was 2% lower than the prior year due to the lower activity in commercial and civil sectors,
partially offset by market share gains in target segments. Divisional EBIT before significant items increased to $103 million from $33 million in the prior year, and the EBIT margin increased to 3.7% from 1.2% in FY20. Growth in earnings and profitability was driven mainly by the Laminex, Tradelink and Stramit businesses, while Rocla’s EBIT included a $6 million benefit from reduced depreciation as it was held for sale as at 30 June 2021.
Significant items charges for the Group were $128 million. $78 million was in respect of an impairment to the Rocla business, based on a reassessment of likely divestment proceeds. The balance of the significant items related to the final phase of the Group’s restructuring programme, principally in the Australia division.
Net interest expense for the Group was $108 million in the year, of which $64 million related to lease interest. The Group’s funding costs for the period decreased by 45% to $44 million, resulting principally from lower debt levels following the repayment of $764 million of debt since June 2020. A tax expense of $116 million in the period compared to a tax benefit of $81 million in the prior year.
Basic earnings per share were 37.0 cents in FY21, compared to (23.5) cents in the prior year. Excluding the impact of significant items, earnings per share were 50.1 cents, compared with 0.4 cents in the prior year.
Group cash flows Cash flows from operating activities for the Group were very strong at $889 million, compared to $410 million in the prior year. In addition to the substantial uplift in earnings, the key driver of this cash flow performance was effective management of working capital. At the same time, the Group has made targeted investments in inventories to manage supply chain constraints and has also ensured prompt payment to suppliers to support overall industry liquidity.
The working capital cycle in the core manufacturing and distribution divisions improved by 5.3 days compared to the prior period, driven by improvements in debtors and inventories. Payables days were unchanged. A small level of inventory growth is expected in FY22 as resilience stocks are rebuilt in some businesses.
In Residential and Development, strong house sales led to a substantial reduction in housing inventories and a $105 million working capital inflow. At 30 June 2021, the division held one finished house in stock, compared to 107 at the end of the prior year. Divisional funds decreased by 12% to $534 million and are expected to rebuild in FY22 as the division invests in ongoing volume growth.
In Construction, overall trading cash flows (excluding significant items) were an outflow of $118 million which comprised an outflow of $104 million against legacy project provisions booked in prior periods; an outflow of $69 million from an unwind of advanced working capital positions; and an inflow of $55 million from the balance of the business.
Capital expenditure for the Group in FY21 was $232 million, including $78 million for the new Winstone Wallboards plant.
External revenue of $8,120 million was $811 million or 11% higher than the prior year’s $7,309 million. EBIT before significant items was $669 million, compared to $160 million in the prior year. Group net earnings were $305 million, compared to a loss of $196 million reported in the prior year. Cash flows from operating activities were $889 million, compared to $410 million in the prior year.
Fletcher Building Limited Annual Report 202128
For
per
sona
l use
onl
y

Additional investments were focused on key strategic priorities in manufacturing automation, digitisation, and carbon reduction.
Strong performance on all dimensions of cash management resulted in Group free cash flow in the period (excluding legacy projects) of $652 million, compared to $269 million in the prior period.
Funding The Group’s balance sheet and funding profile remain strong.
As advised in June 2020, the Group made an early repayment of US$200 and A$99 million of USPP notes on 29 July 2020 from the Group’s cash reserves, retiring the Group’s most expensive source of debt and reducing annual funding costs by $17 million.
Total funding available to the Group as at 30 June 2021 was $1,764 million of which $925 million was undrawn and there was an additional $666 million of cash on hand. The Group’s liquidity was therefore strong at $1.6 billion.
The Group’s gearing at 30 June 2021 was 4.4% compared with 12.3% at 30 June 2020.
The Group’s leverage ratio (net debt / EBITDA) at 30 June 2021 was 0.2 times, compared with 0.9 times at 30 June 2020 and compared to a target ratio of 1.0 – 2.0 times.
Given the strength of this position, on 26 May the Group announced its intention to undertake an on-market share buyback of up to $300 million over the 12 months to May 2022.
The average maturity of the Group’s debt at 30 June 2021 is 3.1 years and the hedged currency split is 38% Australian dollar; 60% New Zealand dollar; and 2% spread over various other currencies.
The Group currently has 70% of all borrowings with fixed interest rates with an average duration of 2.2 years. Inclusive of floating rate borrowings, the average interest rate on the debt (based on period-end borrowings) is 4.0%.
DividendThe 2021 final dividend is 18.0 cents per share, bringing the total dividend for 2021 to 30.0 cents per share. In line with the Group’s tax crediting policy, the Group targets to impute and frank at least the final dividend subject to available tax credits. The final dividend will be unimputed and unfranked for tax purposes.
The final dividend will be paid on Friday 17 September 2021 to holders registered as at 5:00 pm (NZ time) on Friday 27 August 2021. The shares will be quoted on an ex-dividend basis from Thursday 26 August 2021 on the NZX and ASX. The Dividend Reinvestment Plan will not be operative for this dividend payment.
OutlookThe macro backdrop and activity pipeline remain supportive for growth in both New Zealand and Australia. This is driven in particular by strong demand in the Residential sector, while activity in the Commercial and Infrastructure sectors remains stable. Supply chain and labour constraints mean the New Zealand Residential sector is currently at or near capacity, and is likely to mean an extended period of building activity in FY22 and beyond. Input cost inflation and supply chain disruption remain key features of the operating environment in both geographies, with businesses focused on managing continuity of supply for customers and ensuring cost recovery through price. COVID-19 outbreaks and lockdowns remain a risk to market activity and business performance. Overall, the Group has a strong balance sheet, a favourable market outlook, and remain well-positioned to drive performance and growth. An update on FY22 trading and outlook will be provided at Annual Shareholders' Meeting in October 2021.
At Pacific Coil Coaters, Steel GM Adrian Blake and Group Operations Manager Paul Murphy have led the team to increased productivity of >15% through smarter operations, improved process and teamwork. All this with a reduction in the number of manufacturing shifts and an improvement in safety performance.
Fletcher Building Limited Annual Report 2021 29
For
per
sona
l use
onl
y

The Building Products division reported gross revenue of $1,401 million, 19% higher than the prior year. EBIT before significant items was $197 million, compared to $87 million in the prior year.
The strong trading momentum in the first half continued in the second half of the year with all Building Products businesses recording robust results. Higher revenues were reflective of a supportive market environment, notably in the residential sector; market share gains, including as a result of customers’ increasing preference for local manufacturing; and improved pricing disciplines as businesses worked to offset input cost pressures in resin, steel, paper, freight and energy. The EBIT margin before significant items for the division increased strongly to 14.1%, driven by manufacturing efficiency programmes, reduced overheads and higher production volumes. Pleasingly, the Humes and Steel businesses delivered significant earnings improvements on the back of a successful execution of their turnaround plans.
During the year, the division made good progress on initiatives to improve its customer offering and operational efficiency. Winstone Wallboards launched the Customer Specific Quote (CSQ) application, which together with the MyGIB app launched last year has materially improved customer quote and order processing. Humes continued the
rationalisation of its sales and manufacturing operations, with the investment in upgrading its pipe manufacturing facility in Papakura on track for commissioning in mid-FY22. Tasman Insulation completed the automation of its bagger and bag placer processes, while Fletcher Steel rationalised its South Island sites and finalised the relocation of Easysteel and Dimond in Wellington to an improved facility. Iplex launched new products in the rainwater segment and started production of 160mm drum coils and free-standing coils and Polyethylene25 length pipe, in line with its market expansion initiative into the rural and electrical segments. Laminex launched new product ranges in line with its growth strategy and introduced its new website, e-commerce and digital marketing platforms.
Trading cash flow for the division was $244 million, or $251 million excluding significant items. This is reflective of the strong operating earnings and good working capital management, as well as lower-than-usual inventory levels resulting from the strong sales demand.
Capital expenditure for the division was $112 million, of which $78 million related to the construction of the new Winstone Wallboards plant.
The division will continue to focus on delivering improved customer services, innovative new products, and organic entry into targeted adjacencies. It will also continue to drive cost efficiencies through modernisation and automation of manufacturing facilities. At the forefront of these are the investments in the new Winstone Wallboards plant, the modernisation of the Humes Papakura pipe manufacturing plant, and the switch to advanced curing oven technology at Pacific Coilcoaters. These initiatives will also support the division’s objective to reduce its carbon footprint by at least 30% by 2030, as compared to the 2018 baseline. The division is targeting to maintain EBIT margins at around 14% at current market activity levels.
Future Focus
Winstone Wallboards
Laminex New Zealand
Tasman Insulation
Iplex New Zealand
Humes
Fletcher Steel
Altus JV
16%% of Group revenue
Building Products
Watch Video
Investor Day 2021 - Building Products
$1,401mRevenue
Fletcher Building Limited Annual Report 202130
Divisional Review
For
per
sona
l use
onl
y

Building Products Financial Summary
Year ended 30 June 2021NZ$M
2020NZ$M
Change %
Gross revenue 1,401 1,173 19%
External revenue 1,101 922 19%
EBIT before significant items (1) 197 87 126%
EBIT margin before significant items
14.1% 7.4% 6.7%
Significant items (2) (9) (19) 53%
Funds 726 678 7%
ROFE (3) 27.1% 12.8% 14.3%
Trading cash flow 244 125 95%
Capital expenditure 112 53 (111%)
Building Products EBIT before significant items (1)
Year ended 30 June 2021NZ$M
2020NZ$M
Change %
Building Products 157 101 55%
Steel 40 (14) NM
Total 197 87 126%
(1) EBIT before significant items is a non-GAAP measure used by management to assess the performance of the business and has been derived from Fletcher Building Limited's financial statements for the period ended 30 June 2021.
(2) Details of significant items can be found in note 2.1 of the financial statements.(3) EBIT before significant items / closing funds.
Our Building Products businesses
GIB® is New Zealand’s favourite plasterboard owing to our high quality commitment to innovation and excellent customer service. Our new Tauriko facility will ensure we can continue to support customers now and into the future.
Hamish McBeath, CE Building Products
Fletcher Building Limited Annual Report 2021 31
For
per
sona
l use
onl
y

2020 X.X
The Distribution division reported gross revenue of $1,714 million, 17% higher than the prior year. EBIT before significant items was $127 million, an increase of $42 million on the prior year.
Revenue growth was delivered across all customer segments and was particularly strong in the Auckland region (+29% versus prior year) and the lower North Island (+20%). EBIT margin before significant items increased to 7.4% for the year, the result of scale benefits from top line growth and tightly managed operating costs. This includes the ongoing workforce optimisation programme, which is focused on branch efficiencies through improved ways-of-working. Further to this, the PlaceMakers business continued to bring delivery services in house, with 93% of all ex-branch deliveries now managed by the centralised delivery team.
The PlaceMakers Regional Hub programme of work was completed during the year, with 27 of the 65 branches now in 8 regional hubs. This structure is providing greater consistency for customers who transact with multiple branches, as well as simplified and aligned regional leadership and sales teams. The PlaceMakers e-commerce tools were released during the period, creating a best-
in-class platform allowing customers greater flexibility in their interactions with the business. Key features include order and delivery tracking, real-time visibility of stock availability and personalised pricing. Encouraging adoption has been a significant focus during the year, with over 30% of trade customers now registered and usage growing strongly. The division continued to grow points of presence, with the opening of new branches in Hastings, Upper Hutt and Matamata.
Trading cash flow for the division was $122 million, or $129 million excluding significant items. The division has continued to retain tight management of working capital, while balancing this with maintaining inventory levels in a period of strong customer demand and supply chain challenges.
Capital expenditure in the year was $12 million, with investment centred on digital innovation and property improvements.
Ensuring competitive customer offerings, ease of doing business and market leading service remain core to the division’s strategy. Driving adoption of e-commerce tools will continue to be a focus, with integration into customer ecosystems a priority. Increased use of data and analytics will enable personalisation and marketing automation, while also providing insights from which to drive customer solutions. With the Hub structures in place, the focus here is on driving outcomes from greater scale, including the improved purchasing power, the ability to reconfigure the property footprint and enabling closest site delivery. The division is targeting ongoing EBIT margin expansion of 0.5%-1.0% by FY23.
Future Focus
$1,714mRevenue
19%% of Group revenue
Distribution
Watch Video
Investor Day 2021 - Distribution Division
Fletcher Building Limited Annual Report 202132
Divisional Review
PlaceMakers
Mico
Forman Building Systems
For
per
sona
l use
onl
y

Year ended 30 June 2021NZ$M
2020NZ$M
Change %
Gross revenue 1,714 1,471 17%
External revenue 1,684 1,440 17%
EBIT before significant items (1) 127 85 49%
EBIT margin before significant items 7.4% 5.8% 1.6%
Significant items (2) 1 (18) NM
Funds 215 209 3%
ROFE (3) 59.1% 40.7% 18.4%
Trading cash flow 122 117 4%
Capital expenditure 12 21 43%
Distribution Financial Summary
Our Distribution businesses
Key strategic initiatives are well underway to strongly position the business for the future. Initiatives all centred on driving convenience and value for our customers, to deepen loyalty and engagement, and grow margins and market share.
Bruce McEwen, CE Distribution
(1) EBIT before significant items is a non-GAAP measure used by management to assess the performance of the business and has been derived from Fletcher Building Limited's financial statements for the period ended 30 June 2021.
(2) Details of significant items can be found in note 2.1 of the financial statements.
(3) EBIT before significant items / closing funds.
Fletcher Building Limited Annual Report 2021 33
For
per
sona
l use
onl
y

The Concrete division reported gross revenue of $849 million, 15% higher than the prior year. EBIT excluding significant items was $113 million, compared to $74 million in the prior year.
Revenue was underpinned by strong demand across all key product segments, owing to differentiated offering, asset renewal and debottlenecking of key operations and pricing discipline. EBIT grew well ahead of revenue, resulting in EBIT margins before significant items lifting to 13.3%. These results reflect a sustained programme over the past three years of manufacturing and supply chain efficiency initiatives, network optimisation and development of a lean and agile support organisation. This was partially offset by higher electricity costs and product purchases to maintain cement inventories through the commissioning of the Golden Bay Cement waste tyre facility.
The division has made good progress with its decarbonisation plan and a sustained reduction in carbon intensity remains a key focus. Entering FY21, Golden Bay Cement was already materially lower in carbon than imported cement alternatives, due to its higher use of renewable and recycled fuels, and lower freight profile. By the end of FY21, this advantage was reinforced by commissioning of the waste tyre project at Portland, which lifted the rate of coal substitution in the
manufacturing process from around 15% to 35%. Firth achieved 95% of ready-mix products with Environmental Product Declaration. The division continues to extend its offering of sustainable enhanced solutions and services such as supplementary cementitious materials, and concrete recycling and re-use.
Other key initiatives in the division included Firth’s launch of its ready-mix online sales portal and rollout of digital dockets, and continued extension of masonry and differentiated concrete products.
Trading cash flow for the division was $164 million, or $168 million excluding significant items. Working capital remains tightly controlled, with strong market demand also holding inventory at slightly below normal levels.
Capital expenditure in the year of $36 million focused on the waste tyre project at Portland, quarry stripping to access resource and digital initiatives.
The division recognised a $4 million EBIT gain in significant items in the year, mainly relating to the disposal of lower North Island quarries as part of the division's ongoing footprint optimisation programme.
The strategy flows through into FY22 with a continued focus on driving top and bottom- line improvements from market leading services and solutions, leadership in carbon reduction, asset renewal, and lowest delivered costs. The division expects to accelerate growth by commercialising further innovative product solutions, digitalising the business and customer experience, and moving towards more recyclable products. Efficiency initiatives will focus on footprint optimisation, debottlenecking and alternative fuels.
Future Focus
10%% of Group revenue
$849mRevenue
Concrete
Firth Industries
Golden Bay Cement
Winstone Aggregates
Watch Video
Investor Day 2021 - Concrete Division
Fletcher Building Limited Annual Report 202134
Divisional Review
For
per
sona
l use
onl
y

Year ended 30 June 2021NZ$M
2020NZ$M
Change %
Gross revenue 849 740 15%
External revenue 583 503 16%
EBIT before significant items (1) 113 74 53%
EBIT margin before significant items 13.3% 10.0% 3.3%
Significant items (2) 4 (13) NM
Funds 573 607 (6%)
ROFE (3) 19.7% 12.2% 7.5%
Trading cash flow 164 100 64%
Capital expenditure 36 50 28%
(1) EBIT before significant items is a non-GAAP measure used by management to assess the performance of the business and has been derived from Fletcher Building Limited's financial statements for the period ended 30 June 2021.
(2) Details of significant items can be found in note 2.1 of the financial statements.
(3) EBIT before significant items / closing funds.
Our New Zealand concrete business provides a strong platform for sustainable growth thanks to our leading position along the value chain and strong brands, capabilities and footprint.
Nick Traber, CE Concrete
Concrete Financial Summary
Our Concrete businesses
Fletcher Building Limited Annual Report 2021 35
For
per
sona
l use
onl
y

Residential and Development
The Residential and Development division reported gross revenue of $734 million, which was $268 million higher than the prior year. EBIT was $154 million, compared to $65 million before significant items in the prior year.
For the Residential business, a strong housing market was underpinned by historically low mortgage rates and a constrained supply of houses. Sales volumes increased to 836 units, compared to 666 last year. The $600,000 to $900,000 range that has typically been the focus for the business was particularly popular with both first home buyers and investors, with legislation changes on interest deductibility further encouraging investment in new houses. The average price of units sold was 8% higher than the prior year, even though the mix of houses sold was weighted to lower price points. In houses that were comparable to those sold the previous year in the same location, prices were as much as 20% higher – in line with the broader market. The business also continued to optimise house typologies to meet customer preferences and target price points. EBIT for the Residential housing business of $101 million reflected the strong growth in both volumes and prices.
Land Development EBIT of $57 million was the result of two large land transactions in the second half of the year. These were the
Rocla Gailes site in Brisbane and the former Crane Copper Tube site in Sydney. There were also sales of smaller sites as the Development team continues to optimise the portfolio of properties occupied by other Group businesses.
Clever Core, the division’s panelisation business, produced and installed 97 house units for Fletcher Living. During the year significant improvements were made to the design and installation processes, both of which will benefit future years. Clever Core made an EBIT loss of $4 million, in line with the result in the prior year, as it continues to scale and optimise its operation.
Trading cashflow for the division was $261 million, reflecting strong earnings and a reduction in housing stock levels. At 30 June 2021, the division held one finished house in stock, compared to 107 a year before. Divisional funds decreased as a result by 12% to $534 million, despite ongoing purchases of land. This funds balance includes 2,453 residential lots and one rural property for further development or sale, and the division has a further 1,552 units of both zoned and future urban zoned land under unconditional contract including a further rural property.
The division will continue to grow the base Residential business and is targeting to deliver over 1,000 homes per annum across the Auckland and Canterbury markets. Clever Core will continue to scale its manufacturing volumes, targeting approximately 200 units in FY22, which will include the first sales of panelised homes to third parties. The Apartments business will also continue to scale, targeting delivery of approximately 300 units annually, by FY24 focused on the Auckland market. The Residential business will also launch a complementary retirement offer within its residential communities, targeting around 100 new units per year by FY25. The division continues to target circa $25 million EBIT per annum through the sale of legacy Fletcher Building properties plus development of acquired industrial sites.
Future Focus
Watch Video
Investor Day 2021 - Residential Division
% of Group revenue
$734mRevenue
8%
Fletcher Building Limited Annual Report 202136
Residential (Fletcher Living)
Land Development
Clever Core
Divisional Review
For
per
sona
l use
onl
y

Year ended 30 June 2021NZ$M
2020NZ$M
Change %
Gross revenue 734 466 58%
External revenue 721 460 57%
EBIT before significant items (1) 154 65 137%
EBIT margin 21.0% 13.9% 7.1%
Significant items (2) - (1) NM
Funds 534 604 (12%)
ROFE (3) 29% 11% 18%
Trading cash flow 261 118 121%
Capital expenditure 1 3 67%
Year ended 30 June 2021NZ$M
2020NZ$M
Change %
Residential 101 63 60%
Land Development 57 6 NM
Clever Core (4) (4) -
Total 154 65 137%
(1) EBIT before significant items is a non-GAAP measure used by management to assess the performance of the business and has been derived from Fletcher Building Limited's financial statements for the period ended 30 June 2021.
(2) Details of significant items can be found in note 2.1 of the financial statements.(3) EBIT before significant items / closing funds.
Residential and Development Financial Summary
Residential and Development EBIT before significant items (1)
Our Residential and Development businesses
We have seen step-change improvements across each part of the Design for Manufacturing and Assembly (DfMA) process this year. The result is that we are confident of its long term success.
Steve Evans, CE Residential and Development
Fletcher Building Limited Annual Report 2021 37
For
per
sona
l use
onl
y

Watch Video
Construction
2020 X.X
The Construction division reported gross revenue of $1,456 million, which was $138 million or 10% higher than the prior year. EBIT before significant items was $31 million, compared to a loss of $147 million in the prior year.
Revenue was underpinned by solid construction activity levels across New Zealand, particularly in the transport and water sectors. Divisional earnings were driven mainly by the Brian Perry Civil and Higgins businesses, which delivered EBIT margins of 5.7% and 5.3% respectively. The division’s overhead costs were also reduced through a cost-out programme and improved operating leverage.
The Construction division has reshaped its order book to achieve a more balanced risk profile. The forward order book at 30 June 2021 is $3.0 billion, with a further $0.3 billion in preferred works under design-development with Auckland Transport for the AMETI busway alliance project. Approximately two thirds of the order book comprises lower risk smaller self-perform work in Higgins and Brian Perry Civil, national and local maintenance contracts, and multi-year framework and alliance agreements with Watercare and Ka- inga Ora. The division has also embedded the ‘Fletcher One’ standardised governance framework, and invested in digital systems to improve controls and operating efficiencies.
The division’s legacy project portfolio now consists of $0.3 billion of work to complete, down from $0.6 billion at 30 June 2020. Key projects delivered in FY21 include Commercial Bay in Auckland and Te Ni-kau, Grey Hospital & Health Centre. Progress on the major roading projects continues in line with the revised completion dates set post COVID-19, Pu- hoi to Warkworth, Peka Peka to O- taki, and Hamilton City Edge expressways are scheduled to complete in calendar 2022, with work continuing to plan on the New Zealand International Convention Centre.
Trading cash flow for the division in FY21 was an outflow of $123 million, or an outflow of $118 million when excluding significant items. This was comprised of: an outflow of $104 million against legacy project provisions booked in prior periods; an outflow of $69 million from an unwind of advanced working capital positions; and an inflow of $55 million from the balance of the business.
Capital expenditure in the year of $25 million was mainly focused on mobile and static asphalt plants for Higgins to service both New Zealand and the Pacific.
The ongoing focus for Construction is: growing integrated asset lifecycle services to support key infrastructure customers; maintaining a balanced risk profile in its order book, alongside ongoing completion of remaining legacy projects; executing consistently through disciplined operations and specialised self-perform resources; and as a result lifting divisional EBIT margins to a range of 3%-5% by FY22.
Future Focus
Investor Day 2021 - Construction Division
% of Group revenue
$1,456mRevenue
16%
Fletcher Building Limited Annual Report 202138
South Pacific
Brian Perry Civil
Higgins
Buildings
Infrastructure
Divisional Review
For
per
sona
l use
onl
y
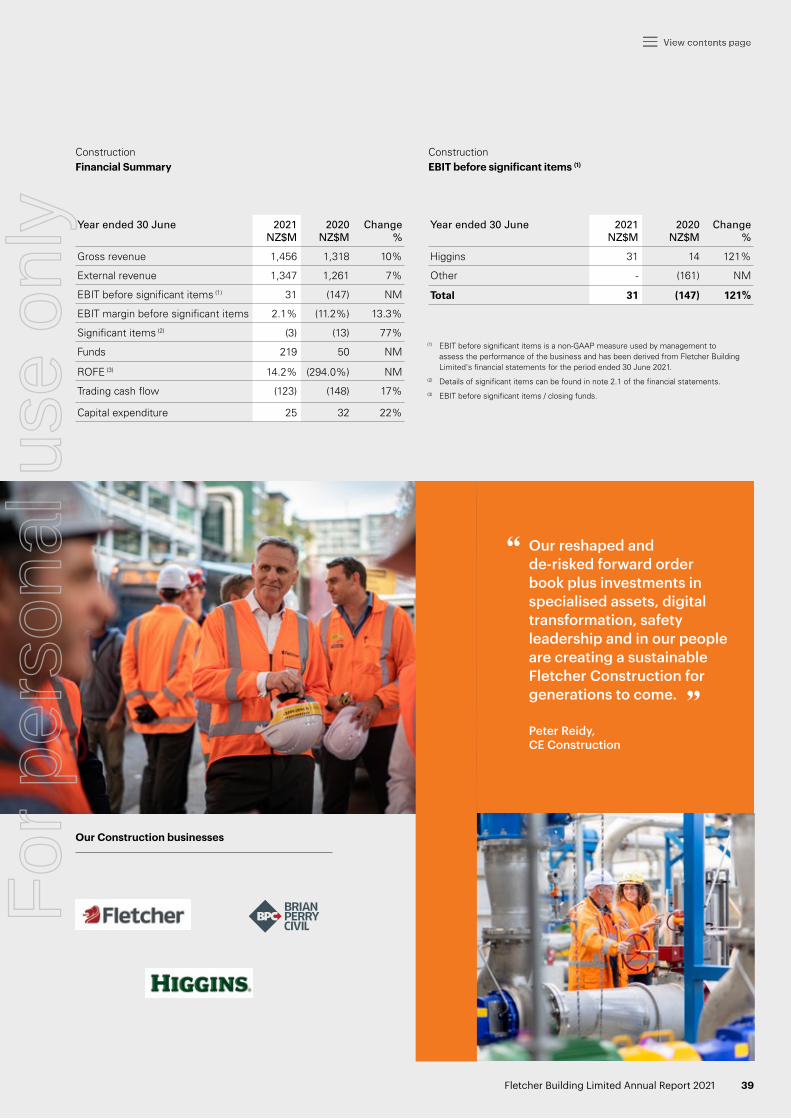
Our reshaped and de-risked forward order book plus investments in specialised assets, digital transformation, safety leadership and in our people are creating a sustainable Fletcher Construction for generations to come.
Peter Reidy, CE Construction
Year ended 30 June 2021NZ$M
2020NZ$M
Change %
Gross revenue 1,456 1,318 10%
External revenue 1,347 1,261 7%
EBIT before significant items (1) 31 (147) NM
EBIT margin before significant items 2.1% (11.2%) 13.3%
Significant items (2) (3) (13) 77%
Funds 219 50 NM
ROFE (3) 14.2% (294.0%) NM
Trading cash flow (123) (148) 17%
Capital expenditure 25 32 22%
Year ended 30 June 2021NZ$M
2020NZ$M
Change %
Higgins 31 14 121%
Other - (161) NM
Total 31 (147) 121%
(1) EBIT before significant items is a non-GAAP measure used by management to assess the performance of the business and has been derived from Fletcher Building Limited's financial statements for the period ended 30 June 2021.
(2) Details of significant items can be found in note 2.1 of the financial statements.(3) EBIT before significant items / closing funds.
Construction Financial Summary
Construction EBIT before significant items (1)
Our Construction businesses
Fletcher Building Limited Annual Report 2021 39
For
per
sona
l use
onl
y

Australia
The Australia division reported gross revenue of $2,758 million which was 2% lower than the prior year. EBIT before significant items was $103 million, compared with $33 million in the prior year.
Overall, the division continues to benefit from significant interventions over the past three years to reduce its cost base and from investments in automation and focused growth initiatives. Market share has grown in most businesses through customer service improvements and new product development, leading to improved product vitality across the division.
Building Products Australia revenue declined by 6% in the year, however EBIT before significant items of $70 million was $44 million higher than the prior year. This was driven in particular by Laminex, which increased earnings by 38% through market share gains in decorative categories, the introduction of new ranges, and supply chain efficiencies. Laminex’s digital sales also increased to over 25% of revenue. Fletcher Insulation grew revenues by 9% and earnings by 61% following the restructuring of its manufacturing and distribution footprints over the past two years. In the pipes business (Iplex, Rocla) revenue declined by 18%, primarily due to low levels of activity in key civil sectors and the exit of the Rocla pipe operations in New South Wales and Queensland. Nonetheless, the combined business made a small profit this year as a result of manufacturing site restructures and operational efficiency improvements.
Distribution Australia reported reduced revenues of 2%, while EBIT before significant items increased by $11 million. Tradelink continued to grow share in the key small to medium (SME) plumber segment,
which now represents 46% of its total revenue – up from 34% previously. Tradelink own brand also continued to grow, now representing 35% of front-of-wall sales – well above the previous 25% target. The Tradelink consumer transactional website was launched during the year and is delivering well ahead of plan. Earnings in Oliveri grew through strong uptake in the new bathroom range, share growth in the traditional kitchen sink and tap market, and successful cost-out initiatives.
Steel Australia sales grew by 12% and EBIT grew to $21m, compared to $5 million in the prior year. Strong momentum in the margin accretive sheds and doors segments coupled with increased new product development were key to the improvement, alongside manufacturing efficiencies from investments in increased automation.
Significant item charges in the division were $120 million for the year. These comprised a $78 million impairment of Rocla, based on a reassessment of likely divestment proceeds, while the remaining $42 million related to the final phase of the division’s restructuring activity.
Trading cash flows were $136 million, or $170 million excluding significant items. The strong cash flow result reflected tight debtor controls and focused improvements in inventory management, balanced with targeted investments to overcome supply chain constraints.
Capital expenditure in the year was $42 million, with key investments in the areas of digital migration, new product development and automation in the manufacturing businesses.
The Australia division’s focus remains on maximising efficiencies in the operating model, maintaining governance on the cost positions taken, embedding price effectiveness in all businesses, the continuation of product and service innovation, and investment in improved digital offers. The division continues to target ongoing expansion of EBIT margins to a range of 5%-7% in FY23. A sale agreement for the Rocla business was signed in July 2021 and the divestment is expected to complete at the end of August 2021.
Future Focus
Laminex Australia
Iplex Australia
Rocla
Fletcher Insulation
Tradelink
Oliveri Solutions
Stramit
Building Products Australia:
Distribution Australia:
Steel Australia:
Watch Video
Investor Day 2021 - Australia Division
% of Group revenue
$2,758mRevenue
31%
Fletcher Building Limited Annual Report 202140
Divisional Review
For
per
sona
l use
onl
y

We have enthusiastically embedded growth levers of innovation, new product development and made logical strategic choices about where we play for value. Our digital programmes are being built out, with learning and synergies being shared across the division as we digitise at pace.
Dean Fradgley, CE Australia
Year ended 30 June 2021NZ$M
2020NZ$M
Change %
Gross revenue 2,758 2,802 (2%)
External revenue 2,684 2,723 (1%)
EBIT before significant items (NZ$m)(1) 103 33 NM
EBIT before significant items (A$m)(1) 96 31 NM
EBIT margin before significant items 3.7% 1.2% 2.5%
Significant items (2) (120) (166) 28%
Funds 1,327 1,494 (11%)
ROFE (3) 7.8% 2.2% 5.6%
Trading cash flow 136 49 178%
Capital expenditure 42 65 35%
Year ended 30 June 2021NZ$M
2020NZ$M
Change %
Building Products Australia 70 26 169%
Distribution Australia 18 7 157%
Steel Australia 21 5 NM
Divisional costs (6) (5) (20%)
Total 103 33 212%
(1) EBIT before significant items is a non-GAAP measure used by management to assess the performance of the business and has been derived from Fletcher Building Limited's financial statements for the period ended 30 June 2021.
(2) Details of significant items can be found in note 2.1 of the financial statements.(3) EBIT before significant items / closing funds.
Australia Financial Summary
Australia EBIT before significant items (1)
Our Australia businesses
Fletcher Building Limited Annual Report 2021 41
For
per
sona
l use
onl
y

Peter CrowleyBEcon, BA, FAICD
Independent Non-Executive Director
Term of office: Appointed director 1 October 2019, last elected 2019 annual meeting.
Board committees: Member of the Audit and Risk Committee, Member of the Nominations Committee and Member of the Safety, Health, Environment and Sustainability Committee.
Peter Crowley has over 40 years of experience in the construction materials and building products industries across Australia, New Zealand, Asia, Europe and North America.
From 2003-2015, he served as managing director and CEO of GWA Group Limited, a leading Australian supplier of building fixtures and fittings to households and commercial premises. He also spent 18 years in the cement industry, including various chief executive roles with The Rugby Group plc. and a variety of managerial roles with Queensland Cement and its parent company Holcim. Peter is a director of Barrambin Trading Company Pty Ltd, The Riverside Coal Transport Company Pty Ltd and Wesley Medical Research Limited.
Our Board
Martin BrydonMBA, FAICD, FAIM, Dip Elect Eng, Dip Elron Eng
Independent Non-Executive Director
Term of office: Appointed director 1 September 2018, last elected 2020 annual meeting.
Board committees: Member of the Nominations Committee, Member of the Remuneration Committee and Member of the Safety, Health, Environment and Sustainability Committee.
Martin has more than 40 years’ experience in the Australian building products sector, having started his career as an indentured engineering cadet with BHP. He joined Cockburn Cement Limited in 1981, where he then served as CEO from 1998-1999. Following Cockburn Cement’s merger into Adelaide Brighton in 1999, he held a number of senior management roles before his appointment as CEO and managing director in 2014. Martin retired following a distinguished 30-year career with Adelaide Brighton in January 2019. He is Chair of ASX listed company Duratec Limited.
Bruce HassallBCom, FCA (CAANZ)
Chair and Independent Non-Executive Director
Term of office: Appointed director 1 March 2017, last elected 2020 annual meeting.
Board committees: Chair of the Nominations Committee and Member of the Remuneration Committee.
Bruce Hassall has had a distinguished career with broad and deep commercial and strategic experience, and connections across the New Zealand economy, including in the small medium enterprise (SME), commercial, government and export sectors.
As former senior partner and CEO of PwC New Zealand he has extensive advisory background and knowledge of the corporate environment. Bruce is the Chair of The Farmers’ Trading Company Limited and Prolife Foods Limited and is a director of Bank of New Zealand and Fonterra Co-operative Group Limited.
Barbara ChapmanCNZM, BCom, CMInstD
Independent Non-Executive Director
Term of office: Appointed director 1 September 2018, last elected 2020 annual meeting.
Board committees: Chair of the Remuneration Committee and Member of the Nominations Committee.
Barbara brings extensive and diverse trans-Tasman executive experience to the Board having served as CEO and managing director of ASB Bank for seven years and having held a number of senior executive roles responsible for marketing, communications, human resources, life insurance and retail banking in New Zealand and Australia. She has an extensive list of professional achievements to her credit, including being named New Zealand Herald’s 2017 Business Leader of the Year.
In 2019, Barbara was made a Companion of the New Zealand Order of Merit for services to business. Barbara is the Chair of Genesis Energy Limited and NZME (New Zealand Media and Entertainment) Limited, and deputy Chair of The New Zealand Initiative. She is also Chair of the APEC CEO Summit 2021.
Fletcher Building Limited Annual Report 202142
For
per
sona
l use
onl
y

Doug McKayONZM, BA, AMP (Harvard), CMInstD
Independent Non-Executive Director
Term of office: Appointed director 1 September 2018, last elected 2018 annual meeting.
Board committees: Chair of the Safety, Health, Environment and Sustainability Committee, Member of the Audit and Risk Committee and Member of the Nominations Committee.
Doug brings considerable business leadership and commercial experience, as the former CEO of major manufacturing and distribution businesses in New Zealand and Australia, such as Lion Nathan, Carter Holt Harvey, Goodman Fielder, Sealord and Independent Liquor. He was the inaugural CEO of the amalgamated Auckland Council until the end of 2013. In 2015, Doug was made an Officer of the New Zealand Order of Merit for services to business and local government. Doug is the Chair of Bank of New Zealand and Eden Park Trust Board and is a director of Genesis Energy Limited, IAG New Zealand Limited and National Australia Bank.
Rob McDonaldBCom, FCA
Independent Non-Executive Director
Term of office: Appointed director 1 September 2018, last elected 2018 annual meeting.
Board committees: Chair of the Audit and Risk Committee, Member of the Nominations Committee and Member of the Remuneration Committee.
Rob McDonald’s finance career spans over 30 years with a strong track record in financial and risk management, developed over two decades with Air New Zealand. As the airline’s chief financial officer, he received a number of accolades during his career, including CFO of the Year in the Deloitte Top 200 in 2015 and the Fairfax Media New Zealand CFO of the Year award in 2010. Rob is the Chair of Contact Energy Limited, a director of AIA New Zealand Limited and the Chartered Accountants of Australia and New Zealand, and a member of the University of Auckland Council.
Cathy QuinnONZM, LLB
Independent Non-Executive Director
Term of office: Appointed director 1 September 2018, last elected 2018 annual meeting.
Board committees: Member of the Audit and Risk Committee, Member of the Nominations Committee and Member of the Safety, Health, Environment and Sustainability Committee.
Cathy practiced as one of New Zealand’s foremost commercial and corporate lawyers for over 30 years. In 2016, Cathy was made an Officer of the New Zealand Order of Merit for services to law and women. Cathy is a director of Fonterra Co-operative Group Limited, Tourism Holdings Limited and Rangatira Limited. She is Pro-Chancellor of the University of Auckland Council and chairs Fertility Associates Holdings Limited.
Fletcher Building Limited Annual Report 2021 43
For
per
sona
l use
onl
y

Executive Team
For the full biographies of our Executive Team, please see our website.
Ross TaylorChief Executive Officer
Steve Evans Chief Executive Residential and Development
Hamish McBeath Chief Executive Building Products
Claire CarrollChief People and Communications Officer
Dean Fradgley Chief Executive Australia
Bruce McEwen Chief Executive Distribution
Wendi CroftChief Health and Safety Officer
Nick TraberChief Executive Concrete
Bevan McKenzie Chief Financial Officer
Peter ReidyChief Executive Construction
Andrew Clarke Group General Counsel and Company Secretary
Daniel Beecham Chief Information Officer
Fletcher Building Limited Annual Report 202144
For
per
sona
l use
onl
y

Corporate Governance
The Board is committed to ensuring that Fletcher Building has appropriate corporate governance arrangements in place that are consistent with the size and nature of the Group’s operations.
At Fletcher Building, governance is about creating a strong and principled ethics-based culture, where accountability and transparency improve the quality and clarity of decision-making within the Group. The primary objective is to create and adhere to a corporate culture that is open and transparent, develops capabilities, and identifies opportunities to create value for our stakeholders.
The Group’s approach to applying the principles and recommendations outlined in the NZX Corporate Governance Code (“the Code”) is set out below (including where its practice materially differs from the Code). The Group’s constitution, the Board and committee charters, code of conduct and policies referred to in this statement are available to view on our website at fletcherbuilding.com/investor-centre/corporate-governance.
This governance statement is current as at 30 June 2021 and was approved by the Board on 17 August 2021.
Principle 1 – Code of Ethical Behaviour “Directors should set high standards of ethical behaviour, model this behaviour and hold management accountable for these
standards being followed throughout the organisation.”
CODE OF CONDUCT
The Group has a Code of Conduct with which all directors, senior executives and employees are required to comply. The Code of Conduct documents minimum standards of ethical behaviour and the Group’s expectations on loyalty and conflicts of interest, insider trading, holding of offices in another company or public office, intellectual property and misconduct.
In addition, the Group has a Anti-bribery and Corruption Policy, which provides for a zero-tolerance approach to bribery and corruption, whether in the private or public sector anywhere in the world. The policy also sets out expectations around giving and receiving gifts, charitable donations and dealings with business partners. The policy notes that political donations are not permitted without approval of the Board. No requests for such approval were made in FY21. All Fletcher Building personnel must adhere strictly to the requirements of this policy. There were no reported breaches of this policy in FY21.
Fletcher Building has a free phone and online service (“FBuCall”) which can be used by any Fletcher Building personnel to report suspected unacceptable, unethical or illegal behaviour in the workplace. This service is operated by external providers, who act as an independent third party to ensure calls are kept anonymous.
Fletcher Building is also committed to upholding Human Rights across all its business operations. Human Rights are fundamental civil, political, economic and social rights and freedoms that every human is entitled to without discrimination and include the right to be treated decently at work, to express opinions and beliefs without fear of recrimination, to have privacy, and to be free from harassment, abuse or discrimination. Our Human Rights Policy describes how Fletcher Building will uphold and monitor human rights within its business operations.
The Modern Slavery Act 2018 is an Australian Commonwealth Act which commenced on 1 January 2019. Our Human Rights Policy includes the statement that Fletcher Building prohibits the use of all forms of forced labour, including indentured labour, bonded labour, prison labour, modern forms of slavery and any form of human trafficking within our supply chain. Modern Slavery Statements are reported to the Australian Border Force and published on an online modern slavery register controlled by the Australian Border Force.
SECURITIES TRADING POLICY
The Group has a Security Trading Policy that applies to all directors, employees and contractors of Fletcher Building Limited and its subsidiaries (“Fletcher Building personnel”), as well as trusts, companies, persons and other entities controlled by Fletcher Building personnel. Persons also covered by the policy are any secondee, adviser or contractor who is in possession of material information that is not available to the market and who intends to trade, or advise or encourage others to trade, in listed securities of Fletcher Building or any of its subsidiaries.
The policy employs the use of black out periods to restrict persons covered by the Security Trading Policy who are likely to have knowledge of, or access to, inside information from trading. This group of personnel must notify the Company Secretary of their intent to trade. In addition, through our share registry, Computershare Investor Services Limited (Computershare), we actively monitor trading in Fletcher Building shares by senior personnel.
Fletcher Building Limited Annual Report 2021 45
For
per
sona
l use
onl
y

Corporate Governance (continued)
Principle 2 – Board Composition and Performance “To ensure an effective board, there should be a balance of independence, skills, knowledge, experience and perspectives.”
BOARD’S ROLES AND RESPONSIBILITIES
The role of the Board is to provide overall strategic guidance and effective oversight of management for the purposes of protecting and enhancing the value of Fletcher Building assets in the best interests of the Group. The Board has statutory responsibility for the affairs and activities of the Group, which in practice is achieved through delegation to the CEO who is charged with the day-to-day leadership and management of the Group.
The Board’s roles and responsibilities are formalised in a Board Charter, which is available on the Group’s website. The Board Charter sets out those functions that are delegated to management and those that are reserved for the Board. Under the Board Charter, the Company Secretary is secretary to the Board and accountable directly to the Board, through the Chair, on all matters to do with the proper functioning of the Board.
NOMINATION AND APPOINTMENT OF DIRECTORS
Procedures for the appointment and removal of directors are governed by the Group’s constitution. The Nominations Committee makes recommendations to the Board in respect of Board and committee composition and, when required, identifies individuals it considers to be qualified to become Board members.
Before a person is appointed to the Board, checks as to the person’s character, experience, education, criminal record and bankruptcy history are conducted. Each director receives a letter formalising his or her appointment. That letter outlines the key terms and conditions of his or her appointment, including Fletcher Building’s expectations of the role of director, and is required to be countersigned confirming agreement.
DIRECTOR INDEPENDENCE
The Group acknowledges the importance of having independent directors, ensuring it has the correct balance of skills to optimise the financial performance of the Group and maximise returns to shareholders.
The Board currently comprises seven directors, with a wide range of skills and experience. The qualifications and experience of each of the directors, including length of service, are set out in “Our Board” section on pages 42 and 43.
The factors that the Board will consider in whether a director is ‘independent’ are set out in Appendix A of the Board Charter. Any director who has a change in relevant circumstance to any of the factors listed in Appendix A must immediately notify the Chair of that change so that his or her independence can be re-assessed. If there is a change in the Board’s determination, it will be announced to the market. The Board considers all the current directors as at 30 June 2021 to be independent.
The Chair is an independent director and is not the CEO. In addition, the Chair of the Audit and Risk Committee is not the Chair of the Board, and pursuant to its charter all members of this committee are non-executive and independent directors.
INCLUSION AND DIVERSITY
Fletcher Building’s Inclusion and Diversity Policy, is available on the Group’s website. The Remuneration Committee annually reviews progress against inclusion and diversity initiatives developed by the Group to deliver outcomes against the policy.
The Board is satisfied with the initiatives being implemented by the Group and its performance with respect to the Inclusion and Diversity Policy. Our inclusion and diversity strategy, set in 2019, concentrates on three dimensions: creation of an inclusive culture, greater female representation across all roles and more diverse ethnicity in leadership. The policy does not currently include a requirement for the Board (or a committee) to set measurable objectives for achieving diversity (as is recommended by the NZX Corporate Governance Code). However, significant focus has been placed on setting targets and action plans this year to increase the number of women in operational roles by 1% annually, including setting gender targets for divisional chief executives, as part of their FY21 short term incentives plans.
Fletcher Building is currently resetting gender representation targets, and has placed a spotlight on the various stages of the recruitment processes to pinpoint where current practices may be hindering or helping the recruitment of women. Action plans are being developed to address any changes needed, to ensure the retention of the women we have, and provide more opportunities for the internal movement of women into operational leadership roles. These business unit plans will be supported by group initiatives designed to increase the awareness of our Inclusion and Diversity strategy and build momentum for change.
Additionally, as members of the Champions for Change network in New Zealand, Fletcher Building has provided diversity reporting as input into the Champions for Change Annual Diversity Report 2021, providing a benchmark against appropriate external comparators as per current policy requirements.
Fletcher Building Limited Annual Report 202146
For
per
sona
l use
onl
y

The numbers and proportion of women and men within Fletcher Building as at 30 June 2021 are set out in the table below.
2021 2020Women Men Women Men
Board of directors 2 (29%) 5 (71%) 2 (29%) 5 (71%)
Executive committee 2 (17%) 10 (83%) 2 (17%) 10 (83%)
Senior management (1) 17 (25%) 51 (75%) 17 (25%) 51 (75%)
All employees 21% 79% 21% 79%
(1) Senior management for these purposes includes any person who reports to a member of the executive committee.
BOARD SKILLS MATRIX
The Board has adopted a skills matrix which takes account of the breadth of the Group’s business interests and the nature of the Group’s strategic focus. Skills and diversity that are relatively underweight are considered when making appointments to the Board. The table below shows the representation of expertise among the current directors for the Board as a whole.
DIRECTOR INDUCTION AND DEVELOPMENT
The Board conducts induction and continuing development for directors, which includes visits to Group operations and briefings from key executives and industry experts. Directors conducted site visits (where COVID-19 travel restrictions permitted) to observe first-hand the safety and other management practices and business responses to issues.
BOARD PERFORMANCE
Reviews of the performance of the Board and individual directors are carried out to ensure the Board as a whole and individual directors are performing to a high standard.
The Board completed a comprehensive review of its performance and processes in late 2019 and will do so again later in 2021. Both reviews are conducted with the assistance of an independent consultant, Propero Consulting Limited. The results of the next review will be reported to the Board by the Chair and consultant.
Business context Capability Key elements Director expertise
Product and market knowledge
Industry
Manufacturing and distribution / land and property development / construction and infrastructure
New Zealand / Australia building products sector
Functional Expertise
Financial expertisePrior CFO, ARC Chair experience, financial risk management
Commercial depthBusiness operations at scale, commercialisation of research-based innovation
Technology and digital innovation
Cybersecurity, data analytics, disruptive technology, digital platforms
Sales and go-to-marketMarketing, retail, service delivery, customer engagement, omnichannel
M&A, divestments, corporate restructuring
M&A, divestments, corporate and balance sheet structuring
Government, legal, regulatory, governance
Engagement with government stakeholders, legal, policy and regulatory environments, NZX/ASX experience, ESG, shareholder engagement
Health and safety Safety standards and best practice
People, culture transformation
Leading transformation / cultural turnaround, talent management and remuneration
Key: Very strong Strong Solid Some gaps
This key represents the assessment of the strength of the skills and experience of the Board as a whole.
Fletcher Building Limited Annual Report 2021 47
For
per
sona
l use
onl
y

Corporate Governance (continued)
Principle 3 – Board Committees
“The board should use committees where this will enhance its effectiveness in key areas, while still retaining board responsibility.”
In accordance with the Board Charter, various committees have been set up to enhance the Board’s effectiveness in key areas, while still retaining overall responsibility. As at 30 June 2021 the Board committees were:
– Audit and Risk Committee (ARC)
– Nominations Committee
– Remuneration Committee
– Safety, Health, Environment and Sustainability Committee (SHES)
Each committee is governed by a charter setting out its roles and responsibilities (a copy of which is available on the Group’s website). Committees do not take action or make decisions on behalf of the Board unless specifically mandated by prior Board authority to do so. Employees only attend meetings of the Audit and Risk Committee and Remuneration Committee at the invitation of the particular committee. From time to time, the Board may create ad-hoc committees to examine specific issues on its behalf.
Committee Role Members as at 30 June 2021
Audit and Risk Committee The role of the ARC is to advise and assist the Board in discharging the responsibilities with respect to external financial reporting, internal control environment, internal audit and external audit functions, and risk management practices.
Rob McDonald (Chair)Peter CrowleyDoug McKayCathy Quinn
Nominations Committee The committee’s role is to identify and recommend individuals to the Board for nomination as members of the Board and its committees and the terms, if any, of such membership.
All non-executive directors are members of the Nominations Committee.Bruce Hassall (Chair)
Remuneration Committee The principal role of the committee is to oversee and regulate compensation and organisation matters affecting the Group, including remuneration and benefits, policies, performance and remuneration of the Group’s senior executives and management development and succession planning of the CEO and his direct reports.
Barbara Chapman (Chair)Martin BrydonBruce Hassall Rob McDonald
Safety, Health, Environment and Sustainability Committee
The role of the committee is to assist the Board to provide leadership and policy for SHES management within Fletcher Building. The committee focuses on compliance with legislative and regulatory requirements and the promotion of good SHES governance.
Doug McKay (Chair)Martin BrydonPeter CrowleyCathy Quinn
Fletcher Building Limited Annual Report 202148
For
per
sona
l use
onl
y

ATTENDANCE AT BOARD AND COMMITTEE MEETINGS
The table below shows directors’ attendance at the Board and committee meetings during the year ended 30 June 2021.
BoardAudit and Risk
CommitteeNominations Committee (1)
Remuneration Committee
Safety, Health, Environment and
Sustainability Committee
Number of meetings held 16 4 2 4 4
Bruce Hassall (Chair)(2) 16 4 2 3 1
Martin Brydon(3) 16 2 2 4
Barbara Chapman 15 2 4
Peter Crowley 16 4 2 4
Rob McDonald 15 4 2 4
Doug McKay 16 4 2 4
Cathy Quinn 16 4 2 4
(1) All non-executive directors are members of the Nominations Committee.
(2) Bruce Hassall attended ARC and SHES committee meetings in an ex officio capacity.
(3) Martin Brydon was appointed as a member of the Remuneration Committee effective 1 January 2021.
The directors' meetings referred to in the table above do not include additional ad hoc or transactional committee meetings held through the year.
TAKEOVER PROTOCOLS
The Board has established detailed protocols that set out the procedure to be followed if there is a takeover offer for the Group, including any communication between Group insiders and the bidder.
Principle 4 – Reporting and Disclosure “The board should demand integrity in financial and non-financial reporting, and in the timeliness and balance of corporate disclosures.”
CONTINUOUS DISCLOSURE
Fletcher Building is committed to ensuring that all of our investors have timely access to full and accurate material information about the Group. Our Continuous Disclosure Policy sets out the internal processes designed to ensure that the Group complies with the disclosure obligations of the NZX and ASX. The Board has adopted this policy, which applies to all members of the Board and executive, all employees of Fletcher Building and its affiliated entities, as well as consultants, contractors and other service providers where they have a relevant contractual obligation to Fletcher Building or one of our businesses. The Continuous Disclosure Policy is available on the Group’s website.
Directors formally consider at each Board meeting whether there is relevant material information which should be disclosed to the market.
DISCLOSURE OF CODES AND CHARTERS
All of our key governance documents (including the Code of Conduct, key corporate policies and Board and committee charters) are available on our website at fletcherbuilding.com/investor-centre/corporate-governance.
INTEGRITY IN NON-FINANCIAL REPORTING
The Board has approved an overarching Sustainability Policy and a sustainability strategy for the business which is summarised on page 18.
The business sustainability strategy was developed by evaluating non-financial environmental, social and governance issues that are material to the business. Performance against the strategy is reported to the SHES Committee of the Board.
Annual progress against the sustainability strategy aims and targets is reviewed by the SHES Committee and included in the Annual Report.
The SHES Committee also receives third party assurance on reported greenhouse gas emissions, and regular updates on actions that are in place or planned to reduce the Group’s greenhouse gas emissions in line with our reduction target.
Significant transitional risks resulting from climate change are reported to the SHES Committee, and significant physical risks are included in the risk management process for the business and reported to the Audit and Risk Committee.
As part of identifying material sustainability issues for the business that reflect wider stakeholder interest, the business is also an active member of the following sustainability organisations:
– Infrastructure Sustainability Council of Australia – Sustainable Business Council
– Sustainable Business Network – New Zealand Green Building Council
– Green Building Council Australia
Fletcher Building Limited Annual Report 2021 49
For
per
sona
l use
onl
y

Corporate Governance (continued)
Principle 5 – Remuneration “The remuneration of directors and executives should be transparent, fair and reasonable.”
Fletcher Building’s remuneration strategy is designed to attract, retain and motivate high calibre people at all levels of the organisation with remuneration programmes that are market-competitive, flexible and affordable, provide incentive to drive for both annual and long-term results, and maximise shareholder value.
Our practices for setting remuneration are detailed in our Remuneration Policy. The policy is governed by the Remuneration Committee in line with its charter, which is available on the Group’s website.
The ‘Remuneration Report’ on pages 57 to 66 outlines in detail the remuneration framework of Fletcher Building, as well as the remuneration of the directors, the CEO and other executives and senior management. This includes a discussion on share-based remuneration.
Principle 6 – Risk Management “Directors should have a sound understanding of the material risks faced by the issuer and how to manage them. The board should regularly
verify that the issuer has appropriate processes that identify and manage potential and material risks.”
Fletcher Building's risk management framework is aligned with ISO31000: 2018 Risk Management – Principles and Guidelines standard. The purpose of the risk management framework is to ensure that the key risks we face are identified, assessed, controlled, monitored and reported so that the Group can achieve its objectives and protect its staff, customers and reputation. The framework provides a consistent structure for: risk management, business processes, corporate knowledge and technology, and alignment with Group strategy.
The Group’s risk management framework is based on the three lines of defence model, as shown in Figure 1 below. Responsibility for operational risk management sits with the managers in the individual business units and the divisional chief executives. Our risk management and assurance processes support this through our Group functions and are ultimately overseen by the Board and the executive leadership team. A dedicated internal audit team takes a risk-based approach to auditing key business activities and reports directly to the Audit and Risk Committee.
FBU Board
ARC Internal Audit
Executive Committee
Finance
Legal
People
Division
BU BU BUBU
Division
EHS
Group Risk IT
Property
3rd Line of Defence:Board, Executive and Internal Assurance
2nd Line of Defence:Group Functions
1st Line of Defence:Business Units
Figure 1
As part of its risk management responsibility, the Audit and Risk Committee receives regular reports of the existing and emerging key risks, progress on the closure of recommendations that are generated through the risk engineering programme, current and target risk ratings as well as controls to mitigate or manage risks.
Fletcher Building Limited Annual Report 202150
For
per
sona
l use
onl
y

ACTIVITIES IN FY21
In FY21, the Group continued its focus on risk management in four key areas: governance and reporting, response and recovery advice, risk management expertise and guidance, and business resilience.
A total of 22 risk workshops were held with the individual business unit leadership teams in FY21. These workshops are a key component of the Group’s risk management framework and assist in developing a bottom-up reporting process. Additionally, the risk workshops process supports the individual business units’ leadership teams to ensure appropriate risk management strategies are being pursued.
Fletcher Building utilises a number of external experts to improve business resilience and help manage some of its key risks, such as business resilience and product quality. As part of our risk engineering programme, external engineers conducted 23 site surveys. The reports and recommendations produced from these site surveys provide valuable risk and resilience insights to Group management as well as our insurers. Similarly, as part of our product quality assurance programme, external product quality auditors surveyed a number of manufacturing facilities. These audits assess the effectiveness of existing controls and processes to assist the continued evolution of the Group’s product quality systems.
COVID-19 RESPONSE:
In FY21, Fletcher Building has managed and continues to actively manage the risks arising from the COVID-19 pandemic. Through the year, the Group's crisis management framework has supported relevant business units and divisions to respond to the dynamic operational environment created by COVID-19. The Group's Crisis Management Team was activated as and when required during the year to address group-wide COVID-19 responses.
All Fletcher Building business units have business continuity plans, which are specific to their business activities. All business units review their business continuity plans regularly to ensure they remain fit for purpose and help respond to a range of crises.
Fletcher Building Limited Annual Report 2021 51
For
per
sona
l use
onl
y

Corporate Governance (continued)
Business resilience
A disruption to business processes, particularly the loss of key assets, may lead to an inability to undertake the activities of a business unit or the Group.
A disruption event at a key site could lead to an extended operational interruption, which may negatively impact the financial performance of a business unit and, ultimately, the Group.
– Business units have business continuity plans in place that look to address the identified operational continuity risks.
– Regular monitoring of the risk environment occurs to ensure that key risks are appropriately covered by insurance, where practical and cost-effective.
– An established independent risk engineering review program is in place for our key sites.
– The business has carried out scenario analysis for physical climate change risk and we review short, medium and long-term risks associated with climate change and resource availability at divisional and Group level to assess our resilience and the risk horizon.
Economic and construction downturn
The building and construction industry in which the Group operates is fundamentally cyclical and is impacted by the macroeconomic conditions within both the New Zealand and Australian economies.
The failure by the Group to identify early and respond to cyclical downturns may impact financial results and sub-optimal business performance by business units and the Group.
– Senior leadership teams of business units and divisions monitor their key markets and are supported by the Corporate centre with in-depth market analysis.
– Regular operational reviews are undertaken with business units and divisions as well as the Board undertaking divisional deep dives.
– Strong focus on working capital, CAPEX and balance sheet management.
Regulatory and legal
With the Group operating in a number of different business sectors as well as countries, it is subject to a wide range of regulatory requirements and jurisdictions. These regulations and jurisdictions can be complex, subject to change and may affect the Group’s operations.
Failure to adhere to or monitor changes to the various regulatory requirements may lead to the imposition of penalties, operational disruption and/or reputational damage.
– The Group has developed a broad range of policies that address the regulatory and legal risks that are faced by the business. A number of these policies are located at: https://www.fletcherbuilding.com/investor-centre/corporate-governance/
– The Group’s commercial Golden Rules provide a framework for all staff on the type of contractual risks that the Group is prepared to accept.
Product quality
The Group constructs, manufactures as well as sources from third parties a range of structures and building products that are required to meet local and international standards and regulations.
Products and structures manufactured, supplied and/or purchased that may not meet relevant international or local standards and regulations may lead to product recalls, remediation costs and/or financial penalties.
– Product quality control systems and processes exist within our businesses to manage this risk.
– Supplier vetting and reviews are undertaken by both our businesses, and where appropriate, by third parties.
– External experts provide independent audits on business units’ manufacturing and product quality control processes.
Supply chain
Disruption to business unit operations through the ineffective coordination and control of the organisational supply chain. The Group’s supply chain may face a variety of challenges such as pandemics, logistical and public infrastructure constraints or disruption to key suppliers.
Disruption to business unit or group operations through ineffective coordination and control of the organisational supply chain may result in operational disruption, penalties and reputational damage.
– Business units have business continuity plans in place that look to address the identified supply chain issues.
– Where possible, business units look to establish contingent supply agreements across material/product suppliers and logistical providers.
Description How this risk may impact Fletcher Building How we manage this risk at Fletcher Building
KEY RISKS:
The Fletcher Building risk management framework is focused on ten key commercial (non-health and safety) risks that the Group faces across its business. However, these risks are dynamic and new risks and uncertainties may materialise during FY22 due to changes in economic conditions, regulatory environment, and other factors. The ten key risks are:
Fletcher Building Limited Annual Report 202152
For
per
sona
l use
onl
y

People
The failure by the Group to attract, retain and engage our people (including engagement with collective representation groups) negatively impacting business units or the Group.
The failure of the current processes to attract and retain talented staff can have a negative impact on the functioning of a business unit and the Group.
Additionally, industrial action by collective representation groups can cause operational disruption.
– The People and Performance function within the Group supports the business by providing advice, tools, processes and policies to drive employee, team and business performance.
– Business units and the Group benefit from the development and learning activities provided by the central Organisational Development team.
– FBuSay, the Group wide employee engagement survey, provides valuable insights about staff engagement.
Description How this risk may impact Fletcher Building How we manage this risk at Fletcher Building
Environment
Business unit operations may cause environmental damage through the failure to comply with the required environmental laws, resource consents and regulations.
Additionally, failure to execute the strategic initiatives required for the Group to achieve its objective of being the New Zealand and Australian leader in sustainable building materials, construction and distribution, in particular achieving a 30% reduction of carbon emissions by 2030.
Failure to comply with the environmental laws, resource consents and regulations may result in imposition of penalties and reputational damage.
Additionally, the inability to achieve the Group’s sustainability objectives may result in decreased demand from customers for the Group’s building materials.
– Business units that have potential environmental impacts have Environmental Management Plans in place and have monitoring processes in place for resource consents.
– At both the Group and business unit levels, we engage with regulators on proposed changes to standards and regulations.
– The Group has a stated sustainability strategy and accompanying annual targets.
Technology resilience
Like many businesses, Fletcher Building is dependent on information technology systems to maintain its operations.
Failure to provide reliable, resilient, adaptable and efficient technology infrastructure may impact the operations of the business units or the Group.
Additionally, the Group is also exposed to threats by third parties that can create operational disruption or result in the loss of confidential data.
Failure to provide reliable, resilient, adaptable, and efficient technology infrastructure may cause operational disruption and/or reputational damage to business units or the Group.
Failure to safeguard confidential information may also result in the imposition of penalties and reputational damage.
– Continued CAPEX investment in technology systems across the Group to support our operations.
– A dedicated team within Group Technology to address the ever-evolving cybersecurity threats that the group faces.
– Group-wide education and awareness training in relation to cyber-threats.
Contractual
The Group has a diverse portfolio of business units and the execution of onerous contract(s) by any one of the business units may result in the Group being liable for liabilities or performance under contracts that are commercially adverse.
The execution of onerous contracts may have the potential to negatively impact financial performance or the reputation of a business unit or the Group.
– The Group has established delegated financial authorities (‘DFA’) that business units and the Group must adhere to.
– The Group has developed commercial Golden Rules which govern the way we contract with external parties.
Corporate reputation and social license to operate
The Group appreciates the privileged position it has in the communities it operates in and the social responsibility that it has to a wide range of stakeholders. In a diverse and ever-changing economic and social environment, the Group needs to consider its operations to ensure that it continues to address the interests of all its key stakeholders.
The failure to act in a way that supports a strong corporate and social reputation for the Group with its key stakeholders (Government, investors, customers and communities) may result in adverse commercial, reputational or regulatory outcomes leading to negatively impacting the financial performance of a business unit or the Group.
– Engagement with the communities and how we work with stakeholders takes different forms for each business unit and project.
Fletcher Building Limited Annual Report 2021 53
For
per
sona
l use
onl
y

RISK CAPTURE AND REPORTING
The risk and uncertainties that are faced by the individual business units are captured in the Group-wide risk management tool, RADAR. The information captured in RADAR enables risk management information captured at the business unit level to be disseminated at higher levels of the organisation.
The Group undertakes operational risk reporting through business unit operational reviews. This allows the Group to see how business units are making decisions in assessing risks and implementing their business strategies. It also assists the group in understanding how different risks affect different parts of the business.
Principle 7 – Auditors “The board should ensure the quality and independence of the external audit process.”
The Audit and Risk Committee performs an annual performance assessment of the external auditor to ensure ongoing quality and effectiveness. EY is our external auditor.
The Auditor Independence Policy includes requirements for the rotation of external audit engagement partners. The Auditor Independence Policy is available on our website. In addition, the policy covers the provision of non-audit services by the Group’s auditor. Auditor’s fees and expenses paid to EY are presented within note 6 of the Group financial statements included in this annual report. The other work performed by the external auditor beyond the statutory audit was pre-approved in accordance with the policy and is not considered to compromise independence as the services did not constitute material sums of money or relate to strategic matters affecting the Group.
Representatives from EY attend Fletcher Building’s Annual Shareholders’ Meeting each year, where they are available to answer questions from shareholders relevant to the audit.
INTERNAL AUDIT
Fletcher Building has an internal audit function, which evaluates and improves the effectiveness of key risk management, control and governance processes. Internal audit develops an annual internal audit plan for approval by the Audit and Risk Committee and is accountable for its implementation. To provide for the independence of the internal audit function, internal audit reports functionally to the Audit and Risk Committee and administratively to the chief financial officer.
Corporate Governance (continued)
Fletcher Building Limited Annual Report 202154
For
per
sona
l use
onl
y

Principle 8 – Shareholder Rights and Relations “The board should respect the rights of shareholders and foster constructive relationships with shareholders that encourage them
to engage with the issuer.”
COMMUNICATING WITH SHAREHOLDERS
Fletcher Building maintains a website, which includes information about Fletcher Building’s financial performance, operational activities, corporate governance and other information of specific relevance to investors and stakeholders. Core requirements on communicating with shareholders are formalised in a Shareholder Communications Policy, which is available on the website.
The Group operates an investor relations programme, which includes scheduled interactions with investors, analysts and other market commentators. Presentations are disclosed on the Group’s website and the NZX and ASX announcement platforms. Shareholder meetings with the Chair and other directors are facilitated throughout the year. The CEO and chief financial officer present via an analysts’ and investors’ conference call after the release of the interim and full year results and answer questions raised by analysts and investors. The Board also annually obtains research on the perceptions that the New Zealand and Australian investment community has of the Group, management and performance.
ELECTRONIC COMMUNICATIONS
Shareholders have the option to receive communications from, and send communications to, Fletcher Building in electronic form. Shareholders are actively encouraged to take up this option.
SHAREHOLDER VOTING
Major decisions that may change the nature of Fletcher Building are presented as resolutions at the Annual Shareholders’ Meeting and voted on by shareholders. There have been no major decisions made during the year which would change the nature of Fletcher Building and which would require shareholder approval.
ANNUAL SHAREHOLDERS’ MEETING
All shareholders are entitled to attend the Group’s Annual Shareholders’ Meeting, either in person or by representative. Resolutions at shareholders’ meeting are by way of a poll, where each shareholder has one vote per share. Fletcher Building encourages shareholders to ask questions in advance of the meeting, to encourage further engagement with the Group and provide management with a view of the concerns of the Group’s shareholders. Our notice of meeting is sent to all our shareholders and is posted on our website at least 20 working dates prior to the meeting.
The Group continues to closely monitor the COVID-19 situation. As a result, the Group may elect to hold the Annual Shareholders’ Meeting in 2021 as a virtual meeting.
Fletcher Building Limited Annual Report 2021 55
For
per
sona
l use
onl
y

As a large business, we recognise our operations have an impact on many people. Our sustainability strategy is based on what is most important to our business, people, communities, customers, key stakeholders and investors; where we have the most impact; and where our actions can lead to meaningful change. These are our material sustainability issues, and they form the basis of the aims within our sustainability strategy.
We identified these material issues by commissioning independent experts to carry out a materiality assessment in FY18 to inform the development of the sustainability strategy for Fletcher Building. The materiality assessment identified the key issues stakeholders want Fletcher Building to address and was designed and executed in line with the AA1000SES internationally recognised standard for stakeholder engagement.
The assessment identified 28 aspects of sustainability that are material for Fletcher Building. We ran a series of internal workshops to identify which aspects were most material in the immediate future, and which aspects were most material for a ten-year horizon.
We also interviewed a number of our major institutional investors who have committed to the UN Principles of Responsible Investment framework and reviewed regional and international trends and disruptors for our market sector, the components of leading sustainability indexes, the performance of leading peers in our market sectors, surveys of attitudes and concerns around sustainability from Colmar Brunton in New Zealand and the Lowy Institute in Australia, and the UN Sustainable Development Goals (SDGs).
The information from these interviews and reviews was used to validate our materiality assessment. The material issues identified underpin the six core aims of our sustainability strategy, which are summarised on page 18 of this report. We intend to carry out a further materiality assessment in FY22.
Two of the most significant material issues for our business are safety and greenhouse gas emissions. In the front section of this report we note the activities we are undertaking to address these issues within our business, and progress against our targets.
METHODOLOGY
Greenhouse Gas Emissions
FY21 Greenhouse Gas (GHG) emissions included in this report were calculated for the period from 1 July 2020 to 30 June 2021 in accordance with the ISO14064-1:2006 International Standard for GHG Emissions Inventories and Verification. Emissions from our businesses were calculated on the equity share basis. This means that emissions from our businesses and from joint ventures we are part of have been included. For joint ventures, the percentage of emissions included is based on our percentage ownership of the joint venture.
Enviro-Mark Solutions Limited have provided third-party verification of our Scope 1, Scope 2 and Scope 3 emissions in accordance with ISO 14064-3:2006. Assurance and verification has been carried out for FY20 and FY21 GHG emissions as included in this report. The verification statements are available on our website.
Environmental Product Declarations
Environmental Product Declarations (EPDs) referred to in this report were developed in accordance with the ISO 14025 standard for Environmental labels and Declarations (Type III) and the EN 15804 EPD standard for the sustainability of construction works and services. This standard harmonizes the scope and indicators for EPDs in the construction sector, making the information transparent and comparable.
Sustainability Materiality and Methodology
Fletcher Building Limited Annual Report 202156
For
per
sona
l use
onl
y

Remuneration Report
Message from the Remuneration Committee Chair
Dear Shareholders
On behalf of the Board, I am pleased to present Fletcher Building’s remuneration report for the financial year ended 30 June 2021.
FY21 performance and remuneration outcomes
The 2021 financial year started with an enormous amount of uncertainty as a result of the ongoing effects of COVID-19 being felt across the world. Through this disruption, we remained focused on achieving our financial outcomes and strategic goals based around the key themes of: safety, customer, our people, sustainability, and growth through innovation. Our incentive targets for our senior leaders in FY21 were closely aligned with these goals, firmly orientating our remuneration outcomes with the delivery of both in-year and long-term value.
I am pleased to report that the business’s performance against strategic goals through FY21 has been strong. The fact that Fletcher Building achieved so much in a uniquely challenging year is a credit to everyone in the company. This performance is also reflected in the short-term incentive (STI) outcomes for the CEO and executive team ranging from 120% to 150% of target. More detail on performance against STI goals is included in the STI section of this remuneration report.
The CEO and executive’s performance against their STI goals was reviewed and approved by the Board. Consideration was given to both the formulaic outcomes against the targets set at the beginning of the year, as well as an assessment of these outcomes in the context of a market environment which proved to be more favourable than was anticipated. The Board considers that the business outcomes have been strong, notwithstanding the improved environment. Therefore, no discretion was exercised by the Board to adjust payments up or down, ensuring STI outcomes delivered to the CEO and senior leaders reflected their contribution to this strong business performance.
Set up for the future
Looking ahead, the business is well positioned to deliver on the ‘performance and growth’ phase of our long-term strategy. Key to this is ensuring that our people strategy and remuneration framework provide the right environment and capability to drive this growth and deliver the right outcomes. Insight into our culture and people capability focus areas is covered in the Our People section of this report.
With this in mind, through FY21 we conducted a thorough review of our executive remuneration framework to ensure it remained fit for purpose for this next phase of our strategy.
Through this process we sought input from multiple stakeholders. Thank you to those who provided valuable input. Two material changes to increase shareholder alignment and to support a stronger link between sustainable performance and remuneration outcomes were identified. These are the introduction of an equity deferral in our STI scheme and increasing our mandatory shareholding levels for the CEO and the executive team. Other changes include the introduction of a safety key performance indicator (KPI) to replace the safety multiplier and enhancing our disclosures.
The remainder of the remuneration section of the annual report provides an overview of the remuneration framework that applied for FY21. The changes set out above will be incorporated into the FY22 annual report with further detail provided following this letter.
I would like to recognise and thank our people for their commitment to serving our customers and supporting one another through this past year.
I invite you to review the full remuneration report.
Barbara Chapman Remuneration Committee Chair
We are well positioned to deliver on the ‘performance and growth’ phase of our strategy with an aligned remuneration framework in place to support this Barbara Chapman Remuneration Committee Chair
Fletcher Building Limited Annual Report 2021 57
For
per
sona
l use
onl
y

FY22 REMUNERATION FRAMEWORK CHANGES
As set out in the Remuneration Committee Chair’s letter, a review of our executive remuneration framework was undertaken in FY21. The following table summarises changes to this framework for FY22 and beyond, and provides the rationale and outcomes of these changes. These changes apply to the CEO and his direct reports.
Change Detail Rationale and outcome
Increase minimum shareholding requirement
Increase in minimum shareholding requirement for the CEO from 50% of base salary to 100% of base salary, and increase other executives from 50% of base salary to 75% of base salary.
This increased level of minimum shareholding supports further alignment of our most senior executives with our shareholders and is more consistent with market practice.
Introduce STI deferral Introduction of a two-year equity deferral into our STI scheme at 50% for the CEO and 40% for executives.
A transition year will apply with half this deferral (25% for the CEO and 20% for executives).
In addition, 20% of long-term incentives (LTI) transfers to STI (at a discount of 40%).
Introducing an equity deferral into our STI scheme increases the weighting of equity in our executive remuneration packages, building further alignment with our shareholders.
To ensure the overall cost of an individual's remuneration package was not increased, whilst managing the in-year cash impacts for individuals, we discounted the transferred portion of LTI to STI. This discount recognises the different probabilities of LTI and STI paying out.
Introduce safety KPI Introduction of safety KPI to replace the safety multiplier. The KPI comprises a lead and lag indicator and will not be contingent on financial performance to ensure a separation of profit from safety.
Safety interactions will remain a gateway for any STI payment to be made. Interactions could include safety leadership walks, or facilitation of a safety leadership programme.
To further strengthen our focus on safety and getting everyone home safely every day, we simplified our approach to safety in our incentives.
Enhance disclosures Enhancing our disclosures where we are applying discretion (or not) with supporting rationale through the remuneration section of the annual report and through engagement with shareholders and proxy advisors.
Building on our new look remuneration report from FY20, this further supports providing greater transparency and understanding of our remuneration frameworks and therefore how they drive performance and link to shareholder outcomes.
Other than in relation to the portion of LTI, transferred at a discount to STI, our LTI scheme remains unchanged for FY22, ensuring the CEO and executive’s remuneration outcomes are aligned with sustainable financial outcomes for our shareholders through the relative total shareholder return performance hurdle. Further details on this plan are provided in the Long-Term Share Scheme section of this remuneration report. We will continue to review this scheme each year ensuring it remains fit for purpose with our strategy.
The mix of remuneration components for the CEO under the new remuneration framework is set out below (after the transition year).
Remuneration Report (Continued)
CEO Maximum
Performance Pay Mix
CEO on Target
Performance Pay Mix
19%STI* Cash
24%STI* Cash
19%STI*
Equity
24%STI*
Equity
27%LTI*
23%LTI*34%
BR*28%BR*
1%Other
Benefits
1%Other
Benefits
Variable Pay (at risk)
Equity Pay
LTI*: Long-term incentive
STI*: Short-term incentive
BR*: Base Remuneration
Fletcher Building Limited Annual Report 202158
For
per
sona
l use
onl
y

FY21 REMUNERATION FRAMEWORK
The following sections describe the remuneration framework in place during FY21.
The role of the Remuneration Committee
The principal role of the Remuneration Committee is broader than purely remuneration matters. Its role is to oversee and regulate remuneration and organisation matters affecting the Group, including remuneration and benefits policies, performance and remuneration of the Group’s senior executives, development and succession planning for the CEO and executives, and major organisation changes.
The Remuneration Committee is kept apprised of relevant market information and best practice, obtaining advice from external advisors when necessary.
Key decisions made and reviews undertaken by the Remuneration Committee during FY21 included: approval of changes to the remuneration framework for FY22, review of succession depth and development for the executive, approval of an updated inclusion and diversity policy, review and approval of the FY21 STI framework for senior leaders, review of pay parity, and pension plan governance matters.
PERFORMANCE AND THE IMPACT ON INCENTIVES
Short-term incentives (STI)
EBIT performance during FY21 was at or above target levels for the CEO and executives resulting in all meeting the performance thresholds required for eligibility for payment on EBIT and individual goals. Cash and working capital performance during FY21 was in some cases well above target performance levels, resulting in eligibility for payment for the CEO and most executives. Safety performance across the Group is tracking well with TRIFR down from 5.7 in FY20 to 5.0 in FY21. Good progress was made against other goals of exit run rate margin, talent, diversity, sustainability, and innovation which in most cases were at or around target levels noting there is no opportunity for stretch performance on these goals. Further detail on the CEO’s STI outcome is provided on page 64.
Long-term incentives (LTI)
The July 2017 long-term share scheme grant, which was within the 12 month retest period up to 30 June 2021, was below the minimum threshold performance levels and therefore was forfeited. The July 2018 long-term share scheme grant was below the minimum threshold performance level, and has therefore entered the 12 month retest period.
Further details on each of these incentive schemes are provided on the following pages.
Executive remuneration strategy and framework
The remuneration framework and how it supports the strategy set out on the next page is based on the FY21 framework. The FY22 annual report will reflect the updated framework in place from FY22.
Fletcher Building Limited Annual Report 2021 59
For
per
sona
l use
onl
y

VisionTo be the leader in New Zealand and Australian
building products and solutions
GovernanceOur Board is responsible for the Group’s remuneration policy, which is available on our website, with the
Remuneration Committee assisting in the conduct of its responsibilities. The principal role of the committee is to oversee and regulate remuneration and organisation matters affecting the Group
Remuneration Principles(a full set of our remuneration principles is available in our remuneration policy)
Remuneration Framework and How it Supports the Strategy
Shareholder Focus on creation
of shareholder value – short and
long-term
Fixed Remuneration Executives are
benchmarked against a peer group composed
of New Zealand and Australian companies generally comparable
in size, complexity and industry
Short-Term Incentives
Recognises on a discretionary basis,
achievement of the Group and individual performance objectives
Long-Term Incentives Aim to drive long- term, sustainable
results and creation of shareholder
value
Includes base salary and any
non-cash benefits and superannuation/
KiwiSaver
Annual cash payment following
final audited financial year
results
Rewards for financial, individual and safety
performance measured using a balanced
scorecard
Relative Total Shareholder Return
referenced to an industry comparator
peer group
Allocation of Fletcher Building
shares, with vesting after 3 years, based on achievement of
shareholder return over this period. Allocation
is made using face value at the time of grant
Set based on capability,
performance, job size, and industry
benchmarks
Attract and retain key talent
to drive the delivery of the Group
strategy. Rewards ongoing performance
in role
Retain and motivates key talent, and drive alignment
by rewarding for achievement of the Group goals and creation of
shareholder value
Supporting the alignment of our most
senior people with shareholder interests ensuring value is only created for our people
where relative total shareholder return is realised. Encouraging
long-term sustainability and achievement of the Group strategy
Remuneration Element
At
Ris
k an
d S
ub
ject
to
Pe
rfo
rman
ce O
utc
om
es
ElementDelivery
PerformanceMeasure
Relationshipto Strategy
Our People Attract and
retain high calibre people, rewarding
high standards of performance
and values
Strategy Focus on key
company goals and objectives –
short and long-term
Risk Encourage con-
duct that does not expose the Group
to inappropriate risk and promotes high
standards
Remuneration Report (Continued)
FY21 REMUNERATION FRAMEWORK
Fletcher Building Limited Annual Report 202160
For
per
sona
l use
onl
y

Remuneration levels are reviewed and benchmarked annually for market competitiveness, and alignment with strategic and performance priorities. A peer group which comprises of New Zealand and Australian companies generally comparable in size, complexity and industry is used to benchmark executives. The benchmarking peer group was reviewed and refreshed in 2019 to ensure it included companies that displayed similar characteristics by way of industry/sector, market capitalisation, revenue, geographic scope and employee numbers. The peer group also generally reflects where the Group wins talent from and loses talent to.
Fixed remuneration
Fletcher Building’s policy is to set fixed remuneration based on capability, performance, size of role, and industry benchmarks in the country in which the employee is located. Participation in retirement savings plans is made available to employees as required by remuneration practices in relevant countries.
Short-term variable incentive (STI)
STIs are designed to incentivise the Group’s earnings, operating cash and those measures that drive sustainable business performance by rewarding employees' performance against both financial and individual goals. Participation in the STI plan is by annual invitation at the discretion of the Group. Target levels of STI opportunity range from 20% to 100% of base salary depending on the role. For the CEO the target STI opportunity is set at 100% of base salary.
Financial targetsFor the CEO and executives in Corporate, the financial target is based on the Group EBIT and operating cash. For executives operating in specific divisions, the financial target is based on their own division EBIT and operating cash or working capital depending on the division's priorities. Each of these financial measures is assessed separately at the time of determining STI payments. To ensure an appropriate balance between focusing on individual division financials where executives are most able to directly influence, and that of the Group where working together creates additional value, a multiplier (either up or down) is applied based on achievement of Group EBIT.
Financial targets are set at three levels: a threshold level, which must be met before any STI is paid, a target level, and a maximum level that reflects stretch performance. For FY21, the financial threshold level was set at 90% of target. The maximum financial level is generally set at 110% of target.
The CEO, Chief Financial Officer, and operating executives have 70% of their STI opportunity based on financial measures, with the remaining 30% on individual goals. As functional executives have a greater ability to directly influence company performance through their individual goals, 50% of their STI opportunity is based on individual goals with the remaining 50% on financial measures.
Individual goals
Individual goals for the executives are aligned to the different priorities and development phases in which their businesses are operating. This may include above plan growth, gross profit margin expansion, talent, diversity, sustainability and innovation, and other strategic goals that drive performance beyond the current financial year. The executives' objectives were reviewed by the Board, and in the case of the CEO were approved directly by the Chair of the Board.
The performance range for individual goals is between 0% and 100%, with no opportunity for stretch performance. If the threshold EBIT target is not met, no individual component of the STI is payable.
Achievement against each executives’ individual goals is reviewed by the Board at the time of reviewing and approving STI payouts.
Safety performance
To reinforce a line-led safety culture, and to place emphasis on the importance of active and authentic leadership for safety on site, safety leadership walks are a gateway for any STI payment to be made. The number of safety walks required to be completed differs by role with operating executives completing no fewer than 12 per year.
In addition, a multiplier of between 0.9 and 1.1 is applied to the overall STI outcome based on achievement against TRIFR targets. Injury reduction targets (i.e., reduction in TRIFR) are set for each business and tracking of this important measure provides us with year on year comparisons of actual safety performance. TRIFR is used as a common measure for injury performance globally and, as such, enables external benchmarking which we use to understand how our safety performance compares to other companies.
In the event of a fatality or serious injury, the Board has the discretion to adjust any or all of the STI payment and in doing so will consider the leader’s length of time in role (and therefore ability to influence), their demonstrated leadership prior to the incident as well as the quality of the leader’s response post-incident. The Board recognises the importance of this discretion and has and will continue to adjust outcomes where it considers appropriate.
In FY21, we had 8 serious injuries across 4 divisions (7 business units). In accordance with our senior leaders STI Discretionary Rules, a review was conducted to assess whether any impact to STI should be applied relating to each incident. First, each incident was investigated for the root cause and all relevant individuals (at all levels) were assessed against a Just Culture framework where required. The review then used a mix of lead and lag performance indicators as well as an assessment of safety leadership and the merits of the incidents themselves to determine whether an impact should be applied to individual leader STIs. Through this process, it was determined that all those assessed were showing strong leadership, investment in safety and overall strong performance indicators with some areas that are being acted on for improvement. There was one incident where best practice wasn’t being applied at the time; however, the associated leaders are no longer with the organisation. As a result, there was no impact to individual leaders on the STI scheme this year.
Clawback
The Board also has the discretion to require repayment of an employee’s STI for a period of up to three years where the Group’s financial statements were incorrectly reported, there is misconduct that causes a financial trading loss that has not been taken into account in the STI calculations or an error or misstatement has resulted in a material overpayment. During FY21 no adjusting subsequent events were identified, therefore the Board was not required to consider application of the clawback provision during FY21.
Fletcher Building Limited Annual Report 2021 61
For
per
sona
l use
onl
y

Long-Term Share Scheme
A long-term performance incentive scheme designed to align employee remuneration with sustainable financial outcomes for shareholders over the longer term is in place. The Group has a share based executive long-term share scheme (ELSS) which is offered to certain senior employees, including the CEO and executives. The scheme is a share-based scheme and participation in any year is by annual invitation at the discretion of the Group.
Under the ELSS, participants purchase shares in the Group at the offer price with an interest-free loan. The offer price is established at market value at the commencement of the three-year restrictive period. The shares are held by a trustee on behalf of participants until the end of that three-year restrictive period. The performance criteria comprises a relative total shareholder return (TSR) measure, and the restrictive period is extended by up to 12 months if the TSR criteria are not met at the end of the initial three-year restrictive period.
Provided the nominated share performance criteria are met and participants remain employed with the Group throughout the restrictive period, a cash bonus is paid to meet the repayment of the interest-free loan and legal title in the shares is then transferred to the participants. To the extent that the share performance criteria are not met or the participant ceases to be employed by the Group, the shares are forfeited and the proceeds used to repay the interest-free loan. Exceptions to this are considered in the case of redundancy, retirement or being an executive with five or more years of service.
Performance criteria for 2020 ELSS grant
The performance criteria for the 2020 ELSS grant is relative TSR. TSR performance is determined by benchmarking, by way of percentile ranking, the TSR performance of the Group against the TSR performance for the same period of a comparator group. For any shares to vest under the ELSS, Fletcher Building’s relative TSR performance must be at or above the 51st percentile of the comparator group. The comparator group used for the 2020 offer comprises Adelaide Brighton, BlueScope, Boral, Brickworks, CSR, GWA Group, James Hardie, Metro Performance Glass, Reece and Steel & Tube.
The relative TSR performance and resulting vesting entitlements are set out below:
Relative TSR percentile Percentage vesting entitlement
Below 51st Nil
At 51st 50%
Above 51st to below 75th 51% – 99% linear pro-rata
At 75th or above 100%
The Board has the discretion to determine the extent to which any shares held in the ELSS should be transferred in any takeover, merger or corporate restructure.
Vesting and forfeiture history
Prior to 2017, the ELSS performance criteria consisted of both relative TSR and an earnings per share (EPS) target. The vesting and forfeiture of shares (due to failure to meet performance criteria) over the last five years are set out in the following table:
Date of grant Shares granted % vested % forfeited EPS Target
July 2020 1,998,635
In-Flight
N/A
July 2019 1,386,100 N/A
July 2018 (1) 1,041,605 N/A
July 2017 890,075 0% 100% (2) N/A
July 2016 905,211 0% 100% 70.1 – 76.3
(1) Fletcher Building's TSR did not meet the minimum vesting threshold for the three years ended 30 June 2021 for the 2018 issue. Therefore, the restrictive period has been extended to 30 June 2022.
(2) The restrictive period for the 2017 issue was extended for 12 months until 30 June 2021. Fletcher Building's TSR did not meet the minimum vesting threshold for the period ended 30 June 2021. Therefore, 100% of the shares in the 2017 issue will be forfeited in August 2021.
In addition, in 2019 the Board granted a special retention in the form of a one-off share-based arrangement to the value of $1,000,000 to the CEO as disclosed in the 2019 annual report. This arrangement will vest on 30 June 2022, subject to his remaining employed with the Group.
Minimum shareholding requirement
Over time, the CEO and executives must acquire and maintain a holding in the Group’s ordinary shares until such time as the greater of the sum invested or the market value of their shareholding exceeds 50% of their base remuneration. Any shares granted under the ELSS scheme do not count towards the minimum shareholding requirement unless they vest. This shareholding requirement strengthens the alignment of executives with the interests of shareholders and puts their own remuneration at risk to long-term Group performance.
In addition, if at the time of appointment to an executive role, the greater of the market value or cost of the individual’s shareholding is less than the value of 10% of their base remuneration, the executive is required to apply no less than 25% of the after-tax value of any STI payment to acquire shares in the Group on or before 31 March of the following financial year. This requirement applies for the first two years of employment as an executive.
Remuneration Report (Continued)
Fletcher Building Limited Annual Report 202162
For
per
sona
l use
onl
y

As at 30 June 2021, the CEO had a holding in the Group’s ordinary shares equal to 66% of his base remuneration. This has been calculated in accordance with the minimum shareholding requirement methodology, which uses the greater of the sum invested or the market value of the shares.
FBuShare
FBuShare is Fletcher Building’s employee share plan available to all permanent employees. The plan aims to connect our people with our performance, and to promote employee engagement and retention. Employees acquire shares in the Group and, if they continue to be employed after a three-year qualification period, they become entitled to receive one bonus award share for every two shares purchased in the first year of each qualification period and still owned at the end of that period. FBuShare does not require any performance criteria to be met. FBuShare has a minimum contribution rate of NZ$250 per annum and a maximum contribution rate of NZ$5,000 per annum (or the equivalent currency in other countries). Directors are not eligible to participate in FBuShare.
CEO’S REMUNERATION
Remuneration package
Ross Taylor’s annual base remuneration as at 30 June 2021 was $2,050,000 (1), with an on-target STI of 100% of base salary and LTI of 100% of base salary.
The current mix of remuneration components for the CEO is set out below, and clearly shows the significant weighting of variable pay (at risk), which is subject to achievement of short-term and long-term strategic goals.
Remuneration received
The base remuneration received for FY21 is lower than the base remuneration set out above as a result of a 30% pay reduction due to COVID-19 that was in place through to end of Q1 FY21. The remuneration Ross Taylor received for FY21 and FY20 comprised of the following:
FY21 FY20
Base remuneration $1,894,073 $1,903,302
Other benefits (2) $129,879 $61,802
Short-term incentive accrued in the financial year, payable in September of the following financial year
$2,888,967 $0
Received (3) $4,912,919 $1,965,104
FY21 FY20
Long-term incentive - number of shares granted 375,273 (4) 263,628 (5)
Long-term incentive - face value of grant $2,050,000 $2,050,000
Refer above for details of the STI and ELSS.
(1) A 30% reduction on this value due to COVID-19 was in place from Q4 FY20 through to end of Q1 FY21.(2) Includes KiwiSaver, Australian superannuation for days worked in Australia as required by Australian taxation law, and medical insurance.(3) This table sets out remuneration awarded for the relevant financial year. The table on page 65 shows remuneration received during the year, which includes amounts relating to prior years
but paid in the year due to timing differences.(4) Based on a share price of NZ$3.66, being the volume weighted average price for the five business days prior to 1 July 2020.(5) Based on a share price of NZ$5.21, being the volume weighted average price for the five business days prior to 1 July 2019.
CEO Maximum
Performance Pay Mix
CEO on Target
Performance Pay Mix
43%STI*
33%STI*
33%LTI*
33%BR*
28%BR*
28%LTI*
1%Other
Benefits1%Other
Benefits
Variable Pay (at risk)
LTI*: Long-term incentive
STI*: Short-term incentive
BR*: Base Remuneration
Fletcher Building Limited Annual Report 2021 63
For
per
sona
l use
onl
y

Measure
Scorecard Weighting
‘Target’ (payout range)
Actual Outcome Comment
Safety GatewayGate for any
paymentProvided active and authentic leadership for safety on site through safety walks and leadership of the Protect Safety Leadership Programme.
Financial Targets
FB Group EBIT (gateway to individual goals)
50% (0%-76%)
The EBIT (before significant items) result of $669 million materially outperformed target, including when normalised for the more favourable market. This resulted in maximum payment for this measure. As EBIT (before significant items) is also the gate to eligibility for payment against individual goals, gate to payment for the individual goals has been opened.
FB Group Cash20%
(0%-30%)
Operational cash flow performance for the FY21 year was materially above target, driven by effective management of working capital. Cash flow performance was effectively balanced with operational requirements to manage inventory and continuity of supply for customers in a complex environment due to COVID-19.
Individual Goals
Talent & Diversity targets delivered across businesses in accordance with Board approved plans
5% (0%-5%)
Quality validated senior talent plan delivering. Whilst the number of women in operational roles was largely flat, clear targets and actions are in place to improve. Pay parity gap narrowed with ongoing plans in place to close.
Overall Construction provisions maintained within the agreed provision allowance as approved at the August 2020 Board meeting
7.5% (0%-7.5%)
Provision envelope maintained, four key legacy projects remaining to complete. Three major roading projects are on track to complete. Convention Centre team reset and performing.
Achieve Exit Run Rate EBIT margins for FY21 that support the FY22 EBIT margin targets
10% (0%-10%)
Run-rate margin improvement delivered in all core divisions, with FY21 margins +100bps ahead of FY19. Uplift is the result of operational excellence and profitability focus that the Group has driven over the last three years, including through FY21.
FY21 actions that support the FY24 Strategic plan, identified and being implemented
7.5% (0%-7.5%)
Solid pipeline of performance improvement and growth initiatives in place to support the Group’s growth and profitability plans. For example: off-site manufacturing and apartments; a range of new product and customer service innovations across the core businesses; acceleration of digitisation initiatives; sector adjacencies; and ongoing operational improvements.
Safety
Safety PerformanceMultiplier
of between 0.9-1.1
Group Total Recordable Injury Frequency Rate (TRIFR) for FY21 was 5.0 a decrease from FY20’s TRIFR of 5.7. As such the targeted improvement was overachieved. A positive outcome from the ongoing Protect programme being line-led and implemented across the Group.
FY21 STI Outcome 100%(0%-150%) 141%
The STI outcome reflects strong business performance and strength of its position as it enters FY22.
Key: Above Target Achievement Full achievement against target Partial achievement against target No achievement against target
CEO FY21 STI OUTCOME
For FY21, the following financial and non-financial measures were considered by the Board to be key to incentivise earnings and operating cash, and to drive sustainable business performance. The table below summarises performance against targets for each of these measures under the CEO’s FY21 STI.
Remuneration Report (Continued)
Fletcher Building Limited Annual Report 202164
For
per
sona
l use
onl
y

From NZ$ to NZ$
New Zealand business activities
International business activities Total
420,000 - 430,000 1 1 2
440,000 - 450,000 0 1 1
460,000 - 470,000 0 1 1
470,000 - 480,000 2 0 2
490,000 - 500,000 1 0 1
500,000 - 510,000 3 1 4
510,000 - 520,000 1 0 1
520,000 - 530,000 2 0 2
530,000 - 540,000 1 0 1
540,000 - 550,000 1 1 2
550,000 - 560,000 1 0 1
560,000 - 570,000 2 0 2
590,000 - 600,000 0 1 1
600,000 - 610,000 1 0 1
620,000 - 630,000 1 0 1
630,000 - 640,000 1 1 2
640,000 - 650,000 1 0 1
650,000 - 660,000 0 1 1
690,000 - 700,000 1 0 1
700,000 - 710,000 0 1 1
730,000 - 740,000 1 1 2
790,000 - 800,000 1 0 1
900,000 - 910,000 1 0 1
1,240,000 - 1,250,000 1 0 1
1,360,000 - 1,370,000 0 1 1
2,020,000 - 2,030,000 1 0 1
2,105 1,746 3,851
From NZ$ to NZ$
New Zealand business activities
International business activities Total
100,000 - 110,000 493 359 852
110,000 - 120,000 349 286 635
120,000 - 130,000 273 267 540
130,000 - 140,000 206 181 387
140,000 - 150,000 131 139 270
150,000 - 160,000 118 89 207
160,000 - 170,000 78 97 175
170,000 - 180,000 77 60 137
180,000 - 190,000 58 49 107
190,000 - 200,000 47 27 74
200,000 - 210,000 36 24 60
210,000 - 220,000 28 26 54
220,000 - 230,000 29 17 46
230,000 - 240,000 30 17 47
240,000 - 250,000 22 13 35
250,000 - 260,000 16 15 31
260,000 - 270,000 14 9 23
270,000 - 280,000 14 9 23
280,000 - 290,000 6 8 14
290,000 - 300,000 7 2 9
300,000 - 310,000 9 6 15
310,000 - 320,000 4 6 10
320,000 - 330,000 3 5 8
330,000 - 340,000 6 4 10
340,000 - 350,000 7 2 9
350,000 - 360,000 3 1 4
360,000 - 370,000 2 5 7
370,000 - 380,000 7 4 11
380,000 - 390,000 3 1 4
390,000 - 400,000 1 3 4
400,000 - 410,000 3 0 3
410,000 - 420,000 0 4 4
EMPLOYEE REMUNERATION
Section 211(1)(g) of the Companies Act 1993 requires disclosure of the number of employees or former employees of the Group whose remuneration and any other benefits received by them during the year in their capacity as employees, was equal to or exceeded $100,000 per annum and to state the number of such employees or former employees in brackets of $10,000. These amounts are included below and include all applicable employees or former employees of Fletcher Building worldwide. The remuneration amounts include all monetary amounts and benefits actually paid during the year, including redundancies and the face value of long-term incentives vested.
This table is required by law and sets out remuneration that has been received during this year, and so includes amounts that relate to prior periods (due to timing of payments).
Fletcher Building Limited Annual Report 2021 65
For
per
sona
l use
onl
y

DIRECTORS’ REMUNERATION
The current total directors’ remuneration pool approved by shareholders in 2011 is $2 million per annum. Directors receive remuneration determined by the Board on the recommendation of the Nominations Committee. Remuneration in aggregate per annum must be within the remuneration pool approved by shareholders. There are no schemes for retirement benefits for non-executive directors. Information of directors’ holding of securities is set out on page 122.
As a result of COVID-19, the Board agreed to a reduction of 30% to the Chair and non-executive director fees effective 1 April 2020 through to the end of September 2020.
In June 2021, the Nominations Committee considered the appropriateness of current fees and recommended to the Board increases to the directors’ fees for FY22 to be paid out of the current shareholder approved remuneration pool of $2 million per annum, as shown in the following table.
The remuneration scale for directors is outlined below: Remuneration scale (1)
Position FY21 FY22
Board of directors Chair (2) $367,200 $376,500
Non-Executive director $142,800 $146,500
Audit and Risk Committee Chair $37,000 $38,000
Member $19,000 $19,500
Remuneration Committee Chair $28,000 $29,000
Member $14,000 $14,500
Nominations Committee Chair - -
Member $8,000 $8,500
Safety, Health, Environment and Chair $28,000 $29,000
Sustainability Committee Member $14,000 $14,500
Expense allowance $5,000 $5,000
Overseas based directors - travelling allowance (3) $18,000 $18,000
(1) This table shows FY21 fees before the application of 30% reduction in Board fees (referred to above) for the period 1 July 2020 to 30 September 2020. FY22 fees are effective from 1 July 2021.(2) No additional fees are paid to the Board Chair for committee roles.(3) Reduced to 50% until COVID-19 travel restrictions are lifted.
Fees to directors for unscheduled, additional work required for the Group is time based, payable at $1,200 per half day. No payments for this work were made in FY21 and none are budgeted for FY22. Directors do not receive any further remuneration for also being directors of Fletcher Building Industries Limited, the NZX listed issuer of the Group’s capital notes. Directors’ fees exclude GST, where appropriate. In addition, Board members are entitled to be reimbursed for costs directly associated with carrying out their duties, including travel costs.
Details of the total remuneration received by each Fletcher Building director for FY21 (ie after including the 30% reduction in Board fees from 1 July 2020 - 30 September 2020) are as follows:
Directors Board Fees
Audit and Risk
CommitteeNominations Committee (1)
Remuneration Committee
Safety, Health, Environment and
Sustainability Committee
Expense allowance
Overseas based
directors travelling
allowanceTotal
Remuneration
Bruce Hassall (Chair)
$339,660 $ -
(Chair)
$5,000 $344,660
Martin Brydon (2) $132,090 $7,400 $7,000 $12,950 $5,000 $9,000 $173,440
Barbara Chapman $132,090 $7,400 $25,900 $5,000 $170,390
(Chair)
Peter Crowley $132,090 $17,575 $7,400 $12,950 $5,000 $9,000 $184,015
Rob McDonald $132,090 $29,909 $7,400 $12,950 $5,000 $187,349
(Chair)
Doug McKay $132,090 $17,575 $7,400 $25,900 $5,000 $187,965
(Chair)
Cathy Quinn $132,090 $17,575 $7,400 $12,950 $5,000 $175,015
Total $1,132,200 $82,634 $44,400 $45,850 $64,750 $35,000 $18,000 $1,422,834
(1) All non-executive directors are members of the Nominations Committee.(2) Martin Brydon was appointed a member of the Remuneration Committee effective 1 January 2021.
Remuneration Report (Continued)
Fletcher Building Limited Annual Report 202166
For
per
sona
l use
onl
y

Financial Report
Fletcher Building Limited Annual Report 2021 67
For
per
sona
l use
onl
y

NZ$MJune 2021
June 2020
June 2019
June 2018
June 2017
June 2016
June 2015
June 2014
June 2013
June 2012 (1)
Financial performance
Operating revenue 8,120 7,309 9,307 9,471 9,399 9,004 8,661 8,401 8,517 8,839
Earnings before interest and taxation (EBIT) 541 (116) 397 (118) 273 719 503 592 569 403
Net earnings 305 (196) 164 (190) 94 462 270 339 326 185
Cash flow from operations 889 410 153 396 243 660 575 489 559 448
Earnings per share - basic (cents per share) 37.0 (23.5) 19.2 (25.5) 13.5 67.0 39.2 49.3 47.6 27.2
Dividends for the period (cents per share) 30.0 - 23.0 - 39.0 39.0 37.0 36.0 34.0 34.0
Return on average funds (%) (2) 15.0 (2.7) 7.4 (2.2) 4.9 13.4 9.6 11.7 10.8 7.4
Return on average equity (%) (3) 8.5 (5.1) 4.0 (5.2) 2.5 12.4 7.7 9.9 9.4 5.2
Financial performance - before significant items
Earnings before interest and taxation (EBIT) 669 160 631 50 525 682 653 624 569 556
Net earnings 413 3 367 (60) 321 418 399 362 326 317
Earnings per share - basic (cents per share) 50.1 0.4 43.0 (8.1) 46.3 60.6 58.0 52.7 47.6 46.5
Return on average funds - before significant items (%) (2)
18.6 3.7 11.8 0.9 9.4 12.7 12.5 12.3 10.8 10.2
Return on average equity - before significant items (%) (3)
11.5 0.1 8.8 (1.7) 8.7 11.6 11.3 10.5 9.4 9.0
Balance sheet
Current assets 3,125 3,824 4,121 3,944 3,419 3,222 3,272 2,958 2,868 3,112
Non-current assets 4,885 4,954 3,589 4,601 4,254 4,045 4,229 3,983 4,257 4,367
Total assets 8,010 8,778 7,710 8,545 7,673 7,267 7,501 6,941 7,125 7,479
Current liabilities 1,906 2,385 2,330 2,356 1,996 1,997 1,947 1,596 1,557 1,936
Non-current liabilities 2,333 2,858 1,207 2,047 2,097 1,557 1,844 1,891 2,014 2,091
Total liabilities 4,239 5,243 3,537 4,403 4,093 3,554 3,791 3,487 3,571 4,027
Capital 3,248 3,280 3,427 3,425 2,678 2,650 2,633 2,624 2,606 2,582
Reserves 507 220 714 693 878 1,041 1,050 795 913 838
Minority equity 16 35 32 24 24 22 27 35 35 32
Total equity 3,771 3,535 4,173 4,142 3,580 3,713 3,710 3,454 3,554 3,452
Total liabilities and equity 8,010 8,778 7,710 8,545 7,673 7,267 7,501 6,941 7,125 7,479
Other financial data
Total shareholders return (%) (4) 107 (21) (29) (6) - 11 (3) 9 51 (27)
Net tangible assets per share ($) 3.30 2.87 3.53 2.85 2.70 2.87 2.80 2.60 2.61 2.65
Gearing (%) (5) 4.4 12.3 7.2 23.5 35.3 27.3 31.8 32.3 33.5 37.4
Leverage (%) (6) 0.2 0.9 0.4 4.8 2.7 1.6 2.0 2.0 2.3 2.6
(1) The June 2012 balance sheet has been restated following revisions to IAS 19 Employee Benefits adopted by the Group. (2) EBIT to average funds (net debt and equity less deferred tax asset). (3) Net earnings to average shareholders' funds. (4) Share price movement in year and gross dividend received, to opening share price. (5) Net debt (borrowings less cash and deposits) to net debt and equity. (6) Net debt to EBITDA before significant items.
Trend Statement
Fletcher Building Limited Annual Report 202168
For
per
sona
l use
onl
y

Consolidated Income StatementFor the year ended 30 June 2021
Note2021
NZ$M2020
NZ$M
Revenue 3 8,120 7,309
Cost of goods sold (5,778) (5,496)
Gross margin 2,342 1,813
Selling, general and administration expenses (1,692) (1,660)
Share of profits of associates and joint ventures 19 7
Significant items 2.1 (128) (276)
Earnings before interest and taxation (EBIT) 541 (116)
Lease interest expense 14 (64) (69)
Funding costs 16 (44) (80)
Earnings before taxation 433 (265)
Taxation (expense)/benefit 25 (116) 81
Earnings after taxation 317 (184)
Earnings attributable to non-controlling interests (12) (12)
Net earnings/(loss) attributable to the shareholders 305 (196)
Net earnings per share (cents) 5
Basic 37.0 (23.5)
Diluted 36.4 (23.5)
Weighted average number of shares outstanding (millions of shares) 5
Basic 824 835
Diluted 867 835
Dividends declared per share (cents) 18 30.0
The accompanying notes form part of and are to be read in conjunction with these financial statements.
On behalf of the Board, 18 August 2021
Bruce Hassall Robert McDonald Chair Director
Fletcher Building Limited Annual Report 2021 69
For
per
sona
l use
onl
y

Consolidated Statement of Comprehensive IncomeFor the year ended 30 June 2021
2021 NZ$M
2020 NZ$M
Net earnings/(loss) attributable to shareholders 305 (196)
Net earnings attributable to non-controlling interests 12 12
Net earnings/(loss) 317 (184)
Other comprehensive income
Items that do not subsequently get reclassified to income statement:
Movement in pension reserve 68 (17)
68 (17)
Items that may be reclassified subsequently to income statement:
Movement in cash flow hedge reserve (7) (6)
Movement in currency translation reserve 3 35
(4) 29
Other comprehensive income 64 12
Total comprehensive income/(loss) for the year 381 (172)
Fletcher Building Limited Annual Report 202170
For
per
sona
l use
onl
y

Consolidated Statement of Movements in EquityFor the year ended 30 June 2021
NZ$M No
te
Sha
re
capi
tal
Ret
aine
d
earn
ings
Sha
re-b
ased
pa
ymen
ts r
eser
ve
Cas
h flo
w
hedg
e re
serv
e
Cur
renc
y tr
ansl
atio
n re
serv
e
Pens
ion
re
serv
e
Tota
l
Non
-con
trol
ling
in
tere
st
Tota
l Eq
uit
y
Total equity at 30 June 2019 3,427 898 11 (6) (184) (5) 4,141 32 4,173
Change in accounting policies (183) (183) (183)
Adjusted equity at 30 June 2019 3,427 715 11 (6) (184) (5) 3,958 32 3,990
Total comprehensive income/(loss) for the year (196) (6) 35 (17) (184) 12 (172)
Movement in non-controlling interests 20 (9) (9)
Dividends paid to shareholders of the parent 18 (128) (128) (128)
Movement in share-based payment reserve 1 1 1
Repurchase of shares 19 (147) (147) (147)
Total equity at 30 June 2020 3,280 391 12 (12) (149) (22) 3,500 35 3,535
Total comprehensive income/(loss) for the year 305 (7) 3 68 369 12 381
Movement in non-controlling interests 20 (31) (31)
Dividends paid to shareholders of the parent 18 (99) (99) (99)
Movement in share-based payment reserve 3 1 16 20 20
Repurchase of shares 19 (24) (24) (24)
Movement in treasury stock 19 (11) (11) (11)
Total equity at 30 June 2021 3,248 598 28 (19) (146) 46 3,755 16 3,771
The accompanying notes form part of and are to be read in conjunction with these financial statements.
Fletcher Building Limited Annual Report 2021 71
For
per
sona
l use
onl
y

Consolidated Balance SheetAs at 30 June 2021
Assets Note2021
NZ$M2020
NZ$MCurrent assets:
Cash and cash equivalents 7 666 1,104
Current tax assets 25 9 66
Contract assets 3 37 69
Derivatives 17 9 125
Debtors 8 1,133 1,041
Inventories 9 1,186 1,215
Total current assets before held for sale 3,040 3,620
Assets classified as held for sale 2.4 85 204
Total current assets 3,125 3,824
Non-current assets:
Property, plant and equipment 12 1,586 1,555
Intangible assets 13 1,120 1,133
Right-of-use assets 14 1,392 1,413
Investments in associates and joint ventures 21 173 158
Inventories 9 272 301
Retirement plan assets 26 108 42
Derivatives 17 10 67
Deferred tax assets 25 224 285
Total non-current assets 4,885 4,954
Total assets 8,010 8,778
LiabilitiesCurrent liabilities:
Creditors, accruals and other liabilities 10 1,314 1,098
Provisions 11 178 251
Lease liabilities 14 178 172
Current tax liabilities 25 5
Derivatives 17 14 7
Contract liabilities 3 87 223
Borrowings 15 106 581
Total current liabilities before held for sale 1,877 2,337
Liabilities directly associated with assets held for sale 2.4 29 48
Total current liabilities 1,906 2,385
Non-current liabilities:
Creditors, accruals and other liabilities 10 23 60
Provisions 11 30 26
Lease liabilities 14 1,519 1,549
Derivatives 17 10 13
Borrowings 15 751 1,210
Total non-current liabilities 2,333 2,858
Total liabilities 4,239 5,243
EquityShare capital 19 3,248 3,280
Reserves 507 220
Shareholders' funds 3,755 3,500
Non-controlling interests 20 16 35
Total equity 3,771 3,535
Total liabilities and equity 8,010 8,778
The accompanying notes form part of and are to be read in conjunction with these financial statements.
Fletcher Building Limited Annual Report 202172
For
per
sona
l use
onl
y

Consolidated Statement of Cash FlowsFor the year ended 30 June 2021
2021 NZ$M
2020 NZ$M
Cash flow from operating activities
Receipts from customers 7,927 7,512
Dividends received 3 1
Payments to suppliers, employees and other (6,922) (6,957)
Interest paid (116) (146)
Income tax paid (3)
Net cash from operating activities 889 410
Cash flow from investing activities
Sale of property, plant and equipment 20 5
Sale of subsidiaries/investments 1
Purchase of property, plant and equipment and intangible assets (231) (240)
Net cash from investing activities (211) (234)
Cash flow from financing activities
Issue of capital notes 142 100
Repurchase of capital notes (145) (220)
Repurchase of shares (24) (147)
Repurchase of shares - transferred to treasury stock (11)
Drawdown of borrowings 401
Repayment of borrowings (761) (269)
Principal elements of lease payments (182) (171)
Distribution to non-controlling interests (31) (9)
Dividends paid to shareholders of the parent (99) (128)
Net cash from financing activities (1,111) (443)
Net movement in cash held (433) (267)
Add: opening cash and cash equivalents 1,104 1,372
Effect of exchange rate changes on net cash (5) (1)
Closing cash and cash equivalents 666 1,104
The accompanying notes form part of and are to be read in conjunction with these financial statements.
Fletcher Building Limited Annual Report 2021 73
For
per
sona
l use
onl
y

Note Description
Financial Performance
Note 2 Key estimates and judgements
Note 3 Revenue from contracts with customers
Note 4 Segmental information
Note 5 Net earnings per share
Note 6 Income statement disclosures
Working Capital Management
Note 7 Cash and cash equivalents
Note 8 Debtors
Note 9 Inventories, including land and developments
Note 10 Creditors, accruals and other liabilities
Note 11 Provisions
Long-term Investments
Note 12 Property, plant and equipment
Note 13 Intangible assets
Note 14 Leases
Note Description
Funding and Financial Risk Management
Note 15 Borrowings
Note 16 Net funding costs
Note 17 Financial risk management
Group Structure and Related Parties
Note 18 Dividends and shareholder tax credits
Note 19 Capital
Note 20 Non-controlling interests
Note 21 Investments in associates and joint ventures
Note 22 Related party disclosures
Other Information
Note 23 Capital expenditure commitments
Note 24 Contingent liabilities
Note 25 Taxation
Note 26 Retirement plans
Note 27 Share-based payments
Note 28 Subsequent events
Contents
Fletcher Building Limited Annual Report 202174
For
per
sona
l use
onl
y

1. Statement of accounting policies
General information
The financial statements presented are those of Fletcher Building Limited (the Company) and its subsidiaries (the Group). The Group is primarily involved in the manufacturing and distribution of building materials and residential, commercial and infrastructure construction. Fletcher Building Limited is domiciled in New Zealand. The registered office of the Company is 810 Great South Road, Penrose, Auckland.
The Company is registered under the Companies Act 1993 and is a Financial Markets Conduct Act (FMCA) 2013 reporting entity in terms of the Financial Reporting Act 2013. The Group is a for-profit entity.
Basis of presentation
These financial statements have been prepared in accordance with Generally Accepted Accounting Practice in New Zealand, which is the New Zealand equivalent to International Financial Reporting Standards (NZ IFRS). They also comply with International Financial Reporting Standards.
These financial statements are presented in New Zealand dollars ($), which is the Group’s presentation currency and rounded to the nearest million unless otherwise stated.
The consolidated financial statements comprise the income statement, statement of comprehensive income, statement of movements in equity, balance sheet, statement of cash flows, and statement of accounting policies, as well as the notes to these financial statements.
Accounting convention
The financial statements are based on the general principles of historical cost accounting, except that certain financial assets and liabilities, as described below are stated at their fair value.
The accounting policies have been applied consistently by the Group and are in line with prior year, unless otherwise stated. Where necessary, certain comparative information has been reclassified to conform to changes in presentation in the current year.
Accounting policies are disclosed within each of the applicable notes to the financial statements and are marked with this icon.
Critical accounting estimates and judgements
The preparation of financial statements in conformity with NZ IFRS requires the Directors to make estimates and judgements that affect the reported amounts of assets and liabilities, disclosure of contingent assets and liabilities at the date of the financial statements and the reported amounts of sales and expenses during the reporting period. Estimates and judgements are continually evaluated and are based on historical experience and other factors, including expectations of future events that are believed to be reasonable under the circumstances. Actual results could differ from those estimates. The estimates and assumptions are reviewed on an ongoing basis.
The estimates and judgements that are critical to the determination of the amounts reported in the financial statements have been disclosed with the relevant notes in the financial statements and are marked with this icon, or where applied to the financial statements as a whole, are detailed below.
Basis of consolidation
The consolidated financial statements comprise the Company, its controlled entities and its interest in associates, partnerships and joint arrangements. Intercompany transactions are eliminated in preparing the consolidated financial statements.
Subsidiaries Subsidiaries are all entities over which the Group has control. The Group controls an entity when the Group is exposed to, or has rights to, variable returns from its involvement with the entity and has the ability to affect those returns through its power to direct the activities of the entity. Subsidiaries are included in the consolidated financial statements using the acquisition method of consolidation, from the date control commences until the date control ceases.
Foreign currency
Translation of the financial statements of foreign operations The assets and liabilities of the Group’s overseas operations are translated into New Zealand currency at the rates of exchange prevailing at balance date. The revenue and expenditure of these entities are translated using an average exchange rate reflecting an approximation of the appropriate transaction rates. Exchange variations arising on the translation of these entities and other currency instruments designated as hedges of such investments are recognised directly in the currency translation reserve. The cumulative exchange variations would be reclassified subsequently to earnings if the overseas operation to which the reserve relates were to be sold or otherwise disposed of.
Foreign currency transactions
Transactions in foreign currencies are translated at exchange rates at the date of the transactions.
Monetary assets and liabilities in foreign currencies at balance date are translated at the rates of exchange prevailing at balance date.
Foreign exchange gains and losses resulting from the settlement of such transactions are recognised in earnings, except where deferred in other comprehensive income as qualifying cash flow hedges and qualifying net investment hedges.
Non-monetary assets and liabilities in foreign currencies are translated at the exchange rates in effect when the amounts of these assets and liabilities were determined.
Notes to the Financial Statements 2021
Fletcher Building Limited Annual Report 2021 75
For
per
sona
l use
onl
y

2. Key estimates and judgementsThis section provides details of the key estimates and judgements undertaken when preparing these financial statements.
CHANGES IN ACCOUNTING POLICIES, INTERPRETATIONS AND AGENDA DECISIONS
Configuration or Customisation Costs in a Cloud Computing Arrangement (NZ IAS 38 Intangible Assets)
In April 2021, the International Financial Reporting Standards Interpretations Committee (IFRIC) issued a final agenda decision, Configuration or customisation costs in a cloud computing arrangement. The IFRIC concluded that costs incurred in configuring or customising software in a cloud computing arrangement can only be recognised as intangible assets if the activities create an intangible asset that the entity controls and the intangible asset meets the recognition criteria.
The Group has historically capitalised costs incurred in configuring or customising a supplier’s application software in a cloud computing arrangement as intangible assets as the Group considered that it would benefit from those costs to implement the cloud-based software over the term of the cloud computing arrangement.
As at 30 June 2021:
– The impact of the change cannot be reliably measured as the Group has yet to fully complete its assessment of the impact of the IFRIC agenda decision. The Group expects to adopt this IFRIC agenda decision in its half year financial statements as at 31 December 2021.
– The process to quantify the impact of the agenda decision is ongoing. A project team has been appointed and a timeline has been determined. The project is ongoing due to the effort required in obtaining the underlying information from historical records covering multiple projects and assessing the nature of each of the costs.
– Intangible assets relating to cloud computing arrangements of $75 million have been capitalised in the consolidated balance sheet and are currently subject to this detailed assessment.
– The Group’s preliminary analysis of 599 applicable cloud computing projects has identified a material amount of historical spend that would be expensed under the new interpretations that would result in a reduction of intangible assets and a restatement of retained earnings.
2.1 SIGNIFICANT ITEMS
In reporting financial information, the Group presents non-GAAP performance measures, which are not defined or specified under the requirements of NZ IFRS.
The Group believes that these non-GAAP measures, which are not considered to be a substitute for or superior to NZ IFRS measures, provide stakeholders with additional useful information on the performance of the business. The non-GAAP measures are consistent with how the business performance is planned and reported to the Board and Audit and Risk Committee.
The Group makes certain significant item adjustments to the statutory profit measures in order to derive non-GAAP measures. The Group discloses certain non-operating items as significant items. The Group’s policy is to recognise significant items for transactions or events outside of the Group's ongoing operations that have a significant impact on reported profit. This policy provides stakeholders with additional useful information as a means to assess the year-on-year trading performance of the Group. On this basis, the following items were included within significant items for the year ended 30 June 2021:
– Restructuring and other associated costs arising from significant strategy changes that are not considered by the Group to be part of the normal operating costs of the business.
– Impacts of significant one-off events that have a material effect on the Group's financial performance and asset valuation.
– Impairment charges and provisions that are considered to be significant in nature and/or value to the trading performance of the business.
– Net gains and losses on the disposal of properties and business where a commitment to close has been demonstrated.
Notes to the Financial Statements 2021 (Continued)
Fletcher Building Limited Annual Report 202176
For
per
sona
l use
onl
y

2021
Restructuring and other (1)
NZ$M
Property rationalisation
(2) NZ$M
Impairment of assets (3)
NZ$M
M&A activity (4)
NZ$MTotal
NZ$M
Building Products (5) (1) (3) (9)
Distribution 1 1
Concrete (2) 2 (2) 6 4
Construction (3) (3)
Australia (19) (12) (89) (120)
Other (4) 1 5 (3) (1)
Total significant items before taxation (33) (9) (89) 3 (128)
Tax benefit on above items 10 3 7 20
Total significant items after taxation (23) (6) (82) 3 (108)
2020
Restructuring and other (1)
NZ$M
Property rationalisation
(2) NZ$M
Impairment of assets (3)
NZ$M
M&A activity (4)
NZ$MTotal
NZ$M
Building Products (6) (3) (10) (19)
Distribution (9) (3) (6) (18)
Concrete (5) (5) (3) (13)
Residential and Development (1) (1)
Construction (8) (3) (2) (13)
Australia (32) (33) (101) (166)
Other (32) (1) (13) (46)
Total significant items before taxation (93) (48) (135) (276)
Tax benefit on above items 24 15 38 77
Total significant items after taxation (69) (33) (97) (199)
(1) Restructuring and other costs
The Group announced its New Zealand and Australia restructuring programme on 20 May 2020. Ongoing implementation of the programme, together with costs of other significant one-off events outside the normal operations of the Group, has resulted in a net charge of $33 million recognised in the year ended 30 June 2021. These charges consist predominantly of redundancy and other employee costs associated with the restructuring programme.
(2) Property rationalisation
In line with the restructuring strategy announced on 20 May 2020 the Group undertook a review of its operational property footprint. The costs incurred by the Group in the year ended 30 June 2021 relate primarily to the exit of manufacturing and distribution sites in Iplex Australia and retail sites in Tradelink.
(3) Impairment of assets
Rocla Pty Limited ($78 million)
The Rocla business continues to be classified as a disposal group held for sale (refer to note 2.4). Under this classification, the net assets of the business are measured at the lower of carrying value or fair value less cost to sell. As at 30 June 2021 the fair value of the business has been assessed to be lower than the carrying value of the net assets. A write down of $78 million has therefore been recognised against these assets.
Iplex Australia ($6 million)
Iplex Australia has recognised a net impairment charge of $6 million to account for the write down of property, plant and equipment and inventory as a result of the restructuring strategy mentioned above.
Fletcher Building Limited Annual Report 2021 77
For
per
sona
l use
onl
y

(4) M&A activity
Winstone Aggregates ($6 million)
On 31 July 2020 the Group completed the sale of Winstone Aggregates quarry assets in Manawatu- , the assets had been reported as property, plant and equipment prior to the disposal. The Group recognised a transaction gain of $6 million in the year ended 30 June 2021 for these assets.
Rocla Pty Limited ($3 million)
Transaction costs of $3 million have been recognised in relation to the sales process of the Rocla business.
2.2 INTANGIBLE ASSET IMPAIRMENT TESTING
Goodwill and brands were tested for impairment in June 2021. Each cash-generating unit (CGU) that carries goodwill is valued on a value-in-use or fair value less costs of disposal basis using a discounted cash flow model. Management has used its past experience of sales growth, operating costs and margin, and external sources of information where appropriate, to determine their expectations for the future. These cash flow projections are principally based on the business units' forecast five year plan, which are risk adjusted where appropriate. Cash flows beyond five years have been extrapolated using estimated terminal growth rates, which do not exceed the long-term average growth rate for the industries and countries in which the business units operate. The terminal growth rate employed was between 2.0% and 2.5% for Australia (2020: 1.75%) and 2.0% for New Zealand (2020: 1.75%).
New Zealand and South Pacific CGUsThe goodwill and brand balances for the 15 New Zealand and South Pacific CGUs represent 45% of the total balance for the Group. The cash flows are discounted using a nominal rate specific to each business and jurisdiction. New Zealand businesses have employed discount rates between 7.0% and 11.0% (2020: between 9.0% and 10.0%), and the South Pacific business has employed a discount rate of 17.5% (2020: 18.5%), reflecting the risk profile of each business and for the regions in which the CGUs operate.
Sensitivity to reasonably possible changes in assumptionsThe impairment assessment confirmed that, for these business units, the recoverable amounts exceed carrying values as at 30 June 2021. Based on current economic conditions and performances of New Zealand and South Pacific CGUs, no reasonably possible change in a key assumption used in the determination of the recoverable value of CGUs would result in a material impairment to the Group.
Australia CGUsThe goodwill and brand balances for the four Australia CGUs represent 55% of the total balance for the Group. The cash flows are discounted using a nominal rate specific to each business. Australian business units employed discount rates between 7.0% and 9.0% (2020: 8.1%), reflecting the risk profile of each business and for the regions in which the CGUs operate.
Sensitivity to reasonably possible changes in assumptionsGroup and divisional management completed a comprehensive strategic review of the Australia division and identified a number of strategic initiatives for the near to medium term to set the division up for long term margin growth. Implementation of these initiatives, coupled with strengthening of Australian residential and construction market activity, has contributed to a lift in the division's business performance and profitability. Management recognises that full benefits of implemented strategic changes will be achieved over the longer term, and, in part, will be dependent on the sustained growth of the Australian economy and residential market.
The key assumptions used in the impairment tests for the significant business units of Laminex Australia and Tradelink are outlined below. No impairment was recognised during the financial year, however, a change in any of the key assumptions noted below would lead to the elimination of the excess of recoverable amount over carrying amount.
Laminex Australia (representing 28% of Group goodwill and brands balances)
Key assumption Value attributed Sensitivity (absolute movement)
Revenue growth (5-year Cumulative Average Growth Rate (CAGR)) 2.80% Decrease by 0.5 ppts
EBIT margin (5-year average) 9.50% Decrease by 2.8 ppts
Discount rate 7.90% Increase by 2.8 ppts
Tradelink (representing 11% of Group goodwill and brands balances)
Key assumption Value attributed Sensitivity (absolute movement)
Revenue growth (5-year Cumulative Average Growth Rate (CAGR)) 4.50% Decrease by 0.7 ppts
EBIT margin (5-year average) 3.70% Decrease by 1.8 ppts
Discount rate 7.30% Increase by 5.3 ppts
Notes to the Financial Statements 2021 (Continued)
Fletcher Building Limited Annual Report 202178
For
per
sona
l use
onl
y

Other CGUs
Based on current economic conditions and CGU performances, no reasonably possible change in any one of the key assumptions used in the determination of the recoverable value of other Australian CGUs would result in a material impairment to the Group.
2.3 SUPPLEMENTARY DISCLOSURES: EARNINGS PER SHARE
Earnings per share is disclosed in full in note 5. The below disclosure has been included to provide additional useful information by removing the impact of significant items in the current and prior year, and the resulting impact on the earnings per share measure.
The effect of significant items on earnings per share from continuing operations is as follows:
2021 NZ$M
2020 NZ$M
Net earnings/(loss) after taxation (as per income statement) 305 (196)
Add back: Significant items after taxation (note 2.1) 108 199
Net earnings before significant items 413 3
Net earnings per share before significant items (cents) 50.1 0.4
Net earnings per share - as per income statement (cents) 37.0 (23.5)
2.4 ASSETS HELD FOR SALE
Rocla Pty Limited On 19 February 2020, the Group announced its intention to divest the Rocla business, a wholly owned subsidiary reported under the Australia segment. The announcement to suspend the divestment process was made on 25 March 2020 in response to COVID-19 and the process was recommenced on 1 June 2020. The Rocla business met the classification requirements of a disposal group held for sale and ceased depreciation of the relevant assets from 1 June 2020. The business, including its assets and associated liabilities, had been classified as held for sale as at 30 June 2020. At 30 June 2021 the Group has assessed the latest facts and circumstances in relation to the Rocla divestment process and concluded that the classification of Rocla as a disposal group remains appropriate. During the year the Group transferred land at Rocla's Brisbane and Sydney sites, which was previously classified as property, plant and equipment, to inventory. The transferred land is developed and realised in the ordinary course of business. These assets have been excluded from held for sale classification and presented under the Residential and Development reportable segment. The Group has reassessed the fair value less costs to sell of the business' remaining net assets as at 30 June 2021 and recognised a write-down of funds by $81 million. The fair value of Rocla's net assets has been assessed based on information received through the divestment process. The summary of Rocla's assets and associated liabilities classified as held for sale is presented below:
Assets2021
NZ$M2020
NZ$M
Debtors 21 30
Inventories 49 50
Property, plant and equipment 10 118
Right-of-use assets 6
Provision for deferred taxation 5
Assets held for sale 85 204
Liabilities
Creditors, accruals and other liabilities 21 28
Provisions 2 13
Lease liabilities 6 7
Liabilities directly associated with assets held for sale 29 48
Net assets directly associated with disposal group 56 156
Fletcher Building Limited Annual Report 2021 79
For
per
sona
l use
onl
y

2.5 SUPPLEMENTARY DISCLOSURES: CONSTRUCTION ACCOUNTING
The Group's Construction division is engaged by a wide variety of customers to construct and maintain building and infrastructure projects across New Zealand and the South Pacific. Services provided by the division include construction contract works, engineering and maintenance services. Each project has a different risk profile based on its individual contractual and delivery characteristics.
Construction projects are inherently more uncertain earlier in their lifetime, which leads to a number of significant estimates and judgements being made at these early stages. The Group's policies for accounting for such projects are outlined below, and demonstrate the significant judgements made. Contract assets and liabilities arising from construction work in progress at year end are disclosed in note 3.
The division performs regular reviews of its customer contracts including reassessment of cost to complete estimates at each reporting date. Onerous contract provisions are recognised under NZ IAS 37: Provisions where the unavoidable costs (i.e., the costs that the division cannot avoid because it has the contract) of meeting the obligations under a contract exceed the economic benefits expected to be received under it. Onerous contract provisions recognised in relation to the Group's legacy building and infrastructure projects have been disclosed in note 11.
Construction accounting policies
Revenue recognition
Construction contract revenue
The Group derives revenue from the construction of building and infrastructure projects across New Zealand and the South Pacific. Contracts entered into may be for the construction of one or several separate inter-linked pieces of large infrastructure. While it is uncommon, contracts can be entered into for the building of several projects. Where this occurs, the Group will identify the single or multiple performance obligations and allocate the total contract price across each performance obligation based on stand-alone selling prices. The contract price is normally fixed at the start of the project.
The nature of construction projects leads to variations in the project size and scope. It is also normal practice for contracts to include bonus and penalty elements based on timely construction or other performance criteria known as variable consideration.
The performance obligation is fulfilled over time and as such revenue is recognised over time. As work is performed on the assets being constructed they are controlled by the customer and have no alternative use to the Group, with the Group having a right to payment for performance to date.
Generally, contracts identify various inter-linked activities required in the construction process. Revenue is recognised on the measured output of each process based on appraisals that are agreed with the customer on a regular basis.
Maintenance contract revenue
Services revenue is primarily generated from maintenance services supplied to roading assets owned by local or central Government in New Zealand and the South Pacific. This revenue also arises in respect of infrastructure assets previously constructed by the Group where maintenance was included in the contract. The service contracts are typically determined to have one single performance obligation which is significantly integrated and is fulfilled over time.
Variable consideration
Revenue in relation to variations, such as a change in the scope of the contract, is only included in the contract price when it is approved by the parties to the contract, the variation is enforceable, or in certain circumstances when the amount becomes highly probable and is approved by the Board of Directors.
Contract assets, contract liabilities and provisions for onerous contracts
Earnings on construction contracts (including sub-contracts) are determined using the percentage of completion method and represent the value of work carried out during the year, including amounts not invoiced. Costs are recognised as incurred and revenue is recognised on the basis of the proportion of total costs at the reporting date to the estimated total costs of the contract. Estimates of the final outcome of each contract may include cost contingencies to take account of specific risks within each contract that have been identified. The cost contingencies are reviewed on a regular basis throughout the contract life and are adjusted where appropriate. However, the nature of the risks on contracts are such that they often cannot be resolved until the end of the project.
Margin on the contract is not recognised until the outcome of the contract can be reliably estimated. The Group uses its professional judgement to assess both the physical completion and the forecast financial result of the contract. When a contract is identified as loss-making, a provision is made for estimated future losses on the entire contract.
Contract assets/liabilities are stated at cost plus profit recognised to date, less progress billings. Costs include all expenditure directly related to specific projects and an allocation of fixed and variable overheads incurred in the Group’s contract activities based on normal operating capacity.
Estimates and judgements are made relating to a number of factors when assessing construction contracts. These primarily include the programme of work throughout the contract period, assessment of future costs after considering changes in the scope of work, maintenance and defect liabilities, expected inflation (for unlet sub-trades) and performance bonuses or penalties.
The significant judgements inherent in accounting for the Group’s most material construction projects are:
- The extent to which a project progresses in line with the complex project programme and timetable previously formed and the resulting impact of any programme delays or gains on project costs, especially project overheads (preliminary and general costs) and any liquidated or other damages;
- Subcontractor costs, in particular costs that are yet to be agreed in scope or price (including inflationary pressures) or that relating to programme prolongation;
- The outcome of ongoing commercial negotiations, including elements of variable consideration and changes in project scope; - Future weather and ground conditions.
Notes to the Financial Statements 2021 (Continued)
Fletcher Building Limited Annual Report 202180
For
per
sona
l use
onl
y

A summary of the major construction projects and their approximate stage of completion is disclosed to demonstrate the uncertainty that remains on these projects.
Status of construction projects (> $200 million original contract value) as at 30 June 2021:
ForecastPercentage
of completionBusiness unit completion* (% cost)
NZICC reinstatements - Cost plus margin Buildings 2024 35%
NZICC - Guaranteed maximum price and fixed price contract Buildings 2024 83%
Pu-hoi to Warkworth - Fixed price contract (Public Private Partnership) Infrastructure 2022 82%
Hamilton City Edge Expressway - Alliance contract Infrastructure / Higgins 2022 88%
Peka Peka to O-taki Expressway - Fixed price contract Infrastructure / Higgins 2022 75%
* Calendar year
Revenue backlog by business unit as at 30 June 2021:
Current revenue backlog NZ$M
Top 5 projects as a % of revenue backlog
Buildings 317 100%
Infrastructure* 329 78%
Brian Perry Civil* 1,318 11%
Higgins 856 30%
South Pacific 122 95%
2,942 N/A
* During the year the Watercare Enterprise Framework Agreement contract has moved to being predominately delivered by Brian Perry Civil, previously the estimated backlog was equally allocated to Infrastructure and Brian Perry Civil business units.
Revenue backlog by business unit as at 30 June 2020:
Current revenue backlog NZ$M
Top 5 projects as a % of revenue backlog
Buildings 352 100%
Infrastructure 1,156 46%
Brian Perry Civil 762 8%
Higgins 545 33%
South Pacific 114 83%
2,929 NA
Revenue backlog refers to the level of construction work the Group is contracted to but is not yet complete at year end. This represents the performance obligations that are yet to be completed for the construction contracts active at the end of the year. The long term nature of the contracts held by the Buildings, Infrastructure and Higgins businesses will see these performance obligations be completed over a period generally between one to five years, although some may extend longer. The Buildings, Infrastructure, Brian Perry Civil, and South Pacific businesses have contracts that are either short term in nature or are nearing completion with those performance obligations likely to be settled within the next 12 months.
New Zealand International Convention Centre (NZICC)
On 22 October 2019 there was a significant fire at the NZICC project construction site causing damage to both the International Convention Centre and Hobson Street Hotel. Contract Works and Third-Party Liability insurances are in place on the project, and the Fletcher Construction Company Limited is an insured party under these policies.
The NZICC project continues to be accounted for under NZ IFRS 15: Revenue from Contracts with Customers and NZ IAS 37: Provisions, Contingent Liabilities and Contingent Assets.
The Group has assessed all relevant known facts and circumstances related to the estimation of cost to complete and insurance recoveries and concluded based on current information that there is no additional requirement for provisions in these financial statements. The Group’s assessment of the cost to complete relies on application of estimates and judgements (e.g. measurement of remediation’s cost to complete, the likelihood of receipt of insurance recoveries and quantification of any claims and costs that are outside of insurance cover) and as such may be subject to change as the project progresses.
Fletcher Building Limited Annual Report 2021 81
For
per
sona
l use
onl
y

This section explains the results and performance of the Group, including the segmental analysis, details of significant items, and earnings per share.
3. REVENUE FROM CONTRACTS WITH CUSTOMERS
The Group revenue is derived from the following streams:
- Sale of building products and materials - Development and sale of residential projects - Construction of building and infrastructure projects (refer to note 2.5) - Maintenance service contracts (refer to note 2.5)
Revenue from contracts with customers is recognised when control of the goods or services is transferred to the customer at an amount that reflects the consideration to which the Group expects to be entitled in exchange for those goods or services. The Group has generally concluded that it is the principal in its revenue arrangements, because it typically controls the goods or services before transferring them to the customer.
Building products and distribution divisions
Sale of building products and materials
The materials and distribution businesses within the Group recognise revenue when control of the goods has passed to the customer, the associated costs and possible return of goods can be estimated reliably, there is no continuing management involvement with the goods, and there is a high probability that a significant reversal in the revenue recognised will not occur. Revenue is measured net of returns, trade discounts and volume rebates. The timing of the transfer of control varies depending on the individual terms of the sales agreement. For most sales, this occurs when the product is delivered to the customer.
Residential and Development division
Development and sale of residential projects
Through the Residential and Development division the Group derives income from the sale of completed houses, construction type projects for enabling or utilities works for large developments, and the sale of development sites surplus to Group requirements. Revenue is recognised when control passes to the customer for each type of transaction. House sales are commonly recognised at the time of settlement, when title passes to the customer and payment is received. Enabling or utilities works are recognised over time using a percentage of completion method. Land development sales are recognised in line with the requirements of the specific sale and purchase agreement.
Performance obligations vary between the types of transactions. The sale of a completed house from Group inventory to a customer is a single performance obligation, as houses are not constructed under contract from a customer. For works contracts and development sales, the division reviews the terms of the sale to determine whether the performance obligations are distinct and separately identifiable.
2021
Sale of building
products and materials
NZ$M
Developmentand sale of residential properties
NZ$M
Constructioncontractrevenue
NZ$M
Maintenancecontractrevenue
NZ$MTotal
NZ$M
Goods and services transferred at a point in time 6,052 721 6,773
Goods and services transferred over time 834 513 1,347
Total revenue from contracts with customers 6,052 721 834 513 8,120
2020
Sale of building
products and materials
NZ$M
Developmentand sale of residentialproperties
NZ$M
Constructioncontractrevenue
NZ$M
Maintenancecontractrevenue
NZ$MTotal
NZ$M
Goods and services transferred at a point in time 5,588 460 6,048
Goods and services transferred over time 760 501 1,261
Total revenue from contracts with customers 5,588 460 760 501 7,309
Notes to the Financial Statements 2021 (Continued)
Financial Review
Fletcher Building Limited Annual Report 202182
For
per
sona
l use
onl
y

Contract assets
The gross amount of construction and maintenance work in progress consists of costs attributable to work performed and emerging profit after providing for any foreseeable losses. In applying the accounting policies on providing for these losses, accounting judgement is required.
Construction contracts with cost and margin in advance of billings are presented as part of contract assets for all contracts in which costs incurred plus recognised profits exceed progress billings. If progress billings and recognised losses exceed costs incurred plus recognised profits, then the difference is presented as contract liabilities.
Contract liabilities
Construction contracts where the total progress billings issued to clients (together with foreseeable losses if applicable) on a project exceed the costs incurred to date plus recognised profit on the contract are recognised as a liability.
2021NZ$M
2020NZ$M
Construction contracts with cost and margin in advance of billings 37 69
Contract assets 37 69
Construction contracts with billings in advance of cost and margin 87 223
Contract liabilities 87 223
4. SEGMENTAL INFORMATION
Segmental information is presented in respect of the Group’s industry and geographical segments. The use of industry segments as the primary format is based on the Group’s management and internal reporting structure, which recognises groups of assets and operations with similar risks and returns. Inter-segment pricing is determined on an arm’s length basis.
Industry segments
2021
Gross revenueNZ$M
2020Gross revenue
NZ$M
2021External revenue
NZ$M
2020External revenue
NZ$M
Building Products 1,401 1,173 1,101 922
Distribution 1,714 1,471 1,684 1,440
Concrete 849 740 583 503
Residential and Development 734 466 721 460
Construction 1,456 1,318 1,347 1,261
Australia 2,758 2,802 2,684 2,723
Other 10 10
Group 8,922 7,980 8,120 7,309
Less: intercompany revenue (802) (671)
Group external revenue 8,120 7,309 8,120 7,309
2021 EBIT before
significant itemsNZ$M
2020EBIT before
significant itemsNZ$M
2021Funds*NZ$M
2020Funds*NZ$M
Building Products 197 87 726 678
Distribution 127 85 215 209
Concrete 113 74 573 607
Residential and Development 154 65 534 604
Construction 31 (147) 219 50
Australia 103 33 1,327 1,494
Corporate (56) (37) 177 (107)
Group 669 160 3,771 3,535
* Funds represent the external assets and liabilities of the Group and are used for internal reporting purposes. Group balances such as borrowings and taxation are allocated to Corporate as these are managed at a Group level.
Fletcher Building Limited Annual Report 2021 83
For
per
sona
l use
onl
y

2021Depreciation, depletion and
amortisation expenseNZ$M
2020Depreciation, depletion and
amortisation expenseNZ$M
2021Capital
expenditure NZ$M
2020Capital
expenditure NZ$M
Building Products 56 53 112 53
Distribution 49 47 12 21
Concrete 71 74 36 50
Residential and Development 3 3 1 3
Construction 40 40 25 32
Australia 128 135 42 65
Corporate 16 18 4 8
Group 363 370 232 232
Geographic segments
2021External revenue
NZ$M
2020External revenue
NZ$M
2021EBIT before
significant itemsNZ$M
2020EBIT before
significant itemsNZ$M
New Zealand 5,237 4,466 510 110
Australia 2,773 2,740 151 42
Other jurisdictions 110 103 8 8
Group 8,120 7,309 669 160
Significant items (note 2.1) (128) (276)
Earnings before interest and taxation (EBIT) 541 (116)
2021Non-current
assetsNZ$M
2020
Non-current assets+
NZ$M
2021Funds*NZ$M
2020
Funds*NZ$M
New Zealand 2,845 2,836 2,230 2,221
Australia 1,646 1,670 1,348 1,495
Other 52 53 69 83
Debt and taxation 124 (264)
Group 4,543 4,559 3,771 3,535
+ Excludes deferred tax assets, retirement plan surplus and financial instruments.
* Funds represent the external assets and liabilities of the Group and are used for internal reporting purposes. Group balances such as net debt and taxation are allocated to Corporate as these are managed at a Group level.
Description of industry segments
Building ProductsThe Building Products division is a manufacturer, distributor, and marketer of building products used in the residential and commercial markets in New Zealand.
Distribution The Distribution division consists of building, plumbing, and pipeline distribution businesses in New Zealand.
ConcreteThe Concrete division includes the Group's interests in the concrete value chain, including extraction of aggregates, and the production of cement and concrete. The division operates in New Zealand.
Residential and Development
The Residential and Development division operates both in New Zealand and Australia and involves building and sale of residential homes in New Zealand and development and sale of commercial and residential land in Australia and New Zealand. Development activity includes the sale of the land property portfolio which are surplus to the Group's operating requirements.
ConstructionThe Construction division is a builder and maintainer of commercial buildings and infrastructure across New Zealand and the South Pacific.
AustraliaThe Australia division manufactures and distributes building materials for a broad range of industries across Australia.
Notes to the Financial Statements 2021 (Continued)
Fletcher Building Limited Annual Report 202184
For
per
sona
l use
onl
y

5. NET EARNINGS PER SHARE
Earnings per share is the portion of a company's profit allocated to each outstanding ordinary share and is calculated by dividing the earnings attributable to shareholders by the weighted average of ordinary shares on issue during the year excluding impacts of treasury stock. Capital notes and options are convertible into the company's shares and may therefore result in dilutive securities for purposes of determining the diluted net earnings per share. The Group may, at its option, purchase or redeem the capital notes for cash at the principal amount plus any accrued but unpaid interest.
2021 2020
Net earnings per share (cents)
Basic 37.0 (23.5)
Diluted 36.4 (23.5)
Numerator NZ$M NZ$M
Net earnings/(loss) 305 (196)
Numerator for basic earnings per share 305 (196)
Dilutive capital notes 11
Numerator for diluted net earnings per share 316 (196)
Denominator (millions of shares)
Weighted average number of shares outstanding (refer to note 19) 824 835
Conversion of dilutive capital notes 43
Denominator for diluted net earnings per share 867 835
6. CONSOLIDATED INCOME STATEMENT DISCLOSURES
2021 NZ$M
2020 NZ$M
The following items are specific disclosures required to be made and are included within the income statement:
Net periodic pension cost 2 2
Employee related short-term costs (1) 1,420 1,446
Other long-term employee related benefits 54 58
Research and development expenditure 2 1
Amortisation of intangibles 24 24
Bad debts written off 3 5
Donations and sponsorships 3 3
Maintenance and repairs 151 143 (1) Short-term employee benefits for the executive committee are included in the above is disclosed in note 22.
Auditor's remuneration
2021 NZ$000's
2020 NZ$000's
Audit and review of the financial statements (1) 3,262 2,858
Total audit and assurance services 3,262 2,858
Other services (2) 16 14
Total non-assurance services 16 14
Total auditor's remuneration 3,278 2,872
(1) The audit includes fees for both the annual audit of the financial statements and the review of the interim financial statements
(2) Other services relate to agreed upon procedures
Fletcher Building Limited Annual Report 2021 85
For
per
sona
l use
onl
y

This section provides details of the key elements of working capital which includes cash, receivables, inventories and short-term liabilities.
7. CASH AND CASH EQUIVALENTS
Cash and cash equivalents comprise cash and demand deposits with banks or other financial institutions and highly liquid investments that are readily convertible to cash.
Cash and cash equivalents include the Group's share of amounts held by joint operations of $17 million (2020: $102 million).
At 30 June 2021, approximately $42 million (2020: $19 million) of total cash and deposits were held in subsidiaries that operate in countries where exchange controls and other legal restrictions apply and are not immediately available for general use by the Group.
2021 NZ$M
2020 NZ$M
Cash and bank balances 252 503
Contract retention bank balances 18 24
Short-term deposits 396 577
666 1,104
Reconciliation of net earnings to net cash from operating activities
2021 NZ$M
2020 NZ$M
Net earnings 305 (196)
Earnings attributable to minority interest 12 12
317 (184)
Add/(less) non-cash items:
Depreciation, depletions and amortisation 363 370
Other non-cash items 91 240
Taxation 113 (81)
Loss on disposal of businesses and property, plant and equipment 3 7
570 536
Net working capital movements
Residential and Development 105 50
Construction (179) (19)
Other divisions:
Debtors (62) 95
Inventories (22) (1)
Creditors 160 (67)
2 58
Net cash from operating activities 889 410
Working Capital Management
Notes to the Financial Statements 2021 (Continued)
Fletcher Building Limited Annual Report 202186
For
per
sona
l use
onl
y

8. DEBTORS
Debtors are amounts due from customers for goods sold or services performed in the ordinary course of business. They are generally due for settlement within 30 to 90 days and are therefore all classified as current. Debtors are recognised initially at the amount of consideration that is unconditional, unless they contain significant financing components, when they are recognised at fair value. The Group holds the trade receivables with the objective of collecting the contractual cash flows and therefore measures them subsequently at amortised cost using the effective interest method. Details about the Group’s impairment policies and the calculation of the loss allowance are provided in note 17.3.
2021 NZ$M
2020 NZ$M
Trade debtors 829 746
Contract debtors 55 69
Contract retentions 35 35
Less expected credit loss provisions (18) (25)
Trade and contract debtors 901 825
Other receivables 232 216
1,133 1,041
Current 802 739
0 - 30 days over standard terms 82 75
31 - 60 days over standard terms 14 6
61+ days over standard terms 21 30
Provision (18) (25)
Trade and contract debtors 901 825
Fair values of debtorsDue to the short-term nature of the current receivables, their carrying amount is considered to be the same as their fair value.
Impairment and risk exposureInformation about the impairment of trade receivables and the Group’s exposure to credit risk and foreign currency risk can be found in note 17.3.
9. INVENTORIES, INCLUDING LAND AND DEVELOPMENTS
Raw materials, work in progress and finished goods
Raw materials and stores, work in progress and finished goods are stated at the lower of cost and net realisable value. Cost comprises direct materials, direct labour and an appropriate proportion of variable and fixed overhead expenditure, the latter being allocated on the basis of normal operating capacity. Cost includes the reclassification from equity of any gains or losses on qualifying cash flow hedges relating to purchases of raw material but excludes borrowing costs. Costs of purchased inventory are determined after deducting rebates and discounts. Net realisable value is the estimated selling price in the ordinary course of business less the estimated costs of completion and the estimated costs necessary to make the sale.
Land held for resale
Land held for resale is stated at the lower of cost and net realisable value. Cost is assigned by specific identification and includes the cost of acquisition and development costs during development.
Fletcher Building Limited Annual Report 2021 87
For
per
sona
l use
onl
y

Notes to the Financial Statements 2021 (Continued)
2021 NZ$M
2020 NZ$M
Raw materials 418 364
Work in progress 314 377
Finished goods 690 736
Consumable stores and spare parts 36 39
1,458 1,516
Inventories held at cost 1,153 1,192
Inventories held at net realisable value 305 324
1,458 1,516
Current portion 1,186 1,215
Non-current portion 272 301
1,458 1,516
Inventory classified as non-current
The non-current portion of inventories relates to land and developments that are expected to be held for greater than 12 months (current portion of $321 million, 2020: $367 million).
The Group's Residential and Development division has commitments for the purchase of land and building services totalling $430 million (2020: $257 million), of which $105 million is expected to be delivered in the year to 30 June 2022 (2020: $77 million).
10. CREDITORS, ACCRUALS AND OTHER LIABILITIES
Trade creditors and other liabilities are stated at cost or estimated liability where accrued. Employee entitlements include annual leave which is recognised on an accrual basis and the liability for long service leave which is measured as the present value of expected future payments to be made in respect of services provided by employees.
Assumptions in determining long service leave relate to the discount rate, estimates relating to the expected future long service leave entitlements, future salary increases, attrition rates and mortality.
2021 NZ$M
2020 NZ$M
Trade creditors 729 609
Contract retentions 24 30
Accrued interest 15 30
Other liabilities 333 299
Employee entitlements 225 181
Workers' compensation schemes 11 9
1,337 1,158
Current portion 1,314 1,098
Non-current portion 23 60
Carrying amount at the end of the year 1,337 1,158
The non-current portion of creditors and accruals as at 30 June 2021 relates to long service employee entitlement obligations.
Fletcher Building Limited Annual Report 202188
For
per
sona
l use
onl
y

11. PROVISIONS
Provisions for restructuring, service and environmental warranties and other provisions are recognised when the Group has a present legal or constructive obligation as a result of past events, it is probable that an outflow of resources will be required to settle the obligation, and the amount can be reliably estimated. Provisions are not recognised for future operating losses other than losses recognised on onerous contracts.
Where there are a number of similar obligations, the likelihood that an outflow will be required in settlement is determined by considering the class of obligations as a whole. A provision is recognised even if the likelihood of an outflow with respect to any one item included in the same class of obligations may be small.
Provisions are measured at the present value of management’s best estimate at the end of the reporting period of the expenditure required to settle the present obligation. The discount rate used to determine the present value is a pre-tax rate that reflects current market assessments of the time value of money and the risks specific to the liability. The increase in the provision due to the passage of time is recognised as an interest expense.
Restructuring
Restructuring provisions are recognised when the Group is demonstrably committed, without realistic possibility of withdrawal, to a formal detailed plan. Costs relating to ongoing activities are not provided for.
Warranty and environmental
Warranty provisions represent an estimate of potential liability for future rectification work in respect of products sold and services provided. Environmental provisions represent an estimate for future liabilities relating to environmental obligations.
Onerous contracts
An onerous contract is a contract under which the unavoidable costs (i.e., the costs that the Group cannot avoid because it has the contract) of meeting the obligations under the contract exceed the economic benefits expected to be received under it. The unavoidable costs under a contract reflect the least net cost of exiting from the contract, which is the lower of the cost of fulfilling it and any compensation or penalties arising from failure to fulfil it. The cost of fulfilling a contract comprises the costs that relate directly to the contract (i.e., both incremental costs and an allocation of costs directly related to contract activities).
Other
Other provisions relate to miscellaneous matters, across the Group, none of which is individually material.
Restructuring NZ$M
Warranty & environmental
NZ$M
Onerous contracts
NZ$MOther NZ$M
Total NZ$M
2021
Carrying amount at the beginning of the year 48 22 162 45 277
Charged to earnings 37 8 23 68
Settled or utilised (34) (2) (78) (18) (132)
Released to earnings (5) (5)
46 28 84 50 208
2020
Carrying amount at the beginning of the year 32 34 264 34 364
Charged to earnings 75 2 150 33 260
Settled or utilised (45) (10) (252) (20) (327)
Released to earnings (1) (4) (2) (7)
Held for sale (13) (13)
48 22 162 45 277
2021 NZ$M
2020 NZ$M
Current portion 178 251
Non-current portion 30 26
Carrying amount at the end of the year 208 277
During the year the Group utilised $34 million (2020: $45 million) in respect of restructuring obligations at certain businesses. Of the remaining balance $37 million is expected to be utilised within the next 12 months. Warranty and environmental provisions are expected to be utilised over the next three years.
Fletcher Building Limited Annual Report 2021 89
For
per
sona
l use
onl
y

Long-term InvestmentsThis section details the long-term assets of the Group including property, plant and equipment, intangible assets and leases.
12. PROPERTY, PLANT AND EQUIPMENT
Land, buildings, plant and machinery and fixtures and fittings are stated at historical cost less depreciation. Historical cost includes expenditure that is directly attributable to the acquisition of the items. The cost of purchasing land, buildings, plant and machinery, fixtures and equipment is the value of the consideration given to acquire the assets and the value of other directly attributable costs which have been incurred in bringing the assets to the location and the condition necessary for their intended service, including subsequent expenditure. Assets are reviewed annually for impairment indicators.
Subsequent costs are included in the asset’s carrying amount or recognised as a separate asset, as appropriate, only when it is probable that future economic benefits associated with the item will flow to the Group and the cost of the item can be measured reliably. The carrying amount of any component accounted for as a separate asset is derecognised when replaced. All other repairs and maintenance are charged to profit or loss during the reporting period in which they are incurred.
Depreciation of property, plant and equipment and amortisation of definite life intangible assets are calculated on the straight-line method. Refer to note 13 for details of intangible assets. Expected useful lives, which are regularly reviewed, typically range between:
Buildings 30–50 years Plant and machinery 5–15 years Fixtures and equipment 2–10 years Intangible assets, including software 5–15 years
Resource extraction assets are held at historic cost and depleted over the shorter of the life of the site or right to use period. Site development costs incurred in order to commence extraction are capitalised as resource extraction assets.
An asset’s carrying amount is written down immediately to its recoverable amount if the asset’s carrying amount is greater than its estimated recoverable amount.
Gains and losses on disposals are determined by comparing proceeds with carrying amount. These are included in profit or loss.
2021Land
NZ$MBuildings
NZ$M
Plant & Machinery
NZ$M
Fixtures & Equipment
NZ$M
Resource Extraction
NZ$MTotal
NZ$M
Carrying value at 1 July 2020 136 158 1,009 157 95 1,555
Additions 32 43 112 25 7 219
Disposals (19) (4) (23)
Depreciation expense (10) (106) (29) (12) (157)
Impairment (1) (4) (1) (6)
Transfer of assets to inventory (3) (3)
Currency translation 1 1
Carrying value at 30 June 2021 165 190 1,012 133 86 1,586
Represented by:
Cost 166 318 2,282 384 121 3,271
Accumulated depreciation and impairment (1) (128) (1,270) (251) (35) (1,685)
165 190 1,012 133 86 1,586
Notes to the Financial Statements 2021 (Continued)
Fletcher Building Limited Annual Report 202190
For
per
sona
l use
onl
y

2020Land
NZ$MBuildings
NZ$M
Plant & Machinery
NZ$M
Fixtures & Equipment
NZ$M
Resource Extraction
NZ$MTotal
NZ$M
Carrying value at 1 July 2019 181 204 1,074 162 95 1,716
Additions 8 10 131 33 12 194
Disposals (1) (11) (12)
Depreciation expense (10) (111) (28) (12) (161)
Impairment (12) (57) (6) (75)
Transfer of assets to inventory (5) (5)
Held for sale (50) (37) (25) (6) (118)
Currency translation 3 3 8 2 16
Carrying value at 30 June 2020 136 158 1,009 157 95 1,555
Represented by:
Cost 137 283 2,214 412 125 3,171
Accumulated depreciation and impairment (1) (125) (1,205) (255) (30) (1,616)
136 158 1,009 157 95 1,555
As at 30 June 2021 property, plant and equipment includes $214 million of assets under construction that are not depreciated until they are commissioned and brought into use (2020: $133 million).
Government Grants
The Ministry for the Environment (New Zealand) part-funded Fletcher Building’s waste tyre capital project with a grant of $16 million awarded to the Group through its Waste Minimisation Fund. In the year ended 30 June 2021 $16 million (2020: $8 million) has been recognised as a deduction from the carrying amount of related qualifying property, plant and equipment assets. The Group did not benefit directly from any other forms of government assistance in the year ended 30 June 2021.
13. INTANGIBLE ASSETS
Intangible assets acquired separately are measured on initial recognition at cost. Following initial recognition, intangibles are carried at cost less any accumulated amortisation and accumulated impairment losses.
The Group's intangible assets with indefinite useful lives are not amortised but are tested for impairment annually, either individually or at the cash-generating unit (CGU) level. Intangible assets with a definite life are amortised on a straight-line basis.
Goodwill is stated at cost, less any impairment losses. Goodwill is allocated to CGUs and is not amortised but is tested annually for impairment, and when an indication of impairment exists. Brands for which all relevant factors indicate that there is no limit to the foreseeable net cash flows are considered to have an indefinite useful life and are held at cost and are not amortised but are subject to an annual impairment test.
For the purposes of considering whether there has been an impairment, assets are grouped at the lowest level for which there are identifiable cash flows that are largely independent of the cash flows of other groups of assets. When the book value of a group of assets exceeds the recoverable amount, an impairment loss arises and is recognised in the consolidated income statement immediately.
Assessing the carrying value of goodwill and indefinite life brands requires management to estimate future cash flows to be generated by the related CGU. The key assumptions used in the value-in-use or fair value less costs of disposal basis include the expected rate of growth of revenues and earnings, the terminal growth rate and the appropriate discount rate to apply.
Fletcher Building Limited Annual Report 2021 91
For
per
sona
l use
onl
y

Impairment
2021Goodwill
NZ$MBrands NZ$M
Other Intangibles*
NZ$MTotal
NZ$M
Carrying value at the beginning of the year 708 281 144 1,133
Additions 13 13
Impairment (2) (1) (3)
Amortisation expense (24) (24)
Currency translation 1 1
706 282 132 1,120
Represented by:
Cost 706 361 345 1,412
Accumulated amortisation and impairment (79) (213) (292)
Carrying value at the end of the year 706 282 132 1,120
2020Goodwill
NZ$MBrands NZ$M
Other Intangibles
NZ$MTotal
NZ$M
Carrying value at the beginning of the year 711 278 140 1,129
Additions 39 39
Impairment (10) (1) (11) (22)
Amortisation expense (24) (24)
Currency translation 7 4 11
708 281 144 1,133
Represented by:
Cost 708 360 333 1,401
Accumulated amortisation and impairment (79) (189) (268)
Carrying value at the end of the year 708 281 144 1,133
As at 30 June 2021 other intangible assets include $25 million of assets being developed (2020: $26 million).
* As disclosed in note 2 changes in accounting policies, interpretations and agenda decisions, the Group is in the process of assessing the impact of IFRIC's interpretation of Configuration or Customisation Costs in a Cloud Computing Arrangement (NZ IAS 38: Intangible Assets). Preliminary analysis has identified a material amount of historical spend that would be expensed under the new interpretations that would result in a reduction of intangible assets and a restatement of retained earnings.
Goodwill2021
NZ$M
Goodwill2020
NZ$M
Brands2021
NZ$M
Brands2020
NZ$M
Significant intangible balances within cash generating units (CGUs)
Laminex Australia 154 154 122 122
Higgins New Zealand 114 114 19 19
Iplex New Zealand 105 105 7 7
Stramit 61 61 41 41
Tradelink 61 61 51 51
Other 211 213 42 41
706 708 282 281
The goodwill allocated to significant CGUs accounts for 70% (2020: 70%) of the total carrying value of goodwill. The remaining 'other' CGUs, which comprise 14 (2020: 14) in total, are each less than 7% of total carrying value. The significant brand assets account for 85% (2020: 85%) of the total carrying value of brands. The remaining 'other' brand assets are each less than 5% of total carrying value (2020: 5%).
Notes to the Financial Statements 2021 (Continued)
Fletcher Building Limited Annual Report 202192
For
per
sona
l use
onl
y

14. LEASES
The Group leases various offices, warehouses, retail stores, equipment and vehicles. Rental contracts are typically made for fixed periods, but may have extension options as described below.
Contracts may contain both lease and non-lease components. The Group allocates the consideration in the contract to the lease and non-lease components based on their relative stand-alone prices. However, for leases of real estate for which the Group is a lessee, it has elected not to separate lease and non-lease components and instead accounts for these as a single lease component.
Lease terms are negotiated on an individual basis and contain a wide range of different terms and conditions. The lease agreements do not impose any covenants other than the security interests in the leased assets that are held by the lessor. Leased assets may not be used as security for borrowing purposes.
Assets and liabilities arising from a lease are initially measured on a present value basis. Lease liabilities include the net present value of the following lease payments:
- fixed payments (including in-substance fixed payments), less any lease incentives receivable - variable lease payment that are based on an index or a rate, initially measured using the index or rate as at the commencement date - amounts expected to be payable by the Group under residual value guarantees - the exercise price of a purchase option if the Group is reasonably certain to exercise that option, and - payments of penalties for terminating the lease, if the lease term reflects the Group exercising that option.
The lease payments are discounted using the interest rate implicit in the lease. If that rate cannot be readily determined, which is generally the case for property leases in the Group, the lessee’s incremental borrowing rate is used, being the rate that the individual lessee would have to pay to borrow the funds necessary to obtain an asset of similar value to the right-of-use asset in a similar economic environment with similar terms, security and conditions.
To determine the incremental borrowing rate, the Group:- where possible, uses recent third-party financing received by the individual lessee as a starting point, adjusted to reflect changes in
financing conditions since third party financing was received- uses a build-up approach that starts with a risk-free interest rate adjusted for credit risk for leases held by the Group, which does not have
recent third party financing, and - makes adjustments specific to the lease, e.g. term, country, currency and security.
Lease payments are allocated between principal and finance cost. The finance cost is charged to profit or loss over the lease period so as to produce a constant periodic rate of interest on the remaining balance of the liability for each period.
In addition, the carrying amount of lease liabilities is remeasured if there is a modification, a change in the lease term, a change in the lease payments (e.g., changes to future payments resulting from a change in an index or rate used to determine such lease payments) or a change in the assessment of an option to purchase the underlying asset.
Right-of-use assets are measured at cost comprising the following: - the amount of the initial measurement of lease liability - any lease payments made at or before the commencement date less any lease incentives received - any initial direct costs, and - restoration costs.
Right-of-use assets are generally depreciated over the shorter of the asset's useful life and the lease term on a straight-line basis. If the Group is reasonably certain to exercise a purchase option, the right-of-use asset is depreciated over the underlying asset’s useful life.
Payments associated with short-term leases of equipment and vehicles and all leases of low-value assets are recognised on a straight-line basis as an expense in profit or loss. Short-term leases are leases with a lease term of 12 months or less. Low-value assets comprise IT equipment and small items of office furniture. Expenses in relation to short-term and low-value leases amounted to $53 million in the year to 30 June 2021 (2020: $33 million).
Extension options
Some leases contain extension options exercisable by the Group up to one year before the end of the non-cancellable contract period. The Group assesses at lease commencement date whether it is reasonably certain to exercise the extension options. The Group reassesses whether it is reasonably certain to exercise the options if there is a significant event or significant change in circumstances within its control. The Group has some lease contracts that include extension and termination options. These options provide flexibility in managing the leased asset portfolio and align with the Group’s business needs. Management exercises significant judgement in determining whether these extension and termination options are reasonably certain to be exercised. Property leases represent 84% of the Group’s leased-asset portfolio. Even though the lease term (including extension and termination options that are reasonably certain to be exercised) is determined on a lease-by-lease basis, the intended use and current market environment generally impact the determination of the lease term at initial recognition of a lease and at each subsequent reporting date. As at 30 June 2021, the five largest lease contracts have all related extension options included in the estimated lease term, resulting in future lease payments being included in the measurement of the lease liability recorded in the consolidated balance sheet.
Fletcher Building Limited Annual Report 2021 93
For
per
sona
l use
onl
y

Right-of-use assets
2021Land
NZ$MBuildings
NZ$M
Plant & machinery
NZ$MTotal
NZ$M
Opening net book value 1 July 2020 20 1,172 221 1,413
Additions and renewals 166 53 219
Depreciation (1) (119) (62) (182)
Impairment (5) (5)
Terminations (6) (44) (6) (56)
Currency translation 2 1 3
Closing balance 30 June 2021 13 1,172 207 1,392
2020
Opening net book value 1 July 2019 18 1,311 209 1,538
Additions and renewals 2 70 73 145
Depreciation (2) (122) (61) (185)
Impairment (23) (23)
Terminations (65) (3) (68)
Held for sale (2) (4) (6)
Currency translation 2 3 7 12
Closing balance 30 June 2020 20 1,172 221 1,413
Lease liabilities
2021 Total
NZ$M
2020 Total
NZ$M
Opening balance 1,721 1,803
Additions 219 146
Repayments (183) (171)
Terminations (61) (67)
Held for sale (7)
Currency translation 1 17
Closing balance 1,697 1,721
Current portion 178 172
Non-current portion 1,519 1,549
Carrying amount at the end of the year 1,697 1,721
Lease expenses recognised in consolidated income statement
2021 Total
NZ$M
2020 Total
NZ$M
Right-of-use asset depreciation 182 185
Right-of-use asset impairment 5 23
Lease interest expense 64 69
251 277
Notes to the Financial Statements 2021 (Continued)
Fletcher Building Limited Annual Report 202194
For
per
sona
l use
onl
y

Funding and Financial Risk ManagementThis section includes details on the Group's funding and outlines the market, credit and liquidity risks that the Group is exposed to and how these risks are managed, including the use of derivative financial instruments.
Capital risk management
The Group's objectives when managing capital are to provide returns to shareholders and benefits for other stakeholders and to maintain an optimal capital structure that safeguards the Group's ability to continue as a going concern. In order to maintain or adjust the capital structure, the Group may adjust the amount of dividends paid to shareholders, return capital to shareholders, issue new shares or sell assets to reduce net debt.
The Group has various debt facilities and covenants. A key measure is a through-the-cycle net debt to EBITDA ratio (leverage). Net debt represents the value of the Group's drawn borrowings adjusted for debt hedging activities and available cash funding. The target leverage ratio range is 1.0 to 2.0 times. It is intended that the Group will not be materially outside the target leverage ratio ranges on a long-term basis.
The Group has not sought and does not hold a credit rating from an accredited rating agency.
15. BORROWINGS
The Group borrows in the form of private placements, bank loans, capital notes and other financial instruments. Funding costs associated with the Group's borrowings are shown in note 16.
Borrowings are initially recognised at fair value net of attributable transaction costs, and are subsequently measured at amortised cost using the effective interest rate method. Any borrowings that have been designated as hedged items (USD and any other foreign currency borrowings) are carried at amortised cost plus a fair value adjustment under hedge accounting requirements. Borrowings denominated in foreign currencies are retranslated to the functional currency at each reporting date.
Economic debt represents the face value of drawn borrowings adjusted for foreign currency movements hedged with derivative instruments. The Group uses cross currency interest rate swaps, interest rate swaps and foreign forward exchange contracts to manage its exposure to interest rates and borrowings sourced in currencies different from that of the borrowing entity's reporting currency. Details of debt hedging activities and instruments used are included in note 17.
Reconciliation of liabilities arising from financing activities
The table below details changes in the Group’s net debt arising from financing activities, including both cash and non-cash changes.
2020 NZ$M
Cash flows NZ$M
Currency translation
NZ$M
Other non-cash movements
(including hedge accounting)
NZ$M2021
NZ$M
Private placements 1,001 (458) (44) (23) 476
Bank loans 400 (396) (4)
Capital notes 365 (3) (1) 361
Other loans 25 (4) (1) 20
Carrying value of borrowings (as per balance sheet)
1,791 (861) (49) (24) 857
Less: value of derivatives used to manage changes in hedged risks on debt instruments
(190) 97 51 24 (18)
Economic debt 1,601 (764) 2 839
Less: cash and cash equivalents (1,104) 433 5 (666)
Net debt 497 (331) 7 173
Fletcher Building Limited Annual Report 2021 95
For
per
sona
l use
onl
y

2019 NZ$M
Cash flows NZ$M
Currency translation
NZ$M
Reclassified to lease
liabilities NZ$M
Other non-cash movements
(including hedge accounting)
NZ$M2020
NZ$M
Private placements 886 (8) 35 88 1,001
Bank loans 258 142 400
Capital notes 485 (120) 365
Other loans 68 2 (2) (44) 1 25
Carrying value of borrowings (as per balance sheet)
1,697 16 33 (44) 89 1,791
Less: value of derivatives used to manage changes in hedged risks on debt instruments
(107) (4) (22) (57) (190)
Economic debt 1,590 12 11 (44) 32 1,601
Less: cash and cash equivalents (1,372) 267 1 (1,104)
Net debt 218 279 12 (44) 32 497
Carrying value of borrowings included within the balance sheet as follows:2021
NZ$M2020
NZ$M
Current borrowings 106 581
Non-current borrowings 751 1,210
Total borrowings 857 1,791
At reporting date, the Group had the following funding facilities:
Utilised facilities 839 1,601
Unutilised syndicate bank loan facilities 925 525
Total facilities 1,764 2,126
Private placements
Private placements comprise loans of USD246 million, CAD15 million, EUR41 million and GBP10 million with maturities between 2026 and 2028.
On 29 July 2020, the Group prepaid AUD99 million and USD200 million of notes on issue with original maturities of 2022 and 2024. These were classified as current at 30 June 2020. The Group recognised a significant item of $2 million in the year (2020: $30 million) related to the private placement make-whole component of the prepayment (including the impact of debt hedging activities) as governed by the private placement borrowing agreement.
Capital notes
At 30 June 2021 the Group had issued $361 million of listed capital notes to retail investors (2020: $365 million) with maturities between 2022 and 2026. The capital notes do not carry voting rights and do not participate in any change in value of the issued shares of Fletcher Building Limited.
Listed capital notes
Listed capital notes are long-term fixed rate unsecured subordinated debt instruments that are traded on the NZDX. On election date, holders may choose either to keep their capital notes on new terms or convert the principal amount and any accrued interest into shares of Fletcher Building Limited, at approximately 98% of the current market price. If the principal amount of these notes held at 30 June 2021 were to be converted to shares, 49 million (2020: 101 million) Fletcher Building Limited shares would be issued at the share price as at 30 June 2021, of $7.52 (2020: $3.70).
Instead of issuing shares to holders who choose to convert, Fletcher Building may, at its option, purchase or redeem the capital notes for cash at the principal amount plus any accrued interest.
As at 30 June 2021, the Group held $140 million (2020: $135 million) of its own capital notes.
Notes to the Financial Statements 2021 (Continued)
Fletcher Building Limited Annual Report 202196
For
per
sona
l use
onl
y

Bank Loans
At 30 June 2021 the Group had a $925 million syndicated revolving credit facility on an unsecured, negative pledge and borrowing covenant basis, with ANZ Bank New Zealand Limited, Bank of China (New Zealand) Limited, Bank of New Zealand, China Construction Bank (New Zealand) Limited, Citibank, N.A., MUFG Bank,Ltd., The Hongkong and Shanghai Banking Corporation Limited and Westpac New Zealand Limited.
The facility has two tranches, $525 million maturing in July 2022 (Tranche 1) and $400 million maturing in July 2024 (Tranche 2).
The funds under this facility can be borrowed in United States, Australian and New Zealand dollars. At 30 June 2021, the Group was in compliance with the applicable covenants.
Other Loans At 30 June 2021 the Group had unsecured loans of $20 million (2020: $25 million) some of which were subject to the negative pledge. Other loans include bank overdrafts, short-term loans, working capital facilities and amortising loans.
Negative pledge
The Group borrows certain funds based on a negative pledge arrangement. The negative pledge includes a cross guarantee between a number of wholly owned subsidiaries and ensures that external senior indebtedness ranks equally in all respects and includes the covenant that security can be given only in very limited circumstances. At 30 June 2021 the Group had debt subject to the negative pledge of $471 million (2020: $1,230 million).
Covenants
On 10 June 2020, the Group agreed amendments to its syndicate and private placement borrowing arrangements which enabled the Group to rely on more favourable terms for covenant testing for the period June 2020 to December 2021 (inclusive). Under the agreement, the Group tested covenants with a level of Total Interest Cover ratio of 1.5 times (normally 2.0 times) and a level of Senior Interest Cover ratio of 2.25 times (normally 3.0 times). In February 2021, the amendments were revised to allow the Group to pay an interim dividend to shareholders. The amendments to the borrowing facilities between the Group and its lenders ceased in June 2021 and the Group returned to normal financial covenant levels.
The Group was in compliance with all financial covenants as at the balance date.
The impact of debt hedging activities on borrowings is represented in the table below:
2021Underlying borrowing
exposureEconomic debt
exposure
Currency of borrowingsFixed rate
NZ$MFloating rate
NZ$M
Impact of hedging
NZ$MFixed rate
NZ$MFloating rate
NZ$M % Fixed
New Zealand Dollar 361 2 137 375 125 75%
Australian Dollar 4 321 212 113 65%
British Pound 20 (20) -
Canadian Dollar 17 (17) -
Euro 71 (71) -
United States Dollar 368 (368) -
Other 14 14 -
Total 837 20 (18) 587 252 70%
2020Underlying borrowing
exposureEconomic debt
exposure
Currency of borrowingsFixed rate
NZ$MFloating rate
NZ$M
Impact of hedging
NZ$MFixed rate
NZ$MFloating rate
NZ$M % Fixed
New Zealand Dollar 365 405 246 415 601 41%
Australian Dollar 118 6 447 317 254 56%
British Pound 20 (20) -
Canadian Dollar 17 (17) -
Euro 73 (73) -
United States Dollar 773 (773) -
Other 14 14 -
Total 1,366 425 (190) 732 869 46%
Fletcher Building Limited Annual Report 2021 97
For
per
sona
l use
onl
y

Liquidity risk
Liquidity risk is the risk that the Group will encounter difficulty in meeting its financial commitments as they fall due. The Group manages its liquidity risk by maintaining a target level of undrawn committed credit facilities and a spread of the maturity dates of the Group's debt facilities that it reviews on an ongoing basis.
The following maturity analysis table sets out the remaining contractual undiscounted cash flows, including estimated interest payments for non-derivative financial liabilities and derivative financial instruments. Creditors and accruals are excluded from this analysis as they are not part of the Group's assessment of liquidity risk because these are offset by debtors with similar payment terms.
2021
Contractual cash flows
NZ$MUp to 1 Year
NZ$M1–2 Years
NZ$M2–5 Years
NZ$MOver 5 Years
NZ$M
Bank loans
Capital notes 360 100 56 204
Private placements 460 460
Other loans 20 6 14
Borrowings - Principal cash flows 840 106 70 204 460
Gross settled derivatives - to pay 780 321 105 354
Gross settled derivatives - to receive (782) (323) (107) (352)
Debt derivatives financial instruments - Principal cash flows
(2) (2) (2) 2
Total principal cash flows 838 104 68 204 462
Contractual interest cash flows 157 35 28 69 25
Total lease cash flow 2,192 233 217 529 1,213
Total contractual cash flows 3,187 372 313 802 1,700
2020
Contractual cash flows
NZ$MUp to 1 Year
NZ$M1–2 Years
NZ$M2–5 Years
NZ$MOver 5 Years
NZ$M
Bank loans 400 400
Capital notes 365 100 100 165
Private placements 1,001 470 531
Other loans 25 11 14
Borrowings - Principal cash flows 1,791 581 100 579 531
Gross settled derivatives - to pay 906 447 105 354
Gross settled derivatives - to receive (1,096) (566) (109) (421)
Debt derivatives financial instruments - Principal cash flows
(190) (119) (4) (67)
Total principal cash flows 1,601 462 100 575 464
Contractual interest cash flows 175 49 37 60 29
Total lease cash flow 2,317 244 226 564 1,283
Total contractual cash flows 4,093 755 363 1,199 1,776
Notes to the Financial Statements 2021 (Continued)
Fletcher Building Limited Annual Report 202198
For
per
sona
l use
onl
y

16. NET FUNDING COSTS
Interest expense and income are recognised on an accrual basis in the profit or loss using the effective interest method.
Funding costs also include the changes in fair value relating to derivatives used to manage interest rate risk, and the associated changes in fair value of the borrowings designated in a hedge relationship attributable to the hedged risk.
2021 NZ$M
2020 NZ$M
Interest income (4) (9)
Interest on borrowings and derivatives 39 65
Interest expense other 3 5
Net interest expense 38 61
Changes in fair value relating to:
Borrowings designated in a hedging relationship (22) 50
Derivatives designated in a hedging relationship 22 (50)
Total changes in fair value
Bank fees, registry and other expenses 1 10
Line fees 7 7
Other (gains)/losses (2) 2
Net funding costs 44 80
Included in interest on borrowings and derivatives is the net settlement of the Group's interest derivatives. This consists of $18 million of interest income and $20 million of interest expense (2020: $39 million interest income; $35 million interest expense). Other (gains)/losses includes credit valuation adjustment (CVA)/debit valuation adjustments (DVA) on derivatives.
Interest rate risk
At 30 June 2021, 70% of the Group's debt was subject to a fixed interest rate (2020: 46% fixed).
(i) Interest rate repricing
The following tables set out the interest rate repricing profile of interest bearing financial liabilities assuming floating rate facilities are utilised to maintain debt levels.
2021 NZ$M
2022 NZ$M
2023 NZ$M
2024 NZ$M
2025 NZ$M
2026 NZ$M
Fixed financial liabilities 587 376 355 135 55
Floating financial liabilities 252 463 484 704 784 839
Economic debt 839 839 839 839 839 839
% Fixed 70% 45% 42% 16% 7% 0%
The Group's overall weighted average interest rate (based on year end borrowings) excluding fees is 4.04% (2020: 3.67%).
(ii) Interest rate risk
It is estimated a 100 basis point increase in interest rates would result in an increase in the Group's interest costs by approximately $2.5 million pre-tax on the Group's debt portfolio exposed to floating rates at balance date (2020: $8.7 million) assuming that all other variables remain constant.
Fletcher Building Limited Annual Report 2021 99
For
per
sona
l use
onl
y

17. FINANCIAL RISK MANAGEMENT
Exposures to credit, liquidity, foreign currency, interest rate and commodity price risks arise in the normal course of the Group’s business. The principles under which these risks are managed are set out in policy documents approved by the Board. The policy documents identify the risks and set out the Group’s objectives, policies and processes to measure, manage and report the risks. The policies are reviewed periodically to reflect changes in financial markets and the Group’s businesses. Risk management is carried out in conjunction with the Group's central treasury function, which ensures compliance with the risk management policies and procedures.
Derivative financial instruments, including foreign forward exchange contracts, interest rate swaps, foreign currency swaps, cross currency interest rate swaps, options, forward rate agreements and commodity price swaps are utilised to reduce exposure to market risks. All the Group’s derivative financial instruments are held to hedge risk on underlying assets, liabilities and forecast and committed trading and funding transactions. The Group policy specifically prohibits the use of derivative financial instruments for trading or speculative purposes.
The table below summarises the key financial market risks to the Group and how these risks are managed:
Financial risk Description Management of risk
Foreign currency trade transaction risk (note 17.1(i))
Arises on the conversion of a Business Unit’s foreign currency revenue and expenditure to its functional currency, such that a material loss or a gain may be incurred. This covers imports, exports, capital expenditure, and foreign currency bank accounts balances that are not in a Business Unit’s functional currency.
It is Group policy that no currency exchange risk may be entered into or allowed to remain outstanding should it arise on committed transactions. The Group uses foreign currency forward contracts and foreign currency options to manage the risk on firm commitments and recognised material trade related exposures. The majority of these transactions have maturities of less than one year from the reporting date.
Foreign currency balance sheet translation risk (note 17.1(ii))
Arises due to the translation of the Group’s foreign denominated assets and liabilities, overseas operations and subsidiaries to the company’s functional currency of NZD, such that the Group’s reporting of financial ratios would be materially affected.
It is the Group's policy to hedge this foreign currency translation risk by borrowing in the currency of the asset in proportion to the Group's long-term debt to debt plus equity ratio as approved by the Board.
Where the underlying debt in any currency does not equate to the required proportion of total debt, debt derivatives, such as foreign exchange forwards, swaps and cross currency interest rate swaps are entered into. These are designated as net investment hedges where the borrowings or contracts are in a different currency from that of the business in which they are recognised.
To manage the net exposure to foreign currency borrowings, the Group enters into cross currency interest rate swaps (CCIRS). CCIRS are used to manage the combined foreign exchange risk and interest rate risk as they swap fixed rate foreign currency borrowings and interest payments into equivalent New Zealand dollar-denominated amounts of principal with floating interest rates.
Interest rate risk (note 15 & note 17.2)
The risk that the value of borrowings or cash flows associated with the borrowings will change due to changes in market rates.
The Group manages the fixed interest rate component of its borrowings by entering into CCIRS, interest rate swaps, forward rate agreements and options. It aims to maintain fixed interest rate borrowings between certain ranges over specific time periods.
Commodity price risk Arises from committed or highly probable trade and capital expenditure transactions that are linked to traded commodities.
The Group manages its commodity price risks through negotiated supply contracts and, for certain commodities, by using commodity price swaps and options. The Group manages its commodity price risk depending on the underlying exposures, economic conditions and access to active derivatives markets. Cash flow hedge accounting is applied to commodity derivative contracts. In the current year, the Group used commodity price swaps to hedge electricity prices and diesel prices. The average hedged electricity price for 2021 was NZ$/MWh 99 (2020: NZ$/MWh 118). The average hedged diesel price for 2021 was NZ$/litre 0.45 (2020: NZ$/litre 0.73).
A 10% increase in the New Zealand electricity spot price or the New Zealand diesel spot price at balance sheet date would not have a material impact on the Group's earnings or equity position.
Disclosure about the credit risk associated with financial instruments and fair value measurement of financial instruments is included in notes 17.3 and 17.4.
Notes to the Financial Statements 2021 (Continued)
Fletcher Building Limited Annual Report 2021100
For
per
sona
l use
onl
y

Derivative financial instruments and hedge accounting
Derivatives are recorded at fair value with the resulting gain or loss on remeasurement recognised in the income statement unless the derivative is designated into an effective hedge relationship as a hedging instrument, in which case the timing of recognition in the income statement depends on the nature of the designated hedge relationship. For a derivative instrument to be classified and accounted for as a hedge, it must be highly correlated with, and effective as a hedge of the underlying risk being managed. This relationship is documented from inception of the hedge. The fair values of derivative financial instruments are determined by applying quoted market prices, where available, or by using inputs that are observable for the asset or liability.
The Group may designate derivatives as:
– Fair value hedges (where the derivative is used to manage the variability in the fair value of recognised assets and liabilities);
– Cash flow hedges (where the derivative is used to manage the variability in cash flows relating to recognised liabilities or forecast transactions); or
– Net investment hedges (where borrowings or derivatives are used to manage the risk of fluctuation in the translated value of its foreign operations).
The Group holds derivative instruments until expiry except where the underlying rationale from a risk management point of view changes, such as when the underlying asset or liability that the instrument hedges no longer exists, in which case early termination occurs.
Fair value hedgesWhere a derivative financial instrument is designated as a hedge of a recognised asset or liability, or of a firm commitment, any gain or loss on the derivative (hedging instrument) is recognised directly in the income statement, together with any changes in the fair value of the hedged risk (hedged item).
Cash flow hedgesWhere a derivative financial instrument is designated as a hedge of the variability in cash flows of assets or liabilities, or of a highly probable forecasted transaction, the effective part of any gain or loss is recognised directly in the cash flow hedge reserve within equity and the ineffective part is recognised immediately in the income statement. The effective portion is reclassified to the income statement when the underlying cash flows affect the income statement.
If the hedge no longer meets the criteria for hedge accounting, hedge accounting is discontinued. The cumulative gain or loss previously recognised in the cash flow hedge reserve remains there until the forecast transaction occurs, or is immediately recognised in the income statement if the transaction is no longer expected to occur.
Net investment hedgesWhere the derivative financial instruments are designated as a hedge of a net investment in a foreign operation, the derivative financial instruments are accounted for on the same basis as cash flow hedges through the foreign currency translation reserve (FCTR) within equity.
Cost of hedgingThe forward elements of foreign exchange forwards and swaps are excluded from designation as the hedging instrument and the foreign currency basis spreads of CCIRS are separately accounted for and recognised in other comprehensive income as a cost of hedging.
Derivatives that do not qualify for hedge accountingWhere a derivative financial instrument does not qualify for hedge accounting, or where hedge accounting has not been elected, any gain or loss is recognised directly in the income statement.
17.1 Foreign currency risk
(i) Currency transaction risk
Cash flow hedge accounting is applied to forecast transactions and short-term intra-group cash funding. The Group designates the spot element of foreign exchange forwards and swaps to hedge its currency risk and applies a hedge ratio of 1:1. The Group's policy is for the critical terms of the foreign exchange forwards and swaps to align with the hedged item. The main currencies hedged are the Australian dollar, the United States dollar and the Euro. The gross value of these foreign exchange derivatives at 30 June 2021 was $656 million (2020: $570 million).
Fletcher Building Limited Annual Report 2021 101
For
per
sona
l use
onl
y

(ii) Currency translation risk
The effect of the Group’s hedge accounting policy in managing foreign exchange risk related to the Group’s net investments in foreign operations is presented in the table below:
Hedging investments and hedging instruments used (NZ$M)
2021 AUD Maturity:
0-4 months
2020 AUD Maturity:
0-4 months
Amount of investment hedged
Foreign currency borrowings 321 235
Notional amount
Foreign currency swaps (321) (235)
Hedge effectiveness
Change in value used for calculating hedge ineffectiveness (2) 2
Net investment hedge gain/(loss) recognised in other comprehensive Income 2 (2)
It is estimated a 10% weakening of the New Zealand dollar against the major foreign currencies the Group is exposed to on the net assets of its foreign operations would result in an increase to equity of approximately $149 million (2020: $138 million) and no material impact on earnings.
The Group applies hedge accounting to foreign currency denominated borrowings that are managed by CCIRS. The hedge ratio applied is 1:1. The hedge relationship may be designated into separate cash flow hedges and fair value hedges to manage the different components of foreign currency and interest rate risk:
- fair value hedge relationship where CCIRS are used to manage the interest rate and foreign exchange risks
- currency risk in relation to foreign currency denominated borrowings with fixed interest rates
- cash flow hedge relationship where CCIRS are used to manage the variability in cash flows arising from interest rate movements on floating interest rate payments and foreign exchange movements on payments of principal and interest.
The Group determines the existence of an economic relationship between the hedging instrument and hedged item based on the currency, reference interest rates, tenors, repricing dates and maturities and the notional amounts. The Group assesses whether the derivative designated in each hedging relationship is expected to be effective in offsetting changes in the fair value of the hedged item using the hypothetical derivative method.
In these hedging relationships, the main sources of ineffectiveness are:
- changes in counterparty credit risk and cross currency basis spreads which are not reflected in the change in the fair value of the hedged item; and
- differences in repricing dates between the cross currency interest rate swaps and the borrowings.
Notes to the Financial Statements 2021 (Continued)
Fletcher Building Limited Annual Report 2021102
For
per
sona
l use
onl
y

The effect of the Group’s hedge accounting policies in managing both its foreign exchange risk and interest rate risk related to borrowings denominated in foreign currency is presented in the table below.
2021
USD 61-85 months
FloatingNZD/USD
0.7055NZ$M
CAD13 months
FloatingNZD/CAD
0.8795NZ$M
EUR13 months
FloatingNZD/EUR
0.5994NZ$M
GBP 13 months
FloatingNZD/GBP
0.5419NZ$M
TotalNZ$M
Cash flow hedging and fair value hedging
Cross currency interest rate swaps
Nominal amount of the hedging instrument 352 17 71 20 460
Carrying amount 6 1 2 9
Accumulated cost of hedging (4) (4)
Change in value used for calculating hedge ineffectiveness 23 23
Hedging loss recognised in other comprehensive income 1 1
Fair value hedge (income statement) (gain)/loss 22 22
2020
USD73-97 months
FloatingNZD/USD
0.7055NZ$M
CAD25 months
FloatingNZD/CAD
0.8795NZ$M
EUR25 months
FloatingNZD/EUR
0.5994NZ$M
GBP25 months
FloatingNZD/GBP
0.5419NZ$M
USD18-42 months
FloatingAUD/USD
1.0082NZ$M
TotalNZ$M
Cash flow hedging and fair value hedging
Cross currency interest rate swaps
Nominal amount of the hedging instrument 383 17 73 20 312 805
Carrying amount 63 3 1 121 188
Accumulated cost of hedging (8) (1) (1) (10)
Change in value used for calculating hedge ineffectiveness
43 (1) 10 52
Hedging (gain) recognised in other comprehensive income
(4) (4)
Hedging (gain) reclassified to income statement (7)* (7)
Fair value hedge (income statement) (gain)/loss (39) (11) (50)
*As a consequence of the prepayment notices issued to private placement noteholders on 29 June 2020, a portion of the related cross currency interest swap designated in a cash flow hedge relationship was ineffective and subsequently reclassified to the income statement and recognised net of the private placement make-whole in significant items.
17.2 Interest rate risk
The Group applies hedge accounting to the borrowings and the associated interest rate swaps, for movements in benchmark market interest rates. Hedge accounting is applied on these instruments for floating-to-fixed instruments as cash flow hedges or for fixed-to-floating instruments as fair value hedges. The Group applies a hedge ratio of 1:1.
The Group determines the existence of an economic relationship between the hedging instrument and hedged item based on the reference interest rates, tenors, repricing dates and maturities and the notional amounts.
The Group assesses whether the derivative designated in each hedging relationship is expected to be effective in offsetting changes in the fair value of the hedged item using the hypothetical derivative method.
In these hedging relationships, the main sources of ineffectiveness are: - the effect of the counterparty and the Group's own credit risk on the fair value of the interest rate swaps which is not reflected in the change
in the fair value of the hedged item; and- differences in repricing dates between the interest rate swaps and the borrowings.
Fletcher Building Limited Annual Report 2021 103
For
per
sona
l use
onl
y

2021
NZD Borrowings9-21 Months
3.08% NZ$M
AUD Borrowings6-30 Months
1.87%NZ$M Total NZ$M
Cash flow hedging
Interest rate swaps
Nominal amount of the hedging instrument 14 212 226
Carrying amount - derivative (liabilities) (1) (7) (8)
Change in value used for calculating hedge ineffectiveness 1 3 4
Hedging (gain)/loss recognised in other comprehensive income (1) (3) (4)
2020
21 Months3.10%NZ$M
18-42 Months 1.87%NZ$M Total NZ$M
Cash flow hedging
Interest rate swaps
Nominal amount of the hedging instrument 50 211 261
Carrying amount - derivative (liabilities) (2) (10) (12)
Change in value used for calculating hedge ineffectiveness (4) (4)
Hedging loss recognised in other comprehensive income 4 4
There was no hedge ineffectiveness recognised in profit or loss during the year.
17.3 Credit risk
Credit risk is the risk of financial loss to the Group if a customer or counterparty to a financial instrument fails to meet its contractual obligations. To the extent the Group has a receivable from another party, there is a credit risk in the event of non-performance by that counterparty and arises principally from receivables from customers, derivative financial instruments and the investment of cash.
(i) Impairment of financial assets
The Group has a credit policy in place under which customers are individually analysed for credit worthiness and assigned a purchase limit. If no external ratings are available, the Group reviews the customer's financial statements, trade references, bankers' references and/or credit agencies' reports to assess credit worthiness. These limits are reviewed on a regular basis. Owing to the Group’s industry spread at balance date, there were no significant concentrations of credit risks in respect of trade receivables. Refer to note 8 for debtor balances and ageing analysis.
The Group has two types of financial assets that are subject to the expected credit loss model:
- Debtors (including trade debtors, contract debtors and contract retentions) (note 8)
- Construction contract assets (note 3)
While cash and cash equivalents are also subject to the impairment requirements of NZ IFRS 9: Financial Instruments, the identified impairment loss was immaterial.
Most goods are sold subject to retention of title clauses, so that in the event of non-payment the Group may have a secured claim. Credit risks may be further mitigated by registering an interest in the goods sold and the proceeds arising from that supply. The Group does not otherwise require collateral in respect of trade receivables.
Debtors and construction contract assets
The Group applies the NZ IFRS 9 simplified approach to measuring expected credit losses which uses a lifetime expected loss allowance for all trade receivables and contract assets.
To measure the expected credit losses, trade receivables and contract assets have been grouped based on shared credit risk characteristics and the days past due. The construction contract assets relate to unbilled work in progress and have substantially the same risk characteristics as the trade receivables for the same types of contracts. The Group has therefore concluded that the expected loss rates for trade receivables are a reasonable approximation of the loss rates for the contract assets.
The expected loss rates are based on the payment profiles of historical sales the corresponding historical credit losses experienced within this period. The historical loss rates are adjusted to reflect current and forward looking information on macroeconomic factors affecting the ability of the customers to settle the receivables. The Group has identified the GDP and the unemployment rate of the countries in which it sells its goods and services to be the most relevant factors, and accordingly adjusts the historical loss rates based on expected changes in these factors.
Notes to the Financial Statements 2021 (Continued)
Fletcher Building Limited Annual Report 2021104
For
per
sona
l use
onl
y

In response to COVID-19 the Group undertook a review of its customer credit portfolio and its exposure to Expected Credit Losses (ECL). The review considered the macroeconomic outlook, client and customer credit quality, the type of collateral held, exposure at default and the effect of payment deferral options as at the reporting date. As at 30 June 2020 this resulted in an additional Group ECL provision of $6m which was recognised within significant items. During the year to 30 June 2021 only $0.6m of this was utilised. Key estimates and judgements used in measurement of the Group's ECL provision as at 30 June 2021 resulting in a full reversal of remaining provision of $5.4m to significant items. Key factors considered as at 30 June 2021 included strong trading conditions, improved economic and market outlook, and absence of increased delinquency rates. The gain on reversal of provision was recognised as a significant item as at 30 June 2021.
The table below provides movement in the Group's ECL provision:
2021 NZ$M
2020 NZ$M
Opening provision for expected credit losses as at 1 July 2020 (25) (15)
Increase in provision for doubtful debts recognised in profit or loss (15)
Receivables written off during the year as uncollectible 1 5
Unused amount reversed 6
Closing provision for expected credit losses as at 30 June 2021 (18) (25)
Trade receivables and contract assets are written off where there is no reasonable expectation of recovery. Indicators that there is no reasonable expectation of recovery include, amongst others, the failure of a debtor to engage in a repayment plan with the Group.
Impairment losses on trade receivables and contract assets are presented as net impairment losses within operating profit. Subsequent recoveries of amounts previously written off are credited against the same line item.
(ii) Derivative financial instruments and the investment of cash
The Group enters into derivative financial instruments and invests cash with various counterparties in accordance with established Board approved credit limits as to credit rating and dollar value but does not require collateral or other security except in limited circumstances. In accordance with the established counterparty limits, there are no significant concentrations of credit risk in respect of these financial instruments and no loss is expected.
The Group has not renegotiated the terms of any financial assets that would otherwise be overdue or impaired. The carrying amount of non-derivative financial assets represents the maximum credit exposure. The carrying amount of derivative financial assets is at their current fair value.
17.4 Fair Values
The estimated fair value measurements for financial assets and liabilities compared to their carrying values in the balance sheet, are as follows:
Classification
2021Carrying
valueNZ$M
2021Fair value
NZ$M
2020Carrying
valueNZ$M
2020Fair value
NZ$M
Financial assets
Cash and liquid deposits Amortised cost 666 666 1,104 1,104
Debtors Amortised cost 1,072 1,072 991 991
Forward exchange contracts - fair value through profit or loss Fair value 3 3 1 1
Forward exchange contracts - cash flow hedge Fair value 4 4 2 2
Forward exchange contracts - net investment hedge Fair value 2 2
Cross currency interest rate swaps - split designation Fair value 9 9 188 188
Commodity price swaps - cash flow hedge Fair value 1 1 1 1
Total financial assets 1,757 1,757 2,287 2,287
Fletcher Building Limited Annual Report 2021 105
For
per
sona
l use
onl
y

Classification
2021Carrying
valueNZ$M
2021Fair value
NZ$M
2020Carrying
valueNZ$M
2020Fair value
NZ$M
Financial liabilities
Creditors and accruals Amortised cost 1,050 1,050 931 931
Bank loans Amortised cost 400 400
Private placements Amortised cost 476 499 1,001 1,007
Other loans Amortised cost 20 20 25 25
Capital notes Amortised cost 361 374 365 372
Forward exchange contracts - fair value through profit or loss Fair value 1 1 2 2
Forward exchange contracts - cash flow hedge Fair value 14 14 4 4
Forward exchange contracts - net investment hedge Fair value 2 2
Interest rate swaps - cash flow hedge Fair value 8 8 12 12
Commodity price swaps - cash flow hedge Fair value 1 1
Total financial liabilities 1,931 1,967 2,742 2,755
Total financial instruments (174) (210) (455) (468)
Fair value measurement
All of the Group's derivatives are in designated hedge relationships and are measured and recognised at fair value.
All derivatives are level 2 valuations based on accepted valuation methodologies. Forward exchange fair value is calculated using quoted forward exchange rates and discounted using yield curves derived from quoted interest rates matching maturity of the contract. The fair value of commodity price swaps is measured using a derived forward curve and discounted using yield curves derived from quoted interest rates matching the maturity of the contract.
Interest rate derivatives are calculated by discounting the future principal and interest cash flows at current market interest rates that are available for similar financial instruments.
Level 1 Quoted prices (unadjusted) in active markets for identical assets or liabilities.
Level 2 Inputs that are observable for the asset or liability, either directly (as prices) or indirectly (derived from prices) other than quoted prices included within level 1.
Level 3 Inputs for the asset or liability that are not based on observable market data (unobservable inputs).
Fair value disclosures
The fair values of borrowings used for disclosure are measured under level 2, by discounting future principal and interest cash flows at the current market interest rate plus an estimated credit margin that is available for similar financial instruments with a similar credit profile to the Group.
The interest rates across all currencies used to discount future principal and interest cash flows are between (0.6%) and 2.5% (2020: (0.5%) and 4.0%) including margins, for both accounting and disclosure purposes.
Notes to the Financial Statements 2021 (Continued)
Fletcher Building Limited Annual Report 2021106
For
per
sona
l use
onl
y

Group Structure and Related PartiesThis section details the Group's capital, non-controlling interest of subsidiaries, investments in associates and joint ventures and information relating to transactions with other Group entities.
18. DIVIDENDS AND SHAREHOLDER TAX CREDITS
Dividends2021
NZ$M2020
NZ$M
Final paid dividend October 2020 128
Interim dividend paid March 2021 99
99 128
In line with the Company's dividend policy, the Board determined that it would declare a final dividend of 18.0 cents per share for the 2021 financial year.
Shareholder tax credits Imputation and franking credits allow the Company to transfer the benefit from the tax it has paid in New Zealand and Australia respectively
to its shareholders when it pays dividends.
2021 NZ$M
2020 NZ$M
Imputation credit account
Imputation credits at the beginning of the year 4 3
Taxation paid 1 1
5 4
2021 A$M
2020 A$M
Franking credit account
Franking credits at the beginning of the year 32 32
Taxation paid/(refunded) (1)
Franking credits received 3 1
35 32
19. CAPITAL
Ordinary shares are classified as shareholders’ funds. Costs directly attributable to the issue of new shares or options are shown in shareholders’ funds as a reduction from the proceeds. Acquired shares are classified as treasury stock and presented as a deduction from share capital under the treasury stock method, as if the shares are cancelled, until they are reissued or otherwise disposed of.
2021 NZ$M
2020 NZ$M
Reported capital at the beginning of the year including treasury stock 3,300 3,447
Repurchase of shares (25) (147)
Vested share-based payment 3
Reported capital at the end of the year including treasury stock 3,278 3,300
Treasury stock (30) (20)
3,248 3,280
All ordinary shares are issued and fully paid and carry equal rights in respect of voting, dividend payments and distribution upon winding up.
Fletcher Building Limited Annual Report 2021 107
For
per
sona
l use
onl
y

2021 2020
Number of ordinary shares issued and fully paid
Number of shares on issue at the beginning of the year 824,256,416 853,347,141
Repurchase of shares (3,104,397) (29,090,725)
Total number of shares on issue 821,152,019 824,256,416
Less shares accounted for as treasury stock (4,573,148) (3,031,034)
816,578,871 821,225,382
The Group recommenced an on-market share buyback in June 2021 after it suspended the programme in March 2020 in response to COVID-19 and its impact on the Group's operating cash flow. For the year ended 30 June 2021, the Group had repurchased 3,104,397 (2020: 29,090,725) shares for the total consideration of $24 million (2020: $147 million). These purchased shares were subsequently cancelled, leaving the total number of shares on issue at 30 June 2021 of 821,152,019 shares. In line with NZ IFRS, $0.1 million of transaction costs relating to the buyback were offset against share capital.
20. NON-CONTROLLING INTERESTS
Non-controlling interests are allocated their share of profit for the year in the income statement and are presented separately within equity in the balance sheet. The effect of all transactions with non-controlling interests that change the Group’s ownership interest but do not result in a change in control are recorded in equity.
2021 NZ$M
2020 NZ$M
Share capital 9 21
Reserves 7 14
16 35
21. INVESTMENTS IN ASSOCIATES AND JOINT VENTURES
Investments in associates are measured using the equity method. The equity method has been used for associate entities over which the Group has significant influence but not control.
A joint arrangement is an arrangement where two or more parties have joint control. The Group classifies its joint arrangements as either joint operations or joint ventures depending on the legal, contractual and other rights and obligations.
2021 NZ$M
2020 NZ$M
Investment by associate/joint venture:
Wespine Industries Pty Ltd 57 53
Hexion Australia Pty Ltd 22 21
Altus NZ Limited 71 64
Other 23 20
173 158
Equity accounted earnings comprise:
Sales - 100% 425 359
Earnings before taxation - 100% 53 18
Earnings before taxation - Fletcher Building share 26 9
Taxation expense (7) (2)
Earnings after taxation - Fletcher Building share 19 7
Notes to the Financial Statements 2021 (Continued)
Fletcher Building Limited Annual Report 2021108
For
per
sona
l use
onl
y

22. RELATED PARTY DISCLOSURES
The disclosures below sets out transactions and outstanding balances that Group companies and other related parties have with each other. Transactions with related parties are conducted on normal business terms.
Key management personnel are defined as the Executive Committee and Board of Directors.
Sales to related parties
NZ$M
Purchases from related parties
NZ$M
Amounts owing from related
parties (within debtors)
NZ$M
Amounts owing to related parties (within creditors)
NZ$M
2021
Wespine Industries Pty Ltd and Hexion Australia Pty Ltd 63 3
Interpipe Holdings Limited 5 1
Altus NZ Limited 12
2020
Wespine Industries Pty Ltd and Hexion Australia Pty Ltd 38 3
Interpipe Holdings Limited 4
Altus NZ Limited 11
2021 NZ$M
2020 NZ$M
Key management personnel compensation
Directors' fees 2 2
Executive committee remuneration paid, payable or provided for:
Short-term employee benefits 20 10
Long-term employee benefits 1
Termination benefits 1
Fletcher Building Retirement Plan
As at 30 June 2021, Fletcher Building Nominees Limited (the New Zealand retirement plan) held $4.5 million of shares in Fletcher Building (2020: $1.8 million of shares).
Fletcher Building Retirement Plan holds an investment in a property leased by Winstone Wallboards, a subsidiary of Fletcher Building Limited. The Group, through its subsidiary Fletcher Residential Limited, during the year exercised its right to purchase the property at an arm's length sales price of $36 million with settlement expected in 2022.
Fletcher Building Limited Annual Report 2021 109
For
per
sona
l use
onl
y

Other information This section provides additional required disclosures that are not covered in the previous sections.
23. CAPITAL EXPENDITURE COMMITMENTS
Capital expenditure commitments are those where future expenditure has been committed at year-end, but not recognised as liabilities is as follows:
2021 NZ$M
2020 NZ$M
Committed at year end:
Property, plant and equipment and other long term assets 344 411
Equity accounted investments 12 12
24. CONTINGENT LIABILITIES
Claims
There are a number of legal claims and exposures that arise from the normal course of the Group's business in respect of which no provision has been made. Where it is more likely than not that such a litigation will result in an outflow of resources that is already reasonably estimated, a claims provision is recorded in the amount of the present value of the expected cash outflows. Such provisions cover the estimated payments to the claimants, legal costs and the cost of potential settlements.
It is frequently impossible to reliably determine the existence of a present obligation or reasonably estimate the probability that a potential outflow of resources will result from a pending or future litigation. Also the amount of liability, if any, that may arise, cannot be measured reliably at this time.
Guarantees
In certain circumstances, the Group guarantees the performance of particular Business Units in respect of their obligations. This includes bonding and bank guarantee facilities used primarily by the construction business as well as performance guarantees for certain of the Group’s subsidiaries.
Silicosis
As at 30 June 2021, Laminex Australia (together with other engineered stone manufacturers and fabricators) was the subject of a number of silica related personal injury claims based in Queensland. The Group has accrued for this known exposure in Queensland. No silica related injury claims have been lodged in any other states. The Group has concluded it is too early to make a reliable estimate of any future potential claims and the extent of liability (if any) Laminex Australia may have in states outside Queensland. Accordingly, the Group has not recognised any provisions in respect of possible future silicosis claims as at 30 June 2021.
Holiday Pay
The Group assesses on an ongoing basis its compliance with the Holidays Act in respect of annual and public holiday payments. Pending the interpretation by the Court of Appeal of legislation defining "discretionary payments" under the Holidays Act, potential implications may arise requiring the Group to remediate past holiday pay payments in respect of staff who have participated in certain incentive schemes.
NZICC
On 22 October 2019 there was a significant fire at the NZICC project construction site causing damage to both the International Convention Centre and Hobson Street Hotel. Contract Works and Third Party Liability insurances are in place on the project, and the Fletcher Construction Company Limited is an insured party under these policies. Certain costs resulting from the fire may fall outside the scope of the Contract Works and Third Party Liability policies, with the possibility that recovery may be sought from the Group. As outlined in note 2.5, such costs that are known or considered probable as at balance date have been included in the assessment of the onerous contract provision. It is possible that as the project progresses additional costs will be identified that will need to be included in the onerous contract provision or as a separate provision. Due to the uncertainty regarding whether additional costs will be identified and incurred post balance date, no additional amounts have been recognised or disclosed as at 30 June 2021.
2021
NZ$M
2020
NZ$M
Contingent liabilities with respect to guarantees extended on trading transactions, performance bonds and other transactions
353 394
Contingent liabilities with respect to claims
353 394
Notes to the Financial Statements 2021 (Continued)
Fletcher Building Limited Annual Report 2021110
For
per
sona
l use
onl
y

25. TAXATION
The provision for current tax is the estimated amount due for payment during the next 12 months by the Group. The provision for deferred tax has been calculated using the balance sheet liability method.
Deferred tax is recognised on tax losses, tax credits and on the temporary difference between the carrying amount of assets and liabilities and their taxable value where recovery is considered probable. Deferred tax is not recognised on the following temporary differences:
- The initial recognition of goodwill.
- The initial recognition of asset and liabilities for a transaction that is not a business combination and, at the time of the transaction, affects neither the accounting profit nor taxable profit or loss.
There are no significant deferred tax liabilities in respect of the undistributed profits of subsidiaries and associates.
Judgements are required about the application of income tax legislation. These judgements and assumptions are subject to risk and uncertainty as there is a possibility of future changes in the interpretation and/or application of tax legislation. This may impact the amount of current and deferred tax assets and liabilities recognised in the balance sheet and the amount of other tax losses and temporary differences not yet recognised. In such circumstances, some or all of the carrying amounts of recognised tax assets and liabilities may require adjustment, resulting in a corresponding credit or charge to the income statement.
Below is the reconciliation of earnings before taxation to taxation expense:
2021 NZ$M
2020 NZ$M
Earnings/(loss) before taxation 433 (265)
Taxation at 28 cents per dollar 121 (74)
Adjusted for:
Difference in tax rates (4)
Non-assessable income (9) (3)
Non-deductible expenses 5 4
Tax losses for which no deferred tax asset was recognised 17 2
Utilisation of previous unrecognised tax losses (17) (3)
Tax in respect of prior years (1) (3)
116 (81)
Tax expense/(benefit) on earnings 116 (81)
116 (81)
Tax on earnings before significant items 137 (4)
Tax benefit on significant items (21) (77)
116 (81)
Total current taxation expense/(benefit) 130 (78)
Total deferred taxation benefit (14) (3)
116 (81)
Fletcher Building Limited Annual Report 2021 111
For
per
sona
l use
onl
y

2021 NZ$M
2020 NZ$M
Current tax assets/(liabilities)
Included within the balance sheet as follows:
Current tax assets 9 66
Current tax liabilities (5)
9 61
Movement during the year:
Opening provision for current tax assets 61 61
Taxation (expense)/benefit (130) 78
Transfer from/(to) deferred taxation 72 (85)
Non-controlling interest share of taxation expense 3 3
Tax recognised directly in reserves 1 3
Net tax payments 2 1
9 61
2021 NZ$M
2020 NZ$M
Provision for deferred tax assets
Included within the balance sheet as follows:
Deferred tax assets 224 285
224 285
Movement during the year:
Opening provision for deferred tax assets 285 119
Taxation expense 14 3
Transfer (from)/to current tax (72) 85
Held for sale (5)
Tax recognised directly in reserves 2 78
224 285
Composed of:
Provisions and other liabilities 145 162
Inventories 16 17
Debtors 5 8
Property, plant and equipment (37) (26)
Brands (83) (83)
Tax losses 92 128
Pensions (3)
Leases 85 84
Other 1 (2)
224 285
The Group has recognised certain tax losses available in Australia (and in New Zealand in FY20) on the basis that the respective companies will have future assessable income. This assessment has been made based on forecast earnings set out in the companies' strategic plans. The Group reviews future loss utilisations at each reporting period.
Notes to the Financial Statements 2021 (Continued)
Fletcher Building Limited Annual Report 2021112
For
per
sona
l use
onl
y

26. RETIREMENT PLANS
Fletcher Building Limited is the principal sponsoring company of a plan that provides retirement and other benefits to employees of the Group in New Zealand. Participation in this plan has been closed for a number of years, although defined contribution savings plans have been made available. Various defined benefit and defined contribution plans exist in Australia following the acquisition of the Crane, Amatek, Tasman Building Products, and Laminex businesses which Group Business Units contribute to on behalf of their employees. Where the plans have a deficit in their funded status, the companies are making additional contributions, as recommended by the Trustees of the plans, to improve the funded status.
The Group’s plan assets and liabilities in respect of individual defined benefit retirement plans are calculated separately for each plan by an independent actuary, as being the fair value of the plan’s assets less the present value of the future obligations to the members. The value of the asset recognised cannot exceed the present value of any future refunds from the plans or reductions in future contributions to the plans, unless a constructive right to a refund of the surplus exists, in which case the amount to be refunded is recognised as an asset. In the Group’s balance sheet, plans that are in a surplus position are not offset with plans that are in a liability position. The refund of the New Zealand surplus is subject to Financial Markets Authority (FMA) approval under FMCA 2013 Section 177.
Obligations for contributions to defined contribution plans are recognised in earnings as incurred. The actuarial cost of providing benefits under defined benefit plans is expensed as it accrues over the service life of the employees, after taking account of the income expected to be earned by the assets owned by the plans. All retirement plan related actuarial gains or losses are recognised in other comprehensive income in the pension reserve in the year in which they arise.
Principal assumptions made in the actuarial calculation of the defined benefit obligation relate to the discount rate, rate of salary inflation and life expectancy. The calculation of the defined benefit obligations are based on years of service and the employees' compensation during their years of employment. Contributions are intended to provide not only for benefits attributed to service to date but also for those expected to be earned in the future. These obligations are accounted for in accordance with NZ IAS 19 Employee Benefits, which has the effect of recognising the volatility in the returns earned by the plans in the pension reserve.
The following table provides the weighted average assumptions used to develop the net periodic pension cost and the actuarial present value of projected benefit obligations for the Group's plans:
2021 %
2020 %
Assumed discount rate on benefit obligations 1.89 1.02
Annual rate of increase in future compensation levels 2.12 2.18
Expected returns on plan assets have been determined by the independent actuaries as the weighted average of the expected return after tax and investment fees for each asset class by the target allocation of assets to each class.
During the year the Group contributed less than $1 million (2020: less than $1 million) in respect of its Australian defined benefit plans. It contributed $54 million (2020: $58 million) in respect of its defined contribution plans worldwide, including KiwiSaver and Australia Superannuation.
Fletcher Building Limited has an obligation to ensure that the funding ratio of the New Zealand plan's assets is at least 115% of the plan's actuarial liability. This is based upon any two consecutive annual actuarial valuations as calculated by the plan's actuary. This calculation is done on the plan's funding basis, which is completed in accordance with NZ IAS 26 Retirement Benefit Plans. At 31 March 2021, the value of the plan assets was 167% of the actuarial liability and the funded surplus was $117 million (31 March 2020: 142%, $73 million). In applying sensitivity analysis, a 1% lower discount rate assumption increases the defined benefit obligation by $20 million, whilst adding one additional year of life expectancy of scheme members increases the obligation by $9 million.
The Group expects to contribute less than $1 million to its New Zealand and Australian defined benefit plans during the year to 30 June 2022. The Group is currently not contributing to the New Zealand plan.
2021 NZ$M
2020 NZ$M
Net periodic pension cost
Service cost 2 3
Net interest cost (1)
Net periodic pension cost - recognised in earnings before interest and taxation 2 2
Recognised net asset
Assets of plans 401 369
Projected benefit obligation (293) (327)
Funded surplus 108 42
Asset ceiling effect
Recognised net asset 108 42
Fletcher Building Limited Annual Report 2021 113
For
per
sona
l use
onl
y

2021 NZ$M
2020 NZ$M
Recognised net asset by jurisdiction:
New Zealand plan 97 31
Australian plans 11 11
Retirement plan assets - recognised within non-current assets 108 42
Recognised net asset 108 42
Movement in recognised net asset
Recognised net asset at the beginning of the year 42 61
Currency translation (1)
Actuarial movements for the year 69 (17)
Net periodic pension cost (2) (2)
Recognised net asset 108 42
Assets of the plans
Assets of plans at the beginning of the year 369 400
Actual return on assets 65 8
Total contributions 1 1
Benefit payments (34) (40)
401 369
Assets of the plans consist of:
Australasian equities 35 45
International equities 132 110
Property 33 30
Bonds 113 104
Cash and short-term deposits 27 29
Other assets 61 51
401 369
Projected benefit obligation
Projected benefit obligation as at the beginning of the year (327) (339)
Service cost (2) (3)
Interest cost (3) (6)
Member contributions (1) (1)
Actuarial (loss)/gain arising on changes in financial assumptions 21 (21)
Actuarial gain arising on other assumptions - experience adjustments (13) 3
Benefit payments 33 40
Currency translation (1)
(293) (327)
Notes to the Financial Statements 2021 (Continued)
Fletcher Building Limited Annual Report 2021114
For
per
sona
l use
onl
y

27. SHARE-BASED PAYMENTS
The Group has a long-term share-based performance incentive scheme targeted at selected employees (invited to participate at the discretion of the Company) most able to influence the results of the Group.
The long-term share scheme allows scheme participants to acquire shares in the Company at market price, funded by an interest-free loan from the Group. The scheme participants are entitled to vote on the shares and to receive cash dividends, the proceeds of which are used to reduce the loan. The shares are held in trust for the scheme participants by the Trustee, Fletcher Building Share Schemes Limited.
Entitlement under the scheme is dependent upon the Group's total shareholder return (TSR) exceeding the 51st percentile of the TSR of the comparator Group over a three year restricted period. The three year restrictive period is automatically extended for an additional year if the minimum vesting threshold is not met. Scheme participants can elect to extend the restrictive period for an additional year if the Group's TSR means that the vesting level is between the 51st and 75th percentile of the comparator Group.
At the end of the restrictive period or any extension, the Group will pay a bonus to the executives to the extent that performance hurdles have been met, the after-tax amount of which will be generally sufficient for the scheme participants to repay the balance of the loan in respect of the shares which are to be transferred. Owing to the integrated nature of the scheme, for accounting purposes the Group accounts for the incentive scheme as being equity-settled. If the performance hurdles are not met or are only partially met, the trustee will acquire the beneficial interest in some or all of the relevant shares. The loan provided in respect of those shares which do not transfer to the scheme participants (the forfeited shares) will be novated to the trustee and will be fully repaid by the transfer of the forfeited shares.
The Group will recognise an expense in earnings, with a corresponding increase in the share-based payments reserve, over the restrictive period. If the performance hurdles based on TSR are not met and the shares do not transfer to the scheme participants, the amount in the share-based payments reserve will remain in equity and will not be released to earnings.
The Group accounts for the share schemes under the treasury stock method. The receivable owing from the scheme participants, representing the shares held in the Company, is deducted from the Group’s paid up capital. The shares are deducted from equity until the end of the restrictive period, at which point they transfer to scheme participants or beneficial ownership of the shares transfers to the trustee.
The following are details with regard to the scheme:
2020 Award
2019 Award
2018 Award
2017 Award
Grant date 1 July 2020 1 July 2019 1 July 2018 1 July 2017
Number of shares granted 1,998,635 1,386,100 1,041,605 890,075 (1)
Market price per share at grant date $3.66 $5.21 $6.99 $7.85
Total value at grant date (NZ$) $7,315,004 $7,221,581 $7,280,819 $6,985,959
Vesting date 30 June 2023 30 June 2022 30 June 2021 30 June 2020
Number of shares:
Number of shares originally granted 1,998,635 1,386,100 1,041,605 890,075
Less forfeited over life of scheme (71,291) (112,523) (205,979) (353,474)
Number of shares held at 30 June 2021 1,927,344 1,273,577 835,626 536,601(1) This is an average share price which includes 182,561 shares granted at $7.34 to Ross Taylor as Chief Executive Officer and the remainder issued to other participants at $7.98.
2021 NZ$M
2020 NZ$M
Total fair value expense in year for executive performance share scheme 6 5
Amount recognised at year end for related bonus payable 15 10
Fair value has been determined using Monte Carlo valuation methodology.
Employee retention share scheme
Special retention arrangements in the form of one-off share-based arrangements have also been put in place for selected employees.
The scheme is an equity settled scheme and the value recognised is based on the fair value of the shares at grant date.
The Group accounts for fair value of award shares over the service period.
Fletcher Building Limited Annual Report 2021 115
For
per
sona
l use
onl
y

Employee share purchase scheme - FBuShare
The employee share purchase scheme, FBuShare, allows eligible Group employees to regularly save up to NZ$5,000 per annum of their after-tax pay and purchase shares in the Company (purchased shares) at market prices. At the end of rolling three year qualification periods, and provided they remain employed by a Group company, employees will be awarded one free award share for every two purchased shares acquired in the first year of each three year qualification period and still held at the end of those periods.
Dividends payable will be re-invested in additional shares. Employees will receive award shares on any additional shares, subject to the same conditions set out above. The employees are responsible for any income tax liability payable on dividends and on the value of any award shares.
At the end of each three year qualification period, employees may continue to hold any purchased, additional and award shares or they may sell some or all of the shares.
The Group accounts for fair value of award shares over the three year qualification periods.
28. SUBSEQUENT EVENTS
Dividend
On 18 August, the Directors declared a final dividend of 18.0 cents per share, payable on Friday 17 September.
COVID-19
COVID-19 restrictions have been introduced by New Zealand and Australian governments since 30 June 2021. The Group will continue to monitor and respond to the changing nature of the pandemic.
Rocla disposal
On 29 July 2021, the Group entered an agreement to dispose 100% of the issued shares in Rocla Pty Limited, a wholly owned subsidiary under the Australia segment, for consideration of A$55 million. The impact of this transaction on carrying value of Rocla Pty Limited’s net assets has been recognised at 30 June 2021 (as disclosed in note 2.4).
Other than the items above, there is no other matter or circumstance that has arisen since the end of the financial year that has significantly affected, or may significantly affect, the Group’s operations or the Group’s consolidated financial statements.
Notes to the Financial Statements 2021 (Continued)
Fletcher Building Limited Annual Report 2021116
For
per
sona
l use
onl
y

Independent Auditor's Report
Independent Auditor's Report to the Shareholders of Fletcher Building Limited
OPINION
We have audited the financial statements of Fletcher Building Limited (“the Company”) and its subsidiaries (together “the Group”) on pages 69 to 116, which comprise the consolidated balance sheet of the Group as at 30 June 2021, and the consolidated income statement, consolidated statement of comprehensive income, consolidated statement of movements in equity and consolidated statement of cash flows for the year then ended of the Group, and the notes to the consolidated financial statements including a summary of significant accounting policies.
In our opinion, the consolidated financial statements on pages 69 to 116 present fairly, in all material respects, the consolidated financial position of the Group as at 30 June 2021 and its consolidated financial performance and cash flows for the year then ended in accordance with New Zealand equivalents to International Financial Reporting Standards and International Financial Reporting Standards.
This report is made solely to the Company's shareholders, as a body. Our audit has been undertaken so that we might state to the Company's shareholders those matters we are required to state to them in an auditor's report and for no other purpose. To the fullest extent permitted by law, we do not accept or assume responsibility to anyone other than the Company and the Company's shareholders, as a body, for our audit work, for this report, or for the opinions we have formed.
BASIS FOR OPINION
We conducted our audit in accordance with International Standards on Auditing (New Zealand). Our responsibilities under those standards are further described in the Auditor’s Responsibilities for the Audit of the Financial Statements section of our report.
We are independent of the Group in accordance with Professional and Ethical Standard 1 International Code of Ethics for Assurance Practitioners (including International Independence Standards) (New Zealand) issued by the New Zealand Auditing and Assurance Standards Board, and we have fulfilled our other ethical responsibilities in accordance with these requirements.
We believe that the audit evidence we have obtained is sufficient and appropriate to provide a basis for our opinion.
Ernst & Young provides agreed upon procedure services to the Group. Partners and employees of our firm may deal with the Group on normal terms within the ordinary course of trading activities of the business of the Group. We have no other relationship with, or interest in, the Group.
KEY AUDIT MATTERS
Key audit matters are those matters that, in our professional judgment, were of most significance in our audit of the consolidated financial statements of the current year. These matters were addressed in the context of our audit of the consolidated financial statements as a whole, and in forming our opinion thereon, but we do not provide a separate opinion on these matters. For each matter below, our description of how our audit addressed the matter is provided in that context.
We have fulfilled the responsibilities described in the Auditor’s responsibilities for the audit of the financial statements section of the audit report, including in relation to these matters. Accordingly, our audit included the performance of procedures designed to respond to our assessment of the risks of material misstatement of the financial statements. The results of our audit procedures, including the procedures performed to address the matters below, provide the basis for our audit opinion on the accompanying consolidated financial statements.
Fletcher Building Limited Annual Report 2021 117
For
per
sona
l use
onl
y

Independent Auditor's Report (Continued)
Construction revenue and associated provision for onerous contracts
Why significant How our audit addressed the key audit matter
A substantial amount of the Group’s revenue relates to revenue from construction contracts. Where these contracts have a long-term duration, revenue and margin are recognised based on the stage of completion of individual contracts. This is calculated based on the proportion of total costs incurred at the reporting date compared to the Group’s estimation of total costs of the contract and the total expected revenue from the relevant contract. Where a contract is expected to be loss-making, a provision is immediately recorded for estimated future losses on the entire contract.
There is a high level of estimation involved in accounting for the Group’s construction contracts, in particular relating to:
– Initial forecasting of total cost to complete, including the estimation of cost contingencies for contracting risks, and revisions to these forecast costs as a result of events or conditions that occur during the performance of the contract or are expected to occur to complete the contract; and
– the recognition of variable consideration based on an assessment by the Group as to whether it is probable that the amount will be approved by the customer and therefore recovered.
Disclosures regarding the Group’s construction contracts are included in notes 2.5, 3 and 11 of the financial statements.
In obtaining sufficient appropriate audit evidence, we:
– evaluated the Group’s processes regarding accounting for contract revenues and costs. We tested controls including:
› the preparation, review and authorisation of monthly project reports, which involves management assessing key aspects of contract performance; and
› the project reviews undertaken by the Group’s Project Management Office and management governance committee;
– used a risk rating process to select a sample of contracts for testing based on a number of quantitative and qualitative factors. These qualitative factors included contracts with significant deterioration of margin and/or completion dates, significant variations and claims and other factors which might indicate a greater level of judgement was required by the Group. For the contracts selected, where relevant, we:
› read the contract terms and conditions to evaluate whether the individual characteristics of each contract were reflected in the Group’s estimation of total costs of the contract;
› for certain selected contracts, undertook site visits (to either contract sites and/or commercial offices) to understand the nature of risks in completion of the contracts;
› tested a sample of costs incurred to date to supporting documentation;
› sample tested the estimated costs to complete by agreeing key forecast cost assumptions to underlying evidence such as subcontractor quotes, tender information, historical invoicing, employment records or agreements with subcontractors;
› evaluated the Group’s ability to forecast total cost to complete by analysing the accuracy of previous forecasts to actual outcomes and current forecasts;
› evaluated the Group’s legal and external experts’ reports received on contentious matters to identify conditions that may relate to the recognition of variable consideration or liquidated or other damages;
› assessed variable consideration, where material, to supporting documentation and by reference to underlying contracts; and
› evaluated contract performance in the period since year end to the date of this report to assess the Group’s year end judgements in respect of revenue recognition and forecast costs to complete.
Specifically in relation to the New Zealand International Convention Centre project (“NZICC”) we also:
› assessed the recognition of insurance recoveries by reference to payment certificates from the insurer; and
› evaluated the forecast costs to complete the remediation works to ensure the forecast costs were within the indemnity limits and the level of cover available under the contract works policy.
– considered the adequacy of the associated disclosures in the financial statements.
Fletcher Building Limited Annual Report 2021118
For
per
sona
l use
onl
y

Goodwill and other intangible assets’ impairment assessments
Why significant How our audit addressed the key audit matter
The Group holds goodwill and other intangible assets of $1.1 billion at 30 June 2021.
The recoverable amount of the Group’s Cash Generating Units (“CGUs”) is determined each reporting period by reference to valuations prepared using discounted cash flow models (DCF models).
DCF models contain significant judgement and estimation in respect of future cash flow forecasts, discount rate and terminal growth rate assumptions. Changes in certain assumptions can lead to significant changes in the assessment of the recoverable amount.
Disclosures regarding the Group’s key assumptions adopted and the sensitivity to reasonably possible changes in key assumptions which could result in impairment for certain CGUs are included in note 2.2 of the financial statements.
In obtaining sufficient appropriate audit evidence, we:
– understood the Group’s goodwill impairment assessment process and identified relevant controls;
– assessed the Group’s determination of CGUs based on our understanding of the nature of the Group’s business units;
– obtained the Group’s DCF models and, for those CGUs with a higher risk of impairment, agreed forecasts to a combination of the Board approved FY22 budget and as applicable the FY23 - FY26 strategic plan or other management papers;
– assessed key inputs to the DCF models including future cash flow forecasts, discount rates, terminal growth rates as well as the Group’s consideration of any impacts of COVID19 on these estimates;
– considered the accuracy of previous Group cash flow forecasting to inform our evaluation of forecasts included in the DCF models of those higher risk CGUs;
– for those CGUs with a higher risk of impairment, involved our valuation specialists to assess the Group’s discount rates. Valuation specialists were also involved in assessing the DCF models for the appropriateness of the valuation methodology employed;
– performed sensitivity analysis in relation to the discount rate and forecast cash flows to consider the potential impact of changes in these assumptions; and
– considered the adequacy of the associated disclosures in the financial statements particularly focusing on the disclosure of the CGUs where the impairment assessment is sensitive to reasonably possible changes in assumptions.
Fletcher Building Limited Annual Report 2021 119
For
per
sona
l use
onl
y

Independent Auditor's Report (Continued)
INFORMATION OTHER THAN THE FINANCIAL STATEMENTS AND AUDITOR’S REPORT
The Directors of the Company are responsible for the Annual Report, which includes information other than the consolidated financial statements and auditor’s report.
Our opinion on the consolidated financial statements does not cover the other information and we do not express any form of assurance conclusion thereon.
In connection with our audit of the consolidated financial statements, our responsibility is to read the other information and, in doing so, consider whether the other information is materially inconsistent with the consolidated financial statements or our knowledge obtained during the audit, or otherwise appears to be materially misstated.
If, based upon the work we have performed, we conclude that there is a material misstatement of this other information, we are required to report that fact. We have nothing to report in this regard.
DIRECTORS’ RESPONSIBILITIES FOR THE FINANCIAL STATEMENTS
The Directors are responsible, on behalf of the entity, for the preparation and fair presentation of the consolidated financial statements in accordance with New Zealand equivalents to International Financial Reporting Standards and International Financial Reporting Standards, and for such internal control as the Directors determine is necessary to enable the preparation of financial statements that are free from material misstatement, whether due to fraud or error.
In preparing the consolidated financial statements, the Directors are responsible for assessing on behalf of the entity the Group’s ability to continue as a going concern, disclosing, as applicable, matters related to going concern and using the going concern basis of accounting unless the Directors either intend to liquidate the Group or cease operations, or have no realistic alternative but to do so.
AUDITOR’S RESPONSIBILITIES FOR THE AUDIT OF THE FINANCIAL STATEMENTS
Our objectives are to obtain reasonable assurance about whether the consolidated financial statements as a whole are free from material misstatement, whether due to fraud or error, and to issue an auditor’s report that includes our opinion. Reasonable assurance is a high level of assurance, but is not a guarantee that an audit conducted in accordance with International Standards on Auditing (New Zealand) will always detect a material misstatement when it exists. Misstatements can arise from fraud or error and are considered material if, individually or in the aggregate, they could reasonably be expected to influence the economic decisions of users taken on the basis of these consolidated financial statements.
A further description of the auditor’s responsibilities for the audit of the financial statements is located at the External Reporting Board’s website: https://www.xrb.govt.nz/standards-for-assurance-practitioners/auditors-responsibilities/audit-report-1/. This description forms part of our auditor’s report.
The engagement partner on the audit resulting in this independent auditor’s report is Brent Penrose.
Chartered AccountantsAuckland
18 August 2021
Fletcher Building Limited Annual Report 2021120
For
per
sona
l use
onl
y

Statutory Disclosures
DISCLOSURE OF INTERESTS BY DIRECTORS
The following are particulars of general disclosures of interest by directors holding office as at 30 June 2021, pursuant to section 140(2) of the Companies Act 1993. The director will be regarded as interested in all transactions between Fletcher Building and the disclosed entity. Changes to entries disclosed during the year to 30 June 2021 are noted in brackets, for the purposes of section 211(1)(e) of the Companies Act 1993.
Bruce Hassall Fletcher Building Industries Limited Chair
Prolife Foods Limited Chair
The Farmers' Trading Company Limited Chair
Bank of New Zealand Director
Fonterra Co-operative Group Limited Director
Martin Brydon Duratec Limited (appointed September 2020) Chair
Brydon Investment Holdings Pty Limited Director
Fletcher Building Industries Limited Director
Rytysh Pty Ltd Director
Barbara Chapman APEC CEO Summit 2021 Chair
Genesis Energy Limited Chair
NZME Limited Chair
The New Zealand Initiative Deputy Chair
Fletcher Building Industries Limited Director
Two Tin Pigs Limited Director
Reserve Bank Independent Expert Advisory Panel Member
Peter Crowley Barrambin Trading Company Pty Limited Director
Fletcher Building Industries Limited Director
Interlaken Estates Pty Limited Director
The Riverside Coal Transport Company Pty Limited Director
Wesley Medical Research Limited Director
Rob McDonald Contact Energy Limited Chair
The University of Auckland Business School Advisory Board Chair
AIA New Zealand Limited Director
Chartered Accountants Australia and New Zealand Director
Fletcher Building Industries Limited Director
RSMcDonald Services Limited Director
McDonald Family Trust Trustee
The University of Auckland Council (appointed June 2021) Member
Doug McKay Bank of New Zealand Chair
Eden Park Trust Board Chair
Fletcher Building Industries Limited Director
Genesis Energy Limited Director
IAG New Zealand Limited Director
National Australia Bank Limited Director
Wymac Consulting Limited Director
Cathy Quinn Fertility Associates Holdings Limited Chair
MinterEllisonRuddWatts Consultant
The University of Auckland Council (appointed June 2021) Pro-Chancellor
Fletcher Building Industries Limited Director
Fonterra Co-operative Group Limited (appointed November 2020) Director
Pin Twenty Limited (corporate trustee of Kintyre Trust replacing St Jude’s Trust, appointed November 2020)
Director / Shareholder
Rangatira Limited Director
Tourism Holdings Limited Director
Fletcher Building Limited Annual Report 2021 121
For
per
sona
l use
onl
y

There were no specific disclosures made during the year of any interests in transaction entered by Fletcher Building or any of its subsidiaries.
INFORMATION USED BY DIRECTORS
There were no notices from directors of the Company requesting to disclose or use Company information received in their capacity as directors.
INDEMNITY AND INSURANCE
In accordance with section 162 of the Companies Act 1993 and the constitution of the Company, Fletcher Building has continued to indemnify and insure its directors, executives and employees acting on behalf of the Company, against potential liability or costs incurred in any proceeding, except to the extent prohibited by law. The insurance does not cover liabilities arising from criminal actions.
DIRECTORS HOLDING OF SECURITIES
The Board charter requires non-executive directors (or their associates) to hold at least 20,000 shares in the Company to demonstrate their commitment and alignment with the Company. This shareholding can be acquired at any time prior to the Annual Shareholders’ Meeting at which they are first subject to re-election. Non-executive directors do not participate in any Company share or option plan.
DISCLOSURE OF DIRECTORS’ INTERESTS IN SECURITIES
Securities of the Company in which each director has a relevant interest at 30 June 2021.
Director Ownership Ordinary Shares Capital Notes
Bruce Hassall (Chair) Beneficial 22,242
Martin Brydon Beneficial 20,000
Barbara Chapman Beneficial 20,000
Peter Crowley Beneficial 20,000
Rob McDonald Beneficial 50,000
Doug McKay Beneficial 20,000
Cathy Quinn Beneficial 30,000
Non-Beneficial (1) 121,197 28,122,500
(1) Cathy Quinn also held a non-beneficial interest in securities as a director/shareholder of Pin Twenty Limited (corporate trustee of Kintyre Trust).
DISCLOSURE OF DIRECTORS’ INTERESTS IN SHARE TRANSACTIONS
There were no director disclosures, pursuant to section 148(2) of the Companies Act 1993, of acquisitions of relevant interests in Fletcher Building shares during the year ended 30 June 2021.
STOCK EXCHANGE LISTINGS
Fletcher Building’s ordinary shares are listed and quoted on the Main Board of NZX Limited and the Australian Securities Exchange (ASX) under the company code ‘FBU’. Fletcher Building’s listing on the ASX is as a Foreign Exempt Listing. Fletcher Building must comply with the NZX Listing Rules but is exempt from almost all of the ASX Listing Rules. For the purposes of ASX Listing Rule 1.15.3, Fletcher Building confirms that it continues to comply with the NZX Listing Rules.
In addition, Fletcher Building Limited maintains a sponsored Level 1 American Depositary Receipt (ADR) programme with Deutsche Bank Trust Company Americas (Deutsche Bank). The ADRs trade over the counter in the United States of America (US) under the ticker code ‘FCREY’, with each ADR representing two ordinary Fletcher Building shares. US investors may prefer to purchase ADRs rather than ordinary shares in Fletcher Building’s home market because ADRs trade, clear and settle according to US market conventions.
EXERCISE OF NZX DISCIPLINARY POWERS
Neither NZX or ASX has taken any disciplinary action against Fletcher Building during the financial year ended 30 June 2021 and there was no exercise of powers by NZX under NZX Listing Rule 9.9.3 (relating to powers to cancel, suspend or censure an issuer) with respect to Fletcher Building during the reporting period.
NZX WAIVERS
There were no waivers granted by NZX or relied on by Fletcher Building Limited in the 12 months preceding 30 June 2021.
Statutory Disclosures (Continued)
Fletcher Building Limited Annual Report 2021122
For
per
sona
l use
onl
y

DISTRIBUTION OF SHAREHOLDERS AND HOLDINGS AS AT 30 JUNE 2021
The total number of voting securities of Fletcher Building at 30 June 2021 was 821,152,019 fully paid ordinary shares, each conferring on the registered holder the right to one vote on a poll at a meeting of shareholders.
Size of holdingNumber of
shareholders % of shareholdersNumber of ordinary
shares % of ordinary shares
1 - 1,000 15,400 46.53 6,488,738 0.79
1,001 - 5,000 12,617 38.12 30,448,808 3.71
5,001 - 10,000 2,833 8.56 20,260,345 2.47
10,001 - 100,000 2,112 6.38 48,360,679 5.89
100,001 Over 137 0.41 715,593,449 87.14
Total 33,099 100.00 821,152,019 100.00
SUBSTANTIAL PRODUCT HOLDERS
According to notices given under the Financial Markets Conduct Act 2013, the following persons were a substantial product holder of the Company as at 30 June 2021. The total number of voting securities of Fletcher Building Limited at 30 June 2021 was 821,152,019 fully paid ordinary shares.
Substantial product holderNumber of ordinary shares in
which relevant interest is held Date of notice
Schroder Investment Management Australia Limited (and its related bodies corporate)
51,334,882 16 April 2021
The Vanguard Group, Inc. 47,403,706 18 December 2018
20 LARGEST SHAREHOLDERS AS AT 30 JUNE 2021
Holder NameNumber of ordinary
shares % of issued capital
HSBC Custody Nominees (Australia) Limited 99,258,880 12.09
JP Morgan Nominees Australia Limited 73,060,069 8.90
HSBC Nominees (New Zealand) Limited - NZCSD 70,439,066 8.58
Citicorp Nominees Pty Limited 57,492,595 7.00
Citibank Nominees (New Zealand) Limited - NZCSD 51,718,641 6.30
HSBC Nominees (New Zealand) Limited A/C State Street - NZCSD 43,355,040 5.28
JPMorgan Chase Bank NA NZ Branch-Segregated Clients Acct - NZCSD 37,643,385 4.58
National Nominees Limited 30,790,399 3.75
Accident Compensation Corporation - NZCSD 25,865,250 3.15
BNP Paribas Nominees (NZ) Limited - NZCSD 18,536,271 2.26
HSBC Nominees A/C NZ Superannuation Fund Nominees Limited - NZCSD 18,078,230 2.20
BNP Paribas Nominees (NZ) Limited - NZCSD 13,951,769 1.70
National Nominees Limited - NZCSD 13,574,625 1.65
BNP Paribas Nominees Pty Ltd 13,389,684 1.63
BNP Paribas Noms Pty Ltd 12,537,825 1.53
ANZ Wholesale Australasian Share Fund - NZCSD 10,172,676 1.24
New Zealand Depository Nominee Limited 9,626,757 1.17
JBWere (NZ) Nominees Limited 8,199,954 1.00
Tea Custodians Limited Client Property Trust Account - NZCSD 7,065,324 0.86
HSBC Custody Nominees (Australia) Limited 6,989,646 0.85
Total 621,746,086 75.72
Fletcher Building Limited Annual Report 2021 123
For
per
sona
l use
onl
y

New Zealand Central Securities Depository Limited (NZCSD) provides a custodial depository service which allows electronic trading of securities to members. It does not have a beneficial interest in these securities. As at 30 June 2021, total holding in NZCSD were 337,697,692 or 41.12% of shares on issue.
AUDITOR FEES
EY has continued to act as auditors of the Group. Please refer to note 6 of the financial statements for audit fees paid to EY in the financial year to 30 June 2021.
CREDIT RATING
The Group has not sought and does not hold a credit rating from an accredited rating agency.
DONATIONS
Please refer to note 6 of the financial statements for donations made in FY21. All political donations must be approved by the Board.
SUBSIDIARY COMPANY INFORMATION
The persons listed below respectively held office as directors of Fletcher Building Limited and its subsidiary companies as at 30 June 2021, or in the case of those persons with the letter (R) after their name ceased to hold office during the year. Except where shown below, Fletcher Building’s indirect ownership interest as at 30 June 2021 was 100%.
No employee of Fletcher Building appointed as a director of Fletcher Building Limited or its subsidiaries receives or retains any remuneration or other benefits, as a director. The remuneration and other benefits of such employees, received as employees, are included in the relevant bandings for remuneration disclosed under Employee Remuneration on page 65. Except where shown below, no other director of any subsidiary company within the Group receives director’s fees or other benefits as a director.
Company Directors
Amatek Holdings Pty Limited M Brodie, B McKenzie
Amatek Industries Pty Limited M Brodie, B McKenzie
Amatek Investments Pty Limited M Brodie, B McKenzie
Approach Signs Limited B McKenzie, P Reidy
Austral Bronze Crane Copper Pty Limited M Brodie, B McKenzie
Australian Construction Products Pty Limited B McKenzie, N Sumich
Bandelle Pty Limited M Brodie, N Sekul
Baron Insulation Pty Ltd P Lavelle, B McKenzie
Boden Building Supplies Limited (70%) P Boden (R), B McEwen
Brian Perry Civil Limited B McKenzie, P Reidy
Building Choices Limited (75%) G Close (R), B McEwen
Building Prefabrication Solutions Limited B McEwen, B McKenzie
Burnham 2020 Limited I Jones (R), B McKenzie, N Traber
Cleaver Building Supplies Limited (75%) M Cleaver, B McEwen
Clever Core New Zealand Limited S Evans, B McKenzie
Crane Enfield Metals Pty Limited M Brodie, B McKenzie
Crane Group Pty Limited M Brodie, B McKenzie
Crane Share Plan Pty Ltd M Brodie, B McKenzie
Crevet Pipelines Pty Ltd B McKenzie, N Sumich
Crevet Pty Ltd M Brodie, B McKenzie
CTCI Pty Limited J Burgess, B McKenzie
Davis & Casey Building Supplies Limited B McEwen
Delcon Holdings (No. 11) Limited D Fradgley, B McKenzie
ee-Fit Pty Limited P Lavelle, B McKenzie
Efa Technologies Pty Limited M Brodie, B McKenzie
Statutory Disclosures (Continued)
Fletcher Building Limited Annual Report 2021124
For
per
sona
l use
onl
y

Fairbairn Building Supplies Limited B McEwen
FBHS (Aust) Pty Limited T Broxham, B McKenzie
FBII (Puhoi) Limited B McKenzie, P Reidy
FBSOL Pty Limited T Broxham, B McKenzie
Fletcher Building (Australia) Pty Limited M Brodie, A Clarke, B McKenzie, N Sekul
Fletcher Building (Fiji) Pte Limited H Clarke, A Kumar, B Leach (R), P Reidy, C White
Fletcher Building Educational Fund Limited C Carroll, J McDonald, P Muir
Fletcher Building Holdings Limited A Clarke, B McKenzie
Fletcher Building Holdings New Zealand Limited A Clarke, B McKenzie
Fletcher Building Industries Limited M Brydon, B Chapman, P Crowley, B Hassall, R McDonald, D McKay, C Quinn
Fletcher Building Infrastructure Investments Limited B McKenzie, P Reidy
Fletcher Building Limited M Brydon, B Chapman, P Crowley, B Hassall, R McDonald, D McKay, C Quinn
Fletcher Building Nominees Limited M Binns, J Chapman, G Clarke, M Farrell, J McDonald (R), H McKenzie, C Munkowits, G Niccol, T Williams
Fletcher Building Products Australia Pty Limited M Brodie, B McKenzie
Fletcher Building Products Limited H McBeath, B McKenzie
Fletcher Building Share Schemes Limited J Chapman, J McDonald (R), G Niccol
Fletcher Building Welfare Fund Nominees Limited R Linton (R), D Lucas, S Schulz, D Sixton
Fletcher Challenge Building Bolivia S.A. M Binns, K Cowie, H Ritchie
Fletcher Challenge Building UK Limited S Evans, B McKenzie
Fletcher Challenge Forest Industries Limited S Evans, B McKenzie
Fletcher Challenge Industries S.A. M Binns, K Cowie, H Ritchie
Fletcher Concrete (Fiji) Pte Limited A Kumar, B Leach (R), P Reidy, C White
Fletcher Concrete and Infrastructure Limited I Jones (R), H McBeath, B McKenzie, N Traber
Fletcher Construction (Solomon Islands) Limited B Leach (R), P Reidy, C White
Fletcher Construction Buildings Limited B McKenzie, P Reidy
Fletcher Construction Company (Fiji) Pte Limited B Leach (R), J Matthews, P Reidy
Fletcher Construction Infrastructure Limited B McKenzie, P Reidy
Fletcher Development Limited S Evans, B McKenzie
Fletcher Distribution Limited B McEwen, B McKenzie
Fletcher Insulation Pty Limited P Lavelle, B McKenzie
Fletcher Morobe Construction Limited B Leach (R), P Reidy, R Simpson
Fletcher Property Limited A Clarke, B McKenzie
Fletcher Residential Limited S Evans, B McKenzie
Fletcher Retirement Limited S Evans, B McKenzie
Fletcher Steel Limited H McBeath, B McKenzie
Forman Building Systems Limited B McEwen, B McKenzie
Gatic Pty Limited B McKenzie, N Sumich
Geoff Brown Building Supplies Limited B McEwen
Geraldton Independent Building Supplies Pty Limited J Burgess, B McKenzie
Higgins Contractors Limited B McKenzie, P Reidy
Higgins Group Holdings Limited B McKenzie, P Reidy
Homai MFR General Partner Limited (51%) S Evans, P Majurey
Iplex Pipelines Australia Pty Limited B McKenzie, N Sumich
Iplex Pipelines NZ Limited H McBeath, B McKenzie
Company Directors
Fletcher Building Limited Annual Report 2021 125
For
per
sona
l use
onl
y

Iplex Properties Pty. Limited B McKenzie, N Sumich
Jeffcoats Building Supplies Ltd (68%) R Jeffcoat, B McEwen
Key Plastics Pty. Ltd. B McKenzie, N Sumich
Kimura Building Supplies (2016) Limited B McEwen
Kingston Bridge Engineering Pty Ltd B McKenzie, N Sumich
Kinsey Kydd Building Supplies Limited (75%) S Kinsey, B McEwen
Koning Building Supplies Limited B McEwen
Koyana Rocla Pipes Limited M Kotnis, G Sharma, C Shiralkar
Kusabs Building Supplies Limited (75%) G Kusabs, B McEwen
Laminates Holdings Pty Limited J Burgess, B McKenzie
Laminex Group Pty Limited J Burgess, B McKenzie
Laminex Overseas Holdings Pty Limited M Brodie, N Sekul
Laminex US Holdings Pty Limited M Brodie, N Sekul
Leary Building Supplies Limited (75%) B Leary, B McEwen
Macready Building Supplies Limited (75%) J Macready, B McEwen
Matt Orr Building Supplies Limited (75%) B McEwen, M Orr
McGill Building Supplies Limited (75%) B McEwen, J McGill
McInnes Building Supplies Limited (75%) B McEwen, G McInnes
Mico New Zealand Limited B McEwen, B McKenzie
Milnes Holdings Pty Limited M Brodie, B McKenzie
Moire Road General Partner Limited (51%) A Crocker, S Evans, S Rapson
Morinda Australia Pty Limited T Broxham, B McKenzie
New Zealand Ceiling & Drywall Supplies Limited (90%) D Thomas
Northern Iron and Brass Foundry Pty. Ltd. B McKenzie, N Sumich
Oliveri Solutions Pty Limited B McKenzie, S Naish
Paul Robinson Building Supplies Limited (75%) B McEwen, P Robinson
Pavement Technology Limited B McKenzie, P Reidy
Penny Engineering Limited B McKenzie, P Reidy
Penrose Retirement Nominees Limited M Binns, J Chapman, G Clarke, M Farrell, J McDonald (R), H McKenzie, C Munkowits, G Niccol, T Williams
PlaceMakers Christchurch Limited (75%) G Close, B McEwen
PlaceMakers Limited B McEwen, B McKenzie
PlaceMakers Supply, Fix & Install Limited (75%) G Close, B McEwen
Polymer Fusion Education Pty Ltd B McKenzie, N Sumich
Raylight Aluminium Limited (87.5%) G Close, B McEwen
Reece Building Supplies Limited (75%) B McEwen, J Reece
Rocla Australia Pty Limited M Brodie, B McKenzie
Rocla Concrete Pipes Pty Limited M Brodie, B McKenzie
Rocla Industries Pty Limited M Brodie, N Sekul
Rocla Pty Limited B McKenzie, N Sumich
Rocla Vic Pty Limited M Brodie, N Sekul
S Cubed Pty Limited T Broxham, B McKenzie
Selwyn Quarries Limited I Jones (R), B McKenzie, N Traber
Shed Boss NZ Limited D Fradgley, B McKenzie
Company Directors
Statutory Disclosures (Continued)
Fletcher Building Limited Annual Report 2021126
For
per
sona
l use
onl
y

Southbound Building Supplies Limited B McEwen, A Rance (R)
Stanley Building Supplies Limited (75%) B McEwen, B Stanley-Joblin
Steven Marshall Building Supplies Limited B McEwen
Stickland Building Supplies Limited B McEwen
Stramit Corporation Pty Limited T Broxham, B McKenzie
Sullivan & Armstrong Building Supplies Limited B McEwen
Tasman Australia Pty Limited M Brodie, N Sekul
Tasman Building Products Pty Limited M Brodie, N Sekul
Tasman Insulation New Zealand Limited H McBeath, B McKenzie
Tasman Sinkware North America, Inc. M Brodie
TBP Group Pty Limited M Brodie, N Sekul
Terrace Insurances (PCC) Limited C Bell, K Carten (R), M Eades, B McKenzie, T Williams
The Fletcher Construction Company (Fanshawe Street) Limited B McKenzie, P Reidy
The Fletcher Construction Company Limited - NZ B McKenzie, P Reidy
The Fletcher Construction Company Limited (Samoa Branch) B McKenzie, P Reidy
The Fletcher Organisation (Vanuatu) Limited B Leach (R), Diract Ltd, Lotim Ltd, P Reidy
The Fletcher Trust and Investment Company Limited B McKenzie, P Reidy
Tradelink Pty Ltd B McKenzie, S Naish
Winstone Wallboards Limited H McBeath, B McKenzie, D Thomas
Young Building Supplies Limited B McEwen
As at 30 June 2021, Fletcher Building held an indirect ownership interest in the following associates and joint ventures.
Company Ownership
Altera Apartments General Partner Limited 50%
Altus NZ Limited 50%
Bellus Apartments General Partner Limited 50%
Byfords Readi-Mix Limited 50%
Cromwell Certified Concrete Limited 50%
Greenraft Limited 33.33%
Hexion Australia Pty Limited 50%
Illico Apartments General Partner Limited 50%
Interpipe Holdings Limited 50%
JFC Pumps Limited 50%
Kaipara Water Transport Limited 25%
NX2 Hold GP Limited 13.40%
Oamaru Shingle Supplies Limited 33.33%
P2W Services Limited 50%
Rangitikei Aggregates Limited 50%
Rodney Aggregates Supplies Limited 50%
Saltus Apartments General Partner Limited 50%
South Pacific Cement Pte Limited 50%
Verto Apartments General Partner Limited 50%
Wespine Industries Pty Limited 50%
Company Directors
Fletcher Building Limited Annual Report 2021 127
For
per
sona
l use
onl
y

Corporate Directory
BOARD OF DIRECTORS
Bruce Hassall (Chair) Martin Brydon Barbara Chapman Peter CrowleyRob McDonald Doug McKay Cathy Quinn
EXECUTIVE TEAM
Ross Taylor Chief Executive Officer
Bevan McKenzie Chief Financial Officer
Andrew Clarke Group General Counsel and Company Secretary
Daniel Beecham Chief Information Officer
Claire Carroll Chief People and Communications Officer
Wendi Croft Chief Health and Safety Officer
Steve Evans Chief Executive Residential and Development
Dean Fradgley Chief Executive Australia
Hamish McBeath Chief Executive Building Products
Bruce McEwen Chief Executive Distribution
Peter Reidy Chief Executive Construction
Nick Traber Chief Executive Concrete
REGISTERED OFFICE
New Zealand
Fletcher Building Limited810 Great South Road, Penrose Auckland 1061, New Zealand
Private Bag 92114Auckland 1142, New Zealand
Phone: +64 9 525 9000 Email: [email protected] Web: www.fletcherbuilding.com
Australia
1051 Nudgee Road, Banyo, QLD 4014, Australia
Locked Bag 71, Virginia BC, QLD 4014, Australia
Phone: +61 7 3260 9777
AUDITOR
EY PO Box 2146 Auckland 1140, New Zealand
SOLICITOR
Bell Gully PO Box 4199 Auckland 1140, New Zealand
INVESTOR RELATIONS ENQUIRIES
Aleida White Head of Investor Relations
Email: [email protected] Phone: +64 21 155 8837
COMPANY NUMBERS
NZ Incorporation 1104175NZBN 9429037065836ARBN 096 046 936
REGISTRY
Computershare Investor Services Limited (Computershare) looks after our share register and is your first point of contact for any queries regarding your investment in Fletcher Building. You can view your investment portfolio, elect to enrol in our Dividend Reinvestment Plan, indicate your preference for electronic communications, supply your email address, change your details or update your payment instructions relating to Fletcher Building at any time by visiting the Computershare Investor Centre at www.investorcentre.com/nz.
New Zealand
Computershare Investor Services Limited Private Bag 92119Auckland 1142, New Zealand
Level 2, 159 Hurstmere Road, Takapuna, Auckland 0622, New Zealand
Phone: +64 9 488 8777 Email: [email protected] Web: www.computershare.com/nz
Australia
Computershare Investor Services Pty Limited GPO Box 3329Melbourne, VIC 3001, Australia
Yarra Falls, 452 Johnston Street Abbotsford, VIC 3067, Australia
Phone: 1800 501 366 (within Australia) Phone: +61 3 9415 4083 (outside Australia)
Receiving your communications electronically
We encourage shareholders to receive investor communications electronically as it keeps costs down, delivery of our communications to you is faster and it is better for the environment. All you need to do is log in to www.investorcentre.com/nz and update your ‘Communication Preference’ to enable us to send all your investor correspondence electronically where possible.
Fletcher Building Limited Annual Report 2021128
For
per
sona
l use
onl
y

Construction on-site at Fletcher Living’s Waiata Shores community, South Auckland.
Fletcher Building Limited Annual Report 2021 129
For
per
sona
l use
onl
y

This Annual Report uses stock sourced from sustainably managed forests.
For
per
sona
l use
onl
y