2019 annual report - ASX
75
2019 ANNUAL REPORT ABN 61 115 768 986 For personal use only
-
Upload
khangminh22 -
Category
Documents
-
view
4 -
download
0
Transcript of 2019 annual report - ASX

2019 ANNUAL REPORT
ABN 61 115 768 986
For
per
sona
l use
onl
y
CONTENTS
CORPORATE DIRECTORY ..................................................................................................................... 1
CHAIRMAN’S REPORT ......................................................................................................................... 2
DIRECTORS’ REPORT ........................................................................................................................... 3
AUDITOR’S INDEPENDENCE DECLARATION ....................................................................................... 29
CORPORATE GOVERNANCE STATEMENT ........................................................................................... 30
CONSOLIDATED STATEMENT OF PROFIT OR LOSS AND OTHER COMPREHENSIVE INCOME ................. 31
CONSOLIDATED STATEMENT OF FINANCIAL POSITION ...................................................................... 32
CONSOLIDATED STATEMENT OF CHANGES IN EQUITY ....................................................................... 33
CONSOLIDATED STATEMENT OF CASHFLOWS ................................................................................... 34
NOTES TO THE FINANCIAL STATEMENTS ........................................................................................... 35
DIRECTORS’ DECLARATION ............................................................................................................... 65
INDEPENDENT AUDITOR’S REPORT ................................................................................................... 66
ADDITIONAL INFORMATION FOR LISTED PUBLIC COMPANIES .......................................................... 71
SCHEDULE OF INTERESTS IN MINING TENEMENTS ............................................................................. 73
For
per
sona
l use
onl
y
1
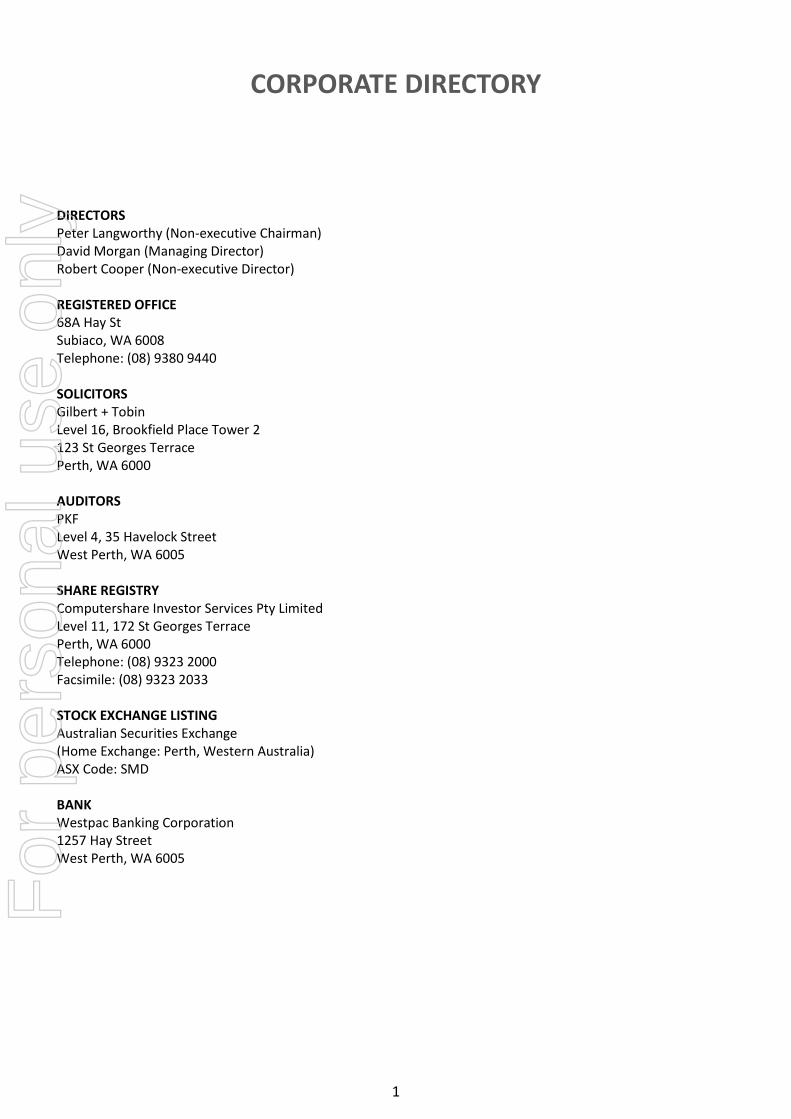
CORPORATE DIRECTORY
DIRECTORS Peter Langworthy (Non-executive Chairman) David Morgan (Managing Director) Robert Cooper (Non-executive Director) REGISTERED OFFICE 68A Hay St Subiaco, WA 6008 Telephone: (08) 9380 9440 SOLICITORS Gilbert + Tobin Level 16, Brookfield Place Tower 2 123 St Georges Terrace Perth, WA 6000 AUDITORS PKF Level 4, 35 Havelock Street West Perth, WA 6005 SHARE REGISTRY Computershare Investor Services Pty Limited Level 11, 172 St Georges Terrace Perth, WA 6000 Telephone: (08) 9323 2000 Facsimile: (08) 9323 2033 STOCK EXCHANGE LISTING Australian Securities Exchange (Home Exchange: Perth, Western Australia) ASX Code: SMD BANK Westpac Banking Corporation 1257 Hay Street West Perth, WA 6005
For
per
sona
l use
onl
y
2
CHAIRMAN’S REPORT
Dear Shareholders, I am pleased to report that, over the past 12 months Syndicated Metals has continued to successfully identify and consolidate prospective, large-scale gold exploration projects in two world-class Western Australian Archaean greenstone belts. At a time of strength and significant opportunity in the Australian gold sector, the Company has transacted on two highly prospective projects which, through the implementation of efficient and effective exploration programs, provide excellent potential for a major gold discovery. The Monument Gold Project lies directly along strike from the 3.3Moz Mt Morgans Gold Project, which is located within the world-class Laverton Tectonic Belt in WA. This area is considered to be one of Australia’s premier gold districts and Syndicated now controls a strategic gold resource with significant exploration upside immediately adjacent to one of the district’s major operating gold mines. The geological setting at Monument has been confirmed as being analogous to the Mt Morgans Project, with the confirmed presence of both extensive, mineralised Banded Iron Formation (“BIF”) structures that host significant high-grade gold domains (such as the 1.6Moz Westralia Gold Deposit) and a number of syenitic intrusive bodies, which represent a key component of a number of other multi-million ounce deposits in the district (such as Jupiter, Cameron Well and Wallaby). As further quality opportunities arise, Syndicated intends to further expand its presence in this world-class gold district. During the year, the Company also established a second large-scale, consolidated exploration project in the northern part of the Southern Cross Greenstone Belt through a dual acquisition and farm-in strategy at the Newington Gold Project, opening up an exciting new exploration and growth opportunity for the Company. The northern portion of the Southern Cross Greenstone Belt is considered to be largely under-explored compared to the highly endowed southern part of the Belt (+20Moz of gold endowment) and the Newington Project covers a 40km strike length of Archaean Greenstone Belt that is highly prospective for gold, nickel, copper and lithium. Early exploration programs will target a number of historical small mining shafts that exploited very high-grade gold mineralisation (~23g/t Au) to determine whether these are part of a bigger gold system. At the time of writing, our maiden drilling program had just been completed with promising assay results delivered. At the same time, quality programs of early-stage exploration will also be undertaken across the broader project. Syndicated has a strong belief that this staged, systematic approach to quality exploration across large-scale consolidated projects will result in a breakthrough discovery in the near future. The Board and management team remain strongly motivated and committed to delivering quality, long-term results to all of our shareholders and will continue to advance both of our key projects in a measured and systematic manner. In conclusion, I would like to take the opportunity once again to thank all of our shareholders for their support, and I look forward to delivering some exciting news in the coming year. Yours sincerely Peter Langworthy Chairman
For
per
sona
l use
onl
y
3
DIRECTORS’ REPORT
Your directors present the following report on Syndicated Metals Limited (the Company) and the entities it controlled (Group) during or at the end of the financial year ended 30 June 2019. INFORMATION ON DIRECTORS The directors of the company at any time during or since the end of the financial year are; Peter Langworthy Non-Executive Chairman (Appointed 20 March 2012)
Mr Langworthy is a geologist with a career spanning more than 30 years in mineral exploration and project development in Australia and Indonesia. He has specific expertise in building successful teams that have been responsible for significant mineral discoveries and in integrating technically sound exploration and resource development strategies into corporate planning. His industry experience includes 12 years in senior management roles with WMC Resources, four years with PacMin Mining as Exploration Manager, five years with Jubilee Mines where he built the team responsible for numerous discoveries at the Cosmos Nickel Mine and the Sinclair Nickel Project, and three years with Talisman Mining as Technical Director. At Jubilee he was part of the corporate team responsible for the growth of the company until it was taken over by Xstrata. Mr Langworthy was an Executive and Non-Executive Director of Capricorn Metals Ltd (formerly Malagasy Minerals Limited) from July 2013 to 8 November 2018 and previously held non-executive directorships with Northern Star Resources Limited, Talisman Mining Limited, Falcon Minerals Limited and Pioneer Resources Limited. Mr Langworthy was appointed as a Non-Executive Director of Silver Mines Limited in June 2016 and was appointed Managing Director of Gateway Mining Limited in March 2018. Mr Langworthy holds an interest in 24,148,240 shares of the Company and 3,000,000 unlisted options. David Morgan Managing Director (Executive Director from 20 March 2012 to 31 August 2013.
Non-Executive Director from 1 September 2013 to 26 April 2018, Managing Director from 27 April 2018)
Mr Morgan is a mining engineer and mechanical engineer with more than 30 years’ experience in the mining industry in Australia and Africa. He has previously held a number of executive development and mine operations roles involving project engineering, maintenance and contract earthmoving for companies such as Rio Tinto, Macmahon and WMC Resources. He was General Manager Operations for Equigold in Queensland where he was responsible for the building, commissioning and management of the Mt Rawdon Gold Mine. He was General Manager Mining and Metallurgy for Sundance Resources' Mbalam Iron Ore Project in Cameroon where he oversaw the completion of a PFS on a $3.3 billion Direct Shipping Ore and Itabirite project for that company, including the delivery of 10 years of JORC compliant, high grade Ore Reserves and the establishment of project metallurgical and processing parameters. Mr Morgan was CEO of ASX-listed RNI NL between 2 November 2015 and 1 September 2016. Mr Morgan holds an interest in 15,966,677 shares of the Company and 7,000,000 unlisted options. Robert Cooper Non-Executive Director (Appointed 4 May 2015) Mr Cooper is a mining engineer with more than 25 years’ industry experience, having held leadership roles across a diverse range of metalliferous commodities, both in Australia and overseas. He has a broad foundation of operating and technical experience in both underground and open pit operations. His career has been defined by a very strong health and safety improvement focus combined with a track record in delivering successful volume and cost outcomes through improvements in operational efficiency. He has previously held leadership positions with BHP Billiton as General Manager of Leinster Nickel Operations within Nickel West and Asset President of Ekati Diamonds in Canada, and with Discovery Metals as General Manager - Operations in Botswana and as General Manager - Development in their Brisbane office.
For
per
sona
l use
onl
y

Directors’ Report
4
INFORMATION ON DIRECTORS (CONT) Mr Cooper is currently the CEO of Round Oak Minerals Pty Limited (formerly CopperChem Limited) a 100% owned subsidiary of Washington H Soul Pattinson & Company Limited which is a substantial shareholder of the Company. Mr Cooper was appointed as a Non-Executive Director of ASX-listed companies, Novonix Limited (formerly Graphitecorp Limited) in October 2016 and Verdant Minerals Limited (formerly Rum Jungle Resources Limited) from July 2016 to June 2019. Mr Cooper holds an interest in 1,580,000 shares of the Company and 2,000,000 unlisted options. The directors have been in office to the date of this report unless otherwise stated. COMPANY SECRETARY Mr Paul Bridson is a Chartered Accountant and Chartered Secretary with more than 25 years accounting and finance experience, including more than 20 years in the resources industry. He was formerly Chief Financial Officer and Company Secretary for an unlisted public gold exploration company and prior to that role fulfilled the same role with ASX listed exploration company Avalon Minerals Ltd. Prior to these roles he was Financial Controller for Gindalbie Metals Ltd and has also held site based finance positions with various other WA based mining and mine service companies. Mr Bridson is a Member of the Institute of Chartered Accountants and Governance Institute of Australia. He holds a Bachelor of Commerce degree from the University of Western Australia. He is also the Company Secretary for ASX-listed Centaurus Metals Limited. PRINCIPAL ACTIVITIES AND SIGNIFICANT CHANGES IN NATURE OF ACTIVITIES During the year the principal activity of the Group consisted of mineral exploration and evaluation in relation to its gold and base metals mineral resources in WA. During the year the Company acquired the Newington Gold Project near Southern Cross in WA and finalised agreements to sell its interests in the Northern Hub and Southern Hub Projects in Queensland. Apart from these transactions, there were no significant changes in the nature of the activities of the Group during the year. OPERATING AND FINANCIAL REVIEW Operating Results The net loss of the Group for the financial year after provision for income tax was $39,957 (2018: loss $5,367,978) which includes mineral exploration expenditure impaired and written off of $1,307,358 (2018: $4,712,813). Financial Performance During the year ended 30 June 2019 the Group’s net cash position remained relatively unchanged as a result of the proceeds from Queensland asset sales offsetting the cash outflows for exploration and evaluation costs and administrative costs incurred in WA. Financial Position At the end of the year the Group had a cash balance of $511,590 (2018: $499,089). The Group has no corporate debt and minimal non-discretionary long-term commitments. The net assets of the Group increased from $4,024,846 at 30 June 2018 to $4,176,349 at 30 June 2019. Total liabilities amounted to $174,165 (2018: $249,601) and were limited to trade and other payables and employee benefit provisions. Strategy The focus of the Group during the financial year was the assessment of new gold projects within WA and the ongoing exploration and evaluation activities at its Monument Gold Project in the Laverton region of WA. The new project assessment culminated in the acquisition of the Newington Gold Project near Southern Cross in WA in May. The Company finalised the sale of the Queensland Northern Hub and Southern Hub Projects during the period, consistent with its focus on WA-based gold projects. The Company retains a 17.5% interest in the Southern Hub Project.
For
per
sona
l use
onl
y

Directors’ Report
5
OPERATING AND FINANCIAL REVIEW (CONT) For the year ended 30 June 2020 the Group plans to continue exploration and evaluation of the WA-based Newington Gold Project and Monument Gold Project.
Operations Overview During the reporting period, the Company’s extensive review of WA-based gold opportunities to compliment the Monument Gold Project, culminated in the dual acquisition of an advanced high-grade gold project and high-quality regional exploration tenement package at the northern end of the Southern Cross Greenstone Belt. The acquisition of the combined projects, referred to as the Newington Gold Project, was finalised towards the end of the year with the maiden drilling program commencing in July 2019. Earlier in the year the Company announced a maiden JORC 2012 Inferred Mineral Resource estimate of 855,000 tonnes @ 1.8g/t Au for 50,000 ounces of gold for the Korong deposit at the Monument Project near Laverton in WA. The Company also commenced a project-level geological and strategic review targeting the two established styles of mineralisation across the Monument Project. The review is focused on optimising the discovery potential for large-scale BIF and syenite-hosted gold systems, similar to some of the other Tier-1 deposits located in the district. Exploration targets are being ranked and prioritised ahead of new exploration programs planned for later this year. The Company continued to crystallise additional value from its former North Queensland asset base via the relinquishment arrangement for the Barbara Copper Project Royalty, realising $460,000 in cash. The Company also completed the sale of the Northern Hub copper tenements in North Queensland to Minotaur Exploration (ASX: MEP) for $400,000, comprising $125,000 in cash and 5,152,883 fully paid ordinary Minotaur shares at a deemed issue price of $0.053 per share. Additionally, the Company completed the sale of an 82.5% interest in the Southern Hub tenements to Carnaby Resources Limited (ASX: CNB). The consideration for the sale of $400,000 comprised the issue of 5,128,205 fully-paid ordinary shares in Carnaby at a deemed issue price of $0.078 per share, representing a stake of 5.34% in Carnaby. Syndicated retains a 17.5% interest in the project.
Exploration and Evaluation
Newington Gold Project – Southern Cross, WA In April the Company announced that it had secured an outstanding new growth opportunity in Western Australia’s Eastern Goldfields through the dual acquisition of an advanced high-grade gold project and high-quality regional exploration tenement package at the northern end of the Southern Cross Greenstone Belt.
The Company executed:
A farm-in agreement with Newfield Resources Limited (ASX: NWF) over the Newfield Gold Project (M77/422 & M77/846), an advanced high-grade exploration opportunity with previous production history; and
A separate option agreement with Gateway Mining Limited (ASX: GML) over the Carterton Gold Project, an adjacent, highly-prospective exploration tenement (E77/2309) at the northern end of the Southern Cross Greenstone Belt.
The dual agreements gave Syndicated a commanding position in a highly prospective, yet-under-explored portion of the world-class Yilgarn Craton, with immediate walk-up drilling targets and a strong pipeline of highly promising exploration targets and opportunities.
For
per
sona
l use
onl
y

Directors’ Report
6
OPERATING AND FINANCIAL REVIEW (CONT)
The Newington Project lies at the northern end of the Southern Cross Greenstone Belt, which is located around 380km east of Perth and hosts more than 150 known gold deposits which have produced over 15Moz of gold (refer Figure 1).
The region has recently attracted strong interest following Ramelius Resources’ (ASX: RMS) major acquisitions in the area surrounding its operating Edna May Gold Mine, including the 1Moz Tampia Hill Project (acquired through its takeover of Explaurum Ltd) and the 0.5Moz Marda Gold Project.
Figure 1: Regional location of the Newington Gold Project
ACQUISITION TERMS & COMMENCEMENT OF FARM-IN
Newfield Gold Project (Newfield Resources Limited)
Under the terms of the farm-in agreement with Newfield Resources Limited, Syndicated has the right to earn up to 85% of the Newfield Project. On the reporting of a JORC 2012 Mineral Resource estimate containing >150,000oz of gold, a further milestone payment of $250,000 is then payable to Newfield Resources.
During the period the Company:
Made an initial cash payment of $25,000 and completed due diligence on the project;
Following satisfaction of all conditions precedent, exercised the option to purchase the right to earn up to 85% of the project by making a further cash payment of $25,000 and issuing 30 million Syndicated shares at a deemed price of 1.0c per share and 10 million Syndicated options to Newfield.
The shares and options are subject to a 12-month escrow restriction from the date of allotment (20 May 2019) while the Options have an exercise price of 3.0c each and expire on 20 May 2022.
Shareholder approval was not sought for the issue of the shares and options and they were issued under the Company’s available Listing Rule 7.1 capacity; and
Commenced the farm-in agreement for staged exploration expenditure of $900,000 over two years.
For
per
sona
l use
onl
y

Directors’ Report
7
OPERATING AND FINANCIAL REVIEW (CONT)
Figure 2: Location of Newfield Project and Carterton Project (E77/2309)
Carterton Project (Gateway Mining Limited)
The Company also secured an option to purchase the adjacent Carterton Gold Project (tenement E77/2309) (refer Figure 2) from Gateway Mining Limited via the payment of $10,000 for a 12-month Right to Purchase, with the combined projects (Newfield and Carterton) now being referred to as the Newington Gold Project.
Completion of the Right to Purchase is based upon the following consideration:
Optional 12-month extension – $10,000 cash;
Maintaining the tenement in good standing for the duration of the option period; and
Purchase price of $300,000 in cash or shares (based on the 5-day VWAP at the date of execution of the option) plus a 1.5% royalty upon the execution of the sale and purchase agreement.
For
per
sona
l use
onl
y

Directors’ Report
8
OPERATING AND FINANCIAL REVIEW (CONT)
NEWINGTON PROJECT DESCRIPTION
The acquisition of the Newfield and Carterton Projects was the result of an extensive review of multiple projects across Western Australia where Syndicated targeted large areas of largely unexplored Archean Greenstone Belt that also had strong indications of the potential for development of high-grade gold systems.
Key factors driving the selection of the Newfield and Carterton Projects included:
The northern extension of the Southern Cross Greenstone Belt is considered particularly under-explored. The southern 75% of the Belt has a gold endowment of +15Moz of gold, while the northern 25% currently lacks any major discovery (refer Figure 1).
The production history and existing drilling data from the Newfield prospects demonstrate that a high-grade gold system is present. This is demonstrated by historical production from the Newfield Central deposit of 41,039 tonnes at a recovered grade of 24.53g/t Au for 32,366 recovered gold ounces.1, 2, 3
The high-grade gold mineralisation at the Newfield prospect remains open in all directions and drilling has also identified the potential for parallel and cross-linking structures. Additional targets identified in drilling include:
Newfield East Prospect4:
13m @ 4.47g/t Au from 8m (ENFRC01)
6m @ 3.79g/t Au from 23m (ENFRC07)
12m @ 2.13g/t Au from 56m (97RC02) Dawson Prospect4:
3m @ 11.03g/t Au from 51m (CSRC021)
4m @ 16.60g/t Au from 83m (incl. 2m @ 29.95g/t Au) (CSRC031)
1m @ 20.01g/t Au from 105m (CSRC036)
The Newfield Central deposit is contained within a high-grade (Norseman-style) laminated quartz reef, within the Newfield Central Fault Zone.
The Gateway Option ground covers the immediate northern extension of the Newfield gold mineralisation under cover to the north as well as covering 21 strike kilometres of the greenstone belt (refer Figure 2).
The majority of previous exploration across the wider project area has focused on base metal exploration. While base metal exploration is not a priority for Syndicated, the project is considered prospective for nickel, copper and lithium.
Extensive zones of transported cover has limited the effectiveness of historical prospecting activities and therefore has not provided early exploration targets.
The core part of the Newington Project is covered by the granted Newfield Mining Leases (M77/422 and M77/846).
1. Pre-2000 production data sourced from the Dept of Mines, Industry, Regulation and Safety (DMIRS) open file databases (7,807 tonnes @ 32.4g/t Au recovered grade for 8,132oz).
2. The 2001-2005 production records sourced from the Newfield Resources Limited Prospectus lodged with ASX on 27 April 2012 and Newfield Central Pty Ltd records (33,232 tonnes @ 22.68g/t Au recovered grade for 24,234 oz).
3. Combined historical production (pre-2000 & 2001 – 2005) of 41,039 tonnes @ 24.53g/t Au recovered grade for 32,366oz. 4. The previous drilling results were sourced from the DMIRS open file databases and Newfield Central Pty Ltd records.
For
per
sona
l use
onl
y

Directors’ Report
9
OPERATING AND FINANCIAL REVIEW (CONT)
MAIDEN RC DRILLING PROGRAM
Subsequent to the end of the year, the Company commenced its maiden drilling program at the Newington Gold Project.
The initial 12-hole Reverse Circulation (RC) program targeted extensions of the previously mined Newfield Central deposit, which delivered 32,366oz at an average recovered head grade of 24.53g/t. The assays results from this drill program were announced on 23 August 2019.
The Newington Gold Project also hosts a number other walk-up drill targets that will be progressively tested, with the aim of more accurately defining the extent of the gold system and an initial high-grade Mineral Resource estimate.
In addition, Syndicated intends to conduct mapping programs to establish the key geological drivers for mineralisation across the Newington Project area and assess the potential for repeated systems in the immediate vicinity of the Newfield prospects.
Figure 3: Newfield Project – Key Prospects
For
per
sona
l use
onl
y

Directors’ Report
10
OPERATING AND FINANCIAL REVIEW (CONT)
Monument Gold Project (WA) The Monument Gold Project comprises a 288km2 tenement package located approximately 55km west of Laverton in the world-class Laverton gold district of WA. The Project is located within the Laverton Tectonic Zone, a major mineralised domain within WA’s Goldfields region which hosts numerous multi-million ounce, Tier-1 gold deposits such as Sunrise Dam (+10Moz), Wallaby (+8Moz), Granny Smith (+2Moz) and Lancefield (+2Moz).
The package comprises 13 contiguous granted tenements and 16 applications which lie immediately to the north-west of the 3.5Moz Mount Morgans Gold Operation, owned by Dacian Gold Limited (ASX: DCN) (refer Figure 4).
Figure 4 – Location of the Monument Gold Project showing regional geology and nearby mining operations.
Maiden Gold Mineral Resource
During the period the Company reported a maiden Inferred Mineral Resource estimate for the Korong deposit comprising 855,000 tonnes grading 1.8g/t Au for 50,000 ounces of contained gold (refer ASX announcement dated 10 September 2018 for full details of the Inferred Mineral Resource calculation). This is the first JORC compliant Mineral Resource to be estimated at the Project and highlights the potential for further economically viable gold resources to be identified along the 12km mineralised corridor that sits along strike from the Resource. The Resource remains open in all directions, with strong potential to extend the mineralisation down-plunge to the north, as well as to discover repeat lodes to the north and south of the main high-grade Korong Lode.
For
per
sona
l use
onl
y

Directors’ Report
11
OPERATING AND FINANCIAL REVIEW (CONT) The mineralised system at Korong is believed to be the same system geologically to the one that hosts most of the mineralisation at Dacian Gold’s 1.6Moz Westralia Gold Deposit, located 12km along strike to the south-east (refer Figure 5). The Inferred Mineral Resource is summarised in Table 1 below.
Figure 5 – Monument Project in Relation to Dacian Gold – BIF Hosted Mineralisation Overview.
Inferred Mineral Resource Summary
The in-situ, drill defined and developed Mineral Resource Inventory was reported inside an optimised pit-shell at a cut-off of 0.5g/t, and outside the optimised shell at a 2.0g/t cut-off.
The modelled mineralised zones that form the basis of the resource show good continuity and were based on data from 22 diamond drill holes (5,008m), 50 percussion drill holes (1,788m) and 72 Reverse Circulation (RC) drill holes (5,126m). These holes include those drilled by previous operators as well as holes completed by Syndicated Metals.
The mineralisation is interpreted as an easterly-dipping and north-plunging lode which has been delineated over a strike length of approximately 500m, a down-plunge extent of 200m and an average thickness of 5m. Drilling successfully defined this horizon and identified high-grade shoots which are likely controlled by folding and faulting.
The Mineral Resource estimate was defined on a nominal drill spacing of 25m x 25m and 25m x 50m.
For
per
sona
l use
onl
y

Directors’ Report
12
OPERATING AND FINANCIAL REVIEW (CONT)
Much of the dip and strike extensions to the ore body are classified as unclassified Mineral Resources and can be easily targeted by further drill programs to grow the Mineral Resource at Korong.
Discrepancy in summation may occur due to rounding.
The Mineral Resource was constrained by a A$2,025 per ounce gold price conceptual optimised pit shell.
Ordinary Kriging was utilised as the interpolation method for the mineralised domains and surrounding waste.
Modelling and estimations were undertaken using Datamine software.
Refer to the ASX announcement dated 10 September 2018 for further information in regard to the Inferred Mineral Resource. The Company is not aware of any new information or data that materially affects the information in this announcement and all material assumptions and technical parameters continue to apply and have not materially changed.
Deposit Cut-Off (g/t) Inferred
Tonnes Grade (g/t) Au Ounces
Korong 0.5 650,000 1.6 33,000
Korong UG 2.0 205,000 2.5 17,000
Total 855,000 1.8 50,000
Table 1 – Korong – JORC Resource Overview
Figure 6 – Korong A$2,025/oz Optimised Pit Shell – Looking West.
Figure 7 – Korong A$2,025/oz Optimised Pit Shell – Looking North-East.
For
per
sona
l use
onl
y

Directors’ Report
13
OPERATING AND FINANCIAL REVIEW (CONT)
Figure 8 – Korong Longitudinal Section with Interpreted Gold Lodes.
Figure 9 – Korong Block Model within A$2,025/oz Optimised Pit Shell.
For
per
sona
l use
onl
y

Directors’ Report
14
OPERATING AND FINANCIAL REVIEW (CONT)
Monument Exploration Review
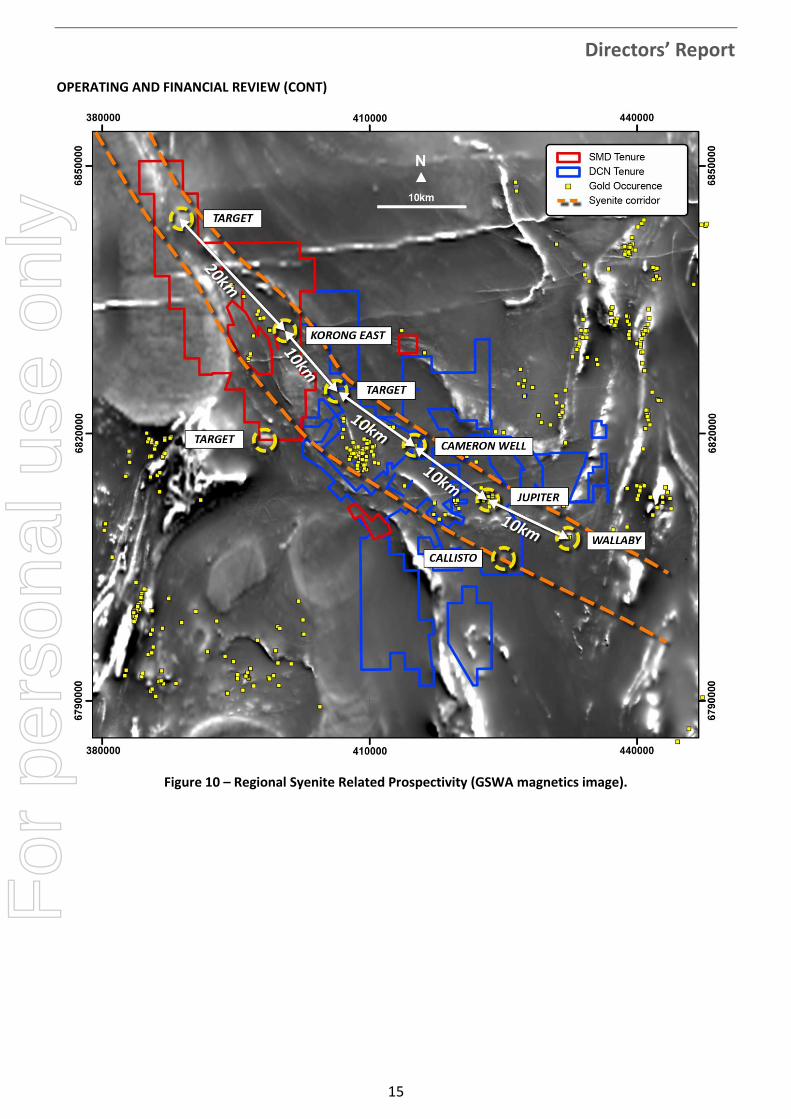
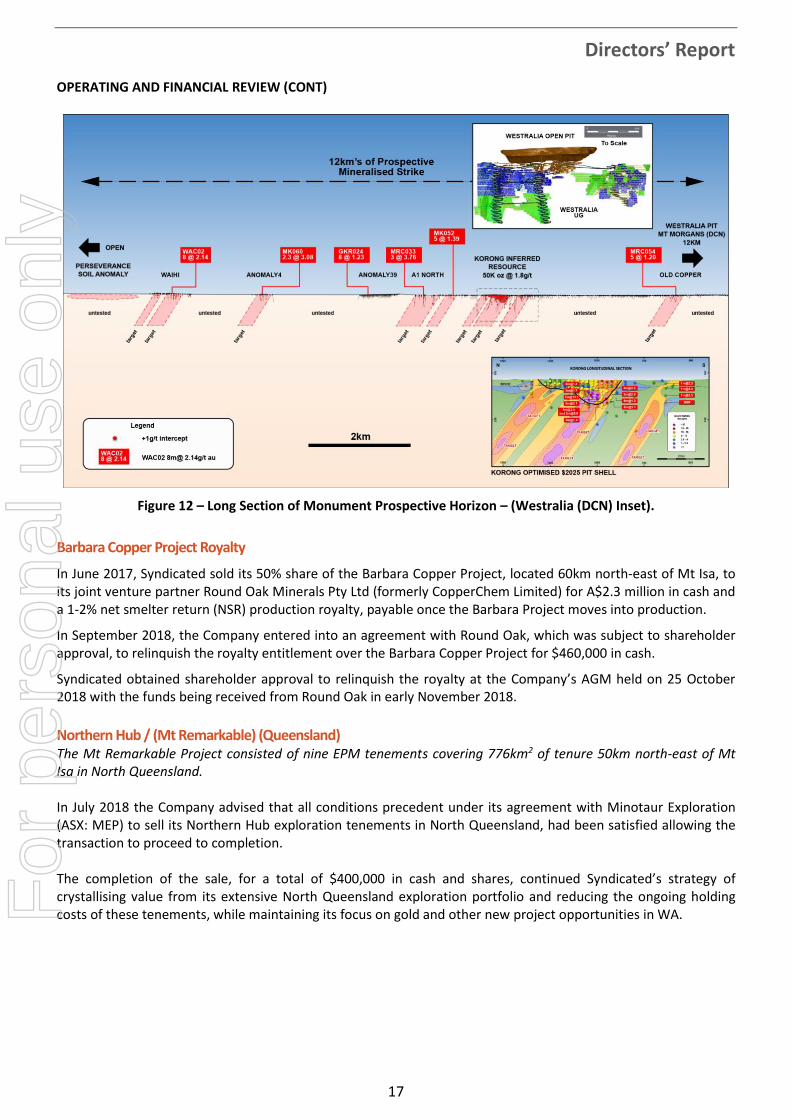
Subsequent to the release of the Korong Mineral Resource, the Company completed an independent technical review of all available exploration data for the Monument Project which confirmed its prospectivity for new discoveries. The Project is prospective for two distinct styles of mineralisation, namely: Banded Iron Formation (or BIF)-hosted gold mineralisation and syenite-related gold mineralisation. These two styles of mineralisation make up the 3.5Moz resource base at Dacian Gold’s nearby Mt Morgans Gold Operations, which has recently achieved full commercial production. Four significant syenite-related gold deposits have been identified through the Laverton Tectonic Zone: Cameron Well, Calisto and Jupiter (Dacian Gold) and Wallaby (Goldfields). These deposits are observed to be systematically emplaced along a 10km wide corridor running NW-SE, as shown in Figure 10. This corridor contains radial magnetic anomalies within the Monument Project that are interpreted as Felsic/Syenite intrusions. Mapping undertaken by the Geological Survey of WA (GSWA), SMD, Geochemical Services Pty Ltd (GSPTY) and Southern Geoscience Consultants (SGC) identified a number of Felsic/Syenitic Intrusions within the Monument Project, which are depicted in Figure 11. Syenites are a type of granite intrusion with a specific litho-geochemical/mineral composition. It is the litho-geochemistry of the syenite in combination with contrasting rock competencies that are believed to be the keys to significant amounts of gold mineralisation associated with this specific type of rock in the Laverton region. The prospective BIF unit at Monument has been proven to be mineralised over more than 12km of strike within Syndicated’s tenure, as shown in Figure 12. Much of the prospective BIF unit is yet to be explored, with multiple geochemical anomalies and historical ore grade drilling intercepts to be further tested. This BIF unit is host to the Korong gold deposit, which hosts an Inferred Resource of 855,000 tonnes @ 1.8g/t Au for 50,000 ounces (see above). The optimised pit shell in relation to the mineralised lodes is shown in Figures 6 and 7 above. Multiple high-grade lodes of mineralisation exist within the BIF unit, which are controlled by structure and thickenings in the BIF units. Based upon the work detailed above, the Company commenced an internal review of the current and future exploration strategies for the Monument Project. The aim of this work is, firstly, to establish the optimal combined exploration methodologies for the two mineralisation styles and, secondly, to develop funding options to support the Project and maximise value for shareholders. This work is currently still in progress.
For
per
sona
l use
onl
y
Directors’ Report
15
OPERATING AND FINANCIAL REVIEW (CONT)
Figure 10 – Regional Syenite Related Prospectivity (GSWA magnetics image).
For
per
sona
l use
onl
y

Directors’ Report
16
OPERATING AND FINANCIAL REVIEW (CONT)
Figure 11 – Monument Project – Felsic/Syenite Intrusion Targets (SMD magnetics image overlain by SGC, GSPTY and GSWA mapping).
For
per
sona
l use
onl
y
Directors’ Report
17
OPERATING AND FINANCIAL REVIEW (CONT)
Figure 12 – Long Section of Monument Prospective Horizon – (Westralia (DCN) Inset).
Barbara Copper Project Royalty
In June 2017, Syndicated sold its 50% share of the Barbara Copper Project, located 60km north-east of Mt Isa, to its joint venture partner Round Oak Minerals Pty Ltd (formerly CopperChem Limited) for A$2.3 million in cash and a 1-2% net smelter return (NSR) production royalty, payable once the Barbara Project moves into production.
In September 2018, the Company entered into an agreement with Round Oak, which was subject to shareholder approval, to relinquish the royalty entitlement over the Barbara Copper Project for $460,000 in cash.
Syndicated obtained shareholder approval to relinquish the royalty at the Company’s AGM held on 25 October 2018 with the funds being received from Round Oak in early November 2018. Northern Hub / (Mt Remarkable) (Queensland) The Mt Remarkable Project consisted of nine EPM tenements covering 776km2 of tenure 50km north-east of Mt Isa in North Queensland. In July 2018 the Company advised that all conditions precedent under its agreement with Minotaur Exploration (ASX: MEP) to sell its Northern Hub exploration tenements in North Queensland, had been satisfied allowing the transaction to proceed to completion. The completion of the sale, for a total of $400,000 in cash and shares, continued Syndicated’s strategy of crystallising value from its extensive North Queensland exploration portfolio and reducing the ongoing holding costs of these tenements, while maintaining its focus on gold and other new project opportunities in WA.
For
per
sona
l use
onl
y
Directors’ Report
18
OPERATING AND FINANCIAL REVIEW (CONT)
Southern Hub / (Fountain Range) (Queensland) The Fountain Range Project consists of 12 EPM tenements covering approximately 293km2 of tenure 100km south-east of Mt Isa in North Queensland.
During the period the Company completed the sale of an 82.5% interest in its Southern Hub exploration tenements in North-West Queensland to ASX-listed explorer Berkut Minerals Limited (ASX: BMT; Berkut).
The transaction replaced the original agreement with Carnaby Resources Limited (Carnaby) announced in 2018. Carnaby entered into a separate share sale agreement with Berkut and Berkut received shareholder approval on 18 April to acquire 100% of the issued capital of Carnaby and to change its name to Carnaby Resources Limited (ASX: CNB).
The consideration for the sale comprised the issue of 5,128,205 fully-paid ordinary shares in Carnaby at a deemed issue price of $0.078 per share, representing a stake of 5.34%. The shares are escrowed for a period of 12 months.
In addition to its holding in Carnaby Resources, Syndicated retains a 17.5% free-carried interest in the Southern Hub tenements.
The completion of the agreement marked the final stage of the rationalisation of the Company’s copper exploration portfolio in North-West Queensland and is consistent with Syndicated’s strategy of crystallising value from its former extensive North-West Queensland exploration portfolio, while maintaining its focus on its WA-based gold projects.
Other Projects Syndicated Royalties Pty Ltd (a 100% owned subsidiary of Syndicated Metals) holds a 2% NSR royalty over metals extracted from tenement EPM13870 held by Hammer Metals Limited (ASX: HMX).
Mineral Resources The Company currently has an Inferred Mineral Resource on the Korong deposit at the Monument Gold Project near Laverton in WA. Details of this Resource are included in the Monument Gold Project section of this Operations Review. The Korong Mineral Resource was announced in September 2018 and has not changed during the reporting period. Mineral Resource Governance Arrangements The Company ensures that all Mineral Resource calculations are subject to appropriate levels of governance and internal controls. Exploration results are collected and managed by competent qualified geologists and overseen by the Exploration Manager. All data collection activities are conducted to industry standards based on a framework of quality assurance and quality control protocols covering all aspects of sample collection, topographical and geophysical surveys, drilling, sample preparation, physical and chemical analysis and data and sample management. Mineral Resource estimates are prepared by qualified Competent Persons and further verified by the Company’s technical staff. If there is a material change in the estimate of a Mineral Resource the estimate and supporting documentation is reviewed by a suitably qualified independent Competent Person. Approval of Mineral Resource Statement The Company reports its Mineral Resources on an annual basis in accordance with the JORC Code 2012 Edition. The Mineral Resources Statement is based on, and fairly represents, information and supporting documentation prepared by competent and qualified professionals and is reviewed by the Company’s technical staff. The Mineral Resource Estimate for the Korong deposit was prepared by Mr Matthew Karl BSc/MSc. Mr Karl is a full-time employee of Mining Plus Pty Ltd and acted as an independent consultant on the Korong Deposit Mineral Resource estimation. Mr Karl is a competent person as defined under the 2012 JORC Code and has consented to the inclusion of the Statement in the form and context in which it appears in this Annual Report.
For
per
sona
l use
onl
y

Directors’ Report
19
OPERATING AND FINANCIAL REVIEW (CONT) Tenements Western Australia – Monument Gold Project The Company’s current tenement holding at the Monument Gold Project near Laverton consists of 100% ownership in 13 granted tenements and applications over a further 16 tenements. The tenements are held by 100% owned subsidiary, Monument Exploration Pty Ltd. Exploration on the tenements is managed by Syndicated Metals. During the reporting period tenements E39/2024, E39/2035, E39/2036, P39/5837, P39/5899, P39/5910 and P39/5880 were granted to the Company with tenement P39/5855 granted subsequent to the end of the period. The Company relinquished tenement P39/5154. Western Australia – Newington Gold Project At the Newington Gold Project near Southern Cross the Company is farming-in to tenements M77/422 and M77/846 held by Newfield Resources Limited. The Company also has an option over the nearby tenement E77/2309 held by Gateway Resources Limited. The Company has applications pending over three additional tenements.
Queensland During the reporting period the Company finalised the sale of the nine Northern Hub tenements to Minotaur Exploration Limited. The Company also finalised the transfer of an 82.5% interest in the 12 Southern Hub tenements to Carnaby Resources Limited. The Company retains a 17.5% interest in these tenements. Competent Person’s Statement The information in this report that relates to Exploration Results is based on information compiled by Mr Peter Langworthy who is a Member of The Australasian Institute of Mining and Metallurgy (MAusIMM) and who has sufficient experience relevant to the style of mineralisation and type of deposit under consideration and to the activity which he is undertaking to qualify as a Competent Person as defined in the 2012 Edition of the Australasian Code for Reporting of Exploration Results, Mineral Resources and Ore Reserves (the “JORC Code”). Mr Langworthy is the Chairman of Syndicated Metals Limited and consents to the inclusion in the report of the Exploration Results in the form and context in which they appear.
The information in this release that relates to the Estimation and Reporting of Mineral Resources has been compiled by Mr Matthew Karl BSc/MSc. Mr Karl is a full-time employee of Mining Plus Pty Ltd and has acted as an independent consultant on the Korong Deposit Mineral Resource estimation. Mr Karl is a Member of the Australasian Institute of Mining and Metallurgy and of the Australian Institute of Geologists and has sufficient experience relevant to the style of mineralisation and type of deposit under consideration and to the activities undertaken to qualify as a Competent Person as defined in the 2012 Edition of the Australasian Code for Reporting of Exploration Results, Mineral Resources and Ore Reserves (the “JORC Code”). Mr Karl consents to the inclusion in this report of the contained technical information relating to the Mineral Resource Estimation in the form and context in which it appears.
Corporate
Receipt of Research and Development Tax Incentive Funds In July 2018, the Company received net funds of $460,000 from the 2017 Research and Development Tax Incentive claim and in February 2019, the Company received funds of $364,275 from the 2018 Research and Development Tax Incentive claim.
Annual General Meeting The Company’s 2018 Annual General Meeting was held on 25 October 2018. All six resolutions received strong support and were passed on a show of hands.
For
per
sona
l use
onl
y

Directors’ Report
20
OPERATING AND FINANCIAL REVIEW (CONT)
Issue of Employee Options On 26 October 2018, the Company issued 5,000,000 unlisted Options as approved by shareholders at the Company’s AGM. The Options were issued to the Managing Director, Mr David Morgan, who was appointed to the position in April 2018, to realign his remuneration from his previous Non-Executive role to the Executive position. The purpose of the issue of Options is to provide an ongoing incentive and retention tool for key personnel within the organisation. The principal terms of the options are as follows: Tranche 1 – 1,666,666 options with an exercise price of 1.35 cents each, vesting on the date of issue and expiring
on 9 September 2022. Tranche 2 – 1,666,667 options with an exercise price of 1.58 cents each, vesting 6 months from issue and expiring
on 9 September 2022. Tranche 3 – 1,666,667 options with an exercise price of 1.8 cents each, vesting 12 months from issue and expiring
on 9 September 2022. Issue of Shares and Options to Newfield Resources Limited On 20 May 2019, the Company issued 30,000,000 fully paid ordinary shares and 10,000,000 unlisted options to Newfield Resources Limited as partial consideration for the exercise of the option to purchase the right to farm-into the Newfield Gold Project. The shares had a deemed issue price of 1 cent each and are subject to voluntary escrow expiring 20 May 2020. The options have an exercise price of 3.0 cents each, vested immediately and expire on 20 May 2022.
Factors and Business Risks Affecting Future Business Performance The following factors and business risks could have a material impact on the Company’s ability to deliver its strategy: Access to funding The Company’s ability to continue to explore and evaluate its projects is contingent upon its ability to source timely access to additional equity funding as it is required. Commodity demand and pricing The Company is exposed to adverse global demand for commodities and/or adverse commodity price movements. This could affect the Company’s ability to raise equity to fund its activities. Tenure risks The Company is exposed to loss of its tenure holding if it is unable to meet its tenement commitments due to lack of funding to do so. Operational risks The Company is exposed to several operational risks including unsuccessful exploration efforts, environmental issues and health and safety issues.
Significant Changes in the State of Affairs During the reporting period the Company issued 30,000,000 shares at a deemed issue price of $0.01 per share and 10,000 000 options exercisable at 3 cents each and expiring 20 May 2022 to Newfield Resources Limited as partial consideration for the exercise of the option to purchase the right to farm-in to the Newfield Gold Project. The Company also entered into an option agreement with Gateway Mining Limited for an adjoining tenement. The Company continued to crystallise additional value from its former North Queensland asset base via the relinquishment of the Barbara Copper Project royalty, realising $460,000 in cash.
For
per
sona
l use
onl
y

Directors’ Report
21
OPERATING AND FINANCIAL REVIEW (CONT) The Company completed the sale of the Northern Hub copper tenements in North Queensland to Minotaur Exploration (ASX: MEP) for $400,000, comprising $125,000 in cash and 5,152,883 fully paid ordinary Minotaur shares at a deemed issue price of $0.053 per share. Additionally, the Company completed the sale of an 82.5% interest in the Southern Hub tenements to Carnaby Resources Limited (ASX: CNB). The consideration for the sale of $400,000 comprised the issue of 5,128,205 fully-paid ordinary shares in Carnaby at a deemed issue price of $0.078 per share, representing a stake of 5.34% in Carnaby. Syndicated retains a 17.5% interest in the project. In the opinion of the directors, other than as outlined in this report, there were no other significant changes in the state of affairs of the Group that occurred during the 2019 financial year. DIVIDENDS PAID OR RECOMMENDED No dividend has been paid or declared since the start of the financial year and no dividend is recommended.
EVENTS SUBSEQUENT TO REPORTING DATE On 2 September 2019, the Company announced that it had raised $1,000,000 via a share placement at $0.008 per share to sophisticated and professional investors and the Company’s directors. The share placement was undertaken within the Company’s Listing Rule 7.1 and 7.1A capacities with the shares being issued on 6 September 2019. The share issue to the directors requires shareholder approval. Investors are able to apply for 1 free unlisted option for every 2 shares subscribed for, exercisable at $0.02 and expiring 3 years from the issue date, subject to shareholder approval. Other than the above matter, there are no matters or circumstances that have arisen since the end of the financial year that have significantly affected or may significantly affect the operations of the entity, the results of those operations or the state of affairs of the entity, in future years. LIKELY DEVELOPMENTS AND EXPECTED RESULTS OF OPERATIONS Other than likely developments contained in the Operating and Financial Review, further information on likely developments in the operations of the Group and the expected results of those operations in future financial years have not been included in this report, as the directors believe that inclusion of such information is likely to result in unreasonable prejudice to the Company. ENVIRONMENTAL REGULATION The Group’s operations are regulated by the requirements of the WA Department of Mines, Industry Regulation and Safety environmental regulations. The Company has complied with all of these requirements. MEETINGS OF DIRECTORS During the financial year meetings of directors were held and the number of meetings attended by each director during the year is shown below. A number of Circular Resolutions also received approval and these are also included below:
Board Meetings & Circular Resolutions
Audit & Risk Committee
Remuneration Committee
Eligible to Attend
Attended Eligible to Attend
Attended Eligible to Attend
Attended
P J Langworthy 11 11 2 2 1 1
D B Morgan 11 11 2 2 1 1
R J Cooper 11 11 2 2 1 1
For
per
sona
l use
onl
y
Directors’ Report
22
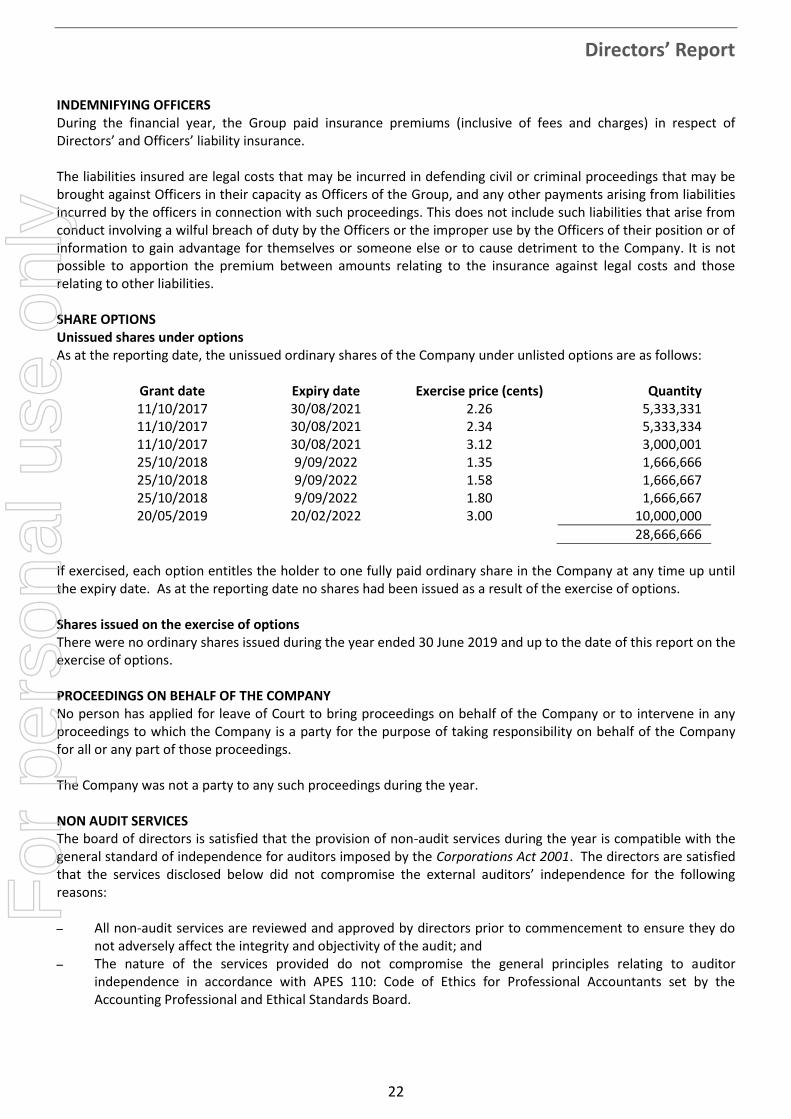
INDEMNIFYING OFFICERS During the financial year, the Group paid insurance premiums (inclusive of fees and charges) in respect of Directors’ and Officers’ liability insurance. The liabilities insured are legal costs that may be incurred in defending civil or criminal proceedings that may be brought against Officers in their capacity as Officers of the Group, and any other payments arising from liabilities incurred by the officers in connection with such proceedings. This does not include such liabilities that arise from conduct involving a wilful breach of duty by the Officers or the improper use by the Officers of their position or of information to gain advantage for themselves or someone else or to cause detriment to the Company. It is not possible to apportion the premium between amounts relating to the insurance against legal costs and those relating to other liabilities. SHARE OPTIONS Unissued shares under options As at the reporting date, the unissued ordinary shares of the Company under unlisted options are as follows:
Grant date Expiry date Exercise price (cents) Quantity 11/10/2017 30/08/2021 2.26 5,333,331 11/10/2017 30/08/2021 2.34 5,333,334 11/10/2017 30/08/2021 3.12 3,000,001 25/10/2018 9/09/2022 1.35 1,666,666 25/10/2018 9/09/2022 1.58 1,666,667 25/10/2018 9/09/2022 1.80 1,666,667 20/05/2019 20/02/2022 3.00 10,000,000
28,666,666
If exercised, each option entitles the holder to one fully paid ordinary share in the Company at any time up until the expiry date. As at the reporting date no shares had been issued as a result of the exercise of options. Shares issued on the exercise of options There were no ordinary shares issued during the year ended 30 June 2019 and up to the date of this report on the exercise of options. PROCEEDINGS ON BEHALF OF THE COMPANY No person has applied for leave of Court to bring proceedings on behalf of the Company or to intervene in any proceedings to which the Company is a party for the purpose of taking responsibility on behalf of the Company for all or any part of those proceedings. The Company was not a party to any such proceedings during the year. NON AUDIT SERVICES The board of directors is satisfied that the provision of non-audit services during the year is compatible with the general standard of independence for auditors imposed by the Corporations Act 2001. The directors are satisfied that the services disclosed below did not compromise the external auditors’ independence for the following reasons: All non-audit services are reviewed and approved by directors prior to commencement to ensure they do
not adversely affect the integrity and objectivity of the audit; and The nature of the services provided do not compromise the general principles relating to auditor
independence in accordance with APES 110: Code of Ethics for Professional Accountants set by the Accounting Professional and Ethical Standards Board.
For
per
sona
l use
onl
y

Directors’ Report
23
The following fees were paid to PKF for non-audit services provided during the year ended 30 June 2019:
Taxation Services $8,100
INDEMNITY AND INSURANCE OF AUDITOR The Company has not, during or since the end of the financial year, indemnified or agreed to indemnify the auditor of the Company or any related entity against a liability incurred by the auditor. During the financial year, the Company has not paid a premium in respect of a contract to insure the auditor of the Company or any related entity. OFFICERS OF THE COMPANY WHO ARE FORMER PARTNERS OF PKF There are no officers of the Company who are former partners of the Group’s auditors, PKF. ROUNDING OF AMOUNTS The Company is of a kind referred to in Corporations Instrument 2016/191, issued by the Australian Securities and Investments Commission, relating to ‘rounding-off’. Amounts in this report have been rounded off in accordance with that Corporations Instrument to the nearest dollar. AUDITOR’S INDEPENDENCE DECLARATION The auditor’s independence declaration for the year ended 30 June 2019 has been received and is included in the financial report.
For
per
sona
l use
onl
y
Directors’ Report
24
REMUNERATION REPORT - AUDITED The remuneration report details the key management personnel remuneration arrangements for the consolidated entity, in accordance with the requirements of the Corporations Act 2001 and its Regulations. Key management personnel are those persons having authority and responsibility for planning, directing and controlling the activities of the entity, directly or indirectly, including all directors. Remuneration policy The remuneration policy of Syndicated Metals Limited has been designed to align key management personnel objectives with shareholder and business objectives by providing a fixed remuneration component and offering specific long-term incentives. The board of Syndicated Metals Limited believes the remuneration policy to be appropriate and effective in its ability to attract and retain the best key management personnel to run and manage the company, as well as create congruence between directors, executives and shareholders. The board’s policy for determining the nature and amount of remuneration for key management personnel of the Company is as follows:
The remuneration policy, setting the terms and conditions for the key management personnel, was developed by the board.
All key management personnel receive a base salary (which is based on industry experience and comparable rates for similar industry roles), superannuation and share based payments.
The board of directors review key management personnel packages annually by reference to the Company’s performance, executive performance and comparable information from industry sectors.
The performance of key management personnel is measured against criteria agreed with each executive. The board may, however, exercise its discretion in relation to approving incentives and share based payments. The policy is designed to attract the highest calibre of executives and reward them for performance that results in long-term growth in shareholder wealth. Under the Company’s Employee Equity Incentive Plan, if in the opinion of the Board a participant acts fraudulently or dishonestly or is in material breach of his or her obligations to the Company or any of its subsidiaries, then the Board may, in its absolute discretion determine that:
- all of the participant’s incentives have lapsed; or - all shares held by the participant (or their nominee), as a result of the exercise of incentives as of the date
of such determination will be bought back and cancelled by the Company (subject to the passage of a special resolution of shareholders), and until then will be subject to a transfer restriction.
The key management personnel receive a superannuation contribution, which for the year ended 30 June 2019 was 9.50%, and do not receive any other retirement benefits. All remuneration paid to key management personnel is valued at the cost to the Company and either expensed through the statement of profit or loss or capitalised to exploration and evaluation costs on the statement of financial position as appropriate. Share based payments are valued using the Black-Scholes or binomial methodologies. The board policy is to remunerate non-executive directors at market rates for time, commitment and responsibilities. The board determines payments to the non-executive directors and reviews their remuneration annually, based on market practice, duties and accountability. Independent external advice is sought when required. The maximum aggregate amount of fees that can be paid to non-executive directors is subject to approval by shareholders. Fees for non-executive directors are not linked to the performance of the Company. However, to align directors’ interests with shareholder interests, the directors are encouraged to hold shares in the Company.
For
per
sona
l use
onl
y

Directors’ Report
25
REMUNERATION REPORT - AUDITED PRINCIPLES OF COMPENSATION Company performance, shareholder wealth and director and executive remuneration The remuneration policy has been tailored to increase goal congruence between shareholders, directors and executives by the issue of share based payments to the directors and executives to encourage the alignment of personal and shareholder interests. The Company believes this policy will be effective in increasing shareholder wealth. Executive Contractual Arrangements Remuneration and other terms of employment for the Chairman and Managing Director are formalised in service agreements. The agreements provide for participation in the Employee Equity Incentive Plan. Other major provisions of the agreements relating to remuneration are set out below.
Mr P J Langworthy - Chairman The term of the agreement is continuous and contains no termination notice period requirements or benefits. Effective 1 August 2018, Chairman’s fees were increased from $46,220 to $66,000 per annum inclusive of statutory superannuation of 9.5%. Mr D B Morgan - Managing Director The term of the agreement is continuous with a termination notice period of 3 months. Upon demotion due to operational matters of the Company the executive may give 1 month’s notice and will be entitled to 6 months base salary and superannuation. Mr Morgan was appointed as Managing Director effective from 26 April 2018 with a base salary of $220,000 per annum plus statutory superannuation of 9.5%. Prior to this date Mr Morgan was a Non-Executive Director with fees of $27,949 per annum plus statutory superannuation of 9.5%. Mr R J Cooper - Non-Executive Director Mr Cooper is employed under a contract for services. The contract is continuous and contains no termination notice period requirements or benefits. Effective 1 August 2018, Non-Executive Director’s fees were increased from $27,949 to $31,000 per annum plus statutory superannuation of 9.5%. Additional Information The earnings of the Group and the factors that are considered to affect total shareholders return for the five years to 30 June 2019 are summarised below:
2019 2018 2017 2016 2015
Sales revenue Nil Nil Nil Nil Nil
Profit/(loss) after income tax (39,957) (5,367,978) 1,075,112 (7,080,625) (1,074,400)
Share price at financial year end ($) $0.004 $0.006 $0.017 $0.006 $0.021
Total dividends declared (cents per share) Nil Nil Nil Nil Nil
Basic earnings per share (cents per share) (0.01) (0.85) 0.18 (1.70) (0.37)
Remuneration of directors and key management personnel Details of the remuneration of directors and key management personnel of the Group are set out in the following tables. The key management personnel of the Group consisted of the following directors of Syndicated Metals Limited:
Peter Langworthy – Non-Executive Chairman
David Morgan – Managing Director
Robert Cooper – Non-Executive Director
For
per
sona
l use
onl
y

Directors’ Report
26
REMUNERATION REPORT - AUDITED Remuneration of directors and key management personnel (cont) For the year ended 30 June 2019
Short-Term Benefits
Post-Employment
Benefits
Share-Based Payments
Proportion of remuneration linked to fixed
component
Proportion of remuneration linked to long term incentive
Directors Fees
Salary and Fees
Superannuation Options Total
$ $ $ $ $ Directors P J Langworthy 64,352 - - 2,727 67,079 96% 4% D B Morgan - 220,000 20,900 18,075 258,975 93% 7% R J Cooper 30,746 - 2,921 1,817 35,484 95% 5%
Total 95,098 220,000 23,821 22,619 361,538
For the year ended 30 June 2018
Short-Term Benefits
Post-Employment
Benefits
Share-Based Payments
Proportion of remuneration linked to fixed
component
Proportion of remuneration linked to long term incentive
Directors Fees
Salary and Fees
Superannuation Options Total
$ $ $ $ $ Directors P J Langworthy 42,210 - 4,010 31,838 78,058 59% 41% D B Morgan 23,291 38,359 5,856 21,225 88,731 76% 24% R J Cooper 27,949 - 2,655 21,225 51,829 59% 41% A T Munckton* - 215,938 17,202 55,210 288,350 81% 19%
Total 93,450 254,297 29,723 129,498 506,968
* Mr Munckton resigned effective 26 April 2018 and Mr Morgan was appointed to the role of Managing Director from this date. Mr Munckton received no termination payments other than accrued annual leave entitlements.
For
per
sona
l use
onl
y

Directors’ Report
27
REMUNERATION REPORT – AUDITED Shareholdings of key management personnel The movement during the reporting year in the number of shares in Syndicated Metals Limited held, directly, indirectly or beneficially, by each key management person, including related parties, is as follows:
2019 Balance at 1 July 2018
Granted as compensation
Bought/ (Sold)
Held upon termination
Balance at 30 June 2019
Directors P J Langworthy 24,148,240 - - - 24,148,240 D B Morgan 15,966,677 - - - 15,966,677 R J Cooper 1,580,000 - - - 1,580,000
41,694,917 - - - 41,694,917
2018 Balance at 1 July 2017
Granted as compensation
Bought/ (Sold)
Held upon termination
Balance at 30 June 2018
Directors P J Langworthy 24,148,240 - - - 24,148,240 D B Morgan 13,966,677 - 2,000,000 - 15,966,677 R J Cooper 1,580,000 - - - 1,580,000 A T Munckton* 6,306,306 - - (6,306,306) -
46,001,223 - 2,000,000 (6,306,306) 41,694,917 * Mr Munckton resigned effective 26 April 2018.
Option holdings of key management personnel
2019 Balance at 1 July 2018
Issued* Expired Held upon termination
Balance at 30 June 2019**
Directors P J Langworthy 3,000,000 - - - 3,000,000 D B Morgan 2,000,000 5,000,000 - - 7,000,000 R J Cooper 2,000,000 - - - 2,000,000
7,000,000 5,000,000 - - 12,000,000
* Issue of Incentive Options to Managing Director approved by shareholders at the Company’s AGM on 25 October 2018. ** Of the above options, 10,333,333 are vested and exercisable and 1,666,667 do not vest until 26 October 2019.
2018 Balance at 1 July 2017
Issued* Expired Held upon termination
**
Balance at 30 June 2018***
Directors P J Langworthy 7,915,351 3,000,000 (7,915,351) - 3,000,000 D B Morgan 2,000,000 2,000,000 (2,000,000) - 2,000,000 R J Cooper - 2,000,000 - - 2,000,000 A T Munckton - 7,000,000 - (7,000,000) -
9,915,351 14,000,000 (9,915,351) (7,000,000) 7,000,000
* Issue of Incentive Options to Directors as approved by shareholders at the Company’s AGM held on 11 October 2017. ** A total of 2,333,334 of these options lapsed upon the resignation of Mr Munckton on 26 April 2018. *** Of the above options, 4,666,666 are vested and exercisable and 2,333,334 did not vest until 11 October 2018.
For
per
sona
l use
onl
y
Directors’ Report
28
REMUNERATION REPORT - AUDITED
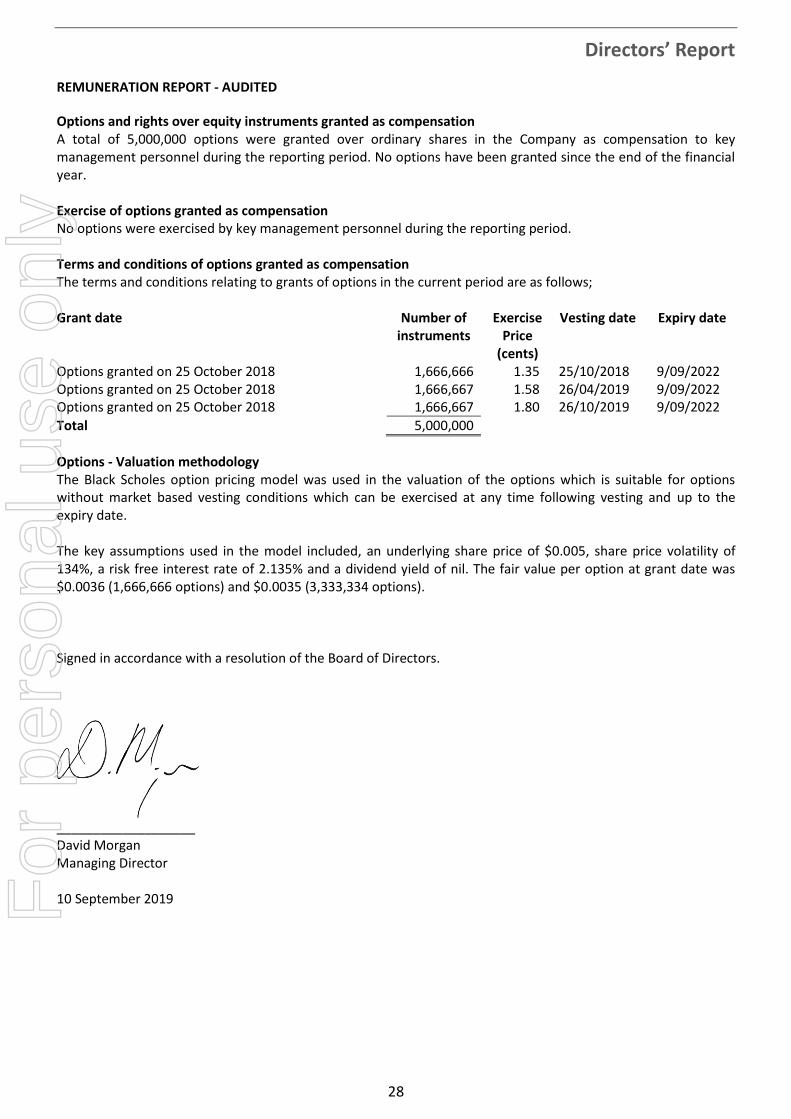
Options and rights over equity instruments granted as compensation A total of 5,000,000 options were granted over ordinary shares in the Company as compensation to key management personnel during the reporting period. No options have been granted since the end of the financial year. Exercise of options granted as compensation No options were exercised by key management personnel during the reporting period. Terms and conditions of options granted as compensation The terms and conditions relating to grants of options in the current period are as follows; Grant date Number of
instruments Exercise
Price (cents)
Vesting date Expiry date
Options granted on 25 October 2018 1,666,666 1.35 25/10/2018 9/09/2022 Options granted on 25 October 2018 1,666,667 1.58 26/04/2019 9/09/2022 Options granted on 25 October 2018 1,666,667 1.80 26/10/2019 9/09/2022
Total 5,000,000
Options - Valuation methodology The Black Scholes option pricing model was used in the valuation of the options which is suitable for options without market based vesting conditions which can be exercised at any time following vesting and up to the expiry date. The key assumptions used in the model included, an underlying share price of $0.005, share price volatility of 134%, a risk free interest rate of 2.135% and a dividend yield of nil. The fair value per option at grant date was $0.0036 (1,666,666 options) and $0.0035 (3,333,334 options). Signed in accordance with a resolution of the Board of Directors.
___________________ David Morgan Managing Director 10 September 2019 F
or p
erso
nal u
se o
nly

Level 4, 35 Havelock Street, West Perth, WA 6005 PO Box 609, West Perth, WA 6872 T: +61 8 9426 8999 F: +61 8 9426 8900 www.pkfperth.com.au PKF Perth is a member firm of the PKF International Limited family of legally independent firms and does not accept any responsibility or liability for the actions or inactions of any individual member or correspondent firm or firms. Liability limited by a scheme approved under Professional Standards Legislation.
29
PKF Perth
AUDITOR’S INDEPENDENCE DECLARATION
TO THE DIRECTORS OF SYNDICATED METALS LIMITED
In relation to our audit of the financial report of Syndicated Metals Limited for the year ended 30 June 2019, to the best of my knowledge and belief, there have been no contraventions of the auditor independence requirements of the Corporations Act 2001 or any applicable code of professional conduct.
PKF PERTH
SIMON FERMANIS PARTNER 10 SEPTEMBER 2019 WEST PERTH, WESTERN AUSTRALIA
For
per
sona
l use
onl
y

30
CORPORATE GOVERNANCE STATEMENT
The Company’s Corporate Governance Statement can be found on the Company’s website at http://www.syndicatedmetals.com.au/corporate-governance.php, under the section marked "Corporate Governance Statements". The following governance-related documents can also be found on the Company's website at the Corporate Governance page:
Charters Board Nomination Committee Audit and Risk Committee Remuneration Committee
Policies and Procedures Process for Performance Evaluation Policy and Procedure for Selection and (Re) Appointment of Directors Induction Program Procedure for the Selection, Appointment and Rotation of External Auditor Code of Conduct (summary) Diversity Policy (summary) Policy on Continuous Disclosure (summary) Compliance Procedures (summary) Shareholder Communication and Investor Relations Policy Securities Trading Policy
For
per
sona
l use
onl
y
31
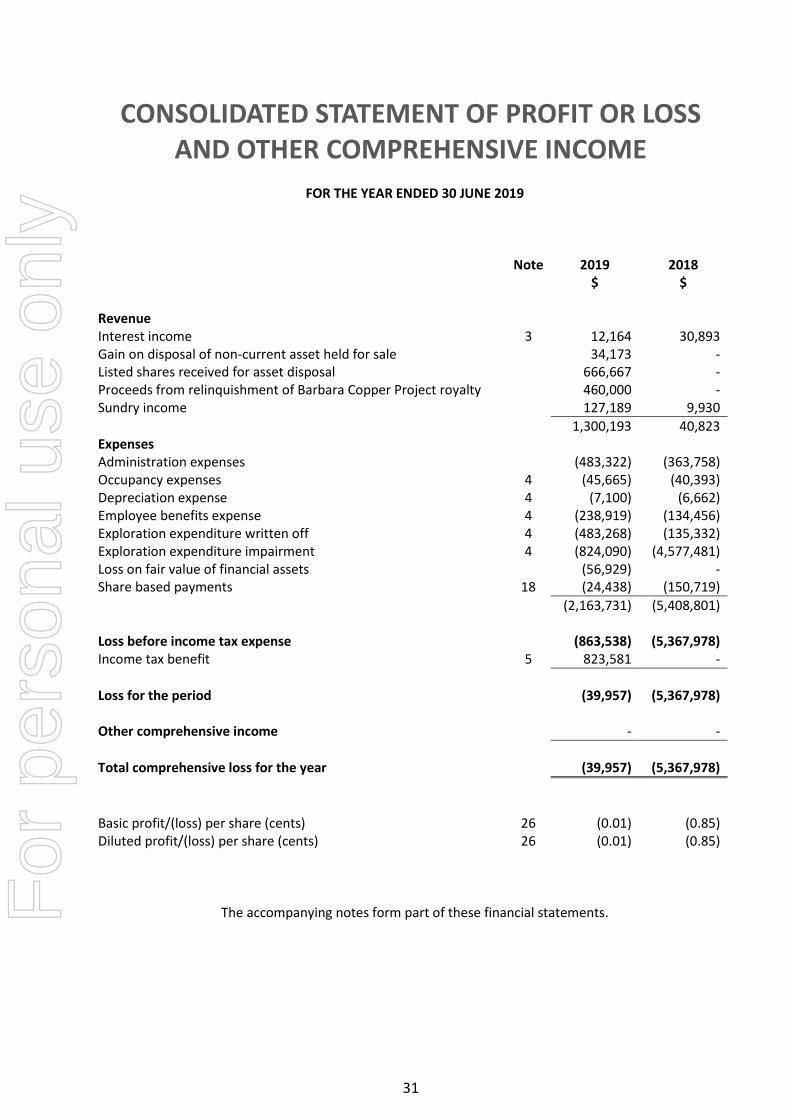
CONSOLIDATED STATEMENT OF PROFIT OR LOSS AND OTHER COMPREHENSIVE INCOME
FOR THE YEAR ENDED 30 JUNE 2019
Note 2019 2018 $ $ Revenue Interest income 3 12,164 30,893 Gain on disposal of non-current asset held for sale 34,173 - Listed shares received for asset disposal 666,667 - Proceeds from relinquishment of Barbara Copper Project royalty 460,000 - Sundry income 127,189 9,930
1,300,193 40,823 Expenses Administration expenses (483,322) (363,758) Occupancy expenses 4 (45,665) (40,393) Depreciation expense 4 (7,100) (6,662) Employee benefits expense 4 (238,919) (134,456) Exploration expenditure written off 4 (483,268) (135,332) Exploration expenditure impairment 4 (824,090) (4,577,481) Loss on fair value of financial assets (56,929) - Share based payments 18 (24,438) (150,719)
(2,163,731) (5,408,801) Loss before income tax expense (863,538) (5,367,978) Income tax benefit 5 823,581 -
Loss for the period (39,957) (5,367,978) Other comprehensive income - -
Total comprehensive loss for the year (39,957) (5,367,978)
Basic profit/(loss) per share (cents) 26 (0.01) (0.85) Diluted profit/(loss) per share (cents) 26 (0.01) (0.85)
The accompanying notes form part of these financial statements. For
per
sona
l use
onl
y
32
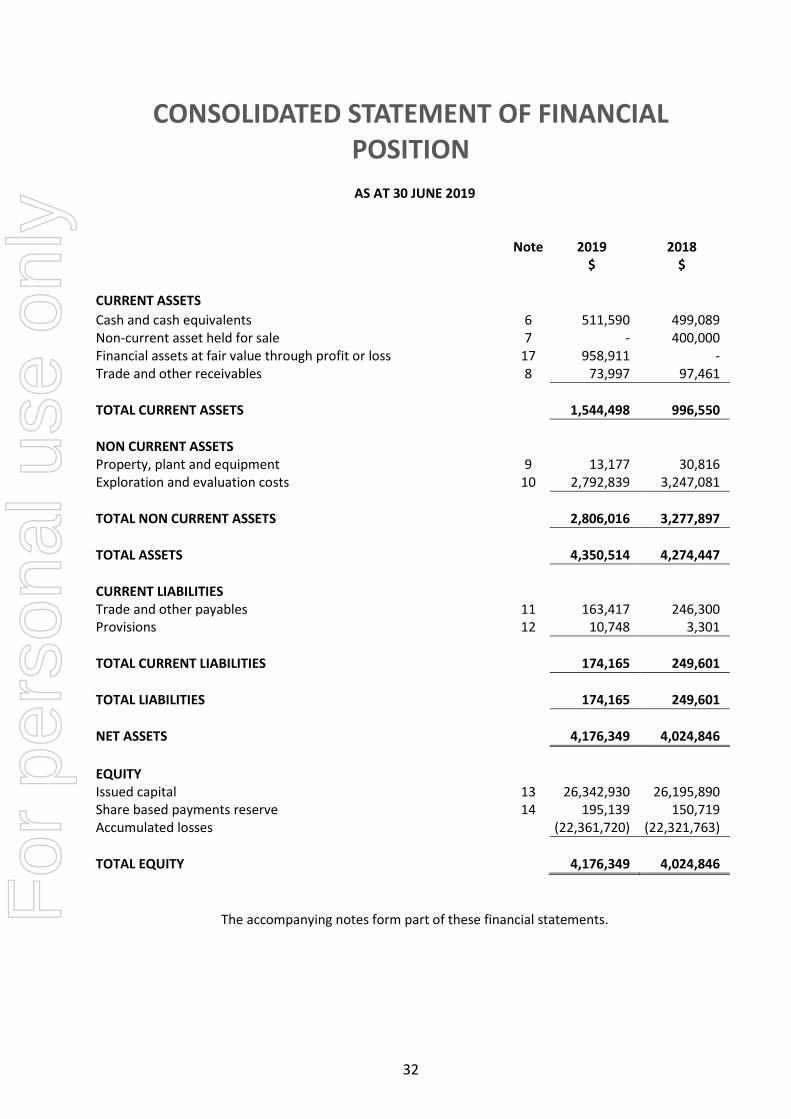
CONSOLIDATED STATEMENT OF FINANCIAL POSITION
AS AT 30 JUNE 2019
Note 2019 2018 $ $ CURRENT ASSETS
Cash and cash equivalents 6 511,590 499,089 Non-current asset held for sale 7 - 400,000 Financial assets at fair value through profit or loss 17 958,911 - Trade and other receivables 8 73,997 97,461
TOTAL CURRENT ASSETS 1,544,498 996,550
NON CURRENT ASSETS Property, plant and equipment 9 13,177 30,816 Exploration and evaluation costs 10 2,792,839 3,247,081
TOTAL NON CURRENT ASSETS 2,806,016 3,277,897
TOTAL ASSETS 4,350,514 4,274,447
CURRENT LIABILITIES Trade and other payables 11 163,417 246,300 Provisions 12 10,748 3,301
TOTAL CURRENT LIABILITIES 174,165 249,601
TOTAL LIABILITIES 174,165 249,601
NET ASSETS 4,176,349 4,024,846
EQUITY Issued capital 13 26,342,930 26,195,890 Share based payments reserve 14 195,139 150,719 Accumulated losses (22,361,720) (22,321,763)
TOTAL EQUITY 4,176,349 4,024,846
The accompanying notes form part of these financial statements. For
per
sona
l use
onl
y

33
CONSOLIDATED STATEMENT OF CHANGES IN EQUITY
FOR THE YEAR ENDED 30 JUNE 2019
Issued Capital Share Based
Payments Reserve
Accumulated Losses
Total
$ $ $ $ Balance at 1 July 2018
26,195,890 150,719 (22,321,763) 4,024,846
Loss for the period - - (39,957) (39,957) Other comprehensive income - - - -
Total comprehensive loss for the period - - (39,957) (39,957)
Transactions with owners, recorded directly in equity
Issue of share capital 150,000 - - 150,000 Share issue costs (2,960) - - (2,960) Fair value of options issued - 44,420 - 44,420
147,040 44,420 - 191,460
Balance at 30 June 2019 26,342,930 195,139 (22,361,720) 4,176,349
Issued Capital Share Based Payments Reserve
Accumulated Losses
Total
$ $ $ $ Balance at 1 July 2017
26,187,467 142,393 (17,096,178) 9,233,682
Loss for the period - - (5,367,978) (5,367,978) Other comprehensive income - - - -
Total comprehensive loss for the period - - (5,367,978) (5,367,978)
Transactions with owners, recorded directly in equity
Issue of share capital 12,099 - - 12,099 Share issue costs (3,676) - - (3,676) Performance rights expired - (142,393) 142,393 - Fair value of options issued - 150,719 - 150,719
8,423 8,326 142,393 159,142
Balance at 30 June 2018 26,195,890 150,719 (22,321,763) 4,024,846
The accompanying notes form part of these financial statements.
For
per
sona
l use
onl
y
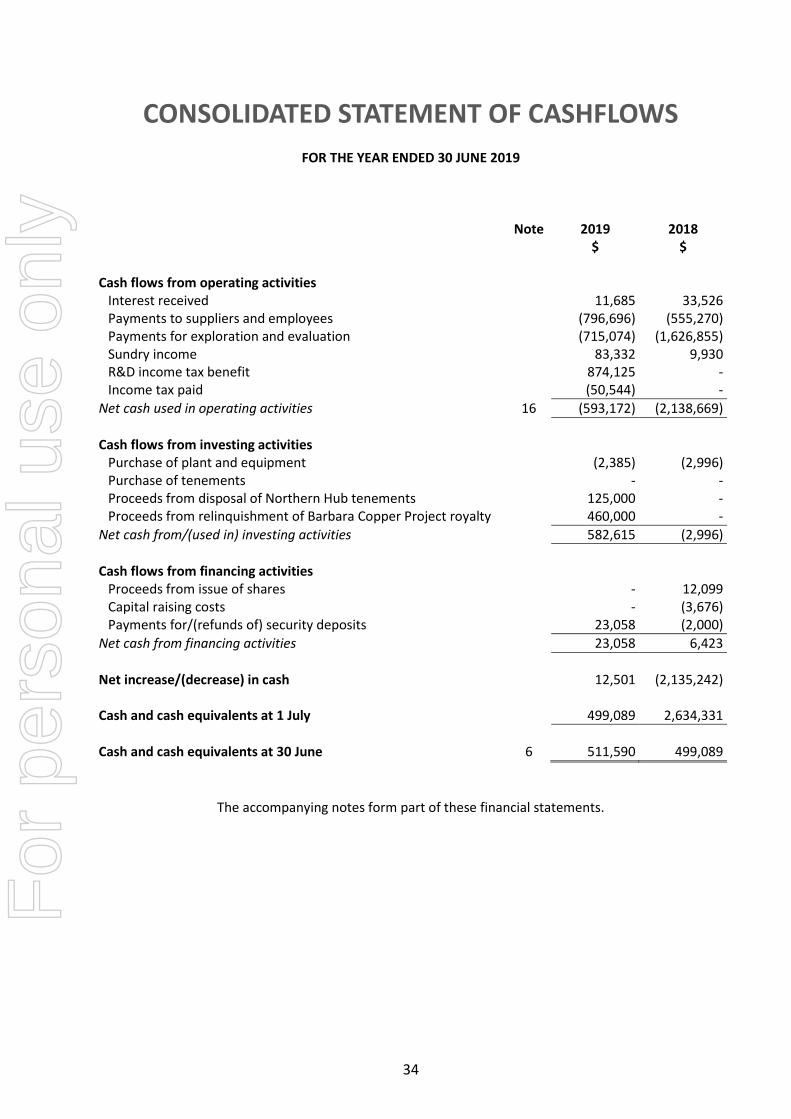
34
CONSOLIDATED STATEMENT OF CASHFLOWS
FOR THE YEAR ENDED 30 JUNE 2019
Note 2019 2018 $ $ Cash flows from operating activities
Interest received 11,685 33,526 Payments to suppliers and employees (796,696) (555,270) Payments for exploration and evaluation (715,074) (1,626,855) Sundry income 83,332 9,930 R&D income tax benefit 874,125 - Income tax paid (50,544) -
Net cash used in operating activities 16 (593,172) (2,138,669)
Cash flows from investing activities
Purchase of plant and equipment (2,385) (2,996) Purchase of tenements - - Proceeds from disposal of Northern Hub tenements 125,000 - Proceeds from relinquishment of Barbara Copper Project royalty 460,000 -
Net cash from/(used in) investing activities 582,615 (2,996)
Cash flows from financing activities
Proceeds from issue of shares - 12,099 Capital raising costs - (3,676) Payments for/(refunds of) security deposits 23,058 (2,000)
Net cash from financing activities 23,058 6,423
Net increase/(decrease) in cash 12,501 (2,135,242) Cash and cash equivalents at 1 July 499,089 2,634,331
Cash and cash equivalents at 30 June 6 511,590 499,089
The accompanying notes form part of these financial statements.
For
per
sona
l use
onl
y

35
NOTES TO THE FINANCIAL STATEMENTS
FOR THE YEAR ENDED 30 JUNE 2019 NOTE 1: STATEMENT OF SIGNIFICANT ACCOUNTING POLICIES Syndicated Metals Limited (the “Company”) is a company domiciled and incorporated in Australia and listed on the Australian Securities Exchange. The consolidated financial statements of the Company as at and for the year ended 30 June 2019 comprise the Company and its subsidiaries (together referred to as the “Group” and individually as “Group entities”). The Group is primarily involved in mineral exploration activity. New, revised or amending Accounting Standards and Interpretations adopted The Group has adopted all of the new, revised or amending Accounting Standards and Interpretations issued by the Australian Accounting Standards Board ('AASB') that are mandatory for the current reporting period. Any new, revised or amending Accounting Standards or Interpretations that are not yet mandatory have not been early adopted. The following Accounting Standards and Interpretations are most relevant to the Group: AASB 9 Financial Instruments The Group has adopted AASB 9 from 1 July 2018. The standard introduced new classification and measurement models for financial assets. A financial asset shall be measured at amortised cost if it is held within a business model whose objective is to hold assets in order to collect contractual cash flows which arise on specified dates and that are solely principal and interest. A debt investment shall be measured at fair value through other comprehensive income if it is held within a business model whose objective is to both hold assets in order to collect contractual cash flows which arise on specified dates that are solely principal and interest as well as selling the asset on the basis of its fair value. All other financial assets are classified and measured at fair value through profit or loss unless the entity makes an irrevocable election on initial recognition to present gains and losses on equity instruments (that are not held-for-trading or contingent consideration recognised in a business combination) in other comprehensive income ('OCI'). Despite these requirements, a financial asset may be irrevocably designated as measured at fair value through profit or loss to reduce the effect of, or eliminate, an accounting mismatch. For financial liabilities designated at fair value through profit or loss, the standard requires the portion of the change in fair value that relates to the entity's own credit risk to be presented in OCI (unless it would create an accounting mismatch). New simpler hedge accounting requirements are intended to more closely align the accounting treatment with the risk management activities of the entity. New impairment requirements use an 'expected credit loss' ('ECL') model to recognise an allowance. Impairment is measured using a 12-month ECL method unless the credit risk on a financial instrument has increased significantly since initial recognition in which case the lifetime ECL method is adopted. For receivables, a simplified approach to measuring expected credit losses using a lifetime expected loss allowance is available.
For
per
sona
l use
onl
y
Notes to the Financial Statements
36
NOTE 1: STATEMENT OF SIGNIFICANT ACCOUNTING POLICIES (CONT) AASB 15 Revenue from Contracts with Customers The Group has adopted AASB 15 from 1 July 2018. The standard provides a single comprehensive model for revenue recognition. The core principle of the standard is that an entity shall recognise revenue to depict the transfer of promised goods or services to customers at an amount that reflects the consideration to which the entity expects to be entitled in exchange for those goods or services. The standard introduced a new contract-based revenue recognition model with a measurement approach that is based on an allocation of the transaction price. This is described further in the accounting policies below. Credit risk is presented separately as an expense rather than adjusted against revenue. Contracts with customers are presented in an entity's statement of financial position as a contract liability, a contract asset, or a receivable, depending on the relationship between the entity's performance and the customer's payment. Customer acquisition costs and costs to fulfil a contract can, subject to certain criteria, be capitalised as an asset and amortised over the contract period. Impact of adoption AASB 9 and AASB 15 were adopted using the modified retrospective approach and as such comparatives have not been restated. There was no impact of adoption on opening accumulated losses as at 1 July 2018. Basis of Preparation and Going Concern Basis The accounting policies set out below have been consistently applied to all years presented. Statement of Compliance The financial report is a general purpose financial report that has been prepared in accordance with Australian Accounting Standards, Australian Accounting Interpretations, other authoritative pronouncements of the Australian Accounting Standards Board and the Corporations Act 2001 as appropriate for for-profit entities. The consolidated financial report of the Group and the financial report of the Company comply with International Financial Reporting Standards (IFRS) and Interpretations adopted by the International Accounting Standards Board (IASB). The consolidated financial report was authorised for issue in accordance with a resolution of the Directors on 10 September 2019. The Directors have the power to amend and reissue the financial statements. Basis of Measurement The consolidated financial statements have been prepared on an accruals basis and are based on historical cost except for certain financial instruments which are fair valued through the profit or loss. Parent entity information In accordance with the Corporations Act 2001, these financial statements present the results of the consolidated entity only. Supplementary information about the parent entity is disclosed in Note 25. Functional and Presentation Currency These consolidated financial statements are presented in Australian dollars, which is the Company’s functional currency. Principles of Consolidation The consolidated financial statements incorporate the assets and liabilities of all subsidiaries of Syndicated Metals Limited ('Company' or 'parent entity') as at 30 June 2019 and the results of all subsidiaries for the year then ended. Syndicated Metals Limited and its subsidiaries together are referred to in these financial statements as the 'Group'.
For
per
sona
l use
onl
y

Notes to the Financial Statements
37
NOTE 1: STATEMENT OF SIGNIFICANT ACCOUNTING POLICIES (CONT) Principles of Consolidation (cont) Subsidiaries are all those entities over which the Group has control. The Group controls an entity when the Group is exposed to, or has rights to, variable returns from its involvement with the entity and has the ability to affect those returns through its power to direct the activities of the entity. Subsidiaries are fully consolidated from the date on which control is transferred to the Group. They are de-consolidated from the date that control ceases. Intercompany transactions, balances and unrealised gains on transactions between entities in the Group are eliminated. Unrealised losses are also eliminated unless the transaction provides evidence of the impairment of the asset transferred. Accounting policies of subsidiaries have been changed where necessary to ensure consistency with the policies adopted by the Group. The acquisition of subsidiaries is accounted for using the acquisition method of accounting. A change in ownership interest, without the loss of control, is accounted for as an equity transaction, where the difference between the consideration transferred and the book value of the share of the non-controlling interest acquired is recognised directly in equity attributable to the parent. Non-controlling interests in the results and equity of subsidiaries are shown separately in the statement of profit or loss and other comprehensive income, statement of financial position and statement of changes in equity of the Group. Losses incurred by the Group are attributed to the non-controlling interest in full, even if that results in a deficit balance. Where the Group loses control over a subsidiary, it derecognises the assets including goodwill, liabilities and non-controlling interest in the subsidiary together with any cumulative translation differences recognised in equity. The Group recognises the fair value of the consideration received and the fair value of any investment retained together with any gain or loss in profit or loss. Operating segments Operating segments are presented using the 'management approach', where the information presented is on the same basis as the internal reports provided to the chief operating decision makers, being the Board. The Board is responsible for the allocation of resources to operating segments and assessing their performance. Significant Accounting Policies (a) Income tax The income tax expense or benefit for the period is the tax payable on that period's taxable income based on the applicable income tax rate for each jurisdiction, adjusted by the changes in deferred tax assets and liabilities attributable to temporary differences, unused tax losses and the adjustment recognised for prior periods, where applicable. Deferred tax assets and liabilities are recognised for temporary differences at the tax rates expected to be applied when the assets are recovered or liabilities are settled, based on those tax rates that are enacted or substantively enacted, except for: ● When the deferred income tax asset or liability arises from the initial recognition of goodwill or an asset
or liability in a transaction that is not a business combination and that, at the time of the transaction, affects neither the accounting nor taxable profits; or
● When the taxable temporary difference is associated with interests in subsidiaries, associates or joint ventures, and the timing of the reversal can be controlled and it is probable that the temporary difference will not reverse in the foreseeable future.
For
per
sona
l use
onl
y
Notes to the Financial Statements
38
NOTE 1: STATEMENT OF SIGNIFICANT ACCOUNTING POLICIES (CONT) (a) Income tax (cont) Deferred tax assets are recognised for deductible temporary differences and unused tax losses only if it is probable that future taxable amounts will be available to utilise those temporary differences and losses. The carrying amount of recognised and unrecognised deferred tax assets are reviewed at each reporting date. Deferred tax assets recognised are reduced to the extent that it is no longer probable that future taxable profits will be available for the carrying amount to be recovered. Previously unrecognised deferred tax assets are recognised to the extent that it is probable that there are future taxable profits available to recover the asset. Deferred tax assets and liabilities are offset only where there is a legally enforceable right to offset current tax assets against current tax liabilities and deferred tax assets against deferred tax liabilities; and they relate to the same taxable authority on either the same taxable entity or different taxable entities which intend to settle simultaneously. Syndicated Metals Limited (the ‘head entity’) and its wholly-owned Australian subsidiaries have formed an income tax consolidated group under the tax consolidation regime. The head entity and each subsidiary in the tax consolidated group continue to account for their own current and deferred tax amounts. The tax consolidated group has applied the ‘separate taxpayer within group’ approach in determining the appropriate amount of taxes to allocate to members of the tax consolidated group. In addition to its own current and deferred tax amounts, the head entity also recognises the current tax liabilities (or assets) and the deferred tax assets arising from unused tax losses and unused tax credits assumed from each subsidiary in the tax consolidated group. Assets or liabilities arising under tax funding agreements with the tax consolidated entities are recognised as amounts receivable from or payable to other entities in the tax consolidated group. The tax funding arrangement ensures that the intercompany charge equals the current tax liability or benefit of each tax consolidated group member, resulting in neither a contribution by the head entity to the subsidiaries nor a distribution by the subsidiaries to the head entity. (b) Exploration and evaluation expenditure Exploration and evaluation expenditure incurred is accumulated in respect of each identifiable area of interest. These costs are carried forward only if they relate to an area of interest for which rights of tenure are current and in respect of which:
such costs are expected to be recouped through successful development and exploitation or from sale of the area; or
exploration and evaluation activities in the area have not, at reporting date, reached a stage which permit a reasonable assessment of the existence or otherwise of economically recoverable reserves, and active operations in, or relating to, the area are continuing.
Accumulated costs in respect of areas of interest which are abandoned are written off in full against profit/(loss) in the year in which the decision to abandon the area is made.
For
per
sona
l use
onl
y
Notes to the Financial Statements
39
NOTE 1: STATEMENT OF SIGNIFICANT ACCOUNTING POLICIES (CONT) (b) Exploration and evaluation expenditure (cont) A regular review is undertaken of each area of interest to determine the appropriateness of continuing to carry forward costs in relation to that area of interest. The recoverability of the carrying amount of the exploration and evaluation assets is dependent on the successful development and commercial exploitation or alternatively sale of the respective areas of interest. Rehabilitation, Restoration and Environmental Costs Long-term environmental obligations are based on the Company’s environmental management plans, in compliance with current environmental and regulatory requirements. The costs will include obligations relating to reclamation, waste site closure, plant closure and other costs associated with the restoration of the site, when relevant. Full provision is made based on the net present value of the estimated cost of restoring the environmental disturbance that has been incurred as at the reporting date. Increases due to additional environmental disturbance (to the extent that it relates to the development of an asset) are capitalised and amortised over the remaining lives of the mines. Annual increases in provision relating to the change in the present value of the provision are accounted for in earnings. The estimated costs of rehabilitation are reviewed annually and adjusted as appropriate for changes in legislation, technology or other circumstances. Cost estimates are not reduced by the potential proceeds from sale of assets or from plant clean-up at closure. (c) Revenue Recognition The consolidated entity recognises revenue as follows: Revenue from contracts with customers Revenue is recognised at an amount that reflects the consideration to which the consolidated entity is expected to be entitled in exchange for transferring goods or services to a customer. For each contract with a customer, the consolidated entity: identifies the contract with a customer; identifies the performance obligations in the contract; determines the transaction price which takes into account estimates of variable consideration and the time value of money; allocates the transaction price to the separate performance obligations on the basis of the relative stand-alone selling price of each distinct good or service to be delivered; and recognises revenue when or as each performance obligation is satisfied in a manner that depicts the transfer to the customer of the goods or services promised. Interest Interest revenue is recognised as interest accrues using the effective interest method. This is a method of calculating the amortised cost of a financial asset and allocating the interest income over the relevant period using the effective interest rate, which is the rate that exactly discounts estimated future cash receipts through the expected life of the financial asset to the net carrying amount of the financial asset. Other revenue Other revenue is recognised when it is received or when the right to receive payment is established.
For
per
sona
l use
onl
y
Notes to the Financial Statements
40
NOTE 1: STATEMENT OF SIGNIFICANT ACCOUNTING POLICIES (CONT) (d) Trade and Other Receivables Trade receivables are initially recognised at fair value and subsequently measured at amortised cost using the effective interest method, less any allowance for expected losses. Trade receivables are generally due for settlement within 30 days. Collectability of trade receivables is reviewed on an ongoing basis. Debts which are known to be uncollectable are written off by reducing the carrying amount directly. An allowance for expected losses of trade receivables is raised when there is objective evidence that the Group will not be able to collect all amounts due according to the original terms of the receivables. Significant financial difficulties of the debtor, probability that the debtor will enter bankruptcy or financial reorganisation and default or delinquency in payments (more than 60 days overdue) are considered indicators that the trade receivable may be impaired. The amount of the allowance for expected losses is the difference between the asset’s carrying amount and the present value of estimated future cash flows, discounted at the original effective interest rate. Cash flows relating to short-term receivables are not discounted if the effect of discounting is immaterial. Other receivables are recognised at amortised cost, less any allowance for expected losses. (e) Impairment of Non-Financial Assets At each reporting date, the Company reviews the carrying values of its tangible and intangible assets to determine whether there is any indication that those assets have been impaired. If such an indication exists, the recoverable amount of the asset, being the higher of the asset’s fair value less costs to sell and value in use, is compared to the asset’s carrying value. Any excess of the asset’s carrying value over its recoverable amount is expensed to the statement of profit or loss and other comprehensive income. Where it is not possible to estimate the recoverable amount of an individual asset, the Company estimates the recoverable amount of the cash-generating unit to which the asset belongs.
(f) Property, Plant and Equipment Each class of property, plant and equipment is carried at cost or fair value less, where applicable, any accumulated depreciation and impairment losses. Plant and equipment is measured on the cost basis less depreciation and impairment losses.
Subsequent costs are included in the asset’s carrying amount or recognised as a separate asset, as appropriate, only when it is probable that future economic benefits associated with the item will flow to the Company and the cost of the item can be measured reliably. All other repairs and maintenance are charged to the statement of profit or loss and other comprehensive income during the financial period in which they are incurred. Depreciation The depreciable amount of all fixed assets including buildings and capitalised lease assets, but excluding freehold land, is depreciated on a straight line basis over their useful lives to the Company commencing from the time the asset is held ready for use. The depreciation rates used for each class of depreciable assets are:
Class of Fixed Asset Depreciation Rate Furniture 15 - 30% Plant and equipment 25 - 50% Vehicles 20 - 30% Computer equipment 25 - 33%
For
per
sona
l use
onl
y

Notes to the Financial Statements
41
NOTE 1: STATEMENT OF SIGNIFICANT ACCOUNTING POLICIES (CONT) (f) Property, Plant and Equipment (cont) The assets’ residual values and useful lives are reviewed, and adjusted if appropriate, at each reporting date. Gains and losses on disposals are determined by comparing proceeds with the carrying amount. These gains and losses are included in the statement of profit or loss and other comprehensive income. When revalued assets are sold, amounts included in the revaluation reserve relating to the asset are transferred to retained earnings. (g) Leases A distinction is made between finance leases which effectively transfer from the lessor to the lessee substantially all the risks and benefits incidental to ownership of leased non-current assets, and operating leases under which the lessor effectively retains substantially all such risks and benefits. Incentives received on entering into operating leases are recognised as liabilities. Lease payments are allocated between rental expense and reduction of the liability. Other operating lease payments are charged to the statement of profit or loss and other comprehensive income in the periods in which they are incurred, as this represents the pattern of benefits derived from the leased assets. (h) Trade and Other Creditors These amounts represent liabilities for goods and services provided to the Company prior to the end of the financial year and which are unpaid. Due to their short-term nature they are measured at amortised cost and are not discounted. The amounts are unsecured and are usually paid within 30 days of recognition.
(i) Employee Benefits (i) Wages, salaries and annual leave Liabilities for wages, salaries and annual leave expected to be settled within 12 months of the reporting date are recognised in respect of employees’ services up to the reporting date and are measured at the amounts expected to be paid when the liabilities are settled. (ii) Employee benefits payable later than one year Employee benefits payable later than one year have been measured at the present value of the estimated future cash outflows to be made for those benefits. (iii) Superannuation Contributions are made by the Company to superannuation funds as stipulated by statutory requirements and are charged as expenses when incurred. (iv) Employee benefit on costs Employee benefit on-costs, including payroll tax, are recognised and included in employee benefits liabilities and costs when the employee benefits to which they relate are recognised as liabilities. (v) Share-based payments Equity-settled share-based compensation benefits are provided to employees. Equity-settled transactions are awards of shares, options over shares or performance rights that are provided to employees in exchange for the rendering of services.
For
per
sona
l use
onl
y

Notes to the Financial Statements
42
NOTE 1: STATEMENT OF SIGNIFICANT ACCOUNTING POLICIES (CONT) (i) Employee Benefits (cont) The cost of equity-settled transactions are measured at fair value on grant date. Fair value is independently determined using either the Binomial or Black-Scholes option pricing model that takes into account the exercise price, the term of the option, the impact of dilution, the share price at grant date and expected price volatility of the underlying share, the expected dividend yield and the risk free interest rate for the term of the option, together with non-vesting conditions that do not determine whether the Group receives the services that entitle the employees to receive payment. No account is taken of any other vesting conditions.
The cost of equity-settled transactions are recognised as an expense with a corresponding increase in equity over the vesting period. The cumulative charge to profit or loss is calculated based on the grant date fair value of the award, the best estimate of the number of awards that are likely to vest and the expired portion of the vesting period. The amount recognised in profit or loss for the period is the cumulative amount calculated at each reporting date less amounts already recognised in previous periods. All changes in the liability are recognised in profit or loss. Market conditions are taken into consideration in determining fair value. Therefore any awards subject to market conditions are considered to vest irrespective of whether or not that market condition has been met, provided all other conditions are satisfied. If equity-settled awards are modified, as a minimum an expense is recognised as if the modification has not been made. An additional expense is recognised, over the remaining vesting period, for any modification that increases the total fair value of the share-based compensation benefit as at the date of modification. If the non-vesting condition is within the control of the Group or employee, the failure to satisfy the condition is treated as a cancellation. If the condition is not within the control of the Group or employee and is not satisfied during the vesting period, any remaining expense for the award is recognised over the remaining vesting period, unless the award is forfeited. If equity-settled awards are cancelled, it is treated as if it has vested on the date of cancellation, and any remaining expense is recognised immediately. If a new replacement award is substituted for the cancelled award, the cancelled and new award are treated as if they were a modification.
(j) Cash and Cash Equivalents Cash and cash equivalents includes cash on hand, deposits held at call with financial institutions, other short-term, highly liquid investments with original maturities of three months or less that are readily convertible to known amounts of cash and which are subject to an insignificant risk of changes in value.
(k) Fair Value Measurement When an asset or liability, financial or non-financial, is measured at fair value for recognition or disclosure purposes, the fair value is based on the price that would be received to sell an asset or paid to transfer a liability in an orderly transaction between market participants at the measurement date; and assumes that the transaction will take place either: in the principal market; or in the absence of a principal market, in the most advantageous market. Fair value is measured using the assumptions that market participants would use when pricing the asset or liability, assuming they act in their economic best interest. For non-financial assets, the fair value measurement is based on its highest and best use. Valuation techniques that are appropriate in the circumstances and for which sufficient data are available to measure fair value, are used, maximising the use of relevant observable inputs and minimising the use of unobservable inputs.
For
per
sona
l use
onl
y
Notes to the Financial Statements
43
NOTE 1: STATEMENT OF SIGNIFICANT ACCOUNTING POLICIES (CONT) (k) Fair Value Measurement Assets and liabilities measured at fair value are classified, into three levels, using a fair value hierarchy that reflects the significance of the inputs used in making the measurements. Classifications are reviewed each reporting date and transfers between levels are determined based on a reassessment of the lowest level input that is significant to the fair value measurement. For recurring and non-recurring fair value measurements, external valuers may be used when internal expertise is either not available or when the valuation is deemed to be significant. External valuers are selected based on market knowledge and reputation. Where there is a significant change in fair value of an asset or liability from one period to another, an analysis is undertaken, which includes a verification of the major inputs applied in the latest valuation and a comparison, where applicable, with external sources of data. (l) Goods and Services Tax (GST) Revenues, expenses and assets are recognised net of the amount of GST, except where the amount of GST incurred is not recoverable from the Australian Taxation Office. In these circumstances the GST is recognised as part of the cost of acquisition of the asset or as part of an item of the expense. Receivables and payables in the statement of financial position are shown inclusive of GST where applicable. Cash flows are presented in the statement of cash flows on a gross basis, except for the GST component of investing and financing activities, which are disclosed as operating cash flows. (m) Comparative Figures When required by Accounting Standards, comparative figures have been adjusted to conform to changes in presentation for the current financial year. (n) Investments and other financial assets Investments and other financial assets are initially measured at fair value. Transaction costs are included as part of the initial measurement, except for financial assets at fair value through profit or loss. Such assets are subsequently measured at either amortised cost or fair value depending on their classification. Classification is determined based on both the business model within which such assets are held and the contractual cash flow characteristics of the financial asset unless, an accounting mismatch is being avoided. Financial assets are derecognised when the rights to receive cash flows have expired or have been transferred and the consolidated entity has transferred substantially all the risks and rewards of ownership. When there is no reasonable expectation of recovering part or all of a financial asset, it's carrying value is written off. (i) Financial assets at fair value through profit or loss Financial assets not measured at amortised cost or at fair value through other comprehensive income are classified as financial assets at fair value through profit or loss. Typically, such financial assets will be either: (i) held for trading, where they are acquired for the purpose of selling in the short-term with an intention of making a profit, or a derivative; or (ii) designated as such upon initial recognition where permitted. Fair value movements are recognised in profit or loss.
For
per
sona
l use
onl
y

Notes to the Financial Statements
44
NOTE 1: STATEMENT OF SIGNIFICANT ACCOUNTING POLICIES (CONT) (n) Investments and other financial assets (cont) (ii) Impairment of financial assets The consolidated entity recognises a loss allowance for expected credit losses on financial assets which are either measured at amortised cost or fair value through other comprehensive income. The measurement of the loss allowance depends upon the consolidated entity's assessment at the end of each reporting period as to whether the financial instrument's credit risk has increased significantly since initial recognition, based on reasonable and supportable information that is available, without undue cost or effort to obtain. Where there has not been a significant increase in exposure to credit risk since initial recognition, a 12-month expected credit loss allowance is estimated. This represents a portion of the asset's lifetime expected credit losses that is attributable to a default event that is possible within the next 12 months. Where a financial asset has become credit impaired or where it is determined that credit risk has increased significantly, the loss allowance is based on the asset's lifetime expected credit losses. The amount of expected credit loss recognised is measured on the basis of the probability weighted present value of anticipated cash shortfalls over the life of the instrument discounted at the original effective interest rate. For financial assets measured at fair value through other comprehensive income, the loss allowance is recognised within other comprehensive income. In all other cases, the loss allowance is recognised in profit or loss. (o) Issued Capital Ordinary shares are classified as equity. Incremental costs directly attributable to the issue of new shares or options are shown in equity as a deduction, net of tax, from the proceeds. Incremental costs directly attributable to the issue of new shares or options, or for the acquisition of a business, are included in the cost of the acquisition as part of the purchase consideration. (p) Non-current assets classified as held for sale Non-current assets and assets of disposal groups are classified as held for sale if their carrying amount will be recovered principally through a sale transaction rather than through continued use. They are measured at the lower of their carrying amount and fair value less costs of disposal. For non-current assets or assets of disposal groups to be classified as held for sale, they must be available for immediate sale in their present condition and their sale must be highly probable. An impairment loss is recognised for any initial or subsequent write down of the non-current assets and assets of disposal groups to fair value less costs of disposal. A gain is recognised for any subsequent increases in fair value less costs of disposal of a non-current asset and assets of disposal groups, but not in excess of any cumulative impairment loss previously recognised. Non-current assets are not depreciated or amortised while they are classified as held for sale. Interest and other expenses attributable to the liabilities of assets held for sale continue to be recognised. Non-current assets classified as held for sale and the assets of disposal groups classified as held for sale are presented separately on the face of the statement of financial position, in current assets. The liabilities of disposal groups classified as held for sale are presented separately on the face of the statement of financial position, in current liabilities.
For
per
sona
l use
onl
y
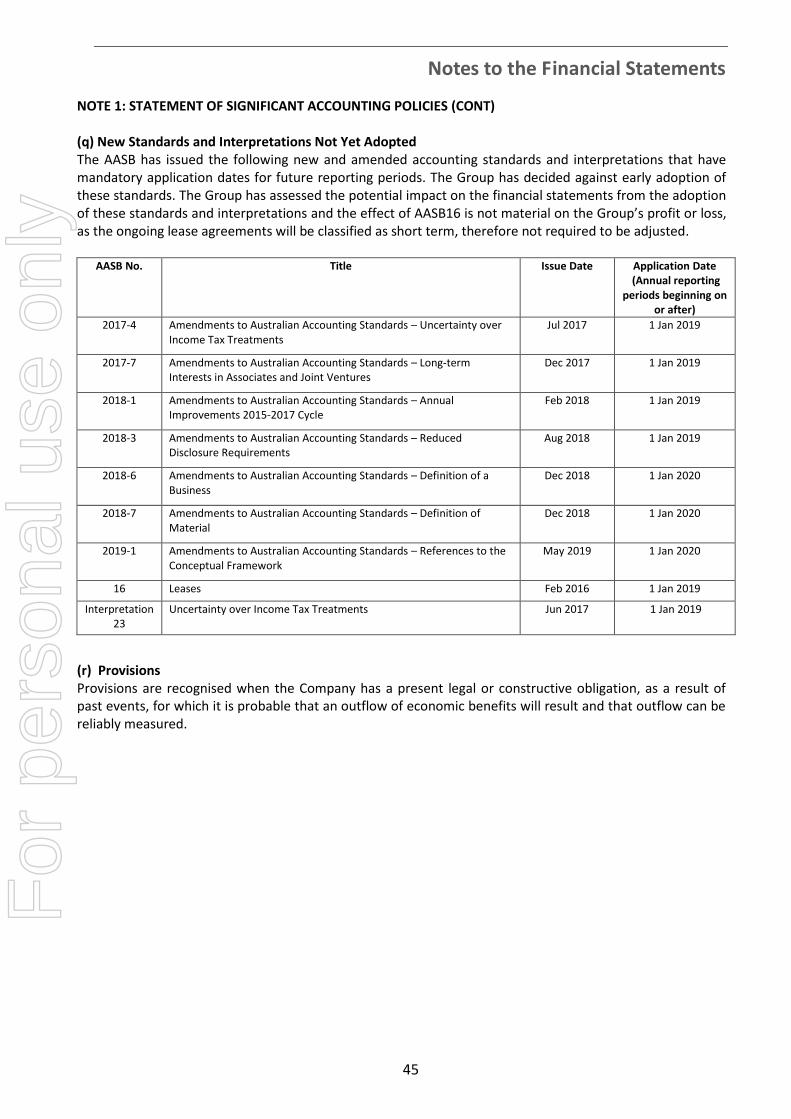
Notes to the Financial Statements
45
NOTE 1: STATEMENT OF SIGNIFICANT ACCOUNTING POLICIES (CONT) (q) New Standards and Interpretations Not Yet Adopted The AASB has issued the following new and amended accounting standards and interpretations that have mandatory application dates for future reporting periods. The Group has decided against early adoption of these standards. The Group has assessed the potential impact on the financial statements from the adoption of these standards and interpretations and the effect of AASB16 is not material on the Group’s profit or loss, as the ongoing lease agreements will be classified as short term, therefore not required to be adjusted.
AASB No. Title Issue Date Application Date
(Annual reporting periods beginning on
or after)
2017-4 Amendments to Australian Accounting Standards – Uncertainty over Income Tax Treatments
Jul 2017 1 Jan 2019
2017-7 Amendments to Australian Accounting Standards – Long-term Interests in Associates and Joint Ventures
Dec 2017 1 Jan 2019
2018-1 Amendments to Australian Accounting Standards – Annual Improvements 2015-2017 Cycle
Feb 2018 1 Jan 2019
2018-3 Amendments to Australian Accounting Standards – Reduced Disclosure Requirements
Aug 2018 1 Jan 2019
2018-6 Amendments to Australian Accounting Standards – Definition of a Business
Dec 2018 1 Jan 2020
2018-7 Amendments to Australian Accounting Standards – Definition of Material
Dec 2018 1 Jan 2020
2019-1 Amendments to Australian Accounting Standards – References to the Conceptual Framework
May 2019 1 Jan 2020
16 Leases Feb 2016 1 Jan 2019
Interpretation 23
Uncertainty over Income Tax Treatments Jun 2017 1 Jan 2019
(r) Provisions Provisions are recognised when the Company has a present legal or constructive obligation, as a result of past events, for which it is probable that an outflow of economic benefits will result and that outflow can be reliably measured.
For
per
sona
l use
onl
y
Notes to the Financial Statements
46
NOTE 1: STATEMENT OF SIGNIFICANT ACCOUNTING POLICIES (CONT) (s) Interests in Joint Arrangements IFRS defines a joint arrangement as one over which two or more parties have joint control, which is the contractually agreed sharing of control over an arrangement. This exists only when the decisions about the relevant activities (being those that significantly affect the returns of the arrangement) require the unanimous consent of the parties sharing control. Joint operations A joint operation is a type of joint arrangement whereby the parties that have joint control of the arrangement have rights to the assets and obligations for the liabilities, relating to the arrangement. In relation to its interests in joint operations, the Company recognises its:
Assets, including its share of any assets held jointly
Liabilities, including its share of any liabilities incurred jointly
Revenue from the sale of its share of the output arising from the joint operation
Share of the revenue from the sale of the output by the joint operation
Expenses, including its share of any expenses incurred jointly.
(t) Earnings per share Basic earnings per share Basic earnings per share is determined by dividing the net profit/(loss) after income tax attributable to members of the Company, excluding any costs of servicing equity other than ordinary shares, by the weighted average number of ordinary shares outstanding during the financial year, adjusted for bonus elements in ordinary shares issued during the year. Diluted earnings per share Diluted earnings per share adjusts the figures used in the determination of basic earnings per share to take into account the after income tax effect of interest and other financing costs associated with dilutive potential ordinary shares and the weighted average number of shares assumed to have been issued for no consideration in relation to dilutive potential ordinary shares. (u) Current and non-current classification Assets and liabilities are presented in the statement of financial position based on current and non-current classification. An asset is classified as current when: it is either expected to be realised or intended to be sold or consumed in normal operating cycle; it is held primarily for the purpose of trading; it is expected to be realised within 12 months after the reporting period; or the asset is cash or cash equivalent unless restricted from being exchanged or used to settle a liability for at least 12 months after the reporting period. All other assets are classified as non-current. A liability is classified as current when: it is either expected to be settled in normal operating cycle; it is held primarily for the purpose of trading; it is due to be settled within 12 months after the reporting period; or there is no unconditional right to defer the settlement of the liability for at least 12 months after the reporting period. All other liabilities are classified as non-current. Deferred tax assets and liabilities are always classified as non-current.
For
per
sona
l use
onl
y

Notes to the Financial Statements
47
NOTE 1: STATEMENT OF SIGNIFICANT ACCOUNTING POLICIES (CONT) (v) Rounding of amounts The Company is of a kind referred to in Corporations Instrument 2016/191, issued by the Australian Securities and Investments Commission, relating to ‘rounding-off’. Amounts in this report have been rounded off in accordance with that Corporations Instrument to the nearest dollar.
NOTE 2: SIGNIFICANT ACCOUNTING JUDGEMENTS AND ESTIMATES
Use of Estimates and Judgements The preparation of financial statements in conformity with AASBs requires management to make judgements, estimates and assumptions that affect the application of accounting policies and the reported amounts of assets, liabilities, income and expenses. Actual results may differ from these estimates. Estimates and underlying assumptions are reviewed on an ongoing basis. Revisions to accounting estimates are recognised in the period in which the estimates are revised and in any future periods affected. Going Concern The financial report has been prepared on the going concern basis, which contemplates continuity of normal business activities and the realisation of assets and the settlement of liabilities in the normal course of business. The Group incurred a loss of $39,957 for the year ended 30 June 2019 (2018: loss $5,367,978). Included within this loss was the impairment and write off of exploration expenditure of $1,307,358 (2018: $4,712,813). The ability of the Company and the Group to continue to pay its debts as and when they fall due is dependent upon the Company successfully raising additional share capital and ultimately developing its mineral properties. The accounts have been prepared on the basis that the Company can meet its commitments as and when they fall due and can therefore continue normal business activities, and the realisation of assets and liabilities in the ordinary course of business. The Directors believe that they will continue to be successful in securing additional funds through equity issues as and when the need to raise working capital arises. There exists a material uncertainty that may cast significant doubt about the Group’s ability to continue as a going concern and therefore, the Group may be unable to realise its assets and discharge its liabilities in the normal course of business. Critical Accounting Judgements, Estimates and Assumptions The carrying amounts of certain assets and liabilities are often determined based on estimates and assumptions of future events. The key estimates and assumptions that have a significant risk of causing a material adjustment to the carrying amounts of certain assets and liabilities within the next annual reporting period are: Share Based Payment Transactions The Group measures the cost of equity-settled transactions with employees by reference to the fair value of the equity instruments at the date at which they are granted. The fair value of the employee options is determined by a valuation using the Black-Scholes option pricing model, using the assumptions detailed in Note 18. The fair value of the performance rights issued in prior periods was determined by a valuation using a binomial model.
For
per
sona
l use
onl
y

Notes to the Financial Statements
48
NOTE 2: SIGNIFICANT ACCOUNTING JUDGEMENTS AND ESTIMATES (CONT) Critical Accounting Judgements, Estimates and Assumptions (cont) Exploration and Evaluation Costs Exploration and evaluation expenditure incurred is accumulated in respect of each identifiable area of interest. These costs are carried forward in respect of an area that has not at reporting date reached a stage which permits a reasonable assessment of the existence or otherwise of economically recoverable reserves and the expenditures are expected to be recouped through successful development and exploitation of the area of interest, or alternatively, by its sale. While there are certain areas of interest from which no reserves have been extracted, the directors are of the continued belief that such expenditure should not be written off since expenditures are expected to be recouped as noted above. Such capitalised expenditure is carried at reporting date at $2,792,839. Impairment of Exploration and Evaluation Assets and Investments in Subsidiaries The ultimate recoupment of the value of exploration and evaluation assets, the Company’s investment in subsidiaries, and loans to subsidiaries is dependent on the successful development and commercial exploitation, or alternatively, sale, of the exploration and evaluation assets. Impairment tests are carried out on a regular basis to identify whether the asset carrying values exceed their recoverable amounts. There is significant estimation and judgement in determining the inputs and assumptions used in determining the recoverable amounts. The key areas of judgement and estimation include:
Recent exploration and evaluation results and resource estimates;
Environmental issues that may impact on the underlying tenements; and
Economic factors that have an impact on the operations and carrying values of assets and liabilities.
Classification of Investments The Company has decided to classify investments in listed securities as financial assets at fair value through profit or loss. These securities are accounted for at fair value. Any increments or decrements in their value at year end are charged or debited to the statement of profit or loss and other comprehensive income. Income tax expenses Judgement is required in assessing whether deferred tax assets and liabilities are recognised on the statement of financial position. Deferred tax assets, including those arising from temporary differences, are recognised only when it is considered more likely than not that they will be recovered, which is dependent on the generation of future assessable income of a nature and of an amount sufficient to enable the benefits to be utilised. Employee benefits provision As discussed in Note 1, the liability for employee benefits expected to be settled more than 12 months from the reporting date are recognised and measured at the present value of the estimated future cash flows to be made in respect of all employees at the reporting date. In determining the present value of the liability, estimates of attrition rates and pay increases through promotion and inflation have been taken into account.
For
per
sona
l use
onl
y

Notes to the Financial Statements
49
NOTE 3: REVENUE FROM CONTINUING OPERATIONS 2019 2018 $ $
Operating activities Interest received 12,164 30,893
NOTE 4: EXPENSES Depreciation expense 18,653 29,749 less capitalised in exploration and evaluation (11,553) (23,087)
7,100 6,662
Share based payments 24,438 150,719
Employee benefits expenses
Salaries and on-costs 332,628 318,352 Superannuation 23,821 29,393
less capitalised in exploration and evaluation (117,530) (213,289)
238,919 134,456
Exploration expenditure written off 483,268 135,332
Exploration expenditure impairment 824,090 4,577,481
Occupancy expenses 45,665 40,393
NOTE 5: INCOME TAX (EXPENSE)/BENEFIT The prima facie tax payable on the operating profit/(loss) is reconciled to the income tax provided in the accounts as follows:
Prima facie tax payable on operating profit/(loss) before income tax at 27.5% (2018: 27.5%)
(237,473)
(1,476,194)
Effect of non-deductible expenses 12,174 41,758 Increase/(decrease) in deferred tax balances not brought to account 225,299 1,434,436 Research and development tax concession refund (874,125) - Income tax incurred from tax consolidation 50,544 -
Income tax benefit (823,581) -
The income tax benefit for the current year relates to the receipt of refundable tax offsets for research and development expenditure incurred in the reporting periods ended 30 June 2017 and 30 June 2018. The following deferred tax balances have not been recognised: Deferred Tax Assets at 27.5% (2018: 27.5%): Carry forward revenue losses 6,185,396 6,382,987 Carry forward capital losses - 8,942 Capital raising costs 19,852 39,428 Provisions and accruals 6,943 7,645 Fair value impairment of investments 15,655 - Other 98,472 69,020
6,326,318 6,508,022
For
per
sona
l use
onl
y
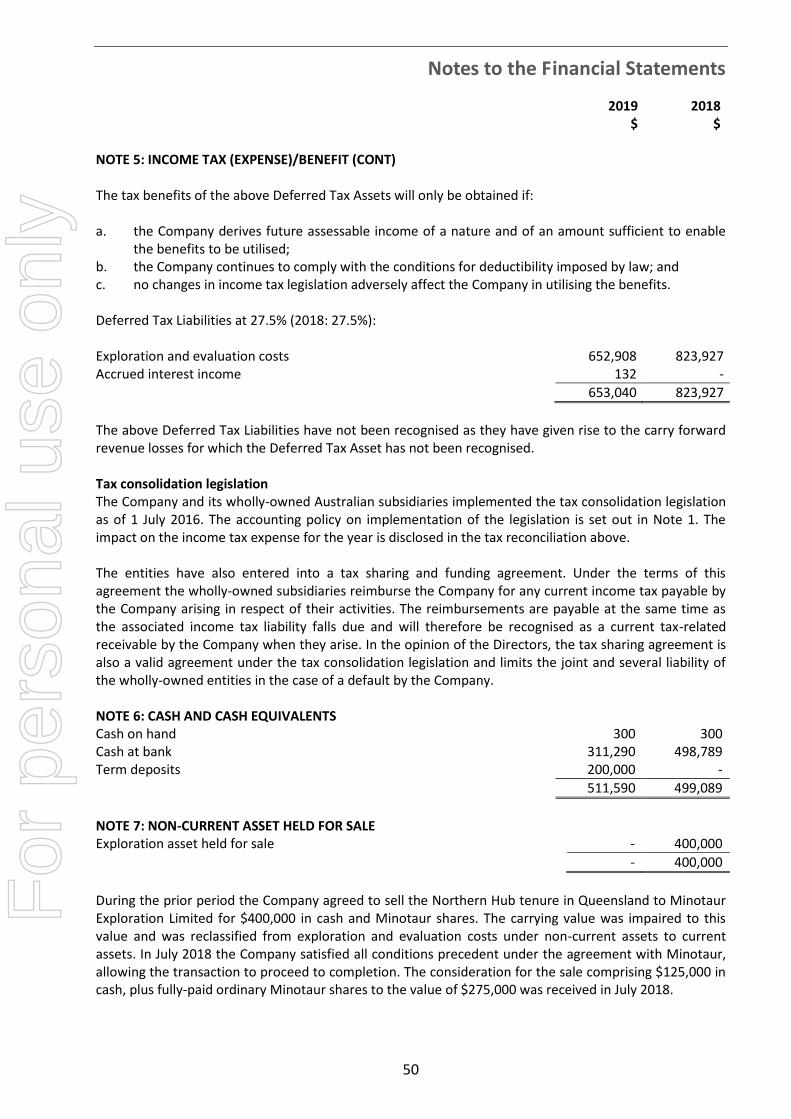
Notes to the Financial Statements
50
2019 2018 $ $ NOTE 5: INCOME TAX (EXPENSE)/BENEFIT (CONT) The tax benefits of the above Deferred Tax Assets will only be obtained if: a. the Company derives future assessable income of a nature and of an amount sufficient to enable
the benefits to be utilised; b. the Company continues to comply with the conditions for deductibility imposed by law; and c. no changes in income tax legislation adversely affect the Company in utilising the benefits. Deferred Tax Liabilities at 27.5% (2018: 27.5%): Exploration and evaluation costs 652,908 823,927 Accrued interest income 132 -
653,040 823,927
The above Deferred Tax Liabilities have not been recognised as they have given rise to the carry forward revenue losses for which the Deferred Tax Asset has not been recognised. Tax consolidation legislation The Company and its wholly-owned Australian subsidiaries implemented the tax consolidation legislation as of 1 July 2016. The accounting policy on implementation of the legislation is set out in Note 1. The impact on the income tax expense for the year is disclosed in the tax reconciliation above. The entities have also entered into a tax sharing and funding agreement. Under the terms of this agreement the wholly-owned subsidiaries reimburse the Company for any current income tax payable by the Company arising in respect of their activities. The reimbursements are payable at the same time as the associated income tax liability falls due and will therefore be recognised as a current tax-related receivable by the Company when they arise. In the opinion of the Directors, the tax sharing agreement is also a valid agreement under the tax consolidation legislation and limits the joint and several liability of the wholly-owned entities in the case of a default by the Company. NOTE 6: CASH AND CASH EQUIVALENTS Cash on hand 300 300 Cash at bank 311,290 498,789 Term deposits 200,000 -
511,590 499,089
NOTE 7: NON-CURRENT ASSET HELD FOR SALE Exploration asset held for sale - 400,000
- 400,000
During the prior period the Company agreed to sell the Northern Hub tenure in Queensland to Minotaur Exploration Limited for $400,000 in cash and Minotaur shares. The carrying value was impaired to this value and was reclassified from exploration and evaluation costs under non-current assets to current assets. In July 2018 the Company satisfied all conditions precedent under the agreement with Minotaur, allowing the transaction to proceed to completion. The consideration for the sale comprising $125,000 in cash, plus fully-paid ordinary Minotaur shares to the value of $275,000 was received in July 2018.
For
per
sona
l use
onl
y
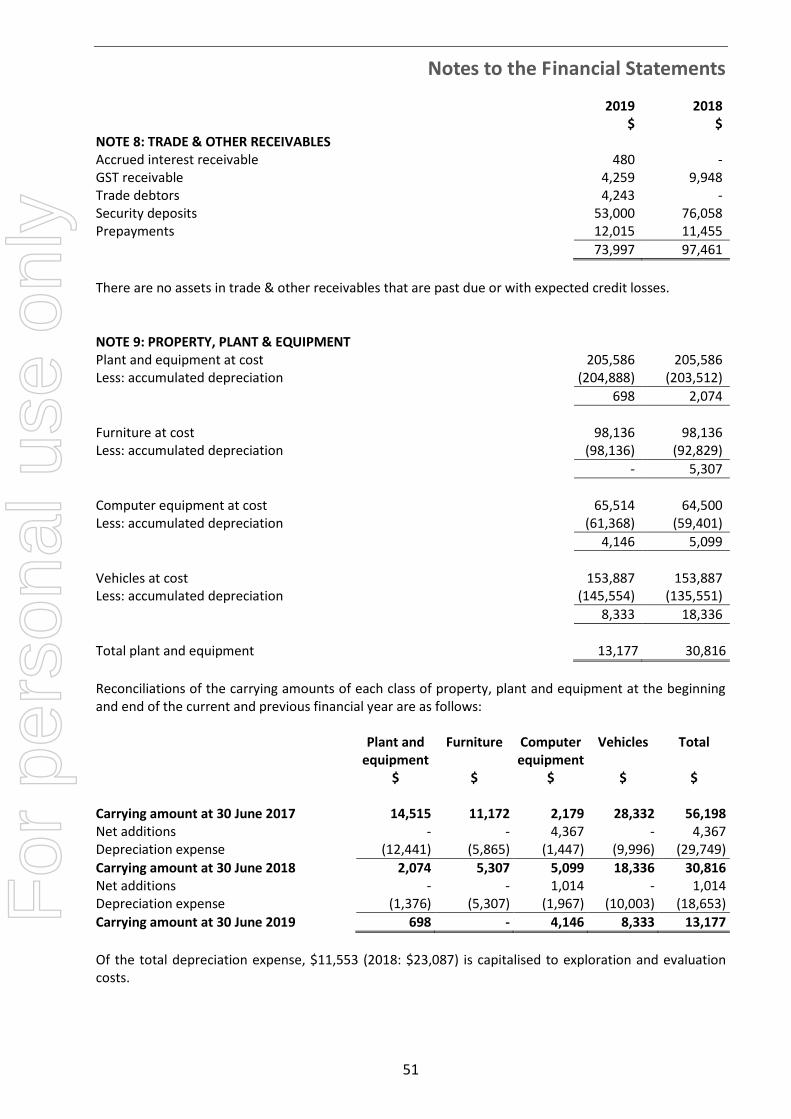
Notes to the Financial Statements
51
2019 2018 $ $ NOTE 8: TRADE & OTHER RECEIVABLES Accrued interest receivable 480 - GST receivable 4,259 9,948 Trade debtors 4,243 - Security deposits 53,000 76,058 Prepayments 12,015 11,455
73,997 97,461
There are no assets in trade & other receivables that are past due or with expected credit losses.
NOTE 9: PROPERTY, PLANT & EQUIPMENT Plant and equipment at cost 205,586 205,586 Less: accumulated depreciation (204,888) (203,512)
698 2,074
Furniture at cost 98,136 98,136 Less: accumulated depreciation (98,136) (92,829)
- 5,307
Computer equipment at cost 65,514 64,500 Less: accumulated depreciation (61,368) (59,401)
4,146 5,099
Vehicles at cost 153,887 153,887 Less: accumulated depreciation (145,554) (135,551)
8,333 18,336
Total plant and equipment 13,177 30,816
Reconciliations of the carrying amounts of each class of property, plant and equipment at the beginning and end of the current and previous financial year are as follows: Plant and
equipment Furniture Computer
equipment Vehicles Total
$ $ $ $ $ Carrying amount at 30 June 2017 14,515 11,172 2,179 28,332 56,198 Net additions - - 4,367 - 4,367 Depreciation expense (12,441) (5,865) (1,447) (9,996) (29,749)
Carrying amount at 30 June 2018 2,074 5,307 5,099 18,336 30,816 Net additions - - 1,014 - 1,014 Depreciation expense (1,376) (5,307) (1,967) (10,003) (18,653)
Carrying amount at 30 June 2019 698 - 4,146 8,333 13,177
Of the total depreciation expense, $11,553 (2018: $23,087) is capitalised to exploration and evaluation costs.
For
per
sona
l use
onl
y

Notes to the Financial Statements
52
2019 2018 $ $
NOTE 10: EXPLORATION AND EVALUATION COSTS Exploration expenditure capitalised 2,792,839 3,247,081
Movement in carrying value: Balance at 1 July 3,247,081 6,706,892 Exploration expenditure capitalised during the year 853,116 1,653,002 Exploration expenditure written off during the year (483,268) (135,332) Exploration expenditure impaired during the year (824,090) (4,577,481) Transferred to non-current asset held for sale - (400,000)
Balance at 30 June 2,792,839 3,247,081
The value of the exploration expenditure is dependent upon:
The continuance of the rights to tenure of the areas of interest;
The results of future exploration; and
The recoupment of costs through successful development and exploitation of the areas of interest or alternatively by their sale.
During the period the Company entered into a farm-in agreement with Newfield Resources Limited and an option agreement with Gateway Mining Limited on the tenements forming the Newington Gold Project near Southern Cross in WA. As at reporting date the Company had not met its earn-in requirements on these tenements and a total of $345,073 was written off. A further amount of $138,195 was written off in relation to project assessment activities and tenement application expenses for tenements that are yet to be granted to the Company. During the period the Company raised a provision for impairment totaling $824,090 in relation to less prospective tenements at the Monument Gold Project near Laverton in WA and holding costs related to the Northern Hub and Southern Hub areas of interest in Queensland before those tenement packages were disposed of to Minotaur Exploration Limited and Carnaby Resources Limited respectively. During the prior period a provision for impairment totaling $4,420,853 was raised in relation to carry forward costs on the Northern Hub (Mt Remarkable) area of interest. During the prior period the Company agreed to sell the Northern Hub tenure to Minotaur Exploration Limited for $400,000 in cash and Minotaur shares. The area of interest was impaired to this value and transferred to non-current asset held for sale. In July 2018 the Company satisfied all conditions precedent under the agreement with Minotaur, allowing the transaction to proceed to completion. The consideration for the sale comprising $125,000 in cash, plus fully-paid ordinary Minotaur shares to the value of $275,000 was received in July. Refer to Note 7. Also during the prior period the Company reached agreement to dispose of an 82.5% interest in the Southern Hub (Fountain Range) area of interest to Carnaby Resources Limited. The area of interest continued to be fully impaired in line with the treatment in prior periods. The impairment totaled $156,628. NOTE 11: TRADE & OTHER PAYABLES Trade and other payables 92,293 178,018
Accruals 70,728 67,059 GST Payable 396 1,223
163,417 246,300
For
per
sona
l use
onl
y

Notes to the Financial Statements
53
2019 2018 $ $
NOTE 12: PROVISIONS Current Provision for annual leave 10,748 3,301
NOTE 13: ISSUED CAPITAL 2019 2018 2019 2018 Shares Shares $ $ (a) Share capital
Fully paid ordinary shares 665,492,379 635,492,379 27,225,126 27,075,126 Less: capital issue costs - - (882,196) (879,236)
665,492,379 635,492,379 26,342,930 26,195,890
(b) Movements in ordinary share capital
Date Details Number of
shares
Issue price Value
$
Balance at 30 June 2017 634,484,141 26,187,467
14/12/2017 Issue of shares upon exercise of options 361,108
0.012 4,333
09/02/2018 Issue of shares upon exercise of options 647,130
0.012 7,766
Less: capital issue costs - - (3,676)
Balance at 30 June 2018 635,492,379 26,195,890
20/05/2019 Issue of shares for Newfield
Resources farm-in 30,000,000
0.005 150,000 Less: capital issue costs - - (2,960)
Balance at 30 June 2019 665,492,379 26,342,930
(c) Ordinary shares
Ordinary shares entitle the holder to participate in dividends and the proceeds on winding up of the Company in proportion to the number of and amounts paid on the shares held. These shares have no par value.
(d) Capital management The Group’s objectives when managing capital are to safeguard the Group’s ability to continue as a going concern, so as to maintain a strong capital base sufficient to maintain future exploration and development of its projects. In order to maintain or adjust the capital structure, the Group may return capital to shareholders, issue new shares or sell assets for in-specie distributions.
For
per
sona
l use
onl
y

Notes to the Financial Statements
54
NOTE 13: ISSUED CAPITAL (CONT) The Group’s focus has been to raise sufficient funds through equity to fund exploration and evaluation activities. The Group monitors capital on the basis of the gearing ratio, however there are no external borrowings as at reporting date. Capital includes accumulated profits and fair value reserve. The Group encourages employees to be shareholders through the issue of free options or performance rights. There were no changes in the Group’s approach to capital management during the year. Neither the Company nor any of its subsidiaries are subject to externally imposed capital requirements.
2019 2018 $ $ (e) Capital Risk Management Cash and cash equivalents 511,590 499,089 Less: Total liabilities (174,165) (249,601)
Net cash and cash equivalents 337,425 249,488
Total equity 4,176,349 4,024,846
Debt to equity ratio at 30 June 4.17% 6.20% Management of Share Capital The Directors primary objective is to maintain a capital structure that ensures the lowest cost of capital available to the Group. Unissued shares under options As at the reporting date, the unissued ordinary shares of Syndicated Metals Limited under unlisted options are as follows:
Grant date
Expiry date Exercise price (cents) Quantity
11/10/2017 30/08/2021 2.26 5,333,331 11/10/2017 30/08/2021 2.34 5,333,334 11/10/2017 30/08/2021 3.12 3,000,001 26/10/2018 9/09/2022 1.35 1,666,666 26/10/2018 9/09/2022 1.58 1,666,667 26/10/2018 9/09/2022 1.80 1,666,667 20/05/2019 20/05/2022 3.0 10,000,000
28,666,666
If exercised, each option entitles the holder to one fully paid ordinary share in the Company at any time up to expiry date. As at the reporting date no shares had been issued as a result of the exercise of options.
For
per
sona
l use
onl
y
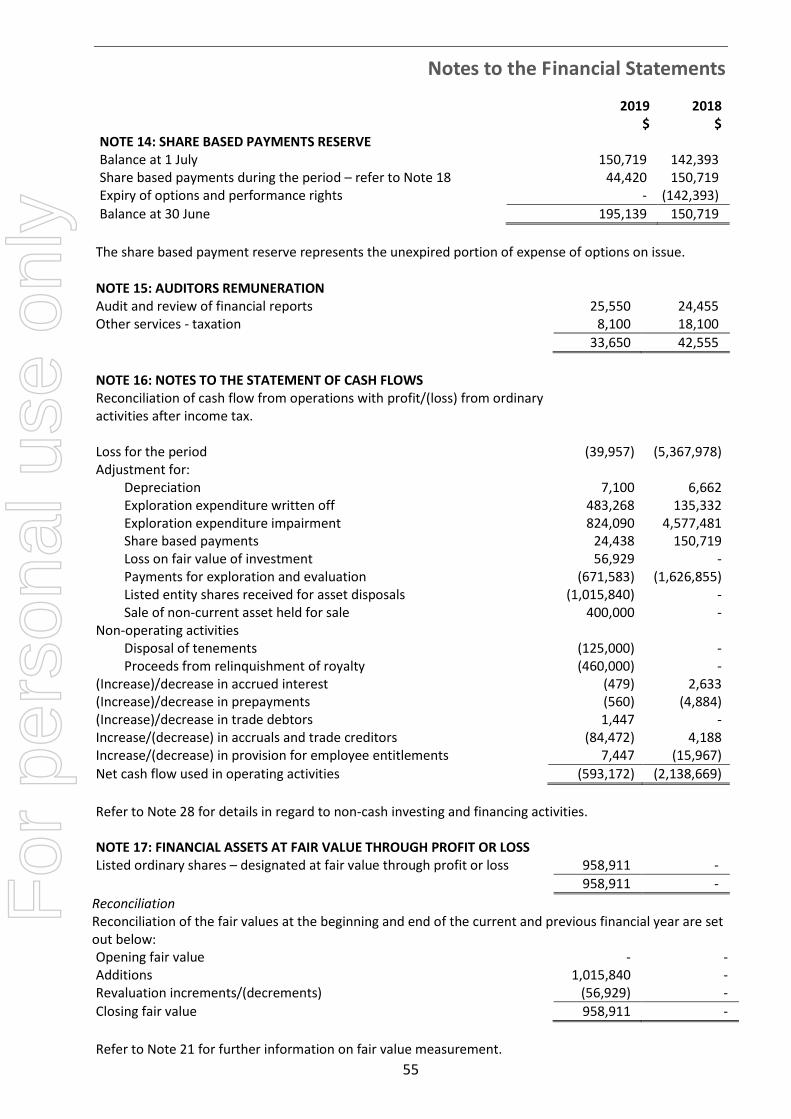
Notes to the Financial Statements
55
2019 2018 $ $
NOTE 14: SHARE BASED PAYMENTS RESERVE Balance at 1 July 150,719 142,393 Share based payments during the period – refer to Note 18 44,420 150,719 Expiry of options and performance rights - (142,393)
Balance at 30 June 195,139 150,719
The share based payment reserve represents the unexpired portion of expense of options on issue.
NOTE 15: AUDITORS REMUNERATION Audit and review of financial reports 25,550 24,455 Other services - taxation 8,100 18,100
33,650 42,555
NOTE 16: NOTES TO THE STATEMENT OF CASH FLOWS Reconciliation of cash flow from operations with profit/(loss) from ordinary activities after income tax.
Loss for the period
(39,957)
(5,367,978)
Adjustment for: Depreciation 7,100 6,662 Exploration expenditure written off 483,268 135,332 Exploration expenditure impairment 824,090 4,577,481 Share based payments 24,438 150,719 Loss on fair value of investment 56,929 - Payments for exploration and evaluation (671,583) (1,626,855) Listed entity shares received for asset disposals (1,015,840) - Sale of non-current asset held for sale 400,000 -
Non-operating activities Disposal of tenements (125,000) - Proceeds from relinquishment of royalty (460,000) -
(Increase)/decrease in accrued interest (479) 2,633 (Increase)/decrease in prepayments (560) (4,884) (Increase)/decrease in trade debtors 1,447 - Increase/(decrease) in accruals and trade creditors (84,472) 4,188 Increase/(decrease) in provision for employee entitlements 7,447 (15,967)
Net cash flow used in operating activities (593,172) (2,138,669)
Refer to Note 28 for details in regard to non-cash investing and financing activities. NOTE 17: FINANCIAL ASSETS AT FAIR VALUE THROUGH PROFIT OR LOSS Listed ordinary shares – designated at fair value through profit or loss 958,911 -
958,911 -
Reconciliation Reconciliation of the fair values at the beginning and end of the current and previous financial year are set out below: Opening fair value - - Additions 1,015,840 - Revaluation increments/(decrements) (56,929) -
Closing fair value 958,911 -
Refer to Note 21 for further information on fair value measurement.
For
per
sona
l use
onl
y

Notes to the Financial Statements
56
NOTE 18: SHARE BASED PAYMENTS Number and weighted average exercise prices of share options The following table illustrates the total number, weighted average exercise prices, and movement in share options issued and/or expired during the year: 2019 2018 Number of
options Weighted average
exercise price
Number of options
Weighted average
exercise price No. (cents) No. (cents) Outstanding at 1 July 13,666,666 2.48 - - Issued during the year 15,000,000 2.53 16,000,000 2.57 Expired during the year - - (2,333,334) 3.12
Outstanding at 30 June 28,666,666 2.50 13,666,666 2.48
Exercisable at 30 June 26,999,999 2.55 10,666,665 2.30
A total of 16,333,334 options vested during the period. Further details are contained in the Share Options section of the Directors’ Report. Terms and conditions of options The terms and conditions relating to grants of options in the current period are as follows;
Grant date/employees entitled Number of instruments
Exercise price
(cents)
Fair value $
Contractual life of options (years)
Vesting date
Options granted to Managing Director - 25 Oct 2018 1,666,666 1.35 6,045 4 25/10/18 Options granted to Managing Director - 25 Oct 2018 1,666,667 1.58 5,894 4 26/04/19 Options granted to Managing Director - 25 Oct 2018 1,666,667 1.80 5,759 4 26/10/19
Options issued to Newfield Resources – 20 May 2019* 10,000,000 3.00 19,982 3 20/05/19
Total 15,000,000 37,680
*10 million options and 30 million shares were issued to Newfield Resources Limited in consideration for the exercise of the option to purchase the right to farm-in to the Newfield Gold Project. Options - Valuation methodology The Black Scholes option pricing model was used in the valuation of the options which is suitable for options without market based vesting conditions which can be exercised at any time following vesting and up to the expiry date. The key assumptions used in the model for the options issued to the Managing Director included, an underlying share price of $0.005, share price volatility of 134%, a risk free interest rate of 2.135% and a dividend yield of nil. The fair value per option at grant date was $0.0036 (1,666,666 options) and $0.0035 (3,333,334 options). The key assumptions used in the model for the options issued to Newfield Resources Limited included, an underlying share price of $0.005, share price volatility of 119%, a risk free interest rate of 1.23% and a dividend yield of nil. The fair value per option at grant date was $0.0020.
For
per
sona
l use
onl
y

Notes to the Financial Statements
57
NOTE 18: SHARE BASED PAYMENTS (CONT) Expenses arising from share-based payment transactions
Total expenses arising from share-based payment transactions recognised during the year as part of employee benefits expense were as follows:
2019 2018
$ $
Options issued 24,438 150,719
24,438 150,719
Reconciliation
Options issued to key management personnel 24,438 150,719 Options issued to Newfield Resources Ltd as partial consideration for farm-in to Newfield Gold Project 19,982 -
Fair value of options issued 44,420 150,719
NOTE 19: COMMITMENTS FOR FUTURE EXPENDITURE The Group has commitments for future expenditure in respect of its tenements and lease of office space. Commitments are as follows: Tenement commitments
Committed at the reporting date but not recognised as liabilities, payable:
- within one year 255,140 377,850
- one to five years 539,820 945,300
794,960 1,323,150
Tenement commitments are only valid if the tenement remains held by the Group. Should the Group decide not to retain the tenure the corresponding commitment for that tenement lapses.
Lease commitments – operating Committed at the reporting date but not recognised as liabilities, payable:
- within one year 29,462 44,760 - one to five years 3,449 26,110
32,911 70,870
The operating lease commitments relate to the lease of the Company’s Perth office premises which expires in January 2020 and minor office equipment. NOTE 20: FINANCIAL INSTRUMENTS The Group’s principal financial instruments comprise cash and short term deposits. The main purpose of the financial instruments is to earn the maximum amount of interest at a low risk to the Group. The Group also has other financial instruments such as trade debtors and creditors which arise directly from its operations. For the period under review, it has been the Group’s policy not to trade in financial instruments. The main risks arising from the Group’s financial instruments are interest rate risk and credit risk. The board reviews and agrees policies for managing each of these risks and they are summarised below:
For
per
sona
l use
onl
y

Notes to the Financial Statements
58
NOTE 20: FINANCIAL INSTRUMENTS (CONT) a) Market Risk (i) Interest rate risk The Group is exposed to interest rate risk (primarily on its cash and cash equivalents), which is the risk that a financial instrument's value will fluctuate as a result of changes in the market interest rates on interest-bearing financial instruments. The Group does not use derivatives to mitigate these exposures. The Group is exposed to movements in market interest rates on short term deposits. The policy is to monitor the interest rate yield curve out to 180 days to ensure a balance is maintained between the liquidity of cash assets and the interest rate return. The Group does not have short or long term debt, and therefore this risk is minimal. The Group adopts a policy of ensuring that as far as possible it maintains excess cash and cash equivalents in short term deposits at interest rates maturing over 30-180 day rolling periods.
Carrying Amount
Carrying Amount
2019 2018 $ $
Profile At the reporting date the interest rate profile of the Company's and the Group’s interest bearing financial instruments was:
Variable rate instruments Cash and cash equivalents 311,290 498,789
Fixed rate instruments Cash and cash equivalents 200,000 -
Cash flow sensitivity analysis for variable rate instruments A change of 100 basis points in interest rates at the reporting date would have increased/(decreased) profit or loss by the amounts shown below. The analysis is performed on the same basis for 2018.
100bp
100bp
Increase Decrease $ $ 30 June 2019 Cash and cash equivalents 5,115 (5,115)
5,115 (5,115)
30 June 2018 Cash and cash equivalents 4,990 (4,990)
4,990 (4,990)
(ii) Foreign currency risk The Group is not exposed to currency risk and at reporting date the Company and the Group hold no financial assets or liabilities which are exposed to foreign currency risk. (iii) Other market price risk Other market price risk is the risk that the value of the instrument will fluctuate as a result of changes in market prices (other than those arising from interest rate risk or currency risk), whether caused by factors specific to an individual investment, its issuer or all factors affecting all instruments traded in the market. The Group is not exposed to other market price risk and at reporting date the Company and the Group hold no financial assets or liabilities which are exposed to other market price risk.
For
per
sona
l use
onl
y
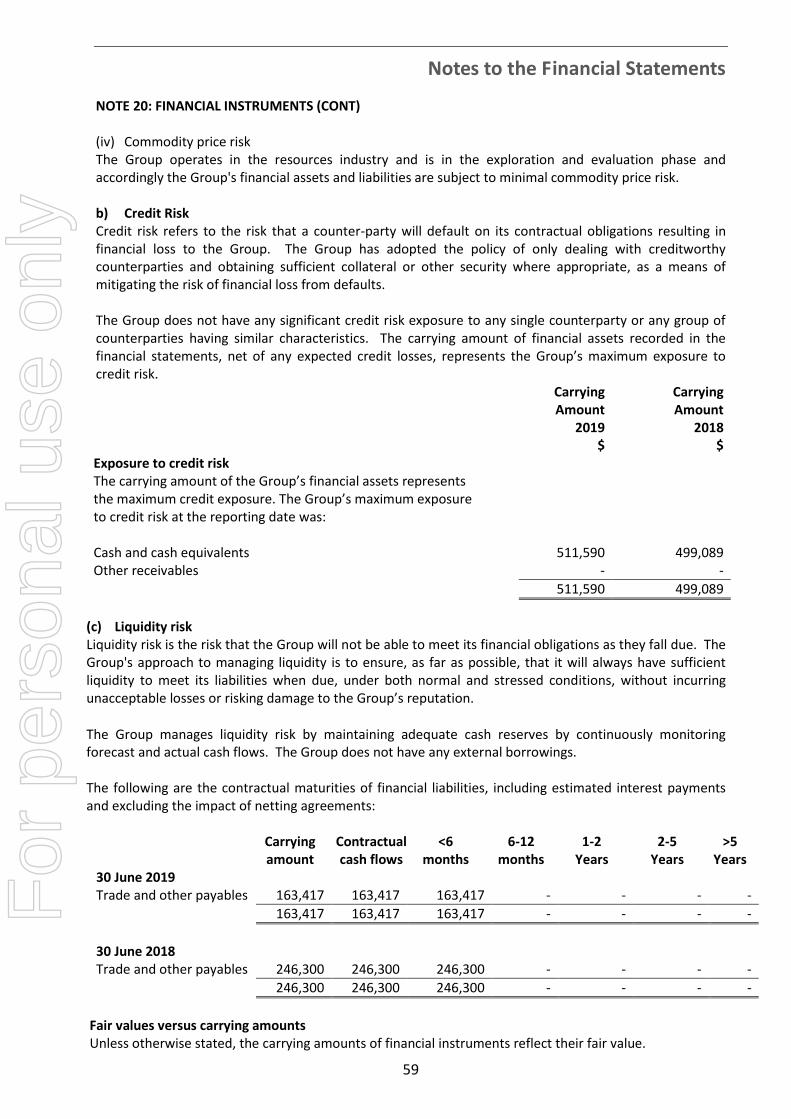
Notes to the Financial Statements
59
NOTE 20: FINANCIAL INSTRUMENTS (CONT) (iv) Commodity price risk The Group operates in the resources industry and is in the exploration and evaluation phase and accordingly the Group's financial assets and liabilities are subject to minimal commodity price risk. b) Credit Risk Credit risk refers to the risk that a counter-party will default on its contractual obligations resulting in financial loss to the Group. The Group has adopted the policy of only dealing with creditworthy counterparties and obtaining sufficient collateral or other security where appropriate, as a means of mitigating the risk of financial loss from defaults. The Group does not have any significant credit risk exposure to any single counterparty or any group of counterparties having similar characteristics. The carrying amount of financial assets recorded in the financial statements, net of any expected credit losses, represents the Group’s maximum exposure to credit risk. Carrying
Amount Carrying Amount
2019 2018 $ $ Exposure to credit risk The carrying amount of the Group’s financial assets represents the maximum credit exposure. The Group’s maximum exposure to credit risk at the reporting date was: Cash and cash equivalents 511,590 499,089 Other receivables - -
511,590 499,089
(c) Liquidity risk Liquidity risk is the risk that the Group will not be able to meet its financial obligations as they fall due. The Group's approach to managing liquidity is to ensure, as far as possible, that it will always have sufficient liquidity to meet its liabilities when due, under both normal and stressed conditions, without incurring unacceptable losses or risking damage to the Group’s reputation.
The Group manages liquidity risk by maintaining adequate cash reserves by continuously monitoring forecast and actual cash flows. The Group does not have any external borrowings. The following are the contractual maturities of financial liabilities, including estimated interest payments and excluding the impact of netting agreements:
Carrying
amount Contractual cash flows
<6 months
6-12 months
1-2 Years
2-5 Years
>5 Years
30 June 2019 Trade and other payables 163,417 163,417 163,417 - - - -
163,417 163,417 163,417 - - - -
30 June 2018 Trade and other payables 246,300 246,300 246,300 - - - -
246,300 246,300 246,300 - - - -
Fair values versus carrying amounts Unless otherwise stated, the carrying amounts of financial instruments reflect their fair value.
For
per
sona
l use
onl
y

Notes to the Financial Statements
60
NOTE 21: FAIR VALUE MEASUREMENT The carrying amounts of trade and other receivables and trade and other payables are assumed to approximate their fair values due to their short-term nature. Fair value hierarchy The following table details the consolidated entity's assets and liabilities, measured or disclosed at fair value, using a three level hierarchy, based on the lowest level of input that is significant to the entire fair value measurement, being: Level 1: Quoted prices (unadjusted) in active markets for identical assets or liabilities that the entity can access at the measurement date Level 2: Inputs other than quoted prices included within Level 1 that are observable for the asset or liability, either directly or indirectly Level 3: Unobservable inputs for the asset or liability. Consolidated 2019 Level 1 Level 2 Level 3 Total Assets Financial assets at fair value 958,911 - - 958,911
958,911 - - 958,911
Consolidated 2018 Level 1 Level 2 Level 3 Total Assets Non-current asset held for sale - 400,000 - 400,000
- 400,000 - 400,000
Assets held for sale are measured at fair value on a non-recurring basis. There were no transfers between levels during the financial year. NOTE 22: INTERESTS IN CONTROLLED ENTITIES Controlled entities consolidated The consolidated financial statements incorporate the assets, liabilities and the results of the following subsidiaries in accordance with the accounting policy described in Note 1. Name
Country of Incorporation
Class of Shares
Equity Holding %*
Investment $
2019 2018 2019 2018 Monument Exploration Pty Ltd Australia Ordinary 100 100 250,000 250,000 Syndicated Royalties Pty Ltd Australia Ordinary 100 100 1 1
250,001 250,001
* Percentage of voting power is in proportion to ownership.
Incorporation of controlled entities Monument Exploration Pty Ltd was incorporated on 12 December 2014 and was purchased by Syndicated Metals on 31 August 2016. Syndicated Royalties Pty Ltd was incorporated on 12 April 2010.
For
per
sona
l use
onl
y

Notes to the Financial Statements
61
NOTE 23: SEGMENT REPORTING The Group has identified its operating segments based on the internal reports that are reviewed and used by the Board to make decisions about resources to be allocated to the segments and assess their performance. Operating segments are identified by Management based on the mineral resource and exploration and evaluation activities in Australia. Discrete financial information about each project is reported to the Board on a regular basis. The reportable segments are based on aggregated operating segments determined by the similarity of the Group characteristics, the nature of the activities and the regulatory environment in which those segments operate. The Group operates in two reportable segments based on geographical areas of the mineral resource and exploration and evaluation activities in Australia.
Queensland WA Unallocated Total 30 June 2019 $ $ $ $ Segment revenue 1,235,969 12,060 52,164 1,300,193
Segment net profit/(loss) 1,138,619 (1,197,949) 19,373 (39,957)
Segment assets - 2,801,870 1,548,644 4,350,514
Segment liabilities 13,725 89,145 71,295 174,165
Queensland WA Unallocated Total 30 June 2018 $ $ $ $ Segment revenue - - 40,823 40,823
Segment net loss (4,577,481) (39,457) (751,040) (5,367,978)
Segment assets 400,000 3,267,361 607,086 4,274,447
Segment liabilities 39,769 115,240 94,592 249,601
For
per
sona
l use
onl
y
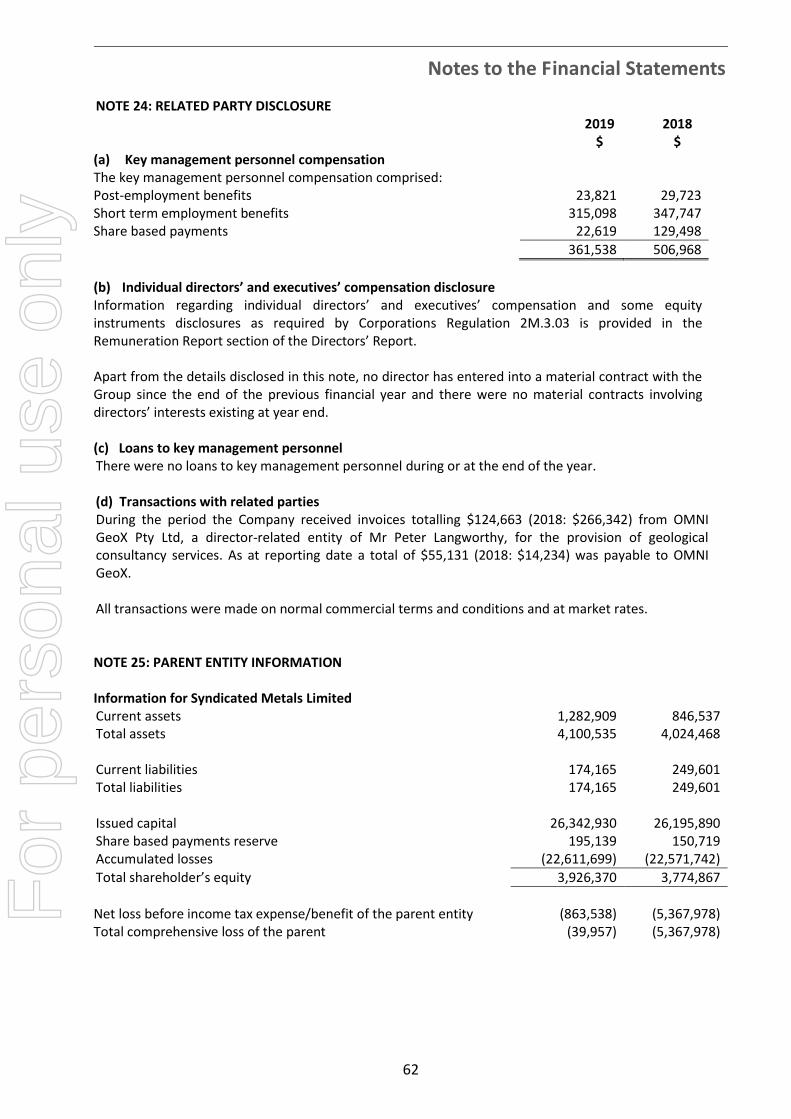
Notes to the Financial Statements
62
NOTE 24: RELATED PARTY DISCLOSURE 2019 2018 $ $ (a) Key management personnel compensation The key management personnel compensation comprised: Post-employment benefits 23,821 29,723 Short term employment benefits 315,098 347,747 Share based payments 22,619 129,498
361,538 506,968
(b) Individual directors’ and executives’ compensation disclosure Information regarding individual directors’ and executives’ compensation and some equity instruments disclosures as required by Corporations Regulation 2M.3.03 is provided in the Remuneration Report section of the Directors’ Report. Apart from the details disclosed in this note, no director has entered into a material contract with the Group since the end of the previous financial year and there were no material contracts involving directors’ interests existing at year end.
(c) Loans to key management personnel There were no loans to key management personnel during or at the end of the year. (d) Transactions with related parties During the period the Company received invoices totalling $124,663 (2018: $266,342) from OMNI GeoX Pty Ltd, a director-related entity of Mr Peter Langworthy, for the provision of geological consultancy services. As at reporting date a total of $55,131 (2018: $14,234) was payable to OMNI GeoX. All transactions were made on normal commercial terms and conditions and at market rates. NOTE 25: PARENT ENTITY INFORMATION Information for Syndicated Metals Limited Current assets 1,282,909 846,537 Total assets 4,100,535 4,024,468 Current liabilities 174,165 249,601 Total liabilities 174,165 249,601 Issued capital 26,342,930 26,195,890 Share based payments reserve 195,139 150,719 Accumulated losses (22,611,699) (22,571,742)
Total shareholder’s equity 3,926,370 3,774,867
Net loss before income tax expense/benefit of the parent entity (863,538) (5,367,978) Total comprehensive loss of the parent (39,957) (5,367,978)
For
per
sona
l use
onl
y
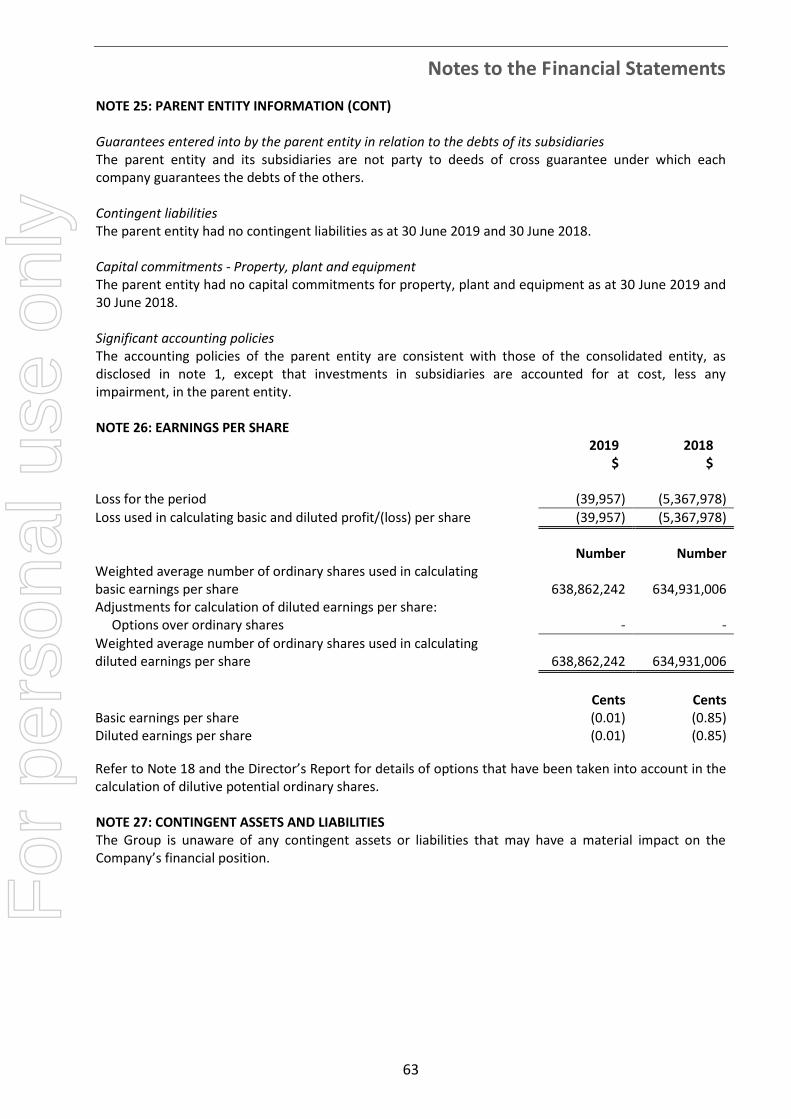
Notes to the Financial Statements
63
NOTE 25: PARENT ENTITY INFORMATION (CONT) Guarantees entered into by the parent entity in relation to the debts of its subsidiaries The parent entity and its subsidiaries are not party to deeds of cross guarantee under which each company guarantees the debts of the others. Contingent liabilities The parent entity had no contingent liabilities as at 30 June 2019 and 30 June 2018. Capital commitments - Property, plant and equipment The parent entity had no capital commitments for property, plant and equipment as at 30 June 2019 and 30 June 2018. Significant accounting policies The accounting policies of the parent entity are consistent with those of the consolidated entity, as disclosed in note 1, except that investments in subsidiaries are accounted for at cost, less any impairment, in the parent entity. NOTE 26: EARNINGS PER SHARE
2019 2018 $ $
Loss for the period
(39,957) (5,367,978)
Loss used in calculating basic and diluted profit/(loss) per share
(39,957) (5,367,978)
Number Number Weighted average number of ordinary shares used in calculating basic earnings per share
638,862,242 634,931,006
Adjustments for calculation of diluted earnings per share: Options over ordinary shares - -
Weighted average number of ordinary shares used in calculating diluted earnings per share 638,862,242 634,931,006
Cents Cents Basic earnings per share (0.01) (0.85) Diluted earnings per share (0.01) (0.85)
Refer to Note 18 and the Director’s Report for details of options that have been taken into account in the calculation of dilutive potential ordinary shares. NOTE 27: CONTINGENT ASSETS AND LIABILITIES The Group is unaware of any contingent assets or liabilities that may have a material impact on the Company’s financial position.
For
per
sona
l use
onl
y
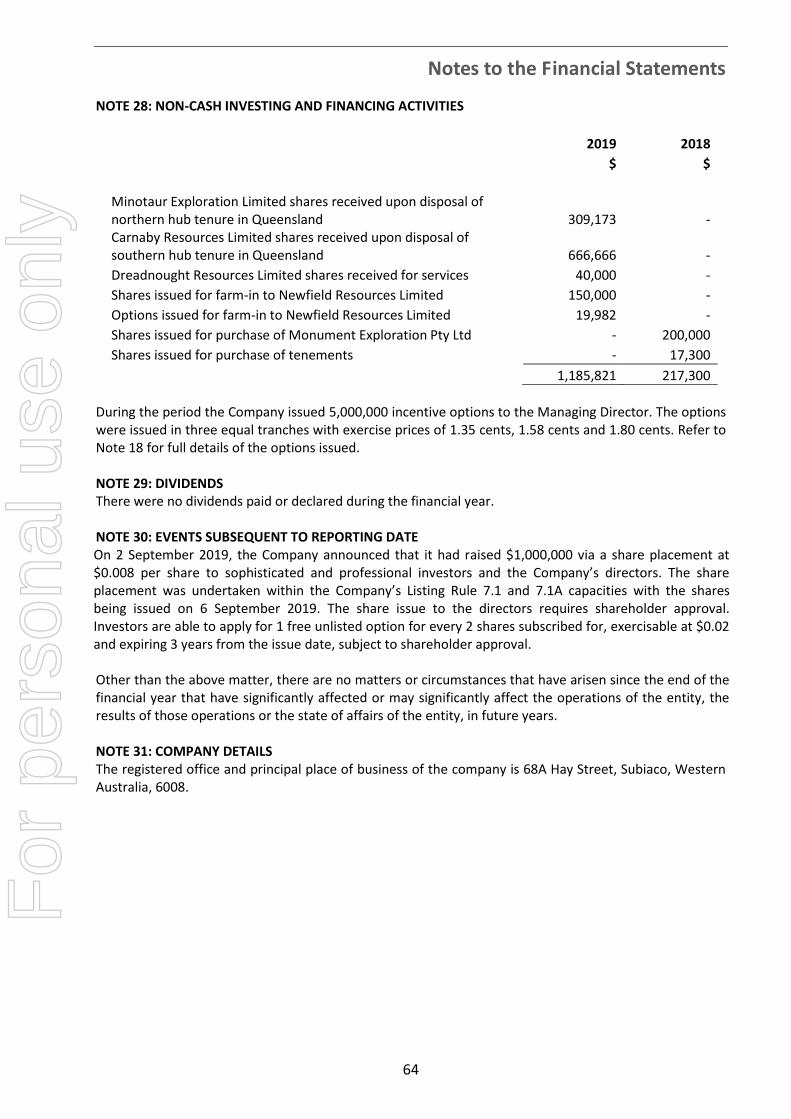
Notes to the Financial Statements
64
NOTE 28: NON-CASH INVESTING AND FINANCING ACTIVITIES
2019 2018
$ $
Minotaur Exploration Limited shares received upon disposal of northern hub tenure in Queensland 309,173 - Carnaby Resources Limited shares received upon disposal of southern hub tenure in Queensland 666,666 -
Dreadnought Resources Limited shares received for services 40,000 -
Shares issued for farm-in to Newfield Resources Limited 150,000 -
Options issued for farm-in to Newfield Resources Limited 19,982 -
Shares issued for purchase of Monument Exploration Pty Ltd - 200,000
Shares issued for purchase of tenements - 17,300
1,185,821 217,300
During the period the Company issued 5,000,000 incentive options to the Managing Director. The options were issued in three equal tranches with exercise prices of 1.35 cents, 1.58 cents and 1.80 cents. Refer to Note 18 for full details of the options issued. NOTE 29: DIVIDENDS There were no dividends paid or declared during the financial year. NOTE 30: EVENTS SUBSEQUENT TO REPORTING DATE On 2 September 2019, the Company announced that it had raised $1,000,000 via a share placement at $0.008 per share to sophisticated and professional investors and the Company’s directors. The share placement was undertaken within the Company’s Listing Rule 7.1 and 7.1A capacities with the shares being issued on 6 September 2019. The share issue to the directors requires shareholder approval. Investors are able to apply for 1 free unlisted option for every 2 shares subscribed for, exercisable at $0.02 and expiring 3 years from the issue date, subject to shareholder approval. Other than the above matter, there are no matters or circumstances that have arisen since the end of the financial year that have significantly affected or may significantly affect the operations of the entity, the results of those operations or the state of affairs of the entity, in future years. NOTE 31: COMPANY DETAILS The registered office and principal place of business of the company is 68A Hay Street, Subiaco, Western Australia, 6008.
For
per
sona
l use
onl
y
65
DIRECTORS’ DECLARATION
The Directors of the Company declare that: 1. The financial statements, notes and additional disclosures included in the Directors’ Report and
designated as audited, are in accordance with the Corporations Act 2001 and:
(a) comply with Australian Accounting Standards and the Corporations Regulations 2001;
(b) give a true and fair view of the financial position as at 30 June 2019 and of the performance for the year ended on that date of the Group; and
(c) the financial statements are in compliance with International Financial Reporting Standards, as
stated in Note 1 to the financial statements. 2. The Chief Executive Officer and Chief Financial Officer have each declared that:
(a) the financial records of the Company for the financial year have been properly maintained in accordance with section 286 of the Corporations Act 2001;
(b) the financial statements and notes for the financial year comply with the Australian
Accounting Standards; and
(c) the financial statements and notes for the financial year give a true and fair view. 3. In the Directors’ opinion there are reasonable grounds to believe that the Company will be able to
pay its debts as and when they become due and payable. This declaration is made in accordance with a resolution of the Board of Directors.
___________________ David Morgan Managing Director 10 September 2019 F
or p
erso
nal u
se o
nly
Level 4, 35 Havelock Street, West Perth, WA 6005 PO Box 609, West Perth, WA 6872 T: +61 8 9426 8999 F: +61 8 9426 8900 www.pkfperth.com.au PKF Perth is a member firm of the PKF International Limited family of legally independent firms and does not accept any responsibility or liability for the actions or inactions of any individual member or correspondent firm or firms. Liability limited by a scheme approved under Professional Standards Legislation.
66
PKF Perth
INDEPENDENT AUDITOR’S REPORT
TO THE MEMBERS OF SYNDICATED METALS LIMITED
Report on the Financial Report
Opinion
We have audited the accompanying financial report of Syndicated Metals Limited (the company), which comprises the consolidated statement of financial position as at 30 June 2019, the consolidated statement of profit or loss and other comprehensive income, the consolidated statement of changes in equity and the consolidated statement of cash flows for the year then ended, notes comprising a summary of significant accounting policies and other explanatory information, and the directors’ declaration of the company and the consolidated entity comprising the company and the entities it controlled at the year’s end or from time to time during the financial year.
In our opinion the financial report of Syndicated Metals Limited is in accordance with the Corporations Act 2001, including:
i) Giving a true and fair view of the consolidated entity’s financial position as at 30 June 2019 and of its performance for the year ended on that date; and
ii) Complying with Australian Accounting Standards and the Corporations Regulations 2001.
Basis for Opinion
We conducted our audit in accordance with Australian Auditing Standards. Those standards require that we comply with relevant ethical requirements relating to audit engagements and plan and perform the audit to obtain reasonable assurance about whether the financial report is free from material misstatement. Our responsibilities under those standards are further described in the Auditor’s Responsibility section of our report.
We believe that the audit evidence we have obtained is sufficient and appropriate to provide a basis for our opinion.
Material Uncertainty Related to Going Concern
Without modifying our opinion, we draw attention to Note 2 in the financial report, which indicated that the consolidated entity incurred a net loss after tax of $39,957 during the year ended 30 June 2019 (2018: net loss after tax of $5,367,978). The consolidated entity will be reliant on future capital raisings to continue as a going concern. This, along with other matters as set forth in Note 2, indicate the existence of a material uncertainty that may cast significant doubt about the consolidated entity’s ability to continue as a going concern and therefore, the consolidated entity may be unable to realise its assets and discharge its liabilities in the normal course of business.
The financial report of the consolidated entity does not include any adjustments in relation to the recoverability and classification of recorded asset amounts or to the amounts and classification of liabilities that might be necessary should the consolidated entity not continue as a going concern.
Independence
We are independent of the consolidated entity in accordance with the Corporations Act 2001 and the ethical requirements of the Accounting Professional and Ethical Standards Board’s APES 110 Code of Ethics for Professional Accountants (the code) that are relevant to our audit of the financial report in Australia. We have also fulfilled our other ethical responsibilities in accordance with the Code. F
or p
erso
nal u
se o
nly
67
PKF Perth
Key Audit Matters
Key audit matters are those matters that, in our professional judgement, were of most significance in our audit of the financial report of the current period. These matters were addressed in the context of our audit of the financial report as a whole, and in forming our opinion thereon, and we do not provide a separate opinion on these matters. For each matter below, our description of how our audit addressed the matter is provided in that context.
1. Carrying value of capitalised exploration expenditure
Why significant How our audit addressed the key audit matter
As at 30 June 2019 the carrying value of exploration and evaluation assets was $2,792,839 (2018: $3,247,081) and the total impairment recognised during the year was $824,090, as disclosed in Note 10.
The Group’s accounting policy in respect of exploration and evaluation expenditure is outlined in Note 1.b with the nature of critical estimates and judgements relating to this balance outlined in Note 2. Significant judgement is required:
in determining whether facts and
circumstances indicate that the exploration
and evaluation assets should be tested for
impairment in accordance with Australian
Accounting Standard AASB 6 Exploration for
and Evaluation of Mineral Resources (“AASB
6”); and
in determining the treatment of exploration and
evaluation expenditure in accordance with
AASB 6, and the Group’s accounting policy. In
particular:
o whether areas of interest meet the
recognition conditions for an asset; and
o which elements of exploration and
evaluation expenditures qualify for
capitalisation for each area of interest.
Our work included, but was not limited to, the following procedures:
to assess indicators of impairment and analyse
the correctness of the impairment charge made
during the year we performed the following:
o assessing whether the rights to tenure of
the areas of interest remained current at
reporting date as well as confirming that
rights to tenure are expected to be
renewed for tenements that will expire in
the near future;
o holding discussions with the directors and
management as to the status of ongoing
exploration programmes for the areas of
interest, as well as assessing if there was
evidence that a decision had been made to
discontinue activities in any specific areas
of interest; and
o obtaining and assessing evidence of the
Group’s future intention for the areas of
interest, including reviewing future
budgeted expenditure and related work
programmes;
considering whether exploration activities for
the areas of interest had reached a stage where
a reasonable assessment of economically
recoverable reserves existed;
testing, on a sample basis, exploration and
evaluation expenditure incurred during the year
for compliance with AASB 6 and the Group’s
accounting policy; and
assessing the appropriateness of the related
disclosures in Note 10.
For
per
sona
l use
onl
y

68
PKF Perth
2. Share based payments
Why significant How our audit addressed the key audit matter
For the year ended 30 June 2019 the value of share based payments vested totalled $44,420, as disclosed in Note 18. $24,438 was fully expensed during the year and $19,982 was written off as part of exploration expenditure incurred during the year.
The consolidated entity’s accounting judgement and estimates in respect of share based payments is outlined in Note 2. Significant judgement is required in relation to:
The valuation method used in the model;
and
The assumptions and inputs used within
the model.
Our work included, but was not limited to, the following procedures:
Reviewed the valuations of options issued,
including:
o assessing the appropriateness of the
valuation method used; and
o assessing the reasonableness of the
assumptions and inputs used within the
valuation model.
Reviewed Board meeting minutes and
Australian Securities Exchange (ASX)
announcements as well as enquired of relevant
personnel to ensure all share based payments
had been recognised;
Assessed the allocation and recognition to
ensure reasonable; and
Assessed the appropriateness of the related
disclosures in Note 2 and Note 18.
Other Information
Other information is financial and non-financial information in the annual report of the Group which is provided in addition to the Financial Report and the Auditor’s Report. The directors are responsible for Other Information in the annual report.
Our opinion on the Financial Report does not cover the Other Information and, accordingly, the auditor does not and will not express an audit opinion or any form of assurance conclusion thereon, with the exception of the Remuneration Report.
In connection with our audit of the Financial Report, our responsibility is to read the Other Information. In doing so, we consider whether the Other Information is materially inconsistent with the Financial Report or our knowledge obtained in the audit, or otherwise appears to be materially misstated.
We are required to report if we conclude that there is a material misstatement of this Other Information in the Financial Report and based on the work we have performed on the Other Information that we obtained prior the date of this Auditor’s Report we have nothing to report.
For
per
sona
l use
onl
y
69
PKF Perth
Directors’ Responsibilities for the Financial Report
The Directors of the company are responsible for the preparation of the financial report that gives a true and fair view in accordance with Australian Accounting Standards and the Corporations Act 2001 and for such internal control as the Directors determine is necessary to enable the preparation of the financial report that gives a true and fair view and is free from material misstatement, whether due to fraud or error. In Note 1, the Directors also state, in accordance with Australian Accounting Standard AASB 101 Presentation of Financial Statements, that the financial report complies with International Financial Reporting Standards.
In preparing the financial report, the Directors are responsible for assessing the consolidated entity’s ability to continue as a going concern, disclosing, as applicable, matters related to going concern and using a going concern basis of accounting unless the Directors either intend to liquidate the consolidated entity or to cease operations, or have no realistic alternative but to do so.
Auditor’s Responsibilities for the Audit of the Financial Report
Our responsibility is to express an opinion on the financial report based on our audit. Our objectives are to obtain reasonable assurance about whether the financial report as a whole is free from material misstatement, whether due to fraud or error, and to issue an auditor’s report that includes our opinion. Reasonable assurance is a high level of assurance, but is not a guarantee that an audit conducted in accordance with Australian Auditing Standards will always detect a material misstatement when it exists. Misstatements can arise from fraud or error and are considered material if, individually or in aggregate, they could reasonably be expected to influence the economic decisions of users taken on the basis of this financial report.
As part of an audit in accordance with Australian Auditing Standards, we exercise professional judgement and maintain professional scepticism throughout the audit.
An audit involves performing procedures to obtain audit evidence about the amounts and disclosures in the financial report.
The procedures selected depend on the auditor’s judgement, including assessment of the risks of material misstatement of the financial report, whether due to fraud or error. In making those risk assessments, the auditor considers internal control relevant to the entity’s preparation of the financial report that gives a true and fair view in order to design audit procedures that are appropriate in the circumstances, but not for the purpose of expressing an opinion on the effectiveness of the entity’s internal control.
The risk of not detecting a material misstatement resulting from fraud is higher than for one resulting from error, as fraud may involve collusion, forgery, intentional omissions, misrepresentations, or the override of internal control.
An audit also includes evaluating the appropriateness of accounting policies used and the reasonableness of accounting estimates made by the Directors, as well as evaluating the overall presentation of the financial report.
We conclude on the appropriateness of the Directors’ use of the going concern basis of accounting and, based on the audit evidence obtained, whether a material uncertainty exists related to events or conditions that may cast significant doubt on the consolidated entity’s ability to continue as a going concern. If we conclude that a material uncertainty exists, we are required to draw attention in our auditor’s report to the related disclosures in the financial report or, if such disclosures are inadequate, to modify our opinion. Our conclusions are based on the audit evidence obtained up to the date of our auditor’s report. However, future events or conditions may cause the consolidated entity to cease to continue as a going concern.
We evaluate the overall presentation, structure and content of the financial report, including the disclosures, and whether the financial report represents the underlying transactions and events in a manner that achieves fair presentation.
We obtain sufficient appropriate audit evidence regarding the financial information of the entities or business activities within the consolidated entity to express an opinion on the financial report. We are responsible for the direction, supervision and performance of the audit. We remain solely responsible for our audit opinion.
We communicate with the Directors regarding, among other matters, the planned scope and timing of the audit and significant audit findings, including any significant deficiencies in internal control that we identify during our audit.
For
per
sona
l use
onl
y
70
PKF Perth
The Auditing Standards require that we comply with relevant ethical requirements relating to audit engagements. We also provide the Directors with a statement that we have complied with relevant ethical requirements regarding independence, and to communicate with them all relationships and other matters that may reasonably be thought to bear on our independence, and where applicable, related safeguards.
From the matters communicated with the Directors, we determine those matters that were of most significance in the audit of the financial report of the current period and are therefore key audit matters. We describe these matters in our auditor’s report unless law or regulation precludes public disclosure about the matter or when, in extremely rare circumstances, we determine that a matter should not be communicated in our report because the adverse consequences of doing so would reasonably be expected to outweigh the public interest benefits of such communication.
Report on the Remuneration Report
Opinion
We have audited the Remuneration Report included in the directors’ report for the year ended 30 June 2019.
In our opinion, the Remuneration Report of Syndicated Metals Limited for the year ended 30 June 2019, complies with section 300A of the Corporations Act 2001.
Responsibilities
The directors of the Company are responsible for the preparation and presentation of the Remuneration Report in accordance with section 300A of the Corporations Act 2001. Our responsibility is to express an opinion on the Remuneration Report, based on our audit conducted in accordance with Australian Auditing Standards.
PKF PERTH
SIMON FERMANIS PARTNER 10 SEPTEMBER 2019 WEST PERTH, WESTERN AUSTRALIA
For
per
sona
l use
onl
y

71
ADDITIONAL INFORMATION FOR LISTED PUBLIC COMPANIES
The Company presents the following additional information included in accordance with the listing requirements of the Australian Securities Exchange: Shareholders
Distribution of shareholders as at 5 September 2019:
Number of Shareholders Number of Ordinary Shares
1 – 1,000 41 4,828
1,001 – 5,000 40 128,955
5,001 – 10,000 69 607,242
10,001 – 100,000 472 24,933,122
100,001 and over 464 639,818,232
1,086 665,492,379
There are 385 shareholders holding unmarketable parcels (being a minimum $500 parcel at $0.01 per unit) totalling 7,390,490 shares. The names of the substantial shareholders who have notified the Company in accordance with Section 671B of the Corporations Act 2001 are:
Number of Shares Held
Percentage Held
Washington H Soul Pattinson and Company Limited* 182,556,392 27.43%
*Washington H Soul Pattinson and Company Limited (WHSP) is the parent company of Round Oak Minerals Pty
Ltd (ROM) (formerly CopperChem Limited). During the period the ROM shareholding was transferred to WHSP.
Unlisted Options
As at the date of this report, the unissued ordinary shares of Syndicated Metals Limited under options are as follows:
Expiry date Exercise price (cents) Quantity Number of Holders
30/08/2021 2.26 5,333,331 5
30/08/2021 2.34 5,333,334 5
30/08/2021 3.12 3,000,001 4
09/09/2022 1.35 1,666,666 1
09/09/2022 1.58 1,666,667 1
09/09/2022 1.80 1,666,667 1
20/05/2022 3.0 10,000,000 1
28,666,666
For
per
sona
l use
onl
y

Additional Information for Listed Public Companies
72
Voting Rights
The voting rights attached to each class of equity security are as follows: Ordinary Shares
Each ordinary share is entitled to one vote when a poll is called, otherwise each member present at a meeting or by proxy has one vote on a show of hands.
Options
Unlisted options do not carry the right to vote until such time as they are exercised and converted to ordinary shares.
Restricted Securities
During the period the Company issued 30,000,000 ordinary shares and 10,000,000 unlisted options to Newfield Resources Limited as consideration for the exercise of the option to purchase the right to farm-in to the Newfield Gold Project. The shares, and any shares issued upon exercise of the options, are subject to voluntary escrow which expires on 20 May 2020.
On-market Buy-back
There is no on-market buy-back currently being undertaken.
Twenty Largest Shareholders as at 5 September 2019
Name Number of Ordinary Fully
Paid Shares Held
% of Issued Ordinary Capital
Held
Washington H Soul Pattinson and Company Limited 182,556,392 27.43
Newfield Resources Limited 30,000,000 4.51
Harmanis Holdings Pty Ltd 24,000,000 3.61
Blamnco Trading Pty Ltd 20,000,000 3.01
Jericho Exploration Pty Ltd 15,814,907 2.38
Sun Metals Corporation Pty Ltd 13,600,000 2.04
Emlyn Holdings Pty Ltd 10,595,885 1.59
ACN 112 940 057 Pty Ltd 10,000,000 1.50
Windsong Valley Pty Ltd 10,000,000 1.50
Mr Dermot Ryan & Mrs Vivienne Ryan 7,000,000 1.05
Saroda Holdings Pty Ltd <Sciarrone Family S/F A/C> 6,902,381 1.04
Metamorphic Investments Pty Ltd 6,306,306 0.95
Alltwen Pty Ltd 6,221,132 0.93
Omni GeoX Pty Ltd 5,952,381 0.89
Spectral Investments Pty Ltd 5,898,762 0.89
Saroda Holdings Pty Ltd <Sciarrone Family A/C> 5,417,534 0.81
BNP Paribas Nominees Pty Ltd 5,140,049 0.77
Running Water Limited 5,107,729 0.77
Hawkestone Resources Pty Ltd 5,000,000 0.75
Ms Lois Blackwood 4,736,679 0.71
380,250,137 57.14
For
per
sona
l use
onl
y

73
SCHEDULE OF INTERESTS IN MINING TENEMENTS
Tenement Lease Name Percentage
Held Status
Current Area
Area Unit
Syndicated Metals Limited – Southern Cross, WA
Newington Gold Project
M77/422 Newfield - Farm-in commenced 86 Hectares
M77/846 Woongaring Hills - Farm-in commenced 39 Hectares
E77/2309 Kawana - Option exercised 45 Blocks
Monument Exploration Pty Ltd – Laverton, WA
Monument Gold Project
E39/1846 Bernie Bore 100% Granted 1 Block
E39/1866 Monument 100% Granted 69 Blocks
P39/5519 Korong South 100% Granted 20 Hectares
E39/2024 Bernborough 100% Granted 1 Block
E39/2035 North Well 100% Granted 10 Blocks
E39/2036 Farnham 100% Granted 18 Blocks
P39/5456 Marionette 100% Granted 120 Hectares
P39/5457 McKenzie Bore 100% Granted 170 Hectares
P39/5837 Waihi North 100% Granted 155 Hectares
P39/5855 Korong 100% Granted 72 Hectares
P39/5880 Mt Morgans 100% Granted 122 Hectares
P39/5899 Fleming Bore 100% Granted 199 Hectares
P39/5910 Mt Morgans 100% Granted 200 Hectares
Syndicated Metals Limited – Mt Isa, Qld
Fountain Range Project (Southern Hub) Current
Sub-blocks
Area (km2)
EPM 14366 Bushy Park 17.5% Granted 8 26
EPM 14369 Dronfield 17.5% Granted 5 16
EPM 17637 Revenue 17.5% Granted 1 3
EPM 18223 Bronzewing Bore 17.5% Granted 3 10
EPM 18980 Mayfield 17.5% Granted 7 22
EPM 19008 Duchess 17.5% Granted 12 38
EPM 25435 Mt Erle #1 17.5% Granted 21 67
EPM 25439 Mt Erle #2 17.5% Granted 5 16
EPM 25853 Southern Hub Extended 17.5% Granted 9 29
EPM 9083 Burke River 17.5% Granted 19 61
EPM 11013 Monastery 17.5% Granted 1 3
EPM 25972 Duchess North 17.5% Granted 2 6
Notes
(1) Syndicated Metals Limited is farming-in to tenements M77/422 and M77/846 which are held by Newfield Resources Limited. Syndicated has an option to purchase tenement E77/2309 which is held by Gateway Mining Limited.
(2) Monument Exploration Pty Ltd is a 100% owned subsidiary of Syndicated Metals Limited.
(3) An interest in the Company’s Southern Hub (Fountain Range) tenure was sold to Carnaby Resources Limited during the period. Carnaby acquired an 82.5% interest in the tenements with Syndicated retaining a 17.5% free carried interest up to a Decision to Mine.
For
per
sona
l use
onl
y