2019 - annual report - Recticel
120
annual report 2019 Shaping the future
-
Upload
khangminh22 -
Category
Documents
-
view
2 -
download
0
Transcript of 2019 - annual report - Recticel

annual report2019
Shaping the future
RECTICEL ANNUAL REPORT 2019 I 1

Sales Annual growth rate
Combined sales & growth rates
1 000
1 100
1 200
1 300
1 400
1 500
-20%
-15%
-10%
-5%
0%
5%
10%
15%
1347.9
2015 2016 2017 2018 2019*
2015 2016 2017 2018 2019*
2014 2015 2016 2017 2018
1328.4
0%
2%
4%
6%
8%
10%
12%
20
0
40
60
80
100
Combined EBITDA & EBITDA margin
EBITDA EBITDA as % of sales
5.1%6.3% 6.4%
85.494.1 93.4
67.8
2015 2016 2017 2018 2019
0.0
1.0
2.0
4.0
3.0
25%
50%
75%
100%
125% Combined Gearing and Leverage
1.51.3
46.9%37.8% 33.8%
1.8
49.4%
EBIT EBIT as % of sales
Combined EBIT & EBIT margin
0
20
10
30
40
50
0%
2%
1%
4%
3%
5%
LeverageGearing
44.348.1
3.3% 3.3% 3.2%
40.3
3.3%
47.0
0.0%
0.5%
1.0%
1.5%
3.0%
2.5%
2.0%
0
10
20
30
Combined earnings after taxes & EAT margin
EAT EAT as % of sales
1.2%
16.3
23.9
0
9
3
6
12
Frequency index - industrial accidents
8.4 8.4
5.8
8.8
Frequency =number of accidents x 1.000.000
number of hours performed
2015100
150
200
250
300Shareholders’ equity (Group share)
2019*2017 20182016
251.2261.8 265.0 274.7
249.0
29.8
4.5
-0.3%2015 2016 2018 2019* 2015 2016 2017 20182017 2019*
3.8%
-15.7%
1.5%
1460.8
(in m
illio
n EU
R)
(in m
illio
n EU
R) (in
mill
ion
EUR)
(in m
illio
n EU
R)
(in m
illio
n EU
R)
20150
50
100
150
200Combined net �nancial debt
2019*
180.4
2017 20182016
126.0 122.9
100.2
123.0
(in m
illio
n EU
R)
0%
5%
10%
15%
20%
25%
30%
20
0
40
60
80
120
100
Combined Adjusted EBITDA & Adjusted EBITDA margin
Adjusted EBITDA Adjusted EBITDA as % of sales
7.2% 7.2%
97.7105.5 103.8
114.7
81.9
6.2%
2015 2016 2017 2018 2019*
(in m
illio
n EU
R)
8.4%
1448.3
1221.0-0.9%
1.6%
28.8
2.5%
2.2%
24.7
2.0%
6.4%
1.1 1.2
50.2%
7.2%
9.4%
Key Figures
2019 : before impact IFRS 16
RECTICEL ANNUAL REPORT 2019 I 1
* Proseat, which was partially divested in 2019, is integrated in the 2019 combined figures according to the ‘equity method’, i.o. previously on a proportionate basis. 2019 figures are also shown including impact of IFRS 16. Figures of previous years have not been restated accordingly.

BUSINESS ETHICS AND ETHICS AND INTEGRITY
REDUCE HS&E IMPACT
OF OUR ACTIVITIES
AN INSPIRING AND
REWARDING PLACE TO
WORK
PEOPLE PEOPLE PEOPLE PEOPLE PEOPLE PEOPLE PEOPLE PEOPLE PEOPLE PEOPLE PEOPLE PEOPLE PEOPLE PEOPLE PEOPLE PEOPLE PEOPLE PEOPLE PEOPLE PEOPLE PEOPLE PEOPLE PEOPLE PEOPLE PEOPLE PEOPLE PEOPLE PEOPLE PEOPLE PEOPLE PEOPLE PEOPLE PEOPLE PEOPLE PEOPLE PEOPLE PEOPLE PEOPLE PEOPLE PEOPLE PEOPLE PEOPLE PEOPLE PEOPLE PEOPLE PEOPLE PEOPLE PEOPLE PEOPLE PEOPLE PEOPLE PEOPLE PEOPLE PEOPLE PEOPLE PEOPLE PEOPLE PEOPLE PEOPLE PEOPLE PEOPLE PEOPLE PEOPLE PEOPLE PEOPLE PEOPLE PEOPLE PEOPLE PEOPLE PEOPLE PEOPLE PEOPLE PEOPLE PEOPLE PEOPLE PEOPLE PEOPLE PEOPLE PRIORITY PLANPRIORITY PLANPRIORITY PLANPRIORITY PLANPRIORITY PLANPRIORITY PLANPRIORITY PLANPRIORITY PLANPRIORITY PLANPRIORITY PLANPRIORITY PLANPRIORITY PLANPRIORITY PLANPRIORITY PLANPRIORITY PLANPRIORITY PLANPRIORITY PLANPRIORITY PLANPRIORITY PLANPRIORITY PLANPRIORITY PLANPRIORITY PLANPRIORITY PLANPRIORITY PLANPRIORITY PLANPRIORITY PLANPRIORITY PLANPRIORITY PLANPRIORITY PLANPRIORITY PLANPRIORITY PLANPRIORITY PLANPRIORITY PLANPRIORITY PLANPRIORITY PLANPRIORITY PLANPRIORITY PLANPRIORITY PLANPRIORITY PLANPRIORITY PLANPRIORITY PLANPRIORITY PLANPRIORITY PLANPRIORITY PLANPRIORITY PLANPRIORITY PLANPRIORITY PLANPRIORITY PLANPRIORITY PLANPRIORITY PLANPRIORITY PLANPRIORITY PLANPRIORITY PLANPRIORITY PLANPRIORITY PLANPRIORITY PLANPRIORITY PLANPRIORITY PLANPRIORITY PLANPRIORITY PLANPRIORITY PLANPRIORITY PLANPRIORITY PLANPRIORITY PLANPRIORITY PLANPRIORITY PLANPRIORITY PLANPRIORITY PLANPRIORITY PLANPRIORITY PLANPRIORITY PLANPRIORITY PLANPRIORITY PLANPRIORITY PLANPRIORITY PLANPRIORITY PLANPRIORITY PLANPRIORITY PLANPRIORITY PLANPRIORITY PLANPRIORITY PLANPRIORITY PLANPRIORITY PLANPRIORITY PLANPRIORITY PLANPRIORITY PLANPRIORITY PLANPRIORITY PLANPRIORITY PLANPRIORITY PLANPRIORITY PLANPRIORITY PLANPRIORITY PLANPRIORITY PLANPRIORITY PLANPRIORITY PLANPRIORITY PLANPRIORITY PLANPRIORITY PLANPRIORITY PLANPRIORITY PLANPRIORITY PLANPRIORITY PLANPRIORITY PLANPRIORITY PLANPRIORITY PLANPRIORITY PLANPRIORITY PLANPRIORITY PLANPRIORITY PLANPRIORITY PLANPRIORITY PLANPRIORITY PLANPRIORITY PLANPRIORITY PLANPRIORITY PLANPRIORITY PLANPRIORITY PLANPRIORITY PLANPRIORITY PLANPRIORITY PLANPRIORITY PLANPRIORITY PLANPRIORITY PLANPRIORITY PLANPRIORITY PLANPRIORITY PLANPRIORITY PLANPRIORITY PLANPRIORITY PLANPRIORITY PLANPRIORITY PLANPRIORITY PLANPRIORITY PLANPRIORITY PLANPRIORITY PLANPRIORITY PLANPRIORITY PLANPRIORITY PLANPRIORITY PLANPRIORITY PLANPRIORITY PLAN
MATERIALASPECT KPI TARGET
Number of legal training courses provided by the Corporate Legal Team and the IP Offi cer (SID)
as face-to-face meetings attended and e-learning
modules completed.
Frequency work accidents represents the average on
Group level for all our plants and offi ces.
The number of countries in which engagement surveys are conducted among blue
and white collars.
Two new countries each year.
Increase the number of legal training courses
provided by the Corporate Legal Team and the IP Offi cer (SID)
as face-to-face meetings attended and e-learning modules completed by
5% per year (cumulative) compared to 460 in 2015.
Frequency = < 3 by 2020
number of accidents x 1,000,000
number of hours performed
5264254602018 20192015 2016 201720142013
4.631 5.309
6 5.8 4.45.88.48.48.8
2018 20192015 2016 201720142013
3
2020
Target
2015 2016 2017
Belgium +United Kingdom,
Spain
Belgium,United Kingdom,
Spain +France, the Netherlands
Poland, Romania
2018 2019
Sweden, NorwayBelgium
*
INNOVATION FULFILLING SOCIETAL
NEEDS
OPTIMISING CARBON
FOOTPRINT
RESOURCE EFFICIENCY
SUSTAINABLE SUSTAINABLE SUSTAINABLE SUSTAINABLE SUSTAINABLE SUSTAINABLE SUSTAINABLE SUSTAINABLE SUSTAINABLE SUSTAINABLE SUSTAINABLE SUSTAINABLE SUSTAINABLE SUSTAINABLE SUSTAINABLE SUSTAINABLE SUSTAINABLE SUSTAINABLE SUSTAINABLE SUSTAINABLE SUSTAINABLE SUSTAINABLE SUSTAINABLE SUSTAINABLE SUSTAINABLE SUSTAINABLE SUSTAINABLE SUSTAINABLE SUSTAINABLE SUSTAINABLE SUSTAINABLE SUSTAINABLE SUSTAINABLE SUSTAINABLE SUSTAINABLE SUSTAINABLE SUSTAINABLE SUSTAINABLE SUSTAINABLE SUSTAINABLE SUSTAINABLE SUSTAINABLE SUSTAINABLE SUSTAINABLE SUSTAINABLE SUSTAINABLE SUSTAINABLE SUSTAINABLE SUSTAINABLE SUSTAINABLE SUSTAINABLE SUSTAINABLE SUSTAINABLE SUSTAINABLE SUSTAINABLE SUSTAINABLE SUSTAINABLE SUSTAINABLE SUSTAINABLE SUSTAINABLE SUSTAINABLE SUSTAINABLE SUSTAINABLE SUSTAINABLE SUSTAINABLE SUSTAINABLE SUSTAINABLE SUSTAINABLE SUSTAINABLE SUSTAINABLE SUSTAINABLE SUSTAINABLE SUSTAINABLE SUSTAINABLE SUSTAINABLE SUSTAINABLE SUSTAINABLE SUSTAINABLE SUSTAINABLE SUSTAINABLE SUSTAINABLE SUSTAINABLE SUSTAINABLE SUSTAINABLE SUSTAINABLE SUSTAINABLE SUSTAINABLE SUSTAINABLE SUSTAINABLE SUSTAINABLE SUSTAINABLE SUSTAINABLE SUSTAINABLE SUSTAINABLE SUSTAINABLE SUSTAINABLE SUSTAINABLE SUSTAINABLE SUSTAINABLE SUSTAINABLE SUSTAINABLE SUSTAINABLE SUSTAINABLE SUSTAINABLE SUSTAINABLE SUSTAINABLE SUSTAINABLE SUSTAINABLE SUSTAINABLE SUSTAINABLE SUSTAINABLE SUSTAINABLE SUSTAINABLE SUSTAINABLE SUSTAINABLE SUSTAINABLE SUSTAINABLE SUSTAINABLE SUSTAINABLE SUSTAINABLE SUSTAINABLE SUSTAINABLE SUSTAINABLE SUSTAINABLE SUSTAINABLE SUSTAINABLE SUSTAINABLE SUSTAINABLE SUSTAINABLE SUSTAINABLE SUSTAINABLE SUSTAINABLE SUSTAINABLE SUSTAINABLE SUSTAINABLE SUSTAINABLE SUSTAINABLE SUSTAINABLE SUSTAINABLE INNOVATION PLANINNOVATION PLANINNOVATION PLANINNOVATION PLANINNOVATION PLANINNOVATION PLANINNOVATION PLANINNOVATION PLANINNOVATION PLANINNOVATION PLANINNOVATION PLANINNOVATION PLANINNOVATION PLANINNOVATION PLANINNOVATION PLANINNOVATION PLANINNOVATION PLANINNOVATION PLANINNOVATION PLANINNOVATION PLANINNOVATION PLANINNOVATION PLANINNOVATION PLANINNOVATION PLANINNOVATION PLANINNOVATION PLANINNOVATION PLANINNOVATION PLANINNOVATION PLANINNOVATION PLANINNOVATION PLANINNOVATION PLANINNOVATION PLANINNOVATION PLANINNOVATION PLANINNOVATION PLANINNOVATION PLANINNOVATION PLANINNOVATION PLANINNOVATION PLANINNOVATION PLANINNOVATION PLANINNOVATION PLANINNOVATION PLANINNOVATION PLANINNOVATION PLANINNOVATION PLANINNOVATION PLANINNOVATION PLANINNOVATION PLANINNOVATION PLANINNOVATION PLANINNOVATION PLANINNOVATION PLANINNOVATION PLANINNOVATION PLANINNOVATION PLANINNOVATION PLANINNOVATION PLANINNOVATION PLANINNOVATION PLANINNOVATION PLANINNOVATION PLANINNOVATION PLANINNOVATION PLANINNOVATION PLANINNOVATION PLANINNOVATION PLANINNOVATION PLANINNOVATION PLANINNOVATION PLANINNOVATION PLANINNOVATION PLANINNOVATION PLANINNOVATION PLANINNOVATION PLANINNOVATION PLANINNOVATION PLANINNOVATION PLANINNOVATION PLANINNOVATION PLANINNOVATION PLANINNOVATION PLANINNOVATION PLANINNOVATION PLANINNOVATION PLANINNOVATION PLANINNOVATION PLANINNOVATION PLANINNOVATION PLANINNOVATION PLANINNOVATION PLANINNOVATION PLANINNOVATION PLANINNOVATION PLANINNOVATION PLANINNOVATION PLANINNOVATION PLANINNOVATION PLANINNOVATION PLANINNOVATION PLANINNOVATION PLANINNOVATION PLANINNOVATION PLANINNOVATION PLANINNOVATION PLANINNOVATION PLANINNOVATION PLANINNOVATION PLANINNOVATION PLANINNOVATION PLANINNOVATION PLANINNOVATION PLANINNOVATION PLANINNOVATION PLANINNOVATION PLANINNOVATION PLANINNOVATION PLANINNOVATION PLANINNOVATION PLANINNOVATION PLANINNOVATION PLANINNOVATION PLANINNOVATION PLANINNOVATION PLANINNOVATION PLANINNOVATION PLANINNOVATION PLANINNOVATION PLANINNOVATION PLANINNOVATION PLANINNOVATION PLANINNOVATION PLANINNOVATION PLANINNOVATION PLANINNOVATION PLANINNOVATION PLANINNOVATION PLANINNOVATION PLANINNOVATION PLANINNOVATION PLANINNOVATION PLANINNOVATION PLANINNOVATION PLANINNOVATION PLANINNOVATION PLANINNOVATION PLANINNOVATION PLANINNOVATION PLANINNOVATION PLANINNOVATION PLANINNOVATION PLANINNOVATION PLANINNOVATION PLANINNOVATION PLANINNOVATION PLANINNOVATION PLANINNOVATION PLAN
MATERIALASPECT KPI TARGET
Sustainability index.
(scope: innovation pipeline Sustainable Innovation
Department)
Recticel Carbon footprint indicator expressed in
tonnes of CO2 equivalent compared to the 100% activity level in 2013.
(scope: production sites)
The method of calculation is derived from the Cradle to
Grave method.
Net Recticel Impact Ratio (whole value chain) defi ned
as ratio of the Recticel Positive Impact to the
Recticel Carbon Footprint. The Recticel Positive Impact
is expressed in tonnes of avoided CO2 equivalent in
use phase .
(using appropriate method of calculation per type of product and
using appropriate conversion factors calculated by a third party)
Tonnes of recycled fl exible foam produced by Recticel.
100% increase by 2020 compared to 2015.
The increase is possible if fl exible foam production
waste is gradually replaced by post-consumer waste.
80% of active R&D projects classifi ed as sustainable by
2020 according to the Sustainability Index.
Reduce Recticel Carbon Footprint Indicator
by 25% in 2020 and by 40% in 2030.
Increase Net Recticel Impact Ratio from 20* in 2013 to 30 by 2020 and
50 (40) by 2030.
We have reached our 2020 target three years early and have amended
our 2030 target to 50.
* We have reviewed our method of calculation. The original results
over 2013, 2014, 2015 were 20, 20, 26.
2018 2019
40% 45% 54%
2015 2016 201720142013 2020
80%66% 62%Target
2018 2019
60%
2015 2016 201720142013
75%
2020 2030
84%100%100% 83% 83% 83% 82%Target Target
2018 2019
30 50(40)
2015 2016 201720142013 2020 2030
37 41342827 36 36
Target Target
2018 2019
-10% -17% -27% -18%
2015 2016 201720142013
100%
2020
BASELINE
Target
SUSTAINABILITY STRATEGY SUMMARY
RECTICEL ANNUAL REPORT 2019 I 3RECTICEL ANNUAL REPORT 2019 I 2

This report is also available online
table of contents1. UNDERSTANDING RECTICEL . . . . . . . . . . . . . . . . . . . . . . . . . . . . . . . . . . . . . . . . . . . . . . . . . . . . . . . . . . . . . . . . . . . . . . . . . . . . . . . . . . . . . . . . . . . . . . . . . . . . . . . . . . . . . .06
1.1. Who we are . . . . . . . . . . . . . . . . . . . . . . . . . . . . . . . . . . . . . . . . . . . . . . . . . . . . . . . . . . . . . . . . . . . . . . . . . . . . . . . . . . . . . . . . . . . . . . . . . . . . . . . . . . . . . . . . . . . . . . . . . . . . . . . . . . . . . . . . . . . . 10
1.2. Highlights of 2019 and early 2020 . . . . . . . . . . . . . . . . . . . . . . . . . . . . . . . . . . . . . . . . . . . . . . . . . . . . . . . . . . . . . . . . . . . . . . . . . . . . . . . . . . . . . . . . . . . . . . . . . . . . . . . . . . . . .12
1.3. Message from our Chairman and Chief Executive Offi cer . . . . . . . . . . . . . . . . . . . . . . . . . . . . . . . . . . . . . . . . . . . . . . . . . . . . . . . . . . . . . . . . . . . . . . . . . . . .16
1.4. Our mission, vision and values . . . . . . . . . . . . . . . . . . . . . . . . . . . . . . . . . . . . . . . . . . . . . . . . . . . . . . . . . . . . . . . . . . . . . . . . . . . . . . . . . . . . . . . . . . . . . . . . . . . . . . . . . . . . . . . . . .18
1.5. Our Group strategy . . . . . . . . . . . . . . . . . . . . . . . . . . . . . . . . . . . . . . . . . . . . . . . . . . . . . . . . . . . . . . . . . . . . . . . . . . . . . . . . . . . . . . . . . . . . . . . . . . . . . . . . . . . . . . . . . . . . . . . . . . . . . . . . . 22
1.6. Our activities: . . . . . . . . . . . . . . . . . . . . . . . . . . . . . . . . . . . . . . . . . . . . . . . . . . . . . . . . . . . . . . . . . . . . . . . . . . . . . . . . . . . . . . . . . . . . . . . . . . . . . . . . . . . . . . . . . . . . . . . . . . . . . . . . . . . . . . . . .30
1.6.1. Insulation . . . . . . . . . . . . . . . . . . . . . . . . . . . . . . . . . . . . . . . . . . . . . . . . . . . . . . . . . . . . . . . . . . . . . . . . . . . . . . . . . . . . . . . . . . . . . . . . . . . . . . . . . . . . . . . . . . . . . . . . . . . . . . . . . . . . . 32
1.6.2. Flexible Foams . . . . . . . . . . . . . . . . . . . . . . . . . . . . . . . . . . . . . . . . . . . . . . . . . . . . . . . . . . . . . . . . . . . . . . . . . . . . . . . . . . . . . . . . . . . . . . . . . . . . . . . . . . . . . . . . . . . . . . . . . . . . . . 36
1.6.3. Bedding . . . . . . . . . . . . . . . . . . . . . . . . . . . . . . . . . . . . . . . . . . . . . . . . . . . . . . . . . . . . . . . . . . . . . . . . . . . . . . . . . . . . . . . . . . . . . . . . . . . . . . . . . . . . . . . . . . . . . . . . . . . . . . . . . . . . . . . 42
1.6.4. Automotive . . . . . . . . . . . . . . . . . . . . . . . . . . . . . . . . . . . . . . . . . . . . . . . . . . . . . . . . . . . . . . . . . . . . . . . . . . . . . . . . . . . . . . . . . . . . . . . . . . . . . . . . . . . . . . . . . . . . . . . . . . . . . . . . . .46
1.7. Sustainable and market-driven innovation . . . . . . . . . . . . . . . . . . . . . . . . . . . . . . . . . . . . . . . . . . . . . . . . . . . . . . . . . . . . . . . . . . . . . . . . . . . . . . . . . . . . . . . . . . . . . . . . .51
1.8. Human resources and major production sites . . . . . . . . . . . . . . . . . . . . . . . . . . . . . . . . . . . . . . . . . . . . . . . . . . . . . . . . . . . . . . . . . . . . . . . . . . . . . . . . . . . . . . . . . . . . 58
2. MANAGEMENT REPORT . . . . . . . . . . . . . . . . . . . . . . . . . . . . . . . . . . . . . . . . . . . . . . . . . . . . . . . . . . . . . . . . . . . . . . . . . . . . . . . . . . . . . . . . . . . . . . . . . . . . . . . . . . . . . . . . . . . . . . .70
2.1. Report of Board of Directors* . . . . . . . . . . . . . . . . . . . . . . . . . . . . . . . . . . . . . . . . . . . . . . . . . . . . . . . . . . . . . . . . . . . . . . . . . . . . . . . . . . . . . . . . . . . . . . . . . . . . . . . . . . . . . . . . . . 72
2.2. Corporate governance statement* . . . . . . . . . . . . . . . . . . . . . . . . . . . . . . . . . . . . . . . . . . . . . . . . . . . . . . . . . . . . . . . . . . . . . . . . . . . . . . . . . . . . . . . . . . . . . . . . . . . . . . . . . . . 88
2.2.1. Applicable rules and reference code . . . . . . . . . . . . . . . . . . . . . . . . . . . . . . . . . . . . . . . . . . . . . . . . . . . . . . . . . . . . . . . . . . . . . . . . . . . . . . . . . . . . . . . . . . . . . .90
2.2.2. Internal control and risk management . . . . . . . . . . . . . . . . . . . . . . . . . . . . . . . . . . . . . . . . . . . . . . . . . . . . . . . . . . . . . . . . . . . . . . . . . . . . . . . . . . . . . . . . . . . .90
2.2.3. External audit . . . . . . . . . . . . . . . . . . . . . . . . . . . . . . . . . . . . . . . . . . . . . . . . . . . . . . . . . . . . . . . . . . . . . . . . . . . . . . . . . . . . . . . . . . . . . . . . . . . . . . . . . . . . . . . . . . . . . . . . . . . . . . . .91
2.2.4. Composition of the Board of Directors . . . . . . . . . . . . . . . . . . . . . . . . . . . . . . . . . . . . . . . . . . . . . . . . . . . . . . . . . . . . . . . . . . . . . . . . . . . . . . . . . . . . . . . . . . . 92
2.2.5. Committees set up by the Board of Directors . . . . . . . . . . . . . . . . . . . . . . . . . . . . . . . . . . . . . . . . . . . . . . . . . . . . . . . . . . . . . . . . . . . . . . . . . . . . . . . . .96
2.2.6. Executive Management . . . . . . . . . . . . . . . . . . . . . . . . . . . . . . . . . . . . . . . . . . . . . . . . . . . . . . . . . . . . . . . . . . . . . . . . . . . . . . . . . . . . . . . . . . . . . . . . . . . . . . . . . . . . . . . . 98
2.2.7. Remuneration report . . . . . . . . . . . . . . . . . . . . . . . . . . . . . . . . . . . . . . . . . . . . . . . . . . . . . . . . . . . . . . . . . . . . . . . . . . . . . . . . . . . . . . . . . . . . . . . . . . . . . . . . . . . . . . . . . . . . . 98
2.2.8. Transactions and other contractual ties between the Company and affi liated companies
and members of the Board of Directors or members of the Management Committee . . . . . . . . . . . . . . . . . . . . . . .108
2.2.9. Insider trading and market manipulation. . . . . . . . . . . . . . . . . . . . . . . . . . . . . . . . . . . . . . . . . . . . . . . . . . . . . . . . . . . . . . . . . . . . . . . . . . . . . . . . . . . . . . . .108
2.2.10. Diversity policy . . . . . . . . . . . . . . . . . . . . . . . . . . . . . . . . . . . . . . . . . . . . . . . . . . . . . . . . . . . . . . . . . . . . . . . . . . . . . . . . . . . . . . . . . . . . . . . . . . . . . . . . . . . . . . . . . . . . . . . . . . . 109
2.2.11. Relationships with the reference shareholders and other elements related
to possible public takeover bids . . . . . . . . . . . . . . . . . . . . . . . . . . . . . . . . . . . . . . . . . . . . . . . . . . . . . . . . . . . . . . . . . . . . . . . . . . . . . . . . . . . . . . . . . . . . . . . . . . . . 110
2.3. Non-fi nancial information statement* . . . . . . . . . . . . . . . . . . . . . . . . . . . . . . . . . . . . . . . . . . . . . . . . . . . . . . . . . . . . . . . . . . . . . . . . . . . . . . . . . . . . . . . . . . . . . . . . . . . . . . .112
2.3.1. Introduction. . . . . . . . . . . . . . . . . . . . . . . . . . . . . . . . . . . . . . . . . . . . . . . . . . . . . . . . . . . . . . . . . . . . . . . . . . . . . . . . . . . . . . . . . . . . . . . . . . . . . . . . . . . . . . . . . . . . . . . . . . . . . . . . . 114
2.3.2. Activities of the Company . . . . . . . . . . . . . . . . . . . . . . . . . . . . . . . . . . . . . . . . . . . . . . . . . . . . . . . . . . . . . . . . . . . . . . . . . . . . . . . . . . . . . . . . . . . . . . . . . . . . . . . . . . . . 114
2.3.3. Independent limited assurance report on non-fi nancial information statement . . . . . . . . . . . . . . . . . . . . . . . . . . . . . . . . . 132
2.4. Financial Report* . . . . . . . . . . . . . . . . . . . . . . . . . . . . . . . . . . . . . . . . . . . . . . . . . . . . . . . . . . . . . . . . . . . . . . . . . . . . . . . . . . . . . . . . . . . . . . . . . . . . . . . . . . . . . . . . . . . . . . . . . . . . . . . . . . .134
* These chapters form an essential part of the Report of the Board of Directors and contain the information required by the Belgian Company Code regarding consolidated accounts.
This document contains specifi c quantitative and/or qualitative future-oriented statements and expectations regarding results and the fi nancial state of the Recticel Group. These statements are not a guarantee for future achievements, as the future holds risks and uncertainties related to future events and developments. Actual results and performance may deviate considerably from the predicted expectations, objectives and possible statements. The most important and relevant risk and uncertainty factors are described in more detail in the “Risk factors and risk management” chapter of the fi nancial section of this Annual Report. Recticel is not obligated to provide updates regarding potential changes or developments pertaining to these risk factors, or to release any information about their potential impacts on its prospects.
RECTICEL ANNUAL REPORT 2019 I 4 RECTICEL ANNUAL REPORT 2019 I 5
About this reportIn this annual report we present the fi nancial and non-fi nancial information of the Recticel Group over 2019.
In the fi rst section - Understanding Recticel - we give an overview of who we are, our mission, vision, values and strategy and how we operate in our markets.
In the second section - Management report - we provide the fi nancial results and the fi nancial state of the Recticel Group. It also includes the Corporate governance section and the Non-fi nancial information statement which was prepared using the recommendations of the GRI Standard guidelines, Core. Limited assurance was provided on the seven KPIs covering the six material aspects.
FINANCIAL CALENDAR FOR SHAREHOLDERS
First quarter 2020 trading update 28 April 2020 (at 07:00 AM CET)Annual General Meeting 26 May 2020 (at 10:00 AM CET)Ex-coupon date 28 May 2020Record date 29 May 2020Dividend payment date 02 June 2020First half-year 2020 results 28 August 2020 (at 07:00 AM CET)Third quarter 2020 trading update 30 October 2020 (at 07:00 AM CET)Annual results 2020 26 February 2021 (at 07:00 AM CET)First quarter 2021 trading update 27 April 2021 (at 07:00 AM CET)Annual General Meeting 25 May 2021 (at 10:00 AM CET)First half-year 2021 results 27 August 2021 (at 07:00 AM CET)Third quarter 2021 trading update 29 October 2021 (at 07:00 AM CET)

1. Understanding Recticel
UnderstandingRecticel
1.
RECTICEL ANNUAL REPORT 2019 I 7RECTICEL ANNUAL REPORT 2019 I 6

Insulation
Bedding
Flexible Foams
Automotive
OUR PRESENCE EUROPE ASIAUNITED STATES
Combined net sales 89% 6% 4%
Employees 6 258 517 253
Sites 68 9 4
In 2019, we set an important step in realizing our ambition of leading the transition to a circular economy and low-carbon society. We are proud to participate in and be the project leader of the PUReSmart project, funded by the European Union’s 2020 innovation and research programme, to develop a complete circular product life cycle and turn polyurethane into a truly sustainable material: recover the used material – such as mattresses – and turn it into building blocks for existing or new products.
In 2019, we further executed our strategic plan and in-depth transformation. This annual report, presents an update of the progress we made in transforming our group into a sustainable and long-term value creating company. We are committed to continuing to integrate sustainability elements into the daily management of our businesses and that to the benefit of all our stakeholders. The current progress report is a further step towards the integration of sustainability in our annual report.
For an in-depth insight into our Group, also visit our corporate website: www.recticel .com
RECTICEL ANNUAL REPORT 2019 I 9RECTICEL ANNUAL REPORT 2019 I 8
EUR 1,220.9 millionin combined
net sales
7,028employees1
presence in
countries
27
sites11 excluding joint ventures
1 excluding minority
shareholdings
in joint ventures
81

1.1. Who we are
RECTICEL ANNUAL REPORT 2019 I 11RECTICEL ANNUAL REPORT 2019 I 10
Relying on our core competence, expertise and skills
in polyurethane chemistry and technology, we strive to
make an essential difference in the universal daily
comfort experience. Based on our industrial activities,
we aim to create shared value for our stakeholders and
society as a whole. We seek to achieve, in an efficient,
sustainable and balanced way, steady, profitable
growth for our clients and shareholders.
We are committed to be better and more innovative
than our competitors, in order to serve our customers
and end-consumers by providing real responsible
solutions to the diverse challenges and dynamic needs
of today’s world. We support our industrial clients around
the world by implementing responsible, value-generating
products and services. In this respect, we are committed
to further reducing any negative effects of our activities
and to further optimize our positive impact across the
value chain, from raw materials sourcing to product
manufacturing, consumption and end-of-life.
CO2 emissions avoided by our insulation solutions
offset more than 40 times the carbon footprint of the
activities of our four business lines combined.
Recticel is present in diverse markets. Some 89%
of our net sales are realised in Europe, but we also
operate in the United States and in Asia. Our activities
are grouped in four business lines: Insulation for the
construction sector, Flexible Foams for domestic,
transport and industrial applications, Bedding and
Automotive.
Although we mainly produce semi-finished products
(Flexible Foams and Automotive), we also develop,
manufacture and commercialise finished products and
durable goods for end-users (Bedding and Insulation).
Recticel (EuronextTM: REC.BE – Reuters: RECTt.BR – Bloomberg: REC.BB) is listed on the EuronextTM stock exchange in Brussels and is part of the BEL Mid® index (EuronextTM: BELM – Reuters: .BELM – Bloomberg: BELM; index weighting: 1.07% - situation 20 April 2020)
Our INSULATION division offers high-quality thermal insulation PU- and PIR-based products used in construction projects and building renovations. These products are marketed under well-known brands and product names such as Eurowall®, Powerroof®, Powerdeck®, Powerwall®, Xentro® and Recticel Insulation®.
Our FLEXIBLE FOAMS division develops and manufactures diverse proven innovative solutions with very specific product attributes to address practical needs such as silencing, sealing, filtering, carrying, protecting, supporting and comforting.
Our BEDDING division develops and produces consumer-ready mattresses, slat bases and box springs, primarily marketed under popular brand names such as Beka®, Lattoflex®, Literie Bultex®, Schlaraffia®, Sembella®, Superba®, Swissflex®, as well as ingredient brands including GELTEX inside® and Bultex®.
Our AUTOMOTIVE division is currently primarily focused on the development of interior trim for the car industry, prioritising innovation, technological progress, superior quality and excellent customer service. In addition, our Group remains involved in the development of seating solutions via the Proseat joint venture in which it holds, until early 2022 at the latest, a minority stake of 25%. Last but not least, early 2020 the Group agreed to bring its Interiors activities under a new joint venture in which it will keep for the time being 49%, with an exit option by March 2024.
1
2
3
4

January 2019
June 2019
April 2019
Corporate After due consideration, Recticel’s Board of Directors - in line with its fi duciary duties - unanimously decides to reject the unsolicited non-binding offer from Kingspan Plc - partly backed by the Greiner group - to acquire Recticel’s Insulation and Flexible Foams divisions, as it believes that for the various reasons disclosed in its press release of 26 April 2019 it is not in the interest of its stakeholders to engage with Kingspan/Greiner in this respect.
Global Safety Day At Recticel, we strive to make our working environment “Simply Safe” for everyone, every day. We identifi ed six major potential risks we face in our operations and other activities and turned them into six Golden Safety Rules. We all know that it is diffi cult to change our habits and adopt new ways of working. During the 2019 Recticel Global Safety Day, we introduced our STOP, THINK, ACT! mantra.
Recticel will continue to organise safety-related projects and events to ensure that our common goal – an incident-free workplace – remains a priority for everyone.
February 2019
Automotive ProseatRecticel confi rms the closing of its divestment from the Proseat joint venture in two steps, as announced in December 2018. All conditions having been met and the necessary regulatory approvals being obtained the closing agreements became immediately effective. All manufacturing, operational and commercial operations continued with no changes in the existing teams in place.
Insulation TurvacOn 31 January 2019, Recticel Insulation became majority shareholder (74%) in Turvac d.o.o., the Slovenian producer of Vacuum Insulation Panels (VIP), by acquiring an additional 24% of the shares of Turvac d.o.o. held by the Slovenian joint venture partner Turna d.o.o. Since November 2016 Recticel already held 50% in the joint venture Turvac d.o.o. which operates from Šoštanj (Slovenia). Under the joint venture agreement, Recticel Insulation commercializes for the European construction market the VIPs produced by the joint venture, whereas the joint venture partner Turna d.o.o. focusses on the sale of VIPs to the household appliances sector (e.g. freezers and refrigerators).
The factory in Šoštanj (Slovenia) has been continually improving its VIP products to comply with the quality required for construction purposes. These CE certifi ed VIP boards offer an aged lambda value of 0.006W/mK, which is the benchmark in the industry.
Flexible Foams United Kingdom Recticel received its third FIRA (Furniture Industry Research Association) Gold Certifi cate for its Foamfl ex™ Reversible Foam. It follows two existing FIRA Gold Certifi cations for Foamfl ex™ Cushion Foam / Foamfl ex™ Cushion Slim and Aurora Seating. The FIRA Gold Certifi cate is a mark of the highest quality standards for furniture products and installation services. It is backed by rigorous testing from FIRA International’s UKAS accredited laboratory. To earn FIRA Gold Certifi cation, the product or installation service must be assessed against specifi ed performance levels, whereby also a thorough factory visit is conducted. Going forward, holders are thereafter regularly reassessed through future testing and inspections to ensure that the standards remain high.
Foamfl ex™ Reversible Foam achieved FIRA Gold after a vigorous testing regime whereby the foam was subjected to constant load pounding test over 80,000 cycles of 750 newtons. It was then measured for any loss of hardness and thickness against the original sample. The results demonstrated that the foam is classifi ed as ‘severe’ rating, making the range suitable for all domestic use, private and commercial vehicle seats and cinema armrests. In addition, Foamfl ex™ Reversible Foam passed the testing under the Furniture and Furnishings (Fire) (Safety) Regulations 1988.
> www.fi ra.co.uk/commercial-services/fi ra-gold
Sustainable innovation PolyUrethane Recycling towards a Smart Circular EconomyRecticel has taken the initiative to coordinate for a duration of four years the newly launched PUReSmart project, a polyurethane recycling research initiative. The project is supported by EUR 6 million in funding from the European Union Horizon 2020 Research and Innovation Programme.
The PUReSmart collaborative consortium gathers nine partners from six different countries and seeks ways of transitioning from the current linear lifecycle of polyurethane (PU) products to a circular economy model. To do so, the PUReSmart project will explore new methods, technologies and approaches to overcome these challenges and transform PU into a true circular material.
PUReSmart targets the recovery of over 90% of end-of-life PU with the goal of converting it into valuable inputs for new and known products. The PUReSmart consortium is an end-to-end collaboration spanning the entire polyurethane reprocessing value chain and comprises both industrial players and dedicated research partners.
Recticel Insulation introduced to the market Deck-VQ®, an ultra-performant thermal insulation solution with a PIR-VIP combination, for fl at roofs and terraces.
By holding 74% of the shares of Turvac d.o.o., Recticel secures the know-how and production base for this high-performance insulation material. This is another step forward to become the European leader in high performance insulation solutions for buildings.
1.2. Highlights of 2019 and early 2020
RECTICEL ANNUAL REPORT 2019 I 13RECTICEL ANNUAL REPORT 2019 I 12

Automotive Interiors Germany Recticel Automobilesysteme GmbH announced its intention to streamline its activities by closing its production site in Schönebeck (Germany) before end 2020. This closure will affect 62 employees. Bedding
Schlaraffi a®
At the imm Cologne 2020 fair, the leading German mattress manufacturer Schlaraffi a® celebrates its 111th anniversary – “Better sleeping for a better life – since 111 years”.
Corporate Electricity Sustainability Roadmap 2020-2025Recticel launches its fi rst Electricity Sustainability Roadmap 2020 - 2025, an ambitious action plan to reduce the CO2 impact related to electricity usage by 75%. The Group will start engaging through the build-up and implementation of an energy savings plan at each plant, the deployment of smart effi cient lighting, and the selective installation of several solar panels and wind mills projects to generate green electricity. This ambitious Roadmap will prioritize 41 plants in Europe.
Januari 2020 March 2020
COVID-19In response to the COVID-19 outbreak Recticel gives prority to ensure safe working conditions. In all sites we implemented strict behavioral and necessary precautionary measures to keep our employees healthy and ensuring a safe workplace, by minimizing contamination risks.
In line with lower demand as a result of COVID-19, we have adapted our production levels, either by curtailing production or by temporarily shutting down production sites. Also temporary unemployment is being implemented to the maximum extent where applicable and top management remuneration is temporarily reduced.
In response to this unprecedented environment, capital expenditure has also been reduced to the minimum, and all non-essential projects have been put on hold.
Insulation FranceOn 2 December, Silentwall® - our acoustic insulation panel - received the Silver Decibel Award at the 18th “Decibel d’Or” Ceremony by the French National Council against Noise (Conseil National du Bruit, CNB) in Paris, France.
The jury particularly appreciated its easy installation and its contribution to the circular economy.
Since 1991, the competition rewards products that demonstrate signifi cant, innovative or outstanding achievements in the fi eld of noise environment improvement. Silentwall®
participated in the category Acoustic materials and construction systems.
The Minister of Ecological Transition and the chairwoman of the CNB presented the award to the French Recticel Insulation team.
Corporate International HeadquartersWith the purpose to improve the daily working conditions at the International Headquarters, the Group decided to move to a new location which better responds to the needs of the streamlined organisation.
Flexible Foams DivestmentRecticel announced that it has reached a binding agreement with Greiner AG to divest its 50% participation in the Eurofoam joint venture. Following the divestment of the Proseat activities in 2019, the divestment from Automotive-Interiors and this Eurofoam deal Recticel will fundamentally refocus on its higher value added activities, and provide increased fl exibility to pursue strategic development opportunities in the future.
Automotive Interiors DivestmentRecticel announced that it has entered into a binding agreement in order to bring its Automotive Interiors business in a new joint venture under the control of Munich-based privately owned investment company Admetos GmbH. Under the terms of the agreement the Automotive Interiors division will be transferred to a new joint venture holding company, controlled by Admetos who will own 51% of its shares, with Recticel detaining the other 49%. The new joint venture will allow Automotive Interiors to build on its leading patented interior trim technology, to further develop its customer base, and to expand its geographic reach.
April 2020
July 2019
Bedding Germany Mid-October 2018, Recticel Schlafkomfort GmbH (Germany) announced its intention to streamline its production activities by closing its production site in Hassfurt, where 79 people are employed. The site was fi nally closed end July 2019.
Flexible Foams Eurofoam Germany The 50/50 joint venture Eurofoam continued to further optimise its overhead and operating cost structure by closing its plant in Troisdorf (Germany).
Corporate Poland To better serve its customers, the Group launches its second phase in the roll-out and development of its centralized European Shared Service Center in Łódz (Poland).
December 2019
Flexible Foams Germany Recticel Flexible Foams attended Foam Expo Europe, Stuttgart, Germany.Under the motto Transforming your world together. Recticel and Eurofoam attended the second edition of Foam Expo Europe from 10 - 12 September 2019, where we presented our various solutions for the world of transport, industrial equipment and consumer goods.
Bedding Czech Republic Recticel starts to test the bedding market in the Czech Republic and Slovakia by launching a direct online business-to-consumer platform for its bedding brand Sembella®.
September 2019
1CONFIDENTIAL INFORMATION© Recticel Automotive, 2011
RECTICEL ANNUAL REPORT 2019 I 15RECTICEL ANNUAL REPORT 2019 I 14

Brussels, April 30th 2020Dear Employee,Dear Customer,Dear Shareholder,Dear Reader,
2019 has been a pivotal year for Recticel in a highly uncertain economic and geopolitical context.
Recticel has transformed deeply its business perimeter thanks to three major strategic transactions. The first transaction was closed in February 2019, concerning the 2-step divestment to Sekisui Plastics Co. of its 51% participation in Proseat. The second transaction related to the 2-step divestment of its Automotive Interiors division to Admetos, which has been signed early April 2020. The third transaction related to the sale of its 50% participation in the Eurofoam JV to Greiner AG, which has also been signed early April 2020. These three major strategic milestones will enable to simplify and focus the Group on its core and high value added activities.
In a year of softening end-use markets and deflationary raw material prices, sales have decreased by 7.2% on a comparable basis, leading to an Adjusted EBITDA of €114.7m. Net Financial Debt reached a new historical low, while earnings after taxes reached their second historical best at €24.4m, leading the Board of Directors to propose a stable dividend of €0.24 per share.
Whilst the Group has taken substantial measures to optimize its cost structure by further streamlining its industrial footprint, it has also invested in important Sustainable Innovation programs and in Digitalisation initiatives that will position our Group at the forefront of its sector.
Mr. Johnny ThijsChairman of the Board of Directors
Mr. Olivier ChapelleChief Executive Officer
Last but not least, the reactivity, collaborative spirit, transparency and agility displayed by our global teams in the context of the COVID-19 pandemic, have enabled the Group to promptly take drastic measures to protect its employees and minimize economic consequences.
In 2019, our sales turnover has decreased by 7.2% to €1.22Bn, primarily driven by price erosion as a consequence of raw material price reductions. Our Adjusted EBITDA has reached €114.7m, driven by the record performance of our Flexible Foams division due to strong operational performance and by the solid improvement of our Bedding division supported by the successful introductions of its new Geltex® 2.0 products. The Automotive activities have been impacted by the substantial slowdown of the global Automotive markets. The Insulation activities, despite double digit volume growth, have generated less profit due to temporary margin erosion linked to increased competition and to the ramp-up of our new factory in Finland which is expected to break even in Q4 2020.
During the year, while ramping up our new Technical Foams converting facilities in China and Morocco and the new Insulation facility in Finland, which were all started up in 2018, we have taken additional footprint optimisation measures with the closure of Hassfurt (Germany – Bedding), Troisdorf (Germany – Flexible Foams) and with the announcement of the closure of Schönebeck (Germany – Automotive).
The Innovation work of the past two years is generating incremental sales with Geltex® 2.0 (Bedding), Simfofit® (Insulation) and Silentwall® (Insulation), while our ColoSense® X-Lite new skin technology for Automotive Interiors trim is now homologated at Daimler. In parallel, work on circular economy and end-of-life recycling projects is progressing rapidly in the context of the following programs: PUReSmart, Valpumat, Carbon4PUR, and SweetWoods. The execution of our Digitalisation Roadmap 2018 is progressing well: we have opened our B2C Bedding e-commerce site in the Czech Republic and Slovakia, we have started up an Artificial Intelligence based Sales & Operation Planning tool in our Insulation division and we are launching our B2B portal before the end of Q2 2020 for our Insulation customers. With regards to 2020, the key focus is now on the COVID-19 pandemic crisis. Our prime concern relates to the safety and health of our employees, and in that context, we have taken all precautionary measures to eliminate the infection risk to the maximum extent possible. After the protection of our employees, the next priority is the protection of our Group. The lockdowns in the various countries where it has been implemented have considerably decreased the demand for our products, which in turn has led us to significantly curtail production output and temporarily shut down production sites. We are thankful and impressed by the level of responsibility, maturity and reactivity of our employees around the world to do whatever it takes to protect the economic strength of our Group and enable a smooth restart in the countries where the lockdown is progressively lifted. Likewise, the collaborative spirit between our staff through the use of virtual meeting places is fantastic, and is teaching us lessons that will be useful post-crisis.
In these exceptional circumstances, we warmly thank our employees for their contribution in 2019 and their full commitment in this COVID-19 crisis. Likewise, we thank our customers for their business and partnership, and our shareholders for their continued trust, support and precious insights. We are striving to close the two divestment deals before the end of Q2 2020, and to leverage the newly created focus to create value for our Group.
Olivier Chapelle Johnny Thijs Chief Executive Officer Chairman of the Board of Directors
1.3. Letter from the Chairman of the Board of Directors and the Chief Executive Officer
RECTICEL ANNUAL REPORT 2019 I 17RECTICEL ANNUAL REPORT 2019 I 16

We aim to be the leading global provider
of comfort solutions in all our core markets
by responding to key global challenges
such as environmental protection, energy
conservation, a growing and ageing
population, and acoustic insulation. To
achieve this, we strongly believe in and focus
on short-term efficiency, mutual benefits
of partnerships, innovation and long-term
sustainability.
Our mission
Our vision
We leverage our outstanding expertise
in polymer applications, particularly
polyurethane. We offer competitive, high
value-added solutions to our customers with
the goal to increase day-to-day comfort and
to generate shared value for our customers,
employees and stakeholders.
1.4. Our mission, vision & values
RECTICEL ANNUAL REPORT 2019 I 19RECTICEL ANNUAL REPORT 2019 I 18

• We never compromise on safety
• We respect people, our partners, our planet and laws
• We are transparent and are not afraid to deliver bad news
• We demonstrate fairness in our dealings with others and provide open and candid feedback
• We don’t take credit for the achievements of others
We act with
respect and
integrityWe strive for
results
• We think ahead, define goals and ensure that they are well understood
• We focus, plan, align and cascade objectives
• We are persistent and assure timely execution
• We manage by facts, not by opinions
• We communicate, share the progress accomplished, adapt plans if needed and celebrate success
• We constantly challenge the status quo
• We remain curious: we never stop learning and we anticipate the challenges of tomorrow
• We passionately embrace change to make things better and to make better things
• We dare to go and we dare to stop
• We aim for the best, but we do not wait for perfection
innovate to create value
We
We take
and feelownership
accountable
• We dare to be ambitious, we challenge and we empower
• We look for solutions, not for excuses
• We assume responsibility for the impact and the results of our actions
• We are strongly committed and act as if it was our own money at stake
• We learn from our mistakes
• We communicate in an open, transparent manner
• We welcome other opinions and value diversity
• We anticipate others’ needs and we support others to succeed
• We trust and build on each other’s strengths
• We do not go for individual glory; we let the team shine
We
to wincooperate
An active Value Ambassador community of over 90 people worldwide supports and promotes these values in our daily corporate life. Each year, we organize the Living The Value Award (LTVA) campaign to recognize and reward colleagues and teams who lead by example. The fi ve winners or representatives of the winning teams are invited by the Management Committee to the LTVA ceremony in Brussels.
Our5values fora promising future
In 2016 we redefi ned fi ve core values and assigned to each of them concrete behaviours. Our values describe how we interact, do business and work together in Recticel in order to grow as a company and as individuals. The ultimate goal of the promotion of our core values - the basis of the expected individual and collective behaviours – is to align our organisation’s actions and attitudes towards internal as well as external stakeholders in such a way that we can successfully execute our corporate strategy and ultimately realise our corporate objectives.
RECTICEL ANNUAL REPORT 2019 I 21RECTICEL ANNUAL REPORT 2019 I 20

Market research shows that polyurethane
applications in general will grow faster
than the global economy on average. This
statement relies on supportive megatrends
such as climate change, sustainability,
conservation, an expanding and ageing
population, urbanisation, increasing mobility
and rising standards of living.
We at Recticel believe that our products and
services can bring real practical solutions to
the various challenges that lie ahead. Our
Group strategy is therefore specifically built
around these key markets supported by long
term megatrends. This is one of the reasons
why we decided to divest our Automotive
segments, believing that the “individual
car” society model will tend to disappear,
progressively replaced by shared vehicles.
By prioritising product and process
innovation, international presence and
operational excellence, we believe we can
successfully differentiate ourselves from
competition.
1.5. Our Group strategy & activities
RECTICEL ANNUAL REPORT 2019 I 23RECTICEL ANNUAL REPORT 2019 I 22
Flexibility, cost-efficiency, customer-orientation and sustainable innovation are embedded in our DNA.
Market & challenges

Segment strategy and strategic viewsBased on the strategic internal and external positioning of each business line, Group management defi ned specifi c strategic actions to realise in a balanced way our global corporate objectives. Some of these action points are common to all business lines, while others are very business line-specifi c. Provided the specifi c market positioning, strength and weakness of each activity, tailor-made strategies have been developed for each individual business line. These differentiated segment strategies can be summarised as follows:
Segment Strategy
Human organisationSustainabilityDigitalisation
Sustainable innovation
International expansion
Simplification
Business line positioningThe key idea of our Group strategic plan is to consider our relative market strengths and competencies and, on this basis, to optimally allocate resources to the different business segments.
With respect to the assessment of the attractiveness of the markets in which our businesses are active we rely on objective criteria such as size, growth, profi tability and capital intensity. Likewise, we also evaluate our relative competitiveness in each of these markets. Based on our fi ndings we consider that our Insulation business line holds the highest potential, followed by Bedding and Flexible Foams. At the other end, our two Automotive business lines are deemed not to offer the same prospects and have hence been qualifi ed as non-core activities.
Group strategyRecticel’s strategy is to position the Group in a sustainable way as the leading supplier of high value-added solutions in our defi ned key markets.
Our priorities over the last years and for the future can be summarised as follows:• sustainable innovation in applications, products and materials in combination with high quality, service
levels and end-consumer brand awareness where applicable;• international expansion outside Europe; and• simplifi cation of the Group structure and clear manufacturing footprint rationalisation.
InsulationOrganically grow through geographic expansion, innovation and the introduction of new products, modules and distribution channels, and if possible, accelerate growth through acquisitions.
Flexible Foams
Bolster profi tability through (i) selective growth initiatives based on new products, (ii) further geographic expansion in the Technical Foams division, particularly in North America, Asia and North Africa, (iii) rationalisation and modernisation of the manufacturing footprint, and (iv) commercial and operational excellence.
Bedding
Prioritise the development of branded products which should be supported by (i) a strong marketing strategy, (ii) distinctive product innovation, (iii) an online strategy, (iv) geographic expansion and (v) an optimised network of highly effi cient production facilities; whereby Europe will remain the focal market.
Automotive Support our partners Sekisui (Proseat) and Admetos (Interiors) in successful transition until the full exits respectively early 2022 and 2024.
MARKET ATTRACTIVENESS >
HIGH
LOW HIGH
COM
PETI
TIV
ENES
S >
INSULATION
BEDDING
FLEXIBLE FOAMS
PROSEAT
INTERIORS
Estimated size of relevant market in Europe
Estimated Recticel market share in Europe
MARKET ATTRACTIVENESS >
HIGH
LOW HIGH
COM
PETI
TIV
ENES
S >
INSULATION
BEDDING
FLEXIBLE FOAMS
PROSEAT
INTERIORS
Estimated size of relevant market in Europe
Estimated Recticel market share in Europe
MARKET ATTRACTIVENESS >
HIGH
LOW HIGH
COM
PETI
TIV
ENES
S >
INSULATION
BEDDING
FLEXIBLE FOAMS
PROSEAT
INTERIORS
Estimated size of relevant market in Europe
Estimated Recticel market share in Europe
GrowFurther improve effi ciency and profi tability
+ Grow by leveragingexisting assets
Divest to Admetos in 2020Divest to Sekisui in 2019
In support of these priorities we strive to continuously develop our human talent, as people and teams are crucial to remain successful in the future. Likewise, sustainable development and digitalisation have become mandatory components for long-term growth.
The building blocks of our strategy:
RECTICEL ANNUAL REPORT 2019 I 25RECTICEL ANNUAL REPORT 2019 I 24

2
3
Sustainable innovation We enhance our craft by sharing our knowledge
throughout our company. This creates powerful intellectual synergies for particularly market-driven innovation. To successfully capture future opportunities, our Research & Development department has been organised in a way to increase the pull effect of the business lines. Moreover, the Group’s upgraded and flexible approach to resource use supports our innovation efforts.
International expansion Although we already hold strong positions in the
European markets, we continue to pursue further growth by expanding internationally, inside as well as outside Europe.
Simplification Since many years now, we have instituted a deep
simplification process throughout our organisation; hereby boosting operational efficiency and reducing fixed costs.
In this context, the Group has executed over the last nine years a major industrial footprint restructuring programme: 60 plants have been eliminated whereas 16 new facilities have been opened or acquired, of which 8 outside Europe. At the same
Strategies of support
1To be truly successful, we believe that each segment strategy must be supported and guided by six action drivers:
time the workforce has been reduced overall by 2,855 employees, including employees of divested operations, and the number of joint-ventures scaled down from 22 to 10. In the same context, the number of subsidiaries has been reduced from 119 legal entities to 69. Further rationalization opportunities will arise in the coming years.
Besides a reduced industrial footprint, synergies are also realised through greater centralisation, standardisation and optimisation of common processes and administrative tasks.
Several high-impact innovations have been introduced:
Our Insulation business line introduced several new solutions, including a higher-performance product with an extremely competitive insulation factor (lambda) of 0.019 W/mK. These PIR panels, commercialised under the Xentro® brand, offer a 13% improvement in thermal insulation through improved chemistry, for energy cost savings. Also, the new Du.Panel® X boards offer improved thermal insulation solutions – this in combination with a good fire resistance - and are particularly designed for stables and storage rooms. Finally, fibre-bonded foams have been added to the product portfolio to improve the acoustic characteristics of thermal insulation panels SilentWall®
Our Flexible Foams business line regularly introduces new generations of acoustic foams, leading to new contracts the Technical Foams application area. Novel acoustic insulation products and solutions for the building sector, such as Silentium3 (Silentium Triplex) were also developed and marketed. For our third-party bedding customers, we developed the new comfort foam, Angelpearl®.
RECTICEL ANNUAL REPORT 2019 I 27RECTICEL ANNUAL REPORT 2019 I 26
PUre innovations
The sound of silenceAdvanced multilayered complexes are under development for use in automotive applications, including electrical vehicle cars, but also for use in low noice industrial equipment applications, such as compressors and gensets. It demonstrates our ambition to be the global preferred supplier of silencing solutions for these industries.
CircularityTogether with our suppliers, we examine every possibility of reinventing our products for the circular economy without compromising on comfort and durability. In January 2020, we introduced 100% recyclable Geltex® mattresses with covers from recycled materials on the Cologne IMM trade fair. This year will see the launch of a range of new developments that underline our vision of sustainable sleep comfort.
Innovative combinationsInsulation’s Comfofix® combines a thermal insulation panel with a recycled flexible foam acoustic layer, enabling an easy-to-install pitched roof insulation product. Du.Panel® X, an advanced thermal insulation panel for the agricultural sector, combines a high insulation value with excellent fire resistance properties.
In 2019 we developed Lumix®, a new type of thermal insulation boards for pitched roofs on agricultural buildings. The Lumix® sheets are covered with a unique dark layer that absorbs rather than reflects light, thus providing more comfort for domestic fowl and pigs in the barn.
Lightweight materials The new generation Colo-Sense® X Lite automotive skins are lighter, high performing and cost effective, cutting transport costs and emissions. They combine extreme durability and excellent mechanical and design properties at the lowest possible weight, significantly reducing vehicle fuel consumption.

4Sustainability We are positioning sustainability in at the heart of
the Group’s research and development activities. It is our ambition to help deliver new solutions that will meet the planet’s sustainability challenges. For all new investments, whether it is for existing products or for new innovative projects, the element of sustainability is taken into consideration to boost our competitive edge and create ever more value for our stakeholders.
Digitalisation The swift and disrupting technological
progress and development of robotics, artifi cial intelligence, internet of things and 3D printing has created an explosion of new threats but also new opportunities. Industries have been, and will continue to be, deeply transformed by digitalisation. Recticel is embracing digitalisation to seize new growth opportunities and make the success of our company sustainable.
With this in mind, the Management Committee has developed a digital vision in support of the company’s overall strategic objectives, and thereby positioned digitalisation as a key driver for innovation.
Digital technologies will enable Recticel to make a step change in creating value and differentiation in the following three areas:
6
• New digital Business Models: Increase our customer intimacy through a better understanding and anticipation of the customer and customer needs, and differentiating value propositions in a changing market place.
• Digital Supply Chain & Customer Experience: Retrieve value from existing and new data sources through seamless interfaces and big data approach to accelerate and streamline the customer experience and create transaction effi ciency.
• Smart Manufacturing & Digital Operations: Further accelerate our use of digital in manufacturing and operations to optimize our operational effi ciency by primarily focusing on: (i) labour effi ciency, (ii) material effi ciency, (iii) production fl ows and (iv) internal logistics.
In all these areas, digital opportunities have been prioritised based upon their potential for the Divisions and Functions.
The renamed Information & Digitalisation Technology department (IDT) acts as a centre of expertise and will work in close collaboration with the businesses to deliver on the digital roadmap which will involve the entire organisation.
Innovate to create value is one of the fi ve core values, the foundation of our corporate culture. We passionately embrace change to make things better and to make better things. Our digital vision refl ects this mindset to constantly challenge the status quo. By working together and building on everyone’s talents and skills, we are confi dent that we will successfully implement our digital roadmap and achieve our goals..
Human organisation and talent The above-mentioned strategic action drivers can
only be successfully executed if they are supported by a strong human resources organisation. Our people are truly the drivers of our transformation; their understanding of our environment allows us to anticipate and address our customers’ needs. We therefore recognize their talent, we empower them as much as we can, and we help them thrive and develop by offering them a wide set of training and development programs.
Our Bedding business line launched the new upgraded GELTEX® 2.0 generation, which offers an improved mix of optimal pressure distribution, ideal support and maximum climate control properties. More particularly, the new GELTEX® 2.0 adds unprecedented performance durability, as well as improved sustainability through the use of CO2 based polyols. This key innovation effort offers Recticel a technological advance in the market.
Our Automotive business line began marketing and prototyping the new Colo-Sense® X-Lite, an improved version of the Colo-Sense® Lite high-performance skin for automotive interiors. Colo-Sense® X-Lite enables a further weight reduction and packaging effi ciency, responding to OEMs’ constant search for lighter products. Now homologated by Daimler.
RECTICEL ANNUAL REPORT 2019 I 29RECTICEL ANNUAL REPORT 2019 I 28
5
E-Commerce site up and running as from October 2019
OmniChannel bedding
New Digital Business Models
Digital Supply Chain & Customers Experience
Smart Manufacturing & Digital Operations
B2B portal insulation
Predictive Demand Planning
Advanced Process Control Foaming
Robotic Process Automation
B2B portal available to customers as from 1Q2020
Project � nalised in 1Q2020
On-going
16 project already executed and in operation
1
2
3

Combined sales per business line
0
100
200
300
400
500
600
700
FlexibleFoams
‘17 ‘18 ‘19 ‘17 ‘18 ‘19 ‘17 ‘18 ‘19 ‘17 ‘18 ‘19
Bedding Insulation Automotive
in m
illio
n EU
R
Polyurethane is an extremely versatile material made
from polyols and isocyanates – both derivatives of crude
oil. Polyurethane chemistry is at the core of our Group
business lines.
For seven decades, Recticel’s pioneering spirit and
passion for comfort has driven our development of
innovative applications and solutions that push the limits
of polyurethane technology. We innovate to ensure our
customers’ expectations are met. We therefore actively
seek new and improved solutions for tomorrow. This way
we can provide adapted solutions for various applications
and challenges.
Centred around polyurethane technology, our activities
are organised around four distinctive business lines,
which serve very specifi c markets.
Our activities are broadly spread geographically, but our
Group remains primarily a European player. Around 89%
of our total Group sales are generated in Europe.
Europe
89%
Rest of world
11%
Combined sales 2019 (before intra-Group sales)Automotive
Bedding Insulation
Flexible Foams
1.6. Our activities
RECTICEL ANNUAL REPORT 2019 I 31RECTICEL ANNUAL REPORT 2019 I 30
Recticel enjoys almost 70 years of experience, expertise and passion for
polyurethane technology.

What we doRecticel Insulation is a reliable and experienced
insulation partner, providing high-performance
insulation solutions for both residential and non-
residential buildings, meeting occupant needs for
comfort and greater energy efficiency.
Conserving energy and lowering the carbon footprint,
particularly for the housing sector, is one of the key
objectives of our Insulation business. Driven by a
culture of innovation, technical competence and flair,
we are dedicated to raising the quality standard of
thermal insulation products. For the construction
industry we are engaged in the manufacturing
and commercialisation of high-performance and
durable thermal insulation boards in rigid closed-cell
polyurethane (PU/PUR) and polyisocyanurate foam
(PIR).
Heavily tested during development and before launch
to ensure excellence in product quality, they are today
- available on an industrial scale - the best insulation
materials against cold and heat.
The range of thermal insulation boards spans an
extensive array of applications across the complete
building envelope. We offer solutions for new-build
and refurbishment projects. Product-wise we have
solution for the thermal insulation of walls, for flat and
pitched roofs, and for floors, Building-wise we supply
products for residential, commercial, industrial, public,
logistics as well as agricultural buildings.
To stay ahead of competition, we seek to continuously
improve the thermal insulation performance of our
products while reducing the amount of material
required. Our products truly have the potential to
significantly reduce energy consumption and CO2
emissions.
Insulation
Flexible Foams
Bedding
Automotive
19.6%
19.2%
43.5%
17.7%
Combined sales 2019 (before intra-Group sales)
1.6.1. Insulation
RECTICEL ANNUAL REPORT 2019 I 33RECTICEL ANNUAL REPORT 2019 I 32

in million EUR
COMBINED KEY FIGURES INSULATION 2017 (2) 2018 (2) 2019 (2)
2019 (INCLUDING IFRS 16
IMPACT)
Sales (1) 272.3 271.2 247.2 247.2
Growth rate of sales (%) 16.3% -0.4% -8.9% -8.9%
Adjusted EBITDA 40.3 44.7 28.5 31.6
Adjusted EBITDA margin (as % of sales) 14.8% 16.5% 11.5% 12.8%
EBITDA 40.1 44.7 28.3 31.4
EBITDA margin (as % of sales) 14.7% 16.5% 11.5% 12.7%
Adjusted EBIT 33.7 38.1 20.2 20.9
Adjusted EBIT margin (as % of sales) 12.4% 14.1% 8.2% 8.4%
EBIT 33.5 38.1 20.1 20.7
EBIT margin (as % of sales) 12.3% 14.1% 8.1% 8.4%
(1) before eliminations of intra-Group transactions(2) before IFRS 16 impact
Market attractivenessThe growth of insulation solutions in the new building market has been, and continues to be, supported by EU Directives and stricter regulations. In addition, several subsidy policies in different member states have driven growth in the renovation market.
Not only legislative incentives, but also underlying customer awareness of global megatrends revolving around environmental protection, sustainability and energy conservation have boosted the thermal insulation materials sector. It is expected that these concerns and initiatives will continue in the near future.
The market potential of thermal insulation products is best illustrated by the fact that the heating and cooling of buildings accounts for approximately 22% of energy consumption worldwide. In Europe, buildings use 40% of the total energy consumed.
Next to the attractiveness of the building insulation sector in general, the extremely high-performing properties of rigid polyurethane foams make them better positioned than traditional alternatives.
Since the end of 2016, we have also added Vacuum
Insulation Panels (VIP) for niche applications to our
product offering. In this respect, we launched in 2018
the fi rst ultra-high-performance encapsulated VIP
insulation – commercialised under the brand name
Deck-VQ® - for application in fl at roofs and terraces.
These high-performance Deck-VQ® products are
characterised by a very low lambda of 0.006 and offer
today the best thermal performance in the market.
Our customers are mainly contractors, building
promoters and wholesale building material stockists
and distributors. In addition, sales and marketing
efforts also target architects and end consumers to
support our commercial policy.
Recticel’s Insulation division operates from 4 major
state of the art production sites in Wevelgem
(Belgium), Bourges (France), Mäntsälä (Finland) and
in Stoke-on-Trent (United Kingdom), with local sales
offi ces in Germany, Poland and the Netherlands.
In addition, the division also operates two fi ber-
bonded foams activities in France and holds a 75%
participation in the Slovenian joint venture company
Turvac which is active in vacuum insulation panels.
The Insulation business line is the Group’s smallest
in terms of industrial footprint and employment. It
currently accounts for 19.6% of total combined sales,
it brings a big contribution to operating results and
offers the highest future growth potential.
Combined sales Insulation
Buildinginsulation
100%
in m
illio
n EU
R
0
50
100
150
200
300
250
2017 2018 2019
271
247
272
www.recticelinsulation.com
CompetitivenessToday Recticel is recognised in the market for its broad and high-quality product range, as well as for its professional and effi cient customer service.
Despite the recent expansion in southern Finland, our industrial footprint remains relatively limited in terms of number of sites. As a result, Recticel remains a particularly cost-effi cient operator.
Since the end of 2016, we have added vacuum insulation panels (VIP) and fi ber-bonded foam insulation solutions to our portfolio. This promising new technology is the most effi cient building insulation solution. However, because of its product characteristics and high cost, VIP remains a complementary technology useful in specifi c and demanding situations or niche projects.
StrategyLooking forward, our business line specifi c strategy will continue to focus on European building insulation markets. Although we expect our existing opportunities to generate further organic growth, we also aspire to accelerate our growth with new investments in capacity and, where appropriate, through external acquisitions. As innovation will continue to drive the future of our Insulation business, the introduction of novel products and the diversifi cation of the distribution channel will remain key priorities.
Market driversSupported by ever-increasing insulation standards, polyurethane insulation is gaining market share from more traditional insulation materials, such as mineral wools (glass wool, rock wool) and polystyrenes (EPS, XPS), as polyurethane thermal insulation solutions are considered to offer today the highest-performing insulation materials on an industrial scale. This enviable position is furthermore supported by European legislation for energy performance requirements and energy effi ciency, e.g. the Energy Performance of Buildings Directive 2010/31/EU (EPBD) and the European Energy Directive (2012/27/EU) (EED).
Besides the external drivers, our Insulation business also benefi ts from its lean and mean production footprint, hereby offering a competitive cost performance.
Finally, supported by consistent research and development efforts, we anticipate high development potential through the introduction of new innovative products and solutions and continuing geographic expansion.
RECTICEL ANNUAL REPORT 2019 I 35RECTICEL ANNUAL REPORT 2019 I 34

Insulation
Flexible Foams
Bedding
Automotive
19.6%
19.2%
43.5%
17.7%
Combined sales 2019 (before intra-Group sales) What we doPolyurethane foams are inherently endlessly versatile.
This versatility explains the large success of PU
foams, which are a true problem-solver in almost
every industry, as they can be tailored to almost any
application.
We are continuously innovating to extend and optimise
our product offering in line with new demands.
Very concretely, we provide durable solutions for
a wide variety of customer needs in domains such
as silencing, sealing, fi ltering, carrying, protecting,
supporting and comforting. Our comprehensive
portfolio of solutions provides practical answers to the
various functionalities demanded by a wide range of
different markets.
7 key product attributes – endless possibilities
1.6.2. Flexible Foams
RECTICEL ANNUAL REPORT 2019 I 37RECTICEL ANNUAL REPORT 2019 I 36

in m
illio
n EU
R
0
200
500
300
700
600
400
100
2017 2018 2019
626 621549
Recticel 63.8%
Comfort55.7%
Joint Ventures36.2%
Technical Foams44.3%
in m
illio
n EU
R
0
200
500
300
700
600
400
100
2017 2018 2019
626 621549
Recticel 63.8%
Comfort55.7%
Joint Ventures36.2%
Technical Foams44.3%
in m
illio
n EU
R
0
200
500
300
700
600
400
100
2017 2018 2019
626 621549
Recticel 63.8%
Comfort55.7%
Joint Ventures36.2%
Technical Foams44.3%
Combined sales Flexible Foams
Combined 2019 sales Flexible FoamsEUR 549.1 million
What really drives our Flexible Foams business line is to provide the right material with the right technology to add value to our customers’ products. To do so, we predominantly offer semi-finished flexible polyurethane foam products and components for B2B markets. We tailor our products using different technologies to influence their properties and behaviour. And as new demands and ideas emerge, new solutions are offered.
We organise our foam’s activities around two poles.
The Technical Foams division offers higher value-added specialty foams destined for smaller niche markets. Technical foam types are used in a wide range of applications, such as sponges, scouring pads, filters, paint rollers, seals, packaging, vibration damping and acoustic insulation.
The more commoditised Comfort Foams division focuses with its bulky foam products primarily on the furniture and upholstery industry. Comfort foams are in this case primarily used as supporting filling materials of furniture and bedding goods.
Currently, our Flexible Foams division operates 11 foaming plants and 23 converting plants across EMEA, Asia-Pacific and North America. Flexible foam activities in Central and Eastern Europe are managed through a joint venture with Eurofoam (50/50 with Greiner of Austria), operating 7 foaming plants and 25 converting units. Business in Italy is covered by the joint venture Orsafoam (33/67 with the Orsa Group of Italy).
The Flexible Foams business line has historically always been our largest and currently generates 43.5% of the Group’s total combined sales.
Market driversPolyurethane can be used in diverse applications (acoustic insulation, vibration dampening, shock absorption, antistatic, etc.) for diversified target markets due to its broad range of attributes. Our major markets are transport, industry, furniture & upholstery, medical, building & sports infrastructure, and consumer goods.
Rising standards of comfort are key drivers of all these markets. Examples are:
• Transport: Vehicle manufacturers are today particularly looking for eco-friendly production and assembly methods as well as lightweight materials that reduce fuel consumption and emissions. Higher engine temperatures and pressures also place extra demands on silencing, sealing and filtering components. Superior silencing materials are required to enhance comfort in car interiors, contributing to general well-being and safer driving. In this, rapidly-evolving challenges are a hallmark of the transport industry.
• Industry: in almost all industrial sectors noise and vibration are major concerns, and manufacturers are forced to depend on silencing solutions to protect employees and meet increasingly strict legislation. At Recticel, we work closely with manufacturers and suppliers throughout the industrial world to bring solutions to these challenges. Industrial devices rely on effective sealing of air, gas, water and liquids for maximum efficiency. Filtering solutions protect machinery and ensure the quality of industrial output, and packaging materials protect end products.
• Furniture & upholstery: consumers are increasingly conscious of their sleep quality and overall personal well-being. Homes are therefore seen as safe havens which demand more comfortable seating as well as better mattresses that enhance the sleep experience. As manufacturer we must offer new features and possibilities to stay ahead of competition. Our product range includes both standard foams and speciality foams with customised features.
RECTICEL ANNUAL REPORT 2019 I 39RECTICEL ANNUAL REPORT 2019 I 38

of our broad portfolio comprise solutions that are useful in diverse applications such as abrasive and cleaning sponges, polishing pads for car and shoe care, cosmetic applicators, clothing, footwear and protective accessories, etc.
Market attractivenessIncreasing daily comfort demands and the substitution of alternative technologies and solutions with polyurethane foams drive the foam market, which annual growth is slightly higher than GDP. Although both product portfolios are manufactured on the same production lines, the fl exible foams market is split between Comfort and Technical Foams. Commodity applications are primarily found in the Comfort segment, while specialty applications are clustered in the Technical Foams segment.
CompetitivenessIn Europe Recticel occupies a leading position in the fl exible foams market with a wide industrial network. Our robust research and development capabilities enable us to hold strong positions in existing markets and develop new niche target markets. On the contrary, outside Europe we hold relatively smaller positions in primarily targeted niche markets for technical foams.
Our wide geographic presence and well-established industrial footprint is essential to our competitiveness and provides us access to competitive raw material prices. In terms of differentiating priorities, our Comfort division focusses on optimal asset management and cost performance, and our Technical Foams division relies on innovation and product differentiation.
StrategyOne of the key strategic pillars of our Flexible Foams business is the rationalisation and modernisation of our industrial footprint. In addition to our aim to become a cost-effi cient producer, we also develop and introduce new products and solutions that target growth, and pursue geographic expansion for our Technical Foams segment, especially outside Europe.
Innovation and effi ciency initiatives have reduced our use of raw materials and should be complemented by our choice of more sustainable raw materials. In partnership with Covestro, formerly Bayer MaterialScience, Recticel is the fi rst company worldwide to use a CO2-based polyol in its fl exible foam production process for products such as mattresses. This helps conserve natural resources and combat climate change.
Thanks to this new technology, CO2 can be used as a partial substitute for oil when creating PU fl exible foams like KAPUA® mattress foam. When manufacturing KAPUA® foam, a minimum of one-seventh of oil content is replaced by CO2 based chemicals.
• Medical: it is no secret that standards of comfort, hygiene and cost-effi ciency continue to rise in the medical sector. An aging population places more pressure on hospitals, while better home care possibilities can help to save resources and improve quality of life. Safe and reliable equipment is needed wherever patients are treated. Our foams are used in numerous medical applications ranging from mattresses and wheelchair cushions to tracheostomy fi lters.
• Building & sports infrastructure: leisure facilities and playgrounds are potentially hazardous. To reduce the risks of injuries foams can protect users and improve athletic performance. We provide various durable solutions in polyurethane foams for protection, safety, isolation, comfort and eventually increased performance.
• Consumer goods: generally speaking, consumers demand for increasing variety and personalisation, cost-effi ciency and user-friendly products. To respond to these requests manufacturers, need constantly to develop new solutions and products. In our sector this translates into the discovery and development of new uses for foams, or the offering of new colours, shapes and textures as well as many other qualities that are useful in home and personal care. Examples
in million EUR
COMBINED KEY FIGURES FLEXIBLE FOAMS 2017 (2) 2018 (2) 2019 (2)
2019 (INCLUDING IFRS 16
IMPACT)
Sales (1) 626.1 621.5 549.1 549.3
Growth rate of sales (%) 3.1% -0.7% -11.7% -11.7%
Adjusted EBITDA 40.6 41.5 49.0 58.9
Adjusted EBITDA margin (as % of sales) 6.5% 6.7% 8.9% 10.7%
EBITDA 30.6 33.0 44.2 54.1
EBITDA margin (as % of sales) 4.9% 5.3% 8.1% 9.9%
Adjusted EBIT 27.9 28.9 36.5 37.6
Adjusted EBIT marge (as % of sales) 4.5% 4.6% 6.6% 6.8%
EBIT 17.7 15.6 31.6 32.7
EBIT margin (as % of sales) 2.8% 2.5% 5.8% 6.0%(1) before eliminations of intra-Group transactions(2) before IFRS 16 impact
RECTICEL ANNUAL REPORT 2019 I 41RECTICEL ANNUAL REPORT 2019 I 40
www.recticelfl exiblefoams.com

What we doOur Bedding business line develops, produces and
commercialises finished mattresses, slat bases
and bed bases which we sell through a broad range
of external distribution channels. We are passionate
about sleeping comfort and we have clear distinct
focus on end-consumers. In this respect, we have a
comprehensive offering of products built around strong
(national) brands – owned or licensed –. Our brand
portfolio includes many highly recognized brands in
the industry. Some of these are further supported by
innovative ingredient brands such as GELTEX® inside.
In addition, to further optimise our manufacturing
footprint, we also offer private label products.
Although our offering appeals to a broad range of
consumers, we are not selling directly to retail.
We sell our products through a network of external
distribution channels. Our customer base is broad
and varied, ranging from independent bedding and
furniture retailers operating between one and 30
stores, department stores, mail order and e-commerce
companies, members of – mostly national – buying
groups to international retail chains owning over 1,000
stores.
Currently, our Bedding division operates 11 main
production sites in Austria (1), Belgium (2), Germany
(2), the Netherlands (1), Poland (1), Romania (1),
Sweden (1) and Switzerland (2).
Our Bedding segment accounts for 19.2% of our
Group’s total combined sales.
Insulation
Flexible Foams
Bedding
Automotive
19.6%
19.2%
43.5%
17.7%
Combined sales 2019 (before intra-Group sales)
1.6.3. Bedding
RECTICEL ANNUAL REPORT 2019 I 43RECTICEL ANNUAL REPORT 2019 I 42

in million EUR
COMBINED KEY FIGURES BEDDING 2017 (2) 2018 (2) 2019 (2)
2019 (INCLUDING IFRS 16
IMPACT)
Sales (1) 272.1 243.8 242.3 242.3
Growth rate of sales (%) -7.1% -10.4% -0.6% -0.6%
Adjusted EBITDA 15.1 6.8 12.4 16.9
Adjusted EBITDA margin (as % of sales) 5.6% 2.8% 5.1% 7.0%
EBITDA 14.3 2.0 11.5 16.0
EBITDA margin (as % of sales) 5.3% 0.8% 4.7% 6.6%
Adjusted EBIT 10.5 2.3 7.8 8.2
Adjusted EBIT margin (as % of sales) 3.9% 1.0% 3.2% 3.4%
EBIT 9.6 -2.1 6.7 7.0
EBIT margin (as % of sales) 3.5% -0.8% 2.8% 2.9%(1) before eliminations of intra-Group transactions(2) before IFRS 16 impact
CompetitivenessChoosing sleeping comfort remains very personal and subjective. There is no such thing as a one-size-fits-all perfect mattress. Personal sleeping habits, individual requirements and extras, specific bedding technologies and material qualities drive a purchase choice. The best mattress is therefore the one that offers each unique consumer the best (personal) comfort and a good price-performance ratio.
Over the last few decades, polyurethane foam mattresses have gained substantial market share from traditional technologies such as springs or latex. The characteristics of foam drive a broad and diverse product range, including the development of hybrid technologies. By leveraging on the closely integrated link we have with our Flexible Foams business, our Bedding business is clearly benefitting from valuable synergies that strengthen our competitiveness. The close relationship between both business lines enables us to swiftly introduce innovations and new products in a competitive and still fragmented market.
Combined sales Bedding
in m
illio
n EU
R
0
100
200
300
2017 2018 2019
272244
Polyurethane27.6%
Springs34.7%
Other14.7%
Bed bases8.0%
Mattresses64.8%
Brandedproducts66.5%
Non-brandedproducts/
Private Label33.5%
Box springs12.4%
Latex2.5%
Otherhybrids35.2%
242
Brands versus non-brands
in m
illio
n EU
R
0
100
200
300
2017 2018 2019
272244
Polyurethane27.6%
Springs34.7%
Other14.7%
Bed bases8.0%
Mattresses64.8%
Brandedproducts66.5%
Non-brandedproducts/
Private Label33.5%
Box springs12.4%
Latex2.5%
Otherhybrids35.2%
242
Mattresses & Bed bases
in m
illio
n EU
R
0
100
200
300
2017 2018 2019
272244
Polyurethane27.6%
Springs34.7%
Other14.7%
Bed bases8.0%
Mattresses64.8%
Brandedproducts66.5%
Non-brandedproducts/
Private Label33.5%
Box springs12.4%
Latex2.5%
Otherhybrids35.2%
242
Combined 2019 sales Bedding
By technology
in m
illio
n EU
R
0
100
200
300
2017 2018 2019
272244
Polyurethane27.6%
Springs34.7%
Other14.7%
Bed bases8.0%
Mattresses64.8%
Brandedproducts66.5%
Non-brandedproducts/
Private Label33.5%
Box springs12.4%
Latex2.5%
Otherhybrids35.2%
242
Market driversMattresses, slat-bases and box-springs are a typically slow-moving consumer goods. It is therefore logic that bedding products only generate high levels of customer interest when the need to buy or replace a mattress or bed arises. In these situations, consumers start to become sensitive to questions such as functional sleep comfort and the perceived benefits of the various bedding technologies. Regarding functional comfort, consumer research consistently identifies body support, pressure distribution and climate comfort, i.e. breathability and moisture evacuation, as the top-ranking purchasing criteria. In mid and premium market segments, properties such as durability, anti-allergenic and anti-bacterial are added to the equation. Particularly the ageing population in Europe is highly sensitive to these arguments.
In their decision-making process, customers therefore mainly have to rely on product communication and storeowner advice to navigate the diverse and sometimes confusing bedding product offering, with in most cases only limited product testing opportunities. On top of this, product image and consumer brand trust are equally important in convincing the customer to make a purchase.
Our Bedding business line benefits optimally from these structural market drivers. Our expertise in materials (foam, springs, latex, etc.) and the strength of our brands are key to capture the opportunities of these naturally mature European markets.
Market attractivenessGenerally speaking, the European bedding market is today primarily driven by demographic evolution and the ever-increasing need for a better, fresh, healthier and aesthetical sleeping comfort. These trends do not only drive more frequent replacement but do also call for consumers’ larger sleeping comfort budgets.
High-value branded products represent the premium market segment, while the private-label segment is growing in market share.
is available at: Beka®, Lattoflex®, Schlaraffia®,
Sembella®, Superba® and Swissflex®
In addition to our technological expertise and regular new product introductions, our competitive positions in European markets are boosted by the strength of our brand portfolio. We are particularly well-positioned in five European countries, where we compete with primarily national brands. With our portfolio of strong local brands with local stories, each offering unique value propositions, we want to bring to customers more comfortable, aesthetically pleasing, fashionable and contemporary sleeping comfort.
StrategyCurrently the strategy of our Bedding division is focused on organic growth in our branded products while striving for optimal cost efficiency in the non-branded segment. Under the current strategy, we focus on strong quality, local brands and complementary ingredient brands such as Geltex®. The whole business is further supported by distinctive product innovation. In a continuous quest for improving cost-competitiveness, we will continue to put efforts in the rationalisation and optimisation of our manufacturing footprint.
RECTICEL ANNUAL REPORT 2019 I 45RECTICEL ANNUAL REPORT 2019 I 44
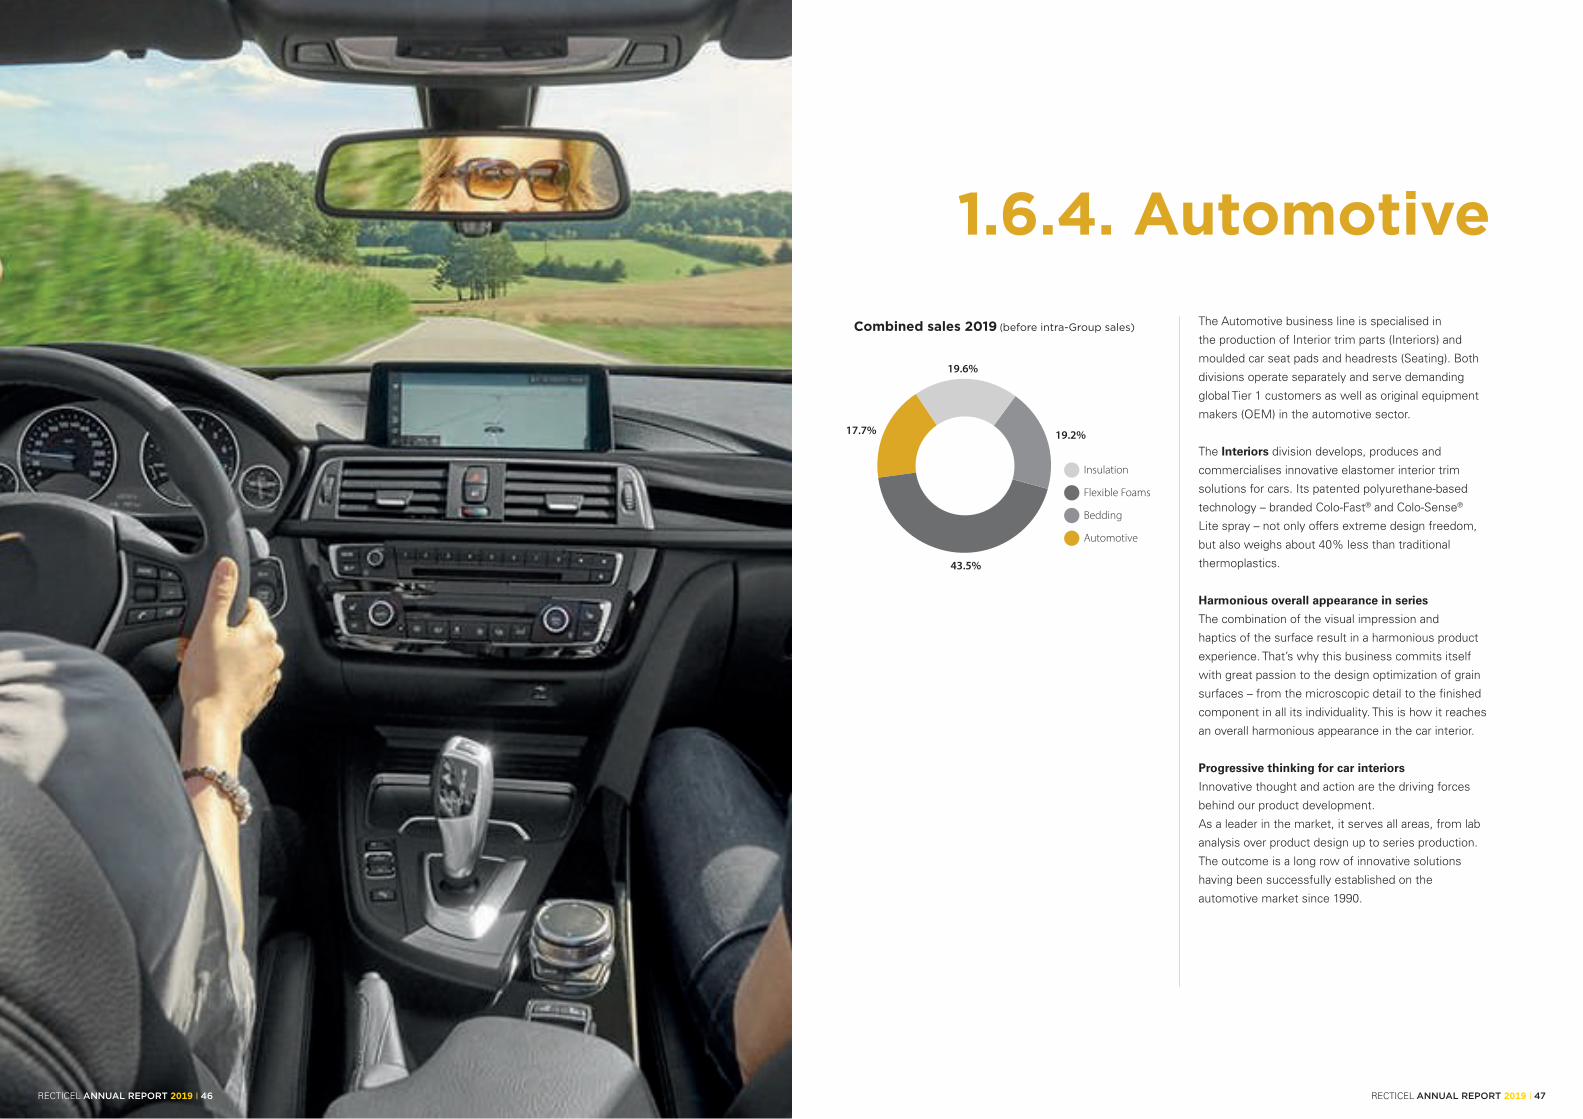
The Automotive business line is specialised in
the production of Interior trim parts (Interiors) and
moulded car seat pads and headrests (Seating). Both
divisions operate separately and serve demanding
global Tier 1 customers as well as original equipment
makers (OEM) in the automotive sector.
The Interiors division develops, produces and
commercialises innovative elastomer interior trim
solutions for cars. Its patented polyurethane-based
technology – branded Colo-Fast® and Colo-Sense®
Lite spray – not only offers extreme design freedom,
but also weighs about 40% less than traditional
thermoplastics.
Harmonious overall appearance in series
The combination of the visual impression and
haptics of the surface result in a harmonious product
experience. That’s why this business commits itself
with great passion to the design optimization of grain
surfaces – from the microscopic detail to the finished
component in all its individuality. This is how it reaches
an overall harmonious appearance in the car interior.
Progressive thinking for car interiors
Innovative thought and action are the driving forces
behind our product development.
As a leader in the market, it serves all areas, from lab
analysis over product design up to series production.
The outcome is a long row of innovative solutions
having been successfully established on the
automotive market since 1990.
Insulation
Flexible Foams
Bedding
Automotive
19.6%
19.2%
43.5%
17.7%
Combined sales 2019 (before intra-Group sales)
1.6.4. Automotive
1.6.4. Automotive
RECTICEL ANNUAL REPORT 2019 I 47RECTICEL ANNUAL REPORT 2019 I 46

Proseat develops, produces and commercialises moulded comfort foam pads for car seats, headrests and lightweight EPP structural car elements. Since early 2019, these activities are managed through Proseat Europe GmbH, a 25/75 joint venture between Recticel and the Japanese public company Sekisui Plastics Co. Ltd. Recticel holds a put option exercisable in 2022 which allows a disposal of its remaining 25% in Proseat.
Proseat’s geographic footprint is restricted to Europe. The company has 8 production sites spread across the Czech Republic (1), France (1), Germany (2), Poland (2), Spain (1) and the United Kingdom (1).
In 2019, our Automotive segment – restricted to Interiors - generated 17.7% of our total combined sales of the Group.
Combined sales Automotive
in m
illio
n EU
R
0
200
400
300
100
2017 2018 2019 (1)
350 364
224
Interiors82.0%
Chemicals(to Proseat)18.0%
Recticel Automotive connects OEM and TIER 1The production chain follows the customers. As a competent partner for its customers, Automotive Interiors supports them in all areas of production and service as there are: trend analysis, product design, sales, tool engineering, production process, and logistics.
As a dynamic partner, the business integrates into the production chain of its customers and produces “plant in plant”. This leads to synergy effects – above all when it comes to developing new and innovative production solutions. Proximity and competence connect and create added value.
Proximity to customers as a production advantageWith approximately 1,400 employees, The Automotive Interiors business operates on three continents.
Global car production is now a matter of course and quality requirements are on the same high level everywhere in the world. Parts are produced along international standards close to its customers or directly on site. This creates reliability and perfect conditions for short lines in production and logistics.
Automotive Interiors is present across 11 production sites located in China (5), the Czech Republic (2), Germany (2) and the United States (2); all supported by central functions located in Belgium (1) and Germany (1).
www.recticel-automotive.com
1 Proseat is integrated in the 2019 combined figures according to the ‘equity method’, i.o. previously on a proportionate basis. Figures of previous years have not been restated.
Market driversToday the car industry is particularly focused on cost price competitiveness and technological development. Both aspects are illustrated by the OEMs continued pressure on suppliers to reduce production costs while remaining highly demanding in terms of quality and technical specifications, such as weight and design freedom. This evolution is also felt at the level of Tier 1 suppliers, which leads to a trend of centralisation and insourcing to optimise capacity. This cascading pressure consequently also impacts Tier 2 suppliers.
Besides cost pressure there is a second leading trend which is linked to sustainability and the reduction of CO2 and other emissions. In the automotive interiors industry, including the seating business, this has led to increased attention on the weight reduction of products, modules and parts.
Market attractiveness The Western European automotive markets are inherently mature, highly competitive and cyclical replacement markets. However, new mobility needs and environmental challenges offer strong innovation incentives, also at the level of practical comfort. Product innovation and differentiation are therefore key to successful answer these new challenges.
CompetitivenessWhile so far, the Proseat activities have been a highly commoditised business, the Interiors business has acquired a leading technological role in the Tier 2 automotive suppliers’ market. Being particularly technology-driven, it offers clearly price-competitive alternative solutions to other technologies, such as for instance PVC. The Automotive Interiors businesses are well-positioned with Tier 1 customers and OEMs. It is recognised for our top-performing, patented products in Interiors, and for its innovative concepts in Seating. The Interiors activity also enjoys an ideal global industrial footprint in Europe, the United States and China.
StrategyDevelopment of innovative solutions responding to the market’s demand and deploy serial production in a cost-efficient manner is the core of the Recticel strategy in Automotive. To realise this, we focus on optimising our industrial footprint and capacity utilisation. Maximising the loading of our factories and the introduction of innovative products ultimately drives our competitiveness.
In line with our defined corporate strategy, it is Recticel’s intention to exercise the put option on its remaining 25% stake in Proseat by 2022.
After the signing of the agreement with Admetos GmbH, the Group will bring its Interiors activities under a new joint venture and stay on board for at least until March 2024 (option date).
in million EUR
COMBINED KEY FIGURES AUTOMOTIVE 2017 (2) 2018 (2) 2019 (1)(2)
2019 (INCLUDING IFRS 16
IMPACT)
Sales(1) 350.4 363.9 223.7 223.7
Growth rate in sales (%) 21.3% 3.9% -38.5% -2.6%
Adjusted EBITDA 25.6 25.9 14.4 22.1
Adjusted EBITDA margin (as % sales) 7.3% 7.1% 6.5% 9.9%
EBITDA 25.0 30.5 17.2 24.8
EBITDA margin (as % of sales) 7.1% 8.4% 7.7% 11.1%
Adjusted EBIT 11.4 9.8 0.9 1.7
Adjusted EBIT margin (as % of sales) 3.3% 2.7% 0.4% 0.8%
EBIT 4.1 12.9 2.2 3.0
EBIT margin (as % of sales) 1.2% 3.5% 1.0% 1.3%
(1) As from 2019 the joint venture Proseat was no longer consolidated following the proportional method, but following the equity method.(2) before IFRS 16
RECTICEL ANNUAL REPORT 2019 I 49RECTICEL ANNUAL REPORT 2019 I 48
A new chapter for InteriorsIn April 2020, Recticel announced that it has
entered into a binding agreement in order to
bring its Automotive Interiors business in a new
joint venture under the control of Munich-based
privately owned investment company Admetos
GmbH. Under the terms of the agreement the
Automotive Interiors division will be transferred
to a new joint venture holding company,
controlled by Admetos who will own 51% of its
shares, with Recticel detaining the other 49%.
The new joint venture will allow Automotive
Interiors to build on its leading patented interior
trim technology, to further develop its customer
base, and to expand its geographic reach. The
agreement contains reciprocal call/put options
for Admetos to acquire, or Recticel to sell, its
remaining 49% share, exercisable as from March
2024 at a price calculated on the basis of a
pre-agreed EBITDA multiple. The transaction is
expected to close in the course of the second
quarter of 2020, subject to customary closing
conditions.

1.7. Sustainable and market-driven innovation
Sustainability is profoundly embedded in Recticel’s strategy. We are committed to finding responsible solutions for the various challenges and needs of our customers and the planet. Our sustainability strategy and progress against our targets are described in detail in our Non-Financial Information Statement, Chapter 2.3 of this Annual Report.
We believe that our company’s success relies on our ability to find innovative solutions for the major challenges facing society today, such as global warming, conservation of natural resources and an ageing population.
In 2016, our Group’s Research and Development Centre merged with our Sustainability Department. The newly created Sustainable Innovation Department (SID) ensures that sustainability and market-driven innovation guide all our research and development efforts.
We refocused our innovation efforts on five innovation programmes, four of which are aligned with the future needs of our business lines, such as developing new comfort foams for bedding or seating applications and finding solutions to fulfil the requirements of technical foams in the field of silencing. Developing new insulation solutions with lower and, therefore, better lambda values is high on our agenda, as is further reducing the weight of our skins for automotive interiors.
The fifth, or ‘corporate’, programme coordinates all initiatives to prepare durable polyurethane products for a low-carbon society and a circular economy.
1.7. Sustainable & market-driven innovation
RECTICEL ANNUAL REPORT 2019 I 51RECTICEL ANNUAL REPORT 2019 I 50

FIT2 – NEW COMFORT FOAM FOR BEDDING AND SEATING
The Fit² programme seeks to gain a deeper scientifi c understanding of comfort for seating and sleeping systems. The new knowledge is refl ected in the Sleep Triangle as the guideline for the development
of new, more durable and sustainable materials and systems.
As a fi rst result, a new generation of Geltex® foams for mattresses was launched in 2018. This new Geltex® foam family offers excellent support, ideal pressure distribution and good climate control. It is more resistant to humidity, temperature changes and mechanical stress, offering a longer lifetime at the same level of comfort. Additionally, the new Geltex®
foam contains CO2-based raw materials, partially replacing traditional fossil fuel-based raw materials.
Together with our suppliers, we examine every possibility of reinventing our products for the circular economy without compromising on comfort and durability. In January 2020, we introduced 100% recyclable Geltex® mattresses with covers from recycled materials at the Cologne IMM trade fair. This year will see the launch of a range of new developments that underline our vision of sustainable sleep comfort.
SILENCING – TECHNICAL FOAMS WITH ENHANCED SILENCING PROPERTIES
The Silencing programme concentrates on the development of differentiated and innovative acoustic solutions for automotive and industry markets. The aim of our research is to reduce noise impacts contributing to more
comfortable and productive environments. We established a centre of competence for acoustics with state-of-the-art equipment, methods and tools for the characterisation of the acoustic performance of materials and solutions.
In 2019, we further extended our acoustic lab capabilities from small-scale and pilot-scale testing of materials and solutions towards real-life testing of complete systems in their applications. We have developed an in-depth expertise to better understand the fundamentals of acoustics: sound, its propagation and the different ways of minimising its impact on the environment.
Advanced multilayered complexes are under development for use in automotive applications, including electric vehicles, and also in low noise industrial equipment applications, such as compressors and gensets. It demonstrates our ambition to be the global preferred supplier of silencing solutions for these industries.
Readying polyurethane for a low-carbon society and a circular economy Innovation and effi ciency initiatives have reduced our use of raw materials and are complemented by our choice of more sustainable raw materials to reduce dependence on fossil resources.
Polyurethane is a durable thermoset material characterised by a high lifespan. It cannot easily be melted or reformed at the end of its use phase.
However, our products contain materials that can be reused or recycled for other value-added purposes. The goal of our research & development projects is to fi nd economically viable solutions for waste streams that also benefi t the environment.
Together with our stakeholders, including customers, employees, suppliers, the industry and knowledge institutes, we explore ways to reduce waste across our entire value chain and design products that are eco-friendly and easy to dismantle.
Until now, new chemical and mechanical recycling processes have already allowed us to reuse our production waste. As of 2020, Recticel will also process end-of-life foam in two of its French plants and transform this valuable material into acoustic insulation solutions, thus gradually replacing the current use of production waste.
Five sustainable innovation programmes With the goal of leading the transition to a circular economy and a low-carbon society as well as promoting well-being, our Sustainable Innovation Department’s R&D efforts are centred around fi ve innovation programmes, each led by an Innovation Manager.
Developed through permanent collaboration between product development teams and SID innovation teams, four of the programmes are aligned with the specifi c market expectations of our divisions and will bring more sustainable solutions to our Automotive, Bedding, Flexible Foams and Insulation customers.
The fi fth programme covers projects impacting all four divisions and coordinates all initiatives to prepare durable polyurethane products for the circular economy. This spans the entire product value chain, from raw materials to polyurethane recycling and reuse.
Sustainability indexIn 2014, we developed a methodology to score all research and development projects spearheaded by the Sustainable Innovation Department. The resulting Sustainability Index, now in its 2nd generation, is a way to measure, track and compare the sustainability performance of active R&D projects. It comprises criteria linked to Planet and People aspects.
Our fi ve innovation programmes underpin our sustainability strategy, differentiate Recticel from its competitors and generate shared value for all stakeholders.
RECTICEL ANNUAL REPORT 2019 I 53RECTICEL ANNUAL REPORT 2019 I 52

PUReSMARTRecticel is coordinating the PUReSmart project, launched on 1 January 2019 for a duration of four years. It is supported by EUR 6 million in funding from the European Union’s Horizon 2020 research and innovation programme. The PUReSmart collaborative consortium gathers nine partners from six different countries and seeks ways of transitioning from the current linear lifecycle of polyurethane (PU) products to a circular economy model.
In this context, Covestro, one of the world’s largest polymer companies and a PUReSmart project member, is already investigating the feasibility of a short-term scaleup from laboratory scale to semi-industrial level, with the aim of making chemical recycling an effi cient industrial process. This solution should then also support the current PUReSmart project.
This project has received funding from the European Union’s Horizon 2020 research and innovation programme under grant agreement N° 814543.
For more information and the video, see https://www.puresmart.eu/
VALPUMATThe Valpumat project, or Valorisation of the Polyurethane of Mattresses, is one of the nine winners of the fi rst Eco-innovation challenge launched in 2017 by Eco-mobilier.
Eco-mobilier is a non-profi t eco-organisation approved by the French Ministry of Ecology, Sustainable Development and Energy. It organises the collection and recycling of used furniture. The Eco-innovation challenge was originally set up to explore new ways of recycling mattresses and to develop new value-added applications based on polyurethane.
Recticel and Tesca Group, a French manufacturer specialising in textiles and seat components for the automotive industry, have teamed up to tackle this innovation challenge.2 Mechanical recycling options are under investigation as well as developing effective sorting methods.
After a mechanical recycling process, the valuable polyurethane material is transformed into acoustic insulation solutions for buildings. Applications for the automotive and industrial industry are also in scope.
As of 2020, Recticel will process end-of-life foam in two of its French plants and transform this valuable material into acoustic insulation solutions, thus gradually replacing production waste.
Besides mechanical recycling projects, Recticel also explores the production of polyurethane using raw materials with lower carbon footprints, including bio-based materials. Two projects, Carbon4PUR and SWEETWOODS, centred on rigid foam for insulation applications, illustrate this commitment:
X-LITE – LIGHTER AUTOMOTIVE INTERIOR TECHNOLOGIES
Recticel continuously advances its polyurethane technology for car interiors, such as dashboard skins. Driven by innovations in layer density reduction techniques, Recticel is launching its fourth generation of dashboard skins.
The new generation Colo-Sense® X Lite automotive skins are lighter, high-performing and cost-effective, cutting transport costs and emissions. They combine extreme durability and excellent mechanical and design properties at the lowest possible weight.
Colo-Sense® X Lite sets the scene for a new era of car interior materials, responding to OEMs’ constant search for lighter products.
CORPORATE SUSTAINABILITY PROGRAMME
This programme steers all initiatives that aim to prepare durable polyurethane products for the circular economy. This covers the whole value chain of our products,
from raw materials to the recycling and reuse of polyurethane. Partnerships with all players in the value chain are essential to a successful transition. A variety of large projects are currently running, in collaboration with different consortia as enablers, that aim to realise our sustainability goals.
Two projects, PUReSmart and Valpumat, focusing on developing chemical and mechanical recycling options for polyurethanes and, more specifi cally, fl exible foams, have been launched:
LOW LAMBDA - REDUCED LAMBDA VALUES IN INSULATION
Sustainability has always been core for the thermal insulation business. Our thermal insulation solutions for building renovations and new constructions contribute to a low-carbon society: CO2 emissions avoided
by our insulation solutions add up to more than 40 times the carbon footprint of the activities of our four business lines combined.
The Low Lambda programme concentrates on developing new rigid foams with better insulation values. Improving the insulation value of a product has an immense, positive effect on natural resource consumption. Xentro® features a 13% lambda value reduction, achieving the lowest lambda value ever for rigid polyurethane panels. Research is ongoing to push the boundaries of insulation properties even further.
Innovative combinationsComfofi x® combines a thermal insulation panel with a recycled, fl exible foam, acoustic layer, enabling an easy-to-install pitched roof insulation product. Du.Panel® X, an advanced thermal insulation panel for the agricultural sector, combines a high insulation value with enhanced fi re resistance properties.
In 2019, we developed Lumix®, a new type of thermal insulation board for pitched roofs on agricultural buildings. The Lumix® sheets are covered with a unique dark layer that absorbs rather than refl ects light, thus providing more comfort for domestic fowl and pigs in the barn and, therefore, excellent for organic livestock farming.
2 https://www.eco-mobilier.fr/nine-innovative-and-ambitious-projects-in-order-to-fi nd-new-ways-of-recycling-and-recovering-materials/
RECTICEL ANNUAL REPORT 2019 I 55RECTICEL ANNUAL REPORT 2019 I 54

Carbon4PURRecticel is proud to be a partner in the Carbon4PUR project, an EU Horizon 2020 research and innovation programme project involving 14 partners from 7 countries, with Covestro as project coordinator.
Carbon4PUR aims to turn industrial waste gases produced by the steel industry (mixed CO/CO2) streams into intermediates for polyurethane plastics for rigid foams building insulation and coatings.
The industrially driven, multidisciplinary consortium is developing a novel process based on direct chemical flue gas mixture conversion, avoiding expensive physical separation, thus substantially reducing the carbon footprint, and also contributing to high monetary savings.
During the first two years of the project, processes were evaluated to convert CO/CO2 to intermediates as polyol building blocks, and catalysts were tested to form reactive intermediates and to convert these to polyols. First process concepts to transfer the chemistry into an industrial process were made.
Recticel has successfully screened the first Carbon4PUR polyol samples on lab scale for insulation applications. A selected number of polyols is now being scaled up to set up semi-industrial trials.
For more information and the video see https://www.carbon4pur.eu
This project has received funding from the European Union’s Horizon 2020 research and innovation programme under grant agreement N° 768919.
SWEETWOODSNine European companies representing 6 EU member states have joined forces for the SWEETWOODS project. The goal of the project is to establish a first-of-its-kind wood fractionation flagship plant to demonstrate the successful and profitable production of high-purity lignin and sugars on an industrial level. Recticel’s aim is to incorporate lignin into rigid polyurethane foams for insulation panels.
On 17 September 2019, Graanul Biotec, Graanul Invest’s sub-company, laid the cornerstone for the wood processing flagship plant on the territory of Graanul Invest in Estonia. The purpose is the development and production of biomaterials from low-quality wood residues. As a result of temperature, pressure and mechanical force, the innovative technology of the plant splits wood fibres into basic elements – high-purity lignin and wood sugars, which can be used in several industries.
The estimated time of completion of the first stage of the flagship plant is the first half of 2020. SWEETWOODS has received funding from the Bio-Based Industries Joint Undertaking under the European Union’s Horizon 2020 research and innovation programme, under grant agreement N° 792061.
https://sweetwoods.eu/
R&D budget The impact of aligning our innovation efforts with market expectations and sustainability priorities is reflected in the annual budget. We see a slight shift in the R&D budget in favour of developments for the Insulation business line and the Corporate Programme (covering all business lines).
The further decrease in the R&D efforts of the Automotive division reflects Recticel’s intent to divest this activity. All our R&D investments remain focused on developing more sustainable solutions for a low-carbon society and a circular economy.
0
5
10
15
2015 2016 20182017 2019
2
0
4
6
8
10
12
14
16
2015 2016 2017 2018 2019
0.99%
13.1 12.8 12.0 12.711.7
0.95% 0.96%0.82% 0.87%
in m
illio
n EU
R
BeddingFlexible Foams InsulationAutomotive Corporate Program
in m
illio
n EU
R
as %
of a
nnua
l sal
es
0.0%
0.5%
1.0%
1.5%
2.0%
Trend in composition of annual budget for Research & Development
Trend in annual gross budget for R&D
0
5
10
15
2015 2016 20182017 2019
2
0
4
6
8
10
12
14
16
2015 2016 2017 2018 2019
0.99%
13.1 12.8 12.0 12.711.7
0.95% 0.96%0.82% 0.87%
in m
illio
n EU
R
BeddingFlexible Foams InsulationAutomotive Corporate Program
in m
illio
n EU
R
as %
of a
nnua
l sal
es
0.0%
0.5%
1.0%
1.5%
2.0%
Trend in composition of annual budget for Research & Development
Trend in annual gross budget for R&D
RECTICEL ANNUAL REPORT 2019 I 57RECTICEL ANNUAL REPORT 2019 I 56

1.8. Human resources & major production sites
1.8. Human re sources & major production sites
RECTICEL ANNUAL REPORT 2019 I 59RECTICEL ANNUAL REPORT 2019 I 58

1.8.1. Training and developing talent at Recticel
1.8.1.1. Talent development
Recticel is putting great emphasis on attracting and onboarding new skilled employees. Once on board, talents are continuously developed. Regular performance management discussions with our ca. 1800 white collar employees are pivotal for assessing the training needs and defining the development plans for each individual employee. The output is also essential to enhance the reward, retention, succession, and career planning process.
1.8.1.2. Recticel University programs
The international Recticel University (RECUN) program is tailored to the development needs identified in the performance management discussions and includes leadership development programs, 360-degree team assessments, project management, change management, and communication modules.
The content of the training modules is continuously adapted to the evolving business needs and aligned with the corporate strategy. Where appropriate, specific trainings are provided at the country or functional level to larger groups in complement to the branded RECUN programs.
1.8.1.3. New training modules in 2019
For 2019, the content of most modules had been reviewed and up-dated. Two new training modules have been added to the current RECUN offerings.
Adopting new ways of working as an enabler to succeed in the Digital Roadmap Recticel is embracing digitalization to seize growth opportunities and make the success of our company more sustainable. In 2018, Recticel engaged into digital initiatives to achieve significant innovation in the areas of Smart Manufacturing & Digital Operations, Digital Supply Chain & Customer Experience, but also to venture into new digital business models.
To succeed in these ambitious initiatives, in 2019 Recticel launched a new training module on Agile and SCRUM methodologies for employees that are involved in these digital pilot projects. The training provided participants with the opportunity to explore new ways of working by introducing new agile project management approaches and collaborative work methods.
Recruitment Interview Skills Hiring new talent is an organisational priority. Selecting the right candidate is one of the most important decisions that a manager can make. A new training module has been introduced that provides hiring managers with the opportunity to improve their skills in conducting interviews, asking the right questions, and making job interviews a positive and engaging experience for candidates.
RECUN Training: “Introducing Agile and SCRUM as New Ways of Working”
1.6.1. Insulation
RECTICEL ANNUAL REPORT 2019 I 61RECTICEL ANNUAL REPORT 2019 I 60
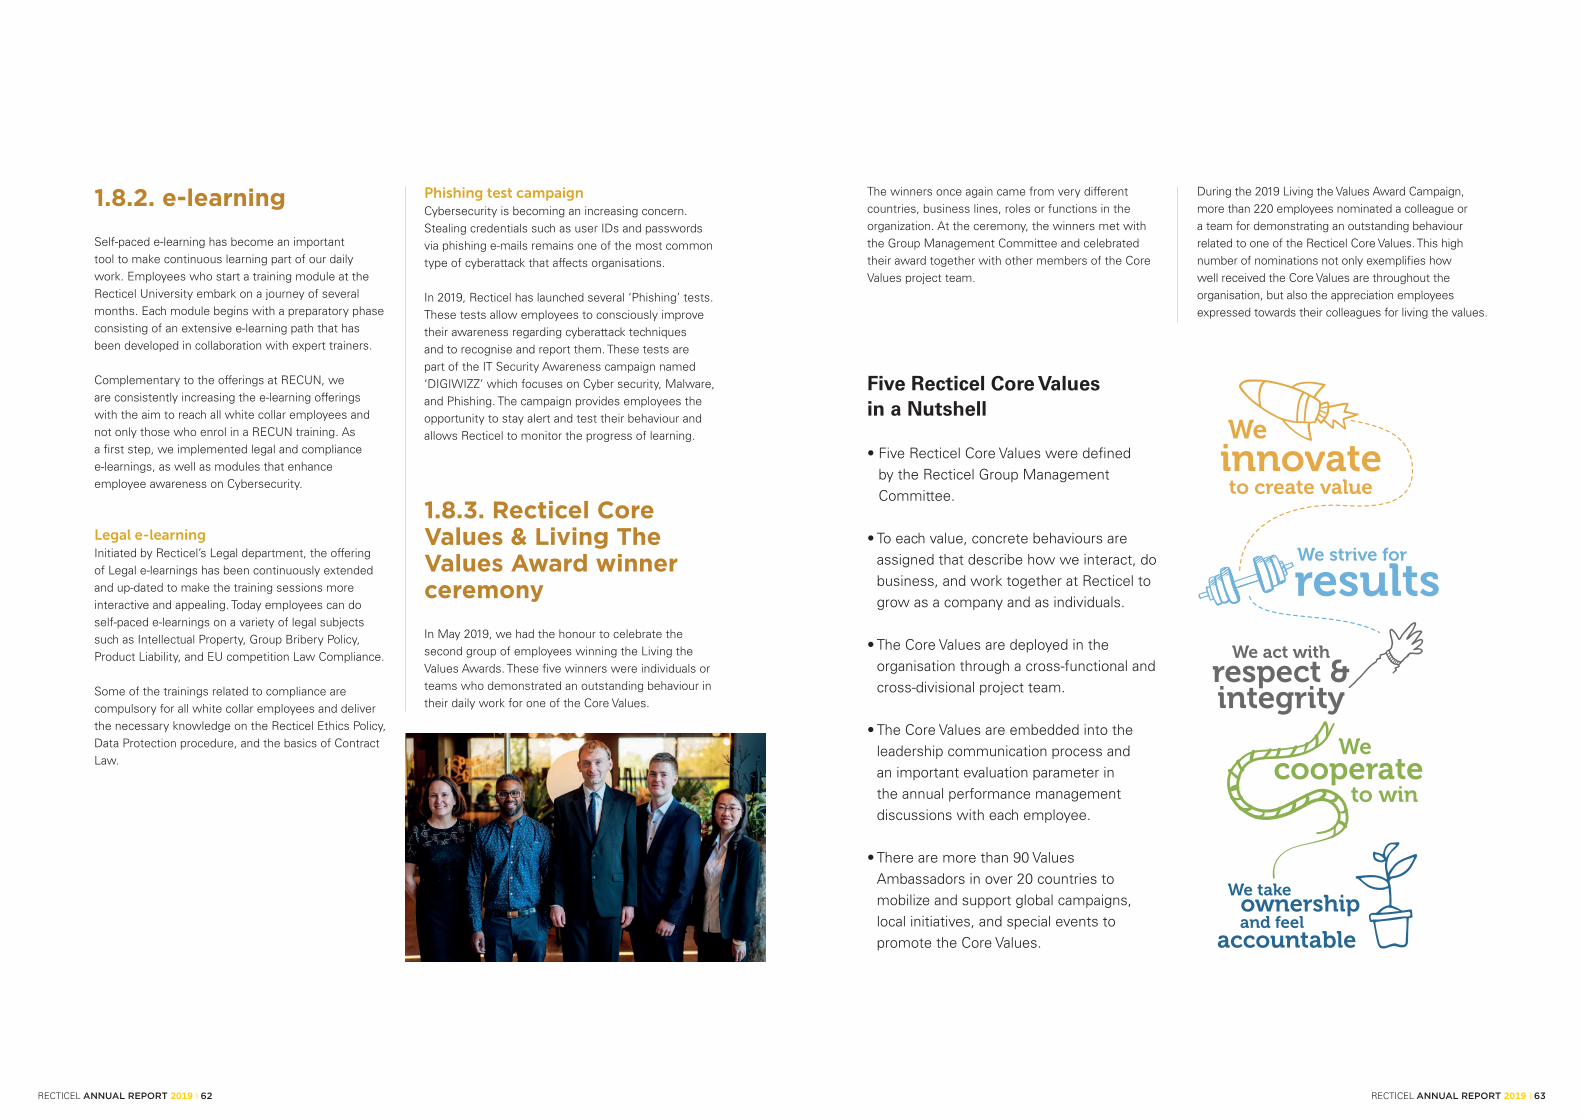
1.8.2. e-learning
Self-paced e-learning has become an important tool to make continuous learning part of our daily work. Employees who start a training module at the Recticel University embark on a journey of several months. Each module begins with a preparatory phase consisting of an extensive e-learning path that has been developed in collaboration with expert trainers.
Complementary to the offerings at RECUN, we are consistently increasing the e-learning offerings with the aim to reach all white collar employees and not only those who enrol in a RECUN training. As a fi rst step, we implemented legal and compliance e-learnings, as well as modules that enhance employee awareness on Cybersecurity.
Legal e-learning Initiated by Recticel’s Legal department, the offering of Legal e-learnings has been continuously extended and up-dated to make the training sessions more interactive and appealing. Today employees can do self-paced e-learnings on a variety of legal subjects such as Intellectual Property, Group Bribery Policy, Product Liability, and EU competition Law Compliance.
Some of the trainings related to compliance are compulsory for all white collar employees and deliver the necessary knowledge on the Recticel Ethics Policy, Data Protection procedure, and the basics of Contract Law.
Phishing test campaign Cybersecurity is becoming an increasing concern. Stealing credentials such as user IDs and passwords via phishing e-mails remains one of the most common type of cyberattack that affects organisations.
In 2019, Recticel has launched several ‘Phishing’ tests. These tests allow employees to consciously improve their awareness regarding cyberattack techniques and to recognise and report them. These tests are part of the IT Security Awareness campaign named ‘DIGIWIZZ’ which focuses on Cyber security, Malware, and Phishing. The campaign provides employees the opportunity to stay alert and test their behaviour and allows Recticel to monitor the progress of learning.
1.8.3. Recticel Core Values & Living The Values Award winner ceremony
In May 2019, we had the honour to celebrate the second group of employees winning the Living the Values Awards. These fi ve winners were individuals or teams who demonstrated an outstanding behaviour in their daily work for one of the Core Values.
The winners once again came from very different countries, business lines, roles or functions in the organization. At the ceremony, the winners met with the Group Management Committee and celebrated their award together with other members of the Core Values project team.
During the 2019 Living the Values Award Campaign, more than 220 employees nominated a colleague or a team for demonstrating an outstanding behaviour related to one of the Recticel Core Values. This high number of nominations not only exemplifi es how well received the Core Values are throughout the organisation, but also the appreciation employees expressed towards their colleagues for living the values.
Five Recticel Core Values in a Nutshell
• Five Recticel Core Values were defi ned by the Recticel Group Management Committee.
• To each value, concrete behaviours are assigned that describe how we interact, do business, and work together at Recticel to grow as a company and as individuals.
• The Core Values are deployed in the organisation through a cross-functional and cross-divisional project team.
• The Core Values are embedded into the leadership communication process and an important evaluation parameter in the annual performance management discussions with each employee.
• There are more than 90 Values Ambassadors in over 20 countries to mobilize and support global campaigns, local initiatives, and special events to promote the Core Values.
innovate to create value
We
We strive for
resultsWe act with
respect &integrity
We
to wincooperate
We take
and feelownership
accountable
RECTICEL ANNUAL REPORT 2019 I 63RECTICEL ANNUAL REPORT 2019 I 62

1.8.5. Engagement survey
An inspiring and rewarding place to workAt Recticel, we are aware that success comes from the ability to attract, engage, and retain a pool of talented employees. The People Priority Plan in our sustainability strategy has the aim to offer all employees a stimulating and rewarding place to work that encourages them to feel engaged and allows them to develop their talents and skills.
Enhanced Employee Engagement through International Surveys Every year Recticel rolls out engagement surveys through an independent research agency, Profacts. This allows employees to provide their feedback in full anonymity on topics such as working environment, leadership, cooperation, communication, career development, and employee engagement.
Two additional countries every year Recticel has set a target to roll out the engagement surveys in two additional countries every year. In 2019, the engagement surveys were rolled out for the first time in France and The Netherlands, and repeated in Belgium, Spain and UK. This gave more than 1800 employees, from 17 locations, the opportunity to express their opinion about the company.
For 2020, Recticel is planning to roll out the engagement survey for the first time in Finland and Estonia and repeat the surveys in Poland and Romania.
1.8.6. People review & succession planning
In 2019, we continued our People Review Process and raised the bar by putting more emphasis on action planning and follow-up, organizing the process at more layers in the organization and assuring more consistency between the people review process and other related processes such as Employee Performance Management discussions or the salary review process.
Facilitated by the Group HR team, business line and functional management teams dedicated an entire day to discussing topics such as succession planning, people related SWOT analysis of each Business Line and Function, identification of high-potentials, future recruitment and retirement planning, and related knowledge transfer plans. The Group Management Committee went through the same process.
This approach helps Recticel to anticipate internal succession needs and to leverage employee motivation, knowledge transfer, and business performance.
2016
Belgium - UK - Spain
Poland -Romania
Sweden -Norway
Belgium, UK, Spain, France, Netherlands
Poland, Romania, Finland,
Estonia
2017 2018 2019 2020
FF People Review
Day
Automotive People
Review Day
BU, BL & Functional
preparations
Group ManCom People
Review Day
(6) Functional People
Reviews
September October November
Bedding People
Review Day
Insulation People
Review Days
1.8.4. Welcome days 2019
Senior managers who recently joined Recticel in an international role were invited to the Welcome Days 2019. The event was highly interactive and gave the participants not only the opportunity to learn more about the company, the business, and the strategic priorities, but also to give their input on such important topics such as Sustainability and Digitalization.
During the two days, the entire Recticel Management Committee was fully engaged. The interactive program was a great success and provided plenty of room for new insights and inspiration to all involved. At the event, new senior managers from the different business lines and functions had the opportunity to connect and build a network with the aim to accelerate organisational learning and drive business development.
Onboarding at Recticel Recticel pays particular attention to the onboarding of new employees. Personalized induction programs provide our newcomers with a learning and development path with the aim to empower them as fast as possible to take full responsibility in their new function
RECTICEL ANNUAL REPORT 2019 I 65RECTICEL ANNUAL REPORT 2019 I 64

1.8.7. Embarking on a digital HR transformation
To better manage an increasing speed of business change and to bring our globally standardized HR processes to the next level, Recticel decided to move its current global HR processes into a new, cloud based, HR information system. This transition will be a signifi cant driver of business integration and end-to-end processing effi ciency and increase our employer branding and attractiveness.
In 2019, a cross-functional project team kicked off to defi ne the scope and system implementation plan. In close collaboration with the purchasing and IDT departments, the HRIS system vendor has been selected. The system implementation will be launched on a global level in 2020. The priority will be the implementation of the core HR systems related to personnel management and the compensation module; this will allow the next annual salary review process to run on the new system.
www.recticel.com
A framework to design your career at Recticel
September 2017
The Recticel Career Map is the result of a strategicgrading process facilitated by the Hay Group. It offersa holistic and consistent view of our organisationand the roles that are present. Our Career Map isthe foundation for a wide variety of HR activities suchas talent management, compensation and benefits,and recruitment. Together with their manager andHR representative, employees will use it as a toolto manage their own career.
Today, our Career Map includes 31 job familiesacross 5 clusters.
A job family is a grouping of individual jobs.It reflects similar types of work and work requirements. Job families span across borders and Business Lines.Each family is described in terms of 1°) purpose,2°) key accountabilities, and 3°) levels. Recticel opted for a framework where families are very identifiable.
Within a family, each level is described using aselection of differentiating factors, both qualitative and quantitative. Each factor feeds into one or more dimensions of the Hay job evaluation methodology: input (expertise), throughput (problem solving) and output (impact). Each level within each job family was graded by Hay using their proprietary job evaluation methodology.
To determine their grade, jobs at Recticel are comparedwith the contents of the job family descriptions and slotted in the overall grading structure. This process is facilitated by HR so that people managers can assign the jobs of their team members to a level — and there-fore a grade — in the relevant job family. The grades of the jobs are then calibrated to avoid inconsistencies. It is expected that the grade for most of the jobs that exist at Recticel can be determined by slotting them in the Career Map.
Olivier Chapelle, Chief Executive Officer Bart Massant, Chief Human Resources Officer
Lionel De Leener, Reward Director
Olivier Butel, Operations Director, Bedding
“ One of the pillars of our Group strategy is simplification. The Recticel Career Map directly contributes to clarifying our organisation and ensuring the consistency of our people management practices across the Group.
The grade of a job is the outcome of an analytical process during which jobs are compared with each other in terms of purpose, accountabilities, and requirements so that, at theend, the entire organisation is described.
The Career Map was reviewed with the members of theGroup Management Committee and is now released to support employees, managers, and HR representatives. A career is a journey into the unknown. I strongly believe that the Career Map will provide guidance and contribute to well-informed decision making.”
“ To a large extent, the successful implementation of the BeddingBusiness Line strategy depends on the deployment of aEuropean Manufacturing Network supported by an Integrated Supply Chain. This involves the further structuring of ourOperations.
The job family descriptions in Operations are “Future Ready”: they set the standards against which our employees can befurther developed and form the basis for the selection processin case of new recruitments.
I am convinced that the Career Map and the supporting jobfamilies provide us with a clear framework to understand andactivate the organisation.”
“ Equipping Recticel with a grading structure that covers almostall our white collar employees is one of the goals of our Group HR strategy. To this end, Recticel asked Hay, a renowned HR consultancy, to identify and describe families of jobs that existacross the organisation, with the help of appointed businessleaders and functional representatives.
The job families enable us to consistently identify the many differentjobs that we have at Recticel and assign them to a grade. Using the job families, employees will be able to identify possible careerpaths, crossing countries, Business Lines, functional domains,and departments. Managers will be equipped to devise succession plans for key roles. This is an exciting development for every employee and we hope that you will actively use the Career Map.”
Hay Group is a renowned HR consultancy. It was established in the USin 1943 and employs more than 2700 consultants in 88 offices worldwide. The Hay job evaluation methodology is used for all levels of jobs acrossall sectors and businesses in more than 12,000 organisations acrossmore than 90 countries.
In addition to job grading, Hay regularly surveys the market and reportson salary management practices. As a Korn Ferry company since 2016,it also offers a wide range of tools and integrated solutions and servicesto manage talents.
If you have questions, please contact your manager orHR representative. They will be happy to provide guidanceto manage your career at Recticel.
1.8.8. Further refi nement of our compensation & benefi t processes
Recticel continues to upgrade its HR processes. As an example, an additional step has been built into the salary review process whereby calibration meetings regarding individual employee performance are being held at Business Line level.
In parallel, Recticel worked on further structuring its remuneration practices based on the recently deployed Recticel Hay Grading structure to streamline compensation and benefi t decisions, including at the time of recruitment. This is supported by an improved online benchmarking interface, Pay Hub, released by Korn Ferry Hay.
RECTICEL ANNUAL REPORT 2019 I 67RECTICEL ANNUAL REPORT 2019 I 66

Major production sitesAlthough we are most active in Europe and present in most European countries, we also maintain strong production and sales networks in Asia and the United States. Our global presence and technological support system are reinforced by our dedication to local service.
COUNTRY FLEXIBLE FOAMS (1) BEDDING INSULATION AUTOMOTIVE
AUSTRIAKremsmünster
LinzTimelkam
BELGIUM WetterenGeraardsbergen
HulshoutWevelgem
CZECH REPUBLICMladá Boleslav
Most
ESTONIA Tallinn
FINLAND Kouvola Mäntsälä
FRANCELangeacLouviers
TrilportBourges Trilport
GERMANYBurkhardtsdorf
EbersbachJöhstadt
Wattenscheid
KönigswinterSchönebeck Wackersdorf
HUNGARY Sajóbábony
INDIATaloja, New Bombay
Bangalore
ITALY Gorla Minore
MOROCCO Tanger
NORWAY Åndalsnes
PEOPLE’S REPUBLIC OF CHINA
Wuxi
Changchun Langfang
Ningbo Shengyang
POLAND Zgierz Łódz
ROMANIA Sibiú Miercurea Sibiului
SLOVENIA Šoštanj
SPAIN Ciudad Rodrigo
SWEDEN Gislaved Gislaved
SWITZERLAND Flüh
THE NETHERLANDS Kesteren Kesteren
TURKEY Istanbul
UNITED KINGDOMAlfreton
CorbyStoke-on-Trent
Burntwood
UNITED STATESDeer Park, NY
Irvine, CAAuburn Hills, MI
Tuscaloosa, Al
(1) For Flexible Foams, only the major foams plants are listed.
This table lists our principal production units (excluding joint venture companies in which the Group has a minority stake). In addition to these sites, we have 40 other conversion units and sales offices in Europe, the United States and Asia. At the end of 2019, our Group operated 81 production units in 27 countries.
Number of staff1
31 DEC 2018 31 DEC 2019
BELGIUM 1 105 15.1% 1 067 15.2%
POLAND 938 12.8% 967 13.8%
CZECH REPUBLIC 922 12.6% 795 11.3%
GERMANY 791 10.8% 693 9.9%
FRANCE 561 7.6% 558 7.9%
PEOPLE'S REPUBLIC OF CHINA 523 7.1% 479 6.8%
UNITED KINGDOM 473 6.4% 464 6.6%
ROMANIA 362 4.9% 366 5.2%
THE NETHERLANDS 291 4.0% 265 3.8%
USA 225 3.1% 253 3.6%
AUSTRIA 222 3.0% 214 3.0%
SWEDEN 163 2.2% 160 2.3%
HUNGARY 133 1.8% 128 1.8%
FINLAND 110 1.5% 105 1.5%
SPAIN 107 1.5% 93 1.3%
ESTONIA 96 1.3% 93 1.3%
TURKEY 88 1.2% 89 1.3%
SWITZERLAND 85 1.2% 88 1.3%
INDIA 42 0.6% 38 0.5%
NORWAY 34 0.5% 34 0.5%
BULGARIA 20 0.3% 25 0.4%
SLOVENIA 8 0.1% 17 0.2%
SLOVAKIA 11 0.1% 11 0.1%
SERBIA 9 0.1% 10 0.1%
MOROCCO 10 0.1% 9 0.1%
UKRAINE 5 0.1% 5 0.1%
RUSSIA 4 0.1% 5 0.1%
LITHUANIA 5 0.1% 0 0.0%
TOTAL 7 341 100% 7 028 100%
31 DEC 2018 31 DEC 2019
Western Europe 3 942 53.7% 3 740 53.2%
Eastern Europe 2 511 34.2% 2 420 34.4%
Rest of world 888 12.1% 868 12.4%
TOTAL 7 341 100% 7 028 100%
Eastern Europe34.4%
Rest of the world12.4%
Corporate3.0%
SID1.2%
Automotive21.8%
Insulation8.6%
Flexible Foams41.8%
Bedding23.7%
Western Europe53.2%
Eastern Europe34.4%
Rest of the world12.4%
Corporate3.0%
SID1.2%
Automotive21.8%
Insulation8.6%
Flexible Foams41.8%
Bedding23.7%
Western Europe53.2%
Headcount per segment (FTE - December 31, 2019)
Headcount per region (FTE - December 31, 2019)
1 Full-time and part-time personnel with permanent or temporary employment contracts valid at the end of the period. Headcount information excludes external agency employees and the proportion of personnel of joint ventures in which the Group has a minority stake(rounded figures).
RECTICEL ANNUAL REPORT 2019 I 69RECTICEL ANNUAL REPORT 2019 I 68

Management report
2.
RECTICEL ANNUAL REPORT 2019 I 71RECTICEL ANNUAL REPORT 2019 I 70

Olivier Chapelle (CEO): “Amid global trade tensions and geopolitical uncertainty, our topline has decreased by 7.2% in 2019. It has been primarily influenced by selling price erosion as a consequence of substantial isocyanates raw material cost decrease, and by soft global Automotive and Comfort markets.
Our Flexible Foams division delivered a record performance, in spite of lower volumes. In changing market dynamics, our Bedding division has confirmed its growth potential over the last 9 months of 2019, and has significantly improved its profitability. Considering the overall turmoil in the sector, especially in China, our Automotive division has adapted itself and managed to limit the impacts on its profitability when compared to sector peers. Our Insulation division has grown its volumes in 2019, but has seen its profitability reduced due to margin erosion on the back of intensified competition in its main markets, in combination with the ramp-up costs of its new Scandinavian facility.
While the Group’s profitability has been slightly affected by these circumstances, Recticel generated a solid cash flow allowing to further reduce its financial debt”.
1 For the definition of terminology used, see Glossary and Alternative Performance Measures (“APM”) at the end of this report.
2 Due to rounding, numbers presented throughout this and other documents may not add up precisely to the totals provided and percentages may not precisely reflect the absolute figures
All comparisons are made with the comparable period of 2018, unless mentioned otherwise.
Following the partial divestment from Proseat (Automotive – Seating) in February 2019, Proseat is integrated in the 2019 combined figures according to the ‘equity method’, i.o. previously on a proportionate basis. For comparison purposes the 2018 data have been restated accordingly.
3 To facilitate comparisons and understanding of the Group’s underlying performance, all comments in this document on developments in revenue or results are made on a like-for-like basis unless otherwise indicated; i.e. 2018 restated data compared to 2019 data before the impact of IFRS 16.
4 Including the drawn amounts under non-recourse factoring programs: EUR 47.0 million per 31 December 2019 versus EUR 32.9 million per 30 September 2019 and EUR 60.2 million per 30 June 2019.
Annual results 2019
• Combined1 sales decreased by 7.2% on a comparable
restated basis2
• Combined Adjusted EBITDA: EUR 114.7 million, EUR
88.2 million before IFRS 16
• Result of the period (share of the Group): EUR 24.8
million, EUR 26.0 million3 before IFRS 16
• Total combined net financial debt4: EUR 227.5 million,
including EUR 87.0 million impact of IFRS 16 (30
September 2019: 237.2 million; 30 June 2019: EUR
261.3 million)
• Proposal to pay a stable gross dividend of EUR 0.24
per share
2.1. Report of our Board of Directors
RECTICEL ANNUAL REPORT 2019 I 73RECTICEL ANNUAL REPORT 2019 I 72

2.1.1.1. Consolidated data1
• Sales: from EUR 1,117.7 million to EUR 1,038.5 million (-7.1%), including a currency
effect of +0.24%
• EBITDA: EUR 95.3 million, EUR 70.8 million3 before IFRS 16
(versus EUR 80.5 million²)
• EBIT: EUR 37.1 million, EUR 34.4 million3 before IFRS 16
(versus EUR 42.9 million²)
• Result of the period (share of the Group): EUR 24.8 million, EUR 26.0 million3
before IFRS 16
• Total net financial debt4: EUR 215.6 million including EUR 80 million impact
of IFRS 16 (30 September 2019: EUR 222.4 million; 30 June 2019:
EUR 243.9 million)
5 Excluding the drawn amounts under non-recourse factoring programs: EUR 47.0 million per 31 December 2019 versus EUR 32.9 million per 30 September 2019 and EUR 51.3 million per 31 December 2018.
Consolidated Sales from EUR 1,117.7 million to EUR 1,038.5 million (-7.1%)
Income from joint ventures and associates: from EUR 10.2 million to EUR 9.3 million1
The decrease in ‘Income from joint ventures & associates’ is mainly due to the lower contribution of the Eurofoam group, impacted by closure costs of the Troisdorf plant (Germany).
Consolidated EBITDA EUR 95.3 million, EUR 70.8 million before IFRS 16 versus
eur 80.5 million in 2018.
Consolidated EBIT EUR 37.1 million, EUR 34.4 million before IFRS 16 versus
EUR 42.9 million in 2018.
Consolidated financial result EUR -8.2 million, EUR -4.2 million before IFRS 16 versus
EUR -3.9 million in 2018.
Net interest charges: EUR -7.0 million, EUR -2.8 million before IFRS 16 versus EUR -3.3 million in 2018.
‘Other net financial income and expenses’: EUR -1.2 million, EUR -1.5 million before IFRS 16 versus EUR -0.6 million in 2018. This item comprises mainly interest capitalisation costs under provisions for pension liabilities (EUR -0.8 million versus EUR -0.8 million in 2018) and exchange rate differences (EUR +0.1 million versus EUR +0.1 million in 2018).
Consolidated income taxes and deferred taxes From EUR -10.2 million to EUR -4.2 million
• Current income tax: EUR -6.7 million (2018: EUR -3.3 million); • Deferred tax: EUR +2.4 million (2018: EUR -7.0 million).
Consolidated result of the period (share of the Group): EUR 24.8 million, EUR 26.0 million before IFRS 16 versus
EUR 28.8 million in 2018.
2.1.1. Key figures
in million EUR
FY2018 (a)
FY2019 before IFRS 16
(b)
Δ %(b)/(a)-1
FY2019 after IFRS 16
(c)
Δ(c) - (b)
Sales 1 117.7 1 038.5 -7.1% 1 038.5 0.0
Gross profit 201.6 189.4 -6.1% 191.1 1.6
as % of sales 18.0% 18.2% 18.4%
Income from joint ventures and associates 10.2 9.4 -8.0% 9.3 (0.1)
EBITDA 80.5 70.8 -12.1% 95.3 24.5
as % of sales 7.2% 6.8% 9.2%
EBIT 42.9 34.4 -20.0% 37.1 2.8
as % of sales 3.8% 3.3% 3.6%
Financial result (3.9) (4.2) 8.3% (8.2) (4.0)
Income taxes and deferred taxes (10.2) (4.2) -58.8% (4.2) 0.0
Result of the period (share of the Group) 28.8 26.0 -9.9% 24.8 (1.2)
Result of the period (share of the Group) - base (per share, in EUR) 0.53 0.47 -11.1% 0.45 (0.02)
31 DEC 18 31 DEC 19 31 DEC 19
Total Equity 265.0 276.6 4.4% 275.4 -1.2
Net financial debt 5 84.6 88.6 4.7% 168.6 80.0
Gearing ratio (Net financial debt4/Total Equity) 31.9% 32.0% 61.2%
Leverage ratio (Net financial debt4/EBITDA) 1.1 1.3 1.8
RECTICEL ANNUAL REPORT 2019 I 75RECTICEL ANNUAL REPORT 2019 I 74

2.1.1.2. Combined data1
• Sales: from EUR 1,315.5 million to EUR 1,220.9 million (-7.2%) including currency effect (+0.1%)
• Adjusted EBITDA: EUR 114.7 million, EUR 88.2 million (-9.6%) before IFRS 16 (versus EUR 97.7 million)²
• EBITDA: EUR 105.6 million, EUR 79.1 million3 (-9.5%) before IFRS 16 (versus EUR 87.3 million)²
• Total net financial debt4: EUR 227.5 million including EUR 87 million IFRS 16 impact (30 September 2019: EUR 237.2 million3; 30 June 2019: 261.3 million3)
in million EUR
FY2018 (as published)
FY2018 (restated) 2
(a)
FY2019 before IFRS 16
(b)
Δ %(b)/(a)-1
FY2019 after IFRS 16
(c)
Δ(c) - (b)
Sales 1 448.3 1 315.5 1 220.9 -7.2% 1 220.9 0.0
Gross profit 239.5 224.8 217.4 -3.3% 219.1 1.7
as % of sales 16.5% 17.1% 17.8% 17.9%
Adjusted EBITDA 103.8 97.7 88.2 -9.7% 114.7 26.6
as % of sales 7.2% 7.4% 7.2% 9.4%
EBITDA 93.4 87.3 79.1 -9.5% 105.6 26.6
as % of sales 6.4% 6.6% 6.5% 8.7%
Adjusted EBIT 63.3 60.9 48.3 -20.7% 51.2 2.9
as % of sales 4.4% 4.6% 4.0% 4.2%
EBIT 47.0 44.9 37.4 -16.7% 40.3 2.9
as % of sales 3.2% 3.4% 3.1% 3.3%
31 DEC 18 31 DEC 18 31 DEC 19 31 DEC 19
Total Equity 265.0 265.0 276.6 4.4% 275.4 -1.2
Net financial debt 6 100.2 84.6 93.4 10.5% 180.4 87.0
Gearing ratio (Net financial debt4/Total Equity) 37.8% 31.9% 33.8% 65.5%
Leverage ratio (Net financial debt4/EBITDA) 1.1 1.0 1.2 1.7
6 Excluding the drawn amounts under non-recourse factoring programs: EUR 47.0 million per 31 December 2019 versus EUR 32.9 million per 30 September 2019 and EUR 51.3 million per 31 December 2018.
in million EUR
FY2018 RESTATED ²
1Q2019 2Q2019 3Q2019 4Q2019 FY2019
Flexible Foams 621.5 148.0 139.2 128.4 133.5 549.1
Bedding 243.8 64.3 55.6 57.8 64.6 242.3
Insulation 271.2 62.5 67.4 62.9 54.4 247.2
Automotive 229.6 54.1 61.0 53.9 54.7 223.7
Eliminations (50.5) (11.2) (10.1) (9.5) (10.4) (41.2)
TOTAL COMBINED SALES 1 315.5 317.6 313.0 293.6 296.8 1 220.9
Adjustment for joint ventures by application of IFRS 11
(197.9) (49.4) (45.1) (43.2) (44.7) (182.4)
TOTAL CONSOLIDATED SALES 1 117.7 268.2 267.9 250.3 252.1 1 038.5
in million EUR
AS PUBLISHED RESTATED 2 2019 VERSUS 2018 RESTATED
1H2018 2H2018 FY2018 1H2018 2H2018 FY2018 1H2019 2H2019 FY2019 Δ 1H Δ 2H Δ FY
Flexible Foams 330.6 290.9 621.5 330.6 290.9 621.5 287.2 261.9 549.1 -13.1% -10.0% -11.7%
Bedding 124.6 119.2 243.8 124.6 119.2 243.8 119.8 122.4 242.3 -3.8% 2.7% -0.6%
Insulation 132.7 138.5 271.2 132.7 138.5 271.2 129.8 117.3 247.2 -2.2% -15.3% -8.9%
Automotive 195.6 168.3 363.9 121.5 108.1 229.6 115.1 108.6 223.7 -5.3% 0.5% -2.6%
Eliminations (27.6) (24.5) (52.1) (26.6) (23.8) (50.5) (21.4) (19.9) (41.2) -19.8% -16.6% -18.3%
TOTAL COMBINED SALES 755.9 692.4 1 448.3 682.7 632.8 1 315.5 630.6 590.4 1 220.9 -7.6% -6.7% -7.2%
Adjustment for joint ventures by application of IFRS 11
(176.2) (154.4) (330.6) (103.0) (94.8) (197.9) (94.5) (87.9) (182.4) -8.3% -7.3% -7.8%
TOTAL CONSOLIDATED SALES 579.7 537.9 1 117.7 579.7 537.9 1 117.7 536.1 502.4 1 038.5 -7.5% -6.6% -7.1%
Detailed comments on sales and results of the different segments are given in chapter 4 on the basis of the combined figures (joint ventures integrated following the proportionate consolidation method).
Main changes in the scope of consolidation in 2019: • Reduction of the participation in Proseat (Automotive – Seating) from 51% to 25%. Consequently,
Proseat is integrated in the combined figures of 2019 according to the ‘equity method’ and no longer on a proportionate basis.
• Increase of the participation in Turvac (Insulation) from 50% to 74%, leading to its full consolidation.
Combined Sales: on a like-for-like basis sales decreased by 7.2% from EUR 1,315.5 million2 (as published: EUR 1,448.3 million) to EUR 1,220.9 million, including a currency impact of +0.1%.
4Q2019 Combined sales decreased on a like-for-like basis by 6.9% from EUR 318.9 million to EUR 296.8 million.
• Flexible Foams sales decreased essentially due to price erosion due to lower raw material costs, and to soft demand in the comfort and automotive end-use markets throughout the year, leading to lower volumes.
• Bedding sales were flat over the full year, after a weak 1Q. The enhanced product offerings of the division allowed for external sales growth rates (2Q2019: +3.6%; 3Q2019: +1.9%; 4Q2019: +4.7%).
• The Insulation volumes increased by a double-digit percentage on an annual basis, although quite weak in 4Q due to inventory adjustments at our customers. The volume effect on sales has however been more than offset by lower selling prices induced by lower raw material costs and intense competition in some markets.
• The Automotive division reported lower sales on a like-for-like basis2 as volumes dropped globally in the main Automotive markets.
Breakdown of the combined sales by segment
2.1.2. Comments on the Group results
RECTICEL ANNUAL REPORT 2019 I 77RECTICEL ANNUAL REPORT 2019 I 76
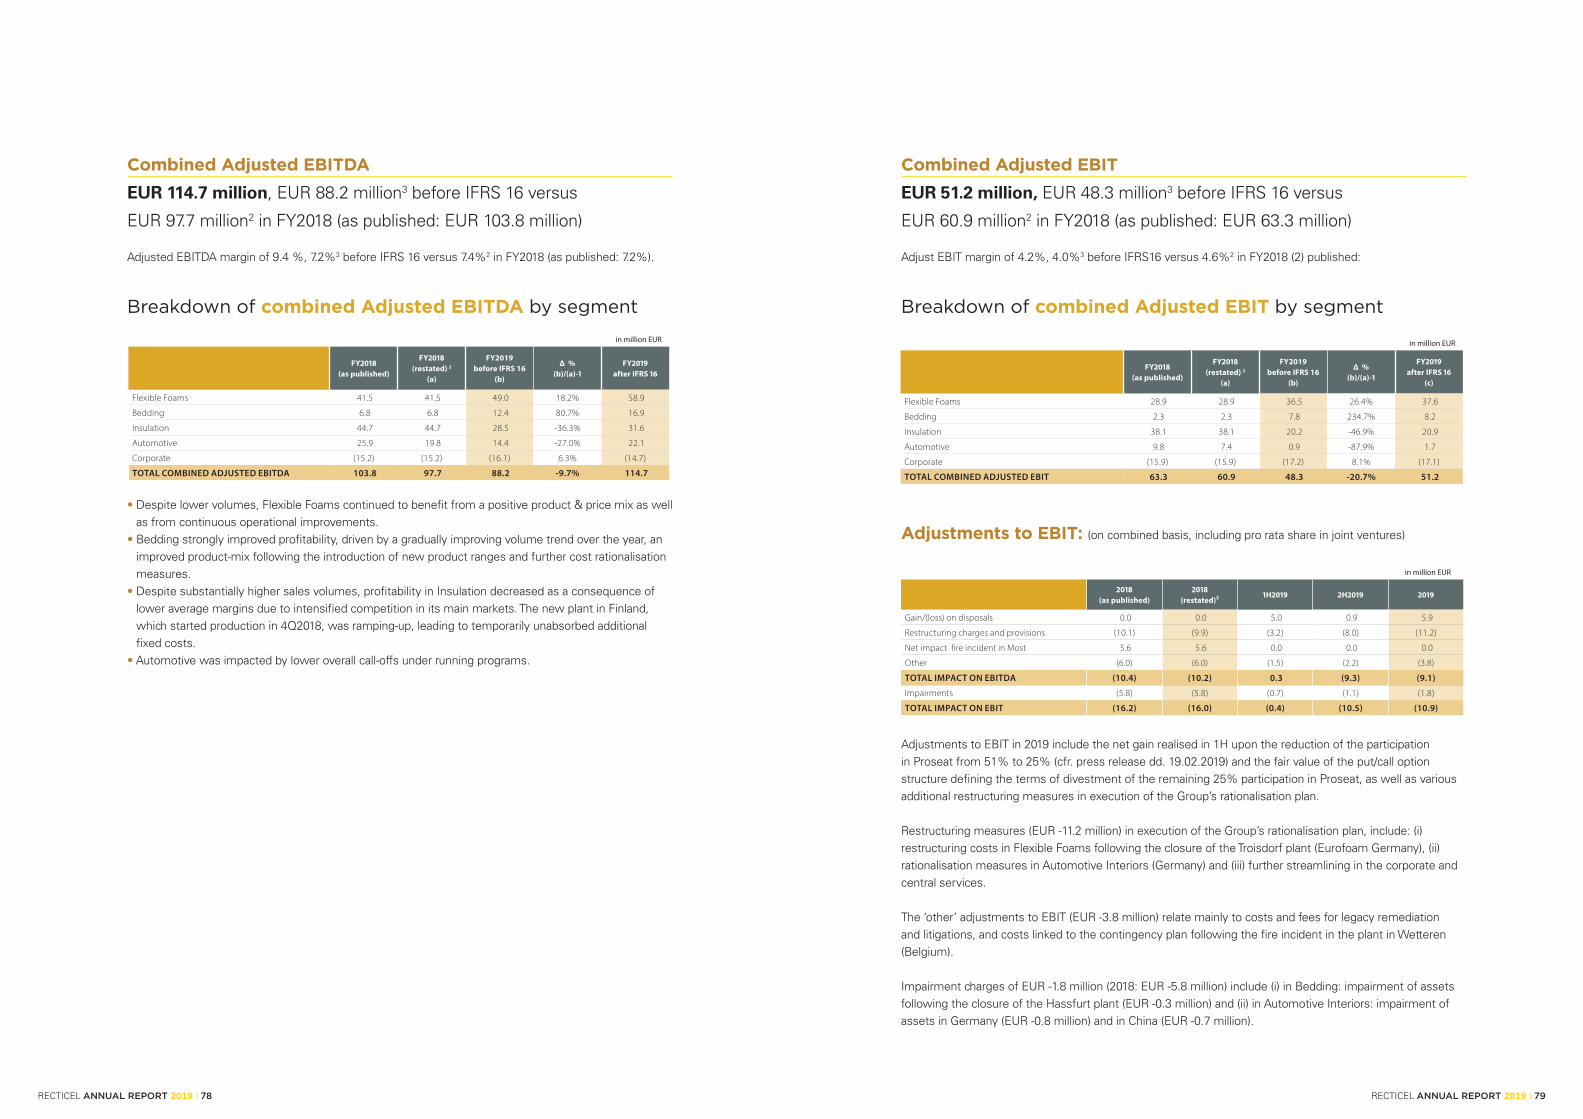
Combined Adjusted EBITDAEUR 114.7 million, EUR 88.2 million3 before IFRS 16 versus
EUR 97.7 million2 in FY2018 (as published: EUR 103.8 million)
Adjusted EBITDA margin of 9.4 %, 7.2%3 before IFRS 16 versus 7.4%2 in FY2018 (as published: 7.2%).
Breakdown of combined Adjusted EBITDA by segment
• Despite lower volumes, Flexible Foams continued to benefit from a positive product & price mix as well as from continuous operational improvements.
• Bedding strongly improved profitability, driven by a gradually improving volume trend over the year, an improved product-mix following the introduction of new product ranges and further cost rationalisation measures.
• Despite substantially higher sales volumes, profitability in Insulation decreased as a consequence of lower average margins due to intensified competition in its main markets. The new plant in Finland, which started production in 4Q2018, was ramping-up, leading to temporarily unabsorbed additional fixed costs.
• Automotive was impacted by lower overall call-offs under running programs.
Combined Adjusted EBITEUR 51.2 million, EUR 48.3 million3 before IFRS 16 versus
EUR 60.9 million2 in FY2018 (as published: EUR 63.3 million)
Adjust EBIT margin of 4.2%, 4.0%3 before IFRS16 versus 4.6%2 in FY2018 (2) published:
Breakdown of combined Adjusted EBIT by segment
Adjustments to EBIT in 2019 include the net gain realised in 1H upon the reduction of the participation in Proseat from 51% to 25% (cfr. press release dd. 19.02.2019) and the fair value of the put/call option structure defining the terms of divestment of the remaining 25% participation in Proseat, as well as various additional restructuring measures in execution of the Group’s rationalisation plan.
Restructuring measures (EUR -11.2 million) in execution of the Group’s rationalisation plan, include: (i) restructuring costs in Flexible Foams following the closure of the Troisdorf plant (Eurofoam Germany), (ii) rationalisation measures in Automotive Interiors (Germany) and (iii) further streamlining in the corporate and central services.
The ‘other’ adjustments to EBIT (EUR -3.8 million) relate mainly to costs and fees for legacy remediation and litigations, and costs linked to the contingency plan following the fire incident in the plant in Wetteren (Belgium).
Impairment charges of EUR -1.8 million (2018: EUR -5.8 million) include (i) in Bedding: impairment of assets following the closure of the Hassfurt plant (EUR -0.3 million) and (ii) in Automotive Interiors: impairment of assets in Germany (EUR -0.8 million) and in China (EUR -0.7 million).
in million EUR
2018 (as published)
2018 (restated)²
1H2019 2H2019 2019
Gain/(loss) on disposals 0.0 0.0 5.0 0.9 5.9
Restructuring charges and provisions (10.1) (9.9) (3.2) (8.0) (11.2)
Net impact fire incident in Most 5.6 5.6 0.0 0.0 0.0
Other (6.0) (6.0) (1.5) (2.2) (3.8)
TOTAL IMPACT ON EBITDA (10.4) (10.2) 0.3 (9.3) (9.1)
Impairments (5.8) (5.8) (0.7) (1.1) (1.8)
TOTAL IMPACT ON EBIT (16.2) (16.0) (0.4) (10.5) (10.9)
Adjustments to EBIT: (on combined basis, including pro rata share in joint ventures)
in million EUR
FY2018 (as published)
FY2018 (restated) 2
(a)
FY2019 before IFRS 16
(b)
Δ %(b)/(a)-1
FY2019 after IFRS 16
Flexible Foams 41.5 41.5 49.0 18.2% 58.9
Bedding 6.8 6.8 12.4 80.7% 16.9
Insulation 44.7 44.7 28.5 -36.3% 31.6
Automotive 25.9 19.8 14.4 -27.0% 22.1
Corporate (15.2) (15.2) (16.1) 6.3% (14.7)
TOTAL COMBINED ADJUSTED EBITDA 103.8 97.7 88.2 -9.7% 114.7
in million EUR
FY2018 (as published)
FY2018 (restated) 2
(a)
FY2019 before IFRS 16
(b)
Δ %(b)/(a)-1
FY2019 after IFRS 16
(c)
Flexible Foams 28.9 28.9 36.5 26.4% 37.6
Bedding 2.3 2.3 7.8 234.7% 8.2
Insulation 38.1 38.1 20.2 -46.9% 20.9
Automotive 9.8 7.4 0.9 -87.9% 1.7
Corporate (15.9) (15.9) (17.2) 8.1% (17.1)
TOTAL COMBINED ADJUSTED EBIT 63.3 60.9 48.3 -20.7% 51.2
RECTICEL ANNUAL REPORT 2019 I 79RECTICEL ANNUAL REPORT 2019 I 78

in million EUR
FY2018 (as published)
FY2018 (restated) 2
(a)
FY2019 before IFRS 16
(b)
Δ %(b)/(a)-1
FY2019 after IFRS 16
Flexible Foams 15.6 15.6 31.6 103.3% 32.7
Bedding (2.1) (2.1) 6.7 n.m. 7.0
Insulation 38.1 38.1 20.1 -47.4% 20.7
Automotive 12.9 10.8 2.2 -79.6% 3.0
Corporate (17.5) (17.5) (23.2) 32.6% (23.1)
TOTAL COMBINED EBIT 47.0 44.9 37.4 -16.7% 40.3
Adjustment for joint ventures by application of IFRS 11 (4.1) (0.1) (3.0) 4206.1% (3.1)
TOTAL CONSOLIDATED EBIT 42.9 44.8 34.4 -23.4% 37.1
Combined EBITDAEUR 105.6 million, EUR 79.1 million3 before IFRS 16 versus EUR 87.3
million2 in FY2018 (as published: EUR 93.4 million)
EBITDA margin of 8.7%, 6.5%3 before IFRS 16 versus 6.6%2 in FY2018 (as published: 6.4%).
Breakdown of EBITDA by segment
Combined EBITEUR 40.3 million, EUR 37.4 million3 before IFRS 16 versus EUR 44.9
million2 in FY2018 (as published: EUR 47.0 million)
EBIT margin of 3.3%, 3.1%3 before IFRS 16 versus 3.4%2 in FY2018 (as published: 3.2%).
Breakdown of EBIT by segment
2.1.3. Financial position
The Group further reduced its combined financial debt.
End-December 2019, the application of IFRS 16 to outstanding operating lease arrangements led to an
addition of EUR 87.0 million to the combined net financial debt and EUR 80.0 million to the consolidated net
financial debt. Compared to the position per 30 June 2019, the reduction in IFRS 16 impact on consolidated
and combined debt results essentially from the exercise of the option to purchase the Insulation plant in
Stoke-on-Trent (United Kingdom) for GBP 18.4 million.
The application of IFRS 16 has no consequences for the Group’s financial covenant testing, as the syndicated
bank financing agreement includes a ‘frozen GAAP’ provision.
The Group confirms that all conditions under the financial arrangements with its banks are respected.
2.1.4. Market segments
IFRS 8 requires operating segments to be identified on the basis of the internal reporting structure of the Group that allows a regular performance review by the chief operating decision maker and an adequate allocation of resources to each segment. Therefore, the Group will continue to comment on the development of the different segments on the basis of the combined figures, consistent with the managerial reporting and in line with IFRS 8.
in million EUR
31 DEC 2018 31 MAR 2019 30 JUN 2019 31 SEP 2019 31 DEC 2019
TOTAL EQUITY - before IFRS 16 265.0 - 266.5 - 276.6
Combined debt figures
Net financial debt on balance sheet 100.2 103.6 83.9 113.5 93.4
+ Impact of application IFRS 16 - 112.0 117.1 90.8 87.0
+ Drawn amounts under factoring programs 51.3 36.0 60.2 32.9 47.0
TOTAL COMBINED NET FINANCIAL DEBT 151.5 251.6 261.3 237.2 227.5
GEARING - COMBINED BEFORE IFRS16 37.8% - - - 33.8%
LEVERAGE - COMBINED BEFORE IFRS16 1.1 - - - 1.2
Consolidated debt figures
Net financial debt on balance sheet 84.6 97.0 73.8 105.5 88.6
+ Impact of application IFRS 16 - 105.0 109.8 84.0 80.0
+ Drawn amounts under factoring programs 51.3 36.0 60.2 32.9 47.1
TOTAL CONSOLIDATED NET FINANCIAL DEBT 135.9 237.9 243.9 222.4 215.6
GEARING - CONSOLIDATED BEFORE IFRS16 31.9% - - - 32.0%
LEVERAGE - CONSOLIDATED BEFORE IFRS16 1.1 - - - 1.3
in million EUR
FY2018 (as published)
FY2018 (restated) 2
(a)
FY2019 before IFRS 16
(b)
Δ %(b)/(a)-1
FY2019 after IFRS 16
Flexible Foams 33.0 33.0 44.2 34.2% 54.1
Bedding 2.0 2.0 11.5 474.1% 16.0
Insulation 44.7 44.7 28.3 -36.6% 31.4
Automotive 30.5 24.5 17.2 -29.8% 24.8
Corporate (16.8) (16.8) (22.2) 31.9% (20.8)
TOTAL COMBINED EBITDA 93.4 87.3 79.1 -9.5% 105.6
Adjustment for joint ventures by application of IFRS 11 (12.9) (5.0) (8.3) 66.4% (10.4)
TOTAL CONSOLIDATED EBITDA 80.5 82.4 70.8 -14.1% 95.3
RECTICEL ANNUAL REPORT 2019 I 81RECTICEL ANNUAL REPORT 2019 I 80

in million EUR
FY2018(a)
FY2019 before IFRS 16
(b)
Δ(b)/(a)-1
FY2019 after IFRS 16
Sales 621.5 549.1 -11.7% 549.1
Adjusted EBITDA 41.5 49.0 18.2% 58.9
as % of sales 6.7% 8.9% 10.7%
EBITDA 33.0 44.2 34.2% 54.1
as % of sales 5.3% 8.1% 9.9%
Adjusted EBIT 28.9 36.5 26.4% 37.6
as % of sales 4.6% 6.6% 6.8%
EBIT 15.6 31.6 103.3% 32.7
as % of sales 2.5% 5.8% 6.0%
SALES
Fourth quarter 2019During 4Q2019 combined sales decreased from EUR 145.4 million to EUR 133.5 million (-8.2%).
Full-year 2019For the full-year 2019, combined sales decreased from EUR 621.5 million to EUR 549.1 million (-11.7%), including a -0.1% impact from exchange rate differences.
Both sub-segments Comfort (EUR 305.9 million; -14.2%) and Technical Foams (EUR 243.1 million; -8.2%) reported lower sales, due to a combination of selling price erosion as a consequence of falling chemical raw material prices, and lower volumes.
PROFITABILITY
Adjusted EBITDA margin of 10.7%, 8.9%3 before IFRS 16 versus 6.7%2 in 2018. The margin improvement is attributable to positive net pricing effects including increased prices for trim foam, an improved product-mix and operational effi ciency gains.
EBITDA includes adjustments for EUR - 4.8 million (2018: EUR -8.5 million) mainly (i) restructuring charges following the closure of the Eurofoam plant in Troisdorf (Germany), (ii) streamlining of central departments, and (iii) net costs linked to the fi re incident in the Wetteren plant (Belgium).
SALES
Fourth quarter 2019Sales dropped by 21.4% in 4Q2019, from EUR 69.3 million to EUR 54.4 million, including a currency impact of +1.1%; primarily due to price erosion linked to isocyanates raw material price reduction, and lower volumes driven by inventory reduction measures taken by customers.
Full-year 2019Despite a double-digit volume growth, sales decreased over the full year 2019 by 8.9% from EUR 271.2 million to EUR 247.2 million, including a currency impact of +0.2%.
Price erosion due to intensifi ed competition has more than offset the positive volume impact.
The new production facility in Finland – which started production in 4Q2018 – is ramping-up, with all products now certifi ed for the Nordic countries.
PROFITABILITY
Adjusted EBITDA margin of 12.8%, 11.5%3 before IFRS 16 versus 16.5%2 in FY2018.
Before IFRS 16 impact, profi tability receded as the growth in sales volumes was more than offset by lower average profi t margins. In addition, the new plant in Finland which started production in 4Q2018 was still ramping-up and hence induced incremental fi xed costs which were not yet absorbed by the additional sales contribution. It is expected that this new plant will generate a positive contribution to the results as from 4Q2020 onwards.
2.1.4.1. Insulationin million EUR
FY2018(a)
FY2019 before IFRS 16
(b)
Δ(b)/(a)-1
FY2019 after IFRS 16
Sales 271.2 247.2 -8.9% 247.2
Adjusted EBITDA 44.7 28.5 -36.3% 31.6
as % of sales 16.5% 11.5% 12.8%
EBITDA 44.7 28.3 -36.6% 31.4
as % of sales 16.5% 11.5% 12.7%
Adjusted EBIT 38.1 20.2 -46.9% 20.9
as % of sales 14.1% 8.2% 8.4%
EBIT 38.1 20.1 -47.4% 20.7
as % of sales 14.1% 8.1% 8.4%
2.1.4.2. Flexible foams
RECTICEL ANNUAL REPORT 2019 I 83RECTICEL ANNUAL REPORT 2019 I 82

SALES
Fourth quarter 2019Sales comprise the Interiors business (4Q2019: EUR 44.7 million; -5.0%) as well as sales of chemical raw materials at cost to the Proseat companies (4Q2019: EUR 10.0 million; +46.3%), as Recticel became - since April 2019 - the sole supplier of such raw materials to Proseat (versus 51% of the volumes previously).
The trend observed during 1Q2019 (-7.2%), 2Q2019 (-3.5%) and 3Q2019 (-0.5%) reversed somewhat in 4Q2019. On a like-for-like basis2 combined sales increased from EUR 53.9 million to EUR 54.7 million (+1.5%) in 4Q2019, including exchange rate differences (+0.5%).
Full-year 2019For the full year 2019, like-for-like sales decreased by 2.6% from EUR 229.6 million to EUR 223.7 million, including a currency impact of +0.8%. Sales comprise the Interiors business (FY2019: EUR 183.5 million; -8.0%) and sales of chemical raw materials at cost to the Proseat companies (FY2019: EUR 40.2 million; +33.3%)
Sales volumes remained adversely affected by the continued weakness of the European and Chinese Automotive markets.
PROFITABILITY
Adjusted EBITDA margin of 9.9%, 6.5%3 before IFRS 16 versus 8.6%2 in 2018 (as published: 7.1%).
Before IFRS 16 impact, the profi tability decreased mainly due to lower volumes in Interiors.
EBITDA includes adjustments for a net amount of EUR +2.7 million (2018: EUR -4.5 million) representing the gain linked to the partial divestment from the Proseat companies in February 2019 and the revaluation of the option structure determining the minimum value of the remaining participation, which is offset by restructuring costs in the Interiors operations in Germany (EUR -2.9 million).
in million EUR
FY2018 (as published)
FY2018 (restated)
(a)
FY2019 before IFRS 16
(b)
Δ(b)/(a)-1
FY2019 after IFRS 16
Sales 363.9 229.6 223.7 -2.6% 223.7
of which Interiors 199.4 199.4 183.5 -8.0% 183.5
of which sale of chemicals to Proseat 14.8 30.1 40.2 33.3% 40.2
Adjusted EBITDA 25.9 19.7 14.4 -26.8% 22.1
as % of sales 7.1% 8.6% 6.5% 9.9%
EBITDA 30.5 24.5 17.2 -29.8% 24.8
as % of sales 8.4% 10.7% 7.7% 11.1%
Adjusted EBIT 9.8 7.4 0.9 -87.9% 1.7
as % of sales 2.7% 3.2% 0.4% 0.8%
EBIT 12.9 10.8 2.2 -79.6% 3.0
as % of sales 3.5% 4.7% 1.0% 1.3%
in million EUR
FY2018(a)
FY2019 before IFRS 16
(b)
Δ(b)/(a)-1
FY2019 after IFRS 16
Sales 243.8 242.3 -0.6% 242.3
Adjusted EBITDA 6.8 12.4 80.7% 16.9
as % of sales 2.8% 5.1% 7.0%
EBITDA 2.0 11.5 474.1% 16.0
as % of sales 0.8% 4.7% 6.6%
Adjusted EBIT 2.3 7.8 234.7% 8.2
as % of sales 1.0% 3.2% 3.4%
EBIT (2.1) 6.7 n.m. 7.0
as % of sales -0.8% 2.8% 2.9%
SALES
Fourth quarter 2019The positive sales trend observed in 2Q2019 (+3.6%) and 3Q2019 (+1.9%), was confi rmed in 4Q2019, following the success of the new generation of Geltex® products. Combined sales increased by 4.4% from EUR 61.9 million to EUR 64.6 million, including a +0.2% impact from exchange rate differences.
Full-year 2019For the full-year 2019, combined sales slightly decreased from EUR 243.8 million to EUR 242.3 million (-0.6%), including a -0.1% impact from exchange rate differences.
The sub-segment “Branded Products” grew by 4.6% thanks to the new innovative Geltex® 2.0 and boxsprings product lines, while the sub-segment “Non-Branded/Private Label” receded by 8.1% in a market characterised by strong competition from e-commerce players, and a specifi c market situation related to one customer in Germany.
PROFITABILITY
Adjusted EBITDA margin of 7.0%, 5.1%3 before IFRS 16 versus 2.8%2 in FY2018.
EBITDA, before IFRS 16 impact, increased from EUR 2.0 million to EUR 11.5 million; including adjustments for EUR -0.9 million (2018: EUR -4.8 million) mainly for reorganisation charges in central departments.
The growth in Branded sales, the reduction of low margin business and cost reductions as a result of the closure of the Hassfurt plant, were the key drivers
behind the profi tability improvement.
2.1.4.3. Bedding 2.1.4.4. Automotive
RECTICEL ANNUAL REPORT 2019 I 85RECTICEL ANNUAL REPORT 2019 I 84

2.1.5. Profit appropriation policy
The Annual General Meeting agrees on the appropriation of the amounts available for distribution based on a proposal from the Board of Directors.
When drawing up its proposal, the Board of Directors strives for the ideal balance between ensuring a stable dividend for shareholders and maintaining sufficient investment and self-financing opportunities to secure the company’s longer-term growth.
The Board of Directors presented the following appropriation of the results to the General Meeting:
2.1.6. Dividend payment
Subject to approval of the profit appropriation by the General Meeting of 26 May 2020, a dividend of EUR 0.24 gross will be paid per ordinary share, or EUR 0.168 net (-30% withholding tax). This dividend will be payable from 2 June 2020. KBC Bank acts as paying agent.
Payments for the registered shares will take place via bank transfer to the shareholders’ bank accounts.
in EUR
Profit/(loss) for the financial year 19 851 565,18
Profit/(loss) brought forward from previous year + 65 478 814,11
Profit/(loss) to be added to legal reserves - 992 578,26
Profit/(loss) to be added to other reserves - 0,00
Result to be appropriated = 84 337 801,03
Gross dividend (1) - 13 295 385,36
Profit to be carried forward = 71 042 415,67
1 Gross dividend per share of EUR 0.24, resulting in a net dividend after tax of EUR 0.168 per ordinary share.
0.40
0.30
0.20
0.10
0.00
Gross dividend per share (in EUR)
2018 20192009 2010
0.250.22
2015
0.20
2016
0.14
2017
0.18
2014
0.20
2011
0.27
2013
0.29
2012
0.28
0.24 0.24
Dividend Key DataGross dividend per share EUR 0.24
Ex-coupon date 28 MAY 2020
Record date 29 MAY 2020
Dividend payment date 2 JUNE 2020
RECTICEL ANNUAL REPORT 2019 I 87RECTICEL ANNUAL REPORT 2019 I 86

2.2. Corporate Governance Statement
RECTICEL ANNUAL REPORT 2019 I 89RECTICEL ANNUAL REPORT 2019 I 88

Corporate policies have been elaborated to cover these principles that are further explained in the Business Control Guide, which provides more concrete and detailed guidelines, for instance guidelines on the level of Tax management, Treasury management, Accounting policies, Investments, Purchases, Mergers and Takeovers, and such. The internal financial reporting and control occurs based on the Group Accounting Manual, Group Accounting Methodology and Cost Accounting Methodology.
This Business Control Guide includes the general delegation of deciding powers and responsibilities for specific areas of competence.
The Board of Directors and executive management regularly reviews the most important risks that the Recticel Group is exposed to and submits a list of priorities. A general description of the risks can be found in the financial part of this annual report. One of the objectives of the internal control and risk management system is also to ensure a timely, complete and accurate communication. To this end the Business Control Guide and all other guidelines contain the necessary regulations on roles and responsibilities. Also, the necessary attention is given to ensuring the security and confidentiality of the data exchange, if and when necessary.
In the event of violation of internal or external laws and regulations, the Recticel Group has also implemented a Group Policy for the Reporting of Misconduct and the Protection of Whistle-blowers to enable anyone to report on behaviour that may represent a violation of the applicable Code of Conduct, the Group Corporate Policies or any other laws and regulations.
Finally, the Audit committee, amongst others, has the task of informing and advising the Board of Directors regarding the annual follow up of the systems of internal control and risk management.
The Internal Audit Department works based on an Internal Audit Charter and has the primary function of delivering reports with opinions and other information indicating to which extent the internal audit meets predetermined criteria. The Internal Audit aims at providing the reasonable assurance that the strategic, operational, compliance and reporting objectives of the Recticel Group can be realized in the most efficient way. To this end they seek to ensure the following objectives: • the reliability and integrity of the information; • compliance with policies, plans, procedures, laws
and agreements; • safeguarding of assets; • economical and efficient use of resources; • achieving the goals set by operations and
programs.
2.2.3. External audit
The external audit of Recticel SA/NV’s company and consolidated annual accounts has been entrusted by the Annual General Meeting of 2019 to the limited liability cooperative company “DELOITTE Bedrijfsrevisoren”, represented by Mr. Kurt DEHOORNE.
The Auditor conducts its audits in accordance with the International Standards on Auditing (ISA) and delivers a report, which confirms if the company’s annual accounts and the consolidated financial statements of the company reflect a true and fair view of the assets, financial condition and results of the company. The Audit committee investigates and discusses these bi-annual reports in the presence of the Auditor, and afterwards also with the Board of Directors.
The remuneration of the Deloitte network (in its capacity as Auditor) for the audit of Recticel NV’s annual and consolidated annual accounts intended in article 3:65 of the Belgian Companies and Associations Code, amounted to EUR 837K for 2019.
2.2.1. Applicable rules and reference code
Recticel publishes its Corporate Governance Charter on its website (www.recticel.com) in accordance with the requirements of the Belgian Corporate Governance Code 2020. The latest version is dated 27 April 2020. Any interested party can download the Charter there, or request a copy from the company’s registered office. The Charter contains a detailed description of the governance structure and the company’s governance policy.
As of this year, Recticel uses the new Belgian Governance Code of 2020 as reference code, which can be found on the website of the Corporate Governance Committee (www.corporategovernancecommittee.be).
Recticel complies with all recommendations contained in the reference code, except for the cases where it is explicitly stated in this statement below.
This chapter contains more factual information regarding corporate governance in general and, the application of the Belgian Corporate Governance Code 2020 (hereinafter also “the Code”) during the last financial year in particular.
Recticel confirms its explicit choice for the monistic governance structure under the Belgian Companies and Associations Code. The Board of Directors is therefore authorized to undertake all necessary or useful actions to achieve the company’s objective, except those that only the general meeting is authorized to perform by law. The authority granted to the Board of Directors was not further limited in the articles of association.
The terms of reference of the Board of Directors are described in more detail in Recticel’s Corporate Governance Charter.
2.2.2. Internal control and risk management
Every entity exists to create value for the stakeholders and this forms the basis of risk management for every company. The challenge that faces the Board of Directors and executive management is in determining how much uncertainty they wish to accept in their strive for creating value. The value is maximized if the administration is successful in creating an optimal balance between growth and turnover on the one hand and the connected risks on the other.
Identifying and quantifying the risks and setting up and maintaining an efficient control mechanism is the responsibility of Recticel Group’s Board of Directors and executive management.
The framework for internal control and risk management applied by the Recticel Group is based on the COSO (Committee of Sponsoring Organisations of the Treadway Commission) model and is in line with the requirements imposed by the Belgian Corporate Governance Code, taking into account the Recticel Group’s size and specific needs.
Since mid-2010 the Board of Directors and the executive management have reviewed the framework for internal control and risk management and an amended Compliance programme is implemented.
The basis is formed by the revised Code of Ethics, applicable on all Recticel directors, corporate officers and employees, and published on Recticel’s website: (https://www.recticel.com/sites/default/files/who_we_are/discover_the_recticel_group/business_ethics_integrity/01_Ethics_policy_English.pdf).
Important matters like ethics, safety, health and environment, quality, conflicts of interest, anti-trust, fraud and others are being dealt with.
RECTICEL ANNUAL REPORT 2019 I 91RECTICEL ANNUAL REPORT 2019 I 90

NAME FUNCTION TYPEYEAR OF
BIRTHSTART OF MANDATE
END OF MANDATE
PRIMARY FUNCTION OUTSIDE OF RECTICEL
MEMBERSHIP COMMITTEE
Johnny THIJS (1) Chairman Independent 1952 2015 2021President Electrabel, Corealis, Hospital Logistics / Director
EssersAC / RC
Olivier CHAPELLE (2) Managing Director
Executive 1964 2009 2022 Director Cofinimmo MC
Benoit DECKERS (3) Director Non-executive 1964 2015 2021CEO of Compagnie du Bois
Sauvage SAAC
Pierre-Yves de LAMINNE de BEX (4) Director Non-executive 1969 2014 19/03/20
President of Compagnie du Bois Sauvage SA / Managing Director Entreprises et Chemins de Fer en
Chine SA
Ingrid MERCKX (5) Director Independent 1966 2012 2022CEO of Securitas Belgium and
LuxembourgAC
Luc MISSORTEN (6) Director Independent 1955 2015 2021 Chairman of Ontex AC / RC
Kurt PIERLOOT (7) Director Independent 1972 2015 2021 CEO Bleckmann RC
Anne DE VOS (8) Director Independent 1958 2017 2020Symrise AG - Global Account
Director Nestle
Frédéric VAN GANSBERGHE (9) (11) Director Non-executive 1958 2014 2022
Managing Director of GALACTIC NV
RC
Elisa VLERICK(10) Director Independent 1986 28/05/19 2022Legal & Tax and Real Estate
development at Vlerick School
(1) in his capacity as Permanent Representative of THIJS JOHNNY BV(2) in his capacity as Permanent Representative of OLIVIER CHAPELLE SRL(3) in his capacity as Permanent Representative of COMPAGNIE DU BOIS SAUVAGES SERVICES SA(4) in his capacity as Permanent Representative of COMPAGNIE DU BOIS SAUVAGE SA until 19/03/2020(5) in her capacity as Permanent Representative of IMRADA BV(6) in his capacity as Permanent Representative of REVALUE BV(7) his capacity as Permanent Representative of CARPE VALOREM BV(8) in her capacity as Permanent Representative of IPGM Consulting GmbH(9) in his capacity as Permanent Representative of ENTREPRISES ET CHEMINS DE FER EN CHINE SA until
31/03/2020(10) in her capacity as Permanent Representative of MOROXCO BV(11) in his capacity as Permanent Representative of COMPAGNIE DU BOIS SAUVAGE SA as of 31/03/2020
AC = Audit CommitteeRC = Renumeration and Nomination CommitteeMC = Management Committee
The global amount of the remunerations for additional services of the Auditor and parties related to the Auditor, amounts to EUR 195K at the level of the Recticel Group. This amount consists of an amount of EUR 28K for additional audit related work and EUR 167K for other consulting assignments (consisting of an amount of EUR 5K for additional tax services, an amount of EUR 34K for other consulting assignments and an amount of EUR 128K for other services related to assurance reporting).
Details on these compensations are included in the explanatory notes on VOL 6.18.2 in the statutory annual accounts as well as in the explanatory notes in the financial part of the Consolidated Annual report.
The Auditor’s mandate will end after the upcoming Ordinary General meeting of 2022.
The yearly remuneration of the statutory auditor amounts to EUR 291K, including domestic expenses and excluding IBR contribution, foreign travel expenses and VAT. .
2.2.4. Composition of the Board of Directors
Recticel’s Board of Directors currently consists of nine members. There are eight non-executive directors, six of which are independent. OLIVIER CHAPELLE SRL/BV, represented by Mr. Olivier CHAPELLE, Managing Director, is the executive director.
The Managing Director represents the management and two directors represent the reference shareholder.
With reference to the obligation to have at least 1/3 of the members of the Board of Directors of the opposite gender as provided by article 7:86 of the Belgian Companies’ and Associations Code, the Board of Directors reviewed different options during the last years in order to increase the number of female members. At present, three out of the nine directors are women. As a result, the obligation of article 7:86 of the Belgian Companies’ and Associations Code is complied with. At the end of the mandate of Ms. Anne De Vos at the ordinary general meeting of 26 May 2020, a new female director will be appointed to replace her in order to further comply with the obligation of article 7:86 of the Belgian Companies’ and Associations Code. Please find below an overview of the members of the
Board of Directors of Recticel of who the mandate expired in the course of 2019 (not reappointed): • Ms. Danielle Sioen, independent director, mandate
from 2016 - 28 May 2019
Amendments since the previous annual report – statutory appointments – presentation of new directors
As proposed by the Board of Directors and based upon the recommendation made by the Remuneration and Nomination committee, the following has been decided during the Ordinary General Meeting dated 28 May 2019 :
• The general meeting renewed the mandate of OLIVIER CHAPELLE BVBA, represented by its permanent representative Mr. Olivier CHAPELLE, as managing director, for a new term of three years expiring after the Ordinary General Meeting of 2022.
The following table provides an overview of the current members of Recticel’s Board of Directors.
RECTICEL ANNUAL REPORT 2019 I 93RECTICEL ANNUAL REPORT 2019 I 92

• The general meeting renewed the mandate of IMRADA BVBA, represented by its permanent representative Ms. Ingrid MERCKX, as non-executive and independent director, for a new term of three years expiring after the Ordinary General Meeting of 2022.
• The general meeting renewed the mandate of ENTREPRISES ET CHEMINS DE FER EN CHINE SA, represented by its permanent representative Mr. Frédéric VAN GANSBERGHE, as non-executive director, for a new term of three years expiring after the Ordinary General Meeting of 2022.
• The general meeting accepted the resignation of Mr. Kurt PIERLOOT as non-executive and independent director with effect as of 1 January 2019 and confirmation of the appointment of CARPE VALOREM BVBA, with registered office at Acaciadreef 29, 3140 Keerbergen, enterprise number 0712.532.009, represented by its permanent representative Mr. Kurt PIERLOOT, as non-executive and independent director, for a term starting on 1 January 2019 and expiring after the Ordinary General Meeting of 2021.
• The general meeting accepted, in replacement of Ms. Danielle Sioen, the appointment of MOROXCO BVBA, with registered office at Beekstraat 56, 8550 Zwevegem, enterprise number 0719.795.230, represented by its permanent representative Ms. Elisa VLERICK, as non-executive and independent director, for a term of three years expiring after the Ordinary General Meeting of 2022.
• The general meeting confirmed IMRADA BVBA represented by its permanent representative Ms. Ingrid MERCKX, as independent director, in the sense of articles 524 §2 and 526bis §2 of the Companies Code. Ms. Ingrid MERCKX meets all the criteria indicated in article 526ter of the Companies Code as well as the independence criteria of the Code on Corporate Governance 2009.
• The general meeting confirmed CARPE VALOREM BVBA represented by its permanent representative Mr. Kurt PIERLOOT, as independent director, in the sense of articles 524 §2 and 526bis §2 of the Companies Code. Mr. Kurt PIERLOOT meets all the criteria indicated in article 526ter of the Companies Code as well as the independence criteria of the Code on Corporate Governance 2009.
• The general meeting confirmed MOROXCO BVBA, represented by its permanent representative Ms. Elisa VLERICK, as independent director, in the sense of articles 524 §2 and 526bis §2 of the Companies Code. Ms. Elisa VLERICK meets all the criteria indicated in article 526ter of the Companies Code as well as the independence criteria of the Code on Corporate Governance 2009.
Upon advice of the Remuneration & Nomination Committee, the Board of Directors proposes at the Ordinary General Meeting of 26 May 2020 to approve the following:
• Establishment that the mandate of IPGM Consulting GmbH, represented by Ms. Anne De Vos, as independent director, expires after the Ordinary General Meeting of 26 May 2020. Decision to proceed with a replacement.
• The board of Directors recommends appointing Ms. Carla Sinanian as non-executive and independent director, for a term of three years expiring after the Ordinary General Meeting of 2023. Ms. Carla Sinanian has the following relevant professional qualifications and exercises already the following functions: Ms. Carla Sinanian is a graduate in Engineering and worked in the past for Medtronic Inc, Synectics Medical, Philips, NXP, Akzo Nobel and Deloitte in strategic and commercial functions. In 2017 she joined ETEX as Chief Strategy Officer where she is until today member of the Executive Committee, responsible for strategy, corporate development and digital functions. She acquired relevant experience in the building materials industry.
In replacement of IPGM Consulting GmbH, represented by Ms. Anne De Vos, appointment of Ms. Carla Sinanian as non-executive and independent director, for a term of three years expiring after the Ordinary General Meeting of 2023.
• Establishment that the mandate of Mr. Pierre-Yves de Laminne de Bex as permanent representative of Compagnie du Bois Sauvage SA, non-executive director, ended on 19 March 2020 as he passed away.
• Acceptance of the replacement of Mr. Pierre-Yves de Laminne de Bex by Mr. Frédéric Van Gansberghe as the new permanent representative of Compagnie du Bois Sauvage SA with effect as of 31 March 2020.
• Acceptance of the resignation of Entreprises et Chemins de Fer en Chine SA, permanently represented by Mr. Frédéric Van Gansberghe, as non-executive director, with effect as of 31 March 2020. Decision not to proceed with a replacement.
• On 24 March 2020, upon recommendation by the Remuneration & Nomination Committee, the Board of Directors accepted the resignation of Revalue BV, permanently represented by Mr. Luc Missorten and decided to proceed with the co-optation of Lubis BV, permanently represented by Mr. Luc Missorten, as independent director, for a term starting on 24 March 2020 and expiring after the Ordinary General Meeting of 2021.
• Acceptance of the resignation of Revalue BV, permanently represented by Mr. Luc Missorten as independent director with effect as of 24 March 2020 and confirmation of the appointment of Lubis BV, permanently represented by Mr. Luc Missorten, as independent director, for the remaining term of the mandate, i.e. for a term starting on 24 March 2020 and expiring after the Ordinary General Meeting of 2021.
• Appointment of Ms. Carla Sinanian as independent director in the meaning of article 7:87 of the Companies and Associations Code. Ms. Carla Sinanian meets all criteria as mentioned in article 7:87 of the Companies and Associations Code (as further developed through the function, family and financial criteria as provided by principle 3.5. of the Corporate Governance Code 2020).
• Confirmation of Lubis BV, permanently represented by Mr. Luc Missorten, as independent director in the meaning of article 7:87 of the Companies and Associations Code. Lubis BV and Mr. Luc Missorten each meet all criteria as mentioned in article 7:87 of the Companies and Associations Code (as further developed through the function, family and financial criteria as provided by principle 3.5. of the Corporate Governance Code 2020).
The Board of Directors pays tribute to Mr. Pierre-Yves de Laminne de Bex, representing Compagnie du Bois Sauvage SA and Director since 2014, who passed away on 19 March 2020. He will be remembered as a friendly, professional colleague.
Functioning of the Board of Directors
The Board of Directors gathered a total of 15 times in 2019. One meeting handled mainly the 2019 budget and two meetings handled the establishment of the annual accounts as per 31 December 2018 and the mid-year accounts as per 30 June 2019. Additional meeting were held with respect to the public takeover bid by Kingspan and the strategy to be adopted by the company.
Each meeting also addressed the state of affairs per business line and the most important current acquisition and/or divestment files. Other subjects (human resources, external communication, litigations and legal issues, delegations of authority and such) are discussed as and when necessary.
The written decision procedure was not applied in 2019.
Mr. Dirk VERBRUGGEN, General Counsel and General Secretary, acts as Secretary of the Board of Directors.
RECTICEL ANNUAL REPORT 2019 I 95RECTICEL ANNUAL REPORT 2019 I 94

The individual attendance rate of the directors at the meetings in 2019 was:
NAME ATTENDANCE RATE IN 2019
Johnny THIJS 15/15
Olivier CHAPELLE 15/15
Benoit DECKERS 15/15
Pierre-Yves de LAMINNE de BEX 15/15
Ingrid MERCKX 13/15
Luc MISSORTEN 13/15
Kurt PIERLOOT 14/15
Frédéric VAN GANSBERGHE 12/15
Anne DE VOS 15/15
Elisa VLERICK (1) 5/6
Danielle SIOEN (2) 7/9
(1) As from 28/5/2019(2) Until 28/5/2019
The Board of Directors organises a self-assessment of its functioning as well as an assessment of its interaction with the members of the Management committee on a regular basis. Such self-assessment starts through a questionnaire to be remitted to and completed by each individual director. The results of the questionnaire are then be discussed and further analysed during a subsequent meeting of the Board of Directors. The last assessment took place in the middle of the year 2017. The individual assessment of the directors is done by the Remuneration and Nomination Committee. The next formal assessment is planned in the course of this year 2020.
2.2.5. Committees set up by the Board of Directors
2.2.5.1. The Audit committee
In accordance with article 7:99 of the Belgian Companies and Associations Code, the audit committee supervises amongst others the fi nancial reporting process, the effectiveness of the internal control and risk management systems of the company, the internal audit, the statutory control of the annual accounts and the consolidated accounts, and the Auditor’s independence. The Audit committee’s terms of reference are included in the Corporate Governance Charter that also describes more in detail the tasks of the Audit Committee.
The Audit committee currently consists of four members. All members are non-executive directors and three members, one of which is the Chairman, are independent directors in the sense of article 7:87,§1 of the Belgian Companies and Associations Code iuncto principle 3.5 of the Corporate Governance Code 2020.
Mr. Dirk VERBRUGGEN, General Counsel and General Secretary, acts as Secretary of the Audit committee.
The composition of the Audit committee complies with the stipulations of Recticel NV’s articles of association and the relevant provisions of the Belgian Companies and Associations Code.
In accordance with the old article 526bis of the Companies Code, still applicable over 2019, Recticel NV declares, as far as necessary, that the Chairman of the Audit committee, Mr. Luc MISSORTEN, meets the independence requirements and that he possesses the requisite expertise in accounting and auditing. Furthermore, two other members of the Audit Committee are also independent. The members of the Audit committee have the collective expertise at the level of the activities of the Company.
The following table contains the members of the Audit committee during the fi nancial year 2019 to date.
NAME FUNCTIONATTENDANCE RATE IN 2019
Luc MISSORTEN (1) Chairman 4/4
Johnny THIJS (2) Member 2/4
Ingrid MERCKX (3) Member 3/4
Benoit DECKERS (4) Member 4/4
(1) In his capacity as Permanent Representative of REVALUE BV(2) In his capacity as Permanent Representative of THIJS JOHNNY BV(3) In her capacity as Permanent Representative of IMRADA BV(4) In his capacity as Permanent Representative of COMPAGNIE DU BOIS SAUVAGES
SERVICES SA
The Audit committee convened four times in 2019. Two meetings were devoted primarily to the audit of the annual accounts per 31 December 2018 and the interim accounts per 30 June 2019. All meetings also focus on the internal audit program, risk management, compliance, taxation and IFRS related accounting questions. There was at least two times a meeting with the statutory auditor and the person responsible for internal audit.
The Audit Committee conducts regularly an informal self-assessment of its functioning during one of its meetings and reserves the necessary time to discuss and analyse the same. In the beginning of 2017, a formal assessment was conducted. The next formal assessment is planned in the course of this year 2020.
2.2.5.2. The Remuneration and Nomination Committee
The Remuneration and Nomination Committee makes proposals to the Board of Directors regarding the remuneration policy and the individual remuneration of directors and members of the Management committee and prepares and explains the remuneration report at the Ordinary General Meeting. They also make the necessary proposals regarding the evaluation and re-appointment of directors as well as the appointment and induction of new directors. The terms of reference of the Remuneration and Nomination Committee are included in Recticel’s Corporate Governance Charter.
The Remuneration and Nomination Committee consists of four members, all non-executive directors, of which three are independent directors.
Mr. Dirk VERBRUGGEN, General Counsel and General Secretary, fulfi ls the role of secretary of the Remuneration and Nomination Committee.
The composition of the Remuneration and Nomination committee meets the requirements with respect to the Belgian Companies and Associations Code, as well as the requirements of the Corporate Governance Code 2020.
The committee is composed as follows:
NAME FUNCTIONATTENDANCE RATE IN 2019
Johnny THIJS (1) Chairman 4/4
Kurt PIERLOOT (2) Member 4/4
Frédéric VAN GANSBERGHE (3) Member 2/4
Luc MISSORTEN (4) Member 4/4
(1) In his capacity as Permanent Representative of THIJS JOHNNY BV(2) In his capacity as Permanent Representative of CARPE VALOREM BV(3) In his capacity as Permanent Representative of ENTREPRISES ET CHEMINS DE FER EN
CHINE SA(4) In his capacity as Permanent Representative of REVALUE BV
In accordance with the old article 526quater of the Companies’ Code, applicable in 2019, Recticel declares that the Remuneration and Nomination committee possesses the necessary expertise in the area of remuneration policy.
The Remuneration and Nomination committee convened four times in 2019.
These meetings dealt with the fi xed and variable remuneration of the executive management as well as with the election and re-election of directors. The CEO was present at the discussion about the remuneration of the other members of the executive management.
The Remuneration and Nomination Committee conducts regularly an informal self-assessment of its functioning during one of its meetings and reserves the necessary time to discuss and analyse the same. A formal assessment is planned in the course of this year 2020.
2.2.5.3 Ad hoc Strategy Committee
In the framework of the Kingspan public offer an ad hoc strategy committee was set up in order to allow the quick follow-up of the events and to prepare the strategy of the company in view of such events.
The ad hoc strategy committee consists of four members, all non-executive directors, of which three are independent directors.
NAME FUNCTIONATTENDANCE RATE IN 2019
Johnny THIJS (1) Chairman 3/3
Kurt PIERLOOT (2) Member 1/3
Benoit Deckers (3) Member 3/3
Luc MISSORTEN (4) Member 3/3
(1) In his capacity as Permanent Representative of THIJS JOHNNY BV(2) In his capacity as Permanent Representative of CARPE VALOREM BV(3) In his capacity as Permanent Representative of COMPAGNIE DU BOIS SAUVAGE
SERVICES SA(4) In his capacity as Permanent Representative of REVALUE BV
The ad hoc strategic committee convened 3 times in 2019.
RECTICEL ANNUAL REPORT 2019 I 97RECTICEL ANNUAL REPORT 2019 I 96

- For the GROWTH objectives, there as been no pay out for Flexible Foams in relation to production volume (tonnes of foam), nor Automotive business volume (orderbook) and Bedding sales (net sales in EUR), however partial pay out for Insulation (volume development in cubic meters).
• Stock options - The 2015 stock option grant vested on January 1, 2019; several beneficiaries exercised their rights in the course of the year. Another grant was made in June 2019 at a strike price of EUR 7.90.
• Retention – Following the public takeover bid by one of its competitors, Recticel introduced a retention bonus for the members of the Management Committee in April 2019, payable in 2020. The bonus foresees the payment of an equivalent of 100% of the annual base pay for the CEO and 50% of the annual base pay for the other members of the Management Committee, pending the beneficiary is still engaged by the Company or qualifies as a Good Leaver on 31st December 2019.
c) Shareholder engagementThe Annual General Meeting held on May 28th, 2019 approved the 2018 remuneration report with 91.30% of shareholder votes. In establishing its remuneration policy and its future revisions, Recticel endeavours to take into account the votes and views of the shareholders. Recticel is committed to an open and transparent dialogue with its shareholders on remuneration as well as other governance matters.
d) Looking ahead • As an attempt to anticipate, the present report was
drafted following the Shareholder Rights Directive II (and the draft European reporting guidelines) and the new Corporate Governance Code 2020, while still complying with the Belgian Companies and Associations Code. Recticel will continue to monitor changes in the corporate governance landscape and will respond accordingly.
• Following careful consideration, the Board of Directors, upon recommendation of the Remuneration and Nomination Committee, decided that the same performance criteria (Group Net Cash Flow, Group and Business Line Adjusted EBITDA, and specific GROWTH objectives for each Business Line) will be used to award bonuses for performance year 2020. The Committee will measure performance against them throughout the year.
2.2.7.2. Our 2019 Remuneration Policy at a glance
a) DirectorsPer policy terms, Directors receive a fixed fee / retainer and an attendance fee, whereas Committee Members receive attendance fees.
BOARD COMMITTEE
CHAIR MEMBER CHAIR MEMBER
Fixed fee € 30,000 € 15,000 N/A N/A
Attendance fee € 5,000 € 2,500 € 5,000 € 2,500
In accordance with the policy, Non-Executive Board Members do not receive variable and or equity-related remuneration as referred to under principle 7.6. of the Corporate Governance Code 2020. Recticel considers that the Corporate Governance Code’s goals of promoting the achievement of strategic objectives in accordance with the company’s risk appetite and behavioural norms and promoting sustainable value creation are better served by remunerating the non-executive directors entirely in cash to avoid any conflicts of interest and guarantee their complete financial independence.
Non-Executive Board Members are not entitled to receive benefits. Expenses incurred when travelling abroad will be arranged for by Recticel directly.
Executive Directors are remunerated in accordance with the remuneration policy for the members of the Management Committee and any director fees paid to the Executive Directors are deducted from the remuneration received as a member of the Management Committee.The level and structure of remuneration paid to the Directors is regularly assessed against “BEL Mid” market practice.
2.2.6. The Executive management
The Board of Directors has entrusted the day-to-day management of the company to its Managing Director and Chief Executive Officer, “OLIVIER CHAPELLE” SRL/BV, located in 1180 Brussels, Avenue de la Sapinière 28, represented by its General Manager and permanent representative, Mr. Olivier CHAPELLE.
The Managing Director is assisted by the Management committee, of which the members (for the period 2019 to present) are indicated in the following list:
NAME FUNCTION
Olivier CHAPELLE (1) (2) Chief Executive Officer
Ralf BECKER Group General Manager Insulation
Betty BOGAERT Chief Information and Digitalisation Officer
Jean-Pierre DE KESEL (3) Chief Sustainable Innovation Officer
François DESNE Group General Manager Flexible Foams
Bart MASSANT Chief Human Resources Officer
Jean-Pierre MELLEN Chief Financial Officer
Jan MEULEMAN Group General Manager Automotive
François PETIT Chief Procurement Officer
Dirk VERBRUGGEN General Counsel & General Secretary
(1) In his capacity as permanent representative of OLIVIER CHAPELLE SRL(2) As from 20/01/2017 : Group General Manager Bedding (3) As from 1/1/2020 as permanent representative of SUSTAINALOGIC BV
The Management committee has an advisory role vis-à-vis the Board of Directors as a whole and is not an executive committee in the sense of article 7:104 of the Belgian Companies and Associations Code.
2.2.7. Remuneration report for financial year 2019
2.2.7.1. Introduction
a) 2019 business results • A highly volatile and increasingly uncertain economic
and geopolitical environment. • A solid volume increase but a lower than
expected margin improvement in the Insulation Business Line.
• A decrease of the top line, influenced by receding Automotive markets and by selling price erosion as a consequence of the isocyanates raw material cost decrease.
• A decrease of the net financial debt supported by solid operational cash flow.
• Continued efforts to actively pursue the optimisation of the overhead and operating cost structures in anticipation of a less favourable economic environment.
b) 2019 remuneration outcomesRemuneration policy - After validation by the AGM in May 2019, Recticel implemented its new remuneration policy, established following the requirements of the Shareholder Rights Directive II, the Belgian Companies and Associations Code and the new Corporate Governance Code 2020. It is available for consultation on the company website. We do not expect a change to the remuneration policy in the next two financial years (2020 and 2021).
Remuneration of Board and Committee members - The Remuneration structure of the members of the Board and the members of the Committees (Audit Committee, and Remuneration and Nomination Committee) was adjusted in January 2017 and remained unchanged since then. The total remuneration paid to Directors varies in accordance with the number of Board and Committee meetings held in the course of the reporting years. For the year 2019, details are provided in the section “2.2.7.3. Remuneration of the Non-Executive Directors”.
Remuneration of Management Committee Members • Bonus awards - In accordance with our policy,
Group Net Cash Flow and Adjusted EBITDA as well as selected Growth objectives are key drivers to determine the level of bonus awards:
- The level of combined net cash flow reached by the Group was at the maximum of the bonus pay out range.
- The level of Group Adjusted EBITDA was too low to generate an award. The picture is different for the Business Lines. For three of the four Business Lines (Bedding, Automotive and Insulation), the level of BL Adjusted EBITDA was too low to generate a pay-out. For Flexible Foams, the level of Adjusted EBITDA achieved triggered a pay out at maximum.
RECTICEL ANNUAL REPORT 2019 I 99RECTICEL ANNUAL REPORT 2019 I 98

ELEMENT OPERATION AND PERFORMANCE CRITERIA
Base Pay Individual’s role, experience, performance and market practice are considered when determining salary levels. Any director fees paid to the Executive Directors are deducted from the remuneration received as a member of the Management Committee.
Other BenefitsThe Management Committee Members receive benefits in line with Recticel’s remuneration policy, including hospitalization, disability coverage and a company car. Members operating through a management company do not receive perquisites and benefits, though certain costs may be invoiced separately.
ELEMENT OPERATION AND PERFORMANCE CRITERIA
One-Year Variable (STI) Operation: • For threshold performance: the bonus pay-out will be nil. • For target performance: the bonus pay-out will be 75% of base salary for the CEO and 37.5% for the other Management
Committee members• For maximum performance: the bonus pay-out will be 117.5% of base salary for the CEO. For the other Management Committee
members, it is 58.00% or 58.75% depending on whether they head a Business Line or a Function• No deferral policy is applicable.
Performance criteria: The annual bonus is linked to both collective targets (both at group and divisional level, the latter only for positions with a divisional scope) and personal targets. Collective objectives are all quantitative and financially driven (e.g. Net Cash Flow, Adjusted EBITDA, …). Personal objectives include at least one target related to sustainable development.
For performance year 2019, the following performance criteria were applied.
Note that the Growth objectives at Business Line level are dependent on Sales, Business Volume and Production Volume.
Article 7:91 of the Belgian Companies and Associations Code prescribes the need to spread variable remuneration payments over a three year period in case certain thresholds are passed. The 25% threshold was passed in the case of the Managing Director and CEO, Olivier Chapelle SRL, represented by Olivier Chapelle and the other members of the Management Committee. Hence the Board of Directors proposed to the 2019 General Shareholder meeting to approve a deviation from the said rule in line with the possibility offered by the legislation. This proposal was approved during the 2019 General Shareholders’ meeting.
Multi-Year Variable (LTI)
The long-term incentive plan is granted by means of stock options. Options granted in 2019 cannot be exercised before January 2023, nor can they be exercised later than end of June 2026.
Dismissal period or severance pay
On termination of the employment of a member of the Management Committee by the company, Recticel will apply a notice of 12 months, unless other applicable legal mandatory provisions require to apply a higher number of months.
PensionMembers of the Management Committee employed before 2003 are included in the Recticel Group Defined Benefit Plan, members hired externally since 2003 are included in the Recticel Group Defined Contribution Plan.
Contract The CEO provides services through a management company.
Clawback
No clawback provisions are in place for the annual bonus plan, in deviation of principle 7.12 of the Corporate Governance Code 2020. Recticel considers that based on general principles of law, the company can recover payments (1) if they were undue or (2) in case of fraud. The company does not wish to renegotiate existing agreements with Management Committee members to provide for additional clawback possibilities.
Shareholding guidelines
The members of the Management Committee are encouraged to build stock ownership in the company up to an amount equivalent to 50% of their annual gross base salary over a period of 5 years, preferably by keeping part of the stocks that they purchase under the existing stock option plan.
Collective
Personal
Combined Group Net Cash Flow
Business Line Adjusted EBITDA
Business Line Growth objectives
Personal objectives
Combined Group Net Cash Flow
Group Adjusted EBITDA
Personal objectives
70%
30%30%
25%
15%
30%
40%
30%
30%
Collective
Personal
Combined Group Net Cash Flow
Business Line Adjusted EBITDA
Business Line Growth objectives
Personal objectives
Combined Group Net Cash Flow
Group Adjusted EBITDA
Personal objectives
70%
30%30%
25%
15%
30%
40%
30%
30%
CEO & Other Members of the Management Committee
Type of collective objectives Nature of collective objectives
Group General Managers Other Management Committee Members (incl.CEO)
b) Management CommitteeThe remuneration policy for Recticel’s Management Committee was reviewed and validated by the Remuneration Committee on February 25, 2019 and approved by the Board of Directors on February 27, 2019. The policy was adopted during the General Meeting of Shareholders on May 28, 2019 and became effective as of January 1, 2019.
The total remuneration package of the Management Committee members consists of the following elements that will be further explained in this report.
Base pay + Other Benefits
Fixed Remuneration
+One-year variable + Multi-year variable
Variable Remuneration
+Extraordinary items
+Pension expenses
=Total Remuneration
The level as well as the structure of the remuneration of the Management Committee is reviewed annually by the Remuneration and Nomination Committee, which consequently presents a proposal to the Board of Directors for approval. When determining the remuneration levels for the members of the Management Committee, Recticel considers a Belgian frame of reference comprising companies similar in size (as compared on the basis of revenues) and exclusive of the Financial Sector. The objective is to establish target remuneration levels that, as a general rule, are at or around the median market level and this as far as the performance of the Company can afford it.
RECTICEL ANNUAL REPORT 2019 I 101RECTICEL ANNUAL REPORT 2019 I 100

b) Fixed remuneration
Base payThe table below shows the base pay actually paid in 2019 to the CEO and the other members of the Management Committee and how it compares to 2018.
INCUMBENT NAME 2019 2018 %
Olivier Chapelle SRL represen-ted by Olivier Chapelle (CEO and Group General Manager Bedding)
€ 545,400 € 540,000 101%
Other Members of the Management Committee
€ 2,292,998 € 2,225,207 103%
The base pay levels for Olivier Chapelle SRL include the fees received as a Member of the Board of Directors (EUR 50,000 in 2019).
Other benefits
The amounts mentioned in the column “Other benefits” in the total remuneration table in section 2.2.7.4. a) relate to the following benefits: insurances (death, disability, medical), company car (leasing costs), fuel costs, mobile phone costs and schooling costs, and exclude pension.
c) Variable Remuneration
STI (“One-Year Variable”)
2019 Performance against TargetsThe achievement of the performance targets was measured during a period of time that started on 1st January 2019 and ended on 31st December 2019. As per our remuneration policy, the evaluation of the CEO’s performance was done by the Remuneration and Nomination Committee on the basis of audited company results before presenting a proposal to the Board of Directors. The evaluation of the other Management Committee members was done by the CEO on the basis of audited company results, who then discusses this with the Remuneration and Nomination Committee before presenting a proposal to the Board of Directors.
INCUMBENT NAMETARGET AS % OF BASE
SALARY
ACTUAL AS % OF BASE
SALARY
ACTUAL AMOUNT
Olivier Chapelle SRL represented by Olivier Chapelle (CEO)
75.0% 52.5% € 286.335
Other Members of the Management Committee
37.5% 33.9% € 779.080
2.2.7.4. Remuneration of the Management Committee Members
a) Total RemunerationAn overview of the total remuneration of the CEO and the other members of the Management Committee in 2019 can be found in the table below.
INCUMBENT NAME
1 – FIXED REMUNERATION2 – VARIABLE
REMUNERATION3 – EXTRAOR-
DINARY ITEMS4 – PENSION
EXPENSE
5 – TOTAL REMUNERA-
TION
PROPORTION OF FIXED AND VARIABLE
REMUNERATION
BASE PAYOTHER
BENEFITSONE-YEAR VARIABLE
MULTI-YEAR VARIABLE
FIXED 2
(1+4)/(5-3)VARIABLE 2
2/(5-3)
Olivier Chapelle SRL represented by Olivier Chapelle (CEO)
€ 545,400 1 € 1,331 € 286,335 € 62,400 € 545,400 € 0 € 1,440,866 61% 39%
Other Members of the Management Committee
€ 2,292,998 € 308,305 € 779,080 € 166,400 € 1,150,153 € 418,419 € 5,115,355 76% 24%
1 Only the CEO receives fees as Executive Director. These are deducted from the Base Pay. Fees therefore are not presented in a separate column in the table above. 2 The proportion of fixed and variable pay excludes the retention bonus introduced in 2019 as this is an extraordinary item (reported in column 3
NAME FIXED FEE ATTENDANCE FEES
THIJS JOHNNY BV, represented by Johnny Thijs 30,000 110,000
OLIVIER CHAPELLE SRL, represented by Olivier Chapelle 15,000 35,000
COMPAGNIE DU BOIS SAUVAGE SERVICES SA, represented by Benoit Deckers 15,000 52,500
COMPAGNIE DU BOIS SAUVAGE SA, represented by Pierre-Yves de Laminne de Bex 15,000 35,000
ENTREPRISES ET CHEMIN DE FER EN CHINE SA, represented by Frederic Van Gansberghe
15,000 32,500
IMRADA BV, represented by Ingrid Merckx 15,000 37,500
REVALUE BV, represented by Luc Missorten 15,000 70,000
CARPE VALOREM BV, represented by Kurt Pierloot 15,000 45,000
IPGM Consulting GmbH, represented by Anne De Vos 15,000 35,000
MOROXCO BV 1, represented by Elisa Vlerick 8,860 10,000
Danielle SIOEN 2 6,140 17,500
1 as from 28/05/20192 until 28/05/2019
2.2.7.3. Remuneration of the Non-Executive Directors
The following table sets out the total remuneration for each Non-Executive Director in 2019, in EUR.Base pay + Other Benefits
Fixed Remuneration
One-year variable + Multi-year variable
Variable Remuneration
RECTICEL ANNUAL REPORT 2019 I 103RECTICEL ANNUAL REPORT 2019 I 102
Fixed
Variable
Fixed
Variable
61%
24%
76%39%
Fixed
Variable
Fixed
Variable
61%
24%
76%39%
Fixed
Variable
Fixed
Variable
61%
24%
76%39%
Fixed
Variable
Fixed
Variable
61%
24%
76%39%
Proportion of fixed and variable remuneration - CEO
Proportion of fixed and variable remuneration - Other members

NAMENUMBER OF SHARES
HELD ON 31ST DEC 2019
VALUE OF THE STOCK ON 31ST DEC 2019
TOTAL VALUE OF SHARES HELD
ACTUAL LEVEL OF SHAREHOLDERSHIP
(% BASE SALARY)
CEO 242,598 € 8.23 € 1,996,582 366%
Other Management Committee Members 147,503 € 8.23 € 1,213,950 55% on average
d) Extraordinary itemsRetention awards made in 2019Following the public takeover bid by one of its competitors, Recticel introduced a retention bonus for the members of the Management Committee in April 2019, payable in 2020. The bonus foresees the payment of an equivalent of 100% of the annual base pay for the CEO and 50% of the annual base pay for the other members of the Management Committee, pending the beneficiary is still engaged by the Company or qualifies as a Good Leaver on 31st December 2019.
e) Pension expense
NAME OF DIRECTOR (POSITION) PENSION EXPENSE
OLIVIER CHAPELLE SRL, represented by Mr. Olivier CHAPELLE, Chief Executive Officer
Included in fee
Other Members of the Management Committee
€ 418,419
For Members of the Management Committee other than the CEO, Recticel reports the actual contributions paid into the plan for DC plan beneficiaries. For DB plan beneficiaries, Recticel reports the service cost as the plan is a collective plan.
f) Additional disclosure• Recticel did not apply any clawback provisions during the
year under review. • None of the Management Committee Members
stepped down during the year under review.• The following table shows the level of shareholdership
of the CEO and the other members of the Management Committee. It shows that the actual level of shareholdership of the CEO is higher than the policy requirement and that, on average, the other Members of the Management Committee comply with the policy.
The level of shareholdership is determined by comparing the value of the number of shares held on 31st December 2019 to 50% of their annual gross base salary (or the sum of the annual gross base salaries in the case of the other
Management Committee members) on 31st December 2019. The value of the shares held is obtained by multiplying the number of shares held on 31st Dec 2019 by the closing price of the stock on that date (€ 8.23).
NAME OF DIRECTOR (POSITION)NUMBER OF
OPTIONS VESTEDSTRIKE PRICE
SHARE PRICE AT VESTING
VALUE AT VESTING
Olivier Chapelle (Chief Executive Officer & Group General Manager Bedding)
30,000 € 4.31 € 6.39 € 62,400
Ralf Becker (Group General Manager Insulation) 10,000 € 4.31 € 6.39 € 20,800
Jan Meuleman (Group General Manager Auto-motive)
10,000 € 4.31 € 6.39 € 20,800
Betty Bogaert (Chief Information & Digitalisation Officer)
10,000 € 4.31 € 6.39 € 20,800
Jean-Pierre de Kesel (Chief Sustainable Innovation Officer)
10,000 € 4.31 € 6.39 € 20,800
Bart Massant (Chief Human Resources Officer) 10,000 € 4.31 € 6.39 € 20,800
Jean-Pierre Mellen (Chief Financial Officer) 10,000 € 4.31 € 6.39 € 20,800
François Petit (Chief Procurement Officer) 10,000 € 4.31 € 6.39 € 20,800
Dirk Verbruggen (General Counsel & General Secretary)
10,000 € 4.31 € 6.39 € 20,800
(ii) 2019 Vesting
The following stock options, relating to the June 2015 grant, vested on January 1, 2019.
François Desné was appointed as Group General Manager Flexible Foams as per October 19, 2016. Therefore, no stock option grant was made to him in 2015 and no options vested in 2019.
NAME OF DIRECTOR (POSITION)NUMBER OF
OPTIONS GRANTEDSTRIKE PRICE
TOTAL THEORETICAL VALUE AT GRANT
Olivier Chapelle (Chief Executive Officer & Group General Manager Bedding) 120,000 € 7.90 € 141,720
Ralf Becker (Group General Manager Insulation) 30,000 € 7.90 € 35,430
François Desné (Group General Manager Flexible Foams) 30,000 € 7.90 € 35,430
Jan Meuleman (Group General Manager Automotive) 30,000 € 7.90 € 35,430
Betty Bogaert (Chief Information & Digitalisation Officer) 30,000 € 7.90 € 35,430
Jean-Pierre de Kesel (Chief Sustainable Innovation Officer) 30,000 € 7.90 € 35,430
Bart Massant (Chief Human Resources Officer) 30,000 € 7.90 € 35,430
Jean-Pierre Mellen (Chief Financial Officer) 30,000 € 7.90 € 35,430
François Petit (Chief Procurement Officer) 30,000 € 7.90 € 35,430
Dirk Verbruggen (General Counsel & General Secretary) 30,000 € 7.90 € 35,430
(i) Grant made in 2019
The theoretical value of the options at grant is calculated by applying the Black & Scholes formula, taking into account certain assumptions regarding dividend payment (dividend yield: 3.07%, interest rate: 0.00000001%, and volatility 26.5%). For the grant in June 2019, the value amounted to EUR 1.181/warrant.
Level of shareholdership of the CEO and the other membersof the Management Committee
LTI (“Multi-Year Variable”)
RECTICEL ANNUAL REPORT 2019 I 105RECTICEL ANNUAL REPORT 2019 I 104

2.2.7.5. Share-based remuneration
The tables below detail the opening and closing balance, as well as movements during the year in terms of share-based remuneration for each of the Management Committee Members. In line with the information presented in previous tables, shares have been valued at fair value at grant / vesting.
INCUMBENT NAME
THE MAIN CONDITIONS OF THE SHARE OPTION PLANS
INFORMATION REGARDING THE REPORTED FINANCIAL YEAR
OPENING BALANCE DURING THE YEAR CLOSING BALANCE
SPECIFICATION OF THE PLAN AWARD DATE VESTING DATE EXERCISE
PERIODSTRIKE PRICE
OF THE OPTION
SHARE OPTIONS OUTSTANDING
AT THE BEGINNING OF THE YEAR
SHARE OPTIONS AWARDED SHARE OPTIONS VESTED SHARE OPTIONS
EXERCISED
SHARE OPTIONS
AWARDED AND UNVESTED
SHARE OPTIONS
VESTED BUT UNEXERCISEDNUMBER VALUE NUMBER VALUE
Olivier Chapelle (Chief Executive Officer & Group General Manager Bedding)
2014 grant 29/04/2014 1/01/2018 1-1-2018 - 28-4-2020 € 5.64
235,000
325,000 30,000
2015 grant 23/06/2015 1/01/2019 1-1-2019 - 22-6-2021 € 4.31 30,000 62,400 € 2016 grant 29/04/2016 1/01/2020 1-1-2020 - 28-4-2025 € 5.73 2017 grant 30/06/2017 1/01/2021 1-1-2021 - 29-6-2024 € 7.00 2018 grant 25/04/2018 1/01/2022 1-1-2022 - 24-4-2025 € 10.21 2019 grant 28/06/2019 1/01/2023 1-1-2023 - 27-6-2026 € 7.90 120,000 141,720 €
Ralf Becker (Group General Manager Insulation)
2015 grant 23/06/2015 1/01/2019 1-1-2019 - 22-6-2021 € 4.31
75,000
10,000 20,800 €
95,000 10,0002016 grant 29/04/2016 1/01/2020 1-1-2020 - 28-4-2025 € 5.73 2017 grant 30/06/2017 1/01/2021 1-1-2021 - 29-6-2024 € 7.00 2018 grant 25/04/2018 1/01/2022 1-1-2022 - 24-4-2025 € 10.21 2019 grant 28/06/2019 1/01/2023 1-1-2023 - 27-6-2026 € 7.90 30,000 35,430 €
François Desné (Group General Manager Flexible Foams)
2017 grant 30/06/2017 1/01/2021 1-1-2021 - 29-6-2024 € 7.0050,000
80,000 02018 grant 25/04/2018 1/01/2022 1-1-2022 - 24-4-2025 € 10.21
2019 grant 28/06/2019 1/01/2023 1-1-2023 - 27-6-2026 € 7.90 30,000 35,430 €
Jan Meuleman (Group General Manager Automotive)
2014 grant 29/04/2014 1/01/2018 1-1-2018 - 28-4-2020 € 5.64
83,353
8,353
95,000 0
2015 grant 23/06/2015 1/01/2019 1-1-2019 - 22-6-2021 € 4.31 10,000 20,800 € 10,0002016 grant 29/04/2016 1/01/2020 1-1-2020 - 28-4-2025 € 5.73 2017 grant 30/06/2017 1/01/2021 1-1-2021 - 29-6-2024 € 7.00 2018 grant 25/04/2018 1/01/2022 1-1-2022 - 24-4-2025 € 10.21 2019 grant 28/06/2019 1/01/2023 1-1-2023 - 27-6-2026 € 7.90 30,000 35,430 €
Betty Bogaert (Chief Information Officer)
2014 grant 29/04/2014 1/01/2018 1-1-2018 - 28-4-2020 € 5.64
86,814
11,814
95,000 10,000
2015 grant 23/06/2015 1/01/2019 1-1-2019 - 22-6-2021 € 4.31 10,000 20,800 € 2016 grant 29/04/2016 1/01/2020 1-1-2020 - 28-4-2025 € 5.73 2017 grant 30/06/2017 1/01/2021 1-1-2021 - 29-6-2024 € 7.00 2018 grant 25/04/2018 1/01/2022 1-1-2022 - 24-4-2025 € 10.21 2019 grant 28/06/2019 1/01/2023 1-1-2023 - 27-6-2026 € 7.90 30,000 35,430 €
Jean-Pierre de Kesel (Chief Sustainable Innovation Officer)
2014 grant 29/04/2014 1/01/2018 1-1-2018 - 28-4-2020 € 5.64
86,814
95,000 21,814
2015 grant 23/06/2015 1/01/2019 1-1-2019 - 22-6-2021 € 4.31 10,000 20,800 € 2016 grant 29/04/2016 1/01/2020 1-1-2020 - 28-4-2025 € 5.73 2017 grant 30/06/2017 1/01/2021 1-1-2021 - 29-6-2024 € 7.00 2018 grant 25/04/2018 1/01/2022 1-1-2022 - 24-4-2025 € 10.21 2019 grant 28/06/2019 1/01/2023 1-1-2023 - 27-6-2026 € 7.90 30,000 35,430 €
Bart Massant (Chief Human Resources Officer)
2015 grant 23/06/2015 1/01/2019 1-1-2019 - 22-6-2021 € 4.31
75,000
10,000 20,800 € 10,000
95,000 02016 grant 29/04/2016 1/01/2020 1-1-2020 - 28-4-2025 € 5.73 2017 grant 30/06/2017 1/01/2021 1-1-2021 - 29-6-2024 € 7.00 2018 grant 25/04/2018 1/01/2022 1-1-2022 - 24-4-2025 € 10.21 2019 grant 28/06/2019 1/01/2023 1-1-2023 - 27-6-2026 € 7.90 30,000 35,430 €
Jean-Pierre Mellen (Chief Financial Officer)
2014 grant 29/04/2014 1/01/2018 1-1-2018 - 28-4-2020 € 5.64
75,000
95,000 10,000
2015 grant 23/06/2015 1/01/2019 1-1-2019 - 22-6-2021 € 4.31 10,000 20,800 € 2016 grant 29/04/2016 1/01/2020 1-1-2020 - 28-4-2025 € 5.73 2017 grant 30/06/2017 1/01/2021 1-1-2021 - 29-6-2024 € 7.00 2018 grant 25/04/2018 1/01/2022 1-1-2022 - 24-4-2025 € 10.21 2019 grant 28/06/2019 1/01/2023 1-1-2023 - 27-6-2026 € 7.90 30,000 35,430 €
RECTICEL ANNUAL REPORT 2019 I 107RECTICEL ANNUAL REPORT 2019 I 106

INCUMBENT NAME
THE MAIN CONDITIONS OF THE SHARE OPTION PLANS
INFORMATION REGARDING THE REPORTED FINANCIAL YEAR
OPENING BALANCE DURING THE YEAR CLOSING BALANCE
SPECIFICATION OF THE PLAN AWARD DATE VESTING DATE EXERCISE
PERIODSTRIKE PRICE
OF THE OPTION
SHARE OPTIONS OUTSTANDING
AT THE BEGINNING OF THE YEAR
SHARE OPTIONS AWARDED SHARE OPTIONS VESTED SHARE OPTIONS
EXERCISED
SHARE OPTIONS
AWARDED AND UNVESTED
SHARE OPTIONS
VESTED BUT UNEXERCISEDNUMBER VALUE NUMBER VALUE
François Petit (Chief Procurement Officer)
2014 grant 29/04/2014 1/01/2018 1-1-2018 - 28-4-2020 € 5.64
61,814
81,814 11,814
2015 grant 23/06/2015 1/01/2019 1-1-2019 - 22-6-2021 € 4.31 10,000 20,800 € 10,0002016 grant 29/04/2016 1/01/2020 1-1-2020 - 28-4-2025 € 5.73 2017 grant 30/06/2017 1/01/2021 1-1-2021 - 29-6-2024 € 7.00 2018 grant 25/04/2018 1/01/2022 1-1-2022 - 24-4-2025 € 10.21 2019 grant 28/06/2019 1/01/2023 1-1-2023 - 27-6-2026 € 7.90 30,000 35,430 €
Dirk Verbruggen (General Counsel & General Secretary)
2014 grant 29/04/2014 1/01/2018 1-1-2018 - 28-4-2020 € 5.64
86,814
106,814 21,814
2015 grant 23/06/2015 1/01/2019 1-1-2019 - 22-6-2021 € 4.31 10,000 20,800 € 2016 grant 29/04/2016 1/01/2020 1-1-2020 - 28-4-2025 € 5.73 2017 grant 30/06/2017 1/01/2021 1-1-2021 - 29-6-2024 € 7.00 2018 grant 25/04/2018 1/01/2022 1-1-2022 - 24-4-2025 € 10.21 2019 grant 28/06/2019 1/01/2023 1-1-2023 - 27-6-2026 € 7.90 30,000 35,430 €
2.2.7.6. Annual Change in Remuneration of Directors versus the Wider Workforce & Company Performance
The European Reporting guidelines and the Belgian legislation are not final yet. This section will be completed once the full requirements of the comparison will be known.
2.2.8. Transactions and other contractual ties between the Company and members of the Board of Directors or members of the Management committee
Chapter 7.1. of the Recticel Corporate Governance Charter describes Recticel NV’s policy on related party transactions that are not governed by the legal conflict of interest scheme. The application of this policy is explained hereafter.
During 2019, no conflicts of interests arose between a director and the Company as referred to in Articles 523 and 524 of the Belgian Companies Code, applicable at that time, except in the context of the granting of the retention bonus mentioned under section 2.2.7. above and the stock option plan edition June 2019 whereby Mr Olivier CHAPELLE had a conflict of interest. The procedure laid down in Article 523 of the Companies Code was applied. Reference is made here to the statutory annual report, which contains an extract of the minutes of February 11, 2019 and June 28, 2019 in this regard.
2.2.9. Insider trading and market manipulation
The company policy regarding the prevention of insider trading and market manipulation is further explained in chapter 7.2 of Recticel’s Corporate Governance Charter as well as the new Dealing Code which has been adopted by the Board of Directors and published on the Recticel web site www.recticel.com..
These measures include the implementation of restrictions on the execution of transactions (« closed periods ») applicable since 2006.
Mr. Dirk VERBRUGGEN was appointed as Compliance Officer, responsible for monitoring the observance of these regulations.
2.2.10. Diversity policy
Recticel strives to create a community where everyone is included and respected, bringing people together for a better world. We believe that a diverse team improves the quality of decision making, and ultimately improves overall performance.
Recticel has currently not established a formal specific diversity policy, but is an equal employer in all aspects of recruitment and selection, and is committed to a fair and consistent approach to recruitment and selection. Recticel works actively to develop a positive employer image amongst the internal and external stakeholders. Recticel commits to hire all candidates irrespective of age, disability, gender reassignment, marriage or civil partnership, pregnancy and maternity, race, religion and belief, sex and sexual orientation or hours of work.
Recticel also commits to offering learning opportunities to all employees irrespective of age, disability, gender reassignment, marriage or civil partnership, pregnancy and maternity, race, religion and belief, sex and sexual orientation or hours of work. Recticel is proud to be present in 20 countries, with employees of different nationalities.
Currently one woman is represented in the Management Committee. Furthermore, one third of the members of the Board of Directors is a woman, in accordance with article 7:86 of the Companies and Associations Code.
The selection process of the members of the Board of Directors is described in the Corporate Governance Charter of Recticel, with the aim to come to a composition that is diverse in all its aspects, both at the level of gender, background, professional experience, competence and education.
RECTICEL ANNUAL REPORT 2019 I 109RECTICEL ANNUAL REPORT 2019 I 108

The company has not concluded a relationship agreement with the main shareholder Compagnie du Bois Sauvage SA in accordance with principle 8.7 of the Corporate Governance Code 2020, as there is a sufficient line of representation of the main shareholder through its representation within the Board of Directors.
The capital structure, with the number of shares and warrants of the company can be found in the chapter “Information on the Share” on the Recticel website (www.recticel.com).
An amendment of the articles of association of Recticel can only be obtained, following the special majorities of article 37 of the Articles of Association.
The Board of Directors submits its proposals regarding the appointment or re-election of directors to the general meeting of the shareholders. The Remuneration and Nomination Committee recommends one or several candidates to the Board, taking into account the needs of the company and following the appointment procedure and the selection criteria drawn up by the Board for that
NAMEDATE OF
NOTIFICATIONNUMBER OF
SHARES
PERCENTAGE OF SHARES AT
THE MOMENT OF NOTIFICATION (1)
PERCENTAGEOF SHARES AT
BALANCE SHEET DATE
PERCENTAGE OF VOTING RIGHTS
ATTACHED TO SHARES AT BALANCE SHEET
DATE (2)
Compagnie du Bois Sauvage SA (3) 13/05/2015 15 094 410 28.17% 27.25% 27.41%
Own shares 13/05/2015 326 800 0.61% 0.59% 0%
Subtotal (own shares included) (3) 13/05/2015 15 421 210 28.78% 27.84% 27.41%
BNP Investment Partners 12/05/2016 1 615 744 3.01% 2.92% 2.93%
KBC Asset Management NV 19/05/2018 1 648 964 3.01% 2.98% 2.99%
Public Not applicable 36 711 521 66.26% 66.67%
Total (excluding own shares) 55 070 639 100.00%
Total (including own shares) 55 397 439 100.00%
(1) The percentage of shares is calculated based upon the number of existing shares at the moment of the notification. (2) The percentage of voting rights is calculated based upon the 55 397 439 existing shares per 31 December 2019 based upon the information the Company has received from its shareholders
per 31 December 2019, which can be different from the actual situation. The calculation has been adjusted to take into account the suspension of the voting rights of the 326,800 own shares
held by the Company as foreseen by the law. (3) The number of own shares of the company was included in the notification, given the fact that they are legally deemed to act in concert with the Company for the purposes of the applicable
transparency disclosure rules. On 8 November 2018, the Financial Market Authority (FSMA) was informed (transactions by leadership) that 50,000 shares were acquired additionally.
2.2.11. Relationships with the reference shareholders and other elements related to possible public takeover bids
Here follows the overview of the shareholders who, under the statutes of the law, have addressed a notification to the company and to the FSMA:
In accordance with the powers granted at the extraordinary general meeting on 7 July 2017, and incorporated in article 6 of the Articles of Association, the Board of Directors has certain powers to issue new shares, convertible bonds, bonds or subscription rights, with or without preferential rights, and offering these to shareholders or other persons, with restriction of the preferential right, under the Companies and Associations Code. In this way the Board of Directors can, via the authorized capital, increase the subscribed capital in all possible ways. The authorization is valid for a period of three years, and can be renewed following the applicable legal rules, and such renewal will be submitted to the Extraordinary General Meeting of 26 May 2020. It may even be exercised after receipt of the notice given by FSMA that a notice of public takeover was submitted.
There are no agreements between the Company and its directors or employees that would provide for compensations after a public takeover bid, the directors resigning or departing without any valid reason, or the employment of the employees being terminated.
The following agreements, whereby the company is party, contain the clauses that take effect, undergo changes or end, in the event of a change of control over Recticel SA/NV: • The “Amendment and Restatement Agreement,
as agreed on 25 February 2016 between Recticel SA/NV and Recticel International Services NV on the one hand and ING Belgium SA/NV, BNP Paribas Fortis SA/NV, Commerzbank Aktiengesellschaft, Filiale Luxembourg and KBC Bank NV on the other hand, for an amount of EUR 175,000,000, whereby, in case of a change of control over the Company, or over a subsidiary that is also an obligor under the amendment and restatement agreement, each of the banks participating in the Facility will have the right to request prepayment and cancellation of their respective Facility commitment, and if banks representing a special majority of the total Facility amount request such, then the total Facility will have to be prepaid and cancelled. This agreement completes and modifies the “Facility Agreement” for an amount of 175,000,000 EUR as signed on 9 December 2011 between the aforementioned parties.
• The Recticel Group’s Stock Option Plans of April 2014, June 2015, April 2016, June 2017, April 2018, June 2019 (warrant plans, April 2014, June 2015, April 2016, June 2017, April 2018, June 2019) issued by the Board of Directors Administration that contain a clause 6.2. which gives the beneficiaries the right to exercise their warrants, if applicable under the conditions determined by the Board of Directors, immediately in the event of a change of control (that is, in the event of a transfer, in one or more transactions, more than fifty percent (50%) of the voting rights) or in the case of the launch of a public share purchase offer.
These clauses were specifically approved by Recticel’s General Shareholder Meeting or will be submitted for approval at the General Meeting on 26 May 2020 (warrant plan June 2019).
In line with article 7:151 of the Belgian Companies and Associations Code, for such a clause to take effect requires the approval of the General Shareholder meeting.
2.2.12. Statement on non-financial information
The statement on non-financial information in accordance with article 3:6,§4 of the Belgian Companies and Associations Code has been enclosed to the statutory annual report of Recticel NV/SA and the consolidated annual report of the Recticel Group.
purpose. The composition of the Board is determined based on the necessary diversity and complementary skills, experience and knowledge.
The general meeting of the shareholders appoints the directors of their choice with a simple majority of the votes cast. Directors can likewise be dismissed “ad nutum” by the general meeting with a majority of the votes cast, before the normal expiry of his or her term of office.
If a position of director becomes vacant as a result of resignation, incapacity or death, the Board may provisionally fill the vacancy, upon recommendation from the Remuneration and Nomination Committee.
There are no legal or statutory limitations on transfer of securities. There are no securities with special control rights. There are no legal or statutory restrictions on the exercise of voting rights, for as far as the shareholder is legally represented at the Ordinary General Meeting, and his/her voting rights have not been suspended for any reason.
RECTICEL ANNUAL REPORT 2019 I 111RECTICEL ANNUAL REPORT 2019 I 110

2.3. Non-financial information statement
RECTICEL ANNUAL REPORT 2019 I 113RECTICEL ANNUAL REPORT 2019 I 112

2.3.1. Introduction
In 2016 we published our fi rst separate sustainability report covering the years 2013-2015 and drawn up in accordance with the GRI G4 guidelines, a comprehensive framework known globally for its credibility, consistency and comparability and now the de facto standard for sustainability reporting. This fi rst report provided insight in our sustainability journey, the strategy itself and the six material aspects, key performance indicators and targets to measure progress.
In September 2017, the EU Directive 2014/95/EU as regards disclosure of non-fi nancial and diversity information by certain large undertakings was transposed into Belgian national law. The Directive recommends using internationally-recognized frameworks and standards to prepare and publish sustainability reports.
Our second sustainability report was drawn up in accordance with the Global Reporting Initiative (GRI) Standard guidelines, Core. It was published in 2018, covered the period 2016-2017 and provided transparency on progress against our 2020 targets. Limited external assurance was performed on the seven KPIs covering the six material aspects.
The reporting over 2018 and 2019 was prepared using the recommendations of the GRI Standard guidelines, Core. We integrated the reporting on non-fi nancial information such as environmental, social, human rights, anti-bribery and anti-corruption topics in our annual reports, and provided transparency on progress against our 2020 targets. The information about diversity is available in our Corporate Governance Statement.
Over 2019, 51 fully-owned Recticel subsidiaries employing 5,847 people in 20 countries were in the scope; joint ventures being excluded.
2.3.2. Activities of the company
Recticel is an international industrial player with an ambitious goal: to take the daily experience of comfort to a new level in quality and innovation. We rely on our expertise in the transformation of polyurethane chemistry to meet customer and societal challenges responsibly, and to generate added value for our clients, shareholders, partners and employees. For a further description of the activities of Recticel and the Recticel Group, reference is made to Chapter 1 of the annual report of Recticel as published on the website of Recticel under https://www.recticel.com/index.php/investors/annual-half-year-reports.html.
2.3.2.1. A strategy for sustainability: Growing together towards a PUre future
a) Recticel’s ambitionRecticel’s ambition is to lead the transition to a circular economy and a low-carbon society. Growing together towards a Pure future expresses our fi rm commitment to reducing any negative effects of our activities and to optimising Recticel’s positive impact across the value chain, from raw materials sourcing to product manufacturing, consumption and end-of-life.
Since 2013, sustainable innovation is a key driver at the heart of our Group strategy.
It was created to respond to key societal challenges, such as energy conservation, CO2 reduction, and an aging and increasing population. Sustainability shapes our portfolio strategy and our innovation priorities, and as a result, it nourishes our long-term competitiveness. The long-term needs and challenges or our sectors and our society are our compass.
Our activities position us in a sustainable way as the leading supplier of polyurethane and polymer-based solutions in our markets for durable (consumer) goods such as insulation panels (50-year lifespan), mattresses (10-year lifespan), car dashboards and highly specialized technological applications with attributes such as silencing, sealing or carrying.
Sustainability has always been at the heart of our activities. Our thermal insulation solutions for building renovations and new constructions contribute to a low-carbon society. CO2 emissions avoided by our insulation solutions add up to more than 40 times the carbon footprint of our activities combined.
In our Automotive business line customer demand for reduced carbon emissions drive our development of lightweight materials. Similarly, in our Flexible Foams business line, innovative lightweight solutions have been developed to speciality applications in car engine compartments that require superior silencing properties.
In other markets, the traditional focus has been on durability and providing optimal comfort during the use phase. In recent years, we have directed our research efforts to eco-design and repurposing our valuable polyurethane materials after their usage phase.
Mechanical and chemical recycling are the two routes we follow towards circularity.
b) Readying polyurethane for the circular economy
Our products are predominantly, though not exclusively, based on polyurethane (PU). This versatile material allows us to develop long-lasting high-quality and durable solutions that promote comfort in our daily life such as insulation panels or mattresses. Preparing them for the transition to a circular economy is an important challenge.
Our strategic Corporate Sustainability Innovation Programme3, led by our Sustainable Innovation Department, the R&D Center of the Group, focuses on discovering new ways of making polyurethane more sustainable in every phase from raw materials, to production, to end-of-life.
Raw materialsInnovation and effi ciency initiatives have reduced our use of raw materials and are complemented by our choice of more sustainable raw materials to reduce dependence on fossil resources.
In partnership with the company Covestro, Recticel was the fi rst company worldwide to use a CO2-based polyol in its fl exible foam production for products such as mattresses.
Carbon capture and utilization is also at the heart of the Carbon4PUR project, a EU Research and Innovation Programme Horizon 2020 project aiming at manufacturing high-value polyurethane materials using industrial waste gases produced by the steel industry (mixed CO/CO2 streams). Recticel is testing this new technology for insulation panels.
3 See Chapter 1.7 Sustainable and market-driven innvation
Segment Strategy
Human organisationSustainabilityDigitalisation
Sustainable innovation
International expansion
Simplification
RECTICEL ANNUAL REPORT 2019 I 115RECTICEL ANNUAL REPORT 2019 I 114

This project has received funding from the European Union’s Horizon 2020 Research and Innovation programme under grant agreement N° 768919.
SWEETWOODS, a EU Horizon 2020 Research and Innovation programme, focuses on biobased materials such as wood to replace fossil fuel. The project aims at demonstrating the successful and profi table production of high-purity lignin, derived from low-quality wood residues and sugars, on an industrial level. Recticel will test its use in rigid foam applications such as insulation panels.
SWEETWOODS has received funding from the Bio-Based Industries Joint Undertaking under the European Union’s Horizon 2020 Research and Innovation programme, under grant agreement N° 792061.
Responsible productionIncluding sustainability in our production processes helps reduce our carbon footprint and increases operational excellence. Together with industrial partners and knowledge institutes, we explore ways to reduce production waste and design products that are eco-friendly and easy to dismantle.
Sustainability is also tactical. It means less waste and greater resistance to material shortages and price fl uctuations.
We have developed a fi ber-bonded foam technology to transform polyurethane production waste into new applications: Simfofi t® acoustic insulation panels reduce sound by up to 12 dB while also helping to conserve energy. The production waste from fi ber-bonded foam products can be reused in the process, and end-of-life material can be recycled, thus closing the materials loop.
We continue to explore the possibilities of fi ber-bonded foam for other application areas, such as automotive and industry. As for Bedding, our German brand Schlaraffi a introduced a concept bed using recycled foam instead of virgin foam in its bedframes and headboards, this January, on the 2020 IMM professional furniture fair in Cologne.
Recyling of end-of-life materialsReplacing production waste by end-of-life material is an important target to achieve resource effi ciency.
Recticel is partner of the Valpumat project, or Valorization of the Polyurethane of Mattresses. This initiative is one of the nine winners of the fi rst Eco-innovation challenge launched in 2017 by Eco-mobilier, France, in order to develop new ways of recycling mattresses. As of 2020, Recticel will process, on an annual basis, end-of-life foam in two of its French plants and transform this valuable material into acoustic insulation solutions, thus gradually phasing out production waste.
New mechanical and chemical recycling processes will allow us to recycle materials, paving the way for new value-added applications.
We are proud to participate in and be the project leader of the PUReSmart project funded by the European Union’s Horizon 2020 Innovation and Research programme to develop a complete circular product life cycle and turn polyurethane into a truly sustainable material: recover the used material (e.g. mattresses) and turn them into building blocks for existing or new products.
In this context, Covestro, one of the world’s largest polymer companies and PUReSmart project member, is already investigating the feasibility of a short-term scale-up from laboratory scale to semi-industrial level, with the aim of making chemical recycling an effi cient industrial process. This solution should then also support the current PUReSmart project.
This project has received funding from the European Union’s Horizon 2020 Research and Innovation programme under grant agreement N° 814543.
In 2019, Recticel signed the Declaration of the Circular Plastics Alliance1 which promotes voluntary actions for a well-functioning EU market in recycled plastics. The declaration lays out how the alliance will reach the target of 10 million tons of recycled plastics used to make new products every year in Europe, by 2025. This target was set by the European Commission in its 2018 Plastics Strategy as part of its efforts to boost plastics recycling in Europe.
Recticel also supports the Moonshot2 initiative launched by the Flemish government in Belgium. In this ambitious industrial innovation programme hosted by Catalisti, Flemish universities, research institutes and industries join hands to develop breakthrough technologies by 2040 to create new climate-friendly processes and products.
On 10 January 2020, a fi rst series of innovation projects received support worth more than 18 million euro to make Flemish industries carbon circular and low in CO2 by 2050. Recticel is joining the Advisory Board of two Moonshot programmes: MOT1 Biobased Chemistry and MOT2 Circularity in Materials.
c) Focus on people and sustainable innovation – six important material aspects
Innovation and people are key in achieving our ambitions. Our business lines will create more shared value through innovation focused on societal needs and aligned with stakeholder expectation.
The parties that invest in and impact our activities to the greatest degree comprise customers (including consumers), employees, and the Board of Directors, authorities, fi nancial analysts and suppliers.
Working closely with them, we defi ned the six most important material aspects for Recticel with the potential to turn sustainability into a keener competitive edge. These aspects form the basis of our Sustainable Innovation plan and People Priority plan.
For a further description of our materiality process, reference is made to our 2017 Sustainability Report as published on the Recticel website. https://www.recticel.com/index.php/sustainability-innovation/sustainability/reports.html 1 See https://ec.europa.eu/growth/industry/policy/circular-plastics-
alliance_en2 See 1 https://moonshotfl anders.be/project-overview-results/
RECTICEL ANNUAL REPORT 2019 I 117RECTICEL ANNUAL REPORT 2019 I 116

d) Risk managementSince the beginning of our sustainability journey, we see sustainability as an opportunity to create shared value for the company and society. Our sustainability journey is closely interwoven with the Recticel Group risk management system, which enables Recticel to identify, manage and mitigate the main issues that could impact our business. Assisted by the Audit Committee, the Board of Directors defines the Group’s major risks. Placing sustainability at the centre of Recticel’s strategy takes these risks into account, and avoids or minimizes any adverse effects of potential risk on the company. This is how we maintain our competitive edge and generate value for our stakeholders.
Sustainability is considered along our entire value chain, from raw material sourcing to product manufacturing, consumption and end-of-life. We take responsibility for our own activities and for those within our sphere of influence, upstream as well as downstream.
Recticel supports the Sustainable Development Goals (SDG) launched in 2015 by the United Nations. This universal set of targets and indicators is designed to help countries and end poverty, protect
the planet and ensure global prosperity as part of a new sustainable development agenda. By upholding recognized standards and principles on human rights, labour, the environment and anti-corruption, business makes an essential contribution to the SDGs.
Recticel has identified five SDGs that are most impactful, relevant and strategically embedded in our company’s sustainability strategy:
Failure to successfully innovate, develop and introduce new products.
Safety, health and the environment: new regulations and its impact
Price volatility of major chemicals. Failure to obtain raw materials
Potential misconduct by employees and managers or third-party contractors.
Safety, health and the environment, new regulations and their impacts.
Attracting and retaining qualifi ed personnel.
Innovation fulfi lling societal needsPreparing durable polyurethane products for the circular economy.
Optimising carbon footprintCO2 emissions avoided by our insulation solutions add up to more than 40 times the carbon footprint of our activities combined.
Resource e� ciencySeeking new ways to prevent, reuse and recycle production and end-of-life foam.
Business ethics and integrityDeveloping comprehensive codes, policies and trainings to provide an ethical framework beyond compliance.
Reduce HS&E impacts of our activitiesWorking towards zero environmental accidents, injuries and occupational illnesses.
An inspiring and rewarding place to workEncouraging employees to feel engaged, develop their talents and contribute to company goals.
CORPORATE RISKS IDENTIFIED
SUSTAINABILITYSTRATEGY
RECT SUS20-risks tabel klein-EN.indd 1RECT SUS20-risks tabel klein-EN.indd 1 10/03/2020 13:5110/03/2020 13:51
2.3.2.2. Recticel targets & results
For the six material aspects previously described, Recticel defined different targets to be met. These targets are measured through key performance indicators (KPI).
For most of our targets we have set a 2020 deadline. In 2020, we will review our materiality matrix together with internal and external stakeholders. We will also determine if new or additional KPIs and targets have to be defined for our 2020-2025 / 2030 sustainability strategy.
The summarized overview of our 2019 results can be found in the ‘Summary Table’ (page 127) and in the ‘Sustainability Strategy Summary’ (page 128), followed by the ‘Independent limited assurance on non-financial information statement’ (page132).
a) Targets related to the environment
• Innovation fulfilling societal needs
Target: 80% of active R&D projects classified as sustainable by 2020 according to the Sustainability Index.
KPI: Sustainability Index (scope: innovation pipeline Sustainable Innovation Department (hereinafter “SID”))
Result 2019: 62%The number of active R&D projects aimed at ground-breaking sustainable development research is constantly increasing. This is not reflected in the 2019 result that remains stable due to the strict assessment methodology we developed in 2015. In our Sustainability Index, we currently compare new projects with their predecessors and assess whether there is a significant improvement on all People and Planet aspects. For projects such as biobased or recycled materials, it is almost impossible to score sufficiently high on all sub-criteria to be classified as sustainable. The assessment methodology therefore needs to be re-evaluated. We are confident that within our R&D projects the focus on sustainable development is in line with our strategic intention.
3.GOOD HEALTH AND WELL-BEING
⊲ Innovation fulfilling societal needs
⊲ Reduce HS&E impacts of our activities
⊲ An inspiring and rewarding place to work
8.DECENT WORK AND ECONOMIC GROWTH
⊲ Business ethics and integrity
⊲ Reduce HS&E impacts of our activities
⊲ An inspiring and rewarding place to work
13.CLIMATE ACTION
⊲ Optimising carbon footprint
⊲ Resource efficiency
⊲ Innovation fulfilling societal needs
17.PARTNERSHIPS FOR THE GOALS
⊲ We take responsibility for our own activities, but also in our sphere of influence upstream (raw materials sourcing) as well as downstream (use and end-of-life)
⊲ We invest in close relationships with the stakeholders: customers, suppliers, knowledge institutes, investors and communities along our value chain
12.RESPONSIBLE CONSUMPTION AND PRODUCTION
⊲ Resource efficiency
⊲ Innovation fulfilling societal needs
⊲ Optimising carbon footprint
⊲ Reduce HS&E impacts of our activities
HOW RECTICEL CONTRIBUTES
RECT SUS20-SDGs-EN.indd 1RECT SUS20-SDGs-EN.indd 1 10/03/2020 13:5310/03/2020 13:53
All aspects linked to innovation have been brought together in the sustainable innovation plan, focusing innovative efforts on meeting the needs of society, optimizing the carbon footprint throughout the value chain and the efficient use of resources. New societal needs and the transition towards a circular economy
bring with them opportunities to differentiate ourselves and create shared value. We have to seize these opportunities and further explore the possibilities for reuse and recycling our products at end-of-life stage while intensifying our focus on production waste reduction.
RECTICEL ANNUAL REPORT 2019 I 119RECTICEL ANNUAL REPORT 2019 I 118

We estimate that, in 2019, the CO2 emissions avoided by our insulation solutions total over 40 times our carbon impact throughout the value chain, making the growth of this business a priority. Our lightweight car components reduce vehicle weight, lowering their fuel consumption and carbon emissions.
To optimize our carbon footprint, we want to reduce our negative impact and increase our positive impact in a significant way. In line with these goals, we focus on areas in our value chain where the biggest progress in carbon footprint reduction can be made: upstream (raw materials) and downstream (usage and end-of-life phases).
UpstreamTogether with our suppliers, we explore innovative solutions and investigate more sustainable raw materials such as a CO2 polyol. Polyols and isocyanates are fossil fuel-derived raw materials used to make polyurethane. The production of these chemicals is energy-intensive. Thus, our suppliers strive to optimize energy efficiency and find alternatives to fossil fuels. Covestro developed a revolutionary new polyol that replaces 20% in weight with a by-product of the CO2 captured from a nearby facility. Recticel supported this innovative development from the beginning and was the first worldwide to implement it for the production of flexible foam used in mattresses.
DownstreamTogether with industry peers and knowledge institutes we investigate the impacts of closing the materials loop. Polyurethane is a thermoset material characterized by high durability. It cannot be melted or reformed at the end of it use phase. Our products contain materials that can be reused or recycled for other value-added purposes. The goal of these research projects is to find economically viable solutions for waste streams that also benefit the environment.
Energy consumptionAlthough the biggest impact on carbon footprint reduction is situated upstream and downstream, we are also fully committed to reducing the impact of our energy consumption.
Since 2013, we have systematically recorded annual energy costs and consumption data across the Group and have strived to make our operations more energy-efficient.
In 2020 we introduce our Electricity Sustainability Roadmap 2020 - 2025, an ambitious action plan to reduce the CO2 impact related to electricity usage by 75%.
We will reach that target following three paths in parallel: 1) Build up and implement an energy saving plan
at each plant; 2) Develop smart efficient lighting; 3) Selectively implement a number of solar panels
and wind mills projects to generate green electricity.
The Roadmap will prioritize our 41 plants in Europe. The three paths have been defined based on the lessons learned from projects on energy usage that have already been carried out, as well as from extensive energy audits conducted in 19 plants.
• Resource efficiency
Target: 100% increase of recycled foam produced by Recticel by 2020 compared to 2015. The increase is possible if flexible foam production waste is gradually replaced by post-consumer waste.
KPI: Tonnes of recycled flexible foam produced by Recticel.
Result 2019: -18% (vis-à-vis the 2015 basis).
BackgroundThe volumes realised with traditional bonded foam continue to decrease and are compensated by higher volumes in fiber-bonded foam. Since the end of 2019, we have started to replace production waste by end-of-life foam in fiber-bonded foam acoustic insulation and bedding applications. This evolution will have a positive impact in 2020 but we take into account that we might not realise our target.
BackgroundOur continued growth depends on our ability to respond to complex and dynamic societal needs. This is why we strive to develop innovative solutions that maximize resource efficiency, reduce carbon emissions and support sustainable, healthy lifestyles. Sustainability is at the core of Recticel’s strategy, and sustainable innovation programmes, led by our Sustainable Innovation Department (SID), shape our company’s future.
Sustainability indexIn 2014, Recticel developed its own methodology to score all research and development projects, spearheaded by the Sustainable Innovation Department. The resulting Sustainability Index, now in its 2nd generation, is a way to measure, track and compare the sustainability performance of active R&D projects. It comprises criteria linked to Planet and People aspects. Projects are scored by the Programme Innovation Manager, Corporate Sustainability Innovation Manager and corporate sustainability experts.
In the Planet aspect, criteria such as carbon footprint, reduced by saving resources, recycling and reusing end-of-life materials, are considered. The People aspect concerns criteria for social responsibility, such as health, safety and environment (HS&E) as well as social impact.
Each development is rescored on an annual basis or when the project enters a new phase, with scorings reviewed when significant changes are made to a project’s scope, or when important new research data have become available. People or Planet criteria can be rescored either in a positive or negative way depending on new insights or developments on the market or the product.
• Optimising carbon footprint
Target 1: Reduce Recticel Carbon Footprint Indicator by 25% in 2020 and by 40% in 2030.
KPI: Recticel Carbon Footprint Indicator expressed in tonnes of CO2 equivalent compared to the 100% activity level in 2013 (scope: production sites). The method of calculation is derived from the Cradle to Grave method.
Result 2019: 82% (18% reduction vis-à-vis the 2013 basis)There have been no fundamental changes over the last three years in footprint reduction. The impact of the new CO2 polyol is still limited, as products have only been recently introduced to the market. We are committed to our target
Target 2: Increase Net Recticel Impact Ratio from 20 in 2013 to 30 by 2020 and 50 in 2030.
KPI: Net Recticel Impact Ratio (whole value chain) defined as ratio of the Recticel Positive Impact to the Recticel Carbon Footprint. The Recticel Positive Impact is expressed in tonnes of avoided CO2 equivalent in use phase (using appropriate method of calculation per type of product and using appropriate conversion factors calculated by a third party).
Result 2019: 41.The growing impact of the Insulation business line volume continues to have a positive impact on the multiple.
BackgroundThe aim of the 2015 United Nations COP 21 Paris Agreement is to limit the increase of the global temperature above pre-industrial as much as possible. Recticel contributes to this aim by optimizing its carbon footprint throughout the value chain, alongside its partners.
We focus on introducing raw materials with lower GWP (global warming potential) values, improving the energy efficiency of our activities, and developing more sustainable products and end-of-life solutions that support a circular economy.
RECTICEL ANNUAL REPORT 2019 I 121RECTICEL ANNUAL REPORT 2019 I 120

Recticel supports the transition from the linear ‘take, make, dispose’ economic model to a circular economy by seeking new ways to prevent and reuse production waste and to mechanically and chemically recycle end-of-life waste while minimizing demand for constrained natural resources.
Our expertise lies predominantly in polyurethane applications for durable (consumer) goods such as insulation panels (50-year lifespan), mattresses (10-year lifespan), car dashboards and highly specialized technological applications with attributes such as silencing, sealing or carrying.
Our R&D efforts and Corporate Sustainability Programme aim to reduce waste and enable production of end-of-life foam to be recycled in value-added new solutions.
New mechanical recycling solutionsFor many years, Recticel has used the production waste of polyurethane as a raw material to make bonded foam. This recycled foam is supplied to customers who utilize it in flooring, upholstery and technical applications.
In the traditional process of recycling flexible foams, foam flakes are coated with isocyanate, pressed into a block, infused with steam and then dried in an energy-intensive process.
In the new fiber-bonded foam process, foam flakes are mixed with fibers and melted in a continuous process that does not require drying. We introduced a first application based on this new technology, an acoustic thermal insulation panel and continue to explore new applications for automotive, industry and bedding.
The production waste from fiber-bonded foam products can be reused in the process, and end-of-life material can be recycled, thus closing the materials loop.
Recticel is partner of the Valpumat project, or Valorization of the Polyurethane of Mattresses. This initiative is one of the nine winners of the first Eco-innovation challenge launched in 2017 by Eco-mobilier, France, in order to develop new ways of recycling mattresses. As of 2020, Recticel will process, on an annual basis, end-of-life foam in two of its French plants and transform this valuable material into acoustic insulation solutions, thus gradually phasing out production waste.
New chemical recycling solutionsIn 2015, we expressed our firm commitment to make polyurethane more sustainable over the coming years. This included closely monitoring and supporting the development of new polymers that combine the advantages of both thermoset (for durability) and thermoplastic (for recyclability) materials. Since then, we have engaged with knowledge institutes and suppliers to join forces.
The Europe-wide PUReSmart project, which comprises nine companies and academic institutions from six countries started in 2019. It aims at developing a complete circular product life cycle and turn flexible polyurethane foam into a truly sustainable material: recover the used material (e.g. mattresses) and turn them into building blocks for existing or new products.
Covestro, one of the project members, is already investigating the feasibility of a short-term scale-up from laboratory scale to semi-industrial level, with the aim of making chemical recycling an efficient industrial process. This solution should then also support the current PUReSmart project.
For a further description of the R&D activities of the Recticel Group, reference is made to Chapter 1.7 Sustainable and Market-Driven Innovation.
b) Targets related to social matters and personnel
• Reduce HS&E impacts of our activities
Target: Frequency work accidents = < 3 by 2020 (number of accidents x 1,000,000 / number of hours performed).
KPI: Frequency work accidents represents the average on Group level for all our plants and offices.
Result 2019: 4,4
BackgroundWe see a significant drop in the frequency compared to last year and are pleased that the ongoing efforts to keep safety top of mind are beginning to bear fruit. We hope that this trend reversal will continue in 2020, although it will remain a challenge to meet our target.
Our ultimate goal is to be incident-free. We work relentlessly to eliminate the possibility of and/or potential for work-related incidents, emissions, production leaks, fires and near-misses. The Recticel Corporate Health, Safety & Environment Policy defines strategic objectives to minimize risks for people and the planet. Through risk assessments, mitigation initiatives and process improvements, we aim to make Recticel a safe place to work and to visit.
Corporate HS&E PolicyThe Recticel Corporate HS&E Policy defines strategic objectives to minimize all HS&E risks and environmental impacts inherent to the company’s activities and products. This is above and beyond our basic obligation to comply with all applicable health, safety and environmental regulations.
We perform root cause analyses and implement corrective and preventive actions on critical operations. Recticel foaming sites adhere to strict regulations (such as SEVESO and/or COMAH), and several plants have certified health & safety and/or environmental management systems (OHSAS 18001 and/or ISO 14001-certified). Recticel is an active member of national and European professional associations such as EUROPUR, PU Europe, Essenscia and Federplast.
The Group HS&E Manual provides guidance for the implementation of the HS&E Policy. Recticel recognizes the need for personal initiative, professional and safe behaviour, safety awareness and respect for each other and the environment to implement the HS&E policy. QHS&E managers in our business lines drive and support the change in safety culture by developing operational standards, improving working environments, raising awareness and training personnel.
Corporate HS&E and Sustainability Steering CommitteeManagement commitment to HS&E is reinforced by our Corporate HS&E and Sustainability Steering Committee (CHSSC) spearheaded by our CEO. It defines Group strategies and policies regarding HS&E and sustainability, advises and assists the business lines with their implementation and follows up on progress. By sharing knowledge and unifying HS&E practices, such as standardized root cause analysis, and HS&E rules company-wide, we seek to make our processes more efficient.
In 2018, we selected an integrated Group HS&E reporting tool to support alignment, improve follow-up and reporting, underpin best practices and facilitate the monitoring of changing regulations. The pilot project in 2019 showed that the selected tool did not fully meet our requirements. A new test phase will therefore be set up in Q1 2020 involving HS&E teams from several major Bedding, Flexible Foams and Insulation business line sites covering different countries. The global rollout will take place in Q2.
We never compromise on safetyWe continue to raise awareness on safety. It is embedded in our Core Value of acting with respect and integrity.
In 2018, we held our first Recticel Global Safety Day1. As well as renewing and clarifying the focus on this vital issue, it relayed an important message: safety is everyone’s responsibility. It marked the launch of our Simply Safe initiative across all business lines and in every site. We introduced a clear framework of Golden Safety Principles and Golden Safety Rules which are now displayed on posters at all our sites.
1 See https://www.recticel.com/simplysafe
RECTICEL ANNUAL REPORT 2019 I 123RECTICEL ANNUAL REPORT 2019 I 122

In 2019, Recticel Global Safety Day’s goal was to make everyone realise that we should all try to change our habits to guarantee a safe working environment. Whenever we notice a hazard, or whenever we start a new task, we should stop, think and then act.
• An inspiring and rewarding place to work
Target : Add two new countries each year where the engagement survey is rolled out.
KPI: The number of countries in which engagement surveys are conducted among blue and white collars.
Result 2019: Belgium, United Kingdom, Spain + France, The Netherlands
We are on track and we will move forward with the defined programme of adding two new countries every year.
BackgroundRecticel’s skilled and creative employees enable us to excel and achieve our sustainable growth ambitions. Success comes from being able to attract, motivate and retain a talented pool of workers. We seek to offer all our employees a stimulating and rewarding place to work, a place where they feel engaged, contribute to company goals, and where their talents can develop. We foster a collaborative and result-driven culture based on cooperation, respect, integrity and accountability. We encourage colleagues, customers and partners to innovate together to deliver winning solutions. Our human resources strategy aims to ensure the availability, engagement, motivation and continuous development of our employees.
Engagement surveyRecticel introduced an engagement survey to gain insight in the satisfaction, loyalty, engagement and motivation of our employees. It is progressively rolled out at a rate of two new countries each year and repeated every three years.
In 2019, we added two new countries, France and the Netherlands, and repeated the survey in Belgium, the United Kingdom and Spain. In 2020, we will roll out the initiative in Finland and Estonia and repeat it in Poland and Romania.
We act with respect and integrityRecticel strives to create a community where everyone is included and respected, bringing people together for a better world. We believe that a diverse team improves the quality of decision making, and ultimately improves overall performance.
Recticel has currently not established a formal specific diversity policy but is an equal employer in all aspects of recruitment and selection, and is committed to a fair and consistent approach to recruitment and selection. Recticel works actively to develop a positive employer image amongst the internal and external stakeholders. Recticel wants to hire all candidates irrespective of age, disability, gender reassignment, marriage or civil partnership, pregnancy and maternity, race, religion and belief, sex and sexual orientation or hours of work.
Recticel also wants to offer learning opportunities to all employees irrespective of age, disability, gender reassignment, marriage or civil partnership, pregnancy and maternity, race, religion and belief, sex and sexual orientation or hours of work.
Recticel is an equal opportunity employer who offers men and women the same opportunities to develop their talents, build a career and balance work-life by offering the opportunity to work full-time or part-time at every stage of this career4. parttime
fulltime
temporary
permanent
8,000
0
1,000
2,000
3,000
4,000
5,000
6,000
7,000
8,000
TOTAL =FEMALEMALE
Total number of employees by employment contract by gender
Total number of employees by employment type by gender
3,7381,732
5,470
5,847
377
236
141
8,000
parttime
fulltime
temporary
permanent
temporary
permanent
0
1,000
2,000
3,000
4,000
5,000
6,000
7,000
8,000
REST OF THE WORLD
EASTERN EUROPE
WESTERN EUROPE
Total number of employees by employment contract by region
TOTAL = 5,847
3,253
117
1,371
238
466
402
5,090
757
temporary
permanent
0
1,000
2,000
3,000
4,000
5,000
6,000
7,000
8,000
FEMALEMALE
0
1,000
2,000
3,000
TOTAL =FEMALEMALE
Total number of employees by employment contract by gender
3,7381,732
5,470
5,847
TOTAL = 5,847
5,090
757
236
1,8113,279
599
0
1,000
2,000
3,000
4,000
5,000
6,000
7,000
8,000
158
WORKFORCE PROFILE
RECT SUS20-workforce profile-EN.indd 1RECT SUS20-workforce profile-EN.indd 1 10/03/2020 13:4910/03/2020 13:49
2 See also information with respect to diversity in section 2.2.10. of the Corporate Gover-nance Declaration
c) Targets related to ethics and integrity
• Business ethics and integrity
Target: Increase the number of legal training courses provided by the Corporate Legal Team and the IP Officer (SID) as face-to-face meetings attended and e-learning modules completed by 5% per year (cumulative) compared to 460 in 2015.
KPI: Number of legal training courses provided by the Corporate Legal Team and the IP Officer (SID) as face-to-face meetings attended and e-learning modules completed.
Result 2019: 5,309 (1.054% increase vis-à-vis the 2015 basis)
BackgroundThe number of training courses attended has increased with 14% compared to 2018. We have expanded our range of mandatory Legal e-learnings for all Recticel office employees with a third training course, “Basics of Contract Law”. For “Data Protection”, “Ethics Policy” and “Basics of Contract Law” the status “completed” is only achieved if the office employee obtains a test result of minimum 80% at the end of the module.
Currently one woman is represented in the Management Committee. Furthermore, one third of the members of the Board of Directors is a woman, in accordance with article 7:86 of the Companies and Associations Code.
The selection process of the members of the Board of Directors is described in the Corporate Governance Charter of Recticel, with the aim to come to a composition that is diverse in all its aspects, both at the level of gender, background, professional experience, competence and education.
See also Chapter 1.8 - Human resources and major production sites
WORKFORCE PROFILE
RECTICEL ANNUAL REPORT 2019 I 125RECTICEL ANNUAL REPORT 2019 I 124

Acting with respect and integrity is one of our core values. Respectful behaviour acknowledges the worth, dignity and uniqueness of others. We have created codes and policies to ensure we do business honestly, respectfully, and in full compliance with international rules and regulations.
A clear set of values and respectful behaviours unites our organisation. Redefined in 2016, our values align our actions and attitudes towards internal and external stakeholders. Behaviours associated with the five key values give direction to our employees and stakeholders.
Recticel highly values the importance of legal training, especially for those target groups who, due to the nature of their professional activities, are at a higher risk of being exposed to noncompliant situations, bribery or corruption. Our Corporate Legal Team regularly provides face-to-face training sessions and subject specific e-learning modules.
Ethics and compliance as part of our DNACorporate compliance is embedded in all our policies. We have developed guidelines for awareness creation, templates for reporting compliance issues, whistleblowing procedures and speak-up communication channels that enable employees to address issues in a variety of ways.
Recticel is aware of corporate risks, and we apply due diligence to both our own operations and supply chain. Where specific risks or exposure to noncompliant situations, bribery or corruption have been identified, policies are implemented that provide guidelines on how to avoid or mitigate them.
d) Targets related to human rights
Regarding the respect of human rights, Recticel has, as a precautionary measure, taken over the obligation in its purchasing conditions that its suppliers do business in an ethical, correct, transparent, trustworthy and social responsible way and that they guarantee that nor their personnel or subcontractors are involved in discrimination, violation of human rights, corruption, violation of antitrust laws, child labor, forced labor, slavery or other unacceptable labor working conditions or terms. In this framework, the suppliers need to comply strictly with the ‘Recticel Supplier Sustainability Requirements (RSSR)’. At first request of Recticel the suppliers need to be able to demonstrate that they respect this RSSR.
Nowadays, Recticel has not yet drafted a specific charter with respect to human rights, nor are there specific KPIs that are applied. This is related to the fact that the activities of the group are situated mainly in Europe. Such indicator is therefore less relevant for the activities of the Company.
Summary The table below provided a summary of Recticel’s sustainability strategy regarding its six material aspects, the seven KPIs and targets.
SUMMARY TABLERECTICEL’S MATERIAL TOPICS AND RELATED KPIs(table subject to PwC limited assurance)(*)
(*) The Independent Limited Assurance report by PwC covering 2019 can be found as an annex to the Non-Financial Information Statement of Recticel.
Sustainability Index
(Percentage of active
R&D projects classifi ed as
sustainable)
45% 54% 66% 62%
Recticel carbon footprint
(tonnes of CO2e)1,082,707 1,090,548 998,407 969,543
Positive impact Recticel
expressed in tonnes of
avoided CO2e in use phase
38,767,116 39,391,355 36,898,355 39,723,922
Tonnes of recycled fl exible
foam produced by Recticel5,567 5,129 4,534 5,044
Number of legal training
courses provided by the
Corporate Legal Team and
the IP Offi cer (SID) as face-
to-face meetings attended
and e-learning modules
completed
425 526 4,631 5,309
Work accident frequency
rate5.8 6 5.8 4.4
The number of countries in
which engagement surveys
are conducted among blue
and white collars
3
countries
2
countries
2
countries
5
countries
MATERIAL ASPECT KPI 2016 2017 2018 2019
INNOVATION FULFILLING SOCIETAL
NEEDS
OPTIMISING CARBON
FOOTPRINT
RESOURCE EFFICIENCY
BUSINESS ETHICS AND INTEGRITY
REDUCING HS&E IMPACTS
OF OUR ACTIVITIES
INSPIRING & REWARDING
PLACE TO WORK
RECT SUS20-summary table-EN.indd 1RECT SUS20-summary table-EN.indd 1 10/03/2020 13:5310/03/2020 13:53
RECTICEL ANNUAL REPORT 2019 I 127RECTICEL ANNUAL REPORT 2019 I 126

Sustainability Index (Percentage
of R&D projects classifi ed as
sustainable)
45%(**) 54%
Recticel carbon footprint
(tonnes of CO2e)1.082.707 tonnes 1.090.548 tonnes
Positive impact Recticel
expressed in tonnes of avoided
CO2e in use phase
38.767.116 tonnes 39.391.355 tonnes
Tonnes of recycled fl exible foam
produced by Recticel5.567 tonnes 5.803 tonnes
Number of legal training courses
provided by the Corporate Legal
Team as face-to-face meetings
and e-learning modules
completed
425 496
Work accident frequency rate 5,8 6
The number of countries in
which engagement surveys
are conducted among blue and
white collars
2 countries 2 countries
BUSINESS ETHICS AND INTEGRITY
REDUCE HS&E IMPACT
OF OUR ACTIVITIES
AN INSPIRING AND
REWARDING PLACE TO
WORK
PEOPLE PEOPLE PEOPLE PEOPLE PEOPLE PEOPLE PEOPLE PEOPLE PEOPLE PEOPLE PEOPLE PEOPLE PEOPLE PEOPLE PEOPLE PEOPLE PRIORITY PLANPRIORITY PLANPRIORITY PLANPRIORITY PLANPRIORITY PLANPRIORITY PLANPRIORITY PLANPRIORITY PLANPRIORITY PLANPRIORITY PLANPRIORITY PLANPRIORITY PLANPRIORITY PLANPRIORITY PLANPRIORITY PLANPRIORITY PLANPRIORITY PLANPRIORITY PLANPRIORITY PLANPRIORITY PLANPRIORITY PLANPRIORITY PLANPRIORITY PLANPRIORITY PLANPRIORITY PLANPRIORITY PLANPRIORITY PLANPRIORITY PLANPRIORITY PLAN
MATERIALASPECT KPI TARGET
Number of legal training courses provided by the Corporate Legal Team and the IP Offi cer (SID)
as face-to-face meetings attended and e-learning
modules completed.
Frequency work accidents represents the average on
Group level for all our plants and offi ces.
The number of countries in which engagement surveys are conducted among blue
and white collars.
Two new countries each year.
Increase the number of legal training courses
provided by the Corporate Legal Team and the IP Offi cer (SID)
as face-to-face meetings attended and e-learning modules completed by
5% per year (cumulative) compared to 460 in 2015.
Frequency = < 3 by 2020
number of accidents x 1,000,000
number of hours performed
5264254602018 20192015 2016 201720142013 2020 2030
4.631
6 5.85.8 38.48.48.8
2018 20192015 2016 201720142013 2020 2030
2015 2016 2017
Belgium +United Kingdom,
SpainPoland,
Romania
2018
Sweden, NorwayBelgium
*
* The fi gures have slightly increased due to a restatement
COMMENTS EVOLUTIONS
The number of training courses attended has increased in a spectacular way through our introduction of two new
e-learning courses1 that are compulsory for all Recticel offi ce employees.
We will reconsider our KPI and target for 2020, as we have surpassed our goal of a 5% increase per year (cumulative).
Despite the fact that we are not yet on target, important headway has been made at Group level to increase
awareness. Even more, systems have been put in place to improve the quality of risk analysis with the goal of
preventing work accidents. We are confi dent that these multiple actions will lead to the further reduction of
accident frequency in the years to come. We maintain our 2020 target even if it is challenging.
We have harmonised reporting standards across the Group, and selected integrated HS&E software for a pilot project to take place in 2019. In addition, we rolled out a common set of ‘Golden Safety Principles and Rules’ during our fi rst
participation in the 2018 ILO World Day for Health and Safety at Work initiative.
We are on track and we will move forward with the defi ned programme of adding two new countries every
year.
Analysis of our results in Norway and Sweden is ongoing. Clear action plans will be developed and key focal points for
each country will be identifi ed. In 2019, engagement surveys will be repeated in Belgium, the UK and Spain. France and the
Netherlands will be added.
PEOPLE PEOPLE PEOPLE PEOPLE PEOPLE PEOPLE PEOPLE PEOPLE PEOPLE PEOPLE PEOPLE PEOPLE PEOPLE PEOPLE PEOPLE PEOPLE PRIORITY PLANPRIORITY PLANPRIORITY PLANPRIORITY PLANPRIORITY PLANPRIORITY PLANPRIORITY PLANPRIORITY PLANPRIORITY PLANPRIORITY PLANPRIORITY PLANPRIORITY PLANPRIORITY PLANPRIORITY PLANPRIORITY PLANPRIORITY PLANPRIORITY PLANPRIORITY PLANPRIORITY PLANPRIORITY PLANPRIORITY PLANPRIORITY PLANPRIORITY PLANPRIORITY PLANPRIORITY PLANPRIORITY PLANPRIORITY PLANPRIORITY PLANPRIORITY PLAN
Despite the fact that we are not yet on target, important headway has been made at Group level to increase
awareness. Even more, systems have been put in place to improve the quality of risk analysis with the goal of
preventing work accidents. We are confi dent that these multiple actions will lead to the further reduction of
accident frequency in the years to come. We maintain our 2020 target even if it is challenging.
We have harmonised reporting standards across the Group, and selected integrated HS&E software for a pilot project to take place in 2019. In addition, we rolled out a common set of ‘Golden Safety Principles and Rules’ during our fi rst
participation in the 2018 ILO World Day for Health and Safety at Work initiative.
We are on track and we will move forward with the defi ned programme of adding two new countries every
year.
Analysis of our results in Norway and Sweden is ongoing. Clear action plans will be developed and key focal points for
each country will be identifi ed. In 2019, engagement surveys will be repeated in Belgium, the UK and Spain. France and the
Netherlands will be added.
1 For ‘Data Protection’ and ‘Ethics Policy’ the status ‘completed’ is only achieved if the offi ce employee obtains a test result of minimum 80% at the end of the module.
INNOVATION FULFILLING SOCIETAL
NEEDS
OPTIMISING CARBON
FOOTPRINT
RESOURCE EFFICIENCY
Sustainability Index (Percentage
of R&D projects classifi ed as
sustainable)
45%(**) 54%
Recticel carbon footprint
(tonnes of CO2e)1.082.707 tonnes 1.090.548 tonnes
Positive impact Recticel
expressed in tonnes of avoided
CO2e in use phase
38.767.116 tonnes 39.391.355 tonnes
Tonnes of recycled fl exible foam
produced by Recticel5.567 tonnes 5.803 tonnes
Number of legal training courses
provided by the Corporate Legal
Team as face-to-face meetings
and e-learning modules
completed
425 496
Work accident frequency rate 5,8 6
The number of countries in
which engagement surveys
are conducted among blue and
white collars
2 countries 2 countries
SUSTAINABLE SUSTAINABLE SUSTAINABLE SUSTAINABLE SUSTAINABLE SUSTAINABLE SUSTAINABLE SUSTAINABLE SUSTAINABLE SUSTAINABLE SUSTAINABLE SUSTAINABLE SUSTAINABLE SUSTAINABLE SUSTAINABLE SUSTAINABLE SUSTAINABLE SUSTAINABLE SUSTAINABLE SUSTAINABLE SUSTAINABLE SUSTAINABLE SUSTAINABLE SUSTAINABLE SUSTAINABLE SUSTAINABLE SUSTAINABLE INNOVATION PLANINNOVATION PLANINNOVATION PLANINNOVATION PLANINNOVATION PLANINNOVATION PLANINNOVATION PLANINNOVATION PLANINNOVATION PLANINNOVATION PLANINNOVATION PLANINNOVATION PLANINNOVATION PLANINNOVATION PLANINNOVATION PLANINNOVATION PLANINNOVATION PLANINNOVATION PLANINNOVATION PLANINNOVATION PLANINNOVATION PLANINNOVATION PLANINNOVATION PLANINNOVATION PLANINNOVATION PLANINNOVATION PLANINNOVATION PLANINNOVATION PLANINNOVATION PLANINNOVATION PLANINNOVATION PLANINNOVATION PLANINNOVATION PLANINNOVATION PLAN
MATERIALASPECT KPI TARGET
Sustainability index.
(scope: innovation pipeline Sustainable Innovation
Department)
Recticel Carbon footprint indicator expressed in
tonnes of CO2 equivalent compared to the 100% activity level in 2013.
(scope: production sites)
The method of calculation is derived from the Cradle to
Grave method.
Net Recticel Impact Ratio (whole value chain) defi ned
as ratio of the Recticel Positive Impact to the
Recticel Carbon Footprint. The Recticel Positive Impact
is expressed in tonnes of avoided CO2 equivalent in
use phase .
(using appropriate method of calculation per type of product and
using appropriate conversion factors calculated by a third party)
Tonnes of recycled fl exible foam produced by Recticel.
100% increase by 2020 compared to 2015.
The increase is possible if fl exible foam production
waste is gradually replaced by post-consumer waste.
80% of active R&D projects classifi ed as sustainable by
2020 according to the Sustainability Index.
Reduce Recticel Carbon Footprint Indicator
by 25% in 2020 and by 40% in 2030.
Increase Net Recticel Impact Ratio from 20* in 2013 to 30 by 2020 and
50 (40) by 2030.
We have reached our 2020 target three years early and have amended
our 2030 target to 50.
* We have reviewed our method of calculation. The original results
over 2013, 2014, 2015 were 20, 20, 26.
2018 2019
40% 45% 54%
2015 2016 201720142013 2020
80%66% 62%Target
2018 2019
60%
2015 2016 201720142013
75%
2020 2030
84%100%100% 83% 83% 83% 82%Target Target
2018 2019
30 50(40)
2015 2016 201720142013 2020 2030
37 41342827 36 36
Target Target
2018 2019
-10% -17% -27% -18%
2015 2016 201720142013
100%
2020
BASELINE
Target
SUSTAINABILITY STRATEGY SUMMARY
RECT SUS20 4pager_EN_V2.indd 1RECT SUS20 4pager_EN_V2.indd 1 29/04/2020 17:3129/04/2020 17:31
COMMENTS EVOLUTIONS
The number of active R&D projects aimed at ground-breaking sustainable development research is constantly increasing. This is not refl ected in the 2019 result that remains stable due to the strict assessment methodology
we developed in 2015. In our Sustainability Index, we currently compare new projects with their predecessors and assess whether there is a signifi cant
improvement on all People and Planet aspects. For projects such as biobased or recycled materials, it is almost impossible to score suffi ciently high on all sub-criteria to be classifi ed as sustainable. The assessment methodology
needs to be re-evaluated. We are confi dent that within our R&D projects the focus on sustainable development is in line with our strategic intention.
In 2020 we will re-evaluate and improve our Sustainability Index scoring
methodogy.
SUSTAINABLE SUSTAINABLE SUSTAINABLE SUSTAINABLE SUSTAINABLE SUSTAINABLE SUSTAINABLE SUSTAINABLE SUSTAINABLE SUSTAINABLE SUSTAINABLE SUSTAINABLE SUSTAINABLE SUSTAINABLE SUSTAINABLE SUSTAINABLE SUSTAINABLE SUSTAINABLE SUSTAINABLE SUSTAINABLE SUSTAINABLE SUSTAINABLE SUSTAINABLE SUSTAINABLE SUSTAINABLE SUSTAINABLE SUSTAINABLE INNOVATION PLANINNOVATION PLANINNOVATION PLANINNOVATION PLANINNOVATION PLANINNOVATION PLANINNOVATION PLANINNOVATION PLANINNOVATION PLANINNOVATION PLANINNOVATION PLANINNOVATION PLANINNOVATION PLANINNOVATION PLANINNOVATION PLANINNOVATION PLANINNOVATION PLANINNOVATION PLANINNOVATION PLANINNOVATION PLANINNOVATION PLANINNOVATION PLANINNOVATION PLANINNOVATION PLANINNOVATION PLANINNOVATION PLANINNOVATION PLANINNOVATION PLANINNOVATION PLANINNOVATION PLANINNOVATION PLANINNOVATION PLANINNOVATION PLANINNOVATION PLAN
There have been no fundamental changes over the last three years in footprint reduction. The impact of the new CO2 polyol is still limited,
as products have only been recently introduced to the market. We are committed to our target.
We expect an important reduction in 2020 due to the increasing use of end-of-life
foam
The growing impact of the Insulation business line volume continues to have a positive impact on the multiple.
We expect that the positive impact of further Insulation growth will continue.
In addition, the reduction of the Recticel carbon footprint will also impact the value.
The volumes realised with traditional bonded foam continue to decrease and are compensated by higher volumes in fi ber-bonded foam. Since the end of 2019, we have started to replace production waste by end-of-life
foam in fi ber-bonded foam acoustic insulation and bedding applications. This evolution will have a positive impact in 2020 but we take into account that we
might not realise our target.
We anticipate that the volumes of end-of-life foam will signifi cantly increase in
2020 and beyond. We will also introduce this recycled material in our Bedding
products, more specifi cally in bedframes and boxsprings. We expect that the use of end-of-life foam will also have a positive
impact on our carbon footprint.
RECT SUS20 4pager_EN_V2.indd 2RECT SUS20 4pager_EN_V2.indd 2 29/04/2020 17:3129/04/2020 17:31
RECTICEL ANNUAL REPORT 2019 I 129RECTICEL ANNUAL REPORT 2019 I 128

Sustainability Index (Percentage
of R&D projects classifi ed as
sustainable)
45%(**) 54%
Recticel carbon footprint
(tonnes of CO2e)1.082.707 tonnes 1.090.548 tonnes
Positive impact Recticel
expressed in tonnes of avoided
CO2e in use phase
38.767.116 tonnes 39.391.355 tonnes
Tonnes of recycled fl exible foam
produced by Recticel5.567 tonnes 5.803 tonnes
Number of legal training courses
provided by the Corporate Legal
Team as face-to-face meetings
and e-learning modules
completed
425 496
Work accident frequency rate 5,8 6
The number of countries in
which engagement surveys
are conducted among blue and
white collars
2 countries 2 countries
BUSINESS ETHICS AND INTEGRITY
REDUCE HS&E IMPACT
OF OUR ACTIVITIES
AN INSPIRING AND
REWARDING PLACE TO
WORK
PEOPLE PEOPLE PEOPLE PEOPLE PEOPLE PEOPLE PEOPLE PEOPLE PEOPLE PEOPLE PEOPLE PEOPLE PEOPLE PEOPLE PEOPLE PEOPLE PRIORITY PLANPRIORITY PLANPRIORITY PLANPRIORITY PLANPRIORITY PLANPRIORITY PLANPRIORITY PLANPRIORITY PLANPRIORITY PLANPRIORITY PLANPRIORITY PLANPRIORITY PLANPRIORITY PLANPRIORITY PLANPRIORITY PLANPRIORITY PLANPRIORITY PLANPRIORITY PLANPRIORITY PLANPRIORITY PLANPRIORITY PLANPRIORITY PLANPRIORITY PLANPRIORITY PLANPRIORITY PLANPRIORITY PLANPRIORITY PLANPRIORITY PLANPRIORITY PLAN
MATERIALASPECT KPI TARGET
Number of legal training courses provided by the Corporate Legal Team and the IP Offi cer (SID)
as face-to-face meetings attended and e-learning
modules completed.
Frequency work accidents represents the average on
Group level for all our plants and offi ces.
The number of countries in which engagement surveys are conducted among blue
and white collars.
Two new countries each year.
Increase the number of legal training courses
provided by the Corporate Legal Team and the IP Offi cer (SID)
as face-to-face meetings attended and e-learning modules completed by
5% per year (cumulative) compared to 460 in 2015.
Frequency = < 3 by 2020
number of accidents x 1,000,000
number of hours performed
5264254602018 20192015 2016 201720142013
4.631 5.309
6 5.8 4.45.88.48.48.8
2018 20192015 2016 201720142013
3
2020
Target
2015 2016 2017
Belgium +United Kingdom,
Spain
Belgium,United Kingdom,
Spain +France, the Netherlands
Poland, Romania
2018 2019
Sweden, NorwayBelgium
*
RECT SUS20 4pager_EN_V2.indd 3RECT SUS20 4pager_EN_V2.indd 3 29/04/2020 17:3129/04/2020 17:31
COMMENTS EVOLUTIONS
The number of training courses attended has increased with 14% compared to 2018. We have expanded our
range of mandatory Legal e-learnings for all Recticel offi ce employees with a third training course, Basics of Contract
Law. (1)
In order to further deepen the knowledge of all Recticel managers and employees on ethics and integrity, we will
organise in 2020 compulsory face-to-face trainings for white and blue collar employees in all our locations.
We will reconsider our KPI and target for 2020, as we have surpassed our goal of a 5% increase per year (cumulative).
We see a signifi cant drop in the frequency compared to last year and are pleased that the ongoing efforts to keep safety top of mind are beginning to bear fruit. We hope that this trend reversal will continue in 2020, although it
will remain a challenge to meet our target.
In 2020 we will introduce a new way of embedding our Golden Safety Rules and Principles within the organisation. All blue and white collar employees worldwide can master
the basic safety guidelines and test their understanding in an interactive game based on real-life situations and problems.
We will also continue to harmonise our reporting standards by implementing a company-wide HS&E reporting tool.
We are on track and we will move forward with the defi ned programme of adding two new countries every
year.
The analysis of our results in France and the Netherlands (new countries added in 2019) and in Belgium, UK, Spain
(countries where the survey was repeated) is ongoing. Clear action plans will be developed per country. In 2020, we will roll out the initiative in Finland and Estonia and repeat the
engagement survey in Poland and Romania.
PEOPLE PEOPLE PEOPLE PEOPLE PEOPLE PEOPLE PEOPLE PEOPLE PEOPLE PEOPLE PEOPLE PEOPLE PEOPLE PEOPLE PEOPLE PEOPLE PRIORITY PLANPRIORITY PLANPRIORITY PLANPRIORITY PLANPRIORITY PLANPRIORITY PLANPRIORITY PLANPRIORITY PLANPRIORITY PLANPRIORITY PLANPRIORITY PLANPRIORITY PLANPRIORITY PLANPRIORITY PLANPRIORITY PLANPRIORITY PLANPRIORITY PLANPRIORITY PLANPRIORITY PLANPRIORITY PLANPRIORITY PLANPRIORITY PLANPRIORITY PLANPRIORITY PLANPRIORITY PLANPRIORITY PLANPRIORITY PLANPRIORITY PLANPRIORITY PLAN
We see a signifi cant drop in the frequency compared to last year and are pleased that the ongoing efforts to keep safety top of mind are beginning to bear fruit. We hope that this trend reversal will continue in 2020, although it
will remain a challenge to meet our target.
In 2020 we will introduce a new way of embedding our Golden Safety Rules and Principles within the organisation. All blue and white collar employees worldwide can master
the basic safety guidelines and test their understanding in an interactive game based on real-life situations and problems.
We will also continue to harmonise our reporting standards by implementing a company-wide HS&E reporting tool.
We are on track and we will move forward with the defi ned programme of adding two new countries every
year.
The analysis of our results in France and the Netherlands (new countries added in 2019) and in Belgium, UK, Spain
(countries where the survey was repeated) is ongoing. Clear action plans will be developed per country. In 2020, we will roll out the initiative in Finland and Estonia and repeat the
engagement survey in Poland and Romania.
1 For “Data Protection”, “Ethics Policy” and “Basics of Contract Law” the status “completed” is only achieved if the offi ce employee obtains a test result of minimum 80% at the end of the module.
RECT SUS20 4pager_EN_V2.indd 4RECT SUS20 4pager_EN_V2.indd 4 29/04/2020 17:3129/04/2020 17:31
RECTICEL ANNUAL REPORT 2019 I 131RECTICEL ANNUAL REPORT 2019 I 130

2.3.3. Independent limited assurance on non-financial information statement
RECTICEL ANNUAL REPORT 2019 I 133RECTICEL ANNUAL REPORT 2019 I 132

2.4. Financial report
RECTICEL ANNUAL REPORT 2019 I 135RECTICEL ANNUAL REPORT 2019 I 134

a These sections are an integral part of the Report by the Board of Directors, and comprise the information as required by the Belgian Company Code for the annual consolidated financial statements.
2.4.2.5.5. Interests in joint ventures and associates . . . . . . . . . . . . . . . . . . . . . . .184
2.4.2.5.6. Other financial assets . . . . . . . . . . . . . . . . . . . . . . . . . . . . . . . . . . . . . . . . .186
2.4.2.5.7. Inventories . . . . . . . . . . . . . . . . . . . . . . . . . . . . . . . . . . . . . . . . . . . . . . . . . . . 187
2.4.2.5.8. Contract assets and contract liabilities . . . . . . . . . . . . . . . . . . . . . . . . . 188
2.4.2.5.9. Trade receivables and other receivables . . . . . . . . . . . . . . . . . . . . . . . .190
2.4.2.5.10. Cash and cash equivalents . . . . . . . . . . . . . . . . . . . . . . . . . . . . . . . . . . . . 191
2.4.2.5.11. Assets held for sale . . . . . . . . . . . . . . . . . . . . . . . . . . . . . . . . . . . . . . . . . . . 191
2.4.2.5.12. Share capital . . . . . . . . . . . . . . . . . . . . . . . . . . . . . . . . . . . . . . . . . . . . . . . . . 192
2.4.2.5.13. Pensions and similar obligations . . . . . . . . . . . . . . . . . . . . . . . . . . . . . . . 192
2.4.2.5.14. Provisions . . . . . . . . . . . . . . . . . . . . . . . . . . . . . . . . . . . . . . . . . . . . . . . . . . . . 197
2.4.2.5.15. Financial liabilities . . . . . . . . . . . . . . . . . . . . . . . . . . . . . . . . . . . . . . . . . . . . 198
2.4.2.5.16. Trade and other payables . . . . . . . . . . . . . . . . . . . . . . . . . . . . . . . . . . . . .199
2.4.2.5.17. Financial instruments and financial risks . . . . . . . . . . . . . . . . . . . . . . . 200
2.4.2.5.18. Business combinations and disposals . . . . . . . . . . . . . . . . . . . . . . . . . . 204
2.4.2.5.19. Capital management . . . . . . . . . . . . . . . . . . . . . . . . . . . . . . . . . . . . . . . . 204
2.4.2.6. Miscellaneous . . . . . . . . . . . . . . . . . . . . . . . . . . . . . . . . . . . . . . . . . . . . . . . . . . . . . . . . . 204
2.4.2.6.1. Off-balance sheet items . . . . . . . . . . . . . . . . . . . . . . . . . . . . . . . . . . . . . . 204
2.4.2.6.2. Share-based payments . . . . . . . . . . . . . . . . . . . . . . . . . . . . . . . . . . . . . . . 205
2.4.2.6.3. Events after the reporting date . . . . . . . . . . . . . . . . . . . . . . . . . . . . . . . 207
2.4.2.6.4. Related party transactions . . . . . . . . . . . . . . . . . . . . . . . . . . . . . . . . . . . 208
2.4.2.6.5. Remuneration of the Board of Directors and of the Management Committee . . . . . . . . . . . . . . . . . . . . . . . . . . . . . . . 209
2.4.2.6.6. Exchange rates . . . . . . . . . . . . . . . . . . . . . . . . . . . . . . . . . . . . . . . . . . . . . . 209
2.4.2.6.7. Staff . . . . . . . . . . . . . . . . . . . . . . . . . . . . . . . . . . . . . . . . . . . . . . . . . . . . . . . . 210
2.4.2.6.8. Audit and non-audit services provided by the statutory auditor . 210
2.4.2.6.9. Contingent assets and liabilities . . . . . . . . . . . . . . . . . . . . . . . . . . . . . . . 210
2.4.2.6.10. Reconciliation table of Alternative Performance Measures . . . . . . . . 211
2.4.3. Recticel s.a./n.v. – General information . . . . . . . . . . . . . . . . . . . . . . . . . . . . . . . . . . . . . . . . .214
2.4.4. Recticel s.a./n.v. – Condensed statutory accounts . . . . . . . . . . . . . . . . . . . . . . . . . . . . . . . 215
2.4.5. Risk factors and risk managementa . . . . . . . . . . . . . . . . . . . . . . . . . . . . . . . . . . . . . . . . . . . . . 217
2.4.6. Declaration by responsible officersa . . . . . . . . . . . . . . . . . . . . . . . . . . . . . . . . . . . . . . . . . . . . 221
2.4.7. Auditor’s report on the consolidated financial statements for the year ending 31 December 2019a . . . . . . . . . . . . . . . . . . . . . . . . . . . . . . . . . . . . . . . . 222
3. GLOSSARY . . . . . . . . . . . . . . . . . . . . . . . . . . . . . . . . . . . . . . . . . . . . . . . . . . . . . . . . . . . . . . . . . . 229
4. KEY FIGURES 2010-2019 . . . . . . . . . . . . . . . . . . . . . . . . . . . . . . . . . . . . . . . . . . . . . . . . . . . . . 231
2.4. Financial report
2.4.1. Consolidated financial statementsa . . . . . . . . . . . . . . . . . . . . . . . . . . . . . . . . . . . . . . . . . . . . 138
2.4.1.1. Consolidated income statement . . . . . . . . . . . . . . . . . . . . . . . . . . . . . . . . . . . . . . . . 138
2.4.1.2. Earnings per share . . . . . . . . . . . . . . . . . . . . . . . . . . . . . . . . . . . . . . . . . . . . . . . . . . . . . 138
2.4.1.3. Consolidated statement of comprehensive income . . . . . . . . . . . . . . . . . . . . . . . . 139
2.4.1.4. Consolidated statement of financial position . . . . . . . . . . . . . . . . . . . . . . . . . . . . . .140
2.4.1.5. Consolidated cash flow statement . . . . . . . . . . . . . . . . . . . . . . . . . . . . . . . . . . . . . . . 141
2.4.1.6. Statement of changes in shareholders’ equity . . . . . . . . . . . . . . . . . . . . . . . . . . . . . 143
2.4.2. Notes to the consolidated financial statements for the year ending 31 December 2019a . . . . . . . . . . . . . . . . . . . . . . . . . . . . . . . . . . . . . . . . . . . . . . . . . . . . 144
2.4.2.1. Summary of significant accounting policies . . . . . . . . . . . . . . . . . . . . . . . . . . . . . . .144
2.4.2.1.1. Statement of compliance – basis of preparation . . . . . . . . . . . . . . . . .144
2.4.2.1.2. Changes in accounting policies and disclosures . . . . . . . . . . . . . . . . .144
2.4.2.1.3. General principles . . . . . . . . . . . . . . . . . . . . . . . . . . . . . . . . . . . . . . . . . . . .146
2.4.2.1.4. Key judgments and major sources of estimation uncertainty . . . . . 157
2.4.2.2. Changes in scope of consolidation . . . . . . . . . . . . . . . . . . . . . . . . . . . . . . . . . . . . . . . 162
2.4.2.3. Business and geographical segments . . . . . . . . . . . . . . . . . . . . . . . . . . . . . . . . . . . . 162
2.4.2.3.1. Business segments . . . . . . . . . . . . . . . . . . . . . . . . . . . . . . . . . . . . . . . . . . . 162
2.4.2.3.2 Geographical information . . . . . . . . . . . . . . . . . . . . . . . . . . . . . . . . . . . . .166
2.4.2.4. Income statement . . . . . . . . . . . . . . . . . . . . . . . . . . . . . . . . . . . . . . . . . . . . . . . . . . . . . . 167
2.4.2.4.1. Gross profit . . . . . . . . . . . . . . . . . . . . . . . . . . . . . . . . . . . . . . . . . . . . . . . . . . 167
2.4.2.4.2. General and administrative expenses - Sales and marketing expenses – Research and development expenses . . . . . . . . . . . . . . . . 167
2.4.2.4.3. Other operating revenues and expenses . . . . . . . . . . . . . . . . . . . . . . . . 168
2.4.2.4.4. Earnings before interest and taxes (EBIT) . . . . . . . . . . . . . . . . . . . . . . . 168
2.4.2.4.5. Financial result . . . . . . . . . . . . . . . . . . . . . . . . . . . . . . . . . . . . . . . . . . . . . . . 170
2.4.2.4.6. Income taxes . . . . . . . . . . . . . . . . . . . . . . . . . . . . . . . . . . . . . . . . . . . . . . . . . 170
2.4.2.4.7. Dividends . . . . . . . . . . . . . . . . . . . . . . . . . . . . . . . . . . . . . . . . . . . . . . . . . . . . 173
2.4.2.4.8. Basic earnings per share . . . . . . . . . . . . . . . . . . . . . . . . . . . . . . . . . . . . . . 173
2.4.2.4.9. Diluted earnings per share . . . . . . . . . . . . . . . . . . . . . . . . . . . . . . . . . . . . . 174
2.4.2.5. Statement of financial position . . . . . . . . . . . . . . . . . . . . . . . . . . . . . . . . . . . . . . . . . . 175
2.4.2.5.1. Intangible assets . . . . . . . . . . . . . . . . . . . . . . . . . . . . . . . . . . . . . . . . . . . . . 175
2.4.2.5.2. Property, plant & equipment . . . . . . . . . . . . . . . . . . . . . . . . . . . . . . . . . . . 177
2.4.2.5.3. Right-of-use assets . . . . . . . . . . . . . . . . . . . . . . . . . . . . . . . . . . . . . . . . . . . 179
2.4.2.5.4. Subsidiaries, joint ventures and associates . . . . . . . . . . . . . . . . . . . . . .180
a These sections are an integral part of the Report by the Board of Directors, and comprise the information as required by the Belgian Company Code for the annual consolidated financial statements.
RECTICEL ANNUAL REPORT 2019 I 137RECTICEL ANNUAL REPORT 2019 I 136
table of contents

2.4.1.3. Consolidated statement of comprehensive incomein thousand EUR
Group Recticel NOTES * 2019 2018
Result for the period after taxes 24 718 28 849
Other comprehensive income
Items that will not subsequently be recycled to profit and loss
Remeasurement gains/losses on defined benefit plans (6 432) 4 529
Deferred taxes on items that will not subsequently be recycled to profit and loss 746 (502)
Currency translation differences (193) (19)
Share in other comprehensive income in joint ventures and associates 2.4.2.5.5. (925) 449
Total (6 804) 4 457
Items that subsequently may be recycled to profit and loss
Hedging reserves 0 665
Currency translation differences 3 296 (1 822)
Foreign currency translation reserve difference to recycle in the income statement 368 0
Deferred taxes on items that subsequently may be recyled to profit and loss 0 (117)
Share in other comprehensive income in joint ventures and associates 2.4.2.5.5. 47 (806)
Total 3 711 (2 080)
Other comprehensive income net of tax (3 093) 2 377
TOTAL COMPREHENSIVE INCOME FOR THE PERIOD 21 624 31 226
of which attributable to non-controlling interests (44) 0
of which attributable to the owners of the parent 21 668 31 226
* The accompanying notes are an integral part of this statement of comprehensive income.
2.4.1. Consolidated financial statements
The consolidated financial statements have been authorised for issue by the Board of Directors on 27 April 2020. They have been prepared in accordance with IFRS accounting policies, details of which are given below.
The Group has initially applied IFRS 16 Leases at 01 January 2019. According to the transition dispositions, the Group has selected to apply IFRS 16 using the modified retrospective approach, i.e. not restating the comparative information.
RECTICEL ANNUAL REPORT 2019 I 139RECTICEL ANNUAL REPORT 2019 I 138
2.4.1.1. Consolidated income statementin thousand EUR
Group Recticel NOTES* 2019 2018
Sales 2.4.2.3. 1 038 517 1 117 652
Distribution costs (60 840) (59 973)
Cost of sales (786 620) (856 056)
Gross profit 2.4.2.4.1. 191 057 201 623
General and administrative expenses 2.4.2.4.2. (73 561) (70 562)
Sales and marketing expenses 2.4.2.4.2. (72 743) (72 593)
Research and development expenses 2.4.2.4.2. (11 599) (11 042)
Impairment of goodwill, intangible and tangible assets 2.4.2.3. (1 821) (5 819)
Other operating revenues 2.4.2.4.3. 20 274 17 900
Other operating expenses 2.4.2.4.3. (23 730) (26 730)
Income from joint ventures and associates 2.4.2.5.5. 9 271 10 170
EBIT 2.4.2.4.4. 37 148 42 947
Interest income and expenses (6 963) (3 253)
Other financial result (1 264) (632)
Financial result 2.4.2.4.5. (8 227) (3 886)
Result of the period before taxes 28 921 39 061
Income taxes 2.4.2.4.6. (4 203) (10 212)
Result of the period after taxes 24 718 28 849
of which non-controlling interests (44) 0
of which share of the Group 24 762 28 849
* The accompanying notes are an integral part of this income statement.
With respect to the application of IFRS 16 and its impact on the consolidated income statement reference is made to note 2.4.2.1.2.
2.4.1.2. Earnings per sharein EUR
Group Recticel NOTES * 2019 2018
Basic earnings per share 2.4.2.4.8. 0.45 0.53
Diluted earnings per share 2.4.2.4.9. 0.45 0.52
The basic earnings per share are calculated on the basis of the weighted average number of shares outstanding during the period.
The diluted earnings per share are calculated on the basis of the weighted average number of shares outstanding during the period, increased for the subscription rights in-the-money.

2.4.1.5. Consolidated cash flow statementin thousand EUR
Group Recticel NOTES * 2019 2018
EARNINGS BEFORE INTEREST AND TAXES (EBIT) 2.4.2.4.4. 37 148 42 947
Amortisation of intangible assets 2.4.2.5.1. 2 667 2 629
Depreciation of tangible assets 2.4.2.5.2. 51 736 27 368
Amortisation of deferred long term and upfront payment 2.4.2.4.4. 1 846 1 637
Impairment goodwill 2.4.2.3.1. 0 1 000
Impairment losses on intangible assets 2.4.2.5.1. 358 0
Impairment losses on tangible assets 2.4.2.5.2. 1 463 4 819
Write-offs/(write-backs) on assets and shares of affiliates 667 508
Changes in provisions (6 740) (2)
Fair value measurement of options Proseat (3 762) 0
(Gains) / Losses on disposals of assets and shares (3 740) (671)
Income from joint ventures and associates (9 270) (10 170)
Result transfer (38) 0
GROSS OPERATING CASH FLOW BEFORE WORKING CAPITAL MOVEMENTS 72 336 70 065
Changes in working capital 1 (938) (4 138)
Trade and other long-term debt maturing within one year (91) (11) 1
Movements of tax credit (639) (2 548) 1
Income taxes paid (3 899) (5 996)
NET CASH FLOW FROM OPERATING ACTIVITIES (a) 66 768 57 372
Interests received 450 284
Dividends received 7 607 5 500
Investments and subscription capital increase 2 (7 476) (125)
Increase of loans and receivables 1 188 (123)
Decrease of loans and receivables 0 2 748
Investments in intangible assets 2.4.2.5.1. (4 502) (3 205)
Investments in property, plant and equipment 2.4.2.5.2. (50 489) (45 873)
Investment in associates 2.4.2.5.5. 0 (2 040)
Disposals of intangible assets 2.4.2.5.1. 1 110
Disposals of property, plant and equipment 2.4.2.5.2. 1 907 453
Disposal of investments 3 20 614 0
NET CASH FLOW FROM INVESTMENT ACTIVITIES (b) (30 717) (42 287)
Interests paid on financial debt (c) (2 453) (4 700)
Dividends paid (13 163) (12 023)
Increase/(Decrease) of capital 819 3 086
Increase of financial debt 51 169 55 690
Reimbursement of lease liabilities (including interests) (d) (24 612) (2 006)
Decrease of financial debt (13 151) (75 722)
NET CASH FLOW FROM FINANCING ACTIVITIES (e) (1 391) (35 676)
Effect of exchange rate changes (f) (697) 480
CHANGES IN CASH AND CASH EQUIVALENTS (a)+(b)+(e)+(f)+(g) 33 963 (20 111)
Net cash position opening balance 4 13 774 33 885
Net cash position closing balance 4 47 737 13 774
CHANGES IN CASH AND CASH EQUIVALENTS 33 963 (20 111)
NET FREE CASH FLOW (a)+(b)+(c)+(d) 8 987 8 379
1 Changes in working capital in 2019 are reported on a net basis versus on a gross basis in 2018; the difference being explained by doubtful receivables and inventory write-off(-back) previously reported in write-off(-back) on assets.
2 Investments and subscription capital increase : Proseat nv (6 584) Acquisition Turvac (880) Capital increase Sembella Matrace s.r.o. (12) Investments and subscription capital increase (7 476) 3 Disposals of financial investments Proseat affiliates 20 614 4 Opening balance of cash and cash equivalents of 2019 has been restated for the overdraft position in accordance with IAS 7. The opening balance for 2018 (EUR 33.9
million) has been amended to reflect this too (as published in Annual Report 2018: EUR 57.8 million).
The impact of the application of IFRS 16 is explained in section 2.4.2.1.2., and impacts primarily the depreciation level and interests paid on lease debt.
The partial divestment from the Proseat companies impacts the EBIT and is subsequently corrected in the gross operating cash flow (i.e. valorisation option structure, gain/(loss) on disposal of assets) and the net cash flow from investment activities. The amount in the item ‘Investments in and subscriptions to capital increases’ as well as ‘Proceeds on sale of shares of equity method investees’ refer mainly to the Proseat transaction (see 2.4.2.2. and 2.4.2.3.1.).
* The accompanying notes are an integral part of this cash flow statement.
in thousand EUR
Group Recticel NOTES * 31 DEC 2019 31 DEC 2018
Share capital 2.4.2.5.12. 138 494 138 068
Share premium 130 334 129 941
Share capital 268 828 268 009
Treasury shares (1 450) (1 450)
Other reserves (25 621) (19 214)
Retained earnings 51 227 39 636
Hedging and translation reserves (18 288) (22 003)
Equity - share of the Group 274 696 264 978
Equity attributable to non-controlling interests 701 0
Total equity 275 397 264 978
Pensions and similar obligations 2.4.2.5.13. 57 164 48 055
Provisions 2.4.2.5.14. 6 905 14 318
Deferred taxes 2.4.2.4.6. 10 023 9 650
Financial liabilities 2.4.2.5.15. 100 334 34 706
Non-current contract liabilities 2.4.2.5.8. 20 339 24 096
Other amounts payable 43 202
Non-current liabilities (1) 194 808 131 027
Pensions and similar obligations 2.4.2.5.13. 696 4 720
Provisions 2.4.2.5.14. 5 759 2 573
Financial liabilities 2.4.2.5.15. 117 415 90 021
Trade payables 2.4.2.5.16. 93 008 90 756
Current contract liabilities 2.4.2.5.8. 32 832 44 964
Income tax payables 1 229 3 061
Other amounts payable 2.4.2.5.16. 81 325 104 957
Current liabilities (2) 332 264 341 052
Total liabilities (1)+(2) 527 072 472 079
TOTAL EQUITY AND LIABILITIES 802 469 737 057
The impact of the application of IFRS 16 on the financial position is explained in section 2.4.2.1.2.
* The accompanying notes are an integral part of this statement of financial position.
2.4.1.4. Consolidated statement of financial positionin thousand EUR
Group Recticel NOTES * 31 DEC 2019 31 DEC 2018
Goodwill 2.4.2.3.1. 24 412 23 354
Intangible assets 2.4.2.5.1. 14 306 12 045
Property, plant & equipment 2.4.2.5.2. 227 617 232 541
Right-of-use assets 2.4.2.5.3. 105 110 0
Investment property 3 331 3 289
Investments in joint ventures and associates 2.4.2.5.4-5. 65 465 68 631
Other financial assets 2.4.2.5.6. 26 382 16 446
Non-current contract assets 2.4.2.5.8. 11 138 15 326
Deferred taxes 2.4.2.4.6. 24 108 20 468
Non-current assets 501 869 392 099
Inventories 2.4.2.5.7. 101 797 103 789
Trade receivables 2.4.2.5.9. 99 117 107 680
Current contract assets 2.4.2.5.8. 11 300 13 782
Other receivables and other financial assets 2.4.2.5.9. 32 667 55 226
Income tax receivables 1 448 5 587
Other investments 154 138
Cash and cash equivalents 2.4.2.5.10. 48 479 39 554
Assets held for sale 2.4.2.5.11. 5 638 19 201
Current assets 300 600 344 958
TOTAL ASSETS 802 469 737 057
* The accompanying notes are an integral part of this statement of financial position.
RECTICEL ANNUAL REPORT 2019 I 141RECTICEL ANNUAL REPORT 2019 I 140

Changes in interest-bearing borrowings
For the year ending 31 December 2019
in thousand EUR
Group Recticel 31 DEC 2018 CASH FLOWS IN 2019
NON-CASH CHANGES
31 DEC 2019CHANGE IN ACCOUNTING
POLICY IFRS 16
REASSESS-MENT
IFRS 16
COST OF DEBT
TRANSFER EXCHANGE DIFFERENCES
CHANGE IN SCOPEINTERESTS
ACCRUEDFAIR VALUE OF
HEDGING INSTRUMENTS
ACTUALISA-TION
Long term borrowings 17 201 4 408 0 0 0 0 0 (1 778) (58) 0 19 773
Short term borrowings 88 683 30 175 0 0 20 0 0 1 778 2 (19 734) 100 922
Lease liabilities 18 144 (21 177) 118 139 (24 576) 0 0 4 357 0 1 511 0 96 398
Accrued interest liabilities 700 (2 453) 0 0 2 302 (95) 0 0 (28) 232 657
Total liabilities from financing activities 124 727 10 953 118 139 (24 576) 2 321 (95) 4 357 0 1 427 (19 502) 217 750
see note 2.4.2.5.15. – Financial liabilities and note 2.4.2.5.3. – Right-of-use assets.
For the year ending 31 December 2018in thousand EUR
Group Recticel 31 DEC 2017 CASH FLOWS IN 2019
NON-CASH CHANGES
31 DEC 2018CHANGE IN ACCOUNTING
POLICY IFRS 16
REASSESS-MENT
COST OF DEBT
TRANSFER EXCHANGE DIFFERENCES
CHANGE IN SCOPEINTERESTS
ACCRUEDFAIR VALUE OF
HEDGING INSTRUMENTS
ACTUALISA-TION
Long term borrowings 78 002 (61 642) 0 0 0 0 0 840 0 0 17 201
Short term borrowings 44 538 43 431 0 0 852 0 0 (852) 713 0 88 683
Lease liabilities 19 855 (1 843) 0 0 0 0 132 0 0 0 18 144
Accrued interest liabilities 2 673 (4 863) 0 0 3 086 (370) 0 12 162 0 700
Total liabilities from financing activities 145 068 (24 916) 0 0 3 938 (370) 132 0 875 0 124 727
2.4.1.6. Statement of changes in shareholders’ equity
For the year ending 31 December 2019
in thousand EUR
Group Recticel CAPITAL SHARE PREMIUM TREASURY SHARES
OTHER RESERVES
RETAINED EARNINGS
TRANSLATION DIFFERENCES
AND HEDGING RESERVES
TOTAL SH AREHOLDERS'
EQUITY
NON- CONTROLLING
INTERESTS
TOTAL EQUITY, NON-
CONTROLLING INTERESTS INCLUDED
Balance at 31 December 2018 138 068 129 941 (1 450) (19 214) 39 636 (22 003) 264 978 0 264 978
Effect of initial application of IFRS 16 0 0 0 0 0 0 0 0 0
01 January 2019 Restated 138 068 129 941 (1 450) (19 214) 39 636 (22 003) 264 978 0 264 978
Dividends 0 0 0 0 (13 254) 0 (13 254) 0 (13 254)
Stock options (IFRS 2) 0 0 0 485 0 0 485 0 485
Capital movements (1) 426 393 0 (100) 100 0 819 0 819
Change in scope 0 0 0 0 0 0 0 745 745
Shareholders' movements 426 393 0 385 (13 154) 0 (11 950) 745 (11 205)
Profit or loss of the period 0 0 0 0 24 762 0 24 762 (44) 24 718
Other comprehensive income 0 0 0 (6 725) (84) 3 715 (3 094) 0 (3 094)
Reclassification 0 0 0 (67) 67 0 0 0 0
Balance at 31 December 2019 138 494 130 334 (1 450) (25 621) 51 227 (18 288) 274 696 701 275 397(1) see note 2.4.2.5.12.
For the year ending 31 December 2018in thousand EUR
Group Recticel CAPITAL SHARE PREMIUM TREASURY SHARES OTHER RESERVES RETAINED
EARNINGS
TRANSLATION DIFFERENCES
AND HEDGING RESERVES
TOTAL SHAREHOLDERS’
EQUITY
NON-CONTROLLING
INTERESTS
TOTAL EQUITY, NON-
CONTROLLING INTERESTS INCLUDED
Balance at 31 December 2017 136 941 127 982 (1 450) (22 633) 40 868 (19 922) 261 786 0 261 786
Effect of initial application of IFRS 15 0 0 0 0 (19 478) 0 (19 478) 0 (19 478)
Effect of initial application of IFRS 9 0 0 0 0 0 0 0 0 0
01 January 2018 Restated 136 941 127 982 (1 450) (22 633) 21 390 (19 922) 242 308 0 (19 478)
Dividends 0 0 0 0 (12 019) 0 (12 019) 0 (12 019)
Stock options (IFRS 2) 0 0 0 377 0 0 377 0 377
Capital movements (1) 1 127 1 959 0 (502) 502 0 3 086 0 3 086
Shareholders' movements 1 127 1 959 0 (125) (11 517) 0 (8 556) 0 (8 556)
Profit or loss of the period 0 0 0 0 28 849 0 28 849 0 28 849
Other comprehensive income 0 0 0 3 544 914 (2 081) 2 377 0 2 377
Balance at 31 December 2018 138 068 129 941 (1 450) (19 214) 39 636 (22 003) 264 978 0 264 978(1) see note 2.4.2.5.12.
RECTICEL ANNUAL REPORT 2019 I 143RECTICEL ANNUAL REPORT 2019 I 142

2.4.2.1. Summary of significant accounting policies
2.4.2.1.1. Statement of compliance - basis of preparation
Recticel s.a./n.v. (the ‘‘Company’’) is a public limited liability company incorporated in Belgium and listed on Euronext Brussels. The Company’s consolidated financial statements include the financial statements of the Company, its subsidiaries, interests in jointly controlled entities (joint ventures) and in associates, both accounted for under the equity method (together referred to as ‘‘the Group’’).
The consolidated financial statements have been prepared in accordance with International Financial Reporting Standards (IFRS) as endorsed by the European Union.
The accounting standards applied in the consolidated financial statements for the year ended 31 December 2019 are consistent with those used to prepare the consolidated financial statements for the year ended 31 December 2018, except for the application of IFRS 16 Leases and IFRIC 23.
2.4.2.1.2. Changes in accounting policies and disclosures
The Group has initially adopted IFRS 16 Leases from 01 January 2019. A number of other new standards are effective from 01 January 2019 but they do not have a material effect on the Group’s financial statements.
2.4.2.1.2.1. Impact of new IFRS pronouncements that are applicable starting from 01 January 2019
2.4.2.1.2.1.1. IFRS 16 Leases
IFRS 16 replaces existing leases guidance, including IAS 17 Leases, IFRIC 4 Determining whether an Arrangement contains a Lease, SIC-15 Operating Leases – Incentives and SIC-27 Evaluating the Substance of Transactions Involving the Legal Form of a Lease.
IFRS 16 introduces a single, on-balance sheet lease accounting model for lessees. A lessee recognises a right-of-use asset representing its right to use the underlying asset and a lease liability representing its obligation to make lease payments. There are recognition exemptions for short-term leases (<365
days) and leases of low-value items (<USD 5,000), of which the Group makes use.
In accordance with the transitional dispositions in IFRS 16, the standard has been adopted retrospectively with the cumulative effect of initially applying the new standard recognized on 01 January 2019 (i.e. modified retrospective approach). Comparative information has therefore not been restated for IFRS 16.
In adopting IFRS 16 for the first time, the Group has applied the following cumulative catch-up options upon initial application: • Leave comparatives as previously reported • Carry forward existing finance lease liabilities • Calculate outstanding lease liabilities (representing the
present value of future lease payments) for existing operating leases using an incremental borrowing rate at the date of transition
• Right-of-use is equal to lease liability • Use of hindsight in determining the lease term where the
contract contains options to extend or terminate the lease
Following the adoption of IFRS 16, the Group has adapted its accounting policy for leases. The new policy is described below. The adoption of IFRS 16 resulted in changes in accounting policies but did not impact the opening equity as per 01 January 2019. For the detailed impact on the opening balance sheet as per 01 January 2019 see below.
2.4.2.1.2.1.2. New accounting policy for leases
The Group has several leases for properties, machinery and equipment and cars and the rental contracts are typically closed for a fixed period. Lease terms are negotiated on an individual basis and contain a wide range of different terms and conditions.
Leases are recognised as a right-of-use asset and corresponding liability at the date of commencement of the lease, i.e. when the leased asset is available for use by the Group. Each lease payment is allocated between the liability and finance cost. The finance cost is charged to the income statement over the lease period to produce a constant periodic rate of interest on the remaining balance of the liability for each period. The right-of-use asset is depreciated over the shorter of the asset’s useful life and the lease term on a straight-line basis if the lease does not include a purchase option. If a purchase option is available and the Group judges that it is reasonably certain to be exercised, the right-of-use asset is depreciated over its useful life.
2.4.2. NOTES TO THE CONSOLIDATED FINANCIAL STATEMENTS FOR THE YEAR ENDING 31 DECEMBER 2019
Assets and liabilities arising from a lease are initially measured on a present value basis. Lease liabilities include the net present value of the following lease payments: • fixed payments (including in-substance fixed payments),
less any lease incentives receivable; • variable lease payments that are based on an index or a
rate; and • purchase option, if any - if the lessee is reasonably certain
to exercise that option.
The lease payments are discounted using the interest rate implicit in the lease, if that rate can be determined, or the Group’s incremental borrowing rate.
Right-of-use assets are measured at cost comprising the following: • the amount of the initial measurement of lease liability; • any lease payments made at or before the
commencement date; • any initial direct costs (except for the leases already
existing at transition date), and • dismantling costs.
Right-of-use assets are presented separately and lease liabilities as part of financial liabilities in the statement of financial position. All lease payments that are due within 12 months are classified as current liabilities. All lease payments that are due at least 12 months after the reporting date are classified as non-current liabilities.
Lease payments related to short-term leases and leases of low-value assets are recognised on a straight-line basis as an expense in profit or loss. Short-term leases are leases with a
lease term of 12 months or less. Low-value assets comprise mainly IT-equipment (laptops, tablets, mobile phones, pc’s) and small items of office equipment and furniture.
Some leases contain variable lease payments. Payments that vary due to the use of the underlying asset are variable lease payments (e.g. lease of property based on the number of square meters used). These variable lease payments are recognised as expense as incurred.
There are no material lease agreements whereby the Group is lessor; except for one building rented to the Eurofoam group.
2.4.2.1.2.1.3. Impact IFRS 16 on statement of financial position
Upon adoption of IFRS 16 (01 January 2019), the Group recognised lease liabilities amounting to EUR 118.1 million (of which EUR 99.3 million non-current lease liabilities and EUR 18.9 million current lease liabilities) in relation to leases which had previously been classified as ‘operating leases’ according to IAS 17 . These liabilities were measured at the present value of the remaining lease payments, discounted using the Group’s incremental borrowing rate as of 01 January 2019.
The weighted average discount rate applied per opening balance sheet date (01 January 2019) was 3.8%.
Following table presents a reconciliation between the note disclosing the non-cancellable lease commitments as reported in the 2018 consolidated financial statements and the lease liabilities recognised at transition date (01 January 2019):
in thousand EUR
Group Recticel
Minimum future payments as disclosed at December 31, 2018 100 150
Contracts excluded as not in scope of IFRS 16 (462)
Extension and termination options reasonably certain to be exercised 54 767
Recognition exemptions
Short-term leases (2 334)
Lease of low-value assets (476)
Minimum future payments in scope of IFRS 16 at December 31, 2018 151 644
Discount effect using the incremental borrowing rate at January 01, 2019 (33 505)
Lease liabilities recognised as a result of IFRS 16 at January 01, 2019 118 139
Finance lease liabilities recognised at December 31, 2018 18 145
Total lease liabilities recognised at January 01, 2019 136 284
The related right-of-use assets were measured at an amount equal to the lease liability, adjusted for prepaid rental expenses amounting to EUR 117.5 million.
RECTICEL ANNUAL REPORT 2019 I 145RECTICEL ANNUAL REPORT 2019 I 144

2.4.2.1.2.1.4. Impact IFRS 16 on equity
There has been no impact on the opening equity following the application of IFRS 16.
2.4.2.1.2.1.5. Impact IFRS 16 on income statement
For the twelve months ending December 31, 2019, depreciation expenses on right-of-use assets (including lease reassessments) were recognised for an amount of EUR 21.7 million. Interest expenses (included in financial expenses) were recognised for an amount of EUR 4.0 million.
In the consolidated income statement per December 31, 2019, rental expenses have been recognised for: • Short-term leases: EUR 2.2 million • Low-value leases: EUR 0.4 million • Other considerations: EUR 1.5 million
If IFRS 16 had not been applied in the consolidated income statement per December 31, 2019, the EBITDA would have been EUR 24.5 million lower, the EBIT EUR 2.8 million lower and net result EUR 1.2 million higher.
2.4.2.1.2.1.6. Impact IFRS 16 on alternative performance measures
The implementation of IFRS 16 modified the computation of the net free cash-flow. Considering that, as a result of IFRS 16, operationally nothing has changed and IFRS 16 is only an accounting change, the definition of net free cash-flow is adjusted to include the repayment of lease liabilities (i.e. excluding the interest expense).
As such, the net free cash-flow will be computed as follows: the sum of the (i) Net cash flow after tax from operating activities, (ii) the Net cash flow from investing activities, (iii) the Interest paid on financial liabilities and (iv) the decrease of lease liabilities; as shown in the consolidated cash flow statement.
2.4.2.1.2.1.7. IFRIC 23 Uncertainty over Income Tax Treatments, effective for annual periods beginning on or after 01 January 2019
IFRIC 23 clarifies the accounting for uncertainties in income taxes. The interpretation is to be applied to the determination of taxable profit (tax loss), tax bases, unused tax losses, unused tax credits and tax rates, when there is uncertainty over income tax treatments under IAS 12.
Despite the initial application of IFRIC 23, there was no impact in the opening equity as per January 1st, 2019, as the Group was already applying the principles of IFRIC 23 in the prior years.
2.4.2.1.2.2. New IFRS pronouncements that are applicable starting from 01 January 2023
2.4.2.1.2.2.1. IFRS 17 Insurance contracts
IFRS 17 is normally applicable to reinsurance contracts, but considering the limited size of the Group’s reinsurance subsidiary Recticel RE s.a., the Group does not expect that IFRS 17 will have a significant impact. In this respect the Group is still analysing the extent of IFRS 17.
2.4.2.1.3. General principlesCurrency of accountsThe financial statements are presented in thousand euro (EUR) (unless specified otherwise), which is the currency of the primary economic environment in which the Group operates. The financial statements of foreign operations are translated in accordance with the policies set out below under ‘Foreign Currencies’.
Historical cost conventionThe financial statements have been prepared on the historical cost basis, except as disclosed in the accounting policies below. Investments in equity instruments which are not quoted in an active market and whose fair value cannot be reliably measured by alternative valuation methods are carried at cost.
Foreign currenciesForeign currency transactions - Transactions in currencies other than EUR are accounted for at the exchange rates prevailing at the date of the transactions. At each reporting date, monetary assets and liabilities that are denominated in foreign currencies are translated at closing rate. Non-monetary assets and liabilities carried at fair value and denominated in foreign currencies are translated at the exchange rates prevailing at the date the fair value was determined. Gains and losses resulting from such translations are recognised in the financial result of the income statement, except when deferred in equity.
Translation from functional currency to the presentation currency - For purposes of presenting consolidated financial statements, the assets and liabilities of the Group’s foreign operations are translated at closing rate. Income and expenses are translated at the average exchange rates for the period unless exchange rates fluctuate significantly. Resulting exchange differences are recognised in other comprehensive income and accumulated in equity (attributable to non-controlling interests as appropriate). On disposal of a foreign operation (i.e. a disposal of the Group’s entire interest in a foreign operation, or a disposal involving loss of control over a subsidiary that includes a foreign operation, a disposal involving loss of joint control over a jointly controlled entity that includes a foreign operation, or a disposal involving loss of significant influence over an associate that includes a foreign operation), exchange differences accumulated in equity are recognised in the income statement.
In addition, in relation to a partial disposal of a subsidiary that does not result in the Group losing control over the subsidiary, the proportionate share of accumulated exchange differences is re-attributable to non-controlling interests and are not recognised in profit or loss. For all other partial disposals (i.e. partial disposals of associates or jointly controlled entities (joint ventures) that do not result in the Group losing significant influence or joint control), the proportionate share of the accumulated exchange differences is reclassified to profit or loss.
Goodwill and fair value adjustments arising on the acquisition of a foreign entity are treated as assets and liabilities of the foreign entity and translated at the closing rate.
Consolidation principlesConsolidated financial statements include subsidiaries and interests in jointly controlled entities (joint ventures) and associates accounted for under the equity method.
Consolidated financial statements are prepared using uniform accounting policies for like transactions and other events in similar circumstances.
All intra-group transactions, balances, income and expenses are eliminated in consolidation.
• SubsidiariesSubsidiaries are entities that are controlled directly or indirectly. Control is the power to govern the financial and operating policies of an entity to obtain benefits from its activities. Consolidation of subsidiaries starts from the date Recticel controls the entity until the date such control ceases.
Changes in the Group’s interest in a subsidiary that do not result in a loss of control are accounted for as equity transactions. The carrying amounts of the Group’s interests and the non-controlling interests are adjusted to reflect the changes in their relative interests in the subsidiary. Any difference between the amount by which the non-controlling interests are adjusted and the fair value of the consideration paid or received is recognised directly in equity.
However, when the Group loses control of a subsidiary, the profit or loss on disposal is calculated as the difference between (i) the aggregate of the fair value of the consideration received and the fair value of any retained interest and (ii) the previous carrying amount of the assets (including goodwill) and liabilities of the subsidiary and any non-controlling interests. Amounts previously recognised in other comprehensive income in relation to the subsidiary are accounted for (i.e. reclassified to profit or loss or transferred directly to retained earnings) in the same manner as would be required if the relevant assets or liabilities were disposed of. The fair value of any investment retained in the former subsidiary at the date when control is lost is regarded as the fair value on initial recognition for subsequent accounting under IFRS 9 Financial Instruments or, when applicable, the cost on initial recognition of an investment in an associate or jointly controlled entity.
• Jointly controlled entitiesIFRS 11 deals with how a joint arrangement of which two or more parties have joint control should be classified and accounted for. Under IFRS 11, there are only two types of joint arrangements – joint operations and joint ventures. The classification of joint arrangements under IFRS 11 is determined based on the rights and obligations of parties to the joint arrangements by considering the structure, the legal form of arrangements, the contractual terms agreed by the parties to the arrangement, and, when relevant, other facts and circumstances. A joint operation is a joint arrangement whereby the parties that have joint control of the arrangement (i.e. joint operators) have rights to the assets, and obligations for the liabilities, relating to the arrangement. A joint venture is a joint arrangement whereby the parties that have joint control of the arrangement (i.e. joint ventures) have rights to the net assets of the arrangement.
The initial and subsequent accounting of joint ventures and joint operations is different. Investments in joint ventures are accounted for using the equity method (proportionate consolidation is no longer allowed). Investments in joint operations are accounted for such that each joint operator recognises its assets (including its share in any assets jointly
The right-of-use assets for an amount of EUR 144.8 million recognised at transition date can be detailed as follows:
in thousand EUR
Group Recticel 31 DEC 2019 01 JAN 2019
Land and buildings 80 874 114 371
Plant, machinery and equipment 13 389 18 981
Furniture and vehicules 10 846 11 496
Total right-of-use assets 105 110 144 849
The amount of right-of-use assets presented earlier is composed of (i) changes in accounting policies (i.e. implementation of IFRS 16; EUR 117.5 million) and (ii) the transfer from Property, plant and equipment of the assets previously recorded as ‘finance leases’ (EUR 27.3 million).
RECTICEL ANNUAL REPORT 2019 I 147RECTICEL ANNUAL REPORT 2019 I 146
held), its liabilities (including its share of any liabilities incurred jointly), its revenue (including its share of revenue from the sale of the output by the joint operation) and its expenses (including its share of any expenses incurred jointly). Each joint operator accounts for the assets and liabilities, as well as revenues and expenses, relating to its interest in the joint operation in accordance with the applicable Standards.
The directors of the Group reviewed and assessed the classification of the Group’s investments in joint arrangements in accordance with the requirements of IFRS 11. The directors concluded that the Group’s investments in Eurofoam and in Proseat should be classified as a joint venture under IFRS 11 and accounted for using the equity method.
• Joint Ventures and AssociatesThe results and assets and liabilities of joint ventures and associates are incorporated in these consolidated financial statements using the equity method of accounting, except when the investment is classified as held for sale, in which case it is accounted for in accordance with IFRS 5 Non-current Assets Held for Sale and Discontinued Operations. Under the equity method, an investment in a joint venture and an associate is initially recognised in the consolidated statement of financial position at cost and adjusted thereafter to recognise the Group’s share of the profit or loss and other comprehensive income of the venture and the associate. When the Group’s share of losses of a venture and an associate exceeds the Group’s interest in that joint venture and associate (which includes any long-term interests that, in substance, form part of the Group’s net investment in the joint venture and associate), the Group discontinues recognising its share of further losses. Additional losses are recognised only to the extent that the Group has incurred legal or constructive obligations or made payments on behalf of the joint venture and associate.
Any excess of the cost of acquisition over the Group’s share of the net fair value of the identifiable assets, liabilities and contingent liabilities of a joint venture and an associate recognised at the date of acquisition is recognised as goodwill, which is included within the carrying amount of the investment. Any excess of the Group’s share of the net fair value of the identifiable assets, liabilities and contingent liabilities over the cost of acquisition, after reassessment, is recognised immediately in profit or loss.
IAS 28.28 only permits recognition of the gain or loss from downstream transactions “to the extent of unrelated investors’ interests in the associate or joint venture”. However, the standard does not specifically address the treatment of revenue derived from transactions with equity-method investees (i.e. revenue from the sale of goods, or interest revenue) and whether that revenue should be eliminated from the consolidated financial statements.
In respect of the treatment of revenues derived from transactions with joint ventures and associates (i.e. sales services, interest revenue, …), the Group has opted not to
eliminate its interest in these transactions. As a matter of example, Recticel receives EUR 100 interest income on a loan provided to a 50/50 joint venture. Under the accounting policy adopted by Recticel this interest income would be accounted for as EUR 100 interest income of the Group. The cost incurred by the joint venture would be accounted for on a proportional (50%) basis through “results in joint ventures and associates” without making any adjustment for the proportional interest held by Recticel.
The requirements of IAS 36 are applied to determine whether it is necessary to recognise any impairment loss with respect to the Group’s investment in a joint venture and an associate. When necessary, the entire carrying amount of the investment (including goodwill) is tested for impairment in accordance with IAS 36 Impairment of Assets as a single asset by comparing its recoverable amount (higher of fair value and fair value less costs to sell) with its carrying amount. Any impairment loss recognised forms part of the carrying amount of the investment. Any reversal of that impairment loss is recognised in accordance with IAS 36 to the extent that the recoverable amount of the investment subsequently increases.
Upon disposal of a joint venture and an associate that results in the Group losing significant influence over that joint venture and associate, any retained investment is measured at fair value at that date and the fair value is regarded as its fair value on initial recognition as a financial asset in accordance with IFRS 9. The difference between the previous carrying amount of the joint venture and associate attributable to the retained interest and its fair value is included in the determination of the gain or loss on disposal of the joint venture and associate. In addition, the Group accounts for all amounts previously recognised in other comprehensive income in relation to that joint venture and associate on the same basis as would be required if that joint venture and associate had directly disposed of the related assets or liabilities. Therefore, if a gain or loss previously recognised in other comprehensive income by that joint venture and associate would be reclassified to profit or loss on the disposal of the related assets or liabilities, the Group reclassifies the gain or loss from equity to profit or loss (as a reclassification adjustment) when it loses significant influence over that joint venture and associate.
• Business combinationsAcquisitions of businesses are accounted for using the acquisition method. The consideration for each acquisition is measured at the aggregate of the fair values (at the date of exchange) of assets given, liabilities incurred or assumed, and equity instruments issued by the Group in exchange for control of the acquiree. Acquisition-related costs are recognised in profit or loss as incurred.
When Recticel acquires an entity or business, the identifiable assets and liabilities of the acquiree are recognised at their fair value at acquisition date, except for:
• deferred tax assets or liabilities and liabilities or assets related to employee benefit arrangements are recognised and measured in accordance with IAS 12 Income Taxes and IAS 19 Employee Benefits respectively;
• liabilities or equity instruments related to share-based payment transactions of the acquiree or the replacement of an acquiree’s share-based payment transactions with share-based payment transactions of the Group are measured in accordance with IFRS 2 Share-based Payment at the acquisition date; and
• assets (or disposal groups) that are classified as held for sale in accordance with IFRS 5 Non-current Assets Held for Sale and Discontinued Operations are measured in accordance with that Standard.
Goodwill is measured as the excess of the sum of the consideration transferred, the amount of any non-controlling interests in the acquiree, and the fair value of the acquirer’s previously held equity interest in the acquiree (if any) over the net of the acquisition-date amounts of the identifiable assets acquired and the liabilities assumed. Where such a difference is negative, the excess is, after a reassessment of the values, recognised as income immediately as a bargain purchase gain.
Non-controlling interests (minority shareholders) that are present ownership interests and entitle their holders to a proportionate share of the entity’s net assets in the event of liquidation may be initially measured either at fair value or at the non-controlling interests’ proportionate share of the recognised amounts of the acquiree’s identifiable net assets. The choice of measurement basis is made on a transaction-by-transaction basis.
If Recticel increases its interest in an entity or business over which it did not yet exercise control (in principle increasing its interest up to and including 50% to 51% or more) (a business combination achieved in stages), the Group’s previously held equity interest in the acquiree is remeasured to fair value at the acquisition date (i.e. the date when the Group obtains control) and the resulting gain or loss, if any, is recognised in profit or loss.
If the initial accounting for a business combination is incomplete by the end of the reporting period in which the combination occurs, the Group reports provisional amounts for the items for which the accounting is incomplete. Those provisional amounts are adjusted during the measurement period (maximum one year after acquisition date), or additional assets or liabilities are recognised, to reflect new information obtained about facts and circumstances that existed as of the acquisition date that, if known, would have affected the amounts recognised as of that date.
Intangible assets acquired separatelyIntangible assets with finite useful lives that are acquired separately are carried at cost less accumulated amortisation and accumulated impairment losses. Amortisation is recognised on a straight-line basis over their estimated useful lives. The estimated useful life and amortisation method are reviewed at the end of each reporting period, with the effect of any changes in estimate being accounted for on a prospective basis.
Intangible assets with indefinite useful lives that are acquired separately are carried at cost less accumulated impairment losses.
Internally-generated intangible assets - research and development expenditureExpenditure on research activities is recognised as an expense in the period in which it is incurred.
An internally-generated intangible asset arising from development (or from the development phase of an internal project) is recognised if, and only if, all the following have been demonstrated: • the technical feasibility of completing the intangible asset
so that it will be available for use or sale; • the intention to complete the intangible asset and use or
sell it; • the ability to use or sell the intangible asset; • how the intangible asset will generate probable future
economic benefits; • the availability of adequate technical, financial and other
resources to complete the development and to use or sell the intangible asset; and
• the ability to measure reliably the expenditure attributable to the intangible asset during its development.
The amount initially recognised for internally-generated intangible assets is the sum of the expenditure incurred from the date when the intangible asset first meets the recognition criteria listed above. Where no internally-generated intangible asset can be recognised, development expenditure is recognised in profit or loss in the period in which it is incurred.
Intangible assets acquired in a business combinationIntangible assets acquired in a business combination and recognised separately from goodwill are initially recognised at their fair value at the acquisition date (which is regarded as their cost).
After initial recognition, intangible assets acquired in a business combination are reported at cost less accumulated amortisation and accumulated impairment losses, on the same basis as intangible assets that are acquired separately.
RECTICEL ANNUAL REPORT 2019 I 149RECTICEL ANNUAL REPORT 2019 I 148

Derecognition of intangible assets An intangible asset is derecognised on disposal, or when no future economic benefits are expected from use or disposal. Gains or losses arising from derecognition of an intangible asset, measured as the difference between the net disposal proceeds and the carrying amount of the asset, and are recognised in profit or loss when the asset is derecognised.
GoodwillGoodwill is measured as the excess of the sum of the consideration transferred, the amount of any non-controlling interests in the acquiree, and the fair value of the acquirer’s previously held equity interest in the acquiree (if any) over the net of the acquisition-date amounts of the identifiable assets acquired and the liabilities assumed.
Goodwill arising on an acquisition of a business is carried at cost less accumulated impairment losses, if any, and is presented separately in the consolidated statement of financial position.
Goodwill is reviewed for impairment at least annually. Any impairment loss is recognised immediately in the income statement and is not subsequently reversed.
On disposal of a subsidiary, associate or jointly controlled entity, the related goodwill is included in the determination of the profit or loss on disposal.
Property, plant and equipmentAn item of property, plant and equipment is recognised if it is probable that associated future economic benefits will flow to the Group and if its cost can be measured reliably. After initial recognition, all items of property, plant and equipment are stated at cost, less accumulated depreciation and impairment losses, except for land which is not depreciated. Cost includes all direct costs and all expenditure incurred to bring the asset to its working condition and location for its intended use.
Properties in the course of construction for production, supply or administrative purposes are carried at cost, less any recognised impairment loss. Cost includes professional fees and, for qualifying assets, borrowing costs capitalised in accordance with the Group’s accounting policy. Such properties are classified to the appropriate categories of property, plant and equipment when completed and ready for intended use. Depreciation of these assets, on the same basis as other property assets, commences when the assets are ready for their intended use.
Subsequent expenditure related to an item of property, plant and equipment is expensed as incurred.
Depreciation is provided over the estimated useful lives of the various classes of property, plant and equipment using the straight-line method. Depreciation starts when the assets are ready for their intended use. The estimated useful lives, residual values and depreciation method are reviewed at the end of
each reporting period, with the effect of any changes in estimate accounted for on a prospective basis.
Project-related assets are depreciated over the production period of the project. In case of reallocation of fully depreciated assets, the latter might require a reconditioning. These reconditioning costs are amortised over the term of the new project, without additional revaluation or reversal of any impairments.
The estimated useful lives of the most significant items of property, plant and equipment are within the following ranges:
The estimated useful lives of the most significant items of property, plant and equipment are within the following ranges: Land improvements : 25 years Offices : 25 to 40 years Industrial buildings : 25 years Plants : 10 to 15 years Machinery Heavy : 11 to 15 years Medium : 8 to 10 years Light : 5 to 7 years Pre-operating costs : 4 years Equipment : 5 to 10 years Furniture : 5 to 10 years Hardware : 3 to 10 years Vehicle fleet Cars : 4 years Trucks : 7 years
The gain or loss arising on the disposal or retirement of an asset is determined as the difference between the sales proceeds and the carrying amount of the asset and is recognised in the income statement.
Impairment of tangible and intangible assetsExcept for goodwill and intangible assets with an indefinite useful life which are tested for impairment at least annually, other tangible and intangible fixed assets are reviewed for impairment when there is an indication that their carrying amount will not be recoverable through use or sale. If an asset does not generate cash flows that are independent from other assets, the Group estimates the recoverable amount of the cash-generating unit to which the asset belongs.
The recoverable amount is the higher of fair value less costs to sell or value-in-use and the carrying amount. In assessing the fair value or value-in-use, the estimated future cash flows are discounted to their present value using a pre-tax discount rate that reflects current market assessments of the time value of money and the risks specific to the asset for which the estimates of future cash flows have been adjusted.
If the recoverable amount of an asset (or cash-generating unit) is estimated to be less than its carrying amount, the carrying amount of the asset (cash-generating unit) is reduced to its recoverable amount. An impairment loss is recognised as an expense immediately.
Where an impairment loss subsequently reverses, the carrying amount of the asset (or cash-generating unit) is increased to the revised estimate of its recoverable amount, but so that the increased carrying amount does not exceed the carrying amount that would have been determined had no impairment loss been recognised for the asset (or cash-generating unit) in previous years. However, impairment losses on goodwill are never reversed.
Non-current assets held for saleNon-current assets and disposal groups are classified as held for sale if their carrying amount will be recovered principally through a sale transaction rather than through continuing use. This condition is regarded as met only when the sale is highly probable and the asset (or disposal group) is available for immediate sale in its present condition. Management must be committed to the sale, which should be expected to qualify for recognition as a completed sale within one year from the date of classification.
Non-current assets (and disposal groups) classified as held for sale are measured at the lower of their previous carrying amount and fair value less costs to sell.
Investment propertyInvestment property, which is property held to earn rentals and/or for capital appreciation, is stated at its fair value at the reporting date. Gains or losses arising from changes in the fair value of investment property are included in profit or loss for the period in which they arise.
Financial assetsFinancial assets are recognised or derecognised on the trade date which is the date the Group undertakes to purchase or sell the asset. Financial assets are initially measured at fair value. Transaction costs that are directly attributable to the acquisition or issue of financial assets are added to the fair value of the financial assets on initial recognition, except for financial assets at fair value through profit or loss, where the transaction costs are recognised immediately in profit or loss.
After initial recognition, financial assets are measured at either amortised cost or fair value, based on the classification of the financial assets.
Classification of financial assetsThe classification of financial assets depends on the entity’s business model for managing the financial assets and the contractual terms of the cash flows. Management determines the classification of its financial assets at initial recognition.
Debt instruments (such as loans, trade and other receivables, cash and cash equivalents) are subsequently measured at amortised cost using the effective interest method, less any impairment if they are held for collection of contractual cash flows where those cash flows represent solely payments of principal and interest. The effective interest method is a method of calculating the amortised cost of a debt instrument and of allocating interest income over the relevant period. The effective interest rate is the rate that exactly discounts estimated future cash receipts (including all fees and margin points paid or received) through the expected life of the debt instrument, or, where appropriate, a shorter period, to the net carrying amount on initial recognition.
Financial investments (equity investments) are normally measured in the consolidated statement of financial position at fair value through profit or loss. However, the Company can make an irrevocable election at initial recognition to measure the investment at fair value through other comprehensive income (“FVTOCI”), with dividend income recognised in profit or loss. Equity investments in non-listed companies previously classified as available-for-sale in accordance with IAS 39 Financial Instruments: Recognition and Measurement are now classified and measured as investments measured at FVTOCI. Management considers that cost is an appropriate estimate of fair value for these non-listed equity investments because there is a wide range of possible fair value measurements and cost represents the best estimate of fair value within that range.
Impairment of financial assetsIFRS 9 requires a forward-looking expected credit loss (“ECL”) approach to assess impairments of financial assets. As such, the Group recognises an allowance for ECLs for all debt instruments not held at fair value through profit or loss and contract assets.
IFRS 9 provides a simplified approach for measuring the loss allowance at an amount equal to lifetime expected credit losses for trade receivables without a significant financing component (short-term trade receivables). These credit losses are the expected credit losses that result from all possible default events over the expected life of those trade receivables, using a provision matrix that considers historical information on defaults adjusted for forward-looking information.
For long-term loans to related parties the general impairment assessment model is applied. IFRS 9 requires the Group to measure the loss allowance for a financial instrument at an amount equal to the lifetime expected credit loss if the credit risk on that financial instrument has increased significantly since initial recognition, or if the financial instrument is a purchased or originated credit-impaired financial asset. On the other hand, if the credit risk on a financial instrument has not increased significantly since initial recognition (except for a purchased or originated credit-impaired financial asset), the Group is required to measure the loss allowance for that financial instrument at an amount equal to 12 months expected credit loss.
RECTICEL ANNUAL REPORT 2019 I 151RECTICEL ANNUAL REPORT 2019 I 150

Management has concluded that it would require undue cost and effort to determine the credit risk of each loan on their respective dates of initial recognition. Accordingly, the Group recognises lifetime expected credit losses for these loans until they are derecognised.
IFRS 9 applies the same measurement approach to loan commitments and financial guarantee contracts (other than measured at fair value through profit or loss) where previously these were measured with reference to IAS 37 Provisions, Contingent Liabilities and Contingent Assets.
Derecognition of financial assetsThe Group derecognises a financial asset only when the contractual rights to the cash flows from the assets expire, or when it transfers the financial asset and substantially all the risks and rewards of ownership of the asset to another entity. If the Group neither transfers nor retains substantially all the risks and rewards of ownership and continues to control the transferred asset, the Group recognises its retained interest in the asset and an associated liability for the amounts it may have to pay.
If the Group retains substantially all the risks and rewards of ownership of a transferred financial asset, the Group continues to recognise the financial asset and also recognises a collateralised borrowing for the proceeds received.
On the entire derecognition of a financial asset in its entirety, the difference between the asset’s carrying amount and the sum of the consideration received and receivable and the cumulative gain or loss that had been recognised in other comprehensive income and accumulated in equity, is recognised in profit or loss.
On the partial derecognition of a financial asset other than its entirety (i.e. when the Group retains an option to repurchase part of a transferred asset), the Group allocates the previous carrying amount of the financial asset between the part it continues to recognise under continuing involvement, and the part it no longer recognises on the basis of the relative fair values of those parts on the date of the transfer.
The difference between the carrying amount allocated to the part that is no longer recognised and the sum of the consideration received for the part no longer recognised and any cumulative gain or loss allocated to it that had been recognised in other comprehensive income is recognised in profit or loss.
A cumulative gain or loss that has been recognised in other comprehensive income is allocated between the part that continues to be recognised and the part that is no longer recognised on the basis of the relative fair values of those parts.
InventoriesInventories are stated at the lower of cost and net realisable value. Cost comprises direct materials and where applicable, direct labour costs and those overheads that have been incurred in bringing the inventories to their present location and condition. Cost is calculated using the weighted average method.
Net realisable value represents the estimated selling price less all estimated costs of completion and costs necessary to make the sale.
Financial liabilities and equity instrumentsAn instrument is classified as a financial liability or as an equity instrument according to the substance of the contractual arrangements entered into. An equity instrument is any contract that evidences a residual interest in the assets of the Group after deducting all its liabilities.
Equity instruments issued by the Company are recorded at the proceeds received, net of direct issuance costs.
Compound financial instrumentsThe components of compound instruments (e.g. convertible notes) issued by the Company are classified separately as debt component and equity component in accordance with the substance of the contractual arrangements and the definitions of the debt portion and an equity portion of such instrument.
At the time the conversion option will be settled by the exchange of a fixed amount of cash or another financial asset for a fixed number of the Company‘s own equity instruments, such compound instrument is re-qualified as an equity instrument.
At the date of issue, the fair value of the liability component is estimated using the prevailing market interest rate for similar non-convertible instruments. This amount is recorded as a liability on an amortised costs basis using the effective interest method until extinguished upon conversion or at the instrument’s maturity date.
The value of the conversion option classified as equity is determined by deducting the amount of the liability component from the fair value of the compound instrument as a whole. This is recognised and included in equity, net of income tax effects and is not subsequently remeasured.
In addition, the conversion option classified as equity will at conversion be transferred to share premium or other equity item.
When the conversion option remains unexercised at the maturity date of the convertible note, the balance recognised in equity will be transferred to financial liability. No gain or loss is recognised in profit or loss upon conversion or expiration of the conversion option.
Transaction costs that relate to the issue of the convertible notes are allocated to the liability and equity components in proportion to the allocation of the gross proceeds. Transaction costs relating to the equity component are recognised directly in equity. Transaction costs relating to the liability component are included in the carrying amount of the liability component and are amortised over the lives of the convertible notes using the effective interest method.
Financial liabilitiesFinancial liabilities (including interest-bearing borrowings and trade payables) are initially measured at fair value minus, in the case of a financial liability not at fair value through profit or loss, transaction costs that are directly attributable to the issue of the financial liability. Subsequently, they are measured at amortised cost, except for derivative instruments.
Interest-bearing borrowings and payablesInterest-bearing borrowings are recorded at the proceeds received, net of transaction costs incurred. Borrowings are subsequently stated at amortised cost using the effective interest method. Any difference between the proceeds (net of transaction costs) and the redemption value (including premiums payable on settlement or redemption) is recognised in the income statement over the period of the borrowing.
Trade payables which are not interest-bearing are stated at cost, being the fair value of the consideration to be paid.
Derivative financial instrumentsDerivative instruments with a negative fair value are classified at fair value through profit and loss (“FVTPL”), unless they are designated and effective as hedges.
Hedge accountingThe Group may designate certain derivatives, in respect of interest rate risk and foreign exchange rate risk, as hedging instruments in a cash flow hedge relationship.
At the inception of the hedge relationship, the entity documents the relationship between the hedging instrument and the hedged item, along with its risk management objectives and its strategy for undertaking various hedge transactions. Furthermore, at the inception of the hedge and on an ongoing basis, the Group documents whether the hedging instrument is effective in offsetting changes in fair values or cash flows of the hedged item attributable to the hedged risk.
Cash flow hedgesChanges in the fair value of derivative financial instruments that are designated and effective as hedges of future cash flows are recognised directly in equity and the ineffective portion is recognised immediately in the income statement. If the cash flow hedge of a firm commitment or a forecasted transaction results in the recognition of an asset or a liability, then, at the time the asset or liability is recognised, the associated gains or losses on the derivative that had previously been recognised in
equity are included in the initial measurement of the asset or liability. For hedges that do not result in the recognition of an asset or a liability, amounts deferred in equity are recognised in the income statement in the same period in which the hedged item affects net profit or loss.
Net investment hedgeHedges of net investments in foreign operations are accounted for similarly to cash flow hedges. Any gain or loss on the hedging instrument relating to the effective portion of the hedge is recognised in other comprehensive income and accumulated in the foreign currency reserve. The gain or loss to the ineffective portion is recognised immediately in profit and loss.
Fair value hedgesA derivative instrument is recognised as fair value hedge when it hedges the exposure to variation of the fair value of the recognised assets or liabilities. Derivatives classified as a fair value hedge and the hedged assets or liabilities are carried at fair value. The corresponding changes of the fair value are recognised in the income statement.
Hedge accounting is discontinued when the hedging instrument expires or is sold, terminated, or exercised, or no longer qualifies for hedge accounting. At that time, any cumulative gain or loss on the hedging instrument recognised in equity is retained in equity until the forecasted transaction occurs. If a hedged transaction is no longer expected to occur, the net cumulative gain or loss recognised in equity is transferred to net profit or loss for the period.
Pensions and similar obligations
• Post-employment benefitsIn accordance with the laws and practices of each country, the affiliated companies of the Group operate defined benefit and/or defined contribution retirement benefit plans. It is Group policy to operate defined contribution plans for newly-hired employees where this is possible and appropriate.
1. Defined contribution plans Contributions payable to defined contribution plans are recognised as an expense in the period in which the related employee’s service is rendered.
2. Defined benefit plans For defined benefit plans, the amount recognised in the statement of financial position is the present value of the defined benefit obligation less the fair value of any plan assets.
If the amount to be recognised in the statement of financial position is an asset, the asset recognised is restricted to the asset ceiling, which is defined as the present value of any economic benefits available in the form of refunds from the plan or reductions in future contributions to the plan.
RECTICEL ANNUAL REPORT 2019 I 153RECTICEL ANNUAL REPORT 2019 I 152

For funded plans subject to a minimum funding requirement, where contributions payable to cover an existing shortfall on the minimum funding basis in respect of services already received are not available as a refund or reduction in future contributions after they are paid into the plan, an additional “onerous” liability is recognised where necessary, in accordance with IFRIC 14.
In the income statement, current and past service costs (including curtailments), settlement costs and administration expenses are charged in ‘‘other operating income & expenses’’, while the net interest cost is booked in ‘‘other financial income & expenses’’.
The present value of the defined benefit obligation and the related current and past service costs are calculated by qualified actuaries using the projected unit credit method. The discount rate is based on the prevailing yields of high-quality corporate bonds terms with a currency and term consistent with the currency and term of the benefit obligations. For currencies for which there is no deep market in such bonds, government bonds are taken into account.
The fair value of insurance contracts that match the amount and timing of some or all of the benefits payable under a plan is deemed to be the present value of the related obligations.
Remeasurements include actuarial gains and losses, resulting from differences between previous actuarial assumptions and actual experience, and from changes in actuarial assumptions, the return on plan assets and any changes in the effect of the asset ceiling and/or onerous liability (excluding amounts included in net interest). Such remeasurements are recognised in other comprehensive income.
Past service costs, arising from plan amendments, are recognised immediately as an expense.
Defined contribution pension plans in Belgium and Switzerland are ‘hybrid’ pension plans that qualify as defined benefit plans for IFRS purposes, because they are by law subject to minimum guaranteed rates of return and have to guarantee minimum annuity conversion rates. There is hence a risk that the Company may have to pay additional contributions related to past service. Any such additional contributions will depend on the actual investment returns as well as the future evolution of the minimum guarantees.
• Termination benefitsA liability and expense for termination benefits is recognised at the earlier of the following dates: (a) when the offer of those benefits can no longer be withdrawn; and (b) when costs are recognised for a restructuring that is within the scope of IAS 37 and involves the payment of termination benefits.
Share-based paymentsEquity-settled share-based payments to employees and others providing similar services are measured at the fair value of the equity instrument at the grant date. Fair value is measured by use of a Black & Scholes model. Further details on how the fair value of equity-settled share-based transactions has been determined can be found in note 2.4.2.6.2.
The fair value determined at the grant date of the equity-settled share-based payments is expensed on a straight-line basis over the vesting period, based on the Group’s estimate of shares that eventually will be vested.
The above policy is applied to all equity-settled share-based payments that were granted after 7 November 2002 and that vested after 01 January 2005. No amount has been recognised in the financial statements in respect of the other equity-settled shared-based payments.
Provisions
• GeneralProvisions are recognised when (i) the Group has a present obligation (legal or constructive) as a result of a past event, (ii) it is probable that the Group will be required to settle the obligation, and (iii) a reliable estimate can be made of the amount of the obligation.
The amount recognised as a provision is the best estimate of the consideration required to settle the present obligation at the end of the reporting period, taking into account the risks and uncertainties surrounding the obligation. Where the effect of the time value of money is material, the amount is the present value of expenditures required to settle the obligation. Impacts of changes in discount rates are generally recognised in the financial result.
When some or all of the economic benefits required to settle a provision are expected to be recovered from a third party, a receivable is recognised as an asset if it is virtually certain that reimbursement will be received if the Group settles the obligation.
• Onerous contractsAn onerous contract is a contract in which the unavoidable costs of meeting the obligations under the contract exceed the economic benefits expected to be received under it. Present obligations arising from onerous contracts are recognised and measured as provisions.
• RestructuringsA restructuring provision is recognised when the Group has developed a detailed formal plan for the restructuring and has, by starting to implement the plan or announcing its main features to those affected by it, raised a valid expectation with those affected that it will carry out the restructuring. The measurement of a restructuring provision includes only the direct expenditures arising from the restructuring, which are those amounts that are both necessarily entailed by the restructuring and not associated with the ongoing activities of the entity.
• Environmental liabilitiesRecticel analyses twice a year all its environmental risks and the corresponding provisions. The Group measures these provisions to the best of its knowledge of applicable regulations, the nature and extent of the pollution, clean-up techniques, and other available information.
Revenue recognitionIFRS 15 establishes the principles that an entity applies when reporting information about the nature, amount, timing and uncertainty of revenue and cash flows from a contract with a customer. Applying IFRS 15, an entity recognises revenue to depict the transfer of promised goods or services to the customer in an amount that reflects the consideration to which the entity expects to be entitled in exchange for those goods or services.
Customers obtain control of products when the goods are delivered to and have been accepted at their premises. Invoices are generated and revenue is recognised at that point in time.
To recognise revenue, IFRS 15 applies a “five steps” model: • identify the contract(s) with a customer. • identify the performance obligations in the contract. • determine the transaction price. • allocate the transaction price to each performance
obligation. • recognise revenue when a performance obligation is
satisfied by transferring a promised good or service to a customer (which is when the customer obtains control of that good or service).
Transaction priceThe transaction price is the amount of consideration to which an entity expects to be entitled in exchange for transferring promised goods or services to a customer. If the consideration promised in a contract includes a variable amount, an entity must estimate the amount of consideration to which it expects to be entitled in exchange for transferring the promised goods or services to a customer.
The most common types of variable consideration that can be identified are: • Volume discounts (Flexible Foams, Bedding, Insulation) • Year-end rebates (Flexible Foams, Bedding, Insulation) • Adjustments to cope with changes in raw material prices
on a prospective basis (Flexible Foams).
It is not unusual to agree on yearly supply agreements with the customer which fixes the selling prices of the goods for the relevant year. These agreements do not include any commitments to volumes made by the customer. The amount of revenue recognised is adjusted for expected rebates and discounts. A contract liability is being recognised upon selling the goods to the customer and released when the credit note is issued.
If a credit note is issued to the customer to compensate for quality claims, this shall be recognised as a reduction of the revenues.
The most common types of considerations paid to the customer (in bedding and insulation) relate to: • Participation to flyers • Participation to advertising campaigns • Promotional in-store activities
The considerations paid to participate in the customer’s flyers shall be deducted from revenue as the services provided by the customer to the Group can generally not be considered as being distinct.
Point in time or over time recognitionA performance obligation may be satisfied at a point in time (typically for promises to transfer goods to a customer) or over time (typically for promises to transfer services to a customer). For a performance obligation satisfied over time, an entity would select an appropriate measure of progress to determine how much revenue should be recognised as the performance obligation is satisfied.
Main part of the revenue of the Group is recognised at a point in time, i.e. at the moment the goods are transferred to the customer, except for the revenue generated by the Automotive business for the sale of moulds.
The Group serves global Tier-1 customers as well as Original Equipment Manufacturers (OEM) in the automotive sector. Parts are produced with moulds purchased on behalf of the Tier 1 / customer. These moulds are re-invoiced to the Tier 1 / customer.
Customers obtain control of the products when the goods are delivered to and have been accepted at their premises.
RECTICEL ANNUAL REPORT 2019 I 155RECTICEL ANNUAL REPORT 2019 I 154

The parts have no alternative use and there are enforceable rights to payment, therefore revenue is recognised over time. As the production time is very short, Recticel however opted to recognise revenue in respect of the parts at a point in time for practical reasons.
The mould is not a distinct performance obligation but is to be combined with the parts to be produced.The revenue on the moulds as it has to be combined with the delivery of the parts, is recognised over time.
Recticel applies a linear recognition of revenue as this does not result in material differences of revenue recognition in the income statement compared to the revenue recognition that would have to be applied in accordance with the principles of IFRS 15: a. the price contractually defined in respect of the mould is
recognised pro rata the number of parts delivered in relation to Recticel’s best estimate of what they believe are probable quantities to be delivered under the contract;
b. Revenue on the parts is recognised based on the actual number of parts sold multiplied by the agreed price per unit.
Moulds revenues and costs are recognised over four years (as this is average term of the production of the parts) as from the moment serial parts are delivered to the customer (i.e. start of production), regardless of the moment when the mould costs are reimbursed by the customer. Before the start of production, an “Other contract asset – contracts in progress” is recognised for all purchase and development costs of the moulds incurred and released as from the start of production over four years.
Interest incomeInterest income is accrued on a time basis, by reference to the principal outstanding and at the effective interest rate applicable, which is the rate that exactly discounts estimated future cash receipts throughout the expected life of the financial asset to that asset’s net carrying amount.
Dividend income Dividend income from investments is recognised when the shareholders’ rights to receive payment have been established.
Government grantsGovernment grants are not recognised until there is reasonable assurance that the Group will comply with the conditions attaching to them and that the grants will be received.
Government grants relating to staff training costs are recognised as income over the periods required to match them with the related costs and are deducted from the related expense.
Government grants relating to property, plant & equipment are treated by deducting the received grants from the carrying amount of the related assets. These grants are recognised as income over the useful life of the depreciable assets.
Income taxesThe tax expense represents the sum of the current tax expense and deferred tax expense. The current tax expense is based on taxable profit for the year. Taxable profit differs from net profit as reported in the income statement because it excludes items of income or expenditure that are taxable or deductible in other years and it further excludes items that will never become taxable or deductible. The Group’s liability for current tax is calculated using tax rates that have been enacted or substantively enacted by reporting date.
Deferred tax is the tax expected to be payable or recoverable on differences between the carrying amounts of assets and liabilities in the financial statements and the corresponding tax base used in the computation of taxable profit. It is accounted for using the balance sheet liability method. Deferred tax liabilities are generally recognised for all taxable temporary differences and deferred tax assets are recognised to the extent that it is probable that taxable profits will be available against which deductible temporary differences can be utilised. Such assets and liabilities are not recognised if the temporary difference arises from goodwill or from the initial recognition (other than in a business combination) of other assets and liabilities in a transaction that affects neither the tax profit nor the accounting profit.
Deferred tax liabilities are recognised for taxable temporary differences arising on investments in subsidiaries and associates, and interests in joint ventures, except where the Group is able to control the reversal of the temporary difference and when it is probable that the temporary difference will not reverse in the foreseeable future. No deferred tax liabilities have been recognised on undistributed retained earnings of subsidiaries, associates and joint ventures, as the impact is not material.
The carrying amount of deferred tax assets is reviewed at least at each reporting date and reduced to the extent that it is no longer probable that sufficient taxable profits will be available to allow all or part of the asset to be recovered.
Deferred tax is calculated at the tax rates that are expected to apply in the period when the liability is settled or the asset is realised. Deferred tax is charged or credited in the income statement, except when it relates to items charged or credited directly to equity, in which case the deferred tax is also dealt with in equity.
2.4.2.1.4. Key judgments and major sources of estimation uncertainty
Drawing up the annual accounts in accordance with IFRS requires management to make the necessary estimates and assessments. The management bases its estimates on past experience and other reasonable assessment criteria. These are reviewed periodically, and the effects of such reviews are taken into account in the annual accounts of the period concerned. Future events which may have a financial impact on the Group are also included in this.
The estimated results of such possible future events may consequently diverge from the actual impact on results. Assessments and estimates were made, inter alia, regarding:
• impairments of goodwill, intangible assets and property, plant and equipment;
• determination of loss allowances for expected credit losses;
• determination of write-downs on inventories; • determination of provisions for restructurings; • determination of provisions for onerous contracts; • determination of provisions for contingent liabilities,
litigations and other exposures; • valuation of post-employment defined benefit
obligations, other long-term employee benefits and termination benefits;
• the recoverability of deferred tax assets; • the recognition of revenue related to the sale of moulds
over a period of 4 years. • the assessment of the lease term is used as judgement
within IFRS 16.
It is not excluded that future revisions of such estimates and assessments could trigger an adjustment in the value of the assets and liabilities in future financial years.
The recent COVID-19 crisis has been treated as a non-adjusting event and as a consequence the major judgements and estimates made per 31 December 2019 are not considering the downturn in economic circumstances due to COVID-19. See also note 2.4.2.6.3. - Events after the reporting date.
• Impairments on goodwill, intangible assets and property, plant and equipment and right-of-use assetsFor amortizable long-term assets, an impairment assessment will in first place be made at the level of the individual asset. Only when it is not possible to estimate a recoverable value on an individual level, the evaluation will be made at the level of the cash generating unit (hereafter “CGU”) to which the asset belongs. For amortizable long-term assets, an impairment analysis should be performed in case of impairment indicators. If such indicators exist, an impairment analysis shall be performed at the CGU level.
For goodwill (and other not depreciated long term assets) an impairment test is performed at least annually. The carrying amount can be allocated on a reasonable and consistent basis. The allocation of goodwill to a CGU or a group of CGUs also takes account of the synergies of the business combination expected by the decision maker. Goodwill can be allocated for impairment testing to a group of CGUs, if the chief operating decision maker considers this as the most appropriate allocation. There is a link between the level at which goodwill is tested for impairment and the level of internal reporting that reflects the way the entity manages its operations and with which the goodwill is associated (as such it cannot exceed the level of the reported segments as defined by IFRS 8).
For the segment Flexible Foams, the CGU level is defined following the market and production capacities. This approach leads to the determination of four CGUs: • CGU “Flexible Foams - United Kingdom”; • CGU “Flexible Foams - Continental Europe”; • CGU “Flexible Foams - Scandinavia”; • CGU “Flexible Foams - International”.
For the segment Bedding, the CGU level is defined as the Bedding segment level as a whole, considering the strong interdependence between the different markets, the shared production capacities as well as the central decision-making process.
For the segment Insulation, the CGU level is defined following the market and production capacities. This approach leads to the determination of two CGUs: • CGU “Insulation - United Kingdom”; • CGU “Insulation - Continental Europe”.
For the segment Automotive, each individual plant (previously each individual project) forms a separate CGU. Interiors business investments were historically often dedicated to a specific car model. Therefore, recoverability of the investment depended on the success of such specific car model. Given changes in technology that provide ability to move more and more project(s) from one line to another and/or to relocate some production assets, the definition of the Cash Generating Unit (CGU) has been reset from individual project (until 2018) to plant level (as from 2019).
An impairment analysis was performed for the above CGUs considering the goodwill allocated to them.
RECTICEL ANNUAL REPORT 2019 I 157RECTICEL ANNUAL REPORT 2019 I 156

Impairment charges are not linked to the general impairment analysis but relate mainly to (i) assets in Automotive Interiors in Germany (EUR -0.8 million) and in China (EUR -0.7 million) and
(ii) idle assets in Bedding following the closure of the Hassfurt (Germany) plant (EUR -0.3 million).
The below table provides an overview of impairments recognised by segment:
For 2019:
in thousand EUR
Group Recticel FLEXIBLE FOAMS BEDDING INSULATION AUTOMOTIVE TOTAL
United Kingdom
Continental Europe Scandinavia Continental
Europe
Goodwill 3 186 1 061 5 411 11 566 2 211 0 23 435
Other intangible assets 294 3 960 608 1 739 1 873 1 853 10 327
Property, plant & equipment 2 655 38 990 7 193 20 613 53 943 48 661 172 055
Assets under construction 943 14 205 909 2 711 1 675 3 974 24 417
Right-of-use assets 13 790 4 184 4 244 15 400 23 900 29 956 91 474
Total net book value 20 868 62 400 18 365 52 029 83 602 84 444 321 708
of which impairments recognised during the period 0 (63) 0 (287) (46) (1 425) (1 821)
Footnote: Working capital is not included in the analysis.
For 2018:
in thousand EUR
Group Recticel FLEXIBLE FOAMS BEDDING AUTOMOTIVE TOTAL
United Kingdom
Continental Europe Scandinavia Interiors
Goodwill 3 044 1 061 5 403 11 318 0 20 827
Other intangible assets 67 843 618 1 264 1 471 4 263
Property, plant & equipment 2 727 39 633 7 626 24 924 53 541 128 450
Assets under construction 575 8 637 373 3 399 7 490 20 473
Total net book value 6 413 50 174 14 019 40 905 62 501 174 012
of which impairments recognised during the period (1 000) (3 849) 0 430 (1 400) (5 819)
Footnote: Working capital is not included in the analysis.
The net book value of the assets retained for impairment tests, as included in the below table, represents about 75.6% of the total property, plant and equipment, 72.2% of the total intangible assets and 87.0% of the total right-of-use assets.
The examined assets relate to (i) the Flexible Foams’ activities in the United Kingdom, Continental Europe and Scandinavia, (ii) Bedding activities at the level of the whole segment and to (iii) the Automotive-Interiors’ operations of the Group.
Impairment charges relate to (i) goodwill in the United Kingdom (Flexible Foams) (EUR -1.0 million, recognised per 30 June 2018), (ii) assets in Continental Europe (Flexible Foams) (EUR -3.8 million) following the closure of the plant in Catarroja (Spain) and (iii) assets in Automotive Interiors in the Czech Republic (EUR -1.4 million, recognised per 31 December 2018).
For the impairment test of the items included in the table above, certain assumptions were made. The impairment tests have been applied on the “cash-generating units” (“CGU”) on the basis of the principles set out above. The recoverable amount of the total CGU is determined on the basis of the value-in-use model.
When determining its expected future cash flows, the Group takes into account prudent, though realistic, assumptions regarding the evolution of its markets, its sales, the raw materials prices, the impact of past restructurings and the gross margins, which all are based on (i) the past experiences of the management and/or (ii) which are in line with trustworthy external information sources. It can however not be excluded that a future reassessment of assumptions and/or market analysis induced by future developments in the economic environment might lead to the recognition of additional impairments.
For the discounting of the future cash flows, a uniform overall Group-based pre-tax discount rate of 7.5% is used for all CGUs (7.2% in 2018). This pre-tax discount rate is based on a (long-term) weighted average cost of capital based on the current market expectations of the time value of money and risks for which future cash flows must be adjusted; the risks being implicit in the cash flows.
For countries with a higher perceived risk (i.e. emerging markets), the level of investments is very limited (1.2% of total fixed assets); hence no separate pre-tax discount rate is used.
The pre-tax discount rate for impairment testing is based on the following assumptions: (EUR based)
Group target ratios: 2019 2018 Gearing: net financial debt/total equity 33.3% 50% % net financial debt 25% 33% % total equity 75% 67%
Pre-tax cost of debt 0.45% 1.0%
Pre-tax cost of equity = (Rf + Em * β + Sp)/(1-T) 11.8% 11.5% Risk free interest rate = Rf 0.45% 0.9% Beta = β 1.20 1.25 Market equity risk premium = Em 6.0% 5.5% Small cap premium = Sp 1.5% 1.0%
Corporate tax rate = T 22.8% 23.5%Assumed inflation rate 1.8% 2.0%
Pre-tax WACC (weighted average cost of capital) 7.5% 7.2%
The discount factors are reviewed at least annually.
A. Flexible Foams
• Key assumptionsThe dynamics of the business model, budgets and projected cash flows are based on stable cost structures which reflect inflation rates on labour and other costs, stable fixed costs and capital expenditure (except for the CGU Flexible Foams – United Kingdom). Gross margins and operating results are sensitive to the volatility of chemical raw material costs, which are unpredictable. Therefore, the budgets assume that increases or decreases in material costs are compensated through adaptions of the sales prices.
For the CGU “Flexible Foams – United Kingdom” and “Flexible Foams – Scandinavia” the value-in-use model projections are based on budgets and financial plans covering in total a three-year period with a sales growth rate of 3.00% as from the second year. After this 3-year period, a perpetuity value is taken
For 2018:
in thousand EUR
Group Recticel FLEXIBLE FOAMS BEDDING INSULATION AUTOMOTIVE CORPORATE TOTAL
United Kingdom 3 044 - 908 - - 3 952
Continental Europe 1 061 - 1 619 - - 2 680
Scandinavia 5 403 - - - - 5 403
Other 0 11 318 - 0 0 11 319
Total net book value of goodwill 9 508 11 318 2 527 0 0 23 354
For 2019:
in thousand EUR
Group Recticel FLEXIBLE FOAMS BEDDING INSULATION AUTOMOTIVE CORPORATE TOTAL
United Kingdom 3 186 - 976 - - 4 162
Continental Europe 1 061 - 2 211 - - 3 272
Scandinavia 5 411 - - - - 5 411
Other 0 11 566 - 0 0 11 566
Total net book value of goodwill 9 659 11 566 3 187 0 0 24 412
The net book value of the assets retained for impairment tests, as included in the below table, represents 100% of the total goodwill.
RECTICEL ANNUAL REPORT 2019 I 159RECTICEL ANNUAL REPORT 2019 I 158

B. Bedding
• Key assumptionsThe dynamics of the business model, budgets and projected cash flows are based on stable cost structures which reflect inflation rates on labour and other costs, stable fixed costs and capital expenditure. Gross margins and operating results are mainly driven by the sales volumes, the product-mix and resulting average sales price, as well as the level of advertising and marketing expenses.
For the CGU “Bedding – Segment”, the value-in-use model projections are based on budgets and financial plans covering a three-year period with an anticipated average sales growth of 1.00% (2018: 2.00%) as from the second year. After this 3-year period, a perpetuity value is taken into account without growth rate. For the first year (i.e. 2020) EBITDA is based on the full-year 2019 level and the full-year effect of the reorganisation measures taken in Germany (i.e. Hassfurt).
On this basis, the value-in-use of the CGU “Bedding – Segment” amounts to 1.8 times (2018: 3.2 times) the net asset book value.
• Sensitivity analysisA first sensitivity analysis (A) is performed to measure the impact of a changing WACC rate (+1%) on the outcome of the impairment tests (see overview table below).
A second sensitivity analysis (B) is performed to measure the impact of a changing gross margin (-1%) on the outcome of the impairment tests (see overview table below).
A sensitivity analysis is also performed to measure the combined effect of a changing WACC rate (+1%) together with a change in gross margin (-1%) – applied on the business plan 2020-2022 and the perpetuity- on the outcome of the impairment tests (see overview table below).
For both sensitivity analyses it is assumed that all other parameters of the underlying assumptions remain unchanged.
SensitivityDISCOUNTED CASH FLOW / NET ASSET BASE (INCLUDING RIGHT-OF-USE ASSETS)
BASE CASE 1% INCREASE OF WACC (A) 1% DECREASE OF GROSS MARGIN ON SALES (B)
COMBINATION OF (A) AND (B)
Bedding 1.8 times book value 1.6 times book value 1.3 times book value 1.2 times book value
into account without growth rate. For the first year (i.e. 2020) EBITDA is based on the full-year 2019 level and the full-year effect of the efficiency measures taken in 2019.
For the CGU “Flexible Foams – Continental Europe”, the value-in-use model projections are based on budgets and financial plans covering in total a three-year period with a sales growth rate of 2.00% as from the second year. After this 3-year period, a perpetuity value is taken into account without growth rate.
On this basis, the value-in-use of the CGU “Flexible Foams – United Kingdom” amounts to 1.5 times (2018: 1.9 times) the net asset book value, the value-in-use of the CGU “Flexible Foams – Continental Europe” amounts to 3.6 times (2018: 5.4 times) the net asset book value, and the value-in-use of the CGU “Flexible Foams – Scandinavia” amounts to 4.5 times (2018: 6.2 times) the net asset book value.
• Sensitivity analysisA first sensitivity analysis (A) is performed to measure the impact of a changing WACC rate (+1%) on the outcome of the impairment tests (see overview table below).
A second sensitivity analysis (B) is performed to measure the impact of a changing gross margin on sales (-1%) on the outcome of the impairment tests – applied on the business plan 2020-2022 and the perpetuity (see overview table below).
A sensitivity analysis is also performed to measure the combined effect of a changing WACC rate (+1%) together with a change in gross margin on sales (-1%) – applied on the business plan and the perpetuity – on the outcome of the impairment tests (see overview table below).
For both sensitivity analyses it is assumed that all other parameters of the underlying assumptions, such as market evolution, sales, raw materials prices, impact of past restructurings and gross margins, operating charges, working capital needs, capital expenditure, … (not exhaustive), remain unchanged.
C. Automotive
• Key assumptionsCash flows:
For the CGU “Interiors”, the value-in-use model projections are based on the budgets and financial plans for the existing and contracted projects per closing date and for the duration of each project at plant level, in combination with an overview of the entire capacity utilisation. Project assets are depreciated over the project life time. The plant based approach for the CGU “Interiors” is considered reasonable given the interchangeability of the assets, the improved plant set-up and the fact that considerable part of the assets is allocated to multiple projects.
Impairments are booked on property, plant and equipment and intangible assets: • if a plant generates insufficient cash flow to cover the
depreciation of the property, plant and equipment and intangible assets assigned to the plant,
• for property, plant and equipment or intangible assets which are expected not to be reallocated to other plants. Consequently, assets which are expected to become available within 2 years and cannot be reallocated to other projects need to be impaired.
In case of reallocation of fully depreciated assets, the latter might require a reconditioning. These reconditioning costs are amortised over the term of the new project, without additional revaluation or reversal of any impairment.
In 2019 an impairment of EUR 1.5 million has been recognised due to the intention to close the plant in Schönebeck (Germany) and the discontinuation of one program in Ningbo (China).
Discount rate:The pre-tax discount rate used amounts to 7.5% (2018: 7.2%) and is based on a weighted average cost of capital based on the current market expectations of the time value of money and the risks for which future cash flows must be adjusted.
• Sensitivity analysisWith regard to the CGU “Interiors”, an increase in the pre-tax discount rate to 8.5% (2018: 8.2%) or decrease of the gross margin on sales of 1% would not give rise to material impairments at plant level. For both sensitivity analyses it is assumed that all other parameters of the underlying assumptions (business plan 2020-2026) remain unchanged. It should be noted that the situation does vary from one plant to another and certain sites have a limited headroom. The analysis also takes into account productivity gains to be realised.
• Loss allowances for expected credit lossesA loss allowance for expected credit losses is recognised for trade debtors for which a risk of total or partial non-recovery of outstanding receivables exists due to the debtor’s poor financial condition or for economic, legal or political reasons. The decision to classify a receivable as doubtful will be made by the management on the basis of all information available to them at any time. In line with the Group accounting principles, details on the amounts of the loss allowance for expected credit losses can be found in note 2.4.2.5.9.
• Provisions for restructurings and onerous contracts
A restructuring provision is recognised when the Group has developed a detailed formal plan for the restructuring and has, by starting to implement the plan or announcing its main features to those affected by it, raised a valid expectation in those affected that it will carry out the restructuring.
An onerous contract is a contract in which the unavoidable costs of meeting the obligations under the contract exceed the economic benefits expected to be received under it.
In line with the Group accounting principles, details on the amounts of provisions for restructurings and onerous contracts can be found in notes 2.4.2.3.1., 2.4.2.4.3. and 2.4.2.5.14.
• Provisions for contingent liabilities, litigations and other exposures
Any significant litigation (tax and other, including threat of litigation) is reviewed by Recticel’s in-house lawyers with the support, when appropriate, of external counsels at least every half-year. This review includes an assessment of the need to recognise provisions and/or to re-measure existing provisions together with the Finance department and the Insurance department. Further details are provided in note 2.4.2.6.9.
• Valuation of post-employment defined benefit obligations, other long-term employee benefits and termination benefits
The actuarial assumptions used in determining the defined benefit obligations at December 31, and the annual cost, can be found in note 2.4.2.5.13. All main employee benefit plans are assessed annually by independent actuaries. Discount rates and inflation rates are defined centrally by management. Other assumptions (such as future salary increases and demographic assumptions) are defined at a local level. All plans are supervised by the Group’s central Human Resources department with the help of a central actuary to check the acceptability of the results and ensure consistency in reporting.
SensitivityDISCOUNTED CASH FLOW / NET ASSET BASE (INCLUDING RIGHT-OF-USE ASSETS)
BASE CASE 1% INCREASE OF WACC (A)
1% DECREASE OF GROSS MARGIN ON SALES (B)
COMBINATION OF (A) AND (B)
Flexible Foams - United Kingdom 1.5 times book value 1.3 times book value 1.2 times book value 1.0 times book value
Flexible Foams - Continental Europe 3.6 times book value 3.1 times book value 3.2 times book value 2.8 times book value
Flexible Foams - Scandinavia 4.5 times book value 3.9 times book value 4.1 times book value 3.6 times book value
RECTICEL ANNUAL REPORT 2019 I 161RECTICEL ANNUAL REPORT 2019 I 160

• Current and deferred taxAll tax returns are prepared in good faith based on the available information with often the assistance of external tax advisors. There are several tax audits ongoing in the Group, notably in Germany. The result of these tax audits is not yet clear as the Group is still in a situation of fact finding. It is currently unclear whether any potential finding would lead to a loss of tax losses carried forward or income taxes to be paid. Until now, no material tax corrections have taken place. However, important tax corrections can never be excluded. In such case, Recticel will defend its position, always in full collaboration with the tax authorities.
Deferred tax assets are mainly recognised for the unused tax losses carried forward to the extent that future taxable profits are expected to be available to offset these unused tax losses carry forwards. For this purpose, management bases recognition of deferred tax assets on its business plans (see note 2.4.2.4.6).
Deferred tax assets increased from EUR 20.5 million to EUR 24.1 million, impacting the income statement by EUR +2.4 million and by EUR +0.8 million the equity level. The impact on the
income statement is mainly driven by the recognition of deferred tax assets in France and Spain.
Deferred tax assets are recognised mainly in Belgium (Recticel n.v. - EUR 17.4 million); Spain(Recticel Iberica – EUR 2.6 million), France (Recticel SAS – EUR 1.4 million), Finland (Recticel OY – EUR 0.5 million) and the United Kingdom (Recticel Ltd. - EUR 0.9 million).
2.4.2.2. Changes in scope of consolidation
The following main changes in the scope of consolidation took place during the year 2019:
• Ownership interest in the Proseat group (Automotive) decreased in February 2019 from 51% (joint venture) to 25% (associate).
• Increase of the participation in Turvac (Insulation) from 50% (joint venture) to 74% (subsidiary with minority interest).
Other information 2019
in thousand EUR
Group Recticel FLEXIBLE FOAMS BEDDING AUTOMOTIVE INSULATION CORPORATE
COMBINED TOTAL
(A)
ADJUSTMENT FOR JOINT VENTURES BY APPLICATION
OF IFRS 11 (B)
CONSOLIDATED (A)+(B)
Depreciation and amortisation 21 356 8 720 20 398 10 714 2 373 63 561 (7 312) 56 295
Impairment losses recognised in profit and loss 63 287 1 425 46 0 1 821 0 1 821
EBITDA 54 136 16 024 24 809 31 426 (20 754) 105 641 (10 377) 95 264
Capital expenditure/additions 17 313 5 143 6 201 26 065 3 504 58 226 (4 556) 53 670
Income statement for the year 2019in thousand EUR
Group Recticel FLEXIBLE FOAMS BEDDING AUTOMOTIVE INSULATION ELIMINATIONS
COMBINED TOTAL
(A)
ADJUSTMENT FOR JOINT VENTURES BY APPLICATION
OF IFRS 11 (B)
CONSOLIDATED (A)+(B)
SALES
External sales 514 493 237 338 221 955 247 164 0 1 220 950
Inter-segment sales 34 571 4 929 1 749 0 (41 249) 0
Total sales 549 063 242 267 223 704 247 164 (41 249) 1 220 950 (182 433) 1 038 517
EARNINGS BEFORE INTEREST AND TAXES (EBIT)
Unallocated corporate expenses (1) (23 127)
EBIT 32 718 7 017 2 986 20 666 (23 127) 40 260 (3 112) 37 148
Financial result (8 227)
Result for the period before taxes 28 921
Income taxes (4 203)
Result for the period after taxes 24 718
of which non-controlling interests (44)
of which share of the Group 24 762
(1) Includes headquarters’ costs (EUR 20.7 million (2018: EUR 15.3 million)) and R&D expenses (Corporate Programme) (EUR 2.4 million (2018: EUR 2.2 million)).
2.4.2.3. Business and geographical segments
2.4.2.3.1. Business segmentsIFRS 8 requires operating segments to be identified on the basis of the internal reporting structure of the Group that allows a regular performance review by the chief operating decision maker and an adequate allocation of resources to each segment. Despite the application of IFRS 11, the chief operating decision makers continue to operate on the basis of financial data per segment on a “Combined” basis, i.e. including Recticel’s pro rata share in the joint ventures, after intercompany eliminations, in accordance with the proportionate consolidation method.
The information reported to the Group’s chief operating decision maker for the purpose of resource allocation and performance assessment per segment is more specifically focussed on Sales, EBITDA, EBIT, Capital Employed and Operational Cash Flow per segment. The principal market segments for these goods are the four operating segments: Flexible Foams, Bedding, Insulation, Automotive, and Corporate. For more details on these segments, reference is made to the first part of this annual report. Information regarding the Group’s reportable segments is presented below. Inter-segment sales are made at conditions which are applicable under the framework of the Group Transfer Pricing Policy.
Disaggregation of combined revenues
in thousand EUR
Group Recticel 2019 2018
Comfort foam 305 937 356 701
Technical foams 243 126 264 783
Flexible Foams 549 063 621 484
Branded Products 157 879 150 966
Non-branded/Private label 84 389 92 823
Bedding 242 268 243 789
Insulation 247 164 271 166
Interiors 183 547 199 449
Seating 1 40 157 164 431
Automotive 223 704 363 880
Eliminations (41 249) (52 056)
TOTAL COMBINED REVENUES 1 220 950 1 448 264
Adjustment for joint ventures by application of IFRS 11 (182 433) (330 612)
TOTAL CONSOLIDATED REVENUES 1 038 517 1 117 652
Timing of revenue recognition
At a point in time 1 196 234 1 426 046
Over time (moulds) 24 716 22 218
TOTAL COMBINED REVENUES 1 220 950 1 448 264
1 In 2019 this relates to the sale of chemical raw materials at cost to Proseat companies. In 2018 this relates to the Group’s pro rata share of sales of the Proseat group.
Revenue recognised over time relates to the sale of moulds in the Automotive segment.
The impact of the partial divestment in the joint venture Proseat on balance sheet and income statement can be summarized as follows:
in thousand EUR
Group Recticel INVESTMENTS IN JOINT VENTURES
TRANSLATION DIFFERENCE
INVESTMENT AT EQUITY METHOD LESS TRANSLATION DIFFERENCES
DISPOSAL PRICE PROFIT (LOSS)
Total disposal of Proseat affiliates (75%) 20 638 (453) 21 091 20 614 (477)
EQUITY ACQUIRED ACQUISITION PRICE
Acquisition 49% of Proseat nv after disposal of Proseat affiliates 8 487 - - (6 584) 1 903
Net total at level Recticel n.v. - - - 14 030 1 426
Disposal affiliates Proseat by Proseat n.v. at 51% (under equity method) 4 606 65 4 671 6 108 1 436
Other elements on disposal of result transfer - - - - (228)
Net total at Group level - - - - 2 634
RECTICEL ANNUAL REPORT 2019 I 163RECTICEL ANNUAL REPORT 2019 I 162

ImpairmentsIn 2019, impairment charges amounted to EUR -1.8 million and relate to (i) idle tangible assets in Bedding following the closure of the Hassfurt (Germany) plant (EUR -0.3 million) and (ii) assets in Automotive Interiors in Germany (EUR -0.8 million) and China (EUR -0.7 million).
EBITDAEBITDA per segment is commented in the first part of this annual report (section Report by the Board of Directors).
ImpairmentsIn 2018, impairment charges amounted to EUR -5.8 million and relate to (i) goodwill in the United Kingdom (Flexible Foams) (EUR -1.0 million), (ii) idle tangible assets in Flexible Foams (EUR -3.9 million) following the closure of the plant in Catarroja (Spain) and (iii) assets in Automotive Interiors in the Czech Republic (EUR -1.4 million).
EBITDAEBITDA per segment is commented in the first part of this annual report (section Report by the Board of Directors).
Adjustments to EBIT (on a combined basis) per segment
in thousand EUR
Group Recticel FLEXIBLE FOAMS BEDDING AUTOMOTIVE INSULATION NOT ALLOCATED COMBINED TOTAL
2019
Impairments (63) (287) (1 425) (46) 0 (1 821)
Gains/(loss) on disposals 399 48 5 457 0 0 5 904
Restructuring charges and provisions (4 701) (939) (2 833) (142) (2 600) (11 215)
Other (493) 32 103 0 (3 424) (3 782)
TOTAL (4 858) (1 146) 1 302 (188) (6 024) (10 914)
2018
Impairments (4 814) 430 (1 400) 0 0 (5 784)
Net impact (excluding impairment) of fire incident in Interiors plant in Most (Czech Republic)
0 0 5 639 0 0 5 639
Restructuring charges (4 339) (4 851) (473) 0 (441) (10 104)
Other (4 161) 13 (649) 0 (1 180) (5 977)
TOTAL (13 314) (4 408) 3 117 0 (1 621) (16 226)
Other information 2018
in thousand EUR
Group Recticel FLEXIBLE FOAMS BEDDING AUTOMOTIVE INSULATION CORPORATE
COMBINED TOTAL
(A)
ADJUSTMENT FOR JOINT VENTURES BY APPLICATION
OF IFRS 11 (B)
CONSOLIDATED (A)+(B)
Depreciation and amortisation 12 605 4 505 16 144 6 588 681 40 523 (8 890) 31 633
Impairment losses recognised in profit and loss 4 814 (430) 1 400 0 0 5 784 35 5 819
EBITDA 32 981 2 004 30 458 44 711 (16 801) 93 353 (12 954) 80 399
Capital expenditure/additions 16 412 3 363 13 636 16 951 2 009 52 371 (7 384) 44 987
The breakdown of the goodwill per business line per 31 December 2018
in thousand EUR
Group Recticel COMBINED TOTAL (A)
ADJUSTMENT FOR JOINT VENTURES BY APPLICATION OF
IFRS 11(B)
CONSOLIDATED(A)+(B)
Eurofoam 482 (482) 0
Continental 1 061 0 1 061
Scandinavia 5 403 0 5 403
United Kingdom 3 044 0 3 044
Total Flexible Foams 9 990 (482) 9 508
Total Bedding 11 319 0 11 319
Continental 1 619 0 1 619
United Kingdom 908 0 908
Total Insulation 2 527 0 2 527
Total goodwill 23 836 (482) 23 354
The breakdown of the goodwill per business line per 31 December 2019
in thousand EUR
Group Recticel COMBINED TOTAL(A)
ADJUSTMENT FOR JOINT VENTURES BY APPLICATION OF
IFRS 11(B)
CONSOLIDATED`(A)+(B)
Eurofoam 469 (469) 0
Continental 1 061 0 1 061
Scandinavia 5 411 0 5 411
United Kingdom 3 191 0 3 191
Total Flexible Foams 10 132 (469) 9 663
Total Bedding 11 613 0 11 613
Continental 2 160 0 2 160
United Kingdom 976 0 976
Total Insulation 3 136 0 3 136
Total goodwill 24 881 (469) 24 412
Income statement for the year 2018in thousand EUR
Group Recticel FLEXIBLE FOAMS BEDDING AUTOMOTIVE INSULATION ELIMINATIONS
COMBINED TOTAL
(A)
ADJUSTMENT FOR JOINT VENTURES BY APPLICATION
OF IFRS 11 (B)
CONSOLIDATED (A)+(B)
SALES
External sales 577 688 237 421 362 018 271 137 0 1 448 264
Inter-segment sales 43 796 6 369 1 862 29 (52 056) 0
Total sales 621 484 243 790 363 880 271 166 (52 056) 1 448 264 (330 612) 1 117 652
EARNINGS BEFORE INTEREST AND TAXES (EBIT)
Unallocated corporate expenses (1) (17 482) 0 (17 482)
EBIT 15 562 (2 070) 12 914 38 123 0 47 046 (4 099) 42 947
Financial result (3 886)
Result for the period before taxes 39 061
Income taxes (10 212)
Result for the period after taxes 28 849
of which non-controlling interests 0
of which share of the Group 28 849
(1) Includes headquarters’ costs (EUR 15.3 million (2017: EUR 14.5 million)) and R&D expenses (Corporate Programme) (EUR 2.2 million (2017: EUR 2.3 million)).
RECTICEL ANNUAL REPORT 2019 I 165RECTICEL ANNUAL REPORT 2019 I 164

Reliance on major customersThe Group has no major customers that represent more than 10% of total sales. The top-10 customers of the Group represent 25.9% (2018: 27.5%) of total consolidated sales.
Intangible assets – Property, plant & equipment – Right-of-use assets – Investment property
in thousand EUR
Group RecticelACQUISITIONS, INCLUDING OWN PRODUCTION
31 DEC 2019 31 DEC 2018 2019 2018
Belgium 83 741 74 234 13 994 6 435
France 38 028 38 030 2 032 4 192
Germany 15 960 12 287 2 557 2 121
United Kingdom 47 638 9 006 23 903 1 349
Other EU countries 112 545 79 113 11 343 23 618
European Union 297 912 212 670 53 829 37 714
Other 52 450 35 206 4 865 7 272
TOTAL 350 362 247 875 58 694 44 987
Following the exercise of its purchase option, the Group acquired in 2019 for an amount of GBP 18.4 million the Insulation plant in Stoke-on-Trent (United Kingdom), which was previously leased by the Group.
The figures in the table above comprise for 2019 the right-of-use assets. The figures for 2018 have not been restated; hence they do not include right-of-use assets.
2.4.2.4. Income statement
2.4.2.4.1. Gross profitOn a like-for-like basis, the gross profit decreased by 6.1% from 201.6 million to EUR 189.4 million before impact of IFRS 16, EUR 191.1 million after impact of IFRS 16. The lower gross profit is primarily explained by lower sales as a combination of overall selling price erosion as a consequence of falling chemical raw material prices, and lower volumes in most segments.
2.4.2.4.2. General and administrative expenses - Sales and marketing expenses – Research and development expenses
On a like-for-like basis, general and administrative expenses increased by EUR 3.2 million to EUR 73.7 million, EUR 73.6 million after impact of IFRS 16 (cfr 2.4.2.4.1. – Gross profit). This increase is mainly explained by salary inflation, higher insurance costs and external services.
On a like-for-like basis, sales and marketing expenses slightly increased from EUR 72.6 million to EUR 72.7 million, EUR 72.9 million after impact of IFRS 16.
On a like-for-like basis, research and development expenses slightly increased from EUR 11.0 million to EUR 11.6 million.
in thousand EUR
Group Recticel 2019 2018
Belgium 123 950 134 531
France 146 606 148 018
Germany 166 469 181 119
United Kingdom 133 976 157 132
Other EU countries 294 607 318 347
European Union 865 607 939 148
Other 172 910 178 504
TOTAL 1 038 517 1 117 652
2.4.2.3.2. Geographical information of revenues
The Group’s operations are mainly located in the European Union.
Sales (by destination)
The following tables provides an analysis of the Group’s sales and fixed assets by geographical market.
For 2019 • Impairment charges amounted to EUR -1.8 million and
relate to (i) idle tangible assets in Bedding following the closure of the Hassfurt (Germany) plant (EUR -0.3 million) and (ii) assets in Automotive Interiors in Germany (EUR -0.8 million) and China (EUR -0.7 million).
• Gain on disposals: On 19 February 2019, Recticel announced the closing of the transactions as a result of which Sekisui Plastics Co., Ltd. acquired 75% in Proseat. Recticel maintains a 25% participation in Proseat with the option to sell this remaining participation within three years if Sekisui exercises its call option during this period, or after three years when Recticel exercises its put option. The transaction results in a net gain of EUR 2.1 million, recognised in other operating revenues in the consolidated income statement. The put and call options have been recognised as derivative financial instruments at fair value with changes in fair value to be recognised in profit or loss (other operating revenues/expenses). The value of both options have been calculated using the Black & Sholes option price formula, with the following key assumptions : (i) spot price equal to the estimated enterprise value, (ii) automotive parts’ sector volatility, (iii) maturity based on terms and conditions set out in the initial share purchase agreement, (iv) a risk-free interest rate of -0.6% and (iv) a dividend yield of 0%. At closing December 2019, the derivative financial instruments amounted to 3.8 million (see line Other).
• Restructuring charges (EUR -11.2 million) refer to additional restructuring measures in execution of the Group’s rationalisation plan, including (i) restructuring costs in Flexible Foams following the closure of the Troisdorf plant (Eurofoam Germany), (ii) rationalisation measures in Automotive Interiors (Germany) and (iii) further streamlining in corporate and central services.
• The ‘other’ adjustments to EBIT (EUR -3.8 million) relate mainly to costs and fees for legacy remediation and litigations, and costs linked to the contingency plan following the fire incident in the plant in Wetteren (Belgium).
For 2018 • Impairment charges amounted to EUR -5.8 million and
relate to (i) goodwill in the United Kingdom (Flexible Foams) (EUR -1.0 million), (ii) idle tangible assets in Flexible Foams (EUR -3.9 million) following the closure of the plant in Catarroja (Spain) and (iii) assets in Automotive Interiors in the Czech Republic (EUR -1.4 million).
• The net impact of the fire incident in Most comprises additional insurance indemnities received following last year’s fire incident in Most (Czech Republic).
• Restructuring measures (EUR -10 million) in execution of the Group’s rationalisation plan, include: (i) further restructuring costs in Flexible Foams for the closure of Catarroja (Spain) and Buren (The Netherlands) plants, (ii) in Bedding mainly anticipated costs of the announced closure of the Hassfurt (Germany) plant, and (iii) some additional rationalisation efforts in Automotive.
• The ‘other’ adjustments to EBIT (EUR -6.0 million) relate to costs and fees for legacy remediation and litigations.
RECTICEL ANNUAL REPORT 2019 I 167RECTICEL ANNUAL REPORT 2019 I 166

2.4.2.4.3. Other operating revenues and expenses
in thousand EUR
Group Recticel 2019 2018
Other operating revenues 20 274 17 900
Other operating expenses (23 730) (26 730)
TOTAL (3 456) (8 830)
Restructuring charges (including site closure, onerous contracts and clean-up costs) (11 215) (10 104)
Gain (Loss) on disposal of intangible, tangible and right-of-use assets 2 510 671
Gain (Loss) on investment operations 2 169 0
Amounts written-back/(-off) on affiliates investments and loss on receivables 557 (0)
IAS 19 Pensions and other obligations (2 099) (1 953)
IAS 19 Operating expenses 280 124
Provisions 157 (3 628)
Insurances (2 195) (1 522)
Fees consultancy and subcontractors (4 875) (3 209)
Other expenses (475) (6 110)
Fair value measurement options Proseat 3 762 0
Reinvoiced expenses 51 1 012
Insurances commission (Recticel RE) 3 947 2 484
Received compensations 2 017 2 217
Other revenues 1 953 11 189
TOTAL (3 456) (8 830)
2.4.2.4.4. Earnings before interest and taxes (EBIT)
The components (by nature) of EBIT are as follows:
Group Recticel 2019 2018
Sales 1 038 517 1 117 652
Purchases and changes in inventories (490 114) (549 563)
Other goods and services (188 885) (216 832)
Labour costs (300 079) (291 647)
Amortisation and depreciation on non-current assets (54 403) (29 997)
Impairments on non-current assets (1 821) (5 819)
Amounts written back/(off) on affiliated investments 557 (0)
Amounts written back/(off) on inventories (492) (152)
Amounts written back/(off) on receivables (573) (2)
Amortisation of deferred long term and upfront payment (1 849) (1 637)
Provisions (2 096) (9 428)
Gain/(Loss) on disposal intangible and tangible assets 2 510 671
Gain/(Loss) on disposal on investments 2 169 0
Gain/(Loss) on trade receivables (15) (171)
Operating taxes (6 012) (6 301)
Other operating expenses (4 148) (14 829)
Own production 3 706 4 908
Operating subsidies 2 096 4 373
Commissions and royalty income 272 246
Operating lease income 1 953 2 168
Reinvoicing of expenses 9 641 7 607
Insurance premiums (Recticel RE) 3 947 2 484
Indemnities 137 8 837
Received compensations 2 108 2 217
Service fees 328 623
Fair value measurement of options Proseat 3 762 0
Other operating income 6 661 7 368
Income from associates & joint ventures 9 271 10 170
EBIT 37 148 42 947
RestructuringDuring 2019, restructuring charges (EUR -11.2 million) refer to additional restructuring measures in execution of the Group’s rationalisation plan, including (i) restructuring costs in Flexible Foams following the closure of the Troisdorf plant (Eurofoam Germany), (ii) rationalisation measures in Automotive Interiors (Germany) and (iii) further streamlining in corporate and central services.
During 2018, restructuring charges are mainly related to (i) further restructuring costs in Flexible Foams for the closure of Catarroja (Spain) and Buren (The Netherlands) plants, (ii) in Bedding mainly anticipated costs for the announced closure of the Hassfurt (Germany) plant, and (iii) some additional rationalisation efforts in Automotive.
Gain (loss) on disposal of tangible and intangible assets
In 2019, this item relates mainly to land and building in Belgium (EUR 0.7 million) and Germany (EUR 0.5 million) and idle assets in Spain (EUR 0.4 million).
In 2018, this item relates mainly to the gain on disposal of equipment of Automotive in Belgium and China (EUR 0.3 million) and in Flexible Foams in The Netherlands (EUR 0.4 million).
Gain (loss) on investment operationsIn 2019, this item relates mainly to divestment of Proseat.
RECTICEL ANNUAL REPORT 2019 I 169RECTICEL ANNUAL REPORT 2019 I 168
Sales: All segments reported lower sales mainly as a result of (i) price erosion due to lower raw material costs, (ii) soft demand in most market leading to lower volumes and (iii) intense competition in some markets. More details per segment can be found in the comments on the combined figures in the Report of the Board of Directors.
Purchases and changes in inventories decreased as a result of lower chemical raw materials prices and lower volumes.
Other goods and services comprise transportation costs (EUR 55.2 million versus EUR 52.7 million in 2018), operating lease expenses (EUR 5.3 million versus EUR 29.3 million in 2018), supplies (EUR 23.5 million versus EUR 23.8 million in 2018), fees (EUR 17.5 million versus EUR 16.2 million in 2018), repair and maintenance costs (EUR 14.2 million versus EUR 16.5 million in
2018), advertising/fairs/exhibition costs (EUR 12.6 million versus EUR 15.7 million in 2018), travel expenses (EUR 9.1 million versus EUR 8.7 million in 2018), administrative expenses (EUR 8.2 million versus EUR 9.1 million in 2018), insurance expenses (EUR 7.9 million versus EUR 5.3 million in 2018), waste removal and environmental expenses (EUR 5.0 million versus EUR 4.8 million in 2018), security expenses (EUR 2.0 million versus EUR 1.9 million in 2018).
Labour costs slightly increased mainly due to salary inflation and the opening of the new Insulation plant in Finland.
The slightly lower income from joint ventures & associates is mainly explained by the lower contribution of the Eurofoam group, which was impacted by closure costs of the Troisdorf plant (Germany).

2.4.2.4.6. Income taxes IFRIC 23 clarifies the accounting for uncertainties in income taxes; i.e. the determination of taxable profit (tax loss), tax bases, unused tax losses, unused tax credits and tax rates, when there is uncertainty over income tax treatments under IAS 12.
1. Income tax chargesin thousand EUR
Group Recticel 2019 2018
Recognised in the income statement
Current income tax:
Current year (6 588) (7 788)
Adjustments in respect of prior year (1) (64) 4 534
Total current tax (6 652) (3 254)
Deferred taxes:
Origination and reversal of temporary differences 851 (813)
Use of tax losses previously recognised as deferred tax assets (2) (1 786) (3 936)
Use of tax losses due to the new tax reform in Belgium (2018) and derecognition in Germany (2019) (3 045) (2 241)
Effect of changes in tax rates on deferred taxes 539 32
Deferred tax on current year's losses (3) 5 890 0
Total deferred tax 2 449 (6 958)
Grand total (4 203) (10 212)
(1) 2018: mainly relating to tax refunds to be received in Germany. (2) The utilization of previous years’ tax losses (EUR -1.8 million against EUR -3.9 million in 2018) is mainly explained by the Czech Republic (EUR -0.3 million), France (EUR
-0.9 million) and Belgium (EUR -0.6 million). (3) Deferred tax on current year’s losses of EUR 5.9 million is mainly explained by the recognition of deferred tax assets in Belgium, France and Spain.
in thousand EUR
Group Recticel 2019 2018
Reconciliation of effective tax rate
Profit / (loss) before taxes 28 921 39 061
Minus income from associates (9 272) (10 170)
Result before tax and income from associates 19 650 28 891
Tax at domestic income tax rate (5 812) (8 546)
Domestic tax rate 29,58% 29,58%
Tax effect of non-deductible expenses (10 530) (5 823)
Tax effect of non-taxable income 9 962 4 919
Use of tax losses previously recognised as deferred tax assets due to the new tax reform in Belgium (2018) and derecognition in Germany (2019) (3 045) (2 241)
Tax effect of current and deferred tax adjustments related to prior years 2 743 (1 060)
Tax effect of tax losses carried forward 0 1 141
Effect of different tax rates of subsidiaries operating in different jurisdictions 1 722 2 237
Effect of changes in tax rates on deferred taxes 539 32
Other 219 (685)
Tax expense for the year (4 203) (10 026)
2. Deferred tax assets and liabilities
in thousand EUR
Group Recticel31 DEC 2019 31 DEC 2018
DEFERRED TAX ASSETS
DEFERRED TAX LIABILITIES
DEFERRED TAX ASSETS
DEFERRED TAX LIABILITIES
Recognised deferred tax assets and liabilities
Intangible assets 9 738 (844) 10 036 (824)
Property, plant & equipment 24 822 (17 105) 21 715 (15 982)
Investments 0 (1 260) 0 (1 213)
Inventories 631 (1 379) 952 (1 338)
Receivables 1 411 (987) 1 263 (998)
Fair value of trading and economic hedge 3 0 0 0
Other current assets 442 (104) 2 640 0
Pension provisions 12 660 0 12 920 0
Other provisions 6 102 (6 452) 4 663 (6 262)
Lease liabilities 19 448 (19 448) 0 0
Other liabilities 1 697 (2 466) 1 553 (2 293)
Tax loss carry-forwards/ Tax credits 161 505 0 159 886 0
Total 238 459 (50 045) 215 628 (28 910)
Valuation allowance (1) (174 328) 0 (175 900) 0
Set-off (2) (40 022) 40 022 (19 260) 19 260
Total (as provided in the statement of financial position) 24 108 (10 023) 20 468 (9 650)
(1) The variance of EUR +1.6 million (EUR 174.3 million versus EUR 175.9 million) is mainly explained by a valuation allowance of EUR +2.1 million, by an effect on tax rate changes of EUR +6.2 million, by an effect on equity of EUR -0.3 million related to equity impact of pensions, the effect of exchange rate differences of EUR -1.2 million, and an effect on changes in scope (Proseat n.v.) of EUR -5.2 million.
(2) According to IAS 12 (Income Taxes), deferred tax assets and deferred tax liabilities should, under certain conditions, be offset if they relate to income taxes levied by the same taxation authority.
RECTICEL ANNUAL REPORT 2019 I 171RECTICEL ANNUAL REPORT 2019 I 170
2.4.2.4.5. Financial result
in thousand EUR
Group Recticel 2019 2018
Interest charges on bonds & notes 0 (19)
Interest on lease liabilities (4 501) (296)
Interest on long-term bank loans (1 110) (759)
Interest on short-term bank loans & overdraft (1 451) (2 097)
Net interest charges on Interest Rate Swaps and Foreign Currency Swaps (27) (645)
Total borrowing cost (7 089) (3 816)
Interest income from bank deposits 81 72
Interest income from financial receivables 248 586
Interest income from financial receivables and cash 329 658
Interest charges on other debts (203) (95)
Total other interest (203) (95)
Interest income and expenses (6 963) (3 253)
Exchange rate differences (368) 71
Net interest cost IAS 19 (806) (759)
Other financial result (90) 56
Total other financial result (1 264) (632)
FINANCIAL RESULT (8 227) (3 886)
The higher borrowing cost results mainly from the application of IFRS 16 Leases (EUR 4.2 million in 2019).
in thousand EUR
Group Recticel 2019 2018
Deferred tax income (charge) recognised directly in equity
Change in accounting policy (IFRS 15) 0 1 247
Impact of IAS 19R on equity 746 (619)
Impact of movements in exchange rates 81 19
Total 827 647

Tax loss carry-forwards – amounts by expiration date:
in thousand EUR
Group Recticel 2019 2018
One year 1 875 1 563
Two years 1 836 4 751
Three years 8 744 69 882
Four years 9 738 6 612
Five years and thereafter 137 633 129 763
Without time limit 374 304 350 389
Total 534 130 562 960
Deferred tax assets recognised and unrecognised by the Group apply to the following elements as at 31 December 2019:
in thousand EUR
Group Recticel TOTAL POTENTIAL DEFERRED TAX ASSETS
RECOGNISED DEFERRED TAX ASSETS
VALUATION ALLOWANCES
Tax losses carried forward (*) 161 505 27 236 134 269
Property, plant and equipment 24 822 3 241 21 581
Pension provisions 12 660 6 141 6 519
Other provisions 6 102 1 590 4 512
Lease liabilities 19 448 19 448 0
Other temporary differences 13 922 6 475 7 447
Total before set-off 238 459 64 131 174 328
(*) As of 31/12/2019, deferred tax assets of EUR 24.1 million (2018: EUR 20.5 million) are recognized out of EUR 534.1 million (2018: EUR 563.0 million) tax losses carryforward. These deferred tax assets represent income likely to be realisable in the foreseeable future.
Deferred tax assets recognised and unrecognised by the Group apply to the following elements as at 31 December 2018:
in thousand EUR
Group Recticel TOTAL POTENTIAL DEFERRED TAX ASSETS
RECOGNISED DEFERRED TAX ASSETS
VALUATION ALLOWANCES
Tax losses carried forward (*) 159 886 23 752 136 134
Property, plant and equipment 21 715 2 430 19 285
Pension provisions 12 922 5 227 7 695
Other provisions 4 663 939 3 724
Other temporary differences 16 442 7 380 9 062
Total before set-off 215 628 39 728 175 900
(*) As of 31/12/2018, deferred tax assets of EUR 20.5 million are recognized out of EUR 563.0 million (2017: EUR 592.4 million) tax losses carryforward. These deferred tax assets represent income likely to be realisable in the foreseeable future.
RECTICEL ANNUAL REPORT 2019 I 173RECTICEL ANNUAL REPORT 2019 I 172
Deferred tax liabilities are recognised for taxable temporary differences arising on investments in subsidiaries and associates, and interests in joint ventures, except where the Group is able to control the reversal of the temporary difference and when it is probable that the temporary
difference will not reverse in the foreseeable future. No deferred tax liabilities have been recognised on undistributed retained earnings of subsidiaries, associates and joint ventures, as the impact is not material.
2.4.2.4.7. DividendsAmounts recognised as distributions to equity holders in the period.
Dividend for the period ending 31 December 2018 of EUR 0.24 per share.
Proposed dividend for the period ending 31 December 2019 of EUR 0.24 per share, or in total for all shares outstanding EUR
13,295,385 (2018: EUR 13,254,483), including the portion attributable to the treasury shares (326,800 in total per 31 December 2019).
The proposed dividend is subject to approval by the shareholders at the Annual General Meeting and has not been included as a liability in these financial statements.
The calculation of the basic and diluted earnings per share is based on the following data:
Group Recticel 2019 2018
"Net profit (loss) for the period (share of the Group) (in thousand EUR)" 24 762 28 849
Net profit (loss) from continuing operations 24 762 28 849
Net profit (loss) from discontinuing operations 0 0
Weighted average shares outstanding
Ordinary shares on 01 January (excluding treasury shares*) 54 900 212 54 449 557
Exercised subscription rights 170 427 450 655
Ordinary shares on 31 December (excluding treasury shares*) 55 070 639 54 900 212
Weighted average shares outstanding 54 959 861 54 659 774
* Number of treasury shares held per 31 December 326 800 326 800
in EUR
Group Recticel 2019 2018
Basic earnings per share 0.45 0.53
Basic earnings per share from continuing operations 0.45 0.53
Basic earnings per share from discontinuing operations 0.00 0.00
2.4.2.4.8. Basic earnings per shareFrom continuing and discontinuing operations

RECTICEL ANNUAL REPORT 2019 I 175RECTICEL ANNUAL REPORT 2019 I 174
2.4.2.4.9. Diluted earnings per share Computation of the diluted earnings per share :
in thousand EUR
Group Recticel 2019 2018
Dilutive elements
Net profit (loss) from continuing operations 24 762 28 849
Profit (loss) attributable to ordinary equity holders of the parent entity including assumed conversions 24 762 28 849
Weighted average ordinary shares outstanding 54 959 861 54 659 774
Stock option plans - subscription rights (1) 194 640 433 521
Weighted average shares for diluted earnings per share 55 154 501 55 093 295
Group Recticel 2019 2018
Diluted earnings per share 0.45 0.52
Diluted earnings per share from continuing operations 0.45 0.52
Diluted earnings per share from discontinuing operations 0.00 0.00
2019 2018
Anti-dilutive elements
Impact on weighted average ordinary shares outstanding
Stock option plan - subscription rights - "out-of-the-money" (1) 171 022 57 256
(1) Per 31 December 2019, all outstanding subscription rights plans as from April 2014 are in-the-money, except the plan of April 2018 and June 2019 which were out-of-the-money. The outstanding subscription rights plans which are out-of-the-money are disclosed as anti-dilutive.
2.4.2.5. Statement of financial position
2.4.2.5.1. Intangible assets
For the year ending 31 December 2019:
in thousand EUR
Group Recticel DEVELOPMENT COSTS
TRADEMARKS, PATENTS & LICENCES
CLIENT PORTFOLIO GOODWILL
OTHER INTANGIBLE
ASSETS
ASSETS UNDER CONSTRUCTION AND ADVANCE PAYMENTS
TOTAL
At the end of the preceding period
Gross book value 14 820 50 802 9 568 262 6 693 82 145
Accumulated amortisation (13 853) (38 271) (9 568) (250) (252) (62 194)
Accumulated impairment (47) (6 328) 0 0 (1 531) (7 906)
Net book value at the end of the preceding period 920 6 203 0 12 4 910 12 045
Movements during the year:
Acquisitions 0 238 0 43 4 299 4 580 (1)
Impairments (14) (57) 0 0 (287) (358)
Amortisation (529) (2 054) (48) (11) (25) (2 667)
Sales and scrapped - gross amount (2 649) (634) (4 881) (27) (161) (8 352) (2)
Sales and scrapped - Accumulated amortization & impairments
2 649 634 4 881 27 161 8 352 (2)
Transfers from one heading to another 67 2 046 0 1 (2 383) (269)
Change in scope 0 0 951 0 0 952
Exchange rate differences 2 20 0 0 0 22
At the end of the current period 446 6 395 903 45 6 516 14 306
Gross book value 12 356 52 693 5 745 279 8 450 79 523
Accumulated amortisation (11 905) (39 928) (4 842) (234) (253) (57 162)
Accumulated impairment (5) (6 370) 0 0 (1 681) (8 056)
Net book value at the end of the period 447 6 395 903 45 6 516 14 306
Useful life (in years) 3-5 3-10 5-10 5 maximum n.a.
Acquisitions Disposals
Cash-out on acquisitions of intangible assets (4 502) Cash-in from disposals of intangible assets 1
Acquisitions included in working capital (77) Disposals included in working capital (1)
(1) Total acquisitions of intangible assets (4 580) (2) Total disposals of intangible assets 0
Reference is also made to note 2.4.2.1.4. - Key judgments and major sources of estimation uncertainty.
In 2019, the total acquisition of intangible assets amounted to EUR 4.6 million, compared to EUR 2.6 million the year before. The investments in intangible assets in 2019 mainly related to “Assets under construction and advance payments” for new developments and licence costs related to the roll-out of the SAP IT platform (EUR 2.1 million) and capitalised development costs for Automotive Interiors projects (EUR 0.3 million).

RECTICEL ANNUAL REPORT 2019 I 177RECTICEL ANNUAL REPORT 2019 I 176
In 2018, the total acquisition of intangible assets amounted to EUR 2.6 million, compared to EUR 3.2 million the year before. The investments in intangible assets in 2018 mainly related to “Assets under construction and advance payments” for new developments and licence costs related to the roll-out of the SAP IT platform (EUR 2.3 million) and capitalised development costs for Automotive Interiors projects (EUR 0.3 million).
2.4.2.5.2. Property, plant & equipment
For the year ending 31 December 2019:
in thousand EUR
Group Recticel LAND AND BUILDINGS
PLANT, MACHINERY &
EQUIPMENTFURNITURE
AND VEHICLESLEASES AND
SIMILAR RIGHTSOTHER TANGIBLE
ASSETSASSETS UNDER
CONSTRUCTION TOTAL
At the end of the preceding period
Gross value 187 887 526 968 25 945 44 698 1 112 15 315 801 925
Accumulated depreciation (117 837) (394 780) (21 749) (17 303) (1 043) (238) (552 950)
Accumulated impairments (3 964) (12 350) (21) (76) 0 (22) (16 433)
Net book value at the end of the preceding period 66 086 119 838 4 175 27 319 69 15 055 232 542
Movements during the year
Change in accounting policies 0 0 0 (27 319) 0 0 (27 319) (1)
Acquisitions 22 679 2 354 465 0 5 23 587 49 090
Impairments (63) (1 390) (10) 0 0 0 (1 463)
Depreciation (4 197) (22 905) (1 942) 0 (17) (45) (29 107) (2)
Sales and scrapped 0 (59) (5) 0 0 (3) (66)
Transfers from one heading to another 3 511 9 452 3 356 0 39 (16 132) 227
Change in scope 1 483 444 18 0 0 0 1 946
Exchange rate differences 783 879 25 0 (1) 81 1 767
At the end of the period 90 282 108 613 6 083 0 96 22 543 227 617
Gross value 218 664 522 391 29 411 0 1 106 22 806 794 378
Accumulated depreciation (124 477) (401 925) (23 309) 0 (1 010) (241) (550 962)
Accumulated impairments (3 905) (11 854) (19) 0 0 (22) (15 800)
Net book value at the end of the period 90 282 108 613 6 082 0 97 22 543 227 617
Acquisitions Disposals
Cash-out on acquisitions of tangible assets (50 489) Cash-in from disposals of tangible assets 1 907
Acquisitions included in working capital 1 399 Disposals included in working capital (1 841)
(1) Total acquisitions of tangible assets (49 090) (2) Total disposals of tangible assets 66
The change in accounting policy is linked to a reclassification to item ‘Right-of-use assets’, by application of IFRS 16.Reference is also made to note 2.4.2.1.4. - Key judgments and major sources of estimation uncertainty.
For the year ending 31 December 2018:
in thousand EUR
Group Recticel DEVELOPMENT COSTS
TRADEMARKS, PATENTS & LICENCES
CLIENT PORTFOLIO GOODWILL
OTHER INTANGIBLE ASSETS
ASSETS UNDER CONSTRUCTION AND ADVANCE PAYMENTS
TOTAL
At the end of the preceding period
Gross book value 14 411 48 720 9 574 260 6 716 79 682
Accumulated amortisation (12 920) (36 544) (9 574) (241) (249) (59 528)
Accumulated impairment 0 (6 300) 0 0 (1 531) (7 831)
Net book value at the end of the preceding period 1 491 5 876 0 19 4 936 12 323
Movements during the year:
Acquisitions, including own production 0 139 0 (2) 2 450 2 586 (1)
Impairments 0 0 0 0 0 0
Expensed amortisation (716) (1 904) (0) (9) (0) (2 629)
Sales and scrapped 0 0 0 19 (0) 19 (2)
Transfers from one heading to another 149 2 124 0 (16) (2 474) (217)
Exchange rate differences (4) (32) 0 (0) (0) (37)
At the end of the current period 920 6 203 0 12 4 910 12 045
Gross book value 14 820 50 802 9 568 262 6 693 82 145
Accumulated amortisation (13 853) (38 271) (9 568) (250) (252) (62 194)
Accumulated impairment (47) (6 328) 0 0 (1 531) (7 906)
Net book value at the end of the period 920 6 203 0 12 4 910 12 045
Useful life (in years) 3-5 3-10 5-10 5 maximum n.a.
Acquisitions Disposals
Cash-out on acquisitions of intangible assets (3 205) Cash-in from disposals of intangible assets 110
Acquisitions included in working capital 619 Disposals included in working capital (91)
(1) Total acquisitions of intangible assets (2 586) (2) Total disposals of intangible assets 19
In 2019, total acquisitions of tangible assets amounted to EUR 49.1 million, compared to EUR 42.4 million last year. The increase is mainly explained by the acquisition of the Insulation plant in Stoke-on-Trent (United Kingdom), following the exercise of a purchase option. Assets under construction mainly relate to Belgium (EUR 7.5 million), Bedding in Germany (EUR 1.4 million), Automotive Interiors in Czech Republic and USA (EUR 5.2 million) and Flexible Foams in France (EUR 1.6 million) and The Netherlands (EUR 5.2 million).
At 31 December 2019, the Group had entered into contractual commitments for the acquisition of property, plant & equipment amounting to EUR 4.3 million (2018: EUR 10.5 million).
In 2019, impairment losses recognised in profit and loss are mainly related to assets in Automotive Interiors in Germany (EUR -0.7 million) and China (EUR -0.7 million).
In 2019, change in scope relates to the increased participation in Turvac (Insulation).

RECTICEL ANNUAL REPORT 2019 I 179RECTICEL ANNUAL REPORT 2019 I 178
The line ‘Lease reassessment’ is mainly linked to the acquisition of the Insulation plant in Stoke-on-Trent (United Kingdom).
The weighted average underlying incremental borrowing rate of right-of-use asset agreements per 31 December 2019 was 3.2%.
Besides the Group benefits from other operating lease arrangements which are not recognised in the balance sheet, following the exception rule under IFRS 16.
The below table comprises the recognised operating lease charge during the financial period.
At 31 December 2019, the Group had entered into contractual commitments for the acquisition of right-of-use assets amounting to EUR 6.2 million.
in thousand EUR
Group Recticel 31 DEC 2019 31 DEC 2018
Low value operating leases 367 not restated
Short term operating leases 2 224 not restated
Services under operating leases 1 240 not restated
Other considerations 1 512 not restated
Total operating leases 5 342 not restated
2.4.2.5.3. Right-of-use assets
For the year ending 31 December 2019:in thousand EUR
Group Recticel LAND AND BUILDINGS
PLANT, MACHINERY
& EQUIPMENT
FURNITURE AND VEHICLES TOTAL
At the end of the preceding period
Gross value 0 0 0 0
Accumulated depreciation 0 0 0 0
Accumulated impairments 0 0 0 0
Net book value at the end of the preceding period 0 0 0 0
Movements during the year
Changes in accounting policies - IFRS 16 87 120 18 904 11 496 117 520
Transfers from Property, plant and equipment 27 308 11 0 27 319
Acquisitions 227 469 4 328 5 024
Lease reassessment (23 439) (1 002) 625 (23 816)
Depreciation (11 843) (5 155) (5 671) (22 669)
Exchange rate differences 1 501 162 68 1 732
At the end of the period 80 874 13 389 10 846 105 110
Gross value 107 173 19 041 16 545 142 759
Accumulated depreciation (25 935) (5 606) (5 698) (37 239)
Accumulated impairments (364) (46) 0 (410)
Net book value at the end of the period 80 874 13 389 10 846 105 110
Contractual tenor (in years) 6 - 12 3 - 12 4
For the year ending 31 December 2018:
in thousand EUR
Group Recticel LAND AND BUILDINGS
PLANT, MACHINERY &
EQUIPMENTFURNITURE AND
VEHICLESLEASES AND
SIMILAR RIGHTSOTHER TANGIBLE
ASSETSASSETS UNDER
CONSTRUCTION TOTAL
At the end of the preceding period
Gross value 174 573 509 343 25 562 44 751 1 146 23 248 778 622
Accumulated depreciation (117 173) (381 437) (21 422) (16 410) (1 060) (240) (537 741)
Accumulated impairments (1 258) (12 741) (2) (76) 0 (21) (14 098)
Net book value at the end of the preceding period 56 142 115 165 4 139 28 265 86 22 987 226 783
Movements during the year
Acquisitions, including own production 665 2 212 484 0 10 39 030 42 400 (1)
Impairments (2 705) (2 061) (10) 0 0 0 (4 777)
Expensed depreciation (3 628) (21 037) (1 758) (925) (21) 0 (27 368)
Sales and scrapped 0 (162) (1) (29) 0 (279) (471) (2)
Transfers from one heading to another 19 422 26 194 1 334 8 (3) (46 772) 182
Exchange rate differences (49) (473) (13) (0) (3) 90 (448)
Reclassification to assets held for sale (3 761) 0 0 0 0 0 (3 761)
At the end of the period 66 086 119 838 4 174 27 319 70 15 055 232 541
Gross value 187 887 526 968 25 945 44 698 1 112 15 315 801 925
Accumulated depreciation (117 837) (394 780) (21 749) (17 303) (1 043) (238) (552 951)
Accumulated impairments (3 964) (12 350) (21) (76) 0 (22) (16 432)
Net book value at the end of the period 66 086 119 838 4 174 27 319 70 15 055 232 541
Acquisitions Disposals
Cash-out on acquisitions of tangible assets (45 873) Cash-in from disposals of tangible assets 453
Acquisitions included in working capital 3 473 Disposals included in working capital 19
(1) Total acquisitions of tangible assets (42 400) (2) Total disposals of tangible assets 471
In 2018, impairment losses recognised in profit and loss are mainly related to (i) goodwill in the United Kingdom (Flexible Foams) (EUR -1.0 million), (ii) idle tangible assets in Flexible Foams (EUR -3.9 million) following the closure of the plant in Catarroja (Spain) and (iii) assets in Automotive Interiors in the Czech Republic (EUR -1.4 million).
In 2018, ‘Sales and scrapped’ reflects (i) the sale and lease-back of an Insulation building in Belgium (EUR -8.8 million), (ii) the write-off of destroyed assets following the fire in the Interiors plant Most (EUR -3.3 million) and (iii) the sale of equipment in Interiors China (EUR -2.4 million).
In 2018, ‘reclassification to assets held for sale’ (EUR 3.8 million) relates to two buildings; one in Espelkamp (Germany), which is rented to the Automotive joint venture Proseat, and one in Hassfurt (Germany) (Bedding).

RECTICEL ANNUAL REPORT 2019 I 181RECTICEL ANNUAL REPORT 2019 I 180
1. SUBSIDIARIES CONSOLIDATED USING THE FULL CONSOLIDATION METHOD (continued)
% shareholding in
31 DEC 2018 31 DEC 2017
NorwayRecticel AS Øysand - 7224 Mehus 100.00 100.00
Poland Recticel Sp. z o.o. Ul. Graniczna 60, 93-428 Lodz 100.00 100.00
Romania Recticel Bedding Romania s.r.l. Miercurea Sibiului, DN1, FN, ground floor room 2 3933 Sibiu County 100.00 100.00
Slovenia Turvac d.o.o. Primorska 6b, 3325 Šoštanj 74.00 50.00 (b)
Sweden
Recticel AB Södra Storgatan 50 b.p. 507 - 33228 Gislaved 100.00 100.00 Spain
Recticel Iberica s.l. Cl. Catalunya 13, Pol. Industrial Cam Ollersanta Perpetua de Mogoda 08130 100.00 100.00
Switzerland Recticel Bedding (Schweiz) AG Bettenweg 12 Postfach 65 - 6233 Büron - Luzern 100.00 100.00
TurkeyRecticel Teknik Sünger Izolasyon Sanayi ve Ticaret a.s. Orta Mahalle, 30 - 34956 Istanbul 100.00 100.00
United Kingdom
Gradient Insulations (UK) Limited Blue Bell Close Clover Nook Industrial Park - DE554RD Alfreton 100.00 100.00Recticel (UK) Limited Blue Bell Close Clover Nook Industrial Park - DE554RD Alfreton 100.00 100.00Recticel Limited Blue Bell Close Clover Nook Industrial Park - DE554RD Alfreton 100.00 100.00
United States of America Recticel North America Inc. Metro North Technology Park - Atlantic Boulevard 1653 - MI 48326 Auburn Hills 100.00 100.00The Soundcoat Company Inc. Burt Drive 1 PO Box 25990 - NY 11729 Deer Park County of Suffolk 100.00 100.00
Significant restrictions to realise assets or settle liabilitiesRecticel s.a./n.v., or some of its subsidiaries have provided guarantees for (i) an aggregate amount of EUR 0.8 million in favour of OVAM regarding the sanitation and rehabilitation projects on some of its sites and/or sites of its subsidiaries, (ii) an aggregate amount of EUR 0.8 million in favour of the Walloon Département du Sol et des Déchets – DSD, and (iii) and aggregate amount of EUR 2.2 million in favour of various local public entities in France (Préfectures).
Recticel s.a./n.v. also provides guarantees and comfort letters (for a total amount of EUR 75.6 million) to and/or on behalf of various direct or indirect subsidiaries, of which the material (> EUR 1 million) ones are: • on behalf of Recticel Iberica S.L.: EUR 1.75 million; • on behalf of Recticel Bedding Romania s.r.l.: EUR 1.4 million; • on behalf of Recticel Ltd.: EUR 17.8 million, of which an
estimated EUR 6.4 million (GBP 5.5 million) for the pension fund;
• on behalf of Recticel Verwaltung GmbH: EUR 5.0 million; • on behalf of Recticel Insulation s.a.s. in the framework of a real
estate lease: EUR 13.0 million; • on behalf of Recticel Teknik Sünger Izolasyon Sanayi ve Ticaret
a.s.: EUR 2.7 million; • on behalf of Recticel India Private Limited: EUR 3.0 million; • on behalf of Sembella GmbH (Austria); • on behalf of Recticel Bedding Schweiz AG: EUR 1.9 million;
• on behalf of Ningbo Recticel Automotive Parts Co. Ltd: EUR 9.3 million;
• on behalf of Recticel Insulation OY: EUR 14.6 million; • on behalf of Recticel Flexible Foams (Wuxi) Co Ltd; and • on behalf of Recticel International Services s.a./n.v.: EUR 3.0
million.
Moreover Recticel s.a./n.v. guarantees (i) Yanfeng Automotive Interiors group (formerly Johnson Controls) for the proper execution of the contracts under two programs of its subsidiary Recticel North America Inc and (ii) Daimler AG for Mercedes programs of the Interiors division.
Under the club deal conditions, the maximum dividend authorised for distribution, excluding the portion attributable to the treasury shares, amounts to the highest of (i) 50% of the consolidated net income of the Group for the previous financial year and (ii) EUR 12.0 million.
The gross dividend over 2019 – to be paid in 2020 – proposed to the Annual General Meeting amounts to EUR 0.24 per share, leading to a total dividend pay-out of EUR 13.2 million (excluding treasury shares). This amounts exceeds the above-mentioned 50% maximum pay-out limit. A waiver has been obtained from the participating banks to authorise such higher payment.
1. SUBSIDIARIES CONSOLIDATED ACCORDING TO THE FULL CONSOLIDATION METHOD
% shareholding in
31 DEC 2019 31 DEC 2018
Austria Sembella GmbH Aderstrasse 35 - 4850 Timelkam 100.00 100.00
Belgium
s.c. sous forme de s.a. Balim b.v. onder vorm van n.v. Olympiadenlaan 2 - 1140 Evere 100.00 100.00
s.a. Finapal n.v. Olympiadenlaan 2 - 1140 Evere 100.00 100.00
s.a. Recticel International Services n.v. Olympiadenlaan 2 - 1140 Evere 100.00 100.00
s.a. Recticel UREPP Belgium n.v. Damstraat 2 - 9230 Wetteren 100.00 100.00s.a. Proseat n.v. Olympiadenlaan 2 - 1140 Evere 100.00 (b)
ChinaNingbo Recticel Automotive Parts Co. Ltd. 525, Changxing Road, (C Area of Pioneer Park) Jiangbei District, Ningbo Municipality 100.00 100.00
Recticel Foams (Shanghai) Co Ltd 525, Kang Yi Road - Kangyiao Industrial Zone, 201315 Shanghai 100.00 100.00
Shenyang Recticel Automotive Parts Co Ltd 12, Hangtian Road - Dongling District, 110043 Shenyang City 100.00 100.00
Shenyang Recticel II Automotive Parts Co Ltd 70, Dawang Road - Dadong District, 11043 Shenyang City 100.00 100.00
Langfang Recticel Automotive Parts Co Ltd 10, Anjin Road - Anci Industrial Zone, 065000 Langfang City 100.00 100.00
Changchun Recticel Automotive Parts Co Ltd.Intersection of C19 Rd. and C43 St. in Automotive industry Development Zone; 13000 Changchun, Jilin Province
100.00 100.00
Recticel Flexible Foam (Wuxi) Co Ltd No 30, Wanquan Road; Xishan Economic and Technological Developement Zone, Wuxi City 100.00 100.00
Czech Republic
RAI Most s.r.o. Moskevska 3055 - Most 100.00 100.00
Recticel Czech Automotive s.r.o. Chuderice-Osada 144 - 418,25 Bilina 100.00 100.00
Recticel Interiors CZ s.r.o. Plazy, 115 - PSC 293 01 Mlada Boleslav 100.00 100.00
Estonia
Recticel ou Pune Tee 22 - 12015 Tallin 100.00 100.00
Finland
Recticel oy Nevantie 2, 45100 Kouvola 100.00 100.00
Recticel Insulation oy Gneissitie, 2 - 04600 Mäntsälä 100.00 100.00
France
Recticel s.a.s. 71, avenue de Verdun - 77470 Trilport (since 1 March 2019) 100.00 100.00
Recticel Insulation s.a.s. 1, rue Ferdinand de Lesseps - 18000 Bourges 100.00 100.00
Germany
Recticel Automobilsysteme GmbH Im Muehlenbruch 10-12 - 53639 Königswinter 100.00 100.00
Recticel Deutschland Beteiligungs GmbH Schlaraffiastrasse 1-10 - 44867 Bochum 6 - Wattenscheid 100.00 100.00
Recticel Grundstücksverwaltung GmbH Schlaraffiastrasse 1-10 - 44867 Bochum 6 - Wattenscheid 100.00 100.00
Recticel Dämmsysteme Gmbh (formerly Recticel Handel GmbH) Im Muehlenbruch 10-12 - 53639 Königswinter 100.00 100.00
Recticel Schlafkomfort GmbH Schlaraffiastrasse 1-10 - 44867 Bochum 6 - Wattenscheid 100.00 100.00
Recticel Verwaltung GmbH & Co. KG Schlaraffiastrasse 1-10 - 44867 Bochum 6 - Wattenscheid 100.00 100.00
LuxembourgRecticel RE s.a. 23, Avenue Monterey, L-2163 Luxembourg 100.00 100.00
Recticel Luxembourg s.a. 23, Avenue Monterey, L-2163 Luxembourg 100.00 100.00
IndiaRecticel India Private Limited 407, Kapadia Chambers, 599 JSS Road, Princess Street, Marine Lines (East), 400002 Mumbai Maharashtra 100.00 100.00
MorrocoRecticel Mousse Maghreb s.à.r.l. 31 Avenue Prince Héritier, Tanger 100.00 100.00
Recticel Maroc s.à.r.l.a.u. Ilot K, Module 4, Atelier 2, Zone Franche d'Exportation de Tanger 100.00 100.00
The Netherlands Enipur Holding B.V. Spoorstraat 69 - 4041 CL Kesteren - (a) 100.00
Recticel B.V. Spoorstraat 69 - 4041 CL Kesteren 100.00 100.00
Recticel Holding Noord B.V. Spoorstraat 69 - 4041 CL Kesteren 100.00 100.00
Recticel International B.V. Spoorstraat 69 - 4041 CL Kesteren 100.00 100.00
2.4.2.5.4. Subsidiaries, joint ventures and associates
Unless otherwise indicated, the percentage shareholdings shown below are identical to the percentage voting rights.
(a) Liquidated on 13 November 2019(b) Previously accounted for using the equity method (51%)
(a) Liquidated on 13 November 2019(b) Previously accounted for using the equity method (51%)

RECTICEL ANNUAL REPORT 2019 I 183RECTICEL ANNUAL REPORT 2019 I 182
3. ASSOCIATES ACCOUNTED FOR USING THE EQUITY METHOD
% shareholding in
31 DEC 2019 31 DEC 2018
Czech Republic
B.P.P. spol s.r.o. ul. Hájecká 11 – 61800 Brno 25.68 25.68
Eurofoam TP spol.s.r.o. ul. Hájecká 11 – 61800 Brno 40.00 40.00
Sinfo Souhradi 84 - 391 43 Mlada Vozice 25.50 25.50
Germany
Proseat Europe GmbH Hessenring 32 - 64546 Mörfelden-Walldorf 25.00 -
Italy
Orsa Foam S.p.a. Via A. Colombo, 60 21055 Gorla Minore (VA) 33.00 33.00
Lithuania
UAB Litfoam Radziunu Village, Alytus Region - (e) 30.00
Poland
Caria Sp. z o.o. ul Jagiellonska 48 - 34 - 130 Kalwaria Zebrzydowska 25.50 25.50
PPHIU Kerko Sp. z o.o. Nr. 366 - 36-073 Strazow 25.86 25.86
Ukraine
Porolon Limited Grodoocka 357 - 290040 - Lviv 47.50 47.50
Apart of having the approval from the controlling shareholder(s) to distribute dividends, there are no specific restrictions on the ability of associates to transfer funds to Recticel in the form of cash dividends, or to repay loans or advances made by Recticel.
Recticel s.a./n.v. also provides guarantees and comfort letters, on behalf of Proseat Europe GmbH: EUR 2.5 million.
4. NON-CONSOLIDATED ENTITIES
Some subsidiaries more than 50% controlled are not consolidated because they are (still) non-material. As soon as they have reached a sufficient size, however, they will be included in the scope of consolidation.
% shareholding in
31 DEC 2019 31 DEC 2018
Czech Republic
Matrace Sembella s.r.o. Hrabinská 498/19 - 73701 Ceský Tesín 100.00 -
China
Recticel Shanghai Ltd No. 518, Fute North Road, Waigaoqiao Free Trade Zone - 200131 Shanghai 100.00 100.00
Japan
Inorec Japan KK Imaika-Cho 1-36, Anjo-Shi 50.00 50.00
Luxembourg
Recfin S.A. 412F, route d'Esch, L-2086 Luxembourg - (f ) 100.00
Sweden
Nordflex A.B. Box 507 - 33200 Gislaved - (g) 100.00
(e) Liquidated
(f) Liquidated on 08 August 2019(g) Merged with Recticel AB
(c) Transferred to subsidiaries consolidated according to the full consolidation method. (d) Transferred to Proseat Europe GmbH on 18 February 2019
2. JOINT VENTURES ACCOUNTED FOR USING THE EQUITY METHOD
% shareholding in
31 DEC 2019 31 DEC 2018
Austria
Eurofoam GmbH Greinerstrasse 70 - 4550 Kremsmünster 50.00 50.00
Belgium
s.a. Proseat n.v. Olympiadenlaan 2 - 1140 Evere 100.00 (c) 51.00
Bulgaria
Eurofoam-BG o.o.d. Raiko Aleksiev Street 40, block n° 215-3 Izgrev district, Sofia 50.00 50.00
Czech RepublicEurofoam Bohemia s.r.o. Osada 144, Chuderice - 418 25 Bilina 50.00 50.00
Proseat Mlada Boleslav s.r.o. Plazy, 115 - PSC 293 01 Mlada Boleslav - (d) 51.00
FranceProseat s.a.s. Avenue de Verdun, 71, 77470 Trilport - (d) 51.00
Germany
Eurofoam Deutschland GmbH Schaumstoffe Hagenauer Strasse 42 – 65203 Wiesbaden 50.00 50.00
Proseat Gmbh & Co. KG Hessenring 32 - 64546 Mörfelden-Walldorf - (d) 51.00
Proseat Schwarzheide GmbH Schipkauer Strasse 1 - 01987 Schwarzheide - (d) 51.00
Proseat Verwaltung GmbH Hessenring 32 - 64546 Mörfelden-Walldorf - (d) 51.00
Hungary
Eurofoam Hungary Kft. Miskolc 16 - 3792 Sajobabony 50.00 50.00
Poland
Eurofoam Polska Sp. z o.o. ul Szczawinska 42 - 95-100 Zgierz 50.00 50.00
Proseat Spolka. z o.o. ul Miedzyrzecka, 16 - 43-382, Bielsko-Biala - (d) 51.00
RomaniaEurofoam s.r.l. Str. Garii nr. 13 Selimbar 2428 - O.P.8 C.P. 802 - Jud. Sibiu 50.00 50.00
Russian FederationEurofoam Kaliningrad Kaliningrad District, Guierwo Region , 238352 Uszakowo 50.00 50.00
Slovak Republic
Poly Dolné Rudiny 1 - SK-01001 Zilina 50.00 50.00
SerbiaEurofoam Sunder d.o.o. Vojvodanska Str. 127 - 21242 Budisava 50.00 50.00
SloveniaTurvac d.o.o. Primorska 6b, 3325 Šoštanj 74.00 (c) 50.00
SpainProseat Foam Manufacturing SLU Carretera Navarcles s/n, Poligono Industrial Santa Ana II - Santpedor (08251 Barcelona) - (d) 51.00
United KingdomProseat LLP Unit A, Stakehill Industrial Estate, Manchester, Lancashire - (d) 51.00
Apart of having the approval from the other joint venture partners to distribute dividends, there are no specific restrictions on the ability of joint ventures to transfer funds to Recticel in the form of cash dividends, or to repay loans or advances made by Recticel.
Recticel s.a./n.v. also provides guarantees and comfort letters, for a total amount of EUR 13.6 million, to and/or on behalf of various direct or indirect joint ventures, of which the material (> EUR 1 million) ones are: • on behalf of Eurofoam GmbH and subsidiaries: EUR 7.5
million; • on behalf of Proseat GmbH & Co KG: EUR 3.6 million.
The Group has no legal nor contractual obligations to support net asset deficiencies of a joint venture for an amount higher than its stake of interest.

RECTICEL ANNUAL REPORT 2019 I 185RECTICEL ANNUAL REPORT 2019 I 184
in thousand EUR
Group RecticelEUROFOAM (50%) PROSEAT (51%) TURVAC (50%)
31 DEC 2019 31 DEC 2018 31 DEC 2019 31 DEC 2018 31 DEC 2019 31 DEC 2018
Net equity (Group share) 80 457 76 229 0 22 997 0 1 433
Goodwill 488 494 0 8 977 0 0
Intragroup eliminations (7 130) (7 109) 0 16 563 0 0
Investment in partnership/Debt as equity 0 0 0 15 276 0 0
Deferred taxes (31) 892 0 (471) 0 0
IAS 19 assumptions 483 (507) 0 0 0 0
IFRS 16 22 0 0 0 0 0
Other (1 206) (301) 0 0 0 0
Investment in affiliates (33 240) (33 250) 0 (35 343) 0 0
Carrying amount of interests in joint ventures 39 842 36 447 0 27 999 0 1 433
Following the announcement on 19 December 2018 regarding the transaction with Sekisui Plastics Co Ltd (excluding Proseat n.v.), 26% of Recticel’s investment in the joint venture Proseat (Automotive Seating) has been transferred in 2018 to Assets
held for sale in the statement of financial position; the remaining 25% stake in Proseat continued to be reported under Interests in joint ventures and associates.
• The above figures are at 100% and are not comparable to the actual position and results of the joint venture companies on a stand-alone basis. Variances may arise due to differences in the accounting rules and scope of consolidation.
• Recticel s.a./n.v. has issued (i) a comfort letter for EUR 7.5 million on behalf of the joint venture company Eurofoam GmbH (Austria/Germany) to cover a local bank loan, (ii) a EUR 2.5 million guarantee on behalf of the joint venture Proseat Europe GmbH to cover a local bank loan, (iii) a EUR 1.1 million guarantee on behalf of the joint venture Proseat GmbH & Co KG to cover local lease agreements and (iv) a guarantee on behalf of the joint venture Proseat GmbH & Co KG to cover a EUR 2.5 million credit line.
2.4.2.5.5. Interests in joint ventures and associates
A list of the significant investments in joint ventures and associates is included in note 2.4.2.5.4.
in thousand EUR
Group Recticel JOINT VENTURES
ASSOCIATES 31 DEC 2019JOINT
VENTURESASSOCIATES 31 DEC 2018
At the end of the preceding period 51 577 17 054 68 631 59 620 16 621 76 241
Movements during the year
Capital increase 0 0 0 2 040 0 2 040 (5)
Remeasurement gains/losses on defined benefit plans (823) (10) (834) (2) 348 0 348 (1)
Income tax relating to components of other comprehensive income (90) 0 (90) 93 0 93
Other comprehensive income net of tax (913) (10) (923) 441 0 441 (8)
Group's share in the result for the period 8 862 402 9 263 (3) 8 841 1 327 10 168 (3)
Translation differences (91) 187 96 (754) (44) (798) (2)
Comprehensive income for the period 7 858 578 8 436 8 528 1 282 9 810
Dividends distributed (5 808) (1 732) (7 540) (4) (4 783) (858) (5 640) (4)
Result transfer 0 0 0 (952) 0 (952)
Change in scope (13 803) 9 742 (4 062) (1) 11 (9) 2
Reclassification to assets held for sale 0 0 0 (12 870) 0 (12 870) (6)
Other 19 (19) 0 (18) 18 0
At the end of the period 39 843 25 623 65 465 51 577 17 055 68 631
Pro forma key figures for the joint ventures (on a 100% basis)
in thousand EUR
Group RecticelEUROFOAM PROSEAT TURVAC TOTAL
31 DEC 2019 31 DEC 2018 31 DEC 2019 31 DEC 2018 31 DEC 2019 31 DEC 2018 31 DEC 2019 31 DEC 2018
Aggregated figures (sum of individual company ledgers before eliminations)
Non current assets 176 108 157 655 0 79 293 0 2 894 176 108 239 842
Cash and cash equivalents 23 462 9 325 0 37 963 0 4 23 462 47 292
Current assets 109 072 108 501 0 229 680 0 547 109 072 338 728
Total assets 285 180 266 156 0 308 973 0 3 441 285 180 578 570
Non-current interest-bearing borrowings (40 278) (25 000) 0 (14 686) 0 0 (40 278) (39 686)
Non current liabilities (57 416) (40 597) 0 (47 905) 0 0 (57 416) (88 502)
Current interest-bearing borrowings (19 948) (18 154) 0 (166 232) 0 (396) (19 948) (184 782)
Current liabilities (66 850) (73 102) 0 (215 979) 0 (575) (66 850) (289 656)
Total liabilities (124 266) (113 699) 0 (263 884) 0 (575) (124 266) (378 158)
Net equity 160 914 152 457 0 45 089 0 2 866 160 914 200 412
Net contribution at 100% in the combined figures of the Group
Revenue 386 941 418 717 0 293 293 0 984 386 941 712 994
Amortization, Depreciation and Impairments (10 631) (9 987) 0 (6 318) 0 (168) (10 631) (16 472)
EBIT 23 970 25 468 0 407 0 (104) 23 970 25 772
Interest income 98 89 0 88 0 0 98 176
Interest expenses (529) (666) 0 (1 666) 0 (10) (529) (2 343)
Total income taxes (5 387) (3 094) 0 (1 451) 0 0 (5 387) (4 545)
Profit or (loss) of the period 18 054 21 708 0 (2 710) 0 (114) 18 054 18 884(1) In 2019 this relates to (i) the acquisition of the 49% stake in
the Proseat companies held by the former joint venture partner Woodbridge and the subsequent sale to Sekisui Plastics Co Ltd of 75% of Proseat – the remaining 25% now controlled through Proseat Europe GmbH and consolidated following the equity method -; (ii) the acquisition of 49% of Proseat NV (Belgium) and (iii) the acquisition of the additional 24% of the shares in Turvac (Insulation) – previously consolidated following the equity method and since 2019 following the full consolidation method.
(2) the actuarial profit relates to the impact of the lower discount rate under IAS19 pension liabilities
(3) In 2019 the item Group’s share in the result of the period decreased compared to 2018 and results mainly from the lower result of Eurofoam, including restructuring costs for the closure of the plant in Troisdorf (Germany). One should also consider the dividends distributed during the period.
(4) Dividends distributed by the joint ventures relate primarily to the Eurofoam group and to a lesser extent Orsafoam.
(1) In 2018 the actuarial profit relates to the impact of the higher discount rate under IAS19 pension liabilities
(2) Exchange rate differences relates mainly to the appreciation of the PLN (Eurofoam Polska)
(3) The higher income from joint ventures & associates is attributable to the Flexible Foams joint venture Eurofoam. The result of Proseat was in line with 2017.
(4) In 2018 dividends distributed by the joint ventures relate solely to the Eurofoam group
(5) In 2018 the share capital of the Proseat group has been increased.
(6) In 2018, 26% out of Recticel’s 51% participation in the joint venture company Proseat (Automotive Seating) has been transferred to ‘Assets held for sale’.
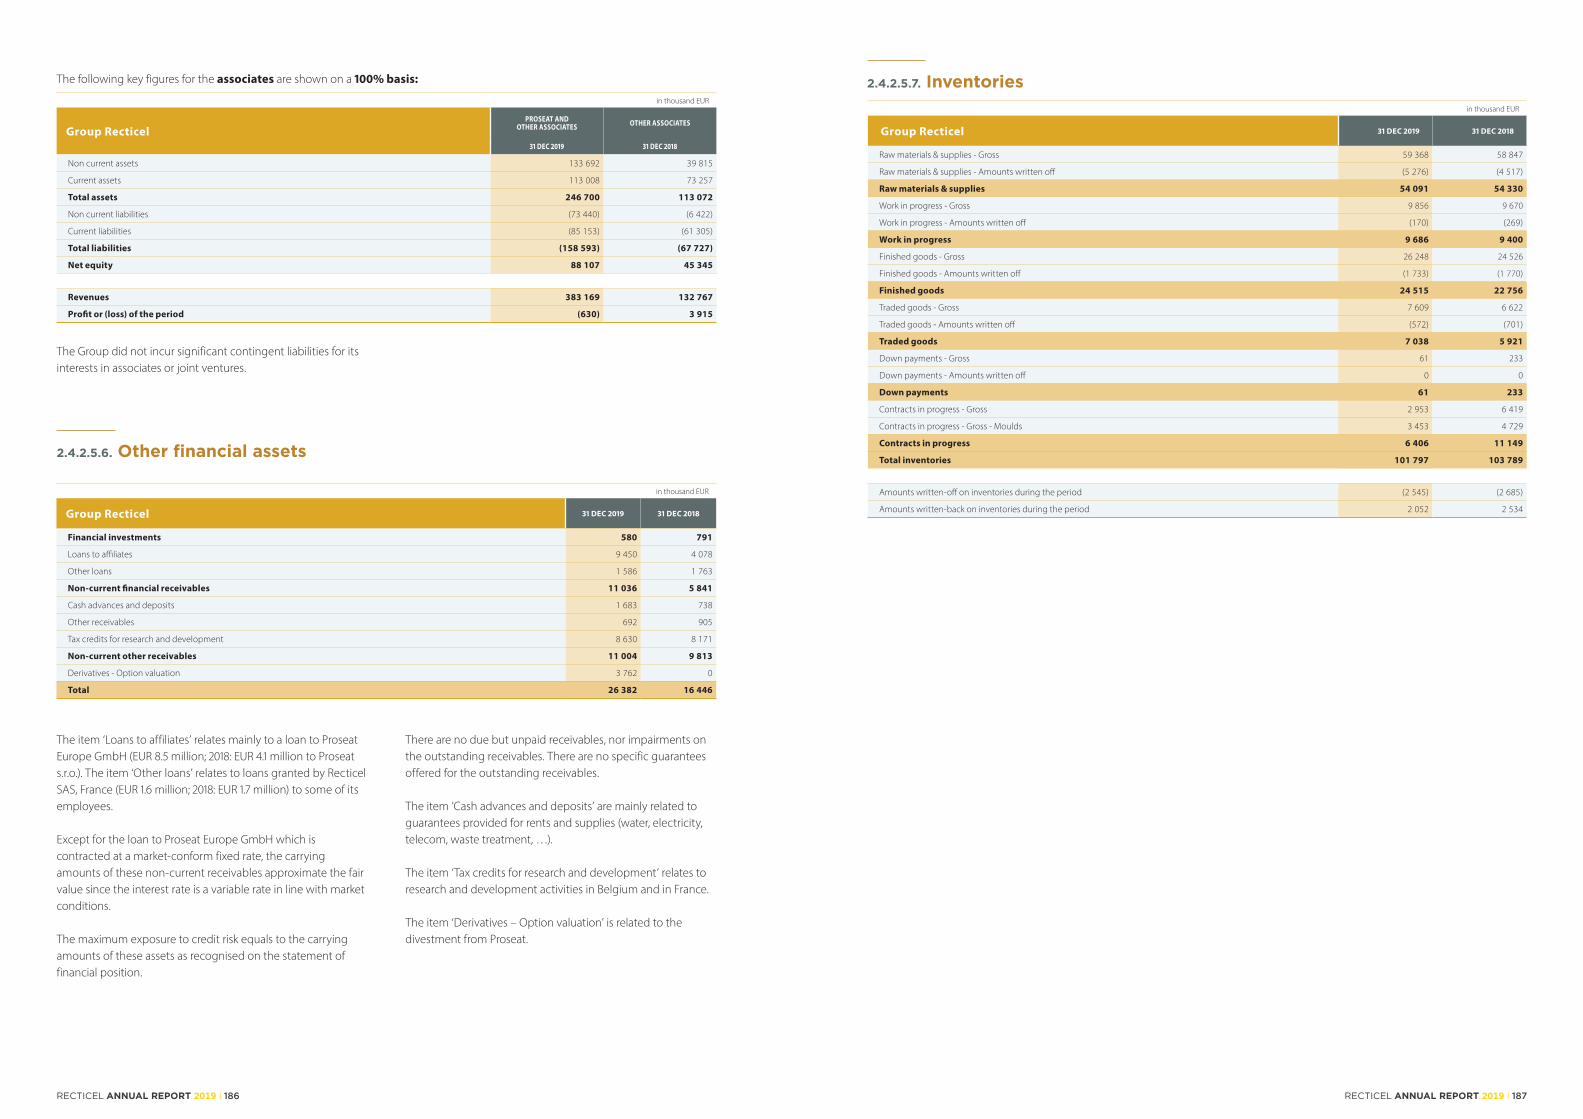
RECTICEL ANNUAL REPORT 2019 I 187RECTICEL ANNUAL REPORT 2019 I 186
in thousand EUR
Group Recticel 31 DEC 2019 31 DEC 2018
Raw materials & supplies - Gross 59 368 58 847
Raw materials & supplies - Amounts written off (5 276) (4 517)
Raw materials & supplies 54 091 54 330
Work in progress - Gross 9 856 9 670
Work in progress - Amounts written off (170) (269)
Work in progress 9 686 9 400
Finished goods - Gross 26 248 24 526
Finished goods - Amounts written off (1 733) (1 770)
Finished goods 24 515 22 756
Traded goods - Gross 7 609 6 622
Traded goods - Amounts written off (572) (701)
Traded goods 7 038 5 921
Down payments - Gross 61 233
Down payments - Amounts written off 0 0
Down payments 61 233
Contracts in progress - Gross 2 953 6 419
Contracts in progress - Gross - Moulds 3 453 4 729
Contracts in progress 6 406 11 149
Total inventories 101 797 103 789
Amounts written-off on inventories during the period (2 545) (2 685)
Amounts written-back on inventories during the period 2 052 2 534
2.4.2.5.6. Other financial assets
in thousand EUR
Group Recticel 31 DEC 2019 31 DEC 2018
Financial investments 580 791
Loans to affiliates 9 450 4 078
Other loans 1 586 1 763
Non-current financial receivables 11 036 5 841
Cash advances and deposits 1 683 738
Other receivables 692 905
Tax credits for research and development 8 630 8 171
Non-current other receivables 11 004 9 813
Derivatives - Option valuation 3 762 0
Total 26 382 16 446
The item ‘Loans to affiliates’ relates mainly to a loan to Proseat Europe GmbH (EUR 8.5 million; 2018: EUR 4.1 million to Proseat s.r.o.). The item ‘Other loans’ relates to loans granted by Recticel SAS, France (EUR 1.6 million; 2018: EUR 1.7 million) to some of its employees.
Except for the loan to Proseat Europe GmbH which is contracted at a market-conform fixed rate, the carrying amounts of these non-current receivables approximate the fair value since the interest rate is a variable rate in line with market conditions.
The maximum exposure to credit risk equals to the carrying amounts of these assets as recognised on the statement of financial position.
There are no due but unpaid receivables, nor impairments on the outstanding receivables. There are no specific guarantees offered for the outstanding receivables.
The item ’Cash advances and deposits’ are mainly related to guarantees provided for rents and supplies (water, electricity, telecom, waste treatment, …).
The item ‘Tax credits for research and development’ relates to research and development activities in Belgium and in France.
The item ‘Derivatives – Option valuation’ is related to the divestment from Proseat.
The following key figures for the associates are shown on a 100% basis:
in thousand EUR
Group RecticelPROSEAT AND
OTHER ASSOCIATES OTHER ASSOCIATES
31 DEC 2019 31 DEC 2018
Non current assets 133 692 39 815
Current assets 113 008 73 257
Total assets 246 700 113 072
Non current liabilities (73 440) (6 422)
Current liabilities (85 153) (61 305)
Total liabilities (158 593) (67 727)
Net equity 88 107 45 345
Revenues 383 169 132 767
Profit or (loss) of the period (630) 3 915
The Group did not incur significant contingent liabilities for its interests in associates or joint ventures.
2.4.2.5.7. Inventories

RECTICEL ANNUAL REPORT 2019 I 189RECTICEL ANNUAL REPORT 2019 I 188
2.4.2.5.8. Contract assets
The following schedule presents the overview of contract assets and liabilities following application of IFRS 15 and includes both the impact of the opening balance and the movements of the period.
For the year ending 31 December 2019:
Group Recticel OPENING BALANCE
CHANGES IN ACCOUNTING
POLICIES
OPENING BALANCE RESTATED
CONSIDERATION PAYABLE TO CUSTOMERS
RELEASE TO INCOME
STATEMENTRECLASSIFICA-
TIONEXCHANGE
DIFFERENCES
CLOSING BALANCE AT THE END OF THE PERIOD
Non-current contract assets - Consideration payable to a customer 1 421 0 1 421 98 (769) 56 6 813
Non-current contract assets - Contracts in progress Moulds 13 905 0 13 905 0 (15 435) 10 360 38 8 869
Non-current contract assets - Contracts in progress Tooling & Packaging 0 0 0 0 (805) 2 258 3 1 456
Non-current contract assets 15 326 0 15 326 98 (17 009) 12 674 48 11 138
Current contract assets - Consideration payable to a customer
349 0 349 0 (20) (56) 1 273
Current contract assets - Contracts in progress Moulds 13 433 0 13 433 0 156 (3 365) 38 10 263
Current contract assets - Contracts in progress Tooling & Packaging 0 0 0 0 0 763 1 765
Current contract assets 13 782 0 13 782 0 136 (2 658) 41 11 300
Total contract assets 29 108 0 29 108 98 (16 873) 10 016 88 22 438
Current contract assets - Contracts in progress Moulds 4 729 0 4 729 0 5 723 (6 995) (4) 3 453
Current contract assets - Contracts in progress Tooling & Packaging 0 0 6 368 0 (403) (3 021) (0) 2 943
Total 33 837 0 40 205 98 (11 553) (0) 84 28 835
Non-current contract liabilities - Mould revenue recognition before SOP 2 375 0 2 375 0 8 897 (8 916) 0 2 357
Non-current contract liabilities - Mould revenue recognition after SOP 21 720 0 21 720 0 (21 198) 12 910 66 13 498
Non-current contract liabilities - Tooling & Packaging revenue recognition before SOP 0 0 0 0 1 812 708 (3) 2 517
Non-current contract liabilities - Tooling & Packaging revenue recognition after SOP 0 0 0 0 0 1 966 2 1 968
Non-current contract liabilities 24 096 0 24 096 0 (10 490) 6 669 65 20 339
Contract liabilities - Expected rebates and volume discounts 24 369 1 24 370 0 (9 463) 0 478 15 385
Contract liabilities - Long term agreements 334 0 334 0 32 0 1 366
Contract liabilities - Moulds revenue recognition 20 262 0 20 262 0 (323) (3 995) 61 16 005
Contract liabilities - Tooling & Packaging revenue recognition 0 0 0 0 (1 153) 2 229 1 1 076
Current contract liabilities 44 964 1 44 965 0 (10 907) (1 766) 541 32 832
Total contract liabilities 69 060 1 69 061 0 (21 397) 4 903 605 53 172
Deferred operating income 4 903 0 4 903 0 0 (4 903) 0 0
Total 73 963 1 73 964 0 (21 397) 0 605 53 172
For the year ending 31 December 2018:
Group Recticel OPENING BALANCE
CHANGES IN ACCOUNTING
POLICIES
"OPENING BALANCE
RESTATED"
CONSIDERATION PAYABLE TO CUSTOMERS
RELEASE TO INCOME STATE-
MENTRECLASSIFICA-
TIONEXCHANGE
DIFFERENCES
CLOSING BALANCE AT THE END OF THE PERIOD
Non-current contract assets - Consideration payable to a customer 0 2 557 2 557 26 (804) (349) (9) 1 421
Non-current contract assets - Contracts in progress 0 32 569 32 569 0 (7 518) (11 108) (38) 13 905
Non-current contract assets 0 35 126 35 126 26 (8 322) (11 457) (47) 15 326
Current contract assets - Consideration payable to a customer
0 0 0 0 0 349 0 349
Current contract assets - Contracts in progress 0 99 99 0 (42) 13 400 (24) 13 433
Current contract assets 0 99 99 0 (42) 13 749 (24) 13 782
Total contract assets 0 35 225 35 225 26 (8 363) 2 292 (71) 29 108
Current contract assets - Contracts in progress Moulds 0 8 252 8 252 0 (1 223) (2 292) (8) 4 729
Current contract assets - Contracts in progress Tooling & Packaging 0 0 0 0 0 0 0 0
Total 0 43 476 43 476 26 (9 586) 0 (78) 33 837
Non-current contract liabilities - Mould revenue recognition before SOP 0 1 289 1 289 0 11 839 (10 751) (1) 2 375
Non-current contract liabilities - Mould revenue recognition after SOP 0 53 472 53 472 0 (22 077) (9 615) (60) 21 720
Non-current contract liabilities 0 54 760 54 760 0 (10 238) (20 366) (61) 24 096
Contract liabilities - Expected rebates and volume discounts 0 20 359 20 359 0 4 102 0 (92) 24 369
Contract liabilities - Long term agreements 0 247 247 0 87 0 (1) 334
Contract liabilities - Moulds revenue recognition 0 0 0 0 (63) 20 366 (42) 20 262
Current contract assets - Contracts in progress Tooling & Packaging 0 0 0 0 0 0 0 0
Current contract liabilities 0 20 606 20 606 0 4 127 20 366 (134) 44 964
Total contract liabilities 0 75 366 75 366 0 (6 112) 0 (195) 69 060
In the Automotive Interiors activity, Recticel developed a polyurethane-based technology for the manufacturing of interior trim components. For optimum implementation of this application, based on the specifications given by its customers,
Recticel ensures the manufacturing of the moulds with its own suppliers during the pre-operating phase, before starting production of components. At the end of this subcontracting process, the moulds are sold to the customer.

RECTICEL ANNUAL REPORT 2019 I 191RECTICEL ANNUAL REPORT 2019 I 190
2.4.2.5.9. Trade receivables and other receivables
in thousand EUR
Group Recticel 31 DEC 2019 31 DEC 2018
Trade receivables 103 942 112 392
Loss allowance for expected credit losses (4 825) (4 712)
Total trade receivables 99 117 107 680
Other receivables (1) 20 119 26 245
Derivatives (forward exchange contracts) 73 19
Loans carried at amortised cost 12 475 28 961
Other financial assets (2) 12 548 28 981
Other receivables and other financial assets (1)+(2) 32 667 55 226
Trade receivables at the reporting date 2019 comprise amounts receivable from the sale of goods and services for EUR 99.1 million (2018: EUR 107.7 million).
In 2019, other receivables amounting to EUR 20.1 million relate to (i) VAT receivable (EUR 8.6 million), (ii) advances paid to third parties for operating costs spread over several financial years (EUR 5.6 million), (iii) prepayments, tax credits and subsidies, and contractual commitments with co-contractors (EUR 5.9 million).
In 2018, other receivables amounting to EUR 26.2 million relate to (i) VAT receivable (EUR 14.3 million), (ii) advances paid to third parties for operating costs spread over several financial years (EUR 4.7 million), (iii) prepayments, tax credits and subsidies, and contractual commitments with co-contractors (EUR 7.2 million).
In 2019, other financial assets (EUR 12.5 million) mainly consist of, a receivable of EUR 11.7 million (2018: EUR 13.8 million) relating to the continuing involvement under non-recourse factoring programs in Belgium, France, The Netherlands and the United Kingdom.
In 2018, other financial assets (EUR 29.0 million) mainly consist of financial receivables on affiliated companies which are not consolidated (EUR 14.7 million), a receivable of EUR 13.8 million (2017: EUR 17.4 million) relating to the continuing involvement under non-recourse factoring programmes in Belgium, France, Germany, The Netherlands and the United Kingdom.
FactoringTo confine credit risks, non-recourse factoring and discounting programs were established for a total amount of EUR 82.4 million (of which EUR 47.1 million were actually used at 31 December 2019).
in thousand EUR
Group Recticel 31 DEC 2019 31 DEC 2018
Factoring without recourse
Gross amount 58 032 64 480
Continuing involvement (11 738) (13 806)
Net amount 46 294 50 674
Retention amount recognized in debt * 758 646
Total amount factoring without recourse 47 051 51 320
* included in the current interest-bearing borrowings
The average outstanding amounts from due receivables vary according to business line between 0.5% and 1.5% of total sales. A strict credit follow-up is organised through a centralised credit management organisation.
The continuing involvement represents the retention of contractual rights as specified in the terms and conditions under the factoring agreement.
Movement in loss allowance for expected credit losses:
in thousand EUR
Group Recticel 31 DEC 2019 31 DEC 2018
At the end of the preceding period (4 711) (4 560)
Additions (1 168) (711)
Reversal 596 710
Non-recoverable amounts 43 (137)
Reclassification 294 0
Exchange differences 123 (12)
Total at the end of the period (4 825) (4 711)
The non-recoverable amounts refer to trade receivable balances which have been written-off as the Group considers that these are not recoverable.
2.4.2.5.10. Cash and cash equivalents Cash and cash equivalents include cash held by the Group and short-term bank deposits with an original maturity of three
months and less. The carrying amount of these assets approximates to their fair value. There are no specific restrictions that apply to cash and cash equivalents.
2.4.2.5.11. Assets held for saleIn 2019 this item relates mainly to a site in Hassfurt (Germany) and in Legutiano (Spain).
In 2018 this item relates to (i) Recticel’s 26% participation in the joint venture company Proseat (Automotive Seating), (ii) two sites held by Recticel Grundstückverwaltung GmbH and (iii) the building in Legutiano (Spain; Flexible Foams).
Following the announcement on 19 December 2018 of the transaction with Sekisui Plastics Co Ltd (see 2.4.2.2.2.), 26% out of Recticel’s 51% participation in the joint venture company Proseat (Automotive Seating) has been transferred to ‘Assets held for sale’; the remaining 25% stake in Proseat is reported under ‘Interests in joint ventures and associates’.

RECTICEL ANNUAL REPORT 2019 I 193RECTICEL ANNUAL REPORT 2019 I 192
2.4.2.5.12. Share capital number
Group Recticel 2019 2018
Number of shares
Number of shares issued and fully paid at 01 January 55 227 012 54 776 357
Number of shares issued and fully paid at 31 December 55 397 439 55 227 012
of which number of treasury shares at 31 December 326 800 326 800
in thousand EUR
Group Recticel 31 DEC 2019 31 DEC 2018
Issued and fully paid shares 138 494 138 068
2.4.2.5.13. Pensions and similar obligationsin thousand EUR
Group Recticel 31 DEC 2019 31 DEC 2018
Post-employment benefits: defined benefit plans 55 543 49 954
Other long-term benefits and termination benefits 2 317 2 821
Net liabilities at 31 December 57 860 52 775
of which current liabilities 696 4 720
of which non-current liabilities 57 164 48 055
Post-employment benefits: defined benefit plans Over 99% of the defined benefit obligation is concentrated in five countries: Belgium (45%), United Kingdom (22%), Switzerland (19%), Germany (7%) and France (6%).
Within these five countries Recticel operates funded and unfunded defined benefit retirement plans. These plans
typically provide retirement benefits related to remuneration and period of service. The following sections describe the three largest retirement plans, which make up 86% of the total defined benefit obligation.
The change in share capital is explained by the exercise of subscription rights in 2019.
Recticel manages its share capital, without any corrections or adjustments. There are no external capital restrictions applicable on the share capital, except for the ‘club deal’
financing facility which is subject to some financial covenants. One covenant requires a minimum absolute total equity amount. A second covenant limits the annual dividend payment to maximum 50% of the result of period after taxes.
in thousand EUR
Group Recticel 31 DEC 2019
DEFINED BENEFIT OBLIGATION
ASSETS FUNDED STATUSADJUSTMENT DUE TO ASSET CEILING/
ONEROUS LIABILITY
NET LIABILITY/ (ASSET)
Belgium 81 602 (53 770) 27 832 0 27 832
United Kingdom 40 417 (36 041) 4 376 1 687 6 063
Switzerland 33 385 (34 839) (1 454) 1 379 (75)
Other countries 25 413 (3 690) 21 723 0 21 723
Total 180 817 (128 340) 52 477 3 066 55 543
Belgium The defined benefit and hybrid pension plans in Belgium are plans funded through group insurances. Only the employer pays contributions to fund the plans. The defined benefit plans are closed for new employees since 2003. Most hybrid plans are still open to new employees. The plans function in and comply with a regulatory framework and comply with the local minimum funding requirements. The plan participants are entitled to a lump sum on retirement at age 65. The pension benefits provided by the plans are related to the employees’ salary. Active members also receive a benefit on death-in-service. The assumed form of benefit payment is in all cases a lump sum, but the plans foresee the option to convert to annuity.
United Kingdom Recticel sponsors one defined benefit plan in the United Kingdom. It is a funded pension plan which is closed to new entrants and to further accrual of benefits for existing members. The plan is administered via a trust which is legally separate from Recticel and is administered by a board of Trustees composed of both employer-appointed and member-nominated Trustees. The Trustees are required by law to act in the interest of the beneficiaries of the plan, and are responsible for the investment policy in respect of plan assets and for the day to day administration of the benefits. The plan functions in and complies with a regulatory framework and is subject to local minimum funding requirements. Under the plan, participants are entitled to annual pensions on retirement at age 65 based on the final pensionable salary and the years of service. Members also receive benefits on death.
UK legislation requires that the liabilities of defined benefit pension schemes are calculated for funding purposes on a prudent basis. The last funding valuation of the plan was carried out as at 01 January 2017 and showed a deficit of GBP 7.4 million. A new recovery plan was agreed in January 2018 to eliminate this deficit by 31 December 2024. Recticel agreed to pay a total amount of GBP 8.4 million as recovery contributions during the period 01 January 2017 to 31 December 2024. The outstanding amount at 31 December 2019 is GBP 5.4 million.
Switzerland Recticel sponsors a hybrid pension plan in Switzerland. Both employer and employees pay contributions to fund the plan. The plan is open to new employees. The plan is administered via a pension fund and a welfare fund which are legally separate from Recticel. The board of Trustees of the pension fund is equally composed of representatives of both the employer and employees, whereas the board of the welfare fund is composed of employer representatives. The Trustees are required by law to act in the interest of all relevant beneficiaries and are responsible for the investment policy with regard to the assets and the administration and financing of the benefits. The plan operates in accordance with a regulatory framework and complies with the local minimum funding requirement. Under the plan, participants are insured against the financial consequences of old age, disability and death.
• Risks associated to defined benefit pension plans
The most significant risks associated with Recticel’s defined benefit plans are :
Asset volatility : The liabilities are calculated using a discount rate set with
reference to corporate bond yields. If assets underperform this yield, this will create a deficit. The schemes hold a significant proportion of equities which, though expected to outperform corporate bonds in the long-term, create volatility and risk in the short-term. The allocation to equities is monitored to ensure it remains appropriate given the long-term obligations.
Changes in bond yields : A decrease in corporate bond yields will increase the value
placed on the liabilities for accounting purposes, although this will be partially offset by an increase in the value of the bond holdings.
Inflation risk : The benefit obligations are linked to inflation, and higher
inflation will lead to higher liabilities (although, in some cases, caps on the level of inflationary increases are in place to protect against extreme inflation). The majority of the assets are either unaffected by or only loosely correlated with inflation, meaning that an increase in inflation will also increase the deficit.
Life expectancy : Many of the obligations are to provide benefits for the life
of the member or take into account member mortality rates, so increases in life expectancy will result in an increase in the liabilities.
Currency risk : The risk that arises from the change in price of the euro
against other currencies.

RECTICEL ANNUAL REPORT 2019 I 195RECTICEL ANNUAL REPORT 2019 I 194
in thousand EUR
Group Recticel 31 DEC 2019 31 DEC 2018
Pension costs recognised in profit and loss and other comprehensive income:
Service cost:
Current service cost 5 769 5 989
Employee contributions (303) (358)
Past service cost (including curtailments) (1 279) (986)
Administration expenses 306 313
Net interest cost:
Interest cost 2 610 2 243
Interest income (1 875) (1 539)
Interest on asset ceiling/ onerous liability 29 16
Pension expense recognised in profit and loss 5 257 5 678
Remeasurements in other comprehensive income
Return on plan assets (in excess of)/below that recognised in net interest (10 634) 4 356
Actuarial (gains)/losses due to changes in financial assumptions 19 254 (6 478)
Actuarial (gains)/losses due to changes in demographic assumptions (1 690) (3 341)
Actuarial (gains)/losses due to experience (293) 447
Changes in the asset ceiling/ onerous liability impact, excluding amounts recognised in net interest cost (203) 486
Total amount recognised in other comprehensive income 6 434 (4 530)
Total amount recognised in profit and loss and other comprehensive income 11 691 1 148
in thousand EUR
Group Recticel 31 DEC 2019 31 DEC 2018
Evolution of the net liability during the year is as follows:
Net liability at 01 January 49 954 54 988
Changes in scope of consolidation 696 0
Expense recognised in the income statement 5 257 5 678
Employer contributions (7 121) (6 129)
Amount recognised in other comprehensive income 6 434 (4 530)
Exchange differences 323 (53)
Net liability at 31 December 55 543 49 954
in thousand EUR
Group Recticel 31 DEC 2019 31 DEC 2018
Amounts recorded in the statement of financial position in respect of the defined benefit plans are:
Defined benefit obligations for funded plans 173 466 149 940
Fair value of plan assets (128 340) (109 445)
Funded status for funded plans 45 126 40 495
Defined benefit obligations for unfunded plans 7 351 6 345
Total funded status at 31 December 52 477 46 840
Asset ceiling/ onereous liability 3 066 3 115
Net liabilities at 31 December 55 543 49 954
Current liabilities 696 635
Non-current liabilities 54 847 49 319
The key actuarial assumptions used at 31 December (weighted averages) are:
Discount rate 0.78% 1.72%
Future pension increases 0.82% 0.87%
Expected rate of salary increases 1.85% 1.81%
Inflation 1.68% 1.70%
The mortality assumptions are based on recent mortality tables. The mortality tables of the United Kingdom, Germany and Switzerland assume that life expectancies will increase in future years.
Movement of the plan assets
Fair value of plan assets at 1 January 109 445 110 604
Changes in scope of consolidation 882 0
Interest income 1 875 1 539
Employer contributions 7 121 6 129
Employee contributions 303 358
Benefits paid (direct & indirect, including taxes on contributions paid) (4 554) (5 437)
Return on plan assets in excess of/(below) that recognised in net interest, excl. interest income 10 634 (4 356)
Administration expenses (306) (313)
Exchange differences 2 940 921
Fair value of plan assets at 31 December 128 340 109 445
In 2019, amounts for past service costs (including curtailments) are related to restructurings in Belgium and in France. The funded plans’ assets are invested in mixed portfolios of shares and bonds, or insurance contracts. The plan assets do not include direct investments in Recticel shares, Recticel bonds or any property used by Recticel companies.
Unit-linked insurance contracts are investments in debt, equity and cash instruments managed by an insurance company, in which Recticel holds a specific number of fund units of which the net asset value is declared on a regular basis. Non-unit-linked insurance contracts are pure insurance policies with only limited financial investment risk.
Government bonds (quoted)13.62%
Corporate bonds (quoted)12.38%
Equity (quoted)15.39%
Cash (quoted)0.33%
Property (quoted)8.49%
Other (non-quoted)
6.08%
Non unit-linked insurance contracts
(non-quoted)27.00%
Unit-linked insurance contracts (non-quoted)
16.71%
Equity24.06%
Cash3.74%
Bonds72.20%
Government bonds (quoted)13.62%
Corporate bonds (quoted)12.38%
Equity (quoted)15.39%
Cash (quoted)0.33%
Property (quoted)8.49%
Other (non-quoted)
6.08%
Non unit-linked insurance contracts
(non-quoted)27.00%
Unit-linked insurance contracts (non-quoted)
16.71%
Equity24.06%
Cash3.74%
Bonds72.20%
Plan assets portfolio mix at 31 December 2019 Asset classes of unit-linked insurance contracts

RECTICEL ANNUAL REPORT 2019 I 197RECTICEL ANNUAL REPORT 2019 I 196
in thousand EUR
Group Recticel 31 DEC 2019 31 DEC 2018
Movement of the defined benefit obligation
Defined benefit obligation at 01 January 156 285 163 088
Changes in scope of consolidation 1 578 0
Current service cost 5 769 5 989
Interest cost 2 610 2 243
Benefits paid (direct & indirect, including taxes on contributions paid) (4 554) (5 437)
Actuarial (gains)/losses on liabilities arising from changes in financial assumptions 19 254 (6 478)
Actuarial (gains)/losses on liabilities arising from changes in demographic assumptions (1 690) (3 341)
Actuarial (gains)/losses on liabilities arising from experience (293) 447
Past service cost (incl. curtailments) (1 279) (986)
Exchange differences 3 137 760
Defined benefit obligation at 31 December 180 817 156 285
Split of the defined benefit obligation per population
Active members 98 652 83 858
Members with deferred benefit entitlements 33 463 29 307
Pensioners/Beneficiaries 48 702 43 120
Total defined benefit obligation at 31 December 180 817 156 285
Changes in the effect of the asset ceiling/ onerous liability during the year
Asset ceiling/ onerous liability impact at 01 January 3 115 2 504
Interest on asset ceiling/ onerous liability 29 16
Changes in the asset ceiling/ onerous liability impact, excluding amounts recognised in net interest cost (203) 486
Exchange differences 125 109
Asset ceiling/ onerous liability impact at 31 December 3 066 3 115
Weighted average duration of the defined benefit obligation at 31 December 13 years 14 years
Sensitivity of defined benefit obligation to key assumptions at 31 December
% increase in defined benefit obligation following a 0.25% decrease in the discount rate 3.40% 3.54%
% decrease in defined benefit obligation following a 0.25% increase in the discount rate -3.22% -3.36%
% decrease in defined benefit obligation following a 0.25% decrease in the inflation rate -1.38% -1.55%
% increase in defined benefit obligation following a 0.25% increase in the inflation rate 1.37% 1.62%
For plans where a full valuation has been performed the sensitivity information shown above is exact and based on the results of this full valuation. For plans where results have been rolled forward from the last full actuarial valuation, the sensitivity information above is approximate and takes into account the duration of the liabilities and the overall profile of the plan membership.
in thousand EUR
Group Recticel 2020
Estimated contributions for the coming year
Expected employer contributions for defined benefit plan
7 408
• Post-employment benefits: defined contribution plansThe total contributions payable in respect of the current year amount to EUR 4,720,433 compared to an amount of EUR 3,371,327 last year.
2.4.2.5.14. ProvisionsFor the year ending 31 December 2019:
in thousand EUR
Group Recticel LITIGATIONS DEFECTIVE PRODUCTS
ENVIRON- MENTAL RISKS
RESTRUC- TURING
PROVISIONS FOR ONEROUS
CONTRACTSOTHER RISKS TOTAL
At the end of the preceding year 188 1 713 2 237 9 063 1 117 2 573 16 891
Movements during the year
Changes in accounting policies 0 0 0 0 (628) 0 (628)
Increases 0 960 0 3 647 0 0 4 607
Utilisations (163) (726) (507) (5 629) 0 (236) (7 262)
Write-backs (50) (353) 0 (390) 0 (157) (950)
Transfer from one heading to another 50 0 0 489 (489) (50) (0)
Exchange rate differences 0 13 0 0 0 (7) 5
At year-end 25 1 607 1 730 7 179 (0) 2 123 12 664
Non-current provisions (more than one year) 25 1 379 1 522 1 853 0 2 123 6 902
Current provisions (less than one year) 0 228 208 5 326 (0) (0) 5 762
Total 25 1 607 1 730 7 179 (0) 2 123 12 664
The movement in the changes in accounting policies relates to the application of IFRS 16.
Provisions for defective products are mainly related to warranties granted for products in the bedding division. The provisions are generally calculated on the basis of 1% of yearly turnover, which corresponds to the management’s best estimate of the risk under 12-month warranties. When historical data are unavailable, the level of the provisions is compared to the yearly effective rate of liabilities, and if necessary, the amount of provision is adjusted.
Provisions for environmental risks cover primarily (i) the identified risk at the Tertre (Belgium) site (see section 2.4.2.6.9.1.) and (ii) other pollution risks in Belgium. EUR -0.4 million of this provision has been used in 2019 to cover clean-up costs on the site in Tertre.
Provisions for reorganisation relate to the outstanding balance of expected expenses relating to (i)(i) the closure of the Bedding plant in Hassfurt (Germany), (ii) some additional rationalisation efforts in Automotive and (iii) the further streamlining in the corporate and central services.
Provisions for other risks relate mainly to legal costs and fees for legacy remediation and litigations (see 2.4.6.9. – Contingent assets and liabilities).
For the major risks (i.e. environmental, reorganisation and other risks) the cash outflow is expected to occur within a two years’ horizon.

RECTICEL ANNUAL REPORT 2019 I 199RECTICEL ANNUAL REPORT 2019 I 198
2.4.2.5.15. Financial liabilities
• Financial liabilities carried at amortised cost include mainly interest-bearing borrowings:
in thousand EUR
Group RecticelNON-CURRENT LIABILITIES CURRENT LIABILITIES
31 DEC 2019 31 DEC 2018 31 DEC 2019 31 DEC 2018
Secured
Lease liabilities 80 561 17 505 15 837 640
Bank loans 18 103 15 500 1 778 0
Bank loans - factoring with recourse 0 0 758 646
Total secured 98 664 33 005 18 373 1 286
Unsecured
Other loans 1 670 1 701 260 260
Current bank loans 0 0 259 2 945
Commercial paper 0 0 96 936 58 985
Bank overdrafts 0 0 742 25 780
Other financial liabilities 0 0 846 765
Total unsecured 1 670 1 701 99 043 88 734
Total liabilities carried at amortised cost 100 334 34 706 117 416 90 021
• Gross financial debt: interest-bearing borrowings, including continuing involvement of off-balance sheet non-recourse factoring programs
in thousand EUR
Group Recticel 31 DEC 2019 31 DEC 2018
Drawn amounts under the various available interest-bearing borrowing facilities
Outstanding amounts under lease liabilities 80 561 17 504
Outstanding amounts under other non-current loans 19 773 17 201
Outstanding amounts under non-current gross interest-bearing borrowings (a) 100 334 34 705
Outstanding amounts under bank overdrafts 742 23 959
Outstanding amounts under current bank loans 2 036 2 945
Outstanding amounts under lease liabilities 15 837 640
Outstanding amounts under factoring programs - retention amount 758 646
Outstanding amounts under commercial paper programs 1 96 936 58 985
Outstanding amounts under other current loans 260 260
Outstanding amounts under other financial liabilities 846 765
Outstanding amounts under current gross interest-bearing borrowings (b) 117 416 88 200
Total outstanding amounts under gross interest-bearing borrowings (c)=(a)+(b) 217 750 122 905
Outstanding amounts under non-recourse factoring programs (d) 47 051 51 320
Total outstanding amounts under gross interest-bearing borrowings and factoring programs (e)=(c)+(d) 264 801 174 225
Weighted average lifetime of non-current interest-bearing borrowings (in years) 3.5 7.1
Weighted average interest rate of gross financial debt at fixed interest rate 1,98% 2,03%
Interest rate range of gross financial debt at fixed interest rate 1.46% - 2.62% 1.46% - 2.62%
Weighted average interest rate of gross financial debt at variable interest rate 0,39% 1,00%
Interest rate range of gross financial debt at variable interest rate 0.25% - 3.70% 0.11% - 3.70%
Weighted average interest rate of total gross financial debt 0.90% 1.32%
Percentage of gross financial debt at fixed interest rate 32.0% 31.0%
Percentage of gross financial debt at variable interest rate 68.0% 69.0%
1 The amount drawn under the commercial paper program is to be covered at any time by the undrawn amount under the club deal facility. Therefor the reported unused amount under the EUR 175 million club deal revolving credit facility is after deduction of the issued amounts under the commercial paper program.
The fair value of floating rate borrowings is close to the nominal value.
The majority of the Group’s financial debt is centrally contracted and managed through Recticel International Services n.v./s.a., which acts as the Group’s internal bank.
(i) Lease liabilitiesLease liabilities comprise (i) following the application of IFRS 16 the operating leases for property, plant and equipment, furniture and vehicles (see note 2.4.2.1.2.1.1.), and (ii) leases formerly classified as ‘finance leases’. These finance leases consist mainly of three leases: • the lease financing the Insulation plant in Bourges
(France), has an outstanding amount as of 31 December 2019 of EUR 6.4 million and is at floating rate;
• the lease financing buildings in Belgium, has an outstanding amount as of 31 December 2019 of EUR 2.0 million and is at a fixed rate;
• the additional lease to finance the extension of the Insulation plant in Wevelgem (Belgium) in 2017, has the outstanding amount as of 31 December 2019 of EUR 8.0 million and is at fixed rate.
(ii) Bank loans – “club deal”On 9 December 2011, Recticel concluded a new five-year club deal for a multi-currency loan of EUR 175 million. The tenor of this ‘club deal’ facility – in which 6 European banks are participating - has been extended in February 2016 for another five years. It currently will mature in February 2021.
(iii) Other bank loans In 2018, Recticel concluded a secured fixed rate bilateral bank loan of EUR 15.5 million for the financing of the new greenfield Insulation plant in Finland. The tenor of this amortising bank loan is 15 years, with maturity in March 2033. The outstanding amount at 31 December 2019 is EUR 14.6 million. In addition, the Group holds for its Automotive activities a local bank loan of EUR 5.2 million in China.
(iv) Commercial paper programIn 2017, the Group started through Recticel n.v. a short-term commercial paper program (TCN – Titres de Créances Négociables) in France for an amount of EUR 100 million, which was increased in 2018 to EUR 150 million. This TCN-program is used to complement the financing of day-to-day working capital needs of the Group. The amount issued under the TCN-program is to be covered by the unused amount under the EUR 175 million club deal credit facility.
• Other financial liabilities
For interest rate swaps reference is made to 2.4.2.5.17 in thousand EUR
Group Recticel 31 DEC 2019 31 DEC 2018
Other financial debt 190 65
Interest accruals 441 270
Total 631 336
2.4.2.5.16. Trade and other payablesTrade payables principally comprise amounts outstanding for trade purchases. Trade payables slightly increased to EUR 93.0 (2018: EUR 90.8 million).
Other current amounts payable decreased by EUR 23.6 million and is composed as follows:in thousand EUR
Group Recticel 31 DEC 2019 31 DEC 2018
Other non current liabilities maturing within one year 162 155
VAT payable - local 7 458 12 968
Other tax payables 1 998 3 172
Payroll, social security 35 666 34 823
Dividend payable 402 311
Result transfer (fiscal unit) 0 12 898
Other debts 13 496 18 986
Accrued liabilities - operating 15 799 11 248
Deferred income - operating 5 170 9 873
Deferred income - insurance premium 667 0
Deferred income - gain on sale and leaseback 506 523
Total 81 324 104 957
The major movement is linked to the partial divestment from the Proseat group (cfr Result transfer - fiscal unit).

RECTICEL ANNUAL REPORT 2019 I 201RECTICEL ANNUAL REPORT 2019 I 200
in thousand EUR
Group Recticel IFRS 9 CATEGORY 31 DEC 2019 31 DEC 2018 FAIR VALUE LEVEL
Financial assets
Transactional hedges - operational FVTPL 73 19 2
Derivatives not designed in a hedge relationship FVTPL 206 43 2
Current trade receivables AC 99 117 107 679 2
Other non-current receivables AC 6 137 1 643 2
Other receivables AC 20 119 26 245 2
Other receivables AC 26 256 27 888 2
Loans to affiliates AC 9 450 4 078 2
Other loans AC 1 586 1 763 2
Non-current loans AC 11 036 5 841 2
Financial receivables AC 12 269 28 961 2
Loans to affiliates AC 23 305 34 803 2
Cash and cash equivalents AC 48 479 37 733 2
Other investments FVTOCI 522 728 2
Financial liabilities
Interest rate swaps designated as cash flow hedge relationship FVTPL 125 229 2
Transactional hedges - operational FVTPL 9 40 2
Derivatives not designated in a hedge relationship FVTPL 81 161 2
Non-current financial liabilities at amortised cost AC 100 334 34 705 2
Current financial liabilities at amortised cost AC 117 201 87 770 2
Trade payables AC 93 089 90 757 2
Other non-current payables AC 43 202 2
Other payables AC 81 325 104 957 2
Other payables AC 81 367 105 159 2
AC = financial assets or liabilities at amortised costFVTPL = Financial assets or liabilities at fair value through profit or lossFVTOCI = financial assets at fair value through other comprehensive income
I.4.2.5.17. Financial instruments and financial risksThe following table presents the financial instruments by category of IFRS 9 and the fair value level for the financial assets and liabilities measured at fair value:
The Group uses the following hierarchy for determining and disclosing the fair value of financial instruments by valuation technique:
Level 1 : quoted (unadjusted) prices in active markets for identical assets or liabilities
Level 2 : other techniques for which all inputs which have a significant effect on the recorded fair value are observable, either directly or indirectly
Level 3 : techniques which use inputs which have a significant effect on the recorded fair value that are not based on observable market data.
During the reporting period ending 31 December 2019, there were no transfers between Level 1 and Level 2 fair value measurements, and no transfers into and out of Level 3 fair value measurements.
Financial risk management• Credit risk
The Group’s principal current financial assets are cash & cash equivalents, trade and other receivables, and investments, which represent the Group’s maximum exposure to credit risk in relation to financial assets.
The Group’s credit risk is primarily attributable to its trade receivables. The amounts presented in the statement of financial position are net of loss allowances for expected credit losses, estimated by the Group’s management based on prior experience and their assessment of the current economic environment.
The risk profile of the trade receivables portfolio is segmented by business line and based on the conditions of sale observed on the market. At the same time, it is confined by the agreed limits of the general conditions of sale and the specifically agreed conditions, adapted accordingly. The latter also depend on the degree of industrial and commercial integration of the customer, as well as on the level of market competitiveness.
The trade receivables portfolio in Flexible Foams, Bedding and Insulation consists of a large number of customers distributed among various markets, for which the credit risk is assessed on an on-going basis and based on which the commercial and financial conditions are granted. In addition, the credit risks on trade receivables, except for Automotive, are mostly covered by credit insurance policies which the Group manages centrally and harmonises. In case of transfer of these receivables to the factoring company, the latter becomes the beneficiary of these credit insurance policies. The credit risk management is also
strengthened by a credit management organisation which to a great extent is centralised, the implementation of SAP software modules (FSCM) and best practice processes regarding the collection of receivables.
In Automotive, credit risks are concentrated, and the Group relies on the solvency ratios allocated by independent rating agencies.
Credit terms granted on sales vary in function of the customer credit assessment, the business line and the country of operations.
There is a limited credit risk assessment on shareholder loans granted to the joint ventures. Shareholder loans to joint ventures are provided in accordance with rules foreseen in the joint venture agreements, which are subject to the evolution of the operational business performance.
• Interest rate risk managementRecticel is hedging economically the interest rate risk linked to its interest-bearing borrowings on a global basis. The main derivative instruments used to convert floating rate debt into fixed rate debt are Interest Rate Swaps (IRS). The amount of fixed rate arrangements in relation to total financial debt is reviewed on an on-going basis by the Finance Committee and adjusted as and when deemed appropriate. In this, the Finance Committee aims at maintaining an appropriate balance between fixed and floating rate arrangements based on a philosophy of sound spreading of interest rate risks.
In an interest rate swap (“IRS”) agreement, the Group undertakes to pay or receive the difference between the amounts of interest at fixed and floating rates on a nominal amount. This type of agreement enables the Group to fix the rate on a portion of its floating rate debt in order to be protected against the risk of higher interest charges on a loan at floating interest rates.
The market value of the portfolio of interest rate swaps on the reporting date is the discounted value of the future cash flows from the contract, using the interest rate curves at that date.
The current portfolio of IRS covers a portion of interest-bearing borrowings for EUR 25 million until February 2021 and a new IRS concluded in July 2019 for EUR 10 million until July 2024 .
The weighted average tenor of the IRS portfolio is 2.11 years.
On 31 December 2019, the fair value of the interest rate swaps was estimated at EUR -0.2 million.
All financial leases (EUR 16.4 million, of which EUR 2.0 million relate to a sale & lease back in Belgium) and a bank loan of EUR 14.6 million are at fixed rate; most other bank debt is contracted at floating rate. The current portfolio of interest rate swaps provides a global hedge for a total of EUR 35.0 million at 31
December 2019. Total fixed-rate arrangements represent 32% of the total net debt including ‘off-balance’ factoring.
Sensitivity to interest rates The Group’s interest rate risk exposure derives from the fact that it finances at both fixed and variable interest rates. The Group manages the risk centrally through an appropriate structure of loans at fixed and variable interest rates and through interest rate swaps (IRS). The interest rate hedges are evaluated regularly to bring them in line with the Group’s view on the trend in interest rates on the financial markets, with the aim of optimising interest charges throughout the various economic cycles. Hedge accounting within IFRS 9 is not applied.
• Profit and loss impact from interest rate hedges
Had the interest rates yield curve risen by 100 basis points, with all other parameters unchanged, the Group’s profit on the IRS portfolio in 2019 would have increased by EUR +0.5 million, compared to EUR +0.4 million in 2018. Conversely, had the interest rates yield curve fallen by 100 basis points, with all other parameters unchanged, the Group’s profit on the IRS portfolio in 2019 would have decreased by EUR -0.3 million, compared to EUR -0.1 million in 2018.
• Currency risk management It is the Group’s policy to hedge foreign exchange exposures resulting from financial and operational activities via Recticel International Services s.a./n.v. (RIS), which acts as internal bank of the Group. This hedging policy is mainly implemented through forward exchange contracts. Hedge accounting under IFRS 9 is not applied for currency risk management.
In general, the Group concludes forward exchange contracts to cover currency risks on incoming and outgoing payments in foreign currency. The Group may also conclude forward exchange contracts and option contracts to cover currency risks associated with planned sales and purchases of the year, at a percentage which varies according to the predictability of the payment flows.
At reporting date, forward exchange contracts were outstanding for a nominal amount of EUR 17.3 million and with a total fair value of EUR +0.2 million.
Sensitivity analysis on currency risks
The Group deals mainly in 6 currencies outside the euro zone: GBP, USD, CHF, SEK, PLN and CZK.

RECTICEL ANNUAL REPORT 2019 I 203RECTICEL ANNUAL REPORT 2019 I 202
The following table details the sensitivity of the Group to a positive or negative variation, compared to the annual variation in the pairs of currencies during the previous financial year.
The sensitivity analysis covers only the financial amounts in foreign currency which are recognised in the statement of financial position and which are outstanding at 31 December and determines their variations at the conversion rates based on the following assumptions: USD and GBP 10%; CZK, PLN, CHF and SEK 5%.
The following table details the Group’s sensitivity in profit or loss to a respectively 10% increase (or decrease) of the US Dollar and Pound Sterling against the Euro, and 5% increase and decrease of the Czech Crown, Polish Zloty, Swedish Krona and Swiss Franc against the Euro. The percentages applied in this sensitivity analysis represent the management’s assessment of the volatility of these currency exchange rates. The sensitivity analysis includes only outstanding foreign currency
denominated monetary assets and liabilities and adjusts their translation at the period end for a 10%, respectively 5%, change in foreign currency rates. The sensitivity analysis includes external loans as well as loans to foreign operations within the Group where the denomination of the loan is in a currency other than the functional currency of the lender or the borrower. It includes also the foreign exchange derivatives (not designated as hedging instruments).
A positive number indicates an increase in profit or loss when the Euro weakens by respectively 10% against the US Dollar or the Pound Sterling, or 5% against the Czech Crown, Polish Zloty, Swedish Krona or Swiss Franc. For a respectively 10% strengthening of the Euro against the US Dollar or the Pound Sterling, or 5% against the Czech Crown, Polish Zloty, Swedish Krona or Swiss Franc, there would be a comparable opposite impact on the profit or loss (i.e. the impact would be negative).
in thousand EUR
Group RecticelSTRENGTHENING OF
USD VERSUS EURSTRENGTHENING OF
GBP VERSUS EURSTRENGTHENING OF
CZK VERSUS EUR STRENGTHENING OF SEK
VERSUS EURSTRENGTHENING OF
CHF VERSUS EURSTRENGTHENING OF
PLN VERSUS EUR
2019 2018 2019 2018 2019 2018 2019 2018 2019 2018 2019 2018
Historical average variation 10% 10% 10% 10% 5% 5% 5% 5% 5% 5% 5% 5%
Profit or (loss) recognized in the P&L account
(288) (2 221) 77 (2 747) 51 (173) (112) (403) 74 326 68 (154)
Financial assets * 46 191 34 441 35 839 7 665 31 896 35 310 9 397 1 479 7 231 10 592 12 539 6 052
Financial liabilities * (44 935) (59 906) (37 640) (62 781) (24 784) (33 311) (10 032) (12 045) (5 818) (3 718) (10 487) (8 626)
Derivatives (4 134) 3 250 2 570 27 647 (6 100) (5 453) (1 600) 2 496 70 (355) (700) (510)
Total net exposure (2 878) (22 215) 769 (27 469) 1 012 (3 455) (2 235) (8 070) 1 483 6 519 1 352 (3 084)
* includes trade and other receivables and trade and other payables.
Financial assets and liabilities represent the foreign currency exposure of the different subsidiaries of the Group in relation to their local currency.
Liquidity riskThe financing sources are well diversified, and the bulk of the debt is irrevocable and long-term or backed-up by long-term commitments. It includes the 5-year club deal revolving credit facility concluded in December 2011 for an amount of EUR 175 million, which was extended in February 2016 for a new 5-year period until February 2021. In the course of the second quarter of 2020, the Group will start negotiations with its banks to renew this facility. In addition to the long-term loans, the Group has a diversified range of short-term financing sources, including a commercial paper program and non-recourse factoring facilities.
The diversified financing structure and the availability of committed unused credit facilities for EUR 166.5 million guarantee the necessary liquidity to ensure the future activities and to meet the short- and medium-term financial commitments.
The Group does not enter in financial instruments that require cash deposits or other guarantees (i.e. margin calls).
The club deal financing agreement is subject to bank covenants based on an adjusted leverage ratio, an adjusted interest cover and a minimum equity requirement; all on a combined basis. At the end of 2019, Recticel complied with all its bank covenants. Following the outbreak of the COVID-19 crisis it is currently not possible to assess whether the Group will be in a position to meet its bank covenants in the coming year (see note 2.4.2.6.3. – Events after the reporting date). These bank covenants will continue to be determined on the basis of the generally accepted accounting principles that were in place at the moment of the closing of the club deal agreement (“frozen GAAP”). The adoption of IFRS 16 has no an impact on the measurement of these covenants.
Under the club deal financing agreement, the maximum dividend authorised for distribution, excluding the portion attributable to the treasury shares, amounts to the highest of (i) 50% of the consolidated net income of the Group for the previous financial year and (ii) EUR 12.0 million.
The gross dividend over 2019 – to be paid in 2020 – proposed to the Annual General Meeting amounts to EUR 0.24 per share, leading to a total dividend pay-out of EUR 13.2 million (excluding treasury shares). This amounts exceeds the above-mentioned 50% maximum pay-out limit. A waiver has been obtained from the participating banks to authorise such higher payment.
• Maturity analysis of financial liabilities
For the year ending 31 December 2019:in thousand EUR
Group RecticelMATURING
WITHIN ONE YEAR
MATURING BETWEEN 1 AND 5
YEARSMATURING
AFTER 5 YEARS TOTAL FUTURE
FINANCIAL CHARGES
CARRYING AMOUNT
(A) (B) (C) (A)+(B)+(C)
Lease liabilities 23 124 58 493 27 836 109 454 (13 055) 96 398
Bank loans 2 532 10 343 10 128 23 004 (3 123) 19 881
Other loans 270 1 001 790 2 061 (131) 1 930
Interest-bearing borrowings 25 926 69 837 38 755 134 518 (16 309) 118 209
Other financial liabilities - Non-derivative 99 326 0 0 99 326 0 99 326
Other financial liabilities - Derivative 215 0 0 215 0 215
Total 217 750
Non-current financial liabilities 100 334
Current financial liabilities 117 416
Total 217 750
For the year ending 31 December 2018:in thousand EUR
Group RecticelMATURING
WITHIN ONE YEAR
MATURING BETWEEN 1 AND 5
YEARSMATURING
AFTER 5 YEARS TOTAL FUTURE
FINANCIAL CHARGES
CARRYING AMOUNT
(A) (B) (C) (A)+(B)+(C)
Lease liabilities 793 11 954 7 472 20 219 (2 074) 18 145
Bank loans 111 6 059 12 660 18 831 (3 331) 15 500
Other loans 423 1 001 823 2 247 (286) 1 961
Interest-bearing borrowings 1 327 19 015 20 956 41 297 (5 692) 35 606
Other financial liabilities - Non-derivative 88 691 0 0 88 691 0 88 691
Other financial liabilities - Derivative 430 0 0 430 0 430
Total 124 727
Non-current financial liabilities 34 706
Current financial liabilities 90 021
Total 124 727
The following table presents the unused credit facilities available to the Group:
in thousand EUR
Group Recticel 31 DEC 2019 31 DEC 2018
Unused amounts under non-current financing facilities
Undrawn available commitments under the club deal facility 1 78 064 116 015
Undrawn available under non-current commitments maturing within one year 0 0
Undrawn available under other non-current commitments 0 0
Total available under non-current facilities 78 064 116 015
Unused amounts under current financing facilities
Undrawn under current on-balance facilities 53 087 45 827
Undrawn under off-balance factoring programs 35 333 37 627
Total available under current facilities 88 420 83 454
Total unused amounts under financing facilities 166 484 199 469
1 The amount drawn under the commercial paper program is to be covered at any time by the undrawn amount under the club deal facility. Therefor the reported unused amount of EUR 78 million under the EUR 175 million club deal revolving credit facility is after deduction of the issued amounts under the commercial paper program.

RECTICEL ANNUAL REPORT 2019 I 205RECTICEL ANNUAL REPORT 2019 I 204
2.4.2.5.18. Business combinations and disposals
There were no material business combinations during 2019, nor in 2018.
2.4.2.5.19. Capital management
The overview below defines the capital components which management considers key in order to realise its capital structure target ratio (i.e. Total net financial debt/Total equity) of less than 50%.
in thousand EUR
Group Recticel 31 DEC 2019 31 DEC 2018
Hedging liabilities 215 430
Non current financial liabilities 100 334 34 706
Current portion of non current financial liabilities 17 875 900
Current financial liabilities 98 885 88 421
Interest accruals 441 270
Gross financial debt 217 750 124 727
Cash and cash equivalents (48 479) (39 554)
Deferred interest (337) (616)
Hedging assets (279) (19)
Net financial debt 168 655 84 538
Drawn amounts under off-balance non-recourse factoring programs 47 052 51 320
Total net financial debt 215 707 135 858
Total equity 275 397 264 978
Ratios
Net financial debt / Total equity 61,2% 31,9%
Total net financial debt / Total equity 78,3% 51,3%
2.4.2.6. Miscellaneous
2.4.2.6.1. Other off-balance sheet items
These guarantees include mainly parental corporate guarantees and letters of comfort for commitments contracted by subsidiaries with banks (EUR 61.7 million),
lessors (EUR 15.4 million), governmental institutions (EUR 3.8 million) and other third parties (EUR 6.5 million).
in thousand EUR
Group Recticel 31 DEC 2019 31 DEC 2018
Guarantees given or irrevocably promised by Recticel SA/NV as security for debts and commitments of companies 87 331 102 916
The table below gives the overview of all outstanding subscription rights per 31 December 2019:
Issue NUMBER OF SUBSCRIPTION RIGHTS OUTSTANDING
EXERCISE PRICE EXERCISE PERIODFAIR VALUE OF
SUBSCRIPTION RIGHTS AT MOMENT OF ISSUE
April 2014 81 980 € 5.64 01 Jan 18 - 28 Apr 20 € 0.846
June 2015 174 000 € 4.31 01 Jan 19 - 22 Jun 21 € 0.513
April 2016 282 500 € 5.73 01 Jan 20 - 28 Apr 25 € 0.786
June 2017 360 000 € 7.00 01 Jan 21 - 29 Jun 24 € 0.928
April 2018 442 500 € 10.21 01 Jan 22 - 24 Apr 25 € 1.572
June 2019 492 500 € 7.90 01 Jan 23 - 27 Jun 26 € 1.181
Total 1 833 480
A more general overview showing the trend during 2019 is given below:
in units
Group Recticel 2019 2018
Total number of subscription rights outstanding per 31 December 1 833 480 1 657 193
Weighted average exercise price € 7.50 € 7.02
Weighted average remaining contractual life (in years) 4.89 4.92
Movements in number of subscription rights
Subscription rights outstanding at the beginning of the period 1 657 193 1 965 262
New subscription rights granted during the period 500 000 460 000
Subscription rights forfeited and expired during the period (153 286) (317 414)
Subscription rights exercised during the period (170 427) (450 655)
Subscription rights outstanding at the end of the period 1 833 480 1 657 193
Status of subscription rights outstanding
Closing share price at end of period € 8.31 € 6.39
Total number of subscription rights exercisable at the end of the period 255 980 165 693
Total number of subscription rights that are 'in-the-money' at the end of the period * 898 480 1 197 143
Total number of subscription rights that are exercisable and 'in-the-money' at the end of the period * 255 980 165 693
* in comparison with the average closing price over the period
2.4.2.6.2. Share-based paymentsThe Recticel Group has implemented a warrant plan for its leading managers.
All subscription rights have a vesting period of 3 years. Beneficiaries can lose the right to exercise their subscription rights in case of voluntary leave or dismissal for misconduct.
The expense recognised for the year for the share-based payments amounts to EUR 0.6 million (2018: EUR 0.7 million).

RECTICEL ANNUAL REPORT 2019 I 207RECTICEL ANNUAL REPORT 2019 I 206
The table below gives the overview of all subscription rights exercised during the period:
in units
Group Recticel 2019 2018
Total number of subscription rights exercised 170 427 450 655
Weighted average exercise price € 4.80 € 6.85
Period during which these subscription rights were exercised 2 March - 20 December 29 March - 18 December
Average closing price of period during which these subscription rights were exercised € 7.83 € 9.11
Average daily closing price for full year € 6.11 € 9.08
Members of the Management Committee received the following subscription rights for the 2019 series:
Name TOTAL NUMBER OF SUBSCRIPTION RIGHTS
TOTAL THEORETICAL VALUE OF SUBSCRIPTION RIGHTS
AT ISSUANCE (*)
Olivier Chapelle 120 000 € 141 720
Ralf Becker 30 000 € 35 430
Betty Bogaert 30 000 € 35 430
François Desné 30 000 € 35 430
Jean-Pierre De Kesel 30 000 € 35 430
Bart Massant 30 000 € 35 430
Jean-Pierre Mellen 30 000 € 35 430
Jan Meuleman 30 000 € 35 430
François Petit 30 000 € 35 430
Dirk Verbruggen 30 000 € 35 430
Total 390 000 € 460 590
(*) The theoretical value is calculated by using a Black & Scholes formula, and taken into account certain assumptions regarding dividend yield, interest rate and volatility.
To date, the Group has not issued share appreciation rights to any of its managers or employees, nor has it implemented any share purchase plan.
The theoretical value of the subscription rights at issuance is calculated by applying the Black & Scholes formula, and taking
into account certain assumptions regarding dividend payment (last dividend compared to share price - dividend yield: 3.07%), interest rate (Euribor 5 years: 0.00%) and volatility (stock market data on the Recticel share: 26.5%). For the issue of June 2019, the fair value amounted to EUR 1.181 per subscription right.
Overview of the outstanding subscription rights held by the members of the current Management Committee: (per 31 December 2019)
in units
IssueaNUMBER OF SUBSCRIPTION RIGHTS HELD
BY THE MEMBERS OF THE CURRENT MANAGEMENT COMMITTEE
April 2014 35 442
June 2015 80 000
April 2016 165 000
June 2017 260 000
April 2018 325 000
June 2019 390 000
Total 1 255 442a the conditions of the various issues are reflected in the global overview
table herabove.
2.4.2.6.3. Events after the reporting date
There were three material post reporting date events after 31 December 2019 :
• COVID-19In response to the COVID-19 outbreak the first concern has been to take all necessary precautionary measures to keep our employees healthy and ensuring a safe workplace. Recticel has implemented strict behavioral and precautionary measures, in line with the recommendations issued by the governments of the countries in which it operates and by the World Health Organization, in order to minimize contamination risks.
While our Automotive activities in China have returned to pre COVID-19 levels, our Automotive activities in Europe and USA are temporarily shut down as most OEMs have shut their assembly plants. In the other business segments, customer demand has been rapidly decreasing and is expected to reach its bottom in April before progressively recovering thereafter. As a consequence, after having drastically adapted our production levels to match demand, we are now planning for a progressive restart of our commercial and manufacturing operations in the countries and segments where they had been curtailed.
Temporary unemployment has been implemented to the maximum extent, where applicable. Also, top management remuneration has temporarily been reduced as a token of solidarity.
In response to this unprecedented environment, capital expenditure is reduced to the minimum, and all non-essential projects have been put on hold.
Since there is no clarity at the moment of issuance of this Annual Report as to what extent and within which timeframe the markets will recover from the COVID-19 crisis, it is impossible to predict its ultimate impact. However, we expect that the consequences of the measures taken to contain the virus will significantly impact our financial performance of 2020.
• Divestment Automotive Interiors division and 50% stake in the Eurofoam Flexible Foams joint venture
On 6 April 2020 the Group entered into a binding agreement in order to bring the Automotive Interiors business in a new joint venture under the control of Munich-based privately owned investment company Admetos GmbH. In addition, Recticel has also reached a binding agreement with Greiner AG to divest its 50% participation in the Eurofoam joint venture. Following the divestment of the Proseat activities in 2019, these two deals will fundamentally refocus Recticel on its higher value added activities, and provide increased flexibility to pursue strategic development opportunities in the future.
Automotive InteriorsUnder the terms of the agreement the Automotive Interiors division will be transferred to a new joint venture holding company, controlled by Admetos who will own 51% of its shares, with Recticel detaining the other 49%. The new joint venture will allow Automotive Interiors to build on its leading patented interior trim technology, to further develop its customer base, and to expand its geographic reach.
The agreement contains reciprocal call/put options for Admetos to acquire, or Recticel to sell, its remaining 49% share, exercisable as from March 2024 at a price calculated on the basis of a pre-agreed EBITDA multiple.
EurofoamRecticel reached an agreement to sell its 50% stake in Eurofoam to its joint-venture partner Greiner AG. The Eurofoam joint venture was established in 1992 to develop flexible foams activities in Eastern Europe. In 1997, the joint venture was extended by both partners’ contribution of their existing activities in Austria and Germany.
Financial impacts on the Recticel GroupBoth transactions are expected to close in the course of the second quarter of 2020, subject to customary closing conditions, mainly the approval by the anti-trust authorities.
While the Automotive Interiors transaction will generate a loss, the closing of the two transactions will allow Recticel to realise in aggregate a net capital gain in the region of EUR 85 million and estimated net cash proceeds of EUR 210 million. Additionally, these transactions will lead to the transfer of EUR 36 million of lease obligations (IFRS 16).
Consequently Recticel Group will be in a solid financial position to optimally drive its strategic expansion.
Material judgements and estimatesThe abovementioned subsequent events are non-adjusting events with regard to the current financial statements. Consequently, the main judgements and estimates made in establishing the 2019 financial statements, relating mainly to impairment testing of goodwill and non-current assets, as well as the determination of deferred tax assets, were made without considering their impact.
Liquidity – Going-concernThe Group liquidity is ensured by the available credit facilities, with a headroom per 15 April 2020 of about EUR 130 million drawable at short notice under our Group ‘club deal’ Credit Facility, the available bilateral credit lines and our factoring program, for which the availability follows the evolution in factorable receivables.

RECTICEL ANNUAL REPORT 2019 I 209RECTICEL ANNUAL REPORT 2019 I 208
Transactions with joint ventures and associates: 2019in thousand EUR
Group Recticel NON-CURRENT RECEIVABLES
TRADE RECEIVABLES
OTHER CURRENT
RECEIVABLESTRADE
PAYABLESOTHER
PAYABLES REVENUES COST OF SALES
Total Proseat companies 8 500 1 756 0 66 (0) 40 565 0
Total Orsafoam companies 0 26 152 229 1 133 (22)
Total Eurofoam companies 0 1 776 42 824 0 22 964 (10 728)
TOTAL 8 500 3 558 194 1 118 1 63 662 (10 749)
Transactions with joint ventures and associates: 2018in thousand EUR
Group Recticel NON-CURRENT RECEIVABLES
TRADE RECEIVABLES
OTHER CURRENT
RECEIVABLESTRADE
PAYABLESOTHER
PAYABLES REVENUES COST OF SALES
Total Proseat companies 4 078 2 885 6 260 18 8 30 362 0
Total Orsafoam companies 0 57 815 169 0 172 (40)
Total Eurofoam companies 0 1 807 42 1 266 0 29 167 (15 910)
Turvac 0 59 0 (2) 0 1 (68)
TOTAL 4 078 4 808 7 117 1 451 8 59 703 (16 018)
Considering the potential negative impact of the COVID-19 crisis on EBITDA over the period until June 2020, on the basis of impact simulations and stress tests, and without taking into account the cash proceeds expected from the two announced divestments, the Group anticipates that one financial covenant may not be respected on the next measurement date, being 30 June 2020. However, when taking into account the debt reduction as a result of the anticipated EUR 210 million cash proceeds from the two announced divestments, which are expected to be closed by June 30, 2020, all financial covenants are to be met.
In the unlikely case where any of the financial covenants would not be met on June 30, 2020 the Group intends to request, and is confident to obtain, a waiver from the banks participating in the ‘club deal’.
It is also the Group’s intention to refinance the ‘club deal’ facility, which will come to maturity in February 2021, taking into account its future financing needs and, after collection of the cash proceeds from the divestments, to arrange for adequate credit facilities as may be required to allow the financing of the intended expansion of its core activities.
After having assessed the likely negative consequences of the COVID-19 crisis including careful consideration of:
• the assumptions taken in the simulation and stress test performed as well as the related uncertainties, being the unknown length and depth of the economic crisis;
• the ability of the company to generate the expected cash proceeds from the announced divestments;
• the ability of the company to obtain a waiver in case a breach of covenant would materialize;
• the ability of the company to refinance the ‘club deal’ facility in February 2021;
the Board, in its session of 27 April 2020, reconfirmed its assessment that the Group is able to continue as a going-concern.
2.4.2.6.4. Related party transactionsTransactions between Recticel s.a./n.v. and its subsidiaries, which are related parties, have been eliminated in the consolidation and are not disclosed in this note. Transactions with other related parties are disclosed below, and concern primarily commercial transactions done at prevailing market conditions. The tables below include only transactions considered to be material, i.e. exceeding a total of EUR 1 million.
Following the partial divestment from the Proseat group, revenues from Proseat companies relate to the sale of chemical raw materials at cost.
2.4.2.6.5. Remuneration of the Board of Directors and of the Management Committee
The remuneration of the members of the Board of Directors and of the Management Committee is included in this note. For more information, reference is made to the remuneration report in the section ‘Corporate Governance’ of this annual report. Total gross remuneration for the members of the Board of Directors:
in EUR
Group Recticel 2019 2018
Director fees 165 000 165 000
Attendence fees Board of Directors 360 000 205 000
Attendence fees Audit Committee 42 500 50 000
Attendence fees Remuneration and Nomination Committee 45 000 22 500
Remuneration for special assignments 32 500 0
TOTAL 645 000 442 500
Total gross remuneration for the members of the Management Committee
in EUR
Group Recticel 2019 2018
Fixed remuneration 2 838 398 2 765 207
Variable remuneration 1 294 215 1 022 788
Pensions 418 419 354 937
Other benefits 309 636 280 761
Extraordinary items 1 695 553 0
TOTAL 6 556 221 4 423 693
in EUR
Group RecticelCLOSING RATE AVERAGE RATE
2019 2018 2019 2018
Bulgarian Lev BGN 0.511300 0.511300 0.511300 0.511300
Swiss Franc CHF 0.921319 0.887390 0.898918 0.865832
Yuan Renminbi CNY 0.127869 0.126983 0.129274 0.128072
Czech Crown CZK 0.039358 0.038874 0.038955 0.038991
EURO EUR 1.000000 1.000000 1.000000 1.000000
Pound Sterling GBP 1.175364 1.117905 1.139250 1.130319
Forint HUF 0.003025 0.003115 0.003074 0.003136
Indian Rupee INR 0.012471 0.012542 0.012685 0.012386
Yen JPY 0.008201 0.007946 0.008196 0.007669
Moroccan Dirham MAD 0.093962 0.091303 0.092776 0.090841
Norwegian Krone NOK 0.101381 0.100520 0.101512 0.104194
Polish Zloty PLN 0.234918 0.232482 0.232687 0.234660
Romanian Leu RON 0.209074 0.214431 0.210733 0.214868
Serbian Dinar RSD 0.008513 0.008461 0.008497 0.008469
Russian Rouble RUB 0.014295 0.012545 0.013802 0.013506
Swedish Krona SEK 0.095723 0.097515 0.094437 0.097482
Turkish Lira TRY 0.149604 0.165049 0.157288 0.175203
Ukrainian Hryvnia UAH 0.037442 0.031812 0.035520 0.031902
US Dollar USD 0.890155 0.873362 0.893276 0.846773
2.4.2.6.6. Exchange rates

RECTICEL ANNUAL REPORT 2019 I 211RECTICEL ANNUAL REPORT 2019 I 210
2.4.2.6.7. Staffin units
Group Recticel 31 DEC 2019 31 DEC 2018
Management Committee 10 10
Employees 2 250 2 366
Workers 3 842 4 108
Average number of people employed (full time equivalent) on a consolidated basis (i.e. excluding joint ventures) 6 102 6 484
Remuneration and social charges (in thousand EUR) 300 079 291 647
Average number of people employed in Belgium 1 047 1 058
in thousand EUR
Group Recticel DELOITTE OTHERS
Audit fees 837 543
Other audit services and legal missions 128 12
Tax services 5 151
Consulting services 34 6
Total fees in 2019 1 004 710
2.4.2.6.8. Audit and non-audit services provided by the statutory auditor
Overview of the audit fees and additional services performed for the Group by the auditor and companies related to the auditor for the year ending 31 December 2019.
In the above overview the fees of the joint venture companies are included at 100%.
2.4.2.6.9. Contingent assets and liabilities
• Tertre (Belgium)1. Carbochimique, which was progressively integrated into
the Recticel Group in the 1980s and early 1990s, owned an industrial site in Tertre (Belgium), where various carbochemical activities had been carried on since 1928. These activities were gradually spun off and sold to other industrial companies, including Yara and Prince Erachem (Eramet group). Finapal, a Recticel subsidiary, retained ownership of some plots on the site, chiefly old dumping sites and settling ponds that have been drained.
In 1986, Recticel sold its “fertilizer” division, in particular the activities of the Tertre site, to Kemira, now acquired by Yara. As part of this agreement, Recticel undertook to set an old basin (“Valcke Basin”), in line with environmental regulations. This requirement was not yet performed because of the mutual dependence of the environmental conditions within the industrial site in Tertre. Yara sued Recticel for precautionary reasons pursuant to this
obligation in July 2003. Both parties negotiated and signed a settlement agreement in the course of 2011, which ended the dispute.
Under the settlement agreement Yara and Recticel committed to prepare together a recovery plan for four contaminated areas of the industrial area in Tertre, including the Valcke Bassin and a dump site of Finapal, and agreed on the cost split thereof.
This plan was approved in December 2013 by Ministerial Order of the Walloon Government, and the specification book was likewise prepared by both parties and approved by the authorities. End December 2015 Ecoterres was appointed as contractor. The works were started in 2016 and the end of the works is expected by end 2020.
The increased cost for remuneration and social charges is explained by salary inflation as well as the cost of lay-offs.
2. Following the sale of the entity Sadacem to the French group Comilog, now part of the group Eramet, Recticel committed itself to sanitise, on a shared cost basis, an old industrial waste site on the grounds of Prince Erachem. The start of the execution of this commitment was studied in consultation with the entity Prince Erachem and has been provisioned in the accounts of the Recticel Group. A proposal was submitted to the Office Wallon des Déchets in April 2009 and since been approved.
The implementation of the restructuring plan started in 2013 and has been completed as planned. The clean-up works were completed in 2017 but are still subject to a monitoring phase during 3 years.
• LitigationsThe Group has been the subject of an antitrust investigation at European level. Recticel announced on 29 January 2014 that a settlement was reached with the European Commission in the polyurethane foam investigation. The case was closed after payment of the last instalment of the effective overall fine in April 2016.
Various claims have been issued by one or more customers, in which these entities allege harm with regard to the conduct covered by the European Commission’s cartel decision. Some procedures have been ended or concluded in the course of 2016-2018, with one court procedure on-going in Germany linked to Eurofoam, and one court procedure recently launched in the United Kingdom. No additional new claims are to be expected as these have now all become time-barred.
While Recticel believes there to be no harm done, and it is up to the customer to prove any damage incurred, Recticel carefully reviews and evaluates the merits for each case with its legal advisors to determine the appropriate defensive strategy and recognises, where appropriate, provisions to cover any legal costs in this regard.
Regarding the on-going litigation no considered judgment can at this stage be formed on the outcome of these procedures or on the amount of any potential loss for the company.
One of our Group entities in the United Kingdom is the subject of an HSE investigation following the accidental death of one of its employees. It cannot be excluded that further procedural steps might be taken by the authorities, leading to prosecution, legal costs and fines.
One of the Group’s entities in France is implicated in a labour law case following the closure of a production site, whereby the former employees have launched a claim to obtain additional compensations, on the basis that the economic reasons for the closure were invalid.
Following the fire incident in Most (Czech Republic), the involved Group entity has been temporarily unable to supply the contractually agreed quantities of products, leading to production interruptions at the direct customers and the car manufacturers. While the Group entity involved have claimed Force Majeure in this respect, this has been put in question or even contested by a number of customers, with indication that further claims could be raised to obtain damage compensation. While the Group is insured in this regard in line with industrial standards, it cannot be excluded that such claims could lead to financial losses for the group companies involved. One customer has launched a legal proceeding in France in the course of the first semester of 2019.
On 31 May 2019, Greiner AG launched an arbitration proceeding against Recticel SA/NV, claiming that Recticel supplied excess quantities of foam to its Bedding subsidiaries located in the territory of the Eurofoam joint venture, in breach of the 1997 Joint Venture agreement and requesting compensation for damages in this regard. Recticel considers this claim to be without merit and will defend its position.
As of 31 December 2019, total overall provisions and accruals for other litigations, environmental risk and other risks on Recticel Group level amounted to EUR 3.9 million in the consolidated financial statement (or EUR 5.0 million in the combined financial statements). With reference to the prejudicial exemption in IAS 37 §92, the Group will not disclose any further information about the assumptions for the provision, including any details about current and the expected number of lawsuits and claims.
The disclosure of such information is believed to be detrimental to the Group in connection with the ongoing confidential negotiations and could inflict financial losses on Recticel and its shareholders.
2.4.2.6.10. Reconciliation table of Alternative Performance Measures
The Group uses and publishes several Alternative Performance Measures (“APM”) to provide additional valuable insight to financial analysts and investors. APMs are related to the standards used by management to monitor and measure financial performance.
The overview tables below summarise the reconciliation of these APMs in respectively the income statement and the statement of financial position.

RECTICEL ANNUAL REPORT 2019 I 213RECTICEL ANNUAL REPORT 2019 I 212
in thousand EUR
31 DEC 2019 31 DEC 2018
COMBINED
ADJUSTEMENT FOR JOINT
VENTURES BY APPLICATION OF
IFRS 11
CONSOLIDATED COMBINED
ADJUSTEMENT FOR JOINT
VENTURES BY APPLICATION OF
IFRS 11
CONSOLIDATED
Income statement
Sales 1 220 949 (182 432) 1 038 517 1 448 264 (330 612) 1 117 652
Gross profit 219 118 (27 824) 191 294 239 499 (37 876) 201 623
EBITDA 105 641 (10 377) 95 264 93 353 (12 853) 80 500
EBIT 40 260 (3 112) 37 148 47 046 (4 099) 42 947
EBIT 40 260 (3 112) 37 148 47 046 (4 099) 42 947
Amortisation intangible assets 3 701 (1 034) 2 667 4 167 (1 538) 2 629
Depreciation tangible assets 33 388 (4 282) 29 107 34 080 (6 712) 27 368
Depreciation right-of-use assets 24 611 (1 982) 22 630 0 0 0
Impairments on goodwill, intangible and tangible fixed assets 1 821 0 1 821 5 783 36 5 819
Amortisation other operational assets 1 1 860 32 1 892 2 276 (539) 1 737
EBITDA 105 641 (10 377) 95 264 93 353 (12 853) 80 5001 Mainly the release of upfront payments in Automotive to profit and loss account.
EBITDA 105 641 - - 93 353 - -
Net impact of fire incident in Most 0 - - (5 639) - -
Restructuring charges 11 215 - - 10 103 - -
Gain/(loss) on disposals (5 904) - - 0 - -
Other 3 782 - - 5 977 - -
Adjusted EBITDA 114 735 - - 103 794 - -
See note 2.4.2.3.1.
EBIT 40 260 - - 47 046 - -
Net impact of fire incident in Most 0 - - (5 639) - -
Restructuring charges 11 215 - - 10 103 - -
Gain/(loss) on disposals (5 904) - - 0 - -
Other 3 782 - - 5 977 - -
Impairments 1 821 - - 5 783 - -
Adjusted EBIT 51 175 - - 63 270 - -
See note 2.4.2.3.1.
Total net financial debt
Non-current financial liabilities 118 714 (18 380) 100 334 47 205 (12 499) 34 706
Current financial liabilities 122 651 (5 236) 117 415 90 437 (2 237) 88 200
Cash (60 210) 11 731 (48 479) (36 780) (953) (37 733)
Other financial assets 1 (709) (3) (712) (691) 83 (608)
Net financial debt on statement of financial position 180 446 (11 888) 168 558 100 171 (15 606) 84 565
Factoring programs 47 049 3 47 051 51 320 0 51 320
Total net financial debt 227 494 (11 885) 215 609 151 491 (15 606) 135 8851 Hedging instruments and interest advances
Gearing ratio (Net financial debt / Total equity)
Total equity 275 397 0 275 397 264 978 0 264 978
Net financial debt on statement of financial position / Total equity 65.5% - 61.2% 37.8% - 31.9%
Total net financial debt / Total equity 82.6% - 78.3% 57.2% - 51.3%
in EUR
in thousand EUR
31 DEC 2019 31 DEC 2018
COMBINED
ADJUSTEMENT FOR JOINT
VENTURES BY APPLICATION OF
IFRS 11
CONSOLIDATED COMBINED
ADJUSTEMENT FOR JOINT
VENTURES BY APPLICATION OF
IFRS 11
CONSOLIDATED
Leverage ratio (Net financial debt / EBITDA)
EBITDA 105 641 (10 377) 95 264 93 353 (12 883) 80 470
Net financial debt on statement of financial position / EBITDA 1.7 - 1.8 1.1 - 1.1
Total net financial debt / EBITDA 2.2 - 2.3 1.6 - 1.7
Net working capital
Inventories and contracts in progress - - 101 797 - - 103 789
Trade receivables - - 99 117 - - 107 679
Current contract assets - - 11 300 - - 13 782
Other receivables - - 20 119 - - 26 245
Income tax receivables - - 1 449 - - 5 587
Trade payables - - (93 008) - - (90 756))
Current contract liabilities - - (32 832) - - (44 964)
Income tax payables - - (1 229) - - (3 061)
Other amounts payable - - (81 325) - - (104 957)
Net working capital - - 25 388 - - 13 344
Current ratio (= Current assets / Current liabilities)
Current assets - - 300 600 - - 344 958
Current liabilities - - 332 264 - - 341 052
Current ratio (factor) - - 0.9 - - 1.0

RECTICEL ANNUAL REPORT 2019 I 215RECTICEL ANNUAL REPORT 2019 I 214
Recticel s.a./n.v.
Address: (until 31 May 2020) Avenue des Olympiades, 2 B-1140 Brussels (Evere)
New Address: (as from 01 June 2020) avenue Bourget, 42 B-1130 Brussels
Established: on 19 June 1896 for thirty years, later extended for an unlimited duration.
Object: (article 3 of the Coordinated Articles) The object of the company is the development, production, conversion, trading, buying, selling and transportation, on its own account or on behalf of third parties, of all plastics, polymers, polyurethanes and other synthetic components, of natural substances, metal products, chemical or other products used by private individuals or by industry, commerce and transport, especially for furniture, bedding, insulation, the construction industry, the automotive sector, chemicals, petrochemicals, as well as products belonging to or necessary for their production or which may result or be derived from this process.
It may achieve its object in whole or in part, directly or indirectly, via subsidiaries, joint ventures, participations in other companies, partnerships or associations.
In order to achieve this object, it can carry out all actions in the industrial, property, financial or commercial field which are associated with its object directly or indirectly, in whole or in part, or which would be of a nature to promote, develop or facilitate its operation or its trade or that of the companies, partnerships or associations in which it has a participation or an interest; it can in particular develop, transfer, acquire, rent, hire out and exploit all movable and immovable goods and all intellectual property.
Legal form: naamloze vernnootschap / société anonyme (limited company)
Recorded in the Brussels register of legal entitiesCompany number: 0405 666 668
Subscribed capital: EUR 138 493 598 (per 31 December 2019)
Type and number of shares: at 31 December 2019 there was only one type of shares, namely ordinary shares; total number of shares outstanding: 55 397 439
Portion of the subscribed capital still to be paid up: 0 shares/EUR 0.
Nature of the shares not fully paid up: none.
Percentage fully paid up: 100%. The shares are all fully paid up.
The accounts were prepared in accordance with requirements specified by the Royal Decree of 30 January 2001.
These annual accounts comprise the balance sheet, the income statement and the notes prescribed by law. They are presented hereafter in condensed form.
In accordance with Belgian law, the management report, the annual accounts of Recticel s.a./n.v. and the report of the Statutory Auditor will be filed with the Belgian National Bank. They are available on request from: Recticel s.a./n.v. Corporate Communications
Address: (until 31 May 2020) Avenue des Olympiades, 2 B-1140 Brussels (Evere)
New Address: (as from 01 June 2020) avenue Bourget, 42 B-1130 Brussels
Tel.: +32 (0)2 775 18 11Fax: +32 (0)2 775 19 90E-mail: [email protected]
The notes to the annual accounts are related to the financial situation of the company as shown in the statement of financial position. The results are also commented on in the preceding annual report.
The Statutory Auditor has delivered an unqualified opinion on the statutory annual accounts of Recticel s.a./n.v..
The statutory annual accounts of Recticel s.a./n.v., as well as the statutory report by the Board of Directors, are freely available on the company’s web site https://www.recticel.com/investors/annual-half-year-reports.html.
2.4.3. Recticel s.a./n.v. - General information
in thousand EUR
Group Recticel 31 DEC 2019 31 DEC 2018
PROFIT AND LOSS ACCOUNT
I. Operating revenues 330 956 341 025
II. Operating charges (323 237) (325 265)
III. Operating profit (loss) 7 719 15 760
IV. Financial income 24 350 21 458
V. Financial charges (12 054) (23 465)
VI. Profit (loss) for the year before taxes 20 015 13 753
VII. Income taxes (164) (911)
VIII. Profit (loss) for the year after taxes 19 852 12 842
IX. Transfer to untaxed reserves 0 0
X. Profit (loss) for the period available for appropriation 19 852 12 842
in thousand EUR
Group Recticel 31 DEC 2019 31 DEC 2018
ASSETS
FIXED ASSETS 383 880 354 873
I. Formation expenses 280 951
II. Intangible assets 30 562 29 948
III. Tangible assets 59 161 57 091
IV. Financial assets 293 877 266 883
CURRENT ASSETS 216 208 214 113
V. Amounts receivable after one year 23 435 13 138
VI. Inventories and contracts in progress 24 467 20 945
VII. Amounts receivable within one year 165 241 176 622
VIII. Cash investments 1 398 1 398
IX. Cash 275 182
X. Deferred charges and accrued income 1 391 1 828
TOTAL ASSETS 600 088 568 986
LIABILITIES
I. Capital 138 494 138 068
II. Share premium account 130 334 129 941
III. Revaluation surplus 2 551 2 551
IV. Reserves 15 046 14 053
V. Profits (losses) brought forward 71 042 65 479
VI. Investment grants 0 0
VII. A. Provisions for liabilities and charges 6 999 7 522
B. Deferred taxes 0 0
VIII. Amounts payable after one year 39 432 14 080
IX. Amounts payable within one year 188 562 189 403
X. Accrued charges and deferred income 7 628 7 889
TOTAL EQUITY AND LIABILITIES 600 088 568 986
2.4.4. Recticel s.a./n.v. - Condensed statutory accounts

RECTICEL ANNUAL REPORT 2019 I 217RECTICEL ANNUAL REPORT 2019 I 216
The statutory annual accounts of Recticel s.a./n.v. as well as the statutory report by the Board of Directors, is freely available on the company’s web site www.recticel.com.
Profit appropriation policy
The General Shareholders Meeting decides on the appropriation of the profit available for the distribution of a dividend based upon a proposal by the Board of Directors. The Board of Directors intends to propose to pay out a stable or gradually increasing annual dividend, considering the following elements: • proper compensation for the shareholders • retention of adequate self-financing capacity to enable investment in value creation opportunities.
The Board of Directors decided to present the following appropriation of the results to the General Meeting:
in EUR
Group Recticel
Profit/(Loss) for the financial year 19 851 565.18
Profit/(Loss) brought forward from previous year + 65 478 814.11
Profit/(Loss) to be added to legal reserves - 992 578.26
Profit/(Loss) to be added to other reserves - 0.00
Result to be appropriated = 84 337 801.03
Gross dividend (1) - 13 295 385.36
Profit to be carried forward = 71 042 415.67(1) Gross dividend per share of EUR 0.24, resulting in a net dividend after tax of EUR 0.168 per ordinary share.
Assisted in its work by the Audit Committee, the Board of Directors determines the Group’s risk management policy, taking the significance of the general corporate risks that it is prepared to accept into account.
Business and management imply dealing with external and internal uncertainties. These uncertainties imply that decisions intrinsically involving potential risks are constantly being taken at all levels. For this reason, and also because a company must be able to achieve its objectives, it is important to outline, assess, quantify and grade corporate risks as precisely as possible. An appropriate, adapted risk management system that can also draw on efficient monitoring mechanisms and best practices must avoid any adverse effects of potential risks on the company and its value or at least control or minimise those effects.
RISK FACTORSThe items dealt with below are the most relevant risk factors for the Recticel Group, as defined during the assessment process described above.
1. The Group’s investment programs are subject to the risk of delays, cost overruns and other complications, and may not achieve the expected returns
The Group’s businesses are, and will continue to be, capital-intensive. A number of its plants have operated for many years, and a large part of the Group’s capital expenditures relate to the repair, maintenance and improvement of these existing facilities.
The Group’s investments programs in the field of repair, maintenance and improvements of its existing equipment and facilities are subject to the risk of incorrect or inadequate evaluation. As a result, these investment programs may suffer from delays or other complications, and may not achieve the return projected at the beginning of such programs. Furthermore, the Group’s actual expenditures may ultimately reveal to be higher than budgeted for various reasons beyond its control. Such cost increases may be material and may have a material adverse effect on its business, financial condition, operating results and cash flows.
2. Price volatility of major chemicalsAs a producer and converter of polyurethane foam and other products, the Group is sensitive to fluctuations in the prices of chemical raw materials, in particular those chemical raw materials used for the production of polyurethane. The main chemical raw materials used by the Group are polyols and isocyanates (TDI and
MDI). Although these base materials are petroleum derivatives, and hence follow the evolution of the oil price, their price evolution may differ from that of petroleum products on the global market. Excess volatility of raw materials prices or their scarcity or shortage may have a negative effect on Recticel’s results and financial situation.
Chemical raw materials represent, on average, nearly 39% of the cost of sales of the Group’s finished products. For certain flexible foam and insulation applications, this share is even higher.
These raw materials are purchased on the open market. The Group has to date not hedged its commodity risk.
The purchase of chemical raw materials is centralised, and the relevant central department negotiates the supply contracts. The centralised approach allows better negotiation power and continuous optimisation.
Although the Group monitors raw material price developments and tries to reflect price increases in its sales prices when appropriate, ultimately the extent to which such increased chemical raw material prices can be charged to customers depends on the commercial negotiations with customers and competition on the market. There may be periods of time in which the Group is not able to timely or fully recover increases in the cost of chemical raw materials due to weakness in demand for its products or the actions of its competitors. On the other hand, during periods in which market prices of Group’s chemical raw materials fall, the Group may face demands from its customers to reduce its prices or experience falls in demand for its products while customers delay orders in anticipation of price reductions.
3. The Group may be subject to the risk of not identifying an M&A opportunity or not being able to afford it
Making acquisitions are an integral part of the Group’s growth strategy. There can be no assurance that any of these transactions will be realised or, if realised, will be beneficial to the Group.
The Group continues to explore additional opportunities to implement its strategy which may require substantial investment and subsequent capital expenditures. To date, the Group has been able to fund its capital investment projects through cash generated from its internal operations and debt financing. If the Group’s cash flows were reduced or if it were to make further acquisitions, the Group would need to seek to fund its cash requirements through additional debt and equity financing or through asset divestitures.
2.4.5. Risk factors and risk management

RECTICEL ANNUAL REPORT 2019 I 219RECTICEL ANNUAL REPORT 2019 I 218
4. If the Group fails to identify, develop and introduce new products successfully it may lose key customers or product orders and its business could be harmed
The Group regularly introduces new products, such as Thermoflex® in its Business Line Flexible Foams, the ingredient GELTEX® inside brand in its Business Line Bedding, Lambda 19 Eurowall® Xentro® and Eurofloor Xentro® in its Business Line Insulation and Colo-Sense Lite® in its Business Line Automotive.
The Group competes in industries that are changing and becoming more complex. The Group’s ability to achieve a successful evolution development of its existing products to new offerings and differentiation of its products requires that accurate predictions of the product development schedule as well as market demand are made. The process of developing new products is complex and often uncertain due to the frequent introduction of new products by competitors. The Group may anticipate demand and market acceptance that differs from the product’s realisable customer demand and revenue stream. Furthermore, in the face of intense industry competition, any unanticipated delay in implementing certain product strategies or in the development, production or marketing of a new product could adversely affect the Group’s revenues.
The Group invests constantly in the development of new products. These investments are subject to a number of risks, including: difficulties and delays in the development, production, testing and marketing of products; customer acceptance of products; resources to be devoted to the development of new technology; and the ability to differentiate the Group’s products and compete with other companies which are active in the same markets.
The Group’s ability to generate future revenue and operating income depends upon, among other factors, its ability to timely develop products that are suitable for manufacturing in a cost-effective manner and that meet defined product design, technical and performance specifications.
All these factors could have a material adverse impact on the Group’s business, operations and financial results.
5. The Group may be subject to misconduct by its employees and managers or third party contractors
The Group may be subject to misconduct by its employees and managers or third-party contractors, such as theft, bribery, sabotage, violation of laws or other illegal actions and may be exposed to the risk of stoppages by third parties, such as transport companies. Any such misconduct may lead to fines or other penalties, slow-downs in production, increased costs, lost revenues, increased liabilities to third parties, impairment of assets or harmed reputation, any of which may have a material adverse effect on the Group’s operations, business and financial results.
The Group has developed various internal initiatives to limit the risk of misconduct of its own employees and managers. These initiatives include the reinforcement of the internal audit function, the setting up of a Compliance Committee whose role is to investigate matters reported to it, as well as the organisation, on a regular basis, of various internal training sessions for employees aimed at increasing awareness on compliance. However, there can be no assurance that such initiatives will result in effectively preventing any misconduct by its employees and managers.
Furthermore, such initiatives are not aimed at third party contractors, as a result of which the Group relies on the third-party contractors’ capacity to prevent misconduct by their own employees and managers.
6. Evaluation of projects and investmentsThe Group may be subject to the risk that an innovation project fails and that the innovation investments do not achieve the target to contribute to a sustainable revenue growth or cost effectiveness, including the risk of not having the right human resources to achieve the incremental changes needed to achieve the innovation strategy.
7. Failure to obtain the needed chemical raw materialsThe Group has negotiated yearly or multi-year supply agreements with important suppliers to secure more than half of its yearly supplies of isocyanates. The supply of polyols is for a minority share secured under yearly supply agreements. The Group sources its remaining chemical raw materials essentially from suppliers with whom it has a long-term relationship, but with monthly or quarterly price and volume negotiations.
Notwithstanding the existence of long-term supply agreements for certain chemical raw materials, the risk of a delivery disruption of chemical raw materials cannot be excluded. Such delivery disruptions may result from, amongst others, a major accident or incident in a supplier’s processing plant, transportation problems or any other fact or circumstance that can give rise to a force majeure situation. In such case, there can be no assurance that the Group can source alternative supplies of chemical raw materials on a timely basis and at acceptable conditions or at all, which could have a material adverse impact on the Group’s business, operations and financial results. Neither can it be excluded that a decrease in volumes of raw material procurement (i.e. due to market trends) could have an impact on raw material prices or that it could incite suppliers to end their supplies to the Group, the latter scenario forcing the Group to search for other suppliers, which may not be available on a timely basis or at an acceptable conditions or at all. This could have a material adverse impact on the Group’s business, operations and financial results.
8. Safety, health and the environment - new regulations and its impacts
Due to the nature of its activities, the Recticel Group is exposed to environmental risks. The Group uses potentially hazardous products (chemicals and the like) as part of its development activities and manufacturing processes. Pollution can never be ruled out. The Group prevents pollution by adopting appropriate industrial policies. Scenarios precisely outlining the modus operandi for tackling this type of crisis and managing the consequences thereof have been circulated throughout the organisation.
It goes without saying that the handling of these same products constitutes a health risk for staff, customers and any other visitor, particularly in the event of failure to comply with the safety rules issued by Recticel.
Due to new regulations, the Group may face the risk that these new regulations may have a significant negative business impact.
Failure to comply with the various laws and regulations governing the Group’s activities is likely to have a negative impact on these activities and invoke its liability.
These activities are particularly subject to various environmental laws and regulations that are likely to expose the Group to major compliance costs or legal proceedings.
The Group further operates in some countries in old industrial sites, already operational at a time when no or insufficient environmental legislation was in place, potentially leading to historic pollution, for which the Group may be held liable leading to important compliance or clean-up costs.
Furthermore, the Group may incur other major costs following the non-fulfilment of its contractual obligations or also in cases where the negotiated contractual provisions in place prove to be insufficient, or even inadequate.
9. The risk that the importance of certain stakeholders is underestimated when making strategic decisions
The Group is exposed to the risk that the importance of certain stakeholders is underestimated when making important strategic decisions for the Group. This could lead to resistance and put at risk the implementation of the strategy.
10. Risks relating to not fully analysing the investment decisions
The Group may face difficulties if investment decisions have not been fully analysed and as such lead to unsuccessful investments not reaching the initial objectives, as well as the risk that investment capacity is absorbed by one business unit, not leaving sufficient investment fund for more profitable investments in other business segments.
11. Risks relating to sub-optimal execution of transactions
The Group is subject to the risk of a suboptimal execution of transactions due to the lack of preparation, communication and/or project management. Although the Group has developed M&A guidelines, there is no assurance that these risks will not materialise, and if so, this might have a material adverse effect on the Group’s operations, business and financial results.
12. The Group’s results may be substantially affected by general macroeconomic trends and the level of activity in its industries
The Group is exposed to the risks related to an economic recession. Economic factors outside of the Group’s control (including slowing economic growth, particularly in Europe where the Group realises approximately 89% of its consolidated turnover, inflation or deflation or fluctuations in interest and foreign currency exchange rates) could affect the Group’s financial results and prospects.
There is a risk that certain markets in which the Group is active will experience economic decline or a prolonged period of negligible growth in the future. The current uncertainty about economic recovery and the pace of growth may negatively affect the level of demand from existing and prospective customers. Additional factors which may influence customer demand include access to credit, budgetary constraints, unemployment rates and consumer confidence.
13. Product liability The Group produces and sells both semi-finished and finished consumer durable goods (bedding and insulation). In both cases, the Group is exposed to any complaints relating to product liability. Recticel tries to offset or limit these risks by means of product guarantees provided for in the conditions of sale and through the application of a strict quality control system. To protect itself from the adverse effects of product liability, the Group has put in place general and product-specific insurance policies.

RECTICEL ANNUAL REPORT 2019 I 221RECTICEL ANNUAL REPORT 2019 I 220
14. The implementation of the Group’s business strategy is dependent on its ability to attract and retain qualified personnel
The Group’s ability to maintain its competitive position and to implement its business strategy will largely depend on its ability to attract and retain skilled personnel and management. The loss or diminution in the services of skilled employees and management, or difficulties in recruiting or retaining them, could have a material adverse effect on the Group’s operations, business and financial results. Competition for personnel with relevant expertise is intense due to the relatively small number of qualified individuals, and the Group may have difficulties in obtaining or enforcing non-compete obligations from its skilled personnel and management, all of which may seriously affect the Group’s ability to retain existing skilled employees and management and attract additional qualified personnel. If the Group were to experience difficulties in recruiting or retaining qualified personnel, this could have a material adverse effect on the Group’s operations, business and financial results.
15. BrexitThe turnover of the Group in the UK represents approximately 11% of the total combined sales. The products the Group sells in the UK are mainly produced locally. The direct impact of Brexit concerns (i) the import of chemical raw materials necessary for local production, as these raw materials are not available in the UK, and (ii) a currency exchange rate risk. Given the broad uncertainty surrounding the Brexit issues, it is currently not possible to provide meaningful comments and conclusions about its possible impacts.
16. COVID-19 (Corona virus)Given the broad uncertainty surrounding COVID-19 on medium and long-term consumer confidence and demand, it is currently not possible to provide meaningful comments and conclusions about its potential impact on business fundamentals, prospects and financial position of the Group. The various business interruption continuity plans in place are regularly updated and effectively deployed when needed. See also note 2.4.2.6.3. - Events after the reporting date.
RISK MONITORINGOperational and industrial risks are usually covered by centrally managed insurance contracts. The conditions governing these contracts are reviewed on a regular basis. Recticel owns a reinsurance subsidiary, whose principal task consists of reinsuring the Group’s own risk associated with the excesses that are payable by the Group under external insurance policies.
The risks and uncertainties for which provisions have been raised in accordance with IFRS rules are explained under the heading 2.4.2.5.14. of the financial section of the annual report. More precisely, these are provisions for litigation, product guarantees, environmental risks and reorganisation charges.
Recticel’s Internal Audit Department is involved in implementing control procedures in the broadest sense and ensures that they are complied with. It also plays a major role in the permanent monitoring of corporate risks and contributes to the basic considerations regarding these risks in the Group.
2.4.6. Declaration by responsible officers
Mr Johnny Thijs (Chairman of the Board of Directors), Mr Olivier Chapelle (Chief Executive Officer) and Mr Jean-Pierre Mellen (Chief Financial Officer), declare that:
• the annual accounts, which have been drawn up in accordance with the applicable accounting standards, give a true and fair view of the assets, the financial situation and the results of Recticel and the consolidated companies;
• the report for the 12 months ending on 31 December 2019 gives a true and fair view of the development and the results of the company and of the position of Recticel and the consolidated companies, as well as a description of the principal risks and uncertainties confronting them.

RECTICEL ANNUAL REPORT 2019 I 223RECTICEL ANNUAL REPORT 2019 I 222
2.4.7. Auditor’s report on the consolidated financial statements for the year ending 31 December 2019
Recticel NV | 31 December 2019
1
Statutory auditor’s report to the shareholders’ meeting of Recticel NV for the year ended 31 December 2019 - Consolidated financial statements In the context of the statutory audit of the consolidated financial statements of Recticel NV (“the company”) and its subsidiaries (jointly “the group”), we hereby submit our statutory audit report. This report includes our report on the consolidated financial statements and the other legal and regulatory requirements. These parts should be considered as integral to the report.
We were appointed in our capacity as statutory auditor by the shareholders’ meeting of 28 May 2019, in accordance with the proposal of the board of directors (“bestuursorgaan” / “organe d’administration”) issued upon recommendation of the audit committee and presentation of the works council. Our mandate will expire on the date of the shareholders’ meeting deliberating on the financial statements for the year ending 31 December 2021. Due to a lack of online archives dating back prior to 1997, we have not been able to determine exactly the first year of our appointment. We have performed the statutory audit of the consolidated financial statements of Recticel NV for at least 22 consecutive periods.
Report on the consolidated financial statements
Unqualified opinion
We have audited the consolidated financial statements of the group, which comprise the consolidated statement of financial position as at 31 December 2019, the consolidated income statement, the consolidated statement of comprehensive income, the consolidated statement of changes in shareholder’s equity and the consolidated cash flow statement for the year then ended, as well as the summary of significant accounting policies and other explanatory notes. The consolidated statement of financial position shows total assets of 802 469 (000) EUR and the consolidated income statement shows a profit (share of the group) for the year then ended of 24 762 (000) EUR.
In our opinion, the consolidated financial statements give a true and fair view of the group’s net equity and financial position as of 31 December 2019 and of its consolidated results and its consolidated cash flow for the year then ended, in accordance with International Financial Reporting Standards (IFRS) as adopted by the European Union and with the legal and regulatory requirements applicable in Belgium.
Basis for the unqualified opinion
We conducted our audit in accordance with International Standards on Auditing (ISA), as applicable in Belgium. In addition, we have applied the International Standards on Auditing approved by the IAASB applicable to the current financial year, but not yet approved at national level. Our responsibilities under those standards are further described in the “Responsibilities of the statutory auditor for the audit of the consolidated financial statements” section of our report. We have complied with all ethical requirements relevant to the statutory audit of consolidated financial statements in Belgium, including those regarding independence.
We have obtained from the board of directors and the company’s officials the explanations and information necessary for performing our audit.
We believe that the audit evidence obtained is sufficient and appropriate to provide a basis for our opinion.
Emphasis of matter
We draw attention to note II.4.2.6.3. of the consolidated financial statements, which describes the possible effects of the Covid-19 crisis on the future profitability and liquidity of the Group and the related risks and uncertainties. The board also mentions the current and planned measures, indicates that it is currently impossible to predict the ultimate impact of the Corona pandemic on the financial performance of the Group and explains the considerations used to support the going concern. Our opinion is not modified in respect of this matter.
Recticel NV | 31 December 2019
2
Key audit matters
Key audit matters are those matters that, in our professional judgment, were of most significance in our audit of the consolidated financial statements of the current period. These matters were addressed in the context of our audit of the consolidated financial statements as a whole and in forming our opinion thereon, and we do not provide a separate opinion on these matters.
Key audit matters How our audit addressed the key audit matters
Impairment risk on goodwill related to the Flexible Foam UK CGU The group has 3 186 (000) EUR goodwill allocated to the UK flexible foam cash generating unit. Considering the historical financial performance, the substantial deviation of the expected financial performance from the budget and the uncertainties around Brexit, we considered the valuation of the goodwill as a key audit matter. The Group reviews the carrying amount of these non-current assets annually or more frequently when impairment indicators are present, by comparing it to the recoverable amount. Estimating the recoverable amount of the assets requires critical management judgement including estimates of future sales, gross margin, discount rate and the assumptions inherent in those estimates.
The Group disclosed the nature and the value of the assumptions used in the impairment analyses in note II.4.2.1.4 of the consolidated financial statements.
We designed our audit procedures to be responsive to this key audit matter. We obtained understanding of the impairment assessment process and evaluated the design and implementation of the relevant key controls in place. In addition, we obtained management’s impairment test, evaluated the reasonableness of estimates and judgments made by management and challenged them. Special focus was given to the key drivers of projected future cash flows, being amongst others estimated gross margin and the applied discount rate. We critically assessed the budget, taking into account the historical accuracy of the budgeting process. Auditor’s valuation specialist has been involved to review the reasonableness of the discount rate. Moreover, we examined sensitivity analyses performed over changes in discount rate, gross margin and EBITDA and assessed the adequacy of the company’s disclosure note to the consolidated financial statements.

RECTICEL ANNUAL REPORT 2019 I 225RECTICEL ANNUAL REPORT 2019 I 224
Recticel NV | 31 December 2019
3
Key audit matters How our audit addressed the key audit matters
Impairment risk of property, plant and equipment relating to the interiors business Due to the nature of the interiors business, significant capital expenditure is involved. The recoverability of the investments is highly depending on the success of the related car models being produced within a specific factory. Due to the unpredictability and the volatility of the produced volumes, the current automotive market conditions and the substantial deviation of the expected financial performance from the budget, there is a risk for impairment if the projects are not generating sufficient future cash flows. The total net book value of the property, plant and equipment relating to the interiors business amounts to 84 444 (000) EUR, including the right of use assets. The group reviews the carrying amounts of the non-current assets when impairment indicators are present. Estimating the recoverable amount of the assets requires critical management judgement, including estimates of future sales, gross margin, discount rate and the assumptions inherent in those estimates. We refer to note II.4.2.1.4 in the consolidated financial statements.
We designed our audit procedures to be responsive to this key audit matter. We obtained understanding of the impairment assessment process and evaluated the design and implementation of the relevant key controls in place. In addition, we obtained management’s impairment test for the plants where impairment indicators exist, evaluated the reasonableness of estimates and judgments made by management and challenged them. Special focus was given to the key drivers of projected future cash flows, being amongst others estimated gross margin and the applied discount rate. We pinpointed our procedures to those plants to those plants where the financial performance was substantially deviating from management’s expectations. Auditor’s valuation specialist has been involved to review the reasonableness of the discount rate. Moreover, we examined sensitivity analyses performed over changes in discount rate and gross margin and assessed the adequacy of the company’s disclosure note to the consolidated financial statements.
Recticel NV | 31 December 2019
4
Key audit matters How our audit addressed the key audit matters
Recoverability of deferred tax assets Per 31 December 2019, the group has deferred tax assets, mainly on tax losses carried forward, amounting to 24 108 (000) EUR. The analysis of the recognition and recoverability of the deferred tax assets is important to our audit because the amounts are material, the assessment process is judgmental and is based on assumptions that are affected by expected future market and economic conditions. Reference is made to note II.4.2.4.6 in the consolidated financial statements.
As a part of our audit, we discussed tax planning and potential issues relating to valuation of deferred tax assets with management. We tested the design and implementation of the management review control performed on the deferred tax balance. Furthermore, we performed substantive audit procedures on the analysis of the recoverability of the deferred tax assets based on the estimated future taxable income, principally by evaluating and testing the key assumptions used to determine the amounts recognized and by challenging them. In addition to the above, we assessed the adequacy of the company’s disclosure note to the consolidated financial statements.
Responsibilities of the board of directors for the preparation of the consolidated financial statements
The board of directors is responsible for the preparation and fair presentation of the consolidated financial statements in accordance with International Financial Reporting Standards (IFRS) as adopted by the European Union and with the legal and regulatory requirements applicable in Belgium and for such internal control as the board of directors determines is necessary to enable the preparation of consolidated financial statements that are free from material misstatement, whether due to fraud or error.
In preparing the consolidated financial statements, the board of directors is responsible for assessing the group’s ability to continue as a going concern, disclosing, as applicable, matters to be considered for going concern and using the going concern basis of accounting unless the board of directors either intends to liquidate the group or to cease operations, or has no other realistic alternative but to do so.
Responsibilities of the statutory auditor for the audit of the consolidated financial statements
Our objectives are to obtain reasonable assurance about whether the consolidated financial statements as a whole are free from material misstatement, whether due to fraud or error, and to issue a statutory auditor’s report that includes our opinion. Reasonable assurance is a high level of assurance, but is not a guarantee that an audit conducted in accordance with ISA will always detect a material misstatement when it exists. Misstatements can arise from fraud or error and are considered material if, individually or in the aggregate, they could reasonably be expected to influence the economic decisions of users taken on the basis of these consolidated financial statements.

RECTICEL ANNUAL REPORT 2019 I 227RECTICEL ANNUAL REPORT 2019 I 226
Recticel NV | 31 December 2019
5
During the performance of our audit, we comply with the legal, regulatory and normative framework as applicable to the audit of consolidated financial statements in Belgium. The scope of the audit does not comprise any assurance regarding the future viability of the company nor regarding the efficiency or effectiveness demonstrated by the board of directors in the way that the company’s business has been conducted or will be conducted.
As part of an audit in accordance with ISA, we exercise professional judgment and maintain professional skepticism throughout the audit. We also:
identify and assess the risks of material misstatement of the consolidated financial statements, whether due to fraud or error, design and perform audit procedures responsive to those risks, and obtain audit evidence that is sufficient and appropriate to provide a basis for our opinion. The risk of not detecting a material misstatement resulting from fraud is higher than for one resulting from an error, as fraud may involve collusion, forgery, intentional omissions, misrepresentations, or the override of internal control;
obtain an understanding of internal control relevant to the audit in order to design audit procedures that are appropriate in the circumstances, but not for the purpose of expressing an opinion on the effectiveness of the group’s internal control;
evaluate the appropriateness of accounting policies used and the reasonableness of accounting estimates and related disclosures made by the board of directors;
conclude on the appropriateness of the use of the going concern basis of accounting by the board of directors and, based on the audit evidence obtained, whether a material uncertainty exists related to events or conditions that may cast significant doubt on the group’s ability to continue as a going concern. If we conclude that a material uncertainty exists, we are required to draw attention in our statutory auditor’s report to the related disclosures in the consolidated financial statements or, if such disclosures are inadequate, to modify our opinion. Our conclusions are based on the audit evidence obtained up to the date of our statutory auditor’s report. However, future events or conditions may cause the group to cease to continue as a going concern;
evaluate the overall presentation, structure and content of the consolidated financial statements, and whether the consolidated financial statements represent the underlying transactions and events in a manner that achieves fair presentation.
obtain sufficient appropriate audit evidence regarding the financial information of the entities and business activities within the group to express an opinion on the consolidated financial statements. We are responsible for the direction, supervision and performance of the group audit. We remain solely responsible for our audit opinion.
We communicate with the audit committee regarding, amongst other matters, the planned scope and timing of the audit and significant audit findings, including any significant deficiencies in internal control that we identify during our audit.
We also provide the audit committee with a statement that we have complied with relevant ethical requirements regarding independence, and we communicate with them about all relationships and other matters that may reasonably be thought to bear on our independence, and where applicable, related safeguards.
Recticel NV | 31 December 2019
6
From the matters communicated to the audit committee, we determine those matters that were of most significance in the audit of the consolidated financial statements of the current period and are therefore the key audit matters. We describe these matters in our report unless law or regulation precludes any public disclosure about the matter.
Other legal and regulatory requirements
Responsibilities of the board of directors
The board of directors is responsible for the preparation and the content of the directors’ report on the consolidated financial statements, the statement of non-financial information attached to the directors’ report on the consolidated financial statements and other matters disclosed in the annual report on the consolidated financial statements.
Responsibilities of the statutory auditor
As part of our mandate and in accordance with the Belgian standard complementary to the International Standards on Auditing (ISA) as applicable in Belgium, our responsibility is to verify, in all material respects, the director’s report on the consolidated financial statements, the statement of non-financial information attached to the directors’ report on the consolidated financial statements and other matters disclosed in the annual report on the consolidated financial statements, as well as to report on these matters.
Aspects regarding the directors’ report on the consolidated financial statements and other information disclosed in the annual report on the consolidated financial statements
In our opinion, after performing the specific procedures on the directors’ report on the consolidated financial statements, this report is consistent with the consolidated financial statements for that same year and has been established in accordance with the requirements of article 3:32 of the Code of companies and associations.
In the context of our statutory audit of the consolidated financial statements we are responsible to consider, in particular based on information that we became aware of during the audit, if the directors’ report on the consolidated financial statements and other information disclosed in the annual report on the consolidated financial statements, i.e chapter I, chapter III and chapter IV, are free of material misstatements, either by information that is incorrectly stated or otherwise misleading. In the context of the procedures performed, we are not aware of such a material misstatement.
The non-financial information as required by article 3:32, § 2 of the Code of companies and associations, has been disclosed in the directors’ report on the consolidated financial statements that is part of section II.3 of the annual report. This non-financial information has been established by the company in accordance with the GRI Standards. In accordance with article 3:80, § 1, 5° of the Code of companies and associations we do not express any opinion on the question whether this non-financial information has been established in accordance with these GRI Standards.

RECTICEL ANNUAL REPORT 2019 I 229RECTICEL ANNUAL REPORT 2019 I 228 RECTICEL ANNUAL REPORT 2019 I 229RECTICEL ANNUAL REPORT 2019 I 228
3. GLOSSARY
Colo-Fast® Aliphatic polyurethane that is distinguished by its colour fastness (light-stable)
Colo-Sense® Variation of Colo-Fast®
IsocyanateHighly reactive substance that easily combines with other substances (such as alcohols). The structure of these alcohols determines the hardness of the PU-foam
Lambda Expression of the thermal conductivity of thermal insulation
MDI Methylene diphenyl diisocyanate
PIR Abbreviation for polyisocyanurate
PolyisocyanurateIs an improved version of polyurethane. PIR-foam has an improved dimensional stability, excellent mechanical properties such as compressive strain and is a much stronger fire retardant. PIR is mainly used as thermal insulation
Polyol Synonym for PU polyalcohol, which is acquired from propylene oxide
PolyurethaneRepresents an important group of products within the large family of polymers or plastics. Polyurethane is a generic term for a wide range of foam types
PU or PUR Polyurethane
SID Is short for Sustainable Innovation Department, the department for international research and development of the Recticel Group
TDI Toluene diphenyl diisocyanate
GENERAL CONCEPTS
Recticel NV | 31 December 2019
Deloitte Bedrijfsrevisoren/Réviseurs d’Entreprises Coöperatieve vennootschap met beperkte aansprakelijkheid/Société coopérative à responsabilité limitée Registered Office: Gateway building, Luchthaven Brussel Nationaal 1 J, B-1930 Zaventem VAT BE 0429.053.863 - RPR Brussel/RPM Bruxelles - IBAN BE 17 2300 0465 6121 - BIC GEBABEBB Member of Deloitte Touche Tohmatsu Limited
Statements regarding independence
Our audit firm and our network have not performed any prohibited services and our audit firm has remained independent from the group during the performance of our mandate.
The fees for the additional non-audit services compatible with the statutory audit, as defined in article 3:65 of the Code of companies and associations, have been properly disclosed and disaggregated in the notes to the consolidated financial statements.
Other statements
This report is consistent with our additional report to the audit committee referred to in article 11 of Regulation (EU) No 537/2014.
Ghent, 28 April 2020
The statutory auditor
Deloitte Bedrijfsrevisoren/Réviseurs d’Entreprises CVBA/SCRL Represented by Kurt Dehoorne

RECTICEL ANNUAL REPORT 2019 I 231RECTICEL ANNUAL REPORT 2019 I 230 RECTICEL ANNUAL REPORT 2019 I 231RECTICEL ANNUAL REPORT 2019 I 230
FINANCIAL CONCEPTSin thousand EUR
Group Recticel31 DEC 2019 31 DEC 2018 31 DEC 2017 31 DEC 2016 31 DEC 2015 31 DEC 2014 31 DEC 2013 31 DEC 2012 31 DEC 2012 31 DEC 2011 31 DEC 2010
CONSOLIDATED CONSOLIDATED CONSOLIDATED CONSOLIDATED CONSOLIDATED CONSOLIDATED CONSOLIDATED COMBINED COMBINED COMBINED COMBINED
ASSETS
Intangible assets 14 306 12 045 12 323 12 104 13 411 12 384 11 954 11 148 13 031 12 580 13 307
Goodwill 24 412 23 354 24 169 25 073 25 888 24 949 24 610 25 113 35 003 34 688 34 365
Property, plant & equipment 227 617 232 541 226 783 216 207 209 681 202 733 204 614 219 180 270 904 255 347 270 979
Right-of-use assets 105 110 0 0 0 0 0 0 0 0 0 0
Investment property 3 331 3 289 3 331 3 331 3 331 3 306 3 330 4 452 4 452 3 331 896
Investments in joint ventures and associates
65 465 68 631 76 241 82 389 73 196 73 644 72 507 69 123 13 784 12 957 15 451
Financial investments 580 63 64 71 30 160 161 236 240 3 399 1 151
Available for sale investments 0 728 603 410 1 015 771 275 111 122 121 86
Non-current contract assets 11 138 15 655 0 0 0 0 0 0 0 0 0
Non-current receivables 25 802 15 326 14 804 13 860 13 595 13 373 10 973 10 153 7 664 8 305 10 070
Deferred tax 24 108 20 468 26 241 37 820 43 272 46 834 48 929 49 530 45 520 50 290 55 739
Non-current assets 501 869 392 099 384 559 391 265 383 419 378 154 377 353 389 046 390 720 381 018 402 044
Inventories and contracts in progress 101 797 103 789 99 408 91 900 93 169 96 634 94 027 91 028 116 607 116 002 113 671
Trade receivables 99 117 107 680 110 935 101 506 83 407 78 109 64 516 78 359 114 540 132 910 141 783
Current contract assets 11 300 13 782 0 0 0 0 0 0 0 0 0
Other receivables 32 667 55 227 73 373 69 561 55 327 49 597 46 358 56 528 48 123 39 567 62 285
Income tax receivables 1 448 5 587 1 350 1 441 2 061 504 3 851 3 736 4 345 3 847 3 552
Available for sale investments 154 138 123 107 91 75 60 45 45 205 181
Cash and cash equivalents 48 479 37 733 57 844 37 174 55 967 26 163 26 237 18 533 27 008 54 575 53 938
Disposal held for sale 5 638 19 201 2 570 0 3 209 8 569 0 0 0 0 0
Current assets 300 600 343 137 345 603 301 689 293 231 259 651 235 049 248 229 310 668 347 106 375 410
Total assets 802 469 735 236 730 162 692 954 676 650 637 805 612 402 637 275 701 388 728 124 777 454
in thousand EUR
Group Recticel31 DEC 2019 31 DEC 2018 31 DEC 2017 31 DEC 2016 31 DEC 2015 31 DEC 2014 31 DEC 2013 31 DEC 2012 31 DEC 2012 31 DEC 2011 31 DEC 2010
CONSOLIDATED CONSOLIDATED CONSOLIDATED CONSOLIDATED CONSOLIDATED CONSOLIDATED CONSOLIDATED COMBINED COMBINED COMBINED COMBINED
LIABILITIES
Capital 138 494 138 068 136 941 135 156 134 329 74 161 72 368 72 329 72 329 72 329 72 329
Share premium 130 334 129 941 127 982 126 071 125 688 108 568 107 042 107 013 107 013 107 013 107 013
Share capital 268 828 268 009 264 923 261 227 260 017 182 729 179 410 179 342 179 342 179 342 179 342
Treasury shares (1 450) (1 450) (1 450) (1 450) (1 450) (1 735) (1 735) 0 0 0 0
Retained earnings 25 606 20 422 18 235 7 425 2 582 1 768 27 364 75 565 95 010 85 191 75 179
Hedging and translation reserves (18 288) (22 003) (19 922) (15 997) (12 189) (16 599) (18 279) (13 817) (13 728) (15 739) (12 853)
Equity before non-controlling interests 274 696 264 978 261 786 251 205 248 960 166 163 186 760 241 090 260 624 248 794 241 668
Non-controlling interests 701 0 0 0 0 0 0 0 0 0 0
Total equity 275 397 264 978 261 786 251 205 248 960 166 163 186 760 241 090 260 624 248 794 241 668
Pensions and similar obligations 57 164 48 055 54 295 50 979 49 581 54 548 44 557 44 548 28 048 35 289 34 988
Provisions 6 905 13 775 14 266 13 208 11 505 7 301 8 149 9 439 9 798 12 964 24 452
Deferred tax 10 023 9 650 9 113 10 116 9 505 8 907 8 203 7 257 8 554 9 134 8 800
Non-current financial liabilities 100 334 34 706 96 080 97 049 40 363 142 135 98 834 120 460 142 507 137 215 167 124
Other amounts payable 43 202 230 183 226 6 810 444 704 501 353 510
Non-current contract liabilities 20 339 24 096 0 0 0 0 0 0 0 0 0
Non-current liabilities 194 808 130 484 173 984 171 535 111 180 219 701 160 187 182 408 189 408 194 955 235 874
Pensions and similar obligations 696 4 720 3 978 4 168 2 370 2 205 1 809 1 404 1 529 3 126 3 846
Provisions 5 759 3 116 1 155 1 780 4 566 4 687 6 732 1 255 1 523 6 328 14 480
Current financial liabilities 117 415 88 200 48 988 50 147 114 675 52 798 66 181 36 454 57 840 67 680 45 691
Trade payables 93 008 90 756 126 584 102 929 94 276 96 373 81 720 86 066 104 980 119 274 141 887
Current contract liabilities 32 832 44 964 0 0 0 0 0 0 0 0 0
Income tax payables 1 229 3 061 2 411 2 291 2 463 414 3 086 2 071 2 281 3 974 7 542
Other amounts payable 81 325 104 957 111 276 108 899 98 160 95 464 105 927 86 527 83 203 83 993 86 466
Current liabilities 332 264 339 774 294 392 270 214 316 510 251 941 265 455 213 777 251 356 284 375 299 912
Total liabilities 802 469 735 236 730 162 692 954 676 650 637 805 612 402 637 275 701 388 728 124 777 454
4. KEY FIGURES 2010-2019
• IFRS measures
Consolidated (figures) financial data following the application of IFRS 11, whereby Recticel’s joint ventures are integrated on the basis of the equity method.
• Alternative Performance MeasuresIn addition, the Group uses alternative performance measures (Alternative Performance Measures or “APM”) to express its underlying performance and to help the reader to better understand the results. APM are not defined performance indicators by IFRS. The Group does not present APM as an alternative to financial measures determined in accordance with IFRS and does not give more emphasis to APM than the defined IFRS financial measures.
Adjusted EBIT(previously labelled REBIT)
EBIT before Adjustments to EBIT
Adjusted EBITDA (previously labelled REBITDA)
EBITDA before Adjustments (to EBIT )
Adjustments to EBIT (previously “Non-recurring elements”)
include operating revenues, expenses and provisions that pertain to restructuring programmes (redundancy payments, closure & clean-up costs, relocation costs,...), reorganisation charges and onerous contracts, impairments on assets ((in)tangible assets and goodwill), revaluation gains or losses on investment property, gains or losses on divestments of non-operational investment property, and on the liquidation of investments in affiliated companies, gains or losses on discontinued operations, revenues or charges due to important (inter)national legal issues.
Combined (figures) financial data including Recticel’s pro rata share in the joint ventures, after elimination of intercompany transactions, in accordance with the proportional consolidation method.
Current ratio Current assets / Current liabilities
EBIT Earnings before interest and tax. Earnings comprise income from joint ventures and associates
EBITDA EBIT + depreciation, amortisation and impairment on assets.
Gearing Net financial debt / Total equity
Leverage Net financial debt / EBITDA
Net free cash-flow Net free cash flow: is the sum of the (i) Net cash flow after tax from operating activities, (ii) the Net cash flow from investing activities and (iii) the Interest paid on financial liabilities; as shown in the consolidated cash flow statement.
Net financial debt Interest bearing financial debts at more than one year + interest bearing financial debts within maximum one year + accrued interests – cash and cash equivalents + Net marked-to-market value position of hedging derivative instruments. The interest-bearing borrowings do not include the drawn amounts under non-recourse factoring/forfeiting programs
Net working capital Inventories and contracts in progress + Trade receivables + Contract assets + Other receivables + Income tax receivables – Trade payables – Contract liabilities – Income tax payables – Other amounts payable
Total net financial debt Net financial debt + the drawn amounts under off-balance sheet non-recourse factoring/forfeiting programs

in million EUR
Group Recticel 2015 2016 2017 2018 2019
Combined income statementSales 1 328.4 1 347.9 1 460.8 1 448.3 1 221.0
Adjusted EBITDA 81.9 97.7 105.5 103.8 114.7
EBITDA 67.8 85.4 94.1 93.4 105.6
Adjusted EBIT 44.9 58.2 66.5 63.3 51.2
EBIT 29.8 44.3 48.1 47.0 40.3
Result of the period after taxes 4.5 16.3 23.9 28.8 24.7
Combined profitability ratiosAdjusted EBITDA / Sales 6.2% 7.2% 7.2% 7.2% 9.4%
EBITDA / Sales 5.1% 6.3% 6.4% 6.4% 8.7%
Adjusted EBIT / Sales 3.4% 4.3% 4.6% 4.4% 4.2%
EBIT / Sales 2.2% 3.3% 3.3% 3.2% 3.3%
Result of the period after taxes (share of the Group) / Sales 0.3% 1.2% 1.6% 2.0% 2.0%
Annual growth rates (combined)Sales 3.8% 1.5% 8.4% -0.9% -15.7%
Adjusted EBITDA 24.2% 19.3% 8.0% -1.6% 10.5%
EBITDA 37.4% 26.0% 10.2% -0.8% 13.1%
Adjusted EBIT 46.5% 29.6% 14.2% -4.8% -19.2%
EBIT 122.4% 48.6% 8.6% -2.2% -14.3%
Result of the period after taxes (share of the Group) -146.6% 259.5% 46.4% 20.6% -14.3%
in million EUR
Consolidated balance sheetNon-current assets 383.4 391.3 384.6 392.1 501.9
Current assets 293.2 301.7 345.6 345.0 300.6
TOTAL ASSETS 676.7 693.0 730.2 737.1 802.5
Total Equity 249.0 251.2 261.8 265.0 275.4
Non-current liabilities 111.2 171.5 174.0 131.0 194.8
Current liabilities 316.5 270.2 294.4 341.1 332.3
TOTAL LIABILITIES 676.7 693.0 730.2 737.1 802.5
Net working capital 39.1 50.3 44.8 73.5 59.6
Market capitalisation (December 31st) 300.9 358.4 423.4 352.9 460.4
Non-controlling interests 0.0 0.0 0.0 0.0 0.7
Combined net financial debt 123.0 126.0 122.9 100.2 180.4
ENTERPRISE VALUE 423.9 484.4 546.3 453.1 641.5
Combined Investments versus Combined DepreciationInvestments in intangible and tangible fixed assets 46.5 53.9 68.3 52.4 55.0
Depreciation (excluding amortisation on goodwill, including impairment) 38.0 39.5 39.0 40.5 56.2
Investments / Sales 3.5% 4.0% 4.7% 3.6% 4.5%
Financial structure ratios Net financial debt / Total equity (including non-controlling interests) 49% 50% 47% 38% 66%
Total equity (including non-controlling interests) / Total assets 37% 36% 36% 36% 34%
Leverage (Combined net financial debt/Combined EBITDA) 1.8 1.5 1.3 1.1 1.7
Current ratio 0.9 1.1 1.2 1.0 0.9
Valuation ratiosPrice / Earnings (Market capitalisation (Dec 31st) / Result of the period (Group share)) 66.2 21.9 17.7 12.2 18.6
Enterprise value / EBITDA 6.3 5.7 5.8 4.9 6.1
Price / Book value (=Market capitalisation/Book value (share of the Group)) 1.21 1.43 1.62 1.33 1.68
Key Figures
RECTICEL ANNUAL REPORT 2019 I 233RECTICEL ANNUAL REPORT 2019 I 232 RECTICEL ANNUAL REPORT 2019 I 233RECTICEL ANNUAL REPORT 2019 I 232
in thousand EUR
Group Recticel2019 2018 2017 2016 2015 2014 2013 2012 2012 2011 2010
CONSOLIDATED CONSOLIDATED CONSOLIDATED CONSOLIDATED CONSOLIDATED CONSOLIDATED CONSOLIDATED COMBINED COMBINED COMBINED COMBINED
INCOME STATEMENT
Sales 1 038 517 1 117 652 1 135 353 1 048 323 1 033 762 983 367 976 763 1 035 050 1 319 488 1 378 122 1 348 430
Distribution costs (60 840) (59 973) (61 952) (57 855) (58 039) (54 135) (52 934) (54 460) (65 838) (65 182) (64 768)
Cost of sales (786 620) (856 056) (889 866) (789 360) (781 282) (757 025) (756 916) (809 871) (1 042 700) (1 101 628) (1 066 780)
Gross profit 191 057 201 623 183 535 201 108 194 441 172 207 166 913 170 719 210 950 211 312 216 882
General and administrative expenses (73 561) (70 562) (78 426) (79 395) (76 723) (72 299) (74 397) (66 772) (83 711) (85 059) (80 367)
Sales and marketing expenses (72 743) (72 593) (69 537) (72 031) (77 123) (73 257) (64 532) (65 796) (74 792) (73 836) (74 331)
Research and development expenses (11 599) (11 042) (13 724) (12 890) (12 537) (13 277) (14 177) (12 940) (14 899) (14 820) (15 794)
Impairments (1 821) (5 819) (7 009) (1 672) (983) (688) (3 365) (1 110) (1 555) (5 260) (10 800)
Other operating result (3 456) (8 830) 27 632 (12 828) (10 714) (12 869) (31 766) 2 867 3 033 8 363 (10 075)
Income from joint ventures and associates
9 271 10 170 2 390 16 927 6 874 8 964 439 6 008 711 1 741 935
Income from investments 0 0 0 0 0 2 0 0 0 (406) 1 164
EBIT 37 148 42 947 44 861 39 219 23 235 8 783 (20 885) 32 976 39 737 42 035 27 614
Interest income and expenses (6 986) (3 272) (6 460) (8 095) (9 554) (10 031) (9 405) (9 320) (11 889) (13 270) (11 770)
Other financial income and expenses (1 241) (614) 1 718 (3 633) (2 968) (2 799) (1 940) (2 271) (2 450) (3 414) (5 325)
Financial result (8 227) (3 886) (4 742) (11 728) (12 522) (12 830) (11 345) (11 591) (14 339) (16 684) (17 095)
Result of the period before taxes 28 921 39 061 40 119 27 491 10 713 (4 047) (32 230) 21 385 25 398 25 351 10 519
Income taxes (4 203) (10 212) (16 206) (11 161) (6 170) (5 702) (3 908) (6 035) (7 834) (7 933) 4 108
Result of the period after taxes 24 718 28 849 23 913 16 330 4 543 (9 749) (36 138) 15 350 17 564 17 418 14 627
of which share of minority interests (44) 0 0 0 0 0 0 0 0 0 188
of which share of the Group 24 762 28 849 23 913 16 330 4 543 (9 749) (36 138) 15 350 17 564 17 418 14 439

in million EUR
Group Recticel 2015 2016 2017 2018 2019
Combined sales per business lineFlexible foams 602.3 607.2 626.1 621.5 549.1
growth rate 1.6% 0.8% 3.1% -0.7% -11.7%
Bedding 294.5 292.9 272.1 243.8 242.3
growth rate 4.6% -0.5% -7.1% -10.4% -0.6%
Insulation 229.4 234.1 272.3 271.2 247.2
growth rate 1.1% 2.1% 16.3% -0.4% -8.9%
Automotive 280.3 288.9 350.4 363.9 223.7
growth rate 6.2% 3.1% 21.3% 3.9% -38.5%
Eliminations (78.1) (75.4) (60.1) (52.1) (41.2)
Total sales 1 328.4 1 347.9 1 460.8 1 448.3 1 220.9
growth rate 3.8% 1.5% 8.4% -0.9% -15.7%
in million EUR
Combined EBITDA per business lineFlexible foams 34.0 39.6 30.6 33.0 54.1
as % of sales 5.6% 6.5% 4.9% 5.3% 9.9%
Bedding 9.5 12.1 14.3 2.0 16.0
as % of sales 3.2% 4.1% 5.3% 0.8% 6.6%
Insulation 33.4 32.9 40.1 44.7 31.4
as % of sales 14.6% 14.0% 14.7% 16.5% 12.7%
Automotive 9.9 18.3 25.0 30.5 24.8
as % of sales 3.5% 6.3% 7.1% 8.4% 11.1%
Corporate (19.1) (17.4) (16.0) (16.8) (20.8)
Total EBITDA 67.8 85.4 94.1 93.4 105.6
as % of sales 5.1% 6.3% 6.4% 6.4% 8.6%
in million EUR
Combined EBIT per business lineFlexible foams 21.1 26.5 17.7 15.6 32.7
as % of sales 3.5% 4.4% 2.8% 2.5% 6.0%
Bedding 3.2 5.8 9.6 (2.1) 7.0
as % of sales 1.1% 2.0% 3.5% -0.8% 2.9%
Insulation 27.5 26.6 33.5 38.1 20.7
as % of sales 12.0% 11.4% 12.3% 14.1% 8.4%
Automotive (1.9) 4.0 4.1 12.9 3.0
as % of sales -0.7% 1.4% 1.2% 3.5% 1.3%
Corporate (20.0) (18.6) (16.8) (17.5) (23.1)
Total EBIT 29.8 44.3 48.1 47.0 40.3
as % of sales 2.2% 3.3% 3.3% 3.2% 3.3%
in units
Key figures per shareNumber of shares (31 December) 53 731 608 54 062 520 54 776 357 55 227 012 55 397 439
Weighted average number of shares outstanding (before dilution) 44 510 623 53 504 432 54 110 396 54 659 774 54 959 861
Weighted average number of shares outstanding (after dilution) 44 704 483 59 643 102 57 941 701 55 093 295 55 154 501
in EUR
Combined REBITDA 1.84 1.83 1.95 1.90 2.09
Combined EBITDA 1.52 1.60 1.74 1.71 1.92
Combined Adjusted EBIT 1.01 1.09 1.23 1.16 0.93
Combined EBIT 0.67 0.83 0.89 0.86 0.73
Result of the period (share of the Group) - Basic (1) 0.10 0.31 0.44 0.53 0.45
Result of the period (share of the Group) - Diluted 0.10 0.30 0.43 0.43 0.00
Gross dividend 0.14 0.18 0.22 0.24 0.24
Pay-out ratio 137% 59% 50% 45% 53%
Net book value (Group share) 4.63 4.65 4.78 4.80 4.96
Price / Earnings ratio (2) 66.2 21.9 17.7 12.2 18.6(1) calculated on the basis of the weigthed average number of shares
outstanding (before dilution effect)
(2) based on the share price of 31 December. Earnings = Result of the period (share of the Group) per share
in EUR
Ordinary shareshare price on 31 December 5.60 6.63 7.73 6.39 8.31
lowest share price of the year 3.88 4.57 6.43 6.06 6.11
highest share price of the year 5.64 6.63 8.75 10.54 9.40
average daily volume traded (units) 83 737 51 513 70 435 65 089 88 871
Recticel s.a./n.v.
Address: (until 31 May 2020) Avenue des Olympiades, 2 B-1140 Brussels (Evere) New Address: (as from 01 June 2020)
avenue Bourget, 42 B-1130 Brussels
Communications & Investor Relations Officer Michel De Smedt
T. + 32 (0)2 775 18 09
F. + 32 (0)2 775 19 91
Dit verslag is beschikbaar in het Nederlands en het Engels.
Ce rapport est disponible en néerlandais et anglais.
This report is available in English and Dutch.
You can also download this Annual Report on www.recticel.com
In case of textual contradictions between the English and the Dutch version the first shall prevail.
General Coordination: Michel De Smedt
Thanks to all colleagues who contributed to the realisation of this Annual Report.
Colophon