Annual Report 2019 - Hempel
96
Annual Report 2019
-
Upload
khangminh22 -
Category
Documents
-
view
1 -
download
0
Transcript of Annual Report 2019 - Hempel
Annual Report 2019

54 Board of Directors
55 Management’s statement
56 Independent auditor’s report
58 Independent limited assurance report
60 Financial statements
22 Customer-focused innovation
26 Corporate governance
32 Risks
36 Corporate responsibility
52 Sustainability data
4 Highlights from 2019
6 Protecting assets
10 Letter to stakeholders
14 2019 in review
19 Strategy
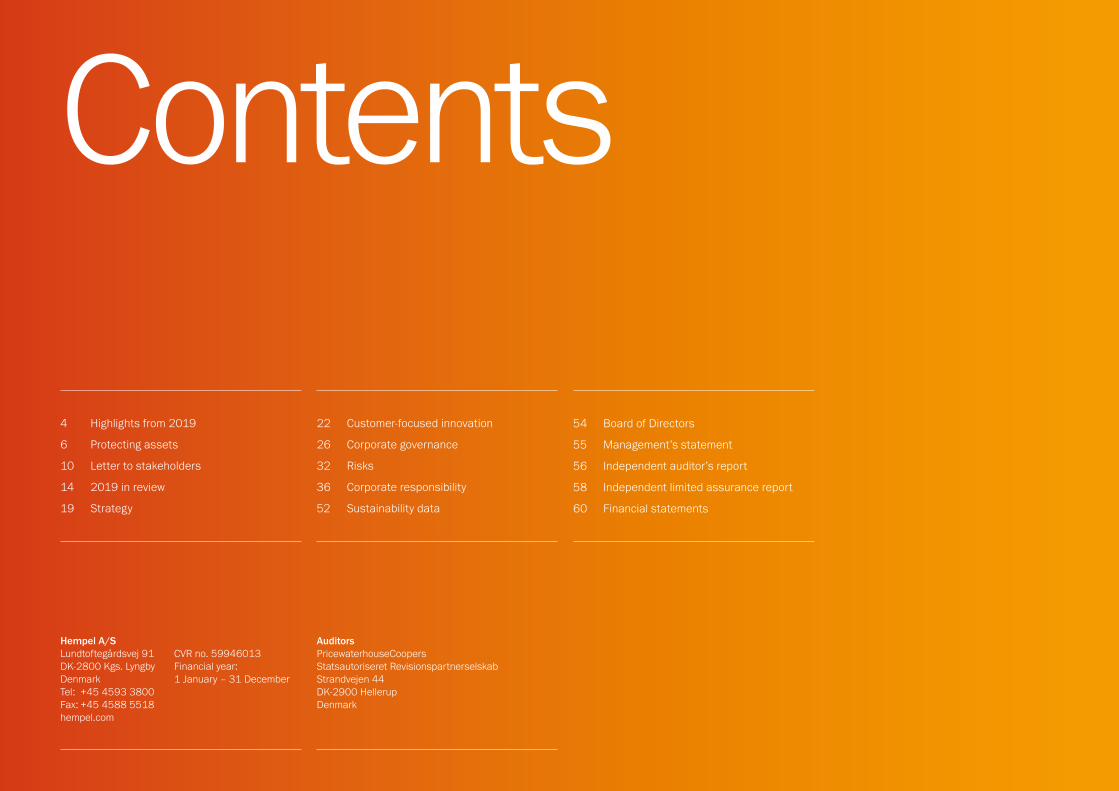
Contents
Hempel A/SLundtoftegårdsvej 91DK-2800 Kgs. LyngbyDenmarkTel: +45 4593 3800Fax: +45 4588 5518hempel.com
CVR no. 59946013Financial year: 1 January – 31 December
AuditorsPricewaterhouseCoopers Statsautoriseret RevisionspartnerselskabStrandvejen 44DK-2900 HellerupDenmark
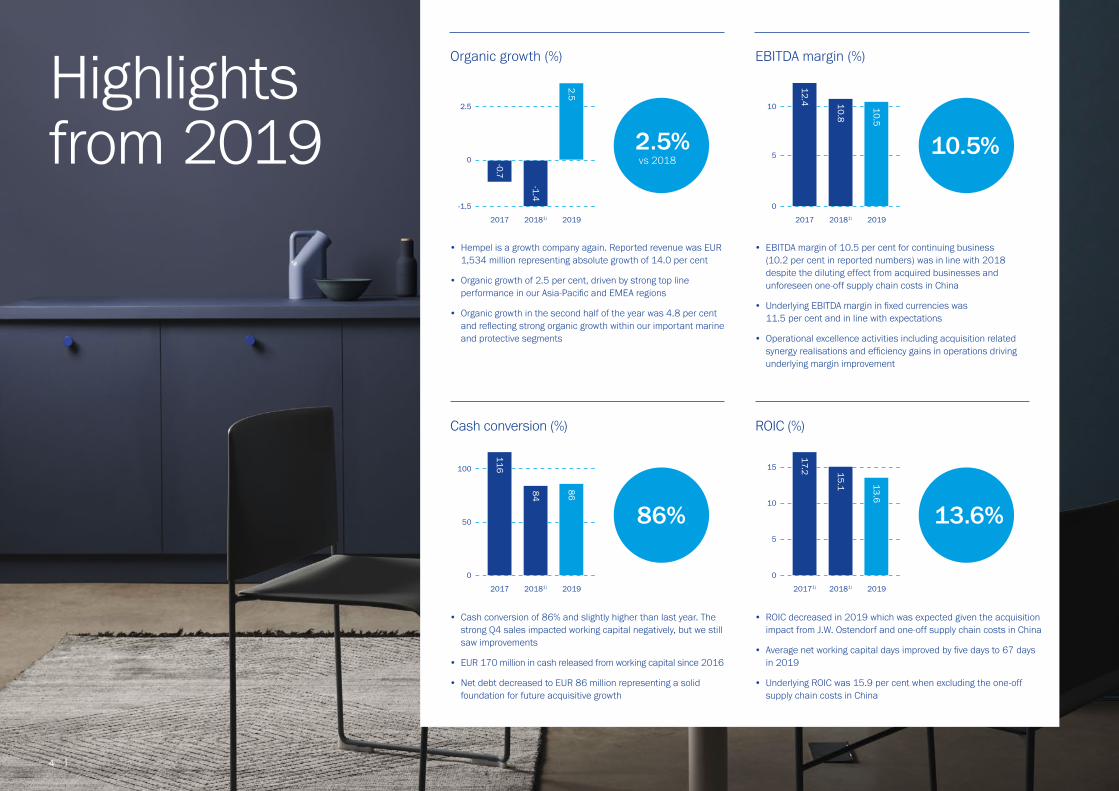
ROIC (%)
• ROIC decreased in 2019 which was expected given the acquisition impact from J.W. Ostendorf and one-off supply chain costs in China
• Average net working capital days improved by five days to 67 days in 2019
• Underlying ROIC was 15.9 per cent when excluding the one-off supply chain costs in China
13.6%10
15
5
0
17.2
20171) 2019
15.1
20181)
13.6
86%
Cash conversion (%)
• Cash conversion of 86% and slightly higher than last year. The strong Q4 sales impacted working capital negatively, but we still saw improvements
• EUR 170 million in cash released from working capital since 2016
• Net debt decreased to EUR 86 million representing a solid foundation for future acquisitive growth
2.5% vs 2018
Organic growth (%)
• Hempel is a growth company again. Reported revenue was EUR 1,534 million representing absolute growth of 14.0 per cent
• Organic growth of 2.5 per cent, driven by strong top line performance in our Asia-Pacific and EMEA regions
• Organic growth in the second half of the year was 4.8 per cent and reflecting strong organic growth within our important marine and protective segments
10.5%
EBITDA margin (%)
10
5
0
20181)
10.8
10.5
12.4
2017 2019
2.5
0
-1.5
20181)
-1.4
2.5
-0.7
2017 2019
• EBITDA margin of 10.5 per cent for continuing business (10.2 per cent in reported numbers) was in line with 2018 despite the diluting effect from acquired businesses and unforeseen one-off supply chain costs in China
• Underlying EBITDA margin in fixed currencies was 11.5 per cent and in line with expectations
• Operational excellence activities including acquisition related synergy realisations and efficiency gains in operations driving underlying margin improvement
Highlights from 2019
100
0
50
20181)84
86
116
2017 2019
4 |
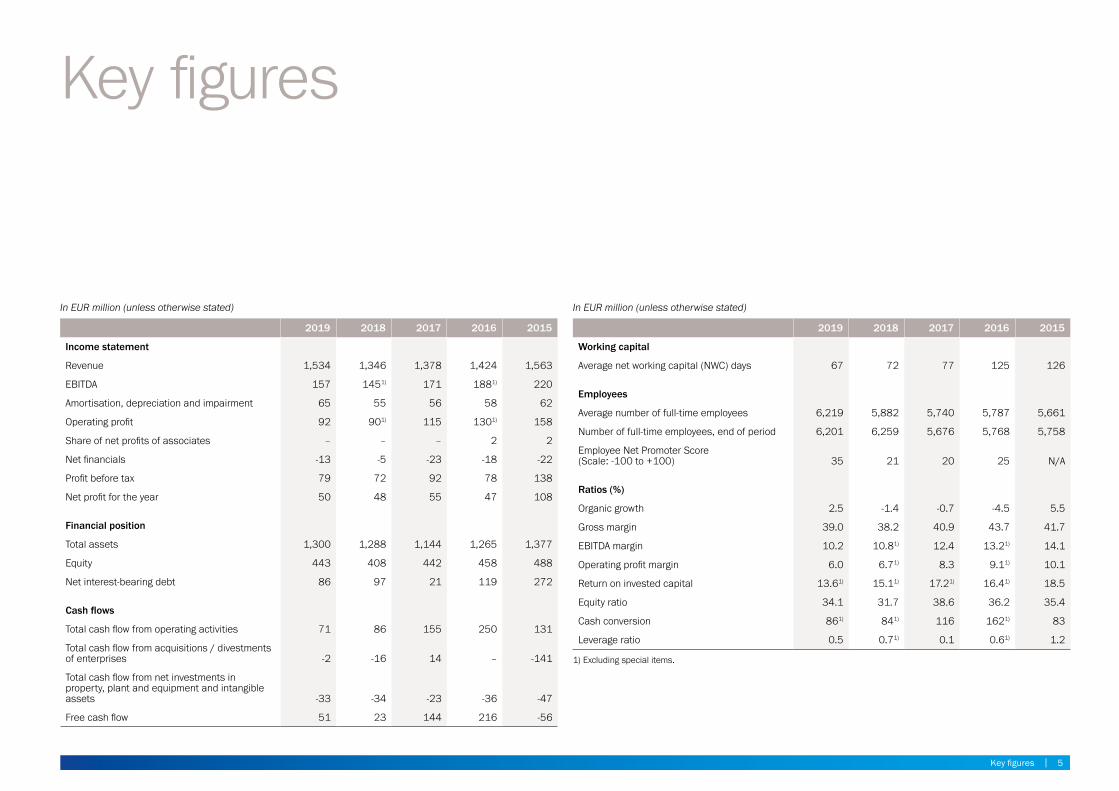
Key figures
In EUR million (unless otherwise stated)
2019 2018 2017 2016 2015
Income statement
Revenue 1,534 1,346 1,378 1,424 1,563
EBITDA 157 1451) 171 1881) 220
Amortisation, depreciation and impairment 65 55 56 58 62
Operating profit 92 901) 115 1301) 158
Share of net profits of associates – – – 2 2
Net financials -13 -5 -23 -18 -22
Profit before tax 79 72 92 78 138
Net profit for the year 50 48 55 47 108
Financial position
Total assets 1,300 1,288 1,144 1,265 1,377
Equity 443 408 442 458 488
Net interest-bearing debt 86 97 21 119 272
Cash flows
Total cash flow from operating activities 71 86 155 250 131
Total cash flow from acquisitions / divestments of enterprises -2 -16 14 – -141
Total cash flow from net investments in property, plant and equipment and intangible assets -33 -34 -23 -36 -47
Free cash flow 51 23 144 216 -56
In EUR million (unless otherwise stated)
2019 2018 2017 2016 2015
Working capital
Average net working capital (NWC) days 67 72 77 125 126
Employees
Average number of full-time employees 6,219 5,882 5,740 5,787 5,661
Number of full-time employees, end of period 6,201 6,259 5,676 5,768 5,758
Employee Net Promoter Score (Scale: -100 to +100) 35 21 20 25 N/A
Ratios (%)
Organic growth 2.5 -1.4 -0.7 -4.5 5.5
Gross margin 39.0 38.2 40.9 43.7 41.7
EBITDA margin 10.2 10.81) 12.4 13.21) 14.1
Operating profit margin 6.0 6.71) 8.3 9.11) 10.1
Return on invested capital 13.61) 15.11) 17.21) 16.41) 18.5
Equity ratio 34.1 31.7 38.6 36.2 35.4
Cash conversion 861) 841) 116 1621) 83
Leverage ratio 0.5 0.71) 0.1 0.61) 1.2
1) Excluding special items.
Key figures | 5
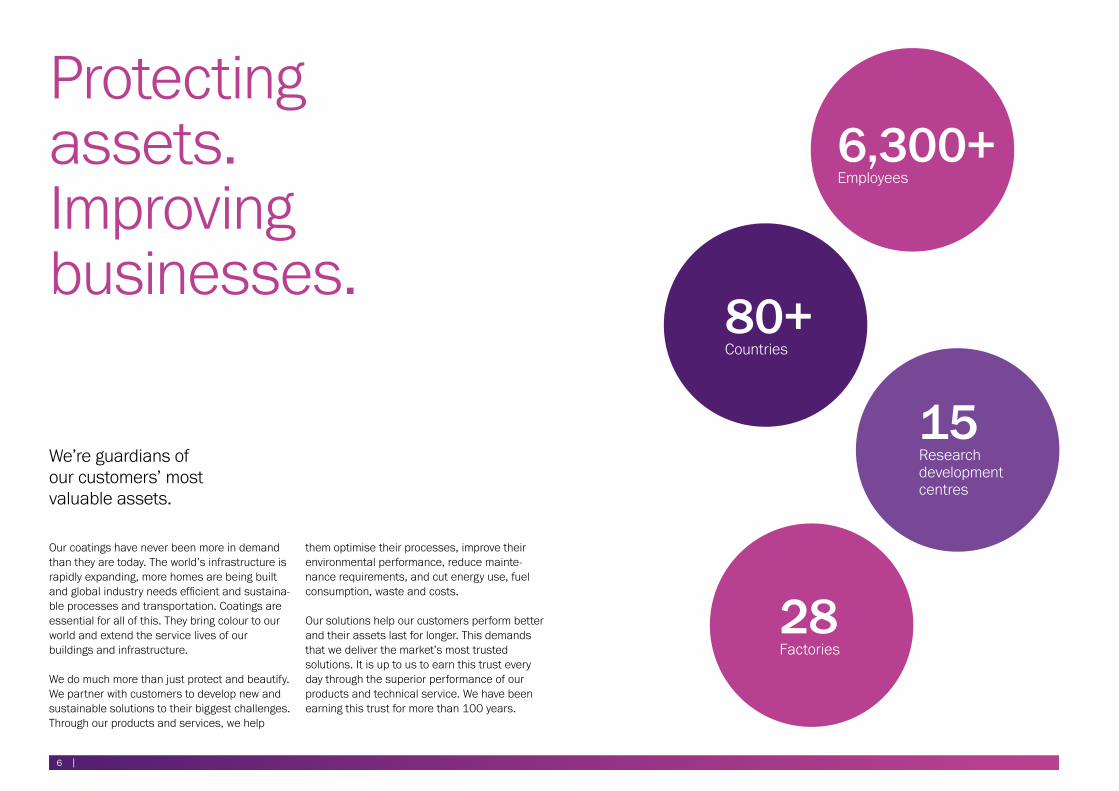
Protecting assets. Improving businesses.
6,300+Employees
80+Countries
15Research development centres
28Factories
We’re guardians of our customers’ most valuable assets.
Our coatings have never been more in demand than they are today. The world’s infrastructure is rapidly expanding, more homes are being built and global industry needs efficient and sustaina-ble processes and transportation. Coatings are essential for all of this. They bring colour to our world and extend the service lives of our buildings and infrastructure.
We do much more than just protect and beautify. We partner with customers to develop new and sustainable solutions to their biggest challenges. Through our products and services, we help
them optimise their processes, improve their environmental performance, reduce mainte-nance requirements, and cut energy use, fuel consumption, waste and costs.
Our solutions help our customers perform better and their assets last for longer. This demands that we deliver the market’s most trusted solutions. It is up to us to earn this trust every day through the superior performance of our products and technical service. We have been earning this trust for more than 100 years.
6 |
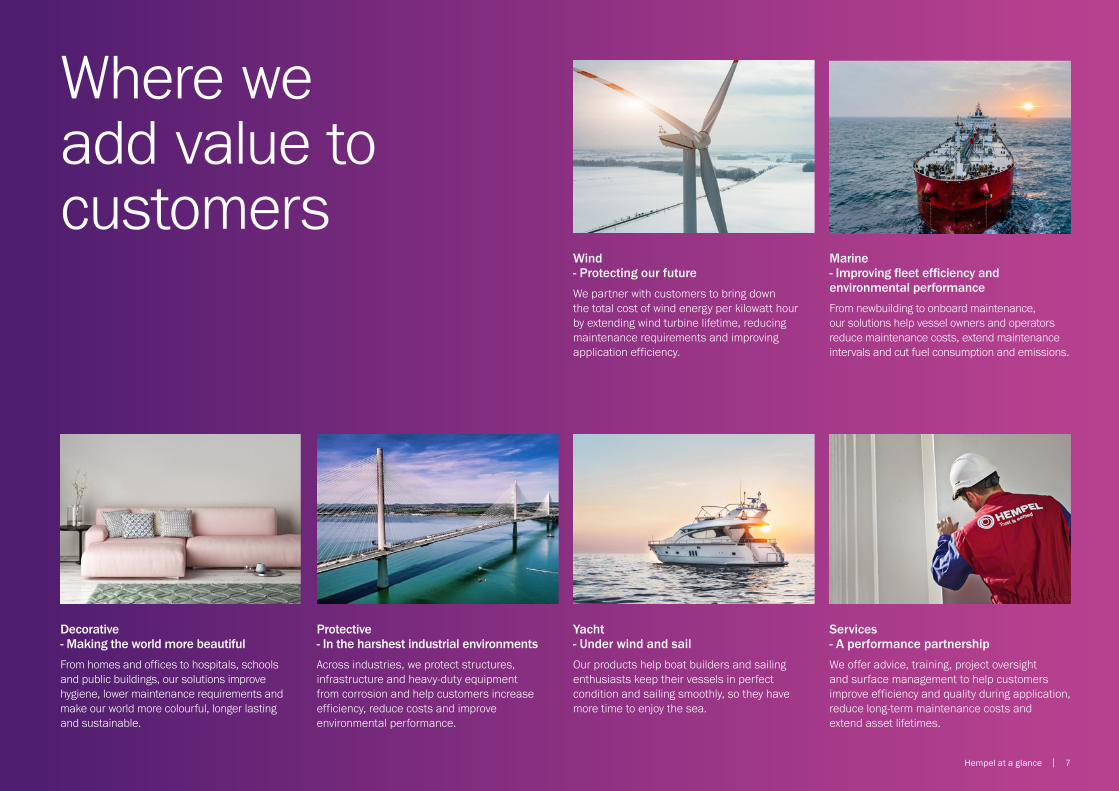
Wind - Protecting our future
We partner with customers to bring down the total cost of wind energy per kilowatt hour by extending wind turbine lifetime, reducing maintenance requirements and improving application efficiency.
Decorative - Making the world more beautiful
From homes and offices to hospitals, schools and public buildings, our solutions improve hygiene, lower maintenance requirements and make our world more colourful, longer lasting and sustainable.
Marine - Improving fleet efficiency and environmental performance
From newbuilding to onboard maintenance, our solutions help vessel owners and operators reduce maintenance costs, extend maintenance intervals and cut fuel consumption and emissions.
Protective - In the harshest industrial environments
Across industries, we protect structures, infrastructure and heavy-duty equipment from corrosion and help customers increase efficiency, reduce costs and improve environmental performance.
Services - A performance partnership
We offer advice, training, project oversight and surface management to help customers improve efficiency and quality during application, reduce long-term maintenance costs and extend asset lifetimes.
Yacht - Under wind and sail
Our products help boat builders and sailing enthusiasts keep their vessels in perfect condition and sailing smoothly, so they have more time to enjoy the sea.
Where we add value to customers
Hempel at a glance | 7

Our unique ownership structure ensures we take a long-term perspective on growth, sustainability and corporate responsibility.
The Hempel Foundation
Hempel is proudly owned by the Hempel Foundation, a commercial foundation dedicated to making a positive difference around the globe. The Foundation is the sole owner of the Hempel Group – an ownership structure that is unique in the coatings industry, and in most industries around the world.
A long-term perspectiveOur founder J.C. Hempel believed that a company has a responsibility to its employees and society in general. Long before it was customary, he introduced employee benefits such as free milk at work, holiday homes for employees and subsidised training. This strong, supportive culture still exists within the Hempel Group today.
In 1948, J.C. Hempel established the Hempel Foundation to provide a solid financial base for the continued existence of the Hempel Group and to give assistance to good causes around
the globe. He transferred all his company shares to the Foundation and it remains the sole shareholder of the Hempel Group today. All dividends from our work are ultimately paid to the Hempel Foundation.
No person or entity owns any part of the Hempel Foundation and no individual share-holder receives any dividends or profit from it. This ensures we take a long-term view on value creation, sustainability and return on invest-ment, and gives us a sustainable perspective when pursuing growth.
In its philanthropic work, the Foundation focuses its efforts on three main areas: empowering children living in poverty to learn; promoting independent research within sustainable coatings science and technology; and sustaining nature’s biodiversity. The Foundation’s contribution in these areas is something every Hempel employee can be proud of.
EUR 21 millionThe amount given by the Hempel Foundation to philanthropic causes in 2019
Hempel at a glance | 9
Letter to stakeholders
2019 was a good year for Hempel, in which we returned to positive organic growth and continued the profound transformation of our global company.

At Hempel, we have spent the last four years getting our house in order, continuing the modernisation of our company that we began with the launch of our Journey to Excellence strategy in particular from March 2016. We have now built the necessary internal structures, procedures and, most importantly, team and culture, to propel our company forward into the 2020’s. This work has been challenging at times, but it has also been an opportunity to push ourselves to improve, and the results are indeed very satisfying.
Performance in 2019We saw a return to organic growth in 2019, driven by strong organic growth in the second half of the year of 4.8 per cent, as well as underlying progress in earnings and margins in most of our regions and segments. 2019 was our first full year with J.W. Ostendorf and in absolute terms we grew by 14.0 per cent. The EBITDA margin development was stable despite supply chain challenges in China and integration of J. W. Ostendorf. Group EBITDA ended the year at EUR 157 million, with a corresponding EBITDA margin of 10.2 per cent.
Our goal of doubling Hempel’s revenue, and leading the markets in which we choose to compete, remains in place. We already lead the
industry in a number of areas and have laid a solid foundation for growth in others. We have built a strong culture, improved compliance and productivity, and embedded innovation and customer-focus throughout the company to ensure we continue to develop value-adding and increasingly sustainable solutions for customers around the globe. In 2019, for example, we launched Hempaguard MaX, a new hull coating solution that builds on the success of our market-leading Hempaguard X7. Hempaguard MaX improves the hydrodynamics of ocean-going vessels to significantly reduce fuel consumption and associated emissions – and can play a key role in helping customers improve profitability and environmental performance.
A culture of care and improvementWe are proud to say that we have a unique culture at Hempel, one in which we dare each other to go further and give each other the support we need to excel. This ensures we have the framework and motivation we need to grow and develop, both as a team and individually. It is encapsulated in our HempelatHeart values and is an essential part of our success.
We are very pleased that 90 per cent of our people worldwide responded to our annual Employee Engagement Survey, which was again
carried out across all countries and functions. The 2019 results, show an impressive increase in overall satisfaction and motivation. Since we launched the survey three years ago, we have seen a steady increase in satisfaction and motivation across the Group. To maintain these good results, we will continue our focus on leadership, employee involvement and communication, both internally and externally, in the years to come.
In 2019, nearly 2,000 customers responded to our Customer Experience Survey and hereby provided us valuable feedback on our work and relationship with them. The results represent significant progress, and are now at an all-time high. Furthermore, it showed that across Hempel, the most important driver of customer loyalty is focus on understanding our customers’ needs and being a trustworthy organisation.
In 2019, the strength of our culture was seen in the turnaround in Asia-Pacific. After years of challenges, we gave the new leadership team responsibility for turning the region around with the full support of the rest of the organisation. It was therefore pleasing to see strong organic growth of 21.9 per cent in Asia-Pacific in the second half of the year, married to strong progress in employee satisfaction. We would like
to congratulate every one of our colleagues in the region for achieving these results. In 2019, we also merged our two sub-regions in the Middle East and worked with our local partners to modernise the ownership structure of our joint ventures. We now have one integrated manage-ment team in the Middle East, operating from our regional headquarters in Bahrain, and we are well positioned to grow and operate successfully in the region in the future.
Unique ownership structureAs leaders of a global company, it is our job to take care of Hempel for the next generation to come – to build on the successes of the past for future generations. Hempel’s ownership structure is integral to making this possible. Our company is entirely owned by the Hempel Foundation, a foundation dedicated to investing in long-term value creation and making a positive difference around the world. This forms a strong part of our heritage, culture and identity. For our employees, it gives a strong sense of pride and a purpose to our work. Through the Hempel Foundation, some of the profits we earn are used to support good causes around the globe. For example, since 2011, the Foundation has initiated projects supporting quality education for 180,000 children. This is something of which every Hempel em-ployee can be proud.
Letter to stakeholders | 11
opening a new factory in Saudi Arabia in early 2020 and continue the work on two new factories in North Asia. In 2019, our manufac-turing in Asia was challenged by circumstances beyond our control, but we were pleased to be able to deal with the issue with no discernible loss of service to customers. In April, the authorities in Kunshan province in China temporarily closed over 1,000 factories in the region, our factory among them. Our factory reopened in November. Despite the major disruption, we still sold more coatings in the region than in 2018. Much credit for this should go to our supply chain team. In particu-lar, we would like to thank our employees in Kunshan, many of whom have travelled long distances to help out with extra shifts at our other factories in China.
Looking to the horizon 2019 was the penultimate year in our Journey to Excellence strategy and we have already come a long way since launching the strategy four years ago. We have finished 25 strategic initiatives, and we have 18 more underway – all designed to modernise Hempel and build a solid founda-tion for future growth.
We reduced average net working capital days from 72 in 2018 to an all-time low of 67 days
in 2019. As a result, we continued to deliver positive cash flow in 2019, and further brought down net debt by EUR 11 million. In addition, we refinanced our credit into a EUR 1 billion credit facility. Combined with our net working capital improvements, which have freed up more than EUR 170 million in cash since 2016, this puts us in a strong position to pursue our growth strategy and acquire new family members with the right cultural and business fit in the next few years.
Looking ahead to 2020, we expect to see organic growth in line with or slightly above the market. From an earnings perspective, we expect to see continuous margin improvements in the underlying business. Reported EBITDA margin, however, is expected to drop slightly due to investments in our future supply chain in China. In absolute terms, we expect our EBITDA to remain stable at around EUR 150-160 million. We will update our strategy, designed to build on our past successes and take us forward to a bright sustainable future, in which we lead the industry in the areas that we choose to compete in. Our goal remains to double Hempel and we remain on track. Right now, our focus is on getting things done, and finishing the transformation of our company that we began four years ago.
Our ownership structure is important for another reason: It gives us the ability to focus on the very long term. Thanks to the financial stability the Foundation provides, we can invest long-term in customer solutions, innovation, sustainability and employee development. There were many examples of progress in these areas in 2019.
We continued to invest in market-driven innovation, launching a number of top-of-the- line products that will help our customers further improve their businesses and environmental performance. We reduced our own waste, energy consumption and use of hazardous raw materials, with the long-term goal of leading sustainability and transparency in the coatings industry. And, we continued our investments in future talent by introducing new development programmes that mean we can now help employees grow from new graduates into seasoned leaders. You can read about all of these developments and more in this report.
Building a strong decorative presence in EuropePart of our strategy requires the successful development of our decorative business. We took great strides in this in 2018 when we acquired J.W. Ostendorf in Germany, including Renaulac in France. Following the acquisition, we have realised more synergies than antici-
pated and we finalised the post-merger integra-tion after just one year – which is a tremendous achievement. Not only have we integrated our core processes, ensuring J.W. Ostendorf and Renaulac are integrated on the back end, but we have quickly realised the benefits of the cultural fit and synergies between the companies.
We can now see that the underlying business performance of the two companies was not as strong as anticipated. The business case remains strong; however, it will take us longer to realise than expected. Therefore, our focus now is to lift margins and further develop our Decorative organisation to ensure we gain the full benefit of the experience and skills that our new colleagues have brought to the company.
Our work with J.W. Ostendorf and Renaulac has shown that we have the ability to quickly and successfully integrate companies into the Hempel family. This has given us a blueprint for future integrations, and we will continue to grow by welcoming new family members and new businesses to our Group, with our perspective of long-term mutual value creation.
Expanding our manufacturing footprintAs part of our drive to sustain growth, we are investing in our manufacturing footprint. We are
12 |
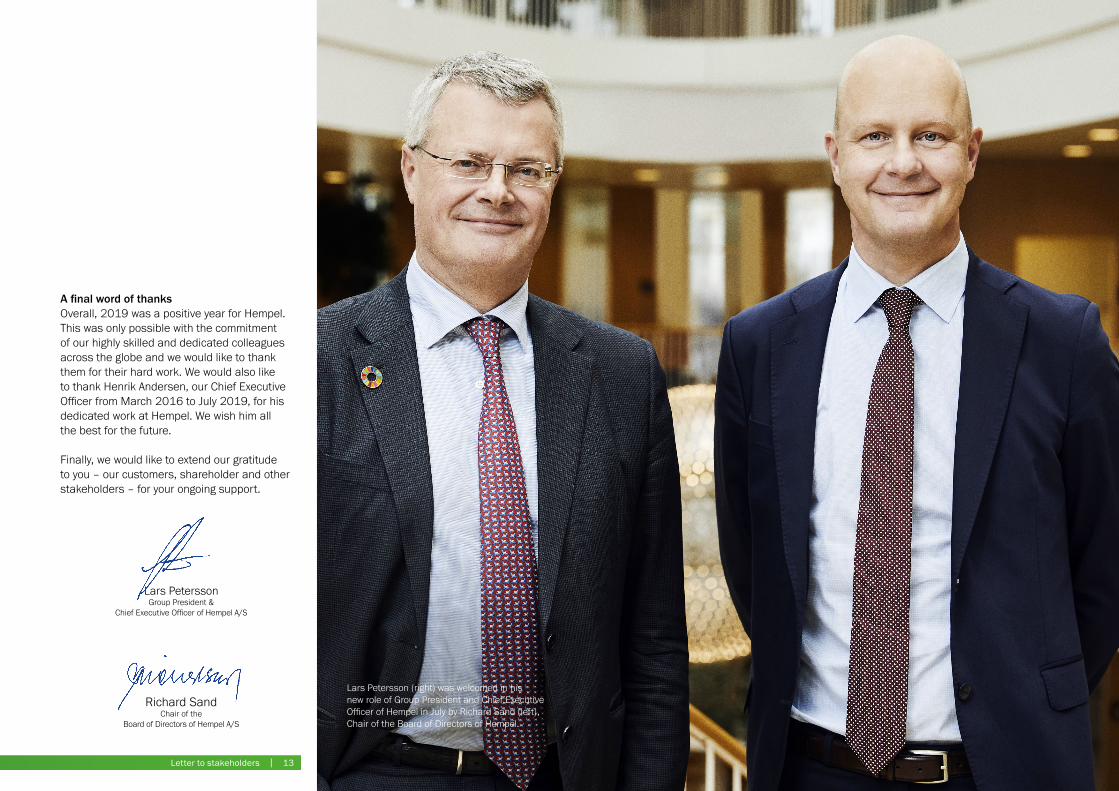
A final word of thanks Overall, 2019 was a positive year for Hempel. This was only possible with the commitment of our highly skilled and dedicated colleagues across the globe and we would like to thank them for their hard work. We would also like to thank Henrik Andersen, our Chief Executive Officer from March 2016 to July 2019, for his dedicated work at Hempel. We wish him all the best for the future.
Finally, we would like to extend our gratitude to you – our customers, shareholder and other stakeholders – for your ongoing support.
Lars Petersson Group President &
Chief Executive Officer of Hempel A/S
Richard SandChair of the
Board of Directors of Hempel A/S
Lars Petersson (right) was welcomed in his new role of Group President and Chief Executive Officer of Hempel in July by Richard Sand (left), Chair of the Board of Directors of Hempel.
Letter to stakeholders | 13

Strong growth and a successful integration made 2019 a positive year for Hempel.
2019in review
Hempel saw a strong performance in 2019, especially in the second half of the year. We are growing again after spending significant time and effort building a foundation for future success. Organic growth was 2.5 per cent in 2019. Compared to last year, we grew 14 per cent in absolute terms; based on the 2.5 per cent organic growth and because 2019 was the first full year with J.W. Ostendorf as an integrated part of the Hempel family. We secured a satisfactory EBITDA margin of 10.2 per cent, and a positive free cash flow of EUR 51 million. Our long-term aspiration is to double Hempel. Although we did not engage in any new acquisi-tions in 2019, we are ready when we find the right fit. We have both the financial capabilities to acquire, in the form of a credit facility agreement with our core banks of EUR 1 billion, and we have a competent and streamlined organisation, ready to reap potential synergies from inviting new members into the Hempel Group – as demonstrated by the successful integration of J.W. Ostendorf, and the corre-sponding financial and cultural synergies that we are now benefitting from. The strong result in 2019 also shows that we are now harvesting the benefits of the excellence projects in our Journey to Excellence strategy, begun four years ago. The strategy has given us a solid platform from which we are now growing – and we will continue to grow into the future. We do see challenging conditions in multiple markets, many of which had an impact on our 2019 result. The ongoing uncertainty around Brexit impact has affected our Decorative business in UK and Ireland; geopolitical uncer-tainty and the economic slowdown in the Middle East affected our Europe, Middle East and Africa (EMEA) region; while the potential state bank-ruptcy of Argentina and the trade war between the US and China increased uncertainty in our Americas and Asia-Pacific regions. In addition, in April the Chinese authorities temporarily closed
more than 1,000 factories in Kunshan, including our factory in the region, which remained closed until 15 November. We experienced material one-off costs in 2019. We reacted quickly to the Kunshan factory shutdown in China to ensure timely deliveries of high-quality coatings to our customers – however, this came at an additional cost. In 2019, we also decided to consolidate our two organisations in the Middle East into one, to create the best possible foundation for further growth in the region. This integration, along with the costs of integrating J.W. Ostendorf with our EMEA region, resulted in extraordinary one-off costs in 2019. Despite these challenges, we delivered a solid performance with an EBITDA of EUR 157 million.
Revenue Hempel’s revenue in 2019 amounted to EUR 1,534 million, or EUR 1,511 in fixed curren-cies. The increase in revenue corresponds to organic growth of 2.5 per cent, which almost exclusively was generated in the second half of the year. The initiatives in our Journey to Excellence strategy have enabled us to grow our business while also creating significant value for our customers. Within this, innovation is a corner-stone of our business as it creates the platform for our future revenue streams. In 2019, we experienced positive organic growth in two out of three regions. EMEA led absolute growth among our regions, growing 19.2 per cent overall. Organic growth ended at 1.7 per cent, which was driven by our Marine segment, where we witnessed a strong performance in dry docking due to a number of factors, including our flagship product, Hempaguard X7. The remaining growth was driven by the acquisitive growth in our decorative business. Our Protective segment also contributed to top-line growth, with our new passive fire protection products
contributing positively. Despite its strong performance, the EMEA region was affected by the geopolitical and economic situation in the Middle East as well as the uncertainty around Brexit as already mentioned. In addition, our Decorative segment was challenged, as the underlying business in the newly acquired J.W. Ostendorf was as not good as expected, though significant synergies have already been released. Organic growth in our Asia-Pacific region amounted to 9.1 per cent for 2019, whereof we saw a strong 21.9 per cent in the second half of the year. This marks the completion of our turnaround in the region. This growth is a result of a successful go-to- market strategy within the Wind sub-segment, where we have closed many large orders with key global and regional wind tower manufacturers. Traditional industries, such as oil & gas and infrastructure, also delivered strong growth in 2019, while our container business lost ground to competitive products as we believe the current price levels are unsustainable. Our Americas region experienced strong growth in some markets, while we witnessed challenges in others. Overall, the region declined 2.0 per cent in 2019. Despite the uncertainty caused by the potential state bankruptcy of Argentina, revenues in South America were solid and we almost doubled sales in the large Brazilian market. In North America, our Rail sub-segment delivered solid performance with double-digit organic growth, we consolidated our leading position in the wind tower industry and grew our Marine segment by almost 15 per cent in 2019. Less positively, growth was negatively impacted by a declining oil & gas market as well as a decline of our Neogard product range in 2019, both of which had a negative impact on our margins in the Americas.
We experienced higher revenue in our three core segments – Marine, Protective and Decorative – than last year. In the Marine segment, a slow
The strong result in 2019 shows that we are harvesting the benefits of the excellence projects in our Journey to Excellence strategy”
“
2019 in review | 15
start to 2019 was followed by solid performance in the latter half of the year, and the segment ended with organic growth of 10.6 per cent, mainly thanks to our performance within dry docking, where the launch of our cutting-edge Hempa guard MaX hull coating solution had a significant impact. Our Protective segment also experienced steady growth, with revenue ending 5.2 per cent higher than last year. This upward trend was partly thanks to strong results within our Wind Energy and Infrastructure sub-segments and good performance in our Rail sub-segment, where we remain a market leader in North America.
EBITDA Group EBITDA for 2019 ended at EUR 157 million, and the corresponding EBITDA margin at 10.2 per cent. Excluding the effect from discontinuing decorative business in Portugal and China and exchange rates, EBITDA margin for 2019 ended at 10.5 per cent or EUR 157 million, versus 10.8 per cent and EUR 145 million in 2018 (measured in fixed currencies). This is a satisfactory result, as we have incurred significant one-off costs during 2019 associated with the Kunshan shutdown, with the integration of J.W. Ostendorf and with the merger of our Middle East regions. Adjusting for these one-off costs, EBITDA for continuing business ended at 172 million in fixed curren-cies, equivalent to an EBITDA margin of 11.5 per cent, close to last year’s organic EBITDA margin of 11.8 per cent. The acquisition of J.W. Ostendorf had a diluting effect on Hempel’s EBITDA margin in 2019. This was expected given the nature of the acquired business, which has a substantial element of low-margin private label paint sales. On a like-for-like basis - excluding the acquired J.W. Ostendorf business, integration costs and the impact from the Kunshan shutdown - the underlying EBITDA in 2019 ended at EUR 172 million and an EBITDA margin at 13.0 per cent. This is higher than the comparable EBITDA margin in 2018 of 11.8 per cent and reflects a solid organic
development of the underlying business, especially when taking the volatile market into consideration. The improvement in earnings from our underlying business was mainly driven by two factors. Firstly, we benefitted from efficiency gains in operations, where the value of cost saving activities in 2019 was more than EUR 40 million. Secondly, the cost of raw materials declined on a like-for-like basis by 6.3 per cent compared to December 2018.
Operating expenses Compared to 2018, operating expenses increased in 2019. Reported operating ex-penses were EUR 1,442 million and EUR 1,421 million in fixed currencies, representing an increase of 13.1 per cent. Operating expenses in fixed currencies for continuing business were EUR 1,408 million, representing an increase of 14.7 per cent compared to 2018. This increase was mainly driven by two factors. Firstly, J.W. Ostendorf became part of Hempel on 1 October 2018. Therefore, 2019 included the first full year with J.W. Ostendorf as part of the Hempel Group. Secondly, the shutdown of our Kunshan factory in China caused operating expenses to increase due to extraordinary costs associated with ensuring timely delivery to our customers. One-off costs e.g. associated with the re- organisation in our Middle East region also had an effect. When excluding these costs, operating expenses increased by 13.5 per cent. The normal operating costs associated with J.W. Ostendorf account for 86 per cent of that increase. On a like-for-like basis, therefore, operating costs for continuing businesses, as a percentage of revenue, decreased from 93.1 per cent in 2018 to 92.7 per cent in 2019 when adjusting for the items mentioned above. This trend was driven by productivity savings originating from continuous improvements and operational excellence activities
We experienced higher revenue in our three segments – Marine, Protective and Decorative – than last year”
“ A proportion of the realised savings were reinvested in innovation projects throughout the organisation, particularly within Research & Development, Digital and our Global Sales organisation. Further more, we invested in talent development and succession – for example, by recruiting more than 22 talents as part of our graduate programme across all our regions in order to strengthen our talent pipeline. The first half of 2019 marked the end of the cases with the Danish Serious Fraud Office and the Prosecution Authority in Kiel, Germany. As a result of the case, Hempel was fined EUR 29 million, which was paid in 2019. The fine was anticipated and fully provisioned for in 2018. Therefore, it had no impact on the net profit result in 2019.
Financial income and expenses The net expense for the year was EUR 13 million compared to EUR 5 million in 2018. The increase was mainly due to significant foreign exchange gains in 2018 (positive at EUR 6 million) which in 2019 were slightly negative at EUR 1 million. Interest expenses increased slightly from EUR 12 million in 2018 to EUR 13 million in 2019. Tax and net profit Tax on profit for the year amounted to EUR 29 million compared to EUR 24 million in 2018. The effective tax rate was 36.7 per cent compared to 33.3 per cent in 2018 (28.2 per cent excluding special items). In 2019 the tax rate was affected by unrecognised deferred tax assets, mainly related to the temporary factory closure in China. Net profit for the year ended at EUR 50 million compared to EUR 48 million in 2018. Capital expenditure In 2019, we increased investments in modernis-ing and upgrading our global production facilities and advancing our digital agenda. Investments in digital solutions amounted to EUR 7 million in 2019. The global upgrade and roll-out of our
16 |
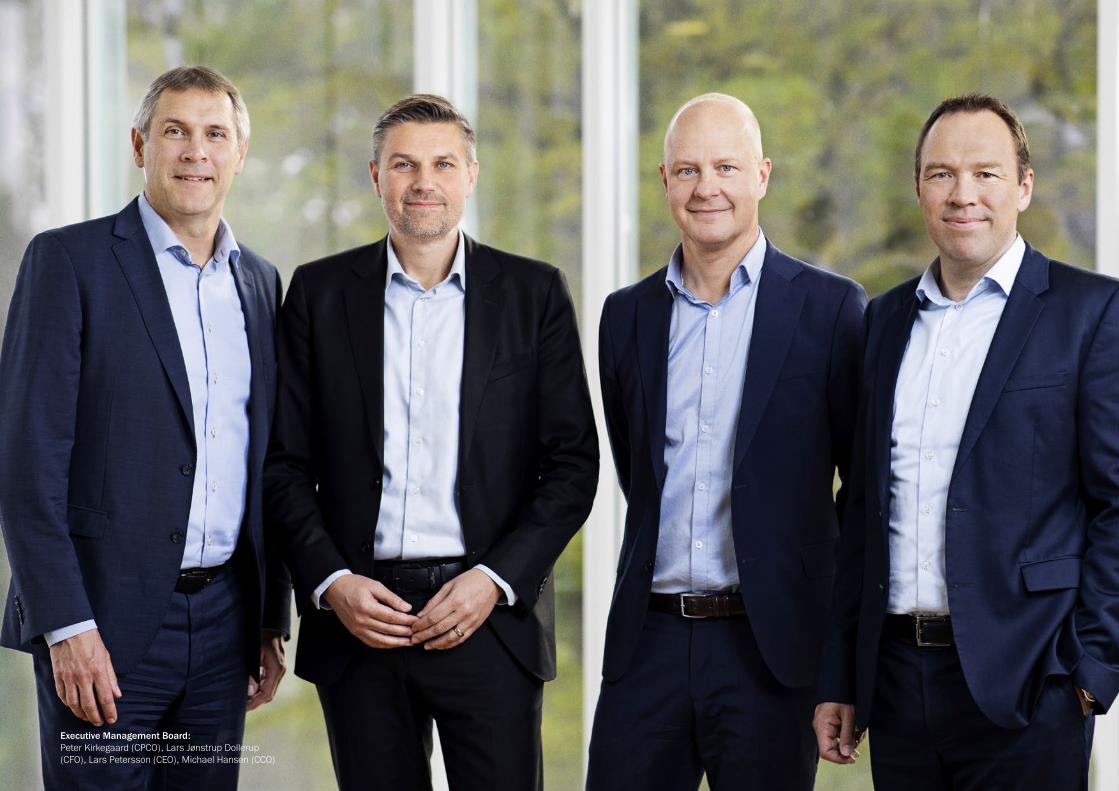
Executive Management Board: Peter Kirkegaard (CPCO), Lars Jønstrup Dollerup (CFO), Lars Petersson (CEO), Michael Hansen (CCO)
Microsoft Dynamics 365 Enterprise Resource Planning system, was the single biggest digital investment. Optimisation of our production facilities included investments of more than EUR 40 million. EUR 9 million were invested in supply chain efficiency projects in our newly established European Decorative region, which includes the acquired J.W. Ostendorf businesses. Furthermore, we almost completed the building of a new factory in Jeddah, Saudi Arabia and we made significant health, safety & environment investments in our Chinese factories. Cash flow and net interest-bearing debt Operating profit ended at EUR 92 million, an increase of EUR 2 million compared to last year. Together with a slight decrease in working capital, this drove cash flow from operating activities to EUR 71 million, compared to EUR 86 million in 2018. The main reason for the decrease in cash flow from operating activities is the payment of the fine to the Danish Serious Fraud Office and the Prosecution Authority in Kiel, Germany of EUR 29 million. Excluding special items cash conversion ended at 86 per cent compared to 84 per cent in 2018. Net working capital continues to be a key focus area. In 2015, net working capital days amounted to 122 days. This had decreased to 69 days by the end of 2019, equal to a yearly average of 67 days in 2019 versus 72 days in 2018. Cash flow from investing activities was a net outflow of EUR 20 million compared to 63 million in 2018. 2019 was impacted by the repayment of a large deposit of EUR 15 million and further a reduction in cash outflow from acquisitions from EUR 19 million in 2018 to EUR 2 million in 2019. The positive generation of cash throughout the year helped reduce net interest-bearing debt. By end of 2019, net interest-bearing debt equalled
EUR 86 million, a decrease of EUR 11 million since December 2018. The net debt level is still low and, with our new credit facility agreement in place, we are in good shape for further acquisitive growth, and ready to reinforce our leading role in the consolidation of the global coatings industry. 2020 and beyond Our long-term, ambitious and realistic aspiration is to double Hempel. We see 2020 as a great opportunity to continue this journey. Despite increasingly volatile market conditions, as well as a potential slowdown in the world economy, we still expect to grow organically in 2020, in line with or better than the market. We also aim to welcome new family members to the Hempel Group, which will further support our growth ambitions. Furthermore, we will dedicate significant investments in 2020 to strengthen our Chinese supply chain. With that, we will establish a solid platform for further profitable growth in our Asia-Pacific region. The underlying performance of our business is expected to further improve in 2020, although earnings will be impacted short term by the supply chain investments. We therefore expect reported earnings margin to be slightly lower in 2020 compared to 2019. In 2020, we will introduce an updated strategy, aiming at taking Hempel beyond and above the positive position that our current Journey to Excellence strategy has created. With our unique ownership structure, Hempel is well positioned to continue investing in the company to ensure we consolidate our position as a leader in innovation and sustaina-bility, with a long-term perspective on value creation and return on investments.
18 |
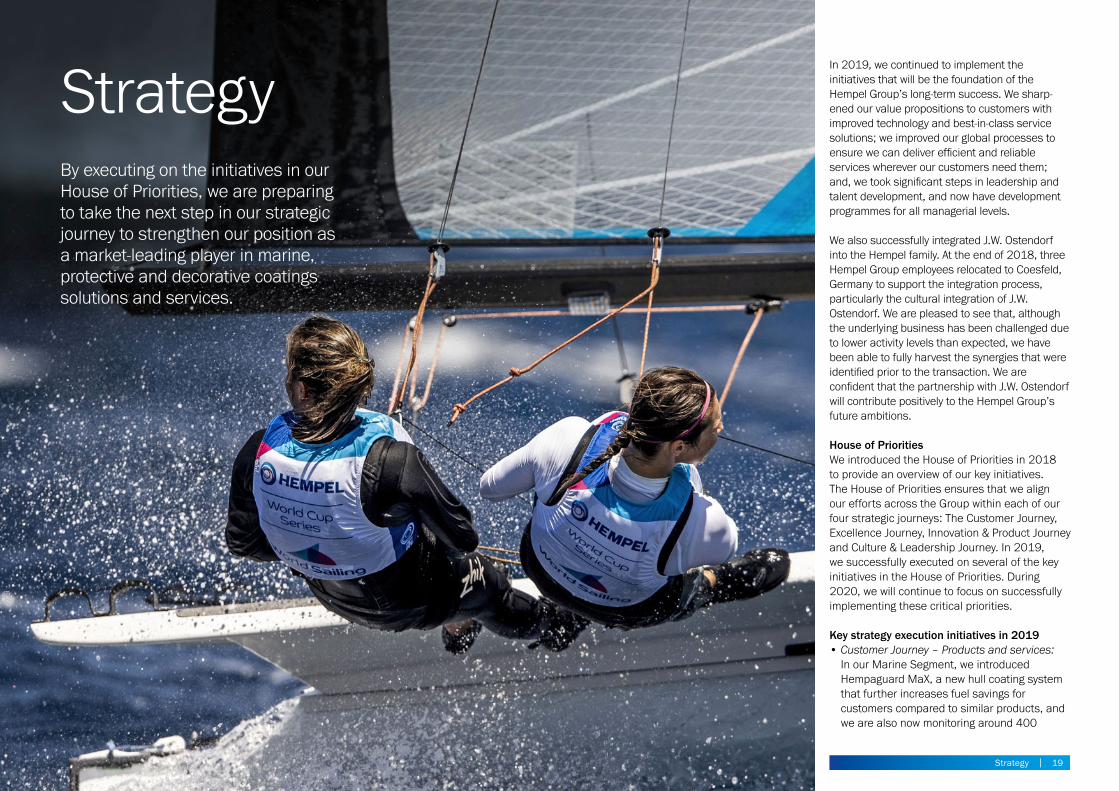
By executing on the initiatives in our House of Priorities, we are preparingto take the next step in our strategicjourney to strengthen our position as a market-leading player in marine, protective and decorative coatings solutions and services.
StrategyIn 2019, we continued to implement the initiatives that will be the foundation of the Hempel Group’s long-term success. We sharp-ened our value propositions to customers with improved technology and best-in-class service solutions; we improved our global processes to ensure we can deliver efficient and reliable services wherever our customers need them; and, we took significant steps in leadership and talent development, and now have development programmes for all managerial levels.
We also successfully integrated J.W. Ostendorf into the Hempel family. At the end of 2018, three Hempel Group employees relocated to Coesfeld, Germany to support the integration process, particularly the cultural integration of J.W. Ostendorf. We are pleased to see that, although the underlying business has been challenged due to lower activity levels than expected, we have been able to fully harvest the synergies that were identified prior to the transaction. We are confident that the partnership with J.W. Ostendorf will contribute positively to the Hempel Group’s future ambitions.
House of Priorities We introduced the House of Priorities in 2018 to provide an overview of our key initiatives. The House of Priorities ensures that we align our efforts across the Group within each of our four strategic journeys: The Customer Journey, Excellence Journey, Innovation & Product Journey and Culture & Leadership Journey. In 2019, we successfully executed on several of the key initiatives in the House of Priorities. During 2020, we will continue to focus on successfully implementing these critical priorities.
Key strategy execution initiatives in 2019• Customer Journey – Products and services:
In our Marine Segment, we introduced Hempaguard MaX, a new hull coating system that further increases fuel savings for customers compared to similar products, and we are also now monitoring around 400
Strategy | 19
vessels through our SHAPE programme. In the Protective segment, we launched a new passive fire protection solution that signifi-cantly reduces application time compared to other market-leading products.
• Customer Journey – Services: We increased our conversion of services into revenue by better monetising the value of our services to our customers. Furthermore, we piloted new integrated service concepts for the global shipping industry and developed digital systems that increase our field service employees’ access to information to improve quality and efficiency.
• Customer Journey – Global Key Account Management: We grew our Global Key Accounts in Marine and Protective by 22.7% in 2019, with our customer portfolios within Marine and Protective growing more than 20% respectively. This is a testament to the strong customer focus that is being built throughout the Hempel organisation.
• Excellence Journey – Waste & energy: We continued to drive initiatives in our supply chain organisation to reduce our electricity use and landfill waste. In 2019, we reduced our relative energy consumption by 6.5%, including an 11% decrease in electricity use. We achieved an 18% reduction in waste to landfill. We also initiated partnerships with our customers to reduce their waste through circular economy.
• Innovation & Product Journey – Assortment excellence: We have significantly cut complex-ity across all our segments by reducing the number of unique items we produce by more than 70% and the number of items sold by 50% since 2016. This has been achieved while growing our sales.
• Culture & Leadership Journey – Sales compe-tency building: In 2019, 789 of our sales employees participated in training, which has lifted our sales force’s capabilities significantly
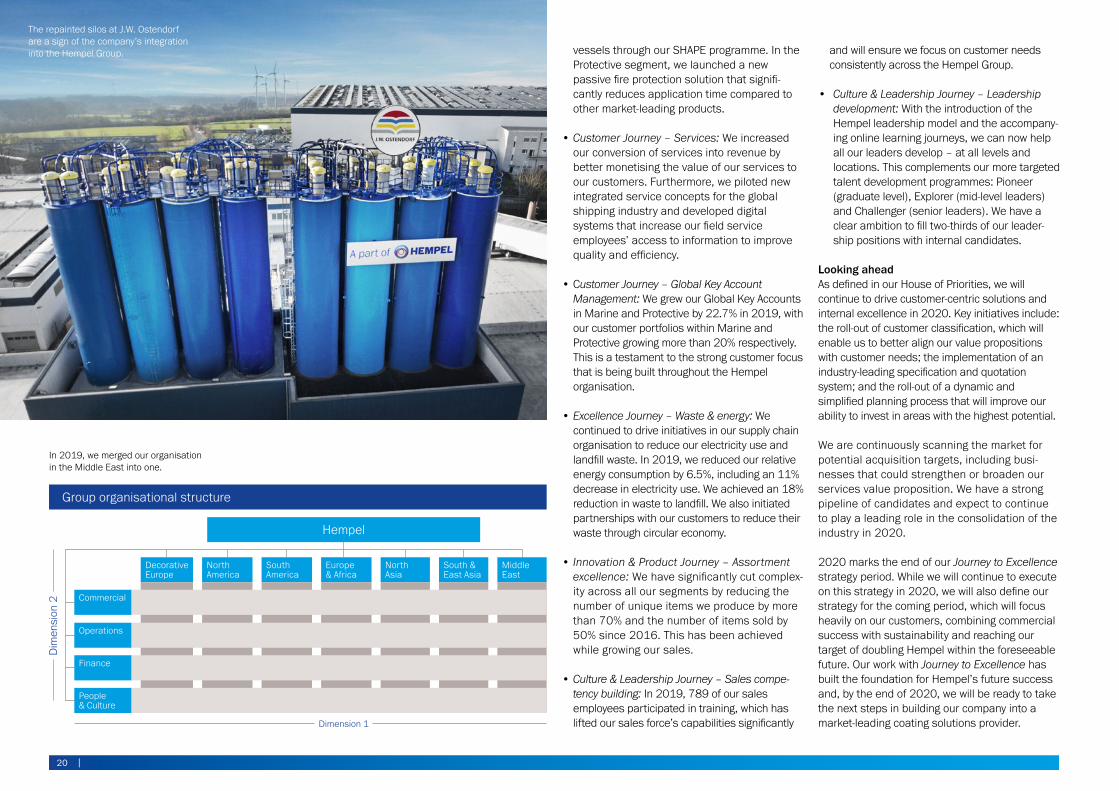
Commercial
NorthAmerica
Decorative Europe
NorthAsia
Middle East
South America
Europe & Africa
South & East Asia
Operations
Finance
People & Culture
Hempel
Group organisational structure
Dim
ensi
on 2
Dimension 1
and will ensure we focus on customer needs consistently across the Hempel Group.
• Culture & Leadership Journey – Leadership development: With the introduction of the Hempel leadership model and the accompany-ing online learning journeys, we can now help all our leaders develop – at all levels and locations. This complements our more targeted talent development programmes: Pioneer (graduate level), Explorer (mid-level leaders) and Challenger (senior leaders). We have a clear ambition to fill two-thirds of our leader-ship positions with internal candidates.
Looking aheadAs defined in our House of Priorities, we will continue to drive customer-centric solutions and internal excellence in 2020. Key initiatives include: the roll-out of customer classification, which will enable us to better align our value propositions with customer needs; the implementation of an industry-leading specification and quotation system; and the roll-out of a dynamic and simplified planning process that will improve our ability to invest in areas with the highest potential.
We are continuously scanning the market for potential acquisition targets, including busi-nesses that could strengthen or broaden our services value proposition. We have a strong pipeline of candidates and expect to continue to play a leading role in the consolidation of the industry in 2020.
2020 marks the end of our Journey to Excellence strategy period. While we will continue to execute on this strategy in 2020, we will also define our strategy for the coming period, which will focus heavily on our customers, combining commercial success with sustainability and reaching our target of doubling Hempel within the foreseeable future. Our work with Journey to Excellence has built the foundation for Hempel’s future success and, by the end of 2020, we will be ready to take the next steps in building our company into a market-leading coating solutions provider.
The repainted silos at J.W. Ostendorf are a sign of the company’s integration into the Hempel Group.
In 2019, we merged our organisation in the Middle East into one.
20 |
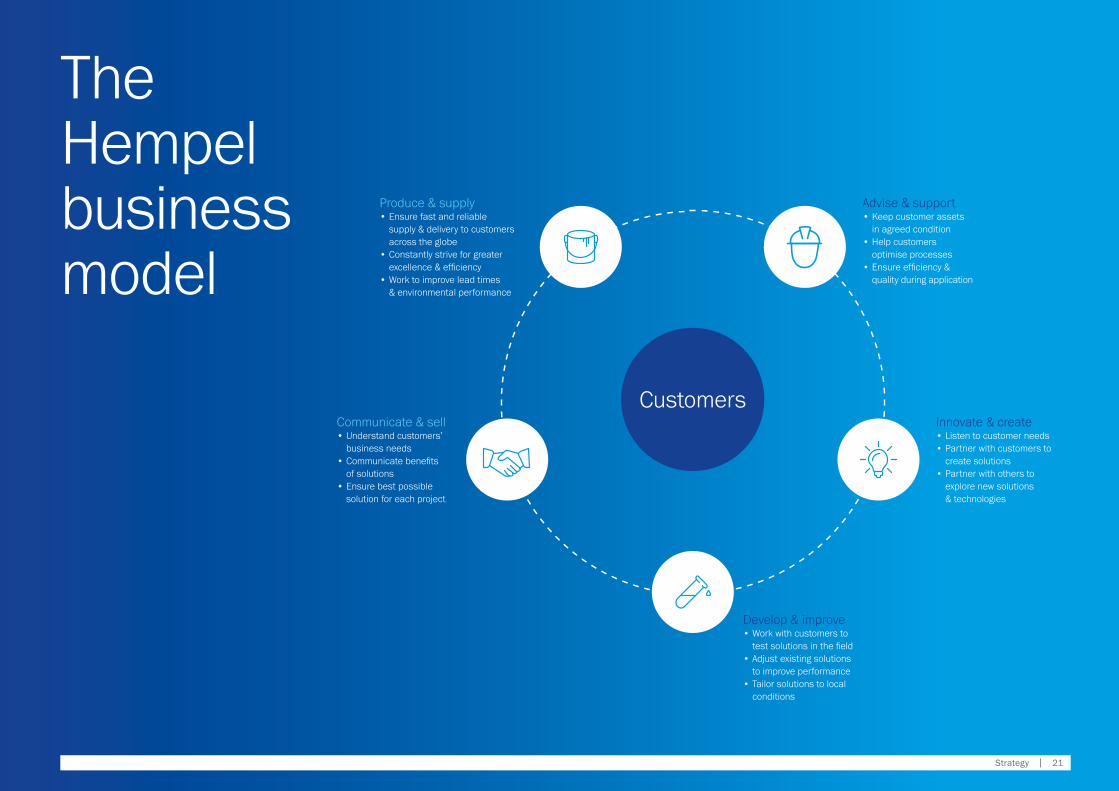
The Hempel business model
CustomersCommunicate & sell • Understand customers’
business needs • Communicate benefits
of solutions • Ensure best possible
solution for each project
Develop & improve • Work with customers to
test solutions in the field• Adjust existing solutions
to improve performance• Tailor solutions to local
conditions
Innovate & create • Listen to customer needs• Partner with customers to
create solutions• Partner with others to
explore new solutions & technologies
Advise & support • Keep customer assets
in agreed condition• Help customers
optimise processes• Ensure efficiency &
quality during application
Produce & supply• Ensure fast and reliable
supply & delivery to customers across the globe
• Constantly strive for greater excellence & efficiency
• Work to improve lead times & environmental performance
Strategy | 21
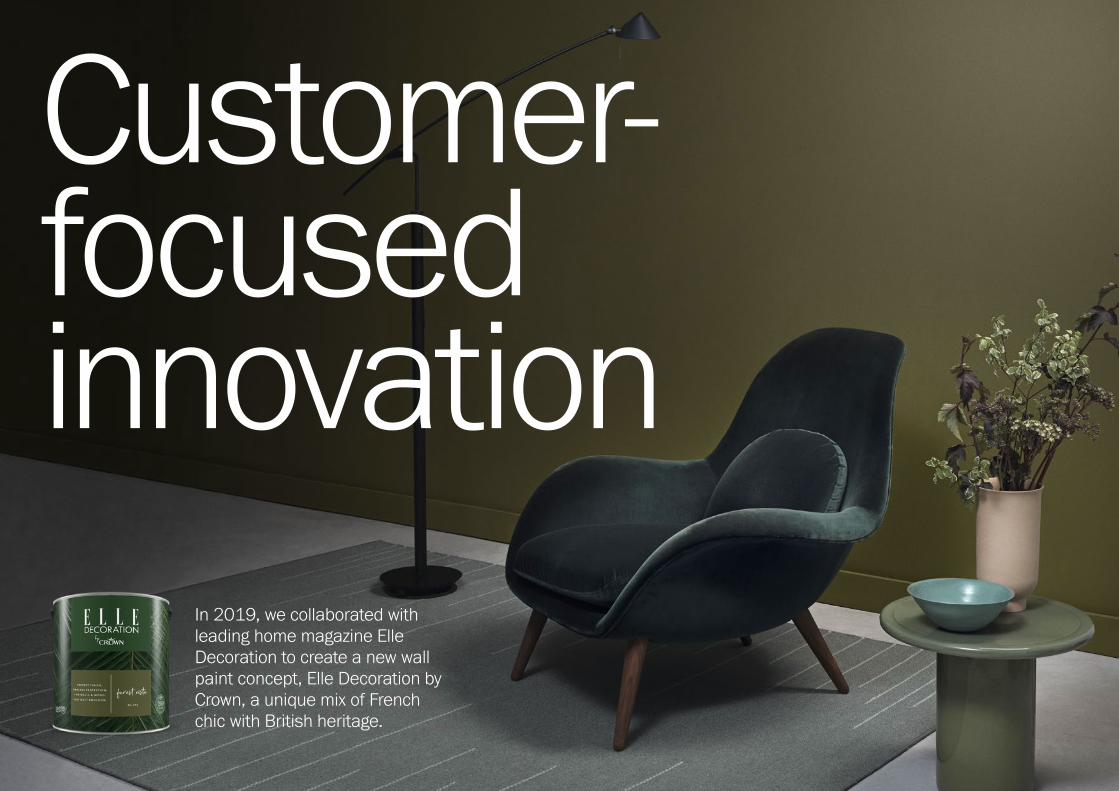
In 2019, we collaborated with leading home magazine Elle Decoration to create a new wall paint concept, Elle Decoration by Crown, a unique mix of French chic with British heritage.
Customer-focused innovation
From bridges and boats to wind turbines and hospitals, our coatings can be found around the globe, protecting our customers’ assets and equipment from corrosion. They bring colour to our world and extend the service lives of our buildings and infrastructure.
The main purpose of a coating is to protect the material beneath, while also improving the material’s aesthetics or functionality. Our customers, therefore, are looking for robust coatings that increase asset longevity, reduce maintenance costs and present their building, brand or asset in the best possible way. Customers also realise that coatings can
improve their operations and business perfor-mance by, for example, reducing fuel consump-tion or energy use, increasing application efficiency and colour choice, or improving sustainability performance.
Delivering these benefits demands that we truly understand our customers’ businesses and work in partnership with them to develop new and innovative solutions that solve their challenges. This requires close collaboration with our customers and colleagues across our entire global organisation, from our customer-facing sales and service teams to our R&D staff and digital teams.
Johannah Christensen, Managing Director, Head of Projects & Programmes at the Global Maritime Forum, a partner of the Getting to Zero Coalition.
International shipping will only succeed in reducing its greenhouse gas emissions by at least 50% by 2050 if commercially viable zero emission vessels start entering the global fleet by 2030. We are excited to work together with Hempel to achieve this joint ambition to drive green development across the world.”
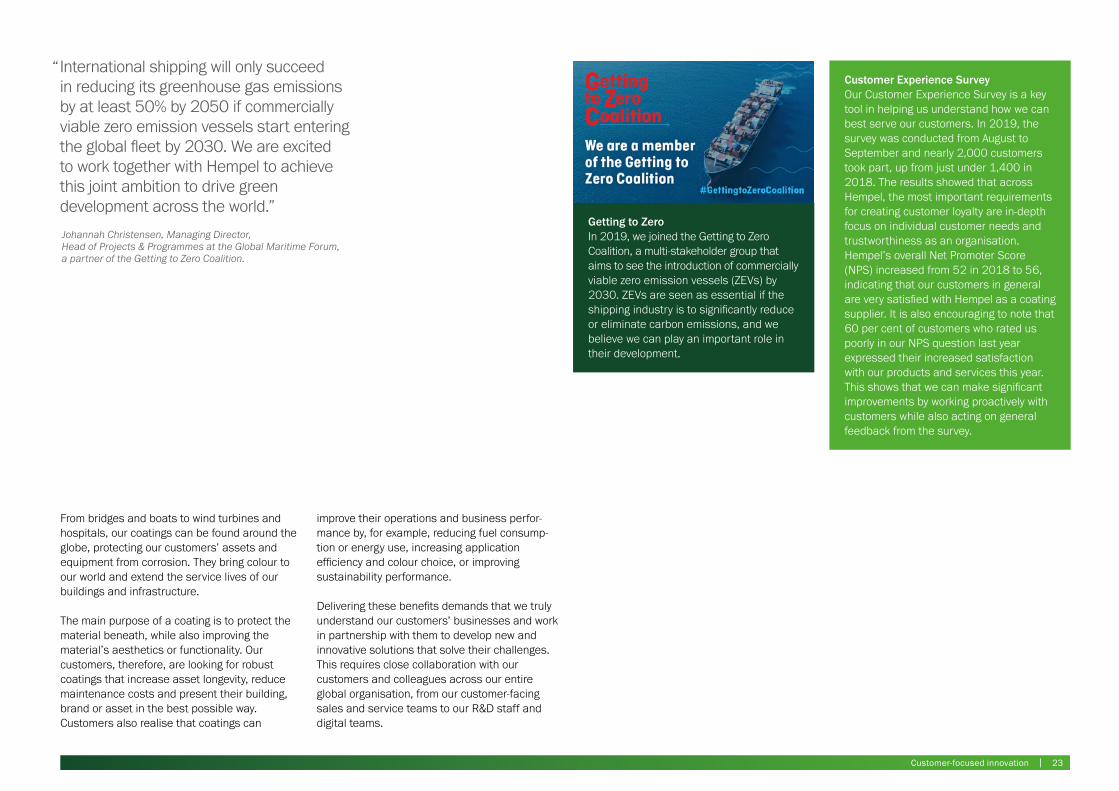
“Customer Experience SurveyOur Customer Experience Survey is a key tool in helping us understand how we can best serve our customers. In 2019, the survey was conducted from August to September and nearly 2,000 customers took part, up from just under 1,400 in 2018. The results showed that across Hempel, the most important requirements for creating customer loyalty are in-depth focus on individual customer needs and trustworthiness as an organisation. Hempel’s overall Net Promoter Score (NPS) increased from 52 in 2018 to 56, indicating that our customers in general are very satisfied with Hempel as a coating supplier. It is also encouraging to note that 60 per cent of customers who rated us poorly in our NPS question last year expressed their increased satisfaction with our products and services this year. This shows that we can make significant improvements by working proactively with customers while also acting on general feedback from the survey.
Getting to Zero In 2019, we joined the Getting to Zero Coalition, a multi-stakeholder group that aims to see the introduction of commercially viable zero emission vessels (ZEVs) by 2030. ZEVs are seen as essential if the shipping industry is to significantly reduce or eliminate carbon emissions, and we believe we can play an important role in their development.
Customer-focused innovation | 23
Global consistency and serviceLike Hempel, many of our customers are global, with operations in different parts of the world. These customers require consistently high- quality products that meet both local and inter national standards, as well as fast service, delivery and response wherever they operate. Our Global Key Account Management concept meets this demand. Our Global Key Accounts saw growth well above market average in 2019, proving that our largest global customers are entrusting increasing parts of their business to us.
Greater operational savingsReducing operational costs is high on the agenda for most of our customers and in 2019 we expanded our services offering to increase focus in this key area. This included launching a tailored service for Protective customers with factory applied line production, with the overall goal of reducing their total cost of production. The Production Line Survey service includes a full review of the customer’s coating application procedures, documentation, specifications, quality control and process flow – and we provide recommendations to help them reduce costs, improve efficiency and increase produc-tion speed. We also completed a number of pilot projects with customers in the Marine segment to test new service offerings designed to reduce operational costs.
As well as services, we introduced new coatings in 2019 to help customers reduce application costs and increase productivity. This included a number of products in our decorative range that help both
Customer focus
professional applicators and home-users by improving ease of application and drying times.
Improving health and safetyCoatings contain chemicals and other sub-stances that can potentially be harmful to people or the environment. We are constantly working to reduce the amount of potentially harmful substances in our products to help customers improve both health and safety during application and overall environmental performance. In 2019, for example, we added a number of biocide-free wall and ceiling paints to our Decorative range. These reduce the risk of exposure to potentially harmful substances during application, which is particularly important in the Decorative industry, where many products are applied by non-professional applicators.
We also launched Hempafire Optima 500, a new waterborne coating in our Hempafire range of passive fire protection (PFP) coatings. PFP coatings improve building safety by extending the load-bearing capacity of structural steel during a fire to give extra time for evacuation and emer-gency response – and they are increasingly demanded by local authorities and building owners. Hempafire Optima 500 provides up to 120 minutes of fire protection and, as a low volatile organic compound (VOC) coating, it helps our customer meet environmental targets. Like the other products in our Hempafire range, Hempafire Optima 500 is optimised for application efficiency and so contributes to improved productivity and reduced project costs for customers compared to similar PFP coatings on the market.
Lower fuel costs and C02 emissions Carbon emissions are a focus in many industries, including the shipping industry where a combina-tion of new regulations and industry desire make it a key consideration. In shipping, carbon emissions are directly related to fuel consumption and, as fuel is the number one expense for most ocean- going vessels, any reduction in fuel use can have a significant dual benefit for vessel operators.
We offer marine customers a comprehensive set of solutions to reduce fuel consumption and associated emissions. These include a range of advanced hull coatings that improve vessel hydrodynamics; technical services that maxim-ise coating performance; and SHAPE, a propul-sion monitoring and analysis service that enables operators to document performance and make continuous improvements.
Our solutions have long been central to improved environmental performance and lower operational costs for many shipping companies. Our indus-try-leading Hempaguard X7, for example, was applied to over 1,500 vessels between its launch in 2013 and October 2019. In that time, it helped the collective vessel owners save USD 500 million in fuel bills and reduced CO2 emissions by 10 million tons. In 2019, we introduced Hempaguard MaX, a three-coat system that offers even greater fuel savings and emission reductions, as well as reduced application time in dry dock.
Reducing long-term maintenance requirementsMost customers want to reduce long-term maintenance requirements. For owners of
offshore assets such as wind turbines and oil & gas platforms, the cost of performing mainte-nance at sea makes this need particularly strong. We worked with one of the world’s leading oil & gas companies to find a solution and, in 2019, launched the water-repellent topcoat Hempatop Repel 800. Our analysis shows that water entering through the coating system is the primary cause of coating failure for offshore assets. By actively repelling water from the coated surface, Hempatop Repel 800 can significantly reduce maintenance requirements compared to currently available coating systems.
Greater personalisationColour is one of the most important considera-tions in decorative coatings. In homes, colour is used to create a certain look, atmosphere and individual style. In hospitals, schools and other institutions, specially designed colour schemes create a feeling of wellbeing, calmness or improved concentration. In 2019, we collabo-rated with leading home magazine Elle Decoration to create a new wall paint concept that combines French chic with British ele-gance. Called Elle Decoration by Crown, the range includes 60 contemporary colour shades, which dry to a tough and durable flat matt finish. Elle Decoration by Crown will be introduced in 2020, giving customers a wider selection of colours to choose from when decorating interiors.
24 |
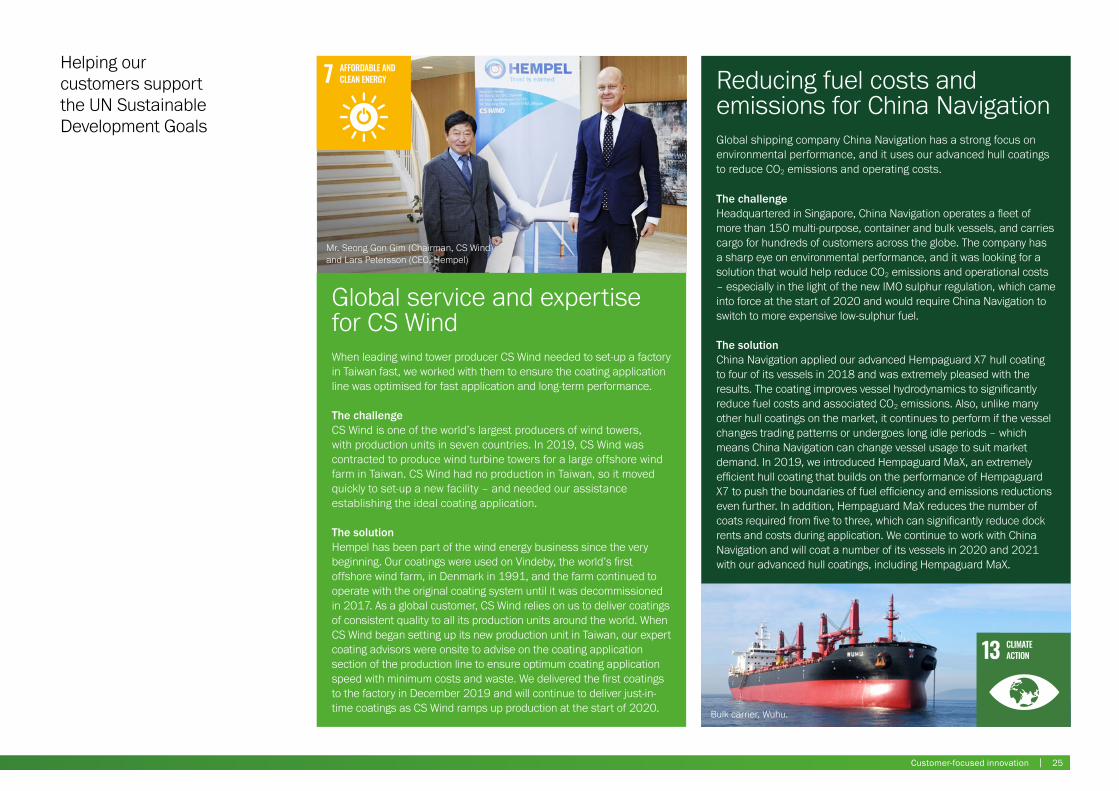
Global service and expertise for CS WindWhen leading wind tower producer CS Wind needed to set-up a factory in Taiwan fast, we worked with them to ensure the coating application line was optimised for fast application and long-term performance.
The challengeCS Wind is one of the world’s largest producers of wind towers, with production units in seven countries. In 2019, CS Wind was contracted to produce wind turbine towers for a large offshore wind farm in Taiwan. CS Wind had no production in Taiwan, so it moved quickly to set-up a new facility – and needed our assistance establishing the ideal coating application.
The solutionHempel has been part of the wind energy business since the very beginning. Our coatings were used on Vindeby, the world’s first offshore wind farm, in Denmark in 1991, and the farm continued to operate with the original coating system until it was decommissioned in 2017. As a global customer, CS Wind relies on us to deliver coatings of consistent quality to all its production units around the world. When CS Wind began setting up its new production unit in Taiwan, our expert coating advisors were onsite to advise on the coating application section of the production line to ensure optimum coating application speed with minimum costs and waste. We delivered the first coatings to the factory in December 2019 and will continue to deliver just-in-time coatings as CS Wind ramps up production at the start of 2020.
Helping our customers support the UN Sustainable Development Goals
Reducing fuel costs and emissions for China NavigationGlobal shipping company China Navigation has a strong focus on environmental performance, and it uses our advanced hull coatings to reduce CO2 emissions and operating costs.
The challengeHeadquartered in Singapore, China Navigation operates a fleet of more than 150 multi-purpose, container and bulk vessels, and carries cargo for hundreds of customers across the globe. The company has a sharp eye on environmental performance, and it was looking for a solution that would help reduce CO2 emissions and operational costs – especially in the light of the new IMO sulphur regulation, which came into force at the start of 2020 and would require China Navigation to switch to more expensive low-sulphur fuel.
The solutionChina Navigation applied our advanced Hempaguard X7 hull coating to four of its vessels in 2018 and was extremely pleased with the results. The coating improves vessel hydrodynamics to significantly reduce fuel costs and associated CO2 emissions. Also, unlike many other hull coatings on the market, it continues to perform if the vessel changes trading patterns or undergoes long idle periods – which means China Navigation can change vessel usage to suit market demand. In 2019, we introduced Hempaguard MaX, an extremely efficient hull coating that builds on the performance of Hempaguard X7 to push the boundaries of fuel efficiency and emissions reductions even further. In addition, Hempaguard MaX reduces the number of coats required from five to three, which can significantly reduce dock rents and costs during application. We continue to work with China Navigation and will coat a number of its vessels in 2020 and 2021 with our advanced hull coatings, including Hempaguard MaX.
Mr. Seong Gon Gim (Chairman, CS Wind) and Lars Petersson (CEO, Hempel)
Bulk carrier, Wuhu.
Customer-focused innovation | 25
In 2019, we further improved our internal control systems while continuing to ensure that high compliance levels are well anchored in all aspects of the business.
Corporate governance
The purpose of corporate governance within Hempel is to ensure that Hempel is led, managed and operated as a modern global company and a leader in the coatings industry. We aim to build on best practices from within and learn from other companies and organisa-tions. Our strong corporate governance supports value creation for our customers, suppliers, employees and the communities in which we operate. It also determines a clear distribution of management responsibilities, which contributes to the long-term success of the company.
In 2019, we continued to improve the overall internal control framework by strengthening our internal control systems and continued the upgrade of our Enterprise Resource Planning system to ensure that systems are established around our policies and guidelines. We also introduced a new employee onboarding framework that ensures all new employees have a fast introduction to policies and complete compliance training within the first two weeks of employment.
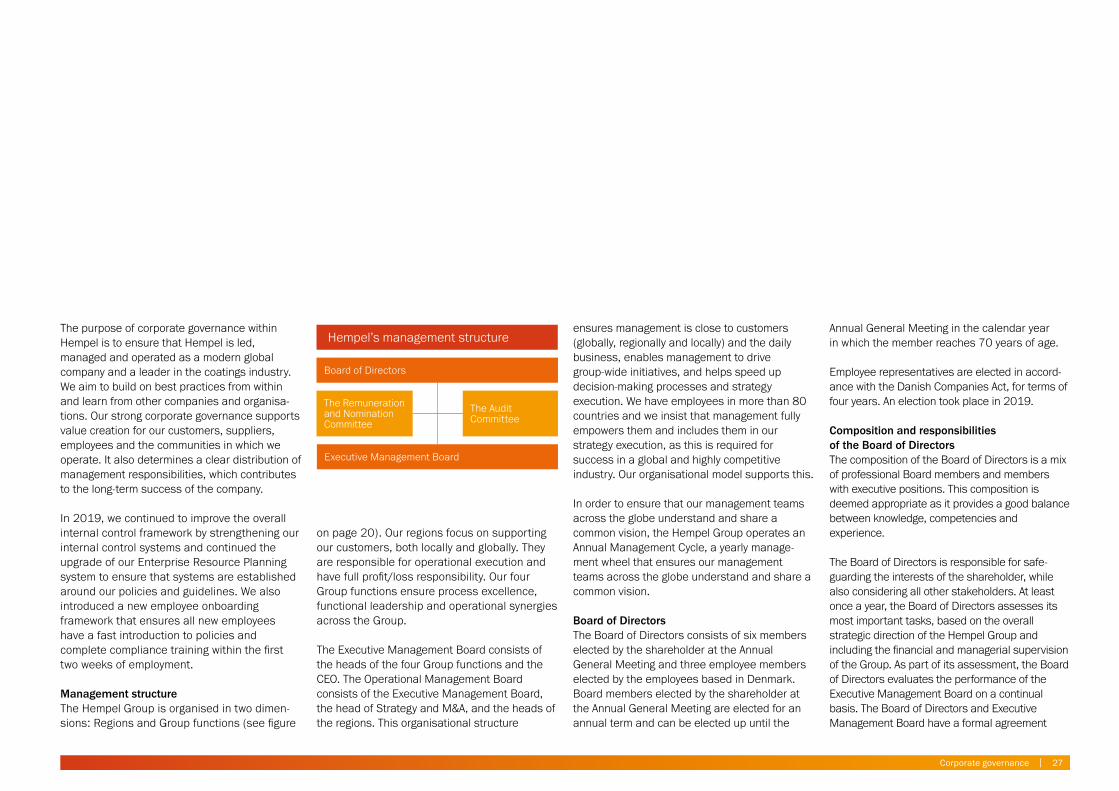
Management structureThe Hempel Group is organised in two dimen-sions: Regions and Group functions (see figure
ensures management is close to customers (globally, regionally and locally) and the daily business, enables management to drive group-wide initiatives, and helps speed up decision-making processes and strategy execution. We have employees in more than 80 countries and we insist that management fully empowers them and includes them in our strategy execution, as this is required for success in a global and highly competitive industry. Our organisational model supports this.
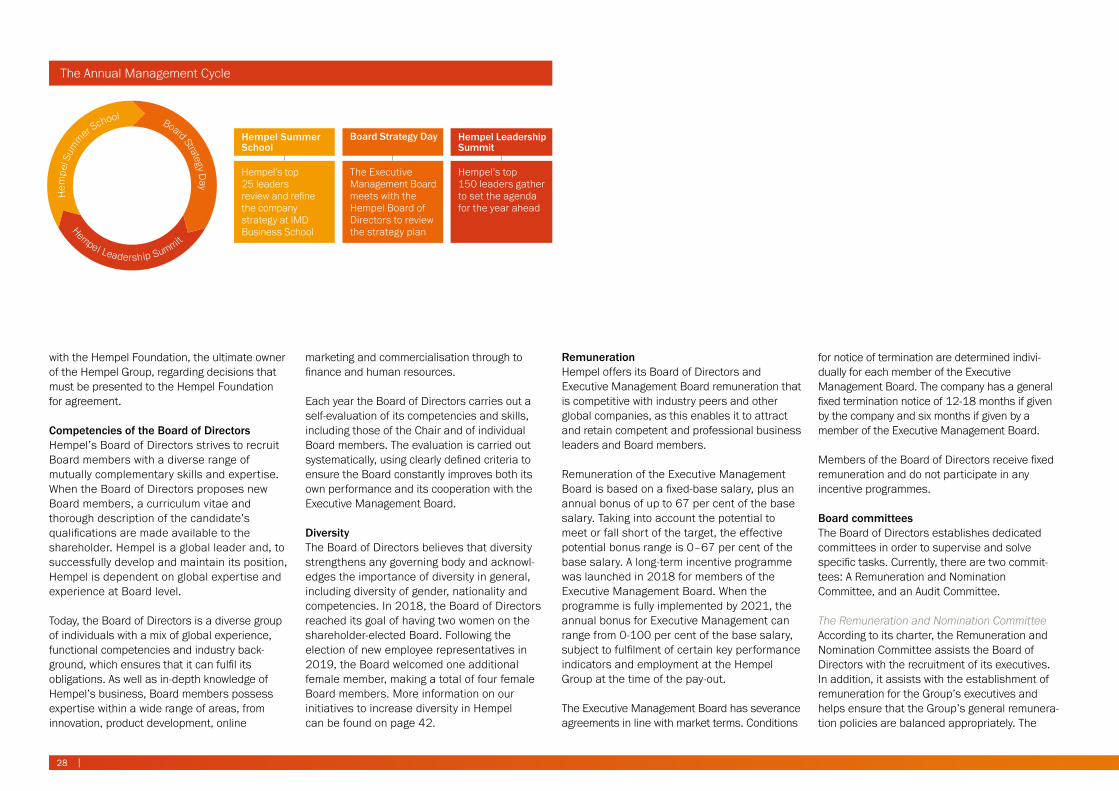
In order to ensure that our management teams across the globe understand and share a common vision, the Hempel Group operates an Annual Management Cycle, a yearly manage-ment wheel that ensures our management teams across the globe understand and share a common vision.
Board of DirectorsThe Board of Directors consists of six members elected by the shareholder at the Annual General Meeting and three employee members elected by the employees based in Denmark. Board members elected by the shareholder at the Annual General Meeting are elected for an annual term and can be elected up until the
on page 20). Our regions focus on supporting our customers, both locally and globally. They are responsible for operational execution and have full profit/loss responsibility. Our four Group functions ensure process excellence, functional leadership and operational synergies across the Group.
The Executive Management Board consists of the heads of the four Group functions and the CEO. The Operational Management Board consists of the Executive Management Board, the head of Strategy and M&A, and the heads of the regions. This organisational structure
Hempel’s management structure
Board of Directors
Executive Management Board
The Remuneration and Nomination Committee
The Audit Committee
Annual General Meeting in the calendar year in which the member reaches 70 years of age.
Employee representatives are elected in accord-ance with the Danish Companies Act, for terms of four years. An election took place in 2019.
Composition and responsibilities of the Board of DirectorsThe composition of the Board of Directors is a mix of professional Board members and members with executive positions. This composition is deemed appropriate as it provides a good balance between knowledge, competencies and experience.
The Board of Directors is responsible for safe-guarding the interests of the shareholder, while also considering all other stakeholders. At least once a year, the Board of Directors assesses its most important tasks, based on the overall strategic direction of the Hempel Group and including the financial and managerial supervision of the Group. As part of its assessment, the Board of Directors evaluates the performance of the Executive Management Board on a continual basis. The Board of Directors and Executive Management Board have a formal agreement
Corporate governance | 27
with the Hempel Foundation, the ultimate owner of the Hempel Group, regarding decisions that must be presented to the Hempel Foundation for agreement.
Competencies of the Board of DirectorsHempel’s Board of Directors strives to recruit Board members with a diverse range of mutually complementary skills and expertise. When the Board of Directors proposes new Board members, a curriculum vitae and thorough description of the candidate’s qualifications are made available to the shareholder. Hempel is a global leader and, to successfully develop and maintain its position, Hempel is dependent on global expertise and experience at Board level.
Today, the Board of Directors is a diverse group of individuals with a mix of global experience, functional competencies and industry back-ground, which ensures that it can fulfil its obligations. As well as in-depth knowledge of Hempel’s business, Board members possess expertise within a wide range of areas, from innovation, product development, online
marketing and commercialisation through to finance and human resources.
Each year the Board of Directors carries out a self-evaluation of its competencies and skills, including those of the Chair and of individual Board members. The evaluation is carried out systematically, using clearly defined criteria to ensure the Board constantly improves both its own performance and its cooperation with the Executive Management Board.
DiversityThe Board of Directors believes that diversity strengthens any governing body and acknowl-edges the importance of diversity in general, including diversity of gender, nationality and competencies. In 2018, the Board of Directors reached its goal of having two women on the shareholder-elected Board. Following the election of new employee representatives in 2019, the Board welcomed one additional female member, making a total of four female Board members. More information on our initiatives to increase diversity in Hempel can be found on page 42.
RemunerationHempel offers its Board of Directors and Executive Management Board remuneration that is competitive with industry peers and other global companies, as this enables it to attract and retain competent and professional business leaders and Board members.
Remuneration of the Executive Management Board is based on a fixed-base salary, plus an annual bonus of up to 67 per cent of the base salary. Taking into account the potential to meet or fall short of the target, the effective potential bonus range is 0–67 per cent of the base salary. A long-term incentive programme was launched in 2018 for members of the Executive Management Board. When the programme is fully implemented by 2021, the annual bonus for Executive Management can range from 0-100 per cent of the base salary, subject to fulfilment of certain key performance indicators and employment at the Hempel Group at the time of the pay-out.
The Executive Management Board has severance agreements in line with market terms. Conditions
The Annual Management Cycle
Board Strategy Day
The Executive Management Board meets with the Hempel Board of Directors to review the strategy plan
Hempel’s top 150 leaders gather to set the agenda for the year ahead
Hempel Leadership Summit
Hem
pel S
ummer S
chool Board Strategy Day
Hempel Leadership Summit
for notice of termination are determined indivi-dually for each member of the Executive Management Board. The company has a general fixed termination notice of 12-18 months if given by the company and six months if given by a member of the Executive Management Board.
Members of the Board of Directors receive fixed remuneration and do not participate in any incentive programmes.
Board committeesThe Board of Directors establishes dedicated committees in order to supervise and solve specific tasks. Currently, there are two commit-tees: A Remuneration and Nomination Committee, and an Audit Committee.
The Remuneration and Nomination CommitteeAccording to its charter, the Remuneration and Nomination Committee assists the Board of Directors with the recruitment of its executives. In addition, it assists with the establishment of remuneration for the Group’s executives and helps ensure that the Group’s general remunera-tion policies are balanced appropriately. The
Hempel’s top 25 leaders review and refine the company strategy at IMD Business School
Hempel Summer School
28 |
existing long-term incentive programme is aligned with comparable listed companies.
Furthermore, the Remuneration and Nomination Committee advises and makes recommendations to the Board of Directors in relation to the skills that the Board of Directors and the Executive Management Board must have to best perform their tasks. Each year, the committee evaluates the Board of Directors and the Executive Management Board, and makes recommenda-tions to the Board of Directors in regard to any changes. The committee helps prepare the Board of Directors’ work by selecting candidates with the assistance of a professional global search firm.
The committee convenes as necessary. However, it has two fixed meetings during the year, in February and November.
The Audit CommitteeAccording to its charter, the Audit Committee’s work includes assisting the Board of Directors with fulfilling its oversight responsibilities for the financial reporting process, the system of internal control, the internal and external audit process, the Group’s process for monitoring compliance with laws and regulations and its Code of Conduct, as well as risk management. Further, the Audit Committee assists the Board of Directors with its tasks in regard to preparing the annual report and the audit thereof and policies related to it.
In 2019, the committee reviewed initiatives to further strengthen compliance as well as the internal control framework, including updating internal policies and procedures. In addition, the committee reviewed the Group’s whistleblower reporting system and whistleblower cases, the main accounting principles and judgments, and tax compliance and key risks.
Internal Audit functionThe Group Internal Audit function is part of the Group’s Finance function. The Head of Group
Corporate governance | 29
Internal Audit meets separately with both the Audit Committee and the Group’s external auditor at least once a year. During 2019, the Internal Audit function continued to strengthen internal procedures and compliance awareness through site visits. The results and recommenda-tions were reported to both local and executive management.
In accordance with its charter, the Audit Committee annually considers the need for an Internal Audit function. Based on the recommen-dations of the Audit Committee, the Board of Directors determines whether an Internal Audit function is required and whether internal control systems are adequate. The Board of Directors’ assessment, which is based on the company’s size and the organisation of the Finance function, is that the organisation in place and the plans laid out are adequate to ensure the necessary focus on compliance for the entire Group.
Business ethics and compliance Hempel’s commitment to business ethics and compliance with international regulations and internal policies is anchored in its Code of Conduct, Business Ethics Policy and other internal corporate guidelines. These outline the fundamental requirements for how Hempel
operates, and describe the responsibilities and ethical standards expected of all employees and relevant business partners. To ensure and document employees’ familiarity with the Code of Conduct, Business Ethics Policy and other key policies, relevant employees electronically sign off on their compliance within specific areas.
In 2019, Hempel’s compliance framework was further strengthened to ensure that the procedures are adequate, sufficient and
applicable to the business and surrounding environment.
In 2019, all Hempel employees except produc-tion, warehouse and store staff completed employee Code of Conduct eLearning with a pass rate of 100 per cent.
The whistleblower reporting systemHempel has had an internal whistleblower reporting system since 2012. The current whistleblower system, launched in 2017, enables any employee or external stakeholder to anonymously report potentially irregular or unethical conduct through an internet portal, by email or via a local phone number. The system is an important tool to ensure that allegations of irregular or unethical conduct are reported and addressed quickly. All reports are treated confidentially and followed up by an objective and independent investigation.
All reports are reviewed by the Compliance and Corporate Responsibility Director, who recom-mends appropriate action to the Ethics Committee. The Ethics Committee then approves how to handle reported issues and decides on appropriate action following the investigation, including disciplinary action. The Audit
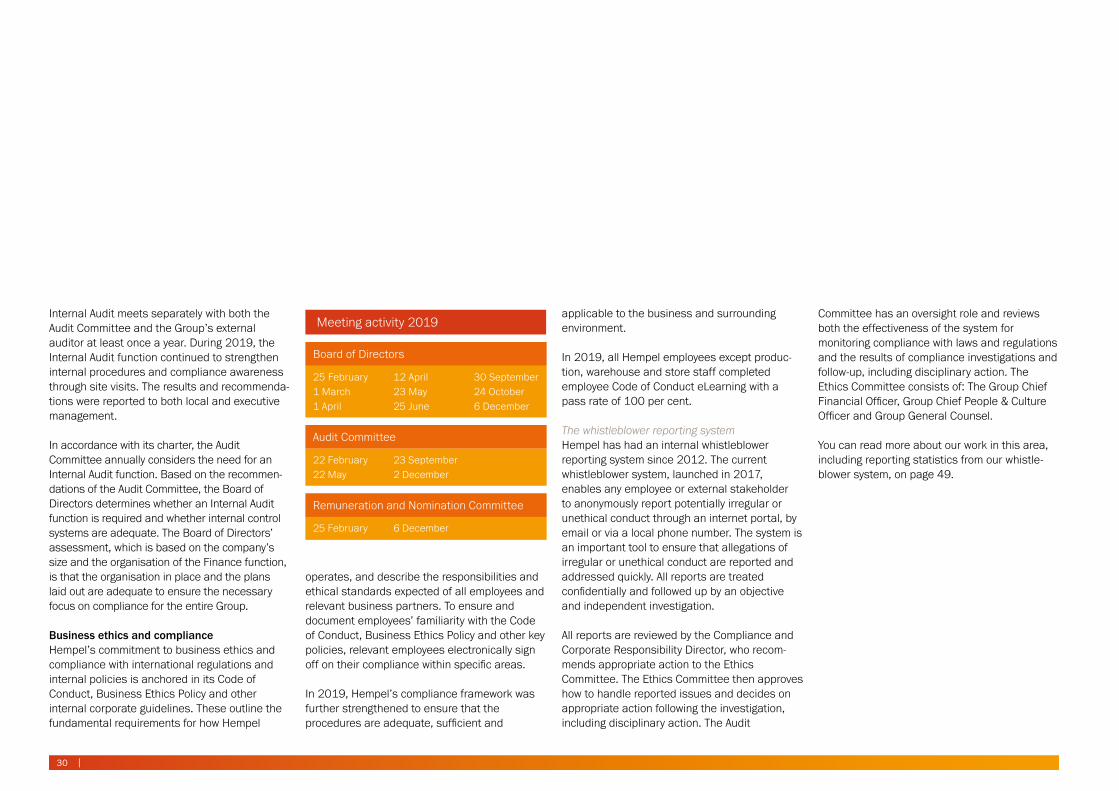
Meeting activity 2019
Board of Directors
25 February1 March1 April
12 April23 May25 June
30 September24 October6 December
Audit Committee
22 February22 May
23 September2 December
Remuneration and Nomination Committee
25 February 6 December
Committee has an oversight role and reviews both the effectiveness of the system for monitoring compliance with laws and regulations and the results of compliance investigations and follow-up, including disciplinary action. The Ethics Committee consists of: The Group Chief Financial Officer, Group Chief People & Culture Officer and Group General Counsel.
You can read more about our work in this area, including reporting statistics from our whistle-blower system, on page 49.
30 |
Corporate governance | 31
Hempel Ethics HotlineA link to the Hempel Ethics Hotline can be found on the Corporate responsibility section of hempel.com

RisksWe continually collaborate across the Group to evaluate and mitigate risk.
As a global company working in many industry segments and with a wide range of operational activities, the Hempel Group is exposed to a variety of risks and opportunities. Risks are therefore a natural part of our business and a precondition for being able to create value. Across our organisation, we work continuously to evaluate the risks we face and to assess the level of acceptable risk within the business. This is done through a process and governance structure with clear roles and responsibilities for identifying and reviewing risks as well as following up on mitigating actions.
Risk governanceThe Board of Directors has final responsibility for risk management and is the final approver of risk tolerance and risk mitigation activities. The Audit Committee monitors key risks, as well as the risk management process and governance structure. The Group Risk Committee has overall responsi-bility for running the risk management process and governance structure within the day-to-day
business. It also evaluates consolidated risks and the status of mitigating actions at Group level.
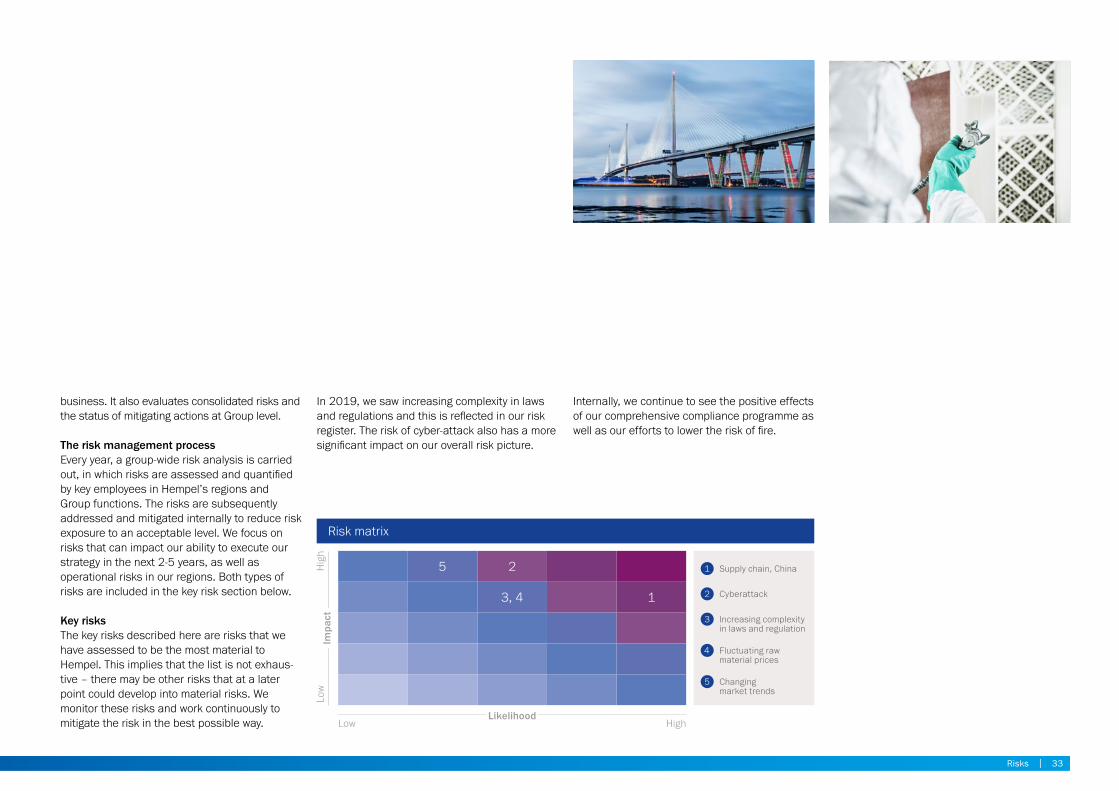
The risk management processEvery year, a group-wide risk analysis is carried out, in which risks are assessed and quantified by key employees in Hempel’s regions and Group functions. The risks are subsequently addressed and mitigated internally to reduce risk exposure to an acceptable level. We focus on risks that can impact our ability to execute our strategy in the next 2-5 years, as well as operational risks in our regions. Both types of risks are included in the key risk section below.
Key risksThe key risks described here are risks that we have assessed to be the most material to Hempel. This implies that the list is not exhaus-tive – there may be other risks that at a later point could develop into material risks. We monitor these risks and work continuously to mitigate the risk in the best possible way.
1 Supply chain, China
2 Cyberattack
Increasing complexity in laws and regulation
3
Fluctuating raw material prices
4
Changing market trends
5
Risk matrix
HighLowLikelihood
Impa
ctH
igh
Low
3, 4 1
25
In 2019, we saw increasing complexity in laws and regulations and this is reflected in our risk register. The risk of cyber-attack also has a more significant impact on our overall risk picture.
Internally, we continue to see the positive effects of our comprehensive compliance programme as well as our efforts to lower the risk of fire.
Risks | 33
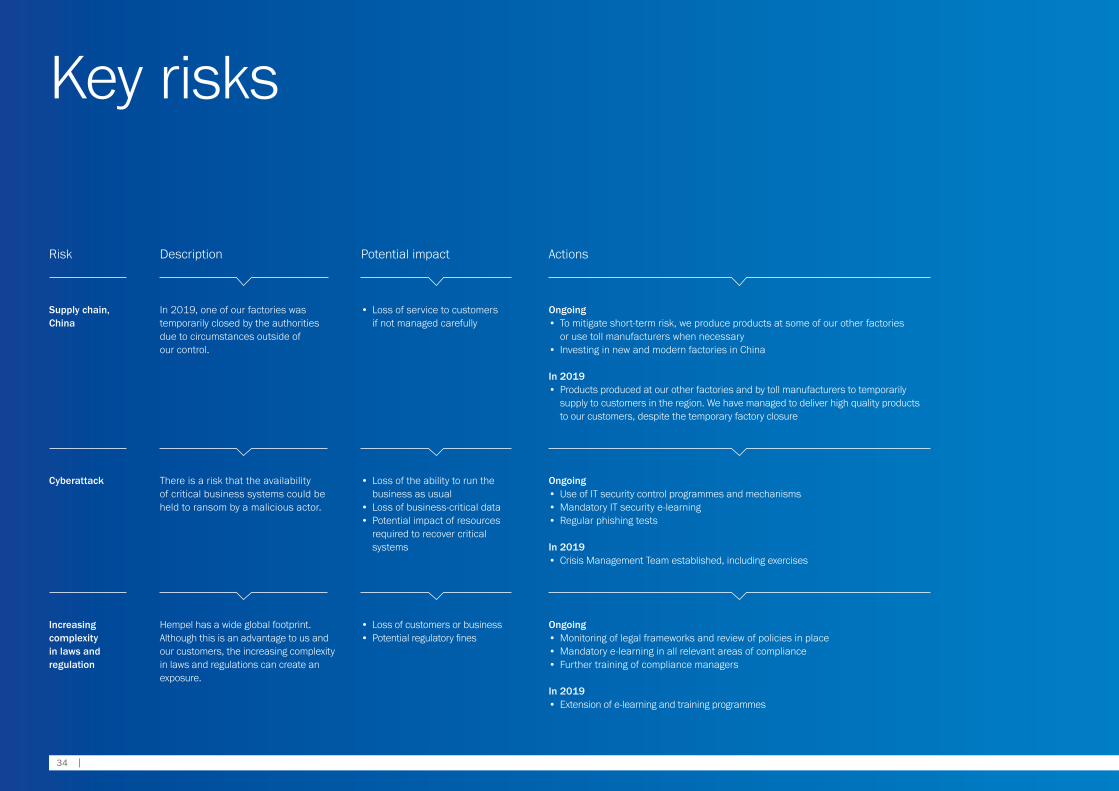
Supply chain, China
In 2019, one of our factories was temporarily closed by the authorities due to circumstances outside of our control.
• Loss of service to customers if not managed carefully
Increasing complexity in laws and regulation
Hempel has a wide global footprint. Although this is an advantage to us and our customers, the increasing complexity in laws and regulations can create an exposure.
• Loss of customers or business• Potential regulatory fines
Ongoing• Monitoring of legal frameworks and review of policies in place• Mandatory e-learning in all relevant areas of compliance• Further training of compliance managers
In 2019• Extension of e-learning and training programmes
Ongoing• To mitigate short-term risk, we produce products at some of our other factories
or use toll manufacturers when necessary • Investing in new and modern factories in China In 2019• Products produced at our other factories and by toll manufacturers to temporarily
supply to customers in the region. We have managed to deliver high quality products to our customers, despite the temporary factory closure
Cyberattack There is a risk that the availability of critical business systems could be held to ransom by a malicious actor.
• Loss of the ability to run the business as usual
• Loss of business-critical data• Potential impact of resources
required to recover critical systems
Ongoing• Use of IT security control programmes and mechanisms• Mandatory IT security e-learning• Regular phishing tests
In 2019• Crisis Management Team established, including exercises
Key risks
Risk Description Potential impact Actions
34 |
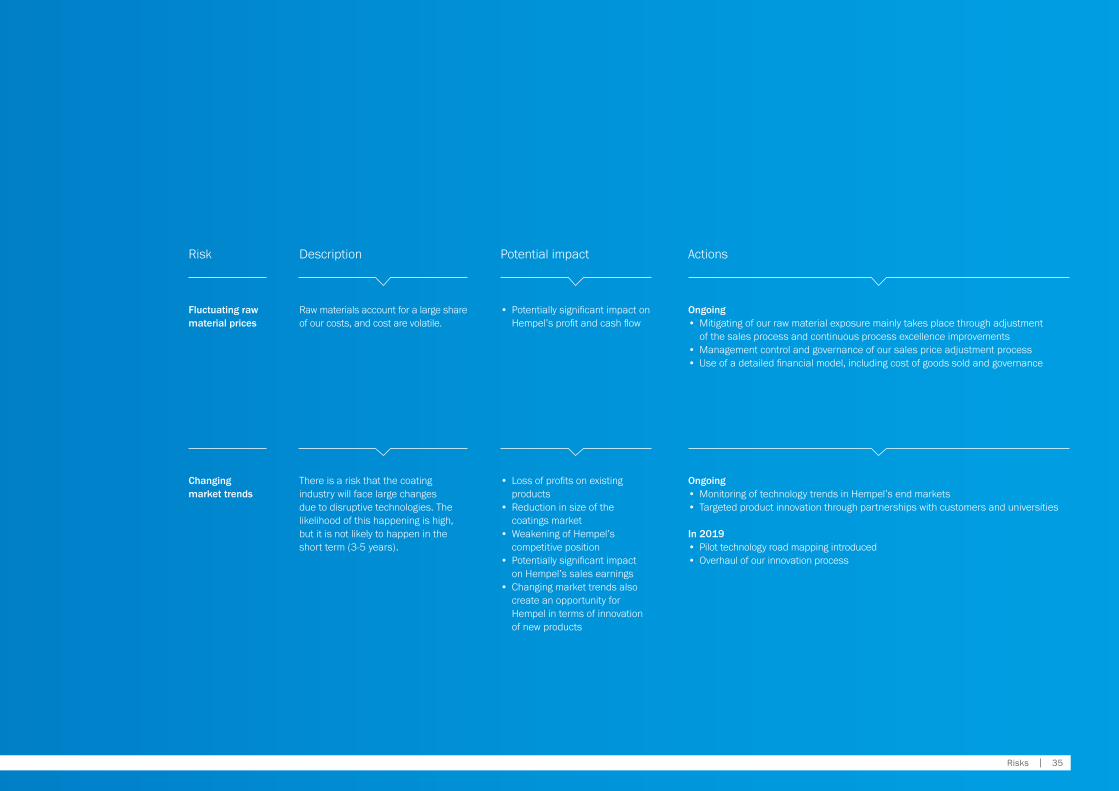
Fluctuating raw material prices
Raw materials account for a large share of our costs, and cost are volatile.
• Potentially significant impact on Hempel’s profit and cash flow
Ongoing• Mitigating of our raw material exposure mainly takes place through adjustment
of the sales process and continuous process excellence improvements• Management control and governance of our sales price adjustment process• Use of a detailed financial model, including cost of goods sold and governance
Changing market trends
There is a risk that the coating industry will face large changes due to disruptive technologies. The likelihood of this happening is high, but it is not likely to happen in the short term (3-5 years).
• Loss of profits on existing products
• Reduction in size of the coatings market
• Weakening of Hempel’s competitive position
• Potentially significant impact on Hempel’s sales earnings
• Changing market trends also create an opportunity for Hempel in terms of innovation of new products
Ongoing• Monitoring of technology trends in Hempel’s end markets• Targeted product innovation through partnerships with customers and universities
In 2019• Pilot technology road mapping introduced • Overhaul of our innovation process
Risk Description Potential impact Actions
Risks | 35

Corporate responsibility
We continued our journey to embed sustainability in all our business activities.
We are continuously working to make our world a better place through our operations and products. We follow the UN Guiding Principles on Business and Human Rights and support the principles in the UN Global Compact. Our efforts in these areas have resulted in good progress in a number of initiatives related to human rights, labour, the environment and anti-corruption.
In 2019, we continued our journey towards embedding sustainability as a strategic element in our business. This included using the Future-Fit benchmark, a comprehensive tool that enables companies to plan a path towards a sustainable and responsible business in line with the UN Sustainable Development Goals. We used Future-Fit to define where our company has the biggest impact on the environment and society, and to establish how we can make most progress on the Sustainable Development Goals. Based on this work, we will continue to implement activities that have a positive impact on society and the environment, and ensure we enable our custom-ers to reach their sustainability goals.
We work with a third-party auditor to improve our data collection and validation process, and we are pleased that this report again includes a limited independent assurance statement on our sustainability data with no qualifications in the conclusion.
The following pages constitute our Communi cation on Progress (COP) as required by the UN Global Compact as well as information required by the Danish Financial Statements Act §99a and 99b.
UN Sustainable Development GoalsThe United Nations has identified 17 Sustainable Development Goals to help address the global challenges of poverty, inequality, climate change, environmental degradation, prosperity, peace and injustice. The following pages describe how our current programmes contribute to achieving these goals.
Corporate responsibility | 37
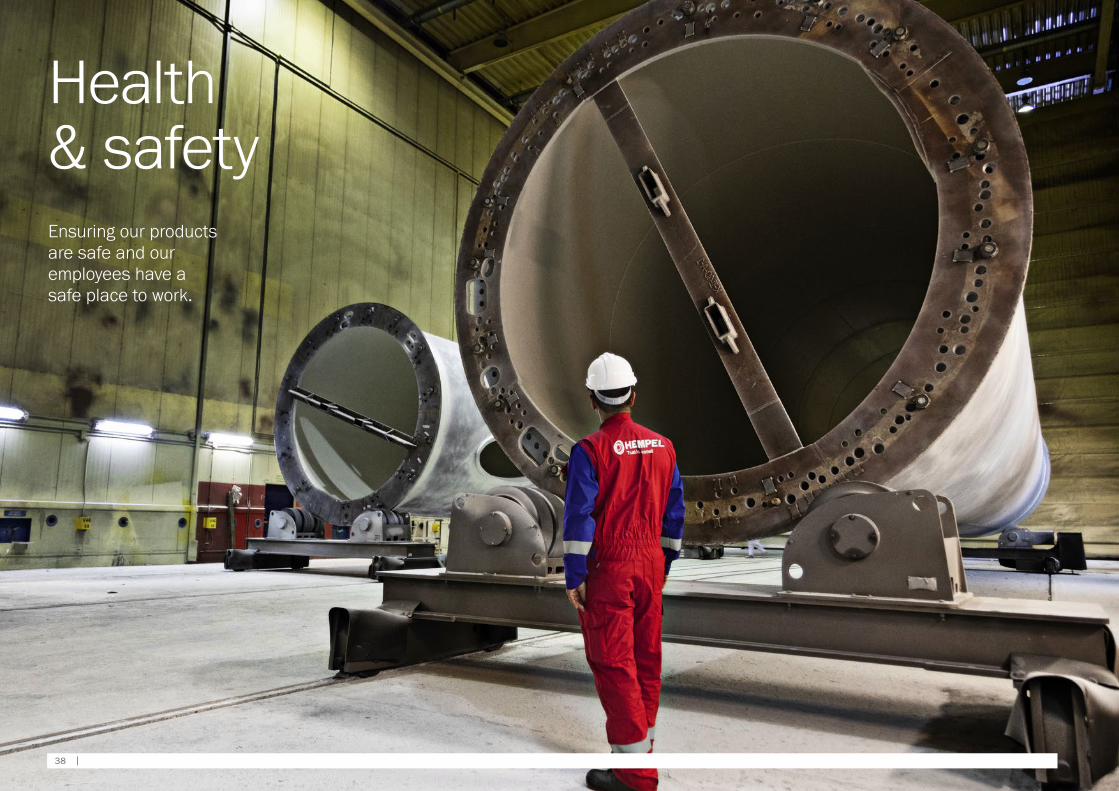
Health & safetyEnsuring our products are safe and our employees have a safe place to work.
38 |
Our Group Health, Safety and Environmental Policy defines our promise to comply with all applicable legal and non-regulatory require-ments, to continually improve and to work to prevent illness and injuries to our employees and the end-users of our products. This commitment to health and safety is embedded in our company values and employee Code of Conduct – and it requires that we continually review our work practices to eliminate risk and ultimately ensure a healthy and safe work environment for all of our employees.
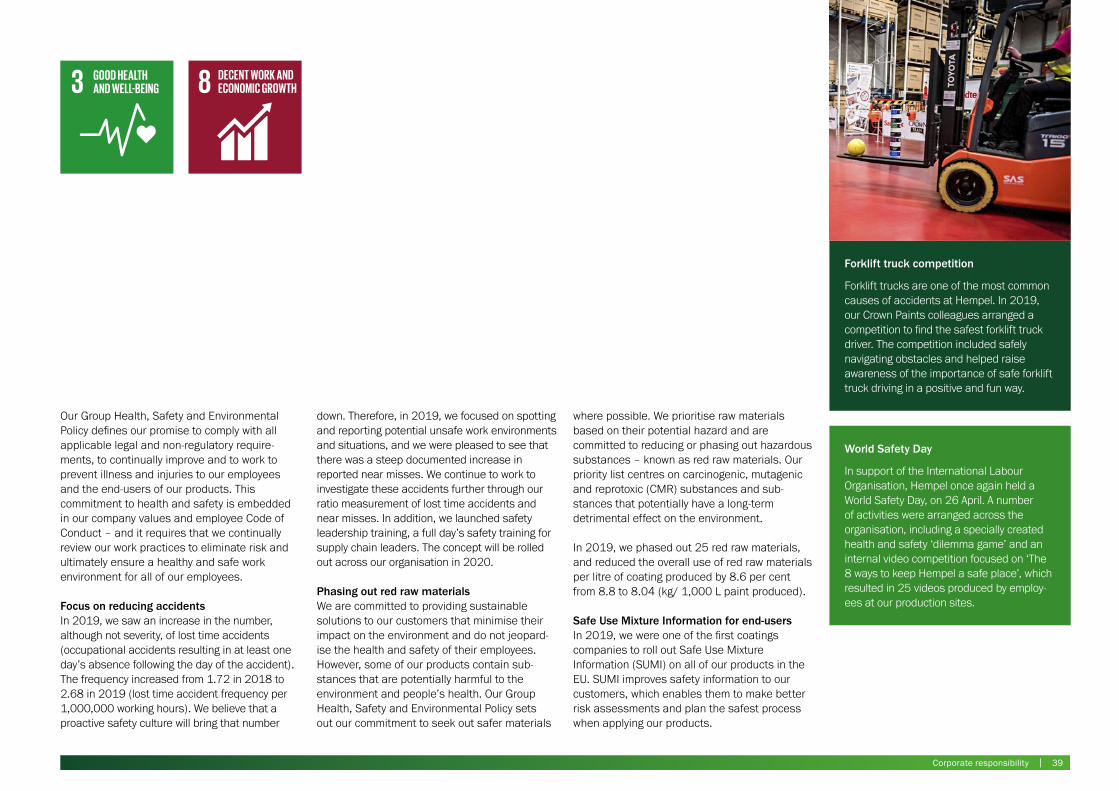
Focus on reducing accidentsIn 2019, we saw an increase in the number, although not severity, of lost time accidents (occupational accidents resulting in at least one day’s absence following the day of the accident). The frequency increased from 1.72 in 2018 to 2.68 in 2019 (lost time accident frequency per 1,000,000 working hours). We believe that a proactive safety culture will bring that number
World Safety Day
In support of the International Labour Organisation, Hempel once again held a World Safety Day, on 26 April. A number of activities were arranged across the organisation, including a specially created health and safety ‘dilemma game’ and an internal video competition focused on ‘The 8 ways to keep Hempel a safe place’, which resulted in 25 videos produced by employ-ees at our production sites.
down. Therefore, in 2019, we focused on spotting and reporting potential unsafe work environments and situations, and we were pleased to see that there was a steep documented increase in reported near misses. We continue to work to investigate these accidents further through our ratio measurement of lost time accidents and near misses. In addition, we launched safety leadership training, a full day’s safety training for supply chain leaders. The concept will be rolled out across our organisation in 2020.
Phasing out red raw materialsWe are committed to providing sustainable solutions to our customers that minimise their impact on the environment and do not jeopard-ise the health and safety of their employees. However, some of our products contain sub-stances that are potentially harmful to the environment and people’s health. Our Group Health, Safety and Environmental Policy sets out our commitment to seek out safer materials
Forklift truck competition
Forklift trucks are one of the most common causes of accidents at Hempel. In 2019, our Crown Paints colleagues arranged a competition to find the safest forklift truck driver. The competition included safely navigating obstacles and helped raise awareness of the importance of safe forklift truck driving in a positive and fun way.
where possible. We prioritise raw materials based on their potential hazard and are committed to reducing or phasing out hazardous substances – known as red raw materials. Our priority list centres on carcinogenic, mutagenic and reprotoxic (CMR) substances and sub-stances that potentially have a long-term detrimental effect on the environment.
In 2019, we phased out 25 red raw materials, and reduced the overall use of red raw materials per litre of coating produced by 8.6 per cent from 8.8 to 8.04 (kg/ 1,000 L paint produced).
Safe Use Mixture Information for end-usersIn 2019, we were one of the first coatings companies to roll out Safe Use Mixture Information (SUMI) on all of our products in the EU. SUMI improves safety information to our customers, which enables them to make better risk assessments and plan the safest process when applying our products.
Corporate responsibility | 39
Our people are our greatest asset. We want to be the employer of choice and believe that one of the ways to do this is by creating a work environment where everyone can develop.
Making everyone feel part of the familyIn 2019, we welcomed 665 new colleagues to Hempel. All new colleagues must be introduced to our organisation and processes, and we want them to quickly feel part of the family. To take our new colleagues more smoothly from ‘beginning’ to ‘belonging’, we launched a new global onboarding programme in 2019. The programme structures our onboarding procedures to ensure we offer all new colleagues a great initial experience. This, in turn, should ensure a stronger commitment and a higher sense of loyalty to Hempel, which will have a positive effect on retention, reduce time-to- performance and limit costs arising from unsuccessful onboarding.
Employee Engagement SurveyWe are very pleased that 90 per cent of our people worldwide responded to our annual Employee Engagement Survey, which was again carried out across all countries and functions.
All people are different. At Hempel, we value different perspectives and constantly challenge each other to become better at what we do.
Our people
We saw an impressive increase in overall satisfaction and motivation of 3 points, from 71 in 2018 to 74 in 2019, and we are now among the top quartile of global companies. Since we began the annual survey three years ago, we have seen a steady increase in satisfaction and motivation across the Group. Our North Asia region in particular has made great progress by increasing focus on employee engagement at all levels of the organisation and improving its initiatives around working conditions, job content and leadership.
In 2019, our global employee Net Promoter Score (eNPS) was 35, an increase of 14 points compared to 2018, showing even more employ-ees would recommend Hempel as a place of work to others. We can see that the gap in eNPS between leaders and managers and other employees has shrunk, which indicates that our efforts to cascade engagement throughout the organisation is paying dividends. Employee loyalty also increased significantly in 2019, rising from 82 points in 2018 to 85 points. This places Hempel above the top quartile global benchmark of 83 points, and shows that the majority of our employees are very committed to the company.
To maintain these good results, we must continue to focus on leadership, employee involvement and communication, both internally and externally, in the years to come.
Investing in our leadership pipelineOur transformational journey can only succeed if we are all engaged and passionate about moving our company forward. This journey begins with our leaders. In 2018, we introduced 10 Leadership Competencies, which explain what it takes to be a Hempel leader in terms of Leading Self, Leading Others and Leading the Business. In 2019, we launched 10 Learning Journeys to help employees in leadership positions develop these competencies. The 10 Learning Journeys are delivered through a combination of podcasts, videos, business cases and other activities, enabling our leaders to pick and choose those most relevant to their development needs and learning style.
We also introduced a suite of nine personal development training programmes for all employ-ees across the organisation. The programmes cover a range of areas – from Personal Efficiency and Basic Finance to Cross-Cultural Management
40 |

and Unconscious Bias & Decision Making – and give our employees a chance to develop their skills and abilities through online training.
To continually strengthen our organisation, we support targeted development of high potential talents throughout their careers. In 2019, we launched Pioneer, a global graduate programme to attract high potential leadership talents early in their careers. 22 new or recent graduates began the 18-month programme during the year. With the launch of Pioneer, we now offer three development programmes for high potential talents, running from graduate through to executive level.
• Pioneer. A global graduate programme to attract high potential leadership talent at the beginning of their careers.
• Explorer. A talent programme for mid-level leaders, focusing on building leadership capabilities and accelerating personal development.
• Challenger. A talent programme for the most senior leaders in our organisation, with focus on strategy, implementation and leadership for executives.
Corporate responsibility | 41

getting these priorities done. The Hempel Leadership Summit is part of our Annual Management Cycle.
Giving everyone an opportunity to developOur Diversity and Equal Opportunity Policy applies to all Hempel offices and ensures that all employment and career development decisions are based on merit and made to support business goals. Through our talent management process, we asses more than 2,100 employees annually in order to identify leadership potential and development opportunities. This process ensures that all our leaders are given equal opportunities for growth. We acknowledge that the number of women in management positions at Hempel does not reflect the number of women in our organisa-tion. Therefore, we have set a target. Our goal is for 25 per cent of management positions to be held by women in 2022, which would mirror the percentage of women in our organisation. Currently, 20 per cent of management positions are held by women. We acknowledge that we need to work even harder to reach our target. We have established a team of Challenger participants who will work on strengthening our approach to diversity and inclusion going forward.
In 2019, we strengthened our female mentoring programme, which uses mentors to help female leaders develop in their current roles and prepare for future roles. By the end of the year, 18 female leaders had gone through or were going through the 12-month programme. In addition, we worked to improve our employer branding and to ensure it attracts candidates of both genders.
Learning and development improved through Let’s TalkLearning and development are key priorities across all functions and levels of our organisa-tion. In 2017, we introduced an employee development tool called Let’s Talk.
In 2019, Let’s Talk was rolled out to employees in our factories and warehouses to make sure managers and employees across all levels and locations have regular dialogues on how they can develop in their jobs. In total, 89 per cent of all employees had a Let’s Talk dialogue with their direct manager, resulting in development plans for the individual.
Our focus on employee development has seen a steady increase in our learning and development score in our Employee Engagement Survey over the last three years. In 2019, learning and development increased to 81, up from 80 in
The People PromiseIn 2019, we introduced the People Promise, new employer branding that will help ensure we attract and retain the best colleagues in the business. The People Promise is based on interviews and surveys with over 800 colleagues – including over 700 that joined Hempel within the last two years – to find out what makes Hempel a special place to work. The research identified four key pillars that together make Hempel stand out from other employers: employee empowerment, family-oriented, global and our unique ownership model. The People Promise was launched on our new website in November 2019 and also forms the basis of our LinkedIn Life profile. In 2020, we will launch a new recruitment toolkit based on the People Promise to help hiring managers and HR staff identify and attract the right candidates for our company.
Hempel Leadership SummitThe Hempel Leadership Summit is our annual leadership conference. This year our 150 top leaders and selected talents gathered in Copenhagen, Denmark on 21-22 November. The theme of this year’s summit was ‘Winning together’ and it focused on executing our strategy by being very explicit about our priorities and engaging our global workforce in
60
40
20
2018 20192017
71 7469
Satisfaction & Motivation score
Hempel Employee Foundations
The Hempel Employee Foundations provide financial support to current and retired employees of the Hempel Group and their immediate family in the event of unfortunate situations or to enable better education opportunities.
2018 and 78 in 2017. In the years to come, we will continue to focus on creating an organisation in which everyone can develop.
Enabling our sales organisation to reach our ambitious targetsOur company has ambitious growth targets. To help achieve those targets, we rolled out a training programme for sales staff across the Hempel Group to lift capabilities and ensure we focus on customer needs consistently. Last year, more than 789 of our sales colleagues under-went the training.
42 |
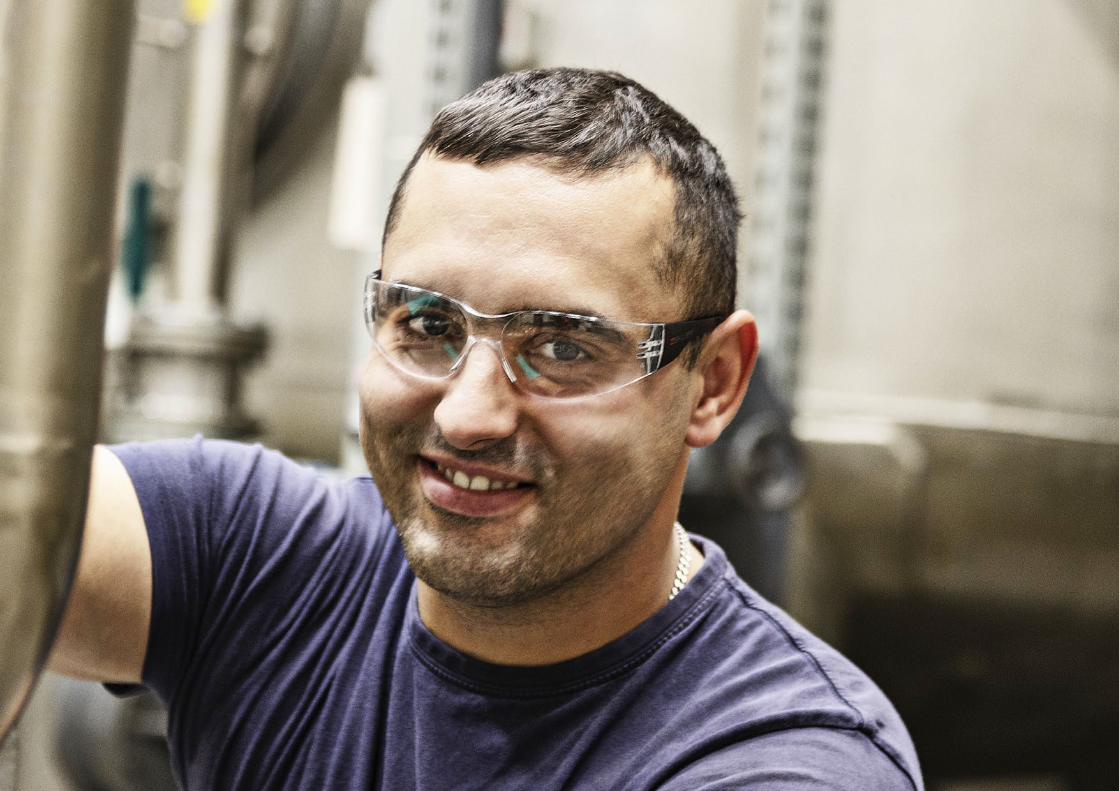
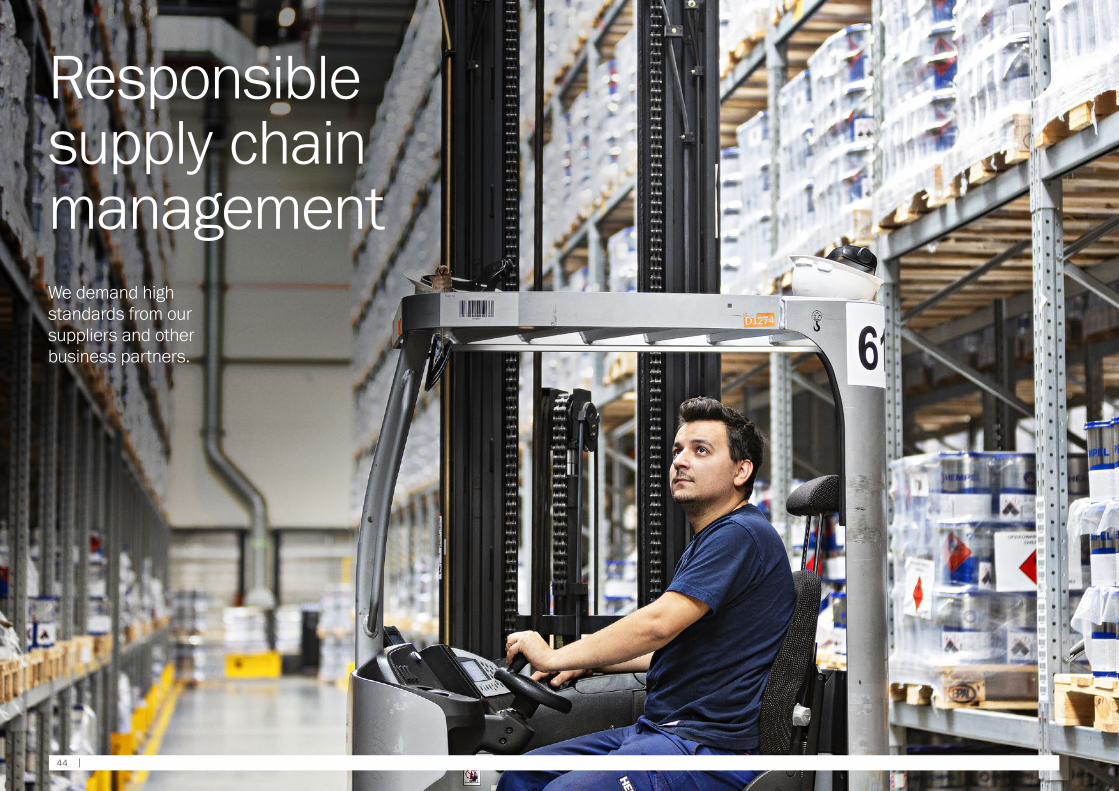
Responsible supply chain managementWe demand high standards from our suppliers and other business partners.
44 |
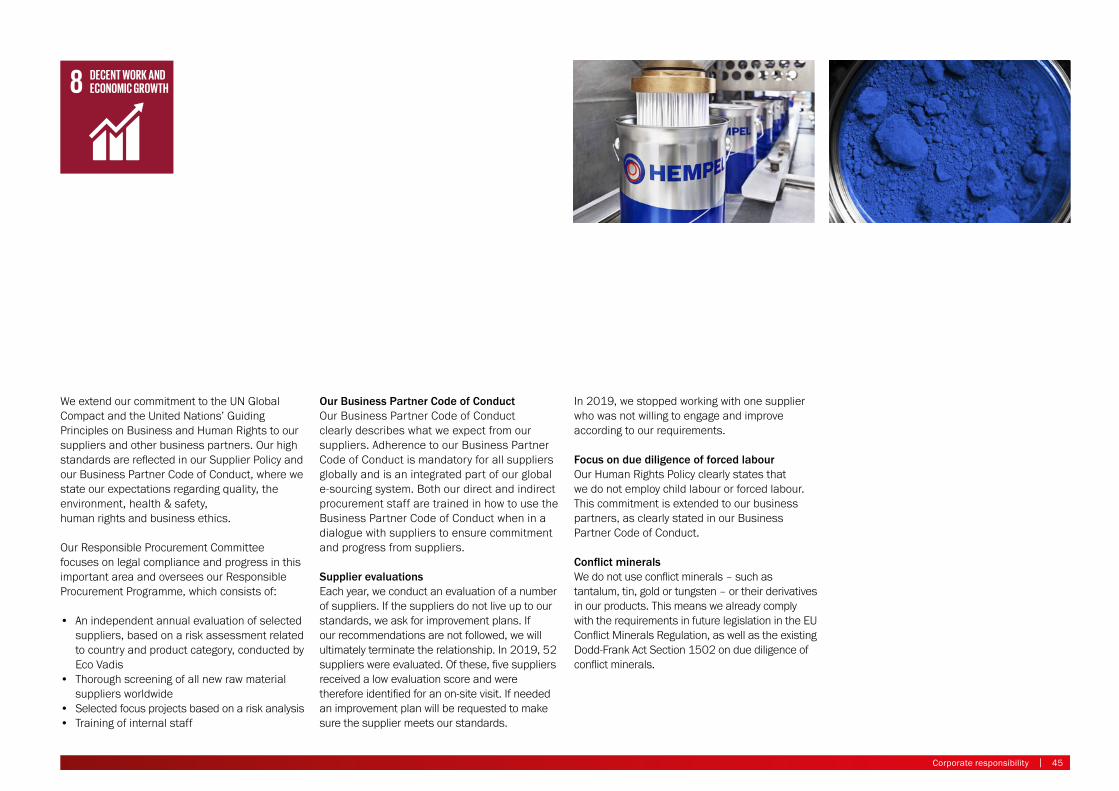
We extend our commitment to the UN Global Compact and the United Nations’ Guiding Principles on Business and Human Rights to our suppliers and other business partners. Our high standards are reflected in our Supplier Policy and our Business Partner Code of Conduct, where we state our expectations regarding quality, the environment, health & safety, human rights and business ethics.
Our Responsible Procurement Committee focuses on legal compliance and progress in this important area and oversees our Responsible Procurement Programme, which consists of:
• An independent annual evaluation of selected suppliers, based on a risk assessment related to country and product category, conducted by Eco Vadis
• Thorough screening of all new raw material suppliers worldwide
• Selected focus projects based on a risk analysis• Training of internal staff
Our Business Partner Code of ConductOur Business Partner Code of Conduct clearly describes what we expect from our suppliers. Adherence to our Business Partner Code of Conduct is mandatory for all suppliers globally and is an integrated part of our global e-sourcing system. Both our direct and indirect procurement staff are trained in how to use the Business Partner Code of Conduct when in a dialogue with suppliers to ensure commitment and progress from suppliers.
Supplier evaluationsEach year, we conduct an evaluation of a number of suppliers. If the suppliers do not live up to our standards, we ask for improvement plans. If our recommendations are not followed, we will ultimately terminate the relationship. In 2019, 52 suppliers were evaluated. Of these, five suppliers received a low evaluation score and were therefore identified for an on-site visit. If needed an improvement plan will be requested to make sure the supplier meets our standards.
In 2019, we stopped working with one supplier who was not willing to engage and improve according to our requirements.
Focus on due diligence of forced labourOur Human Rights Policy clearly states that we do not employ child labour or forced labour. This commitment is extended to our business partners, as clearly stated in our Business Partner Code of Conduct.
Conflict mineralsWe do not use conflict minerals – such as tantalum, tin, gold or tungsten – or their derivatives in our products. This means we already comply with the requirements in future legislation in the EU Conflict Minerals Regulation, as well as the existing Dodd-Frank Act Section 1502 on due diligence of conflict minerals.
Corporate responsibility | 45
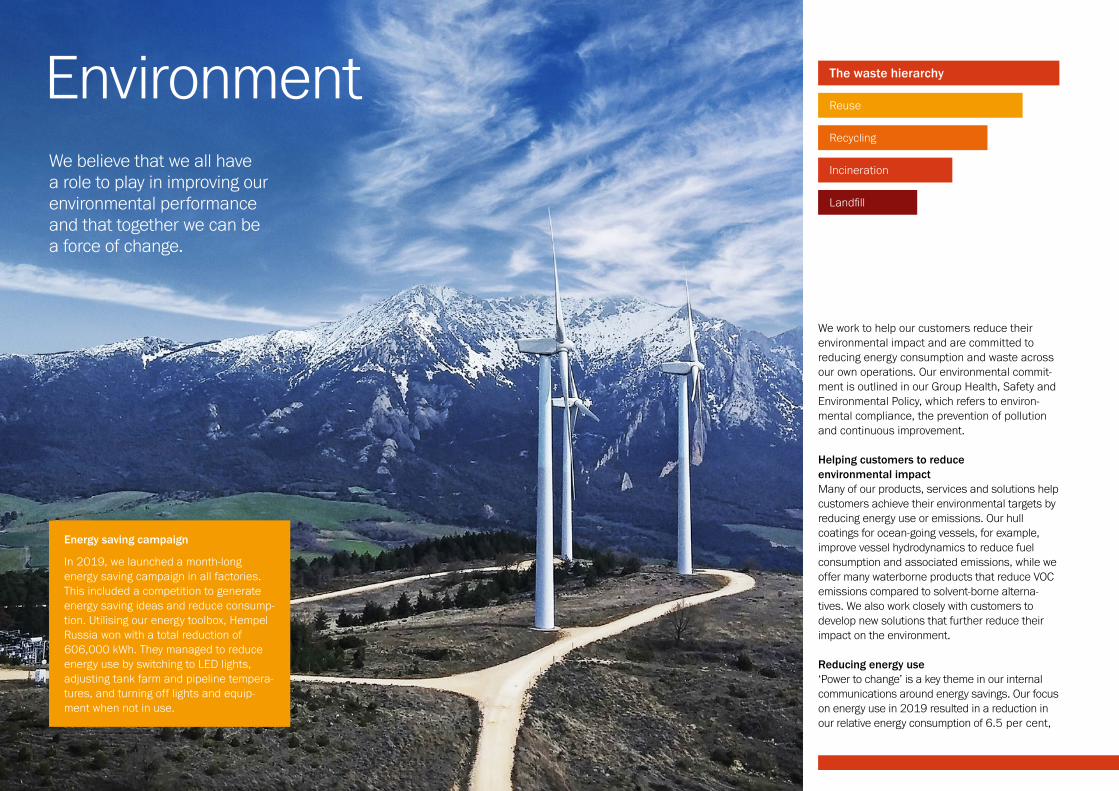
EnvironmentWe believe that we all have a role to play in improving our environmental performance and that together we can be a force of change.
We work to help our customers reduce their environmental impact and are committed to reducing energy consumption and waste across our own operations. Our environmental commit-ment is outlined in our Group Health, Safety and Environmental Policy, which refers to environ-mental compliance, the prevention of pollution and continuous improvement.
Helping customers to reduce environmental impactMany of our products, services and solutions help customers achieve their environmental targets by reducing energy use or emissions. Our hull coatings for ocean-going vessels, for example, improve vessel hydrodynamics to reduce fuel consumption and associated emissions, while we offer many waterborne products that reduce VOC emissions compared to solvent-borne alterna-tives. We also work closely with customers to develop new solutions that further reduce their impact on the environment.
Reducing energy use‘Power to change’ is a key theme in our internal communications around energy savings. Our focus on energy use in 2019 resulted in a reduction in our relative energy consumption of 6.5 per cent,
Reuse
Recycling
Incineration
Landfill
The waste hierarchy
Energy saving campaign
In 2019, we launched a month-long energy saving campaign in all factories. This included a competition to generate energy saving ideas and reduce consump-tion. Utilising our energy toolbox, Hempel Russia won with a total reduction of 606,000 kWh. They managed to reduce energy use by switching to LED lights, adjusting tank farm and pipeline tempera-tures, and turning off lights and equip-ment when not in use.
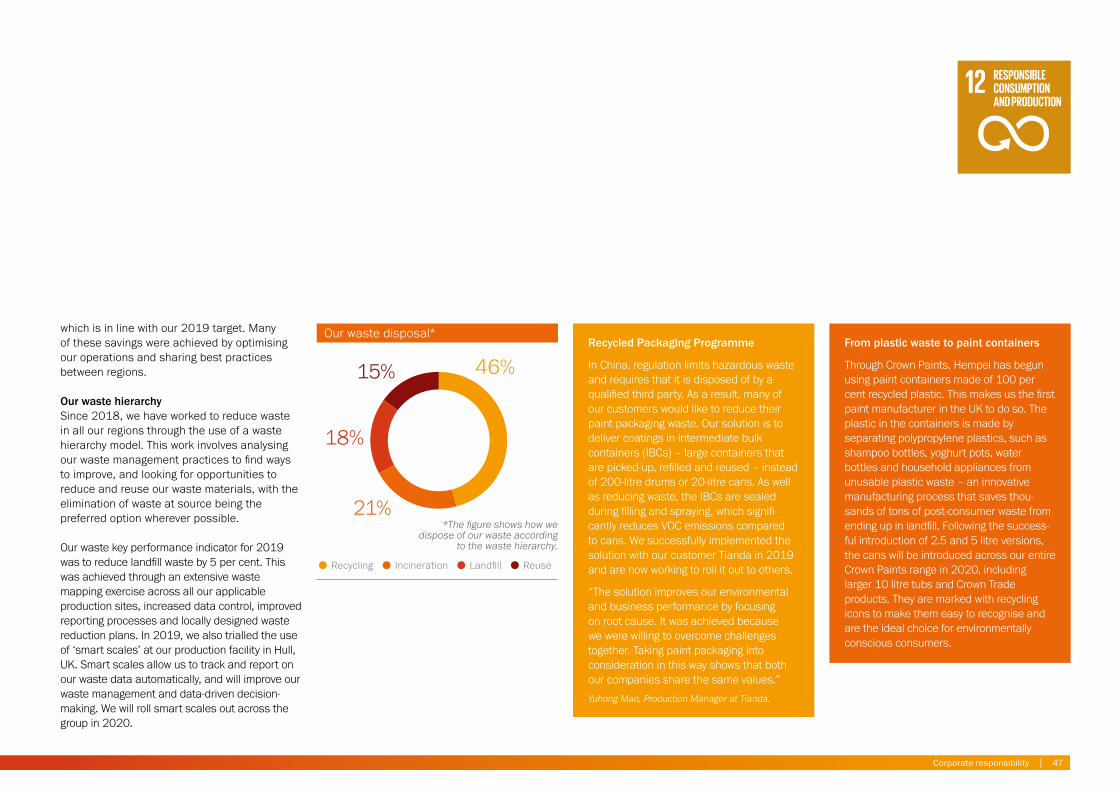
which is in line with our 2019 target. Many of these savings were achieved by optimising our operations and sharing best practices between regions.
Our waste hierarchySince 2018, we have worked to reduce waste in all our regions through the use of a waste hierarchy model. This work involves analysing our waste management practices to find ways to improve, and looking for opportunities to reduce and reuse our waste materials, with the elimination of waste at source being the preferred option wherever possible.
Our waste key performance indicator for 2019 was to reduce landfill waste by 5 per cent. This was achieved through an extensive waste mapping exercise across all our applicable production sites, increased data control, improved reporting processes and locally designed waste reduction plans. In 2019, we also trialled the use of ‘smart scales’ at our production facility in Hull, UK. Smart scales allow us to track and report on our waste data automatically, and will improve our waste management and data-driven decision-making. We will roll smart scales out across the group in 2020.
Recycled Packaging Programme
In China, regulation limits hazardous waste and requires that it is disposed of by a qualified third party. As a result, many of our customers would like to reduce their paint packaging waste. Our solution is to deliver coatings in intermediate bulk containers (IBCs) – large containers that are picked-up, refilled and reused – instead of 200-litre drums or 20-litre cans. As well as reducing waste, the IBCs are sealed during filling and spraying, which signifi-cantly reduces VOC emissions compared to cans. We successfully implemented the solution with our customer Tianda in 2019 and are now working to roll it out to others.
“The solution improves our environmental and business performance by focusing on root cause. It was achieved because we were willing to overcome challenges together. Taking paint packaging into consideration in this way shows that both our companies share the same values.”
Yuhong Mao, Production Manager at Tianda.
From plastic waste to paint containers
Through Crown Paints, Hempel has begun using paint containers made of 100 per cent recycled plastic. This makes us the first paint manufacturer in the UK to do so. The plastic in the containers is made by separating polypropylene plastics, such as shampoo bottles, yoghurt pots, water bottles and household appliances from unusable plastic waste – an innovative manufacturing process that saves thou-sands of tons of post-consumer waste from ending up in landfill. Following the success-ful introduction of 2.5 and 5 litre versions, the cans will be introduced across our entire Crown Paints range in 2020, including larger 10 litre tubs and Crown Trade products. They are marked with recycling icons to make them easy to recognise and are the ideal choice for environmentally conscious consumers.
Our waste disposal*
Recycling Incineration ReuseLandfill
46%15%
18%
21%*The figure shows how we
dispose of our waste according to the waste hierarchy.
Corporate responsibility | 47
Ethical behaviourOur business is built on trust. We earn trust and inspire confidence through the way we do business.
48 |
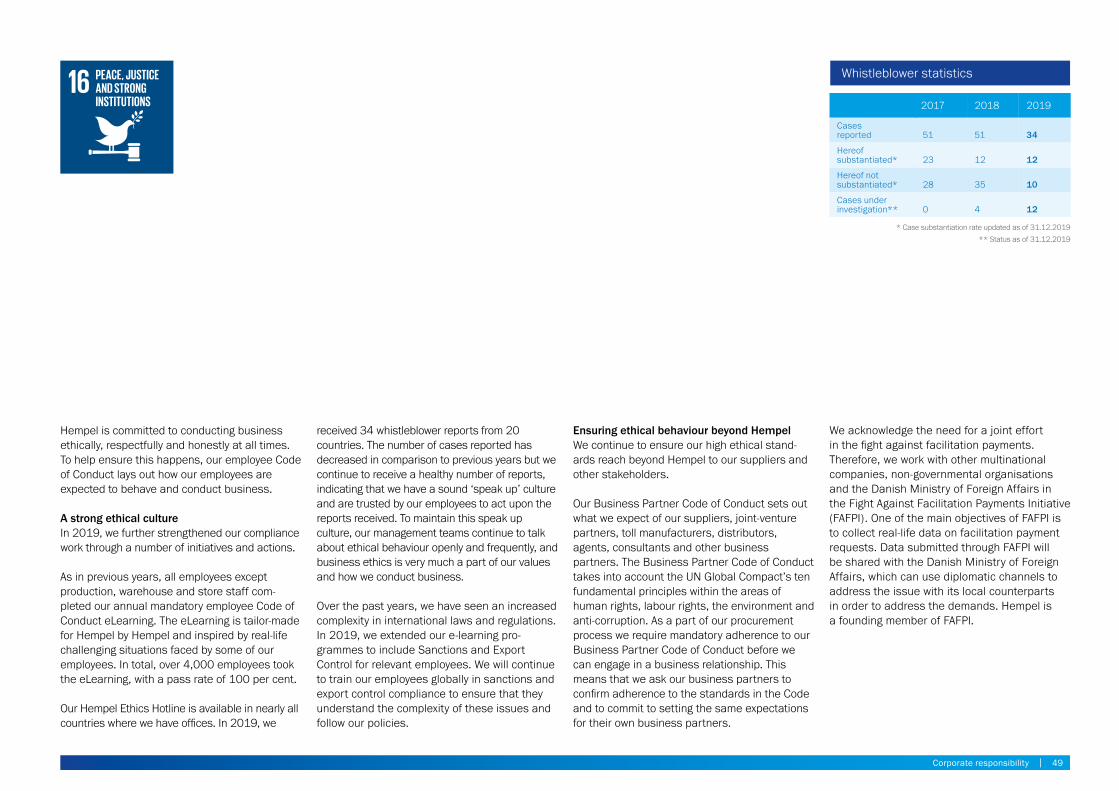
Hempel is committed to conducting business ethically, respectfully and honestly at all times. To help ensure this happens, our employee Code of Conduct lays out how our employees are expected to behave and conduct business.
A strong ethical culture In 2019, we further strengthened our compliance work through a number of initiatives and actions.
As in previous years, all employees except production, warehouse and store staff com-pleted our annual mandatory employee Code of Conduct eLearning. The eLearning is tailor-made for Hempel by Hempel and inspired by real-life challenging situations faced by some of our employees. In total, over 4,000 employees took the eLearning, with a pass rate of 100 per cent.
Our Hempel Ethics Hotline is available in nearly all countries where we have offices. In 2019, we
received 34 whistleblower reports from 20 countries. The number of cases reported has decreased in comparison to previous years but we continue to receive a healthy number of reports, indicating that we have a sound ‘speak up’ culture and are trusted by our employees to act upon the reports received. To maintain this speak up culture, our management teams continue to talk about ethical behaviour openly and frequently, and business ethics is very much a part of our values and how we conduct business.
Over the past years, we have seen an increased complexity in international laws and regulations. In 2019, we extended our e-learning pro-grammes to include Sanctions and Export Control for relevant employees. We will continue to train our employees globally in sanctions and export control compliance to ensure that they understand the complexity of these issues and follow our policies.
Ensuring ethical behaviour beyond HempelWe continue to ensure our high ethical stand-ards reach beyond Hempel to our suppliers and other stakeholders.
Our Business Partner Code of Conduct sets out what we expect of our suppliers, joint-venture partners, toll manufacturers, distributors, agents, consultants and other business partners. The Business Partner Code of Conduct takes into account the UN Global Compact’s ten fundamental principles within the areas of human rights, labour rights, the environment and anti-corruption. As a part of our procurement process we require mandatory adherence to our Business Partner Code of Conduct before we can engage in a business relationship. This means that we ask our business partners to confirm adherence to the standards in the Code and to commit to setting the same expectations for their own business partners.
We acknowledge the need for a joint effort in the fight against facilitation payments. Therefore, we work with other multinational companies, non-governmental organisations and the Danish Ministry of Foreign Affairs in the Fight Against Facilitation Payments Initiative (FAFPI). One of the main objectives of FAFPI is to collect real-life data on facilitation payment requests. Data submitted through FAFPI will be shared with the Danish Ministry of Foreign Affairs, which can use diplomatic channels to address the issue with its local counterparts in order to address the demands. Hempel is a founding member of FAFPI.
Cases reported
Hereof not substantiated*
Hereof substantiated*
Cases under investigation**
Whistleblower statistics
20192017 2018
3451 51
1028 35
1223 12
120 4
* Case substantiation rate updated as of 31.12.2019** Status as of 31.12.2019
Corporate responsibility | 49
Community engagement
As a company, we believe that we should contribute to society in general and the local communities in which we operate.
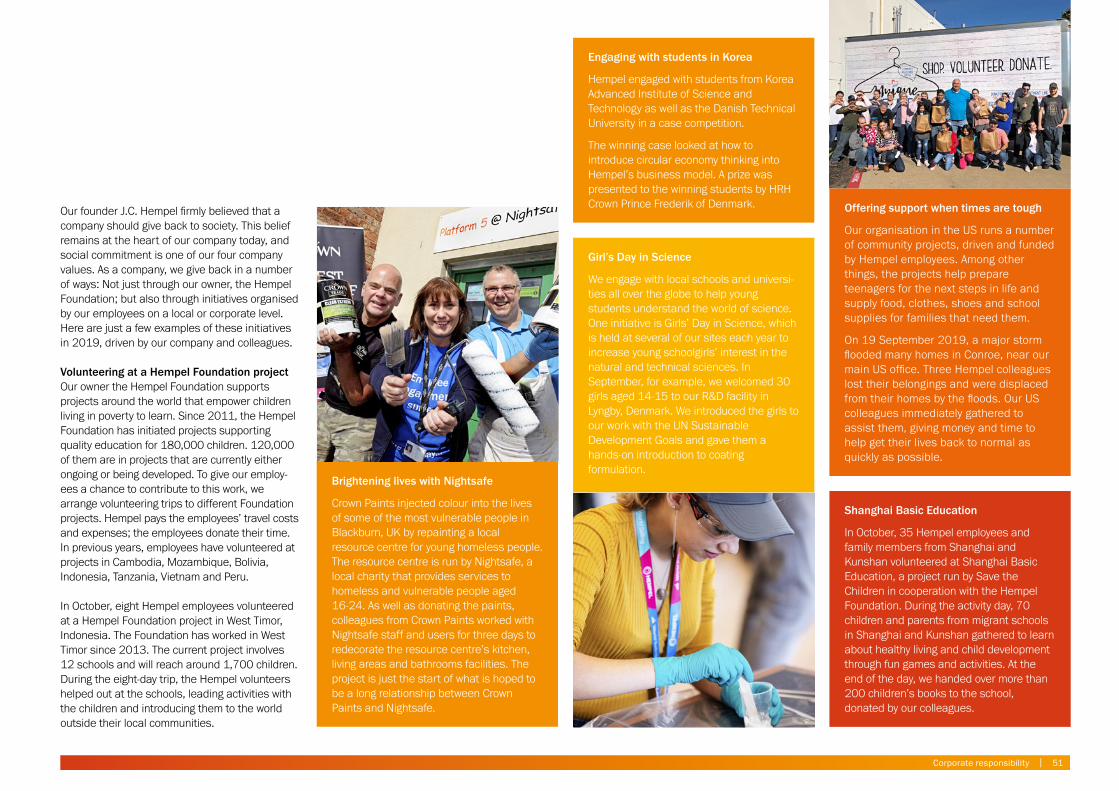
Our founder J.C. Hempel firmly believed that a company should give back to society. This belief remains at the heart of our company today, and social commitment is one of our four company values. As a company, we give back in a number of ways: Not just through our owner, the Hempel Foundation; but also through initiatives organised by our employees on a local or corporate level. Here are just a few examples of these initiatives in 2019, driven by our company and colleagues.
Volunteering at a Hempel Foundation projectOur owner the Hempel Foundation supports projects around the world that empower children living in poverty to learn. Since 2011, the Hempel Foundation has initiated projects supporting quality education for 180,000 children. 120,000 of them are in projects that are currently either ongoing or being developed. To give our employ-ees a chance to contribute to this work, we arrange volunteering trips to different Foundation projects. Hempel pays the employees’ travel costs and expenses; the employees donate their time. In previous years, employees have volunteered at projects in Cambodia, Mozambique, Bolivia, Indonesia, Tanzania, Vietnam and Peru.
In October, eight Hempel employees volunteered at a Hempel Foundation project in West Timor, Indonesia. The Foundation has worked in West Timor since 2013. The current project involves 12 schools and will reach around 1,700 children. During the eight-day trip, the Hempel volunteers helped out at the schools, leading activities with the children and introducing them to the world outside their local communities.
Corporate responsibility | 51
Shanghai Basic Education
In October, 35 Hempel employees and family members from Shanghai and Kunshan volunteered at Shanghai Basic Education, a project run by Save the Children in cooperation with the Hempel Foundation. During the activity day, 70 children and parents from migrant schools in Shanghai and Kunshan gathered to learn about healthy living and child development through fun games and activities. At the end of the day, we handed over more than 200 children’s books to the school, donated by our colleagues.
Offering support when times are tough
Our organisation in the US runs a number of community projects, driven and funded by Hempel employees. Among other things, the projects help prepare teenagers for the next steps in life and supply food, clothes, shoes and school supplies for families that need them.
On 19 September 2019, a major storm flooded many homes in Conroe, near our main US office. Three Hempel colleagues lost their belongings and were displaced from their homes by the floods. Our US colleagues immediately gathered to assist them, giving money and time to help get their lives back to normal as quickly as possible.
Girl’s Day in Science
We engage with local schools and universi-ties all over the globe to help young students understand the world of science. One initiative is Girls’ Day in Science, which is held at several of our sites each year to increase young schoolgirls’ interest in the natural and technical sciences. In September, for example, we welcomed 30 girls aged 14-15 to our R&D facility in Lyngby, Denmark. We introduced the girls to our work with the UN Sustainable Development Goals and gave them a hands-on introduction to coating formulation.
Engaging with students in Korea
Hempel engaged with students from Korea Advanced Institute of Science and Technology as well as the Danish Technical University in a case competition.
The winning case looked at how to introduce circular economy thinking into Hempel’s business model. A prize was presented to the winning students by HRH Crown Prince Frederik of Denmark.
Brightening lives with Nightsafe
Crown Paints injected colour into the lives of some of the most vulnerable people in Blackburn, UK by repainting a local resource centre for young homeless people. The resource centre is run by Nightsafe, a local charity that provides services to homeless and vulnerable people aged 16-24. As well as donating the paints, colleagues from Crown Paints worked with Nightsafe staff and users for three days to redecorate the resource centre’s kitchen, living areas and bathrooms facilities. The project is just the start of what is hoped to be a long relationship between Crown Paints and Nightsafe.
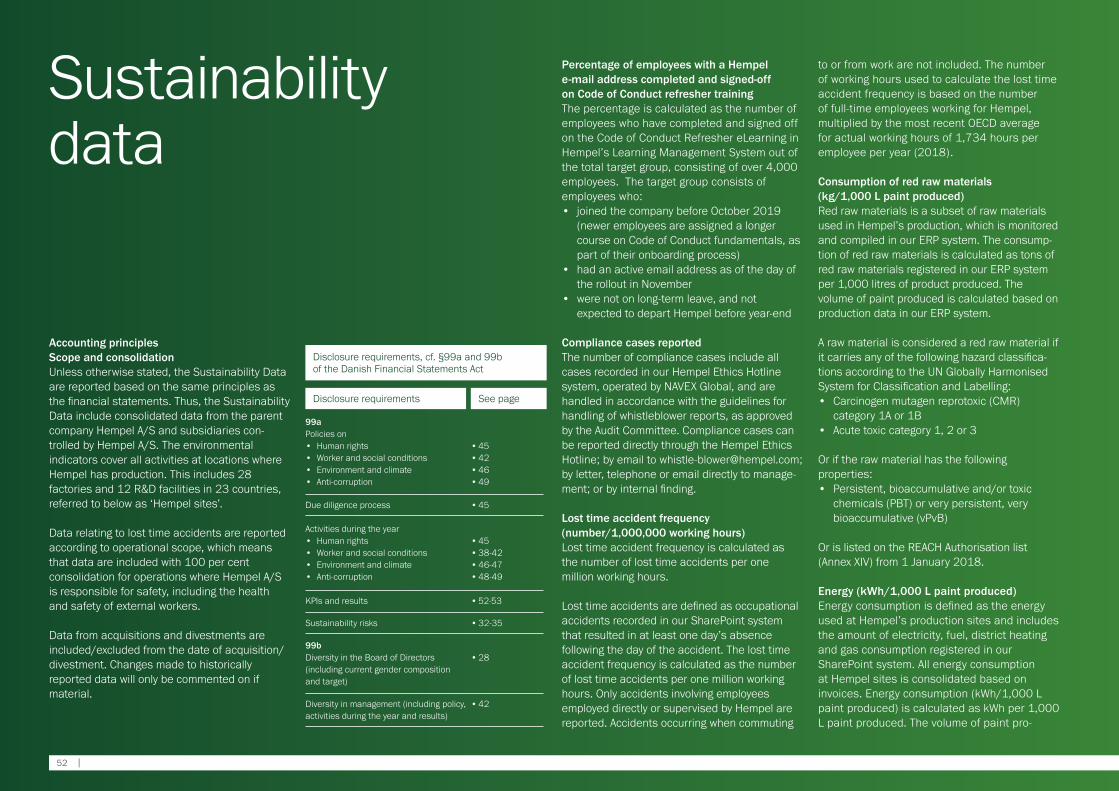
Sustainability data
Accounting principles Scope and consolidationUnless otherwise stated, the Sustainability Data are reported based on the same principles as the financial statements. Thus, the Sustainability Data include consolidated data from the parent company Hempel A/S and subsidiaries con-trolled by Hempel A/S. The environmental indicators cover all activities at locations where Hempel has production. This includes 28 factories and 12 R&D facilities in 23 countries, referred to below as ‘Hempel sites’.
Data relating to lost time accidents are reported according to operational scope, which means that data are included with 100 per cent consolidation for operations where Hempel A/S is responsible for safety, including the health and safety of external workers.
Data from acquisitions and divestments are included/excluded from the date of acquisition/divestment. Changes made to historically reported data will only be commented on if material.
Percentage of employees with a Hempel e-mail address completed and signed-off on Code of Conduct refresher trainingThe percentage is calculated as the number of employees who have completed and signed off on the Code of Conduct Refresher eLearning in Hempel’s Learning Management System out of the total target group, consisting of over 4,000 employees. The target group consists of employees who:• joined the company before October 2019
(newer employees are assigned a longer course on Code of Conduct fundamentals, as part of their onboarding process)
• had an active email address as of the day of the rollout in November
• were not on long-term leave, and not expected to depart Hempel before year-end
Compliance cases reportedThe number of compliance cases include all cases recorded in our Hempel Ethics Hotline system, operated by NAVEX Global, and are handled in accordance with the guidelines for handling of whistleblower reports, as approved by the Audit Committee. Compliance cases can be reported directly through the Hempel Ethics Hotline; by email to [email protected]; by letter, telephone or email directly to manage-ment; or by internal finding.
Lost time accident frequency (number/1,000,000 working hours)Lost time accident frequency is calculated as the number of lost time accidents per one million working hours.
Lost time accidents are defined as occupational accidents recorded in our SharePoint system that resulted in at least one day’s absence following the day of the accident. The lost time accident frequency is calculated as the number of lost time accidents per one million working hours. Only accidents involving employees employed directly or supervised by Hempel are reported. Accidents occurring when commuting
to or from work are not included. The number of working hours used to calculate the lost time accident frequency is based on the number of full-time employees working for Hempel, multiplied by the most recent OECD average for actual working hours of 1,734 hours per employee per year (2018).
Consumption of red raw materials (kg/1,000 L paint produced)Red raw materials is a subset of raw materials used in Hempel’s production, which is monitored and compiled in our ERP system. The consump-tion of red raw materials is calculated as tons of red raw materials registered in our ERP system per 1,000 litres of product produced. The volume of paint produced is calculated based on production data in our ERP system.
A raw material is considered a red raw material if it carries any of the following hazard classifica-tions according to the UN Globally Harmonised System for Classification and Labelling:• Carcinogen mutagen reprotoxic (CMR)
category 1A or 1B• Acute toxic category 1, 2 or 3
Or if the raw material has the following properties:• Persistent, bioaccumulative and/or toxic
chemicals (PBT) or very persistent, very bioaccumulative (vPvB)
Or is listed on the REACH Authorisation list (Annex XIV) from 1 January 2018.
Energy (kWh/1,000 L paint produced)Energy consumption is defined as the energy used at Hempel’s production sites and includes the amount of electricity, fuel, district heating and gas consumption registered in our SharePoint system. All energy consumption at Hempel sites is consolidated based on invoices. Energy consumption (kWh/1,000 L paint produced) is calculated as kWh per 1,000 L paint produced. The volume of paint pro-
Disclosure requirements, cf. §99a and 99b of the Danish Financial Statements Act
Disclosure requirements See page
99aPolicies on• Human rights• Worker and social conditions• Environment and climate• Anti-corruption
99bDiversity in the Board of Directors (including current gender composition and target)
Activities during the year• Human rights• Worker and social conditions• Environment and climate• Anti-corruption
Due diligence process
Diversity in management (including policy, activities during the year and results)
Sustainability risks
KPIs and results
• 45• 42• 46• 49
• 28
• 45• 38-42• 46-47• 48-49
• 45
• 42
• 32-35
• 52-53
52 |
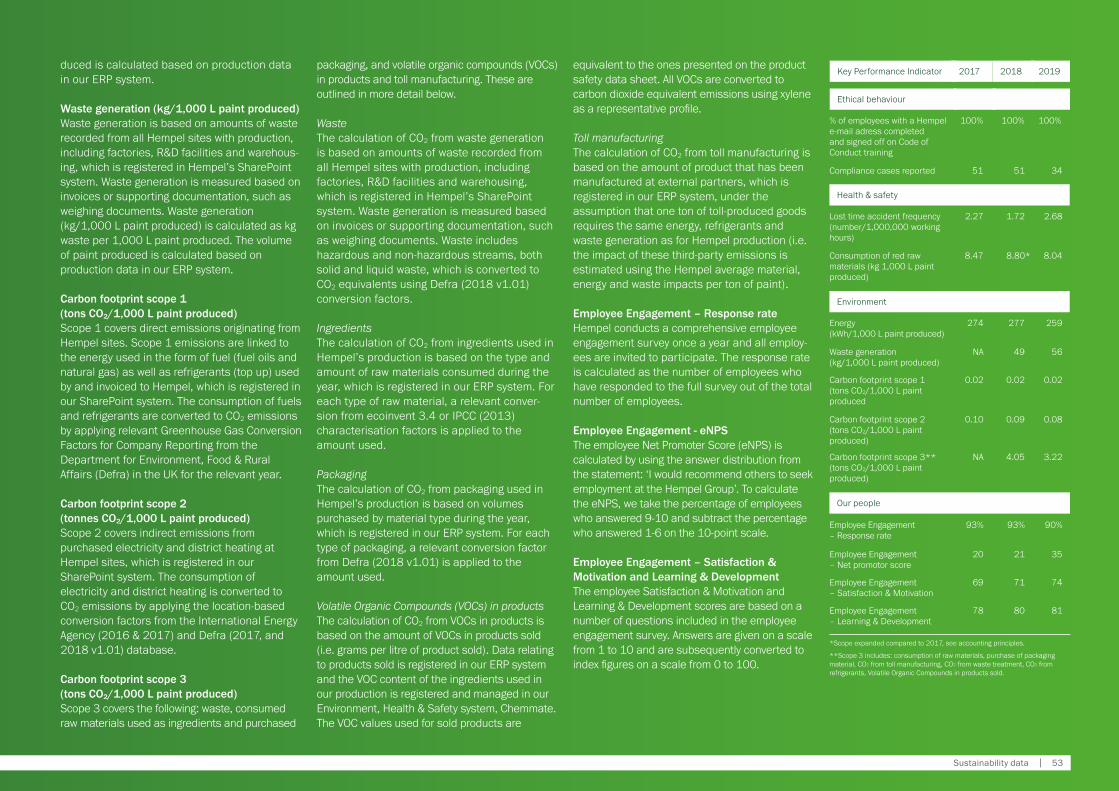
duced is calculated based on production data in our ERP system.
Waste generation (kg/1,000 L paint produced)Waste generation is based on amounts of waste recorded from all Hempel sites with production, including factories, R&D facilities and warehous-ing, which is registered in Hempel’s SharePoint system. Waste generation is measured based on invoices or supporting documentation, such as weighing documents. Waste generation (kg/1,000 L paint produced) is calculated as kg waste per 1,000 L paint produced. The volume of paint produced is calculated based on production data in our ERP system.
Carbon footprint scope 1 (tons CO2/1,000 L paint produced)Scope 1 covers direct emissions originating from Hempel sites. Scope 1 emissions are linked to the energy used in the form of fuel (fuel oils and natural gas) as well as refrigerants (top up) used by and invoiced to Hempel, which is registered in our SharePoint system. The consumption of fuels and refrigerants are converted to CO2 emissions by applying relevant Greenhouse Gas Conversion Factors for Company Reporting from the Department for Environment, Food & Rural Affairs (Defra) in the UK for the relevant year.
Carbon footprint scope 2 (tonnes CO2/1,000 L paint produced)Scope 2 covers indirect emissions from purchased electricity and district heating at Hempel sites, which is registered in our SharePoint system. The consumption of electricity and district heating is converted to CO2 emissions by applying the location-based conversion factors from the International Energy Agency (2016 & 2017) and Defra (2017, and 2018 v1.01) database.
Carbon footprint scope 3 (tons CO2/1,000 L paint produced)Scope 3 covers the following: waste, consumed raw materials used as ingredients and purchased
packaging, and volatile organic compounds (VOCs) in products and toll manu facturing. These are outlined in more detail below.
WasteThe calculation of CO2 from waste generation is based on amounts of waste recorded from all Hempel sites with production, including factories, R&D facilities and warehousing, which is registered in Hempel’s SharePoint system. Waste generation is measured based on invoices or supporting documentation, such as weighing documents. Waste includes hazardous and non-hazardous streams, both solid and liquid waste, which is converted to CO2 equivalents using Defra (2018 v1.01) conversion factors.
IngredientsThe calculation of CO2 from ingredients used in Hempel’s production is based on the type and amount of raw materials consumed during the year, which is registered in our ERP system. For each type of raw material, a relevant conver-sion from ecoinvent 3.4 or IPCC (2013) characterisation factors is applied to the amount used.
PackagingThe calculation of CO2 from packaging used in Hempel’s production is based on volumes purchased by material type during the year, which is registered in our ERP system. For each type of packaging, a relevant conversion factor from Defra (2018 v1.01) is applied to the amount used.
Volatile Organic Compounds (VOCs) in products The calculation of CO2 from VOCs in products is based on the amount of VOCs in products sold (i.e. grams per litre of product sold). Data relating to products sold is registered in our ERP system and the VOC content of the ingredients used in our production is registered and managed in our Environment, Health & Safety system, Chemmate. The VOC values used for sold products are
Ethical behaviour
Key Performance Indicator 20182017 2019
% of employees with a Hempel e-mail adress completed and signed off on Code of Conduct training
Compliance cases reported
Health & safety
Lost time accident frequency (number/1,000,000 working hours)
Consumption of red raw materials (kg 1,000 L paint produced)
Our people
Employee Engagement – Response rate
Employee Engagement – Net promotor score
Employee Engagement – Satisfaction & Motivation
Employee Engagement – Learning & Development
Environment
Energy (kWh/1,000 L paint produced)
Carbon footprint scope 1 (tons CO2/1,000 L paint produced
Carbon footprint scope 2 (tons CO2/1,000 L paint produced)
Carbon footprint scope 3** (tons CO2/1,000 L paint produced)
Waste generation (kg/1,000 L paint produced)
*Scope expanded compared to 2017, see accounting principles.
**Scope 3 includes: consumption of raw materials, purchase of packaging material, CO2 from toll manufacturing, CO2 from waste treatment, CO2 from refrigerants, Volatile Organic Compounds in products sold.
100%
34
2.68
90%
35
74
81
259
0.02
0.08
3.22
56
8.04
100%
51
1.72
93%
21
71
80
277
0.02
0.09
4.05
49
8.80*
100%
51
2.27
93%
20
69
78
274
0.02
0.10
NA
NA
8.47
equivalent to the ones presented on the product safety data sheet. All VOCs are converted to carbon dioxide equivalent emissions using xylene as a representative profile.
Toll manufacturingThe calculation of CO2 from toll manufacturing is based on the amount of product that has been manufactured at external partners, which is registered in our ERP system, under the assumption that one ton of toll-produced goods requires the same energy, refrigerants and waste generation as for Hempel production (i.e. the impact of these third-party emissions is estimated using the Hempel average material, energy and waste impacts per ton of paint).
Employee Engagement – Response rateHempel conducts a comprehensive employee engagement survey once a year and all employ-ees are invited to participate. The response rate is calculated as the number of employees who have responded to the full survey out of the total number of employees.
Employee Engagement - eNPSThe employee Net Promoter Score (eNPS) is calculated by using the answer distribution from the statement: ‘I would recommend others to seek employment at the Hempel Group’. To calculate the eNPS, we take the percentage of employees who answered 9-10 and subtract the percentage who answered 1-6 on the 10-point scale.
Employee Engagement – Satisfaction & Motivation and Learning & DevelopmentThe employee Satisfaction & Motivation and Learning & Development scores are based on a number of questions included in the employee engagement survey. Answers are given on a scale from 1 to 10 and are subsequently converted to index figures on a scale from 0 to 100.
Sustainability data | 53
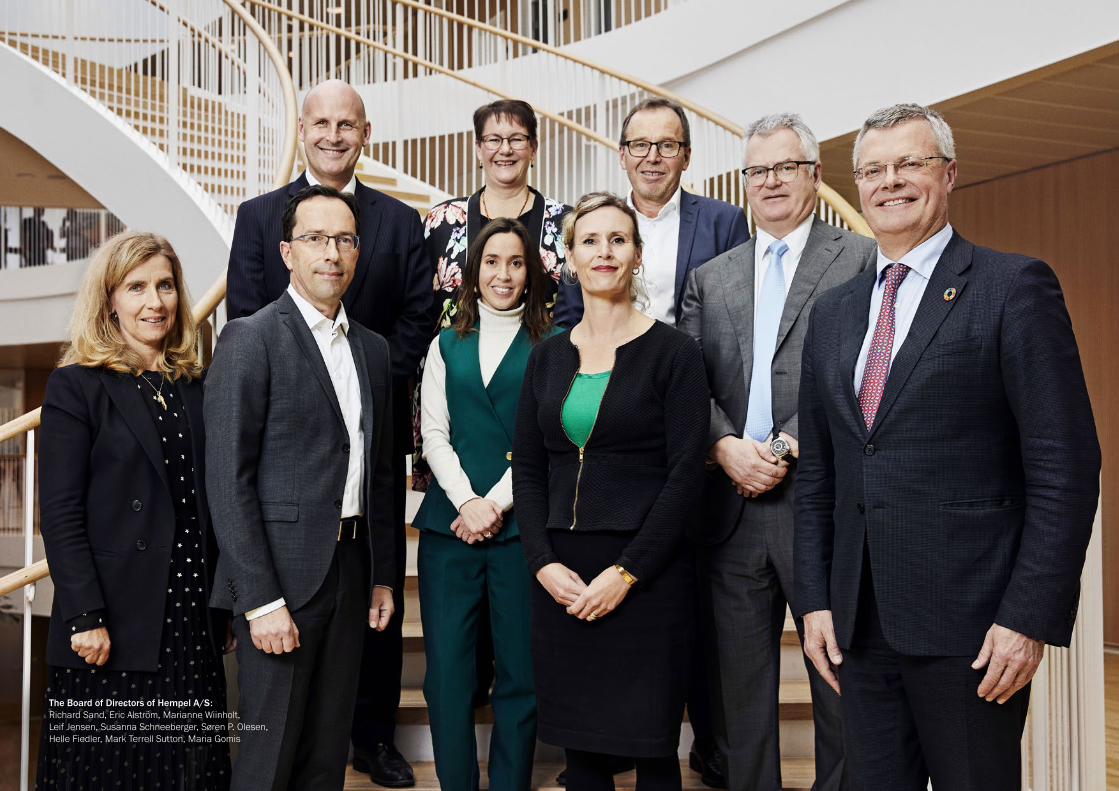
The Board of Directors of Hempel A/S: Richard Sand, Eric Alström, Marianne Wiinholt, Leif Jensen, Susanna Schneeberger, Søren P. Olesen, Helle Fiedler, Mark Terrell Sutton, Maria Gomis
The Board of Directors and the Executive Management Board have today considered and adopted the Annual Report of Hempel A/S for the financial year 1 January – 31 December 2019.
The Annual Report is prepared in accordance with the Danish Financial Statements Act.
In our opinion, the financial statements and the consolidated financial statements give a true and fair view of the financial position at 31 December 2019 of the company and the Group and of the results of the company’s and Group’s operations and cash flows for 2019.
In our opinion, Management’s Review includes a true and fair account of the development in the operations and financial circumstances of the Group and the parent company, of the results for the year and of the financial position of the Group and the parent company as well as a description of the most significant risks and elements of uncertainty facing the Group and the parent company.
In our opinion, the sustainability data represents a reasonable, fair and balanced representation of the Group’s sustainability performance and is presented in accordance with the stated accounting policies.
We recommend that the Annual Report be adopted at the Annual General Meeting.
Kgs. Lyngby, 26 February 2020
Management’s statement
Board of Directors
Richard SandChair
Eric Alström Deputy Chair
Marianne WiinholtChair of the Audit Committee
Helle FiedlerElected by the employees
Mark Terrell Sutton Elected by the employees
Maria GomisElected by the employees
Leif Jensen Susanna Schneeberger
Søren P. Olesen
Executive Management Board
Lars PeterssonGroup President & Chief Executive Officer
Peter KirkegaardExecutive Vice President & Chief People & Culture Officer
Lars Jønstrup DollerupExecutive Vice President & Chief Financial Officer
Michael HansenExecutive Vice President & Chief Commercial Officer
Management’s statement | 55
To the shareholder of Hempel A/S
OpinionIn our opinion, the consolidated financial statements and the parent company financial statements give a true and fair view of the financial position of the Group and the parent company at 31 December 2019, and of the results of the Group’s and the parent company’s operations as well as the consolidated cash flows for the finan cial year 1 January - 31 December 2019 in accordance with the Danish Financial Statements Act.
We have audited the consolidated financial statements and the parent company financial statements of Hempel A/S for the financial year 1 January - 31 December 2019, which comprise income statement, balance sheet, statement of changes in equity and notes, including a summary of significant accounting policies, for both the Group and the parent company, as well as the consolidated statement of cash flows (“financial statements”).
Basis for opinionWe conducted our audit in accordance with International Standards on Auditing (ISAs) and the additional requirements applicable in Den mark. Our responsibilities under those standards and requirements are further described in the Auditor’s Responsibilities for the Audit of the Financial Statements section of our report. We are indepen-dent of the Group in accordance with the Inter na-tional Ethics Standards Board for Accountants’ Code of Ethics for Professional Accountants (IESBA Code) and the additional requirements applicable in Denmark, and we have fulfilled our other ethical responsibilities in accordance with these require-ments. We believe that the audit evidence we have obtained is sufficient and appropriate to provide a basis for our opinion.
Statement on Management’s ReviewManagement is responsible for Management’s Review. Our opinion on the financial statements
does not cover Management’s Review, and we do not express any form of assurance conclusion thereon.
In connection with our audit of the financial statements, our responsibility is to read Manage-ment’s Review and, in doing so, consider whether Management’s Review is materially inconsistent with the financial statements or our knowledge obtained during the audit, or otherwise appears to be materially misstated. Moreover, it is our responsibility to consider whether Manage ment’s Review provides the information required under the Danish Financial Statements Act.
Based on the work we have performed, in our view, Management’s Review is in accordance with the consolidated financial statements and the parent company financial statements and has been prepared in accordance with the requirements of the Danish Financial Statements Act. We did not identify any material misstatement in Management’s Review.
Management’s responsibilities for the financial statementsManagement is responsible for the preparation of consolidated financial statements and parent com pany financial statements that give a true and fair view in accordance with the Danish Financial Statements Act, and for such internal control as management determines is necessary to enable the preparation of financial statements that are free from material misstatement, whether due to fraud or error.
In preparing the financial statements, manage-ment is responsible for assessing the Group’s and the parent company’s ability to continue as a going concern, disclosing, as applicable, matters related to going concern and using the going concern basis of accounting in preparing the financial statements unless management either intends to liquidate the Group or the parent company or to cease operations, or has no realistic alternative but to do so.
Independent auditor’s report
Auditor’s responsibilities for the audit of the financial statementsOur objectives are to obtain reasonable assurance about whether the financial state-ments as a whole are free from material misstatement, whether due to fraud or error, and to issue an auditor’s report that includes our opinion. Reasonable assurance is a high level of assurance, but is not a guarantee that an audit conducted in accordance with ISAs and the additional requirements applicable in Denmark will always detect a material misstatement when it exists. Misstatements can arise from fraud or error and are considered material if, individually or in the aggregate, they could reason - ably be expected to influence the economic decisions of users taken on the basis of these financial statements.
As part of an audit conducted in accordance with ISAs and the additional requirements applicable in Denmark, we exercise professional judgment and maintain professional scepticism throughout the audit. We also:
• Identify and assess the risks of material misstatement of the financial statements,
whether due to fraud or error, design and perform audit procedures responsive to those risks, and obtain audit evidence that is sufficient and appropriate to provide a basis for our opinion. The risk of not detecting a material misstatement resulting from fraud is higher than for one resulting from error as fraud may involve collusion, forgery, intentional omissions, misrepresentations, or the override of internal control
• Obtain an understanding of internal control relevant to the audit in order to design audit procedures that are appropriate in the circumstances, but not for the purpose of expressing an opinion on the effectiveness of the Group’s and the parent company’s internal control
• Evaluate the appropriateness of accounting policies used and the reasonableness of accounting estimates and related disclosures made by management
• Conclude on the appropriateness of manage-ment’s use of the going concern basis of accounting in preparing the financial state-ments and, based on the audit evidence obtained, whether a material uncertainty exists related to events or conditions that may
cast significant doubt on the Group’s and the parent company’s ability to continue as a going concern. If we conclude that a material uncertainty exists, we are required to draw attention in our auditor’s report to the related disclosures in the financial statements or, if such disclosures are inadequate, to modify our opinion. Our conclusions are based on the audit evidence obtained up to the date of our auditor’s report. However, future events or conditions may cause the Group and the parent company to cease to continue as a going concern
• Evaluate the overall presentation, structure and contents of the financial statements, including the disclosures, and whether the financial statements represent the underlying transactions and events in a manner that gives a true and fair view
• Obtain sufficient appropriate audit evidence regarding the financial information of the entities or business activities within the Group to express an opinion on the consolidated financial statements. We are responsible for the direction, supervision and performance of the group audit. We remain solely responsible for our audit opinion.
We communicate with those charged with governance regarding, among other matters, the planned scope and timing of the audit and significant audit findings, including any signifi-cant deficiencies in internal control that we identify during our audit.
Hellerup, 26 February 2020
PricewaterhouseCoopersStatsautoriseret RevisionspartnerselskabCVR no. 33771231
Anders Stig LauritsenState Authorised Public Accountantmne32800
Mads MelgaardState Authorised Public Accountantmne34354
Auditor’s report | 57
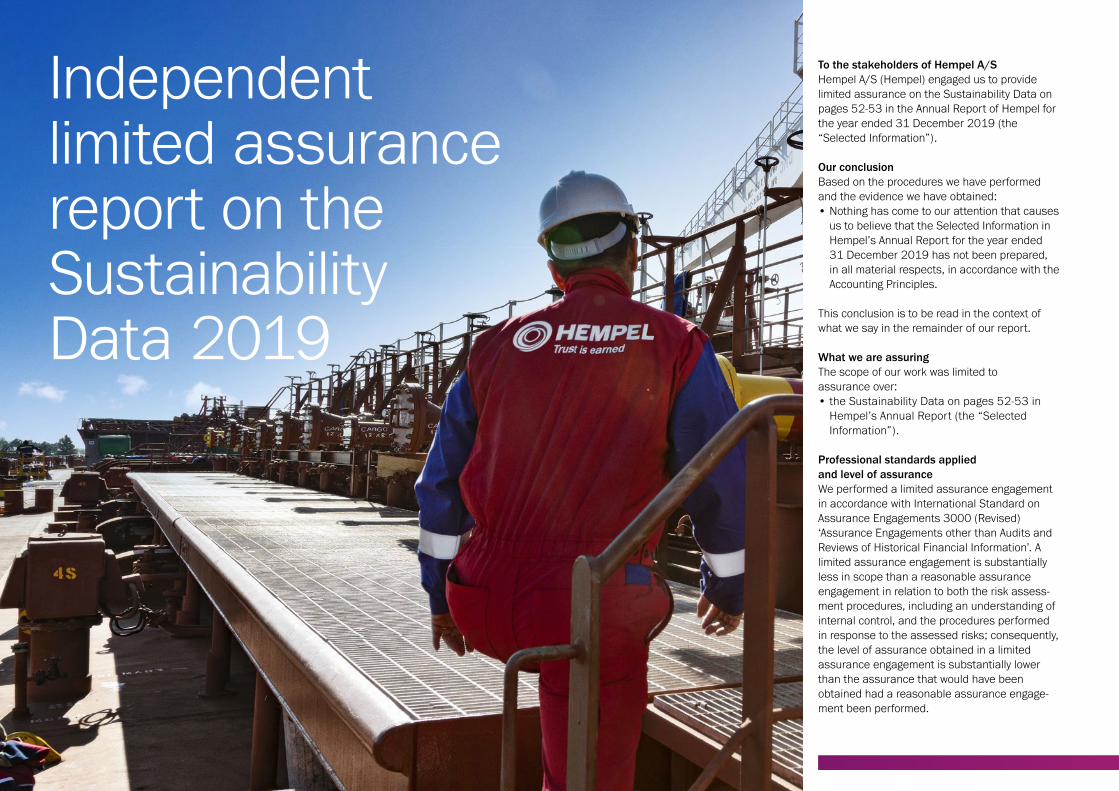
To the stakeholders of Hempel A/S Hempel A/S (Hempel) engaged us to provide limited assurance on the Sustainability Data on pages 52-53 in the Annual Report of Hempel for the year ended 31 December 2019 (the “Selected Information”).
Our conclusionBased on the procedures we have performed and the evidence we have obtained:• Nothing has come to our attention that causes
us to believe that the Selected Information in Hempel’s Annual Report for the year ended 31 December 2019 has not been prepared, in all material respects, in accordance with the Accounting Principles.
This conclusion is to be read in the context of what we say in the remainder of our report.
What we are assuringThe scope of our work was limited to assurance over:• the Sustainability Data on pages 52-53 in
Hempel’s Annual Report (the “Selected Information”).
Professional standards applied and level of assuranceWe performed a limited assurance engagement in accordance with International Standard on Assurance Engagements 3000 (Revised) ‘Assurance Engagements other than Audits and Reviews of Historical Financial Information’. A limited assurance engagement is substantially less in scope than a reasonable assurance engagement in relation to both the risk assess-ment procedures, including an understanding of internal control, and the procedures performed in response to the assessed risks; consequently, the level of assurance obtained in a limited assurance engagement is substantially lower than the assurance that would have been obtained had a reasonable assurance engage-ment been performed.
Independent limited assurance report on the Sustainability Data 2019
Our independence and quality controlWe have complied with the Code of Ethics for Professional Accountants issued by the International Ethics Standards Board for Accountants, which includes independence and other ethical requirements founded on fundamen-tal principles of integrity, objectivity, professional competence and due care, confidentiality and professional behaviour. The firm applies Inter-national Standard on Quality Control 1 and accordingly maintains a comprehensive system of quality control including documented policies and procedures regarding compliance with ethical requirements, professional standards and applicable legal and regulatory requirements. Our work was carried out by an independent multidis-ciplinary team with experience in sustainability reporting and assurance.
Understanding reporting and measurement methodologiesThe Selected Information needs to be read and understood together with the Accounting Principles (pages 52-53) in Hempel’s Annual Report 2019, which management of Hempel is solely responsi-ble for selecting and applying. The absence of a significant body of established practice on which to draw to evaluate and measure non-financial
information allows for different, but acceptable, measurement techniques and can affect comparability between entities and over time.
Work performedWe are required to plan and perform our work in order to consider the risk of material misstate-ment of the Selected Information. In doing so, we:• conducted interviews with data owners to
understand the key processes and controls for reporting site performance data;
• obtained an understanding of the key pro-cesses and controls for measuring, recording and reporting the Selected Information.
• on a selective basis performed review of the Selected Information at corporate head office to check that data has been appropriately recorded, consolidated and reported;
• performed analysis of data from reporting sites, selected on the basis of risk and materiality to the group; and
• considered the disclosure and presentation of the Selected Information.
Hempel’s responsibilitiesHempel’s management are responsible for:• designing, implementing and maintaining
internal controls over information relevant to
the preparation of the Selected Information that is free from material misstatement, whether due to fraud or error;
• establishing objective Accounting Principles for preparing the Selected Information;
• measuring and reporting the Selected Information based on the Accounting Principles; and
• the content of the Sustainability Data in Hempel’s Annual Report 2019.
Our responsibilityWe are responsible for:• planning and performing the engagement to
obtain limited assurance about whether the Selected Information has been prepared, in all material respects, in accordance with the Accounting Principles and in this context is free from material misstatement, whether due to fraud or error;
• forming an independent conclusion, based on the procedures we have performed and the evidence we have obtained; and
• reporting our conclusion to the Stakeholders of Hempel.
Anders Stig LauritsenState Authorised Public Accountantmne32800
Mads MelgaardState Authorised Public Accountantmne34354
Hellerup, 26 February 2020
PricewaterhouseCoopersStatsautoriseret RevisionspartnerselskabCVR no. 33771231
Auditor’s report | 59

Financial statements
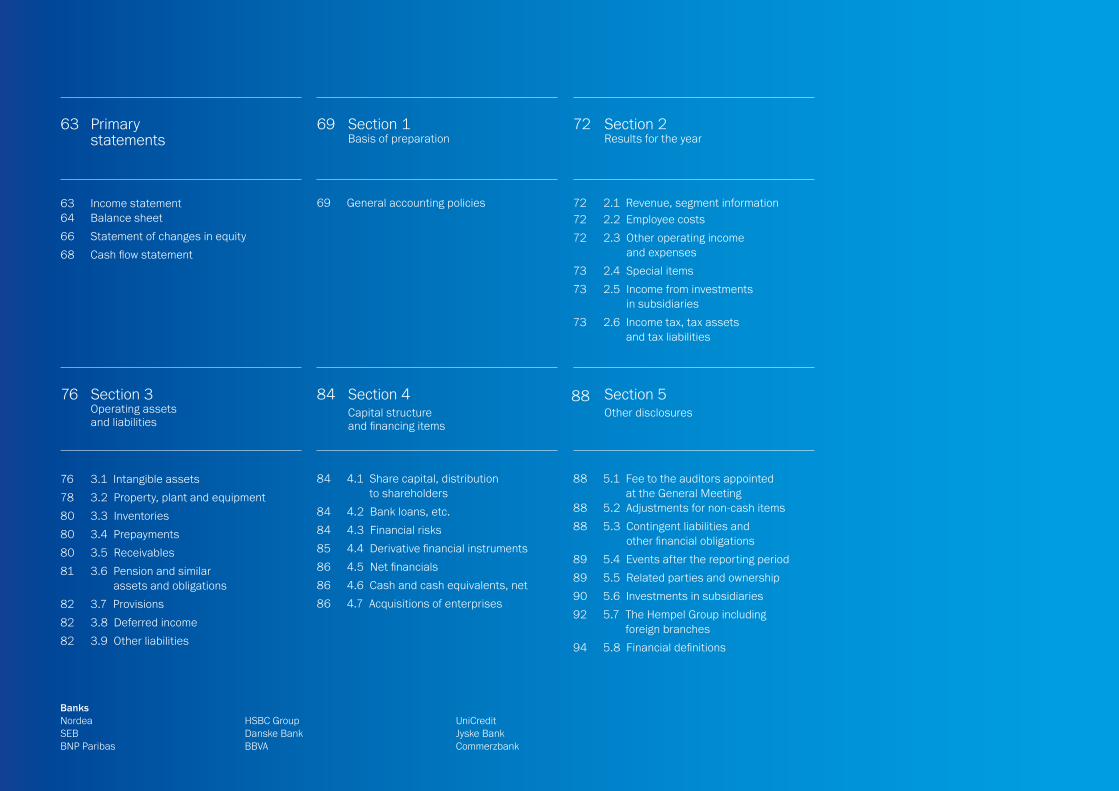
BanksNordea SEB BNP Paribas
69 General accounting policies
Primary statements
Section 1Basis of preparation
Section 2 Results for the year
63 69 72
63 Income statement64 Balance sheet
66 Statement of changes in equity
68 Cash flow statement
72 2.1 Revenue, segment information72 2.2 Employee costs
72 2.3 Other operating income and expenses
73 2.4 Special items
73 2.5 Income from investments in subsidiaries
73 2.6 Income tax, tax assets and tax liabilities
84 4.1 Share capital, distribution to shareholders
84 4.2 Bank loans, etc.
84 4.3 Financial risks
85 4.4 Derivative financial instruments
86 4.5 Net financials
86 4.6 Cash and cash equivalents, net
86 4.7 Acquisitions of enterprises
Section 3Operating assets and liabilities
Section 4Capital structure and financing items
Section 5Other disclosures
76 84 88
76 3.1 Intangible assets
78 3.2 Property, plant and equipment
80 3.3 Inventories
80 3.4 Prepayments
80 3.5 Receivables
81 3.6 Pension and similar assets and obligations
82 3.7 Provisions
82 3.8 Deferred income
82 3.9 Other liabilities
88 5.1 Fee to the auditors appointed at the General Meeting
88 5.2 Adjustments for non-cash items
88 5.3 Contingent liabilities and other financial obligations
89 5.4 Events after the reporting period
89 5.5 Related parties and ownership
90 5.6 Investments in subsidiaries
92 5.7 The Hempel Group including foreign branches
94 5.8 Financial definitions
HSBC GroupDanske BankBBVA
UniCreditJyske BankCommerzbank

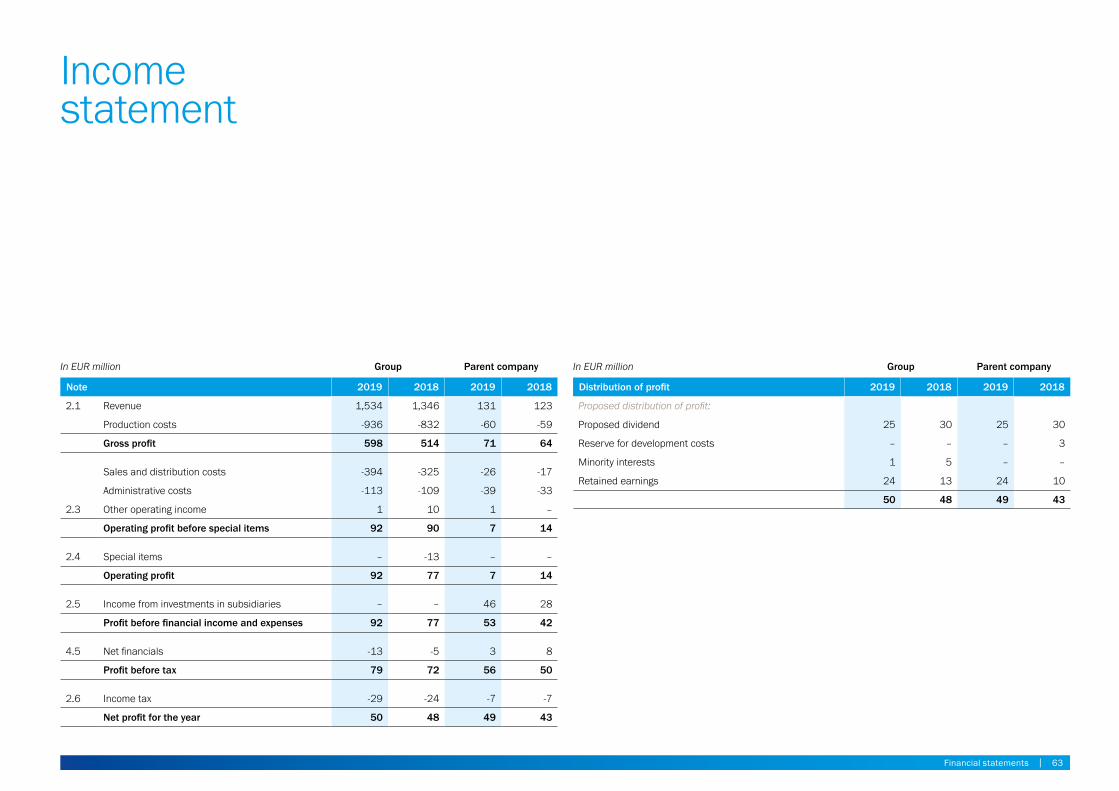
Income statement
In EUR million Group Parent company
Note 2019 2018 2019 2018
2.1 Revenue 1,534 1,346 131 123
Production costs -936 -832 -60 -59
Gross profit 598 514 71 64
Sales and distribution costs -394 -325 -26 -17
Administrative costs -113 -109 -39 -33
2.3 Other operating income 1 10 1 –
Operating profit before special items 92 90 7 14
2.4 Special items – -13 – –
Operating profit 92 77 7 14
2.5 Income from investments in subsidiaries – – 46 28
Profit before financial income and expenses 92 77 53 42
4.5 Net financials -13 -5 3 8
Profit before tax 79 72 56 50
2.6 Income tax -29 -24 -7 -7
Net profit for the year 50 48 49 43
In EUR million Group Parent company
Distribution of profit 2019 2018 2019 2018
Proposed distribution of profit:
Proposed dividend 25 30 25 30
Reserve for development costs – – – 3
Minority interests 1 5 – –
Retained earnings 24 13 24 10
50 48 49 43
Financial statements | 63
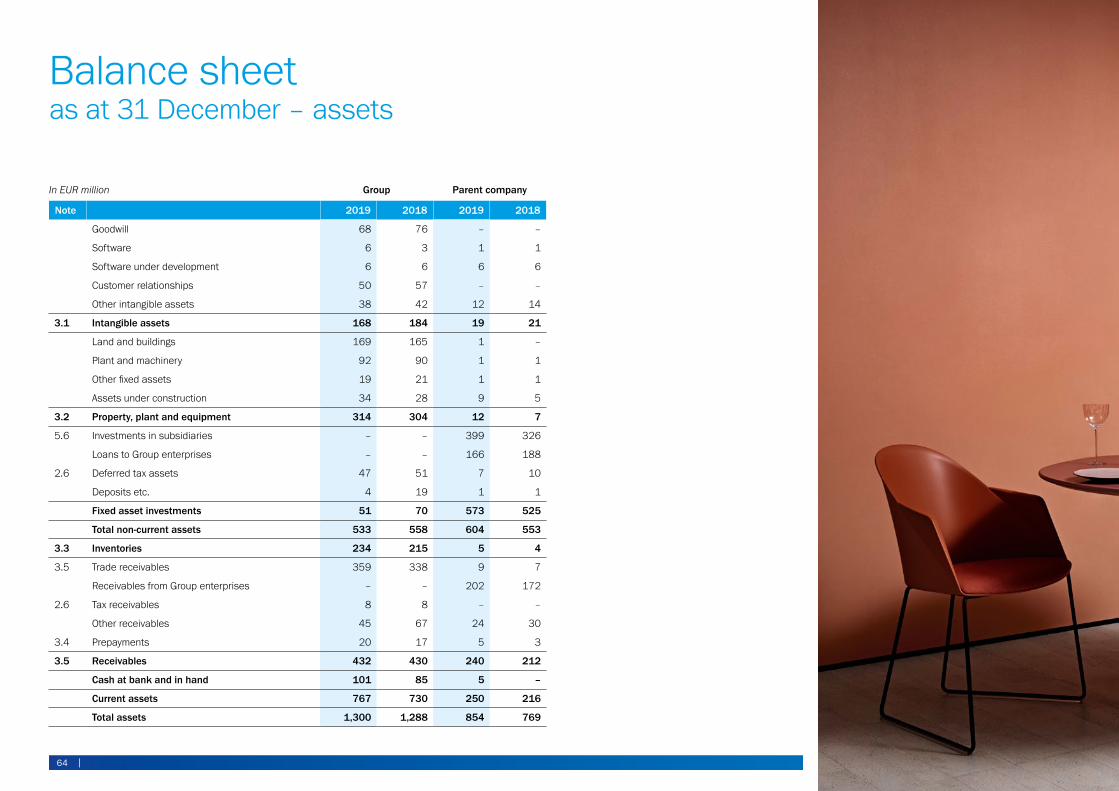
Balance sheetas at 31 December – assets
In EUR million Group Parent company
Note 2019 2018 2019 2018
Goodwill 68 76 – –
Software 6 3 1 1
Software under development 6 6 6 6
Customer relationships 50 57 – –
Other intangible assets 38 42 12 14
3.1 Intangible assets 168 184 19 21
Land and buildings 169 165 1 –
Plant and machinery 92 90 1 1
Other fixed assets 19 21 1 1
Assets under construction 34 28 9 5
3.2 Property, plant and equipment 314 304 12 7
5.6 Investments in subsidiaries – – 399 326
Loans to Group enterprises – – 166 188
2.6 Deferred tax assets 47 51 7 10
Deposits etc. 4 19 1 1
Fixed asset investments 51 70 573 525
Total non-current assets 533 558 604 553
3.3 Inventories 234 215 5 4
3.5 Trade receivables 359 338 9 7
Receivables from Group enterprises – – 202 172
2.6 Tax receivables 8 8 – –
Other receivables 45 67 24 30
3.4 Prepayments 20 17 5 3
3.5 Receivables 432 430 240 212
Cash at bank and in hand 101 85 5 –
Current assets 767 730 250 216
Total assets 1,300 1,288 854 769
64 |
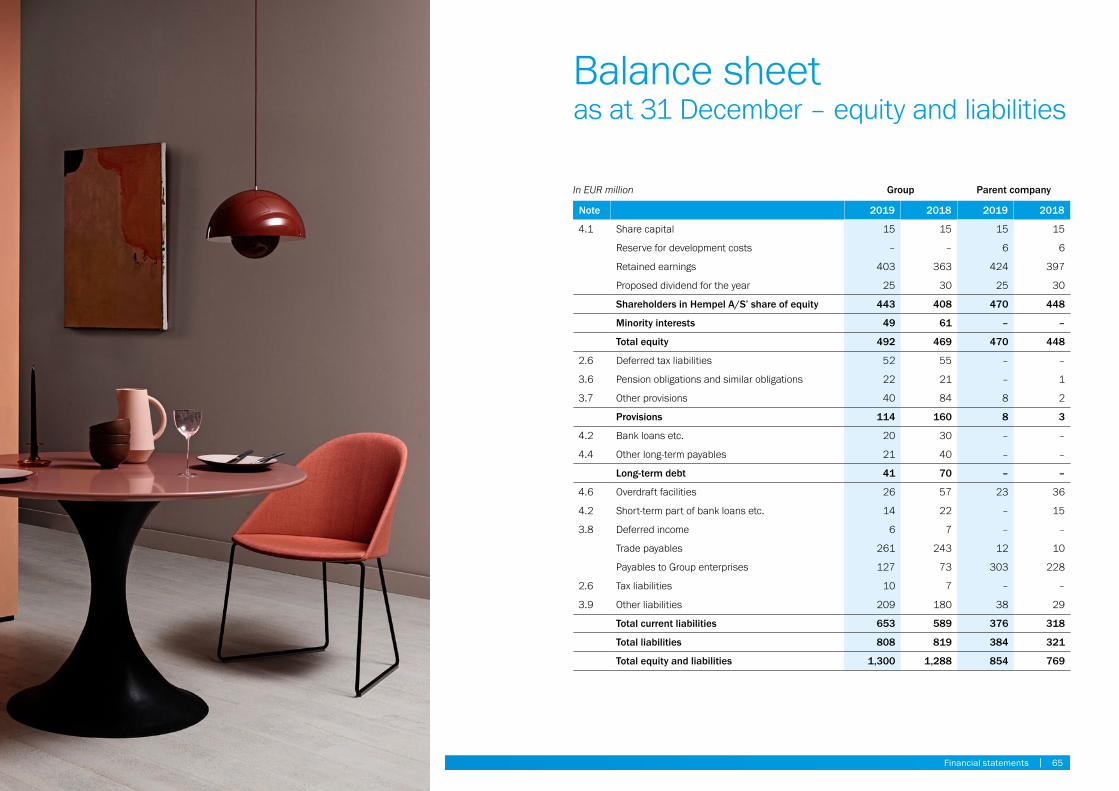
Balance sheetas at 31 December – equity and liabilities
In EUR million Group Parent company
Note 2019 2018 2019 2018
4.1 Share capital 15 15 15 15
Reserve for development costs – – 6 6
Retained earnings 403 363 424 397
Proposed dividend for the year 25 30 25 30
Shareholders in Hempel A/S’ share of equity 443 408 470 448
Minority interests 49 61 – –
Total equity 492 469 470 448
2.6 Deferred tax liabilities 52 55 – –
3.6 Pension obligations and similar obligations 22 21 – 1
3.7 Other provisions 40 84 8 2
Provisions 114 160 8 3
4.2 Bank loans etc. 20 30 – –
4.4 Other long-term payables 21 40 – –
Long-term debt 41 70 – –
4.6 Overdraft facilities 26 57 23 36
4.2 Short-term part of bank loans etc. 14 22 – 15
3.8 Deferred income 6 7 – –
Trade payables 261 243 12 10
Payables to Group enterprises 127 73 303 228
2.6 Tax liabilities 10 7 – –
3.9 Other liabilities 209 180 38 29
Total current liabilities 653 589 376 318
Total liabilities 808 819 384 321
Total equity and liabilities 1,300 1,288 854 769
Financial statements | 65
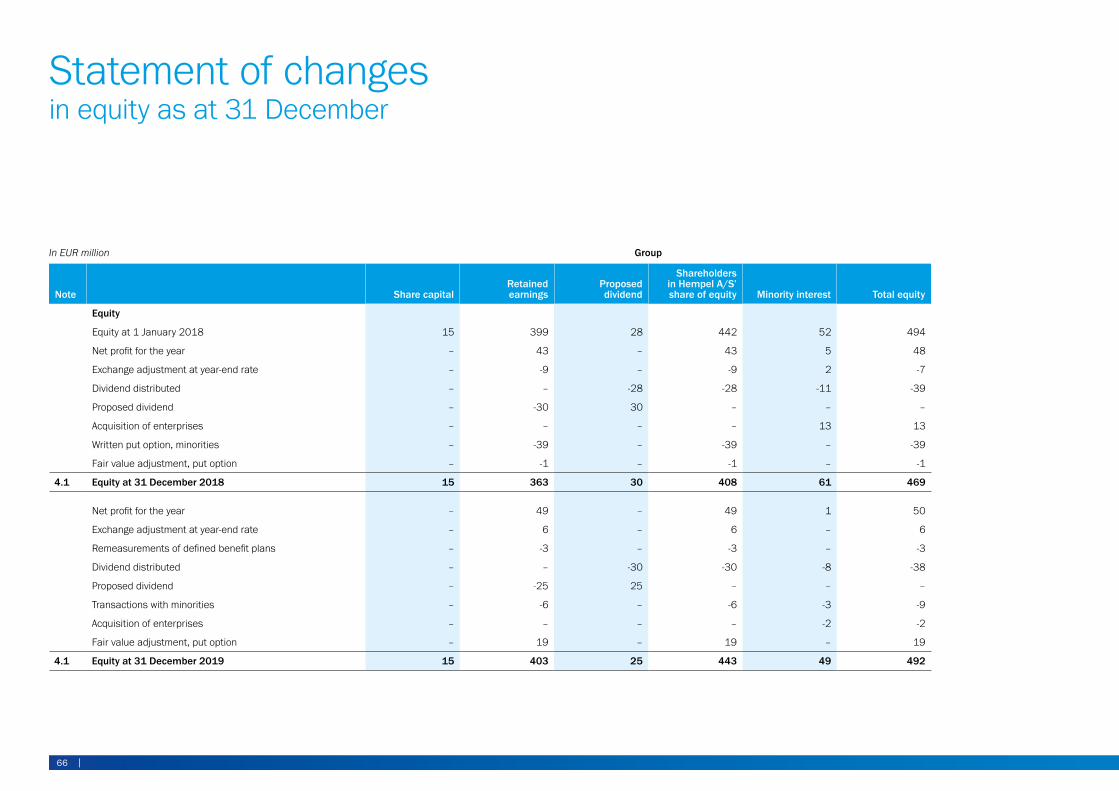
Statement of changesin equity as at 31 December
In EUR million Group
Note Share capitalRetained earnings
Proposed dividend
Shareholders in Hempel A/S’ share of equity Minority interest Total equity
Equity
Equity at 1 January 2018 15 399 28 442 52 494
Net profit for the year – 43 – 43 5 48
Exchange adjustment at year-end rate – -9 – -9 2 -7
Dividend distributed – – -28 -28 -11 -39
Proposed dividend – -30 30 – – –
Acquisition of enterprises – – – – 13 13
Written put option, minorities – -39 – -39 – -39
Fair value adjustment, put option – -1 – -1 – -1
4.1 Equity at 31 December 2018 15 363 30 408 61 469
Net profit for the year – 49 – 49 1 50
Exchange adjustment at year-end rate – 6 – 6 – 6
Remeasurements of defined benefit plans – -3 – -3 – -3
Dividend distributed – – -30 -30 -8 -38
Proposed dividend – -25 25 – – –
Transactions with minorities – -6 – -6 -3 -9
Acquisition of enterprises – – – – -2 -2
Fair value adjustment, put option – 19 – 19 – 19
4.1 Equity at 31 December 2019 15 403 25 443 49 492
Financial statements | 6766 |
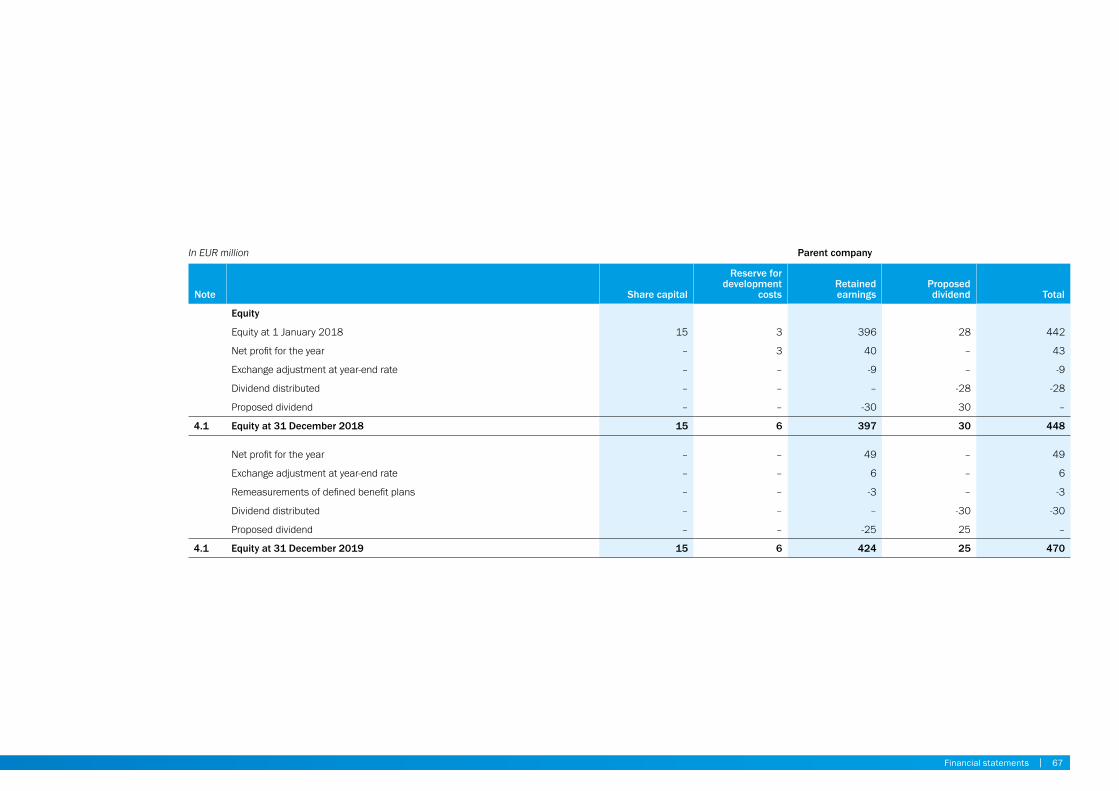
In EUR million Parent company
Note Share capital
Reserve for development
costsRetained earnings
Proposed dividend Total
Equity
Equity at 1 January 2018 15 3 396 28 442
Net profit for the year – 3 40 – 43
Exchange adjustment at year-end rate – – -9 – -9
Dividend distributed – – – -28 -28
Proposed dividend – – -30 30 –
4.1 Equity at 31 December 2018 15 6 397 30 448
Net profit for the year – – 49 – 49
Exchange adjustment at year-end rate – – 6 – 6
Remeasurements of defined benefit plans – – -3 – -3
Dividend distributed – – – -30 -30
Proposed dividend – – -25 25 –
4.1 Equity at 31 December 2019 15 6 424 25 470
Financial statements | 6766 |
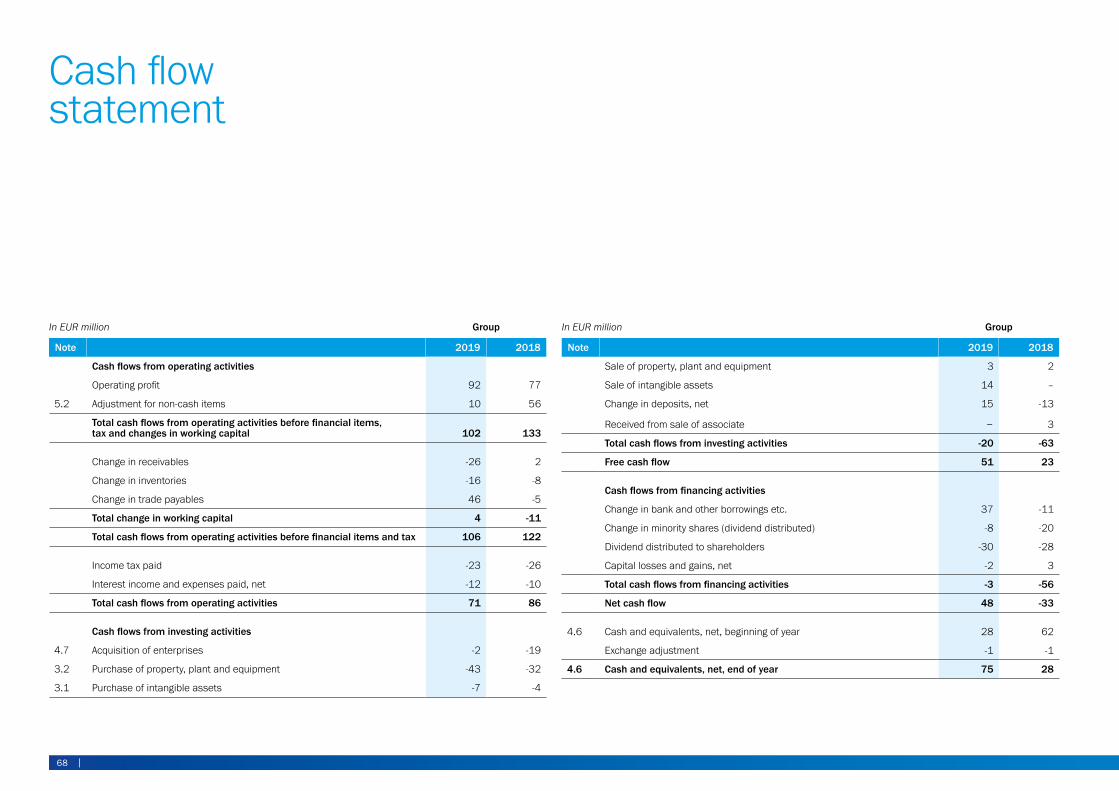
Cash flow statement
In EUR million Group
Note 2019 2018
Cash flows from operating activities
Operating profit 92 77
5.2 Adjustment for non-cash items 10 56
Total cash flows from operating activities before financial items, tax and changes in working capital 102 133
Change in receivables -26 2
Change in inventories -16 -8
Change in trade payables 46 -5
Total change in working capital 4 -11
Total cash flows from operating activities before financial items and tax 106 122
Income tax paid -23 -26
Interest income and expenses paid, net -12 -10
Total cash flows from operating activities 71 86
Cash flows from investing activities
4.7 Acquisition of enterprises -2 -19
3.2 Purchase of property, plant and equipment -43 -32
3.1 Purchase of intangible assets -7 -4
In EUR million Group
Note 2019 2018
Sale of property, plant and equipment 3 2
Sale of intangible assets 14 –
Change in deposits, net 15 -13
Received from sale of associate – 3
Total cash flows from investing activities -20 -63
Free cash flow 51 23
Cash flows from financing activities
Change in bank and other borrowings etc. 37 -11
Change in minority shares (dividend distributed) -8 -20
Dividend distributed to shareholders -30 -28
Capital losses and gains, net -2 3
Total cash flows from financing activities -3 -56
Net cash flow 48 -33
4.6 Cash and equivalents, net, beginning of year 28 62
Exchange adjustment -1 -1
4.6 Cash and equivalents, net, end of year 75 28
Financial statements | 6968 |
Section 1 Basis of preparation
1.1 General accounting policies
All entities in the Hempel Group follow the same Group accounting policies. This section gives a summary of the significant accounting policies.
GeneralThe Annual Report of Hempel A/S for 2019 has been prepared in accordance with the provisions of the Danish Financial Statements Act (Årsregn-skabs loven) applying to large enterprises of reporting class C. The Annual Report for 2019 is presented in EUR millions. The accounting policies applied remain unchanged from previous years.
In the Annual Report, the notes are grouped in sections and include the relevant accounting policies.
Recognition and measurement Revenues are recognised in the income state-ment as earned. Furthermore, value adjustments of financial assets and liabilities measured at fair value or amortised costs are recognised.
Moreover, all expenses incurred to achieve the earnings for the year are recognised in the income statement, including depreciation, amortisation, impairment losses and provisions as well as reversals due to changed accounting estimates of amounts that were previously recognised in the income statement.
Assets are recognised in the balance sheet when it is probable that future economic benefits attributable to the asset will flow to the Group and the value of the asset can be measured reliably.
Liabilities are recognised in the balance sheet when it is probable that future economic benefits will flow out of the Group and the value of the liability can be measured reliably. Assets and liabilities are initially measured at cost. Subsequently, assets and liabilities are meas-ured as described in individual sections.
Recognition and measurement take into account predictable losses and risks occurring before the presentation of the Annual Report that confirm or invalidate affairs and conditions existing at the balance sheet date. 2018 total assets and total liabilities have been restated, and minor variances to the 2018 Annual Report occur.
Euro is used as the presentation currency. All other currencies are regarded as foreign currencies.
Basis of consolidationThe consolidated financial statements comprise the parent company, Hempel A/S, and subsidiar-
ies in which the parent company directly or indirectly holds more than 50 per cent of the votes or in which the parent company, through share ownership or otherwise, exercises control. Enterprises in which the Group holds between 20 per cent and 50 per cent of the votes and exercises significant influence but not control are classified as associates.
On consolidation, items of a uniform nature are combined. Elimination is made of intercompany income and expenses, shareholdings, dividends and accounts as well as of realised and unrealised profits and losses on transactions between the consolidated enterprises.
The parent company’s investments in the consolidated subsidiaries are set off against the parent company’s share of the net asset value of subsidiaries stated at the time of consolidation.
Minority interestsOn statement of Group results and Group equity, the shares of results and equity of subsidiaries attributable to minority interests are recognised as separate items in the distribution of profits and the equity. Minority interests are recognised
Financial statements | 6968 |
on the basis of a remeasurement of acquired assets and liabilities to fair value at the time of acquisition of subsidiaries.
The measurement is prorated according to the minority’s share and goodwill related to minority interests is not recognised.
On subsequent changes to minority interests, the changed share is included in results as of the date of change.
Foreign currency translation Functional and presentation currencyItems included in the financial statements of each of Hempel’s entities are measured using the cur rency of the primary economic environ-ment in which the entity operates (functional currency). Transactions denominated in other currencies than the functional currency are considered transactions denominated in foreign currencies. The consolidated financial state-ments are presented in euro.
Translation of transactions and balancesTransactions in foreign currencies are translated at the exchange rates at the dates of transaction. Gains and losses arising due to differences between the transaction date rates and the rates
at the dates of payment are recognised in financial income and expenses in the income statement. Where foreign exchange transactions are considered hedging of future cash flows, the value adjustments are recognised directly in equity.
Receivables, payables and other monetary items in foreign currencies that have not been settled at the balance sheet date are translated at the exchange rates at the balance sheet date. Any differences between the exchange rates at the balance sheet date and the transaction date rates are recognised in financial income and expenses in the income statement.
Fixed assets acquired in foreign currencies are measured at the transaction date rates.
Translation of Group companies Financial statements of foreign subsidiaries and associates are translated into euros at the exchange rates prevailing at the end of the reporting period for balance sheet items, and at average exchange rates for income statement items, with the exception of exchange rate adjustments of investments in subsidiaries and associates arising from:• the translation of foreign subsidiaries’ and
associates’ net assets at the beginning of the
70 |
year at the exchange rates at the end of the reporting period
• the translation of foreign subsidiaries’ and associates’ income statement from average exchange rates to exchange rates at the end of the reporting period
• the translation of intra-Group receivables that are considered to be an addition to net investments in subsidiaries
These specific exchange rate adjustments are recognised directly in equity.
Classification of operating expenses in the income statement Production costs Production costs comprise costs incurred to achieve revenue for the year. Costs comprise raw materials, consumables, direct labour costs and indirect production costs such as mainte-nance and depreciation, etc., as well as operation, administration and management of factories.
Production costs also include research and development costs that do not qualify for capitalisation as well as amortisation of capitalised development costs. Also included are inventory write-downs.
Sales and distribution costs Sales and distribution expenses comprise costs incurred to distribute sales and for sales campaigns, including costs for sales and distribution staff, advertising costs and depreci-ation of sales equipment.
Administrative costsAdministrative costs comprise costs incurred for management and administration of the Group, including costs for administrative staff and manage ment as well as office costs and depreciation and write-downs for bad debt losses. Amortisation of goodwill, customer relationships and brands are recognised in administrative costs.
Cash flow statement The cash flow statement is presented using the indirect method based on the operating profit (loss). The cash flow statement for the Group shows the cash flows for the year broken down by operating, investing and financing activities, changes for the year in cash and cash equivalents as well as cash and cash equiva-lents for the Group at the beginning and end of the year. The cash flow statement cannot be immediately derived from the published financial records.
Cash flows from operating activitiesCash flows from operating activities are calculated as the net profit/loss for the year adjusted for changes in working capital, interest and tax paid and non-cash operating items, such as depreciation, amortisation and impairment losses and provisions. Working capital com-prises current assets less short-term debt excluding items included in cash and cash equivalents.
Cash flows from investing activitiesCash flows from investing activities comprise cash flows from acquisitions and disposals of intangible assets, property, plant and equip-ment, fixed asset investments, as well as acquistions of enterprises.
Cash flows from financing activities Cash flows from financing activities comprise cash flows from the raising and repayment of principal long-term debt as well as payments to and from shareholders.
Cash and cash equivalentsCash and cash equivalents comprise cash and short-term marketable securities with a term of three months or less and are subject to an insignificant risk of change in value.
Separate presentation of special itemsWith reference to §11(3) of the Danish Financial Statements Act, the Hempel Group has departed from the presentation requirements in the Act. It is management’s assessment that a separate presentation of certain costs provides a true and fair view of the financial statements. The Hempel Group has therefore presented costs related to identified and potential irregularities within Hempel’s subsidiaries in certain countries as ‘Special items’ in the income statement. Costs include penalties, costs associated with investiga-tions performed and severance payments. Management has found it necessary to present these costs separately as they are material to the Group, non-recurring and extraordinary in terms of Hempel’s continuing global business. It is the view of management that a note disclosure only is not sufficient to ensure that the performance of the continuing business is understood correctly by the reader of the financial statements. Individual line items included in ‘Operating profit’ are impacted by a total of EUR 0 million (2018: EUR 13 million). However, the change in pres-entation does not impact operating profit after special items, profit after tax, total assets, total equity or cash flow.
Financial statements | 71
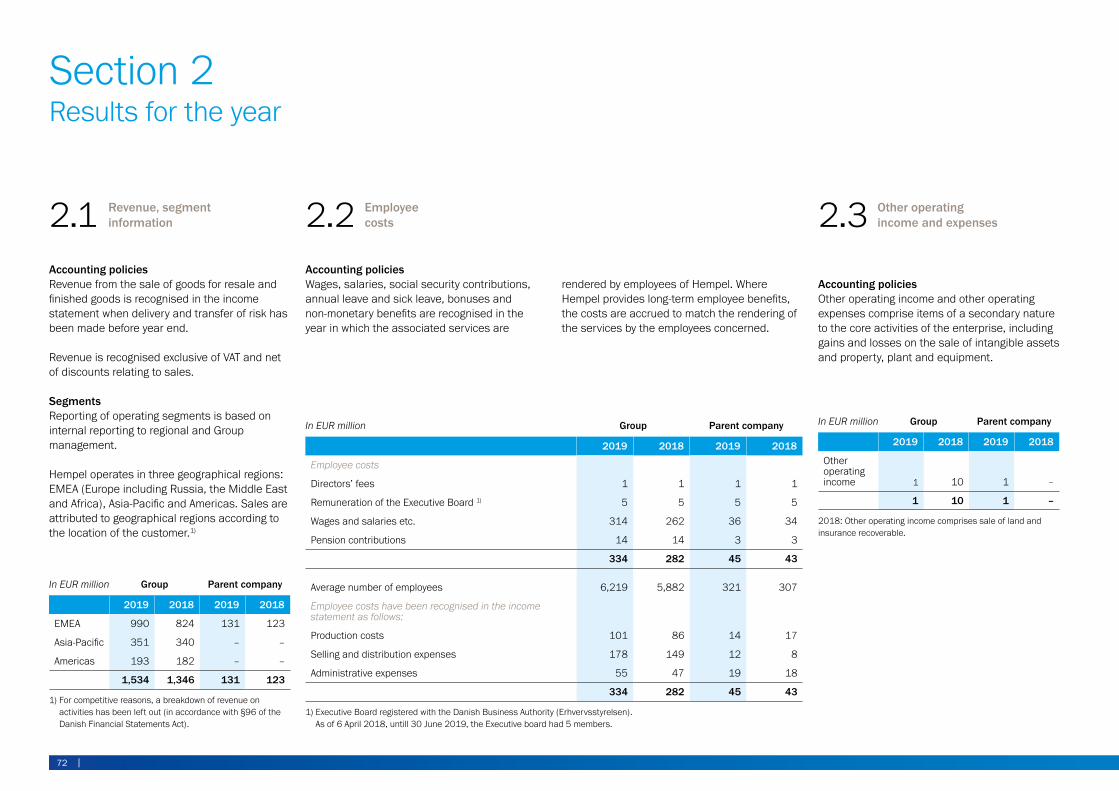
In EUR million Group Parent company
2019 2018 2019 2018
EMEA 990 824 131 123
Asia-Pacific 351 340 – –
Americas 193 182 – –
1,534 1,346 131 123
1) For competitive reasons, a breakdown of revenue on activities has been left out (in accordance with §96 of the Danish Financial Statements Act).
In EUR million Group Parent company
2019 2018 2019 2018
Employee costs
Directors’ fees 1 1 1 1
Remuneration of the Executive Board 1) 5 5 5 5
Wages and salaries etc. 314 262 36 34
Pension contributions 14 14 3 3
334 282 45 43
Average number of employees 6,219 5,882 321 307
Employee costs have been recognised in the income statement as follows:
Production costs 101 86 14 17
Selling and distribution expenses 178 149 12 8
Administrative expenses 55 47 19 18
334 282 45 43
1) Executive Board registered with the Danish Business Authority (Erhvervsstyrelsen). As of 6 April 2018, untill 30 June 2019, the Executive board had 5 members.
In EUR million Group Parent company
2019 2018 2019 2018
Other operating income 1 10 1 –
1 10 1 –
2018: Other operating income comprises sale of land and insurance recoverable.
Section 2Results for the year
2.1Accounting policiesRevenue from the sale of goods for resale and finished goods is recognised in the income statement when delivery and transfer of risk has been made before year end.
Revenue is recognised exclusive of VAT and net of discounts relating to sales.
SegmentsReporting of operating segments is based on internal reporting to regional and Group management.
Hempel operates in three geographical regions: EMEA (Europe including Russia, the Middle East and Africa), Asia-Pacific and Americas. Sales are attributed to geographical regions according to the location of the customer.1)
Revenue, segment information 2.2 Employee
costs
Accounting policiesWages, salaries, social security contributions, annual leave and sick leave, bonuses and non-monetary benefits are recognised in the year in which the associated services are
rendered by employees of Hempel. Where Hempel provides long-term employee benefits, the costs are accrued to match the rendering of the services by the employees concerned.
2.3 Other operating income and expenses
Accounting policiesOther operating income and other operating expenses comprise items of a secondary nature to the core activities of the enterprise, including gains and losses on the sale of intangible assets and property, plant and equipment.
Financial statements | 7372 |
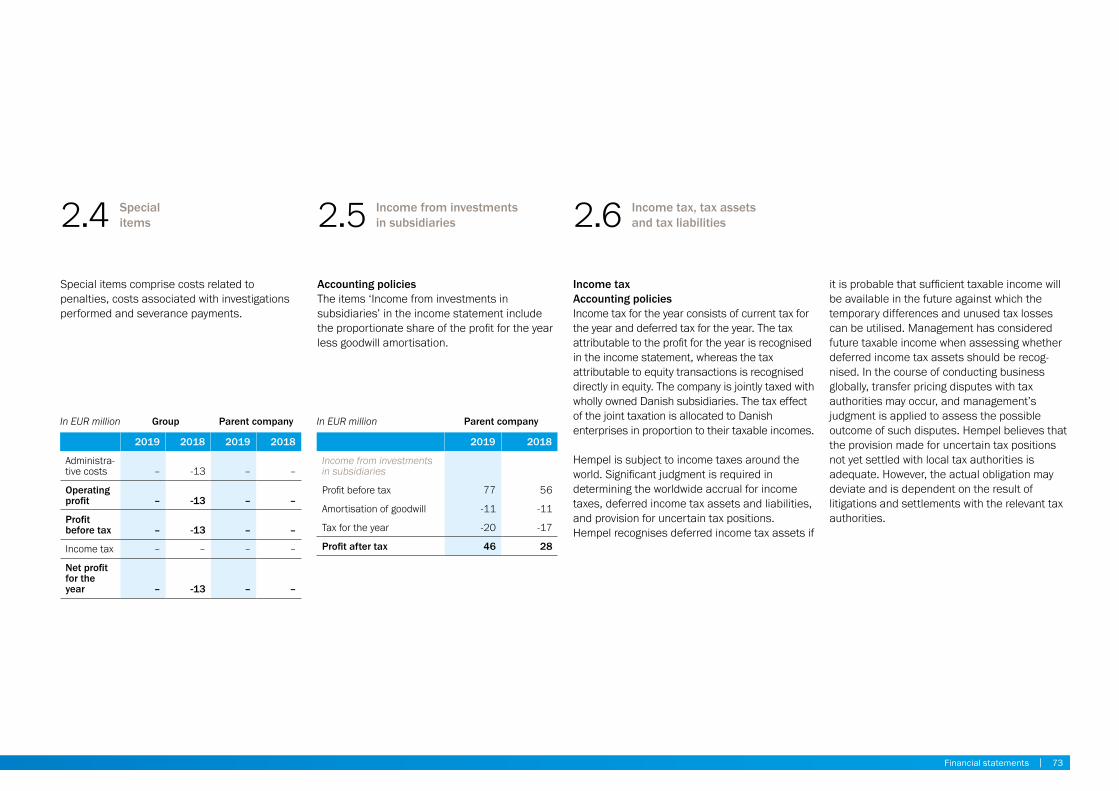
In EUR million Group Parent company
2019 2018 2019 2018
Administra-tive costs – -13 – –
Operating profit – -13 – –
Profit before tax – -13 – –
Income tax – – – –
Net profit for the year – -13 – –
In EUR million Parent company
2019 2018
Income from investments in subsidiaries
Profit before tax 77 56
Amortisation of goodwill -11 -11
Tax for the year -20 -17
Profit after tax 46 28
2.4 Special items
Special items comprise costs related to penalties, costs associated with investigations performed and severance payments.
2.5 Income from investments in subsidiaries
Accounting policiesThe items ‘Income from investments in subsidiaries’ in the income statement include the proportionate share of the profit for the year less goodwill amortisation.
2.6 Income tax, tax assets and tax liabilities
Income taxAccounting policiesIncome tax for the year consists of current tax for the year and deferred tax for the year. The tax attributable to the profit for the year is recognised in the income statement, whereas the tax attributable to equity transactions is recognised directly in equity. The company is jointly taxed with wholly owned Danish subsidiaries. The tax effect of the joint taxation is allocated to Danish enterprises in proportion to their taxable incomes.
Hempel is subject to income taxes around the world. Significant judgment is required in determining the worldwide accrual for income taxes, deferred income tax assets and liabilities, and provision for uncertain tax positions. Hempel recognises deferred income tax assets if
it is probable that sufficient taxable income will be available in the future against which the temporary differences and unused tax losses can be utilised. Management has considered future taxable income when assessing whether deferred income tax assets should be recog-nised. In the course of conducting business globally, transfer pricing disputes with tax authorities may occur, and management’s judgment is applied to assess the possible outcome of such disputes. Hempel believes that the provision made for uncertain tax positions not yet settled with local tax authorities is adequate. However, the actual obligation may deviate and is dependent on the result of litigations and settlements with the relevant tax authorities.
Financial statements | 7372 |
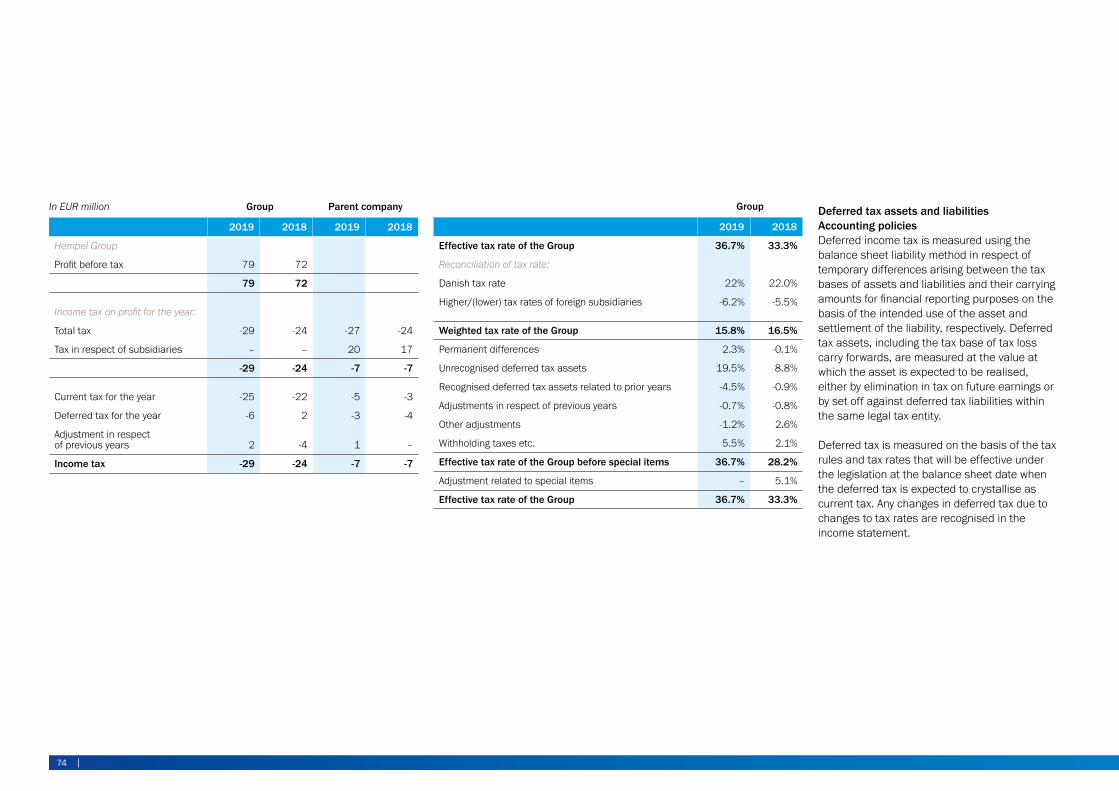
In EUR million Group Parent company
2019 2018 2019 2018
Hempel Group
Profit before tax 79 72
79 72
Income tax on profit for the year:
Total tax -29 -24 -27 -24
Tax in respect of subsidiaries – – 20 17
-29 -24 -7 -7
Current tax for the year -25 -22 -5 -3
Deferred tax for the year -6 2 -3 -4
Adjustment in respect of previous years 2 -4 1 –
Income tax -29 -24 -7 -7
Group
2019 2018
Effective tax rate of the Group 36.7% 33.3%
Reconciliation of tax rate:
Danish tax rate 22% 22.0%
Higher/(lower) tax rates of foreign subsidiaries -6.2% -5.5%
Weighted tax rate of the Group 15.8% 16.5%
Permanent differences 2.3% -0.1%
Unrecognised deferred tax assets 19.5% 8.8%
Recognised deferred tax assets related to prior years -4.5% -0.9%
Adjustments in respect of previous years -0.7% -0.8%
Other adjustments -1.2% 2.6%
Withholding taxes etc. 5.5% 2.1%
Effective tax rate of the Group before special items 36.7% 28.2%
Adjustment related to special items – 5.1%
Effective tax rate of the Group 36.7% 33.3%
Deferred tax assets and liabilitiesAccounting policiesDeferred income tax is measured using the balance sheet liability method in respect of temporary differences arising between the tax bases of assets and liabilities and their carrying amounts for financial reporting purposes on the basis of the intended use of the asset and settlement of the liability, respectively. Deferred tax assets, including the tax base of tax loss carry forwards, are measured at the value at which the asset is expected to be realised, either by elimination in tax on future earnings or by set off against deferred tax liabilities within the same legal tax entity.
Deferred tax is measured on the basis of the tax rules and tax rates that will be effective under the legislation at the balance sheet date when the deferred tax is expected to crystallise as current tax. Any changes in deferred tax due to changes to tax rates are recognised in the income statement.
Financial statements | 7574 |
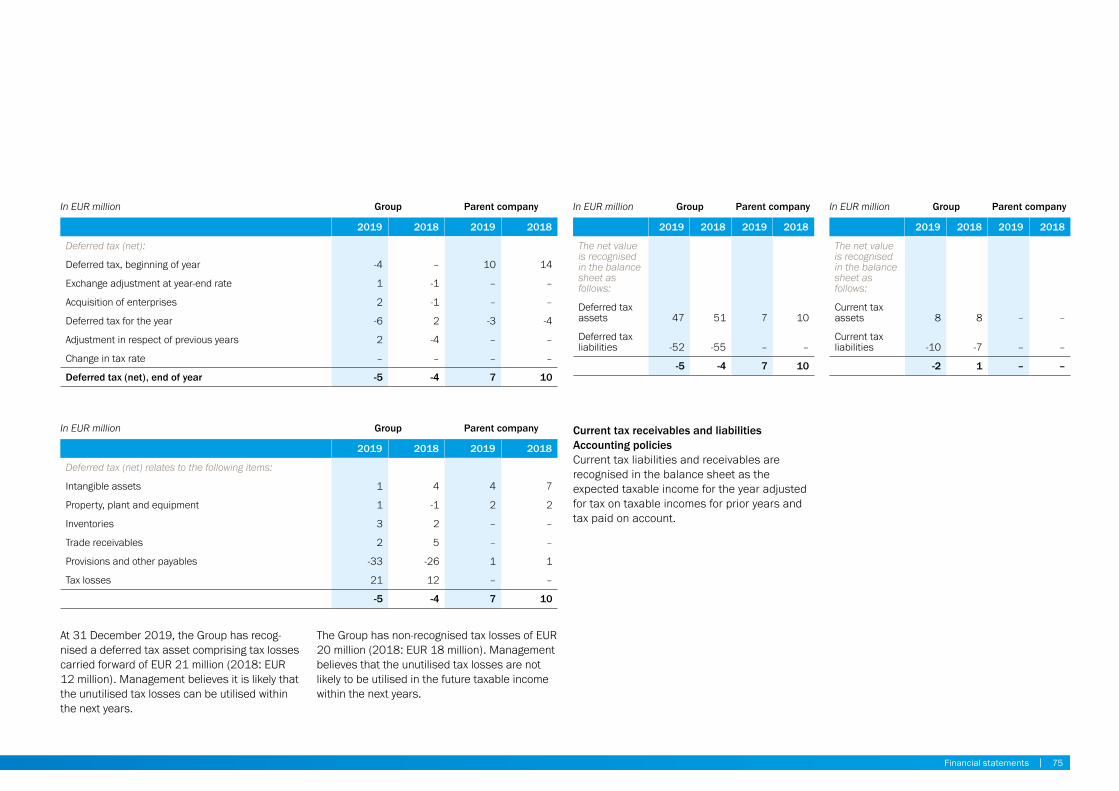
In EUR million Group Parent company
2019 2018 2019 2018
Deferred tax (net):
Deferred tax, beginning of year -4 – 10 14
Exchange adjustment at year-end rate 1 -1 – –
Acquisition of enterprises 2 -1 – –
Deferred tax for the year -6 2 -3 -4
Adjustment in respect of previous years 2 -4 – –
Change in tax rate – – – –
Deferred tax (net), end of year -5 -4 7 10
In EUR million Group Parent company
2019 2018 2019 2018
Deferred tax (net) relates to the following items:
Intangible assets 1 4 4 7
Property, plant and equipment 1 -1 2 2
Inventories 3 2 – –
Trade receivables 2 5 – –
Provisions and other payables -33 -26 1 1
Tax losses 21 12 – –
-5 -4 7 10
In EUR million Group Parent company
2019 2018 2019 2018
The net value is recognised in the balance sheet as follows:
Deferred tax assets 47 51 7 10
Deferred tax liabilities -52 -55 – –
-5 -4 7 10
In EUR million Group Parent company
2019 2018 2019 2018
The net value is recognised in the balance sheet as follows:
Current tax assets 8 8 – –
Current tax liabilities -10 -7 – –
-2 1 – –
At 31 December 2019, the Group has recog-nised a deferred tax asset comprising tax losses carried forward of EUR 21 million (2018: EUR 12 million). Management believes it is likely that the unutilised tax losses can be utilised within the next years.
The Group has non-recognised tax losses of EUR 20 million (2018: EUR 18 million). Management believes that the unutilised tax losses are not likely to be utilised in the future taxable income within the next years.
Current tax receivables and liabilitiesAccounting policiesCurrent tax liabilities and receivables are recognised in the balance sheet as the expected taxable income for the year adjusted for tax on taxable incomes for prior years and tax paid on account.
Financial statements | 7574 |
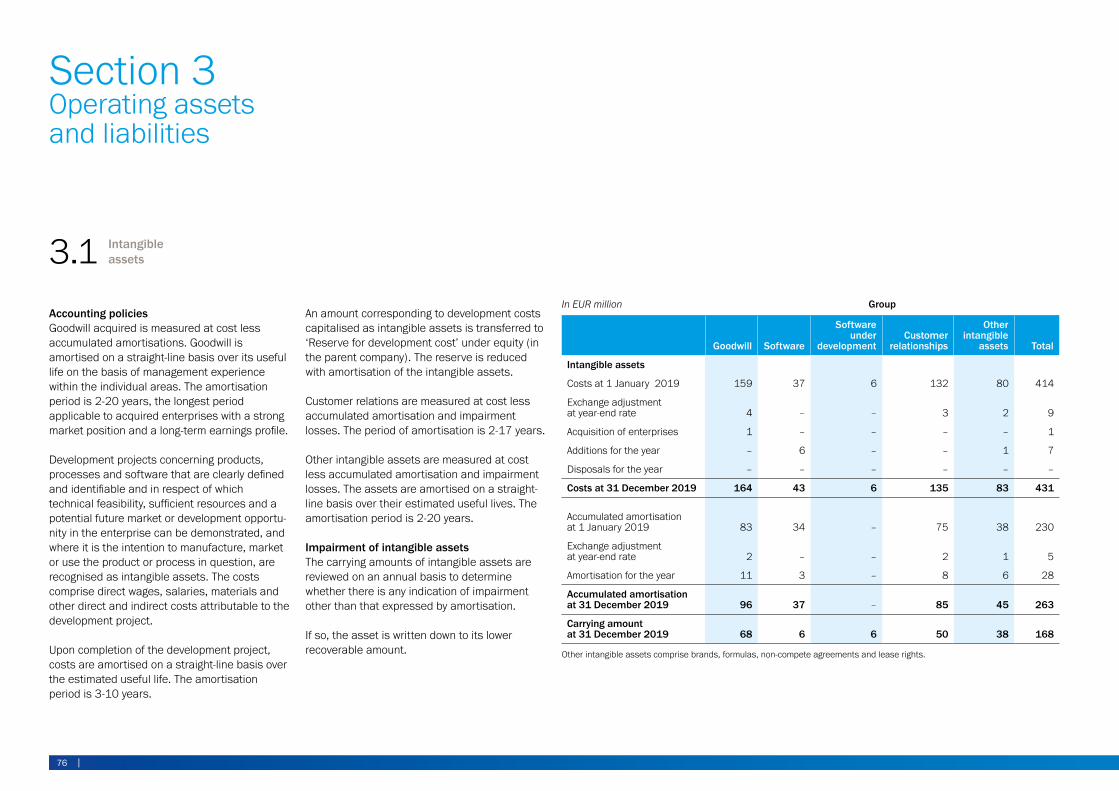
In EUR million Group
Goodwill Software
Software under
developmentCustomer
relationships
Other intangible
assets Total
Intangible assets
Costs at 1 January 2019 159 37 6 132 80 414
Exchange adjustment at year-end rate 4 – – 3 2 9
Acquisition of enterprises 1 – – – – 1
Additions for the year – 6 – – 1 7
Disposals for the year – – – – – –
Costs at 31 December 2019 164 43 6 135 83 431
Accumulated amortisation at 1 January 2019 83 34 – 75 38 230
Exchange adjustment at year-end rate 2 – – 2 1 5
Amortisation for the year 11 3 – 8 6 28
Accumulated amortisation at 31 December 2019 96 37 – 85 45 263
Carrying amount at 31 December 2019 68 6 6 50 38 168
Other intangible assets comprise brands, formulas, non-compete agreements and lease rights.
Section 3 Operating assets and liabilities
3.1 Intangible assets
Accounting policies Goodwill acquired is measured at cost less accumulated amortisations. Goodwill is amortised on a straight-line basis over its useful life on the basis of management experience within the individual areas. The amortisation period is 2-20 years, the longest period applicable to acquired enterprises with a strong market position and a long-term earnings profile.
Development projects concerning products, processes and software that are clearly defined and identifiable and in respect of which technical feasibility, sufficient resources and a potential future market or development opportu-nity in the enterprise can be demonstrated, and where it is the intention to manufacture, market or use the product or process in question, are recognised as intangible assets. The costs comprise direct wages, salaries, materials and other direct and indirect costs attributable to the development project.
Upon completion of the development project, costs are amortised on a straight-line basis over the estimated useful life. The amortisation period is 3-10 years.
An amount corresponding to development costs capitalised as intangible assets is transferred to ‘Reserve for development cost’ under equity (in the parent company). The reserve is reduced with amortisation of the intangible assets.
Customer relations are measured at cost less accumulated amortisation and impairment losses. The period of amortisation is 2-17 years.
Other intangible assets are measured at cost less accumulated amortisation and impairment losses. The assets are amortised on a straight-line basis over their estimated useful lives. The amortisation period is 2-20 years.
Impairment of intangible assetsThe carrying amounts of intangible assets are reviewed on an annual basis to determine whether there is any indication of impairment other than that expressed by amortisation.
If so, the asset is written down to its lower recoverable amount.
Financial statements | 7776 |
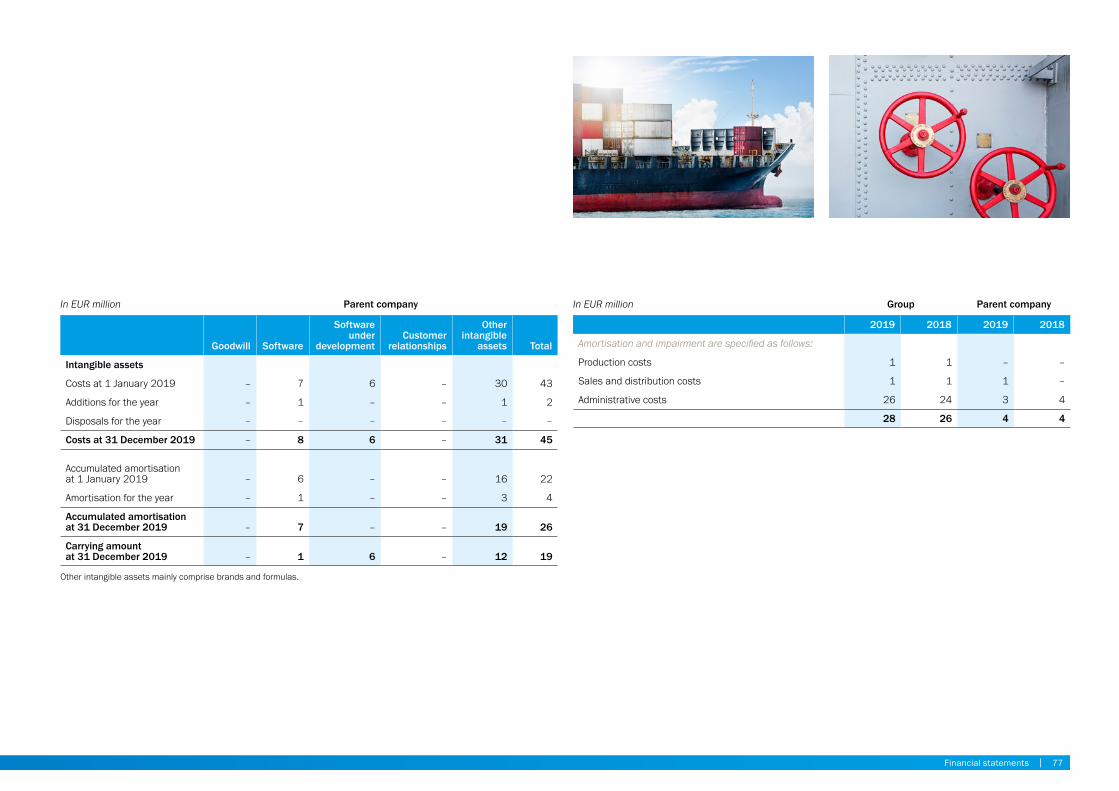
In EUR million Parent company
Goodwill Software
Software under
developmentCustomer
relationships
Other intangible
assets Total
Intangible assets
Costs at 1 January 2019 – 7 6 – 30 43
Additions for the year – 1 – – 1 2
Disposals for the year – – – – – –
Costs at 31 December 2019 – 8 6 – 31 45
Accumulated amortisation at 1 January 2019 – 6 – – 16 22
Amortisation for the year – 1 – – 3 4
Accumulated amortisation at 31 December 2019 – 7 – – 19 26
Carrying amount at 31 December 2019 – 1 6 – 12 19
Other intangible assets mainly comprise brands and formulas.
In EUR million Group Parent company
2019 2018 2019 2018
Amortisation and impairment are specified as follows:
Production costs 1 1 – –
Sales and distribution costs 1 1 1 –
Administrative costs 26 24 3 4
28 26 4 4
Financial statements | 7776 |
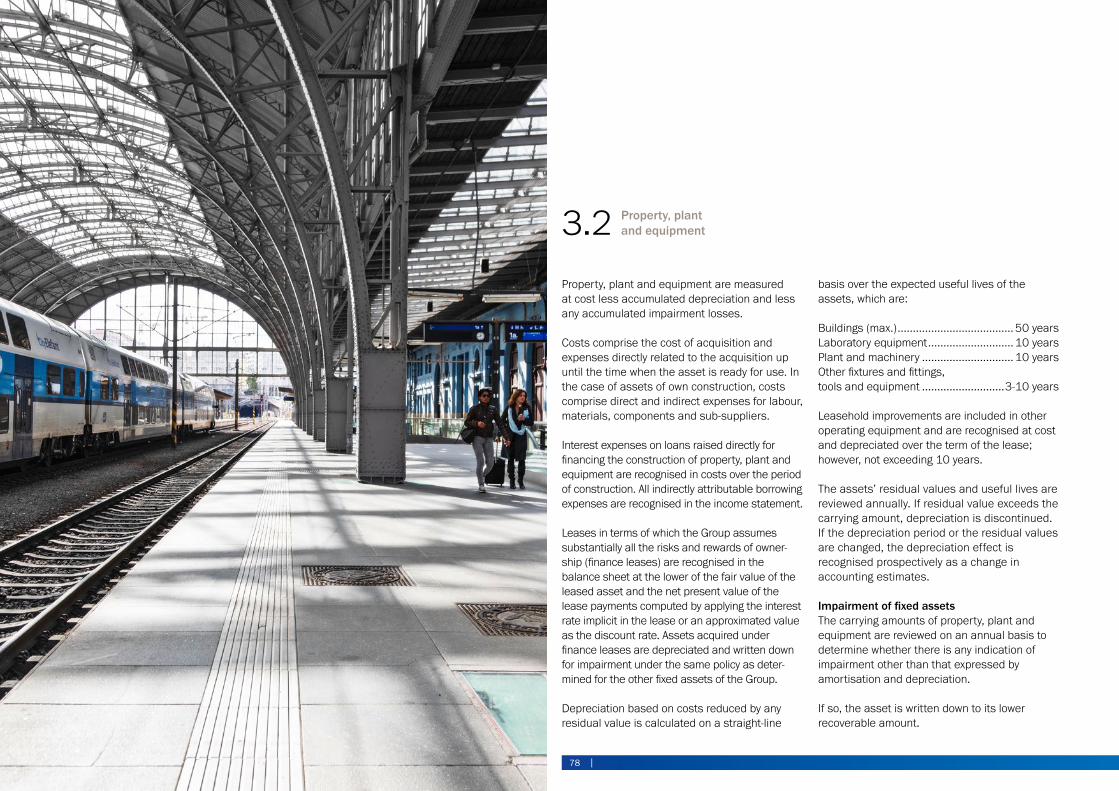
3.2 Property, plant and equipment
Property, plant and equipment are measured at cost less accumulated depreciation and less any accumulated impairment losses.
Costs comprise the cost of acquisition and expenses directly related to the acquisition up until the time when the asset is ready for use. In the case of assets of own construction, costs comprise direct and indirect expenses for labour, materials, components and sub-suppliers.
Interest expenses on loans raised directly for financing the construction of property, plant and equipment are recognised in costs over the period of construction. All indirectly attributable borrowing expenses are recognised in the income statement.
Leases in terms of which the Group assumes substantially all the risks and rewards of owner-ship (finance leases) are recognised in the balance sheet at the lower of the fair value of the leased asset and the net present value of the lease payments computed by applying the interest rate implicit in the lease or an approximated value as the discount rate. Assets acquired under finance leases are depreciated and written down for impairment under the same policy as deter-mined for the other fixed assets of the Group.
Depreciation based on costs reduced by any residual value is calculated on a straight-line
basis over the expected useful lives of the assets, which are:
Buildings (max.) ...................................... 50 yearsLaboratory equipment ............................ 10 yearsPlant and machinery .............................. 10 yearsOther fixtures and fittings, tools and equipment ...........................3-10 years
Leasehold improvements are included in other operating equipment and are recognised at cost and depreciated over the term of the lease; however, not exceeding 10 years.
The assets’ residual values and useful lives are reviewed annually. If residual value exceeds the carrying amount, depreciation is discontinued. If the depreciation period or the residual values are changed, the depreciation effect is recognised prospectively as a change in accounting estimates.
Impairment of fixed assetsThe carrying amounts of property, plant and equipment are reviewed on an annual basis to determine whether there is any indication of impairment other than that expressed by amortisation and depreciation.
If so, the asset is written down to its lower recoverable amount.
78 |
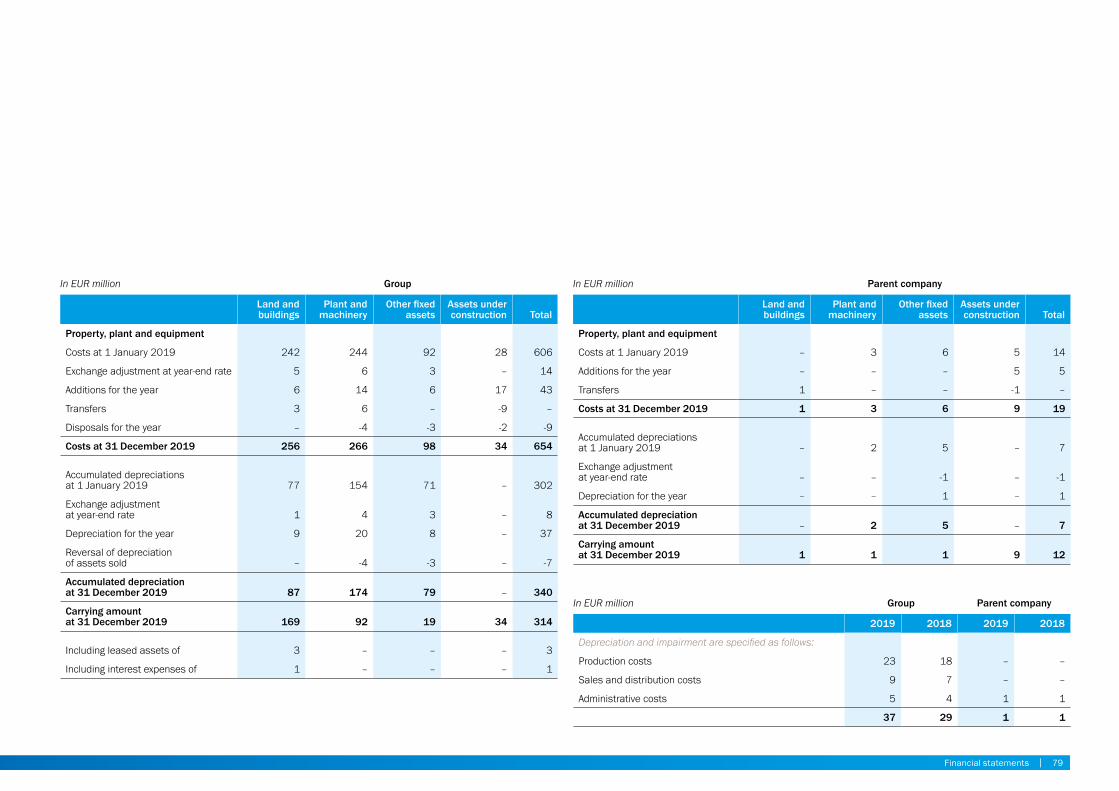
In EUR million Group
Land and buildings
Plant and machinery
Other fixed assets
Assets under construction Total
Property, plant and equipment
Costs at 1 January 2019 242 244 92 28 606
Exchange adjustment at year-end rate 5 6 3 – 14
Additions for the year 6 14 6 17 43
Transfers 3 6 – -9 –
Disposals for the year – -4 -3 -2 -9
Costs at 31 December 2019 256 266 98 34 654
Accumulated depreciations at 1 January 2019 77 154 71 – 302
Exchange adjustment at year-end rate 1 4 3 – 8
Depreciation for the year 9 20 8 – 37
Reversal of depreciation of assets sold – -4 -3 – -7
Accumulated depreciation at 31 December 2019 87 174 79 – 340
Carrying amount at 31 December 2019 169 92 19 34 314
Including leased assets of 3 – – – 3
Including interest expenses of 1 – – – 1
In EUR million Parent company
Land and buildings
Plant and machinery
Other fixed assets
Assets under construction Total
Property, plant and equipment
Costs at 1 January 2019 – 3 6 5 14
Additions for the year – – – 5 5
Transfers 1 – – -1 –
Costs at 31 December 2019 1 3 6 9 19
Accumulated depreciations at 1 January 2019 – 2 5 – 7
Exchange adjustment at year-end rate – – -1 – -1
Depreciation for the year – – 1 – 1
Accumulated depreciation at 31 December 2019 – 2 5 – 7
Carrying amount at 31 December 2019 1 1 1 9 12
In EUR million Group Parent company
2019 2018 2019 2018
Depreciation and impairment are specified as follows:
Production costs 23 18 – –
Sales and distribution costs 9 7 – –
Administrative costs 5 4 1 1
37 29 1 1
Financial statements | 79
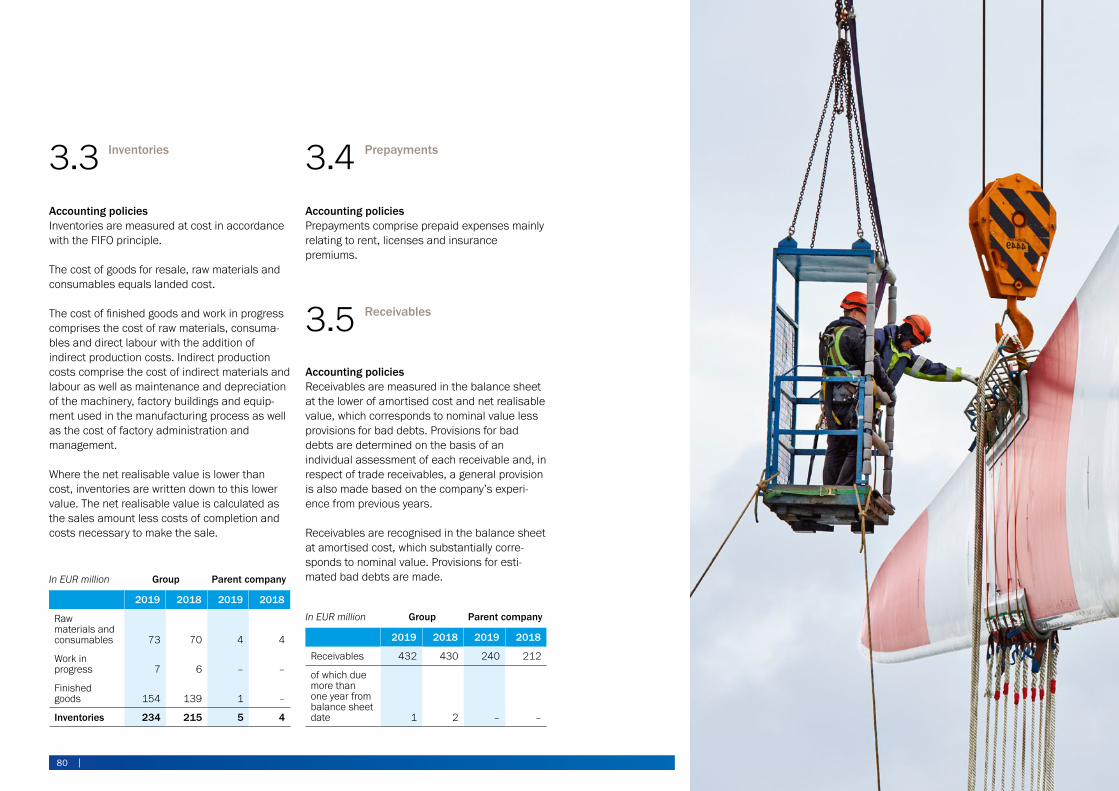
3.3 Inventories
Accounting policiesInventories are measured at cost in accordance with the FIFO principle.
The cost of goods for resale, raw materials and consumables equals landed cost.
The cost of finished goods and work in progress comprises the cost of raw materials, consuma-bles and direct labour with the addition of indirect production costs. Indirect production costs comprise the cost of indirect materials and labour as well as maintenance and depreciation of the machinery, factory buildings and equip-ment used in the manufacturing process as well as the cost of factory administration and management.
Where the net realisable value is lower than cost, inventories are written down to this lower value. The net realisable value is calculated as the sales amount less costs of completion and costs necessary to make the sale.
3.4 Prepayments
Accounting policiesPrepayments comprise prepaid expenses mainly relating to rent, licenses and insurance premiums.
3.5 Receivables
Accounting policiesReceivables are measured in the balance sheet at the lower of amortised cost and net realisable value, which corresponds to nominal value less provisions for bad debts. Provisions for bad debts are determined on the basis of an individual assessment of each receivable and, in respect of trade receivables, a general provision is also made based on the company’s experi-ence from previous years.
Receivables are recognised in the balance sheet at amortised cost, which substantially corre-sponds to nominal value. Provisions for esti-mated bad debts are made.In EUR million Group Parent company
2019 2018 2019 2018
Raw materials and consumables 73 70 4 4
Work in progress 7 6 – –
Finished goods 154 139 1 –
Inventories 234 215 5 4
In EUR million Group Parent company
2019 2018 2019 2018
Receivables 432 430 240 212
of which due more than one year from balance sheet date 1 2 – –
80 |
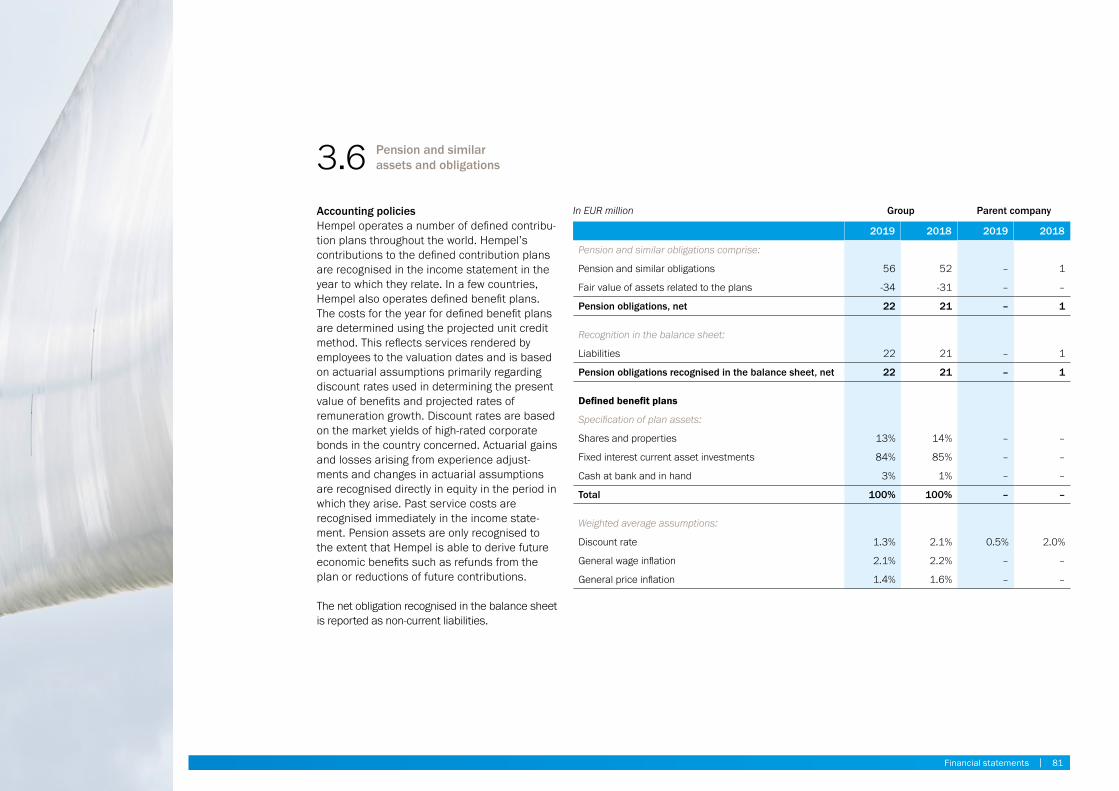
In EUR million Group Parent company
2019 2018 2019 2018
Pension and similar obligations comprise:
Pension and similar obligations 56 52 – 1
Fair value of assets related to the plans -34 -31 – –
Pension obligations, net 22 21 – 1
Recognition in the balance sheet:
Liabilities 22 21 – 1
Pension obligations recognised in the balance sheet, net 22 21 – 1
Defined benefit plans
Specification of plan assets:
Shares and properties 13% 14% – –
Fixed interest current asset investments 84% 85% – –
Cash at bank and in hand 3% 1% – –
Total 100% 100% – –
Weighted average assumptions:
Discount rate 1.3% 2.1% 0.5% 2.0%
General wage inflation 2.1% 2.2% – –
General price inflation 1.4% 1.6% – –
3.6 Pension and similar assets and obligations
Accounting policiesHempel operates a number of defined contribu-tion plans throughout the world. Hempel’s contributions to the defined contribution plans are recognised in the income statement in the year to which they relate. In a few countries, Hempel also operates defined benefit plans. The costs for the year for defined benefit plans are determined using the projected unit credit method. This reflects services rendered by employees to the valuation dates and is based on actuarial assumptions primarily regarding discount rates used in determining the present value of benefits and projected rates of remuneration growth. Discount rates are based on the market yields of high-rated corporate bonds in the country concerned. Actuarial gains and losses arising from experience adjust-ments and changes in actuarial assumptions are recognised directly in equity in the period in which they arise. Past service costs are recognised immediately in the income state-ment. Pension assets are only recognised to the extent that Hempel is able to derive future economic benefits such as refunds from the plan or reductions of future contributions.
The net obligation recognised in the balance sheet is reported as non-current liabilities.
Financial statements | 81
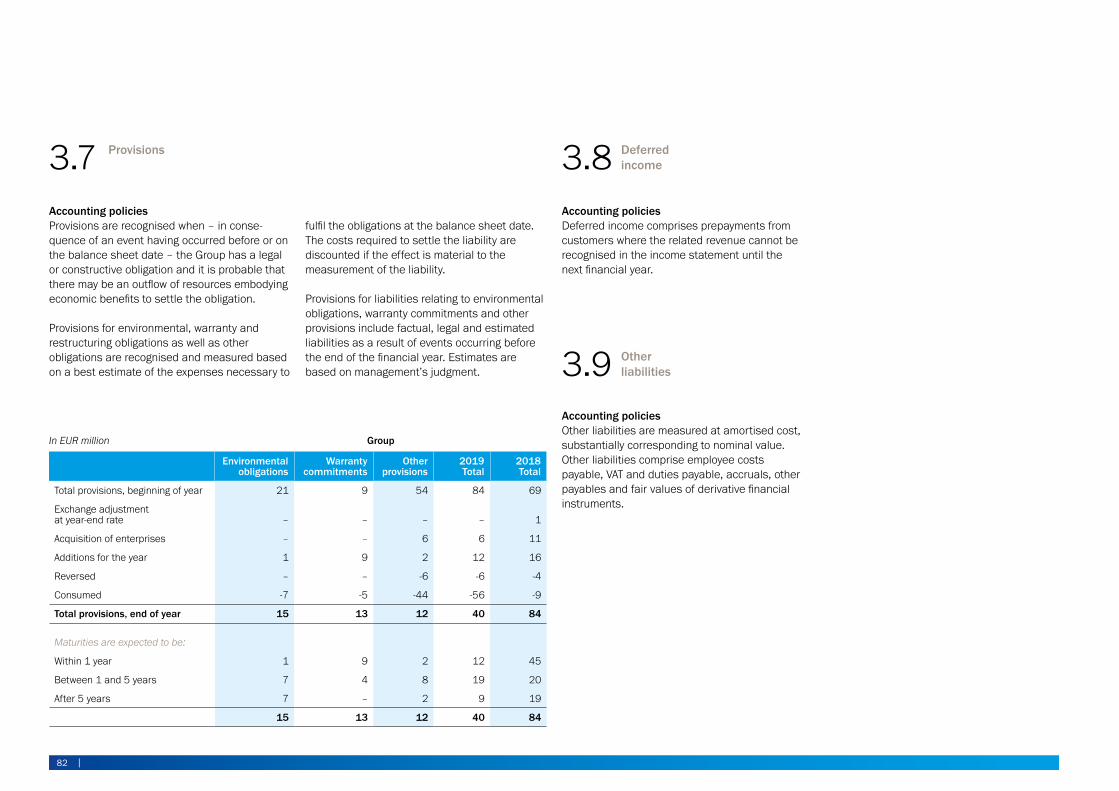
In EUR million Group
Environmental obligations
Warranty commitments
Other provisions
2019 Total
2018 Total
Total provisions, beginning of year 21 9 54 84 69
Exchange adjustment at year-end rate – – – – 1
Acquisition of enterprises – – 6 6 11
Additions for the year 1 9 2 12 16
Reversed – – -6 -6 -4
Consumed -7 -5 -44 -56 -9
Total provisions, end of year 15 13 12 40 84
Maturities are expected to be:
Within 1 year 1 9 2 12 45
Between 1 and 5 years 7 4 8 19 20
After 5 years 7 – 2 9 19
15 13 12 40 84
3.7 Provisions
Accounting policiesProvisions are recognised when – in conse-quence of an event having occurred before or on the balance sheet date – the Group has a legal or constructive obligation and it is probable that there may be an outflow of resources embodying economic benefits to settle the obligation.
Provisions for environmental, warranty and restructuring obligations as well as other obligations are recognised and measured based on a best estimate of the expenses necessary to
fulfil the obligations at the balance sheet date. The costs required to settle the liability are discounted if the effect is material to the measurement of the liability.
Provisions for liabilities relating to environmental obligations, warranty commitments and other provisions include factual, legal and estimated liabilities as a result of events occurring before the end of the financial year. Estimates are based on management’s judgment.
3.8 Deferred income
Accounting policiesDeferred income comprises prepayments from customers where the related revenue cannot be recognised in the income statement until the next financial year.
3.9 Other liabilities
Accounting policiesOther liabilities are measured at amortised cost, substantially corresponding to nominal value. Other liabilities comprise employee costs payable, VAT and duties payable, accruals, other payables and fair values of derivative financial instruments.
82 |

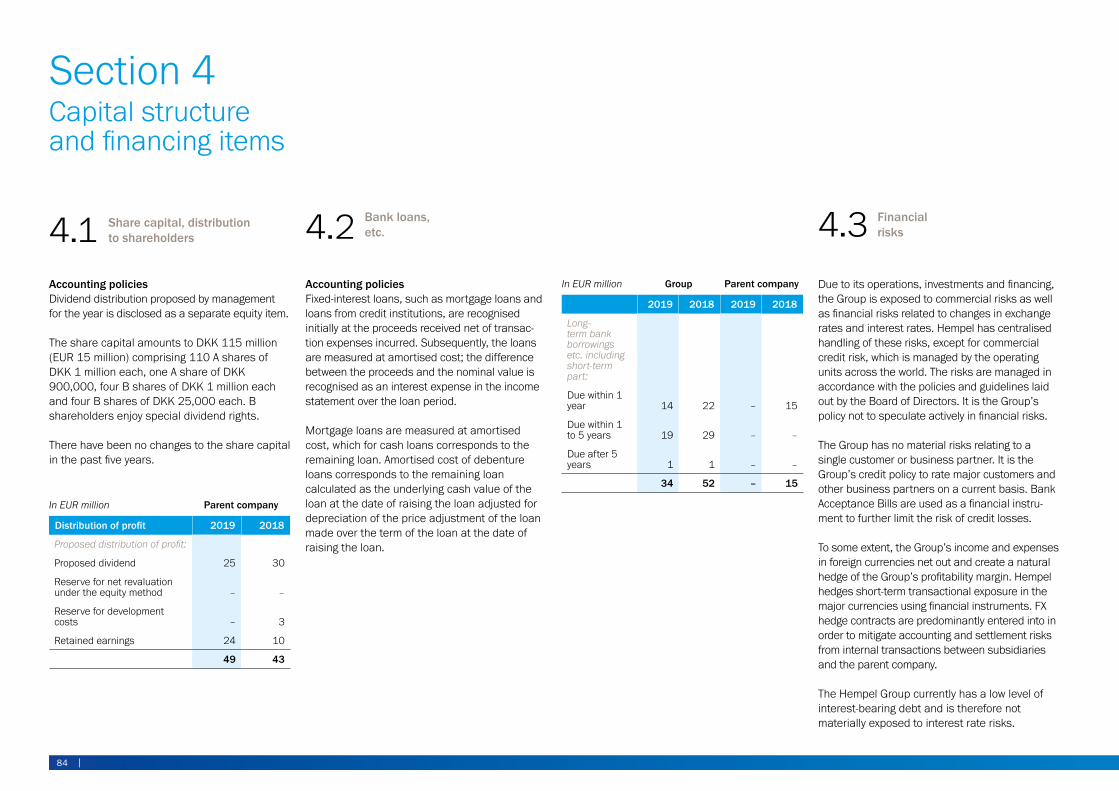
In EUR million Parent company
Distribution of profit 2019 2018
Proposed distribution of profit:
Proposed dividend 25 30
Reserve for net revaluation under the equity method – –
Reserve for development costs – 3
Retained earnings 24 10
49 43
In EUR million Group Parent company
2019 2018 2019 2018
Long-term bank borrowings etc. including short-term part:
Due within 1 year 14 22 – 15
Due within 1 to 5 years 19 29 – –
Due after 5 years 1 1 – –
34 52 – 15
Section 4 Capital structure and financing items
4.1 Share capital, distribution to shareholders
Accounting policies Dividend distribution proposed by management for the year is disclosed as a separate equity item.
The share capital amounts to DKK 115 million (EUR 15 million) comprising 110 A shares of DKK 1 million each, one A share of DKK 900,000, four B shares of DKK 1 million each and four B shares of DKK 25,000 each. B shareholders enjoy special dividend rights.
There have been no changes to the share capital in the past five years.
4.2 Bank loans, etc.
Accounting policies Fixed-interest loans, such as mortgage loans and loans from credit institutions, are recognised initially at the proceeds received net of transac-tion expenses incurred. Subsequently, the loans are measured at amortised cost; the difference between the proceeds and the nominal value is recognised as an interest expense in the income statement over the loan period.
Mortgage loans are measured at amortised cost, which for cash loans corresponds to the remaining loan. Amortised cost of debenture loans corresponds to the remaining loan calculated as the underlying cash value of the loan at the date of raising the loan adjusted for depreciation of the price adjustment of the loan made over the term of the loan at the date of raising the loan.
4.3 Financial risks
Due to its operations, investments and financing, the Group is exposed to commercial risks as well as financial risks related to changes in exchange rates and interest rates. Hempel has centralised handling of these risks, except for commercial credit risk, which is managed by the operating units across the world. The risks are managed in accordance with the policies and guidelines laid out by the Board of Directors. It is the Group’s policy not to speculate actively in financial risks.
The Group has no material risks relating to a single customer or business partner. It is the Group’s credit policy to rate major customers and other business partners on a current basis. Bank Acceptance Bills are used as a financial instru-ment to further limit the risk of credit losses.
To some extent, the Group’s income and expenses in foreign currencies net out and create a natural hedge of the Group’s profitability margin. Hempel hedges short-term transactional exposure in the major currencies using financial instruments. FX hedge contracts are predominantly entered into in order to mitigate accounting and settlement risks from internal transactions between subsidiaries and the parent company.
The Hempel Group currently has a low level of interest- bearing debt and is therefore not materially exposed to interest rate risks.
Financial statements | 8584 |
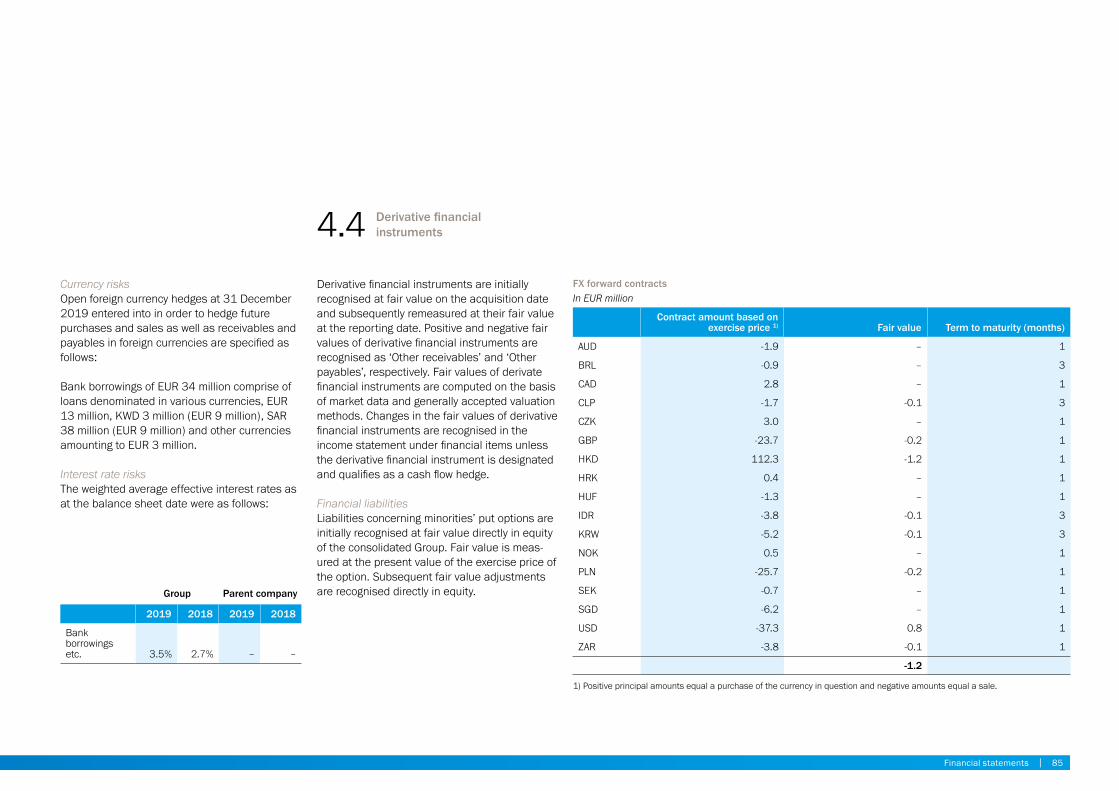
FX forward contractsIn EUR million
Contract amount based on exercise price 1) Fair value Term to maturity (months)
AUD -1.9 – 1
BRL -0.9 – 3
CAD 2.8 – 1
CLP -1.7 -0.1 3
CZK 3.0 – 1
GBP -23.7 -0.2 1
HKD 112.3 -1.2 1
HRK 0.4 – 1
HUF -1.3 – 1
IDR -3.8 -0.1 3
KRW -5.2 -0.1 3
NOK 0.5 – 1
PLN -25.7 -0.2 1
SEK -0.7 – 1
SGD -6.2 – 1
USD -37.3 0.8 1
ZAR -3.8 -0.1 1
-1.2
1) Positive principal amounts equal a purchase of the currency in question and negative amounts equal a sale.
Group Parent company
2019 2018 2019 2018
Bank borrowings etc. 3.5% 2.7% – –
4.4 Derivative financial instruments
Derivative financial instruments are initially recognised at fair value on the acquisition date and subsequently remeasured at their fair value at the reporting date. Positive and negative fair values of derivative financial instruments are recognised as ‘Other receivables’ and ‘Other payables’, respectively. Fair values of derivate financial instruments are computed on the basis of market data and generally accepted valuation methods. Changes in the fair values of derivative financial instruments are recognised in the income state ment under financial items unless the derivative financial instrument is designated and qualifies as a cash flow hedge.
Financial liabilitiesLiabilities concerning minorities’ put options are initially recognised at fair value directly in equity of the consolidated Group. Fair value is meas-ured at the present value of the exercise price of the option. Subsequent fair value adjustments are recognised directly in equity.
Currency risks Open foreign currency hedges at 31 December 2019 entered into in order to hedge future purchases and sales as well as receivables and payables in foreign currencies are specified as follows:
Bank borrowings of EUR 34 million comprise of loans denominated in various currencies, EUR 13 million, KWD 3 million (EUR 9 million), SAR 38 million (EUR 9 million) and other currencies amounting to EUR 3 million.
Interest rate risksThe weighted average effective interest rates as at the balance sheet date were as follows:
Financial statements | 8584 |
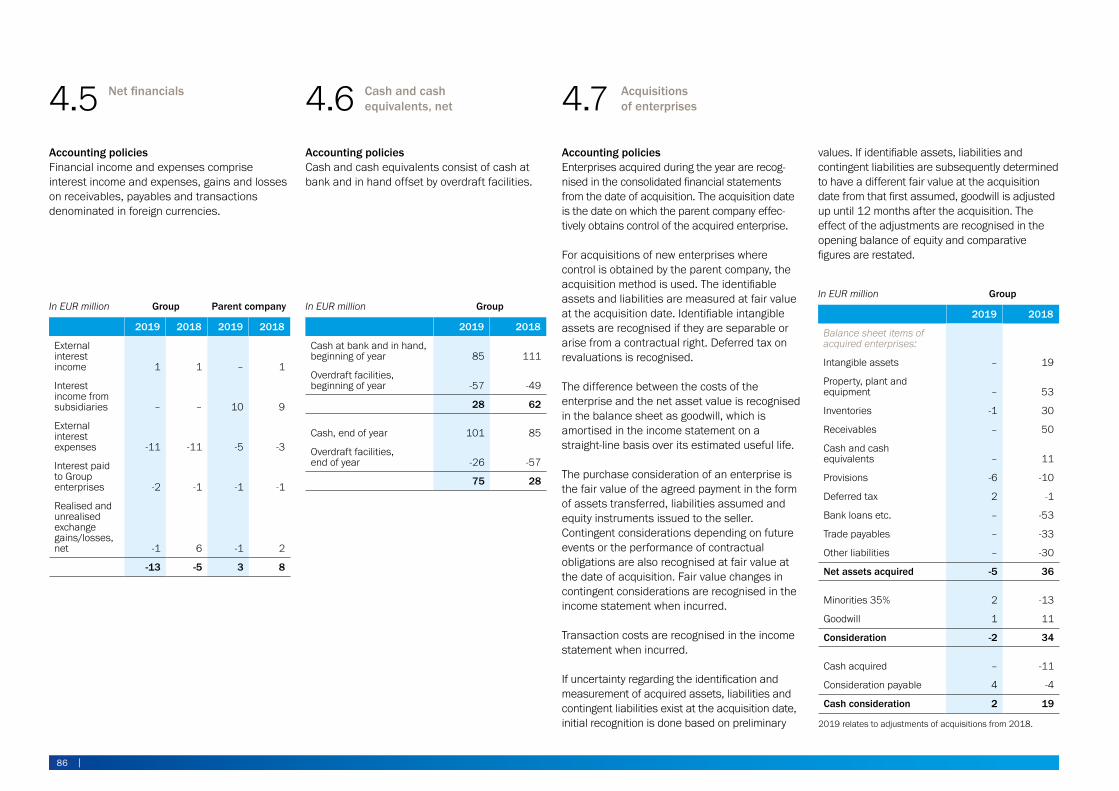
In EUR million Group Parent company
2019 2018 2019 2018
External interest income 1 1 – 1
Interest income from subsidiaries – – 10 9
External interest expenses -11 -11 -5 -3
Interest paid to Group enterprises -2 -1 -1 -1
Realised and unrealised exchange gains/losses, net -1 6 -1 2
-13 -5 3 8
In EUR million Group
2019 2018
Cash at bank and in hand, beginning of year 85 111
Overdraft facilities, beginning of year -57 -49
28 62
Cash, end of year 101 85
Overdraft facilities, end of year -26 -57
75 28
In EUR million Group
2019 2018
Balance sheet items of acquired enterprises:
Intangible assets – 19
Property, plant and equipment – 53
Inventories -1 30
Receivables – 50
Cash and cash equivalents – 11
Provisions -6 -10
Deferred tax 2 -1
Bank loans etc. – -53
Trade payables – -33
Other liabilities – -30
Net assets acquired -5 36
Minorities 35% 2 -13
Goodwill 1 11
Consideration -2 34
Cash acquired – -11
Consideration payable 4 -4
Cash consideration 2 19
2019 relates to adjustments of acquisitions from 2018.
4.5 Net financials
Accounting policiesFinancial income and expenses comprise interest income and expenses, gains and losses on receivables, payables and transactions denominated in foreign currencies.
4.6 Cash and cash equivalents, net
Accounting policiesCash and cash equivalents consist of cash at bank and in hand offset by overdraft facilities.
4.7 Acquisitions of enterprises
Accounting policiesEnterprises acquired during the year are recog-nised in the consolidated financial statements from the date of acquisition. The acquisition date is the date on which the parent company effec-tively obtains control of the acquired enterprise.
For acquisitions of new enterprises where control is obtained by the parent company, the acquisition method is used. The identifiable assets and liabilities are measured at fair value at the acquisition date. Identifiable intangible assets are recognised if they are separable or arise from a contractual right. Deferred tax on revaluations is recognised.
The difference between the costs of the enterprise and the net asset value is recognised in the balance sheet as goodwill, which is amortised in the income statement on a straight-line basis over its estimated useful life.
The purchase consideration of an enterprise is the fair value of the agreed payment in the form of assets transferred, liabilities assumed and equity instruments issued to the seller. Contingent considerations depending on future events or the performance of contractual obligations are also recognised at fair value at the date of acquisition. Fair value changes in contingent considerations are recognised in the income statement when incurred.
Transaction costs are recognised in the income statement when incurred.
If uncertainty regarding the identification and measurement of acquired assets, liabilities and contingent liabilities exist at the acquisition date, initial recognition is done based on preliminary
values. If identifiable assets, liabilities and contingent liabilities are subsequently determined to have a different fair value at the acquisition date from that first assumed, goodwill is adjusted up until 12 months after the acquisition. The effect of the adjustments are recognised in the opening balance of equity and comparative figures are restated.
86 |

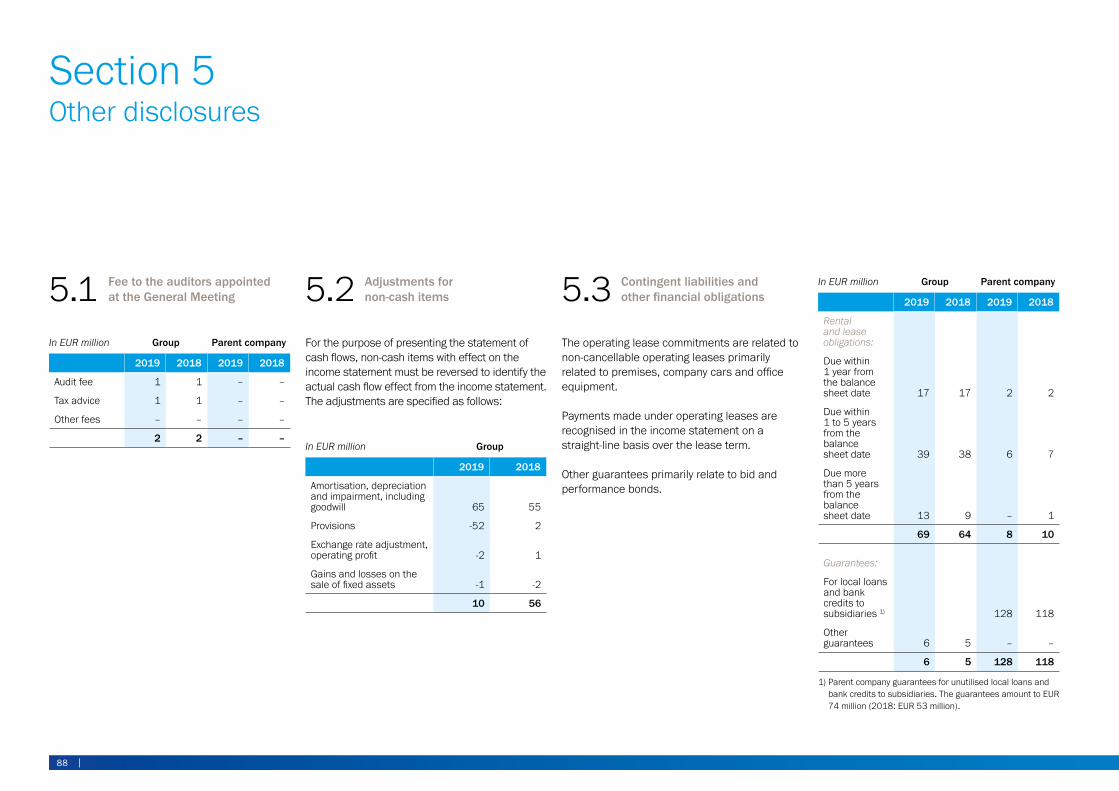
In EUR million Group Parent company
2019 2018 2019 2018
Audit fee 1 1 – –
Tax advice 1 1 – –
Other fees – – – –
2 2 – –In EUR million Group
2019 2018
Amortisation, depreciation and impairment, including goodwill 65 55
Provisions -52 2
Exchange rate adjustment, operating profit -2 1
Gains and losses on the sale of fixed assets -1 -2
10 56
In EUR million Group Parent company
2019 2018 2019 2018
Rental and lease obligations:
Due within 1 year from the balance sheet date 17 17 2 2
Due within 1 to 5 years from the balance sheet date 39 38 6 7
Due more than 5 years from the balance sheet date 13 9 – 1
69 64 8 10
Guarantees:
For local loans and bank credits to subsidiaries 1) 128 118
Other guarantees 6 5 – –
6 5 128 118
1) Parent company guarantees for unutilised local loans and bank credits to subsidiaries. The guarantees amount to EUR 74 million (2018: EUR 53 million).
Section 5 Other disclosures
5.1 Fee to the auditors appointed at the General Meeting 5.2 Adjustments for
non-cash items
For the purpose of presenting the statement of cash flows, non-cash items with effect on the income statement must be reversed to identify the actual cash flow effect from the income statement. The adjustments are specified as follows:
5.3 Contingent liabilities and other financial obligations
The operating lease commitments are related to non- cancellable operating leases primarily related to premises, company cars and office equipment.
Payments made under operating leases are recognised in the income statement on a straight-line basis over the lease term.
Other guarantees primarily relate to bid and performance bonds.
Financial statements | 8988 |
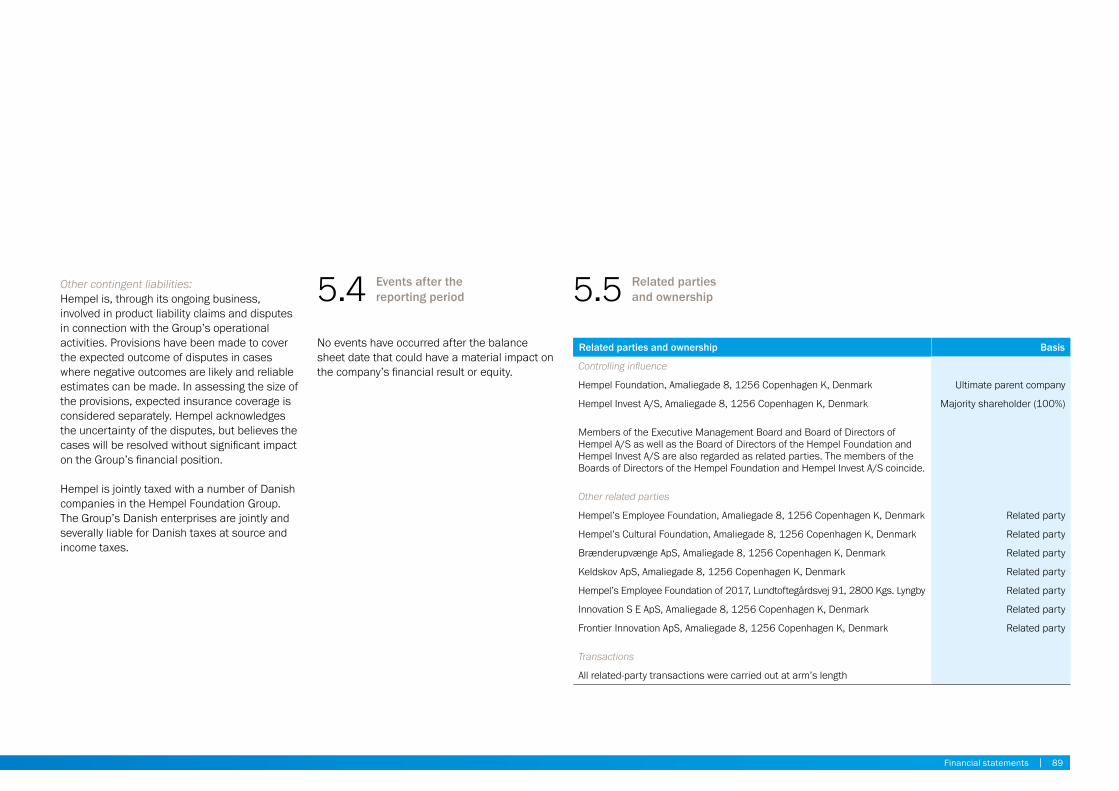
Related parties and ownership Basis
Controlling influence
Hempel Foundation, Amaliegade 8, 1256 Copenhagen K, Denmark Ultimate parent company
Hempel Invest A/S, Amaliegade 8, 1256 Copenhagen K, Denmark Majority shareholder (100%)
Members of the Executive Management Board and Board of Directors of Hempel A/S as well as the Board of Directors of the Hempel Foundation and Hempel Invest A/S are also regarded as related parties. The members of the Boards of Directors of the Hempel Foundation and Hempel Invest A/S coincide.
Other related parties
Hempel’s Employee Foundation, Amaliegade 8, 1256 Copenhagen K, Denmark Related party
Hempel’s Cultural Foundation, Amaliegade 8, 1256 Copenhagen K, Denmark Related party
Brænderupvænge ApS, Amaliegade 8, 1256 Copenhagen K, Denmark Related party
Keldskov ApS, Amaliegade 8, 1256 Copenhagen K, Denmark Related party
Hempel’s Employee Foundation of 2017, Lundtoftegårdsvej 91, 2800 Kgs. Lyngby Related party
Innovation S E ApS, Amaliegade 8, 1256 Copenhagen K, Denmark Related party
Frontier Innovation ApS, Amaliegade 8, 1256 Copenhagen K, Denmark Related party
Transactions
All related-party transactions were carried out at arm’s length
Other contingent liabilities: Hempel is, through its ongoing business, involved in product liability claims and disputes in connection with the Group’s operational activities. Provisions have been made to cover the expected outcome of disputes in cases where negative outcomes are likely and reliable estimates can be made. In assessing the size of the provisions, expected insurance coverage is considered separately. Hempel acknowledges the uncertainty of the disputes, but believes the cases will be resolved without significant impact on the Group’s financial position.
Hempel is jointly taxed with a number of Danish companies in the Hempel Foundation Group. The Group’s Danish enterprises are jointly and severally liable for Danish taxes at source and income taxes.
5.4 Events after the reporting period
No events have occurred after the balance sheet date that could have a material impact on the company’s financial result or equity.
5.5 Related parties and ownership
Financial statements | 8988 |
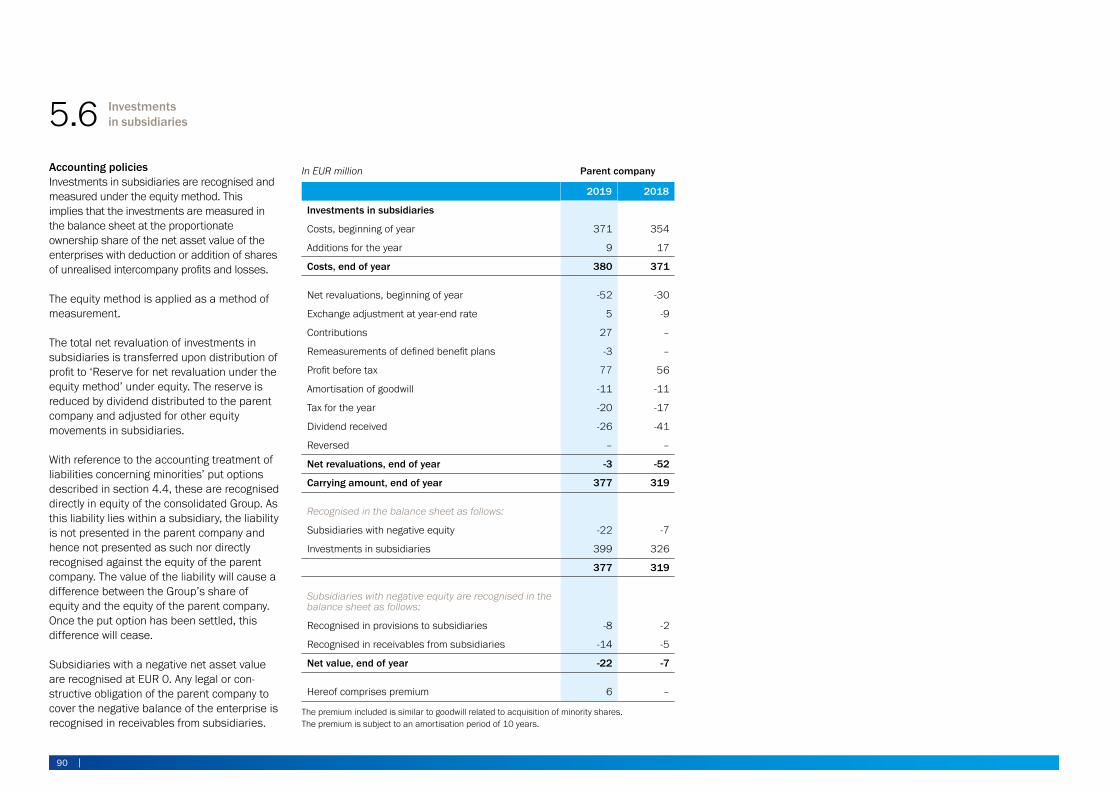
In EUR million Parent company
2019 2018
Investments in subsidiaries
Costs, beginning of year 371 354
Additions for the year 9 17
Costs, end of year 380 371
Net revaluations, beginning of year -52 -30
Exchange adjustment at year-end rate 5 -9
Contributions 27 –
Remeasurements of defined benefit plans -3 –
Profit before tax 77 56
Amortisation of goodwill -11 -11
Tax for the year -20 -17
Dividend received -26 -41
Reversed – –
Net revaluations, end of year -3 -52
Carrying amount, end of year 377 319
Recognised in the balance sheet as follows:
Subsidiaries with negative equity -22 -7
Investments in subsidiaries 399 326
377 319
Subsidiaries with negative equity are recognised in the balance sheet as follows:
Recognised in provisions to subsidiaries -8 -2
Recognised in receivables from subsidiaries -14 -5
Net value, end of year -22 -7
Hereof comprises premium 6 –
The premium included is similar to goodwill related to acquisition of minority shares. The premium is subject to an amortisation period of 10 years.
5.6 Investments in subsidiaries
Accounting policiesInvestments in subsidiaries are recognised and measured under the equity method. This implies that the investments are measured in the balance sheet at the proportionate ownership share of the net asset value of the enterprises with deduction or addition of shares of unrealised intercompany profits and losses.
The equity method is applied as a method of measurement.
The total net revaluation of investments in subsidiaries is transferred upon distribution of profit to ‘Reserve for net revaluation under the equity method’ under equity. The reserve is reduced by dividend distributed to the parent company and adjusted for other equity movements in subsidiaries.
With reference to the accounting treatment of liabilities concerning minorities’ put options described in section 4.4, these are recognised directly in equity of the consolidated Group. As this liability lies within a subsidiary, the liability is not presented in the parent company and hence not presented as such nor directly recognised against the equity of the parent company. The value of the liability will cause a difference between the Group’s share of equity and the equity of the parent company. Once the put option has been settled, this difference will cease.
Subsidiaries with a negative net asset value are recognised at EUR 0. Any legal or con-structive obligation of the parent company to cover the negative balance of the enterprise is recognised in receivables from subsidiaries.
90 |
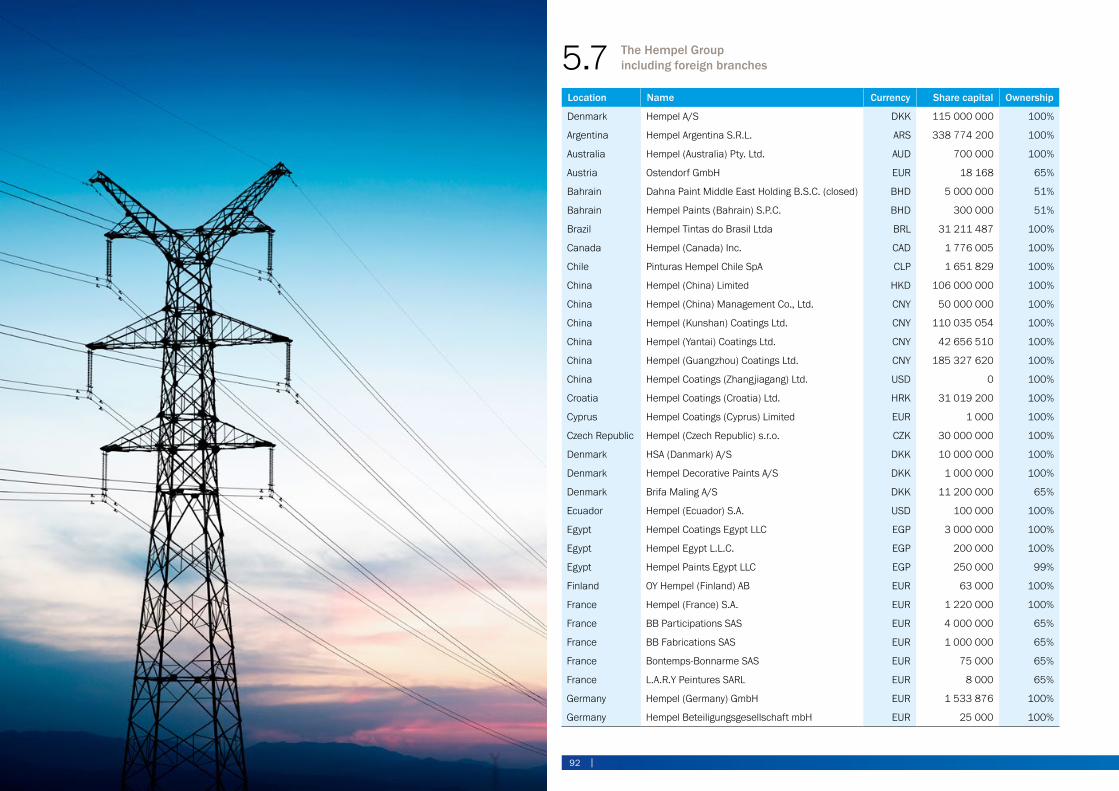
Location Name Currency Share capital Ownership
Denmark Hempel A/S DKK 115 000 000 100%
Argentina Hempel Argentina S.R.L. ARS 338 774 200 100%
Australia Hempel (Australia) Pty. Ltd. AUD 700 000 100%
Austria Ostendorf GmbH EUR 18 168 65%
Bahrain Dahna Paint Middle East Holding B.S.C. (closed) BHD 5 000 000 51%
Bahrain Hempel Paints (Bahrain) S.P.C. BHD 300 000 51%
Brazil Hempel Tintas do Brasil Ltda BRL 31 211 487 100%
Canada Hempel (Canada) Inc. CAD 1 776 005 100%
Chile Pinturas Hempel Chile SpA CLP 1 651 829 100%
China Hempel (China) Limited HKD 106 000 000 100%
China Hempel (China) Management Co., Ltd. CNY 50 000 000 100%
China Hempel (Kunshan) Coatings Ltd. CNY 110 035 054 100%
China Hempel (Yantai) Coatings Ltd. CNY 42 656 510 100%
China Hempel (Guangzhou) Coatings Ltd. CNY 185 327 620 100%
China Hempel Coatings (Zhangjiagang) Ltd. USD 0 100%
Croatia Hempel Coatings (Croatia) Ltd. HRK 31 019 200 100%
Cyprus Hempel Coatings (Cyprus) Limited EUR 1 000 100%
Czech Republic Hempel (Czech Republic) s.r.o. CZK 30 000 000 100%
Denmark HSA (Danmark) A/S DKK 10 000 000 100%
Denmark Hempel Decorative Paints A/S DKK 1 000 000 100%
Denmark Brifa Maling A/S DKK 11 200 000 65%
Ecuador Hempel (Ecuador) S.A. USD 100 000 100%
Egypt Hempel Coatings Egypt LLC EGP 3 000 000 100%
Egypt Hempel Egypt L.L.C. EGP 200 000 100%
Egypt Hempel Paints Egypt LLC EGP 250 000 99%
Finland OY Hempel (Finland) AB EUR 63 000 100%
France Hempel (France) S.A. EUR 1 220 000 100%
France BB Participations SAS EUR 4 000 000 65%
France BB Fabrications SAS EUR 1 000 000 65%
France Bontemps-Bonnarme SAS EUR 75 000 65%
France L.A.R.Y Peintures SARL EUR 8 000 65%
Germany Hempel (Germany) GmbH EUR 1 533 876 100%
Germany Hempel Beteiligungsgesellschaft mbH EUR 25 000 100%
5.7 The Hempel Group including foreign branches
92 |
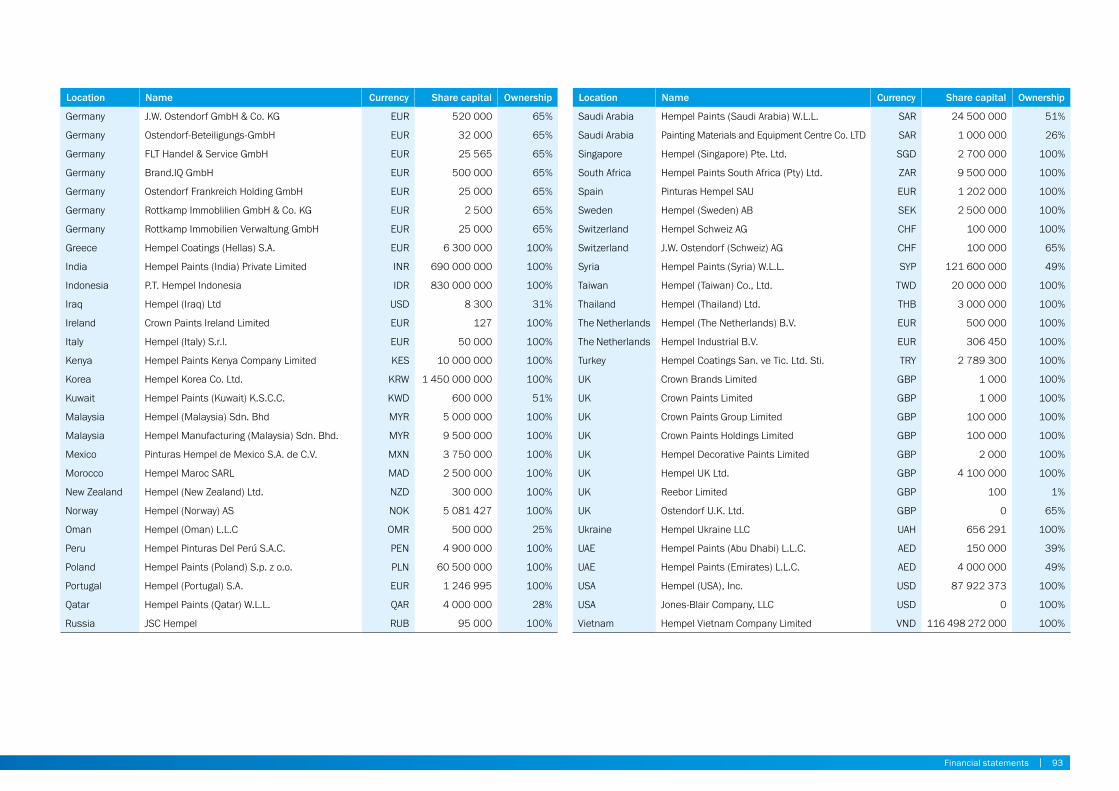
Location Name Currency Share capital Ownership
Germany J.W. Ostendorf GmbH & Co. KG EUR 520 000 65%
Germany Ostendorf-Beteiligungs-GmbH EUR 32 000 65%
Germany FLT Handel & Service GmbH EUR 25 565 65%
Germany Brand.IQ GmbH EUR 500 000 65%
Germany Ostendorf Frankreich Holding GmbH EUR 25 000 65%
Germany Rottkamp Immoblilien GmbH & Co. KG EUR 2 500 65%
Germany Rottkamp Immobilien Verwaltung GmbH EUR 25 000 65%
Greece Hempel Coatings (Hellas) S.A. EUR 6 300 000 100%
India Hempel Paints (India) Private Limited INR 690 000 000 100%
Indonesia P.T. Hempel Indonesia IDR 830 000 000 100%
Iraq Hempel (Iraq) Ltd USD 8 300 31%
Ireland Crown Paints Ireland Limited EUR 127 100%
Italy Hempel (Italy) S.r.l. EUR 50 000 100%
Kenya Hempel Paints Kenya Company Limited KES 10 000 000 100%
Korea Hempel Korea Co. Ltd. KRW 1 450 000 000 100%
Kuwait Hempel Paints (Kuwait) K.S.C.C. KWD 600 000 51%
Malaysia Hempel (Malaysia) Sdn. Bhd MYR 5 000 000 100%
Malaysia Hempel Manufacturing (Malaysia) Sdn. Bhd. MYR 9 500 000 100%
Mexico Pinturas Hempel de Mexico S.A. de C.V. MXN 3 750 000 100%
Morocco Hempel Maroc SARL MAD 2 500 000 100%
New Zealand Hempel (New Zealand) Ltd. NZD 300 000 100%
Norway Hempel (Norway) AS NOK 5 081 427 100%
Oman Hempel (Oman) L.L.C OMR 500 000 25%
Peru Hempel Pinturas Del Perú S.A.C. PEN 4 900 000 100%
Poland Hempel Paints (Poland) S.p. z o.o. PLN 60 500 000 100%
Portugal Hempel (Portugal) S.A. EUR 1 246 995 100%
Qatar Hempel Paints (Qatar) W.L.L. QAR 4 000 000 28%
Russia JSC Hempel RUB 95 000 100%
Location Name Currency Share capital Ownership
Saudi Arabia Hempel Paints (Saudi Arabia) W.L.L. SAR 24 500 000 51%
Saudi Arabia Painting Materials and Equipment Centre Co. LTD SAR 1 000 000 26%
Singapore Hempel (Singapore) Pte. Ltd. SGD 2 700 000 100%
South Africa Hempel Paints South Africa (Pty) Ltd. ZAR 9 500 000 100%
Spain Pinturas Hempel SAU EUR 1 202 000 100%
Sweden Hempel (Sweden) AB SEK 2 500 000 100%
Switzerland Hempel Schweiz AG CHF 100 000 100%
Switzerland J.W. Ostendorf (Schweiz) AG CHF 100 000 65%
Syria Hempel Paints (Syria) W.L.L. SYP 121 600 000 49%
Taiwan Hempel (Taiwan) Co., Ltd. TWD 20 000 000 100%
Thailand Hempel (Thailand) Ltd. THB 3 000 000 100%
The Netherlands Hempel (The Netherlands) B.V. EUR 500 000 100%
The Netherlands Hempel Industrial B.V. EUR 306 450 100%
Turkey Hempel Coatings San. ve Tic. Ltd. Sti. TRY 2 789 300 100%
UK Crown Brands Limited GBP 1 000 100%
UK Crown Paints Limited GBP 1 000 100%
UK Crown Paints Group Limited GBP 100 000 100%
UK Crown Paints Holdings Limited GBP 100 000 100%
UK Hempel Decorative Paints Limited GBP 2 000 100%
UK Hempel UK Ltd. GBP 4 100 000 100%
UK Reebor Limited GBP 100 1%
UK Ostendorf U.K. Ltd. GBP 0 65%
Ukraine Hempel Ukraine LLC UAH 656 291 100%
UAE Hempel Paints (Abu Dhabi) L.L.C. AED 150 000 39%
UAE Hempel Paints (Emirates) L.L.C. AED 4 000 000 49%
USA Hempel (USA), Inc. USD 87 922 373 100%
USA Jones-Blair Company, LLC USD 0 100%
Vietnam Hempel Vietnam Company Limited VND 116 498 272 000 100%
Financial statements | 93
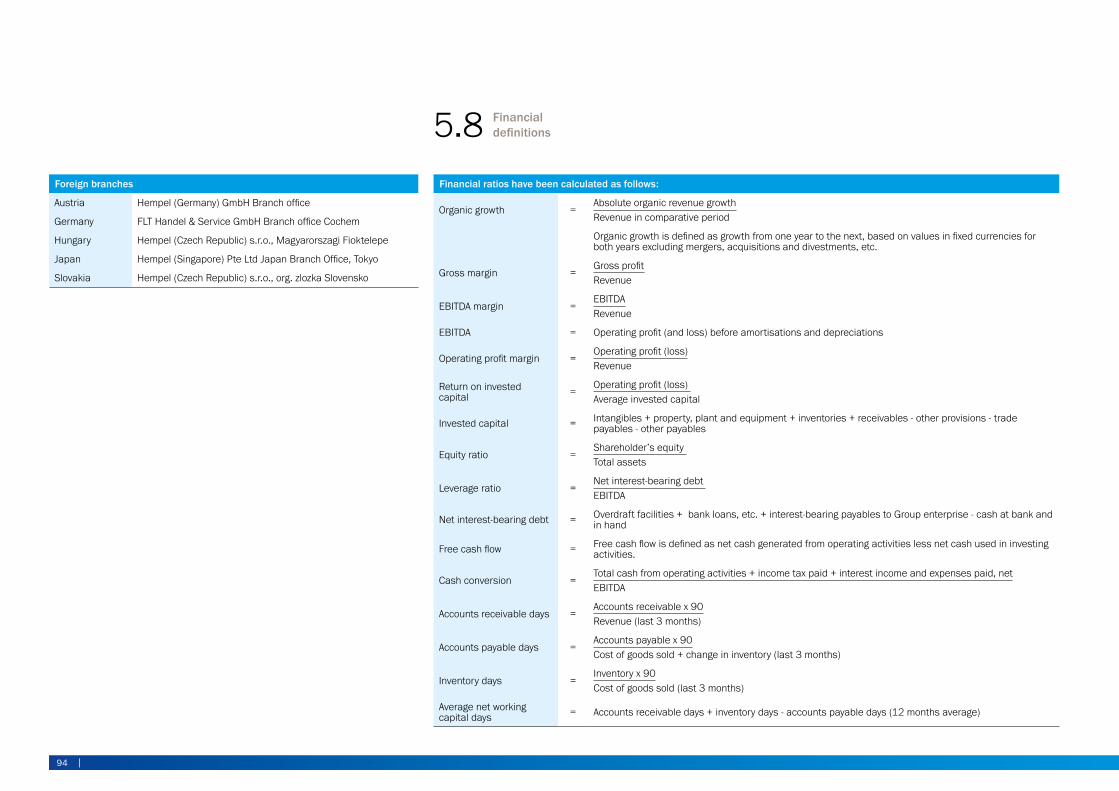
Foreign branches
Austria Hempel (Germany) GmbH Branch office
Germany FLT Handel & Service GmbH Branch office Cochem
Hungary Hempel (Czech Republic) s.r.o., Magyarorszagi Fioktelepe
Japan Hempel (Singapore) Pte Ltd Japan Branch Office, Tokyo
Slovakia Hempel (Czech Republic) s.r.o., org. zlozka Slovensko
Financial ratios have been calculated as follows:
Organic growth =Absolute organic revenue growthRevenue in comparative period
Organic growth is defined as growth from one year to the next, based on values in fixed currencies for both years excluding mergers, acquisitions and divestments, etc.
Gross margin =Gross profitRevenue
EBITDA margin =EBITDARevenue
EBITDA = Operating profit (and loss) before amortisations and depreciations
Operating profit margin =Operating profit (loss)Revenue
Return on invested capital =
Operating profit (loss) Average invested capital
Invested capital = Intangibles + property, plant and equipment + inventories + receivables - other provisions - trade payables - other payables
Equity ratio =Shareholder’s equity Total assets
Leverage ratio =Net interest-bearing debt EBITDA
Net interest-bearing debt = Overdraft facilities + bank loans, etc. + interest-bearing payables to Group enterprise - cash at bank and in hand
Free cash flow = Free cash flow is defined as net cash generated from operating activities less net cash used in investing activities.
Cash conversion =Total cash from operating activities + income tax paid + interest income and expenses paid, netEBITDA
Accounts receivable days =Accounts receivable x 90Revenue (last 3 months)
Accounts payable days =Accounts payable x 90Cost of goods sold + change in inventory (last 3 months)
Inventory days =Inventory x 90Cost of goods sold (last 3 months)
Average net working capital days = Accounts receivable days + inventory days - accounts payable days (12 months average)
5.8 Financial definitions
94 |
Follow Hempel on social media to get all the latest news, thought-leadership articles, videos and stories about our work.
Follow us
Streaming
hempel.com
hempel.com
Hempel A/SLundtoftegårdsvej 91DK-2800 Kgs. LyngbyDenmark
Tel: +45 4593 3800Fax: +45 4588 5518Email: [email protected]