2019-annual-report.pdf - MSI
239
-
Upload
khangminh22 -
Category
Documents
-
view
1 -
download
0
Transcript of 2019-annual-report.pdf - MSI


Stock Code:2377
MICRO‐STAR INTERNATIONAL CO., LTD.
2019 ANNUAL REPORT
MSI annual report is available at:
Taiwan Stock Exchange Market Observation Post System:
http://mops.twse.com.tw
Company website:
http://www.msi.com
Printed on April 30, 2020
Notice to readers This English‐version annual report is a summary translation of the Chinese version and is not an official document of the shareholders’ meeting. If there is any discrepancy between the English and Chinese versions, the Chinese version shall prevail.

I. SPOKESPERSON & DEPUTY SPOKESPERSON Spokesperson:Hung,Pao‐Yu Title:Chief Financial Officer Tel.:886‐2‐3234‐5599 E‐mail:[email protected] DEPUTY SPOKESPERSON Deputy Spokesperson:Lin,Yi‐Kai Title:Assistant Vice President of Finance Center Finance Division Tel.:886‐2‐3234‐5599 E‐mail:[email protected] DEPUTY SPOKESPERSON:Chang,Ju‐Ting Title:Assistant Vice President of Finance Center Global Finance Division Tel.:886‐2‐3234‐5599 E‐mail:[email protected] II. HEADQUARTERS AND PLANTS Tel.:886‐2‐3234‐5599 Address:No.69, Lide St., Zhonghe Dist., New Taipei City 235, Taiwan (R.O.C) Ⅲ.SECURITIES DEALING INSTITUTE
Name :Chinatrust Transfer Agent Address :5F, No.83, Sec. 1, Chung‐Chin S. Rd., Zhongzheng Dist., Taipei City Tel. :886‐2‐6636‐5566 Website :http://www.ctbcbank.com IV. AUDITORS Name : CPA:Liang, Hua‐Ling & Lai,Chung‐Hsi CPA Firm :PricewaterhouseCoopers, Taiwan Address :27F, No.333, Sec. 1, Keelung Rd., Xinyi Dist., Taipei City 110 Tel. :(886) 2 2729‐6666 website:http://www.pwc.com V. NAME OF TRADING SITE FOR LISTED SECURITIES OVERSEAS: None VI. COMPANY WEBSITE http://www.msi.com

CONTENTS
Page Ⅰ.Letter to shareholders 1 Ⅱ.Introduction of the company 4
(Ⅰ)Establishment date 4 (Ⅱ)Development history 4
Ⅲ.Corporate governance report 8 (Ⅰ)Corporate Organization 8 (Ⅱ)Directors, Supervisors, President, Vice President, Assistant V.P., and department heads 10
(Ⅲ)Remuneration paid during the most recent fiscal year to directors, supervisors, president and vice
presidents
16
(Ⅳ)Corporate governance 20
(Ⅴ)CPAs fees 43
(Ⅵ)CPA’s information 43
(Ⅶ)MSI’s chairman, president, and managers in charge of its finance and accounting operations did not
hold any positions within MSI’s independent audit firm or its affiliates in the most recent year
43
(Ⅷ)Information on Net Change in Shareholding and Net Change in Shares Pledged by Directors,
Supervisors, Department Heads, and Shareholders of 10% shareholding or more
44
(Ⅸ)Relationship among the Top Ten Shareholders 45
(Ⅹ)Ownership of Shares in Affiliated Enterprises 46
Ⅳ.Capital Overview 47
(Ⅰ)Capital and shares 47
(Ⅱ)Corporate bonds 52
(Ⅲ)Preferred shares 52
(Ⅳ)Overseas depositary receipts 52
(Ⅴ)Employee stock warrants 52
(Ⅵ)Restricted Employee Shares 52
(Ⅶ)The section on issuance of new shares in connection with mergers or acquisitions or with acquisitions
of shares of other companies shall specify the following matters
52
(Ⅷ)The status of implementation of capital allocation plans 52
Ⅴ.Operation summary 53
(Ⅰ)Business content 53
(Ⅱ)Market analysis and the condition of sale and production 66
(Ⅲ)Employees 71
(Ⅳ)Environmental expenditures information 71
(Ⅴ)Employee / employer relation 73
(Ⅵ)Material Contracts 77
Ⅵ.Financial information 78
(Ⅰ)Five‐year Financial Summary 78
(Ⅱ)Five‐year Financial Analysis 82
(Ⅲ)Supervisors’ /Audit Committee’s Report for the most recent year 85
(Ⅳ)Financial statements in the most recent year 86
(Ⅴ)Corporation‐only financial report audited and attested by a CPA from the most recent year 86
(Ⅵ)State the financial position of the Company if any insolvency occurs in the Company or in the affiliates
most recent year until the date this report is printed
86
Ⅶ.Review of Financial Conditions, Financial Performance, and Risk Management 87
(Ⅰ)Analysis of Financial Status 87
(Ⅱ)Analysis of Financial Performance 88
(Ⅲ)Analysis of cash flows 89
(Ⅳ)Major capital expenditures and impact on financial and business in the most recent year 89

(Ⅴ)Reinvestment in the most recent year 89
(Ⅵ)Risk analysis and evaluation in the most recent year and up to the date of the annual report printed 90 (Ⅶ)Other material events 97
Ⅷ.Special disclosures 98 (Ⅰ)Related party 98 (Ⅱ)Subscription of marketable securities privately in the most recent year and up to the date of the report
printed 107
(Ⅲ)Status of MSI Common Shares Acquired, Disposed of, and Held by Subsidiaries 107 (Ⅳ)Other Necessary Supplement 107 (Ⅴ)Occurrence of events difined in Securities Transaction Law Article 36.2.2 that has great impact on
shareholders’ equity or security price in the most recent year and up to the date of the repost printed
107

1
Ⅰ.Letter to Shareholders
Dear Shareholders:
The global economy in 2019 has been affected by the US–China trade war, and unstable territorial politics.
The uncertainty of supply–demand in the industrial chain surges and the operation faces more difficulties
and challenges. We respond to the variables in the environment with flexible deployment, including
expanding the production lines in Taiwan, and allying with US gaming platform design company BlueStacks
to reach cloud game application. While pursuing the shipments of hardware, we enhance our ability to
integrate software and hardware, and employ AI to add value to our products to reduce the impact from
external variations. Besides the continuing provision of high‐end gaming equipment and peripherals, we
launch high‐end image processing products to meet the demands from content creators. Products and OEM
services in server, industrial computer, auto electronics businesses conjoin AIoT applications and offer
different solutions in order to bring higher added value to the clients and create a win‐win situation for
shareholders, clients, employees and suppliers.
(Ⅰ) Operating Performance in 2019
1.Consolidated financial results Unit: NT$ thousands
Year Item
2019 2018 YoY amount YoY %
Sales revenue 120,491,417 118,527,273 1,964,144 1.66%
Gross profit 15,862,156 16,129,686 (267,530) (1.66%)
After‐tax profit 5,587,210 6,041,129 (453,919) (7.51%)
Basic earnings per share(After‐tax) (NT$)
6.61 7.15 (0.54) (7.55%)
Diluted earnings per share (After‐tax) (NT$)
6.56 7.08 (0.52) (7.34%)
2. Profitability analysis
Year Item
Financial Analysis for the Last Two‐Years
2019 2018
Financial structure(%)
Debt to asset ratio (%) 48.61 45.72
Long‐term capital to property, plant and equipment(%)
648.29 641.74
Solvency(%)
Current ratio(%) 188.25 199.30
Quick ratio(%) 103.70 104.68
Interest earned ratio (times) (%) 27,783.82 49,733.08
Profitability (%)
Return on assets (%) 9.71 11.60
Return on shareholders’equity (%) 18.33 20.92
Profit ratio (%) 4.64 5.10
Basic after‐tax EPS(NT$) 6.61 7.15

2
3.Research and Development Status
MSI is the global benchmark brand in the field of gaming and digital content creation. Supported by
advanced research and development, and motivated by client satisfaction, MSI commits itself to
build fine digital products with excellent quality, design for humanity and style, and which keep
creating user value.
In 2019 Computex, MSI GT76 Titan flagship laptop won ”Golden Award”, the highest recognition.
Four products, MSI Trident X Plus gaming desktop, MSI Optix MPG341CQR gaming monitor, MSI
Prestige P100 Series creator desktop, and MS‐9A95 AIoT cloud server and smart management
solution for global customer service under the edge computing structure received the “Category
Awards.” We demonstrate a sound R&D technology in hardware, and show MSI’s ability of
integrating software and hardware to the world. In 2019, nine products received Taiwan Excellence
Awards. MSI promises that we will keep working in innovation, design and performance, and bring a
higher product and service value to users.
(Ⅱ) Operating Plan for 2020
To adjust to the future environment, MSI’s adopted operation guidelines, estimated goals and
important sales strategies for 2020 are as follows:
1.Operation guideline
(1)Sales and marketing aspect: progressively explore new markets and new customers and establish a
long‐term entrusted stable business relationship with customers with potentials and sound
financial status to create mutual benefits.
(2)Product R&D aspect: Develop products which meet users’ needs.
(3)Finance aspect: uphold the principle of steady and stable operation, and control various financial
risks.
(4)Manufacturing, quality and service aspect: continue implementing automated manufacturing to
increase quality and efficiency. Improve repair and services to enhance customer satisfaction.
2. Expected Sales and Rationales
We cover a wide range of products. While we continuously devote our efforts in the market of
high‐end products and pursuit of stable growth of each product, we will seek to increase the
shipment in new product development and marketing, including motherboards, display cards, laptops,
PCs, gaming monitors, gaming peripherals, servers, industrial computers, and auto electronics. We
anticipate room for growth in the market. The company’s objective is to increase the overall revenue,
and will proactively broaden the market share of every product.

3
3.Important sales policies
(1)Production policy aspect: Always paying attention to the global major political and economic
situations to respond to the possible change in market demand and the suppliers’ productivity.
To increase capacity utilization rate by adopting planned procurement of components. To
adopt flexible production to reduce stock level yet fulfilling customer’s order demand. To
observe the dynamic of supply chains and to ensure an effective production of employees,
equipment, materials, and manufacturing methods.
(2)Sales policy aspect: to provide good quality products that fulfill customers’ need. To gain a
win‐win success in sales target with our customers.
Looking forward into 2020, the uncertainty of the global ICT industry and macroeconomic
environment keeps growing. Various competitions and challenges come along one after another due
to the impact on supply and demand brought by the Covid‐19 pandemic. As the outside environment
changes rapidly, we will coordinate the sales, marketing, R&D, and operational departments, and keep
raising the operational performance. Our employees will work together to promote every business to
maintain the continuous growth of performance.I hereby on behalf of the MSI management team
express our appreciation to all our shareholders, customers and suppliers. We also appreciate the
hard efforts of all employees and directors made during the past year. We hope our shareholders will
keep supporting and encouraging us. We will work harder to achieve a greater performance and sales
results to share with you.
Sincerely yours,
Chairman: Hsu, Hsiang

4
II. Introduction of the Company (Ⅰ)Establishment date: August 4, 1986
(Ⅱ)Development history
2020 The global leading brand of gaming product MSI is recognized for its countless elite performance. It receives the CES Innovation Award 2020 in 10 categories.
MSI is the leader of the gaming industry, has a strong brand, and again won the 28th Taiwan Excellence Award that covers four major aspects of “R&D,” “Design,” “Quality,” and ”Marketing.” Subject to the prudent evaluation by the judges, MSI received 9 distinctions in the Taiwan Excellence Award 2020. Among others, the Prestige P100 desktop PC in the Content Creation series has won the Taiwan Excellence Silver Award 2020.
In 2020, MSI GS66 Stealth gaming laptop, MSI MPG SEKIRA 500X gaming chassis, and MSI MPG SEKIRA 500G multitasking computer chassis stood out among other competitors’ products, and won the Germany iF Design Award 2020, the Academy Award in the world of design.
2019 MSI's products were favored by CES 2019 jurors with GS65 e‐sports notebook, Infinite e‐sports desktop, Trident X e‐sports desktop, GeForce® RTX™ 2080 Ti GAMING X TR10 e‐sports display card, Prestige PS341WU display, Optix MPG341QR smart e‐sports display and Optix MAG271QR curved e‐sports display claimed a total of 12 major awards for innovation including the CES Computer Hardware and Components Innovation Award, CES E‐sports Innovation Award, CES High‐performance Home Audio / Video Innovation Award, CES Computer Peripheral Innovation Award, CES e‐sports Innovation Award and so forth.
MSI passed the rigorous tests in the four areas of “Research and Development”, “Design”, “Quality” and “Marketing” with its notebooks, e‐sports desktops, e‐sports peripherals, industrial computers, automatic electronics, etc.” under the careful evaluation and discussion of more than 90 well‐known local experts across the industry, government and academia to win the Taiwan Excellence Award for 21 consecutive years. Not only that, the game linking RGB colorful lighting curved LED e‐sports screen Optix MPG27CQ/MPG27C, in addition to being the winner of Taiwan Excellence Awards, won the "Silver Award" for its characteristics of linking with games.
In 2019, MSI won the iF Design Award 2019 in 4 categories with its gaming laptop GF63 and GF75, military style motherboard MAG Z390 TOMAHAWK, and Optix MPG27CQ, the first gaming monitor synchronizing the game in the world.
In Computex Taipei 2019, MSI received four design awards for the products: Trident X series desktop PC, gaming laptop GS75, Prestige PS341WU display, and MS‐9A79 palm‐size shockproof fanless Box PC.
In the 18th COMPUTEX Best Choice Award, 5 of MSI’s products beat the other 300 competitors and won 5 awards. The flagship gaming laptop MSI GT76 Titan has the most stunning performance and won the gold award. MSI Trident X Plus gaming PC, MSI Optix MPG341CQR monitor, MSI Prestige P100 Series creator PC, and MS‐9A95 AIoT cloud server and smart management solution for global customer service under the edge computing structure received the “Category Rewards.” It proves MSI’s dominant position in the global gaming field, and ambition to extend into the creator market.
Branding Taiwan valuation is hosted by the Industrial Development Bureau, MOEA. The Taiwan Institute of Economic Research hires the global brand valuation institution Interbrand to conduct the valuation by the same method used in the “Top 100 Global Brands” for BusinessWeek. The valuation result is an important indicator for measuring the positions of Taiwanese brands in the international market. MSI was selected as Top 20 Brands again in 2019.
2018 MSI won the CES 2018 Best E‐sports Innovation Gold Award with its powerful and clear‐cut Trident 3 Arctic. In addition, along with Trident 3 Arctic, MSI Technology's high‐performance Z370 GODLIKE GAMING e‐sports motherboard, top GTX 1080Ti Lightning e‐sports display card, innovative Optix MPG27CQ curved e‐sports display and the new generation Infinite X e‐sports desktop also won five CES 2018 Innovation Awards in the computer hardware and component category and the e‐sports category.
MSI passed the rigorous tests in the four areas of “Research and Development”, “Design”, “Quality” and “Marketing” with its products such as notebooks, motherboard, display card,

5
e‐sports desktops, e‐sports peripherals, industrial computers and servers to win the Taiwan Excellence Award for 20 consecutive years. Not only that, the VR One e‐sports backpack, in addition to be the winner of Taiwan Excellence Awards, won the "Silver Award" for its emphasis on the wireless VR e‐sports experience.
Winning the internationally renowned iF Product Design Award, known as the Oscar Award for Product Design, means an exceptional glory of the product for being selected out of thousands of its kind. As the world‐leading e‐sports brand, MSI shone forth to win 3 major iF awards with its outstanding e‐sports GL63 which carries gaming‐panel display, the lightest and thinnest backpack e‐sports box VR ONE, and the pure white high‐quality motherboard X299 TOMAHAWK AC.
For the 17th COMPUTEX Best Choice Award for Innovative Technology of the Year, MSI's 4 products stood out from the 350 competing items to win 5 awards. The MSI Optix MPG27 series of curved e‐sports display won the double champions for "Best Design Award" and "Category Award". MSI has been developing its the automotive electronics brand for many years and its FUNTORO smart fleet management and cloud service platform, with its brilliant performance, won the "Gold Award". The MSI GE73 Raider RGB e‐sports notebook, and MSI FUNTORO smart court business service solution, both claimed the "Category Award", once again affirming MSI's leading position in the global e‐sports field, as well as its ambition to step into the field of software platform services.
The Computex Taipei Innovation Design Award was jointly organized by the Taiwan External Trade Development Council (TAITRA) and iF International Forum Design GmbH (Germany). In 2018, MSI once again unveiled the breath‐taking next‐gen PRO 24X AIO computer to create a new era for the high ‐tech industry.
MSI was nominated as one of the “2018 Taiwan Top 20 International Brands”in the “Taiwan International Brand Value Survey”conducted by Interbrand, a global authoritative brand value survey agency which was commissioned by Taiwan Institute of Economic Research under the program sponsored by the Industrial Development Bureau of the Ministry of Economic Affairs.
2017 MSI VR One Backpack PC, GS63VR Stealth Pro gaming laptop and Z270 GAMING M7 gaming motherboard won CES 2017 Innovations Award.
MSI has been awarded from Taiwan Excellence, including gaming NB, MB, VGA, Desktop and headset products.
MSI won two iF Design Awards with Z270 TOMAHAWK gaming motherboard and Trident 3 gaming desktop PC.
2016 MSI GS40 Phantom, AIO Gaming 27XT, and Vortex Gaming Tower won CES 2016 Innovations Award.
GT80 Titan won iF DESIGN AWARD 2016 MSI GAMING notebook won Readers' Choice Awards 2016
2015 MSI GT72 Dominator Pro laptop, GS30 Shadow, AG240 4K Edition AIO and X99 GAMING 9 are prestigious CES Innovations 2015 honorees.
MSI has been awarded from Taiwan Excellence for 17 consecutive years. 8 products are awarded, including MB/ VGA/ NB/ AIO products.
Honored as World’s 4th Best Laptop Brand of 2015 and NO.1 in Ranking of Asian Brands by Laptop Magazine.
2014 MSI GS70 laptop and AG2712A gaming All‐in‐One PC are prestigious CES Innovations 2014 honorees.
MSI has been awarded from Taiwan Excellence for 16 consecutive years. A total of 13 MSI products are awarded, including the Z87M GAMING motherboard, the GK‐601 Dragon Edition gaming keyboard, the ultrathin GS70 laptop, the GT60 3K Edition laptop, the N780 Lightning graphics card, the AG2712A gaming All‐in‐One PC and the Adora24 ultra‐slim All‐in‐One PC.
MSI Z97 XPOWER AC won COMPUTEX TAIPEI 2014 d&i and Best Choice Award
2013 The No. 1 and Only Best Choice Golden Awarded Motherboard‐ MSI Z87‐GD65 GAMING MSI Taiwan Excellence Award Winner, 15 years of affirmation. Eleven product of the leading
company are awarded MSI has won the 2013 CES Innovations Awards with the GT70 Dragon Edition notebook and the
N680GTX Lightning graphics card.

6
2012 MSI X79 Series Mainboards break the World Record of 170MHz Base Clock and 5.83GHz CPU Clock of Sandy
MSI GT70 notebook is the only winner awarded Buyer's Choice, Best Choice, and Media's Choice in Computex 2012.
15 products of MSI got 2012 Taiwan Excellence Award. MSI Z68A‐GD80 (G3) and GT780DXR won CES 2012 Innovations Award.
2011 MSI Won one of Top 100 Taiwan Brands Distinguished among 500 brands. All the 23 products MSI participated in Taiwan Excellence Award selection won the prize,
WindTop AE2420 3D AIO won the Gold Award. MSI Z68A‐GD80 (G3), GT780DXR and N460GTX Hawk receive CES Innovations Award Honors.
2010 X‐Slim X340 was handed the Taiwan Excellence Silver Award and voted second most popular. MSI Big Bang‐Fuzion mainboard and Telematics both won Best Choice of COMPUTEX. MSI participated in 2010 Taiwan Excellence Award selection, and all nominated products won
the prize.
2009 MSI has been chosen as one of “2009 Top 50 Corporate Citizens” from CommomWealth Magazine (Issue 416) in Taiwan. MSI has been chosen as one of "2009 Top 70 CSR Excellent Enterprises" from Global Views magazine (Issue 273) in Taiwan.
MSI Netbook & Car Infotainment product won the Best Choice of COMPUTEX TAIPEI 2009. Announced the world's power‐saving No. 1 Netbook. Announced the 1st Ultra Slim Notebook. Announced the 1st All‐in‐One PC
2008 Announced the world's 1st Hybrid Storage Netbook. MSI has been ranked No. 19 of the Top 20 Taiwan Global Brands MSI has been awarded "16th Industrial Technology Advancement Awards" by the Ministry of
Economic Affairs. "Excellent Enterprise Innovation Award" & "Individual Achievement Award" affirmed the MSI R&D innovation strategy and management.
MSI is the only one winner of Best Enterprise of COMPUTEX TAIPEI 2008; MSI mainboard & notebook were honored to receive the "Best Choice of COMPUTEX TAIPEI 2008".
Announced the 1st Car Infotainment product. Announced the world's 1st 10” Netbook product.
2007 Announced the 1st double‐wheel and smart video & music interactive navigation service robot. The only one mainboard won the Best Choice of COMPUTEX 2007 award. Announced the world's 1st overclocking notebook. MSI Notebook (PR200) won the "Red Dot Award: Product Design 2007". Announced the world's 1st Crystal Collection Notebook product. Announced the world's 1st HATO Notebook (Concept Product).
2006 MSI CE products won the iF Design Award in Germany. MSI is the only one winner in Tom's Hardware Guide (Worldwide No. 1 online IT Media) Both
"Editor's Choice awards for Intel® P975 and P965 platform. Announced the world's 1st Pocket Size DTV. Obtained UL QC 080000 hazardous substance process management system certification. Announced the world's 1st solar‐powered notebook and MP3 Player product (Concept Product).
2005 MSI CE products won the iF Design Award in Germany.
2004 Announced the 1st Portable Multimedia Player product. MSI CE products won the Good Design Awards in Japan.
2003 Announced the 1st Notebook product. Obtained BVQI OHSAS 18000:1999 occupational health and safety management system
certification. Announced the 1st Pen Tablet PC product Obtained UL QS 9000:1998 quality management system certification.
2002 Announced the world's 1st PC2PC WLAN mainboard. Announced the 1st MSI communication product. Announced the world's 1st PC2PC Bluetooth mainboard. Inaugurated its EU Hub in Netherlands.

7
2001 Established MSI Electronics (Kunshan) Co., Ltd.
Established China service center in Shanghai. Announced the 1st Optical Device product. Inaugurated the MSI Plant Ⅲ in Jung‐He, Taipei County.
2000 Announced the 1st Server product. Established MSI Computer (Shenzhen) Co., Ltd.
1999 Obtained BVQI ISO 14001:1996 environmental management system certification.
1998 MSI became a public company as it went on IPO (Initial Public Offering) on the Taiwan Stock Exchange (TAIEX).
Announced the industry's 1st mainboard designed for Socket 7 processor, which supports 100MHz FSB.
Announced industry's 1st mainboard designed to support Dual PentiumR II processor.
1995 Inaugurated the MSI Plant I in Jung‐He, the suburb of Taipei. Obtained TUV ISO 9001:1994 quality management system certification.
1991 Announced the 1st Graphics Card product.
1989 Announced the 1st Barebone product.
1988 Obtained TUV ISO 9002:1994 quality management system certification.
1986 Announced the 486 and 586 mainboards. MSI was established, focusing on the design and manufacture of Mainboards and Add‐on Cards. Announced the 386DX mainboards. Announced the 1st overclocking 286 mainboards.
1. The most recent fiscal year as well as the current fiscal year up to the date of publication of the
annual report, include information on the following, Investment,merger and acquisition
activities,corporate reorganization:None.
(1) The most recent fiscal year as well as the current fiscal year up to the date of publication of
the annual report, include information on the following,merger and acquisition
activities,corporate reorganization:None.
(2) Investment in affiliates in the past year and up to the date of report:
For investments in affiliated enterprises, please see page 98~101 of this report.
2. Instances in which a major quantity of shares belonging to directors, supervisors, or shareholders
holding greater than a 10 percent stake in the company is transferred or otherwise changes
hands; any change in managerial control; any material change in operating methods or type of
business; and any other matters of material significance that could affect shareholders' equity.
This section shall further explain how the above matters will affect the company:None.

8
Corp. Sales &
Marketing
Corp. Supply Chain
Corp. R&D
Corp. Manufacture
Corp. Quality
Assurance
Enterprise Platform Solution
B.U.
Computing and Display
BU
Audit Committee
Remuneration Committee
Shareholders’ Meeting
Chairman
Vice Chairman
President
&
CEO
Finance Center
Ⅲ.Corporate governance report (Ⅰ)Corporate Organization
1. Organization Chart
Global Management Center
Note Book B.U.
Automotive & Commercial
Solution B.U.
Management Committee
Industrial Platform Soluation
B.U.
Internal Audit office
Customized Product Solutions
BU
Graphics and peripheral
BU
Board of Directors
OSH Office
EP & CSR Committee
Info. Security Mgmt Committee

9
2.Major Corporate Function
Department Functions
Internal Audit Office To investigate and assess the soundness, suitability, adequacy, status of implementation, and operating performance of departmental internal controls.
Management Committee Analyze and discuss group strategy, operation, organization, senior manager appointment and removal, investment required for business development, new business and other critical topics; provide consultation and recommendations for the Board of Directors, and lead the management team to implement.
President & CEO To manage the corporate operation and development affairs, to set development and operational goals, and to supervise implement process.
Global Management Center Handle the general management and development of the company, including logistics, legal affairs, intellectual propertymanagement, sustainable business development planning, implementation and management, information system development, hardware and system software usage and maintenance, human resources administration, employee welfare, training and HR development, general affairs, factory affairs and asset management. Provide management and strategy recommendations to the President based on operational statistics.
Finance Center (1) Accounting Division: Accounting and billing affairs, voucher preparation, receipt review, and financial reports' preparation and analysis.
(2)Finance Division: Fund dispatch, risk management, and registrar and transfer operation.
(3)Global Finance Division: investment management.
OSH Office Promote the actions in work safety and health.
EP & CSR Committee Promote the actions of environmental protection and corporate social responsibility programs, review the annual objectives of economic, environmental, and social aspects, and periodically supervise the enforcement.
Info. Security Mgmt Committee
Promote information security management, and supervise the operation of the information security management mechanism.
Each Products B.U. Product development, sales and related business.
Corp.Sales & Marketing PO management, market cultivation, business information collection, and customer credit investigation.
Corp.R&D Design, development and quality control of products; process enhancement; and technology improvement.
Corp.Supply Chain Procurement, control and management of raw materials, and production scheduling and management.
Corp. Manufacture Product manufacturing.
Corp.Quality Assurance Quality assurance, quality control, customer complaints, and post‐delivery service.

10
(Ⅱ) Directors, Supervisors, President, Vice President, Assistant VP, and department heads
1. Directors As of: April 12, 2020 Unit: Shares
Note 1:To follow the instructions of the competent authority in conducting to promote corporate governance.
Retiring:President :Mr.Hsu,Hsiang;new appointments:President & CEO:Mr. Chiang,Sheng‐Chang
Note2:Mr. Chiang, Sheng‐Chang, existing director between June 16, 2009 and June 15, 2012, was elected again on June 12, 2015; Mr. Wang, Sung‐Chou, existing director between May 28, 2003 and June 14,
2006 and independent director between June 14, 2006 and June 16, 2009, was elected again as independent director on June 15, 2012 and June 12, 2015; Mr.Hsu,Kao‐Shan, existing director between Feb 28, 1998 and June 14, 2006, was elected as supervisor between June 14, 2006 and June 12, 2015 ,resigned on May 20, 2016.
Title Nationality/ Country of Origin
Name Gender Date
elected Term (Years)
Date of first elected
Shareholding when elected
Current Shareholding Spouse & Minor Shareholding
Shareholding by Nominee
Arrangement
Executives, Directors or Supervisors who are spouses or within two degrees
Rem
arks
Shares % Shares % Shares % Shares % Title Name Relation
Chairman. ( Note 1)
R.O.C
Hsu,Hsiang Male 2018.06.15 3 1986.07.23 51,983,151 6.15% 51,983,151 6.15% 18,864,257 2.23% 9,376,328 1.11% - - - Vice
Chairman Huang,Chin‐Ching Male 2018.06.15 3 1986.07.23 20,937,377 2.48% 20,937,377 2.48% 2,148,564 0.25% 7,521,761 0.89% Director Liao,Chun‐Keng 2nd
consanguinity
Director Lin,Wen‐Tung Male 2018.06.15 3 1986.07.23 25,672,499 3.04% 25,672,499 3.04% 62,895 0.01% ─ ─ - - -
Director Yu, Hsien‐Neng Male 2018.06.15 3 1986.07.23 17,892,824 2.12% 17,892,824 2.12% 184,922 0.02% ─ ─ - - -
Director ( Note 1.2)
Chiang,Sheng‐Chang Male 2018.06.15 3 2009.06.16 1,117,074 0.13% 1,117,074 0.13% 0 0.00% ─ ─ - - -
Director
Kuo,Hsu‐Kuang Male 2018.06.15 3 2018.06.15 0 0.00% 50,000 0.01% 0 0.00% ─ ─ - - -
Director
Liao,Chun‐Keng Male 2018.06.15 3 2018.06.15 35,000 0.00% 50,000 0.01% 0 0.00% ─ ─ Vice Chairman
Huang,Chin‐Ching 2nd consanguinity
Director
Hung,Yu‐Sheng Male 2018.06.15 3 2018.06.15 306,660 0.04% 306,660 0.04% 0 0.00% ─ ─ - - -
Independent Director ( Note2)
Wang,Sung‐Chou Male 2018.06.15 3 2003.05.28 0 0.00% 0 0.00% 468 0.00% ─ ─ - - -
Independent Director
Liu ,Cheng‐Yi Male 2018.06.15 3 2012.06.15 0 0.00% 0 0.00% 0 0.00% ─ ─ - - -
Independent Director ( Note2)
Hsu,Kao‐Shan Male 2018.06.15 3 1998.02.28 418,686 0.05% 418,686 0.05% 220,924 0.03% ─ ─ - - -

11
Title Name Education Current Job
Experience Title Representative
Chairman Hsu,Hsiang The electronic engineering from National Cheng Kung University. The Chairman of MSI Director & President of MICRO‐STAR NETHERLANDS HOLDING B. V.
MICRO STAR INTERNATIONAL CO., LTD. The engineer of Sony Industries Taiwan Co., Ltd.
Vice Chairman
Huang,Chin‐Ching The electronics from Chung Yuan Christian University. The Vice Chairman and Senior Vice President of MSI Director & President of the following companies: MSI COMPUTER (AUSTRALIA) PTY. LTD. MSI COMPUTER CAYMAN CO., LTD. Director of the following company: MSI COMPUTER CORP. Executive Director & President of the following company: MSI ELECTRONIC (KUNSHAN) CO., LTD.
MICRO STAR INTERNATIONAL CO., LTD. MICRO STAR INTERNATIONAL CO., LTD. MICRO STAR INTERNATIONAL CO., LTD. MICRO ELECTRONICS
The engineer of Sony Industries Taiwan Co., Ltd.
Director Lin,Wen‐Tung The electronic engineering from the Lien Ho Industrial and Technological Junior College.
The Senior Vice President of MSI Director & President of MSI COMPUTER JAPAN CO., LTD. Director of the following company: MSI COMPUTER (AUSTRALIA) PTY. LTD.
MICRO STAR INTERNATIONAL CO., LTD. MICRO STAR INTERNATIONAL CO., LTD.
The engineer of Sony Industries Taiwan Co., Ltd.
Director Yu,Hsien‐Neng The electronics from Feng Chia University. The Senior Vice President of MSI Director & President of the following companies: MICRO‐STAR INTERNATIONAL (B.V.I) HOLDING CO., LTD. MSI POLSKA SP. Z O.O Director of the following company MSI COMPUTER CORP. Executive Director & President of the following company: MSI COMPUTER (SHENZHEN) CO., LTD. SHENZHEN MEGA INFORMATION CO., LTD.
MSI PACIFIC MSI HOLDING MICRO STAR INTERNATIONAL CO., LTD. MSI(B.V.I.) MSI PACIFIC
The engineer of Sony Industries Taiwan Co., Ltd.
Director Chiang,Sheng‐Chang The institute of electronics from National Chiao Tung University. The President & Chief Executive Officer of MSI
The assistant vice president of ALi Corporation.
Director Kuo,Hsu‐Kuang The master of business administration from University of Southern Queensland
The Executive Vice President & NB BU GM of MSI
The manager of Chun‐Sheng Computer
Director Liao,Chun‐Keng The master of business administration from University of South Australia The Executive Vice President & GNP BU GM of MSI
The sales manager of Magic Systech Inc
Director Hung,Yu‐Sheng ITI International Business Administration Program Shih Chien College of Design and Management
The Executive Vice President & CND BU GM of MSI The Executive Director of the following companies: MSI (Shenzhen) Co., Ltd.
STAR INFORMATION HOLDING CO., LTD
MA of Pou Chen Group
Independent Director
Wang,Sung‐Chou The master of business administration from National Chengchi University.
Independent Director of MICRO STAR INTERNATIONAL CO., LTD. Director of the following companies: Kae Lee Investment Co., Ltd. Supervisor of the following companies: Videoland Inc.、KK Enterprise Co., Ltd.、Taiwan Sports Lottery Company
Director of the KGI INVESTMENT ADVISORY CORPORATION China Securities Co., Ltd.( now KGI Securities Co., Ltd.) Supervisor of the GARND PACIFIC PETROCHEMICAL CORPORATION
Independent Director
Liu ,Cheng‐Yi The master of science in finance from The City University of New York. None
Director of Administration Division of Micro Star International Co., Ltd. Supervisor of TXC CORPORATION Independent Director of Jochu Technology Co., Ltd. The Assistant Manager of Twin Head International Corp.
Independent Director
Hsu,Kao‐Shan Criminal investigation of Central Police University Li Tsai Attorneys‐At‐Law
Supervisor of Micro Star International Co., Ltd. Attorney of Yung Jan Attorneys‐At‐Law

12
Criteria
Name
With over five years of job experience and the following business qualification Independence Criteria(Note) Also an independent director of other public company
Teachers of public or private colleges for the subject of commerce, law, finance, accounting, or business
Judge, prosecutor, attorney, accountant, or business salespersons passed national exam & certified specialists or technicians
With job experience in commerce, law, finance, accounting, or business
1 2 3 4 5 6 7 8 9 10 11 12
Hsu,Hsiang   0
Huang,Chin‐Ching   0
Lin,Wen‐Tung   0
Yu, Hsien‐Neng   0
Chiang,Sheng‐Chang   0
Kuo,Hsu‐Kuang   0
Liao,Chun‐Keng   0
Hung,Yu‐Sheng   0
Wang,Sung‐Chou   0
Liu ,Cheng‐Yi   0
Hsu,Kao‐Shan   0
(1) Not an employee of the company or its affiliate. (2) Not a director or supervisor of the company or its affiliate (except for independent directors appointed in accordance with the Act or the local laws by, and concurrently serving as such at, the company, its parent company,
subsidiaries, or a subsidiary under the same parent company). (3) Not the person himself, spouse or minor child, or individual shareholder holding more than 1% of the company’s outstanding shares in the name of a third party, or top 10 shareholder. (4) Not the spouse, relative within the second degree of consanguinity, or direct blood relative within the third degree of consanguinity of a manager, a person under (2) or (3). (5) Not directly holding more than 5% of the company’s outstanding shares, top 5 shareholder, or a director, supervisor or employee of a corporate shareholder appointing its representative as the director or supervisor of the
company pursuant to Article 27 paragraphs 1 or 2 of the Company Act (except for independent directors appointed in accordance with the Act or the local laws by, and concurrently serving as such at, the company, its parent company, subsidiaries, or a subsidiary under the same parent company).
6) Not a director, supervisor, or employee of a company controlled by the same person holding the majority of the Board or the voting shares of the company and the other company (except for independent directors appointed in accordance with the Act or the local laws by, and concurrently serving as such at, the company, its parent company, subsidiaries, or a subsidiary under the same parent company).
(7) Not a director (governor), supervisor, or employee of a company or institution whose chairman, president, or a person holding an equivalent position is the same person or the spouse of the chairman, president, or a person holding an equivalent position at the company (except for independent directors appointed in accordance with the Act or the local laws by, and concurrently serving as such at, the company, its parent company, subsidiaries, or a subsidiary under the same parent company).
(8) Not a director (governor), supervisor, manager, or shareholder with more than 5% shareholding of a specific company or institution having financial or business relationship with the company (except for independent directors appointed in accordance with the Act or the local laws by, and concurrently serving as such at, the company, its parent company, subsidiaries, or a subsidiary under the same parent company) .
(9) Not a professional individual, or an owner, partner, director, supervisor, or officer of a sole proprietorship, partnership, company, or institution, or their spouses, who provides auditing services to the company or any affiliate of the company, or that provides commercial, legal, financial, accounting or related services to the company or any affiliate of the company for which the provider has received cumulative compensation exceeding NT$500,000 in the past 2 years; provided however that this restriction does not apply to a member of the remuneration committee, public tender offer review committee, or special committee for merger/consolidation and acquisition, who exercises powers pursuant to the Securities and Exchange Act or to the Business Mergers and Acquisitions Act.
(10) Not a spouse or relative within the second degree of consanguinity of any other director. (11) No such situation under Article 30 of the Company Act. (12) Not a government, corporate or its representative elected pursuant to Article 27 of the Company Act.

13
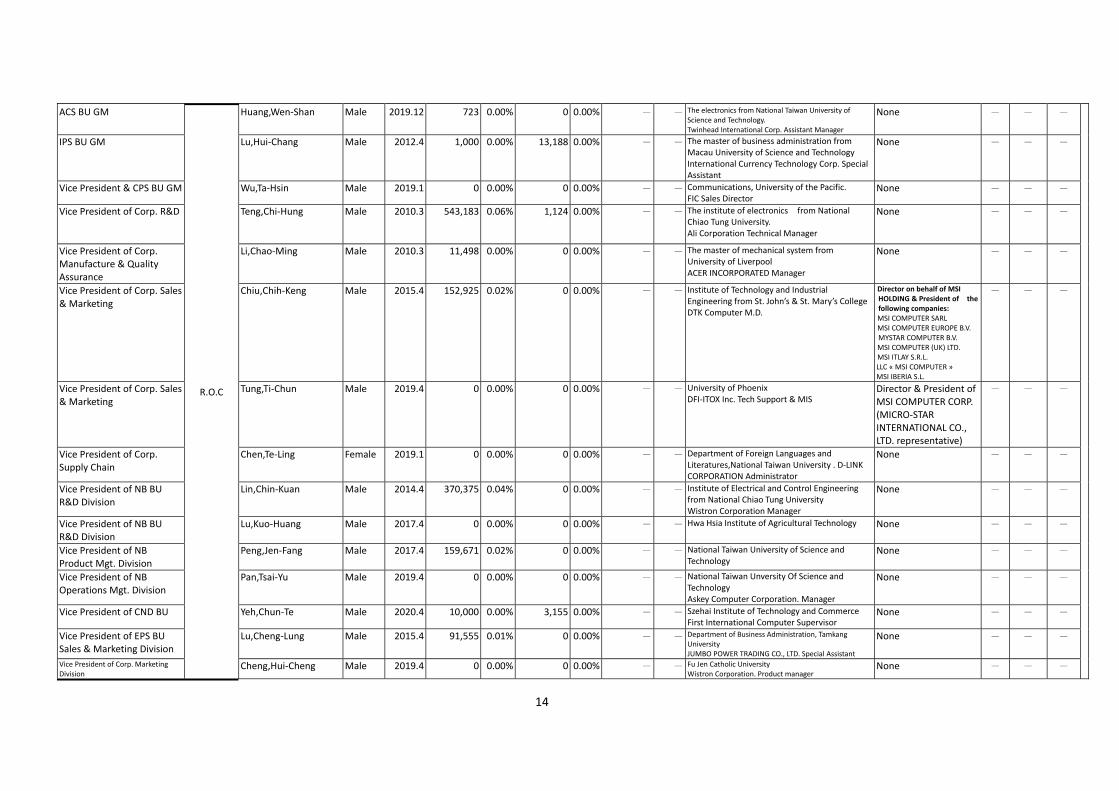
2. Information of the management Base Date: April 12, 2020 Unit: Shares
Title Nationality/Country of
Origin Name Gender
Date Elected
Shareholding Spouse & Minor Shareholding
Shareholding by Nominee Arrangement
Experience (Education) Other Position
Managers who are Spouses or Within Two
Degrees of Shareholding Kinship R
emarks
Shares % Shares % Shares % Title Name Relation
Chairman (Note1)
R.O.C
Hsu,Hsiang Male 1994.4 51,983,151 6.15% 18,864,257 2.23% 9,376,328 1.11% The electronic engineering from National Cheng Kung University. The engineer of Sony Industries Taiwan Co., Ltd.
Refer to page 11 - - -
President & Chief Executive Officer (Note1)
Chiang,Sheng‐Chang Male 2010.3 1,117,074 0.13% 0 0.00% - - The institute of electronics from National Chiao Tung University. The assistant vice president of ALi Corporation.
None - - -
Senior Vice President of Management Committee
Huang,Chin‐Ching Male 2001.7 20,937,377 2.48% 2,148,564 0.25% 7,521,761 0.89% The electronics from Chung Yuan Christian University. The engineer of Sony Industries Taiwan co., Ltd.
Refer to page11 SVP Liao,Chun‐Keng
2nd consanguinity
Senior Vice President of Management Committee
Lin,Wen‐Tung Male 2001.7 25,672,499 3.04% 62,895 0.01% - - The electronic engineering from the Lien Ho Industrial and Technological Junior College. The engineer of Sony Industries Taiwan co., Ltd.
Refer to page 11 - - -
Senior Vice President of Management Committee
Yu,Hsien‐Neng Male 2001.7 17,892,824 2.12% 184,922 0.02% - - The electronics from Feng Chia University. The engineer of Sony Industries Taiwan co., Ltd.
Refer to page 11 - - -
Senior Vice President of Management Committee
Lu,Chi‐Long Male 2001.7 18,650,835 2.21% 1,965,350 0.23% - - The electronics from National Taiwan University of Science and Technology. The engineer of Sony Industries Taiwan co., Ltd.
None - - -
Executive Vice President & NB BU GM
Kuo,Hsu‐Kuang Male 2013.4 50,000 0.01% 0 0.00% - - The master of business administration from University of Southern Queensland The manager of Chun‐Sheng Computer
None - - -
Executive Vice President& GNP BU GM
Liao,Chun‐Keng Male 2014.4 50,000 0.01% 0 0.00% - - The master of business administration from University of South Australia The Sales Manager of Magic Systech Inc.
None EVP & GNP BU GM
Huang,Chin‐Ching
2nd consanguinity
Executive Vice President & CND BU GM
Hung,Yu‐Sheng Male 2012.4 306,660 0.04% 0 0.00% - - ITI International Business Administration Program Shih Chien College of Design and Management MA of Pou Chen Group
Refer to page 11 - - -
EPS BU GM Tsai,Rong‐Fong Male 2010.3 297,647 0.04% 297,646 0.04% - - The electronics from Chung Yuan Christian University. The General Manager of DTK Technology (Hong Kong).
None - - -
14
ACS BU GM
R.O.C
Huang,Wen‐Shan Male 2019.12 723 0.00% 0 0.00% - - The electronics from National Taiwan University of Science and Technology. Twinhead International Corp. Assistant Manager
None - - -
IPS BU GM Lu,Hui‐Chang Male 2012.4 1,000 0.00% 13,188 0.00% - - The master of business administration from Macau University of Science and Technology International Currency Technology Corp. Special Assistant
None - - -
Vice President & CPS BU GM Wu,Ta‐Hsin Male 2019.1 0 0.00% 0 0.00% - - Communications, University of the Pacific. FIC Sales Director
None - - -
Vice President of Corp. R&D Teng,Chi‐Hung Male 2010.3 543,183 0.06% 1,124 0.00% - - The institute of electronics from National Chiao Tung University. Ali Corporation Technical Manager
None - - -
Vice President of Corp. Manufacture & Quality Assurance
Li,Chao‐Ming Male 2010.3 11,498 0.00% 0 0.00% - - The master of mechanical system from University of Liverpool ACER INCORPORATED Manager
None - - -
Vice President of Corp. Sales & Marketing
Chiu,Chih‐Keng Male 2015.4 152,925 0.02% 0 0.00% - - Institute of Technology and Industrial Engineering from St. John’s & St. Mary’s College DTK Computer M.D.
Director on behalf of MSI HOLDING & President of the following companies: MSI COMPUTER SARL MSI COMPUTER EUROPE B.V. MYSTAR COMPUTER B.V. MSI COMPUTER (UK) LTD. MSI ITLAY S.R.L. LLC « MSI COMPUTER » MSI IBERIA S.L.
- - -
Vice President of Corp. Sales & Marketing
Tung,Ti‐Chun Male 2019.4 0 0.00% 0 0.00% - - University of Phoenix DFI‐ITOX Inc. Tech Support & MIS
Director & President of MSI COMPUTER CORP. (MICRO‐STAR INTERNATIONAL CO., LTD. representative)
- - -
Vice President of Corp. Supply Chain
Chen,Te‐Ling Female 2019.1 0 0.00% 0 0.00% - - Department of Foreign Languages and Literatures,National Taiwan University . D‐LINK CORPORATION Administrator
None - - -
Vice President of NB BU R&D Division
Lin,Chin‐Kuan Male 2014.4 370,375 0.04% 0 0.00% - - Institute of Electrical and Control Engineering from National Chiao Tung University Wistron Corporation Manager
None - - -
Vice President of NB BU R&D Division
Lu,Kuo‐Huang Male 2017.4 0 0.00% 0 0.00% - - Hwa Hsia Institute of Agricultural Technology None - - -
Vice President of NB Product Mgt. Division
Peng,Jen‐Fang Male 2017.4 159,671 0.02% 0 0.00% - - National Taiwan University of Science and Technology
None - - -
Vice President of NB Operations Mgt. Division
Pan,Tsai‐Yu Male 2019.4 0 0.00% 0 0.00% - - National Taiwan Unversity Of Science and Technology Askey Computer Corporation. Manager
None - - -
Vice President of CND BU Yeh,Chun‐Te Male 2020.4 10,000 0.00% 3,155 0.00% - - Szehai Institute of Technology and Commerce First International Computer Supervisor
None - - -
Vice President of EPS BU Sales & Marketing Division
Lu,Cheng‐Lung Male 2015.4 91,555 0.01% 0 0.00% - - Department of Business Administration, Tamkang University JUMBO POWER TRADING CO., LTD. Special Assistant
None - - -
Vice President of Corp. Marketing Division
Cheng,Hui‐Cheng Male 2019.4 0 0.00% 0 0.00% - - Fu Jen Catholic University Wistron Corporation. Product manager
None - - -

15
Vice President of Global Management Center
R.O.C
Tsai,Wei‐Hsin Male 2010.3 77 0.00% 0
0.00% - - Chinese Culture University Department of International
Business Administration LITE‐ON TECHNOLOGY CORP. Communications Group Accounting Department Assistant Vice President
None - - -
Vice President of Finance Center
Hung,Pao‐Yu Female 2016.4 343,218 0.04% 0 0.00% - - Finance MBA, National Taiwan University President Securities Corp. Underwriting Department Manager
Supervisor of the following companies: MSI COMPUTER (SHENZHEN) CO., LTD. (MSI(B.V.I.)Representative) SHENZHEN MEGA INFORMATIONCO., LTD. (MSI PACIFIC Representative) MSI TRADING (SHENZHEN) CO., LTD. (MEGA TECHNOLOGY HOLDING CO., LTD. Representative) MSI (Shenzhen) Co., Ltd. (STAR INFORMATION Representative) MSI (Shanghai) Co., Ltd. (MSI PACIFIC Representative) Director on behalf of MICRO STAR of the following company: MSI PACIFIC INTERNATIONAL HOLDING CO., LTD. Director on behalf of MSI PACIFIC of the following companies: MICRO ELECTRONICS HOLDING CO., LTD. MEGA TECHNOLOGY HOLDING CO., LTD. MEGA COMPUTER CO., LTD. MHK INTERNATIONAL CO., LTD. STAR INFORMATION HOLDING CO., LTD. Director on behalf of MEGA TECHNOLOGY of the following company: RAIDEALS INC.
- - -
Assistant Vice President of Internal Auditing Office
Liu,Chu‐Hao Male 2010.3 10,000 0.00% 19,609 0.00% - - Department of Accounting, Tamkang University Mag Technology Co., Ltd. Audit Assistant Manager
The Executive Director of MSI TRADING (SHENZHEN) CO., LTD.(MEGA TECHNOLOGY HOLDING CO., LTD. Representative) Supervisor of MSI ELECTRONIC (KUNSHAN) CO., LTD (MICRO ELECTRONICS Representative) Supervisor of MSI KOREA CO., LTD.(MSI PACIFIC RepresentativeSupervisor of MSI COMPUTER JAPAN CO., LTD. (MICRO STAR Representative)
- - -
Note1:To follow the instructions of the competent authority in conducting to promote corporate governance. Retiring:President :Mr. Hsu,Hsiang;new appointments:President & CEO:Mr. Chiang,Sheng‐Chang
3.The Chairman, president, or equivalent officer (the most senior manager) is the same person, are spouses, or relatives within the first degree of consanguinity: No

16
(Ⅲ)Remuneration paid during the most recent fiscal year to directors, supervisors, president and vice presidents
1.Remuneration of Directors, Supervisors (1) Remuneration of Directors (including Independent Directors)
Unit:NT$
Title Name
Remuneration of Directors Ratio of Total Remuneration (A+B+C+D) to Net Income (%)
Remuneration received by Directors who are also employees Ratio of Total Compensation
(A+B+C+D+E+F+G) to Net Income (%)
Compensation Paid to Directors from an Invested Company Other
than the Company’s Subsidiary
Base Compensation(A)
Severance Pay(B) Remuneration to
Directors (C) Allowances(D)
Salary, Bonuses, and Allowances(E)
Severance Pay (F) Remuneration to Employee(G)
MSI
Companies in the consolidated financial statements
MSI
Companies in the consolidated financial statements
MSI
Companies in the consolidated financial statements
MSI
Companies in the consolidated financial statements
MSI
Companies in the consolidate financial statements
MSI
Companies in the consolidate financial statements
MSI
Companies in the consolidated financial statements
MSI Companies in the consolidated Financial statements MSI
Companies in the
consolidated financial
statements Cash amount
Stock amount
Cash amount
Stock amount
Chairman Hsu,Hsiang
0 0 0 0 36,000,000 36,000,000 0 0 0.64% 0.64% 83,506,949 83,506,949 0 0 39,000,000 0 39,000,000 0 2.84% 2.84% None
Vice Chairman Huang,Chin‐Ching
Director Lin,Wen‐Tung
Director Yu, Hsien‐Neng
Director Chiang,Sheng‐Chang
Director Kuo,Hsu‐Kuang
Director Liao,Chun‐Keng
Director Hung,Yu‐Sheng Independent Director Wang,Sung‐Chou
0 0 0 0 13,500,000 13,500,000 0 0 0.24% 0.24% 0 0 0 0 0 0 0 0 0.24% 0.24% None Independent Director Liu,Cheng‐Yi
Independent Director Hsu,Kao‐Shan 1.Please describe the payment policy, system, standard and structure of the independent director remuneration, and the relevance between the amount of the remuneration and the responsibilities, risks, contributed time, and other factors: Pursuant to Article 16‐4 of the company’s bylaws, and based on the company’s operational performance, director’s performance, and payment standard of the same industry, the remuneration committee will propose the recommendations to the Board of Directors to decide the remuneration of the company’s independent directors
2.Remuneration received in the most recent year by the director of the company for rendering services (such as serving as a non‐employed consultant) to any company listed in the Financial Report:None. Remuneration Bracket
Range of Remuneration
Name of Directors
Total of (A+B+C+D) Total of (A+B+C+D+E+F+G)
MSI Companies in the consolidated
financial statements H MSI
Companies in the consolidated financial statements (Ⅰ)
Below 1,000,000 1,000,000(included)~2,000,000(excluded) 2,000,000(included)~3,500,000(excluded)
3,500,000(included)~5,000,000(excluded)
Hsu,Hsiang、Huang,Chin‐Ching、Lin,Wen‐Tung、
Yu, Hsien‐Neng、Chiang,Sheng‐Chang、Kuo,Hsu‐Kuang、
Liao,Chun‐Keng、Hung,Yu‐Sheng、Wang,Sung‐Chou、
Liu ,Cheng‐Yi、Hsu,Kao‐Shan
Hsu,Hsiang、Huang,Chin‐Ching、Lin,Wen‐Tung、
Yu, Hsien‐Neng、Chiang,Sheng‐Chang、Kuo,Hsu‐Kuang、
Liao,Chun‐Keng、Hung,Yu‐Sheng、Wang,Sung‐Chou、
Liu ,Cheng‐Yi、Hsu,Kao‐Shan
Wang,Sung‐Chou、Liu ,Cheng‐Yi、Hsu,Kao‐Shan Wang,Sung‐Chou、Liu ,Cheng‐Yi、Hsu,Kao‐Shan
5,000,000(included)~10,000,000(excluded) 10,000,000(included)~15,000,000(excluded)
15,000,000(included)~30,000,000(excluded) Hsu,Hsiang、Huang,Chin‐Ching、Lin,Wen‐Tung、
Yu, Hsien‐Neng、Chiang,Sheng‐Chang、
Kuo,Hsu‐Kuang、Liao,Chun‐Keng、Hung,Yu‐Sheng
Hsu,Hsiang、Huang,Chin‐Ching、Lin,Wen‐Tung、
Yu, Hsien‐Neng、Chiang,Sheng‐Chang、
Kuo,Hsu‐Kuang、Liao,Chun‐Keng、Hung,Yu‐Sheng
30,000,000(included)~50,000,000(excluded) 50,000,000(included)~100,000,000(excluded)
Over $100,000,000
Total 49,500,000 49,500,000 172,006,949 172,006,949

17
2. Remuneration of President and Vice Presidents Unit:NT$
Title Name
Salary(A) Severance Pay(B) Bonuses and Allowances (C) Remuneration to Employee(D) Ratio of total compensation (A+B+C+D) to net
income (%)
Compensation paid to the President and Vice President from an Invested Company Other Than the Company’s Subsidiary
MSI
Companies in the consolidated financial statements
MSI
Companies in the consolidated financial statements
MSI
Companies in the consolidated financial statements
MSI Companies in the consolidated financial statements MSI
Companies in the consolidated financial
statements Cash
amount Stock amount
Cash amount
Stock amount
Chairman ( Note) Hsu,Hsiang
79,741,574 79,741,574 1,944,000 1,944,000 118,090,000 118,090,000 73,500,000 0 73,500,000 0 4.89% 4.89% None
President & Chief Executive Officer ( Note) Chiang,Sheng‐Chang
Senior Vice President of Management Committee Huang,Chin‐Ching
Senior Vice President of Management Committee Lin,Wen‐Tung
Senior Vice President of Management Committee Yu,Hsien‐Neng
Senior Vice President of Management Committee Lu,Chi‐Long
Executive Vice President & NB BU GM Kuo,Hsu‐Kuang
Executive Vice President & GNP BU GM Liao,Chun‐Keng
Executive Vice President & CND BU GM Hung,Yu‐Sheng
EPS BU GM Tsai,Rong‐Fong
ACS BU GM Huang,Wen‐Shan
IPS BU GM Lu,Hui‐Chang
Vice President & CPS BU GM Wu,Ta‐Hsin
Vice President of Corp. R&D Teng,Chi‐Hung
Vice President of Corp. Manufacture & Quality Assurance
Li,Chao‐Ming
Vice President of Corp. Sales & Marketing Chiu,Chih‐Keng
Vice President of Corp. Sales & Marketing Tung,Ti‐Chun
Vice President of Corp. Supply Chain Chen,Te‐Ling
Vice President of NB BU R&D Division Lin,Chin‐Kuan
Vice President of NB BU R&D Division Lu,Kuo‐Huang
Vice President of NB Product Mgt. Division Peng,Jen‐Fang
Vice President of NB Operations Mgt. Division Pan,Tsai‐Yu
Vice President of CND BU Yeh,Chun‐Te
Vice President of EPS BU Sales & Marketing Division
Lu,Cheng‐Lung
Vice President of Corp. Marketing Division Cheng,Hui‐Cheng
Vice President of Global Management Center Tsai,Wei‐Hsin
Vice President of Finance Center Hung,Pao‐Yu

18
Remuneration Bracket
Range of Remuneration Name of President and Vice President
MSI Companies in the consolidated financial statements E
Below 1,000,000 1,000,000(included)~2,000,000(excluded) 2,000,000(included)~3,500,000(excluded) 3,500,000(included)~5,000,000(excluded)
5,000,000(included)~10,000,000(excluded)
Lu,Hui‐Chang、Lu,Cheng‐Lung、Chiu,Chih‐Keng、Lin,Chin‐Kuan、Peng,Jen‐Fang、Lu,Kuo‐Huang、
Wu,Ta‐Hsin、Chen,Te‐Ling 、Tung,Ti‐Chun、Pan,Tsai‐Yu、Huang,Wen‐Shan、Cheng,Hui‐Cheng、
Yeh,Chun‐Te、Tsai,Wei‐Hsin、Hung,Pao‐Yu
Lu,Hui‐Chang、Lu,Cheng‐Lung、Chiu,Chih‐Keng、Lin,Chin‐Kuan、Peng,Jen‐Fang、Lu,Kuo‐Huang、Wu,Ta‐Hsin、
Chen,Te‐Ling 、Tung,Ti‐Chun、Pan,Tsai‐Yu、Huang,Wen‐Shan、Cheng,Hui‐Cheng、Yeh,Chun‐Te、Tsai,Wei‐Hsin、
Hung,Pao‐Yu
10,000,000(included)~15,000,000(excluded) Yu, Hsien‐Neng、Lu,Chi‐Long、Teng,Chi‐Hung、Li,Chao‐Ming、Tsai,Rong‐Fong、Liao,Chun‐Keng、
Hung,Yu‐Sheng
Yu, Hsien‐Neng、Lu,Chi‐Long、Teng,Chi‐Hung、Li,Chao‐Ming、Tsai,Rong‐Fong、Liao,Chun‐Keng、Hung,Yu‐Sheng
15,000,000(included)~30,000,000(excluded) Hsu,Hsiang、Chiang,Sheng‐Chang、Huang,Chin‐Ching、Lin,Wen‐Tung、Kuo,Hsu‐Kuang Hsu,Hsiang、Chiang,Sheng‐Chang、Huang,Chin‐Ching、Lin,Wen‐Tung、Kuo,Hsu‐Kuang
30,000,000(included)~50,000,000(excluded) 50,000,000(included)~100,000,000(excluded) Over $100,000,000
Total 273,275,574 273,275,574
Names of managers receiving remuneration to employees, and status of allocation thereof
Managers
Title Name Stock Amount Cash Amount Total Ratio of Total Amount to Net Income (%)
Chairman Hsu,Hsiang
0 74,800,000 74,800,000 1.34%
President & Chief Executive Officer Chiang,Sheng‐Chang
Senior Vice President of Management Committee Huang,Chin‐Ching
Senior Vice President of Management Committee Lin,Wen‐Tung
Senior Vice President of Management Committee Yu, Hsien‐Neng
Senior Vice President of Management Committee Lu,Chi‐Long
Executive Vice President & NB BU GM Kuo,Hsu‐Kuang
Executive Vice President & GNP BU GM Liao,Chun‐Keng
Executive Vice President & CND BU GM Hung,Yu‐Sheng
EPS BU GM Tsai,Rong‐Fong
ACS BU GM Huang,Wen‐Shan
IPS BU GM Lu,Hui‐Chang
Vice President & CPS BU GM Wu,Ta‐Hsin
Vice President of Corp. R&D Teng,Chi‐Hung
Vice President of Corp.Manufacture & Quality Assurance Li,Chao‐Ming
Vice President of Corp. Sales & Marketing Chiu,Chih‐Keng
Vice President of Corp. Sales & Marketing Tung,Ti‐Chun
Vice President of Corp. Supply Chain Chen,Te‐Ling
Vice President of NB BU R&D Division Lin,Chin‐Kuan
Vice President of NB BU R&D Division Lu,Kuo‐Huang
Vice President of NB Product Mgt. Division Peng,Jen‐Fang
Vice President of NB Operations Mgt. Division Pan,Tsai‐Yu
Vice President of CND BU Yeh,Chun‐Te
Vice President of EPS BU Sales & Marketing Division Lu,Cheng‐Lung
Vice President of Corp. Marketing Division Cheng,Hui‐Cheng
Vice President of Global Management Center Tsai,Wei‐Hsin
Vice President of Finance Center Hung,Pao‐Yu
Assistant Vice President of Internal Auditing Office Liu,Chu‐Hao Note:To follow the instructions of the competent authority in conducting to promote corporate governance. Retiring:President :Mr.Hsu,Hsiang;new appointments:President & CEO:Mr. Chiang,Sheng‐Chang

19
3.The Company is in any situation under Article 10, paragraph 1, subparagraph 3, subsections 2‐1 or 2‐5 of the Regulations Governing Information to be Published in Annual Reports of Public Companies: No
4. Compare and state the ratio of total remuneration paid to the company’s Directors, Supervisors, President, and V.P. by the company and the companies in the consolidated financial statements to net income in the last two years; also, describe the policy, standard, and combination of remuneration paid; moreover, the procedure of defining remuneration and its relation to business performance and future risks . (1)Analyze the ratio of the total remuneration paid to the company’s Directors, Supervisors, President, and V.P. in the last two years to net income:
Year Item
Directors & Supervisors President and Vice President
Ratio of the total remuneration paid to the company’s Directors, Supervisors in the last two years to net income
Ratio of the total remuneration paid to the President, and V.P. in the last two years to
net income
2019 2018 2019 2018
0.88% 0.82% 4.89% 4.75%
1.Policies of remuneration Articles 19‐1 of Incorporation of Micro‐Star International Co., Ltd. The pre‐tax income of the current fiscal year shall first offset the accumulated deficits. If the balance is positive, then the Company shall allocate the remuneration to be distributed to employees, directors and supervisors in accordance with the following ratio. Employee remuneration in the percentage of 6% to 10%. Individuals eligible for employee remuneration include the Company’s employees and the employees of the Company’s subsidiaries meeting certain requirements. Such requirements are to be set by the Board of Directors. Remuneration to be distributed to directors and supervisors shall not exceed 1%. The decision of the percentage of remuneration to be distributed to employees, directors and supervisors set forth in the preceding Paragraph, the forms of distribution (cash or stock dividends) and the amounts and shares thereof shall be made through the special resolutions of the Board of Directors and reported to the shareholders’ meeting. (The Company established an Audit Committee to replace supervisors on June 15, 2018)
Carried out in accordance with the Company’s Remuneration Management Regulations, Performance Review Regulation, Employee Bonus Evaluation and Distribution Rules.
2.Criteria and composition of remuneration
The remunerations of directors are distributed based on the number of directors and considering the contribution of individual directors to the Company.
Includes base salary, Duty allowance and performance bonuses.
3.Procedures to fix remuneration
Resolved by the board meeting, and approved by the general meeting of shareholders. Based on their educational and professional backgrounds.
4.Interrelationship with MSI business
Based on the Company’s performance and profitability. Remuneration is paid based on target achievement rate, performance, profitability and contribution of the respective.
(2) Except for the Company, all the other companies included in the Consolidated Statement did not pay remunerations for the directors, supervisors, president, and vice presidents of the Company.

20
(Ⅳ) Corporate governance 1.Board of Directors
The Board had 9 (A) meetings during 2019/1/1~2020/4/30:
Title Name Attendance in Person (B)
By Proxy Attendance Rate (%) (B/A)
Remarks
Chairman Hsu,Hsiang 9 0 100.00%
Vice Chairman Huang,Chin‐Ching 7 2 77.78%
Director Lin,Wen‐Tung 8 1 88.89%
Director Yu, Hsien‐Neng 7 2 77.78%
Director Chiang,Sheng‐Chang 8 1 88.89%
Director Kuo,Hsu‐Kuang 9 0 100.00%
Director Liao,Chun‐Keng 9 0 100.00%
Director Hung,Yu‐Sheng 9 0 100.00%
Independent Director Wang,Sung‐Chou 9 0 100.00% Note1
Independent Director Liu,Cheng‐Yi 9 0 100.00% Note1
Independent Director Hsu,Kao‐Shan 9 0 100.00% Note1
Note1: Independent directors attended in person in 2019 and up to date till the Annual Report printed (with an attendance rate of 100%).
3.Board of Director Self (Peer) Evaluation Cycle and Period, Scope, Method, and Topic are as below:
Implementation of Board of Director Evaluation
Cycle Period Scope Method
Once per year January 1, 2019 to December 31, 2019 Board of Directors, individual director and functional committees
Internal self‐evaluation questionnaire for the Board (functional committees) and each director
Topic
The performance evaluation of the Board of Directors, directors, functional committees of 2019 was completed on January 17, 2020. The evaluation topics of each scope include the following:
(1) Board of Directors performance evaluation: The performance evaluation of the Board of Directors includes the level of participation in the company’s operation, decision quality of the Board of Directors, body and structure of the Board of Directors, selection of directors and continuing study, internal control.
(2) Individual director performance evaluation: The performance evaluation of individual directors includes the knowledge of the company’s objectives and tasks, understanding of the responsibilities of directors, level of participation in the company’s operation, internal relationship cultivation and communication, continuing study of the director’s profession, internal control.
(3) Functional committee’s performance evaluation: Including the level of participation in the company’s operation, understanding of the responsibilities of the functional committee, decision quality of the functional committee, body of the functional committee and selection of members, internal control.

21
2. Audit Committee or Attendance of Supervisors at Board Meetings: (1)Attendance of Supervisors at Board Meetings:The Company established an Audit Committee to replace supervisors on June 15, 2018 and
the supervisors are relieved of the position starting on that day. (2)Operation of the Audit Committee:
4 meetings (A) held by Audit Committee in 2019, the attendance of the independent directors is as follows:
Title Name Attendance in Person (B) Attendance
Rate (%) 【B/A】
Remarks
Independent director Wang,Sung‐Chou 4 100.00% June 15,2018 Newly
appointed
Independent director Liu,Cheng‐Yi 4 100.00% June 15,2018 Newly
appointed
Independent director Hsu,Kao‐Shan 4 100.00% June 15,2018 Newly
appointed
Other items that shall be recorded: 1. If any of the following applies to the operations of the Audit Committee , the date and session of the Board of Directors’ Meeting, as well as the resolutions, resolutions of the Audit Committee and the corporation’s actions in response to the opinions of the Audit Committee should be stated. (1)Items listed in Article 14(5) of the Securities and Exchange Act. (2)Except the items in the preceding issues, other resolutions approved by two‐thirds of all directors but yet to be approved by the Audit
Committee:None. 2. Execution process where the independent director abstain from begin a stakeholder, the name of the director, the content of proposal, the reson of abstinence and the results of the voting should be stated: None
Audit Committee Meeting Date
Agenda
Audit Committee Resolution Results
Audit Committees’ opinions
Corporation’s responses to the comments of the Audit Committee
Execution process where the
independent director abstain from begin a
stakeholder
Wang,Sung ‐Chou
Liu,Cheng ‐Yi
Hsu,Kao‐Shan
The reson of
abstinence
The results of the voting should be
stated
2019.03.21 (2019/1)
(1)2018 Financial Statement of this Company. (2)The Statement on Internal Control System of
2018 of this Company. (3)Amendments to Procedure for the
Endorsement and Guarantee Operations Procedure, Operations Procedure for Loaning of Funds to Other Parties, Acquisition and Disposal of Assets
Proposal approved
None None None None None None
2019.04.30 (2019/2)
(1)Business Performance Report ‐ First Quarter 2019
Proposal approved
None None None None None None
2019.08.09 (2019/3)
(1)Financial Report of second quarter, 2019 (2)Evaluated the independence of CPA
engagement.
Proposal approved
None None None None None None
2019.11.07 (2019/4)
(1)Financial Report of third quarter, 2019 Proposal approved
None None None None None None
3.Communication between directors and head of internal audit and CPA (including material issues, audit methods and results relating to the corporation’s finances and business). (1) The internal audit supervisor submits an audit summary report to the Audit Committee on a monthly basis in accordance with the annual audit plan. (2) The Company convenes an audit committee, and invites the accounting and auditing supervisors attend and invites relevant supervisors as needed. (3)The independent directors and the internal audit office, and the CPA have the direct channel to communicate with each other, by phone, written
correspondence, or face‐to‐face meeting. The communication is smooth. (4)The independent directors shall call the communication meeting at least once per year with the CPA, and at least once per quarter with the internal audit
office. For the communication details, please refer to the Company's website:https://tw.msi.com/about/company/

22
3. Corporate Governance Implementation Status and Deviations from “Corporate Governance Best‐Practice Principles for TWSE/TPEx Listed Companies”
Evaluation Item
Implementation Status Deviations from “the Corporate Governance Best‐Practice Principles for TWSE/TPEx Listed Companies” and Reasons
Y N Abstract Illustration
1. If the Company established and disclosed Corporate Governance Principles in accordance with Corporate Governance Best‐Practice Principles for TWSE/TPEx Listed Companies?
V The Company has established the Corporate Governance Best‐Practice Principles based on “Corporate Governance Best‐Practice Principles has been disclosed on the Company’s website. None
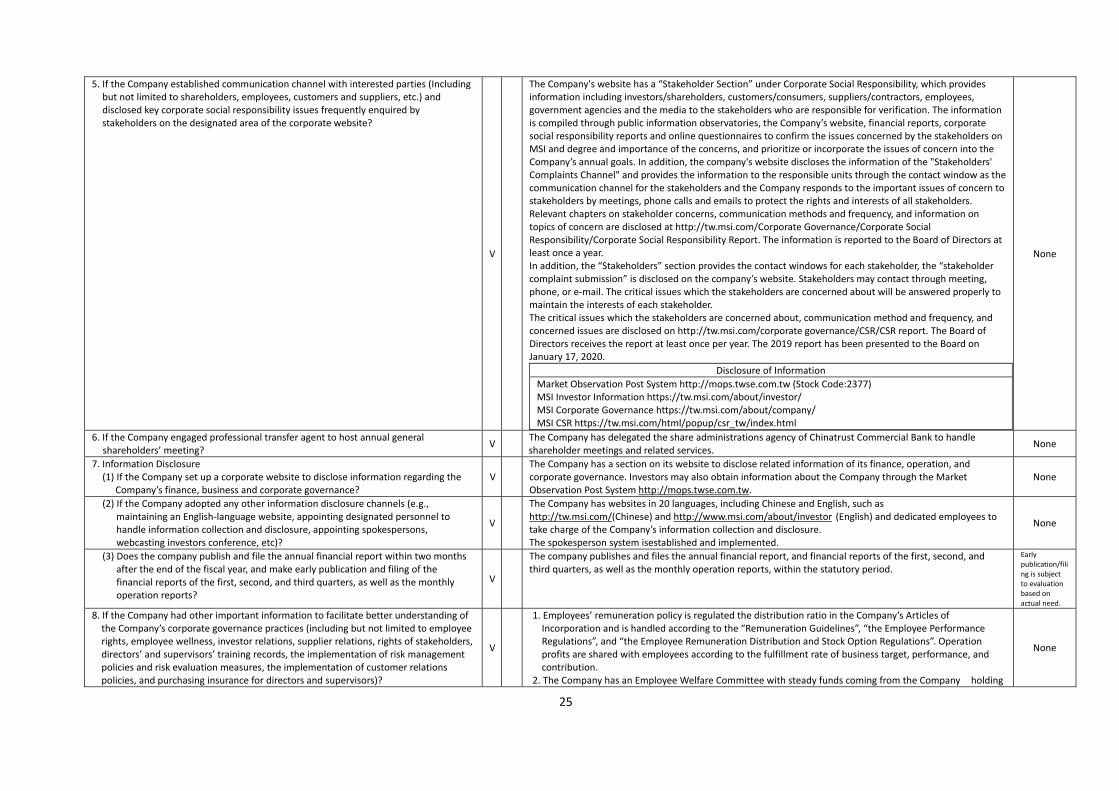
2. Shareholding Structure & Shareholders’ Rights (1) If the Company established internal procedures to handle shareholder suggestions,
proposals, complaints and litigation and execute accordingly? V
In addition to the existing hotline and email channels, the Company has established an internal operating procedure, and has designated appropriate departments, such as Investor Relations, Public Relations, Legal Department, to handle shareholders’ suggestions, doubts, disputes and litigation.
None
(2) If the Company maintained of a list of major shareholders and a list of ultimate owners of these major shareholders?
V The Finance Dept is responsible for collecting the updated information of major shareholders and the list of ultimate owners of those shares.
None
(3) If risk management mechanism and “firewall” between the Company and its affiliates are in place?
V
「Group business management regulations」 are made to strictly regulate the activities of trading,
endorsement and loans between the Company and its affiliates. In addition, the “Criteria of Internal Control Mechanism for a Public Company”, outlined by the Financial Supervisory Commission when drafting the guidelines for the “Supervision and Governance of Subsidiaries”, was followed in order to implement total risk control with espect to subsidiaries.
None
(4) If the Company established internal policies that forbid insiders from trading based on non‐disclosed information? V
To protect shareholders’ rights and fairly treat shareholders, the Company has established the internal rules to forbid insiders trading on undisclosed information. The Company has also strongly advocated these rules in order to prevent any violations.
None

23
3.Structure of Board of Directors and its responsibility (1) Does the Board of Directors set and implement a diversification policy?
V
The Company has the “Corporate Governance Principles” in place and diversified policies are established with regard to the composition of members of the Board of Directors. The directors (including independent directors) are nominated. The Board of Directors members are nominated according to law by shareholders and naturally elected during a shareholders’ meeting. Member diversification is considered by the Board members. Factors taken into account include, but are not limited to gender, age, cultures, educational background, race, professional experience, skills, knowledge and terms of service. The members of board of directors possess a diveres range of expertise in the fields of Operational Decision Making, Operations Management, Crisis Management, Industy Knowledge, International Market Outlook, Leadership Decision Making, Finance& Accounting and law, can adequately fulfill the Company’s future development needs.
Name Gender Age Operational
Decision Making
Operation Management
Crisis Management
Industry Knowledge
International Market Outlook
Leadership Decision Making
Finance& Accounting
law
Hsu,Hsiang Male 63 Huang,Chin‐Ching Male 62 Lin,Wen‐Tung Male 62 Yu, Hsien‐Neng Male 62 Chiang,Sheng‐Chang Male 56 Kuo,Hsu‐Kuang Male 53 Liao,Chun‐Keng Male 56 Hung,Yu‐Sheng Male 49 Wang,Sung‐Chou Male 58 Liu,Cheng‐Yi Male 59 Hsu,Kao‐Shan Male 58
There are 11 male members and 0 female members on the Board. 8 of them are employees and 3 are non‐employees. The average age is 58. The company will work on having more female members on the Board, reducing the number of employee‐directors, and recruiting younger members.
None
(2) If the Company established any other functional committee in addition to Compensation Committee, Audit Committee as required by law?
V
In order for the sound supervision and reinforcement of management, the Company established the Remuneration Committee and Audit Committee. The functional committees shall be responsibilities for the Board of Directors.
The company has not yet established other functional committee.Scheduled to radually establish according to the laws and regulations as well as the practical requirement of the

24
company.
(3) Does the company specify the process and method of the performance evaluation of the Board of Directors, conduct the annual evaluation, and report the evaluation results to the Board of Directors and use such for considering the remuneration and re‐appointment of each director?
V
The Company has the Guidelines for Evaluating Performance of the Board of Directors in place. Self‐assessments are organized once a year and cover participation in corporate operation, quality of decisions made by the Board of Directors, the composition and structure of the Board of Directors, the election and continuing education of Board directors, among others. The questionnaires were sent out in January 2020 to respective directors. The 2019 Board of Directors self‐assessment was completed on January 17, 2020 and the results are disclosed on the website of the Company.
None
(4) If the Company assess the independence of CPA periodically?
V
The Board has reviewed the qualification of CPA’s independency on August 9, 2019. The review includes the evaluation, as below items:
Assessment assessment result(Y/N)
Independen(Y/N)
The designated accountant does not have direct or indirect financial interest relationship with the Company.
N Y
The designated accountant does not have a financing or guarantee relationship with the Company or any director of the Company.
N Y
The designated accountant does not have close business relationship or potential employment relationship with the Company.
N Y
The designated accountant does/did not currently/ in the recent two years serve as a director, supervisor, or manager of the Company or play a role having significant influence on the audit case.
N Y
The designated accountant does not promote or act as an intermediate for the shares or other securities issued by the Company.
N Y
The designated accountant does not serve as the advocate of the Company nor as the representative of the Company to mediate the dispute between the Company and any third party.
N Y
The designated accountant does not have kinship with any directors or managers of the Company or the person having significant influence on the audit service.
N Y
The assessment results show that the declaration of independence has not been breached in the relationship between the Company and the CPAs; independence disqualified.
None
4. Does the public (OTC) company appoint the adequate number of competent corporate governance staff, and a corporate governance manager to be responsible for handling corporate governance scheme (including but not limited to providing information to the directors and supervisors necessary to perform their duties, assisting the directors and supervisors in legal compliance, processing the Board meetings and shareholders meetings according to the laws, processing company registration and registration of changes, and producing minutes of the Board meetings and shareholders meetings)?
V
The Financial Department of the Company is set up with dedicated corporate governance personnel who have more than 3 years of experience in the managerial work such as corporate finance, stock affairs and meeting proceedings with the scope of duties as follows: providing the information required by the directors to conduct business, propagating the regulations related to the operation, assisting the directors with compliance with laws and regulations, arranging for directors for further study, handling matters related to the board of directors and shareholders' meeting, changing registration and corporate governance, etc. The board of directors pass the resolution on March 21st, 2019 to have these personnel supervised by a corporate governance supervisor who isqualified as a manager and reports the implementation to the board of directors at least once a year. Business execution in the most recent year is as follows: (1) Corporate governance and securities‐related acts promotion (2) Assistance with the convening of Board of Directors and Shareholders Meetings (3) Preparation of the Board's agenda, provision of meeting materials and delivery of notices, reminding of avoidance of conflict of interests, production and mailing of the proceedings (4) Publication of the Company’s major news (5) Arrangement of the annual training of the directors (6) Registration of the shareholders' meeting, and production of the meetings notice, the annual report, the handbooks within the statutory time limit (7) Change registration with the Ministry of Economic Affairs after amendment of the by‐laws or re‐election of directors.(8)The educational programs provided for the first‐time corporate governance staff were completed as required. Please see page 28.
None
25
5. If the Company established communication channel with interested parties (Including but not limited to shareholders, employees, customers and suppliers, etc.) and disclosed key corporate social responsibility issues frequently enquired by stakeholders on the designated area of the corporate website?
V
The Company's website has a “Stakeholder Section” under Corporate Social Responsibility, which provides information including investors/shareholders, customers/consumers, suppliers/contractors, employees, government agencies and the media to the stakeholders who are responsible for verification. The information is compiled through public information observatories, the Company’s website, financial reports, corporate social responsibility reports and online questionnaires to confirm the issues concerned by the stakeholders on MSI and degree and importance of the concerns, and prioritize or incorporate the issues of concern into the Company’s annual goals. In addition, the company's website discloses the information of the "Stakeholders' Complaints Channel" and provides the information to the responsible units through the contact window as the communication channel for the stakeholders and the Company responds to the important issues of concern to stakeholders by meetings, phone calls and emails to protect the rights and interests of all stakeholders. Relevant chapters on stakeholder concerns, communication methods and frequency, and information on topics of concern are disclosed at http://tw.msi.com/Corporate Governance/Corporate Social Responsibility/Corporate Social Responsibility Report. The information is reported to the Board of Directors at least once a year. In addition, the “Stakeholders” section provides the contact windows for each stakeholder, the “stakeholder complaint submission” is disclosed on the company’s website. Stakeholders may contact through meeting, phone, or e‐mail. The critical issues which the stakeholders are concerned about will be answered properly to maintain the interests of each stakeholder. The critical issues which the stakeholders are concerned about, communication method and frequency, and concerned issues are disclosed on http://tw.msi.com/corporate governance/CSR/CSR report. The Board of Directors receives the report at least once per year. The 2019 report has been presented to the Board on January 17, 2020.
Disclosure of Information
Market Observation Post System http://mops.twse.com.tw (Stock Code:2377) MSI Investor Information https://tw.msi.com/about/investor/ MSI Corporate Governance https://tw.msi.com/about/company/ MSI CSR https://tw.msi.com/html/popup/csr_tw/index.html
None
6. If the Company engaged professional transfer agent to host annual general shareholders’ meeting?
V The Company has delegated the share administrations agency of Chinatrust Commercial Bank to handle shareholder meetings and related services.
None
7. Information Disclosure (1) If the Company set up a corporate website to disclose information regarding the
Company’s finance, business and corporate governance? V
The Company has a section on its website to disclose related information of its finance, operation, and corporate governance. Investors may also obtain information about the Company through the Market Observation Post System http://mops.twse.com.tw.
None
(2) If the Company adopted any other information disclosure channels (e.g., maintaining an English‐language website, appointing designated personnel to handle information collection and disclosure, appointing spokespersons, webcasting investors conference, etc)?
V
The Company has websites in 20 languages, including Chinese and English, such as http://tw.msi.com/(Chinese) and http://www.msi.com/about/investor (English) and dedicated employees to take charge of the Company’s information collection and disclosure. The spokesperson system isestablished and implemented.
None
(3) Does the company publish and file the annual financial report within two months after the end of the fiscal year, and make early publication and filing of the financial reports of the first, second, and third quarters, as well as the monthly operation reports?
V
The company publishes and files the annual financial report, and financial reports of the first, second, and third quarters, as well as the monthly operation reports, within the statutory period.
Early publication/filing is subject to evaluation based on actual need.
8. If the Company had other important information to facilitate better understanding of the Company’s corporate governance practices (including but not limited to employee rights, employee wellness, investor relations, supplier relations, rights of stakeholders, directors’ and supervisors’ training records, the implementation of risk management policies and risk evaluation measures, the implementation of customer relations policies, and purchasing insurance for directors and supervisors)?
V
1. Employees’ remuneration policy is regulated the distribution ratio in the Company’s Articles of Incorporation and is handled according to the “Remuneration Guidelines”, “the Employee Performance Regulations”, and “the Employee Remuneration Distribution and Stock Option Regulations”. Operation profits are shared with employees according to the fulfillment rate of business target, performance, and contribution.
2. The Company has an Employee Welfare Committee with steady funds coming from the Company holding
None

26
(1) Employee rights events and providing benefit programs for employees. 3. Besides having employees covered by Labor Insurance and National Health Insurance as required by law so
that they can be assured safety while at work, the Company also offers the group insurance for extra protection to employees and their family.
(2) Employee care employee wellness
V
The Company was certified by OHSAS18001 (Occupation Health and Safety Assessment Series Certification) in December 2003 and received the “health promotion symbol for spontaneous healthy workplace certification”. Besides periodical employee health examinations, the Company has a employee clinic, nursing room, various health‐related tests, workshops, and training from time to time, there are also diversified society events and employees are provided with related consultation services and help solutions on issues such as career, workplace inter‐person relationship, emotions at work, work management, physical and mental stress, communications between husband and wife, child care and education, gender relations, laws in life, wealth management, and tax reduction so that the health of employees in all aspects, physical, mental, and spiritual, is taken well care of.
None
(3) Investor relations V
The Company discloses information from time to time through the Market Observation Post System and the Company’s website, and has the “Investor Relations Contact Window” available for the shareholders to contact by phone or through email in order to maintain the investor relationship.
No Deviation
(4) Supplier Relations
V
1. In order to protect the rights of suppliers, as long as not against regulatory requirements and damage to our shareholders’ rights, financial information required by the suppliers for the Company’s creditline evaluation will be provided.
2. In order to accomplish sustainable management for the Company and for all suppliers, suppliers continue to be asked to promise compliance with regulations concerning health and safety, the environment, labor, and ethics as well as guidelines for the management system and risk control and suppliers will receive educational training and periodic audits, among other related auxiliary measures, to help them keep enforcing and improving the said regulations and guidelines.
None
(5) Stakeholder rights
V
1. The Company discloses on its website information on corporate governance, finance, sustainability, and products and also related information on the Market Observation Post System for the stakeholders’ reference.
2. The Company has a section “Contact MSI” on website. If stakeholders have issues about economy, environment, and society, they can communicate the issues with the Company through the said channel; this helps protect the rights of respective stakeholders.
None
(6) Further education status of directors and supervisors V
The Company’s directors, supervisors, and high‐ranking managers receive continuing education as required by “the Directions for the Implementation of Continuing Education for Directors and Supervisors” of TWSE Listed and TPEx Listed Companies on a yearly basis. The continuing education programs are listed below.
None
(7) Risk management policy and risk measurement measures
V
The Company’s policy towards risk management is to set various rules and regulations in order to weigh and evaluate possible impacts of the various risk matters on the profits and losses of the Company and to stipulate respective response policies accordingly. For the analysis and evaluation of risk matters, other important risks and response measures, please refer to Page90~97
None
(8) Implementation of customer policy V
Regulations to be followed are established in the Company’s internal control system to ensure fulfillment of customer service and product protection and the responsible unit is available for real‐time communication during transaction with customers in order to ensure that customers’ rights are protected.
None
(9) Purchase of liability insurance for directors and supervisors V
Directors are covered by the Company’s D&O insurance. (And disclosed in the Market Observation Post System http://mops.twse.com.tw)
None
9. Please describe the improvements of the corporate governance evaluation results released by the corporate governance center of the Taiwan Stock Exchange Corporation in the last year, and propose priority matters or measures to strengthen areas yet unimproved. Reasons for failure to get scores during corporate governance rating:

27
(1) To improve information disclosure of the English version materials, the English version meeting notice and meeting handbook were produced for the 2018 shareholders meeting and English version meeting notice, meeting handbook and annual report were produced in the 2018 shareholders meeting, both of which were required to be uploaded within a specified period.
(2)The Company set up the Audit Committees to replace the responsibilities of the supervisors. (3)To follow the instructions of the competent authority in conducting to promote corporate governance. Retiring:President :Mr.Hsu,Hsiang;new appointments:President & CEO:Mr. Chiang,Sheng‐Chang

28
Continuing Education/Training of Directors、Supervisors and Managements
Year Training Course Host by Duration Attendees
2003 Corporate Governance Fu Jen Catholic University 3 hours All Directors、Supervisors and Managements
2004 Corporate Governance and Risk Management The Taiwan Corporate Governance Association 3 hours All Directors、Supervisors and Managements
2005 Use financial statements to analyze and improve business performance Securities & Futures Institute 3 hours Directors、Supervisors and Managements
2006 Directors, Supervisors and Senior Managers' Responsibilities for Financial Reporting Securities & Futures Institute 3 hours All Directors、Supervisors and Managements
2007 Audit Strategy of Corporate Governance and Enterprise Tax Planning The Taiwan Corporate Governance Association 3 hours All Directors、Supervisors and Managements
2008 Business Transformation and Change Management The Taiwan Corporate Governance Association 3 hours All Directors、Supervisors and Managements
2009 Brand Management and Innovation The Taiwan Corporate Governance Association 3 hours All Directors、Supervisors and Managements
2010 Corporate Governance under International Taxation The Taiwan Corporate Governance Association 3 hours All Directors、Supervisors and Managements
2011 Financial statements and analysis of trends in the industry The Taiwan Corporate Governance Association 3 hours All Directors、Supervisors and Managements
2012 Disputes and Risks Caused by Taiwan Enterprises' Investment in China The Taiwan Corporate Governance Association 3 hours All Directors、Supervisors and Managements
2013 Financial thinking of business transformation The Taiwan Corporate Governance Association 3 hours All Directors、Supervisors and Managements
2014 New Trend of Internal Control Practice ‐ Corporate Social Responsibility and Risk Management
The Taiwan Corporate Governance Association 3 hours All Directors、Supervisors and Managements
2015 Comprehensively improve adaptability ‐ Enterprise crisis management The Taiwan Corporate Governance Association 6 hours All Directors、Hsu,Fen‐Lan、Hsu,Gau‐Shan and
Managements
2015 In 2015, the latest tax update issued the latest information analysis Taiwan CPA Association, ROC 6 hours Hsu,Jun‐Shyan (National Association of Certified Public
Accountants lecturer)
2016 The reform and sustainable management of the board of directors; the key strategies and practices of breakthroughs in business innovation
The Taiwan Corporate Governance Association 6 hours All Directors、Supervisors and Managements
2017 Big Data Analysis and Corporate Fraud Detection The Taiwan Corporate Governance Association 3 hours All Directors(except Tsai,Rong‐Fong)、Supervisors and
Managements
2017 Reconstruction of IT Security Strategy from Cyber Crime View The Taiwan Corporate Governance Association 3 hours All Directors(except Tsai,Rong‐Fong)、Supervisors and
Managements
2017 Corporate Governance Forum series‐sustainable operation Taiwan academy of Banking and Finance 3 hours Tsai,Rong‐Fong
2017 2017 Insider Trading and Corporate Social Responsibility Forum Securities & Futures Institute 3 hours Tsai,Rong‐Fong
2018 The introduction for the latest income tax or value‐added tax reforms in China and the United States and the trend and impact of global anti‐tax avoidance regulations.
The Taiwan Corporate Governance Association 3 hours All Directors、Managements and Corporate overnance Officer
2018 Global Economic Outlook The Taiwan Corporate Governance Association 3 hours All Directors、Managements and Corporate overnance Officer
2018 The 12th Taipei Corporate Governance Forum Financial Supervisory Commission 6 hours Liao,Chun‐Keng
2018 The 12th Taipei Corporate Governance Forum Financial Supervisory Commission 3 hours Hung,Yu‐Sheng
2018 2018 Forbid Insider Trading Promotion Meeting Taiwan Stock Exchange Corporation 3 hours Hung,Yu‐Sheng、Kuo,Hsu‐Kuang
2018 Discussion on fraud cases of corporate financial statements Securities & Futures Institute 3 hours Kuo,Hsu‐Kuang
2019 How could directors and supervisors supervising t the business risk and crisis management of the Company?
Taiwan Corporate Governance Association 3 hours All Directors、Managements and Corporate Governance
Officer
2019 Impact from the U.S.‐China Trade War to the industry in Taiwan and the reaction planning
Taiwan Corporate Governance Association 3 hours All Directors、Managements and Corporate Governance
Officer
2019 2019 Corporate Governance Practices Seminar Corporate Governance Professionals
Association 3 hours Corporate Governance Officer
2019 Corporate Governance and Business Operational Sustainability Course Taiwan academy of Banking and Finance 3 hours Corporate Governance Officer
2019 Task Force on Climate‐related Financial Disclosures (TCFD) Forum (educational program for corporate governance)
Taiwan Stock Exchange Corporation 3 hours Corporate Governance Officer

29
4.Professional Qualifications and Independence Analysis of Remuneration Committee Members (1)Established:The Borad of directors of the company set up the Remuneration Committee on December 18, 2011.
A.Remuneration Committee members information:
Title
Criteria Name
Meets one of the following professional qualification requirements, together with at least five years’ work experience
Independence Criteria (Note)
Number of other public companies in which the individual is concurrently
serving as an Compensation Committee member
Remarks
An instructor of higher position in a department of commerce, law, finance, accounting, or other academic department related to the business needs of the company in a public or private junior college, college or university
A judge, public prosecutor, attorney, CPA, or other professional or technical specialist who has passed a national examination and been awarded a certificate in a profession necessary for the business of the company
Have work experience in the areas of commerce, law, finance, accounting, or otherwise necessary for the business of the company
1 2 3 4 5 6 7 8 9 10
Independent Director
Hsu,Kao‐Shan 0
Independent Director
Wang,Sung‐Chou 0
Independent Director
Liu,Cheng‐Yi 0
Note: If any member meets any of the following descriptions within two years prior to the appointment and during the term of office, please check the box of the corresponding number. (1) Not an employee of the company or its affiliate. (2) Not a director or supervisor of the company or its affiliate (except for independent directors appointed in accordance with the Act or the local laws by, and concurrently serving as such at, the company, its
parent company, subsidiaries, or a subsidiary under the same parent company). (3) Not the person himself, spouse or minor child, or individual shareholder holding more than 1% of the company’s outstanding shares in the name of a third party, or top 10 shareholder. (4) Not the spouse, relative within the second degree of consanguinity, or direct blood relative within the third degree of consanguinity of a manager, a person under (2) or (3). (5) Not directly holding more than 5% of the company’s outstanding shares, top 5 shareholder, or a director, supervisor or employee of a corporate shareholder appointing its representative as the director or
supervisor of the company pursuant to Article 27 paragraphs 1 or 2 of the Company Act (except for independent directors appointed in accordance with the Act or the local laws by, and concurrently serving as such at, the company, its parent company, subsidiaries, or a subsidiary under the same parent company).
(6) Not a director, supervisor, or employee of a company controlled by the same person holding the majority of the Board or the voting shares of the company and the other company (except for independent directors appointed in accordance with the Act or the local laws by, and concurrently serving as such at, the company, its parent company, subsidiaries, or a subsidiary under the same parent company).
(7) Not a director (governor), supervisor, or employee of a company or institution whose chairman, president, or a person holding an equivalent position is the same person or the spouse of the chairman, president, or a person holding an equivalent position at the company (except for independent directors appointed in accordance with the Act or the local laws by, and concurrently serving as such at, the company, its parent company, subsidiaries, or a subsidiary under the same parent company).
(8) Not a director (governor), supervisor, manager, or shareholder with more than 5% shareholding of a specific company or institution having financial or business relationship with the company (except for independent directors appointed in accordance with the Act or the local laws by, and concurrently serving as such at, the company, its parent company, subsidiaries, or a subsidiary under the same parent company).
(9) Not a professional individual, or an owner, partner, director, supervisor, or officer of a sole proprietorship, partnership, company, or institution, or their spouses, who provides auditing services to the company or any affiliate of the company, or that provides commercial, legal, financial, accounting or related services to the company or any affiliate of the company for which the provider has received cumulative compensation exceeding NT$500,000 in the past 2 years; provided however that this restriction does not apply to a member of the remuneration committee, public tender offer review committee, or special committee for merger/consolidation and acquisition, who exercises powers pursuant to the Securities and Exchange Act or to the Business Mergers and Acquisitions Act.
(10) No such situation under Article 30 of the Company Act.

30
B. Attendance of Members at Remuneration Committee Meetings
① There are 3 members in the Remuneration Committee.
② Tenure of the current of Remuneration committee is from June 15, 2018 to June14, 2021. A total of 5 (A) meetings of the Remuneration Committee were held in 2019, The attendance record of the Remuneration Committee members was as follows:
Title Name Attendance in
Person (B)
By Proxy Attendance Rate (%)
B/A Remarks
Convener Hsu,Kao‐Shan 5 0 100% June 15,2018 Newly appointed
Member Wang,Sung‐Chou 5 0 100%
Member Liu,Cheng‐Yi 5 0 100%
Other mentionable items: 1. If the board of directors declines to adopt or modifies a recommendation of the remuneration committee, it should specify the date of the meeting, session, content of the motion, resolution by the board of directors, and the Company’s response to the remuneration committee’s opinion (eg., the remuneration passed by the Board of Directors exceeds the recommendation of the remuneration committee, the circumstances and cause for the difference shall be specified): None.
2. Resolutions of the remuneration committee objected to by members or subject to a qualified opinion and recorded or declared in writing, the date of the meeting, session, content of the motion, all members’ opinions and the response to members’ opinion should be specified: None.
(2) Scope of duties and Excution in the most recent year: A. Scope of duties ① Establishing and periodically reviewing the annual and long‐term performance goals for the directors, supervisors, and managerial officers of this Corporation and the policies, systems, standards, and structure for
their compensation. ② Periodically assessing the degree to which performance goals for the directors, supervisors, and managerial officers of this Corporation have been achieved, and setting the types and amounts of their individual
compensation. B. Execution in the most recent year
Remuneration Committee
Meeting Date Session
Agenda Remuneration Committee
Resolution Results
Corporation’s responses to the comments of the Remuneration Committee
2019.01.25 2019/1
(1) Amendment of various compensation measures of the Company. (2) Promotion of managers and review of their salary structure. (3) Distribution of year‐end bonus of the Company's managers.
Proposal approved Proposal approved Proposal approved
None None None
2019.3.13 2019/2
(1) Proposed distribution of 2018 compensation of employees and directors.
(2) Adjustment of the salary of the Company’s managers and distribution of their performance bonus.
Proposal approved Proposal approved
None None
2019.08.09 2019/3
(1) Amendment of “the Employee Remuneration Distribution and Stock Option Regulations”
(2) Distribution of 2018 compensation for the Company’s managers, directors.
Proposal aproved None
2019.10.04 2019/4 (1)PThe salary structure and bonus of management promoted this
year. Proposal aproved None
2019.11.07 2019/5 (1) Amendment of "Self‐Evaluation or Peer Evaluation of the Board of
Directors of MSI." Proposal approved None

31
5.Differences between CSR enforcement and Corporate Social Responsibility Best Practice Principles for TWSE/GTSM Listed Companies, and the reasons:
Item
Implementation Status Different from “the CSR best
practice principles” issued by
TWSE and its reason(s)
Y N Summary
1. Does the company conduct risk evaluation for the environmental, social, and corporate governance topics related to the company’s operation based on the materiality principle, and specify relevant risk management policy or strategy?
V
MSI risk management policy is to evaluate the impact of various risk issues (including environmental、social and corporate governance issues) on the company's profit and loss.
Based on the significance (responsibility、influence) of the contents to the company, various
response policies has been formulated. The scope of risk management includes the main risks faced during the operation, including financial risk、legal risk、strategy and operational risk、information security risk, and climate
risk.Our company continues to monitor and invest resources for risk control and response preparation through the Business Continuity Plan (BCP) irregularly. For related management policies and strategies, please refer to MSI's annual report or CSR report.
None
2.If the Company set up a unit exclusively or concurrently to execute CSR policies and if the Board appointed member(s) of management team to supervise and report its implementation status to the Board?
V
With regard to the framework of corporate social responsibilities promoted by the Company, the Board of Directors authorizes the general manager to command respective full‐time (part‐time) units to establish and discuss corporate social responsibilities‐related policies and the enforcement of systems. Meanwhile, the sustainable development office is available to take charge of organizing related matters on corporate social responsibilities and to periodically report to the Board of Directors. For the operation and implementation status, refer to the Company’s Corporate Social Responsibility Report for details http://tw.msi.com.
None
3. Environmental Topics (1)If the Company established proper environment management system based on the
characteristics of the industry where the Company belongs to? V
We establish related environmental management methods according to the operating and production characteristics. MSI have passed the certifications of ISO 14001、IECQ/QC
080000、ISO14064‐1 & 2、ISO 14006 and ISO 14072. None
(2)If the Company endeavored to utilize resources more efficiently and utilized renewable materials which have a lower impact on the environment?
V
Based on the requirements of international regulations, customer requests and eco‐labels, we identify related environmental aspects and impacts according to the standard process to discover significant influences as priorities for improvement. With technology and cost feasibility, we establish rigorous requirements for design management and implement them on product life cycle by considering resource conservation, recycling and reuse, energy saving, pollution prevention and other environmental impacts. 1. The packaging materials are designed in a way that they can be decomposed by hand without using tools for reduced consumption of composite materials.
2. The instruction manuals are electronized to realize paperless product publications for reduced use of pulp.
3. Modular design is adopted for products to improve recycling efficiency. 4.Soy ink is used for packaging and printing pigments to improve the recycling rate of packaging materials when discarded.
None

32
(3) Does the company evaluate the current and future potential risks and opportunities due to climate change, and take measures in response to climate change topics?
V
The probability and severity of natural disasters (including drought, mites, snowstorms, high temperature/heat waves, typhoons/strong rainfall) brought about by extreme weathers may affect the Company's production and operations. The risks may include production constraints, operations, equipment, and investment cost rise and inefficiency, etc. By including the issue of climate change in the risk management of sustainable business operations. MSI aims to implement climate change management mechanism through “mitigation” and “adaption” for reduction of the magnitude of impact of climate change on businesses. The Company also strengthens its resilience through the risk through adoption of the carbonation measures of feasibility assessment through the management mechanism of climate change in the two directions of “mitigation” and “adjustment”. Continue to pay attention to changes in relevant domestic and international regulations after the Paris Climate Agreement and evaluate the internal response of the company. The Company strengthens its resilience through appropriate regulatory measures with the specific mehods as follows: (1) Periodically check and update the organization’s carbon emission investigation to achieve
the goal of reducing the greenhouse gas. (2)Evaluate feasible technologies and materials for product design and reduce energy loss of
products. (3)Save water, improve the reuse rate of rainwater and wastewater, and establish emergency measures for water resources.
None
(4) Does the company calculate the emissions of greenhouse gas, water usage, and total weight of wastes in the past two years, and specify the policies for energy saving, carbon reduction, greenhouse gas emission reduction, water‐saving, or other waste management? V
MSI has set the environmental protection and energy saving goals for various forms of energy/resourceof use, emissions and reductions through the environmental management system, and MSI has also set management guidelines for audits and improvements. For details,please refer to MSI's CSR report. https://storage‐asset.msi.com/html/popup/csr_tw/index.html
None
4. Social Topics (1)If the Company followed relevant labor laws, and internationally recognized human rights
principal, and established appropriate management policies and procedures? V
MSI is a melting pot of talents from different ethnic groups all from over the world. Therefore, we treat employees in the same way without distinction of any kind, such as race, color, sex, age, religion, political or other opinions, national or social origins, or other status. All the employees are treated equally with regard to their opportunities in employment, appraisal, promotion, salary, benefits and training to ensure equality of their rights. We ensure to respect labor rights and the implementation of equal treatment.
None
(2) Does the company specify and implement reasonable employee welfare measures (including compensation, leave, and other benefits), and properly reflect the management performance or achievements in the employee compensation?
V
The Company has remuneration policies in place. Reasonable salaries and remunerations are given to employees according to their responsibilities and contribution at work as determined by the performance evaluation. Various remuneration regulations are approved by the Remuneration Committee. Meanwhile, the “Work Rules” of the Company clearly specify employee behavior and discipline, award/punishment are given according to employee performance.
None

33
(3)If the Company provided safe and healthy working environment to employees and conducted relevant training on safety and health management to employees periodically?
V
The company has set up the Occupational Safety and Health management entities, Occupational Safety and Health committee, Meal Committee and medical care office, conducted regular safety and health training for employees and contractors to provide a safe workplace and ensure employee’s physical and mental health.The company has received the ISO 45001 Occupational Safety and Health Management System Certification and the “Healthy Workplace Self‐certified Health Promotion Label”. In order to promote the safety of the working environment and physical protection of employees, the company continues to carry out related equipment maintenance and safety testing.
Item Equipment Maintenance (Safety Test)
Firefighting (fire extinguisher, smoke detector) Once/Monthly, quarterly
Air conditioning (heat dissipation, blower, ice water host)
Once/Monthly, quarterly
Electricity (generator, power outage maintenance) Once/Monthly, quarterly
Carbon dioxide Once/Biannually (Test)
Noise Once/Biannually (Test)
Illuminance Once/Annually (Test)
Wind speed control (laboratory local exhaust) Once/ Annually (Test)
Organic solvent (isopropyl alcohol, methanol, n‐hexane)
Once/Biannually (Test)
Lead, tin Once/Biannually (Test)
Drinking water Once/Monthly(Test)
Employee cafeteria food ingredients and tableware Bimonthly (Sampling test)
None
(4)If the Company provided career planning, relevant training and skill development for employees?
V
The Company highly values training and career developments for its employees. In order to continue promoting quality talent cultivation and key skills management, there are the Regulations Governing Educational Training that address continuing education and training for employees. Meanwhile, budget is appropriated on a yearly basis to facilitate organization of various types of educational training. Lecturers are hired periodically or from time to time to hold workshops. Reflective of the different rankings and levels of professionalism, internal or external educational training is provided to help employees form complete professional skills and inspire them to seek self‐growth.
None
(5) Does the company comply with the laws and international standards regarding customer health and safety, client privacy, marketing and labeling of products and services, and specify the policy of consumer rights and complaint procedures?
V
Besides purchasing appropriate product liability insurance in order to protect the rights of customers and consumers, global service systems are created in countries and regions such as Taiwan, Europe, America, Japan, Korea, and China, including self‐operated or outsourced maintenance sites and customer service centers and websites that have multiple language options. Downloading and updates online, after‐sales service, product maintenance and repairs, technical support, and complaint procedures are available for consumers as well. Products by Micro‐Star are marketed and labeled in compliance with applicable laws and regulations and industrial standards and there are dedicated departments to make sure that requirements are fulfilled according to internal operating and regulatory documents. Product verification, quality control, and third‐party testing help ensure that products are marketed and labeled in compliance of applicable standards.
None

34
(6) Does the company specify any supplier management policy to request the suppliers to comply with the regulations regarding environmental protection, occupational health and safety, or worker’ rights, and how is the enforcement status?
V
The Company has established the Supplier Management Guidelines. New suppliers go through evaluation that covers human rights, the environmental and social responsibilities. For existing suppliers, there are also supplier evaluations from time to time in order to ensure that suppliers comply with corporate social responsibilities. It also reduces losses in bilateral transactions or good will because of the environmental or social responsibilities. The Company specifies in the supplier procurement contract that if suppliers violate its corporate social responsibility policy and the violation has a significant influence on the environment and the society, Micro‐Star may terminate or dismiss the terms and conditions in the contract at any time. The Company also enforces the policy that requires all suppliers to sign its custom procurement contract.
None
5. Does the company prepare the corporate social responsibility reports according to the internationally accepted guidelines or instructions to disclose the company’s non‐financial information? Has any third‐party verification agency provided affirmed or certified opinion for such report?
V
The content structure of MSI's CSR report is prepared in accordance with GRI Standards of the Global Reporting Initiative (GRI) and the Taiwan Stock Exchange Corporation Rules Governing the Preparation and Filing of Corporate Social Responsibility Reports by TWSE Listed Companies, and certified by an independent third party (BSI Pacific Limited, Taiwan Branch) in accordance with the AA1000AP (AA1000 AccountAbility Principles) guarantee standard, and obtain the GRI Standard verification statement. MSI's CSR report will be uploaded to the Market Observation Post System (MOPS) on 2020.06.29.
None
6. If the Company established any guideline of corporate social responsibility in accordance with “Corporate Social Responsibility Best‐Practice Principles for TWSE/GTSM‐Listed Companies” and please state the implementation status of the guideline and any reasons for non‐implementation: None. Pursuant to the "Listed Company Corporate Governance Best Practice Principles" and passed by the Board of Directors, the Company has established the "MSI Corporate Governance Best Practice Principles", of which the Board of Directors.

35
VII. Other material information that helps to understand the operation of corporate social responsibility:
MSI continues to engage the community and participate in education, charity auction and environmental protection activities through sponsorship and employee volunteers. In Taiwan, we not only get involved in public
services through investment of our internal resources, but also joined in the activities of charity groups. Through the process of service to and in the communities, we expand our love and care into the world and unify
our employees' values and commitment towards MSI's corporate social responsibilities. MSI will continue to make its presence in services for the rural areas and disadvantaged groups.
(1) Education and care
1. School lunch: This year, we sponsored the school lunch at remote schools in New Taipei City. 61 schools and about 6,420 disadvantage students benefited.
2. After‐school programs: We launched the after‐school program “MSI Guide Student Aspire” for disadvantaged students to raise their basic learning ability, their confidence despite of an inferior family background,
develop their potential, and build a caring, warm society with mutual support. We opened 112 after‐school programs at 34 elementary and junior high schools in New Taipei City, and about 1,873 students
benefited.
We launched the English proficiency improvement plan “MSI Teach Education Change” for remote and disadvantaged students to reduce the influence in English language learning due to the gap between city and
countryside, resources, and family socioeconomic status. 18 elementary, junior high and senior high schools in Hsinchu City, and about 6,938 students benefited.
3. Technological creation: We sponsored the summer camps in elementary and junior high schools in New Taipei City, established the on‐campus PowerTech club and participated in the New Taipei City contests and
national competition. We promoted the PowerTech Youth Technological Creation Contest to every school, increased students’ craft skills and general science knowledge. 25 elementary and junior high schools in
New Taipei City, and about 1,198 students benefited.
4. Special ed student family field trip: We sponsored the students of centralized special education classes in the third to sixth grade in elementary schools in New Taipei City, and their families to spend a day at Leo Foo
Village. The special ed students were introduced to and have experienced a wide variety of animal and plant ecology through the outdoor explorations with their families. Special ed students and their families spent
time in nature together, and learned things from these leisure activities. The field trip offered the opportunity to let the families with challenged children learn together, and relieve the parents’ nerve and burden of
providing care. 80 special needs families and 400 students benefited.
5. Sistema Taiwan sponsorship: We sponsored Sistema Taiwan, a charitable program for music education, and supported the music education for disadvantaged kids in Ruifang and Shuanxi areas to expand the
possibility of life by learning music.
6. Gaming contest sponsorship: We sponsored the Taoyuan Cup High School and Vocational High School League of Legends and Garena Contest to encourage teamwork among college students and high school
students, problem‐ solving ability, and self‐confidence, while inspiring their interests in the gaming industry through such competitions, and training the talents for the future aerotropolis.
(2) Support for disadvantaged groups
1. Dream‐Come‐True fund: We supported diligent and hardworking students who come from underprivileged families or experience family crisis to complete school education through the “Dream‐Come‐True fund for
Underprivileged Students with Excellence.” We hope that these kids can commit themselves to learning without worrying about their family or personal hardship with the support from the DCT fund.
2. High‐risk caregiver support program: We sponsored Hondao Senior Citizen’s Welfare Foundation MSI Program – providing the all‐in‐one services, family care services, respite care, and value‐added services to
high‐risk families. 391 care receivers and 306 care givers from high‐risk families benefited.
(3) Corporate Volunteering
1. Receipt donation and spring festival couplets giveaway: MSI invited the employees to join the public welfare event and give away spring festival couplets for receipts donated. We gave 1,835 donated receipts to the
Fund for Children and Families.
2. North‐East Ballade Disabled Cheerleader Group: MSI volunteers participated in the “North‐East Ballade Disabled Cheerleading Contest,” and worked as reception staff and accompanying staff to assist the school
teams in finishing the contest. The North‐East Ballade Disabled Cheerleading Contest combined two reinforcers, music and dance therapies to stipulate the disabled’s learning motif. We brought the support to the
parents of disabled kids through the events to accompany their kids and create better room for growth.
3. Receipt donation: MSI Horticultural Club encouraged people to donate the receipts to charities by giving away narcissus bulbs, per five receipt. 52 employees participated.
4. Public interest participation: Participated in the events held by MSI Horticultural Club and donated NT$7,900 of registration fees to the Fund for Children and Families and Educational Development Association of
Taitung County.
5. Public interest forum: MSI Dancing Club invited Taiwan Guide Dog Association to give a public speech promoting the correct mindset about guide dogs. We purchased NT$20,000 of Taiwan Guide Dog Association’s
charity sales merchandise, and donated NT$10,000 to the Taiwan Guide Dog Association.

36
6. Public interest hiking: MSI Runners Club joined the hiking event held by Formosa Cancer Foundation, caring for women’s health, and advocating the prevention of breast cancer. The total event registration fee
NT$2,100 was donated to Formosa Cancer Foundation.
7. Public interest badge charity sale: The Photography Club invited colleagues to make magnetic badges with pictures. The revenue from the charity sales of magnetic badges of NT$8,000 was donated to Hsu’s
Sanctuary. 8. Yoga Marathon: The Yoga Club supported the 2019 Year End Feast and Public Welfare Event Booth of Fund for Children and Families with a NT$20,000 contribution and NT$7,000 in vouchers.
(4) Medical Support 1. Blood donation: MSI invites the blood donation center to hold the blood donation event “Spread the Love Blood Donation Event” at the company every year. Department managers and colleagues join the blood donation, show care, and help patients to survive. This is a kind behavior with mutual benefits. 258 people donated 421 bags in 2019.
(5) Giving Back to the Community 1. Earth God Cultural Festival: Supported and sponsored the Earth God Cultural Festival held by Zhonghe District Office in New Taipei City. 2. Donation of police duty gear: Donated police duty gear to the Traffic Division, New Taipei City Police Department. Supplied one set of photography equipment for taking aerial photos at the accident scene. At the
accident scene, police officers can immediately use the drone to collect evidence, use the software to mark and label information on the pictures, obtain accurate, detailed, and quick photos of the accident scene as evidence for traffic incidents.
(6) Computer Donation 1. World Vision Taiwan: Donated 15 desktop PCs to Cathwel Service Adoption Service Center and Jonah House. 2. Association of Waldorf Schools of Taipei: Donated 17 desktop PCs to Association of Waldorf Schools of Taipei to set up the information classroom on the new campus, and improving the information and digital
learning of the students and people in the neighborhood. 3. Social Welfare Department, New Taipei City: Donated 24 desktop PCs for kids and one notebook to the Good Day Platform for Underprivileged Families run by the Social Welfare Department of New Taipei City
Government. Underprivileged kids can learn how to use the computers, enhance their basic skills, and increase their confidence in themselves. 4. National Chengkung University: Donated 10 workstation computers to NCKU Department of Architecture and join the education of professional graphic and design talent. 5. National Taiwan University of Science and Technology: Donated 10 workstation computers to Taiwan Tech and assisted in the development of professional design talent education.
(7) Environmental Protection Activities 1. Protection of wetland ecosystem: MSI sponsored Taiwan Society of Wilderness (SOW) to fund Wugu wetlands conservation project to conduct ecological census, wading birds tidal flat construction, volunteering, and advocate environmental protection education.
2. Good Rice Action sponsorship: Sponsored the rice growing on 0.5 Jia agricultural land in Nan’ao. The harvested rice will be donated to the Good Day Platform for Underprivileged Families run by the Social Welfare Department of New Taipei City Government so that the underprivileged people can also enjoy delicious rice.
3. Roadside trees sponsorship: Sponsored the roadside tree project on Chiaohe Road in Zhonghe District in New Taipei City to enhance the aesthetics and safety of roadside trees, and benefit the community. 4. Tee trees sponsorship: We care about the concept for environmental sustainability and ecology preservation, protect the water resource in Pinlin area, maintain Feitsui Reservoir, and take care of the health and life of tea farmers in Pinlin area. We sponsored the organic tea tree growing and promotion project of the Fu‐tien Organic Agriculture Promotion Center affiliated with Tse‐Xin Organic Agriculture Foundation. The harvested tea leaves will be donated to the Good Day Platform for Underprivileged Families run by the Social Welfare Department of New Taipei City Government so that the underprivileged elders can also enjoy good tea.
(8) Emergency Support: In 2018, we donated NT$ five million to the designated account for the Social Emergency Fund of Hualien County to help earthquake victims rebuild.
VIII. If the company’s CSR report passes the inspection standards of any verification institution, please describe such situation: <MSI 2018 CSR Report> is based on the GRI Standard published by the Global Reporting Initiative
(GRI), and verified by British Standards Institution (BSI) Taiwan Branch in accordance with AccountAbility1000 (AA1000) Guarantee Standards, and receives the GRI Standard: Core Option Verification Statement.

37
6. Difference between implementation of ethical corporate management and Ethical Corporate Management Best Practice Principles for TWSE/GTSM Listed Companies, and the reasons:
Implementation of ethical corporate management
Indicator Operation Variation from Corporate
Governance Best Practice Principles and Reason Yes No Summary
1. Codify Ethical Management Policies and Plans (1) Does the company specify the ethical management policy, which has been passed by the Board of Directors, and specify the policy and measures of ethical management in its regulations and external documents? Do the Board of Directors and Senior Management proactively perform the commitment to ethical management?
V
The Board of Directors and senior management diligently perform their commitment to ethical management. Since we introduced the “Electronic Industry Citizenship Coalition (EICC) in 2008, we and our suppliers follow the highest moral and ethical standards. The requirements of honest business and prohibition of illegal profit are specified in the supplier agreements. In order to prevent unethical conduct during the business activities, our “Procedures of Board of Directors Meetings” and “Responsibilities of Independent Directors” ask directors to recuse from any motion in the Board meeting with which they have conflict of interest without being asked to. The Board of Directors also passed the “Corporate Governance Guidelines,” “Ethical Management Guidelines,” “Code of Ethics” and “Work Rules” to specify and implement the ethical conduct of directors, managers, employees and suppliers, punishment of perpetrators, and complaint system.
None
(2 Does the company establish the evaluation mechanism of risk of unethical management, periodically analyze and evaluate the business activities with higher risk of unethical management in its course of business, and specify the plans of preventing unethical conduct accordingly, which at least cover the preventions of conduct set forth in Article 7, paragraph 2 of the Ethical Corporate Management Best Practice Principles for TWSE/GTSM Listed Companies?
V
The company’s “Ethical Management Guidelines” specified the measures of preventing unethical conducts set forth in Article 7, paragraph 2 of the Ethical Corporate Management Best Practice Principles for TWSE/GTSM Listed Companies, including prohibition on giving and receiving bribes, offering illegal political contribution, and engaging in improper charitable donation or sponsorship, providing or accepting unreasonable gifts, treatments, or other improper profits.
None
(3) Does the company specify and implement the procedures, behavioral guidelines, punishment of perpetrators, and complaint system in the plans of preventing unethical conduct, and periodically review and modify such plans?
V
The company complies with the rule of conflict of interest and anti‐corruption. In addition to asking all employees and suppliers to sign the moral ethics statements, providing internal and external training to new employees and suppliers, we also prohibit improper profits, or treatment from interested parties and other unethical conduct in the course of business activities. We specify the anti‐corruption policy, reward and punishment procedures. The internal audit office develops the periodic audit scheme, accepts report of violation, and reports to the Board to prevent corruption incidents.
None
2.Implementing ethical management (1)Does the Company evaluate the ethical record of its transaction parties and explicitly include
clauses on ethical behavior in contracts? V
The Company has articles about honest behavior in its business contract and avoids doing business with people with records of dishonest behavior. None
(2) Does the company set up a dedicated division of promoting ethical management under the Board of Directors, and periodically (at least annually) report the ethical management policy and plans of preventing unethical conduct to the Board, and supervise the enforcement?
V
In order to prevent against conflicts of interest and to offer channels for proper statements, independent directors form the part‐time unit in charge of ethical management at the Company in order to promote and consolidate honest operations and the unit reports to the Board of Directors periodically.
None
(3)Does the Company have a conflict‐of‐interest prevention policy with suitable channels for reporting such conflicts, and enforces such a policy?
V In case of any illegal condition in violation of honest operation, complaints may be filed with or the condition may be reported to the Company’s supervisors or the Internal Audit Office.
None
(4) Does the company have an effective accounting system and internal control system in place in order to implement ethical management, and request the internal audit division to prepare the audit plans based on the risk evaluation of unethical conduct in order to inspect non‐compliance with the unethical conduct prevention plan, or hire an accounting firm to do so?
V
The Internal Audit Office audits the Company’s accounting system, internal control system, and fulfillment of honest operations on a yearly basis according to the Regulations Governing Establishment of Internal Control Systems by Public Companies and the Ethical Management Principles Prepare relevant audit plans and conduct the inspection accordingly
None

38
(5)Does the Company regularly host internal and external training on ethical management?
V
The company advertises the concept of ethical management on its website, and provides internal and external training to the employees. Substantive measures for implementing ethical management policy in 2019 include the new employee consensus training program. The program covers the introduction to internal control and audit, prevention of unethical conduct, and how to report a violation. There were 132 people who participated in the 66‐hour training session.
None
3.Operation of the corporate whistleblower system (1)Does the Company have an explicit whistleblower and incentive scheme in place that protects
whistleblowers and assigns appropriate personnel for investigating the target of the whistleblower complaint?
V
In the event that stakeholders discover that the Company’s directors and Independent directors, managers, and employees are engaged in illegal behavior in violation of ethical management (including corruption and immoral behavior), they may file a complaint with or report to the Company’s supervisors or Internal Audit Office. If it is found to be true, punishment will be imposed according to the internal rules and applicable laws and regulations.
None
(2) Does the company specify the standard investigation process for reported violation, subsequent measures upon the completion of investigation, and relevant confidentiality mechanism? V
The company’s “Procedures of Reporting Violation to Audit Office and Subsequent Measures” specify the standard investigation process, subsequent measures upon the completion of investigation, and relevant confidentiality mechanism
None
(3)Does the Company have measures to protect whistleblowers against retaliation?
V
The reporter and the receiving head shall assist the audit unit in conducting an investigation. No unilateral investigation, comments, transcribing the case and the reporter is allowed. No inquiry about or release of the true identity of the reporter or disciplining the reporter and the reported party is allowed, either.
None
4.Greater disclosure (1)Does the Company disclose is ethical management principles and progress on its promotion through its website or the Market Observation Post System website?
V
Besides in the Market Observation Post System, the contents of the Company’s Ethical Management Principles and the promotion efficacy are disclosed on the Company's website http://tw.msi.com/.
None
5.If the Company has drafted an ethical management principle according to “Ethical Corporate Management Best Practice Principles for TWSE/GTSM‐Listed Companies,” the operation of the principle and the deviation from the principle should be clearly stated: The Company has established “Code of Ethical” based on TWSE/GTSM’s “Ethical Corporate Management Principles”.
6.Other material information that helps to understand the operation of the Company’s ethical management (such as the Company’s declaration of its resolve and policies to its business partners; the Company’s invitation of training to its partners; and the Company’s revision of its ethical management principles):None
7. How to search for the Corporate Governance Principles and applicable rules: In order to create a corporate culture of ethical management and normalize its development, the Company has established the Ethical Management Principles, Code of Moral Conduct, and also the Board of Directors Rules of Procedure, Scope of Responsibilities of Independent Directors, and Corporate Governance Principles in compliance with the Corporate Governance Best Practice Principles for TWSE/TPEx Listed Companies (all are disclosed on the Market Observation Post System website http://mops.twse.com.tw) in order to promote the operating efficiency, decision‐making ability of the Board of Directors and the moral standards.
8. Other Information: (1)Continuing education for directors: The Company holds seminars on topics relating corporate governance from time to time for directors to attend. The status of continuing
education is disclosed on the Market Observation Post System website as required. For detailed continuing education received by directors and high‐ranking managers of the Company over the past few years, refer to Page 28.
(2) Coverage of directors by liability insurance: The Company revised its Articles of Incorporation on June 9, 2004 that the Board of Directors may be authorized to decide to purchase liability insurance for all directors and supervisors to cover liability risk within the scope of their operation when duty. The Company purchases liability insurance for directors every year and disclose the information on the Market Observation Post System website.
(3) Presence of absence of an operating procedure for handling significant information: The Company has an operating procedure for handling information in place as part of its internal control system and periodically audits it.

39
(4)The selection and remuneration of the company's senior executives were approved by the board of directors and the remuneration committee. In order to implement the succession plan of key management and cooperate with the competent authorities to promote corporate governance. The succession plan was drafted several years ago, including assessment of current high‐ranking managers based on their professionalism, performance, and personality traits, continuous cultivation of successors at all levels within the organization and recruitment of excellent talents when needed to achieve internal benign competition and succession. On June 16, 2009, Mr. Chiang Shengchang, an excellent manager, was recruited into the board of directors and was promoted to be the executive vice president and general manager of the Desktop Platform Division in March 2010 so that he can have a complete experience. With the internal organization adjustment on Jan.1, 2019, the succession plan was formally launched as Mr. Hsu Hsiang becoming the chairman of the company and Mr. Chiang Shengchang the general manager and CEO of the Company, adhering to the practice that the chairman and general manager of the Company are not the same person. In the future, the board of directors and management committee will continue to advance the succession plan, implement corporate governance and realize sustainable operation.
(5) Annual work focuses and operational situation of the Audit Committee: Annual work focuses Operational situation
1. Main items reviewed by the audit committee: Frequency The first audit committee of the Company was established on June 15, 2018. It consists of three independent directors and Mr. Wang, Sung‐Chou was elected as the convener. The current audit committee has held 9 meetings as of Apr.30, 2020 and operates smoothly.
(1)Adoption or amendment of an internal control system pursuant to Article 14‐1 of the Securities and Exchange Act.
Depends on actual needs
(2)Assessment of the effectiveness of the internal control system. Once per year
(3)Adoption or amendment, pursuant to Article 36‐1 of the Securities and Exchange Act., of handling procedures for financial or operational actions of material significance, such as acquisition or disposal of assets, derivatives trading, extension of monetary loans to others, or endorsements or guarantees for others.
Depends on actual needs
(4)A matter bearing on the personal interest of a director. Depends on actual needs
(5)A material asset or derivatives transaction.
Depends on actual needs
(6)A material monetary loan, endorsement, or provision of guarantee. Depends on actual needs
(7)The offering, issuance, or private placement of any equity‐type securities. Depends on actual needs
(8)The hiring or dismissal of an attesting CPA, or the compensation given thereto. Once per year
(9)The appointment or discharge of a financial, accounting, or internal auditing officer. Personnel change
(10)Annual and semi‐annual financial reports. Once per quarter
(11)Any other material matter so required by the company or the Competent Authority. Depends on the situation
2. Independent Directors with internal audit supervisors Once per quarter Communicate with the audit supervisor on the following matters: the annual audit plan, the implementation of the audit plan for the previous year, internal control deficiencies and the improvement of anomalies, the audit report and the follow‐up report, etc.
Independent Directors with CPA At least once per year
We communicate with our CPAs in writing or face‐to‐face about the following topics: Fair presentation of the financial statements, annual financial statement audit plan, individual entity of group audit, and Key Audit Matters.

40
9. Internal Control System
(1)Statement of Internal Control System
Micro Star International Co., Ltd. Statement of Internal Control System
March. 20, 2020
Based on the findings of self‐assessment, the company states the following with regard to its internal control system in 2019: 1. The company is fully aware that establishing, operating and maintaining an internal control system are the responsibilities of its Board of Directors and management. The aim of the internal control system is to provide reasonable assurance to effectiveness and efficiency of operations (including profitability, performance and safeguarding of assets), reliability, timeliness, transparency, and regulatory compliance of reporting and compliance with applicable laws, regulations, and bylaws.
2. An internal control system has inherent limitations. No matter how perfectly designed, an effective internal control system can only provide reasonable assurance of accomplishing the aforementioned three objectives. Moreover, the effectiveness of an internal control system may be subject to changes of environmental or circumstances. Nevertheless, the internal control system of the company contains self‐monitoring mechanism and the company takes corrective actions whenever a deficiency is identified.
3. The company evaluates the design and operating effectiveness of its internal control system based on the criteria provided in the Regulations Governing Establishment of Internal Control Systems by Public Companies (herein below, the “Regulations”). The criteria adopted by the Regulations identify five components of internal control based on the process of management control: (A) control environment, (2) risk assessment, (3) control activities, (4) information and communication, and (5) monitoring activities. Each component further contains several items. Please refer to the Regulations for details.
4. The company has evaluated the design and operating effectiveness of its internal control system according to the aforesaid criteria.
5. Based on the findings of the assessment mentioned in the preceding paragraph, the company believes that, as of December 31, 2019, its internal control system (including its supervision and management of subsidiaries), as well as its internal controls to monitor the achievement of its objectives concerning effectiveness and efficiency of operations, reliability, timeliness, transparency, and regulatory compliance of reporting, and compliance with applicable laws, regulations, and bylaws, were effective in design and operation, and reasonably assured the achievement of the above‐stated objectives.
6. This Statement will be integral part of the company’s Annual Report and Prospectus, and will be made public. Any falsehood, concealment, or other illegality in the content made public will entail legal liability under Articles 20, 32, 171 and 174 of the Securities and Exchange Act.
7. This Statement has been passed by the Board of Directors in their meeting held on March. 20, 2020 with neither one of eleven attending directors expressing dissenting opinions, and the remainder all affirming the content of this Statement.
Micro Star International Co., Ltd. Chairman:HSU,HSIANG
President:Chiang,Sheng‐Chang
(2)If the Company is requested by the SEC to retain CPA’S service for examining internal control system, the
Independent Auditor’s Report must be disclosed:None

41
10. The penalties delivered to the Company and the staffs of the Company, or the penalties delivered by the Company to the staffs for violations of internal control system, the major nonconformity, and the corrective action in the most recent year and up to the date of the annual report: None.
11. The Major Resolutions of Shareholders’ Meeting and Board Meetings in the most recent year and up to the date of the annual report: (1)Major Resolutions of Shareholders’ Meeting
Meeting date
Abstract of important proposals Execution situation
2019.06.14 1. Report Item:
(1)Business report of 2018. (2)Supervisors' review report of 2018. (3)Report of Employees’ Compensation and
Directors’ Compensation for 2018. 2. Adoption Items:
(1)To adopt 2018 Business Report and Financial Statements.
(2)To adopt the proposal for distribution of 2018 profits.
3. Discussion Items:
(1)Amendment to the ‟Articles of Incorporation”
(2) Amendment to the ‟Operational Procedures for Loaning of Company Funds”.
(3) Amendment to the ‟Operational Procedures for Endorsements and Guarantees ”.
(4) Amendment to the ‟Operational Procedures for Acquisition and Disposal of Assets”.
(5). To approve the Proposal of Cash Distribution from the Capital Surplus
1. The 2019 shareholders’ meeting minutes were disclosed on the Market Observation Post System website on June 24, 2019.
2. Remunerations for employees and directors were issued on August 16, 2019. 3. Distribution of 2018 earnings: Shareholders’ bonus ‐ dividend in the value of $5.0 per share; August 28, 2019 was set to be the record date and the dividends were issued on September 20, 2019.
4. To amend the articles of incorporation:The Ministry of Economic Affairs approved the registration change at on July 1, 2019.
5. To amend the ‟Operational Procedures for Loaning of Company Funds”, the ‟Operational Procedures for Endorsements and Guarantees”, the ‟Operational Procedures for Acquisition and Disposal of Assets”, and the information was disclosed on the Market Observation Post System website on June 14, 2019.
(2)Major Resolutions of Board Meetings
Board of Directors Meeting
Session Contents proposed
Opinion of independent director The company’s handling of independent director’s opinion
Independent Director
Wang,Sung‐Chou Liu ,Cheng‐Yi Hsu,Kao‐Shan
2019.01.25 2019/1 1.Report Items: (1)Derivative financial transactions report.
2.Adoption and Discussion Items:
(1)Approved Salary Compensation Committee’s proposal (2)Approved the Business Plan of 2019.
None None None None
2019.03.21 2019/2 1.Report Items:
(1)Internal Audit reports (2)Derivative financial transactions report.
2.Adoption and Discussion Items:
(1)Approved the 2018 Financial Statement. (2)Approved the Statement on Internal Control System
of 2018. (3)Approved Salary Compensation Committee’s proposal (4)Approved matters related to the convening of the
2019 shareholders’ meeting. (5)Approved matters related to the shareholders’
general meeting acceptance of shareholders’ proposals.
(6)Approved the amendments to the Articles of Incorporation.
(7)Approved amendments to Procedure for the Operations Procedure for Loaning of Funds to Other Parties,Endorsement and Guarantee Operations Procedure, Acquisition and Disposal of Assets of this Company.
(8)Approved the aappointment of Corporate Governance Officer.
(9)Approved amendments to Procedure for the Rules of
None None None None

42
Procedure for Board of Directors Meetings. (10)Approved current Bank credit line and incremental
credit line application.
2019.04.30 2019/3 1.Report Items: (1)Business Performance Report ‐ First Quarter 2019 (2)Internal Audit reports (3)Derivative financial transactions report.
2.Adoption and Discussion Items:
(1)Approved the 2018 earning distribution proposal. (2)Approval the capital reserve distributed by cash proposal.
None None None None
2019.08.09 2019/4 1.Report Items: (1)Report Items: Financial Report of second quarter, 2019.
(2)Internal Audit reports (3)Derivative financial transactions report. (4)Liability insurance for Directors.
2.Adoption and Discussion Items:
(1)Approved the proposition to determine the base date for the distribution of cash dividend and capital reserve in cash to shareholders.
(2)Approved Salary Compensation Committee’s proposal.
(3)Approved the evaluation of the independence ofCPA engagement.
(4) Approved the dissolution of a subsidiary‐MSI Computer Trading (Shenzhen) Co., Ltd.
None None None None
2019.10.04 2019/5 1.Report Items: (1)Derivative financial transactions report.
2.Adoption and Discussion Items:
(1)Approved Salary Compensation Committee’s proposal
None None None None
2019.11.07 2019/6 1.Report Items: (1)Financial Report of third quarter, 2019. (2)Internal Audit reports (3)Derivative financial transactions report. (4)Corporate governance report (5)Corporate ethical management report. (6) Corporate Social Responsibility report. (7)Communication with each stakeholder report.
2.Adoption and Discussion Items:
(1)Approved the 2020 audit plan. (2) Approved the 2018 retained earnings investment in
substantive purposes. (3) Approved the amendment to the company’s
“Procedures of Board of Directors Self‐evaluation or Peer‐evaluation”.
None None None None
2020.01.17 2020/1 1.Report Items: (1)Derivative financial transactions report.
2.Adoption and Discussion Items:
(1)Approved Salary Compensation Committee’s proposal (2)Approved the Business Plan of 2020 .
None None None None
2020.03.20 2020/2 1.Report Items:
(1)Internal Audit reports (2)Derivative financial transactions report. (3) Board of Directors self‐evaluation or peer‐evaluation
report. (4) The company is able to prepare the financial
statements on its own. 2.Adoption and Discussion Items:
(1)Approved the 2019 Financial Statements (2)Approved the Statement on Internal Control System
of 2019. (3)Approved Salary Compensation Committee’s proposal (4)Approved matters related to the convening of the
2020 shareholders’ meeting. (5)Approved matters related to the shareholders’
general meeting acceptance of shareholder proposals.
(6)Approved the amendments to the Articles of
None None None None

43
Incorporation. (7)Approved amendments to Procedure for the Rules of
Procedure for Board of Directors Meetings (8)Approved amendments to Remuneration Committee
Charter (9) Approved amendments to Audit Committee Charter (10)Approved current Bank credit line and incremental
credit line application.
2020.04.30 2020/3 1.Report Items: (1)Financial Reportof First Quarter 2020 (2)Internal Audit reports (3)Derivative financial transactions report.
2.Adoption and Discussion Items:
(1) Approved matters related to the convening of the 2020 shareholders’ meeting.
(2) 2019 Earnings Distribution and cash dividends plan (3) Approved the incorporation of Canadian subsidiary.
None None None None
12.Major Issues of Record or Written Statement Made by Any Director Dissenting to Important Resolutions Passed by
the Board of Directors in most recent year and up to date of the annual report: None.
13.In the most recent year and as of the print and publication date of the annual report, is there any resignation or removal of the company’s chairman, president, controller, financial officer, internal audit office, corporate governance officer, or research and development officer To follow the instructions of the competent authority in conducting to promote corporate governance. Retiring:
President :Mr.Hsu,Hsiang;new appointments:President & CEO:Mr. Chiang,Sheng‐Chang
(Ⅴ) CPAs Fees
Accounting Firm Name of CPA Period Covered by CPAs’ Audit Remarks
PricewaterhouseCoopers, Taiwan Liang, Hua‐Ling Lai, Chung‐Hsi 2019
Unit: NT$ thousands
Fee Items Fee Range
Auditing Fees
Non‐Auditing Fees
Amount Items
1 Below 2,000 thousand 553 Transfer pricing study consultant fee 2 2,000 thousand (included) ~4,000 thousand
3 4,000 thousand (included) ~6,000 thousand 4,067
4 6,000 thousand (included) ~8,000 thousand
5 8,000 thousand (included) ~10,000 thousand
6 Over 10,000 thousand (included)
1. In case the non‐auditing fees paid to CPAs, CPA firm and the CPA firm’s related party account for over a quarter of the total auditing fees, the auditing amount and non‐auditing amount; also, the non‐auditing service must be disclosed: None (voluntary disclosure).
2. In case the auditing fee paid in the year retaining service from another CPA firm is less than the auditing fee paid in the year before, the amount of auditing fee before / after the change of CPA Firm and the reasons for the said change must be disclosed: None.
3. Reduction of auditing fees by more than 15% compared to the previous year: None. (Ⅵ)Change of CPA’s Information:None.
(VII)MSI’s chairman, president, and managers in charge of its finance and accounting operations did not hold any positions
within MSI’s independent audit firm or its affiliates in the most recent year.

44
(Ⅷ)Information on Net Change in Shareholding and Net Change in Shares Pledged by Directors, Supervisors, Department
Heads, and Shareholders of 10% shareholding or more 1.Changes in Shareholding of Directors, Supervisors, Managers and Major Shareholders:
Unit: shares
Title Name
2019 (Note) 2020/1/1~2020/04/12 (Note)
Holding Increase (Decrease)
Pledged Holding Increase (Decrease)
Holding Increase (Decrease)
Pledged Holding Increase (Decrease)
Chairman Hsu,Hsiang 0 0 0 0
Vice Chairman & Senior Vice President of Management
Committee
Huang,Chin‐Ching 0 0 0 0
Director & Senior Vice President of Management Committee Lin,Wen‐Tung 0 0 0 0
Director & Senior Vice President of Management Committee Yu, Hsien‐Neng 0 0 0 0
Director & President & Chief Executive Officer Chiang,Sheng‐Chang 0 0 0 0
Director & Executive Vice President & NB BU GM Kuo,Hsu‐Kuang 0 0 0 0
Director & Executive Vice President & GNP BU GM Liao,Chun‐Keng 5,000 0 10,000 0
Director & Executive Vice President & CND BU GM Hung,Yu‐Sheng 0 0 0 0
Independent Director Wang,Sung‐Chou 0 0 0 0
Independent Director Liu ,Cheng‐Yi 0 0 0 0
Independent Director Hsu,Kao‐Shan 0 0 0 0
Senior Vice President of Management Committee Lu,Chi‐Long 0 0 0 0
EPS BU GM Tsai,Rong‐Fong 0 0 0 0
ACS BU GM(Note3) Huang,Wen‐Shan 0 0 0 0
IPS BU GM Lu,Hhi‐Chang 0 0 0 0
Vice President & CPS BU GM(Note1) Wu,Ta‐Hsin 0 0 0 0
Vice President of Corp. R&D Teng,Chi‐Hung 0 0 0 0
Vice President of Corp. Manufacture & Quality Assurance Li,Chao‐Ming 0 0 0 0
Vice President of Corp. Sales & Marketing Chiu,Chih‐Keng 0 0 0 0
Vice President of Corp. Sales & Marketing(Note2) Tung,Ti‐Chun 0 0 0 0
Vice President of Corp. Supply Chain(Note1) Chen,Te‐Ling 0 0 0 0
Vice President of NB BU R&D Division Lin,Chin‐Kuan 0 0 0 0
Vice President of NB BU R&D Division Lu,Kuo‐Huang 0 0 0 0
Vice President of NB Product Mgt. Division(Note2) Peng,Jen‐Fang 0 0 0 0
Vice President of NB Operations Mgt. Division Pan,Tsai‐Yu 0 0 0 0
Vice President of CND BU (Note4) Yeh,Chun‐Te 0 0 0 0
Vice President of EPS BU Sales & Marketing Division Lu,Cheng‐Lung 0 0 0 0
Vice President of Corp. Marketing Division(Note2) Cheng,Hui‐Cheng 0 0 0 0
Vice President of Global Management Center Tsai,Wei‐Hsin 0 0 0 0
Vice President of Finance Center Hung,Pao‐Yu 0 0 0 0
Assistant Vice President of Internal Auditing Office Liu,Chu‐Hao 0 0 0 0
Note1: January 1,2019 Newly appointed. Note2: April 1,2019 Newly appointed. Note3: Decemberl 1,2019 Newly appointed. Note4: April 1,2020 Newly appointed.
2.Information of Shares Transferred: Not transferred to related parties.
3.Information of Equity Pledged: None.

45
(Ⅸ)Relationship among the Top Ten Shareholders
As of APR 12,2020 Unit:Share;%
Name Shareholding Spouse and Minor
Shareholding by Nominee Arrangement
Name and Relationship Between the Company’s Top Ten Shareholders, or Spouses or Relatives Within Two Degrees
Remark
Shares % Shares % Shares % Name Relations
Hsu,Hsiang 51,983,151 6.15% 18,864,257 2.23% 9,376,328 1.11% Hsu,Fen‐Lan Spouse
Cathay Life insurance fully authorizes HSBC Global Asset management (Taiwan) Ltd.
Investment Account
38,463,000 4.55% ‐ ‐ ‐ ‐
Lin,Wen‐Tung 25,672,499 3.04% 62,895 0.01% ‐ ‐ ‐ ‐
New Labor Pension Fund 25,279,000 2.99% ‐ ‐ ‐ ‐
Fubon Life Insurance Co., Ltd. 22,644,000 2.68% ‐ ‐ ‐ ‐
Yuanta/P‐shares Taiwan Dividend Plus ETF 22,532,549
2.67% ‐ ‐ ‐ ‐
Huang,Chin‐Ching 20,937,377 2.48% 2,148,564 0.25% 7,521,761 0.89% ‐ ‐
Lu,Chi‐Lung 18,650,835 2.21% 1,965,350 0.23% ‐ ‐ ‐ ‐
Yu,Hsien‐Neng 17,892,824 2.12% 184,922 0.02% ‐ ‐ ‐ ‐
Hsu,Fen‐Lan 13,408,517 1.59% 57,438,891 6.80% 9,376,328 1.11% Hsu,Hsiang Spouse

46
(Ⅹ)Ownership of Shares in Affiliated Enterprises: As of Dec. 31, 2019 Unit:Share;%
Long‐Term Investment(Note)
Ownership by MSI Ownership by Directors, Management or Direct/Indirect
affiliates
Total
Shares % Shares % Shares %
MICRO‐STAR INTERNATIONAL (B.V.I.) HOLDING CO., LTD. 0 0% 47,465,071 100% 47,465,071 100%
MSI COMPUTER CORP. 575,458 100% 0 0% 575,458 100%
MYSTAR COMPUTER B.V. 0 0% 0 100% 0 100%
MSI COMPUTER (AUSTRALIA) PTY. LTD. 221,836 100% 0 0% 221,836 100%
MICRO‐STAR NETHERLANDS HOLDING B.V. 424,000 100% 0 0% 424,000 100%
MSI COMPUTER JAPAN CO., LTD. 1,400 100% 0 0% 1,400 100%
MSI COMPUTER SARL 0 0% 0 100% 0 100%
MSI COMPUTER (SHENZHEN) CO., LTD. 0 0% 0 100% 0 100%
MSI COMPUTER (CAYMAN) CO., LTD. 50,000 100% 0 0% 50,000 100%
MSI COMPUTER (UK) LTD. 0 0% 0 100% 0 100%
MSI ELECTRONICS (KUNGSHAN) CO., LTD. 0 0% 0 100% 0 100%
MSI COMPUTER EUROPE B.V. 0 0% 0 100% 0 100%
STAR INFORMATION HOLDING CO., LTD. 0 0% 4,502,601 100% 4,502,601 100%
MICRO ELECTRONICS HOLDING CO., LTD. 0 0% 33,315,472 100% 33,315,472 100%
MSI PACIFIC INTERNATIONAL HOLDING CO., LTD. 30,204,118 100% 0 0% 30,204,118 100%
MSI KOREA CO., LTD. 0 0% 80,000 100% 80,000 100%
SHENZHEN MEGA INFORMATION CO., LTD. 0 0% 0 100% 0 100%
MSI POLSKA SP. Z O.O. 0 0% 0 100% 0 100%
MEGA TECHNOLOGY HOLDING CO., LTD. 0 0% 3,050,000 100% 3,050,000 100%
MSI COMPUTER TRADING (SHENZHEN) CO., LTD. 0 0% 0 100% 0 100%
MEGA COMPUTER CO., LTD. 0 0% 1 100% 1 100%
LLC“ MSI COMPUTER” 0 0% 0 100% 0 100%
MSI COMPUTER TECHNOLOGIES LIMITED COMPANY 0 0% 0 100% 0 100%
MSI ITALY S.R.L. 0 0% 0 100% 0 100%
MHK INTERNATIONAL CO., LTD. 0 0% 1 100% 1 100%
MSI (SHENZHEN) CO., LTD. 0 0% 0 100% 0 100%
MSI (SHANGHAI) CO., LTD. 0 0% 0 100% 0 100%
RAIDEALS INC. 0 0% 0 100% 0 100%
MSI IBERIA S.L. 0 0% 0 100% 0 100%Note: Long‐term investment accounted for using equity method.

47
Ⅳ. Capital Overview (Ⅰ)Capital and Shares
1.Capital and Shares Unit:1,000 Shares;NT$ thousands
Month /Year
Par Value (NT$)
Authorized Capital Paid‐in Capital Remark
Shares Amount (NT$1,000)
Shares Amount (NT$1,000)
Sources of Capital
Capital Increased by Assets Other than Cash
Other
1986.08 - 500 5,000 500 5,000 Incorporation None -
1990.06 10 3,000 30,000 3,000 30,000 Issuance of Shares for cash 25,000 None -
1991.08 10 6,000 60,000 6,000 60,000 Issuance of Shares for cash 30,000 None -
1994.05 10 10,000 100,000 10,000 100,000 Issuance of Shares for cash 40,000 None -
1995.07 10 18,000 180,000 18,000 180,000 Issuance of Shares for cash 80,000 None -
1996.10 16 60,000 600,000 40,750 407,500 Issuance of Shares for cash137,500 and Capitalization of retained earnings 90,000
None JUL 10,1996 Taiwan‐Finance‐Securities‐I‐NO.41320
1997.06 30 100,000 1,000,000 70,800 708,000 Issuance of Shares for cash 48,280 and Capitalization of retained earnings 244,500 and Capitalization of employees’ bonuses 7,720
None APR 28,1997 Taiwan‐Finance‐Securities‐I‐No.32301
1998.04 - 126,000 1,260,000 109,200 1,092,000 Capitalization of retained earnings 283,200, Capitalization of reserves 70,800 and Capitalization of employees’ bonuses 30,000
None MAR 9, 1998 Taiwan‐Finance‐Securities‐I‐ No.23751
1999.03 108 126,000 1,260,000 136,800 1,368,000 Issuance of Shares for cash 276,000 None DEC 17,1998 Taiwan‐Finance‐Securities‐I‐ No.98986
1999.07 - 320,000 3,200,000 196,376 1,963,760 Capitalization of retained earnings 547,200 and Capitalization of employees’ bonuses 48,560
None JUN 10,1999 Taiwan‐Finance‐Securities‐I‐ No. 54332
2000.07 - 320,000 3,200,000 291,000 2,910,000 Capitalization of retained earnings 883,692 and Capitalization of employees’ bonuses 62,548
None MAY 26,2000 Taiwan‐Finance‐Securities‐I‐ No.45969
2001.01 - 320,000 3,200,000 291,914 2,919,136 Conversion of bonds 9,136 None -
2001.05 - 680,000 6,800,000 376,582 3,765,818 Capitalization of retained earnings 729,784 and Capitalization of employees’ bonuses 116,898
None MAY 23,2001 Taiwan‐Finance‐Securities‐I‐No.132149
2002.01 - 680,000 6,800,000 386,027 3,860,270 Conversion of bonds 94,451 None -
2002.03 - 680,000 6,800,000 395,283 3,952,834 Conversion of bonds 92,564 None -
2002.07 - 680,000 6,800,000 555,632 5,556,326 Capitalization of retained earnings 1,383,492 and Capitalization of employees’ bonuses 220,000
None MAY 28,2002 Taiwan‐Finance‐Securities‐I‐No.129029
2003.09 - 960,000 9,600,000 660,477 6,604,775 Capitalization of retained earnings 833,448 and Capitalization of employees’ bonuses 215,000
None JUL 17,2003 Taiwan‐Finance‐Securities‐I‐No.0920132258
2003.11 - 960,000 9,600,000 670,395 6,703,956 Conversion of bonds 99,181 None -
2004.09 - 960,000 9,600,000 756,435 7,564,351 Capitalization of retained earnings 670,395 and Capitalization of employees’ bonuses 190,000
None JUN 28 ,2004 Taiwan‐Finance‐Securities‐I‐ No.0930128388
2005.07 - 1,020,000 10,200,000 782,128 7,821,282 Capitalization of retained earnings 226,931 and Capitalization of employees’ bonuses 30,000
None JUL 11,2005 Taiwan‐Finance‐Securities‐I‐ No.0940127923
2006.07 - 1,500,000 15,000,000 880,562 8,805,624 Capitalization of retained earnings 860,341 and Capitalization of employees’ bonuses 124,000
None JUL 21,2006 Financial‐Supervisory‐Securities‐I No.0950132069
2007.07 - 1,500,000 15,000,000 882,447 8,824,474 Employee stock option exercise 18,850 None -

48
2007.09 - 1,500,000 15,000,000 947,781 9,477,811 Capitalization of retained earnings 528,337 and Capitalization of employees’ bonuses 125,000
None JUL 9,2007 Financial‐Supervisory‐Securities‐ I No.0960035165
2007.10 - 1,500,000 15,000,000 950,277 9,502,770 Employee stock option exercise 24,960 None -
2008.02 - 1,500,000 15,000,000 950,754 9,507,540 Employee stock option exercise 4,770 None -
2008.05 - 1,500,000 15,000,000 950,937 9,509,372 Employee stock option exercise 1,831 None -
2008.08 - 1,500,000 15,000,000 951,304 9,513,040 Employee stock option exercise 3,669 None -
2008.09 - 1,500,000 15,000,000 951,459 9,514,590 Employee stock option exercise 1,550 None -
2008.10 - 1,500,000 15,000,000 1,007,696 10,076,965 Capitalization of retained earnings 380,374 and Capitalization of employees’ bonuses 182,000
None JUL 1,2008 Financial‐Supervisory‐Securities‐ I No. 0970032658
2008.10 - 1,500,000 15,000,000 1,008,028 10,080,285 Employee stock option exercise 3,320 None -
2009.02 - 1,500,000 15,000,000 1,008,074 10,080,745 Employee stock option exercise 460 None -
2009.04 - 1,500,000 15,000,000 1,008,246 10,082,455 Employee stock option exercise 1,710 None -
2009.07 - 1,500,000 15,000,000 1,008,742 10,087,416 Employee stock option exercise 4,961 None -
2009.09 - 1,500,000 15,000,000 1,067,626 10,676,262 Capitalization of retained earnings 504,123 and Capitalization of employees’ bonuses 79,533 Employee stock option exercise 5,190
None JUL 1,2009 Financial‐Supervisory‐Securities‐ I No. 0980032766
2009.10 - 1,500,000 15,000,000 1,068,132 10,681,322 Employee stock option exercise 5,060 None -
2010.01 - 1,500,000 15,000,000 1,068,667 10,686,672 Employee stock option exercise 5,350 None -
2010.05 - 1,500,000 15,000,000 1,069,191 10,691,912 Employee stock option exercise 5,240 None -
2010.07 - 1,500,000 15,000,000 1,069,249 10,692,492 Employee stock option exercise 580 None -
2010.11 - 1,500,000 15,000,000 1,069,347 10,693,472 Employee stock option exercise 980 None -
2011.01 - 1,500,000 15,000,000 1,070,225 10,702,252 Employee stock option exercise 8,780 None -
2011.04 - 1,500,000 15,000,000 1,071,223 10,712,232 Employee stock option exercise 9,980 None -
2011.09 - 1,500,000 15,000,000 996,157 9,961,572 Treasury stock cancellation 750,660 None JUL 4,2011 Financial‐Supervisory‐Securities‐I No.1000031682 AUG 26,2011 Financial‐Supervisory‐Securities‐I No. 1000040409
2011.11 - 1,500,000 15,000,000 964,157 9,641,572 Treasury stock cancellation 320,000 None OCT 28,2011 Financial‐Supervisory‐Securities‐I No.1000052520
2012.02 - 1,500,000 15,000,000 924,856 9,248,562 Treasury stock cancellation 393,010 None FEB 13,2012 Financial‐Supervisory‐Securities‐I No. 1010004861
2012.04 - 1,500,000 15,000,000 884,856 8,848,562 Treasury stock cancellation 400,000 None APR 18,2012 Financial‐Supervisory‐Securities‐I No.1010016081
2012.07 - 1,500,000 15,000,000 844,856 8,448,562 Treasury stock cancellation 400,000 None JUL 18,2012 Financial‐Supervisory‐Securities‐I No.1010033145

49
(1)Type of shares
As of APR 12,2020 Unit:Shares
Type of shares
Authorized Capital
Remarks Issued Shares (Note)
Un‐issued Shares Total Shares
Common stock 844,856,199 655,143,801 1,500,000,000
Authorized capital stock, of which, 150,000 thousand shares are reserved for exercising Conversion of bonds and 80,000 thousand shares are reserved for employee stock options.
Note:Listed stock.
(2)Information for Shelf Registration: None. 2.Status of Shareholders
As of APR 12,2020 Unit:Shares
Status of Shareholders
QTY
Government Agencies
Financial Institutions
Other Juridical Persons
Domestic Natural Persons
Foreign Institutions & Natural Persons
Total
Number of Shareholders 0 35 216 40,660 688 41,599
Shareholding (shares) 0 121,482,940 118,375,529 318,334,833 286,662,897 844,856,199
% 0.00% 14.38% 14.01% 37.68% 33.93% 100.00%
3.Shareholding Distribution Status
(1)Common Shares As of APR 12,2020Unit:Shares
Class of Shareholding Number of Shareholders Shareholding (Shares) %
1~ 999 21,356 3,469,380 0.41%
1,000~ 5,000 16,017 31,349,497 3.71%
5,001~ 10,000 2,060 15,350,750 1.82%
10,001~ 15,000 644 7,981,342 0.94%
15,001~ 20,000 279 5,022,465 0.59%
20,001~ 30,000 310 7,748,028 0.92%
30,001~ 40,000 162 5,711,078 0.68%
40,001~ 50,000 86 3,958,564 0.47%
50,001~ 100,000 226 16,196,268 1.92%
100,001~ 200,000 134 18,888,118 2.24%
200,001~ 400,000 105 30,065,587 3.56%
400,001~ 600,000 48 23,627,651 2.80%
600,001~ 800,000 32 22,492,607 2.66%
800,001~1,000,000 18 16,228,753 1.92%
1,000,001 or over 122 636,766,111 75.36%
Total 41,599 844,856,199 100.00%
(2)Preferred share:The company did not issue any preferred share.

50
4.List of Major Shareholders
As of APR 12,2020 Unit:Shares
Share holding Holder's Name
Shares %
Hsu,Hsiang 51,983,151 6.15%
Cathay Life insurance fully authorizes HSBC Global Asset management (Taiwan) Ltd. Investment Account
38,463,000 4.55%
Lin,Wen‐Tung 25,672,499 3.04%
New Labor Pension Fund 25,279,000 2.99%
Fubon Life Insurance Co., Ltd. 22,644,000 2.68%
Yuanta/P‐shares Taiwan Dividend Plus ETF 22,532,549 2.67%
Huang,Chin‐Ching 20,937,377 2.48%
Lu,Chi‐Lung 18,650,835 2.21%
Yu,Hsien‐Neng 17,892,824 2.12%
Hsu,Fen‐Lan 13,408,517 1.59%
5. Market Price, Net Worth, Earnings, and Dividends per Share
Unit: Shares; NT$
Year Items
2019 2018 As of April 30, 2020
Market price per Share
Highest Market Price 94.70 131.00 99.60
Lowest Market Price 71.80 63.50 68.50
Average Market Price 84.20 92.03 89.19
Net worth per share Before Distribution 36.71 35.44 38.07(Note2)
After Distribution (Note1) 30.44 (Note1)
Earnings per share
Weighted average shares
Basic 844,856,199 844,856,199 844,856,199(Note2)
Diluted 852,233,958 852,782,222 853,155,319(Note2)
Earnings per share
Before adjustment
Basic 6.61 7.15 1.48 (Note2)
Diluted 6.56 7.08 1.47 (Note2)
After adjustment Basic (Note1) 7.15 ‐
Diluted (Note1) 7.08 ‐
Dividends per share
Cash dividends Dividends from Retained earnings (Note1) NT$4.5/Share ‐
Dividends from Capital Surplus (Note1) NT$0.5/Share ‐
Stock dividends Dividends from Retained earnings ‐ ‐ ‐
Dividends from Capital Surplus ‐ ‐ ‐
Accumulated undistributed dividends ‐ ‐ ‐
Analysis of return on investment
Price/Earning Ratio Basic 12.83 12.81 ‐
Diluted 12.92 12.94 ‐
Price/Dividend Ratio (Note1) 18.32 ‐
Cash dividends yield rate (Note1) 5.46% ‐
Note1: Subject to the approval of 2020 annual shareholders’ meeting. Note2: 2020Q1 financial report was reviewed by CPA.

51
6.Dividend policy of the company and its implementation
(1)Dividend Policy The Company is in a highly changeable industry. Many high‐end lucrative products are in growth. The distribution of dividends shall be made taking into consideration the needs of Company future development and operation, and the interests of shareholders. If the annual results shall have profit, such profits should first pay all taxes and reimburse accumulative loss, then take 10% legal reserve and special reserve according to the Company Act. After previous deductions and reserves, the Company can take 10% to 90% of the distributable earnings plus undistributed retained earnings as bonus. The Board of Directors shall propose profit distribution plan to be approved by the shareholders’ meeting. Shareholders’ bonus shall be distributed in accordance with the percentage of the shares owned among the total outstanding shares of the Company. Shareholders’ bonus will be distributed through the forms of both cash and stock dividends. In such distribution combination, cash dividends shall take no less than 30% of the total distributed bonus. In the event there are deductions under the account of shareholders' equity which cannot be allocated from after‐tax profits of the current fiscal year, whether accumulated from previous year or occurred in the current year, the Company shall allocate sufficient special reserves from the beginning aggregate balance of undistributed earnings and subtract such shareholders’ equity deductions before profits distribution.
(2)Proposed Distribution of Dividend:
2019
Cash dividend from retain earnings NT$4.2(per Share)
Total NT$4.2(per Share)
(3)Any expected major changes in the dividend policy: None
7.Impact to the company's business performance and earnings per share (EPS) for free shares allotment proposed by this shareholders' meeting: Not applicable.
8.Compensation for employees and directors (1)Quantity or scope of compensation for employees, directors as prescribed by the articles of association (Article 19‐1) The pre‐tax income of the current fiscal year shall first offset the accumulated deficits. If the balance is positive, then the Company shall allocate the remuneration to be distributed to employees and directors in accordance with the following ratio. A. Employee remuneration in the percentage of 6% to 10%. Individuals eligible for employee remuneration include the Company’s employees and the employees of the Company’s subsidiaries meeting certain requirements. Such requirements are to be set by the Board of Directors.
B. Remuneration to be distributed to directors shall not exceed 1%. The decision of the percentage of remuneration to be distributed to employees, directors set forth in the preceding Paragraph, the forms of distribution (cash or stock dividends) and the amounts and shares thereof shall be made through the special resolutions of the Board of Directors and reported to the shareholders’ meeting.
(2) Accouting methods for the differences between the remunerations’ provision amount and actual distribution amount: The remunerations provision for employees, directors in 2019 is according to contemporary profits and with reference to the distribution ratio from the year before and the percentage specified in the Articles of Incorporation. In case of any difference between the actual distributed value decided by the Board of Directors, it will be handled as changes in accounting estimates.
(3)Situation of the Board of Directors’ passing remuneration distribution:
A. The amount of employee, director remuneration in cash or stock distribution. If it differs from the estimated amount in the recognized expense year, the balance, reason, and handling situation shall be disclosed: The Board of Directirs passed a resolution, determining that the remuneration of employees in 2019 is NTD505,000,000, and the remuneration of directors in 2019 is NTD 49,500,000, which are the same as the recognized expense amount in 2019.
B. The proportion of employee remuneration amount in stock distribution based on the net profit after tax from stand alone financial statements of this period and the total employee remuneration: None
(4)For the actual distribution situation of employees, directors and supervisors remuneration last year (including distributed shares, amount, and stock price), if it differs from the recognized employees, directors and supervisors

52
remuneration, the balance, reason, and handling situation shall be specified: In 2018, the relevant information on the employees, directors and supervisors remuneration is summarized below: Employees bonus distribution:NTD 515,000,000; directors remuneration distribution:NTD49,500,000. It is the same as the recognized expense amount in 2018.
9.Repurchase by the company of its own shares: None.
(Ⅱ)Corporate bond: None.
(Ⅲ)Preferred shares: None.
(Ⅳ)Overseas depositary receipt: None.
(Ⅴ)Employee stock warrant: None.
(Ⅵ)Restricted Employee Shares: None.
(Ⅶ)The section on issuance of new shares in connection with mergers or acquisitions or with acquisitions of shares of other
companies shall specify the following matters:
1.If, during the most recent fiscal year or during the current fiscal year up to the date of publication of the annual report,
the company has completed any issuance of new shares in connection with a merger or acquisition or with acquisition
of shares of any other company:None.
2. Where the board of directors has, during the most recent fiscal year or during the current fiscal year up to the date of
publication of the annual report, adopted a resolution approving any issuance of shares in connection with a merger or
acquisition or with acquisition of shares of any other company:None.
(Ⅷ)The status of implementation of capital allocation plans:
1. A description of the plan
Where various issuance or private placement of securities have yet to be completed, or have been completed in the
most recent 3 years but where the benefits of the plan have yet to be realized:
All securities of the Company have been issued and no unrealized benefits.
2.Status of implementation: Not Applicable

53
Ⅴ. Operation summary
(Ⅰ)Business content
1.Scope of business
(1)The purpose for which the Company is formed shall be as follows: 1. Design of various computer hardware and software and manufacture, sale and purchase of
computer products, parts and components; 2. Manufacture and sale of electronic components and parts; 3. Import‐export trading business in relation of the foregoing businesses; 4. Agency business for quotation, bid and distribution of related products; 5. CC01030 Manufacturing business of electric appliances; 6. CC01060 Manufacturing business of wired communications equipments; 7. CC01070 Manufacturing business of wireless communications equipments; 8. CE01030 Manufacturing business of optical devices; 9. CH01040 Manufacturing business of toys; 10. F109040 Wholesale business of toys and entertainment products; 11. F113020 Wholesale business of electric appliances; 12. F113050 Wholesale business of office machines and equipments; 13. F113070 Wholesale business of telecommunications equipments and materials; 14. F209030 Retail business of toys and entertainment products; 15. F213030 Retail business of office machines and equipments; 16. F213060 Retail business of telecommunications equipments and materials; 17. F213010 Retail business of electric appliances; 18. CC01101 Manufacturing business of regulated RF telecommunications equipments and
materials; 19. F401021 Import business of regulated RF telecommunications equipments and materials; 20. CF01011 Manufacturing business of medical equipments; 21. F108031 Wholesale business of medical equipments; 22. F208031 Retail business of medical equipments; 23. CE01010 Manufacturing business of general equipments; and 24. ZZ99999 All other businesses not prohibited or restricted by laws and regulations except
businesses requiring special permits. (2)Proportion of each business
2019 Unit: NT$ thousands
Major product Sales revenue %
Computer and peripherals 120,491,417 100%

54
(3) Current products and services of the Company
A. Motherboard: Intel® and AMD® platform Gaming and Content Creation motherboards
B. Professional Graphics Card: NVIDIA® and AMD® platform graphics cards;Professional Gaming Gears: Keyboard,
Mouse, Headset, Control Devices
C. Server: Server system, Workstation, Storage system, Network application system, Intrusion prevention system (IPS)
& Unified threat management (UTM), Telecom next generation firewall (NGFW), IoT edge server and gateway, IoT
facial recognition gateway.
D. Desktop computer: Gaming Desktops, Mini Desktops, Desktops, All‐in‐One, Gaming ALL‐in‐One
E. Industrial computer: Industrial computer motherboard, industrial computer system, POS, PPC, industrial
hand‐held tablet, High‐end Harsh Environment Products, Industrial 4.0 and AIoT.
F. Telematics and Automotive Electronics: FMS Solution, Telematics Solution and Interactive Infotainment Solution.
G. Laptop: High‐performance flagship gaming laptops, Ultra‐thin and light gaming laptops,High‐performance
multimedia laptops, Content Creation laptops, Mobile workstations
H. Monitors: Gaming Monitors for high‐end gamers
I. Case: RGB Gaming Cases and Content Creation Cases
(4) New products (services) planned to be developed
A. Motherboard:
Development of motherboard with multi‐core processors for better performance.
Development of motherboard utilizing the latest AI and human‐computer interaction technology, for better
user experience
Development of motherboard with better thermal solution and more durable components.
Improvement of the RGB LED effects and better synchronization with other peripherals.
B. Professional Graphics Cards:
Development of graphics card and thermal modules with better performance and lower energy
consumption.
Development of overclocking graphics card with the latest technology and components.
Development of fans with better heat dissipation and lower noise.
Development of graphics card with improved RGB lighting effects and functions.
Continuous improvement and integration of graphics card applications.
Development of graphics card with “Real‐Time Ray Tracing” and “AI deep learning” technologies.
Professional Gaming Gears:
Catering to the gamers’ needs, we plan to develop professional “Gaming Keyboard”, “Gaming Mouse”,
“Gaming Headset” with innovative functions and effects.
Development of professional gaming peripherals, like “Gaming control devices”, “Gaming mouse pad”, etc.
C. Server:
Development of the new generation Server & Workstation for Intel® Whitley & Tatlow platform.
Development of the new generation Network application system for Intel® Whitley & Tanner Ridge platform.

55
Development of the new generation multi‐function IoT facial recognition gateway
Development of the multi‐function IoT edge server and gateway
Development of the next generation Telecom firewall (NGFW) 16U system
Development of the high‐density Unified threat management (UTM) for Intel® Whitley platform
Enhancement of the new generation Intrusion prevention system (IPS) for Intel® Mehlow platform
D. Desktop computer:
Development of the gaming desktop series for the newest Intel® 400 platform.
Innovating the Cubi mini computer series for the newest Intel® CML‐U series platform.
Continuing the development of the All‐in‐One products for the Intel® platform.
Continuing the development of the high‐end gaming desktop with the exclusive Silent Storm cooling design.
Innovating flagship gaming desktop with the industry’s leading skills and technology.
Continuing the development of desktop computers that caters to the need of the LAN Party gamers.
Development of a technology that can deeply integrate gaming monitors with gaming desktops.
Applying AI technology to gaming desktops.
Innovating desktops that are suitable for professionals within the Multimedia and Content Creation industry.
E. Industrial computer:
Development of the Intel® Coffee Lake fan‐free and expandable PCI Express and PCI Express robust system.
Development of wide Temperature/Voltage product series which can comply with EN50155/IEC61373 in
vehicle Transportation market.
Development of expansion cards for add‐on values and functionalities.
Development of industrial M12 connector waterproof and dust‐proof high‐performance system.
Development of the Intel® Whiskey Lake low‐power consumption and high‐performance fanless super thin
digital electronic bulletin board system that includes the HDMI 2.0 high‐resolution image processing feature.
Development of the newest generation thin high‐performance image processing motherboard with
over‐voltage and over‐current protection.
Development of the changeable‐structured products with an expandable I/O module motherboard
integrated with the system.
Development of the IoT system with a total package solution.
Development of the single unit digital electronic bulletin board and a beginner's simple editing software to
provide a quick and easy advertisement managing solution.
Development of the Pico‐ITX broad‐temperature small low power‐consumption CPU module product
Development of the broad temperature small IoT fanless embedded system supporting railway regulations.
Development of a system that can support two sets of PoE and CAN Bus at the same time.
Development of an automobile embedded system supporting broad temperature and broad pressure
specifications.
F. Telematics and Automotive Electronics:
FUNTORO FMS Solution focus on fleet efficiency, driver performance, driving safety and cost reduction into
one stop total solution for fleet owner combine with hardware, software and cloud‐based services.
56
FUNTORO Telematics Solution focus on vehicle management and tracking, driving safety and passenger
safety, passenger information/station and route information/public address system integration, interactive
advertising and sensor data processing and cloud analyzing with embedded AIoT technology.
FUNTORO Infotainment Solution focuses on integration with passenger information/CCTV/LED and LCD
display/interactive multimedia/smart advertising/passenger load/on‐line shopping. This is ideal for operator
making creative cash flow and new business models to get the competitive advantage. With this solution, we
provide passengers with new experiences different from traditional multimedia function and operator reaps
the benefits from enhanced brand image, increased passenger load and revenue.
G. Laptop:
Breaking boundaries in design, and leading the advancements in the gaming notebook industry, MSI
introduced the first ever thin bezel gaming notebook to the market. Even with reduced dimensions and
lightweight, the notebook is still capable of high‐performance and high heat dissipation, bringing the best
user experience to users.
Development of high‐end gaming notebooks with latest graphic cards and CPUs, wide‐view, wide color
gamut, high refresh rates, High‐Res Audio for headsets, and single/multi‐colored backlit gaming keyboards.
MSI gaming notebooks also come with MSI exclusive features to provide the best visual and auditory user
experience, including True Color, for accurate color display, and Giant speaker, for immersive sound.
MSI worked with famous App emulator Developer to provide MSI App Player, an emulator that can enable
users to play mobile games on PCs, to enjoy bigger screen and better performance. It also supports multiple
sessions, allowing multiple games/Apps to run smoothly at the same time.
MSI Prestige Series are developed especially for content creators, and capable of auto‐detecting content
creator‐related software and optimize system performance accordingly. Considering creators’ needs for
mobility and long‐work hours, Prestige Series are designed to be light weight with long battery life.
MSI has been dedicated to develop mobile workstations that have been certified by various ISVs to have the
best compatibility for their software. MSI has also spent much effort in creating thinner and lighter
workstations with higher performance, better heat dissipation capabilities, and best mobility.
H. Monitors:
Development of the high‐end curved gaming monitors with features such as wide screen size, 4K and WQHD
high resolution.
Continuing the development of the gaming monitors that adhere to the standard of eSports tournaments.
Continuing the development of gaming monitors that can show game‐related status and information on the
monitor panel
Applying AI technology to gaming monitors.
Innovating monitors that are suitable for professionals within the multimedia and content creation industry.
I. Case:
Development of the gaming cases focused on the RGB LED effects and can utilize 3D printing technology for
personalization.
Development of the content creation workstation case focused on airflow and space.

57
2.Industry Overview
(1) Current Status and Development of the Industry
For the PC industry, upstream semiconductor companies keep developing new technology, gaming companies
continuously launch major projects, competitions and livestreaming services prompt, content creators and other
customers’ demand for high‐end PCs increases, and various applications deriving from AIoT. Sales of related
products are given more opportunities.
The company’s current development of related businesses is summarized as below:
A. Parts and components:
For the overview of the global motherboard market in 2019, the total amount shows a slight decline. However,
the booming development of global e‐sports related industries and users' increasing need for high‐end
computing have powered up the demand for the middle and high‐level e‐sports dedicated motherboards and
the display card. Looking forward to 2020, Intel, AMD and NVIDIA will all have new products launched, and the
innovation of many game masterpieces is believed to stimulate PC platform users to upgrade or complete
system replacement, the segmentation of demand will continue to be the trend. This will also drive users to
choose products that better suit their needs. Considering these two factors, it is expected that MSI
motherboards and display cards will have further growth in the middle and high‐end computer market in 2020.
B. Systematic products:
The current global PC market has reached saturation point. High‐end PCs such as e‐sports ones have become the
way out for manufacturers to seek transformation and growth, whether they produce desktops or notebooks.
Moreover, the booming development of e‐sports‐related industries, the engagement of many operators and the
continuous launch of various PC games are conducive to the expansion of the gaming and e‐sports market. MSI
has been deeply involved in the field of e‐sports for many years with the system product development centered
around users and software and hardware highly integrated as it continues to develop more user‐friendly new
functions. In the high‐end PC markets such as e‐sports, MSI has become the first choice for players. In addition,
MSI has also created a new high‐performance thin and light notebook for the creators, which adheres to the
Company’s tradition of basing the design on the needs of creators with an aim to become the best partner of the
creators.
C. Servers, industrial computers, and automobile electronics:
Industrial PCs are mainly applied in different industries and in a variety of special purposes; their design and
functions are mostly tailored to different customer needs, which belongs to a business model of diverse
products in small quantities. Customization and specialty also bring higher gross profits, and the average gross
profit margin of global industrial computer manufacturers can reach as high as 30% to 40%.
According to IDC statistics, 2019 global server shipments were forecast to decline by 1% to a total of 11.74
million units. In 2020, shipments are forecast to decline by 2% to a total of 11.53 million units.
According to the survey in America by Commercial Vehicle Telematics Market report, the Global Commercial
Telematics Market size was around US$7.76 billion in 2019 and will reach US$14.56 billion by 2026 with a CAGR
of 9.4% during 2021‐2026.

58
The telematics system is the future trend. It has become a trend that the governments worldwide make laws to
require all commercial vehicles to install Electronic Logging Devices (ELD). The increase of 5G connectivity plans
and maturity of cloud technical application will further drive the growth of the global telematics system market.
By combining the smart transportation system in the future, driver and vehicle safety will improve. Fleet owners
can also enjoy more efficiency and opportunities for their commercial decisions.

59
(2)Correlation of the upstream, midstream, and downstream of the industry:
Upstream Mid‐Stream Dowmstream
(3)Product development trends:
A. Parts and components:
Intel, AMD and NVIDIA are major chip suppliers with new products launched in 2020, of which the
specifications and performance will surpass existing products. With the trend of blockchain technology being
applied to digital currencies has fading, the demand e‐sports players can finally be met for the market to return
to a healthy state; a new wave of high‐end computer markets is expected to grow more significantly as more
games become available. As for the manufacturing of PC components, Taiwanese manufacturers such as MSI
are still in a leading position.
B.Systematic products:
The computer industry enters into a diverse and changeable stage. Product development is not limited to the
hardware, but includes the integration of software and hardware platforms. MSI’s systematic products including
laptop and desktop PCs are based on the fundamental needs of users. We upgrade the hardware, and
emphasize on the progression of software functionality. We are devoted to the integration of software and
hardware, and enhancement of users’ audiovisual experience, making it easier and more user‐friendly to
operate the products. After adding gaming monitors into our product line, the deep integration of PC and
Semiconductor
Special IC
CPU
Static memory
Logic circuit pinch
Programmable (ROM)
Diode
Motherboard
Monitor
Network server
Interface cards Work station
PSU Desktop
Metallic plastic
PCB
CPU socket
Connectors
Sockets
Computer case Notebook
Computer keyboard
Soft/Hard Drives Software
Basic I/O Systems
OS Other I/O

60
monitor, the outset from players’ perspective, and redefinition of new software and hardware functionality
support each other, and allow the players to acquire an unprecedented experience.
C. Servers, industrial computers, and automobile electronics:
Industrial computers are developing toward total solutions from hardware to software and from the front end
to the back end. Vertical integration of services and applications requires the capability to develop the firmware
and the technicality for vertical integration so that high‐performance, integrative, expansive, and highly
compatible system platforms may be applied to a variety of sectors. Therefore, individual manufacturers are
developing the vertical integration application market and expediting their technicality required for a high level
of integration. A flexible operational pattern and cost leadership will be the new wave of challenges.
Cloud computing brings the structural change to the server market. Although the deployment of large data
centers can increase the shipment and revenue of server business, the demand of new servers will decrease
since the business world utilizes the server applications through virtualization, or receives the services directly
from the cloud service providers. ODM model and SI management stand side by side for MSI’s server business.
The conversion to the new platform Whitley is supported by our strength, the mainstream x86 structure. AMD
structure starts to attract more customers, and increase the market share since it has a value per cost higher
than Intel. Therefore, we also join the development of the AMD platform, while joining power structure and
maintaining minimum shipments. We also deploy the ODM business in the global UTM market to provide
comprehensive solutions for information security.
In the development of automobile electronics, smart safety is the mainstream, including telematics, self‐driving
cars, and the Internet of vehicles, among others. With foreign heavyweight manufacturers putting in resources,
Taiwan telematics suppliers are following suit and entering the automobile electronic field. MSI is a long‐term
investigator of telematics systems and has built a deep and solid R&D foundation. Certified by related
international standards, it will continue to apply its robust capabilities in integrating software and hardware to
contribute to total solutions such as FMS.
3. Overview of Technology and Research and Development
Research and development expenses and technologies or products successfully developed in the most recent year and
up to the date the annual report was printed
Unit: NT$thousands
Annual research and
development
expenditure
Research and development outcome
2019.1.1~2019.12.31
3,315,224
2020.1.1~2020.3.31
789,524
A. Motherboard
Intel® 300 series motherboards support the 9th generation core processors.
AMD® 400 series motherboards supports the 2nd generation Ryzen™ processors
The M.2 Xpander Aero card is the PCI‐E to M.2 add‐on card with the best thermal solution in the
market for user to adopt four M.2 SSD with Raid settings.
The Streaming Boost card is the capture card solution for gamer to get the content from mobile

61
devices and console. It is also a great bridge among PC, console and mobile game market and
satisfies the demands from gamers.
The OLED Dynamic Dashboard is an on‐board panel for gamer to monitor all the status. It even
allows gamers to put customized logo by themselves.
The pre‐installed I/O Shielding gives end users a better DIY experience via pre‐installed
components and prevents users from damaging their motherboard while building the desktop and
decreasing the RMA issue.
The Audio Boost HD is the latest sound technology, which enhances the bass effect with powerful
sound experience. The Audio Boost HD also received the Hi‐Res Audio certification for its perfect
sound performance.
The System Save adopts the special integrated IC and optimized BIOS for end users. It provides
user an easy way to reset the default setting or update the latest BIOS to avoid system crash.
Next generation of M.2 Shield Frozr adopts the new improved “sandwich structure” to ensure the
M.2 SSD is always in a good temperature environment even under full loading.
B. Professional Graphics Cards
Utilized the latest thermal module and GPU to develop graphics card with better performance and
lower energy consumption.
Developed graphics card with “Real‐Time Ray Tracing” , “AI deep learning” and “graphic
acceleration” technologies, for a new gaming experience.
Developed a total S/W and H/W solution which utilized the latest GPU and visualization software
for accelerated operation, to provide stunning images.
Developed professional graphics cards dedicated for block chain application
Developed high‐end graphics card with both water‐cooling and fan‐cooling based thermal
solution. The new water‐cooling architecture helps improved overall thermal efficiency for the
chipset, memory and power module.
Developed new graphics card with the MSI exclusive patented “TriFrozr” thermal design. This
design utilized the latest Torx fan, a huge heatsink and numerous heat pipes to provide the
maximum thermal efficiency. The graphics card also provides the cool MSI dragon RGB lighting
system for visual satisfaction.
Enhanced the MSI exclusive “TWIN FROZR” thermal module, letting the airflow steering control
technology to be more refined, allowing the airflow to be redirected towards the SuperSU heat
pipes.
MSI exclusive design of square thermal conduction surface, combined with large super heat pipes,
to greatly improve thermal conductivity.
MSI exclusive patented “HybridFrozr” energy‐saving low‐noise technology provides temperature
monitoring function, which automatically adjusts fan speed based on actual usage.
Developed the new generation of MSI exclusive patented “Torx Fan 3.0” technology, with a further
62
breakthrough of combining traditional and drainage fan blades, and utilizing a curve shape design,
to increase the angle of wind direction and decrease fan noise.
Developed new generation of high‐speed graphics card using the NVLink GPU bridge which can
seamlessly connect 2 high end NVIDIA® RTX™graphics cards, to precisely show 4K high‐definition/
high‐resolution and high‐speed screen update frequency, eliminate screen aliasing, slow display
and input delay, for a smoother gaming experience.
Continuous improvement of MSI exclusive “Afterburner” application, which can accurately
monitor and adjust clock, voltage and related parameters.
Developed Vigor gaming mechanical keyboards for gamers who utilized introverted aluminum dark
metal brushed top cover and 4 interchangeable metal key caps. The metal keys caps provide better
“feedback feeling” and also prevent key cap printing wear. Vigor keyboard have numerous
multimedia control keys, which user can customize for any application.
Developed the first gaming mouse specifically designed for shooting game. This gaming mouse
utilized the latest gaming induction motor and Japan‐made gaming micro‐switch, designed
specifically for right hand user. It uses the intensive asymmetric mouse foot design, combined with
gold plated USB connector and braided cable, to create a Clutch USB Ergonomic Design Gaming
Grade Mouse.
C. Servers
Development of the new generation Server and Workstation to support latest Intel’s processors to
improve computing capability and performance.
Development of the new generation Network application system for Intel® Purley & Mehlow
platform to fulfill multi‐application at SDN/NFV and SD‐WAN/vCPE.
Development of the new generation multi‐function IoT facial recognition gateway, and focus on
slim and wide‐range application.
Development of IoT edge server and gateway and integrated LPWAN solution to fulfill wireless
environment and demand.
Development of the high‐density 6U/4U Unified threat management (UTM).
Development of the new generation Intel® FPGA DDoS attack defense equipment.
Development of the new generation Intrusion prevention system (IPS) for Intel® Mehlow platform
D. Desktop computers
Development of the gaming desktops series for the newest Intel® 400 platform, providing the
newest products in the industry for the customers.
Innovating the Cubi mini computer series for the newest Intel® CML‐U series platform, combining
the fanless design to provide the best user experiences while promoting the life‐span of the
products.

63
Continuing the development of the All‐in‐One products for the Intel® platform, following the
beautiful, thin, bezel‐less design trend and supporting the 10 point touch technology, creating an
office hardware that is both decorative and convenient for business and personal purposes.
Continuing the development of high‐end gaming desktop with the exclusive Silent Storm cooling
design, refining the product lines and establishing the leading position with the industry.
Innovating flagship gaming desktop with leading skills in the industry, providing powerful and
noise‐free gaming powerhouse.
Continuing the development of desktop computer that caters to the need of LAN Party gamers,
providing both powerful hardware spec and eye‐catching ID design that can take the LAN party by
storm.
Development of a technology that can deeply integrate gaming monitors with gaming desktops
and achieve best integral experience.
Applying AI technology to gaming desktops. With the information captured in big data, gaming
desktops now offers more personal applications.
Innovating desktops that are suitable for professionals within the multimedia and content creation
industry, taking in more niche market within the field of desktops.
E. Industrial computers
The highly expandable and robust fanless system is researched and developed. The integration
ability is higher and it effectively addresses cooling issues.
Development of expansion cards for add‐on values and functionalities, and flexible upgrade.
The HDMI 2.0 high‐resolution image and the SPDIF digital sound effects are integrated for added
value to the audio‐visual digital electronic bulletin board system.
The low power consumption and low profile are further developed with 2 LVDS dual‐output high
performance industrial products.
Developed Industrial M12 connector waterproof and dust‐proof high‐performance systems to
address the user demand on the outdoor application market.
The user‐friendly operation is upgraded with reinforced Easy Maintenance and the mechanism
designed for the maintenance.
The changeable‐structured products with an expandable I/O module motherboard integrated with
the system is researched and developed to effectively address the demand on the diversified
application market for a versatile unit.
Developed the fanless diversified expandable assembly application system.
Developed the broad temperature small IoT fanless embedded system
Developed the built‐in PoE and CAN Bus interfacing inside the embedded system.
Developed the high performance Coffee Lake CPU module.
Continuously developing COM Express product line to fulfill the demands of Industrial market
application.

64
F. Telematics and Automotive Electronics
FUNTORO Sleeper Bus Solution focuses on specific area to solve the MOD solution weakness. It
also integrates the advertising/LBS/remote cloud management to expand the value added
function.
FUNTORO WiFi Streaming MOD Solution focuses on infotainment for bus and coach. It integrates
passenger internet access/vehicle information/navigation/advertising/LBS/remote cloud
management function.
FUNTORO Sightseeing Solution focuses on tourism oriented bus operator. It integrates interactive
multimedia platform with LBS/backend cloud management system.
FUNTORO Hybrid Stadium & Arena Solution focuses on sports related activity with wire and
wireless multimedia function. It also integrates live event/highlight moment/instant message
announcement/F&B ordering and on‐line shopping for stadium or arena owner running new
business models.
G. Laptops
MSI has been dedicated in gaming notebook for more than 10 years. Through professional gaming
experience sharing, sponsoring gaming events, and absorbing gaming enthusiasts into the
company, MSI understands gamers’ needs and design products that satisfy gamers’ dreams.
Incorporated latest technologies, including Intel® 8th Gen. CPUs, in all gaming notebook products
First to bring gaming notebooks with NVIDIA® RTX™ 20 Series Graphic cards to the market, while
added multiple gaming features such as Overclocking, auto/manual temperature control, and
gaming environment optimization.
MSI is the only company to design different gaming notebooks targeting at different player
segments: those who desire extreme performance and those who prioritize mobility. Customers in
each segments group are free to pick the gaming notebook that is most suitable for their user
behaviors.
Continued partnership with top Gaming brand Steel Series® to improve backlit gaming keyboard
and software. Per‐key gaming keyboard allows users to adjust backlight color for each individual
key. Moreover, keyboard backlights can be linked to designated games to provide different effects
based on users’ settings.
In recent years, social media and self‐media flourished, and the needs for graphics and video
editing grew accordingly. For these creators, MSI designed the Prestige Series, focused on panel
color saturation and accuracy. It also comes with specially‐designed management software that
can be used for system optimization and battery life management. MSI is also the first to bring
Quick Charging, supporting Qualcomm® QC 3.0, to notebooks. MSI has been dedicated to provide
low‐noise products as well. As a result, MSI’s Prestige became the first and only notebook ever to
receive Quiet Mark certification, an international approval program awarding designs with minimal

65
noises in its category.
Expanding market for professional high‐end mobile workstations that are designed for
high‐performance graphics cards specialized in computer‐aided design and imagery.
MSI notebooks’ recognition has reached a new height, maintaining the position of gamers’ favorite
gaming notebook brand.
H. Monitors
Development of the high‐end curved gaming monitor with features such as wide screen size, and
4K and WQHD high resolution.
Continuing the development of the gaming monitors that adhere to the standard of eSports
tournaments and expanding the product coverage to the flat screen market.
Development of a technology that can deeply integrate gaming monitors with gaming desktops
and achieve the best gaming experience.
Continuing the development of gaming monitors that can show game‐related status and
information on the monitor panel. Cooperating with multiple gaming companies to promote the
interactivity between the user and monitor, making the monitor more than just a display.
Applying AI technology to gaming monitors. With the information captured in big data, gaming
monitors now offers more personal applications.
Innovating monitors that are suitable for professionals within the multimedia and content creation
industry. Fine‐tuning the wide color gamut element that all the artists and creators care about.
4.Short‐term and long‐term development plan
(1)Short‐term development plan:
Brand marketing: Cultivation and management of distribution channels continued and MSI expects itself to become
the No. 1 choice of Gaming products. Self‐brands are being expanded. The overall steady growths
in various types of products such as laptops, desktop computers, motherboards, display cards,
industrial computers, servers, automobile electronics, among others are the primary development
focus in current‐stage business marketing.
OEM: The Company works closely with international heavyweights in order to find out profitable commercial
models. The economics of scale approach is adopted to continue bring down the production cost and to
enhance the overall profits for the customers and the company.
Research and development, manufacturing, and service: From research and development of products to
manufacturing, and mass production, customers are provided with high‐quality products and after‐sales services.
(2)Long‐term development plan:
The Company builds on its solid R&D capabilities and has been well received among customers and users with its
outstanding quality of products and optimal services. In the future, it will continue to be devoted to creating instant
competitive advantages for its core capabilities and seeking opportunities to diversify its operations. Besides
motherboards, display cards, laptops, servers, and desktop computers that it specializes in, it will also work hard to
gradually become a profitable leader in other products such as industrial computers and automobile electronics.

66
(Ⅱ) Market Analysis and The Conditions of Sales and Production:
1. Market Analysis
(1)Sales Regions:
Unit: NT$ thousands
YearSales Region Net Sales % Net Sales %
Europe 32,331,545 26.83 31,237,944 26.36 Asia 49,677,491 41.23 53,313,499 44.98 America 33,122,365 27.49 28,327,803 23.90 Others 2,099,064 1.74 1,972,387 1.66
117,230,465 97.29 114,851,633 96.90 3,260,952 2.71 3,675,640 3.10
120,491,417 100.00 118,527,273 100.00
Domestic salesTotal
20182019
Export sales
Subtotal
(2) Market share and market demand and supply and market growth
A. Market Share
The Company is one of the heavyweight PC manufacturers in the world, with product lines including
motherboards, display cards, desktop computers, laptops, and other commercial products. Because of its
continuous devotion to increasing investment in research and development and brand management and
focus on high‐end markets with high gross profits such as that for Gaming, the Company is able to secure a
steady leading position in terms of the sales and market shares of laptops and display cards. The
motherboards, on the other hand, remain steady as one of the Top 3 on the market.
B. Supply
PCs are a mature sector. With respective suppliers paying increased attention to the market for high‐end
Gaming, competition is turning more and more fierce as well. Estimated by the survey and investigation
institute IDC, the global PC shipment in 2020 is expected to consist of around 374.2 million units, slightly
declined comparing with 2019. On emerging markets, however, business opportunities keep growing for
Gaming. Multiple brands continue to invest in the research and development as well as marketing of
Gaming‐related products. Despite the competition, the Company will continue listening to the users in order
to know their needs and will create products that meet users’ needs with its professional R&D capabilities
and production technology so as to become the No. 1 high‐end brand referred by users.
C. Demand
As the gaming industry develops, players ask for enhanced audio and lighting effects in the games. The
performance of regular low‐priced computers cannot satisfy the players’ need due to the rise of gaming
competitions and livestream platforms. Therefore, the pursuit of performance directly increases the players’
demand of mid‐ to high‐end PCs, motherboards and display cards. In recent years, the significant growth of
NVIDIA in gaming marketing also shows the shift of PC demand towards mid‐ and high‐end products. The
demand from content creators is not completely satisfied yet. According to the data published by the major
software manufacturer Adobe, there are 18 million members in its creator platform. The demand of various
content creation is high and complicated. MSI will also develop the products that tailor the users’ need and
become an indispensable partner for creators.
D. Competitive niche and advantageous and disadvantageous factors for future developments as well as response
measures
① Competitive niche and advantageous factors for future developments

67
a. Outstanding product development capabilities
The Company has a management team with more than 20 years of experiences in research and
development and technical experiences. The members are heads of respective business groups and
supervisors at the main office. As such, they have a deep understanding of promising technologies and
are efficient in making decisions. Meanwhile, they can combine numerous technical trends to make the
best of teamwork. Research and development staff, on the other hand, are highly experienced
professionals; they contribute to the outstanding R&D accomplishments of the Company and the
award‐winning stream of its products over the past years. The excellent rating with regard to its
performance by professional media and user referral on respective major markets are the best proof.
b. Productivity featuring high quality and flexibility
From design, development, to mass production, the Company is known for its quality mass production
technology and highly efficient productivity. Meanwhile, the Company constantly introduces and
updates automatic and smart equipment in order to improve production quality and to bring down the
cost. In addition, the Company has a systematic management process and complete educational
training programs for operators so that the product yield rate exceeds 99%, which contributes
significantly to both improved quality and product image.
c. Outstanding management capability
Information technology products are known for their short life cycle and fast changing prices. Potential
competitors do not necessarily come from the same sector. In response to the quick changes in
competition on the market, the Company pays attention to market dynamics at all times in order to
respond quickly and to reduce the inventory stress. Risk management is concerned, the Company
adheres to its credit policy for the security of outstanding accounts recevibable to keep the actual bad
debt amount low. Therefore, its management capability demonstrated through both its management of
the inventory and accounts receivable is highly recognized.
d. Sound management system and outstanding product quality
The Company is certified by ISO9001 Quality Management Systems, ISO14001 Environmental
Management Systems, OHSAS18001 Occupational Health and Safety Assessment Series, IECQ QC
080000 Hazardous Substance Process Management System Requirements, IATF Automotive Quality
Management System, and TL 9000 Telecommunications Quality Management System.
Order processing, material preparation, production control, field management, shipment and
environmental protection, safety and health, risk management, and quality assurance are all included
as part of standard and specification management. Engineering staff for research and development and
manufacturing, among others, are also constantly devoted to the improvement of reasonable and
automatic processes and reducing impacts on the environment as well as investigating alternative
materials in order to improve the yield rate while at the same time bringing down the cost.
e. Pursuit of satisfying services for customers
Customers have increased demand for technical support and after‐sales service. In order to increase
customer satisfaction, the Company has after‐sales service centers and online customer service

68
available on major markets so that real‐time assistance can be provided to customers and customers
are entitled to convenient and quick services and technical support. The Company can also quickly
keep track of market and user dynamics and investigate customer satisfaction to be the basis for
quality advancement.
f. Flourishing developments of the Gaming and gaming sectors
According to the statistics of market study Newzoo, online gaming has a double‐digit growth every year.
By 2020, the total output of the global gaming industry will achieve US$1.1 billion with an annual
growth of 15.7%. Furthermore, Digi Capital estimated that in 2023, the total revenue of software and
hardware in the global gaming industry will exceed US$200 billion. Every government is getting serious
about the gaming industry, and society has grown a higher recognition of it. There are large gaming
competitions and livestreams domestically and overseas. The gaming industry market has been
expanding. The company may land our products on the tremendous business opportunities brought by
online gaming.
g.Rise of self‐media
Nowadays, audiovisual and design content creation platforms are rising alongside the increase of
communication bandwidth and speed. Each content creator’s requirements for hardware equipment
vary, ranging from document, music creation, video shooting and editing. The requirements in common
are stability and performance that tailor the scenario setting of the user. And MSI is inherently strong in
such field.
② Disadvantageous factors for future developments
a. Short life span of information technology products. Spearheaded by main suppliers that have an effect
on product development, downstream manufacturers can only follow market trends or the footsteps of
international heavyweights in producing homogeneous products, which tends to result in price cut
competition on the market and the difficulty to maintain reasonable profits. Many manufacturers in the
industry try to secure their market share by reducing their prices, which, however, also squeezes the
room for profitability.
b. Sectors accounting for a higher ratio in exportation is more easily affected by the volatility of exchange
rate. Drastic changes in the exchange rate will affect their profitability.
③ Countermeasures
a. Reinforced collaboration with key part suppliers in the upstream to develop competitive new products
early on; devotion to R&D to help improve product efficacy and create high value‐added and touching
products for strengthened brand value and for creating reasonable profits for the Company;
maintaining sufficient throughput to be capable of accepting ODM/OEM orders from international
heavyweight clients and to improve income; and introduction of automatic and smart manufacturing to
deal with diversification of products in small quantities and to more flexibly meet customers’ demand
by adjusting the production lines.

69
b. Increased ratio of paying in foreign currencies to bring up the natural hedging ratio to counterbalance
assets and liabilities in foreign currencies and continued adoption of hedging measures such as foreign
exchange hedging transactions to reduce risks associated with the volatility in exchange rate along with
close attention paid to impacts of various policies of major countries, including tax reform and balance
sheet reduction in the US and the changes in regional political and economic situations as a result of
emerging trade protectionism and cautious response to impacts caused by capital flows in Asian and
Central American countries, global exchange rates, and financial credit.
2. Important purposes and production/preparation processes of primary products
(1) Purposes of main products
The Company mainly manufactures and sells computers, motherboards, and interface cards. Motherboards are
important components of computers that are responsible for output and input features, including sending
images, controlling the network, sound effects, and other multi‐media features; they are indispensable for
computers.
Name of product Purpose
Motherboard Important component of personal computers, taking care of internal computing, output, and input features of a computer system, the backbone of a computer
Laptop A mobile PC with high‐performance calculation.
Interface card One of the important components of a PC, which converts the display information required by the computer system, drives and controls the display to present correct information, and an important component for human‐machine dialogue.
(2) Production processes

70
3. Supply of Major Raw Materials:
Major Products Major Raw Materials Suppliers Supply Status
Motherboard
Integrated Circuit B Stable supply available
C Stable supply available
Printed Circuit Board Global Brands Manufacture Ltd. Stable supply available
APCB Electronics (S.Z.)co., Ltd. Stable supply available
Note: Due to confidential business information and nondisclosure agreement concerns, some real vendors’ names are substituted with codes.
4. Major Customers with over 10% Net Sales and Suppliers with over 10% total Purchases of the Last Two Fiscal Years: (1) Purchases
Major Suppliers of the Last Two Fiscal Years Unit: NT$ thousands
Year 2019 2018 2020Q1
Item Name Amount Percentage of net annual
purchase〔%〕
Relation with issuer
Name Amount Percentage of net annual purchase〔%〕
Relation with issuer
Name Amount Percentage of net
purchase of Q1〔%〕
Relation with issuer
1 B 23,226,957 23.17 None B 23,647,793 22.73 None B 5,169,913 26.21 None
Others 77,018,531 76.83 Others 80,404,710 77.27 Others 14,554,975 73.79
Net purchase amount
100,245,488 100.00 Net purchase amount
104,052,503 100.00 Net purchase amount
19,724,888 100.00
Note1: Due to confidential business information and nondisclosure agreement concerns, some real vendors’ names are substituted with codes. Note2: Causes of increase and decrease-Supply chain diversification.
(2) Sales: Not Applicable.
71
5. Production Quantities and Values of the Last Two Fiscal Years:
Unit: 1000 pieces; NT$ thousands Year Product
2019 2018
Capacity Output Amount Capacity Output Amount
Computer and peripherals 29,568 23,169 97,073,813 38,689 25,199 98,609,096
6. Sales Quantities and Values of the Last Two Fiscal Years:
Unit: 1000 pieces; NT$ thousands
Year Product
2019 2018
Domestic Sales Export Sales Domestic Sales Export Sales
QTY Amount QTY Amount QTY Amount QTY Amount
Computer and periphera 372 3,260,952 20,546 117,230,465 410 3,675,640 19,250 114,851,633
(Ⅲ)Employees
Status of employees over the past two years and up to the date of the report printed
Year Item
2019 2018 As of
April 30,2020
Employee
Sales & Management 1,013 996 1,019
Technician 1,731 1,374 1,758
Total 2,744 2,370 2,777
Average age(years) 37.82 37.80 37.90
Average years of service(years) 7.94 8.48 8.27
Education (%)
Ph.D 0.15 0.17 0.15
Masters 20.30 22.07 20.66
College/University 68.61 73.50 69.28
Senior High School 8.97 3.76 8.13
Junior High School and below 1.77 0.50 1.78
Total 100.00 100.00 100.00
(Ⅳ)Environmental expenditures information
The company's operating activities are mainly about the production, assembly, research and development, sales of
electronic products and related administrative operations as it belongs to the non‐high pollution and high energy
consumption industry, but the MSI is still committed to improving environmental protection and green product
management. The relevant performance is as follows:
1. In the most recent year and as of the print and publication date of the annual report, is there any loss due to
environmental contamination? Disclose the estimated amount now and possibly occurring in the future and responsive
measures: None.
2. The management performance of the green products:
(1) The total amount of fines or derivative losses incurred in the most recent year due to product violations of international
environmental laws or clients’ requirements on hazardous substances: None.
(2) Issued “Green Product Control Regulations” and regularly revises them according to the latest international
environmental protection laws and clients’ requirements as the basis for the management of hazardous substances in
the supply chain, as well as the internal green product design and selection criteria.
(3)More than140,000 components have been certified by Green Products since 2010.
72
3.Environmental Management Performance:
The MSI operating activities are based on compliance with environmental laws 、continuous improvement of
processes、work environment and equipment to reduce pollutant emissions、energy consumption and safety and
health risks. Each environmental performance has a dedicated unit responsible for management and regular
monitoring. The following will describe the status of various environmental performances during the reporting period.
(1) Passed the ISO 14001 environmental management system certification.
(2) Passed the 14064‐1 Greenhouse Gas Accounting and Verification Certification for continuous improvement of
greenhouse gas reduction.
(3) Our facilities and products’ waste disposal management meet environmental protection requirements.
(4) The air/noise/sewage test results meet the requirements of the regional regulatory authorities.
4. Greenhouse Gas Management:
(1) The Company has carried out verification of greenhouse gas emission data since 2008 and has continually and
actively implemented energy conservation practices.
(2) In 2010, the Company began to be surveyed for the Carbon Disclosure Project (CDP).
(3)MSI is committed to managing carbon emission and greenhouse gas emission. We pledge to achieve the following
before 2025: 50% reduction in greenhouse gas emissions (2007 base).
(4)Greenhouse Gas Emission of the reporting period(2019) : 59,091.7 tons CO2e.
(5)Greenhouse gas emission record has been verified by Bureau Veritas Certification Taiwan (“BVC”).
Unit:CO2 ton CO2e/Year
2019 2018 Change(+/‐) Verified by third party
59,091.7 62,713.95 ‐3622.25
IS0 14064‐1 VERIFICATION STATEMENT GREENHOUSE GAS EMISSIONS
5. The electricity saving measures management:
Since the Company deals mainly with factory assemblies and office R&D processes, there are no highly
energy‐consuming operations at all. Water and electricity account for the majority of our consumption. As such, we
are promoting water conservation, electricity saving, and improved power efficiency as part of our energy‐saving
efforts. Related measures are described below:
(1) Opening hours of boilers in the factory regulated living areas: Hot water usage is controlled by the IC card to
reduce the use of fuels.
(2) Use of the air‐compressor residual heat recycle system: Heat generated by the air compressor is recycled and
re‐heated to reduce the use of fuels.
(3) Air‐cooling efficiency regulation: By means of regular inspections, hot spots for air‐conditioning and areas with
relatively few people go through proper temperature regulation to reduce the use of electricity resources.
(4) Zoned electricity consumption control: Electricity meters are installed in respective segments of production lines
throughout the factory to control the electricity consumed for air‐conditioning, lighting, and power. This is also
enforced for the public cold‐water machine room and nitrogen air compressor machine room.
(5) Lighting modification: Office spaces of Micro‐Star have all been switched to use LED lights, which does not only increase
the required lighting intensity in workplaces but also is more effective in terms of energy‐saving.

73
(6) Water resource management: MSI adopts a water‐free environmental production process. The primary water source is tap
water to supply employee’s daily life. The main water resource management in respective plants promotes water‐saving.
The strategy is to improve the water usage facilities, such as installing water‐saving valves, and water‐saving faucets to save
water in daily activities. With respect to wastewater treatment, the operational and production plants all meet the
standards of sewage discharge prescribed by local government, and have reclaimed water systems in the factories. The
recycled water is used for plant irrigation and toilet flushing.
6. Waste Electrical and Electronic Equipment Management:
(1)EU zone: entered into recycling system or undertaken waste product recycling plans according to EU's Waste
Electrical and Electronic Equipment (WEEE) Directive and legal requirements in various EU nations. Products sold in
EU zones should be entered into local recycling systems, and products need to be labeled with WEEE recycle bin to
clearly ensure that we are in full compliance with WEEE Directive's regulations.
(2)Taiwan: recycling process of waste IT products is primarily handled by the Environmental Protection
Administration (EPA) in Taiwan. The Company pays fees pertaining to recycle processing according to regulations
for imported products, and these fees will be used toward recycling, issuing subsidies, audit approval for quantities
processed, management of recycling firms, and administration duties by the EPA.
(3) Other zones: the Company undertakes relevant procedures and registers at qualified recycling systems according
to local governmental requirements at different regions.
7. Corporate environmental protection expenditure and investments in 2019 are described as follows:
Item Amount (NTD)
The goal and benefits
The total expenditure on environmental protection
20,629,333 Includes waste disposal, sewage control and inspection, external environment management services, management system verification etc.
The total amount of investments in environmental protection
247,474,000 The company's environmental equipment operation and maintenance cost ensure that the equipment is working properly.
(V) Employer‐employee relations
1. The various employee benefits, continuing education, training, retirement system available at the Company and their
implementation and the agreement between the employer and employees as well as protection of the various rights
of employees
(1)Employee benefits:
The Company believes in sharing its operational accomplishments with its employees. We have the Employee
Welfare Committee in place and we plan benefits for employees according to the Employee Welfare Guidelines so
that our employees have a steady life and their rights are protected. The various benefits we offer to employees
include group insurance, birthday giftfund, child birth and wedding giftfund, funeral and illness consolationfund,
gifts (vouchers) on Labor Day and Mid‐autumn Festival, arts and cultural events, society activities, periodic health
examinations, travel subsidies, employee restaurants, cafeteria, dormitory, subsidies for gatherings, library, medical
assistance room, nursery room, outstanding performance reward, year‐end bonus, employee rewards, and other
preferred solutions from time to time.

74
(2) Employee health management:
The Company cares about the health of its employees. There are professional medical assistance rooms available
on respective premises and health examinations are organized periodically in order to keep track of and care about
employees with abnormal health conditions. During flue seasons, there are reminders for employees so that they
reduce visiting public areas and pay closer attention to personal hygiene. The Company also reinforce cleaning and
disinfection of office areas and pay for the French trivalent Pasteur flu vaccine that it arranges for staff to receive. If
a rapid screen is determined by the physician that finds a positive flu result, the employee will be entitled to 3
consecutive days off on official leave so that he/she can stay home and get well soon.
(3)Employee Assistance Program (EAP):
The Employee Assistance Project (EAP) was initiated on 1 November, 2011. By dialing 8585 (help me, help me in
Taiwanese), employees can get help for the following issues: work stress, emotional problems, tax, legal affairs,
medical care, and others. By combing internal and external services, EAP helps employees to solve related problems
and release work stress and emotions to regain mental health, so that their family will not need to worry about
their physical and mental condition.
(4)Employee Development:
Employee development is our focus. Given employees are indispensable from the future development of MSI;
therefore, we begin with the selection, education, and retention of employees. As for employee education, we
start from plan and implement internal and external training for employees. We have also established the Training
and Education Management Regulations as the reference of continuing education and internal training of
employees. Employees at MSI can receive continuing education and seek self‐development through comprehensive
learning channels and resources, such as internal training, external training, and expatriation.
A.Newcomer general education
Regularly held newcomer consensus trainings with contents including work rules, employees' rights and related
channels, the introduction to the MSI management system, green product concept, and corporate laws, general
education of hazardous substance, business continuity management, first‐aid knowledge, introduction of
infirmary, fire safety, labor safety and health education, IT Center, and other trainings with basic concepts and
case studies of current events. The training ratio for newcomers is 100%.
B.MSI University
We began planning the MSI University (MSIU) in 2009 to cope with the highly competitive business environment
in the electronics industry with talent cultivation. By improving the R&D and innovation capacity in key
technology and with the improvement of managerial competency and efficiency, we aim to enhance MSI
employees' competitiveness in the electronics industry.
① Leadership College
This is a complete set of courses on the leadership and management skills needed to become a supervisor. All
supervisor‐level employees are required to complete this set of courses. This series of courses aims to
reinforce supervisors’ awareness and knowledge of the Company's internal system and operating procedures
and provides supervisors the opportunities to learn leadership and management skills. The design of these
courses allows supervisors to reinforce their weak areas and refresh the skills they have acquired and enables
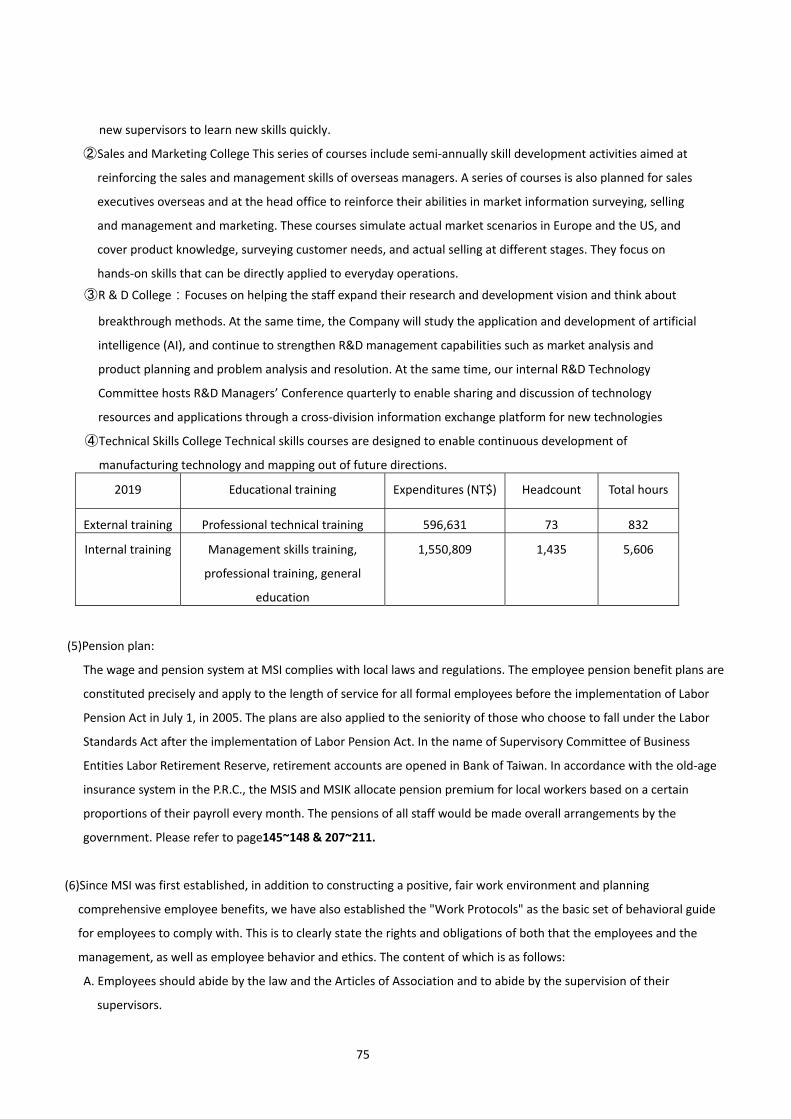
75
new supervisors to learn new skills quickly.
② Sales and Marketing College This series of courses include semi‐annually skill development activities aimed at
reinforcing the sales and management skills of overseas managers. A series of courses is also planned for sales
executives overseas and at the head office to reinforce their abilities in market information surveying, selling
and management and marketing. These courses simulate actual market scenarios in Europe and the US, and
cover product knowledge, surveying customer needs, and actual selling at different stages. They focus on
hands‐on skills that can be directly applied to everyday operations.
③ R & D College:Focuses on helping the staff expand their research and development vision and think about
breakthrough methods. At the same time, the Company will study the application and development of artificial
intelligence (AI), and continue to strengthen R&D management capabilities such as market analysis and
product planning and problem analysis and resolution. At the same time, our internal R&D Technology
Committee hosts R&D Managers’ Conference quarterly to enable sharing and discussion of technology
resources and applications through a cross‐division information exchange platform for new technologies
④ Technical Skills College Technical skills courses are designed to enable continuous development of
manufacturing technology and mapping out of future directions.
2019 Educational training Expenditures (NT$) Headcount Total hours
External training Professional technical training 596,631 73 832
Internal training Management skills training,
professional training, general
education
1,550,809 1,435 5,606
(5)Pension plan:
The wage and pension system at MSI complies with local laws and regulations. The employee pension benefit plans are
constituted precisely and apply to the length of service for all formal employees before the implementation of Labor
Pension Act in July 1, in 2005. The plans are also applied to the seniority of those who choose to fall under the Labor
Standards Act after the implementation of Labor Pension Act. In the name of Supervisory Committee of Business
Entities Labor Retirement Reserve, retirement accounts are opened in Bank of Taiwan. In accordance with the old‐age
insurance system in the P.R.C., the MSIS and MSIK allocate pension premium for local workers based on a certain
proportions of their payroll every month. The pensions of all staff would be made overall arrangements by the
government. Please refer to page145~148 & 207~211.
(6)Since MSI was first established, in addition to constructing a positive, fair work environment and planning
comprehensive employee benefits, we have also established the "Work Protocols" as the basic set of behavioral guide
for employees to comply with. This is to clearly state the rights and obligations of both that the employees and the
management, as well as employee behavior and ethics. The content of which is as follows:
A. Employees should abide by the law and the Articles of Association and to abide by the supervision of their
supervisors.

76
B. Employees should not harm the good name and reputation of the Company, nor should employees use their
positions to receive gifts.
C. Employees shall not disclose the company's business, technical, and other confidential information.
D. Establish the standards of employee salaries, cash rewards, bonuses, retirement, leaves, and standards of incentives
and disincentives.
E. Sexual harassment prevention.
2.Losses borne due to employer‐employee conflicts in the most recent year and up to the date the annual report was
printed, possible estimated values at present and in the future, and countermeasures: There were no major
employer‐employee conflicts in the most recent year and up to the date the annual report was printed.

77
(Ⅵ)Material Contracts
Important contracts that remained effective as of the date the annual report was printed and expired in the most recent
year on supply and distribution, technical collaboration, engineering projects, long‐term loans and that are sufficient to
impact shareholders’ equities:
Nature of contract
Contracting Party Term of Agreement Main contents Restrictions
Large authorization contract
Microsoft Corporation From Aug.1, 2018 till termination by either party
GLOBAL PARTNER AGREEMENT Windows, Office, Apps & DSB software licensing
Non‐negotiable

78
Ⅵ. Financial Information (Ⅰ) Five‐Year Financial Summary
1. Condensed Balance Sheet (1) Condensed Balances Sheet (Consolidated)
Unit: NT$ thousands
2019 2018 2017 2016 201553,887,660 49,356,897 43,185,288 44,556,225 40,285,522 50,808,7424,893,433 4,738,544 5,087,802 5,092,392 5,432,454 4,853,175
‐ ‐ ‐ ‐ ‐ ‐ 1,567,615 1,078,732 880,299 819,167 812,893 1,628,907
Total assets 60,348,708 55,174,173 49,153,389 50,467,784 46,530,869 57,290,824 Before
distribution 28,625,273 24,765,061 20,920,657 23,193,111 20,542,332 24,354,026 After
distribution (Note4) 28,989,343 24,722,509 26,994,964 23,499,328 (Note4)710,970 463,251 429,462 384,175 246,520 771,295
Before
distribution 29,336,243 25,228,312 21,350,119 23,577,286 20,788,852 25,125,321 After
distribution (Note4) 29,452,594 25,151,971 27,379,139 23,745,848 (Note4)
31,012,465 29,945,861 27,803,270 26,890,498 25,742,017 32,165,503
Share capital 8,448,562 8,448,562 8,448,562 8,448,562 8,448,562 8,448,562 Before
distribution 803,918 1,226,049 1,225,615 2,070,471 2,920,142 804,214 After
distribution (Note4) 803,620 1,225,615 1,225,615 2,075,286 (Note4) Before
distribution 22,554,510 20,777,216 18,550,908 16,601,625 13,843,360 23,805,019
After
distribution (Note4) 16,975,363 14,749,056 13,644,628 11,731,220 (Note4)(794,525) (505,966) (421,815) (230,160) 529,953 (892,292)
‐ ‐ ‐ ‐ ‐ 0‐ ‐ ‐ ‐ ‐ 0
Before
distribution 31,012,465 29,945,861 27,803,270 26,890,498 25,742,017 32,165,503 After
distribution (Note4) 25,721,579 24,001,418 23,088,645 22,785,021 (Note4)
Non‐controlling interests
Non‐current liabilities
Treasury shares
Equity attributable to shareholders
of the parent
Capital surplus
Current
liabilities
Total
liabilities
Retained
earnings
Total equity
Property, plant and equipment (Note3)
As of March
31,2020
(Note2)
Year
Item Current assets
Intangible assets
Financial Summary for The Last
Five Years (Note1)
Other assets
Other equity interest
Note1: The above financial information for each year was audited by CPA. Note2: 2020Q1 financial report was reviewed by CPA. Note3: MSI did not carry out asset revaluation from 2015 to 2020Q1. Note4: Subject to the approval of annual shareholders’ meeting 2020.

79
(2) Condensed Balance Sheet (Separate) Unit: NT$ thousands
2019 2018 2017 2016 201551,885,809 47,717,145 41,279,986 42,260,743 38,064,588 2,567,030 2,363,138 2,373,408 2,399,128 2,420,844
‐ ‐ ‐ ‐ ‐ 8,254,456 7,497,489 7,685,025 8,724,428 9,084,023
Total assets 62,707,295 57,577,772 51,338,419 53,384,299 49,569,455 Before distribution 31,246,204 27,296,657 23,228,722 26,262,842 23,643,667 After distribution (Note3) 31,520,939 27,030,574 30,064,695 26,600,663
448,626 335,254 306,427 230,959 183,771 Before distribution 31,694,830 27,631,911 23,535,149 26,493,801 23,827,438 After distribution (Note3) 31,856,193 27,337,001 30,295,654 26,784,434
31,012,465 29,945,861 27,803,270 26,890,498 25,742,017 8,448,562 8,448,562 8,448,562 8,448,562 8,448,562
Before distribution 803,918 1,226,049 1,225,615 2,070,471 2,920,142 After distribution (Note3) 803,620 1,225,615 1,225,615 2,075,286 Before distribution 22,554,510 20,777,216 18,550,908 16,601,625 13,843,360 After distribution (Note3) 16,975,363 14,749,056 13,644,628 11,731,220
(794,525) (505,966) (421,815) (230,160) 529,953 ‐ ‐ ‐ ‐ ‐ ‐ ‐ ‐ ‐ ‐
Before distribution 31,012,465 29,945,861 27,803,270 26,890,498 25,742,017 After distribution (Note3) 25,721,579 24,001,418 23,088,645 22,785,021
Item
Total equity
Retained earnings
Other equity interest
Non‐controlling interests
Non‐current liabilities
Treasury shares
Equity attributable to shareholders of the parent
Financial Summary for The Last
Five Years (Note1)
Current assets
Intangible assets Other assets
Property, plant and equipment (Note2)
Capital surplus
Current liabilities
Total liabilities
Share capital
Year
Note1:The above financial information for each year was audited by CPA.
Note2:MSI did not carry out asset revaluation from 2015 to 2019.
Note3:Subject to the approval of annual shareholders’ meeting 2020.
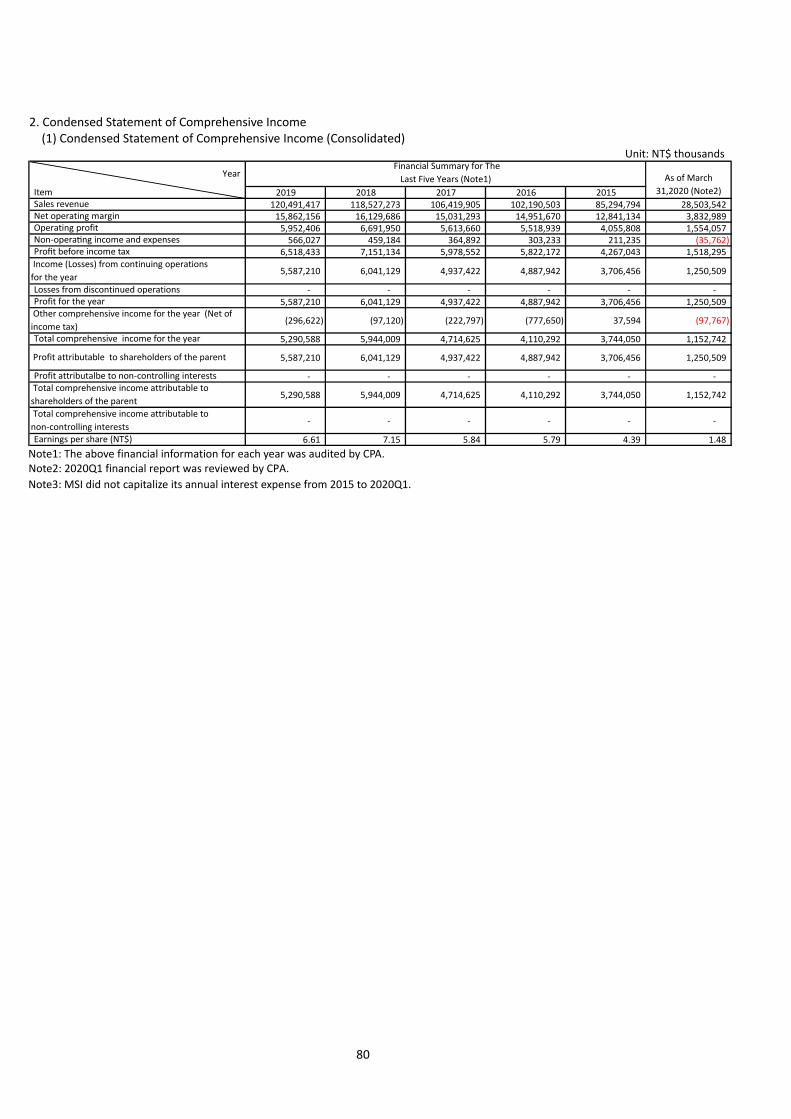
80
2. Condensed Statement of Comprehensive Income (1) Condensed Statement of Comprehensive Income (Consolidated)
Unit: NT$ thousands
2019 2018 2017 2016 2015120,491,417 118,527,273 106,419,905 102,190,503 85,294,794 28,503,54215,862,156 16,129,686 15,031,293 14,951,670 12,841,134 3,832,9895,952,406 6,691,950 5,613,660 5,518,939 4,055,808 1,554,057566,027 459,184 364,892 303,233 211,235 (35,762)
6,518,433 7,151,134 5,978,552 5,822,172 4,267,043 1,518,295
5,587,210 6,041,129 4,937,422 4,887,942 3,706,456 1,250,509
‐ ‐ ‐ ‐ ‐ ‐ 5,587,210 6,041,129 4,937,422 4,887,942 3,706,456 1,250,509
(296,622) (97,120) (222,797) (777,650) 37,594 (97,767)
5,290,588 5,944,009 4,714,625 4,110,292 3,744,050 1,152,742
5,587,210 6,041,129 4,937,422 4,887,942 3,706,456 1,250,509
‐ ‐ ‐ ‐ ‐ ‐
5,290,588 5,944,009 4,714,625 4,110,292 3,744,050 1,152,742
‐ ‐ ‐ ‐ ‐ ‐
6.61 7.15 5.84 5.79 4.39 1.48
As of March
31,2020 (Note2)
Total comprehensive income attributable to
shareholders of the parent
Total comprehensive income attributable to
non‐controlling interests
Income (Losses) from continuing operations
for the year
Operating profit Non‐opera ng income and expenses
Profit before income tax
Profit attributalbe to non‐controlling interests
Financial Summary for The
Last Five Years (Note1)
Losses from discontinued operations
Net operating margin
Earnings per share (NT$)
Year
Item Sales revenue
Other comprehensive income for the year (Net of
income tax)
Profit attributable to shareholders of the parent
Total comprehensive income for the year
Profit for the year
Note1: The above financial information for each year was audited by CPA. Note2: 2020Q1 financial report was reviewed by CPA.
Note3: MSI did not capitalize its annual interest expense from 2015 to 2020Q1.

81
(2) Condensed Statement of Comprehensive Income (Separate alone) Unit: NT$ thousands
2019 2018 2017 2016 2015118,740,373 116,988,422 105,404,563 100,749,878 84,096,460 13,642,788 14,232,111 13,374,882 13,342,413 11,324,106 5,485,208 6,340,116 5,302,969 5,191,871 3,809,214 919,011 689,118 549,147 542,204 397,125
6,404,219 7,029,234 5,852,116 5,734,075 4,206,339
5,587,210 6,041,129 4,937,422 4,887,942 3,706,456 ‐ ‐ ‐ ‐ ‐
5,587,210 6,041,129 4,937,422 4,887,942 3,706,456
(296,622) (97,120) (222,797) (777,650) 37,594 5,290,588 5,944,009 4,714,625 4,110,292 3,744,050 5,587,210 6,041,129 4,937,422 4,887,942 3,706,456
‐ ‐ ‐ ‐ ‐
5,290,588 5,944,009 4,714,625 4,110,292 3,744,050
‐ ‐ ‐ ‐ ‐ 6.61 7.15 5.84 5.79 4.39 Earnings per share (NT$)
YearItemSales revenue
Total comprehensive income attributable to
shareholders of the parent Total comprehensive income attributable to non‐
controlling interests
Income (Losses) from continuting operations
for the year
Net operating margin
Profit for the year
Financial Summary for The Last Five Years (Note1)
Operating profit Non‐operating income and expenses
Profit before income tax
Profit attributalbe to non‐controlling interests
Losses from discontinued operations
Other comprehensive income for the year (Net of
income tax)
Profit attributable to shareholders of the parent Total Comprehensive income for the year
Note1: The above financial information for each year was audited by CPA. Note2: MSI did not capitalize its annual interest expense from 2015 to 2019.
3. Auditors’ Opinions from 2013 to 2018
Auditing Year Accounting Firm CPAs Audit Opinion
2015 PricewaterhouseCoopers Chou, Hsiao‐Tzu
Yeh,Tsui‐Miao
Modified unqualified
2016 PricewaterhouseCoopers Chou, Hsiao‐Tzu
Lai,Chung‐Hsi
Unqualified opinion with other matters
paragraphs
2017 PricewaterhouseCoopers Liang, Hua‐Ling
Lai,Chung‐Hsi
Unqualified opinion with other matters
paragraphs
2018 PricewaterhouseCoopers Liang, Hua‐Ling
Lai,Chung‐Hsi
Unqualified opinion with other matters
paragraphs
2019 PricewaterhouseCoopers Liang, Hua‐Ling
Lai,Chung‐Hsi
Unqualified opinion with other matters
paragraphs
Note: CPA changed in 2016 & 2017 due to PricewaterhouseCoopers’ internal organization change.

82
(Ⅱ) Five‐Year Financial Analysis
1. Financial Analysis for Consolidated Report
Financial Analysis for Consolidated Report
Item2019 2018 2017 2016 2015
Ratio of liabilities to assets 48.61 45.72 43.44 46.72 44.68 43.86
Ratio of long‐term capital to
property, plant and equipment 648.29 641.74 554.91 535.60 478.39 678.66
Current ratio 188.25 199.30 206.42 192.11 196.11 208.63
Quick ratio 103.70 104.68 122.23 115.93 117.36 117.69
Times interest earned 27,783.82 49,733.08 178,404.56 226,291.61 26,101.12 23,890.27
Accounts receivable turnover (times) 7.22 7.59 7.24 7.66 6.82 6.80
Average collection period 51 48 50 48 54 54
Inventory turnover (times) 4.56 5.19 5.45 5.42 4.64 4.47
Accounts payable turnover (times) 5.92 6.61 5.36 5.10 4.63 5.41
Average days in sales 80 70 67 67 79 82
Property, plant and equipment
turnover (times) 25.02 24.12 20.91 19.42 15.12 23.40
Total assets turnover (times) 2.09 2.27 2.14 2.11 1.84 1.94
Ratio of return on total assets (%) 9.71 11.60 9.92 10.08 8.00 8.54
Ratio of return on equity (%) 18.33 20.92 18.05 18.57 14.74 15.83
Ratio of Profit before tax to paid‐in
capital (%) 77.15 84.64 70.76 68.91 50.51 71.88
Profit ratio (%) 4.64 5.10 4.64 4.78 4.35 4.39
Earnings per share (NT$) 6.61 7.15 5.84 5.79 4.39 1.48
Cash flow ratio (%) 32.40 0.34 11.68 21.72 27.88 1.61
Cash flow adequacy ratio (%) 80.93 49.76 83.34 94.93 ‐ 84.89
Cash reinvestment ratio (%) 13.84 (10.00) (3.80) 5.97 9.23 1.04
Operating leverage 1.74 1.64 1.73 1.76 2.05 1.69
Financial leverage 1.00 1.00 1.00 1.00 1.00 1.00Leverage
Solvency
%
Operating
performance
Profitability
Cash flow
As of March
31,2020
(Note2)
Financial Analysis in the past Five Years (Note1) Year
Financial
structure %
Note1: The above financial information for each year was audited by CPA. Note2: 2020Q1 financial report was reviewed by CPA. Analysis of financial ratio differences over 20% for the last two years:
Times interest earned Profit before income tax this year decrease and interest expenses increase.
Cash flow ratio The net cash flow from operating activities this year increased, causing the increase in cash flow ratio.
Cash flow adequacy ratio The net cash flow from operating activities this year increased while the inventory increase amount decreased, causing the increase in cash flow adequacy ratio.
Cash reinvestment ratio The net cash flow from operating activities this year increased, causing the increase in cash reinvestment ratio.

83
2.Financial Analysis for separate report
Financial Analysis for Stand Alone Report
Item 2019 2018 2017 2016 2015Financial
structure %50.54 47.99 45.84 49.63 48.07
1,225.58 1,281.39 1,184.36 1,130.47 1,070.94166.05 174.81 177.71 160.91 160.9988.90 89.52 102.11 94.49 94.28
47,524.61 77,951.74 796,306.26 731,487.12 35,981.08
6.96 7.32 7.03 7.31 6.4652 50 52 50 57
4.58 5.20 5.49 5.48 4.72
6.11 6.73 5.40 5.15 4.7880 70 66 67 77
48.17 49.40 44.17 41.81 34.651.97 2.15 2.01 1.96 1.729.31 11.11 9.43 9.50 7.59
18.33 20.92 18.05 18.57 14.74
75.80 83.20 69.27 67.87 49.794.71 5.16 4.68 4.85 4.416.61 7.15 5.84 5.79 4.39
26.24 (3.62) 4.05 15.42 25.57
Cash flow adequacy ratio (%) 70.28 37.15 69.60 84.70 ‐
Cash reinvestment ratio (%) 12.49 (15.44) (9.91) 3.93 13.12
Operating leverage 1.63 1.54 1.62 1.65 1.90
Financial leverage 1.00 1.00 1.00 1.00 1.00
Financial Analysis in the past Five
Years(Note)
Earnings per share (NT$)
Quick ratio
Average days in sales
Year
Profit ratio (%)
Times interest earnedAccounts receivable turnover
(times)
Average collection period
Accounts payable turnover
(times)
Ratio of liabilities to assets
Ratio of long‐term capital to
property, plant and equipmentCurrent ratio
Property, plant and equipment
turnover (times)Total assets turnover (times)Ratio of return on total assets (%)
Solvency
%
Operating
performance
Profitability
Cash flow
Leverage
Inventory turnover (times)
Ratio of Profit before tax to paid‐in
capital (%)
Cash flow ratio (%)
Ratio of return on equity (%)
Note: The above financial information for each year was audited by CPA. Analysis of financial ratio differences over 20% for the last two years:
Times interest earned Profit before income tax this year decrease and interest expenses increase.
Cash flow ratio The net cash flow from operating activities this year increased, causing the increase in cash flow ratio.
Cash flow adequacy ratio The net cash flow from operating activities this year increased while the inventory increase amount decreased, causing the increase in cash flow adequacy ratio.
Cash reinvestment ratio The net cash flow from operating activities this year increased, causing the increase in cash reinvestment ratio.

84
Glossary: 1. Financial structure (1) Ratio of liabilities to assets = Total liabilities / Total assets (2) Ratio of long‐term capital to property, plant, and equipment = (Total equity +Non‐current liabilities) / Net property, plant, and equipment 2. Solvency (1) Current ratio = Current assets / Current liabilities (2) Quick ratio = (Current assets‐ Inventory‐Prepaid expenses) / Current liabilities (3) Times interest earned = Net income before tax and interest expense/ Interest expense of the year 3. Operating ability (1) Accounts receivable turnover (including accounts receivable and notes receivable derived from business operation) = Net sales / Average accounts receivable (including accounts receivable and notes receivable derived from business operation). (2) Average collection period = 365 / Accounts receivable turnover (3) Inventory turnover = Cost of goods sold / Average inventory amount (4) Accounts payable turnover (including accounts payable and notes payable derived from business operation) = Cost of goods sold / Average accounts payable (including accounts payable and notes payable derived from business operation) (5) Average days in sales = 365 / Inventory turnover (6) Property, plant, and equipment turnover = Net sales / Average net property, plant, and equipment (7) Total assets turnover = Net sales / Average total assets 4. Profitability (1) Ratio of return on total assets= [Net income (loss) + Interest expense x (1 ‐ tax rate)] / Average total assets (2) Ratio of return on Equity = Net income (loss) / Average total equity (3) Profit ratio = Net income (loss) / Net sales (4) Earnings per share = (Profit attributable to shareholders of the parent – preferred stock dividend) / Weighted average stock shares issued 5. Cash flow (1) Cash flow ratio = Net cash flow from operating activity / Current liabilities (2) Net cash flow adequacy ratio = Net cash flow from operating activity in the past five years / (Capital expenditure + Inventory increase + Cash dividend) in the past five years (3) Cash reinvestment ratio = (Net cash flow from operating activity ‐ Cash dividend) / (Gross property, plant, and equipment + Long‐term investment + Other non‐current assets + working capital) 6. Leverage (1) Operating leverage = (Net Sales revenue – Variable operating cost and expense) / Operating profit (2) Financial leverage = Operating profit / (Operating profit ‐ interest expense)

85
(Ⅲ) Audit Committee's Review Report of 2019.
Audit Committee's Review Report
The Board of Directors has prepared the Company's 2019 Business Report, Financial Statements, and
proposal for allocation of earnings. The CPA firm of PWC was retained to audit MSI's Financial Statements and
has issued an audit report relating to the Financial Statements. The Business Report, Financial Statements, and
earnings allocation proposal have been reviewed and determined to be correct and accurate by the Audit
Committee members of Micro‐Star International Co., Ltd. According to relevant requirements of the Securities
and Exchange Act and the Company Law, we hereby submit this report.
Micro‐Star International Co., Ltd.
Chairman of the Audit Committee:
Mr. Wang,Sung‐Chou
April 30, 2020

86
(Ⅳ)Financial statements in the most recent years : Please refer to page108~175
(Ⅴ) Corporation‐only financial report audited and attested by a CPA from the most recent year: Please refer to page 176~232
(Ⅵ)State the financial position of the Company if any insolvency occurs in the Company or affiliates in the most
recent year until the date this report is printed:None

87
Ⅶ. Review of Financial Conditions, Financial Performance, and Risk Management
(Ⅰ) Analysis of Financial Status
Comparison and Analysis of Financial Status Unit: NT$ thousands
YearItem Amount %Current Assets 53,887,660 49,356,897 4,530,763 9.18%Property, plant, and equipment 4,893,433 4,738,544 154,889 3.27%Intangible assets ‐ ‐ ‐ ‐Other Assets 1,567,615 1,078,732 488,883 45.32%Total Assets 60,348,708 55,174,173 5,174,535 9.38%Current Liabilities 28,625,273 24,765,061 3,860,212 15.59%Non‐current liabilities 710,970 463,251 247,719 53.47%Total Liabilities 29,336,243 25,228,312 4,107,931 16.28%Equity attributable to shareholders
of the parent
31,012,465 29,945,861 1,066,604 3.56%
Share capital 8,448,562 8,448,562 0 0.00%Capital surplus 803,918 1,226,049 (422,131) (34.43%)Retained Earnings 22,554,510 20,777,216 1,777,294 8.55%Other equity interest (794,525) (505,966) (288,559) (57.03%)Treasury shares ‐ ‐ ‐ ‐Non‐controlling interests ‐ ‐ ‐ ‐
Total Equity 31,012,465 29,945,861 1,066,604 3.56%
2019 2018 Difference
(1) Analysis of significant changes in assets, liabilities and equity for the last two years: Other assets: The increase was mainly due to increase both in financial asset at fair value through other comprehensive income and right‐of‐use assets. Non‐current liabilities: The increase was mainly due to increase in lease liabilities. Capital surplus: The decrease was mainly due to the issuance of cash dividend. Other equity interest: The amount caused by financial statements translation differences from forieng entities.
(2) Future plans for the major impact on financial position:The above deviations were caused by general business operations, having
no major impact on MSI’s financial position.

88
(Ⅱ) Analysis of Financial Performance
Comparison and Analysis of Financial Performance
Unit: NT$ thousandsYear
Item
Sales revenue 120,491,417 118,527,273 1,964,144 1.66%Net operating margin 15,862,156 16,129,686 (267,530) (1.66%)Operating profit 5,952,406 6,691,950 (739,544) (11.05%)Non‐operating income and expenses 566,027 459,184 106,843 23.27%Profit before income tax 6,518,433 7,151,134 (632,701) (8.85%)Income (Losses) from continuting
operations
5,587,210 6,041,129 (453,919) (7.51%)
Losses from discontinued operations ‐ ‐ ‐ ‐Profit for the year 5,587,210 6,041,129 (453,919) (7.51%)Other comprehensive income for the year
(Net of income tax)
(296,622) (97,120) (199,502) 205.42%
Total comprehensive income for the year 5,290,588 5,944,009 (653,421) (10.99%)Profit attributable to sharholders of the
parent
5,587,210 6,041,129 (453,919) (7.51%)
Profit attributable to non‐controlling
interests
‐ ‐ ‐ ‐
Total comprehensive income attributable
to shareholders of the parent
5,290,588 5,944,009 (653,421) (10.99%)
Total comprehensive income attributable
to Non‐controlling interests
‐ ‐ ‐ ‐
Earnings per share 6.61 7.15 (0.54) (7.55%)
2019 2018 Amount %
1. Analysis of significant changes in sales revenue, operating profit, and profit before income tax for the last 2 years: Non‐operating income and expenses: The increase was mainly due to increase in other income. Other comprehensive income for the year: The decrease was mainly due to increase of financial statements translation differences from foreign entities.
2.Possible impact on financial performance and future plans: There is no disadvantage on future finance and business.

89
(Ⅲ)Analysis of Cash Flow
Unit:NT$ thousands
Beginning cash
balance (A)
Net cash flow from operating activities
(B)
Cash inflow(outflow)
(C)
Cash surplus (deficit)
(A)+(B)+(C)
Remedial measures for the expected insufficient cash
Investment plan
Financing plan
8,815,680 9,273,570 (7,254,366) 10,834,884 ‐ ‐
1. Analysis of Cash flow change: (1) Operating activities: cash inflow 9,273,570 (2) Investing activities: cash outflow 1,115,559 (3) Financing activities: cash outflow 5,905,726 (4) Exchange rate changes: cash outflow 233,081
2. Remedial actions for liquidity shortfall: Not Applicable.
Year Item
2019 2018 Variance
Cash flow ratio 32.40% 0.34% 9,429%
Cash flow adequacy ratio 80.93% 49.76% 62.64%
Cash reinvestment ratio 13.84% (10.00%) 238.40%
Analysis of financial ratio change: The net cash flow from operating activities this year increase, causing the increase in cash flow ratio. The net cash flow from operating activities this year increased while the inventory increase amount decreased, causing the increase in cash flow adequacy ratio. The net cash flow from operating activities this year increased, causing the increase in cash reinvestment ratio.
3. Cash flow analysis for the coming year:
Unit:NT$ thousands
Beginning
cash balance
Estimated net cash
flow from operating
activities
Estimated cash
inflow(outflow)
Estimated Cash
surplus (deficit)
Remedial measures for the expected insufficient cash
Investment plan
Financing plan
10,834,884 6,200,000 (6,000,000) 11,034,884 ‐ ‐
(1) Analysis of cash flow change in current period: A. Operating activities: Cash inflow this year is expected to be due to profit and working capital changes.
B. Investing and financing activities:Cash outflow this year is expected to be due to the issuance of cash dividend
and equipments and short‐term loans replacement.
(2) Remedial actions for liquidity shortfall: Not Applicable.
(Ⅳ) Recent years major capital expenditures and impact on financial and business: None.
(Ⅴ)Reinvestment in recent years:
1.The company's reinvestment policy for the most recent fiscal year:
The re‐investment policy of the Company is meant mainly to explore overseas markets and provide
in‐depth services in major countries so that the revenue and worldwide market shares can be increased.
2.The main reasons for the profits/losses generated thereby, the plan for improving re‐investment
profitability: Income from reinvested businesses of the Company in 2019 totaled NT$685,979 thousand
mainly due to stable global economy, increased consumer demand, growths in sales of overseas
subsidiaries, and increased profits.
3.Investment plans for the coming year: Currently, no significant investment plans will be processed this

90
year.
(Ⅵ)Risk analysis and evaluation in recent years and up to the date of the annual report printed
1.The impact of interest rate, exchange rate, and inflation on the Company’s income and expense and the
responsive measures:
(1) Interest rate
The changing interest rate can impact the Company in two parts. As far as assets are concerned, income
for the Company from cash and cash equivalents increases or decreases as the interest rate changes. For
liabilities, expenditure on interest charged for short‐term loans also increases or decreases as the
interest rate changes. The impacts on the assets and liabilities from the changing interest rate as
described above can be counterbalancing. If it is expected that the interest rate will significantly change,
the Company can reduce its impact on the Company’s profits and losses by adjusting durations of
deposits and borrowings or through interest rate swap.
(2) Exchange rate
Sales of the Company are mainly export‐oriented. Among them, more than 80% are priced in USD.
Among the materials purchased, also more than 90% are paid in USD. The natural hedging ratio is high.
Plus the current exchange rate hedging that is adopted to reduce risks associated with the changing
exchange rate, the impacts of changing exchange rate on the Company are not too huge. The Company
will continue to reduce the impacts that the changing exchange rate has on profits and losses by
undertaking hedging transactions.
(3) Inflation
Generally speaking, inflation affects the purchasing power and willingness of consumers and reduces
the demand for consumer products; it will have a negative influence on the overall revenue and profits
and losses of the Company. Impacts of inflation, however, are comprehensive; that is, not only individual
companies are affected. In other words, the government financial departments shall stipulate related
measures with macroeconomics in mind. Nevertheless, the Company will devoted to bringing down its
production cost in order to keep its revenue by introducing products at a price that can better inspire
consumers to buy and to accordingly reduce the negative impacts that inflation has on the Company's
profits and losses.
2.Conducting high‐risk and high‐leverage investment, granting loans to others, endorsement & guarantee
and directives policy, root cause of profit and loss, and the responsive measures:
The Company’s policy is not to undertake high‐risk, high‐leverage investments and not to lend funds to
others or serve as endorser or guarantor. In terms of its policy on derivatives, it only engages itself in
hedging transactions. The exchange rate hedging transactions the Company undertook in the most recent
year accordingly reduced the impacts of the changing exchange rate on the Company’s profits and losses.
In the future, such undertaking will keep going in order to reduce the impacts that the volatility in
exchange rate on the Company's profitability.

91
3.R&D plans and budgeted R&D expense:
Products development planned in 2020
(1)Products development
A. Motherboards
Development of the next generation of Intel® gaming and content creation motherboards.
Development of the AMD® 500 Series gaming and content creation motherboards for the 3rd generation
Ryzen™ processors. Development of the better performance and better reliability motherboard for more cores processor. Development of better components and latest technology for motherboard. Development of better thermal solution and coating for the heatsink on motherboard Development of new RGB effect and materials for better gamer experience Development of more different function of add‐on card Improvement of applications which provide better performance and experience.
B. Professional Graphics Card Development of graphics card and thermal modules with better performance and lower energy
consumption. Development of overclocking graphics card with the latest technology and components. Development of fans with better heat dissipation and lower noise. Development of graphics card with improved RGB lighting effects and functions. Continuous improvement and integration of graphics card applications. Development of graphics card with “Real‐Time Ray Tracing” and “AI deep learning” technologies.
C. Servers Development of the new generation Server & Workstation for Intel® Whitley & Tatlow platform Development of the new generation Network application system for Intel® Whitley & Tanner Ridge platform Development of the new generation multi‐function IoT facial recognition gateway Development of the multi‐function IoT edge server and gateway Development of the new generation Telecom firewall (NGFW) 16U system Development of the high‐density Unified threat management (UTM) for Intel® Whitley platform Enhancement of the new generation Intrusion prevention system (IPS) for Intel® Mehlow platform
D. Desktop Computers Development of the gaming desktop series for the newest Intel® 400 platform. Innovating the Cubi mini computer series for the newest Intel® CML‐U series platform. Continuing the development of the All‐in‐One products for the Intel® platform. Continuing the development of the high‐end gaming desktop with the exclusive Silent Storm cooling design. Innovating flagship gaming desktop with the industry’s leading skills and technology. Continuing the development of desktop computers that caters to the need of the LAN Party gamers. Development of a technology that can deeply integrate gaming monitors with gaming desktops. Applying AI technology to gaming desktops. Innovating desktops that are suitable for professionals within the Multimedia and Content Creation industry.
E. Industrial Computers Further upgrading R&D capabilities to provide broad temperature broad pressure water‐proof and dust‐proof
solutions that can be used under extreme condition. In response to Industry 4.0, in‐depth cultivation of highly expandable robust fanless systems to make it
smaller and further advances the cooling performance. Continued development of flexible Mini‐PCIe or PCI/PCIe interface cards for add‐on values and
functionalities. Offering the option of expanding the number of independent displays from 3 to 6 or 9 and development of
higher‐resolution imaging treatment to enhance the efficiency and to satisfy the needs of users on the high‐end market.
Enhanced OCP/OVP and hardware design and protection mechanism in case of possible power issues during harsh operations.
Compliance with regulations in different countries for safety of products to enhance the ESD design regulations.
Support of the application of EU IEC‐60068‐2 international shock regulations for railways and transportation.

92
Exchange and integration of IoT (Industrial Internet of Things) full‐function system with real‐time point‐to‐point data to plan and operate global smart application management.
Development of the Apollo Lake broad‐temperature small low power‐consumption CPU module product. Development of the broad temperature small IoT fan‐less embedded system supporting railway regulations. Development of a system that can support two sets of PoE and CAN Bus at the same time. Development of automobile embedded system supporting broad temperature and broad pressure
specifications. Development of “Email Alert for HIDAC Monitoring Events” function to enhance add‐on value.
F. Telematics and Automotive Electronics Developed FUNTORO ITS Solution through sensing technology connected to the on‐board equipment
processing AIOT and cloud‐based backend management, creating added value function to improve transportation efficiency.
Developed FUNTORO PID Solution to provide transportation information/traffic guide/advertising/public policy announcement/cloud‐based backend management in various electronic digital signages. Through the AIoT embedded platform, management control center can simultaneously manage the electronic digital signages around the world.
Developed the FUNTORO Railway PIDS Solution, which is based on transportation vehicles and integrated the on‐board computer/CCTV/exterior display/interior display/in‐vehicle controller/public address system/intercom system. The management control center can manage the status of the entire vehicle anywhere and in real‐time.
Developed specific field and in‐vehicle cloud‐based advertising solutions through cloud backend information exchange and management, providing owners with a variety of innovative commercial advertising business models.
G. Laptops Designed Gaming laptops with more immersive gaming experience Incorporated AI applications into notebooks Designed professional notebooks targeting at content creators, aimed to improve work efficiency Devoted efforts to develop professional workstations with more linkage to professional ISVs
H. Monitors Development of the high‐end curved gaming monitors with features such as wide screen size, 4K and WQHD
high resolution. Continuing the development of the gaming monitors that adhere to the standard of eSports tournaments. Continuing the development of gaming monitors that can show game‐related status and information on the
monitor panel Applying AI technology to gaming monitors. Innovating monitors that are suitable for professionals within the multimedia and content creation industry.
I. Case Development of gaming case with various RGB effect and materials. Development of content creation case with better thermal, airflow solution and anti‐noise.

93
(2) Progress of unaccomplished R&D plans: Product design and development stage. (3) Current progress of R&D projects yet to be completed: The overall progress is about 20% to 80% at present,
depending on respective products involved. (4) Major factors that affect the future success of R&D:A. Market factor B. Delayed key parts and components C.
Shortage of parts and components. (5)R&D budget in 2020:NT$3.35 billion
(6)Projection on mass production:2020~2021。
4.The impact of domestic and international policies and law change on the Company’s finance and the responsive measures:None
5.The impact of technology change and industrial change on the Company’s finance and the responsive measures:None
6.The impact of industrial image change on business risk management and the responsive measures:None
7.The expected effect, potential risk, and responsive measures of merger:None
8.The expected effect, potential risk. and responsive measures of plant expansion:None
9.The risk relating to excessive concentration on procurement and customer:None
10.The impact of massive stock transfer or change by directors, supervisors, and shareholders with over 10% shareholding, the risk, and the responsive measures:None
11.The impact of right to operate change on the Company. The risk, and the responsive measures:None
12.Legal and non‐legal events:
(1)As of the publication date of annual report, whether the directors, supervisors, President, and shareholders with shareholding ratio over ten percent of the Company are involved in any significant litigation, non‐litigation or administrative litigation cases, such cases have been sentenced or are currently pending, and the results there of have a significant impact on shareholders’ equity or securities price:None
(2) Significant litigation, non‐litigation or administrative litigation cases of the Company in the most recent years and up to the date, such cases that have been sentenced or are currently pending, and the results thereof that have a significant impact on shareholders’ equity or securities price:None
13.Other significant risks and responsive measure:
(1) Risk management policy: The Company’s policy towards risk management is to evaluate possible impacts of the various risk matters on the profits and losses of the Company and to stipulate respective response policies accordingly.
Risk assessment Impacts on profits and losses Countermeasure
1. Financial risk The Company has an optimal financial structure; its debt ratio is 49% and net worth reaches 31 billion. Financial risk is hence not high.
Continue with the optimal financial structure in order to reduce financial risk
(1) Market risk (including exchange rate and interest rate)
Major products of the Company are sold to Europe, Asia, and America; they are not overly focused on a specific single market. Therefore, market risk is not high.
Continue to diversify areas of distribution in order to reduce market risk
(2 ) Credit risk The primary credit risk of the Company comes from accounts receivable from its customers. Insurance has been purchased for the accounts receivable as safety measure to reduce such risk. Therefore, credit risk is not high.
Continue to have accounts receivable covered by insurance as safety measure to reduce credit risk
(3) Liquidity risk The current ratio of the Company is up to 188%; the liquidity risk is not high.
Continue with the optimal current ratio in order to reduce liquidity risk
(4) For the nature and extent of significant financial risks, refer to Pages 158~162 , 223~229 for details.
2. Legal risk ‐ domestic laws and regulations
The Labor Standards Act was revised on December 21, 2016. (One fixed day off and one flexible rest day)
With the implementation of the new system under the Labor Standards Act, companies follow the Labor Standards Act while calculating the service hours, days available for leave, and overtime for their employees and calculation of overtime for

94
working on days off is added to the revised Act. In addition, service on days off is under strict control in order to meet regulatory requirements.
Labor Incident Act implemented from Jan. 1, 2020
To comply with the Act, the Company holds seminars for managers in order to have better communication between supervisors and staffs and minimize the laber cases. Meanwhile, employees and his/her supervisors may receive emails from the Company when employees work overtime. The email is indicating the Compnay’s care and willing to assist. Supervisors of employees may evaluate if any adjustment needed for the job loading.
3. Evaluation of strategic and operational risks
The Company successfully extended its scope of business from core products, such as computer motherboards, display cards, and laptops to servers and automobile electronics, among other diversified fields. As far as operation is concerned, as the management complexity increases, daily response mechanisms need to be developed for the evaluation of strategic and operational risks. In terms of management, the strategy is to extend core specialties and combine the many technologies researched and developed over the years and to keep track of demand on the market for the industry. The hope is to create another wave of growths for the Company and to bring about maximum benefits for the Company’s shareholders. In order for strategic goals to be precisely fulfilled, the Company operates by connecting the value chain through its business departments and the functional main part when it comes to organization and operation. Annual goals are set according to the competition in the industry facing product business departments and managerial meetings are called for periodically to discuss the strategy and operational efficacy in order to adopt immediate countermeasures that help bring down operational risk.
(1) Periodically review the growths in core sectors Set goals for growth, market share, and profitability that are higher than industrial averages
(2) Set reasonable return on investment based on the careful evaluation in advance and the management plan for a new business and demand that profits and losses reach a balance within a given period of time. Set phased strategic goals reflective of the nature of the sector involved, such as obtaining purchase orders from prospective customers, timely mass production, and securing a certain market share on the strategic target market.
(3) Related departments meet on a monthly basis to review the operational efficacy and examine and adjust the strategies on a quarterly basis; related organizational adjustment is made right away for unachievable ones in order to control risk.
(4) Keep timely track of daily operations around the world through the real‐time information system, including shipment, stock, purchase order, operating fund, among others, and set the alert criteria.
(5) Gather managers around the world periodically to discuss management strategies that concern where the Company will go next. High‐raking management is to adjust strategies taking into consideration resources available throughout the Company and the operational status.
In light of the rapidly changing operating environment for the high‐tech industry, the Company proactively invests in information technology and the required talent internally and keeps track of

95
changes in customers, products, and techniques externally. It will constantly review strategic and operational risks and adjust the Company resources in order to continue bringing about accomplishments and profits.
4. Information security risk The company introduced ISO27001 in 2020, and expects to conduct third‐party verification and obtain the certificates in October 2020. The schedule and policy document list are as below:
Identification No.
Task Name Begin Finish Duration 2020/Q1 2020/Q2 2020/Q3 2020/Q4
MAR APR MAY JUN JUL AUG SEP OCT NOV
1 Project kick-off 2020/2/10 2020/3/10 4.4w
2 Variance analysis 2020/2/11 2020/3/11 4.4w
3 System building 2020/3/11 2020/6/30 16w 4 Risk evaluation management 2020/7/1 2020/8/31 8.8w
5 System promotion and implementation (system publication, implementation and adjustment)
2020/7/1 2020/8/31 8.8w
6 System promotion and implementation (BCP drill) 2020/7/21 2020/8/31 6w 7 Internal audit 2020/9/1 2020/9/23 3.4w 8 Management review 2020/9/15 2020/9/30 2.4w 9 System certification 2020/10/1 2020/11/2 4.6w
10 Project closure 2020/10/15 2020/11/2 2.6w Item Policy Document Name Content
1 Information security policy Guidelines for information security, covering information security policy, review and evaluation
2 Information security organization Structure and responsibilities of the information security organization, including: 1. Basic information security structure 2. Stakeholder group
3 Information asset classification and management
Asset classification and management measures, including: 1. Asset attributability 2. Information classification method
4 Personnel safety management Explanations about safety management processes before, during, and after the employment, or change of employment, including: 1. Word descriptions and safety of resource allocation 2. User training 3. Safety and failure event reactions
5 Physical and environmental safety management
1. Safe areas 2. Equipment safety 3. General control measures
6 Communication and operation management
1. Operating process and responsibility 2. System planning and acceptance inspection 3. Malicious software prevention 4. Daily routine management 5. Internet management 6. Storage media processing and security 7. Information and software exchange 8. Subcontract processes
7 Access control regulation and management
1. Operational requirements of access control 2. User access management 3. User responsibility 4. Internet access control 5. Operating system access control measures 6. Application system access control 7. Monitoring system access and use 8. Mobile computer process, and remote work access control 9. Third party access security
8 System development and maintenance 1. System security requirements 2. Application system security 3. Password control measures 4. System documentation security 5. Development and support process security
9 Business Continuity Management (BCM) 1. BCM planning and framework 2. Business impact analysis 3. Business Continuity Plans (BCP) preparation and implementation 4. BCP testing, maintenance, and revaluation
10 Information security breach management 1. Information security breach management procedures 2. Information security breach handling and follow‐up 3. Information security breach analysis and statistics
11 Information security audit 1. Security policy and technical conformity review

96
2. System and operation management audit considerations
12 Risk evaluation management 1. Asset authentication 2. Risk analysis 3. Risk handling 4. Legal compliance
13 Management review Procedures and guidance for management review
5. Climate risks The probability and severity of natural disasters (including drought, mites, snowstorms, high temperature/heat waves, typhoons/strong rainfall) brought about by extreme weathers may affect the Company's production and operations. The risks may include production constraints, operations, equipment, and investment cost rise and inefficiency, etc. There is no significant impact at present.
Climate change and potential disasters have made risk analysis and extremity forecast two very critical issues for the electronics industry. At MSI, we have performed impact analysis and risk assessment on areas we consider to be vulnerable given the prevailing climate and environmental changes. These assessments provide us with a general idea of our existing protections and risk exposure, which we may exploit to explore potential opportunities. Despite the fact that MSI is not an energy‐intensive manufacturer, the Company has made pro‐active statements about its control over GHG emission, signed various commitments and taken action to reduce GHG in living as well as operational activities. Meanwhile, strategies have been developed in response to environmental and operational impacts. (1) Management Strategy Resilience to climate change:
Implement risk identification, response and prevention measures in relation to climate change and avoid impact to operations.
Promote low‐carbon production: Adopt optimized technologies to reduce greenhouse gas emission, and set reduction goals.
Incorporate green energy equipment: Acquire and utilize renewable energy equipment such as solar‐powered heaters to reduce dependency on power grid.
Improve energy efficiency: Devise energy and carbon reduction measures and enforce action plans for improved energy efficiency.
(2)Control Measures Identification、evaluation and
analysis of impacts and risks associated with future climate.
Adaptation planning and review. Energy/resource coordination. New protection facilities or improved
disaster prevention equipment. Regular examination of asset and
commercial insurance coverage to determine whether they are adequate for compensating losses caused by climate change.

97
(2) Organizational structure of risk management The Company has the “Continued Operational Management Procedure” in place to help reduce impacts and damages derived from emergency events facing the organization and to ensure normal operations of the Company for the sake of sustainable management. The organization structure of the Company's risk management is implemented and operated by the President who coordinates and directs the risk management plan. The businesses and units responsible for management under the President are responsible for assessing the operational risks, production risks, environmental safety risks, information security risks, climate change risks, etc. and executes daily risk management. The President reports to the board of directors at least once a year. Risk controlled management by functions: A. Board of Directors: The Board is the top decision management of the whole Group’s risk controlled. To
cope with the whole operational risk and business environment, the Board rules the risk management policy and supervise the operational risk can be controlled effectively and improve the management efficiency.
B. Internal Audit office: Responsible for the internal control system’s establishment and implement, Internal Audit procedures’ planning and execution, strengthen internal control function and make sure the effect contributes continuously to achieve the Group’s operation performance effective and efficiency and business result is reliable,on time, disclousure in line with Authority’s regulations.
C. Finance: Responsible for the Group’s financial operation, cash management and risk management to minimize the financial risk. Plan for the short, mid, long term finance and investment strategy.
D. Legal: Responsible not only documentation’s legal compliance, but also legal risk management, to comply with government’s supervision and hadle contracts and law suits dispute to minimize the Group’s legal risk.
E. Information: Responsible for the Group’s IT hardware and software’s planning, establishment, operation and maintanence.Evaluate each kind of information risks and take necessary actions to make sure the safty and minimize the risk.
F.Business: Responsible for marketing strategy, products promotion and control the market trend to minimize the operation risk.
(Ⅶ)Other material events:None
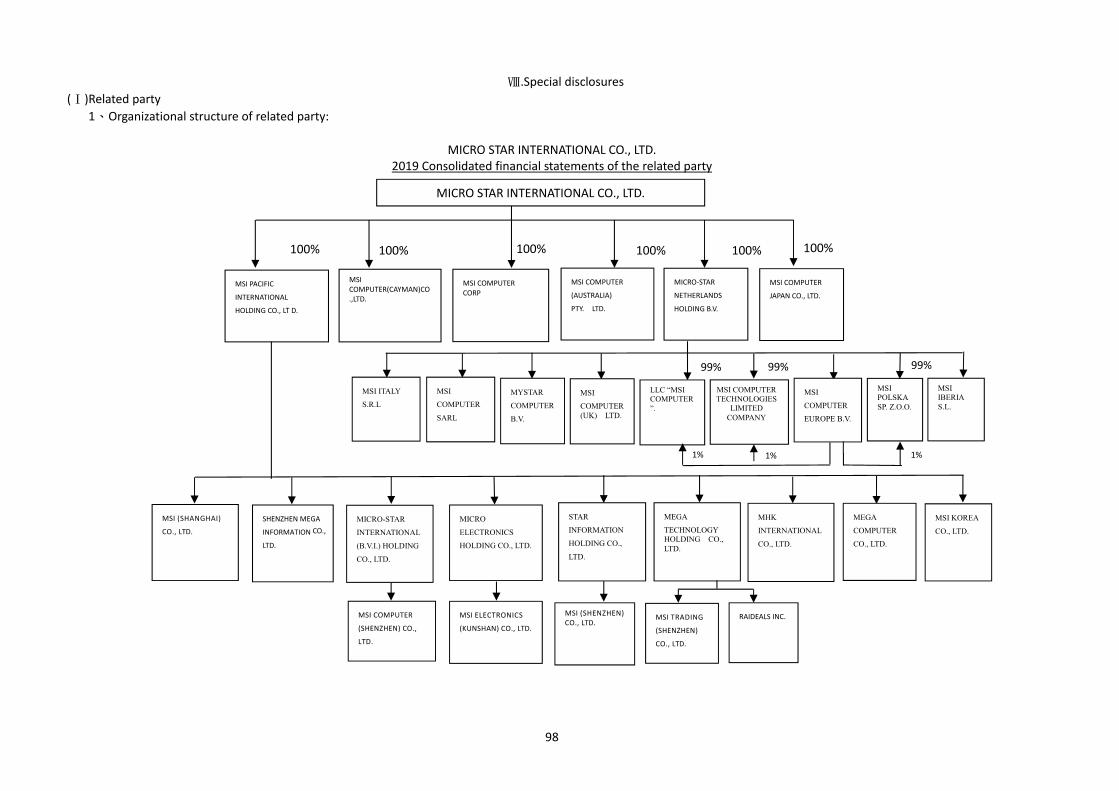
98
Ⅷ.Special disclosures
(Ⅰ)Related party
1、Organizational structure of related party:
MICRO STAR INTERNATIONAL CO., LTD.
2019 Consolidated financial statements of the related party
MICRO STAR INTERNATIONAL CO., LTD.
100% 100% 100% 100% 100% 100%
MSI COMPUTER
JAPAN CO., LTD.
MICRO‐STAR
NETHERLANDS
HOLDING B.V.
MSI COMPUTER
(AUSTRALIA)
PTY. LTD.
MSI COMPUTER CORP
MSI PACIFIC
INTERNATIONAL
HOLDING CO., LT D.
MSI COMPUTER(CAYMAN)CO.,LTD.
99% 99% 99%
LLC “MSI COMPUTER”.
MSI
COMPUTER (UK) LTD.
MYSTAR
COMPUTER
B.V.
MSI
COMPUTER
SARL
MSI COMPUTER TECHNOLOGIES
LIMITED COMPANY
1%
MSI KOREA
CO., LTD.
MEGA
TECHNOLOGY HOLDING CO., LTD.
STAR
INFORMATION
HOLDING CO.,
LTD.
MICRO-STAR
INTERNATIONAL
(B.V.I.) HOLDING
CO., LTD.
MHK
INTERNATIONAL
CO., LTD.
MEGA
COMPUTER
CO., LTD.
MSI TRADING
(SHENZHEN)
CO., LTD.
SHENZHEN MEGA
INFORMATION CO.,
LTD.
MSI (SHENZHEN) CO., LTD.
MSI ITALY
S.R.L
MSI
COMPUTER
EUROPE B.V.
MSI POLSKA SP. Z.O.O.
1% 1%
MSI ELECTRONICS
(KUNSHAN) CO., LTD.
MICRO
ELECTRONICS
HOLDING CO., LTD.
RAIDEALS INC.
MSI (SHANGHAI)
CO., LTD.
MSI COMPUTER
(SHENZHEN) CO.,
LTD.
MSI IBERIA S.L.

99
2.Company profile of related party
(Unit: thousands) Name of corporat ion Date of Establishment Address Capital Major Business Scope
MICRO‐STAR INTERNATIONAL
(B.V.I.) HOLDING CO., LTD. 1998.02.04 TORTOLA,BRITISH VIRGIN ISLANDS USD 47,521 Holding company
MSI COMPUTER CORP. 1998.03.25 CA,U.S.A. USD 460 Sales and maintenance of computers and electronic components
MYSTAR COMPUTER B.V. 1998.05.28 EINDHOVEN,THE NETHERLANDS EUR 2,027 Sales support of computers and electronic components
MSI COMPUTER (AUSTRALIA) PTY. LTD. 1998.07.31 NSW,AUSTRALIA AUD 222 Sales and maintenance of computers and electronic components
MICRO‐STAR NETHERLANDS HOLDING B.V. 1998.12.21 EINDHOVEN,THE NETHERLANDS EUR 1,102 Holding company
MSI COMPUTER JAPAN CO., LTD. 1999.01.21 TOKYO,JAPAN JPY 20,000 Sales support and maintenance of computers and electronic components
MSI COMPUTER SARL 1993.10.01
(1999.6.30 purchase) BUSSY SAINT GEORGES,FRANCE EUR 730 Sales support of computers and electronic components
MSI COMPUTER (SHENZHEN) CO., LTD. 2000.04.12 SHENZHEN,CHINA
USD 51,800 Sales and manufacture of computers and electronic components
MSI COMPUTER (CAYMAN) CO., LTD. 2001.02.13 GEORGE TOWN,CAYMAN ISLANDS USD 3,040 Holding company
MSI COMPUTER (UK) LTD. 2000.10.12 STAINES,UK EUR 1,130 Sales support of computers and electronic components
MSI ELECTRONICS (KUNSHAN) CO., LTD. 2001.12.18 KUNSHAN,CHINA USD 51,000 Sales and manufacture of computers and electronic components
MSI COMPUTER EUROPE B.V. 2002.04.09 EINDHOVEN,THE NETHERLANDS EUR 1,149 Logistic
STAR INFORMATION HOLDING CO., LTD. 2002.06.14 TORTOLA,BRITISH VIRGIN ISLANDS USD 4,503 Holding company
MICRO ELECTRONICS HOLDING CO., LTD. 2002.06.14 TORTOLA,BRITISH VIRGIN ISLANDS USD 33,315 Holding company
MSI PACIFIC INTERNATIONAL HOLDING CO., LTD. 2002.06.18 GEORGE TOWN,CAYMAN ISLANDS USD 30,204 Holding company
MSI KOREA CO., LTD. 2002.12.27 SEOUL,KOREA KRW800,000 Sales and maintenance of computers and electronic components

100
MEGA INFORMATION HOLDING CO.,LTD. 2003.09.19 TORTOLA,BRITISH VIRGIN ISLANDS USD ‐ Deregistration in May 2019.
SHENZHEN MEGA INFORMATION CO., LTD. 2003.11.19 SHENZHEN,CHINA USD 700 Examines and maintenance of computers and electronic
components
MSI POLSKA SP. Z O.O. 2006.04.24 WROCLAWSKIE,POLAND EUR1,171 Sales and maintenance of computers and electronic components
MEGA TECHNOLOGY HOLDING CO., LTD. 2008.04.01 TORTOLA,BRITISH VIRGIN ISLANDS USD3,050 Holding company
MSI TRADING (SHENZHEN) CO., LTD. 2008.04.01 SHENZHEN,CHINA USD3,000 Sales and maintenance of computers and electronic components
MEGA COMPUTER CO., LTD. 2008.02.25 HONG KONG HKD ‐ Sales support of computers and electronic components
LLC “MSI COMPUTER” 2009.10.09 MOSCOW,RUSSIA
EUR1,647 Sales support and maintenance of computers and electronic components
MSI COMPUTER TECHNOLOGIES LIMITED COMPANY
2010.11.04 ISTANBUL,TURKEY EUR77 under liquidation
MSI ITALY S.R.L. 2010.11.12 MILANO,ITALY EUR50 Sales support of computers and electronic components
MHK INTERNATIONAL CO., LTD. 2013.02.01 HONG KONG HKD ‐ Sales support of computers and electronic components
MSI (SHENZHEN) CO., LTD. 2013.09.02 SHENZHEN,CHINA USD1,000 Sales and maintenance of computers and electronic components
LINKING FUTURE CO., LTD. 2008.02.25 HONG KONG HKD ‐ Deregistration in June 2019
MSI (SHANGHAI) CO., LTD. 2017.12.12 SHANGHAI, CHINA USD 1,000 Sales and maintenance of computers and electronic components
RAIDEALS INC. 2018.03.23 CA, U.S.A. USD 50 Sales and maintenance of computers and electronic components
MSI IBERIA S.L. 2019.05.06 BARCELONA, SPAIN EUR 150 Sales support of computers and electronic components

101
3.A controlling and hierarchical relationship according to Article 369.3 of Company Law:None
4.Business scope of MSI Group:
MICRO‐STAR NETHERLANDS HOLDING B.V.、MICRO‐STAR INTERNATIONAL (B.V.I.) HOLDING CO.,LTD.、MSI COMPUTER (CAYMAN) CO.,LTD.、STAR INFORMATION HOLDING CO., LTD.、MICRO
ELECTRONICS HOLDING CO., LTD.、MSI PACIFIC INTERNATIONAL HOLDING CO., LTD.、、MEGA TECHNOLOGY HOLDING CO., LTD. are holding and investment company. MSI
headquarter and rest of affiliated companies are focused in IT industry. MSI Headquarter is focused on manufacturing and sales, MSI COMPUTER (SHENZHEN) CO., LTD. and MSI ELECTRONICS (KUNSHAN) CO., LTD. are MSI’s contract manufactor, SHENZHEN MEGA INFORMATION CO., LTD. is worldwide repair center, rest overseas companies are focus in sales and marketing, selling MSI own brand products.

102
5.Directors, Supervisors and Presidents of related party Unit:shares
Name of corporation Title Name of representative Shareholding
Shares %
MICRO STAR INTERNATIONAL (B.V.I.) HOLDING CO., LTD. Director & President MICRO STAR INTERNATIONAL CO., LTD. Representative:Yu,Hsien‐Neng
0 0
0%0%
MSI COMPUTER CORP. Director & President
Director Director
MICRO STAR INTERNATIONAL CO.,LTD. Representative:Tung,Ti‐Chun
Huang,Chin‐Ching Yu,Hsien‐Neng
575,458 0 0 0
100%0%0%0%
MYSTAR COMPUTER B.V. Director & President Director
MICRO STAR INTERNATIONAL CO.,LTD. Representative:Chiu, Chih‐Chien
Wang,Ming‐Jung
0 0 0
0%0%0%
MSI COMPUTER (AUSTRALIA) PTY. LTD. Director & President Director
Director
MICRO STAR INTERNATIONAL CO.,LTD. Representative:Huang,Chin‐Ching
Lin,Wen‐Tung Chen,Yuan‐Kang
221,836 0 0 0
100%0%0%0%
MICRO‐STAR NETHERLANDS HOLDING B.V. Director & President MICRO STAR INTERNATIONAL CO.,LTD. Representative:Hsu,Hsiang
424,000 0
100%0%
MSI COMPUTER JAPAN CO., LTD. Director & President Supervisor
MICRO STAR INTERNATIONAL CO.,LTD. Representative:Lin,Wen‐Tung
Liu, Chu‐Hao
1,400 0 0
100%0%0%
MSI COMPUTER SARL Director & President Director
MICRO STAR INTERNATIONAL CO.,LTD. Representative:Chiu, Chih‐Chien
Wang,Ming‐Jung
0 0 0
0%0%0%
MSI COMPUTER (SHENZHEN) CO., LTD.
Executive Director & President
Supervisor
MICRO STAR INTERNATIONAL CO.,LTD. Representative:Yu,Hsien‐Neng
Hung, Pao‐Yu
0 0 0
0%0%0%
MSI COMPUTER (CAYMAN) CO., LTD. Director & President MICRO STAR INTERNATIONAL CO.,LTD. Representative:Huang,Chin‐Ching
50,000 0
100%0%
MSI COMPUTER (UK) LTD. Director & President
Director
MICRO STAR INTERNATIONAL CO.,LTD. Representative:Chiu, Chih‐Chien
Wang,Ming‐Jung
0 0 0
0%0%0%
MSI ELECTRONICS (KUNSHAN) CO., LTD.
Executive Director & President
Supervisor
MICRO STAR INTERNATIONAL CO.,LTD. Representative:Huang,Chin‐Ching
Liu,Chu‐Hao
0 0 0
0%0%0%
MSI COMPUTER EUROPE B.V. Director & President MICRO STAR INTERNATIONAL CO.,LTD. Representative:Chiu, Chih‐Chien
0 0
0%0%
STAR INFORMATION HOLDING CO., LTD. Director MICRO STAR INTERNATIONAL CO.,LTD. Representative:Hung, Pao‐Yu
0 0
0%0%

103
MICRO ELECTRONICS HOLDING CO., LTD. Director MICRO STAR INTERNATIONAL CO.,LTD. Representative:Hung, Pao‐Yu
0 0
0%0%
MSI PACIFIC INTERNATIONAL HOLDING CO., LTD. Director MICRO STAR INTERNATIONAL CO.,LTD. Representative:Hung, Pao‐Yu
30,204,118
0 100%
0%
MSI KOREA CO., LTD. Director & President
Supervisor
MICRO STAR INTERNATIONAL CO.,LTD. Representative:Kung,Fan‐Shu
Liu, Chu‐Hao
0 0 0
0%0%0%
MEGA INFORMATION HOLDING CO.,LTD. Deregistration
SHENZHEN MEGA INFORMATION CO., LTD. Executive Director & President Supervisor
MICRO STAR INTERNATIONAL CO.,LTD. Representative:Yu,Hsien‐Neng
Hung, Pao‐Yu
0 0 0
0%0%0%
MSI POLSKA SP. Z O.O. Director & President MICRO STAR INTERNATIONAL CO.,LTD. Representative:Yu,Hsien‐Neng
0 0
0%0%
MEGA TECHNOLOGY HOLDING CO., LTD. Director MICRO STAR INTERNATIONAL CO.,LTD. Representative:Hung, Pao‐Yu
0 0
0%0%
MSI TRADING (SHENZHEN) CO., LTD. Executive Director
Supervisor
MICRO STAR INTERNATIONAL CO.,LTD. Representative:Liu,Chu‐Hao
Hung, Pao‐Yu
0 0 0
0%0%0%
MEGA COMPUTER CO., LTD. Director MICRO STAR INTERNATIONAL CO.,LTD. Representative:Hung, Pao‐Yu
0 0
0%0%
LLC “MSI COMPUTER” Director & President Director
MICRO STAR INTERNATIONAL CO.,LTD. Representative:Chiu, Chih‐Chien
Wang,Ming‐Jung
0 0 0
0%0%0%
MSI COMPUTER TECHNOLOGIES LIMITED COMPANY liquidator Cevat Binici 0 0%
MSI ITALY S.R.L. Director & President
Director
MICRO STAR INTERNATIONAL CO.,LTD. Representative:Chiu, Chih‐Chien
Wang,Ming‐Jung
0 0 0
0%0%0%
MHK INTERNATIONAL CO., LTD. Director MICRO STAR INTERNATIONAL CO.,LTD. Representative:Hung, Pao‐Yu
0 0
0%0%
MSI (SHENZHEN) CO., LTD. Executive Director
Supervisor
MICRO STAR INTERNATIONAL CO.,LTD. Representative:Hung,Yu‐Sheng
Hung, Pao‐Yu
0 0 0
0%0%0%
LINKING FUTURE CO., LTD. Deregistration
MSI (SHANGHAI) CO., LTD. Executive Director
Supervisor
MICRO STAR INTERNATIONAL CO.,LTD. Representative:Wang, Yu‐Pao
Hung,Pao‐Yu
0 0 0
0%0%0%

104
RAIDEALS INC. Director & President MICRO STAR INTERNATIONAL CO.,LTD. Representative:Hung, Pao‐Yu
0 0
0%0%
MSI IBERIA S.L. Director & President
Director
MICRO STAR INTERNATIONAL CO.,LTD. Representative:Chiu, Chih‐Chien
Wang,Ming‐Jung
0 0 0
0%0%0%

105
6.Business operation of the related party
Expressed in thousands of NTD (Except as otherwise indicated)
Name of corporation Capital (unit: thousands)
Total Assets Total Liabilities
Net Worth Revenue Operating Income (Loss)
Net Income (Loss)
Earning(Loss) Per Share (NTD) (after tax)
MICRO‐STAR INTERNATIONAL (B.V.I.) HOLDING CO., LTD.
USD 47,521 (Rate 29.98)
4,012,980 46,252 3,966,728 0 (4,792) 358,243 0.25 (NOTE 2)
MSI COMPUTER CORP. USD 460 (Rate 29.98)
9,317,149 9,281,138 36,011 17,352,520 2,842 1,344 0.10 (NOTE 2)
MYSTAR COMPUTER B.V. EUR 2,027 (NOTE 1)
(Rate 33.59)
439,479 293,119 146,360 1,933,037 21,544 17,981 0.26 (NOTE 2)
MSI COMPUTER (AUSTRALIA) PTY.LTD. AUD 222 (Rate 21.005)
10,044 3,291 6,753 23,943 280 444 0.10 (NOTE 2)
MICRO‐STAR NETHERLANDS HOLDING B.V. EUR 1,102 (NOTE 1)
(Rate 33.59)
631,658 2,274 629,384 41,017 111 55,869 1.51 (NOTE 2)
MSI COMPUTER JAPAN CO., LTD. JPY 20,000 (Rate 0.276)
49,782 35,251 14,531 91,914 2,627 1,737 0.31 (NOTE 2
MSI COMPUTER SARL EUR 730 (NOTE 1)
(Rate 33.59)
81,151 28,698 52,453 95,528 4,459 4,824 0.20 (NOTE 2)
MSI COMPUTER (SHENZHEN) CO., LTD.
USD 51,800(Rate 29.98)
5,103,006 1,294,412 3,808,594 3,099,472 234,722 358,343 0.23 (NOTE 2)
MSI COMPUTER (CAYMAN) CO., LTD. USD 3,040(Rate 29.98)
140,759 17,195 123,564 10,384 819 (526) (0.01) (NOTE 2)
MSI COMPUTER (UK) LTD. EUR 1,130(NOTE 1)
(Rate 33.59)
27,294 11,696 15,598 61,029 2,906 2,952 0.08 (NOTE 2)
MSI ELECTRONIC (KUNSHAN) CO., LTD.
USD 51,000(Rate 29.98)
3,050,090 733,102 2,316,988 1,507,834 146,888 235,827 0.15 (NOTE 2)
MSI COMPUTER EUROPE B.V. EUR 1,149(Rate 33.59)
163,804 118,642 45,162 216,051 4,458 3,590 0.09 (NOTE 2)
STAR INFORMATION HOLDING CO., LTD. USD 4,503(Rate 29.98)
27,461 0 27,461 0 (48) (7,397) (0.05) (NOTE 2)
MICRO ELECTRONICS HOLDING CO., LTD. USD 33,315(Rate 29.98)
2,440,932 18,511 2,422,421 0 (6,277) 237,493 0.24 (NOTE 2)
MSI PACIFIC INTERNATIONAL HOLDING CO., LTD. USD 30,204 (Rate 29.98)
11,664,210 4,977,962 6,686,248 1,989,521 (367) 637,111 0.70 (NOTE 2)
MSI KOREA CO., LTD. KRW 800,000 (Rate 0.026)
498,791 217,010 281,781 4,216,087 27,938 23,988 1.15 (NOTE 2)

106
MEGA INFORMATION HOLDING CO., LTD. USD ‐ (Rate 29.98)
‐ ‐ ‐ ‐ ‐ ‐ ‐ (NOTE 3)
SHENZHEN MEGA INFORMATION CO., LTD.
USD 700 (Rate 29.98)
31,786 10,293 21,493 40,745 836 194 0.01 (NOTE 2)
MSI POLSKA SP. Z O.O. EUR1,171 (NOTE 1)
(Rate 33.59)
80,700 47,474 33,226 162,471 4,229 1,708 0.04 (NOTE 2)
MEGA TECHNOLOGY HOLDING CO., LTD. USD 3,050 (Rate 29.98)
0 6,638 (6,638) 0 0 (850) (0.01) (NOTE 2)
MSI TRADING (SHENZHEN) CO., LTD USD 3,000 (Rate 29.98)
3,674 12,002 (8,328) 0 (1,084) (1,082) (0.01) (NOTE 2)
MEGA COMPUTER CO., LTD. HKD ‐ (Rate 3.849)
1,936,552 1,930,512 6,040 6,160,674 (656) (370) ‐ (NOTE 2)
LLC “MSI COMPUTER” EUR 1,647 (Rate 33.59)
45,882 5,454 40,428 77,088 4,356 6,482 0.12 (NOTE 2)
MSI COMPUTER TECHNOLOGIES LIMITED COMPANY EUR 77 (Rate 33.59)
11 65 (54) 0 0 0 0 (NOTE 4)
MSI ITALY S.R.L. EUR 50 (Rate 33.59)
28,067 25,513 2,554 43,843 2,121 1,107 0.66 (NOTE 2)
MHK INTERNATIONAL CO., LTD. HKD ‐ (Rate 3.849)
79,441 58,763 20,678 152,225 8,088 8,131 ‐ (NOTE 2)
MSI (SHENZHEN) Co., LTD. USD 1,000 (Rate 29.98)
25,476 11,642 13,834 12,308 (8,517) (7,662) (0.26) (NOTE2)
LINKING FUTURE CO., LTD. HKD ‐ (Rate 3.849)
‐ ‐ ‐ ‐ ‐ ‐ ‐ (NOTE5)
MSI (SHANGHAI) Co., LTD. USD 1,000 (Rate 29.98)
2,058,333 2,084,667 (26,334) 6,393,740 10,500 11,614 0.39 (NOTE2)
RAIDEALS INC. USD 50 (Rate 29.98)
8,963 7,273 1,690 135,916 314 233 0.16 (NOTE2)
MSI IBERIA S.L. EUR150 (Rate 33.59)
29,101 23,296 5,805 16,580 790 790 0.16 (NOTE2)
Note 1:Capital includes surplus.
Note 2:Earnings per share was calculated based on each NTD of capital instead of each share.
Note 3: In May 2019, MEGA INFORMATION HOLDING CO., LTD. has completed the deregistration process.
Note 4: MSI COMPUTER TECHNOLOGIES LIMITED COMPANY is under liquidation.
Note 5: In June 2019, LINKING FUTURE CO., LTD.has completed the deregistration process.

107
7.Consolidated Financial Statements of the parent company and subsidiaries:Please refer to page 108~175
8.Related Party Report:Not Applicable
9. Affiliated companies’ transaction on guarantee, endorsement, loans to others and derivatives: please
refer to page 164.
(Ⅱ)Subscription of marketable securities privately in the most recent years and up to the date of the report
printed:None
(Ⅲ)Status of MSI Common Shares Acquired, Disposed of, and Held by Subsidiaries: None
(Ⅳ)Other Necessary Supplement: None.
(Ⅴ)Occurrence of events defined in Securities Transaction Law Article 36.2.2 that has great impact on
shareholders’ equity or security price in the most recent years and up to the date of the repost printed:
None

108
MICRO-STAR INTERNATIONAL CO., LTD. AND SUBSIDIARIES CONSOLIDATED FINANCIAL STATEMENTS AND REPORT OF INDEPENDENT ACCOUNTANTS DECEMBER 31, 2019 AND 2018
-------------------------------------------------------------------------------------------------------------- For the convenience of readers and for information purpose only, the auditors’ report and the accompanying financial statements have been translated into English from the original Chinese version prepared and used in the Republic of China. In the event of any discrepancy between the English version and the original Chinese version or any differences in the interpretation of the two versions, the Chinese-language auditors’ report and financial statements shall prevail.

109
Representation Letter In connection with the Consolidated Financial Statements of Affiliated Enterprises of MICRO-STAR INTERNATIONAL CO., LTD. and its subsidiaries (the “Consolidated FS of the Affiliates”), we represent to you that, the entities required to be included in the Consolidated FS of the Affiliates as of and for the year ended December 31, 2019 in accordance with the “Criteria Governing Preparation of Affiliation Reports, Consolidated Business Reports and Consolidated Financial Statements of Affiliated Enterprises” are the same as those required to be included in the Consolidated Financial Statements of MICRO-STAR INTERNATIONAL CO., LTD. and its subsidiaries (the “Consolidated FS of the Group”) in accordance with International Financial Reporting Standard 10. Additionally, the information required to be disclosed in the Consolidated FS of Affiliates is disclosed in the Consolidated FS of the Group. Consequently, MICRO-STAR INTERNATIONAL CO., LTD. and its subsidiaries do not prepare a separate set of Consolidated FS of Affiliates. Very truly yours, MICRO-STAR INTERNATIONAL CO., LTD. By Joseph Hsu, Chairman March 20, 2020

110
REPORT OF INDEPENDENT ACCOUNTANTS TRANSLATED FROM CHINESE To the Board of Directors and Shareholders of MICRO-STAR INTERNATIONAL CO., LTD. AND SUBSIDIARIES Opinion We have audited the accompanying consolidated balance sheets of MICRO-STAR INTERNATIONAL CO., LTD. AND SUBSIDIARIES (the “Group”) as of December 31, 2019 and 2018, and the related consolidated statements of comprehensive income, of changes in equity and of cash flows for the years then ended, and notes to the consolidated financial statements, including a summary of significant accounting policies. In our opinion, the accompanying consolidated financial statements present fairly, in all material respects, the consolidated financial position of the Group as of December 31, 2019 and 2018, and its consolidated financial performance and its consolidated cash flows for the years then ended in accordance with the “Regulations Governing the Preparation of Financial Reports by Securities Issuers” and the International Financial Reporting Standards, International Accounting Standards, IFRIC Interpretations, and SIC Interpretations as endorsed by the Financial Supervisory Commission. Basis for opinion We conducted our audits in accordance with the “Regulations Governing Auditing and Attestation of Financial Statements by Certified Public Accountants” and generally accepted auditing standards in the Republic of China (ROC GAAS). Our responsibilities under those standards are further described in the Auditor’s Responsibilities for the Audit of the consolidated Financial Statements section of our report. We are independent of the Group in accordance with the Code of Professional Ethics for Certified Public Accountants in the Republic of China (the “Code”), and we have fulfilled our ethical responsibilities in accordance with the Code. Based on our audits and the audit reports of other independent accountants, we believe that the audit evidences we have obtained are sufficient and appropriate to provide a basis for our opinion. Key audit matters Key audit matters are those matters that, in our professional judgement, were of most significance in our audit of the consolidated financial statements for the year ended December 31, 2019. These matters were addressed in the context of our audit of the consolidated financial statements as a whole and, in forming our opinion thereon, we do not provide a separate opinion on these matters. Key audit matters for the Group’s consolidated financial statements of the year ended December 31, 2019 are stated as follows: Occurrence of sales revenue from significant customers Description Please refer to Note 4(26) for accounting policies on revenue recognition. Other than international brands, the Group sells its products to customers in various countries. With the Group actively developing new products, sales revenue increases progressively every year, and the occurrence of sales revenue is critical to the financial statements. Thus, the occurrence of sales revenue from new significant customers, excluding

111
international brands, was identified as a key audit matter. How our audit addressed the matter We performed the following audit procedures in respect of the above key audit matter: A. Obtained an understanding of and assessed internal controls in relation to sales revenue from new
significant customers, and validated the operating effectiveness of those above mentioned internal controls.
B. Obtained detailed listing of sales revenue from new significant customers in the current year, and validated supporting documents, including sales invoices, customer purchase orders and delivery documents.
C. Inspected contents and relevant evidences in relation to sales returns and discounts occurring subsequent to the reporting period and assessed the reasonableness of respective sales revenue recognised.
Estimation of allowance for inventory valuation losses Description Please refer to Note 4(12), for accounting policies on inventory valuation, Note 5(2) for the uncertainty of accounting estimates and assumptions applied on inventory valuation, and Note 6(5) for details of inventories. As of December 31, 2019, the balances of inventories and allowance for inventory valuation losses are NT$23,062,460 thousand and NT$534,260 thousand, respectively. The Group is primarily engaged in manufacturing and sales of motherboard, interface card, notebook computer and other electronic products. Due to the rapid technological innovations, shorter electronic product life cycles, and the fluctuation of market prices within the industry, there is a higher risk of inventory losses due from market value decline or obsolescence. The Group recognises inventories at the lower of cost and net realisable value. As the monetary values of inventories are material, and there are various types of inventories, the estimation and determination of the net realisable value of inventories as of the balance sheet date are subject to management’s judgement and contain a high level of uncertainty and have material effects on the financial statements, and therefore, it was identified as a key audit matter. How our audit addressed the matter We performed the following audit procedures in respect of the above key audit matter:
A. Assessed the reasonableness and the consistency of policies in relation to the provision of allowance for inventory valuation losses and procedures based on our understanding of the Group’s operations and industry.
B. Validated the appropriateness of system logic of the report of individually identified obsolete inventory prepared by management and confirmed the consistency with Group’s policies.
C. Validated the appropriateness of estimation basis for net realisable value of inventories and inspected respective supporting documents, including sales prices or purchase prices, reperformed the calculation of the report and assessed the reasonableness of management’s determination of net realisable value of inventories.
112
Other matter –Reference to audits of other independent accountants We did not audit the financial statements of certain consolidated subsidiaries and investments accounted for under the equity method that are included in the consolidated financial statements. Those financial statements were audited by other independent accountants, whose reports thereon have been furnished to us, and our opinion expressed herein is based solely on reports of the other independent accountants. Total assets of the abovementioned entities (including investments accounted for under the equity method) amounted to NT$11,727,830 thousand and NT$9,411,349 thousand as of December 31, 2019 and 2018, constituting 19% and 17% of consolidated total assets, respectively. Sales revenue of the above mentioned entities amounted to NT$23,178,240 thousand and NT$22,331,098 thousand, for the years ended December 31, 2019 and 2018, constituting 19% and 19% of consolidated total sales revenue, respectively. Other matter – Parent company only financial reports We have audited and expressed an unmodified opinion with other matter section on the parent company only financial statements of MICRO-STAR INTERNATIONAL CO., LTD. as of and for the years ended December 31, 2019 and 2018. Responsibilities of management and those charged with governance for the consolidated financial statements Management is responsible for the preparation and fair presentation of the consolidated financial statements in accordance with the “Regulations Governing the Preparation of Financial Reports by Securities Issuers” and the International Financial Reporting Standards, International Accounting Standards, IFRIC Interpretations, and SIC Interpretations as endorsed by the Financial Supervisory Commission, and for such internal control as management determines is necessary to enable the preparation of consolidated financial statements that are free from material misstatement, whether due to fraud or error. In preparing the consolidated financial statements, management is responsible for assessing the Group’s ability to continue as a going concern, disclosing, as applicable, matters related to going concern and using the going concern basis of accounting unless management either intends to liquidate the Group or to cease operations, or has no realistic alternative but to do so. Those charged with governance, including supervisors, are responsible for overseeing the Group’s financial reporting process. Independent accountant’s responsibilities for the audit of the consolidated financial statements Our objectives are to obtain reasonable assurance about whether the consolidated financial statements as a whole are free from material misstatement, whether due to fraud or error, and to issue an auditor’s report that includes our opinion. Reasonable assurance is a high level of assurance, but is not a guarantee that an audit conducted in accordance with ROC GAAS will always detect a material misstatement when it exists. Misstatements can arise from fraud or error and are considered material if, individually or in the aggregate, they could reasonably be expected to influence the economic decisions of users taken on the basis of these consolidated financial statements. As part of an audit in accordance with ROC GAAS, we exercise professional judgement and maintain professional skepticism throughout the audit. We also:

113
1. Identify and assess the risks of material misstatement of the consolidated financial statements, whether due to fraud or error, design and perform audit procedures responsive to those risks, and obtain audit evidence that is sufficient and appropriate to provide a basis for our opinion. The risk of not detecting a material misstatement resulting from fraud is higher than for one resulting from error, as fraud may involve collusion, forgery, intentional omissions, misrepresentations, or the override of internal control.
2. Obtain an understanding of internal control relevant to the audit in order to design audit procedures that are appropriate in the circumstances, but not for the purpose of expressing an opinion on the effectiveness of the Group’s internal control.
3. Evaluate the appropriateness of accounting policies used and the reasonableness of accounting estimates and related disclosures made by management.
4. Conclude on the appropriateness of management’s use of the going concern basis of accounting and, based on the audit evidence obtained, whether a material uncertainty exists related to events or conditions that may cast significant doubt on the Group’s ability to continue as a going concern. If we conclude that a material uncertainty exists, we are required to draw attention in our auditor’s report to the related disclosures in the consolidated financial statements or, if such disclosures are inadequate, to modify our opinion. Our conclusions are based on the audit evidence obtained up to the date of our auditor’s report. However, future events or conditions may cause the Group to cease to continue as a going concern.
5. Evaluate the overall presentation, structure and content of the consolidated financial statements, including the disclosures, and whether the consolidated financial statements represent the underlying transactions and events in a manner that achieves fair presentation.
6. Obtain sufficient appropriate audit evidence regarding the financial information of the entities or business activities within the Group to express an opinion on the consolidated financial statements. We are responsible for the direction, supervision and performance of the group audit. We remain solely responsible for our audit opinion.
We communicate with those charged with governance regarding, among other matters, the planned scope and timing of the audit and significant audit findings, including any significant deficiencies in internal control that we identify during our audit. We also provide those charged with governance with a statement that we have complied with relevant ethical requirements regarding independence, and to communicate with them all relationships and other matters that may reasonably be thought to bear on our independence, and where applicable, related safeguards. From the matters communicated with those charged with governance, we determine those matters that were of most significance in the audit of the consolidated financial statements of the current period and are therefore the key audit matters. We describe these matters in our auditor’s report unless law or regulation precludes public disclosure about the matter or when, in extremely rare circumstances, we determine that a matter should not be communicated in our report because the adverse consequences of doing so would reasonably be expected to outweigh the public interest benefits of such communication. Liang, Hua-Ling Lai, Chung-Hsi
For and on behalf of PricewaterhouseCoopers, Taiwan March 20, 2020

114
---------------------------------------------------------------------------------------------------------------------------- The accompanying consolidated financial statements are not intended to present the financial position and results of operations and cash flows in accordance with accounting principles generally accepted in countries and jurisdictions other than the Republic of China. The standards, procedures and practices in the Republic of China governing the audit of such financial statements may differ from those generally accepted in countries and jurisdictions other than the Republic of China. Accordingly, the accompanying consolidated financial statements and report of independent accountants are not intended for use by those who are not informed about the accounting principles or auditing standards generally accepted in the Republic of China, and their applications in practice. As the financial statements are the responsibility of the management, PricewaterhouseCoopers cannot accept any liability for the use of, or reliance on, the English translation or for any errors or misunderstandings that may derive from the translation.

MICRO-STAR INTERNATIONAL CO., LTD. AND SUBSIDIARIES CONSOLIDATED BALANCE SHEETS
DECEMBER 31, 2019 AND 2018 (Expressed in thousands of New Taiwan dollars)
115
December 31, 2019 December 31, 2018 Assets Notes AMOUNT % AMOUNT % Current assets 1100 Cash and cash equivalents 6(1) $ 10,834,884 18 $ 8,815,680 16 1110 Financial assets at fair value
through profit or loss - current 6(2)
152,805 - 98,400 - 1150 Notes receivable, net 6(4) 47,114 - 35,183 - 1170 Accounts receivable, net 6(4) 17,205,783 29 16,040,189 29 1200 Other receivables 227,116 - 159,681 - 1220 Current income tax assets 16,417 - 44,944 - 130X Inventories, net 6(5) 22,527,840 37 22,052,862 40 1410 Prepayments 6(6) 1,675,701 3 1,381,022 3 1476 Other current financial assets 1,200,000 2 728,936 1 11XX Total current assets 53,887,660 89 49,356,897 89 Non-current assets 1517 Non-current financial assets at fair
value through other comprehensive income
6(3)
151,975 - - - 1600 Property, plant and equipment 6(7) and 8 4,893,433 8 4,738,544 9 1755 Right-of-use assets 6(8) 474,897 1 - - 1760 Investment property - net 6(10) 300,559 1 341,241 1 1840 Deferred income tax assets 6(25) 471,523 1 438,204 1 1900 Other non-current assets 6(11) and 8 168,661 - 299,287 - 15XX Total non-current assets 6,461,048 11 5,817,276 11 1XXX Total assets $ 60,348,708 100 $ 55,174,173 100 (Continued)

MICRO-STAR INTERNATIONAL CO., LTD. AND SUBSIDIARIES CONSOLIDATED BALANCE SHEETS
DECEMBER 31, 2019 AND 2018 (Expressed in thousands of New Taiwan dollars)
The accompanying notes are an integral part of these consolidated financial statements.
116
December 31, 2019 December 31, 2018 Liabilities and Equity Notes AMOUNT % AMOUNT % Current liabilities 2100 Short-term borrowings 6(12) $ 1,500,000 3 $ 3,000,000 6 2120 Financial liabilities at fair value
through profit or loss - current 6(2)
24,943 - 5,555 - 2150 Notes payable - - 200 - 2170 Accounts payable 20,391,520 34 14,933,624 27 2200 Other payables 6(13) 3,844,835 6 3,418,250 6 2230 Current income tax liabilities 402,714 1 1,017,290 2 2250 Provision for liabilities - current 6(16) 556,720 1 501,095 1 2280 Current lease liabilities 159,081 - - - 2365 Refund liabilities- current 1,636,499 3 1,796,905 3 2399 Other current liabilities, others 108,961 - 92,142 - 21XX Total current liabilities 28,625,273 48 24,765,061 45 Non-current liabilities 2540 Long-term borrowings 6(14) and 8 15,095 - 16,442 - 2570 Deferred income tax liabilities 6(25) 27,214 - 2,297 - 2580 Non-current lease liabilities 247,767 1 - - 2640 Net defined benefit liability,
non-current 6(15)
221,974 - 217,609 - 2670 Other non-current liabilities, others 198,920 - 226,903 1 25XX Total non-current liabilities 710,970 1 463,251 1 2XXX Total liabilities 29,336,243 49 25,228,312 46 Equity attributable to owners of
parent
Share capital 6(17) 3110 Share capital - common stock 8,448,562 14 8,448,562 15 Capital surplus 6(18) 3200 Capital surplus 803,918 1 1,226,049 2 Retained earnings 6(19) 3310 Legal reserve 4,982,577 8 4,378,464 8 3320 Special reserve 505,966 1 421,815 1 3350 Unappropriated retained earnings 17,065,967 28 15,976,937 29 Other equity interest 3400 Other equity interest ( 794,525 ) ( 1 ) ( 505,966 ) ( 1) 31XX Equity attributable to owners of
the parent
31,012,465 51 29,945,861 54 3XXX Total equity 31,012,465 51 29,945,861 54 3X2X Total liabilities and equity $ 60,348,708 100 $ 55,174,173 100

MICRO-STAR INTERNATIONAL CO., LTD. AND SUBSIDIARIES CONSOLIDATED STATEMENTS OF COMPREHENSIVE INCOME
FOR THE YEARS ENDED DECEMBER 31, 2019 AND 2018 (Expressed in thousands of New Taiwan dollars, except earnings per share)
The accompanying notes are an integral part of these consolidated financial statements.
117
Year ended December 31 2019 2018 Items Notes AMOUNT % AMOUNT %
4000 Sales revenue 6(20) $ 120,491,417 100 $ 118,527,273 1005000 Operating costs 6(5)(23) ( 104,629,261 ) ( 87 ) ( 102,397,587 ) ( 86 )5900 Net operating margin 15,862,156 13 16,129,686 14
Operating expenses 6(23) 6100 Selling expenses ( 5,508,321 ) ( 4 ) ( 5,166,468 ) ( 4 )6200 General and administrative expenses ( 1,070,509 ) ( 1 ) ( 921,767 ) ( 1 )6300 Research and development expenses ( 3,315,224 ) ( 3 ) ( 3,347,836 ) ( 3 )6450 Expected credit loss ( 15,696 ) - ( 1,665 ) -6000 Total operating expenses ( 9,909,750 ) ( 8 ) ( 9,437,736 ) ( 8 )6900 Operating profit 5,952,406 5 6,691,950 6
Non-operating income and expenses 7010 Other income 6(21) 715,283 - 655,733 -7020 Other gains and losses 6(22) ( 125,710 ) - ( 182,141 ) -7050 Finance costs ( 23,546 ) - ( 14,408 ) -7000 Total non-operating income and
expenses
566,027 - 459,184 -7900 Profit before income tax 6,518,433 5 7,151,134 67950 Income tax expense 6(25) ( 931,223 ) ( 1 ) ( 1,110,005 ) ( 1 )8200 Profit for the year $ 5,587,210 4 $ 6,041,129 5
Other comprehensive income Components of other comprehensive loss that will not be reclassified to profit or loss
8311 Actuarial loss on defined benefit plan 6(15) ( $ 10,079 ) - ( $ 21,430 ) -8349 Income tax related to components of
other comprehensive income that will not be reclassified to profit or loss
6(25)
2,016 - 8,461 -8310 Components of other comprehensive
loss that will not be reclassified to profit or loss
( 8,063 ) - ( 12,969 ) - Components of other comprehensive income that will be reclassified to profit or loss
8361 Financial statements translation
differences of foreign operations
( 288,559 ) - ( 84,151 ) -8360 Components of other comprehensive
loss that will be reclassified to profit or loss
( 288,559 ) - ( 84,151 ) -8300 Total other comprehensive loss for
the year
( $ 296,622 ) - ( $ 97,120 ) -8500 Total comprehensive income for the
year
$ 5,290,588 4 $ 5,944,009 5 Profit attributable to:
8610 Owners of the parent $ 5,587,210 4 $ 6,041,129 5 Comprehensive income attributable to:
8710 Owners of the parent $ 5,290,588 4 $ 5,944,009 5 Earnings per share (in dollars) 6(26)
9750 Basic earnings per share $ 6.61 $ 7.159850 Diluted earnings per share $ 6.56 $ 7.08

MICRO-STAR INTERNATIONAL CO., LTD. AND SUBSIDIARIES CONSOLIDATED STATEMENTS OF CHANGES IN EQUITY FOR THE YEARS ENDED DECEMBER 31, 2019 AND 2018
(Expressed in thousands of New Taiwan dollars) Equity attributable to owners of the parent Capital surplus Retained earnings
Notes
Share capital - common stock
Additional paid-in
capital
Treasury stock
transactions
Donated assets
received
Employee stock
warrants
Legal reserve
Special reserve
Unappropriated
retained earnings
Financial statements translation differences of
foreign operations
Total equity
The accompanying notes are an integral part of these consolidated financial statements.
118
2018
Balance at January 1, 2018 $8,448,562 $1,050,563 $130,592 $- $44,460 $3,884,722 $389,482 $14,276,704 ( $421,815 ) $27,803,270
Profit for the year - - - - - - - 6,041,129 - 6,041,129
Other comprehensive loss for the year - - - - - - - ( 12,969 ) ( 84,151 ) ( 97,120)
Total comprehensive income - - - - - - - 6,028,160 ( 84,151 ) 5,944,009
Appropriations of 2017 earnings : 6(19)
Legal reserve - - - - - 493,742 - ( 493,742 ) - -
Special reserve - - - - - - 32,333 ( 32,333 ) - -
Cash dividends - - - - - - - ( 3,801,852 ) - ( 3,801,852)
Due to donated assets received - - - 434 - - - - - 434
Balance at December 31, 2018 $8,448,562 $1,050,563 $130,592 $434 $44,460 $4,378,464 $421,815 $15,976,937 ( $505,966 ) $29,945,861
2019
Balance at January 1, 2019 $8,448,562 $1,050,563 $130,592 $434 $44,460 $4,378,464 $421,815 $15,976,937 ( $505,966 ) $29,945,861
Profit for the year - - - - - - - 5,587,210 - 5,587,210
Other comprehensive loss for the year - - - - - - - ( 8,063 ) ( 288,559 ) ( 296,622)
Total comprehensive income - - - - - - - 5,579,147 ( 288,559 ) 5,290,588
Appropriation of 2018 earnings 6(19)
Legal reserve - - - - - 604,113 - ( 604,113 ) - -
Special reserve - - - - - - 84,151 ( 84,151 ) - -
Cash dividends - - - - - - - ( 3,801,853 ) - ( 3,801,853)
Cash distribution from capital surplus 6(19) - ( 422,429 ) - - - - - - - ( 422,429)
Due to donated assets received - - - 298 - - - - - 298
Balance at December 31, 2019 $8,448,562 $628,134 $130,592 $732 $44,460 $4,982,577 $505,966 $17,065,967 ( $794,525 ) $31,012,465

MICRO-STAR INTERNATIONAL CO., LTD. AND SUBSIDIARIES CONSOLIDATED STATEMENTS OF CASH FLOWS
FOR THE YEARS ENDED DECEMBER 31, 2019 AND 2018 (Expressed in thousands of New Taiwan dollars)
Years ended December 31 Notes 2019 2018
119
CASH FLOWS FROM OPERATING ACTIVITIES Profit before tax $ 6,518,433 $ 7,151,134 Adjustments Adjustments to reconcile profit (loss) Depreciation (including right-of-use assets and investment properties)
890,056 685,785
Amortization (including long-term prepaid rents)
6(23) 224 9,188
Expected credit loss 15,696 1,665 Net gains on financial assets and liabilities at fair value through profit or loss
( 39,222 ) ( 70,334 )
Interest expense 23,546 14,408 Interest income 6(21) ( 82,368 ) ( 88,788 ) Gain on disposal of property, plant and equipment
6(22) ( 2,906 ) ( 46,913 )
Loss on disposal of investments - 2,849 Gain on lease modification ( 214 ) - Loss on unrealized foreign currency exchange 24,242 28,275 Changes in operating assets and liabilities Changes in operating assets Financial assets held for trading - ( 26,147 ) Notes receivable, net ( 11,931 ) ( 35,162 ) Accounts receivable ( 1,179,668 ) 899,718 Other receivables ( 70,951 ) 182,643 Inventories, net ( 474,978 ) ( 5,731,835 ) Prepayments ( 294,679 ) ( 88,294 ) Other current financial assets ( 471,064 ) ( 660,101 ) Other non-current assets 97,176 3,808 Changes in operating liabilities Notes payable ( 200 ) 200 Accounts payable 5,457,896 ( 1,098,711 ) Other payables 427,104 ( 70,215 ) Provision for liabilities - current 55,625 46,351 Current refund liabilities ( 160,406 ) ( 36,726 ) Other current liabilities, others 16,728 ( 12,732 ) Net defined benefit liability ( 5,714 ) ( 6,578 ) Cash inflow generated from operations 10,732,425 1,053,488 Interest received 84,991 86,892 Interest paid ( 23,559 ) ( 13,974 ) Income tax paid ( 1,520,287 ) ( 1,042,224 ) Net cash flows from operating activities 9,273,570 84,182 (Continued)

MICRO-STAR INTERNATIONAL CO., LTD. AND SUBSIDIARIES CONSOLIDATED STATEMENTS OF CASH FLOWS
FOR THE YEARS ENDED DECEMBER 31, 2019 AND 2018 (Expressed in thousands of New Taiwan dollars)
Years ended December 31 Notes 2019 2018
The accompanying notes are an integral part of these consolidated financial statements.
120
CASH FLOWS FROM INVESTING ACTIVITIES Acquisition of financial assets at fair value through other comprehensive income
6(3) ( $ 151,975 ) $ -
Acquisition of property, plant and equipment 6(7) ( 982,667 ) ( 450,502 ) Proceeds from disposal of property, plant and equipment
57,700 50,311
Acquisition of investment properties 6(10) ( 3,602 ) ( 2,409 ) Increase in refundable deposits ( 15,894 ) ( 3,620 ) Increase in other financial assets ( 19,121 ) ( 46,369 ) Net cash flows used in investing activities
( 1,115,559 ) ( 452,589 )
CASH FLOWS FROM FINANCING ACTIVITIES Decrease (increase) in short-term borrowings ( 1,500,000 ) 3,000,000 Repayment of the principal portion of lease liabilities
( 152,916 ) -
Payment of long-term borrowings ( 843 ) ( 898 ) (Decrease) increase in guarantee deposits received ( 27,983 ) 33,807 Cash dividends paid 6(19) ( 3,801,853 ) ( 3,801,852 ) Cash distribution from capital surplus 6(19) ( 422,429 ) - Due to donated assets received 298 434 Net cash flows used in financing activities
( 5,905,726 ) ( 768,509 )
Effect of exchange rate ( 233,081 ) ( 75,468 ) Net increase (decrease) in cash and cash equivalents 2,019,204 ( 1,212,384 ) Cash and cash equivalents at beginning of year 6(1) 8,815,680 10,028,064 Cash and cash equivalents at end of year 6(1) $ 10,834,884 $ 8,815,680

121
MICRO-STAR INTERNATIONAL CO., LTD. AND SUBSIDIARIES NOTES TO THE CONSOLIDATED FINANCIAL STATEMENTS
FOR THE YEARS ENDED DECEMBER 31, 2019 AND 2018 (Expressed in thousands of New Taiwan dollars, except as otherwise indicated)
1. HISTORY AND ORGANISATION MICRO-STAR INTERNATIONAL CO., LTD. (the “Company”) was incorporated as a company limited by shares under the laws of the Republic of China (R.O.C.) in August 1986 and started its operations in the same year. The Company and its subsidiaries (collectively referred herein as the “Group”) are primarily engaged in the manufacture and sale of motherboards and computer hardware. The shares of the Company have been listed on the Taiwan Stock Exchange since October 1998. The Company is the Group’s ultimate parent company. 2. THE DATE OF AUTHORISATION FOR ISSUANCE OF THE CONSOLIDATED FINANCIAL
STATEMENTS AND PROCEDURES FOR AUTHORISATION These consolidated financial statements were reported to the Board of Directors on March 20, 2020. 3. APPLICATION OF NEW STANDARDS, AMENDMENTS AND INTERPRETATIONS
(1) Effect of the adoption of new standards and amendments to International Financial Reporting Standards (“IFRS”) as endorsed by the Financial Supervisory Commission (“FSC”) New standards, interpretations and amendments endorsed by the FSC effective from 2019 are as follows:
Except for the following, the above standards and interpretations have no significant impact to the Group’s financial condition and financial performance based on the Group’s assessment. IFRS 16, ‘Leases A. IFRS 16, ‘Leases’, replaces IAS 17, ‘Leases’ and related interpretations and SICs. The standard
requires lessees to recognise a right-of-use asset and a lease liability (except for those leases with terms of 12 months or less and leases of low-value assets). The accounting stays the same for lessors, which is to classify their leases as either finance leases or operating leases and account for those two types of leases differently. IFRS 16 only requires enhanced disclosures to be provided by lessors.
B. The Group has elected to apply IFRS 16 by not restating the comparative information (referred herein as the ‘modified retrospective approach’) when applying “IFRSs” effective in 2019 as endorsed by the FSC. Accordingly, the Group increased ‘right-of-use asset’ by $401,094, increased ‘lease liability’ by $319,195 and decreased other non-current assets by $81,899 with respect to the
New Standards, Interpretations and Amendments
Effective date byInternational Accounting
Standards BoardAmendments to IFRS 9, ‘Prepayment features with negativecompensation’
January 1, 2019
IFRS 16, ‘Leases’ January 1, 2019Amendments to IAS 19, ‘Plan amendment, curtailment or settlement’ January 1, 2019Amendments to IAS 28, ‘Long-term interests in associates and jointventures’
January 1, 2019
IFRIC 23, ‘Uncertainty over income tax treatments’ January 1, 2019Annual improvements to IFRSs 2015-2017 cycle January 1, 2019

122
lease contracts of lessees on January 1, 2019. C. The Group has used the following practical expedients permitted by the standard at the date of
initial application of IFRS 16: (a).Reassessment as to whether a contract is, or contains, a lease is not required, instead, the
application of IFRS 16 depends on whether or not the contracts were previously identified as leases applying IAS 17 and IFRIC 4.
(b).The use of a single discount rate to a portfolio of leases with reasonably similar characteristics. (c).The exclusion of initial direct costs for the measurement of ‘right-of-use asset’. (d).The use of hindsight in determining the lease term where the contract contains options to
extend or terminate the lease. D. The Group calculated the present value of lease liabilities by using the weighted average
incremental borrowing interest rate range from 0.3% to 7.75%. E. The Group recognised lease liabilities which had previously been classified as ‘operating leases’
under the principles of IAS 17, ‘Leases’. The reconciliation between operating lease commitments under IAS 17 measured at the present value of the remaining lease payments, discounted using the lessee’s incremental borrowing rate and lease liabilities recognised as of January 1, 2019 is as follows:
(2) Effect of new issuances of or amendments to IFRSs as endorsed by the FSC but not yet
adopted by the Group New standards, interpretations and amendments endorsed by the FSC effective from 2020 are
as follows:
The above standards and interpretations have no significant impact to the Group’s financial condition and operating result based on the Group’s assessment.
Operating lease commitments disclosed by applying IAS 17 as at December 31, 2018 289,555$ Less: Short-term leases 11,687)( Less: Low-value assets 5,304)( Add: Adjustments as a result of a different treatment of extension and termination options 56,399 Total lease contracts amount recognised as lease liabilities by applying IFRS 16 on January 1, 2019 328,963$
Incremental borrowing interest rate at the date of initial application 0.3%~7.75%Lease liabilities recognised as at January 1, 2019 by applying IFRS 16 319,195$
New Standards, Interpretations and Amendments
Effective date byInternational Accounting
Standards BoardAmendment to IAS 1 and IAS 8, ‘Disclosure Initiative-Definition ofMaterial’
January 1, 2020
Amendments to IFRS 3, ‘Definition of a business’ January 1, 2020Amendment to IFRS 9, IAS 39 and IFRS 7, ‘Interest rate benchmarkreform’
January 1, 2020

123
(3) IFRSs issued by IASB but not yet endorsed by the FSC New standards, interpretations and amendments issued by IASB but not yet included in the IFRSs as endorsed by the FSC are as follows:
The above standards and interpretations have no significant impact to the Group’s financial condition and operating result based on the Group’s assessment.
4. SUMMARY OF SIGNIFICANT ACCOUNTING POLICIES The principal accounting policies applied in the preparation of these consolidated financial statements are set out below. These policies have been consistently applied to all the periods presented, unless otherwise stated.
(1) Compliance statement The consolidated financial statements of the Group have been prepared in accordance with the “Regulations Governing the Preparation of Financial Reports by Securities Issuers”, International Financial Reporting Standards, International Accounting Standards, IFRIC Interpretations, and SIC Interpretations as endorsed by the FSC (collectively referred herein as the “IFRSs”).
(2) Basis of preparation A. Except for the following items, the consolidated financial statements have been prepared under the
historical cost convention: (a) Financial assets and financial liabilities (including derivative instruments) at fair value through
profit or loss. (b) Financial assets at fair value through other comprehensive income. (c) Defined benefit liabilities recognised based on the net amount of pension fund assets less
present value of defined benefit obligation. B. The preparation of financial statements in conformity with IFRSs requires the use of certain
critical accounting estimates. It also requires management to exercise its judgement in the process of applying the Group’s accounting policies. The areas involving a higher degree of judgement or complexity, or areas where assumptions and estimates are significant to the consolidated financial statements are disclosed in Note 5.
(3) Basis of consolidation A. Basis for preparation of consolidated financial statements:
(a) All subsidiaries are included in the Group’s consolidated financial statements. Subsidiaries are all entities (including structured entities) controlled by the Group. The Group controls an entity when the Group is exposed, or has rights, to variable returns from its involvement with the entity and has the ability to affect those returns through its power over the entity. Consolidation of subsidiaries begins from the date the Group obtains control of the subsidiaries and ceases when the Group loses control of the subsidiaries.
New Standards, Interpretations and Amendments
Effective date byInternational Accounting
Standards BoardAmendments to IFRS 10 and IAS 28, ‘Sale or contribution of assetsbetween an investor and its associate or joint venture’
To be determined byInternational Accounting
Standards BoardIFRS 17, ‘Insurance contracts’ January 1, 2021Amendments to IAS 1, ‘Classification of liabilities as current or non- January 1, 2022current’

124
(b) Inter-company transactions, balances and unrealized gains or losses on transactions between companies within the Group are eliminated. Accounting policies of subsidiaries have been adjusted where necessary to ensure consistency with the policies adopted by the Group.
(c) Changes in a parent’s ownership interest in a subsidiary that do not result in the parent losing control of the subsidiary (transactions with non-controlling interests) are accounted for as equity transactions, i.e. transactions with owners in their capacity as owners. Any difference between the amount by which the non-controlling interests are adjusted and the fair value of the consideration paid or received is recognised directly in equity.
(d) When the Group loses control of a subsidiary, the Group remeasures any investment retained in the former subsidiary at its fair value. That fair value is regarded as the fair value on initial recognition of a financial asset or the cost on initial recognition of the associate or joint venture. Any difference between fair value and carrying amount is recognised in profit or loss. All amounts previously recognised in other comprehensive income in relation to the subsidiary are reclassified to profit or loss on the same basis as would be required if the related assets or liabilities were disposed of. That is, when the Group loses control of a subsidiary, all gains or losses previously recognised in other comprehensive income in relation to the subsidiary should be reclassified from equity to profit or loss, if such gains or losses would be reclassified to profit or loss when the related assets or liabilities are disposed of.
B. Subsidiaries included in the consolidated financial statements:

125
Main business
Name of investor Name of subsidiaries activities 2019/12/31 2018/12/31 NoteMICRO-STARINTERNATIONALCO., LTD.
MICRO-STAR NETHERLANDS HOLDING B.V. [MSI (HOLDING)]
Investment holdingcompany
100 100 B
〃 MSI COMPUTER CORP. [MSI (LA)]
Sales andmaintenance ofcomputers andelectronic components
100 100 〃
〃 MSI PACIFIC INTERNATIONAL HOLDING CO., LTD. [MSI (PACIFIC)]
Investment holdingcompany
100 100 A
〃 MSI COMPUTER JAPAN CO., LTD. [MSI (JAPAN)]
Sales support andmaintenance ofcomputers andelectroniccomponents
100 100 〃
〃 MSI COMPUTER (AUSTRALIA) PTY. LTD. [MSI (AUSTRALIA)]
Maintenance andafter-sales servicesof computers andelectroniccomponents
100 100 〃
〃 MSI COMPUTER (CAYMAN) CO., LTD. [MSI COMPUTER (CAYMAN)]
Investment holdingcompany
100 100 B
MSI (HOLDING) MYSTAR COMPUTER B.V. [MYSTAR]
Sales support ofcomputers andelectroniccomponents
100 100 〃
〃 MSI TECHNOLOGY GMBH [MSI (GMBH)]
〃 - - E
〃 MSI COMPUTER SARL [MSI (SARL)]
〃 100 100 B
〃 MSI COMPUTER (UK) LTD. [MSI (UK)]
〃 100 100 〃
〃 MSI POLSKA SP. Z O. O. [MSI (POLSKA)]
Sales support andmaintenance andafter-sales servicesof computers andelectroniccomponents
99 99 〃
Ownership(%)

126
Main business
Name of investor Name of subsidiaries activities 2019/12/31 2018/12/31 Note
Ownership(%)
MSI (HOLDING) MSI COMPUTER EUROPE B.V. [MSI (EUROPE)]
Logistics services ofcomputers andelectroniccomponents
100 100 B
〃 LLC MSI COMPUTER [MSI (RUSSIA)]
Sales support andmaintenance ofcomputers andelectroniccomponents
99 99 〃
〃 MSI COMPUTER TECHNOLOGIES LIMITED COMPANY [MSI (TURKEY)]
Sales support ofcomputers andelectroniccomponents
99 99 B and F
〃 MSI ITALY S.R.L. [MSI (ITALY)]
〃 100 100 B
〃 MSI IBERIA S.L. [MSI (IBERIA)]
〃 100 - B and D
MSI (EUROPE) MSI POLSKA SP. Z O. O. [MSI (POLSKA)]
Sales support andmaintenance andafter-sales servicesof computers andelectroniccomponents
1 1 B
〃 LLC MSI COMPUTER [MSI (RUSSIA)]
Sales support andmaintenance ofcomputers andelectroniccomponents
1 1 〃
〃 MSI COMPUTER TECHNOLOGIES LIMITED COMPANY [MSI (TURKEY)]
Sales support ofcomputers andelectroniccomponents
1 1 B and F
MSI (PACIFIC) MSI KOREA CO., LTD. [MSI (KOREA)]
Sales andmaintenance ofcomputers andelectroniccomponents
100 100 B
〃 STAR INFORMATION HOLDING CO., LTD. [STAR INFORMATION]
Investment holdingcompany
100 100 A
〃 MEGA INFORMATION HOLDING CO., LTD. [MEGA INFORMATION]
〃 - 100 C and N

127
Main business
Name of investor Name of subsidiaries activities 2019/12/31 2018/12/31 Note
Ownership(%)
MSI (PACIFIC) MICRO-STAR INTERNATIONAL (B.V.I) HOLDING CO., LTD. [MSI (B.V.I.)]
Investment holdingcompany
100 100 A
〃 MICRO ELECTRONICS HOLDING CO., LTD. [MICRO ELECTRONICS]
〃 100 100 〃
〃 MEGA TECHNOLOGY HOLDING CO., LTD. [MEGA TECHNOLOGY]
〃 100 100 〃
〃 MEGA COMPUTER CO., LTD. [MEGA COMPUTER]
Sales support ofcomputers andelectroniccomponents
100 100 B
〃 MHK INTERNATIONAL CO., LTD. [MSI (MHK)]
〃 100 100 〃
〃 MSI (SHANGHAI) Sales andmaintenance ofcomputers andelectroniccomponents
100 100 A and G
〃 SHENZHEN MEGA INFORMATION CO., LTD. [SHENZHEN MEGA INFORMATION]
Examination andmaintenance ofcomputers, andelectroniccomponents
100 100 A and I
〃 STAR COMPUTER HOLDING CO., LTD. [STAR COMPUTER]
General trade - - J and L
〃 MOSA CO., LTD. [MOSA] 〃 - - 〃
〃 LINKING FUTURE CO., LTD. [LINKING]
〃 - - J and M
MEGAINFORMATION
SHENZHEN MEGA INFORMATION CO., LTD. [SHENZHEN MEGA INFORMATION]
Examination andmaintenance ofcomputers, andelectroniccomponents
- - I

128
Main business
Name of investor Name of subsidiaries activities 2019/12/31 2018/12/31 Note
Ownership(%)
MICROELECTRONICS
MSI ELECTRONICS (KUNGSHAN) CO., LTD. [MSI ELECTRONICS (KUNSHAN)]
Manufacture andmaintenance ofcomputers, andelectroniccomponents
100 100 A
STARINFORMATION
MSI (SHENZHEN) CO., LTD. [MSI SHENZHEN]
Sales andmaintenanceof computers andelectroniccomponents
100 100 〃
MSI (B.V.I.) MSI COMPUTER (SHENZHEN) CO., LTD. [MSI COMPUTER (SHENZHEN)]
Manufacture andmaintenance ofcomputers, andelectroniccomponents
100 100 〃
MEGATECHNOLOGY
MSI COMPUTER TRADING (SHENZHEN) CO., LTD. [MSI TRADING (SHENZHEN)]
Sales andmaintenanceof computers andelectroniccomponents
100 100 〃
〃 RAIDEALS INC. [RAIDEALS]
Sales computersand electroniccomponents
100 100 A and H
STARCOMPUTER
MIDI CO., LTD. General trade - - J and L
MOSA CLICK TRADING CO., LTD.
〃 - - 〃
〃 EASYGOLD TRADING CO., LTD.
〃 - - 〃
〃 MRL TRADING CO., LTD. 〃 - - 〃
〃 BETTER TECHWIDE CO., LTD.
〃 - - 〃
〃 LEAD TREND CO., LTD. 〃 - - 〃
〃 SAILING OCEAN CO., LTD.
〃 - - 〃
〃 MULTI-STAR SHINE CO., LTD.
〃 - - 〃
〃 WIDE RANGE TRADING CO., LTD.
〃 - - 〃
〃 IDEAPLUS TRADING CO., LTD.
〃 - - J and K
〃 MAXWIDE TRADING CO., LTD.
〃 - - 〃
〃 STAR FIRST TRADING CO., LTD.
〃 - - 〃

129
Note A: These investee companies are included in the consolidated financial statement based on their financial statements which were audited by the Group’s independent accountants for the corresponding period.
Note B: There investee companies are included in the consolidated financial statement based on their financial statements which were audited by other independent accountants for the corresponding period.
Note C: As of December 31, 2018, these investee companies are included in the consolidated financial statements based on their financial statements which were audited by the Group’s independent accountants for the correponding period.
Note D: Registration of MSI IBERIA was completed on May 6 , 2019. Thus, it has been included in the consolidated financial statements from that date.
Note E: In November 2018, this subsidiary has completed the liquidation process. Note F: The subsidiary is in the process of liquidation. Note G: MSI (SHANGHAI) received capital infusion from MSI (PACIFIC) on March 7, 2018. Thus,
it has been included in the consolidated financial statements from that date. Note H: RAIDEALS received capital infusion from MEGA TECHNOLOGY on July 2, 2018. Thus,
it has been included in the consolidated financial statements from that date. Note I: SHENZHEN MEGA INFORMATION has completed a shareholder structure change during
the third quarter of 2018. It was changed from its original shareholder of MEGA INFORMATION to MSI (PACIFIC) directly holding the entire equity.
Note J: The company only sets up registration without any capital injection nor has any actual operation.
Note K: On May 1, 2018, this subsidiary has cancelled the registration. Note L: On November 1, 2018, this subsidiary has cancelled the registration. Note M: On June 14, 2019, this subsidiary has cancelled the registration. Note N: On May 1, 2019, this subsidiary has cancelled the registration. C. Subsidiaries not included in the consolidated financial statements: None. D. Adjustments for subsidiaries with different balance sheet dates: None. E. Significant restrictions: None. F. Subsidiaries that have non-controlling interests that are material to the Group: None. (4) Foreign currency translation
Items included in the financial statements of each of the Group’s entities are measured using the currency of the primary economic environment in which the entity operates (the “functional currency”). The consolidated financial statements are presented in New Taiwan Dollars, which is the Company’s functional and the Group’s presentation currency. A. Foreign currency transactions and balances
(a) Foreign currency transactions are translated into the functional currency using the exchange rates prevailing at the dates of the transactions or valuation where items are remeasured. Foreign exchange gains and losses resulting from the settlement of such transactions are recognised in profit or loss in the period in which they arise.
(b) Monetary assets and liabilities denominated in foreign currencies at the period end are re-translated at the exchange rates prevailing at the balance sheet date. Exchange differences arising upon re-translation at the balance sheet date are recognised in profit or loss.
(c) Non-monetary assets and liabilities denominated in foreign currencies held at fair value through profit or loss are re-translated at the exchange rates prevailing at the balance sheet date; their translation differences are recognised in profit or loss. Non-monetary assets and

130
liabilities denominated in foreign currencies held at fair value through other comprehensive income are re-translated at the exchange rates prevailing at the balance sheet date; their translation differences are recognised in other comprehensive income. However, non-monetary assets and liabilities denominated in foreign currencies that are not measured at fair value are translated using the historical exchange rates at the dates of the initial transactions.
(d) All foreign exchange gains and losses are presented in the statement of comprehensive income within ‘other gains and losses’.
B. Translation of foreign operations (a) The operating results and financial position of all the group entities, associates and joint
arrangements that have a functional currency different from the presentation currency are translated into the presentation currency as follows: i. Assets and liabilities for each balance sheet presented are translated at the closing
exchange rate at the date of that balance sheet; ii. Income and expenses for each statement of comprehensive income are translated at
average exchange rates of that period; and iii. All resulting exchange differences are recognised in other comprehensive income.
(b) When the foreign operation partially disposed of or sold is a subsidiary, cumulative exchange differences that were recorded in other comprehensive income are proportionately transferred to the non-controlling interest in this foreign operation. In addition, even when the Group retains partial interest in the former foreign subsidiary after losing control of the former foreign subsidiary, such transactions should be accounted for as disposal of all interest in the foreign operation.
(5) Classification of current and non-current items A. Assets that meet one of the following criteria are classified as current assets; otherwise they are
classified as non-current assets: (a) Assets arising from operating activities that are expected to be realized, or are intended to
be sold or consumed within the normal operating cycle; (b) Assets held mainly for trading purposes; (c) Assets that are expected to be realized within twelve months from the balance sheet date; (d) Cash and cash equivalents, excluding restricted cash and cash equivalents and those that are
to be exchanged or used to settle liabilities more than twelve months after the balance sheet date.
B. Liabilities that meet one of the following criteria are classified as current liabilities; otherwise they are classified as non-current liabilities: (a) Liabilities that are expected to be settle within the normal operating cycle; (b) Liabilities arising mainly from trading activities; (c) Liabilities that are to be settled within twelve months from the balance sheet date; (d) Liabilities for which the repayment date cannot be extended unconditionally to more than
twelve months after the balance sheet date. Terms of a liability that could, at the option of the counterparty, result in its settlement by the issue of equity instruments do not affect its classification.
(6) Cash equivalents Cash equivalents refer to short-term highly liquid investments that readily convert to known amount of cash and subject to an insignificant effect of value of changes in rate. Time deposits and money market fund that meet the definition above and are held for the purpose of meeting

131
short-term cash commitments in operations are classified as cash equivalents. (7) Financial assets at fair value through profit or loss
A. Financial assets at fair value through profit or loss are financial assets that are not measured at amortised cost or fair value through other comprehensive income.
B. On a regular way purchase or sale basis, financial assets at fair value through profit or loss are recognised using trade date accounting.
C. At initial recognition, the Group measures the financial assets at fair value and recognises the transaction costs in profit or loss. The Group subsequently measures the financial assets at fair value, and recognises the gain or loss in profit or loss.
(8) Financial assets at fair value through other comprehensive income A. Financial assets at fair value through over comprehensive in come comprise equity securities
which are not held for trading, and for which the Group has made an irrevocable election at initial recognition to recognize changes in fair value in other comprehensive income and debt instruments which meet all of the following criteria: (a) The objective of the Group’s business model is achieved both by collecting contractual cash
flows and selling financial assets; and (b) The assets’ contractual cash flows represents solely payments of principal and interest.
B. On a regular way purchase or sale basis, financial assets at fair value through other comprehensive income are recognised and derecognised using trade date accounting.
C. At initial recognition, the Group measures the financial assets at fair value plus transaction costs. The Group subsequently measures the financial assets at fair value: The changes in fair value of equity investments that were recognised in other comprehensive income are reclassified to retained earnings and are not reclassified to profit or loss following the derecognition of the investment. Dividends are recognised as revenue when the right to receive payment is established, future economic benefits associated with the dividend will flow to the Group and the amount of the dividend can be measured reliably.
(9) Accounts and notes receivable A. Accounts and notes receivable entitle the Group a legal right to receive consideration in
exchange for transferred goods or rendered services. B. The short-term accounts and notes receivable without bearing interest are subsequently
measured at initial invoice amount as the effect of discounting is immaterial. (10) Impairment of financial assets
For financial assets measured at amortised cost including accounts receivable that have a significant financing component , at each reporting date, the Group recognises the impairment provision for 12 months expected credit losses if there has not been a significant increase in credit risk since initial recognition or recognises the impairment provision for the lifetime expected credit losses (ECLs) if such credit risk has increased since initial recognition after taking into consideration all reasonable and verifiable information that includes forecasts. On the other hand, for accounts receivable or contract assets that do not contain a significant financing component, the Group recognises the impairment provision for lifetime ECLs.
(11) Leasing arrangements (lesser)-Operating leases Payments made under an operating lease (net of any incentives received from the lessor) are recognised in profit or loss on a straight-line basis over the lease term.
(12) Inventories Inventories are stated at the lower of cost and net realizable value. Cost is determined using the weighted-average method. The cost of finished goods and work-in-process comprises raw

132
materials, other direct costs and related production overheads. The item-by-item approach is used in applying the lower of cost and net realizable value. Net realizable value is the estimated selling price in the ordinary course of business, less the estimated cost of completion and applicable variable selling expenses.
(13) Property, plant and equipment A Property, plant and equipment are initially recorded at cost. Borrowing costs incurred during
the construction period are capitalised. B. Subsequent costs are included in the asset’s carrying amount or recognised as a separate asset,
as appropriate, only when it is probable that future economic benefits associated with the item will flow to the Group and the cost of the item can be measured reliably. The carrying amount of the replaced part is derecognised. All other repairs and maintenance are charged to profit or loss during the financial period in which they are incurred.
C. Land is not depreciated. Other property, plant and equipment apply cost model and are depreciated using the straight-line method to allocate their cost over their estimated useful lives. Each part of an item of property, plant, and equipment with a cost that is significant in relation to the total cost of the item must be depreciated separately.
D. The assets’ residual values, useful lives and depreciation methods are reviewed, and adjusted if appropriate, at each balance sheet date. If expectations for the assets’ residual values and useful lives differ from previous estimates or the patterns of consumption of the assets’ future economic benefits embodied in the assets have changed significantly, any change is accounted for as a change in estimate under IAS 8, ‘Accounting Policies, Changes in Accounting Estimates and Errors’, from the date of the change. The estimated useful lives of property, plant and equipment are as follows:
(14) Leasing arrangements (lessee)-right-of-use assets/ lease liabilities
Effective 2019 (modified retrospective approach) A. Leases are recognised as a right-of-use asset and a corresponding lease liability at the date at
which the leased asset is available for use by the Group. For short-term leases or leases of low-value assets, lease payments are recognised as an expense on a straight-line basis over the lease term.
B. Lease liabilities include the net present value of the remaining lease payments at the commencement date, discounted using the incremental borrowing interest rate. Lease payments are mainly fixed payments, less any fixed payments that can be received.
The Group subsequently measures the lease liability at amortised cost using the interest method and recognises interest expense over the lease term. The lease liability is remeasured and the amount of remeasurement is recognised as an adjustment to the right-of-use asset when there are changes in the lease term or lease payments and such changes do not arise from contract modifications.
C. At the commencement date, the right-of-use asset is stated at cost mainly comprising the amount of the initial measurement of lease liability. The right-of-use asset is measured subsequently using the cost model and is depreciated from the commencement date to the earlier of the end of the asset’s useful life or the end of the lease term. When the lease liability is remeasured, the amount of remeasurement is recognised as an
Buildings 5~55 yearsMachinery and equipment 2~10 yearsOther properties (include transportation equipment, office equipment, and leasehold improvements)
2~10 years

133
adjustment to the right-of-use asset. (15) Operating leases (lessee)
Prior to 2018 Payments made under an operating lease (net of any incentives received from the lessor) are recognised in profit or loss on a straight-line basis over the lease term.
(16) Investment property An investment property is stated initially at its cost and measured subsequently using the cost model. Except for land, investment property is depreciated on a straight-line basis over its estimated useful life of 20 years.
(17) Impairment of non-financial assets The Group assesses at each balance sheet date the recoverable amounts of those assets where there is an indication that they are impaired. An impairment loss is recognised for the amount by which the asset’s carrying amount exceeds its recoverable amount. The recoverable amount is the higher of an asset’s fair value less costs to sell or value in use. When the circumstances or reasons for recognizing impairment loss for an asset in prior years no longer exist or diminish, the impairment loss is reversed. The increased carrying amount due to reversal should not be more than what the depreciated or amortised historical cost would have been if the impairment had not been recognised.
(18) Borrowings Borrowings comprise long-term and short-term bank borrowings. Borrowings are recognised initially at fair value, net of transaction costs incurred. Borrowings are subsequently stated at amortised cost; any difference between the proceeds (net of transaction costs) and the redemption value is recognised in profit or loss over the period of the borrowings using the effective interest method.
(19) Notes and accounts payable A. Accounts payable are liabilities for purchases of raw materials, goods or services and notes
payable are those resulting from operating and non-operating activities. B. The short-term notes and accounts payable without bearing interest are subsequently measured
at initial invoice amount as the effect of discounting is immaterial. (20) Financial liabilities at fair value through profit or loss
A. Financial liabilities are classified in this category of held for trading if acquired principally for the purpose of repurchasing in the short-term. Derivatives are also categorized as financial liabilities held for trading unless they are designated as hedges.
B. At initial recognition, the Group measures the financial liabilities at fair value. All related transaction costs are recognized in profit or loss. The Group subsequently measures these financial liabilities at fair value with any gain or loss recognised in profit or loss.
(21) Provisions Provisions of warranties are recognised when the Group has a present legal or constructive obligation as a result of past events, and it is probable that an outflow of economic resources will be required to settle the obligation and the amount of the obligation can be reliably estimated. Provisions are measured at the present value of the expenditures expected to be required to settle the obligation on the balance sheet date, which is discounted using a pre-tax discount rate that reflects the current market assessments of the time value of money and the risks specific to the obligation. When discounting is used, the increase in the provision due to passage of time is recognised as interest expense. Provisions are not recognised for future operating losses.

134
(22) Employee benefits A. Short-term employee benefits
Sort-term employee benefits are measured at the undiscounted amount of the benefits expected to be paid in respect of service rendered by employees, and should be recognized as expense in that period when the employees render service.
B. Pensions (a) Defined contribution plans
For defined contribution plans, the contributions are recognised as pension expense when they are due on an accrual basis. Prepaid contributions are recognised as an asset to the extent of a cash refund or a reduction in the future payments.
(b) Defined benefit plans i. Net obligation under a defined benefit plan is defined as the present value of an amount of
pension benefits that employees will receive on retirement for their services with the Group in current period or prior periods. The liability recognised in the balance sheet in respect of defined benefit pension plans is the present value of the defined benefit obligation at the balance sheet date less the fair value of plan assets, together with adjustments for unrecognised past service costs. The net defined benefit obligation is calculated annually by independent actuaries using the projected unit credit method. The rate used to discount is determined by using interest rates of government bonds (at the balance sheet date).
ii. Remeasurement arising on defined benefit plans are recognised in other comprehensive income in the period in which they arise and are recorded as retained earnings.
iii. Past service costs are recognised immediately in profit or loss. C. Termination benefits
Termination benefits are employee benefits provided in exchange for the termination of employment as a result from either the Group’s decision to terminate an employee’s employment before the normal retirement date, or an employee’s decision to accept an offer of redundancy benefits in exchange for the termination of employment. The Group recognizes expense as it can no longer withdraw an offer of termination benefits or it recognises relating restructuring costs, whichever is earlier. Benefits that are expected to be due more than 12 months after balance sheet date shall be discounted to their present value.
D. Employees’ compensation and directors’ and supervisors’ remuneration Employees’ remuneration and directors’ and supervisors’ remuneration are recognised as expense and liability, provided that such recognition is required under legal or constructive obligation and those amounts can be reliably estimated. Any difference between the resolved amounts and the subsequently actual distributed amounts is accounted for as changes in estimates. If employee compensation is distributed by shares, the Group calculates the number of shares based on the closing price at the previous day of the board meeting resolution.
(23) Income tax A. The tax expense for the period comprises current and deferred tax. Tax is recognised in profit or
loss, except to the extent that it relates to items recognised in other comprehensive income or items recognised directly in equity, in which cases the tax is recognised in other comprehensive income or equity.
B. The current income tax expense is calculated on the basis of the tax laws enacted or substantively enacted at the balance sheet date in the countries where the Group and its subsidiaries operate and generate taxable income. Management periodically evaluates positions

135
taken in tax returns with respect to situations in accordance with applicable tax regulations. It establishes provisions where appropriate based on the amounts expected to be paid to the tax authorities. An additional tax is levied on the unappropriated retained earnings and is recorded as income tax expense in the year the stockholders resolve to retain the earnings.
C. Deferred income tax is recognised, using the balance sheet liability method, on temporary differences arising between the tax bases of assets and liabilities and their carrying amounts in the consolidated balance sheet. However, the deferred income tax is not accounted for if it arises from initial recognition of goodwill or of an asset or liability in a transaction other than a business combination that at the time of the transaction affects neither accounting nor taxable profit or loss. Deferred income tax is provided on temporary differences arising on investments in subsidiaries, except where the timing of the reversal of the temporary difference is controlled by the Group and it is probable that the temporary difference will not reverse in the foreseeable future. Deferred income tax is determined using tax rates (and laws) that have been enacted or substantially enacted by the balance sheet date and are expected to apply when the related deferred income tax asset is realised or the deferred income tax liability is settled.
D. Deferred income tax assets are recognised only to the extent that it is probable that future taxable profit will be available against which the temporary differences can be utilised. At each balance sheet date, unrecognised and recognised deferred income tax assets are reassessed.
E. Current income tax assets and liabilities are offset and the net amount reported in the balance sheet when there is a legally enforceable right to offset the recognised amounts and there is an intention to settle on a net basis or realise the asset and settle the liability simultaneously. Deferred income tax assets and liabilities are offset on the balance sheet when the entity has the legally enforceable right to offset current tax assets against current tax liabilities and they are levied by the same taxation authority on either the same entity or different entities that intend to settle on a net basis or realise the asset and settle the liability simultaneously.
(24) Share capital Ordinary shares are classified as equity. Incremental costs directly attributable to the issue of new shares or stock options are shown in equity as a deduction, net of tax, from the proceeds.
(25) Dividends Dividends are recorded in the Company’s financial statements in the period in which they are approved by the Company’s shareholders. Cash dividends are recorded as liabilities.
(26) Revenue recognition A. Sales of goods
(a) The Group manufactures and sells motherboards, graphic cards, a variety of computer hardware, and electronic components. Sales are recognised when control of the products has transferred, being when the products are delivered to the customer, the customer has full discretion over the channel and price to sell the products, and there is no unfulfilled obligation that could affect the customer’s acceptance of the products. Delivery occurs when the products have been shipped to the specific location, the risks of obsolescence and loss have been transferred to the customer, and either the customer has accepted the products in accordance with the sales contract, or the Group has objective evidence that all criteria for acceptance have been satisfied.
(b) Revenue from the products is recognised based on the price specified in the contract, net of the estimated value added tax, returns and volume discounts and rebates. The volume discounts to the customers are estimated based on the anticipated annual sales quantities and the right of return for defective products is estimated on the basis of historical experience.

136
Revenue is only recognised to the extent that it is highly probable that a significant reversal will not occur. The estimation is subject to an assessment at each reporting date. A refund liability is recognised for expected volume discounts payable to customers in relation to sales made until the end of the reporting period. The period between the transfer of the promised goods or services to the customer and payment by the customer does not exceed one year. As a result, the Group does not adjust any of the transaction prices for the time value of money.
(c) The Group’s obligation to provide a refund for faulty products under the standard warranty terms is recognised as a provision.
(d) A receivable is recognised when the goods are delivered as this is the point in time that the consideration is unconditional because only the passage of time is required before the payment is due.
B. Incremental costs of obtaining a contract Given that the contractual period lasts less than one year, the Group recognises the incremental costs of obtaining a contract as an expense when incurred although the Group expects to recover those costs.
(27) Operating segments Operating segments are reported in a manner consistent with the internal reporting provided to the chief operating decision-maker. The chief operating decision-maker is responsible for allocating resources and assessing performance of the operating segments.
5. CRITICAL ACCOUNTING JUDGEMENTS, ESTIMATES AND KEY SOURCES OF ASSUMPTION UNCERTAINTY The preparation of these consolidated financial statements requires management to make critical judgements in applying the Group’s accounting policies and make critical assumptions and estimates concerning future events. Assumptions and estimates may differ from the actual results and are continually evaluated and adjusted based on historical experience and other factors. The information is addressed below:
(1) Critical judgements in applying the Group’s accounting policies None.
(2) Critical accounting estimates and assumptions Evaluation of inventories As inventories are stated at the lower of cost and net realisable value, the Group must determine the net realisable value of inventories on balance sheet date using judgements and estimates. Due to the rapid technology innovation, the Group evaluates the amounts of normal inventory consumption, obsolete inventories or inventories without market selling value on balance sheet date, and writes down the cost of inventories to the net realisable value. Such an evaluation of inventories is principally based on the demand for the products within the specified period in the future. Therefore, there might be material changes to the evaluation. As of December 31, 2019, the carrying amount of inventories was $22,527,840.
6. DETAILS OF SIGNIFICANT ACCOUNTS (1) Cash and cash equivalents

137
A. The Group transacts with a variety of financial institutions all with high credit quality to
disperse credit risk, so it expects that the probability of counterparty default is remote. B. As of December 31, 2019 and 2018, cash and cash equivalents amounting to $100,244 and
$69,316, respectively, were pledged to others as collateral and classified as other non-current financial assets.
(2) Financial assets and liabilities at fair value through profit or loss - current
A. The Group recognised net (loss) gain of ($5,089) and $70,334 on financial assets held for
trading for the years ended December 31, 2019 and 2018, respectively. B. The Group entered into contract related to derivative financial asset and liabilities which was not
accounted with Hedge Accounting and contract information are as follows:
December 31, 2019 December 31, 2018Cash on hand and petty cash 4,210$ 4,007$ Checking accounts and demand deposits 9,651,879 6,827,542 Time deposits 1,178,795 1,984,131 Total 10,834,884$ 8,815,680$
Asset items December 31, 2019 December 31, 2018Financial assets mandatorily measured at fair value through profit or loss
Stock of publicly traded or listed companies 119,571$ 125,303$ Derivatives – Forward exchange contract 3,660 6,376 Derivatives – Foreign exchange swap 52,981 7,956
176,212 139,635 Evaluation adjustment 23,407)( 41,235)( Total 152,805$ 98,400$
Liability items December 31, 2019 December 31, 2018Financial liabilities held for trading Derivatives – Forward exchange contract 24,943$ 5,555$
Contract Amount
Derivative Financial Assets Notional Principal
(In thousands) Contract periodForward exchange contracts EUR 2,000 2019.10.21~2020.02.10
〃 GBP 500 2019.12.09~2020.02.18〃 KRW 1,156,000 2019.12.30~2020.01.15〃 SEK 4,650 2019.12.30~2020.02.10〃 JPY 216,310 2019.12.04~2020.02.03
Foreign exchange swap USD 94,000 2019.11.07~2020.02.24〃 CNY 473,584 2019.08.14~2020.05.18
December 31, 2019

138
The Group entered into forward foreign exchange contracts to hedge exchange risk. However, these forward foreign exchange contracts are not accounted for under hedge accounting.
C. The Group has no financial assets at fair value through profit or loss pledged to others. D. Information relating to financial assets at fair value through other comprehensive income is
provided in Note 12(2)(3). (3) Financial assets at fair value through other comprehensive income
A. The Group has elected to classify equity instruments that are considered to be strategic
investments as financial assets at fair value through other comprehensive income. The fair value of such investments amounted to $151,975 at December 31, 2019.
Contract Amount
Derivative Financial Liabilities Notional Principal
(In thousands) Contract periodForward exchange contracts CAD 8,000 2019.10.21~2020.03.24
〃 RUB 224,291 2019.12.05~2020.01.16〃 EUR 44,000 2019.10.15~2020.04.08〃 SEK 2,852 2019.12.03~2020.01.08〃 GBP 5,500 2019.10.17~2020.02.18〃 AUD 6,500 2019.10.31~2020.02.24
Contract Amount
Derivative Financial Assets Notional Principal
(In thousands) Contract periodForward exchange contracts EUR 6,000 2018.11.20~2019.01.08
〃 GBP 3,500 2018.10.22~2019.02.01〃 AUD 4,200 2018.11.01~2019.02.01
Foreign exchange swap USD 158,000 2018.11.15~2019.02.25
Contract Amount
Derivative Financial Liabilities Notional Principal
(In thousands) Contract periodForward exchange contracts JPY 381,282 2018.11.19~2019.02.01
〃 EUR 24,000 2018.11.29~2019.02.11〃 GBP 1,300 2018.12.20~2019.01.24
December 31, 2018
December 31, 2019
December 31, 2018
Items December 31, 2019
Non-current items:
Equity instruments Unlisted stocks 151,975$ Valuation adjustment -
Total 151,975$

139
B. As at December 31, 2019, without taking into account any collateral held or other credit enhancements, the maximum exposure to credit risk in respect of the amount that best represents the financial assets at fair value through other comprehensive income held by the Group was $151,975.
C. The Group has no financial assets at fair value through other comprehensive income pledged to others as collateral.
D. Information relating to credit risk of financial assets at fair value through other comprehensive income is provided in Note 12(2)(3).
(4) Accounts receivable
A. The ageing analysis of accounts receivable and notes receivable:
The above ageing analysis was based on past due date.
B. As of December 31, 2019 and 2018, accounts receivable and notes receivable were all from contracts with customers. And as of January 1, 2018, the balance of receivables from contracts with customers amounted to $15,108,124.
C. Most of the Group’s accounts receivable have been insured or have collateral as security, and the Group will be able to obtain insurance claims or enforce a collateral in case these accounts default.
D. As of December 31, 2019 and 2018, without taking into account any collateral held or other credit enhancements, the maximum exposure to credit risk in respect of the amount that best represents the Group’s notes and accounts receivable were $47,114 and $35,183;$17,205,783 and $16,040,189, respectively.
E. Information relating to credit risk of accounts receivable and notes receivable is provided in Note 12(2).
(5) Inventories
December 31, 2019 December 31, 2018
Notes receivable 47,114$ 35,183$ Accounts receivable 17,237,493$ 16,059,595$ Less: Allowance for doubtful accounts 31,710)( 19,406)(
17,205,783$ 16,040,189$
Accounts Notes Accounts Notes receivable receivable receivable receivable
Not past due 14,068,801$ 47,114$ 12,943,013$ 35,183$
1 to 75 days 3,044,781 - 3,078,726 -
76 to 365 days 120,008 - 37,097 -
Over 365 days 3,903 - 759 -
17,237,493$ 47,114$ 16,059,595$ 35,183$
December 31, 2019 December 31, 2018

140
The cost of inventories recognised as expense for the period:
The Group reversed from a previous inventory write-down and accounted for as reduction of cost of goods sold because parts of inventories which were recognized as expense have been sold in 2019.
(6) Prepayments
(7) Property, plant and equipment
Cost
Allowance forvaluation loss Book value
Raw material 6,579,127$ 130,049)($ 6,449,078$ Work-in-process 1,378,828 1,311)( 1,377,517 Finished goods 15,104,505 403,260)( 14,701,245
23,062,460$ 534,620)($ 22,527,840$
Cost
Allowance forvaluation loss Book value
Raw material 7,536,411$ 325,737)($ 7,210,674$ Work-in-process 1,343,677 1,987)( 1,341,690 Finished goods 13,904,487 403,989)( 13,500,498
22,784,575$ 731,713)($ 22,052,862$
December 31, 2018
December 31, 2019
2019 2018Cost of inventories recognised as expense 104,629,261$ 102,397,587$ (Gains on reversal of decline) losses on decline in market value 191,805)( 392,240
December 31, 2019 December 31, 2018Overpaid tax for offsetting the future tax payable 922,464$ 780,088$ Office supplies 490,408 364,726 Prepayment for goods 30,266 20,507 Others 232,563 215,701
1,675,701$ 1,381,022$
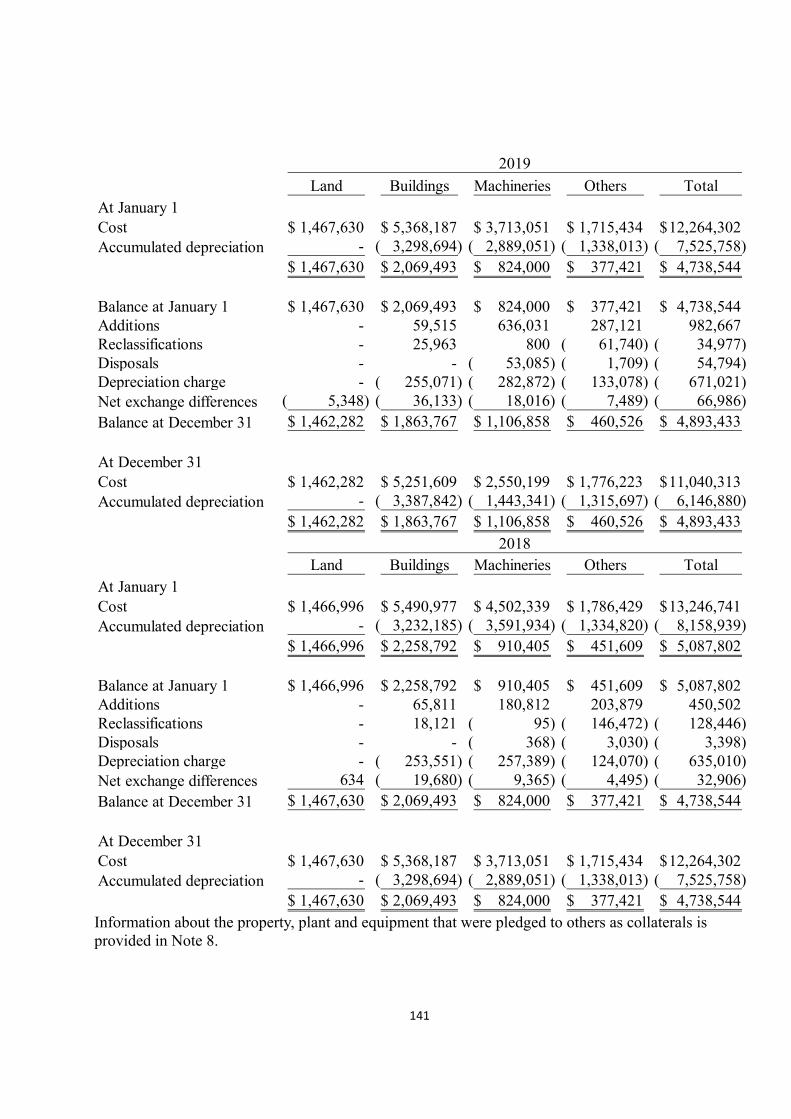
141
Information about the property, plant and equipment that were pledged to others as collaterals is provided in Note 8.
Land Buildings Machineries Others TotalAt January 1Cost 1,467,630$ 5,368,187$ 3,713,051$ 1,715,434$ 12,264,302$ Accumulated depreciation - 3,298,694)( 2,889,051)( 1,338,013)( 7,525,758)(
1,467,630$ 2,069,493$ 824,000$ 377,421$ 4,738,544$
Balance at January 1 1,467,630$ 2,069,493$ 824,000$ 377,421$ 4,738,544$ Additions - 59,515 636,031 287,121 982,667 Reclassifications - 25,963 800 61,740)( 34,977)( Disposals - - 53,085)( 1,709)( 54,794)( Depreciation charge - 255,071)( 282,872)( 133,078)( 671,021)( Net exchange differences 5,348)( 36,133)( 18,016)( 7,489)( 66,986)( Balance at December 31 1,462,282$ 1,863,767$ 1,106,858$ 460,526$ 4,893,433$
At December 31Cost 1,462,282$ 5,251,609$ 2,550,199$ 1,776,223$ 11,040,313$ Accumulated depreciation - 3,387,842)( 1,443,341)( 1,315,697)( 6,146,880)(
1,462,282$ 1,863,767$ 1,106,858$ 460,526$ 4,893,433$
2019
Land Buildings Machineries Others TotalAt January 1Cost 1,466,996$ 5,490,977$ 4,502,339$ 1,786,429$ 13,246,741$ Accumulated depreciation - 3,232,185)( 3,591,934)( 1,334,820)( 8,158,939)(
1,466,996$ 2,258,792$ 910,405$ 451,609$ 5,087,802$
Balance at January 1 1,466,996$ 2,258,792$ 910,405$ 451,609$ 5,087,802$ Additions - 65,811 180,812 203,879 450,502 Reclassifications - 18,121 95)( 146,472)( 128,446)( Disposals - - 368)( 3,030)( 3,398)( Depreciation charge - 253,551)( 257,389)( 124,070)( 635,010)( Net exchange differences 634 19,680)( 9,365)( 4,495)( 32,906)( Balance at December 31 1,467,630$ 2,069,493$ 824,000$ 377,421$ 4,738,544$
At December 31Cost 1,467,630$ 5,368,187$ 3,713,051$ 1,715,434$ 12,264,302$ Accumulated depreciation - 3,298,694)( 2,889,051)( 1,338,013)( 7,525,758)(
1,467,630$ 2,069,493$ 824,000$ 377,421$ 4,738,544$
2018

142
(8)Leasing arrangements-lessee Effective 2019 (modified retrospective approach) A. The Group leases various assets including land, buildings, machinery and equipment, and other
equipment. Rental contracts are typically made for periods of 2 months to 10 years. Lease terms are negotiated on an individual basis and contain a wide range of different terms and conditions. The lease agreements do not impose covenants, but leased assets may not be used as security for borrowing purposes.
B. The carrying amount of right-of-use assets and the depreciation charge are as follows:
C. For the year ended December 31, 2019, the additions to right-of-use assets were $290,570. D. The information on profit and loss accounts relating to lease contracts is as follows:
E. For the year ended December 31, 2019, the Group’s total cash outflow for leases were $248,697.
(9) Leasing arrangements – lessor A. The Group recognised rental income of $ 116,675 and $ 97,487 based on operating lease contracts
in year 2019 and 2018, respectively. None of these included variable lease payments.. B. B. The maturity analysis of the undiscounted lease payments in the operating lease is as follows:
C. The maturity analysis of the undiscounted lease payments in the operating lease is as follows:
December 31, 2019 2019Carrying amount Depreciation charge
Land 70,355$ 8,809$ Buildings 361,312 132,799Machinery and equipment 6,717 2,433 Other equipment 36,513 20,153
474,897$ 164,194$
#VALUE! 2019Items affecting profit or lossInterest expense on lease liabilities $ 1,489 $ 6,450Expense on leases of low-value and short-term assets 31,713 52,040 Expense on variable lease payments 8,916 37,443
2019 2018
Rental income 116,675$ 97,487$
December 31, 2019 December 31, 2018
Year 2020 $ 71,211 Year 2019 $ 81,544 After year 2021 61,051 After year 2020 79,990 Total 132,262$ Total 161,534$

143
(10) Investment property
2019Buildings
At January 1Cost 1,129,777$ Accumulated depreciation 788,536)(
341,241$
Balance at January 1 341,241$ Additions 3,602 Reclassifications 21,319 Depreciation charge 54,841)( Net exchange differences 10,762)(
Balance at December 31 300,559$
At December 31Cost 1,167,190$ Accumulated depreciation 866,631)(
300,559$
2018Buildings
At January 1Cost 957,443$ Accumulated depreciation 619,551)(
337,892$
Balance at January 1 337,892$ Additions 2,409 Reclassifications 57,691 Depreciation charge 50,775)( Net exchange differences 5,976)(
Balance at December 31 341,241$
At December 31Cost 1,129,777$ Accumulated depreciation 788,536)(
341,241$

144
A. Rental income from the lease of the investment and direct operating expenses arising from the investment property:
B. As of December 31, 2019 and 2018, the fair value of the Group’s investments in property
amounting to $3,403,426 and $2,484,968, respectively, as derived from market prices in the nearby area, are included in Level 2.
(11) Long-term prepaid rents (shown as ‘Other non-current assets’)
A. A subsidiary of the Group signed a land use right contract with the Ministry of Land and
Resources of the People's Republic of China for the use of the land at Kunshan City and Shenzhen City with a term of 50 years. The Group recognized rental expenses of $8,986 for the year ended December 31, 2018.
B. The Group applied IFRS 16 for the first time on January 1, 2019. For the impact of its application, please refer to Note 3(1). For the details of significant accounts, please refer to Note 6(8).
(12) Short-term borrowings
(13) Other payables
2019 2018Rental income from the lease of the investment property 116,675$ 97,487$ Direct operating expenses arising from the investment property 76,351$ 69,936$
December 31, 2018
Land use right 81,899$
Type of borrowings December 31, 2019 Interest rate range Collateral
Bank borrowings Bank unsecured borrowings 1,500,000$ 0.88%~0.90% None
Type of borrowings December 31, 2018 Interest rate range Collateral
Bank borrowings Bank unsecured borrowings 3,000,000$ 0.94%~0.99% None
December 31, 2019 December 31, 2018Accrued salary and bonus 1,303,131$ 1,319,253$ Directors’ and supervisors’ remuneration and employees’ bonus 554,500 564,500 Accrued freight 617,251 502,979 Advertising expenses payable 355,107 273,429 Accrued molding expense 217,077 164,846 Other accrued expenses 797,769 593,243
3,844,835$ 3,418,250$

145
(14) Long-term borrowings
(15) Pensions
A. (a) The Company has a defined benefit pension plan in accordance with the Labor Standards Law, covering all regular employees’ service years prior to the enforcement of the Labor Pension Act on July 1, 2005 and service years thereafter of employees who chose to continue to be subject to the pension mechanism under the Law. Under the defined benefit pension plan, two units are accrued for each year of service for the first 15 years and one unit for each additional year thereafter, subject to a maximum of 45 units. Pension benefits are based on the number of units accrued and the average monthly salaries and wages of the last 6 months prior to retirement. The Company and its domestic subsidiaries contribute monthly an amount equal to 2% of the employees’ monthly salaries and wages to the retirement fund deposited with Bank of Taiwan, the trustee, under the name of the independent retirement fund committee. Also, the Company would assess the balance in the aforementioned labor pension reserve account by December 31, every year. If the account balance is insufficient to pay the pension calculated by the aforementioned method to the employees expected to qualify for retirement in the following year, the Company will make contributions for the deficit by next March.
Borrowing period and Type of borrowings repayment term Interest rate range Collateral December 31, 2019Long-term bankborrowings Secured borrowings
Starting from March24, 2016 to March 24,2021, repayment ofprincipal and interest ofUSD 4,307.77 monthlyand remaining principalon the due date.
Three month LIBOR plus 1.75%
Land andBuilding
16,026$
Less: current portion 931)( 15,095$
Borrowing period and Type of borrowings repayment term Interest rate range Collateral December 31, 2018Long-term bankborrowings Secured borrowings
Starting from March24, 2016 to March 24,2021, repayment ofprincipal and interest ofUSD 4,307.77 monthlyand remaining principalon the due date.
Three month LIBOR plus 1.75%
Land andBuilding
17,282$
Less: current portion 840)( 16,442$

146
(b) The amounts recognised in the balance sheet are as follows:
(c) Movements in net defined benefit liabilities are as follows:
December 31, 2019 December 31, 2018Present value of defined benefit obligations 524,869$ 502,487$ Fair value of plan assets 302,895)( 284,878)( Net defined benefit liability 221,974$ 217,609$
Present value ofdefined benefit
obligations
Fair value ofplan
assetsNet defined
benefit liability
2019Balance at January 1 502,487$ 284,878)($ 217,609$ Current service cost 3,710 - 3,710 Interest (expense) income 5,025 2,849)( 2,176
511,222 287,727)( 223,495
Remeasurements:Return on plan assets (excluding amounts included in interestincome or expense) - 9,912)( 9,912)( Change in financial assumptions 15,767 - 15,767 Experience adjustments 4,224 - 4,224
19,991 9,912)( 10,079 Pension fund contribution - 11,600)( 11,600)( Paid pension 6,344)( 6,344 -
Balance at December 31 524,869$ 302,895)($ 221,974$

147
(d) The Bank of Taiwan was commissioned to manage the Fund of the Company’s defined benefit
pension plan in accordance with the Fund’s annual investment and utilisation plan and the “Regulations for Revenues, Expenditures, Safeguard and Utilisation of the Labor Retirement Fund” (Article 6: The scope of utilisation for the Fund includes deposit in domestic or foreign financial institutions, investment in domestic or foreign listed, over-the-counter, or private placement equity securities, investment in domestic or foreign real estate securitization products, etc.). With regard to the utilisation of the Fund, its minimum earnings in the annual distributions on the final financial statements shall be no less than the earnings attainable from the amounts accrued from two-year time deposits with the interest rates offered by local banks. If the earnings is less than aforementioned rates, government shall make payment for the deficit after being authorized by the Regulator. The Company and its domestic subsidiaries have no right to participate in managing and operating that fund and hence the Company and its domestic subsidiaries are unable to disclose the classification of plan assets fair value in accordance with IAS 19 paragraph 142. The composition of fair value of plan assets as of December 31, 2019 and 2018 is given in the Annual Labor Retirement Fund Utilisation Report announced by the government.
(e) The principal actuarial assumptions used were as follows:
Assumptions regarding future mortality experience are set based on the fifth round of empirical life tables of the Taiwan life insurance industry. Because the main actuarial assumption changed, the present value of defined benefit obligation is affected. The analysis was as follows:
Present value ofdefined benefit
obligations
Fair value ofplan
assetsNet defined
benefit liability
2018Balance at January 1 470,631$ 267,874)($ 202,757$ Current service cost 2,764 - 2,764 Interest (expense) income 5,177 2,947)( 2,230
478,572 270,821)( 207,751
Remeasurements:Return on plan assets (excluding amounts included in interestincome or expense) - 7,679)( 7,679)( Change in financial assumptions 5,335 - 5,335 Experience adjustments 23,774 - 23,774
29,109 7,679)( 21,430 Pension fund contribution - 11,572)( 11,572)( Paid pension 5,194)( 5,194 -
Balance at December 31 502,487$ 284,878)($ 217,609$
2019 2018Discount rate 0.70% 1.00%Future salary increases 2.75% 2.75%

148
The sensitivity analysis above is based on one assumption which changed while the other conditions remain unchanged. In practice, more than one assumption may change all at once. The method of analysing sensitivity and the method of calculating net pension liability in the balance sheet are the same. The methods and types of assumptions used in preparing the sensitivity analysis did not change compared to the previous period.
(f) Expected contributions to the defined benefit pension plans of the Group for the year ending December 31, 2020 amount to $11,628.
(g) As of December 31, 2019, the weighted average duration of the retirement plan is 11 years. The analysis of timing of the future pension payment was as follows:
B. (a) Effective July 1, 2005, the Company has established a defined
contribution pension plan (the “New Plan”) under the Labor Pension Act (the “Act”), covering all regular employees with R.O.C. nationality. Under the New Plan, the Company contribute monthly an amount based on 6% of the employees’ monthly salaries and wages to the employees’ individual pension accounts at the Bureau of Labor Insurance. The benefits accrued are paid monthly or in lump sum upon termination of employment.
(b) The Company’s mainland China subsidiaries have a defined contribution plan. Monthly contributions to an independent fund administered by the government in accordance with the pension regulations in the People’s Republic of China (PRC) are based on certain percentage of employees’ monthly salaries and wages. Other than the monthly contributions, the Group has no further obligations.
(c) The pension costs under defined contribution pension plans of the Group for the years ended December 31, 2019 and 2018, were $279,412 and $262,954, respectively.
Increase 0.25% Decrease 0.25% Increase 0.25% Decrease 0.25%December 31, 2019Effect on present value ofdefined benefit obligation 13,187)($ 13,680$ 12,065$ 11,713)($ December 31, 2018Effect on present value ofdefined benefit obligation 13,186)($ 13,699$ 12,176$ 11,802)($
Discount rate Future salary increases
Within 1 year 28,485$ 1-2 year(s) 32,316 2-3 years 35,314 3-4 years 26,862 4-5 years 24,649 6-10 years 134,261 Over 10 years 282,604
564,491$

149
(16) Provisions for liabilities
Analysis of total provisions:
The Group gives warranties on computer components and personal computers sold. Provision for warranty is estimated based on historical warranty data.
(17) Share capital As of December 31, 2019, the Company’s authorized capital was $15,000,000 (including 80,000 thousand shares reserved for employee stock options and 150,000 thousand shares reserved for convertible bonds issued by the Company), and the paid-in capital was $8,448,562 with a par value of $10 (in dollars) per share. All proceeds from shares issued have been collected.
(18) Capital surplus Pursuant to the R.O.C. Company Act, capital surplus arising from paid-in capital in excess of par value on issuance of common stocks and donations can be used to cover accumulated deficit or to issue new stocks or cash to shareholders in proportion to their share ownership, provided that the Company has no accumulated deficit. Further, the R.O.C. Securities and Exchange Law requires that the amount of capital surplus to be capitalised mentioned above should not exceed 10% of the paid-in capital each year. Capital surplus should not be used to cover accumulated deficit unless the legal reserve is insufficient.
(19) Retained earnings A. Under the Company's Articles of Incorporation, the current year's earnings, if any, shall first be
used to pay all taxes and offset prior year's operating losses, then 10% of the remaining amount shall be set aside or reversed as legal reserve. The balance plus unappropriated retained earnings at the beginning of the period shall be appropriated 10%~90% as proposed by the Board of Directors and resolved by the stockholders during their meeting.
B. The Company’s dividend policy is summarized below: as the Company operates in a volatile business environment and is in the stable growth stage, except for the Company’s future expansion plans, stockholders’ interest is taken into consideration. The Group appropriated dividends in proportion to total number of shares, dividends could be distributed in stock or cash, and cash dividends shall account for at least 30% of the total dividends distributed.
C. Except for covering accumulated deficit or issuing new stocks or cash to shareholders in proportion to their share ownership, the legal reserve shall not be used for any other purpose. The use of legal reserve for the issuance of stocks or cash to shareholders in proportion to their share ownership is permitted, provided that the distribution of the reserve is limited to the portion in excess of 25% of the Company’s paid-in capital.
D. (a) In accordance with the regulations, the Company shall set aside special reserve from the debit balance on other equity items at the balance sheet date before distributing earnings. When debit balance on other equity items is reversed subsequently, the reversed amount could be included
Warranty 2019 2018
At January 1 501,095$ 454,744$ Additional provisions 748,955 680,895 Used during the period 693,294)( 634,589)( Exchange differences 36)( 45
At December 31 556,720$ 501,095$
December 31, 2019 December 31, 2018
Current 556,720$ 501,095$

150
in the distributable earnings. (b) The amounts previously set aside by the Company as special reserve on initial application of
IFRSs in accordance with Jin-Guan-Zheng-Fa-Zi Letter No. 1010012865, dated April 6, 2012, shall be reversed proportionately when the relevant assets are used, disposed of or reclassified subsequently. Such amounts are reversed upon disposal or reclassified if the assets are investment property of land, and reversed over the use period if the assets are investment property other than land.
E. The appropriations of 2018 and 2017 earnings had been resolved at the stockholders’ meeting on June 14, 2019 and June 15, 2018, respectively, were as follows:
The cash dividends of the Company from capital surplus has been approved by the stockholders on June 14, 2019 amount to $422,429. The appropriation of 2018 earnings as approved by the stockholders is the same as with the appropriation resolved by the Board of Directors during its meeting on April 30, 2019. Information about earnings appropriation of the Company as resolved by Board of Directors will be posted in the “Market Observation Post System” at the website of the Taiwan Stock Exchange.
F. For the information relating to employees’ compensation and directors’ and supervisors’ remuneration, please refer to Note 6(24).
(20) Operating revenue The Group derives revenue from the transfer of goods at a point in time in the following major segment:
(21) Other income
Amount
Dividends pershare (dollar) Amount
Dividends pershare (dollar)
Legal reserve 604,113$ 493,742$ Special reserve 84,151 32,333 Cash dividend 3,801,853 4.50$ 3,801,852 4.50$
20172018
2019 Computer and
peripherals segment Other Total
Total segment revenue 120,486,414$ 5,003$ 120,491,417$
Timing of revenue recognitionAt a point in time 120,486,414$ 5,003$ 120,491,417$
2018 Computer and
peripherals segment Other Total
Total segment revenue 118,523,473$ 3,800$ 118,527,273$
Timing of revenue recognitionAt a point in time 118,523,473$ 3,800$ 118,527,273$
2019 2018
Rental revenue 116,675$ 97,487$
Interest income 82,368 88,788
Others 516,240 469,458
Total 715,283$ 655,733$

151
(22) Other gains and losses
(23) Expenses by nature
(24) Employee benefit expense
A. According to the Articles of Incorporation of the Company, a ratio of distributable profit of the
current year, after covering accumulated losses, shall be distributed as employees’ compensation and directors’ remuneration. The ratio shall be 6%~10% for employees’ compensation and shall not be higher than 1% for directors’ remuneration.
B. For the years ended December 31, 2019 and 2018, employees’ remuneration was accrued at $505,000 and $515,000, respectively; while directors’ remuneration was accrued at $49,500 and $49,500, respectively. The aforementioned amounts were recognized in salary expenses respectively. The employees’ compensation and directors’ remuneration were estimated and accrued based on the historical distribution ratio and the profit of the current year for the year ended December 31, 2019. Employees’ compensation and directors’ remuneration of 2018 as resolved at the meeting of Board of Directors were in agreement with those amounts recognized in the 2018 financial statements. Information about employees’ compensation and directors’ remuneration of the Company as resolved by the Board of Directors and shareholders will be posted in the “Market Observation Post System” website of the Taiwan Stock Exchange.
(25) Income tax A. Income tax expense
(a) Components of income tax expense:
2019 2018(Losses) gains on financial assets and liabilities at fair value through profit or loss 5,089)($ 70,334$ Net gains on disposal of property, plant and equipment 2,906 46,913 Net currency exchange losses 34,836)( 185,053)( Other losses 88,691)( 114,335)( Total 125,710)($ 182,141)($
Operating costs Operating Expense Total Operating costs Operating Expense Total
Employee benefitexpense 2,270,444$ 4,977,124$ 7,247,568$ 2,201,288$ 4,858,915$ 7,060,203$ Depreciation charges onproperty, plantand equipment 531,806 358,250 890,056 477,940 207,845 685,785
Amortization charges 201 23 224 8,226 962 9,188
By function
By nature
2019 2018
2019 2018
Wages and salaries 6,241,522$ 6,090,327$ Labor and health insurance fees 396,369 378,343 Pension costs 285,297 267,948 Other personnel expenses 324,380 323,585
Total 7,247,568$ 7,060,203$

152
(b) The income tax charge relating to components of other comprehensive income:
B. Reconciliation between income tax expense and accounting profit
Note: The basis for computing the applicable tax rate are the rates applicable in the respective countries where the Group entities operate.
C. Amounts of deferred tax assets or liabilities as a result of temporary differences, tax losses and investment tax credits are as follows:
2019 2018Current tax:Current tax on profits for the period 1,076,139$ 1,374,017$ Prior year income tax overestimation 138,530)( 167,618)( Total current tax 937,609 1,206,399 Deferred tax:Origination and reversal of temporary differences 6,386)( 118,020)( Impact of change in tax rate - 21,626 Total deferred tax 6,386)( 96,394)( Income tax expense 931,223$ 1,110,005$
2019 2018Remeasurement of defined benefit obligations 2,016$ 4,286$ Impact of change in tax rate - 4,175
2,016$ 8,461$
2019 2018Tax calculated based on profit before tax and statutory tax rate (Note)
1,409,440$ 1,525,635$
Effect from items disallowed by tax regulation 2,886 6,086 Temporary differences not recognised as deferred taxliabilities
137,196)( 83,280)(
Effect from investment tax credits 282,279)( 250,279)( Prior year income tax overestimation 138,530)( 167,618)( Additional 10% tax on undistributed earnings 76,902 57,835 Impact of change in tax rate - 21,626 Income tax expense 931,223$ 1,110,005$
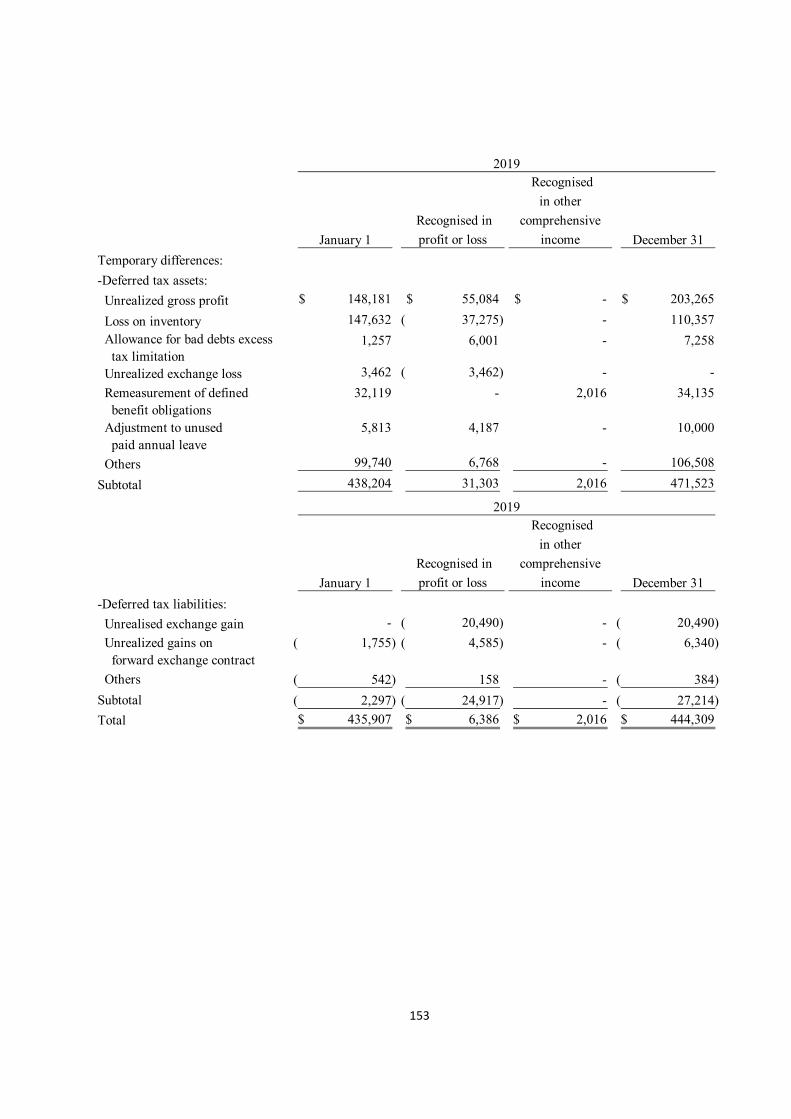
153
January 1
Recognised in
profit or loss
Recognised
in other
comprehensive
income December 31
Temporary differences:
-Deferred tax assets:
Unrealized gross profit 148,181$ 55,084$ -$ 203,265$
Loss on inventory 147,632 37,275)( - 110,357
Allowance for bad debts excess tax limitation
1,257 6,001 - 7,258
Unrealized exchange loss 3,462 3,462)( - -
Remeasurement of defined benefit obligations
32,119 - 2,016 34,135
Adjustment to unused paid annual leave
5,813 4,187 - 10,000
Others 99,740 6,768 - 106,508
Subtotal 438,204 31,303 2,016 471,523
2019
January 1
Recognised in
profit or loss
Recognised
in other
comprehensive
income December 31
2019
-Deferred tax liabilities:
Unrealised exchange gain - 20,490)( - 20,490)(
Unrealized gains on forward exchange contract
1,755)( 4,585)( - 6,340)(
Others 542)( 158 - 384)(
Subtotal 2,297)( 24,917)( - 27,214)(
Total 435,907$ 6,386$ 2,016$ 444,309$
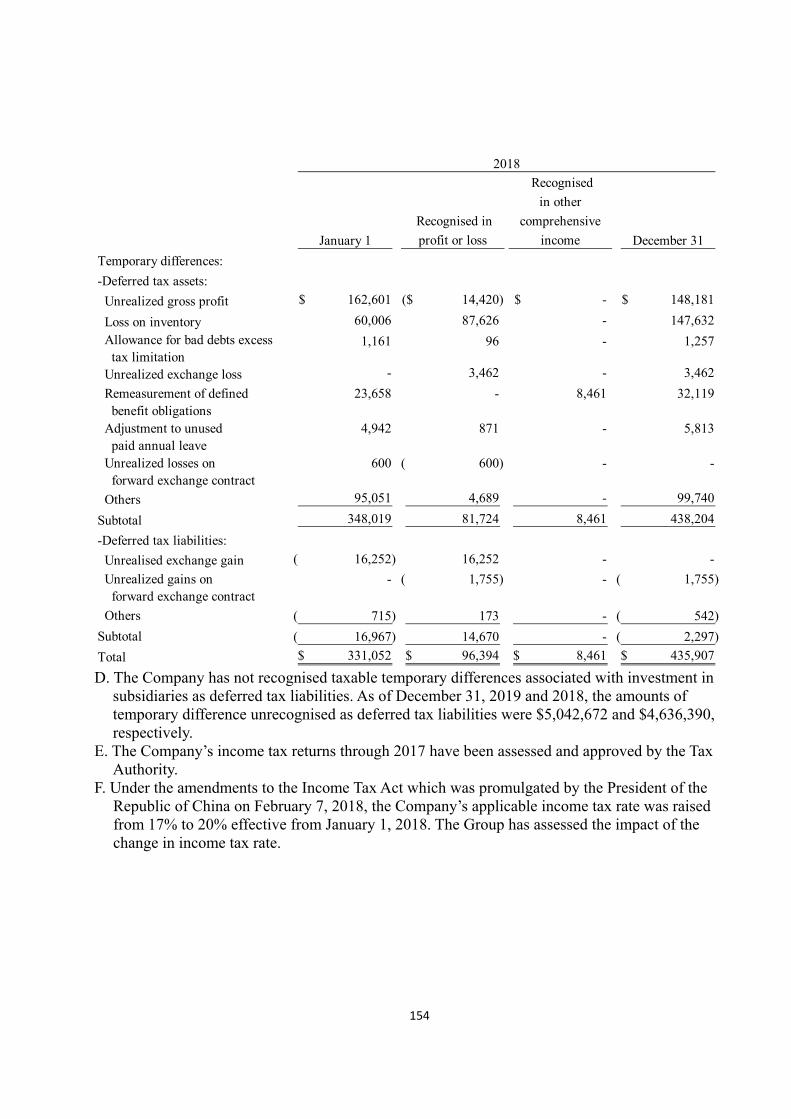
154
D. The Company has not recognised taxable temporary differences associated with investment in
subsidiaries as deferred tax liabilities. As of December 31, 2019 and 2018, the amounts of temporary difference unrecognised as deferred tax liabilities were $5,042,672 and $4,636,390, respectively.
E. The Company’s income tax returns through 2017 have been assessed and approved by the Tax Authority.
F. Under the amendments to the Income Tax Act which was promulgated by the President of the Republic of China on February 7, 2018, the Company’s applicable income tax rate was raised from 17% to 20% effective from January 1, 2018. The Group has assessed the impact of the change in income tax rate.
January 1
Recognised in
profit or loss
Recognised
in other
comprehensive
income December 31
Temporary differences:
-Deferred tax assets:
Unrealized gross profit 162,601$ 14,420)($ -$ 148,181$
Loss on inventory 60,006 87,626 - 147,632
Allowance for bad debts excess tax limitation
1,161 96 - 1,257
Unrealized exchange loss - 3,462 - 3,462
Remeasurement of defined benefit obligations
23,658 - 8,461 32,119
Adjustment to unused paid annual leave
4,942 871 - 5,813
Unrealized losses on forward exchange contract
600 600)( - -
Others 95,051 4,689 - 99,740
Subtotal 348,019 81,724 8,461 438,204
-Deferred tax liabilities:
Unrealised exchange gain 16,252)( 16,252 - -
Unrealized gains on forward exchange contract
- 1,755)( - 1,755)(
Others 715)( 173 - 542)(
Subtotal 16,967)( 14,670 - 2,297)(
Total 331,052$ 96,394$ 8,461$ 435,907$
2018

155
(26) Earnings per share
7. RELATED PARTY TRANSACTIONS
(1) Names of related parties and relationship None.
(2) Significant related party transactions
Retroactively adjustedweighted-average
outstanding ordinary Earnings per shareAmount after tax shares (in thousands) (in NT dollars)
Basic earnings per share Profit attributable to ordinary shareholders of the parent 5,587,210$ 844,856 6.61$ Diluted earnings per shareProfit attributable to ordinary shareholders of the parent 5,587,210$ 844,856 Assumed conversion of all dilutive potential ordinary shares Employees’ compensation - 7,378 Profit attributable to ordinary shareholders of the parent plus assumed conversion of all dilutive potential ordinary shares 5,587,210$ 852,234 6.56$
Retroactively adjustedweighted-average
outstanding ordinary Earnings per shareAmount after tax shares (in thousands) (in NT dollars)
Basic earnings per share Profit attributable to ordinary shareholders of the parent 6,041,129$ 844,856 7.15$ Diluted earnings per shareProfit attributable to ordinary shareholders of the parent 6,041,129$ 844,856 Assumed conversion of all dilutive potential ordinary shares Employees’ compensation - 7,926 Profit attributable to ordinary shareholders of the parent plus assumed conversion of all dilutive potential ordinary shares 6,041,129$ 852,782 7.08$
2018
2019

156
None. (3) Key management compensation
8. PLEDGED ASSETS
The Group’s assets pledged as collateral are as follows:
9. SIGNIFICANT CONTINGENT LIABILITIES AND UNRECOGNISED CONTRACT
COMMITMENTS (1)Contingencies:None. (2)Commitments:None.
10. SIGNIFICANT DISASTER LOSS None.
11. SIGNIFICANT EVENTS AFTER THE BALANCE SHEET DATE None.
12. OTHERS (1) Capital management
The Group’s objectives when managing capital are to safeguard the Group’s ability to continue as a going concern in order to provide returns for shareholders and to maintain an optimal capital structure to reduce the cost of capital. In order to maintain or adjust the capital structure, the Group may adjust the amount of dividends paid to shareholders, return capital to shareholders, issue new shares or repurchase outstanding shares.
(2) Financial instruments A. Financial instruments by category
2019 2018
Salaries and other employee benefits 350,353$ 343,134$
December 31, December 31, Asset items 2019 2018 Purpose
Other non-current assets - Otherfinancial assets 100,244$ 69,316$
Performance securityguarantee
Property, plant and equipment 126,733 133,634 For guarantee oflong-term loans
226,977$ 202,950$
Book value

157
B. Risk management policies
The Group’s activities expose it to a variety of financial risks: including market risk (including foreign exchange risk, interest rate risk and price risk), credit risk and liquidity risk. The Group’s overall risk management programme focuses on the unpredictability of financial markets and seeks to minimise potential adverse effects on the Group’s financial position and financial performance.
December 31, 2019 December 31, 2018Financial assets Financial assets at fair value through profit or loss
Financial assets mandatorily measured at fair value through profit or loss 152,805$ 98,400$
Financial assets at fair value through other comprehensive income Designation of equity instrument 151,975 -$ Financial assets at amortised cost Cash and cash equivalents 10,834,884 8,815,680 Notes receivable 47,114 35,183 Accounts receivable 17,205,783 16,040,189 Other receivables 227,116 159,681 Other current financial assets 1,200,000 728,936 Other non-current financial assets 102,009 82,889 Guarantee deposits paid 42,242 26,348
29,963,928$ 25,987,306$
December 31, 2019 December 31, 2018Financial liabilities Financial liabilities at fair value through profit or loss Financial liabilities held for trading 24,943$ 5,555$ Financial liabilities at amortised cost Short-term borrowings 1,500,000 3,000,000 Notes payable - 200 Accounts payable 20,391,520 14,933,624 Other accounts payable 3,844,835 3,418,250 Long-term borrowings (including current portion) 16,026 17,282 Guarantee deposits received 198,920 226,903
25,976,244$ 21,601,814$ Lease liabilities 406,848$ -$

158
C. Significant financial risks and degrees of financial risks (a) Market risk
Foreign exchange risk i. The Group operates internationally and is exposed to foreign exchange risk arising from
various currency exposures, foreign exchange risk arises from future commercial transactions, recognised assets and liabilities and net investments in foreign operations.
ii. Management has set up a policy to require group companies to manage their foreign exchange risk against their functional currency.
iii. The Group has certain investments in foreign operations, whose net assets are exposed to foreign currency translation risk.
iv. The Group hedges foreign exchange rate by using forward exchange contracts. However, the Group does not adopt hedging accounting. Details of financial assets or liabilities at fair value through profit or loss are provided in Note 6(2).
v. The Group’s businesses involve some non-functional currency operations. The information on assets and liabilities denominated in foreign currencies whose values would be materially affected by the exchange rate fluctuations is as follows:
(Foreign currency: Foreign Currency
AmountBook Value
functional currency) (In Thousands) Exchange rate (NTD)Financial assets Monetary items USD: NTD 396,064$ 29.9800 11,873,988$ EUR: NTD 51,697 33.5900 1,736,500 RMB: NTD 162,475 4.3050 699,454 GBP: NTD 7,794 39.3600 306,785 CAD: NTD 10,468 22.9900 240,670 Financial liabilities Monetary items USD: NTD 673,526 29.9800 20,192,315 USD: RMB 16,433 6.9640 492,673 EUR: NTD 11,924 33.5900 400,520
December 31, 2019

159
vi. The exchange loss arising from significant foreign exchange variation on the
monetary items held by the Group for the years ended December 31, 2019 and 2018, amounted to $34,836 and $185,053, respectively.
vii. Analysis of foreign currency market risk arising from significant foreign exchange variation:
(Foreign currency: Foreign Currency
AmountBook Value
functional currency) (In Thousands) Exchange rate (NTD)Financial assets Monetary items USD: NTD 330,728$ 30.7150 10,158,307$ RMB:NTD 352,127 4.4720 1,574,712 EUR: NTD 44,719 35.2000 1,574,113 CAD: NTD 15,079 22.5800 340,492 GBP: NTD 8,128 38.8800 315,999 USD: RMB 8,443 6.8683 259,331 RUB: NTD 585,852 0.4421 259,005 Financial liabilities Monetary items USD: NTD 488,018 30.7150 14,989,481 USD: RMB 22,115 6.8683 679,263 EUR: NTD 10,117 35.2000 356,121
December 31, 2018
(Foreign currency:
functional currency)
Degree of
variation
Effect on profitor loss
(before tax)
Effect on othercomprehensive
incomeFinancial assets Monetary items USD: NTD 1% 118,740$ -$ EUR: NTD 1% 17,365 - RMB: NTD 1% 6,995 - GBP: NTD 1% 3,068 - CAD: NTD 1% 2,407 - Financial liabilities Monetary items USD: NTD 1% 201,923 - USD: RMB 1% 4,927 - EUR: NTD 1% 4,005 -
2019Sensitivity analysis

160
Price risk i. The Group’s equity securities, which are exposed to price risk, are the held financial assets at
fair value through profit or loss and financial assets at fair value through other comprehensive income. To manage its price risk arising from investments in equity securities, the Group diversifies its portfolio. Diversification of the portfolio is done in accordance with the limits set by the Group.
ii. The Group has investments in equity securities. The prices of equity securities would change due to the change of the future value of investee companies. If the prices of these equity securities had increased/decreased by 1% with all other variables held constant, post-tax profit for the years ended December 31, 2019 and 2018 would have increased/decreased by $769 and $673, as a result of gain or loss of equity instruments at fair value through profit or loss.
Cash flow and fair value interest rate risk i. The Group’s interest rate risk arises from long-term borrowings. Borrowings issued at
variable rates expose the Group to cash flow interest rate risk which is partially offset by cash and cash equivalents held at variable rates. For the years ended December 31, 2019 and 2018, the Group borrowings are issued at variable rate denominated in US dollars.
ii. The Group analyses its interest rate exposure on a dynamic basis. Various scenarios are simulated taking into consideration refinancing, renewal of existing positions, alternative financing and hedging. Based on these scenarios, the Group calculates the impact on profit and loss of a defined interest rate shift. For each simulation, the same interest rate shift is used for all currencies. The scenarios are run only for liabilities that represent the major interest-bearing positions.
iii. At December 31, 2019 and 2018, if interest rates on USD and NTD denominated borrowings had been 1% higher/lower with all other variables held constant, post-tax profit for the years ended December 31, 2019 and 2018 would have been $128 and $138 lower/higher,
(Foreign currency: functional currency)
Degree ofvariation
Effect on profitor loss
(before tax)
Effect on othercomprehensive
incomeFinancial assets Monetary items USD: NTD 1% 101,583$ -$ RMB:NTD 1% 15,747 - EUR: NTD 1% 15,741 - CAD: NTD 1% 3,405 - GBP: NTD 1% 3,160 - USD: RMB 1% 2,593 - RUB: NTD 1% 2,590 - Financial liabilities Monetary items USD: NTD 1% 149,895 - USD: RMB 1% 6,793 - EUR: NTD 1% 3,561 -
2018Sensitivity analysis

161
respectively, mainly as a result of higher/lower interest expense on floating rate borrowings. (b) Credit risk
i. Credit risk refers to the risk of financial loss to the Group arising from default by the clients or counterparties of financial instruments on the contract obligations. The main factor is that counterparties could not repay in full the accounts receivable cash flow based on the agreed terms.
ii. The Group manages their credit risk taking into consideration the entire group’s concern. For banks and financial institutions, only parties with a rating of investment grade are accepted. According to the Group’s credit policy, each local entity in the Group is responsible for managing and analysing the credit risk for each of their new clients before standard payment and delivery terms and conditions are offered. Internal risk control assesses the credit quality of the customers, taking into account their financial position, past experience and other factors. Individual risk limits are set based on internal or external ratings in accordance with limits set by the management. The utilisation of credit limits is regularly monitored. Credit risk arises from credit exposures to wholesale and retail customers, including outstanding receivables.
iii. The Group adopts assumptions, if the contract payments were past due over 90 days based on the terms, there has been a significant increase in credit risk on that instrument since initial recognition.
iv. The Group adopts the assumptions under IFRS 9, the default occurs when the contract payments are past due over 150 days.
v. The following indicators are used to determine whether the credit impairment of debt instruments has occurred: (i) It becomes probable that the issuer will enter bankruptcy or other financial
reorganization due to their financial difficulties; (ii) The disappearance of an active market for that financial asset because of financial
difficulties; (iii) Default or delinquency in interest or principal repayments; (iv) Adverse changes in national or regional economic conditions that are expected to cause
a default. vi. The Group applies the modified approach using provision matrix, loss rate methodology
to estimate expected credit loss under the provision matrix basis. vii. The Group wrote-off the financial assets, which cannot be reasonably expected to be
recovered, after initiating recourse procedures. However, the Group will continue executing the recourse procedures to secure their rights.
viii. The Group used the forecastability to adjust historical and timely information to assess the default possibility of debt instrument on December 31, 2019 and 2018.The except credit loss rate of the Group’s overdue accounts receivable was not material as of December 31, 2019 and 2018.
ix. The Group applies the simplified approach to provide loss allowance for accounts receivable that have no significant impact. The Company had not recognized related impact for the years ended December 31, 2019 and 2018.
(c) Liquidity risk i. Cash flow forecasting is performed in the operating entities of the Group and aggregated
by Group treasury. Group treasury monitors rolling forecasts of the Group’s liquidity requirements to ensure it has sufficient cash to meet operational needs. Such forecasting

162
takes into consideration the Group’s internal balance sheet ratio targets and external regulatory or legal requirements.
ii. The table below analyses the Group’s non-derivative financial liabilities and net-settled or gross-settled derivative financial liabilities into relevant maturity groupings based on the remaining period at the balance sheet date to the contractual maturity date for non-derivative financial liabilities and to the expected maturity date for derivative financial liabilities. The amounts disclosed in the table are the contractual undiscounted cash flows.
Non-derivative financial liabilities:
Derivative financial liabilities As of December 31, 2019 and 2018, the derivative financial liabilities mature within 1 year.
iii. The Group does not expect the timing of occurrence of the cash flows estimated through the maturity date analysis will be significantly earlier, nor expect the actual cash flow amount will be significantly different.
(3) Fair value information A. The different levels that the inputs to valuation techniques are used to measure fair value of
financial and non-financial instruments have been defined as follows: Level 1: Quoted prices (unadjusted) in active markets for identical assets or liabilities that the
entity can access at the measurement date. A market is regarded as active where a market in which transactions for the asset or liability takes place with sufficient frequency and volume to provide pricing information on an on going basis.
Level 2: Inputs other than quoted prices included within Level 1 that are observable for the asset or liability, either directly or indirectly.
Level 3: Unobservable inputs for the asset or liability.
December 31, 2019
Less than 1year
Between 1to 2 years
Between 2to 3 years Over 3 years
Short-term borrowings 1,500,000$ -$ -$ -$ Accounts payable 20,391,520 - - - Other payables 3,844,835 - - - Lease liabilities 194,646 144,775 80,921 38,352 Long-term borrowings(including current portion) 1,550 14,266 - - Other financial liabilities 605 106,506 - 91,809
Non-derivative financial liabilities:
December 31, 2018
Less than 1year
Between 1to 2 years
Between 2to 3 years Over 3 years
Short-term borrowings 3,000,000$ -$ -$ -$ Notes payable 200 - - - Accounts payable 14,933,624 - - - Other payables 3,418,250 - - - Long-term borrowings(including current portion) 1,588 1,588 14,616 - Other financial liabilities 21,665 110,576 437 94,225

163
B. Financial instruments not measured at fair value The Group’s cash and cash equivalents, notes receivable, accounts receivable, other receivables, other financial assets, long-term borrowings, guarantee deposits paid, short-term borrowings, notes payable, accounts payable and other payables, guarantee deposits received are approximate to their fair values. The transaction value information is provided in Note 12(2)A. The fair value information of the Group’s investments in property is provided in Note 6(10).
C. The related information of financial and non-financial instruments measured at fair value by level on the basis of the nature, characteristics and risks of the assets and liabilities is as follows:
D. The methods and assumptions the Group used to measure fair value are as follows:
December 31, 2019 Level 1 Level 2 Level 3 Total
Assets:Recurring fair value measurementsFinancial assets at fairvalue through profit or loss
-Equity security 96,164$ -$ -$ 96,164$ -Forward exchange contract - 3,660 - 3,660 -Foreign exchange swap - 52,981 - 52,981 Financial assets at fair valuethrough other comprehensiveincome -Equity securities - - 151,975 151,975 Total 96,164$ 56,641$ 151,975$ 304,780$
Liabilities:Recurring fair value measurementsFinancial liabilities at fairvalue through profit or loss -Forward exchange contract -$ 24,943$ -$ 24,943$
December 31, 2018 Level 1 Level 2 Level 3 Total
Assets:Recurring fair value measurementsFinancial assets at fairvalue through profit or loss
-Equity security 84,068$ -$ -$ 84,068$ -Forward exchange contract - 6,376 - 6,376 -Foreign exchange swap - 7,956 - 7,956 Total 84,068$ 14,332$ -$ 98,400$ Liabilities:Recurring fair value measurementsFinancial liabilities at fairvalue through profit or loss -Forward exchange contract -$ 5,555$ -$ 5,555$

164
(a) The level 1 financial instruments-equity security held by the Group are listed shares, and the market quoted price is determined by the closing price of the security.
(b) Except for financial instruments with active markets, the fair value of other financial instruments is measured by using valuation techniques or by reference to counterparty quotes.
(c) When assessing non-standard and low-complexity financial instruments, for example, debt instruments without active market, interest rate swap contracts, foreign exchange swap contracts and options, the Group adopts valuation technique that is widely used by market participants. The inputs used in the valuation method to measure these financial instruments are normally observable in the market.
(d) The valuation of derivative financial instruments is based on valuation model widely accepted by market participants, such as present value techniques and option pricing models. Forward exchange contracts are usually valued based on the current forward exchange rate.
E. For the years ended December 31, 2019 and 2018, there was no transfer between Level 1 and Level 2.
F. For the years ended December 31, 2019 and 2018, there was no transfer in or out from Level 3. G. The Group entrusts an external evaluation agency to evaluate the fair value classified as the third
level. 13. SUPPLEMENTARY DISCLOSURES
(1) Significant transactions information A. Loans to others: None. B. Provision of endorsements and guarantees to others: None. C. Holding of marketable securities at the end of the period (not including subsidiaries, associates
and joint ventures): Please refer to table 1. D. Acquisition or sale of the same security with the accumulated cost exceeding $300 million or
20% of the Company’s paid-in capital: None. E. Acquisition of real estate reaching NT$300 million or 20% of paid-in capital or more: None. F. Disposal of real estate reaching NT$300 million or 20% of paid-in capital or more: None. G. Purchases or sales of goods from or to related parties reaching NT$100 million or 20% of
paid-in capital or more: Please refer to table 2. H. Receivables from related parties reaching NT$100 million or 20% of paid-in capital or more:
Please refer to table 3. I. Derivative financial instruments transactions: Please refer to Note 6(2). J. Significant inter-company transactions during the reporting periods: Please refer to table 4.
(2) Information on investees Names, locations and other information of investee companies (not including investees in Mainland China): Please refer to table 5.
(3) Information on investments in Mainland China A. Basic information: Please refer to table 6. B. Significant transactions conducted with investees in Mainland China directly or indirectly
through other companies in the third areas: Please refer to table 7. 14. SEGMENT INFORMATION
(1) General information and measurement of segment information The Group’s operating segment profit (loss) is measured by the operating income (loss), which is used as a basis in assessing the performance of operating segments. “Operating Segments,” the Group’s reportable operating segments are as follows: Computer and peripherals business group: Mainly engages in development and sale of mother

165
boards, graphic cards, notebooks, and computer peripherals. Other segments: Mainly engages in development and sale of other products and in charge of general administration department expenses. There is no material change in the basis for grouping of entities and division of segments in the Group or in the measurement basis for segment information during this period.
(2) Information about segment profit or loss, assets and liabilities: A. The revenue and segment information provided to the chief operating decision-maker for the
reportable segments is as follows: For the year ended December 31, 2019
For the year ended December 31, 2018
The above revenue was derived from the transactions with external customers. The above amounts are provided to the chief operating decision-maker for allocating resources and assessing performance of operating segments.
B. The adoption of IFRS 16, ‘Leases’, had the following impact on the segment information in 2019:
(3) Reconciliation for segment income
Sales between segments are carried out at arm’s length. The revenue from external customers reported to the chief operating decision-maker is measured in a manner consistent with that in the statement of comprehensive income. A reconciliation of reportable segment income to the income before tax from continuing operations for the years ended December 31, 2019 and 2018 is provided as follows:
Computer andperipherals segment Other Total
Total segment revenue 120,486,414$ 5,003$ 120,491,417$ Operating income 6,141,732$ 189,326)($ 5,952,406$ Other non-operating revenue 566,027 Profit before tax 6,518,433$
Computer andperipherals segment Other Total
Total segment revenue 118,523,473$ 3,800$ 118,527,273$ Operating income (loss) 6,991,151$ 299,201)($ 6,691,950$ Other non-operating revenue 459,184
Profit before tax 7,151,134$
Computer andperipherals segments
Depreciation expense increased 164,194$
Segment assets increased 474,897$
Segment liabilities increased 406,848$

166
(4) Information on products and services
Revenue from external customers is mainly from the sales of computer and peripherals and related components. Details of revenue are as follows:
(5) Geographical information
Geographical information for the years ended December 31, 2019 and 2018 is as follows:
(6) Major customer information
The Group had no individual customer whose sales amount accounts for more than 10% of net operating revenue in the consolidated statement of comprehensive income.
2019 2018
Reportable segments income 5,952,406$ 6,691,950$ Unappropriated amount: Other non-operating income 566,027 459,184 Income before tax fromcontinuing operations 6,518,433$ 7,151,134$
2019 2018Computer and peripherals sale revenue 120,491,417$ 118,527,273$
Revenue Non-current assets Revenue Non-current assets Asia 52,938,443$ 5,395,625$ 56,989,139$ 5,006,120$ Europe 32,331,545 283,179 31,237,944 175,745 America 33,122,365 154,501 28,327,803 138,585 Others 2,099,064 852 1,972,387 417
120,491,417$ 5,834,157$ 118,527,273$ 5,320,867$
2019 2018
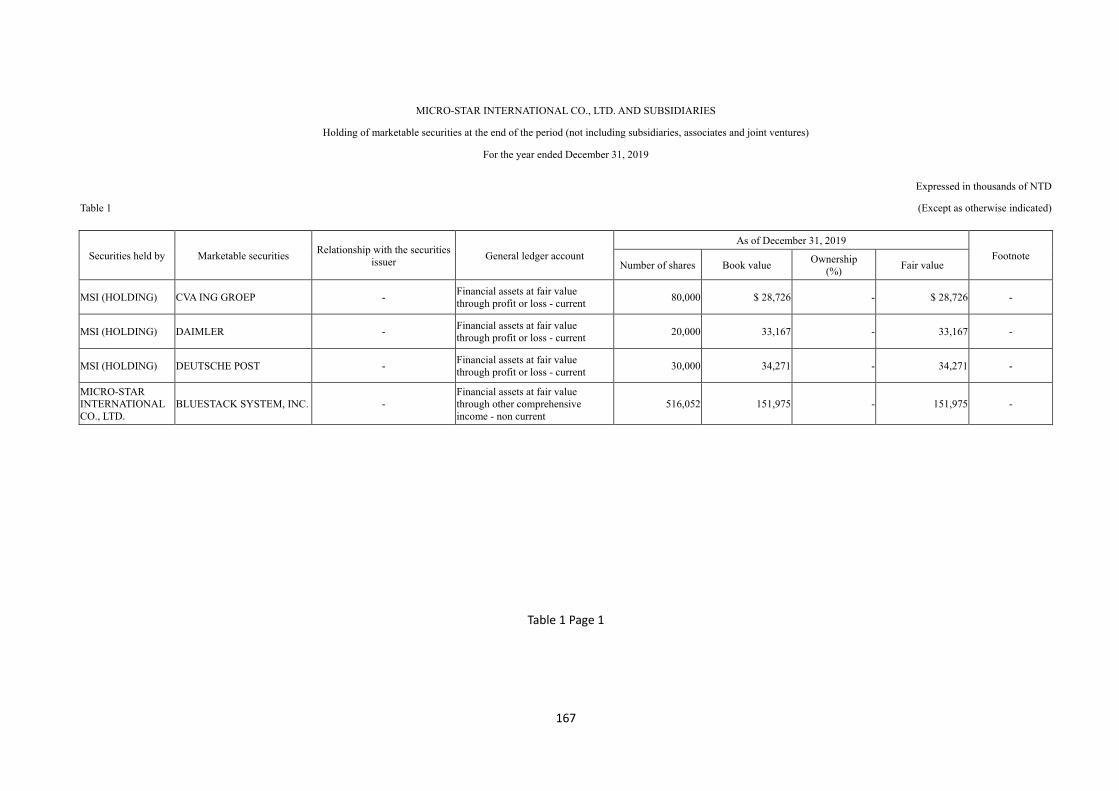
167
MICRO-STAR INTERNATIONAL CO., LTD. AND SUBSIDIARIES
Holding of marketable securities at the end of the period (not including subsidiaries, associates and joint ventures)
For the year ended December 31, 2019
Expressed in thousands of NTD
Table 1 (Except as otherwise indicated)
Securities held by Marketable securities Relationship with the securities
issuer General ledger account
As of December 31, 2019
Footnote Number of shares Book value
Ownership (%)
Fair value
MSI (HOLDING) CVA ING GROEP - Financial assets at fair value through profit or loss - current
80,000 $ 28,726 - $ 28,726 -
MSI (HOLDING) DAIMLER - Financial assets at fair value through profit or loss - current
20,000 33,167 - 33,167 -
MSI (HOLDING) DEUTSCHE POST - Financial assets at fair value through profit or loss - current
30,000 34,271 - 34,271 -
MICRO-STAR INTERNATIONAL CO., LTD.
BLUESTACK SYSTEM, INC. - Financial assets at fair value through other comprehensive income - non current
516,052 151,975 - 151,975 -
Table 1 Page 1

168
MICRO-STAR INTERNATIONAL CO., LTD. AND SUBSIDIARIES
Purchases or sales of goods from or to related parties reaching NT$100 million or 20% of paid-in capital or more
For the year ended December 31, 2019
Expressed in thousands of NTD
Table 2 (Except as otherwise indicated)
Transaction company (Note 4)
Name of the counter party
(Note 4)
Relationship with the
counterparty
Description of the transaction
Description and reasons of difference in
transaction terms compared to third party
transactions
Accounts or notes receivable (payable)
Footnote
Purchases/(Sales)
Amount (Note 3)
% of total purchase (sale)
Credit terms Unit price Credit terms Balance (Note 3)
% of total accounts or notes
receivable/(payable)
MICRO-STAR INTERNATIONAL CO., LTD.
MSI (LA) Subsidiary Sales $(16,439,951) (14) 80~100 days Insignificant
difference Note 1 $5,255,324 30 -
MICRO-STAR INTERNATIONAL CO., LTD.
MEGA COMPUTER Second-tier Subsidiary
Sales (6,006,849) (5) 40-70 days Insignificant
difference Note 1 1,092,387 6 -
MICRO-STAR INTERNATIONAL CO., LTD.
MYSTAR Second-tier Subsidiary
Sales (1,766,513) (1) 40-70 days Insignificant
difference Note 1 268,427 2 -
MICRO-STAR INTERNATIONAL CO., LTD.
MSI (KOREA) Second-tier Subsidiary
Sales (4,052,002) (3) 50-70 days Insignificant
difference Note 1 16,046 - -
MEGA COMPUTER MSI (SHANGHAI) Affiliated company
Sales (6,161,555) (100) 40-70 days Insignificant
difference Note 1 1,926,413 100 -
MSI (PACIFIC) MSI COMPUTER (SHENZHEN)
Subsidiary Processing overhead
1,434,356 72 Note 2 Insignificant
difference Note 2 (2,858,031) (70) -
MSI (PACIFIC) MSI ELECTRONICS (KUNSHAN)
Subsidiary Processing overhead
538,107 27 Note 2 Insignificant
difference Note 2 (972,705) (24) -
MSI (PACIFIC) MICRO-STAR INTERNATIONAL CO., LTD.
Ultimate parent
company
Revenue from
processing (1,989,521) (100) Note 2
Insignificant difference
Note 2 4,064,144 100 -
MSI (LA) RAIDEALS Affiliated company
Sales (128,149) (1) 40-70 days Insignificant
difference Note 1 6,190 - -
Note 1: The credit terms to third par Note 2: Credit terms depend on the financial condition of the paying firm. Note 3: Balances after elimination in conformity with regulations. Note 4: Corresponding transactions are not disclosed.
Table 2 Page 1

169
MICRO-STAR INTERNATIONAL CO., LTD. AND SUBSIDIARIES
Receivables from related parties reaching NT$100 million or 20% of paid-in capital or more
December 31, 2019
Expressed in thousands of NTD
Table 3 (Except as otherwise indicated)
Creditor Counterparty Relationship
with the counterparty
Balance as of December 31, 2019 Turnover rate Overdue receivables
Amount collected subsequent to the balance sheet date
Allowance for doubtful accounts Amount Action taken
MICRO-STAR INTERNATIONAL CO., LTD.
MSI (LA) Subsidiary $5,255,324 3.27 $- - $2,816,226 $ -
MICRO-STAR INTERNATIONAL CO., LTD.
MEGA COMPUTER
Second-tier Subsidiary
1,092,387 6.37
- - 382,813 -
MICRO-STAR INTERNATIONAL CO., LTD.
MYSTAR Second-tier Subsidiary
268,426 6.29
- - 239,211 -
MSI (PACIFIC) (Note)
MICRO-STAR INTERNATIONAL CO., LTD.
Ultimate parent
company 4,064,144 0.53
-
- 559,514 -
MSI COMPUTER (SHENZHEN) (Note)
MSI (PACIFIC) Parent
Company 2,858,031 0.53
-
- 364,021 -
MSI ELECTRONICS (KUNSHAN) (Note)
MSI (PACIFIC) Parent
Company 972,705 0.64
-
- 195,493 -
MSI (B.V.I.) MSI (PACIFIC) Parent
Company 140,104 -
-
-
- -
MEGA COMPUTER
MSI (SHANGHAI) Affiliated company
1,926,413 3.58
- - 378,840 -
Note: Processing overhead receivable.
Table 3 Page 1

170
MICRO-STAR INTERNATIONAL CO., LTD. AND SUBSIDIARIES Significant inter-company transactions during the year ended December 31, 2019
Expressed in thousands of NTD
Table 4 (Except as otherwise indicated)
Number Company name
(Note 4) Counterparty
(Note 4) Relationship
Transaction
General ledger account Amount (Note 1)
Transaction terms
Percentage of consolidated total operating revenues
or total assets
0 MICRO-STAR INTERNATIONAL CO., LTD.
MSI (KOREA) Parent company to
second-tier subsidiary Sales $4,052,002 Note 2 3.36%
0 MICRO-STAR INTERNATIONAL CO., LTD.
MSI (LA) Parent company to
subsidiary Sales 16,439,951 Note 2 13.64%
0 MICRO-STAR INTERNATIONAL CO., LTD.
MEGA COMPUTER Parent company to
second-tier subsidiary Sales 6,006,849 Note 2 4.99%
0 MICRO-STAR INTERNATIONAL CO., LTD.
MYSTAR Parent company to
second-tier subsidiary Sales 1,766,513 Note 2 1.47%
0 MICRO-STAR INTERNATIONAL CO., LTD.
MSI (LA) Parent company to
subsidiary Accounts receivable 5,255,324 Note 2 8.71%
0 MICRO-STAR INTERNATIONAL CO., LTD.
MEGA COMPUTER Parent company to
second-tier subsidiary Accounts receivable 1,092,387 Note 2 1.81%
0 MICRO-STAR INTERNATIONAL CO., LTD.
MYSTAR Parent company to
second-tier subsidiary Accounts receivable 268,426 Note 2 0.44%
0 MICRO-STAR INTERNATIONAL CO., LTD.
MSI (PACIFIC) Parent company to
subsidiary Processing cost 1,895,512 Note 3 1.57%
0 MICRO-STAR INTERNATIONAL CO., LTD.
MSI (PACIFIC) Parent company to
subsidiary Manufacturing and operating expense
66,080 Note 3 0.05%
0 MICRO-STAR INTERNATIONAL CO., LTD.
MSI (JAPAN) Parent company to
subsidiary Manufacturing and operating expense
81,319 Note 2 0.07%
0 MICRO-STAR INTERNATIONAL CO., LTD.
MSI (KOREA) Parent company to
second-tier subsidiary Manufacturing and operating expense
74,374 Note 2 0.06%
0 MICRO-STAR INTERNATIONAL CO., LTD.
MEGA COMPUTER Parent company to
second-tier subsidiary Manufacturing and operating expense
272,264 Note 2 0.23%
0 MICRO-STAR INTERNATIONAL CO., LTD.
MSI (PACIFIC) Parent company to
subsidiary Manufacturing and operating expense
53,226 Note 2 0.04%
0 MICRO-STAR INTERNATIONAL CO., LTD.
MSI (EUROPE) Parent company to
second-tier subsidiary Manufacturing and operating expense
222,778 Note 2 0.18%
0 MICRO-STAR INTERNATIONAL CO., LTD.
MYSTAR Parent company to
second-tier subsidiary Manufacturing and operating expense
172,203 Note 2 0.14%
0 MICRO-STAR INTERNATIONAL CO., LTD.
MSI (POLSKA) Parent company to
second-tier subsidiary Manufacturing and operating expense
145,120 Note 2 0.12%
0 MICRO-STAR INTERNATIONAL CO., LTD.
MSI (MHK) Parent company to
second-tier subsidiary Manufacturing and operating expense
149,473 Note 2 0.12%
Table 4 Page 1

171
0 MICRO-STAR INTERNATIONAL CO., LTD.
MSI (RUSSIA) Parent company to
second-tier subsidiary Manufacturing and operating expense
102,039 Note 2 0.08%
0 MICRO-STAR INTERNATIONAL CO., LTD.
MSI (SARL) Parent company to
second-tier subsidiary Manufacturing and operating expense
$85,024 Note 2 0.07%
0 MICRO-STAR INTERNATIONAL CO., LTD.
MSI (UK) Parent company to
second-tier subsidiary Manufacturing and operating expense
61,075 Note 2 0.05%
0 MICRO-STAR INTERNATIONAL CO., LTD.
MSI (LA) Parent company to
subsidiary Manufacturing and operating expense
101,197 Note 2 0.08%
0 MICRO-STAR INTERNATIONAL CO., LTD.
MSI ELECTRONICS (KUNSHAN) Parent company to
second-tier subsidiary Processing cost 630,364 Note 3 0.52%
0 MICRO-STAR INTERNATIONAL CO., LTD.
MSI COMPUTER (SHENZHEN) Parent company to
second-tier subsidiary Processing cost 1,627,044 Note 3 1.35%
1 MSI (PACIFIC) MICRO ELECTRONICS Subsidiary to
second-tier subsidiary Accrued expenses
payable 93,304 Note 3 0.15%
1 MSI (PACIFIC) MSI (B.V.I.) Subsidiary to
second-tier subsidiary Accrued expenses
payable 140,104 Note 3 0.23%
1 MSI (PACIFIC) MSI ELECTRONICS (KUNSHAN) Subsidiary to
second-tier subsidiary Accrued expenses
payable 972,705 Note 3 1.61%
1 MSI (PACIFIC) MSI COMPUTER (SHENZHEN) Subsidiary to
second-tier subsidiary Accrued expenses
payable 2,858,031 Note 3 4.74%
1 MSI (PACIFIC) MICRO-STAR INTERNATIONAL CO., LTD.
Subsidiary to parent Accounts receivable 4,064,144 Note 3 6.73%
1 MSI (PACIFIC) MICRO-STAR INTERNATIONAL CO., LTD.
Subsidiary to parent Processing Revenue 1,989,521 Note 3 1.65%
1 MSI (PACIFIC) MSI ELECTRONICS (KUNSHAN) Subsidiary to
second-tier subsidiary Processing cost 495,168 Note 3 0.41%
1 MSI (PACIFIC) MSI COMPUTER (SHENZHEN) Subsidiary to
second-tier subsidiary Processing cost 1,400,344 Note 3 1.16%
2 MEGA COMPUTER MSI (SHANGHAI) Second-tier subsidiary
to second-tier subsidiary Sales 6,161,555 Note 2 5.11%
2 MEGA COMPUTER MSI (SHANGHAI) Second-tier subsidiary
to second-tier subsidiary Accounts receivable 1,926,413 Note 2 3.19%
3 MSI (LA) RAIDEALS Subsidiary to
second-tier subsidiary Sales 128,149 Note 2 0.21%
Note 1: Balances after elimination in conformity with regulations. Note 2: Transaction terms were approximately the same as those to third parties. Note 3: Processing overhead was determined based on the quantities, contract amount and delivery time.
Note 4: Individual transactions not exceeding $50,000 and their corresponding transactions are not disclosed.
Table 4Page 2

172
MICRO-STAR INTERNATIONAL CO., LTD. AND SUBSIDIARIES Information on investees (not including investees in Mainland China)
For the year ended December 31, 2019 Expressed in thousands of NTD (Except as otherwise indicated)
Table5
Investor Investee Location Main business activities
Initial investment amount Shares held as at December 31, 2019
Net profit (loss) of the investee for
the year ended December 31,
2019
Investment income (loss)
recognised by the Company for the
year ended December 31,
2019
Footnote
Balance as at December 31,
2019
Balance as at December 31,
2018
Number of shares
Ownership (%)
Book value
MICRO-STAR INTERNATIONAL CO., LTD.
MSI (LA) U.S.A Sales and maintenance of computers,and electronic components
$258,468 $258,468 575,458 100.00 $36,011 $1,344 $1,344 Direct
subsidiary
MICRO-STAR INTERNATIONAL CO., LTD.
MSI (AUSTRALIA)
Australia Maintenance and after-sales service of computers and electronic components
57,420 57,420 221,836 100.00 6,753 444 444 Direct
subsidiary
MICRO-STAR INTERNATIONAL CO., LTD.
MSI (JAPAN) Japan Sales support and maintenance of computers and electronic components
20,411 20,411 1,400 100.00 14,531 1,737 1,737 Direct
subsidiary
MICRO-STAR INTERNATIONAL CO., LTD.
MSI (PACIFIC) Cayman Islands
Holding company 1,511,382 1,511,382 30,204,118 100.00 6,686,248 637,111 627,111 Direct
subsidiary MICRO-STAR INTERNATIONAL CO., LTD.
MSI (HOLDING)
Netherlands Holding company 45,724 45,724 424,000 100.00 629,384 55,869 55,869 Direct
subsidiary
MICRO-STAR INTERNATIONAL CO., LTD.
MSI COMPUTER (CAYMAN)
Cayman Islands
Holding company 99,093 99,093 50,000 100.00 123,564 (526) (526) Direct
subsidiary
MSI (PACIFIC) MSI (KOREA) South Korea Sales and maintenance of computers and electronic components
24,374 24,374 80,000 100.00 281,781 23,988 - Indirect subsidiary
MSI (PACIFIC) MSI (B.V.I.) British Virgin
Island Holding company 1,784,681 1,784,681 47,465,071 100.00 3,966,728 358,243 -
Indirect subsidiary
MSI (PACIFIC) MICRO ELECTRONICS
British Virgin Island
Holding company 1,168,593 1,168,593 33,315,472 100.00 2,422,421 237,493 - Indirect subsidiary
MSI (PACIFIC) STAR INFORMATION
British Virgin Island
Holding company 144,721 144,721 4,502,601 100.00 27,461 (7,397) - Indirect subsidiary
MSI (PACIFIC) MEGA TECHNOLOGY
British Virgin Island
Holding company $ 92,819 $92,819 3,050,000 100.00 $ (6,638) $ (850) - Indirect subsidiary
Table 5 Page 1

173
MSI (PACIFIC) MEGA COMPUTER
Hong Kong Sales support of computers and electronic components
- - 1 100.00 6,040 (370) $ - Indirect subsidiary
MSI (PACIFIC) MSI (MHK) Hong Kong Sales support of computers and electronic components
- - 1 100.00 20,678 8,131 - Indirect subsidiary
MSI (HOLDING) MYSTAR Netherlands Sales support of computers and electronic components
71,353 71,353 - 100.00 146,360 17,981 - Indirect subsidiary
MSI (HOLDING) MSI (RUSSIA) Russia Sales support and maintenance of computers and electronic components
68,258 68,258 - 99.00 39,891 6,482 - Indirect subsidiary
MSI (HOLDING) MSI (POLSKA) Poland Maintenance and after-sales service of computers and electronic components
46,077 46,077 - 99.00 33,054 1,708 - Indirect subsidiary
MSI (HOLDING) MSI (SARL) France Sales support of computers and electronic components
26,646 26,646 - 100.00 52,453 4,824 - Indirect subsidiary
MSI (HOLDING) MSI (UK) Britan Sales support of computers and electronic components
37,226 37,226 - 100.00 15,598 2,952 - Indirect subsidiary
MSI (HOLDING) MSI (TURKEY) Turkey Sales support of computers and electronic components
3,229 3,229 - 99.00 (80) - - Indirect subsidiary (Note 2)
MSI (HOLDING) MSI (ITALY) Italy Sales support of computers and electronic components
2,153 2,153 - 100.00 2,554 1,107 - Indirect subsidiary
MSI (HOLDING) MSI (EUROPE) Netherlands Logistics services of computers and electronic components
37,620 37,620 - 100.00 45,162 3,590 - Indirect subsidiary
MSI (HOLDING) MSI (IBERIA) Spain Sales support of computers and electronic components
5,177 - - 100.00 5,805 790 - Indirect subsidiary
MSI (EUROPE) MSI (RUSSIA) Russia Sales support of computers and electronic components
689 689 - 1.00 537 6,482 - Indirect subsidiary
MSI (EUROPE) MSI (POLSKA) Poland Sales support of computers and electronic components
467 467 - 1.00 172 1,708 - Indirect subsidiary
MSI (EUROPE) MSI (TURKEY) Turkey Sales support of computers and electronic components
33 33 - 1.00 26 - - Indirect subsidiary (Note 2)
MEGA TECHNOLOGY RAIDEALS U.S.A Sales support of computers and electronic components
1,523 1,523 - 100.00 1,690 233 - Indirect subsidiary
Note 1: The table is presented in New Taiwan dollars. Except for the initial investment amount is valued at historical exchange rate, the others are valued with exchange rate 1USD=29.98 NTD; 1EUR=33.59 NTD on December 31, 2019 and average rate with 1USD=30.9059 NTD; 1EUR=34.6139 NTD for the year ended December 31, 2019.
Note 2: As of December 31, 2019, the liquidation process has not been completed. Note 3: In November 2018, this subsidiary has completed the liquidation process.
Table 5 Page 2
MICRO-STAR INTERNATIONAL CO., LTD. AND SUBSIDIARIES

174
Information on investments in Mainland China - Basic information For the year ended December 31, 2019
Expressed in thousands of NTD Table 6 (Except as otherwise indicated)
Investee in Mainland China Main business activities Paid-in capital
Investment method
Accumulated amount of remittance
from Taiwan to Mainland China as of January 1,
2019
Amount remitted from Taiwan to Mainland
China/ Amount remitted back to Taiwan for the year ended December
31, 2019
Accumulated amount of remittance
from Taiwan to Mainland China as of
December 31, 2019
Net income of investee as of December
31, 2019
Ownership held by the Company (direct or indirect)
Investment income (loss) recognised by the Company for the year
ended December 31,
2019 (Note 2)
Book value of investments in
Mainland China as of
December 31, 2019
Accumulated amount of investment
income remitted back to
Taiwan as of
December 31, 2019
Footnote
Remitted to Mainland
China
Remitted back to Taiwan
MSI COMPUTER (SHENZHEN) Sales and manufacture of computers, and electronic components
$1,726,857 Note 1 $1,726,857 $ - $ - $1,726,857 $358,343 100.00 $ 58,343 $3,808,594 $- -
MSI ELECTRONICS (KUNSHAN)
Sales and manufacture of computers, and electronic components
1,772,675 Note 1 1,772,675 - - 1,772,675 235,827 100.00 235,827 2,316,988 - -
SHENZHEN MEGA INFORMATION
Examination and maintenance of computers, and electronic components
23,940 Note 1 23,940 - - 23,940 194 100.00 194 21,493 - -
MSI COMPUTER TRADING (SHENZHEN)
Sales and maintenance of computers and electronic components
91,296 Note 1 - - - - (1,082) 100.00 (1,082) (8,328) - Note 3
MSI (SHENZHEN) Sales and maintenance of computers and electronic components
30,092 Note 1 - - - - (7,662) 100.00 (7,662) 13,834 - Note 4
MSI (SHANGHAI) Sales and maintenance of computers and electronic components
29,275 Note 1 - - - - 11,614 100.00 11,614 (26,334) - Note 5
Company name
Accumulated amount of remittance from Taiwan to
Mainland China as of December 31, 2019
Investment amount approved by the Investment Commission of the Ministry
of Economic Affairs (MOEA)
Ceiling on investments in Mainland China imposed by the Investment
Commission of MOEA MICRO-STAR INTERNATIONAL CO., LTD. $3,602,547 $3,850,987 $18,607,479
Note 1: The investments were made indirectly through 100% owned subsidiary of the Company.
Note 2: Evaluated based on audited financial statements of the investee companies. Note 3: The amount of US $3,000 thousand was remitted by the Company's subsidiary, MSI (Pacific), to MSI COMPUTER TRADING (SHENZHEN). Note 4: The amount of US $1,000 thousand was remitted by the Company's subsidiary, MSI (Pacific), to MSI (SHENZHEN).
Note 5: The amount of US $1,000 thousand was remitted by the Company's subsidiary, MSI (Pacific), to MSI (SHANGHAI). Note 6: In pursuance of Shen-Zi Letter No.09704604680 from the Ministry of Economic Affairs dated August 29, 2008. The amended "Regulations for examination of investments and technical cooperation in Mainland Area" sets the
limitation for investments in Mainland China to be higher of net book value or 60% of consolidated net book value. Note 7: The table is presented in New Taiwan dollars. Except for the initial investment amount is valued at historical exchange rate, the others are valued with exchange rate 1USD=29.98 NTD on December 31, 2018 and average rate with
1USD=30.9059 NTD for the year ended December 31, 2019.
Table 6 Page 1

175
MICRO-STAR INTERNATIONAL CO., LTD. AND SUBSIDIARIES
Information on investments in Mainland China - Significant transactions conducted with investees in Mainland China directly or indirectly through other companies in third areas
For the year ended December 31, 2019
Expressed in thousands of NTD
Table 7 (Except as otherwise indicated)
Investee in Mainland
China
Sales/ (Purchase) Property transaction Accounts receivable/ (payable)
Amount of
endorsements/guarantees
secured with collaterals Accommodation of funds
Others (Note) Amount % Amount %
Balance as of
December 31, 2019 %
Balance as
of
December
31, 2019 Purpose
Ceiling
amount
Balance as
of
December
31, 2019
Interest rate
range
Interest
expense
MSI COMPUTER
(SHENZHEN)
$ - - $ - - (2,858,031) ( 70) $ - - $ - $ - - $ - 1,434,356
MSI
ELECTRONICS
(KUNSHAN)
- - - - (972,705) ( 24) - - - - - - 538,107
MSI (SHANGHAI) 6,161,555 100 - - 1,926,413 100 - - - - - - -
Note: Processing overhead.
Table 7 Page 1

176
MICRO-STAR INTERNATIONAL CO., LTD.
PARENT COMPANY ONLY FINANCIAL
STATEMENTS AND REPORT OF INDEPENDENT
ACCOUNTANTS
DECEMBER 31, 2019 AND 2018
---------------------------------------------------------------------------------------------------------------------
For the convenience of readers and for information purpose only, the auditors’ report and the accompanying
financial statements have been translated into English from the original Chinese version prepared and used in
the Republic of China. In the event of any discrepancy between the English version and the original
Chinese version or any differences in the interpretation of the two versions, the Chinese-language auditors’
report and financial statements shall prevail.

177
REPORT OF INDEPENDENT ACCOUNTANTS TRANSLATED FROM CHINESE To the Board of Directors and Shareholders of MICRO-STAR INTERNATIONAL CO., LTD. Opinion We have audited the accompanying parent company only balance sheets of MICRO-STAR INTERNATIONAL CO., LTD. (the “Company”) as at December 31, 2019 and 2018, and the related parent company only statements of comprehensive income, of changes in equity and of cash flows for the years then ended, and notes to the parent company only financial statements, including a summary of significant accounting policies. In our opinion, the accompanying parent company only financial statements present fairly, in all material respects, the parent company only financial position of the Company as at December 31, 2019 and 2018, and its parent company only financial performance and its parent company only cash flows for the years then ended in accordance with the “Regulations Governing the Preparation of Financial Reports by Securities Issuers”. Basis for opinion We conducted our audits in accordance with the “Regulations Governing Auditing and Attestation of Financial Statements by Certified Public Accountants” and generally accepted auditing standards in the Republic of China (ROC GAAS). Our responsibilities under those standards are further described in the Auditor’s Responsibilities for the Audit of the Parent Company Only Financial Statements section of our report. We are independent of the Company in accordance with the Code of Professional Ethics for Certified Public Accountants in the Republic of China (the “Code”), and we have fulfilled our ethical responsibilities in accordance with the Code. Based on our audits and the audit reports of other independent accountants, we believe that the audit evidences we have obtained are sufficient and appropriate to provide a basis for our opinion. Key audit matters Key audit matters are those matters that, in our professional judgment, were of most significance in our audit of the parent company only financial statements of the year ended December 31, 2019. These matters were addressed in the context of our audit of the parent company only financial statements as a whole and, in forming our opinion thereon, we do not provide a separate opinion on these matters. Key audit matters for the Company’s parent company only financial statements for the year ended December 31, 2019 are stated as follows: Occurrence of sales revenue from significant customers Description Please refer to Note 4(24) for accounting policies on revenue recognition. Other than international brands, the Company sells its products to customers in various countries. With the Company actively developing new products, sales revenue increases progressively every year, and the occurrence of sales revenue is critical to the financial statements. Thus, the occurrence of sales revenue from new significant customers, excluding international brands, was identified as a key audit matter. How our audit addressed the matter We performed the following audit procedures in respect of the above key audit matter: A. Obtained an understanding of and assessed internal controls in relation to sales revenue from new
significant customers, and validated the operating effectiveness of those abovementioned internal controls. B. Obtained detailed listing of sales revenue from new significant customers in the current year, and validated
supporting documents, including sales invoices, customer purchase orders and delivery documents.

178
C. Inspected contents and relevant evidences in relation to sales returns and discounts occurring subsequent to the reporting period and assessed the reasonableness of respective sales revenue recognized.
Estimation of allowance for inventory valuation losses Description Please refer to Note 4(10), for accounting policies on inventory valuation, Note 5(2) for the uncertainty of accounting estimates and assumptions applied on inventory valuation, and Note 6(5) for details of inventories. As of December 31, 2019, the balances of inventories and allowance for inventory valuation losses are NT$23,137,902 thousand and NT$381,847 thousand, respectively. The Company is primarily engaged in manufacturing and sales of motherboard, interface card, notebook computer and other electronic products. Due to the rapid technological innovations, shorter electronic product life cycles, and the fluctuation of market prices within the industry, there is a higher risk of inventory losses due from market value decline or obsolescence. The Company recognises inventories at the lower of cost and net realisable value. As the monetary values of inventories are material, and there are various types of inventories, the estimation and determination of the net realisable value of inventories at the balance sheet date are subject to management’s judgement and contain a high level of uncertainty and have material effects of the financial statements, and therefore, it was identified as a key audit matter. How our audit addressed the matter We performed the following audit procedures in respect of the above key audit matter: A. Assessed the reasonableness and the consistency of policies in relation to the provision of allowance for
inventory valuation losses and procedures based on our understanding of the Company’s operations and industry.
B. Validated the appropriateness of system logic of the report of individually identified obsolete inventory prepared by management and confirmed the consistency with Company’ policies.
C. Validated the appropriateness of estimation basis for net realisable value of inventories and inspected respective supporting documents, including sale prices or purchase prices, reperformed the calculation of the report and assessed the reasonableness of management’s determination of net realizable value of inventories.
Other matter-Reference to audits of other independent accountants We did not audit the financial statements of certain investments accounted for under the equity method that are included in the parent company only financial statements. Those financial statements were audited by other independent accountants, whose reports thereon have been furnished to us, and our opinion expressed herein is based solely on reports of the other independent accountants. Total assets of the abovementioned investees (including investments accounted for under the equity method) amounted to NT$1,097,458 thousand and NT$1,054,586 thousand as at December 31, 2019 and 2018, constituting 1.75% and 1.83% of total assets, respectively. Comprehensive income of the abovementioned investees amounted to NT$88,436 thousand and NT$28,776 thousand, for the years ended December 31, 2019 and 2018, constituting 1.67% and 0.48% of total comprehensive income, respectively. Responsibilities of management and those charged with governance for the parent company only financial statements Management is responsible for the preparation and fair presentation of the parent company only financial statements in accordance with the “Regulations Governing the Preparation of Financial Reports by Securities Issuers” and for such internal control as management determines is necessary to enable the preparation of parent company only financial statements that are free from material misstatement, whether due to fraud or error.

179
In preparing the parent company only financial statements, management is responsible for assessing the Company’s ability to continue as a going concern, disclosing, as applicable, matters related to going concern and using the going concern basis of accounting unless management either intends to liquidate the Company or to cease operations, or has no realistic alternative but to do so. Those charged with governance, including audit committee, are responsible for overseeing the Company’s financial reporting process. Independent accountant's responsibilities for the audit of the parent company only financial statements Our objectives are to obtain reasonable assurance about whether the parent company only financial statements as a whole are free from material misstatement, whether due to fraud or error, and to issue an auditor’s report that includes our opinion. Reasonable assurance is a high level of assurance, but is not a guarantee that an audit conducted in accordance with ROC GAAS will always detect a material misstatement when it exists. Misstatements can arise from fraud or error and are considered material if, individually or in the aggregate, they could reasonably be expected to influence the economic decisions of users taken on the basis of these parent company only financial statements. As part of an audit in accordance with ROC GAAS, we exercise professional judgement and maintain professional skepticism throughout the audit. We also: 1. Identify and assess the risks of material misstatement of the parent company only financial statements,
whether due to fraud or error, design and perform audit procedures responsive to those risks, and obtain audit evidence that is sufficient and appropriate to provide a basis for our opinion. The risk of not detecting a material misstatement resulting from fraud is higher than for one resulting from error, as fraud may involve collusion, forgery, intentional omissions, misrepresentations, or the override of internal control.
2. Obtain an understanding of internal control relevant to the audit in order to design audit procedures that are appropriate in the circumstances, but not for the purpose of expressing an opinion on the effectiveness of the Company's internal control.
3. Evaluate the appropriateness of accounting policies used and the reasonableness of accounting estimates and related disclosures made by management.
4. Conclude on the appropriateness of management’s use of the going concern basis of accounting and, based on the audit evidence obtained, whether a material uncertainty exists related to events or conditions that may cast significant doubt on the Company’s ability to continue as a going concern. If we conclude that a material uncertainty exists, we are required to draw attention in our auditor’s report to the related disclosures in the parent company only financial statements or, if such disclosures are inadequate, to modify our opinion. Our conclusions are based on the audit evidence obtained up to the date of our auditor's report. However, future events or conditions may cause the Company to cease to continue as a going concern.
5. Evaluate the overall presentation, structure and content of the parent company only financial statements, including the disclosures, and whether the parent company only financial statements represent the underlying transactions and events in a manner that achieves fair presentation.
6. Obtain sufficient appropriate audit evidence regarding the financial information of the entities or business activities within the Company to express an opinion on the parent company only financial statements. We are responsible for the direction, supervision and performance of the audit. We remain solely responsible for our audit opinion.
We communicate with those charged with governance regarding, among other matters, the planned scope and timing of the audit and significant audit findings, including any significant deficiencies in internal control that we identify during our audit.

180
We also provide those charged with governance with a statement that we have complied with relevant ethical requirements regarding independence, and to communicate with them all relationships and other matters that may reasonably be thought to bear on our independence, and where applicable, related safeguards. From the matters communicated with those charged with governance, we determine those matters that were of most significance in the audit of the parent company only financial statements of the current period and are therefore the key audit matters. We describe these matters in our auditor’s report unless law or regulation precludes public disclosure about the matter or when, in extremely rare circumstances, we determine that a matter should not be communicated in our report because the adverse consequences of doing so would reasonably be expected to outweigh the public interest benefits of such communication. Liang, Hua-Ling Lai, Chung-Hsi
For and on behalf of PricewaterhouseCoopers, Taiwan March 20, 2020 ----------------------------------------------------------------------------------------------------------------------------------- The accompanying parent company only financial statements are not intended to present the financial position and results of operations and cash flows in accordance with accounting principles generally accepted in countries and jurisdictions other than the Republic of China. The standards, procedures and practices in the Republic of China governing the audit of such financial statements may differ from those generally accepted in countries and jurisdictions other than the Republic of China. Accordingly, the accompanying parent company only financial statements and report of independent accountants are not intended for use by those who are not informed about the accounting principles or auditing standards generally accepted in the Republic of China, and their applications in practice. As the financial statements are the responsibility of the management, PricewaterhouseCoopers cannot accept any liability for the use of, or reliance on, the English translation or for any errors or misunderstandings that may derive from the translation.
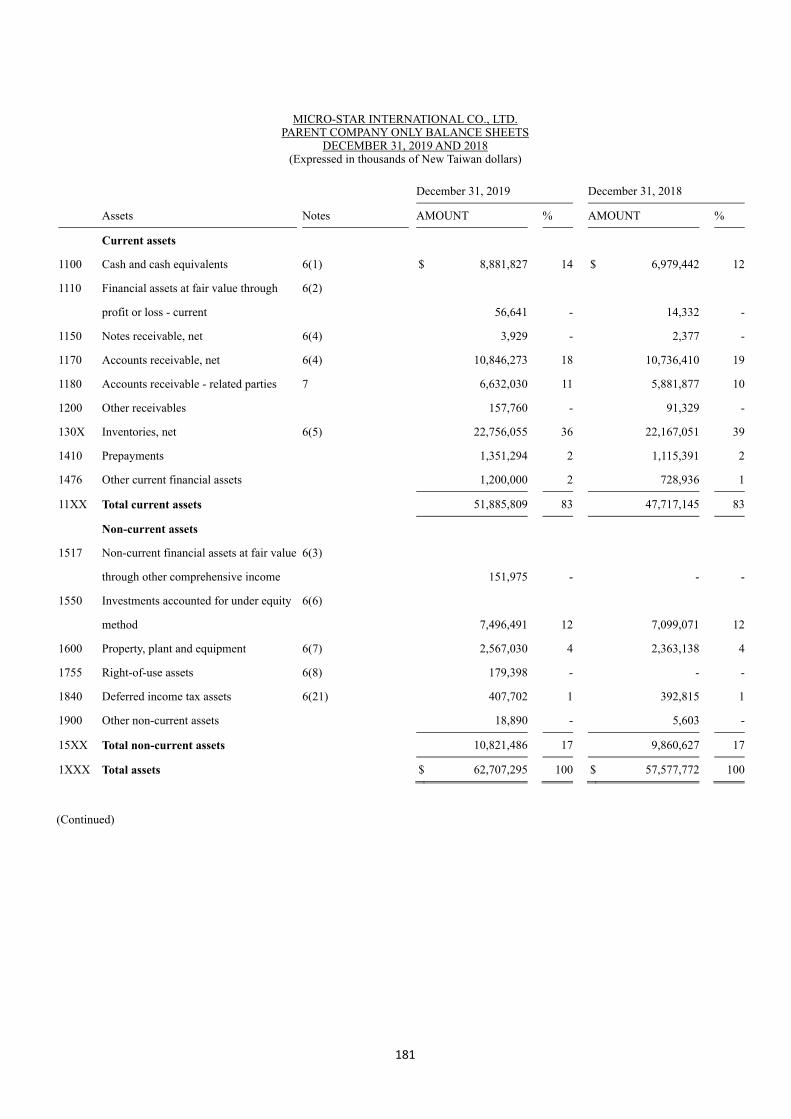
MICRO-STAR INTERNATIONAL CO., LTD. PARENT COMPANY ONLY BALANCE SHEETS
DECEMBER 31, 2019 AND 2018 (Expressed in thousands of New Taiwan dollars)
181
December 31, 2019 December 31, 2018
Assets Notes AMOUNT % AMOUNT %
Current assets
1100 Cash and cash equivalents 6(1) $ 8,881,827 14 $ 6,979,442 12
1110 Financial assets at fair value through
profit or loss - current
6(2)
56,641 - 14,332 -
1150 Notes receivable, net 6(4) 3,929 - 2,377 -
1170 Accounts receivable, net 6(4) 10,846,273 18 10,736,410 19
1180 Accounts receivable - related parties 7 6,632,030 11 5,881,877 10
1200 Other receivables 157,760 - 91,329 -
130X Inventories, net 6(5) 22,756,055 36 22,167,051 39
1410 Prepayments 1,351,294 2 1,115,391 2
1476 Other current financial assets 1,200,000 2 728,936 1
11XX Total current assets 51,885,809 83 47,717,145 83
Non-current assets
1517 Non-current financial assets at fair value
through other comprehensive income
6(3)
151,975 - - -
1550 Investments accounted for under equity
method
6(6)
7,496,491 12 7,099,071 12
1600 Property, plant and equipment 6(7) 2,567,030 4 2,363,138 4
1755 Right-of-use assets 6(8) 179,398 - - -
1840 Deferred income tax assets 6(21) 407,702 1 392,815 1
1900 Other non-current assets 18,890 - 5,603 -
15XX Total non-current assets 10,821,486 17 9,860,627 17
1XXX Total assets $ 62,707,295 100 $ 57,577,772 100
(Continued)

MICRO-STAR INTERNATIONAL CO., LTD. PARENT COMPANY ONLY BALANCE SHEETS
DECEMBER 31, 2019 AND 2018 (Expressed in thousands of New Taiwan dollars)
The accompanying notes are an integral part of these parent company only financial statements.
182
December 31, 2019 December 31, 2018 Liabilities and Equity Notes AMOUNT % AMOUNT % Current liabilities 2100 Short-term borrowings 6(9) $ 1,500,000 2 $ 3,000,000 5 2120 Financial liabilities at fair value through
profit or loss - current 6(2)
24,943 - 5,555 - 2150 Notes payable - - 200 - 2170 Accounts payable 19,764,458 32 14,658,805 25 2200 Other payables 6(10) 3,049,919 5 2,754,512 5 2220 Other payables - related parties 7 4,272,610 7 3,671,761 6 2230 Current income tax liabilities 6(21) 362,183 1 961,026 2 2250 Provisions for liabilities - current 6(12) 579,337 1 514,601 1 2280 Current lease liabilities 71,892 - - - 2365 Refund liabilities-current 1,555,509 2 1,702,658 3 2399 Other current liabilities, others 65,353 - 27,539 - 21XX Total current Liabilities 31,246,204 50 27,296,657 47 Non-current liabilities 2570 Deferred income tax liabilities 6(21) 26,830 - 1,755 - 2580 Non-current lease liabilities 108,013 - - - 2640 Net defined benefit liability, non-current 6(11) 221,974 1 217,609 1 2670 Other non-current liabilities, others 91,809 - 115,890 - 25XX Total non-current liabilities 448,626 1 335,254 1 2XXX Total Liabilities 31,694,830 51 27,631,911 48 Equity Share capital 6(13) 3110 Share capital - common stock 8,448,562 13 8,448,562 15 Capital surplus 6(14) 3200 Capital surplus 803,918 1 1,226,049 2 Retained earnings 6(15) 3310 Legal reserve 4,982,577 8 4,378,464 7 3320 Special reserve 505,966 1 421,815 1 3350 Unappropriated retained earnings 17,065,967 27 15,976,937 28 Other equity interest 3400 Other equity interest ( 794,525 ) ( 1 ) ( 505,966 ) ( 1) 3XXX Total equity 31,012,465 49 29,945,861 52 3X2X Total liabilities and equity $ 62,707,295 100 $ 57,577,772 100

MICRO-STAR INTERNATIONAL CO., LTD. PARENT COMPANY ONLY STATEMENTS OF COMPREHENSIVE INCOME
FOR THE YEARS ENDED DECEMBER 31, 2019 AND 2018 (Expressed in thousands of New Taiwan dollars, except earnings per share amounts)
The accompanying notes are an integral part of these parent company only financial statements.
183
Year ended December 31 2019 2018 Items Notes AMOUNT % AMOUNT % 4000 Sales revenue 6(16) and 7 $ 118,740,373 100 $ 116,988,422 100 5000 Operating costs 6(5)(20) and 7 ( 105,097,585 ) ( 89 ) ( 102,756,311 ) ( 88) 5900 Net operating margin 13,642,788 11 14,232,111 12 Operating expenses 6(20) and 7 6100 Selling expenses ( 4,689,816 ) ( 4 ) ( 4,474,176 ) ( 4) 6200 General and administrative expenses ( 526,354 ) - ( 445,352 ) - 6300 Research and development expenses ( 2,937,315 ) ( 2 ) ( 2,983,104 ) ( 3) 6450 Expected credit (loss) gain 6(4) ( 4,095 ) - 10,637 - 6000 Total operating expenses ( 8,157,580 ) ( 6 ) ( 7,891,995 ) ( 7) 6900 Operating profit 5,485,208 5 6,340,116 5 Non-operating income and expenses 7010 Other income 6(17) 297,400 - 401,353 - 7020 Other gains and losses 6(2)(18) ( 50,864 ) - ( 119,607 ) - 7050 Finance costs ( 13,504 ) - ( 9,029 ) - 7070 Share of profit of associates and joint
ventures accounted for using equity method, net
6(6)
685,979 1 416,401 1 7000 Total non-operating income and expenses 919,011 1 689,118 1 7900 Profit before income tax 6,404,219 6 7,029,234 6 7950 Income tax expense 6(21) ( 817,009 ) ( 1 ) ( 988,105 ) ( 1) 8200 Profit for the year $ 5,587,210 5 $ 6,041,129 5 Other comprehensive income Other components of other comprehensive
income that will not be reclassified to profit or loss
8311 Other comprehensive income, before tax,
actuarial losses on defined benefit plans 6(11)
( $ 10,079 ) - ( $ 21,430 ) - 8349 Income tax related to components of other
comprehensive income that will not be reclassified to profit or loss
6(21)
2,016 - 8,461 - 8310 Components of other comprehensive
income that will not be reclassified to profit or loss
( 8,063 ) - ( 12,969 ) - Components of other comprehensive
income that will be reclassified to profit or loss
8361 Financial statements translation differences
of foreign operations
( 288,559 ) - ( 84,151 ) - 8360 Components of other comprehensive
income that will be reclassified to profit or loss
( 288,559 ) - ( 84,151 ) - 8300 Total other comprehensive loss for the year ( $ 296,622 ) - ( $ 97,120 ) - 8500 Total comprehensive income for the year $ 5,290,588 5 $ 5,944,009 5 Basic earnings per share 6(22) 9750 Total basic earnings per share $ 6.61 $ 7.15 9850 Total diluted earnings per share $ 6.56 $ 7.08

MICRO-STAR INTERNATIONAL CO., LTD. PARENT COMPANY ONLY STATEMENTS OF CHANGES IN EQUITY
FOR THE YEARS ENDED DECEMBER 31, 2019 AND 2018 (Expressed in thousands of New Taiwan dollars)
Capital Surplus Retained Earnings
Notes
Share capital - common stock
Additional paid-in capital
Treasury stock transactions
Donated assets received
Employee stock warrants
Legal reserve
Special reserve
Unappropriated retained earnings
Financial statements translation
differences of foreign
operations
Total equity
Note: The directors' and supervisors' remuneration were $49,500 and $49,500, and employees' bonuses were $515,000 and $505,000 in 2017 and 2018, respectively, which had been deducted from net income for the year.
The accompanying notes are an integral part of these parent company only financial statements.
184
2018 Balance at January 1, 2018 $8,448,562 $1,050,563 $130,592 $- $44,460 $3,884,722 $389,482 $14,276,704 ( $421,815 ) $27,803,270 Profit for the year - - - - - - - 6,041,129 - 6,041,129 Other comprehensive loss for the year - - - - - - - ( 12,969 ) ( 84,151 ) ( 97,120 ) Total comprehensive income - - - - - - - 6,028,160 ( 84,151 ) 5,944,009 Appropriations of 2017 earnings (Note) : 6(15) Legal reserve - - - - - 493,742 - ( 493,742 ) - - Special reserve - - - - - - 32,333 ( 32,333 ) - - Cash dividends - - - - - - - ( 3,801,852 ) - ( 3,801,852 ) Due to donated assets received - - - 434 - - - - - 434 Balance at December 31, 2018 $8,448,562 $1,050,563 $130,592 $ 434 $44,460 $4,378,464 $421,815 $15,976,937 ( $505,966 ) $29,945,8612019 Balance at January 1, 2019 $8,448,562 $1,050,563 $130,592 $434 $44,460 $4,378,464 $421,815 $15,976,937 ( $505,966 ) $29,945,861 Profit for the year - - - - - - - 5,587,210 - 5,587,210 Other comprehensive loss for the year - - - - - - - ( 8,063 ) ( 288,559 ) ( 296,622 ) Total comprehensive income - - - - - - - 5,579,147 ( 288,559 ) 5,290,588 Appropriations of 2018 earnings (Note) : 6(15) Legal reserve - - - - - 604,113 - ( 604,113 ) - - Special reserve - - - - - - 84,151 ( 84,151 ) - - Cash dividends - - - - - - - ( 3,801,853 ) - ( 3,801,853 ) Cash dividends from capital surplus 6(14) - ( 422,429 ) - - - - - - - ( 422,429 ) Due to donated assets received - - - 298 - - - - - 298 Balance at December 31, 2019 $8,448,562 $628,134 $130,592 $732 $44,460 $4,982,577 $505,966 $17,065,967 ( $794,525 ) $31,012,465

MICRO-STAR INTERNATIONAL CO., LTD. PARENT COMPANY ONLY STATEMENTS OF CASH FLOWS
FOR THE YEARS ENDED DECEMBER 31, 2019 AND 2018 (Expressed in thousands of New Taiwan dollars)
Years ended December 31 Notes 2019 2018
185
CASH FLOWS FROM OPERATING ACTIVITIES Profit before tax $ 6,404,219 $ 7,029,234 Adjustments Adjustments to reconcile profit (loss) Depreciation 6(7)(8)(19) 157,384 74,533 Amortization 6(19) 4 23 Expected credit gain 6(4) 4,095 ( 10,637 ) Net gains on financial assets and liabilities at fair value through profit or loss
( 22,921 ) ( 12,309 )
Interest expense 13,504 9,029 Interest income 6(17) ( 57,384 ) ( 69,958 ) Share of profit of associates and joint ventures accounted for using equity method
( 685,979 ) ( 416,401 )
Gain on disposal of property, plant and equipment
6(18) ( 11 ) ( 300 )
Gain on lease modification ( 163 ) - Loss on unrealized foreign currency exchange 24,242 28,275 Changes in operating assets and liabilities Changes in operating assets Notes receivable, net ( 1,552 ) ( 2,356 ) Accounts receivable ( 113,958 ) 831,502 Accounts receivable due from related parties
( 750,153 ) ( 416,752 )
Other receivables ( 70,283 ) ( 14,636 ) Other receivables - related parties - 6,488 Inventories, net ( 589,004 ) ( 5,750,389 ) Prepayments ( 235,903 ) 30,163 Other current financial assets ( 471,064 ) ( 660,101 ) Changes in operating liabilities Notes payable ( 200 ) 200 Accounts payable 5,105,653 ( 1,205,689 ) Other payables 295,762 83,943 Other payables - related parties 600,849 265,934 Provisions for liabilities - current 64,736 59,857 Current refund liabilities ( 147,149 ) 6,045 Other current liabilities, others 37,814 ( 40,790 ) Net defined benefit liability ( 5,714 ) ( 6,578 ) Cash inflow (outflow) generated from operations
9,556,824 ( 181,670 )
Interest received 61,236 68,609 Interest paid ( 13,859 ) ( 8,637 ) Income tax paid ( 1,403,648 ) ( 866,252 ) Net cash flows from (used in) operating activities
8,200,553 ( 987,950 )
(Continued)

MICRO-STAR INTERNATIONAL CO., LTD. PARENT COMPANY ONLY STATEMENTS OF CASH FLOWS
FOR THE YEARS ENDED DECEMBER 31, 2019 AND 2018 (Expressed in thousands of New Taiwan dollars)
Years ended December 31 Notes 2019 2018
The accompanying notes are an integral part of these parent company only financial statements.
186
CASH FLOWS FROM INVESTING ACTIVITIES Acquisition of financial assets at fair value through other comprehensive income
6(3) ( $ 151,975 ) $ -
Acquisition of property, plant and equipment 6(7) ( 298,543 ) ( 64,263 ) Proceeds from disposal of property, plant and equipment
13 300
Increase in refundable deposits ( 13,291 ) ( 1,740 ) Proceeds from capital reduction of investments accounted for using equity method
6(6) - 613,937
Net cash flows (used in) from investing activities
( 463,796 ) 548,234
CASH FLOWS FROM FINANCING ACTIVITIES (Decrease) increase in short-term borrowings 6(9) ( 1,500,000 ) 3,000,000 Repayment of the principal portion of lease liabilities
6(8) ( 62,065 ) -
(Decrease) increase in guarantee deposits received ( 24,081 ) 28,472 Cash dividends paid 6(15) ( 3,801,853 ) ( 3,801,852 ) Cash distribution from capital reserve 6(14) ( 422,429 ) - Due to donated assets received 298 434 Net cash flows used in financing activities
( 5,810,130 ) ( 772,946 )
Effect of exchange rate ( 24,242 ) ( 28,275 ) Net increase (decrease) in cash and cash equivalents 1,902,385 ( 1,240,937 ) Cash and cash equivalents at beginning of year 6(1) 6,979,442 8,220,379 Cash and cash equivalents at end of year 6(1) $ 8,881,827 $ 6,979,442

187
MICRO-STAR INTERNATIONAL CO., LTD. NOTES TO THE PARENT COMPANY ONLY FINANCIAL STATEMENTS
FOR THE YEARS ENDED DECEMBER 31, 2019 AND 2018 (Expressed in thousands of New Taiwan dollars, except as otherwise indicated)
1. HISTORY AND ORGANISATION
MICRO-STAR INTERNATIONAL CO., LTD. (the “Company”) was incorporated as a company limited by shares under the laws of the Republic of China (R.O.C.) in August 1986 and started its operations in the same year. The Company is primarily engaged in the manufacture and sale of motherboards and computer hardware. The shares of the Company have been listed on the Taiwan Stock Exchange since October 1998.
2. THE DATE OF AUTHORISATION FOR ISSUANCE OF THE PARENT COMPANY ONLY FINANCIAL STATEMENTS AND PROCEDURES FOR AUTHORISATION These parent company only financial statements were authorised for issuance by to the Board of Directors on March 20, 2020.
3. APPLICATION OF NEW STANDARDS, AMENDMENTS AND INTERPRETATIONS (1) Effect of the adoption of new standards and amendments to International
Financial Reporting Standards (“IFRS”) as endorsed by the Financial Supervisory Commission (“FSC”) New standards, interpretations and amendments endorsed by the FSC effective from 2019 are as follows:
Except for the following, the above standards and interpretations have no significant impact to the Company’s financial condition and financial performance based on the Company’s assessment. IFRS 16, ‘Leases’ A. IFRS 16, ‘Leases’, replaces IAS 17, ‘Leases’ and related interpretations and SICs.
The standard requires lessees to recognise a 'right-of-use asset' and a lease liability (except for those leases with terms of 12 months or less and leases of low-value assets). The accounting stays the same for lessors, which is to classify their leases
New Standards, Interpretations and Amendments
Effective date byInternational Accounting
Standards Board
Amendments to IFRS 9, ‘Prepayment features with negativecompensation’
January 1, 2019
IFRS 16, ‘Leases’ January 1, 2019Amendments to IAS 19, ‘Plan amendment, curtailment or settlement’ January 1, 2019Amendments to IAS 28, ‘Long-term interests in associates and jointventures’
January 1, 2019
IFRIC 23, ‘Uncertainty over income tax treatments’ January 1, 2019Annual improvements to IFRSs 2015-2017 cycle January 1, 2019

188
as either finance leases or operating leases and account for those two types of leases differently. IFRS 16 only requires enhanced disclosures to be provided by lessors.
B. The Company has elected to apply IFRS 16 by not restating the comparative information (referred herein as the ‘modified retrospective approach’) when applying “IFRSs” effective in 2019 as endorsed by the FSC. Accordingly, the Company increased ‘right-of-use asset’ by $89,836, and increased ‘lease liability’ by $89,836.
C. The Company has used the following practical expedients permitted by the standard at the date of initial application of IFRS 16: (a) Reassessment as to whether a contract is, or contains, a lease is not required,
instead, the application of IFRS 16 depends on whether or not the contracts were previously identified as leases applying IAS 17 and IFRIC 4.
(b) The use of a single discount rate to a portfolio of leases with reasonably similar characteristics.
(c) The exclusion of initial direct costs for the measurement of ‘right-of-use asset’. (d) The use of hindsight in determining the lease term where the contract contains
options to extend or terminate the lease. D. The Company calculated the present value of lease liabilities by using the
weighted average incremental borrowing interest rate range from 1%. E. The Company recognised lease liabilities which had previously been classified as
‘operating leases’ under the principles of IAS 17, ‘Leases’. The reconciliation between operating lease commitments under IAS 17 measured at the present value of the remaining lease payments, discounted using the lessee’s incremental borrowing rate and lease liabilities recognised as of January 1, 2019 is as follows:
(2) Effect of new issuances of or amendments to IFRSs as endorsed by the FSC but
not yet adopted by the Company New standards, interpretations and amendments endorsed by the FSC effective from 2020 are as follows:
Operating lease commitments disclosed by applying IAS 17 as atDecember 31, 2018 66,747$ Less: Short-term leases 6,072)( Less: Low-value assets 1,133)( Add: Adjustments as a result of a different treatment of extension and termination options 31,811 Total lease contracts amount recognised as lease liabilities by applyingIFRS 16 on January 1, 2019 91,353$
Incremental borrowing interest rate at the date of initial application 1%Lease liabilities recognised as at January 1, 2019 by applying IFRS 16 89,836$

189
The above standards and interpretations have no significant impact to the Company’s financial condition and operating result based on the Company’s assessment.
(3) IFRSs issued by IASB but not yet endorsed by the FSC New standards, interpretations and amendments issued by IASB but not yet included in the IFRSs as endorsed by the FSC are as follows:
The above standards and interpretations have no significant impact to the Company’s financial condition and operating result based on the Company’s assessment.
4. SUMMARY OF SIGNIFICANT ACCOUNTING POLICIES The principal accounting policies applied in the preparation of these parent company only financial statements are set out below. These policies have been consistently applied to all the periods presented, unless otherwise stated. (1) Compliance statement
The parent company only financial statements of the Company have been prepared in accordance with the “Regulations Governing the Preparation of Financial Reports by Securities Issuers”.
(2) Basis of preparation A. Except for the following items, the parent company only financial statements
have been prepared under the historical cost convention: (a) Financial assets and financial liabilities (including derivative instruments)
at fair value through profit or loss. (b) Financial assets at fair value through other comprehensive income (c) Defined benefit liabilities recognised based on the net amount of pension
fund assets less present value of defined benefit obligation.
New Standards, Interpretations and Amendments
Effective date byInternational Accounting
Standards BoardAmendment to IAS 1 and IAS 8, ‘Disclosure Initiative-Definition ofMaterial’
January 1, 2020
Amendments to IFRS 3, ‘Definition of a business’ January 1, 2020Amendments to IFRS 9, IAS 39 and IFRS 7, ‘Interest rate benchmarkreform’
January 1, 2020
New Standards, Interpretations and Amendments
Effective date byInternational Accounting
Standards BoardAmendments to IFRS 10 and IAS 28, ‘Sale or contribution of assetsbetween an investor and its associate or joint venture’
To be determined byInternational Accounting
Standards BoardIFRS 17, ‘Insurance contracts’ January 1, 2021Amendments to IAS 1, ‘Classification of liabilities as current or non-current’
January 1, 2022

190
B. The preparation of financial statements in conformity with International Financial Reporting Standards, International Accounting Standards, IFRIC Interpretations, and SIC Interpretations as endorsed by the FSC (collectively referred herein as the “IFRSs”) requires the use of certain critical accounting estimates. It also requires management to exercise its judgement in the process of applying the Company’s accounting policies. The areas involving a higher degree of judgement or complexity, or areas where assumptions and estimates are significant to the parent company only financial statements are disclosed in Note 5.
(3) Foreign currency translation The parent company only financial statements are presented in New Taiwan Dollars, which is the Company’s functional and presentation currency.
A. Foreign currency transactions and balances (a) Foreign currency transactions are translated into the functional currency
using the exchange rates prevailing at the dates of the transactions or valuation where items are remeasured. Foreign exchange gains and losses resulting from the settlement of such transactions are recognised in profit or loss in the period in which they arise.
(b) Monetary assets and liabilities denominated in foreign currencies at the period end are re-translated at the exchange rates prevailing at the balance sheet date. Exchange differences arising upon re-translation at the balance sheet date are recognised in profit or loss.
(c) Non-monetary assets and liabilities denominated in foreign currencies held at fair value through profit or loss are re-translated at the exchange rates prevailing at the balance sheet date; their translation differences are recognised in profit or loss. Non-monetary assets and liabilities denominated in foreign currencies held at fair value through other comprehensive income are re-translated at the exchange rates prevailing at the balance sheet date; their translation differences are recognised in other comprehensive income. However, non-monetary assets and liabilities denominated in foreign currencies that are not measured at fair value are translated using the historical exchange rates at the dates of the initial transactions.
(d) All foreign exchange gains and losses are presented in the statement of comprehensive income within ‘other gains and losses’.
B. Translation of foreign operations (a) The operating results and financial position of all the group entities that
have a functional currency different from the presentation currency are translated into the presentation currency as follows:
i. Assets and liabilities for each balance sheet presented are translated at the closing exchange rate at the date of that balance sheet;
ii. Income and expenses for each statement of comprehensive income are translated at average exchange rates of that period; and

191
iii. All resulting exchange differences are recognised in other comprehensive income.
(b) When the foreign operation partially disposed of or sold is a subsidiary, cumulative exchange differences that were recorded in other comprehensive income are proportionately transferred to the non-controlling interest in this foreign operation. In addition, even when the Company retains partial interest in the former foreign subsidiary after losing control of the former foreign subsidiary, such transactions should be accounted for as disposal of all interest in the foreign operation.
(4) Classification of current and non-current items A. Assets that meet one of the following criteria are classified as current assets;
otherwise they are classified as non-current assets: (a) Assets arising from operating activities that are expected to be realized,
or are intended to be sold or consumed within the normal operating cycle; (b) Assets held mainly for trading purposes; (c) Assets that are expected to be realized within twelve months from the
balance sheet date; (d) Cash and cash equivalents, excluding restricted cash and cash equivalents
and those that are to be exchanged or used to settle liabilities more than twelve months after the balance sheet date. The Company classifies assets that do not meet the above criteria as
non-current. B. Liabilities that meet one of the following criteria are classified as current
liabilities; otherwise they are classified as non-current liabilities: (a) Liabilities that are expected to be settle within the normal operating
cycle; (b) Liabilities arising mainly from trading activities; (c) Liabilities that are to be settle within twelve months from the balance
sheet date; (d) Liabilities for which the repayment date cannot be extended
unconditionally to more than twelve months after the balance sheet date. Terms of a liability that could, at the option of the counterparty, result in its settlement by the issue of equity instruments do not affect its classification.
The Company classifies liabilities that do not meet the above criteria as non-current.
(5) Cash equivalents Cash equivalents refer to short-term highly liquid investments that readily convert to known amount of cash and subject to an insignificant effect of value of changes in rate. Time deposits and money market fund that meet the definition above and are held for the purpose of meeting short-term cash commitments in operations are classified as cash equivalents.
(6) Financial assets at fair value through profit or loss

192
A. Financial assets at fair value through profit or loss are financial assets that are not measured at amortised cost or fair value through other comprehensive income.
B. On a regular way purchase or sale basis, financial assets at fair value through profit or loss are recognised and derecognised using trade date accounting.

193
C. At initial recognition, the Company measures the financial assets at fair value and recognises the transaction costs in profit or loss. The Company subsequently measures the financial assets at fair value, and recognises the gain or loss in profit or loss.
(7)Financial assets at fair value through other comprehensive income A. Financial assets at fair value through other comprehensive income comprise of
equity securities which are not held for trading, and for which the Company has made an irrevocable election at initial recognition to recognize changes in fair value in other comprehensive income and debt instruments which meet all of the following criteria:
(a) The objective of the Company’s business model is achieved both by collecting contractual cash flows and selling financial assets; and
(b) The assets’ contractual cash flows represents solely payments of principal and interest.
B. On a regular way purchase or sale basis, financial assets at fair value through other comprehensive income are recognised and derecognised using trade date accounting.
C. At initial recognition, the Company measures the financial assets at fair value plus transaction costs. The Company subsequently measures the financial assets at fair value:
The changes in fair value of equity investments that were recognised in other comprehensive income are reclassified to retained earnings and are not reclassified to profit or loss following the derecognition of the investment. Dividends are recognised as revenue when the right to receive payment is established, future economic benefits associated with the dividend will flow to the Company and the amount of the dividend can be measured reliably.
(8) Accounts and notes receivable A. Accounts and notes receivable entitle the Company a legal right to receive
consideration in exchange for transferred goods or rendered services. B. The short-term accounts and notes receivable without bearing interest are
subsequently measured at initial invoice amount as the effect of discounting is immaterial.
(9) Impairment of financial assets For financial assets measured at amortised cost including accounts receivable that have a significant financing component, at each reporting date, the Company recognises the impairment provision for 12 months expected credit losses if there has not been a significant increase in credit risk since initial recognition or recognises the impairment provision for the lifetime expected credit losses (ECLs) if such credit risk has increased since initial recognition after taking into consideration all reasonable and verifiable information that includes forecasts. On the other hand, for accounts receivable or contract assets that do not contain a significant financing component, the Company recognises the impairment provision for lifetime ECLs.
(10) Inventories

194
Inventories are stated at the lower of cost and net realizable value. Cost is determined using the weighted-average method. The cost of finished goods and work-in-progress comprises raw materials, direct labour, other direct costs and related production overheads. The item-by-item approach is used in applying the lower of cost and net realizable value. Net realizable value is the estimated selling price in the ordinary course of business, less the estimated cost of completion and applicable variable selling expenses.
(11) Investments accounted for using the equity method / Subsidiaries A. Subsidiaries are all entities (including structured entities) controlled by the
Company. The Company controls an entity when the Company is exposed, or has rights, to variable returns from its involvement with the entity and has the ability to affect those returns through its power over the entity.
B. Inter-company transactions, balances and unrealised gains or losses on transactions between the Company and its subsidiaries are eliminated. Accounting policies of subsidiaries have been adjusted where necessary to ensure consistency with the policies adopted by the Company.
C. The Company’s share of its subsidiaries’ post-acquisition profits or losses is recognised in profit or loss, and its share of post-acquisition movements in other comprehensive income is recognised in other comprehensive income. When the Company’s share of losses in a subsidiary equals or exceeds its interest in the subsidiary, the Company continues to recognise the losses in proportion to the ownership.
D. Changes in a parent’s ownership interest in a subsidiary that do not result in the parent losing control of the subsidiary (transactions with non-controlling interests) are accounted for as equity transactions, i.e. transactions with owners in their capacity as owners. Any difference between the amount by which the non-controlling interests are adjusted and the fair value of the consideration paid or received is recognised directly in equity.
E. When the Company loses control of a subsidiary, the Company remeasures any investment retained in the former subsidiary at its fair value. That fair value is regarded as the fair value on initial recognition of a financial asset or the cost on initial recognition of the associate or joint venture. Any difference between fair value and carrying amount is recognised in profit or loss. All amounts previously recognised in other comprehensive income in relation to the subsidiary are reclassified to profit or loss on the same basis as would be required if the related assets or liabilities were disposed of. That is, when the Company loses control of a subsidiary, all gains or losses previously recognised in other comprehensive income in relation to the subsidiary should be reclassified from equity to profit or loss, if such gains or losses would be reclassified to profit or loss when the related assets or liabilities are disposed of.
F. Pursuant to the “Rules Governing the Preparation of Financial Statements by Securities Issuers,” profit (loss) of the current period and other comprehensive income in the parent company only financial statements shall equal to the amount attributable to owners of the parent in the consolidated financial statements.

195
Owners’ equity in the parent company only financial statements shall equal to equity attributable to owners of the parent in the consolidated financial statements.
(12) Property, plant and equipment A Property, plant and equipment are initially recorded at cost. Borrowing costs
incurred during the construction period are capitalised. B. Subsequent costs are included in the asset’s carrying amount or recognised as a
separate asset, as appropriate, only when it is probable that future economic benefits associated with the item will flow to the Company and the cost of the item can be measured reliably. The carrying amount of the replaced part is derecognised. All other repairs and maintenance are charged to profit or loss during the financial period in which they are incurred.
C. Land is not depreciated. Other property, plant and equipment apply cost model and are depreciated using the straight-line method to allocate their cost over their estimated useful lives. Each part of an item of property, plant, and equipment with a cost that is significant in relation to the total cost of the item must be depreciated separately.
D. The assets’ residual values, useful lives and depreciation methods are reviewed, and adjusted if appropriate, at each balance sheet date. If expectations for the assets’ residual values and useful lives differ from previous estimates or the patterns of consumption of the assets’ future economic benefits embodied in the assets have changed significantly, any change is accounted for as a change in estimate under IAS 8, ‘Accounting Policies, Changes in Accounting Estimates and Errors’, from the date of the change. The estimated useful lives of property, plant and equipment are as follows:
(13) Leasing arrangements (lessee)-right-of-use assets/ lease liabilities
Effective 2019 (modified retrospective approach) A. Leases are recognised as a right-of-use asset and a corresponding lease liability at
the date at which the leased asset is available for use by the Group. For short-term leases or leases of low-value assets, lease payments are recognised as an expense on a straight-line basis over the lease term.
B. Lease liabilities include the net present value of the remaining lease payments at the commencement date, discounted using the incremental borrowing interest rate. Lease payments are mainly fixed payments, less any fixed payments that can be received.
The Group subsequently measures the lease liability at amortised cost using the interest method and recognises interest expense over the lease term. The lease liability is remeasured and the amount of remeasurement is recognised as an
Buildings and structures 5~55 yearsMachinery and equipment 2~10 yearsOther properties (include transportation equipment, office equipment, and leasehold improvements)
2~10 years

196
adjustment to the right-of-use asset when there are changes in the lease term or lease payments and such changes do not arise from contract modifications.
C. At the commencement date, the right-of-use asset is stated at cost mainly comprising the amount of the initial measurement of lease liability.
The right-of-use asset is measured subsequently using the cost model and is depreciated from the commencement date to the earlier of the end of the asset’s useful life or the end of the lease term. When the lease liability is remeasured, the amount of remeasurement is recognised as an adjustment to the right-of-use asset.
(14) Operating leases (lessee) Prior to 2018 Payments made under an operating lease (net of any incentives received from the lessor) are recognised in profit or loss on a straight-line basis over the lease term.
(15) Impairment of non-financial assets The Company assesses at each balance sheet date the recoverable amounts of those assets where there is an indication that they are impaired. An impairment loss is recognised for the amount by which the asset’s carrying amount exceeds its recoverable amount. The recoverable amount is the higher of an asset’s fair value less costs to sell or value in use. When the circumstances or reasons for recognizing impairment loss for an asset in prior years no longer exist or diminish, the impairment loss is reversed. The increased carrying amount due to reversal should not be more than what the depreciated or amortised historical cost would have been if the impairment had not been recognised.
(16) Borrowings Borrowings comprise long-term and short-term bank borrowings. Borrowings are recognised initially at fair value, net of transaction costs incurred. Borrowings are subsequently stated at amortised cost; any difference between the proceeds (net of transaction costs) and the redemption value is recognised in profit or loss over the period of the borrowings using the effective interest method.
(17) Notes and accounts payable A. Accounts payable are liabilities for purchases of raw materials, goods or services
and notes payable are those resulting from operating and non-operating activities. B. The short-term notes and accounts payable without bearing interest are
subsequently measured at initial invoice amount as the effect of discounting is immaterial.
(18) Financial liabilities at fair value through profit or loss A. Financial liabilities are classified in this category of held for trading if acquired
principally for the purpose of repurchasing in the short-term. Derivatives are also categorised as financial liabilities held for trading unless they are designated as hedges.
B. At initial recognition, the Company measures the financial liabilities at fair value. All related transaction costs are recognised in profit or loss. The Company subsequently measures these financial liabilities at fair value with any gain or loss recognised in profit or loss.
(19) Provisions

197
Provisions (including warranties and contingent liabilities from business combinations, etc.) are recognised when the Company has a present legal or constructive obligation as a result of past events, and it is probable that an outflow of economic resources will be required to settle the obligation and the amount of the obligation can be reliably estimated. Provisions are measured at the present value of the expenditures expected to be required to settle the obligation on the balance sheet date, which is discounted using a pre-tax discount rate that reflects the current market assessments of the time value of money and the risks specific to the obligation. When discounting is used, the increase in the provision due to passage of time is recognised as interest expense. Provisions are not recognised for future operating losses.
(20) Employee benefits A. Short-term employee benefits
Sort-term employee benefits are measured at the undiscounted amount of the benefits expected to be paid in respect of service rendered by employees, and should be recognized as expense in that period when the employees render service.
B. Pensions (a) Defined contribution plans
For defined contribution plans, the contributions are recognised as pension expense when they are due on an accrual basis. Prepaid contributions are recognised as an asset to the extent of a cash refund or a reduction in the future payments.
(b) Defined benefit plans i. Net obligation under a defined benefit plan is defined as the present value of an
amount of pension benefits that employees will receive on retirement for their services with the Company in current period or prior periods. The liability recognised in the balance sheet in respect of defined benefit pension plans is the present value of the defined benefit obligation at the balance sheet date less the fair value of plan assets, together with adjustments for unrecognised past service costs. The net defined benefit obligation is calculated annually by independent actuaries using the projected unit credit method. The rate used to discount is determined by using interest rates of government bonds (at the balance sheet date).
ii. Remeasurement arising on defined benefit plans are recognised in other comprehensive income in the period in which they arise and are recorded as retained earnings.
iii. Past service costs are recognised immediately in profit or loss. C. Termination benefits
Termination benefits are employee benefits provided in exchange for the termination of employment as a result from either the Company’s decision to terminate an employee’s employment before the normal retirement date, or an employee’s decision to accept an offer of redundancy benefits in exchange for the termination of employment. The Company recognizes expense as it can no longer withdraw an offer of termination benefits or it recognises relating restructuring costs, whichever is earlier. Benefits that are expected to be due more than 12 months after balance sheet date shall be discounted to their present value.

198
D. Employees’ bonus and directors’ and supervisors’ remuneration Employees’ remuneration and directors’ and supervisors’ remuneration are recognised as expense and liability, provided that such recognition is required under legal or constructive obligation and those amounts can be reliably estimated. Any difference between the resolved amounts and the subsequently actual distributed amounts is accounted for as changes in estimates. If employee compensation is distributed by shares, the Company calculates the number of shares based on the closing price at the previous day of the board meeting resolution.
(21) Income tax A. The tax expense for the period comprises current and deferred tax. Tax is
recognised in profit or loss, except to the extent that it relates to items recognised in other comprehensive income or items recognised directly in equity, in which cases the tax is recognised in other comprehensive income or equity.
B. The current income tax expense is calculated on the basis of the tax laws enacted or substantively enacted at the balance sheet date in the countries where the Company and its subsidiaries operate and generate taxable income. Management periodically evaluates positions taken in tax returns with respect to situations in accordance with applicable tax regulations. It establishes provisions where appropriate based on the amounts expected to be paid to the tax authorities. An additional tax is levied on the unappropriated retained earnings and is recorded as income tax expense in the year the stockholders resolve to retain the earnings.
C. Deferred income tax is recognised, using the balance sheet liability method, on temporary differences arising between the tax bases of assets and liabilities and their carrying amounts in the parent company only balance sheet. However, the deferred income tax is not accounted for if it arises from initial recognition of goodwill or of an asset or liability in a transaction other than a business combination that at the time of the transaction affects neither accounting nor taxable profit or loss. Deferred income tax is provided on temporary differences arising on investments in subsidiaries, except where the timing of the reversal of the temporary difference is controlled by the Company and it is probable that the temporary difference will not reverse in the foreseeable future. Deferred income tax is determined using tax rates (and laws) that have been enacted or substantially enacted by the balance sheet date and are expected to apply when the related deferred income tax asset is realised or the deferred income tax liability is settled.
D. Deferred income tax assets are recognised only to the extent that it is probable that future taxable profit will be available against which the temporary differences can be utilised. At each balance sheet date, unrecognised and recognised deferred income tax assets are reassessed.
E. Current income tax assets and liabilities are offset and the net amount reported in the balance sheet when there is a legally enforceable right to offset the recognised amounts and there is an intention to settle on a net basis or realise the asset and settle the liability simultaneously. Deferred income tax assets and liabilities are offset on the balance sheet when the entity has the legally enforceable right to offset current tax assets against current tax liabilities and they are levied by the

199
same taxation authority on either the same entity or different entities that intend to settle on a net basis or realise the asset and settle the liability simultaneously.
(22) Share capital Ordinary shares are classified as equity. Incremental costs directly attributable to the issue of new shares or stock options are shown in equity as a deduction, net of tax, from the proceeds.
(23) Dividends Dividends are recorded in the Company’s financial statements in the period in which they are approved by the Company’s shareholders. Cash dividends are recorded as liabilities.
(24) Revenue recognition A. Sales of goods
(a) The Company manufactures and sells motherboards, graphic cards, a variety of computer hardware, and electronic components. Sales are recognised when control of the products has transferred, being when the products are delivered to the customer, the customer has full discretion over the channel and price to sell the products, and there is no unfulfilled obligation that could affect the customers’ acceptance of the products. Delivery occurs when the products have been shipped to the specific location, the risks of obsolescence and loss have been transferred to the customer, and the customer has accepted the products in accordance with the sales contract, or the Company has objective evidence that all criteria for acceptance have been satisfied.
(b) Revenue from the products is recognised based on the price specified in the contract, net of the estimated value added tax, returns and volume discounts and rebates. The volume discounts to the customers are estimated based on the anticipated annual sales quantities and the right of return for defective products is estimated on the basis of historical experience. Revenue is only recognised to the extent that it is highly probable that a significant reversal will not occur. The estimation is subject to an assessment at each reporting date. A refund liability is recognised for expected volume discounts payable to customers in relation to sales made until the end of the reporting period. The period between the transfer of the promised goods or services to the customer and payment by the customer does not exceed one year. As a result, the Company does not adjust any of the transaction prices for the time value of money.
(c) The Company’s obligation to provide a refund for faulty products under the standard warranty terms is recognised as a provision.
(d) A receivable is recognised when the goods are delivered as this is the point in time that the consideration is unconditional because only the passage of time is required before the payment is due.
B. Incremental costs of obtaining a contract Given that the contractual period lasts less than one year, the Company recognises the incremental costs of obtaining a contract as an expense when incurred although the Company expects to recover those costs.

200
5. CRITICAL ACCOUNTING JUDGEMENTS, ESTIMATES AND KEY SOURCES OF ASSUMPTION UNCERTAINTY The preparation of these parent company only financial statements requires management to make critical judgements in applying the Company’s accounting policies and make critical assumptions and estimates concerning future events. Assumptions and estimates may differ from the actual results and are continually evaluated and adjusted based on historical experience and other factors. The information is addressed below: (1) Critical judgements in applying the Company’s accounting policies
None. (2) Critical accounting estimates and assumptions
Evaluation of inventories As inventories are stated at the lower of cost and net realisable value, the Company must determine the net realisable value of inventories on balance sheet date using judgements and estimates. Due to the rapid technology innovation, the Company evaluates the amounts of normal inventory comsumption, obsolete inventories or inventories without market selling value on balance sheet date, and writes down the cost of inventories to the net realisable value. Such an evaluation of inventories is principally based on the demand for the products within the specified period in the future. Therefore, there might be material changes to the evaluation. As of December 31, 2019, the carrying amount of inventories was $22,756,055.
6. DETAILS OF SIGNIFICANT ACCOUNTS (1) Cash and cash equivalents
A. The Company transacts with a variety of financial institutions all with high credit quality to disperse credit risk, so it expects that the probability of counterparty default is remote.
B. The Company has no cash and cash equivalents pledged to others. (2) Financial assets and liabilities at fair value through profit or loss - current
December 31, 2019 December 31, 2018Cash on hand and petty cash 1,828$ 2,706$ Checking accounts and demand deposits 8,363,399 5,468,732 Time deposits 516,600 1,508,004
8,881,827$ 6,979,442$
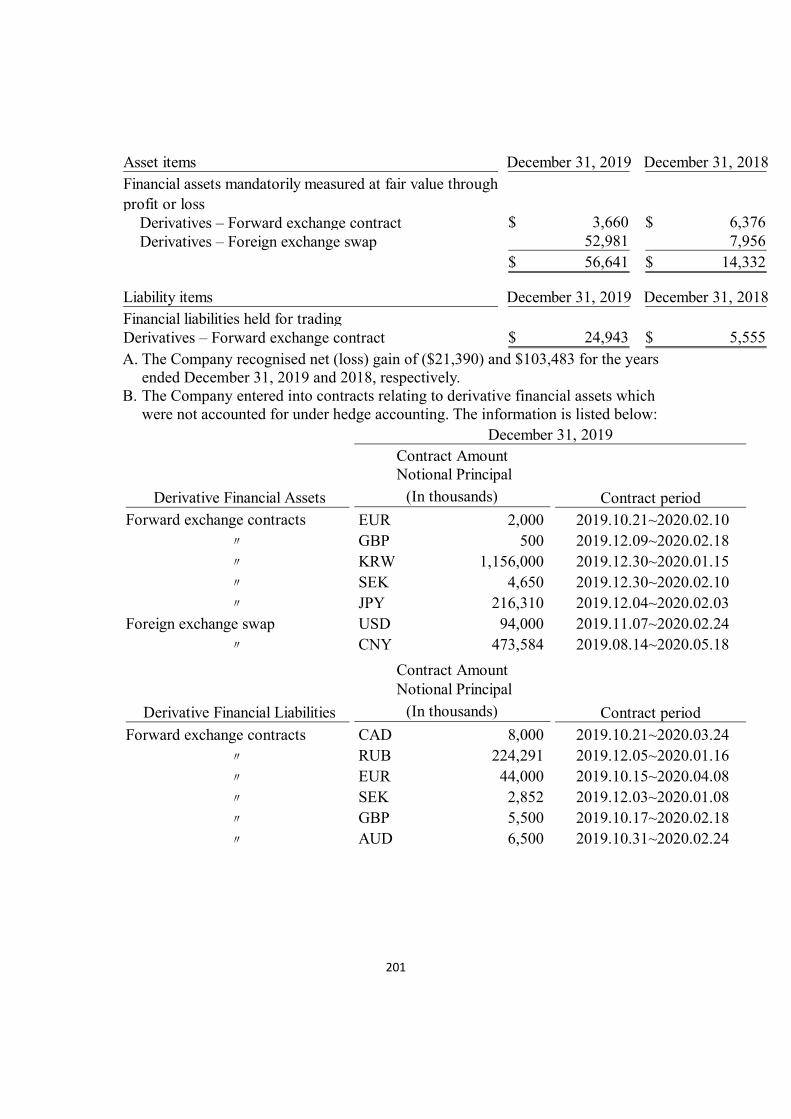
201
A. The Company recognised net (loss) gain of ($21,390) and $103,483 for the years
ended December 31, 2019 and 2018, respectively. B. The Company entered into contracts relating to derivative financial assets which
were not accounted for under hedge accounting. The information is listed below:
Asset items December 31, 2019 December 31, 2018Financial assets mandatorily measured at fair value throughprofit or loss Derivatives – Forward exchange contract 3,660$ 6,376$ Derivatives – Foreign exchange swap 52,981 7,956
56,641$ 14,332$
Liability items December 31, 2019 December 31, 2018Financial liabilities held for tradingDerivatives – Forward exchange contract 24,943$ 5,555$
Derivative Financial Assets Contract periodForward exchange contracts EUR 2,000 2019.10.21~2020.02.10
〃 GBP 500 2019.12.09~2020.02.18 〃 KRW 1,156,000 2019.12.30~2020.01.15 〃 SEK 4,650 2019.12.30~2020.02.10 〃 JPY 216,310 2019.12.04~2020.02.03
Foreign exchange swap USD 94,000 2019.11.07~2020.02.24 〃 CNY 473,584 2019.08.14~2020.05.18
Derivative Financial Liabilities Contract periodForward exchange contracts CAD 8,000 2019.10.21~2020.03.24
〃 RUB 224,291 2019.12.05~2020.01.16 〃 EUR 44,000 2019.10.15~2020.04.08 〃 SEK 2,852 2019.12.03~2020.01.08 〃 GBP 5,500 2019.10.17~2020.02.18 〃 AUD 6,500 2019.10.31~2020.02.24
Notional Principal(In thousands)
Contract AmountDecember 31, 2019
Contract Amount Notional Principal
(In thousands)

202
The Company entered into forward foreign exchange contracts to hedge exchange risk. However, these forward foreign exchange contracts are not accounted under Hedge Accounting.
C. The Company has no financial assets at fair value through profit or loss pledged to others.
D. Information relating to credit risk of financial assets at fair value through profit or loss is provided in Note 12(3).
(3) Financial assets at fair value through other comprehensive income
A. The Company has elected to classify equity instruments that are considered to be
strategic investments as financial assets at fair value through other comprehensive income. The fair value of such investments amounted to $151,975 at December 31, 2019.
B. As at December 31, 2019, without taking into account any collateral held or other credit enhancements, the maximum exposure to credit risk in respect of the amount that best represents the financial assets at fair value through other comprehensive income held by the Company was $151,975.
C. The Company’s financial assets at fair value through other comprehensive income pledged to others as collateral are not provided.
D. Information relating to financial assets at fair value through other comprehensive income is provided in Note 12(3).
Derivative Financial Assets Contract periodForward exchange contracts EUR 6,000 2018.11.20~2019.01.08
〃 GBP 3,500 2018.10.22~2019.02.01〃 AUD 4,200 2018.11.01~2019.02.01
Foreign exchange swap USD 158,000 2018.11.15~2019.02.25
Derivative Financial Liabilities Contract periodForward exchange contracts JPY 381,282 2018.11.19~2019.02.01
〃 EUR 24,000 2018.11.29~2019.02.11〃 GBP 1,300 2018.12.20~2019.01.24
Contract Amount Notional Principal
(In thousands)
December 31, 2018Contract Amount
Notional Principal(In thousands)
Items December 31, 2019
Non-current items:
Equity instruments Unlisted stocks 151,975$ Valuation adjustment -
Total 151,975$

203
(4) Notes and accounts receivable
A. The ageing analysis of accounts receivable and notes receivable that were past due
but not impaired is as follows:
The above ageing analysis was based on past due date.
B. As of December 31, 2019 and 2018, accounts receivable and notes receivable were all from contracts with customers. And as of January 1, 2018, the balance of receivables from contracts with customers amounted to $9,860,683.
C. Most of the Group’s accounts receivable have been insured or have collateral as security, and the Group will be able to obtain insurance claims or enforce a collateral in case these accounts default..
D. The Company does not hold any collateral. E. As of December 31, 2019 and 2018, without taking into account any collateral held
or other credit enhancements, the maximum exposure to credit risk in respect of the amount that best represents the Company’s notes and accounts receivable were $3,929 and $2,377, $10,846,273 and $10,736,410, respectively.
F. Information relating to credit risk of accounts receivable and notes receivable is provided in Note 12(2).
December 31, 2019 December 31, 2018
Notes receivable 3,929$ 2,377$ Accounts receivable 10,850,453$ 10,736,495$ Less: Loss allowance 4,180)( 85)(
10,846,273$ 10,736,410$
Accounts receivable Notes receivable Accounts receivable Notes receivableNot past due 9,415,881$ 3,929$ 8,711,108$ 2,377$ 1 to 75 days 1,418,600 - 2,025,254 - 76 to 365 days 13,174 - 61 - Over 365 days 2,798 - 72 -
10,850,453$ 3,929$ 10,736,495$ 2,377$
December 31, 2019 December 31, 2018

204
(5) Inventories
The cost of inventories recognised as expense for the year:
The Company reversed from a previous inventory write-down and accounted for as reduction of cost of goods sold because parts of inventories which were recognized as expense have been sold in 2019.
(6) Investments accounted for using equity method
A. Details of the Company’s subsidiaries are provided in Note 4(3) of the Company’s
consolidated financial statements as of and for the year ended December 31, 2019. B. For the years ended December 31, 2019 and 2018, investments accounted for using
equity method are MSI COMPUTER CORP.、MICRO-STAR NETHERLANDS HOLDING B.V.、MSI COMPUTER (CAYMAN) CO., LTD.、MSI KOREA CO., LTD.、MEGA COMPUTER CO., LTD. and MHK INTERNATIONAL CO., LTD.,
Cost
Allowance forvaluation loss Book value
Raw materials 6,579,127$ 130,049)($ 6,449,078$ Work in progress 1,378,828 1,311)( 1,377,517 Finished goods 15,179,947 250,487)( 14,929,460
23,137,902$ 381,847)($ 22,756,055$
December 31, 2019
Cost
Allowance forvaluation loss Book value
Raw materials 7,536,411$ 325,737)($ 7,210,674$ Work in progress 1,343,677 1,987)( 1,341,690 Finished goods 13,914,163 299,476)( 13,614,687
22,794,251$ 627,200)($ 22,167,051$
December 31, 2018
2019 2018Cost of inventories recognised as expense 105,097,585$ 102,756,311$ (Gains on reversal of decline) losses on decline in market value 245,353)( 337,378
December 31, 2019 December 31, 2018MSI PACIFIC INTERNATIONAL HOLDING CO., LTD. 6,686,248$ 6,320,046$ MICRO-STAR NETHERLANDS HOLDING B.V. 629,384 596,852 MSI COMPUTER (CAYMAN) CO., LTD. 123,564 127,131 MSI COMPUTER CORP. 36,011 35,562 MSI COMPUTER JAPAN CO., LTD. 14,531 12,954 MSI COMPUTER (AUSTRALIA) PTY. LTD. 6,753 6,526
7,496,491$ 7,099,071$

205
such investments are recognised based on the investees’ financial statements audited by independent accountants and the portion of above mentioned subsidiaries accounted for using equity method was $88,436 and $28,776, respectively.
C. To meet the Group’s operation plan and maintain the capital efficiency, the subsidiary of the Company, MSI PACIFIC INTERNATIONAL HOLDING CO., LTD., reduced its capital on May 3, 2018 by USD 17,000 thousand;the subsidiary of the Company, MICRO-STAR NETHERLANDS HOLDING B.V., reduced its capital on September 24, 2018 by EUR 3,000 thousand.
(7) Property, plant and equipment
Buildingsand Other
Land structures Machinery assets TotalAt January 1, 2019
Cost 1,331,538$ 1,445,791$ 412,750$ 300,924$ 3,491,003$ Accumulated depreciation - 554,322)( 343,443)( 230,100)( 1,127,865)(
1,331,538$ 891,469$ 69,307$ 70,824$ 2,363,138$ 2019Balance at January 1 1,331,538$ 891,469$ 69,307$ 70,824$ 2,363,138$ Additions - 20,028 148,435 130,080 298,543 Disposals - - - ( 2) 2)( Reclassified - 22,005 800 ( 22,805) - Depreciation charge - 31,974)( 22,380)( 40,295)( 94,649)( Balance at December 31 1,331,538$ 901,528$ 196,162$ 137,802$ 2,567,030$
At December 31, 2019
Cost 1,331,538$ 1,487,824$ 526,019$ 341,693$ 3,687,074$ Accumulated depreciation - 586,296)( 329,857)( 203,891)( 1,120,044)(
1,331,538$ 901,528$ 196,162$ 137,802$ 2,567,030$
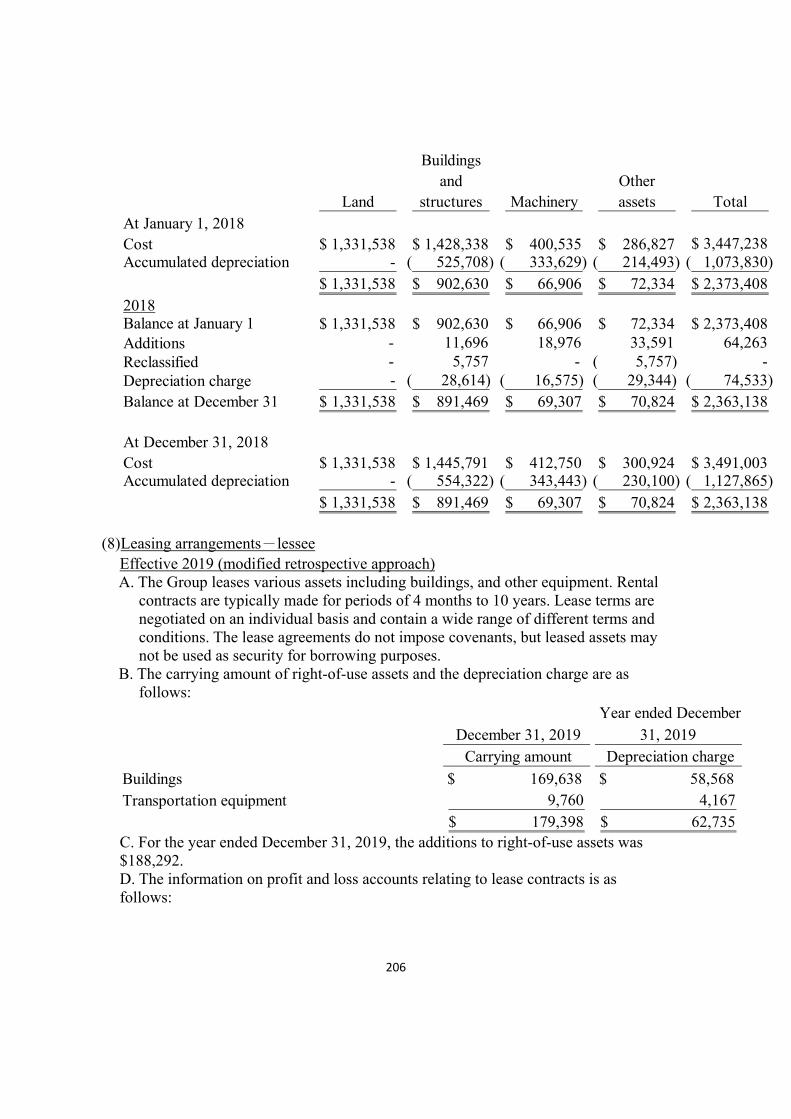
206
(8) Leasing arrangements-lessee Effective 2019 (modified retrospective approach) A. The Group leases various assets including buildings, and other equipment. Rental
contracts are typically made for periods of 4 months to 10 years. Lease terms are negotiated on an individual basis and contain a wide range of different terms and conditions. The lease agreements do not impose covenants, but leased assets may not be used as security for borrowing purposes.
B. The carrying amount of right-of-use assets and the depreciation charge are as follows:
C. For the year ended December 31, 2019, the additions to right-of-use assets was $188,292. D. The information on profit and loss accounts relating to lease contracts is as follows:
Buildingsand Other
Land structures Machinery assets TotalAt January 1, 2018Cost 1,331,538$ 1,428,338$ 400,535$ 286,827$ 3,447,238$ Accumulated depreciation - 525,708)( 333,629)( 214,493)( 1,073,830)(
1,331,538$ 902,630$ 66,906$ 72,334$ 2,373,408$ 2018Balance at January 1 1,331,538$ 902,630$ 66,906$ 72,334$ 2,373,408$ Additions - 11,696 18,976 33,591 64,263 Reclassified - 5,757 - ( 5,757) - Depreciation charge - ( 28,614) ( 16,575) ( 29,344) 74,533)( Balance at December 31 1,331,538$ 891,469$ 69,307$ 70,824$ 2,363,138$
At December 31, 2018Cost 1,331,538$ 1,445,791$ 412,750$ 300,924$ 3,491,003$ Accumulated depreciation - 554,322)( 343,443)( 230,100)( 1,127,865)(
1,331,538$ 891,469$ 69,307$ 70,824$ 2,363,138$
December 31, 2019 Year ended December
31, 2019 Carrying amount Depreciation charge
Buildings $ 169,638 $ 58,568Transportation equipment (Business vehicles) 9,760 4,167
179,398$ 62,735$

207
E. For the year ended December 31, 2019, the Company’s total cash outflow for leases was $113,102.
(9) Short-term borrowings
(10) Other payables
(11) Pensions
A. (a) The Company has a defined benefit pension plan in accordance with the Labor Standards Law, covering all regular employees’ service years prior to the enforcement of the Labor Pension Act on July 1, 2005 and service years thereafter of employees who chose to continue to be subject to the pension mechanism under the Law. Under the defined benefit pension plan, two units are accrued for each year of service for the first 15 years and one unit for each additional year thereafter, subject to a maximum of 45 units. Pension benefits are based on the number of units accrued and the average monthly salaries and wages of the last 6 months prior to retirement. The Company contributes monthly an amount equal to 2% of the employees’ monthly salaries and wages to the retirement fund deposited with Bank of Taiwan, the trustee, under the name of the independent retirement fund committee. Also, the Company would
Year ended December31, 2019
Items affecting profit or lossInterest expense on lease liabilities $ 1,603Expense on leases of low-value and short-term assets 11,991 Expense on variable lease payments 37,443
Type of borrowings December 31, 2019 Interest rate range Collateral
Bank borrowings Bank unsecured borrowings 1,500,000$ 0.88%~0.90% None
Type of borrowings December 31, 2018 Interest rate range Collateral
Bank borrowings Bank unsecured borrowings 3,000,000$ 0.94%~0.99% None
December 31, 2019 December 31, 2018Accrued salary and bonus 922,399$ 912,204$ Employee compensation and directors' and supervisors' remuneration 554,500 564,500 Accrued freight 617,251 502,979 Advertising expense payable 355,107 273,429 Accrued molding expense 217,077 164,846 Other accrued expenses 383,585 336,554
3,049,919$ 2,754,512$

208
assess the balance in the aforementioned labor pension reserve account by December 31, every year. If the account balance is insufficient to pay the pension calculated by the aforementioned method to the employees expected to qualify for retirement in the following year, the Company will make contributions for the deficit by next March.
(b) The amounts recognised in the balance sheet are as follows:
(c) Movements in net defined benefit liabilities are as follows:
December 31, 2019 December 31, 2018
Present value of defined benefit obligations 524,869$ 502,487$ Fair value of plan assets 302,895)( 284,878)( Net defined benefit liability 221,974$ 217,609$
Present value ofdefined benefit
obligations
Fair value ofplan
assetsNet defined
benefit liability
2019Balance at January 1 502,487$ 284,878)($ 217,609$ Current service cost 3,710 - 3,710 Interest expense (income) 5,025 2,849)( 2,176
511,222 287,727)( 223,495
Remeasurements:
Return on plan assets (excluding amounts included in interest income or expense)
- 9,912)( 9,912)(
Change in financial assumptions 15,767 - 15,767 Experience adjustments 4,224 - 4,224
19,991 9,912)( 10,079 Pension fund contribution - 11,600)( 11,600)( Paid pension 6,344)( 6,344 -
Balance at December 31 524,869$ 302,895)($ 221,974$

209
(d) The Bank of Taiwan was commissioned to manage the Fund of the Company’s
defined benefit pension plan in accordance with the Fund’s annual investment and utilisation plan and the “Regulations for Revenues, Expenditures, Safeguard and Utilisation of the Labor Retirement Fund” (Article 6: The scope of utilisation for the Fund includes deposit in domestic or foreign financial institutions, investment in domestic or foreign listed, over-the-counter, or private placement equity securities, investment in domestic or foreign real estate securitization products, etc.). With regard to the utilisation of the Fund, its minimum earnings in the annual distributions on the final financial statements shall be no less than the earnings attainable from the amounts accrued from two-year time deposits with the interest rates offered by local banks. If the earnings is less than aforementioned rates, government shall make payment for the deficit after being authorized by the Regulator. The Company has no right to participate in managing and operating that fund and hence the Company is unable to disclose the classification of plan assets fair value in accordance with IAS 19 paragraph 142. The composition of fair value of plan assets as of December 31, 2019 and 2018 is given in the Annual Labor Retirement Fund Utilisation Report announced by the government.
Present value ofdefined benefit
obligations
Fair value ofplan
assetsNet defined
benefit liability
2018Balance at January 1 470,631$ 267,874)($ 202,757$ Current service cost 2,764 - 2,764 Interest expense (income) 5,177 2,947)( 2,230
478,572 270,821)( 207,751
Remeasurements:
Return on plan assets (excluding amounts included in interest income or expense)
- 7,679)( 7,679)(
Change in financial assumptions 5,335 - 5,335 Experience adjustments 23,774 - 23,774
29,109 7,679)( 21,430 Pension fund contribution - 11,572)( 11,572)( Paid pension 5,194)( 5,194 -
Balance at December 31 502,487$ 284,878)($ 217,609$

210
(e) The principal actuarial assumptions used were as follows:
Assumptions regarding future mortality experience are set based on the fifth round of empirical life tables of the Taiwan life insurance industry.. Because the main actuarial assumption changed, the present value of defined benefit obligation is affected. The analysis was as follows:
The sensitivity analysis above is based on one assumption which changed while the other conditions remain unchanged. In practice, more than one assumption may change all at once. The method of analysing sensitivity and the method of calculating net pension liability in the balance sheet are the same. The methods and types of assumptions used in preparing the sensitivity analysis did not change compared to the previous period.
(f) Expected contributions to the defined benefit pension plans of the Company for the year ending December 31, 2019 amount to $11,628.
(g) As of December 31, 2019, the weighted average duration of the retirement plan is
11 years. The analysis of timing of the future pension payment was as follows:
B. (a) Effective July 1, 2005, the Company has established a defined contribution
pension plan (the “New Plan”) under the Labor Pension Act (the “Act”), covering all regular employees with R.O.C. nationality. Under the New Plan, the Company contributes monthly an amount based on 6% of the employees’ monthly salaries and wages to the employees’ individual pension accounts at
2019 2018
Discount rate 0.70% 1.00%
Future salary increases 2.75% 2.75%
Increase 0.25% Decrease 0.25% Increase 0.25% Decrease 0.25%
December 31, 2019Effect on present value ofdefined benefit obligation 13,187)($ 13,680$ 12,065$ 11,713)($ December 31, 2018Effect on present value ofdefined benefit obligation 13,186)($ 13,699$ 12,176$ 11,802)($
Discount rate Future salary increases
Within 1 year 28,485$ 1-2 year(s) 32,316 2-3 years 35,314 3-4 years 26,862 4-5 years 24,649 6-10 years 134,261 Over 10 years 282,604
564,491$

211
the Bureau of Labor Insurance. The benefits accrued are paid monthly or in lump sum upon termination of employment.
(b) The pension costs under defined contribution pension plans of the Company for the years ended December 31, 2019 and 2018, were $106,892 and $101,745, respectively.
(12) Provisions
Analysis of total provisions:
The Company gives warranties on computer components and personal computers sold. Provision for warranty is estimated based on historical warranty data.
(13) Share capital As of December 31, 2019, the Company’s authorized capital was $15,000,000 (including 80,000 thousand shares reserved for employee stock options and 150,000 thousand shares reserved for convertible bonds issued by the Company), and the paid-in capital was $8,448,562 with a par value of $10 (in dollars) per share. All proceeds from shares issued have been collected.
(14) Capital surplus Pursuant to the R.O.C. Company Act, capital surplus arising from paid-in capital in excess of par value on issuance of common stocks and donations can be used to cover accumulated deficit or to issue new stocks or cash to shareholders in proportion to their share ownership, provided that the Company has no accumulated deficit. Further, the R.O.C. Securities and Exchange Law requires that the amount of capital surplus to be capitalised mentioned above should not exceed 10% of the paid-in capital each year. Capital surplus should not be used to cover accumulated deficit unless the legal reserve is insufficient.
(15) Retained earnings A. Under the Company's Articles of Incorporation, the current year's earnings, if any,
shall first be used to pay all taxes and offset prior year's operating losses, then 10% of the remaining amount shall be set aside or reversed as legal reserve. The balance plus unappropriated retained earnings at the beginning of the period shall be appropriated 10%~90% as proposed by the Board of Directors and resolved by the stockholders during their meeting.
B. The Company’s dividend policy is summarized below: as the Company operates in a volatile business environment and is in the stable growth stage, except for the Company’s future expansion plans, stockholders’ interest is taken into
Warranty 2019 2018At January 1 514,601$ 454,744$ Additional provisions 758,066 694,401 Used during the period 693,294)( 634,589)( Exchange differences 36)( 45 At December 31 579,337$ 514,601$
December 31, 2019 December 31, 2018Current 579,337$ 514,601$

212
consideration. The Company appropriated dividends in proportion to total number of shares, dividends could be distributed in stock or cash, and cash dividends shall account for at least 30% of the total dividends distributed.
C. Except for covering accumulated deficit or issuing new stocks or cash to shareholders in proportion to their share ownership, the legal reserve shall not be used for any other purpose. The use of legal reserve for the issuance of stocks or cash to shareholders in proportion to their share ownership is permitted, provided that the distribution of the reserve is limited to the portion in excess of 25% of the Company’s paid-in capital.
D. (a)In accordance with the regulations, the Company shall set aside special reserve from the debit
balance on other equity items at the balance sheet date before distributing earnings. When debit balance on other equity items is reversed subsequently, the reversed amount could be included in the distributable earnings.
(b)The amounts previously set aside by the Company as special reserve on initial application of IFRSs in accordance with Jin-Guan-Zheng-Fa-Zi Letter No. 1010012865, dated April 6, 2012, shall be reversed proportionately when the relevant assets are used, disposed of or reclassified subsequently. Such amounts are reversed upon disposal or reclassified if the assets are investment property of land, and reversed over the use period if the assets are investment property other than land.
E. The appropriations of 2018 and 2017 earnings had been resolved at the stockholders’ meeting on June 14, 2019 and June 15, 2018, respectively as follows:
On June 14, 2019, the Board of Directors proposed cash dividends from capital surplus was $422,429. The appropriation of 2018 earnings as approved by the stockholders is the same as with the appropriation resolved by the Board of Directors during its meeting on April 30, 2019. Information about earnings appropriation of the Company as resolved by Board of Directors will be posted in the “Market Observation Post System” at the website of the Taiwan Stock Exchange.
F.For the information relating to employees’ compensation and directors’ and supervisors’ remuneration, please refer to Note 6(20).
(16) Operating revenue The Company derives revenue from the transfer of goods at a point in time in the following major segment:
Amount
Dividends pershare (dollar) Amount
Dividends pershare (dollar)
Legal reserve 604,113$ 493,742$ Special reserve 84,151 32,333 Cash dividends 3,801,853 4.50$ 3,801,852 4.50$
2018 2017

213
(17) Other income
(18) Other gains and losses
(19) Expenses by nature
(20) Employee benefit expense
Computer and2019 peripherals segment Other Total
Total segment revenue 118,735,370$ 5,003$ 118,740,373$ Timing of revenue recognition
At a point in time 118,735,370$ 5,003$ 118,740,373$
Computer and2018 peripherals segment Other Total
Total segment revenue 116,984,622$ 3,800$ 116,988,422$ Timing of revenue recognition
At a point in time 116,984,622$ 3,800$ 116,988,422$
2019 2018
Interest income 57,384$ 69,958$ Others 240,016 331,395
Total 297,400$ 401,353$
2019 2018(Losses) gains on financial assets (liabilities) at fair value through profit or loss
21,390)($ 103,483$
Net currency exchange losses 31,685)( 215,635)( Gains on disposal of property, plant and equipment 11 300 Miscellaneous disbursement 2,200 7,755)( Total 50,864)($ 119,607)($
Operatingcosts
OperatingExpense
TotalOperating
costsOperatingExpense
Total
Employee benefit expense 325,211$ 3,488,159$ 3,813,370$ 253,751$ 3,496,989$ 3,750,740$
Depreciation charges 23,541 133,843 157,384 7,408 67,125 74,533
Amortized charges - 4 4 - 23 23
By function
By nature
2019 2018

214
A. According to the Articles of Incorporation of the Company, a ratio of distributable
net profit of the current year, after covering accumulated losses, shall be distributed as employees’ compensation and directors’ remuneration. The ratio shall be 6%~10% for employees’ compensation and shall not be higher than 1% for directors’ remuneration.
B. For the years ended December 31, 2019 and 2018, employees’ compensation was accrued at $505,000 and $515,000, respectively; while directors’ remuneration was both accrued at $49,500. The aforementioned amounts were recognised in salary expenses. The employees’ compensation and directors’ remuneration were estimated and accrued based on distributable profit of the current year for the year ended December 31, 2019. Employees’ compensation and directors’ remuneration of 2018 as resolved at the meeting of Board of Directors were in agreement with those amounts recognised in the 2018 financial statements. Information about employees’ compensation and directors’ remuneration of the Company as resolved by the Board of Directors and shareholders will be posted in the “Market Observation Post System” at the website of the Taiwan Stock Exchange.
Operatingcosts
OperatingExpense
TotalOperating
costsOperatingExpense
Total
Wages and salaries 282,790$ 3,064,152$ 3,346,942$ 227,078$ 3,077,748$ 3,304,826$ Labour and health insurancefees
19,170 192,968 212,138 11,803 188,064 199,867
Pension costs 10,050 102,728 112,778 6,493 100,246 106,739
Directors’ remuneration 4,811 44,689 49,500 3,989 45,511 49,500
Other personnel expenses 8,390 83,622 92,012 4,388 85,420 89,808
Total 325,211$ 3,488,159$ 3,813,370$ 253,751$ 3,496,989$ 3,750,740$
By function
By nature
2019 2018

215
(21) Income tax A. Income tax expense
(a) Components of income tax expense:
(b) The income tax (charge)/credit relating to components of other comprehensive
income:
B. Reconciliation between income tax expense and accounting profit
2019 2018Current tax:Current tax on profits for the period 928,953$ 1,256,305$ Prior year income tax overestimation 124,148)( 169,730)( Total current tax 804,805 1,086,575 Deferred tax:Origination and reversal of temporary differences 12,204 120,096)( Impact of charge in tax rate - 21,626 Total deferred tax 12,204 98,470)( Income tax expense 817,009$ 988,105$
2019 2018
Remeasurement of defined benefit obligations 2,016$ 4,286$ Impact of charge in tax rate - 4,175
2,016$ 8,461$
2019 2018Tax calculated based on profit before tax and statutory tax rate
1,280,844$ 1,405,847$
Effect from items disallowed by tax regulation 2,886 6,086 Temporary differences not recognised as deferred taxliabilities
137,196)( 83,280)(
Effect from investment tax credits 282,279)( 250,279)( Additional 10% tax on undistributed earnings 76,902 57,835 Prior year income tax overestimation 124,148)( 169,730)( Impact of charge in tax rate - 21,626 Income tax expense 817,009$ 988,105$
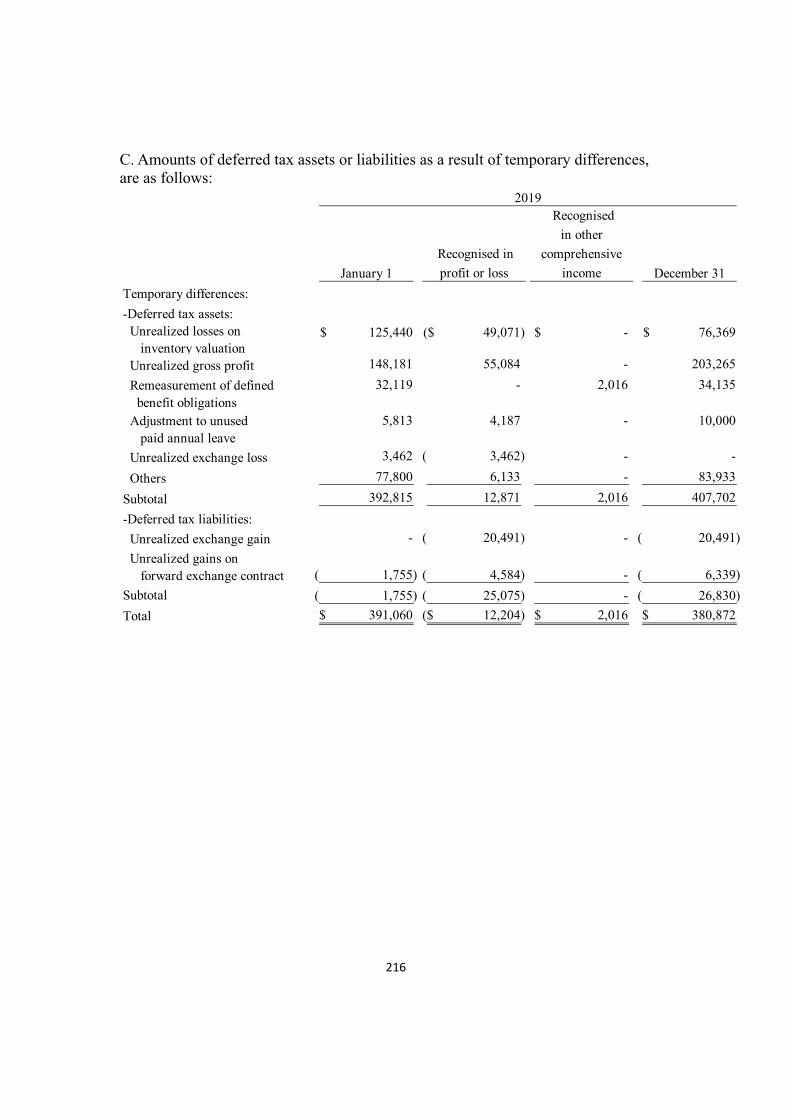
216
C. Amounts of deferred tax assets or liabilities as a result of temporary differences, are as follows:
January 1
Recognised in
profit or loss
Recognised
in other
comprehensive
income December 31
Temporary differences:
-Deferred tax assets: Unrealized losses on inventory valuation
125,440$ 49,071)($ -$ 76,369$
Unrealized gross profit 148,181 55,084 - 203,265
Remeasurement of defined benefit obligations
32,119 - 2,016 34,135
Adjustment to unused paid annual leave
5,813 4,187 - 10,000
Unrealized exchange loss 3,462 3,462)( - -
Others 77,800 6,133 - 83,933
Subtotal 392,815 12,871 2,016 407,702
-Deferred tax liabilities:
Unrealized exchange gain - 20,491)( - 20,491)(
Unrealized gains on forward exchange contract 1,755)( 4,584)( - 6,339)(
Subtotal 1,755)( 25,075)( - 26,830)(
Total 391,060$ 12,204)($ 2,016$ 380,872$
2019
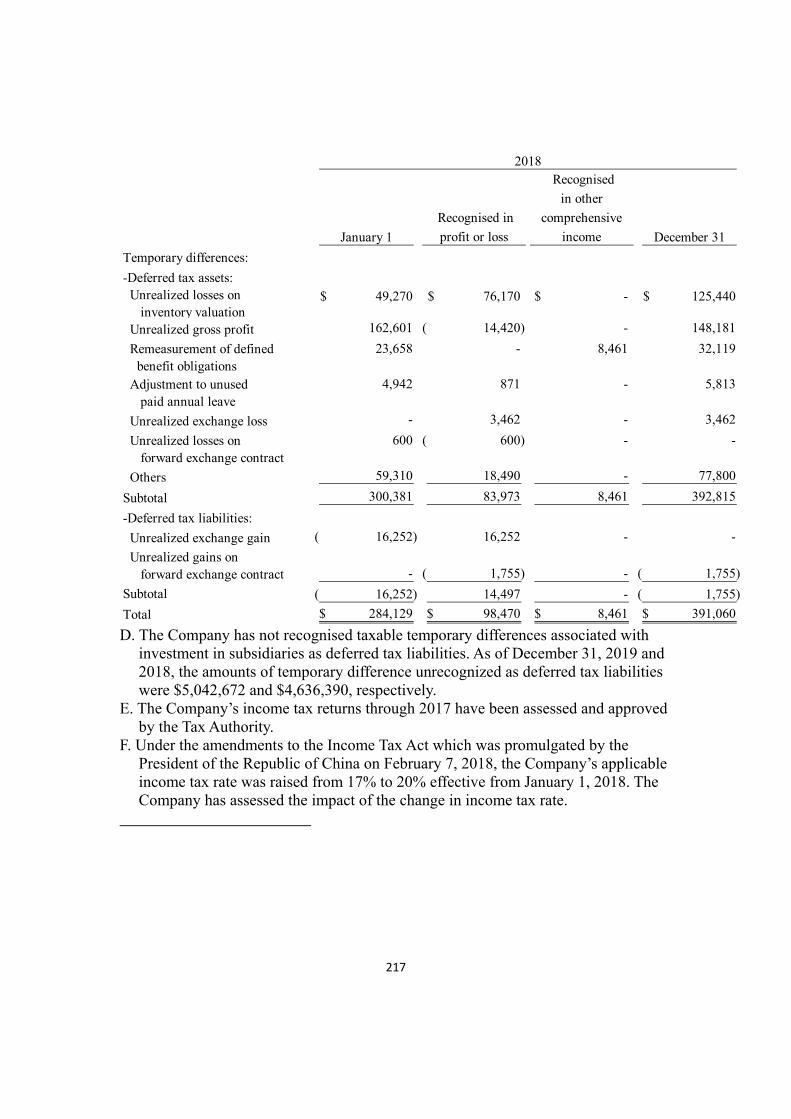
217
D. The Company has not recognised taxable temporary differences associated with
investment in subsidiaries as deferred tax liabilities. As of December 31, 2019 and 2018, the amounts of temporary difference unrecognized as deferred tax liabilities were $5,042,672 and $4,636,390, respectively.
E. The Company’s income tax returns through 2017 have been assessed and approved by the Tax Authority.
F. Under the amendments to the Income Tax Act which was promulgated by the President of the Republic of China on February 7, 2018, the Company’s applicable income tax rate was raised from 17% to 20% effective from January 1, 2018. The Company has assessed the impact of the change in income tax rate.
January 1
Recognised in
profit or loss
Recognised
in other
comprehensive
income December 31
Temporary differences:
-Deferred tax assets: Unrealized losses on inventory valuation
49,270$ 76,170$ -$ 125,440$
Unrealized gross profit 162,601 14,420)( - 148,181
Remeasurement of defined benefit obligations
23,658 - 8,461 32,119
Adjustment to unused paid annual leave
4,942 871 - 5,813
Unrealized exchange loss - 3,462 - 3,462
Unrealized losses on forward exchange contract
600 600)( - -
Others 59,310 18,490 - 77,800
Subtotal 300,381 83,973 8,461 392,815
-Deferred tax liabilities:
Unrealized exchange gain 16,252)( 16,252 - -
Unrealized gains on forward exchange contract - 1,755)( - 1,755)(
Subtotal 16,252)( 14,497 - 1,755)(
Total 284,129$ 98,470$ 8,461$ 391,060$
2018

218
(22) Earnings per share
7. RELATED PARTY TRANSACTIONS
(1) Parent and ultimate controlling party
Retroactively adjustedweighted-average
outstanding ordinary Earnings per shareAmount after tax shares (in thousands) (in NT dollars)
Basic earnings per share Profit attributable to ordinary shareholders of the parent 5,587,210$ 844,856 6.61$ Diluted earnings per shareProfit attributable to ordinary shareholders of the parent 5,587,210$ 844,856 Assumed conversion of all dilutive potential ordinary sharesEmployees compensation - 7,378 Profit attributable to ordinary shareholders of the parent plus assumed conversion of all dilutive potential ordinary shares 5,587,210$ 852,234 6.56$
2019
Retroactively adjustedweighted-average
outstanding ordinary Earnings per shareAmount after tax shares (in thousands) (in NT dollars)
Basic earnings per share Profit attributable to ordinary shareholders of the parent 6,041,129$ 844,856 7.15$ Diluted earnings per shareProfit attributable to ordinary shareholders of the parent 6,041,129$ 844,856 Assumed conversion of all dilutive potential ordinary sharesEmployees compensation - 7,926 Profit attributable to ordinary shareholders of the parent plus assumed conversion of all dilutive potential ordinary shares 6,041,129$ 852,782 7.08$
2018

219
The Company’s shares are held by public, therefore there is no ultimate parent and controlling party.
(2) Names of related parties and relationship
(3) Significant related party transactions A. Sales revenue, net
The sales price and payment terms to related parties were not significantly different from those sales to third parties.
Names of related parties Relationship with the Company
MSI COMPUTER (AUSTRALIA) PTY. LTD. [MSI (AUSTRALIA)] Subsidiary
MSI COMPUTER CORP. [MSI (LA)] Subsidiary
MSI COMPUTER JAPAN CO., LTD. [MSI (JAPAN)] Subsidiary
MICRO-STAR NETHERLANDS HOLDING B.V. [MSI (HOLDING)] Subsidiary
MSI PACIFIC INTERNATIONAL HOLDING CO., LTD. [MSI(PACIFIC)] Subsidiary
MSI COMPUTER SARL [MSI (SARL)] Second-tier subsidiary
MYSTAR COMPUTER B.V. [MYSTAR] Second-tier subsidiary
MSI COMPUTER (UK) LTD. [MSI (UK)] Second-tier subsidiary
MSI KOREA CO., LTD. [MSI (KOREA)] Second-tier subsidiary
MSI POLSKA SP. Z O.O. [MSI (POLSKA)] Second-tier subsidiary
MSI ITALY S.R.L. [MSI (ITALY)] Second-tier subsidiary
MSI COMPUTER EUROPE B.V. [MSI (EUROPE)] Second-tier subsidiary
LLC MSI COMPUTER [MSI (RUSSIA)] Second-tier subsidiary
MHK INTERNATIONAL CO., LTD. [MSI (MHK)] Second-tier subsidiary
MEGA COMPUTER CO., LTD. [MEGA COMPUTER] Second-tier subsidiary
MSI IBERIA S.L. [MSI IBERIA] Second-tier subsidiary
MSI (SHENZHEN) CO., LTD. [MSI SHENZHEN] Second-tier subsidiary
MSI ELECTRONICS (KUNGSHAN) CO., LTD.[MSI ELECTRONICS (KUNGSHAN)] Second-tier subsidiary
MSI COMPUTER (SHENZHEN) CO., LTD.[MSI COMPUTER (SHENZHEN)] Second-tier subsidiary
2019 2018Sales of goods: MSI (LA) 16,439,951$ 15,843,711$ Subsidiaries 11,828,366 11,747,224
Total 28,268,317$ 27,590,935$

220
B. Manufacturing expense - processing costs
The Company subcontracts manufacturing to a second-tier subsidiary through first-tier subsidiaries. The transaction model is that the Company provides raw materials, mutually agreed with the second-tier subsidiary to process the products based on quantities, amounts and lead time of orders. The accounts payable would be paid depending on the cash flow situation of the Company. The manner of carrying out the processing trade with the second-tier subsidiary is in accordance with (1998) Tai-Cai-Zheng (6) Letter No. 00747 of Securities and Futures Commission, Ministry of Finance, R.O.C. Starting July 1, 2019, the Company agreed on manufacturing items with second-tier subsidiary directly.
C. Operating expenses - after-sales service and advertisement expense
The Company recognised the operating expenses monthly based on the number of services provided by subsidiaries and second-tier subsidiaries, with the same credit term available to third parties.
D. Receivables from related parties
Accounts receivable mainly arises from sales, with the same credit term available
to third parties. E. Other payables
The abovementioned other payables mainly arises from processing costs and purchases of services, with the same credit term available to third parties.
(4) Key management compensation
2019 2018
Subsidiary: MSI (PACIFIC) 1,895,512$ 4,066,892$ Second-tier Subsidiary: MSI ELECTRONICS (KUNSHAN) 630,364 - MSI COMPUTER (SHENZHEN) 1,627,044 -
4,152,920$ 4,066,892$
2019 2018
Purchases of services:
Subsidiaries 1,769,312$ 1,752,337$
December 31, 2019 December 31, 2018Accounts receivable MSI (LA) 5,255,324$ 4,797,787$ Subsidiaries 1,376,706 1,084,090
Total 6,632,030$ 5,881,877$
December 31, 2019 December 31, 2018MSI (PACIFIC) $ 4,095,703 $ 3,508,869Subsidiaries 176,907 162,892
Total 4,272,610$ 3,671,761$

221
8. PLEDGED ASSETS
None. 9. SIGNIFICANT CONTINGENT LIABILITIES AND UNRECOGNISED CONTRACT
COMMITMENTS (1) Contingencies:None. (2) Commitments:None.
10. SIGNIFICANT DISASTER LOSS None.
11. SIGNIFICANT EVENTS AFTER THE BALANCE SHEET DATE None.
12. OTHERS (1) Capital management
When the Company managing the needs of future working capital, research and development expense and dividends payment based on the factors of its current industrial characteristics and the Company’s future development status to safeguard the Company’s ability to continue as a going concern in order to provide returns for shareholders and maintain an optimal capital structure to increase share value on a long-term basis. In order to maintain or adjust the capital structure, the Company may adjust the amount of dividends paid to shareholders, return capital to shareholders, issue new shares or repurchase outstanding shares.
(2) Financial instruments
2019 2018Salaries and other short-term employee benefits 319,047$ 316,453$ Post-employment benefits 1,944 1,512
Total 320,991$ 317,965$

222
A. Financial instruments by category
B. Risk management policies
The Company’s activities expose it to a variety of financial risks: market risk (including foreign exchange risk, interest rate risk and price risk), credit risk and liquidity risk. The Company’s overall risk management programme focuses on the unpredictability of financial markets and seeks to minimise potential adverse effects on the Company’s financial position and financial performance.
December 31, 2019 December 31, 2018Financial assets Financial assets at fair value through profit or loss Financial assets mandatorily measured at fair value through profit or loss
56,641$ 14,332$
Financial assets at fair value through other comprehensive income Designation of equity instrument 151,975 - Financial assets at amortised cost Cash and cash equivalents 8,881,827 6,979,442 Notes receivable 3,929 2,377 Accounts receivable 17,478,303 16,618,287 Other receivables 157,760 91,329 Other financial assets 1,200,000 728,936 Guarantee deposits paid 18,883 5,592
27,949,318$ 24,440,295$ December 31, 2019 December 31, 2018
Financial liabilities Financial liabilities at fair value through profit or loss Financial liabilities held for trading 24,943$ 5,555$ Financial liabilities at amortised cost Short-term borrowings 1,500,000 3,000,000 Notes payable - 200 Accounts payable 19,764,458 14,658,805 Other payables 7,322,529 6,426,273 Guarantee deposits received 91,809 115,890
28,703,739$ 24,206,723$
Derivative financial assets for hedging 179,905$ -$

223
C. Significant financial risks and degrees of financial risks (a) Market risk
Foreign exchange risk i. The Company operates internationally and is exposed to foreign exchange
risk arising from various currency exposures, foreign exchange risk arises from future commercial transactions, recognised assets and liabilities and net investments in foreign operations.
ii. Management has set up a policy to manage their foreign exchange risk against their functional currency.
iii. The Company has certain investments in foreign operations, whose net assets are exposed to foreign currency translation risk.
iv. The Company hedges foreign exchange rate by using forward exchange contracts. However, the Company does not adopt hedging accounting. Details of financial assets or liabilities at fair value through profit or loss are provided in Note 6(2).
v. The Company’s businesses involve some non-functional currency operations. The information on assets and liabilities denominated in foreign currencies whose values would be materially affected by the exchange rate fluctuations is as follows:

224
(Foreign currency: Foreign Currency
AmountBook Value
functional currency) (In Thousands) Exchange rate (NTD)Financial assets Monetary items USD: NTD 729,998$ 29.9800 21,885,332$ RMB:NTD 609,253 4.3050 2,622,835 EUR: NTD 58,210 33.5900 1,955,278 KRW:NTD 18,048,735 0.0260 469,267 GBP: NTD 7,794 39.3600 306,785 CAD:NTD 10,292 22.9900 236,603 RUB: NTD 444,494 0.4843 215,268 JPY:NTD 660,692 0.2760 182,351 AUD:NTD 8,157 21.0050 171,332 Non-monetary items USD: NTD 228,346 29.9800 6,845,823 EUR: NTD 18,737 33.5900 629,384 Financial liabilities Monetary items USD: NTD 693,808 29.9800 20,800,378 RMB:NTD 1,003,591 4.3050 4,320,458 EUR: NTD 13,210 33.5900 443,723 JPY:NTD 412,320 0.2760 113,800
December 31, 2019

225
vi. The exchange loss arising from significant foreign exchange
variation on the monetary items held by the Company for the years ended December 31, 2019 and 2018, amounted to $31,685 and $215,635, respectively.
vii. Analysis of foreign currency market risk arising from significant foreign exchange variation:
(Foreign currency: Foreign Currency
AmountBook Value
functional currency) (In Thousands) Exchange rate (NTD)Financial assets Monetary items USD: NTD 600,402$ 30.7150 18,441,362$ RMB:NTD 681,497 4.4720 3,047,654 EUR: NTD 50,820 35.2000 1,788,876 CAD:NTD 16,264 22.5800 367,252 GBP: NTD 8,128 38.8800 315,999 RUB: NTD 585,694 0.4421 258,935 KRW:NTD 7,668,444 0.0276 211,649 AUD:NTD 7,743 21.6650 167,749 JPY:NTD 460,616 0.2782 128,144 Non-monetary items USD: NTD 211,061 30.7150 6,482,739 EUR: NTD 16,956 35.2000 596,852 Financial liabilities Monetary items USD: NTD 528,120 30.7150 16,221,204 RMB:NTD 759,944 4.4720 3,398,468 EUR: NTD 11,505 35.2000 404,959
December 31, 2018

226
Degree ofvariation
Effect on profitor loss
(before tax)
Effect on othercomprehensive
incomeFinancial assets Monetary items USD: NTD 1% 218,853$ -$ RMB:NTD 1% 26,228 - EUR: NTD 1% 19,553 - KRW:NTD 1% 4,693 GBP: NTD 1% 3,068 CAD:NTD 1% 2,366 - RUB: NTD 1% 2,153 - JPY:NTD 1% 1,824 - AUD:NTD 1% 1,713 - Financial liabilities Monetary items USD: NTD 1% 208,004 - RMB:NTD 1% 43,205 - EUR: NTD 1% 4,437 - JPY:NTD 1% 1,138 -
2019Sensitivity analysis

227
Cash flow and fair value interest rate risk The Group analyses its interest rate exposure on a dynamic basis. Various scenarios are simulated taking into consideration refinancing, renewal of existing positions, alternative financing and hedging. Based on these scenarios, the Group calculates the impact on profit and loss of a defined interest rate shift. For each simulation, the same interest rate shift is used for all currencies. The scenarios are run only for liabilities that represent the major interest-bearing positions.
(b) Credit risk i. Credit risk refers to the risk of financial loss to the Company arising from default
by the clients or counterparties of financial instruments on the contract obligations. The main factor is that counterparties could not repay in full the accounts receivable cash flow based on the agreed terms.
ii. The Company manages their credit risk taking into consideration the entire group’s concern. For banks and financial institutions, only parties with a rating of investment grade are accepted. According to the Company’s credit policy, each local entity in the Company is responsible for managing and analysing the credit risk for each of their new clients before standard payment and delivery terms and conditions are offered. Internal risk control assesses the credit quality of the customers, taking into account their financial position, past experience and other factors. Individual risk limits are set based on internal or external ratings in
Degree ofvariation
Effect on profitor loss
(before tax)
Effect on othercomprehensive
incomeFinancial assets Monetary items USD: NTD 1% 184,414$ -$ RMB:NTD 1% 30,477 - EUR: NTD 1% 17,889 - CAD:NTD 1% 3,673 - GBP: NTD 1% 3,160 - RUB: NTD 1% 2,589 - KRW:NTD 1% 2,116 - AUD:NTD 1% 1,677 - JPY:NTD 1% 1,281 - Financial liabilities Monetary items USD: NTD 1% 162,212 - RMB:NTD 1% 33,985 - EUR: NTD 1% 4,050 -
2018Sensitivity analysis

228
accordance with limits set by the management. The utilisation of credit limits is regularly monitored. Credit risk arises from credit exposures to wholesale and retail customers, including outstanding receivables.
iii. The Company adopts assumptions, if the contract payments were past due over 90 days based on the terms, there has been a significant increase in credit risk on that instrument since initial recognition.
iv. The Company adopts the assumptions under IFRS 9, the default occurs when the contract payments are past due over 150 days.
v. The following indicators are used to determine whether the credit impairment of debt instruments has occurred: (i) It becomes probable that the issuer will enter bankruptcy or other financial
reorganization due to their financial difficulties; (ii) The disappearance of an active market for that financial asset because of
financial difficulties; (iii) Default or delinquency in interest or principal repayments; (iv) Adverse changes in national or regional economic conditions that are
expected to cause a default. vi. The Company applies the modified approach using provision matrix, loss rate
methodology to estimate expected credit loss under the provision matrix basis. vii. The Company wrote-off the financial assets, which cannot be reasonably
expected to be recovered, after initiating recourse procedures. However, the Group will continue executing the recourse procedures to secure their rights.
viii. The Company used the forecastability to adjust historical and timely information to assess the default possibility of debt instrument on December 31, 2019 and 2018.The except credit loss rate of the Company’s overdue accounts receivable was not material as of December 31, 2019 and 2018.
ix. The Company applies the simplified approach to provide loss allowance for accounts receivable that have no significant impact. The Company had not recognized related impact for the years ended December 31, 2019 and 2018.

229
(c) Liquidity risk i. Cash flow forecasting is performed in the operating entities of the Company and
aggregated by Company treasury. Company treasury monitors rolling forecasts of the Company’s liquidity requirements to ensure it has sufficient cash to meet operational needs. Such forecasting takes into consideration the Company’s internal balance sheet ratio targets and external regulatory or legal requirements.
ii. The table below analyses the Company’s non-derivative financial liabilities and net-settled or gross-settled derivative financial liabilities into relevant maturity groupings based on the remaining period at the balance sheet date to the contractual maturity date for non-derivative financial liabilities and to the expected maturity date for derivative financial liabilities. The amounts disclosed in the table are the contractual undiscounted cash flows.
Derivative financial liabilities As of December 31, 2019 and 2018, the derivative financial liabilities are foreign exchange contracts that mature within 1 year.
iii. The Company does not expect the timing of occurrence of the cash flows estimated through the maturity date analysis will be significantly earlier, nor expect the actual cash flow amount will be significantly different.
(3) Fair value information A. The different levels that the inputs to valuation techniques are used to measure fair
value of financial and non-financial instruments have been defined as follows: Level 1: Quoted prices (unadjusted) in active markets for identical assets or liabilities that the entity can access at the measurement date. A market is regarded as active where a market in which transactions for the asset or liability takes place
December 31, 2019
Less than 1year
Between 1to 2 years
Between 2to 3 years Over 3 years
Short-term borrowings 1,500,000$ -$ -$ -$ Accounts payable 19,764,458 - - - Other payables 7,322,529 - - - Lease liabilities 75,925 67,262 33,706 5,069 Other financial liabilities - - - 91,809
Non-derivative financial liabilities:
December 31, 2018
Less than 1year
Between 1to 2 years
Between 2to 3 years Over 3 years
Short-term borrowings 3,000,000$ -$ -$ -$ Notes payable 200 - - - Accounts payable 14,658,805 - - - Other payables 6,426,273 - - - Other financial liabilities 21,665 - - 94,225
Non-derivative financial liabilities:

230
with sufficient frequency and volume to provide pricing information on an on going basis. Level 2: Inputs other than quoted prices included within Level 1 that are observable for the asset or liability, either directly or indirectly. Level 3: Unobservable inputs for the asset or liability.
B. Financial instruments not measured at fair value The Company’s cash and cash equivalents, notes receivable, accounts receivable, other receivables, other financial assets, guarantee deposits paid, short-term borrowings, notes payable, accounts payable, other payables, and guarantee deposits received are approximate to their fair values. The transaction value information is provided in Note 12(2)A.
C. The related information of financial and non-financial instruments measured at fair value by level on the basis of the nature, characteristics and risks of the assets and liabilities is as follows:
December 31, 2019 Level 1 Level 2 Level 3 Total
Assets:Recurring fair value measurementsFinancial assets at fairvalue through profit or loss
-Forward exchange contract -$ 3,660$ -$ 3,660$ -Foreign exchange swap - 52,981 - 52,981 Financial assets at fair value throughother comprehensive income -Equity securities - - 151,975 151,975 Total -$ 56,641$ 151,975$ 208,616$
Liabilities:Recurring fair value measurementsFinancial liabilities at fairvalue through profit or loss -Forward exchange contract -$ 24,943$ -$ 24,943$

231
D. The methods and assumptions the Company used to measure fair value are as
follows: (a) When assessing non-standard and low-complexity financial instruments, for
example, debt instruments without active market, interest rate swap contracts, foreign exchange swap contracts and options, the Company adopts valuation technique that is widely used by market participants. The inputs used in the valuation method to measure these financial instruments are normally observable in the market.
(b) Except for financial instruments with active markets, the fair value of other financial instruments is measured by using valuation techniques or by reference to counterparty quotes.
(c) The valuation of derivative financial instruments is based on valuation model widely accepted by market participants, such as present value techniques and option pricing models. Forward exchange contracts are usually valued based on the current forward exchange rate.
E. For the years ended December, 2019 and 2018, there was no transfer between Level 1 and Level 2.
F. For the years ended December 31, 2019 and 2018, there was no transfer in or out from Level 3.
G. The company entrusts an external evaluation agency to evaluate the fair value classified as the third level.
13. SUPPLEMENTARY DISCLOSURES (1) Significant transactions information
A. Loans to others: None. B. Provision of endorsements and guarantees to others: None. C. Holding of marketable securities at the end of the period (not including
subsidiaries, associates and joint ventures): Please refer to table 1. D. Acquisition or sale of the same security with the accumulated cost
exceeding $300 million or 20% of the Company’s paid-in capital: None.
December 31, 2018 Level 1 Level 2 Level 3 Total
Assets:Recurring fair value measurementsFinancial assets at fairvalue through profit or loss
-Forward exchange contract -$ 6,376$ -$ 6,376$ -Foreign exchange swap - 7,956 - 7,956 Total -$ 14,332$ -$ 14,332$
Liabilities:Recurring fair value measurementsFinancial liabilities at fairvalue through profit or loss -Forward exchange contract -$ 5,555$ -$ 5,555$

232
E. Acquisition of real estate reaching NT$300 million or 20% of paid-in capital or more: None.
F. Disposal of real estate reaching NT$300 million or 20% of paid-in capital or more: None.
G. Purchases or sales of goods from or to related parties reaching NT$100 million or 20% of paid-in capital or more: Please refer to table 2.
H. Receivables from related parties reaching NT$100 million or 20% of paid-in capital or more: Please refer to table 3.
I. Derivative financial instruments undertaken during the year ended December 31, 2019: Please refer to Notes 6(2) and 12(2).
J. Significant inter-company transactions during the reporting periods: Please refer to table 4.
(2) Information on investees (not including investees in Mainland China) Names, locations and other information of investee companies (not including investees in Mainland China): Please refer to table 5.
(3) Information on investments in Mainland China A. Basic information: Please refer to table 6. B. Significant transactions conducted with investees in Mainland China
directly or indirectly through other companies in the third areas: Please refer to table 7.
14. OPERATING SEGMENT INFORMATION Not applicable.
Detailed tables are attached from Page 167 to 175.

233
Micro Star International Co., Ltd.
Chairman: Hsu, Hsiang