Evolution Mining Limited - ASX
118
ANNUAL REPORT 2012 EVOLUTION MINING LIMITED www.evolutionmining.com.au ASX:EVN For personal use only
-
Upload
khangminh22 -
Category
Documents
-
view
2 -
download
0
Transcript of Evolution Mining Limited - ASX

ANNUAL REPORT
2012EVOLUTION MINING LIMITEd
www.evolutionmining.com.au
ASX:EVN
For
per
sona
l use
onl
y

2012 EVOLUTION MINING ANNUAL REPORT
EVOLUTION MINING LIMITEd ABN 74 084 669 036
CONTENTS
Highlights 2
Executive Chairman’s Report 3
Safety and People 5
Environment and Community 6
Review of Operations 7
Discovery 12
Mineral Resources and Ore Reserves 15
Chief Financial Officer’s Review 32
Board of Directors 33
Corporate Governance 35
Directors’ Report 41
Auditor’s Independence Declaration 63
Statement of Comprehensive Income 64
Statement of Financial Position 65
Statement of Changes in Equity 66
Statement of Cash Flow 67
Notes to the Financial Statements 68
Directors’ Declaration 111
Shareholder Information 112
Independent Audit Report 114
Corporate Directory 116
Evolution Mining Limited is a leading, growth-focused Australian gold miner. The
Company operates four wholly-owned Australian operations – Cracow, Edna May, Mt
Rawdon and Pajingo – and is constructing the Mt Carlton development project.
Evolution is forecasting production in FY2013 of between 370,000 - 410,000 ounces
gold equivalent. Cash operating costs (before royalties and after by-product credits)
are expected to be in the range of A$730 - A$790 per ounce.
Evolution has a strong balance sheet which provides the flexibility to fully fund current
exploration, development and production activities and also assess value-accretive
growth opportunities.
Evolution was formed in November 2011 through the merger of Catalpa Resources
Limited and Conquest Mining Limited, and the concurrent purchase of Newcrest
Mining Limited’s interests in the Cracow and Mt Rawdon gold mines in Queensland.
COMPANY PROFILE
Brisbane
Perth Sydney
Melbourne
Gladstone
Townsville
Darwin
Edna May
Mt RawdonCracow
Mt CarltonPajingo
For
per
sona
l use
onl
y

002
CORPORATE •CreationofthefourthlargestASX-listedgoldproducerdeliveringoperationaldiversity,predictability and meaningful growth •SuccessfulcompletionandimplementationofthemergerbetweenCatalpaResourcesLimitedand Conquest Mining Limited and the concurrent purchase of Newcrest Mining Limited’s interests in the Cracow and Mt Rawdon gold mines on 2 November 2011 to form Evolution Mining Limited •SuccessfulinstitutionalandretailentitlementsoffercompletedinDecember2011,raising A$152.5 million •StrongmaidennetprofitofA$37.3millionandanunderlyingnetprofitofA$63.4million (partial year ownership) •Revenuefromgoldandsilversalesincreasedby285%toA$469.5million •OperationsdeliverunderlyingEBITDAofA$190million •Goldsalesof288,617ouncesataveragesalesofA$1,600perounce •InclusionintheS&P/ASX200Indexfrom17March2012inrecognitionofincreasedscaleanddiversity
OPERATIONS •Totalgoldproductionof346,979ouncesinFY2012(280,401ouncesattributable1) in-line with FY2012 guidance expectations at a cash cost of A$771 per ounce, significantly below guidance of A$800 – A$850 per ounce •IncreasedproductionforecastinFY2013ataloweraveragecostperounce •Cracowperformedconsistentlydeliveringabove100,000ouncesforthe7thconsecutiveyear •Stand-outperformancerecordedatPajingofollowingtheimplementationofoperationalinitiativesto improvelong-termsustainableperformancewithproductionup165%onFY2011 •MtRawdonachievedrecordJunequarterproductionof32,734ouncesatA$531perouncetoproduce more than 95,000 ounces at A$684 per ounce in FY2012 •EdnaMayimprovedproductionby12%comparedtoFY2011withakeyfocusonimprovingplant reliability and utilisation to continue into FY2013
dEVELOPMENT •Grantingofa25yearminingleasefortheMtCarltongold-silver-copperprojecton5December2011 by the Queensland Government •ConstructionofMtCarltongold-silver-copperprojectonscheduleforcommissioninginDecember2012 •A$85millioncapitalexpendedatMtCarltoninFY2012
EXPLORATION •A$18.5MdiscoveryexpenditureinFY2012 •ExplorationsuccessatCracowwiththeconfirmationofanewhigh-gradeepithermalgoldshoot named Coronation •AcquisitionoftheHolletonGoldProjectannounced25June2012,astrategiclandholdingproviding the ability to leverage off existing infrastructure at Edna May
ORE RESERVES ANd MINERAL RESOURCES •GroupMineralResourcesestimatedat7.0millionouncesgoldequivalentincludingOreReserves estimated at 3.33 million ounces gold equivalent2 •375,000additionalouncesdefinedbyresourcedefinitiondrillingatPajingo •UndergroundMineralResourceestimateforEdnaMayincreasedto270,000ounces;remainsopenat depthandalongstrike
OUTLOOk •Totalgoldproductionforthe2013financialyearhasbeenforecasttoincreasetobetween370,000- 410,000 ounces at a cash cost of between A$730 and A$790 per ounce
1IncludesincreasedinterestinCracowfrom30%to100%on2November2011,100%ofMtRawdonfrom2November2011,
and100%ofPajingofrom18October2011. 2 Refer to the Mineral Resources and Ore Reserves Statement within this report for full details.
hIGhLIGhTSF
or p
erso
nal u
se o
nly

2012 EVOLUTION MINING ANNUAL REPORT
EXECUTIVE ChAIRMAN’S REPORT
For
per
sona
l use
onl
y

004
Australia’s newest mid-tier gold producer, Evolution Mining Limited, was created on 2nd November 2011 to meet what we perceived to be the demands of the investment community, providing a mid-tier gold company with the ability to deliver operational predictability, achieve meaningful growth and with the financial capacity to fund that growth. These attributes are considered fundamental to creating a sustainable company able to deliver superior returns to its shareholders and Evolution is now one of very few companies in the Australian gold sector that can credibly claim to have these qualities.
Historically, mid-tier gold companies have outperformed both smaller (junior) and larger (major) gold companies in terms of share price performance. Numerous examples of successful mid-tier gold companiesexistintheNorthAmericanmarketsbuttherearefewrecentexamplesinAustraliaasaresultoftheconsolidationthattookplace in the Australian gold sector between 1998 and 2003.
InternationalgoldcompaniestookadvantageoftheweakAustraliandollar and acquired a large number of promising local mid-tier gold companies.
Through the merger of Catalpa Resources Limited and Conquest Mining Limited combined with the concurrent purchase of Newcrest Mining Limited’s interests in the Cracow and Mt Rawdon gold mines, we believe Evolution has created a platform to develop into a globally competitive mid-tier gold company.
Our strategy of developing a mid-tier gold company in Australia has won the support of major global institutional investors. We received strong support from institutional investors both locally and abroad for the entitlement offer completed in November 2011 and were fortunate tohaveinfluentialfundmanagers,BlackRockInvestmentManagement(UK)LimitedandBakerSteelCapitalManagersLLPcommittoaA$50 million investment in addition to their pro-rata entitlements. Both groups remain supportive of Evolution and have acquired additional shares since completion of the entitlement offer.
NewcrestMining,Evolution’smajorshareholder,at33%,wasinstrumental in developing the vision and strategy for the creation of Evolution. Importantly this support has continued post completion of the transaction and we are very fortunate to have ongoing access to the depth of experience and expertise of one of the world’s leading gold companies within our major shareholder.
Our experience to date at Evolution has reinforced our conviction. In the 2012 financial year we produced 280,401 ounces of gold (attributable), which was in-line with our guidance, at an average cash operating cost of A$771 per ounce, significantly below our guidance. This is an extremely satisfying outcome in only eight months as a new company. Financially we have been able to deliver a strong underlying profit result of A$63.4 million while maintaining balance sheet strength.
Our Cracow and Mt Rawdon mines performed strongly, producing 102,565 and 95,403 ounces respectively in FY2012. Edna May produced 73,264 ounces and by year end we had initiated a number of changes to address plant throughput constraints and were beginning to see improvements towards the end of the year. Our Pajingo mine is a good example of how a combination of access to capital,atalentedmanagementteamandamotivatedworkforcecanreinvigorate an operation. Pajingo produced 45,889 ounces in FY2011 and an outstanding 75,747 ounces in FY2012, which we expect to improve upon in FY2013.
We strongly believe that every one of our assets is a better fit in Evolution than it was in its prior vehicle. We see significant operational and exploration upside at each of our assets. In FY2013 we expect to grow our production to 370,000 - 410,000 ounces gold equivalent (payable) at a cash cost of A$730 - 790 per ounce. This guidance includes an estimated cost of A$15 per ounce from the impact of
the carbon tax and it also reflects the fact that FY2013 will see the commissioningrampupofMtCarlton,ourkeydevelopmentproject.We expect that, once commissioned, Mt Carlton will be our lowest cost mine and therefore shareholders can expect the trend of growing production and declining costs to continue into FY2014.
We recognise that dividends are an important element of total shareholder returns. In FY2012 the Board of Evolution did not resolve to pay a dividend as we continue to invest heavily in our growth projects and exploration. Capital returns will be considered in the futureandIlookforwardtoupdatingyouonEvolution’sdividendpolicy in FY2013.
Many resources companies are finding it challenging in the current environment to retain high-quality people in Australia. However, I am pleased to say Evolution has been able to attract a very talented group of people. Evolution offers its employees long-term career stability as well as challenging and rewarding roles within adynamicorganisation.Wehavesuccessfullyrecruitedforallkeyroles of the expanded leadership team at Evolution and have also turned our attention to the longer term needs of the Company, with the initiation of a graduate recruitment program. This recruitment program commenced in March 2012 and 12 graduates across a range of mining and finance disciplines will join the Evolution team by January2013.
Thesafetyofourworkforceisofparamountimportanceandacorecultural value. I believe that all injuries are preventable. The 12 month rollingTotalRecordableInjuryFrequencyRateof23.5asat30June2012 was too high. We are committed to significantly improving our safetyrecordandhaveembarkedonacomprehensivesafetyregimeincorporating safety leadership, training and hazard awareness throughout the Company.
The formation of Evolution and the integration of the assets have, as expected,presentedmanychallenges.Ithastakenalotofhardwork,commitment and perseverance from everyone involved – employees, shareholdersandDirectors–andIwouldliketothankyouallforthe commitment you have shown to establishing what we believe is developing into an outstanding Australian gold company.
Iremainconfidentabouttheoutlookforgoldasgovernmentsaroundthe world continue to grapple with the difficulties of high public debt levels and low economic growth. The response we areseeinginpartsofEuropeandtheUnitedStatescanonlybepositive for the gold price as currencies are devalued and investors seektoprotectthevalueoftheircapitalthroughexposuretoassetslikegold.
We are on an exciting journey and I firmly believe that Evolution is attherightplaceattherighttimeandIlookforwardtocontinuingto demonstrate this as we grow the Company. As a mid-tier gold miner, Evolution is in a sweet spot in the gold industry, with a proven management team and a strong financial position. We are developing atrack-recordofdeliveringoperationalpredictabilityandalsomeaningful growth which we believe is a winning formula.
JAkE kLEINEXECUTIVE ChAIRMAN
IN ThE 2012 FINANCIAL YEAR wE PROdUCEd 280,401 OUNCES OF GOLd (ATTRIBUTABLE), IN-LINE wITh OUR GUIdANCE, AT AN AVERAGE CASh OPERATING COST OF A$771 PER OUNCE, SIGNIFICANTLY BELOw OUR GUIdANCE. ThIS IS AN EXTREMELY SATISFYING OUTCOME IN ONLY EIGhT MONThS AS A NEw COMPANY
For
per
sona
l use
onl
y

2012 EVOLUTION MINING ANNUAL REPORT
SAFETY ANdPEOPLE
SAFETYEvolution is committed to building a strong and participative safety culture across all of its sites with amajorfocusonimprovingworkplacesafety.TheCompany is developing a new group-wide Health, Safety and Environment management system which includes ourapproachtoRiskManagement,PrincipleHazardControl, Crisis Management and Consultation and is supported by a safety leadership program commited to improvingworkplacesafety.
“Safety - every job, every day” is one of Evolution’s core values. To support this value, Evolution has developed the following set of Safety Principles which together form the foundation of our approach to injury prevention within our organisation:
ALL INJURIES ANd INCIdENTS ARE PREVENTABLE
NO TASk IS SO IMPORTANT ThAT IT CANNOT BE dONE SAFELY
wORkING SAFELY IS A CONdITION OF EMPLOYMENT
MANAGEMENT TAkES ACCOUNTABILITY FOR SAFETY PERFORMANCE
EVERYONE IS EMPOwEREd TO STOP AT RISk BEhAVIOUR ANd CONTROL UNSAFE CONdITIONS ANd
EVERYONE TAkES ACCOUNTABILITY FOR ThEIR OwN SAFETY ANd FOR ThE SAFETY OF ThOSE AROUNd ThEM
During the year, Evolution conducted a group-wide audit of operations which focused on emergency preparedness and response capabilities. This initiative identified a number of opportunities to enhance our processes which have been prioritised for implementation and included in FY2013 safety improvement programs.
PEOPLEAs a new organisation Evolution presents an exciting proposition for employees and is attracting and retaining highcalibrepeopleinkeyrolesacrosstheorganisation.Recruitment projects including the graduate program and the Mt Carlton Mining Operations initiative have been very competitive and successful in attracting excellent candidates.SpecificallyourfirstGraduateintakeresultedin the employment of 12 exceptional candidates across various sites and the corporate office.
Evolution recognises that building internal capability and expertiseisakeycommitmentandpriorityinbuildinga successful global organisation. Role clarity and development plans are being designed and implemented for all employees and the Leadership Development Program is an exciting initiative in FY2013 next year for current and emerging leaders. Evolution believes these initiatives will contribute to a fully engaged and motivated workforce,resultinginlowturnover,ahighperformanceculture and ultimately shareholder value.
‘We’re all Evolution’ has been a defining theme in FY2012 in terms of people, policy and process. Coming together to form one company has been exciting and challenging. Evolution has been building its employee brand and has a truly national feel, demonstrated by the opportunity takenbyourpeopletotransferbetweensitesandstaywith Evolution.
Evolution is sensitive to the balance of policy and compliance in a culture which encourages high performance and personal judgment, fosters innovation and promotes behaviours aligned to the Values of Safety, Respect,AccountabilityandExcellence.Keypolicieshave been developed across the group in Diversity, Relocation,Travel,InformationTechnologyUseandSecurity, and Study Assistance.
Strategic initiatives introduced this year such as the performance management system and remuneration principles are designed to promote excellent performance and provide employees an opportunity to benefit financially in one of our short term incentive plans. Details of incentive plans are set out in the Remuneration section of this Annual Report.
At our operations, Evolution is committed to providing qualitylivingconditionsfortheworkforce.Provisionandupgrade of site accommodation and communications have enabled employees to enjoy high quality living areas and the technology to stay connected with family and friends.
Mt Rawdon: Truck pulling community fundraiser - Mt Perry
For
per
sona
l use
onl
y

006
ENVIRONMENTANd COMMUNITY
ENVIRONMENTAL RESPONSIBILITYEvolution aims to achieve best practice environmental performance by using practical environmental solutions at each site, as documented in the Evolution Mining Environmental Policy.Workactivitiesincludeproactivemonitoring of the receiving environment, water, soil and air quality. Ongoing monthly audits ensure levels comply with government parameters and are used by environmental scientists to create detailed action plans that allow constant, sustained improvement. This diligence contributes to a high standard of reporting that ensures submissions to government are approved first time.
In the last 12 months, Evolution has submitted environmental applications and received approvals for:
• ThedevelopmentoftheMtCarltonproject
• ThedevelopmentoftheVenue/VNUgoldproject at Pajingo
• Thedevelopmentofanundergroundmineat Edna May
• TwoTailingsStorageFacilitywallliftsatMt Rawdon and Cracow
A landform efficiency design plan is being implemented at Mt Rawdon that aims to reduce operational material movement and cost and to achieve rehabilitation design objectives. Environmental Management Systems in accordance with relevant international and Australian standards have been implemented at Evolution’s new site, Mt Carlton, and similar strategies are being implemented and refined across other sites.
Evolution is implementing best practice innovative water management strategies across all of its sites to effectively manage operation in the wet season. These strategies are designed to prevent uncontrolled discharges during the wet season, and limit operational disruption.
REhABILITATION Evolution is executing an ongoing strategy of progressive rehabilitation. This proactive management ensures the disturbancefootprintandimpactiskepttoanabsoluteminimum. This management strategy helps reduce the ongoing effect on the receiving environment and contributes to manageable rehabilitation within the Company’s quality expectations and at a reasonable cost.
This strategy is proven at Edna May, with the proactive management of the endemic shrub species Eremophila Resinosa to ensure survival during mining activity and longevity after mine closure. This is being achieved through a collaborative approach with government and the scientific community.
COMMUNITY Evolution aims to set a high standard of social performance across its sites and within the communities in which it operates. A progressive and inclusive strategy isbeingdevelopedwithcommunitiesandstakeholderswhich will become integral to the way we conduct business at each of our operations.
Each operation is currently involved in regular reporting and monitoring of grievances and incidents, community impact and levels of engagement with investment activities.
A high standard of Indigenous Relations is a priority forEvolutionwiththeIndigenousLandUse Agreements and Cultural Heritage Management Plans and Agreements in place at Cracow, Mt Carlton and Pajingo. Cultural Heritage Management negotiations are also underway at Mt Rawdon. These Agreements involve Indigenous employment targets, traineeships, scholarships, economic development and business opportunities.
Our community and Indigenous relations activities and the relationshipsdevelopedwithourstakeholderscontinueto be developed and improved. Evolution aims to ensure a high standard of positive and proactive relationships are set and upheld across the business and its entire stakeholdercommunity.
Rock Wallabies - Cracow
Cultivation of Eremophila Resinosa - Edna May
For
per
sona
l use
onl
y

2012 EVOLUTION MINING ANNUAL REPORT
20,000
0
40,000
60,000
80,000
100,000
120,000
PR
Od
UC
TIO
N (
OU
NC
ES)
CRACOw PAJINGO EdNA MAY MT RAwdON
102,565
75,747 73,265
95,403
SEP qTR2011
PR
Od
UC
TIO
N (
OU
NC
ES)
400,000
300,000
200,000
100,000
0dEC qTR
2011MAR qTR
2012JUN qTR
2012FY2012
75,895 89,812 84,122 97,149
346,979
FY2012 GOLd PROdUCTION BY qUARTER
FY2012 GOLd PROdUCTION BY OPERATION
Note:Productionassumes100%assetownershipforthefullyear.OwnershipinterestinCracowincreasedfrom30%to100%on2November2011,100%ofMtRawdonacquired 2November2011,and100%Pajingoacquired18October2011. Pajingo development cut
For
per
sona
l use
onl
y

008
REVIEw OF OPERATIONS
FY2012 UNITS CRACOw PAJINGO EdNA MAY MT RAwdON TOTAL
Tonnes processed 000’t 527 487 2,373 3,434 6,822
Head grade g/t 6.47 5.08 1.07 0.95 1.72
Total gold produced oz 102,565 75,747 73,264 95,403 346,979
Attributable gold produced 1 oz 78,779 57,154 73,264 71,205 280,401
Attributable Cash Cost 2,4 A$/oz 678 780 949 684 771
Attributable Total Cost 3 A$/oz 1,078 1,138 1,178 960 1,087
1. IncludesincreasedinterestinCracowfrom30%to100%on2November2011,100%ofMtRawdonfrom2November2011,and100%ofPajingofrom18October2011,andcorrectedsilver
production from the December 2011 quarterly report
2. Before royalties and after silver credits
3. Includes cash costs, depreciation, amortisation and royalties
4. Includes a final year adjustment for Edna May
CRACOw OPERATIONSTheCracowmineislocated500kilometresnorthwest of Brisbane, Queensland. The Cracow region has a long history of gold mining, with 850,000 ounces of gold produced from 1932 - 1992, predominantly from open-pit mining. The current underground operation commenced production in 2004. The Cracow operation has a stable production base, continually producing around 100,000 ounces per annum since 2006 and replacing annual mining depletion with new reserves. Gold mineralisation at Cracow occurs in steeply dipping, low-sulphidation epithermal fissure quartz veins.
MININGAt Cracow, underground mining is by open stope, downhole sub-level benching with waste backfill.FY2012annualgoldproductionof102,565 ounces was towards the upper end of the guidance range of between 90,000 - 107,000 ounces. Cash operating costs for FY2012 were A$678 per ounce, at the lower end of the guidance range of A$670 - A$740 per ounce. A total of 457,000 ore tonnes were mined fromKilkenny,Phoenix,Sovereign,KlondykeNorth, Royal and Roses Pride orebodies and total development for the year was 5,658 metres.
A number of initiatives commenced to improve mine productivity levels including the upgrade of the primary ventilation system to re-establish accesstothelowerKiIkennyorebodyandtheaddition of resources to the mining fleet.
MILLINGA total of 527,000 tonnes were treated at an averagegradeof6.47g/tgoldanda93.5%recovery rate for the year. A throughput capacity of 550,000 tonnes per annum is expected to be achieved during FY2013.
OUTLOOkGold production for FY2013 has been forecast at between 90,000 - 100,000 ounces at a cash operating cost of between A$780 - A$820 per ounce.
MT RAwdON OPERATIONSThe Mt Rawdon gold mine is located 75 kilometressouthwestofBundaberg,Queensland.The mine has been in production since 2001 and has a current forecast mine life of 10 years. The process plant has a design capacity of 3.5 million tonnes per annum and produces a gold-silver doré.
MININGMine production is derived from a single open pit, utilising conventional drill and blast, load and haul methodologies. These functions areundertakenbyseparatecontractorswithmanagement by Evolution staff. The operation is scheduled to continue until FY2023 at current estimates with a low life-of-mine strip ratio of approximately 2:1.
Gold production in FY2012 totalled 95,403 ounces at an average cash cost of A$684 per ounce. Gold production was within the guidance range of between 90,000 and 105,000 ounces
and well below cash cost guidance of A$760 per ounce. This included a record quarter production inJuneof32,734ouncesduetopositivegradereconciliations. Total ore tonnes mined were 3,976,000tonnesat0.90g/tgoldandtotalwastemovement was 13,634,000 tonnes.
MILLINGA total of 3,434,000 tonnes were treated at an averagegradeof0.95g/tgoldanda91.0%recovery rate for the year.
OUTLOOkGold production for FY2013 has been forecast at between 95,000 - 110,000 ounces at average cash operating costs of between A$600 - A$660 per ounce.
Pajingo development cut
ThE CRACOw OPERATION hAS A STABLE PROdUCTION BASE, CONTINUALLY PROdUCING AROUNd 100,000 OUNCES PER ANNUM SINCE 2006 ANd REPLACING ANNUAL MINING dEPLETION wITh NEw RESERVES
For
per
sona
l use
onl
y

2012 EVOLUTION MINING ANNUAL REPORT
REVIEw OF OPERATIONS
PAJINGO OPERATIONSThePajingomineislocated50kilometressouthof Charters Towers, north Queensland. Production commenced at Pajingo in 1986. Ore is mined from both underground and open pits and then processed on site to produce a gold-silver doré. The processing plant is currently operating at 350,000 - 450,000 tonnes per annum due to mine constraints but has a design capacity of 650,000 tonnes per annum.
Pajingo is a low sulphidation epithermal field hosted in structurally controlled quartz veins located mainly in the Vera-Nancy corridor. The average width of the mineralised structures is 1 - 3 metres.
MININGUndergroundminingisbasedonlongholeopen stoping with ore hauled to surface via decline. Open pit mining is by conventional drill and blast, load and haul methodology.
An impressive turnaround was achieved at Pajingo in FY2012. Gold production of 75,747 ounces for FY2012 was well above guidance of 70,000 ounces, and representeda165%increaseonFY2011productionof 45,889 ounces. Cash operating costs for FY2012 were A$780 per ounce, well below guidance of A$867 per ounce. This is an excellent outcome and a direct result of the re-tooling and capital investment programs implemented by Evolution to improve Pajingo’s long-term sustainable performance.
Total underground ore mined in FY2012 was 304,000 tonnesat7.84g/tgold,sourcedprimarilyfromJandam,Bell Vein, Zed West, Faith and Sonia orebodies. Total development for the year was 5,405 metres. Open pit ore production in FY2012 was 193,000 tonnes at a grade of 2.72g/tgoldsourcedfromJanetAopenpit.
MILLINGA total of 487,000 tonnes were treated at an average gradeof5.08g/tgoldanda96.2%recoveryratefortheyear.Plantthroughputincreasedbyaround70%comparedtoFY2011(100%ConquestMining)duetoanincrease in mill feed.
OUTLOOkGold production for FY2013 has been forecast at between 85,000 - 90,000 ounces at a cash operating cost of between A$730 - A$780 per ounce. This will be achieved by accessing high-grade production in Sonia and mining theVenueandVNUopen-pits.
EdNA MAY OPERATIONSTheEdnaMaygoldmineislocated350kilometreseastof Perth, Western Australia. The mine was first operated in the 1950s and has had three historical periods of mining. The current single pit operation commenced gold production in April 2010. The process plant has a throughput capacity of 2.6 million tonnes per annum and is a conventional crushing, grinding, carbon-in-leach circuit producing gold doré. The Edna May gold mineralisation consists of high-grade reef structures and associatedstockworkveininghostedwithinthreeen-echelon tonalitic gneiss intrusions (Edna May, Greenfinch and Golden Point).
MININGOpen pit mining is by conventional drill and blast, load andhaulmethod.Abulkminingapproachhasbeenadopted to the extraction of remnant high-grade reef structuresandassociatedstockworkmineralisationwithalife-of-mine strip ratio of 3:1.
Gold production in FY2012 totalled 73,265 ounces, an 11.7%increaseonFY2011production;however,itwasbelow the FY2012 guidance of between 85,000 - 93,000 ounces predominantly as a result of poor plant reliability. Cash operating costs of A$949 per ounce were in-line with guidance of between A$890 to A$990 per ounce. Total ore tonnesminedwere2,666,000tonnesat1.07g/tgoldandtotal waste movement was 5,470,000 tonnes. Initiatives to improveplantreliability,commencedintheJunehalf,areexpected to positively impact production performance in FY2013.
MILLINGA total of 2,373,000 tonnes were treated at an average gradeof1.07g/tgoldandan89.4%recoveryratefortheyear. Improvements to plant reliability will continue through FY2013 with a steady-state capacity of 2.6 million tonnes per annum expected.
OUTLOOkGold production for FY2013 has been forecast at between 75,000 - 80,000 ounces at cash operating costs of between A$840 to A$890 per ounce with cost reductions to be achieved by improvements to plant reliability.
AN IMPRESSIVE TURNAROUNd wAS AChIEVEd AT PAJINGO wITh FY2012 PROdUCTION ABOVE GUIdANCE ANd CASh OPERATING COSTS wELL BELOw GUIdANCE
For
per
sona
l use
onl
y

010
REVIEw OF OPERATIONS
The Mt Carlton Gold-Silver-Copper Project is Evolution’s keyorganicgrowthassetandislocated150kilometressouth of Townsville, Queensland. Construction of the 800,000 tonne per annum plant commenced in December 2011 and is on schedule for commissioning in December 2012 with capital expenditure anticipated between A$170 - A$180 million.
Mt Carlton is a high-sulphidation epithermal style deposit withmineralisationoccurringwithinfelsicvolcanicrockson the northern margin of the Permian Bowen Basin. The Mt Carlton deposit comprises two discrete zones: the large dominant V2 deposit and the smaller, silver rich A39 zone, discovered in 2006.
Open pit mining operations have adopted a conventional excavatorandhaultruckoperation.Processingwillbebyconventional crushing, grinding and flotation to produce a polymetallicconcentrate.Life-of-mineoff-takeagreementsfor the sale of gold-silver-copper concentrate from the V2 deposit (Shandong Guoda Gold Co. Limited) and silver-copper concentrates from the A39 deposit (Humon Smelting Co. Limited) are in place.
Since the mining lease was granted in December 2011, the project development has advanced with construction approximately50%completeasat30June2012.
Mining commenced in both V2 and A39 stage-one pits and the majority of the mining fleet has been mobilised to siteandthemineisontracktodelivercommissioningoreto the processing plant in December 2012.
Expenditure committed on project development to the end ofJune2012wasapproximatelyA$85million.Evolutionforecasts Mt Carlton to contribute 25,000 - 30,000 gold equivalent ounces in FY2013 as the project ramps up to full production.
dEVELOPMENTMT CARLTON GOLd-SILVER-COPPER PROJECT
Construction activities at Mt Carlton
For
per
sona
l use
onl
y

2012 EVOLUTION MINING ANNUAL REPORT
REVIEw OF OPERATIONS
Mt Carlton will produce two distinct concentrates in FY2013, a gold-silver-copper concentrate from the V2 deposit and a silver-copper concentrate from the A39 deposit. The majority of FY2013 production is expected to come from the high-grade, silver-rich A39 deposit. The production guidance provided in the table above refers to payable metal (i.e. after smelter deductions) and converts A39 silver production to a gold equivalent figure (on the basis of a commodity price ratio of A$1,500 per ounce for gold and A$28 per ounce for silver). At the V2 deposit, silver and copper production is accounted for as a by-product (i.e. silver and copper revenue is offset against operating costs). Similarly at the A39 deposit, copper production is accounted for as a by-product. Mt Carlton is forecast to produce approximately 9,250 wet metric tonnes (“wmt”) of concentrate from the V2 deposit, containing 13,000 - 14,000 ounces of gold and 200,000 - 250,000 ounces of silver, and approximately 13,000wmt of concentrate from the A39 deposit, containing 1,250,000 - 1,350,000 ounces of silver, in FY2013. Expected metal production from Mt Carlton therefore equates to 40,000 - 45,000 ounces gold equivalent in concentrate. Evolution has previously provided guidance for Mt Carlton on the basis of metal contained in concentrate (rather than payable metal) and on this basis FY2013 Group production guidance would be 385,000 – 425,000 ounces gold equivalent.
Mt Carlton FY2013 cash operating costs will be impacted by a high proportion of production from the A39 deposit and costs associated with the ramp-up in production rate. In FY2013 the milled grade at the A39 deposit is expected toaverage240g/tsilverandhaveacashoperatingcostof A$20 per ounce silver payable. The position improves significantly in FY2014 when a larger proportion of V2 ore is processed and Mt Carlton cash operating costs are forecast to fall below A$500 per ounce gold equivalent payable which will substantially lessen Evolution’s average Group cash costs.
Cracow, Pajingo, Mt Rawdon and Edna May guidance, as shown in the table above, refers only to gold production (i.e. silver production has not been included as a gold equivalent co-product but accounted for as a by-product).
FY2013 OUTLOOk Evolution is forecasting increased production in FY2013 of between 370,000 - 410,000 ounces gold equivalent as a result of the commencement of production from Mt Carlton and continued improvements at Pajingo. Cash operating costs (before royalties and after by-product credits) are expected to be in the range of A$730 to A$790 per ounce which is below the range provided for FY2012. Included in these costs is an allowance for the carbon tax which is expected to add about A$15 per ounce to group cash operating costs in FY2013.
Amine-by-minebreakdownoftheproductionforecastsisprovidedinthetablebelow.
GUIdANCE FY2013 GOLd EqUIVALENT PROdUCTION (OUNCES)
CASh OPERATING COSTS(A$/OUNCE)
Cracow 90,000 – 100,000 780 – 820
Pajingo 85,000 – 90,000 730 – 780
Mt Rawdon 95,000 – 110,000 600 – 660
Edna May 75,000 – 80,000 840 – 890
Mt Carlton 25,000 – 30,000 790 – 860
Group 370,000 – 410,000 730 – 790
For
per
sona
l use
onl
y

012
dISCOVERY
Evolution is committed to growth through discovery and believes significant value can be realised within its extensive and highly prospective exploration portfolio in Queensland and Western Australia. The Company’s FY2012 exploration strategy focused on sustaining current mining operations and delivering transformational growth.
Discovery expenditure of A$18.5 million was incurred during FY2012, particularly as a result of the accelerated drilling programs at Pajingo, Cracow and Mt Carlton. Morethan60%ofthebudgetwasappliedtodrilling,witha total of 86,961 metres completed during the year with a focused and effective approach for targeting and drilling exploration areas. Exploration activities targeting new discoveries included the systematic economic review,rankinganddrillingofprospectswithintheCompany’s6,800squarekilometreportfoliooftenementsacross Australia.
The objective for FY2013 is to continue delivering sustainable and transformational growth through the progression of targets in the Company’s project pipeline. Evolution’s Board has approved a A$28 million budget for Discovery in FY2013 which can readily be expanded to
fund the drill out of discoveries or any high quality project acquisitions made during the year.
In addition to the new Coronation discovery at Cracow, the Company has made encouraging intersections at Greenfinch and Perrins at Edna May and at Mt Carlton and Pajingo in Queensland. Recognising the significant impact that a major discovery can have on the Company’s value, exploration activities will continue to focus on drilling the Company’s highest priority exploration targets in FY2013 to deliver operational sustainability and transformational growth.
The Discovery team continues to review advanced exploration projects and project development opportunities in Australia and South East Asia with the potential to improve the current portfolio of assets.
GUIdANCE FY2013 GOLd EqUIVALENT PROdUCTION (OUNCES)
CASh OPERATING COSTS(A$/OUNCE)
Cracow 90,000 – 100,000 780 – 820
Pajingo 85,000 – 90,000 730 – 780
Mt Rawdon 95,000 – 110,000 600 – 660
Edna May 75,000 – 80,000 840 – 890
Mt Carlton 25,000 – 30,000 790 – 860
Group 370,000 – 410,000 730 – 790
Reverse circulation drilling at Perrins Prospect
For
per
sona
l use
onl
y

2012 EVOLUTION MINING ANNUAL REPORT
dISCOVERY
CRACOw, qUEENSLANdCORONATIONSurface drilling continued at the Coronation discovery announced at the end of the March quarter 2012, with a focus on defining the extents of the new zone of mineralisation.Furtherdrillingwillbeundertakenfromunderground positions during FY2013 with the aim of upgrading the target to an Inferred Resource by the end of FY2013. The Coronation shoot is located approximately 550 metres below surface and 250 metres north of active mining operations, underscoring the potential significance ofthefindwhichremainsopenalongstrike.
CRACOw SOUThA27squarekilometregradientarraysurveywasundertakenwiththeaimofidentifyingresistiveandchargeable mineralisation south of the Cracow Gold Field. Geologicalmappingofthisareawasalsoundertakento help define potential drill targets. Interpretation of the mapping and gradient array data has been completed and it is anticipated that a number of prospective targets generatedfromthisworkwillbedrilltestedinFY2013.
EdNA MAY, wESTERN AUSTRALIA EdNA MAY UNdERGROUNd ArevisionoftheEdnaMayUndergroundMineralResource was completed during the year and resulted in a70%increaseto1.2Mtat7.0g/tgoldfor270,000ouncesofwhich50%isclassifiedasIndicatedMineralResource(refer to page 20 of this Annual Report). The upgrade in Mineral Resource confidence was enabled through recent infill and extensional diamond drilling completed during 2011 for a total of 19 diamond holes for 10,303 metres.
The underground Mineral Resource has only been defined to a depth of 550 metres below surface and remains open bothatdepthandalongstrike.Infilldrillingtodatehasprioritised the upgrade of Inferred Resources close to the existing decline, beneath the open pit operation.
GREENFINChDiamond and reverse circulation drilling completed at Greenfinch targeting extensions to high-grade gold mineralisation successfully extended gold mineralisation down-dip a further 150 metres. Additional drilling is planned and an updated resource estimate is targeted in the second half of FY2013. Drilling during the year included nine diamond drill holes for 3,762 metres and 24 RC holes for 5,970 metres drilled. Significant diamond intersectionsincluded1.26metresgrading93.27g/tgoldfrom249.73metresand6.76metresgrading11.47g/tgold from 167 metres.
PERRINSPerrinsislocatedwithincloseproximity(6kilometres)tothe Edna May gold operations. Drilling during the year was aimed at delineating a near surface oxide resource. A total of 27 vertical RC holes were drilled for 1,510 metres. Gold mineralisation was intersected in several holes hostedbyagneissicrockwithin45metresofsurface.
Significantinterceptsincluded8.0mgrading10.87g/tgoldfrom 23 metres.
Further drilling is planned at Perrins to test continuity of the primary mineralisation to determine potential for high grade mill feed.
hOLLETONAs part of the strategy to maximise the potential of the Edna May operation, Evolution entered into a binding sale and purchase agreement with Independence Group NL (“Independence”) to acquire the Holleton Gold Project (“Holleton”)duringtheJunequarter2012.Holletonconsists of 14 mining, exploration and prospecting licensescoveringapproximately650squarekilometreswithin the Southern Cross Province of the Yilgarn Craton inWesternAustralia.Thetenementpackageislocatedabout70kilometrestothesouthofEdnaMayandabout70kilometrestothesouth-southwestofSouthernCross.
MT CARLTON, qUEENSLANdMINE LEASE EXPLORATIONGeophysicsundertakenoverthewesternportionofthemining lease identified distinct chargeability and resistivity targets similar to the V2 deposit that are currently being prioritised for drill testing.
Initial drilling of the geophysical targets has returned significant alteration and associated massive sulphide veining returning anomalous results of 26.0m grading 60.8g/tsilver,0.3%leadand0.48%zincfrom167metresincluding5metresgrading165g/tsilver,0.3%leadand0.7%zincfrom176metres.Thisinterceptrepresentsmineralisation in a similar geological setting to the A39 deposit and was drilled in a previously untested area 350 metres west of the A39 pit. Additional drilling is planned in FY2013 to follow up this significant intercept.
REGIONAL EXPLORATION Detailed geological mapping has commenced on the Capsize trend, an east-west zone of intense alteration extendingovera15kilometrestrikelengthwhichincludesknownprospectsatCapsizeCreekandStrathmore.
Geological mapping in conjunction with the acquisition of detailed airborne magnetic and radiometric data, detailed multi-element soil geochemistry and follow-up ground geophysical surveys in FY2013 are planned to define additional drill targets along the Capsize trend.
EVOLUTION’S BOARd hAS APPROVEd A A$28 MILLION BUdGET FOR dISCOVERY IN FY2013 whICh CAN REAdILY BE EXPANdEd TO FUNd ThE dRILL OUT OF dISCOVERIES OR ANY hIGh qUALITY PROJECT ACqUISITIONS MAdE dURING ThE YEAR
For
per
sona
l use
onl
y

014
dISCOVERY
MT RAwdON, qUEENSLANdRESOURCE dEFINITION ANd EXTENSION A geotechnical program of seven holes for 2,308 metres wasundertakenfordeterminationoffinal-walldesignparametersforthecutback.Severaloftheseholespassed through zones of sulphidic mineralisation and two holes were deepened specifically to intersect and possibly upgrade areas of Inferred Mineral Resource at Mt Rawdon.
REGIONAL EXPLORATION A number of exploration targets were identified at Mt Rawdon as part of a regional prospectivity review incorporating geophysical, geochemical, structural and geological data. The review was completed at the end oftheyearandtargetswillbeassessed,rankedandincorporated into future exploration programs.
PAJINGO, qUEENSLANdMOONLIGhT PROSPECTDrilling at the Moonlight prospect targeted a northwest trending zone of mineralised epithermal quartz veining andbrecciationapproximately1.5kilometressouthof mine infrastructure. Approximately 13,380 metres of drilling were completed during the year where mineralisationhastodatebeenintersectedoverastrikelength of approximately 400 metres. The zone ofmineralisationremainsopenalongstriketothenorthwest with recent drilling indicating that it may be closing to the southeast. Best results returned during the quarterincluded5.3metresgrading6.48g/tgoldfrom390.7 metres.
STARLIGhT CORRIdORThe Starlight Corridor is a structural zone of quartz veining and brecciation that intersects the main Vera-Nancy trend. Drilling during the quarter focused on Starlight B prospect where a zone of near surface mineralisation has been definedoverastrikelengthofapproximately200metres.The drilling was designed to test western extensions ofthiszone;however,assayresultsfailedtohighlightsignificant mineralisation from this phase of drilling. Mineralisation remains open to the east.
Starlight C prospect is located approximately 200 metres south of Starlight B and roughly 200 metres east of the current underground development. Results include 6.10metresgrading1.64g/tgoldfrom119metresand2.00metresgrading4.95g/tgoldfrom60metresandsuggest gold grades are increasing with depth. These intersections are interpreted to represent the upper portion of a mineralised shoot that is open at depth.
AVIARY GROUPThe Aviary prospect is a conceptual porphyry-style exploration target with potential to host large tonnage low-grade gold mineralisation. The outcropping geology at Eagles Nest prospect hosts widespread gold bearing quartz veins (and associated metals) together with extensive sericite alteration which suggests the area has potential to host such deposits.
Todatesome90rockchipsampleshavebeencollectedfromwithintheAviaryareawithbestresultsof52.6g/tgoldtakenfromanarrowmesothermalquartzveinfromthePelican prospect.
SONIA EASTERN EXTENSIONUndergrounddrillingatSoniaextendedmineralisationand confirmed the continuity of a structurally controlled, high-grade dilational zone. Drilling to convert a portion of Sonia from Inferred to Indicated Resource was completed. Best results returned to date included 9.2 metres grading 22.2g/tgoldand2.1metresgrading171.7g/tgold.
Cracow Mine Geologist - John Crombie
For
per
sona
l use
onl
y

2012 EVOLUTION MINING ANNUAL REPORT
GroupMineralResourcesarenowestimatedat7.0millionouncesgoldequivalent,aslightincreaseof0.4%comparedtotheJune2011estimateof6.97million ounces. Resources depleted by mining have effectively been replaced by newly defined mineralisation at Pajingo and an increase to the Edna May underground resource. Mineral Resources are reported inclusive of Ore Reserves.
GroupOreReservesarenowestimatedat3.33millionouncesgoldequivalent,adecreaseof4.6%comparedtotheJune2011estimateof3.49millionounces.Thischangeislargelyduetodepletionbyminingofapproximately400kozpredominantlyoffsetbysignificantreserveincreasesatPajingoandCracow. The Mineral Resources and Ore Reserves have been prepared according to the Australasian Code for Reporting of Exploration Results, Mineral ResourcesandOreReserves(JORCCode).
This resource and reserve update only includes exploration and resource definition drilling information up to 31 December 2011 but has been depleted forminingto30June2012.Thisdiscrepancyintimingisaconsequenceofthelargetaskofcompilingthedisparatedatabasesforprojectsthatwerepreviously owned by three different companies and then using similar estimation practices across the projects for the first time under Evolution ownership. Recent exploration success at Cracow (Coronation discovery) and at Pajingo (Moonlight prospect), in particular, have not been included in this resource and reserve update as information was unavailable at the cut-off date.
Evolution has made a strong commitment to exploration and resource definition drilling at each of its mines. The Company has budgeted A$28 million for exploration and A$12 million for resource definition drilling in the current financial year. It has an extensive and highly prospective exploration portfolio in Queensland and Western Australia and expects to increase resources and reserves in excess of mining depletion over the next 12 months.
MINERAL RESOURCES ANd ORE RESERVES STATEMENT - JUNE 2012
Underground contractor - Cracow
For
per
sona
l use
onl
y

016
Notes: • 1Includesstockpiles • *CombinedfigureforV2using0.35g/tAucut-offandA39using42g/tAgcut-off • Mineral Resource figures are inclusive of Ore Reserves • Data is reported to significant figures and differences may occur due to roundingThe gold equivalence calculation represents total metal value for each metal summed and expressed in equivalent gold grade or ounces.ThepricesusedinthecalculationbeingA$1350/ozAu,A$28.00/ozAgandA$2.00/lbCuMetallurgicalrecoverytoconcentrateof90.0%forgold,92.0%forsilveratV2and88%silveratA39and92.0%forcopperasindicatedby metallurgicaltestworkAuEqforsilver=((PriceAgperOzxAgRecovery)/(PriceAuperOzxAuRecovery))xAgGradeAuEqforcopper=((PriceCuperlbx2204.623)x(CuRecovery))/(PriceAuperOzxAuRecovery/31.1034768)x(CuGrade/100)
Group Mineral Resources - June 2012
Gold Resources Measured Indicated Inferred Total Resources
Project Type Cut-Off
Tonnes (Million)
Gold Grade (g/t)
Gold Metal (koz)
Tonnes (Million)
Gold Grade (g/t)
Gold Metal (koz)
Tonnes (Million)
Gold Grade (g/t)
Gold Metal (koz)
Tonnes (Million)
Gold Grade (g/t)
Gold Metal (koz)
Cracow1 Underground 2.3 0.203 8.9 58 1.06 7.3 248 2.83 5.1 462 4.09 5.8 768
Edna May1 Open-pit 0.4 17.8 1.0 549 18.9 0.9 526 7.87 0.8 194 44.6 0.9 1,269
Edna May
Underground 3.0 - - - 0.63 7.2 146 0.576 6.9 127 1.21 7.0 273
Mt Carlton
Open-pit 0.4 9.02 2.0 586 14.7 1.5 695 1.41 1.5 68 25.2 1.7 1,350
Mt Rawdon1 Open-pit 0.2 0.614 0.5 10 44.7 0.7 1,058 7.17 0.5 125 52.5 0.7 1,194
Pajingo Open-pit 0.7 - - - 0.221 3.7 26 0.01 2.2 1 0.231 3.6 27
Pajingo1 Underground 2.4 0.274 6.6 58 2.11 5.5 375 2.78 4.9 440 5.16 5.3 873
Twin Hills Open-pit 0.5 - - - 2.42 2.2 170 0.64 1.7 35 3.06 2.1 204
Twin Hills Underground 2.0 0.54 4.1 71 0.32 3.5 36 0.7 3.9 87 1.56 3.9 194
Sub Total 28.5 1.5 1,332 85.1 1.2 3,280 24.0 2.0 1,540 138 1.4 6,152
Silver Resources Measured Indicated Inferred Total Resources
Project Type Cut-Off
Tonnes (Million)
Silver Grade (g/t)
Silver Metal (koz)
Tonnes (Million)
Silver Grade (g/t)
Silver Metal (koz)
Tonnes (Million)
Silver Grade (g/t)
Silver Metal (koz)
Tonnes (Million)
Silver Grade (g/t)
Silver Metal (koz)
Mt Carlton
Open-pit * 11.4 57 20,790 14.9 19 9,004 1.5 16 796 27.9 34 30,590
Total 11.4 57 20,790 14.9 19 9,004 1.5 16 796 27.9 34 30,590
Copper Resources Measured Indicated Inferred Total Resources
Project Type Cut-Off
Tonnes (Million)
Copper Grade
(%)
Copper Metal
(kt)
Tonnes (Million)
Copper Grade
(%)
Copper Metal
(kt)
Tonnes (Million)
Copper Grade
(%)
Copper Metal
(kt)
Tonnes (Million)
Copper Grade
(%)
Copper Metal
(kt)
Mt Carlton
Open-pit * 11.4 0.24 27.6 14.9 0.21 32.1 1.51 0.20 3.0 27.9 0.23 62.8
Total 11.4 0.24 27.6 14.9 0.21 32.1 1.51 0.20 3.0 27.9 0.23 62.8
Gold Equivalent Resources
Measured Indicated Inferred Total Resources
Tonnes (Million)
Gold Equiv. Grade (g/t)
Gold Equiv. Metal (koz)
Tonnes (Million)
Gold Equiv. Grade (g/t)
Gold Equiv. Metal (koz)
Tonnes (Million)
Gold Equiv. Grade (g/t)
Gold Equiv. Metal (koz)
Tonnes (Million)
Gold Equiv. Grade (g/t)
Gold Equiv. Metal (koz)
Total Group 30.8 1.9 1,852 85.3 1.3 3,577 24.1 2.0 1,567 140 1.6 6,996
MINERAL RESOURCES ANd ORE RESERVES STATEMENT - JUNE 2012
For
per
sona
l use
onl
y

2012 EVOLUTION MINING ANNUAL REPORT
MINERAL RESOURCES ANd ORE RESERVES STATEMENT – JUNE 2012
Group Ore Reserves - June 2012
Gold Reserves Proved Probable Total Reserve
Project Type Cut-Off Tonnes (Million)
Gold Grade (g/t)
Gold Metal (koz)
Tonnes (Million)
Gold Grade (g/t)
Gold Metal (koz)
Tonnes (Million)
Gold Grade (g/t)
Gold Metal (koz)
Cracow1 Underground 3.0 0.126 10.9 44 1.16 5.3 198 1.28 5.9 242
Edna May1 Open-pit 0.4 12.9 1.0 418 11.7 0.9 349 24.6 1.0 767
Mt Carlton Open-pit 0.7 4.52 3.1 446 4.61 2.5 366 9.13 2.8 812
Mt Rawdon1 Open-pit 0.3 0.614 0.5 10 35.6 0.8 904 36.2 0.8 914
Pajingo Open-pit 0.7 - - - 0.214 3.3 23 0.214 3.3 23
Pajingo1 Underground 3.0 0.046 6.0 9 0.859 5.5 153 0.904 5.6 161
Total 18.2 1.6 927 54.1 1.1 1,991 72.4 1.3 2,918
Silver Reserves Proved Probable Total Reserve
Project Type Cut-Off Tonnes (Million)
Silver Grade (g/t)
Silver Metal (koz)
Tonnes (Million)
Silver Grade (g/t)
Silver Metal (koz)
Tonnes (Million)
Silver Grade (g/t)
Silver Metal (koz)
Mt Carlton Open-pit ** 5.56 69 12,322 4.61 20 2,991 10.2 47 15,313
Total 5.56 69 12,322 4.61 20 2,991 10.2 47 15,313
Copper Reserves Proved Probable Total Reserve
Project Type Cut-Off Tonnes (Million)
Copper Grade
(%)
Copper Metal
(kt)
Tonnes (Million)
Copper Grade
(%)
Copper Metal
(kt)
Tonnes (Million)
Copper Grade
(%)
Copper Metal
(kt)
Mt Carlton Open-pit ** 5.56 0.30 16.8 4.61 0.23 10.5 10.2 0.27 27.3
Total 5.56 0.30 16.8 4.61 0.23 10.5 10.2 0.27 27.3
Gold Equivalent Reserves
Proved Probable Total Reserve
Tonnes (Million)
Gold Equiv. Grade (g/t)
Gold Equiv. Metal (koz)
Tonnes (Million)
Gold Equiv. Grade (g/t)
Gold Equiv. Metal (koz)
Tonnes (Million)
Gold Equiv. Grade (g/t)
Gold Equiv. Metal (koz)
Total Group 19.3 2.0 1,236 54.1 1.2 2,090 73.4 1.4 3,326
Note: • 1 Includesstockpiles • **CombinedfigureforV2using0.69g/tAucut-offandA39using53g/tAgcut-off • Data is reported to significant figures and differences may occur due to roundingThe gold equivalence calculation represents total metal value for each metal summed and expressed in equivalent gold grade or ounces.ThepricesusedinthecalculationbeingA$1,350/ozAu,A$28.00/ozAgandA$2.00/lbCu.metallurgicalrecoverytoconcentrateof90.0%forgold,92.0%forsilveratV2and88%silveratA39and92.0%forcopperasindicatedby metallurgicaltestwork.Calculation does not include payabilities1 Troy Ounce = 31.1034768 gramsAuEqforSilver=((PriceAgperOzxAgRecovery)/(PriceAuperOzxAuRecovery))xAgGradeAuEqforCopper=((PriceCuperlbx2204.623)x(CuRecovery))/(PriceAuperOzxAuRecovery/31.1034768)x(CuGrade/100)
For
per
sona
l use
onl
y

018
MINERAL RESOURCE ANd ORE RESERVES STATEMENT - JUNE 2012
COMPETENT PERSONS STATEMENTTheinformationinthisstatementthatrelatestotheMineralResourcesorOreReserveslistedinthetablebelowisbasedonworkcompiledbythepersonwhose name appears in the same row, who is employed on a full-time basis by the employer named in that row and is a member of the institute named in that row. Each person named in the table below has sufficient experience which is relevant to the style of mineralisation and type of deposit under considerationandtotheactivitywhichheorshehasundertakentoqualifyasaCompetentPersonasdefinedbythe“AustralasianCodeforReportingofExplorationResults,MineralResourcesandOreReserves”(JORCCode).Eachpersonnamedinthetablebelowconsentstotheinclusioninthisreportofthe matters based on his or her information in the form and context in which they appear.
Resource/Reserve Name of Competent Person Employer Institute
Mt Carlton Ore Reserve John WycheAustralian Mine Design and Development Pty Limited
Australasian Institute of Mining and Metallurgy
Mt Carlton Mineral Resources John Winterbottom Evolution Mining Australian Institute of Geoscientists
Pajingo Mineral Resources Calvin Ferguson Evolution Mining Australasian Institute of Mining and Metallurgy
Pajingo Underground Ore Reserves Andrew Fox Formerly Evolution Mining Australasian Institute of Mining and Metallurgy
Pajingo Open-pit Ore Reserves Cameron Skinner Evolution Mining Australasian Institute of Mining and Metallurgy
Twin Hills Mineral Resources Peter Brown Formerly Evolution Mining Australian Institute of Geoscientists
Edna May Underground Mineral Resource
John Winterbottom Evolution Mining Australian Institute of Geoscientists
Edna May Open-pit Mineral Resources and Ore Reserves
Luke Cox Evolution Mining Australasian Institute of Mining and Metallurgy
Cracow Mineral Resources John Winterbottom Evolution Mining Australian Institute of Geoscientists
Cracow Ore Reserves Fusheng Li Evolution Mining Australasian Institute of Mining and Metallurgy
Mt Rawdon Mineral Resource John Winterbottom Evolution Mining Australian Institute of Geoscientists
Mt Rawdon Ore Reserve Karl SmithKarl Smith Mine and Geology Consulting Pty Ltd
Australasian Institute of Mining and Metallurgy
Group Ore Reserves - June 2012
Gold Reserves Proved Probable Total Reserve
Project Type Cut-Off Tonnes (Million)
Gold Grade (g/t)
Gold Metal (koz)
Tonnes (Million)
Gold Grade (g/t)
Gold Metal (koz)
Tonnes (Million)
Gold Grade (g/t)
Gold Metal (koz)
Cracow1 Underground 3.0 0.126 10.9 44 1.16 5.3 198 1.28 5.9 242
Edna May1 Open-pit 0.4 12.9 1.0 418 11.7 0.9 349 24.6 1.0 767
Mt Carlton Open-pit 0.7 4.52 3.1 446 4.61 2.5 366 9.13 2.8 812
Mt Rawdon1 Open-pit 0.3 0.614 0.5 10 35.6 0.8 904 36.2 0.8 914
Pajingo Open-pit 0.7 - - - 0.214 3.3 23 0.214 3.3 23
Pajingo1 Underground 3.0 0.046 6.0 9 0.859 5.5 153 0.904 5.6 161
Total 18.2 1.6 927 54.1 1.1 1,991 72.4 1.3 2,918
Silver Reserves Proved Probable Total Reserve
Project Type Cut-Off Tonnes (Million)
Silver Grade (g/t)
Silver Metal (koz)
Tonnes (Million)
Silver Grade (g/t)
Silver Metal (koz)
Tonnes (Million)
Silver Grade (g/t)
Silver Metal (koz)
Mt Carlton Open-pit ** 5.56 69 12,322 4.61 20 2,991 10.2 47 15,313
Total 5.56 69 12,322 4.61 20 2,991 10.2 47 15,313
Copper Reserves Proved Probable Total Reserve
Project Type Cut-Off Tonnes (Million)
Copper Grade
(%)
Copper Metal
(kt)
Tonnes (Million)
Copper Grade
(%)
Copper Metal
(kt)
Tonnes (Million)
Copper Grade
(%)
Copper Metal
(kt)
Mt Carlton Open-pit ** 5.56 0.30 16.8 4.61 0.23 10.5 10.2 0.27 27.3
Total 5.56 0.30 16.8 4.61 0.23 10.5 10.2 0.27 27.3
Gold Equivalent Reserves
Proved Probable Total Reserve
Tonnes (Million)
Gold Equiv. Grade (g/t)
Gold Equiv. Metal (koz)
Tonnes (Million)
Gold Equiv. Grade (g/t)
Gold Equiv. Metal (koz)
Tonnes (Million)
Gold Equiv. Grade (g/t)
Gold Equiv. Metal (koz)
Total Group 19.3 2.0 1,236 54.1 1.2 2,090 73.4 1.4 3,326
For
per
sona
l use
onl
y

2012 EVOLUTION MINING ANNUAL REPORT
dISCUSSION OF MINERAL RESOURCES ANd ORE RESERVESPAJINGO MINERAL RESOURCETheJune2012PajingoMineralResourceestimateof5.39milliontonnesat5.2g/tgoldfor900kozrepresentsanincreaseof172koz(24%)netofminingdepletioncomparedto the previous estimate. Changes in the 2012 Mineral Resource estimate compared to the previously reported estimate include:
• Anincreaseof375kozasaresultofresourcedefinition drilling within the main Vera-Nancy trend successfully definingadditionalresourcesattheJandamand Faithlodes;
• NewmineralisedlodesatJanine,Oliviaand LeapingDog;
• Adecreaseof116kozduetoachangeinthecut-off gradeforundergroundresourcesfrom1.0g/tto2.4g/t gold;and
• Mining depletion.
Open-pitMineralResourcesarereportedata0.65g/tgoldcut-off, constrained to an A$1,350 per ounce pit shell andestimatedusingOrdinaryKrigingintoblockswithdimensions 10 metres east by 4 metres north by 5 metres elevation.
UndergroundMineralResourcesarereportedata2.4g/tgoldcut-offandestimatedusingOrdinaryKrigingintoblockswithdimensions10metreseastby5metresnorthby10 metres elevation.
PAJINGO ORE RESERVESTheJune2012PajingoOreReserveestimateof1.12milliontonnesat5.1g/tgoldfor184kozrepresentsanincreaseof44kozounces(31%)netofminingdepletioncomparedtothe 2011 Ore Reserve estimate.
Changes in the 2012 Ore Reserve estimate compared to the previously reported estimate include:
• IncreaseinFaithOreReserveof13kozgold;
• IncreaseinSoniaOreReserveof14kozgolddueto additionaldrillinginSoniaandSoniaEast;
• IncreaseinVeracityOreReserveof19kozgold;
• InclusionofLeapingDogOreReserveof13koz gold: and
• Mining depletion.
TheOreReservesarereportedata3.0g/tgold(dilutedpanelgrade)cut-offforundergroundand0.65g/tgoldforopen pit. Ore Reserves were estimated based on a gold priceofA$1,350perounceandagoldrecoveryof96%.
CRACOw MINERAL RESOURCETheJune2012CracowMineralResourceestimateof4.09milliontonnesat5.8g/tgoldfor768kozrepresentsadecreaseof124koz(14%)netofminingdepletioncompared to the previous estimate.
Changes in the 2012 Mineral Resource estimate compared to the previously reported estimate include:
• Decrease in ounces due to the narrowing of some lodestructures;
• Changeincut-offgradefrom2.5g/tgoldto2.3g/tgold resultingina14kozincrease;and
• Mining depletion.
TheMineralResourcesarereportedata2.3g/tgoldcut-offandestimatedusingOrdinaryKrigingintoblockswitharange of dimensions optimised to the characteristics and geometry of each deposit.
CRACOw ORE RESERVESTheJune2012CracowOreReserveestimateof1.28milliontonnesat5.9g/tgoldfor242kozrepresentsaminimalchange(-1%)netofminingdepletioncomparedtotheprevious estimate.
Changes in the 2012 Ore Reserve estimate compared to the previously reported estimate include:
• IncreasesattheKilkennyandRosesPridelodes (20koznetofdepletion);
• ExtensionoftheKlondykeNorthShootasaresultof additionaldrilling(17koz);and
• Mining depletion.
The Ore Reserves have been reported above a cut-off gradeof3.0g/tgold.OreReserveswereestimatedbasedon a gold price of A$1,350 per ounce and a gold recovery of93%.
MT RAwdON MINERAL RESOURCETheJune2012MtRawdonMineralResourceestimateof52.5milliontonnesat0.7g/tgoldfor1,194kozrepresentsanincreaseof167koz(16%)netofminingdepletioncomparedto the previous estimate.
Changes in the 2012 Mineral Resource estimate compared to the previously reported estimate include:
• Increaseof307kozasaresultofconstraining mineralisation to an A$1,800 per ounce pit shell (from A$1,200 per ounce previously) and a change in cut-off gradefrom0.38g/tgoldto0.23g/tgold.
• Decreaseof32kozduetomodelmethodology changes;
• 2kozincreasefromastockpilebalancechange;and
• Mining depletion.
TheMineralResourcesarereportedata0.23g/tgold(un-factored model grade) cut-off, constrained to an A$1,800 perouncepitshellandestimatedusingOrdinaryKrigingintoblockswithdimensions20metreseastby20metresnorth by 10 elevation.
MINERAL RESOURCES ANd ORE RESERVES STATEMENT - JUNE 2012
For
per
sona
l use
onl
y

020
MT RAwdON ORE RESERVESTheJune2012MtRawdonOreReserveestimateof36.2milliontonnesat0.8g/tgoldfor914kozrepresentsaslightdecrease(1%)netofminingdepletioncomparedtotheprevious estimate.
Changes in the 2012 Ore Reserve estimate compared to the previously reported estimate include:
• Increaseof101kozduetoloweringthecut-offfrom 0.4g/tto0.3g/tgoldandchangingthegoldprice assumption from A$1,133 per ounce to A$1,350 perounce;
• Decreaseof6kozduetomodelmethodology changes;and
• Mining depletion.
TheOreReservesarereportedata0.30g/tgold(un-factored model grade) cut-off. Ore Reserves were estimated based on a gold price of A$1,350 per ounce andavariablegoldrecoveryaveraging89.5%.
EdNA MAY MINERAL RESOURCETheJune2012EdnaMayMineralResourceestimateof45.8milliontonnesat1.0g/tgoldfor1,542kozrepresentsadecreaseof220koz(13%)netofminingdepletioncompared to the 2011 estimate.
An increase in the underground Mineral Resource estimateof107kozwasoff-setbythefollowingchanges:
• Decreaseof67kozduetore-interpretationof mineralisation outside the Edna May Gneiss within theopen-pitresource;
• Decreaseof38kozduetoreportingaveragegrades (E-Type1) panel grades excluding panels from the open-pitresourcebelowthe0.4g/tcut-offratherthan usingtherecoveryproportionassignedtoapanel;
• Decreaseof146kozduetoimprovedstructural domaining to better capture the changes in orientationofmineralisation;and
• Mining depletion.
TheMineralResourcesarereportedata0.4g/tgoldcut-off for the Edna May and Greenfinch open-pits and 3.0g/tgoldcut-offfortheEdnaMayUnderground.EdnaMay and Greenfinch were estimated using E-Type Multiple IndicatorKrigingintoblockswithdimensions25metreseast by 25 metres north by 5 elevation and 20 metres east by 15 metres north by 5 elevation respectively. Edna May open pit was reported above the 1050mRL (290 metres below surface).
Edna May’s underground deposit was estimated using acombinationofOrdinaryKrigingintoblockswithdimensions 5 metres east by 5 metres north by 5 metres elevation and is reported below the 1050mRL. No additional drilling has been included in the 2012 Mineral Resource as compared to the previously reported Mineral Resource.
EdNA MAY ORE RESERVESTheJune2012EdnaMayOreReserveestimateof24.6milliontonnesat1.0g/tgoldfor767kozrepresentsadecreaseof160koz(17%)netofminingdepletioncompared to the 2011 estimate.
Changes in the 2012 Ore Reserve estimate compared to the previously reported estimate include:
•Decreaseof83kozduetooptimisationoftheopen-pit design using the revised Mineral Resource estimate (i.e. excludes mineralisation outside the Edna May Gneiss, and uses E-Type grade estimates), and an increase in the input costs for the Ore Reserve estimation;and
•Mining depletion.
The2012OreReservesarereportedata0.4g/tgoldcut-off. Ore Reserves were estimated based on a gold price of A$1,500 per ounce gold price and a gold recovery of91.5%.
MINERAL RESOURCES ANd ORE RESERVES STATEMENT - JUNE 2012
Pajingo gold pour
1TheE-Typeestimateistakenasthemeangradeforablockinspaceaccountingfortheestimationerrororuncertaintyoftheresultantgrade.The identification of the mean value is based on the CCDF (conditional cumulative distribution function) of real data.
For
per
sona
l use
onl
y

2012 EVOLUTION MINING ANNUAL REPORT
MT CARLTON MINERAL RESOURCETheJune2012MtCarltonMineralResourceestimateof27.9milliontonnesat2.4g/tgoldequivalentfor2.2milliongoldequivalentouncesrepresentsa2%increaseingoldequivalent ounces compared to the previous estimate. Changes in the 2012 Mineral Resource estimate compared to the previously reported estimate are a result of:
• Changes in grade estimation methodology from a recovery value model to an average grade (E-Type) model;and
• Changes in cut-off value parameters from an in-situ valueof$A20/tpreviouslytoacut-offgradeof0.35g/t goldforV2and42g/tsilverforA39.
The Mt Carlton Mineral Resource consists of the V2 and A39 deposits.
TheV2depositMineralResourcesarereportedata0.35g/tgold cut-off and estimated using E-Type Multiple Indicator Krigingintoblockswithdimensions25metreseastby25metres north by 5 metres elevation.
TheA39depositMineralResourcesarereportedata42g/tsilver cut-off and estimated using a combination of Ordinary Kriging,formorebroadlyspacedresourcedefinitiondrilling,and Sequential Gaussian Simulation for close-spaced grade-controldrilledareasofthedepositintoblockswithdimensions 10 metres by 10 metres by 2.5 metres elevation.
MT CARLTON ORE RESERVESTheJune2012MtCarltonOreReserveestimateof10.2milliontonnesat3.7g/tgoldequivalentfor1.22milliongoldequivalentouncesrepresentsaslightdecrease(3%)ingoldequivalent ounces compared to the previous estimate.
Changes are largely the result of a change in grade estimation technique from a recovery value model to an average grade (E-Type) model.
Changes in the 2012 Ore Reserve estimate compared to the 2011 Ore Reserve estimate are a result of:
• Updatedresourcemodelusingasimplergrade estimationtechniqueandadditionaldrilling;
• Updatedmetalprices,processrecoveries,mining costs, smelter payables, concentrate transport costs androyalties;and
• New final pit designs based on updated pit optimisation with updated resource model and inputs.
Mt Carlton Ore Reserves are estimated based on metal prices of A$1,350 per ounce for gold, A$28.00 per ounce for silver and A$2.00 per pound for copper.
TheV2depositOreReservesarereportedata0.69g/tgoldcut-off. The V2 deposit Ore Reserve estimate used variable metal recoveries proportionate to head grade with gold recoveryrangingfrom82%to90%andsilverandcopperrecoveriesrangingfrom84%to92%.
TheA39DepositOreReservesarereportedata53g/tsilver cut-off. The A39 deposit Ore Reserve estimate used metal recoveries proportionate to head grade with a silver recoveryof88%andcopperrecoveryof92%.
The new modelling parameters as described above have also seen the waste to ore ratios improve significantly at both the V2 and A39 pits. The V2 strip ratio (waste tonnes to ore tonnes) has fallen to 2.7 from 3.9 previously and the A39 strip ratio has fallen to 3.3 from 11.9 previously.
TwIN hILLS MINERAL RESOURCETheJune2012TwinHillsMineralResourceestimateof4.62milliontonnesat2.7g/tgoldfor398kozisunchangedfromthe 2011 estimate as no new drilling or estimation has been conducted at Twin Hills.
The Mineral Resource estimate is reported above a cut-off of0.5g/tgoldandwithinaA$1,500perouncepitshellfortheTwinHillsopen-pitand2.0g/tgoldfortheTwinHillsUndergroundDeposits.
TwIN hILLS ORE RESERVESNo Ore Reserves have been estimated for Twin Hills.
MINERAL RESOURCES ANd ORE RESERVES STATEMENT - JUNE 2012
For
per
sona
l use
onl
y

022
MINERAL RESOURCES ANd ORE RESERVES STATEMENT - JUNE 2012
MINERAL RESOURCES ANd ORE RESERVE TABLES BY OPERATION
Pajingo Mineral Resources - June 2012
Mineral Resources by Lodes
Measured Resource Indicated Resource Inferred Resource Total Resource
Tonnes Grade Cont. Metal Tonnes Grade Cont.
Metal Tonnes Grade Cont. Metal Tonnes Grade Cont.
Metal
Mt Au (g/t) Au (koz) Mt Au (g/t) Au
(koz) Mt Au (g/t) Au (koz) Mt Au (g/t) Au
(koz)
Underground
Cindy - - - 0.06 7.2 14 0.043 4.8 7 0.104 6.2 21
Venue - - - 0.137 4.5 20 0.18 3.8 22 0.317 4.1 42
Faith 0.002 5.7 0.3 0.174 6.0 34 0.125 4.7 19 0.301 5.5 53
Jandam1 0.213 6.6 45 0.846 5.0 137 0.691 4.6 101 1.75 5.0 283
Sonia2 - - - 0.22 8.2 58 0.248 8.7 69 0.468 8.5 128
Veracity - - - 0.308 5.3 53 0.074 5.1 12 0.383 5.3 65
Zed - - - 0.225 5.4 39 1.05 4.9 167 1.28 5.0 206
Leaping Dog 0.053 6.6 11 0.077 4.6 11 0.005 5.1 1 0.134 5.4 23
Olivia - - - - - - 0.305 3.6 35 0.305 3.6 35
Janine - - - 0.059 4.5 8 0.06 3.7 7 0.119 4.1 16
Open-Pit
Venue3 - - - 0.221 3.7 26 0.01 2.2 1 0.231 3.6 27
Stockpiles 0.008 5.3 1 - - - - - - 0.008 5.3 1
Total 0.274 6.6 58 2.33 5.4 401 2.79 4.9 441 5.39 5.2 900
1IncludesJ1,J1HW,J2,J3andJ4Lodes2 Includes Sonia and Sonia east Lodes3IncludesVenueandVeraNorthUpperLodesNotes:Data is reported to significant figures and differences may occur due to roundingPajingoMineralResourceshavebeenreportedaboveacut-offgradeof2.4g/tofgoldforunderground,0.65g/tofgoldforopenpitandconstrainedtoanA$1,350pitdesignPajingowasestimatedusingOrdinaryKrigingintoblockswithdimensions10metreseastby5metresnorth by 10 metres elevationMineral Resource figures are inclusive of Ore ReservesCompetent Person: Calvin Ferguson, a member of the Australasian Institute of Mining and Metallurgy
For
per
sona
l use
onl
y

2012 EVOLUTION MINING ANNUAL REPORT
MINERAL RESOURCES ANd ORE RESERVES STATEMENT - JUNE 2012
1IncludesJ1,J1HW,J2,J3andJ4Lodes2 Includes Sonia and Sonia East Lodes3IncludesVenueandVeraNorthUpperLodesNotes:Data is reported to significant figures and differences may occur due to roundingOreReservesarereportedabovea3.0g/tgoldcut-offOreReservesarecalculatedusingaA$1,350perouncegoldpriceandagoldrecoveryof96%UndergroundCompetentPerson:AndrewFox,amemberoftheAustralasianInstituteofMiningandMetallurgyOpen-pitCompetentPerson:CameronSkinner,amemberoftheAustralasianInstituteofMiningandMetallurgy
Pajingo Ore Reserves - June 2012
Ore Reserves by Lodes
Proved Probable Total
Tonnes Grade Cont. Metal Tonnes Grade Cont.
Metal Tonnes Grade Cont. Metal
Mt Au (g/t) Au (koz) Mt Au (g/t) Au (koz) Mt Au (g/t) Au (koz)
Underground
Cindy - - - 0.031 5.9 6 0.031 5.9 6
Faith 0.003 4.2 0.4 0.171 5.5 30 0.174 5.5 31
Jandam1 - - - 0.018 4.4 3 0.018 4.4 3
Leaping Dog 0.035 6.3 7 0.04 4.6 6 0.075 5.4 13
Sonia2 - - - 0.219 7.1 50 0.219 7.1 50
Veracity - - - 0.228 4.4 32 0.228 4.4 32
Zed - - - 0.152 5.3 26 0.152 5.3 26
Open-pit
Venue3 - - - 0.214 3.3 23 0.214 3.3 23
Stockpiles 0.008 5.3 1 - - - 0.008 5.3 1
Total 0.046 6.0 9 1.07 5.1 175 1.12 5.1 184
For
per
sona
l use
onl
y

024
MINERAL RESOURCES ANd ORE RESERVES STATEMENT - JUNE 2012
Cracow Mineral Resources - June 2012
Mineral Resources by
Lodes
Measured Resource Indicated Resource Inferred Resource Total Resource
Tonnes Grade Cont. Metal Tonnes Grade Cont.
Metal Tonnes Grade Cont. Metal Tonnes Grade Cont.
Metal
Mt Au (g/t)
Au (koz) Mt Au
(g/t) Au
(koz) Mt Au (g/t)
Au (koz) Mt Au
(g/t) Au
(koz)
Royal 0.017 8.8 5 - - - 0.085 6.7 18 0.103 7.1 23
Crown 0.073 9.4 22 - - - 0.38 4.5 55 0.454 5.3 77
Klondyke North 0.001 7.7 0.3 0.225 5.7 41 0.192 3.7 23 0.418 4.7 64
Sovereign 0.037 5.0 6 0.119 4.3 17 0.381 3.6 44 0.536 3.9 67
Kilkenny 0.051 9.9 16 0.282 7.4 67 0.776 5.2 131 1.11 6.0 215
Tipperary - - - 0.319 7.6 78 0.156 5.5 28 0.476 6.9 106
Empire - - - - - - 0.474 6.1 93 0.474 6.1 93
Roses Pride 0.007 7.2 2 0.051 15.9 26 0.385 5.7 70 0.443 6.9 98
Phoenix 0.005 14.2 2 0.063 9.3 19 0.002 4.4 0.3 0.069 9.5 21
Stockpiles 0.011 13.3 5 - - - - - - 0.011 13.3 5
Total 0.203 8.9 58 1.06 7.3 248 2.83 5.1 462 4.09 5.8 768
Notes: Data is reported to significant figures and differences may occur due to roundingCracowMineralResourceshavebeenreportedaboveacut-offgradeof2.3g/tofgoldCracowwasestimatedusingOrdinaryKrigingintoblockswitharangeofdimensionsoptimisedtothecharacteristicsand geometry of each depositMineral Resource figures are inclusive of Ore ReservesCompetentPerson:JohnWinterbottom,amemberofAustralianInstituteofGeoscientists
For
per
sona
l use
onl
y

2012 EVOLUTION MINING ANNUAL REPORT
MINERAL RESOURCES ANd ORE RESERVES STATEMENT - JUNE 2012
Notes:Data is reported to significant figures and differences may occur due to roundingOreReservesarereportedabovea3.0g/tgoldcut-offOreReservesarecalculatedusingaA$1,350perouncegoldpriceandagoldrecoveryof93%Cracow tonnes and grades are stated to a number of significant digits reflecting confidence of the estimateCompetent Person: Fusheng Li, a member of the Australasian Institute of Mining and Metallurgy
Cracow Ore Reserves - June 2012
Ore Reserves by Lodes
Proved Probable Total
Tonnes Grade Cont. Metal Tonnes Grade Cont.
Metal Tonnes Grade Cont. Metal
Mt Au (g/t) Au (koz) Mt Au (g/t) Au (koz) Mt Au (g/t) Au (koz)
Royal 0.015 8.0 4 - - - 0.015 8.0 4
Crown 0.032 12.2 13 0.003 1.0 0.1 0.035 11.1 13
Klondyke North 0.0004 5.7 0.1 0.158 4.4 22 0.159 4.4 22
Sovereign 0.004 7.5 1 0.038 4.3 5 0.042 4.7 6
Kilkenny 0.053 11.8 20 0.368 4.7 55 0.421 5.6 75
Roses Pride 0.007 4.6 1 0.094 8.1 24 0.101 7.8 25
Phoenix 0.002 8.5 1 0.096 7.7 24 0.098 7.7 24
Tipperary - - - 0.398 5.2 66 0.398 5.2 66
Stockpiles 0.011 13.3 5 - - - 0.011 13.3 5
Total 0.126 10.9 44 1.16 5.3 198 1.28 5.9 242
For
per
sona
l use
onl
y

026
MINERAL RESOURCES ANd ORE RESERVES STATEMENT - JUNE 2012
Notes: Data is reported to significant figures and differences may occur due to roundingMtRawdonMineralResourceshavebeenreportedaboveacut-offgradeof0.23g/tofgoldandconstrainedtoanA$1,800pitoptimisation shellMtRawdonwasestimatedusingOrdinaryKrigingintoblockswithdimensions20metreseastby20metresnorthby5 metres elevationMineral Resource figures are inclusive of Ore ReservesCompetentPerson:JohnWinterbottom,amemberofAustralianInstituteofGeoscientists
Mt Rawdon Mineral Resources - June 2012
Mineral Resources
Measured Resource Indicated Resource Inferred Resource Total Resource
Tonnes Grade Cont. Metal Tonnes Grade Cont.
Metal Tonnes Grade Cont. Metal Tonnes Grade Cont.
Metal
Mt Au (g/t) Au (koz) Mt Au (g/t) Au
(koz) Mt Au (g/t)
Au (koz) Mt Au
(g/t) Au
(koz)
Open Pit - - - 44.7 0.7 1,058 7.17 0.5 125 51.9 0.7 1,183
Stockpiles 0.6 0.5 10 - - - - - - 0.6 0.5 10
Total 0.6 0.5 10 44.7 0.7 1,058 7.17 0.5 125 52.5 0.7 1,194
Mt Rawdon Ore Reserves - June 2012
Ore Reserves
Proved Probable Total
Tonnes Grade Cont. Metal Tonnes Grade Cont. Metal Tonnes Grade Cont. Metal
Mt Au (g/t) Au (koz) Mt Au (g/t) Au (koz) Mt Au (g/t) Au (koz)
Open Pit - - - 35.6 0.8 904 35.6 0.8 904
Stockpiles 0.6 0.5 10 - - - 0.6 0.5 10
Total 0.6 0.5 10 35.6 0.8 904 36.2 0.8 914
Notes: Data is reported to significant figures and differences may occur due to roundingOreReservesarereportedabovea0.3g/tgoldcut-offOreReservesarecalculatedusingaA$1,350perouncegoldpriceandavariablegoldrecovery,approximately89.5%foraverageheadgradereportedMt Rawdon tonnes and grades are stated to a number of significant digits reflecting confidence of the estimateCompetentPerson:KarlSmith,amemberoftheAustralasianInstituteofMiningandMetallurgy
For
per
sona
l use
onl
y

2012 EVOLUTION MINING ANNUAL REPORT
Edna May Ore Reserves - June 2012
Ore Reserves by Deposit
Proved Probable Total Ore Reserves
Tonnes Grade Cont. Metal Tonnes Grade Cont.
Metal Tonnes Grade Cont. Metal
Mt Au (g/t) Au (koz) Mt Au (g/t) Au (koz) Mt Au (g/t) Au (koz)
Greenfinch 0.8 1.1 28 1.7 1.0 58 2.5 1.1 86
Edna May (OP) 12.1 1.0 390 8.07 1.0 259 20.2 1.0 649
Edna May (U/G) - - - - - - - - -
Stockpiles - - - 1.92 0.5 31 1.92 0.5 31
Total 12.9 1.0 418 11.7 0.9 349 24.6 1.0 767
Notes:OreReservesarereportedabovea0.4g/tgoldcut-offOreReserveswerecalculatedusingaA$1,500perouncegoldpriceandagoldrecoveryof91.5%CompetentPerson:LukeCox,amemberoftheAustralasianInstituteofMiningandMetallurgyData is reported to significant figures and differences may occur due to rounding
MINERAL RESOURCES ANd ORE RESERVES STATEMENT - JUNE 2012
Notes: Data is reported to significant figures and differences may occur due to roundingEdnaMayandGreenfinchMineralResourceshavebeenreportedaboveacut-offgradeof0.4g/tofgoldandEdnaMayundergroundreported above3g/tgoldEdnaMayandGreenfinchwereestimatedusingE-TypeMultipleIndicatorKriging(MIK)intoblockswithdimensions25metreseastby25metres north by 5 metres elevation and 20 metres east by 15 metres north by 5 metres elevation respectively. Edna May open-pit was reported above the 1050mRL (290 metres below surface)EdnaMay’sundergrounddepositwasestimatedusingacombinationofOrdinaryKrigingintoblockswithdimensions5metreseastby5metres north by 5 metres elevation and is reported below the 1050mRLMineral Resource figures are inclusive of Ore ReservesCompetentPerson:Underground,JohnWinterbottomamemberofAustralianInstituteofGeoscientistsCompetentPerson:Open-pit&Greenfinch,LukeCoxamemberoftheAustralasianInstituteofMiningandMetallurgy
Edna May Mineral Resources - June 2012
Mineral Resources by Deposit
Measured Resource Indicated Resource Inferred Resource Total Resource
Tonnes Grade Cont. Metal Tonnes Grade Cont.
Metal Tonnes Grade Cont. Metal Tonnes Grade Cont.
Metal
Mt Au (g/t)
Au (koz) Mt Au
(g/t) Au
(koz) Mt Au (g/t)
Au (koz) Mt Au
(g/t) Au
(koz)
Greenfinch 0.866 1.1 31 2.58 1.0 83 0.65 1.0 20 4.09 1.0 134
Edna May (OP) 16.9 1.0 518 14.4 0.9 412 7.22 0.8 174 38.6 0.9 1,104
Edna May (U/G) - - - 0.63 7.2 146 0.58 6.9 127 1.21 7.0 273
Stockpiles - - - 1.92 0.5 31 - - - 1.92 0.5 31
Total 17.8 1.0 549 19.5 1.1 672 8.44 1.2 321 45.8 1.0 1,542
For
per
sona
l use
onl
y

028
MINERAL RESOURCES ANd ORE RESERVES STATEMENT - JUNE 2012
Gold - Mt Carlton Mineral Resources - June 2012
Mineral Resources by Deposit
Measured Resource Indicated Resource Inferred Resource Total Resource
Tonnes Grade Cont. Metal Tonnes Grade Cont.
Metal Tonnes Grade Cont. Metal Tonnes Grade Cont.
Metal
Mt Au (g/t) Au (koz) Mt Au (g/t) Au
(koz) Mt Au (g/t) Au (koz) Mt Au (g/t) Au
(koz) V2 9.02 2.0 586 14.7 1.5 695 1.41 1.5 68 25.2 1.7 1,350
Total 9.02 2.0 586 14.7 1.5 695 1.41 1.5 68 25.2 1.7 1,350
Silver - Mt Carlton Mineral Resources - June 2012
Mineral Resources by Deposit
Measured Resource Indicated Resource Inferred Resource Total Resource
Tonnes Grade Cont. Metal Tonnes Grade Cont.
Metal Tonnes Grade Cont. Metal Tonnes Grade Cont.
Metal
Mt Ag (g/t) Ag (koz) Mt Ag (g/t) Ag
(koz) Mt Ag (g/t) Ag (koz) Mt Ag (g/t) Ag
(koz) V2 9.02 21 6,159 14.7 18 8,410 1.41 12 534 25.2 19 15,103 A39 2.38 192 14,631 0.231 80 594 0.095 85 262 2.7 178 15,487
Total 11.4 57 20,790 14.9 19 9,004 1.51 16 796 27.9 34 30,590
Copper - Mt Carlton Mineral Resources - June 2012
Mineral Resources by Deposit
Measured Resource Indicated Resource Inferred Resource Total Resource
Tonnes Grade Cont. Metal Tonnes Grade Cont.
Metal Tonnes Grade Cont. Metal Tonnes Grade Cont.
Metal
Mt Cu (%) Cu (kt) Mt Cu (%) Cu (kt) Mt Cu (%) Cu (kt) Mt Cu (%) Cu (kt)
V2 9.02 0.27 24.5 14.7 0.22 32.1 1.41 0.22 3.0 25.2 0.24 59.7A39 2.38 0.13 3.1 0.231 0.01 0.03 0.095 0.04 0.004 2.7 0.12 3.1
Total 11.4 0.24 27.6 14.9 0.21 32.1 1.51 0.20 3.0 27.9 0.23 62.8
Gold Equivalence (Silver) - Mt Carlton Mineral Resources - June 2012
Mineral Resources by Deposit
Measured Resource Indicated Resource Inferred Resource Total Resource
Tonnes Grade Cont. Metal Tonnes Grade Cont.
Metal Tonnes Grade Cont. Metal Tonnes Grade Cont.
Metal
Mt AuEq (g/t)
AuEq (koz) Mt AuEq
(g/t) AuEq (koz) Mt AuEq
(g/t) AuEq (koz) Mt AuEq
(g/t) AuEq (koz)
V2 9.02 0.5 131 14.7 0.4 178 1.41 0.2 11 25.2 0.4 320 A39 2.38 3.9 297 0.231 1.6 12 0.095 1.7 5 2.7 3.6 314
Sub-Total 11.4 1.2 427 14.9 0.4 190 1.51 0.3 17 27.9 0.7 634
Gold Equivalence (Copper) - Mt Carlton Mineral Resources - June 2012
Mineral Resources by Deposit
Measured Resource Indicated Resource Inferred Resource Total Resource
Tonnes Grade Cont. Metal Tonnes Grade Cont.
Metal Tonnes Grade Cont. Metal Tonnes Grade Cont.
Metal
Mt AuEq (g/t)
AuEq (koz) Mt AuEq
(g/t) AuEq (koz) Mt AuEq
(g/t) AuEq (koz) Mt AuEq
(g/t) AuEq (koz)
V2 9.02 0.3 82 14.7 0.2 107 1.41 0.2 10 25.2 0.2 199A39 2.38 0.1 10 0.231 0.01 0.1 0.095 0.004 0.01 2.7 0.1 10
Sub-Total 11.4 0.3 92 14.9 0.2 107 1.51 0.2 10 27.9 0.2 210
Total Gold Equivalence - Mt Carlton Mineral Resources - June 2012
Mineral Resources by Deposit
Measured Resource Indicated Resource Inferred Resource Total Resource
Tonnes Grade Cont. Metal Tonnes Grade Cont.
Metal Tonnes Grade Cont. Metal Tonnes Grade Cont.
Metal
Mt AuEq (g/t)
AuEq (koz) Mt AuEq
(g/t) AuEq (koz) Mt AuEq
(g/t) AuEq (koz) Mt AuEq
(g/t) AuEq (koz)
V2 9.02 2.8 799 14.7 2.1 981 1.41 2.0 90 25.2 2.3 1,869A39 2.38 4.0 307 0.231 1.6 12 0.095 1.7 5 2.7 3.7 325
Total 11.4 3.0 1,106 14.9 2.1 993 1.51 2.0 95 27.9 2.4 2,193
For
per
sona
l use
onl
y

2012 EVOLUTION MINING ANNUAL REPORT
MINERAL RESOURCES ANd ORE RESERVES STATEMENT - JUNE 2012
Notes:Data is reported to significant figures and differences may occur due to roundingMtCarltonV2depositMineralResourceshavebeenreportedaboveacut-offgradeof0.35g/tofgoldandA39depositreportedabove42g/tsilverMtCarltonV2depositwasestimatedusingE-TypeMultipleIndicatorKrigingintoblockswithdimensions25metreseastby25metresnorthby 5 metres elevationMtCarltonA39depositwasestimatedusingacombinationofOrdinaryKriging,formorebroadlyspacedResourceDefinitiondrilling,andSequentialGaussianSimulationforclosespacedgradecontroldrilledareasofthedepositintoblockswithdimensions10metresby10metresby2.5metres elevationMineral Resource figures are inclusive of Ore ReservesCompetentPerson:JohnWinterbottom,amemberofAustralianInstituteofGeoscientistsThe gold equivalence calculation represents total metal value for each metal summed and expressed in equivalent gold grade or ounces The prices used in the calculation being A$1,350/oz Au, A$28.00/oz Ag and A$2.00/lb Cu. Gold, silver and copper will each be recovered to concentrate; metallurgical recovery to concentrate of 90.0% for gold, 92.0% for silver at V2 and 88% silver at A39 and 92.0% for copper as indicated by metallurgical testwork1 Troy Ounce = 31.1034768 grams1t = 2204.62262 lbAu Eq for Silver = ((Price Ag per Oz x Ag Recovery)/(Price Au per Oz x Au Recovery)) x Ag GradeAu Eq for Copper = ((Price Cu per lb x 2204.623) x (Cu Recovery)) / (Price Au per Oz x Au Recovery / 31.1034768) x (Cu Grade / 100)
For
per
sona
l use
onl
y

030
Gold - Mt Carlton Mine Ore Reserves - June 2012
Mineral Reserves by Deposit
Proved Probable Total Ore Reserve
Tonnes Grade Cont. Metal Tonnes Grade Cont.
Metal Tonnes Grade Cont. Metal
Mt Au (g/t) Au (koz) Mt Au (g/t) Au (koz) Mt Au (g/t) Au (koz) V2 4.52 3.1 446 4.61 2.5 366 9.13 2.8 812
Total 4.52 3.1 446 4.61 2.5 366 9.13 2.8 812
Silver - Mt Carlton Ore Reserves - June 2012
Mineral Reserves by Deposit
Proved Probable Total Ore Reserve
Tonnes Grade Cont. Metal Tonnes Grade Cont.
Metal Tonnes Grade Cont. Metal
Mt Ag (g/t) Ag (koz) Mt Ag (g/t) Ag (koz) Mt Ag (g/t) Ag (koz)
V2 4.52 24 3,470 4.61 20 2,991 9.13 22 6,461 A39 1.04 265 8,852 - - - 1.04 265 8,852
Total 5.56 69 12,322 4.61 20 2,991 10.2 47 15,313
Copper - Mt Carlton Ore Reserves - June 2012
Mineral Reserves by Deposit
Proved Probable Total Ore Reserve
Tonnes Grade Cont. Metal Tonnes Grade Cont.
Metal Tonnes Grade Cont. Metal
Mt Cu (%) Cu (kt) Mt Cu (%) Cu (kt) Mt Cu (%) Cu (kt)
V2 4.52 0.32 14.3 4.61 0.23 10.5 9.13 0.27 24.8A39 1.04 0.24 2.5 - - - 1.04 0.24 2.5
Total 5.56 0.30 16.8 4.61 0.23 10.5 10.2 0.27 27.3
Gold Equivalence (Silver) - Mt Carlton Ore Reserves - June 2012
Mineral Reserves by Deposit
Proved Probable Total Ore Reserve
Tonnes Grade Cont. Metal Tonnes Grade Cont.
Metal Tonnes Grade Cont. Metal
Mt AuEq (g/t) AuEq (koz) Mt AuEq (g/t) AuEq (koz) Mt AuEq (g/t) AuEq (koz)
V2 4.52 0.5 74 4.61 0.4 63 9.13 0.5 137 A39 1.04 5.4 180 - - - 1.04 5.4 180
Total 5.56 1.4 253 4.61 0.4 63 10.2 1.0 317
Gold Equivalence (Copper) - Mt Carlton Ore Reserves - June 2012
Mineral Reserves by Deposit
Proved Probable Total Ore Reserve
Tonnes Grade Cont. Metal Tonnes Grade Cont.
Metal Tonnes Grade Cont. Metal
Mt AuEq (g/t) AuEq (koz) Mt AuEq (g/t) AuEq (koz) Mt AuEq (g/t) AuEq (koz)
V2 4.52 0.3 48 4.61 0.2 35 9.13 0.3 83A39 1.04 0.2 8 - - - 1.04 0.2 8
Total 5.56 0.3 56 4.61 0.2 35 10.2 0.3 91
Total Gold Equivalence - Mt Carlton Ore Reserves - June 2012
Mineral Reserves by Deposit
Proved Probable Total Ore Reserve
Tonnes Grade Cont. Metal Tonnes Grade Cont.
Metal Tonnes Grade Cont. Metal
Mt AuEq (g/t) AuEq (koz) Mt AuEq (g/t) AuEq (koz) Mt AuEq (g/t) AuEq (koz)
V2 4.52 3.9 567 4.61 3.1 464 9.13 3.5 1,032A39 1.04 5.6 188 - - - 1.04 5.6 188
Total 5.56 4.2 755 4.61 3.1 464 10.2 3.7 1,220
MINERAL RESOURCES ANd ORE RESERVES STATEMENT - JUNE 2012
For
per
sona
l use
onl
y

2012 EVOLUTION MINING ANNUAL REPORT
MINERAL RESOURCES ANd ORE RESERVES STATEMENT - JUNE 2012
Notes:Data is reported to significant figures and differences may occur due to roundingV2OreReservesarereportedabovea0.69g/tgoldcut-offandA39OreReservesreportedabovea53g/tsilvercut-offOre Reserves were calculated using a A$1,350 per ounce gold price, a silver price of A$28 per ounce and a copper price of A$2 per poundV2depositusedvariablerecoveriesproportionatetoheadgradewithgoldrecoveryrangingfrom82to90%,Silverandcopperrecoveriesrangedfrom 84to92%A39depositused88%and92%forsilverandcopperrecoveriesrespectively,withnorecoveryattributedtogoldSmelter payabilities were also considered in the reserve calculationCompetentPerson:JohnWyche,amemberoftheAustralasianInstituteofMiningandMetallurgyThe gold equivalence calculation represents total metal value for each metal summed and expressed in equivalent gold grade or ounces The prices used in the calculation being A$1,350/oz Au, A$28.00/oz Ag and A$2.00/lb Cu. Gold, silver and copper will each be recovered to concentrate; metallurgical recovery to concentrate of 90.0% for gold, 92.0% for silver at V2 and 88% silver at A39 and 92.0% for copper as indicated by metallurgical testwork1 Troy Ounce = 31.1034768 grams1t = 2204.62262 lbAu Eq for Silver = ((Price Ag per Oz x Ag Recovery)/(Price Au per Oz x Au Recovery)) x Ag GradeAu Eq for Copper = ((Price Cu per lb x 2204.623) x (Cu Recovery)) / (Price Au per Oz x Au Recovery / 31.1034768) x (Cu Grade / 100)
Twin Hills Mineral Resources - June 2012
Mineral Resources by Deposit
Measured Resource Indicated Resource Inferred Resource Total Resource
Tonnes Grade Cont. Metal Tonnes Grade Cont.
Metal Tonnes Grade Cont. Metal Tonnes Grade Cont.
Metal
Mt Au (g/t)
Au (koz) Mt Au
(g/t) Au
(koz) Mt Au (g/t)
Au (koz) Mt Au
(g/t) Au
(koz) Underground
309 - - - 0.04 3.9 5 0.5 4.3 69 0.54 4.3 74
Lone Sister 0.54 4.1 71 0.28 3.4 31 0.2 2.8 18 1.02 3.7 120
Open-Pit
309 - - - 2.42 2.2 170 0.64 1.7 35 3.06 2.1 204
Stockpiles - - - - - - - - - - - -
Total 0.54 4.1 71 2.74 2.3 205 1.34 2.8 122 4.62 2.7 398
Notes: Data is reported to significant figures and differences may occur due to roundingTwinHillsMineralResourceshavebeenreportedaboveacut-offgradeof2.0g/tofgoldforunderground,0.5g/tofgoldforopen-pitandwithinaA$1,500 pit shellTwinHillsLoneSisterwasestimatedusingOrdinaryKrigingand309usingMultipleIndicatorKriging(EType)intoblockswithdimensions5metreseast by 5 metres north by 5 metres elevationCompetent Person: Peter Brown, a member of the Australasian Institute of Mining and Metallurgy
For
per
sona
l use
onl
y

032
ChIEF FINANCIAL OFFICER’S REVIEw
The 2012 financial year was a transformational period for Evolution Mining, formed through the successful completion of the merger between of Catalpa Resources and Conquest Mining and acquisition of certain assets from Newcrest Mining in November 2011. From this new platform Evolution delivered a material increase in underlying net profit of A$63.4 million (before non-recurring items) and a reported net profit of A$37.3 million.
TotalrevenueofA$469.5millionwas285%higherthantheprioryear, due to a combination of higher gold prices and significantly higher gold production after the merger and acquisitions. Gold revenue in 2012 was A$461.8 million from the sale of 288,617 ounces at an average gold price of A$1,600 per ounce.
Costofsalesincreasedby232%toA$337.7millioncomparedtothe prior year, predominantly a result of increased production costs in-line with the higher output, and to higher rates of depreciation and amortisation. On a unit basis, group cash costs decreased by19%fromA$956perouncetoA$771perounceduring2012.Included in costs of sales are royalty costs of A$22.5 million and depreciation and amortisation of A$93.6 million.
UnderlyingGroupEBITDAwasA$190.0million.TheunderlyingEBITDA for the operations, which is before corporate and exploration charges, was A$225.4 million which represents a strong resultconsidering100%ownershipfortheCracowandMtRawdonoperations occurred for only part of the reporting period. The highest EBITDA contribution was from Mt Rawdon, at A$74.6 million, followed by Cracow at A$64.7 million, Edna May at A$45.4 million and Pajingo A$40.7 million. Despite the operational challenges experienced at Edna May during FY2012, the business unit contributed20%ofGroupEBITDA.
Evolution’s net assets during the period increased by A$901.7 million to A$1,056.4 million as a result of the net fair value uplift of assets acquired, net profit for the period and net equity raised. This has resulted in the company maintaining a strong balance sheet with the capacity to fund all of its existing development projects and the flexibility to pursue opportunistic growth as it arises. Cash at year end totalled A$141.8 million with total borrowings of A$38.1 million, comprising A$31.5 million project debt and the balance in finance leases.
Capital spent at existing operations totalled some A$150 million, with A$44.2 million invested at Pajingo in underground development and equipment purchases, A$43.8 million invested at Edna May in waste stripping and process improvements, A$31.8 million at Cracow in underground development and A$30.1 million at Mt Rawdon, predominantly in waste stripping. Mt Carlton expenditure was an additional A$94 million during the year, of which A$85 million is classified as direct project capital expenditure.
Exploration (discovery) expenditure during the year was A$18.5 million, with the majority aimed at near mine targets at Edna May, Pajingo and Cracow.
12 months ending 30 June 2012 A$’000
30 June 2011 A$’000
Total Revenue 469,484 121,870
Underlying EBITDA(1) 189,991 28,831
Underlying EBIT(1) 95,979 8,556
Underlying Net Profit(1) 63,395 (1,621)
Business combination costs net of tax (19,963) (682)
Fair value uplift of 30% Cracow net of tax 1,930 -
Tax effect of permanent differences (8,050) -
Reported Net Profit 37,313 (2,303)
(1)EBITDA, EBIT and Underlying Net Profit are non-IFRS financial information and not subject to audit.
TIM ChURChERChIEF FINANCIAL OFFICER
For
per
sona
l use
onl
y

2012 EVOLUTION MINING ANNUAL REPORT
BOARd OF dIRECTORS
FROM LEFT: JOhN ROwE, JAMES ASkEw, PAUL MARkS, JAkE kLEIN, PETER SMITh, LAwRIE CONwAY, GRAhAM FREESTONEF
or p
erso
nal u
se o
nly

034
JACOB kLEIN, B Com (hons), ACAEXECUTIVE ChAIRMANMrKleinwasappointedasExecutiveChairmaninOctober2011,following the merger of Conquest Mining Limited and Catalpa Resources Limited. Previously he served as the Executive Chairman ofConquestMiningLimited.Priortothat,MrKleinwasPresidentandCEOofSinoGoldMiningLimited,wherealongwithMrAskew(director from 2002 and Chairman from 2005 of Sino Gold) he managed the development of that company into the largest foreign participant in the Chinese gold industry. Sino Gold Mining Limited waslistedontheASXin2002withamarketcapitalisationof$100million and was purchased by Eldorado Gold Corporation in late 2009 for over A$2 billion.
JAMES ASkEw, BE (Mining), MEngSc, FAusIMM, MCIMM, MSME (AIME)NON-EXECUTIVE dIRECTOR MrAskewisaminingengineerwithover40yearsbroadinternational experience as a director and chief executive officer for a wide range of Australian and international publicly listed mining, mining finance and other mining related companies. He has also served on the boards of numerous resource public companies, whichcurrentlyincludeIvanhoeAustraliaLimited(sinceJune2011),Oceana Gold Limited (Chairman since November 2006) and Golden StarResourcesLimited(since1999).MrAskewisChairmanoftheRiskCommitteeandamemberoftheNominationandRemunerationCommittee for Evolution Mining.
LAwRIE CONwAY, B Bus, CPANON-EXECUTIVE dIRECTOR Mr Conway is the current Newcrest Executive General Manager (Commercial and West Africa) responsible for Newcrest’s group SupplyandLogistics,Marketing,InformationTechnology,andLaboratory functions as well as Newcrest’s business in West Africa. Mr Conway has more than 21 years commercial experience in the resources sector across a diverse range of commercial and financial activities at Newcrest and previously at BHP Billiton. Mr Conway has held a mix of corporate and operational commercial roles within Australia, Papua New Guinea and Chile.
GRAhAM FREESTONE, BEc (hons)LEAd INdEPENdENT dIRECTOR Mr Freestone has over 40 years experience in the natural resources industry. He has a broad finance, corporate and commercial backgroundobtainedinAustraliaandinternationallythroughseniorfinance positions with the Shell Group, Acacia Resources Limited and AngloGold. He was Acacia Resources Limited’s Chief Financial Officer and Company Secretary from 1994 until 2001. From 2001 to 2009 he was a Non-Executive Director of Lion Selection Limited. Mr Freestone is Lead Independent Director and Chairman of the Audit Committee for Evolution Mining.
PAUL MARkS, BEng (Chem), Mapp FinNON-EXECUTIVE dIRECTOR MrMarkshas35yearsexperienceacrossarangeofindustriesfrom foreign exchange and commodities trading, chemical and hydrocarbonprocessing.MrMarkshaspreviouslyheldthepositions of Vice-President of Foreign Exchange with Prudential-Bache Securities, Senior Strategist Foreign Exchange AEFC, the merchantbankingarmoftheCommonwealthBankofAustraliaandSeniorForeignExchangeStrategistwithNationalAustraliaBank.
JOhN ROwE, BSc (hons) ARSM, MAusIMMNON–EXECUTIVE dIRECTOR Mr Rowe was appointed as Non-Executive Director to the Westonia Mines Limited board (being the previous name of Catalpa Resources Limited) on 12 October 2006. Mr Rowe brings a wealth ofgeologicalandbusinessdevelopmentskillstotheCompany.MrRowehassome40yearsexperiencewithinthegoldandnickelindustries. He has held a variety of positions in mine management, exploration and business development. Mr Rowe is also a Non-Executive Director of Panoramic Resources Limited and Southern Cross Goldfields Limited. Mr Rowe is Chairman of the Nomination and Remuneration Committee for Evolution Mining.
PETER SMITh, FAusIMM, GAICd, MBA USqNON-EXECUTIVE dIRECTOR Mr Smith is the current Newcrest Executive General Manager Australian Operations (appointed in September 2010, following Newcrest’s merger with Lihir Gold Limited). Mr Smith has over 34 years mining experience across a broad spectrum of responsibilities, including a range of senior corporate roles with WMC Resources Ltd, Rio Tinto and Lihir Gold Limited. Mr Smith has previously held the positions of Chief Operating Officer at Lihir Gold Limited and, prior to that, Executive Director of Western Metals Ltd.
For
per
sona
l use
onl
y

2012 EVOLUTION MINING ANNUAL REPORT
CORPORATE GOVERNANCE
Evolution Mining has implemented and is committed to the ASXCorporateGovernanceCouncil’s(“Council”)secondedition (with 2010 amendments) Corporate Governance Principles and Recommendations and to maintaining high standard of corporate governance. Where the Company’s corporate governance practices do not correlate with all the practices recommended by the Council, or the Company does not consider it practicable or necessary to implement some principles due to the size and stage of development of its operations, the Board’s reasoning for any departure is explained.
EvolutioncomplieswiththeASXCorporateGovernanceCouncil recommendations, unless otherwise stated.
Set out below are the fundamental corporate governance practices of the Company.
PRINCIPLE 1: LAY SOLId FOUNdATIONS FOR MANAGEMENT ANd OVERSIGhTROLE OF ThE BOARd The Board’s role is to govern the Company and has thereby established the functions reserved to the Board. In governing the Company, the Directors must act in the best interests of the Company as a whole. Each member of the Board is committed to spending sufficient time to enable them to carry out their duties as a Director of the Company.
RESPONSIBILITIES OF ThE BOARd ANd BOARd PROCESSES In general, the Board is ultimately responsible for, and has the authority to determine all matters relating to the policies, practices, management and operations of the Company. The Board of Directors of the Company is responsible for establishing the corporate governance standardsandmanagementframework.Thisframeworkdivides the functions of running the Company between the Board, the Executive Chairman and senior executives. The Board guides and monitors the business affairs of the Company on behalf of the shareholders by whom they are elected and to whom they are accountable. It is required to do all things that may be necessary to be done in order to carry out the objectives of the Company. The Board delegates authority to senior executives and management to carry out delegated duties in support of the objectives of the Company. It is the role of Senior Management to manage the Company in accordance with the direction and delegations of the Board and the responsibility of the Board to oversee the activities of management in carrying out these delegated duties.
As at the date of this report the Board has established the following committees to assist it in discharging its functions:
• AuditCommittee;
• NominationandRemunerationCommittee;and
• RiskManagementCommittee.
The Board’s functions and the functions delegated to senior executives are set out in the Board Charter which is available on the Company’s website under “Corporate Governance”.
The Board holds regular meetings and is expected to meet periodically throughout the year. Directors’ attendance at meetings held during this year is set out onpage45ofthisannualreport.TheBoardpacksfortheBoard meeting are prepared and circulated in advance. Senior Executives are invited into Board meetings and are regularly involved in Board discussions.
ThE ROLE OF ThE NOMINATION ANd REMUNERATION COMMITTEEIn accordance with its Charter, the Remuneration and Nomination Committee is structured such that it is chaired by an independent Non-Executive Director and has at least three non-executive Directors as members.
The Executive Chairman and the Senior Executives are responsible for the day to day running of the Company. The Board has in place a performance appraisal and remuneration system for the Executive Chairman and Senior Executives designed to enhance performance. Management performance is formally reviewed twice per year. The criterion for the evaluation of the Executive Chairman and Senior Executives is their performanceagainstkeyperformanceindicators.Theperformance of the Executive Chairman is monitored and assessed by the members of the Nomination and Remuneration Committee.
The Chairman of the Nomination and Remuneration Committee is Mr Rowe, a Non-Executive Director. The othermembersoftheCommitteeareMrAskewandMrConway who both are Non-Executive Directors.
PRINCIPLE 2: STRUCTUREd TO Add VALUEThe Board currently comprises seven Directors, one of whom,MrKlein,isExecutiveChairman.Theremainingsix Directors are Non-Executive Directors with a mix of commercial, exploration, project development, mining and financialskillsandexperience.FurtherdetailsabouttheDirectorsincludingskills,experienceandtermofofficeare set out on pages 42 and 43 of this annual report.
The Company recognises the importance of Non-Executive Directors and the external perspective and advice that Non-Executive Directors can offer. It is the approach and attitude of each Non-Executive Director which determines independence and this must be consideredinrelationtoeachDirector,whiletakingintoaccount all other relevant factors including those set out in the Board Charter (available on the Company’s website under “Corporate Governance”). Determination of the independence of each Director is made with reference to the factors set out in the Board Charter that list the relationships affecting independent status. The Board is comprised of a majority of independent Directors.
The Board, at least annually, assesses the independence
For
per
sona
l use
onl
y

036
CORPORATE GOVERNANCE
of its Non-Executive Directors. This assessment may occur more than once each year if there is a change in circumstances that may impact upon the independence of a Non-Executive Director. Individual Directors must not participate in assessing their own independence, and must provide to the Board all information relevant to the assessment. In assessing independence, the Board considers all circumstances relevant to determining whether the Non- Executive Director is free from any interest and any business or other relationship which could, or could reasonably be perceived to materially interfere with that Director’s ability to exercise unfettered and independent judgment on Company issues. Directors arerequiredtotakeintoconsiderationanypotentialconflicts of interest when accepting appointments to other boards.
Directors are initially appointed by the full Board subject to election by shareholders at the next general meeting. Underthe Company’s constitution the tenure of a Director is subject to reappointment by shareholders not later than the third anniversary following his or her last appointment. There is no maximum age for Directors.
MrKleinistheExecutiveChairmanofEvolution. This rolerequiresMrKleintooperateastheChairmanoftheBoard and also in the capacity of a role equivalent to a Chief Executive Officer. As a result there is not a clear division of responsibility between these functions. Also, asanExecutiveChairman,MrKleinisnotindependentof Evolution in accordance with Recommendation 2.2 of theASXPrinciplesandRecommendations.HoweverthedualroleofMrKleinisbalancedbythepresenceofaclear majority of independent Directors on the Board and the appointment of Mr Graham Freestone in February 2012 as Lead Independent Director. In this role, Mr Freestone chairs the discussions of the Non-Executive Directors and represents the Board and the Company in situations where the Executive Chairman may be conflicted.AssuchtheBoardbelievesMrKleinisthebestpersontoundertaketheExecutiveChairmanroleanddoes not believe it necessary at this stage to appoint an Independent Chairman of the Board.
INdEPENdENT PROFESSIONAL AdVICE ANd ACCESS TO INFORMATIONEach Director has the right of access to all Company information and to Company Executives. Further, each Director and the Board collectively, subject to informingtheExecutiveChairman,hastherighttoseekindependent professional advice from a suitably qualified advisor, at the Company’s expense, with the approval of the Executive Chairman, to assist them to carry out their responsibilities. Where appropriate, a copy of this advice is to be made available to all other members of the Board.
PRINCIPLE 3: PROMOTE EThICAL ANd RESPONSIBLE dECISION MAkINGCOdE OF CONdUCTThe Board has adopted a Board Code of Conduct that deals with:
• obligationsunderlegislation;
• personalbehaviour;
• conflictofinterest;
• remuneration,expensesandotherbenefits;
• informationandrecords;and
• trading in Company Securities.
OneoftheBoard’skeyaimsistoavoidconflictsofinterest (both real and apparent) and to ensure that all Board issues receive proper consideration, unfettered by outside influences. If a conflict does exist, there are various courses of action available, depending upon the significance of the conflict.
In addition, as part of its commitment to recognising its legal obligations, the legitimate expectations of stakeholdersandpromotingpracticesnecessarytomaintain confidence in the Company’s integrity, the Company has established a Code of Conduct for all employees and contractors. The code aims to provide guidance to Directors, Senior Executives, management and employees on the standards of personal and corporate behaviour and the responsibility and accountability required of the Company’s personnel for reporting and investigating unethical practices. The code contains practices necessary to maintain externalstakeholders’confidenceinthe Company’s integrity,thepracticesnecessarytotakeintoaccount their legal obligations and the responsibilities of individuals for reporting and investigating reports of unethical practices.
SECURITIES TRAdING POLICYThe Company has adopted a securities trading policy for the Directors, Senior Executives, employees, consultants and contractors of the Company which is appropriate for a Company whose shares are admitted to tradingontheASX.
This policy was revised in December 2010 as a result of changestotheASXListingRulesapplicabletosecuritiestrading. In the avoidance of doubt of compliance, Directors and other employees are directed to consult with the Company Secretary and the Executive Chairman.
A copy of the Securities Trading Policy is available on the Company’s website under “Corporate Governance”.F
or p
erso
nal u
se o
nly

2012 EVOLUTION MINING ANNUAL REPORT
CORPORATE GOVERNANCE
PRINCIPLE 4: SAFEGUARd INTEGRITY IN FINANCIAL REPORTINGThe Board has established an Audit Committee to assist the Board to safeguard the integrity of financial reporting. The responsibilities of the Committee are set out in a formal charter approved by the Board. This charter is available on the Company’s website under “Corporate Governance”.
The Audit Committee currently comprises three Non-Executive Directors. Mr Freestone is the Chairmain of the Audit Committee and an independent Non-Executive Director.MrMarksandMrConway,bothNon-ExecutiveDirectors are also members of the Committee. The composition of the Audit Committee satisfies the Board’s requirements in performing the Committee’s function given the size and complexity of the business at present.
Further details of the members of the Audit Committee and their attendance at committee meetings are set out on page 45 of this Annual Report.
PRINCIPLE 5: MAkE TIMELY ANd BALANCEd dISCLOSUREThe Board has designated the Executive Chairman, Company Secretary and the Vice President Investor Relations as the individuals responsible for overseeing andco-ordinatingdisclosureofinformationtotheASXaswellascommunicatingwiththeASX.
The Board has established a written policy for ensuringcompliancewithASXlistingruledisclosurerequirements and accountability at senior executive level for that compliance. A copy of the Continuous Disclosure Policy is available on the Company’s website under “Corporate Governance”.
The Board provides shareholders with information by applying this policy. The policy includes identifying matters that may have a material effect on the price of the Company’ssecurities,notifyingthemtotheASX,postingthem on the Company’s website and issuing media releases.
PRINCIPLE 6: RESPECT ThE RIGhTS OF ShAREhOLdERSThe Board respects the rights of its shareholders (by promoting effective communication with shareholders and encouraging shareholder participation at annual general meetings). To facilitate the effective exercise of those rights, the Company has established a Shareholder Communication Policy which is available on the Company’s website under “Corporate Governance”.
The Board encourages full participation of shareholders at the Annual General Meeting, to ensure a high level of accountability and identification with the Company’s strategy and goals. Important issues are presented to the shareholders as single resolutions.
The Company also invites the external auditor to attend its Annual General Meeting and to be available to answer shareholders’ questions about the conduct of the audit and the preparation and content of the auditor’s report.
From time to time, briefings are arranged to give analysts and others who advise shareholders an understanding of the Company’s activities. In conducting briefings the Companytakescaretoensurethatanypricesensitiveinformation released is made available to all shareholders (institutionalandprivate)andthemarketatthesametime.TheseannouncementsarelodgedwiththeASXandthenposted on the Company’s website.
PRINCIPLE 7: INTERNAL CONTROL ANd RISk MANAGEMENTTheBoardhasestablishedaRiskManagementCommitteetooverseetheCompany’sriskmanagementsystems, policies, practices and plans on behalf of the board and report the results of its activities to the Board. The Company is committed to the identification, monitoringandmanagementofmaterialbusinessrisksofitsactivitiesviaitsriskmanagementframework.CopiesoftheRiskManagementPolicyandtheRiskCommitteeCharter are available on the Company’s website under “Corporate Governance”.
The Board assumes ultimate responsibility for the oversightandmanagementofmaterialbusinessrisksandsatisfies itself annually, or more frequently as required, that management has developed and implemented a soundsystemofriskmanagementandinternalcontroltomanagetheCompany’smaterialbusinessrisks.TheBoarddelegatesthedetailedworkofthistasktotheRiskManagementCommitteeandtheBoardperiodicallyreviewsthiswork.AkeyelementintheriskmanagementframeworkisthereportingbymanagementontheCompany’skeyrisks.TheRiskManagementCommitteeoverseestheadequacyandcontentofriskreportingfrommanagement. Based on reports compiled throughout the year, management prepares an annual summary report to indicate the effectiveness of the Company’s management ofitsmaterialbusinessrisks.ThisreportwillbepreparedfortheRiskManagementCommitteebutultimatelybeprovided to the Board for its review.
ATTESTATIONS BY EXECUTIVE ChAIRMAN ANd ChIEF FINANCIAL OFFICERInaccordancewithrecommendation7.3oftheASXCorporate Governance Principles and Recommendations, the Executive Chairman and Chief Financial Officer are required to state in writing to the Board that:
1. The statement given in accordance with section 295A of the Corporations Act, is founded on a soundsystemofriskmanagementandinternal control which implements the policies adopted by theBoard;and
2.TheCompany’sriskmanagementandinternal control system is operating efficiently and effectively in all material respects in relation to financialreportingrisks.
The Board receives regular updates from management on whethertheCompany’smaterialbusinessrisksarebeingmanagedeffectively.AGroupRiskManagerhasbeen
For
per
sona
l use
onl
y

038
CORPORATE GOVERNANCE
appointed with overall responsibility for the management, identification, monitoring, reporting and mitigation of Environmental,HealthandSafetyrisks.Themanagementandreportingofrisksiscommunicatedbymanagementthrough the Executive Chairman and in Board reporting at regularBoardandRiskManagementCommitteeMeetings.
PRINCIPLE 8: REMUNERATE FAIRLY ANd RESPONSIBLYNOMINATION ANd REMUNERATION COMMITTEEThe Company has established a Nomination and Remuneration Committee which has responsibility for the formulation of remuneration policies. The role of the Nomination and Remuneration Committee is set out in a formal charter approved by the Board (available on the Company’s website under “Corporate Governance”). Its objectives are to:
• Reviewandrecommendappropriateremuneration policies which are designed to enhance Board, andExecutiveperformance;
• MaintainaBoardthathasanappropriatemixof skillsandexperiencetobeaneffectivedecision- makingbody;and
• EnsurethattheBoardiscomprisedofDirectors who contribute to the successful management of the Company and discharge their duties having regard to the law and the highest standards of corporate governance.
REMUNERATION REPORT ANd REMUNERATION POLICIESThe Board (with the assistance of the Nomination and Remuneration Committee) has established a policy to ensure that it remunerates fairly and responsibly. The remuneration philosophy of the Board is designed to ensure that the level and composition of remuneration is competitive, reasonable and appropriate for the results delivered and to attract and maintain talented and motivated Directors and employees. The Nomination and Remuneration Committee is responsible for the oversight of the Company Performance Rights and the related plan.
Prior to the merger with Conquest Mining Limited (“Conquest”) and the acquisition of the two assets from Newcrest Mining Limited (“Newcrest”), the Company established a remuneration advisory committee comprising members from each of the Company, Conquest and Newcrest. This committee was charged with the responsibilityformakingrecommendationstotheBoardregarding the principles of remuneration to be applied to theKeyManagementPersonnel(“KMP”)oftheCompany,havingregardtotheASXcorporategovernanceprinciplesand the remuneration practices of Australian mining companies of a comparable size to the Company.
The remuneration advisory committee engaged an independent remuneration consultant, Mercer Australia, (“Mercer”) to prepare a report (“the Mercer Report”) to assist the Nomination and Remuneration Committee,
amongst other items, to determine the appropriate levelsforNon-ExecutiveDirectorsFees’andKMPremuneration. The remuneration advisory committee was replaced by the Nomination and Remuneration Committee upon the formation of the Company in October 2011. The recommendations of the Mercer report were adopted by the Board, having regard for the aggregate maximum Directors fee pool limit, which is currently set at $750,000 for Non-Executive Directors. This limit is set by shareholders at an Annual General Meeting.
Non-Executive Directors of the Company are not entitled to participate in any equity plan of the Company and do not receive retirement benefits, other than statutory superannuation entitlements.
Further details on the structure of Executive Directors, Non-ExecutiveDirectorsandKMPremunerationaresetout in the Remuneration Report on pages 47 to 59 of this Annual Report.
Personnel of the Company are not permitted to enter into transactions with securities (or any derivative thereof) whichlimittheeconomicriskofanyunvestedentitlementsawarded under any equity-based remuneration scheme, or otherwise awarded, or which will be offered by the Company in the future.
dIVERSITYThe Board is committed to have an appropriate blend of diversity within the Group and especially within the Senior Executive team. A diversity policy is approved by the Executive Chairman and an approved component of the Board Charter to ensure diversity within the organisation. A copy of the Diversity Policy is available on the Company’s website under “Corporate Governance”. Of the Senior Management team the ratio of male to female participation is as follows:
MALE FEMALE
Board 100% Nil
Senior Management 93% 7%
Group 85% 15%
For
per
sona
l use
onl
y
2012 EVOLUTION MINING ANNUAL REPORT
EVOLUTION MINING LIMITEdFINANCIALS
For
per
sona
l use
onl
y

040
TABLE OF CONTENTS
Directors’ Report 41
Auditor’s Independence Declaration 63
Statement of Comprehensive Income 64
Statement of Financial Position 65
Statement of Changes in Equity 66
Statement of Cash Flows 67
Notes to the Financial Statements 68
Directors’ Declaration 111
Shareholder Information 112
Independent Auditor’s Report 114
These financial statements are the consolidated financial statements of the consolidated entity consisting of Evolution Mining Limited and its subsidiaries. The financial statements are presented in the Australian currency.
The June 2012 full year results and balances reflect twelve months of Catalpa Resources Limited (100% Edna May and 30% of Cracow operations), the consolidation of Conquest Mining Limited from 17 October 2011 and the consolidation of 100% interest in Mt Rawdon and a 70% interest in Cracow from 2 November 2011. Comparative data is based on Catalpa Resources Limited results prior to the merger.
The financial statements were authorised for issue by the directors on 30 August 2012. The directors have the power to amend and reissue the financial statements.
EVOLUTION MINING LIMITEd FINANCIAL REPORT
For
per
sona
l use
onl
y
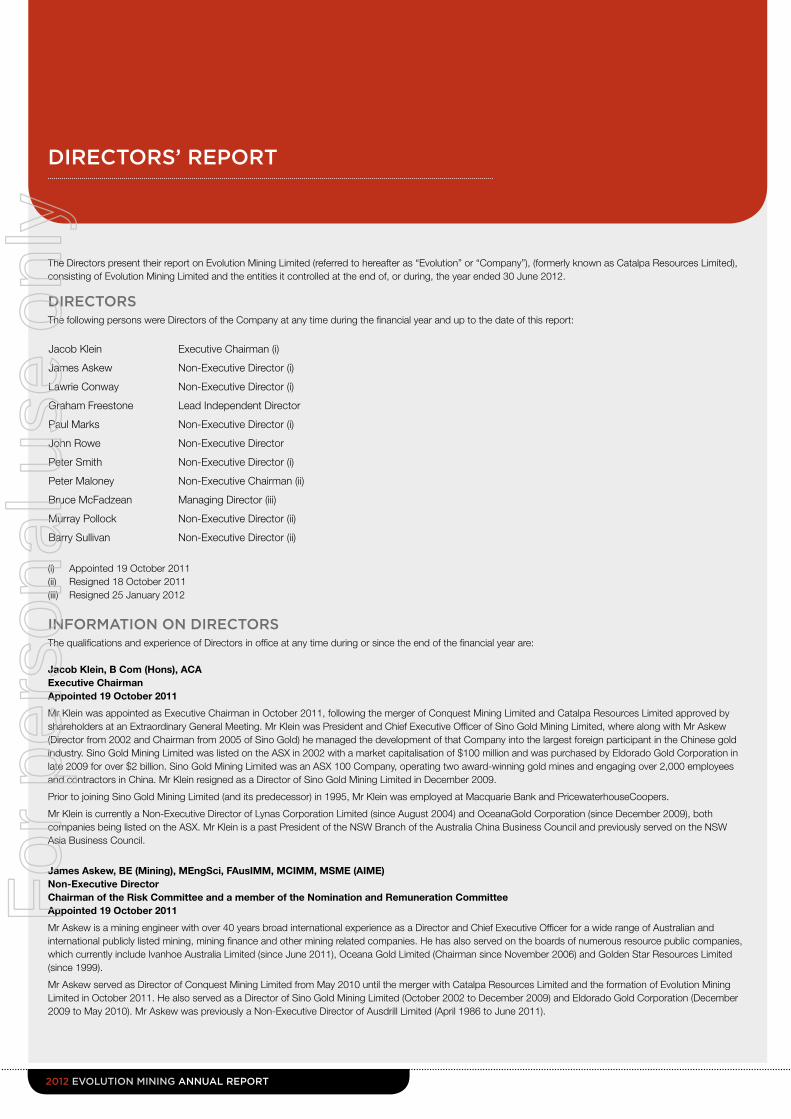
2012 EVOLUTION MINING ANNUAL REPORT
The Directors present their report on Evolution Mining Limited (referred to hereafter as “Evolution” or “Company”), (formerly known as Catalpa Resources Limited), consisting of Evolution Mining Limited and the entities it controlled at the end of, or during, the year ended 30 June 2012.
Jacob Klein Executive Chairman (i)
James Askew Non-Executive Director (i)
Lawrie Conway Non-Executive Director (i)
Graham Freestone Lead Independent Director
Paul Marks Non-Executive Director (i)
John Rowe Non-Executive Director
Peter Smith Non-Executive Director (i)
Peter Maloney Non-Executive Chairman (ii)
Bruce McFadzean Managing Director (iii)
Murray Pollock Non-Executive Director (ii)
Barry Sullivan Non-Executive Director (ii)
dIRECTORSThe following persons were Directors of the Company at any time during the financial year and up to the date of this report:
(i) Appointed 19 October 2011 (ii) Resigned 18 October 2011(iii) Resigned 25 January 2012
INFORMATION ON dIRECTORSThe qualifications and experience of Directors in office at any time during or since the end of the financial year are:
Jacob Klein, B Com (Hons), ACAExecutive ChairmanAppointed 19 October 2011
Mr Klein was appointed as Executive Chairman in October 2011, following the merger of Conquest Mining Limited and Catalpa Resources Limited approved by shareholders at an Extraordinary General Meeting. Mr Klein was President and Chief Executive Officer of Sino Gold Mining Limited, where along with Mr Askew (Director from 2002 and Chairman from 2005 of Sino Gold) he managed the development of that Company into the largest foreign participant in the Chinese gold industry. Sino Gold Mining Limited was listed on the ASX in 2002 with a market capitalisation of $100 million and was purchased by Eldorado Gold Corporation in late 2009 for over $2 billion. Sino Gold Mining Limited was an ASX 100 Company, operating two award-winning gold mines and engaging over 2,000 employees and contractors in China. Mr Klein resigned as a Director of Sino Gold Mining Limited in December 2009.
Prior to joining Sino Gold Mining Limited (and its predecessor) in 1995, Mr Klein was employed at Macquarie Bank and PricewaterhouseCoopers.
Mr Klein is currently a Non-Executive Director of Lynas Corporation Limited (since August 2004) and OceanaGold Corporation (since December 2009), both companies being listed on the ASX. Mr Klein is a past President of the NSW Branch of the Australia China Business Council and previously served on the NSW Asia Business Council.
James Askew, BE (Mining), MEngSci, FAusIMM, MCIMM, MSME (AIME)Non-Executive Director Chairman of the Risk Committee and a member of the Nomination and Remuneration CommitteeAppointed 19 October 2011
Mr Askew is a mining engineer with over 40 years broad international experience as a Director and Chief Executive Officer for a wide range of Australian and international publicly listed mining, mining finance and other mining related companies. He has also served on the boards of numerous resource public companies, which currently include Ivanhoe Australia Limited (since June 2011), Oceana Gold Limited (Chairman since November 2006) and Golden Star Resources Limited (since 1999).
Mr Askew served as Director of Conquest Mining Limited from May 2010 until the merger with Catalpa Resources Limited and the formation of Evolution Mining Limited in October 2011. He also served as a Director of Sino Gold Mining Limited (October 2002 to December 2009) and Eldorado Gold Corporation (December 2009 to May 2010). Mr Askew was previously a Non-Executive Director of Ausdrill Limited (April 1986 to June 2011).
dIRECTORS’ REPORT
For
per
sona
l use
onl
y

042
Lawrie Conway B Bus, CPANon-Executive Director and Member of the Audit and Nomination and Remuneration CommitteesAppointed 19 October 2011
Mr Conway is the current Newcrest Executive General Manager (Commercial and West Africa) responsible for Newcrest’s group Supply and Logistics, Marketing, Information Technology, and Laboratory functions as well as Newcrest’s business in West Africa.
Mr Conway has more than 21 years commercial experience in the resources sector across a diverse range of commercial and financial activities at Newcrest and previously at BHP Billiton. Mr Conway has held a mix of corporate and operational commercial roles within Australia, Papua New Guinea and Chile.
Graham Freestone, B Ec (Hons)Lead Independent Director and Chairman of the Audit Committee
Mr Freestone has over 40 years’ experience in the natural resources industry. He has a broad finance, corporate and commercial background obtained in Australia and internationally through senior finance positions with the Shell Group, Acacia Resources Limited and AngloGold. He was Acacia Resources Limited’s Chief Financial Officer and Company Secretary from 1994 until 2001. From 2001 to 2009 he was a Non-Executive Director of Lion Selection Limited and its Audit Committee Chair. He became a Director and Chair of the Audit and Risk Committee of Catalpa Resources Limited in 2009. Mr Freestone has not held any other listed company directorships within the last 3 years.
Paul Marks, BEng (Chem), Mapp FinNon-Executive Director and Member of the Audit CommitteeAppointed 19 October 2011
Mr Marks has 35 years of experience across a range of industries from foreign exchange and commodities trading, chemical and hydrocarbon processing. Mr Marks has previously held the positions of Vice-President of Foreign Exchange with Prudential-Bache Securities, Senior Strategist Foreign Exchange AEFC, the merchant banking arm of the Commonwealth Bank of Australia and Senior Foreign Exchange Strategist with National Australia Bank.
Previously Mr Marks served as Director of Conquest Mining Limited from December 2009 until the merger with Catalpa Resources Limited and the formation of Evolution Mining Limited in October 2011 and has also served on the board of Prana Biotechnology Ltd.
John Rowe, BSc (Hons) ARSM, MAusIMMNon–Executive Director and Chairman of Nomination and Remuneration Committee
Mr Rowe was appointed as Non-Executive Director to the Westonia Mines Limited board (being the previous name of Catalpa Resources Limited) on 12 October 2006. Mr Rowe brings a wealth of geological and business development skills to the Company. Mr Rowe has some 40 years’ experience within the gold and nickel industries. He has held a variety of positions in mine management, exploration and business development and has consulted for John Rowe and Associates since 2006.
Mr Rowe is also a Non-Executive Director of Panoramic Resources Limited (since 2006) and Southern Cross Goldfields Limited (since 2010). Mr Rowe was appointed Non-Executive Chairman of Magma Metals Limited in June 2012, which was then delisted at the end of June 2012. Mr Rowe has not held any other listed company directorships within the last 3 years.
Peter Smith, F Aus IMM, GAICD, MBA USQNon-executive Director and Member of the Risk CommitteeAppointed 19 October 2011
Mr Smith is the current Newcrest Executive General Manager Australian Operations (appointed in September 2010, following Newcrest’s merger with Lihir Gold Limited). Mr Smith has over 34 years mining experience across a broad spectrum of responsibilities, including a range of senior corporate roles with WMC Resources Ltd, Rio Tinto and Lihir Gold Limited.
Mr Smith has previously held the positions of Chief Operating Officer at Lihir Gold Limited and, prior to that, Executive Director of Western Metals Ltd.
Peter Maloney, B Com MBANon-Executive Chairman (Resigned 18 October 2011)
Mr Maloney served as a Non-Executive Chairman of Catalpa Resources from 10 December 2009 to 18 October 2011.
Bruce McFadzean, Dip Mining FAusIMMManaging Director & CEO (Resigned 25 January 2012)
Mr McFadzean served as the Managing Director & Chief Executive Officer of Catalpa Resources from 9 June 2008 and Managing Director of Evolution to 25 January 2012.
dIRECTORS’ REPORT
For
per
sona
l use
onl
y

2012 EVOLUTION MINING ANNUAL REPORT
Murray Pollock, MAICDNon-Executive Director (Resigned 18 October 2011)Mr Pollock served as a Non-Executive Director of Catalpa Resources from 21 October 2000 to 18 October 2011.
Barry Sullivan, BSc (Min), ARSM, F AusIMM, MAICDNon-Executive Director (Resigned 18 October 2011)Mr Sullivan served as a Non-Executive Director of Catalpa Resources from June 2008 to 18 October 2011.
INFORMATION ON COMPANY SECRETARYThe names and particulars of the Company Secretaries of the Company during or since the end of the financial year are:
Evan Elstein, BCom (Accounting and Finance), ACACompany Secretary (Appointed 19 October 2011)Mr Elstein is the Company’s General Manager for Information Technology and Company Secretary. He is a Chartered Accountant and a member of the Institute of Chartered Accountants in Australia. He has over 20 years’ experience in senior financial, commercial and technology roles, where his responsibilities have included the roll out of IT projects and services, business improvement initiatives and merger and acquisition activities. He has held senior positions with IT consulting companies in Australia, and previously served as the Chief Financial Officer and Company Secretary of Hartec Limited. Prior to that, Mr Elstein was employed by Dimension Data and Grant Thornton in South Africa.
Erik Palmbachs, BBus (CPA), MSc (Min Econ), FCISJoint Company Secretary and Chief Financial Officer (Resigned 18 October 2011)Mr Palmbachs was appointed Company Secretary on 30 December 2010 and resigned as Company Secretary on 18 October 2011.
Paul Mason, (BE ACA ACIS)Joint Company Secretary and Financial Controller (Resigned 18 October 2011)Mr Mason was appointed Company Secretary on 30 December 2010 and resigned as Company Secretary on 18 October 2011.
PRINCIPAL ACTIVITIESEvolution Mining Limited was formed in November 2011 through the merger of Catalpa Resources Limited and Conquest Mining Limited on 17 October 2011 and the concurrent acquisition of Newcrest Mining Limited’s 70% interest in the Cracow Gold Mine and 100% interest in the Mt Rawdon Gold Mine on 2 November 2011.
The Company owns and operates four gold mines in Queensland and Western Australia and is developing a fifth gold-silver-copper project in Queensland. The Company’s key assets are 100% interests in the Edna May Gold Mine, the Cracow Gold Mine, the Pajingo Gold Mine, the Mt Rawdon Gold Mine and the Mt Carlton gold, silver, copper development project.
During the year, the Company also engaged in exploration activities in and around its operations.
dIVIdENdSNo dividends were paid or declared during the financial year. No recommendation for payment of dividends has been made.
REVIEw OF OPERATIONSEvolution’s attributable gold production for the year ended 30 June 2012 was 280,401 ounces (2011: 96,109 ounces). Total gold production, assuming operations were wholly-owned for the year to 30 June 2012 was 346,979 ounces.
The Cracow Gold Mine, QLD (100%), produced 102,565 ounces of gold, which was towards the upper end of the Company’s expected output range of between 90,000-107,000 ounces.
The Edna May Gold Mine, WA (100%), produced 73,264 ounces of gold. This was below the Company’s expected output range of between 85,000-93,000 ounces, predominantly as a result of lower mill throughput due to poor plant reliability. Initiatives to improve plant reliability are planned to positively impact production performance in the 2013 financial year.
Mt Rawdon Gold Mine, QLD (100%) produced 95,403 ounces of gold which was within the Company’s expected output range of between 90,000-105,000 ounces.
The Pajingo Gold Mine, QLD (100%), produced 75,747 ounces of gold which was above the Company’s expected output of 70,000 ounces. Gold production in the 2012 year represents a 65% increase on that achieved in the previous year of 45,889 ounces and is a result of the capital investment programs implemented by Evolution to improve Pajingo’s long-term sustainable performance.
dIRECTORS’ REPORT
For
per
sona
l use
onl
y

044
The Mt Carlton gold-silver-copper project, QLD (100%), is Evolution’s key organic growth asset and is planned to expand the Company’s portfolio of 100% owned, Australian producing mines from four to five during the 2013 financial year. Procurement and engineering was largely complete and construction was approximately 50% complete at 30 June 2012. Project commissioning is planned in the December quarter of 2012. The project is planned to deliver approximately 800,000 ounces of gold, 17.3 million ounces of silver and 34,000 tonnes of copper over a 12 year life.
The Group generated gold sales revenue of $461.9 million from the sale of 288,617 ounces of gold and silver sales revenue of $7.6 million from the sale of 254,850 ounces of silver.
Reported profit from ordinary activities of the Company for the financial year ended 30 June 2012 was $37.313 million (2011: loss of $2.303 million). The net income for the period included business combination expenses of $28.518 million.
As at 30 June 2012 the Company had 601 employees and 503 contractors.
SIGNIFICANT ChANGES IN ThE STATE OF AFFAIRSSignificant changes in the state of affairs of the Company during the financial year follows in chronological order:
• SuccessfulcompletionandimplementationofthemergerbetweenCatalpaResourcesLimitedandConquestMiningLimitedandtheconcurrentpurchase of Newcrest Mining Limited’s interests in Cracow and Mt Rawdon in Queensland on 2 November 2011 to form Evolution Mining Limited, thereby creating one of Australia’s largest ASX-listed gold producers.
• SuccessfulinstitutionalandretailentitlementsoffercompletedinDecember2011,raisingA$152.459million.
• On5December2011,a25yeartermMiningLeasefortheMtCarltonprojectwasgrantedbytheQueenslandGovernment,thusallowingproject construction to commence.
• InJanuarytheCompanyannouncedamanagementrestructurewhichresultedintheresignationofMrBruceMcFadzeanasManagingDirectorofthe Company with the responsibilities combined into the Executive Chairman’s role held by Mr Jacob Klein.
Apart from the above, or as noted elsewhere in this report, no significant changes in the state of affairs of the Company occurred during the financial year.
SUBSEqUENT EVENTS On 25 June 2012, Evolution agreed to acquire the Holleton gold project, located to south of its Edna May Gold Mine in Western Australia. Pursuant to the terms of the agreement, Evolution has subsequently issued 500,000 fully paid shares to Independence Group NL.
FUTURE dEVELOPMENTSOther likely developments in the operations of the Company and the expected results of those operations in future financial years have not been included in this report as the inclusion of such information is likely to result in unreasonable prejudice to the Company. Accordingly this information has not been disclosed in this report.
ENVIRONMENTAL REGULATIONSThe Company is subject to significant environmental regulation in respect to its exploration, mining and processing activities. The Company aims to ensure the appropriate standard of environmental care is achieved, and in doing so, that it is aware of and is in compliance with all environmental legislation. The Directors of the Company are not aware of any breach of environmental legislation for the year under review.
dIRECTORS’ REPORT
For
per
sona
l use
onl
y

2012 EVOLUTION MINING ANNUAL REPORT
PERFORMANCE OF EVOLUTION MINING LIMITEdThe table below sets out summary information about the Company’s earnings and movements in the Company’s share price for the last 5 years.
30 June 2012
$000
30 June 2011
$000
30 June 2010
$000
30 June 2009
$000
30 June 2008
$000
Revenue 469,484 121,870 22,274 264 595
Net profit/(loss) before tax 66,483 3,955 (4,520) (6,849) (2,292)
Net profit/(loss) after tax 37,313 (2,303) 5,547 6,814 (2,292)
Share price at start of year($) $1.36 $1.62 $1.10 $0.55 $0.77
Share price at end of year($) $1.46 $1.36 $1.62 $1.10 $0.55
Dividends - - - - -
Basic earnings per share (cents per share) 7.10 (1.37) 3.93 (13.97) (7.37)
dIRECTORS’ MEETINGSThe number of meetings of the Company’s board of directors and of each board committee held during the year ended 30 June 2012, and the number of meetings attended by each director were:
A: Number of meetings held while in office B: Meetings attended during the time the Director held office or was a member of the committee during the year. From the date of the merger with Conquest, the Audit and Risk Committees were separated.
dIRECTORS’ REPORT
Board Meetings Audit Committee Meetings
Risk Management Meetings
Nomination and Remuneration
Committee Meetings
A B A B A B A B
J Klein 7 7 - - - - - -
J Askew 7 6 - - 2 2 1 1
L Conway 7 7 1 1 - - 1 1
G Freestone 11 9 3 3 - - 1 1
P Marks 7 7 1 1 - - - -
J Rowe 11 11 2 2 2 2 2 2
P Smith 7 7 - - 2 2 - -
P Maloney 4 4 - - - - 1 1
B McFadzean 7 7 - - - - - -
M Pollock 4 4 2 2 - - 1 1
B Sullivan 4 3 2 2 - - 1 1
For
per
sona
l use
onl
y
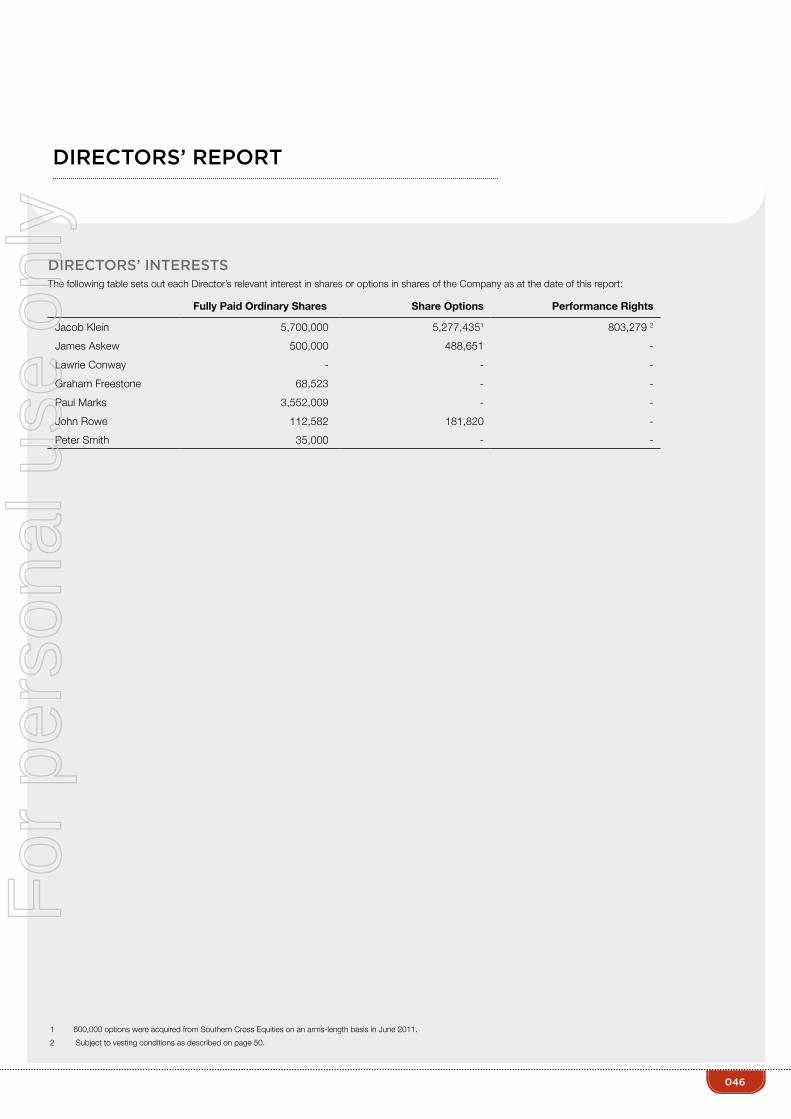
046
Fully Paid Ordinary Shares Share Options Performance Rights
Jacob Klein 5,700,000 5,277,4351 803,279 2
James Askew 500,000 488,651 -
Lawrie Conway - - -
Graham Freestone 68,523 - -
Paul Marks 3,552,009 - -
John Rowe 112,582 181,820 -
Peter Smith 35,000 - -
1 600,000 options were acquired from Southern Cross Equities on an arms-length basis in June 2011.
2 Subject to vesting conditions as described on page 50.
dIRECTORS’ INTERESTSThe following table sets out each Director’s relevant interest in shares or options in shares of the Company as at the date of this report:
dIRECTORS’ REPORT
For
per
sona
l use
onl
y

2012 EVOLUTION MINING ANNUAL REPORT
REMUNERATION REPORT (AUdITEd)INTROdUCTION The Remuneration Report forms part of the Directors’ Report for the year ended 30 June 2012. This report contains details of the remuneration paid to Directors and Key Management Personnel (“KMP”) as well as the remuneration strategy and policies that were applicable in the 2012 financial year. KMP’s are defined those senior executives having the authority and responsibility for planning, directing and controlling the activities of the Company and are members of the senior leadership team.
The remuneration philosophy of the Board is to ensure that the Company remunerates fairly and responsibly. It is designed to ensure that the level and composition of remuneration is competitive, reasonable and appropriate for the results delivered and to attract and retain appropriately experienced Directors and employees. The remuneration strategies and practices in place have been designed to support this philosophy.
The Board has established a Nomination and Remuneration Committee, consisting solely of Non-Executive Directors, with the delegated responsibility to report on, and make recommendations to the Board on the:
• appropriatenessoftheremunerationpoliciesandsystems,havingregardtowhethertheyare:
- relevant to the Company’s wider objectives and strategies;
- legal and defensible;
- in accordance with the human resource objectives of the Company;
• performanceoftheExecutiveChairman(onanannualbasis)andensurethereisaprocessfordeterminingkeyperformanceindicatorsforthe ensuing period;
• remunerationoftheExecutiveChairman,Non-ExecutiveDirectorsandKMP’s,inaccordancewithapprovedBoardpoliciesandprocesses.
The prescribed details for each person covered by this report are detailed below under the following headings:
• Industrycontext
• Useofremunerationconsultants
• Remunerationstrategy
• Remunerationpolicy
• RelationshipbetweentheremunerationpolicyandCompanyperformance
• Directorandkeymanagementpersonneldetails
• RemunerationofDirectorsandkeymanagementpersonnel
• Executiveserviceagreements
• Share-basedcompensationandperformancerights
INdUSTRY CONTEXT Evolution is a gold producer and operates in Queensland and Western Australia. In Queensland there are three business units; two underground operations and one open pit operation. In Western Australia there is one business unit, an open pit operation. Evolution also has one project in development in Queensland.
As at 30 June 2012, the Company workforce comprised of 601 employees and 503 contractors. Evolution competes nationally for labour in the wider resources industry as skills are generally transferable across commodities and states.
USE OF REMUNERATION CONSULTANTSMercer (Australia) Pty Limited (“Mercer”) were engaged by the Nomination and Remuneration Committee to provide remuneration advice regarding Non-Executive and Executive Directors, and KMP’s, covering fixed remuneration and short and long term incentives. Mercer has confirmed that the above recommendations have been made free from undue influence by members of the Group’s key management personnel.
Under the terms of the engagement, the advice was provided directly to Mr John Rowe, Chairman of the Nomination and Remuneration Committee. As a result the board is satisfied that the recommendations were made free from undue influence from any members of the key management personnel. The total amount paid to Mercer was $83,000 for these services.
dIRECTORS’ REPORT
For
per
sona
l use
onl
y

048
REMUNERATION STRATEGYThe development of the remuneration strategy for the 2012 financial year hinged on the successful formation of Evolution following the merger of Catalpa Resources Limited with Conquest Mining Limited and the concurrent acquisition of the two Newcrest assets. The remuneration strategy was reset and new short term and long term incentive plans established to align with objectives of the newly established entity.
The objectives of the remuneration strategy for the 2012 financial year were to ensure that:
• totalremunerationforDirectorsandKMP’sandeachleveloftheworkforcewasappropriateandcompetitive;
• totalremunerationcomprisedareasonablefixedcomponentandasignificant“atrisk”componentbasedonperformancehurdles;
• corporateshorttermincentiveswereappropriatewithhurdlesthatweremeasureable,transparentandachievable;
• incentiveplansweredesignedtomotivateandincentiviseforhighperformanceanddeliveryonorganisationalobjectives;
• thecorporatelongtermincentivesfocusedonshareholdervalue;and
• theprinciplesandintegrityoftheremunerationreviewprocessdeliveredfairandequitableoutcomes.
REMUNERATION POLICY The Evolution remuneration policy has been designed to align Executive Director and KMP objectives with shareholder and business objectives by providing a total fixed remuneration (“TFR”) component and offering specific “at risk” short and long-term incentives based on key performance areas affecting the Company’s financial performance. The Nomination and Remuneration committee was formed to review the specifics of Directors and KMP remuneration and oversee all Company compensation changes and principles. The Board of Evolution believes the remuneration policy to be strategic, appropriate and effective in its ability to attract and retain Executive Directors and KMP’s and to operate and manage the Company.
Evolution defines and applies its remuneration policy and elements by considering the overall business plan, key employee value drivers, individual employee performance and industry benchmark data.
All KMP’s receive a remuneration package in line with the overall Company policy and additionally takes into account factors such as length of service and experience. The Nomination and Remuneration Committee reviews executive packages annually by reference to the Company’s performance, individual KMP performance and comparable information from industry sectors and other listed companies in similar industries.
The remuneration elements offered by Evolution include total fixed remuneration (TFR), which consists of a base salary plus superannuation and a variable or “at risk” remuneration component provided through short and long term incentive plans. Every permanent employee has eligibility under the Company’s various short term incentive plans (“STIP’s”).
Directors and KMP’s receive a superannuation guarantee contribution (SGC) required by Law, which is currently 9% and capped in line with the SGC maximum quarterly payment, and do not receive any other retirement benefits. Some individuals, however, may choose to sacrifice part of their salary to increase payments towards superannuation.
The Board policy is to remunerate Non-Executive Directors at market rates for comparable companies for time, commitment and responsibilities. The Nomination and Remuneration Committee determines Non-Executive Directors fees and reviews this annually, based on market practice, their duties and areas of responsibility. Independent external advice is sought when required. The maximum aggregate amount of fees that can be paid to Non-Executive Directors is subject to approval by shareholders at the Annual General Meeting (currently $750,000 per annum). Fees for Non-Executive Directors are not linked to the performance of the Company and they do not participate in the Company’s STIP or Long Term Incentive Plan (“LTIP”).
dIRECTORS’ REPORT
For
per
sona
l use
onl
y

2012 EVOLUTION MINING ANNUAL REPORT
RELATIONShIP BETwEEN ThE REMUNERATION POLICY ANd COMPANY PERFORMANCEThe remuneration policy has been designed to align individual and team accountabilities with the Group’s business plan goals.
A cornerstone element of the remuneration policy is the introduction of various incentive plans for eligible employees at the Company, addressing both short and long term goals. The purpose of these incentives is to encourage the alignment of employee effort with shareholder interests.
Evolution’s STIPs includes the Corporate Plan, a Production Bonus, an Annual Performance Bonus and the Mt Carlton Construction Bonus. Employees have eligibility into one plan only and are measured consistently against outcomes at Threshold, Target and Maximum milestones.
The Corporate STIP applies to employees at the level of Manager and above across the Company. The STIP Award is a cash bonus, up to maximum percentage of TFR. It is assessed and paid annually conditional upon the achievement of key corporate objectives, which for FY12 were in areas of safety, production, merger activities and project development goals, as well as individual KPI’s. All KPI’s were established to ensure effort and performance was aligned to business goals.
A Corporate STIP bonus totalling $2.3 million was awarded to the eligible group at 30 June 2012 to be communicated and paid in September quarter of FY13.
The Production bonus applies to site personnel, who are not eligible for the Corporate STIP (Manager and above). The Production STIP is a cash award of up to 20 per cent on TFR which is paid monthly against the outcomes of each Operational Site KPI’s scorecard.
The Annual Performance Bonus applies to corporate employees and those employees who, by exception, are not included in a Corporate STIP or Production Bonus Plan. The Annual Bonus award is targeted at up to 20 per cent, depending on the employees position, as a cash bonus on TFR paid annually against the outcomes of functional (eg: exploration) and personal KPI’s.
The Mt Carlton Construction bonus applies to employees at Mt Carlton, who are not eligible in the Corporate STIP. The Construction award is a cash bonus of up to 20 per cent on TFR paid aligned to milestone events and outcomes during the construction and commissioning phase of Mt Carlton.
The Company believes its incentive policy is effective in increasing shareholder wealth and delivering appropriate and motivational reward to all employees.
Details of Corporate STIP’s and bonuses paid are shown in the Remuneration Table on page 54.
There are two long term incentive plans currently in existence at Evolution specifically, the Employees and Contractors Option Plan (“ECOP”) and the Employee Share Option and Performance Rights Plan (“ESOP”), also referred to as the Long Term Incentive Plan (“LTIP”).
Employees and Contractors Option Plan (“ECOP”)
The ECOP was established and approved at the Annual General Meeting on 27 November 2008. The plan permits the Company, at the discretion of the Directors, to grant options over unissued ordinary shares of the Company to eligible Directors, members of staff and contractors as specified in the plan rules.
Options under ECOP
Following the merger of Evolution (then named Catalpa Resources Limited) and Conquest Mining Limited (“Conquest”) by a scheme of arrangement implemented on 2 November 2011, 488,651 options were issued on 17 November 2011 to the former Conquest option holders as consideration for the cancellation of the outstanding options in Conquest Mining Limited, under this plan. During the year 227,282 options were exercised and there were 2,261,387 options outstanding at 30 June 2012 (2011: 2,000,018), all of which have been issued to Directors and KMP’S.
The movement in the options under this plan is summarised in the table below:
This plan is now closed and no further options will be issued under this plan.
30 June 2012
Number
30 June 2011
NumberOutstanding balance at the beginning of the year (1 July) 2,000,018 2,018,200
Issued during the period 488,651 -
Exercised during the period (227,282) -
Expired during the period - (18,182)
Outstanding balance at the end of the year 2,261,387 2,000,018
dIRECTORS’ REPORT
For
per
sona
l use
onl
y

050
ThE EMPLOYEE ShARE OPTION ANd PERFORMANCE RIGhTS PLAN (“ESOP”)The ESOP was established and approved at the Annual General Meeting on 23 November 2010, and amended on 19 October 2011. The plan permits the Company, at the discretion of the Directors, to grant both options and performance rights over unissued ordinary shares of the Company to eligible Directors and members of staff as specified in the plan rules.
Under the ESOP, the options and performance rights, issued for nil consideration, are granted in accordance with performance guidelines established by the Directors of the Company. In exercising their discretion under the rules, the Directors will take into account matters such as the position of the eligible person, the role they play in the Company, the nature or terms of their employment or contract and the contribution they make to the Company as a whole. The options and performance rights are issued for a specified period and each option or performance right is convertible into one ordinary share. The exercise price of the options, determined in accordance with the rules of the plan, is based on the market price of a share on invitation date, grant date, or another specified date after grant close. All options and performance rights expire on the earlier of their expiry date or termination of the employee’s employment subject to Director discretion. Options and performance rights do not vest until a specified period after granting and their exercise is conditional on the achievement of certain performance hurdles that are aligned with shareholder interests.
There are no voting or dividend rights attached to the options or performance rights. Voting rights will attach to the ordinary shares when the options have been exercised or the performance rights vested. Unvested options and performance rights cannot be transferred and will not be quoted on the ASX.
Options under ESOP
Following the merger of Evolution and Conquest, 8,586,087 options were issued on 17 November 2011 to the former Conquest option holders as consideration for the cancellation of the outstanding options in Conquest Mining Limited, under this plan. During the year 5,068,319 options were exercised and there were 9,215,087 options outstanding at 30 June 2012 (2011: 5,856,542), of which 6,941,436 were issued to Directors and KMP’s (2011: 679,000).
The movement in the options under this plan is summarised in the table below:
No further options will be issued under ESOP as Performance Rights are the selected long term incentive mechanism.
2012 Performance rights under ESOP
A long term incentive plan approved by shareholders on 23 November 2010 provided for the issuance of performance rights to Executive Directors and eligible employees. The introduced LTIP for employees at the level of Manager and above, effective from 1 July 2011, provides equity based “at risk” remuneration, up to maximum percentages, based on, and in addition to each eligible employee’s Total Fixed Remuneration (TFR). These incentives are aimed at retaining and incentivising KMP’s and senior managers on a basis that is aligned with shareholder interests, and are provided via performance rights.
During the year the Company issued 3,668,344 Performance Rights to employees. The movement in Performance Rights under this plan is summarised in the table below:
None of the performance rights granted during the period have vested as at the reporting date.
30 June 2012
Number
30 June 2011
NumberOutstanding balance at the beginning of the year (1 July) 5,856,542 5,402,605
Issued during the period 8,586,087 679,000
Exercised during the period (5,068,319) (225,063)
Expired during the period (159,223) -
Outstanding balance at the end of the year 9,215,087 5,856,542
30 June 2012
Number
30 June 2011
NumberOutstanding balance at the beginning of the year (1 July) 1,151,000 -
Performance rights granted during the period 3,668,344 1,151,000
Exercised during the period (1,026,000) -
Lapsed during the period (125,000) -
Forfeited during the year (87,586) -
Outstanding balance at the end of the year 3,580,758 1,151,000
dIRECTORS’ REPORT
For
per
sona
l use
onl
y

2012 EVOLUTION MINING ANNUAL REPORT
For the 2012 financial year the Performance Rights have been split into two tranches, hereinafter referred to as the “First Tranche” and “Second Tranche”, to reflect Evolution’s remuneration strategy following the merger between Catalpa Resources Limited and Conquest Mining Limited. Performance Rights issued during the year under the LTIP generally have a term of 3 years (other than a two year period for the First Tranche) and vest based on the achievement of specific targets with respect to:
• Evolution’srelativetotalshareholderreturn(TSR)measuredagainsttheTSRforapeerCompanyof20comparatorgoldminingcompanies(PeerGroup); (60% weighting) and
• Evolution’snetC1cashcostsperouncerankingamongstthePeerGroup(40%weighting).
The first tranche of performance rights will be tested on 30 June 2013 and the second tranche tested on 30 June 2014.
(i) TSR Performance
A total of 60% of the Performance Rights will be tested against Evolution’s TSR performance relative to the Peer Group (on the 30 June 2013) and the Second Tranche Performance Rights will be tested on the 30 June 2014, together the “Relevant Date”.
Evolution’s TSR will be based on the percentage by which its 30-day volume weighted average share price quoted on ASX (VWAP) at the close of trade on the Relevant Date (plus the value of any dividends paid during the performance period) has increased over the company’s 30-day VWAP at the close of trade on the Grant Date.
The TSR for each Peer Group will be based on the percentage by which the Peer Group’s 30-day VWAP at the close of trade on the Relevant Date (plus the value of any dividends paid during the performance period) has increased over that company’s 30-day VWAP at the close of trade on the Grant Date. The current Peer Group selected by the Board is:
The Board has the discretion to adjust the composition and number of the companies in the peer group to take into account events including, but not limited to, takeovers, mergers and demergers that might occur during the performance period.
The proportion of the TSR Performance Rights that will vest will be based on the Relevant Date TSR as compared to the 2013 or 2014 Peer Group TSRs. The proportion of the TSR Performance Rights that will vest will be determined as follows:
Alacer Gold Corp CGA Mining Ltd Medusa Mining Ltd Regis Resources NL
Alamos Gold Inc Dundee Precious Metals Inc New Gold Inc Resolute Mining Ltd
Allied Gold Ltd Golden Star Resources Ltd Northgate Minerals Corp 1 Semafo Inc
Aurico Gold Inc Intrepid Mines Ltd Oceana Gold Corp St Barbara Ltd
Centamin Egypt Inc Kingsgate Consolidated Ltd Perseus Mining Ltd Troy Resources NL
Level of performance achieved Evolution TSR performance as compared to the Peer Group TSR % of TSR Performance Rights vesting
Threshold Top 50th percentile 33%
Above the top 50th percentile and below the top 25th percentile
Straight-line pro-rata between 33% and 66%
Target Top 25th percentile 66%
Above the top 25th percentile and below the top 10th percentile
Straight-line pro-rata between 66% and 100%
Exceptional Top 10th percentile or above 100%
1 Northgate has been taken over and has been replaced by Silver Lake for the FY13 LTIP’s.
dIRECTORS’ REPORT
For
per
sona
l use
onl
y
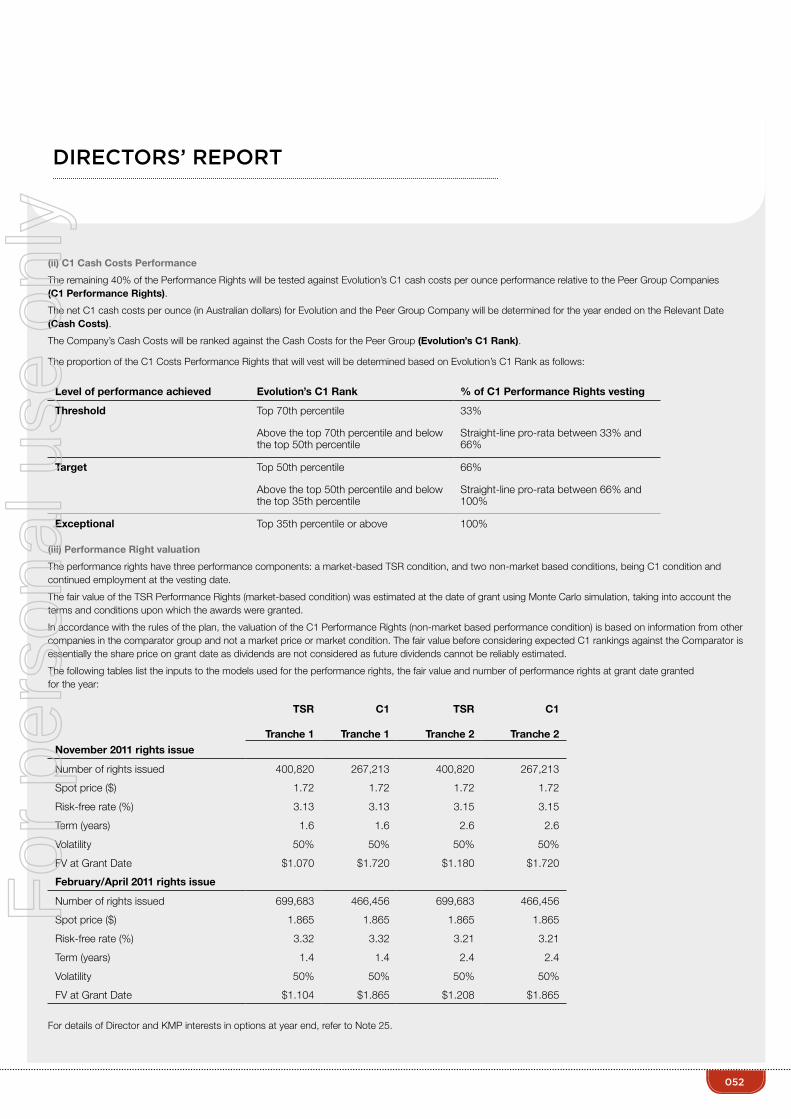
052
(ii) C1 Cash Costs Performance
The remaining 40% of the Performance Rights will be tested against Evolution’s C1 cash costs per ounce performance relative to the Peer Group Companies (C1 Performance Rights).
The net C1 cash costs per ounce (in Australian dollars) for Evolution and the Peer Group Company will be determined for the year ended on the Relevant Date (Cash Costs).
The Company’s Cash Costs will be ranked against the Cash Costs for the Peer Group (Evolution’s C1 Rank).
The proportion of the C1 Costs Performance Rights that will vest will be determined based on Evolution’s C1 Rank as follows:
(iii) Performance Right valuation
The performance rights have three performance components: a market-based TSR condition, and two non-market based conditions, being C1 condition and continued employment at the vesting date.
The fair value of the TSR Performance Rights (market-based condition) was estimated at the date of grant using Monte Carlo simulation, taking into account the terms and conditions upon which the awards were granted.
In accordance with the rules of the plan, the valuation of the C1 Performance Rights (non-market based performance condition) is based on information from other companies in the comparator group and not a market price or market condition. The fair value before considering expected C1 rankings against the Comparator is essentially the share price on grant date as dividends are not considered as future dividends cannot be reliably estimated.
The following tables list the inputs to the models used for the performance rights, the fair value and number of performance rights at grant date granted for the year:
For details of Director and KMP interests in options at year end, refer to Note 25.
Level of performance achieved Evolution’s C1 Rank % of C1 Performance Rights vesting
Threshold Top 70th percentile 33%
Above the top 70th percentile and below the top 50th percentile
Straight-line pro-rata between 33% and 66%
Target Top 50th percentile 66%
Above the top 50th percentile and below the top 35th percentile
Straight-line pro-rata between 66% and 100%
Exceptional Top 35th percentile or above 100%
TSR
Tranche 1
C1
Tranche 1
TSR
Tranche 2
C1
Tranche 2 November 2011 rights issue
Number of rights issued 400,820 267,213 400,820 267,213
Spot price ($) 1.72 1.72 1.72 1.72
Risk-free rate (%) 3.13 3.13 3.15 3.15
Term (years) 1.6 1.6 2.6 2.6
Volatility 50% 50% 50% 50%
FV at Grant Date $1.070 $1.720 $1.180 $1.720
February/April 2011 rights issue
Number of rights issued 699,683 466,456 699,683 466,456
Spot price ($) 1.865 1.865 1.865 1.865
Risk-free rate (%) 3.32 3.32 3.21 3.21
Term (years) 1.4 1.4 2.4 2.4
Volatility 50% 50% 50% 50%
FV at Grant Date $1.104 $1.865 $1.208 $1.865
dIRECTORS’ REPORT
For
per
sona
l use
onl
y

2012 EVOLUTION MINING ANNUAL REPORT
dIRECTOR ANd kEY MANAGEMENT PERSONNEL dETAILSExcept as noted, the named persons held their current positions for the whole of the financial year and up to the date of this report:
Jacob Klein Executive Chairman (appointed 19 October 2011)
James Askew Non-Executive Director (appointed 19 October 2011)
Lawrie Conway Non-Executive Director (appointed 19 October 2011)
Graham Freestone Lead Independent Director
Paul Marks Non-Executive Director (appointed 19 October 2011)
John Rowe Non-Executive Director
Peter Smith Non-Executive Director (appointed 19 October 2011)
Peter Maloney Non-Executive Chairman (resigned 18 October 2011)
Bruce McFadzean Managing Director (resigned 25 January 2012)
Murray Pollock Non-Executive Director (resigned 18 October 2011)
Barry Sullivan Non-Executive Director (resigned 18 October 2011)
The term “key management personnel” is used in this remuneration report to refer to the following Senior Executives. These are defined as having the authority and responsibility for planning, directing and controlling the activities of the Company and are members of the senior leadership team. Except as noted, the named persons held their current positions for the whole of the financial year and up to the date of this report:
Tim Churcher Vice President Finance & Chief Financial Officer (appointed 24 October 2011)
Aaron Colleran Vice President Business Development and Investor Relations (appointed 19 October 2011)
Evan Elstein Company Secretary and General Manager Information Technology (appointed 19 October 2011)
Mark Le Messurier Chief Operating Officer (appointed 19 October 2011)
Adrian Pelliccia General Manager Exploration (Australia)
Raelene Wyatt General Manager Human Resources
John Fraser General Manager – Edna May Gold Mine (Resigned 23 December 2011)
Paul Mason Joint Company Secretary (resigned as Company Secretary on 18 October 2011 and as Financial Controller on 27 January 2012)
Erik Palmbachs Chief Financial Officer and Joint Company Secretary (resigned as Company Secretary 18 October 2011 and as Chief Financial Officer on 29 February 2012)
Stuart Pether Vice President Project Development (resigned effective 30 June 2012)
dIRECTORS’ REPORT
For
per
sona
l use
onl
y

054
REMUNERATION OF dIRECTORS ANd kEY MANAGEMENT PERSONNELThe Directors and the Company executives received the following amounts as compensation for their services as Directors and executives of the Company during the period:
YEAR ENdEd 30 JUNE 2012
(i) Employment commenced on 19 October 2011(ii) Employment terminated on 18 October 2011 (iii) Employment terminated on 25 January 2012(iv) Employment commenced on 24 October 2011(v) Employment terminated on 23 December 2011 (vi) Employment terminated on 27 January 2012 (vii) Employment terminated on 29 February 2012
(viii) Employment terminated on 30 June 2012(ix) Non-monetary benefits relate to fully maintained vehicles and car parking provided by the Company(x) Amortised value of share based rights comprises the fair value of options and performance rights expensed during the year
dIRECTORS’ REPORT
TOTAL FIXED REMUNERATION
POST EMPLOYMENT
BENEFITSSTI LTI
Name Base Salary and Fees
Non-Monetary
Benefits (ix)Superannuation Bonus Amortised
value (x) Termination Total
Directors
Jacob Klein (i) $484,931 - $11,079 $390,600 $223,093 - $1,109,703
James Askew (i) $68,333 - - - - - $68,333
Lawrie Conway (i) $70,274 - - - - - $70,274
Graham Freestone $94,037 - $8,463 - - - $102,500
Paul Marks (i) $61,033 - $4,773 - - - $65,806
John Rowe $99,635 - $3,881 - - - $103,516
Peter Smith (i) $65,003 - - - - - $65,003
Peter Maloney (ii) $37,205 - $3,348 - - - $40,553
Bruce McFadzean (iii) $435,891 $37,725 $17,980 $70,000 $578,955 $625,019 $1,765,570
Murray Pollock (ii) $23,333 - $2,100 - - - $25,433
Barry Sullivan (ii) $21,104 - $1,899 - - - $23,003
Key Management Personnel
Tim Churcher (iv) $265,017 - $10,517 $128,767 $32,782 - $437,083
Aaron Colleran (i) $269,418 - $11,479 $188,000 $39,403 - $508,300
Evan Elstein (i) $178,227 - $11,079 $122,600 $17,731 - $329,637
Mark Le Messurier (i) $271,980 $6,377 $11,079 $189,880 $39,797 - $519,113
Adrian Pelliccia $240,395 $9,002 $18,997 $166,300 $122,549 - $557,243
Raelene Wyatt $226,868 - $14,799 $100,000 $51,876 - $393,543
John Fraser (v) $181,987 - $19,691 - - - $201,678
Paul Mason (vi) $109,610 - $9,567 - $43,338 $45,005 $207,520
Erik Palmbachs (vii) $232,809 $25,602 $48,766 $38,000 $191,040 $298,000 $834,217
Stuart Pether (viii) $337,039 $23,493 $18,850 $146,000 $256,749 $391,527 $1,173,658
Total $3,774,129 $102,199 $228,347 $1,540,147 $1,597,313 $1,359,551 $8,601,686For
per
sona
l use
onl
y
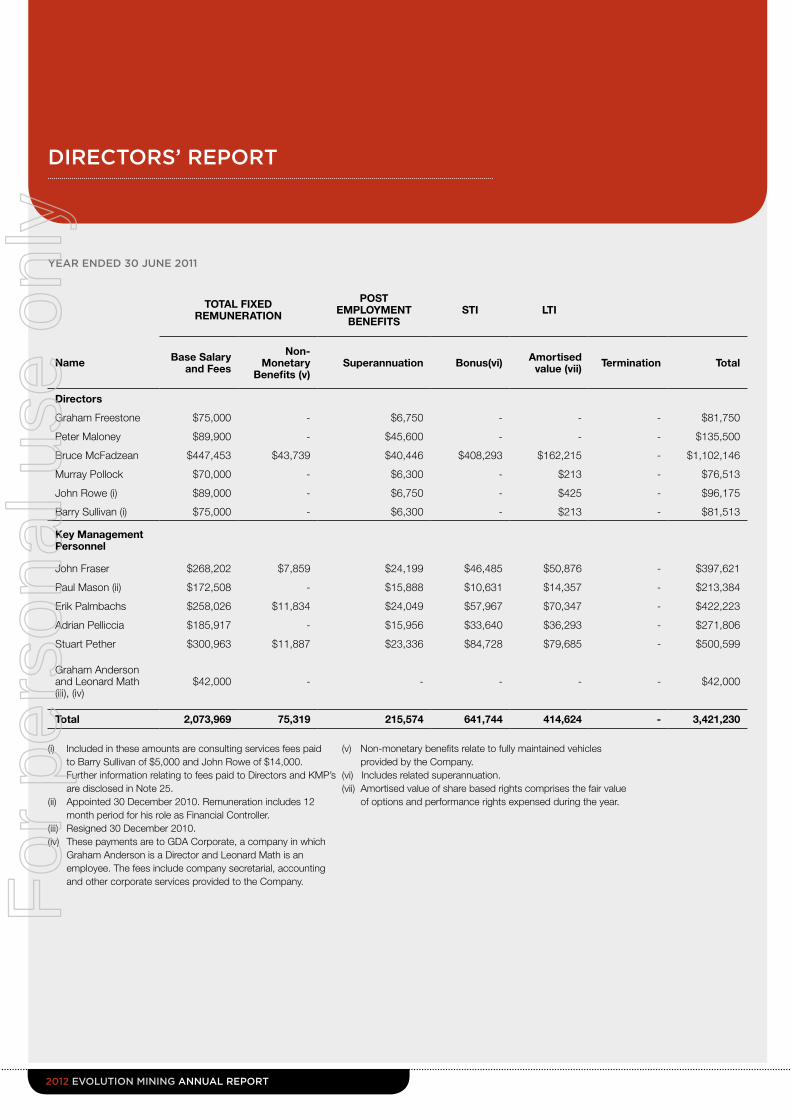
2012 EVOLUTION MINING ANNUAL REPORT
YEAR ENdEd 30 JUNE 2011
(i) Included in these amounts are consulting services fees paid to Barry Sullivan of $5,000 and John Rowe of $14,000. Further information relating to fees paid to Directors and KMP’s are disclosed in Note 25. (ii) Appointed 30 December 2010. Remuneration includes 12 month period for his role as Financial Controller. (iii) Resigned 30 December 2010.(iv) These payments are to GDA Corporate, a company in which Graham Anderson is a Director and Leonard Math is an employee. The fees include company secretarial, accounting and other corporate services provided to the Company.
(v) Non-monetary benefits relate to fully maintained vehicles provided by the Company.(vi) Includes related superannuation.(vii) Amortised value of share based rights comprises the fair value of options and performance rights expensed during the year.
dIRECTORS’ REPORT
TOTAL FIXED REMUNERATION
POST EMPLOYMENT
BENEFITSSTI LTI
Name Base Salary and Fees
Non-Monetary
Benefits (v)Superannuation Bonus(vi) Amortised
value (vii) Termination Total
Directors
Graham Freestone $75,000 - $6,750 - - - $81,750
Peter Maloney $89,900 - $45,600 - - - $135,500
Bruce McFadzean $447,453 $43,739 $40,446 $408,293 $162,215 - $1,102,146
Murray Pollock $70,000 - $6,300 - $213 - $76,513
John Rowe (i) $89,000 - $6,750 - $425 - $96,175
Barry Sullivan (i) $75,000 - $6,300 - $213 - $81,513
Key Management Personnel
John Fraser $268,202 $7,859 $24,199 $46,485 $50,876 - $397,621
Paul Mason (ii) $172,508 - $15,888 $10,631 $14,357 - $213,384
Erik Palmbachs $258,026 $11,834 $24,049 $57,967 $70,347 - $422,223
Adrian Pelliccia $185,917 - $15,956 $33,640 $36,293 - $271,806
Stuart Pether $300,963 $11,887 $23,336 $84,728 $79,685 - $500,599
Graham Anderson and Leonard Math (iii), (iv)
$42,000 - - - - - $42,000
Total 2,073,969 75,319 215,574 641,744 414,624 - 3,421,230
For
per
sona
l use
onl
y

056
The relative proportions of remuneration that are linked to performance and those that are fixed are as follows:
(i) Relates to options issued in December 2008(ii) Comprises share options and performance rights expensed as share based payments during the year.
dIRECTORS’ REPORT
Fixed Remuneration At Risk – STI At Risk – LTI (ii)
Name 2012 2011 2012 2011 2012 2011
Directors
Jacob Klein 44.7% - 35.2% - 20.1% -
James Askew 100.0% - - - - -
Lawrie Conway 100.0% - - - - -
Graham Freestone 100.0% 100.0% - - - -
Paul Marks 100.0% - - - - -
John Rowe (i) 100.0% 99.6% - - - 0.4%
Peter Smith 100.0% - - - - -
Peter Maloney 100.0% 100.0% - - - -
Bruce McFadzean 63.2% 48.2% 4.0% 37.0% 32.8% 14.7%
Murray Pollock (i) 100.0% 99.7% - - - 0.3%
Barry Sullivan (i) 100.0% 99.7% - - - 0.3%
Key Management Personnel
Tim Churcher 63.0% - 29.5% - 7.5% -
Aaron Colleran 55.3% - 37.0% - 7.7% -
Evan Elstein 57.4% - 37.2% - 5.4% -
Mark Le Messurier 55.8% - 36.6% - 7.6% -
Adrian Pelliccia 48.2% 74.3% 29.8% 12.4% 22.0% 13.4%
Raelene Wyatt 61.4% - 25.4% - 13.2% -
John Fraser 100.0% 75.5% - 11.7% - 12.8%
Paul Mason 79.1% 88.3% - 5.0% 20.9% 6.7%
Erik Palmbachs 72.5% 69.6% 4.6% 13.7% 22.9% 16.7%
Stuart Pether 65.7% 67.2% 12.4% 16.9% 21.9% 15.9%
For
per
sona
l use
onl
y

2012 EVOLUTION MINING ANNUAL REPORT
EXECUTIVE SERVICE AGREEMENTSRemuneration and other key terms of employment for the Executive Directors and Key Management Personnel are formalized in the Executive Services Agreements table below:
(i) Employment commenced on 19 October 2011(ii) Employment commenced on 24 October 2011(iii) Employment terminated on 25 January 2012(iv) Employment terminated on 23 December 2011(v) Employment terminated on 27 January 2012(vi) Employment terminated on 29 February 2012(vii) Employment terminated on 30 June 2012
dIRECTORS’ REPORT
Name Term of Agreement
Total Fixed Remuneration ($)
Notice Period by Executive
Notice Period by Evolution
Termination Payment
Existing Executive Directors and Key Management Personnel
Jacob Klein Executive Chairman (i) Open
800,000 200,000 fixed Director’s fees
6 months 6 months 12 month total fixed remuneration
Tim Churcher Chief Financial Officer (ii) Open 415,000 3 months 6 months 6 month total fixed
remuneration
Aaron Colleran Vice President Business Development and Investor Relations (i)
Open 415,000 3 months 6 months 6 month total fixed remuneration
Evan Elstein Company Secretary and General Manager - IT and Business Systems (i)
Open 290,000 3 months 6 months 6 month total fixed remuneration
Mark Le Messurier Chief Operating Officer (i) Open 435,000 3 months 6 months 6 month total fixed
remuneration
Adrian Pelliccia General Manager – Exploration (Australia) Open 290,000 3 months 6 months 6 month total fixed
remuneration
Raelene Wyatt General Manager - Human Resources Open 270,000 3 months 6 months 6 month total fixed
remuneration
Terminated Executive Directors and Key Management Personnel
Bruce McFadzean Managing Director (iii) - 650,000 6 months 6 months 12 month total fixed
remuneration
John Fraser (iv) General Manager – Edna May Gold Mine - 310,000 1 month 1 month 1 month total fixed
remuneration
Paul Mason (v) Joint Company Secretary and Financial Controller (Catalpa Resources Limited)
- 196,200 1 month 1 month 3 month total fixed remuneration
Erik Palmbachs (vi) Joint Company Secretary and Chief Financial Officer (Catalpa Resources Limited)
- 310,000 1 month 1 month 12 month total fixed remuneration
Stuart Pether Vice President Project Development (vii) - 400,000 3 months 6 months 12 month total fixed
remunerationFor
per
sona
l use
onl
y

058
Fixed salary, inclusive of the required superannuation contribution amount, is reviewed annually by the Board following the end of the financial year. The amounts set out above are the Executives’ total fixed remuneration as at 30 June 2012.
ShARE-BASEd COMPENSATION & PERFORMANCE RIGhTSThe following share options granted to Directors and Key Management Personnel as remuneration were outstanding at the beginning of the period:
(i) Employment terminated on 25 January 2012(ii) Employment terminated on 29 February 2012(iii) Employment terminated on 30 June 2012
All share options listed above were outstanding at the end of the year. No grants of share-based payment compensation to Directors and Key Management Personnel lapsed during the financial year.
dIRECTORS’ REPORT
Awarded No Grant date Expiry date
Fair value per award $
Fair value of options
at grant date
Exercise price Vested %
DIRECTORS
B McFadzean (i) 180,000 1-Jul-10 30-Jun-15 0.98 176,400 1.69 100%
180,000 1-Jul-10 30-Jun-15 0.98 176,400 1.69 100%
227,274 23-Dec-08 23-Dec-13 0.2 45,455 1.049 100%
227,272 23-Dec-08 23-Dec-13 0.1 22,727 1.489 100%
227,273 23-Dec-08 23-Dec-13 0.18 40,909 1.269 100%
227,273 23-Dec-08 23-Dec-13 0.14 31,818 0.829 100%
1,269,092 493,709
J Rowe 45,455 23-Dec-08 23-Dec-13 0.2 9,091 1.049 100%
45,455 23-Dec-08 23-Dec-13 0.18 8,182 1.269 100%
45,454 23-Dec-08 23-Dec-13 0.1 4,545 1.489 100%
45,456 23-Dec-08 23-Dec-13 0.14 6,364 0.829 100%
181,820 28,182
KMP’s
E Palmbachs (ii) 55,000 1-Jul-10 30-Jun-15 0.980 53,900 1.69 100%
55,000 1-Jul-10 30-Jun-15 0.980 53,900 1.69 100%
56,819 23-Dec-08 23-Dec-13 0.150 8,523 0.609 100%
56,819 23-Dec-08 23-Dec-13 0.140 10,227 0.829 100%
56,819 23-Dec-08 23-Dec-13 0.200 11,364 1.049 100%
56,819 23-Dec-08 23-Dec-13 0.180 7,955 1.269 100%
337,276 145,869
A Pelliccia 34,000 1-Jul-10 30-Jun-15 0.980 33,320 1.69 100%
34,000 33,320
S Pether (iii) 62,500 1-Jul-10 30-Jun-15 0.980 61,250 1.69 100%
62,500 1-Jul-10 30-Jun-15 0.980 61,250 1.69 100%
113,637 11-Mar-09 11-Mar-14 0.150 17,046 0.609 100%
113,637 11-Mar-09 11-Mar-14 0.140 15,909 0.829 100%
113,637 11-Mar-09 11-Mar-14 0.200 22,727 1.049 100%
113,637 11-Mar-09 11-Mar-14 0.180 20,455 1.269 100%
579,548 198,637
For
per
sona
l use
onl
y

2012 EVOLUTION MINING ANNUAL REPORT
The options were issued in accordance with the provisions of the Transaction Implementation Deed to the former Conquest Mining Limited Directors as part of the merger with Catalpa Resources Limited, prior to the formation of Evolution Mining.
No other share options were granted to Directors and Key Management Personnel during the year.
The following performance rights were granted to Executive Directors and Key Management Personnel during the year.
(i) Employment commenced on 19 October 2011
(ii) Employment terminated on 25 January 2012
(iii) Employment commenced on 24 October 2011
Details of the performance rights plan and vesting conditions are provided on page 50 of this report.
During the year the following Directors or Key Management Personnel exercised options that were granted to them in previous years as part of their compensation. Each option converted into one ordinary share of Evolution Mining Limited.
No grants of share-based payment compensation to Directors and Key Management Personnel lapsed in the current financial year.
The value of share-based payments granted during the period is recognised in compensation over the vesting period of the grant, in accordance with Australian Accounting Standards.
dIRECTORS’ REPORT
Name Grant Date Max No. of Performance Rights Granted
Value of Performance Rights at Grant Date
Directors
Jacob Klein (i) 28/11/2011 803,279 $1,094,869
Bruce McFadzean (ii) 28/11/2011 532,787 $726,189
Key Management Personnel
Tim Churcher (iii) 17/02/2012 163,665 $235,612
Aaron Colleran (i) 17/02/2012 196,721 $283,200
Evan Elstein (i) 17/02/2012 88,525 $127,440
Mark Le Messurier (i) 17/02/2012 198,689 $286,032
Adrian Pelliccia 17/02/2012 88,525 $127,440
Raelene Wyatt 17/02/2012 81,967 $118,000
No. of options exercised
No. of ordinary shares issued on exercise of
options during the yearAmount paid Amount unpaid
Value of options exercised at the exercise date(ii)
Murray Pollock (i) 90,912 90,912 $108,822 - $52,092
Barry Sullivan (i) 45,458 45,458 $64,414 - $13,319
For
per
sona
l use
onl
y

060
ShARES UNdER OPTIONAt the date of this report, the Company has 13,666,474 unissued shares under option with exercise prices ranging between $0.609 and $3.062 and with expiry dates between 19 October 2012 and 25 November 2016.
The holders of these options, which are unlisted, do not have the right, by virtue of the option, to participate in any share issue of the Company.
Details of shares issued during and up to the date of this report as a result of exercise of unlisted and listed options issued by the Company are:
(i) The new issue of options over ordinary shares in Evolution Mining on 17/11/2011 was issued as a replacement for the Conquest Mining Limited options following the merger between Catalpa Resources Limited and Conquest Mining Limited.
Date Details
Opening Balance as
at 1 July 2011
No. of Options
Converted into
Ordinary Shares
Amount Paid for
the Shares
Amount Unpaid for the Shares
Options Expired
Closing Balance
Listed Options 5,177,542
04/08/2011 Conversion 118,977 $1.10 - 5,036,565
06/09/2011 Conversion 84,250 $1.10 - 4,952,315
11/10/2011 Conversion 643,870 $1.10 - 4,308,445
27/10/2011 Conversion 1,569,409 $1.10 - 2,739,036
31/10/2011 Conversion 2,601,813 $1.10 - 159,223
04/11/2011 Cancellation 159,223 -
30/06/2012 Total 5,018,319 159,223 Nil
Unlisted Options 8,739,624
21/10/2011 Conversion 45,455 0.867 - 8,694,169
21/10/2011 Conversion 45,457 1.087 - 8,648,712
21/10/2011 Conversion 45,456 1.307 - 8,603,256
21/10/2011 Conversion 45,456 1.527 - 8,557,800
17/11/2011 New issue (i) 11,324,738 19,882,538
03/11/2011 Conversion 22,730 1.527 - 19,859,808
03/11/2011 Conversion 22,728 1.307 - 19,837,080
21/02/2012 Conversion 50,000 1.69 - 19,787,080
21/02/2012 Conversion 6,060,606 0.825 - 13,726,474
05/8/2012 Expired 60,000 13,666,474
30/06/2012 Total 6,337,888 60,000 13,666,474
dIRECTORS’ REPORT
Name Grant Date Max No. of Performance Rights Granted
Value of Performance Rights at Grant Date
Directors
Jacob Klein (i) 28/11/2011 803,279 $1,094,869
Bruce McFadzean (ii) 28/11/2011 532,787 $726,189
Key Management Personnel
Tim Churcher (iii) 17/02/2012 163,665 $235,612
Aaron Colleran (i) 17/02/2012 196,721 $283,200
Evan Elstein (i) 17/02/2012 88,525 $127,440
Mark Le Messurier (i) 17/02/2012 198,689 $286,032
Adrian Pelliccia 17/02/2012 88,525 $127,440
Raelene Wyatt 17/02/2012 81,967 $118,000
No. of options exercised
No. of ordinary shares issued on exercise of
options during the yearAmount paid Amount unpaid
Value of options exercised at the exercise date(ii)
Murray Pollock (i) 90,912 90,912 $108,822 - $52,092
Barry Sullivan (i) 45,458 45,458 $64,414 - $13,319
For
per
sona
l use
onl
y

2012 EVOLUTION MINING ANNUAL REPORT
dIRECTORS’ REPORT
IMdEMNIFICATION OF OFFICERS ANd AUdITORSDuring the financial year the Company paid a premium in respect of a contract insuring the Directors of the Company, the company secretaries and all executive officers of the Company and of any related body corporate against a liability incurred as such a Director, secretary or executive officer to the extent permitted by the Corporations Act 2001. The contract of insurance prohibits disclosure of the nature of the liability and the amount of the premium.
The Company has entered into a Deed of Indemnity, Insurance and Access with each Director. In summary the Deed provides for:
• AccesstocorporaterecordsforeachDirectorforaperiodafterceasingtoholdofficeintheCompany;
• TheprovisionofDirectorsandOfficersLiabilityInsurance;and
• IndemnityforlegalcostsincurredbyDirectorsincarryingoutthebusinessaffairsoftheCompany.
Except for the above the Company has not otherwise, during or since the financial year, except to the amount permitted by law, indemnified or agreed to indemnify an officer or auditor of the Company or of any related body corporate against a liability incurred as such an officer or auditor.
NON-AUdIT SERVICESDetails of amounts paid or payable to the auditor for non-audit services provided during the period by the auditor are detailed in Note 26. The Directors are satisfied that the provision of non-audit services during the period by the auditor is compatible with the general standard of independence for auditors imposed by the Corporations Act 2001.
The Directors are of the opinion that the services disclosed in Note 26 to the financial statements do not compromise the external auditor’s independence, based on the Auditor’s representations and appraisal and advice received from the Audit Committee, for the following reasons:
• Allnon-auditserviceshavebeenreviewedtoensuretheydonotimpacttheintegrityandobjectivityoftheauditor;and
• NoneoftheservicesunderminethegeneralprinciplesrelatingtoauditorindependenceassetoutinCodeofConductAPES110CodeofEthicsfor Professional Accountants issued by the Accounting Professional and Ethical Standards Board, including reviewing or auditing the auditor’s own work, acting in a management or decision-making capacity for the Company, acting as advocate for the Company or jointly sharing economic risks and rewards.
For
per
sona
l use
onl
y

062
AUdITOR’S INdEPENdENCE dECLARATIONThe Auditor’s Independence Declaration is included on page 63 of the financial report.
ROUNdING OFF AMOUNTSThe Company is a company of the kind referred to in ASIC Class Order 98/0100, dated 10 July 1998, and in accordance with that Class Order amounts in the directors’ report and the financial report are rounded to the nearest thousand dollars unless otherwise indicated.
Signed in accordance with a resolution of the directors made pursuant to s306(3) of the Corporations Act 2001.
On behalf of the Directors
dIRECTORS’ REPORT
Jacob Klein
Executive Chairman
Graham Freestone
Lead Independent Director and Chair of the Audit Committee
Sydney
30 August 2012
For
per
sona
l use
onl
y

2012 EVOLUTION MINING ANNUAL REPORT
AUdITORS’ INdEPENdENCE dECLARATION
For
per
sona
l use
onl
y

064
CONSOLIdATEd STATEMENT OF COMPREhENSIVE INCOME
Consolidated
Year ended
30 June 2012 30 June 2011
Notes $’000 $’000
Sales revenue 469,484 121,870
Cost of sales 5 (337,697) (101,757)
Gross profit 131,787 20,113
Interest income 5,633 1,626
Fair value re-measurement of previously held interest in the Cracow gold mine 22 2,757 -
Exploration and evaluation costs expensed as incurred (5,482) (2,631)
Share based payments expense 23 (2,299) (560)
Corporate administration costs 5 (28,762) (8,366)
Costs related to business combinations 22 (28,518) (974)
Other income 735 -
Finance costs 5 (9,368) (5,253)
Profit before income tax expense 66,483 3,955
Income tax expense 6 (29,170) (6,258)
Profit/(Loss) for the year attributable to owners of the parent 37,313 (2,303)
Other comprehensive income/(loss), net of income tax
Change in fair value of available for sale financial assets (net of tax) (5,770) 157
Total comprehensive income/(loss) for the year attributable to owners of the parent
31,543 (2,146)
Earnings per share
Basic profit/(loss) cents per share 24 7.10 (1.37)
Diluted profit/(loss) cents per share 24 6.94 (1.37)
The above Consolidated Statement of Comprehensive Income should be read in conjunction with the accompanying notes.For
per
sona
l use
onl
y

2012 EVOLUTION MINING ANNUAL REPORT
Consolidated
30 June 2012 30 June 2011
Notes $’000 $’000
Current assets
Cash and cash equivalents 21 141,784 30,051
Trade and other receivables 7 27,939 2,719
Inventories 8 35,144 18,099
Other current assets 9 14,306 1,255
Total current assets 219,173 52,124
Non-current assets
Other financial assets 10 3,714 784
Other non-current assets 11 122 864
Property, plant and equipment 12 265,079 103,367
Mine development and exploration 13 758,687 60,526
Inventories 8 4,308 -
Deferred tax asset 6 - 7,831
Goodwill 14 18,365 -
Total non-current assets 1,050,276 173,372
Total assets 1,269,449 225,496
Current liabilities
Trade and other payables 15 110,440 19,496
Interest bearing liabilities 17 18,392 15,133
Provisions 16 8,550 1,716
Total current liabilities 137,382 36,345
Non-current liabilities
Interest bearing liabilities 17 17,454 29,620
Deferred Tax Liability 6 10,711 -
Provisions 16 47,483 4,840
Total non-current liabilities 75,648 34,460
Total liabilities 213,030 70,805
Net assets 1,056,418 154,691
Equity
Issued capital 18 1,045,751 185,465
Reserves 19 9,429 5,301
Accumulated earnings/(losses) 20 1,238 (36,075)
Total equity 1,056,418 154,691
The above Consolidated Statement of Financial Position should be read in conjunction with the accompanying notes
CONSOLIdATEd STATEMENT OF FINANCIAL POSITION
For
per
sona
l use
onl
y

066
Consolidated Share-based Fair value
Issued payments Revaluation Accumulated Total
capital reserve Reserve Losses equity $’000 $’000 $’000 $’000 $’000
Balance at 1 July 2010 162,613 4,584 - (28,469) 138,728
Correction of error * (5,303) (5,303)
Restated total equity 162,613 4,584 - (33,772) 133,425
Loss for the year - - - (2,303) (2,303)
Other comprehensive income for the year :Fair value gain on available for sale financial assets, net of tax - - 157 - 157
Total comprehensive loss for the year - - 157 (2,303) (2,146)
Issue of share capital** 22,852 - - - 22,852
Recognition of share-based payments - 560 - - 560
Balance at 30 June 2011 185,465 5,144 157 (36,075) 154,691
* The opening balance as at 1 July 2010 has been restated for an error in the opening tax balances relating to property, plant and equipment and other assets.
** Issue proceeds net of transaction costs
Consolidated Share-based Fair value Accumulated
Issued payments Revaluation Earnings Total
capital reserve Reserve /(Losses) Equity
$’000 $’000 $’000 $’000 $’000
Balance at 1 July 2011 185,465 5,144 157 (36,075) 154,691
Profit for the year - - - 37,313 37,313
Other comprehensive income for the year:
Fair value loss on available for sale financial assets, net of tax - - (5,770) - (5,770)
Total comprehensive income for the year - - (5,770) 37,313 31,543
Issue of share capital (Note 18) 865,377 - - - 865,377
Transaction costs on share issues (5,091) - - - (5,091)
Cost of replacement options - 7,525 - - 7,525
Other - 74 - - 74
Recognition of share-based payments - 2,299 - - 2,299
Balance at 30 June 2012 1,045,751 15,042 (5,613) 1,238 1,056,418
The above Consolidated Statement of Changes in Equity should be read in conjunction with the accompanying notes.
CONSOLIdATEd STATEMENT OF ChANGES IN EqUITY
For
per
sona
l use
onl
y

2012 EVOLUTION MINING ANNUAL REPORT
Consolidated
Year ended
30 June 2012 30 June 2011
Notes $’000 $’000
Cash flows from operating activities
Receipts from sales of gold 448,499 121,870
Payments to suppliers and employees (inclusive of goods and services tax) (275,499) (96,675)
Interest received 5,559 1,626
Interest paid (6,275) (4,362)
Net cash provided by operating activities 21 172,284 22,459
Cash flows from investing activities
Purchase of property, plant and equipment (55,783) (22,990)
Payment for mine development and exploration (161,019) (28,359)
Cash acquired on acquisition of Conquest Mining Limited 22 12,748 -
Maturity of/(investments in) term deposits 895 (865)
Proceeds on the disposal of investments 2 -
Gold sale receipts capitalised - 21,481
Interest paid and capitalised - (1,921)
Net cash used in investing activities (203,157) (32,654)
Cash flows from financing activities
Proceeds from issue of equity securities 163,346 22,852
Transaction costs of issuing shares (5,091) -
Repayment of interest bearing liabilities (15,649) (17,719)
Net cash provided by financing activities 142,606 5,133
Net increase/(decrease) in cash and cash equivalents 111,733 (5,062)
Cash and cash equivalents at the beginning of the year 30,051 35,113
Cash and cash equivalents at the end of the year 21 141,784 30,051
The above Consolidated Statement of Cash Flows should be read in conjunction with the accompanying notes.
CONSOLIdATEd STATEMENT OF CASh FLOwS
For
per
sona
l use
onl
y

068
1. SUMMARY OF SIGNIFICANT ACCOUNTING POLICIESThe principal accounting policies adopted in the preparation of these consolidated financial statements are set out below. These policies have been consistently applied to all the years presented, unless otherwise stated. The financial statements are for the consolidated entity consisting of Evolution Mining Limited and its subsidiaries (“Evolution” or “Group”).
(a) Basis of preparationThese general purpose financial statements have been prepared in accordance with Australian Accounting Standards and Interpretations issued by the Australian Accounting Standards Board and the Corporations Act 2001. Evolution is a for-profit entity for the purpose of preparing the financial statements.
The consolidated financial statements of the Group also comply with International Financial Reporting Standards (IFRS) as issued by the International Accounting Standards Board (IASB). These financial statements have been prepared on the basis of historical cost, except for the revaluation of certain available for sale financial assets. Cost is based on the fair values of the consideration given in exchange for assets.
The preparation of financial statements requires the use of certain critical accounting estimates. It also requires management to exercise its judgement in the process of applying the Group’s accounting policies. The areas involving a higher degree of judgement or complexity, or areas where assumptions and estimates are significant to the financial statements are disclosed in Note 2.
The Group did not adopt any new and/or revised Accounting Standards, Amendments and Interpretations from 1 July 2011 which had an effect on the financial position or performance of the Group. The Group has also not elected to apply any pronouncements before their operative date in the annual reporting period beginning 1 July 2011.
The June 2012 year results and balances reflect twelve months of Catalpa Resources (100% Edna May and 30% of Cracow operations), the consolidation of Conquest Mining Limited from 17 October 2011 and the consolidation of Mt Rawdon and a 70% interest in Cracow from 2 November 2011. Comparative data is based on the Group’s results before the business combinations outlined in Note 22.
(b) Principles of consolidation(i) Business Combinations
Business combinations are accounted for by applying the acquisition method as at the acquisition date, which is the date on which control is transferred to the Group. Control is the power to govern the financial and operating policies of an entity so as to obtain benefits from its activities.
Consideration is measured at the fair value of the assets transferred, liabilities incurred and equity interests issued by the Group on acquisition date. Consideration also includes the acquisition date fair values of any contingent consideration arrangements, any pre-existing equity interests in the acquiree and share-based payment awards of the acquiree that are required to be replaced in a business combination. Where equity instruments are issued as part of the consideration, the value of the equity instruments is their published market price at the acquisition date unless, in rare circumstances it can be demonstrated that the published price at acquisition date is not fair value and that other evidence and valuation methods provide a more reliable measure of fair value.
Identifiable assets acquired and liabilities and contingent liabilities assumed in business combinations are, with limited exceptions, initially measured at their fair values at acquisition date. Goodwill represents the excess of the consideration transferred and the amount of the non-controlling interest in the acquiree over fair value of the identifiable net assets acquired. If the consideration and non-controlling interest of the acquiree is less than the fair value of the net identifiable assets acquired, the difference is recognised in profit or loss as a bargain purchase price, but only after a reassessment of the identification and measurement of the net assets acquired.
Acquisition related costs are expensed when incurred. Transaction costs arising on the issue of equity instruments are recognised directly in equity.
Where settlement of any part of the cash consideration is deferred, the amounts payable in future are discounted to present value at the date of exchange using the entity’s incremental borrowing rate as the discount rate.
If the Group holds a non-controlling equity investment in an acquiree immediately before obtaining control, the Group re-measures that previously held equity investment at its acquisition date fair value and recognises any resulting gain or loss in profit or loss.
Acquisitions of non-controlling interests are accounted for as transactions with equity holders in their capacity as equity holders and no goodwill is recognised as a result of these transactions.
NOTES TO ThE FINANCIAL STATEMENTS
For
per
sona
l use
onl
y

2012 EVOLUTION MINING ANNUAL REPORT
(ii) Subsidiaries
Subsidiaries are entities controlled by the Group. The financial statements of subsidiaries are included in the consolidated financial statements from the date that control commences until that control ceases. The accounting policies of subsidiaries have been changed when necessary to align them with the policies adopted by the Group.
(iii) Joint venture arrangements
Until the acquisition on 2 November 2011, the Group had an interest in a joint venture that is a jointly controlled operation being a 30% interest in Cracow. A joint venture is a contractual arrangement whereby two or more parties undertake an economic activity that is subject to joint control. A jointly controlled operation involves use of assets and other resources of the venturers rather than establishment of a separate entity. The Group recognises its interest in the jointly controlled operation by recognising its interest in the assets and the liabilities of the joint venture. The Group also recognises the expenses that it incurs and its share of the income that it earns from the sale of goods or services by the jointly controlled operation.
(iv) Transactions eliminated on consolidation
Intra-group balances and transactions, and any unrealised income and expenses arising from intra-group transactions, are eliminated in preparing the consolidated financial statements. Unrealised gains arising from transactions with equity accounted investees are eliminated against the investment to the extent of the Group’s interest in the investee. Unrealised losses are eliminated in the same way as unrealised gains, but only to the extent that there is no evidence of impairment.
(v) Change in ownership interests
The Group treats transactions with non-controlling interests that do not result in a loss of control as transactions with equity owners of the Group. A change in ownership interest results in an adjustment between the carrying amounts of the controlling and non-controlling interests to reflect their relative interests in the subsidiary. Any difference between the amount of the adjustment to non-controlling interests and any consideration paid or received in recognised in a separate reserve within equity attributable to owners of Evolution.
When the Group ceases to have control, joint control or significant influence, any retained interest in the entity is remeasured to its fair value with the change in carrying amount recognised in profit or loss. The fair value is the initial carrying amount for the purposes of subsequently accounting for the retained interest as an associate, jointly controlled entity or financial asset. In addition, any amounts previously recognised in other comprehensive income in respect of that entity are accounted for as if the Group had directly disposed of the related assets or liabilities. This may mean that amounts previously recognised in other comprehensive income are reclassified to profit or loss. If the ownership interest in a jointly-controlled entity or an associate is reduced but joint control or significant influence is retained, only a proportionate share of the amounts previously recognised in other comprehensive income are reclassified to profit or loss where appropriate.
(c) Operating SegmentsAn operating segment is a component of equity that engages in business activities from which it may earn revenues and incur expenses, whose operating results are reviewed regularly by the entity’s chief operating decision makers.
The Group has identified its operating segments based on the internal reports that are reviewed and used by the Executive Chairman and the management team (the chief operating decision makers) in assessing performance and in determining the allocation of resources. The Group has identified its operating segments as being Edna May, Cracow, Mt Rawdon and Pajingo mine sites, with Mt Carlton and Corporate combined for reporting purposes.
(d) Revenue recognition
Revenue is recognised to the extent that it is probable that the economic benefit will flow to the entity and the revenue can be reliably measured. Revenue is measured at the fair value of the consideration received or receivable. The following specific recognition criteria must also be met before revenue is recognised.
Metal Sales
Revenue from sales of refined metals is recognised when the significant risks and rewards of ownership have passed to the buyer and can be reliably measured, which means the following:
• Theproductisinaformsuitablefordeliveryandnofurtherprocessingisrequiredbyoronbehalfoftheconsolidatedentity;
• Thequantityandquality(grade)oftheproductcanbedeterminedwithreasonableaccuracy;
• Theproducthasbeendispatchedtothecustomerandisnolongerunderthephysicalcontroloftheconsolidatedentity;
• Thesellingpricecanbemeasuredreliably;
• Itisprobablethattheeconomicbenefitsassociatedwiththetransactionwillflowtotheconsolidatedentity;and
• Thecostsincurred,orexpectedtobeincurred,inrespectofthetransactioncanbemeasuredreliably.
As a result of the above policy generally revenue is recognised at time of shipment. Where metal is delivered into the physical gold delivery contract with Macquarie Bank Limited (‘Macquarie’) revenue is recognised at the time of the metal transfer into to the Macquarie metals account. Refined bullion at the mint awaiting metal transfer to Macquarie’s account is treated as inventory as significant risks and rewards have not passed to the buyer.
NOTES TO ThE FINANCIAL STATEMENTS
For
per
sona
l use
onl
y

070
Interest Income
Interest income is recognised based on the control of the right to receive the interest payment as it accrues in profit and loss using the effective interest method.
(e) Income tax
The income tax expense or benefit for the period is the tax payable on the current period’s taxable income based on the national income tax rate for each jurisdiction adjusted by changes in deferred tax assets and liabilities attributable to temporary differences and to unused tax losses.
The current income tax charge is calculated on the basis of the tax laws enacted or substantively enacted at the end of the reporting period in the countries where the Company’s subsidiaries and associates operate and generate taxable income. Management periodically evaluates positions taken in tax returns with respect to situations in which applicable tax regulation is subject to interpretation. It establishes provisions where appropriate on the basis of amounts expected to be paid to the tax authorities.
Deferred income tax is provided in full, using the liability method, on temporary differences arising between the tax bases of assets and liabilities and their carrying amounts in the consolidated financial statements. However, the deferred income tax is not accounted for if it arises from initial recognition of an asset or liability in a transaction other than a business combination that at the time of the transaction affects neither accounting nor taxable profit or loss. Deferred income tax is determined using tax rates (and laws) that have been enacted or substantially enacted by the balance sheet date and are expected to apply when the related deferred income tax asset is realised or the deferred income tax liability is settled.
Deferred tax assets are recognised for deductible temporary differences and unused tax losses only if it is probable that future taxable amounts will be available to utilise those temporary differences and losses.
Deferred tax liabilities and assets are not recognised for temporary differences between the carrying amount and tax bases of investments in controlled entities where the Company is able to control the timing of the reversal of the temporary differences and it is probable that the differences will not reverse in the foreseeable future.
Deferred tax assets and liabilities are offset when there is a legally enforceable right to offset current tax assets and liabilities and when the deferred tax balances relate to the same taxation authority. Current tax assets and tax liabilities are offset where the entity has a legally enforceable right to offset and intends either to settle on a net basis, or to realise the asset and settle the liability simultaneously.
Current and deferred tax balances attributable to amounts recognised directly in other comprehensive income or equity are also recognised directly in other comprehensive income or equity.
Tax Consolidation Legislation
Evolution and its wholly owned Australian controlled entities have implemented the tax consolidation legislation. As a consequence these entities are taxed as a single entity and the deferred tax assets and liabilities of these entities are set off in the consolidated financial statements.
Evolution Mining Limited is the head entity of the tax consolidated group and each member of the group account for their own current and deferred tax amounts. These tax amounts are measured as if each entity in the tax consolidated group continues to be a stand-alone taxpayer in its own right. In addition to its own current and deferred tax amounts, Evolution Mining Limited also recognises the current tax liabilities (or assets) and the deferred tax assets arising from unused tax losses and unused tax credits assumed from controlled entities in the tax consolidated group.
The entities have also entered into a tax funding agreement under which the wholly owned entities fully compensate Evolution Mining Limited for any current tax payable assumed and are compensated Evolution Mining Limited for any current tax receivable and deferred tax assets relating to unused tax losses or unused tax credits that are transferred to Evolution Mining Limited under the tax consolidation legislation. The funding amounts are determined by reference to the amounts recognised in the wholly owned entities’ financial statements.
The amounts receivable/payable under the tax funding agreement is due upon receipt of the funding advice from the head entity, which is issued as soon as practicable after the end of each financial year. The head entity may also require payment of interim funding amounts to assist with its obligations to pay tax instalments.
Assets or liabilities arising under tax funding agreements with the tax consolidated entities are recognised as current amounts receivable from or payable to other entities in the group.
Any difference between the amounts assumed and amounts receivable or payable under the tax funding agreement are recognised as a contribution to (or distribution from) wholly owned tax consolidated entities.
NOTES TO ThE FINANCIAL STATEMENTS
For
per
sona
l use
onl
y
2012 EVOLUTION MINING ANNUAL REPORT
(f) Leases
Leases of property, plant and equipment where the Group, as lessee, has substantially all the risks and rewards of ownership are classified as finance leases. Finance leases are capitalised at the lease’s inception at the fair value of the leased property or, if lower, the present value of the minimum lease payments. The corresponding rental obligations, net of finance charges, are included in other short-term and long-term payables. Each lease payment is allocated between the liability and finance cost. The finance cost is charged to profit or loss over the lease period so as to produce a constant periodic rate of interest on the remaining balance of the liability for each period. The property, plant and equipment acquired under finance leases is depreciated over the shorter of the asset’s useful life and the life of the mine.
Leases where a significant portion of the risks and rewards of ownership are not transferred to the Group as lessee are classified as operating leases. Payments made under operating leases (net of any incentives received from the lessor) are charged to the income statement on a straight-line basis over the period of the lease.
(g) Impairment of assets
Goodwill is not amortised and is tested for impairment annually or more frequently if events or changes in circumstances indicate that goodwill may be impaired. At each reporting date, the Group reviews the carrying amounts of its tangible and other intangible assets to determine whether there is any indication that those assets have suffered an impairment loss. If any such indication exists, the recoverable amount of the asset is estimated in order to determine the extent of the impairment loss (if any). Where the asset does not generate cash in-flows that are independent from other assets, the Group estimates the recoverable amount of the cash-generating unit to which the asset belongs.
Recoverable amount is the higher of fair value less costs to sell and value in use. In assessing value in use, the estimated future cash flows are discounted to their present value using a pre-tax discount rate that reflects current market assessments of the time value of money and the risks specific to the asset for which the estimates of future cash flows have not been adjusted.
If the recoverable amount of an asset (or cash-generating unit) is estimated to be less than its carrying amount, the carrying amount of the asset (cash-generating unit) is reduced to its recoverable amount. An impairment loss is recognised in profit or loss immediately.
Where an impairment loss subsequently reverses, the carrying amount of the asset (cash-generating unit) is increased to the revised estimate of its recoverable amount, but only to the extent that the increased carrying amount does not exceed the carrying amount that would have been determined had no impairment loss been recognised for the asset (cash-generating unit) in prior years. A reversal of an impairment loss is recognised in profit or loss immediately.
(h) Cash and cash equivalents
For cash flow statement presentation purposes, cash and cash equivalents includes cash on hand, deposits held at call with financial institutions, other short-term highly liquid investments with original maturities of three months or less that are readily convertible to known amounts of cash and which are subject to insignificant risk of changes in value, and bank overdrafts.
(i) Trade and other receivables
Receivables are recognised and carried at original invoice amount less a provision for any uncollectible debts. An estimate for doubtful debts is made when collection of the full amount is no longer probable. Bad debts are written-off as incurred.
(j) Inventories
Gold in solution form, gold dore, refined gold bullion, stockpiled ore, concentrates and work in progress are physically measured or estimated and valued at the lower of cost and net realisable value. Cost represents the weighted average cost and includes direct costs and an appropriate portion of fixed and variable production overhead expenditure, including depreciation and amortisation, incurred in converting materials into finished goods.
Materials and supplies are valued at the lower of cost and net realisable value. Any provision for obsolescence is determined by reference to specific stock items identified. A regular and ongoing review is undertaken to establish the extent of surplus items and a provision is made for any potential loss on their disposal.
Net realisable value is the estimated selling price in the ordinary course of business, less estimated costs of completion and estimated costs necessary to make the sale.
NOTES TO ThE FINANCIAL STATEMENTS
For
per
sona
l use
onl
y

072
(k) Investments and other financial assets
Classification
The Group classifies its investments in the following categories: financial assets at fair value through profit or loss, loans and receivables, held-to-maturity investments and available-for-sale financial assets. The classification depends on the purpose for which the investments were acquired. Management determines the classification of its investments at initial recognition and, in the case of assets classified as held-to-maturity, re- evaluates this designation at each reporting date. The Group may choose to reclassify the financial assets depending on change in intentions and circumstances.
(i) Financial assets at fair value through profit or loss
Financial assets at fair value through profit or loss are financial assets held for trading. A financial asset is classified in this category if acquired principally for the purpose of selling in the short term. Derivatives are classified as held-for-trading unless they are designated as hedges.
(ii) Loans and receivables
Loans and receivables are non-derivative financial assets with fixed or determinable payments that are not quoted in an active market. They are included in current assets, except for those with maturities greater than 12 months after the balance sheet date which are classified as non-current assets. Loans and receivables are included in trade and other receivables in the statement of financial position.
(iii) Available-for-sale financial assets
Available-for-sale financial assets, comprising principally marketable equity securities, are non-derivatives that are either designated in this category or not classified in any of the other categories. They are included in non -current assets unless management intends to dispose of the investment within 12 months of the balance sheet date.
Recognition and derecognition
Regular purchases and sales of financial assets are recognised on trade-date, which is the date on which the Group commits to purchase or sell the asset. Investments are initially recognised at fair value plus transaction costs for all financial assets not carried at fair value through profit or loss. Financial assets carried at fair value through profit or loss is initially recognised at fair value and transaction costs are expensed to profit or loss. Financial assets are derecognised when the rights to receive cash flows from the financial assets have expired or have been transferred and the Group has transferred substantially all the risks and rewards of ownership.
When securities classified as available-for-sale are sold, the accumulated fair value adjustments recognised in other comprehensive income are included in profit or loss as gains and losses from investment securities.
Subsequent measurement
Loans and receivables and held-to-maturity investments are carried at amortised cost using the effective interest method.
Available-for-sale financial assets and financial assets at fair value through profit or loss are subsequently carried at fair value. Gains or losses arising from changes in the fair value of the ‘financial assets at fair value through profit or loss’ category are presented in profit or loss within other income or other expenses in the period in which they arise. Changes in the fair value of securities classified as Available for Sale are recognised in the other comprehensive income.
Dividend income from financial assets at fair value through profit or loss is recognised in profit or loss as part of revenue when the Group’s right to receive payments is established.
Fair value
The fair values of quoted investments are based on last trade prices. If the market for a financial asset is not active (and for unlisted securities), the Group establishes fair value by using valuation techniques. These include the use of recent arm’s length transactions, reference to other instruments that are substantially the same, discounted cash flow analysis, and option pricing models making maximum use of market inputs and relying as little as possible on entity-specific inputs.
Impairment
The Group assesses at each balance date whether there is objective evidence that a financial asset or group of financial assets is impaired. In the case of equity securities classified as available-for-sale, a significant or prolonged decline in the fair value of a security below its cost is considered as an indicator that the securities are impaired. If any such evidence exists for available-for-sale financial assets, the cumulative loss – measured as the difference between the acquisition cost and the current fair value, less any impairment loss on that financial asset previously recognised in profit or loss – is removed from equity and recognised in profit or loss. Impairment losses recognised in profit or loss on equity instruments classified as available-for-sale are not reversed through the income statement.
NOTES TO ThE FINANCIAL STATEMENTS
For
per
sona
l use
onl
y
2012 EVOLUTION MINING ANNUAL REPORT
(l) Fair value estimation
The fair value of financial assets and financial liabilities must be estimated for recognition and measurement or for disclosure purposes. The fair value of financial instruments traded in active markets (such as publicly traded derivatives, and trading and available-for-sale securities) is based on quoted market prices at the balance sheet date. The quoted market price used for financial assets held by the Group is the last trade price. The carrying value less impairment provision of trade receivables and payables are assumed to approximate their fair values due to their short-term nature.
(m) Mine development and exploration
(i) Mine development
In open pit mining operations, it is necessary to remove overburden and other waste materials to access ore from which minerals can be extracted economically. The process of mining overburden and waste materials is referred to as stripping. During the development of a mine (or pit), before production commences, stripping costs are capitalised as mine development.
During the production stage of some pits, further development of the pit may require a phase of unusually high overburden removal activity that is similar in nature to pre-production pit development. This typically occurs when ‘cut-backs’ are made to gain access to a specific section of the ore body. The costs of such unusually high overburden removal activity are also capitalised as mine development.
Mine development costs are amortised on a units of production basis over the life of the pit to which they relate. In applying the units of production method, amortisation is calculated using the expected total contained ounces within the pit to achieve a consistent amortisation rate per ounce. To achieve this, the amortisation rate is based on the ratio of total pit development costs (incurred and anticipated) over the expected total contained ounces.
Change in policy from 1 July 2011
A voluntary change in accounting policy on mine development has been applied from 1 July 2011 to align the accounting treatment across the new operations within the Group. Previously, all costs associated with open pit ‘cut-back’ activity were treated as deferred mining expenditure rather than as a mine development asset. This change has resulted in an increased cost of goods sold including higher depreciation and amortisation charge, with a net impact of $17.111 million reduction in the profit before tax for the year. The impact on the prior period has not been determined as it is impractical to determine the effect of this change in policy on prior periods.
(ii) Exploration and evaluation expenditure
Exploration and evaluation activity involves the search for mineral resources, the determination of technical feasibility and the assessment of commercial viability of an identified resource. Exploration and evaluation activity includes:
• researchingandanalysinghistoricalexplorationdata;
• gatheringexplorationdatathroughtopographical,geochemicalandgeophysicalstudies;
• exploratorydrilling,trenchingandsampling;
• determiningandexaminingthevolumeandgradeoftheresource;
• surveyingtransportationandinfrastructurerequirements;and
• conductingmarketandfinancestudies.
Early stage exploration expenditure on new areas of interest are expensed as incurred. Exploration and evaluation expenditure is capitalised in relation to areas of interest in or around producing mines or where management believes the costs are recoverable.
Exploration expenditure for each area of interest is carried forward as an asset provided the rights to tenure of the area of interest are current and one of the following conditions is met:
• theexplorationandevaluationexpendituresareexpectedtoberecoupedthroughsuccessfuldevelopmentandexploitationoftheareaofinterest,or alternatively, by its sale; and
• explorationandevaluationactivitiesintheareaofinteresthavenotatthereportingdatereachedastagewhichpermitsareasonableassessmentofthe existence or otherwise of economically recoverable reserves, and active and significant operations in, or in relation to, the area of interest are continuing.
An impairment review is performed, either individually or at the cash-generating unit level, when there are indicators that the carrying amount of the assets may exceed their recoverable amounts. To the extent that this occurs, the excess is fully provided against, in the financial year in which this is determined. Exploration and evaluation assets are reassessed on a regular basis and these costs are carried forward provided that at least one of the conditions outlined above is met.
Administration costs that are not directly attributable to a specific exploration area are charged to the income statement. Expenditure is transferred to mine development assets once the work completed to date supports the future development of the property and such development receives appropriate approvals.
NOTES TO ThE FINANCIAL STATEMENTS
For
per
sona
l use
onl
y
074
(n) Deferred mining expenditure
The Group incurs costs of removing overburden and other waste during the production phase of a pit. Other than unusually high overburden removal in cutback campaigns (referred to in Note 1(m) above), these costs are deferred where this is the most appropriate basis for matching the costs against the related economic benefits and the effect is material. This is generally the case where there are fluctuations in stripping costs over the life of a pit.
The amount of stripping costs expensed or deferred is based on the stripping ratio which is determined by dividing the tonnage of waste mined (excluding any waste associated with mine development) by the quantity of ore mined. Stripping costs incurred in the period are deferred as other assets to the extent that the current period stripping ratio exceeds the life of pit ratio. Such deferred costs are then expensed in subsequent periods to the extent that the current period stripping ratio falls short of the life of pit stripping ratio.
The impact of changes in the estimated life of pit stripping ratios is accounted for prospectively from when the change is determined.
Deferred mining expenditure is recognised in other current assets.
(o) Property, plant and equipment
Land is carried at historical cost. All plant and equipment is stated at historical cost less depreciation. Historical cost is fair value of the item at acquisition date and includes expenditure that is directly attributable to the acquisition of the items.
Subsequent costs are included in the asset’s carrying amount or recognised as a separate asset, as appropriate, only when it is probable that future economic benefits associated with the item will flow to the Group and the cost of the item can be measured reliably. The carrying amount of the replaced part is derecognised. All other repairs and maintenance are charged to profit or loss during the reporting period in which they are incurred.
Land is not depreciated. Depreciation of plant and equipment is calculated using the straight line method to allocate their cost, net of their residual values, over their estimated useful lives. The rates vary between 10% and 33% per annum.
The assets’ residual values and useful lives are reviewed, and adjusted if appropriate, at each balance sheet date. An asset’s carrying amount is written down immediately to its recoverable amount if the asset’s carrying amount is greater than its estimated recoverable amount. Gains and losses on disposals are determined by comparing proceeds with carrying amount. These are included in profit or loss.
(p) Goodwill
Goodwill acquired in a business combination is initially measured at cost, being the excess of the consideration transferred over the fair value of the net identifiable assets acquired and liabilities assumed. After initial recognition, goodwill is measured at cost less any accumulated impairment losses.
Impairment is determined by comparing the carrying amount of goodwill in comparison to the value of relevant assets. Impairment losses recognised for goodwill are not subsequently reversed.
(q) Intangible Assets
Mining Tenements, Mining Rights and Mining Information
Mining tenements have a finite useful life and are carried at cost less, where applicable, any accumulated amortisation and accumulated impairment losses. The carrying values of mining tenements and mining rights are reviewed to ensure they are not in excess of their recoverable amounts. Amortisation of mining tenements and mining rights commences from the date when commercial production commences or in the case of the acquisitions, from the date of acquisition and is charged to the profit or loss. Mining tenements are amortised over the life of the mine using units of production basis in ounces.
Mining information has a finite useful life and is carried at cost less accumulated amortisation. Mining Information amortisation is recognised over the period that the information is expected to remain relevant.
The amortisation of the above intangibles is classified as a cost of sale.
(r) Trade and other payables
These amounts represent liabilities for goods and services provided to the Group prior to the end of the financial year which are unpaid. The amounts are unsecured and are paid on normal commercial terms.
NOTES TO ThE FINANCIAL STATEMENTS
For
per
sona
l use
onl
y

2012 EVOLUTION MINING ANNUAL REPORT
(s) Borrowings
Borrowings are initially recognised at fair value, net of transaction and establishment costs incurred. Borrowings are subsequently measured at amortised cost. Any difference between the proceeds (net of transaction costs) and the redemption amount is recognised in profit or loss over the period of the borrowings using the effective interest method.
Borrowings are removed from the statement of financial position when the obligation specified in the contract is discharged, cancelled or expired. The difference between the carrying amount of the financial liability that has been extinguished or transferred to another party and the consideration paid, including any non-cash assets transferred or liabilities assumed, is recognised in other income or other expenses.
Borrowings are classified as current liabilities unless the Group has an unconditional right to defer settlement of the liability for at least 12 months after the reporting date.
(t) Borrowing costs
Borrowing costs incurred for the construction of a qualifying asset are capitalised during the period of time that is required to complete and prepare the asset for its intended use or sale. Other borrowing costs are expensed.
(u) Site restoration
Site restoration costs include the dismantling and removal of mining plant, equipment and building structures, waste removal and rehabilitation of the site in accordance with the requirements of the mining permits. Such costs are determined using estimates of future costs, current legal requirements and technology.
Costs of site restoration are recognised in full at present value as a non-current liability. An equivalent amount is capitalised as part of the cost of the asset when an obligation arises to decommission or restore a site to a certain condition after abandonment as a result of bringing the assets to its present location. The capitalised cost is amortised over the life of the project and the provision is accreted periodically as the discounting of the liability unwinds. The unwinding of the discount is recorded as interest expense.
Any changes in the estimates for the costs or other assumptions are accounted for on a prospective basis. In determining the costs of site restoration there is uncertainty regarding the nature and extent of the restoration due to community expectations and future legislation. The costs are determined on the basis that restoration will be completed within one year of abandoning a site.
(v) Royalties
Western Australian State government royalties and other royalties payable under existing agreements are payable on production and are therefore recognised on delivery of gold dore to the refinery. Queensland State government royalties are payable on a revenue basis and therefore recognised at the time of revenue recognition.
(w) Employee benefits
(i) Wages and salaries, annual leave and other employee benefits
Provision is made for employee benefits accumulated as a result of employees rendering services up to the reporting date. These benefits include wages and salaries, annual leave, and long service leave.
Liabilities arising in respect of wages and salaries, annual leave and any other short-term employee benefits are measured at their nominal amounts based on remuneration rates which are expected to be paid when the liability is settled. All other employee benefit liabilities are measured at the present value of the estimated future cash outflow to be made in respect of services provided by employees up to the reporting date. In determining the present value of future cash outflows, the market yield as at the reporting date on national government bonds, which have terms to maturity approximating the terms of the related liability, are used.
(ii) Share based payments
The Group provides benefits to its employees (including key management personnel) in the form of share-based payments, whereby employees render services in exchange for shares or rights over shares (equity-settled transactions). The Group provides awards to its employees and directors through the Company’s Employee Share Option and Performance Rights Plan. Shares and options may also be issued directly to other parties.
Vesting conditions that are linked to the price of shares of the Company (market conditions) are taken into account when determining the fair value of equity settled transactions. Other vesting conditions such as service conditions are excluded from the measurement of fair value but are considered in estimating the number of investments that may ultimately vest.
NOTES TO ThE FINANCIAL STATEMENTS
For
per
sona
l use
onl
y

076
The cost of these equity-settled transactions is measured by reference to the fair value of the equity instruments at the date at which they are granted. The fair value is determined using a Black Scholes model. A Monte Carlo simulation in conjunction with the Black Scholes model is applied to take into account any market conditions associated with an award.
The cost of equity-settled transactions is recognised, together with a corresponding increase in equity, over the period in which the performance and/or service conditions are fulfilled (the vesting period), ending on the date on which the relevant employees become fully entitled to the award (the vesting date).
At each subsequent reporting date until vesting, the cumulative charge to the statement of comprehensive income is the product of:
(a) The grant date fair value of the award.
(b) The current best estimate of the number of awards that will vest, taking into account such factors as the likelihood of employee turnover during the vesting period and the likelihood of non-market performance conditions being met.
(c) The expired portion of the vesting period.
The charge to the statement of comprehensive income for the period is the cumulative amount as calculated above less the amounts already charged in previous periods. There is a corresponding entry to equity.
Until an award has vested, any amounts recorded are contingent and will be adjusted if more or fewer awards vest than were originally anticipated to do so. Any award subject to a market condition or non-vesting condition is considered to vest irrespective of whether or not that market condition or non-vesting is fulfilled, provided that all other conditions are satisfied.
If a non-vesting condition is within the control of the Company or the participant, the failure to satisfy the condition is treated as a cancellation. If a non-vesting condition within the control of neither the Group, Company nor employee is not satisfied during the vesting period, any expense for the award not previously recognised is recognised over the remaining vesting period, unless the award is forfeited.
If the terms of an equity-settled award are modified, as a minimum an expense is recognised as if the terms had not been modified. An additional expense is recognised for any modification that increases the total fair value of the share-based payment arrangement, or is otherwise beneficial to the employee, as measured at the date of modification. If an equity-settled award is cancelled, it is treated as if it had vested on the date of cancellation, and any expense not yet recognised for the award is recognised immediately. However, if a new award is substituted for the cancelled award and designated as a replacement award on the date that it is granted, the cancelled and new award are treated as if they were a modification of the original award.
The dilutive effect, if any, of outstanding options is reflected as additional share dilution in the computation of diluted earnings per share.
(x) Issued capital
Ordinary shares are classified as equity. Incremental costs directly attributable to the issue of new shares or options are shown in equity as a deduction, net of tax, from the proceeds.
(y) Earnings per share
(i) Basic earnings per share
Basic earnings per share is calculated by dividing the profit attributable to equity holders of the Company, excluding any costs of servicing equity other than ordinary shares, by the weighted average number of ordinary shares outstanding during the financial year, adjusted for bonus elements in ordinary shares issued during the year.
(ii) Diluted earnings per share
Diluted earnings per share adjusts the figures used in the determination of basic earnings per share to take into account the after income tax effect of interest and other financing costs associated with dilutive potential ordinary shares and the weighted average number of shares assumed to have been issued for no consideration in relation to dilutive potential ordinary shares.
NOTES TO ThE FINANCIAL STATEMENTS
For
per
sona
l use
onl
y

2012 EVOLUTION MINING ANNUAL REPORT
(z) Goods and Services Tax (GST)
Revenues, expenses and assets are recognised net of the amount of associated GST, unless the GST incurred is not recoverable from the taxation authority. In this case it is recognised as part of the cost of acquisition of the asset or as part of the expense.
Receivables and payables are stated inclusive of the amount of GST receivable or payable. The net amount of GST recoverable from, or payable to, the taxation authority is included with other receivables or payables in the statement of financial position.
Cash flows are presented on a gross basis. The GST components of cash flows arising from investing or financing activities which are recoverable from, or payable to the taxation authority, are presented as operating cash flow.
(aa) Rounding of amounts
All amounts are presented in Australian dollars, unless otherwise noted. The Company is a company of the kind referred to in ASIC Class Order 98/0100, dated 10 July 1998, and in accordance with that Class Order amounts in the Directors’ report and the financial report are rounded off to the nearest thousand dollars, unless otherwise stated.
(bb) New standards and interpretations not yet adopted
The Group did not adopt any new and/or revised Accounting Standards, Amendments and Interpretations from 1 July 2011 which had an effect on the financial position or performance of the Group.
The Group has not elected to early adopt any other new standards, amendments or interpretations that are issued but are not yet effective. Certain new accounting standards and interpretations have been published that are not mandatory for 30 June 2012 reporting periods. The Group’s assessment of the impact of these new standards and interpretations is set out below.
AASB 9 Financial Instruments, AASB 2009-11 Amendments to Australian Accounting Standards arising from AASB 9 and AASB 2010-7 Amendments to Australian Accounting Standards arising from AASB 9 (December 2010) (effective from 1 January 2013*)
AASB 9 Financial Instruments addresses the classification, measurement and derecognition of financial assets and financial liabilities. The standard is not applicable until 1 January 2013* but is available for early adoption. When adopted, the standard will affect in particular the Group’s accounting for its available-for-sale financial assets, since AASB 9 only permits the recognition of fair value gains and losses in other comprehensive income if they relate to equity investments that are not held for trading.
There will be no impact on the Group’s accounting for financial liabilities, as the new requirements only affect the accounting for financial liabilities that are designated at fair value through profit or loss and the Group does not have any such liabilities. The derecognition rules have been transferred from AASB 139 Financial Instruments: Recognition and Measurement and have not been changed. The Group has not yet decided when to adopt AASB 9.
* In December 2011, the IASB delayed the application date of IFRS 9 to 1 January 2015. The AASB is expected to make an equivalent amendment to AASB 9 shortly.
AASB 10 Consolidated Financial Statements
AASB 10 replaces all of the guidance on control and consolidation in AASB 127 Consolidated and Separate Financial Statements, and Interpretation 12 Consolidation – Special Purpose Entities. The core principle that a consolidated entity presents a parent and its subsidiaries as if they are a single economic entity remains unchanged, as do the mechanics of consolidation. However, the standard introduces a single definition of control that applies to all entities. It focuses on the need to have both power and rights or exposure to variable returns. Power is the current ability to direct the activities that significantly influence returns. Returns must vary and can be positive, negative or both. Control exists when the investor can use its power to affect the amount of its returns. There is also new guidance on participating and protective rights and on agent/principal relationships. While the Group does not expect the new standard to have a significant impact on its composition, it has yet to perform a detailed analysis of the new guidance in the context of its various investees that may or may not be controlled under the new rules.
AASB 13 Fair Value Measurement and AASB 2011-8 Amendments to Australian Accounting Standards arising from AASB 13 (effective 1 January 2013)
AASB 13 was released in September 2011. It explains how to measure fair value and aims to enhance fair value disclosures. The Group has yet to determine which, if any, of its current measurement techniques will have to change as a result of the new guidance. It is therefore not possible to state the impact, if any, of the new rules on any of the amounts recognised in the financial statements. However, application of the new standard will impact the type of information disclosed in the notes to the financial statements. The Group does not intend to adopt the new standard before its operative date, which means that it would be first applied in the annual reporting period ending 30 June 2014.
NOTES TO ThE FINANCIAL STATEMENTS
For
per
sona
l use
onl
y
078
AASB 1053 Application of Tiers of Australian Accounting Standards and AASB 2010-2 Amendments to Australian Accounting Standards arising from Reduced Disclosure Requirements (effective 1 July 2013)
On 30 June 2010 the AASB officially introduced a revised differential reporting framework in Australia. Under this framework, a two-tier differential reporting regime applies to all entities that prepare general purpose financial statements. As Evolution is listed on the ASX, it is therefore not eligible to adopt the new Australian Accounting Standards – Reduced Disclosure Requirements. As a consequence, the two standards will have no impact on the financial statements of the entity.
AASB 2011-9 Amendments to Australian Accounting Standards – Presentation of Items of Other Comprehensive Income(effective 1 July 2012)
In September 2011, the AASB made an amendment to AASB 101 Presentation of Financial Statements which requires entities to separate items presented in other comprehensive income into two groups, based on whether they may be recycled to profit or loss in the future. This will not affect the measurement of any of the items recognised in the balance sheet or the profit or loss in the current period. The Group intends to adopt the new standard from 1 July 2012.
AASB 2011-4 Amendments to Australian Accounting Standards to Remove Individual Key Management Personnel Disclosure Requirements (effective 1 July 2013)
In July 2011 the AASB decided to remove the individual key management personnel (KMP) disclosure requirements from AASB 124 Related Party Disclosures, to achieve consistency with the international equivalent standard and remove a duplication of the requirements with the Corporations Act 2001. While this will reduce the disclosures that are currently required in the notes to the financial statements, it will not affect any of the amounts recognised in the financial statements. The amendments apply from 1 July 2013 and cannot be adopted early. The Corporations Act requirements in relation to remuneration reports will remain unchanged for now, but these requirements are currently subject to review and may also be revised in the near future.
AASB Interpretation 20 Stripping Costs in the Production Phase of a Surface Mine and AASB 2011-12 Amendments to Australian Accounting Standards arising from Interpretation 20 (effective 1 January 2013)
Interpretation 20 sets out the accounting for overburden waste removal (stripping) costs in the production phase of a mine. It states that these costs can only be recognised as an asset if they can be attributed to an identifiable component of the ore body, the costs relating to the improved access to that component can be measured reliably and it is probable that future economic benefits associated with the stripping activity (improved access to the orebody) will flow to the entity. The Group has not yet undertaken a review of its existing stripping cost assets in light of the requirements of the interpretation and hence is unable to quantify the effect, if any, on the amounts recognised in the financial statements.
(cc) Parent entity financial information
The financial information for the parent entity Evolution Mining Limited, disclosed in Note 31 has been prepared on the same basis as the consolidated financial statement.
2. CRITICAL ACCOUNTING JUdGEMENTS ANd kEY SOURCES OF ESTIMATION UNCERTAINTYIn the application of Australian Accounting Standards, management is required to make judgments, estimates and assumptions about carrying values of assets and liabilities that are not readily apparent from other sources. The estimates and associated assumptions are based on historical experience and various other factors that are believed to be reasonable under the circumstance, the results of which form the basis of making the judgments. Actual results may differ from these estimates.
The estimates and underlying assumptions are reviewed on an ongoing basis. Revisions to accounting estimates are recognised in the period in which the estimate is revised if the revision affects only that period or in the period of the revision and future periods if the revision affects both current and future periods.
The judgments, estimates and assumptions that management has made in the process of applying the Group’s accounting policies and that have the most significant effects on the amounts recognised in the financial statements are discussed below.
(i) Determination of mineral resources and ore reserves
The Group estimates its Mineral Resources and Ore Reserves in accordance with the Australian Code of Reporting of Exploration Results, Mineral Resources and Ore Reserves (the ‘JORC Code’). The information on mineral resources and ore reserves is prepared by or under the supervision of Competent Persons as defined in the JORC Code. The amounts presented are based on the Mineral Resources and Ore Reserves determined under the JORC Code.
NOTES TO ThE FINANCIAL STATEMENTS
For
per
sona
l use
onl
y

2012 EVOLUTION MINING ANNUAL REPORT
There are numerous uncertainties inherent in estimating mineral resources and ore reserves and assumptions that are valid at the time of estimation which may change significantly when new information becomes available. Changes in the forecast prices of commodities, exchange rates, production costs or recovery rates may change the economic status of reserves and may, ultimately, result in the reserves being restated. Such changes in reserves could impact on depreciation and amortisation rates, asset carrying values and provisions for decommissioning and restoration.
(ii) Fair values of assets and liabilities on acquisition
Identifiable assets acquired and liabilities and contingent liabilities assumed in a business combination are measured initially at their fair value at the acquisition date. The excess of the cost of acquisition over the fair value of the Group’s share of the identifiable net assets acquired is recorded as goodwill.
(iii) Estimation for the provision for rehabilitation and dismantling
Provision for rehabilitation and dismantling property, plant and equipment is estimated taking into consideration facts and circumstances available at the balance sheet date. This estimate is based on the expenditure required to undertake the rehabilitation and dismantling, taking into consideration time value of money.
(iv) Recovery of deferred tax assets
Deferred tax assets are recognised for tax losses and deductible temporary differences to the extent management considers that it is probable that future taxable profits will be available to utilise those tax losses and temporary differences.
(v) Impairment of property, plant and equipment and capitalised mine development expenditure
The Group reviews for impairment of property, plant and equipment, in accordance with its accounting policy. The recoverable amount of these assets has been determined based on the higher of the assets’ fair value less costs to sell and value in use. These calculations require the use of estimates and judgements.
The future recoverability of capitalised mine development expenditure is dependent on a number of factors, including the level of proved, probable, mineral resources and ore reserves, future technological changes which could impact the cost of mining, future legal changes (including changes to environment restoration obligations) and changes to commodity prices. To the extent that capitalised mine development expenditure is determined not to be recoverable in the future, this will reduce profits and net assets in the period in which this determination is made.
3. FINANCIAL RISk MANAGEMENTThe Group’s activities expose it to a variety of financial risks: market risk (including interest rate risk and price risk), credit risk and liquidity risk. The Group’s overall risk management program focuses on the unpredictability of financial markets and seeks to minimise potential adverse effects on the financial performance of the Group. The Group has not used derivative financial instruments such as interest rate swaps to hedge interest rate risk exposures given the low level of borrowings in the consolidated statement of financial position. The Group uses different methods to measure different types of risk to which it is exposed, the main risk being commodity price risk of gold and silver sold.
Risk management is carried out at a corporate level under policies approved by the Board of Directors. Management identifies, evaluates and hedges financial risks in close cooperation with the Group’s operating units. The board provides written principles for overall risk management, as well as policies covering specific areas, such as interest rate risk, credit risk, gold price risk and use of derivative financial instruments and non-derivative financial instruments, and investment of excess liquidity.
The Group holds the following financial instruments:
30 June 2012 30 June 2011
$’000 $’000
Financial Assets
Cash and cash equivalents 141,784 30,051
Trade and other receivables 26,459 3,407
Available for sale investments 3,714 784
171,957 34,242
Financial liabilities
Trade and other payables 110,440 19,496
Interest bearing liabilities 35,845 44,753
146,285 64,249
NOTES TO ThE FINANCIAL STATEMENTS
For
per
sona
l use
onl
y

080
a) Market Risk
Currency Risk
The Group’s exposure to currency risk is limited to the impact of currency fluctuations on some of the input costs e.g. diesel, steel etc. At the balance date the Group holds no financial assets or liabilities which are exposed to foreign currency risk.
Commodity Price Risk
The Group is currently exposed to the risk of fluctuations in prevailing market commodity prices on the gold and silver currently produced from the Pajingo, Cracow, Mt Rawdon and Edna May gold mine. The Group has in place physical gold delivery contracts covering sales of 224,177 ozs of gold at a price of A$1,573 per ounce to be delivered over a period of approximately 4 years (refer to Note 27, 2011: 286,336 ozs).
Interest Rate Risk
The Group’s interest rate risk arises from cash on hand invested in term deposits and borrowings. Short term deposits of $112.150 million (2011: Nil) are placed with investment grade banks in Australia for time frames to ensure an appropriate balance between liquidity and interest rate earned. Borrowings of $31.5 million (2011: $47.5 million) incur interest at a variable rate and the Group has not entered into interest rate swap contracts or similar derivative financial instruments to hedge the fluctuations in interest rates given the size and maturity of the borrowings. An increase/decrease of variable interest rates of 0.25% will result in an increase/ decrease $78,750 in interest expense relating to debt and $244,000 in interest income relating to term deposits.
b) Credit risk
Credit risk is the risk of financial loss to the Group if a customer or counterparty to a financial instrument fails to meet its contractual obligations and arises principally from the Group’s receivables from customers and investment securities. At the balance sheet date there were no significant concentrations of credit risk given customers and banks have investment grade credit ratings.
c) Liquidity Risk
Liquidity risk is the risk that the Group will not be able to meet its financial obligations as they fall due. Prudent liquidity risk management implies maintaining sufficient cash and term deposits, the availability of funding through an adequate amount of committed credit facilities and the ability to close out market positions. The Group manages liquidity risk by continuously monitoring forecast and actual cash flows and matching the maturity profiles of financial assets and liabilities.
Maturities of financial liabilities
The following are the Group’s contractual maturities of financial liabilities, including estimated interest payments and excluding the impact of netting agreements:
The amounts disclosed in the tables below have been drawn up based on the undiscounted cash flows (including both interest and principal cash flows expected) using contractual maturities and the earliest date on which the Group can be required to pay financial liabilities.
Contractual maturities of financial liabilities
(A$’000)
Less than 1 year 1-2 years 2-5 years Over 5 years
Total contractual cash flows
Carrying amount
30 June 2012
Trade and other payables 110,440 - - 110,440 110,440
Finance lease liabilities 3,232 3,092 632 - 6,956 6,646
Other borrowings 18,518 13,773 2,029 - 34,320 31,500
Total liabilities 132,190 16,865 2,661 - 151,716 148,586
30 June 2011
Trade and other payables 19,496 - - - 19,496 19,496
Finance lease liabilities 309 467 - - 776 684
Other borrowings 19,456 18,518 13,773 - 51,748 47,522
Total liabilities 39,261 18,985 13,773 - 72,020 67,702
NOTES TO ThE FINANCIAL STATEMENTS
For
per
sona
l use
onl
y

2012 EVOLUTION MINING ANNUAL REPORT
(d) Fair value measurements
The fair value of financial assets and financial liabilities must be estimated for recognition and measurement or for disclosure purposes. AASB 7 Financial Instruments: Disclosures requires disclosure of fair value measurements by level of the following fair value measurement hierarchy:
• Level1:quotedprices(unadjusted)inactivemarketsforidenticalassetsorliabilities
• Level2:inputsotherthanquotedpricesincludedwithinlevel1thatareobservablefortheassetorliability,eitherdirectly(asprices)orindirectly(derived from prices); and
• Level3:inputsfortheassetorliabilitythatarenotbasedonobservablemarketdata(unobservableinputs).
The following table presents the Group’s assets measured and recognised at fair value at 30 June 2012 and 30 June 2011:
The shares in Monto Minerals and Renaissance Minerals are listed on the Australian Securities Exchange and recorded at fair value with reference to the listed price at balance sheet date. The options in Monto Minerals are recorded by using Black-Scholes valuation model to determine the fair value of the options with reference to the strike price of the options, volatility and term. An increase/decrease of 5% in the share price of the listed investments will result in an increase/decrease of $175,200 (2011: $39,000) through fair value reserves for the listed shares.
The carrying amounts of trade receivables and payables are assumed to approximate their fair values due to their short-term nature. The fair value of financial liabilities for disclosure purposes is estimated by discounting the future contractual cash flows at the current market interest rate that is available to the Group for similar financial instruments. The fair value of current borrowings approximates the carrying amount, as the impact of discounting is not significant.
30 June 2012 30 June 2011
A$’000 Level 1 Level 2 Total Level 1 Level 2 Total
Available for sale financial assets
Options in Monto Minerals - 210 210 - - -
Shares available for sale 3,504 - 3,504 784 - 784
Total financial assets held at fair value 3,504 210 3,714 784 - 784
NOTES TO ThE FINANCIAL STATEMENTS
For
per
sona
l use
onl
y

082
4. SEGMENT INFORMATIONDescription of segments
The Group’s operations are all conducted in the mining industry in Australia.
The Group has identified its operating segments based on the internal reports that are reviewed and used by the Executive Chairman and the senior leadership team (the chief operating decision makers) in assessing performance and in determining the allocation of resources. The presentation of segment information has changed from the previous period as a result of changes in management and the new structure of the larger Evolution Group.
The Group’s four operational mine sites and Corporate are each treated as individual operating segment. Management monitors the operating results of its business units separately for the purpose of making decisions about resource allocation and performance assessment.
Corporate includes the Mt Carlton asset under construction that was acquired as part of the Conquest acquisition. The remainder of Corporate includes transaction costs related to the merger and asset acquisitions, share-based payment expenses and other corporate expenditures supporting the business during the year.
Year ended 30 June 2012
*EBITDA has been calculated excluding the costs relating to business combinations.
Edna May Cracow Pajingo Mt
Rawdon Exploration Corporate/ Mt Carlton Total
$’000 $’000 $’000 $’000 $’000 $’000 $’000
Segment revenue 121,816 129,306 102,186 116,176 - - 469,484
Adjusted EBITDA* 45,378 64,704 40,726 74,581 (5,482) (30,651) 189,257
Reconciliation of profit before income tax:
Depreciation and amortisation (94,012)
Costs related to business combinations (28,518)
Fair value re-measurement of previously held interest in the Cracow gold mine 2,757
Interest income 5,633
Finance costs (9,368)
Other income 735
Profit before income tax 66,483
Capital additions (44,582) (24,396) (44,510) (34,172) (28,288) (102,286) (278,234)
NOTES TO ThE FINANCIAL STATEMENTS
For
per
sona
l use
onl
y

2012 EVOLUTION MINING ANNUAL REPORT
Year ended 30 June 2011 (Restated)
*EBITDA has been calculated excluding the costs relating to business combinations.
5. PROFIT BEFORE TAXProfit before income tax includes the following specific items:
Edna May Cracow Pajingo Mt Rawdon Exploration Corporate/ Mt Carlton Total
$’000 $’000 $’000 $’000 $’000 $’000 $’000
Segment revenue 77,900 43,970 - - - - 121,870
Adjusted EBITDA* 17,049 11,859 - - - - 28,908
Reconciliation of profit before income tax:
Depreciation and amortisation (20,352)
Costs related to business combinations (974)
Interest income 1,626
Finance costs (5,253)
Profit before income tax 3,955
Capital additions (2,844) (24,897) - - - - (27,741)
30 June 2012 30 June 2011
$’000 $’000
Cost of sales
Mine operating costs 221,601 74,380
Depreciation and amortisation 93,603 20,275
Royalty and other selling costs 22,493 4,851
Other - 2,251
337,697 101,757
Corporate administration costs
Depreciation and amortisation 409 77
Operating lease payments 614 215
Employee wages and salaries 13,548 2,258
Contractor, consultants and advisory expense 10,351 -
Other administrative 3,840 5,816
28,762 8,366
Finance costs
Finance leases 552 25
Bank guarantee fees 508 -
Amortisation of debt establishment costs 1,152 869
Unwinding of discount on provisions 1,940 -
Interest expense 5,216 4,359
9,368 5,253
NOTES TO ThE FINANCIAL STATEMENTS
For
per
sona
l use
onl
y
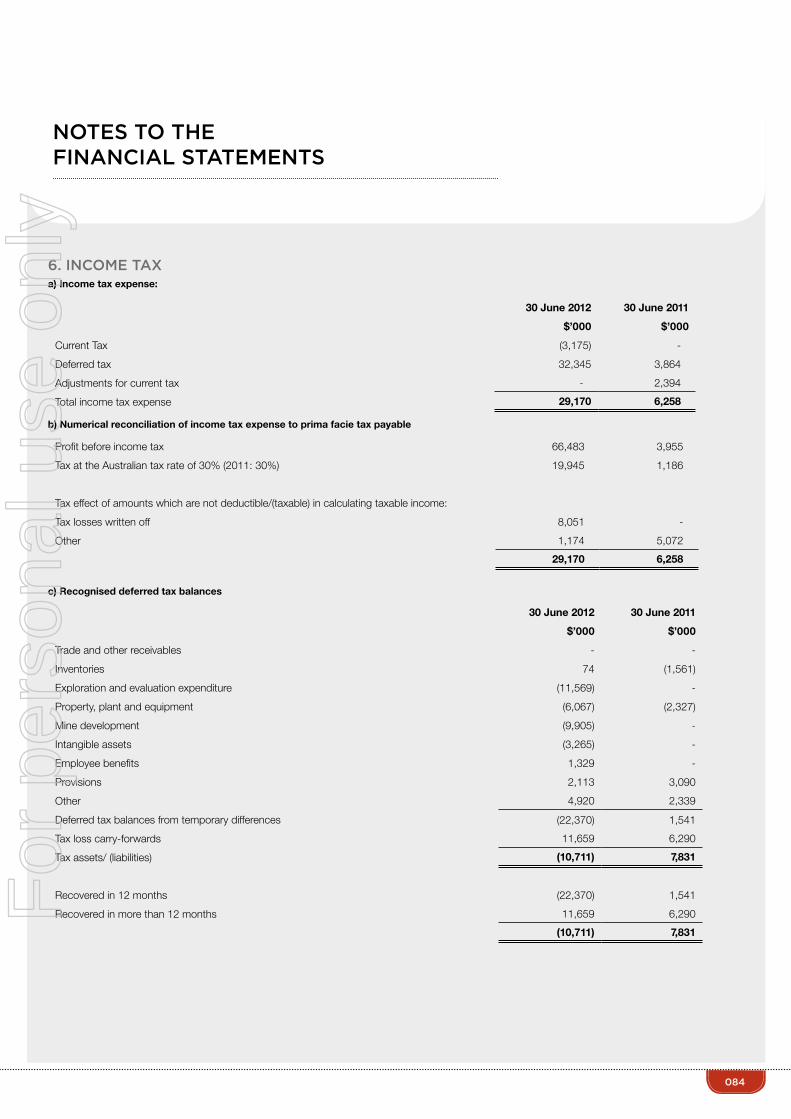
084
6. INCOME TAXa) Income tax expense:
b) Numerical reconciliation of income tax expense to prima facie tax payable
c) Recognised deferred tax balances
Edna May Cracow Pajingo Mt Rawdon Exploration Corporate/ Mt Carlton Total
$’000 $’000 $’000 $’000 $’000 $’000 $’000
Segment revenue 77,900 43,970 - - - - 121,870
Adjusted EBITDA* 17,049 11,859 - - - - 28,908
Reconciliation of profit before income tax:
Depreciation and amortisation (20,352)
Costs related to business combinations (974)
Interest income 1,626
Finance costs (5,253)
Profit before income tax 3,955
Capital additions (2,844) (24,897) - - - - (27,741)
30 June 2012 30 June 2011
$’000 $’000
Current Tax (3,175) -
Deferred tax 32,345 3,864
Adjustments for current tax - 2,394
Total income tax expense 29,170 6,258
Profit before income tax 66,483 3,955
Tax at the Australian tax rate of 30% (2011: 30%) 19,945 1,186
Tax effect of amounts which are not deductible/(taxable) in calculating taxable income:
Tax losses written off 8,051 -
Other 1,174 5,072
29,170 6,258
30 June 2012 30 June 2011
$’000 $’000
Trade and other receivables - -
Inventories 74 (1,561)
Exploration and evaluation expenditure (11,569) -
Property, plant and equipment (6,067) (2,327)
Mine development (9,905) -
Intangible assets (3,265) -
Employee benefits 1,329 -
Provisions 2,113 3,090
Other 4,920 2,339
Deferred tax balances from temporary differences (22,370) 1,541
Tax loss carry-forwards 11,659 6,290
Tax assets/ (liabilities) (10,711) 7,831
Recovered in 12 months (22,370) 1,541
Recovered in more than 12 months 11,659 6,290
(10,711) 7,831
NOTES TO ThE FINANCIAL STATEMENTS
For
per
sona
l use
onl
y

2012 EVOLUTION MINING ANNUAL REPORT
d) Movement in deferred tax balances during the year
7. TRAdE ANd OThER RECEIVABLES
No trade receivables were past due or impaired as at 30 June 2012 (2011: Nil).
8. INVENTORIES
Balance 1 July 2011 (Restated)
Recognised in profit or loss
Recognised in business
combination
Balance 30 June 2012
$’000 $’000 $’000 $’000
Inventories (1,561) 1,635 - 74
Exploration and evaluation expenditure - (11,569) - (11,569)
Property, plant and equipment (2,327) 460 (4,200) (6,067)
Mine development - (18,005) 8,100 (9,905)
Intangible assets - (3,265) - (3,265)
Employee benefits - (58) 1,387 1,329
Provisions 3,090 (976) - 2,113
Other 2,339 (2,761) 5,342 4,920
Tax losses carried forward 6,290 5,369 - 11,659
Deferred tax assets/ (liabilities) 7,831 (29,170) 10,629 (10,711)
30 June 2012 30 June 2011
$’000 $’000
Trade receivables 18,292 -
GST refundable 6,692 438
Accrued interest income 74 -
Prepayment and other receivables 2,881 2,281
27,939 2,719
30 June 2012 30 June 2011
$’000 $’000
Current
Stores 10,474 5,203
Ore 15,658 5,650
Bullion and Gold in circuit 9,012 7,246
35,144 18,099
Non-Current
Stores 4,308 -
4,308 -
NOTES TO ThE FINANCIAL STATEMENTS
For
per
sona
l use
onl
y
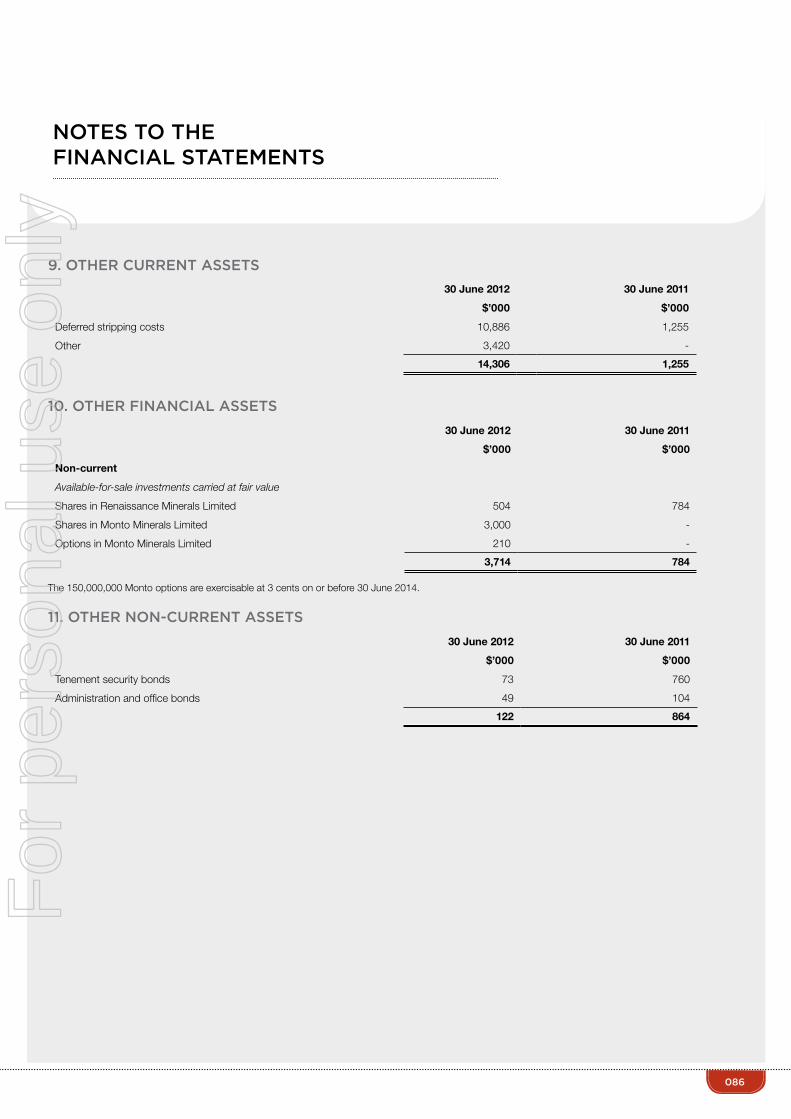
086
9. OThER CURRENT ASSETS
10. OThER FINANCIAL ASSETS
The 150,000,000 Monto options are exercisable at 3 cents on or before 30 June 2014.
11. OThER NON-CURRENT ASSETS
Balance 1 July 2011 (Restated)
Recognised in profit or loss
Recognised in business
combination
Balance 30 June 2012
$’000 $’000 $’000 $’000
Inventories (1,561) 1,635 - 74
Exploration and evaluation expenditure - (11,569) - (11,569)
Property, plant and equipment (2,327) 460 (4,200) (6,067)
Mine development - (18,005) 8,100 (9,905)
Intangible assets - (3,265) - (3,265)
Employee benefits - (58) 1,387 1,329
Provisions 3,090 (976) - 2,113
Other 2,339 (2,761) 5,342 4,920
Tax losses carried forward 6,290 5,369 - 11,659
Deferred tax assets/ (liabilities) 7,831 (29,170) 10,629 (10,711)
30 June 2012 30 June 2011
$’000 $’000
Current
Stores 10,474 5,203
Ore 15,658 5,650
Bullion and Gold in circuit 9,012 7,246
35,144 18,099
Non-Current
Stores 4,308 -
4,308 -
30 June 2012 30 June 2011
$’000 $’000
Deferred stripping costs 10,886 1,255
Other 3,420 -
14,306 1,255
30 June 2012 30 June 2011
$’000 $’000
Non-current
Available-for-sale investments carried at fair value
Shares in Renaissance Minerals Limited 504 784
Shares in Monto Minerals Limited 3,000 -
Options in Monto Minerals Limited 210 -
3,714 784
30 June 2012 30 June 2011
$’000 $’000
Tenement security bonds 73 760
Administration and office bonds 49 104
122 864
NOTES TO ThE FINANCIAL STATEMENTS
For
per
sona
l use
onl
y

2012 EVOLUTION MINING ANNUAL REPORT
12. PROPERTY, PLANT ANd EqUIPMENT
Freehold Land Plant and equipment Total
$’000 $’000 $’000
30 June 2012
Cost 9,261 291,117 300,378
Accumulated depreciation and impairment - (35,299) (35,299)
Net carrying amount 9,261 255,818 265,079
Reconciliation of movement for the year
Carrying amount at the beginning of the year 465 102,901 103,367
Additions 6,536 55,890 62,426
Amounts acquired in a business combination 2,260 117,767 120,027
Transfers to Mine development and Exploration - (688) (688)
Other adjustments relating to business combination - 851 851
Reclassifications - - -
Disposals - (1,348) (1,349)
Depreciation - (19,555) (19,555)
Impairment - - -
Carrying amount at the end of the year 9,261 255,818 265,079
Carrying amount of lease assets - 8,544 8,544
Carrying amount of assets under construction - 27,376 27,376
- 35,920 35,920
Freehold Land Plant and equipment Total
$’000 $’000 $’000
30 June 2011
Cost 465 118,991 119,456
Accumulated depreciation and impairment - (16,089) (16,089)
Net carrying amount 465 102,902 103,367
Reconciliation of movement for the year
Carrying amount at the beginning of the year 390 84,616 85,006
Additions 54 20,837 20,891
Amounts acquired in a business combination - - -
Transfers from Mine development - 4,687 4,687
Borrowing costs capitalised - 1,921 1,921
Reclassifications 21 (21) -
Depreciation - (9,138) (9,138)
Impairment - - -
Carrying amount at the end of the year 465 102,902 103,367
Carrying amount of lease assets - 683 683
Carrying amount of assets under construction - - -
- 683 159,476
NOTES TO ThE FINANCIAL STATEMENTS
For
per
sona
l use
onl
y

088
13. MINE dEVELOPMENT ANd EXPLORATION
(a) The other adjustments relate to the fair value adjustment on the previously held 30% interest in the Cracow gold project.
Mines under construction Producing mines Exploration and
evaluation Total
$’000 $’000 $’000 $’000
30 June 2012
Cost 247,380 530,198 91,479 869,056
Accumulated depreciation and impairment - (97,459) (12,910) (110,369)
Net carrying amount 247,380 432,738 78,569 758,687
Reconciliation of movement for the year
Carrying amount at the beginning of the year - 60,526 - 60,526
Additions 99,140 88,379 28,288 215,807
Amounts acquired in a business combination 148,240 363,751 46,172 558,163
Transfers from Property, plant and equipment - 28 660 688
Other Adjustments relating to Business Combination (a)
- 1,243 (293) 950
Reclassifications - (7,256) 7,256 -
Disposals - - (2,991) (2,991)
Depreciation and amortisation (73,933) (524) (74,457)
Impairment - - -
Carrying amount at the end of the year 247,380 432,738 78,569 758,687
Mines under construction Producing mines Exploration and
evaluation Total
$’000 $’000 $’000 $’000
30 June 2011
Cost - 68,919 - 68,919
Accumulated depreciation and impairment-
(8,393) - (8,393)
Net carrying amount - 60,526 - 60,526
Reconciliation of movement for the year
Carrying amount at the beginning of the year - 68,919 - 68,919
Additions - 6,850 - 6,850
Amounts acquired in a business combination - - - -
Transfers to Property, plant and equipment - (4,687) - (4,687)
Borrowing costs capitalised - - - -
Reclassifications - - - -
Disposals and obsolete items - - - -
Depreciation and amortisation - (10,556) - (10,556)
Impairment - - - -
Carrying amount at the end of the year - 60,526 - 60,526The amortisation of pre-production stripping costs is recorded as a cost of sale under depreciation and amortisation. The ultimate recoupment of costs carried forward for exploration and evaluation expenditure phases is dependent on the successful development and commercial exploitation, or alternatively, the sale of the respective areas.
NOTES TO ThE FINANCIAL STATEMENTS
For
per
sona
l use
onl
y

2012 EVOLUTION MINING ANNUAL REPORT
14. GOOdwILL
Given the nature of goodwill, its carrying amount is assessed for impairment on an annual basis relative to the value of relevant assets. No impairment has been recognised for goodwill for the year ended 30 June 2012 (2011: $Nil).
15. TRAdE ANd OThER PAYABLES
Note: Other creditors and accruals include significant capital accruals related to Mt Carlton project and stamp duty costs relating to the business combinations.
16. PROVISIONS
30 June 2012 30 June 2011
$’000 $’000
Goodwill at cost 18,365 -
30 June 2012 30 June 2011
$’000 $’000
Trade creditors 39,669 18,256
Other creditors and accruals 70,771 1,240
110,440 19,496
30 June 2012 30 June 2011
$’000 $’000
Current Provisions
Employee entitlements 8,550 1,716
Non-Current Provisions
Long Service Leave 524 501
Rehabilitation provision 46,959 4,339
47,483 4,840
Reconciliations of carrying amount movements of non-current provisions
Rehabilitation provision
Long Service Leave Total
$’000 $’000 $’000
Carrying amount at the beginning of the year 4,339 501 4,840
Charges during the year (610) - (610)
Amounts acquired in a business combination 22,360 661 23,021
Write-back of unused provisions - (369) (369)
Unwinding of discount 1,940 - 1,940
Change in provision assumptions 18,930 (269) 18,661
Carrying amount at the end of the year 46,959 524 47,483
The Group makes full provision for the future cost of rehabilitating mine sites and related production facilities on a discounted basis at the time of developing the mines and installing and using those facilities. The rehabilitation provision represents the present value of rehabilitation costs related to the Group’s mine sites. The nature of these costs includes dismantling and removing structures, rehabilitating mines and tailings dams, dismantling operating facilities, closure of plant and waste sites, and restoration, reclamation and re-vegetation of affected areas.
For the purposes of providing for the rehabilitation obligation at all mines it has been assumed rehabilitation costs will be incurred at the end of the mine’s useful life. The timing of this obligation is likely to change depending on a number of factors which may impact mine life including the identified reserve and resource, gold prices and costs of production which all impact the economic viability of the projects.
NOTES TO ThE FINANCIAL STATEMENTS
For
per
sona
l use
onl
y

090
Provisions have been determined with reference to the Group’s internal estimates and consultation with the Department of Environment and Resource Management. As noted in this report the Twin Hills project is currently on a care and maintenance program. A provision has been made to cover disturbance to date. Consultation is currently in process with the Department of Environment and Resource Management to reduce the environmental bond required at this site, in line with management’s assessment of the rehabilitation provision required. Provision estimates are reviewed regularly to take into account any material changes to assumptions. However actual rehabilitation costs will ultimately depend upon future market prices for the necessary decommissioning works required which will reflect market conditions at the relevant time.
17. INTEREST BEARING LIABILITIES
The Edna May loan facility is secured by:
• AfixedandfloatingchargeoverallassetsandundertakingsofEdnaMayOperationsPtyLtd.TotalnetassetsofEdnaMayare$138.4million;
• AmortgageovertheEdnaMayGoldOperationstenements;and
• AfixedchargeoverEdnaMay’sproceedsaccountandgoldaccountheldwithMacquarie.
Macquarie has placed covenants over the bank loan based on production levels and operating costs. The Group has complied with these covenants or in certain cases Macquarie has waived compliance during the year.
18. ISSUEd CAPITAL
30 June 2012 30 June 2011
$’000 $’000
Goodwill at cost 18,365 -
30 June 2012 30 June 2011
$’000 $’000
Current
Bank loan 16,500 16,000
Less: Borrowing costs (1,151) (1,152)
Finance lease liabilities 3,043 285
18,392 15,133
Non-Current
Bank loan 15,000 31,522
Less: Borrowing costs (1,150) (2,301)
Finance lease liabilities 3,604 399
17,454 29,620
30 June 2012 $’000
30 June 2011 $’000
Issued capital comprises 1,045,751 185,465707,105,713 fully paid ordinary shares
(30 June 2011: 178,095,822)30 June 2012 30 June 2011
Movement in issued shares for the period No. $’000 No. $’000
Opening balance for the year 178,095,822 185,465 162,749,311 162,613
Shares issued for merger 180,401,006 311,733 - -
Shares issued for asset acquisition 231,082,631 390,299 - -
Placement of shares 105,144,047 152,459 15,121,448 23,438
Shares issued on exercise of options 11,356,207 10,887 225,063 248
Compensation payments to option holders - - - (8)
Shares issued on conversion of performance rights 1,026,000 - - -
Costs associated with the issue of shares - (5,091) - (826)
Closing balance for the year 707,105,713 1,045,751 178,095,822 185,465
NOTES TO ThE FINANCIAL STATEMENTS
For
per
sona
l use
onl
y

2012 EVOLUTION MINING ANNUAL REPORT
During the period, the Company issued 180,401,006 fully paid ordinary shares after the scheme of arrangement became effective between Conquest Mining Limited and its shareholders.
The Company also issued 231,082,631 fully paid ordinary shares in exchange for the asset acquisition from Newcrest Mining Limited. The Company also issued 105,144,047 fully paid ordinary shares at $1.45 per share in November 2011 under the Company’s accelerated renounceable entitlement offer.
The Company issued 11,356,207 fully paid ordinary shares on exercise of 5,018,319 listed options and 6,337,888 unlisted options. The Company issued 1,026,000 fully paid ordinary shares on conversion of performance rights under the Employee Share Option and Performance Rights Plan.
Capital Management
Capital is defined as the equity of the Company. The Group’s objectives when managing capital are to safeguard the Group’s ability to continue as a going concern, so as to maintain a strong capital base sufficient to maintain future exploration and development of its projects. In order to maintain or adjust the capital structure, the Group may return capital to shareholders, issue new shares or sell assets to reduce debt. The Group’s focus has been to raise sufficient funds through equity to fund capital investment in the Mt Carlton project and exploration and evaluation activities.
The Group monitors its liquidity through regular cash flow forecasts.
19. RESERVESShare based payment reserve
Option reserve comprises the consideration received for the issue of options over unissued ordinary shares of the Company and the fair value of options over unissued ordinary shares granted as employee remuneration until the options are exercised or expire.
At 30 June 2012 there were 13,726,474 options on issue (2011: 13,917,166). Refer to disclosure at Note 23 for further detail.
Fair Value revaluation reserve
The fair Value revaluation reserve includes the cumulative net change in the fair value of available for sale investments until the investment is derecognised.
These investments relates to 2,800,000 fully paid ordinary shares in Renaissance Minerals Limited, 300,000,000 fully paid ordinary shares in Monto Minerals Limited (“Monto”) and 150,000,000 options in Monto exercisable at 3 cents on or before 30 June 2014. Refer to Note 10 for further detail with respect to the available for sale listed securities and unlisted options.
30 June 2012 $’000
30 June 2011 $’000
Options over ordinary shares 5,144 4,584
Cost of replacement options issued as consideration to Conquest option holders 7,525 -
Share based payment expense recognised in equity as a cost of issuing shares - -
Share based payment expense recognised in profit and loss 2,299 560
Other 74 -
Balance at the end of year 15,042 5,144
30 June 2012 30 June 2011
$’000 $’000
Balance at beginning of year 157 -
Change in fair value of available for sale listed securities (5,770) 224
Tax effect of change in fair value - (67)
Balance at end of year (5,613) 157
NOTES TO ThE FINANCIAL STATEMENTS
For
per
sona
l use
onl
y

092
20. ACCUMULATEd EARNINGS/ (LOSSES)Movements in retained earnings are as follows:
* The opening balance as at 1 July 2010 has been restated for an error in the opening tax balances relating to property plant and equipment and other assets.
30 June 2012 30 June 2011
$’000 $’000
Balance at beginning of year 157 -
Change in fair value of available for sale listed securities (5,770) 224
Tax effect of change in fair value - (67)
Balance at end of year (5,613) 157
30 June 2012 30 June 2011
$’000 $’000
Balance at the beginning of the year (36,075) (28,469)
Net profit/ (loss) for the year 37,313 (2,303)
Correction of error to retained earnings* - (5,303)
Balance at the end of the year 1,238 (36,075)
NOTES TO ThE FINANCIAL STATEMENTS
For
per
sona
l use
onl
y

2012 EVOLUTION MINING ANNUAL REPORT
21. NOTES TO ThE CONSOLIdATEd STATEMENT OF CASh FLOwS For the purposes of the statement of cash flows, cash includes cash on hand and in banks, and money market investments readily convertible to cash within two working days, net of outstanding bank overdrafts.
30 June 2012 30 June 2011
$’000 $’000
(a) Reconciliation of cash and cash equivalents
Reconciliation of cash balance comprises:
Cash at bank 29,634 13,788
Short term deposits 112,150 14,042
Group’s share of cash held by joint venture - 2,221
141,784 30,051
(b) Reconciliation of profit/ (loss) to net cash inflow from operating activities:
Profit/ (loss) for the year 37,313 (2,303)
Add/(less) items classified as investing/financing activities:
Depreciation and amortisation 94,012 20,275
Share based payment 2,299 560
Amortisation of borrowing costs 1,152 869
Unwind of discount in provisions 1,940 -
Fair value change on Cracow 30% holding (2,757) -
Exploration assets written off during the period 2,991
Interest paid and capitalised - 1,921
Interest expense capitalised as bank loan principal - 22
Proceeds from sale of gold capitalised - (21,481)
Payments to suppliers and employees capitalised - 21,874
Change in assets and liabilities during the financial year:
(Increase)/decrease in other receivables (22,347) (1,361)
(Increase)/decrease in deferred mining expenditure (8,756) -
(Increase)/decrease in inventories 6,665 (7,982)
Increase/(decrease) in trade and other payables 27,577 3,799
Increase/(decrease) in provisions 3,086 431
Increase/(decrease) in deferred tax balance 29,109 5,835
Net cash provided by operating activities 172,284 22,459
NOTES TO ThE FINANCIAL STATEMENTS
For
per
sona
l use
onl
y

094
22. BUSINESS COMBINATIONSOn 15 June 2011, Evolution Mining Limited and Conquest Mining Limited announced that they had entered into a binding share purchase agreement to implement a transaction that would result in the creation of a leading growth-focused Australian gold company through an all-scrip merger of equals.
In a separate but inter-conditional transaction, Evolution Mining Limited acquired 100% of the Mt Rawdon Gold Project and 70% of the Cracow Gold Project from Newcrest Mining Limited. All regulatory approvals were obtained 17 October 2011. The scheme became effective and the asset acquisitions were completed on 2 November 2011.
Acquisition of Conquest Mining Limited and subsidiaries (‘Conquest’)
The acquisition date of the Conquest Group by Evolution was 17 October 2011.
Consideration comprised the issue of Evolution Mining fully paid ordinary shares to eligible Conquest shareholders and the replacement of certain Conquest Group options. The new shares were issued at a ratio of 0.3 new shares to 1 Conquest share.
A total of 180,401,006 fully paid ordinary shares were issued to Conquest shareholders as consideration. These shares were valued at $311.733 million based upon the closing share price on the date of acquisition. In addition, 11,324,738 Evolution options were issued as replacement options to Conquest option holders. These options were valued at $7.525 million at the date of acquisition using a Black Scholes model.
The fair value of the identifiable assets and liabilities of the Conquest Group as at the date of acquisition were:
Consideration issued and paid for the above transaction was as follows:
Acquisition date fair values
$‘000
Cash and cash equivalents 12,748
Trade and other receivables 3,682
Inventories 16,992
Investments 8,552
Property, plant and equipment 43,576
Mine development and exploration 266,763
Deferred tax asset 1,835
Total Assets 354,148
Trade and other payables 21,338
Interest bearing liabilities 6,113
Provisions 7,439
Total Liabilities 34,890
Net Assets 319,258
$‘000
Shares issued, at fair value 311,733
Conquest replacement options issued 7,525
Total consideration 319,258
The cash inflow was as follows:
Net cash acquired 12,748
Net consolidated cash inflow 12,748
NOTES TO ThE FINANCIAL STATEMENTS
For
per
sona
l use
onl
y

2012 EVOLUTION MINING ANNUAL REPORT
Conquest Mining Limited holds a 100% interest in the following companies:
Acquisition of the Mt Rawdon Gold Mine and 70% of the Cracow Gold Mine from Newcrest Mining Limited (‘Newcrest’)
On 2 November 2011, being the acquisition date for the purpose of this financial report, Evolution acquired a 100% interest in the Mt Rawdon gold mine and the remaining 70% of interest in Cracow gold mine. Evolution previously held a 30% joint venture interest in the Cracow gold mine through its subsidiaries. The transactions were asset acquisitions however certain employees and other elements required to continue the operation of the mine were transferred with the assets acquired.
These transactions have been accounted for as business combinations in this financial report.
The total consideration transferred consisted of the issuing of 231,082,631 Evolution shares to a nominee of Newcrest. The fair value of shares issued was based upon the closing company share price on 2 November 2011.
The fair value of the identifiable assets and liabilities of the Cracow Gold Project (70% interest) and the Mt Rawdon gold project as at the date of acquisition were:
CQT Gold Australia Pty Ltd ACN 128 947 419
CQT Holdings Pty Limited ACN 115 279 653
NQM Gold 2 Pty Limited ACN 129 020 248
NQM Gold Pty Limited ACN 126 817 043
Walker Resources Pty Limited ACN 116 453 742
Baal Gammon Operations Pty Limited ACN 125 765 451
NQM Exploration Pty Limited ACN 125 728 154
Acquisition date fair values
$‘000
Trade and other receivables 350
Inventories 15,500
Property, plant and equipment 76,451
Mine development and exploration 291,400
Deferred tax asset 8,793
Total Assets 392,494
Trade and other payables 1,383
Provisions 19,177
Total Liabilities 20,560
Fair value of net identifiable assets 371,934
Add: Goodwill 18,365
Net assets acquired 390,299
NOTES TO ThE FINANCIAL STATEMENTS
For
per
sona
l use
onl
y

096
Consideration issued and paid for the above transaction was as follows:
On 2 November 2011, Evolution gained control of the Cracow gold mine as it increased its interest in the project from 30% to 100%. Evolution remeasured its 30% equity investment in Cracow resulting in a gain of $2.757 million which has been recognised as an income item separately disclosed as a line item in the Statement of Comprehensive Income. The acquisition-date fair value of the 30% equity interest in Cracow was $48.509 million.
Acquisition costs recognised with respect to the above business combinations were $28.518 million.
The acquired entities contributed operating revenue of $329.216 million and net profit before tax of $83.793 million to the Group for the period. If these acquisitions had occurred on 1 July 2011 consolidated operating revenue and consolidated profit before tax for the year ended 30 June 2012 would have increased by $105.707 million and $27.592 million respectively.
Goodwill was recognised as a result of the acquisition as follows:
Goodwill has been recognised in the above business combinations due to the synergies which result from the transaction. These benefits include the following: • TheacquisitionsallowEvolutiontocontrol100%oftheCracowGoldMine.TheacquisitionoftheremaininginterestwillallowEvolutiontobettermanage and prioritise exploration and development expenditure for the growth and sustainability of the mine. • TheincreasedsizedoftheGroupwillallowforimprovedaccesstodebtandequitymarkets. • Costsavingsmayeventuatefromtheeliminationofduplicatedcorporatestructures,improvedprocurementpowerandsharedservicesfunctions.
23. ShARE BASEd PAYMENTS(a) Types of share based payment plansEvolution has two option and performance rights plans in existence:
Employee Share Option and Performance Rights Plan (‘ESOP’)ESOPRP was established and approved at the Annual General Meeting on 23 November 2010, and amended on 19 October 2011. The plan permits the Company, at the discretion of the Directors, to grant both options and performance rights over unissued ordinary shares of the Company to eligible Directors and members of staff as specified in the plan rules.
Employees and Contractors Option Plan (‘ECOP’)An ECOP was established and approved at the Annual General Meeting on 27 November 2008. The plan permits the Company, at the discretion of the Directors, to grant options over unissued ordinary shares of the Company to eligible Directors, members of staff and contractors as specified in the plan rules. No further options will be issued under this plan.
$‘000
Shares issued, at fair value 390,299
Total consideration 390,299
The net cash inflow from the above transaction was as follows:
Net cash acquired -
Net consolidated cash inflow -
$‘000
Total consideration 390,299
Less: fair value of net identifiable assets (371,934)
18,365
NOTES TO ThE FINANCIAL STATEMENTS
For
per
sona
l use
onl
y

2012 EVOLUTION MINING ANNUAL REPORT
30 June 2012 $‘000
30 June 2011 $‘000
Expense arising from equity settled share based payment transactions recognised in profit and loss 2,299 560
30 June 2012 Number
30 June 2012 WAEP
($)
30 June 2011 Number
30 June 2011 WAEP
($)
Outstanding at the beginning of the year (1 July) 13,917,166 1.01 13,481,411 0.98
Replacement options issued to Conquest option holders (i) 11,324,738 1.88 - -
Options granted to employees during the year - - 679,000 1.69
Exercised during the year (11,356,207) 0.96 (225,063) 1.10
Expired during the year (159,223) 1.10 (18,182) 1.14
Outstanding at the end of the year 13,726,474 1.77 13,917,166 1.01
Exercisable at the end of the year 13,726,474 1.78 13,917,166 1.01
Number
Options issued under ECOP 488,651
Options issued under ESOP 8,586,087
Options issued outside of ECOP and ESOP:
Options acquired by Mr Klein from Southern Cross Equities 600,000
Options issued to Baker Steel Capital Managers 1,650,000
Total 11,324,738
(b) Recognised share based payment expenses
During the year Evolution issued 11,324,738 unquoted options as consideration for the cancellation of outstanding options previously held by Conquest option holders. The options were issued at various exercise prises and expiry dates. All options were fully vested and no further service period was required for the replacement options. All replacement options were issued under the ESOP on equivalent terms and conditions as the original grant by Conquest. The options had a fair value of $7,525,000.
(c) Summary and movement of options on issue
The following table illustrates the number and weighted average exercise prices (WAEP) in Australian Dollars ($) of, and movements in, share options issued during the period:
(i) The replacement options of 11,324,738 comprise the following:
The weighted average remaining contractual life of options outstanding at the end of the financial year was 3.0 years (2011: 2.8 years) with exercise prices ranging from $0.609 to $3.062. The weighted average fair value of options granted during the year was $0.664 (2011: $0.98).
NOTES TO ThE FINANCIAL STATEMENTS
For
per
sona
l use
onl
y

98
30 June 2012 $‘000
30 June 2011 $‘000
Expense arising from equity settled share based payment transactions recognised in profit and loss 2,299 560
The outstanding balance as at 30 June 2012 is represented by:
Options issued as part of the ECOP
- 613,641 options with an exercise price ranging from $0.609 to $0.829
- 886,369 options with an exercise price ranging from $1.049 to $1.269
- 676,306 options with an exercise price ranging from $1.472 to $1.936
- 85,071 options with an exercise price ranging from $2.072 to $2.412
Options issued as part of the ESOP
- 2,166,043 options with an exercise price ranging from $1.267 to $1.472
- 5,310,198 options with an exercise price ranging from $1.690 to $1.936
- 1,738,846 options with an exercise price ranging from $2.072 to $2.412
Options issued outside both the ECOP and ESOP
- 600,000 options with an exercise price of $3.062
- 1,650,000 options with an exercise price of $1.962
(d) Summary and movement of performance rights on issue as part of ESOP
The following table illustrates the number and weighted average exercise prices (WAEP) in Australian Dollars ($) of, and movements in, performance rights issued during the year:
The weighted average fair value of performance rights granted during the year was $1.411 (2011: $1.31).
(e) Fair value determination
Performance rights
During the year, Evolution issued two equal tranches of performance rights which will be tested on 30 June 2013 and 30 June 2014. They have three performance components: a market-based TSR condition, and two non-market based conditions, being C1 condition and continued employment at the vesting date.
(i) TSR Performance Right valuation
The fair value of the TSR Performance Rights (market-based condition) was estimated at the date of grant using Monte Carlo simulation, taking into account the terms and conditions upon which the awards were granted.
30 June 2012 Number
30 June 2012 WAEP
($)
30 June 2011 Number
30 June 2011 WAEP
($)
Outstanding at the beginning of the period (1 July) 1,151,000 - - -
Performance rights granted during the period 3,668,344 - 1,151,000 -
Exercised during the period (1,026,000) -
Lapsed during the period (125,000) - - -
Forfeited during the year (87,586) - - -
Outstanding at the end of the period 3,580,758 - 1,151,000 -
Exercisable at the end of the period - - - -
NOTES TO ThE FINANCIAL STATEMENTS
For
per
sona
l use
onl
y

2012 EVOLUTION MINING ANNUAL REPORT
(ii) C1 Performance Right valuation
In accordance with the rules of the plan, the valuation of the C1 Performance Rights (non-market based performance condition) is based on information from other companies in the comparator group and not a market price or market condition. The fair value before considering expected C1 rankings against the Comparator is essentially the share price on grant date as future dividends cannot be reliably estimated.
The following tables list the inputs to the models used for the performance rights granted for the year:
Conquest replacement options:
The fair value of the Conquest Mining replacement options was determined using a Black-Scholes model.
The following table lists the inputs to the models used to determine the fair value of the replacement options granted during the year:
The volatility above was determined with reference to historical volatility but also incorporates factors that management believes will impact the actual volatility of the Company’s shares in future periods.
24. EARNINGS PER ShARE
TSR
Tranche 1
TSR
Tranche 2
C1
Tranche 1
C1
Tranche 2 November 2011 rights issue
Spot price ($) 1.72 1.72 1.72 1.72
Risk-free rate (%) 3.13 3.15 3.13 3.15
Term (years) 1.6 2.6 1.6 2.6
Volatility 50% 50% 50% 50%
February/April 2012 rights issue
Spot price ($) 1.87 1.87 1.87 1.87
Risk-free rate (%) 3.32 3.21 3.32 3.21
Term (years) 1.4 2.4 1.4 2.4
Volatility 50% 50% 50% 50%
Grant Date 17 October 2011
Spot Price ($) 1.77
Risk-free rate (%) 3.7
Term (years) Various
Volatility (%) 50%
Year ended Year ended
30 June 2012 30 June 2011
Basic earnings profit /(loss) per share (cents per share) 7.10 (1.37)
Diluted earnings profit /(loss) per share (cents per share) 6.94 (1.37)
Weighted average number of ordinary shares on issue used in the calculation of basic earnings per share 525,862,667 168,728,054
Effect of dilution:
Share options and performance rights 13,270,640 -
Weighted average number of ordinary shares used in the calculation of diluted earnings per share 537,882,443 168,728,054
NOTES TO ThE FINANCIAL STATEMENTS
Replacement options issued to Conquest option holders
For
per
sona
l use
onl
y

100
Basic earnings per share (‘EPS’) is calculated by dividing the net profit/(loss) after income tax attributable to members of the Company by the weighted average number of ordinary shares of the Company outstanding during the financial year. Diluted earnings per share adjusts the figures used in the determination of basic earnings per share to take into account the after income tax effect of interest and other financing costs associated with dilutive potential ordinary shares and the weighted average number of shares assumed to have been issued for no consideration in relation to dilutive potential ordinary shares.
25. RELATEd PARTY TRANSACTIONSParent entity
The ultimate parent entity within the Group is Evolution Mining Limited.
The balances and transactions between the Company and its subsidiaries, which are related parties of the Company, have been eliminated on consolidation and are not disclosed in this note. Details of transactions between the Group and other related parties are disclosed below.
(a) Equity interests in related parties
Equity interests in subsidiaries
Details of the percentage ownership of subsidiaries are disclosed in Note 22 to the financial statements.
(b) Transactions with Directors and KMP’s
KMP compensation
Details of KMP compensation are provided in the Remuneration Report of the Directors’ Report designated as audited.
Loans to Directors and senior management
There were no loans to Directors or senior management during the period.
(c) KMP Compensation
The aggregate compensation provided to Directors and KMP’s is set out below:
Consolidated
30 June 2012 $
30 June 2011 $
Short-term benefits 5,416,475 2,791,032
Post-employment benefits 228,347 215,574
Termination benefits 1,359,551 -
Share-based payments 1,597,313 414,624
Total 8,601,686 3,421,230
NOTES TO ThE FINANCIAL STATEMENTS
For
per
sona
l use
onl
y

2012 EVOLUTION MINING ANNUAL REPORT
(d) Director and KMP’s equity holdings
(i) Fully paid ordinary shares of Evolution Mining Limited:
2012
(i) Employment commenced on 19 October 2011
(ii) Employment terminated on 18 October 2011
(iii) Employment terminated on 25 January 2012
(iv) Employment commenced on 24 October 2011
(v) Resigned 23 December 2011
(vi) Employment terminated on 27 January 2012
(vii) Employment terminated on 29 February 2012
(viii) Employment terminated on 30 June 2012
(ix) Includes 5,255,247 shares issued on 2 November 2011 pursuant to the Scheme of Arrangement with Conquest Mining Limited.
(x) Includes 484,097 shares issued on 2 November 2011 pursuant to the Scheme of Arrangement with Conquest Mining Limited.
(xi) Includes 6,676,147 shares issued on 2 November 2011 pursuant to the Scheme of Arrangement with Conquest Mining Limited.
NOTES TO ThE FINANCIAL STATEMENTS
Balance at start of period or date
of appointment
Received on exercise of options
and performance rights
Net other change
Balance at end of period or date of
resignation
Directors
Jacob Klein (i) - - 5,590,000(ix) 5,590,000
James Askew (i) - - 500,000(x) 500,000
Lawrie Conway (i) - - - -
Graham Freestone 58,245 - 10,278 68,523
Paul Marks (i) - - 6,952,009(xi) 6,952,009
John Rowe 95,695 - 16,887 112,582
Peter Smith (i) - - 35,000 35,000
Peter Maloney (ii) 1,379,579 - - 1,379,579
Bruce McFadzean (iii) 171,619 175,682 61,288 408,589
Murray Pollock (ii) 1,839,492 - - 1,839,492
Barry Sullivan (ii) 111,005 - - 111,005
KMP’s
Tim Churcher (iv) - - - -
Aaron Colleran (i) - - 82,998 82,998
Evan Elstein (i) - - 3,529 3,529
Mark Le Messurier (i) - - 22,176 22,176
Adrian Pelliccia - - 94,117 94,117
Raelene Wyatt - - - -
John Fraser (v) - - - -
Paul Mason (vi) 10,000 - 53,528 63,528
Erik Palmbachs (vii) 11,576 - 131,543 143,119
Stuart Pether (viii) 175,516 - 125,000 300,516
For
per
sona
l use
onl
y

102
Fully paid ordinary shares for the previous financial year:
2011
NOTES TO ThE FINANCIAL STATEMENTS
Balance at start of period or date of
appointment
Received on exercise of options
Net other change
Balance at end of period or date of
resignation
Directors
Graham Freestone 58,245 - - 58,245
Peter Maloney 1,379,579 - - 1,379,579
Bruce McFadzean 97,369 - 74,250 171,619
Murray Pollock 1,839,492 - - 1,839,492
John Rowe 95,695 - - 95,695
Barry Sullivan 111,005 - - 111,005
KMP’s
Graham Anderson (i) - - - -
John Fraser - - - -
Paul Mason (ii) 10,000 - - 10,000
Leonard Math (i) - - - -
Erik Palmbachs 11,576 - - 11,576
Adrian Pelliccia 16,932 - (16,932) -
Stuart Pether 175,516 - - 175,516
(i) Resigned 30 December 2010
(ii) Appointed 30 December 2010
For
per
sona
l use
onl
y

2012 EVOLUTION MINING ANNUAL REPORT
(ii) Options
The numbers of options over ordinary shares in the Company held during the financial year by each Director of Evolution Mining Limited and other KMP’s of the Group, including their personally related parties, are set out below:
2012
1 All options vested during the period pursuant to the formation of Evolution Mining Limited (then named Catalpa Resources Limited) following the merger with Conquest Mining Limited by a scheme of arrangement implemented on 2 November 2011. 2 4,677,435 options were issued as consideration for the cancellation of the outstanding options in Conquest Mining Limited following the merger of Evolution (then named Catalpa Resources Limited) and Conquest Mining Limited by a scheme of arrangement implemented on 2 November 2011. The balance of 600,000 options were acquired from Southern Cross Equities on an arms-length basis in June 2011.3 488,651 options were issued as consideration for the cancellation of the outstanding options in Conquest Mining Limited following the merger of Evolution (then named Catalpa Resources Limited) and Conquest Mining Limited by a scheme of arrangement implemented on 2 November 2011. 4 The options expired on 31 October 2011.
NOTES TO ThE FINANCIAL STATEMENTS
Balance
at start of
period
Granted
as
compen-
sation
ExercisedNet other
change
Balance at
year end or
resignation
date
Balance
vested
Vested &
exercise-
able
Options
vested
during
period1
Directors
Jacob Klein - - - 5,277,4352 5,277,435 5,277,435 5,277,435 5,277,435
James Askew - - - 488,6513 488,651 488,651 488,651 488,651
Lawrie Conway - - - - - - - -
Graham Freestone - - - - - - - -
Paul Marks - - - - - - - -
John Rowe 181,820 - - - 181,820 181,820 181,820 -
Peter Smith - - - - - - - -
Peter Maloney - - - - - - - -
Bruce McFadzean 1,284,774 - - (15,682)4 1,269,092 1,269,092 1,269,092 344,318
Murray Pollock 301,554 - - 301,554 301,554 301,554 -
Barry Sullivan 45,458 - - - 45,458 45,458 45,458 -
KMP’s
Tim Churcher - - - - - - - -
Aaron Colleran - - - 1,080,000 1,080,000 1,080,000 1,080,000 1,080,000
Evan Elstein - - - 105,000 105,000 105,000 105,000 105,000
Mark Le Messurier - - - 450,000 450,000 450,000 450,000 450,000
Adrian Pelliccia 34,000 - - - 34,000 34,000 34,000 -
Raelene Wyatt - - - - - - - -
John Fraser 50,000 - (50,000) - - - - 50,000
Paul Mason - - - - - - - -
Erik Palmbachs 337,276 - - - 337,276 337,276 337,276 110,000
Stuart Pether 579,548 - - - 579,548 579,548 579,548 125,000
At end of period
For
per
sona
l use
onl
y
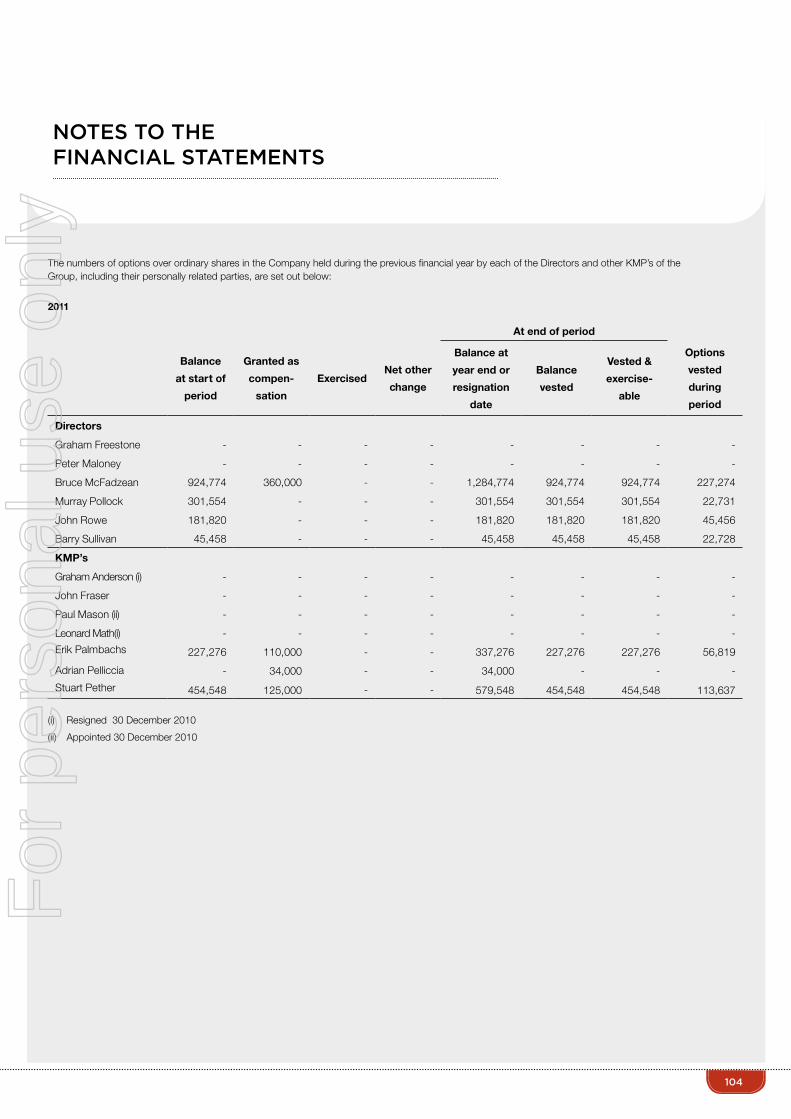
104
The numbers of options over ordinary shares in the Company held during the previous financial year by each of the Directors and other KMP’s of the Group, including their personally related parties, are set out below:
2011
NOTES TO ThE FINANCIAL STATEMENTS
Balance
at start of
period
Granted
as
compen-
sation
ExercisedNet other
change
Balance at
year end or
resignation
date
Balance
vested
Vested &
exercise-
able
Options
vested
during
period1
Directors
Jacob Klein - - - 5,277,4352 5,277,435 5,277,435 5,277,435 5,277,435
James Askew - - - 488,6513 488,651 488,651 488,651 488,651
Lawrie Conway - - - - - - - -
Graham Freestone - - - - - - - -
Paul Marks - - - - - - - -
John Rowe 181,820 - - - 181,820 181,820 181,820 -
Peter Smith - - - - - - - -
Peter Maloney - - - - - - - -
Bruce McFadzean 1,284,774 - - (15,682)4 1,269,092 1,269,092 1,269,092 344,318
Murray Pollock 301,554 - - 301,554 301,554 301,554 -
Barry Sullivan 45,458 - - - 45,458 45,458 45,458 -
KMP’s
Tim Churcher - - - - - - - -
Aaron Colleran - - - 1,080,000 1,080,000 1,080,000 1,080,000 1,080,000
Evan Elstein - - - 105,000 105,000 105,000 105,000 105,000
Mark Le Messurier - - - 450,000 450,000 450,000 450,000 450,000
Adrian Pelliccia 34,000 - - - 34,000 34,000 34,000 -
Raelene Wyatt - - - - - - - -
John Fraser 50,000 - (50,000) - - - - 50,000
Paul Mason - - - - - - - -
Erik Palmbachs 337,276 - - - 337,276 337,276 337,276 110,000
Stuart Pether 579,548 - - - 579,548 579,548 579,548 125,000
At end of period
Balance
at start of
period
Granted as
compen-
sation
ExercisedNet other
change
Balance at
year end or
resignation
date
Balance
vested
Vested &
exercise-
able
Options
vested
during
period
Directors
Graham Freestone - - - - - - - -
Peter Maloney - - - - - - - -
Bruce McFadzean 924,774 360,000 - - 1,284,774 924,774 924,774 227,274
Murray Pollock 301,554 - - - 301,554 301,554 301,554 22,731
John Rowe 181,820 - - - 181,820 181,820 181,820 45,456
Barry Sullivan 45,458 - - - 45,458 45,458 45,458 22,728
KMP’s
Graham Anderson (i) - - - - - - - -
John Fraser - - - - - - - -
Paul Mason (ii) - - - - - - - -
Leonard Math(i) - - - - - - - -
Erik Palmbachs 227,276 110,000 - - 337,276 227,276 227,276 56,819
Adrian Pelliccia - 34,000 - - 34,000 - - -
Stuart Pether 454,548 125,000 - - 579,548 454,548 454,548 113,637
(i) Resigned 30 December 2010
(ii) Appointed 30 December 2010
For
per
sona
l use
onl
y
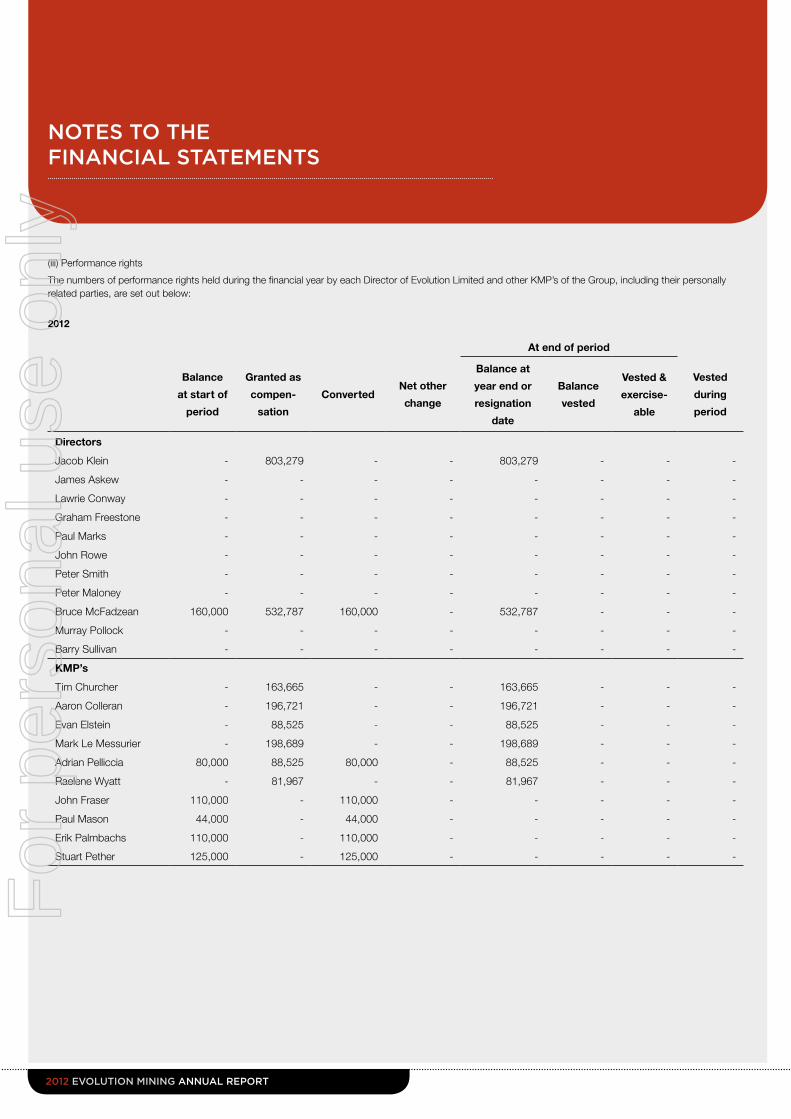
2012 EVOLUTION MINING ANNUAL REPORT
(iii) Performance rights
The numbers of performance rights held during the financial year by each Director of Evolution Limited and other KMP’s of the Group, including their personally related parties, are set out below:
2012
NOTES TO ThE FINANCIAL STATEMENTS
At end of period
Balance
at start of
period
Granted as
compen-
sation
ConvertedNet other
change
Balance at
year end or
resignation
date
Balance
vested
Vested &
exercise-
able
Vested
during
period
Directors
Jacob Klein - 803,279 - - 803,279 - - -
James Askew - - - - - - - -
Lawrie Conway - - - - - - - -
Graham Freestone - - - - - - - -
Paul Marks - - - - - - - -
John Rowe - - - - - - - -
Peter Smith - - - - - - - -
Peter Maloney - - - - - - - -
Bruce McFadzean 160,000 532,787 160,000 - 532,787 - - -
Murray Pollock - - - - - - - -
Barry Sullivan - - - - - - - -
KMP’s
Tim Churcher - 163,665 - - 163,665 - - -
Aaron Colleran - 196,721 - - 196,721 - - -
Evan Elstein - 88,525 - - 88,525 - - -
Mark Le Messurier - 198,689 - - 198,689 - - -
Adrian Pelliccia 80,000 88,525 80,000 - 88,525 - - -
Raelene Wyatt - 81,967 - - 81,967 - - -
John Fraser 110,000 - 110,000 - - - - -
Paul Mason 44,000 - 44,000 - - - - -
Erik Palmbachs 110,000 - 110,000 - - - - -
Stuart Pether 125,000 - 125,000 - - - - -
For
per
sona
l use
onl
y
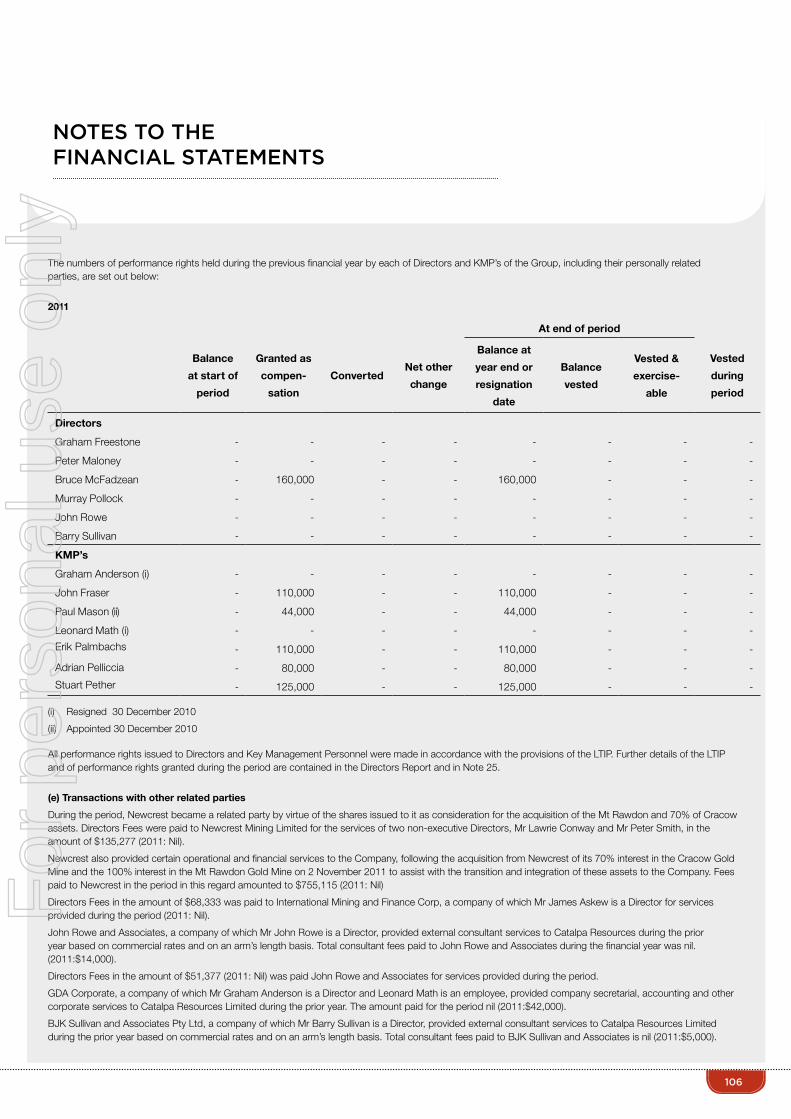
106
The numbers of performance rights held during the previous financial year by each of Directors and KMP’s of the Group, including their personally related parties, are set out below:
2011
All performance rights issued to Directors and Key Management Personnel were made in accordance with the provisions of the LTIP. Further details of the LTIP and of performance rights granted during the period are contained in the Directors Report and in Note 25.
(e) Transactions with other related parties
During the period, Newcrest became a related party by virtue of the shares issued to it as consideration for the acquisition of the Mt Rawdon and 70% of Cracow assets. Directors Fees were paid to Newcrest Mining Limited for the services of two non-executive Directors, Mr Lawrie Conway and Mr Peter Smith, in the amount of $135,277 (2011: Nil).
Newcrest also provided certain operational and financial services to the Company, following the acquisition from Newcrest of its 70% interest in the Cracow Gold Mine and the 100% interest in the Mt Rawdon Gold Mine on 2 November 2011 to assist with the transition and integration of these assets to the Company. Fees paid to Newcrest in the period in this regard amounted to $755,115 (2011: Nil)
Directors Fees in the amount of $68,333 was paid to International Mining and Finance Corp, a company of which Mr James Askew is a Director for services provided during the period (2011: Nil).
John Rowe and Associates, a company of which Mr John Rowe is a Director, provided external consultant services to Catalpa Resources during the prior year based on commercial rates and on an arm’s length basis. Total consultant fees paid to John Rowe and Associates during the financial year was nil. (2011:$14,000).
Directors Fees in the amount of $51,377 (2011: Nil) was paid John Rowe and Associates for services provided during the period.
GDA Corporate, a company of which Mr Graham Anderson is a Director and Leonard Math is an employee, provided company secretarial, accounting and other corporate services to Catalpa Resources Limited during the prior year. The amount paid for the period nil (2011:$42,000).
BJK Sullivan and Associates Pty Ltd, a company of which Mr Barry Sullivan is a Director, provided external consultant services to Catalpa Resources Limited during the prior year based on commercial rates and on an arm’s length basis. Total consultant fees paid to BJK Sullivan and Associates is nil (2011:$5,000).
NOTES TO ThE FINANCIAL STATEMENTS
At end of period
Balance
at start of
period
Granted as
compen-
sation
ConvertedNet other
change
Balance at
year end or
resignation
date
Balance
vested
Vested &
exercise-
able
Vested
during
period
Directors
Graham Freestone - - - - - - - -
Peter Maloney - - - - - - - -
Bruce McFadzean - 160,000 - - 160,000 - - -
Murray Pollock - - - - - - - -
John Rowe - - - - - - - -
Barry Sullivan - - - - - - - -
KMP’s
Graham Anderson (i) - - - - - - - -
John Fraser - 110,000 - - 110,000 - - -
Paul Mason (ii) - 44,000 - - 44,000 - - -
Leonard Math (i) - - - - - - - -
Erik Palmbachs - 110,000 - - 110,000 - - -
Adrian Pelliccia - 80,000 - - 80,000 - - -
Stuart Pether - 125,000 - - 125,000 - - -
(i) Resigned 30 December 2010
(ii) Appointed 30 December 2010
For
per
sona
l use
onl
y

2012 EVOLUTION MINING ANNUAL REPORT
26. AUdITOR’S REMUNERATIONDuring the year, the following fees were paid or payable for services provided by the auditor of the parent entity:
27. GOLd dELIVERY COMMITMENTS
30 June 2012
$
30 June 2011
$PwC Australia
(a) Audit and other assurance services
Audit and review of financial statements 310,000 -
Other assurance services 79,000 -
389,000 -
(b) Taxation services – tax compliance and advice 163,533 -
(c) Other services – accounting advice and support 50,967 -
214,500 -
Deloitte Touche Tohmatsu
(a) Audit and other assurance services
Audit and review of financial statements 113,538 98,425
(a) Other services
Proposed merger with Conquest Mining Limited 113,350 26,000
Advice on corporate strategy - 84,983
Merger implementation assistance 386,474 -
613,362 209,408
As at 30 June 2012 Gold for physical delivery Contracted sales price Value of committed sales
(ounces) A$ $’000
Within one year 66,589 1,573 104,744
Later than one year but not greater than five years 157,588 1,573 247,886
224,177 352,630
As at 30 June 2011 Gold for physical delivery Contracted sales price Value of committed sales
(ounces) A$ $’000
Within one year 62,159 1,573 97,776
Later than one year but not greater than five years 224,177 1,573 352,631
286,336 450,407
The counterparty to the physical gold delivery contract is Macquarie Bank Limited (‘Macquarie’). The contracts are settled on a quarterly basis by physical delivery of gold per Macquarie’s instructions. The contracts are accounted for as sale contracts with revenue recognised once the gold has been delivered to Macquarie or its agent.The physical gold delivery contract is considered a contract to sell a non-financial item and is therefore out of the scope of AASB 139. As a result no derivatives are required to be recognised. The Company has no other gold sale commitments with respect to its current operations.
NOTES TO ThE FINANCIAL STATEMENTS
(b)
(a)
(b)
(c)
(b)
For
per
sona
l use
onl
y

108
28. CAPITAL ANd LEASE COMMITMENTSExploration expenditure commitmentsIn order to maintain current rights of tenure to exploration tenements, the Group is required to perform minimum exploration work to meet minimum expenditure requirements specified by various government authorities. These obligations are subject to renegotiation when application for a mining lease is made and at various other times. These obligations are not provided for in the financial report and are payable:
Capital commitmentsThe Group has the following capital commitments in relation to capital projects at operating mines and the construction of the Mt Carlton project:
Non-cancellable operating lease expense commitmentsThe Group has the following operating lease commitments not provided for in the financial statements:
Finance lease and hire purchase commitments
30 June 2012
$
30 June 2011
$PwC Australia
(a) Audit and other assurance services
Audit and review of financial statements 310,000 -
Other assurance services 79,000 -
389,000 -
(b) Taxation services – tax compliance and advice 163,533 -
(c) Other services – accounting advice and support 50,967 -
214,500 -
Deloitte Touche Tohmatsu
(a) Audit and other assurance services
Audit and review of financial statements 113,538 98,425
(a) Other services
Proposed merger with Conquest Mining Limited 113,350 26,000
Advice on corporate strategy - 84,983
Merger implementation assistance 386,474 -
613,362 209,408
30 June 2012 30 June 2011
$’000 $’000
Not later than one year 6,828 871
Later than one year but not later than five years - 50
Total 6,828 921
30 June 2012 30 June 2011
$’000 $’000
Not later than one year 34,370 629
Later than one year but not later than five years - -
Total 34,370 629
30 June 2012 30 June 2011
$’000 $’000
Not later than one year 26,814 351
Later than one year but not later than five years 5,062 1,551
Total 31,876 1,902
30 June 2012 30 June 2011
$’000 $’000
Within one year 3,480 358
Within two to five years 3,775 424
Later than five years - -
Total minimum lease payments 7,255 782
Less amounts representing finance charges (608) (98)
Present value of minimum lease payments 6,647 684
Current portion 3,043 285
Non-current portion 3,604 399
6,647 684
29. CONTINGENCIESThe Group has provided bank guarantees in favour of various government authorities and service providers with respect to site restoration, contractual obligations and premises at 30 June 2012. The total of these guarantees at 30 June 2012 was $30.130 million with various financial institutions.(30 June 2011: $5.10 million).
In addition to the above guarantees, Newcrest Mining Limited (‘Newcrest’) is holding $13.550 million in performance bonds relating to Cracow and Mt Rawdon operations on behalf of the Group (2011: $2.10 million). These bonding obligations will be transferred to Evolution once the asset sale agreements have been appropriately stamped by the Queensland Office of State Revenue.
NOTES TO ThE FINANCIAL STATEMENTS
For
per
sona
l use
onl
y

2012 EVOLUTION MINING ANNUAL REPORT
30. JOINTLY CONTROLLEd OPERATIONThe Cracow Gold Operations located in Queensland was a joint venture which the Group previously held 30% and acquired the remaining 70% from Newcrest on 2 November 2011 (refer to Note 22). Under this previous arrangement, each joint venture partner was responsible for selling their share of gold produced.
The Group’s interest, as a venturer, in assets employed in the Cracow Gold Operations is detailed below. The amounts are included in the consolidated financial statements under their respective asset categories as a result of the proportionate consolidation of the Cracow Gold Operations:
Each joint venture partner was responsible for selling their share of gold production, hence the joint venture did not generate any revenue from gold sales.
31. INFORMATION RELATING TO EVOLUTON MINING LIMITEd (“ThE PARENT ENTITY”)
30 June 2012 30 June 2011Share of joint venture operation’s assets and liabilities
$‘000 $‘000
Current assets - 5,929
Non-current assets - 27,223
Total assets - 33,152
Current liabilities - 5,297
Non-current liabilities - 572
Total liabilities - 5,869
Net assets - 27,283
Share of joint venture revenue, expenses and results
Interest revenue 82 57
Expenses (13,968) (26,888)
Loss before income tax (13,886) (26,831)
30 June 2012 30 June 2011
$’000 $’000
Financial position of parent entity at year end
Current assets 135,912 1,807
Total assets 996,434 158,679
Current liabilities 30,265 1,962
Total liabilities 80,641 10,974
Total equity of the parent entity comprising of:
Share capital 1,045,751 185,465
Reserves 14,845 5,301
Accumulated losses (144,804) (43,061)
Total equity 915,792 147,705
Result of parent entity
(Loss) of the parent entity (82,671) (12,984)
Other comprehensive (loss)/ income (5,770) 157
Total comprehensive (loss) of the parent entity (88,441) (12,827)
The parent company has entered into a deed of cross guarantee with its subsidiaries.The Group has provided bank guarantees, as detailed in Note 29 “Contingencies”.
NOTES TO ThE FINANCIAL STATEMENTS
For
per
sona
l use
onl
y

110
32. EVENTS AFTER ThE BALANCE ShEET dATEOn 25 June 2012, Evolution had agreed to acquire Holleton gold project, located south of its Edna May Gold Mine in Western Australia. Pursuant to the terms of the agreement, Evolution has subsequently issued 500,000 fully paid shares to Independence Group NL.
No other matter or circumstance has arisen since 30 June 2012 that has significantly affected, or may significantly affect, the operations of the Group, or the state of affairs of the Group and its controlled entities in subsequent periods.
30 June 2012 30 June 2011
$’000 $’000
Financial position of parent entity at year end
Current assets 135,912 1,807
Total assets 996,434 158,679
Current liabilities 30,265 1,962
Total liabilities 80,641 10,974
Total equity of the parent entity comprising of:
Share capital 1,045,751 185,465
Reserves 14,845 5,301
Accumulated losses (144,804) (43,061)
Total equity 915,792 147,705
Result of parent entity
(Loss) of the parent entity (82,671) (12,984)
Other comprehensive (loss)/ income (5,770) 157
Total comprehensive (loss) of the parent entity (88,441) (12,827)
NOTES TO ThE FINANCIAL STATEMENTS
For
per
sona
l use
onl
y

2012 EVOLUTION MINING ANNUAL REPORT
The Directors declare that:
(a) The financial report of the Consolidated Entity, and the additional disclosures included in the Directors’ report designated as audited are in accordance with the Corporations Act 2001, including:
(i) giving a true and fair view of the Consolidated Entity’s financial position as at 30 June 2012
(ii) and of the Consolidated Entity’s performance for the year ended on that date;
(iii) complying with Accounting Standards and Corporations Regulations 2001;
(b) There are reasonable grounds to believe that the Company will be able to pay its debts as and when they become due and payable; and
(c) in the directors’ opinion, the financial statement and notes thereto are in accordance with International Financial Reporting Standards issued by the International Accounting Standards Board, as stated in Note 1 (a) to the financial statements.
This declaration has been made after receiving the declarations required to be made to Directors in accordance with section 295A of the Corporations Act 2001 for the financial year-ended 30 June 2012.
Jacob Klein
Executive Chairman
Graham Freestone
Lead Independent Director and Chair of the Audit Committee
Sydney
30 August 2012
dIRECTORS’ dECLARATION
For
per
sona
l use
onl
y

112
ShAREhOLdER INFORMATION
dISTRIBUTION OF ShARES (AS AT 17 SEPTEMBER 2012)
Range Securities % No of Holders %
100,001 and Over 628,017,986 88.75 202 1.76
10,001 to 100,000 53,667,634 7.58 2,052 17.85
5,001 to 10,000 12,478,515 1.76 1,734 15.09
1,001 to 5,000 12,108,716 1.71 4,682 40.73
1 to 1,000 1,332,862 0.19 2,824 24.57
Total 707,605,713 100.00 11,494 100.00
Unmarketable Parcels 0 0.00 0 0.00
SUBSTANTIAL ShAREhOLdERSThe following shareholders are recorded as substantial shareholders (as at 17 September 2012):
Fully Paid Ordinary Shares
Name Number Percentage
Newcrest Mining 231,082,631 32.66%
Van Eck Associates Corporation 43,595,715 6.16%
Total 274,678,346 38.82%
For
per
sona
l use
onl
y

2012 EVOLUTION MINING ANNUAL REPORT
ShAREhOLdER INFORMATION
TwENTY LARGEST ShAREhOLdERS (AS AT 17 SEPTEMBER 2012)
Fully Paid Ordinary Shares
Ordinary Shareholders Number Percentage
NEWCREST HOLDINGS (INVESTMENTS) PTY LTD 231,082,631 32.66%
NATIONAL NOMINEES LIMITED 122,556,810 17.32%
HSBC CUSTODY NOMINEES (AUSTRALIA) LIMITED 73,473,272 10.38%
J P MORGAN NOMINEES AUSTRALIA LIMITED 38,839,085 5.49%
JP MORGAN NOMINEES AUSTRALIA LIMITED 22,371,469 3.16%
CITICORP NOMINEES PTY LIMITED 22,299,164 3.15%
BNP PARIBAS NOMS PTY LTD 11,006,571 1.56%
MR DONALD ROBIN WALKER 6,015,385 0.85%
TRINITY MANAGEMENT PTY LTD 5,382,930 0.76%
AMP LIFE LIMITED 4,933,179 0.70%
HSBC CUSTODY NOMINEES (AUSTRALIA) LIMITED-GSCO ECA 4,787,840 0.68%
HSBC CUSTODY NOMINEES (AUSTRALIA) LIMITED - A/C 2 4,449,722 0.63%
LUJETA PTY LTD 4,220,000 0.60%
MR MARK GARETH CREASY 3,856,176 0.54%
UBS WEALTH MANAGEMENT AUSTRALIA NOMINEES PTY LTD 3,437,403 0.49%
CITICORP NOMINEES PTY LIMITED 2,913,581 0.41%
RBC INVESTOR SERVICES AUSTRALIA NOMINEES PTY LIMITED 2,588,243 0.37%
MR DAVID GEORGE METFORD 2,305,000 0.33%
BNP PARIBAS NOMS PTY LTD 2,171,442 0.31%
RENEAGLE PTY LTD 2,039,330 0.29%
Total 570,729,233 80.66%
Balance of Register 136,876,480 19.34%
Grand total 707,605,713 100.00%
1.5 ShARE BUY-BACkSThere is no current on-market buy-back scheme.
2. OThER INFORMATION Evolution Mining Limited, incorporated and domiciled in Australia, is a public listed Company limited by Shares.
For
per
sona
l use
onl
y

114
Fully Paid Ordinary Shares
Ordinary Shareholders Number Percentage
NEWCREST HOLDINGS (INVESTMENTS) PTY LTD 231,082,631 32.66%
NATIONAL NOMINEES LIMITED 122,556,810 17.32%
HSBC CUSTODY NOMINEES (AUSTRALIA) LIMITED 73,473,272 10.38%
J P MORGAN NOMINEES AUSTRALIA LIMITED 38,839,085 5.49%
JP MORGAN NOMINEES AUSTRALIA LIMITED 22,371,469 3.16%
CITICORP NOMINEES PTY LIMITED 22,299,164 3.15%
BNP PARIBAS NOMS PTY LTD 11,006,571 1.56%
MR DONALD ROBIN WALKER 6,015,385 0.85%
TRINITY MANAGEMENT PTY LTD 5,382,930 0.76%
AMP LIFE LIMITED 4,933,179 0.70%
HSBC CUSTODY NOMINEES (AUSTRALIA) LIMITED-GSCO ECA 4,787,840 0.68%
HSBC CUSTODY NOMINEES (AUSTRALIA) LIMITED - A/C 2 4,449,722 0.63%
LUJETA PTY LTD 4,220,000 0.60%
MR MARK GARETH CREASY 3,856,176 0.54%
UBS WEALTH MANAGEMENT AUSTRALIA NOMINEES PTY LTD 3,437,403 0.49%
CITICORP NOMINEES PTY LIMITED 2,913,581 0.41%
RBC INVESTOR SERVICES AUSTRALIA NOMINEES PTY LIMITED 2,588,243 0.37%
MR DAVID GEORGE METFORD 2,305,000 0.33%
BNP PARIBAS NOMS PTY LTD 2,171,442 0.31%
RENEAGLE PTY LTD 2,039,330 0.29%
Total 570,729,233 80.66%
Balance of Register 136,876,480 19.34%
Grand total 707,605,713 100.00%
INdEPENdENT AUdITOR’S REPORT
For
per
sona
l use
onl
y

2012 EVOLUTION MINING ANNUAL REPORT
INdEPENdENT AUdITOR’S REPORT
For
per
sona
l use
onl
y

116
INdEPENdENT AUdITOR’S REPORTCORPORATE INFORMATIONABN 74 084 669 036
Directors Jacob Klein (Executive Chairman)
James Askew (Non-Executive Director)
Lawrie Conway (Non-Executive Director)
Graham Freestone (Lead Independent Director)
Paul Marks (Non-Executive Director)
John Rowe (Non-Executive Director)
Peter Smith (Non-Executive Director)
Company SecretaryEvan Elstein
Registered Office Level 28, 175 Liverpool StreetSYDNEY NSW 2000
Postal Address Level 28, 175 Liverpool StreetSYDNEY NSW 2000Tel: (+612) 9696 2900Fax: (+612) 9696 2901
Share RegisterLink Market ServicesLevel 12, 680 George Street SYDNEY NSW 2000Tel: 1300 554 474 or (+612) 8280 7111 Fax: (+612) 9287 0303 Email:[email protected]
Auditors PricewaterhouseCoopers201 Sussex StreetSYDNEY NSW 2000Tel: (+612) 8266 0000
Internet Addresswww.evolutionmining.com.au
Stock Exchange ListingEvolution Mining Limited (EVN) shares are listed on the Australian Securities Exchange.
For
per
sona
l use
onl
y

For
per
sona
l use
onl
y