DRAGON MINING LIMITED 龍 資 源 有 限 公 司* - :: HKEX ...
307
If you are in any doubt as to any aspect about this circular or as to the action to be taken, you should consult your licensed securities dealer, bank manager, solicitor, professional accountant or other professional adviser. If you have sold or transferred all your shares in Dragon Mining Limited, you should at once hand this circular, together with the enclosed form of proxy, to the purchaser or the transferee or to the bank, the licensed securities dealer or other agent through whom the sale or transfer was effected for transmission to the purchaser or the transferee. Hong Kong Exchanges and Clearing Limited and The Stock Exchange of Hong Kong Limited take no responsibility for the contents of this circular, make no representation as to its accuracy or completeness and expressly disclaim any liability whatsoever for any loss howsoever arising from or in reliance upon the whole or any part of the contents of this circular. DRAGON MINING LIMITED 龍資源有限公司* (Incorporated in Western Australia with limited liability ACN 009 450 051) (Stock Code: 1712) POTENTIAL CHANGE OF SUBSTANTIAL SHAREHOLDER IN CONNECTION WITH THE PROPOSED TRANSFER AND NOTICE OF EXTRAORDINARY GENERAL MEETING A notice convening the extraordinary general meeting (the “EGM”) of Dragon Mining Limited (the “Company”) to be held at Plaza 3, Lower Lobby, Novotel Century Hong Kong, 238 Jaffe Road, Wanchai, Hong Kong on Thursday, 12 August 2021 at 3:00 p.m. (Hong Kong time) is set out on pages III-1 to III-4 of this circular. Whether or not you are able to attend the meeting, you are requested to complete the accompanying form of proxy (“Proxy Form”) in accordance with the instructions printed thereon and return the same to (i) the Company’s principal share registrar in Australia, Computershare Investor Services Pty Limited of Yarra Falls, 452 Johnston Street, Abbotsford, VIC, 3067, Melbourne, Australia; or (ii) the Company’s Hong Kong share registrar, Computershare Hong Kong Investor Services Limited of 17M Floor, Hopewell Centre, 183 Queen’s Road East, Wanchai, Hong Kong as soon as possible and in any event by 3:00 p.m. on Tuesday, 10 August 2021 (Hong Kong time), being not later than 48 hours before the time appointed for the holding of the meeting or any adjournment thereof. Completion and return of the Proxy Form will not preclude the shareholders of the Company (the “Shareholder(s)”) from attending and voting in person at the meeting or any adjournment thereof if they so wish. PRECAUTIONARY MEASURES FOR THE EGM Please see page 1 of this document for measures being taken to try to prevent and control the spread of the Novel Coronavirus (COVID-19) at the EGM, including: • compulsory temperature checks • compulsory wearing of surgical face masks for each attendee Any person who does not comply with the precautionary measures or is subject to any Hong Kong Government prescribed quarantine may be denied entry into the EGM venue. The Company also encourages the Shareholders to consider appointing the chairman of the EGM as his/her proxy to vote on the relevant resolution at the EGM as an alternative to attending the EGM in person. THIS CIRCULAR IS IMPORTANT AND REQUIRES YOUR IMMEDIATE ATTENTION * For identification purpose only 9 July 2021
-
Upload
khangminh22 -
Category
Documents
-
view
1 -
download
0
Transcript of DRAGON MINING LIMITED 龍 資 源 有 限 公 司* - :: HKEX ...

If you are in any doubt as to any aspect about this circular or as to the action to be taken, you should consultyour licensed securities dealer, bank manager, solicitor, professional accountant or other professional adviser.
If you have sold or transferred all your shares in Dragon Mining Limited, you should at once hand this circular,together with the enclosed form of proxy, to the purchaser or the transferee or to the bank, the licensed securitiesdealer or other agent through whom the sale or transfer was effected for transmission to the purchaser or thetransferee.
Hong Kong Exchanges and Clearing Limited and The Stock Exchange of Hong Kong Limited take noresponsibility for the contents of this circular, make no representation as to its accuracy or completeness andexpressly disclaim any liability whatsoever for any loss howsoever arising from or in reliance upon the whole orany part of the contents of this circular.
DRAGON MINING LIMITED龍 資 源 有 限 公 司*
(Incorporated in Western Australia with limited liability ACN 009 450 051)
(Stock Code: 1712)
POTENTIAL CHANGE OF SUBSTANTIAL SHAREHOLDERIN CONNECTION WITH THE PROPOSED TRANSFER
ANDNOTICE OF EXTRAORDINARY GENERAL MEETING
A notice convening the extraordinary general meeting (the “EGM”) of Dragon Mining Limited (the “Company”)to be held at Plaza 3, Lower Lobby, Novotel Century Hong Kong, 238 Jaffe Road, Wanchai, Hong Kong onThursday, 12 August 2021 at 3:00 p.m. (Hong Kong time) is set out on pages III-1 to III-4 of this circular. Whetheror not you are able to attend the meeting, you are requested to complete the accompanying form of proxy (“ProxyForm”) in accordance with the instructions printed thereon and return the same to (i) the Company’s principalshare registrar in Australia, Computershare Investor Services Pty Limited of Yarra Falls, 452 Johnston Street,Abbotsford, VIC, 3067, Melbourne, Australia; or (ii) the Company’s Hong Kong share registrar, ComputershareHong Kong Investor Services Limited of 17M Floor, Hopewell Centre, 183 Queen’s Road East, Wanchai, HongKong as soon as possible and in any event by 3:00 p.m. on Tuesday, 10 August 2021 (Hong Kong time), being notlater than 48 hours before the time appointed for the holding of the meeting or any adjournment thereof.Completion and return of the Proxy Form will not preclude the shareholders of the Company (the“Shareholder(s)”) from attending and voting in person at the meeting or any adjournment thereof if they sowish.
PRECAUTIONARY MEASURES FOR THE EGM
Please see page 1 of this document for measures being taken to try to prevent and control the spread of theNovel Coronavirus (COVID-19) at the EGM, including:
• compulsory temperature checks
• compulsory wearing of surgical face masks for each attendee
Any person who does not comply with the precautionary measures or is subject to any Hong KongGovernment prescribed quarantine may be denied entry into the EGM venue. The Company alsoencourages the Shareholders to consider appointing the chairman of the EGM as his/her proxy to vote onthe relevant resolution at the EGM as an alternative to attending the EGM in person.
THIS CIRCULAR IS IMPORTANT AND REQUIRES YOUR IMMEDIATE ATTENTION
* For identification purpose only 9 July 2021
Page
PRECAUTIONARY MEASURES FOR THE EGM . . . . . . . . . . . . . . . . . . . . . . . . . . 1
DEFINITIONS . . . . . . . . . . . . . . . . . . . . . . . . . . . . . . . . . . . . . . . . . . . . . . . . . . . . . 2
LETTER FROM THE BOARD . . . . . . . . . . . . . . . . . . . . . . . . . . . . . . . . . . . . . . . . . 5
APPENDIX I — EXPLANATORY MEMORANDUM . . . . . . . . . . . . . . . . . . I-1
APPENDIX II — INDEPENDENT EXPERT’S REPORT . . . . . . . . . . . . . . . . II-1
APPENDIX III — NOTICE OF EGM . . . . . . . . . . . . . . . . . . . . . . . . . . . . . . . . III-1
CONTENTS
– i –
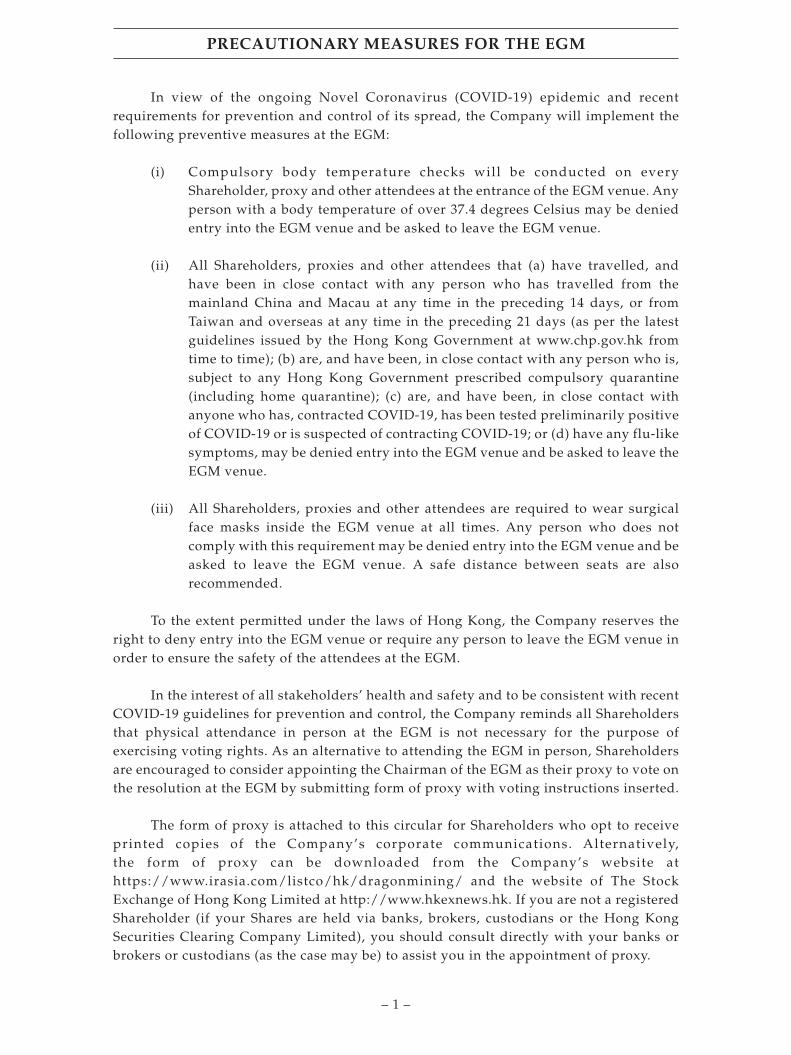
In view of the ongoing Novel Coronavirus (COVID-19) epidemic and recentrequirements for prevention and control of its spread, the Company will implement thefollowing preventive measures at the EGM:
(i) Compulsory body temperature checks will be conducted on everyShareholder, proxy and other attendees at the entrance of the EGM venue. Anyperson with a body temperature of over 37.4 degrees Celsius may be deniedentry into the EGM venue and be asked to leave the EGM venue.
(ii) All Shareholders, proxies and other attendees that (a) have travelled, andhave been in close contact with any person who has travelled from themainland China and Macau at any time in the preceding 14 days, or fromTaiwan and overseas at any time in the preceding 21 days (as per the latestguidelines issued by the Hong Kong Government at www.chp.gov.hk fromtime to time); (b) are, and have been, in close contact with any person who is,subject to any Hong Kong Government prescribed compulsory quarantine(including home quarantine); (c) are, and have been, in close contact withanyone who has, contracted COVID-19, has been tested preliminarily positiveof COVID-19 or is suspected of contracting COVID-19; or (d) have any flu-likesymptoms, may be denied entry into the EGM venue and be asked to leave theEGM venue.
(iii) All Shareholders, proxies and other attendees are required to wear surgicalface masks inside the EGM venue at all times. Any person who does notcomply with this requirement may be denied entry into the EGM venue and beasked to leave the EGM venue. A safe distance between seats are alsorecommended.
To the extent permitted under the laws of Hong Kong, the Company reserves theright to deny entry into the EGM venue or require any person to leave the EGM venue inorder to ensure the safety of the attendees at the EGM.
In the interest of all stakeholders’ health and safety and to be consistent with recentCOVID-19 guidelines for prevention and control, the Company reminds all Shareholdersthat physical attendance in person at the EGM is not necessary for the purpose ofexercising voting rights. As an alternative to attending the EGM in person, Shareholdersare encouraged to consider appointing the Chairman of the EGM as their proxy to vote onthe resolution at the EGM by submitting form of proxy with voting instructions inserted.
The form of proxy is attached to this circular for Shareholders who opt to receiveprinted copies of the Company’s corporate communications. Alternatively,the form of proxy can be downloaded from the Company’s website athttps://www.irasia.com/listco/hk/dragonmining/ and the website of The StockExchange of Hong Kong Limited at http://www.hkexnews.hk. If you are not a registeredShareholder (if your Shares are held via banks, brokers, custodians or the Hong KongSecurities Clearing Company Limited), you should consult directly with your banks orbrokers or custodians (as the case may be) to assist you in the appointment of proxy.
PRECAUTIONARY MEASURES FOR THE EGM
– 1 –

In this circular (other than in Appendix II), unless the context otherwise requires, the
following expressions shall have the following meanings:
“AGL” Allied Group Limited, a company incorporated inHong Kong with limited liability, the shares of whichare listed on the main board of the Stock Exchange(Stock Code: 373)
“APAC” APAC Resources Limited, a company incorporated inBermuda with limited liability, the shares of which arelisted on the main board of the Stock Exchange (StockCode: 1104)
“APAC Group” APAC and its subsidiaries from time to time
“API(1)” Allied Properties Investments (1) Company Limited, acompany incorporated in the British Virgin Islandswith limited liability, being a direct wholly-ownedsubsidiary of APOL and a substantial shareholder ofAPAC which owns approximately 39.90% of theissued share capital of APAC as at the LatestPracticable Date
“APL” Allied Properties (H.K.) Limited, a companyincorporated in Hong Kong with limited liability, andowns the entire issued share capital of APOL
“APOL” Allied Properties Overseas Limited, a companyincorporated in the British Virgin Islands with limitedliability, being the vendor under the Sale andPurchase Agreement
“APRL” Allied Properties Resources Limited, a companyincorporated in the British Virgin Islands with limitedliability, being a direct wholly-owned subsidiary ofAPOL as at the date of the Sale and PurchaseAgreement
“ASIC” Australian Securities and Investments Commission
“associate(s)” has the meaning ascribed to it under the CorporationsAct
“ASX” Australian Securities Exchange operated by ASXLimited
DEFINITIONS
– 2 –

“Board” the board of Directors
“Company” Dragon Mining Limited ACN 009 450 051, a companyincorporated in Australia with limited liability, theshares of which are listed on the main board of theStock Exchange (Stock Code: 1712)
“Corporations Act” Corporations Act 2001 (Commonwealth of Australia)
“Director(s)” director(s) of the Company
“Dragon Shares” 41,032,727 Shares, representing approximately 25.83%of the issued share capital of the Company
“EGM” the extraordinary general meeting of the Company tobe held at Plaza 3, Lower Lobby, Novotel CenturyHong Kong, 238 Jaffe Road, Wanchai, Hong Kong onThursday, 12 August 2021 at 3:00 p.m. (Hong Kongtime) or any adjournment thereof
“GLL” Genuine Legend Limited, a company incorporated inthe British Virgin Islands with limited liability and adirect wholly-owned subsidiary of APAC, being thepurchaser under the Sale and Purchase Agreement
“HK$” Hong Kong dollars, the lawful currency of HongKong
“Hong Kong” the Hong Kong Special Administrative Region of thePeople’s Republic of China
“Independent Expert” BDO Corporate Finance (WA) Pty Ltd ACN 124 031045
“Independent Expert’s Report” the independent expert’s report prepared by theIndependent Expert dated 9 July 2021
“Latest Practicable Date” 5 July 2021, being the latest practicable date prior tothe printing of this circular for ascertaining certaininformation contained herein
“Listing Rules” the Rules Governing the Listing of Securities on theStock Exchange
DEFINITIONS
– 3 –

“non-associated Shareholders” all Shareholders excluding (i) APOL, GLL, APAC,API(1) and any of their associates in respect of theCompany, details of which are set out in section 6(b)of Appendix I to this circular; and (ii) Messrs. ArthurGeorge Dew and Brett Robert Smith
“Proposed Transfer” the proposed transfer by APOL of all of its shares inAPRL to GLL, and the assignment to GLL ashareholder ’s loan in the principal amount ofHK$412,260,336 due to APOL by APRL
“Proxy Form” the proxy form for the EGM
“relevant interest” has the meaning ascribed to it under the CorporationsAct
“Resolution” the ordinary resolution in relation to the ProposedTransfer to be proposed at the EGM
“Sale and Purchase Agreement” the sale and purchase agreement dated 14 May 2021entered into between GLL and APOL in relation to theProposed Transfer
“Sale Share” one ordinary share of par value of US$1.00 in thecapital of APRL legally and beneficially owned byAPOL, representing the entire issued share capital ofAPRL as at the date of the Sale and PurchaseAgreement
“Share(s)” ordinary share(s) of the Company
“Shareholder(s)” holder(s) of the Share(s)
“Stock Exchange” The Stock Exchange of Hong Kong Limited
“substantial shareholder(s)” has the meaning ascribed to it under the Listing Rules
“US$” United States dollars, the lawful currency of theUnited States
“voting power” has the meaning ascribed to it under the CorporationsAct
“%” per cent
DEFINITIONS
– 4 –
DRAGON MINING LIMITED龍 資 源 有 限 公 司*
(Incorporated in Western Australia with limited liability ACN 009 450 051)
(Stock Code: 1712)
Executive Director:Brett Robert Smith
(Chief Executive Officer)
Non-Executive Directors:Arthur George Dew
(Chairman of the Board of Directors)Lam Lai
Alternate Director:Wong Tai Chun Mark (acting as the
alternate Director to Arthur George Dew)
Independent Non-Executive Directors:Carlisle Caldow ProcterPak Wai Keung MartinPoon Yan Wai
Registered Office:Unit 202, Level 2,39 Mends Street,South Perth,Western Australia 6151Australia
Principal Place of Businessin Hong Kong:
22nd Floor,Allied Kajima Building,138 Gloucester Road, Wanchai,Hong Kong
9 July 2021
To the Shareholders
Dear Sir or Madam,
POTENTIAL CHANGE OF SUBSTANTIAL SHAREHOLDERIN CONNECTION WITH THE PROPOSED TRANSFER
ANDNOTICE OF EXTRAORDINARY GENERAL MEETING
INTRODUCTION
Reference is made to the announcement of the Company dated 14 May 2021. TheCompany has been informed by APOL (a substantial shareholder of the Company) that, on14 May 2021, APOL entered into the Sale and Purchase Agreement with GLL.
* For identification purpose only
LETTER FROM THE BOARD
– 5 –
As disclosed in the announcement and circular of APAC dated 14 May 2021 and 25June 2021, respectively, pursuant to the Sale and Purchase Agreement and subject to thefulfillment (or waiver where applicable) of the conditions thereunder, (i) GLL shallacquire and APOL shall sell the Sale Share, representing the entire issued share capital ofAPRL; and (ii) the shareholder ’s loan in the principal amount of HK$412,260,336 due toAPOL by APRL shall be assigned by APOL to GLL. As at the date of the Sale and PurchaseAgreement and the Latest Practicable Date, respectively, the principal asset of APRL wasits 41,032,727 Shares, which represents approximately 25.83% of the issued share capital ofthe Company. Upon completion of the Proposed Transfer, APAC, via GLL and APRL, shallbecome a substantial shareholder of the Company. Details of the Proposed Transfer are setout in Appendix I to this circular.
The Independent Expert has also been commissioned by the Company to preparethe Independent Expert’s Report, which contains comments on the relative advantagesand disadvantages of the Proposed Transfer to the non-associated Shareholders of theCompany, details of which are set out in Appendix II of this circular.
An EGM will be convened for the Shareholders to consider and, if thought fit,approve GLL, APAC and API(1) to acquire a relevant interest in 41,032,727 Shares byacquiring all of the issued share capital of APRL on the terms and conditions set out in theSale and Purchase Agreement, and consequently, for GLL, APAC, API(1) and theirrespective associates to hold voting power in the Company of approximately 25.83%.
The purpose of this circular is to provide you with, among other things, (i) anexplanatory memorandum on the proposed change of substantial shareholders inconnection with the Proposed Transfer; (ii) an independent expert’s report; and (iii) anotice of the EGM.
DIRECTORS’ INTERESTS IN THE PROPOSED TRANSFER
As at the Latest Practicable Date, Mr. Arthur George Dew, being the Chairman and anon-executive Director, is also the chairman and a non-executive director of each of AGLand APAC, and holds 220,000 Shares, representing approximately 0.14% of the issuedshare capital of the Company. Mr. Brett Robert Smith, being the Chief Executive Officerand an executive Director, is also the deputy chairman and an executive director of APAC,and holds 118,866 Shares, representing approximately 0.07% of the issued share capital ofthe Company. Accordingly, Messrs. Arthur George Dew and Brett Robert Smith aredeemed to be interested in the Proposed Transfer and therefore have abstained fromvoting on the relevant Board resolution.
Apart from the above, none of the Directors (i) holds any interest in any securities inAPOL, GLL, APRL, APAC, API(1) or any of their respective associates; (ii) is a party to anyagreement with any other person in connection with, or conditional upon, the outcome ofthe Proposed Transfer; and (iii) has agreed to receive or is entitled to receive any benefitfrom APOL, GLL, APRL, APAC, API(1) or any of their respective associates, as at theLatest Practicable Date.
LETTER FROM THE BOARD
– 6 –

EGM
As at the Latest Practicable Date, AGL indirectly held (i) 486,457,630 shares inAPAC, representing approximately 39.90% of the total issued share capital of APAC; and(ii) 41,032,727 Shares, representing approximately 25.83% of the issued share capital of theCompany. Accordingly, AGL and its associates (including APRL, APOL and APL) willabstain from voting on the Resolution. In any event, pursuant to the Corporations Act, theCompany will disregard any votes cast on the Resolution by APRL, GLL, APAC, API(1) orany of their associates (a list of which is set out in section 6(b) of Appendix I to thiscircular). Further, given the deemed interests in the Proposed Transfer as set out above,Messrs. Arthur George Dew and Brett Robert Smith will also abstain from voting on theResolution. To the best of the knowledge and belief of the Directors having made allreasonably enquiries, save as disclosed in this circular, no other Shareholder has amaterial interest in the Proposed Transfer such that he/she/it shall abstain from voting onthe Resolution.
Pursuant to Rule 13.39(4) of the Listing Rules, any vote of shareholders at a generalmeeting must be taken by poll except where the chairman, in good faith, decides to allowa resolution which relates purely to a procedural or administrative matter to be voted onby a show of hands. As the Resolution does not relate purely to a procedural oradministrative matter, it will be put to vote by way of poll at the EGM. An announcementon the results of the vote by poll will be made by the Company after the EGM in themanner prescribed under Rule 13.39(5) of the Listing Rules.
The notice of EGM is set out on pages III-1 to III-4 of this circular. A Proxy Form isenclosed with this circular. Whether or not you are able to attend the EGM, you arerequested to complete the accompanying Proxy Form in accordance with the instructionsprinted thereon and return the same to (i) the Company’s principal share registrar inAustralia, Computershare Investor Services Pty Limited of Yarra Falls, 452 JohnstonStreet, Abbotsford, VIC, 3067, Melbourne, Australia; or (ii) the Company’s Hong Kongshare registrar, Computershare Hong Kong Investor Services Limited of 17M Floor,Hopewell Centre, 183 Queen’s Road East, Wanchai, Hong Kong as soon as possible and inany event by 3:00 p.m. on Tuesday, 10 August 2021 (Hong Kong time), being not later than48 hours before the time appointed for the holding of the EGM or any adjournmentthereof. Completion and return of the Proxy Form will not preclude you from attendingand voting in person at the EGM or any adjournment thereof if you so wish.
RECOMMENDATION
Having taken into account details of the Proposed Transfer and the comments of theIndependent Expert, the Directors (except Messrs. Arthur George Dew and Brett RobertSmith, who have abstained from voting on the relevant Board resolution) are of theopinion that the proposed Resolution for approval of GLL, APAC and API(1) to acquire arelevant interest in 41,032,727 Shares by acquiring all of the issued share capital of APRLon the terms and conditions set out in the Sale and Purchase Agreement, andconsequently, for GLL, APAC, API(1) and their respective associates to hold voting powerin the Company of approximately 25.83% are each in the best interests of the Companyand the Shareholders as a whole, and accordingly, recommend all non-associatedShareholders to vote in favour of the Resolution.
LETTER FROM THE BOARD
– 7 –
GENERAL INFORMATION
Your attention is drawn to the additional information set out in the appendices tothis circular. The English text of this circular shall prevail over the Chinese text.
Yours faithfully,For and on behalf of the Board
Dragon Mining LimitedBrett Robert Smith
Executive Director and Chief Executive Officer
LETTER FROM THE BOARD
– 8 –
This Appendix contains particulars which would enable the Shareholders to make aninformed view on whether to vote for or against the Resolution in connection with the ProposedTransfer.
1. RESPONSIBILITY STATEMENT
This Explanatory Memorandum has been prepared to help Shareholders understandthe business to be put to them at the forthcoming EGM. The information contained herein(except for information regarding APAC and its intentions) has been prepared by theCompany and is the responsibility of the Company. Information concerning APAC and itsintentions has been provided by APAC, and none of the Company, its associates or itsadvisers assumes any responsibility for the accuracy or completeness of that information.
2. BACKGROUND
(a) Proposed Transfer
Reference is made to the announcement of the Company dated 14 May 2021.The Company has been informed by APOL (a substantial shareholder of theCompany) that, on 14 May 2021, APOL entered into the Sale and PurchaseAgreement with GLL.
As disclosed in the announcement and circular of APAC dated 14 May 2021and 25 June 2021, respectively, pursuant to the Sale and Purchase Agreement andsubject to the fulfillment (or waiver where applicable) of the conditions thereunder,(i) GLL shall acquire and APOL shall sell the Sale Share, representing the entireissued share capital of APRL; and (ii) the shareholder ’s loan in the principal amountof HK$412,260,336 due to APOL by APRL shall be assigned by APOL to GLL. As atthe date of the Sale and Purchase Agreement and the Latest Practicable Date,respectively, the principal asset of APRL was its 41,032,727 Shares in the Company,which represents approximately 25.83% of the issued share capital of the Company.Upon completion of the Proposed Transfer, APAC, via GLL and APRL, shall becomea substantial shareholder of the Company.
Completion of the Proposed Transfer is conditional upon satisfaction of,among other things, the following conditions precedent:
(i) the passing of the resolution(s) by both (a) the requisite majority of theshareholders of APAC who are entitled to vote on the relevantresolution(s) under the Listing Rules and other applicable laws andregulations; and (b) APAC, in its capacity as the sole shareholder ofGLL, to approve GLL entering into and undertaking its obligations asset out in the Sale and Purchase Agreement and the transactionscontemplated thereunder;
(ii) the passing of the resolution(s) by the requisite majority of theShareholders approving the Sale and Purchase Agreement and thetransactions contemplated thereunder in accordance with the relevantlaws of Australia; and
APPENDIX I EXPLANATORY MEMORANDUM
– I-1 –

(iii) all necessary regulatory approvals and third-party consents havingbeen obtained and not revoked prior to completion of the ProposedTransfer.
APOL and APAC have advised that a special general meeting of APAC’sshareholders will be held on 20 July 2021 to consider the Proposed Transfer.
In the event that shareholders of APAC do not approve the Sale and PurchaseAgreement and the transactions contemplated thereunder, the Sale and PurchaseAgreement will be terminated with immediate effect and, as such, the Company willtake such action as is necessary to cancel the EGM and advise the Shareholders ofsuch cancellation.
(b) Rationale for the Proposed Transfer
The Company has been advised by APAC that, it was the focus of the APACGroup to look for investment opportunities in listed and unlisted securities globallyin the resources sector in both resource investment and primary strategicinvestment business segments. Taking into account a combination of factors,including but not limited to (i) the favourable financial performance and growthpotential of the gold mining and processing business of the Company; and (ii) theimpracticality of acquiring a significant minority position in the Company throughon-market transactions given its low market liquidity, the directors of APAC believethe Proposed Transfer is an attractive investment opportunity for the APAC Groupto further extend its natural resources investment in gold mining and enhance thereturns on investment for the APAC Group.
(c) Information on the parties to the Proposed Transfer
As advised by APOL and APAC, the information on the parties to theProposed Transfer is as follows:
APOL
APOL is a company incorporated under the laws of the British VirginIslands with limited liability and an indirect wholly-owned subsidiary ofAGL. The principal business activity of APOL is investment holding.
GLL
GLL is a company incorporated under the laws of the British VirginIslands with limited liability and a direct wholly-owned subsidiary of APAC.The principal business activity of GLL is investment holding.
APPENDIX I EXPLANATORY MEMORANDUM
– I-2 –
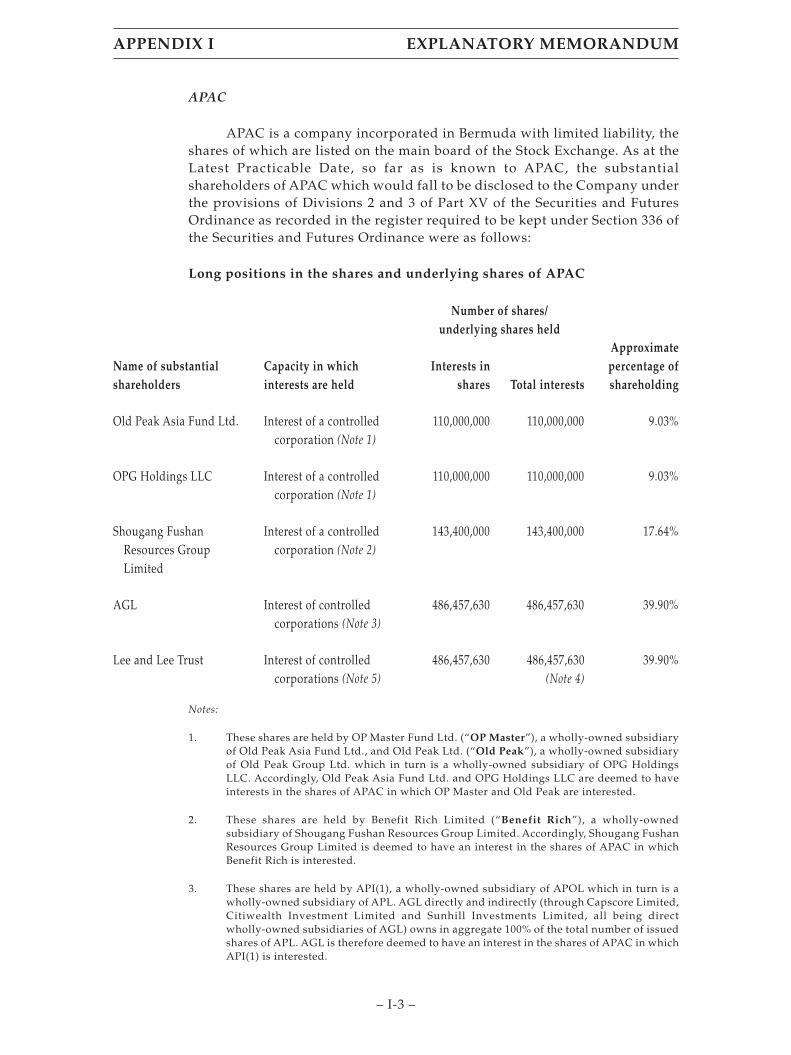
APAC
APAC is a company incorporated in Bermuda with limited liability, theshares of which are listed on the main board of the Stock Exchange. As at theLatest Practicable Date, so far as is known to APAC, the substantialshareholders of APAC which would fall to be disclosed to the Company underthe provisions of Divisions 2 and 3 of Part XV of the Securities and FuturesOrdinance as recorded in the register required to be kept under Section 336 ofthe Securities and Futures Ordinance were as follows:
Long positions in the shares and underlying shares of APAC
Number of shares/underlying shares held
Name of substantialshareholders
Capacity in whichinterests are held
Interests inshares Total interests
Approximatepercentage ofshareholding
Old Peak Asia Fund Ltd. Interest of a controlledcorporation (Note 1)
110,000,000 110,000,000 9.03%
OPG Holdings LLC Interest of a controlledcorporation (Note 1)
110,000,000 110,000,000 9.03%
Shougang FushanResources GroupLimited
Interest of a controlledcorporation (Note 2)
143,400,000 143,400,000 17.64%
AGL Interest of controlledcorporations (Note 3)
486,457,630 486,457,630 39.90%
Lee and Lee Trust Interest of controlledcorporations (Note 5)
486,457,630 486,457,630(Note 4)
39.90%
Notes:
1. These shares are held by OP Master Fund Ltd. (“OP Master”), a wholly-owned subsidiaryof Old Peak Asia Fund Ltd., and Old Peak Ltd. (“Old Peak”), a wholly-owned subsidiaryof Old Peak Group Ltd. which in turn is a wholly-owned subsidiary of OPG HoldingsLLC. Accordingly, Old Peak Asia Fund Ltd. and OPG Holdings LLC are deemed to haveinterests in the shares of APAC in which OP Master and Old Peak are interested.
2. These shares are held by Benefit Rich Limited (“Benefit Rich”), a wholly-ownedsubsidiary of Shougang Fushan Resources Group Limited. Accordingly, Shougang FushanResources Group Limited is deemed to have an interest in the shares of APAC in whichBenefit Rich is interested.
3. These shares are held by API(1), a wholly-owned subsidiary of APOL which in turn is awholly-owned subsidiary of APL. AGL directly and indirectly (through Capscore Limited,Citiwealth Investment Limited and Sunhill Investments Limited, all being directwholly-owned subsidiaries of AGL) owns in aggregate 100% of the total number of issuedshares of APL. AGL is therefore deemed to have an interest in the shares of APAC in whichAPI(1) is interested.
APPENDIX I EXPLANATORY MEMORANDUM
– I-3 –

4. This represents the same interests of AGL in 486,457,630 shares of APAC.
5. Mr. Lee Seng Hui together with Ms. Lee Su Hwei and Mr. Lee Seng Huang are the trusteesof Lee and Lee Trust, being a discretionary trust. The Lee and Lee Trust controlsapproximately 74.96% of the total number of issued shares of AGL (inclusive of Mr. LeeSeng Hui’s personal interests) and is therefore deemed to have an interest in the shares ofAPAC in which AGL is interested through API(1).
APAC Group is an established investment fund and commodity tradinghouse which owns strategic interests in natural resource companies with themain business lines comprising of primary strategic investment, resourceinvestment, and commodity trading business, focused primarily on metals,mining and energy and investment in financial assets. As at the LatestPracticable Date, APAC holds the following investments in ASX-listed miningcompanies:
(i) 46.30% interest in Tanami Gold NL (ASX: TAM), a gold explorer inWestern Australia;
(ii) 36.35% interest in Mount Gibson Iron Limited (ASX:MGX), an ironore producer in Western Australia;
(iii) 15.31% interest in Metals X Limited (ASX:MLX), a base metalsexplorer and producer in Australia;
(iv) 10.89% interest in Prodigy Gold NL (ASX: PRX) (formerly ABMResources NL, ASX: ABU), a gold explorer in Western Australia;and
(v) 0.47% interest in Westgold Resources Limited (ASX:WGX), a goldexplorer and producer in Australia.
AGL
AGL is a company incorporated in Hong Kong with limited liability, theshares of which are listed on the main board of the Stock Exchange. As set outabove, Mr. Lee Seng Hui together with Ms. Lee Su Hwei and Mr. Lee SengHuang are the trustees of Lee and Lee Trust, being a discretionary trust. TheLee and Lee Trust controls approximately 74.96% of the total number of issuedshares of AGL (inclusive of Mr. Lee Seng Hui’s personal interests) as at theLatest Practicable Date.
The principal business activity of AGL is investment holding. Theprincipal business activities of its major subsidiaries are property investmentand development, hospitality related activities, provision of elderly careservices, property management, cleaning and security guarding services inHong Kong, the provision of finance and investments in listed and unlistedsecurities.
APPENDIX I EXPLANATORY MEMORANDUM
– I-4 –

3. SHAREHOLDER APPROVAL REQUIREMENT
(a) Takeovers prohibition and shareholder approval exception
Section 606 of the Corporations Act contains a general prohibition on a personacquiring a relevant interest in issued voting shares in a listed company through atransaction which results in the voting power in the company of that person oranother person increasing from 20% or below to more than 20% or from a startingpoint of more than 20% to a higher percentage.
A “relevant interest” in shares arises if, among other things:
• the person is the holder of the shares;
• the person has the power to, or controls the power to, exercise a right tovote attaching to the shares or dispose of the shares; or
• the person controls, or has voting power of 20% or more in, a companythat has a relevant interest in the shares.
There are a number of exceptions to the prohibition in section 606 of theCorporations Act, including the exception set out in item 7 of section 611. Item 7allows a person to acquire a relevant interest in a company’s voting shares in excessof the 20% threshold with the approval of shareholders provided:
• no votes are cast in favour of such resolution by the proposed buyer andtheir associates or the proposed seller and their associates; and
• the members of the company were given all information known to theproposed buyer or their associates, or known to the company, that wasmaterial to the decision on how to vote on such resolution, including:
o the identity of the person proposing to make the acquisition andtheir associates;
o the maximum extent of the increase in that person’s and each oftheir associates’ voting power in the company that would resultfrom the acquisition; and
o the voting power that person and each of their associates wouldhave as a result of the acquisition.
A person will only be considered an associate of another person if providedfor under section 12 of the Corporations Act.
APPENDIX I EXPLANATORY MEMORANDUM
– I-5 –
(b) Application to the Proposed Transfer
Pursuant to the Proposed Transfer, GLL, APAC and API(1) will acquire arelevant interest in the Dragon Shares and consequently GLL, APAC, API(1) andtheir respective associates will hold voting power in the Company of approximately25.83%.
Accordingly, the Resolution seeks the approval of non-associatedShareholders for the purposes of item 7 of section 611 of the Corporations Act toallow GLL, APAC and API(1) to acquire a relevant interest in the Dragon Shares andfor GLL, APAC, API(1) and their respective associates to acquire voting power in theCompany above the 20% threshold.
Importantly, as the Lee and Lee Trust ultimately holds a relevant interest inmore than 20% of APAC, Lee and Lee Trust and each of its associates (includingAGL, APL, APOL and APRL) will continue to hold a relevant interest in the DragonShares and voting power in the Company of approximately 25.83%.
Information in relation to the associates of APOL, GLL, APAC and API(1) is setout in section 6(b) of this Explanatory Memorandum.
4. INDEPENDENT EXPERT’S REPORT
To assist Shareholders in their consideration of the Proposed Transfer and reachinga conclusion on whether to vote for or against the Resolution, the Company hascommissioned the Independent Expert to prepare the Independent Expert’s Report inrelation to the Proposed Transfer. Details of which are set out in Appendix II to thiscircular.
The Independent Expert has given and has not withdrawn its consent to the issue ofthis circular with the inclusion of its report given as of the date of the circular andreferences to its name in the form and context in which they appear.
5. RELEVANT CONSIDERATIONS FOR SHAREHOLDERS
(a) Reasons to vote in favour of the Resolution
(i) The Independent Expert has concluded the advantages of the ProposedTransfer outweigh the disadvantages.
As set out in the Independent Expert’s Report, the Independent Experthas concluded that, in the absence of an alternate offer, the advantages of theProposed Transfer outweigh the disadvantages to the Shareholders.Specifically, the Independent Expert did not consider there to be anydisadvantages in approving the Proposed Transfer.
APPENDIX I EXPLANATORY MEMORANDUM
– I-6 –

In particular, the Independent Expert notes that the Proposed Transferwill not result in any shift in value or dilution resulting from the transfer ofexisting Shares between APOL and GLL.
In addition, the Independent Expert has noted there is no premium forcontrol to be paid by APAC and as such, Shareholders are not missing out onthe opportunity to participate and receive a premium for control for theirShares.
Shareholders are urged to read the Independent Expert’s Reportcarefully to understand the scope of the report, the methodology of theassessment, the sources of information and the assumptions made.
(ii) APAC has substantial experience in investing in resources companiesand is likely to be an active and supportive Shareholder.
APAC’s primary strategic investment business targets substantialinvestments in mineral explorers and producers that may provide cashflow,productivity assets or offtake opportunity. APAC has a specialist resourcesinvestment team and experience in holding substantial interests in resourcescompanies, including Tanami Gold NL, Mount Gibson Iron Limited, Metals XLimited, Prodigy Gold NL (formerly ABM Resources NL) and WestgoldResources Limited. Accordingly, APAC is likely to be able to bring additionalexperience and operate as an active and supportive Shareholder in theCompany, which may benefit the non-associated Shareholders.
(b) Reasons to vote against the Resolution
(i) Alternative view to the Independent Expert
Shareholders may disagree with the conclusions reached in theIndependent Expert’s Report.
(ii) Advantages may not be realised
The advantages outlined in section 5(a) of this ExplanatoryMemorandum include forward looking statements. Such statements are onlypredictions and are subject to inherent risks and uncertainties as well as thedecisions of third parties over whom the Company may have little or noinfluence. Ultimately, actual events or results may differ materially from theevents or results expressed or implied in any forward looking statement andShareholders may disagree with the likelihood of those advantages beingrealised.
(iii) Changes to APAC’s intentions
A summary of APAC’s intentions in respect of the Company if theProposed Transfer completes is set out in section 6 of this ExplanatoryMemorandum.
APPENDIX I EXPLANATORY MEMORANDUM
– I-7 –

APAC’s intentions have been formed on the basis of facts andinformation concerning the Company and the general business environmentwhich is known to APAC as at the Latest Practicable Date. APAC has indicatedthat final decisions on these matters will be made by it in light of all materialfacts and circumstances at the relevant time. Accordingly, APAC’s intentionsmay change as new information becomes available or as circumstanceschange.
(iv) Opportunity for a superior proposal
Shareholders might consider that a superior proposal to the ProposedTransfer may emerge, for example a takeover offer for all of the Shares in theCompany from an independent third party. However, it should be noted thatany such superior proposal, unless the acquirer intended to acquire less than100% of the Company’s Shares, would need to be subject to the agreement ofAPRL, as the holder of approximately 25.83% of the Company’s Shares.
(c) Other relevant considerations
(i) The Company’s costs and expenses will be fully reimbursed
The Company has entered into a cost reimbursement deed with APOLand GLL, under which any cost or expense to the Company associated withfacilitating the Proposed Transfer, including the costs of legal advisers andholding the EGM, will be fully reimbursed within 10 business days of the dateof the EGM, regardless of whether the Resolution is passed.
(ii) No impact on issued capital or financial position
No new Shares will be issued by the Company nor will any money bepaid or received under or in connection with the Proposed Transfer, as suchthere will be no impact on the Company’s issued capital or financial position.
6. FURTHER INFORMATION REGARDING APAC
(a) Intentions of APAC
(i) Appointment of Directors
APAC has advised that it has no current intention to make any changesto the Board following completion of the Proposed Transfer.
APPENDIX I EXPLANATORY MEMORANDUM
– I-8 –

(ii) Intentions for the future of the Company
Save as disclosed in this Explanatory Memorandum, APAC has advisedthat, upon completion of the Proposed Transfer:
• it has no current intention to change the business of the Company,such that it will continue materially in the same manner as at theLatest Practicable Date;
• it has no current intention to inject further capital into theCompany;
• it has no current intention regarding the future employment of thepresent employees of the Company;
• it has no current intention in relation to any proposal wherebyproperty will be transferred between itself or its associates andthe Company; and
• it has no current intention to otherwise redistribute the fixedassets of the Company.
(iii) Financial and dividend policies of the Company
APAC has no current intention to significantly change the financial ordividend policies of the Company (to the extent that there are any specificpolicies in place).
(iv) Additional transactions
The Company has been advised by each of the parties to the ProposedTransfer that they have no current intention to enter into, either directly orthrough their associates, any further transactions in respect of the Companyor its Shares.
(v) General
The intentions and statements of future conduct set out above are ofcurrent intention only as at the Latest Practicable Date which may change asnew information becomes available or circumstances change. The statementsshould be read in this context and also as being subject to the legal obligationof the Directors, including any nominees of APAC, to act in good faith in thebest interest of the Company and for proper purposes, and to have regard tothe interests of the Shareholders.
APPENDIX I EXPLANATORY MEMORANDUM
– I-9 –

The implementation of APAC’s current intentions of its ownership ofthe Shares will be subject to the laws of Australia (including the CorporationsAct), the laws of Hong Kong and the Company’s constitution.
(b) List of associates
The following persons have been identified as associates of APOL, GLL,APAC and API(1) in respect of the Company:
• APL;
• AGL;
• Lee and Lee Trust;
• Mr. Lee Seng Hui;
• Ms. Lee Su Hwei;
• Mr. Lee Seng Huang;
• in relation to APAC, Mr. Arthur George Dew (director of APAC); and
• in relation to APAC, Mr. Brett Robert Smith (director of APAC).
7. OTHER MATERIAL INFORMATION
Save as disclosed in the circular, there is no other information that is known to theDirectors which may reasonably be expected to be material to the making of a decision byShareholders whether or not to vote in favour of the Resolution.
APPENDIX I EXPLANATORY MEMORANDUM
– I-10 –

Set out below is the text of the Independent Expert’s Report received from BDO CorporateFinance (WA) Pty Ltd, the Independent Expert, in respect of the Proposed Transfer for the purposeof inclusion in this circular.
FINANCIAL SERVICES GUIDE
9 July 2021
BDO Corporate Finance (WA) Pty Ltd ABN 27 124 031 045 (‘we’ or ‘us’ or ‘ours’ asappropriate) has been engaged by Dragon Mining Limited (‘Dragon Mining’ or ‘theCompany’) to provide an independent expert’s report on the proposed sale of shares inAllied Properties Resources Limited (“APRL”), which holds approximately 25.83% of theissued share capital of Dragon Mining, from Allied Properties Overseas Limited (‘APOL’)to Genuine Legend Limited (‘GLL’). You are being provided with a copy of our reportbecause you are a shareholder of Dragon Mining and this Financial Services Guide (‘FSG’)is included in the event you are also classified under the Corporations Act 2001 (‘the Act’)as a retail client.
Our report and this FSG accompanies the circular of Dragon Mining dated 9 July2021 (‘Circular’) required to be provided to you by Dragon Mining to assist you indeciding on whether or not to approve the proposal.
Financial Services Guide
This FSG is designed to help retail clients make a decision as to their use of ourgeneral financial product advice and to ensure that we comply with our obligations as afinancial services licensee.
This FSG includes information about:
• Who we are and how we can be contacted;
• The services we are authorised to provide under our Australian FinancialServices Licence No. 316158;
• Remuneration that we and/or our staff and any associates receive inconnection with the general financial product advice;
• Any relevant associations or relationships we have; and
• Our internal and external complaints handling procedures and how you mayaccess them.
Information about us
We are a member firm of the BDO network in Australia, a national association ofseparate entities (each of which has appointed BDO (Australia) Limited ACN 050 110 275to represent it in BDO International). The financial product advice in our report isprovided by BDO Corporate Finance (WA) Pty Ltd and not by BDO or its related entities.BDO and its related entities provide professional services primarily in the areas of audit,tax, consulting, mergers and acquisition, and financial advisory services.
APPENDIX II INDEPENDENT EXPERT’S REPORT
– II-1 –
We and BDO (and its related entities) might from time to time provide professionalservices to financial product issuers in the ordinary course of business and the directors ofBDO Corporate Finance (WA) Pty Ltd may receive a share in the profits of related entitiesthat provide these services.
Financial services we are licensed to provide
We hold an Australian Financial Services Licence that authorises us to providegeneral financial product advice for securities to retail and wholesale clients, and deal insecurities for wholesale clients. The authorisation relevant to this report is generalfinancial product advice.
When we provide this financial service we are engaged to provide an expert reportin connection with the financial product of another person. Our reports explain who hasengaged us and the nature of the report we have been engaged to provide. When weprovide the authorised services we are not acting for you.
General Financial Product Advice
We only provide general financial product advice, not personal financial productadvice. Our report does not take into account your personal objectives, financial situationor needs. You should consider the appropriateness of this general advice having regard toyour own objectives, financial situation and needs before you act on the advice. If youhave any questions, or don’t fully understand our report you should seek professionalfinancial advice.
Fees, commissions and other benefits that we may receive
We charge fees for providing reports, including this report. These fees arenegotiated and agreed with the person who engages us to provide the report. Fees areagreed on an hourly basis or as a fixed amount depending on the terms of the agreement.The fee payable to BDO Corporate Finance (WA) Pty Ltd for this engagement isapproximately A$80,000.
Except for the fees referred to above, neither BDO, nor any of its directors,employees or related entities, receive any pecuniary benefit or other benefit, directly orindirectly, for or in connection with the provision of the report and our directors do nothold any shares in Dragon Mining.
Remuneration or other benefits received by our employees
All our employees receive a salary. Our employees are eligible for bonuses based onoverall productivity but not directly in connection with any engagement for the provisionof a report. We have received a fee from Dragon Mining for our professional services inproviding this report. That fee is not linked in any way with our opinion as expressed inthis report.
APPENDIX II INDEPENDENT EXPERT’S REPORT
– II-2 –
Referrals
We do not pay commissions or provide any other benefits to any person for referringcustomers to us in connection with the reports that we are licensed to provide.
Complaints resolution
Internal complaints resolution process
As the holder of an Australian Financial Services Licence, we are required to have asystem for handling complaints from persons to whom we provide financial productadvice. All complaints must be in writing addressed to The Complaints Officer, BDOCorporate Finance (WA) Pty Ltd, PO Box 700 West Perth WA 6872.
When we receive a written complaint we will record the complaint, acknowledgereceipt of the complaint within 15 days and investigate the issues raised. As soon aspractical, and not more than 45 days after receiving the written complaint, we will advisethe complainant in writing of our determination.
Referral to External Dispute Resolution Scheme
A complainant not satisfied with the outcome of the above process, or ourdetermination, has the right to refer the matter to the Australian Financial ComplaintsAuthority (‘AFCA’).
AFCA is an external dispute resolution scheme that deals with complaints fromconsumers in the financial system. It is a not-for-profit company limited by guarantee andauthorised by the responsible federal minister. AFCA was established on 1 November 2018to allow for the amalgamation of all Financial Ombudsman Service (‘FOS’) schemes intoone. AFCA will deal with complaints from consumers in the financial system by providingfree, fair and independent financial services complaint resolution. If an issue has not beenresolved to your satisfaction you can lodge a complaint with AFCA at any time.
Our AFCA Membership Number is 12561. Further details about AFCA are availableon its website www.afca.org.au or by contacting it directly via the details set out below.
Australian Financial Complaints AuthorityGPO Box 3Melbourne VIC 3001AFCA Free call: 1800 931 678Website: www.afca.org.auEmail: [email protected]
You may contact us using the details set out in the accompanying report.
We accept no duty of care or liability to you or any third party for any loss sufferedin connection with the use of this document.
APPENDIX II INDEPENDENT EXPERT’S REPORT
– II-3 –

TABLE OF CONTENTS
1. Introduction . . . . . . . . . . . . . . . . . . . . . . . . . . . . . . . . . . . . . . . . . . . . . . . . . . . II-5
2. Summary and Opinion . . . . . . . . . . . . . . . . . . . . . . . . . . . . . . . . . . . . . . . . . . . II-5
3. Scope of the Report . . . . . . . . . . . . . . . . . . . . . . . . . . . . . . . . . . . . . . . . . . . . . II-8
4. Outline of the Proposed Transaction . . . . . . . . . . . . . . . . . . . . . . . . . . . . . . . . II-10
5. Profile of Dragon Mining . . . . . . . . . . . . . . . . . . . . . . . . . . . . . . . . . . . . . . . . . II-11
6. Profile of Current and Proposed Substantial Shareholders . . . . . . . . . . . . . . . II-24
7. Economic analysis . . . . . . . . . . . . . . . . . . . . . . . . . . . . . . . . . . . . . . . . . . . . . . II-27
8. Industry analysis . . . . . . . . . . . . . . . . . . . . . . . . . . . . . . . . . . . . . . . . . . . . . . . II-31
9. Valuation approach adopted . . . . . . . . . . . . . . . . . . . . . . . . . . . . . . . . . . . . . . II-37
10. Valuation of Dragon Mining . . . . . . . . . . . . . . . . . . . . . . . . . . . . . . . . . . . . . . . II-40
11. Evaluation of the Proposed Transaction . . . . . . . . . . . . . . . . . . . . . . . . . . . . . . II-64
12. Conclusion . . . . . . . . . . . . . . . . . . . . . . . . . . . . . . . . . . . . . . . . . . . . . . . . . . . . II-69
13. Sources of information . . . . . . . . . . . . . . . . . . . . . . . . . . . . . . . . . . . . . . . . . . . II-69
14. Independence . . . . . . . . . . . . . . . . . . . . . . . . . . . . . . . . . . . . . . . . . . . . . . . . . . II-70
15. Qualifications . . . . . . . . . . . . . . . . . . . . . . . . . . . . . . . . . . . . . . . . . . . . . . . . . . II-71
16. Disclaimers and consents . . . . . . . . . . . . . . . . . . . . . . . . . . . . . . . . . . . . . . . . . II-71
Appendix 1 – Glossary and copyright notice . . . . . . . . . . . . . . . . . . . . . . II-73
Appendix 2 – Valuation Methodologies . . . . . . . . . . . . . . . . . . . . . . . . . . II-78
Appendix 3 – Minority Interest Discount . . . . . . . . . . . . . . . . . . . . . . . . . II-81
Appendix 4 – Independent Valuation Report prepared by RPM . . . . . . . II-86
© 2021 BDO Corporate Finance (WA) Pty Ltd
APPENDIX II INDEPENDENT EXPERT’S REPORT
– II-4 –

9 July 2021
The DirectorsDragon Mining LimitedUnit 202, Level 239 Mends StreetSouth Perth, WA 6151
Dear Directors
INDEPENDENT EXPERT’S REPORT
1. INTRODUCTION
On 17 May 2021, Dragon Mining Limited (‘Dragon Mining’ or ‘the Company’)announced that one of the Company’s substantial shareholders, Allied PropertiesOverseas Limited (‘APOL’), a wholly-owned subsidiary of Allied Group Limited (‘AGL’),had entered into a conditional sale and purchase agreement (‘the Sale and PurchaseAgreement’) to transfer all of its shares in its wholly-owned subsidiary Allied PropertiesResources Limited (‘APRL’) to Genuine Legend Limited (‘GLL’), a wholly-ownedsubsidiary of APAC Resources Limited (‘APAC’) and to assign GLL a shareholder ’s loan inthe principal amount of approximately HK$412 million (‘Shareholder Loan’) currentlydue to APOL by APRL subject to adjustment (‘the Proposed Transaction’).
Under the terms of the Proposed Transaction, the consideration payable by GLL toAPOL will be approximately HK$103 million in cash.
As at the date of the announcement, APRL owned 41,032,727 shares in DragonMining, representing approximately 25.83% of the issued share capital of the Company. Asthe Proposed Transaction will result in GLL’s ownership of Dragon Mining increasingfrom below 20% to more than 20%, approval from Dragon Mining shareholders notassociated with the Proposed Transaction (‘Shareholders’) is required in order for theProposed Transaction to proceed under the Corporations Act 2001 (Cth) (‘the Act’).
Further details of the Proposed Transaction are outlined in Section 4 of our Report.All figures are quoted in Australian dollars unless otherwise stated.
2. SUMMARY AND OPINION
2.1 Requirement for the report
The directors of Dragon Mining have requested that BDO Corporate Finance (WA)Pty Ltd (‘BDO’) prepare an independent expert’s report (‘our Report’) to express anopinion as to whether or not the advantages of the Proposed Transaction outweigh thedisadvantages from the perspective of Shareholders.
Our Report is prepared pursuant to item 7 of section 611 of the Act (‘Item 7 s611’)and is to be included in the Circular in order to assist Shareholders in their decisionwhether to approve the Proposed Transaction.
APPENDIX II INDEPENDENT EXPERT’S REPORT
– II-5 –
2.2 Approach
Our Report has been prepared having regard to Australian Securities andInvestments Commission (‘ASIC’) Regulatory Guide 74 ‘Acquisitions Approved byMembers’ (‘RG 74’), Regulatory Guide 111 ‘Content of Expert’s Reports’ (‘RG 111’) andRegulatory Guide 112 ‘Independence of Experts’ (‘RG 112’).
In arriving at our opinion, we have assessed the terms of the Proposed Transactionas outlined in the body of this report. We have considered:
• How the advantages of the Proposed Transaction compare to thedisadvantages of the Proposed Transaction;
• Whether approving the Proposed Transaction will deter the likelihood of atakeover offer being made for Dragon Mining, which would provideShareholders with the opportunity to receive a premium for control for theirshares;
• Whether a premium for control is being offered in relation to the transfer ofDragon Mining shares;
• Whether further transactions are planned between Dragon and any of theparties to the Proposed Transaction or their associates;
• Other factors which we consider to be relevant to Shareholders in theirassessment of the Proposed Transaction; and
• The position of Shareholders should the Proposed Transaction not proceed.
2.3 Opinion
We have considered the terms of the Proposed Transaction as outlined in the body ofthis report and have concluded that, in the absence of an alternative offer, the advantagesof the Proposed Transaction outweigh the disadvantages to Shareholders. Specifically, wedo not consider there to be any disadvantages in approving the Proposed Transaction.
We consider the Proposed Transaction to be advantageous to Shareholders becausethere is no shift in value or dilution resulting from the transfer of existing Dragon Miningshares between GLL and APOL. In addition, there is no premium for control to be paid byAPAC and as such, Shareholders are not missing out on the opportunity to participate andreceive a premium for control for their shares in Dragon Mining.
Furthermore, the underlying consequence of the Proposed Transaction is minimal asthere is no practical change in ultimate ownership, given that APOL and APAC are bothinvestment holdings of the Lee and Lee Trust (‘L&L Trust’), with AGL being focused onproperty investment and development and financial services together with propertymanagement and elderly care services, and APAC being focused on resourcesinvestments, which is deemed to be more appropriate for Dragon Mining.
APPENDIX II INDEPENDENT EXPERT’S REPORT
– II-6 –

2.4 Advantages and Disadvantages
We have considered the analysis in Section 11 of our Report, in terms of both:
• Advantages and disadvantages of the Proposed Transaction; and
• Other considerations, including the position of Shareholders if the ProposedTransaction does not proceed and the consequences of not approving theProposed Transaction.
The advantages considered are summarised below:
ADVANTAGES AND DISADVANTAGES
Section Advantages
11.1.1 No premium for control will be payable by APAC, meaning thatShareholders will not miss out on the opportunity to receive a premiumfor control for their shares in Dragon Mining
11.1.2 APAC specialises in investments in resource companies
11.1.3 The ownership consequence of the Proposed Transaction is minimal asthere is no practical change in ultimate ownership
11.1.4 APAC has no current intention to alter the board, future operations orfinancial position of Dragon Mining
11.1.5 All costs incurred in relation to the Proposed Transaction are to bereimbursed by APAC
11.1.6 Shareholders will experience no dilution to their individual holdings inthe Company, or their collective interests in the Company
Source: BDO analysis
We do not consider there to be any disadvantages to Shareholders should theProposed Transaction proceed.
APPENDIX II INDEPENDENT EXPERT’S REPORT
– II-7 –

Other key matters we have considered include:
Section Description
11.3 Alternative proposals
11.4 If the Proposed Transaction is approved, it is unlikely that it willdeter a takeover bid
11.5 Practical level of control
11.6 Consequences of not approving the Proposed Transaction
Source: BDO analysis
3. SCOPE OF THE REPORT
3.1 Purpose of the Report
Section 606 of the Corporations Act (‘Section 606’) expressly prohibits theacquisition of shares or further shares by a party, if the party acquiring the interest does sothrough a transaction and because of the transaction, that party’s (or someone else’s)voting power in the company increases from 20% or below to more than 20%. In the case ofthe Proposed Transaction, GLL will acquire APOL’s 25.83% interest in Dragon Mining,resulting in GLL’s voting power increasing from below 20% to more than 20%.
Section 611 of the Corporations Act (‘Section 611’) provides exceptions to theSection 606 prohibition and item 7 s611 permits such an acquisition if Shareholders haveagreed to the acquisition. This agreement must be by resolution passed at a generalmeeting at which no votes are cast in favour of the resolution by the party to theacquisition or any party who is associated with the acquiring party. Item 7 s611 states thatShareholders must be given all information that is material to the decision on how to voteat the meeting.
RG 74 states that to satisfy the obligation to provide all material information on howto vote on the item 7 s611 resolution, Dragon Mining can commission an IndependentExpert’s Report. The directors of Dragon Mining have commissioned this IndependentExpert’s Report to satisfy this obligation.
APPENDIX II INDEPENDENT EXPERT’S REPORT
– II-8 –

3.2 Regulatory guidance
In determining whether the advantages of the Proposed Transaction outweigh thedisadvantages, we have had regard to the views expressed by ASIC in RG 111 whichsuggests that an opinion as to whether the advantages of a transaction outweigh thedisadvantages should focus on the purpose and outcome of the transaction, that is, thesubstance of the transaction rather than the legal mechanism utilised to effect it.
RG 111 suggests that an expert should assess whether a premium for control will beprovided to the vendor of any shares. The greater any premium for control then thegreater the advantages of undertaking the transaction must be to Shareholders.
RG 111 sets out that the expert should inquire whether further transactions areplanned between the entity, the vendor or their associates and if any are contemplateddetermine if these are at arm’s length.
RG 111 also suggests that an expert should consider whether the transaction willdeter the making of a takeover bid.
3.3 Adopted basis of evaluation
RG 111 suggests that the main purpose of an Independent Expert’s Report is toadequately deal with the concerns that could reasonably be anticipated of those personsaffected by the transaction.
Having regard to RG 111, we have completed our Report as follows:
• An investigation into the advantages and disadvantages of the ProposedTransaction (Section 11);
• An analysis of any premium for control to be received by APOL (Section 10.5);and
• An analysis of any other issues that could be reasonably anticipated toconcern Shareholders as a result of the Proposed Transaction (Section 11).
This assignment is a Valuation Engagement as defined by Accounting Professional& Ethical Standards Board professional standard APES 225 ‘Valuation Services’ (‘APES
225’).
APPENDIX II INDEPENDENT EXPERT’S REPORT
– II-9 –

A Valuation Engagement is defined by APES 225 as follows:
‘an Engagement or Assignment to perform a Valuation and provide a Valuation Reportwhere the Valuer is free to employ the Valuation Approaches, Valuation Methods, and ValuationProcedures that a reasonable and informed third party would perform taking into consideration allthe specific facts and circumstances of the Engagement or Assignment available to the Valuer atthat time.’
This Valuation Engagement has been undertaken in accordance with therequirements set out in APES 225.
4. OUTLINE OF THE PROPOSED TRANSACTION
On 17 May 2021, Dragon Mining announced that one of the Company’s substantialshareholders, APOL, a wholly-owned subsidiary of AGL, had entered into the Sale andPurchase Agreement to transfer all of its shares in its 100% owned subsidiary, APRL, toGLL, a wholly-owned subsidiary of APAC and to assign to GLL a Shareholder Loan,currently due to APOL by APRL subject to adjustment.
Upon completion of the Proposed Transaction (if approved), APRL will become awholly-owned subsidiary of GLL and form part of the larger APAC group, and theShareholder Loan will be assigned to GLL and become due to GLL by APRL. TheShareholder Loan is interest free and repayable on demand.
Under the terms of the Sale and Purchase Agreement, the consideration payable byGLL to APOL for its 100% interest in APRL will be HK$102,581,817.50 in cash.
The announcement by Dragon Mining was dated 14 May 2021 and released on theHong Kong Stock Exchange (‘HKEx’) before market open on 17 May 2021. APACannounced the Proposed Transaction on the HKEx in its own disclosure at market close on14 May 2021.
As shown in Section 6.1 of this Report, the only existing asset held by APRL is its25.83% interest in Dragon Mining (representing 41,032,727 shares in Dragon Mining),which is held at a current book value of HK$84,471,185. Apart from the investment inDragon Mining and the Shareholder Loan, APRL holds no other assets or liabilities.
Therefore, in line with the announcement by APAC on the HKEx on 14 May 2021, theProposed Transaction is structured such that the cash consideration payable ofHK$102,581,817.50 is directly in relation to the acquisition of APRL’s investment inDragon Mining. APAC disclosed in its announcement for illustrative purposes that this isequivalent to a value of HK$2.50 per Dragon Mining share.
The Proposed Transaction is subject to certain conditions precedent, the mostsignificant of which are set out below:
• The passing of the resolution by the requisite majority of Shareholdersapproving the Proposed Transaction in accordance with item 7 of section 611of the Act;
APPENDIX II INDEPENDENT EXPERT’S REPORT
– II-10 –

• The passing of the resolutions by both the requisite majority of the APACshareholders who are entitled to vote on the relevant resolutions under theHKEx Listing Rules and other applicable laws and regulations and APAC, inits capacity as the sole shareholder of GLL, to approve GLL entering into andundertaking its obligations as set out in the Sale and Purchase Agreement;
• All other necessary governmental and regulatory approvals, consents,waivers, authorisation, registrations, filings and compliance with all therequirements under the Listing Rules and other applicable laws andregulations in connection with the Proposed Transaction having beenobtained and not revoked prior to completion of the Proposed Transaction.
We note that if any of the aforementioned conditions precedent are not satisfied orwaived by 14 August 2021 or such other date as may be agreed between GLL and APOL inwriting and that is the later to occur of:
(a) three months after the date of the Sale and Purchase Agreement; and
(b) the date as may be approved by ASIC
the Sale and Purchase Agreement will be terminated.
5. PROFILE OF DRAGON MINING
5.1 History
Dragon Mining is a HKEx-listed gold producing company with operations in theNordic region encompassing production plants and mining assets in Finland and Sweden.The Company’s primary operations include:
• The Vammala Processing Plant (‘Vammala Plant’) in Finland;
• The Jokisivu Gold Mine (‘Jokisivu’) in Finland;
• The Kaapelinkulma Gold Mine (‘Kaapelinkulma’) in Finland;
• The Orivesi Gold Mine (‘Orivesi’) in Finland;
• The Svartliden Processing Plant (‘Svartliden Plant’) in Sweden;
• The Fäboliden Gold Mine (‘Fäboliden’) in Sweden; and
• The Svartliden Gold Mine (‘Svartliden’) in Sweden, now ceased.
The Company was previously listed on the ASX, but resolved to delist from the ASXon 19 October 2018 due to the majority of the Company’s shareholders residing outside ofAustralia as well as a general lack of interest from Australian-based investors towardDragon Mining’s foreign gold assets. The Company subsequently completed a successfullisting on the HKEx on 2 November 2018.
APPENDIX II INDEPENDENT EXPERT’S REPORT
– II-11 –

The Company’s registered headquarters remain in South Perth, Western Australia,and the parent entity, Dragon Mining Limited, remains an Australian-incorporated publicunlisted company subject to the Corporations Act.
The current directors of Dragon Mining are:
• Mr. Brett Robert Smith – Chief Executive Officer and Executive Director;
• Mr. Arthur George Dew – Chairman and Non-Executive Director;
• Mr. Wong Tai Chun Mark – Alternate Director to Arthur George Dew;
• Ms. Lam Lai – Non-Executive Director;
• Mr. Carlisle Caldow Procter – Independent Non-Executive Director;
• Mr. Pak Wai Keung Martin – Independent Non-Executive Director; and
• Mr. Poon Yan Wai – Independent Non-Executive Director.
5.2 Corporate Structure
Dragon Mining has a number of wholly owned subsidiaries as depicted below:
Dragon Mining Limited(Australia)
龍資源有限公司1
(Hong Kong)Dragon Mining Oy
(Finland)
Dragon Mining Investments Pty Ltd
(Australia)
Viking Gold & Prospecting AB
(Sweden)
100% 100% 100% 100% 100%
Dragon Mining (Sweden) AB
1 Translated to Dragon Mining LimitedSource: Annual Report 2020.
5.3 Finnish Operations
We have presented a brief overview of the Company’s mining operations in Finlandto the extent that it relates to our assessment. Further information on the technicalinformation of the projects is available in the Independent Technical Specialist Report inAppendix 4.
Operations Overview
Dragon Mining’s Finnish operations encompass the Jokisivu, Kaapelinkulma andOrivesi gold mines, from which the ore that is extracted is processed through the VammalaPlant (collectively, ‘the Vammala Production Centre’ or ‘Vammala PC’). The Vammala PCis located in southern Finland, approximately 160km northwest of Helsinki.
APPENDIX II INDEPENDENT EXPERT’S REPORT
– II-12 –

The Vammala Plant is a 300,000 tonnes per annum (‘tpa’) conventional crushing,milling and flotation facility, which was recommissioned in June 2007. From 2007 to 2019,the Vammala Plant primarily processed ore sourced from Orivesi and Jokisivu and hadproduced approximately 362 thousand ounces (‘koz’) of gold over the period to December2019. In parallel, the Company was progressing the development of Kaapelinkulma, atwhich production first commenced in April 2019 through open pit operations.
Currently, production for the Vammala PC is primarily sourced from Jokisivu,which accounted for 261 kilotonnes (‘kt’) of the total 316kt ore milled at the Vammala PCfor the year ended 31 December 2020. This follows the cessation of mining at Orivesi inJune 2019, which historically produced higher grade ore tonnes. Furthermore, theCompany has recently advised having mined the permitted volume at Kaapelinkulma,which means that production at Vammala going forward will stem solely from mining atJokisivu.
In view of the above, the Company commenced active drilling campaignsthroughout 2020 with the aim of generating sufficient resources to maintain the 300kt perannum production schedule. This is in line with the Company’s operational cycle,whereby the Vammala PC’s mine life is based on a rolling two year period, with drillingprogrammes undertaken every few years to supplement the 300kt production schedule.
Exploration
During 2020, Dragon Mining completed 167 diamond core drill holes over thecourse of 20,083 metres at targeted deposits in Jokisivu and Kaapelinkulma. This iscompared to the 90 diamond core holes for 11,035 metres completed in 2019. In addition,early stage exploration activities were conducted over Orivesi through the undertaking ofa geochemical survey and review of geophysical datasets.
On 16 March 2021, the Company announced its updated resource and reserveestimates for its Nordic operations. The latest mineral resource and reserves estimates forthe Vammala PC as at 31 December 2020 are outlined in the tables below:
Measured Indicated Inferred TotalMineral Resource Estimate Tonnes Gold Ounces Tonnes Gold Ounces Tonnes Gold Ounces Tonnes Gold Ounces
kt g/t kozs kt g/t kozs kt g/t kozs kt g/t kozs
Vammala PCJokisivu 640 4.8 100 1,500 3.6 180 530 4.0 67 2,700 4.0 340Kaapelinkulma 26 2.3 2 79 3.2 8 170 2.6 14 280 2.7 24Orivesi 93 5.0 15 110 5.9 21 71 4.8 11 270 5.3 46
Total 760 4.8 120 1,700 3.8 210 770 3.7 93 3,200 4.0 410
Source: Annual Report 2020 and Management.
APPENDIX II INDEPENDENT EXPERT’S REPORT
– II-13 –

Proved Probable TotalOre Reserves Tonnes Gold Ounces Tonnes Gold Ounces Tonnes Gold Ounces
kt g/t kozs kt g/t kozs kt g/t kozs
Vammala PCJokisivu 490 2.5 40 1,300 2.3 93 1,800 2.3 130Kaapelinkulma – – – 21 4.1 3 21 4.1 3
Source: Annual Report 2020 and Management.
In December 2020, Dragon Mining entered into an asset sale agreement to acquire anExploration Permit application (ML2018:0082) from Sunstone Metals Limited(‘Sunstone’), which fully surrounds the Dragon Mining Jokisivu project area. Theacquisition was completed in the first half of 2021 and comprises possible gold depositextensions which are interpreted to continue from Jokisivu into the exploration area.
In addition the Company applied for a new Exploration License encompassing theUunimäki gold project (‘Uunimäki’) which is expected to be granted in the second half of2021. Uunimäki is an advanced exploration area having been subjected to diamond coredrilling and other exploration activities.
Environmental
On 12 March 2020, the Regional State Administrative Agency for Southern Finland(‘AVI’) issued Dragon Mining with a new environmental permit for the Vammala PC toprocess 300,000tpa of ore including from Kaapelinkulma. However, the new permitcontained much stricter permit conditions for crushing which would have hindered theCompany’s ongoing approach to operations. Therefore, the Company is in the midst ofappealing these conditions. Operations continue based on the existing environmentalpermit from 2008 while the appeal is being processed.
5.4 Swedish Operations
We have presented a brief overview of the Company’s mining operations in Swedento the extent that it relates to our assessment. Further information on the technicalinformation of the projects is available in the Independent Technical Specialist Report inAppendix 4.
Operations Overview
Dragon Mining’s Swedish operations encompass the Svartliden and Fäboliden goldmines as well as the Svartliden Plant (collectively, ‘the Svartliden Production Centre’ or‘Svartliden PC’). The Svartliden PC is located in northern Sweden, approximately 750kmnorth of Stockholm.
The Svartliden PC was first established as part of an integrated operationcomprising the Svartliden Plant and the Svartliden open-pit and underground goldmining operation that was brought into production in March 2005 with a total of 391,610
APPENDIX II INDEPENDENT EXPERT’S REPORT
– II-14 –

ounces (‘oz’) of gold produced (including external concentrates) up to the end of 2016.Underground mining at the Svartliden gold deposit was completed in the December 2013quarter, following which stockpiled material was processed until April 2015.
The primary focus of the Company’s Swedish operations is therefore on theFäboliden gold project. The Company was granted an Environmental Permit fortest-mining at Fäboliden starting May 2018. On 16 March 2020, the Company announcedthe updated results of its Life of Mine study for open cut operations at Fäboliden, whichshowed an increase in ore reserves which in turn, resulted in an increase in the forecastopen pit mine life. Over the course of 2020, Dragon Mining mined and transported 39,951tonnes of ore at 2.7g/t of gold to the Svartliden Plant. Processing of this ore at theSvartliden Plant was completed by November 2020.
The Svartliden Plant is a 300,000tpa conventional comminution and carbon in leach(‘CIL’) plant, which is currently on partial care and maintenance with the exception ofoccasional concentrate processing from the Company’s Finnish operations as well as testore from Fäboliden.
Exploration
The Company’s primary exploration activity for its Swedish operations has been theundertaking of diamond core drilling campaigns at Fäboliden from late 2020 to early 2021.The latest mineral resource and reserves estimates for the Svartliden PC as at 31 December2020 are outlined in the tables below:
Measured Indicated Inferred TotalMineral Resource Estimate Tonnes Gold Ounces Tonnes Gold Ounces Tonnes Gold Ounces Tonnes Gold Ounces
kt g/t kozs kt g/t kozs kt g/t kozs kt g/t kozs
Svartliden PCFäboliden 100 3.4 11 4,300 2.9 410 5,800 3.3 610 10,000 3.1 1,000Svartliden 120 3.4 13 310 3.8 38 60 4.0 8 490 3.7 59
Total 220 3.4 24 4,600 3.0 440 5,900 3.3 620 11,000 3.1 1,100
Source: Annual Report 2020 and Management.
Proved Probable TotalOre Reserves Tonnes Gold Ounces Tonnes Gold Ounces Tonnes Gold Ounces
kt g/t kozs kt g/t kozs kt g/t kozs
Svartliden PCFäboliden 110 3.0 11 2,000 2.9 190 2,100 2.9 200
Source: Annual Report 2020 and Management.
APPENDIX II INDEPENDENT EXPERT’S REPORT
– II-15 –
On 16 October 2020, the Company announced the results of its Fäbolidenunderground scoping study (‘Scoping Study’) for the purposes of assessing the viabilityof undertaking underground mining operations at Fäboliden. The Scoping Studyhighlighted a 15 year operating life with an average annual production of 23kozs of gold,which demonstrated the potential of a viable underground operation for the Company toadvance further evaluation.
Environmental
The key environmental issue for Dragon Mining’s Swedish operations is theapplication for the Fäboliden Environmental Permit to allow full scale mining tocommence at Fäboliden.
A recent ruling in March 2021 by the European Court of Justice (‘EU Court’) whichrejected certain Swedish case law relating to a Habitat’s Directive, implied that additionalfield work and assessments were necessary for Dragon Mining’s current EnvironmentalPermit application to receive approval.
On 20 May 2021, the Company announced that it had requested from the SwedishLand and Environment Court for a deferral to submit its relevant material on 25 October2021 and to hold the court hearing shortly thereafter. The Company emphasised in itsrequest that it is imperative that the Environmental Permit application be processedbefore the end of 2021.
5.5 Recent Corporate Actions
On 7 January 2021, Dragon Mining announced a placement of up to 21,000,000 newshares at an issue price of HK$2.05 per Dragon Mining share to raise gross proceeds of upto approximately HK$43.05 million under general mandate (‘Placement’). The intentionof the Placement was to strengthen the Company’s financial position and liquidity inanticipation for the requirement of significant additional funds to pay for additionalenvironmental bonds relating to the Company’s mines in Finland and Sweden as a resultof changes to regulatory policies.
The Placement was completed on 22 January 2021 for the issue of 20,000,000 shares.The Company announced that it intended to apply the entire net proceeds ofapproximately HK$39.74 million toward the payment of additional environmental bonds.
APPENDIX II INDEPENDENT EXPERT’S REPORT
– II-16 –
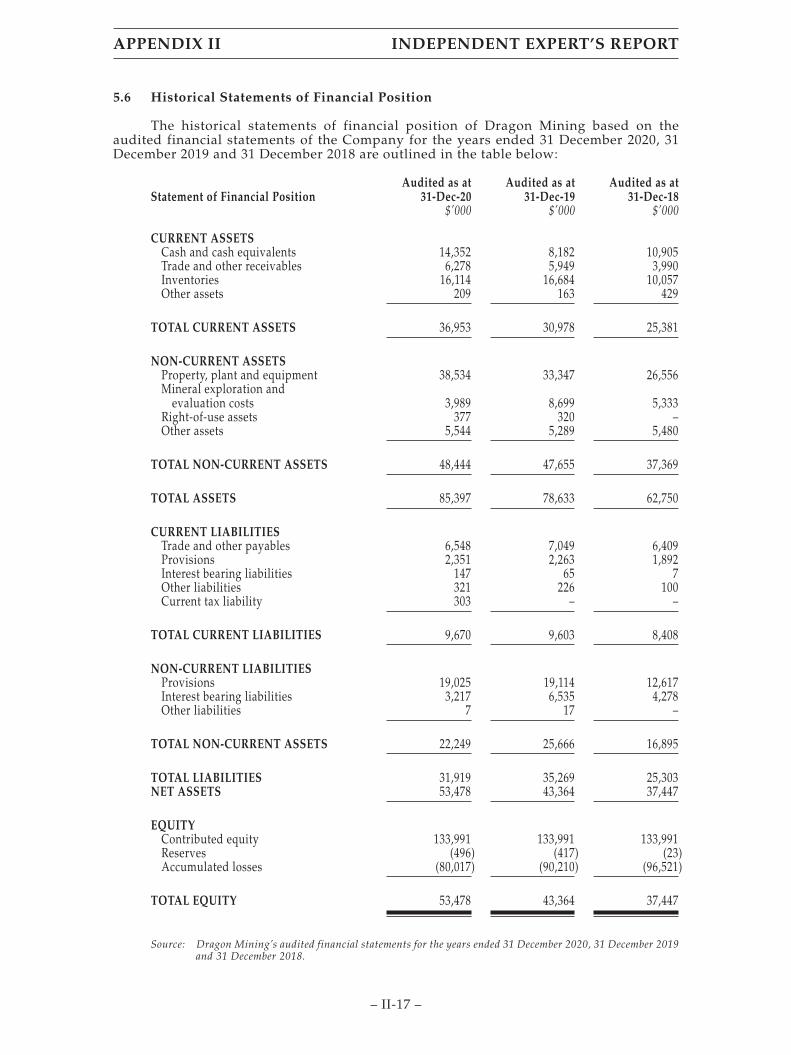
5.6 Historical Statements of Financial Position
The historical statements of financial position of Dragon Mining based on theaudited financial statements of the Company for the years ended 31 December 2020, 31December 2019 and 31 December 2018 are outlined in the table below:
Statement of Financial PositionAudited as at
31-Dec-20Audited as at
31-Dec-19Audited as at
31-Dec-18$’000 $’000 $’000
CURRENT ASSETSCash and cash equivalents 14,352 8,182 10,905Trade and other receivables 6,278 5,949 3,990Inventories 16,114 16,684 10,057Other assets 209 163 429
TOTAL CURRENT ASSETS 36,953 30,978 25,381
NON-CURRENT ASSETSProperty, plant and equipment 38,534 33,347 26,556Mineral exploration and
evaluation costs 3,989 8,699 5,333Right-of-use assets 377 320 –Other assets 5,544 5,289 5,480
TOTAL NON-CURRENT ASSETS 48,444 47,655 37,369
TOTAL ASSETS 85,397 78,633 62,750
CURRENT LIABILITIESTrade and other payables 6,548 7,049 6,409Provisions 2,351 2,263 1,892Interest bearing liabilities 147 65 7Other liabilities 321 226 100Current tax liability 303 – –
TOTAL CURRENT LIABILITIES 9,670 9,603 8,408
NON-CURRENT LIABILITIESProvisions 19,025 19,114 12,617Interest bearing liabilities 3,217 6,535 4,278Other liabilities 7 17 –
TOTAL NON-CURRENT ASSETS 22,249 25,666 16,895
TOTAL LIABILITIES 31,919 35,269 25,303NET ASSETS 53,478 43,364 37,447
EQUITYContributed equity 133,991 133,991 133,991Reserves (496) (417) (23)Accumulated losses (80,017) (90,210) (96,521)
TOTAL EQUITY 53,478 43,364 37,447
Source: Dragon Mining’s audited financial statements for the years ended 31 December 2020, 31 December 2019and 31 December 2018.
APPENDIX II INDEPENDENT EXPERT’S REPORT
– II-17 –
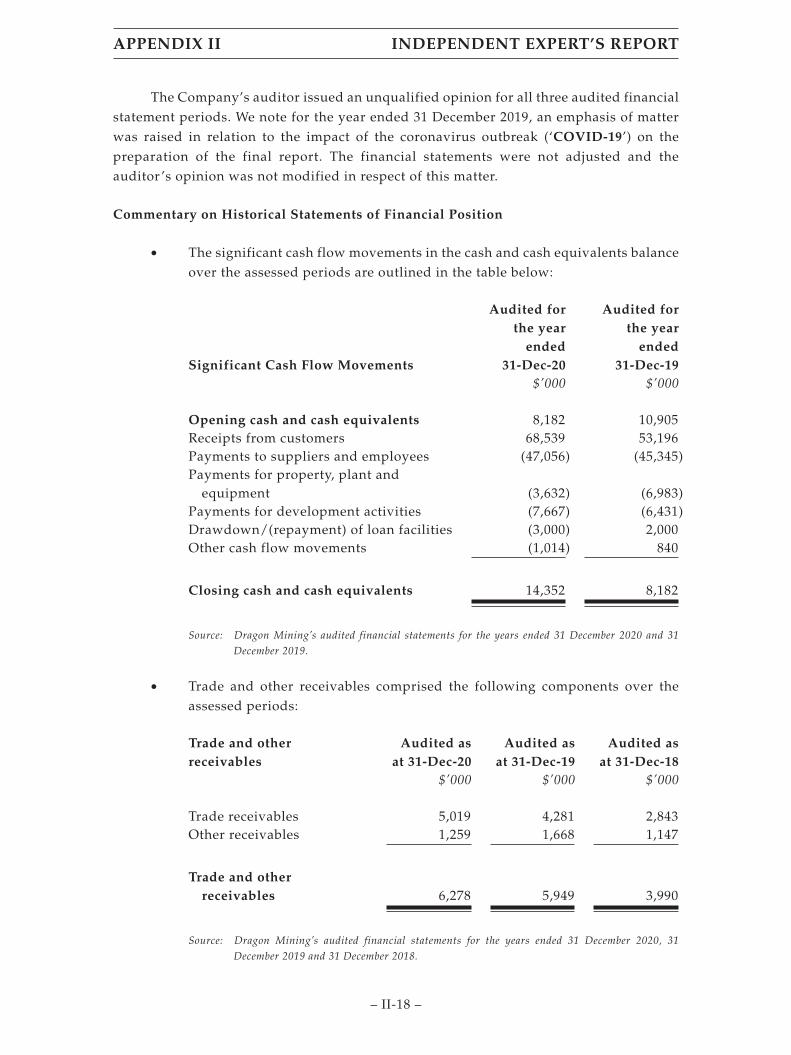
The Company’s auditor issued an unqualified opinion for all three audited financialstatement periods. We note for the year ended 31 December 2019, an emphasis of matterwas raised in relation to the impact of the coronavirus outbreak (‘COVID-19’) on thepreparation of the final report. The financial statements were not adjusted and theauditor ’s opinion was not modified in respect of this matter.
Commentary on Historical Statements of Financial Position
• The significant cash flow movements in the cash and cash equivalents balanceover the assessed periods are outlined in the table below:
Significant Cash Flow Movements
Audited forthe year
ended31-Dec-20
Audited forthe year
ended31-Dec-19
$’000 $’000
Opening cash and cash equivalents 8,182 10,905Receipts from customers 68,539 53,196Payments to suppliers and employees (47,056) (45,345)Payments for property, plant and
equipment (3,632) (6,983)Payments for development activities (7,667) (6,431)Drawdown/(repayment) of loan facilities (3,000) 2,000Other cash flow movements (1,014) 840
Closing cash and cash equivalents 14,352 8,182
Source: Dragon Mining’s audited financial statements for the years ended 31 December 2020 and 31December 2019.
• Trade and other receivables comprised the following components over theassessed periods:
Trade and otherreceivables
Audited asat 31-Dec-20
Audited asat 31-Dec-19
Audited asat 31-Dec-18
$’000 $’000 $’000
Trade receivables 5,019 4,281 2,843Other receivables 1,259 1,668 1,147
Trade and otherreceivables 6,278 5,949 3,990
Source: Dragon Mining’s audited financial statements for the years ended 31 December 2020, 31December 2019 and 31 December 2018.
APPENDIX II INDEPENDENT EXPERT’S REPORT
– II-18 –

Other receivables include bank guarantees held on deposit with NationalAustralia Bank (‘NAB’) for the lease of the Company’s corporate premises.The deposits are rolled over every three months in accordance with the leaseterms.
• Inventories are held at the lower of cost and net realisable value. Thebreakdown of inventories at the assessed periods are outlined in the tablebelow:
InventoriesAudited as
at 31-Dec-20Audited as
at 31-Dec-19Audited as
at 31-Dec-18$’000 $’000 $’000
Ore and concentratestockpiles 7,261 9,875 4,509
Gold in circuit valued 8,003 5,896 4,499Raw materials and stores 850 913 1,049
Total Inventories 16,114 16,684 10,057
Source: Dragon Mining’s audited financial statements for the years ended 31 December 2020, 31December 2019 and 31 December 2018.
• Property, plant and equipment of $38.53 million as at 31 December 2020comprised the following components:
Property, plant and equipment Land Buildings
Property,plant and
equipmentMine
properties Total$’000 $’000 $’000 $’000 $’000
Finland (Dragon Mining Oy)Gross carrying amount – at cost 853 1,641 18,964 86,514 107,972Less: Accumulated depreciation – (1,257) (17,698) (70,825) (89,780)
Sweden (Dragon Mining AB)Gross carrying amount – at cost 524 939 17,045 49,587 68,095Less: Accumulated depreciation – (928) (15,686) (31,286) (47,900)
Corporate (Dragon Mining LimitedAustralia)Gross carrying amount – at cost – – 74 146 220Less: Accumulated depreciation – – (64) (9) (73)
Net carrying amount 1,377 395 2,635 34,127 38,534
Source: Dragon Mining’s audited financial statements for the year ended 31 December 2020,Consolidation workbook for the year ended 31 December 2020.
APPENDIX II INDEPENDENT EXPERT’S REPORT
– II-19 –

• The balance movements of property, plant and equipment from 31 December2019 to 31 December 2020 are further outlined below:
Property, plant and equipment Land Buildings
Property,plant and
equipmentMine
properties Total$’000 $’000 $’000 $’000 $’000
Carrying amount at31 December 2019 1,362 496 2,369 29,120 33,347
Additions – 7 1,391 1,060 2,458Depreciation – (110) (1,111) (6,733) (7,954)Disposals – – – – –Net foreign exchange movement 15 2 50 (357) (290)Reclassifications – – (64)1 11,0372 10,973
Carrying amount at31 December 2020 1,377 395 2,635 34,127 38,534
1 Reclassification of right-of-use assets2 Reclassification of exploration expenditure to mine properties.
Source: Dragon Mining’s audited financial statements for the year ended 31 December 2020.
• Right-of-use-assets of $0.38 million as at 31 December 2020 comprised $0.22million related to property and $0.16 million related to plant and equipmentwhich are all related to operations;
• Other current assets of $0.21 million as at 31 December 2020 related toprepayments while other non-current assets of $5.54 million related toenvironmental bonds that have been deposited with the Swedish and Finnishgovernment authorities;
• Trade and other payables of $6.55 million as at 31 December 2020 all related totrade payables and accruals;
APPENDIX II INDEPENDENT EXPERT’S REPORT
– II-20 –

• Provisions primarily related to rehabilitation provisions for the Company’sprojects. The breakdown of provisions is outlined in the table below:
ProvisionsAudited as
at 31-Dec-20Audited as
at 31-Dec-19Audited as
at 31-Dec-18$’000 $’000 $’000
CurrentEmployee entitlements 1,839 2,263 1,762Rehabilitation 313 – –Other 199 – 130
Current provisions 2,351 2,263 1,892
Non-currentEmployee entitlements 149 122 86Rehabilitation 18,876 18,992 12,531
Non-current provisions 19,025 19,114 12,617
Source: Dragon Mining’s audited financial statements for the years ended 31 December 2020, 31December 2019 and 31 December 2018.
• The breakdown of provisions between the Company’s Finnish and Swedishoperations as at 31 December 2020 is further outlined in the table below:
ProvisionsEmployee
entitlements Rehabilitation Other Total$’000 $’000 $’000 $’000
CurrentFinland (Dragon Mining Oy) 1,241 302 199 1,742Sweden (Dragon Mining AB) 440 11 – 451Corporate (Dragon Mining Limited
Australia) 158 – – 158
Current provisions 1,839 313 199 2,351
Non-currentFinland (Dragon Mining Oy) – 12,242 – 12,242Sweden (Dragon Mining AB) – 6,634 – 6,634Corporate (Dragon Mining Limited
Australia) 149 – – 149
Non-current provisions 149 18,876 – 19,025
Source: Dragon Mining’s audited financial statements for the year ended 31 December 2020,Consolidation workbook for the year ended 31 December 2020.
APPENDIX II INDEPENDENT EXPERT’S REPORT
– II-21 –
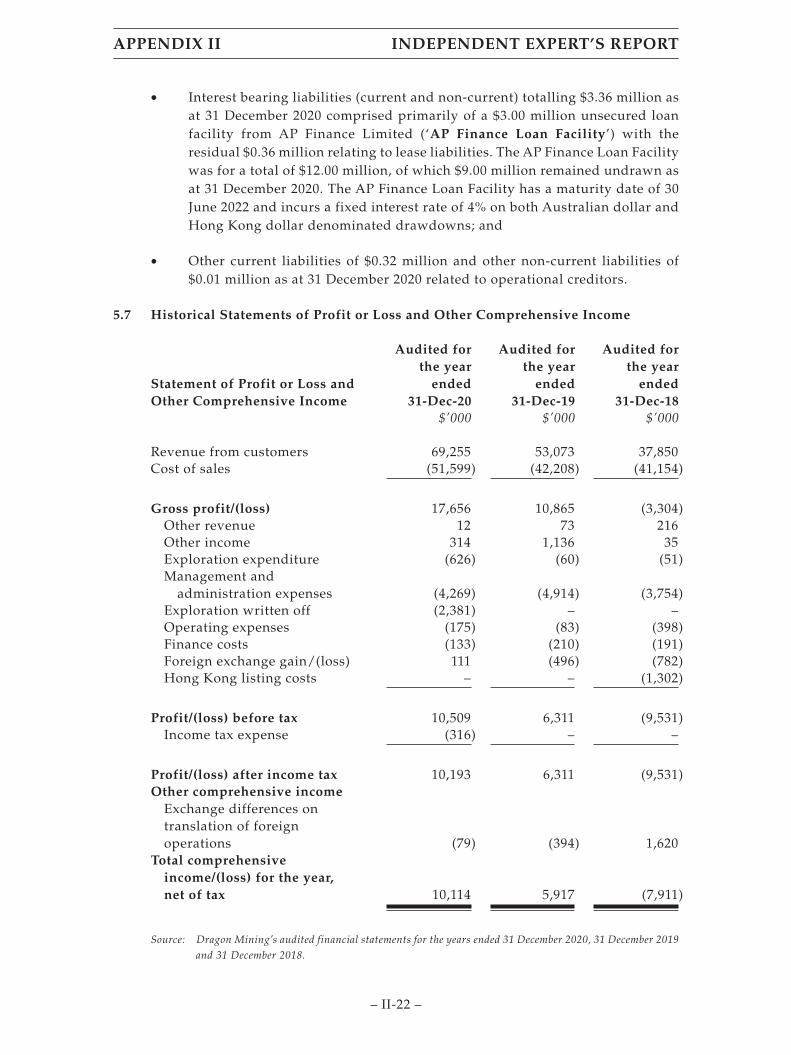
• Interest bearing liabilities (current and non-current) totalling $3.36 million asat 31 December 2020 comprised primarily of a $3.00 million unsecured loanfacility from AP Finance Limited (‘AP Finance Loan Facility’) with theresidual $0.36 million relating to lease liabilities. The AP Finance Loan Facilitywas for a total of $12.00 million, of which $9.00 million remained undrawn asat 31 December 2020. The AP Finance Loan Facility has a maturity date of 30June 2022 and incurs a fixed interest rate of 4% on both Australian dollar andHong Kong dollar denominated drawdowns; and
• Other current liabilities of $0.32 million and other non-current liabilities of$0.01 million as at 31 December 2020 related to operational creditors.
5.7 Historical Statements of Profit or Loss and Other Comprehensive Income
Statement of Profit or Loss andOther Comprehensive Income
Audited forthe year
ended31-Dec-20
Audited forthe year
ended31-Dec-19
Audited forthe year
ended31-Dec-18
$’000 $’000 $’000
Revenue from customers 69,255 53,073 37,850Cost of sales (51,599) (42,208) (41,154)
Gross profit/(loss) 17,656 10,865 (3,304)Other revenue 12 73 216Other income 314 1,136 35Exploration expenditure (626) (60) (51)Management and
administration expenses (4,269) (4,914) (3,754)Exploration written off (2,381) – –Operating expenses (175) (83) (398)Finance costs (133) (210) (191)Foreign exchange gain/(loss) 111 (496) (782)Hong Kong listing costs – – (1,302)
Profit/(loss) before tax 10,509 6,311 (9,531)Income tax expense (316) – –
Profit/(loss) after income tax 10,193 6,311 (9,531)Other comprehensive income
Exchange differences ontranslation of foreignoperations (79) (394) 1,620
Total comprehensiveincome/(loss) for the year,net of tax 10,114 5,917 (7,911)
Source: Dragon Mining’s audited financial statements for the years ended 31 December 2020, 31 December 2019and 31 December 2018.
APPENDIX II INDEPENDENT EXPERT’S REPORT
– II-22 –

Commentary on Historical Statements of Profit or Loss and Other ComprehensiveIncome
• The Company experienced a gross loss in the year ended 31 December 2018due to a decrease in the production of higher grade ore tonnes with theshortfall not fully compensated by the addition of lower-grade ore tonnesfrom Jokisivu, as well as some operational challenges encountered in theoperations of Orivesi. Cost of sales were also higher because of the lowerproduction and processing of lower-grade ore;
• The Company experienced gross profits and net profits in the years ended 31December 2019 and 31 December 2020, due to stronger USD gold prices andimproved gold production compared to the year ended 31 December 2018;
• Revenue from customers relate to gold sales, which increased from $53.07million in the year ended 31 December 2019 to $69.26 million in the year ended31 December 2020. The increase of 30.5% was attributable to the stronger USDgold spot prices in 2020, as well as the increased quantity of gold sold, whichcorresponded to the reduction in gold inventory brought forward from theyear ended 31 December 2019;
• Other income of $1.14 million for the year ended 31 December 2019 relate tothe sale of property, plant and equipment for Swedish operations;
• Exploration expenditure increased significantly from $0.06 million in the yearended 31 December 2019 to $0.63 million in the year ended 31 December 2020.The increase was attributable primarily to the exploration drilling campaignat the Company’s Finnish operations pertaining to Kaapelinkulma, Jokisivuand the recently closed Orivesi; and
• Exploration written off of $2.38 million for the year ended 31 December 2020related to capitalised exploration costs for Orivesi being fully written off uponcessation of mining.
5.8 Capital Structure
The share structure of Dragon Mining as at 30 April 2021 is outlined below:
Number
Total Ordinary Shares on Issue 158,840,613Top 20 Shareholders* 152,434,319Top 20 Shareholders – % of shares on issue 95.97%
* Includes HKSCC Nominees Limited representing shareholdings on the HKEx, which comprises 92.17% of thetotal shares outstanding.
Source: Dragon Mining’s share registry report as at 30 April 2021.
APPENDIX II INDEPENDENT EXPERT’S REPORT
– II-23 –
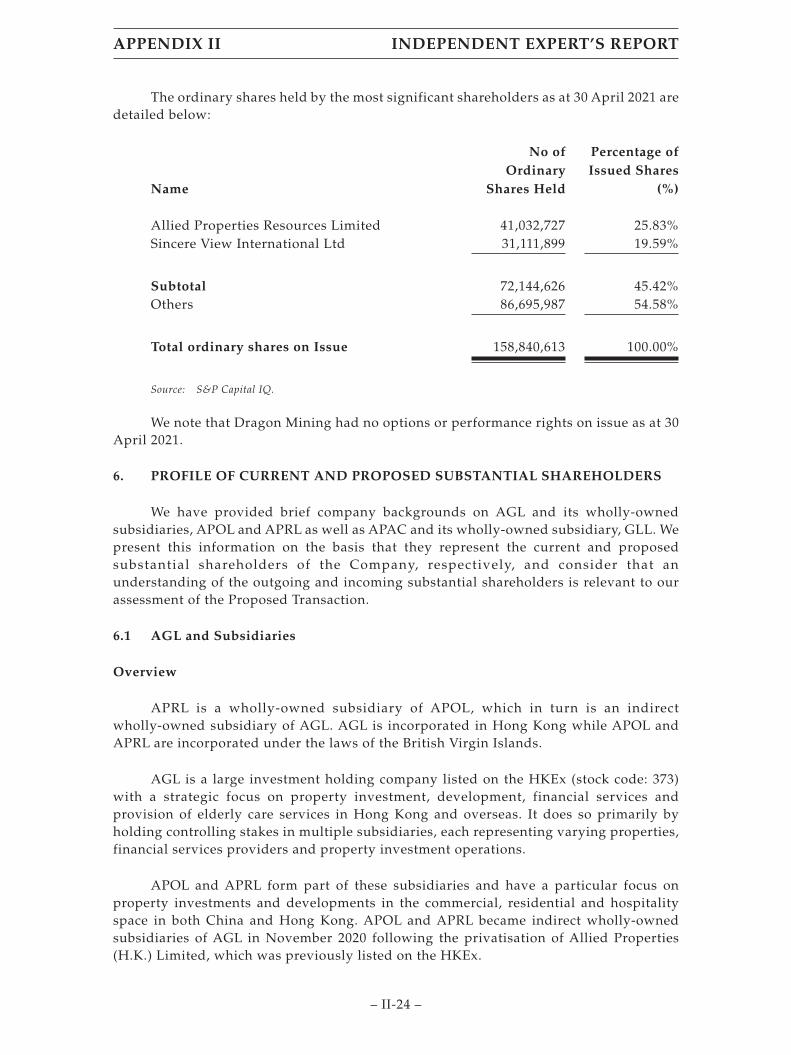
The ordinary shares held by the most significant shareholders as at 30 April 2021 aredetailed below:
Name
No ofOrdinary
Shares Held
Percentage ofIssued Shares
(%)
Allied Properties Resources Limited 41,032,727 25.83%Sincere View International Ltd 31,111,899 19.59%
Subtotal 72,144,626 45.42%Others 86,695,987 54.58%
Total ordinary shares on Issue 158,840,613 100.00%
Source: S&P Capital IQ.
We note that Dragon Mining had no options or performance rights on issue as at 30April 2021.
6. PROFILE OF CURRENT AND PROPOSED SUBSTANTIAL SHAREHOLDERS
We have provided brief company backgrounds on AGL and its wholly-ownedsubsidiaries, APOL and APRL as well as APAC and its wholly-owned subsidiary, GLL. Wepresent this information on the basis that they represent the current and proposedsubstantial shareholders of the Company, respectively, and consider that anunderstanding of the outgoing and incoming substantial shareholders is relevant to ourassessment of the Proposed Transaction.
6.1 AGL and Subsidiaries
Overview
APRL is a wholly-owned subsidiary of APOL, which in turn is an indirectwholly-owned subsidiary of AGL. AGL is incorporated in Hong Kong while APOL andAPRL are incorporated under the laws of the British Virgin Islands.
AGL is a large investment holding company listed on the HKEx (stock code: 373)with a strategic focus on property investment, development, financial services andprovision of elderly care services in Hong Kong and overseas. It does so primarily byholding controlling stakes in multiple subsidiaries, each representing varying properties,financial services providers and property investment operations.
APOL and APRL form part of these subsidiaries and have a particular focus onproperty investments and developments in the commercial, residential and hospitalityspace in both China and Hong Kong. APOL and APRL became indirect wholly-ownedsubsidiaries of AGL in November 2020 following the privatisation of Allied Properties(H.K.) Limited, which was previously listed on the HKEx.
APPENDIX II INDEPENDENT EXPERT’S REPORT
– II-24 –
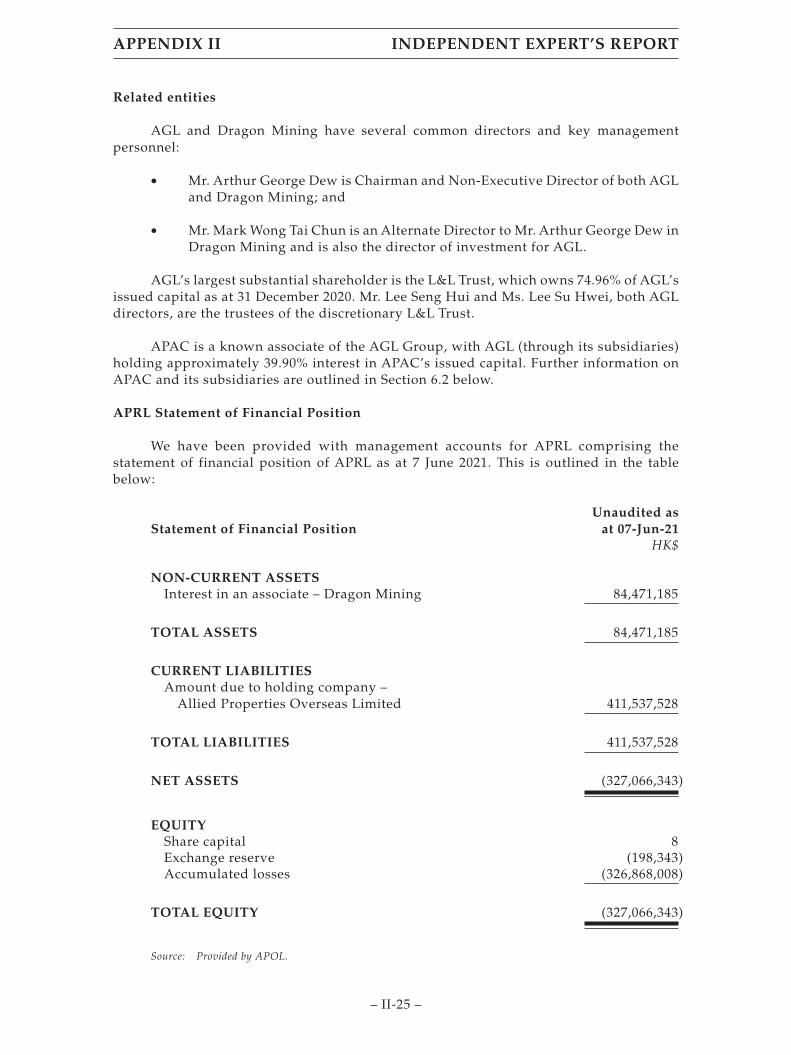
Related entities
AGL and Dragon Mining have several common directors and key managementpersonnel:
• Mr. Arthur George Dew is Chairman and Non-Executive Director of both AGLand Dragon Mining; and
• Mr. Mark Wong Tai Chun is an Alternate Director to Mr. Arthur George Dew inDragon Mining and is also the director of investment for AGL.
AGL’s largest substantial shareholder is the L&L Trust, which owns 74.96% of AGL’sissued capital as at 31 December 2020. Mr. Lee Seng Hui and Ms. Lee Su Hwei, both AGLdirectors, are the trustees of the discretionary L&L Trust.
APAC is a known associate of the AGL Group, with AGL (through its subsidiaries)holding approximately 39.90% interest in APAC’s issued capital. Further information onAPAC and its subsidiaries are outlined in Section 6.2 below.
APRL Statement of Financial Position
We have been provided with management accounts for APRL comprising thestatement of financial position of APRL as at 7 June 2021. This is outlined in the tablebelow:
Statement of Financial PositionUnaudited as
at 07-Jun-21HK$
NON-CURRENT ASSETSInterest in an associate – Dragon Mining 84,471,185
TOTAL ASSETS 84,471,185
CURRENT LIABILITIESAmount due to holding company –
Allied Properties Overseas Limited 411,537,528
TOTAL LIABILITIES 411,537,528
NET ASSETS (327,066,343)
EQUITYShare capital 8Exchange reserve (198,343)Accumulated losses (326,868,008)
TOTAL EQUITY (327,066,343)
Source: Provided by APOL.
APPENDIX II INDEPENDENT EXPERT’S REPORT
– II-25 –

In relation to APRL’s statement of financial position, we note the following:
• The only asset held by APRL is its investment in Dragon Mining which iscarried at a book value of HK$84.47 million;
• The only liability held by APRL is in relation to the Shareholder Loan with acurrent book value of HK$411.54 million; and
• Apart from the above, there are no other assets or liabilities held by APRL.
The Proposed Transaction comprises a cash consideration component ofHK$102,581,817.50 payable by GLL to APOL for its 100% interest in APRL, as well as anassignment of the Shareholder Loan from APOL to GLL. Therefore, the structure of theProposed Transaction implies that the $102,581,817.50 is in direct relation to theacquisition of APRL’s 41,032,727 shares in Dragon Mining.
6.2 APAC and GLL
Overview
GLL is a wholly-owned subsidiary of APAC, which is a natural resources investmentand commodities business company listed on the HKEx (stock code: 1104). The Companyis incorporated in Bermuda with limited liability.
APAC operates through four key business segments:
• Primary strategic investment business, which comprises:
o a 36.35% interest in ASX-listed Mount Gibson Iron Limited; and
o a 46.30% interest in ASX-listed Tanami Gold Limited.
• Resource investment business, which comprises emerging investments thatmay become primary strategic investments including:
o a 15.31% interest in ASX-listed Metals X Limited;
o a 10.89% interest in ASX-listed Prodigy Gold Limited; and
o minor holdings of less than 5% interest in approximately 60 othernatural resource companies listed on various major stock exchanges.
• Commodity business, which is based in Shanghai, primarily trading in ironore; and
• Principal investment and financial services, which covers income generatedfrom financing loans receivable, convertible notes and other financial assets.
APPENDIX II INDEPENDENT EXPERT’S REPORT
– II-26 –

Related entities
APAC and Dragon Mining also have several common directors and keymanagement personnel:
• Mr. Brett Robert Smith is the Chief Executive Officer and Executive Director ofDragon Mining and the Deputy Chairman and Executive Director of APAC;
• Mr. Arthur George Dew is the Chairman and Non-Executive Director of bothAPAC and Dragon Mining; and
• Mr. Mark Wong Tai Chun is an Alternate Director to Mr. Arthur George Dew inDragon Mining and APAC.
APAC’s largest substantial shareholder is AGL (through its subsidiaries), whichholds approximately 39.90% interest in APAC’s issued capital. Mr. Lee Seng Hui who isthe Chief Executive and Executive Director of AGL and trustee to the L&L Trust, is also aNon-Executive Director of APAC.
7. ECONOMIC ANALYSIS
In the following section, we set out an analysis of the current economic context andoutlook in Finland and Sweden and consider the implications for Dragon Mining’soperations and the mining industry. We have also presented a brief analysis of the currenteconomic context of Hong Kong to the extent that it relates to Dragon Mining’s corporateenvironment.
We have not presented an economic analysis on Australia on the basis that it onlyrepresents the Company’s country of incorporation and headquarters.
7.1 Finland
Overview
Finland is a member of the European Union (‘EU’) and is known to be one of theleading countries in innovation and economic performance. However, like many others,the effects of the COVID-19 pandemic has hit the national economy with Gross DomesticProduct (‘GDP’) estimated to record a contraction of 2.9% in 2020 according to theInternational Monetary Fund (‘IMF’). This was mainly driven by a sharp contraction inprivate consumption.
The pandemic also led to a fall in government revenues and a rise in expenditures,prompting an increase in the budget deficit to 1.9% in 2020 from 0.3% in 2019. Fiscalsupport measures primarily comprised grants and compensations for losses incurredduring the forced closure of businesses and extensions to unemployment benefit schemes.
Inflation for 2020 is expected to be subdued at 0.4% in 2020 and is estimated to riseonly marginally in 2021 and 2022 to 1.4% and 1.5%, respectively (IMF estimates).
APPENDIX II INDEPENDENT EXPERT’S REPORT
– II-27 –
However, compared to most other EU countries, Finland has performedconsiderably better and the outlook for GDP is positive with the IMF estimating GDPgrowth at 2.3% and 2.5% for 2021 and 2022, respectively.
Economic activity in Finland is primarily made up of its services sector, whichaccounts for around 60% of total GDP. The industry sector, which includes mining,accounts for approximately 24% of GDP with forestry and paper production being one ofthe country’s main exports.
Overall, the economic context of Dragon Mining’s Finnish operations appear to begenerally positive with the economy set to recover after the adverse impacts of COVID-19.
Source: IMF World Economic Outlook Database, April 2021.
Mining
The main governing laws and regulations relating to mining activity in Finland arethe Repealed Mining Act and the Finnish Mining Act of 1 July 2011. The current miningauthority is Turvallisuus-ja kemikaalivirasto (‘Tukes’), which grants the relevant permitsfor exploration and mining.
There is no specified restriction on the maximum duration for the validity of amining permit (unless it is a fixed term permit). This is also the case for miningconcessions which were the mining area rights granted prior to 2011. However, theFinnish Mining Act states that the permit may expire by the decision of Tukes if the permitholder does not initiate mining activity or relevant works within five years of grant asspecified under the Finnish Mining Act.
On the other hand, exploration permits have a maximum validity period of fouryears upon grant, which may be extended for a maximum of three years at a time. In total,the permit may remain valid for a maximum of 15 years if all prerequisites for extensionsexist.
Another key requirement for mining activities is an environmental permit grantedby AVI pursuant to the Environmental Protection Act. Occasionally, a company mayrequire a water permit which is usually processed jointly with an environmental permitmatter.
Dragon Mining has historically satisfied the requirements of the Finnish Mining Actto qualify for the relevant exploration and mining permits. However, more recently, it isthe applications for environmental permits that pose potential delays for the Company’soperations as changes to related environmental regulations and legislations lead to morecomplex application processes.
Source: Finnish Mining Act 2011, Dragon Mining Prospectus 2018.
APPENDIX II INDEPENDENT EXPERT’S REPORT
– II-28 –

7.2 Sweden
Overview
Sweden is also a member of the EU. The impact of COVID-19 on the Swedisheconomy is similar to the impact on the Finnish economy with the IMF projecting GDPcontraction to be contained at 2.8% for 2020 aided by softer preventative restrictionsearlier in the year and a strong third quarter recovery. GDP growth is estimated to turnpositive in 2021 at 3.1%, however, declining business confidence and risingunemployment rates are anticipated to weigh on economic recovery.
Unemployment worsened even after slowing to 6.8% pre COVID-19, with the IMFprojecting an 8.3% unemployment rate in 2020 and 8.7% in 2021. This is driven by theslowed activity in the services industry even when Sweden opted against nationwidelockdowns.
Economic activity in Sweden is primarily made up of the services sector, whichaccounts for around 65% of total GDP. The industry sector contributes 22% of GDPdominated by major car manufacturing groups, Ikea and H&M.
Sweden has a similar economic profile to Finland and the economic environment forDragon Mining’s operations appears generally positive.
Source: IMF World Economic Outlook Database, April 2021.
Mining
The mineral and mining industry has been significant for the Swedish economywith Sweden accounting for 91% of Europe’s iron ore. The Swedish government’s mineralstrategy to increase ore production is also accompanied by a strong emphasis onsustainable mining.
A mining operation in Sweden is required to have an exploitation concession inaccordance with the Mineral Act 1991 and an environmental permit according to theEnvironmental Code (the principal environmental law in Sweden).
The process for gaining an exploration permit and exploitation concession isgoverned by the Mining Inspectorate who is also the governing authority regardingmatters regulated by the Mineral Act 1991. The County Administrative Board in Sweden(‘CAB’) also takes part in the environmental evaluation of applications for explorationpermits and exploitation concessions. Applications for exploitation concessions need todemonstrate economic viability and should also be accompanied by an environmentalimpact assessment (‘EIA’).
APPENDIX II INDEPENDENT EXPERT’S REPORT
– II-29 –

The EIA is also a key requirement for the application for an environmental permit,which is a process carried out by the Land and Environmental Court that includes a courthearing. Test mining applications however, are processed by the CAB, which DragonMining had managed to receive approval for in relation to testing at Fäboliden.
As previously mentioned, the court hearing for the environmental permit for fullscale mining at Fäboliden has been delayed with the Company having to submitadditional material for its application due to certain EU Court rulings. While theCompany aims to attain its environmental permit by the end 2021, this poses the key riskarea that may delay its mining operations.
Source: Swedish Mining Act 1991, Dragon Mining Prospectus 2018.
7.3 Hong Kong
Overview
Recent political instability has proceeded to jeopardise Hong Kong’s status as astable and efficient trade and investment hub. The six month protests against the HongKong extradition bill in 2019 and the US-China trade war sent the economy into its firstrecession in a decade. In the third quarter of 2019 the economy had contracted anannualised 2.9%. The protests disrupted retail sales and tourism, with tourist arrivalsobserving a 56% decline year-on-year in November 2019.
Furthermore, on the back of the 2019 economic downturn, COVID-19 plunged HongKong into its second consecutive year of annual contraction with a 6.1% decrease in GDPfor 2020, reflecting the country’s most severe contraction on record. The sharp fall in GDPwas largely driven by a sharp reduction in domestic demand. Domestic consumptionactivities were severely disrupted by the outbreak and the resultant social distancingmeasures, while investment spending retreated noticeably. However, despite globaldisruptions, Hong Kong’s annual exports only suffered a minor decline, being supportedin part by the swift resumption of production and economic activities in mainland China.
In response to the COVID-19 pandemic, the Hong Kong Government introducedrelief measures totalling HK$300 billion through various initiatives. These measuresincluded a one-off cash transfer of HK$10,000 to eligible residents, waged subsidiesthrough the Employment Support Scheme and one-off subsidies, rent concessions and feewaivers for hard-hit sectors.
With the development of COVID-19 vaccines and strong exports, the first quarter of2021 saw the economy rebound, albeit with real GDP below pre-pandemic levels. In theMarch 2021 quarter, GDP rose 7.8% from March 2020 lows, ending six consecutive quartersof growth decline and its longest recession. The rebound was largely driven by a strongincrease in exports, led by mainland China’s swift economic recovery and the US.However, this growth has been inhibited in part by weak consumer spending and tourismas strict social distancing measures remain in place.
APPENDIX II INDEPENDENT EXPERT’S REPORT
– II-30 –

The Hong Kong Monetary Authority forecasts real GDP growth in the range of 3.5%to 5.5% throughout 2021 as COVID-19 vaccination roll-outs continue and mainlandChina’s economy strengthens to support Hong Kong’s exports. However, this expectationremains shrouded amongst uncertainties, in particular, further COVID-19 outbreaks,vaccine rollout efficacy and lingering US-China trade tensions.
Source: Hong Kong Monetary Authority 2020 Annual Report, Bloomberg.
8. INDUSTRY ANALYSIS
Gold is a soft malleable metal which is highly desirable due to its rarity, permanenceand unique mineral properties. Gold has been used in jewellery and as a form of currencyfor thousands of years, however more recently, there has been increasing demand for itsuse in the manufacture of electronics, dentistry, medicine and aerospace technology.
In addition to its practical applications, gold also serves as an international store ofmonetary value. Gold is widely regarded as a monetary asset as it is considered lessvolatile than world currencies and therefore provides a safe haven investment duringperiods of economic uncertainty.
Once mined, gold continues to exist indefinitely and is often melted down andrecycled to produce alternative or replacement products. Consequently, demand for goldis supported by both gold ore mining and gold recycling. A summary of the recenthistorical supply of gold is provided in the table below:
Gold supply (tonnes) 2012 2013 2014 2015 2016 2017 2018 2019 2020Q1
2021
Mine production 2,940 3,128 3,242 3,334 3,459 3,492 3,554 3,530 3,389 851Net producer hedging (45) (28) 105 13 38 (26) (13) 6 (52) (25)Recycled gold 1,638 1,197 1,132 1,070 1,233 1,111 1,132 1,274 1,283 270
Total supply 4,533 4,297 4,479 4,417 4,730 4,577 4,673 4,810 4,620 1,096
Source: World Gold Council Quarter 1 2021 Statistics, 31 March 2021
Historically, the price of gold is negatively correlated to the prices of other assetclasses during times of uncertainty and financial crises. Growing uncertainty on the backof the recent COVID-19 outbreak has caused the price of gold to rally, as investors demandthe high liquidity that gold provides. The recent increase in the price of gold haspositively impacted the gold industry and will continue to do so if economic uncertaintyprevails.
The gold ore mining industry has performed steadily in recent years, with growthdriven by price increases and slow economic growth. However, gold mine production in2019 was lower than in 2018, the first annual decline in production since 2008. This declinecan be mainly attributed to China’s fall in mine output by 6% due to strict environmentalrestrictions that have come into force in recent years. Gold production fell again in 2020due to the impact COVID-19 had on mine closures, which stalled operations globally.
APPENDIX II INDEPENDENT EXPERT’S REPORT
– II-31 –
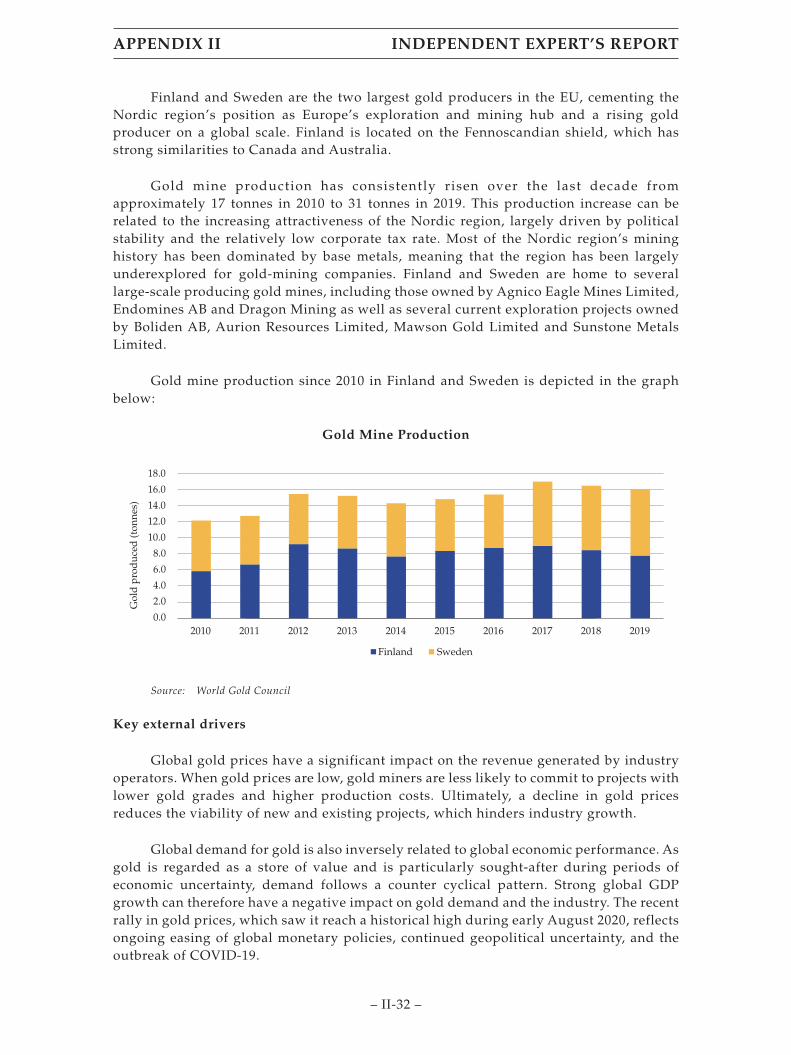
Finland and Sweden are the two largest gold producers in the EU, cementing theNordic region’s position as Europe’s exploration and mining hub and a rising goldproducer on a global scale. Finland is located on the Fennoscandian shield, which hasstrong similarities to Canada and Australia.
Gold mine production has consistently risen over the last decade fromapproximately 17 tonnes in 2010 to 31 tonnes in 2019. This production increase can berelated to the increasing attractiveness of the Nordic region, largely driven by politicalstability and the relatively low corporate tax rate. Most of the Nordic region’s mininghistory has been dominated by base metals, meaning that the region has been largelyunderexplored for gold-mining companies. Finland and Sweden are home to severallarge-scale producing gold mines, including those owned by Agnico Eagle Mines Limited,Endomines AB and Dragon Mining as well as several current exploration projects ownedby Boliden AB, Aurion Resources Limited, Mawson Gold Limited and Sunstone MetalsLimited.
Gold mine production since 2010 in Finland and Sweden is depicted in the graphbelow:
Gold Mine Production
0.0
2.0
4.0
6.0
8.0
10.0
12.0
14.0
16.0
18.0
2010 2011 2012 2013 2014 2015 2016 2017 2018 2019
Finland Sweden
Gol
d p
rod
uced
(ton
nes)
Source: World Gold Council
Key external drivers
Global gold prices have a significant impact on the revenue generated by industryoperators. When gold prices are low, gold miners are less likely to commit to projects withlower gold grades and higher production costs. Ultimately, a decline in gold pricesreduces the viability of new and existing projects, which hinders industry growth.
Global demand for gold is also inversely related to global economic performance. Asgold is regarded as a store of value and is particularly sought-after during periods ofeconomic uncertainty, demand follows a counter cyclical pattern. Strong global GDPgrowth can therefore have a negative impact on gold demand and the industry. The recentrally in gold prices, which saw it reach a historical high during early August 2020, reflectsongoing easing of global monetary policies, continued geopolitical uncertainty, and theoutbreak of COVID-19.
APPENDIX II INDEPENDENT EXPERT’S REPORT
– II-32 –

The World Gold Council forecasts gold prices in 2021 to be positive, yet moresubdued than the previous year. This may be driven by the recovery of consumer demandrelative to 2020 as economic conditions improve. Gold’s performance may also be boostedfurther by a prolonged low interest rate environment which would all but remove theopportunity cost of investing in gold. In addition, the potential for a second wave ofCOVID-19 remains, which would likely cause a spike in demand for gold as a safe havenasset.
Gold ore mining trends
Gold ore mining is a capital intensive and high-cost process, which is becomingincreasingly difficult and more expensive as the quality of ore reserves diminishes. Theindustry also incurs many indirect costs related to exploration, royalties, overheads,marketing and native title law. Typically, many of these costs are fixed in the short term asa result of industry operators’ inability to significantly alter cost structures once a minecommences production.
Until the late 1980s, South Africa produced approximately half of the total gold oremined globally. More recently however, the industry has diversified geographically asChina and Australia now dominate global gold production. According to the United StatesGeological Survey (‘USGS’), total estimated global gold ore mined for 2020 wasapproximately 3,287 metric tonnes. The chart below illustrates the estimated global goldproduction by country for 2019.
According to the World Gold Council, global gold production fell 4% in 2020following the effects of COVID-19. The virus led to a number of gold mine closures acrossthe world due to lockdown restrictions imposed by individual countries across the March2020 quarter. Notably, the production from the world’s largest gold producers, includingNewmont Corporation, Barrick Gold Corporation, AngloGold Ashanti Limited andNewcrest Mining Limited, had more than halved in the June 2020 quarter to 1.4Moz, downfrom 2.9 million ounces (‘Moz’) in the June 2019 quarter.
APPENDIX II INDEPENDENT EXPERT’S REPORT
– II-33 –

The decrease in supply was hardest felt in the Americas region as production fell by28% in Peru, 18% in Argentina and 15% in Chile. The World Gold Council expectsCOVID-19 interruptions to diminish further in 2021, removing a potential headwind tomine production. This is likely to be assisted by a return to growth by the Grasberg minein Indonesia, the largest producing gold mine in the world, which was responsible for alarge fall in mine supply in 2020.
Global Gold Production by Country (2020)
Rest of World China
Australia Russia
United States Canada
Indonesia Peru
Ghana Mexico
Uzbekistan Kazakhstan
South Africa Brazil
Argentina Papua New Guinea
27%
12%
10%9%
6%
5%
4%
4%
4%
3%
3%3%
3%
3%2%
2%
Source: 2021 USGS and BDO analysis
Despite China’s leading global gold production in 2020, Australia, Russia and SouthAfrica hold the largest known gold reserves globally. As depicted below, the USGSestimates that collectively, these three countries account for approximately 38% of globalgold reserves.
Global Gold Reserves by Country (2020)
19%
19%
14%5%6%
5%
5%
5%
4%
4%3%
3%3%
2%2%
2%
Rest of World Australia
Russia South Africa
United States Peru
Indonesia Brazil
Canada China
Uzbekistan Argentina
Mexico Papua New Guinea
Kazakhstan Ghana
Source: 2021 USGS and BDO analysis.
APPENDIX II INDEPENDENT EXPERT’S REPORT
– II-34 –
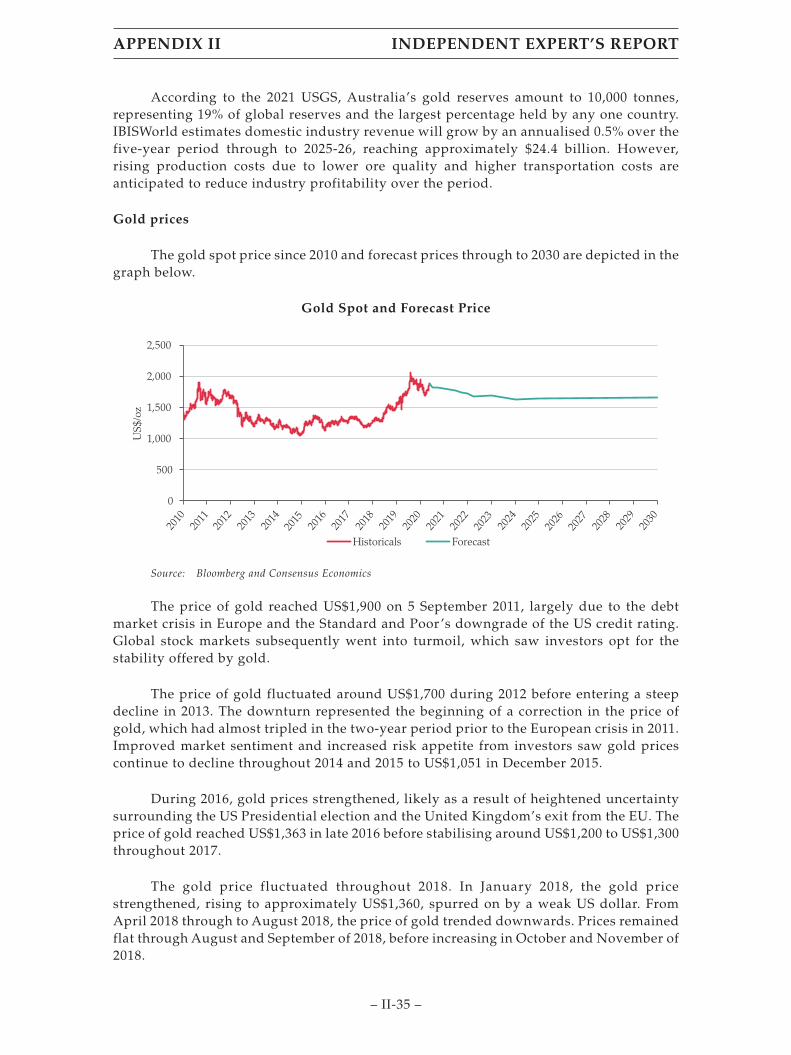
According to the 2021 USGS, Australia’s gold reserves amount to 10,000 tonnes,representing 19% of global reserves and the largest percentage held by any one country.IBISWorld estimates domestic industry revenue will grow by an annualised 0.5% over thefive-year period through to 2025-26, reaching approximately $24.4 billion. However,rising production costs due to lower ore quality and higher transportation costs areanticipated to reduce industry profitability over the period.
Gold prices
The gold spot price since 2010 and forecast prices through to 2030 are depicted in thegraph below.
Gold Spot and Forecast Price
0
500
1,000
1,500
2,000
2,500
US$
/oz
Historicals Forecast
2010
2011
2012
2013
2014
2015
2016
2017
2018
2019
2020
2021
2022
2023
2024
2025
2026
2027
2028
2029
2030
Source: Bloomberg and Consensus Economics
The price of gold reached US$1,900 on 5 September 2011, largely due to the debtmarket crisis in Europe and the Standard and Poor ’s downgrade of the US credit rating.Global stock markets subsequently went into turmoil, which saw investors opt for thestability offered by gold.
The price of gold fluctuated around US$1,700 during 2012 before entering a steepdecline in 2013. The downturn represented the beginning of a correction in the price ofgold, which had almost tripled in the two-year period prior to the European crisis in 2011.Improved market sentiment and increased risk appetite from investors saw gold pricescontinue to decline throughout 2014 and 2015 to US$1,051 in December 2015.
During 2016, gold prices strengthened, likely as a result of heightened uncertaintysurrounding the US Presidential election and the United Kingdom’s exit from the EU. Theprice of gold reached US$1,363 in late 2016 before stabilising around US$1,200 to US$1,300throughout 2017.
The gold price fluctuated throughout 2018. In January 2018, the gold pricestrengthened, rising to approximately US$1,360, spurred on by a weak US dollar. FromApril 2018 through to August 2018, the price of gold trended downwards. Prices remainedflat through August and September of 2018, before increasing in October and November of2018.
APPENDIX II INDEPENDENT EXPERT’S REPORT
– II-35 –

The price of gold declined to US$1,270 in May 2019, before rallying past US$1,500 toreach a six year high. Demand for gold was primarily driven by investors looking to avoidUS-China trade war uncertainties, while civil unrest in Hong Kong prompted investors toabandon riskier asset classes for safe haven assets. The gold price continued to remainaround US$1,500 throughout October 2019, although it dipped slightly to US$1,465 inmid-November 2019.
Gold prices have fluctuated significantly throughout 2020. Demand for goldincreased in response to the uncertainty created by the global spread of COVID-19, asinvestors prioritised safe haven assets. In late March 2020, the increasing demand for goldwas interrupted by a panic sell-off as investors began to realise their profits amidst thegrowing uncertainty caused by the crisis. Gold spot prices fell to a yearly low of US$1,471,before rallying. Throughout May and June 2020, prices remained elevated aroundUS$1,700.
Through early July 2020, gold prices steadily increased to above the US$1,800 level,before spiking in late July and early August to exceed US$2,000. The COVID-19 crisisremains the primary driver of the gold price, as central banks continue to inject trillions ofdollars into financial markets and investors further prioritise safe haven assets.Additionally, the availability of cheap money through low global interest rates is furtherspurring investment in gold. Gold prices reached a record high of approximately US$2,064on 6 August 2020, before declining slightly below the US$2,000 mark through toNovember 2020. Through to early January 2021, the price of gold increased as a result offurther fallout from the US Election, climbing back over US$1,900 after remaining in theUS$1,800s through most of December 2020.
During March 2021, the price of gold fell below US$1,700 for the first time in eightmonths as rising US treasury yields threaten gold’s appeal as an inflation hedge byincreasing the opportunity cost of holding the precious metal. Demand was alsoweakened by increased consumer confidence in the gradual reopening of globaleconomies as COVID-19 vaccination rates rise. However, gold has since rebounded asglobal inflation concerns rose and the US dollar weakened.
According to Consensus Economics forecasts, the price of gold is set to decline overthe medium term but remain high in comparison to historical levels. This medium-termdecline is likely to occur on the back of developments in relation to a COVID-19vaccination as well as stability in the United States following the presidential election ofJoe Biden.
Source: Bloomberg, Consensus Economics, IBISWorld and Reuters
APPENDIX II INDEPENDENT EXPERT’S REPORT
– II-36 –
9. VALUATION APPROACH ADOPTED
There are a number of methodologies which can be used to value a business or theshares in a company. The principal methodologies which can be used are as follows:
• Capitalisation of future maintainable earnings (‘FME’);
• Discounted cash flow (‘DCF’);
• Quoted market price basis (‘QMP’);
• Net asset value (‘NAV’); and
• Market based assessment (such as a Resource Multiple).
A summary of each of these methodologies is outlined in Appendix 2.
Different methodologies are appropriate in valuing particular companies, based onthe individual circumstances of that company and available information.
It is possible for a combination of different methodologies to be used together todetermine an overall value where separate assets and liabilities are valued using differentmethodologies. When such a combination of methodologies is used, it is referred to as a‘sum-of-parts’ (‘Sum-of-Parts’) valuation.
The approach using the Sum-of-Parts involves separately valuing each asset andliability of the company. The value of each asset may be determined using differentmethodologies as described above. The component parts are then valued using the NAVmethodology, which involves aggregating the estimated fair market value of eachindividual asset and liability of the company.
9.1 Value of Dragon Mining
In order to assess whether a premium for control is being received by APOL for thesale of its shares in Dragon Mining to GLL, we consider it appropriate to assess the valueof a Dragon Mining share on a minority interest basis and to compare this to theconsideration payable by GLL to APOL for each Dragon Mining share.
Should the price paid per share exceed our assessed value per share of DragonMining, then GLL will be deemed to be paying a premium for control for APOL’s shares inDragon Mining. As such, Shareholders will be missing out on the opportunity to be paid apremium for control if a formal takeover offer had been made for all of the shares inDragon Mining. The greater the control premium, the greater the advantages of theProposed Transaction to the Shareholders would need to be to support a finding that theadvantages of the Proposed Transaction outweigh the disadvantages.
APPENDIX II INDEPENDENT EXPERT’S REPORT
– II-37 –
Conversely, should our assessed value per Dragon Mining share on a minorityinterest basis exceed the consideration per share to be received by APOL, then GLL will bedeemed to be not paying a premium for control. As such, Shareholders are not missing outon the opportunity to participate and receive a premium for control for their shares.
Therefore, we have assessed the value of a Dragon Mining share on a minorityinterest basis, which is to be compared with the consideration per share to be received byAPOL, in order to determine the quantum of the premium for control to be paid, if any.
As the quoted prices of Dragon Mining’s shares and the cash consideration payableby GLL to APOL are both denominated in Hong Kong dollars, our final valuationassessment is also denominated in Hong Kong dollars. Foreign currencies, whereapplicable, are converted at prevailing spot exchange rates sourced from Bloomberg.
In our assessment of APOL’s interest in Dragon Mining, we have chosen to employthe following valuation methodologies:
• Sum-of-Parts, which estimates the market value of a company by assessing therealisable value of its identifiable assets and liabilities. The value of each assetand liability may be determined using different methods and the componentparts are then aggregated using the NAV methodology. The value derivedfrom this methodology reflects a controlling interest value, therefore, we haveassessed a minority interest discount to be applied in order to derive the valueof a Dragon Mining share on a minority interest basis; and
• QMP as our secondary methodology, as this represents the value that aShareholder may receive for a Dragon Mining share if it were to be sold onmarket. The value derived from this methodology reflects a minority interestvalue.
We have employed the Sum-of-Parts methodology in estimating the fair marketvalue of Dragon Mining by aggregating the estimated fair market values of its underlyingassets and liabilities, having consideration to the:
• Value of the Company’s Finnish operations and mineral assets having relianceon the valuation carried out by an independent technical expert, comprising:
o The value of the Jokisivu mine, applying the DCF methodology;
o The value of Kaapelinkulma;
o The value of Orivesi;
o The value of early stage exploration tenements in Finland not includedin the above;
o The value of the Vammala Plant; and
o The value of closure costs for the Company’s Finnish operations.
APPENDIX II INDEPENDENT EXPERT’S REPORT
– II-38 –

• Value of the Company’s Swedish operations and mineral assets havingreliance on the valuation carried out by an independent technical expert,comprising:
o The value of Fäboliden open cut mine operations, applying the DCFmethodology;
o The value of any resource and exploration assets not included in theFäboliden DCF valuation;
o The value of Svartliden;
o The value of the Svartliden Plant;
o The value of gold in-circuit at Svartliden; and
o The value of closure costs for the Company’s Swedish operations.
• Value of the Company’s other assets and liabilities, applying the costapproach under the NAV methodology.
We have chosen these methodologies for the following reasons:
• Jokisivu and Fäboliden are valued using a DCF methodology as DragonMining’s main assets comprise the future cash flows to be generated from themining operations at Jokisivu and Fäboliden;
• The other components to our Sum-of-Parts valuation are valued usingalternative valuation methodologies by an independent technical specialist,as contained in the Technical Specialist Report in Appendix 4;
• The FME methodology is most commonly applicable to profitable businesseswith steady growth histories and forecasts. The FME methodology is also notconsidered to be appropriate for valuing finite life assets, such as miningassets; and
• The QMP basis is a relevant methodology to consider because DragonMining’s shares are listed on the HKEx, therefore reflecting the value that aShareholder will receive for a share sold on the market. This means that thereis a regulated and observable market where Dragon Mining shares can betraded. However, in order for the QMP methodology to be consideredappropriate, Dragon Mining’s shares should be liquid and the market shouldbe fully informed on the Company’s activities.
APPENDIX II INDEPENDENT EXPERT’S REPORT
– II-39 –
Technical Expert
In performing our valuation of Dragon Mining using the Sum-of-Parts method, wehave relied on the independent Technical Specialist Report prepared by RPM AdvisoryServices Pty Ltd (‘RPM’), which includes an assessment of the market value of theCompany’s aforementioned assets.
We instructed RPM to provide an independent market valuation of the Company’saforementioned assets. RPM considered a number of different valuation methodologieswhen valuing these assets and has been prepared in accordance with the AustralasianCode for Public Reporting of Technical Assessments and Valuation of Mineral Assets (2015Edition) (‘VALMIN Code’) and the JORC Code.
We are satisfied with the valuation methodologies adopted by RPM, which webelieve are in accordance with industry practices and are compliant with the requirementsof the VALMIN code. The specific valuation methodologies used by RPM are referred to inthe respective sections of our Report and in further detail in the Technical SpecialistReport contained in Appendix 4 of our Report.
10. VALUATION OF DRAGON MINING
10.1 Sum-of-Parts
We have valued Dragon Mining using a Sum-of-Parts approach, with our valuationincluding:
• The value of the Company’s Finnish Operations and mineral assets, including:
o The value of the Jokisivu mine, applying the DCF methodology;
o The value of Kaapelinkulma;
o The value of Orivesi;
o The value of early stage exploration tenements in Finland not includedin the above;
o The value of the Vammala Plant; and
o The value of closure costs for the Company’s Finnish operations.
• The value of the Company’s Swedish Operations and mineral assets,including:
o The value of Fäboliden open cut mine operations, applying the DCFmethodology;
o The value of any resource and exploration assets not included in theFäboliden DCF valuation;
APPENDIX II INDEPENDENT EXPERT’S REPORT
– II-40 –

o The value of Svartliden;
o The value of the Svartliden Plant;
o The value of gold in-circuit at Svartliden; and
o The value of closure costs for the Company’s Swedish operations.
• The value of other assets and liabilities not included in the above.
The valuation of mineral assets undertaken by RPM was denominated in US dollars,therefore, we have converted the US dollar-denominated valuation figures into HongKong dollars for our Sum-of-Parts valuation.
The value of other assets and liabilities in Dragon Mining are based on theCompany’s audited statement of financial position as at 31 December 2020, which isdenominated in Australian dollars. Therefore, we have converted the value of other assetsand liabilities to Hong Kong dollars for our Sum-of-Parts valuation.
Foreign currencies, where applicable, are converted at prevailing spot exchangerates sourced from Bloomberg.
APPENDIX II INDEPENDENT EXPERT’S REPORT
– II-41 –

The summary of our Sum-of-Parts valuation is set out in the table below:
Valuation ofDragon Mining Ref Low Preferred High
HK$m HK$m HK$m
Finnish OperationsDCF value of Jokisivu mine 10.1.1 60.29 81.24 130.04Value of Kaapelinkulma 10.1.2 3.65 7.84 14.12Value of Orivesi 10.1.3 6.52 14.04 25.29Value of other Finnish mineral
assets 10.1.4 3.10 3.18 3.26Value of Vammala Plant 10.1.5 4.50 4.50 4.50Value of closure costs for
Finnish operations 10.1.6 (65.64) (65.64) (65.64)
Sub-total 12.42 45.16 111.57
Swedish OperationsDCF value of Fäboliden open
cut mine 10.1.7 62.69 65.10 135.24Residual value of Fäboliden
not in DCF 10.1.8 134.62 281.81 502.71Value of Svartliden 10.1.9 11.17 24.13 43.53Value of Svartliden Plant 10.1.10 3.41 3.41 3.41Value of gold in-circuit
at Svartliden 10.1.11 41.05 41.05 41.05Value of closure costs for
Swedish operations 10.1.12 (39.57) (39.57) (39.57)
Sub-total 213.37 375.93 686.37
Value of other assets andliabilities 10.1.13 126.69 126.69 126.69
Total value of Dragon Mining(controlling interest) 352.48 547.78 924.63
Number of shares outstanding 5.8 158,840,613 158,840,613 158,840,613
Value per share (HK$)(controlling interest) 2.219 3.449 5.821
Minority discount 10.1.14 26% 23% 20%Value per share (HK$)
(minority interest) 1.642 2.656 4.657
Source: BDO analysis.
APPENDIX II INDEPENDENT EXPERT’S REPORT
– II-42 –

RPM Valuation Summary
The valuation of mineral assets undertaken by RPM was denominated in US dollars,which is summarised in the table below:
RPM Valuation Summary Ref Low Preferred HighUS$m US$m US$m
Finnish OperationsDCF value of Jokisivu mine 10.1.1 7.77 10.47 16.76Value of Kaapelinkulma 10.1.2 0.47 1.01 1.82Value of Orivesi 10.1.3 0.84 1.81 3.26Value of other Finnish
mineral assets 10.1.4 0.40 0.41 0.42Value of Vammala Plant 10.1.5 0.58 0.58 0.58
Sub-total 10.06 14.28 22.84
Swedish OperationsDCF value of Faboliden open
cut mine 10.1.7 8.08 8.39 17.43Residual value of Faboliden
not in DCF 10.1.8 17.35 36.32 64.79Value of Svartliden 10.1.9 1.44 3.11 5.61Value of Svartliden Plant 10.1.10 0.44 0.44 0.44Value of gold in-circuit
at Svartliden 10.1.11 5.29 5.29 5.29
Sub-total 32.60 53.55 93.56
Value of closure costs forFinnish operations 10.1.6 (8.46) (8.46) (8.46)
Value of closure costs forSwedish operations 10.1.12 (5.10) (5.10) (5.10)
Sub-total (13.56) (13.56) (13.56)
Total value of Dragon MiningAssets 29.10 54.27 102.84
Source: Technical Specialist Report (Appendix 4), BDO analysis.
APPENDIX II INDEPENDENT EXPERT’S REPORT
– II-43 –

10.1.1. DCF value of Jokisivu
We have instructed RPM to independently value the Jokisivu mine asset. Inperforming the valuation assessment for Jokisivu, RPM applied the DCF valuationmethodology based on Jokisivu’s life of mine plan, up to date operating and capital costsand other technical parameters.
RPM also applied a comparable transactions valuation methodology using resourcemultiples. However, RPM states that the DCF valuation is preferred as it deals withrecently estimated ore reserves at Jokisivu, while the comparable transactions methoddoes not. Therefore, the preferred valuation was weighted towards the DCF net presentvalue with the high and low ends of the assessment based on the comparable transactionsmethodology.
Included within the DCF value of the Jokisivu mine are tenement areas Jokisivu 2and 3, which are mining claims closely associated with the Jokisivu mining claim andmining operation.
The results of RPM’s valuation of Jokisivu are summarised below:
DCF value of Jokisivu mine Low Preferred High$m $m $m
DCF value of Jokisivu Mine(USD) 7.77 10.47 16.76
USD/HKD exchange rate 7.759 7.759 7.759DCF value of Jokisivu Mine
(HKD) 60.29 81.24 130.04
Source: Technical Specialist Report (Appendix 4), BDO analysis, Bloomberg.
Based on the above analysis, we consider the value of the Jokisivu Mine to be in therange of HK$60.29 million to HK$130.04 million with a preferred value of HK$81.24million. Further information on the assumptions and methodologies applied can be foundin the Technical Specialist Report in Appendix 4 of our Report.
APPENDIX II INDEPENDENT EXPERT’S REPORT
– II-44 –

10.1.2. Value of Kaapelinkulma
We have instructed RPM to independently value Kaapelinkulma and its associatedmineral resource. In performing the valuation assessment for Kaapelinkulma, RPMapplied the comparable transactions valuation methodology using resource multiples.RPM considered it reasonable to apply a 10% discount to the value of the resource due tocertain environmental risk factors.
The results of RPM’s valuation of Kaapelinkulma are summarised below:
Value of Kaapelinkulma Low Preferred High$m $m $m
Value of Kaapelinkulma (USD) 0.47 1.01 1.82USD/HKD 7.759 7.759 7.759Value of Kaapelinkulma (HKD) 3.65 7.84 14.12
Source: Technical Specialist Report (Appendix 4), BDO analysis, Bloomberg.
Based on the above analysis, we consider the value of Kaapelinkulma to be in therange of HK$3.65 million to HK$14.12 million with a preferred value of HK$7.84 million.
10.1.3. Value of Orivesi
We have instructed RPM to independently value Orivesi and its associated residualmineral resource. In performing the valuation assessment for Orivesi, RPM applied thecomparable transactions valuation methodology using resource multiples. RPMconsidered it reasonable to apply a 25% discount to the value of the resource to reflect therisk of these resources being available in a mine which closed previously for economicreasons and the cost of reopening the mine.
The results of RPM’s valuation of Orivesi are summarised below:
Value of Orivesi Low Preferred High$m $m $m
Value of Orivesi (USD) 0.84 1.81 3.26USD/HKD 7.759 7.759 7.759Value of Orivesi (HKD) 6.52 14.04 25.29
Source: Technical Specialist Report (Appendix 4), BDO analysis, Bloomberg.
Based on the above analysis, we consider the value of the Orivesi to be in the rangeof HK$6.52 million to HK$25.29 million with a preferred value of HK$14.04 million.
APPENDIX II INDEPENDENT EXPERT’S REPORT
– II-45 –

10.1.4. The value of early stage exploration tenements in Finland not included in the
above
We have instructed RPM to independently value the other Finnish mineral assetsnot captured in the above. In performing the valuation assessment for these mineralassets, RPM applied the comparable transactions valuation methodology using areamultiples as the primary methodology. RPM applied the Geoscientific valuationmethodology as a secondary crosscheck, however, as there is no requirement for Dragonto provide expenditure commitments for both Swedish and Finnish mining authorities,the cost to hold the tenements (which is a key input in the Geoscientific method) was notaccurately determined and could lead to a misleading low valuation. Therefore, RPMweighted their assessment toward the valuation under the area multiples methodology.
The results of RPM’s valuation of the other exploration tenements in Finland aresummarised below:
Value of other Finnishmineral assets Low Preferred High
$m $m $m
Value of other Finnishmineral assets (USD)Sarvisuo 1-2 0.05 0.05 0.05Sarvisuo 3 0.05 0.05 0.05Ori 0.01 0.02 0.03Jokisivu 4-5 0.10 0.10 0.10Jokisivu 7-8 0.02 0.02 0.02Jokisivu 10 0.12 0.12 0.12Uunimäki 1 0.05 0.05 0.05
Total (USD) 0.40 0.41 0.42
USD/HKD 7.759 7.759 7.759Value of other Finnish mineral
assets (HKD) 3.10 3.18 3.26
Source: Technical Specialist Report (Appendix 4), BDO analysis, Bloomberg.
Based on the above analysis, we consider the value of the other Finnish mineralassets not captured in the above to be in the range of HK$3.10 million to HK$3.26 millionwith a preferred value of HK$3.18 million.
APPENDIX II INDEPENDENT EXPERT’S REPORT
– II-46 –

10.1.5. Value of Vammala Plant
We have instructed RPM to independently value the Vammala Plant. In performingthe valuation assessment, RPM applied the cost method with the results summarisedbelow:
Value of Vammala Plant Low Preferred High$m $m $m
Value of Vammala Plant (USD) 0.58 0.58 0.58USD/HKD 7.759 7.759 7.759Value of Vammala Plant (HKD) 4.50 4.50 4.50
Source: Technical Specialist Report (Appendix 4), BDO analysis, Bloomberg.
Based on the above analysis, we consider the value of the Vammala Plant to beHK$4.50 million.
10.1.6. Value of closure costs for Finnish operations
We have instructed RPM to independently value the closure costs with regards tothe mining operations in Finland with the results summarised below:
Value of closure costs forFinnish operations Low Preferred High
$m $m $m
Value of closure costs for Finnishoperations (USD)Kaapelinkulma (0.78) (0.78) (0.78)Orivesi (5.40) (5.40) (5.40)Jokisivu* N/A N/A N/AVammala Plant (2.28) (2.28) (2.28)
Total (USD) (8.46) (8.46) (8.46)
Value of closure costs forFinnish operations Low Preferred High
$m $m $m
USD/HKD 7.759 7.759 7.759Value of closure costs for
Finnish operations (HKD) (65.64) (65.64) (65.64)
* Closure costs for Jokisivu are included in the DCF value of Jokisivu and therefore not included in thisassessment.
Source: Technical Specialist Report (Appendix 4), BDO analysis, Bloomberg.
APPENDIX II INDEPENDENT EXPERT’S REPORT
– II-47 –

Based on the above analysis, we consider the value of the closure costs for Finnishoperations to be HK$65.64 million.
10.1.7. DCF value of Fäboliden open cut mine
We have instructed RPM to independently value the Fäboliden open cut mine asset.In performing the valuation assessment for Fäboliden, RPM applied the DCF valuationmethodology based on Fäboliden’s open cut life of mine plan, up to date operating andcapital costs and other technical parameters.
RPM also applied a comparable transactions valuation methodology using resourcemultiples as a crosscheck to the DCF. The preferred valuation was weighted towards theDCF net present value with the high and low ends of the assessment based on thecomparable transactions methodology.
The results of RPM’s valuation of Fäboliden are summarised below:
DCF value of Fäbolidenopen cut mine Low Preferred High
$m $m $m
DCF value of Fäbolidenopen cut mine (USD) 8.08 8.39 17.43
USD/HKD 7.759 7.759 7.759DCF value of Fäboliden
open cut mine (HKD) 62.69 65.10 135.24
Source: Technical Specialist Report (Appendix 4), BDO analysis, Bloomberg.
Based on the above analysis, we consider the value of the Fäboliden open cut mineto be in the range of HK$62.69 million to HK$135.24 million with a preferred value ofHK$65.10 million. Further information on the assumptions and methodologies appliedcan be found in the Technical Specialist Report in Appendix 4 of our Report.
10.1.8. Value of any resource and exploration assets not included in the Fäboliden DCF
We have instructed RPM to independently value the residual Fäboliden resource notcontained within the DCF, which primarily comprises of 80% inferred resources from theFäboliden underground mine asset, for which the Scoping Study had been completed. Theunderground resource at Fäboliden, was valued using the comparable transactionsvaluation methodology using resource multiples.
RPM also assessed the value of the exploration assets related to Fäbolidencomprising Fäboliden nr 11, which was valued using area multiples and Geoscientificapproaches.
APPENDIX II INDEPENDENT EXPERT’S REPORT
– II-48 –

The results of RPM’s valuation of other resource and exploration assets in Fäbolidenare summarised below:
Residual value of Fäboliden notin DCF Low Preferred High
$m $m $m
Residual value of Fäbolidennot in DCF (USD)Fäboliden underground 16.39 35.36 63.83Fäboliden nr 11 0.96 0.96 0.96
Total (USD) 17.35 36.32 64.79
USD/HKD 7.759 7.759 7.759Residual value of Fäboliden
not in DCF (HKD) 134.62 281.81 502.71
Source: Technical Specialist Report (Appendix 4), BDO analysis, Bloomberg.
Based on the above analysis, we consider the residual value of the residualFäboliden assets to be in the range of HK$134.62 million to HK$502.71 million with apreferred value of HK$281.81 million.
10.1.9. Value of Svartliden
We have instructed RPM to independently value the Svartliden mine asset, forwhich the existing operation and mineral resources cover the majority of the explorationconcession Svartlidengruvan K nr 1. In performing the valuation assessment forSvartliden, RPM applied the comparable transactions valuation methodology usingresource multiples. RPM considered it reasonable to apply a 25% discount to the value ofthe resource to reflect the risk of these resources being available in a mine which closedpreviously for economic reasons and the cost of reopening the mine.
The results of RPM’s valuation of Svartliden are summarised below:
Value of Svartliden Low Preferred High$m $m $m
Value of Svartlidengruvan K nr 1(USD) 1.44 3.11 5.61
USD/HKD 7.759 7.759 7.759Value of Svartlidengruvan K nr 1
(HKD) 11.17 24.13 43.53
Source: Technical Specialist Report (Appendix 4), BDO analysis, Bloomberg.
Based on the above analysis, we consider the value of Svartliden to be in the range ofHK$11.17 million to HK$43.53 million with a preferred value of HK$24.13 million.
APPENDIX II INDEPENDENT EXPERT’S REPORT
– II-49 –
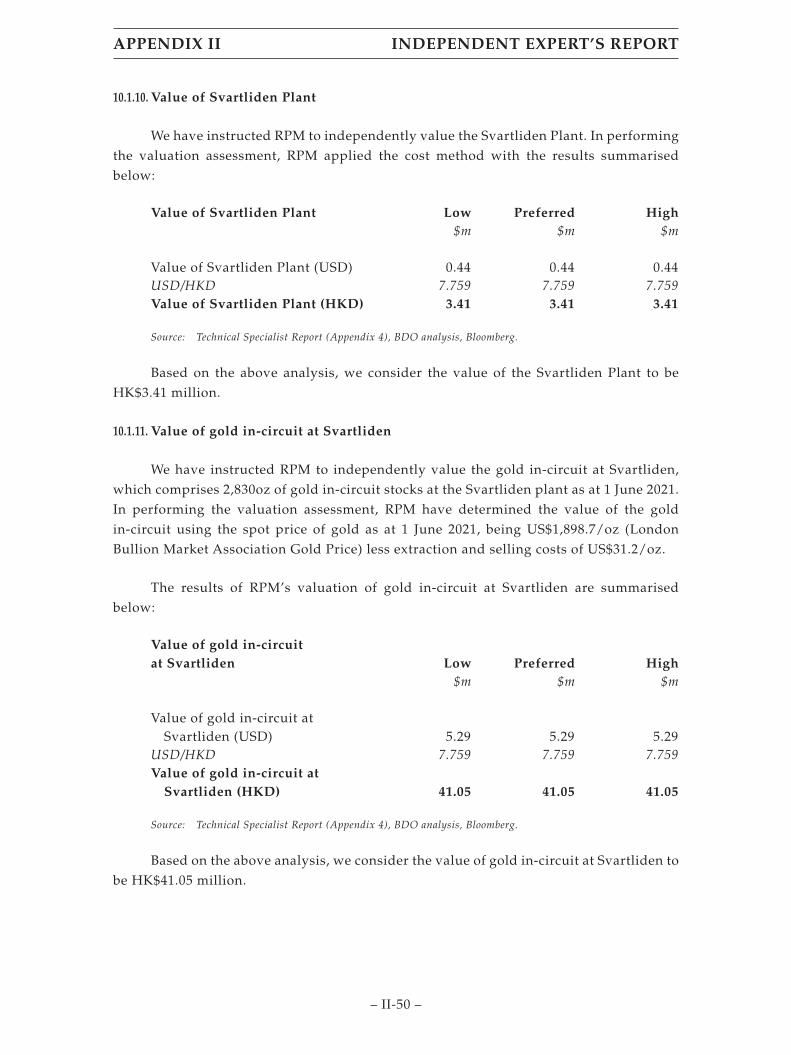
10.1.10. Value of Svartliden Plant
We have instructed RPM to independently value the Svartliden Plant. In performingthe valuation assessment, RPM applied the cost method with the results summarisedbelow:
Value of Svartliden Plant Low Preferred High$m $m $m
Value of Svartliden Plant (USD) 0.44 0.44 0.44USD/HKD 7.759 7.759 7.759Value of Svartliden Plant (HKD) 3.41 3.41 3.41
Source: Technical Specialist Report (Appendix 4), BDO analysis, Bloomberg.
Based on the above analysis, we consider the value of the Svartliden Plant to beHK$3.41 million.
10.1.11. Value of gold in-circuit at Svartliden
We have instructed RPM to independently value the gold in-circuit at Svartliden,which comprises 2,830oz of gold in-circuit stocks at the Svartliden plant as at 1 June 2021.In performing the valuation assessment, RPM have determined the value of the goldin-circuit using the spot price of gold as at 1 June 2021, being US$1,898.7/oz (LondonBullion Market Association Gold Price) less extraction and selling costs of US$31.2/oz.
The results of RPM’s valuation of gold in-circuit at Svartliden are summarisedbelow:
Value of gold in-circuitat Svartliden Low Preferred High
$m $m $m
Value of gold in-circuit atSvartliden (USD) 5.29 5.29 5.29
USD/HKD 7.759 7.759 7.759Value of gold in-circuit at
Svartliden (HKD) 41.05 41.05 41.05
Source: Technical Specialist Report (Appendix 4), BDO analysis, Bloomberg.
Based on the above analysis, we consider the value of gold in-circuit at Svartliden tobe HK$41.05 million.
APPENDIX II INDEPENDENT EXPERT’S REPORT
– II-50 –

10.1.12. Value of closure costs for Swedish operations
We have instructed RPM to independently value the closure costs with regards tothe mining operations in Sweden with the results summarised below:
Value of closure costs forSwedish operations Low Preferred High
$m $m $m
Value of closure costs for Swedishoperations (USD)Fäboliden Mine* N/A N/A N/ASvartliden Mine and Plant (5.10) (5.10) (5.10)Fäboliden Mine Test Project** N/A N/A N/A
Total (5.10) (5.10) (5.10)
USD/HKD 7.759 7.759 7.759Value of closure costs for
Swedish operations (HKD) (39.57) (39.57) (39.57)
* Closure costs for Fäboliden mine are included in the DCF value of Fäboliden and therefore not included in
this assessment.
** Closure costs for Fäboliden mine test project is null and void as the full Fäboliden closure cost will cover
this cost upon environmental approvals.
Source: Technical Specialist Report (Appendix 4), BDO analysis, Bloomberg.
Based on the above analysis, we consider the value of the closure costs to beHK$39.57 million.
10.1.13. Value of Dragon Mining’s other assets and liabilities
The other assets and liabilities of Dragon Mining represent the assets and liabilitiesthat have not been specifically addressed elsewhere in our Sum-of-Parts valuation. Fromour discussions with Dragon Mining and analysis of these other assets and liabilities,outlined in the table below, we do not believe that there is a material difference betweenthe book value and the fair value unless an adjustment has been noted below.
APPENDIX II INDEPENDENT EXPERT’S REPORT
– II-51 –

The table below represents a summary of the assets and liabilities identified:
Statement of Financial PositionAudited as
at 31-Dec-20 Adjustment AdjustedNote $’000 $’000 $’000
CURRENT ASSETSCash and cash equivalents a) 14,352 2,203 16,555Trade receivables 5,019 (5,019) –Other receivables b) 1,259 – 1,259Inventories 16,114 (16,114) –Other assets c) 209 – 209
TOTAL CURRENT ASSETS 36,953 (18,930) 18,023
NON-CURRENT ASSETSProperty, plant and equipment –
operations 38,387 (38,387) –Property, plant and equipment –
corporate d) 147 – 147Mineral exploration and
evaluation costs 3,989 (3,989) –Right-of-use assets 377 (377) –Other assets c) 5,544 – 5,544
TOTAL NON-CURRENT ASSETS 48,444 (42,753) 5,691
TOTAL ASSETS 85,397 (61,683) 23,714
CURRENT LIABILITIESTrade and other payables 6,548 (6,548) –Provisions – Employee
entitlements e) 1,839 – 1,839Provision – Rehabilitation 313 (313) –Provisions – Other 199 (199) –Interest bearing liabilities f) 147 – 147Other liabilities 321 (321) –Current tax liability 303 – 303
TOTAL CURRENT LIABILITIES 9,670 (7,381) 2,289
APPENDIX II INDEPENDENT EXPERT’S REPORT
– II-52 –

Statement of Financial PositionAudited as
at 31-Dec-20 Adjustment AdjustedNote $’000 $’000 $’000
NON-CURRENT LIABILITIESProvisions – Employee
entitlements e) 149 – 149Provision – Rehabilitation 18,876 (18,876) –Interest bearing liabilities f) 3,217 (3,000) 217Other liabilities 7 (7) –
TOTAL NON-CURRENT ASSETS 22,249 (21,883) 366
TOTAL LIABILITIES 31,919 (29,264) 2,655
NET ASSETS (A$’000) 53,478 (32,419) 21,059
AUD/HKD 6.016 6.016 6.016NET ASSETS (HK$’000) 321,724 (195,033) 126,691
Source: Dragon Mining’s audited financial statements for the year ended 31 December 2020, 31 May 2021
unconsolidated management accounts and BDO analysis.
Management does not prepare consolidated accounts outside of the Company’sreporting periods. Therefore, management provided us with unconsolidated accounts asat 31 May 2021, comprising the unaudited statements of financial position for DragonMining and its subsidiaries. We have not undertaken a review of Dragon Mining’sunaudited accounts in accordance with Australian Auditing and Assurance Standard 2405‘Review of Historical Financial Information’ and do not express an opinion on thisfinancial information. However, nothing has come to our attention as a result of ourprocedures that would suggest the financial information within the management accountshas not been prepared on a reasonable basis.
We have made adjustments to the audited statement of financial position as at 31December 2020, where we deem there to be a significant change in the balance of the otherassets and liabilities based on management accounts as at 31 May 2021. In addition, anyassets and liabilities that are deemed to be captured elsewhere in our Sum-of-Partsvaluation are adjusted down to a nil balance.
APPENDIX II INDEPENDENT EXPERT’S REPORT
– II-53 –
We note the following in relation to the above valuation of Dragon Mining’s otherassets and liabilities:
Note a): Cash and cash equivalents
Dragon Mining’s management accounts as at 31 May 2021 show a consolidated cashand cash equivalents balance of $16.56 million (after foreign currency conversion atprevailing exchange rates) as at 31 May 2021. Management has confirmed that this is anaccurate reflection of the Company’s cash balance, which had increased since $14.35million as at 31 December 2020 primarily due to the Placement completed in January 2021.
Therefore, we have applied an adjustment of $2.20 million to the audited cash andcash equivalents balance as at 31 December 2020.
Note b): Other receivables
As outlined in Section 5.6 of our Report, the Company held other receivables of$1.26 million at 31 December 2020 relating to bank guarantees held on deposit with NABfor the lease of the Company’s corporate premises. These have not been capturedelsewhere in our Sum-of-Parts valuation.
Therefore, we have retained the balance of other receivables.
Note c): Other assets
As outlined in Section 5.6 of our Report, other current assets of $0.21 million at 31December 2020 relate to prepayments and other non-current assets of $5.54 million relateto environmental bonds deposited with the Swedish and Finnish government authorities,both of which have not been captured elsewhere in our Sum-of-Parts valuation.
Therefore, we have retained the balance of other current and non-current assets.
Note d): Property, plant and equipment
As outlined in Section 5.6 of our Report, $0.15 million of the property, plant andequipment at 31 December 2020 related to corporate while the remaining $38.39 millionrelated to operations. Property, plant and equipment related to corporate purposes is notcaptured elsewhere in our Sum-of-Parts valuation and has therefore been retained.
Note e): Provisions – employee entitlements
As outlined in Section 5.6 of our Report, provisions (current and non-current)comprise employee entitlements, rehabilitation and other provisions. Provisions foremployee entitlements are deemed to not be captured in our Sum-of-Parts valuation andhence are retained.
APPENDIX II INDEPENDENT EXPERT’S REPORT
– II-54 –

Note f): Interest bearing liabilities
Management has advised that the AP Finance Loan Facility drawdown of $3.00million has been paid off subsequent to 31 December 2020. Therefore, we have applied anadjustment of $3.00 million to the audited non-current interest bearing liabilities balanceas at 31 December 2020.
Note g): Other operational assets and liabilities
We consider that the following assets and liabilities are operational in nature, andhence their balances are captured within the mineral asset valuation performed by RPM inthe Technical Specialist Report:
• Trade receivables;
• Inventories;
• Property, plant and equipment for operations;
• Mineral exploration and evaluation costs;
• Right-of-use assets;
• Trade and other payables;
• Provisions for rehabilitation;
• Other provisions; and
• Other liabilities (relating to operations).
As these items have been addressed within the valuation of mineral assets in ourSum-of-Parts valuation, we have adjusted their balances to nil in our valuationassessment of other assets and liabilities.
10.1.14. Minority discount
The value of a Dragon Mining share derived under the Sum-of-Parts approach isreflective of a controlling interest, that is, the value that an acquirer would pay to gain acontrolling stake in the Company and its operations.
However as outlined in Section 9.1, in order to assess whether a premium for controlis being received by APOL for the sale of its shares in Dragon Mining to GLL, and in turn,whether Shareholders are missing out on a premium for control, we consider itappropriate to assess the value of Dragon Mining on a minority interest basis.
Therefore, we have adjusted our valuation of a Dragon Mining share to reflect theminority interest holding. The minority discount is based on the inverse of the controlpremium and is calculated using the formula 1 – (1/(1+control premium)).
APPENDIX II INDEPENDENT EXPERT’S REPORT
– II-55 –

Based on our analysis in Appendix 3, we consider an appropriate control premiumto be in the range of 25% to 35% with a midpoint of 30%, and therefore, the minorityinterest discount is in the range of 20% to 26% with a midpoint of 23%.
10.2 Quoted Market Prices for Dragon Mining shares
To provide a comparison to the valuation of a Dragon Mining share in Section 10.1,we have also assessed the quoted market price for a Dragon Mining share.
The quoted market value of a company’s shares is reflective of a minority interest,which is an interest in a company that is not significant enough for the holder to have anindividual influence in the operations and value of that company.
Minority interest value
Our analysis of the quoted market price of a Dragon Mining share is based on thepricing prior to the announcement of the Proposed Transaction. This is because the valueof a Dragon Mining share after the announcement may include the effects of any change invalue as a result of the Proposed Transaction.
Information on the Proposed Transaction was announced to the market firstly byAPAC at market close on 14 May 2021 and subsequently at market open on 17 May 2021.Therefore, the following chart provides a summary of the share price movement over the12 months to 14 May 2021, which was the last trading day prior to the announcement.
Dragon Mining share price and trading volume history
0.5
–
1.0
1.5
2.0
2.5
3.0
3.5
0.000
0.500
1.000
1.500
2.000
2.500
3.000
Volu
me
(mill
ions
)
Shar
e Pr
ice
(HK
$)
Volume Closing Price
03-Ju
n-20
02-Ju
l-20
30-Ju
l-20
27-A
ug-20
24-S
ep-2
0
22-O
ct-20
19-N
ov-2
0
17-D
ec-2
0
19-Ja
n-21
17-F
eb-2
1
17-M
ar-21
16-A
pr-21
14-M
ay-2
1
Source: Bloomberg and BDO analysis.
The daily price of Dragon Mining shares from 14 May 2020 to 14 May 2021 hasranged from a low of HK$1.650 on 21 July 2020 to a high of HK$2.630 on 10 December 2020and 11 December 2020. The highest single day of trading over the assessed period was 10December 2020, when 3,157,000 shares were traded.
APPENDIX II INDEPENDENT EXPERT’S REPORT
– II-56 –
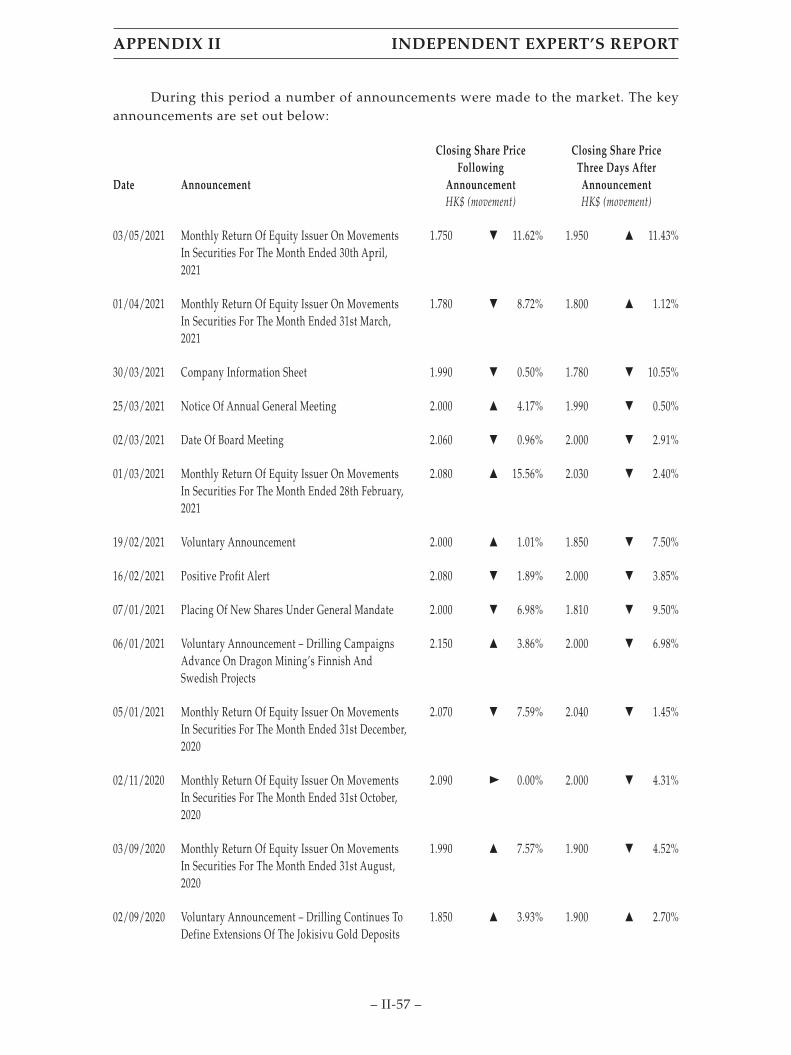
During this period a number of announcements were made to the market. The keyannouncements are set out below:
Date Announcement
Closing Share PriceFollowing
Announcement
Closing Share PriceThree Days AfterAnnouncement
HK$ (movement) HK$ (movement)
03/05/2021 Monthly Return Of Equity Issuer On MovementsIn Securities For The Month Ended 30th April,2021
1.750 ▼ 11.62% 1.950 ▲ 11.43%
01/04/2021 Monthly Return Of Equity Issuer On MovementsIn Securities For The Month Ended 31st March,2021
1.780 ▼ 8.72% 1.800 ▲ 1.12%
30/03/2021 Company Information Sheet 1.990 ▼ 0.50% 1.780 ▼ 10.55%
25/03/2021 Notice Of Annual General Meeting 2.000 ▲ 4.17% 1.990 ▼ 0.50%
02/03/2021 Date Of Board Meeting 2.060 ▼ 0.96% 2.000 ▼ 2.91%
01/03/2021 Monthly Return Of Equity Issuer On MovementsIn Securities For The Month Ended 28th February,2021
2.080 ▲ 15.56% 2.030 ▼ 2.40%
19/02/2021 Voluntary Announcement 2.000 ▲ 1.01% 1.850 ▼ 7.50%
16/02/2021 Positive Profit Alert 2.080 ▼ 1.89% 2.000 ▼ 3.85%
07/01/2021 Placing Of New Shares Under General Mandate 2.000 ▼ 6.98% 1.810 ▼ 9.50%
06/01/2021 Voluntary Announcement – Drilling CampaignsAdvance On Dragon Mining’s Finnish AndSwedish Projects
2.150 ▲ 3.86% 2.000 ▼ 6.98%
05/01/2021 Monthly Return Of Equity Issuer On MovementsIn Securities For The Month Ended 31st December,2020
2.070 ▼ 7.59% 2.040 ▼ 1.45%
02/11/2020 Monthly Return Of Equity Issuer On MovementsIn Securities For The Month Ended 31st October,2020
2.090 ▼ 0.00% 2.000 ▼ 4.31%
03/09/2020 Monthly Return Of Equity Issuer On MovementsIn Securities For The Month Ended 31st August,2020
1.990 ▲ 7.57% 1.900 ▼ 4.52%
02/09/2020 Voluntary Announcement – Drilling Continues ToDefine Extensions Of The Jokisivu Gold Deposits
1.850 ▲ 3.93% 1.900 ▲ 2.70%
APPENDIX II INDEPENDENT EXPERT’S REPORT
– II-57 –
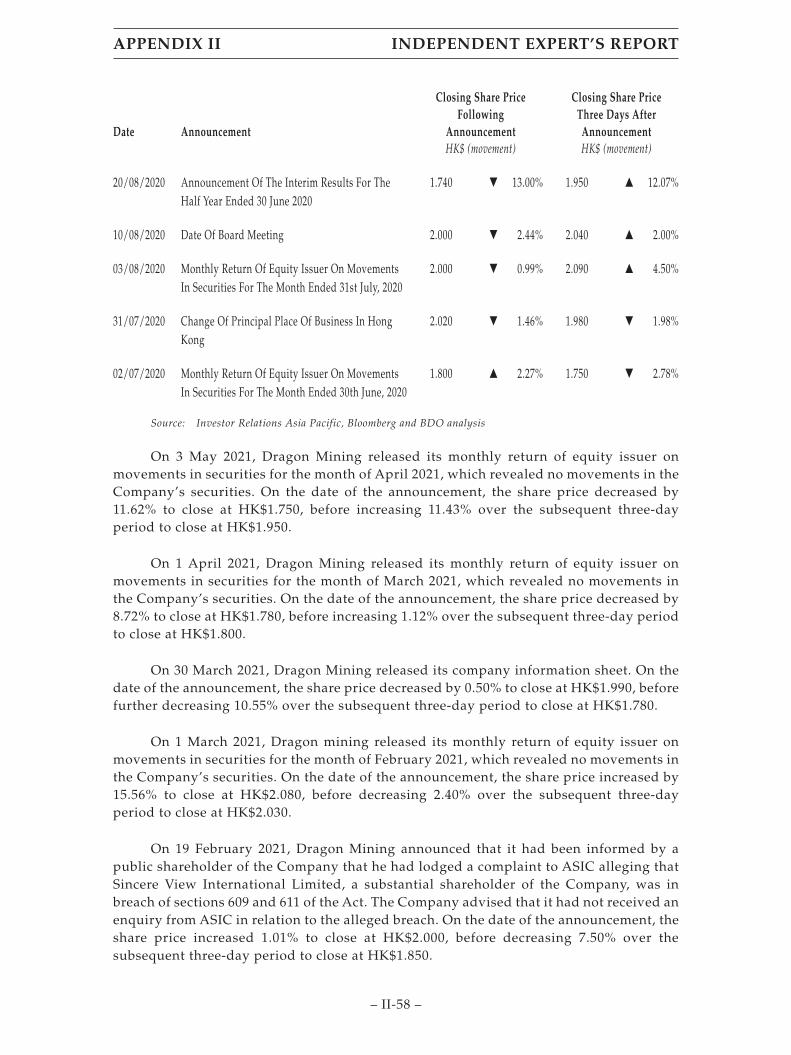
Date Announcement
Closing Share PriceFollowing
Announcement
Closing Share PriceThree Days AfterAnnouncement
HK$ (movement) HK$ (movement)
20/08/2020 Announcement Of The Interim Results For TheHalf Year Ended 30 June 2020
1.740 ▼ 13.00% 1.950 ▲ 12.07%
10/08/2020 Date Of Board Meeting 2.000 ▼ 2.44% 2.040 ▲ 2.00%
03/08/2020 Monthly Return Of Equity Issuer On MovementsIn Securities For The Month Ended 31st July, 2020
2.000 ▼ 0.99% 2.090 ▲ 4.50%
31/07/2020 Change Of Principal Place Of Business In HongKong
2.020 ▼ 1.46% 1.980 ▼ 1.98%
02/07/2020 Monthly Return Of Equity Issuer On MovementsIn Securities For The Month Ended 30th June, 2020
1.800 ▲ 2.27% 1.750 ▼ 2.78%
Source: Investor Relations Asia Pacific, Bloomberg and BDO analysis
On 3 May 2021, Dragon Mining released its monthly return of equity issuer onmovements in securities for the month of April 2021, which revealed no movements in theCompany’s securities. On the date of the announcement, the share price decreased by11.62% to close at HK$1.750, before increasing 11.43% over the subsequent three-dayperiod to close at HK$1.950.
On 1 April 2021, Dragon Mining released its monthly return of equity issuer onmovements in securities for the month of March 2021, which revealed no movements inthe Company’s securities. On the date of the announcement, the share price decreased by8.72% to close at HK$1.780, before increasing 1.12% over the subsequent three-day periodto close at HK$1.800.
On 30 March 2021, Dragon Mining released its company information sheet. On thedate of the announcement, the share price decreased by 0.50% to close at HK$1.990, beforefurther decreasing 10.55% over the subsequent three-day period to close at HK$1.780.
On 1 March 2021, Dragon mining released its monthly return of equity issuer onmovements in securities for the month of February 2021, which revealed no movements inthe Company’s securities. On the date of the announcement, the share price increased by15.56% to close at HK$2.080, before decreasing 2.40% over the subsequent three-dayperiod to close at HK$2.030.
On 19 February 2021, Dragon Mining announced that it had been informed by apublic shareholder of the Company that he had lodged a complaint to ASIC alleging thatSincere View International Limited, a substantial shareholder of the Company, was inbreach of sections 609 and 611 of the Act. The Company advised that it had not received anenquiry from ASIC in relation to the alleged breach. On the date of the announcement, theshare price increased 1.01% to close at HK$2.000, before decreasing 7.50% over thesubsequent three-day period to close at HK$1.850.
APPENDIX II INDEPENDENT EXPERT’S REPORT
– II-58 –

On 7 January 2021, Dragon Mining announced a placement of up to 21,000,000 newshares at an issue price of HK$2.05 to raise up to HK$43.05 million under generalmandate, with the intention to apply the entire net proceeds for the payment of additionalenvironmental bonds for its mines in Finland and Sweden as a result of changes toregulatory policies. On the date of the announcement, the share price decreased by 6.98%to close at HK$2.000, before further decreasing 9.50% over the subsequent three-dayperiod to close at HK$1.810.
On 6 January 2021, Dragon Mining released its quarterly drilling update for itsFinnish and Swedish Projects for the December 2020 quarter. On the date of theannouncement, the share price increased by 3.86% to close at HK$2.150, before decreasing6.98% over the subsequent three-day period to close at HK$2.000.
On 5 January 2021, Dragon Mining released its monthly return of equity issuer onmovements in securities for the month of December 2020, which revealed no movementsin the Company’s securities. On the date of the announcement, the share price decreasedby 7.59% to close at HK$2.070, before further decreasing 1.45% over the subsequentthree-day period to close at HK$2.040.
On 3 September 2020, Dragon Mining released its monthly return of equity issuer onmovements in securities for the month of August 2020, which revealed no movements inthe Company’s securities. On the date of the announcement, the share price increased by7.57% to close at HK$1.990, before decreasing 4.52% over the subsequent three-day periodto close at HK$1.900.
On 20 August 2020, Dragon Mining released its interim results for the half yearended 30 June 2020 highlighting a basic earnings per share of HK$4.51 for the six monthsto 30 June 2020, up from a basic earnings per share of HK$1.94 in the comparative half yearended 30 June 2019. On the date of the announcement, the share price decreased by 13.00%to close at HK$1.740, before increasing 12.07% over the subsequent three-day period toclose at HK$1.950.
To provide further analysis of the market prices for a Dragon Mining share, we havealso considered the weighted average market price for 10, 30, 60 and 90 day periods to 14May 2021.
Share Price per unit 14-May-21 10 Days 30 Days 60 Days 90 Days
Closing price HK$1.950Volume weighted average price HK$1.815 HK$1.857 HK$1.928 HK$2.004
Source: Bloomberg and BDO analysis
The above weighted average prices are prior to the date of the announcement of theProposed Transaction, to avoid the influence of any increase in the price of Dragon Miningshares that has occurred since the Proposed Transaction was announced.
APPENDIX II INDEPENDENT EXPERT’S REPORT
– II-59 –
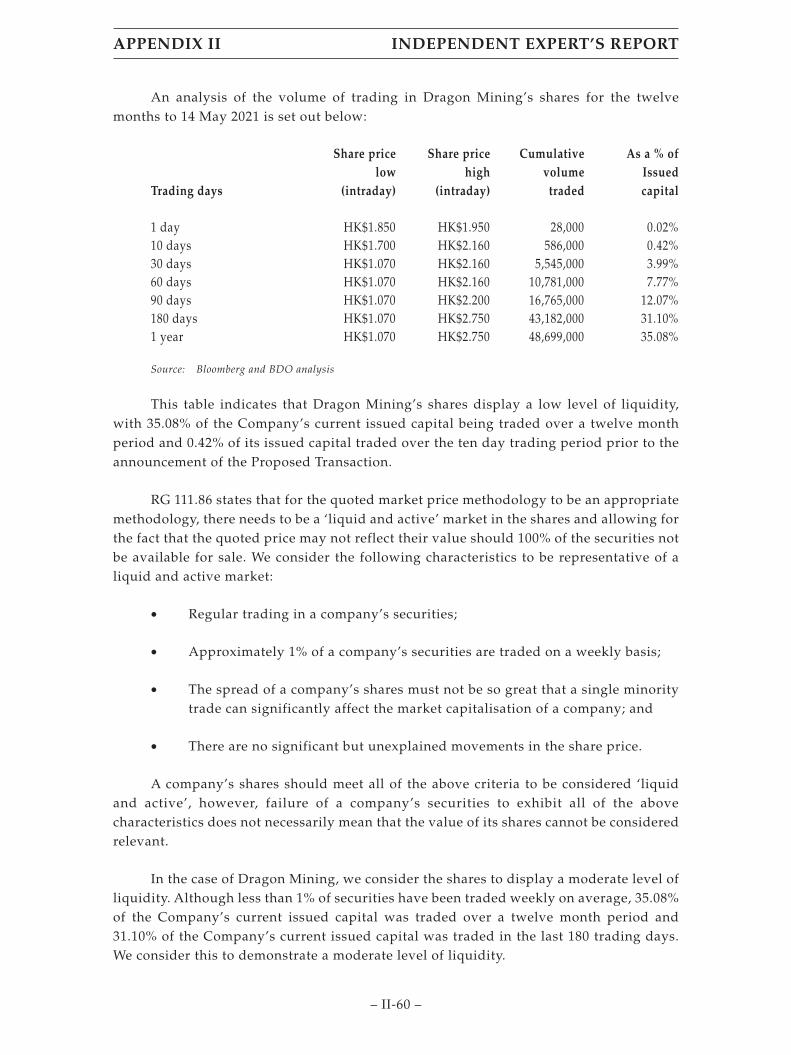
An analysis of the volume of trading in Dragon Mining’s shares for the twelvemonths to 14 May 2021 is set out below:
Trading days
Share pricelow
(intraday)
Share pricehigh
(intraday)
Cumulativevolume
traded
As a % ofIssuedcapital
1 day HK$1.850 HK$1.950 28,000 0.02%10 days HK$1.700 HK$2.160 586,000 0.42%30 days HK$1.070 HK$2.160 5,545,000 3.99%60 days HK$1.070 HK$2.160 10,781,000 7.77%90 days HK$1.070 HK$2.200 16,765,000 12.07%180 days HK$1.070 HK$2.750 43,182,000 31.10%1 year HK$1.070 HK$2.750 48,699,000 35.08%
Source: Bloomberg and BDO analysis
This table indicates that Dragon Mining’s shares display a low level of liquidity,with 35.08% of the Company’s current issued capital being traded over a twelve monthperiod and 0.42% of its issued capital traded over the ten day trading period prior to theannouncement of the Proposed Transaction.
RG 111.86 states that for the quoted market price methodology to be an appropriatemethodology, there needs to be a ‘liquid and active’ market in the shares and allowing forthe fact that the quoted price may not reflect their value should 100% of the securities notbe available for sale. We consider the following characteristics to be representative of aliquid and active market:
• Regular trading in a company’s securities;
• Approximately 1% of a company’s securities are traded on a weekly basis;
• The spread of a company’s shares must not be so great that a single minoritytrade can significantly affect the market capitalisation of a company; and
• There are no significant but unexplained movements in the share price.
A company’s shares should meet all of the above criteria to be considered ‘liquidand active’, however, failure of a company’s securities to exhibit all of the abovecharacteristics does not necessarily mean that the value of its shares cannot be consideredrelevant.
In the case of Dragon Mining, we consider the shares to display a moderate level ofliquidity. Although less than 1% of securities have been traded weekly on average, 35.08%of the Company’s current issued capital was traded over a twelve month period and31.10% of the Company’s current issued capital was traded in the last 180 trading days.We consider this to demonstrate a moderate level of liquidity.
APPENDIX II INDEPENDENT EXPERT’S REPORT
– II-60 –

Our assessment is that a range of values for Dragon Mining shares (on a minorityinterest basis) based on market pricing, after disregarding post announcement pricing, isbetween HK$1.850 and HK$2.000, with a rounded midpoint value of HK$1.925.
10.3 Assessment of the value of a Dragon Mining share
The results of the valuations performed are summarised in the table below:
Low Preferred HighHK$ HK$ HK$
Sum-of-Parts (Section 10.1) 1.642 2.656 4.657QMP (Section 10.2) 1.850 1.925 2.000Assessed value per Dragon
Mining share (minority) 1.925 2.656 3.387
Source: BDO analysis
We note that the value ranges overlap and the low value obtained under the QMPmethod is higher than the low value obtained from the Sum-of-Parts method. Thedifference in values derived from the above methodologies may be explained by thefollowing:
• Our QMP analysis in section 10.2 indicates that Dragon Mining shares displaya moderate level of liquidity with 35.08% of the Company’s issued capitaltraded in the twelve months prior to the announcement of the Transaction.Therefore, the quoted market price may not necessarily be fully reflective ofthe underlying value of the Company’s shares.
• The Sum-of-Parts approach shows a wide range of values from low to high.This is a consequence of the wide range in values of the Company’s miningassets, in particular of Jokisivu and Fäboliden reflecting the wide range ofpossible value outcomes.
We consider the Sum-of-Parts to be the most appropriate methodology to valueDragon Mining because Dragon Mining is a gold mining company, therefore its core valuelies in the mineral assets that it holds. The Sum-of-Parts valuation includes a valuation ofthe Company’s mineral assets by RPM. A technical specialist is likely to have a moreinformed and realistic view of the value of the Company’s mineral assets and explorationareas than that assigned by the market, therefore we consider incorporating this valuationinto the Sum-of-Parts valuation to be the most appropriate approach.
However, we note that the values under our Sum-of-Parts methodology display awide range primarily driven by the wide range of values derived from the TechnicalSpecialist Report. For the purpose of our assessment, we consider it reasonable to placegreater reliance on the preferred value under the Sum-of-Parts valuation of HK$2.656.This is on the basis that it is the best indicator of the value of Dragon Mining’s mineralassets, underpinned by RPM’s preferred assessments with particular relation to Jokisivuand Fäboliden using the DCF methodology.
APPENDIX II INDEPENDENT EXPERT’S REPORT
– II-61 –
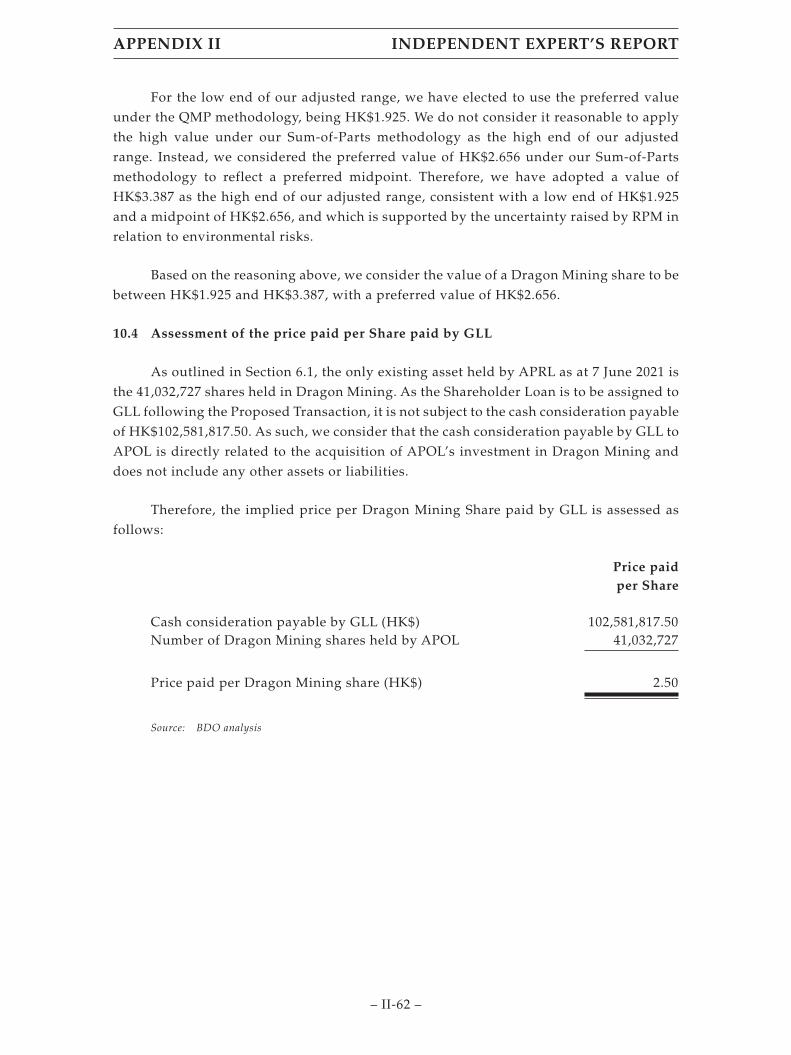
For the low end of our adjusted range, we have elected to use the preferred valueunder the QMP methodology, being HK$1.925. We do not consider it reasonable to applythe high value under our Sum-of-Parts methodology as the high end of our adjustedrange. Instead, we considered the preferred value of HK$2.656 under our Sum-of-Partsmethodology to reflect a preferred midpoint. Therefore, we have adopted a value ofHK$3.387 as the high end of our adjusted range, consistent with a low end of HK$1.925and a midpoint of HK$2.656, and which is supported by the uncertainty raised by RPM inrelation to environmental risks.
Based on the reasoning above, we consider the value of a Dragon Mining share to bebetween HK$1.925 and HK$3.387, with a preferred value of HK$2.656.
10.4 Assessment of the price paid per Share paid by GLL
As outlined in Section 6.1, the only existing asset held by APRL as at 7 June 2021 isthe 41,032,727 shares held in Dragon Mining. As the Shareholder Loan is to be assigned toGLL following the Proposed Transaction, it is not subject to the cash consideration payableof HK$102,581,817.50. As such, we consider that the cash consideration payable by GLL toAPOL is directly related to the acquisition of APOL’s investment in Dragon Mining anddoes not include any other assets or liabilities.
Therefore, the implied price per Dragon Mining Share paid by GLL is assessed asfollows:
Price paidper Share
Cash consideration payable by GLL (HK$) 102,581,817.50Number of Dragon Mining shares held by APOL 41,032,727
Price paid per Dragon Mining share (HK$) 2.50
Source: BDO analysis
APPENDIX II INDEPENDENT EXPERT’S REPORT
– II-62 –
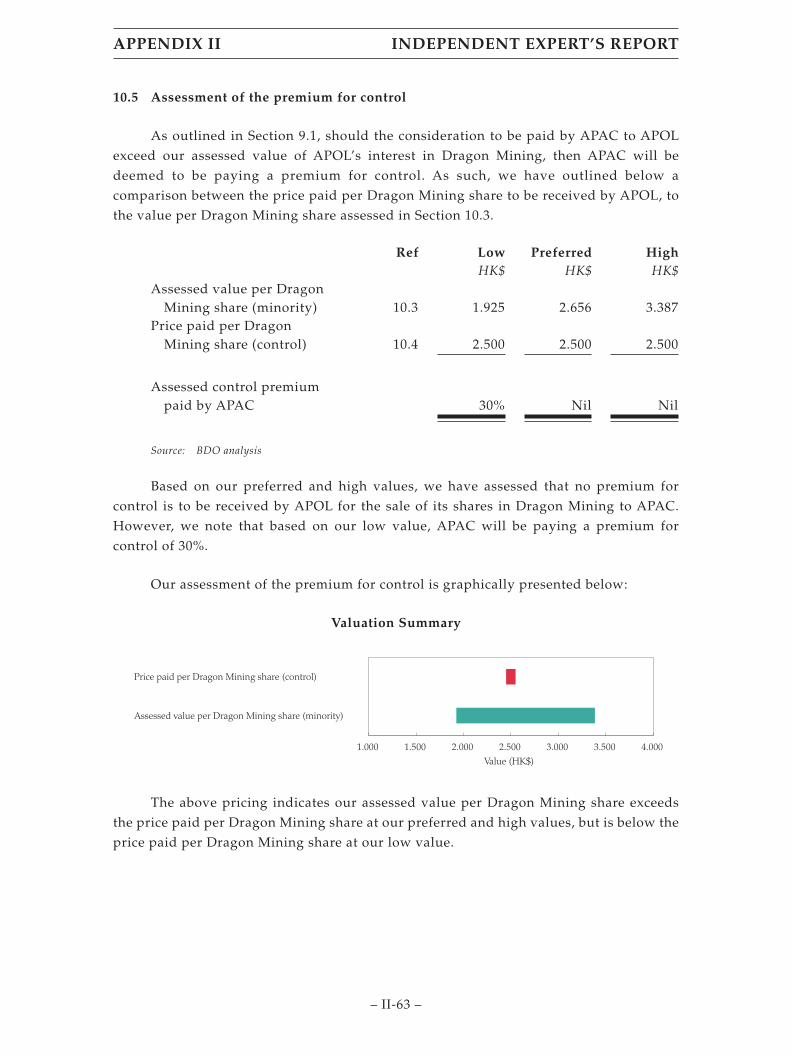
10.5 Assessment of the premium for control
As outlined in Section 9.1, should the consideration to be paid by APAC to APOLexceed our assessed value of APOL’s interest in Dragon Mining, then APAC will bedeemed to be paying a premium for control. As such, we have outlined below acomparison between the price paid per Dragon Mining share to be received by APOL, tothe value per Dragon Mining share assessed in Section 10.3.
Ref Low Preferred HighHK$ HK$ HK$
Assessed value per DragonMining share (minority) 10.3 1.925 2.656 3.387
Price paid per DragonMining share (control) 10.4 2.500 2.500 2.500
Assessed control premiumpaid by APAC 30% Nil Nil
Source: BDO analysis
Based on our preferred and high values, we have assessed that no premium forcontrol is to be received by APOL for the sale of its shares in Dragon Mining to APAC.However, we note that based on our low value, APAC will be paying a premium forcontrol of 30%.
Our assessment of the premium for control is graphically presented below:
Valuation Summary
1.000 1.500 2.000 2.500 3.000 3.500 4.000
Value (HK$)
Price paid per Dragon Mining share (control)
Assessed value per Dragon Mining share (minority)
The above pricing indicates our assessed value per Dragon Mining share exceedsthe price paid per Dragon Mining share at our preferred and high values, but is below theprice paid per Dragon Mining share at our low value.
APPENDIX II INDEPENDENT EXPERT’S REPORT
– II-63 –

However, note that under our low value, the premium for control of 30% beingoffered by APAC to APOL is within our assessed premium for control range of 25% to 35%for Dragon Mining, as detailed in Appendix 3. To further illustrate, we have graphicallypresented the relationship between the value per Dragon Mining share and the premiumfor control being offered by APAC to APOL below:
Control Premium Assessment
Con
trol
Pre
miu
m/D
isco
unt (
%)
Value per Share (HK$)
Low1.925
-26%
-6%
0%
30%
25%
35%
2.500 2.656
BDO assessed range(Appendix 3)
3.387Preferred High
Based on the above, a value per Dragon Mining share (as assessed) that is greaterthan HK$2.50 (being the price paid per Dragon Mining share by APAC), will imply thatthere is not a premium for control in the price paid by APAC. Conversely, a value perDragon Mining share (as assessed) that is less than HK$2.50 will imply that there is apremium for control in the price paid by APAC.
Therefore, given that we have placed greater reliance on our preferred value ofHK$2.656, we have assessed that no premium for control is to be received by APOL for thesale of its shares in Dragon Mining to APAC.
11. EVALUATION OF THE PROPOSED TRANSACTION
11.1 Advantages of the Proposed Transaction
11.1.1. No premium for control will be payable by APAC, meaning that Shareholders
will not miss out on the opportunity to receive a premium for control for their
shares in Dragon Mining
In Section 10.5, we assessed the value per Dragon Mining share prior to theannouncement of the Proposed Transaction and compared this to the price paid perDragon Mining share by APAC, in order to assess whether a premium for control is to bereceived by APOL, for the sale of its shares in Dragon Mining to APAC.
APPENDIX II INDEPENDENT EXPERT’S REPORT
– II-64 –

As outlined in Section 10.5, we have concluded that no premium for control is to bereceived by APOL for the sale of its shares in Dragon Mining to APAC, based on ourpreferred and high values. Given that we have placed greater reliance on our preferredvalue, we have assessed that no premium for control is to be received by APOL for the saleof its shares in Dragon Mining to APAC. Therefore, Shareholders are not missing out onthe opportunity to participate and receive a premium for control for their Dragon Miningshares should the Proposed Transaction proceed.
However, we note that based on our low value, APAC will be paying a premium forcontrol of approximately 30%, which is within our assessed premium for control range of25% to 35% for Dragon Mining, as detailed in Appendix 3.
The relationship between the value per Dragon Mining share and the premium forcontrol being offered by APAC to APOL is illustrated below:
Control Premium Assessment
Con
trol
Pre
miu
m/D
isco
unt (
%)
Value per Share (HK$)
Low1.925
-26%
-6%
0%
30%
25%
35%
2.500 2.656
BDO assessed range(Appendix 3)
3.387Preferred High
11.1.2. APAC specialises in investments in resource companies
APAC’s primary strategic investment business targets substantial investments inmineral exploration and production companies, including Mount Gibson Iron Limitedand Tanami Gold NL. Therefore, APAC’s specialist resources investment team mayprovide benefits to Dragon Mining.
Specifically, given that APAC has experience in holding interests in resourcecompanies listed on major stock exchanges including Australia, Canada, Hong Kong, theUnited Kingdom and the US, the management of APAC will likely bring additionalexperience and operate as an active and supportive shareholder in the Company. Asoutlined in Section 5(a)(ii) of Appendix I to the Circular, APAC may be able to providecashflow, productivity assets or offtake opportunity.
APPENDIX II INDEPENDENT EXPERT’S REPORT
– II-65 –
Furthermore, the value of the 25.83% interest in Dragon Mining would represent amuch larger percentage of the total value of APAC’s active investments, relative to thetotal value of AGL’s active investments. Therefore, APAC may have more financialincentive to maximise the value of its investment in Dragon Mining, which will benefit thenon-associated Shareholders of Dragon Mining.
11.1.3. The ownership consequence of the Proposed Transaction is minimal as there is no
practical change in ultimate ownership
As outlined in Section 3.2 of our Report, RG 111 suggests that an opinion as towhether the advantages of a transaction outweigh the disadvantages, should focus on thepurpose and outcome of the transaction, that is, the substance of the transaction ratherthan the legal mechanism utilised to effect it.
As highlighted in Section 6 of our Report and affirmed by Section 2(c) of AppendixI to the Circular, AGL and APAC are both investment holdings of the L&L Trust, with AGLbeing focused on property, retail and financial investments and APAC being focused onresources investments. As such, the Proposed Transaction will result in the transfer of the25.83% interest in Dragon Mining to a more logical holding company, being APAC.
Should the Proposed Transaction proceed, the L&L Trust will still hold a relevantinterest in Dragon Mining and hence there will be no practical change of ownership in theCompany. Therefore, the position of Shareholders will largely be unaffected by thesubstance of the Proposed Transaction.
11.1.4. APAC has no current intention to alter the board, future operations or financial
position of Dragon Mining
Affirming Section 11.1.2 above that the position of Shareholders will largely beunaffected by the substance of the Proposed Transaction, APAC has disclosed its currentintentions in Section 6 of Appendix I to the Circular. APAC has advised that it has nocurrent intentions to change the composition of the board of directors of Dragon Mining,the future of the Company or the financial and dividend policies of the Company.
However, as stated in Section 5(b)(iii) of Appendix I to the Circular, APAC’sintentions have been formed on the basis of facts and information concerning theCompany and the general business environment which is known to APAC at the currentdate. APAC will make final decisions on these matters in light of all material facts andcircumstances at the relevant time. Accordingly, APAC’s intentions may change as newinformation becomes available or as circumstances change.
APPENDIX II INDEPENDENT EXPERT’S REPORT
– II-66 –
11.1.5. All costs incurred in relation to the Proposed Transaction are to be reimbursed byAPAC
The directors of Dragon Mining have advised that all costs and expenses incurred inrelation to the Proposed Transaction will be fully reimbursed by APAC, regardless ofwhether the Proposed Transaction is approved. Therefore, the transfer of existing sharesbetween APOL and APAC will not impact the value of existing Shareholders’ interests.
11.1.6. Shareholders will experience no dilution to their individual holdings in theCompany, or their collective interests in the Company
Given that the Proposed Transaction will result in a transfer of existing shares inDragon Mining, rather than the issue of new shares, Shareholders’ individual andcollective interests prior to, and following the Proposed Transaction will remainunchanged and Shareholders will continue to hold a 74.17% interest in the Company. Wenote that the only change in voting power arising from the Proposed Transaction will bean increase in GLL’s interest from nil to 25.83% and a corresponding decrease in APOL’sinterest from 25.83% to nil.
11.2 Disadvantages of the Proposed Transaction
We do not consider there to be any disadvantages to Shareholders should theProposed Transaction proceed.
11.3 Alternative proposals
We have made enquiries to APOL and APAC regarding their intentions in the eventthat Shareholders do not approve the Proposed Transaction. Based on these responses, weare not aware of any alternative proposals that are likely to emerge, should the ProposedTransaction not be approved.
Furthermore, the Directors of Dragon Mining are not aware of any other proposalthat may emerge should the Proposed Transaction not be approved.
In the event that a takeover is made for Dragon Mining and therefore potentiallyproviding Shareholders with the opportunity to receive a premium for control for theirshares, this would need to be subject to the agreement of APRL, the holder of 25.83% of theCompany’s issued shares.
11.4 If the Proposed Transaction is approved, it is unlikely that it will deter a takeoverbid
Given that the Proposed Transaction represents a transfer of existing shares, thereare no control implications as APOL is being replaced by APAC as the Company’ssubstantial shareholder. As such, we consider it unlikely that if the Proposed Transactionis approved, it would have any impact on the likelihood of receiving a takeover bid froman alternate party.
APPENDIX II INDEPENDENT EXPERT’S REPORT
– II-67 –

11.5 Practical level of control
Prior to the Proposed Transaction, APOL holds 25.83% of Dragon Mining’s issuedcapital. If the Proposed Transaction is approved, then this interest will be transferred toAPAC, which will mean that APAC will replace APOL as a substantial shareholder. Asoutlined in Section 11.1.2, AGL and APAC are both investment holdings of the L&L Trust,with AGL being focused on property, retail and financial investments and APAC beingfocused on resources investments.
Therefore, the L&L Trust will still hold a relevant interest in Dragon Mining andhence there will be no control implications for existing Shareholders as the ProposedTransaction represents a transfer of existing shares in the Company. As such,Shareholders’ interests prior to, and following the Proposed Transaction, will remainunchanged.
11.6 Consequences of not approving the Proposed Transaction
11.6.1. APOL will remain as Dragon Mining’s substantial shareholder
If the Proposed Transaction is not approved, then the Company’s shareholdingstructure will remain unchanged as APOL will continue to hold 25.83% of Dragon Mining.
11.6.2. Should the Proposed Transaction not proceed, an alternative for APAC could be to
progressively increase its interest pursuant to the creep provisions of Section 611
of the Act, which would result in the outcome of the Proposed Transaction
eventuating either way
We have not been advised of APAC’s intention should the Proposed Transaction notproceed. However, should APAC still intend to acquire a substantial interest in DragonMining, it is possible that APAC could acquire and progressively increase its in DragonMining interest pursuant to the creep provisions of section 611 of the Act whereby acontrolling shareholder can acquire an additional 3% interest every six months withoutobtaining shareholder approval. We note from our analysis in Section 10.2 that DragonMining shares display a moderate level of liquidity, with 35.08% of shares traded in thetwelve months prior to the announcement of the Proposed Transaction. Therefore, if theseon-market purchases were to occur, this may provide Shareholders with an opportunity toliquidate their positions and may place upward pressure on the Company’s share price.
However, as detailed below in Section 11.3, based on our enquiries, nothing hascome to our attention to suggest that an alternative offer would be presented toShareholders if the Proposed Transaction is not approved. Even if an alternative offer wasmade, the price, structure and terms of such an offer are not known and cannot bepredicted.
APPENDIX II INDEPENDENT EXPERT’S REPORT
– II-68 –
12. CONCLUSION
We have considered the terms of the Proposed Transaction as outlined in the body ofthis report and have concluded that, in the absence of an alternative offer, the advantagesof the Proposed Transaction outweigh the disadvantages to Shareholders. Specifically, wedo not consider there to be any disadvantages in approving the Proposed Transaction.
We consider the Proposed Transaction to be advantageous to Shareholders becausethere is no shift in value or dilution resulting from the transfer of existing Dragon Miningshares between GLL and APOL. In addition, there is no premium for control to be paid byAPAC and as such, Shareholders are not missing out on the opportunity to participate andreceive a premium for control for their shares in Dragon Mining.
Furthermore, the underlying consequence of the Proposed Transaction is minimal asthere is no practical change in ultimate ownership, given that APOL and APAC are bothinvestment holdings of the L&L Trust with AGL being focused on property investmentand development and financial services together with property management and elderlycare services, and APAC being focused on resources investments, which is deemed to bemore appropriate for Dragon Mining.
13. SOURCES OF INFORMATION
This report has been based on the following information:
• Draft Circular, including the Explanatory Memorandum as set out inAppendix I thereto;
• Audited financial statements of Dragon Mining for the years ended 31December 2018, 31 December 2019 and 31 December 2020;
• Unaudited management accounts of Dragon Mining for the period ended 31May 2021;
• Independent Valuation Report of Dragon Mining’s mineral assets dated 9 July2021 performed by RPM;
• Share registry information of Dragon Mining;
• Sale and Purchase Agreement;
• Announcements made by Dragon Mining and APAC;
• Dragon Mining Prospectus 2018;
• Finnish Mining Act 2011;
• IMF World Economic Outlook Database, April 2021;
APPENDIX II INDEPENDENT EXPERT’S REPORT
– II-69 –

• Swedish Mining Act 1991;
• Hong Kong Monetary Authority 2020 Annual Report;
• World Gold Council;
• USGS;
• IBISWorld;
• Consensus Economics;
• Bloomberg;
• Information in the public domain; and
• Discussions with Directors and Management of Dragon Mining.
14. INDEPENDENCE
BDO Corporate Finance (WA) Pty Ltd is entitled to receive a fee of A$80,000(excluding GST and reimbursement of out of pocket expenses). The fee is not contingenton the conclusion, content or future use of this Report. Except for this fee, BDO CorporateFinance (WA) Pty Ltd has not received and will not receive any pecuniary or other benefitwhether direct or indirect in connection with the preparation of this report.
BDO Corporate Finance (WA) Pty Ltd has been indemnified by Dragon Mining inrespect of any claim arising from BDO Corporate Finance (WA) Pty Ltd’s reliance oninformation provided by Dragon Mining including the non-provision of materialinformation, in relation to the preparation of this report.
Prior to accepting this engagement BDO Corporate Finance (WA) Pty Ltd hasconsidered its independence with respect to Dragon Mining and GLL and any of theirrespective associates with reference to ASIC Regulatory Guide 112 ‘Independence ofExperts’. In BDO Corporate Finance (WA) Pty Ltd’s opinion it is independent of DragonMining and GLL and their respective associates.
Neither the two signatories to this report nor BDO Corporate Finance (WA) Pty Ltd,have had within the past two years any professional relationship with Dragon Mining ortheir associates, other than in connection with the preparation of this report.
A draft of this report was provided to Dragon Mining and its advisors forconfirmation of the factual accuracy of its contents. No significant changes were made tothis report as a result of this review.
BDO is the brand name for the BDO International network and for each of the BDOMember firms.
APPENDIX II INDEPENDENT EXPERT’S REPORT
– II-70 –

BDO (Australia) Ltd, an Australian company limited by guarantee, is a member ofBDO International Limited, a UK company limited by guarantee, and forms part of theinternational BDO network of Independent Member Firms. BDO in Australia, is a nationalassociation of separate entities (each of which has appointed BDO (Australia) LimitedACN 050 110 275 to represent it in BDO International).
15. QUALIFICATIONS
BDO Corporate Finance (WA) Pty Ltd has extensive experience in the provision ofcorporate finance advice, particularly in respect of takeovers, mergers and acquisitions.
BDO Corporate Finance (WA) Pty Ltd holds an Australian Financial ServicesLicence issued by the Australian Securities and Investments Commission for giving expertreports pursuant to the Listing rules of the ASX and the Corporations Act.
The persons specifically involved in preparing and reviewing this report wereSherif Andrawes and Adam Myers of BDO Corporate Finance (WA) Pty Ltd. They havesignificant experience in the preparation of independent expert reports, valuations andmergers and acquisitions advice across a wide range of industries in Australia and weresupported by other BDO staff.
Sherif Andrawes is a Fellow of the Institute of Chartered Accountants in England &Wales and a Fellow of Chartered Accountants Australia & New Zealand. He has over 30years’ experience working in the audit and corporate finance fields with BDO and itspredecessor firms in London and Perth. He has been responsible for over 400 publiccompany independent expert’s reports under the Corporations Act or ASX Listing Rulesand is a CA BV Specialist. These experts’ reports cover a wide range of industries inAustralia with a focus on companies in the natural resources sector. Sherif Andrawes isthe Corporate Finance Practice Group Leader of BDO in Western Australia, the GlobalHead of Natural Resources for BDO and a former Chairman of BDO in Western Australia.
Adam Myers is a member of Chartered Accountants Australia & New Zealand andthe Joint Ore Reserves Committee. Adam’s career spans over 20 years in the Audit andAssurance and Corporate Finance areas. Adam is a CA BV Specialist and has considerableexperience in the preparation of independent expert reports and valuations in general forcompanies in a wide number of industry sectors.
16. DISCLAIMERS AND CONSENTS
This report has been prepared at the request of Dragon Mining for inclusion in theCircular which will be sent to Shareholders. Dragon Mining engaged BDO CorporateFinance (WA) Pty Ltd to prepare an independent expert’s report to consider the proposedtransfer of a substantial holdings in Dragon Mining from APOL to GLL.
BDO Corporate Finance (WA) Pty Ltd hereby consents to this report accompanyingthe Circular. Apart from such use, neither the whole nor any part of this report, nor anyreference thereto may be included in or with, or attached to any document, circularresolution, statement or letter without the prior written consent of BDO CorporateFinance (WA) Pty Ltd.
APPENDIX II INDEPENDENT EXPERT’S REPORT
– II-71 –

BDO Corporate Finance (WA) Pty Ltd takes no responsibility for the contents of theCircular other than this report.
We have no reason to believe that any of the information or explanations supplied tous are false or that material information has been withheld. It is not the role of BDOCorporate Finance (WA) Pty Ltd acting as an independent expert to perform any duediligence procedures on behalf of the Company. The Directors of the Company areresponsible for conducting appropriate due diligence in relation to GLL. BDO CorporateFinance (WA) Pty Ltd provides no warranty as to the adequacy, effectiveness orcompleteness of the due diligence process.
The opinion of BDO Corporate Finance (WA) Pty Ltd is based on the market,economic and other conditions prevailing at the date of this report. Such conditions canchange significantly over short periods of time.
With respect to taxation implications it is recommended that individualShareholders obtain their own taxation advice, in respect of the Proposed Transactiontailored to their own particular circumstances. Furthermore, the advice provided in thisreport does not constitute legal or taxation advice to Shareholders, or any other party.
BDO Corporate Finance (WA) Pty Ltd has also considered and relied uponindependent valuations for mineral assets held by Dragon Mining. The valuer engaged forthe mineral asset valuation, RPM, possess the appropriate qualifications and experience inthe industry to make such assessments. The approaches adopted and assumptions madein arriving at their valuation is appropriate for this report. We have received consent fromthe valuer for the use of their valuation report in the preparation of this report and toappend a copy of their report to this report.
The statements and opinions included in this report are given in good faith and inthe belief that they are not false, misleading or incomplete.
The terms of this engagement are such that BDO Corporate Finance (WA) Pty Ltd isrequired to provide a supplementary report if we become aware of a significant changeaffecting the information in this report arising between the date of this report and prior tothe date of the meeting or during the offer period.
Yours faithfullyBDO CORPORATE FINANCE (WA) PTY LTD
Sherif Andrawes Adam MyersDirector Director
APPENDIX II INDEPENDENT EXPERT’S REPORT
– II-72 –

APPENDIX 1 – GLOSSARY OF TERMS
Reference Definition
The Act The Corporations Act 2001 Cth
AFCA Australian Financial Complaints Authority
AGL Allied Group Limited
APAC APAC Resources Limited
APES 225 Accounting Professional & Ethical Standards Boardprofessional standard APES 225 ‘Valuation Services’
AP Finance Loan Facility The $3.00 million unsecured loan facility from APFinance Limited
APOL Allied Properties Overseas Limited
APRL Allied Properties Resources Limited
ASIC Australian Securities and Investments Commission
ASX Australian Securities Exchange
AVI The Regional State Administrative Agency forSouthern Finland
BDO BDO Corporate Finance (WA) Pty Ltd
CAB The County Administrative Board in Sweden
CIL Carbon in leach
Circular Circular of Dragon Mining
The Company Dragon Mining Limited
COVID-19 The coronavirus outbreak
Corporations Act The Corporations Act 2001 Cth
DCF Discounted Future Cash Flows
Dragon Mining Dragon Mining Limited
APPENDIX II INDEPENDENT EXPERT’S REPORT
– II-73 –

EBIT Earnings before interest and tax
EBITDA Earnings before interest, tax, depreciation andamortisation
EIA Environmental Impact Assessment
EU European Union
EU Court European Court of Justice
Fäboliden The Fäboliden Gold Mine in Sweden
FME Future Maintainable Earnings
FOS Financial Ombudsman Service
FSG Financial Services Guide
GDP Gross Domestic Product
GLL Genuine Legend Limited
HKEx Hong Kong Stock Exchange
IMF International Monetary Fund
Item 7 s611 Item 7 of section 611 of the Corporations Act 2001 Cth
Jokisivu The Jokisivu Gold Mine in Finland
JORC Code The Australasian Code for Reporting of ExplorationResults, Mineral Resources and Ore Reserves (2012Edition)
Kaapelinkulma The Kaapelinkulma Gold Mine in Finland
Koz Thousand ounces
Kt Kilotonnes
L&L Trust The Lee and Lee Trust
Moz Million ounces
NAB National Australia Bank
APPENDIX II INDEPENDENT EXPERT’S REPORT
– II-74 –

NAV Net Asset Value
Orivesi The Orivesi Gold Mine in Finland
oz Ounces
Placement The Placement announced by Dragon Mining of up to21,000,000 new shares at an issue price of HK$2.05 perDragon Mining share to raise gross proceeds of up toapproximately HK$43.05 million under generalmandate
The Proposed Transaction The transaction outlined in the Sale and PurchaseAgreement announced by Dragon Mining Limited on17 May 2021
QMP Quoted market price
RBA Reserve Bank of Australia
Regulations Corporations Act Regulations 2001 (Cth)
Our Report This Independent Expert’s Report prepared by BDO
RG 74 Acquisitions approved by Members (December 2011)
RG 111 Content of expert reports (March 2011)
RG 112 Independence of experts (March 2011)
RPM RPM Advisory Services Pty Ltd
The Sale and PurchaseAgreement
The Sale and Purchase Agreement entered into byAllied Properties Overseas Limited and GenuineLegend Limited as announced by Dragon MiningLimited on 17 May 2021
Scoping Study The Fäboliden underground scoping study
Section 606 Section 606 of the Corporations Act
Section 611 Section 611 of the Corporations Act
Shareholders Shareholders of Dragon Mining Limited notassociated with the Proposed Transaction
APPENDIX II INDEPENDENT EXPERT’S REPORT
– II-75 –

Shareholder Loan The loan due to Allied Properties Overseas Limited byAllied Properties Resources Limited, and beingassigned from Allied Properties Overseas Limited toGenuine Legend Limited pursuant to the Sale andPurchase Agreement
Sum-of-Parts A combination of different methodologies usedtogether to determine an overall value where separateassets and liabilities are valued using differentmethodologies
Sunstone Sunstone Metals Limited
Svartliden The Svartliden Gold Mine in Sweden
Svartliden Plant The Svartliden Processing Plant in Sweden
tpa Tonnes per annum
Tukes Turvallisuus-ja kemikaalivirasto
Uunimäki The Uunimäki Gold Project
USGS United States Geological Survey
VALMIN Code Australasian Code for Public Reporting of TechnicalAssessments and Valuations of Mineral Assets (2015Edition)
Valuation Engagement An Engagement or Assignment to perform aValuation and provide a Valuation Report where theValuer is free to employ the Valuation Approaches,Valuation Methods, and Valuation Procedures that areasonable and informed third party would performtaking into consideration all the specific facts andcircumstances of the Engagement or Assignmentavailable to the Valuer at that time.
Vammala Plant The Vammala Processing Plant in Finland
VWAP Volume Weighted Average Price
WACC Weighted Average Cost of Capital
Copyright © 2021 BDO Corporate Finance (WA) Pty Ltd
APPENDIX II INDEPENDENT EXPERT’S REPORT
– II-76 –
All rights reserved. No part of this publication may be reproduced, published,distributed, displayed, copied or stored for public or private use in any informationretrieval system, or transmitted in any form by any mechanical, photographic orelectronic process, including electronically or digitally on the Internet or World Wide Web,or over any network, or local area network, without written permission of the author. Nopart of this publication may be modified, changed or exploited in any way used forderivative work or offered for sale without the express written permission of the author.
For permission requests, write to BDO Corporate Finance (WA) Pty Ltd, at theaddress below:
The DirectorsBDO Corporate Finance (WA) Pty Ltd38 Station StreetSUBIACO, WA 6008Australia
APPENDIX II INDEPENDENT EXPERT’S REPORT
– II-77 –

APPENDIX 2 – VALUATION METHODOLOGIES
Methodologies commonly used for valuing assets and businesses are as follows:
1 NET ASSET VALUE
Asset based methods estimate the market value of an entity’s securities based on therealisable value of its identifiable net assets. Asset based methods include:
• Orderly realisation of assets method
• Liquidation of assets method
• Net assets on a going concern method
The orderly realisation of assets method estimates fair market value by determiningthe amount that would be distributed to entity holders, after payment of all liabilitiesincluding realisation costs and taxation charges that arise, assuming the entity is woundup in an orderly manner.
The liquidation method is similar to the orderly realisation of assets method exceptthe liquidation method assumes the assets are sold in a shorter time frame. Since wind upor liquidation of the entity may not be contemplated, these methods in their strictest formmay not be appropriate. The net assets on a going concern method estimates the marketvalues of the net assets of an entity but does not take into account any realisation costs.
Net assets on a going concern basis are usually appropriate where the majority ofassets consist of cash, passive investments or projects with a limited life. All assets andliabilities of the entity are valued at market value under this alternative and this combinedmarket value forms the basis for the entity’s valuation.
Often the FME and DCF methodologies are used in valuing assets forming part ofthe overall Net assets on a going concern basis. This is particularly so for exploration andmining companies where investments are in finite life producing assets or prospectiveexploration areas.
These asset based methods ignore the possibility that the entity’s value could exceedthe realisable value of its assets as they do not recognise the value of intangible assets suchas management, intellectual property and goodwill. Asset based methods are appropriatewhen an entity is not making an adequate return on its assets, a significant proportion ofthe entity’s assets are liquid or for asset holding companies.
APPENDIX II INDEPENDENT EXPERT’S REPORT
– II-78 –
2 QUOTED MARKET PRICES BASIS
A valuation approach that can be used in conjunction with (or as a replacement for)other valuation methods is the quoted market price of listed securities. Where there is aready market for securities such as the ASX, through which shares are traded, recentprices at which shares are bought and sold can be taken as the market value per share.Such market value includes all factors and influences that impact upon the ASX. The useof ASX pricing is more relevant where a security displays regular high volume trading,creating a liquid and active market in that security.
3 CAPITALISATION OF FUTURE MAINTAINABLE EARNINGS
This method places a value on the business by estimating the likely FME, capitalisedat an appropriate rate which reflects business outlook, business risk, investorexpectations, future growth prospects and other entity specific factors. This approachrelies on the availability and analysis of comparable market data.
The FME approach is the most commonly applied valuation technique and isparticularly applicable to profitable businesses with relatively steady growth historiesand forecasts, regular capital expenditure requirements and non-finite lives.
The FME used in the valuation can be based on net profit after tax or alternatives tothis such as earnings before interest and tax (‘EBIT’) or earnings before interest, tax,depreciation and amortisation (‘EBITDA’). The capitalisation rate or ‘earnings multiple’is adjusted to reflect which base is being used for FME.
4 DISCOUNTED FUTURE CASH FLOWS
The DCF methodology is based on the generally accepted theory that the value of anasset or business depends on its future net cash flows, discounted to their present value atan appropriate discount rate (often called the weighted average cost of capital). Thisdiscount rate represents an opportunity cost of capital reflecting the expected rate ofreturn which investors can obtain from investments having equivalent risks.
Considerable judgement is required to estimate the future cash flows which must beable to be reliably estimated for a sufficiently long period to make this valuationmethodology appropriate.
A terminal value for the asset or business is calculated at the end of the future cashflow period and this is also discounted to its present value using the appropriate discountrate.
DCF valuations are particularly applicable to businesses with limited lives,experiencing growth, that are in a start-up phase, or experience irregular cash flows.
APPENDIX II INDEPENDENT EXPERT’S REPORT
– II-79 –
5 MARKET BASED ASSESSMENT
The market based approach seeks to arrive at a value for a business by reference tocomparable transactions involving the sale of similar businesses. This is based on thepremise that companies with similar characteristics, such as operating in similarindustries, command similar values. In performing this analysis it is important toacknowledge the differences between the comparable companies being analysed and thecompany that is being valued and then to reflect these differences in the valuation.
The resource multiple is a market based approach which seeks to arrive at a valuefor a company by reference to its total reported resources and to the enterprise value pertonne/lb of the reported resources of comparable listed companies. The resource multiplerepresents the value placed on the resources of comparable companies by a liquid market.
APPENDIX II INDEPENDENT EXPERT’S REPORT
– II-80 –

APPENDIX 3 – MINORITY INTEREST DISCOUNT
Minority discount
The value of a Dragon Mining share derived under the Sum-of-Parts approach isreflective of a controlling interest, which we are required to convert to a minority interestvalue for our assessment. The conversion is done by applying a minority interest discount,which is widely perceived as the inverse of a control premium.
We have set out below an assessment of a reasonable premium for control likely tobe paid by an acquirer purchasing a controlling stake in Dragon Mining, which is thenused to derive the relevant minority interest discount to apply to our Sum-of-Partsvaluation.
Premium for control
The concept of a premium for control reflects the additional value that is attached toa controlling interest. We have reviewed the control premiums on completed transactions,paid by acquirers of HKEx-listed general mining companies and all HKEx-listedcompanies. In assessing the appropriate sample of transactions from which to determinean appropriate control premium, we have excluded transactions where an acquirerobtained a controlling interest (20% and above) at a discount (i.e. less than a 0% premium)and at a premium in excess of 100%.
There were seven HKEx-listed company transactions for which the announcedpremium was in excess of 100%. We have removed these transactions from our analysisbecause we consider it likely that the particular acquirer in these transactions would bepaying for special value and/or synergies in excess of the standard premium for control.Whereas, the purpose of this analysis is to assess the premium that is likely to be paid forcontrol by a hypothetical acquirer, rather than the specific strategic value flowing toparticular acquirers.
APPENDIX II INDEPENDENT EXPERT’S REPORT
– II-81 –

We have summarised our findings below:
All HKEx-listed Companies
YearNumber of
Transactions
AverageDeal Value
(HK$m)
AverageControl
Premium(%)
2021 11 2,679.82 46.022020 39 4,589.61 37.032019 23 3,154.15 24.222018 26 4,938.26 19.922017 41 4,692.23 19.512016 39 2,628.93 23.322015 17 12,510.26 27.162014 19 4,216.89 16.262013 12 12,034.33 29.042012 19 2,414.55 30.642011 14 933.49 23.71
Source: Bloomberg and BDO analysis
HKEx-listed General Mining Companies
YearNumber of
Transactions
AverageDeal Value
(HK$m)
AverageControl
Premium(%)
2021 – – –2020 1 1,799.94 20.172019 1 3.25 5.152018 – – –2017 1 49,315.13 33.532016 2 86.99 10.162015 1 6,187.19 68.672014 – – –2013 – – –2012 – – –2011 – – –
Source: Bloomberg and BDO analysis
We note that there was a limited number of data points for transactions relating toHKEx-listed mining companies. Therefore, we have also included the control premiumson completed transactions, paid by acquirers of ASX-listed general mining companies andASX-listed gold mining companies, from which we note to have a larger number of datapoints for our assessment.
APPENDIX II INDEPENDENT EXPERT’S REPORT
– II-82 –
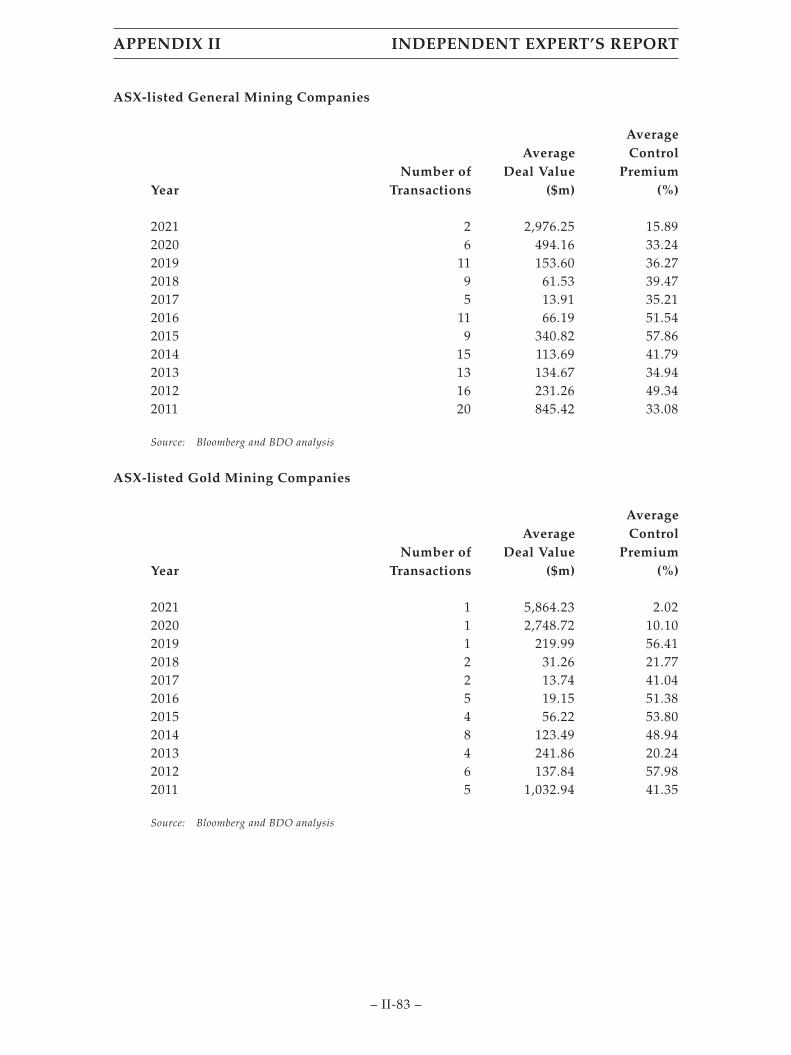
ASX-listed General Mining Companies
YearNumber of
Transactions
AverageDeal Value
($m)
AverageControl
Premium(%)
2021 2 2,976.25 15.892020 6 494.16 33.242019 11 153.60 36.272018 9 61.53 39.472017 5 13.91 35.212016 11 66.19 51.542015 9 340.82 57.862014 15 113.69 41.792013 13 134.67 34.942012 16 231.26 49.342011 20 845.42 33.08
Source: Bloomberg and BDO analysis
ASX-listed Gold Mining Companies
YearNumber of
Transactions
AverageDeal Value
($m)
AverageControl
Premium(%)
2021 1 5,864.23 2.022020 1 2,748.72 10.102019 1 219.99 56.412018 2 31.26 21.772017 2 13.74 41.042016 5 19.15 51.382015 4 56.22 53.802014 8 123.49 48.942013 4 241.86 20.242012 6 137.84 57.982011 5 1,032.94 41.35
Source: Bloomberg and BDO analysis
APPENDIX II INDEPENDENT EXPERT’S REPORT
– II-83 –

The mean and median of the HKEx data set comprising control transactions from2011 onwards for all HKSE-listed companies and HKEx-listed general mining companiesare set out below:
All HKEx-listedCompanies
HKEx-listed GeneralMining Companies
Entire Data SetMetrics Deal Value
ControlPremium Deal Value
ControlPremium
(HK$m) (%) (HK$m) (%)
Mean 4,600.78 26.03 9,579.92 24.64Median 513.73 18.88 986.90 15.17
Source: Bloomberg and BDO analysis
Similarly, the mean and median of the ASX data set comprising control transactionsfrom 2011 onwards for ASX-listed general mining companies and ASX-listed gold miningcompanies are set out below:
ASX-listed GeneralMining Companies
ASX-listed Gold MiningCompanies
Entire Data SetMetrics Deal Value
ControlPremium Deal Value
ControlPremium
($m) (%) ($m) (%)
Mean 336.87 40.87 452.02 43.42Median 45.11 38.28 40.69 41.63
Source: Bloomberg and BDO analysis
In arriving at an appropriate control premium to apply, we note that observedcontrol premiums can vary due to the:
• Nature and magnitude of non-operating assets;
• Nature and magnitude of discretionary expenses;
• Perceived quality of existing management;
• Nature and magnitude of business opportunities not currently beingexploited;
• Ability to integrate the acquiree into the acquirer ’s business;
• Level of pre-announcement speculation of the transaction; and
• Level of liquidity in the trade of the acquiree’s securities.
APPENDIX II INDEPENDENT EXPERT’S REPORT
– II-84 –
The tables above indicate that the long-term average control premium paid byacquirers of all HKEx-listed companies and HKEx-listed general mining companies isapproximately 26.03% and 24.64% respectively.
The long-term average control premium paid by acquirers of ASX-listed generalmining companies and ASX-listed gold mining companies is generally higher, atapproximately 40.87% and 43.32% respectively.
However, in assessing the ASX transactions included in our tables above, we notethat the data appeared to be positively skewed.
In a population where the data is skewed, the median often represents a superiormeasure of central tendency compared to the mean. We note that the median announcedcontrol premium over the assessed period was approximately 38.28% for ASX-listedgeneral mining companies and 41.63% for ASX-listed gold mining companies.
In determining a reasonable premium for control for Dragon Mining, we haveweighted our analysis towards the HKEx data set on the basis that the HKEx is the tradingplatform for which Dragon Mining operates on. However, we have adopted the meancontrol premiums observed on the HKEx as the low end of our assessed range based onthe data observed from ASX gold mining companies, which show general higherpremiums. We consider an appropriate premium for control to be between 25% and 35%,with a midpoint of 30%.
Minority interest discount conclusion
The minority discount is based on the inverse of the control premium and iscalculated using the formula: 1 – (1/(1+control premium))
Therefore, our implied minority interest discount ranges from 20% to 26% with amidpoint of 23%.
APPENDIX II INDEPENDENT EXPERT’S REPORT
– II-85 –
APPENDIX 4 – INDEPENDENT VALUATION REPORT
DOCUMENT CONTROL SHEET
Client
BDO Corporate Finance (WA) Pty Ltd on behalf of Dragon Mining Ltd
Report Name Date
Dragon Mining Ltd Independent Technical Expert Report andValuation
9 July 2021
Job No. Revision No.
ADV-AU-00183 Final
File Name:
ADV-AU-00183_BDO_Dragon - IER_Valuation_Final3.dox
Authorisations
Name Position Signature Date
Prepared By Steve Hinde Executive Consultant 22/06/2021
Valuation Steve Hinde Executive Consultant 22/06/2021
Tenements Steve Hinde Executive Consultant 22/06/2021
Geology David Allmark Principal ResourceGeologist
22/06/2021
Mining – Sweden Igor Bojanic General Manager –Metals ConsultingAustralasia + Russia /CIS
22/06/2021
APPENDIX II INDEPENDENT EXPERT’S REPORT
– II-86 –
Name Position Signature Date
Mining – Finland Blaine Bovee Director of Studies –Principal MiningEngineer
22/06/2021
Processing Andrew Newell Executive Consultant 22/06/2021
Exploration Steve Hinde Executive Consultant 22/06/2021
Environmental Terry Brown Vice President,Environmental andSocial Services
22/06/2021
Social/Community Luke Stephens Principal Social Specialist 22/06/2021
Approved By Philippe Baudry Executive GeneralManager – Consulting& Advisory Services
22/06/2021
Distribution
Organisation RecipientNo. Of HardCopies
No. OfElectronicCopies Comment
BDO Corporate Finance (WA)Pty Ltd
Sherif Andrawes 1
APPENDIX II INDEPENDENT EXPERT’S REPORT
– II-87 –

IMPORTANT INFORMATION ABOUT THIS DOCUMENT
1. Our Client
This report has been produced by or on behalf of RPM Advisory Services Pty Ltd(“RPM”) solely for BDO Corporate Finance (WA) Pty Ltd on behalf of Dragon MiningLimited and the shareholders of Dragon Mining Limited (collectively the “Client”).
2. Client Use
The Client’s use and disclosure of this report is subject to the terms and conditionsunder which RPM prepared the report.
3. Notice to Third Parties
RPM prepared this report for the Client only. If you are not the Client:
• RPM has prepared this report having regard to the particular needs andinterests of the Client, and in accordance with the Client’s instructions. It didnot draft this report having regard to any other person’s particular needs orinterests. Your needs and interests may be distinctly different to the Client’sneeds and interests, and the report may not be sufficient, fit or appropriate foryour purposes.
• RPM does not make and expressly disclaims from making any representationor warranty to you – express or implied – regarding this report or theconclusions or opinions set out in this report (including without limitationany representation or warranty regarding the standard of care used inpreparing this report, or that any forward-looking statements, forecasts,opinions or projections contained in the report will be achieved, will prove tobe correct or are based on reasonable assumptions).
• RPM expressly disclaims any liability to you and any duty of care to you.
• RPM does not authorise you to rely on this report. If you choose to use or relyon all or part of this report, then any loss or damage you may suffer in sodoing is at your sole and exclusive risk.
APPENDIX II INDEPENDENT EXPERT’S REPORT
– II-88 –

4. Inputs, subsequent changes and no duty to update
RPM has created this report using data and information provided by or on behalf ofthe Client as per Appendix C and data and information which RPM has produced inestimating Mineral Resources and Ore Reserves for the Clients assets. Unless specificallystated otherwise, RPM has verified to the best of its ability the data and information usedto create this report. RPM otherwise accepts no liability for the accuracy or completenessof that data and information, even if that data and information has been incorporated intoor relied upon in creating this report (or parts of it).
The conclusions and opinions contained in this report apply as at the date of thereport. Events (including changes to any of the data and information that RPM used inpreparing the report) may have occurred since that date which may impact on thoseconclusions and opinions and make them unreliable. RPM is under no duty to update thereport upon the occurrence of any such event, though it reserves the right to do so.
5. Mining Unknown Factors
The ability of any person to achieve forward-looking production and economictargets is dependent on numerous factors that are beyond RPM’s control and that RPMcannot anticipate. These factors include, but are not limited to, site-specific mining andgeological conditions, management and personnel capabilities, availability of funding toproperly operate and capitalize the operation, variations in cost elements and marketconditions, developing and operating the mine in an efficient manner, unforeseen changesin legislation and new industry developments. Any of these factors may substantiallyalter the performance of any mining operation.
EXECUTIVE SUMMARY
Background
RPM Advisory Services Pty Ltd (“RPM”) was engaged to provide services to BDOCorporate Finance (WA) Pty Ltd (“BDO”) on behalf of Dragon Mining Limited (“DragonMining” or the “Company”) and the shareholders of Dragon Mining Limited (collectivelythe “Client”), regarding the compilation of an Independent Technical Valuation (“theValuation”) of Dragon Mining’s Finnish and Swedish mineral assets (the “Assets”).
The Valuation Date for the Assets is 1st June 2021. The Valuation is undertaken inUSD based on the Foreign Exchange Rates for USD:SEK and USD:Euro as at the ValuationDate.
APPENDIX II INDEPENDENT EXPERT’S REPORT
– II-89 –
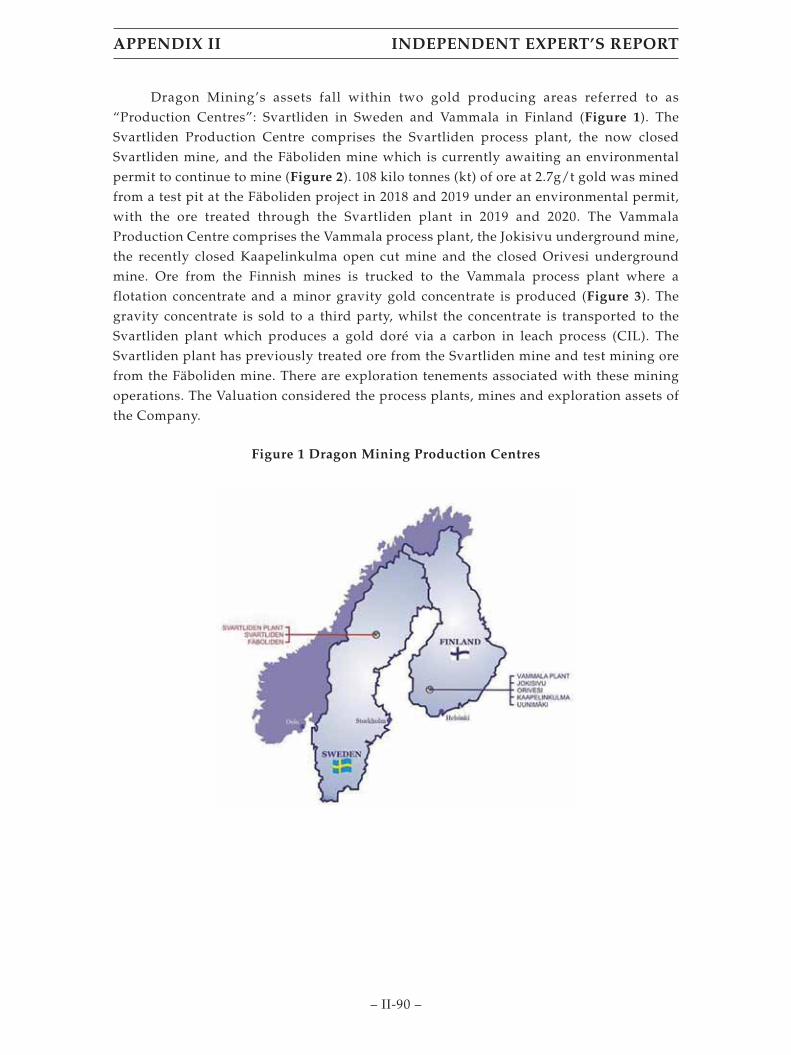
Dragon Mining’s assets fall within two gold producing areas referred to as“Production Centres”: Svartliden in Sweden and Vammala in Finland (Figure 1). TheSvartliden Production Centre comprises the Svartliden process plant, the now closedSvartliden mine, and the Fäboliden mine which is currently awaiting an environmentalpermit to continue to mine (Figure 2). 108 kilo tonnes (kt) of ore at 2.7g/t gold was minedfrom a test pit at the Fäboliden project in 2018 and 2019 under an environmental permit,with the ore treated through the Svartliden plant in 2019 and 2020. The VammalaProduction Centre comprises the Vammala process plant, the Jokisivu underground mine,the recently closed Kaapelinkulma open cut mine and the closed Orivesi undergroundmine. Ore from the Finnish mines is trucked to the Vammala process plant where aflotation concentrate and a minor gravity gold concentrate is produced (Figure 3). Thegravity concentrate is sold to a third party, whilst the concentrate is transported to theSvartliden plant which produces a gold doré via a carbon in leach process (CIL). TheSvartliden plant has previously treated ore from the Svartliden mine and test mining orefrom the Fäboliden mine. There are exploration tenements associated with these miningoperations. The Valuation considered the process plants, mines and exploration assets ofthe Company.
Figure 1 Dragon Mining Production Centres
APPENDIX II INDEPENDENT EXPERT’S REPORT
– II-90 –
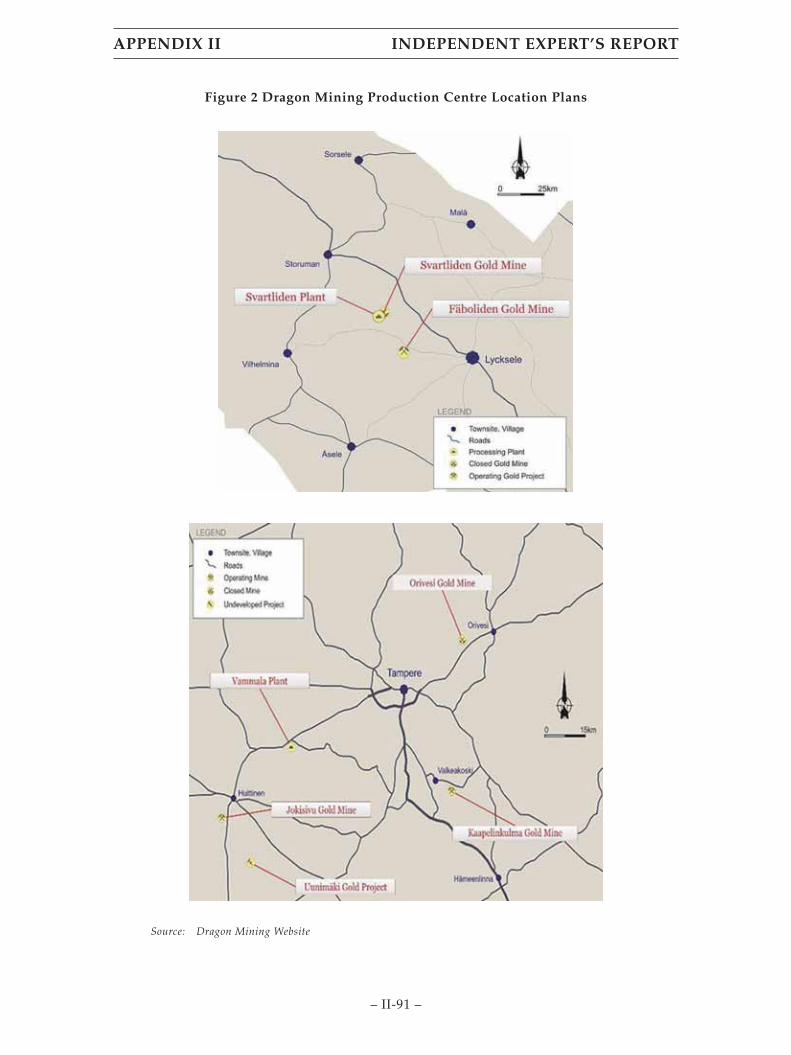
Figure 2 Dragon Mining Production Centre Location Plans
Source: Dragon Mining Website
APPENDIX II INDEPENDENT EXPERT’S REPORT
– II-91 –

Figure 3 Dragon Mining Production Flow
Source: Dragon Mining Website
Tenements
Dragon Mining has six mining permits or concessions, three exploration permits,three exploration Permit Applications and one Reservation in Finland (Table 1).
Dragon Mining has two exploitation concessions and one exploration permit inSweden (Table 2).
The tenements are wholly owned by Dragon Mining’s local subsidiaries, DragonMining AB (Sweden) and Dragon Mining OY (Finland).
All tenements are wholly owned by Dragon Mining.
RPM provides the below information for reference only and recommends that landtitles and ownership rights be reviewed by legal experts.
Table 1 Finland Tenements
Area Asset ID Type Registered Holder Area (Ha)
Orivesi Orivesi 2676 Mining Concession Dragon Mining Oy 39.82Sarvisuo 1-2 ML2013:0006 Exploration Permit Dragon Mining Oy 41.10Sarvisuo 3 ML2015:0026 Exploration Permit
ApplicationDragon Mining Oy 46.51
Ori VA2020:0021 Reservation Dragon Mining Oy 1,979.73
APPENDIX II INDEPENDENT EXPERT’S REPORT
– II-92 –

Area Asset ID Type Registered Holder Area (Ha)
Jokisivu Jokisivu 7244 Mining Concession Dragon Mining Oy 48.32Jokisivu 2 KL2015:0005 Mining Permit Dragon Mining Oy 21.30Jokisivu 3 KL2018:0010 Mining Permit Dragon Mining Oy 8.97Jokisivu 4-5 ML2012:0112 Exploration Permit Dragon Mining Oy 85.76Jokisivu 7-8 ML2017:0131 Exploration Permit Dragon Mining Oy 18.60Jokisivu 10 ML2018:0082 Exploration Permit
ApplicationDragon Mining Oy 900.33
Kaapelinkulma Kaapelinkulma K7094 Mining Concession Dragon Mining Oy 65.10Uunimäki Uunimäki 1 ML2020:0020 Exploration Permit
ApplicationDragon Mining Oy 89.22
Stormi Stormi 1895 Mining Concession Dragon Mining Oy 157.53
Table 2 Sweden Tenements
Area Asset Type Registered Holder Area (Ha)
Svartliden SvartlidengruvanK nr 1
ExploitationConcession
Dragon Mining(Sweden) AB
87.54
Fäboliden Fäboliden K nr 1 ExploitationConcession
Dragon Mining(Sweden) AB
122.00
Fäboliden Fäboliden nr 11 ExplorationPermit
Dragon Mining(Sweden) AB
836.26
Geology
Finland
The Orivesi Gold Mine has two areas of mineralisation (Kutema and Sarvisuo)which are approximately 300m apart. The Kutema and Sarvisuo lodes occur assub-vertical, pipe-like structures with extensive vertical continuity and thickness. Goldmineralisation is related to strongly deformed and silicified zones characterized byshearing, boudinaging, folding and quartz veining with gold occurring as fine nativegold, and carried by some gold tellurides, and electrum (Au, Ag).
The Jokisivu Gold Mine has two areas of mineralisation (Kujankallio and Arpola)which are approximately 200m apart. The lodes are controlled by a conjugate set ofbrittle-ductile shear zones between two major NW-trending shear zones in the Jokivisumetadiorite. Mineralisation is hosted within relatively undeformed and unaltered diorite,in 1-5m wide shear zones characterised by laminated, pinching and swelling quartz veinsand a well-developed moderately (50°) east-northeast plunging lineation. Gold occursmostly as free grains in quartz veins.
The Kaapelinkulma Gold Mine is an orogenic-type gold deposit associated with aquartz diorite inclusion and controlling NNE and NE-trending sinistral shear zones.Mineralised shear zones contain banded quartz veins and veinlets characterized byvariable pyrrhotite, arsenopyrite, loellingite, pyrite, chalcopyrite, scheelite, tellurides,bismuth, maldonite and gold. Native free gold is mostly associated with quartz.
APPENDIX II INDEPENDENT EXPERT’S REPORT
– II-93 –
Sweden
The Fäboliden and Svartliden deposits are hosted in a sequence ofvolcano-sedimentary packages in the Bothnian Basin which consist of strongly foliatedand biotite-rich argillites with lesser sandstones. The Fäboliden mineralisation isgenerally situated at or near the boundary between the lower sediments and theintermediate volcanics, with mineralisation associated with small quartz or sulfide veinswhere arsenopyrite is dominant. Mineralisation at Svartliden is epigenetic, located inhydrothermally altered ductile shear zones and hosted by a banded iron formation (BIF)located on the contact between a sediment and metabasalt. Gold is associated witharsenopyrite and pyrrhotite.
Mineral Resource Estimates
The Mineral Resource Estimates were reviewed for all deposits. The geologicalinterpretation methodologies are reasonable based on known occurrences ofmineralisation from drilling, information from mine geologists on-site and gold assays.For some deposits, the erratic distribution of the high-grade mineralised zonesnecessitated using variable interpretation gold cut-off grades.
The statistical analysis, modelling and estimation has been carried out according tointernational best practice. For Orivesi, RPM recommends trialling variography for thelarger objects and an Ordinary Kriging estimate for comparison with the Inverse Distanceestimate.
The validation and resource classification methodologies used are reasonable andexpected for these styles of deposit. Overall, the Mineral Resources are acceptable andhave been estimated and reported to be in accordance with the recommended guidelinesof the 2012 Edition of the Australasian Code for Reporting of Exploration Results, MineralResources and Ore Reserves (the “JORC Code”).
The Mineral Resources are summarised in the following tables.
APPENDIX II INDEPENDENT EXPERT’S REPORT
– II-94 –

Orivesi Mineral Resource
The Mineral Resource for the Orivesi Gold Mine is shown below on Table 3 reportedat a cut-off grade of 2.6 g/t Au and depleted for mining as of 31st December 2019.
Table 3 Orivesi Mine December 2019 Mineral Resource Estimate
Measured Indicated Inferred TotalDeposit Quantity Au Au Quantity Au Au Quantity Au Au Quantity Au Au
kt g/t koz kt g/t koz kt g/t koz kt g/t koz
Kutema 59 4.5 9 61 5.1 10 13 4.4 2 130 4.8 20Sarvisuo 34 5.7 6 47 7.0 11 58 4.9 9 140 5.8 26Stockpiles – – – 1 3.8 <1 – – – 1 3.8 <1
Total 93 5.0 15 110 5.9 21 71 4.8 11 270 5.3 47
Note:
1) The Mineral Resources has been compiled under the supervision of Mr. David Allmark who is afull-time employee of RPM and a Registered Member of the Australian Institute of Geoscientists.Mr. Allmark has sufficient experience that is relevant to the style of mineralisation and type ofdeposit under consideration and to the activity that he has undertaken to qualify as a CompetentPerson as defined in the JORC Code.
2) All Mineral Resources figures reported in the table above represent estimates at 31st December,2019. Mineral Resource estimates are not precise calculations, being dependent on theinterpretation of limited information on the location, shape and continuity of the occurrence andon the available sampling results. The totals contained in the above table have been rounded toreflect the relative uncertainty of the estimate. Rounding may cause some computationaldiscrepancies.
3) Mineral Resources have been reported in accordance with the Australasian Code for Reporting ofExploration Results, Mineral Resources and Ore Reserves (The Joint Ore Reserves CommitteeCode – JORC 2012 Edition).
4) The Mineral Resources have been reported at a gold cut-off grade of 2.6 g/t Au determined usinga gold price of USD 1,770/troy ounce extrapolated for the potential economic extraction of theresource at a level approximating 120% of the nominal forecast gold price of USD 1,475/troyounce as at 13th November, 2019, a mining cost of USD 88.48/t of ore for underground, aprocessing cost of USD 28.45/t of ore and a processing recovery of 85%.
Jokisivu Mineral Resource
The Mineral Resource for the Jokisivu Gold Mine is shown below on Table 4
reported at a cut-off grade of 1.3 g/t Au and depleted for mining as of 31st December 2020.
APPENDIX II INDEPENDENT EXPERT’S REPORT
– II-95 –

Table 4 Jokisivu Gold Mine December 2020 Mineral Resource Estimate
Measured Indicated Inferred TotalDeposit Quantity Au Au Quantity Au Au Quantity Au Au Quantity Au Au
Mt g/t oz Mt g/t oz Mt g/t oz Mt g/t oz
Kujankallio 0.5 5.0 79,000 0.9 3.4 100,000 0.1 2.9 13,000 1.6 3.8 190,000Arpola 0.2 4.2 20,000 0.5 4.4 71,000 0.4 4.4 55,000 1.0 4.4 150,000Stockpiles – – – <0.1 2.1 5,000 – – – <0.1 2.1 5,000
Total 0.6 4.8 100,000 1.5 3.6 180,000 0.5 4.0 67,000 2.7 4.0 340,000
Note:
1) The Mineral Resources has been compiled under the supervision of Mr. David Allmark who is afull-time employee of RPM and a Registered Member of the Australian Institute of Geoscientists.Mr. Allmark has sufficient experience that is relevant to the style of mineralisation and type ofdeposit under consideration and to the activity that he has undertaken to qualify as a CompetentPerson as defined in the JORC Code.
2) All Mineral Resources figures reported in the table above represent estimates at 31st December,2020. Mineral Resource estimates are not precise calculations, being dependent on theinterpretation of limited information on the location, shape and continuity of the occurrence andon the available sampling results. The totals contained in the above table have been rounded toreflect the relative uncertainty of the estimate. Rounding may cause some computationaldiscrepancies.
3) Mineral Resources have been reported in accordance with the Australasian Code for Reporting ofExploration Results, Mineral Resources and Ore Reserves (The Joint Ore Reserves CommitteeCode – JORC 2012 Edition).
4) The Mineral Resources have been reported at a gold cut-off grade of 1.3 g/t Au determined usinga gold price of US$1,890/troy ounce extrapolated for the potential economic extraction of theresource at a level approximating 120% of an average consensus forecast gold price ofUS$1,575/troy ounce that was generated from annual Consensus gold forecasts over the mine lifeperiod, a mining cost of US$39.50/t of ore for underground, a processing cost of US$25.54/t of oreand a processing recovery of 87%.
APPENDIX II INDEPENDENT EXPERT’S REPORT
– II-96 –

Kaapalinkulma Mineral Resource
The Mineral Resource for the Kaapelinkulma Gold Mine reported at a cut-off gradeof 0.7 g/t Au based on actual mining and processing costs and recoveries and depleted formining as at 31st December 2020 is shown below on Table 5.
Table 1 Kaapelinkulma Gold Mine December 2020 Mineral Resource Estimate
Measured Indicated Inferred TotalType Quantity Au Au Quantity Au Au Quantity Au Au Quantity Au Au
t g/t Ounces t g/t Ounces t g/t Ounces t g/t Ounces
Oxide – – – – – – – – – – – –Transitional – – – – – – – – – – – –Fresh 26,000 2.3 2,000 72,000 3.3 8,000 174,000 2.6 14,000 272,000 2.7 24,000Stockpiles – – – 8,000 2.9 1,000 – – – 8,000 2.9 1,000
Total 26,000 2.3 2,000 79,000 3.2 8,000 174,000 2.6 14,000 279,000 2.7 24,000
Note:
1) The Mineral Resources has been compiled under the supervision of Mr. David Allmark who is afull-time employee of RPM and a Registered Member of the Australian Institute of Geoscientists.Mr. Allmark has sufficient experience that is relevant to the style of mineralisation and type ofdeposit under consideration and to the activity that he has undertaken to qualify as a CompetentPerson as defined in the JORC Code.
2) All Mineral Resources figures reported in the table above represent estimates at 31st December,2020. Mineral Resource estimates are not precise calculations, being dependent on theinterpretation of limited information on the location, shape and continuity of the occurrence andon the available sampling results. The totals contained in the above table have been rounded toreflect the relative uncertainty of the estimate. Rounding may cause some computationaldiscrepancies.
3) Mineral Resources have been reported in accordance with the Australasian Code for Reporting ofExploration Results, Mineral Resources and Ore Reserves (The Joint Ore Reserves CommitteeCode – JORC 2012 Edition).
4) The Mineral Resources have been reported at a gold cut-off grade of 0.7 g/t Au determined usinga gold price of US$2,250 per troy ounce which was extrapolated for the potential economicextraction of the resource at a level approximating 120% of the short term Consensus forecast goldprice of US$1,880 per troy ounce, a mining cost of €16.59/bcm of ore and waste for open pitmining, a processing cost of €25.20/t of ore and a processing recovery of 83%. An exchange rate ofUSD1.00 = EUR0.84 was utilised as provided by Dragon Mining and checked by RPM.
APPENDIX II INDEPENDENT EXPERT’S REPORT
– II-97 –

Svartliden Mineral resource
The Mineral Resource for the Svartliden Gold Mine reported at a cut-off grade of1.3 g/t Au for open pit material and 3.0 g/t Au for underground material and depleted formining as at 30th April 2014 is shown below on Table 6.
Table 6 Svartliden Gold Mine April 2014 Mineral Resource Estimate
Measured Indicated Inferred TotalType Quantity Au Quantity Au Quantity Au Quantity Au Au
kt g/t kt g/t kt g/t kt g/t koz
Stockpiles 411 2.2 411 2.2 29.6Open Pit 77 3.2 150 3.1 228 3.2 23.1Underground 20 5.9 96 5.9 39 4.9 155 5.7 28.2
Total 508 2.5 246 4.2 39 4.9 794 3.2 80.9
Note:
1) Totals may differ due to rounding.
2) Exclusive of Mineral Reserves reported in Svartliden stockpiles.
Fäboliden Mineral Resource
The Mineral Resource for the Fäboliden Gold Mine reported at a cut-off grade of1.1 g/t Au for open pit material above a revenue factor 1.2 optimised pit shell and at acut-off grade of 2.0 g/t Au for underground material below the revenue factor 1.2optimised pit shell depleted for mining as at 31st December 2020 is shown below on Table
7.
Table 7 Fäboliden Deposit December 2020 Mineral Resource Estimate
AuCut-Off
Measured Indicated Inferred TotalMaterial Quantity Au Au Quantity Au Au Quantity Au Au Quantity Au Au
g/t Mt g/t oz Mt g/t oz Mt g/t oz Mt g/t oz
Open Pit 1.1 0.10 3.4 11,000 3.0 2.9 280,000 0.62 2.4 48,000 3.7 2.8 340,000Underground 2.0 – – – 1.3 3.0 130,000 5.2 3.4 560,000 6.5 3.3 690,000Stockpiles – – – – <0.1 1.8 1,600 – – – <0.1 1.8 1,600
Total 0.10 3.4 11,000 4.3 2.9 410,000 5.8 3.3 610,000 10 3.1 1,000,000
APPENDIX II INDEPENDENT EXPERT’S REPORT
– II-98 –
Note:
1) The Mineral Resources has been compiled under the supervision of Mr. David Allmark who is afull-time employee of RPM and a Registered Member of the Australian Institute of Geoscientists.Mr. Allmark has sufficient experience that is relevant to the style of mineralisation and type ofdeposit under consideration and to the activity that he has undertaken to qualify as a CompetentPerson as defined in the JORC Code.
2) All Mineral Resources figures reported in the table above represent estimates at 31st December,2020. Mineral Resource estimates are not precise calculations, being dependent on theinterpretation of limited information on the location, shape and continuity of the occurrence andon the available sampling results. The totals contained in the above table have been rounded toreflect the relative uncertainty of the estimate. Rounding may cause some computationaldiscrepancies.
3) Mineral Resources have been reported in accordance with the Australasian Code for Reporting ofExploration Results, Mineral Resources and Ore Reserves (The Joint Ore Reserves CommitteeCode – JORC 2012 Edition).
4) The Mineral Resources have been reported at gold cut-off grades and above and below a revenuefactor 1.2 optimised pit shell determined using a gold price of US$1,740 per troy ounce(extrapolated for the potential economic extraction of the resource at a level approximating 120%of the long term Consensus forecast gold price as at January 2021 of USD1,450/oz), a mining costof US$14.76/t of ore for open pit; and US$38.02/t of ore for underground, a processing cost ofUS$34.30/t of ore and a processing recovery of 82%.
Exploration
Dragon Mining’s exploration tenements are all associated with the mineral depositsand mines, except for Uunimäki which is a new application in the Vammala district.
There is one exploration tenement in Sweden, Exploration Permit Fäboliden nr 11. Itoccurs along strike to the southwest of the Exploitation Concession associated with theFäboliden deposit. Minor drill has been carried out with some promising intersectionsworthy of follow up.
There are six exploration tenements in Finland, three Exploration Permits and threeExploration Permit Applications. There is a Reservation tenement covering a large areaaround the Orivisi mine, which is a pre-cursor to exploration permit applications. TheUunimäki Exploration Permit Application is situated approximately 45km to the south ofthe Vammala plant.
Limited exploration has been carried out in the last several years by Dragon Miningon these tenements. Most exploration effort has focussed on exploring and infill drilling ofmineral resources.
Exploration potential exists along strike of existing mineralisation and also alongstrike and at depth on existing mining tenements.
APPENDIX II INDEPENDENT EXPERT’S REPORT
– II-99 –

Mining
A high-level review was completed on the Jokisivu Underground Mine (Finland)and Fäboliden open cut mine (Sweden) with a particular focus on:
• Study status to meet the requirements of the JORC Code.
• Mining methods and mine design.
• Estimation of the ore cut-off grade.
• Life-of-mine (LOM) schedule.
• Derivation of mining costs.
• Estimation of Ore Reserves.
The outcomes of the Jokisivu and Fäboliden reviews are discussed below.
The Orivesi and the Kaapalinkulma mines have ceased production and have nocurrent Ore Reserves and hence have been excluded from this Review.
Finland (Jokisivu Mine)
A life-of-mine (LOM) plan to a pre-feasibility study (PFS) level of accuracy haspreviously been prepared in order to support the declaration of an Ore Reserves estimate.The purpose of the mine plan was to assess if the Ore Reserves are technically achievableand economically viable.
The mining method at Jokisivu is long-hole open stoping (LHOS) with rockfill and isapplied in an overhand manner. Mining advances from the bottom upwards inapproximately 80m high mining panels leaving a sill pillar between the panels. Backfillmaterial can be either waste rock from development or waste rock from the surfacedepending on the availability of material. In RPM’s opinion the mining method isreasonable for the style and characteristics of the deposit. It has been largely applied sincethe inception of the underground mine and has a track record of being successfullyapplied. The design criteria underpinning the approach to underground mining isreasonable and again reflects current operations.
The mining modifying factors, that is the ore loss and dilution applied in the miningstudy, are based on operational experience and in-situ to run-of-mine (ROM) orereconciliations. The dilution applied was 30% for stoping and 5% for ore development.The ore recovery is estimated at 90% for stoping and 95% for ore development. In RPM’sopinion the approach to estimating mining modifying factors and outcomes arereasonable.
The marginal cut-off grades (COG) define the lowest grade of rock which can bemined and still pay for itself. The cut-off grades determined for the Jokisivu mine for thepurpose of mine planning and estimation of Ore Reserves are set out on Table 8.
APPENDIX II INDEPENDENT EXPERT’S REPORT
– II-100 –

Table 8 Jokisivu Underground Cut-off (g/t Au) at USD1,699/oz
Area Project Operating Stoping Ore Dev.
Kujankallio In Situ AuGrade (g/t)
Arpola In Situ AuGrade (g/t)
3.2 2.3 1.6 0.9
The stoping cut-off grade at the long-term price is 1.8 g/t Au. RPM has reviewed theestimation of the marginal cut-off grade and confirms it to be reasonable and accurate.
The economic mining limits were identified using the Vulcan Mine Stope Optimiser(MSO) software to define stope design shapes using the breakeven COG’s describedabove. The mining limit optimisation process was restricted to only Measured andIndicated Mineral Resources. Inferred Resources were assigned a grade of zero for thepurposes of the analysis and are hence considered as waste rock. This approach toestimating economic mining limits using the MSO software follows accepted industrypractices. In RPM’s opinion the approach is reasonable.
A life-of-mine schedule was prepared for underground ore extraction as illustratedin Figure 4. The results indicate that the target production of 300 kt per year is achieved to2023, reducing to 250 kt per year as the Kujankallio region winds down and then ceases in2025. The Arpola region ends operations in 2027.
Figure 4 Underground LOM Schedule
2021 2022 2023 2024 2025 2026 2027
Kujankallio 174 k 165 k 155 k 139 k 176 k 240 k 52 k
Arpola 131 k 139 k 131 k 120 k 73 k - -
Ore Grade (g/t) 2.7 2.5 2.2 2.6 2.1 1.8
-
0.5
1.0
1.5
2.0
2.5
3.0
-
50 k
100 k
150 k
200 k
250 k
300 k
350 kG
rad
e
Ton
nes
Axis Title
Mine ROM Ore Production (t) and Grade (g/t)
The ore processing schedule is illustrated in Figure 5. It indicates that the targetproduction of 300 ktpa feed is achieved to 2024 with support of stockpiled ore beforereducing as production at Kujankallio reduces.
APPENDIX II INDEPENDENT EXPERT’S REPORT
– II-101 –

Figure 5 LOM Ore Processing Schedule
0.00
0.50
1.00
1.50
2.00
2.50
3.00
0
50
100
150
200
250
300
350
2021 2022 2023 2024 2025 2026 2027
Feed
Gra
de (g
/t)
Ore
pro
cess
ed (k
t)Processing Schedule
Ore Tonnes (kt) Grade (g/t)
In RPM’s opinion the LOM underground schedule aligns with current operationaloutputs, and hence should be achievable.
The underground mining costs as set out in Table 9 are understood to be based on anactual operation costs.
Table 9 Jokisivu Mining Operating Costs
Cost Centre Item UnitsValue
(USD)
U/G Development Cost Capex Development $/m 2,767Opex Development $/m 2,216
U/G Mining Ore Dev. $/t ore 20.23U/G Stoping Costs $/t ore 9.11U/G Opex Fixed
Cost$/t ore 9.91
U/G Backfill Cost $/t ore 1.22
Total Variable Cost $/t ore 40.47
In RPM’s opinion, an average variable mining cost of USD40/t ore and the miningdevelopment costs are reasonable based on our experience with similar small-scale goldmines. Given they are based on actual operational results increases the confidence in theoutcomes.
APPENDIX II INDEPENDENT EXPERT’S REPORT
– II-102 –

In summary, the high-level mining review found no technical fatal flaws. The mineplan appears to be practical and achievable as it is underpin by a mining methodapproach, design criteria and costs based on actual operating data.
RPM prepared an Ore Reserve Statement on behalf of Dragon Mining dated 31December 2020. The Statement was prepared in compliance with the requirements of thereporting guidelines of the JORC Code. The Ore Reserves estimated as of 31 December2020 is set out on Table 10.
Table 10 Summary of Jokisivu Gold Mine Ore Reserves
Zone Category 2020 Reserveskt g/t koz
ARPProved 108 2 7Probable 486 2.4 37Total 594 2.3 44
KUJProved 381 2.7 33Probable 719 2.2 51Total 1,100 2.4 84
Stockpiles Probable 69 2.1 5
TOTALProved 490 2.5 40Probable 1,273 2.3 93Total 1,763 2.3 132
Notes:
1. The Statement of JORC Ore Reserves has been compiled under the supervision of Mr. JoeMcDiarmid who is a full-time Manager – Metals Consulting Australasia employed by RPM and isa Member of the Australian Institute of Mining and Metallurgy. Mr. McDiarmid has sufficientexperience which is relevant to the style of mineralisation and type of deposit underconsideration to qualify as a Competent Person as defined in the JORC Code;
2. Tonnages are dry metric tonnes;
3. The economic in-situ ore cut-off grades were determined based on a variable gold price rangingfrom USD1,699 per troy ounce in the short term to USD1,443 per troy ounce long term, andhistorical costs and metallurgical modifying factors.
Kujankallio stope cut-off grade of 1.6 g/t AuArpola stope cut-off grade of 1.6 g/t Au
4. Ore Reserve estimates are not precise calculations, being dependent on the interpretation oflimited information on the location, shape and continuity of the occurrence and on the availablesampling results. The quantities contained in the above table have been rounded to reflect therelative uncertainty of the estimate. Rounding may cause some computational discrepancies.
APPENDIX II INDEPENDENT EXPERT’S REPORT
– II-103 –
Mineral Resources are reported inclusive of Ore Reserves (that is, Ore Reserves arenot additional to Mineral Resources).
In RPM’s opinion the estimate of Ore Reserves is reasonable and meets therequirements of the JORC Code. The estimate is suitable to support the valuation of theasset.
Sweden (Fäboliden Mine)
The mining method is open cut selective mining by hydraulic excavators mining in2.5m flitches loading standard off-highway rear dump trucks hauling to surface orestockpiles and waste disposal dumps. These would be supported by front-end loaders forstockpile rehandle.
A life-of-mine (LOM) plan to a pre-feasibility study (PFS) level of accuracy has beenprepared in order to support the declaration of an Ore Reserves estimate. The purpose ofthe mine plan was to assess if the Ore Reserves are technically achievable andeconomically viable.
The economic pit limits were defined by considering the physical constraints tomining, which, for Fäboliden, is primarily the Exploitation Concession area. There are noother physical constraints to mining within the concession area such as property,infrastructure or environmental issues.
The Geovia Whittle 4X software was used to identify the economic open cut pitlimits. Key inputs to the pit limit optimisation process included the Resource model,geotechnical parameters, metallurgical modifying factors and historical or forecastoperating costs. This study was completed with revenue generated only by Measured andIndicated Resources. That is, no value was allocated to Inferred Resources and hence itwas considered by the analysis as waste rock.
In RPM’s opinion the approach to estimating the economic mining limits aligns withaccepted industry practice. The selected pit shell was used to guide the ultimate pit designwhich formed the basis of the estimation of Ore Reserves and the mine planning study.The pit design criteria are based on the geotechnical study undertaken by Intra Tech andwas confirmed during the PFS process through consultation with Dragon Mining.
RPM reviewed the ultimate pit design and, in our opinion, it appears practical andachievable. Sufficient detailed design has been completed to support the estimation ofmineable quantities and life-of-mine planning.
The mining modifying factors (ore loss and dilution) applied to the mineable in situore to enable conversion to ROM ore were estimated from a selective mining unit (SMU)analysis. The SMU defines the size of material that can be selectively excavated based onthe mining parameters. The analysis indicated a global ore loss of 13% and dilution of23%. In RPM’s opinion the approach to estimating mining modifying factors followsaccepted industry practice and is reasonable.
APPENDIX II INDEPENDENT EXPERT’S REPORT
– II-104 –
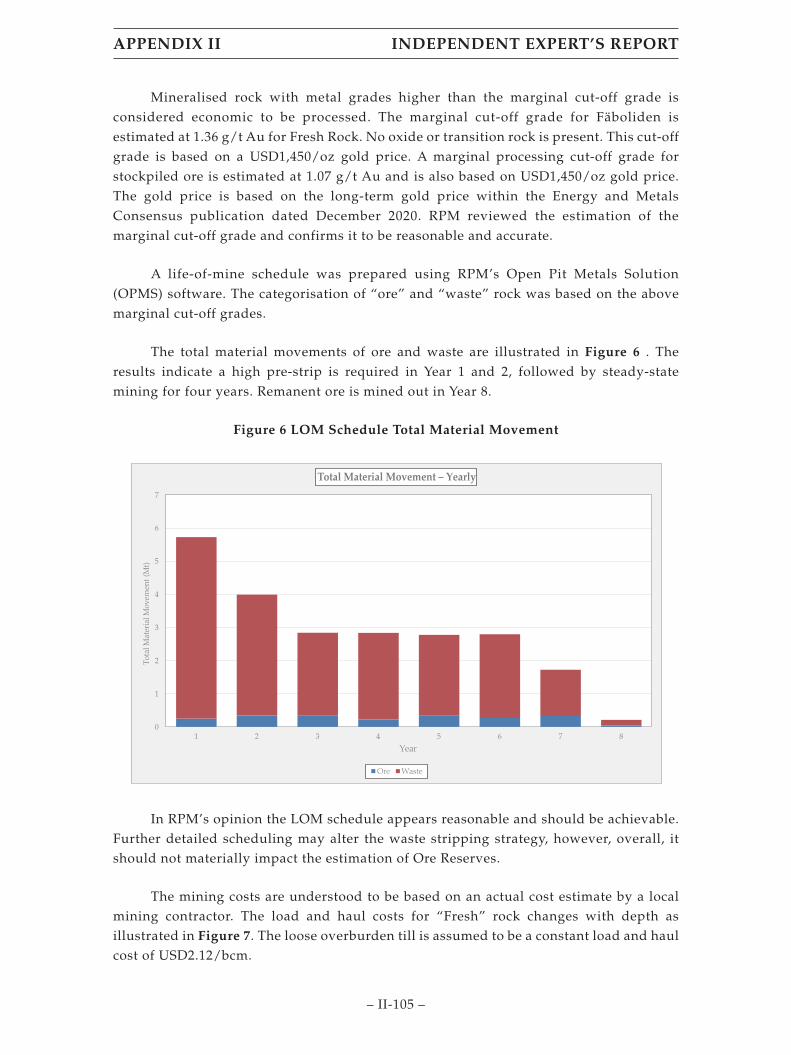
Mineralised rock with metal grades higher than the marginal cut-off grade isconsidered economic to be processed. The marginal cut-off grade for Fäboliden isestimated at 1.36 g/t Au for Fresh Rock. No oxide or transition rock is present. This cut-offgrade is based on a USD1,450/oz gold price. A marginal processing cut-off grade forstockpiled ore is estimated at 1.07 g/t Au and is also based on USD1,450/oz gold price.The gold price is based on the long-term gold price within the Energy and MetalsConsensus publication dated December 2020. RPM reviewed the estimation of themarginal cut-off grade and confirms it to be reasonable and accurate.
A life-of-mine schedule was prepared using RPM’s Open Pit Metals Solution(OPMS) software. The categorisation of “ore” and “waste” rock was based on the abovemarginal cut-off grades.
The total material movements of ore and waste are illustrated in Figure 6 . Theresults indicate a high pre-strip is required in Year 1 and 2, followed by steady-statemining for four years. Remanent ore is mined out in Year 8.
Figure 6 LOM Schedule Total Material Movement
0
1
2
3
4
5
6
7
1 2 3 4 5 6 7 8
Year
Total Material Movement – Yearly
Ore Waste
Tota
l Mat
eria
l Mov
emen
t (M
t)
In RPM’s opinion the LOM schedule appears reasonable and should be achievable.Further detailed scheduling may alter the waste stripping strategy, however, overall, itshould not materially impact the estimation of Ore Reserves.
The mining costs are understood to be based on an actual cost estimate by a localmining contractor. The load and haul costs for “Fresh” rock changes with depth asillustrated in Figure 7. The loose overburden till is assumed to be a constant load and haulcost of USD2.12/bcm.
APPENDIX II INDEPENDENT EXPERT’S REPORT
– II-105 –

In addition to the load and haul costs, other mining costs are:
• Drill and blast:
– Till: USD0.12/bcm.
– Fresh: USD3.04/bcm.
• Fuel cost of USD2.00/bcm.
• In addition to the mining contractor ’s costs, historical cost estimates of:
• Mine site Admin: USD1.90/t ore.
• Grade Control: USD3.61/t ore.
• Service Costs: USD3.89/t ore.
Figure 7 Fresh Rock Load and Haul Mining Costs
y = 0.00003339x2 + 0.00951035x + 2.44407853
y = 0.00003549x2 + 0.01015205x + 2.60475133
2.00
2.50
3.00
3.50
4.00
4.50
5.00
5.50
0 20 40 60 80 100 120 140 160 180 200
Loa
d a
nd
Hau
l Cos
t (U
SD
/BC
M)
Depth (m)
Waste Load and Haul Ore Load and Haul Poly. (Waste Load and Haul) Poly. (Ore Load and Haul)
Load and Haul Costs by Bench
The average mining cost over the LOM period averages USD3.50/t. In RPM’sopinion, this average mining cost is on the low side for a small-scale gold mine. Also,though the load and haul costs are based on an actual mining contract estimate, no miningis currently being undertaken, and any future activity will likely be based on an adjustedcontract that will be based on inflated costs. For the purposes of the cashflow model, RPMrecommends that the mining activity cost be increased by 5%.
APPENDIX II INDEPENDENT EXPERT’S REPORT
– II-106 –
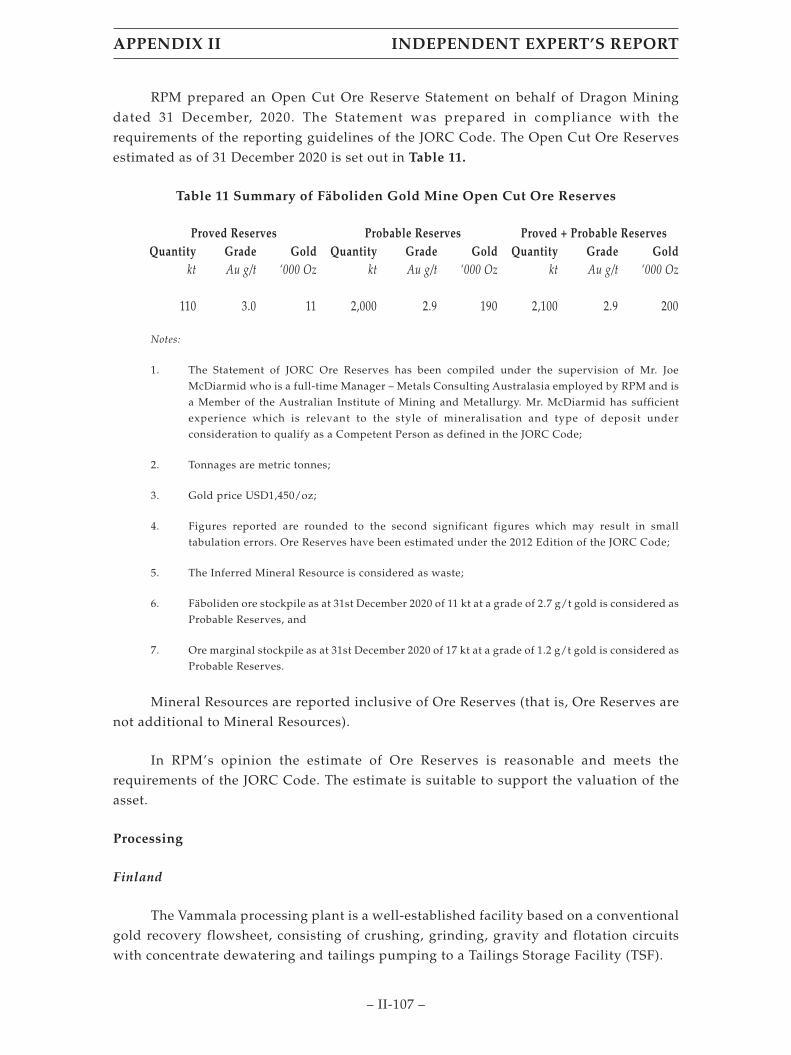
RPM prepared an Open Cut Ore Reserve Statement on behalf of Dragon Miningdated 31 December, 2020. The Statement was prepared in compliance with therequirements of the reporting guidelines of the JORC Code. The Open Cut Ore Reservesestimated as of 31 December 2020 is set out in Table 11.
Table 11 Summary of Fäboliden Gold Mine Open Cut Ore Reserves
Proved Reserves Probable Reserves Proved + Probable ReservesQuantity Grade Gold Quantity Grade Gold Quantity Grade Gold
kt Au g/t ‘000 Oz kt Au g/t ‘000 Oz kt Au g/t ‘000 Oz
110 3.0 11 2,000 2.9 190 2,100 2.9 200
Notes:
1. The Statement of JORC Ore Reserves has been compiled under the supervision of Mr. JoeMcDiarmid who is a full-time Manager – Metals Consulting Australasia employed by RPM and isa Member of the Australian Institute of Mining and Metallurgy. Mr. McDiarmid has sufficientexperience which is relevant to the style of mineralisation and type of deposit underconsideration to qualify as a Competent Person as defined in the JORC Code;
2. Tonnages are metric tonnes;
3. Gold price USD1,450/oz;
4. Figures reported are rounded to the second significant figures which may result in smalltabulation errors. Ore Reserves have been estimated under the 2012 Edition of the JORC Code;
5. The Inferred Mineral Resource is considered as waste;
6. Fäboliden ore stockpile as at 31st December 2020 of 11 kt at a grade of 2.7 g/t gold is considered asProbable Reserves, and
7. Ore marginal stockpile as at 31st December 2020 of 17 kt at a grade of 1.2 g/t gold is considered asProbable Reserves.
Mineral Resources are reported inclusive of Ore Reserves (that is, Ore Reserves arenot additional to Mineral Resources).
In RPM’s opinion the estimate of Ore Reserves is reasonable and meets therequirements of the JORC Code. The estimate is suitable to support the valuation of theasset.
Processing
Finland
The Vammala processing plant is a well-established facility based on a conventionalgold recovery flowsheet, consisting of crushing, grinding, gravity and flotation circuitswith concentrate dewatering and tailings pumping to a Tailings Storage Facility (TSF).
APPENDIX II INDEPENDENT EXPERT’S REPORT
– II-107 –
The operation has a design throughput capacity of 300 ktpa which has beenconsistently exceeded over the last five years, averaging 312 ktpa. The 2021 productionrate up to May was equivalent to 302 ktpa, with the forecast throughput falling away in2025 and the last feed to the processing plant in 2027.
The processing plant is treating Jokisivu ores, where the gold is predominantlypresent in pyrite, and recovered to the flotation concentrate. A small quantity of the goldis free and recovered by gravity.
Overall site gold recoveries vary with feed grade, however average 86.9% over thenext 7 years.
The flotation concentrate is transported to the Svartliden operation in Sweden forfurther treatment while the gravity gold concentrate, typically 99.3% gold, is soldseparately.
Dragon Mining proposes to spend USD2.68 M in capital during 2021, principally aTSF lift, a ‘ditch’, rod mill linings and replacement of a crusher. RPM considers that thiscapital expenditure is reasonable and notes that it includes a 10% contingency.
Based on historical data, RPM considers that both the Vammala processing cost(USD25.54/milled tonne) and the concentrate ‘selling cost’ (USD408.43/dmt concentrate),which consists of concentrate transport and shipping costs to the plant as well as theSvartliden processing costs, to be reasonable.
Both the nature and the application of concentrate terms, e.g. 90% gold payability, isconsidered inappropriate. The payability factor of 90% was increased to 94.9% based onrecords.
RPM has included a sustaining capital cost of USD0.25M/annum (USD0.83/milledtonne) and estimated a salvage value of USD0.61 M for the Vammala processing operation.
Sweden
The Svartliden processing plant is also a well-established facility based on aconventional gold recovery flowsheet, consisting of crushing, grinding, leaching(Carbon-In-Leach, ‘CIL’), gold recovery and detoxification circuits with tailings pumpingto a Tailings Storage Facility (TSF).
The operation has a design throughput capacity of 300 ktpa with the mine scheduleproposing to deliver this amount of plant feed annually.
Gold recovery from the Vammala flotation concentrate is 94.9%.
Projected gold recovery from the open cut ores is 80% which is supported by trialprocessing and test work.
Dragon Mining proposes to spend USD0.54 M on water treatment once approval formining is granted. RPM considers that this expenditure is reasonable.
APPENDIX II INDEPENDENT EXPERT’S REPORT
– II-108 –

RPM has included a sustaining capital cost of USD0.2 M/annum (USD0.68/milledtonne).
Based on historical data, RPM considers that the Svartliden processing cost(USD44.39/milled tonne) for treating locally mined ores to be reasonable. This costincludes General & Administration costs.
RPM has estimated a salvage value of USD0.46 M for the Svartliden processingoperation.
Environmental
Sweden Projects
Fäboliden Mine
• The Project is projected for start-up in the initial part of 2022. However, a morerealistic view is that permit acquisition may extend to the middle to latter partof 2022. Environmental lawsuits are also common in Sweden, which poses thepotential for more delays.
• Seepage from the waste rock storage facility is expected to generate ARD withleachable elements detrimental to water quality. A groundwater and surfacewater monitoring program should be installed to provide early detection ofwater quality impacts. Implementation of appropriate mitigation actions maybe required if impacts are found.
• The project is projected to cause habitat loss of about 280 ha that could affectthe conservation status of populations. The potential impact to a number offauna and flora species including a protected orchid is the primary concern.Investigations related to impacts of the operation on water quality andhabitats must be considered. The potential negative impacts on the typicalfish species and benthic fauna within the mixing zone is also a concern.
As inventories will not be able to be carried out before the court hearing associatedwith the permitting action, the County Administration Board (CAB) is requiringacquisition of a Species Protection Exemption. The details of the Exemption are notknown, but it appears it would include conditions supporting biodiversity protection. TheCAB indicated that a permit cannot be issued before a species protection exemption hasbeen granted. The alternative result would be not to grant the permit until a satisfactoryspecies protection inventory was conducted.
APPENDIX II INDEPENDENT EXPERT’S REPORT
– II-109 –
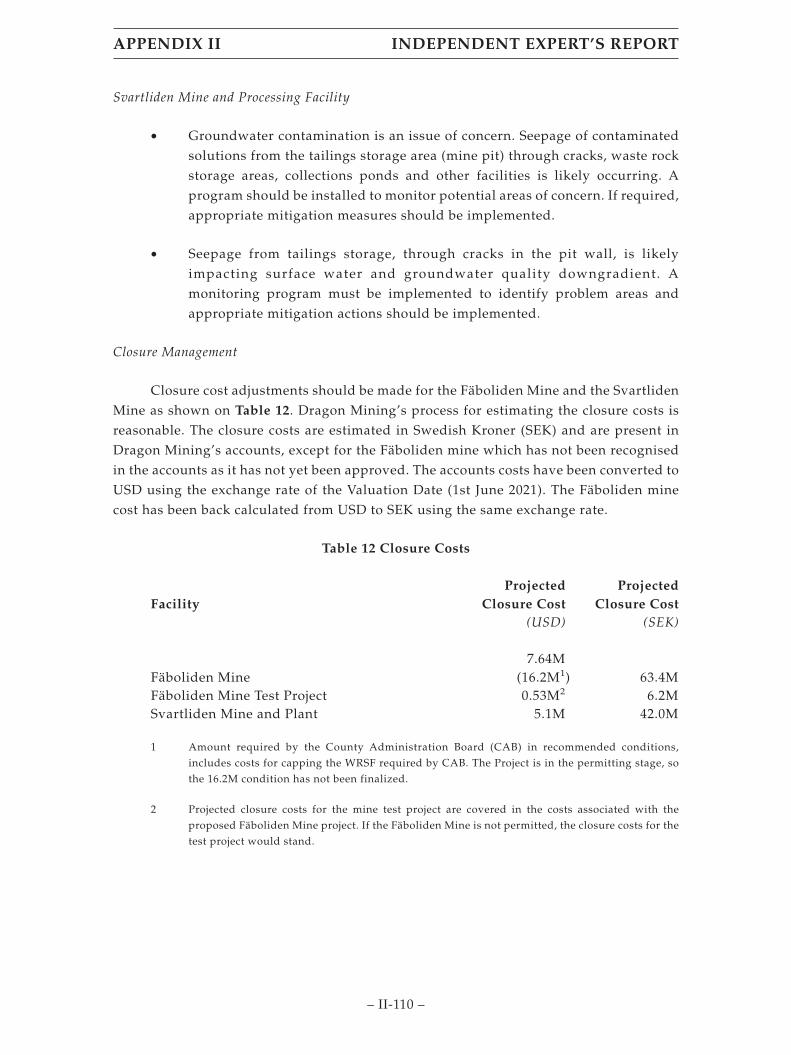
Svartliden Mine and Processing Facility
• Groundwater contamination is an issue of concern. Seepage of contaminatedsolutions from the tailings storage area (mine pit) through cracks, waste rockstorage areas, collections ponds and other facilities is likely occurring. Aprogram should be installed to monitor potential areas of concern. If required,appropriate mitigation measures should be implemented.
• Seepage from tailings storage, through cracks in the pit wall, is likelyimpacting surface water and groundwater quality downgradient. Amonitoring program must be implemented to identify problem areas andappropriate mitigation actions should be implemented.
Closure Management
Closure cost adjustments should be made for the Fäboliden Mine and the SvartlidenMine as shown on Table 12. Dragon Mining’s process for estimating the closure costs isreasonable. The closure costs are estimated in Swedish Kroner (SEK) and are present inDragon Mining’s accounts, except for the Fäboliden mine which has not been recognisedin the accounts as it has not yet been approved. The accounts costs have been converted toUSD using the exchange rate of the Valuation Date (1st June 2021). The Fäboliden minecost has been back calculated from USD to SEK using the same exchange rate.
Table 12 Closure Costs
FacilityProjected
Closure CostProjected
Closure Cost(USD) (SEK)
Fäboliden Mine7.64M
(16.2M1) 63.4MFäboliden Mine Test Project 0.53M2 6.2MSvartliden Mine and Plant 5.1M 42.0M
1 Amount required by the County Administration Board (CAB) in recommended conditions,includes costs for capping the WRSF required by CAB. The Project is in the permitting stage, sothe 16.2M condition has not been finalized.
2 Projected closure costs for the mine test project are covered in the costs associated with theproposed Fäboliden Mine project. If the Fäboliden Mine is not permitted, the closure costs for thetest project would stand.
APPENDIX II INDEPENDENT EXPERT’S REPORT
– II-110 –
Finland Projects
Kaapelinkulma Mine
• Surface water monitoring results appear to show impact caused by the miningoperation. The Company should increase monitoring activities to show thecauses of the problem. Once determined, appropriate mitigation measuresshould be implemented.
• Seepage from the waste storage facility may be impacting surface water andgroundwater quality. A monitoring program must be implemented to identifyproblem areas and appropriate mitigation actions should be implemented, ifrequired. Capping the waste rock storage facilities at closure will reducewater infiltration and reduce seepage into the receiving streams andgroundwater.
• The presence of several protected and endangered species makes biodiversityan important consideration of environmental quality. A detailed managementprogram, noted as a biodiversity action plan in the IFC Performance Standard6, must be developed, implemented and closely monitored.
Orivesi Mine
• The Orivesi mine is not operating and is projected for closure. The Project hasoperated for about 25 years with the known ore reserves mined out in June2019. The mine’s environmental permit issue was resolved at the same timeafter a long legal process with a Supreme Administration Court determinationthat the mine would not be permitted and would no longer be allowed tooperate.
• Water treatment for surface water and groundwater in the mine area willlikely extend for several decades. Appropriate facilities must be maintained toprevent environmental impact. The costs associated with monitoring andmaintenance including disposal of water treatment waste must beincorporated into the closure costs.
• Seepage from the waste rock storage facilities will migrate into the surfaceand groundwater systems. The closure plan must include a detailedmanagement system that mitigates impacts to the water resources.
APPENDIX II INDEPENDENT EXPERT’S REPORT
– II-111 –

Jokisivu Mine
• The Jokisivu Project is operating under an Environmental Permit issued onDecember 3, 2010 and revised on June 13, 2016. A new environmental permitwas issued on February 17, 2021 with conditions that are currently underappeal by Dragon Mining. Operations can continue to operate under existingrequirements until the appeal is finalized.
• The groundwater is located at the surface. Potential contamination fromhydrocarbon toxic chemical spills is great. Management and trainingprograms should be developed and implemented.
Vammala Processing Plant
• The new Vammala Environmental Permit was issued on 12 March 2020 tooperate at the 300 ktpa. The permit contains much stricter permit conditionsrelated to crushing than were imposed in the existing permit issued in 2014.The primary reason for the conditions is related to complaints received fromstakeholders. The Company submitted an appeal of the conditions to theAdministrative Court of Vaasa on 20 April 2020. The Company can continue tooperate under its existing permit conditions until the court action is decided.
• The Court included additional dust control measures as conditions to theapproved permit primarily to appease stakeholders that complained aboutdust. The Court will not likely modify this condition.
• Tailings stored in the Vammala TSF represent materials processed over thepast 45 years or so. Seepage from the facility poses a significant impact risk tothe environment. Appropriate mitigation actions and long-term managementplanning must be incorporated into the closure plan to prevent environmentalissues in the future.
Closure Management
Closure cost adjustments should be made for the Fäboliden Mine and the SvartlidenMine as shown on Table 13. Dragon Mining’s process for estimating the closure costs isreasonable. The closure costs are estimated in Euro (€) and are present in Dragon Mining’saccounts. The accounts costs have been converted to USD using the exchange rate of theValuation Date (1st June 2021).
APPENDIX II INDEPENDENT EXPERT’S REPORT
– II-112 –

Table 13 Closure Costs
FacilityProjected
Closure CostProject
Closure Cost(USD) (€)
Kaapelinkulma Mine 0.78M1 0.60MOrivesi Mine 5.4M3 4.17MJokisivu Mine 5.3M2 4.11MVammala Plant 2.28M 1.75M
1 Based on the analysis done waste rock is classified as inert waste. Much of the material isprojected for use as aggregate for building applications. Remaining waste rock dump is coveredwith till from mine site.
2 Closure estimate is based on 3rd party independent estimate presented in the permitting process.Waste rock is possibly acid forming.
3 Closure estimate is based on Jokisivu estimate due to similarity between mines.
Community
RPM reviewed available information and did not identify any high risks. There area few areas of moderate concern:
• The sites use an ad hoc approach to social management and lack many goodinternational industry practice (GIIP) policies and procedures. The ad hocapproach is currently working, but the lack of policies and procedures reducesthe sites’ ability to proactively engage with local community.
• The Finnish assets are situated near residential areas and have periodiccommunity complaints related to noise and dust. It is likely that residents willcontinue to appeal approval of mining and processing permits, leading toproject delays.
• The Swedish assets are situated in land that traditionally belongs to the SamiIndigenous people group. While there are occasionally tensions, the Companyhas a long history of engagement. It is possible that members of the Sami willappeal approval of mining permits to protect their traditional reindeer land,leading to project delays.
• Two NGOs, Friends of the Earth Finland and the Finnish Association forNature Conservation, have conducted campaigns against the mines in thepast. It is possible that the NGOs will attempt to create legal roadblocks fornecessary permits, leading to project delays.
APPENDIX II INDEPENDENT EXPERT’S REPORT
– II-113 –

Risks
RPM believes the key risks are:
• There is a medium risk the remnant Mineral Resources for Orivesi andSvartliden may not be economically extractable if the mines remain closed forlong periods.
• Fäboliden Mine may have further delays to receiving approvals to commenceor possibly not gain approvals for mining.
• For many of the deposits, there is a low risk the Inferred Resource maydecrease with further in-fill drilling due to the discontinuous nature of themineralisation.
• There are no specific risks associated with processing at either processingoperation.
Opportunities
RPM suggests that the following opportunities exist:
• Exploration in areas surrounding the Orivesi Gold Mine is continuing todefine resources that may justify re-opening of the mine.
• Infill drilling and mapping of drives at Kujankallio is likely to result inupgrade of Indicated Resources.
• Fäboliden underground mining.
• Jokisivu resource may continue with depth further extending the mine life.
• Increased gold recovery at the Svartliden operation, and
• Sale of the Vammala flotation concentrate to a smelter or trading house, whichwould attract very good terms and improve revenues.
Valuation
RPM completed a review to support the Independent Technical Valuation of DragonMining’s assets. The assets comprise one operating mine and one development projectwith Ore Reserves, as well as Mineral Resources, mining and exploration tenements, andprocess plant infrastructure.
This Valuation was prepared in accordance with the 2015 edition of the AustralasianCode for Public Reporting of Technical Assessments and Valuations of Mineral Assets(“The VALMIN Code”). The ITER considered key documents and information related tothe projects and provided opinions focussed on geology, exploration, tenements, mining,processing and environmental.
APPENDIX II INDEPENDENT EXPERT’S REPORT
– II-114 –

The Valuation Date for the assets is the 1st June 2021. The Valuation is based on USdollars using Federal Reserve foreign exchange rates as at 1st June 2021 for USD:SEK andUSD:Euro.
As recommended by the VALMIN Code, RPM used a number of valuationapproaches to determine individual values for Dragon Mining’s assets.
The valuation methods selected are in accordance with recommendation byVALMIN in relation to the suitability of certain valuation approaches as a function of thematurity of projects. These methods included an Income-based approach (discounted cashflow analysis) and a Market approach (Comparable Transactions), with support from aGeoscientific approach (modified Kilburn method). An Appraised Value approach(Multiples of Exploration Expenditure (MEE)) was not possible for exploration tenementsdue to the lack of exploration expenditure in the last five years.
The Jokisivu underground mine, and ore and concentrate stocks were valued by theJokisivu financial model. The Fäboliden open cut project and ore stocks were valued in theFäboliden financial model. Comparable transactions using resource multiples were usedas a secondary valuation method.
The Mineral Resources at Fäboliden (underground mineral resources) and theresidual Mineral resources at Svartliden, Orivesi and Kaapalinkulma closed mines werevalued using Comparable Transactions methods.
The exploration tenements were valued using area multiples from ComparableTransactions with a secondary check by the Geoscientific method.
Gold in-circuit stocks were valued using the gold price on the 1st of June 2021(LMBA Gold Bullion price) less costs of processing, transport, refining and interestpayment.
A salvage value was applied to the process plants.
Approaches used for each asset are noted on Table 9.
One of the key risks and uncertainties in the valuation of the assets is findingappropriate comparable transactions. Each mining lease has strategic value to DragonMining as a group of tenements supporting operations and this may not always be thecase for comparable transactions examples.
RPM notes that transaction values may have increased since the middle of 2019,though due to the limited number of comparable transactions in Scandinavia this isdifficult to support. Gold prices are forecast to remain strong in the short term; as a resultRPM decided to use a market factor of 1.25 in its valuations.
APPENDIX II INDEPENDENT EXPERT’S REPORT
– II-115 –

Table 14 presents a summary of the valuation completed by RPM for theabove-mentioned assets as at the Valuation Date (1st June 2021).
Table 14 Valuation Approaches Used for Each Asset
ComparableTransactions
Tenement DCFResource
MultiplesArea
Multiples GeoscientificValue less
cost Salvage($/oz) ($/Ha)
FinlandOrivesi ✓ ✓
Sarvisuo 1-2 ✓ ✓
Sarvisuo 3 ✓ ✓
Ori ✓ ✓
Jokisivu ✓ ✓
Jokisivu 2 ✓ ✓
Jokisivu 3 ✓ ✓
Jokisivu 4-5 ✓ ✓
Jokisivu 7-8 ✓ ✓
Jokisivu 10 ✓ ✓
Kaapelinkulma ✓ ✓
Uunimäki 1 ✓ ✓
Stormi (Vammala) ✓
SwedenSvartlidengruvan
K nr 1 ✓ ✓
Svartliden Plant ✓
Svartliden Plant GIC ✓
Fäboliden Open Cut ✓ ✓
FäbolidenUnderground ✓
Fäboliden nr 11 ✓ ✓
Dragon Mining Assets Valuation Summary
The valuation summary is presented on Table 15. The Vammala Production Area isvalued in a range of USD10.1 M to USD22.8 M with a preferred value of USD14.3 M. TheSvartliden Production Area is valued in a range of USD32.6 M to USD93.6 M with apreferred value of USD53.6 M.
Closure costs are USD13.6 M.
As at the Valuation Date (1st June 2021) the total Valuation for the Dragon Miningassets has a range of USD29.1 M to USD102.8 M with a preferred value of USD54.2 M.
APPENDIX II INDEPENDENT EXPERT’S REPORT
– II-116 –

Note, the required closure cost estimate from the CAB for the granting of theFäboliden environmental permit is USD16.2 M. This is significantly higher than theclosure cost estimate Dragon Mining have submitted (USD7.64 M) and is in the process ofbeing negotiated by Dragon Mining. This represents a risk that the granting of theenvironmental permit may require a higher cost that that currently estimated and mayhave an impact on the valuation.
Table 15 Dragon Mining Assets – Valuation Summary as at 1st June 2021
Preferred Valuation(USD M)*
Tenement Low High Preferred
FinlandOrivesi Mine 0.84 3.26 1.81Sarvisuo 1-2 0.05 0.05 0.05Sarvisuo 3 0.05 0.05 0.05Ori 0.01 0.03 0.02Jokisivu Mine* 7.77 16.76 10.47Jokisivu 4-5 0.10 0.10 0.10Jokisivu 7-8 0.02 0.02 0.02Jokisivu 10 0.12 0.12 0.12Kaapelinkulma 0.47 1.82 1.01Uunimäki 1 0.05 0.05 0.05Vammala Plant 0.58 0.58 0.58
Low High PreferredSub-Total 10.06 22.84 14.28
SwedenSvartlidengruvan K nr 1 1.44 5.61 3.11Fäboliden Open Cut 8.08 17.43 8.39Fäboliden Underground 16.39 63.83 35.36Fäboliden nr 11 0.96 0.96 0.96Svartliden Plant 0.44 0.44 0.44Svartliden Plant gold in-circuit
stocks 5.29 5.29 5.29
Low High PreferredSub-Total 32.60 93.56 53.55
Total 42.66 116.40 67.83
* Note: Includes Jokisivu 2 and 3.
APPENDIX II INDEPENDENT EXPERT’S REPORT
– II-117 –

RPM Qualification and Experience
RPM operates as an independent technical consultant providing resourceevaluation, mining engineering and mine valuation services to the resources and financialservices industries. This report was prepared on behalf of RPM by technical specialists,details of whose qualifications and experience are set out in Section 1.7.2. and AppendixB.
RPM has been paid, and has agreed to be paid, professional fees for its preparationof this report. Its remuneration is not dependent on the findings of this Report or theoutcome of the any transaction.
Neither RPM, nor any of its directors, staff or sub-consultants who contributed tothe preparation of this report have any economic or beneficial interest (present orcontingent) in:
• the Company, securities of the Company or companies associated with theCompany; or
• the Client, securities of the Client or companies associated with the Client; or
• The rights or options in the relevant Assets.
The work undertaken is an ITER and VALMIN valuation of the informationprovided by or on behalf of the Company, as well as information collected during siteinspections completed by RPM as part of the ITER process. It specifically excludes allaspects of legal issues, marketing, commercial and financing matters, insurance, landtitles and usage agreements, and any other agreements/contracts that Company may haveentered into.
RPM does not warrant the completeness or accuracy of information provided by theCompany which has been used in the preparation of this report.
Drafts of this report were provided to the Client, but only for the purpose ofconfirming the accuracy of factual material and the reasonableness of assumptions reliedupon in the report.
In RPM’s view, the data available was generally sufficient for RPM to complete thescope of work. The quality and quantity of data available and the cooperative assistanceprovided to RPM clearly demonstrated the Company’s assistance in the ITER process.
All opinions, findings and conclusions expressed in the report are those of RPM andits specialist advisors.
Steve HindeExecutive ConsultantRPMGlobal
APPENDIX II INDEPENDENT EXPERT’S REPORT
– II-118 –

TABLE OF CONTENTS
EXECUTIVE SUMMARY
1. INTRODUCTION . . . . . . . . . . . . . . . . . . . . . . . . . . . . . . . . . . . . . . . . . . . . . . II-124
1.1 Relevant Assets . . . . . . . . . . . . . . . . . . . . . . . . . . . . . . . . . . . . . . . . . . . II-125
1.2 Scope of Work . . . . . . . . . . . . . . . . . . . . . . . . . . . . . . . . . . . . . . . . . . . . II-126
1.3 Site Inspections . . . . . . . . . . . . . . . . . . . . . . . . . . . . . . . . . . . . . . . . . . . II-127
1.4 Information Sources . . . . . . . . . . . . . . . . . . . . . . . . . . . . . . . . . . . . . . . . II-127
1.5 Information about this Document . . . . . . . . . . . . . . . . . . . . . . . . . . . . . II-128
1.6 Limitations and Exclusions . . . . . . . . . . . . . . . . . . . . . . . . . . . . . . . . . . II-128
1.7 Study Team . . . . . . . . . . . . . . . . . . . . . . . . . . . . . . . . . . . . . . . . . . . . . . II-131
2. ASSET OVERVIEW . . . . . . . . . . . . . . . . . . . . . . . . . . . . . . . . . . . . . . . . . . . . . II-134
2.1 Vammala Production Centre . . . . . . . . . . . . . . . . . . . . . . . . . . . . . . . . . II-135
2.2 Svartliden Production Centre . . . . . . . . . . . . . . . . . . . . . . . . . . . . . . . . II-136
3. LEASES, CONCESSIONS AND PERMITS . . . . . . . . . . . . . . . . . . . . . . . . . . . . II-137
3.1 Mining and Exploration Permits . . . . . . . . . . . . . . . . . . . . . . . . . . . . . . II-137
3.2 Expenditure Commitments . . . . . . . . . . . . . . . . . . . . . . . . . . . . . . . . . . II-140
4. GEOLOGY . . . . . . . . . . . . . . . . . . . . . . . . . . . . . . . . . . . . . . . . . . . . . . . . . . . . II-141
4.1 Vammala Production Centre . . . . . . . . . . . . . . . . . . . . . . . . . . . . . . . . . II-141
4.2 Svartliden Production Centre . . . . . . . . . . . . . . . . . . . . . . . . . . . . . . . . II-145
5. MINERAL RESOURCES . . . . . . . . . . . . . . . . . . . . . . . . . . . . . . . . . . . . . . . . . II-149
5.1 Vammala Production Centre . . . . . . . . . . . . . . . . . . . . . . . . . . . . . . . . . II-149
5.2 Svartliden Production Centre . . . . . . . . . . . . . . . . . . . . . . . . . . . . . . . . II-156
6. ORE RESERVES AND MINING . . . . . . . . . . . . . . . . . . . . . . . . . . . . . . . . . . . . II-160
6.1 Vammala Production Centre . . . . . . . . . . . . . . . . . . . . . . . . . . . . . . . . . II-160
6.2 Svartliden Production Centre . . . . . . . . . . . . . . . . . . . . . . . . . . . . . . . . II-169
7. METALLURGY AND ORE PROCESSING . . . . . . . . . . . . . . . . . . . . . . . . . . . . II-179
7.1 Vammala Plant - Finland . . . . . . . . . . . . . . . . . . . . . . . . . . . . . . . . . . . . II-179
7.2 Svartliden Processing Plant - Sweden . . . . . . . . . . . . . . . . . . . . . . . . . . II-185
8. EXPLORATION PERMIT REVIEW . . . . . . . . . . . . . . . . . . . . . . . . . . . . . . . . . II-189
8.1 Vammala Production Centre . . . . . . . . . . . . . . . . . . . . . . . . . . . . . . . . . II-190
8.2 Svartliden Production Centre . . . . . . . . . . . . . . . . . . . . . . . . . . . . . . . . II-194
APPENDIX II INDEPENDENT EXPERT’S REPORT
– II-119 –

9. ENVIRONMENTAL MANAGEMENT . . . . . . . . . . . . . . . . . . . . . . . . . . . . . . . II-197
9.1 Site Inspections . . . . . . . . . . . . . . . . . . . . . . . . . . . . . . . . . . . . . . . . . . . II-197
9.2 Svartliden Production Centre - Sweden . . . . . . . . . . . . . . . . . . . . . . . . . II-197
9.3 Vammala Production Centre - Finland . . . . . . . . . . . . . . . . . . . . . . . . . II-205
10. COMMUNITY MANAGEMENT . . . . . . . . . . . . . . . . . . . . . . . . . . . . . . . . . . . II-218
11. RISKS AND OPPORTUNITIES . . . . . . . . . . . . . . . . . . . . . . . . . . . . . . . . . . . . II-221
11.1 Opportunities . . . . . . . . . . . . . . . . . . . . . . . . . . . . . . . . . . . . . . . . . . . . . II-221
11.2 Risks . . . . . . . . . . . . . . . . . . . . . . . . . . . . . . . . . . . . . . . . . . . . . . . . . . . . II-221
12. TECHNICAL VALUATION . . . . . . . . . . . . . . . . . . . . . . . . . . . . . . . . . . . . . . . II-226
12.1 Background . . . . . . . . . . . . . . . . . . . . . . . . . . . . . . . . . . . . . . . . . . . . . . II-226
12.2 Ownership Changes and Key Developments . . . . . . . . . . . . . . . . . . . . . II-227
12.3 Mining Licences and Tenements . . . . . . . . . . . . . . . . . . . . . . . . . . . . . . II-227
12.4 Mineral Resources and Ore Reserves . . . . . . . . . . . . . . . . . . . . . . . . . . . II-227
12.5 Previous Valuations of Dragon Mining Assets . . . . . . . . . . . . . . . . . . . II-227
12.6 Basis of value . . . . . . . . . . . . . . . . . . . . . . . . . . . . . . . . . . . . . . . . . . . . . II-228
12.7 Valuation Approaches . . . . . . . . . . . . . . . . . . . . . . . . . . . . . . . . . . . . . . II-230
12.8 Valuation Results . . . . . . . . . . . . . . . . . . . . . . . . . . . . . . . . . . . . . . . . . . II-234
12.9 Valuation Summary . . . . . . . . . . . . . . . . . . . . . . . . . . . . . . . . . . . . . . . . II-262
LIST OF TABLES
Table 1-1 Dragon Mining Assets . . . . . . . . . . . . . . . . . . . . . . . . . . . . . . . . . . . . . . II-125
Table 3-1 Swedish Mining and Exploration Assets . . . . . . . . . . . . . . . . . . . . . . . . II-138
Table 3-2 Finnish Mining and Exploration Assets . . . . . . . . . . . . . . . . . . . . . . . . . II-140
Table 5-1 Orivesi Mine December 2019 Mineral Resource Estimate . . . . . . . . . . . II-150
Table 5-2 Jokisivu Gold Mine December 2020 Mineral Resource Estimate . . . . . . II-153
Table 5-3 Kaapelinkulma Gold Mine December 2020 Mineral Resource Estimate . II-155
Table 5-4 Svartliden Gold Mine April 2014 Mineral Resource Estimate . . . . . . . . II-157
Table 5-5 Fäboliden Deposit December 2020 Mineral Resource Estimate . . . . . . . II-159
Table 6-1 Stope Optimisation Parameters . . . . . . . . . . . . . . . . . . . . . . . . . . . . . . . II-161
Table 6-2 Underground Design Criteria . . . . . . . . . . . . . . . . . . . . . . . . . . . . . . . . II-162
Table 6-3 Underground Design Drive Sizes . . . . . . . . . . . . . . . . . . . . . . . . . . . . . II-162
Table 6-4 Mining Dilution . . . . . . . . . . . . . . . . . . . . . . . . . . . . . . . . . . . . . . . . . . . II-163
APPENDIX II INDEPENDENT EXPERT’S REPORT
– II-120 –

Table 6-5 Mining Recovery . . . . . . . . . . . . . . . . . . . . . . . . . . . . . . . . . . . . . . . . . . II-163
Table 6-6 Jokisivu Underground Cut-off (g/t Au) at USD1,699/oz . . . . . . . . . . . II-164
Table 6-7 Jokisivu Mining Operating Costs . . . . . . . . . . . . . . . . . . . . . . . . . . . . . . II-167
Table 6-8 Jokisivu Non-Mining Operating Costs . . . . . . . . . . . . . . . . . . . . . . . . . II-167
Table 6-9 Summary of Jokisivu Gold Mine Ore Reserves as at 31 December 2020 . II-168
Table 6-10 Geotechnical Parameters . . . . . . . . . . . . . . . . . . . . . . . . . . . . . . . . . . . . II-172
Table 6-11 Marginal Cut-Off Grade Inputs . . . . . . . . . . . . . . . . . . . . . . . . . . . . . . . II-174
Table 6-12 Summary of Fäboliden Gold Mine Open Cut Ore Reserves as at31 December 2020 . . . . . . . . . . . . . . . . . . . . . . . . . . . . . . . . . . . . . . . . II-178
Table 7-1 Salvage Value Breakdown for the Vammala Processing Plant . . . . . . . . II-183
Table 7-2 Salvage Value Breakdown for the Svartliden Processing Plant . . . . . . . II-187
Table 9-1 Closure Costs for the Sweden Mining and Processing Operations . . . . II-204
Table 9-2 Closure Cost Projections for the Vammala Production Centre Facilities . II-216
Table 9-3 Environmental Permits . . . . . . . . . . . . . . . . . . . . . . . . . . . . . . . . . . . . . II-217
Table 11-1 Risk Assessment Ranking . . . . . . . . . . . . . . . . . . . . . . . . . . . . . . . . . . . II-222
Table 11-2 Dragon Mining Asset Risks . . . . . . . . . . . . . . . . . . . . . . . . . . . . . . . . . . II-223
Table 12-1 Comparison of Valuation Approaches . . . . . . . . . . . . . . . . . . . . . . . . . . II-230
Table 12-2 Geoscientific Ranking Factors . . . . . . . . . . . . . . . . . . . . . . . . . . . . . . . . II-232
Table 12-3 Summary of Valuation Approaches . . . . . . . . . . . . . . . . . . . . . . . . . . . . II-234
Table 12-4 Comparable Transactions Resource Multiples . . . . . . . . . . . . . . . . . . . . II-235
Table 12-5 Comparable Transactions Area Multiples . . . . . . . . . . . . . . . . . . . . . . . II-237
Table 12-6 Area Multiples Subset . . . . . . . . . . . . . . . . . . . . . . . . . . . . . . . . . . . . . . II-237
Table 12-7 Vammala Production Area Multiples Method Valuations . . . . . . . . . . . II-239
Table 12-8 Vammala Production Geoscientific Method Valuations . . . . . . . . . . . . . II-240
Table 12-9 BAC and GeoFactors for Geoscientific Method . . . . . . . . . . . . . . . . . . . II-250
Table 12-10 Vammala Production Area Exploration TenementsValuation Summary . . . . . . . . . . . . . . . . . . . . . . . . . . . . . . . . . . . . . . II-250
Table 12-11 Svartliden Production Area Multiples Valuations . . . . . . . . . . . . . . . . . II-251
Table 12-12 Svartliden Production Area Multiples Method Valuations . . . . . . . . . . II-260
Table 12-13 Svartliden Production Geoscientific Method Valuations . . . . . . . . . . . . II-260
Table 12-14 BAC and GeoFactors for Geoscientific Method . . . . . . . . . . . . . . . . . . . II-260
APPENDIX II INDEPENDENT EXPERT’S REPORT
– II-121 –

Table 12-15 Vammala Production Area Exploration TenementsValuation Summary . . . . . . . . . . . . . . . . . . . . . . . . . . . . . . . . . . . . . . II-261
Table 12-16 Vammala Production Area Valuation Summary . . . . . . . . . . . . . . . . . . II-262
Table 12-17 Svartliden Production Area Valuation Summary . . . . . . . . . . . . . . . . . . II-263
Table 12-18 Swedish Assets Closure Cost Estimates . . . . . . . . . . . . . . . . . . . . . . . . . II-263
Table 12-19 Finnish Assets Closure Cost Estimates . . . . . . . . . . . . . . . . . . . . . . . . . II-264
Table 12-20 Dragon Mining Assets - Valuation Summary as at 1st June 2021 . . . . . II-265
LIST OF FIGURES
Figure 1-1 Current and Future Production Flow Sheet . . . . . . . . . . . . . . . . . . . . . . II-124
Figure 2-1 Dragon Mining Production Centres . . . . . . . . . . . . . . . . . . . . . . . . . . . . II-134
Figure 2-2 Vammala Production Centre Location . . . . . . . . . . . . . . . . . . . . . . . . . . II-135
Figure 2-3 Svartliden Production Centre Location . . . . . . . . . . . . . . . . . . . . . . . . . II-136
Figure 3-1 Sweden Svartliden Tenement and Surface Infrastructure Location . . . . II-138
Figure 3-2 Fäboliden Tenements . . . . . . . . . . . . . . . . . . . . . . . . . . . . . . . . . . . . . . . II-139
Figure 3-3 Dragon Mining Finland Tenements . . . . . . . . . . . . . . . . . . . . . . . . . . . . II-139
Figure 4-1 Vammala Processing Centre Regional Geology . . . . . . . . . . . . . . . . . . . II-142
Figure 4-2 Orivesi Local Geology . . . . . . . . . . . . . . . . . . . . . . . . . . . . . . . . . . . . . . II-143
Figure 4-3 Jokisivu Local Geology . . . . . . . . . . . . . . . . . . . . . . . . . . . . . . . . . . . . . II-144
Figure 4-4 Kaapalinkulma Local Geology . . . . . . . . . . . . . . . . . . . . . . . . . . . . . . . . II-145
Figure 4-5 Svartliden Processing Centre Regional Geology . . . . . . . . . . . . . . . . . . II-146
Figure 4-6 Fäboliden Local Geology . . . . . . . . . . . . . . . . . . . . . . . . . . . . . . . . . . . . II-147
Figure 4-7 Svartliden Local Geology Cross-Section . . . . . . . . . . . . . . . . . . . . . . . . II-148
Figure 6-1 Underground LOM Schedule . . . . . . . . . . . . . . . . . . . . . . . . . . . . . . . . . II-166
Figure 6-2 LOM Ore Processing Schedule . . . . . . . . . . . . . . . . . . . . . . . . . . . . . . . . II-166
Figure 6-3 Price Sensitivity – ROM Ore Tonnage and Grade . . . . . . . . . . . . . . . . . II-171
Figure 6-4 Pit and Dump Design . . . . . . . . . . . . . . . . . . . . . . . . . . . . . . . . . . . . . . . II-173
Figure 6-5 LOM Schedule Total Material Movement . . . . . . . . . . . . . . . . . . . . . . . . II-175
Figure 6-6 LOM Ore Processing Schedule . . . . . . . . . . . . . . . . . . . . . . . . . . . . . . . . II-176
Figure 6-7 Fresh Rock Load and Haul Mining Costs . . . . . . . . . . . . . . . . . . . . . . . II-177
Figure 7-1 Vammala Processing Flowsheet . . . . . . . . . . . . . . . . . . . . . . . . . . . . . . . II-179
Figure 7-2 Svartliden Processing Flowsheet . . . . . . . . . . . . . . . . . . . . . . . . . . . . . . II-185
APPENDIX II INDEPENDENT EXPERT’S REPORT
– II-122 –
Figure 8-1 Dragon Mining Production Centres . . . . . . . . . . . . . . . . . . . . . . . . . . . . II-189
Figure 8-2 Dragon Mining Tenement Locations . . . . . . . . . . . . . . . . . . . . . . . . . . . II-190
Figure 8-3 Vammala Production Centre Tenement General Locations . . . . . . . . . . II-191
Figure 8-4 Regional Geology and Orivesi Tenements . . . . . . . . . . . . . . . . . . . . . . . II-191
Figure 8-5 Jokivisu Tenements and Local Geology . . . . . . . . . . . . . . . . . . . . . . . . . II-192
Figure 8-6 Detailed Tenements on Local Geology . . . . . . . . . . . . . . . . . . . . . . . . . . II-193
Figure 8-7 Uunimäki 1 Tenement and Local Geology . . . . . . . . . . . . . . . . . . . . . . . II-194
Figure 8-8 Aeromagnetics of Fäboliden Tenements . . . . . . . . . . . . . . . . . . . . . . . . II-195
Figure 8-9 Bedrock Geochemistry . . . . . . . . . . . . . . . . . . . . . . . . . . . . . . . . . . . . . . II-196
Figure 8-10 Drilling on Exploration Permit Fäboliden nr 11 . . . . . . . . . . . . . . . . . . . II-196
Figure 12-1 Gold Price History with Resource Multiples . . . . . . . . . . . . . . . . . . . . . II-236
Figure 12-2 Gold Price History with Area Multiples . . . . . . . . . . . . . . . . . . . . . . . . II-238
Figure 12-3 Cross Section of Kutema Mineral Resource Classification . . . . . . . . . . II-245
Figure 12-4 Cross Section of Sarvisuo Mineral Resource by Classification . . . . . . . II-246
Figure 12-5 Kaapalinkulma Mineral Resource Classification (Plan View) . . . . . . . . II-248
Figure 12-6 Fäboliden Mineral Resource Classification(Longitudinal View looking West) . . . . . . . . . . . . . . . . . . . . . . . . . . . II-256
Figure 12-7 Svartliden Mine Mineral Resources (Isometric) . . . . . . . . . . . . . . . . . . . II-258
Figure 12-8 Svartliden Tenement and Surface Infrastructure Location . . . . . . . . . . II-258
LIST OF APPENDICES
Appendix A. Comparable Market Transactions . . . . . . . . . . . . . . . . . . . . . . . . . II-266
Appendix B. Qualifications and Experience . . . . . . . . . . . . . . . . . . . . . . . . . . . . II-270
Appendix C. Files Considered for the ITER and Valuation . . . . . . . . . . . . . . . . II-275
APPENDIX II INDEPENDENT EXPERT’S REPORT
– II-123 –
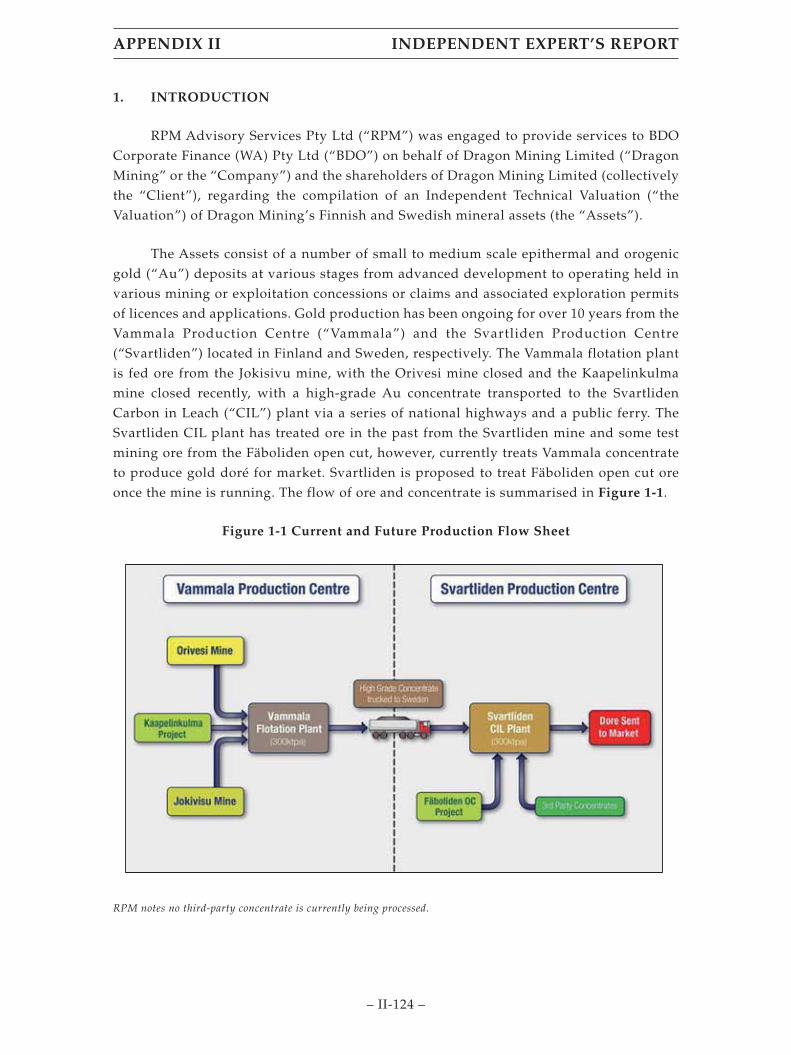
1. INTRODUCTION
RPM Advisory Services Pty Ltd (“RPM”) was engaged to provide services to BDOCorporate Finance (WA) Pty Ltd (“BDO”) on behalf of Dragon Mining Limited (“DragonMining” or the “Company”) and the shareholders of Dragon Mining Limited (collectivelythe “Client”), regarding the compilation of an Independent Technical Valuation (“theValuation”) of Dragon Mining’s Finnish and Swedish mineral assets (the “Assets”).
The Assets consist of a number of small to medium scale epithermal and orogenicgold (“Au”) deposits at various stages from advanced development to operating held invarious mining or exploitation concessions or claims and associated exploration permitsof licences and applications. Gold production has been ongoing for over 10 years from theVammala Production Centre (“Vammala”) and the Svartliden Production Centre(“Svartliden”) located in Finland and Sweden, respectively. The Vammala flotation plantis fed ore from the Jokisivu mine, with the Orivesi mine closed and the Kaapelinkulmamine closed recently, with a high-grade Au concentrate transported to the SvartlidenCarbon in Leach (“CIL”) plant via a series of national highways and a public ferry. TheSvartliden CIL plant has treated ore in the past from the Svartliden mine and some testmining ore from the Fäboliden open cut, however, currently treats Vammala concentrateto produce gold doré for market. Svartliden is proposed to treat Fäboliden open cut oreonce the mine is running. The flow of ore and concentrate is summarised in Figure 1-1.
Figure 1-1 Current and Future Production Flow Sheet
RPM notes no third-party concentrate is currently being processed.
APPENDIX II INDEPENDENT EXPERT’S REPORT
– II-124 –
1.1 Relevant Assets
The Relevant Assets considered for the purposes of the ITER and Valuation are theVammala Production Centre in Finland and the Svartliden Production Centre in Swedenas listed on Table 1-1.
Table 1-1 Dragon Mining Assets
Asset Name Asset Type
FinlandOrivesi Mining Concession with Residual Mineral ResourcesSarvisuo 1-2 Exploration PermitSarvisuo 3 Exploration Permit ApplicationOri Reservation (Pre-exploration stage tenement)Jokisivu Operating Mine with Ore Reserves and Mineral ResourcesJokisivu 2 Mining PermitJokisivu 3 Mining PermitJokisivu 4-5 Exploration LicenceJokisivu 7-8 Exploration LicenceJokisivu 10 Exploration Licence ApplicationKaapelinkulma Residual Mineral ResourcesUunimäki 1 Exploration Licence ApplicationStormi (Vammala) Operating Process Plant
SwedenSvartlidengruvan K nr 1 Residual Mineral ResourcesSvartliden Plant Operating Process PlantFäboliden K nr 1 Open Cut Mine Pre- Development and Potential
Underground Mineral ResourcesFäboliden nr 11 Exploration Permit
Two Production Centres are included in the Relevant Assets which supportproduction from two operating underground mines. The Vammala Production Centre(gold only) is located in southern Finland while the Svartliden Production Centre (goldonly) is located in northern Sweden. The Svartliden Production Centre supports theVammala plant, treating gold concentrates and is planned to support Fäboliden pre-development project in the near future. The deposits are located in various explorationand mining tenements wholly owned by Dragon Mining’s local subsidiaries, DragonMining AB (Sweden) and Dragon Mining OY (Finland).
APPENDIX II INDEPENDENT EXPERT’S REPORT
– II-125 –
1.2 Scope of Work
The Review scope of work (“SOW”) involves the following:
1.2.1 Technical Review
The Independent Technical Review (“ITER” or the “Review”) involved:
• A desktop review of the pertinent data as provided by the Company and fromRPM’s own files to guide the Valuation;
• A review of exploration data provided by the Company;
• Review of licence permitting including tenure of the licence area and currentstatus of the licence;
• Review of environmental and other associated approvals which may impacton the valuation including rehabilitation bonds and other such liabilities; and
• review of the key input parameters to reflect RPM’s own opinion ahead ofundertaking the Technical Valuation.
1.2.2 Technical Valuation
This Independent Technical Valuation (the “Valuation”) was prepared in accordancewith the 2015 edition of the Australasian Code for Public Reporting of TechnicalAssessments and Valuations of Mineral Assets (“The VALMIN Code”). The TechnicalValuation was conducted using at least two appropriate valuation methods after appraisalof information provided. These include an Income-based Approach (Discounted CashFlow (DCF)), a Market Approach (Comparable Transactions), Appraised Value Approach(Multiples of Exploration Expenditure) (MEE)) and the Geoscientific Approach (modifiedKilburn method). An explanation is provided if only one valuation method is used.
• A summary of the Valuation approaches employed for each of the Assets isoutlined below:
• Dragon Mining’s Finnish operations comprising:
− The Vammala Production Centre primarily encompassing the VammalaProcessing Plant and Jokisivu Gold Mine Ore Reserves using a DCFmethodology, with residual resources from Kaapelinkulma Gold Mineand Orivesi Gold Mine to be included if deemed appropriate;
− Residual resources in relation to the Company’s Finnish operations(Mineral Resources and advanced and early-stage exploration assets)that are not captured in the DCF valuation above, on a general mineralasset valuation basis, and
APPENDIX II INDEPENDENT EXPERT’S REPORT
– II-126 –

− Scrap value of the Vammala Processing Plant and equipment.
• Dragon Mining’s Swedish operations comprising:
− The Svartliden Production Centre encompassing the SvartlidenProcessing Plant and Fäboliden development project gold mine using aDCF methodology;
− Residual resources in relation to the Company’s Swedish operations(Mineral Resources and advanced and early-stage exploration assets)that are not captured in the DCF valuation above, on a general mineralasset valuation basis if deemed appropriate, and
− Scrap value of the Svartliden Processing Plant and equipment.
• Any other exploration assets that RPMGlobal considered are likely to havematerial value.
1.3 Site Inspections
A number of site visits have been undertaken by RPM with initial site visitsconducted by Mr. Aaron Green in June 2007, Mr. Paul Payne in May 2009, Mr. TrevorStevenson and Mr. Joe McDiarmid in October 2013. As part of the detailed review RPM’sCompetent Persons (CP’s) Mr. Jeremy Clark and Mr. Joe McDiarmid visited the assets inMay, 2015. Drilling, logging, and sampling procedures, as well as mining practices, wereviewed and it was concluded that these were being conducted to best industry practice.During the May 2015 site visit RPM inspected the mines, the ore processing plants, thetailings storage facilities, the water supply system, the power distribution system, andconducted general inspections of the Projects area. A further site visit was conducted byMr. McDiarmid in November, 2016 and Mr. Clark visited the Finland assets in December,2017. The visits were also used to gain a better understanding of the Projects’ status. A sitevisit was undertaken to the Jokisivu Mine and Fäboliden Project by Mr. McDiarmid inNovember 2019 as part of a review of the operations.
During the site visits, RPM had open discussions with the Company’s personnel ontechnical aspects of the projects. The Company’s personnel were cooperative and open infacilitating RPM’s work.
No site visits have subsequently been undertaken due to COVID-19 restrictions,however, there have been little changes to the assets other than depletion of some MineralResources and Ore Reserves through mining.
1.4 Information Sources
The contents of this Review have been created using data and information providedby Dragon Mining, from RPM’s own records or from discussions with Dragon Miningpersonnel, as well as published announcements made to the Hong Kong Stock Exchange
APPENDIX II INDEPENDENT EXPERT’S REPORT
– II-127 –

(HKEX) by Dragon Mining. All documents considered are listed in Appendix C of thisreport. In RPM’s opinion, the information provided was of good quality, but did not coverall aspects for all tenements. Where necessary RPM supplied opinions based on itsexperience and reasonable mining industry norms to address the requirements of theITER.
Information generated by third parties, consultants or contractors to Dragon Mininghas not been independently validated by RPM.
RPM accepts no liability for the accuracy or completeness of data and informationprovided to it by Dragon Mining, or any third parties, even if that data and informationhas been incorporated into or relied upon in creating this Review. The Review has beenproduced by RPM using information that was available to RPM up to the 18th of June2021.
Whilst all due care and responsibility has been taken by RPM in completing its SOW,RPM notes that documentation from Dragon Mining for this Review was delayed whichresulted in the Review having to be completed in a compressed time frame.
1.5 Information about this Document
This Review has been prepared by or on behalf of RPM solely for BDO on behalf ofDragon Mining and the shareholders of Dragon Mining. All copyright and otherintellectual property rights in this Review are owned by and the property of RPM.
To the fullest extent permitted under law, use of or reliance on this Review by anythird parties who have not entered into a reliance agreement with RPM, is at their sole riskand RPM will not be liable for any liability, loss or damage suffered by a third partyrelying on this report regardless of the cause of action, whether breach of contract, tort(including negligence) or otherwise. For the avoidance of doubt BDO, Dragon Mining andthe shareholders of Dragon Mining are not third parties.
RPM makes no warranty, express or implied in respect of this Review, particularlywith regard to any commercial investment decision made on the basis of this Review. ThisReview has been prepared without taking into account the objectives, financial situationor needs of any individual, entity or organization.
1.6 Limitations and Exclusions
RPM’s review was based on various reports, plans and tabulations provided byDragon Mining or the Company either directly from the mine site and other offices, orfrom reports by other organisations whose work is the property of the Dragon Mining orthe Company. Dragon Mining has not advised RPM of any material change, or event likelyto cause material change, to the operations or forecasts since the date of asset inspections.
The work undertaken for this Report is that required for a technical review of theinformation, coupled with such inspections as the Team considered appropriate toprepare this Report.
APPENDIX II INDEPENDENT EXPERT’S REPORT
– II-128 –
It specifically excludes all aspects of legal issues, commercial and financing matters,land titles and agreements, except such aspects as may directly influence technical,operational or cost issues and where applicable to the JORC Code and VALMIN Codeguidelines.
RPM has specifically excluded making any comments on the competitive position ofthe Relevant Asset compared with other similar and competing producers around theworld. RPM strongly advises that any potential investors make their own comprehensiveassessment of both the competitive position of the Relevant Asset in the market, and thefundamentals of the gold market at large.
1.6.1 Limited Liability
This Report has been prepared by RPM for the purposes of BDO preparing anIndependent Expert’s Report for inclusion within a Circular to be provided to theshareholders of the Dragon Mining or the Company. RPM will not be liable for any loss ordamage suffered by a third party relying on this report or any references or extractstherefrom contrary to the purpose (regardless of the cause of action, whether breach ofcontract, tort (including negligence) or otherwise) unless and to the extent that RPM hasconsented to such reliance or use.
1.6.2 Responsibility and Context of this Report
The contents of this Report have been based upon and created using data andinformation provided by or on behalf of Dragon Mining or the Company. RPM accepts noliability for the accuracy or completeness of data and information provided to it by, orobtained by it from Dragon Mining, the Company or any third parties, even if that dataand information has been incorporated into or relied upon in creating this report. Thereport has been produced by RPM in good faith using information that was available toRPM as at the date stated on the cover page and is to be read in conjunction with thecircular which has been prepared and forms part of the referenced transaction.
This report contains forecasts, estimates and findings that may materially change inthe event that any of the information supplied to RPM is inaccurate or is materiallychanged. RPM is under no obligation to update the information contained in the report.
Notwithstanding the above, in RPM’s opinion, the data and information providedby or on behalf of Dragon Mining or the Company was reasonable and nothing discoveredduring the preparation of this Report suggests that there was a significant error ormisrepresentation of such data or information.
APPENDIX II INDEPENDENT EXPERT’S REPORT
– II-129 –

1.6.3 Indemnification
BDO directly, as well as on behalf of Dragon Mining have indemnified and heldharmless RPM and its subcontractors, consultants, agents, officers, directors, andemployees from and against any and all claims, liabilities, damages, losses, and expenses(including lawyers’ fees and other costs of litigation, arbitration or mediation) arising outof or in any way related to:
• RPM’s reliance on any information provided by Dragon Mining; or
• RPM’s services or materials; or
• Any use of or reliance on these services or material,
save and except in cases of death or personnel injury, property damage, claims by thirdparties for breach of intellectual property rights, gross negligence, wilful misconduct,fraud, fraudulent misrepresentation or the tort of deceit, or any other matter which be solimited or excluded as a matter of applicable law (including as a Competent Person underthe Listing Rules), and regardless of any breach of contract or strict liability by RPM.
1.6.4 Inherent Mining Risks
Mining is carried out in an environment where not all events are predictable.
Whilst an effective management team can identify the known risks and takemeasures to manage and mitigate those risks, there is still the possibility for unexpectedand unpredictable events to occur. It is not possible therefore to totally remove all risks orstate with certainty that an event that may have a material impact on the operation of amine, will not occur.
It is therefore not possible to state with certainty, forward-looking production andeconomic targets, as they are dependent on numerous factors that are beyond the controlof RPM and cannot be fully anticipated by RPM. These factors include but are not limitedto, site-specific mining and geological conditions, the capabilities of management andemployees, availability of funding to properly operate and capitalize the operation,variations in cost elements and market conditions, developing and operating the mine inan efficient manner. Unforeseen changes in legislation and new industry developmentscould also substantially alter the performance of any mining operation.
1.6.5 Capability and Independence
RPM provides advisory services to the mining and finance sectors. Within its coreexpertise it provides independent technical reviews, resource evaluation, miningengineering and mine valuation services to the resources and financial services industries.
RPM has independently assessed the Relevant Assets of the Projects by reviewingpertinent data, including resources, reserves, manpower requirements and the life of mine
APPENDIX II INDEPENDENT EXPERT’S REPORT
– II-130 –

plans relating to productivity, production, operating costs and capital expenditures. Allopinions, findings and conclusions expressed in this Report are those of RPM and itsspecialist advisors.
Drafts of this Report were provided by BDO to Dragon Mining, but only for thepurpose of confirming the accuracy of factual material and the reasonableness ofassumptions relied upon in this Report.
RPM has been paid, and/or has agreed to be paid, professional fees based on aschedule of rates fee estimated at AUD96,560 for its preparation of this Report. Itsremuneration is not dependent upon the findings of this Report or on the outcome of thetransaction.
None of RPM or its directors, staff or specialists who contributed to this Report haveany economic or beneficial interest (present or contingent), in:
• the Projects, securities of the companies associated with the Projects or that ofDragon Mining; or
• the right or options in the Relevant Assets; or
• the outcome of the proposed transaction.
This Valuation was compiled on behalf of RPM by the signatories to this Valuation,details of whose qualifications and experience are set out in Appendix B of this Valuation.The specialists who contributed to the findings within this Valuation have each consentedto the matters based on their information in the form and context in which it appears.
This Review report was prepared by RPM for BDO on behalf of Dragon Mining.RPM operates as an independent technical consultant providing Mineral Resourceevaluation, mining and processing engineering as well as mine technical valuationservices to the resources and financial services industry. RPM believes its’ independencehas not been compromised in undertaking this Review.
RPM has agreed to be paid professional fees by Dragon Mining for the preparationof this report.
1.7 Study Team
The Study Team comprised professionals from RPM’s Australian and Denveroffices.
The Technical Engineering View has been reported taking into account therecommended guidelines of the JORC Code and the Valuation has been reported by acompetent person under the VALMIN code.
APPENDIX II INDEPENDENT EXPERT’S REPORT
– II-131 –
1.7.1 Team Responsibilities
As part of the Team, members who have worked to compile this report include thefollowing:
• Mr. Steve Hinde – Steve managed the project and was responsible for reviewof the exploration geological information, the tenement information and wasresponsible for the VALMIN valuation included in the report.
• Mr. David Allmark was responsible for the review of the Geology and MineralResources in the report.
• Mr. Igor Bojanic was responsible for the review of the Mining and OreReserves of the Fäboliden mine in the report, and other parts of the report.
• Mr. Blaine Bovee was responsible for the review of the Mining and OreReserves of the Jokisivu mine in the report.
• Dr. Andrew Newell was responsible for the review of the Mineral Processingand estimation of the salvage value in the report.
• Dr. Terry Brown was responsible for the review of the Environmental andClosure costs in the report.
• Mr. Luke Stephens was responsible for the review of the Social andCommunity in the report.
• Mr. Philippe Baudry was responsible for the review of the report as a memberof RPM’s Independent Public Reporting committee.
1.7.2 ITER Responsibility and VALMIN Valuation
The information in this report that relates to the technical review and to theVALMIN valuation is based on information compiled and reviewed by or under thedirection of Mr. Steve Hinde, who is a member of the Australasian Institute of Mining andMetallurgy and the Australian Institute of Geoscientists and is a full-time employee ofRPM.
Mr. Hinde has sufficient experience that is relevant to the style of mineralizationand types of mineral deposits under consideration, and to the activity he is undertaking,to qualify him as a Competent Person (as defined in the 2012 Edition of the JORC Code)and as a Specialist as defined under the VALMIN Code. Mr. Hinde has 40 years’experience in the mining industry and has the appropriate relevant qualifications,experience, competence and independence to be considered an “Expert” or “Specialist”under the definitions provided in the VALMIN Code. Mr Hinde has completed numerousmineral property valuations globally and is a qualified mineral property valuator underthe VALMIN Code.
APPENDIX II INDEPENDENT EXPERT’S REPORT
– II-132 –

All signatories to this report have no interest whatsoever in the mining Assetsreviewed and will gain no reward for the provision of this review. RPM will receive aprofessional fee for the preparation of this statement.
Steve Hinde BSc (Geology) (Hons), Masters Mineral Economics,MAusIMM, MAIG, CP/QP
APPENDIX II INDEPENDENT EXPERT’S REPORT
– II-133 –

2. ASSET OVERVIEW
The Assets are contained within a series of exploration and mining tenements whichare concentrated in two areas, the operating Vammala and Svartliden Production Centreslocated in southern Finland and northern Sweden respectively (Figure 2-1). These twoareas contain a number of small to medium scale, medium to very high grade epithermaland orogenic gold (“Au”) deposits.
Figure 2-1 Dragon Mining Production Centres
Source: Dragon Mining Website
The Company has a long history of operating in Scandinavia with Dragon Miningcommencing mining in 2004 at Svartliden initially through a medium scale open pit andsubsequent underground operation which eventually closed in 2013. Ore was treated atthe Svartliden process plant. The Fabiliden open cut and any possible underground ore isplanned to be treated at the Svartliden plant.
Mining operations in Finland commenced with underground production at Orivesiin 2007 which was supplemented with ore from Jokisivu in 2009 initially via open pitoperations and subsequently underground operations in 2011. The Orivesi mine wascompleted in 2019 but was replaced by production from the Kaapalinkulma mine in 2019until the latter was exhausted in April 2021. All current production is currently beingsourced from the Jokisivu underground mine. Ore was, and is currently, treated at theVammala plant which produces a concentrate shipped to Svartliden for furtherprocessing, and a minor amount of gravity gold concentrate for sale.
APPENDIX II INDEPENDENT EXPERT’S REPORT
– II-134 –

2.1 Vammala Production Centre
The Vammala Production Centre is located in the Tampere Region in southernFinland (Figure 2-2). Vammala consists of an operating 300k tonnes per annum (ktpa)flotation processing plant and the operating underground Jokisivu, and the inactiveunderground Orivesi and Kaapalinkulma mines. Vammala produces a gold-bearingsulphide concentrate and a minor amount of gravity gold, the former transported to theSvartliden plant by road and ferry for processing to produce gold doré.
The Vammala concentrate has previously been sold to third parties, and thisrepresents a cover for any risk relating to capacity issues.
Figure 2-2 Vammala Production Centre Location
Source: Dragon Mining Website
The Vammala Production Centre region is low undulating hills with freshwaterlakes and rivers with pine and birch tree vegetation. The area has a continental /subarcticclimate with cold winters averaging below 0°C with snow and mild summers above 10°C.The region has a small population of 470k and a strong engineering, communication andbiotechnology, and a forestry/pulp and paper industry. There is significant power, water,and road and rail infrastructure.
APPENDIX II INDEPENDENT EXPERT’S REPORT
– II-135 –

2.2 Svartliden Production Centre
The Svartliden Production Centre is located in northern Sweden in the SkellefteMining District (Figure 2-3). The process plant commenced operation in 2005 and is acarbon in leach (CIL) circuit with a 300 ktpa capacity. The plant has previously treated orefrom the Svartliden mine, test ore from the Fäboliden open cut project and is currentlytreating concentrates from Vammala and at times third-party sources.
Svartliden is located in the Lycksele regional hub with good road and railinfrastructure. The region consists of low undulating hills with freshwater lakes forestedwith pine and birch trees. There is a subarctic climate with summers averaging below 20°Cand winters of -15°C (5°F). Annual precipitation averages 440mm and occurs all yearround. Local industry is subsistence farming and livestock rearing, with reindeer, sheepand poultry. There is large scale gold and base metal mining and processing in theSkellefte Mining District. The area has extensive power, water and transportinfrastructure.
Figure 2-3 Svartliden Production Centre Location
Source: Dragon Mining Website
APPENDIX II INDEPENDENT EXPERT’S REPORT
– II-136 –
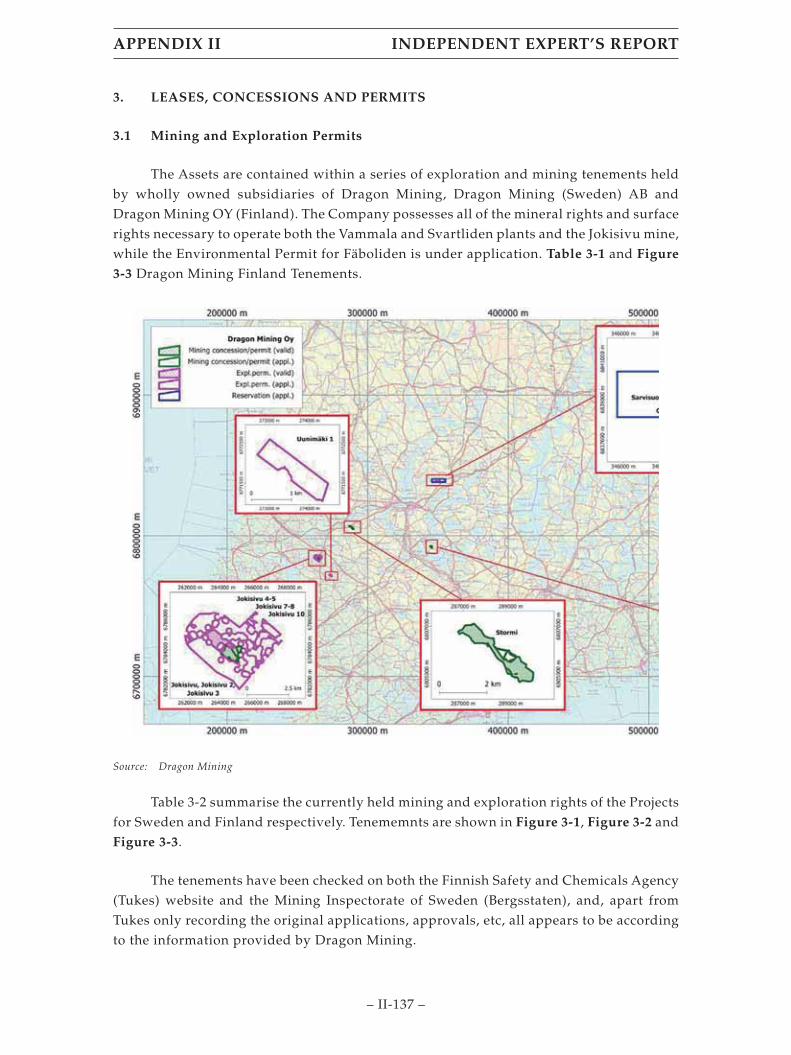
3. LEASES, CONCESSIONS AND PERMITS
3.1 Mining and Exploration Permits
The Assets are contained within a series of exploration and mining tenements heldby wholly owned subsidiaries of Dragon Mining, Dragon Mining (Sweden) AB andDragon Mining OY (Finland). The Company possesses all of the mineral rights and surfacerights necessary to operate both the Vammala and Svartliden plants and the Jokisivu mine,while the Environmental Permit for Fäboliden is under application. Table 3-1 and Figure
3-3 Dragon Mining Finland Tenements.
Source: Dragon Mining
Table 3-2 summarise the currently held mining and exploration rights of the Projectsfor Sweden and Finland respectively. Tenememnts are shown in Figure 3-1, Figure 3-2 andFigure 3-3.
The tenements have been checked on both the Finnish Safety and Chemicals Agency(Tukes) website and the Mining Inspectorate of Sweden (Bergsstaten), and, apart fromTukes only recording the original applications, approvals, etc, all appears to be accordingto the information provided by Dragon Mining.
APPENDIX II INDEPENDENT EXPERT’S REPORT
– II-137 –

RPM provides this information for reference only and recommends that land titlesand ownership rights be reviewed by legal experts.
Table 3-1 Swedish Mining and Exploration Assets
Area Asset Type Area (Ha)DateGranted Expiry Date
Svartliden SvartlidengruvanK nr 1
ExploitationConcession
87.54 10-Apr-02 10-Apr-27
Fäboliden Fäboliden K nr 1 ExploitationConcession
122.00 3-Jun-04 3-Jun-29
Fäboliden Fäboliden nr 11 Exploration Permit 836.26 4-Aug-16 4-Aug-23
Source: Provided by the Client.
Figure 3-1 Sweden Svartliden Tenement and Surface Infrastructure Location
Source: Dragon Mining
APPENDIX II INDEPENDENT EXPERT’S REPORT
– II-138 –

Figure 3-2 Fäboliden Tenements
Source: RungePincockMinarco, 2018
Figure 3-3 Dragon Mining Finland Tenements
Source: Dragon Mining
APPENDIX II INDEPENDENT EXPERT’S REPORT
– II-139 –

Table 3-2 Finnish Mining and Exploration Assets
Asset ID Type1
Area(Ha)
Original Date2 Extension Date2
Arrival Registration Valid Expiry Arrival Registration Valid Expiry
OrivesiOrivesi 2676 MC 39.82 21/06/1994 14/09/1994 29/10/1994 Valid until
further notice5
Sarvisuo 1-24 ML2013:0006 EP 41.10 12/02/2013 17/04/2015 17/05/2015 19/05/2018 23/01/2018 4/09/2019Sarvisuo 34 ML2015:0026 EPA 46.51 22/06/2015 2/06/2017 2/07/20174 3/07/2020 11/06/2020Ori VA2020:0021 RES3 1,979.73 27/03/2020 20/05/2020 Not valid 26/03/2022
JokisivuJokisivu 7244 MC 48.32 2/12/2003 9/01/2005 13/02/2005 Valid until
further notice5
Jokisivu 2 KL2015:0005 MP 21.30 16/04/2015 18/08/2015 18/09/2015 Valid untilfurther notice5
Jokisivu 3 KL2018:0010 MP 8.97 7/12/2018 29/04/2019 30/05/2019 Valid untilfurther notice5
Jokisivu 4-5 ML2012:0112 EP 85.76 4/06/2012 8/05/2014 8/06/2014 10/06/2017 7/04/2017 4/09/2019 5/10/2019 4/10/2022Jokisivu 7-8 ML2017:0131 EP 18.60 20/12/2017 1/06/2018 3/07/2018 2/07/2021 28/05/2021Jokisivu 10 ML2018:0082 EPA 900.33 14/09/2018
KaapelinkulmaKaapelinkulma K7094 MC 65.10 4/11/2008 24/10/2012 20/05/2016 Valid until
further notice5
UunimäkiUunimäki 1 ML2020:0020 EPA 89.22 31/03/2020
StormiStormi 1895 MC 157.53 20/08/1971 13/11/1972 28/12/1972 Valid until
further notice5
Source: Provided by the Client.
Note 1: MC (Mining Concession), MP (Mining Permit), EP (Exploration Permit), EPA (Exploration Permit Application),RES (Reservation).
Note 2: Arrival date is the date of lodgement of the application, registration date is the mining authorities is the date ofapproval. A tenement however does not become legally valid until such times as the appeals process has beencompleted.
Note 3: A reservation is a form of tenure that allows you to evaluate the merits of the area through “light” exploration.Essentially it provides you first/exclusive rights to apply for Exploration Licences within this area.
Note 4: With reference to Sarvisuo 1-2 and Sarvisuo 3, Exploration Licences not valid when applying for an extension.
Note 5: Mining permit/concession valid until further notice. Tukes (Mining Authority) reviews provisions of currentmining permit at least every ten years.
3.2 Expenditure Commitments
Neither Tukes nor Bergsstaten, the mining authorities for Finland and Swedenrespectively, stipulate a company has to define an expenditure commitment on applyingfor a tenement. However, it is expected that the tenement will advance throughexploration expenditure while it is being held. Dragon Mining has no official expenditurecommitments for its tenements, however, there is a risk of losing a tenement or beingunable to obtain an extension if there is no exploration expenditure.
APPENDIX II INDEPENDENT EXPERT’S REPORT
– II-140 –
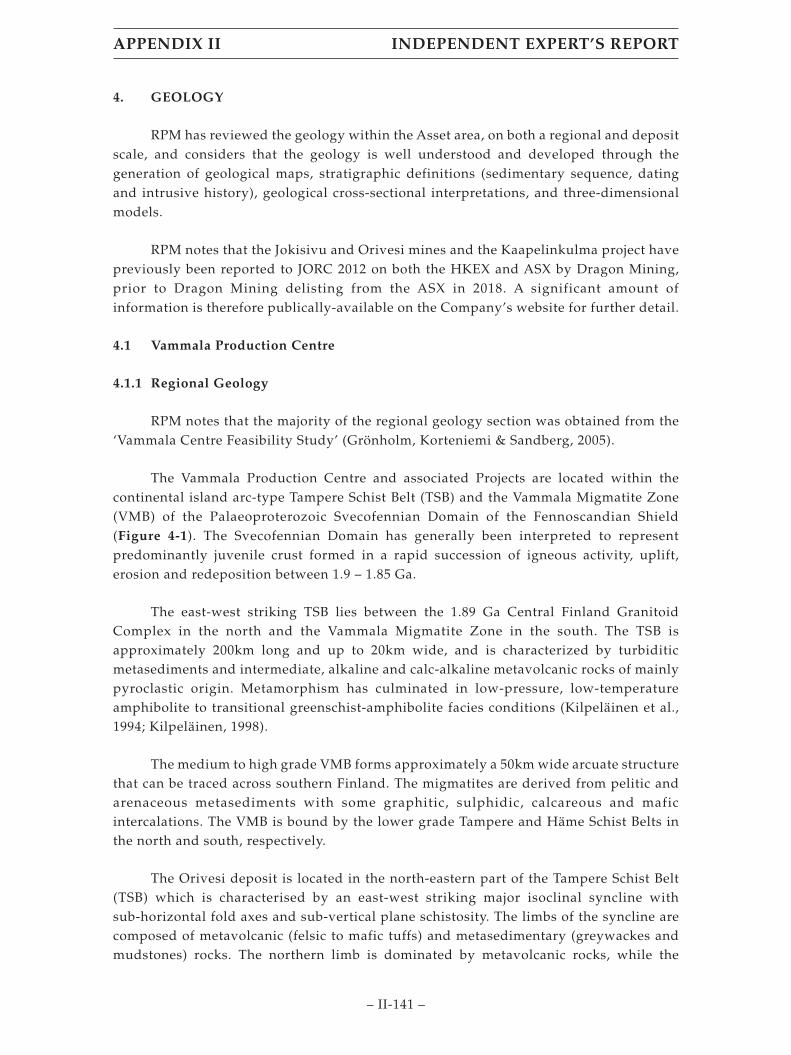
4. GEOLOGY
RPM has reviewed the geology within the Asset area, on both a regional and depositscale, and considers that the geology is well understood and developed through thegeneration of geological maps, stratigraphic definitions (sedimentary sequence, datingand intrusive history), geological cross-sectional interpretations, and three-dimensionalmodels.
RPM notes that the Jokisivu and Orivesi mines and the Kaapelinkulma project havepreviously been reported to JORC 2012 on both the HKEX and ASX by Dragon Mining,prior to Dragon Mining delisting from the ASX in 2018. A significant amount ofinformation is therefore publically-available on the Company’s website for further detail.
4.1 Vammala Production Centre
4.1.1 Regional Geology
RPM notes that the majority of the regional geology section was obtained from the‘Vammala Centre Feasibility Study’ (Grönholm, Korteniemi & Sandberg, 2005).
The Vammala Production Centre and associated Projects are located within thecontinental island arc-type Tampere Schist Belt (TSB) and the Vammala Migmatite Zone(VMB) of the Palaeoproterozoic Svecofennian Domain of the Fennoscandian Shield(Figure 4-1). The Svecofennian Domain has generally been interpreted to representpredominantly juvenile crust formed in a rapid succession of igneous activity, uplift,erosion and redeposition between 1.9 – 1.85 Ga.
The east-west striking TSB lies between the 1.89 Ga Central Finland GranitoidComplex in the north and the Vammala Migmatite Zone in the south. The TSB isapproximately 200km long and up to 20km wide, and is characterized by turbiditicmetasediments and intermediate, alkaline and calc-alkaline metavolcanic rocks of mainlypyroclastic origin. Metamorphism has culminated in low-pressure, low-temperatureamphibolite to transitional greenschist-amphibolite facies conditions (Kilpeläinen et al.,1994; Kilpeläinen, 1998).
The medium to high grade VMB forms approximately a 50km wide arcuate structurethat can be traced across southern Finland. The migmatites are derived from pelitic andarenaceous metasediments with some graphitic, sulphidic, calcareous and maficintercalations. The VMB is bound by the lower grade Tampere and Häme Schist Belts inthe north and south, respectively.
The Orivesi deposit is located in the north-eastern part of the Tampere Schist Belt(TSB) which is characterised by an east-west striking major isoclinal syncline withsub-horizontal fold axes and sub-vertical plane schistosity. The limbs of the syncline arecomposed of metavolcanic (felsic to mafic tuffs) and metasedimentary (greywackes andmudstones) rocks. The northern limb is dominated by metavolcanic rocks, while the
APPENDIX II INDEPENDENT EXPERT’S REPORT
– II-141 –
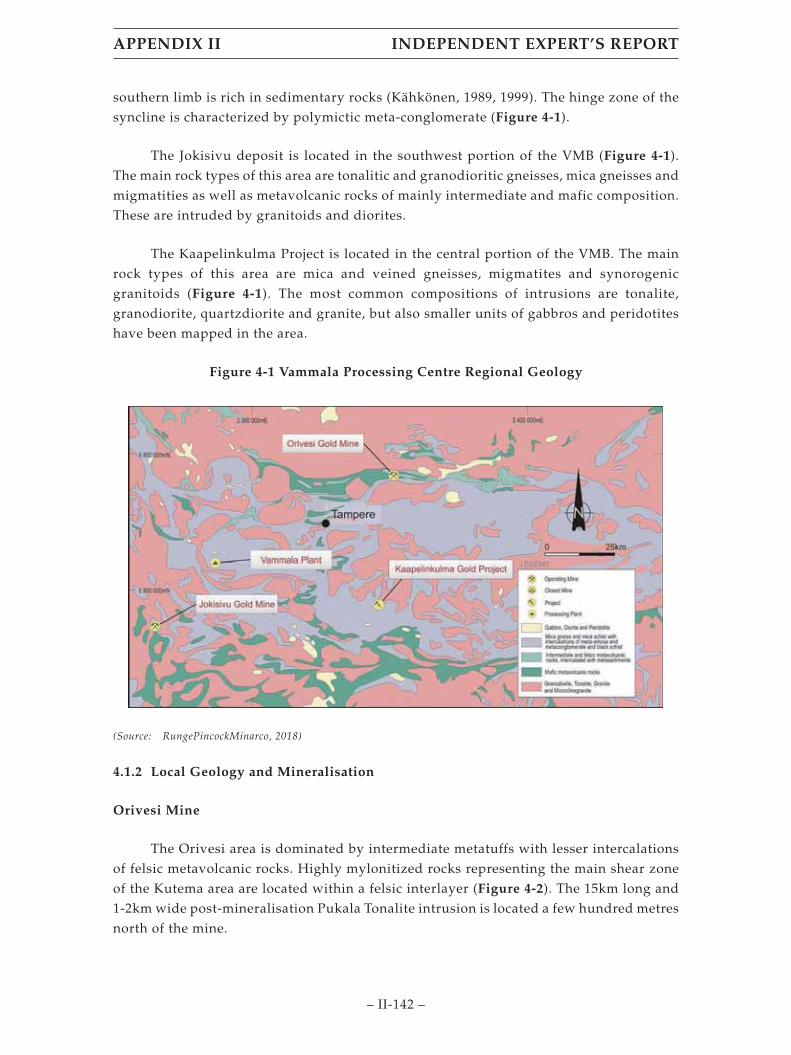
southern limb is rich in sedimentary rocks (Kähkönen, 1989, 1999). The hinge zone of thesyncline is characterized by polymictic meta-conglomerate (Figure 4-1).
The Jokisivu deposit is located in the southwest portion of the VMB (Figure 4-1).The main rock types of this area are tonalitic and granodioritic gneisses, mica gneisses andmigmatities as well as metavolcanic rocks of mainly intermediate and mafic composition.These are intruded by granitoids and diorites.
The Kaapelinkulma Project is located in the central portion of the VMB. The mainrock types of this area are mica and veined gneisses, migmatites and synorogenicgranitoids (Figure 4-1). The most common compositions of intrusions are tonalite,granodiorite, quartzdiorite and granite, but also smaller units of gabbros and peridotiteshave been mapped in the area.
Figure 4-1 Vammala Processing Centre Regional Geology
(Source: RungePincockMinarco, 2018)
4.1.2 Local Geology and Mineralisation
Orivesi Mine
The Orivesi area is dominated by intermediate metatuffs with lesser intercalationsof felsic metavolcanic rocks. Highly mylonitized rocks representing the main shear zoneof the Kutema area are located within a felsic interlayer (Figure 4-2). The 15km long and1-2km wide post-mineralisation Pukala Tonalite intrusion is located a few hundred metresnorth of the mine.
APPENDIX II INDEPENDENT EXPERT’S REPORT
– II-142 –

Orivesi is a metamorphosed and deformed high-sulphidation epithermal golddeposit which is associated with the Kutema alteration zone of chlorite-sericite-quartzschist. The Orivesi Mine has two areas of mineralisation (Kutema and Sarvisuo) which areapproximately 300m apart. The Kutema and Sarvisuo lodes occur as sub-vertical pipe-likestructures with extensive vertical continuity and thickness. The deepest grade drillintersection in the Kutema area is well below 1,000m from surface.
Gold mineralisation is related to strongly deformed and silicified zonescharacterized by shearing, boudinaging, folding and quartz veining during syn- tolate-stage deformation. Most of gold occurs as fine native gold, generally <60μm, alongquartz grain boundaries and in late-stage fractures. A lesser amount of gold is carried byAu-Te tellurides, and electrum (Au, Ag). Pyrite, pyrrhotite, chalcopyrite and, lesscommonly, sphalerite are the most common sulphides associated with goldmineralisation. The highly silicified portions of the inner alteration zone are generallyvery poor in sulphides, and gold lodes may often contain more tellurides than sulphides.
Figure 4-2 Orivesi Local Geology
(Source: RungePincockMinarco, 2018)
Jokisivu Mine
The Jokisivu Mine has two areas of mineralisation (Kujankallio and Arpola) whichare approximately 200m apart. The Jokisivu Mine is a Palaeoproterozoic orogenic golddeposit located in the Vammala Migmatite Belt. The deposit is controlled by a conjugateset of brittle-ductile shear zones between two major NW- trending shear zones in theJokivisu metadiorite (Figure 4-3). The Jokisivu diorite is surrounded by mica gneisses,volcanogenic and arenitic metasedimentary gneisses and granitoids of tonalitic togranodioritic composition.
APPENDIX II INDEPENDENT EXPERT’S REPORT
– II-143 –

Mineralisation is hosted within relatively undeformed and unaltered diorite, in1-5m wide shear zones characterised by laminated, pinching and swelling quartz veinsand a well-developed moderately (50°) east- northeast plunging lineation. TheKujankallio vein sets have been shown by drilling to extend to at least 525m depthwhereas Arpola has only been drilled to 200m. Gold occurs chiefly as free grains in quartzveins, locally related to arsenopyrite, loellingite, pyrrhotite and scheelite.
Figure 4-3 Jokisivu Local Geology
(Source: RungePincockMinarco, 2018)
Kaapelinkulma Mine
At Kaapelinkulma, a 4km by 8km oval-shaped granitoid intrusion of tonalite andgranodiorite composition is surrounded by mica and veined gneisses with graphitic andsulphidic interlayers. A boomerang-shaped, 1.8km long and 50-120m wide gently-dippingunit of quartz diorite occurs as a mega-inclusion in the western part of tonalite intrusion(Figure 4-4). The known quartz-diorite unit extends to the shallow levels, only 30- 120mbelow surface.
Kaapelinkulma is 50-100m wide and 1,800m long and is an orogenic-type golddeposit associated with the quartz diorite inclusion. Controlling structures are a set ofnarrow (0.1-5m), NNE and NE trending sinistral shear zones dipping at 35-40° to the ESE.Two zones of gold mineralisation have been identified associated with quartz veins inNNW-trending en echelon shear zones mainly near the western contact area of quartzdiorite, which is strongly biotite-altered and quartz-veined.
Mineralised shear zones contain banded quartz veins and veinlets characterized byvariable pyrrhotite, arsenopyrite, loellingite, pyrite, chalcopyrite, scheelite, tellurides,bismuth, maldonite and gold. Native free gold, often visible, is chiefly associated withquartz and some gold is associated with native bismuth and as inclusions in arsenopyrite.
APPENDIX II INDEPENDENT EXPERT’S REPORT
– II-144 –
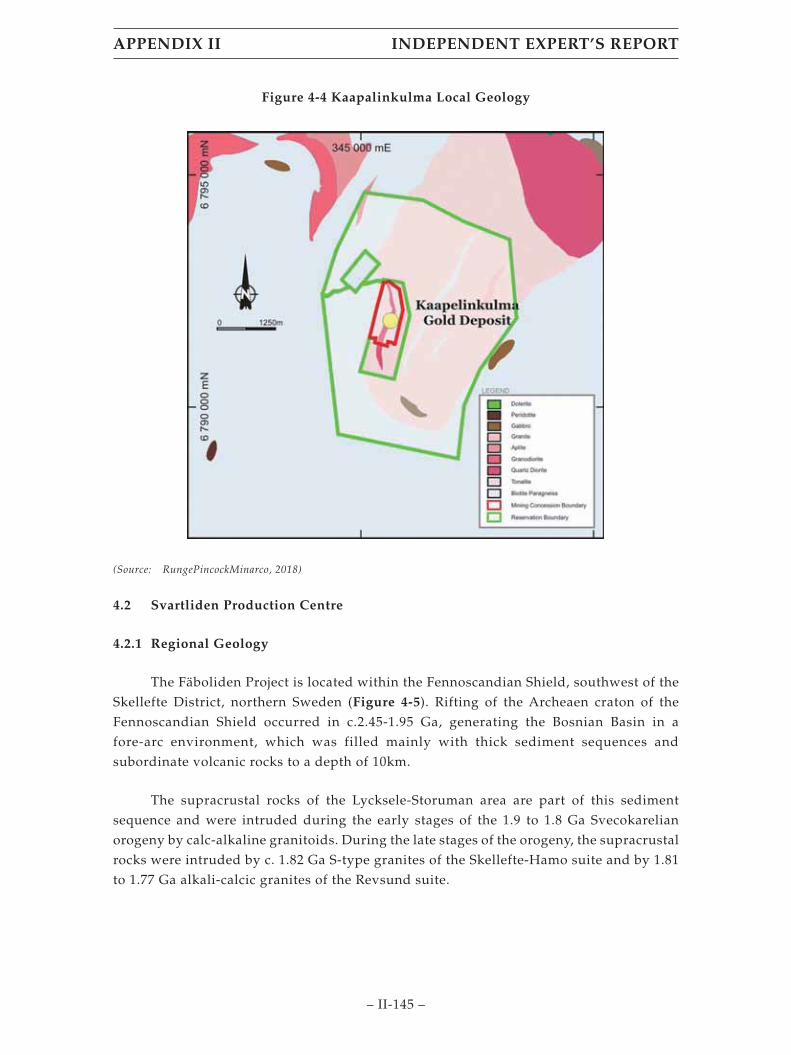
Figure 4-4 Kaapalinkulma Local Geology
(Source: RungePincockMinarco, 2018)
4.2 Svartliden Production Centre
4.2.1 Regional Geology
The Fäboliden Project is located within the Fennoscandian Shield, southwest of theSkellefte District, northern Sweden (Figure 4-5). Rifting of the Archeaen craton of theFennoscandian Shield occurred in c.2.45-1.95 Ga, generating the Bosnian Basin in afore-arc environment, which was filled mainly with thick sediment sequences andsubordinate volcanic rocks to a depth of 10km.
The supracrustal rocks of the Lycksele-Storuman area are part of this sedimentsequence and were intruded during the early stages of the 1.9 to 1.8 Ga Svecokarelianorogeny by calc-alkaline granitoids. During the late stages of the orogeny, the supracrustalrocks were intruded by c. 1.82 Ga S-type granites of the Skellefte-Hamo suite and by 1.81to 1.77 Ga alkali-calcic granites of the Revsund suite.
APPENDIX II INDEPENDENT EXPERT’S REPORT
– II-145 –

Figure 4-5 Svartliden Processing Centre Regional Geology
(Source: Golders, 2010)
4.2.2 Local Geology and Mineralisation
Fäboliden Mine
The Fäboliden deposit, l ike Svartliden, is hosted in a sequence ofvolcano-sedimentary packages in the Bothnian Basin (Figure 4-6). The metasediments andmetavolcanic rocks are strongly foliated and biotite- rich argillites with lesser sandstonesto coarse grain size. The Revsund granitoid is medium to coarse- grained with potassiumfeldspar porphyroblasts. The host stratigraphy strikes NNE-SSW and dips fromapproximately 50° to 70° east with the orientation steepening in the north.
Alteration associated with the mineralisation is pervasive diopside,calcic-amphibole and biotite with some silicification in the volcanics. In the sediments,light silicification is common with variable feldspar alteration, some sericitization andchlorite alteration, and variable diopside, calcic-amphibole alteration. More distalalteration is pervasive calcite, and diopside, calcic-amphibole and biotite in veins in thevolcanics. The sediments show minor biotite and sericite.
Fäboliden has been classified as an orogenic gold deposit. The mineralisation isgenerally situated at or near the boundary between the lower sediments and theintermediate volcanics. The mineralisation is associated with small quartz or sulfide veins(less than 5 cm in thickness) where arsenopyrite is dominant. The gold is fine-grained andfound in fractures and as inclusions within arsenopyrite-löllingite (Alvarez, J. and others,
APPENDIX II INDEPENDENT EXPERT’S REPORT
– II-146 –
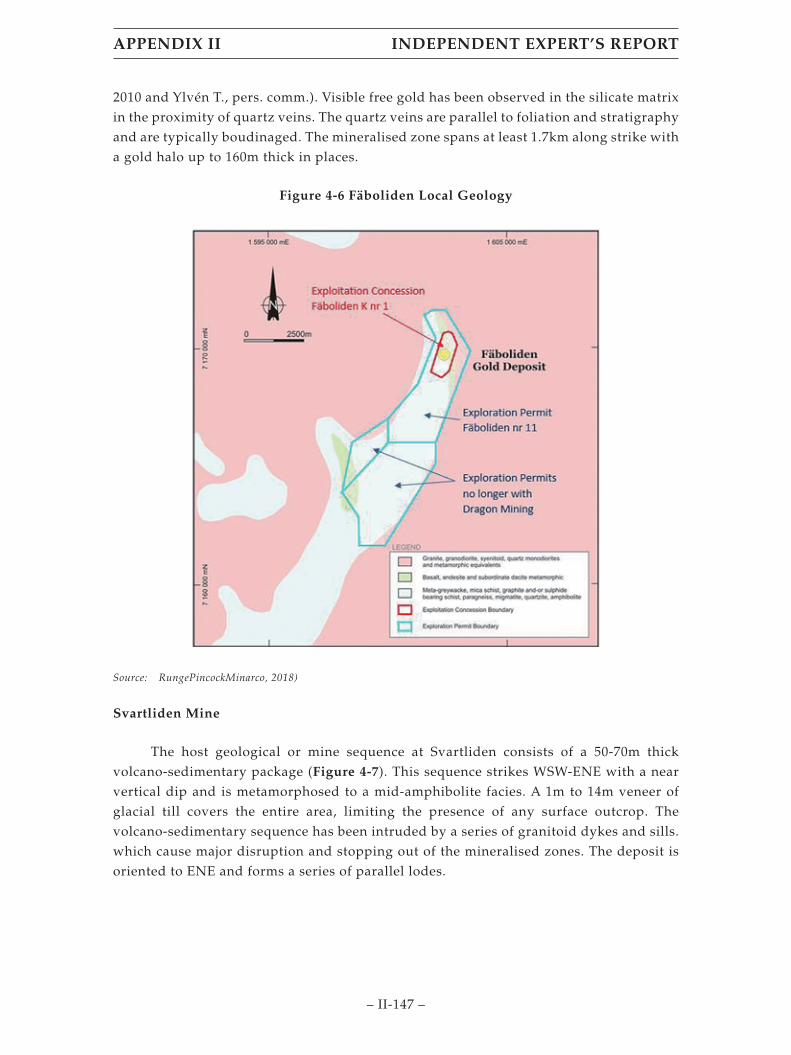
2010 and Ylvén T., pers. comm.). Visible free gold has been observed in the silicate matrixin the proximity of quartz veins. The quartz veins are parallel to foliation and stratigraphyand are typically boudinaged. The mineralised zone spans at least 1.7km along strike witha gold halo up to 160m thick in places.
Figure 4-6 Fäboliden Local Geology
Source: RungePincockMinarco, 2018)
Svartliden Mine
The host geological or mine sequence at Svartliden consists of a 50-70m thickvolcano-sedimentary package (Figure 4-7). This sequence strikes WSW-ENE with a nearvertical dip and is metamorphosed to a mid-amphibolite facies. A 1m to 14m veneer ofglacial till covers the entire area, limiting the presence of any surface outcrop. Thevolcano-sedimentary sequence has been intruded by a series of granitoid dykes and sills.which cause major disruption and stopping out of the mineralised zones. The deposit isoriented to ENE and forms a series of parallel lodes.
APPENDIX II INDEPENDENT EXPERT’S REPORT
– II-147 –

Figure 4-7 Svartliden Local Geology Cross-Section
(Source: Runge, 2010)
The gold mineralisation at Svartliden is epigenetic gold in hydrothermally alteredductile shear zones. The mineralization is hosted by a banded iron formation (BIF) locatedon the contact between a sediment and metabasalt. Gold is associated with arsenopyriteand pyrrhotite. Alteration is calc-silicate, silicification, plagioclase and biotite alterationwith silicification proximal to the ore zones.
The ore zone is a sulphide skarn with complete host rock replacement to quartz,sulphides, Ca-amphiboles, Fe-diopside, pyrrhotite, arsenopyrite, graphite and Fe-richbiotite. Outside the ore zones there is moderate to intense biotite alteration and formationof skarn veins.
Tight folding followed by dextral shearing post-dates the mineralisation.
RPM Comment
The regional and local geology and mineralisation is well understood by DragonMining.
APPENDIX II INDEPENDENT EXPERT’S REPORT
– II-148 –
5. MINERAL RESOURCES
RPM has acted as Dragon Mining’s Independent Competent Person for theestimation of Mineral Resources since 2007, whereby Dragon Mining’s own technical teamcompletes the resource estimates which are audited and revised by RPM, prior to RPMcompleting the classification under the recommended guidelines of JORC and sign off asCompetent Person. On occasion RPM has also undertaken the resource estimates to assistDragon Mining in meeting its reporting timelines.
5.1 Vammala Production Centre
5.1.1 Orivesi
The latest resource estimates were completed by Dragon Mining, audited andrevised by RPM in November 2018, and then depleted for mining undertaken to the end of2019. All data was sent for RPM to conduct the depletion of the block models andestimates, classify and report the Mineral Resource and provide Competent Personsign-off in line with the guidelines of JORC.
Data and Geological Interpretation
Drill holes used in the Mineral Resource estimate for Kutema included 737 diamondholes (“DDH”) and 4,850 underground production (“sludge”) holes for a total of 48,919m,while the Mineral Resource estimate for Sarvisuo included 409 surface and undergrounddiamond holes, 2,160 underground sludge holes and two reverse circulation (“RC”) holesfor a total of 16,075m within the mineralisation wireframes.
Mineralisation wireframes were constructed by Dragon Mining using a nominal 0.6to 1.0 g/t Au cut-off grade in conjunction with geological boundaries for the Kutemadeposit and mostly a nominal 0.5 g/t Au cut-off grade for Sarvisuo. In some areas, forSarvisuo, the cut-off grade was reduced to as low as 0.10 g/t Au to encompass allmineralisation and to capture the high-grade mineralisation, which is erraticallydistributed within the broader mineralised zones.
Statistical Analysis, Modelling and Estimation
Samples were composited to 1.5m and high grade cut values of 50 g/t Au were usedfor Kutema and 70 g/t Au for Sarvisuo. Surpac block models used block sizes of 5m NS by10m EW by 10m vertical with sub- blocks of 1.25m by 2.5m by 2.5m for Kutema and 2m NSby 10m EW by 10m vertical with sub-blocks of 0.5m by 2.5m by 2.5m for Sarvisuo.
An Inverse Distance Squared (ID2) interpolation with an oriented ‘ellipsoid’ searchwas used for both estimates. For Kutema a first pass radius of 25m, a second pass of 60mand a third pass of 200m was used. Sarvisuo used a first pass radius of 30m, 60m for thesecond pass and a third pass radius of 200m. A minimum number of samples of 10, 4 and
APPENDIX II INDEPENDENT EXPERT’S REPORT
– II-149 –

2 were used for the first, second and third passes, respectively, for both deposits, and amaximum of 20 samples was used for all passes and greater than 99% of the blocks werefilled in the first two passes.
A bulk density value of 2.80 t/m3 was assigned to all material (mineralisation andwaste) based on 87 actual core measurements and almost 20 years of mining experience atthe Orivesi Mine.
Model Validation and Resource Classification
The resource estimates were validated using industry standard approaches ofcomparing the average Au grades of the composite file inputs against the block modeloutputs; a check that the interpolation of the block model correctly honoured the drillingdata and a reconciliation of resource model mined with production data for 2019. Theresults of the validation indicated that, overall, the trend of the modelled grades wasconsistent with the drill hole grades and that there is a good correlation between thecomposites and estimated grades with larger discrepancies for individual lodes resultingfrom clustering of high grades.
The Mineral Resources for Kutema and Sarvisuo were classified on the basis ofsample spacing and continuity of the interpreted lodes. The Measured Resourceincorporated the main mineralised lodes with underground level development andsludge drilling; Indicated Resource in areas of reasonably close-spaced diamond drilling(less than 30m by 30m); and the Inferred Resource included areas of the deposits wheresampling was greater than 30m by 30m, small, isolated pods of mineralisation outside themain mineralised lodes and geologically complex zones. The extrapolation of the lodesalong strike and down dip was limited to a distance of 25m for Kutema and 20m forSarvisuo, or to half the drill spacing. Areas of extrapolation have been classified asInferred Mineral Resource.
Mineral Resources
The Mineral Resource for the Orivesi Gold Mine is shown below on Table 5-1reported at a cut-off grade of 2.6 g/t Au and depleted for mining as of 31st December 2019.
Table 5-1 Orivesi Mine December 2019 Mineral Resource Estimate
Deposit
Measured Indicated Inferred TotalQuantity
ktAug/t Au koz
Quantitykt
Aug/t Au koz
Quantitykt
Aug/t Au koz
Quantitykt
Aug/t
Aukoz
Kutema 59 4.5 9 61 5.1 10 13 4.4 2 130 4.8 20Sarvisuo 34 5.7 6 47 7.0 11 58 4.9 9 140 5.8 26Stockpiles – – – 1 3.8 <1 – – – 1 3.8 <1
Total 93 5.0 15 110 5.9 21 71 4.8 11 270 5.3 47
APPENDIX II INDEPENDENT EXPERT’S REPORT
– II-150 –

Note:
5) The Mineral Resources has been compiled under the supervision of Mr. David Allmark who is a full-timeemployee of RPM and a Registered Member of the Australian Institute of Geoscientists. Mr. Allmark hassufficient experience that is relevant to the style of mineralisation and type of deposit underconsideration and to the activity that he has undertaken to qualify as a Competent Person as defined inthe JORC Code.
6) All Mineral Resources figures reported in the table above represent estimates at 31st December, 2019.Mineral Resource estimates are not precise calculations, being dependent on the interpretation of limitedinformation on the location, shape and continuity of the occurrence and on the available samplingresults. The totals contained in the above table have been rounded to reflect the relative uncertainty of theestimate. Rounding may cause some computational discrepancies.
7) Mineral Resources have been reported in accordance with the Australasian Code for Reporting ofExploration Results, Mineral Resources and Ore Reserves (The Joint Ore Reserves Committee Code –JORC 2012 Edition).
8) The Mineral Resources have been reported at a gold cut-off grade of 2.6 g/t Au determined using a goldprice of USD 1,770/troy ounce extrapolated for the potential economic extraction of the resource at alevel approximating 120% of the nominal forecast gold price of USD 1,475/troy ounce as at 13thNovember, 2019, a mining cost of USD 88.48/t of ore for underground, a processing cost of USD 28.45/tof ore and a processing recovery of 85%.
5.1.2 Jokisivu
The latest resource estimates were completed by Dragon Mining, audited andrevised by RPM in November 2020, and then depleted for mining undertaken to the end ofDecember 2019. All data was sent for RPM to conduct the depletion of the block modelsand estimates, classify and report the Mineral Resource and provide Competent Personsign-off in line with the guidelines of JORC.
Data and Geological Interpretation
Drill holes used in the Mineral Resource estimate for Kujankallio included 688diamond drill holes, 47 reverse circulation drill holes, 2,440 sludge holes, 312 percussiondrill holes, 17 surface channels, and 14 mini drill holes for 19,738m intersecting themineralised lodes. Drill holes used in the Mineral Resource estimate for Arpola included315 diamond holes, 545 sludge holes, 79 reverse circulation holes, 1 mini-drill hole, 7percussion holes and 22 surface trenches, for a total of 5,844m intersecting the mineralisedlodes.
In general, a 1 g/t Au cut-off grade was used to delineate the mineralised zones forKujankallio and 0.5 g/t Au for Arpola. The 2020 interpretation for Arpola utilised a 1.0 g/tAu cut-off, however grades as low as 0.2 g/t Au were included where known quartzveining, shearing and scheelite and arsenopyrite mineralisation warranted it. Nominimum width was applied due to the pinch and swell nature of the ore body.
Statistical Analysis, Modelling and Estimation
Samples were composited to 1m intervals Top-cuts varied between 10g/t to 100g/tAu for Kujankallio and 4g/t to 80g/t for Arpola. Surpac block models were used for theestimates with block sizes of 2m NS by 5m EW by 5m vertical with sub-cells of 0.5m by
APPENDIX II INDEPENDENT EXPERT’S REPORT
– II-151 –
1.25m by 1.25m for Kujankallio, and 2m NS by 10m EW by 5m vertical with sub-cells of0.5m by 2.5m by 1.25m for Arpola.
An OK grade interpolation used an oriented ‘ellipsoid’ search with a first passradius of 45m, 60m for the second pass and 150m to 200m for the third pass forKujankallio, and a first pass radius of 30m to 45m, 60m for the second pass and 90m for thethird pass for Arpola. Greater than 90% of the blocks were filled in the first two passes forboth deposits. IDW2 was also carried out as a check on the OK method.
A bulk density value determined by Dragon Mining of 2.80t/m3 was used for fresh(both mineralised and waste) rock below the glacial till for both Kujankallio and Arpola,and a bulk density of 1.75t/m3 was used for glacial till material. These values areconsistent with similar mineralisation styles and lithologies at other Dragon Miningoperations in the area.
Model Validation and Resource Classification
The resource estimates were validated using industry standard approaches ofcomparing the average Au grades of the composite file inputs against the block modeloutputs; a check that the interpolation of the block model correctly honoured the drillingdata and a reconciliation of resource model mined with production data for 2019. Theresults of the validation indicated that, overall, the trend of the modelled grades wasconsistent with the drill hole composite grades, however there is some divergencebetween the block model grades and composite grades in areas where the number ofcomposite samples are low. RPM notes the comparison is close between the OK and IDW2
average grades.
The Kujankallio Measured Mineral Resource has been defined by extensive open cutand underground grade control drilling (10m strike spacing), surface trenching andunderground mapping. The Indicated Mineral Resource was defined within areas ofreasonably close-spaced diamond drilling (less than 30m by 30m) due to the goodcontinuity and predictability of the lode positions. The Inferred Mineral Resourceincluded areas of the resource where sampling was greater than 30m by 30m, and small,isolated pods of mineralisation outside the main mineralised zones and geologicallycomplex zones.
The Arpola Mineral Resource was classified on the basis of sample spacing andcontinuity of the interpreted zones. In general, any zone defined by surfacetrenching/drilling where drill hole spacing was up to 20m and good geological lodecontinuity was apparent (or confirmed by underground development drives) wasclassified as Measured Mineral Resource. Other zones where drill hole spacing was lessthan 30m by 30m and reasonable geological lode continuity was apparent were classifiedas Indicated Mineral Resource. Those zones where drill hole spacing was greater than 30mby 30m, or where the continuity and/or geometry were uncertain, were classified asInferred Mineral Resource. Zones with less than four intersections were also classified asInferred.
APPENDIX II INDEPENDENT EXPERT’S REPORT
– II-152 –

Mineral Resources
The Mineral Resource for the Jokisivu Gold Mine is shown below on Table 5-2reported at a cut-off grade of 1.3 g/t Au and depleted for mining as of 31st December 2020.
Table 5-2 Jokisivu Gold Mine December 2020 Mineral Resource Estimate
Deposit
Measured Indicated Inferred TotalQuantity
Mt Au g/t Au ozQuantity
Mt Au g/t Au ozQuantity
Mt Au g/t Au ozQuantity
Mt Au g/t Au oz
Kujankallio 0.5 5.0 79,000 0.9 3.4 100,000 0.1 2.9 13,000 1.6 3.8 190,000Arpola 0.2 4.2 20,000 0.5 4.4 71,000 0.4 4.4 55,000 1.0 4.4 150,000Stockpiles – – – <0.1 2.1 5,000 – – – <0.1 2.1 5,000
Total 0.6 4.8 100,000 1.5 3.6 180,000 0.5 4.0 67,000 2.7 4.0 340,000
Note:
5) The Mineral Resources has been compiled under the supervision of Mr. David Allmark who is a full-timeemployee of RPM and a Registered Member of the Australian Institute of Geoscientists. Mr. Allmark hassufficient experience that is relevant to the style of mineralisation and type of deposit underconsideration and to the activity that he has undertaken to qualify as a Competent Person as defined inthe JORC Code.
6) All Mineral Resources figures reported in the table above represent estimates at 31st December, 2020.Mineral Resource estimates are not precise calculations, being dependent on the interpretation of limitedinformation on the location, shape and continuity of the occurrence and on the available samplingresults. The totals contained in the above table have been rounded to reflect the relative uncertainty of theestimate. Rounding may cause some computational discrepancies.
7) Mineral Resources have been reported in accordance with the Australasian Code for Reporting ofExploration Results, Mineral Resources and Ore Reserves (The Joint Ore Reserves Committee Code –JORC 2012 Edition).
8) The Mineral Resources have been reported at a gold cut-off grade of 1.3 g/t Au determined using a goldprice of US$1,890/troy ounce extrapolated for the potential economic extraction of the resource at a levelapproximating 120% of an average consensus forecast gold price of US$1,575/troy ounce that wasgenerated from annual Consensus gold forecasts over the mine life period, a mining cost of US$39.50/t ofore for underground, a processing cost of US$25.54/t of ore and a processing recovery of 87%.
5.1.3 Kaapelinkulma
The latest Mineral Resources for the Kaapelinkulma Gold Mine were estimated andreported by RPM in 2021. The mineralisation interpretation was completed by DragonMining and then revised by RPM prior to RPM completing the estimate in December 2020.The model was depleted for mining undertaken to the end of December 2020. All data wassent for RPM to complete the block model and estimate, classify and report the MineralResource and provide Competent Person sign-off in line with the guidelines of JORC.
Data and Geological Interpretation
Drill holes used in the resource estimate included 153 surface diamond drill holes(“DD”), 66 reverse circulation (“RC”) holes, 41 percussion holes and 13 sawed channels atsurface trenches for a total of 1,186m within the wireframes.
APPENDIX II INDEPENDENT EXPERT’S REPORT
– II-153 –

Mineralisation wireframes were constructed by Dragon Mining using a nominal0.5g/t gold cut-off grade. However, in some areas, the cut-off grade was reduced to as lowas 0.3g/t gold to generate sensible geological shapes and to capture the high-grademineralisation which is erratically distributed within the broader mineralised zones.
Statistical Analysis, Modelling and Estimation
Samples were composited to 1m intervals and high-grade cuts ranging from 12g/tto 50g/t gold were applied. A Surpac block model was used for the estimate with a blocksize of 10m NS by 2m EW by 5m vertical with sub-blocks of 2.5m by 0.5m by 1.25m.
Inverse Distance Squared (ID2) interpolation with an oriented ‘ellipsoid’ search wasused for the estimate. The ellipsoid was oriented to the average strike, plunge and dip ofthe mineralised zones. An ‘isotropic’ search ellipsoid was used for the final estimationpass for all objects. For the major objects, a first pass radius of 40m and a second pass of80m were used with a minimum number of samples of 10 and a maximum of 40. For theminor objects, a first pass radius of 25m and a second pass of 50m were used with aminimum number of samples of 10 and a maximum of 40. A third pass search radius of100m was used with one minimum sample to fill the model. Greater than 80% of the blockswere filled in the first two passes.
A bulk density value of 2.83 t/m3 was assigned to all material (mineralisation andwaste) below the till based on 630 core measurements and a bulk density of 1.8t/m3 wasused for the till material. These values are consistent with similar mineralisation stylesand lithologies.
Model Validation and Resource Classification
The resource estimates were validated using industry standard approaches ofcomparing the average Au grades of the composite file inputs against the block modeloutputs; a check that the interpolation of the block model correctly honoured the drillingdata and a reconciliation of resource model mined with production data for 2019. Theresults of the validation indicated that, overall, the trend of the modelled grades wasconsistent with the drill hole composite grades, however there were some largerdifferences between composite and block model grades which were found to be due toclustering of higher-grade values.
The Mineral Resource was classified on the basis of drill hole spacing and continuityof the interpreted lodes. The Measured Mineral Resource was defined only in seven of themain lodes (objects 9, 10, 12 and 37 to 40) within areas of channel sampling, close-spaceddiamond drilling and RC drilling (less than 10m by 10m spacing) due to the strongmineralised continuity and predictability of the lode positions. The Indicated MineralResource was defined within areas of channel sampling, close-spaced diamond drillingand RC drilling where the spacing was 10m to 20m by 10m to 20m where there wassufficient mineralised continuity and predictability of the lode positions. Those zoneswhere drill hole spacing was greater than 20m by 20m, or where the continuity and/orgeometry were uncertain were classified as Inferred Mineral Resource. The newly definedlodes at depth beneath the South deposit have also been classified as Inferred Mineral
APPENDIX II INDEPENDENT EXPERT’S REPORT
– II-154 –
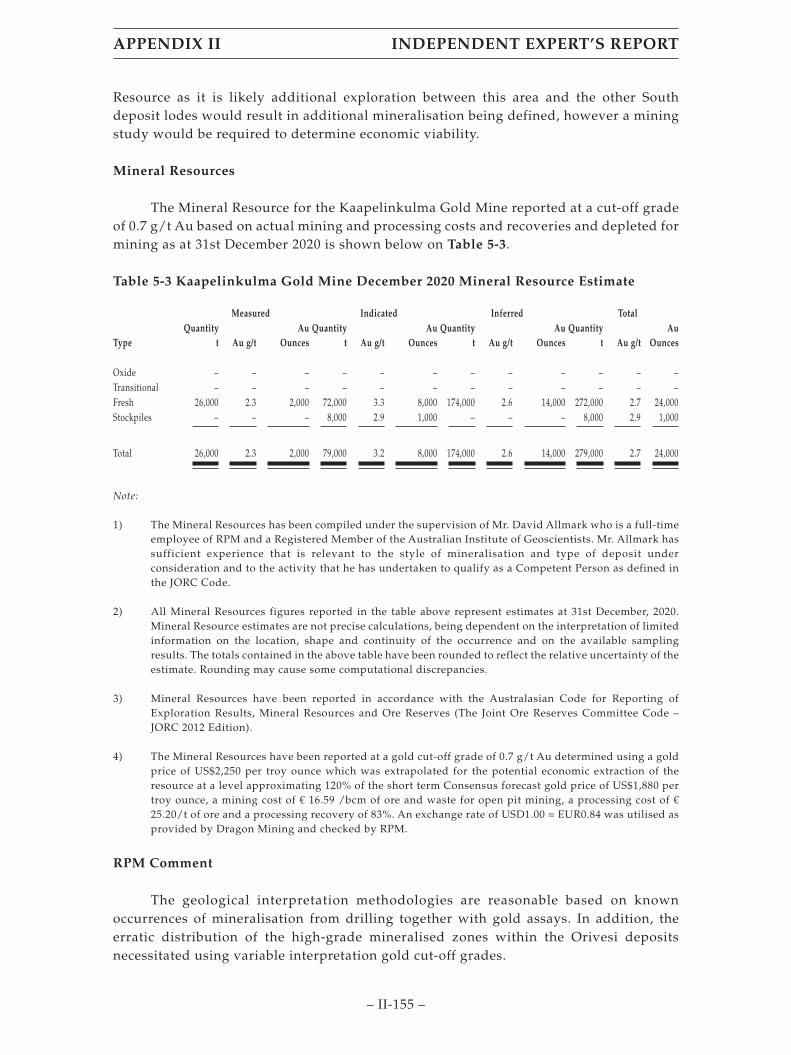
Resource as it is likely additional exploration between this area and the other Southdeposit lodes would result in additional mineralisation being defined, however a miningstudy would be required to determine economic viability.
Mineral Resources
The Mineral Resource for the Kaapelinkulma Gold Mine reported at a cut-off gradeof 0.7 g/t Au based on actual mining and processing costs and recoveries and depleted formining as at 31st December 2020 is shown below on Table 5-3.
Table 5-3 Kaapelinkulma Gold Mine December 2020 Mineral Resource Estimate
Type
Measured Indicated Inferred TotalQuantity
t Au g/tAu
OuncesQuantity
t Au g/tAu
OuncesQuantity
t Au g/tAu
OuncesQuantity
t Au g/tAu
Ounces
Oxide – – – – – – – – – – – –Transitional – – – – – – – – – – – –Fresh 26,000 2.3 2,000 72,000 3.3 8,000 174,000 2.6 14,000 272,000 2.7 24,000Stockpiles – – – 8,000 2.9 1,000 – – – 8,000 2.9 1,000
Total 26,000 2.3 2,000 79,000 3.2 8,000 174,000 2.6 14,000 279,000 2.7 24,000
Note:
1) The Mineral Resources has been compiled under the supervision of Mr. David Allmark who is a full-timeemployee of RPM and a Registered Member of the Australian Institute of Geoscientists. Mr. Allmark hassufficient experience that is relevant to the style of mineralisation and type of deposit underconsideration and to the activity that he has undertaken to qualify as a Competent Person as defined inthe JORC Code.
2) All Mineral Resources figures reported in the table above represent estimates at 31st December, 2020.Mineral Resource estimates are not precise calculations, being dependent on the interpretation of limitedinformation on the location, shape and continuity of the occurrence and on the available samplingresults. The totals contained in the above table have been rounded to reflect the relative uncertainty of theestimate. Rounding may cause some computational discrepancies.
3) Mineral Resources have been reported in accordance with the Australasian Code for Reporting ofExploration Results, Mineral Resources and Ore Reserves (The Joint Ore Reserves Committee Code –JORC 2012 Edition).
4) The Mineral Resources have been reported at a gold cut-off grade of 0.7 g/t Au determined using a goldprice of US$2,250 per troy ounce which was extrapolated for the potential economic extraction of theresource at a level approximating 120% of the short term Consensus forecast gold price of US$1,880 pertroy ounce, a mining cost of € 16.59 /bcm of ore and waste for open pit mining, a processing cost of €25.20/t of ore and a processing recovery of 83%. An exchange rate of USD1.00 = EUR0.84 was utilised asprovided by Dragon Mining and checked by RPM.
RPM Comment
The geological interpretation methodologies are reasonable based on knownoccurrences of mineralisation from drilling together with gold assays. In addition, theerratic distribution of the high-grade mineralised zones within the Orivesi depositsnecessitated using variable interpretation gold cut-off grades.
APPENDIX II INDEPENDENT EXPERT’S REPORT
– II-155 –

The statistical analysis, modelling and estimation has been carried out according tointernational best practice. For Orivesi RPM recommends trialling variography for thelarger objects and an Ordinary Kriging (“OK”) estimate for comparison with the ID2estimate.
The validation methodologies used and results are reasonable and as expected forthese styles of deposits.
The Mineral Resources have been estimated using acceptable procedures forinterpretation, statistical analysis, block modelling, grade estimation, validation andclassification according to the JORC Code (2012).
5.2 Svartliden Production Centre
5.2.1 Svartliden
The Mineral Resources for the Svartliden Gold Mine were estimated and lastreported by RPM in April 2014. The mineralisation interpretation was completed byDragon Mining and then revised by RPM prior to RPM completing the resource model.The model was depleted for mining undertaken to the end of December 2013. All data wassent for RPM to complete the block model and estimate, classify and report the MineralResource and provide Competent Person sign-off in line with the guidelines of JORC. TheSvartliden Gold Mine is currently not in production and has been on care andmaintenance since 2014.
Data and Geological Interpretation
A total of 2,731 holes were included in the Mineral Resource estimate; 279exploration holes and 2,452 grade control holes, the majority of which lie within the minedportion of the deposit.
Wireframes were constructed by extending those generated by Dragon Mining minegeologists using grade control drilling. In the deeper portions of the deposit,cross-sectional interpretations were based on mineralised envelopes constructed at a1.3g/t Au cut-off grade. Some lower grade mineralisation was included to maintaincontinuity of the lodes.
Statistical Analysis, Modelling and Estimation
Samples were composited to 1m intervals and a high grade cut of 60g/t Au wasrequired to limit the influence of erratic high grade values. In the area defined as the openpit resource, a high grade cut of 30g/t was used to be consistent with mine geologypractices which were supported by good reconciliation with gold production. A Surpacblock model used a block size of 2m NS by 10m EW by 10m vertical with sub-cells of 0.5mby 2.5m by 2.5m.
OK grade interpolation used a search ellipse oriented to the plane of mineralisation.For the open pit Mineral Resources a first pass radius of 25m or 80m was used with a
APPENDIX II INDEPENDENT EXPERT’S REPORT
– II-156 –
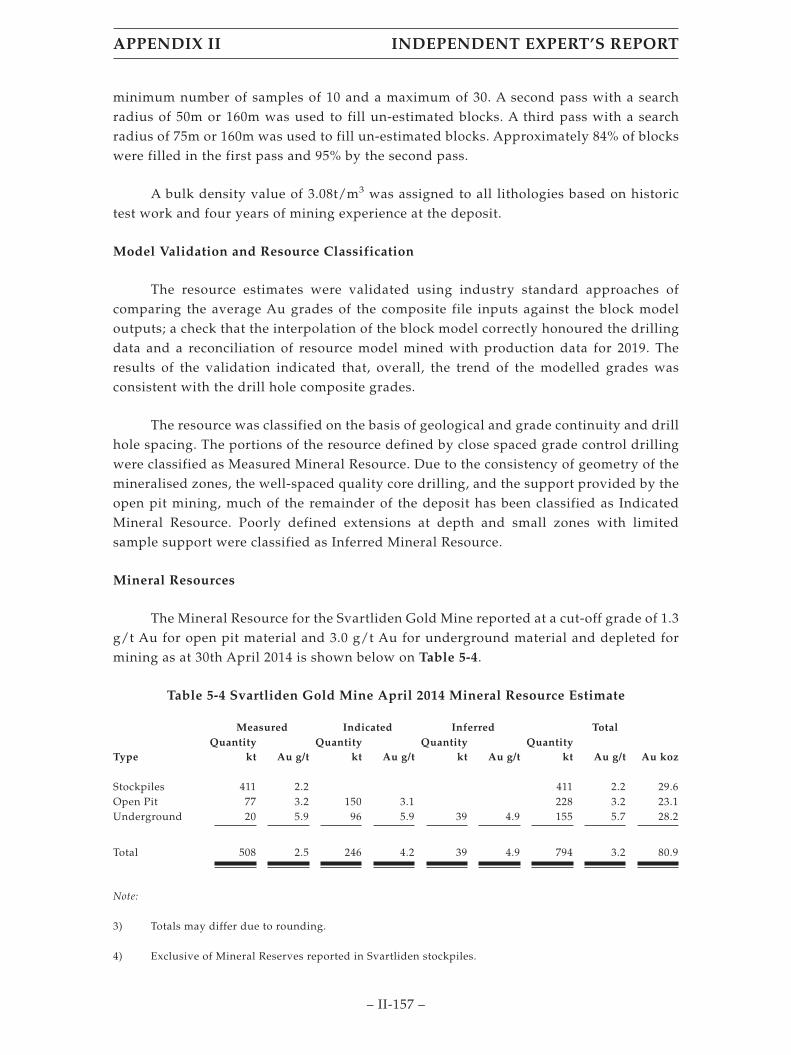
minimum number of samples of 10 and a maximum of 30. A second pass with a searchradius of 50m or 160m was used to fill un-estimated blocks. A third pass with a searchradius of 75m or 160m was used to fill un-estimated blocks. Approximately 84% of blockswere filled in the first pass and 95% by the second pass.
A bulk density value of 3.08t/m3 was assigned to all lithologies based on historictest work and four years of mining experience at the deposit.
Model Validation and Resource Classification
The resource estimates were validated using industry standard approaches ofcomparing the average Au grades of the composite file inputs against the block modeloutputs; a check that the interpolation of the block model correctly honoured the drillingdata and a reconciliation of resource model mined with production data for 2019. Theresults of the validation indicated that, overall, the trend of the modelled grades wasconsistent with the drill hole composite grades.
The resource was classified on the basis of geological and grade continuity and drillhole spacing. The portions of the resource defined by close spaced grade control drillingwere classified as Measured Mineral Resource. Due to the consistency of geometry of themineralised zones, the well-spaced quality core drilling, and the support provided by theopen pit mining, much of the remainder of the deposit has been classified as IndicatedMineral Resource. Poorly defined extensions at depth and small zones with limitedsample support were classified as Inferred Mineral Resource.
Mineral Resources
The Mineral Resource for the Svartliden Gold Mine reported at a cut-off grade of 1.3g/t Au for open pit material and 3.0 g/t Au for underground material and depleted formining as at 30th April 2014 is shown below on Table 5-4.
Table 5-4 Svartliden Gold Mine April 2014 Mineral Resource Estimate
Type
Measured Indicated Inferred TotalQuantity
kt Au g/tQuantity
kt Au g/tQuantity
kt Au g/tQuantity
kt Au g/t Au koz
Stockpiles 411 2.2 411 2.2 29.6Open Pit 77 3.2 150 3.1 228 3.2 23.1Underground 20 5.9 96 5.9 39 4.9 155 5.7 28.2
Total 508 2.5 246 4.2 39 4.9 794 3.2 80.9
Note:
3) Totals may differ due to rounding.
4) Exclusive of Mineral Reserves reported in Svartliden stockpiles.
APPENDIX II INDEPENDENT EXPERT’S REPORT
– II-157 –

5.2.2 Fäboliden
The Mineral Resources for the Fäboliden Gold Mine were estimated and reported byRPM in 2021. The mineralisation interpretation was completed by Dragon Mining andthen revised by RPM prior to RPM completing the resource model in December 2020. Themodel was depleted for mining undertaken to the end of December 2020. All data was sentfor RPM to complete the block model and estimate, classify and report the MineralResource and provide Competent Person sign-off in line with the guidelines of JORC.
Data and Geological Interpretation
Drill holes used in the Mineral Resource estimate included 68 RC holes and 364 DDholes for a total of 63,972m within the wireframes. Mineralisation wireframes wereconstructed by Dragon Mining using a nominal 0.5g/t gold cut-off grade. However, insome areas, the cut-off grade was reduced to as low as 0.3g/t gold to generate sensiblegeological shapes and to capture the high-grade mineralisation which is erraticallydistributed within the broader mineralised zones.
Statistical Analysis, Modelling and Estimation
Samples were composited to 1m intervals. High grade cuts of 15g/t and 40g/t goldwere applied and high-grade cuts were also applied to Ag. A Surpac 2019 block model wasused for the estimate with a block size of 10m NS by 5m EW by 5m vertical with sub-blocksof 1.25m by 1.25m by 1.25m. For the grade control area, the parent block size was set to 5mNS by 2.5m EW by 2.5m vertical.
Ordinary Kriging (“OK”) grade interpolation was used for the estimate, constrainedby Mineral Resource outlines based on mineralisation envelopes prepared using anominal 0.5g/t gold cut-off grade for low grade and 1.0g/t to 1.3g/t for high grade, witha minimum down-hole length of 2m. Three passes were used to estimate the blocks in themodel and more than 95% of blocks were filled in the first two passes.
Bulk densities ranging between 1.8t/m3 and 2.97t/m3 were assigned in the blockmodel dependent on lithology and weathering.
Model Validation and Resource Classification
The resource estimates were validated using industry standard approaches ofcomparing mean grades of blocks to mean grades of input data (composites), swath plotsto check estimated grades against the drill hole grades, and a visual qualitativecomparison of the block estimates to the composites. The review indicates that, whilevariation globally can be seen, there is good correlation between block estimates andcomposite grades further supported by visual inspection.
Reconciliation was completed for the test pit mining conducted to date. Thecomparison shows a 27% reduction in tonnes and a 12.5% increase in grade resulting in a17% reduction in gold metal in the in situ grade control model compared to the resource
APPENDIX II INDEPENDENT EXPERT’S REPORT
– II-158 –

model. An explanation for the large differences in total quantities could be that highergrade material was selectively mined, as the quantity of material greater than 2.0 g/t Auin the mined open pit part of the model is comparable to the reconciliation data in terms ofquantity, grade and metal content.
The Mineral Resource was classified as Measured, Indicated and Inferred MineralResource based on data quality, sample spacing, and lode continuity. The MeasuredMineral Resource was defined within areas of grade control RC and DD of less than 10mby 6m drill spacing in the test mining area. The Indicated Mineral Resource was definedwithin areas of close-spaced diamond and RC drilling of less than 50m by 50m, and wherethe continuity and predictability of the lode positions was good. The Inferred MineralResource was assigned to areas where drill hole spacing was greater than 50m by 50m,where small, isolated pods of mineralisation occur outside the main mineralised zones,and to geologically complex zones.
Mineral Resources
The Mineral Resource for the Fäboliden Gold Mine reported at a cut-off grade of 1.1g/t Au for open pit material above a revenue factor 1.2 optimised pit shell and at a cut-offgrade of 2.0 g/t Au for underground material below the revenue factor 1.2 optimised pitshell depleted for mining as at 31st December 2020 is shown below on Table 5-5.
Table 5-5 Fäboliden Deposit December 2020 Mineral Resource Estimate
Material
AuCut-Off
g/t
Measured Indicated Inferred TotalQuantity
Mt Au g/t Au ozQuantity
Mt Au g/t Au ozQuantity
Mt Au g/t Au ozQuantity
Mt Au g/t Au oz
Open Pit 1.1 0.10 3.4 11,000 3.0 2.9 280,000 0.62 2.4 48,000 3.7 2.8 340,000Underground 2.0 – – – 1.3 3.0 130,000 5.2 3.4 560,000 6.5 3.3 690,000Stockpiles – – – – <0.1 1.8 1,600 – – – <0.1 1.8 1,600
Total 0.10 3.4 11,000 4.3 2.9 410,000 5.8 3.3 610,000 10 3.1 1,000,000
Note:
5) The Mineral Resources has been compiled under the supervision of Mr. David Allmark who is a full-timeemployee of RPM and a Registered Member of the Australian Institute of Geoscientists. Mr. Allmark hassufficient experience that is relevant to the style of mineralisation and type of deposit underconsideration and to the activity that he has undertaken to qualify as a Competent Person as defined inthe JORC Code.
6) All Mineral Resources figures reported in the table above represent estimates at 31st December, 2020.Mineral Resource estimates are not precise calculations, being dependent on the interpretation of limitedinformation on the location, shape and continuity of the occurrence and on the available samplingresults. The totals contained in the above table have been rounded to reflect the relative uncertainty of theestimate. Rounding may cause some computational discrepancies.
7) Mineral Resources have been reported in accordance with the Australasian Code for Reporting ofExploration Results, Mineral Resources and Ore Reserves (The Joint Ore Reserves Committee Code –JORC 2012 Edition).
8) The Mineral Resources have been reported at gold cut-off grades and above and below a revenue factor1.2 optimised pit shell determined using a gold price of US$1,740 per troy ounce (extrapolated for the
APPENDIX II INDEPENDENT EXPERT’S REPORT
– II-159 –
potential economic extraction of the resource at a level approximating 120% of the long term Consensusforecast gold price as at January 2021 of USD 1,450/oz), a mining cost of US$14.76/t of ore for open pit;and US$38.02/t of ore for underground, a processing cost of US$34.30/t of ore and a processing recoveryof 82%.
RPM Comment
The geological interpretation methodology was reasonable and based oninformation from the mine geologists on-site.
The statistical analysis, modelling and estimation has been carried out according tointernational best practice.
The validation methodologies used and results are reasonable and as expected forthis style of deposit. The basis upon which the resources were classified is acceptable andin line with international best practice.
The Mineral Resources for the Fäboliden and Svartliden Gold Mines have beenestimated using acceptable procedures for interpretation, statistical analysis, blockmodelling, grade estimation, validation and classification according to the JORC Code(2012).
6. ORE RESERVES AND MINING
6.1 Vammala Production Centre
6.1.1 Orivesi
The Orivesi mine ceased production in 2019 and has no current Ore Reserves. Thereare residual Mineral Resources.
6.1.2 Jokisivu
Approach
For the purpose of the valuation, RPM completed a high-level review of the OreReserves and mining, with a particular focus on:
• Study status to meet the requirements of the JORC Code.
• Mining methods and mine design.
• Estimation of the ore cut-off grade.
• Life-of-mine (LOM) schedule.
• Derivation of mining costs.
• Estimation of Ore Reserves.
APPENDIX II INDEPENDENT EXPERT’S REPORT
– II-160 –

Each of these aspects are discussed below.
Study Status
A life-of-mine (LOM) plan to a pre-feasibility study (PFS) level of accuracy has beenprepared in order to support the declaration of an Ore Reserves estimate. The purpose ofthe mine plan was to assess if the Ore Reserves are technically achievable andeconomically viable.
RPM Comment
The JORC Code requires that the minimum level of service to support the estimationof an Ore Reserve is a PFS. RPM reviewed the overall approach and considered the mineplanning completed on the Jokisivu underground mine meets the requirements of a PFS.The mining costs are understood to be based on actual mining operating costs. Theprocessing and overhead costs are understood to be actual historical costs associated withthe Vammala and Svartliden plants. The level of mine planning meets the requirements ofa PFS for this style of mine and includes confirming mining methods and mine design,LOM scheduling and financial modelling.
Mining Method and Mine Design
The mining method at Jokisivu is long-hole open stoping (LHOS) with rockfill and isapplied in an overhand manner. Mining advances from the bottom upwards inapproximately 80m high mining panels leaving a sill pillar between the panels. Backfillmaterial can be either waste rock from development or waste rock from the surfacedepending on the availability of material. Access drives from the main decline to miningareas are developed at 15 to 20m vertical sub-level intervals.
Underground mining of both lode systems is by means of trackless diesel/electricpowered equipment such as drill jumbos, front end loaders and trucks. Open stopes aredeveloped over varying heights with floor pillars left at regular intervals. These floorpillars are then extracted at a later time. The mines production rate is 240,000 tpa with theore being truck hauled over public roads to the processing plant at Vammala.
Table 6-1 sets out the stope optimisation parameters used for the Jokisivu deposit.
Table 6-1 Stope Optimisation Parameters
Mining Method Units LHOS
Bottom up/Top down extraction Top/Bottom Bottom UpDefault density t/m³ 2.80Stope length (along strike) m 5Sub level interval m 15Minimum stope width m 3Maximum stope width m 12
APPENDIX II INDEPENDENT EXPERT’S REPORT
– II-161 –

Outlying and impractical stopes (such as those too close to existing open voids)were removed from the results in order to create a final selection to use in the mine designprocess. Centrelines for operating and capital development were then created based onthe selected stope shapes and supplied site layouts. Table 6-2 and Table 6-3 summarise thedesign parameters used for the underground layout.
Table 6-2 Underground Design Criteria
Design Criteria Unit Value
Slope of decline 1: 7Transverse/Longitudinal Trans/Long LongNumber of declines # 1Decline minimum stand-off from orebody m 30Decline minimum radius m 23Footwall drive standoff from orebody m 20Level Spacing m 15Minimum distance between oredrives m 5Minimum Sill Pillar Thickness m 5Minimum Rib Pillar Thickness m 5
Table 6-3 Underground Design Drive Sizes
Drive Sizes Unit Width Height
Decline m 6.1 5.2Access Drive m 5.0 5.4Ore Drive m 4.2 5.1Vent Drive m 5.0 5.1Vent Rise m 3.0
RPM Comment
The mining method is reasonable for the style and characteristics of the deposit. Ithas been largely applied since the inception of the underground mine and has a trackrecord of being successfully applied. The design criteria underpinning the approach tounderground mining is reasonable and again reflects current operations.
Mining Modifying Factors
The mining modifying factors are those parameters applied to the mineable in situore to enable conversion to ROM ore. The key mining modifying factors are the ore lossand waste rock dilution. The ore loss and waste rock dilution is largely a function of thecharacteristics of the ore body and the mining method. The mining modifying factors aredependent on the mining method and characteristics of the deposit.
APPENDIX II INDEPENDENT EXPERT’S REPORT
– II-162 –

Dilution estimates for Jokisivu as applied in the PFS are set out on Table 6-4 and aimto account for:
• Over-break into the hanging or footwall material from drilling and blastingoperations;
• rock failure (wall slough) from adjacent walls to the stope boundaries due toweak rock mass characteristics, and
• bogging dilution from the floors.
Of note, the mining dilution estimates are reportedly based on operationalexperience and in-situ to ROM ore reconciliations.
Table 6-4 Mining Dilution
Mine Zone UnitDilution
Stope Development
Kujankallio % 30 5Arpola % 30 5
The PFS estimate for mining recovery is set out on Table 6-5 and accounts formining-related ore losses due to:
• broken mineralisation not recovered from the stope;
• in-stope support pillars;
• stope under break and unrecoverable bridging;
• misclassification of material resulting in mineralised material hauled to thewaste dump (by accident), and
• abandoned mineralised material due to excessive dilution from stope wallfailures (waste or backfill). Mining recovery has also been estimated based onon-site operational experience and reconciliation data.
Table 6-5 Mining Recovery
Mine Zone UnitRecovery
Stope Development
Kujankallio % 90 95Arpola % 90 95
APPENDIX II INDEPENDENT EXPERT’S REPORT
– II-163 –
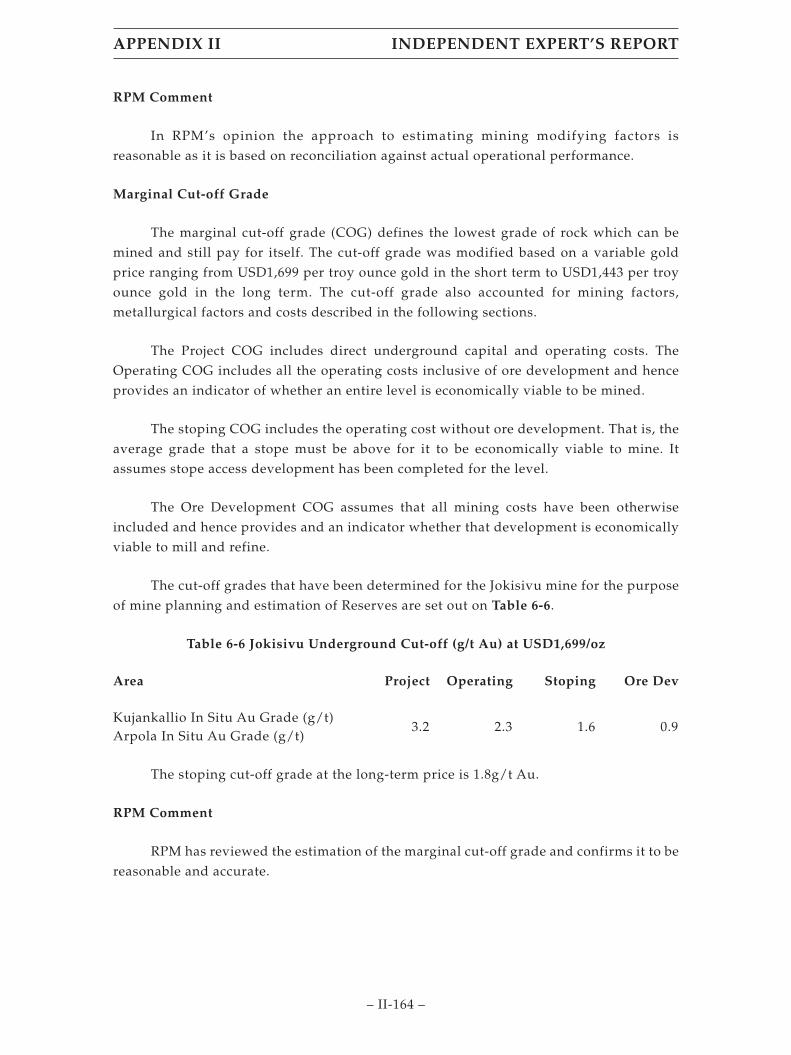
RPM Comment
In RPM’s opinion the approach to estimating mining modifying factors isreasonable as it is based on reconciliation against actual operational performance.
Marginal Cut-off Grade
The marginal cut-off grade (COG) defines the lowest grade of rock which can bemined and still pay for itself. The cut-off grade was modified based on a variable goldprice ranging from USD1,699 per troy ounce gold in the short term to USD1,443 per troyounce gold in the long term. The cut-off grade also accounted for mining factors,metallurgical factors and costs described in the following sections.
The Project COG includes direct underground capital and operating costs. TheOperating COG includes all the operating costs inclusive of ore development and henceprovides an indicator of whether an entire level is economically viable to be mined.
The stoping COG includes the operating cost without ore development. That is, theaverage grade that a stope must be above for it to be economically viable to mine. Itassumes stope access development has been completed for the level.
The Ore Development COG assumes that all mining costs have been otherwiseincluded and hence provides and an indicator whether that development is economicallyviable to mill and refine.
The cut-off grades that have been determined for the Jokisivu mine for the purposeof mine planning and estimation of Reserves are set out on Table 6-6.
Table 6-6 Jokisivu Underground Cut-off (g/t Au) at USD1,699/oz
Area Project Operating Stoping Ore Dev
Kujankallio In Situ Au Grade (g/t)Arpola In Situ Au Grade (g/t)
3.2 2.3 1.6 0.9
The stoping cut-off grade at the long-term price is 1.8g/t Au.
RPM Comment
RPM has reviewed the estimation of the marginal cut-off grade and confirms it to bereasonable and accurate.
APPENDIX II INDEPENDENT EXPERT’S REPORT
– II-164 –
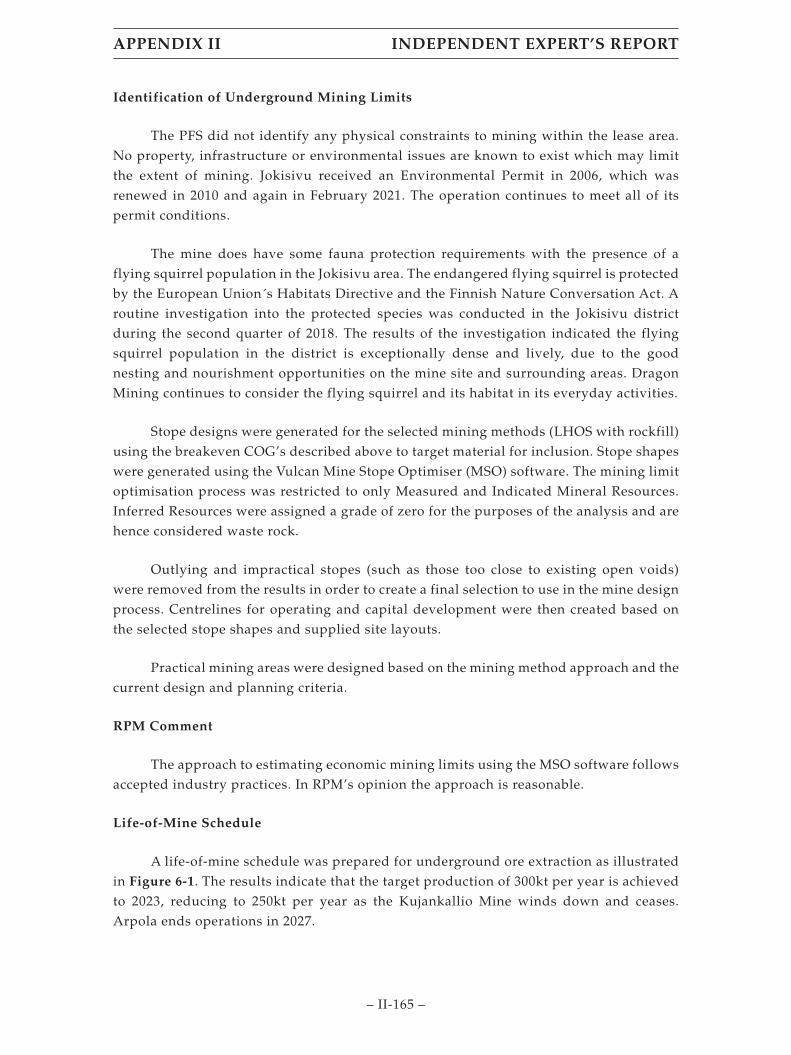
Identification of Underground Mining Limits
The PFS did not identify any physical constraints to mining within the lease area.No property, infrastructure or environmental issues are known to exist which may limitthe extent of mining. Jokisivu received an Environmental Permit in 2006, which wasrenewed in 2010 and again in February 2021. The operation continues to meet all of itspermit conditions.
The mine does have some fauna protection requirements with the presence of aflying squirrel population in the Jokisivu area. The endangered flying squirrel is protectedby the European Union´s Habitats Directive and the Finnish Nature Conversation Act. Aroutine investigation into the protected species was conducted in the Jokisivu districtduring the second quarter of 2018. The results of the investigation indicated the flyingsquirrel population in the district is exceptionally dense and lively, due to the goodnesting and nourishment opportunities on the mine site and surrounding areas. DragonMining continues to consider the flying squirrel and its habitat in its everyday activities.
Stope designs were generated for the selected mining methods (LHOS with rockfill)using the breakeven COG’s described above to target material for inclusion. Stope shapeswere generated using the Vulcan Mine Stope Optimiser (MSO) software. The mining limitoptimisation process was restricted to only Measured and Indicated Mineral Resources.Inferred Resources were assigned a grade of zero for the purposes of the analysis and arehence considered waste rock.
Outlying and impractical stopes (such as those too close to existing open voids)were removed from the results in order to create a final selection to use in the mine designprocess. Centrelines for operating and capital development were then created based onthe selected stope shapes and supplied site layouts.
Practical mining areas were designed based on the mining method approach and thecurrent design and planning criteria.
RPM Comment
The approach to estimating economic mining limits using the MSO software followsaccepted industry practices. In RPM’s opinion the approach is reasonable.
Life-of-Mine Schedule
A life-of-mine schedule was prepared for underground ore extraction as illustratedin Figure 6-1. The results indicate that the target production of 300kt per year is achievedto 2023, reducing to 250kt per year as the Kujankallio Mine winds down and ceases.Arpola ends operations in 2027.
APPENDIX II INDEPENDENT EXPERT’S REPORT
– II-165 –

Figure 6-1 Underground LOM Schedule
2021 2022 2023 2024 2025 2026 2027
Kujankallio 174 k 165 k 155 k 139 k 176 k 240 k 52 k
Arpola 131 k 139 k 131 k 120 k 73 k - -
Ore Grade (g/t) 2.7 2.5 2.2 2.6 2.1 1.8
-
0.5
1.0
1.5
2.0
2.5
3.0
-
50 k
100 k
150 k
200 k
250 k
300 k
350 k
Gra
de
Ton
nes
Axis Title
Mine ROM Ore Production (t) and Grade (g/t)
The ore processing schedule is illustrated in Figure 6-2. It indicates that the targetproduction of 300ktpa feed is achieved to 2024 with support of stockpiled before reducingas production at Kujankallio reduces.
Figure 6-2 LOM Ore Processing Schedule
0.00
0.50
1.00
1.50
2.00
2.50
3.00
0
50
100
150
200
250
300
350
2021 2022 2023 2024 2025 2026 2027
Feed
Gra
de
(g/t
)
Processing Schedule
Ore Tonnes (kt) Grade (g/t)
Ore
pro
cess
ed (k
t)
APPENDIX II INDEPENDENT EXPERT’S REPORT
– II-166 –
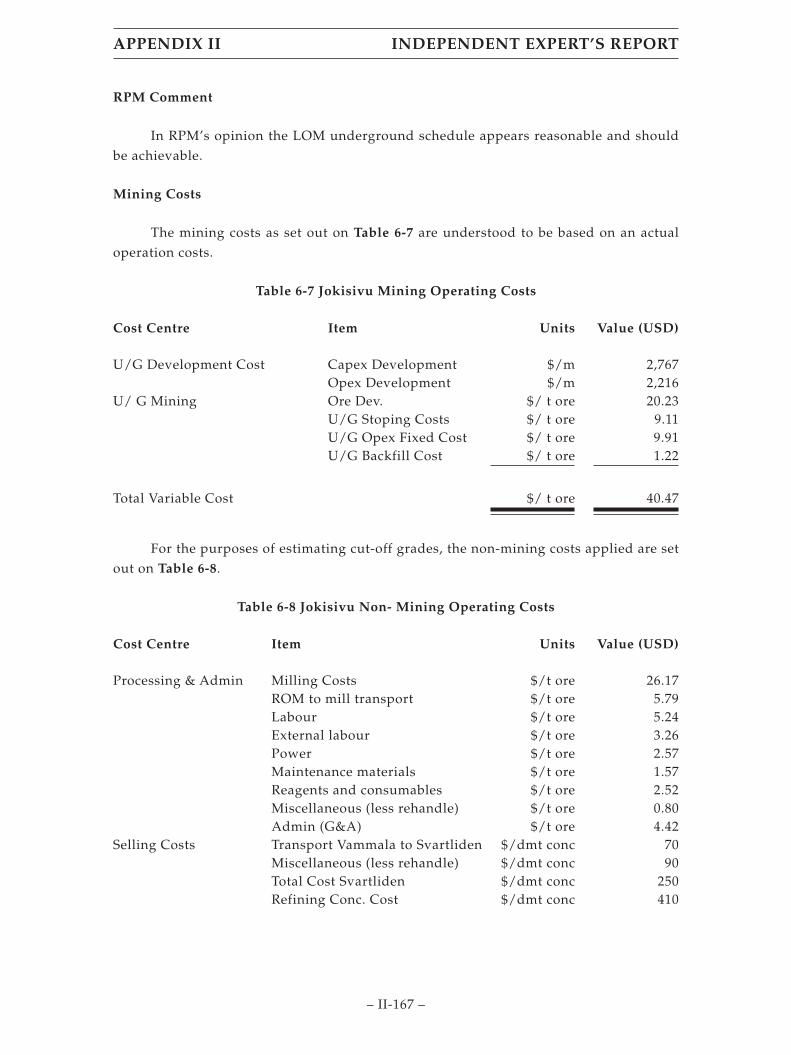
RPM Comment
In RPM’s opinion the LOM underground schedule appears reasonable and shouldbe achievable.
Mining Costs
The mining costs as set out on Table 6-7 are understood to be based on an actualoperation costs.
Table 6-7 Jokisivu Mining Operating Costs
Cost Centre Item Units Value (USD)
U/G Development Cost Capex Development $/m 2,767Opex Development $/m 2,216
U/ G Mining Ore Dev. $/ t ore 20.23U/G Stoping Costs $/ t ore 9.11U/G Opex Fixed Cost $/ t ore 9.91U/G Backfill Cost $/ t ore 1.22
Total Variable Cost $/ t ore 40.47
For the purposes of estimating cut-off grades, the non-mining costs applied are setout on Table 6-8.
Table 6-8 Jokisivu Non- Mining Operating Costs
Cost Centre Item Units Value (USD)
Processing & Admin Milling Costs $/t ore 26.17ROM to mill transport $/t ore 5.79Labour $/t ore 5.24External labour $/t ore 3.26Power $/t ore 2.57Maintenance materials $/t ore 1.57Reagents and consumables $/t ore 2.52Miscellaneous (less rehandle) $/t ore 0.80Admin (G&A) $/t ore 4.42
Selling Costs Transport Vammala to Svartliden $/dmt conc 70Miscellaneous (less rehandle) $/dmt conc 90Total Cost Svartliden $/dmt conc 250Refining Conc. Cost $/dmt conc 410
APPENDIX II INDEPENDENT EXPERT’S REPORT
– II-167 –
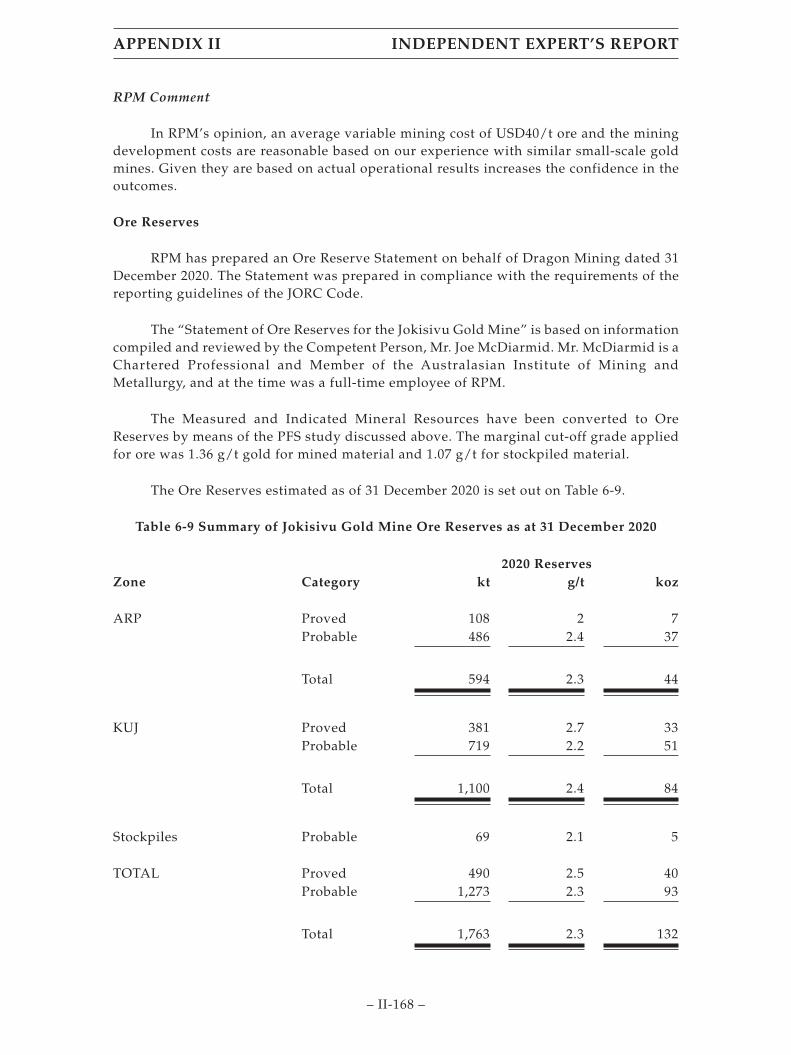
RPM Comment
In RPM’s opinion, an average variable mining cost of USD40/t ore and the miningdevelopment costs are reasonable based on our experience with similar small-scale goldmines. Given they are based on actual operational results increases the confidence in theoutcomes.
Ore Reserves
RPM has prepared an Ore Reserve Statement on behalf of Dragon Mining dated 31December 2020. The Statement was prepared in compliance with the requirements of thereporting guidelines of the JORC Code.
The “Statement of Ore Reserves for the Jokisivu Gold Mine” is based on informationcompiled and reviewed by the Competent Person, Mr. Joe McDiarmid. Mr. McDiarmid is aChartered Professional and Member of the Australasian Institute of Mining andMetallurgy, and at the time was a full-time employee of RPM.
The Measured and Indicated Mineral Resources have been converted to OreReserves by means of the PFS study discussed above. The marginal cut-off grade appliedfor ore was 1.36 g/t gold for mined material and 1.07 g/t for stockpiled material.
The Ore Reserves estimated as of 31 December 2020 is set out on Table 6-9.
Table 6-9 Summary of Jokisivu Gold Mine Ore Reserves as at 31 December 2020
Zone Category2020 Reserves
kt g/t koz
ARP Proved 108 2 7Probable 486 2.4 37
Total 594 2.3 44
KUJ Proved 381 2.7 33Probable 719 2.2 51
Total 1,100 2.4 84
Stockpiles Probable 69 2.1 5
TOTAL Proved 490 2.5 40Probable 1,273 2.3 93
Total 1,763 2.3 132
APPENDIX II INDEPENDENT EXPERT’S REPORT
– II-168 –

Notes:
1. The Statement of JORC Ore Reserves has been compiled under the supervision of Mr. Joe McDiarmid whois a full-time Manager – Metals Consulting Australasia employed by RPM and is a Member of theAustralian Institute of Mining and Metallurgy. Mr. McDiarmid has sufficient experience which isrelevant to the style of mineralisation and type of deposit under consideration to qualify as a CompetentPerson as defined in the JORC Code;
2. Tonnages are dry metric tonnes;
3. The economic in-situ ore cut-off grades were determined based on a variable gold price ranging fromUSD1,699 per troy ounce in the short term to USD1,443 per troy ounce long term, and historical costs andmetallurgical modifying factors.
Kujankallio stope cut-off grade of 1.6 g/t Au.Arpola stope cut-off grade of 1.6 g/t Au.
4. Ore Reserve estimates are not precise calculations, being dependent on the interpretation of limitedinformation on the location, shape and continuity of the occurrence and on the available samplingresults. The quantities contained in the above table have been rounded to reflect the relative uncertaintyof the estimate.
Mineral Resources are reported inclusive of Ore Reserves (that is, Ore Reserves arenot additional to Mineral Resources).
RPM Comment
In RPM’s opinion the estimate of Ore Reserves is reasonable and meets therequirements of the JORC Code. The estimate is suitable to support the valuation of theasset.
6.1.3 Kaapalinkulma
The Kaapalinkulma open cut mine ceased production recently in April 2021 and hasno current Ore Reserves. There are residual Mineral Resources.
6.2 Svartliden Production Centre
6.2.1 Fäboliden
Approach
For the purpose of the valuation, RPM completed a high-level review of the OreReserves and mining, with a particular focus on:
• Study status to meet the requirements of the JORC Code.
• Identification of open cut mining limits.
• Pit design parameters and overall pit slope angles.
• Estimation of the ore cut-off grade.
APPENDIX II INDEPENDENT EXPERT’S REPORT
– II-169 –

• Life-of-mine (LOM) schedule.
• Derivation of mining costs.
• Estimation of Ore Reserves.
Each of these aspects as discussed below.
Study Status
A life-of-mine (LOM) plan to a pre-feasibility study (PFS) level of accuracy has beenprepared in order to support the declaration of an Ore Reserves estimate. The purpose ofthe mine plan was to assess if the Ore Reserves are technically achievable andeconomically viable.
RPM Comment
The JORC Code requires that the minimum level of service to support the estimationof an ore Reserve is a PFS. RPM reviewed the overall approach and considers the mineplanning completed on the Fäboliden open cut mine meets the requirements of a PFS. Themining costs are understood to be based on actual mining contractor costings. Theprocessing and overhead costs are understood to be actual historical costs associated withthe Svartliden plant. The level of mine planning meets the requirements of a PFS for thisstyle of mine and includes confirming open pit limits, preparing a detailed ultimate pitdesign, LOM scheduling and financial modelling.
Identification of Open Pit Limits
The pit limits were defined by considering the physical constraints to mining, whichfor Fäboliden, is the Exploitation Concession area as discussed in Section 3. RPM is notaware of any other physical constraints to mining within the concession area such asproperty, infrastructure or environmental issues.
RPM used the Geovia Whittle 4X software to identify the open cut mining limits.Key inputs to the pit limit optimisation process included the Resource model,geotechnical parameters, metallurgical modifying factors and historical or forecastoperating costs. This study was completed with revenue generated only by Measured andIndicated Resources. That is, no value was allocated to Inferred Resources and hence itwas considered by the analysis as waste rock.
A sensitivity analysis to gold price was completed on metal prices ranging fromUSD462 per ounce to USD1,716 per ounce. The change in mineable quantities, that is, theopen pit shell, is driven by the characteristics of the deposit and the costs and modifyingfactors applied. The ROM ore tonnage and grade results are presented in Figure 6-3.
APPENDIX II INDEPENDENT EXPERT’S REPORT
– II-170 –
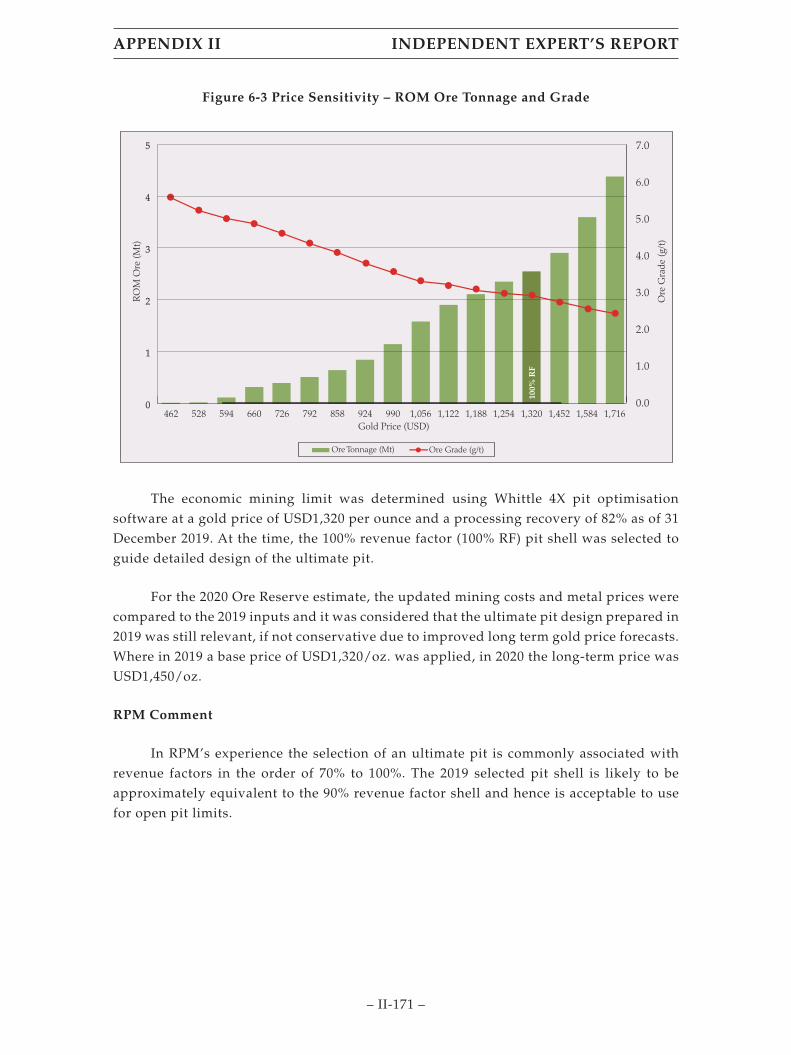
Figure 6-3 Price Sensitivity – ROM Ore Tonnage and Grade
0
1
2
3
4
5
0.0
1.0
2.0
3.0
4.0
5.0
6.0
7.0
462 528 594 660 726 792 858 924 990 1,056 1,122 1,188 1,254 1,320 1,452 1,584 1,716
RO
M O
re (M
t)
Ore
Gra
de (g
/t)
Gold Price (USD)
Ore Tonnage (Mt) Ore Grade (g/t)
100%
RF
The economic mining limit was determined using Whittle 4X pit optimisationsoftware at a gold price of USD1,320 per ounce and a processing recovery of 82% as of 31December 2019. At the time, the 100% revenue factor (100% RF) pit shell was selected toguide detailed design of the ultimate pit.
For the 2020 Ore Reserve estimate, the updated mining costs and metal prices werecompared to the 2019 inputs and it was considered that the ultimate pit design prepared in2019 was still relevant, if not conservative due to improved long term gold price forecasts.Where in 2019 a base price of USD1,320/oz. was applied, in 2020 the long-term price wasUSD1,450/oz.
RPM Comment
In RPM’s experience the selection of an ultimate pit is commonly associated withrevenue factors in the order of 70% to 100%. The 2019 selected pit shell is likely to beapproximately equivalent to the 90% revenue factor shell and hence is acceptable to usefor open pit limits.
APPENDIX II INDEPENDENT EXPERT’S REPORT
– II-171 –
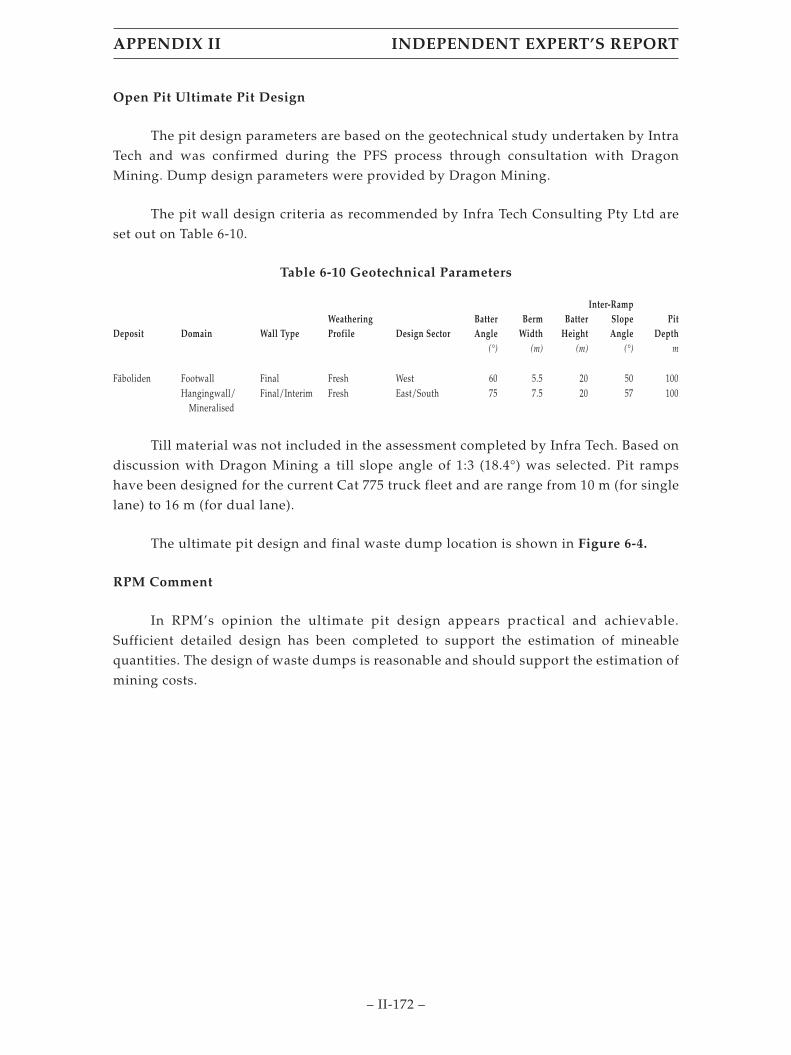
Open Pit Ultimate Pit Design
The pit design parameters are based on the geotechnical study undertaken by IntraTech and was confirmed during the PFS process through consultation with DragonMining. Dump design parameters were provided by Dragon Mining.
The pit wall design criteria as recommended by Infra Tech Consulting Pty Ltd areset out on Table 6-10.
Table 6-10 Geotechnical Parameters
Deposit Domain Wall TypeWeatheringProfile Design Sector
BatterAngle
BermWidth
BatterHeight
Inter-RampSlopeAngle
PitDepth
(°) (m) (m) (°) m
Fäboliden Footwall Final Fresh West 60 5.5 20 50 100Hangingwall/
MineralisedFinal/Interim Fresh East/South 75 7.5 20 57 100
Till material was not included in the assessment completed by Infra Tech. Based ondiscussion with Dragon Mining a till slope angle of 1:3 (18.4°) was selected. Pit rampshave been designed for the current Cat 775 truck fleet and are range from 10 m (for singlelane) to 16 m (for dual lane).
The ultimate pit design and final waste dump location is shown in Figure 6-4.
RPM Comment
In RPM’s opinion the ultimate pit design appears practical and achievable.Sufficient detailed design has been completed to support the estimation of mineablequantities. The design of waste dumps is reasonable and should support the estimation ofmining costs.
APPENDIX II INDEPENDENT EXPERT’S REPORT
– II-172 –

Figure 6-4 Pit and Dump Design
Mining Modifying Factors
The mining modifying factors are those parameters applied to the mineable in situore to enable conversion to ROM ore. The key mining modifying factors are the ore lossand waste rock dilution. The ore loss and waste rock dilution are largely a function of thecharacteristics of the ore body and the mining method.
The mining modifying factors are dependent on the mining method andcharacteristics of the deposit. The mining method is selective mining by hydraulicexcavators mining in 2.5m flitches loading standard off-highway rear dump truckshauling to surface ore stockpiles and waste disposal dumps. These would be supported byfront-end loaders for stockpile rehandle.
APPENDIX II INDEPENDENT EXPERT’S REPORT
– II-173 –
Mining loss and dilution is estimated by modifying the geological block model tothe selective mining unit (SMU) size reflective of the mining method. The SMU defines thesize of material that can be selectively excavated based on the mining parameters.
An ore loss and dilution analysis was completed, and based on the structure of themineralisation, and proposed mining method, the SMU selected for this study was 5m NSby 2.5m EW by 2.5m vertical. At the ore-waste boundary a 0.4m digging accuracy, with0.2m over-dig and 0.2m under-dig, was applied to the SMU blocks, to create a ROM modelthat was used in-pit optimisation and subsequent planning. The ROM model wascalculated to have a global ore loss of 13% and dilution of 23%.
RPM Comment
In RPM’s opinion the approach to estimating mining modifying factors followsaccepted industry practice and is reasonable.
Marginal Cut-off Grade
Mineralised rock with metal grades higher than the marginal cut-off grade isconsidered economic to be processed. The data inputs to estimate the marginal cut-offgrade is set out on Table 6-11.
Table 6-11 Marginal Cut-Off Grade Inputs
Item Units (USD) Value
Metal Recovery % 82.0%Incremental Ore Cost $/t feed 9.39Processing Cost $/t feed 33.13Admin/Other Cost $/t feed 1.18Rehandle $/t feed 0.00Ore Haulage $/t feed 5.94Refining Cost $/oz metal 5.00Royalty % 0.00Gold Price $/oz metal $1,450
It is understood that the parameters were largely based on historical performance ofthe trial mining and ore processing phase in 2019.
On the basis of these parameters the marginal cut-off grade is estimated at 1.36 g/tAu for Fresh Rock. No oxide or transition rock is present. This cut-off grade is based on aUSD1,450/oz gold price. A marginal processing cut-off grade for stockpiled ore isestimated at 1.07 g/t Au and is also based on USD1,450/oz gold price. The gold price isbased on the long-term gold price within the Energy and Metals Consensus publicationdated December 2020.
APPENDIX II INDEPENDENT EXPERT’S REPORT
– II-174 –

RPM Comment
RPM has reviewed the estimation of the marginal cut-off grade and confirms it to bereasonable and accurate.
Life-of-Mine Schedule
A life-of-mine schedule was prepared using RPM’s Open Pit Metals Solution(OPMS) software. The categorisation of “ore” and “waste” rock was based on the abovemarginal cut-off grades.
The total material movements of ore and waste are illustrated in Figure 6-5. Theresults indicate a high pre-strip is required in Year 1 and 2, followed by steady-statemining for four years. Remnant ore is mined out in Year 8.
Figure 6-5 LOM Schedule Total Material Movement
0
1
2
3
4
5
6
7
1 2 3 4 5 6 7 8
Year
Total Material Movement – Yearly
Ore Waste
Tota
l Mat
eria
l Mov
emen
t (M
t)
The ore processing schedule is illustrated in Figure 6-6. It indicates that the targetproduction of 300ktpa feed is achieved from Year 2 and continues to Year 7. Remnantprocessing of ore occurs in Year 8.
APPENDIX II INDEPENDENT EXPERT’S REPORT
– II-175 –
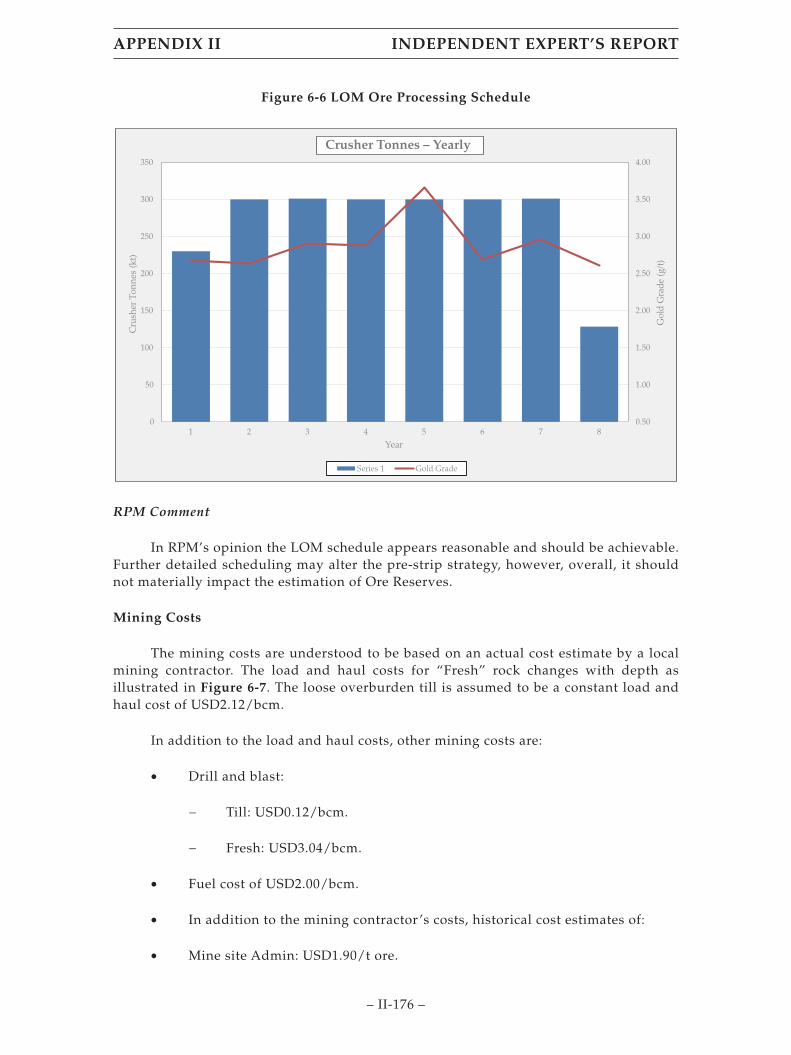
Figure 6-6 LOM Ore Processing Schedule
0.50
1.00
1.50
2.00
2.50
3.00
3.50
4.00
0
50
100
150
200
250
300
350
1 2 3 4 5 6 7 8
Gol
d G
rade
(g/t
)
Cru
sher
Ton
nes
(kt)
Year
Crusher Tonnes – Yearly
Series 1 Gold Grade
RPM Comment
In RPM’s opinion the LOM schedule appears reasonable and should be achievable.Further detailed scheduling may alter the pre-strip strategy, however, overall, it shouldnot materially impact the estimation of Ore Reserves.
Mining Costs
The mining costs are understood to be based on an actual cost estimate by a localmining contractor. The load and haul costs for “Fresh” rock changes with depth asillustrated in Figure 6-7. The loose overburden till is assumed to be a constant load andhaul cost of USD2.12/bcm.
In addition to the load and haul costs, other mining costs are:
• Drill and blast:
− Till: USD0.12/bcm.
− Fresh: USD3.04/bcm.
• Fuel cost of USD2.00/bcm.
• In addition to the mining contractor ’s costs, historical cost estimates of:
• Mine site Admin: USD1.90/t ore.
APPENDIX II INDEPENDENT EXPERT’S REPORT
– II-176 –

• Grade Control: USD3.61/t ore.
• Service Costs: USD3.89/t ore.
Figure 6-7 Fresh Rock Load and Haul Mining Costs
y = 0.00003339x2 + 0.00951035x + 2.44407853
y = 0.00003549x2 + 0.01015205x + 2.60475133
2.00
2.50
3.00
3.50
4.00
4.50
5.00
5.50
0 20 40 60 80 100 120 140 160 180 200
Loa
d a
nd
Hau
l Cos
t (U
SD
/BC
M)
Depth (m)
Waste Load and Haul Ore Load and Haul Poly. (Waste Load and Haul) Poly. (Ore Load and Haul)
Load and Haul Costs by Bench
RPM Comment
The average mining cost over the LOM period averages USD3.50/t. In RPM’sopinion, this average mining cost is on the low side for a small-scale gold mine. Also,though the load and haul costs are based on an actual mining contract estimate, no miningis currently being undertaken, and any future activity will likely be based on an adjustedcontract that will be based on inflated costs.
For the purposes of the cash flow model, RPM recommends that the mining activitycost be increased by 5%.
Ore Reserves
RPM has prepared an Open Cut Ore Reserve Statement on behalf of Dragon Miningdated 31 December 2020. The Statement was prepared in compliance with therequirements of the reporting guidelines of the JORC Code.
The “Statement of Open Cut Ore Reserves for the Fäboliden Gold Mine” is based oninformation compiled and reviewed by the Competent Person, Mr. Joe McDiarmid. Mr.
APPENDIX II INDEPENDENT EXPERT’S REPORT
– II-177 –
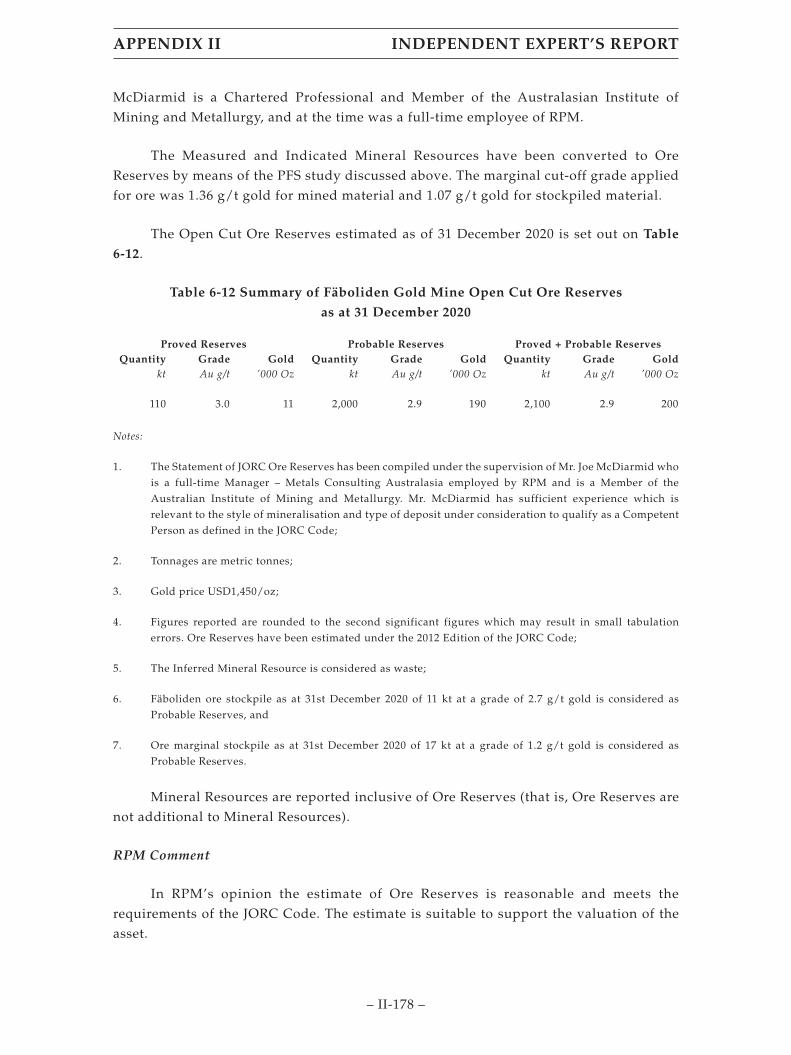
McDiarmid is a Chartered Professional and Member of the Australasian Institute ofMining and Metallurgy, and at the time was a full-time employee of RPM.
The Measured and Indicated Mineral Resources have been converted to OreReserves by means of the PFS study discussed above. The marginal cut-off grade appliedfor ore was 1.36 g/t gold for mined material and 1.07 g/t gold for stockpiled material.
The Open Cut Ore Reserves estimated as of 31 December 2020 is set out on Table
6-12.
Table 6-12 Summary of Fäboliden Gold Mine Open Cut Ore Reserves
as at 31 December 2020
Proved Reserves Probable Reserves Proved + Probable ReservesQuantity Grade Gold Quantity Grade Gold Quantity Grade Gold
kt Au g/t ’000 Oz kt Au g/t ’000 Oz kt Au g/t ’000 Oz
110 3.0 11 2,000 2.9 190 2,100 2.9 200
Notes:
1. The Statement of JORC Ore Reserves has been compiled under the supervision of Mr. Joe McDiarmid whois a full-time Manager – Metals Consulting Australasia employed by RPM and is a Member of theAustralian Institute of Mining and Metallurgy. Mr. McDiarmid has sufficient experience which isrelevant to the style of mineralisation and type of deposit under consideration to qualify as a CompetentPerson as defined in the JORC Code;
2. Tonnages are metric tonnes;
3. Gold price USD1,450/oz;
4. Figures reported are rounded to the second significant figures which may result in small tabulationerrors. Ore Reserves have been estimated under the 2012 Edition of the JORC Code;
5. The Inferred Mineral Resource is considered as waste;
6. Fäboliden ore stockpile as at 31st December 2020 of 11 kt at a grade of 2.7 g/t gold is considered asProbable Reserves, and
7. Ore marginal stockpile as at 31st December 2020 of 17 kt at a grade of 1.2 g/t gold is considered asProbable Reserves.
Mineral Resources are reported inclusive of Ore Reserves (that is, Ore Reserves arenot additional to Mineral Resources).
RPM Comment
In RPM’s opinion the estimate of Ore Reserves is reasonable and meets therequirements of the JORC Code. The estimate is suitable to support the valuation of theasset.
APPENDIX II INDEPENDENT EXPERT’S REPORT
– II-178 –

7. METALLURGY AND ORE PROCESSING
7.1 Vammala Plant – Finland
7.1.1 Background
The Vammala processing plant is a well-established facility based on a conventionalgold recovery flowsheet, consisting of crushing, grinding, gravity and flotation circuitswith concentrate dewatering and tailings pumping to a Tailings Storage Facility (TSF) asshown on Figure 7-1.
The operation has a design throughput capacity of 300ktpa which has beenconsistently exceeded over the last five years, averaging 312ktpa. The 2021 productionrate up to May was equivalent to 302ktpa.
The processing plant is treating Jokisivu ores, where the gold is predominantlypresent in pyrite and recovered to the flotation concentrate. A small quantity of the gold isfree and recovered by gravity.
The flotation concentrate is transported to the Svartliden operation in Sweden forfurther treatment while the gravity gold concentrate, typically 99.3% gold, is soldseparately.
Figure 7-1 Vammala Processing Flowsheet
APPENDIX II INDEPENDENT EXPERT’S REPORT
– II-179 –
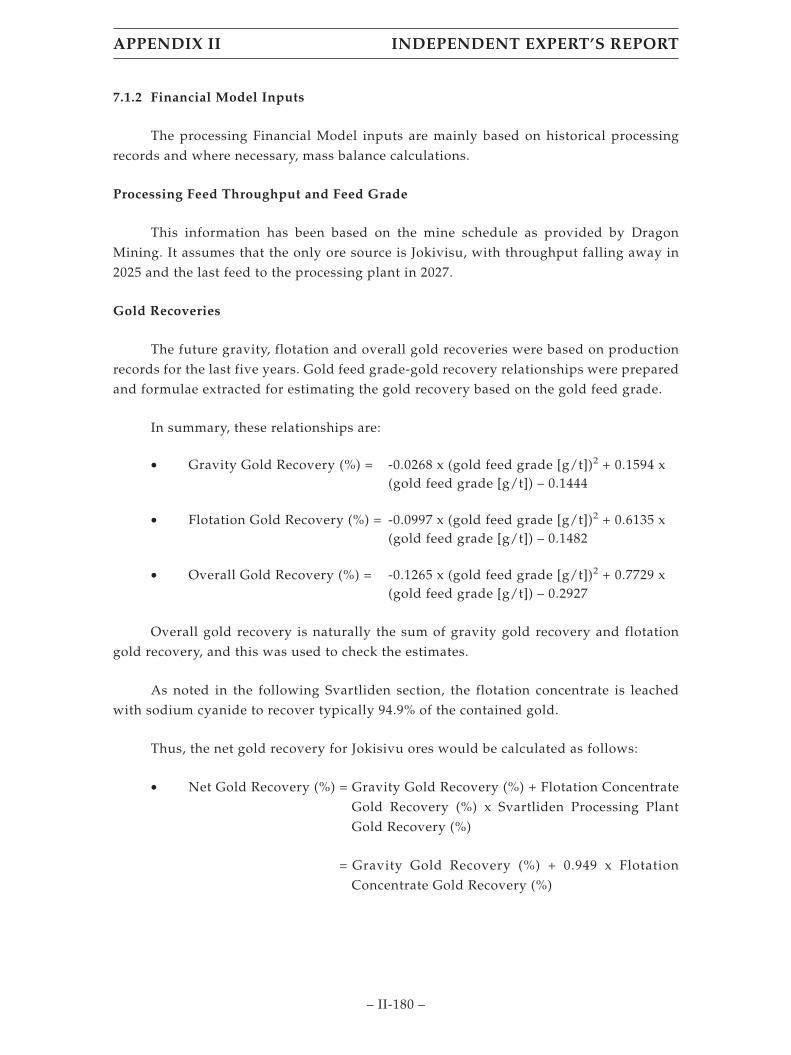
7.1.2 Financial Model Inputs
The processing Financial Model inputs are mainly based on historical processingrecords and where necessary, mass balance calculations.
Processing Feed Throughput and Feed Grade
This information has been based on the mine schedule as provided by DragonMining. It assumes that the only ore source is Jokivisu, with throughput falling away in2025 and the last feed to the processing plant in 2027.
Gold Recoveries
The future gravity, flotation and overall gold recoveries were based on productionrecords for the last five years. Gold feed grade-gold recovery relationships were preparedand formulae extracted for estimating the gold recovery based on the gold feed grade.
In summary, these relationships are:
• Gravity Gold Recovery (%) = -0.0268 x (gold feed grade [g/t])2 + 0.1594 x(gold feed grade [g/t]) – 0.1444
• Flotation Gold Recovery (%) = -0.0997 x (gold feed grade [g/t])2 + 0.6135 x(gold feed grade [g/t]) – 0.1482
• Overall Gold Recovery (%) = -0.1265 x (gold feed grade [g/t])2 + 0.7729 x(gold feed grade [g/t]) – 0.2927
Overall gold recovery is naturally the sum of gravity gold recovery and flotationgold recovery, and this was used to check the estimates.
As noted in the following Svartliden section, the flotation concentrate is leachedwith sodium cyanide to recover typically 94.9% of the contained gold.
Thus, the net gold recovery for Jokisivu ores would be calculated as follows:
• Net Gold Recovery (%) = Gravity Gold Recovery (%) + Flotation ConcentrateGold Recovery (%) x Svartliden Processing PlantGold Recovery (%)
= Gravity Gold Recovery (%) + 0.949 x FlotationConcentrate Gold Recovery (%)
APPENDIX II INDEPENDENT EXPERT’S REPORT
– II-180 –

Concentrates
Gravity
Production data over the last five years shows that the gravity concentrate averaged99.3% gold and, not unsurprisingly, is sold directly.
Flotation
Concentrate Grade
The future flotation concentrate grades were estimated from historical productionrecords by developing a gold feed grade-flotation concentrate gold grade relationship.The relationship employed was as follows:
• Flotation Concentrate Gold Grade (g/t) = 26.103 x natural logarithm (goldfeed grade [g/t]) + 101.97
Concentrate Quantities
Although historical production records provide details of flotation concentrateproduction quantities, a concentrate mass recovery relationship was not developed sinceit would introduce errors into the Financial Model calculations.
Flotation concentrate production quantities were calculated by mass balanceequations using the flotation gold recovery, the throughput and feed gold grade as well asthe flotation concentrate gold grade as follows:
• Flotation concentrate quantity (dmt/a) = Throughput (dmt/a) x GoldFeed Grade(g/t) x GoldFlotation Recovery (%) /Flotation Concentrate GoldGrade (g/t)
Capital and Sustaining Capital Costs
The Financial Model shows a capital expenditure of USD2.68 M (€2.2 M), includinga 10% contingency, in 2021, based on a Tailings Facility Storage lift, ‘Horvelo’ ditchproject, rod mill linings and replacing a crusher. Although a breakdown of the individualcost centres was not provided, RPM considers that the proposed capital expenditure isreasonable. The contingency is reasonable considering the likely basis of the estimates.
A sustaining capital cost based on 5% of the proposed to be installed capitalexpenditure is considered inadequate; the sustaining capital cost should be based on thecombined installed capital of existing equipment and offices as well.
Consequently, RPM would recommend an allowance of USD0.25 M per annum(USD0.83/milled tonne) including the proposed sustaining capital for the proposedcapital expenditure.
APPENDIX II INDEPENDENT EXPERT’S REPORT
– II-181 –

Process Operating Costs
RPM considers that USD26.17/milled tonne is a reasonable processing cost for theVammala processing plant based on historical data.
Concentrate Treatment Costs
The Financial Model records a ‘selling cost’ of USD410.12/dmt concentrate. The‘selling cost’ consists of the concentrate transport and shipping costs to deliver theconcentrate from site to the Svartliden processing plant as well as the process operatingcosts incurred at Svartliden.
RPM considers that this cost is reasonable based on historical data.
RPM considers that both the nature and application of concentrate terms to theflotation concentrate in the Financial Model is inappropriate and recommends that it isremoved from the revenue calculations.
Concentrate terms are offered by smelters or trading houses and not between twooperations owned by the same company.
Moreover, based on current gold-bearing concentrate terms, the Vammalaconcentrate would be considered very attractive and rewarded with some great terms,such as 96-97% gold payability, USD45/dmt treatment cost and, most likely, Free OnBoard (FOB) for shipping.
7.1.3 Processing Plant Salvage Value
The salvage value of the Vammala processing plant has been estimated based oneither assigning a second hand (typically equipment) or scrap metal value (typicallystructural steel, copper wires, etc.) to each part of the processing operation.
The assigned values are based on RPM’s estimates for secondhand equipment pricesand scrap metal in the current market. The estimates are necessarily high level andincorporate a number of assumptions, such the condition of equipment at the end of theoperation, no changes to the current equipment portfolio as well as the quantities of scrapmaterial.
For the Vammela processing operation, a salvage value of around USD0.61 M hasbeen determined, as broken down in Table 7-1.
APPENDIX II INDEPENDENT EXPERT’S REPORT
– II-182 –

Table 7-1 Salvage Value Breakdown for the Vammala Processing Plant
Section Item Comment Value(’000 USD)
Crushing Circuit Jaw crusher Second hand value 27.1Gyratory crusher Second hand value 34.9Cone crusher Second hand value 27.1Conveyor belts Second hand value 2.7Screen Second hand value 1.4Structure Scrap metal 15.5Electrics
MCC, instrumentation Second hand value 5.8Wiring Scrap metal 4.7
Milling Circuit Fine Ore Bin Scrap metal 11.6Rod mill Second hand value 58.1Ball mill Second hand value 69.8Hydrocyclones Second hand value 3.5Reichert Cones Second hand value 1.2Spirals Second hand value 1.9Shaking table Second hand value 0.6Pumps Second hand value 5.8Hoppers, structure Scrap metal 19.4Piping, valves Scrap metal 4.3Electrics
MCCs, instrumentation Second hand value 6.2Wiring Scrap metal 4.7
Flotation &DewateringCircuits
Flotation cells Second hand value 7.8Agitators Second hand value 0.6Concentrate Thickener Second hand value 5.8Filter Second hand value 7.8Pumps (including TSF &
return water) Second hand value 3.5Tanks, piping, structure Scrap metal 15.5Electrics
MCCs, instrumentation Second hand value 3.9Wiring Scrap metal 2.7
APPENDIX II INDEPENDENT EXPERT’S REPORT
– II-183 –

Section Item Comment Value(’000 USD)
Infrastructure Blower Second hand value 2.7Air Compressor Second hand value 4.3Electrics
Lighting Scrap metal 2.7Transformers, MCCs Second hand value 17.4Wiring Scrap metal 6.2
ReagentsAgitators Second hand value 0.8Tanks, structure Scrap metal 4.7Pumps Second hand value 1.0
BuildingsProcessing Scrap metal 46.5Processing Control Room Scrap metal 3.9Instrumentation, controllers Second hand value 5.8Wiring Scrap metal 1.6Changeroom Scrap metal 11.6Heaters Second hand value 5.8Warehouse Scrap metal 11.6Spares Second hand value 34.9Maintenance Scrap metal 15.5Tools Second hand value 11.6Offices Scrap metal 7.8Furniture Second hand value 3.1Laboratory Scrap metal 3.9Equipment Second hand value 2.7Other Second hand value 1.2Reagent Storage Scrap metal 3.9Racking Second hand value 7.4
WaterPumps Second hand value 1.9Tanks, piping Scrap metal 4.7
Other Vehicles (transport, forklift,crane) Second hand value 27.1
Miscellaneous Second hand value 3.9
Total 610.0
Note: Total may differ due to rounding.
In summary, the salvage value for the Vammala plant is USD0.61M.
APPENDIX II INDEPENDENT EXPERT’S REPORT
– II-184 –
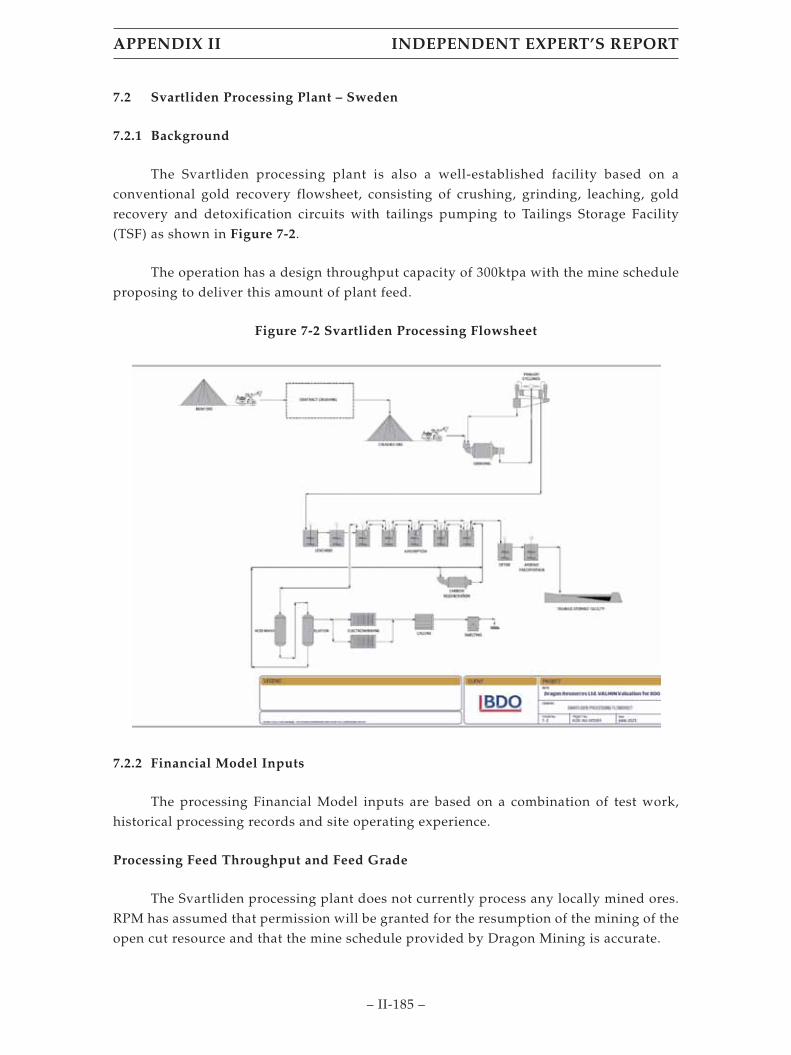
7.2 Svartliden Processing Plant – Sweden
7.2.1 Background
The Svartliden processing plant is also a well-established facility based on aconventional gold recovery flowsheet, consisting of crushing, grinding, leaching, goldrecovery and detoxification circuits with tailings pumping to Tailings Storage Facility(TSF) as shown in Figure 7-2.
The operation has a design throughput capacity of 300ktpa with the mine scheduleproposing to deliver this amount of plant feed.
Figure 7-2 Svartliden Processing Flowsheet
7.2.2 Financial Model Inputs
The processing Financial Model inputs are based on a combination of test work,historical processing records and site operating experience.
Processing Feed Throughput and Feed Grade
The Svartliden processing plant does not currently process any locally mined ores.RPM has assumed that permission will be granted for the resumption of the mining of theopen cut resource and that the mine schedule provided by Dragon Mining is accurate.
APPENDIX II INDEPENDENT EXPERT’S REPORT
– II-185 –
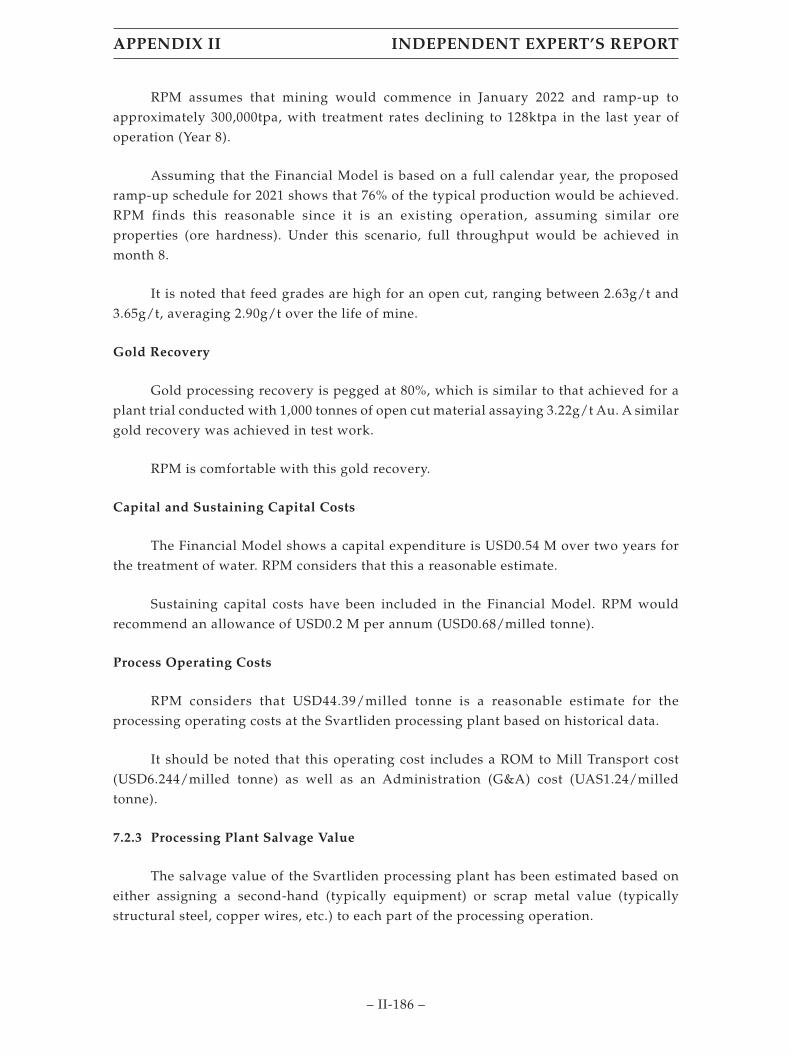
RPM assumes that mining would commence in January 2022 and ramp-up toapproximately 300,000tpa, with treatment rates declining to 128ktpa in the last year ofoperation (Year 8).
Assuming that the Financial Model is based on a full calendar year, the proposedramp-up schedule for 2021 shows that 76% of the typical production would be achieved.RPM finds this reasonable since it is an existing operation, assuming similar oreproperties (ore hardness). Under this scenario, full throughput would be achieved inmonth 8.
It is noted that feed grades are high for an open cut, ranging between 2.63g/t and3.65g/t, averaging 2.90g/t over the life of mine.
Gold Recovery
Gold processing recovery is pegged at 80%, which is similar to that achieved for aplant trial conducted with 1,000 tonnes of open cut material assaying 3.22g/t Au. A similargold recovery was achieved in test work.
RPM is comfortable with this gold recovery.
Capital and Sustaining Capital Costs
The Financial Model shows a capital expenditure is USD0.54 M over two years forthe treatment of water. RPM considers that this a reasonable estimate.
Sustaining capital costs have been included in the Financial Model. RPM wouldrecommend an allowance of USD0.2 M per annum (USD0.68/milled tonne).
Process Operating Costs
RPM considers that USD44.39/milled tonne is a reasonable estimate for theprocessing operating costs at the Svartliden processing plant based on historical data.
It should be noted that this operating cost includes a ROM to Mill Transport cost(USD6.244/milled tonne) as well as an Administration (G&A) cost (UAS1.24/milledtonne).
7.2.3 Processing Plant Salvage Value
The salvage value of the Svartliden processing plant has been estimated based oneither assigning a second-hand (typically equipment) or scrap metal value (typicallystructural steel, copper wires, etc.) to each part of the processing operation.
APPENDIX II INDEPENDENT EXPERT’S REPORT
– II-186 –
The assigned values are based on RPM’s estimates for second-hand equipmentprices and scrap metal in the current market. The estimates are necessarily high level andincorporate a number of assumptions, such as the condition of equipment at the end of theoperation, no changes to the current equipment portfolio as well as the quantities of scrapmaterial.
Note that the crushing circuit has not been included in the estimate, since it wasassumed that this circuit was owned by the crushing contractors.
For the Svartliden processing operation, a salvage value of around USD0.46 M hasbeen determined, as broken down on Table 7-2.
Table 7-2 Salvage Value Breakdown for the Svartliden Processing Plant
Section Item Comment Value(’000 USD)
Crushing Circuit ElectricsMCCs Second hand value 1.6Wiring Scrap metal 1.2
Milling Circuit Ball mill Second hand value 93.0Regrind mill Second hand value 23.2Hydrocyclones Second hand value 2.7Pumps Second hand value 3.9Hoppers, structure Scrap metal 19.4Piping, valves Scrap metal 4.3Electrics
MCCs, instrumentation Second hand value 6.2Wiring Scrap metal 4.7
Leaching Circuit ScreensTrash, safety Second hand value 1.6Interstage (SS) Second hand value 7.8
Pumps (including TSF &return water) Second hand value 2.3
Agitators Second hand value 3.9Tanks, piping, structure Scrap metal 19.4Detoxification
Agitators Second hand value 0.6Pumps Second hand value 0.6Tanks, piping, structure Scrap metal 5.8
ElectricsMCCs, instrumentation Second hand value 5.4Wiring Scrap metal 2.7
Gold Recovery Elution columns Second hand value 3.9Heat exchangers Second hand value 1.9Electrowinning Cells Second hand value 1.9Furnace, ovens Second hand value 0.9
APPENDIX II INDEPENDENT EXPERT’S REPORT
– II-187 –

Section Item Comment Value(’000 USD)
Pumps Second hand value 1.6Tanks, piping, structure Scrap metal 5.8Electrics
MCCs, instrumentation Second hand value 2.7Wiring Scrap metal 2.3
Infrastructure Air Compressor Second hand value 4.3Electrics
Lighting Scrap metal 2.7Transformers, MCCs Second hand value 13.6Wiring Scrap metal 4.7
ReagentsAgitators Second hand value 0.8Tanks, piping, structure Scrap metal 4.7Pumps Second hand value 1.0
BuildingsProcessing Scrap metal 46.5Control Room Scrap metal 3.9Instrumentation, controllers Second hand value 3.9Wiring Scrap metal 1.4Changeroom Scrap metal 11.6Heaters Second hand value 5.8Warehouse Scrap metal 11.6Spares Second hand value 27.1Maintenance Scrap metal 11.6Tools Second hand value 15.5Offices Scrap metal 7.8Furniture Second hand value 3.1Laboratory Scrap metal 3.9Equipment Second hand value 2.7Other Second hand value 1.2Reagent Storage Scrap metal 1.9Racking Second hand value 5.8
WaterPumps Second hand value 1.9Tanks, piping Scrap metal 4.7
Other Vehicles (transport, forklift,crane) Second hand value 23.3
Miscellaneous Second hand value 3.9
Total 461.8
Note: Total may differ due to rounding.
In summary, the salvage value for the Fäboliden plant is USD0.46M.
APPENDIX II INDEPENDENT EXPERT’S REPORT
– II-188 –

Recommendations
RPM makes the following recommendations:
• Conduct test work on Fäboliden open cut ores to determine the potential forimproved gold recoveries, and
• Test the market for the sale of Vammala flotation concentrates.
8. EXPLORATION PERMIT REVIEW
The general locations of the exploration permits are shown in Figure 8-1 and Figure
8-2.
Figure 8-1 Dragon Mining Production Centres
APPENDIX II INDEPENDENT EXPERT’S REPORT
– II-189 –
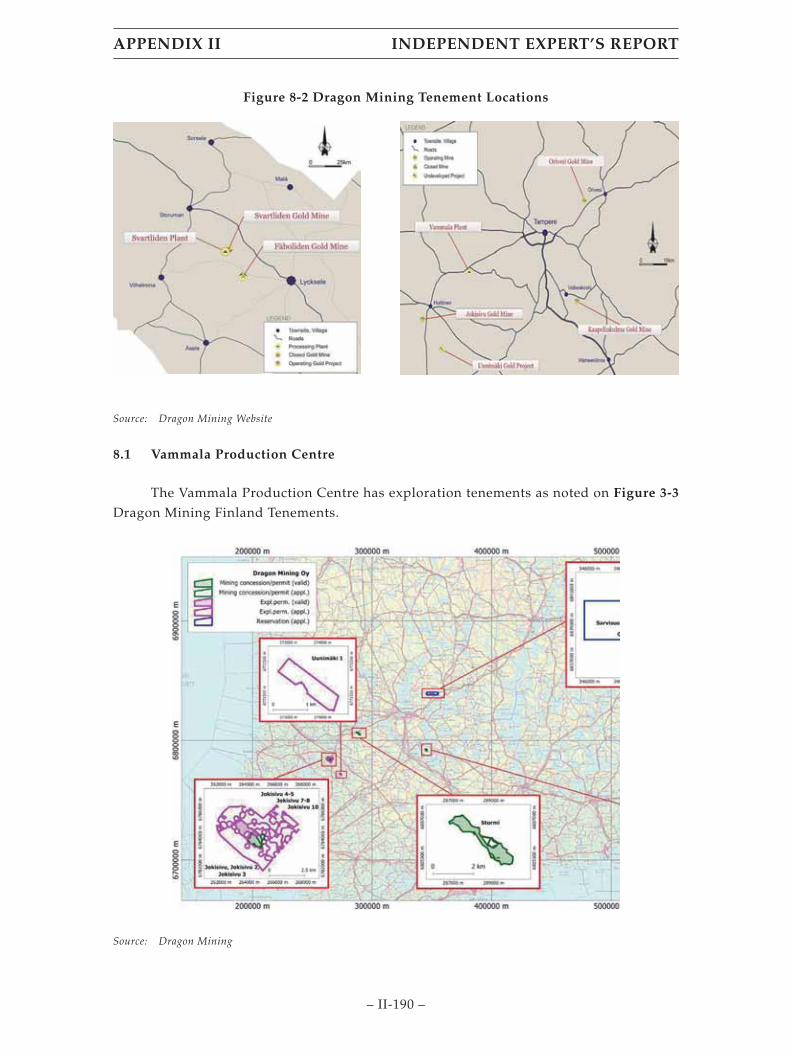
Figure 8-2 Dragon Mining Tenement Locations
Source: Dragon Mining Website
8.1 Vammala Production Centre
The Vammala Production Centre has exploration tenements as noted on Figure 3-3
Dragon Mining Finland Tenements.
Source: Dragon Mining
APPENDIX II INDEPENDENT EXPERT’S REPORT
– II-190 –
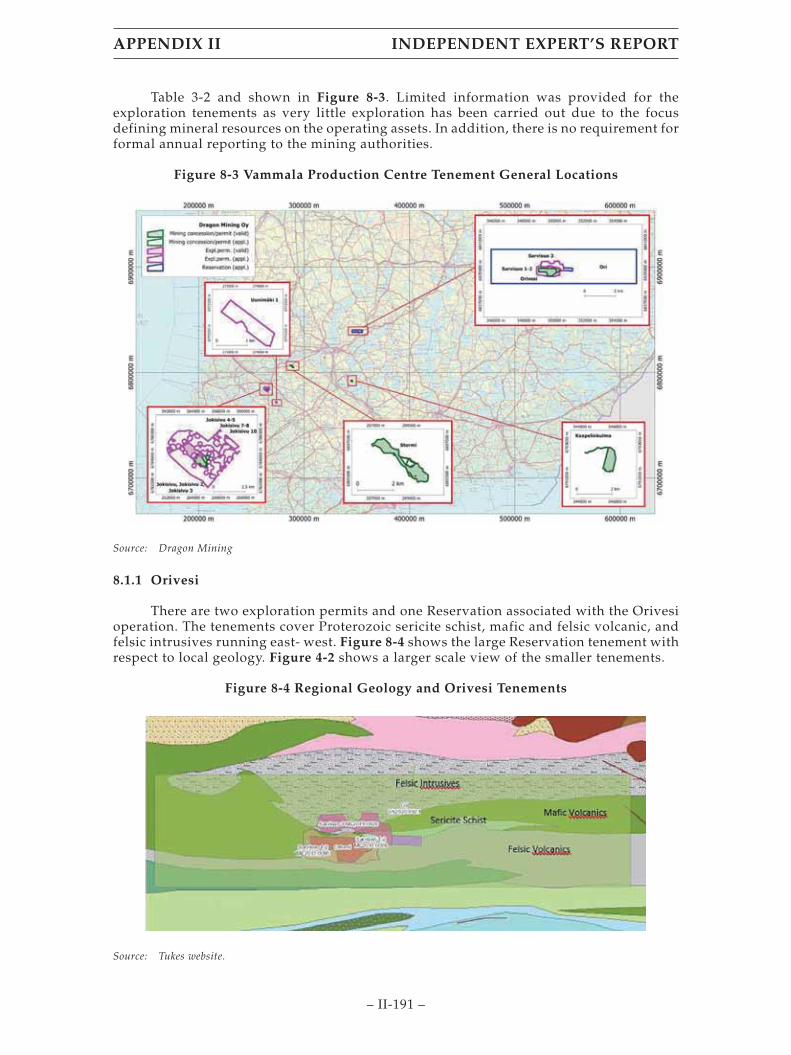
Table 3-2 and shown in Figure 8-3. Limited information was provided for theexploration tenements as very little exploration has been carried out due to the focusdefining mineral resources on the operating assets. In addition, there is no requirement forformal annual reporting to the mining authorities.
Figure 8-3 Vammala Production Centre Tenement General Locations
Source: Dragon Mining
8.1.1 Orivesi
There are two exploration permits and one Reservation associated with the Orivesioperation. The tenements cover Proterozoic sericite schist, mafic and felsic volcanic, andfelsic intrusives running east- west. Figure 8-4 shows the large Reservation tenement withrespect to local geology. Figure 4-2 shows a larger scale view of the smaller tenements.
Figure 8-4 Regional Geology and Orivesi Tenements
Source: Tukes website.
APPENDIX II INDEPENDENT EXPERT’S REPORT
– II-191 –
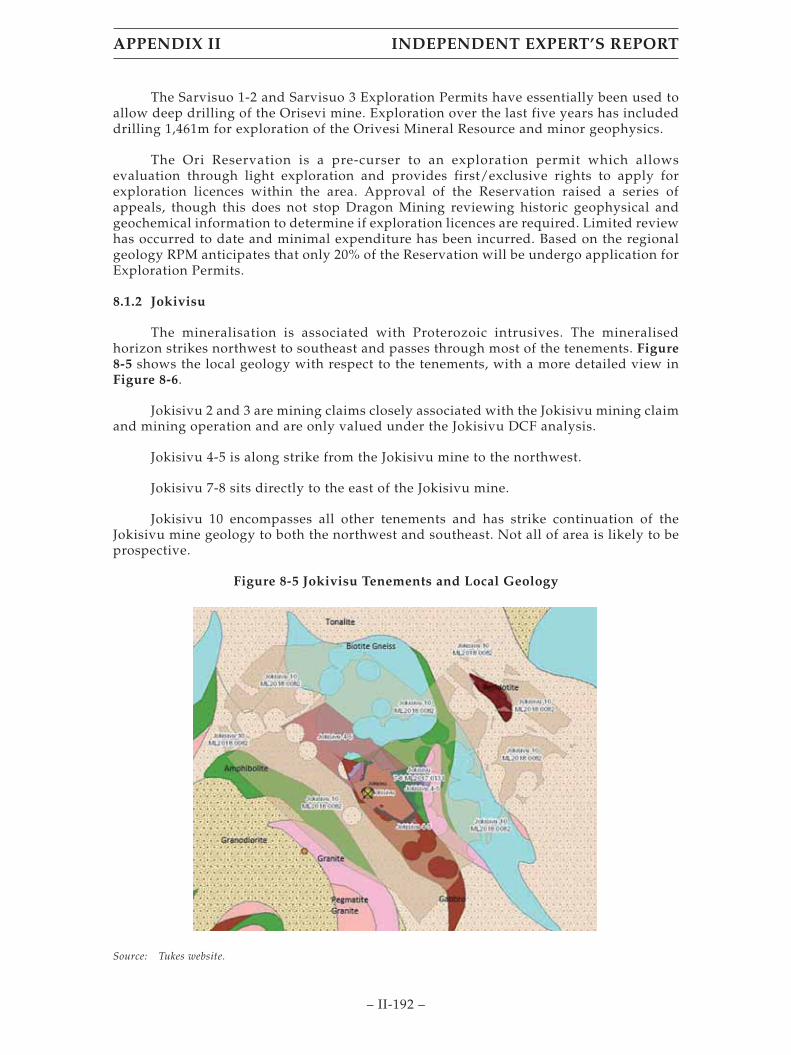
The Sarvisuo 1-2 and Sarvisuo 3 Exploration Permits have essentially been used toallow deep drilling of the Orisevi mine. Exploration over the last five years has includeddrilling 1,461m for exploration of the Orivesi Mineral Resource and minor geophysics.
The Ori Reservation is a pre-curser to an exploration permit which allowsevaluation through light exploration and provides first/exclusive rights to apply forexploration licences within the area. Approval of the Reservation raised a series ofappeals, though this does not stop Dragon Mining reviewing historic geophysical andgeochemical information to determine if exploration licences are required. Limited reviewhas occurred to date and minimal expenditure has been incurred. Based on the regionalgeology RPM anticipates that only 20% of the Reservation will be undergo application forExploration Permits.
8.1.2 Jokivisu
The mineralisation is associated with Proterozoic intrusives. The mineralisedhorizon strikes northwest to southeast and passes through most of the tenements. Figure8-5 shows the local geology with respect to the tenements, with a more detailed view inFigure 8-6.
Jokisivu 2 and 3 are mining claims closely associated with the Jokisivu mining claimand mining operation and are only valued under the Jokisivu DCF analysis.
Jokisivu 4-5 is along strike from the Jokisivu mine to the northwest.
Jokisivu 7-8 sits directly to the east of the Jokisivu mine.
Jokisivu 10 encompasses all other tenements and has strike continuation of theJokisivu mine geology to both the northwest and southeast. Not all of area is likely to beprospective.
Figure 8-5 Jokivisu Tenements and Local Geology
Source: Tukes website.
APPENDIX II INDEPENDENT EXPERT’S REPORT
– II-192 –

Figure 8-6 Detailed Tenements on Local Geology
Source: Tukes website.
8.1.3 Uunimäki
The Uunimäki 1 tenement is an exploration permit application 15km to thesoutheast of the Jokisivu mine. It contains one gold prospect associated with Proterozoicgabbro (Figure 8-7).
The Uunimäki project has historic drilling which is planned to be reviewed byDragon Mining.
Only 50% of this tenement appears to have prospective geology and therefore thetenement area is factored by 50% in the area multiples and Geoscientific valuationmethods.
APPENDIX II INDEPENDENT EXPERT’S REPORT
– II-193 –

Figure 8-7 Uunimäki 1 Tenement and Local Geology
Source: Tukes website.
8.2 Svartliden Production Centre
Dragon holds only one exploration tenement in Sweden, which is the ExplorationPermit Fäboliden nr 11. The permit is situated along strike to the southwest from theFäboliden deposit which contains Ore Reserves.
The Fäboliden tenements are covered by a detailed airborne survey (Figure 8-8)which shows continuation of the mine lithologies and structures to the southwest of themine into the Fäboliden nr 11 Exploration Permit. A parallel magnetic feature to the east(Eastern Sequence) is also present which is anomalous in gold (Figure 8-9).
APPENDIX II INDEPENDENT EXPERT’S REPORT
– II-194 –
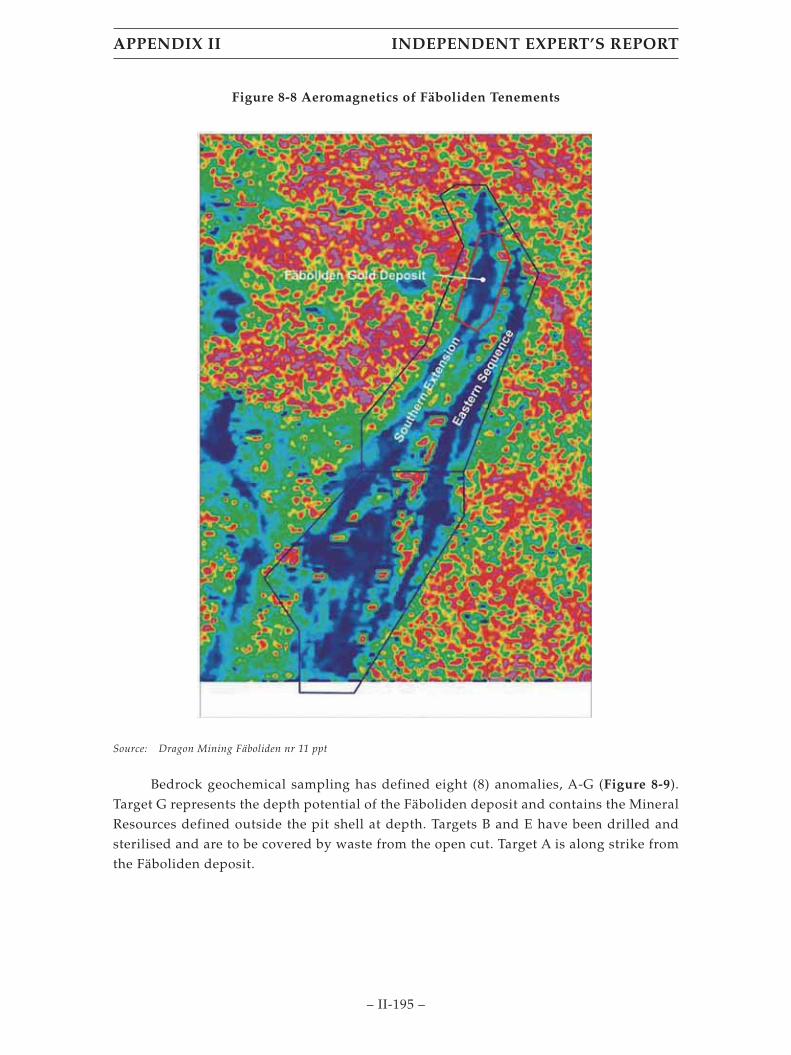
Figure 8-8 Aeromagnetics of Fäboliden Tenements
Source: Dragon Mining Fäboliden nr 11 ppt
Bedrock geochemical sampling has defined eight (8) anomalies, A-G (Figure 8-9).Target G represents the depth potential of the Fäboliden deposit and contains the MineralResources defined outside the pit shell at depth. Targets B and E have been drilled andsterilised and are to be covered by waste from the open cut. Target A is along strike fromthe Fäboliden deposit.
APPENDIX II INDEPENDENT EXPERT’S REPORT
– II-195 –

Figure 8-9 Bedrock Geochemistry
Source: Dragon Mining Fäboliden nr 11 ppt
Some drilling has been carried out with encouraging drill hole intercepts includinga best intercept of 6m @ 3.85 g/t Au (Figure 8-10).
Figure 8-10 Drilling on Exploration Permit Fäboliden nr 11
Source: Dragon Mining Fäboliden nr 11 ppt
APPENDIX II INDEPENDENT EXPERT’S REPORT
– II-196 –

9. ENVIRONMENTAL MANAGEMENT
Dragon Mining’s respective operations in Finland and Sweden are headed by SiteManagers. Each asset has a local management team, supervising Environment, Health andSafety (EHS). Dragon Mining is generally aware of the environmental requirementsapplicable to their operations through their interactions with relevant authorities dealingwith permitting and compliance actions.
9.1 Site Inspections
An initial site inspection of Dragon Mining operational assets in Finland andSweden was undertaken by Mr. Henri de Branche and Mr. Jussi Kuusola on 9 to 13December 2015. Interviews with site managers of the mine and collection and review ofavailable information were conducted during the site visit. A follow-up site visit wasconducted by Mr. Henri de Branche at Svartliden Production Centre on 15 February 2017and interviews with selected Dragon Mining Sweden and Finland representatives tookplace in February 2017. RPM is unaware of any further visits relating to Permitting,Environmental, Social and Community.
9.2 Svartliden Production Centre – Sweden
9.2.1 Fäboliden Mine (Full Scale Operation)
Environmental Impact Assessment and Permitting Approvals
The Environmental Code is the principal environmental law dealing with mining inSweden. The Environmental Code is closely tied to the Minerals Act, which, is applicableto all exploration and exploitation on land. Two types of rights are granted under theMinerals Act – exploration permits and exploitation concessions. The Mining Inspectorategrants these rights. To conduct mining operations an exploitation concession and a permitunder the Environmental Code must be acquired. With respect to mining operations,permits under the Environmental Code are granted by the Land and EnvironmentalCourt.
The Mining Inspectorate hears applications for exploitation concessions, inconsultation with the County Administrative Board (CAB), which examines whether thesite is acceptable from an environmental point of view. Supervision of compliance withthe environmental conditions is usually carried out by the CAB and by the municipality’sEnvironment Health Board.
On 23 November 2017, CAB granted Dragon Mining a Permit for test miningoperations at Fäboliden. This operation was completed meeting the permit requirements.
Dragon Mining submitted a Permit application for full-scale mining at Fäboliden tothe Land and Environment Court 4 July 2018. The company is currently working with theCourt providing information required to meet the expectations of the stakeholdersincluding the CAB.
APPENDIX II INDEPENDENT EXPERT’S REPORT
– II-197 –

During the initial review of the Project, CAB decided the Fäboliden Project was notexpected to cause significant environmental impact. As a result, the permitting processwas initiated with an expectation of a 30 month approval process. CAB completed theirreview of the EIA and developed conditions required for the Project to mitigate potentialenvironmental impacts caused by the Project. A number of conditions were included in thePermit Final Decision issued by CAB including air quality, noise and vibration, traffic, etc.The primary conditions required to allow operations to be able to coexist with opposinginterests include the following:
• Arsenic and uranium may exceed limits at the end of the mixing zone andlikely will require water treatment;
• Reindeer herding: protection measures required are required as the Samicommunity (Indigenous Peoples) have special consideration, compensationmay be part of the resolution;
• Capping of WRSF to reduce water infiltration and resulting seepage;
• Biodiversity issues related to Natura 2000 testing including protected species,critical habitats and protected areas;
• Increased closure costs to account for capping of WRD for a total SEK135M.The CAB also has a condition that the total amount of closure costs must bemade available prior to issuing the permit.
The Company is trying to change many of the conditions through theEnvironmental and Land Court system.
An Environmental Test Permit was issued to mine ore from the Fäboliden Mine andprocess it at the Svartliden Processing Plant. The permit was issued March 8, 2017 with anexploration determined as the test completion date.
RPM Comment
For valuation to be carried out the Project is projected by RPM for start-up in theinitial part of 2022. However, a more realistic view is that permit acquisition may extendto the middle to latter part of 2022. Environmental lawsuits are also common in Sweden,which poses the potential for more delays.
Status of Environmental Components
Air Quality Management
The company goal is to minimize air quality impacts caused by the miningoperations on local communities and the environment. Equipment and operationalpractices are modified where needed to minimize air pollutants. Potential emissions arecontinuously monitored to identify mining activity responsible for airborne emissions.
APPENDIX II INDEPENDENT EXPERT’S REPORT
– II-198 –

Soils Management
Surface soils are removed prior to site construction or use and stockpiled for reusein closure. Detailed studies of the suitability of stockpiled soils for reclamation will beconducted. Reclaimed areas will be re-vegetated with local species.
Water Resources Management
Surface Water Management
Diversions will be construction around the mining area to minimise inflow ofunaffected water to the mining area. This will minimize the volume of affected water to becollected and treated.
Potentially affected water flows included in the water management system includedrainage from the open pit and underground mine as well as leachate from ore storageand waste rock storage areas. Collected water will be process by the treatment plant beforedischarged to the environment. The water management system will be expandedgradually, in step with the expansion of the various facilities. The system’s capacity willbe governed by the size of the open pit and waste rock storage, and water from theunderground mine.
Leachate from waste rock storage and ore storage will be conveyed to the watertreatment plant using ditches, while mining water will flow to the plant using pipes.Physically, the water treatment plants are located downstream on the north side of thewaste rock storage. Collected leachate from the waste rock storage will flow to a collectionbasin that acts as a flow equalizer while enhancing precipitation of aluminium and ironhydroxides, and suspended particles. Water flows from the pond to the water treatmentplant.
Leachate from waste rock characterization studies trials were used to develop thewater treatment system. The treatment process will remove arsenic and metals using theaddition of ferrous sulphate followed by sedimentation. After precipitation with ferroussulphate, the water pH will be adjusted forming metal hydroxides precipitates. Thesludge will be dewatered in geotubes that are placed in a separate landfill located withinthe water treatment area directly adjacent to, and upstream of, the sedimentation basins.Water removed from the geotubes will be returned to the water treatment system.
RPM Comment
Surface water management should not cause unforeseen issues. Water treatmentcapacity is an important aspect of management during operations and the post-closureproject phases.
Groundwater Management
Characterization work has developed a good understanding of potential impacts ofthe Project on groundwater in the area of influence. The project area is not within, or
APPENDIX II INDEPENDENT EXPERT’S REPORT
– II-199 –

directly adjacent to, any designated groundwater body. The groundwater impact resultingfrom the mining operations is of a local nature and is mainly groundwater lowering. Theimpact is reversible because the groundwater levels are restored as the mine is filled withwater after closure. No groundwater abstraction occurs downstream of the Project withinthe calculated area of influence.
RPM Comment
No groundwater issues are expected.
Waste Rock Management
Waste rock characterization shows most of the material as potentially acid forming(PAG). Collecting ditches and water treatment will be used to minimize impact. Treateddischarged water will be tested for pH, metals, nitrogen, etc. The control program willalso include monitoring of water quality in the downstream waters.
Waste rock will be stored in an area of about 47 ha. The facility will not be lined toprevent any build-up of water that could cause stability issues as the waste dump becomeslarge. A series of catchment ditches and diversions will be construction to collect andtransport seepage to the water treatment facility. At closure, the facility will be capped torestrict oxygen and water flow into the facility to slow sulfide oxidation and decreaseseepage.
RPM Comment
Seepage from the waste rock storage facility is expected to generate ARD withleachable elements detrimental to water quality. A groundwater and surface watermonitoring program should be installed to provide early detection of water qualityimpacts. Implementation of appropriate mitigation actions may be required if impacts arefound.
Biodiversity Management Plan
Biodiversity actions may become a major issue delaying the issuance of the miningpermit. The CAB has issued serious concerns that the Company must conduct a Natura2000 investigation. The entire watercourse from the source area to the mouth ofÖrefjärden, including tributaries, is designated as a Natura 2000 area called Öreälven(Swedish Environmental Protection Agency 2018). Four habitat types and five specieswere identified in the Species and Habitats Directive (Council of the European Union2006) that would be protected in this area.
The project is projected to cause habitat loss of about 280 ha that could affect theconservation status of populations. The potential impact to a number of fauna and floraspecies including a protected orchid is the primary concern. Investigations related toimpacts of the operation on water quality and habitats must be considered. The potentialnegative impacts on the typical fish species and benthic fauna within the mixing zone isalso a concern.
APPENDIX II INDEPENDENT EXPERT’S REPORT
– II-200 –

As inventories will not be able to be carried out before the court hearing associatedwith the permitting action, the CAB is requiring acquisition of a Species ProtectionExemption. The details of the Exemption are not known, but it appears it would includeconditions supporting biodiversity protection. The CAB indicated that a permit cannot beissued before a species protection exemption has been granted. The alternative resultwould be not to grant the permit until a satisfactory species protection inventory wasconducted.
RPM Comment
Resolution of the species protection issue is critical for the project to acquire themining permit in a timely manner without disruption to the project timeline.
9.2.2 Svartliden Mine and Processing Facility
The Svartliden mine and processing facility consists of open pits, waste rock storagefacilities, crushing plant, concentrator, sand reservoirs, clarification dust, water treatmentplants, laboratory and office space. No mining has taken place during 2020, neither inopen pit nor underground. Enriched ore from the company’s mines in Finland has beenprocessed in Svartliden in in accordance with notified activities to the CAB. Test mining inFäboliden was conducted in accordance with the test permit during May throughSeptember. The ore was transported to Svartliden for crushing and enrichment inSvartliden’s processing plant based on a permit issued on May 8, 2017.
Authorization and Permitting Approvals
In December 2012, a new Operating Permit was received by Dragon Mining for theSvartliden Operation. The permit included underground mining, tailings disposal in thecompleted open pit and adjusted discharge conditions. The permit is valid withoutexpiration. Permitting actions required for the processing plant appear to be in place.
RPM Comment
No permitting issues for the Svartliden Mine and Processing plant are apparent.
Environmental Management
Air Quality Management
The company goal is to minimize air quality impacts caused by the miningoperations on local communities and the environment. Equipment and operationalpractices are modified where needed to minimize air pollutants. Potential emissions arecontinuously monitored to identify activities responsible for airborne emissions.
RPM Comment
Best management practices are in place to control air emissions.
APPENDIX II INDEPENDENT EXPERT’S REPORT
– II-201 –
Soils Management
Topsoil is salvaged and stockpiled for reuse during closure. Detailed studies of thesuitability of stockpiled soils for reclamation have not been completed.
Surface Water Management
Surface water management consists of preventing water from entering the projectarea using bypass diversions. The water collected from the project area is collected andused for dust control or treated and sent to the processing plant.
The primary issues with surface water management is associated with the collectionof seepage from the waste rock storage facilities and the tailings facility. These waters arepumped to containment ponds and treated for use to discharged once the water qualitycriteria are met. An apparent issue relates to waters not contained, that seep into thesurface water downgradient of the facility. As long as the water quality meets the streambaseline at Sediment Pond F13 no issues exist. Data collected exceeds water qualityrequirements occasionally but meets the permit criteria, which allows a certain number ofexceedances annually.
The Company is currently developing a water management and purification systemfor water streams from ore processing, drainage water from the open pit, collectedleachate from the waste rock storage and water from the tailings storage facility.
RPM Comment
Maintaining water quality of receiving streams appears an ongoing challenge.Management programs must continue to be a priority with implementation of bestmanagement practices to deal with issues as through operations and the post-closurephases of the project. The water management purification system should improve waterquality conditions.
Groundwater Management
Groundwater in the Project area is near the surface and likely interacts with themany wetlands located in the area. The mining and processing facilities have the potentialto impact the groundwater system, but the current conditions of the system are notknown. It is not apparent that groundwater quality is monitored as no monitoring wellswere identified in the documentation provided.
However, the Company used the best available technology to reduce groundwaterpollution including the techniques listed below:
• Sealed drainage systems;
• Storage tanks with double hull or permanent embankments;
• Impermeable and acid-resistant floors; and
APPENDIX II INDEPENDENT EXPERT’S REPORT
– II-202 –

• Automatic level control for reaction vessels.
RPM Comment
Groundwater contamination is an issue of concern. Seepage of contaminatedsolutions from the tailings storage area (mine pit) through cracks, waste rock storageareas, collections ponds and other facilities is likely occurring. A program should beinstalled to monitor potential areas of concern. If required, appropriate mitigationmeasures should be implemented.
Waste Rock Management
Most waste rock generated during mining and construction was characterized witha low acid generating potential with limited quantities of leachable elements potentiallyinfluencing water quality. The potentially acid generating rock, about 1.7M tonnes, wasplaced in areas thought to have limited leaching potential. Arsenic was noted as anelement of concern in these materials.
Seepage from waste rock storage facilities is collected and analysed to determinequality. The water is treated, if required, and used to support the project or likelydischarged.
RPM Comment
Seepage from the waste storage facility is likely impacting surface water andgroundwater quality. A monitoring program must be implemented to identify problemareas and appropriate mitigation actions should be implemented.
Capping the waste rock storage facilities at closure will reduce water infiltrationand reduce seepage into the receiving streams and groundwater.
Tailings Management
Tailings generated from the processing activities is stored in the open pit. Thematerial will be covered with a column of water and is not expected to oxidize. However,the tailings are characterized with low levels of cyanide and leachable elementspotentially detrimental to water quality.
RPM Comment
Seepage from tailings storage, through cracks in the pit wall, is likely impactingsurface water and groundwater quality downgradient. A monitoring program must beimplemented to identify problem areas and appropriate mitigation actions should beimplemented.
APPENDIX II INDEPENDENT EXPERT’S REPORT
– II-203 –

Biodiversity Management Plan
No documentation was provided for biodiversity management at the time of writingthe report.
9.2.3 Project Closure
Closure Management
The goal of project closure of the Fäboliden and Svartliden Mines and the processingfacility at Svartliden is to establish pre-mining conditions. Infrastructure, including roads,buildings, ponds, etc., will be removed and the waste rock storage areas will be capped tomeet regulatory requirements for oxygen diffusion and water infiltration. The tailingsstorage facility will not be covered but access to the mine pit will be controlled usingappropriate blockades and signs.
Closure and Post-Closure Costs
Closure Cost Projections for the Fäboliden and Svartliden Mines and the processingfacility at Svartliden are shown in Table 9-1.
Dragon Mining’s process for estimating the closure costs is reasonable. The closurecosts are estimated in Swedish Kroner (SEK) and are present in Dragon Mining’s accounts,except for the Fäboliden mine which has not been recognised in the accounts as it has notyet been approved. The accounts costs have been converted to USD using the exchangerate of the Valuation Date (1st June 2021). The Fäboliden mine cost has been backcalculated from USD to SEK using the same exchange rate.
Table 9-1 Closure Costs for the Sweden Mining and Processing Operations
Facility
ProjectedClosure Cost
(USD)
ProjectedClosure Cost
(SEK)
Fäboliden Mine 7.64M (16.2M1) 63.4MFäboliden Mine Test Project 0.53M2 6.2MSvartliden Mine and Plant 5.1M 42.0M
1 Amount required by the County Administration Board (CAB) in recommended conditions, includes costs for
capping the WRSF required by CAB. The Project is in the permitting stage, so the USD16.2M condition has not
been finalized.
2 Projected closure costs for the mine test project are covered in the costs associated with the proposed Fäboliden
Mine project. If the Fäboliden Mine is not permitted, the closure costs for the test project would stand.
APPENDIX II INDEPENDENT EXPERT’S REPORT
– II-204 –
9.3 Vammala Production Centre – Finland
9.3.1 Kaapelinkulma Mine
Authorization and Permitting Approvals
The Kaapelinkulma Gold Mine is operating under a permit issued August 31, 2014.A revision permit was issued October 14, 2015 to make a few modifications including amonitoring program.
The Project is now planning to expand the mining project. The expansion willrequire a new environmental permit. The application process was initiated but the statusis unknown.
Air Quality Management
Mining dust consists of large-sized, over-diameter 30 μm, but the dust also containssome respirable particulate matter (PM 10) with a diameter of less than 10 μm. Dusting ismonitored and, if necessary, prevented by irrigation of roads, disturbed areas andstockpiled material. Drilling rigs are equipped with a collection system to reduce dustemissions. Dusting from exposed areas will be reduced by establishing vegetation cover.
The operation will increase the airborne dust content somewhat in the vicinity of themine. The effects of the dust will be limited to a distance of 200m from the extraction siteand further than 500m the dust concentrations decrease sharply. The transport of fineparticles harmful to health in populated areas are unlikely to be affected by distance andprevailing wind conditions.
RPM Comment
Mitigation measures used to control dust from the mining operation are expected tobe adequate to meet applicable regulatory requirements.
Soils Management
The natural soil in the mine area contains arsenic levels exceeding the lowerguideline value of 50 mg/kg according to the PIMA regulation. Therefore, an arsenicconcentration of 50 mg/kg will be considered as a threshold or baseline concentration.
Topsoil salvage operations will be used to support mine closure activities. Thestockpiles will be stabilized to prevent wind and water erosion and will serve as noisebarriers.
APPENDIX II INDEPENDENT EXPERT’S REPORT
– II-205 –
Surface Water Management
As noted in the other Dragon Projects, surface water management consists ofpreventing water from entering the project area using bypass diversions. The watercollected from the project area is used for dust control or treated and sent to the processingplant. Water discharged from the site is treated to remove sediment and to remove specificelements required to meet applicable water quality standards. The drainage waters of themine are discharged into Haavanoja and Vallonjärvi to Lake Vallonjärvi. The lake is asmall shallow flow-through lake.
Water contamination in the mining area consists mainly of solids, nitrogen andsulfate. Naturally elevated concentrations of arsenic in the soil are in an insoluble form,reducing transport. Water treatment (pH adjustment) will keep the metals in an insolubleform (precipitates), which are readily collected in the clarification tanks.
The primary issues with surface water management are associated with thecollection of seepage from the waste rock storage facilities. These waters are pumped tocontainment ponds and treated for use or discharged once the water quality criteria aremet. An apparent issue relates to waters not contained that seep into the surface waterdowngradient of the facility.
Water monitoring will include collecting samples from sampling locations includingwater and sediment from Lake Vallonjärvi. A complete set of variables will be analysedincluding oxygen, iron, manganese and uranium.
In March 2017 and 2018, samples were collected from five sampling locations inaccordance with the monitoring program. There was evidence of mine impact in both 2017and 2018. For Ulavanoja and Vallonoja, the results show high chromium, aluminium,nitrogen and phosphorus concentrations while arsenic and heavy metals were low.
The concentration of nitrogen and phosphorus was elevated in Lake Vallonjärvi andlow oxygen levels were noted during 2017 sampling. In In 2018, nitrogen and phosphorusconcentrations were more than half of the previous year. Heavy metals concentrationswere low at both sampling periods.
RPM Comment
Surface water monitoring results appear to show impact caused by the miningoperation. The Company should increase monitoring activities to show the causes of theproblem. Once determined, appropriate mitigation measures should be implemented.
Groundwater Management
The base of the mine pit is lower than the groundwater level, so the groundwaterseeps into the pit. Monitoring wells were installed to measure impacts of the operations onwater levels and water quality.
Impacts on stakeholders wells will be carefully monitored and appropriatecompensation will be conducted, if required. Stakeholder wells located in the vicinity ofthe project must be monitored as required by regulatory authorities.
APPENDIX II INDEPENDENT EXPERT’S REPORT
– II-206 –
Based on the monitoring results, the groundwater was oxygen-free or low-oxygen.Soluble metal concentrations were low and below groundwater environmental qualitystandards with the exception of arsenic, which is naturally high in soils and rock found inthe area.
RPM Comment
The Project does not appear to significantly impact Groundwater conditions.Monitoring should be continued to identify potential issues in the future.
Waste Rock Management
Most waste rock generated during mining was characterized with a low acidgenerating potential with limited quantities of leachable elements potentially influencingwater quality. However, arsenic was noted as an element of concern as the shake testsconducted resulted in levels above standards.
Seepage from waste rock storage facilities is collected and analysed to determinequality. The water is treated, if required, and used to support the project or likelydischarged.
RPM Comment
Seepage from the waste storage facility may be impacting surface water andgroundwater quality. A monitoring program must be implemented to identify problemareas and appropriate mitigation actions should be implemented, if required.
Capping the waste rock storage facilities at closure will reduce water infiltrationand reduce seepage into the receiving streams and groundwater.
Biodiversity Management Plan
About 250m from the eastern edge of the Project is the Pitkäkor which is a 17-hectareNatura site. The area is also part of the old-growth forest protection program. Accordingto the Natura habitat inventory carried out in the area, the area is primarily boreal forestwith 1.2 ha of non-forest land and 2.7 ha of wooded bogs. Both boreal natural forests andwooded bogs are a priority consideration.
The dominant flora species in the Project area include blueberries, cabbage,lingonberry, spring beetle, alveus root, forest sauce and in the openings sand sauce andgrass blade. Several protected species were identified in the area, which requiresappropriate measures for protection.
The protection of the flying squirrel (protected species) and the rainbow trout wasnoted as important issues related to the project. A study was conducted and apparentlyapproved as the project moved forward. Monitoring programs were established to meetregulatory requirements.
APPENDIX II INDEPENDENT EXPERT’S REPORT
– II-207 –

RPM Comment
The presence of several protected and endangered species makes biodiversity animportant consideration of environmental quality. A detailed management program,noted as a biodiversity action plan in the IFC Performance Standard 6, must be developed,implemented and closely monitored.
Monitoring Program
All monitoring results required by permits and other regulatory requirements mustbe transmitted to the electronic registers of the administration (PIVET, KERTY). Themonitoring results must be reported to the Pirkanmaa ELY Centre on a quarterly basis.This information shows variations in water quality during the year and thus providesmore detail required to understand potential impacts.
An annual report on environmental protection must be submitted to the PirkanmaaELY Centre by the end of February, each year. The report, which shall be submittedelectronically where applicable, must include the following:
• Mine production data and times;
• Quality of chemicals (e.g. explosives, water treatment chemicals)consumption data;
• Information on generated extractive waste and other waste: quantity, type ofwaste and place of delivery, and storage situation at the turn of the year;
• Volume of water discharged from clarification basins and estimate ofoperational emissions (solid, total nitrogen, metals);
• Energy consumption;
• Results of emission monitoring and environmental impact monitoring;
• Report on incidents during the year and other exceptional such situations,their causes and duration, emissions and waste and measures to preventdisturbances in the future;
• Changes in operations implemented and planned during the year, and
• Summary of maintenance measures relevant to environmental protection (e.g.sludge removal from clarification tanks).
The documents on which the annual reporting is based, such as analysis results,logbooks, fault printouts and other measurement results and certificates of release toservice kept for at least the last three years for the authorities.
APPENDIX II INDEPENDENT EXPERT’S REPORT
– II-208 –

RPM Comment
The monitoring program appears to be functioning as required by the regulatoryauthorities. However, RPM suggests expansion of water quality monitoring in the vicinityof the waste rock storage facilities to identify whether environmental impacts exist.
9.3.2 Orivesi Mine
The Orivesi mine is not operating and is projected for closure. The Project hasoperated for about 25 years with the known ore reserves mined out in June 2019. Themine’s environmental permit issue was resolved at the same time after a long legal processwith a Supreme Administration Court determination that the mine would not bepermitted and would no longer be allowed to operate.
The Finland Mining Act requires that closure establishes a stable condition that issafe for the public and the environment. After closure, the area should not need to beguarded, nor should follow yup measures be required.
Dragon Mining Oy submitted the closure plan to the Regional State AdministrativeAgency on 5 December 2019. The plan was supplemented to meet Agency requirements onJune 30, 2020.
The closure plan specifies completing soil contamination mapping as the initialstep. The research subjects include soil-based maintenance and storage areas, fueldistribution point, former oil heating tank the environment, and the ore interim storagearea. This study plan will be approved by the supervisor Environmental ProtectionAuthority, Pirkanmaa ELY Centre before closure activities commence.
The soil contamination study also includes evaluation of the mine sludges and soilsfrom sludge dewatering ponds and from effluents discharged from the mining areaassessment. Pollution investigations are carried out according to the comments of thesupervisory environmental protection authority. The pollution study will assessrequirements for rehabilitation, taking into account the use of the area after closure.
Authorization and Permitting Approvals
The Company is awaiting final approval of the closure plan which will allowinitiation of the work.
Environmental Management
Air Quality Management
The company goal is to minimize air quality impacts caused by the closureoperations on local communities and the environment. Equipment and operationalpractices will meet Best Management Practices to minimize air emissions.
APPENDIX II INDEPENDENT EXPERT’S REPORT
– II-209 –

Soils Management
Stockpiled topsoil will be used as the final cover for areas prepared for vegetationestablishment.
Surface Water Management
The mine is subject to full-time load monitoring and discharge of water obligationmonitoring. Previous monitoring results show effects of the mine on the water resourcesincluding high concentrations of nitrogen and sulphate along with increased levels ofaluminium, zinc and cadmium.
Once the mine is closed, levels of nitrogen and sulfate will likely decrease whilemetals may remain high.
After the mine is closed, the Company will likely be required to continuemonitoring until the water quality meets the regulatory standards or approaches baselineconditions. Water treatment is expected to continue for a period of time with thepossibility to extend for a number of years.
RPM Comment
Water treatment will likely extend for several decades. Appropriate facilities mustbe maintained to prevent environmental impact. The costs associated with monitoringand maintenance including disposal of water treatment waste must be incorporated intothe closure costs.
Groundwater Management
Groundwater flow into the mine will take about 10 years before water discharges tothe surface. At that time, active treatment will likely be required to remove contaminantsto levels that allow discharge into the environment. Passive treatment alternatives couldalso be used if the amount of water is depleted and the elemental concentrations are low.
Redox conditions in the mine will likely remove contaminants such as nitrogen andsulfate and could change solubility of many of the other constituents, some precipitatingout while others becoming more soluble. Monitoring will guide treatment requirements.
RPM Comment
As noted in the surface water section, water treatment will likely extend for severaldecades. Appropriate facilities must be maintained to prevent environmental impact. Thecosts associated with monitoring and maintenance including disposal of water treatmentwaste must be incorporated into the closure costs.
Waste Rock Management
The most significant environmental impacts of waste rock are related to oxidation ofthe sulfide minerals they contain. As rainwater flows through the waste rock pile, the
APPENDIX II INDEPENDENT EXPERT’S REPORT
– II-210 –
waters can acidify and dissolve metals and elements such as arsenic. Most of the seepagefrom the storage facilities migrates into the surface groundwater systems. Appropriatewater treatment systems are required to manage the seepage and treat it, if required.
RPM Comment
Seepage from the waste rock storage facilities will migrate into the surface andgroundwater systems. The closure plan must include a detailed management system thatmitigates impacts to the water resources.
Biodiversity Management Plan
No documentation was provided for biodiversity management.
RPM Comment
Closure must be completed with the idea that water quality must be maintained andecosystems must be established to resemble pre-mining conditions.
9.3.3 Jokisivu Mine
Authorization and Permitting Approvals
The Jokisivu Project is operating under an Environmental Permit issued onDecember 3, 2010 and revised on June 13, 2016. A new environmental permit was issuedon February 17, 2021 with conditions that are currently under appeal by Dragon.Operations can continue to operate under existing requirements until the appeal isfinalized.
RPM Comment
The project is permitted to operate at existing production levels.
Air Quality Management
Dust emissions are generally associated with transport of ore and waste rock fromthe mine pit to respective drop areas. Blasting and road traffic will also contribute to dustissues. Dust is generally controlled using water spray. Gases emissions associated withvehicle use is also an important consideration for air quality. These emissions arecalculated and are likely used to estimate GHG emissions.
RPM Comment
The use of BMP to control dust and gaseous emissions should prevent issues withstakeholders and environmental regulators.
APPENDIX II INDEPENDENT EXPERT’S REPORT
– II-211 –
Soils Management
The mining area is located on a moraine-covered northwest-southeast ridge withrock areas at the edges. In the depressions of the southern part of the mining area thedepressions consist of fine-grained clay and silt materials.
Surface soils are removed prior to site construction and stockpiled for reuse inclosure. Reclaimed areas will be re-vegetated with local species.
RPM Comment
The topsoil management program will enhance reclamation activities.
Surface Water Management
Excess surface water is collected, treated and discharged into the environmentthrough surface water treatment basins. Water treatment is available to remove elements,if required.
Bypass diversions are established to remove non-contact water from impacting thewaste rock storage area. Water impacted by the waste rock are collected along the edges ofthe facility and treated to lower pH or remove elements, if necessary. Collected water ispumped to sedimentation basins to remove suspended solids and discharged to theenvironment.
RPM Comment
Surface water management is an ever-changing system. As issues are detected andsolved, modification of BMP’s is conducted to better mitigate issues.
Groundwater Management
The mine is located in an important, protected recharge area for the groundwatersystem. Groundwater is found at 1 to 2m below the surface. The water quality is good anddoes not show any impact from previous activities. Water levels decrease from 60 to 120cmduring the dry period.
A groundwater monitoring program was established to determine baseline andpotential impact from operations.
RPM Comment
The groundwater is located near the surface. Potential contamination fromhydrocarbon toxic chemical spills is great. Management and training programs should bedeveloped and implemented.
APPENDIX II INDEPENDENT EXPERT’S REPORT
– II-212 –

Waste Rock Management
Site preparation for the waste rock storage facility consisted of leveling the area andcompacting the moraine material during construction. This compacted zone is importantto significantly reduce seepage into the groundwater system.
Waste rock characterization was conducted in 2013 and 2019. Arsenic levelsexceeded guideline values for samples collected during both samplings while copperlevels from rock samples exceeded guidelines during the 2013 tests but did not exceed theguidelines for samples collected in 2019. The difference is likely related to sampling areas.High levels of arsenic are found in soils and rock in the project area.
Acid formation tests showed very limited acid formation capability. Thecharacterization work demonstrates limited water quality issues expected from wasterock storage.
RPM Comment
Seepage from waste rock storage is not expected to cause environmental risk.However, it is important to establish a waste rock sampling program that identifiesmaterials characterized with acid forming materials and leachable elements that couldimpact the environment. Mitigation actions may be required to control impacts.
Biodiversity Management
The mine is located outside the vicinity of nature reserves with the closest Natura2000 area located about 5km away. The biodiversity survey conducted in 2003 noted theexistence of three (3) flying squirrel territories connected to the north-west of the forest.The flying squirrels vacated the area in 2005 prior to project start-up. Since the flyingsquirrel was considered an endangered species, some biodiversity consideration shouldbe made.
RPM Comment
A biodiversity management plan should be developed and implemented.Monitoring of flora and fauna species should be conducted with emphasis on flyingsquirrel habitat should be considered.
9.3.4 Vammala Processing Plant
Authorization and Permitting Approvals
The Vammala Environmental Permit was issued on 12 March 2020 to operate at the300ktpa. The permit contains much stricter permit conditions related to crushing thanwere imposed in the existing permit issued in 2014. The primary reason for the conditionsis related to complaints received from stakeholders. The Company submitted an appeal ofthe conditions to the Administrative Court of Vaasa on 20 April 2020. The Company cancontinue to operate under its existing permit conditions until the court action is decided.
APPENDIX II INDEPENDENT EXPERT’S REPORT
– II-213 –
RPM Comment
The environmental permit allows operations to continue based on the existingconditions. If the appeal is approved, the conditions will be modified to reflect thechanges. RPM does not expect significant changes will be made to the conditions.
Air Quality Management
Dust controlling measures include the use of dust suppressants, liming, and use ofwater cannons and sprinklers. The crushing unit is also equipped with a dust controllingdevice. The concentration of dust particles is not regulated in the Permit, however, theCompany maintains both passive and active processes to minimise and manage dustparticles. Present readings show that any dust generated is below government guidelinesand is not considered harmful to either human health or the environment.
RPM Comment
The Court included additional dust control measures as conditions to the approvedpermit primarily to appease stakeholders that complained about dust. RPM does notexpect the Court to make significant modifications to their conditions.
Surface Water Management
Emission monitoring and environmental impact monitoring at the Vammalaconcentrator are carried out on the Kokemäenjoki River under the supervised of theFinnish Water Protection Association (now KVVY Tutkimus Oy). Water flows aremeasured and sampled regularly.
Water generated in the Plant area are often characterized with high concentrationsof nickel, sulphate, copper and associated high electrical conductivity. This water iscollected and pumped to the TSF for storage.
The water quality of receiving rivers is very poor resulting from other mining andprocessing operations. However, data appears to show increases in nickel downgradientof the Plant. However, the nickel limit according to Government Decree 868/2010 (4μg Nibio/l) was not exceeded as an annual average of bioavailable concentrations downstream.All observations were below the MAC-EQS limit of 34 μg Ni Liu/l. Concentrations ofcadmium and lead fell below the environmental quality standard concentrations. Thebasic quality of river water is primarily impacted other sources and is not significantlyaffected by runoff from the Processing Plant area.
RPM Comment
Although there is no clear water impact resulting from the Plant area, the Companyshould develop a water management plan that includes the use of BMP’s to reduce oreliminate runoff risks to streams.
APPENDIX II INDEPENDENT EXPERT’S REPORT
– II-214 –

Groundwater Management
An aquifer system was noted to not exist in the tailings storage area. Groundwaterdoes exist but it does not have the characteristics that support water supply. The nearestgroundwater aquifer available to support water use is about 4.5km southwest.
Groundwater monitoring shows a small increase in nickel and sulphate content andelectrical conductivity. However, the environmental quality standards have not beenexceeded.
RPM Comment
The groundwater monitoring program should include monitoring points close tothe aquifer system located 4.5km away to show potential impacts. If impacts occur,mitigation actions will be required.
Tailings Management
Tailings formed in the enrichment process are pumped from the process plant to thetailings storage facility (TSF). The TSF is located in the rolling moraine rock where therock rises in places up to the ground. On top of the bottom moraine, in rock depressions,clay material has collected. The clay covers more than half of the area on average at athickness of about 5m. The TSF is bordered by mixed forests and arable land.
The TSF is located in a low terrain between the rock thresholds. The basin of the TSFis either moraine or open rock. The eastern and southern parts of the basin have a 1-2mmoraine layer with rock underneath. Near the main dam there is more clay (about 1m)under the tailings and more moraine or hard clay under the clay. The dam is constructedon moraine layer underlain by rock.
Tailings have been deposited in the facility since 1975. As operations continue, theTSF has expanded into an area of an old mine pit previously used for tailings storage.Tailings have been deposited in the open pit since 1980. The bottom of the open pit was ata level of +40m before filling.
At present, the TSF covers an area of about 35 ha and is divided into to the threesub-basins A, B and C. TSF D will be constructed south of the existing TSF when thecurrent storage is filled.
Leachate from the TSF is collected on the south-east side of the facility and pumpedback into the water circuit. Leachate south and west of the TSF and stormwater from theconcentrator area is collected in a channel that is partly excavated in the rock. The waterseeping from the tailings ponds eventually flows into the concentrator area to a pumpingstation (Eika well) that pumps water back to the TSF.
The tailings stored in the facility represent many different materials. Some tailingsare characterized with concentrations of nickel while others contain sulfides. Organicmaterials resulting from processing materials mined at Orivesa contain high levels of acidproducing shales.
APPENDIX II INDEPENDENT EXPERT’S REPORT
– II-215 –

RPM Comment
Tailings stored in the Vammala TSF represent materials processed over the past 45years or so. Seepage from the facility poses a significant impact risk to the environment.Appropriate mitigation actions and long-term management planning must beincorporated into the closure plan to prevent environmental issues in the future.
9.3.5 Project Closure
Closure Management
The goal of project closure of the Kaapelinkulma, Orivesi and Jokisivu Mines andthe Vammala processing facility is to establish pre-mining conditions. Infrastructureincluding roads, buildings, ponds, etc. will be removed and the waste rock storage areaswill be capped to meet regulatory requirements for oxygen diffusion and waterinfiltration. The tailings storage facility will not be covered but access to the mine pit willbe controlled using appropriate blockades and signs.
Closure and Post-Closure Costs
Closure Cost Projections for the Kaapelinkulma, Orivesi, and Jokisivu Mines andthe Vammala processing facility are shown in Table 9-2.
Dragon Mining’s process for estimating the closure costs is reasonable. The closurecosts are estimated in Euro (€) and are present in Dragon Mining’s accounts. The accountscosts have been converted to USD using the exchange rate of the Valuation Date (1st June2021).
Table 9-2 Closure Cost Projections for the Vammala Production Centre Facilities
Facility
ProjectedClosure Cost
(USD)
ProjectClosure Cost
(€)
Kaapelinkulma Mine 0.78M1 0.60MOrivesi Mine 5.4M3 4.17MJokisivu Mine 5.3M2 4.11Vammala Plant 2.28M 1.75
1 Based on the analysis done waste rock is classified as inert waste. Much of the material is projected for use as
aggregate for building applications. Remaining waste rock dump is covered with till from minesite.
2 Closure estimate is based on 3rd party independent estimate presented in the permitting process. Waste rock is
possibly acid forming.
3 Closure estimate is based on Jokisivu estimate due to similarity between mines.
APPENDIX II INDEPENDENT EXPERT’S REPORT
– II-216 –

Environmental permits
The Projects currently holds numerous environmental, construction, and operatingpermits. Table 9-3 outlines the current licences and permits held.
Table 9-3 Environmental Permits
Asset Permit NameValidity
Issuance Expiry
Vammala Plant Environmental Permit15/2008/2, DnroLSY-2001-Y-42
19-Mar-08 Valid until appeals of newpermit have beenprocessed duly.
Environmental PermitLSSAVI/3810 &3809/2017
12-Mar-20 Appealed.
KaapelinkulmaGold Mine
Environmental Permit92/2011/1, DnroLSSAVI/315/04.08/2010
26-Aug-11 Until further notice.
Environmental Permit175/2015/1 (DnroLSSAVI/4511/04.08/2014)
14-Oct-15 Until further notice.
Svartliden Plant Environmental Permit M1704-10
30-Nov-12 Until further notice.
Decision for cleaningdevices of the waterhandling in Svartliden
18-Feb-14 None.
Decision for order of safetymeasures regardingnotification forprocessing enriched orein Svartliden
20-Apr-15 20/04/2017
Decision to process orefrom test mining inFäboliden
8-May-17 When test mining iscomplete.
Decision to continue toprocess enriched ore inSvartliden
7-Apr-17 7-Apr-20
Decision to continue toprocess enriched ore inSvartliden
5-Mar-20 5-Mar-23
Fäboliden GoldMine
Environmental Permit – TestMining 551-5277-2016
23-Nov-17 30-Sep-27
APPENDIX II INDEPENDENT EXPERT’S REPORT
– II-217 –

Asset Permit NameValidity
Issuance Expiry
Jokisivu GoldMine
Environmental Permit58/2010/1, DnroESAVI/6066/2015
3-Dec-10 Until further notice. Validuntil appeals of newpermit have beenprocessed duly.
Environmental Permit162/2016/1, DnroESAVI/6066/2015
13-Jun-16 Until further notice. Validuntil appeals of newpermit have beenprocessed duly.
Environmental Permit51/2021, DnroESAVI/43764/2019
17-Feb-21 Appealed.
Orivesi Gold Mine Environmental Permit1/2006/2, DnroLSY-2000-Y-284
24-Feb-06 Temporary permit until31.12.2010
Environmental Permitapplication 28 April 2010
In 6 June 2019, the SupremeAdministrative Courtupheld the decision of theRegional State
Administrative Agency(“AVI”) to reject theEnvironmental Permit.
Source: Provided by the Client.
RPM provides this information for reference only and recommends that land titlesand ownership rights be reviewed by legal experts.
10. COMMUNITY MANAGEMENT
RPM reviewed available information and did not identify any high risks. There area few areas of moderate concern:
• The site uses an ad hoc approach to social management and lacks many goodinternational industry practice (GIIP) policies and procedures. The ad hocapproach is currently working, but the lack of policies and procedures reducesthe sites’ ability to proactively engage with local community.
• The Finnish assets are situated near residential areas and have periodiccommunity complaints related to noise and dust. It is likely that residents willcontinue to appeal approval of mining and processing permits, leading toproject delays.
• The Swedish assets are situated in land that traditionally belongs to the SamiIndigenous people group. While there are occasionally tensions, the Company
APPENDIX II INDEPENDENT EXPERT’S REPORT
– II-218 –
has a long history of engagement. It is possible that members of the Sami willappeal approval of mining permits to protect their traditional reindeer land,leading to project delays.
• Two NGOs, Friends of the Earth Finland, and the Finnish Association forNature Conservation, have conducted campaigns against the mines in thepast. It is possible that the NGOs will attempt to create legal roadblocks fornecessary permits, leading to project delays.
Social Management
GIIP involves a structured approach to social management, that is, a SocialManagement System (SMS) made up of policies, procedures, and management plans. AnSMS is designed to ensure a consistent and replicable approach to maintaining sociallicense to operate. The Company exhibits two components of GIIP, a Code of Conduct andan annual sustainability report, but the bulk of required policies, procedures andmanagement plans are missing. At a minimum, the Company should develop andimplement country specific stakeholder engagement plans and site-specific externalgrievance management process.
The lack of engagement plans is reflected in the informal approach tocommunication with neighbouring communities, relying on local employees to representthe Company. There are no dedicated Community Relations staff.
RPM Comment
In countries with a strong regulatory framework, like Sweden and Finland,regulations somewhat reduce the need for a formal SMS. Regulations are not as effectiveat managing social risk, and strong local engagement is the key to maintaining sociallicense. RPM recommends that the Company develop and implement, at a minimum,country specific stakeholder engagement plans and site-specific external grievancemanagement processes. The ad hoc approach is moderately effective, but the lack ofpolicies and procedures reduces the sites’ ability to proactively engage with localcommunity, and leaves the sites open to community risk. The current communityengagement is reactive and not proactive.
Vammala Production Centre
The Jokisivu mine and Vammala process plant are located near residential areas. Thenearest neighbours are located within the safety protection distance (600m). Theproximity to local homes has led to local stakeholder complaints. Two neighbours of theVammala plant have appealed the permitting application due to noise levels. Otherresidents have complained about dust levels. The Company has taken action to installdust monitoring stations that allow real-time monitoring and increased watering.
Communities near the tailings storage facility (TSF) could potentially be impactedin the event of dam failure. Safety assessments for the TSF are conducted by governmentalauthorities, and emergency response plans are in place.
APPENDIX II INDEPENDENT EXPERT’S REPORT
– II-219 –

RPM Comment
RPM anticipates delays to the permitting process due to the history of complaintsand formal appeals to the permitting process. RPM recommends developing a proactivelocal engagement strategy to establish a positive narrative around the production centreand the local benefits. The lack of grievance mechanism means the Company has nosystem to identify and mitigate local risk.
Svartliden Production Centre
The Swedish operations are in the traditional herding area of the Sami Indigenouspeople. Engagement with local communities and the Sami villages’ representatives isrequired in Svartliden’s environment permit. The site has conducted regular engagementactivities with the Sami since 2004. The Sami have raised grievances against the project,mostly of general nature regarding restricted land access across the project footprint. Areindeer impact study was conducted and concludes that with the proper mitigationactions in place, there should be no significant negative impacts on the Sami, theirlivelihoods, or the reindeer.
The Sami are expected to present challenges for the permitting of the Fäbolidenproject. Consultations with Sami representatives on management measures for potentialimpacts of the project on reindeer herding are ongoing.
RPM Comment
GIIP requires a specific Indigenous engagement plan. Annual or bi-annual formalengagement is an important step, however it is not considered a sufficiently robustapproach to engaging with Indigenous populations. RPM recommends a clear Indigenousengagement strategy that includes culturally appropriate information sharing, proactiveengagement and a clear grievance management system.
External Organisations
Two organisations, Friends of the Earth Finland, and the Finnish Association forNature Conversation, have conducted campaigns against mining permit approvals. Thebulk of their action was in 2013 related to Orivesi. They opposed the continued miningoperations at Orivesi during the permit appeal process. As a result, the Western and InnerFinland State Administrative agency (ELY) rejected the issuance of the new environmentalpermit. The organisations demanded that ELY close down the mining operations after thenew permit was denied, however ELY rejected this demand and allowed Orivesi tocontinue mining under the existing permit.
RPM Comment
There are no current anti-Dragon Mining campaigns originating from the twoorganisations. The history of issues from 2013 would suggest that additional anti-miningactivity is possible and could impact the approval timelines.
APPENDIX II INDEPENDENT EXPERT’S REPORT
– II-220 –
11. RISKS AND OPPORTUNITIES
11.1 Opportunities
RPM highlight the following key opportunities:
11.1.1 Exploration Potential and Mine Life Extension
• Exploration in areas surrounding the Orivesi Gold Mine is continuing todefine resources that may justify re-opening of the mine.
• Infill drilling and mapping of drives at Kujankallio is likely to result inupgrade of Indicated Resources.
• For Kaapelinkulma, there is an opportunity to capture additionalmineralisation by constructing low grade halo wireframes around existinghigh-grade mineralisation. There is also an opportunity to define furthermineralisation beneath the South deposit.
• For Svartliden, the mineralisation remains open at depth beneath the east pitand there is potential to laterally extend lodes at depth.
11.1.2 Processing
• Increased gold recovery at the Svartliden operation, and
• Sale of the Vammala flotation concentrate to a smelter or trading house, mayattract very good terms and improve revenues.
11.2 Risks
Mining is a relatively high-risk business when compared to other industrial andcommercial operations. Each mine has unique characteristics and responses duringmining and processing, which can never be wholly predicted. RPM’s review of theProjects indicates risk profiles typical of small-moderate scale mines at similar levels ofresource, mine planning and development in the Nordic Region. Until further studiesprovide greater certainty, RPM notes that it has identified risks and opportunities with theProjects as outlined in Table 11-2.
RPM has attempted to classify risks associated with Dragon Mining based onGuidance Note 7 issued by The Stock Exchange of Hong Kong Limited. Risks are ranked asHigh, Medium or Low, and are determined by assessing the perceived consequence of arisk and its likelihood of occurring using the following definitions:
APPENDIX II INDEPENDENT EXPERT’S REPORT
– II-221 –
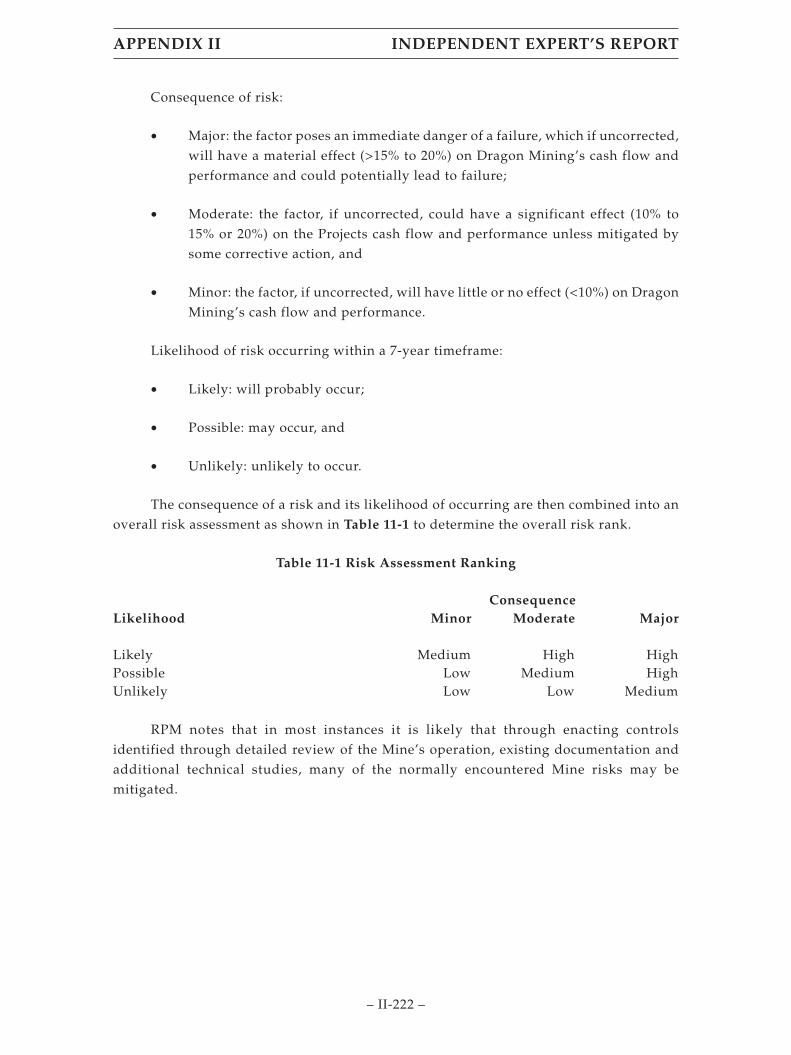
Consequence of risk:
• Major: the factor poses an immediate danger of a failure, which if uncorrected,will have a material effect (>15% to 20%) on Dragon Mining’s cash flow andperformance and could potentially lead to failure;
• Moderate: the factor, if uncorrected, could have a significant effect (10% to15% or 20%) on the Projects cash flow and performance unless mitigated bysome corrective action, and
• Minor: the factor, if uncorrected, will have little or no effect (<10%) on DragonMining’s cash flow and performance.
Likelihood of risk occurring within a 7-year timeframe:
• Likely: will probably occur;
• Possible: may occur, and
• Unlikely: unlikely to occur.
The consequence of a risk and its likelihood of occurring are then combined into anoverall risk assessment as shown in Table 11-1 to determine the overall risk rank.
Table 11-1 Risk Assessment Ranking
LikelihoodConsequence
Minor Moderate Major
Likely Medium High HighPossible Low Medium HighUnlikely Low Low Medium
RPM notes that in most instances it is likely that through enacting controlsidentified through detailed review of the Mine’s operation, existing documentation andadditional technical studies, many of the normally encountered Mine risks may bemitigated.
APPENDIX II INDEPENDENT EXPERT’S REPORT
– II-222 –
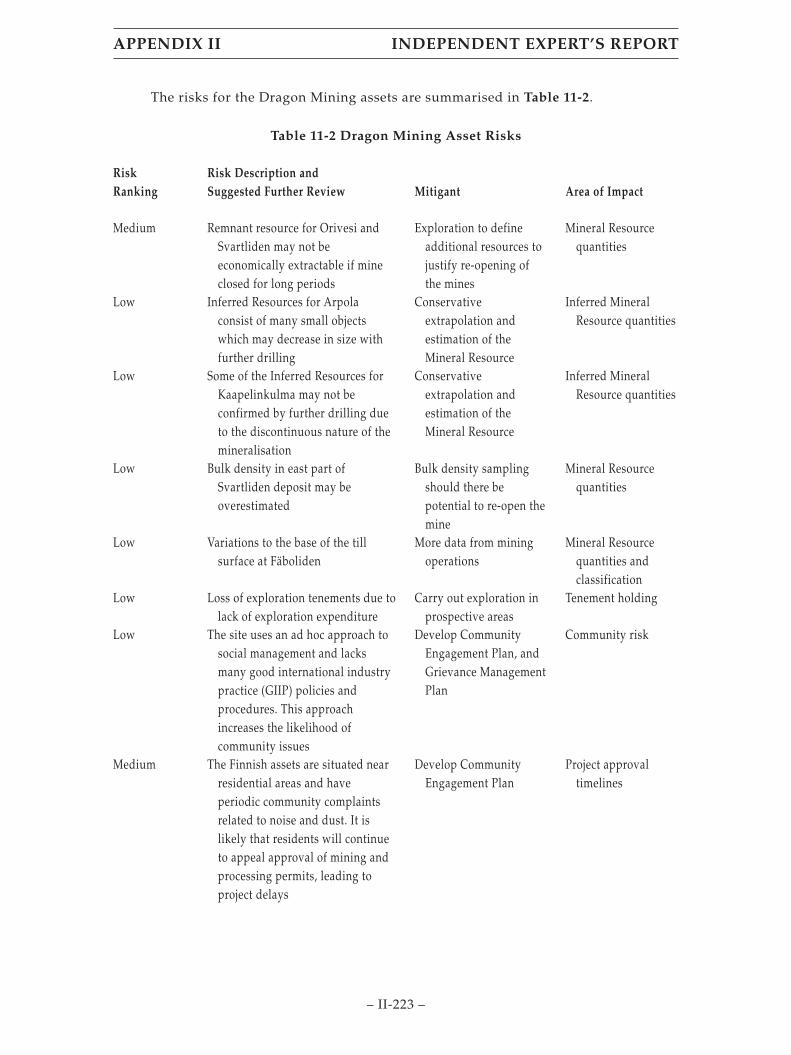
The risks for the Dragon Mining assets are summarised in Table 11-2.
Table 11-2 Dragon Mining Asset Risks
RiskRanking
Risk Description andSuggested Further Review Mitigant Area of Impact
Medium Remnant resource for Orivesi andSvartliden may not beeconomically extractable if mineclosed for long periods
Exploration to defineadditional resources tojustify re-opening ofthe mines
Mineral Resourcequantities
Low Inferred Resources for Arpolaconsist of many small objectswhich may decrease in size withfurther drilling
Conservativeextrapolation andestimation of theMineral Resource
Inferred MineralResource quantities
Low Some of the Inferred Resources forKaapelinkulma may not beconfirmed by further drilling dueto the discontinuous nature of themineralisation
Conservativeextrapolation andestimation of theMineral Resource
Inferred MineralResource quantities
Low Bulk density in east part ofSvartliden deposit may beoverestimated
Bulk density samplingshould there bepotential to re-open themine
Mineral Resourcequantities
Low Variations to the base of the tillsurface at Fäboliden
More data from miningoperations
Mineral Resourcequantities andclassification
Low Loss of exploration tenements due tolack of exploration expenditure
Carry out exploration inprospective areas
Tenement holding
Low The site uses an ad hoc approach tosocial management and lacksmany good international industrypractice (GIIP) policies andprocedures. This approachincreases the likelihood ofcommunity issues
Develop CommunityEngagement Plan, andGrievance ManagementPlan
Community risk
Medium The Finnish assets are situated nearresidential areas and haveperiodic community complaintsrelated to noise and dust. It islikely that residents will continueto appeal approval of mining andprocessing permits, leading toproject delays
Develop CommunityEngagement Plan
Project approvaltimelines
APPENDIX II INDEPENDENT EXPERT’S REPORT
– II-223 –

RiskRanking
Risk Description andSuggested Further Review Mitigant Area of Impact
Medium The Swedish assets are situated inland that traditionally belongs tothe Sami Indigenous peoplegroup. It is possible the Sami willattempt to halt project approvals
Develop IndigenousEngagement Strategythat exceeds therequirements underthe law
Project approvaltimelines
Low Environmental NGOs havepreviously conducted campaignsagainst the mines. It is possiblethe NGOs will conduct furthercampaigns to attempt to haltproject approvals
Local communicationstrategy
Project approvaltimelines
Low Predicted gold recoveries notachieved for Jokisivu ores
Maintain currentoperating practices
Revenue
Low Predicted gold recoveries notachieved for Fäboliden open-cutores
Implement proposedprocessing conditions
Revenue
Low Increase in Vammala processoperating costs
Maintain currentoperating practices
Revenue
Low Increase in Svartliden processoperating costs
Implement proposedprocessing practices
Revenue
Low Increase in Vammala capitalexpenditure
Lock in firm quotationsfor equipment and unitcosts
Revenue
Medium Fäboliden Mine: The CAB indicatedthat a permit cannot be issuedbefore a species protectionexemption has been granted. Thealternative result would be not togrant the permit until asatisfactory species protectioninventory was conducted
Apply for a SpeciesProtection Exemption
Environmental permitacquisition
Medium Fäboliden Mine: Seepage from thewaste rock storage facility isexpected to generate ARD withleachable elements detrimental towater quality
A groundwater andsurface watermonitoring programshould be installed toprovide early detectionof water qualityimpacts.Implementation ofappropriate mitigationactions may berequired if impacts arefound
Environmental: Waterquality impact
APPENDIX II INDEPENDENT EXPERT’S REPORT
– II-224 –

RiskRanking
Risk Description andSuggested Further Review Mitigant Area of Impact
Medium Svartliden Mine and ProcessingFacility: Seepage from tailingsstorage, through cracks in the pitwall, is likely impacting surfacewater and groundwater qualitydowngradient
A monitoring programmust be implementedto identify problemareas and appropriatemitigation actionsshould be implemented
Environmental: Waterquality impact
Low Kaapelinkulma Mine: The presenceof several protected andendangered species makesbiodiversity an importantconsideration of environmentalquality
A detailed managementprogram, noted as abiodiversity action planin the IFC PerformanceStandard 6, must bedeveloped,implemented andclosely monitored
Environmental:Biodiversity
Medium Orivesi Mine: Water treatment forsurface water and groundwater inthe mine area will likely extendfor several decades. Appropriatefacilities must be maintained toprevent environmental impact.The costs associated withmonitoring and maintenanceincluding disposal of watertreatment waste must beincorporated into the closure costs
Develop and implement amonitoring and watertreatment plan
Environmental: Waterquality controlduring the post-closure phase
Low The groundwater is located near thesurface. Potential contaminationfrom hydrocarbon toxic chemicalspills is great. Management andtraining programs should bedeveloped and implemented
Management andtraining programsshould be developedand implemented
Environmental: Waterquality control
APPENDIX II INDEPENDENT EXPERT’S REPORT
– II-225 –

RiskRanking
Risk Description andSuggested Further Review Mitigant Area of Impact
Medium New Vammala EnvironmentalPermit (Mar 2020) contains muchstricter permit conditions relatedto crushing than existing permit(2014) due to complaints receivedfrom stakeholders. The Companysubmitted appeal of conditions toAdministrative Court of Vaasa 20April 2020. The Company cancontinue to operate under itsexisting permit conditions untilthe court action is decided. If notruled in Company favour mayimpact production
Continue to appealstricter conditions
Production rates
Medium Tailings stored in the Vammala TSFrepresent materials processed overthe past 45 years. Seepage fromthe facility poses a significantimpact risk to the environment
Appropriate mitigationactions and long-termmanagement planningmust be incorporatedinto the closure plan toprevent environmentalissues in the future
Environmental:Potential impact towater resources dueto TSF seepage.
12. TECHNICAL VALUATION
This Valuation is made in accordance with the following:
• The Australasian Code for Reporting of Exploration Results, MineralResources and Ore Reserves (“The JORC Code”), 2012 Edition;
• The 2015 edition of the Australasian Code for Public Reporting of TechnicalAssessments and Valuations of Mineral Assets (“The VALMIN Code”);
• ASX Listing Rules (Chapter 5) and Relevant Guidance Notes, and
• Australian Securities and Investments Commission (“ASIC”) RegulatoryGuide 111 and 112 in relation to the “Content of expert reports” and the“Independence of Experts” respectively.
12.1 Background
RPM was commissioned by BDO on behalf of Dragon Mining to prepare anIndependent Valuation for Dragon Mining’s Sweden and Finland assets.
APPENDIX II INDEPENDENT EXPERT’S REPORT
– II-226 –

The information in this report that relates to the VALMIN valuation of DragonMining’s assets is based on information compiled and reviewed by Mr. Steve Hinde, whois a member of the Australasian Institute of Mining and Metallurgy and is a full-timeemployee of RPM.
Mr. Hinde has more than 40 years’ experience in the mining industry and has theappropriate relevant qualifications, experience, competence and independence to beconsidered an “Expert” or “Specialist” under the definitions provided in the VALMINCode. Mr Hinde has completed numerous mineral property valuations globally andqualifies as a mineral property valuator under the VALMIN Code.
Mr Hinde has no interest whatsoever in the assets reviewed and will gain no rewardfor the provision of this Independent Valuation. RPM will receive a professional fee for thepreparation of this statement.
The assets agreed with BDO and Dragon Mining to be reviewed and valued aresummarised in Table 1-1.
In conjunction with this Valuation, RPM conducted a high level ITER, the findingsof which are captured in the earlier sections of this report. The ITER provides the technicalreview and assurance on which the Valuation is based.
12.2 Ownership Changes and Key Developments
Dragon Mining purchased the Fäboliden project from Lappland Goldminers AB inDecember 2015 for SEK38M. At the time Lappland were bankrupt. As the asset was in adistressed state the resource multiple based on the existing Mineral Resources at the timewas USD1.58/oz. This does not represent a Comparable transaction and so was not usedin the valuation using Comparable Transactions.
12.3 Mining Licences and Tenements
RPM completed a high-level tenure review and determined that the tenementsgranted to Dragon Mining are currently valid and appear to be in good standing (seeSection 3.1).
12.4 Mineral Resources and Ore Reserves
Dragon Mining has Ore Reserves for the operating Jokisivu underground mine andthe Fäboliden open cut development project. There are Mineral Resources at Jokisivu andalso Mineral Resources for the Fäboliden open cut and potential underground operation.There are residual Mineral Resources at the closed Svartliden mine in Sweden and theclosed Orivesi and Kaapalinkulma mines in Finland. Details of Mineral Resources and OreReserves are in Sections 5 and 6.
12.5 Previous Valuations of Dragon Mining Assets
No previous valuations have been provided for review and RPM understands therehave been none.
APPENDIX II INDEPENDENT EXPERT’S REPORT
– II-227 –

12.6 Basis of value
The VALMIN Code primarily uses the terms Market Value and Technical Value.
• Technical Value is an assessment of a Mineral Asset’s future net economicbenefit at the Valuation Date under a set of assumptions deemed mostappropriate by a Practitioner, excluding any premium or discount to accountfor market considerations.
• Market Value is the estimated amount (or the cash equivalent of some otherconsideration) for which the Mineral Asset should exchange on the date ofValuation between a willing buyer and a willing seller in an arm’s lengthtransaction after appropriate marketing where the parties had each actedknowledgeably, prudently and without compulsion.
Valuation date is the 1st of June, 2021.
Three Valuation Approaches are noted by the VALMIN Code as being widelyaccepted approaches.
Market-based Approach
The Market Approach is based primarily on the notion of substitution. In thisValuation Approach the Mineral Asset being valued is compared with the transactionvalue of similar Mineral Assets under similar time and circumstance on an open market.These include:
• Comparable Sales Transaction, and
• Joint Venture Terms.
Income-based Approach
The Income Approach is based on the notion of cashflow generation. In thisValuation Approach the anticipated benefits of the potential income or cashflow of aMineral Asset are analysed. These include:
• Discounted cashflow (DCF), and
• Multiples of Earnings.
Cost-based Approach
The Cost Approach is based on the notion of cost contribution to Value. In thisValuation Approach the costs incurred on the Mineral Asset are the basis of analysis.These include:
APPENDIX II INDEPENDENT EXPERT’S REPORT
– II-228 –

• Sunk costs, and
• Current Replacement Costs.
The selection of an appropriate Valuation Method will depend on such factors asthe:
• nature of the Valuation;
• development status of the Mineral Assets, and
• extent and reliability of available information.
The VALMIN Code (2015) provides a classification of mineral assets which relate tothe applicability of the Valuation approaches. These are:
• Early-stage Exploration Projects – Tenure holdings where mineralisation mayor may not have been identified, but where Mineral Resources have not beenidentified;
• Advanced Exploration Projects – Tenure holdings where considerableexploration has been undertaken and specific targets identified that warrantfurther detailed evaluation, usually by drill testing, trenching or some otherform of detailed geological sampling. A Mineral Resource estimate may ormay not have been made, but sufficient work will have been undertaken on atleast one prospect to provide both a good understanding of the type ofmineralisation present and encouragement that further work will elevate oneor more of the prospects to the Mineral Resources category;
• Pre-Development Projects – Tenure holdings where Mineral Resources havebeen identified and their extent estimated (possibly incompletely), but wherea decision to proceed with development has not been made. Properties at theearly assessment stage, properties for which a decision has been made not toproceed with development, properties on care and maintenance andproperties held on retention titles are included in this category if MineralResources have been identified, even if no further work is being undertaken;
• Development Projects – Tenure holdings for which a decision has been madeto proceed with construction or production or both, but which are not yetcommissioned or operating at design levels. Economic viability ofDevelopment Projects will be proven by at least a Pre-Feasibility Study;
• Production Projects – Tenure holdings – particularly mines, wellfields andprocessing plants – that have been commissioned and are in production.
APPENDIX II INDEPENDENT EXPERT’S REPORT
– II-229 –

The Valuation approaches applicable to these mineral asset classifications areshown on Table 12-1.
Table 12-1 Comparison of Valuation Approaches
ValuationApproach
ExplorationProjects
Pre-developmentProjects
DevelopmentProjects
ProductionProjects
Market Yes Yes Yes YesIncome No In some cases Yes YesCost Yes In some cases No No
The Valuation of a mineral asset should use at least two approaches and the reasonsfor selection of the Valuation approach should be explained. The marketpremium/discount must be explained. A range of values and a preferred value must bedetermined.
12.7 Valuation Approaches
The valuation methods selected are in accordance with the recommendation byVALMIN in relation to the suitability of certain valuation approaches as a function of thematurity of projects. These methods included an Income-Based approach (discounted cashflow (DCF) analysis) and a Market approach (Comparable Transactions), with supportfrom a Geoscientific approach (modified Kilburn method). An Appraised Value approach(Multiples of Exploration Expenditure (MEE)) was not possible for exploration tenementsdue to the lack of exploration expenditure in the last five years. A salvage value wasapplied to the process plants.
12.7.1 Income-based Approach
For an Income-based approach a discounted cash flow model (DCF) may be used todetermine the Net Present Value of an asset if suitable information is available. Anyavailable cash flow models or mining schedules for an asset are utilised which includes:
• Life of mine production schedule.
• Operating cost of mining equipment.
• Operating cost of fixed plant items.
• Capital costs of both mining equipment and fixed plant.
• On-site labour for the entire operation.
• Pricing assumptions.
• Tax and depreciation rates.
• Royalties.
APPENDIX II INDEPENDENT EXPERT’S REPORT
– II-230 –
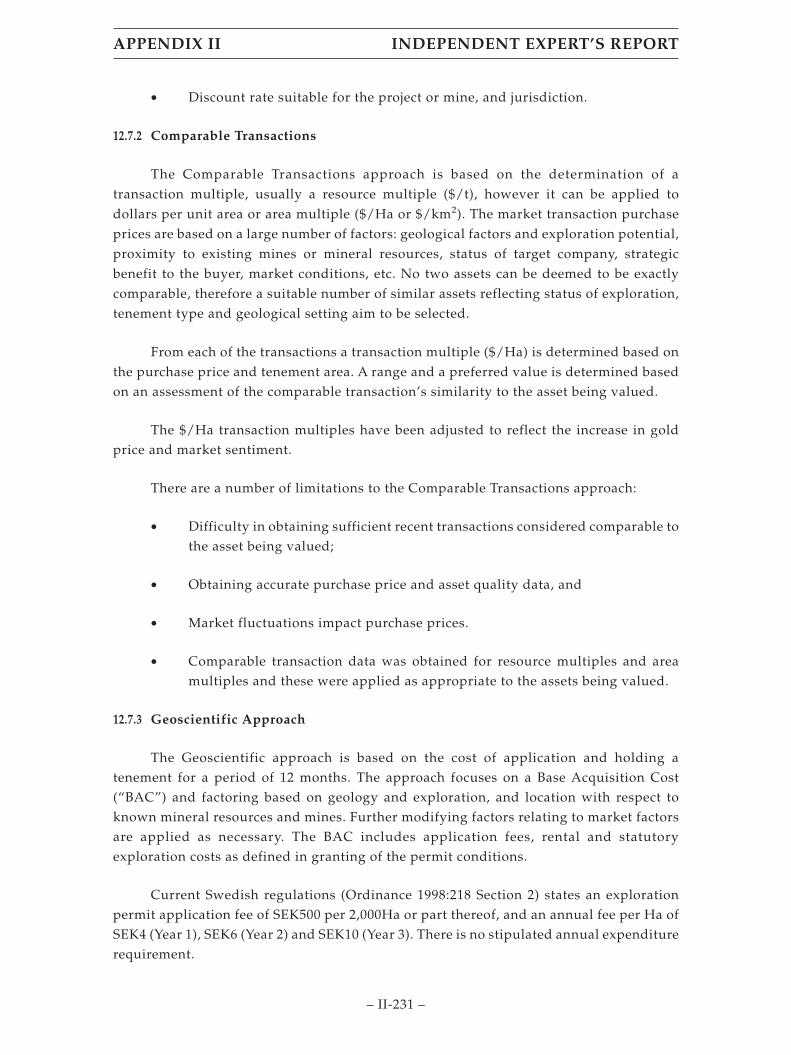
• Discount rate suitable for the project or mine, and jurisdiction.
12.7.2 Comparable Transactions
The Comparable Transactions approach is based on the determination of atransaction multiple, usually a resource multiple ($/t), however it can be applied todollars per unit area or area multiple ($/Ha or $/km2). The market transaction purchaseprices are based on a large number of factors: geological factors and exploration potential,proximity to existing mines or mineral resources, status of target company, strategicbenefit to the buyer, market conditions, etc. No two assets can be deemed to be exactlycomparable, therefore a suitable number of similar assets reflecting status of exploration,tenement type and geological setting aim to be selected.
From each of the transactions a transaction multiple ($/Ha) is determined based onthe purchase price and tenement area. A range and a preferred value is determined basedon an assessment of the comparable transaction’s similarity to the asset being valued.
The $/Ha transaction multiples have been adjusted to reflect the increase in goldprice and market sentiment.
There are a number of limitations to the Comparable Transactions approach:
• Difficulty in obtaining sufficient recent transactions considered comparable tothe asset being valued;
• Obtaining accurate purchase price and asset quality data, and
• Market fluctuations impact purchase prices.
• Comparable transaction data was obtained for resource multiples and areamultiples and these were applied as appropriate to the assets being valued.
12.7.3 Geoscientific Approach
The Geoscientific approach is based on the cost of application and holding atenement for a period of 12 months. The approach focuses on a Base Acquisition Cost(“BAC”) and factoring based on geology and exploration, and location with respect toknown mineral resources and mines. Further modifying factors relating to market factorsare applied as necessary. The BAC includes application fees, rental and statutoryexploration costs as defined in granting of the permit conditions.
Current Swedish regulations (Ordinance 1998:218 Section 2) states an explorationpermit application fee of SEK500 per 2,000Ha or part thereof, and an annual fee per Ha ofSEK4 (Year 1), SEK6 (Year 2) and SEK10 (Year 3). There is no stipulated annual expenditurerequirement.
APPENDIX II INDEPENDENT EXPERT’S REPORT
– II-231 –

According to Finland’s Mining Act (621/2011) issued in Helsinki 10th June 2011,Part 1 Exploration and Exploitation of Mining Minerals, Chapter 1, Section 99, there is noexploration permit application fee and no stipulated annual expenditure requirement.There is an Exploration Fee whereby the exploration permit holder pays annualcompensation (exploration fee) to the owners of land included in the exploration area,being 20/Ha for years 1-4, 30/Ha for years 5-7, 40/Ha for years 8-10, and 50/Ha onwards.
Geological factors were originally developed by Kilburn (1990), with a rating from0.1 to 10. These have since been modified by numerous others. RPM uses the geologicalfactors as shown in Table 12-2.
Due to the high current gold price and the short-medium term forecast for this toremain high, a market factor of 1.25 has been used to determine market value fromtechnical value.
Table 12-2 Geoscientific Ranking Factors
Rating Off Property Factor On Property Factor Anomaly Factor Geological Factor
0 No prospect ofmineralisation
0.5 Unsuitable environmentwith little chance ofmineralisation
Unsuitable environmentwith little chance ofmineral prospectivity
Previous explorationwith poor results – noencouragement
Generally unfavourablegeology
0.75 No known mineraldeposit in district
No knownmineralisation intenement area
No targets identified Generally <50%favourable geology
1 Indications ofprospectivity insurrounding areas
Indications ofmineralisation
Previous exploration –no targets identified
Generally favourablegeology in area <75%
1.5 Promising results fromdrilling around thearea
Drilling showsencouragement withprospectivemineralisation
Early stage targets Generally favourablegeology in area.Mineralisedstructures/stratigraphypresent
2 Historical workings inadjacent areas
Significant drilling Well-defined targetsidentified
Strongly favourablegeology
2.5 Along strike fromhistorical workings
Historic productionwithin the area
Several well-definedtargets
3 Mineral Resourcesidentified in adjacentareas
Recent mining in area Significant targets
3.5 Adjacent area hasMineral Resources andproject prefeasibilitystatus
Historic mining withreasonable production
Economic targets
APPENDIX II INDEPENDENT EXPERT’S REPORT
– II-232 –
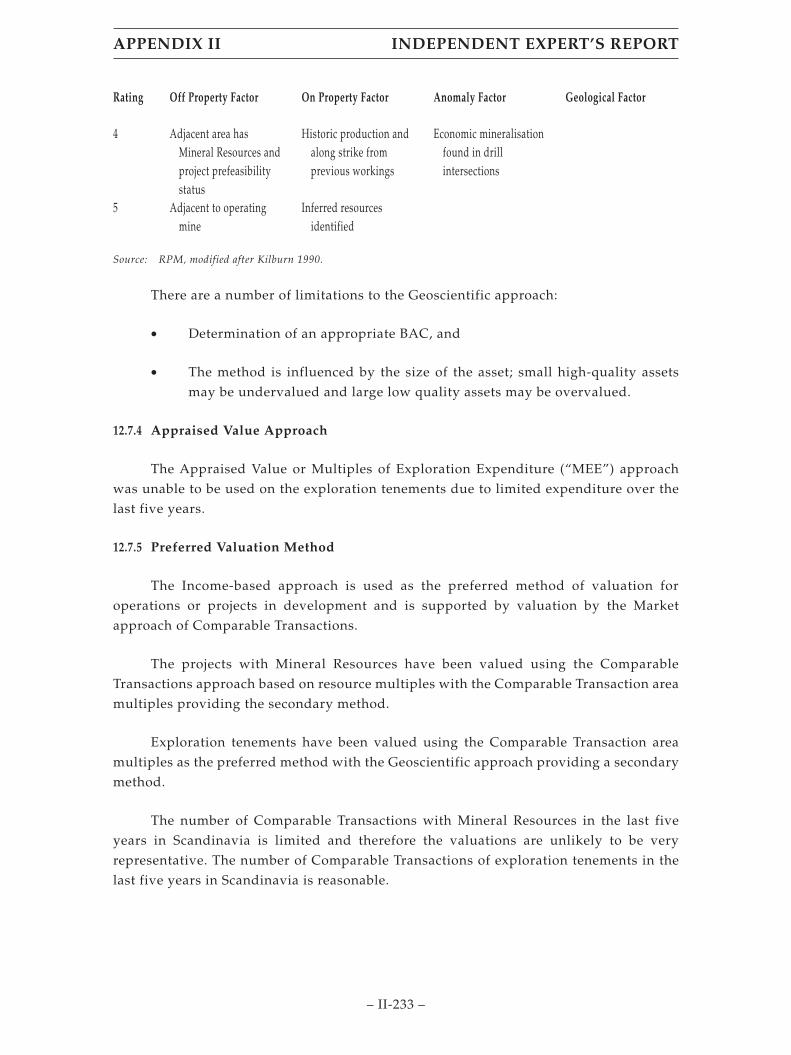
Rating Off Property Factor On Property Factor Anomaly Factor Geological Factor
4 Adjacent area hasMineral Resources andproject prefeasibilitystatus
Historic production andalong strike fromprevious workings
Economic mineralisationfound in drillintersections
5 Adjacent to operatingmine
Inferred resourcesidentified
Source: RPM, modified after Kilburn 1990.
There are a number of limitations to the Geoscientific approach:
• Determination of an appropriate BAC, and
• The method is influenced by the size of the asset; small high-quality assetsmay be undervalued and large low quality assets may be overvalued.
12.7.4 Appraised Value Approach
The Appraised Value or Multiples of Exploration Expenditure (“MEE”) approachwas unable to be used on the exploration tenements due to limited expenditure over thelast five years.
12.7.5 Preferred Valuation Method
The Income-based approach is used as the preferred method of valuation foroperations or projects in development and is supported by valuation by the Marketapproach of Comparable Transactions.
The projects with Mineral Resources have been valued using the ComparableTransactions approach based on resource multiples with the Comparable Transaction areamultiples providing the secondary method.
Exploration tenements have been valued using the Comparable Transaction areamultiples as the preferred method with the Geoscientific approach providing a secondarymethod.
The number of Comparable Transactions with Mineral Resources in the last fiveyears in Scandinavia is limited and therefore the valuations are unlikely to be veryrepresentative. The number of Comparable Transactions of exploration tenements in thelast five years in Scandinavia is reasonable.
APPENDIX II INDEPENDENT EXPERT’S REPORT
– II-233 –

This is summarised in Table 12-3.
Table 12-3 Summary of Valuation Approaches
Tenement DCF
ComparableTransactions
GeoscientificValue less
cost Salvage
ResourceMultiples
($/oz)
AreaMultiples
($/Ha)
FinlandOrivesi ✓ ✓
Sarvisuo 1-2 ✓ ✓
Sarvisuo 3 ✓ ✓
Ori ✓ ✓
Jokisivu ✓ ✓
Jokisivu 2 ✓ ✓
Jokisivu 3 ✓ ✓
Jokisivu 4-5 ✓ ✓
Jokisivu 7-8 ✓ ✓
Jokisivu 10 ✓ ✓
Kaapelinkulma ✓ ✓
Uunimäki 1 ✓ ✓
Stormi (Vammala) ✓
SwedenSvartlidengruvan
K nr 1 ✓ ✓
Svartliden Plant ✓
Svartliden Plant GIC ✓
Fäboliden Open Cut ✓ ✓
FäbolidenUnderground ✓
Fäboliden nr 11 ✓ ✓
12.8 Valuation Results
12.8.1 Comparable Transactions
Comparable transactions were researched using S&P Global Market Intelligencedatabase. Scandinavian countries were researched, specifically Sweden, Finland, Norwayand Denmark. There were no transaction involving Ore Reserves, limited transactionsinvolving Mineral Resources and several relevant transactions for tenements only.
APPENDIX II INDEPENDENT EXPERT’S REPORT
– II-234 –

These transactions are summarised below in Table 12-4 for Resource Multiples.
Table 12-4 Comparable Transactions Resource Multiples
Date Announced/Completed Project Location Buyer Seller Ownership
M&IMultiple
USD/oz
M, I & InfMultiple
USD/oz
Announced 12_05_2021Pending
Barsele – OC +bulk UG
Sweden Barsele MineralsCorp.
Agnico Eagle MinesLtd
55% 436 106
Announced 12_05_2021Pending
Barsele – OC +selective UG
Sweden Barsele MineralsCorp.
Agnico Eagle MinesLtd
55% 556 74
Completed 8/02/2018 Laiva (Nordic) Finland Firesteel ResourcesInc (now NordicGold Corp)
Nordic MinesMarknad AB
40% 74 19
Completed 8/12/2017 Laiva (Nordic) Finland Firesteel ResourcesInc (now NordicGold Corp)
Nordic MinesMarknad AB
60% 184 46
Completed 6/11/2015 Barsele Sweden Agnico Eagle MinesLtd
Orex Minerals Inc 55% 55 26
Resource Multiples for transactions with Mineral Resources are limited to fourtransactions on two projects, Barsele and Laiva. The Barsele project is a very large MineralResource of 3.45Mt @ 1.32 g/t Au for 240k oz of gold open cut and 15.6Mt @ 2.64 g/t Au for1.33M oz of gold for a selective underground operation. The tenements for the Barseleproject are also very large at around 47k Ha, much larger than the Dragon Miningtenements. The tenements have numerous exploration targets. The Laiva project is anopen cut project and has similar total gold ounces to Dragon Mining, but the DragonMining assets have better grades in both open cut and underground. Laiva averages 1.44g/t Au, whereas the Fäboliden open cut averages 2.8 g/t Au. The two resource multiplesfor the Barsele project in 2021 are due to two mining options: an open cut with anunderground bulk mining option; an open cut with a selective underground miningoption. Dragon Mining has open cut and underground operations and so the bulkunderground option for Barsele is not applicable.
Note, the relative proportions of Measured and Indicated Resource categories in thetotal resource base (i.e., including Inferred Resources) for the Comparable Transactions ishigh (54-87%) with the proportion of Measured Resources very low. These are similarproportions as for the Dragon Mining assets; therefore, no factor was applied for resourcecategory.
The limited transactions causes issues with selecting relevant resource multiples.RPM has selected the resource multiple range of USD19/oz to USD74/oz, with a preferredresource multiple of USD41/oz. This is closer to the Laiva project value.
APPENDIX II INDEPENDENT EXPERT’S REPORT
– II-235 –
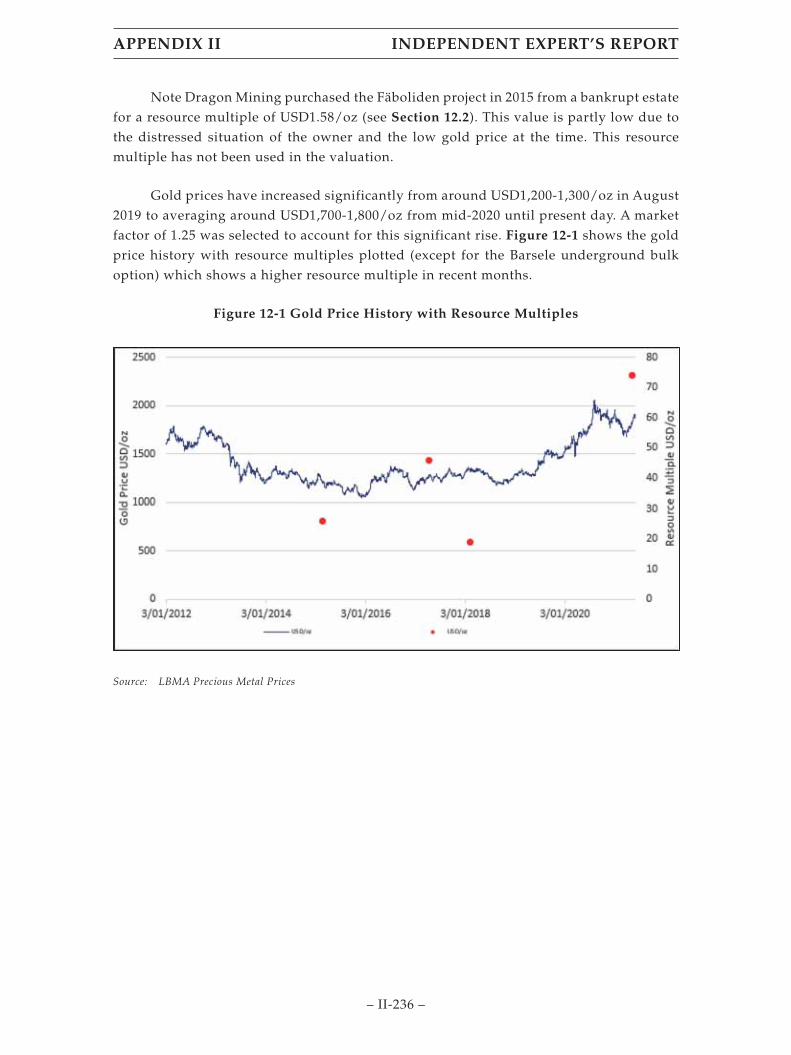
Note Dragon Mining purchased the Fäboliden project in 2015 from a bankrupt estatefor a resource multiple of USD1.58/oz (see Section 12.2). This value is partly low due tothe distressed situation of the owner and the low gold price at the time. This resourcemultiple has not been used in the valuation.
Gold prices have increased significantly from around USD1,200-1,300/oz in August2019 to averaging around USD1,700-1,800/oz from mid-2020 until present day. A marketfactor of 1.25 was selected to account for this significant rise. Figure 12-1 shows the goldprice history with resource multiples plotted (except for the Barsele underground bulkoption) which shows a higher resource multiple in recent months.
Figure 12-1 Gold Price History with Resource Multiples
Source: LBMA Precious Metal Prices
APPENDIX II INDEPENDENT EXPERT’S REPORT
– II-236 –
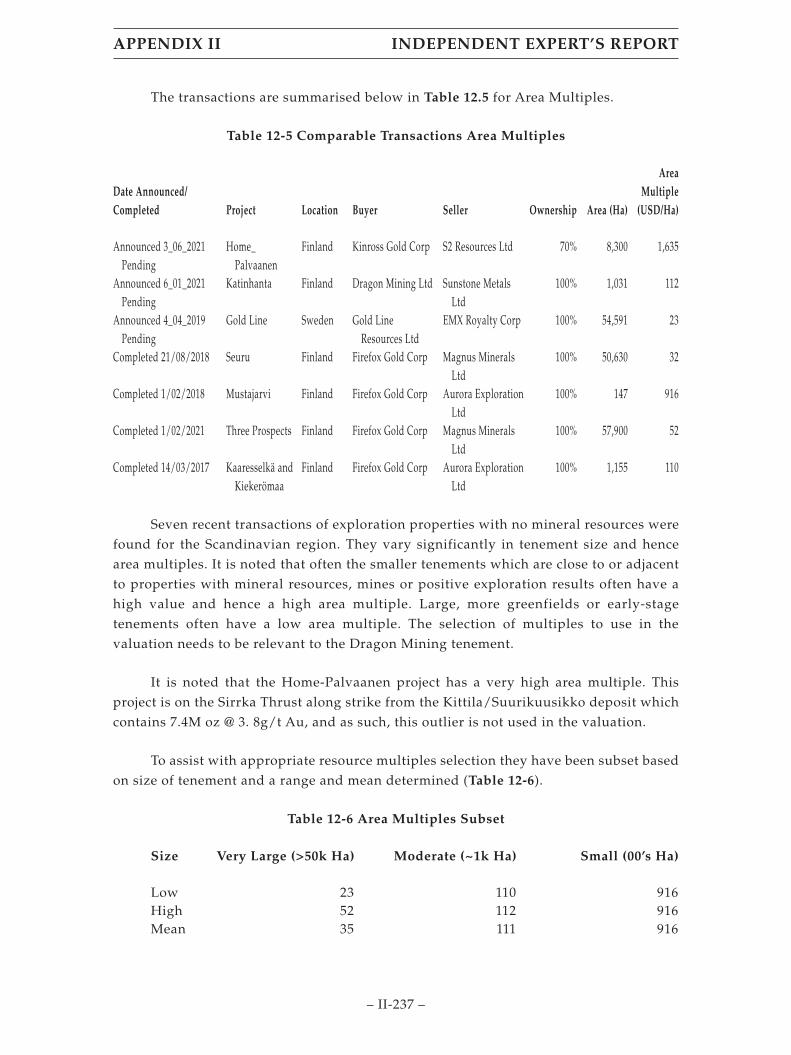
The transactions are summarised below in Table 12.5 for Area Multiples.
Table 12-5 Comparable Transactions Area Multiples
Date Announced/Completed Project Location Buyer Seller Ownership Area (Ha)
AreaMultiple
(USD/Ha)
Announced 3_06_2021Pending
Home_Palvaanen
Finland Kinross Gold Corp S2 Resources Ltd 70% 8,300 1,635
Announced 6_01_2021Pending
Katinhanta Finland Dragon Mining Ltd Sunstone MetalsLtd
100% 1,031 112
Announced 4_04_2019Pending
Gold Line Sweden Gold LineResources Ltd
EMX Royalty Corp 100% 54,591 23
Completed 21/08/2018 Seuru Finland Firefox Gold Corp Magnus MineralsLtd
100% 50,630 32
Completed 1/02/2018 Mustajarvi Finland Firefox Gold Corp Aurora ExplorationLtd
100% 147 916
Completed 1/02/2021 Three Prospects Finland Firefox Gold Corp Magnus MineralsLtd
100% 57,900 52
Completed 14/03/2017 Kaaresselkä andKiekerömaa
Finland Firefox Gold Corp Aurora ExplorationLtd
100% 1,155 110
Seven recent transactions of exploration properties with no mineral resources werefound for the Scandinavian region. They vary significantly in tenement size and hencearea multiples. It is noted that often the smaller tenements which are close to or adjacentto properties with mineral resources, mines or positive exploration results often have ahigh value and hence a high area multiple. Large, more greenfields or early-stagetenements often have a low area multiple. The selection of multiples to use in thevaluation needs to be relevant to the Dragon Mining tenement.
It is noted that the Home-Palvaanen project has a very high area multiple. Thisproject is on the Sirrka Thrust along strike from the Kittila/Suurikuusikko deposit whichcontains 7.4M oz @ 3. 8g/t Au, and as such, this outlier is not used in the valuation.
To assist with appropriate resource multiples selection they have been subset basedon size of tenement and a range and mean determined (Table 12-6).
Table 12-6 Area Multiples Subset
Size Very Large (>50k Ha) Moderate (~1k Ha) Small (00’s Ha)
Low 23 110 916High 52 112 916Mean 35 111 916
APPENDIX II INDEPENDENT EXPERT’S REPORT
– II-237 –

Gold prices have increased significantly from around USD1,200-1,300/oz in August2019 to averaging around USD1,700-1,800/oz from mid-2020 until present day. A marketfactor of 1.25 was selected to account for this significant rise. Figure 12-2 shows the goldprice history with area multiples plotted.
Figure 12-2 Gold Price History with Area Multiples
Source: LBMA Precious Metal Prices
12.8.2 Vammala Production Centre
The Jokisvu Mine, as it is supported by a mining study and Ore Reserves, is valuedby DCF as the primary method and resource multiples based on Comparable Transactionsas a secondary method.
The Vammala assets which have residual Mineral Resources are valued by resourcemultiples as a primary method and area multiples as a secondary method. In some casesthe Geoscientific method has also been used.
Vammala assets which have no Mineral Resources and are exploration tenementsare valued by area multiples as a primary method and the Geoscientific method as asecondary method.
The Vammala process plant has been valued with a salvage value.
Results of the valuation calculations using the area multiples are shown in Table
12-7. It is noted that in some cases only one transaction is comparable and hence only onearea multiple is applied. In these cases, the low, high and preferred multiples are the same.Due to the lack of transaction multiples in general the preferred value is the average.
APPENDIX II INDEPENDENT EXPERT’S REPORT
– II-238 –
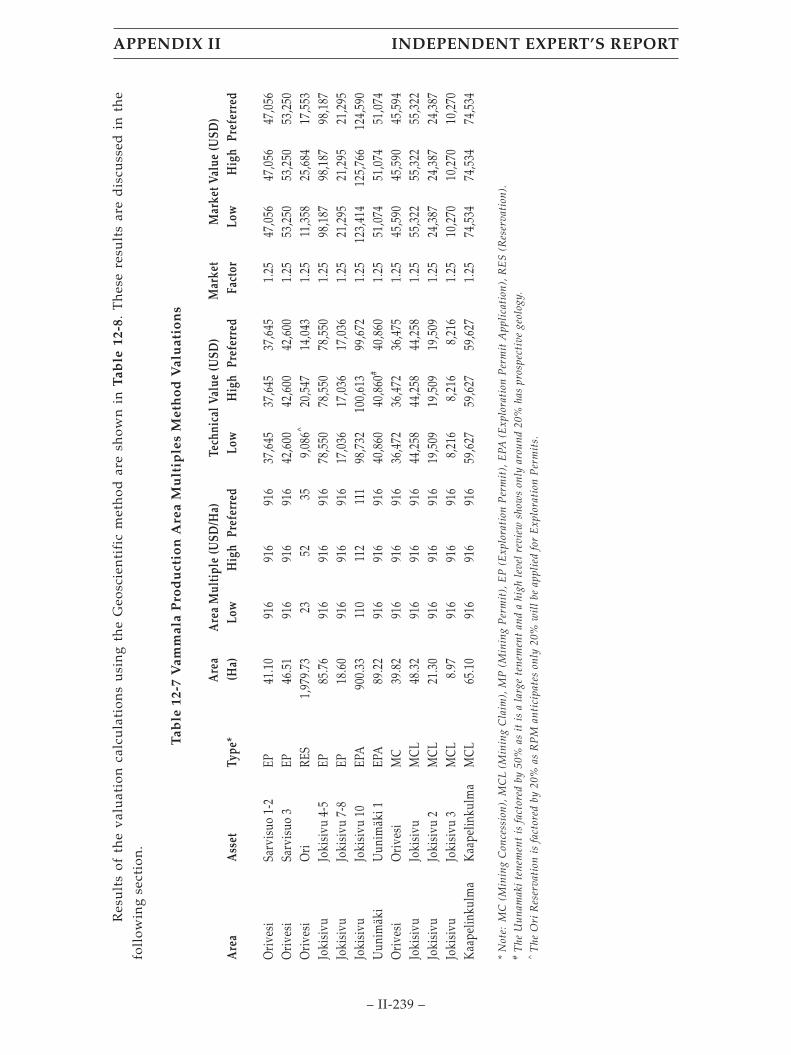
Res
ult
sof
the
val
uat
ion
calc
ula
tion
su
sin
gth
eG
eosc
ien
tifi
cm
eth
odar
esh
own
inT
able
12-8
.T
hes
ere
sult
sar
ed
iscu
ssed
inth
efo
llow
ing
sect
ion
.
Tab
le12
-7V
amm
ala
Pro
du
ctio
nA
rea
Mu
ltip
les
Met
ho
dV
alu
atio
ns
Are
aA
sset
Type
*A
rea
(Ha)
Are
aM
ulti
ple
(USD
/Ha)
Tech
nica
lVal
ue(U
SD)
Mar
ket
Fact
orM
arke
tVal
ue(U
SD)
Low
Hig
hPr
efer
red
Low
Hig
hPr
efer
red
Low
Hig
hPr
efer
red
Ori
vesi
Sarv
isuo
1-2
EP41
.10
916
916
916
37,6
4537
,645
37,6
451.
2547
,056
47,0
5647
,056
Ori
vesi
Sarv
isuo
3EP
46.5
191
691
691
642
,600
42,6
0042
,600
1.25
53,2
5053
,250
53,2
50O
rive
siO
riRE
S1,
979.
7323
5235
9,08
6^20
,547
14,0
431.
2511
,358
25,6
8417
,553
Joki
sivu
Joki
sivu
4-5
EP85
.76
916
916
916
78,5
5078
,550
78,5
501.
2598
,187
98,1
8798
,187
Joki
sivu
Joki
sivu
7-8
EP18
.60
916
916
916
17,0
3617
,036
17,0
361.
2521
,295
21,2
9521
,295
Joki
sivu
Joki
sivu
10EP
A90
0.33
110
112
111
98,7
3210
0,61
399
,672
1.25
123,
414
125,
766
124,
590
Uun
imäk
iU
unim
äki1
EPA
89.2
291
691
691
640
,860
40,8
60#
40,8
601.
2551
,074
51,0
7451
,074
Ori
vesi
Ori
vesi
MC
39.8
291
691
691
636
,472
36,4
7236
,475
1.25
45,5
9045
,590
45,5
94Jo
kisi
vuJo
kisi
vuM
CL48
.32
916
916
916
44,2
5844
,258
44,2
581.
2555
,322
55,3
2255
,322
Joki
sivu
Joki
sivu
2M
CL21
.30
916
916
916
19,5
0919
,509
19,5
091.
2524
,387
24,3
8724
,387
Joki
sivu
Joki
sivu
3M
CL8.
9791
691
691
68,
216
8,21
68,
216
1.25
10,2
7010
,270
10,2
70K
aape
linku
lma
Kaa
pelin
kulm
aM
CL65
.10
916
916
916
59,6
2759
,627
59,6
271.
2574
,534
74,5
3474
,534
*N
ote:
MC
(Min
ing
Con
cess
ion)
,MC
L(M
inin
gC
laim
),M
P(M
inin
gP
erm
it),
EP
(Exp
lora
tion
Per
mit
),E
PA(E
xplo
rati
onP
erm
itA
ppli
cati
on),
RE
S(R
eser
vati
on).
#T
heU
unam
aki
tene
men
tis
fact
ored
by50
%as
itis
ala
rge
tene
men
tan
da
high
leve
lre
view
show
son
lyar
ound
20%
has
pros
pect
ive
geol
ogy.
^T
heO
riR
eser
vati
onis
fact
ored
by20
%as
RP
Man
tici
pate
son
ly20
%w
ill
beap
plie
dfo
rE
xplo
rati
onP
erm
its.
APPENDIX II INDEPENDENT EXPERT’S REPORT
– II-239 –
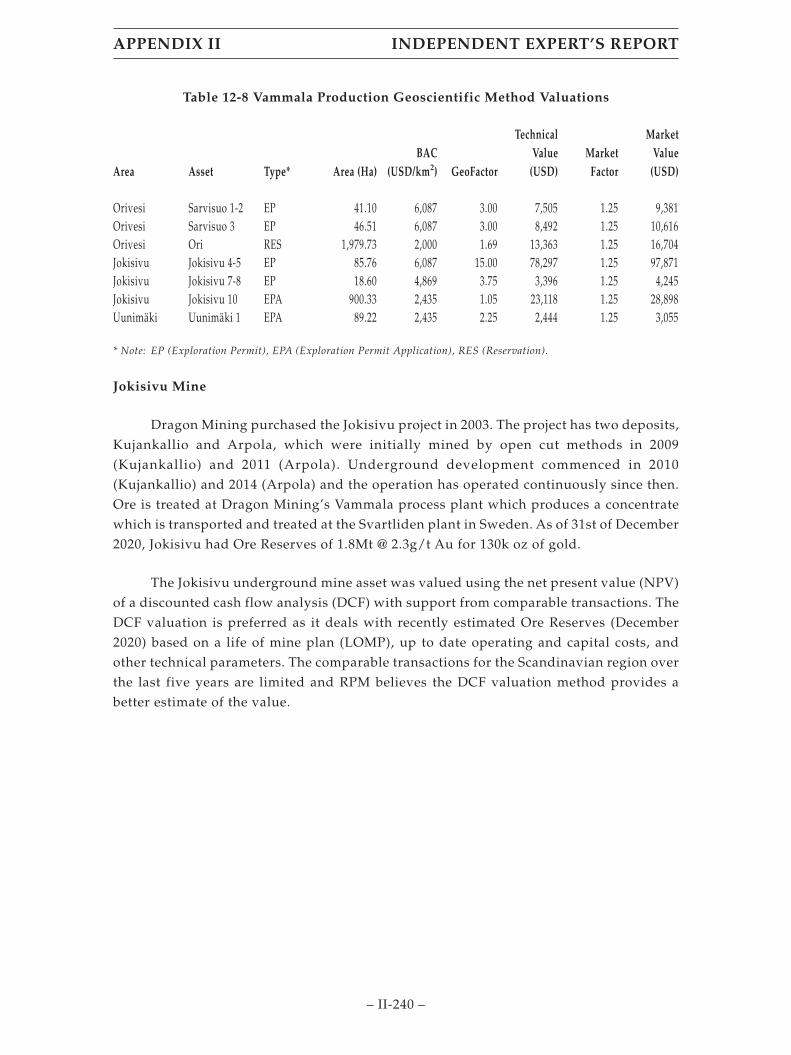
Table 12-8 Vammala Production Geoscientific Method Valuations
Area Asset Type* Area (Ha)BAC
(USD/km2) GeoFactor
TechnicalValue
(USD)Market
Factor
MarketValue
(USD)
Orivesi Sarvisuo 1-2 EP 41.10 6,087 3.00 7,505 1.25 9,381Orivesi Sarvisuo 3 EP 46.51 6,087 3.00 8,492 1.25 10,616Orivesi Ori RES 1,979.73 2,000 1.69 13,363 1.25 16,704Jokisivu Jokisivu 4-5 EP 85.76 6,087 15.00 78,297 1.25 97,871Jokisivu Jokisivu 7-8 EP 18.60 4,869 3.75 3,396 1.25 4,245Jokisivu Jokisivu 10 EPA 900.33 2,435 1.05 23,118 1.25 28,898Uunimäki Uunimäki 1 EPA 89.22 2,435 2.25 2,444 1.25 3,055
* Note: EP (Exploration Permit), EPA (Exploration Permit Application), RES (Reservation).
Jokisivu Mine
Dragon Mining purchased the Jokisivu project in 2003. The project has two deposits,Kujankallio and Arpola, which were initially mined by open cut methods in 2009(Kujankallio) and 2011 (Arpola). Underground development commenced in 2010(Kujankallio) and 2014 (Arpola) and the operation has operated continuously since then.Ore is treated at Dragon Mining’s Vammala process plant which produces a concentratewhich is transported and treated at the Svartliden plant in Sweden. As of 31st of December2020, Jokisivu had Ore Reserves of 1.8Mt @ 2.3g/t Au for 130k oz of gold.
The Jokisivu underground mine asset was valued using the net present value (NPV)of a discounted cash flow analysis (DCF) with support from comparable transactions. TheDCF valuation is preferred as it deals with recently estimated Ore Reserves (December2020) based on a life of mine plan (LOMP), up to date operating and capital costs, andother technical parameters. The comparable transactions for the Scandinavian region overthe last five years are limited and RPM believes the DCF valuation method provides abetter estimate of the value.
APPENDIX II INDEPENDENT EXPERT’S REPORT
– II-240 –

Discounted Cash Flow Valuation
The technical and financial parameters utilised in the financial model have beenvalidated and where necessary updated. The following financial parameters were utilisedin the financial model.
• Finnish Corporate Tax
− Corporate tax rate is 20.0%
− Losses may be carried forward for ten subsequent years. However, theright to carry forward losses may be forfeited in certain instances, suchas in cases where there is a direct or indirect change in the ownership ofthe company operating at a loss. However, a special permit can beapplied in certain situations from the Finnish tax authorities to retainthe tax losses despite the change in ownership. Loss carrybacks are notallowed.
• Depreciation
− The capital cost of mines is written off in proportion to the quantitiesextracted. i.e. units of production.
• Royalties
− Annual excavation fee of €5,000 euros per square kilometre and 0.15% ofthe “calculated value” of minerals or metals pulled from the ground.
• Foreign Exchange Rates
− Exchange rates based on Federal Reserve (Release Date: 1st June 2021)
− Currency units per US$
• EUR/USD 1.2194
• SEK/USD 8.3019
• AUD/USD 1.2977
APPENDIX II INDEPENDENT EXPERT’S REPORT
– II-241 –

• Inflation
− Used in determining Real gold price from Nominal Prices quoted byEnergy and Metals Forecast, 17th May 2021.
− Source – Federal Reserve source 17th March 2021, based on MedianPersonal Consumption Expenditures (PCE) rates used:
Year 2021 2022 20232024 &
Onwards
Rate 2.4% 2.0% 2.1% 2.0%
• Gold Prices
− Source – Energy and Metals Forecast – gold price USD/oz
− Using nominal price conversion adjusted by Federal Reserve inflationrate to obtain Real Prices as below. Note long term price (2026-2030) isalready in Real dollars so no conversion was required.
Year 2021 2022 2023 2024 20252026-2030
USD/oz 1,732 1,636 1,559 1,513 1,478 1,423
• Discount Rate
− BDO have advised their discount rate estimate based on a WACC is8.5%. RPM has elected to use the 8.5% DR in the financial models.
The production profile in the financial model has been adjusted to account for theore mined from January to May 2021 inclusive. The processing of ore within the financialmodel is treated essentially as a toll- treatment operation to allow a stand-alone valuation.
Note the existing ore stockpiles as at the end of May 2021 at Kaapalinkulma,Jokisivu and the Vammala plant are incorporated into the financial model. The existingconcentrate stockpiles as at the end of May 2021 at Vammala and Svartliden plants areincorporated into the financial model.
RPM reviewed the processing recoveries history for both the gravity and flotationconcentrates and developed a relationship between recoveries and feed grades. This wasapplied in the financial model. In addition, the payability factor of 90% (i.e., Svartlidenrecovery of gold from concentrate) was increased to 94.9% based on records.
Currently the Vammala and Svartliden treatment plant costs are being solelyallocated to the Jokisivu mine now the Kaapalinkulma mine is completed.
APPENDIX II INDEPENDENT EXPERT’S REPORT
– II-242 –

The mine closure cost was adjusted in the financial model to reflect the currentclosure cost estimates.
Jokisivu 2 and 3 are mining claims closely associated with the Jokisivu mining claimand mining operation and are only valued under the Jokisivu DCF analysis.
The resulting NPV is USD10.47M.
Comparable Transactions Valuation
No comparable transactions which incorporated Ore Reserves were noted forScandinavia in the last five years. As a result, the Jokisivu mine asset is valued usingresource multiples.
As at 31st December 2020 the Mineral Resources were 2.7Mt @ 4.0g/t Au for 340k ozof gold. As of 31st of December 2020, Jokisivu had Ore Reserves of 1.8Mt @ 2.3g/t Au for130k oz of gold.
The Mineral Resource is reported at a 1.3 g/t gold cut-off grade. The cut-off level isbased on mining costs and a gold price of USD1,890 per ounce that has been extrapolatedfor the potential economic extraction of the open-pit and underground resource at a levelapproximating 120% of the long-term consensus forecast gold price of USD1,575 perounce as at January 2021.
Jokisivu has the following breakdown of Mineral Resources:
• Measured Resources: 0.6Mt @ 4.8g/t Au for 100k oz gold.
• Indicated Resources: 1.5Mt @ 3.6g/t Au for 180k oz gold.
• Inferred Resources: 0.5Mt @ 4.0g/t Au for 67k oz gold.
• Total Resources: 2.7Mt @ 4.0g/t Au for 340k oz gold.
• Total Resources Depleted for 2021 mining: 2.5Mt @ 4.0g/t Au for 327k oz gold.
The proportion of Inferred Resources to total resources is low at 20%, compared tothat for the comparable transactions, however the proportion of Indicated and InferredResources to total resources is 73%, so no factor for resource category has been applied forthe valuation.
As the mine is permitted and has been in operation for several years no risk factor isapplied.
The Barsele project option which incorporates open cut and bulk undergroundmining is not comparable with the Jokisivu mine as the latter is a selective undergroundoperation. RPM did not use this Barsele resource multiple in the valuation estimation.Therefore, the transaction multiples used in the valuation ranged from USD19/oz toUSD74/oz, with a mean of USD41/oz.
APPENDIX II INDEPENDENT EXPERT’S REPORT
– II-243 –

Based on the Mineral Resources and the resource multiples above, and applying amarket factor of 1.25, the Mineral Resources have a value range of USD7.77M toUSD30.24M with a preferred value of USD16.76M.
Jokisivu Summary Valuation
The Comparable Transactions preferred value for the Jokisvu asset is higher thanthe DCF valuation, though the DCF value falls in the lower part of the range. Based onthese values RPM suggests a value range of USD7.77M to USD16.76M with a preferredvalue of USD10.47M.
Orivesi Asset
Mining at the Orivesi mine commenced in 1992 producing 422k oz of gold until2003. The mine was acquired by Dragon Mining in 2003 and recommenced mining in June2007 and finally closing in 2019. Orivesi produced a total of 3.3Mt @ 7.1g/t Au.
As at 31st December 2020 Mineral Resources for Orivesi mine were 270 kt @ 5.3g/tAu for 47k oz of gold. There are no current Ore Reserves.
Orivesi has the following breakdown of Mineral Resources:
• Measured Resources: 93kt @ 5.0g/t Au for 15k oz gold.
• Indicated Resources: 110kt @ 5.9g/t Au for 21k oz gold.
• Inferred Resources: 71kt @ 4.8g/t Au for 11k oz gold.
• Total Resources: 270kt @ 5.3g/t Au for 47k oz gold.
The 2020 Mineral Resource is reported at a 2.6 g/t Au cut-off grade for undergroundmaterial. The cut-off grade levels are based on mining costs and a gold price of USD1,770per ounce that has been extrapolated for the potential economic extraction of the open-pitand underground resource at a level approximating 120% of the short-term consensusforecast gold price of USD1,475 per ounce as at 30th March 2019. Gold prices wereconsistently low prior to closure, but have since risen to levels above that before mineclosure, which may offer an opportunity for mining.
APPENDIX II INDEPENDENT EXPERT’S REPORT
– II-244 –

The location of current resources by classification for both the Kutema and Sarvisuodeposits is shown in Figure 12-3 and Figure 12-4 below.
Figure 12-3 Cross Section of Kutema Mineral Resource Classification
Source: Orivesi Gold Mine Mineral Resource Update 20th March 2020
Note: Cross-Section constrained for unmined material above 2.6g/t Au Cut-off
APPENDIX II INDEPENDENT EXPERT’S REPORT
– II-245 –

Figure 12-4 Cross Section of Sarvisuo Mineral Resource by Classification
Source: Orivesi Gold Mine Mineral Resource Update 20th March 2020
Note: Cross-Section constrained for unmined material above 2.6g/t Au Cut-off
As noted in the Figure 12-3 and Figure 12-4 above, the Mineral Resources areremnant and scattered through the mine and mostly at significant depths.
The mine is decommissioned and flooded and would require significant remedialwork to restart.
APPENDIX II INDEPENDENT EXPERT’S REPORT
– II-246 –

The residual gold ounces should be discounted by 25% for valuation to represent therisk of these resources being available in a mine which has closed previously for economicreasons and the cost of reopening the mine.
Note, all of the comparable transaction projects have a significant proportion ofInferred Resources to total resources. Orivesi has 67% Indicated and Inferred Resources,however, as they are also residual resources the resource multiples have been discountedby 25%.
Based on the resource multiples of a range (USD 19/oz to USD 74/oz) and mean(USD 41/oz) the residual resources after applying a market factor of 1.25 have a valuerange of USD1.12M to US4.35M with a preferred value of USD2.41M. After discounting by25%, the residual resources have a value range of USD0.84 M to USD3.26M with apreferred value of USD1.81M.
Due to the small size of the Orivesi tenement Comparable Transactions by areamultiples using the area multiple of USD916/Ha and a Market Factor of 1.25 only gives apreferred value of USD46k. The Orivesi tenement contains significant residual MineralResources that are best valued using the resource multiples approach.
Orivesi Summary Valuation
The Orivesi asset is valued using the Comparable Transactions resource multiplesmethod. Based on this RPM suggests a value range of USD0.84 M to USD3.26M with apreferred value of USD1.81M.
Kaapalinkulma Asset
Mining at the Kaapalinkulma open cut mine commenced in April 2019 and ceasedproduction in April 2021 after Ore Reserves were exhausted.
As of 31st December 2020, the Mineral Resources for the Kaapalinkulma mine were279 kt @ 2.7g/t Au for 24k oz of gold. There are no current Ore Reserves.
The Mineral Resource is reported at a 0.76 g/t gold cut-off grade. The cut-off levelsare based on mining costs and a gold price of US$2,250 per ounce that has beenextrapolated for the potential economic extraction of the open-pit and undergroundresource at a level approximating 120% of the short-term consensus forecast gold price ofUS$1,880 per ounce as at 31st December 2020. Depending on gold price the resources maybe mineable at some future date.
Kaapalinkulma has the following breakdown of Mineral Resources:
• Measured Resources: 26kt @ 2.3g/t Au for 2k oz gold.
• Indicated Resources: 79kt @ 3.2g/t Au for 8k oz gold.
• Inferred Resources: 174kt @ 2.6g/t Au for 14k oz gold.
• Total Resources: 279kt @ 2.7g/t Au for 24k oz gold.
• Total Resources after mining depletion 2021: 266kt @ 2.6g/t Au for 22k oz.
APPENDIX II INDEPENDENT EXPERT’S REPORT
– II-247 –

The location of current resources by classification for the Kaapalinkulma deposit isshown in Figure 12-5.
Figure 12-5 Kaapalinkulma Mineral Resource Classification (Plan View)
Source: Kaapelinkulma Gold Mine Mineral Resource Update 31st December 2020.
There is an exclusion zone for mining within the southern portion of theKaapelinkulma South deposit due to it being the habitat of a rare butterfly. An appealsprocess is available for environmental permitting. According to Dragon Mining previousappeals have resulted in successful delineation of a mining permit, and as such this areawas included in the Mineral Resource estimation. The Mineral Resource outside of thisexclusion zone was separately estimated to be 171kt @ 2.9g/t Au for 16k oz of gold.
APPENDIX II INDEPENDENT EXPERT’S REPORT
– II-248 –
The Ore Reserves as of 31st December 2020 were 21kt @ 4.1g/t Au for 2,800oz ofgold, which included stockpiles at the Vammala treatment plant of 8kt @ 2.8g/t Au,however, these have since been mined and the deposit is exhausted. As there has been noupdated Mineral Resource estimation since the mine has ceased production, and as theOre Reserve is currently exhausted, the Ore Reserve (less the stockpile) was subtractedfrom the Mineral Resource to produce a depleted Mineral Resource of 266 kt @ 2.6g/t Aufor 21.92k oz of gold.
The mining is only recently completed and would not require significant remedialwork to restart.
The residual gold ounces in the exclusion zone should be discounted at 10% forvaluation to represent the risk related to the granting of the environmental permit. Inaddition, the resource outside the exclusion zone should be discounted by 10% to accountfor the fact that these resources cannot be converted to Ore Reserves under current timesof high prices and the need to recommence the mine. This factor is higher than that forSvartliden and Orivesi due to the mine only recently being exhausted of Ore Reserves.
Based on the resource multiples of a range (USD 19/oz to USD 74/oz) and mean(USD 41/oz) the residual resources after applying a market factor of 1.25 have a valuerange of USD0.52M to USD2.03M with a preferred value of USD1.12M. After discountingby 10%, the residual resources have a value range of USD0.47M to USD1.82M with apreferred value of USD1.01M.
Due to the small size of the Kaapalinkulma tenement Comparable Transactions byarea multiples using the area multiple of USD916/Ha and a Market Factor of 1.25 gives apreferred value of USD75k. The Kaapalinkulma tenement contains significant residualMineral Resources and is best valued using the resource multiples approach.
Kaapalinkulma Summary Valuation
The Kaapalinkulma asset is valued using the Comparable Transactions resourcemultiples method. Based on this RPM suggests a value range of USD0.47M to USD1.82Mwith a preferred value of USD1.01M.
Vammala Plant
The Vammala plant operating, capital and sustaining capital is incorporated into theJokisivu financial model. The remaining value for this asset is as a salvage value. Thesalvage value has been estimated at USD0.61M (see Section 7.1.3). RPM believes the costof selling the asset would amount to around 5% of its value. Hence, the RPM estimatedvalue for the Fäboliden plant is USD0.58M.
Exploration Tenements
The exploration tenements have been valued using the area multiples andGeoscientific approaches. These are summarised in Table 12-7 and Table 12-8 respectively.
APPENDIX II INDEPENDENT EXPERT’S REPORT
– II-249 –
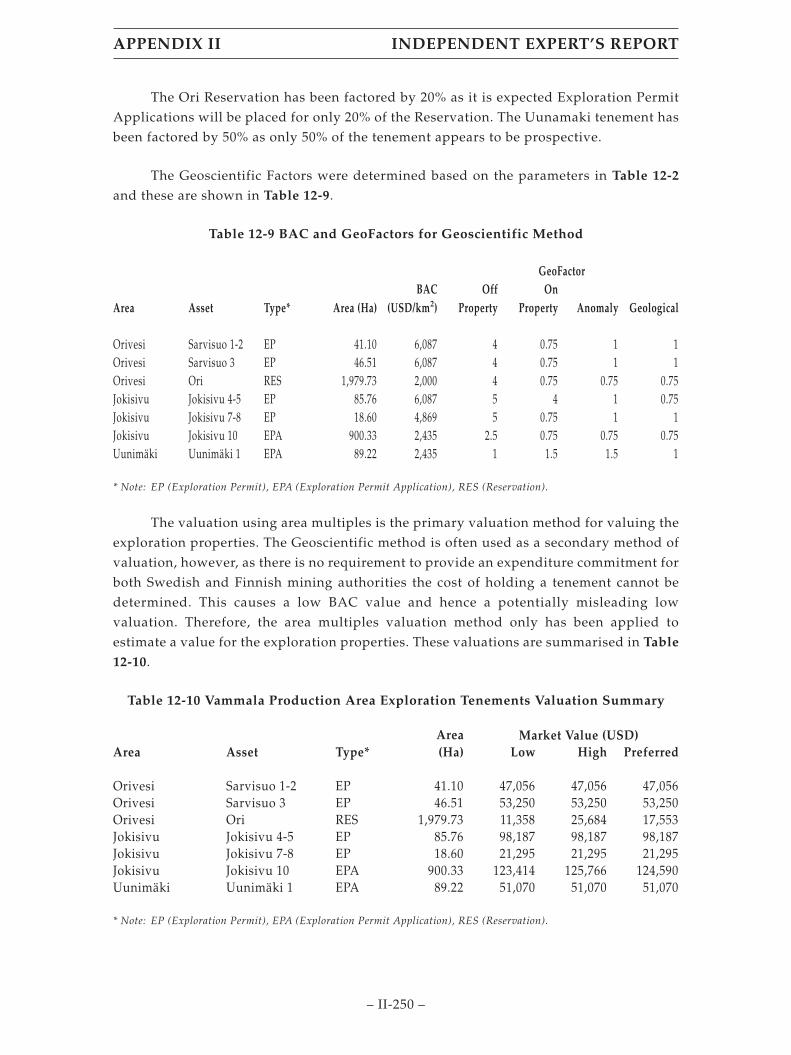
The Ori Reservation has been factored by 20% as it is expected Exploration PermitApplications will be placed for only 20% of the Reservation. The Uunamaki tenement hasbeen factored by 50% as only 50% of the tenement appears to be prospective.
The Geoscientific Factors were determined based on the parameters in Table 12-2
and these are shown in Table 12-9.
Table 12-9 BAC and GeoFactors for Geoscientific Method
Area Asset Type* Area (Ha)BAC
(USD/km2)
GeoFactorOff
PropertyOn
Property Anomaly Geological
Orivesi Sarvisuo 1-2 EP 41.10 6,087 4 0.75 1 1Orivesi Sarvisuo 3 EP 46.51 6,087 4 0.75 1 1Orivesi Ori RES 1,979.73 2,000 4 0.75 0.75 0.75Jokisivu Jokisivu 4-5 EP 85.76 6,087 5 4 1 0.75Jokisivu Jokisivu 7-8 EP 18.60 4,869 5 0.75 1 1Jokisivu Jokisivu 10 EPA 900.33 2,435 2.5 0.75 0.75 0.75Uunimäki Uunimäki 1 EPA 89.22 2,435 1 1.5 1.5 1
* Note: EP (Exploration Permit), EPA (Exploration Permit Application), RES (Reservation).
The valuation using area multiples is the primary valuation method for valuing theexploration properties. The Geoscientific method is often used as a secondary method ofvaluation, however, as there is no requirement to provide an expenditure commitment forboth Swedish and Finnish mining authorities the cost of holding a tenement cannot bedetermined. This causes a low BAC value and hence a potentially misleading lowvaluation. Therefore, the area multiples valuation method only has been applied toestimate a value for the exploration properties. These valuations are summarised in Table
12-10.
Table 12-10 Vammala Production Area Exploration Tenements Valuation Summary
Area Asset Type*Area(Ha)
Market Value (USD)Low High Preferred
Orivesi Sarvisuo 1-2 EP 41.10 47,056 47,056 47,056Orivesi Sarvisuo 3 EP 46.51 53,250 53,250 53,250Orivesi Ori RES 1,979.73 11,358 25,684 17,553Jokisivu Jokisivu 4-5 EP 85.76 98,187 98,187 98,187Jokisivu Jokisivu 7-8 EP 18.60 21,295 21,295 21,295Jokisivu Jokisivu 10 EPA 900.33 123,414 125,766 124,590Uunimäki Uunimäki 1 EPA 89.22 51,070 51,070 51,070
* Note: EP (Exploration Permit), EPA (Exploration Permit Application), RES (Reservation).
APPENDIX II INDEPENDENT EXPERT’S REPORT
– II-250 –

12.8.3 Svartliden Production Centre
The Fäboliden Mine has a mining study and Ore Reserves and hence has beenvalued by DCF as a primary method and resource multiples based on ComparableTransactions as a secondary method.
Svartliden Production assets also include Mineral Resources or residual MineralResources which have been valued by resource multiples as a primary method and areamultiples as a secondary method where appropriate. In some cases the Geoscientificmethod has also been used.
Where the Svartliden Production assets have no Mineral Resources and areexploration tenements, the areas are valued by area multiples as a primary method andthe Geoscientific method as a secondary method.
The Svartliden process plant has been valued with a salvage value.
Results of the valuation calculations using the area multiples are shown in Table
12-11. These results are discussed in the following section.
Table 12-11 Svartliden Production Area Multiples Valuations
Area Asset Type*Area(Ha)
AreaMultiple#
(USD/Ha)
TechnicalValue
(USD)Market
Factor
MarketValue
(USD)
Svartliden Svartlidengruvan K nr 1 EC 87.54 916 80,180 1.25 100,225Fäboliden Fäboliden nr 11 EP 836.26 916 765,953 1.25 957,442
* Note: EC (Exploitation Concession), EP (Exploration Permit).# Note: Low, High and Preferred Area Multiples are the same, giving one Technical Value and one Market Value.
APPENDIX II INDEPENDENT EXPERT’S REPORT
– II-251 –
Fäboliden Open Cut Asset
The Fäboliden open cut mine asset was valued using the net present value (NPV) ofa discounted cash flow analysis (DCF) with support from comparable transactions. TheDCF valuation is preferred as it deals with recently estimated Ore Reserves (December2020) based on a life of mine plan (LOMP), up-to-date operating and capital costs, andother technical parameters. The Fäboliden mine has produced 100 kt of ore from an opencut under a test mining permit with ore treated at the Svartliden plant so the inputparameters to the financial model are well understood. The comparable transactions forthe Scandinavian region over the last five years are limited and RPM believes the DCFvaluation method provides a better estimate of the value.
Discounted Cash Flow Valuation
The technical and financial parameters utilised in the financial model have beenvalidated and where necessary updated. The following financial parameters were utilisedin the financial model.
• Swedish Corporate Tax
− As of January 2021 the corporate tax rate was reduced to 20.6%;
− Losses generated in a company can be carried forward indefinitely andoffset against the taxable profit. Restrictions on the use of losses may,however, apply when a change of ownership occurs.
• Depreciation
− Mines: These depletion amounts may be deducted annually but arelimited to 100% of the acquisition cost of the mine. i.e. units ofproduction.
• Royalties
− Annual fee of 0.2% of the average value of the minerals mined.
• Foreign Exchange Rates
− Exchange rates based on Federal Reserve (Release Date: 1st June 2021)
− Currency units per US$
• EUR/USD 1.2194
• SEK/USD 8.3019
• AUD/USD 1.2977
APPENDIX II INDEPENDENT EXPERT’S REPORT
– II-252 –

• Inflation
− Used in determining Real gold price from Nominal Prices quoted byEnergy and Metals Forecast, 17th May 2021.
− Source – Federal Reserve source 17th March 2021, based on MedianPersonal Consumption Expenditures (PCE) rates used:
Year 2021 2022 20232024 &
Onwards
Rate 2.4% 2.0% 2.1% 2.0%
• Gold Prices
− Source – Energy and Metals Forecast – gold price USD/oz
− Using nominal price conversion adjusted by Federal Reserve inflationrate to obtain Real Prices as below. Note long term price (2026-2030) isalready in Real dollars so no conversion was required.
Year 2021 2022 2023 2024 20252026-2030
USD/oz 1,732 1,636 1,559 1,513 1,478 1,423
• Discount Rate
− BDO have advised their discount rate estimate based on a WACC is8.5%. RPM has elected to use the 8.5% DR in the financial models.
The production profile in the financial model has been adjusted by a one yearextension to account for the potential delay in commencement of mining due to thegranting of the environmental permit. The project now commences in January 2022. Theprocessing of ore within the financial model is treated essentially as a toll-treatmentoperation to allow a stand-alone valuation.
Note the existing stockpile of ore at Fäboliden (11,700 wet metric tonnes @ 2.7g/tAu) is included in the financial model.
RPM reviewed the technical input parameters which were deemed acceptable. RPMadded a 10% increase in haulage cost based on the expectation of an increase from the oldcontract price. Note, the mine operating cost contingency was not applied to this item.
The full mine closure cost was incorporated in the financial model.
The resulting NPV is USD8.39M.
APPENDIX II INDEPENDENT EXPERT’S REPORT
– II-253 –
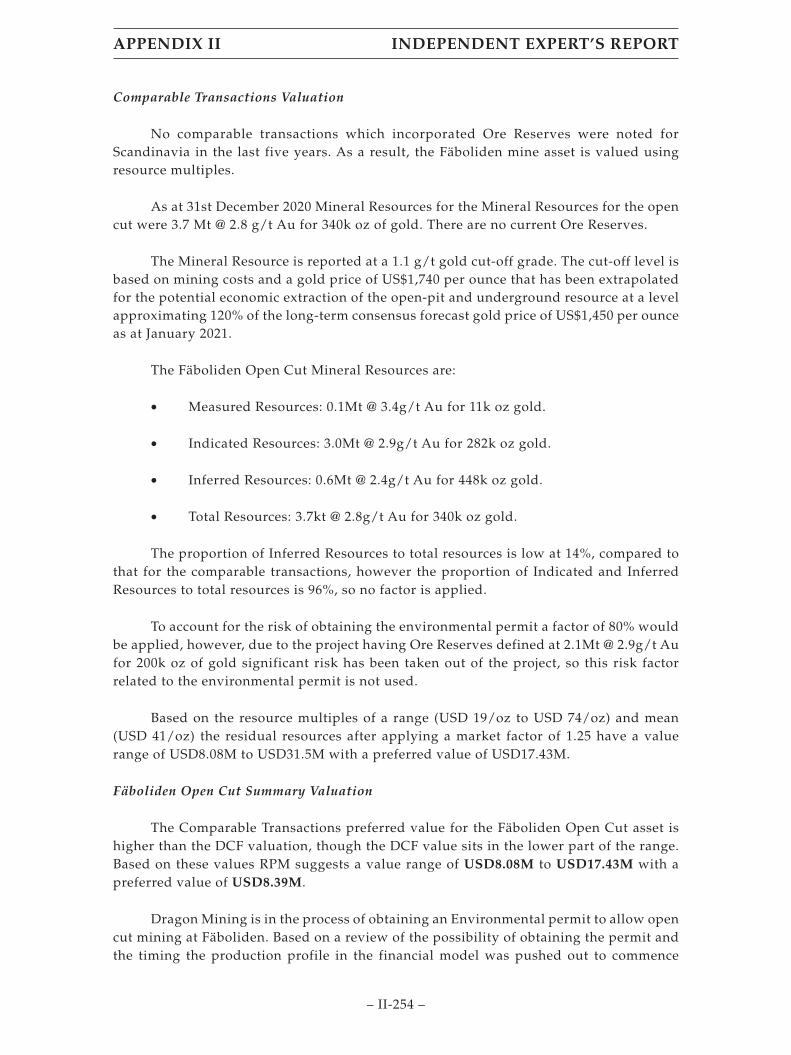
Comparable Transactions Valuation
No comparable transactions which incorporated Ore Reserves were noted forScandinavia in the last five years. As a result, the Fäboliden mine asset is valued usingresource multiples.
As at 31st December 2020 Mineral Resources for the Mineral Resources for the opencut were 3.7 Mt @ 2.8 g/t Au for 340k oz of gold. There are no current Ore Reserves.
The Mineral Resource is reported at a 1.1 g/t gold cut-off grade. The cut-off level isbased on mining costs and a gold price of US$1,740 per ounce that has been extrapolatedfor the potential economic extraction of the open-pit and underground resource at a levelapproximating 120% of the long-term consensus forecast gold price of US$1,450 per ounceas at January 2021.
The Fäboliden Open Cut Mineral Resources are:
• Measured Resources: 0.1Mt @ 3.4g/t Au for 11k oz gold.
• Indicated Resources: 3.0Mt @ 2.9g/t Au for 282k oz gold.
• Inferred Resources: 0.6Mt @ 2.4g/t Au for 448k oz gold.
• Total Resources: 3.7kt @ 2.8g/t Au for 340k oz gold.
The proportion of Inferred Resources to total resources is low at 14%, compared tothat for the comparable transactions, however the proportion of Indicated and InferredResources to total resources is 96%, so no factor is applied.
To account for the risk of obtaining the environmental permit a factor of 80% wouldbe applied, however, due to the project having Ore Reserves defined at 2.1Mt @ 2.9g/t Aufor 200k oz of gold significant risk has been taken out of the project, so this risk factorrelated to the environmental permit is not used.
Based on the resource multiples of a range (USD 19/oz to USD 74/oz) and mean(USD 41/oz) the residual resources after applying a market factor of 1.25 have a valuerange of USD8.08M to USD31.5M with a preferred value of USD17.43M.
Fäboliden Open Cut Summary Valuation
The Comparable Transactions preferred value for the Fäboliden Open Cut asset ishigher than the DCF valuation, though the DCF value sits in the lower part of the range.Based on these values RPM suggests a value range of USD8.08M to USD17.43M with apreferred value of USD8.39M.
Dragon Mining is in the process of obtaining an Environmental permit to allow opencut mining at Fäboliden. Based on a review of the possibility of obtaining the permit andthe timing the production profile in the financial model was pushed out to commence
APPENDIX II INDEPENDENT EXPERT’S REPORT
– II-254 –
January 2022. It is possible this could be pushed out further which would impact thevaluation. It is also possible the permit may not be granted at all. Assuming an 80%probability of obtaining the permit the valuation range based on Comparable Transactionswould be USD6.5M to USD25.2M and the preferred value would be USD13.9M. Thepreferred value based on the DCF analysis would be USD6.7M.
Fäboliden Underground Asset
The Fäboliden mine asset sits within Exploitation Concession Fäboliden K nr 1. ThisConcession holds both the Fäboliden open cut Mineral Resources and Ore Reserves andadditional Mineral Resources beneath the open cut shell. These latter are 80% InferredResources with the remainder Indicated Resources and thus no underground Ore Reservecould be estimated. These Mineral Resources are valued using resource multiples fromcomparable transactions as a primary valuation method. There is limited opportunity toutilise a secondary method. Exploration expenditure for these resources over the last fiveyears has not been collected separate from the open cut expenditure. A cost method wasemployed based on the number of drill metres and assays which define the MineralResource beneath the open cut. Drilling and assay costs are applied to derive anexpenditure amount and this is used to derive a secondary value to support thecomparable transactions method.
Comparable Transactions
As at 31st December 2020 Mineral Resources for the Mineral Resources outside theopen cut were 6.5Mt @ 3.3g/t Au for 690k oz of gold. There are no current Ore Reserves.
The Mineral Resource is reported at a 2.0 g/t gold cut-off grade, higher than the1.1g/t Au cut-off grade used for the Fäboliden open cut resource due to higher miningcosts. The cut-off grade is based on mining costs and a gold price of US$1,740 per ouncethat has been extrapolated for the potential economic extraction of the open-pit andunderground resource at a level approximating 120% of the long-term consensus forecastgold price of US$1,450 per ounce as at January 2021.
The Fäboliden underground breakdown of Mineral Resource is:
• Indicated Resources: 1.3Mt @ 3.0g/t Au for 130k oz gold.
• Inferred Resources: 5.2Mt @ 3.4g/t Au for 560k oz gold.
• Total Resources: 6.5Mt @ 3.3g/t Au for 690k oz gold.
APPENDIX II INDEPENDENT EXPERT’S REPORT
– II-255 –

The location of current resources by classification for the Fäboliden deposit isshown in Figure 12-6.
Figure 12-6 Fäboliden Mineral Resource Classification (Longitudinal View looking West)
Source: Fäboliden Gold Mine Mineral Resource Update 30th April 2021.
The proportion of Inferred Resources to total resources is similar to that for thecomparable transactions so no factor is applied.
Based on the resource multiples of a range (USD 19/oz to USD 74/oz) and mean(USD 41/oz) the residual resources after a market factor of 1.25 have a value range ofUSD16.39M to USD63.83M with a preferred value of USD35.36M.
The cost method of valuation based on expenditure over the last five years is notsuitable as there has been limited relevant expenditure. The drilling into the MineralResource beneath the open pit in the last five years has been minimal at 23 drill holes for1,799m. Accounting for the drilling metres cost and the 1,072 assays, and any on costs forgeology core handling and storage would amount to less than USD0.5M. The cost methodof valuation is not appropriate for the Fäboliden Underground Mineral Resources.
The value of the tenement by area is also insignificant and would beunrepresentative. Therefore, a secondary valuation is not possible.
Note, a high-level scoping study was carried out on the Mineral Resources beneaththe open cut to determine test the possibility of an underground operation. The study washigh level and based on 20% Indicated and 80% Inferred Resources and so no Ore Reservescould be determined. As this is a high-level study that uses of Inferred Resources it is notsuitable for an Income-based approach for valuation using the DCF method.
APPENDIX II INDEPENDENT EXPERT’S REPORT
– II-256 –

Fäboliden Underground Summary Valuation
The Comparable Transactions preferred value for the Fäboliden Underground assethas a value range of USD16.39M to USD63.83M with a preferred value of USD35.36M.
Dragon Mining is in the process of obtaining an Environmental permit to allowmining at Fäboliden. It is possible the permit may not be granted. Assuming an 80%probability of obtaining the environmental permit the valuation range based onComparable Transactions would be USD16.4M to USD51.1M and the preferred valuewould be USD28.3M.
Svartliden Mine Asset
The Svartliden Mine commenced operation as an open pit mine in 2004, withunderground mining commencing in 2011. Mining was completed in November 2013 foreconomic reasons. Svartliden Gold Mine produced 377k oz of gold from 3,182 kt @ 4.1 g/tgold. Average process recovery 91%.
As of 31st December 2016, the Svartliden Mine had residual Mineral Resources of490 kt @ 3.7g/t for 59k oz; 244kt @ 3.0g/t for 24k oz in an open cut and 245 kt @ 4.4g/t Aufor 35k oz in the underground (ASX Announcement 28th February 2017).
The remaining mineralisation is to the east and beneath the Svartliden open-pit(Figure 12-7). Dragon Mining reports the deposit has been closed-off by drilling at depthand along strike and there is little scope for additional Mineral Resources to be definedfrom further drilling in the immediate mine area.
The Mineral Resource is reported at a 1.0 g/t gold cut-off grade for open-pitmaterial and 1.7 g/t gold for underground material. The cut-off levels are based on miningcosts and a gold price of US$1,500 per ounce that has been extrapolated for the potentialeconomic extraction of the open-pit and underground resource at a level approximating115% of the short term consensus forecast gold price of US$1,260 per ounce as at 1 July2016. The resources may be mineable at some future date should gold price continue toincrease. However, the mine is decommissioned and flooded and would requiresignificant remedial work to restart.
The Svartliden Mine breakdown of Mineral Resources is:
• Measured Resources: 508kt @ 2.5g/t Au for 41k oz gold.
• Indicated Resources: 246kt @ 4.2g/t Au for 33k oz gold.
• Inferred Resources: 39kt @ 4.9g/t Au for 6k oz gold.
• Total Resources: 794kt @ 3.2g/t Au for 81k oz gold.
The residual gold ounces should be discounted by 25% for valuation to represent therisk of these resources being available in a mine which has closed previously for economicreasons and the cost of reopening the mine.
APPENDIX II INDEPENDENT EXPERT’S REPORT
– II-257 –
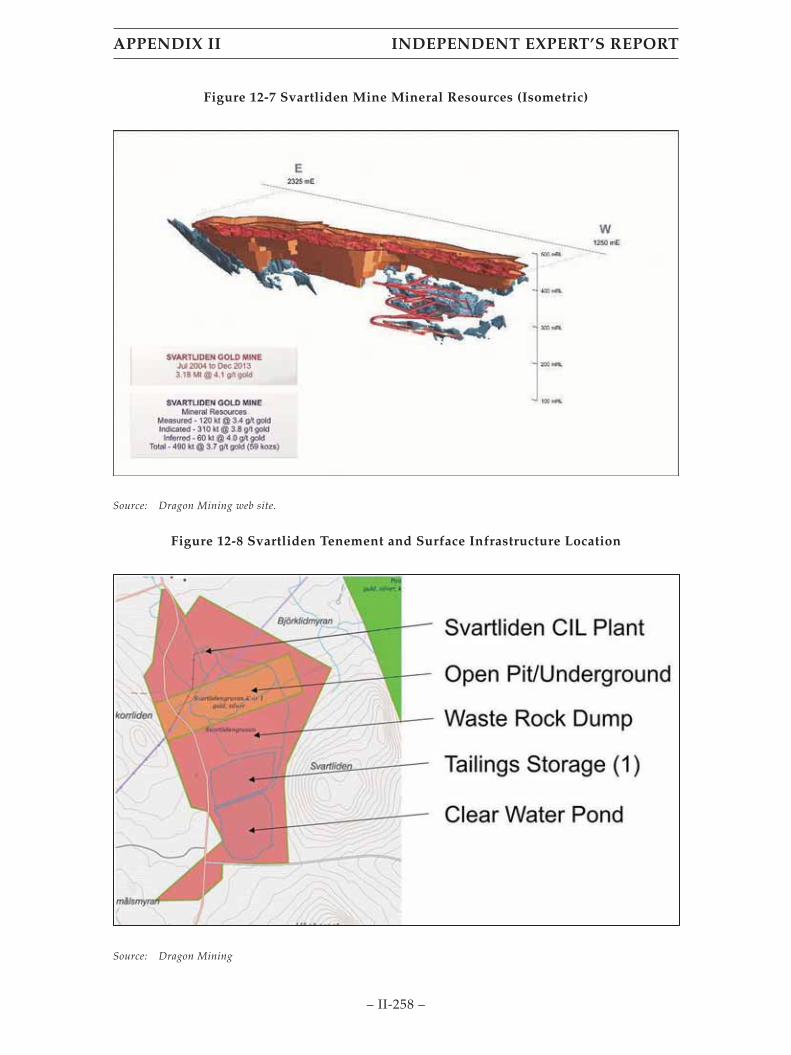
Figure 12-7 Svartliden Mine Mineral Resources (Isometric)
Source: Dragon Mining web site.
Figure 12-8 Svartliden Tenement and Surface Infrastructure Location
Source: Dragon Mining
APPENDIX II INDEPENDENT EXPERT’S REPORT
– II-258 –

The existing operation and Mineral Resources cover the majority of the ExploitationConcession Svartlidengruvan K nr 1 (Figure 12-8) and Dragon Mining states that themineralisation is essentially closed off.
Based on the resource multiples of a range (USD 19/oz to USD 74/oz) and mean(USD 41/oz) the residual resources have a value range of USD1.92M to USD7.48M with apreferred value of USD4.15M. After discounting by 25%, the residual resources have avalue range of USD1.44M to USD5.61M with a preferred value of USD3.11M.
A secondary valuation using the area multiples method gave a value of USD100k(Table 12-12) (no range due to lack of transaction data). The value of the concession in itsown right rests solely with the residual resources and primary method of resourcemultiples is accepted as the method to value the concession.
Exploration Properties
The exploration tenement Fäboliden nr 11 has been valued using the area multiplesand Geoscientific approaches. The area multiples method returned a value of USD0.96M(see Table 12-13). There is no range due to there being only one comparable transaction.The Geoscientific method returned a value of USD0.26M. RPM has a preferred value ofUSD0.96M.
APPENDIX II INDEPENDENT EXPERT’S REPORT
– II-259 –

Tab
le12
-12
Sv
artl
iden
Pro
du
ctio
nA
rea
Mu
ltip
les
Met
ho
dV
alu
atio
ns
Area
Asse
tTy
pe*
Area
(Ha)
Area
Mul
tiple
(USD
/Ha)
Tech
nica
lVal
ue(U
SD)
Mar
ket
Fact
orM
arke
tVal
ue(U
SD)
Low
Hig
hPr
efer
red
Low
Hig
hPr
efer
red
Low
Hig
hPr
efer
red
Svar
tlide
nSv
artli
deng
ruva
nK
nr1
EC87
.5491
691
691
680
,180
80,18
080
,180
1.25
100,2
2510
0,225
100,2
25Fä
bolid
enFä
bolid
ennr
11EP
836.2
691
691
691
676
5,953
765,9
5376
5,953
1.25
957,4
4295
7,442
957,4
42
*N
ote:
EC
(Exp
loit
atio
nC
once
ssio
n),E
P(E
xplo
rati
onP
erm
it).
Tab
le12
-13
Sv
artl
iden
Pro
du
ctio
nG
eosc
ien
tifi
cM
eth
od
Val
uat
ion
s
Are
aA
sset
Ty
pe*
Are
a(H
a)B
AC
(US
D/k
m2)
Geo
Fac
tor
Tec
hn
ical
Val
ue
(US
D)
Mar
ket
Fac
tor
Mar
ket
Val
ue
(US
D)
Fäbo
lid
enFä
boli
den
nr
11E
P83
6.26
289.
0020
7,66
61.
2525
9,58
2
*N
ote:
EP
(Exp
lora
tion
Per
mit
).
Th
eG
eosc
ien
tifi
cFa
ctor
sw
ere
det
erm
ined
base
don
the
par
amet
ers
inT
able
12-2
and
thes
ear
esh
own
inT
able
12-1
4.
Tab
le12
-14
BA
Can
dG
eoF
acto
rsfo
rG
eosc
ien
tifi
cM
eth
od
Are
aA
sset
Ty
pe*
Are
a(H
a)B
AC
(US
D/k
m2)
Geo
Fac
tor
Off
Pro
per
tyO
nP
rop
erty
An
om
aly
Geo
log
ical
Ori
ves
iSa
rvis
uo
1-2
EP
41.1
06,
087
40.
751
1O
riv
esi
Sarv
isu
o3
EP
46.5
16,
087
40.
751
1O
riv
esi
Ori
RE
S1,
979.
732,
000
40.
750.
750.
75Jo
kisi
vu
Joki
siv
u4-
5E
P85
.76
6,08
75
41
0.75
Joki
siv
uJo
kisi
vu
7-8
EP
18.6
04,
869
50.
751
1Jo
kisi
vu
Joki
siv
u10
EPA
900.
332,
435
2.5
0.75
0.75
0.75
Uu
nim
äki
Uu
nim
äki
1E
PA89
.22
2,43
51
1.5
1.5
1
*N
ote:
EP
(Exp
lora
tion
Per
mit
),E
PA(E
xplo
rati
onP
erm
itA
ppli
cati
on),
RE
S(R
eser
vati
on).
APPENDIX II INDEPENDENT EXPERT’S REPORT
– II-260 –
The valuation using area multiples is the primary valuation method for valuing theexploration properties. The Geoscientific method is often used as a secondary method ofvaluation, however, as there is no requirement to provide an expenditure commitment forboth Swedish and Finnish mining authorities the cost of holding a tenement cannot bedetermined. This causes a low BAC value and hence a potentially misleading lowvaluation. Therefore, the area multiples valuation method only has been applied toestimate a value for the exploration properties. These valuations are summarised in Table12-15.
Table 12-15 Vammala Production Area Exploration Tenements Valuation Summary
Area Asset Type*Area(Ha)
Market Value (USD)Low High Preferred
Orivesi Sarvisuo 1-2 EP 41.10 47,056 47,056 47,056Orivesi Sarvisuo 3 EP 46.51 53,250 53,250 53,250Orivesi Ori RES 1,979.73 11,358 25,684 17,553Jokisivu Jokisivu 4-5 EP 85.76 98,187 98,187 98,187Jokisivu Jokisivu 7-8 EP 18.60 21,295 21,295 21,295Jokisivu Jokisivu 10 EPA 900.33 123,414 125,766 124,590Uunimäki Uunimäki 1 EPA 89.22 51,070 51,070 51,070
* Note: EP (Exploration Permit), EPA (Exploration Permit Application), RES (Reservation).
Svartliden Plant
The Svartliden plant has gold in-circuit stocks which were 2,830oz as at the end ofMay 2021. These in- circuit stocks are gold sitting within the circuit at a moment in time.They include material in the milling, leaching, carbon loading, elution and electrowinningcircuits up to the process of producing doré. The estimation of gold in circuit has beendetermined appropriately.
There are costs associated with the extraction to produce doré and transport, refineand sell. The cost of extraction RPM has determined partially from actual costs providedby Dragon Mining and its own experience in costs associated with the process and hasdetermined a cost of USD23.92/oz. Dragon Mining uses an average cost from invoicesprovided by Argo-Heraeus gold refiners for transport, refining and interest costs ofSEK60/oz (USD7.23/oz) (invoice 19th May 2021 viewed). Total extraction and sellingcosts are USD31.15/oz.
As the stocks are within the circuit as at the 1st June 2021 the spot price ofUSD1,898.7/oz (LMBA Gold Bullion price) is used to determine value. The in-circuitstocks are valued at USD5.29M.
The Svartliden plant operating costs, capital and sustaining capital are incorporatedinto the Jokisivu and to a lesser extent the Fäboliden financial models. The remainingvalue for this asset is as a salvage value. The salvage value has been estimated atUSD0.46M (see Section 7.2.3). RPM estimates the cost of selling the asset would amount toaround 5% of its value. Hence, the final value for the Fäboliden plant is estimated atUSD0.44M.
APPENDIX II INDEPENDENT EXPERT’S REPORT
– II-261 –

12.9 Valuation Summary
Vammala Production Area
The valuation summary for the Vammala Production Area is shown in Table 12-16.
The Vammala Production Area is valued in a range of USD10.1M to USD22.8M witha preferred value of USD14.3M.
Table 12-16 Vammala Production Area Valuation Summary
Area AssetValuation (USD M)
Low High Preferred
Jokivisu Jokivisu Mine* 7.77 16.76 10.47Kaapalinkulma Mine
Residual Resources0.47 1.82 1.01
Jokisivu 4-5 0.10 0.10 0.10Jokisivu 7-8 0.02 0.02 0.02Jokisivu 10 0.12 0.12 0.12
Orivesi Orivesi Mine ResidualResources
0.84 3.26 1.81
Sarvisuo 1-2 0.05 0.05 0.05Sarvisuo 3 0.05 0.05 0.05Ori 0.01 0.03 0.02
Uunimäki Uunimäki 1 0.05 0.05 0.05Vammala Vammala Plant 0.58 0.58 0.58
Total 10.06 22.84 14.28
* Note: Includes Jokisivu 1 and Jokisivu 2 tenements
APPENDIX II INDEPENDENT EXPERT’S REPORT
– II-262 –

Svartliden Production Area
The valuation summary for the Svartliden Production Area is shown in Table 12-17.
The Svartliden Production Area is valued in a range of USD32.6M to USD93.6M
with a preferred value of USD53.6M.
Table 12-17 Svartliden Production Area Valuation Summary
Area AssetValuation (USD M)
Low High Preferred
Fäboliden Fäboliden Open CutMine
8.08 17.43 8.39
FäbolidenUndergroundResource
16.39 63.83 35.36
Fäboliden nr 11ExplorationTenement
0.96 0.96 0.96
Svartliden Svartliden Mine 1.44 5.61 3.11Svartliden Plant 0.44 0.44 0.44Svartliden gold
in-circuit stocks5.29 5.29 5.29
Total 32.60 93.56 53.55
Closure Costs
The closure costs for all operations are shown in Table 12-18 and Table 12-19 (seeSection 9).
Table 12-18 Swedish Assets Closure Cost Estimates
Facility Projected Closure Cost (USD)
Fäboliden Mine 7.64M (16.2M1)Fäboliden Mine Test Project 0.53M2
Svartliden Mine and Plant 5.1M
1 Amount required by the County Administration Board (CAB) in recommended conditions, includes costs for
capping the WRSF required by CAB. The Project is in the permitting stage, so the 16.2M condition has not been
finalized.
2 Projected closure costs for the mine test project are covered in the costs associated with the proposed Fäboliden
Mine project. If the Fäboliden Mine is not permitted, the closure costs for the test project would stand.
APPENDIX II INDEPENDENT EXPERT’S REPORT
– II-263 –

Table 12-19 Finnish Assets Closure Cost Estimates
Facility Projected Closure Cost(USD)
Kaapelinkulma Mine 0.78M1
Orivesi Mine 5.4M2
Jokisivu Mine 5.3M2
Vammala Plant 2.28M2
1 Waste rock storage Facility at the Kaapelinkulma Mine does not require capping. The material does not contain
high levels of acid forming materials and the high arsenic levels are similar to baseline soil and rock conditions.
Much of the material is projected for use as aggregate for building applications.
2 Capping costs for the WRSF’s and TSF’s are based on The Waste Security Guide developed by the Ministry of
Environment – Finland, published in 2012. The TSF cap is projected to cost between 0.6 and 3 euros/m2, and a
WRSF cap is estimated to cost between 1.5 and 7 euros/m2 dependent on characterization of the material.
It should be noted that closure costs have been estimated and are carried in theDragon Mining accounts in SEK (Sweden) and Euro (Finland). The USD exchange ratefluctuates so the estimation of closure costs in USD will fluctuate. These closure costs havebeen estimated from SEK and Euro values using the exchange rates with the USD on theValuation date (1st June 2021). The total closure cost to be accounted for in the valuation isUSD13.6M. This total does not include the following costs for the following reasons:
• The Fäboliden open cut closure cost is accounted for in the Fäboliden financialmodel valuation.
• The Fäboliden test mine closure cost is null and void as the full Fäbolidenclosure cost will cover this once the closure cost is accepted and theenvironmental permit issued.
• The Jokisivu closure cost is accounted for in the Jokisivu financial modelvaluation.
APPENDIX II INDEPENDENT EXPERT’S REPORT
– II-264 –

Dragon Mining Assets Valuation Summary
Table 12-20 summarises the total outcomes of the valuation process as of a valuationdate 1st of June 2021. The Vammala Production Area is valued in a range of USD8.7M toUSD22.8M with a preferred value of USD10.2M. The Svartliden Production Area is valuedin a range of USD27.3M to USD88.3M with a preferred value of USD48.3M.
Table 12-20 Dragon Mining Assets – Valuation Summary as at 1st June 2021
Tenement Preferred Valuation (USD M)*Low High Preferred
FinlandOrivesi Mine 0.84 3.26 1.81Sarvisuo 1-2 0.05 0.05 0.05Sarvisuo 3 0.05 0.05 0.05Ori 0.01 0.03 0.02Jokisivu Mine* 7.77 16.76 10.47Jokisivu 4-5 0.10 0.10 0.10Jokisivu 7-8 0.02 0.02 0.02Jokisivu 10 0.12 0.12 0.12Kaapelinkulma 0.47 1.82 1.01Uunimäki 1 0.05 0.05 0.05Vammala Plant 0.58 0.58 0.58
Low High Preferred
Sub-Total 10.06 22.84 14.28
SwedenSvartlidengruvan K nr 1 1.44 5.61 3.11Fäboliden Open Cut 8.08 17.43 8.39Fäboliden Underground 16.39 63.83 35.36Fäboliden nr 11 0.96 0.96 0.96Svartliden Plant 0.44 0.44 0.44Svartliden gold in-circuit stocks 5.29 5.29 5.29
Low High Preferred
Sub-Total 32.6 93.56 53.55
Total 42.66 116.40 67.83
APPENDIX II INDEPENDENT EXPERT’S REPORT
– II-265 –

* Note: Includes Jokisivu 2 and 3.
The Dragon Mining assets are valued in a range of USD42.7M to USD116.4M with apreferred value of USD67.8M.
Closure costs are USD13.6M.
The Total Valuation for the Dragon Mining assets has a range of USD22.4M toUSD97.5M with a preferred value of USD54.2M.
The required closure cost estimate from the CAB for the granting of the Fäbolidenenvironmental permit is USD16.2M. This is significantly higher than the closure costestimate Dragon Mining have submitted (USD7.64M) and is in the process of beingnegotiated by Dragon Mining. This represents a risk that the granting of theenvironmental permit may require a higher cost that that currently estimated and mayhave an impact on the valuation.
APPENDIX A. COMPARABLE MARKET TRANSACTIONS
Comparable Transactions with Resource Multiples
Barsele – 1
Project: Barsele – Open Cut and Bulk Underground Option
Buyer: Barsele Minerals Corp.
Seller: Agnico Eagle Mines Ltd
Project details
Location: Vässterbottens Län, Sweden, ~30km north of Svartliden
Mineral Resources: Measured & Indicated Resources 264k oz, Total Resources1,085k oz and grade is similar to Fäboliden.at ~2.4g/t Au.
Tenement: Very large tenement area (~47k Ha) with numerous targets.
Transaction
Announced/Completed: Announced 12th May 2021
Deal: Non-binding letter of intent to acquire 55% in Barseleproject:
• $45.0M cash.
APPENDIX II INDEPENDENT EXPERT’S REPORT
– II-266 –

• Common shares such that Agnico will hold 14.9%interest in Barsele Mineral Corp’s common shares ontransaction closing.
• 6 million warrants to acquire remaining 55% interestin Barsele.
• 2.0% NSR with rights to repurchase.
• Payment of $2.5M for each additional 1M oz Au of OreReserves and Mineral Resources identified abovecurrent Resources.
Total Payment: USD63.34M Ownership: 55%
Resource multiple: Measured & Indicated Resources only USD 436/Ha, AllResources USD 106/Ha
Barsele – 2
Project: Barsele – Open Cut and Underground Selective Option
Buyer: Barsele Minerals Corp.
Seller: Agnico Eagle Mines Ltd
Project details
Location: Vässterbottens Län, Sweden, ~30km north of Svartliden.
Mineral Resources: Measured & Indicated Resources 264k oz, Total Resources1,085k oz and grade is similar to Fäboliden.at ~2.4g/tAu.Tenement: Very large tenement area (~47k Ha) withnumerous targets.
Transaction
Announced/Completed: Announced 12th May 2021
Deal: Non-binding letter of intent to acquire 55% in Barseleproject:
• $45.0M cash.
• Common shares such that Agnico will hold 14.9%interest in Barsele Mineral Corp’s common shares ontransaction closing.
APPENDIX II INDEPENDENT EXPERT’S REPORT
– II-267 –

• 6 million warrants to acquire remaining 55% interestin Barsele.
• 2.0% NSR with rights to repurchase.
• Payment of $2.5M for each additional 1M oz Au of OreReserves and Mineral Resources identified abovecurrent Resources.
Total Payment: USD63.34M
Ownership: 55%
Resource multiple: Measured & Indicated Resources only USD 556/Ha, AllResources USD 74/Ha
Laiva (Nordic) 2018
Project: Laiva (Nordic)
Buyer: Firesteel Resources Inc (now Nordic Gold Corp).
Seller: Nordic Mines Marknad AB
Project details
Location: Finland.
Mineral Resources: Measured & Indicated Resources 151k oz, Total Resources596k oz. Grade is lower than Fäboliden at 1.44g/t.
Transaction
Announced/Completed: Completed 8th Feb 2018
Deal: Acquired remaining 40% in Laiva project from NordicMines AB:
• 58.42M common shares such that Nordic Gold willhold 60%% interest in the Laiva project throughacquisition of Nordic Mines Marknad AB.
Total Payment: USD4.48M
Ownership: 40%
Resource multiple: Measured & Indicated Resources only USD 74/Ha, AllResources USD 19/Ha
APPENDIX II INDEPENDENT EXPERT’S REPORT
– II-268 –

Laiva (Nordic) 2017
Project: Laiva (Nordic)
Buyer: Firesteel Resources Inc (now Nordic Gold Corp).
Seller: Nordic Mines Marknad AB
Project details
Location: Finland.
Mineral Resources: Measured & Indicated Resources 151k oz, Total Resources596k oz. Grade is lower than Fäboliden at 1.44g/t.
Transaction
Announced/Completed: Completed 8th Dec 2017
Deal: Acquired 60% in Laiva project from Nordic Mines AB:
• Cash €1M
• Common shares worth CDN20M
Total Payment: USD16.63M
Ownership: 60%
Resource multiple: Measured & Indicated Resources only USD 184/Ha, AllResources USD 46/Ha
Barsele 2015
Project: Barsele – Open Cut and Bulk Underground Option
Buyer: Agnico Eagle Mines Ltd
Seller: Orex Minerals Inc
Project details
Location: Vässterbottens Län, Sweden, ~30km north of Svartliden
Mineral Resources: Measured & Indicated Resources 558k oz, Total Resources1,201k oz.
APPENDIX II INDEPENDENT EXPERT’S REPORT
– II-269 –

Transaction
Announced/Completed: Completed 6th Nov 2015
Deal: Non-binding letter of intent to acquire up to 70% in Barseleproject through earn in and JV:
• SEK83.72M cash and SEK58.6 on exploration over 3years for initial 55%.
• Additional 15% by completing a pre-feasibility study.
• Common shares such that Agnico will hold 14.9%interest in Barsele Mineral Corp’s common shares ontransaction closing.
• 2.0% NSR with rights to repurchase.
Total Payment: USD17.0M
Ownership: 55%
Resource multiple: Measured & Indicated Resources only USD 55/Ha, AllResources USD 26/Ha
APPENDIX B. QUALIFICATIONS AND EXPERIENCE
Steve Hinde
BSc (Geology) (Hons), Masters Mineral Economics, MAusIMM, MAIG, CP/QP
Steve is a geologist with 40 years’ in the mining industry, with broad experience inmineral exploration, mine geology, mining, consulting, auditing, business developmentand valuation.
Steve has extensive mine operating experience with geological and technicalservices responsibility in gold and base metals. He also has broad exploration experiencefrom grass roots to brownfields and mine- based, both underground and surface, for gold,copper and lead-zinc.
He has auditing experience from mineral resources and capital projects, throughmineral processing and logistics to sales and marketing.
Alongside this Steve also has consulting experience in technical due diligence,commodity and project reviews, financial analysis and valuations of copper,molybdenum, uranium, gold, iron ore, nickel and rare metals projects in Australia andoverseas.
APPENDIX II INDEPENDENT EXPERT’S REPORT
– II-270 –

Steve’s strong management and leadership skills, adaptable manner and teamenthusiasm, has established good client relationships achieving repeat business.
Steve qualifies as a Competent Person under JORC Guidelines and an Expert andSpecialist under the VALMIN Code and is a member of the AusIMM and the AIG.
David Allmark
Bachelor of Science (Applied Geology), Postgraduate Diploma (Applied Geology),Advanced Diploma (Business Systems), Graduate Certificate (Geostatistics), MAusIMM,MAIG, CP/QP
David is a Principal Geologist with over 20 years’ experience as a Geologist in themining industry, for gold exploration, as well as nickel, base metal, and iron oreexperience in Australia, China, Indonesia, Philippines, Africa and Mongolia. During thistime he has been responsible for the planning, implementation and supervision of variousexploration programs, open pit and underground production duties, detailed structuraland geological mapping and logging and a wide range of experience in resourceestimation techniques. His professional responsibility including: JORC and NI43-101compliant resource estimation and reporting; geological exploration consulting forprojects ranging from grassroots to feasibility stages. David has worked with companiessuch as Samantha Gold, Resolute (Higginsville, Chalice and Indie), Normandy, WMC,Image, Portman, Dragon Mountain Gold, Micromine and RPM.
With relevant experience in a wide range of commodity and deposit types, Davidmeets the requirements for Qualified Person for 43-101 reporting, and Competent Person(“CP”) for JORC reporting for most metalliferous Mineral Resources. David is a memberof the AusIMM and the Australian Institute of Geoscientists. Currently responsible formanagement of team of geologists across four countries conducting resource estimation,due diligence and exploration advisory work predominantly for gold, base metals andother commodities.
Blaine Bovee
BSc Bachelor of Science in Mining Engineering, QP
Over 25-years of underground mining engineering and operational experience,gaining broad knowledge and providing practical solutions. Substantial experience inhard rock gold mines. Heavily involved with underground mine start-ups both atdomestic and international locations. Mine Manager/Technical Manager of undergroundmines. Key contributor to Underground Mining standards and guidelines.Owner/operator of an underground mining construction company.
Igor Bojanic
Bachelor of Engineering (Mining, Hons), Masters of Environmental Management,Graduate Diploma of Business, FAusIMM, MICA, MIQ
APPENDIX II INDEPENDENT EXPERT’S REPORT
– II-271 –

Igor has over 34 years’ experience in the mining industry, and has a broad range oftechnical and operational experience. He has been involved in over 250 technical studieson metalliferous and coal mining projects throughout the world.
Igor commenced his career with BHP Iron at Mt Whaleback in the Pilbara and thentransferred to BHP’s gold division working at the Browns Creek Gold Mine. He continuedwithin the gold industry moving to the Telfer Gold Mine in the early 1990’s followed bysecondments as a consultant to the Tuckabianna Gold Mine (WA) and the Macraes GoldMine in New Zealand.
During his consulting career he has undertaken numerous technical studies rangingfrom small-scale strategic analyses to definitive feasibility studies for projects throughoutthe world, including all regions within Australia, West Africa, North America and theMiddle East. He is the currently completing a Definitive Feasibility Study on a goldproject in Saudi Arabia.
Igor ’s key strengths include strategic analysis of new and existing mining projectsto optimise value, and developing mine plans that deliver practical and achievableoutcomes. He is a senior Project Manager and is familiar with both the Australian JORCCode and the Canadian NI 43-101 reporting requirements having been involved with anumber of relevant studies. In addition, Igor has post-graduate qualifications in businessand environmental management.
Dr. Andrew Newell
Bachelor of Engineering (Metallurgy), Master of Engineering Science, PhD(Base-metal & PGM Sulphidisation/Flotation), CP
Andrew is a Metallurgical Engineer with over 40 years of experience in a variety ofoperating, managerial, technical, research and consulting roles in base and preciousmetals processing as well as industrial minerals in the fields of minerals processing,hydrometallurgy, plant design, process engineering (including equipment selection anddesign) and metallurgical test work.
He meets the requirements of a Qualified Person under NI-43-101 as well as that ofa Competent Person under JORC.
His experience includes operating experience in base-metal concentrators, preciousmetal leaching facilities as well as diamond processing, uranium and copper leaching andbase-metal smelting.
He has also been responsible for the design and commissioning of flotation andleaching equipment, flotation plants as well as precious metals leaching plants.
In addition, he has had considerable experience in process and process plantevaluations, due diligence audits, feasibility studies and metallurgical test work andprogram development.
APPENDIX II INDEPENDENT EXPERT’S REPORT
– II-272 –
Dr. Terry Brown
B.Sc. Forest Management (Watershed Management), M.Sc. Soil Chemistry/Morphology, Ph.D. Soil and Water Chemistry, American Chemical Society, ARCPACCertified Professional Soil Scientist, American
Over 38 years of U.S. and International experience serving in environmentalmanagement positions with two coal mining companies, a U.S. federal coalmining/environmental regulatory agency, an international research institute and anenvironmental management consulting firm. Specializing in due diligence reviews(environmental and social aspects) for financial institutions, mining companies and oiland gas operations.
Focusing on soil and water management activities including: Water Management –potential for development of acid rock drainage in mineral and coal mines, elementdissolution, tailings storage, waste rock management, water treatment, erosion andsedimentation control, and water and soil chemistry; Soil Management – soil chemistry,soil morphology/mapping, soil fertility and soil microbiology/ bioremediation.
Significant experience in environmental impact analysis, development of impactmitigation measures, permitting of mine construction and operations, reclamation/mineclosure planning, pit lake development, environmental monitoring, soil mapping,evaluation of compliance with environmental standards, liability determinations, andenvironmental cost accounting.
Knowledge of the U.S. federal and International laws/regulations applicable tometals mines, coal mines, and industrial minerals. Substantial experience with theEquator Principles III, IFC Performance Standards, and IFC EHS Guidelines on Miningand other IFC Guidelines for mine associated facilities.
Luke Stephens
BA International Studies, MSc Development Practices, Certificate “SocialPerformance Leadership”
Luke has over 20 years of experience in the mining industry. He is committed toensuring shared value for mining companies and their local communities. He is adept atanticipating, recognizing and responding to social performance needs of stakeholders.Luke has a strong experiential and theoretical understanding of social license to operate.He is a creative thinker able to identify root causes of community issues, elicit localsolutions, collaboratively develop formalised programs and monitor and evaluate themthrough to realization.
APPENDIX II INDEPENDENT EXPERT’S REPORT
– II-273 –

Philippe Baudry
Associate Diploma (Geology), Bachelor of Applied Science (Mining and ExplorationGeology), Post Graduate Certificate Geostatistics, Executive Acumen Course, MAusIMM,QP/CP
Phil is a geologist with over 20 years of experience in the mining industry. With astrong background in mine geology, Phil gained a post graduate qualification inGeostatistics leading to a specialisation in resource estimation and project evaluation.
Over the last 14 years Phil has worked as a consultant focused on the Asian andRussian regions and has been based in Beijing for the past 10 years where he has built upand managed RPM’s business in north Asia including offices in China, Hong Kong,Mongolia and Russia before taking overall responsibility for RPM’s global advisorydivision which includes over 100 employees in 22 offices and has further expanded intoTurkey.
During his time at RPM Phil has worked and holds close relationships with allleading financial institutions across Asia, Europe and North America. This work hasranged from Lender ’s Engineer, Due Diligences to IPO’s and Phil has gained a detailedunderstanding of the requirements of both investors and banks in regards to capitalraising through debt and equity, public technical report requirements and listingprocesses on various financial exchanges.
Phil has an in depth knowledge of the Soviet and other Asian resource/reservereporting systems and has gained significant experience in both reviewing projects basedon these systems and in converting projects from this region to international standards ofreporting such as JORC.
Phil was born in France and spent 13 years living in France prior to moving toAustralia. He is fluent in both French and English and through his time in Russia hasgained survival Russian language skills.
With substantial experience in a wide range of commodity and deposit types gainedacross the globe, Phil meets the requirements for Qualified Person for 43-101 reporting,and Competent Person for JORC reporting for most metalliferous Mineral Resources andis an active member of the Australian Institute of Geoscientists (Membership No: 3721).
APPENDIX II INDEPENDENT EXPERT’S REPORT
– II-274 –
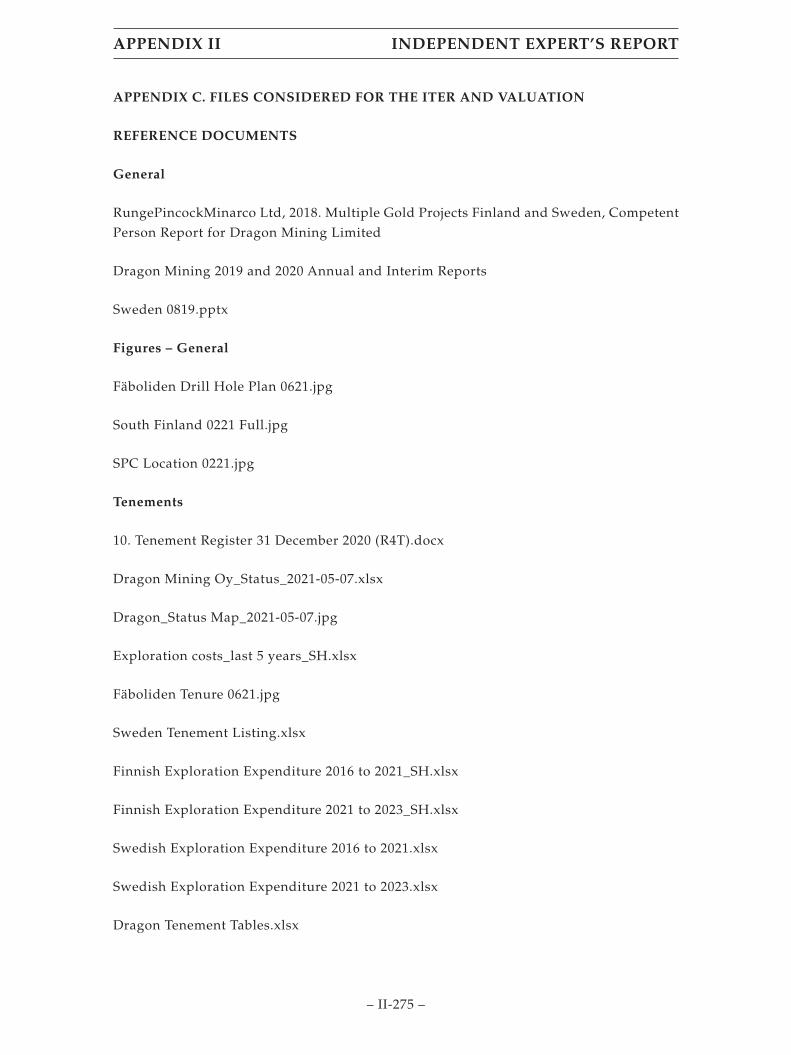
APPENDIX C. FILES CONSIDERED FOR THE ITER AND VALUATION
REFERENCE DOCUMENTS
General
RungePincockMinarco Ltd, 2018. Multiple Gold Projects Finland and Sweden, CompetentPerson Report for Dragon Mining Limited
Dragon Mining 2019 and 2020 Annual and Interim Reports
Sweden 0819.pptx
Figures – General
Fäboliden Drill Hole Plan 0621.jpg
South Finland 0221 Full.jpg
SPC Location 0221.jpg
Tenements
10. Tenement Register 31 December 2020 (R4T).docx
Dragon Mining Oy_Status_2021-05-07.xlsx
Dragon_Status Map_2021-05-07.jpg
Exploration costs_last 5 years_SH.xlsx
Fäboliden Tenure 0621.jpg
Sweden Tenement Listing.xlsx
Finnish Exploration Expenditure 2016 to 2021_SH.xlsx
Finnish Exploration Expenditure 2021 to 2023_SH.xlsx
Swedish Exploration Expenditure 2016 to 2021.xlsx
Swedish Exploration Expenditure 2021 to 2023.xlsx
Dragon Tenement Tables.xlsx
APPENDIX II INDEPENDENT EXPERT’S REPORT
– II-275 –
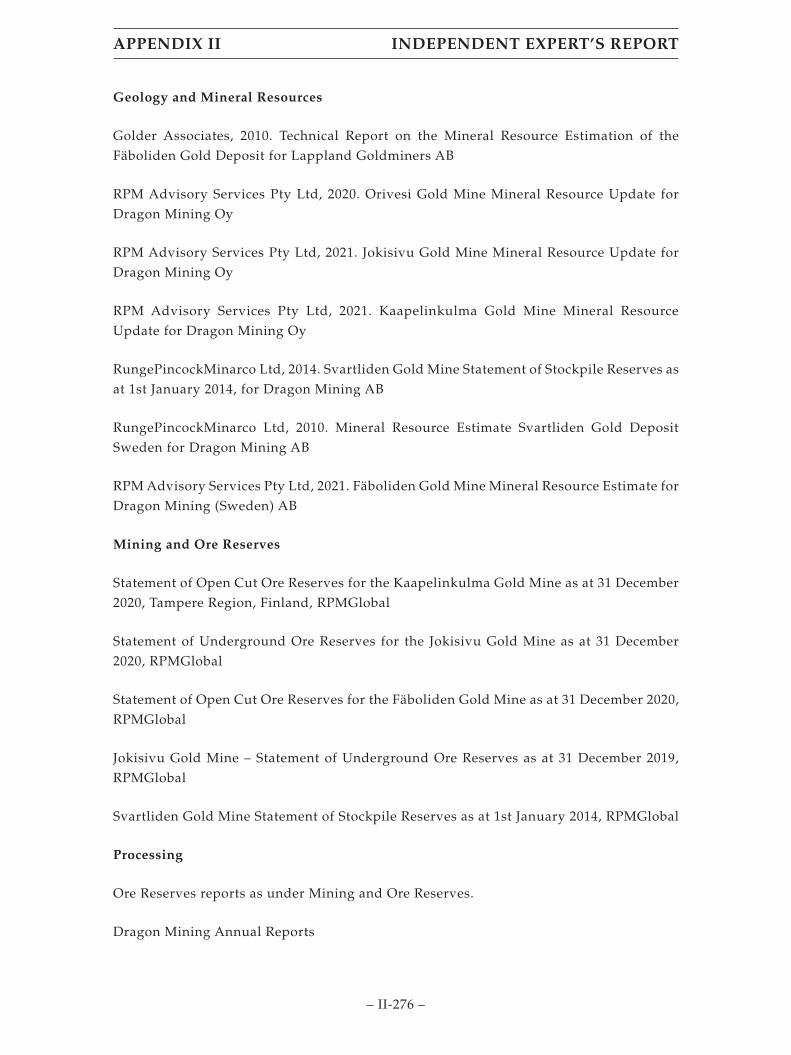
Geology and Mineral Resources
Golder Associates, 2010. Technical Report on the Mineral Resource Estimation of theFäboliden Gold Deposit for Lappland Goldminers AB
RPM Advisory Services Pty Ltd, 2020. Orivesi Gold Mine Mineral Resource Update forDragon Mining Oy
RPM Advisory Services Pty Ltd, 2021. Jokisivu Gold Mine Mineral Resource Update forDragon Mining Oy
RPM Advisory Services Pty Ltd, 2021. Kaapelinkulma Gold Mine Mineral ResourceUpdate for Dragon Mining Oy
RungePincockMinarco Ltd, 2014. Svartliden Gold Mine Statement of Stockpile Reserves asat 1st January 2014, for Dragon Mining AB
RungePincockMinarco Ltd, 2010. Mineral Resource Estimate Svartliden Gold DepositSweden for Dragon Mining AB
RPM Advisory Services Pty Ltd, 2021. Fäboliden Gold Mine Mineral Resource Estimate forDragon Mining (Sweden) AB
Mining and Ore Reserves
Statement of Open Cut Ore Reserves for the Kaapelinkulma Gold Mine as at 31 December2020, Tampere Region, Finland, RPMGlobal
Statement of Underground Ore Reserves for the Jokisivu Gold Mine as at 31 December2020, RPMGlobal
Statement of Open Cut Ore Reserves for the Fäboliden Gold Mine as at 31 December 2020,RPMGlobal
Jokisivu Gold Mine – Statement of Underground Ore Reserves as at 31 December 2019,RPMGlobal
Svartliden Gold Mine Statement of Stockpile Reserves as at 1st January 2014, RPMGlobal
Processing
Ore Reserves reports as under Mining and Ore Reserves.
Dragon Mining Annual Reports
APPENDIX II INDEPENDENT EXPERT’S REPORT
– II-276 –

Exploration
Fäboliden nr 11.pptx
See tenements files for expenditure
Dragon Mining Annual and Interim report 2019, 2020
Environmental
Dragon Mining Limited ESG Report 2020
Finland (Jokivisu) – Waste Management Plan:
Kaivannaisjatteen_jatehuoltosuunnitelma_17122019.pdf
Finland (Kaapalinkulma) – Waste Management Plan:
Jätehuoltosuunnitelma 301118 final.pdf
Finland (Jokivisu) – Water Management Plan:
Dragon Huittinen Jokisivun kaivos_päivitetty tarkkailuohjelma 2021.pdf
Tutkimusraportti_DRAGOHU_2020_final.pdf
Finland (Kaapalinkulma) – Water Management Plan:
DragonMiningOy_Kaapelinkulmankultakaivos_Tarkkailuohjelma_2015.pdf
Tutkimusraportti_DRAGOVLK_2020_final.pdf
Sweden (Fäboliden) – Environmental Impact Statement – Bilaga H,Miljökonsekvensbeskrivning
Sweden (Svartliden) – Environmental Report 2020 – MILJÖRAPPORT 2020
Sweden (Fäboliden) – Water Management Plan 2018 – Vattenhanteringsplan ochvattenbalansberäkning – Fäboliden
Sweden (Fäboliden) – Natura Study 2018 – Påverkan på Natura 2000-området Öreälvenfrån Fäbolidengruvan, en riskbedömning
Sweden (Fäboliden) – Waste Management Plan 2018 – Avfallshanteringsplan,Fäbolidengruvan
Sweden (Svartliden) – Waste Management Plan 2018 – Avfallshanteringsplan, Svartliden
APPENDIX II INDEPENDENT EXPERT’S REPORT
– II-277 –
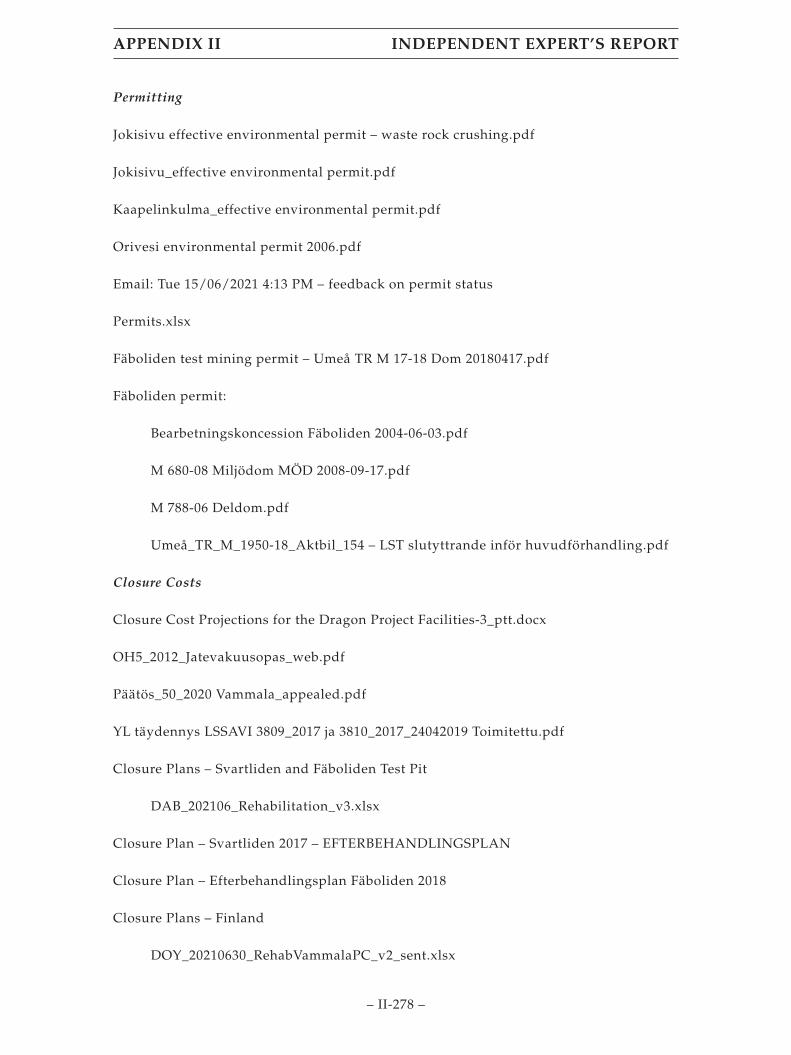
Permitting
Jokisivu effective environmental permit – waste rock crushing.pdf
Jokisivu_effective environmental permit.pdf
Kaapelinkulma_effective environmental permit.pdf
Orivesi environmental permit 2006.pdf
Email: Tue 15/06/2021 4:13 PM – feedback on permit status
Permits.xlsx
Fäboliden test mining permit – Umeå TR M 17-18 Dom 20180417.pdf
Fäboliden permit:
Bearbetningskoncession Fäboliden 2004-06-03.pdf
M 680-08 Miljödom MÖD 2008-09-17.pdf
M 788-06 Deldom.pdf
Umeå_TR_M_1950-18_Aktbil_154 – LST slutyttrande inför huvudförhandling.pdf
Closure Costs
Closure Cost Projections for the Dragon Project Facilities-3_ptt.docx
OH5_2012_Jatevakuusopas_web.pdf
Päätös_50_2020 Vammala_appealed.pdf
YL täydennys LSSAVI 3809_2017 ja 3810_2017_24042019 Toimitettu.pdf
Closure Plans – Svartliden and Fäboliden Test Pit
DAB_202106_Rehabilitation_v3.xlsx
Closure Plan – Svartliden 2017 – EFTERBEHANDLINGSPLAN
Closure Plan – Efterbehandlingsplan Fäboliden 2018
Closure Plans – Finland
DOY_20210630_RehabVammalaPC_v2_sent.xlsx
APPENDIX II INDEPENDENT EXPERT’S REPORT
– II-278 –

Kaapalinkulma:
Liite1_Kaapelinkulman kaivos_PIMA_tutkimussuunnitelma_26042021.pdf
Liite2_Jälkitarkkailuohjelma_DRAGOVLK_2021.pdf
Täydennys_Kaapelinkulma_sulkemissuunnitelma_28042021.pdf
Kaapelinkulma_sulkemissuunnitelma_28012021.pdf
Liitteet_1-4_koottuna.pdf
Email: Thursday 17/06/21 4:31pm (MT) – closure cost information
Biodiversity Studies
Sweden: Fäboliden Reindeer Husbandry 2018 – ANALYS AV PÅVERKAN PÅRENSKÖTSELN I VAPSTENS SAMEBY TILL FÖLJD AV GRUVVERKSAMHET VIDFÄBOLIDEN
Sweden: Fäboliden Reindeer Grazing Study 2018 – Renbetesinventering
Sweden Fäboliden – Naturvärdesinventering av området kring guldfyndigheten iFäboliden, Lycksele kommun 2015-2016
Sweden Fäboliden – Påverkan på Natura 2000-området Öreälven från Fäbolidengruvan,en riskbedömning
Finland: DragonMining_Jokisivu_liito-oravaselvitys_2018.pdf
Kaapelinkulman_kirjopapurikkoseuranta_kesä 2020.pdf
Orivesi:
1320 pohjaelain-tarkkailuohjelma 2014.pdf
Dragon_Alajalkajärven kalkkikäsittelyn vaikutusten seuranta_vesikasvit 2020.pdf
Dragonor_Alajalkajarvi_kalkkikäsittely_2017.pdf
Oriveden kaivoksen pohjaeläimet 2020 KVVY.pdf
Oriveden_kaivoksen_kalataloudellinen_velvoitetarkkailu_vuonna_2018.pdf
Oriveden_kaivoksen_sedimenttitutkimus_vuonna_2018.pdf
APPENDIX II INDEPENDENT EXPERT’S REPORT
– II-279 –
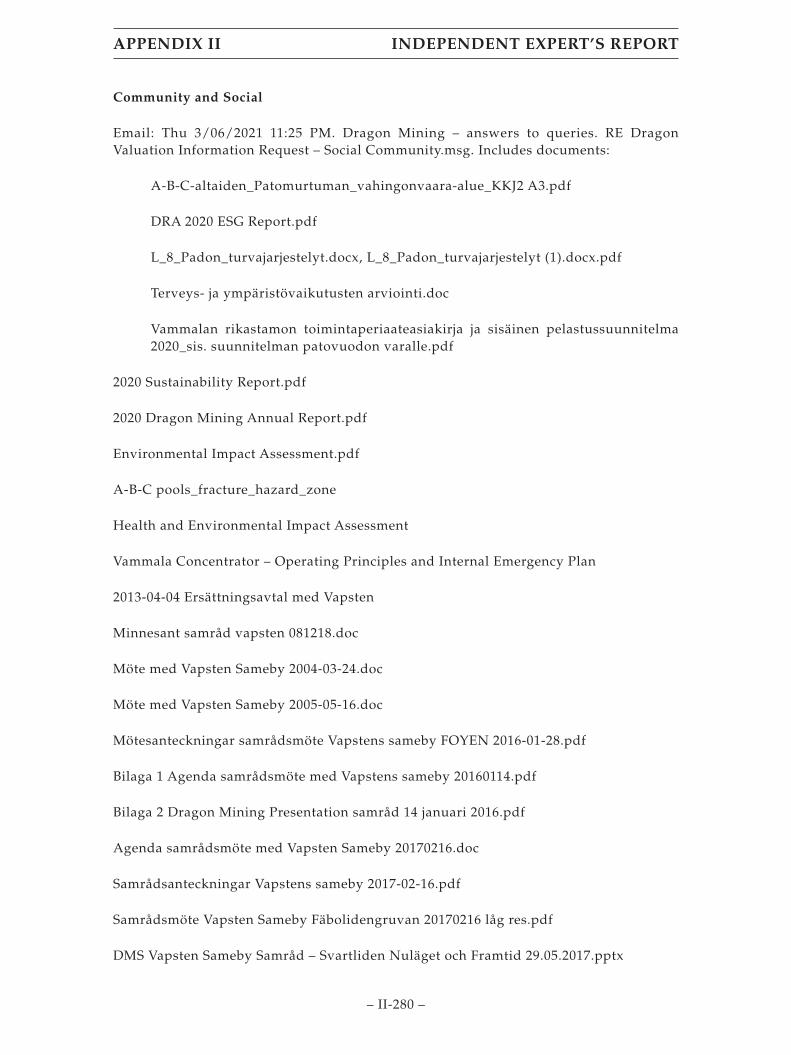
Community and Social
Email: Thu 3/06/2021 11:25 PM. Dragon Mining – answers to queries. RE DragonValuation Information Request – Social Community.msg. Includes documents:
A-B-C-altaiden_Patomurtuman_vahingonvaara-alue_KKJ2 A3.pdf
DRA 2020 ESG Report.pdf
L_8_Padon_turvajarjestelyt.docx, L_8_Padon_turvajarjestelyt (1).docx.pdf
Terveys- ja ympäristövaikutusten arviointi.doc
Vammalan rikastamon toimintaperiaateasiakirja ja sisäinen pelastussuunnitelma2020_sis. suunnitelman patovuodon varalle.pdf
2020 Sustainability Report.pdf
2020 Dragon Mining Annual Report.pdf
Environmental Impact Assessment.pdf
A-B-C pools_fracture_hazard_zone
Health and Environmental Impact Assessment
Vammala Concentrator – Operating Principles and Internal Emergency Plan
2013-04-04 Ersättningsavtal med Vapsten
Minnesant samråd vapsten 081218.doc
Möte med Vapsten Sameby 2004-03-24.doc
Möte med Vapsten Sameby 2005-05-16.doc
Mötesanteckningar samrådsmöte Vapstens sameby FOYEN 2016-01-28.pdf
Bilaga 1 Agenda samrådsmöte med Vapstens sameby 20160114.pdf
Bilaga 2 Dragon Mining Presentation samråd 14 januari 2016.pdf
Agenda samrådsmöte med Vapsten Sameby 20170216.doc
Samrådsanteckningar Vapstens sameby 2017-02-16.pdf
Samrådsmöte Vapsten Sameby Fäbolidengruvan 20170216 låg res.pdf
DMS Vapsten Sameby Samråd – Svartliden Nuläget och Framtid 29.05.2017.pptx
APPENDIX II INDEPENDENT EXPERT’S REPORT
– II-280 –

Rennäringsanalys 20170425 SLUTLIG.pdf
Minnesanteckningar samråd 20170529.pdf
Samrådsmöte 2010_aktuell.pdf
Handlingsplan_rutiner och utredningar 2010.docx
Minnesanteckningar_Stängselmöte_20130308_20130404.pdf
H3_1 – Renbetesinventering 20171116.pdf
H3 – Rennäringsanalys 20180601.pdf
Valuation
holes_in_expl_ug_res_20210609 SH.xlsx
Ore_Dragon Mining Oy Prodn.xlsx. Monthly ore production Jan-May 2021 for Jokivisuand Kaapalinkulma and end of May closing ore stockpiles.
DRA_2021_MgmtPack.xlsx. Monthly accounts and production to date.
Scoping Study Summary V2.pdf
Argor.pdf – Argor refining/transport/interest invoice May 2021
DAB_2021_Key figures.xlsx – Inventory details, product, cost, NRV.
Financial Models:
2020 Dragon Fäboliden OP Assumption Sheet OR V1.xlsb – initial financial model used for2020 Ore Reserves estimate.
Dragon Jokisivu UG Worksheet V2_1pt6.xlsm – initial financial model used for 2020 OreReserves estimate.
Dragon Jokisivu UG FM V1d.xlsm – Final financial model for Jokivisu
Dragon Fäboliden OP Financial Model V1b.xlsb – Final financial model for Jokivisu
Rates etc.docx – financial parameters and sources for use in financial models.
Email: Mon 14/06/2021 7:26 PM from Dragon Mining explaining Svartliden Capex ofEuro2M
APPENDIX II INDEPENDENT EXPERT’S REPORT
– II-281 –
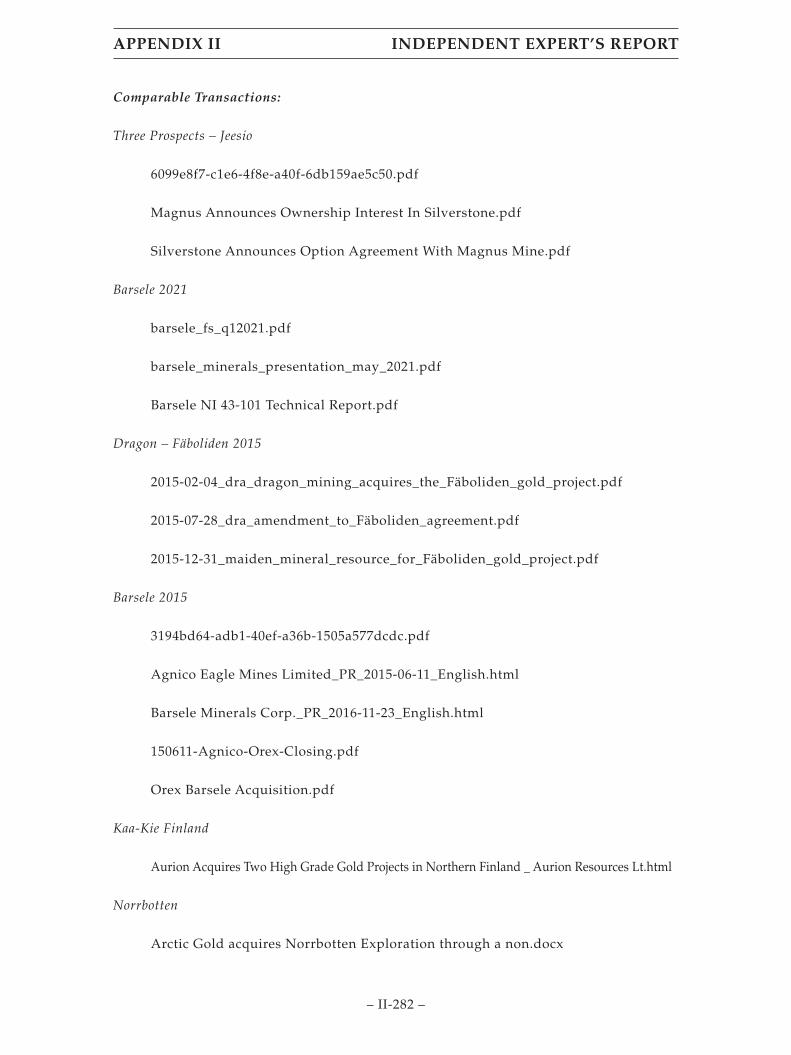
Comparable Transactions:
Three Prospects – Jeesio
6099e8f7-c1e6-4f8e-a40f-6db159ae5c50.pdf
Magnus Announces Ownership Interest In Silverstone.pdf
Silverstone Announces Option Agreement With Magnus Mine.pdf
Barsele 2021
barsele_fs_q12021.pdf
barsele_minerals_presentation_may_2021.pdf
Barsele NI 43-101 Technical Report.pdf
Dragon – Fäboliden 2015
2015-02-04_dra_dragon_mining_acquires_the_Fäboliden_gold_project.pdf
2015-07-28_dra_amendment_to_Fäboliden_agreement.pdf
2015-12-31_maiden_mineral_resource_for_Fäboliden_gold_project.pdf
Barsele 2015
3194bd64-adb1-40ef-a36b-1505a577dcdc.pdf
Agnico Eagle Mines Limited_PR_2015-06-11_English.html
Barsele Minerals Corp._PR_2016-11-23_English.html
150611-Agnico-Orex-Closing.pdf
Orex Barsele Acquisition.pdf
Kaa-Kie Finland
Aurion Acquires Two High Grade Gold Projects in Northern Finland _ Aurion Resources Lt.html
Norrbotten
Arctic Gold acquires Norrbotten Exploration through a non.docx
APPENDIX II INDEPENDENT EXPERT’S REPORT
– II-282 –
Laiva 14-11-2017
Nordic Marknad AB_MR_2017-12-11_English.pdf
Otso Gold Corp._Misc._2017-11-10_English.pdf
Otso Gold Corp._MR_2017-11-14_English.pdf
89d336ae-cae8-45f9-935a-51bc472d4c4d.pdf
Laiva 10_4-2017
Nordic Mines AB_MR_2017-04-10_English.html
Mustajarvi
FireFox Gold Acquires Mustajärvi Gold Project In Central Lapland Greenstone Bel.pdf
Nordic
c207ff35-021b-45ab-9293-6694be653b20.pdf
Seuru
e78da0e4-0a00-4b13-9c16-1aa12c60a536.pdf
Gold Line
716fc54f-2dbe-4fb9-982d-93951695186c.pdf
CAN_USD EX HistoricalPrices.csv
emxfsdecember2019.pdf
Katinhanta – Dragon
49e70c86-b2a5-4ea5-8fcc-db4ea4825086.pdf
Home_Palvaanen
9a7592f6-7a26-4be8-b3b0-bac987bff730.pdf
APPENDIX II INDEPENDENT EXPERT’S REPORT
– II-283 –
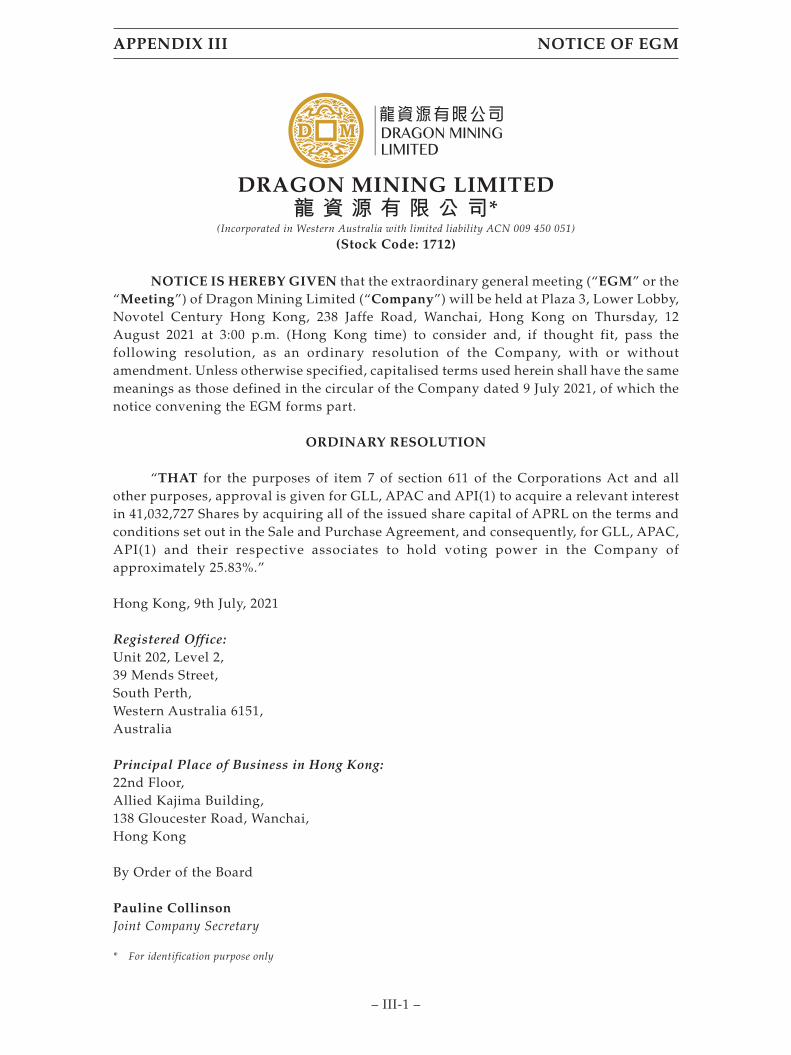
DRAGON MINING LIMITED龍 資 源 有 限 公 司*
(Incorporated in Western Australia with limited liability ACN 009 450 051)
(Stock Code: 1712)
NOTICE IS HEREBY GIVEN that the extraordinary general meeting (“EGM” or the“Meeting”) of Dragon Mining Limited (“Company”) will be held at Plaza 3, Lower Lobby,Novotel Century Hong Kong, 238 Jaffe Road, Wanchai, Hong Kong on Thursday, 12August 2021 at 3:00 p.m. (Hong Kong time) to consider and, if thought fit, pass thefollowing resolution, as an ordinary resolution of the Company, with or withoutamendment. Unless otherwise specified, capitalised terms used herein shall have the samemeanings as those defined in the circular of the Company dated 9 July 2021, of which thenotice convening the EGM forms part.
ORDINARY RESOLUTION
“THAT for the purposes of item 7 of section 611 of the Corporations Act and allother purposes, approval is given for GLL, APAC and API(1) to acquire a relevant interestin 41,032,727 Shares by acquiring all of the issued share capital of APRL on the terms andconditions set out in the Sale and Purchase Agreement, and consequently, for GLL, APAC,API(1) and their respective associates to hold voting power in the Company ofapproximately 25.83%.”
Hong Kong, 9th July, 2021
Registered Office:Unit 202, Level 2,39 Mends Street,South Perth,Western Australia 6151,Australia
Principal Place of Business in Hong Kong:22nd Floor,Allied Kajima Building,138 Gloucester Road, Wanchai,Hong Kong
By Order of the Board
Pauline CollinsonJoint Company Secretary
* For identification purpose only
APPENDIX III NOTICE OF EGM
– III-1 –
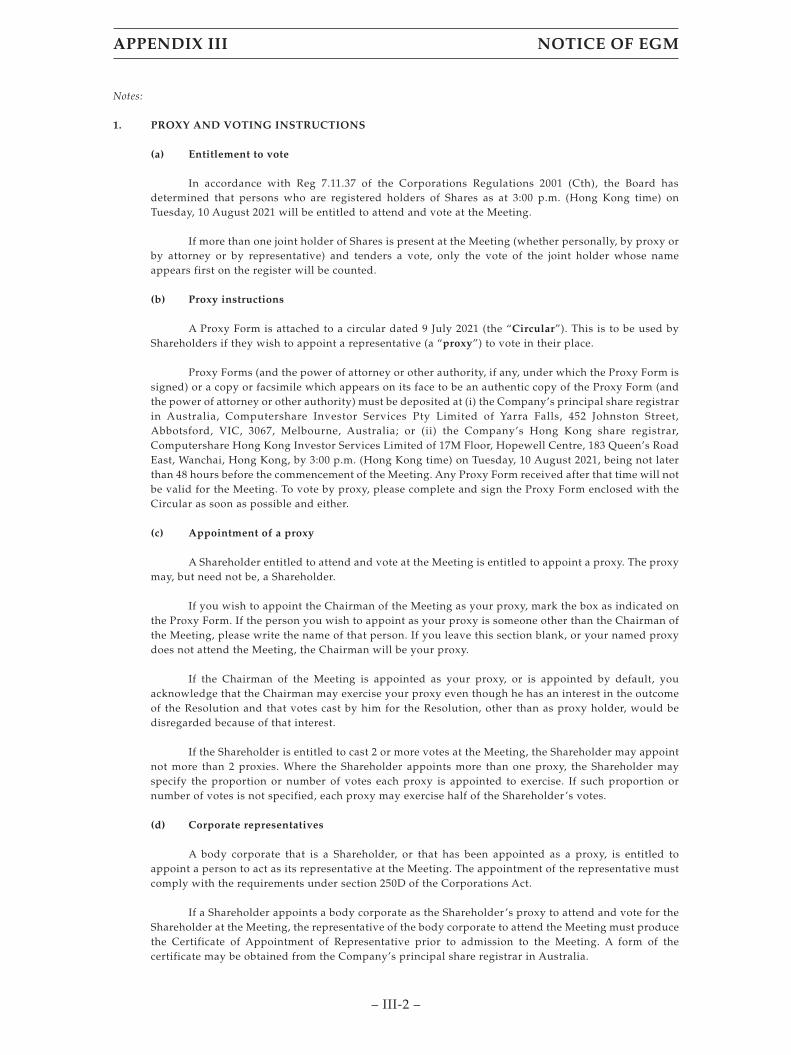
Notes:
1. PROXY AND VOTING INSTRUCTIONS
(a) Entitlement to vote
In accordance with Reg 7.11.37 of the Corporations Regulations 2001 (Cth), the Board hasdetermined that persons who are registered holders of Shares as at 3:00 p.m. (Hong Kong time) onTuesday, 10 August 2021 will be entitled to attend and vote at the Meeting.
If more than one joint holder of Shares is present at the Meeting (whether personally, by proxy orby attorney or by representative) and tenders a vote, only the vote of the joint holder whose nameappears first on the register will be counted.
(b) Proxy instructions
A Proxy Form is attached to a circular dated 9 July 2021 (the “Circular”). This is to be used byShareholders if they wish to appoint a representative (a “proxy”) to vote in their place.
Proxy Forms (and the power of attorney or other authority, if any, under which the Proxy Form issigned) or a copy or facsimile which appears on its face to be an authentic copy of the Proxy Form (andthe power of attorney or other authority) must be deposited at (i) the Company’s principal share registrarin Australia, Computershare Investor Services Pty Limited of Yarra Falls, 452 Johnston Street,Abbotsford, VIC, 3067, Melbourne, Australia; or (ii) the Company’s Hong Kong share registrar,Computershare Hong Kong Investor Services Limited of 17M Floor, Hopewell Centre, 183 Queen’s RoadEast, Wanchai, Hong Kong, by 3:00 p.m. (Hong Kong time) on Tuesday, 10 August 2021, being not laterthan 48 hours before the commencement of the Meeting. Any Proxy Form received after that time will notbe valid for the Meeting. To vote by proxy, please complete and sign the Proxy Form enclosed with theCircular as soon as possible and either.
(c) Appointment of a proxy
A Shareholder entitled to attend and vote at the Meeting is entitled to appoint a proxy. The proxymay, but need not be, a Shareholder.
If you wish to appoint the Chairman of the Meeting as your proxy, mark the box as indicated onthe Proxy Form. If the person you wish to appoint as your proxy is someone other than the Chairman ofthe Meeting, please write the name of that person. If you leave this section blank, or your named proxydoes not attend the Meeting, the Chairman will be your proxy.
If the Chairman of the Meeting is appointed as your proxy, or is appointed by default, youacknowledge that the Chairman may exercise your proxy even though he has an interest in the outcomeof the Resolution and that votes cast by him for the Resolution, other than as proxy holder, would bedisregarded because of that interest.
If the Shareholder is entitled to cast 2 or more votes at the Meeting, the Shareholder may appointnot more than 2 proxies. Where the Shareholder appoints more than one proxy, the Shareholder mayspecify the proportion or number of votes each proxy is appointed to exercise. If such proportion ornumber of votes is not specified, each proxy may exercise half of the Shareholder ’s votes.
(d) Corporate representatives
A body corporate that is a Shareholder, or that has been appointed as a proxy, is entitled toappoint a person to act as its representative at the Meeting. The appointment of the representative mustcomply with the requirements under section 250D of the Corporations Act.
If a Shareholder appoints a body corporate as the Shareholder ’s proxy to attend and vote for theShareholder at the Meeting, the representative of the body corporate to attend the Meeting must producethe Certificate of Appointment of Representative prior to admission to the Meeting. A form of thecertificate may be obtained from the Company’s principal share registrar in Australia.
APPENDIX III NOTICE OF EGM
– III-2 –

(e) Proxies and conduct of Meeting
Sections 250BB and 250BC of the Corporations Act apply to voting by proxy and will apply to theconduct of the Meeting. Broadly, this means that:
(a) if proxy holders vote, they must cast all directed proxies as directed; and
(b) any directed proxies which are not voted will automatically default to the Chairman, whomust vote the proxies as directed.
Pursuant to section 250BB of the Corporations Act, an appointment of a proxy may specify theway the proxy is to vote on a particular resolution and, if it does:
(a) the proxy need not vote on a show of hands, but if the proxy does so, the proxy must votethat way (i.e. as directed); and
(b) if the proxy has 2 or more appointments that specify different ways to vote on theresolution – the proxy must not vote on a show of hands; and
(c) if the proxy is the Chairman of the Meeting at which the resolution is voted on – the proxymust vote on a poll, and must vote that way (i.e. as directed); and
(d) if the proxy is not the Chairman – the proxy need not vote on the poll, but if the proxy doesso, the proxy must vote that way (i.e. as directed).
Under section 250BC of the Corporations Act, if:
(a) an appointment of a proxy specifies the way the proxy is to vote on a particular resolutionat a meeting of a company’s members;
(b) the appointed proxy is not the Chairman of the Meeting;
(c) at the meeting, a poll is duly demanded on the resolution; and
(d) either of the following applies:
(i) the proxy is not recorded as attending the meeting;
(ii) the proxy does not vote on the resolution,
the Chairman of the Meeting is taken, before voting on the resolution closes, to have been appointed asthe proxy for the purposes of voting on the resolution at the meeting.
2. CLOSURE OF REGISTERS OF MEMBERS
For determining the entitlement to attend and vote at the Meeting, the register of members of theCompany will be closed from Monday, 9 August 2021 to Thursday, 12 August 2021 (both days inclusive), duringwhich period no transfer of Shares will be registered. In order for a Shareholder to be eligible to attend and voteat the Meeting, all transfer forms accompanied by the relevant share certificates must be lodged with the (i) theCompany’s principal share registrar in Australia, Computershare Investor Services Pty Limited of Yarra Falls,452 Johnston Street, Abbotsford, VIC, 3067, Melbourne, Australia; or (ii) Company’s Hong Kong share registrar,Computershare Hong Kong Investor Services Limited of Shops 1712–1716, 17th Floor, Hopewell Centre, 183Queen’s Road East, Wanchai, Hong Kong for registration not later than 4:30 p.m. on Friday, 6 August 2021 (HongKong time).
APPENDIX III NOTICE OF EGM
– III-3 –

3. SHAREHOLDER QUESTIONS
At the Meeting, the Chairman will allow a reasonable opportunity for Shareholders to ask questions onthe Resolution to be proposed at the EGM.
To assist the management of the Company in responding to questions please submit any questions youmay have in writing to the Joint Company Secretary in Australia no later than 5:00 p.m. (Hong Kong time) onFriday, 6 August 2021:
In person or by post:Unit 202, Level 2,39 Mends Street,South Perth,Western Australia 6151,Australia
By phone: (08) 6311 8004 (within Australia)+61 8 6311 8004 (outside Australia)
By e-mail: [email protected]
4. In order to facilitate the prevention and control of the spread of the Novel Coronavirus (COVID-19)epidemic and to safeguard the health and safety of the Shareholders, the Company encouragesShareholders to consider appointing the chairman of the Meeting as his/her proxy to vote on theresolution at the Meeting as an alternative to attending the Meeting in person.
5. A copy of this notice of Meeting was lodged with the Australian Securities and Investments Commission(“ASIC”) on 22 June 2021 pursuant to ASIC Regulatory Guide 74. Neither ASIC nor any of its officers takeany responsibility for the contents of this notice of Meeting.
APPENDIX III NOTICE OF EGM
– III-4 –