OVERSEAS REGULATORY ANNOUNCEMENT - HKEXnews
66
Hong Kong Exchanges and Clearing Limited and The Stock Exchange of Hong Kong Limited (the “Stock Exchange”) take no responsibility for the contents of this announcement, make no representation as to its accuracy or completeness and expressly disclaim any liability whatsoever for any loss howsoever arising from or in reliance upon the whole or any part of the contents of this announcement. (Incorporated in the Cayman Islands with limited liability) (Stock Code: 8061) OVERSEAS REGULATORY ANNOUNCEMENT The following is a translation of an announcement of PT First Media Tbk (a subsidiary of AcrossAsia Limited (“AcrossAsia”) listed on the Indonesia Stock Exchange in which AcrossAsia has an approximately 55.1% interest) published on the Indonesia Stock Exchange. Hong Kong, 16th June, 2016 1
-
Upload
khangminh22 -
Category
Documents
-
view
4 -
download
0
Transcript of OVERSEAS REGULATORY ANNOUNCEMENT - HKEXnews

Hong Kong Exchanges and Clearing Limited and The Stock Exchange of Hong Kong Limited (the “Stock Exchange”) take no responsibility for the contents of this announcement, make no representation as to its accuracy or completeness and expressly disclaim any liability whatsoever for any loss howsoever arising from or in reliance upon the whole or any part of the contents of this announcement.
(Incorporated in the Cayman Islands with limited liability) (Stock Code: 8061)
OVERSEAS REGULATORY ANNOUNCEMENT
The following is a translation of an announcement of PT First Media Tbk (a subsidiary of AcrossAsia Limited (“AcrossAsia”) listed on the Indonesia Stock Exchange in which AcrossAsia has an approximately 55.1% interest) published on the Indonesia Stock Exchange.
Hong Kong, 16th June, 2016
1

Letter No. SB-028/CSL/OJK/V/2016 Company Name First Media Tbk Stock Code KBLV Attachment 3 Subject Submission of Other Advertisement
The Company/Issuer submits herewith the proof of other advertisement that has been advertised in printed media:
Information Name of Print Media Date of Publication
Disclosure to Shareholders in order to comply with IX.E.1 and OJK Regulations 31
Investor Daily 26 May 2016
Sender Harianda NoerlanPosition Corporate SecretaryDate and Time 26 May 2015 15:50:43Attachment
This document is an official document of First Media Tbk which does not require a signature since it is electronically generated by the electronic reporting system. First Media Tbk takes
full responsibility for the information contained in this document.
“
20160526 KBLV - KI IX.E.1 - InvestorDaily.pdf20160526 FM - SB_028 - Penyampaian Bukti Iklan KI IX.E.1 MMM-INUX.pdfReport FO Internux Debt Equity Swap.pdf
2

DISCLOSURE OF INFORMATION TO SHAREHOLDERS In Compliance with Capital Market Supervisory Agency and Financial Institution
(Bapepam dan LK) Regulation No.IX.E.1 regarding Affiliation Transaction and Conflict of Interest of Certain Transaction
and Financial Authority Services (Otoritas Jasa Keuangan/OJK) Regulation
No. 31/POJK/.04/2015 regarding Disclosure of Material Information or Fact by Issuer or Public Company
This Disclosure of Information to Shareholder is concerning with the participation on new shares issued by PT Internux (“Internux”) by PT Mitra Mandiri Mantap (“MMM”), the Company’s Controlled Company, by way of conversion of Internux’s debt owing to MMM in the amount of Rp440,000,000,000 (four hundred fourty billion Rupiah) into 4,400,000,000 (four billion four hundred million) shares in Internux (“Transaction”).
Transaction is an Affiliation Transaction in accordance with Regulation IX.E.1, Attachment of Decree of Chairman of Capital Market Supervisory Agency and Financial Institution No. KEP-412/BL/2009 dated 25 November 2009 regarding Affiliation Transaction and Conflict of Interest of Certain Transaction (“Regulation IX.E.1”). Transaction does not contain Conflict of Interest as mentioned in the Regulation IX.E.1 and not included as Material Transaction as mentioned in the Regulation IX.E.2, Attachment of Decree of Chairman of Capital Market Supervisory Agency and FinancialInstitution No. Kep-614/BL/2011 dated 28 November 2011 regarding Material Transaction and Alteration in Core Business (“Regulation IX.E.2”).
STATEMENT OF THE BOARD OF DIRECTORS AND THE BOARD OF COMMISSIONERS
In relation to this Transaction, the Company’s Board of Directors and Board of Commissioners take full responsibility on the truth of all information contained in this Disclosure of Information and confirmed that after conducting sufficient examination on available information regarding Transaction, and as far as their knowledge and belief, there are no other important or material information in relation to Transaction which have not been disclosed and therefore will cause information contained herein become incorrect and/or misleading.
This Disclosure of Information is issued in Jakarta, on 26 May 2016.
PT First Media Tbk (“Company”)
Line of Business: Telecommunication and Content Provider
Head Office BeritaSatu Plaza 4th Floor
Jalan Jenderal Gatot Subroto Kav 35-36 Jakarta Selatan, 12950
Telephone: (+6221) 527 8811 Facsimile: (+6221) 527 8833
3

DESCRIPTION OF TRANSACTION
1. Object of Transaction
In accordance with Deed PT Internux No. 13 dated 27 April 2016 made before Andalia Farida, SH, MH, Notary in Jakarta, with such deed has been informed and filed in the Legal Entity Administration System according to Letter of Ministry of Law and Human Rights No. AHU-AH.01.03-0051354 and has been registered in the Company’s Registry No. AHU- 0064071.AH.01.11.YEAR 2016 dated 24 May 2016 (“PT Internux’s Deed No. 13 dated 27 April 2016”), has occured a participation on new shares issued by Internux by MMM, a Controlled Company of the Company by way of conversion of debt due by Internux to MMM in the amount of Rp440,000,000,000 (four hundred fourty billion Rupiah) into 4,400,000,000 (four billion four hundred million) shares in Internux (“Transaction”).
2. Value of Transaction
The value of Transaction is Rp 440,000,000,000 (four hundred fourty billion Rupiah).
Transaction is not a Material Transaction as mentioned in the RegulationIX.E.2. This is due to the value of Transaction is Rp 440,000,000,000 (four hundred fourty billionRupiah) which is equal to 5.2% (five point two percent) of the Company’s equity based on theConsolidated Financial Statement for the period ended on 31 December 2015 that has beenaudited by Public Accountant Office Amir Abadi Jusuf, Aryanto, Mawar & Partner.
Transaction does not contain Conflict of Interest as mentioned in the Regulation IX.E.1.
3. Parties to the Transaction
a. PT Mitra Mandiri Mantap (“MMM”), a Controlled Company of the Company.
Brief History
MMM domiciled in Jakarta and established with the name of PT Mitra Mandiri Mantap, basedon the Deed of Establishment No. 03 dated 14 January 2010, made before Henny KurniaTjahja SH, Notary in Jakarta, which has obtained ratification from the Minister of Law andHuman Rights of the Republic of Indonesia based on the Decree No. AHU-05411.AH.01.01.Year 2010 dated 2 January 2010 (hereinafter referred to as “MMM’s Deed ofEstablishment”)and has been registered in the Company’s Registry No.AHU-0008035.AH.01.09.Year 2010 dated 2 January 2010.
(hereinafter referred to as “MMM’s Deed of Establishment”).
Business Activities
Business activities of MMM are to engage in the following fields:a. trade;b. industry;c. development;d. mining;e. agriculture;f. land transportation;g. service; andh. printing.
To reach the above purpose and goal, MMM may conduct the following business activities: a. Conduct business activities in general trade, including export and import, trade between
islands and local, either for individual or other entity based on commission or by mandate, act as purveyor, wholesaler, supplier, distributor, agency or representative of other companies or entitties, from domestic or abroad except of travel agent.
b. Conduct businesses in machinery industry, technical and mechanical equipments,electronics, vehicle’s bodies and components, office stationeries, household needs,
4

building materials, wood working and furniture industries, paper industry, tooling and furniture also wood processing industry as well as trading their products.
c. Conduct businesses in chartering building by accepting, planning and carry out theconstructions of homes, building, streets, bridges, irrigation, airstrip, dock or act asgeneral contractor, installations, iron and steel constructions, real estate, especially saleand purchase of buildings and its land rights, manage and doing rental of office buildings,housing, apartment, condominium, shopping space and others, manage parkingspace/building and warehouse building.
d. Conducting businesses in general mining including exploration, exploitation andmarketing mining products that are permitted by the Government.
e. Conducting businesses in agricultural, plantation, forestry, stockbreeding, fishery,fishpond.
f. Conducting businesses in land transportation, for peopel or goods, expedition andwarehousing.
g. Conducting businesses in general services, among others construction services,engineering services, architect services, landscape, design and interior, technical servicesincluding installation/assembly, repairment and maintenance and also technicalequipments installations, equipment installations for water, gas, telecommunication,electrical and mechanical as well as other relevant businesses, except law and taxservices.
h. Conducting businesses in printing, kartonage and packing, design and graphic printing,publishing and advertising, as well as other relevant businesses.
Capital Structure and Shareholders
Based on Deed No. 102 dated 24 December 2014, made before Charles Hermawan, SH, Notary in Tangerang, which has obtained approval from Minister of Law and Human Rights based on Decree No. AHU-13507.40.20.2014 dated 24 December 2014 and filed in the Legal Entity Administration System in accordance with Letter of Ministry of Law and Human Rights No. AHU-10249.40.21.2014 dated 24 December 2014, the Capital Structure and Shareholders of MMM is as follows:
Remarks
Nominal Value Rp1,000,000 per share
Number of Shares Nominal Value
(Rupiah) %
Authorized Capital 12,916 12,916,000,000 100.00
Issued and Fully Paid-Up Capital:
PT First Media Tbk 2,229 2,229,000,000 69.04
PT Cahaya Emeralda Cemerlang 500 500,000,000 15.48
PT Inti Permata Provita 500 500,000,000 15.48
Total 3,229 3,229,000,000 100.00
Shares in portfolio 9,687 9,687,000,000
Management and Supervision
Based on Deed of MMM No. 06 dated 19 December 2012, made before Henny Kurnia Tjahja, S.H., Notary in Central Jakarta, which has been notified and filed in the Legal Entity Administration System in accordance with Letter of Ministry of Law and Human Rights No. AHU-AH.01.10-02169 dated 29 January 2013, the compositions of the Board of Commissioners and the Board of Directors of MMM are as follows:
Board of Commissioners Commissioner : Bambang Sucahyo
Board of Directors Director : M.A Ismail Ning
5

b. Information about the Company
Brief History
The Company was established with the name PT Safira Ananda based on Deed ofEstablishment No. 37, dated 6 January 1994, made before Siti Safariyah, SH, CN, as substitutenotary of B.R.Ay. Mahyastoeti Notonagoro, SH, Notary in Jakarta. This Deed of Establishmenthas been approved by the Ministry of Justice of the Republic of Indonesia as stated in theDecree No. C2-1.446HT.01.01.Th.95, dated 1 February 1995 and has been registered in theregistry book in the Court of Central Jakarta under No. 549/III/1995, dated30 March 1995, and also has been announced in the Supplement of State Gazette No. 6613,State Gazette of the Republic of Indonesia No. 81, dated 8 October 1999 (“the Company’sDeed of Establishment”).
The Company’s articles of association has been amended several times among othersamendment of the Company’s name. In 2007, the Company’s name was changed from PTBroadband Multimedia Tbk turn into PT First Media Tbk based on Deed of Statement ofExtraordinary General Meeting of Shareholders Resolutions No.37 dated 25 May 2007,made before Tintin Surtini, SH, MH, M.Kn, as substitute of Surjadi, SH, Notary in Jakarta,which has been approved by the Minister of Law and Human Rights of the Republic ofIndonesia as stated in the Decree No. W7-06790.HT.01.04.TH.2007 dated 19 June 2007.
On 11 June 2015, the Company has obtained approval from the Company’s ExtraordinaryGeneral Meeting of Shareholders to adjust and rearrange all of the Company’s articles ofassociation based on OJK Regulation 33/POJK.04/2014 with notarial deed made beforeAndalia Farida, SH., MH., Notary in Jakarta, No. 33 dated 15 May 2015, which suchamendment has been notified and filed in the Legal Entity Administration System as stated inthe Letter of Ministry of Law and Human Rights No. AHU-AH.01.03-0940134 dated 11 June2014 (“the Company’s Deed No. 33”).
On 15 April 2016, the Company has changed its board of management as stated in the Deedof Minutes of Meeting No. 04 dated 15 April 2016, made before Andalia Farida, SH., MH.,Notary in Jakarta, which has been notified and filed in the Legal Entity Administration SystemNo. AHU-AH.01.03-0045537 dated 3 May 2015 (“the Company’s Deed No. 04”).
Business Activities
The business activities of the Company is telecommunication and content provider.
Capital Structure and Shareholders
Based on the Company’s Deed No. 33 and List of Shareholders issued by Share Registrar,PT Sharestar Indonesia, dated 2 May 2016, the capital structure and shareholders of theCompany is as follows:
Remarks Nominal Value Rp500,- per share
Number of Shares Nominal Value (Rupiah)
%
Authorized Capital 6,967,587,600 3,483,693,800,000
Issued and Fully Paid-Up Capital:
PT Reksa Puspita Karya 588,167,378 294,083,689,000 33.76
Public 1,154,000,529 577,000,264,500 66.24
Total 1,742,167,907 871,083,953,500 100.00
Shares in portfolio 5,225,419,693 2,612,609,846,500
Management and Supervision
Based on the Company’s Deed No. 04, the compositions of the Board of Commissioners and the Board of Directors of the Company are as follows:
6

BOARD OF COMMISSIONERS President Commissioner : Theo L. Sambuaga Independent Commissioner : Didik J. Rachbini Independent Commissioner : Muladi Independent Commissioner : Nanan Soekarna Independent Commissioner : Ito Sumardi
DIREKSI President Director : Ali Chendra Vice President Director : Irwan Djaja Independent Director : Harianda Noerlan Director : Dicky Setiadi Moechtar Director : Johannes Tong Director : Edward Sanusi Director : Maria Clarissa Fernandez Joesoep
c. PT Internux, a subsidiary of MMM
Brief History
Internux is domiciled in Makassar and established based on Deed of Establishment No. 16 dated 11 October 2000 made before Junus Kadir, a Subsitute Notary of Sitske Limowa, SH, Notary in Makassar, which has obtained ratification from the Minister of Law and Human Rights of the Republic of Indonesia based on Decree No. C-03778.HT.01.01.Year 2001 dated25 July 2001, and registered in the Company's Registry No. 2020/5/03162 dated 25 July 2001
(hereinafter referred to as “Deed of Establishment”).
On 25 January 2009, Internux has obtained approval from its shareholders to adjust and rearrange all of Internux’s articles of association in accordance with Law No. 40 Year 2007 regarding the Limited Liability Company, as stated in the Deed of Minutes of General Shareholders Meeting No. 6 dated 25 January 2009, made before Dumondo Yan Tosingke, SH, that has obtained approval from the Ministry of Law and Human Rights of the Republic of Indonesia by Decree No. AHU-25273.AH.01.02 Year 2009 dated 9 June 2009 and has been registered in the Company’s Registry No. AHU-0032554.AH.01.01.Year 2009 dated 9 June 2009.
In addition, the Internux’s articles of association has been amended several times and the last amendment as stated in the Deed No. 13 dated 27 April 2016, made before Andalia Farida, S.H., M.H., Notary in Jakarta, which such amendment has been notified and filed in the Legal Entity Administration System as stated in the Letter of Ministry of Law and Human Rights No. AHU-AH.01.03-0051354 and has been registered in the Company’s Registry No. AHU-0064071.AH.01.11.YEAR 2016 dated 24 May 2016 (“PT Internux’s Deed No. 13 dated 27 April 2016”).
Business Activities
In accordance with its articles of association, the purpose and goal of Internux is to engage in telecommunication business.
To reach that purpose and goal, Internux may conduct the following activities: a. Conduct and/or provide telecommunication network;b. Conduct and/or provide services in telecommunication which is internet service provider;
andc. Conduct and/or provide broadband wireless internet services.
Currently, Internux conducts its business activities based on the Operating License for Local Fixed Network - Packet-switched Based in Zone 4 (Banten, Jakarta, Bogor, Depok, Tangerang, Bekasi) and Operating License for Internet Access Services (Internet Service Provider).
7

Capital Structure and Shareholders
The Composition of Shareholders Before Transaction
Based on Deed of Statement of Internux’s Shareholders Resolutions No. 13 dated 20 November 2015, made before Andalia Farida, S.H., M.H., Notary in Jakarta, which has obtained approval from the Minister of Law and Human Rights based on Decree No. AHU- 0947887.AH.01.02.YEAR 2015 and has been notified and filed in the Legal Entity Administration System as stated in the Letter of Ministry of Law and Human Rights No. AHU-AH.01.03-0987594 (“PT Internux’s Deed No. 13 dated 20 November 2015”), the capital structure and shareholders of Internux are as follows:
Remarks Nominal Value Rp100,- per shares
Number of Shares Nominal Value (Rupiah)
%
Authorized Capital 68,225,881,200 6,822,588,120,000
Issued and Fully Paid-Up Capital: PT Mitra Mandiri Mantap 11,973,407,400 1,197,340,740,000 70.20 Prosper International Limited 1,671,768,800 167,176,880,000 9.80 Asia Pacific Mobile Pte Ltd 3,411,294,100 341,129,410,000 20.00
Total 17,056,470,300 1,705,647,030,000 100.00
Shares in portfolio 51,169,410,900 5,116,941,090,000
The Composition of Shareholders After Transaction
Based on PT Internux’s Deed No. 13 dated 27 April 2016, the capital structure and shareholders of Internux are as follows:
Remarks Nominal Value Rp100,- per share
Number of Shares Nominal Value (Rupiah)
%
Authorized Capital 68,225,881,200 6,822,588,120,000
Issued and Fully Paid-Up Capital: PT Mitra Mandiri Mantap 16,373,407,400 1,637,340,710,000 72.59 Prosper International Limited 1,671,768,800 167,176,880,000 7.41 Asia Pacific Mobile Pte Ltd 4,511,294,100 451,129,410,000 20.00
Total 22,556,470,300 2,255,647,030,000 100.00
Shares in portfolio 45,669,410,900 4,566,941,090,000
Note: in conjunction with the Transaction, one of the other of Internux’s shaholders, Asia Pacific Mobile Pte Ltd, also increase its share ownership in Internux by way of capital injection as much as Rp110,000,000,000 (one hundred ten billion Rupiah) or equal to 1,100,000,000 (one billion one hundred million) shares.
Management and Supervision
Based on PT Internux’s Deed dated 20 November 2015, the compositions of the Board of Commissioners and the Board of Directors of Internux are as follows:
Board of Commissioners President Commissioner : M.A Ismail Ning Commissioner : T. Bachrumsjah Hamzah Commissioner : Yukio Takebe Independent Commissioner : Bintan R Saragih, S.H Independent Commissioner : Sasmito Dirdjo
8

Board of Directors President Directors : Dicky Setiadi Moechtar Independent Directors : Indryanarum Directors : Yuhi Abe Directors : Timotius Max Sulaiman, SE
4. The Nature of Affiliation of Parties to the Transaction
MMM is the controlling shareholder of Internux, wherein the Company is the controllingshareholder of MMM. The Company and Internux have similarity in the composition of membersof the Board of Directors in which Mr. Dicky Setiadi Moechtar as one of the Company’s Board ofDirectors, he is also the President Director of Internux.
5. Consideration and Reason of Transaction
The consideration of the Company in doing this Transaction through Controlled Company is:a. To decrease financial burden as impact of the reduction in recorded loan balances;b. Potential of growth industry that is highly prospective, then it is expected to increase the
potential of yields through divident or capital gain;
6. Summary of Independent Appraisal
The Company has appointend Public Appraisal Office Firman Suryantoro Sugeng Suzy Hartomo& Rekan (KJPP FAST) as the Independent Appraisal for providing fairness opinion on theTransaction.
KJPP FAST is a Public Appraisal Office officially established based on Decree of Minister ofFinance No. 2.09.0074 dated 8 December 2009 and registered as professional services office ofcapital market supporting in Capital Market Supervisory Agency and Financial Institution withRegistration Letter No. S-865/BL/2010 dated 29 January 2010.
In the Fairness Opinion Report on the plan of issued and paid-up capital injection in Internux byMMM with Report No. 004/FO/FAST-JKT/V/16 dated 24 May 2016, KJPP FAST has provided itsopinion in the fairness of issued and paid-up capital injection plan as much as 4,400,000,000(four billion four hundred million) shares in Internux by MMM (“Fairness Opinion”) as follows:
a. Identity of the Parties
Parties to the Transaction Plan are as follows:
- Internux, a subsidiary of MMM, as the party that will issue its new shares.
- MMM, a subsidiary of the Company, as the party that will purchase the new shares isuedby Internux through conversion of MMM’s receivables into shares in Internux.
- The Company as the controlling shareholder of MMM.
b. Object / Fairness Analysis of Transaction
The object of the Transaction Plan in the Fairness Opinion is the transaction of issued andpaid-up capital injection in Internux by MMM that is controlled by the Company, by way ofconversion of MMM’s receivables in Internux.
c. Purpose and Goal of Fairness Opinion
For the execution of Transaction and in order to comply provisions as stipulated in theRegulation IX.E.1 above, the Company has appointed KJPP FAST as the independentappraisal to provide opinion on the fairness opinion of the Transaction.
9

d. Assumption and Limiting Conditions
In carrying out the analysis, KJPP FAST assumes and depends on the accuracy andcompleteness of all financial information and other information given to KJPP FAST by theCompany or generally availabale, and KJPP FAST does not perform and therefore notresponsible on the independent checks of such information. KJPP FAST also depends on theguarantee from the Company’s management that they do not know facts that cause theinformation given to us become incomplete or mislead.
KJPP FAST does not perform inspection on the fixed assets or facilities of the Company. Inaddition, KJPP FAST also does not provide opinion on the tax impact of the Transaction.Services provided by KJPP FAST to the Company in relation to Transaction is only financialevaluation and appraise on the fairness (arms-length) of the Transaction and not accounting,audit or tax services.
The work of KJPP FAST in relation to Transaction does not and cannot be interpreted in anyform, as a review or audit or implementation of certain procedures on the financialinformation. That work is also cannot be intended to reveal the weakness in internal control,failure or deviation in financial statement or breach of law. Other than that, KJPP FAST doesnot have authority and does not try to obtain other form of transactions which are availablefor the Company.
The Fairness Opinion is made based on market condition, economic condition, business ingeneral condition, and financial condition, as well as Government regulations on the date ofthe issuance of this report.
In the making of Fairness Opinion, KJPP FAST also used several other assumptions, suchas the fulfillment of all conditions and obligations of the Company and all parties involved inthe Transaction. The Transaction will be executed as described in accordance with thescheduled time period, also the accuracy of information about Transaction that has beendisclosed by the Company’s management.
In the making of Fairness Opinion, KJPP FAST is basing his analysis to the financial projection made by the Company’s management. In the making of financial projection, several assumptions are developed based on the Company’s performance on the years before and based on the Company’s management plan in the future.
The followings are main points of limiting conditions assumed by KJPP FAST based on thefinancial projection used in the review of Fairness Opinion:
1. No material changes on political condition, economic, law or regulations that will affect theactivities of the Company, industry or country or area where the Company operates.
2. No material changes on tax fare, customs, currency exchange rate, and interest rate usedin projection assumption which can materially affect the performance of the Company, inaddition to the projected.
3. No material changes on structure and main activities of the Company or to main incomesources of the Company at this moment and within the projected period.
4. No material changes on the Company’s management.
5. No significant obstacles from industrial disputes, or labor procurement or other things thatcan affect the business activities of the Company.
6. No significant changes on the market condition and prices of products and services thatare currently produced by the Compay, in addition to the projected.
Other than that, various information and relevant suggestions given by the Company’s management in relation ot the changes in every factor within the scheduled time period has also been considered.
10

7. No material changes to cost structure or other expenses of the Company, in addition tothe projected.
8. No material purchase of fixed assets, in addition to the projected.
9. No exception on the provisioning to be made by, in addition to the projected, oncontingent liabilities or arbitration over litigation against threat or vice versa, bad debtsoutstanding, unfulfilled contract or other asset.
10. No material changes on the existing agreements and provisions.
11. The achievement of the Company’s performance within the projection period that will beused entirely for the Company’s development as projected within projection period andnot used for other interests.
12. No use of funds or affiliation transaction that will significantly affect the Company’soperations.
13. The Company’s business plan runs as scheduled and projected.
14. Fairness Opinion is aimed for the interest of the Company’s management, and otherparties that directly involved, in relation to the Transaction, where this Fairness Opinionwill be used to help management in the process of disclose of information that relates tothe Transaction, and is prohibited to be used by other party, for other interest or re-printed, diseminate, quoted or referred at anytime, by any way or for whatever purposewithout prior written approval from KJPP FAST. The Fairness Opinion is not arecommendation to shareholders to perform other actions in relation to Transaction, andcannot be used in this way by shareholders.
15. In the Fairness Opinion, there are statements, appraisals, estimations and projectionsmade based on information given by the Company’s management in order to anticipatethe execution of the Company’s operations within the projection period. Such statements,appraisals, estimations or projections reflect the assumptions made by the Company’smanagement to estimate the results that will be gained within the projection period, inwhich such assumptions may happen or may not happened.
16. KJPP FAST does not responsible or guarantee every liabilities or loss that may incur asthe result of action based on the use of some of analysis and information withoutconsidering the whole content of Fairness Opinion that may cause misleading opinion onthe process which underlie the Fairness Opinion. All statements in the Fairness Opinionshould be linked as a whole with the objective of Fairness Opinion.
17. Subsequents Events after the date of Fairness Opinion may have significant impact to theappraisal of the Company’s performance within the projection period. KJPP FAST is notobligated to renew this report or to revise the analysis based on events and transactionsafter the effective date of the analysis, which is 31 December 2015.
e. Approach and Procedure of Fairness Analysis
In the making of Fairness Opinion of this Transaction, KJPP FAST has performing analysisthrough approach and procedure of Transaction appraisal from the following things:
1. Analysis on Transaction;2. Qualitative and Quantitative Analysis on Transaction;3. Analysis on the fairness of Transaction.
f. Analysis on the fairness of Transaction
11

1. Based on benefit and risk analysis, the benefit of the Transaction for the Company is toincrease the potential of yields through divident or capital gain, in a row with the prospectof Internux growth. While the risk of Transaction for the Company is the business risk ofInternux which may cause the yields obtained are not in line with expectations.
2. Based on the profit and loss analysis, the profit of Transaction for the Company is todecrease the financial burden thus increasing the value of Internux specifically or thevalue of the Company in general. While the loss of Transaction for the Company is nolonger receive fixed income of interest on the debt incurred. Similarly, the decision ofdivident distribution will depend on other shareholders.
3. Based on industry analysis, the internet user and its penetration in Indonesia within 2014showed an increase where the internet user is growing as much as 16.2 million from 71.9million into 88.1 million with penetration as much as 34.9%. In addition to that, the internetuser in Indonesia is estimated to continuously grow rapidly with growth projection for theperiod of 2012-2015 is as much as 30.18% (CAGR). This industry is also supported bythe Government’s initiative to strength the national connectivity, including thedevelopment of information, communication and technology (ICT). Thus the potential ofthis industry growth is felt pretty promissing in the future.
4. Based on the share conversion value analysis, the Transaction uses book-value based,then gives MMM additional 2.39% share ownerhsip or in total become 72.59% shareownership in Internux. While if the Transaction uses market-value based, where the fairmarket value of Internux’s share as stated in the Report of KJPP FAST No.003/SV/FAST-JKT/V/16 dated 20 May 2016, then it will gives MMM additional 2.13%share ownership or in total become 72.33% share ownership of Internux. Thus it can besaid that Transaction is benefiting the Company due to its share ownership in Internuxbecome more optimal.
5. Based on the pro forma financial statement, the liquidity of the Company after theTransaction is unchanged if compared prior to Transaction as indicated on the currentratio and quick ratio before and after the Transaction. The solvability level of the Companyafter the Transaction is also unchanged if compared to prior the Transaction as indicatedon the debt to equity ratio before and after Transaction. Similarly with the profitability ofthe Company after Transaction is also unchanged compared prior to Transaction asindicated on the level of obtained yields before and after the Transaction. Thus it can beindicated in general that the Company’s financial position after Transaction is unchanged.
6. Based on the appraisal on the financial projection, it is shown that the average ofprofitability ratio projection after Transaction is slightly decreasing but not significantcompared to average of profitability level prior to the Transaction, and besides that thereis no outlier indication. Similarly, the comparison of liquidity ratio shows that the averageof liquidity ratio projection before and after the Transaction is unchanged, and no outlierindication that relates to the liquidity projection. Furthermore, the comparison of solvabilityratio between solvability ratio projection after Transaction is also unchanged compared toaverage prior to the Transaction, and also there is no outlier indication that relates tosolvability projection. Based on outlier analysis as described, it can be concluded that theexisting financial projection is still in fairness.
7. Based on the calculation result of the present value of the incremental net cash flowbetween if the Transaction is executed and if the Transaction is not executed is notshowing negative value, with assumption the relevant discount rate in which the yields onrisk-free is 9.21%, the equity risk premium is 8.59%, beta unlevered is 0.8093, defaultspread is 2.44%, and DER industry 35.42%. This is indicating that the Transaction is notgiving negative impact to the Company.
12

g. Summary
Based on the purpose of assignment, scope, used data and information, main assumptions,limiting conditions, approach and procedure of fairness analysis, the fairness analysys of theTransaction as described above, KJPP FAST believes that the Transaction is fair.
7. Statement of the Board of Directors and the Board of Commissioners
In relation to this Transaction, the Company’s Board of Directors and Board of Commissionerstakes full responsibility on the truth of all information contained in this Disclosure of Informationand confirmed that after conduct sufficient examination on available information regardingTransaction, and as far as their knowledge and belief, there are no other important or materialinformation in relation to Transaction which have not been disclosed and therefore will causeinformation contained herein become incorrect and/or misleading.
8. Further Information
Should shareholders require further information in regards to the information herein, maycontact:
PT FIRST MEDIA Tbk BeritaSatu Plaza 4th Floor
Jl.Jend.Gatot Subroto Kav. 35-36 Jakarta 12950
Telephone: (021) 527 8811Facsimile: (021) 527 8833
Attn. : Corporate Secretary
INVESTOR DAILY, THURSDAY 26 MAY 2016 (P.7)
13

No : SB-028/CSL/OJK/V/2016 Jakarta, 26 May 2016
To
Financial Services Authority
Attn: Executive of the Securities and Exchange Commossions
Gedung Soemitro Djojohadikusumo
Jalan Lapangan Banteng Timur 2-4
Jakarta 10710
Re : Submission of Proof of Advertisement of Disclosure Information IX.E.I. of PT First Media Tbk
Dear Sir,
With reference to comply the Indonesia Capital Market and Financial Institution Supervisory Agency
(Bapepam-LK) Regulation No. IX.E.I, the enclosure of Decision of Capital Market Supervisory Agency
(Bapepam) Chairman No. Kep-412/BL/2009 dated 25 November 2009 regarding Affiliation Transaction and
Conflict of Interests of Certain Transaction (“Regulation No. IX.E.I”), we herewith convey the information
disclosure of Affiliation Transaction that has been published in newspaper Investor Daily dated 26 May 2016.
Here attached documents of summary of report independent evaluator by KJPP FAST No.:004/FO/FAST-
JKT/V/16 dated 24 May 2016 in terms of fairness opinion on the transaction.
This notice has been conveyed accordingly. Thank you for your attention.
Yours sincerely,
PT First Media Tbk
For and on behalf of the Board of Directors
(signature)
Harianda Noerlan Maria Clarissa Joesoep
Director and Corporate Secretary Director
Copy :
- The Board of Directors of Indonesia Stock Exchange
14

PUBLIC SERVICE OFFICE ASSESSOR
Firman Suryantoro
Sugeng Suzy, Hartomo & Rekan
Certified Business & Property Appraisers
Minister of Finance Decree No. 1359/KM.1/2009, No. premission 2.09.0074
To the Directors
PT FIRST MEDIA, TBK
Beritasatu Plaza 4th floor
Jl. Jend. Gatot Subroto Kav. 35-36
Jakarta 12950
----------------------------------------------------------------------------- FAIRNESS OPINION REPORT TO THE TRANSACTION
15

Halaman 2/51
Jakarta, 24 May 2016
Report No.: 004/FO/FAST-JKT/V/16
To :
Board of Directors
PT First Media Tbk
BeritaSatu Plaza Lantai 4
Jl. Jend Gatot Subroto Kav. 35-36
Jakarta 12950
Dear Sirs, ,
Subject : Fairness Opinion for Transaction
One of subsidiaries of PT First Media Tbk (“Company”), namely PT Mitra Mandiri Mantap
(“MMM”), has the intention to convert the debt of PT Internux Tbk (“Internux”), a subsidiary, to
MMM to become a share participation. In respect of this matter, the Company has appointed us,
Public Appraisal Service Office Firman Suryantoro Sugeng Suzy Hartomo & Rekan (“KJPP
FAST”), as the official appraiser based on the permit letter issued by the Ministry of Finance
No. 2.09.0074 dated 8 December 2009, and registered under the name KJPP FAST as capital
market supporting professions pursuant to the letter of Capital Market Supervisory Agency and
Financial Institution (“Bapepam-LK”) (currently “Otoritas Jasa Keuangan” or abbreviated as
“OJK”) No. No. S-865/BL/2010 dated 29 January 2010, to give an independent opinion on the
fairness of transaction as disclosed in the following, in accordance with the letter of offer that has
been approved, No. 005/SI/FAST-JKT-2/SV-FO/I/16 dated 26 January 2016.
BACKGROUND
The Company is a limited liability company having a status as a publicly-listed company,
incorporated in 1994. The Company is mainly engaged in the operation of telecommunication
service and broadcasting content provider. Currently, the main income of the Company comes
from internet access service and packet-switched based local permanent network using 4G LTE
technology, contributed by Internux, and the latest technology cinema network service contributed
by the other Company subsidiary, PT Cinemaxx Global Pasifik (“Cinemaxx”). The Company is
domiciled in Jakarta having its head office in BeritaSatu Plaza, 5th floor, Jalan Jend Gatot Subroto
Kav. 35-36, Jakarta 12950 with telephone number 021-5278811, facsimile number 021-5278833
and websie www.firstmedia.co.id.
MMM, as the Company subsidiary, is a holding company with the subsidiary Internux engaged in
in the field of internet service provision (internet service provider) and as a provider of Broadband
Wireless Access (BWA) service. As part of the restructurization plan of its business group, MMM
has the intention to convert the debt of Internux to MMM, consisting of business debt and loan, to
become share participation in Internux with a nominal value of Rp 100 per share (“Transaction”).
16

Halaman 3/51
AFFILIATION TRANSACTION
For the purpose of this Transaction, the Company, MMM and Internux have an affiliation
relationship as follow :
Company is the controlling shareholder of MMM, and MMM is the controlling shareholder of
Internux;
Dicky Setiadi Moechtar as the Director in the Company and President Director in Internux.
In view of the nature of the affiliation relationship mentioned above, the Company considers that
the implementation of Transaction involves or is related to (either directly or indirectly) MMM and
Internux that has an affiliation relationship with the Company, and therefore is an affiliation
Transaction as referred to in the Regulation of Bapepam-LK No. IX.E.1 on “Affiliation Transaction
and Conflict of Interests of Certain Transactions” contained in the Enclosure of Decision of
Chairman of Bapepam-LK No. Kep-412/BL/2009 dated 25 November 2009 (“Regulation
No. IX.E.1”).
In accordance with Regulation No. IX.E.1, the Company is required to obtain Fairness Opinion
Report to determine the fairness of the Transaction which is prepared and issued by an
independent appraiser.
PARTIES INVOLVED IN THE TRANSACTION
The parties involved in the Transaction are as follows:
Internux as the party which will issue new shares as the convesion of Internux indebtedness
to MMM.
MMM as the party which is going to receive new shares as the conversion of Internux
indebtedness to MMM.
The Company as the controlling shareholder of MMM.
PURPOSE OF ASSIGNMENT
For the purpose of the implementation of Transaction and to comply with the provisions as
provided for in the Regulation No. IX.E.1 mentioned above, the Company has appointed KJPP
FAST as an independent appraiser to give a fairness opinion (“Fairness Opinion”) of the
Transaction.
OBJECT OF THE TRANSACTION
The object of the Transaction in this Fairness Opinion is the Transaction of the conversion of
Internux indebtedness to MMM to become MMM’s share participation in Internux.
EFFECTIVE DATE (CUT-OFF DATE) OF FAIRNESS OPINION
The effective date (cut-off date) of Fairness Opinion of the Transaction was as at 31 December
2015, the parameter and financial statement used in the analysis were using data as at 31
December 2015.
The validity of Fairness Opinion, namely a period of 6 (six) months since the effective date of an
appraisal (cut-off date) in a Fairness Opinion.
17

Halaman 4/51
APPRAISER INDEPENDENCE
In preparing this Fairness Opinion, KJPP FAST has acted independently without any conflict of
interest and is not affiliated with the Company or parties affiliated to the Company.
KJPP FAST also does not have any interest or personal gain related to this assignment. This
Fairness Opinion is not made to give an advantage or to harm any party. The fee received by us
is not at all affected by the fairness generated. KJPP FAST only received fees in accordance with
the letter of offer that has been approved No. 005/SI/FAST-JKT-2/SV-FO/I/16 dated 26 January
2016.
APPRAISER’S STATEMENT
In preparing this Fairness Opinion, the calculation and analysis in giving a Fairness Opinion have
been made correctly. The Business Apparaiser is responsible for the Fairness Opinion.
SCOPE
The scope of the Fairness Opinion made in relation to the Transaction is only the preparation of a
Fairness Opinion for a Transaction that refers to the Regulation of Bapepam-LK No. VIII.C.3 on
“Guidelines for the Appraisal and Presentation of Business Appraisal Report in Capital Market”
contained in the Enclosure of Decision of Chairman of Bapepam-LK No. Kep-196/BL/2012 dated
19 April 2012 (“Regulation No. VIII.C.3”) and Indonesian Appraisal Standard Edition VI of 2015
(“SPI Edition VI-2015”).
DATA AND INFORMATION USED
In giving a Fairness Opinion for the Transaction, we have scrutinized, considered, referred to, or
implemented the procedure of the following data and information:
1. Draft of Information Disclosure to the Shareholders related to the Transaction;
2. Draft Loan Agreement (New Loan Agreement) dated 24 July 2015 and the Amendment
Agreement dated 28 September 2015 between MMM, PT Mitsui Indonesia and Internux;
3. Consolidated Financial Statement of the Company and its subsidiaries for the period of
twelve months ended 31 December 2015 and 2014 that has been audited by Public
Accountant Office Amir Abadi Jusuf, Aryanto, Mawar & Rekan (“KAP AAJ”) as contained in
its report No. R/136.AGA/dwd.3/2016 dated 17 March 2016;
4. Consolidated Financial Statement of the Company and its subsidiaries for the period of
twelve months ended 31 December 2014 and 2013 that has been audited by KAP AAJ as
contained in its report No. R/144.AGA/dwd.2/2015 dated 23 March 2015;
5. Consolidated Financial Statement of the Company and its subsidiaries for the period of
twelve months ended 31 December 2013 and 2012 that has been audited by KAP AAJ as
contained in its report No. R/110.AGA/dwd.1/2014 dated 10 March 2014;
18

Halaman 5/51
6. Consolidated Financial Statement of the Company and its subsidiaries for the period of
twelve months ended 31 December 2012 and 2011 that has been audited by KAP AAJ as
contained in its report No. R/115.AGA/grc.1/2013 dated 15 March 2013;
7. Consolidated Financial Statement of the Company and its subsidiaries for the period of
twelve months ended 31 December 2011 and 2010 that has been audited by KAP AAJ as
contained in its report No. R/079.AGA/dwd.3/2012 dated 2 March 2012;
8. Consolidated Financial Statement Company and its subsidiaries for the period of twelve
months ended 31 December 2010 and 2009 that has been audited by KAP AAJ as contained
in its report No. R/018.AGA/dwd.2/2011 dated 7 February 2011;
9. Consolidated Financial Statement Company and its subsidiaries for the period of twelve
months ended 31 December 2009 and 2008 that has been audited by KAP AAJ as contained
in its report No. R/040-S.AGA/9.1/03/10 dated 2 March 2010;
10. Financial Statement of Internux for the period of twelve months ended 31 December 2015
and 2014 that has been audited by KAP AAJ as contained in its report No.
R/217.AGA/tjn.1/2016 dated 16 March 2016;
11. Financial Statement of Internux for the period of twelve months ended 31 December 2014,
2013 and 2012 that has been audited by KAP AAJ as contained in its report
No.R/124.AGA/dwd.3/2015 dated 11 March 2015;
12. Projection of Company’s financial statement prior and after the Transaction for the period 1
January 2016 until 31 December 2020;
13. Proforma Company’s financial statement at 31 December 2015 in respect of the Transaction
that has been reviewed by KAP AAJ as contained in its report No. R/006.ARC/dwd/2016
dated 25 April 2016;
14. Current Annual Report of the Company;
15. Result of an interview with the Company management, regarding the reasons, background,
and other matters related to Transaction;
16. Other documents, originating from internal Company as well as other trusted third parties,
relevant to the assignment.
19

Halaman 6/51
LIMITING CONDITIONS
In preparing Fairness Opinions, we base our analysis on the financial projection prepared by the
Company management. In preparing financial projections, several assumptions are developed
based on the performance of the Company during the previous years and based on the Company
management plans in the future. In addition, some relevant information and suggestions given by
the Company management related to the changes of each factor within a specified period will
also be taken into consideration.
The followings are the basic limiting requirements that we assume in a financial projection used in
the scrutiny of Fairness Opinions:
1. There is no material change concerning political, economical, legal conditions or laws that will
affect the activities of the Company, industry or state or territory where the Company
operates.
2. There is no material change concerning tax tariff, customs and excise, currency exchange
rate and interest used in the project assumption that may materially affect the performace of
the Company other than that has been projected.
3. There is no material change in the structure and main activities of the Company or in the
main source of revenues of the Company at present and in the projected period.
4. There is no material change in the Company management.
5. There are no meaningful constraints coming from industrial dispute, or procurement of work
force or other matters that may affect the Company business activities.
6. There are no significant changes on the market condition and prices of products as well as
services currently provided by the Company, unless those that have been projected.
7. There are no material changes on the cost structure or other charges to the Company, unless
those that have been projected.
8. There are no material purchase of fixed assets other than those that have been projected.
9. There are no exemption on the reserve that has to be made unless those that have been
projected on the contingent obligation or litigation arbitration against threats or otherwise,
extraordinary uncollectible receivables, contracts or other assets that have not been fulfilled.
10. There are no material changes on the existing agreements and provisions.
11. The achievement of Company financial performance during the projection period will all be
utilized for the development of the Company as has been projected during the projection
period and will not be used for other interests.
12. There is no appropriation of funds or affiliation Transaction which may significantly affect the
Company operation.
13. The Company business plan works as planned and projected.
14. Fairness Opinion is addressed for the interest of the Company management, and other
parties directly related, in the relation to the Transaction, where the Fairness Opinion shall be
used to assist the management in the information disclosure process related to the
Transaction, and shall not be used by any other party, for other interests or reprinted,
20

Halaman 7/51
disseminated, cited, or referred to at any time, by means or for any purpose without a prior
written consent from us. Fairness Opinion is not a recommendation to the shareholders to
take other actions related to the Transaction, and it shall not be used in such manner by
shareholders.
15. In the Fairness Opinion there are statements, assessments, estimations and projections
made based on the information made available by the Company management for the
purpose of anticipating the implementation of Company operation during the projection
period. The statements, assessments, estimations and projections reflect the assumptions
made by the Company management to estimate the results to be obtained during the
projection period, where the assumptions may occur or may not occur.
16. KJPP FAST shall not be responsible or guarantee each obligation or loss that may incur as a
result of an action taken based on the use of a part of the analysis and information without
considering the content of Fairness Opinion in overall that may lead to a misleading concept
over the process underlying the Fairness Opinion. All statements contained in the Fairness
Opinion should be one interrelated whole with the purpose of the formulation of Fairness
Opinion.
17. Events that occur after the date of Fairness Opinion may have a significant impact to the
evaluation of Company performance during the projection period. We are not obliged to
update this report or to revise the analysis due to events and transactions that occur after the
effective date of analysis used, i.e. 31 December 2015.
BASIC ASSUMPTIONS
In conducting an analysis, we assume and rely on the accuracy and completeness of all financial
information and other information given to us by the Company or which are available in general,
and we do not make and therefore are not responsible to make an independent verification to
such information. We also rely on the warranty from the Company management that they are not
aware of the facts that may cause the information given to use to be incomplete or misleading.
We do not make an inspection on the fixed assets of Company facilities. Additionally, we also do
not give an opinion on the impact of taxation on the Transaction. Services that we provide to the
Company related to the Transaction is merely a financial evaluation and arms-length evaluation
of the Transaction and not accounting, audit or tax services.
21

Halaman 8/51
Our works which are related to the Transaction shall not constitute and shall not be interpreted in
any form, as a review or an audit or an implementation of certain procedures on financial
information. The works should neither be meant to disclose the weakness in internal control,
mistake, or irregularities in the financial statement or violation of the law. In addition, we do not
have an authority and we do not make an endeavor to obtain other forms of Transactions
available for the Company.
This Fairness Opinion is prepared based on the market condition, economic condition, general
business condition and financial condition, as well as Government regulations as at the date this
report is issued.
In preparing this Fairness Opinion, we also use a number of other assumptions, such as the
fulfillment of all conditions and obligations of Company and all parties involved in the Transaction.
Transaction will be conducted as has been explained in accordance with the specified time
period, and the accuracy of information concerning transactions disclosed by the Company
management.
EVENTS AFTER THE DATE OF APPRAISAL
1. Based on the Deed of Meeting Resolutions Statement No. 04 dated 15 April 2016 drawn up
before Andalia Farida, S.H., M.H., Notary in Jakarta, the composition of members of Board of
Commissioners and Board of Directors of the Company are as follows:
Board of Commissioners
President Commissioner : Theo L. Sambuaga
Independent Commissioner : Didik J. Rachbini
Independent Commissioner : Muladi
Independent Commissioner : Nanan Soekarna
Independent Commissioner : Ito Sumardi
Board of Directors
Presiden Director : Ali Chendra
Deputy President Director : Irwan Djaja
Independent Director : Harianda Noerlan
Director : Dicky Setiadi Moechtar
Director : Johannes Tong
Director : Edward Sanusi
Director : Maria Clarissa Fernandez Joesoep
2. Pursuant to Deed No. 13 dated 27 April 2016, drawn up before Andalia Farida, S.H., M.H.,
Notary in Jakarta, that has obtained the approval from the Minister of Law and Human Rights
No. AHU-AH.01.03-0051354, issued on 24 May 2016, the composition of Internux
shareholders is as follows :
22

Halaman 9/51
Shareholders Number of
Shares Value (Rp) Percentage
PT Mitra Mandiri Mantap 16.373.407.400 1.637.340.740.000 72,59%
Prosper International Limited 4.511.294.100 451.129.410.000 20,00%
Asia Pacific Mobile Pte. Ltd. 1.671.768.800 167.176.880.000 7,41%
Total 22.556.470.300 2.255.647.030.000 100,00%
Such event or any other event up to the date of completion of appraisal report shall not impact
materially to the result of appraisal analysis on the Transaction.
APPROACH AND PROCEDURE OF FAIRNESS ANALYSIS
In preparing a Fairness Opinion on this Transaction, we have conducted an analysis through an
approach and procedure for appraisal of Transaction of the following matters:
A. Analysis on Transaction;
B. Qualitative and quantitative analysis of Transaction;
C. Analysis on the fairness of Transaction.
23

Halaman 10/51
A. ANALYSIS ON TRANSACTION
I. Reasons of Transaction
The main considerations of Company in conducting Transaction are as follows:
Reduce financial expense as it gives the impact of reduced balance of loan
recorded.
Potentiality of most prospective industrial growth thus it is expected that it may
increase the potential return through dividends as well capital gain.
II. Analysis of Relations of Transacting Parties
a. Company
1. Brief History of the Company
The Company was established on 6 January 1994 pursuant to the notarial
deed drawn up by the notary B.R.A.Y. Mahyastoeti Notonagoro, S.H., No. 37
having a name of PT Safira Ananda. The deed of establishment has been
validated by the Minister of Justice in the decision letter No. C2-
1.446.HT.01.01.Th.95 dated 1 February 1995 and has been announced in the
Official Gazette No. 81 Supplement No. 6613 dated 8 October 1999. The
Articles of Association of the Company experienced a number of changes, last
the Company made an amendment of the deed drawn up before notary
Andalia Farida, S.H., M.H., No. 4, dated 15 April 2016 which amendment has
been notified and kept in the legal entity administration system in accordance
with the Letter of Ministry of Law and Huan Rights No. AHU-AH.01.03-
0045537 dated 3 May 2016.
The new business incubation of the Company focusing on technology, media,
and telecommunication businesses. The current Company Portofolio is mainly
related to the provision of services through broadband communication network
(“network”) (broadband communication network), which at present the
revenues are mainly generated by the subsidiary Internux. The other main
Company Portofolio is the operation of cinema business, which at present its
revenues are generated by the subsidiary Cinemaxx, where up to now already
have 14 (fourteen) cinema locations in a number of areas as follows : (i) Plaza
Semanggi, (ii) FX Sudirman, (iii) Palembang Icon, (iv) Ponorogo City Center,
(v) Lippo Plaza Manado, (vi) Lippo Mall Kuta, (vii) Sun Plaza Medan, (viii)
Orange County Cikarang, (ix) Lippo Plaza Jogja, (x) Maxxbox Lippo Village,
(xi) Mall Matahari WTC Serpong, (xii) Lippo Plaza Medan, (xiii) Metropolis
Town Square and (xiv) Lippo Plaza Cikarang.
The holding company of the Company is AcrossAsia Limited, a company
incorporated in Cayman Islands and its share ownership has been registered
in Hong Kong Stock Exchange.
The Company is domiciled in BeritaSatu Plaza Lantai 4, Jl. Jendral Gatot
Subroto Kav 35-36 Jakarta. The Company started its commercial activities on
1 March 1999.
24

Halaman 11/51
2. Capital Structure and Share Ownership of the Company
The composition of Company shareholders per 31 December 2015 is as
follows:
Table 1: Composition of Company Shareholders
Shareholders Number of shares Value (Rp) Percentage
AcrossAsia Ltd. 959.976.602 479.988.301.000 55,10%
PT Reksa Puspita Karya 588.167.378 294.083.689.000 33,76%
Masyarakat 194.023.927 97.011.963.500 11,14%
Total 1.742.167.907 871.083.953.500 100,00%
3. Management and Supervision of the Company
Per 31 December 2015, the composition of members of Board of
Commissioners and Board of Directors of the Company is as follows:
Board of Commissioners
President Commissioner : Theo Leo Sambuaga
Independent Commissioner : Didik Junaedi Rachbini
Independent Commissioner : Muladi
Independent Commissioner : Ito Sumardi DS
Independent Commissioner : Nanan Soekarna
Commissioner : Markus Permadi
Commissioner : Benny Haryanto Djie
Commissioner : Richard Setiadi WP
Board of Directors
President Director : Ali Chendra
Vice President Director : Irwan Djaja
Independent Director : Harianda Noerlan
Director : Dicky Setiadi Moechtar
Director : Johannes Tong
Director : Anthony Chandra Kartawiria
Director : Richard Kartawijaya
4. Company’s Business Activities
In terms of business activities, the Company is currently engaged in the
operation of telecommunication service and is a provider of broadcasting
content. The new business incubation of the Company focuses on technology,
media, and telecommunication businesses. At present the Company portofolio
is mainly related to the service provision through broadband communication
network which at present the other income is mainly generated by the
subsidiary, Internux. The other main Company Portofolio is the operation of
cinema business which revenues are generated by the subsidiary, Cinemaxx.
25

Halaman 12/51
Pursuant to the Decision Letter of Minister of Communication and Informatics
of the Republic of Indonesia No. 237/KEP/M.KOMINFO/07/2009 dated 27 July
2009, the Company has been determined as one of the winners in the
selection to obtain operating license for Packet Switched-based Local
Permanent Network using Radio Frequency Band 2,3 GHz for the purpose of
Wireless Broadband service in Zone 1 (northern part of Sumatra) and Zone 4
(Banten, Jakarta, Bogor, Depok, Tangerang and Bekasi). Furthermore, the
Company has obtained the operating license for Packet Switched-based Local
Permanent Network No. 420/KEP/M.KOMINFO/11/2009 dated 6 November
2009 and as amended by the Decision of Minister of Communication and
Informatics of the Republic of Indonesia No.179/KEP/M.KOMINFO/04/2012
dated 2 April 2012. By the issuance of such Operating License the license for
the network operation which was previously owned by the Company as set
forth in the Decision of Minister of Communication Number KP.227 of 2001
dated 26 September 2001 on operating license for Packet Switched-based
Local Permanent Network is revoked and declared not valid.
b. MMM
1. Brief History of MMM
MMM was established pursuant to the Deed of Establishment of the Limited
Liability Company PT Mitra Mandiri Mantap No. 03 dated 14 January 2010,
drawn up before Henny Kurnia Tjahja S.H., Notary in Jakarta Pusat. The Deed
of Establishment has obtained the validation from the Minister of Law and
Human Rights pursuant to the Decision of Minister of Law and Human Rights
No. AHU-05411.AH.01.01.Tahun 2010 dated 2 February 2010 and has been
recorded in the Company Register No. AHU-0008035.AH.01.09.Tahun 2010
dated 2 February 2010. The articles of association of MMM were amended
several times, last by the deed drawn up before Charles Hermawan, S.H.,
Notary in Tangerang, No. 102 dated 24 December 2014, where the deed has
obtained the approval from the Minister of Law and Human Rights pursuant to
the Decision of Minister of Law and Human Rights No. AHU-
13507.40.20.2014 dated 24 December 2014 and has been recorded in the
Company Register No. AHU-0135900.40.80.2014 dated 24 December 2014.
MMM is domiciled in Jl. KH. Moch. Mansyur No. 36 A, Kelurahan Duri Pulo,
Kecamatan Gambir, Jakarta Pusat.
MMM through its subsidiary i.e. Internux is the operator of Broadband
Wireless Access pursuant to the Operating License
No.243/KEP/M.KOMINFO/04/2012 dated 26 April 2012 with area coverage of
Zone 4 (Banten area, Jakarta, Bogor, Depok, Tangerang and Bekasi) and is
an operator for Internet Access Service pursuant to the Operating License for
Internet Access Service (Internet Service Provider) No 34 of 2014 with
national area coverage.
2. Capital Structure and Share Ownership of MMM
26

Halaman 13/51
The composition of shareholders of MMM per 31 December 2015 is as
follows:
Table 2: Composition of MMM Shareholders
Shareholders Number of
Shares Value (Rp) Percentage
PT First Media Tbk 2.229 2.229.000.000 69,04%
PT Cahaya Emeralda Cemerlang 500 500.000.000 15,48%
PT Inti Permata Provita 500 500.000.000 15,48%
Total ‘ 3.229 3.229.000.000 100,00%
3. Management and Supervision of MMM
Per 31 December 2015, the composition of members of Board of
Commissioners and Board of Directors of MMM are as follows :
Board of Commissioners
Commissioner : Bambang Sucahyo
Board of Directors
Director : Mas Agoes Ismail Ning
4. MMM Business Activities
Pursuant to Article 3 of MMM’s Articles of Association as set forth in the Deed
of Establishment of PT Mitra Mandiri Mantap No. 03 dated 14 January 2010,
drawn up before Henny Kurnia Tjahja S.H, Notary in Jakarta, the purpose and
intention of MMM are to engage in trading, industrial, construction, mining,
agricultural, land transportation, services and printing businesses.
In achieving the purpose and objectives mentioned above, MMM may conduct
the following business activities:
a. Conduct business activities in general trading, including export and import,
trade between the island and local trade, either for the calculation for
natural person or other legal persons based on commission or by a
mandate, acting as provider, wholesaler, supplier, distributor, agency or
representative of the companies or other legal persons, either from within
the country or overseas with the exception of travel agent.
b. Engage in the business of machinery industry, technical and mechanical
equipment, electrical equipment, electronics, car bodywork and
components of motor vehicles, office stationery, household needs,
building materials, wood working and furniture industries, paper industry,
industry of tools and instruments as well as wood processing industry and
trading of its products.
c. Engage in the business of building contractor by accepting, planning and
implementing building of houses, buildings, roads, bridges, irrigation,
aircraft runway, jetties, or acting as general contractor, fixing installations,
steel and metal construction, engage in the real estate business,
particularly sale and purchase of buildings including the title of its land,
27

Halaman 14/51
manage and lease office buildings, houses, apartments, condominiums,
shop space etc, manage parking area/building and warehouse buildings.
d. Engage in the business activities in the field of general mining including
exploration, exploitation as well as marketing of mining products permitted
by the Government.
e. Engage in the business activities in the field of agriculture, plantation,
forestry, animal husbandry, fishery, rearing pond.
f. Engage in the business activities of land transportation, either for persons
or goods, expedition and warehousing.
g. Engage in the business activities in the field of services in general, among
other things, construction service, engineering technical service,
architectural service, landscape, design and interior, technical business
operator service that includes installation / assembly, repair and
maintenance as well as installation of technical equipment, installation of
equipment for water, gas, telecommunication, electrical and mechanical
as well as relevant business fields, except legal and taxation fields.
h. Engage in the business activities of printing including binding, cartonage
and packing, design and graphic printing, document printing (publication)
and advertising, as well as relevant business activities.
c. Internux
1. Brief History of Internux
Internux was established on 11 October 2000 pursuant to the Notarial Deed of
Junus Kadir, S.H., No.16, under the Decree of the Chief Judge of Makassar
District Court dated 23 September 2000, No.
03/P.C.NOT/I/2000/PN.Makassar, appointed as the substitute of Sitske
Limowa, S.H., Notary in Makassar, and it was further contained in the Deed of
Amendment No. 106 dated 22 June 2001 drawn up before Sri Hartini Widjaja,
S.H., Notary in Makassar. Both deeds have been validated by the Minister of
Justice in the letter of decision No. C-03778.HT.01.01. Th.2001 dated 25 July
2001 and has been announced in the Official Gazettte No. 67 Supplement
No. 7211 dated 22 August 2003. The articles of association of Internux were
amended several times, last by the deed No. 13 dated 20 November 2015
drawn up before Andalia Farida, S.H., M.H., Notary in Jakarta, that has been
approved by the Minister of Law and Human Rights No. AHU-
0947887.AH.01.02.Tahun 2015, issued on 14 December 2015.
Internux is domiciled in Jl. Sultan Hasanuddin No. 19, Ujung Pandang, Kota
Makassar, South Sulawesi. Internux has a branch office in BeritaSatu Plaza
Lantai 7, Jl. Jenderal Gatot Subroto Kav. 35-36 Jakarta 12950. Internux
started its commercial operation in December 2013.
2. Capital Structure and Share Ownership of Internux
The composition of shareholders of Internux per 31 December 2015 is as
follows:
Table 3: Composition of Shareholders of Internux
28

Halaman 15/51
Shareholders Number of
Shares Value (Rp) Percentage
PT Mitra Mandiri Mantap 11.973.407.400 1.197.340.740.000 70,20%
Prosper International Limited 1.671.768.800 167.176.880.000 9,80%
Asia Pacific Mobile Pte. Ltd. 3.411.294.100 341.129.410.000 20,00%
Total 17.056.470.300 1.705.647.030.000 100,00%
3. Management and Supervision of Internux
Per 31 December 2015, the composition of members of Board of
Commissioners and Board of Directors of Internux is as follows :
Board of Commissioners
President Commissioner : Masagus Ismail Ning
Independent Commissioner : Sasmito Dirdjo
Independent Commissioner : Bintan Regen Saragih
Commissioner : Yukio Takebe
Commissioner : Teuku Bachrumsjah Hamzah
Board of Directors
President Director : Dicky Setiadi Moechtar
Independent Director : Indryanarum
Director : Yuhi Abe
Director : Timotius Max Sulaiman
4. Internux Business Activities
In accordance with the provisions of articles of association, the purpose and
objectives of Internux are to engage in the telecommunication sector. In
achieving the purpose and objectives, Internux may carry out the following
activities:
a. Operate and/or provide telecommunication network;
b. Operate and/or provide facilities/services in the telecommunication sector
i.e. internet access service (Internet Service Provider); and
c. Operate and/or provide broadband wireless internet service.
Internux currently is engaged mainly in the operation of internet access
service (Internet Service Provider) and broadband wireless access using 4G
Technology.
Pursuang to the Decision of Director General of Posts and Telecommunication
No. 305/Dirjen/2005 dated 23 November 2005, Internux has obtained a
license for Internet Access Service Operation (Internet Service Provider) with
national operation coverage where the license has been renewed based on
the decision of Minister of Communication and Informatics of the Republic of
Indonesia No. 34 of 2014 on the Operating License for Internet Access
Service (Internet Service Provider) for Internux with national operation
coverage as issued on 29 January 2014.
29

Halaman 16/51
Pursuant to the Decision Letter of Minister of Communication and Informatics
of the Republic of Indonesia No. 237/KEP/M.KOMINFO/ 07/2009 dated 27
July 2009, Internux has been determined as one of the winners in the
selection to obtain a principle license for the operation of Packet Switched
based Local Permanent Network using Radio Frequency Band 2,3 GHz for
the requirement of Wireless Broadband service in Zone 4 (Banten, Jakarta,
Bogor, Depok, Tangerang and Bekasi areas). Furthermore, Internux has
obtained a principle license for the operation Packet Switched based Local
Permanent Network No. 422/KEP/M.KOMINFO/11/2009 dated 6 November
2009 which subsequently was superseded by the Decision of Minister of
Communication and Informatics of the Republic of Indonesia
No.142/KEP/M.KOMINFO/03/2012 dated 5 March 2012. On 26 April 2012
Internux obtained a license for the Operation of Packet-Switched based Local
Permanent Network pursuant to the Decision of Minister of Comminication
and Informatics No. 243/KEP/M.KOMINFO/04/2012.
III. Transaction Benefit and Risk Analysis
The Benefit of the Transaction for the Company is as follows:
Increase the potential yield through dividends as well as capital gain along with
Internux’ growth prospect.
The Risk of the Transaction for the Company is as follows:
Business risk of Internux is there is a possibility that the return does not
commensurate with the expectation.
IV. Analysis of the Basic Requirements of the Transaction
Pursuant to Deed No. 13 dated 27 April 2016, drawn up before Andalia Farida, S.H.,
M.H., Notary in Jakarta as has been approved by the Minister of Law and Human Rights
by Letter of Decision No. AHU-AH.01.03-0051354 dated 24 May 2016, some of the
points of the said agreement are as follows :
Approving the conversion of Internux indebtedness that was provided by MMM in
the amount of Rp 440.000.000.000 based on and in accordance with New Loan
Agreement dated 24 July 2015 drawn up and signed by MMM, PT Mitsui Indonesia
and Internux, as amended by Amendment Agreement dated 28 September 2015
(“Loan Agreement”) into shares in Internux capital, and therefore it is decided to
approve the issuance of 4.400.000.000 new shares in the Internux capital to be
subscribed by MMM related to the said indebtedness conversion.
30

Halaman 17/51
Stating the receipt of the share subscription price paid by Asia Pacific Mobile Pte.
Ltd. (“APM”) in the amount of Rp 110.000.000.000, and therefore it is decided to
approve the issuance of 1.100.000.000 new shares in Internux capital to be
subscribed by APM as a result of such payment.
Approving payment of Internux loan that was provided by PT Mitsui Indonesia (for
and on behalf of APM) in the amount of Rp 110.000.000.000 based on a Loan
Agreement, and therefore it is decided to utilize the share subscription price paid by
APM in the amount of Rp 110.000.000.000 as the settlement for Internux loan to PT
Mitsui Indonesia under the Loan Agreement.
Approving that Internux will increase the subscribed and paid-up capital in Internux
from initially in the amount of Rp 1.705.647.030.000, comprising of 17.056.470.300
shares in Internux capital, each share having a nominal value of Rp 100, to Rp
2.255.647.030.000 comprising of 22.556.470.300 shares in Internux capital, each
share having a nominal value of Rp 100, by means of issuing 5.550.000.000 new
shares in Internux capital, each share having a nominal value of Rp 100 with an
aggregate nominal value of Rp 550.000.000.000 where the said new shares will be
subscribec by MMM and APM.
Prosper International Limited (“PIL”) hereby voluntarily and irrevocably waives its
right to subscribe (pre-emptive rights) in relation to the issuance of such new
shares.
After increeasing subscribed and paid-up capital, the capital structure of Internux
shall be as follows:
Table 4: Capital Structure
Capital Number of
shares Value (Rp) Value/share (Rp)
Authorized capital 68.225.881.200 6.822.588.120.000 100
Subscribed capital 22.556.470.300 2.255.647.030.000 100
Paid-up capital 22.556.470.300 2.255.647.030.000 100
Table 5: Share ownership
Shareholder Number of
shares Value (Rp) Percentage
MMM 16.373.407.400 1.637.340.740.000 72,59%
APM 4.511.294.100 451.129.410.000 20,00%
PIL 1.671.768.800 167.176.880.000 7,41%
Total 22.556.470.300 2.255.647.030.000 100,00%
Approve to amend Article 4 paragraph (1) and (2) Articles of Association of Internux
for the adjustment of a new capital structure of Internux mentioned above.
31

Halaman 18/51
B. QUALITATIVE AND QUANTITATIVE ANALYSIS OF TRANSACTION
I. Business Environment Analysis
a. Indonesian Economic Macro Analysis
There are risks that the global economic recovery will continue to weaken.
Meanwhile, the risks in global financial market arising from the potential increase of
Interest Rate of American (USA) Central Bank Policy or Fed Fund Rate (FFR), are
gradually less. USA economic recovery is still restrained in line with the
consumption which is still weak, improvement in the housing sector slowed down
and manufacture sector is still in the contraction territory. USA economic recovery
is not yet stable and it has given rise to the estimated FFR increase is shifted to
semester II 2016 with an increase which is not as high as before. Eurpoean Central
Bank (ECB) still continues the policy of quantitave easing (QE) in line with the
European economic growth and inflation which is still low. Japanese Central Bank
has also started to apply negative interest rate policy. On the other hand, Chinese
economy continues to slow down as a result of the weak manufacturing and
investment sector, along with the deleveraging process carried out by corporation
sector. In the meantime, it is estimated that the world oil price tends to decrease in
the commodity market, as a result of increased supplies and lower demands.
Indonesian economic growth in Quarter IV 2015 was recorded 5,04% (yoy), higher
than the previous quarter 4,74% (yoy) (Table 1.3). The increased economic growth
of quarter IV 2015 among others was driven by the role of government, either in
the form of government consumption and infrastructure investment, as well as the
holding of regional head elections (Pilkada). On the other hand, the private sector
role is still limited, which is reflected from the household consumption and non-
building investment which are not yet strong. Externally, export is still declining
along with the global slow global economic recovery and the continued decline of
commodity price. Economic growth is not evenly distributed throughout the
business sectors and it is more supported by construction sector related to
infrastructure and service sector.
The increased economic growth is not evenly distributed throughout the business
sectors. The increased growth is mainly supported by the construction sector
related to infrastructure project and service sector, while other business sectors,
including manufacture, the growth is not robust enough. Construction sector
performance has been growing stronger driven by the acceleration of government
infrastructure project development. In the services sector, the increase was among
others driven by government administration subsector along with the increased
government spending and financial service subsector. Meanwhile, manufacturing
sector is still slowing down, along with the tendency of weakening private
consumption and the slowing down of manufacturing export at the end of the year.
The slow down is confirmed by the development of Purchasing Manager Index
(PMI) HSBC which is still in the contraction territory. When viewed from the type of
industry, the lower performance of industry occurred mainly in the chemical
industry, related to the declining export demand. However, the signficant increase
in the performance of oil and gas refinery industry is capable to curb further
worsening performance of refinery industry.
32
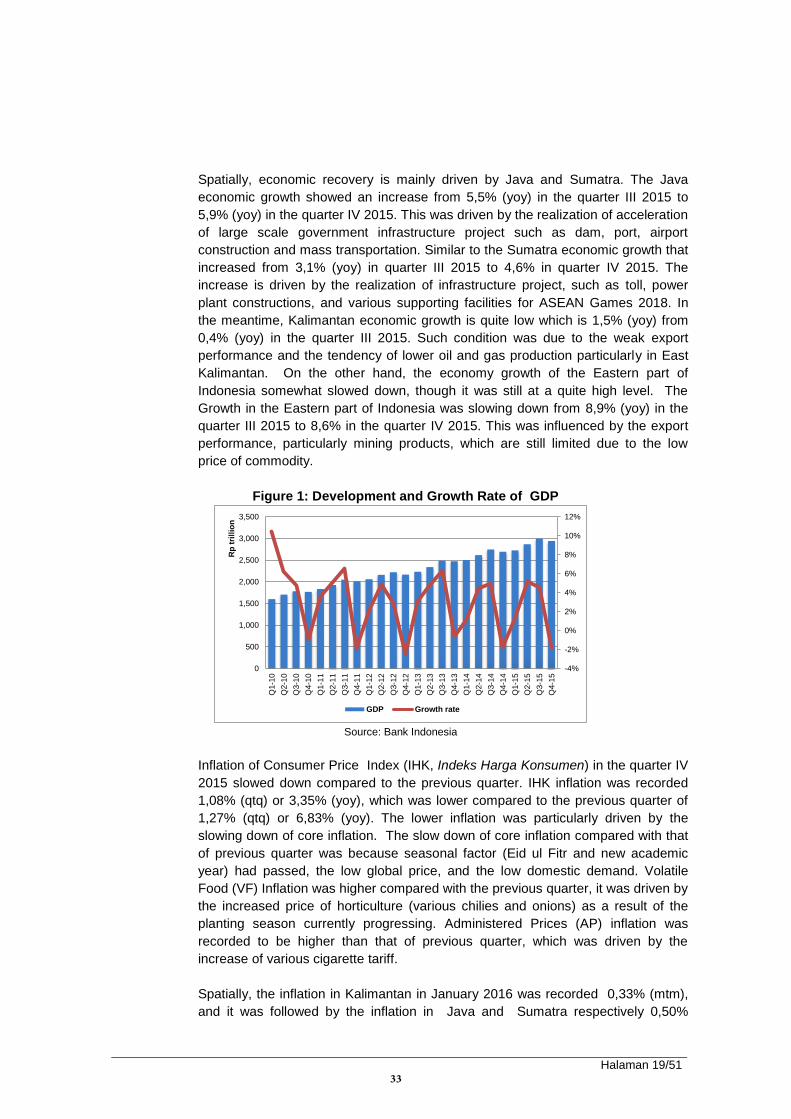
Halaman 19/51
Spatially, economic recovery is mainly driven by Java and Sumatra. The Java
economic growth showed an increase from 5,5% (yoy) in the quarter III 2015 to
5,9% (yoy) in the quarter IV 2015. This was driven by the realization of acceleration
of large scale government infrastructure project such as dam, port, airport
construction and mass transportation. Similar to the Sumatra economic growth that
increased from 3,1% (yoy) in quarter III 2015 to 4,6% in quarter IV 2015. The
increase is driven by the realization of infrastructure project, such as toll, power
plant constructions, and various supporting facilities for ASEAN Games 2018. In
the meantime, Kalimantan economic growth is quite low which is 1,5% (yoy) from
0,4% (yoy) in the quarter III 2015. Such condition was due to the weak export
performance and the tendency of lower oil and gas production particularly in East
Kalimantan. On the other hand, the economy growth of the Eastern part of
Indonesia somewhat slowed down, though it was still at a quite high level. The
Growth in the Eastern part of Indonesia was slowing down from 8,9% (yoy) in the
quarter III 2015 to 8,6% in the quarter IV 2015. This was influenced by the export
performance, particularly mining products, which are still limited due to the low
price of commodity.
Figure 1: Development and Growth Rate of GDP
Source: Bank Indonesia
Inflation of Consumer Price Index (IHK, Indeks Harga Konsumen) in the quarter IV
2015 slowed down compared to the previous quarter. IHK inflation was recorded
1,08% (qtq) or 3,35% (yoy), which was lower compared to the previous quarter of
1,27% (qtq) or 6,83% (yoy). The lower inflation was particularly driven by the
slowing down of core inflation. The slow down of core inflation compared with that
of previous quarter was because seasonal factor (Eid ul Fitr and new academic
year) had passed, the low global price, and the low domestic demand. Volatile
Food (VF) Inflation was higher compared with the previous quarter, it was driven by
the increased price of horticulture (various chilies and onions) as a result of the
planting season currently progressing. Administered Prices (AP) inflation was
recorded to be higher than that of previous quarter, which was driven by the
increase of various cigarette tariff.
Spatially, the inflation in Kalimantan in January 2016 was recorded 0,33% (mtm),
and it was followed by the inflation in Java and Sumatra respectively 0,50%
-4%
-2%
0%
2%
4%
6%
8%
10%
12%
0
500
1,000
1,500
2,000
2,500
3,000
3,500
Q1-1
0
Q2-1
0
Q3-1
0
Q4-1
0
Q1-1
1
Q2-1
1
Q3-1
1
Q4-1
1
Q1-1
2
Q2-1
2
Q3-1
2
Q4-1
2
Q1-1
3
Q2-1
3
Q3-1
3
Q4-1
3
Q1-1
4
Q2-1
4
Q3-1
4
Q4-1
4
Q1-1
5
Q2-1
5
Q3-1
5
Q4-1
5
Rp
tri
llio
n
GDP Growth rate
33

Halaman 20/51
(mtm). Inflation in Kalimantan was lower as it was supported by the price
correction that occurred in the commodity of broiler chicken and red chillies as
well as air transportation in all regions. The correction of broiler chicken price was
due to the efforts of regional government in maintaining supplies among others by
balancing market intervention. The reduced inflation pressure in Java was not as
much as in the other areas. This condition was due to the relatively high inflation in
various areas in Java among others Banten and East Java. While Jakarta that has
relatively large weighting in Java area experienced a quite low inflation so that it
could minimize the inflation driven from the other provinces in Java. Inflation in the
Eastern part of Indonesia (KTI) was the highest compared to the other areas i.e.
0,73%. Higher inflation in KTI could be prevented by deflation in some areas such
as Gorontalo, Central Sulawesi, North Sulawesi and West Sulawesi. The deflation
occurred in the commodities such as bird’s eye chillies and fresh fishes.
Figure 2: Development of IHK and Inflation
Source: Bank Indonesia
Liquidity in Interbank Money Market (PUAB, Pasar Uang Antar Bank) is somewhat
tight, however in general it is still maintained. The DF position went down from
Rp92,1 trillion in the quarter III 2015 to Rp79,2 trillion in quarter IV 2015. The
average interest rate of PUAB O/N in the quarter IV 2015 experienced an increase
from 5,85% (qtq) in the quarter III 2015 to 5,97% (qtq). Such an increase was
among others, influenced by the increased liquidity requirements in December
2015. However, in general the liquidity is still maintained, it is reflected from the
average volume of total PUAB in the quarter IV 2015 that increased to Rp12,39
trillion from Rp10,85 trillion in the previous quarter. Money market liquidity started
to recover gradually in January 2016 in line with the return of common money in
the banking system and fiscal expansion.
Credit growth in the quarter IV 2015 was recorded to be declining from 11,1% (yoy)
in the quarter III 2015 to 10,45% (yoy). The declining credit growth in the quarter IV
2015 was mainly from the declining growth of Working Capital Credit (KMK, Kredit
Modal Kerja) from 10,72% (yoy) in the quarter III 2015 to 9,04% (yoy) in the quarter
IV. Meanwhile, the growth of investment Credit (KI, Kredit Investment) increased to
14,7% (yoy) in the quarter IV 2015 from 12,95% (yoy) in the quarter III 2015.
However, the KI growth was not able to spur the increase of total credit growth. In
the business sectors, the increased growth of credit among others occurred in the
-2%
-1%
0%
1%
2%
3%
4%
5%
6%
7%
8%
9%
0
20
40
60
80
100
120
140
160
Au
g-1
1
Dec-1
1
Ap
r-12
Au
g-1
2
Dec-1
2
Ap
r-13
Au
g-1
3
Dec-1
3
Ap
r-14
Au
g-1
4
Dec-1
4
Ap
r-15
Au
g-1
5
Dec-1
5
Ind
ex
CPI Inflation rate
34

Halaman 21/51
electrical, water and gas sectors, transportation sector and business services
sector. Meanwhile the growh of Third Party Funds (DPK, Dana Pihak Ketiga) in the
quarter IV 2015 was recorded 7,3% (yoy), which was lower than the previous
quarter of 11,7% (yoy). The declined DPK was mainly due to the growh of deposit
that declined from 11,2% (yoy) in the quarter III 2015 to 5,0% (yoy) in the quarter
IV 2015. Giral growth also experienced a slowing down from 13,7% (yoy) in the
quarter III 2015 to 10,3% (yoy). Meanwhile, the growth of Rupiah saving increased
in the quarter IV 2015 to 7,3% (yoy) from the previous quarter of 4% (yoy).
However, such an increase was not able to drive the growth of DPK.
Deposit interest rate during quarter IV 2015 was relatively stable, while credit
interest declined in the quarter IV 2015. Weighted average (RRT, Rata-rata
tertimbang) of deposit interest rate in the quarter IV 2015 was stable at 7,94%
(yoy) or equal with the RRT of deposit interest rate in the quarter III 2015. Despite
it was relatively stable compared to that of previous quarter, RRT of deposit
interest rate in December (quarter IV) 2015 increased 7bps from the previous
month. The increase was influenced by the banking liquidity condition which was
relatively tightening in December 2015 particularly due to the seasonal factor of
increased liquidity requirement to meet Christmas and New Year requirements, as
well as fiscal operation which was more contractive. Meanwhile, RRT of credit
interest rate in the quarter IV 2015 declined 8 bps to 12,83% (yoy) from previously
12,91% (yoy) in the quarter III 2015. The decline was mainly from working capital
credit (KMK) and credit investment (KI) interest rates which respectively declined
12bps and 7bps to 12,46% (yoy) and 12,12% (yoy). With such development, the
spread between credit interest rate and deposit narrowed down to 489 bps from
the previous month of 495 bps.
Figure 3: Growth of BI Rate, JIBOR and DPK Interest Rate
Source : Bank Indonesia
Indonesia Balance of Payment (NPI) in the quarter IV 2015 recorded a surplus,
supported by the surplus of capital and financial transation (TMF, Transaksi Modal
dan Finansial) which was higher than the deficit of current Transaction The
increase of TMF surplus was supported by the increase of foreign capital flow,
along with the declining uncertainty in global financial market and improvement of
confidence on Indonesian economic prospect. Meanwhile, Transaction current
deficit increased to 2,4% GDP in the midst of Indonesian economic recovery
0
1
2
3
4
5
6
7
8
9
10
Au
g-1
1
Dec-1
1
Ap
r-12
Au
g-1
2
Dec-1
2
Ap
r-13
Au
g-1
3
Dec-1
3
Ap
r-14
Au
g-1
4
Dec-1
4
Ap
r-15
Au
g-1
5
Dec-1
5
(%)
BI Rate JIBOR 3-month
35

Halaman 22/51
process and the weak global demand. In overall for the year of 2015, current
Transaction deficit was recorded at 2,06% GDP, which was much lower than
3,09% GDP in 2014. On the other hand, Indonesian Trade Balance in January
2016 recorded a surplus, supported by the declining deficit of oil and gas balance
of trade. With such a development, foreign exchange reserves at the end of
January 2016 recorded at 102,1 billion US Dollar or equal to 7,5 months of import
or 7,2 months of import and government foreign debt payment. The figure was
above international adequacy standard about 3 months of import. Forward looking,
Bank Indonesia believed that NPI performance will be better with the current deficit
transation is controlled below 3% of GDP.
During quarter IV 2015, appreciation of Rupiah exchange rate continued up to
January 2016. The trend of rupiah appreciation was supported by the increased
flow of foreign capital, particularly to the market of state commercial papers. This
was driven by investor’s positive perception towards the direction of Indonesian
economy, along with the lower BI Rate, a set of Government policies to improve
investment climate, and a more effective implementation of various infrastructure
project. In addition, the reduced risk of global financial market, which is reflected
from the estimated FFR path which is more dovish, has also driven Rupiah
appreciation.
Externally, the strengthening of Rupiah during quarter IV 2015 related to the
reduced uncertainty in global financial market, in line with the result of FOMC
September 2015 which was dovish, FFR increase on 17 December 2015 that has
been anticipated by the market and the statement of the Fed after the increase of
FFR that normalization will be made gradually and limited. Domesticallly, the
improved optimism of Indonesian economic prospect, along with a series of
government policies and stabilization package of exchange rate issued by Bank
Indonesia, also boosted the strengthening of Rupiah. Such positive factors also
encouraged the increase incoming flow of foreign capital, particularly to the market
of state commercial papers, which subsequently boosted the strengthening of
Rupiah.
Figure 4: Development of Foreign Exchange Reserves and Rupiah Exchange Rate
Source: Bank Indonesia
0
2
4
6
8
10
12
14
16
0
20
40
60
80
100
120
140
Au
g-1
1
De
c-1
1
Ap
r-1
2
Au
g-1
2
Dec-1
2
Ap
r-1
3
Au
g-1
3
Dec-1
3
Ap
r-1
4
Au
g-1
4
Dec-1
4
Ap
r-1
5
Au
g-1
5
Dec-1
5
Rp
th
ou
san
d/U
S$
US
$ b
illi
on
Reserves Exchange rate
36

Halaman 23/51
Indonesian economic growth in 2016 is estimated to increase and would achieve a
range of 5,2-5,6%. It is estimated that such economic growth will be supported by
fiscal stimulus, particularly the faster realization of infrastructure project
development. Private investment is expected to increase along with the impact of
government policy package and the utilization of measurable monetary easing by
maintaining macro stability. Inflation at the end of 2016 is estimated to be around
the mid range of inflation target 4±1%. Domestically, inflation pressure from the
demand side is expected to increase compared to the previous year along with the
economic growth which is closer to its potential rate. It is expected that inflation
could still be maintained with the support of policies and coordination between
Bank Indonesia and Government. On the other hand, it is estimated that inflation
pressure from external factor is not going to be that great. This is supported by the
estimation that there will be a limited increase of international commodity prices,
which is in line with the rate of world economic improvement which is still in
progress gradually, decline of oil prices and exchange rate which is relatively
stable. In 2017, economic growth is expected to again increase. The increase is in
line with the global economic growth rate being maintained and improved
international commodity price. In term of domestic demand, infrastructure
development is expected remain to be the main contributor for economic growth in
the midst of limited global growth. In term of consumption, it is estimated that the
purchasing power of the society could be maintained with inflation rate is within the
range of the target 4±1%.
b. Industry Analysis
The provider of internet access service (internet service provider) or data
communication in principle offer internet access service to the customers starting
from individual consumers up to large corporations. The availability of large
number of customers for the players in this industry has more or less weakened
the bargaining power of the buyers. Switching cost of this product is relatively
moderate, where this cost could be in the form of cost of time which is required to
switch to another competitor or its closing cost. The reputation of the name or
brand could also play an important role in this industry. However, price is still the
main consideration of buyers, other than factors such as access speed and
connection quality. An example of differentiation which is generally available in the
market is to offer only to the consumers of internet access service or making it in a
package with telecommunication service or cable TV. Internet penetration is quite
high in a number of Asia Pacific regions such as Japan, South Korea, Australia,
Singapore and Taiwan. This was due to the fact that many users view that internet
access is something most important and many business actors deem it as
something vital. Meanwhihle in other areas such as India and China, internet
penetration is not that high. However, the market continues to grow and internet
increasingly plays an important role. Overall, the bargaining power of buyers is
moderate in this industry.
Basically, ISP is acting as an intermediary between customers and
telecommunication infrastructure that support internet technology, such as ADSL
channels, server, software etc. Some ISP have and operate physical networks
themselves. For companies such as these, the main supplier is the manufacturer of
software and hardware, such as Cisco Systems. However, there are now quite a
37

Halaman 24/51
few ISP that do not have their own networks and rather buy the access to the
required infrastructure from operators of other networks. For ISP with this type of
business model such as this, the main supplier is the operator-owner of network.
On the other hand, we seldom find ISP in such both forms that make integration
backwards, considering that the downstream business is vastly different. The
majority of operator-owner of networks have integrated forward in ISP retail market,
and compete directly with ISP that does not have their own networks. On the other
hand the manufacturer of network equipment does not fully depend on ISP market
for their income, considering that they can also operate in another market such as
corporation intranet. Network owner usually generates income from telephone
service, directory issuance, advertising, and ISP (retail as well as non-retail). In
overall the supplier’s bargaining power is quite strong in this industry.
Figure 5: Number of Internet Users in Indonesia
Source : IDC (2013)
New player will be interested in this market by the rigorous growth rate, the speedy
development of infrastructure and population density in several counries. Players
without their own insfrastructures can purchase access to telecommunication
network, to the extent local telecommunication market regulation permits to do so.
This reduced capital requirements to enter the market, despite the urge from the
customers to increase bandwidth could also mean that investment for
infrastructures will be required in the future. Price competition is most likely
occurring in this market, in view of the high number of players. New players also
need to make a differentiation from the existing players to attract customers.
Though this is not easy to sell services of commodity that could be specified with
some parameters like bandwidth and time to download/upload. While the
regulations in this market differs from one country to the other. In overall, the
pressure from new players in this industry is moderate.
0
20
40
60
80
100
120
140
160
2003 2004 2005 2006 2007 2008 2009 2010 2011 2012 2013 2014E 2015E
Juta
pe
ngg
un
a
38

Halaman 25/51
Internet has a lot of advantages in various daily activities, and up to now there is no
other alternatives that could compete with it. Internet has developed rapidly
because it could be the substitution of various products and services. This
includes traditional forms of advertisement, news, musical physical media (and
video) such as CD and DVD, physical form of goods and services shop, and
communication services such as letters and telephones. While the benefit of other
form of internet substitution is considered small along with the increasingly popular
internet among consumers and corporations. However, there are two examples of
internet substitution that could maintain its excellence, namely consumers that pay
attention to the issue of security of online financial transaction and business that
intends to advertise to the segments with population unconnected with online. In
overall, substitution of internet is considered to be weak.
The market of internet service providers in Asia Pacific is relatively fragmented,
where there is not one company dominating the market. While at the level of each
country, market consolidation is shown more. For example, in India about 10% of
existing ISP controls 90% customers, while in China Telecom and China Unicom
control with almost the same number in China market. The companies present in a
market such as this operates in a complex environment technologically, where the
presence of new technology will increase the number of competitors for high speed
internet connection. For the customers themselves, the switching cost is relatively
low, and as a matter of fact the customer behavior that switch easily is often a
problem for ISP to solve, particularly in the individual customer market. In general a
company offers various communication-based services, such as TV and telephone,
so that the success in internet access business does not determine the
sustainability of that company. In addition, rapid market growth means that the
players do not merely compete with the other competitors to obtain market share.
In overall, the level of competition in this market is considered to be moderate.
Meanwhile Indonesia with a large population and rigorous economic growth
provides a sustainable platform for intermet and data communication market. This
industry in Indonesia is estimated to still continue substantially along with the more
sophisticated consumers and their product demand. The current projection and
trend generally shows a strong growth of data service and a shift from traditional
telecommunication to the direction of HSPA+ and LTE technology application.
When referring to international standards, the penetration of internet acces as well
as immobile telephone connection in Indonesia is still low. However, there are
some tendencies towards a significant growth in this industry in Indonesia which is
supported by a number of factors, among others are:
Sustainable economic growth is expected to encourage the increase of
demand of telecommunication and data service.
The shifting to wireless telephone network, where telecommunication service
and wireless data will be increasingly popular refers to the expansion of service
coverage accompanied with the increased quality of wireless network, mobile
device price which is more affordable and additional features for prepayment
service that will facilitate mobile data access.
Additional number of telecommunication operators, so that market competition
in this sector in Indonesia will be more open and stringent in the future as a
result of reformation of Government regulation that abolish
monopolistic/duopolistic system.
39

Halaman 26/51
Figure 6: Number of Broadband Customers in Indonesia
Source: Ministry of Communication and Information Technology (2013)
In the long term, the sustainable growth of national economy is also supported by
Government initiatives through MP3EI that had been announced in 2011. One of
the three main pillars of MP3EI is the strengthening of national connectivity,
including the development of information technology and communication (TIK)
sector. In addition, the shifting of consumer preference to digital life style will be
the key factor in boosting business growth in the years to come. This condition will
result into the continued increasing demand of broadband service (including mobile
broadband). It is estimated that increased demand of data communication and
corporate internet will continue the years to come along with the national capacity
expansion to provide service to more customers of Small Medium Businesses
(UKM). Based on the estimation of a number of analysis, the number of internet
users in Indonesia will develop rapidly and penetration of broadband per capita is
estimated to increase significantly. Penetration of household broadband is
estimated will grow from 5% in 2012 to 9% in 2017, while penetration of
broadband mobile per capita will grown from 5% to 10% during the same period.
Internet advertisement is estimated to grow with CAGR of 31% in the next five
years and control almost 7% market share in 2017. The boosting factor is user
engagement which will continue to grow and the better demography profile and
mobile market growth.
In addition, Indonesia is the fourth largest country in Asia after China, India, and
Japan based on the number of internet users in June 2014, with a total of 71,2
million users. However, the penetration of internet service in Indonesia compared
with the number of population is still low i.e. 28,1% per 30 June 2014, also when
compared with the neighboring countries in Asia namely, 67%-80% in Malaysia,
Singapore and Brunei Darussalam (source: Internet World Statistic, 30 June
2014). While based on the result of national research made by Associaton of
Indonesian Internet Service Users (APJII), internet users and its penetration during
the year of 2014 showed an increase. Internet users experienced a growth of 16,2
milloin from 71,9 million to 88,1 million with penetration of 34,9% (source: statistic
APJII). APJII projected that Indonesia will grow with compounded annual growth
rate of 30,18% in the periode 2012-2015. Internet growth in the future will also be
influenced by the growth of demand of social media, application and content in
0
20,000
40,000
60,000
80,000
100,000
120,000
2011 2012 2013F 2014F
53,586
73,65390,330
112,3322,702
3,571
4,583
5,526
Jum
lah
pe
lan
ggan
Jumlah pelanggan wireless broadband Jumlah pelanggan fixed broadband
40

Halaman 27/51
online network. Instant messaging service is a popular online application, followed
by social network and games. Indonesia is the second user of Facebook after India
among the Asian countries (source: Internet World Statistic, 31 December 2012).
The level of penetration of fixed broadband usage and mobile broadband in
Indonesia compared with the number of houses is still low, respectively, about 5%
and 6% in 2013 (source: MediaRoute26, Issue 124, 20 February 2014).
Currently, the East Asia and Pacific region is still one of the contributors for the
main growth of world economy. Despite of the growth in ASEAN region was cut up
to 4,6%, Indonesia still recorded a growth of 4,8% in 2015. Reformation in the
economic field, including improvement in financial, employment policies and the
market which is more transparent and the improved accountability have assisted in
maintaining economic growth, though it was still corrected due to the pressure of
world economic growth, including the slowing down of Chinese economy and the
plummeted commodity and energy price.
Indonesian economic growth is substantially supported by household consumption
and primary commodity export. The strengthening of this household consumption
is due to the fact that the demographic structure mostly is in the productive age
and belongs to the middle class that increase income per capita. Interestingly,
58,4% of internet users in Indonesia are young generation, where 48,5% are in the
age of 15 – 34 years. Indonesian Government has indeed encouraged
infrastructure and TIK development as they understand well that Indonesian
economic development will be greatly influenced by the use of TIK.Social media
provides contribution in the economic micro empowerment in Indonesian society.
On the other hand, 95% internet access is still made through mobile devices, such
as smartphone and tablet. Thus Indonesia still needs internet network
infrastructure development through cable which is often called the truly broadband
to the houses as well as buildings. Governance, either in government as well as
private sector, which is transparant and integrated also demands e-Government
strategy application to make the data connected with a secure system thus in
facilitating the traffic of information communication a better broadband internet
service network is required. Observing this, the Company realizes that TMT
business development is wide open, though competition is increasingly tighter with
the commencement of MEA 2015 meaning that there will be new competitors from
a number of ASEAN countries that will enter internet user market in Indonesia, the
largest market in South East Asia region.
II. Advantage and Disadvantage of Transaction
The advantage of Transaction for the Company is as follows:
Reduce financial charges so as to increase Internux value in particular as well as
Company value in general.
The disadvantage of Transaction for the Company is as follows:
There is no more fixed income in the form of interest arising from debt. Similarly,
the decision for dividend distribution will depend on the other shareholders.
41

Halaman 28/51
III. Operational Performance Analysis
The Company is the holding company of a number of companies, where the structure of
subsidiaries of the Company is as follows:
Table 6: Structure of Direct Subsidiary of the Company
Subsidiary Business % Share Status
PT Link Net Tbk Cable-based nework,
multimedia service, internet and
business management
consultation
33,82 Operation
PT First Media Production Film & video recording 100,00 Operation
PT First Media News Film & video recording 100,00 Operation
PT Margayu Vatri Chantiqa Trading 100,00 Investment
PT Bintang Merah Perkasa Abadi Telecommunication 100,00 Investment
PT Graha Raya Ekatama Andalan Terpadu Trading 100,00 Investment
PT Delta Nusantara Networks Internet 100,00 Operation
PT Mitra Mandiri Mantap Trading 69,04 Investment
PT Citra Investama Andalan Terpadu Trading 100,00 Investment
PT Daya Sarana Mantap Trading 100,00 Investment
Source of Company revenues include among others TV cable, internet connection, data
communication, provider of news content (BeritaSatu), film and video recording (First
Media Production), and provision of Broadband Wireless Access (Wireless) service.
Broadband internet network service business with cable
This service business initially was operated by the Company itself in 2007 and it was
then novated to PT Link Net Tbk (“LN”) in 2011 up to now. This business service
promote the concept TriplePlay that provides an integrated service of its three products,
namely (i) high speed broadband internet service (“FastNet”), (ii) subscription television
service through cable (“HomeCable”), and (iii) digital communication service through
digital telecommunication network (“DataComm”). The TriplePlay service is operated
with Hybrid Fiber Coaxial (“HFC”) cable system with technology and is able to operate
870 MHz two-way broadband services.
“FastNet” is an internet service product using cable media and is present in Indonesia
being the first that provides internet service which is speedy and low cost with the price
of Rp 99.000,- for the speed of 384 Kbps.
With HFC network having frequency up to 870 Mhz, it is able to deliver large bandwidth
to the Indonesian people. At present FastNet service can be enjoyed in the areas of
Jabodetabek, Bandung, Surabaya and Bali.
“HomeCable” is a subscription television service provided by LN in cooperation with PT
First Media Television (“FMTV”) as the license holder for the operation of subscribed
broadcasting. HomeCable Service will be explained in the part of the Business of
Subscribed Television with Cable.
“DataComm” is high speed data communication service using optic fibre cable network
(fibrer optic) for business and other commercial purposes. By using fiber optic network
infrastructure, DataComm provides data service to the consumers/corporate consumers
42

Halaman 29/51
in various industrial and business sectors. DataComm service has been enjoyed by a
number of corporation in the golden triangle area of DKI Jakarta.
Wireless broadband internet network service business
Internux is the subsisidary of the Company that operates wireless broadband internet
network – Broadband Wireless Access (BWA) with the trademark “BOLT!Super4GLTE”.
Product BOLT! that adopts 4G LTE-TDD technology. This product answers the need of
broadband internet service of the society, namely mobile broadband internet service, so
that customers can utilize the service when they are mobile, and even when in a
journey. With the mission “Transforming Lives”, BOLT! Now provides services for
internet mobile requirements through 3.400 BTS network which is spread in the areas of
Jakarta, Bogor, Tangerang, Depok, Bekasi, and Medan.
In line with the Company commitment to be the foremost in providing TMT services,
Internux made innovations in enhacing its service quality. In 2015, BOLT! Made a
bundling with the product smartphone (“BOLT!4G Powerphone E1”), tablet (“BOLT!4G
Tablet X1”), and mobile WiFi Hydra, and strategically collaborated with Samsung
presenting Samsung Galaxy J5. In addition, BOLT! also made a breakthrough by
introducing ULTRA LTE that offer three advantages, namely ultra speed, ultra coverage
and ultra value. In presenting ULTRA LTE, BOLT! made an upgrade of its 4G LTE
network with the leading technology advanced mobile network, namely LTE Advanced
(LTE-A) which is the current 4G technology evolution which is able to provide download
speed up to 200 Mbps. This allows customers to download a file of 1 GB within only 40
seconds. BOLT! Customers can also enjoy ULTRA LTE service through Samsung Note
5 and Samsung S6 Edge+.
BOLT! has market segmentation of regular customer (individual) and corporation
customers, that subscribe BOLT! Service by pre-payment or post-payment. At the end
of 2015, the data shows that regular customers were 1,3 million customers. The number
was increase from the number of BOLT! regular customers in 2014 which were 958.508
customers. The data of corporation customers in 2015 was 4.513 customers. Similar
with regular customers, the data indicates that the number of corporation customers
increased from 1.236 customers of BOLT! Corporation customers in 2014.
Telephony business through integrated smart network
Observing the business development in Indonesia and the increasingly tighter
competition among companies engaged in telecommunication industry, the Company
enhanced its services with telephony value added service provided by PT MSH Niaga
Telecom Indonesia. Telephony value added service is a telecommunication service by
phone with affordable price. The service covers among others, telephony service
through smart network, calling card, interactive voice response technology service and
radio call for public.
The market share of Company is largely corporate customers with area of service in
Jakarta and Surabaya. The Company up to 31 December 2015 already provided
services to more or less 1.300 corporation customers in various industries such as
hospital, insurance, pharmaceutical, automotive, and mining.
Telecommunication infrastructure construction business
43

Halaman 30/51
PT Prima Wira Utama (“PWU”) is a subsidiary of the Company engaged in the business
of construction, management, operation and arrangement for telecommunication
infrastructure requirements. The telecommunication infrastructre includes but not
limited to Distributed Antenna System (DAS), strengthening of cellular telephone signal,
internet, telephony, subscription television, information and data communication, digital
signage, CCTV, EDC machine, and many others. This telecommunication infrastructure
service is provided in office buildings, residential areas (housing and apartments),
hospitals, hotels, educational centres and shopping centres. The type of
telecommunication using infrastructures are owned by the Company.
For the purpose of supporting PWU needs and demand from clients, PWU has built
telecommunication supporting service in the building (in building solution) in 59
buildings throughout Indonesia.
In addition, PWU has built wireless infrastructures (Wi-Fi) in 25 shopping centres and 3
hospitals, to deliver Wi-Fi service to tenants and visitors of the shopping centres or
hospitals. These infrastructures are presented by PWU in cooperation with LN and PT
Delta Nusantara Networks (“DNN”) hence visitors could enjoy super fast Wi-Fi service
up to 100Mbps, where this is the fastest facility provided for visitors in shopping centres
and hospitals in Indonesia.
Internet Service Provider (ISP)
DNN is a subsidiary of the Company engaged in the field of internet service provider
(ISP) by using fiber optic and radio link combined network. This subsidiary has
strengthened the Company in the service business of internet service network in the city
of Tangerang, Bandung, Belawan, Medan, Palembang, and in 2015 developed its
services to the city of Bogor. In the same year, internet service network provided by
DNN also served tenants in various shopping centre buildings belonging to Lippo Malls.
This is realized as a result of cooperation with another Company’s subsidiary, PWU.
At the end of 2015, DNN developed internet business with the trademark “FirstNet” to
serve internet users in various areas that are not easily reached by terresterial network.
DNN market share comprising of corporation customers, with 177 customers in total in
2015. That number is an increase of 16,45% from the total customers of 152 in 2014 .
Business of subscription television with cable
The Company association entity, FMTV, worked in cooperation with LN and used their
cable network to deliver television broadcasting with High Definition quality with the
highest number of broadcast channels in Indonesia, labelled “HomeCable”. Broadcast
Programs delivered by HomeCable vary, starting from programs for education, news,
music, entertainment, lifestyle, film, sport up to program for children. In addition to
presenting overseas broadcast channels HomeCable also provide 9 (nine) local
channels and it is in-house productions such as J’Go, Dangdutz, Hi TV, MIX, Reformed
21, Foodie TV, Kairos TV, Karaoke TV and BeritaSatu. The nine in-house channels
produced by PT First Media Production (“FMP”) and PT First Media News (“FMN”) as a
form of HomeCable creative channel to promote care about Indonesian content. Not
only excellent high quality broadcasting is presented, subscription television
broadcasting service named HomeCable is also equipped with an interactive application
which is a strong bargaining power to the market. The market of young generation and
44

Halaman 31/51
teenagers, nowadays utilizing television as information center, followed by media online
internet, so that interactive application is required. This HomeCable subscription
television broadcast has covered the areas of Jabodetabek, Bandung, Surabaya and
Bali.
Business of subscription television direct-to-home (satellite)
This business is run by a company which is affiliated with the Company, namely PT
Indonesia Media Televisi (“IMTV”) based on the license for subscription broadcasting
operation they have. In providing subscription television service direct-to-home labeled
“BiGTV”, IMTV used satellite technology as the main infrastructure to broadcast the
programs throughout Indonesia. By utilizing 9 transponder capacitu to bring 184
channels with the composition of 30 HD channels and 154 SD channels, television
service through BiGTV satellite could reach potential viewers throughout Indonesia.
This is indeed one of the objectives of the Company in providing access to the best
entertainment service to the society wherever they are in Indonesia. Similar to
HomeCable, BiGTV also present local broadcasting contents produced in-house. BiGTV
has positioned its brand as subscription television brand that instills love of Indonesian
people to their country Indonesia. This becomes the attention of BiGTV, in view of the
high penetration of foreign content going around in Indonesia that has caused lower
penetration of local content and the society forgets about local contents which are
actually not inferior compared to foreign content. The vision to advance the Indonesian
society through television content is the main target of the Company. Through quality
television content, BiGTV could expand the knowledge of the society with good
information which is entertaining, educating and strengthening the unity of the nation.
45

Halaman 32/51
Broadcasting content production business
In the megamedia business, media convergence is required and content has to be
made to be able to strengthen the capacity to compete. The subsidiaries, FMP and
FMN become the Company’s business units in the production and development of
broadcasting content.
FMP business unit is engaged in film production that has three production groups
namely creative, production house and post-production. In addition, FMP also produce
advertisements and develop in-house broadcast delivered by subscription television
broadcasting service of the Company: HomeCable and BiGTV.
The Company realizes the increasing need of the society for current information or
updated at any time. This has encouraged FMN subsidiary which is incorporated to
generate news product and information channeled through “BeritaSatu News Channel”
and distributed through subscription television broadcasting service of the Company. As
such, Company, through its subsidiary FMN, could provide information and news to the
public with high journalism standard, and uphold integrity, objectivity, impartiality, and
accuracy of news. Strong editorial vision and upholds the values of being objective,
sharp, comprehensive and investigative are the values that are maintained by
BeritaSatu News Channel in presenting the news to the viewers.
Cinema business
Through the subsidiary Cinemaxx, Company presents the latest technology cinema
network Big Picture, Big Sound that provide the best audio-visual experience in
watching film (Maxximum Movie Experience). With 2 types of cinema namely Ultra XD
and Cinemaxx Gold, Cinemaxx presents the enjoyment of watching wide screen movies
optimally. Ultra XD cinema provides an amazing cinematic experience with different
sensation through gigantic curved screen of 22 meters. While Cinemaxx Gold gives a
VIP experience in watching movies, where viewers may enjoy first class service from
the seats that comprise of luxurious leather sofa complete with twin-motor recliners, so
that the viewers could adjust their sitting position with just touching the button, up to
food ala stars hotel delivered directly to the seats of the viewers. Since December 2014
to the end of 2015, Cinemaxx already have and operates 14 cinemas with a total of 73
screens located in the areas: Plaza Semanggi - Jakarta, FX Sudirman – Jakarta,
Palembang Icon, Ponorogo City Center, Lippo Plaza Manado, Lippo Mall Kuta, Sun
Plaza Medan, Lippo Plaza Medan, Orange County Cikarang, Lippo Plaza Cikarang,
Lippo Plaza Jogja, Maxxbox Lippo Village, Mal Matahari WTC Serpong, Metropolis
Town Square.
IV. Financial Performance Analysis
The following is the highlights of financial data of the Company based on financial
statements for the year ending on 31 December 2015-2011 that has been audited by
KAP AAJ. The highlights of the Company are as follows:
a. Comprehensive Profit and Loss Statement
Company income for 2015 reached Rp 1.062.980 million, experienced a decline of
Rp 961.993 million or 47,5% compared to 2014 which was Rp 2.024.973 million.
46

Halaman 33/51
The decline was due to Company no longer consolidated PT Link Net Tbk. The
revenues from internet service contributed 58,1%, and cinema contributed 16,6%
from total income. The remaining 25,3% of total income was obtained through
communication device and other income.
Income in 2014 reached Rp 2.024.973 million, experiencing an increase of Rp
270.871 million or 15% compared to 2013 which was Rp 1.754.102 million. Income
from subscription television contributed 32%, internet service contributed 51% of
the total income. The remaining 17% of total income was obtained through data
communication service, advertisement media, and other income. The increase was
mainly due to the increase of the number of home subscribers as well as increase
of the income from corporations. Income from broadband internet and corporation
customer data communication in 2014 was Rp 1.198.642 million, experiencing an
increase of 27% compared to the previous year mainly due to the growing number
of customers. Income from subscription television service increased 18% in 2014,
reaching Rp 649.743 million along with the increased number of customers and
ARPU. In addition, the Company continued to sell advertisements to various
companies. Income from advertisements was Rp 77.944 million in 2014 providing a
contribution of 4% from the total income of the Company.
Income in 2013 was Rp 1.754.102 million, experiencing an increase of Rp 431.663
million or 32,64% compared to the previous year. Income from subscription cable
TV service contributed 31.5%, internet service contributed 46.4% of the total
income. The remaining 22,1% of the total income was obtained from data
communication service, advertisement media, and other income.
Income during 2012 reached Rp 1.322.439 million, experiencing an increase of Rp
280.238 million or 26,9% compared to 2011 which was Rp 1.042.201 million.
Incme from subscription cable TV service contributed 30,9%, internet service
contributed 46,7% of total income. The remaining 22,4% of total income obtained
from data communication service, advertisement media, and other income.
While income in 2011 reached Rp 1.042.201 million, experiencing an increase of
Rp 209.620 million or 25,2% compared to 2010 which was Rp 832.581 million.
Income from subscription cable TV service contributed 25,3%, internet service
contributed 46,8% of total income. The remaining 27,9% of total income was
obtained from data communication service, advertisement media, and other
income.
Company’s service expense in the form of costs and expenses paid for the
followings :
Service expenses for internet that includes internet bandwidth cost, cost for
lease, internet device, and other internet access costs.
Service expense for data communication, that includes installation cost and
device cost.
Service expense for movies.
Expense for communication device.
Cost for other services.
Table 7: Company’s Comprehensive Profit and Loss Statement (Rp Million)
47

Halaman 34/51
Service expense in 2015 was Rp 1.421.501 million, which experienced an increase
of Rp 829.585 million or 140,2% compared to service expense in 2014 that
reached Rp 591.916 million. This was due to the additional BTS lease expense for
BTS tower, expenses for obtaining customers and communication device in 2015.
Throughout 2014, the Company recorded total service expense of Rp 591.916
million, an increase of 25% compared to the previous year. Service expense
experienced an increase which was faster than the increase of income as a result
of an increase in programming expense and broadband internet expense related to
the expansion of the Company, and the effect of the weakening of Rupiah
exchange rate against foreign currency where the programming expense and
broadband internet expense were largely in US Dollar. Based on the average of
exchange rate throughout the year, Rupiah weakened 13% in 2014 compared to
the previous year. Percentage of service expense vs. income in 2014 was 29%, an
increase from 27% in 2013.
Service expense in 2013 reached Rp 474.114 million, experiencing an increase of
Rp 88.987 million or 23,11% compared to the previous year. This was due to the
additional cable television channels, additional bandwidth capacity and increase in
revenues in 2013. Generally, the ratio of total service expense charged to the
income experienced an increase to 27,0% in 2013.
Service expense in 2012 was Rp 385.127 million, experienced an increase of Rp
121.448 million or 46,1% compared to the service expense in 2011 which reached
Rp 263.679 million. This was due to mainly the additional channels for cable
television programs, additional bandwidth capacity, a quite significant additional
lease for tower for the business of broadband wireless access which was still in the
development stage, and it was in line with the increase of revenues in 2012.
Generally the ratio total service expense charged vs income experienced an
increase of 29,1% in 2012 compared to 2011 which was 25,3%.
U r a i a n 31 Des 10 31 Des 11 31 Des 12 31 Des 13 31 Des 14 31 Des 15
Pendapatan bersih 832,581 1,042,201 1,322,439 1,754,102 2,024,973 1,062,980
Beban layanan 181,458 263,679 385,127 474,114 591,916 1,421,501
Laba (rugi) kotor 651,123 778,522 937,312 1,279,988 1,433,057 -358,521
Beban operasi 542,716 744,720 929,999 1,080,007 1,019,719 1,423,635
Penjualan & pemasaran 52,741 87,628 125,379 158,068 133,698 173,936
Umum & administrasi 345,697 461,968 560,461 583,255 494,364 500,873
Depresiasi 144,278 195,124 244,159 338,684 391,657 748,826
Laba (rugi) dari operasi 108,407 33,802 7,313 199,981 413,338 -1,782,156
Pendapatan (biaya) lain-lain - bersih -42,445 1,709 10,899 -122,260 7,738,541 -161,069
Laba (rugi) sebelum pajak 65,962 35,511 18,212 77,721 8,151,879 -1,943,225
Beban pajak -24,039 -31,915 -7,742 -57,784 -265,727 429,511
Efek penyesuaian proforma 0 0 0 0 57,167 0
Laba (rugi) komprehensif 41,923 3,596 10,470 19,937 7,943,319 -1,513,714
48
Halaman 35/51
Service expense in 2011 was Rp 263.679 million, experienced an increase of Rp
82.221 million or 45,3% compared to the service expense in 2010 that reached Rp
181.458 million. This was mainly due to additional channels of cable television
programs and in line with the increased revenues in 2011. Generally the ratio of
total service expense charged against income experienced an increase of 25,3% in
2011 compared to 2010 which was 21,8%.
The Company recorded a gross loss margin of 33,7% in 2015, which was less than
the gross profit margin in 2014 which was 70,8%, this was due to an increase of
service expense. In 2014, the Company recorded gross profit margin 71%, which
was less compared to the gross profit margin in 2013 which was 73%, this was due
to an increase of service expense as explained above. Meanwhile the gross profit
margin of 73% in 2013, was an increase compared to the gross profit margin of
70,9% in 2012, this was in line with the increase of Company income. During the
previous period, the gross profit margin in 2010 which was 78,2% experienced a
growth to 74,7% in 2011.
Operating expense consists of selling expense and administration and general
expenses. Selling expense consist of mostly employee expense for sales staff,
commission and promotion expenses, while general expense and administration
expense consist of employee expense for non-sales staff, expense of reduced
account receivable and lease expense.
Operating expense increased Rp 46.747 million from Rp 628.062 million in 2014,
to Rp 674.809 million in 2015. Increase of operating increase mainly is related to
expense of salary and welfare for employees. Operating expense which was Rp
628.062 million in 2014 decreased to Rp 113.261 million compared to the previous
year.
The decline mostly was due to the reduced general and administration expenses
as a result of Company operational efficiency. General and administration
expenses in 2014 amounted to Rp 494.364 million or Rp 88.891 million less than
the previous year. Selling expense amounted to Rp 133.698 million in 2014, which
was a decline of Rp 24.370 million compared to the previous year.
49

Halaman 36/51
Operating expense in 2013 reached Rp 741.323 million, it increased Rp 55.483
million compared to 2012. The increase was related to the increase of sales
expense namely increase of marketing expense as well as administration and
general expenses such as for the development of subscription television service
and internet service and in line with the expansion cable network for 261.000
home-passed.
During 2012, operating expense increased Rp 136.244 million from Rp 549.596
million in 2011, to Rp 685.840 million in 2012. The increase of operating expense
mainly is related to the increase of sales expense namely increase in marketing
and sales activities as an effort to increase revenues, also related to administration
and general expenses, among others, business development for Cable TV and
Internet Broadband, business development for broadband wireless access and
other expenses. The increase of operating expense was in line with the expansion
of cable network in 2012 for 278.000 home-passed as well as additional networks
and increase in broadband wireless access devices to support more Transaction
volume, as part of the increase of revenues.
In the previous period operating expense increased Rp 151.158 million from Rp
398.438 million in 2010, to Rp 549.596 million in 2011. The increase of operating
expense was mainly related to the increase of administration and general
expenses, mainly related to business development of broadband wireless access
among others permit and license expenses, development expenses, administration
expenses and other costs. The increase of operating cost was in line with the
expansion of cable network in 2011 for 149.000 home-passed, enhanced activities
to support Transaction volume increase, as part of the increase of revenues.
Current year loss in 2015 was Rp 1.513.714 million which experienced a decline of
119,1% compared to current year profit in 2014 which was Rp 7.943.319 million.
The decrease of Current Year Profit in 2015 was because during 2014 there was a
profit from the sales of part of the shares owned by the subsidiary and profit from
the recorded investment in the association entity with a fair value.
Current year profit and current year comprehensive profit after proforma
adjustment in 2014 amounted to Rp 7.943.319 million, which experienced an
increase of Rp 7.923.382 million or 39.742% compared to 2013 which was Rp
19.937 million. The increase was mainly due to the significant increase of
revenues and supported by Company operational efficiency. In 2014, Company
also recorded a profit from the sale of a part of shares owned by the subsidiary
amounting to Rp 1.333.120 million, profit for the realization of Transaction value
with non-controlling party was in the amount of Rp 537.233 million and profit for the
recorded investment in association entity with a fair value was Rp 5.957.966
million.
Current Yyear profit in 2013 was Rp 19.937 million or an increase of 90,42% from
the previous year, particularly it was due to an increase in operating income.
Current year profit in 2012 was Rp 10.470 million, or experienced an increase of
about 191% compared to the current year profit of Rp 3.596 million in 2011. In the
previous periode the operating income in 2011 was Rp 33.802 million, or a decline
50

Halaman 37/51
of 68,8% compared to the operating income of Rp 108.407 million in 2010. The
decline of net operating income in 2011 was mainly due to the factors in the above
mentioned operating expense.
Comprehensive income in 2015 was Rp 1.289.061 million, experiencing a
decrease of Rp 9.233.549 million compared to the comprehensive profit in 2014
which amounted to Rp 7.944.488 million. Comprehensive profit in 2013 was Rp
19.937 million which experienced an increase of about Rp 9.467 million compared
to the previous year. Comprehensive profit in 2012 was Rp 10.470 million,
experienced an increase of about Rp 6.874 million compared to comprehensive
profit in 2011 which was Rp 3.596 million. Comprehensive profit in 2011 was Rp
3.596 million, experienced a decreasse of about Rp 38.327 million compared to
comprehensive profit in 2010 which was Rp 41.923 million.
The loss that can be attributed to the owner of holding company in 2015 was Rp
624.967 million, while to the non-controlling interest the loss was Rp 888.747
million. The profit attributed to the non-controlling interest decreased Rp 1.094.590
million or declined 531,8% compared to 2014.
Profit that can be attributed to the owner of holding company in 2014 was Rp
7.737.476 million, while to the non-controlling interest was Rp 205.843 million.
Profit attributed to the owner of holding company increased Rp 7.840.851 million,
particularly it was contributed from the profit of sale of a part of subsidiary’s share
ownership, profit from the realization of value of Transaction with non-controlling
party and recorded a profit investment in association entity with a fair value. The
profit attributed to the non-controlling interest increased Rp 82.531 million
compared to 2013, that was contributed from the increase of income of internet
service and subscription television which was significant and supported by the
operational efficiency of the Company in 2014.
The profit that can be attributed to the owner of the holding company in 2013 was a
loss of Rp 103.375 million in 2012 compared to a loss of Rp 105.162 million, while
to the non-controlling interest there was a profit of Rp 123.312 million, which
increased Rp 7.680 million or 6.6% compared to the profit of 2012 of Rp 115.632
million. This was contributed from cable business namely internet and TV cable
that recorded a significant increase of profit in 2013. The previous year the profit
that can be attributed to the owner of the holding company in 2011 was a loss of
Rp 44.208 million, while to the non-controlling interest was Rp 47.804 million.
b. Consolidated Statement of Financial Position
Asset growth
Total asset per 31 December 2015 amounted to Rp 13.711.988 million, that
experienced an increase of Rp 760.042 million or 5,9% compared to the total asset
per 31 December 2014, which was Rp 12.951.946 million. Current asset of the
Company decreased Rp 272.988 million from Rp 1.479.197 million per 31
December 2014 to Rp 1.206.209 million per 31 December 2015. Non current asset
of the Company increased Rp 1.033.030 million from Rp 11.472.749 million per 31
December 2014 to Rp 12.505.779 million per 31 December 2015.
51

Halaman 38/51
Total asset per 31 December 2014 amounted to Rp 12.951.946 million,
experienced an increase of Rp 7.710.254 million or 147% compared to total aset
per 31 December 2013, which was Rp 5.241.692 million. Current asset of the
Company increased Rp 255.616 million from Rp 1.223.581 million per 31
December 2013 to Rp 1.479.197 million per 31 December 2014. Non-current
Asset of the Company increased Rp 7.454.638 million, from Rp 4.018.111 million
per 31 December 2013 to Rp 11.472.749 million per 31 December 2014. The
increase was mainly due to the increase of balance of an investment account in
Association Entity from Investment Company in PT Link Net Tbk in the amount of
Rp 6.200.739 million.
Total asset per 31 December 2013 reached Rp 5.241.692 million, experienced an
increase of 21.7% compared to total asset per 31 December 2012 which amounted
to Rp 4.306.576 million. Current asset increased Rp 85.267 million from
Rp 1.138.314 million per 31 December 2012 to Rp 1.223.581 million per 31
December 2013. While non-current asset increased Rp 849.849 million from Rp
3.168.262 million per 31 December 2012 to Rp 4.018.111 million per 31 December
2013.
The year 2012 experienced an increase of Rp 613.129 million or 16,6% compared
to the asset per 31 December 2011, amounting to Rp 3.693.447 million. Current
asset decreased Rp 85.507 million, to Rp 1.138.314 million as at 31 December
2012 from Rp 1.223.821 million on 31 December 2011, mainly due to the a decline
in the prepaid expenses. Non-current asset increased Rp 698.636 million to Rp
3.168.262 million as at 31 December 2012 from Rp 2.469.626 million as at 31
December 2011, mainly due to additional fixed assets, increase of deferred tax
assets – net and advance payment for purchase of goods.
Total asset per 31 December 2011 amounted to Rp 3.693.447 million, experienced
an increase of Rp 2.030.202 million or 122,1% compared to asset per 31
December 2010, which was Rp 1.663.245 million. Current asset increased Rp
1.022.256 million, amounbting to Rp 1.223.821 million as at 31 December 2011
from Rp 201.565 million on 31 December 2010, mainly due to an increase of cash
and cash equivalent. Non-current asset increased Rp 1.007.946 million to Rp
2.469.626 million as at 31 December 2011 from
Rp 1.461.680 million as at 31 December 2010, mainly due to an increase of
prepaid expenses and receivables from related party.
Table 8: Consolidated Statement of Financial Position on Company Assets (Rp Million)
52
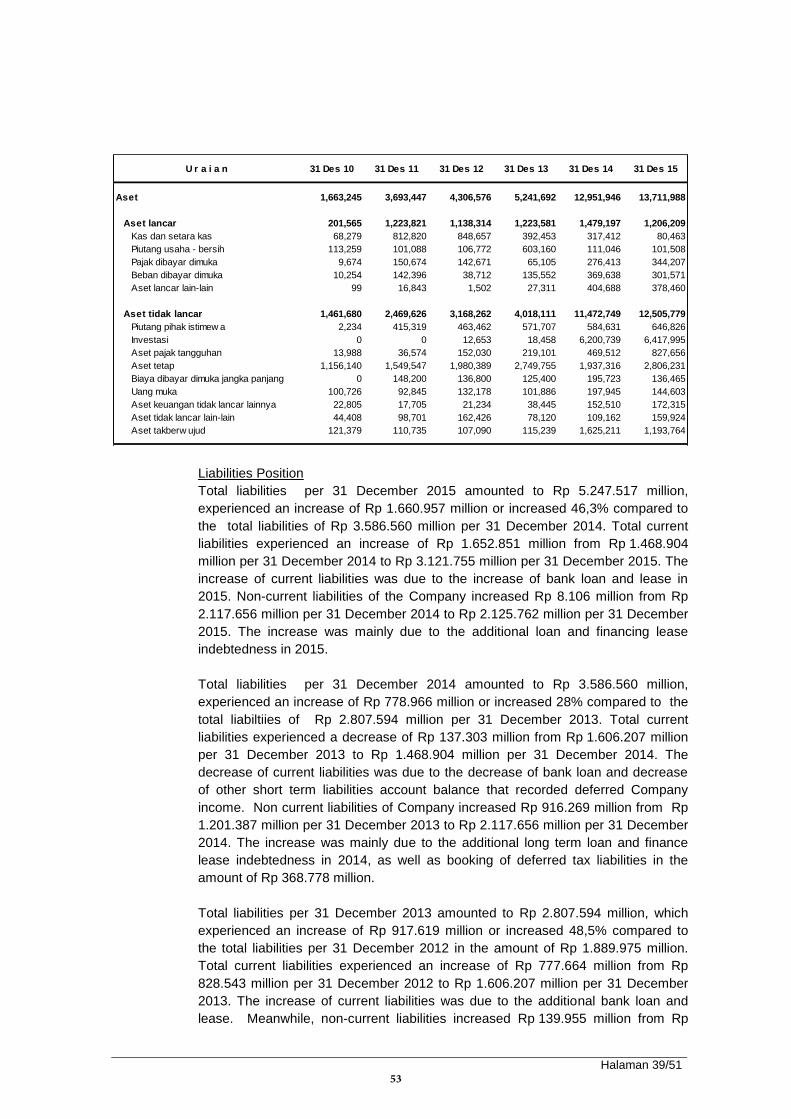
Halaman 39/51
Liabilities Position
Total liabilities per 31 December 2015 amounted to Rp 5.247.517 million,
experienced an increase of Rp 1.660.957 million or increased 46,3% compared to
the total liabilities of Rp 3.586.560 million per 31 December 2014. Total current
liabilities experienced an increase of Rp 1.652.851 million from Rp 1.468.904
million per 31 December 2014 to Rp 3.121.755 million per 31 December 2015. The
increase of current liabilities was due to the increase of bank loan and lease in
2015. Non-current liabilities of the Company increased Rp 8.106 million from Rp
2.117.656 million per 31 December 2014 to Rp 2.125.762 million per 31 December
2015. The increase was mainly due to the additional loan and financing lease
indebtedness in 2015.
Total liabilities per 31 December 2014 amounted to Rp 3.586.560 million,
experienced an increase of Rp 778.966 million or increased 28% compared to the
total liabiltiies of Rp 2.807.594 million per 31 December 2013. Total current
liabilities experienced a decrease of Rp 137.303 million from Rp 1.606.207 million
per 31 December 2013 to Rp 1.468.904 million per 31 December 2014. The
decrease of current liabilities was due to the decrease of bank loan and decrease
of other short term liabilities account balance that recorded deferred Company
income. Non current liabilities of Company increased Rp 916.269 million from Rp
1.201.387 million per 31 December 2013 to Rp 2.117.656 million per 31 December
2014. The increase was mainly due to the additional long term loan and finance
lease indebtedness in 2014, as well as booking of deferred tax liabilities in the
amount of Rp 368.778 million.
Total liabilities per 31 December 2013 amounted to Rp 2.807.594 million, which
experienced an increase of Rp 917.619 million or increased 48,5% compared to
the total liabilities per 31 December 2012 in the amount of Rp 1.889.975 million.
Total current liabilities experienced an increase of Rp 777.664 million from Rp
828.543 million per 31 December 2012 to Rp 1.606.207 million per 31 December
2013. The increase of current liabilities was due to the additional bank loan and
lease. Meanwhile, non-current liabilities increased Rp 139.955 million from Rp
U r a i a n 31 Des 10 31 Des 11 31 Des 12 31 Des 13 31 Des 14 31 Des 15
Aset 1,663,245 3,693,447 4,306,576 5,241,692 12,951,946 13,711,988
Aset lancar 201,565 1,223,821 1,138,314 1,223,581 1,479,197 1,206,209
Kas dan setara kas 68,279 812,820 848,657 392,453 317,412 80,463
Piutang usaha - bersih 113,259 101,088 106,772 603,160 111,046 101,508
Pajak dibayar dimuka 9,674 150,674 142,671 65,105 276,413 344,207
Beban dibayar dimuka 10,254 142,396 38,712 135,552 369,638 301,571
Aset lancar lain-lain 99 16,843 1,502 27,311 404,688 378,460
Aset tidak lancar 1,461,680 2,469,626 3,168,262 4,018,111 11,472,749 12,505,779
Piutang pihak istimew a 2,234 415,319 463,462 571,707 584,631 646,826
Investasi 0 0 12,653 18,458 6,200,739 6,417,995
Aset pajak tangguhan 13,988 36,574 152,030 219,101 469,512 827,656
Aset tetap 1,156,140 1,549,547 1,980,389 2,749,755 1,937,316 2,806,231
Biaya dibayar dimuka jangka panjang 0 148,200 136,800 125,400 195,723 136,465
Uang muka 100,726 92,845 132,178 101,886 197,945 144,603
Aset keuangan tidak lancar lainnya 22,805 17,705 21,234 38,445 152,510 172,315
Aset tidak lancar lain-lain 44,408 98,701 162,426 78,120 109,162 159,924
Aset takberw ujud 121,379 110,735 107,090 115,239 1,625,211 1,193,764
53

Halaman 40/51
1.061.432 million per 31 December 2012 to Rp 1.201.387 million per 31 December
2013 due to the additional loan and financing lease indebtedness in 2013.
Total liabilities in 2012 experienced an increase of Rp 602.659 million or increased
46,8% compared to total liabilities of Rp 1.287.316 million on 31 December 2011.
Total current liabilities experienced an increase of Rp 345.145 million from Rp
483.398 million in 31 December 2011 to Rp 828.543 million in 31 December 2012.
The increase of current liabilities was due to the increased business indebtedness,
additional financing lease indebtedness and the expense payable in 2012. Non-
current liabilities increased Rp 257.514 million from Rp 803.918 million per 31
December 2011 to Rp 1.061.432 million as at 31 December 2012. The increase
was mainly due to the additional loan and financing lease indebtedness in 2012.
Total liabilities per 31 December 2011 amounted to Rp 1.287.316 million,
experienced an increase of Rp 397.902 million increased 44,7% compared to total
liabilities of Rp 889.414 million as at 31 December 2010. Total current liabilities
experienced a decrease of Rp 346.115 million from Rp 829.513 million on 31
December 2010 to Rp 483.398 million on 31 December 2011. The decrease of
current liabilties was due to payment of bank loan and other liabilities in 2011. Non
current liabilities increased Rp 744.017 million from Rp 59.901 million as at 31
December 2010 to Rp 803.918 million as at 31 December 2011.
Equity growth
Total equity per 31 December 2015 amounted Rp 8.464.471 million, experienced a
decrease of Rp 900.915 million or decreased 6,6% compared to total equity per 31
December 2014 which was in the amount of Rp 9.365.386 million. The decrease
was due to the comprehensive profit value obtained by the Company in 2014.
Total equity per 31 December 2014 amounted to Rp 9.365.386 million,
experienced an increase of Rp 6.931.288 million or 285% compared to total
equity per 31 December 2013 which was in the amount of Rp 2.434.098 million.
The increase was due to comprehensive profit value obtained by the Company in
2014.
Total equity per 31 December 2013 was in the amount of Rp 2.434.098 million,
experienced an increase of Rp 17.497 million or 0,7% compared to the previous
year which was due to the comprehensive profit value obtained in 2013.
54

Halaman 41/51
Total equity per 31 December 2012 amounted to Rp 2.416.601 million,
experienced an increase of Rp 10.470 million or increased 0,4% compared to the
total equity per 31 December 2011 which was Rp 2.406.131 million. The increase
was due to the comprehensive profit value obtained in 2012.
Total equity per 31 December 2011 amounted to Rp 2.406.131 million,
experienced an increase of Rp 1.632.300 million or 210,9% compared to the total
equity per 31 December 2010, which was Rp 773.831 million. On 27 June 2011,
LN (subsidiary) issued new shares to Asia Link Dewa Pte Ltd totalling
1.032.649.384 shares in the value of Rp 1.627.703 million. On the same date,
FMTV (subsidiary) issued new shares to Asia Link Dewa Pte. Ltd. totalling 2.375
shares and to Asia Link Company Limited totalling 125 shares, with the value of
Rp 1.000 million.
Table 9: Consolidated Statement of Financial Position on Liabilities & Equity of the
Company (Rp Million)
Liquidity and source of funding
Net cash flow of the Company used for operating activities in 2015 amounted to Rp
1.006.982 million, which experienced a decrease of Rp 1.046.918 million
compared to 2014 where net cash flow obtained from operating activities was in
the amount of Rp 39.936 million. This was mainly due to a decrease in the receipt
of from customers of Rp 1.379.733 million which was offset by the increase cash
payment to suppliers in the amount of Rp 69.658 million and a decrease of
payment for business expense and others in the amount of Rp 332.281 million.
Net cash flow of the Company obtained from operating activities in 2014 was Rp
39.936 million, experienced a decrease of Rp 345.236 million compared to 2013
where net cash flow used for operating activities was Rp 385.172 million. This was
mainly due to the increase of receipt of cash from customers in the amount of Rp
490.942 million which was offset by the increase of cash payment to suppliers in
U r a i a n 31 Des 10 31 Des 11 31 Des 12 31 Des 13 31 Des 14 31 Des 15
Liabilitas dan ekuitas 1,663,245 3,693,447 4,306,576 5,241,692 12,951,946 13,711,988
Liabilitas lancar 829,513 483,398 828,543 1,606,207 1,468,904 3,121,755
Utang usaha 34,646 195,591 336,528 382,763 766,492 1,071,288
Beban akrual 60,669 60,930 110,308 133,419 273,743 470,584
Utang pajak 18,536 55,366 91,567 33,970 8,735 11,419
Bagian lancar kew ajiban imbalan kerja 356 14,678 16,971 15,848 5,823 8,469
Bagian lancar liabilitas jangka panjang 465,520 23,257 108,989 359,295 315,055 804,178
Liabilitas keuangan jangka pendek 6,481 3,448 55,396 198,011 59,644 370,773
Pinjaman jangka pendek 224,820 105,000 95,821 12,000 7,543 327,205
Liabilitas lancar lainnya 18,485 25,128 12,963 470,901 31,869 57,839
Liabilitas tidak lancar 59,901 803,918 1,061,432 1,201,387 2,117,656 2,125,762
Utang bank & lembaga keuangan 14,299 49,829 166,898 262,799 1,480,363 1,384,473
Utang sew a pembiayaan 25,069 2,960 113,507 127,898 212,375 321,458
Utang obligasi 0 722,310 729,573 736,829 0 0
Liabilitas keuangan jangka panjang 589 0 7,994 8,284 26,291 8,434
Kew ajiban imbalan kerja 19,944 28,819 43,460 65,577 29,849 42,619
Liabilitas pajak tangguhan 0 0 0 0 368,778 368,778
Ekuitas 773,831 2,406,131 2,416,601 2,434,098 9,365,386 8,464,471
Ekuitas atribusi ke pemilik entitas induk 773,831 1,758,452 1,653,290 1,547,475 8,257,700 7,749,782
Kepentingan non pengendali 0 647,679 763,311 886,623 1,107,686 714,689
55

Halaman 42/51
the amount of Rp 591.325 million and an increase of payment for business
expense and others in the amount of Rp 98.488 million.
Net cash flow obtained from operating activities in 2013 was Rp 385.172 million,
experienced a decrease of Rp 51.262 million compared to 2012. This was mainly
due to the increase of payment to suppliers and business expense.
Net cash flow obtained from operating activities in 2012 was Rp 436.434 million,
experienced an increase of Rp 442.895 million compared to 2011 where net cash
flow used for operating activities was Rp 6.461 million. This was mainly due to the
increase of cash receipt from customers in the amount of Rp 223.000 million and a
decrease of cash flow from payment for the license of broadband wireless access
in the amount of Rp 211.810 million.
Net cash flow used for operating activities in 2011 was Rp 6.461 million,
experienced a decrease of Rp 172.242 million compared to 2010 where net cash
flow obtained from operating activities was in the amount of r Rp 165.781 million.
Net cash used for investment activities reached Rp 305.764 million in 2015,
experienced a decrease of Rp 477.196 million or 278% from net cash used for
investment activities which amounted to Rp 171.432 million in 2014.
Net cash obtained from investment activities reached Rp 171.432 million in 2014,
experienced an increase of Rp 1.221.317 million or 116% from net cash used for
investment activities in the amount of Rp 1.049.885 million in 2013. In 2014, the
Company still made an Investment and capital spending for increasing quality,
network expansion and equipment related to the product and service development,
among others content of subcription television, content production etc. The largest
cash expenses in investment activities in 2014 were for fixed asset acquisition in
the amount of Rp 1.147.944 million.
Net cash used for Investment activities reached Rp. 1.049.885 million in 2013,
experienced an increase of 72,4% from 2012 which was due to capital spending for
quality enhancement, network expansion and equipment related to product and
service development. The largest cash expenses in investment activities in 2013
were for fixed asset acquisition in the amount of Rp 1.333.184 million.
Net cash used for Investment activities reached Rp 609.026 million in 2012,
experienced a decrease of Rp 107.670 million or 15,0% from Rp 716.696 million in
2011. In 2012, the Company still made an Investment and capital spending for
quality enhancement, network expansion and equipment related to new product
and service development, among others business of broadband wireless access,
TV content, TV production etc. The largest cash expenses in investment activities
in 2012 were fixed asset acquisition in the amount of Rp 734.288 million.
Net cash used in investment activities reached Rp 716.696 million in 2011,
experienced a significant increase of Rp 538.683 million or 302,6% from Rp
178.013 million in 2010. This was due to the Company in 2011 making an
investment and capital spending for quality enhancement, network expansion and
equipment related to new product and service development, among others
56

Halaman 43/51
services of broadband wireless access, TV content, TV production etc. The
largest cash expenses in Investment activities in 2011 were fixed asset acquisition
in the amount of Rp 610.603 million.
In 2015, net cash flow was obtained from financing activities in the amount of Rp
1.084.418 million, experienced an increase of Rp 1.185.969 million or 1167%
compared to 2014.
In 2014, net cash flow used for financing activities amounted to Rp 101.551 million,
experienced a decrease of Rp 309.861 million or 149% compared to 2013.
Net cash flow from financing activities in the amount of Rp 208.310 million in 2013
experienced a decrease of Rp 119 million or 0,06% from 2012. In 2012, net cash
flow obtained from financing activities amounted Rp 208.429 million, experienced a
significant decrease in the amount of Rp 1.259.269 million or 85,8% compared to
2011, at the time the Company received funds from Asia Link Dewa Pte. Ltd. and
Asia Link Company Limited for the issuance of LN and FMTV (subsidiaries) shares
in the amount of Rp 1.628.703 million and issuance of bonds to Asia Link Dewa
Pte. Ltd. in the amount of Rp 722.310 million at the end of June 2011.
In 2011, net cash flow for funding activities reached Rp 1.467.698 million,
experienced an increase of Rp 1.418.906 million or 2.908,1% compared to 2010.
c. Financial ratios
Liquidity ratio
One way to calculate the liquidity is based on current ratio, namely the comparison
berween current assets and current liabilities that reflect the ability of the Company
in meeting its short-term liabilities. The average current ratio of the Company
during the period 31 December 2010-2015 is 1,05 times.
Solvability ratio (leverage ratio)
Solvability shows the ability of Companies to meet its entire liabilities, which is
measured using two approaches, namely through a comparison between total
liabilities and total assets and through a comparison between total liabilities and
total own capital (equity). During the periode 31 December 2010-2015 the average
ratio of total liabilities against total assets is 0,77 time. While in the same period,
the average ratio of total liabilities against total equity is 0,42 time.
57
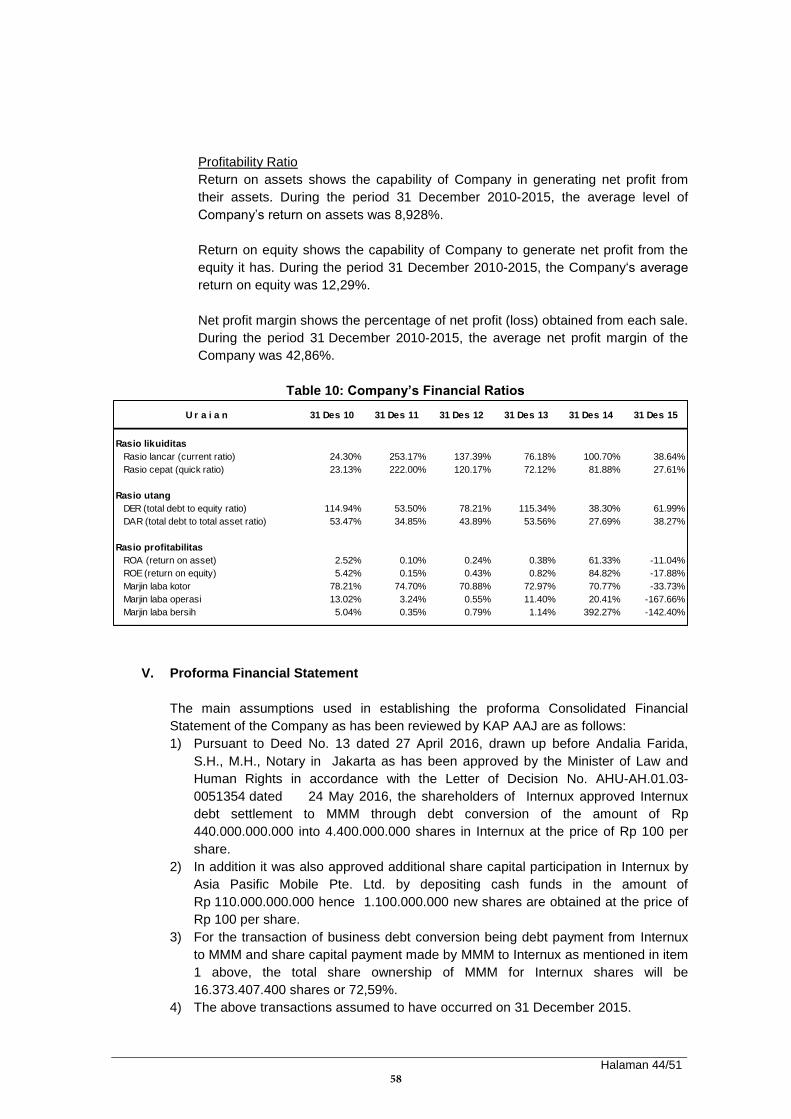
Halaman 44/51
Profitability Ratio
Return on assets shows the capability of Company in generating net profit from
their assets. During the period 31 December 2010-2015, the average level of
Company’s return on assets was 8,928%.
Return on equity shows the capability of Company to generate net profit from the
equity it has. During the period 31 December 2010-2015, the Company‘s average
return on equity was 12,29%.
Net profit margin shows the percentage of net profit (loss) obtained from each sale.
During the period 31 December 2010-2015, the average net profit margin of the
Company was 42,86%.
Table 10: Company’s Financial Ratios
V. Proforma Financial Statement
The main assumptions used in establishing the proforma Consolidated Financial
Statement of the Company as has been reviewed by KAP AAJ are as follows:
1) Pursuant to Deed No. 13 dated 27 April 2016, drawn up before Andalia Farida,
S.H., M.H., Notary in Jakarta as has been approved by the Minister of Law and
Human Rights in accordance with the Letter of Decision No. AHU-AH.01.03-
0051354 dated 24 May 2016, the shareholders of Internux approved Internux
debt settlement to MMM through debt conversion of the amount of Rp
440.000.000.000 into 4.400.000.000 shares in Internux at the price of Rp 100 per
share.
2) In addition it was also approved additional share capital participation in Internux by
Asia Pasific Mobile Pte. Ltd. by depositing cash funds in the amount of
Rp 110.000.000.000 hence 1.100.000.000 new shares are obtained at the price of
Rp 100 per share.
3) For the transaction of business debt conversion being debt payment from Internux
to MMM and share capital payment made by MMM to Internux as mentioned in item
1 above, the total share ownership of MMM for Internux shares will be
16.373.407.400 shares or 72,59%.
4) The above transactions assumed to have occurred on 31 December 2015.
U r a i a n 31 Des 10 31 Des 11 31 Des 12 31 Des 13 31 Des 14 31 Des 15
Rasio likuiditas
Rasio lancar (current ratio) 24.30% 253.17% 137.39% 76.18% 100.70% 38.64%
Rasio cepat (quick ratio) 23.13% 222.00% 120.17% 72.12% 81.88% 27.61%
Rasio utang
DER (total debt to equity ratio) 114.94% 53.50% 78.21% 115.34% 38.30% 61.99%
DAR (total debt to total asset ratio) 53.47% 34.85% 43.89% 53.56% 27.69% 38.27%
Rasio profitabilitas
ROA (return on asset) 2.52% 0.10% 0.24% 0.38% 61.33% -11.04%
ROE (return on equity) 5.42% 0.15% 0.43% 0.82% 84.82% -17.88%
Marjin laba kotor 78.21% 74.70% 70.88% 72.97% 70.77% -33.73%
Marjin laba operasi 13.02% 3.24% 0.55% 11.40% 20.41% -167.66%
Marjin laba bersih 5.04% 0.35% 0.79% 1.14% 392.27% -142.40%
58
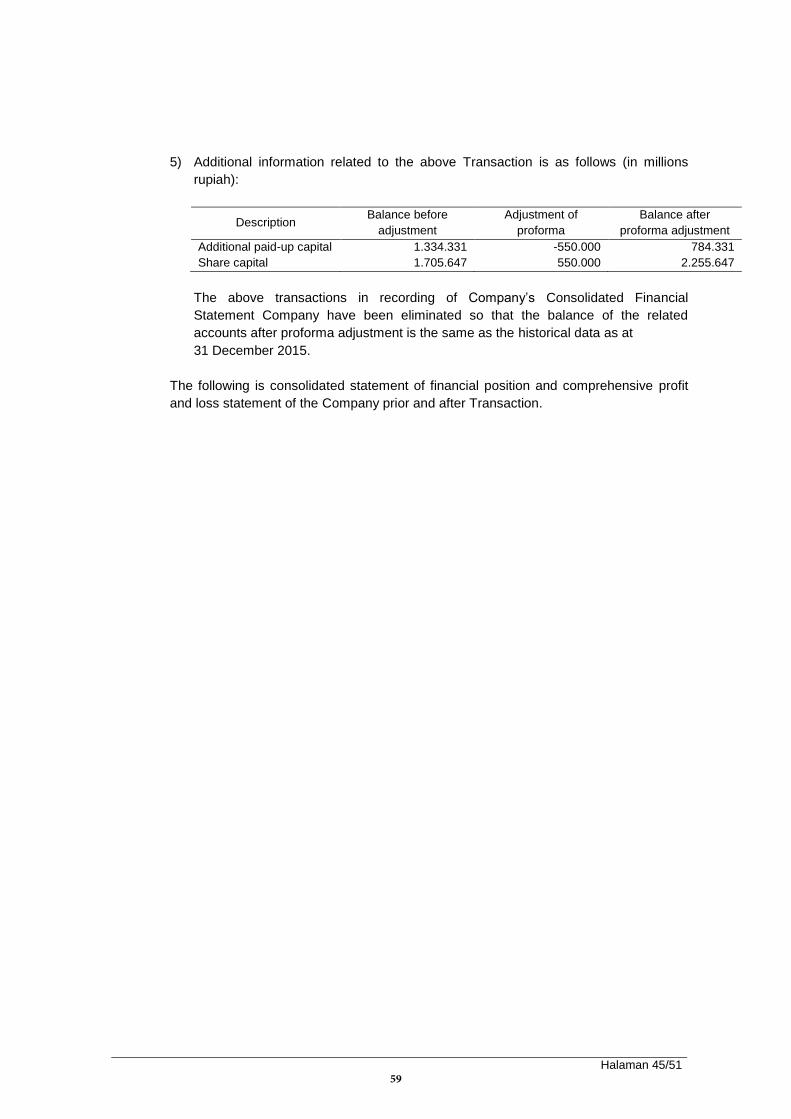
Halaman 45/51
5) Additional information related to the above Transaction is as follows (in millions
rupiah):
Description Balance before
adjustment
Adjustment of
proforma
Balance after
proforma adjustment
Additional paid-up capital 1.334.331 -550.000 784.331
Share capital 1.705.647 550.000 2.255.647
The above transactions in recording of Company’s Consolidated Financial
Statement Company have been eliminated so that the balance of the related
accounts after proforma adjustment is the same as the historical data as at
31 December 2015.
The following is consolidated statement of financial position and comprehensive profit
and loss statement of the Company prior and after Transaction.
59

Halaman 46/51
Table 11: Proforma Financial Position Statement (Rp Million, Except %)
Based on the above proforma financial statement, the liquidity of Company after the
Transaction did not experience any change compared to before the Transaction as
indicated from current ratio and quick ratio before and after the Transaction. Company
solvability after Transaction also did not change compared to before the Transaction as
indicated from the debt ratio to equity before and after Transaction. Similarly with
Company profitability after Transaction also did not experience any change compared to
prior theTransaction as indicated from the return generated before and after the
Transaction. Hence it can be indicated that generally the Company financial position
after the Transaction remains the same.
31 Desember 2015
Sebelum Setelah Selisih Selisih
Transaksi Transaksi nilai %
Aset 13,711,988 13,711,988 0 0.00%
Aset lancar 1,206,209 1,206,209 0 0.00%
Kas dan setara kas 80,463 80,463 0 0.00%
Piutang usaha - bersih 101,508 101,508 0 0.00%
Pajak dibayar dimuka 344,207 344,207 0 0.00%
Beban dibayar dimuka 301,571 301,571 0 0.00%
Aset lancar lain-lain 378,460 378,460 0 0.00%
Aset tidak lancar 12,505,779 12,505,779 0 0.00%
Piutang pihak istimew a 646,826 646,826 0 0.00%
Investasi 6,417,995 6,417,995 0 0.00%
Aset pajak tangguhan 827,656 827,656 0 0.00%
Aset tetap 2,806,231 2,806,231 0 0.00%
Biaya dibayar dimuka jangka panjang 136,465 136,465 0 0.00%
Uang muka 144,603 144,603 0 0.00%
Aset keuangan tidak lancar lainnya 172,315 172,315 0 0.00%
Aset tidak lancar lain-lain 159,924 159,924 0 0.00%
Aset takberw ujud 1,193,764 1,193,764 0 0.00%
Liabilitas dan ekuitas 13,711,988 13,711,988 0 0.00%
Liabilitas lancar 3,121,755 3,121,755 0 0.00%
Utang usaha 1,071,288 1,071,288 0 0.00%
Beban akrual 470,584 470,584 0 0.00%
Utang pajak 11,419 11,419 0 0.00%
Bagian lancar kew ajiban imbalan kerja 8,469 8,469 0 0.00%
Bagian lancar liabilitas jangka panjang 804,178 804,178 0 0.00%
Liabilitas keuangan jangka pendek 370,773 370,773 0 0.00%
Pinjaman jangka pendek 327,205 327,205 0 0.00%
Liabilitas lancar lainnya 57,839 57,839 0 0.00%
Liabilitas tidak lancar 2,125,762 2,125,762 0 0.00%
Utang pihak berelasi non-usaha 0 0 0 0.00%
Utang bank & lembaga keuangan 1,384,473 1,384,473 0 0.00%
Utang sew a pembiayaan 321,458 321,458 0 0.00%
Liabilitas keuangan jangka panjang 8,434 8,434 0 0.00%
Kew ajiban imbalan kerja 42,619 42,619 0 0.00%
Liabilitas pajak tangguhan 368,778 368,778 0 0.00%
Ekuitas 8,464,471 8,464,471 0 0.00%
Ekuitas atribusi ke pemilik entitas induk 7,749,782 7,749,782 0 0.00%
Kepentingan non pengendali 714,689 714,689 0 0.00%
U r a i a n
60

Halaman 47/51
Table 12: Proforma Financial Ratio
VI. Appraisal on Management Financial Projection
Company Financial projection before and after Transaction prepared by Company
Management, in principle has the same assumptions, except in the assumption of non-
controlling interest as a result of increased share ownership in Internux.
In appraising the projection fairness, outlier analysis could be made on the average
historical financial ratios, projections before the Transaction, and projection after the
Transaction, as follows :
Table 13: Comparison of Projection and Historical Financial Ratios
Based on the comparison of profitability ratios, it is shown that the average profitability
ratio projection after Transaction slightly declined however it was not significant
compared to the average profitability level prior to Transaction, besides there was an
indication of outlier. Similar to the comparison of liquidity ratio, it was shown that the
average liquidity ratio projection before and after the Transaction remains the same and
there is no indication of outlier related to liquidity projection. Hereinafter the comparison
31 Desember 2015
Sebelum Setelah Selisih Selisih
Transaksi Transaksi nilai %
Rasio likuiditas
Rasio lancar (current ratio) 38.64% 38.64% 0.00% 0.00%
Rasio cepat (quick ratio) 27.61% 27.61% 0.00% 0.00%
Rasio utang
DER (total debt to equity ratio) 61.99% 61.99% 0.00% 0.00%
DAR (total debt to total asset ratio) 38.27% 38.27% 0.00% 0.00%
Rasio profitabilitas
ROA (return on asset) -11.04% -11.04% 0.00% 0.00%
ROE (return on equity) -17.88% -17.88% 0.00% 0.00%
Marjin laba kotor -33.73% -33.73% 0.00% 0.00%
Marjin laba operasi -167.66% -167.66% 0.00% 0.00%
Marjin laba bersih -142.40% -142.40% 0.00% 0.00%
U r a i a n
Rata-rata Outlier
Historis Sebelum Setelah Batas bawah IQR Batas atas
Transaksi Transaksi
Rasio likuiditas
Rasio lancar (current ratio) 105.06% 220.68% 220.68% 76.16% 57.81% 307.39%
Rasio cepat (quick ratio) 91.15% 220.68% 220.68% 58.77% 64.76% 317.82%
Rasio utang
DER (total debt to equity ratio) 77.05% 88.97% 88.97% 74.07% 5.96% 97.92%
DAR (total debt to total asset ratio) 41.96% 46.16% 46.16% 40.90% 2.10% 49.32%
Rasio profitabilitas
ROA (return on asset) 8.92% 2.00% 1.98% -3.21% 3.47% 10.67%
ROE (return on equity) 12.29% 2.45% 2.40% -5.00% 4.95% 14.79%
Marjin laba kotor 55.63% 50.99% 50.99% 47.52% 2.32% 56.79%
Marjin laba operasi -19.84% 4.07% 4.07% -25.82% 11.96% 22.00%
Marjin laba bersih 42.86% 8.61% 8.41% -17.33% 17.22% 51.57%
U r a i a n
61

Halaman 48/51
solvability ratio between the solvability ratio projection after Transaction compared to
the average prior to Transaction remains the same, and there was no indication of
outlier either related to solvability projection. Based on outlier analysis as described, it
can be concluded that the current financial projection is still reasonable.
VII. Incremental Analysis
Based on the financial statement projection of the Company (prior and after
Transaction) during the period 1 January 2016-31 December 2020, an incremental
analysis was made to see the impact of net cash flow of the Company if the Transaction
is carried out compared to if the Transaction is not carried out. The assumption of
equity capital cost used as a relevant discount rate, where risk-free return 9,21% (return
of SUN per 31 December 2015 with maturity of 30 years, source: Indonesian Bond
Pricing Agency), equity risk premium 8,59% (source: study of Aswath Damodaran,
January 2016), beta unlevered 0,8093 (source: study of Aswath Damodaran, January
2016), default spread 2,44% (source: study of Aswath Damodaran, January 2016), and
DER industry 35,42% (source : study of Aswath Damodaran, January 2016).
The result of calculation of current value from incremental net cash flow of the Company
between if the Transaction is carried out and if the Transaction is not carried out, did
not show a negative value. This indicates the Transaction did not give a negative impact
to the Company.
Table 14: Incrementatl Net Cash Flow (Rp Million)
31 Des 16 31 Des 17 31 Des 18 31 Des 19 31 Des 20
(12 bulan) (12 bulan) (12 bulan) (12 bulan) (12 bulan)
Arus kas bersih (sebelum Transaksi)
Arus kas bersih eksplisit 1,463,448 -325,545 -224,587 139,915 693,101
Arus kas bersih implisit 4,327,423
Total arus kas bersih 1,463,448 -325,545 -224,587 139,915 5,020,524
Faktor diskonto 0.8653 0.7487 0.6479 0.5606 0.4197
PV arus kas bersih 1,266,304 -243,743 -145,501 78,435 2,107,239
Total PV arus kas bersih @ 31 Des 2015 3,062,733
Arus kas bersih (setelah Transaksi)
Arus kas bersih eksplisit 1,463,448 -325,545 -224,587 139,915 693,101
Arus kas bersih implisit 4,327,423
Total arus kas bersih 1,463,448 -325,545 -224,587 139,915 5,020,524
Faktor diskonto 0.8653 0.7487 0.6479 0.5606 0.4197
PV arus kas bersih 1,266,304 -243,743 -145,501 78,435 2,107,239
Total PV arus kas bersih @ 31 Des 2015 3,062,733
PV arus kas inkrimental 0
U r a i a n
62

Halaman 49/51
C. ANALYSIS ON FAIRNESS OF TRANSACTION
1) Based on the benefit-risk analysis, the benefit of Transaction for the Company is to
increase the potential return through dividend or capital gain in line with Internux growth
prospect. Meanwhile the risk of the Transaction for the Company is business risk of
Internux which possibly may cause the return obtained is not according to the
expectation.
2) Based on the benefit loss analysis, the benefit of the Transaction for the Company is to
reduce the financial expense so that it would increase the value of Internux in particular
and the value of the Company in general. Meanwhile, the loss of Transaction for the
Company is that there is no more fixed income in the form of interest generated from the
debt. The resolution on the distribution of dividends will also depend on the other
shareholders.
3) Based on the industrial analysis, the user of internet and its penetration in Indonesia
during 2014 showed an increase, where internet users have grown 16,2 million from
71,9 million to 88,1 million with a penetration of 34,9%. Besides, internet users in
Indonesia are estimated to continuously grow rapidly with the projection growth of
30,18% (CAGR) during 2012-2015. This industry is also supported by the initiatives of
the Government to strengthen the national connectivity, including the development of
information and communication technology (TIK) sector. Hence, the potential growth of
this industry is quite promising in the future.
4) Based on the analysis of share conversation value, the Transaction used book-value
based conversion therefore it gave an additional 2,39% share ownership of MMM or in
total 72,59% share ownership in Internux. Meanwhile if, the Transaction used market-
value based conversation, where the fair market value of Internux is as set forth in the
report of KJPP FAST No. 003/SV/FAST-JKT/V/16 dated 20 May 2016, therefore it will
give an additional 2,13% share ownership of MMM or in total 72,33% share ownership
in Internux. Hence it could be said that the Transaction is beneficial for the Company
because share ownership in Internux becomes more optimal.
5) Based on the proforma financial report, Company liquidity after Transaction remained
the same compared to before Transaction as indicated from the current ratio and quick
ratio before and after Transaction. Company solvability after Transaction also did not
experience any change compared to before Transaction as indicated from the debt ratio
vs. equity before and after Transaction. Similarly with the Company profitability, after
Transaction it did not experience any change compared to before Transaction as
indicated from the return generated before and after Transaction. Hence it is indicated
that in general the financial position of Company after Transaction remains the same.
6) Based on the evaluation on financial projection, it is shown that the average projection
of profitability ratio after Transaction slightly declined but it was not significant compared
to the average rate of profit before Transaction, besides there is no indication of outlier.
Similar to the comparison of liquidity ratio, it is shown that the average projection of
liquidity ratio before and after Transaction remains the same, there is no indication of
outlier related to liquidity projection. Furthermore, the comparison of solvability ratio
between solvability ratio projection after Transaction compared to the average before
Transaction also did not experience any change, and there was no indication of outlier
related to solvability projection. Based on outlier analysis as has been described, it can
be concluded that the current financial projection is still reasonable.
63

Halaman 50/51
7) Based on the result of calculation of the current value of Company’s incremental net
cash flow between if the Transaction is carried out and if the Transaction is not carried
out, it did not show a negative value, with the assumption of relevant discount rate
where the risk-free return 9,21%, equity risk premium 8,59%, beta unlevered 0,8093,
default spread 2,44%, and DER industry 35,42%. These indicated that the Transaction
did not give a negative impact to the Company.
CONCLUSION
Based on the objectives of the assignment, scope, data and information used, basic assumptions,
limiting conditions, approaches and procedures of fairness analysis, fairness analysis of the
Transaction as described in the fairness opinion analysis above, KJPP FAST is of the opinion that
the Transaction is fair.
DISTRIBUTION OF FAIRNESS OPINION
Fairness opinion ia addressed to the interest of Company management in its relation with the
Transaction and it shall not be used by other parties, or for other interests. Fairness opinion is not
a recommendation to shareholders to approve the Transaction or to take any other actions in
relation to the Transaction, and it cannot be used in that manner by shareholders .
Fairness opinion should be deemed as an integral part and the use of a part of the analysis and
information without considering the overall content of Fairness opinion may lead to a misleading
conception about the process underlying the Fairness Opinion.
Fairness Opinion is also prepared based on the economic condition and regulations currently
existing. We are not responsible to update or to complete the Fairness Opinion with the events
occurring after the date of Fairness Opinion. Fairness Opinion is not valid if it is not signed by the
authorized party of KJPP FAST.
Yours sincerely, PUBLIC APPRAISAL SERVICE OFFICE FIRMAN SURYANTORO SUGENG SUZY HARTOMO & REKAN Registered Business & Property Appraisers
Partner,
Ir. Suzy Israwati, MAPPI Cert.
Appraiser License from Minister of Finance of the Republic of Indonesia :B-1.09.00097
Appraiser qualification : Business Appraiser Capital Market Supervisory Board (Bapepam) Registered License :05/PM.22/STTD-P/B/2015
MAPPI Member : 92-S-00215
APPRAISER’S STATEMENT
1. The factual statements presented in this appraisal report is true to the best knowledge of the Appraiser;
64
Halaman 51/51
2. Business Appraiser is responsible for the Report of Fairness Opinion on the Transaction;
3. The assignment of professional appraisal has been made on the Appraisal Object on the Cut Off Date 31 December 2015;
4. Analysis was made for the purpose as disclosed in the Report of Fairness Opinion on Transaction;
5. The assignment of professional appraisal has been carried out in accordance with the prevailing laws and regulations;
6. The conclusion made in the assignment of professional appraisal has been presented as the conclusion of Fairness Opinion on Transaction;
7. The scope of work and data analyzed has been disclosed;
8. The conclusion of Fairness opinion on the Transaction is in accordance with the assumptions and limiting conditions; and
The Business Appraisal believes that the economic and industrial data in the Report of Fairness Opinion of the Transaction that were obtained from various sources can be accounted for.
Number Name Signature
1. Person in charge
Ir. Suzy Israwati, MAPPI Cert.
Appraiser’s License : B-1.09.00097
…………………………
2. Reviewer
Ir. Firman Sagaf, MSc, MAPPI Cert.
Appraiser’s License : PB-1.08.00063
…………………………
3. Appraiser
Hanandewa, ST, MM, MSc.
MAPPI: 03-T-01763
…………………………”
65

This announcement, for which the Directors of AcrossAsia (namely, executive Director: Mr. Vicente Binalhay ANG; and independent non-executive Directors: Mr. Albert Saychuan CHEOK, Dr. Boh Soon LIM and Mr. Thomas Yee Man LAW and Mr. Ganesh Chander GROVER) collectively and individually accept full responsibility, includes particulars given in compliance with the Rules Governing the Listing of Securities on the Growth Enterprise Market (the “GEM”) of the Stock Exchange for the purpose of giving information with regard to AcrossAsia. The Directors, having made all reasonable enquiries, confirm that to the best of their knowledge and belief the information contained in this announcement is accurate and complete in all material respects and not misleading or deceptive, and there are no other matters the omission of which would make any statement herein or this announcement misleading.
This announcement will remain on the “Latest Company Announcements” page of the GEM website at www.hkgem.com for at least seven days from its date of publication and on AcrossAsia’s website at www.across-asia.com.
66