Xtrackers - HKEXnews
385
Xtrackers ** Société d’investissement à capital variable R.C.S. Luxembourg N° B-119.899 Unaudited Semi-Annual Report For the period from 1 January 2021 to 30 June 2021 No subscription can be accepted on the basis of the financial reports. Subscriptions are only valid if they are made on the basis of the latest published prospectus of Xtrackers** accompanied by the latest annual report and the most recent semi-annual report, if published thereafter. ** This includes synthetic ETFs.
-
Upload
khangminh22 -
Category
Documents
-
view
4 -
download
0
Transcript of Xtrackers - HKEXnews

Xtrackers**
Société d’investissement à capital variableR.C.S. Luxembourg N° B-119.899
Unaudited Semi-Annual ReportFor the period from 1 January 2021 to 30 June 2021
No subscription can be accepted on the basis of the financial reports. Subscriptions are only valid if they are made on thebasis of the latest published prospectus of Xtrackers** accompanied by the latest annual report and the most recentsemi-annual report, if published thereafter.
** This includes synthetic ETFs.

Page
Organisation 4Information for Hong Kong Residents 6Statistics 7Statement of Net Assets as at 30 June 2021 28Statement of Investments as at 30 June 2021 48Xtrackers MSCI WORLD SWAP UCITS ETF* 48Xtrackers MSCI EUROPE UCITS ETF 53Xtrackers MSCI JAPAN UCITS ETF 64Xtrackers MSCI USA SWAP UCITS ETF* 70Xtrackers EURO STOXX 50 UCITS ETF 74Xtrackers DAX UCITS ETF 76Xtrackers FTSE MIB UCITS ETF 77Xtrackers SWITZERLAND UCITS ETF 79Xtrackers FTSE 100 INCOME UCITS ETF 80Xtrackers FTSE 250 UCITS ETF 83Xtrackers MSCI UK ESG UCITS ETF 90Xtrackers MSCI EMERGING MARKETS SWAP UCITS ETF* 94Xtrackers MSCI EM ASIA SWAP UCITS ETF* 99Xtrackers MSCI EM LATIN AMERICA ESG SWAP UCITS ETF*(1) 103Xtrackers MSCI EM EUROPE, MIDDLE EAST & AFRICA ESG SWAP UCITS ETF*(2) 104Xtrackers MSCI TAIWAN UCITS ETF 105Xtrackers MSCI BRAZIL UCITS ETF 107Xtrackers NIFTY 50 SWAP UCITS ETF* 109Xtrackers MSCI KOREA UCITS ETF 111Xtrackers FTSE CHINA 50 UCITS ETF 114Xtrackers EURO STOXX QUALITY DIVIDEND UCITS ETF 116Xtrackers STOXX GLOBAL SELECT DIVIDEND 100 SWAP UCITS ETF* 118Xtrackers STOXX EUROPE 600 BASIC RESOURCES SWAP UCITS ETF* 121Xtrackers STOXX EUROPE 600 OIL & GAS SWAP UCITS ETF* 123Xtrackers STOXX EUROPE 600 HEALTH CARE SWAP UCITS ETF* 124Xtrackers STOXX EUROPE 600 BANKS SWAP UCITS ETF* 126Xtrackers STOXX EUROPE 600 TELECOMMUNICATIONS SWAP UCITS ETF* 128Xtrackers STOXX EUROPE 600 TECHNOLOGY SWAP UCITS ETF* 129Xtrackers STOXX EUROPE 600 UTILITIES SWAP UCITS ETF* 130Xtrackers STOXX EUROPE 600 FOOD & BEVERAGE SWAP UCITS ETF* 132Xtrackers STOXX EUROPE 600 INDUSTRIAL GOODS SWAP UCITS ETF* 134Xtrackers BLOOMBERG COMMODITY EX-AGRICULTURE & LIVESTOCK SWAP UCITS ETF*(3) 135Xtrackers SHORTDAX DAILY SWAP UCITS ETF* 137Xtrackers EURO STOXX 50 SHORT DAILY SWAP UCITS ETF* 139Xtrackers SLI UCITS ETF 141Xtrackers FTSE 100 SHORT DAILY SWAP UCITS ETF* 142Xtrackers S&P 500 INVERSE DAILY SWAP UCITS ETF* 143Xtrackers PORTFOLIO UCITS ETF 145Xtrackers MSCI AC ASIA EX JAPAN SWAP UCITS ETF* 146Xtrackers MSCI PACIFIC EX JAPAN UCITS ETF 148Xtrackers MSCI RUSSIA CAPPED SWAP UCITS ETF* 152Xtrackers FTSE VIETNAM SWAP UCITS ETF* 154Xtrackers LPX PRIVATE EQUITY SWAP UCITS ETF* 157Xtrackers S&P ASX 200 UCITS ETF 159Xtrackers STOXX EUROPE 600 UCITS ETF 164Xtrackers S&P GLOBAL INFRASTRUCTURE SWAP UCITS ETF* 179Xtrackers CAC 40 UCITS ETF 181Xtrackers MSCI EUROPE MID CAP UCITS ETF 183Xtrackers MSCI EUROPE SMALL CAP UCITS ETF 190Xtrackers S&P SELECT FRONTIER SWAP UCITS ETF* 213Xtrackers USD OVERNIGHT RATE SWAP UCITS ETF* 215
Xtrackers**
Table of contents
(1) During the period ending 30 June 2021 this Sub-Fund changed its name. Please see point 6 in the significant events of the period section of the Notes to the FinancialStatements of this semi-annual report for further information.(2) During the period ending 30 June 2021 this Sub-Fund changed its name. Please see point 5 in the significant events of the period section of the Notes to the FinancialStatements of this semi-annual report for further information.(3) During the period ending 30 June 2021 this Sub-Fund changed its name. Please see point 3 in the significant events of the period section of the Notes to the FinancialStatements of this semi-annual report for further information.*This is a synthetic ETF.**This includes synthetic ETFs.
2
Page
Xtrackers S&P 500 2X LEVERAGED DAILY SWAP UCITS ETF* 216Xtrackers SHORTDAX X2 DAILY SWAP UCITS ETF* 218Xtrackers LEVDAX DAILY SWAP UCITS ETF* 219Xtrackers BLOOMBERG COMMODITY SWAP UCITS ETF*(3) 220Xtrackers S&P 500 2X INVERSE DAILY SWAP UCITS ETF* 221Xtrackers CSI300 SWAP UCITS ETF* 224Xtrackers MSCI CANADA UCITS ETF 229Xtrackers MSCI INDONESIA SWAP UCITS ETF* 232Xtrackers MSCI MEXICO UCITS ETF 235Xtrackers MSCI EUROPE VALUE UCITS ETF 236Xtrackers S&P 500 SWAP UCITS ETF* 241Xtrackers FTSE DEVELOPED EUROPE REAL ESTATE UCITS ETF 253Xtrackers MSCI CHINA UCITS ETF 257Xtrackers MSCI INDIA SWAP UCITS ETF* 274Xtrackers MSCI MALAYSIA UCITS ETF 277Xtrackers MSCI THAILAND UCITS ETF 278Xtrackers MSCI PHILIPPINES UCITS ETF 280Xtrackers MSCI AFRICA TOP 50 SWAP UCITS ETF* 281Xtrackers SPAIN UCITS ETF 283Xtrackers MSCI PAKISTAN SWAP UCITS ETF* 285Xtrackers MSCI SINGAPORE UCITS ETF 286Xtrackers ATX UCITS ETF 289Xtrackers MSCI EMU UCITS ETF 290Xtrackers DAX INCOME UCITS ETF 296Xtrackers FTSE 100 UCITS ETF 297Xtrackers NIKKEI 225 UCITS ETF 300Xtrackers HARVEST CSI300 UCITS ETF 305Xtrackers HARVEST FTSE CHINA A-H 50 UCITS ETF 318Notes to the Financial Statements 320Information for Shareholders 373
Xtrackers**
Table of contents (continued)
(3) During the period ending 30 June 2021 this Sub-Fund changed its name. Please see point 3 in the significant events of the period section of the Notes to the FinancialStatements of this semi-annual report for further information.*This is a synthetic ETF.**This includes synthetic ETFs.
3

Registered OfficeXtrackers**
49, avenue J.F. KennedyL-1855 LuxembourgGrand Duchy of Luxembourg
Board of Directors
- Thilo WendenburgIndependent director, c/o DWS Investment S.A., 2, boulevard Konrad Adenauer, L-1115 Luxembourg, Grand Duchy of Luxembourg.
- Philippe Ah-SunGlobal Head of Passive Operations at DWS Investments UK Limited, Winchester House, 1 Great Winchester Street, London EC2N 2DB, UnitedKingdom.
- Alex McKennaHead of Hybrid and Liquid Solutions at DWS Investments UK Limited, Winchester House, 1 Great Winchester St, London EC2N 2DB, UnitedKingdom.
- Freddy BrauschMember of the Luxembourg Bar, independent director, 35, avenue J. F. Kennedy, L-1855 Luxembourg, Grand Duchy of Luxembourg.
- Julien Boulliat(1)
Head of Portfolio Engineering Systematic Investment Solutions at DWS Investments UK Limited, Winchester House, 1 Great Winchester St,London EC2N 2DB, United Kingdom.
DepositaryState Street Bank International GmbH, Luxembourg Branch49, avenue J.F. KennedyL-1855 LuxembourgGrand Duchy of Luxembourg
Management CompanyDWS Investment S.A.2, boulevard Konrad AdenauerL-1115 LuxembourgGrand Duchy of Luxembourg
Administrative Agent, Paying Agent, Domiciliary Agent and Listing AgentState Street Bank International GmbH, Luxembourg Branch49, avenue J.F. KennedyL-1855 LuxembourgGrand Duchy of Luxembourg
Registrar and Transfer AgentState Street Bank International GmbH, Luxembourg Branch49, avenue J.F. KennedyL-1855 LuxembourgGrand Duchy of Luxembourg
Xtrackers**
Organisation
(1)Julien Boulliat was appointed to the Board of Directors as at the annual general meeting held on 23 April 2021.** This includes synthetic ETFs.
4

Investment Managers / Sub-Portfolio Managers to certain Sub-Funds (see note 12)DWS Investments UK LimitedWinchester House1 Great Winchester StreetLondon EC2N 2DBUnited Kingdom
DWS Investment GmbHMainzer Landstrasse 11-1760329 Frankfurt am MainGermany
DWS Investments Hong Kong Limited60/F, International Commerce Centre1 Austin Road West, KowloonHong Kong
Harvest Global Investments Limited31/F, One Exchange Square8, Connaught Place, CentralHong Kong
Securities Lending Agent to certain Sub-Funds (see note 8)Deutsche Bank AG, Frankfurt am Main head officeTaunusanlage 1260325 Frankfurt am MainGermany
Deutsche Bank AG, London branchWinchester House1 Great Winchester StreetLondon EC2N 2DBUnited Kingdom
Deutsche Bank AG, New York branch60 Wall StreetNew York NY 10005United States of America
Auditor of the CompanyKPMG Luxembourg, Société Coopérative39, Avenue John F. KennedyL-1855 LuxembourgLuxembourg(2)
Legal Advisers to the CompanyElvinger Hoss Prussensociété anonyme2, place Winston ChurchillL-1340 LuxembourgGrand Duchy of Luxembourg
Hong Kong RepresentativeDWS Investments Hong Kong Limited60/F, International Commerce Centre1 Austin Road West, KowloonHong Kong
Capitalised terms used herein shall have the same meaning as in the prospectus of Xtrackers** applicable as at 30 June 2021 (the �Prospectus�) unless thecontext requires otherwise.
Xtrackers**
Organisation (continued)
(2)KPMG Luxembourg Société Coopérative was appointed Auditor of the Company at the annual general meeting held on 23 April 2021.** This includes synthetic ETFs.
5

KPMG Luxembourg Société Coopérative, the Company’s auditor, is a Recognised Public Interest Entity Auditor.
Sub-Funds authorised in Hong Kong
As at 30 June 2021, only the following Sub-Funds of Xtrackers** (collectively the “Authorised Sub-Funds”) are authorised by theSecurities and Futures Commission in Hong Kong (the “SFC”):
Sub-FundShare Class available for Hong
Kong investorsXtrackers MSCI WORLD SWAP UCITS ETF* 2CXtrackers MSCI USA SWAP UCITS ETF* 1CXtrackers MSCI TAIWAN UCITS ETF 1CXtrackers MSCI BRAZIL UCITS ETF 2CXtrackers NIFTY 50 SWAP UCITS ETF* 1CXtrackers MSCI KOREA UCITS ETF 1CXtrackers FTSE CHINA 50 UCITS ETF 1CXtrackers MSCI PACIFIC EX JAPAN UCITS ETF 2CXtrackers MSCI RUSSIA CAPPED SWAP UCITS ETF* 2DXtrackers FTSE VIETNAM SWAP UCITS ETF* 1CXtrackers CSI300 SWAP UCITS ETF* 2DXtrackers MSCI INDONESIA SWAP UCITS ETF* 2CXtrackers MSCI CHINA UCITS ETF 2CXtrackers MSCI MALAYSIA UCITS ETF 2CXtrackers MSCI THAILAND UCITS ETF 2CXtrackers MSCI PHILIPPINES UCITS ETF 2CXtrackers MSCI SINGAPORE UCITS ETF 2C
None of the Sub-Funds of Xtrackers**, other than the Authorised Sub-Funds, are authorised for public sale in Hong Kong nor are theyavailable to Hong Kong residents.
Depositary Confirmation
As required under Chapter 4.5(f) of the Code on Unit Trusts and Mutual Funds issued by the SFC (the “SFC Code”), State Street BankInternational GmbH, Luxembourg Branch, in its capacity as the Depositary of Xtrackers**, hereby confirms that in its opinion and to itsknowledge and belief, as far as required from a depositary under applicable Luxembourg laws and regulations and the depositaryagreement with Xtrackers**, the Management Company of Xtrackers** has, in all material respects, managed Xtrackers** in accordancewith the provisions of Xtrackers’** Articles of Incorporation during the period ending 30 June 2021.
Xtrackers**
Information for Hong Kong Residents
* This is a synthetic ETF.** This includes synthetic ETFs.
6

XtrackersMSCI WORLD
SWAP UCITS ETF*
XtrackersMSCI EUROPE
UCITS ETF
XtrackersMSCI JAPAN
UCITS ETF
XtrackersMSCI USA SWAP
UCITS ETF*
USD USD JPY USD
Total NetAssetValue
30 June 20211C 4,016,404,082 2,999,589,553 2,491,245,488(1) 4,159,571,9911D 1,249,692(2) 149,591,211 – –2C 15,858,967 – – –
2C - USD Hedged – 156,553,429 – –2D - USD Hedged – – 40,528,637(1) –
3C – – – –4C - EUR Hedged 563,458,636(3) – 438,715,723(3) –6C - GBP Hedged – – 9,444,219(4) –7C - CHF Hedged – – 30,091,992(5) –
31 December 20201C 3,336,717,136 3,154,834,920 2,400,482,799(1) 3,259,657,2611D – 358,114,871 – –2C 15,008,280 – – –
2C - USD Hedged – 103,291,131 – –2D - USD Hedged – – 81,628,387(1) –
3C – – – –4C - EUR Hedged 458,324,538(3) – 394,029,561(3) –6C - GBP Hedged – – 9,416,655(4) –7C - CHF Hedged – – 32,517,399(5) –
31 December 20191C 3,247,313,795 2,942,132,499 2,102,771,656(1) 2,941,408,3001D – 719,590,891 – –2C 27,061,456 – – –
2C - USD Hedged – 118,089,170 – –2D - USD Hedged – – 111,298,854(1) –
3C – – – –4C - EUR Hedged 277,803,984(3) – 796,017,681(3) –6C - GBP Hedged – – 8,732,840(4) –7C - CHF Hedged – – 43,500,821(5) –
(1)Share class expressed in USD.(2)The share class was launched on 3 March 2021. Please see point 1 in the other significant events of the period section of the Information for Shareholders of thissemi-annual report for further information.(3)Share class expressed in EUR.(4)Share class expressed in GBP.(5)Share class expressed in CHF.
Xtrackers**
Statistics
* This is a synthetic ETF.** This includes synthetic ETFs.
7

XtrackersMSCI WORLD
SWAP UCITS ETF*
XtrackersMSCI EUROPE
UCITS ETF
XtrackersMSCI JAPAN
UCITS ETF
XtrackersMSCI USA SWAP
UCITS ETF*
USD USD JPY USD
NetAssetValue per Share
30 June 20211C 89.36 85.23 74.19(1) 123.641D 18.11(2) 76.74 – –2C 8.97 – – –
2C - USD Hedged – 13.07 – –2D - USD Hedged – – 26.50(1) –
3C – – – –4C - EUR Hedged 31.74(3) – 24.85(3) –6C - GBP Hedged – – 27.97(4) –7C - CHF Hedged – – 17.78(5) –
31 December 20201C 79.06 76.09 73.31(1) 107.701D – 69.68 – –2C 7.94 – – –
2C - USD Hedged – 11.37 – –2D - USD Hedged – – 24.80(1) –
3C – – – –4C - EUR Hedged 27.89(3) – 22.92(3) –6C - GBP Hedged – – 25.71(4) –7C - CHF Hedged – – 16.43(5) –
31 December 20191C 68.19 72.12 64.19(1) 88.911D – 69.10 – –2C 6.84 – – –
2C - USD Hedged – 11.55 – –2D - USD Hedged – – 23.90(1) –
3C 19,208.67(6) – – –4C - EUR Hedged 25.00(3) – 21.44(3) –6C - GBP Hedged – – 23.87(4) –7C - CHF Hedged – – 15.35(5) –
(1)Share class expressed in USD.(2)The share class was launched on 3 March 2021. Please see point 1 in the other significant events of the period section of the Information for Shareholders of thissemi-annual report for further information.(3)Share class expressed in EUR.(4)Share class expressed in GBP.(5)Share class expressed in CHF.(6)This share class was terminated on 15 November 2019. Last Net Asset Value per Share before termination disclosed.
Xtrackers**
Statistics (continued)
* This is a synthetic ETF.** This includes synthetic ETFs.
8

XtrackersEURO STOXX50 UCITS ETF
XtrackersDAX UCITS
ETF
XtrackersFTSE MIB
UCITS ETF
XtrackersSWITZERLAND
UCITS ETF
EUR EUR EUR CHF
Total NetAssetValue
30 June 20211C 4,852,277,149 4,124,648,653 – 341,826,6041D 3,072,646,380 – 45,326,892 873,685,953
31 December 20201C 3,960,902,096 3,688,586,042 – 349,941,0131D 2,417,650,875 – 35,589,813 863,280,524
31 December 20191C 2,956,379,879 3,604,011,021 – 214,470,7941D 3,135,899,556 – 48,985,156 753,815,837
NetAssetValue per Share
30 June 20211C 62.49 148.62 – 141.971D 42.79 – 24.89 126.62
31 December 20201C 53.69 131.72 – 125.081D 37.41 – 21.96 113.21
31 December 20191C 55.28 127.79 – 122.411D 39.99 – 24.24 112.58
Xtrackers**
Statistics (continued)
** This includes synthetic ETFs.
9

XtrackersFTSE 100
INCOME UCITSETF
XtrackersFTSE 250
UCITS ETF
XtrackersMSCI UK
ESG UCITS ETF
XtrackersMSCI
EMERGINGMARKETS SWAP
UCITS ETF*
GBP GBP GBP USD
Total NetAssetValue
30 June 20211C – – – 1,304,174,5021D 71,950,970 77,205,587 43,132,264 –
31 December 20201C – – – 1,226,888,6271D 63,086,841 54,096,011 36,758,432 –
31 December 20191C – – – 1,505,883,0791D 82,651,068 50,355,700 53,172,755 –
NetAssetValue per Share
30 June 20211C – – – 60.771D 7.03 21.70 3.89 –
31 December 20201C – – – 56.681D 6.53 19.98 3.64 –
31 December 20191C – – – 48.271D 7.91 21.82 4.32 –
Xtrackers**
Statistics (continued)
* This is a synthetic ETF.** This includes synthetic ETFs.
10

XtrackersMSCI EM ASIA
SWAP UCITS ETF*
XtrackersMSCI EM
LATIN AMERICAESG
SWAP UCITSETF*(7)
XtrackersMSCI EM EUROPE,
MIDDLE EAST &AFRICA
ESG SWAP UCITSETF*(8)
XtrackersMSCI TAIWAN
UCITS ETF
USD USD USD USD
Total NetAssetValue
30 June 20211C 409,700,211 120,989,711 50,559,404 172,625,9941D 314,953,839(2) – – –
31 December 20201C 702,548,017 66,645,527 42,859,926 233,077,9811D – – – –
31 December 20191C 588,172,105 84,795,276 50,846,171 127,460,1511D – – – –
NetAssetValue per Share
30 June 20211C 72.17 44.19 31.97 57.171D 22.88(2) – – –
31 December 20201C 68.27 43.19 28.74 47.671D – – – –
31 December 20191C 53.67 50.55 31.16 34.701D – – – –
(2)The share class was launched on 3 March 2021. Please see point 1 in the other significant events of the period section of the Information for Shareholders of thissemi-annual report for further information.(7)During the period ending 30 June 2021 this Sub-Fund changed its name. Please see point 6 in the significant events of the period section of the Notes to the FinancialStatements of this semi-annual report for further information.(8)During the period ending 30 June 2021 this Sub-Fund changed its name. Please see point 5 in the significant events of the period section of the Notes to the FinancialStatements of this semi-annual report for further information.
Xtrackers**
Statistics (continued)
* This is a synthetic ETF.** This includes synthetic ETFs.
11

XtrackersMSCI BRAZIL
UCITS ETF
XtrackersNIFTY 50 SWAP
UCITS ETF*
XtrackersMSCI KOREA
UCITS ETF
XtrackersFTSE CHINA 50
UCITS ETF
USD USD USD USD
Total NetAssetValue
30 June 20211C 110,563,447 140,574,131 150,261,055 136,556,7212C 4,064,070 – – –
31 December 20201C 189,368,934 130,240,416 140,024,543 129,201,2302C 3,684,925 – – –
31 December 20191C 124,622,491 144,752,081 89,338,180 130,911,4672C 7,932,552 – – –
NetAssetValue per Share
30 June 20211C 50.40 205.86 110.05 44.042C 5.11 – – –
31 December 20201C 45.70 186.47 102.55 44.462C 4.64 – – –
31 December 20191C 56.81 167.54 71.63 40.292C 5.76 – – –
Xtrackers**
Statistics (continued)
* This is a synthetic ETF.** This includes synthetic ETFs.
12

XtrackersEURO STOXX
QUALITYDIVIDENDUCITS ETF
XtrackersSTOXX GLOBAL
SELECTDIVIDEND
100 SWAPUCITS ETF*
XtrackersSTOXX EUROPE
600 BASICRESOURCES
SWAP UCITS ETF*
XtrackersSTOXX EUROPE
600 OIL & GASSWAP UCITS
ETF*
EUR EUR EUR EUR
Total NetAssetValue
30 June 20211C – – 124,013,670 37,821,4201D 194,710,104 636,058,185 – –
31 December 20201C – – 332,293,417 29,954,6691D 201,887,375 399,056,084 – –
31 December 20191C – – 33,570,069 33,968,5501D 228,311,746 454,552,377 – –
NetAssetValue per Share
30 June 20211C – – 140.65 75.201D 21.11 29.05 – –
31 December 20201C – – 118.00 66.931D 18.98 26.30 – –
31 December 20191C – – 104.98 85.681D 22.43 30.73 – –
Xtrackers**
Statistics (continued)
* This is a synthetic ETF.** This includes synthetic ETFs.
13

XtrackersSTOXX EUROPE
600 HEALTHCARE
SWAP UCITS ETF*
XtrackersSTOXX EUROPE
600 BANKSSWAP UCITS ETF*
XtrackersSTOXX
EUROPE 600TELECOMMUNI-
CATIONSSWAP UCITS ETF*
XtrackersSTOXX
EUROPE 600TECHNOLOGY
SWAP UCITSETF*
EUR EUR EUR EUR
Total NetAssetValue
30 June 20211C 96,394,167 46,182,047 5,319,445 42,554,058
31 December 20201C 92,317,929 32,988,330 4,848,726 42,158,623
31 December 20191C 128,250,292 65,273,903 6,678,880 46,624,084
NetAssetValue per Share
30 June 20211C 179.52 34.55 68.25 108.57
31 December 20201C 158.13 27.48 58.32 90.47
31 December 20191C 160.43 36.24 66.64 78.91
Xtrackers**
Statistics (continued)
* This is a synthetic ETF.** This includes synthetic ETFs.
14

XtrackersSTOXX
EUROPE 600UTILITIES SWAP
UCITS ETF*
XtrackersSTOXX EUROPE
600 FOOD &BEVERAGE
SWAP UCITS ETF*
XtrackersSTOXX EUROPE
600 INDUSTRIALGOODS
SWAP UCITS ETF*
XtrackersBLOOMBERGCOMMODITY
EX-AGRICULTURE& LIVESTOCK
SWAP UCITSETF*(9),(10)
EUR EUR EUR USD
Total NetAssetValue
30 June 20211C 16,039,785 68,123,948 30,874,385 –
1C - EUR Hedged – – – 239,708,092(3)
2C – – – 100,838,6713C - GBP Hedged – – – 8,158,621(4)
31 December 20201C 18,396,978 57,395,298 22,593,608 –
1C - EUR Hedged – – – 114,892,538(3)
2C – – – 61,643,9773C - GBP Hedged – – – 5,615,802(4)
31 December 20191C 21,049,621 60,402,627 33,835,446 –
1C - EUR Hedged – – – 181,404,411(3)
2C – – – 88,786,2513C - GBP Hedged – – – 8,290,055(4)
NetAssetValue per Share
30 June 20211C 118.09 156.41 138.04 –
1C - EUR Hedged – – – 20.38(3)
2C – – – 29.173C - GBP Hedged – – – 27.26(4)
31 December 20201C 118.98 137.80 117.88 –
1C - EUR Hedged – – – 16.30(3)
2C – – – 23.183C - GBP Hedged – – – 21.75(4)
31 December 20191C 106.53 146.81 111.24 –
1C - EUR Hedged – – – 16.78(3)
2C – – – 23.323C - GBP Hedged – – – 22.30(4)
(3)Share class expressed in EUR.(4)Share class expressed in GBP.(9)During the period ending 30 June 2021 this Sub-Fund changed its name. Please see point 3 in the significant events of the period section of the Notes to the FinancialStatements of this semi-annual report for further information.(10)During the period ending 30 June 2021 this Sub-Fund changed its currency. Please see point 3 in the significant events of the period section of the Notes to theFinancial Statements of this semi-annual report for further information.
Xtrackers**
Statistics (continued)
* This is a synthetic ETF.** This includes synthetic ETFs.
15

XtrackersSHORTDAX DAILYSWAP UCITS ETF*
XtrackersEURO STOXX
50 SHORT DAILYSWAP UCITS ETF*
XtrackersSLI UCITS
ETF
XtrackersFTSE 100
SHORT DAILYSWAP UCITS ETF*
EUR EUR CHF GBP
Total NetAssetValue
30 June 20211C 302,129,618 132,585,724 – 10,839,2411D – – 117,933,952 –
31 December 20201C 300,463,380 135,063,708 – 20,734,6851D – – 89,205,268 –
31 December 20191C 352,469,613 302,502,067 – 14,060,3251D – – 51,946,401 –
NetAssetValue per Share
30 June 20211C 14.05 8.95 – 3.371D – – 202.20 –
31 December 20201C 16.16 10.59 – 3.771D – – 175.51 –
31 December 20191C 18.90 11.57 – 3.611D – – 168.51 –
Xtrackers**
Statistics (continued)
* This is a synthetic ETF.** This includes synthetic ETFs.
16

XtrackersS&P 500
INVERSE DAILYSWAP UCITS ETF*
XtrackersPORTFOLIO
UCITS ETF
XtrackersMSCI AC ASIA
EX JAPANSWAP UCITS ETF*
XtrackersMSCI PACIFIC
EX JAPANUCITS ETF
USD EUR USD USD
Total NetAssetValue
30 June 20211C 243,567,171 480,526,885 667,359,545 715,715,2862C – – – 2,050,518
31 December 20201C 240,389,404 395,696,599 708,799,152 623,503,6832C – – – 1,872,994
31 December 20191C 332,056,914 408,169,806 562,134,790 640,177,5182C – – – 3,119,013
NetAssetValue per Share
30 June 20211C 8.35 270.90 61.71 75.092C – – – 7.55
31 December 20201C 9.69 246.88 58.18 68.592C – – – 6.90
31 December 20191C 12.80 236.92 46.96 64.612C – – – 6.50
Xtrackers**
Statistics (continued)
* This is a synthetic ETF.** This includes synthetic ETFs.
17
XtrackersMSCI RUSSIA
CAPPEDSWAP UCITS ETF*
XtrackersFTSE VIETNAM
SWAP UCITS ETF*
XtrackersLPX PRIVATE
EQUITYSWAP UCITS ETF*
XtrackersS&P ASX 200
UCITS ETF
USD USD EUR AUD
Total NetAssetValue
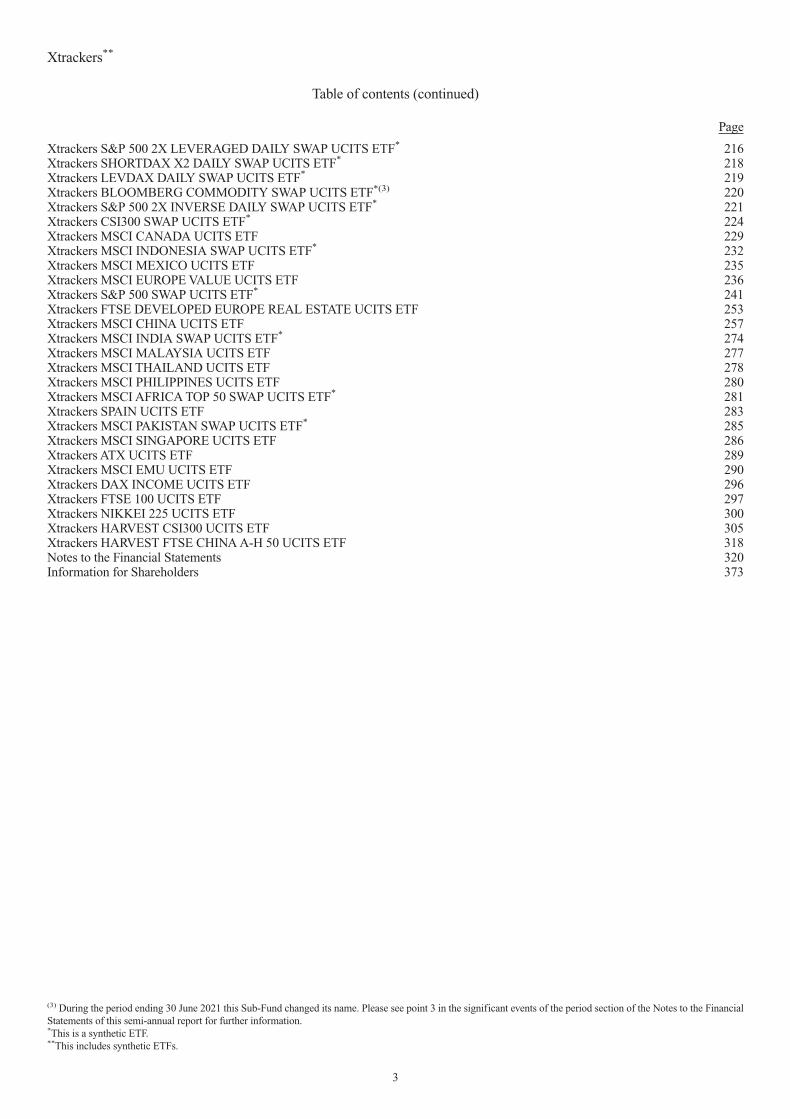
30 June 20211C 139,465,479 457,778,487 261,906,180 –1D – – – 104,412,6522D 6,465,352 – – –
31 December 20201C 108,740,020 364,512,798 144,871,057 –1D – – – 97,553,1222D 10,721,703 – – –
31 December 20191C 181,731,971 272,365,172 157,335,008 –1D – – – 110,424,3132D 14,346,674 – – –
NetAssetValue per Share
30 June 20211C 40.21 45.40 90.92 –1D – – – 60.312D 3.14 – – –
31 December 20201C 33.71 35.53 67.82 –1D – – – 54.772D 2.80 – – –
31 December 20191C 38.81 30.42 67.72 –1D – – – 58.062D 3.54 – – –
Xtrackers**
Statistics (continued)
* This is a synthetic ETF.** This includes synthetic ETFs.
18

XtrackersSTOXX
EUROPE 600UCITS ETF
XtrackersS&P GLOBAL
INFRASTRUCTURESWAP
UCITS ETF*
XtrackersCAC 40
UCITS ETF
XtrackersMSCI EUROPE
MID CAPUCITS ETF
EUR USD EUR USD
Total NetAssetValue
30 June 20211C 1,580,319,193 239,175,033 – 52,962,5121D – – 146,015,483 –
2C - EUR Hedged 5,965,044 – – –
31 December 20201C 1,401,217,624 202,271,527 – 46,008,7601D – – 128,920,702 –
2C - EUR Hedged 6,525,965 – – –
31 December 20191C 1,591,495,989 228,324,803 – 40,532,6901D – – 104,615,442 –
2C - EUR Hedged 6,589,192 – – –
NetAssetValue per Share
30 June 20211C 102.31 48.97 – 158.521D – – 67.29 –
2C - EUR Hedged 99.88 – – –
31 December 20201C 88.73 46.76 – 142.881D – – 57.27 –
2C - EUR Hedged 87.34 – – –
31 December 20191C 90.47 50.12 – 125.881D – – 63.03 –
2C - EUR Hedged 88.18 – – –
Xtrackers**
Statistics (continued)
* This is a synthetic ETF.** This includes synthetic ETFs.
19
XtrackersMSCI EUROPE
SMALL CAPUCITS ETF
XtrackersS&P SELECT
FRONTIERSWAP UCITS
ETF*
XtrackersUSD
OVERNIGHTRATE SWAPUCITS ETF*
XtrackersS&P 500 2X
LEVERAGEDDAILY
SWAP UCITS ETF*
USD USD USD USD
Total NetAssetValue
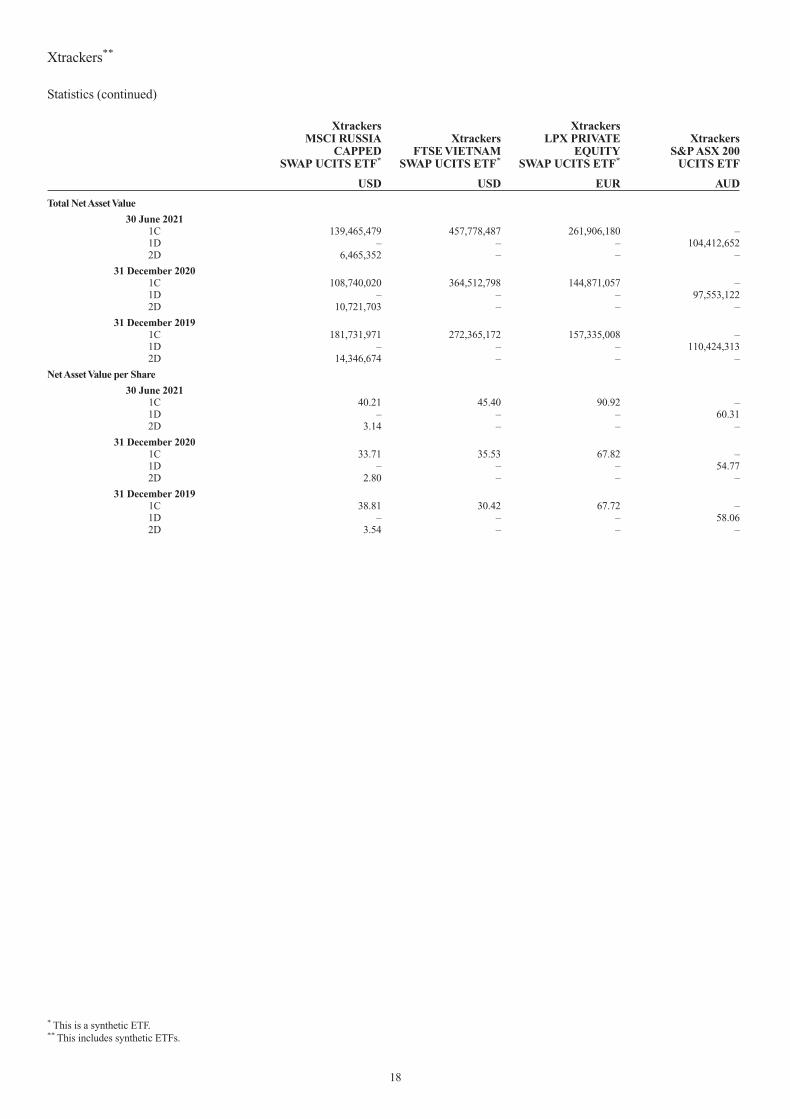
30 June 20211C 1,424,859,480 97,902,788 8,322,313 190,312,876
31 December 20201C 997,476,251 89,255,611 13,095,489 121,495,070
31 December 20191C 967,899,210 109,988,075 15,365,401 93,440,539
NetAssetValue per Share
30 June 20211C 69.63 17.16 179.45 145.56
31 December 20201C 62.17 15.12 179.52 111.35
31 December 20191C 54.58 15.40 179.10 91.39
Xtrackers**
Statistics (continued)
* This is a synthetic ETF.** This includes synthetic ETFs.
20

XtrackersSHORTDAX
X2 DAILYSWAP UCITS ETF*
XtrackersLEVDAX DAILY
SWAP UCITS ETF*
XtrackersBLOOMBERGCOMMODITY
SWAP UCITSETF*(9),(10)
XtrackersS&P 500 2X
INVERSEDAILY SWAPUCITS ETF*
EUR EUR USD USD
Total NetAssetValue
30 June 20211C 131,809,404 41,607,716 – 72,658,985
2C - EUR Hedged – – 12,060,805(3) –
31 December 20201C 123,571,334 52,412,179 – 69,700,901
2C - EUR Hedged – – 17,521,867(3) –
31 December 20191C 111,462,264 45,133,391 – 67,991,364
2C - EUR Hedged – – 17,493,745(3) –
NetAssetValue per Share
30 June 20211C 1.46 150.23 – 0.49
2C - EUR Hedged – – 16.92(3) –
31 December 20201C 1.94 118.77 – 0.67
2C - EUR Hedged – – 14.03(3) –
31 December 20191C 2.92 124.80 – 1.32
2C - EUR Hedged – – 14.33(3) –(3)Share class expressed in EUR.(9)During the period ending 30 June 2021 this Sub-Fund changed its name. Please see point 3 in the significant events of the period section of the Notes to the FinancialStatements of this semi-annual report for further information.(10)During the period ending 30 June 2021 this Sub-Fund changed its currency. Please see point 3 in the significant events of the period section of the Notes to theFinancial Statements of this semi-annual report for further information.
Xtrackers**
Statistics (continued)
* This is a synthetic ETF.** This includes synthetic ETFs.
21

XtrackersCSI300 SWAP
UCITS ETF*
XtrackersMSCI CANADA
UCITS ETF
XtrackersMSCI
INDONESIASWAP UCITS ETF*
XtrackersMSCI MEXICO
UCITS ETF
USD USD USD USD
Total NetAssetValue
30 June 20211C 1,849,402,479 373,927,493 84,650,953 114,958,7701D –(11) – – –2C – – 1,959,856 –2D 37,257,726 – – –
31 December 20201C 1,692,025,818 292,078,318 116,195,846 81,663,3691D 50,608 – – –2C – – 2,246,298 –2D 37,065,466 – – –
31 December 20191C 502,295,829 299,315,157 149,058,435 72,424,5951D 9,791,975 – – –2C – – 2,477,500 –2D 31,971,290 – – –
NetAssetValue per Share
30 June 20211C 19.37 72.29 12.83 4.961D –(11) – – –2C – – 12.81 –2D 1.61 – – –
31 December 20201C 18.60 59.95 14.70 4.371D 15.34 – – –2C – – 14.68 –2D 1.57 – – –
31 December 20191C 12.82 57.04 16.20 4.481D 10.93 – – –2C – – 16.19 –2D 1.11 – – –
(11)This share class was liquidated on 16 March 2021. Please see point 2 in the other significant events of the period section of the Information for Shareholders of thissemi-annual report for further information.
Xtrackers**
Statistics (continued)
* This is a synthetic ETF.** This includes synthetic ETFs.
22
XtrackersMSCI EUROPE
VALUE UCITS ETF
XtrackersS&P 500 SWAP
UCITS ETF*
XtrackersFTSE
DEVELOPEDEUROPE REAL
ESTATE UCITS ETF
XtrackersMSCI CHINA
UCITS ETF
EUR USD EUR USD
Total NetAssetValue
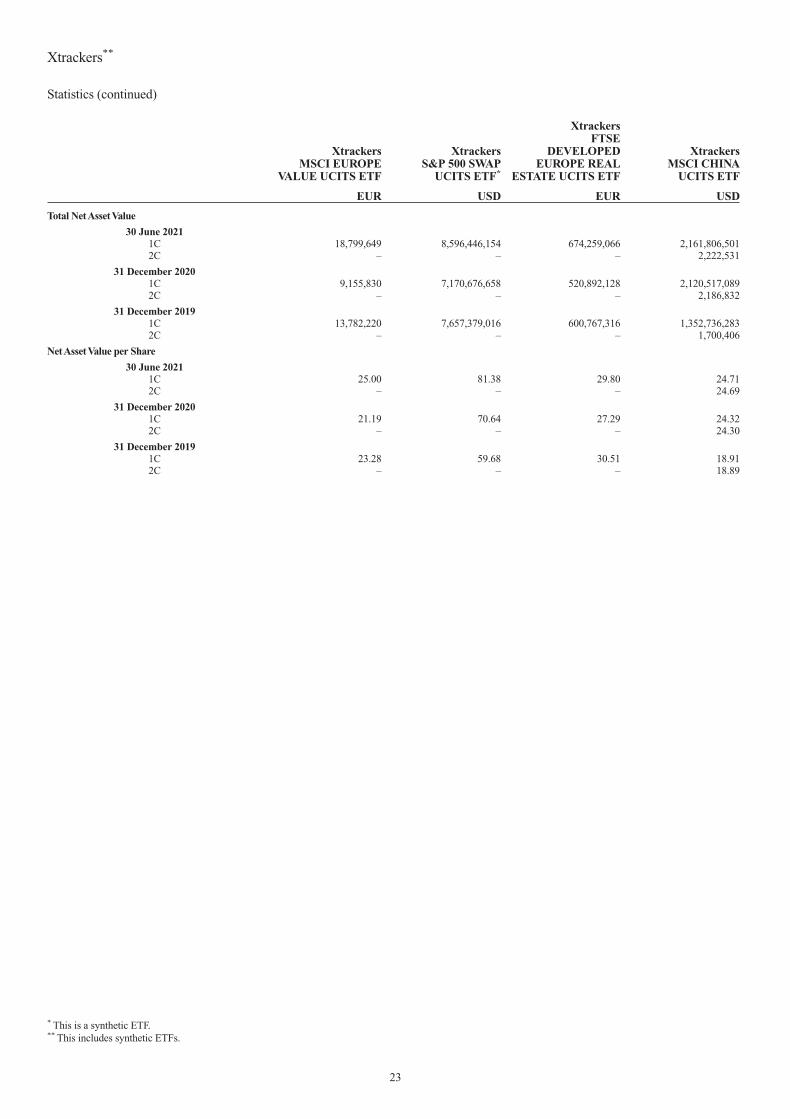
30 June 20211C 18,799,649 8,596,446,154 674,259,066 2,161,806,5012C – – – 2,222,531
31 December 20201C 9,155,830 7,170,676,658 520,892,128 2,120,517,0892C – – – 2,186,832
31 December 20191C 13,782,220 7,657,379,016 600,767,316 1,352,736,2832C – – – 1,700,406
NetAssetValue per Share
30 June 20211C 25.00 81.38 29.80 24.712C – – – 24.69
31 December 20201C 21.19 70.64 27.29 24.322C – – – 24.30
31 December 20191C 23.28 59.68 30.51 18.912C – – – 18.89
Xtrackers**
Statistics (continued)
* This is a synthetic ETF.** This includes synthetic ETFs.
23

XtrackersMSCI INDIA
SWAP UCITS ETF*
XtrackersMSCI MALAYSIA
UCITS ETF
XtrackersMSCI
THAILANDUCITS ETF
XtrackersMSCI
PHILIPPINESUCITS ETF
USD USD USD USD
Total NetAssetValue
30 June 20211C 80,814,829 38,696,665 66,362,417 27,637,1712C – 1,059,178 2,545,837 1,403,309
31 December 20201C 84,426,417 16,081,079 38,697,388 40,189,8842C – 1,155,382 2,570,541 1,458,444
31 December 20191C 130,799,499 40,262,742 37,800,992 44,438,3252C – 1,120,407 2,921,268 1,526,179
NetAssetValue per Share
30 June 20211C 15.45 11.04 23.36 1.772C – 11.03 23.36 1.77
31 December 20201C 13.84 12.04 23.59 1.832C – 12.04 23.58 1.83
31 December 20191C 12.19 11.68 26.81 1.922C – 11.67 26.80 1.92
Xtrackers**
Statistics (continued)
* This is a synthetic ETF.** This includes synthetic ETFs.
24

XtrackersMSCI AFRICATOP 50 SWAP
UCITS ETF*
XtrackersSPAIN UCITS
ETF
XtrackersMSCI PAKISTAN
SWAP UCITS ETF*
XtrackersMSCI
SINGAPOREUCITS ETF
USD EUR USD USD
Total NetAssetValue
30 June 20211C 38,896,896 160,767,547 13,069,535 48,442,9241D – 12,162,387 – –2C – – – 3,539,630
31 December 20201C 32,389,665 50,365,870 12,788,903 38,413,7621D – 6,666,420 – –2C – – – 3,267,649
31 December 20191C 32,987,518 70,521,722 25,940,313 41,168,5301D – 7,436,241 – –2C – – – 1,812,480
NetAssetValue per Share
30 June 20211C 7.99 24.14 1.14 1.551D – 20.18 – –2C – – – 1.55
31 December 20201C 7.53 21.50 1.12 1.431D – 18.25 – –2C – – – 1.43
31 December 20191C 8.29 23.96 1.21 1.541D – 21.48 – –2C – – – 1.54
Xtrackers**
Statistics (continued)
* This is a synthetic ETF.** This includes synthetic ETFs.
25

XtrackersATX UCITS
ETF
XtrackersMSCI EMUUCITS ETF
XtrackersDAX INCOME
UCITS ETF
XtrackersFTSE 100
UCITS ETF
EUR EUR EUR GBP
Total NetAssetValue
30 June 20211C 75,634,584 – – 79,555,273
1C - USD Hedged – 208,375,490(1) – –1D – 1,815,214,485 552,499,256 –
2C - GBP Hedged – 73,826,937(4) – –2C - USD Hedged – – 48,467,441(1) –3C - CHF Hedged – 17,269,955(5) – –4C - CHF Hedged – – 8,013,916(5) –
31 December 20201C 49,149,679 – – 69,219,624
1C - USD Hedged – 185,986,510(1) – –1D – 1,788,097,155 575,494,306 –
2C - GBP Hedged – 63,533,202(4) – –2C - USD Hedged – – 14,031,860(1) –3C - CHF Hedged – 14,972,994(5) – –4C - CHF Hedged – – 7,945,601(5) –
31 December 20191C 41,974,995 – – 69,658,245
1C - USD Hedged – 198,078,084(1) – –1D – 1,953,625,679 486,670,592 –
2C - GBP Hedged – 67,153,945(4) – –2C - USD Hedged – – 3,641,288(1) –3C - CHF Hedged – 14,421,295(5) – –4C - CHF Hedged – – 13,323,579(5) –
NetAssetValue per Share
30 June 20211C 58.63 – – 9.47
1C - USD Hedged – 55.38(1) – –1D – 46.56 120.20 –
2C - GBP Hedged – 26.86(4) – –2C - USD Hedged – – 25.14(1) –3C - CHF Hedged – 18.36(5) – –4C - CHF Hedged – – 18.71(5) –
31 December 20201C 47.26 – – 8.55
1C - USD Hedged – 47.79(1) – –1D – 40.91 108.80 –
2C - GBP Hedged – 23.17(4) – –2C - USD Hedged – – 22.24(1) –3C - CHF Hedged – 15.92(5) – –4C - CHF Hedged – – 16.61(5) –
31 December 20191C 53.13 – – 9.67
1C - USD Hedged – 47.81(1) – –1D – 42.84 109.98 –
2C - GBP Hedged – 23.32(4) – –2C - USD Hedged – – 21.42(1) –3C - CHF Hedged – 16.01(5) – –4C - CHF Hedged – – 16.08(5) –
(1)Share class expressed in USD.(4)Share class expressed in GBP.(5)Share class expressed in CHF.
Xtrackers**
Statistics (continued)
** This includes synthetic ETFs.
26

XtrackersNIKKEI 225UCITS ETF
XtrackersHARVEST CSI300
UCITS ETF
XtrackersHARVEST FTSE
CHINA A-H50 UCITS ETF
JPY USD USD
Total NetAssetValue
30 June 20211C 9,754,234,028 – –1D 201,338,932,723 729,128,539 15,739,864
2D - EUR Hedged 66,366,348(3) – –
31 December 20201C 7,801,620,374(12) – –1D 234,210,023,734 697,508,351 15,536,427
2D - EUR Hedged 120,422,128(3) – –
31 December 20191C – – –1D 168,256,024,255 490,719,711 9,305,107
2D - EUR Hedged 14,214,047(3) – –
NetAssetValue per Share
30 June 20211C 8,804.61 – –1D 2,974.23 15.77 39.35
2D - EUR Hedged 40.57(3) – –
31 December 20201C 8,337.88(12) – –1D 2,849.66 15.65 38.84
2D - EUR Hedged 38.95(3) – –
31 December 20191C – – –1D 2,453.92 11.61 31.02
2D - EUR Hedged 34.09(3) – –(3)Share class expressed in EUR.(12)During the year ending 31 December 2020 this share class was launched.
Xtrackers**
Statistics (continued)
** This includes synthetic ETFs.
27

XtrackersMSCI WORLD
SWAP UCITS ETF*
XtrackersMSCI EUROPE
UCITS ETF
XtrackersMSCI JAPAN
UCITS ETF
XtrackersMSCI USA SWAP
UCITS ETF*
Notes USD USD JPY USDASSETSInvestments at market value 4,847,833,140 3,286,433,922 343,627,410,790 4,262,839,978Cash at bank 3,048,993 8,698,651 1,215,647,324 843,105Due from broker 0 889,809 36,476,997 0Receivable for fund shares sold 4,030,483 0 0 0Receivable for investments sold 0 49,170 0 0Receivable on spot contracts 0 0 0 0Receivable on swap contracts 127,853 0 0 90,450Receivable due from swap counterparty 4 1,121,205,403 0 0 879,859,515Interest and dividends receivable, net 816 6,081,950 415,269,561 0Unrealised gain on forward foreign exchange contracts 7 0 4,269,900 0 0Unrealised gain on swap 4 0 0 0 0Unrealised gain on futures contracts 6 0 0 11,403,000 0Other assets 0 36,919 166,857,388 0
TOTAL ASSETS 5,976,246,688 3,306,460,321 345,473,065,060 5,143,633,048
LIABILITIESBank overdraft 0 0 0 0Payable for fund shares repurchased 0 0 0 0Payable for investments purchased 0 0 311,880,866 0Payable on spot contracts 815 0 0 0Payable on swap contracts 3,955,166 0 0 0Interest payable 0 0 0 0Payable due to swap counterparty 4 0 0 0 0Unrealised loss on forward foreign exchange contracts 7 17,686,108 0 1,063,906,964 0Unrealised loss on swap 4 1,249,448,290 0 0 983,108,072Unrealised loss on futures contracts 6 0 17,787 0 0Management Company Fee 10 2,656,885 140,189 194,324,137 317,735Fixed Fee 10 780,753 568,152 94,903,263 635,250Other liabilities 0 0 5,314 0
TOTAL LIABILITIES 1,274,528,017 726,128 1,665,020,544 984,061,057
TOTAL NET ASSETS 4,701,718,671 3,305,734,193 343,808,044,516 4,159,571,991
Xtrackers**
Statement of Net Assets as at 30 June 2021
* This is a synthetic ETF.** This includes synthetic ETFs.
The accompanying notes form an integral part of these financial statements.
28

XtrackersEURO STOXX50 UCITS ETF
XtrackersDAX UCITS
ETF
XtrackersFTSE MIB
UCITS ETF
XtrackersSWITZERLAND
UCITS ETF
Notes EUR EUR EUR CHFASSETSInvestments at market value 7,895,592,362 4,124,725,158 45,325,888 1,215,473,120Cash at bank 22,445,381 526,225 7,906 423,648Due from broker 2,060,457 0 0 0Receivable for fund shares sold 4,324,600 0 0 0Receivable for investments sold 0 3,752,963 13,152 4,611,496Receivable on spot contracts 0 0 0 0Receivable on swap contracts 0 0 0 0Receivable due from swap counterparty 4 0 0 0 0Interest and dividends receivable, net 6,159,093 1,940 1,422 29,575Unrealised gain on forward foreign exchange contracts 7 0 0 0 0Unrealised gain on swap 4 0 0 0 0Unrealised gain on futures contracts 6 0 0 0 0Other assets 13,536 13,430 223 32,946
TOTAL ASSETS 7,930,595,429 4,129,019,716 45,348,591 1,220,570,785
LIABILITIESBank overdraft 0 0 0 0Payable for fund shares repurchased 4,324,630 3,753,648 0 4,462,980Payable for investments purchased 0 0 0 0Payable on spot contracts 0 0 0 0Payable on swap contracts 0 0 0 0Interest payable 0 0 0 0Payable due to swap counterparty 4 0 0 0 0Unrealised loss on forward foreign exchange contracts 7 0 0 0 0Unrealised loss on swap 4 0 0 0 0Unrealised loss on futures contracts 6 195,750 0 0 0Management Company Fee 10 127,164 68,222 14,466 396,002Fixed Fee 10 1,017,311 545,779 7,233 198,001Other liabilities 7,045 3,414 0 1,245
TOTAL LIABILITIES 5,671,900 4,371,063 21,699 5,058,228
TOTAL NET ASSETS 7,924,923,529 4,124,648,653 45,326,892 1,215,512,557
Xtrackers**
Statement of Net Assets as at 30 June 2021 (continued)
** This includes synthetic ETFs.
The accompanying notes form an integral part of these financial statements.
29

XtrackersFTSE 100
INCOME UCITSETF
XtrackersFTSE 250
UCITS ETF
XtrackersMSCI UK
ESG UCITS ETF
XtrackersMSCI
EMERGINGMARKETS SWAP
UCITS ETF*
Notes GBP GBP GBP USDASSETSInvestments at market value 71,645,563 77,049,642 43,136,523 1,309,735,725Cash at bank 72,897 22,964 0 423,990Due from broker 25,251 14,420 0 0Receivable for fund shares sold 0 0 0 0Receivable for investments sold 0 0 0 78,042,087Receivable on spot contracts 0 0 0 0Receivable on swap contracts 0 0 0 29,471,502Receivable due from swap counterparty 4 0 0 0 345,870,514Interest and dividends receivable, net 220,534 138,012 80,741 403Unrealised gain on forward foreign exchange contracts 7 0 0 0 0Unrealised gain on swap 4 0 0 0 0Unrealised gain on futures contracts 6 0 0 0 0Other assets 0 2,018 0 0
TOTAL ASSETS 71,964,245 77,227,056 43,217,264 1,763,544,221
LIABILITIESBank overdraft 0 0 73,216 0Payable for fund shares repurchased 0 0 0 28,910,162Payable for investments purchased 0 0 0 0Payable on spot contracts 0 0 0 403Payable on swap contracts 0 0 0 78,042,087Interest payable 0 0 0 0Payable due to swap counterparty 4 0 0 0 0Unrealised loss on forward foreign exchange contracts 7 144 0 0 0Unrealised loss on swap 4 0 0 0 351,343,676Unrealised loss on futures contracts 6 2,295 1,987 0 0Management Company Fee 10 1,207 6,495 5,239 635,272Fixed Fee 10 9,629 12,987 6,545 438,119Other liabilities 0 0 0 0
TOTAL LIABILITIES 13,275 21,469 85,000 459,369,719
TOTAL NET ASSETS 71,950,970 77,205,587 43,132,264 1,304,174,502
Xtrackers**
Statement of Net Assets as at 30 June 2021 (continued)
* This is a synthetic ETF.** This includes synthetic ETFs.
The accompanying notes form an integral part of these financial statements.
30

XtrackersMSCI EM ASIA
SWAP UCITS ETF*
XtrackersMSCI EM
LATIN AMERICAESG
SWAP UCITSETF*(1)
XtrackersMSCI EM EUROPE,
MIDDLE EAST &AFRICA
ESG SWAP UCITSETF*(2)
XtrackersMSCI TAIWAN
UCITS ETF
Notes USD USD USD USDASSETSInvestments at market value 720,754,281 127,400,550 50,845,081 172,512,059Cash at bank 469,728 102,886 51,243 0Due from broker 0 0 0 0Receivable for fund shares sold 0 0 0 0Receivable for investments sold 223,091 0 0 4,849,340Receivable on spot contracts 0 0 0 0Receivable on swap contracts 30,476 951 762 0Receivable due from swap counterparty 4 119,827,890 0 13,177,794 0Interest and dividends receivable, net 1,240 0 0 346,130Unrealised gain on forward foreign exchange contracts 7 0 0 0 1,445Unrealised gain on swap 4 0 0 0 0Unrealised gain on futures contracts 6 0 0 0 0Other assets 0 0 0 13,808
TOTAL ASSETS 841,306,706 127,504,387 64,074,880 177,722,782
LIABILITIESBank overdraft 0 0 0 11,079Payable for fund shares repurchased 0 0 0 4,813,380Payable for investments purchased 0 0 0 39,481Payable on spot contracts 1,240 0 0 7,607Payable on swap contracts 223,090 0 0 0Interest payable 0 0 0 0Payable due to swap counterparty 4 0 1,498,474 0 0Unrealised loss on forward foreign exchange contracts 7 0 0 0 0Unrealised loss on swap 4 115,807,154 4,891,598 13,460,614 0Unrealised loss on futures contracts 6 0 0 0 0Management Company Fee 10 385,252 86,264 37,981 155,936Fixed Fee 10 235,919 38,340 16,881 69,305Other liabilities 0 0 0 0
TOTAL LIABILITIES 116,652,655 6,514,676 13,515,476 5,096,788
TOTAL NET ASSETS 724,654,051 120,989,711 50,559,404 172,625,994
(1)During the period ending 30 June 2021 this Sub-Fund changed its name. Please see point 6 in the significant events of the period section of the Notes to the FinancialStatements of this semi-annual report for further information.(2)During the period ending 30 June 2021 this Sub-Fund changed its name. Please see point 5 in the significant events of the period section of the Notes to the FinancialStatements of this semi-annual report for further information.
Xtrackers**
Statement of Net Assets as at 30 June 2021 (continued)
* This is a synthetic ETF.** This includes synthetic ETFs.
The accompanying notes form an integral part of these financial statements.
31

XtrackersMSCI BRAZIL
UCITS ETF
XtrackersNIFTY 50 SWAP
UCITS ETF*
XtrackersMSCI KOREA
UCITS ETF
XtrackersFTSE CHINA 50
UCITS ETF
Notes USD USD USD USDASSETSInvestments at market value 113,834,563 143,777,431 149,983,670 136,553,325Cash at bank 0 152,414 177,793 0Due from broker 95,668 0 69,319 0Receivable for fund shares sold 0 0 0 0Receivable for investments sold 0 3,042,262 0 0Receivable on spot contracts 0 11,799 0 0Receivable on swap contracts 0 2,208 0 0Receivable due from swap counterparty 4 0 13,492,414 0 0Interest and dividends receivable, net 921,257 0 187,721 981,957Unrealised gain on forward foreign exchange contracts 7 0 0 0 137Unrealised gain on swap 4 0 0 0 0Unrealised gain on futures contracts 6 0 0 1,632 0Other assets 0 0 3,363 399
TOTAL ASSETS 114,851,488 160,478,528 150,423,498 137,535,818
LIABILITIESBank overdraft 98,540 0 0 719,195Payable for fund shares repurchased 0 0 0 0Payable for investments purchased 0 0 0 122,280Payable on spot contracts 0 0 0 0Payable on swap contracts 0 3,054,062 0 0Interest payable 0 0 0 0Payable due to swap counterparty 4 0 0 0 0Unrealised loss on forward foreign exchange contracts 7 3,655 0 0 0Unrealised loss on swap 4 0 16,651,396 0 0Unrealised loss on futures contracts 6 6,683 0 0 0Management Company Fee 10 79,680 152,130 112,461 91,748Fixed Fee 10 35,413 46,809 49,982 45,874Other liabilities 0 0 0 0
TOTAL LIABILITIES 223,971 19,904,397 162,443 979,097
TOTAL NET ASSETS 114,627,517 140,574,131 150,261,055 136,556,721
Xtrackers**
Statement of Net Assets as at 30 June 2021 (continued)
* This is a synthetic ETF.** This includes synthetic ETFs.
The accompanying notes form an integral part of these financial statements.
32

XtrackersEURO STOXX
QUALITYDIVIDENDUCITS ETF
XtrackersSTOXX GLOBAL
SELECTDIVIDEND
100 SWAPUCITS ETF*
XtrackersSTOXX EUROPE
600 BASICRESOURCES
SWAP UCITS ETF*
XtrackersSTOXX EUROPE
600 OIL & GASSWAP UCITS
ETF*
Notes EUR EUR EUR EURASSETSInvestments at market value 194,291,347 658,230,050 125,583,330 38,224,249Cash at bank 0 2,142,182 54,582 17,344Due from broker 26,219 0 0 0Receivable for fund shares sold 0 0 0 0Receivable for investments sold 0 3,608,583 0 0Receivable on spot contracts 0 3,985 0 0Receivable on swap contracts 0 41,017 0 0Receivable due from swap counterparty 4 0 186,342,106 23,317,040 11,577,038Interest and dividends receivable, net 708,557 0 0 0Unrealised gain on forward foreign exchange contracts 7 0 0 0 0Unrealised gain on swap 4 0 0 0 0Unrealised gain on futures contracts 6 0 0 0 0Other assets 90,390 0 0 0
TOTAL ASSETS 195,116,513 850,367,923 148,954,952 49,818,631
LIABILITIESBank overdraft 304,414 0 0 0Payable for fund shares repurchased 0 0 0 0Payable for investments purchased 0 3,612,486 0 0Payable on spot contracts 0 0 0 0Payable on swap contracts 0 0 0 0Interest payable 0 0 0 0Payable due to swap counterparty 4 0 0 0 0Unrealised loss on forward foreign exchange contracts 7 0 0 0 0Unrealised loss on swap 4 0 208,388,849 24,875,483 11,978,932Unrealised loss on futures contracts 6 3,080 0 0 0Management Company Fee 10 65,943 485,982 32,900 9,139Fixed Fee 10 32,972 121,496 32,899 9,140Other liabilities 0 1,700,925 0 0
TOTAL LIABILITIES 406,409 214,309,738 24,941,282 11,997,211
TOTAL NET ASSETS 194,710,104 636,058,185 124,013,670 37,821,420
Xtrackers**
Statement of Net Assets as at 30 June 2021 (continued)
* This is a synthetic ETF.** This includes synthetic ETFs.
The accompanying notes form an integral part of these financial statements.
33

XtrackersSTOXX EUROPE
600 HEALTHCARE
SWAP UCITS ETF*
XtrackersSTOXX EUROPE
600 BANKSSWAP UCITS ETF*
XtrackersSTOXX
EUROPE 600TELECOMMUNI-
CATIONSSWAP UCITS ETF*
XtrackersSTOXX
EUROPE 600TECHNOLOGY
SWAP UCITSETF*
Notes EUR EUR EUR EURASSETSInvestments at market value 97,222,130 45,836,307 5,449,045 42,492,963Cash at bank 22,376 17,234 0 16,012Due from broker 0 0 0 0Receivable for fund shares sold 1,000,415 0 0 0Receivable for investments sold 0 0 0 0Receivable on spot contracts 0 0 0 0Receivable on swap contracts 20,122 4,427 0 0Receivable due from swap counterparty 4 15,077,966 8,994,023 410,326 12,614,825Interest and dividends receivable, net 0 0 0 1,279Unrealised gain on forward foreign exchange contracts 7 0 0 0 0Unrealised gain on swap 4 0 0 0 0Unrealised gain on futures contracts 6 0 0 0 0Other assets 0 0 0 0
TOTAL ASSETS 113,343,009 54,851,991 5,859,371 55,125,079
LIABILITIESBank overdraft 0 0 2,431 0Payable for fund shares repurchased 0 0 0 0Payable for investments purchased 0 0 0 0Payable on spot contracts 0 0 0 0Payable on swap contracts 998,868 0 0 0Interest payable 0 0 0 0Payable due to swap counterparty 4 0 0 0 0Unrealised loss on forward foreign exchange contracts 7 0 0 0 0Unrealised loss on swap 4 15,905,000 8,646,896 534,857 12,549,232Unrealised loss on futures contracts 6 0 0 0 0Management Company Fee 10 22,487 11,524 1,319 10,895Fixed Fee 10 22,487 11,524 1,319 10,894Other liabilities 0 0 0 0
TOTAL LIABILITIES 16,948,842 8,669,944 539,926 12,571,021
TOTAL NET ASSETS 96,394,167 46,182,047 5,319,445 42,554,058
Xtrackers**
Statement of Net Assets as at 30 June 2021 (continued)
* This is a synthetic ETF.** This includes synthetic ETFs.
The accompanying notes form an integral part of these financial statements.
34
XtrackersSTOXX
EUROPE 600UTILITIES SWAP
UCITS ETF*
XtrackersSTOXX EUROPE
600 FOOD &BEVERAGE
SWAP UCITS ETF*
XtrackersSTOXX EUROPE
600 INDUSTRIALGOODS
SWAP UCITS ETF*
XtrackersBLOOMBERGCOMMODITY
EX-AGRICULTURE& LIVESTOCK
SWAP UCITSETF*(3),(4)
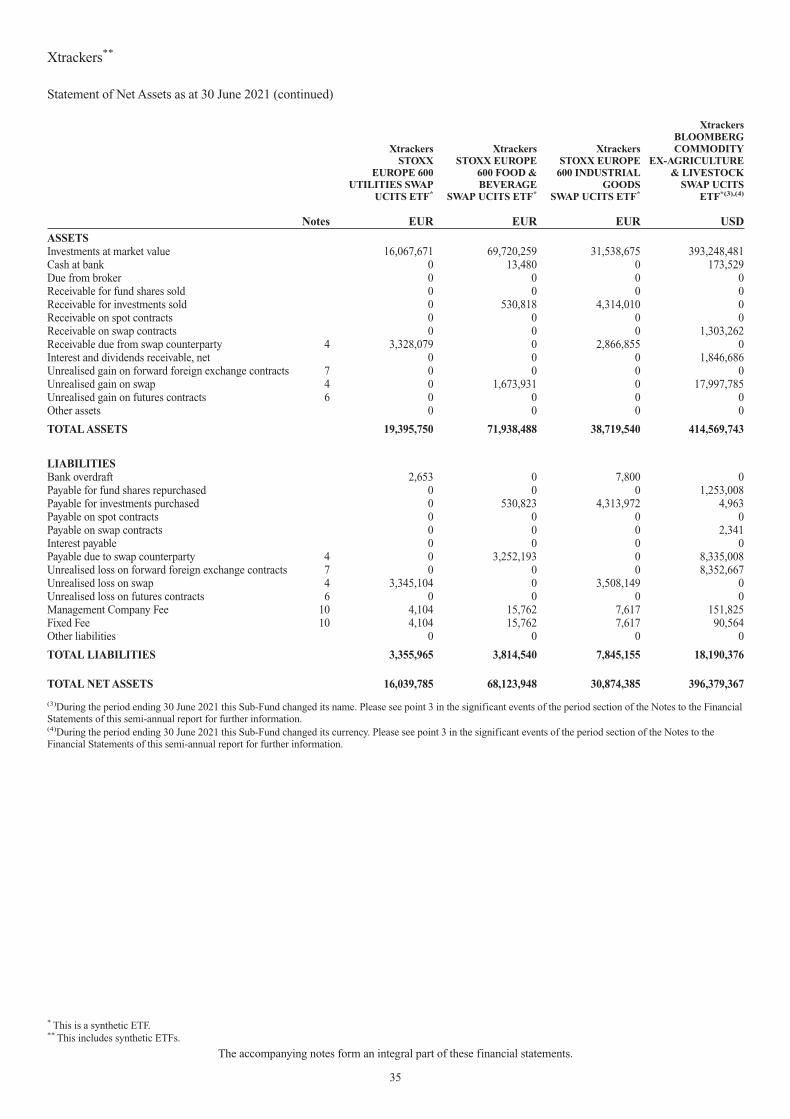
Notes EUR EUR EUR USDASSETSInvestments at market value 16,067,671 69,720,259 31,538,675 393,248,481Cash at bank 0 13,480 0 173,529Due from broker 0 0 0 0Receivable for fund shares sold 0 0 0 0Receivable for investments sold 0 530,818 4,314,010 0Receivable on spot contracts 0 0 0 0Receivable on swap contracts 0 0 0 1,303,262Receivable due from swap counterparty 4 3,328,079 0 2,866,855 0Interest and dividends receivable, net 0 0 0 1,846,686Unrealised gain on forward foreign exchange contracts 7 0 0 0 0Unrealised gain on swap 4 0 1,673,931 0 17,997,785Unrealised gain on futures contracts 6 0 0 0 0Other assets 0 0 0 0
TOTAL ASSETS 19,395,750 71,938,488 38,719,540 414,569,743
LIABILITIESBank overdraft 2,653 0 7,800 0Payable for fund shares repurchased 0 0 0 1,253,008Payable for investments purchased 0 530,823 4,313,972 4,963Payable on spot contracts 0 0 0 0Payable on swap contracts 0 0 0 2,341Interest payable 0 0 0 0Payable due to swap counterparty 4 0 3,252,193 0 8,335,008Unrealised loss on forward foreign exchange contracts 7 0 0 0 8,352,667Unrealised loss on swap 4 3,345,104 0 3,508,149 0Unrealised loss on futures contracts 6 0 0 0 0Management Company Fee 10 4,104 15,762 7,617 151,825Fixed Fee 10 4,104 15,762 7,617 90,564Other liabilities 0 0 0 0
TOTAL LIABILITIES 3,355,965 3,814,540 7,845,155 18,190,376
TOTAL NET ASSETS 16,039,785 68,123,948 30,874,385 396,379,367
(3)During the period ending 30 June 2021 this Sub-Fund changed its name. Please see point 3 in the significant events of the period section of the Notes to the FinancialStatements of this semi-annual report for further information.(4)During the period ending 30 June 2021 this Sub-Fund changed its currency. Please see point 3 in the significant events of the period section of the Notes to theFinancial Statements of this semi-annual report for further information.
Xtrackers**
Statement of Net Assets as at 30 June 2021 (continued)
* This is a synthetic ETF.** This includes synthetic ETFs.
The accompanying notes form an integral part of these financial statements.
35

XtrackersSHORTDAX DAILYSWAP UCITS ETF*
XtrackersEURO STOXX
50 SHORT DAILYSWAP UCITS ETF*
XtrackersSLI UCITS
ETF
XtrackersFTSE 100
SHORT DAILYSWAP UCITS ETF*
Notes EUR EUR CHF GBPASSETSInvestments at market value 302,611,173 129,725,373 117,914,643 10,753,694Cash at bank 147,212 36,682 63,937 9,317Due from broker 0 0 0 0Receivable for fund shares sold 1,001,642 1,000,830 0 0Receivable for investments sold 0 0 21,284 0Receivable on spot contracts 0 0 0 56Receivable on swap contracts 42,283 30,135 0 0Receivable due from swap counterparty 4 39,755,333 14,900,416 0 2,614,975Interest and dividends receivable, net 0 0 0 0Unrealised gain on forward foreign exchange contracts 7 0 0 0 0Unrealised gain on swap 4 0 0 0 0Unrealised gain on futures contracts 6 0 0 0 0Other assets 0 0 4,470 0
TOTAL ASSETS 343,557,643 145,693,436 118,004,334 13,378,042
LIABILITIESBank overdraft 0 0 0 0Payable for fund shares repurchased 0 0 0 0Payable for investments purchased 0 0 22,896 0Payable on spot contracts 0 0 0 0Payable on swap contracts 992,947 998,442 0 0Interest payable 0 0 0 56Payable due to swap counterparty 4 0 0 0 0Unrealised loss on forward foreign exchange contracts 7 0 0 0 0Unrealised loss on swap 4 40,233,208 12,038,767 0 2,527,972Unrealised loss on futures contracts 6 0 0 0 0Management Company Fee 10 151,402 52,877 28,492 6,464Fixed Fee 10 50,468 17,626 18,994 4,309Other liabilities 0 0 0 0
TOTAL LIABILITIES 41,428,025 13,107,712 70,382 2,538,801
TOTAL NET ASSETS 302,129,618 132,585,724 117,933,952 10,839,241
Xtrackers**
Statement of Net Assets as at 30 June 2021 (continued)
* This is a synthetic ETF.** This includes synthetic ETFs.
The accompanying notes form an integral part of these financial statements.
36

XtrackersS&P 500
INVERSE DAILYSWAP UCITS ETF*
XtrackersPORTFOLIO
UCITS ETF
XtrackersMSCI AC ASIA
EX JAPANSWAP UCITS ETF*
XtrackersMSCI PACIFIC
EX JAPANUCITS ETF
Notes USD EUR USD USDASSETSInvestments at market value 251,560,357 480,561,754 665,724,578 717,142,221Cash at bank 109,325 344,089 492,825 0Due from broker 0 0 0 44,547Receivable for fund shares sold 0 0 0 0Receivable for investments sold 0 0 0 0Receivable on spot contracts 0 0 0 40Receivable on swap contracts 44,424 0 71,136 0Receivable due from swap counterparty 4 19,359,491 0 143,212,344 0Interest and dividends receivable, net 0 11,687 0 2,627,153Unrealised gain on forward foreign exchange contracts 7 0 0 0 0Unrealised gain on swap 4 0 0 0 0Unrealised gain on futures contracts 6 0 0 0 0Other assets 0 9,550 0 1,866
TOTAL ASSETS 271,073,597 480,927,080 809,500,883 719,815,827
LIABILITIESBank overdraft 0 0 0 1,162,590Payable for fund shares repurchased 0 0 0 0Payable for investments purchased 0 0 0 580,920Payable on spot contracts 0 0 0 0Payable on swap contracts 0 0 0 0Interest payable 0 0 0 0Payable due to swap counterparty 4 0 0 0 0Unrealised loss on forward foreign exchange contracts 7 0 0 0 0Unrealised loss on swap 4 27,314,135 0 141,427,402 0Unrealised loss on futures contracts 6 0 0 0 3,829Management Company Fee 10 115,384 272,195 494,266 121,023Fixed Fee 10 76,907 127,948 219,670 181,661Other liabilities 0 52 0 0
TOTAL LIABILITIES 27,506,426 400,195 142,141,338 2,050,023
TOTAL NET ASSETS 243,567,171 480,526,885 667,359,545 717,765,804
Xtrackers**
Statement of Net Assets as at 30 June 2021 (continued)
* This is a synthetic ETF.** This includes synthetic ETFs.
The accompanying notes form an integral part of these financial statements.
37

XtrackersMSCI RUSSIA
CAPPEDSWAP UCITS ETF*
XtrackersFTSE VIETNAM
SWAP UCITS ETF*
XtrackersLPX PRIVATE
EQUITYSWAP UCITS ETF*
XtrackersS&P ASX 200
UCITS ETF
Notes USD USD EUR AUDASSETSInvestments at market value 148,132,555 464,099,659 254,705,122 103,677,050Cash at bank 111,543 445,042 474,738 155,669Due from broker 0 0 0 57,786Receivable for fund shares sold 0 0 2,477,514 0Receivable for investments sold 8,045,345 0 0 193,078Receivable on spot contracts 15,498 0 0 0Receivable on swap contracts 3,721 617 17,946 0Receivable due from swap counterparty 4 28,104,254 43,088,056 65,944,608 0Interest and dividends receivable, net 0 0 0 470,023Unrealised gain on forward foreign exchange contracts 7 0 0 0 0Unrealised gain on swap 4 0 0 0 0Unrealised gain on futures contracts 6 0 0 0 0Other assets 0 0 0 0
TOTAL ASSETS 184,412,916 507,633,374 323,619,928 104,553,606
LIABILITIESBank overdraft 0 0 0 0Payable for fund shares repurchased 0 0 0 0Payable for investments purchased 4,054,801 0 0 51,874Payable on spot contracts 0 0 0 0Payable on swap contracts 4,006,042 0 2,472,219 0Interest payable 0 0 0 0Payable due to swap counterparty 4 0 0 0 0Unrealised loss on forward foreign exchange contracts 7 0 0 0 0Unrealised loss on swap 4 30,271,992 49,234,931 58,727,175 0Unrealised loss on futures contracts 6 0 0 0 3,550Management Company Fee 10 103,327 474,084 199,269 51,318Fixed Fee 10 45,923 145,872 79,708 34,212Other liabilities 0 0 235,377 0
TOTAL LIABILITIES 38,482,085 49,854,887 61,713,748 140,954
TOTAL NET ASSETS 145,930,831 457,778,487 261,906,180 104,412,652
Xtrackers**
Statement of Net Assets as at 30 June 2021 (continued)
* This is a synthetic ETF.** This includes synthetic ETFs.
The accompanying notes form an integral part of these financial statements.
38

XtrackersSTOXX
EUROPE 600UCITS ETF
XtrackersS&P GLOBAL
INFRASTRUC-TURE SWAPUCITS ETF*
XtrackersCAC 40
UCITS ETF
XtrackersMSCI EUROPE
MID CAPUCITS ETF
Notes EUR USD EUR USDASSETSInvestments at market value 1,582,481,409 246,802,869 145,960,066 52,781,020Cash at bank 1,220,012 369,265 0 78,638Due from broker 251,927 0 0 10,795Receivable for fund shares sold 0 0 0 0Receivable for investments sold 22,817 0 0 3,862Receivable on spot contracts 0 0 0 0Receivable on swap contracts 0 6,277 0 0Receivable due from swap counterparty 4 0 37,264,663 0 0Interest and dividends receivable, net 2,816,070 0 223,297 110,571Unrealised gain on forward foreign exchange contracts 7 0 0 0 0Unrealised gain on swap 4 0 0 0 0Unrealised gain on futures contracts 6 0 0 0 0Other assets 18,725 0 286 250
TOTAL ASSETS 1,586,810,960 284,443,074 146,183,649 52,985,136
LIABILITIESBank overdraft 0 0 118,858 0Payable for fund shares repurchased 0 0 0 0Payable for investments purchased 0 0 0 0Payable on spot contracts 0 0 0 0Payable on swap contracts 0 0 0 0Interest payable 0 0 0 0Payable due to swap counterparty 4 0 0 0 0Unrealised loss on forward foreign exchange contracts 7 1,705 0 0 0Unrealised loss on swap 4 0 44,877,556 0 0Unrealised loss on futures contracts 6 520 0 0 395Management Company Fee 10 262,241 160,438 24,654 13,337Fixed Fee 10 261,656 80,219 24,654 8,892Other liabilities 601 149,828 0 0
TOTAL LIABILITIES 526,723 45,268,041 168,166 22,624
TOTAL NET ASSETS 1,586,284,237 239,175,033 146,015,483 52,962,512
Xtrackers**
Statement of Net Assets as at 30 June 2021 (continued)
* This is a synthetic ETF.** This includes synthetic ETFs.
The accompanying notes form an integral part of these financial statements.
39

XtrackersMSCI EUROPE
SMALL CAPUCITS ETF
XtrackersS&P SELECT
FRONTIERSWAP UCITS
ETF*
XtrackersUSD
OVERNIGHTRATE SWAPUCITS ETF*
XtrackersS&P 500 2X
LEVERAGEDDAILY
SWAP UCITS ETF*
Notes USD USD USD USDASSETSInvestments at market value 1,421,522,938 101,522,370 8,282,954 182,969,641Cash at bank 1,279,857 76,979 0 493,492Due from broker 197,341 0 0 0Receivable for fund shares sold 0 0 0 0Receivable for investments sold 1,958,351 0 0 0Receivable on spot contracts 0 0 0 0Receivable on swap contracts 0 110,913 401 1,368,614Receivable due from swap counterparty 4 0 10,541,478 113,694 45,770,602Interest and dividends receivable, net 2,209,040 0 1,796 0Unrealised gain on forward foreign exchange contracts 7 0 0 0 0Unrealised gain on swap 4 0 0 0 0Unrealised gain on futures contracts 6 0 0 0 0Other assets 65,578 0 0 0
TOTAL ASSETS 1,427,233,105 112,251,740 8,398,845 230,602,349
LIABILITIESBank overdraft 0 0 2,369 0Payable for fund shares repurchased 0 0 0 1,306,546Payable for investments purchased 1,633,754 0 0 0Payable on spot contracts 0 0 0 0Payable on swap contracts 0 60,223 0 0Interest payable 0 0 0 0Payable due to swap counterparty 4 0 0 0 0Unrealised loss on forward foreign exchange contracts 7 939 0 0 0Unrealised loss on swap 4 0 14,135,114 72,011 38,800,675Unrealised loss on futures contracts 6 8,406 0 0 0Management Company Fee 10 487,017 121,275 695 121,501Fixed Fee 10 243,509 32,340 1,457 60,751Other liabilities 0 0 0 0
TOTAL LIABILITIES 2,373,625 14,348,952 76,532 40,289,473
TOTAL NET ASSETS 1,424,859,480 97,902,788 8,322,313 190,312,876
Xtrackers**
Statement of Net Assets as at 30 June 2021 (continued)
* This is a synthetic ETF.** This includes synthetic ETFs.
The accompanying notes form an integral part of these financial statements.
40

XtrackersSHORTDAX
X2 DAILYSWAP UCITS ETF*
XtrackersLEVDAX DAILY
SWAP UCITS ETF*
XtrackersBLOOMBERGCOMMODITY
SWAP UCITSETF*(3),(4)
XtrackersS&P 500 2X
INVERSEDAILY SWAPUCITS ETF*
Notes EUR EUR USD USDASSETSInvestments at market value 131,764,472 43,903,374 10,201,483 75,403,786Cash at bank 379,198 105,830 10,675 216,029Due from broker 0 0 0 0Receivable for fund shares sold 0 0 0 0Receivable for investments sold 8,239,986 0 0 1,176,958Receivable on spot contracts 0 0 0 4,565Receivable on swap contracts 4,677 1,688,560 0 8,475Receivable due from swap counterparty 4 7,473,490 0 2,226,234 7,519,658Interest and dividends receivable, net 0 0 52,900 0Unrealised gain on forward foreign exchange contracts 7 0 0 0 0Unrealised gain on swap 4 0 0 2,290,438 0Unrealised gain on futures contracts 6 0 0 0 0Other assets 0 0 0 0
TOTAL ASSETS 147,861,823 45,697,764 14,781,730 84,329,471
LIABILITIESBank overdraft 0 0 0 0Payable for fund shares repurchased 0 1,686,830 0 0Payable for investments purchased 0 0 0 0Payable on spot contracts 0 0 0 0Payable on swap contracts 8,239,986 1,890 0 1,181,523Interest payable 0 0 0 0Payable due to swap counterparty 4 0 1,048,944 0 0Unrealised loss on forward foreign exchange contracts 7 0 0 468,744 0Unrealised loss on swap 4 7,679,210 1,328,282 0 10,409,215Unrealised loss on futures contracts 6 0 0 0 0Management Company Fee 10 88,815 10,329 3,776 56,963Fixed Fee 10 44,408 13,773 6,295 22,785Other liabilities 0 0 0 0
TOTAL LIABILITIES 16,052,419 4,090,048 478,815 11,670,486
TOTAL NET ASSETS 131,809,404 41,607,716 14,302,915 72,658,985
(3)During the period ending 30 June 2021 this Sub-Fund changed its name. Please see point 3 in the significant events of the period section of the Notes to the FinancialStatements of this semi-annual report for further information.(4)During the period ending 30 June 2021 this Sub-Fund changed its currency. Please see point 3 in the significant events of the period section of the Notes to theFinancial Statements of this semi-annual report for further information.
Xtrackers**
Statement of Net Assets as at 30 June 2021 (continued)
* This is a synthetic ETF.** This includes synthetic ETFs.
The accompanying notes form an integral part of these financial statements.
41
XtrackersCSI300 SWAP
UCITS ETF*
XtrackersMSCI CANADA
UCITS ETF
XtrackersMSCI
INDONESIASWAP UCITS ETF*
XtrackersMSCI MEXICO
UCITS ETF
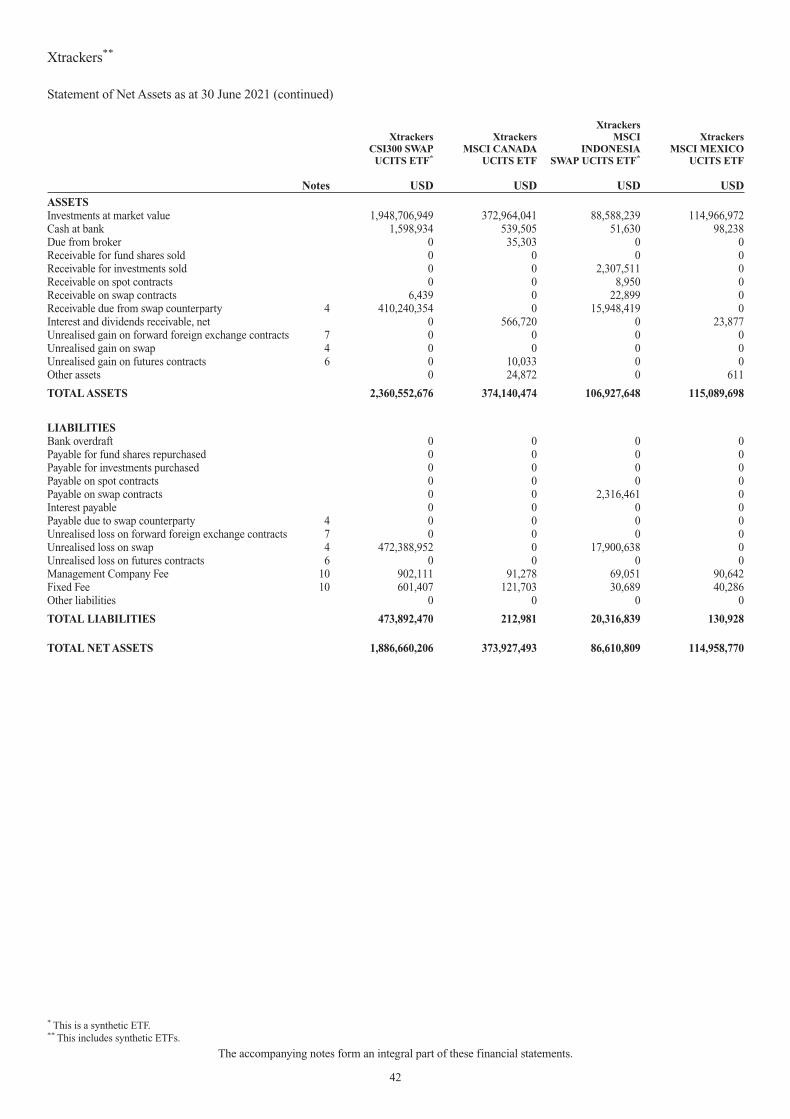
Notes USD USD USD USDASSETSInvestments at market value 1,948,706,949 372,964,041 88,588,239 114,966,972Cash at bank 1,598,934 539,505 51,630 98,238Due from broker 0 35,303 0 0Receivable for fund shares sold 0 0 0 0Receivable for investments sold 0 0 2,307,511 0Receivable on spot contracts 0 0 8,950 0Receivable on swap contracts 6,439 0 22,899 0Receivable due from swap counterparty 4 410,240,354 0 15,948,419 0Interest and dividends receivable, net 0 566,720 0 23,877Unrealised gain on forward foreign exchange contracts 7 0 0 0 0Unrealised gain on swap 4 0 0 0 0Unrealised gain on futures contracts 6 0 10,033 0 0Other assets 0 24,872 0 611
TOTAL ASSETS 2,360,552,676 374,140,474 106,927,648 115,089,698
LIABILITIESBank overdraft 0 0 0 0Payable for fund shares repurchased 0 0 0 0Payable for investments purchased 0 0 0 0Payable on spot contracts 0 0 0 0Payable on swap contracts 0 0 2,316,461 0Interest payable 0 0 0 0Payable due to swap counterparty 4 0 0 0 0Unrealised loss on forward foreign exchange contracts 7 0 0 0 0Unrealised loss on swap 4 472,388,952 0 17,900,638 0Unrealised loss on futures contracts 6 0 0 0 0Management Company Fee 10 902,111 91,278 69,051 90,642Fixed Fee 10 601,407 121,703 30,689 40,286Other liabilities 0 0 0 0
TOTAL LIABILITIES 473,892,470 212,981 20,316,839 130,928
TOTAL NET ASSETS 1,886,660,206 373,927,493 86,610,809 114,958,770
Xtrackers**
Statement of Net Assets as at 30 June 2021 (continued)
* This is a synthetic ETF.** This includes synthetic ETFs.
The accompanying notes form an integral part of these financial statements.
42

XtrackersMSCI EUROPE
VALUE UCITS ETF
XtrackersS&P 500 SWAP
UCITS ETF*
XtrackersFTSE
DEVELOPEDEUROPE REALESTATE UCITS
ETF
XtrackersMSCI CHINA
UCITS ETF
Notes EUR USD EUR USDASSETSInvestments at market value 18,763,116 8,570,454,379 674,053,201 2,163,163,917Cash at bank 1,445 1,954,747 0 0Due from broker 1,450 0 0 0Receivable for fund shares sold 0 47,950,834 0 0Receivable for investments sold 0 0 450,228 253,255Receivable on spot contracts 0 1,706 0 0Receivable on swap contracts 0 42,272,748 0 0Receivable due from swap counterparty 4 0 2,800,942,709 0 0Interest and dividends receivable, net 38,259 0 1,786,639 8,878,896Unrealised gain on forward foreign exchange contracts 7 0 0 0 0Unrealised gain on swap 4 0 0 0 0Unrealised gain on futures contracts 6 13 0 0 0Other assets 85 0 0 10,547
TOTAL ASSETS 18,804,368 11,463,577,123 676,290,068 2,172,306,615
LIABILITIESBank overdraft 0 0 1,205,227 5,949,178Payable for fund shares repurchased 0 0 0 0Payable for investments purchased 0 40,918,318 458,780 0Payable on spot contracts 0 0 0 994Payable on swap contracts 0 49,081,720 0 0Interest payable 0 1,706 0 0Payable due to swap counterparty 4 0 0 0 0Unrealised loss on forward foreign exchange contracts 7 0 0 0 0Unrealised loss on swap 4 0 2,775,029,558 0 0Unrealised loss on futures contracts 6 0 0 0 0Management Company Fee 10 1,573 699,825 143,830 1,571,937Fixed Fee 10 3,146 1,399,842 221,276 698,639Other liabilities 0 0 1,889 56,835
TOTAL LIABILITIES 4,719 2,867,130,969 2,031,002 8,277,583
TOTAL NET ASSETS 18,799,649 8,596,446,154 674,259,066 2,164,029,032
Xtrackers**
Statement of Net Assets as at 30 June 2021 (continued)
* This is a synthetic ETF.** This includes synthetic ETFs.
The accompanying notes form an integral part of these financial statements.
43

XtrackersMSCI INDIA
SWAP UCITS ETF*
XtrackersMSCI MALAYSIA
UCITS ETF
XtrackersMSCI
THAILANDUCITS ETF
XtrackersMSCI
PHILIPPINESUCITS ETF
Notes USD USD USD USDASSETSInvestments at market value 83,781,884 39,524,029 68,909,941 29,043,430Cash at bank 77,764 3,674,807 41,532 15,463Due from broker 0 51,797 0 0Receivable for fund shares sold 0 0 0 0Receivable for investments sold 0 0 0 0Receivable on spot contracts 0 0 0 0Receivable on swap contracts 0 0 0 0Receivable due from swap counterparty 4 0 0 0 0Interest and dividends receivable, net 0 101,092 0 12,116Unrealised gain on forward foreign exchange contracts 7 0 0 0 0Unrealised gain on swap 4 0 0 0 0Unrealised gain on futures contracts 6 0 0 0 0Other assets 0 938 16,132 0
TOTAL ASSETS 83,859,648 43,352,663 68,967,605 29,071,009
LIABILITIESBank overdraft 0 0 0 0Payable for fund shares repurchased 0 3,562,396 0 0Payable for investments purchased 0 0 0 0Payable on spot contracts 0 0 0 0Payable on swap contracts 0 0 0 0Interest payable 0 0 0 0Payable due to swap counterparty 4 2,385,620 0 0 0Unrealised loss on forward foreign exchange contracts 7 0 0 0 0Unrealised loss on swap 4 557,691 0 0 0Unrealised loss on futures contracts 6 0 5,193 0 0Management Company Fee 10 74,439 17,538 35,611 21,135Fixed Fee 10 27,069 11,692 23,740 9,394Other liabilities 0 0 0 0
TOTAL LIABILITIES 3,044,819 3,596,819 59,351 30,529
TOTAL NET ASSETS 80,814,829 39,755,844 68,908,254 29,040,480
Xtrackers**
Statement of Net Assets as at 30 June 2021 (continued)
* This is a synthetic ETF.** This includes synthetic ETFs.
The accompanying notes form an integral part of these financial statements.
44
XtrackersMSCI AFRICATOP 50 SWAP
UCITS ETF*
XtrackersSPAIN UCITS
ETF
XtrackersMSCI PAKISTAN
SWAP UCITS ETF*
XtrackersMSCI
SINGAPOREUCITS ETF
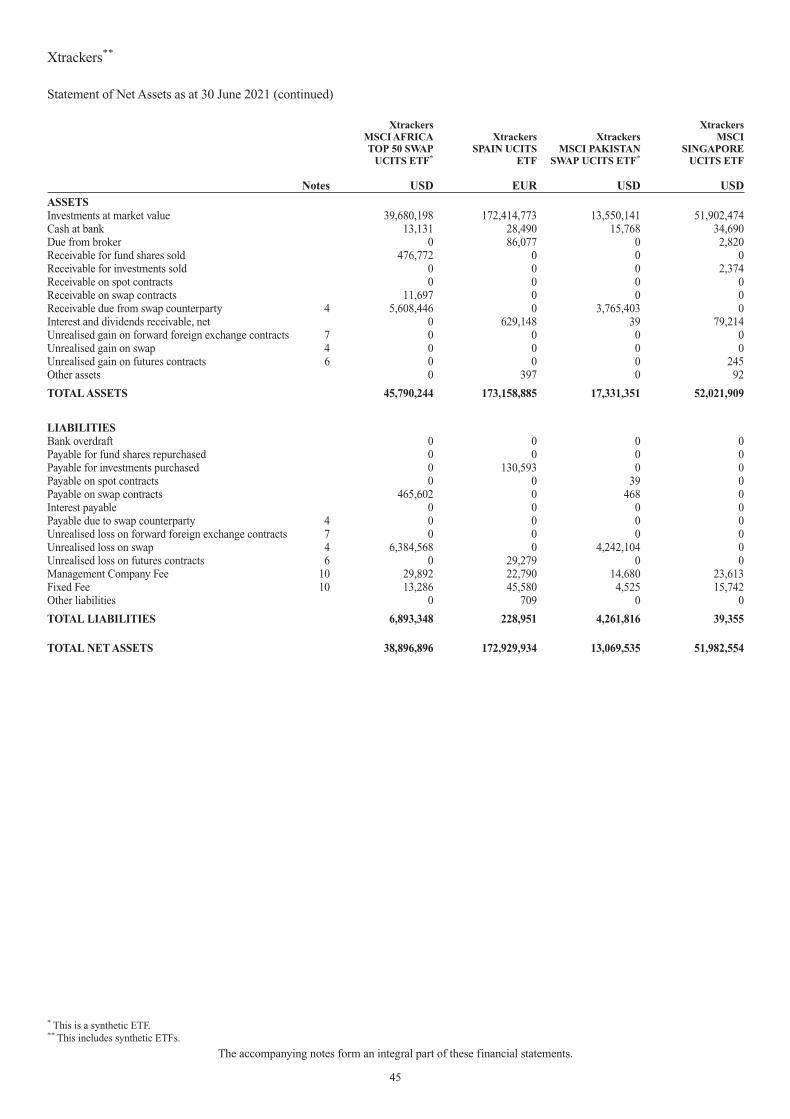
Notes USD EUR USD USDASSETSInvestments at market value 39,680,198 172,414,773 13,550,141 51,902,474Cash at bank 13,131 28,490 15,768 34,690Due from broker 0 86,077 0 2,820Receivable for fund shares sold 476,772 0 0 0Receivable for investments sold 0 0 0 2,374Receivable on spot contracts 0 0 0 0Receivable on swap contracts 11,697 0 0 0Receivable due from swap counterparty 4 5,608,446 0 3,765,403 0Interest and dividends receivable, net 0 629,148 39 79,214Unrealised gain on forward foreign exchange contracts 7 0 0 0 0Unrealised gain on swap 4 0 0 0 0Unrealised gain on futures contracts 6 0 0 0 245Other assets 0 397 0 92
TOTAL ASSETS 45,790,244 173,158,885 17,331,351 52,021,909
LIABILITIESBank overdraft 0 0 0 0Payable for fund shares repurchased 0 0 0 0Payable for investments purchased 0 130,593 0 0Payable on spot contracts 0 0 39 0Payable on swap contracts 465,602 0 468 0Interest payable 0 0 0 0Payable due to swap counterparty 4 0 0 0 0Unrealised loss on forward foreign exchange contracts 7 0 0 0 0Unrealised loss on swap 4 6,384,568 0 4,242,104 0Unrealised loss on futures contracts 6 0 29,279 0 0Management Company Fee 10 29,892 22,790 14,680 23,613Fixed Fee 10 13,286 45,580 4,525 15,742Other liabilities 0 709 0 0
TOTAL LIABILITIES 6,893,348 228,951 4,261,816 39,355
TOTAL NET ASSETS 38,896,896 172,929,934 13,069,535 51,982,554
Xtrackers**
Statement of Net Assets as at 30 June 2021 (continued)
* This is a synthetic ETF.** This includes synthetic ETFs.
The accompanying notes form an integral part of these financial statements.
45

XtrackersATX UCITS
ETF
XtrackersMSCI EMUUCITS ETF
XtrackersDAX INCOME
UCITS ETF
XtrackersFTSE 100
UCITS ETF
Notes EUR EUR EUR GBPASSETSInvestments at market value 74,064,355 2,082,978,285 599,490,674 79,247,722Cash at bank 365,679 2,238,981 465,302 30,488Due from broker 206,456 278,427 0 24,216Receivable for fund shares sold 0 0 0 0Receivable for investments sold 0 0 0 0Receivable on spot contracts 0 0 0 0Receivable on swap contracts 0 0 0 0Receivable due from swap counterparty 4 0 0 0 0Interest and dividends receivable, net 1,074,037 2,364,083 1,318 266,244Unrealised gain on forward foreign exchange contracts 7 0 5,280,113 816,240 0Unrealised gain on swap 4 0 0 0 0Unrealised gain on futures contracts 6 0 0 0 0Other assets 3,727 25,054 653 0
TOTAL ASSETS 75,714,254 2,093,164,943 600,774,187 79,568,670
LIABILITIESBank overdraft 0 0 0 0Payable for fund shares repurchased 0 0 0 0Payable for investments purchased 0 0 0 0Payable on spot contracts 0 0 0 0Payable on swap contracts 0 0 0 0Interest payable 0 0 0 0Payable due to swap counterparty 4 0 0 0 0Unrealised loss on forward foreign exchange contracts 7 0 0 0 159Unrealised loss on swap 4 0 0 0 0Unrealised loss on futures contracts 6 48,295 26,460 0 1,260Management Company Fee 10 12,550 96,337 13,299 1,331Fixed Fee 10 18,825 358,526 80,383 10,647Other liabilities 0 3,152 797 0
TOTAL LIABILITIES 79,670 484,475 94,479 13,397
TOTAL NET ASSETS 75,634,584 2,092,680,468 600,679,708 79,555,273
Xtrackers**
Statement of Net Assets as at 30 June 2021 (continued)
** This includes synthetic ETFs.
The accompanying notes form an integral part of these financial statements.
46

XtrackersNIKKEI 225UCITS ETF
XtrackersHARVEST CSI300
UCITS ETF
XtrackersHARVEST FTSE
CHINA A-H50 UCITS ETF COMBINED
Notes JPY USD USD EURASSETSInvestments at market value 219,234,445,889 725,862,103 15,635,692 54,968,070,519Cash at bank 471,277,241 4,022,381 51,651 69,898,258Due from broker 22,574,065 0 0 4,648,972Receivable for fund shares sold 0 0 0 54,039,812Receivable for investments sold 0 0 0 109,566,034Receivable on spot contracts 0 0 0 39,937Receivable on swap contracts 0 0 0 65,054,992Receivable due from swap counterparty 4 0 0 0 5,511,708,916Interest and dividends receivable, net 453,004,443 433,844 77,800 45,098,599Unrealised gain on forward foreign exchange contracts 7 0 0 0 9,698,242Unrealised gain on swap 4 0 0 0 18,781,792Unrealised gain on futures contracts 6 10,305,932 0 0 174,979Other assets 4,483,265 0 0 1,662,098
TOTAL ASSETS 220,196,090,835 730,318,328 15,765,143 60,858,443,150
LIABILITIESBank overdraft 0 0 0 8,424,494Payable for fund shares repurchased 0 0 0 47,435,827Payable for investments purchased 167,678,434 0 32 52,674,890Payable on spot contracts 0 0 0 9,358Payable on swap contracts 0 0 0 133,772,413Interest payable 0 0 0 1,504Payable due to swap counterparty 4 0 0 0 14,604,785Unrealised loss on forward foreign exchange contracts 7 163,314,788 0 0 31,681,362Unrealised loss on swap 4 0 0 0 5,782,238,035Unrealised loss on futures contracts 6 0 0 0 347,750Management Company Fee 10 5,426,283 823,701 17,479 14,107,066Fixed Fee 10 31,085,826 366,088 7,768 10,782,716Other liabilities 73,798 0 0 2,129,964
TOTAL LIABILITIES 367,579,129 1,189,789 25,279 6,098,210,164
TOTAL NET ASSETS 219,828,511,706 729,128,539 15,739,864 54,760,232,986
Xtrackers**
Statement of Net Assets as at 30 June 2021 (continued)
** This includes synthetic ETFs.
The accompanying notes form an integral part of these financial statements.
47

Description QuantityCurrency
(local) Cost Market Value
% ofNet
Assets
Transferable securities and money market instruments admitted to an official stock exchange listing
Shares
AustraliaAfterpay Ltd. 2,090,704 AUD 172,372,101 185,479,209 3.95
172,372,101 185,479,209 3.95BelgiumGalapagos NV 75,877 EUR 6,127,665 5,262,181 0.11
6,127,665 5,262,181 0.11BermudaArch Capital Group Ltd. 170,493 USD 6,345,750 6,638,997 0.14
6,345,750 6,638,997 0.14Cayman IslandsHerbalife Nutrition Ltd. 38,471 USD 2,009,725 2,028,576 0.04Pagseguro Digital Ltd.-A- 1,133,509 USD 57,170,675 63,385,823 1.35Vinci Partners Investments Ltd.-A- 195,992 USD 2,255,868 2,841,884 0.06
61,436,268 68,256,283 1.45CuracaoSchlumberger NV 450,000 USD 15,957,000 14,404,500 0.31
15,957,000 14,404,500 0.31GermanyAuto1 Group SE 144A 30,894 EUR 1,755,044 1,357,409 0.03Henkel AG & Co. KGaA 29,338 EUR 2,961,593 2,701,595 0.06ProSiebenSat.1 Media SE 250,000 EUR 5,493,508 4,973,371 0.10zooplus AG 5,507 EUR 1,770,945 1,784,202 0.04
11,981,090 10,816,577 0.23NetherlandsAerCap Holdings NV 294,575 USD 8,642,830 15,085,186 0.32Elastic NV 664,180 USD 90,680,841 96,810,877 2.06Merus NV 87,187 USD 2,455,186 1,837,030 0.04ProQR Therapeutics BV 402,548 USD 1,795,364 2,713,173 0.06
103,574,221 116,446,266 2.48United States8x8 Inc. 1,391,457 USD 32,448,777 38,626,846 0.82Abbott Laboratories 124,016 USD 13,523,945 14,377,175 0.31Acacia Research Corp. 87 USD 339 588 0.00Adobe Inc. 65,074 USD 32,938,041 38,109,937 0.81Advanced Micro Devices Inc. 25,000 USD 1,965,250 2,348,250 0.05Aerie Pharmaceuticals Inc. 253,592 USD 4,226,979 4,060,008 0.09Akamai Technologies Inc. 7,123 USD 794,001 830,542 0.02Alcoa Corp. 983,200 USD 32,425,936 36,221,088 0.77Alexion Pharmaceuticals Inc. 214,436 USD 37,906,137 39,394,038 0.84Align Technology Inc. 67,890 USD 35,031,240 41,480,790 0.88Alphabet Inc.-A- 6,564 USD 14,224,127 16,027,910 0.34Alphabet Inc.-C- 22,704 USD 46,364,220 56,903,489 1.21Altair Engineering Inc.-A- 116,554 USD 7,570,182 8,038,729 0.17Amazon.com Inc. 61,585 USD 194,583,001 211,862,254 4.51Amedisys Inc. 36,266 USD 8,864,498 8,882,631 0.19American Electric Power Co. Inc. 36,000 USD 3,093,480 3,045,240 0.06American Equity Investment Life Holdings Co. 144,591 USD 4,317,936 4,673,181 0.10American Superconductor Corp. 67,870 USD 987,509 1,180,259 0.03Amgen Inc. 69,164 USD 16,651,925 16,858,725 0.36
Xtrackers**
Xtrackers MSCI WORLD SWAP UCITS ETF*
Statement of Investmentsas at 30 June 2021(expressed in USD)
* This is a synthetic ETF.** This includes synthetic ETFs.
The accompanying notes form an integral part of these financial statements.
48

Description QuantityCurrency
(local) Cost Market Value
% ofNet
Assets
Transferable securities and money market instruments admitted to an official stock exchange listing
Shares (continued)
United States (continued)Anaplan Inc. 779,245 USD 51,624,981 41,533,758 0.88Apollo Medical Holdings Inc. 44,872 USD 1,446,225 2,818,410 0.06Apple Inc. 714,156 USD 90,143,780 97,810,806 2.08Arrow Electronics Inc. 243 USD 16,107 27,661 0.00Arthur J Gallagher & Co. 144,350 USD 20,122,390 20,220,548 0.43Asana Inc.-A- 342,033 USD 12,265,303 21,216,307 0.45Astronics Corp. 174,995 USD 2,455,180 3,064,162 0.07Autodesk Inc. 190,297 USD 53,165,715 55,547,694 1.18Bank of America Corp. 2,223,030 USD 86,209,103 91,655,527 1.95Bank of New York Mellon Corp. 292,973 USD 14,408,412 15,009,007 0.32Barnes & Noble Education Inc. 108,304 USD 589,174 780,872 0.02Berkshire Hathaway Inc.-B- 172,662 USD 41,297,842 47,986,223 1.02BioAtla Inc. 341,119 USD 15,520,914 14,456,623 0.31Biogen Inc. 123,136 USD 33,627,279 42,638,303 0.91Bio-Rad Laboratories Inc.-A- 101,024 USD 66,913,246 65,088,753 1.38Black Knight Inc. 80,179 USD 5,861,085 6,252,358 0.13Blackstone Group Inc.-A- 579,427 USD 51,343,026 56,285,539 1.20BlueLinx Holdings Inc. 51,285 USD 1,933,957 2,578,610 0.06Boeing Co. 70,150 USD 14,777,448 16,805,134 0.36Booking Holdings Inc. 23,629 USD 53,160,760 51,702,379 1.10Boston Scientific Corp. 40,172 USD 1,555,460 1,717,755 0.04Broadcom Inc. 25,000 USD 11,820,000 11,921,000 0.25Cannae Holdings Inc. 103,419 USD 4,074,186 3,506,938 0.07Carlyle Group Inc. 333,601 USD 14,097,978 15,505,774 0.33CarParts.com Inc. 175,244 USD 2,386,823 3,567,968 0.08Caterpillar Inc. 60,734 USD 13,989,470 13,217,540 0.28Centene Corp. 10,790 USD 713,510 786,915 0.02Charles Schwab Corp. 35,000 USD 2,465,050 2,548,350 0.05Chefs’ Warehouse Inc. 23 USD 327 732 0.00Chegg Inc. 16,464 USD 1,621,704 1,368,323 0.03Chevron Corp. 270,000 USD 28,206,000 28,279,800 0.60Chico’s FAS Inc. 782,691 USD 2,097,612 5,150,107 0.11Chipotle Mexican Grill Inc. 843 USD 1,284,774 1,306,937 0.03Cirrus Logic Inc. 45,588 USD 3,366,674 3,880,451 0.08Citigroup Inc. 95,042 USD 7,115,795 6,724,221 0.14Coca-Cola Co. 107,170 USD 5,888,992 5,798,969 0.12Concentrix Corp. 16,001 USD 1,792,272 2,572,961 0.05ConocoPhillips 323,000 USD 17,875,960 19,670,700 0.42Cooper Cos Inc. 13,648 USD 5,231,824 5,408,293 0.12Copart Inc. 57,339 USD 6,119,192 7,559,000 0.16Costco Wholesale Corp. 12,800 USD 4,867,984 5,064,576 0.11Denbury Inc. 303,345 USD 11,973,563 23,290,829 0.50Digital Turbine Inc. 8,166 USD 500,004 620,861 0.01DocuSign Inc. 5,727 USD 1,461,817 1,601,097 0.03Dollar Tree Inc. 9,070 USD 925,511 902,465 0.02Dominion Energy Inc. 218,904 USD 16,792,126 16,104,767 0.34DoorDash Inc.-A- 782,267 USD 130,896,737 139,501,674 2.97Duke Energy Corp. 69,000 USD 7,107,000 6,811,680 0.15
Xtrackers**
Xtrackers MSCI WORLD SWAP UCITS ETF* (continued)
Statement of Investmentsas at 30 June 2021(expressed in USD)
* This is a synthetic ETF.** This includes synthetic ETFs.
The accompanying notes form an integral part of these financial statements.
49

Description QuantityCurrency
(local) Cost Market Value
% ofNet
Assets
Transferable securities and money market instruments admitted to an official stock exchange listing
Shares (continued)
United States (continued)Ecolab Inc. 13,702 USD 2,872,487 2,822,201 0.06Electronic Arts Inc. 19,000 USD 2,686,600 2,732,770 0.06Eli Lilly & Co. 15,000 USD 2,924,100 3,442,800 0.07Emerson Electric Co. 45,000 USD 4,261,950 4,330,800 0.09Energy Recovery Inc. 99,224 USD 2,021,193 2,260,323 0.05Enphase Energy Inc. 33,703 USD 5,256,657 6,188,882 0.13Estee Lauder Cos Inc.-A- 17,000 USD 5,210,840 5,407,360 0.12Euronet Worldwide Inc. 34,000 USD 4,369,000 4,601,900 0.10Eventbrite Inc.-A- 430,926 USD 7,961,372 8,187,594 0.17EverQuote Inc.-A- 13,701 USD 428,841 447,749 0.01Exelixis Inc. 451,145 USD 9,970,305 8,219,862 0.18Exxon Mobil Corp. 488,500 USD 28,496,330 30,814,580 0.66Facebook Inc.-A- 213,882 USD 63,862,134 74,368,910 1.58Foghorn Therapeutics Inc. 83,685 USD 1,933,960 892,919 0.02Forestar Group Inc. 68,908 USD 1,534,581 1,440,866 0.03Forma Therapeutics Holdings Inc. 467,668 USD 17,991,188 11,640,256 0.25frontdoor Inc. 421,916 USD 18,813,234 21,019,855 0.45General Motors Co. 122,236 USD 4,955,700 7,232,704 0.15Green Dot Corp.-A- 15,012 USD 668,184 703,312 0.02Haemonetics Corp. 79,243 USD 9,449,728 5,280,754 0.11Harmonic Inc. 167,695 USD 1,371,745 1,428,761 0.03Hilton Grand Vacations Inc. 271,576 USD 5,648,781 11,240,531 0.24Home Depot Inc. 123,377 USD 37,950,765 39,343,692 0.84Honeywell International Inc. 133,822 USD 29,510,231 29,353,856 0.62Hostess Brands Inc. 938,916 USD 13,768,598 15,201,050 0.32IAA Inc. 512,464 USD 27,657,682 27,949,787 0.59iHeartMedia Inc.-A- 92,311 USD 1,371,741 2,485,935 0.05Inari Medical Inc. 9,142 USD 906,064 852,766 0.02Innovage Holdings Corp. 149,765 USD 3,757,604 3,191,492 0.07Innoviva Inc. 169,643 USD 2,280,002 2,274,913 0.05Intel Corp. 660,004 USD 37,081,556 37,052,625 0.79International Business Machines Corp. 42,000 USD 6,055,140 6,156,780 0.13Invitation Homes REIT Inc. 821,416 USD 29,242,410 30,630,603 0.65IQVIA Holdings Inc. 11,659 USD 2,718,879 2,825,209 0.06Johnson & Johnson 231,605 USD 38,177,768 38,154,608 0.81Kezar Life Sciences Inc. 279,265 USD 1,535,958 1,516,409 0.03Kraton Corp. 279,471 USD 10,102,877 9,024,119 0.19Laboratory Corp. of America Holdings 3,705 USD 670,568 1,022,024 0.02Las Vegas Sands Corp. 12,813 USD 575,560 675,117 0.01Liberty Broadband Corp. 56,427 USD 8,469,128 9,799,113 0.21Liberty Media Corp-Liberty Formula One 1,776,462 USD 78,164,328 85,643,233 1.82Liberty Media Corp-Liberty SiriusXM 1,175,606 USD 40,487,871 54,536,362 1.16Liberty Media Corp-Liberty SiriusXM-A- 203,170 USD 8,949,639 9,463,659 0.20Lowe’s Cos Inc. 35,448 USD 7,228,202 6,875,849 0.15Lululemon Athletica Inc. 15,856 USD 4,521,180 5,786,964 0.12Macquarie Infrastructure Corp. 357,691 USD 11,074,113 13,688,835 0.29Martin Marietta Materials Inc. 4,000 USD 1,427,520 1,407,240 0.03Mastercard Inc.-A- 722,688 USD 263,116,247 263,846,162 5.61
Xtrackers**
Xtrackers MSCI WORLD SWAP UCITS ETF* (continued)
Statement of Investmentsas at 30 June 2021(expressed in USD)
* This is a synthetic ETF.** This includes synthetic ETFs.
The accompanying notes form an integral part of these financial statements.
50

Description QuantityCurrency
(local) Cost Market Value
% ofNet
Assets
Transferable securities and money market instruments admitted to an official stock exchange listing
Shares (continued)
United States (continued)MercadoLibre Inc. 134,256 USD 195,867,602 209,142,654 4.45Merck & Co. Inc. 15,804 USD 1,212,957 1,229,077 0.03MetLife Inc. 119,647 USD 7,723,214 7,160,873 0.15Micron Technology Inc. 616,214 USD 51,240,851 52,365,866 1.11Microsoft Corp. 994,219 USD 252,167,575 269,333,927 5.73Mission Produce Inc. 107,786 USD 1,635,114 2,232,248 0.05Monster Beverage Corp. 18,613 USD 1,773,819 1,700,298 0.04Moody’s Corp. 28,416 USD 9,430,702 10,297,106 0.22Natera Inc. 269,551 USD 25,960,457 30,602,125 0.65Netflix Inc. 1,245 USD 655,667 657,621 0.01NGM Biopharmaceuticals Inc. 119,900 USD 3,227,708 2,364,428 0.05NOW Inc. 496,728 USD 3,124,419 4,713,949 0.10NVIDIA Corp. 9,000 USD 6,248,970 7,200,900 0.15Occidental Petroleum Corp. 169,612 USD 4,808,500 5,303,767 0.11Odonate Therapeutics Inc. 60,901 USD 930,567 212,544 0.00Oncorus Inc. 449,294 USD 6,914,635 6,200,257 0.13OneSpan Inc. 38,310 USD 1,116,116 978,437 0.02O’Reilly Automotive Inc. 21,755 USD 10,032,318 12,317,899 0.26Orion Energy Systems Inc. 347,212 USD 3,798,499 1,989,525 0.04PayPal Holdings Inc. 204,595 USD 52,632,435 59,635,351 1.27PDF Solutions Inc. 38,117 USD 711,644 692,967 0.01PepsiCo Inc. 100,000 USD 14,610,000 14,817,000 0.32Pfizer Inc. 1,187,302 USD 47,348,604 46,494,746 0.99Philip Morris International Inc. 76,366 USD 7,535,033 7,568,634 0.16Phillips 66 136,000 USD 11,526,010 11,671,520 0.25Pinterest Inc.-A- 941,029 USD 63,152,491 74,294,240 1.58Procter & Gamble Co. 304,619 USD 40,023,760 41,102,242 0.87ProSight Global Inc. 54,996 USD 703,949 701,749 0.02Protagonist Therapeutics Inc. 793,806 USD 22,242,444 35,626,013 0.76Qorvo Inc. 1,333 USD 176,046 260,801 0.01QUALCOMM Inc. 132,000 USD 18,033,240 18,866,760 0.40Qualtrics International Inc.-A- 1,596,634 USD 54,285,556 61,071,250 1.30Radiant Logistics Inc. 101,646 USD 716,604 704,407 0.02RBC Bearings Inc. 911 USD 131,394 181,672 0.00Red Rock Resorts Inc.-A- 169,049 USD 4,149,025 7,184,582 0.15Repay Holdings Corp. 761,000 USD 16,840,930 18,294,440 0.39Rubicon Project Inc. 156,910 USD 5,058,778 5,309,834 0.11Sailpoint Technologies Holdings Inc. 211,683 USD 9,709,899 10,810,651 0.23salesforce.com Inc. 22,500 USD 5,126,243 5,496,075 0.12SBA Communications REIT Corp. 123,136 USD 39,069,821 39,243,443 0.83Scientific Games Corp. 87,393 USD 3,652,153 6,767,714 0.14Sciplay Corp.-A- 151,508 USD 2,649,875 2,568,061 0.05ServiceNow Inc. 79,238 USD 38,591,518 43,545,243 0.93Sherwin-Williams Co. 61,768 USD 16,629,799 16,828,692 0.36Snowflake Inc.-A- 1,195,016 USD 238,811,997 288,954,869 6.15SPS Commerce Inc. 19,694 USD 1,944,783 1,966,446 0.04Square Inc.-A- 468,528 USD 97,890,467 114,227,126 2.43SQZ Biotechnologies Co. 69,276 USD 807,758 1,001,038 0.02
Xtrackers**
Xtrackers MSCI WORLD SWAP UCITS ETF* (continued)
Statement of Investmentsas at 30 June 2021(expressed in USD)
* This is a synthetic ETF.** This includes synthetic ETFs.
The accompanying notes form an integral part of these financial statements.
51

Description QuantityCurrency
(local) Cost Market Value
% ofNet
Assets
Transferable securities and money market instruments admitted to an official stock exchange listing
Shares (continued)
United States (continued)StoneMor Inc. 397,929 USD 962,988 1,042,574 0.02Super Micro Computer Inc. 2,912 USD 88,321 102,444 0.00SVB Financial Group 2,481 USD 569,613 1,380,503 0.03Synchrony Financial 32,000 USD 1,426,880 1,552,640 0.03Take-Two Interactive Software Inc. 44,248 USD 7,172,099 7,832,781 0.17Tapestry Inc. 226,855 USD 9,970,277 9,863,655 0.21TechTarget Inc. 66,374 USD 2,647,659 5,143,321 0.11Tenet Healthcare Corp. 737,151 USD 48,217,047 49,381,745 1.05Texas Instruments Inc. 207,679 USD 37,160,013 39,936,672 0.85Triumph Bancorp Inc. 175,355 USD 15,908,206 13,020,109 0.28Twilio Inc.-A- 124,465 USD 39,216,432 49,059,124 1.04Twitter Inc. 43,619 USD 1,760,265 3,001,423 0.06Tyler Technologies Inc. 1,860 USD 642,556 841,408 0.02Union Pacific Corp. 53,000 USD 11,910,690 11,656,290 0.25United Parcel Service Inc.-B- 153,185 USD 31,149,719 31,857,884 0.68UNITY Biotechnology Inc. 168,158 USD 756,711 780,253 0.02Vapotherm Inc. 59,900 USD 3,159,725 1,416,036 0.03Veritone Inc. 132,362 USD 2,546,645 2,608,855 0.06Verizon Communications Inc. 392,435 USD 22,772,501 21,988,133 0.47Vertex Pharmaceuticals Inc. 416,968 USD 89,247,323 84,073,258 1.79Vulcan Materials Co. 8,000 USD 1,443,920 1,392,560 0.03Walmart Inc. 81,566 USD 11,233,270 11,502,437 0.24Walt Disney Co. 99,588 USD 17,945,726 17,504,583 0.37Washington Federal Inc. 770,822 USD 25,298,378 24,496,723 0.52WEC Energy Group Inc. 38,000 USD 3,579,980 3,380,100 0.07Western Digital Corp. 22,000 USD 1,480,160 1,565,740 0.03Whiting Petroleum Corp. 219,623 USD 8,982,581 11,980,435 0.25Willdan Group Inc. 18,203 USD 691,896 685,161 0.01Workiva Inc. 67,191 USD 3,719,022 7,480,374 0.16Zoetis Inc. 95,813 USD 16,453,008 17,855,711 0.38
4,101,263,893 4,440,529,127 94.44
Total - Shares 4,479,057,988 4,847,833,140 103.11
Total Transferable securities and money market instruments admitted to an officialstock exchange listing 4,479,057,988 4,847,833,140 103.11
TOTAL INVESTMENT PORTFOLIO 4,479,057,988 4,847,833,140 103.11
Xtrackers**
Xtrackers MSCI WORLD SWAP UCITS ETF* (continued)
Statement of Investmentsas at 30 June 2021(expressed in USD)
* This is a synthetic ETF.** This includes synthetic ETFs.
The accompanying notes form an integral part of these financial statements.
52

Description QuantityCurrency
(local) Cost Market Value
% ofNet
Assets
Transferable securities and money market instruments admitted to an official stock exchange listing(A)
Shares
AustriaErste Group Bank AG 84,071 EUR 2,357,975 3,084,713 0.09OMV AG 44,319 EUR 1,785,936 2,521,204 0.08Raiffeisen Bank International AG 44,545 EUR 1,018,458 1,008,975 0.03Verbund AG 20,492 EUR 910,361 1,887,010 0.06voestalpine AG 34,925 EUR 1,183,857 1,422,280 0.04
7,256,587 9,924,182 0.30BelgiumAgeas SA 52,693 EUR 2,276,069 2,924,469 0.09Anheuser-Busch InBev SA 229,298 EUR 19,445,520 16,535,737 0.50Colruyt SA 16,389 EUR 938,138 916,589 0.03Elia Group SA 9,909 EUR 1,156,176 1,045,847 0.03Groupe Bruxelles Lambert SA 33,991 EUR 3,002,487 3,802,840 0.11KBC Group NV 75,238 EUR 4,709,666 5,737,154 0.17Proximus SADP 45,775 EUR 1,293,642 884,296 0.03Sofina SA 4,638 EUR 1,288,691 2,000,975 0.06Solvay SA 22,303 EUR 2,495,156 2,835,348 0.09UCB SA 38,046 EUR 3,173,887 3,977,671 0.12Umicore SA 59,320 EUR 2,135,802 3,622,903 0.11
41,915,234 44,283,829 1.34DenmarkAmbu A/S-B- 50,403 DKK 1,700,320 1,937,974 0.06AP Moller-Maersk A/S-A- 957 DKK 1,366,759 2,658,609 0.08AP Moller-Maersk A/S-B- 1,845 DKK 2,724,924 5,303,542 0.16Carlsberg AS-B- 31,000 DKK 3,506,733 5,779,238 0.18Chr Hansen Holdings A/S 31,743 DKK 2,477,545 2,865,225 0.09Coloplast A/S-B- 35,751 DKK 3,878,259 5,866,755 0.18Danske Bank A/S 207,567 DKK 4,399,034 3,652,792 0.11Demant A/S 32,594 DKK 809,494 1,834,876 0.06DSV PANALPINA A/S 62,293 DKK 4,931,142 14,528,791 0.44Genmab A/S 19,725 DKK 3,715,390 8,071,756 0.24GN Store Nord AS 38,532 DKK 2,141,333 3,366,185 0.10Novo Nordisk A/S-B- 518,185 DKK 27,769,638 43,417,946 1.31Novozymes A/S-B- 62,633 DKK 2,974,785 4,721,535 0.14Orsted AS 144A 56,928 DKK 4,180,608 7,989,194 0.24Pandora A/S 30,093 DKK 2,056,907 4,045,642 0.12ROCKWOOL International A/S-B- 2,586 DKK 973,252 1,259,069 0.04Tryg A/S 108,353 DKK 2,268,308 2,660,204 0.08Vestas Wind Systems A/S 305,715 DKK 5,170,170 11,935,003 0.36
77,044,601 131,894,336 3.99FinlandElisa OYJ 42,803 EUR 1,837,951 2,554,248 0.08Fortum OYJ 133,658 EUR 2,705,146 3,686,829 0.11Kesko OYJ-B- 82,194 EUR 2,166,395 3,036,312 0.09Kone OYJ-B- 102,284 EUR 5,302,118 8,345,348 0.25Neste OYJ 127,314 EUR 3,214,980 7,796,697 0.24Nokia OYJ 1,622,531 EUR 8,799,671 8,688,547 0.26Nordea Bank Abp 975,008 SEK 9,267,111 10,860,341 0.33Orion OYJ-B- 31,927 EUR 1,252,840 1,372,507 0.04
Xtrackers**
Xtrackers MSCI EUROPE UCITS ETF
Statement of Investmentsas at 30 June 2021(expressed in USD)
** This includes synthetic ETFs.
The accompanying notes form an integral part of these financial statements.
53

Description QuantityCurrency
(local) Cost Market Value
% ofNet
Assets
Transferable securities and money market instruments admitted to an official stock exchange listing(A)
Shares (continued)
Finland (continued)Sampo OYJ-A- 150,086 EUR 6,383,420 6,898,779 0.21Stora Enso OYJ-R- 175,066 EUR 2,057,504 3,194,093 0.10UPM-Kymmene OYJ 160,618 EUR 3,974,250 6,076,216 0.18Wartsila OYJ Abp 142,455 EUR 2,008,908 2,114,252 0.07
48,970,294 64,624,169 1.96FranceAccor SA 51,128 EUR 2,100,763 1,909,325 0.06Aeroports de Paris 8,934 EUR 1,211,837 1,163,843 0.03Air Liquide SA 142,546 EUR 16,771,685 24,961,242 0.75Alstom SA 83,780 EUR 3,320,914 4,231,519 0.13Amundi SA 144A 18,289 EUR 1,389,900 1,612,572 0.05Arkema SA 18,474 EUR 1,701,222 2,317,901 0.07Atos SE 29,790 EUR 2,144,317 1,812,325 0.05AXA SA 582,217 EUR 13,560,593 14,765,305 0.45BioMerieux 12,467 EUR 1,174,858 1,448,893 0.04BNP Paribas SA 338,494 EUR 18,614,167 21,223,088 0.64Bollore SA 265,983 EUR 1,168,216 1,425,741 0.04Bouygues SA 68,750 EUR 2,549,771 2,542,941 0.08Bureau Veritas SA 88,454 EUR 2,087,457 2,798,669 0.08Capgemini SE 48,253 EUR 4,740,326 9,270,168 0.28Carrefour SA 184,537 EUR 4,176,307 3,629,503 0.11Cie de Saint-Gobain 152,287 EUR 6,345,880 10,030,371 0.30Cie Generale des Etablissements Michelin SCA 50,985 EUR 5,667,357 8,132,293 0.25CNP Assurances 51,656 EUR 900,206 879,065 0.03Covivio REIT 15,654 EUR 1,369,288 1,338,842 0.04Credit Agricole SA 351,090 EUR 4,360,747 4,918,852 0.15Danone SA 196,297 EUR 13,990,518 13,820,667 0.42Dassault Aviation SA 754 EUR 853,417 887,016 0.03Dassault Systemes SE 39,761 EUR 4,593,014 9,642,705 0.29Edenred 74,205 EUR 2,810,222 4,228,388 0.13Eiffage SA 25,068 EUR 2,168,365 2,550,676 0.08Electricite de France SA 139,930 EUR 1,943,931 1,911,664 0.06Engie SA 549,641 EUR 8,984,637 7,531,124 0.23EssilorLuxottica SA 85,871 EUR 10,579,852 15,849,517 0.48Eurazeo SE 11,887 EUR 710,337 1,036,115 0.03Faurecia SE 24,475 EUR 1,339,125 1,200,761 0.04Faurecia SE 10,833 EUR 339,463 529,933 0.02Gecina REIT SA 13,818 EUR 1,960,896 2,117,171 0.06Getlink SE 132,410 EUR 1,742,041 2,064,880 0.06Hermes International 9,531 EUR 5,381,225 13,885,513 0.42Iliad SA 4,462 EUR 690,973 652,970 0.02Ipsen SA 11,350 EUR 1,190,522 1,180,709 0.04Kering SA 22,573 EUR 8,984,851 19,728,999 0.60Klepierre REIT SA 62,110 EUR 1,986,334 1,600,551 0.05La Francaise des Jeux SAEM 144A 28,739 EUR 1,064,075 1,689,766 0.05Legrand SA 80,484 EUR 5,165,258 8,519,512 0.26L’Oreal SA 75,815 EUR 17,779,745 33,787,822 1.02LVMH Moet Hennessy Louis Vuitton SE 83,544 EUR 25,841,620 65,518,217 1.98
Xtrackers**
Xtrackers MSCI EUROPE UCITS ETF (continued)
Statement of Investmentsas at 30 June 2021(expressed in USD)
** This includes synthetic ETFs.
The accompanying notes form an integral part of these financial statements.
54

Description QuantityCurrency
(local) Cost Market Value
% ofNet
Assets
Transferable securities and money market instruments admitted to an official stock exchange listing(A)
Shares (continued)
France (continued)Natixis SA 284,918 EUR 1,463,584 1,351,538 0.04Orange SA 600,372 EUR 8,634,068 6,845,702 0.21Orpea SA 15,560 EUR 1,845,316 1,979,043 0.06Pernod Ricard SA 63,046 EUR 9,091,921 13,996,249 0.42Publicis Groupe SA 64,571 EUR 3,694,252 4,130,444 0.12Remy Cointreau SA 6,839 EUR 771,079 1,412,016 0.04Renault SA 57,845 EUR 3,692,666 2,338,177 0.07Safran SA 102,855 EUR 10,262,784 14,261,411 0.43Sanofi 340,978 EUR 32,280,840 35,729,781 1.08Sartorius Stedim Biotech 8,322 EUR 1,297,388 3,936,770 0.12Schneider Electric SE 162,117 EUR 13,568,754 25,508,346 0.77SCOR SE 47,716 EUR 1,624,431 1,517,648 0.05SEB SA 8,326 EUR 1,123,907 1,504,768 0.05Societe Generale SA 243,966 EUR 8,673,163 7,192,481 0.22Sodexo SA 26,624 EUR 2,571,501 2,484,828 0.07Suez SA 104,002 EUR 1,606,584 2,472,887 0.07Teleperformance 17,674 EUR 3,348,160 7,174,474 0.22Thales SA 32,104 EUR 2,738,555 3,275,728 0.10TotalEnergies SE 751,833 EUR 36,861,586 34,018,967 1.03Ubisoft Entertainment SA 27,870 EUR 2,202,713 1,951,334 0.06Unibail-Rodamco-Westfield REIT 37,504 EUR 7,380,492 3,246,304 0.10Valeo SA 69,103 EUR 2,590,237 2,079,053 0.06Veolia Environnement SA 162,173 EUR 3,490,198 4,898,417 0.15Vinci SA 160,207 EUR 13,278,592 17,097,162 0.52Vivendi SE 214,142 EUR 5,453,019 7,194,435 0.22Wendel SE 8,074 EUR 983,939 1,085,801 0.03Worldline SA 144A 71,501 EUR 5,249,107 6,693,566 0.20
401,235,068 545,724,464 16.51Germanyadidas AG 57,296 EUR 11,292,908 21,328,676 0.65Allianz SE 124,072 EUR 23,814,768 30,942,923 0.94BASF SE 276,400 EUR 22,156,898 21,777,897 0.66Bayer AG 295,643 EUR 27,687,793 17,954,390 0.54Bayerische Motoren Werke AG 99,638 EUR 8,726,088 10,552,938 0.32Bayerische Motoren Werke AG-Pref- 17,113 EUR 1,178,272 1,538,309 0.05Bechtle AG 8,215 EUR 1,792,325 1,526,111 0.05Beiersdorf AG 30,334 EUR 3,076,616 3,660,264 0.11Brenntag SE 46,494 EUR 2,481,740 4,323,864 0.13Carl Zeiss Meditec AG 12,112 EUR 1,224,722 2,340,553 0.07Commerzbank AG 301,500 EUR 2,904,212 2,138,858 0.06Continental AG 33,104 EUR 5,589,262 4,867,213 0.15Covestro AG 144A 58,140 EUR 3,471,386 3,754,922 0.11Daimler AG 257,559 EUR 16,870,140 22,999,585 0.70Delivery Hero SE 144A 47,257 EUR 3,571,696 6,243,090 0.19Deutsche Bank AG 621,958 EUR 10,011,419 8,103,058 0.25Deutsche Boerse AG 57,555 EUR 6,794,848 10,047,064 0.30Deutsche Lufthansa AG 89,940 EUR 1,468,956 1,012,202 0.03Deutsche Post AG 298,298 EUR 10,067,161 20,291,202 0.61
Xtrackers**
Xtrackers MSCI EUROPE UCITS ETF (continued)
Statement of Investmentsas at 30 June 2021(expressed in USD)
** This includes synthetic ETFs.
The accompanying notes form an integral part of these financial statements.
55

Description QuantityCurrency
(local) Cost Market Value
% ofNet
Assets
Transferable securities and money market instruments admitted to an official stock exchange listing(A)
Shares (continued)
Germany (continued)Deutsche Telekom AG 1,003,012 EUR 16,335,082 21,186,885 0.64Deutsche Wohnen SE 102,874 EUR 3,690,478 6,292,674 0.19E.ON SE 675,629 EUR 7,743,773 7,815,186 0.24Evonik Industries AG 63,105 EUR 1,892,077 2,116,369 0.06Fresenius Medical Care AG & Co. KGaA 61,696 EUR 4,657,334 5,124,499 0.15Fresenius SE & Co. KGaA 125,836 EUR 6,763,841 6,565,329 0.20FUCHS PETROLUB SE-Pref- 20,915 EUR 926,679 1,017,424 0.03GEA Group AG 46,168 EUR 1,636,839 1,870,283 0.06Hannover Rueck SE 18,146 EUR 2,291,535 3,036,381 0.09HeidelbergCement AG 44,782 EUR 3,153,636 3,841,760 0.12HelloFresh SE 49,705 EUR 3,138,407 4,832,327 0.15Henkel AG & Co. KGaA 31,272 EUR 2,921,414 2,879,688 0.09Henkel AG & Co. KGaA-Pref- 53,615 EUR 5,602,041 5,661,347 0.17Infineon Technologies AG 392,993 EUR 7,324,336 15,761,832 0.48KION Group AG 21,715 EUR 1,568,744 2,314,575 0.07Knorr-Bremse AG 21,830 EUR 2,406,807 2,511,156 0.08LANXESS AG 25,000 EUR 1,459,588 1,714,219 0.05LEG Immobilien AG 21,701 EUR 2,774,430 3,125,544 0.09Merck KGaA 38,893 EUR 4,126,251 7,458,127 0.23MTU Aero Engines AG 16,053 EUR 2,963,009 3,976,884 0.12Muenchener Rueckversicherungs-Gesellschaft AG 42,160 EUR 9,324,921 11,546,939 0.35Nemetschek SE 17,379 EUR 1,363,609 1,329,742 0.04Porsche Automobil Holdings SE-Pref- 46,080 EUR 3,308,545 4,937,840 0.15Puma SE 31,816 EUR 1,879,786 3,793,813 0.11Rational AG 1,540 EUR 1,372,844 1,395,283 0.04RWE AG 193,321 EUR 5,728,771 7,006,170 0.21SAP SE 314,242 EUR 32,262,871 44,286,887 1.34Sartorius AG-Pref- 7,887 EUR 1,591,646 4,106,054 0.12Scout24 AG 144A 27,789 EUR 2,141,233 2,343,759 0.07Siemens AG 230,213 EUR 23,483,887 36,479,560 1.10Siemens Healthineers AG 144A 82,006 EUR 3,586,396 5,025,930 0.15Symrise AG 38,716 EUR 3,212,954 5,394,816 0.16TeamViewer AG 144A 48,407 EUR 2,466,755 1,820,915 0.06Telefonica Deutschland Holdings AG 313,299 EUR 1,191,548 826,680 0.02Uniper SE 27,532 EUR 792,668 1,014,116 0.03United Internet AG 29,190 EUR 1,224,729 1,193,575 0.04Volkswagen AG 9,768 EUR 1,843,141 3,206,417 0.10Volkswagen AG-Pref- 55,848 EUR 10,201,706 13,987,813 0.42Vonovia SE 161,779 EUR 7,471,966 10,459,870 0.32Zalando SE 144A 49,931 EUR 2,592,922 6,036,786 0.18Zalando SE 144A 14,154 SEK — 1,711,255 0.05
364,600,409 472,409,828 14.29IrelandCRH PLC 236,252 EUR 7,228,091 11,907,284 0.36DCC PLC 29,660 GBP 2,452,596 2,424,830 0.07Flutter Entertainment PLC 50,085 EUR 6,569,408 9,069,743 0.28Kerry Group PLC-A- 47,857 EUR 4,746,331 6,685,579 0.20Kingspan Group PLC 46,456 EUR 2,256,333 4,387,543 0.13
Xtrackers**
Xtrackers MSCI EUROPE UCITS ETF (continued)
Statement of Investmentsas at 30 June 2021(expressed in USD)
** This includes synthetic ETFs.
The accompanying notes form an integral part of these financial statements.
56

Description QuantityCurrency
(local) Cost Market Value
% ofNet
Assets
Transferable securities and money market instruments admitted to an official stock exchange listing(A)
Shares (continued)
Ireland (continued)Ryanair Holdings PLC 1 EUR 13 19 0.00Smurfit Kappa Group PLC 73,753 EUR 2,696,153 4,001,466 0.12
25,948,925 38,476,464 1.16Isle Of ManGVC Holdings PLC 176,115 GBP 1,932,819 4,246,699 0.13
1,932,819 4,246,699 0.13ItalyAmplifon SpA 37,470 EUR 1,511,807 1,850,302 0.06Assicurazioni Generali SpA 331,999 EUR 5,919,389 6,655,800 0.20Atlantia SpA 149,103 EUR 3,300,738 2,700,062 0.08DiaSorin SpA 7,576 EUR 1,583,939 1,433,009 0.04Enel SpA 2,447,583 EUR 14,985,425 22,733,086 0.69Eni SpA 759,527 EUR 12,192,080 9,250,431 0.28FinecoBank Banca Fineco SpA 183,434 EUR 1,997,753 3,197,757 0.10Infrastrutture Wireless Italiane SpA 144A 101,134 EUR 1,102,161 1,140,821 0.03Intesa Sanpaolo SpA 4,970,160 EUR 12,449,220 13,730,342 0.41Mediobanca Banca di Credito Finanziario SpA 186,898 EUR 1,648,842 2,183,178 0.07Moncler SpA 58,310 EUR 2,466,648 3,945,691 0.12Nexi SpA 144A 132,243 EUR 2,249,413 2,902,869 0.09Poste Italiane SpA 144A 157,220 EUR 1,322,099 2,078,887 0.06Prysmian SpA 76,659 EUR 1,716,363 2,748,208 0.08Recordati Industria Chimica e Farmaceutica SpA 31,466 EUR 1,292,402 1,798,609 0.05Snam SpA 606,834 EUR 2,766,035 3,508,268 0.11Telecom Italia SpA 2,998,532 EUR 2,201,121 1,489,592 0.04Telecom Italia SpA-RSP- 1,813,955 EUR 1,192,791 961,143 0.03Terna Rete Elettrica Nazionale SpA 423,410 EUR 2,405,511 3,155,336 0.10UniCredit SpA 639,600 EUR 10,118,415 7,547,095 0.23
84,422,152 95,010,486 2.87JerseyExperian PLC 276,051 GBP 6,724,546 10,624,430 0.32Ferguson PLC 67,724 GBP 4,702,590 9,402,512 0.28Glencore PLC 3,007,283 GBP 9,283,485 12,855,827 0.39WPP PLC 368,742 GBP 5,475,348 4,962,562 0.15
26,185,969 37,845,331 1.14LuxembourgArcelorMittal SA 215,716 EUR 4,193,315 6,612,888 0.20Aroundtown SA 300,651 EUR 2,329,008 2,346,048 0.07Eurofins Scientific SE 40,180 EUR 2,094,519 4,593,410 0.14InPost SA 60,186 EUR 1,115,492 1,208,087 0.03Tenaris SA 142,105 EUR 1,849,764 1,549,058 0.05
11,582,098 16,309,491 0.49NetherlandsABN AMRO Bank NV 144A 127,294 EUR 2,379,873 1,538,564 0.05Adyen NV 144A 5,936 EUR 7,054,841 14,504,902 0.44Aegon NV 538,478 EUR 2,936,433 2,234,396 0.07Airbus SE 176,982 EUR 14,954,629 22,759,719 0.69Akzo Nobel NV 57,352 EUR 4,563,851 7,087,035 0.21Argenx SE 707 EUR 165,891 213,884 0.01
Xtrackers**
Xtrackers MSCI EUROPE UCITS ETF (continued)
Statement of Investmentsas at 30 June 2021(expressed in USD)
** This includes synthetic ETFs.
The accompanying notes form an integral part of these financial statements.
57
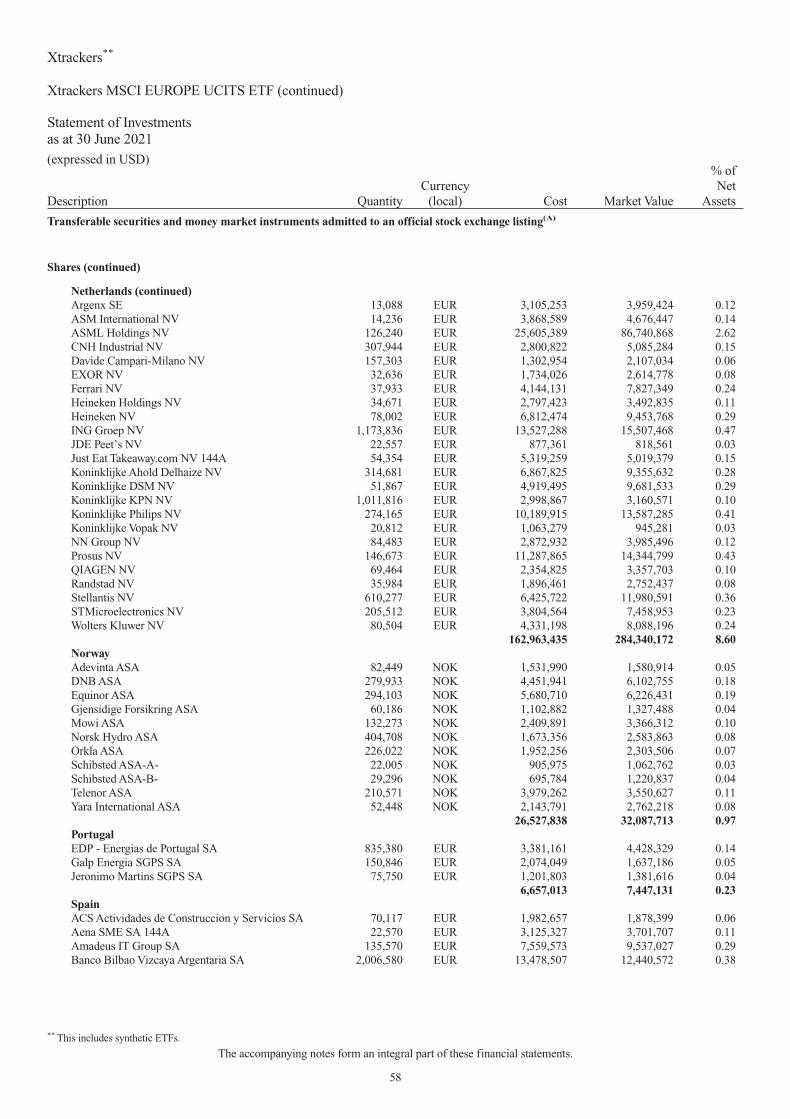
Description QuantityCurrency
(local) Cost Market Value
% ofNet
Assets
Transferable securities and money market instruments admitted to an official stock exchange listing(A)
Shares (continued)
Netherlands (continued)Argenx SE 13,088 EUR 3,105,253 3,959,424 0.12ASM International NV 14,236 EUR 3,868,589 4,676,447 0.14ASML Holdings NV 126,240 EUR 25,605,389 86,740,868 2.62CNH Industrial NV 307,944 EUR 2,800,822 5,085,284 0.15Davide Campari-Milano NV 157,303 EUR 1,302,954 2,107,034 0.06EXOR NV 32,636 EUR 1,734,026 2,614,778 0.08Ferrari NV 37,933 EUR 4,144,131 7,827,349 0.24Heineken Holdings NV 34,671 EUR 2,797,423 3,492,835 0.11Heineken NV 78,002 EUR 6,812,474 9,453,768 0.29ING Groep NV 1,173,836 EUR 13,527,288 15,507,468 0.47JDE Peet’s NV 22,557 EUR 877,361 818,561 0.03Just Eat Takeaway.com NV 144A 54,354 EUR 5,319,259 5,019,379 0.15Koninklijke Ahold Delhaize NV 314,681 EUR 6,867,825 9,355,632 0.28Koninklijke DSM NV 51,867 EUR 4,919,495 9,681,533 0.29Koninklijke KPN NV 1,011,816 EUR 2,998,867 3,160,571 0.10Koninklijke Philips NV 274,165 EUR 10,189,915 13,587,285 0.41Koninklijke Vopak NV 20,812 EUR 1,063,279 945,281 0.03NN Group NV 84,483 EUR 2,872,932 3,985,496 0.12Prosus NV 146,673 EUR 11,287,865 14,344,799 0.43QIAGEN NV 69,464 EUR 2,354,825 3,357,703 0.10Randstad NV 35,984 EUR 1,896,461 2,752,437 0.08Stellantis NV 610,277 EUR 6,425,722 11,980,591 0.36STMicroelectronics NV 205,512 EUR 3,804,564 7,458,953 0.23Wolters Kluwer NV 80,504 EUR 4,331,198 8,088,196 0.24
162,963,435 284,340,172 8.60NorwayAdevinta ASA 82,449 NOK 1,531,990 1,580,914 0.05DNB ASA 279,933 NOK 4,451,941 6,102,755 0.18Equinor ASA 294,103 NOK 5,680,710 6,226,431 0.19Gjensidige Forsikring ASA 60,186 NOK 1,102,882 1,327,488 0.04Mowi ASA 132,273 NOK 2,409,891 3,366,312 0.10Norsk Hydro ASA 404,708 NOK 1,673,356 2,583,863 0.08Orkla ASA 226,022 NOK 1,952,256 2,303,506 0.07Schibsted ASA-A- 22,005 NOK 905,975 1,062,762 0.03Schibsted ASA-B- 29,296 NOK 695,784 1,220,837 0.04Telenor ASA 210,571 NOK 3,979,262 3,550,627 0.11Yara International ASA 52,448 NOK 2,143,791 2,762,218 0.08
26,527,838 32,087,713 0.97PortugalEDP - Energias de Portugal SA 835,380 EUR 3,381,161 4,428,329 0.14Galp Energia SGPS SA 150,846 EUR 2,074,049 1,637,186 0.05Jeronimo Martins SGPS SA 75,750 EUR 1,201,803 1,381,616 0.04
6,657,013 7,447,131 0.23SpainACS Actividades de Construccion y Servicios SA 70,117 EUR 1,982,657 1,878,399 0.06Aena SME SA 144A 22,570 EUR 3,125,327 3,701,707 0.11Amadeus IT Group SA 135,570 EUR 7,559,573 9,537,027 0.29Banco Bilbao Vizcaya Argentaria SA 2,006,580 EUR 13,478,507 12,440,572 0.38
Xtrackers**
Xtrackers MSCI EUROPE UCITS ETF (continued)
Statement of Investmentsas at 30 June 2021(expressed in USD)
** This includes synthetic ETFs.
The accompanying notes form an integral part of these financial statements.
58
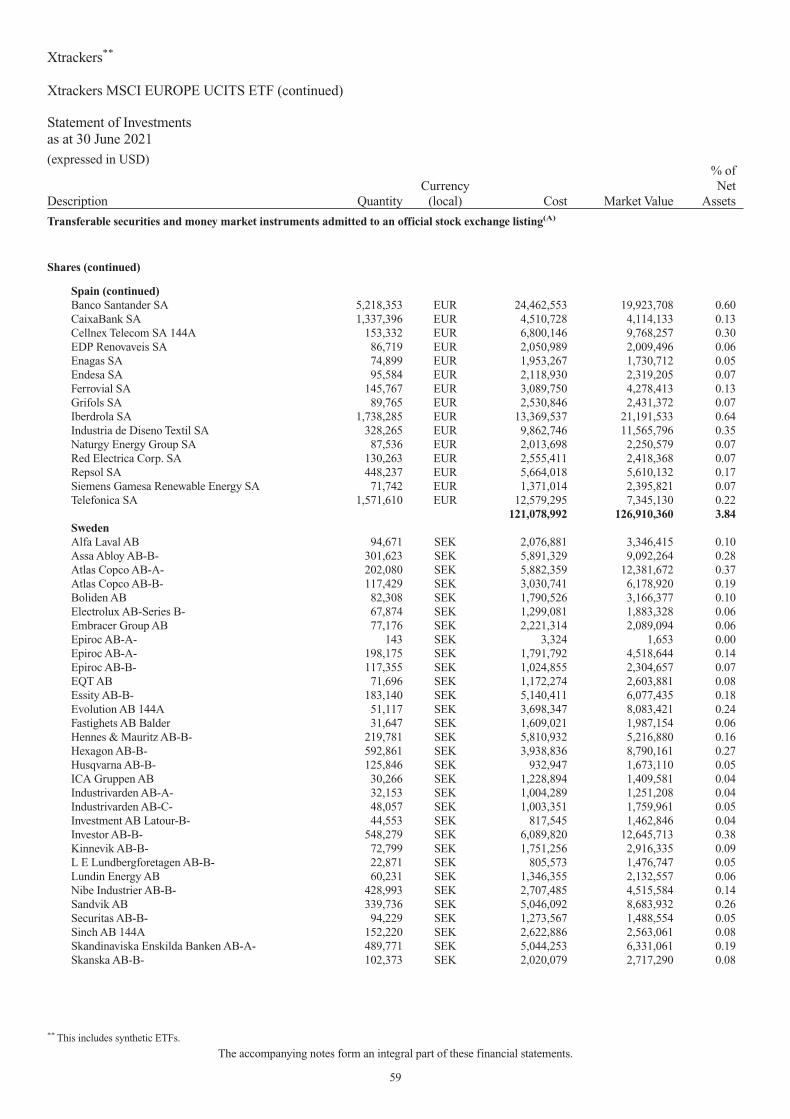
Description QuantityCurrency
(local) Cost Market Value
% ofNet
Assets
Transferable securities and money market instruments admitted to an official stock exchange listing(A)
Shares (continued)
Spain (continued)Banco Santander SA 5,218,353 EUR 24,462,553 19,923,708 0.60CaixaBank SA 1,337,396 EUR 4,510,728 4,114,133 0.13Cellnex Telecom SA 144A 153,332 EUR 6,800,146 9,768,257 0.30EDP Renovaveis SA 86,719 EUR 2,050,989 2,009,496 0.06Enagas SA 74,899 EUR 1,953,267 1,730,712 0.05Endesa SA 95,584 EUR 2,118,930 2,319,205 0.07Ferrovial SA 145,767 EUR 3,089,750 4,278,413 0.13Grifols SA 89,765 EUR 2,530,846 2,431,372 0.07Iberdrola SA 1,738,285 EUR 13,369,537 21,191,533 0.64Industria de Diseno Textil SA 328,265 EUR 9,862,746 11,565,796 0.35Naturgy Energy Group SA 87,536 EUR 2,013,698 2,250,579 0.07Red Electrica Corp. SA 130,263 EUR 2,555,411 2,418,368 0.07Repsol SA 448,237 EUR 5,664,018 5,610,132 0.17Siemens Gamesa Renewable Energy SA 71,742 EUR 1,371,014 2,395,821 0.07Telefonica SA 1,571,610 EUR 12,579,295 7,345,130 0.22
121,078,992 126,910,360 3.84SwedenAlfa Laval AB 94,671 SEK 2,076,881 3,346,415 0.10Assa Abloy AB-B- 301,623 SEK 5,891,329 9,092,264 0.28Atlas Copco AB-A- 202,080 SEK 5,882,359 12,381,672 0.37Atlas Copco AB-B- 117,429 SEK 3,030,741 6,178,920 0.19Boliden AB 82,308 SEK 1,790,526 3,166,377 0.10Electrolux AB-Series B- 67,874 SEK 1,299,081 1,883,328 0.06Embracer Group AB 77,176 SEK 2,221,314 2,089,094 0.06Epiroc AB-A- 143 SEK 3,324 1,653 0.00Epiroc AB-A- 198,175 SEK 1,791,792 4,518,644 0.14Epiroc AB-B- 117,355 SEK 1,024,855 2,304,657 0.07EQT AB 71,696 SEK 1,172,274 2,603,881 0.08Essity AB-B- 183,140 SEK 5,140,411 6,077,435 0.18Evolution AB 144A 51,117 SEK 3,698,347 8,083,421 0.24Fastighets AB Balder 31,647 SEK 1,609,021 1,987,154 0.06Hennes & Mauritz AB-B- 219,781 SEK 5,810,932 5,216,880 0.16Hexagon AB-B- 592,861 SEK 3,938,836 8,790,161 0.27Husqvarna AB-B- 125,846 SEK 932,947 1,673,110 0.05ICA Gruppen AB 30,266 SEK 1,228,894 1,409,581 0.04Industrivarden AB-A- 32,153 SEK 1,004,289 1,251,208 0.04Industrivarden AB-C- 48,057 SEK 1,003,351 1,759,961 0.05Investment AB Latour-B- 44,553 SEK 817,545 1,462,846 0.04Investor AB-B- 548,279 SEK 6,089,820 12,645,713 0.38Kinnevik AB-B- 72,799 SEK 1,751,256 2,916,335 0.09L E Lundbergforetagen AB-B- 22,871 SEK 805,573 1,476,747 0.05Lundin Energy AB 60,231 SEK 1,346,355 2,132,557 0.06Nibe Industrier AB-B- 428,993 SEK 2,707,485 4,515,584 0.14Sandvik AB 339,736 SEK 5,046,092 8,683,932 0.26Securitas AB-B- 94,229 SEK 1,273,567 1,488,554 0.05Sinch AB 144A 152,220 SEK 2,622,886 2,563,061 0.08Skandinaviska Enskilda Banken AB-A- 489,771 SEK 5,044,253 6,331,061 0.19Skanska AB-B- 102,373 SEK 2,020,079 2,717,290 0.08
Xtrackers**
Xtrackers MSCI EUROPE UCITS ETF (continued)
Statement of Investmentsas at 30 June 2021(expressed in USD)
** This includes synthetic ETFs.
The accompanying notes form an integral part of these financial statements.
59

Description QuantityCurrency
(local) Cost Market Value
% ofNet
Assets
Transferable securities and money market instruments admitted to an official stock exchange listing(A)
Shares (continued)
Sweden (continued)SKF AB-B- 114,844 SEK 2,264,916 2,926,107 0.09Svenska Cellulosa AB SCA-B- 182,325 SEK 2,325,079 2,990,018 0.09Svenska Handelsbanken AB-A- 438,934 SEK 5,365,072 4,955,884 0.15Swedbank AB-A- 272,525 SEK 5,336,862 5,074,383 0.15Swedish Match AB 488,112 SEK 2,201,988 4,165,317 0.13Tele2 AB-B- 150,719 SEK 1,863,270 2,054,903 0.06Telefonaktiebolaget LM Ericsson-B- 878,353 SEK 8,631,439 11,047,006 0.33Telia Co. AB 799,956 SEK 3,969,863 3,552,595 0.11Volvo AB-A- 60,260 SEK 1,636,255 1,495,200 0.05Volvo AB-B- 430,218 SEK 6,185,641 10,357,850 0.31
119,856,800 179,368,759 5.43SwitzerlandABB Ltd. 521,972 CHF 10,951,458 17,725,646 0.54Adecco Group AG 46,635 CHF 2,834,749 3,171,392 0.10Alcon Inc. 150,376 CHF 8,175,561 10,538,603 0.32Baloise Holdings AG 13,951 CHF 1,991,024 2,177,886 0.07Banque Cantonale Vaudoise 9,065 CHF 885,408 814,953 0.02Barry Callebaut AG 1,074 CHF 1,946,077 2,498,080 0.08Chocoladefabriken Lindt & Spruengli AG 310 CHF 2,342,264 3,087,088 0.09Chocoladefabriken Lindt & Spruengli AG 33 CHF 2,383,613 3,459,404 0.10Cie Financiere Richemont SA 157,086 CHF 12,113,865 19,025,020 0.58Clariant AG 64,929 CHF 1,262,858 1,292,469 0.04Coca-Cola HBC AG 60,300 GBP 1,432,174 2,177,500 0.07Credit Suisse Group AG 736,605 CHF 10,748,071 7,723,455 0.23EMS-Chemie Holdings AG 2,112 CHF 1,178,779 2,076,928 0.06Geberit AG 11,147 CHF 4,550,245 8,369,144 0.25Givaudan SA 2,779 CHF 6,819,710 12,936,698 0.39Holcim Ltd. 157,550 CHF 7,413,550 9,459,647 0.29Julius Baer Group Ltd. 67,351 CHF 2,676,387 4,399,473 0.13Kuehne & Nagel International AG 16,250 CHF 2,445,132 5,565,803 0.17Logitech International SA 52,093 CHF 3,347,746 6,317,548 0.19Lonza Group AG 22,410 CHF 6,189,944 15,899,257 0.48Nestle SA 866,985 CHF 78,346,414 108,069,467 3.27Novartis AG 668,176 CHF 54,362,076 60,951,588 1.84Partners Group Holdings AG 6,830 CHF 5,189,039 10,355,650 0.31Roche Holdings AG 211,424 CHF 62,052,161 79,722,870 2.41Roche Holdings AG 9,630 CHF 3,234,968 3,915,134 0.12Schindler Holdings AG 12,253 CHF 2,429,544 3,751,392 0.11Schindler Holdings AG 6,056 CHF 1,171,251 1,771,561 0.05SGS SA 1,821 CHF 4,386,044 5,622,474 0.17Siemens Energy AG 120,269 EUR 3,146,351 3,625,580 0.11Sika AG 42,666 CHF 5,551,609 13,962,747 0.42Sonova Holdings AG 16,582 CHF 2,865,446 6,242,804 0.19Straumann Holdings AG 3,111 CHF 2,217,097 4,964,272 0.15Swatch Group AG 8,708 CHF 3,211,971 2,990,122 0.09Swatch Group AG 15,833 CHF 1,089,952 1,045,713 0.03Swiss Life Holdings AG 9,634 CHF 3,116,976 4,685,938 0.14Swiss Prime Site AG 22,862 CHF 1,762,312 2,270,494 0.07
Xtrackers**
Xtrackers MSCI EUROPE UCITS ETF (continued)
Statement of Investmentsas at 30 June 2021(expressed in USD)
** This includes synthetic ETFs.
The accompanying notes form an integral part of these financial statements.
60

Description QuantityCurrency
(local) Cost Market Value
% ofNet
Assets
Transferable securities and money market instruments admitted to an official stock exchange listing(A)
Shares (continued)
Switzerland (continued)Swiss Re AG 90,768 CHF 7,772,295 8,197,450 0.25Swisscom AG 7,794 CHF 4,150,861 4,453,714 0.14Temenos AG 20,098 CHF 2,824,391 3,230,987 0.10UBS Group AG 1,103,247 CHF 14,155,241 16,900,500 0.51Vifor Pharma AG 14,670 CHF 2,052,059 1,900,506 0.06Zurich Insurance Group AG 45,278 CHF 13,615,533 18,182,716 0.55
370,392,206 505,529,673 15.29United Kingdom3i Group PLC 292,856 GBP 2,895,240 4,745,559 0.14Admiral Group PLC 58,035 GBP 1,547,985 2,520,622 0.08Anglo American PLC 389,695 GBP 8,766,768 15,463,938 0.47Antofagasta PLC 118,670 GBP 1,409,884 2,353,311 0.07Ashtead Group PLC 135,212 GBP 3,087,112 10,019,343 0.30Associated British Foods PLC 107,208 GBP 3,917,318 3,281,952 0.10AstraZeneca PLC 395,033 GBP 31,701,451 47,384,729 1.43Auto Trader Group PLC 144A 290,749 GBP 1,704,394 2,544,084 0.08AVEVA Group PLC 34,596 GBP 1,510,030 1,772,152 0.05Aviva PLC 1,182,265 GBP 6,798,269 6,629,322 0.20BAE Systems PLC 968,964 GBP 6,694,776 6,987,364 0.21Barclays PLC 5,224,423 GBP 13,498,726 12,350,210 0.37Barratt Developments PLC 306,445 GBP 2,364,918 2,943,049 0.09Berkeley Group Holdings PLC 36,946 GBP 1,759,153 2,345,245 0.07BHP Group PLC 635,590 GBP 14,150,264 18,702,165 0.57BP PLC 6,123,129 GBP 36,591,829 26,645,212 0.81British American Tobacco PLC 655,891 GBP 31,042,448 25,370,260 0.77British Land REIT Co. PLC 264,933 GBP 2,275,327 1,811,293 0.05BT Group PLC 2,685,983 GBP 10,403,743 7,198,470 0.22Bunzl PLC 101,416 GBP 2,710,312 3,347,017 0.10Burberry Group PLC 121,818 GBP 2,777,827 3,476,778 0.11Coca-Cola Europacific Partners PLC 61,590 USD 2,671,364 3,653,519 0.11Compass Group PLC 536,827 GBP 9,712,015 11,287,148 0.34Croda International PLC 41,986 GBP 2,401,342 4,273,555 0.13Diageo PLC 704,094 GBP 23,672,318 33,664,135 1.02Direct Line Insurance Group PLC 410,637 GBP 1,800,480 1,616,733 0.05Evraz PLC 153,447 GBP 945,926 1,254,918 0.04GlaxoSmithKline PLC 1,513,995 GBP 32,909,468 29,686,874 0.90Halma PLC 114,247 GBP 2,771,473 4,248,690 0.13Hargreaves Lansdown PLC 107,053 GBP 2,266,217 2,349,946 0.07Hikma Pharmaceuticals PLC 52,023 GBP 1,635,647 1,757,871 0.05HSBC Holdings PLC 6,129,615 GBP 48,192,371 35,335,953 1.07Imperial Brands PLC 284,804 GBP 9,486,721 6,125,900 0.19Informa PLC 452,041 GBP 3,844,693 3,132,352 0.09InterContinental Hotels Group PLC 54,967 GBP 2,905,015 3,652,434 0.11Intertek Group PLC 48,568 GBP 2,782,348 3,710,313 0.11J Sainsbury PLC 502,061 GBP 1,763,131 1,885,129 0.06JD Sports Fashion PLC 155,225 GBP 1,487,648 1,970,663 0.06Johnson Matthey PLC 58,240 GBP 2,378,361 2,472,402 0.07Kingfisher PLC 635,190 GBP 2,574,051 3,198,427 0.10
Xtrackers**
Xtrackers MSCI EUROPE UCITS ETF (continued)
Statement of Investmentsas at 30 June 2021(expressed in USD)
** This includes synthetic ETFs.
The accompanying notes form an integral part of these financial statements.
61
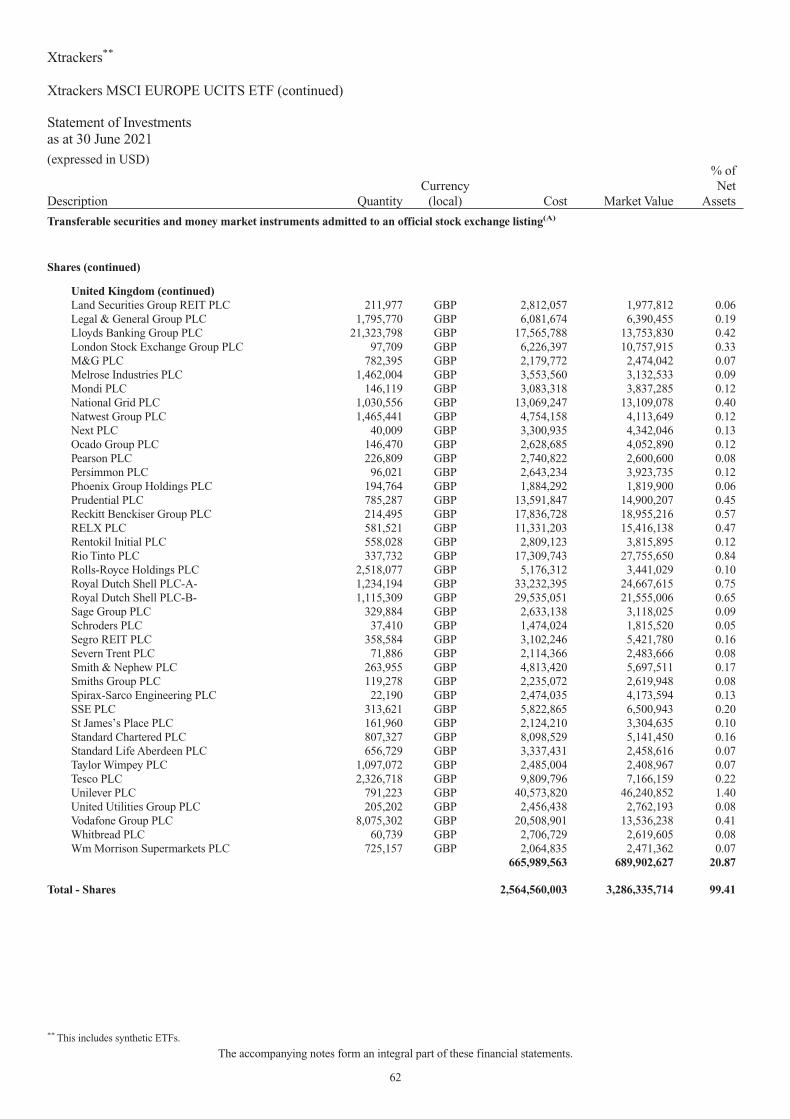
Description QuantityCurrency
(local) Cost Market Value
% ofNet
Assets
Transferable securities and money market instruments admitted to an official stock exchange listing(A)
Shares (continued)
United Kingdom (continued)Land Securities Group REIT PLC 211,977 GBP 2,812,057 1,977,812 0.06Legal & General Group PLC 1,795,770 GBP 6,081,674 6,390,455 0.19Lloyds Banking Group PLC 21,323,798 GBP 17,565,788 13,753,830 0.42London Stock Exchange Group PLC 97,709 GBP 6,226,397 10,757,915 0.33M&G PLC 782,395 GBP 2,179,772 2,474,042 0.07Melrose Industries PLC 1,462,004 GBP 3,553,560 3,132,533 0.09Mondi PLC 146,119 GBP 3,083,318 3,837,285 0.12National Grid PLC 1,030,556 GBP 13,069,247 13,109,078 0.40Natwest Group PLC 1,465,441 GBP 4,754,158 4,113,649 0.12Next PLC 40,009 GBP 3,300,935 4,342,046 0.13Ocado Group PLC 146,470 GBP 2,628,685 4,052,890 0.12Pearson PLC 226,809 GBP 2,740,822 2,600,600 0.08Persimmon PLC 96,021 GBP 2,643,234 3,923,735 0.12Phoenix Group Holdings PLC 194,764 GBP 1,884,292 1,819,900 0.06Prudential PLC 785,287 GBP 13,591,847 14,900,207 0.45Reckitt Benckiser Group PLC 214,495 GBP 17,836,728 18,955,216 0.57RELX PLC 581,521 GBP 11,331,203 15,416,138 0.47Rentokil Initial PLC 558,028 GBP 2,809,123 3,815,895 0.12Rio Tinto PLC 337,732 GBP 17,309,743 27,755,650 0.84Rolls-Royce Holdings PLC 2,518,077 GBP 5,176,312 3,441,029 0.10Royal Dutch Shell PLC-A- 1,234,194 GBP 33,232,395 24,667,615 0.75Royal Dutch Shell PLC-B- 1,115,309 GBP 29,535,051 21,555,006 0.65Sage Group PLC 329,884 GBP 2,633,138 3,118,025 0.09Schroders PLC 37,410 GBP 1,474,024 1,815,520 0.05Segro REIT PLC 358,584 GBP 3,102,246 5,421,780 0.16Severn Trent PLC 71,886 GBP 2,114,366 2,483,666 0.08Smith & Nephew PLC 263,955 GBP 4,813,420 5,697,511 0.17Smiths Group PLC 119,278 GBP 2,235,072 2,619,948 0.08Spirax-Sarco Engineering PLC 22,190 GBP 2,474,035 4,173,594 0.13SSE PLC 313,621 GBP 5,822,865 6,500,943 0.20St James’s Place PLC 161,960 GBP 2,124,210 3,304,635 0.10Standard Chartered PLC 807,327 GBP 8,098,529 5,141,450 0.16Standard Life Aberdeen PLC 656,729 GBP 3,337,431 2,458,616 0.07Taylor Wimpey PLC 1,097,072 GBP 2,485,004 2,408,967 0.07Tesco PLC 2,326,718 GBP 9,809,796 7,166,159 0.22Unilever PLC 791,223 GBP 40,573,820 46,240,852 1.40United Utilities Group PLC 205,202 GBP 2,456,438 2,762,193 0.08Vodafone Group PLC 8,075,302 GBP 20,508,901 13,536,238 0.41Whitbread PLC 60,739 GBP 2,706,729 2,619,605 0.08Wm Morrison Supermarkets PLC 725,157 GBP 2,064,835 2,471,362 0.07
665,989,563 689,902,627 20.87
Total - Shares 2,564,560,003 3,286,335,714 99.41
Xtrackers**
Xtrackers MSCI EUROPE UCITS ETF (continued)
Statement of Investmentsas at 30 June 2021(expressed in USD)
** This includes synthetic ETFs.
The accompanying notes form an integral part of these financial statements.
62

Description QuantityCurrency
(local) Cost Market Value
% ofNet
Assets
Transferable securities and money market instruments admitted to an official stock exchange listing(A)
Rights
SpainACS Actividades de Construccion y ServiciosSA-Rights- 09.07.21 70,117 EUR — 98,119 0.00
— 98,119 0.00
Total - Rights — 98,119 0.00
Total Transferable securities and money market instruments admitted to an officialstock exchange listing 2,564,560,003 3,286,433,833 99.41
Other transferable securities and money market instruments(A)
Shares
PortugalBanco Espirito Santo SA(1) 695,239 EUR 1,106,654 82 0.00
1,106,654 82 0.00United KingdomNMC Health PLC(1) 50,541 GBP 1,852,184 7 0.00
1,852,184 7 0.00
Total - Shares 2,958,838 89 0.00
Total Other transferable securities and money market instruments 2,958,838 89 0.00
TOTAL INVESTMENT PORTFOLIO 2,567,518,841 3,286,433,922 99.41(A) Any duplicate securities appearing herein with the same name are either quoted on different stock exchanges or have different ISINs.
(1) The security is fair valued.
Xtrackers**
Xtrackers MSCI EUROPE UCITS ETF (continued)
Statement of Investmentsas at 30 June 2021(expressed in USD)
** This includes synthetic ETFs.
The accompanying notes form an integral part of these financial statements.
63
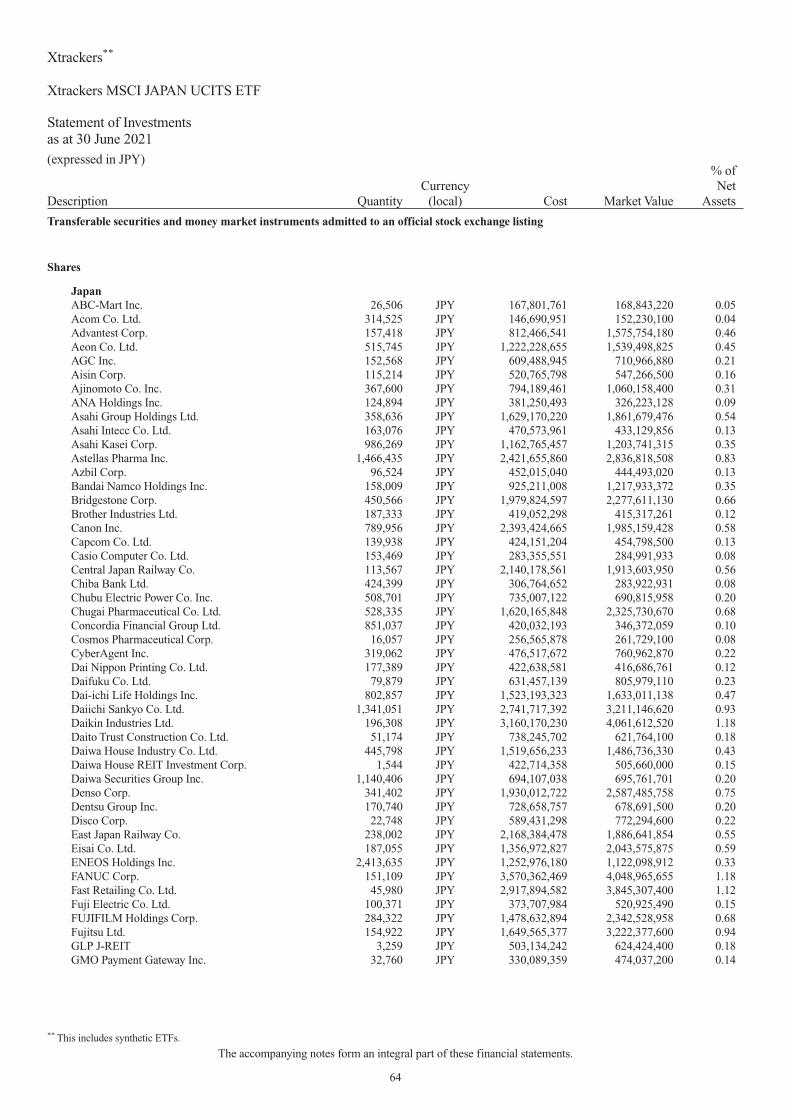
Description QuantityCurrency
(local) Cost Market Value
% ofNet
Assets
Transferable securities and money market instruments admitted to an official stock exchange listing
Shares
JapanABC-Mart Inc. 26,506 JPY 167,801,761 168,843,220 0.05Acom Co. Ltd. 314,525 JPY 146,690,951 152,230,100 0.04Advantest Corp. 157,418 JPY 812,466,541 1,575,754,180 0.46Aeon Co. Ltd. 515,745 JPY 1,222,228,655 1,539,498,825 0.45AGC Inc. 152,568 JPY 609,488,945 710,966,880 0.21Aisin Corp. 115,214 JPY 520,765,798 547,266,500 0.16Ajinomoto Co. Inc. 367,600 JPY 794,189,461 1,060,158,400 0.31ANA Holdings Inc. 124,894 JPY 381,250,493 326,223,128 0.09Asahi Group Holdings Ltd. 358,636 JPY 1,629,170,220 1,861,679,476 0.54Asahi Intecc Co. Ltd. 163,076 JPY 470,573,961 433,129,856 0.13Asahi Kasei Corp. 986,269 JPY 1,162,765,457 1,203,741,315 0.35Astellas Pharma Inc. 1,466,435 JPY 2,421,655,860 2,836,818,508 0.83Azbil Corp. 96,524 JPY 452,015,040 444,493,020 0.13Bandai Namco Holdings Inc. 158,009 JPY 925,211,008 1,217,933,372 0.35Bridgestone Corp. 450,566 JPY 1,979,824,597 2,277,611,130 0.66Brother Industries Ltd. 187,333 JPY 419,052,298 415,317,261 0.12Canon Inc. 789,956 JPY 2,393,424,665 1,985,159,428 0.58Capcom Co. Ltd. 139,938 JPY 424,151,204 454,798,500 0.13Casio Computer Co. Ltd. 153,469 JPY 283,355,551 284,991,933 0.08Central Japan Railway Co. 113,567 JPY 2,140,178,561 1,913,603,950 0.56Chiba Bank Ltd. 424,399 JPY 306,764,652 283,922,931 0.08Chubu Electric Power Co. Inc. 508,701 JPY 735,007,122 690,815,958 0.20Chugai Pharmaceutical Co. Ltd. 528,335 JPY 1,620,165,848 2,325,730,670 0.68Concordia Financial Group Ltd. 851,037 JPY 420,032,193 346,372,059 0.10Cosmos Pharmaceutical Corp. 16,057 JPY 256,565,878 261,729,100 0.08CyberAgent Inc. 319,062 JPY 476,517,672 760,962,870 0.22Dai Nippon Printing Co. Ltd. 177,389 JPY 422,638,581 416,686,761 0.12Daifuku Co. Ltd. 79,879 JPY 631,457,139 805,979,110 0.23Dai-ichi Life Holdings Inc. 802,857 JPY 1,523,193,323 1,633,011,138 0.47Daiichi Sankyo Co. Ltd. 1,341,051 JPY 2,741,717,392 3,211,146,620 0.93Daikin Industries Ltd. 196,308 JPY 3,160,170,230 4,061,612,520 1.18Daito Trust Construction Co. Ltd. 51,174 JPY 738,245,702 621,764,100 0.18Daiwa House Industry Co. Ltd. 445,798 JPY 1,519,656,233 1,486,736,330 0.43Daiwa House REIT Investment Corp. 1,544 JPY 422,714,358 505,660,000 0.15Daiwa Securities Group Inc. 1,140,406 JPY 694,107,038 695,761,701 0.20Denso Corp. 341,402 JPY 1,930,012,722 2,587,485,758 0.75Dentsu Group Inc. 170,740 JPY 728,658,757 678,691,500 0.20Disco Corp. 22,748 JPY 589,431,298 772,294,600 0.22East Japan Railway Co. 238,002 JPY 2,168,384,478 1,886,641,854 0.55Eisai Co. Ltd. 187,055 JPY 1,356,972,827 2,043,575,875 0.59ENEOS Holdings Inc. 2,413,635 JPY 1,252,976,180 1,122,098,912 0.33FANUC Corp. 151,109 JPY 3,570,362,469 4,048,965,655 1.18Fast Retailing Co. Ltd. 45,980 JPY 2,917,894,582 3,845,307,400 1.12Fuji Electric Co. Ltd. 100,371 JPY 373,707,984 520,925,490 0.15FUJIFILM Holdings Corp. 284,322 JPY 1,478,632,894 2,342,528,958 0.68Fujitsu Ltd. 154,922 JPY 1,649,565,377 3,222,377,600 0.94GLP J-REIT 3,259 JPY 503,134,242 624,424,400 0.18GMO Payment Gateway Inc. 32,760 JPY 330,089,359 474,037,200 0.14
Xtrackers**
Xtrackers MSCI JAPAN UCITS ETF
Statement of Investmentsas at 30 June 2021(expressed in JPY)
** This includes synthetic ETFs.
The accompanying notes form an integral part of these financial statements.
64

Description QuantityCurrency
(local) Cost Market Value
% ofNet
Assets
Transferable securities and money market instruments admitted to an official stock exchange listing
Shares (continued)
Japan (continued)Hakuhodo DY Holdings Inc. 186,382 JPY 294,306,419 321,322,568 0.09Hamamatsu Photonics KK 110,648 JPY 518,967,312 741,341,600 0.22Hankyu Hanshin Holdings Inc. 180,937 JPY 708,972,286 619,709,225 0.18Harmonic Drive Systems Inc. 33,826 JPY 280,133,372 207,015,120 0.06Hikari Tsushin Inc. 16,498 JPY 311,086,754 321,875,980 0.09Hino Motors Ltd. 230,718 JPY 252,240,101 225,411,486 0.07Hirose Electric Co. Ltd. 25,764 JPY 371,452,089 418,665,000 0.12Hisamitsu Pharmaceutical Co. Inc. 40,220 JPY 244,659,931 220,003,400 0.06Hitachi Construction Machinery Co. Ltd. 85,609 JPY 273,538,422 290,642,555 0.08Hitachi Ltd. 762,550 JPY 3,192,197,844 4,850,580,550 1.41Hitachi Metals Ltd. 170,819 JPY 269,492,216 362,819,556 0.11Honda Motor Co. Ltd. 1,284,195 JPY 4,178,344,590 4,558,892,250 1.33Hoshizaki Corp. 42,474 JPY 415,294,313 400,954,560 0.12Hoya Corp. 293,869 JPY 2,608,358,284 4,328,690,370 1.26Hulic Co. Ltd. 210,725 JPY 240,289,002 263,406,250 0.08Ibiden Co. Ltd. 82,593 JPY 401,926,867 494,732,070 0.14Idemitsu Kosan Co. Ltd. 162,987 JPY 490,777,019 437,294,121 0.13Iida Group Holdings Co. Ltd. 117,334 JPY 247,805,974 335,575,240 0.10Inpex Corp. 808,912 JPY 796,708,564 670,588,048 0.19Isuzu Motors Ltd. 435,671 JPY 585,437,314 639,129,357 0.19Ito En Ltd. 42,445 JPY 274,171,979 279,712,550 0.08ITOCHU Corp. 935,343 JPY 2,172,046,357 2,993,097,600 0.87Itochu Techno-Solutions Corp. 74,575 JPY 229,046,917 256,538,000 0.07Japan Airlines Co. Ltd. 112,814 JPY 323,003,496 270,866,414 0.08Japan Exchange Group Inc. 401,000 JPY 847,204,795 990,470,000 0.29Japan Metropolitan Fund Invest REIT 5,523 JPY 583,582,015 664,969,200 0.19Japan Post Bank Co. Ltd. 319,516 JPY 383,103,574 298,108,428 0.09Japan Post Holdings Co. Ltd. 1,246,126 JPY 1,378,261,020 1,134,348,498 0.33Japan Post Insurance Co. Ltd. 179,148 JPY 344,549,658 367,969,992 0.11Japan Real Estate Investment REIT Corp. 975 JPY 596,707,858 665,925,000 0.19Japan Tobacco Inc. 944,236 JPY 2,630,621,095 1,981,479,246 0.58JFE Holdings Inc. 388,873 JPY 656,342,325 505,923,773 0.15JSR Corp. 159,093 JPY 378,727,461 534,552,480 0.16Kajima Corp. 355,698 JPY 568,106,997 500,467,086 0.15Kakaku.com Inc. 105,018 JPY 253,026,240 352,335,390 0.10Kansai Electric Power Co. Inc. 550,397 JPY 691,914,890 583,145,622 0.17Kansai Paint Co. Ltd. 139,347 JPY 361,424,105 394,491,357 0.11Kao Corp. 379,770 JPY 2,808,645,503 2,595,727,950 0.75KDDI Corp. 1,270,158 JPY 3,901,379,091 4,401,097,470 1.28Keio Corp. 81,392 JPY 503,259,120 531,489,760 0.15Keisei Electric Railway Co. Ltd. 101,946 JPY 358,384,159 361,398,570 0.11Keyence Corp. 153,248 JPY 5,997,574,324 8,592,615,360 2.50Kikkoman Corp. 114,710 JPY 608,997,113 840,824,300 0.24Kintetsu Group Holdings Co. Ltd. 134,138 JPY 619,702,152 523,138,200 0.15Kirin Holdings Co. Ltd. 647,655 JPY 1,491,674,824 1,402,820,730 0.41Kobayashi Pharmaceutical Co. Ltd. 41,666 JPY 408,595,253 395,410,340 0.11Kobe Bussan Co. Ltd. 109,106 JPY 311,845,803 381,871,000 0.11Koei Tecmo Holdings Co. Ltd. 46,008 JPY 201,005,334 249,363,360 0.07
Xtrackers**
Xtrackers MSCI JAPAN UCITS ETF (continued)
Statement of Investmentsas at 30 June 2021(expressed in JPY)
** This includes synthetic ETFs.
The accompanying notes form an integral part of these financial statements.
65

Description QuantityCurrency
(local) Cost Market Value
% ofNet
Assets
Transferable securities and money market instruments admitted to an official stock exchange listing
Shares (continued)
Japan (continued)Koito Manufacturing Co. Ltd. 81,736 JPY 519,912,824 564,795,760 0.16Komatsu Ltd. 690,950 JPY 2,047,802,416 1,907,367,475 0.55Konami Holdings Corp. 73,880 JPY 384,880,627 492,779,600 0.14Kose Corp. 26,012 JPY 419,882,540 454,689,760 0.13Kubota Corp. 811,449 JPY 1,627,130,556 1,823,325,903 0.53Kurita Water Industries Ltd. 77,670 JPY 269,862,107 413,981,100 0.12Kyocera Corp. 252,927 JPY 1,669,781,571 1,737,102,636 0.51Kyowa Kirin Co. Ltd. 212,817 JPY 527,813,276 838,498,980 0.24Lasertec Corp. 59,411 JPY 628,088,364 1,282,683,490 0.37Lawson Inc. 39,521 JPY 250,852,231 203,137,940 0.06Lion Corp. 178,834 JPY 385,883,995 336,565,588 0.10Lixil Corp. 210,529 JPY 529,477,918 604,849,817 0.18M3 Inc. 347,556 JPY 1,461,642,635 2,819,721,828 0.82Makita Corp. 176,458 JPY 789,312,503 922,875,340 0.27Marubeni Corp. 1,236,743 JPY 915,466,588 1,194,817,412 0.35Mazda Motor Corp. 444,453 JPY 547,431,207 464,008,932 0.13McDonald’s Holdings Co. Japan Ltd. 63,747 JPY 307,593,291 312,360,300 0.09Medipal Holdings Corp. 145,136 JPY 305,820,921 307,978,592 0.09MEIJI Holdings Co. Ltd. 96,516 JPY 766,861,164 641,831,400 0.19Mercari Inc. 81,163 JPY 316,115,121 478,861,700 0.14MINEBEA MITSUMI Inc. 286,062 JPY 602,019,141 840,736,218 0.24MISUMI Group Inc. 223,871 JPY 659,610,055 841,754,960 0.24Mitsubishi Chemical Holdings Corp. 1,008,302 JPY 844,487,227 941,249,917 0.27Mitsubishi Corp. 995,107 JPY 2,728,164,261 3,013,183,996 0.88Mitsubishi Electric Corp. 1,438,774 JPY 2,301,774,247 2,320,023,075 0.67Mitsubishi Estate Co. Ltd. 931,935 JPY 1,853,699,034 1,674,221,228 0.49Mitsubishi Gas Chemical Co. Inc. 125,506 JPY 275,151,950 295,692,136 0.09Mitsubishi HC Capital Inc. 521,845 JPY 322,563,197 310,497,775 0.09Mitsubishi Heavy Industries Ltd. 252,538 JPY 994,215,651 825,546,722 0.24Mitsubishi UFJ Financial Group Inc. 9,631,869 JPY 5,936,672,584 5,780,084,587 1.68Mitsui & Co. Ltd. 1,217,880 JPY 2,271,278,001 3,045,308,940 0.89Mitsui Chemicals Inc. 145,707 JPY 431,642,113 558,786,345 0.16Mitsui Fudosan Co. Ltd. 722,009 JPY 1,840,616,008 1,857,729,157 0.54Miura Co. Ltd. 68,536 JPY 336,084,810 330,000,840 0.10Mizuho Financial Group Inc. 1,897,779 JPY 3,335,592,567 3,012,724,163 0.88MonotaRO Co. Ltd. 198,540 JPY 399,254,189 522,160,200 0.15MS&AD Insurance Group Holdings Inc. 349,948 JPY 1,184,343,883 1,122,633,184 0.33Murata Manufacturing Co. Ltd. 452,205 JPY 2,975,289,576 3,835,602,810 1.12Nabtesco Corp. 88,035 JPY 339,865,932 369,747,000 0.11NEC Corp. 193,243 JPY 843,414,894 1,105,349,960 0.32Nexon Co. Ltd. 384,014 JPY 770,044,642 950,818,664 0.28NGK Insulators Ltd. 202,371 JPY 397,583,394 377,219,544 0.11NH Foods Ltd. 64,340 JPY 316,405,663 277,948,800 0.08Nidec Corp. 352,160 JPY 3,120,394,125 4,534,060,000 1.32Nihon M&A Center Inc. 239,198 JPY 592,123,691 689,129,438 0.20Nintendo Co. Ltd. 88,220 JPY 4,014,326,809 5,700,776,400 1.66Nippon Building Fund REIT Inc. 1,171 JPY 747,695,162 811,503,000 0.24Nippon Express Co. Ltd. 60,021 JPY 422,276,337 507,777,660 0.15
Xtrackers**
Xtrackers MSCI JAPAN UCITS ETF (continued)
Statement of Investmentsas at 30 June 2021(expressed in JPY)
** This includes synthetic ETFs.
The accompanying notes form an integral part of these financial statements.
66

Description QuantityCurrency
(local) Cost Market Value
% ofNet
Assets
Transferable securities and money market instruments admitted to an official stock exchange listing
Shares (continued)
Japan (continued)Nippon Paint Holdings Co. Ltd. 560,290 JPY 704,762,181 844,917,320 0.25Nippon Prologis REIT Inc. 1,635 JPY 467,004,013 577,972,500 0.17Nippon Sanso Holdings Corp. 119,995 JPY 213,867,714 273,228,615 0.08Nippon Shinyaku Co. Ltd. 38,891 JPY 339,018,612 342,629,710 0.10Nippon Steel Corp. 671,767 JPY 1,345,344,907 1,258,555,475 0.37Nippon Telegraph & Telephone Corp. 1,014,451 JPY 2,615,941,914 2,936,328,420 0.85Nippon Yusen KK 127,497 JPY 339,187,671 717,808,110 0.21Nissan Chemical Corp. 96,382 JPY 484,274,773 524,318,080 0.15Nissan Motor Co. Ltd. 1,827,042 JPY 1,462,555,940 1,007,248,255 0.29Nisshin Seifun Group Inc. 156,718 JPY 295,554,902 254,666,750 0.07Nissin Foods Holdings Co. Ltd. 49,554 JPY 387,107,691 396,432,000 0.12Nitori Holdings Co. Ltd. 63,342 JPY 1,091,947,682 1,245,303,720 0.36Nitto Denko Corp. 118,732 JPY 965,005,039 984,288,280 0.29Nomura Holdings Inc. 2,427,011 JPY 1,434,058,315 1,378,056,846 0.40Nomura Real Estate Holdings Inc. 90,748 JPY 214,097,122 255,727,864 0.07Nomura Real Estate Master Fund REIT Inc. 3,359 JPY 530,285,289 598,237,900 0.17Nomura Research Institute Ltd. 277,439 JPY 678,779,742 1,019,588,325 0.30NSK Ltd. 308,115 JPY 366,538,420 289,319,985 0.08NTT Data Corp. 497,356 JPY 679,195,782 861,917,948 0.25Obayashi Corp. 507,583 JPY 553,729,706 448,195,789 0.13Obic Co. Ltd. 55,108 JPY 758,299,968 1,141,286,680 0.33Odakyu Electric Railway Co. Ltd. 232,810 JPY 613,821,689 653,264,860 0.19Oji Holdings Corp. 645,098 JPY 391,214,242 411,572,524 0.12Olympus Corp. 916,813 JPY 1,432,123,239 2,024,323,104 0.59Omron Corp. 145,883 JPY 996,941,074 1,285,229,230 0.37Ono Pharmaceutical Co. Ltd. 291,807 JPY 800,354,981 723,389,553 0.21Oracle Corp. Japan 30,419 JPY 288,014,998 258,561,500 0.08Oriental Land Co. Ltd. 157,601 JPY 2,057,104,320 2,494,823,830 0.73ORIX Corp. 961,767 JPY 1,674,208,336 1,802,832,242 0.52Orix JREIT Inc. 2,082 JPY 444,089,579 445,131,600 0.13Osaka Gas Co. Ltd. 293,165 JPY 628,237,227 606,558,385 0.18Otsuka Corp. 89,077 JPY 400,126,635 519,318,910 0.15Otsuka Holdings Co. Ltd. 308,286 JPY 1,422,389,432 1,420,273,602 0.41Pan Pacific International Holdings Corp. 325,148 JPY 582,029,483 749,791,288 0.22Panasonic Corp. 1,742,602 JPY 2,243,779,792 2,240,114,871 0.65PeptiDream Inc. 74,881 JPY 392,330,144 408,101,450 0.12Persol Holdings Co. Ltd. 138,820 JPY 314,195,827 304,709,900 0.09Pigeon Corp. 92,426 JPY 411,516,256 289,293,380 0.08Pola Orbis Holdings Inc. 73,315 JPY 207,959,183 215,106,210 0.06Rakuten Group Inc. 682,121 JPY 771,352,604 855,379,734 0.25Recruit Holdings Co. Ltd. 1,069,715 JPY 3,895,247,325 5,851,341,050 1.70Renesas Electronics Corp. 985,113 JPY 1,070,615,545 1,183,120,713 0.34Resona Holdings Inc. 1,683,510 JPY 862,234,772 719,195,472 0.21Ricoh Co. Ltd. 529,638 JPY 541,002,947 660,458,586 0.19Rinnai Corp. 28,545 JPY 286,237,052 301,720,650 0.09Rohm Co. Ltd. 69,187 JPY 635,824,948 710,550,490 0.21Ryohin Keikaku Co. Ltd. 197,513 JPY 514,062,859 460,205,290 0.13Santen Pharmaceutical Co. Ltd. 286,345 JPY 485,783,846 438,107,850 0.13
Xtrackers**
Xtrackers MSCI JAPAN UCITS ETF (continued)
Statement of Investmentsas at 30 June 2021(expressed in JPY)
** This includes synthetic ETFs.
The accompanying notes form an integral part of these financial statements.
67

Description QuantityCurrency
(local) Cost Market Value
% ofNet
Assets
Transferable securities and money market instruments admitted to an official stock exchange listing
Shares (continued)
Japan (continued)SBI Holdings Inc. 192,753 JPY 468,763,828 506,554,884 0.15SCSK Corp. 40,856 JPY 228,679,501 270,466,720 0.08Secom Co. Ltd. 164,912 JPY 1,480,380,666 1,392,516,928 0.40Seiko Epson Corp. 222,030 JPY 433,804,592 433,846,620 0.13Sekisui Chemical Co. Ltd. 297,992 JPY 558,523,951 565,886,808 0.16Sekisui House Ltd. 484,722 JPY 973,924,286 1,104,439,077 0.32Seven & i Holdings Co. Ltd. 593,866 JPY 2,550,341,676 3,145,708,202 0.91SG Holdings Co. Ltd. 252,956 JPY 460,692,006 736,860,828 0.21Sharp Corp. 170,796 JPY 348,112,410 313,069,068 0.09Shimadzu Corp. 186,877 JPY 566,432,349 802,636,715 0.23Shimano Inc. 58,576 JPY 1,132,610,942 1,543,477,600 0.45Shimizu Corp. 431,428 JPY 423,071,335 367,576,656 0.11Shin-Etsu Chemical Co. Ltd. 279,131 JPY 3,594,699,530 5,186,253,980 1.51Shionogi & Co. Ltd. 209,455 JPY 1,219,642,251 1,212,953,905 0.35Shiseido Co. Ltd. 315,147 JPY 2,034,610,532 2,575,066,137 0.75Shizuoka Bank Ltd. 348,872 JPY 318,541,778 299,681,048 0.09SMC Corp. 45,191 JPY 2,243,064,056 2,966,789,150 0.86SoftBank Corp. 2,266,734 JPY 3,112,163,346 3,294,697,869 0.96SoftBank Group Corp. 988,019 JPY 5,646,840,396 7,681,847,725 2.23Sohgo Security Services Co. Ltd. 56,699 JPY 302,111,104 286,896,940 0.08Sompo Holdings Inc. 249,549 JPY 1,038,170,975 1,024,648,194 0.30Sony Corp. 993,965 JPY 6,949,310,555 10,749,731,475 3.13Square Enix Holdings Co. Ltd. 67,022 JPY 374,900,519 369,291,220 0.11Stanley Electric Co. Ltd. 101,657 JPY 334,623,651 326,827,255 0.10Subaru Corp. 484,169 JPY 1,459,838,570 1,061,056,364 0.31SUMCO Corp. 218,932 JPY 496,605,271 596,589,700 0.17Sumitomo Chemical Co. Ltd. 1,175,969 JPY 660,852,800 692,645,741 0.20Sumitomo Corp. 884,742 JPY 1,364,604,355 1,316,496,096 0.38Sumitomo Dainippon Pharma Co. Ltd. 140,796 JPY 238,375,441 327,773,088 0.10Sumitomo Electric Industries Ltd. 593,600 JPY 942,731,427 972,910,400 0.28Sumitomo Metal Mining Co. Ltd. 194,585 JPY 774,151,114 841,580,125 0.24Sumitomo Mitsui Financial Group Inc. 1,029,088 JPY 4,106,088,694 3,941,407,040 1.15Sumitomo Mitsui Trust Holdings Inc. 265,816 JPY 1,034,591,448 937,798,848 0.27Sumitomo Realty & Development Co. Ltd. 243,678 JPY 902,075,056 967,401,660 0.28Suntory Beverage & Food Ltd. 108,740 JPY 488,343,531 454,533,200 0.13Suzuki Motor Corp. 289,295 JPY 1,467,182,847 1,359,975,795 0.40Sysmex Corp. 132,215 JPY 1,173,392,726 1,745,238,000 0.51T&D Holdings Inc. 425,145 JPY 624,983,617 610,508,220 0.18Taisei Corp. 150,902 JPY 671,777,414 549,283,280 0.16Taisho Pharmaceutical Holdings Co. Ltd. 27,287 JPY 227,890,315 162,357,650 0.05Takeda Pharmaceutical Co. Ltd. 1,242,213 JPY 5,221,208,179 4,619,790,147 1.34TDK Corp. 102,305 JPY 1,134,809,625 1,380,094,450 0.40Terumo Corp. 509,446 JPY 1,680,541,289 2,293,525,892 0.67THK Co. Ltd. 94,169 JPY 309,410,592 312,170,235 0.09TIS Inc. 174,988 JPY 403,245,844 496,440,956 0.14Tobu Railway Co. Ltd. 150,046 JPY 492,356,984 430,932,112 0.13Toho Co. Ltd. 87,486 JPY 346,073,777 400,685,880 0.12Toho Gas Co. Ltd. 58,882 JPY 282,637,259 320,318,080 0.09
Xtrackers**
Xtrackers MSCI JAPAN UCITS ETF (continued)
Statement of Investmentsas at 30 June 2021(expressed in JPY)
** This includes synthetic ETFs.
The accompanying notes form an integral part of these financial statements.
68

Description QuantityCurrency
(local) Cost Market Value
% ofNet
Assets
Transferable securities and money market instruments admitted to an official stock exchange listing
Shares (continued)
Japan (continued)Tohoku Electric Power Co. Inc. 341,939 JPY 411,721,365 297,486,930 0.09Tokio Marine Holdings Inc. 497,795 JPY 2,558,069,687 2,542,736,860 0.74Tokyo Century Corp. 28,816 JPY 180,574,241 172,031,520 0.05Tokyo Electric Power Co. Holdings Inc. 1,212,484 JPY 520,367,500 400,119,720 0.12Tokyo Electron Ltd. 117,698 JPY 3,008,769,960 5,658,919,840 1.65Tokyo Gas Co. Ltd. 293,973 JPY 774,827,836 616,461,381 0.18Tokyu Corp. 390,800 JPY 649,392,690 590,498,800 0.17TOPPAN Inc. 204,988 JPY 384,250,518 365,903,580 0.11Toray Industries Inc. 1,093,157 JPY 895,217,268 807,952,339 0.23Toshiba Corp. 323,154 JPY 1,106,212,594 1,552,754,970 0.45Tosoh Corp. 203,315 JPY 389,104,863 389,551,540 0.11TOTO Ltd. 111,768 JPY 575,364,314 642,666,000 0.19Toyo Suisan Kaisha Ltd. 69,352 JPY 319,053,918 296,479,800 0.09Toyota Industries Corp. 115,365 JPY 811,028,407 1,108,657,650 0.32Toyota Motor Corp. 1,671,171 JPY 12,283,570,275 16,227,070,410 4.72Toyota Tsusho Corp. 167,415 JPY 633,248,594 878,928,750 0.26Trend Micro Inc. 105,665 JPY 585,838,939 614,970,300 0.18Tsuruha Holdings Inc. 31,359 JPY 426,267,916 404,844,690 0.12Unicharm Corp. 317,011 JPY 1,172,493,233 1,417,039,170 0.41United Urban Investment REIT Corp. 2,361 JPY 379,082,838 379,412,700 0.11USS Co. Ltd. 172,232 JPY 360,991,962 333,785,616 0.10Welcia Holdings Co. Ltd. 73,858 JPY 244,947,892 268,104,540 0.08West Japan Railway Co. 128,089 JPY 914,045,301 811,315,726 0.24Yakult Honsha Co. Ltd. 101,374 JPY 664,927,225 637,642,460 0.19Yamada Holdings Co. Ltd. 542,505 JPY 294,887,237 278,305,065 0.08Yamaha Corp. 105,868 JPY 519,285,555 638,384,040 0.19Yamaha Motor Co. Ltd. 221,147 JPY 574,947,297 667,863,940 0.19Yamato Holdings Co. Ltd. 231,082 JPY 587,112,667 730,219,120 0.21Yaskawa Electric Corp. 188,932 JPY 768,117,579 1,025,900,760 0.30Yokogawa Electric Corp. 178,490 JPY 340,903,910 296,293,400 0.09Z Holdings Corp. 2,099,332 JPY 1,014,834,165 1,168,908,058 0.34ZOZO Inc. 97,400 JPY 289,013,289 367,685,000 0.11
294,193,741,849 343,627,410,790 99.95
Total - Shares 294,193,741,849 343,627,410,790 99.95
Total Transferable securities and money market instruments admitted to an officialstock exchange listing 294,193,741,849 343,627,410,790 99.95
TOTAL INVESTMENT PORTFOLIO 294,193,741,849 343,627,410,790 99.95
Xtrackers**
Xtrackers MSCI JAPAN UCITS ETF (continued)
Statement of Investmentsas at 30 June 2021(expressed in JPY)
** This includes synthetic ETFs.
The accompanying notes form an integral part of these financial statements.
69
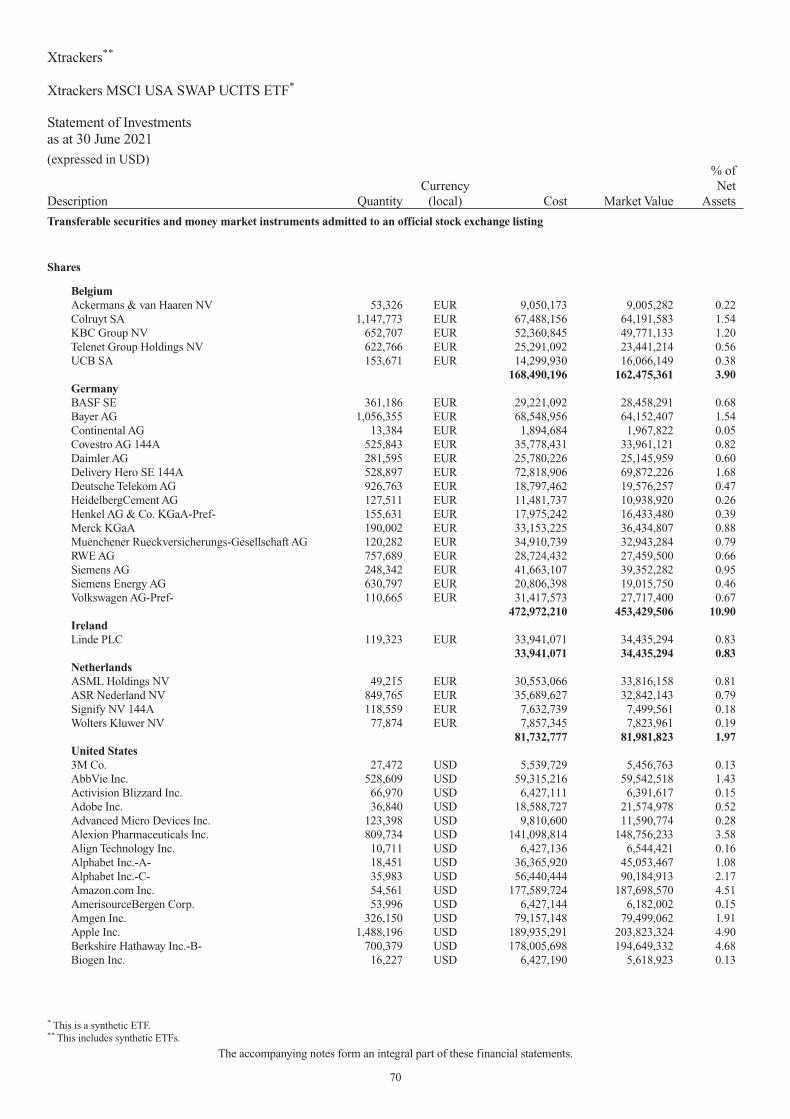
Description QuantityCurrency
(local) Cost Market Value
% ofNet
Assets
Transferable securities and money market instruments admitted to an official stock exchange listing
Shares
BelgiumAckermans & van Haaren NV 53,326 EUR 9,050,173 9,005,282 0.22Colruyt SA 1,147,773 EUR 67,488,156 64,191,583 1.54KBC Group NV 652,707 EUR 52,360,845 49,771,133 1.20Telenet Group Holdings NV 622,766 EUR 25,291,092 23,441,214 0.56UCB SA 153,671 EUR 14,299,930 16,066,149 0.38
168,490,196 162,475,361 3.90GermanyBASF SE 361,186 EUR 29,221,092 28,458,291 0.68Bayer AG 1,056,355 EUR 68,548,956 64,152,407 1.54Continental AG 13,384 EUR 1,894,684 1,967,822 0.05Covestro AG 144A 525,843 EUR 35,778,431 33,961,121 0.82Daimler AG 281,595 EUR 25,780,226 25,145,959 0.60Delivery Hero SE 144A 528,897 EUR 72,818,906 69,872,226 1.68Deutsche Telekom AG 926,763 EUR 18,797,462 19,576,257 0.47HeidelbergCement AG 127,511 EUR 11,481,737 10,938,920 0.26Henkel AG & Co. KGaA-Pref- 155,631 EUR 17,975,242 16,433,480 0.39Merck KGaA 190,002 EUR 33,153,225 36,434,807 0.88Muenchener Rueckversicherungs-Gesellschaft AG 120,282 EUR 34,910,739 32,943,284 0.79RWE AG 757,689 EUR 28,724,432 27,459,500 0.66Siemens AG 248,342 EUR 41,663,107 39,352,282 0.95Siemens Energy AG 630,797 EUR 20,806,398 19,015,750 0.46Volkswagen AG-Pref- 110,665 EUR 31,417,573 27,717,400 0.67
472,972,210 453,429,506 10.90IrelandLinde PLC 119,323 EUR 33,941,071 34,435,294 0.83
33,941,071 34,435,294 0.83NetherlandsASML Holdings NV 49,215 EUR 30,553,066 33,816,158 0.81ASR Nederland NV 849,765 EUR 35,689,627 32,842,143 0.79Signify NV 144A 118,559 EUR 7,632,739 7,499,561 0.18Wolters Kluwer NV 77,874 EUR 7,857,345 7,823,961 0.19
81,732,777 81,981,823 1.97United States3M Co. 27,472 USD 5,539,729 5,456,763 0.13AbbVie Inc. 528,609 USD 59,315,216 59,542,518 1.43Activision Blizzard Inc. 66,970 USD 6,427,111 6,391,617 0.15Adobe Inc. 36,840 USD 18,588,727 21,574,978 0.52Advanced Micro Devices Inc. 123,398 USD 9,810,600 11,590,774 0.28Alexion Pharmaceuticals Inc. 809,734 USD 141,098,814 148,756,233 3.58Align Technology Inc. 10,711 USD 6,427,136 6,544,421 0.16Alphabet Inc.-A- 18,451 USD 36,365,920 45,053,467 1.08Alphabet Inc.-C- 35,983 USD 56,440,444 90,184,913 2.17Amazon.com Inc. 54,561 USD 177,589,724 187,698,570 4.51AmerisourceBergen Corp. 53,996 USD 6,427,144 6,182,002 0.15Amgen Inc. 326,150 USD 79,157,148 79,499,062 1.91Apple Inc. 1,488,196 USD 189,935,291 203,823,324 4.90Berkshire Hathaway Inc.-B- 700,379 USD 178,005,698 194,649,332 4.68Biogen Inc. 16,227 USD 6,427,190 5,618,923 0.13
Xtrackers**
Xtrackers MSCI USA SWAP UCITS ETF*
Statement of Investmentsas at 30 June 2021(expressed in USD)
* This is a synthetic ETF.** This includes synthetic ETFs.
The accompanying notes form an integral part of these financial statements.
70

Description QuantityCurrency
(local) Cost Market Value
% ofNet
Assets
Transferable securities and money market instruments admitted to an official stock exchange listing
Shares (continued)
United States (continued)Boeing Co. 55,144 USD 12,900,503 13,210,297 0.32Booking Holdings Inc. 13,994 USD 33,047,531 30,620,131 0.74Boston Scientific Corp. 204,876 USD 8,463,420 8,760,498 0.21Brighthouse Financial Inc. 152,490 USD 7,308,083 6,944,395 0.17Cadence Design Systems Inc. 225,047 USD 29,148,338 30,790,931 0.74Caterpillar Inc. 154,582 USD 36,745,687 33,641,681 0.81Centene Corp. 91,816 USD 6,427,120 6,696,141 0.16Cigna Corp. 155,366 USD 36,773,579 36,832,618 0.89Citigroup Inc. 1,603,876 USD 119,327,464 113,474,227 2.73Citizens Financial Group Inc. 415,915 USD 20,512,928 19,078,021 0.46Coherent Inc. 65,946 USD 17,368,037 17,432,166 0.42Comcast Corp.-A- 1,118,461 USD 63,092,385 63,774,646 1.53Corteva Inc. 267,038 USD 12,192,955 11,843,135 0.28Coupa Software Inc. 69,507 USD 15,953,000 18,218,480 0.44Crowdstrike Holdings Inc.-A- 35,793 USD 6,748,054 8,995,139 0.22Crown Holdings Inc. 63,453 USD 6,427,154 6,485,531 0.16CVS Health Corp. 352,984 USD 27,423,327 29,452,985 0.71Dell Technologies Inc.-C- 140,509 USD 13,757,350 14,004,532 0.34Duke Energy Corp. 62,266 USD 6,427,097 6,146,900 0.15Eagle Materials Inc. 46,979 USD 6,737,258 6,676,186 0.16Edwards Lifesciences Corp. 23,923 USD 2,014,556 2,477,705 0.06Elanco Animal Health Inc. 7,564 USD 272,153 262,395 0.01Electronic Arts Inc. 237,852 USD 33,758,334 34,210,253 0.82Eli Lilly & Co. 80,547 USD 16,039,324 18,487,147 0.44Emerson Electric Co. 197,501 USD 18,567,069 19,007,496 0.46EOG Resources Inc. 186,773 USD 14,004,240 15,584,339 0.37Estee Lauder Cos Inc.-A- 52,378 USD 15,708,162 16,660,394 0.40Expedia Group Inc. 64,576 USD 10,943,478 10,571,737 0.25Facebook Inc.-A- 465,464 USD 142,316,753 161,846,487 3.89GoDaddy Inc.-A- 7,832 USD 655,705 681,071 0.02GrafTech International Ltd. 554,506 USD 6,737,248 6,443,360 0.15Honeywell International Inc. 120,028 USD 27,708,947 26,328,142 0.63Howmet Aerospace Inc. 116,428 USD 4,130,865 4,013,273 0.10IAA Inc. 128,280 USD 7,194,969 6,996,391 0.17ICU Medical Inc. 12,149 USD 2,498,199 2,500,264 0.06IDEXX Laboratories Inc. 8,682 USD 4,753,916 5,483,117 0.13Illumina Inc. 99,891 USD 39,825,438 47,269,420 1.14Incyte Corp. 61,924 USD 5,093,868 5,209,666 0.13IQVIA Holdings Inc. 92,895 USD 21,540,192 22,510,316 0.54Johnson & Johnson 648,549 USD 107,280,519 106,841,962 2.57Kansas City Southern 95,808 USD 27,174,023 27,149,113 0.65KLA Corp. 13,286 USD 4,218,969 4,307,454 0.10Laboratory Corp. of America Holdings 23,070 USD 5,508,655 6,363,860 0.15Lamb Weston Holdings Inc. 77,810 USD 6,427,106 6,276,155 0.15Las Vegas Sands Corp. 182,826 USD 11,209,062 9,633,102 0.23Lowe’s Cos Inc. 163,032 USD 33,243,855 31,623,317 0.76Marvell Technology Inc. 94,519 USD 4,500,995 5,513,293 0.13Mastercard Inc.-A- 281,184 USD 106,056,667 102,657,467 2.47
Xtrackers**
Xtrackers MSCI USA SWAP UCITS ETF* (continued)
Statement of Investmentsas at 30 June 2021(expressed in USD)
* This is a synthetic ETF.** This includes synthetic ETFs.
The accompanying notes form an integral part of these financial statements.
71

Description QuantityCurrency
(local) Cost Market Value
% ofNet
Assets
Transferable securities and money market instruments admitted to an official stock exchange listing
Shares (continued)
United States (continued)McKesson Corp. 33,085 USD 6,427,092 6,327,175 0.15Merck & Co. Inc. 486,298 USD 37,323,372 37,819,395 0.91Microchip Technology Inc. 41,748 USD 6,427,105 6,251,346 0.15Micron Technology Inc. 226,744 USD 13,739,752 19,268,705 0.46Microsoft Corp. 802,747 USD 201,539,995 217,464,162 5.23Mohawk Industries Inc. 2,279 USD 382,917 438,001 0.01Monster Beverage Corp. 408,649 USD 38,455,134 37,330,086 0.90Netflix Inc. 151,672 USD 75,584,224 80,114,667 1.93New Relic Inc. 59,966 USD 3,693,306 4,015,923 0.10Newmont Corp. 251,355 USD 16,003,773 15,930,880 0.38NIKE Inc.-B- 360,021 USD 48,304,018 55,619,644 1.34Nutanix Inc.-A- 592,808 USD 19,094,240 22,657,122 0.54NVIDIA Corp. 175,589 USD 121,916,710 140,488,759 3.38PayPal Holdings Inc. 411,808 USD 110,005,839 120,033,796 2.89PepsiCo Inc. 43,252 USD 6,426,382 6,408,649 0.15Pfizer Inc. 938,144 USD 36,915,966 36,737,719 0.88PNC Financial Services Group Inc. 115,427 USD 20,645,273 22,018,855 0.53Post Holdings Inc. 318,150 USD 36,961,168 34,509,730 0.83Procter & Gamble Co. 401,183 USD 53,983,521 54,131,622 1.30PVH Corp. 71,429 USD 7,865,042 7,685,046 0.18QUALCOMM Inc. 121,333 USD 16,115,516 17,342,126 0.42Qurate Retail Inc.-Series A- 542,338 USD 7,416,472 7,099,204 0.17Ross Stores Inc. 170,319 USD 20,163,881 21,119,556 0.51S&P Global Inc. 57,218 USD 21,662,163 23,485,128 0.56ServiceNow Inc. 1,417 USD 671,488 778,712 0.02Skyworks Solutions Inc. 37,441 USD 6,427,122 7,179,312 0.17Stanley Black & Decker Inc. 31,778 USD 6,427,101 6,514,172 0.16Starbucks Corp. 760,628 USD 85,763,622 85,045,817 2.04Synopsys Inc. 24,588 USD 5,781,376 6,781,125 0.16Take-Two Interactive Software Inc. 24,002 USD 3,142,102 4,248,834 0.10TJX Cos Inc. 451,781 USD 29,885,844 30,459,075 0.73T-Mobile US Inc. 48,188 USD 6,519,023 6,979,068 0.17Ulta Beauty Inc. 11,961 USD 4,130,851 4,135,755 0.10Union Pacific Corp. 209,377 USD 47,099,356 46,048,284 1.11Univar Solutions Inc. 54,156 USD 1,444,700 1,320,323 0.03Vail Resorts Inc. 19,898 USD 6,427,054 6,298,115 0.15Verizon Communications Inc. 64,833 USD 3,778,467 3,632,593 0.09Vertex Pharmaceuticals Inc. 70,047 USD 15,137,857 14,123,577 0.34Walgreens Boots Alliance Inc. 149,461 USD 7,897,519 7,863,143 0.19Walt Disney Co. 64,346 USD 11,567,281 11,310,096 0.27Wells Fargo & Co. 301,032 USD 13,960,882 13,633,739 0.33
Xtrackers**
Xtrackers MSCI USA SWAP UCITS ETF* (continued)
Statement of Investmentsas at 30 June 2021(expressed in USD)
* This is a synthetic ETF.** This includes synthetic ETFs.
The accompanying notes form an integral part of these financial statements.
72

Description QuantityCurrency
(local) Cost Market Value
% ofNet
Assets
Transferable securities and money market instruments admitted to an official stock exchange listing
Shares (continued)
United States (continued)Xilinx Inc. 73,624 USD 9,430,498 10,648,975 0.26Zebra Technologies Corp.-A- 12,589 USD 5,824,301 6,665,750 0.16
3,342,089,734 3,530,517,994 84.88
Total - Shares 4,099,225,988 4,262,839,978 102.48
Total Transferable securities and money market instruments admitted to an officialstock exchange listing 4,099,225,988 4,262,839,978 102.48
TOTAL INVESTMENT PORTFOLIO 4,099,225,988 4,262,839,978 102.48
Xtrackers**
Xtrackers MSCI USA SWAP UCITS ETF* (continued)
Statement of Investmentsas at 30 June 2021(expressed in USD)
* This is a synthetic ETF.** This includes synthetic ETFs.
The accompanying notes form an integral part of these financial statements.
73

Description QuantityCurrency
(local) Cost Market Value
% ofNet
Assets
Transferable securities and money market instruments admitted to an official stock exchange listing
Shares
BelgiumAnheuser-Busch InBev SA 2,243,767 EUR 164,493,107 136,443,471 1.72
164,493,107 136,443,471 1.72FinlandKone OYJ-B- 1,071,161 EUR 76,923,585 73,695,877 0.93
76,923,585 73,695,877 0.93FranceAir Liquide SA 1,255,074 EUR 135,077,556 185,324,227 2.34AXA SA 5,450,646 EUR 113,052,723 116,562,065 1.47BNP Paribas SA 3,055,032 EUR 150,580,181 161,519,542 2.04Danone SA 1,721,519 EUR 103,423,549 102,206,583 1.29Engie SA 4,926,412 EUR 68,706,183 56,919,764 0.72EssilorLuxottica SA 789,912 EUR 89,963,637 122,941,904 1.55Kering SA 194,047 EUR 97,722,874 143,012,639 1.80L’Oreal SA 649,232 EUR 147,370,559 243,981,386 3.08LVMH Moet Hennessy Louis Vuitton SE 702,301 EUR 224,318,292 464,431,651 5.86Pernod Ricard SA 543,563 EUR 79,103,899 101,754,994 1.28Safran SA 1,004,732 EUR 95,568,893 117,473,265 1.48Sanofi 3,026,719 EUR 245,462,700 267,440,891 3.38Schneider Electric SE 1,502,279 EUR 124,875,130 199,322,378 2.52TotalEnergies SE 6,966,975 EUR 290,214,548 265,824,931 3.35Vinci SA 1,567,056 EUR 118,066,504 141,019,369 1.78Vivendi SE 2,016,440 EUR 45,945,378 57,125,745 0.72
2,129,452,606 2,746,861,334 34.66Germanyadidas AG 494,628 EUR 105,420,159 155,263,729 1.96Allianz SE 1,092,246 EUR 189,258,625 229,699,334 2.90BASF SE 2,433,235 EUR 167,352,750 161,664,133 2.04Bayer AG 2,602,639 EUR 202,390,802 133,281,143 1.68Bayerische Motoren Werke AG 848,915 EUR 65,560,447 75,816,599 0.96Daimler AG 2,224,010 EUR 134,072,646 167,467,953 2.11Deutsche Boerse AG 503,348 EUR 70,332,490 74,092,826 0.94Deutsche Post AG 2,609,928 EUR 87,123,045 149,705,470 1.89Deutsche Telekom AG 8,590,177 EUR 125,537,732 153,008,233 1.93Infineon Technologies AG 3,459,647 EUR 116,137,468 117,005,261 1.48Muenchener Rueckversicherungs-Gesellschaft AG 371,149 EUR 74,372,369 85,716,861 1.08SAP SE 2,893,627 EUR 272,378,192 343,878,633 4.34Siemens AG 1,981,830 EUR 193,897,391 264,812,125 3.34Volkswagen AG-Pref- 484,990 EUR 78,054,940 102,429,888 1.29Vonovia SE 1,429,793 EUR 84,112,536 77,952,314 0.98
1,966,001,592 2,291,794,502 28.92IrelandCRH PLC 2,106,485 EUR 66,578,577 89,525,613 1.13Flutter Entertainment PLC 444,552 EUR 70,404,581 67,883,090 0.86Linde PLC 1,375,820 EUR 235,747,906 334,805,797 4.22
372,731,064 492,214,500 6.21ItalyEnel SpA 20,579,955 EUR 120,817,095 161,182,208 2.04
Xtrackers**
Xtrackers EURO STOXX 50 UCITS ETF
Statement of Investmentsas at 30 June 2021(expressed in EUR)
** This includes synthetic ETFs.
The accompanying notes form an integral part of these financial statements.
74

Description QuantityCurrency
(local) Cost Market Value
% ofNet
Assets
Transferable securities and money market instruments admitted to an official stock exchange listing
Shares (continued)
Italy (continued)Eni SpA 6,654,844 EUR 84,166,046 68,345,248 0.86Intesa Sanpaolo SpA 48,324,939 EUR 108,907,608 112,572,945 1.42
313,890,749 342,100,401 4.32NetherlandsAdyen NV 144A 74,210 EUR 117,925,913 152,909,705 1.93Airbus SE 1,542,382 EUR 121,205,584 167,255,904 2.11ASML Holdings NV 1,111,334 EUR 259,243,524 643,906,920 8.12ING Groep NV 10,338,468 EUR 107,059,223 115,170,533 1.45Koninklijke Ahold Delhaize NV 2,770,338 EUR 60,146,447 69,452,374 0.88Koninklijke Philips NV 2,413,561 EUR 83,024,028 100,862,714 1.27Prosus NV 1,178,013 EUR 95,911,758 97,150,732 1.23
844,516,477 1,346,708,882 16.99SpainAmadeus IT Group SA 1,193,462 EUR 79,194,480 70,796,166 0.89Banco Santander SA 45,938,863 EUR 179,929,722 147,900,169 1.87Iberdrola SA 15,525,434 EUR 125,869,113 159,601,461 2.02Industria de Diseno Textil SA 2,944,315 EUR 79,235,256 87,475,599 1.10
464,228,571 465,773,395 5.88
Total - Shares 6,332,237,751 7,895,592,362 99.63
Total Transferable securities and money market instruments admitted to an officialstock exchange listing 6,332,237,751 7,895,592,362 99.63
TOTAL INVESTMENT PORTFOLIO 6,332,237,751 7,895,592,362 99.63
Xtrackers**
Xtrackers EURO STOXX 50 UCITS ETF (continued)
Statement of Investmentsas at 30 June 2021(expressed in EUR)
** This includes synthetic ETFs.
The accompanying notes form an integral part of these financial statements.
75

Description QuantityCurrency
(local) Cost Market Value
% ofNet
Assets
Transferable securities and money market instruments admitted to an official stock exchange listing
Shares
Germanyadidas AG 622,945 EUR 121,729,551 195,542,436 4.74Allianz SE 1,415,813 EUR 246,030,366 297,745,474 7.22BASF SE 3,155,945 EUR 205,753,929 209,680,986 5.08Bayer AG 3,375,666 EUR 248,694,279 172,867,856 4.19Bayerische Motoren Werke AG 1,101,061 EUR 78,335,814 98,335,758 2.38Continental AG 371,104 EUR 50,499,113 46,009,474 1.12Covestro AG 144A 663,716 EUR 36,057,926 36,145,973 0.88Daimler AG 2,884,943 EUR 153,414,457 217,236,208 5.27Delivery Hero SE 144A 647,078 EUR 65,746,158 72,084,489 1.75Deutsche Bank AG 7,099,427 EUR 77,527,704 77,994,305 1.89Deutsche Boerse AG 630,590 EUR 72,043,869 92,822,848 2.25Deutsche Post AG 3,376,187 EUR 105,567,578 193,658,086 4.69Deutsche Telekom AG 11,077,802 EUR 160,093,899 197,317,809 4.78Deutsche Wohnen SE 1,028,031 EUR 41,670,164 53,025,839 1.29E.ON SE 7,141,692 EUR 67,497,903 69,660,064 1.69Fresenius Medical Care AG & Co. KGaA 682,179 EUR 47,689,010 47,779,817 1.16Fresenius SE & Co. KGaA 1,413,687 EUR 67,915,674 62,195,160 1.51HeidelbergCement AG 507,712 EUR 31,225,586 36,727,886 0.89Henkel AG & Co. KGaA-Pref- 599,507 EUR 54,916,273 53,380,103 1.29Infineon Technologies AG 4,471,517 EUR 83,038,931 151,226,705 3.67Merck KGaA 444,085 EUR 44,108,996 71,808,545 1.74MTU Aero Engines AG 183,297 EUR 37,731,425 38,290,743 0.93Muenchener Rueckversicherungs-Gesellschaft AG 481,392 EUR 96,783,576 111,177,483 2.69RWE AG 2,323,536 EUR 59,133,026 71,007,260 1.72SAP SE 3,470,964 EUR 342,775,946 412,489,362 10.00Siemens AG 2,582,731 EUR 248,499,566 345,104,516 8.37Volkswagen AG-Pref- 629,041 EUR 94,959,350 132,853,459 3.22Vonovia SE 1,854,462 EUR 82,953,689 101,105,268 2.45
3,022,393,758 3,665,273,912 88.86IrelandLinde PLC 1,718,760 EUR 274,527,702 418,260,246 10.14
274,527,702 418,260,246 10.14SwitzerlandSiemens Energy AG 1,620,417 EUR 48,144,539 41,191,000 1.00
48,144,539 41,191,000 1.00
Total - Shares 3,345,065,999 4,124,725,158 100.00
Total Transferable securities and money market instruments admitted to an officialstock exchange listing 3,345,065,999 4,124,725,158 100.00
TOTAL INVESTMENT PORTFOLIO 3,345,065,999 4,124,725,158 100.00
Xtrackers**
Xtrackers DAX UCITS ETF
Statement of Investmentsas at 30 June 2021(expressed in EUR)
** This includes synthetic ETFs.
The accompanying notes form an integral part of these financial statements.
76

Description QuantityCurrency
(local) Cost Market Value
% ofNet
Assets
Transferable securities and money market instruments admitted to an official stock exchange listing
Shares
ItalyA2A SpA 171,700 EUR 237,196 296,011 0.65Amplifon SpA 14,343 EUR 322,759 597,243 1.32Assicurazioni Generali SpA 143,098 EUR 2,243,043 2,419,072 5.34Atlantia SpA 54,704 EUR 1,108,138 835,330 1.84Azimut Holdings SpA 13,575 EUR 237,352 278,016 0.61Banca Generali SpA 6,213 EUR 178,877 223,544 0.49Banca Mediolanum SpA 31,880 EUR 170,099 261,544 0.58Banco BPM SpA 167,831 EUR 468,755 455,326 1.01BPER Banca 116,875 EUR 142,328 214,524 0.47Buzzi Unicem SpA 10,354 EUR 206,692 231,619 0.51DiaSorin SpA 2,503 EUR 276,995 399,229 0.88Enel SpA 864,083 EUR 5,540,369 6,767,498 14.93Eni SpA 279,257 EUR 3,697,614 2,867,969 6.33FinecoBank Banca Fineco SpA 67,842 EUR 698,276 997,277 2.20Hera SpA 87,401 EUR 279,502 304,505 0.67Infrastrutture Wireless Italiane SpA 144A 39,133 EUR 356,269 372,233 0.82Interpump Group SpA 8,932 EUR 262,616 446,064 0.99Intesa Sanpaolo SpA 1,845,854 EUR 4,104,319 4,299,917 9.49Italgas SpA 54,442 EUR 269,089 300,084 0.66Leonardo SpA 44,483 EUR 407,062 303,018 0.67Mediobanca Banca di Credito Finanziario SpA 82,424 EUR 716,298 811,876 1.79Moncler SpA 23,891 EUR 863,738 1,363,220 3.01Nexi SpA 144A 48,574 EUR 653,776 899,105 1.98Pirelli & C SpA 144A 53,082 EUR 302,809 259,889 0.57Poste Italiane SpA 144A 50,734 EUR 423,360 565,684 1.25Prysmian SpA 29,289 EUR 658,042 885,406 1.95Recordati Industria Chimica e Farmaceutica SpA 10,760 EUR 392,243 518,632 1.15Saipem SpA 61,643 EUR 236,609 125,813 0.28Snam SpA 247,681 EUR 1,043,665 1,207,445 2.67Telecom Italia SpA 1,193,430 EUR 712,588 499,928 1.10Terna Rete Elettrica Nazionale SpA 156,702 EUR 825,787 984,715 2.17UniCredit SpA 241,865 EUR 3,028,484 2,406,557 5.31Unipol Gruppo SpA 53,533 EUR 222,579 245,824 0.54
31,287,328 33,644,117 74.23LuxembourgTenaris SA 51,968 EUR 590,643 477,690 1.05
590,643 477,690 1.05NetherlandsCNH Industrial NV 109,387 EUR 1,031,499 1,523,214 3.36Davide Campari-Milano NV 54,952 EUR 399,738 620,683 1.37EXOR NV 11,492 EUR 628,936 776,399 1.71Ferrari NV 13,513 EUR 1,574,133 2,351,262 5.19
Xtrackers**
Xtrackers FTSE MIB UCITS ETF
Statement of Investmentsas at 30 June 2021(expressed in EUR)
** This includes synthetic ETFs.
The accompanying notes form an integral part of these financial statements.
77

Description QuantityCurrency
(local) Cost Market Value
% ofNet
Assets
Transferable securities and money market instruments admitted to an official stock exchange listing
Shares (continued)
Netherlands (continued)Stellantis NV 224,839 EUR 2,726,225 3,721,985 8.21STMicroelectronics NV 72,228 EUR 1,385,907 2,210,538 4.88
7,746,438 11,204,081 24.72
Total - Shares 39,624,409 45,325,888 100.00
Total Transferable securities and money market instruments admitted to an officialstock exchange listing 39,624,409 45,325,888 100.00
TOTAL INVESTMENT PORTFOLIO 39,624,409 45,325,888 100.00
Xtrackers**
Xtrackers FTSE MIB UCITS ETF (continued)
Statement of Investmentsas at 30 June 2021(expressed in EUR)
** This includes synthetic ETFs.
The accompanying notes form an integral part of these financial statements.
78

Description QuantityCurrency
(local) Cost Market Value
% ofNet
Assets
Transferable securities and money market instruments admitted to an official stock exchange listing
Shares
SwitzerlandABB Ltd. 1,542,777 CHF 31,817,093 48,427,770 3.98Alcon Inc. 457,882 CHF 25,744,036 29,661,596 2.44Cie Financiere Richemont SA 420,938 CHF 29,898,041 47,124,009 3.88Credit Suisse Group AG 2,290,881 CHF 26,567,121 22,203,219 1.83Geberit AG 33,469 CHF 14,911,089 23,227,486 1.91Givaudan SA 7,433 CHF 21,024,879 31,984,199 2.63Holcim Ltd. 464,161 CHF 19,803,686 25,760,935 2.12Kuehne & Nagel International AG 51,847 CHF 13,924,986 16,414,760 1.35Logitech International SA 150,347 CHF 12,706,304 16,853,899 1.39Lonza Group AG 69,464 CHF 24,240,113 45,554,491 3.75Nestle SA 2,501,569 CHF 229,378,633 288,230,780 23.71Novartis AG 2,208,347 CHF 174,316,766 186,207,819 15.32Partners Group Holdings AG 20,478 CHF 16,896,061 28,699,917 2.36Roche Holdings AG 616,045 CHF 178,995,630 214,722,485 17.67SGS SA 4,990 CHF 11,597,260 14,241,460 1.17Sika AG 125,330 CHF 21,042,215 37,912,325 3.12Sonova Holdings AG 49,510 CHF 16,501,683 17,229,480 1.42Swiss Re AG 269,574 CHF 22,573,591 22,504,038 1.85UBS Group AG 3,272,069 CHF 38,281,462 46,332,497 3.81Zurich Insurance Group AG 140,571 CHF 44,278,050 52,179,955 4.29
974,498,699 1,215,473,120 100.00
Total - Shares 974,498,699 1,215,473,120 100.00
Total Transferable securities and money market instruments admitted to an officialstock exchange listing 974,498,699 1,215,473,120 100.00
TOTAL INVESTMENT PORTFOLIO 974,498,699 1,215,473,120 100.00
Xtrackers**
Xtrackers SWITZERLAND UCITS ETF
Statement of Investmentsas at 30 June 2021(expressed in CHF)
** This includes synthetic ETFs.
The accompanying notes form an integral part of these financial statements.
79

Description QuantityCurrency
(local) Cost Market Value
% ofNet
Assets
Transferable securities and money market instruments admitted to an official stock exchange listing
Shares
GuernseyPershing Square Holdings Ltd. 6,103 GBP 147,866 161,424 0.22
147,866 161,424 0.22IrelandCRH PLC 29,676 GBP 604,939 1,085,251 1.51DCC PLC 3,727 GBP 223,980 220,564 0.31Flutter Entertainment PLC 6,271 GBP 700,637 824,323 1.14Smurfit Kappa Group PLC 9,818 GBP 213,591 385,651 0.54
1,743,147 2,515,789 3.50Isle Of ManGVC Holdings PLC 22,048 GBP 177,259 384,848 0.54
177,259 384,848 0.54JerseyExperian PLC 34,596 GBP 483,290 963,845 1.34Ferguson PLC 8,469 GBP 375,348 851,135 1.18Glencore PLC 455,302 GBP 1,098,930 1,408,932 1.96Polymetal International PLC 13,485 GBP 162,696 209,624 0.29WPP PLC 44,285 GBP 569,025 431,424 0.60
2,689,289 3,864,960 5.37LuxembourgB&M European Value Retail SA 33,682 GBP 156,268 193,065 0.27
156,268 193,065 0.27NetherlandsJust Eat Takeaway.com NV 144A 6,823 GBP 465,540 456,595 0.63
465,540 456,595 0.63SpainInternational Consolidated Airlines Group SA 140,771 GBP 307,009 245,251 0.34
307,009 245,251 0.34SwitzerlandCoca-Cola HBC AG 7,375 GBP 121,944 192,783 0.27
121,944 192,783 0.27United Kingdom3i Group PLC 35,982 GBP 213,283 422,069 0.59Admiral Group PLC 7,932 GBP 138,759 249,382 0.35Anglo American PLC 46,519 GBP 694,325 1,336,258 1.86Antofagasta PLC 13,075 GBP 108,481 187,692 0.26Ashtead Group PLC 16,909 GBP 221,260 906,999 1.26Associated British Foods PLC 13,133 GBP 361,258 291,027 0.40AstraZeneca PLC 49,680 GBP 2,365,649 4,313,714 6.00Auto Trader Group PLC 144A 35,705 GBP 162,875 226,155 0.31Avast PLC 144A 20,845 GBP 105,934 102,099 0.14AVEVA Group PLC 4,479 GBP 141,904 166,081 0.23Aviva PLC 148,189 GBP 679,381 601,499 0.84BAE Systems PLC 122,012 GBP 593,645 636,903 0.89Barclays PLC 640,701 GBP 1,481,378 1,096,368 1.52Barratt Developments PLC 38,236 GBP 203,664 265,817 0.37Berkeley Group Holdings PLC 4,264 GBP 153,758 195,931 0.27BHP Group PLC 78,641 GBP 1,237,842 1,675,053 2.33BP PLC 752,793 GBP 3,390,284 2,371,298 3.30
Xtrackers**
Xtrackers FTSE 100 INCOME UCITS ETF
Statement of Investmentsas at 30 June 2021(expressed in GBP)
** This includes synthetic ETFs.
The accompanying notes form an integral part of these financial statements.
80

Description QuantityCurrency
(local) Cost Market Value
% ofNet
Assets
Transferable securities and money market instruments admitted to an official stock exchange listing
Shares (continued)
United Kingdom (continued)British American Tobacco PLC 86,356 GBP 3,145,493 2,417,968 3.36British Land REIT Co. PLC 34,932 GBP 234,064 172,878 0.24BT Group PLC 330,142 GBP 1,122,192 640,475 0.89Bunzl PLC 12,724 GBP 224,391 303,976 0.42Burberry Group PLC 15,166 GBP 230,914 313,330 0.44Compass Group PLC 67,397 GBP 821,465 1,025,782 1.43Croda International PLC 5,087 GBP 215,280 374,810 0.52Diageo PLC 86,872 GBP 1,846,693 3,006,640 4.18DS Smith PLC 48,202 GBP 217,788 201,436 0.28Evraz PLC 21,780 GBP 89,828 128,938 0.18Fresnillo PLC 6,949 GBP 42,823 53,618 0.07GlaxoSmithKline PLC 186,989 GBP 2,855,934 2,654,122 3.69Halma PLC 14,311 GBP 197,401 385,252 0.54Hargreaves Lansdown PLC 14,288 GBP 219,610 227,036 0.32Hikma Pharmaceuticals PLC 6,374 GBP 135,135 155,908 0.22HSBC Holdings PLC 772,963 GBP 4,631,033 3,225,575 4.48Imperial Brands PLC 35,638 GBP 916,337 554,884 0.77Informa PLC 56,538 GBP 372,337 283,595 0.39InterContinental Hotels Group PLC 6,916 GBP 240,269 332,660 0.46Intermediate Capital Group PLC 10,504 GBP 83,809 223,105 0.31Intertek Group PLC 6,095 GBP 210,471 337,054 0.47ITV PLC 140,743 GBP 179,355 176,703 0.25J Sainsbury PLC 62,169 GBP 179,595 168,975 0.23JD Sports Fashion PLC 18,615 GBP 113,085 171,072 0.24Johnson Matthey PLC 7,175 GBP 231,382 220,488 0.31Kingfisher PLC 79,801 GBP 172,656 290,875 0.40Land Securities Group REIT PLC 26,919 GBP 279,105 181,811 0.25Legal & General Group PLC 224,140 GBP 529,977 577,385 0.80Lloyds Banking Group PLC 2,679,025 GBP 1,916,080 1,250,837 1.74London Stock Exchange Group PLC 13,732 GBP 503,456 1,094,440 1.52M&G PLC 98,201 GBP 195,686 224,782 0.31Melrose Industries PLC 181,755 GBP 391,041 281,902 0.39Mondi PLC 18,304 GBP 262,231 347,959 0.48National Grid PLC 129,648 GBP 1,178,959 1,193,799 1.66Natwest Group PLC 198,024 GBP 540,746 402,385 0.56Next PLC 4,808 GBP 297,530 377,716 0.53Ocado Group PLC 18,381 GBP 223,154 368,171 0.51Pearson PLC 28,539 GBP 283,246 236,874 0.33Persimmon PLC 11,994 GBP 215,409 354,783 0.49Phoenix Group Holdings PLC 23,827 GBP 167,063 161,166 0.22Prudential PLC 98,901 GBP 1,202,721 1,358,405 1.89Reckitt Benckiser Group PLC 23,966 GBP 1,332,022 1,533,105 2.13RELX PLC 70,350 GBP 967,194 1,350,016 1.88Rentokil Initial PLC 70,507 GBP 199,059 349,010 0.49Rightmove PLC 32,440 GBP 170,949 210,665 0.29Rio Tinto PLC 41,099 GBP 1,355,529 2,444,980 3.40Rolls-Royce Holdings PLC 282,088 GBP 671,630 279,041 0.39Royal Dutch Shell PLC-A- 155,220 GBP 3,097,946 2,245,723 3.12
Xtrackers**
Xtrackers FTSE 100 INCOME UCITS ETF (continued)
Statement of Investmentsas at 30 June 2021(expressed in GBP)
** This includes synthetic ETFs.
The accompanying notes form an integral part of these financial statements.
81

Description QuantityCurrency
(local) Cost Market Value
% ofNet
Assets
Transferable securities and money market instruments admitted to an official stock exchange listing
Shares (continued)
United Kingdom (continued)Royal Dutch Shell PLC-B- 140,273 GBP 2,674,791 1,962,419 2.73Royal Mail PLC 34,618 GBP 207,217 199,884 0.28Sage Group PLC 40,792 GBP 215,357 279,099 0.39Schroders PLC 4,218 GBP 116,479 148,178 0.21Scottish Mortgage Investment Trust PLC 53,768 GBP 242,496 715,652 0.99Segro REIT PLC 45,279 GBP 274,399 495,579 0.69Severn Trent PLC 9,059 GBP 180,310 226,566 0.31Smith & Nephew PLC 33,339 GBP 373,227 520,922 0.72Smiths Group PLC 14,980 GBP 184,634 238,182 0.33Spirax-Sarco Engineering PLC 2,773 GBP 178,167 377,544 0.52SSE PLC 39,463 GBP 541,744 592,142 0.82St James’s Place PLC 20,120 GBP 191,036 297,172 0.41Standard Chartered PLC 96,487 GBP 822,683 444,805 0.62Standard Life Aberdeen PLC 81,172 GBP 336,655 219,976 0.31Taylor Wimpey PLC 136,711 GBP 214,783 217,302 0.30Tesco PLC 288,827 GBP 907,930 643,940 0.90Unilever PLC 98,724 GBP 3,862,543 4,176,519 5.80United Utilities Group PLC 25,774 GBP 212,691 251,142 0.35Vodafone Group PLC 1,061,719 GBP 2,196,207 1,288,290 1.79Weir Group PLC 9,785 GBP 172,888 181,120 0.25Whitbread PLC 7,622 GBP 244,792 237,959 0.33
61,514,782 63,630,847 88.44
Total - Shares 67,323,104 71,645,562 99.58
Total Transferable securities and money market instruments admitted to an officialstock exchange listing 67,323,104 71,645,562 99.58
Other transferable securities and money market instruments
Shares
United KingdomNMC Health PLC(1) 4,846 GBP 119,604 1 0.00
119,604 1 0.00
Total - Shares 119,604 1 0.00
Total Other transferable securities and money market instruments 119,604 1 0.00
TOTAL INVESTMENT PORTFOLIO 67,442,708 71,645,563 99.58
(1) The security is fair valued.
Xtrackers**
Xtrackers FTSE 100 INCOME UCITS ETF (continued)
Statement of Investmentsas at 30 June 2021(expressed in GBP)
** This includes synthetic ETFs.
The accompanying notes form an integral part of these financial statements.
82

Description QuantityCurrency
(local) Cost Market Value
% ofNet
Assets
Transferable securities and money market instruments admitted to an official stock exchange listing
Shares
BermudaHiscox Ltd. 62,989 GBP 725,552 523,817 0.68Lancashire Holdings Ltd. 45,680 GBP 320,365 279,790 0.36
1,045,917 803,607 1.04Cayman IslandsVietnam Enterprise Investments Ltd.-C- 36,167 GBP 171,396 253,169 0.33
171,396 253,169 0.33GermanyTUI AG 137,166 GBP 370,936 506,828 0.66
370,936 506,828 0.66Gibraltar888 Holdings PLC 50,524 GBP 106,373 193,911 0.25
106,373 193,911 0.25GuernseyApax Global Alpha Ltd. 144A 69,140 GBP 120,099 134,408 0.17Chrysalis Investments Ltd. 102,838 GBP 218,727 252,981 0.33Genesis Emerging Markets Fund Ltd. 22,829 GBP 160,514 209,799 0.27HarbourVest Global Private Equity Ltd. 15,017 GBP 223,905 325,869 0.42Hipgnosis Songs Fund Ltd. 203,497 GBP 222,773 247,452 0.32International Public Partnerships Ltd. 304,269 GBP 478,822 508,129 0.66Renewables Infrastructure Group Ltd. 395,082 GBP 482,937 505,705 0.65Schroder Oriental Income Fund Ltd. 50,429 GBP 130,785 137,167 0.18Sequoia Economic Infrastructure Income Fund Ltd. 331,373 GBP 365,529 368,487 0.48Sirius Real Estate Ltd. 181,817 GBP 148,607 201,090 0.26Syncona Limited 87,988 GBP 188,139 183,015 0.24UK Commercial Property REIT Ltd. 137,792 GBP 109,202 105,411 0.14VinaCapital Vietnam Opportunity Fund Ltd. 31,850 GBP 115,600 153,358 0.20
2,965,639 3,332,871 4.32IrelandC&C Group PLC 73,879 GBP 239,592 179,526 0.23Grafton Group PLC 41,101 GBP 333,301 471,429 0.61Greencore Group PLC 98,321 GBP 190,463 123,491 0.16United Drug PLC 47,364 GBP 318,997 506,321 0.66
1,082,353 1,280,767 1.66Isle Of ManPlaytech PLC 57,109 GBP 298,904 242,828 0.32
298,904 242,828 0.32IsraelPlus500 Ltd. 18,500 GBP 229,123 246,975 0.32
229,123 246,975 0.32Jersey3i Infrastructure PLC 112,091 GBP 295,987 334,031 0.43Centamin PLC 203,158 GBP 202,630 205,596 0.27GCP Infrastructure Investments Ltd. 163,226 GBP 191,230 165,185 0.21IWG PLC 135,225 GBP 424,953 406,486 0.53JTC PLC 144A 21,326 GBP 128,129 131,155 0.17Man Group PLC 265,353 GBP 372,847 477,503 0.62Sanne Group PLC 28,336 GBP 185,651 235,755 0.30
Xtrackers**
Xtrackers FTSE 250 UCITS ETF
Statement of Investmentsas at 30 June 2021(expressed in GBP)
** This includes synthetic ETFs.
The accompanying notes form an integral part of these financial statements.
83

Description QuantityCurrency
(local) Cost Market Value
% ofNet
Assets
Transferable securities and money market instruments admitted to an official stock exchange listing
Shares (continued)
Jersey (continued)TP ICAP Group PLC 148,302 GBP 427,545 289,782 0.37Wizz Air Holdings PLC 144A 14,310 GBP 530,168 668,134 0.87
2,759,140 2,913,627 3.77LuxembourgBBGI Global Infrastructure S.A. 124,860 GBP 201,325 219,004 0.28
201,325 219,004 0.28NetherlandsRHI Magnesita NV 5,372 GBP 202,096 217,566 0.28
202,096 217,566 0.28SingaporeXP Power Ltd. 2,828 GBP 92,547 157,802 0.20
92,547 157,802 0.20United Kingdom4imprint Group PLC 5,195 GBP 141,696 138,966 0.18Aberforth Smaller Companies Trust PLC 16,664 GBP 214,049 254,959 0.33Aggreko PLC 45,366 GBP 447,805 391,055 0.51Airtel Africa PLC 187,590 GBP 128,429 144,538 0.19AJ Bell PLC 54,261 GBP 203,908 235,384 0.30Alliance Trust PLC 59,482 GBP 432,013 590,656 0.77Allianz Technology Trust PLC 80,542 GBP 178,428 237,196 0.31AO World PLC 53,824 GBP 102,545 136,175 0.18Ascential PLC 74,174 GBP 248,574 308,564 0.40Ashmore Group PLC 85,649 GBP 343,703 329,749 0.43Assura REIT PLC 493,910 GBP 343,532 365,740 0.47Aston Martin Lagonda Global Holdings PLC 144A 12,606 GBP 261,135 236,678 0.31Auction Technology Group PLC 9,381 GBP 121,810 108,069 0.14Avi Global Trust PLC 19,695 GBP 140,170 190,845 0.25Avon Rubber PLC 5,293 GBP 150,733 138,465 0.18Babcock International Group PLC 94,497 GBP 491,608 274,041 0.35Baillie Gifford Japan Trust PLC 17,585 GBP 155,361 180,422 0.23Baillie Gifford Shin Nippon PLC 58,347 GBP 150,123 134,198 0.17Baillie Gifford US Growth Trust PLC 57,648 GBP 159,819 203,209 0.26Balfour Beatty PLC 124,818 GBP 342,937 382,692 0.50Bankers Investment Trust PLC 245,930 GBP 216,314 280,360 0.36BB Healthcare Trust PLC 99,225 GBP 170,717 196,862 0.25Beazley PLC 112,706 GBP 454,224 374,635 0.49Bellway PLC 23,202 GBP 678,873 751,745 0.97Biffa PLC 144A 41,640 GBP 108,411 135,330 0.18Big Yellow Group REIT PLC 30,358 GBP 288,429 396,779 0.51BlackRock Smaller Cos Trust PLC 9,139 GBP 147,480 178,393 0.23BlackRock World Mining Trust PLC 33,976 GBP 144,784 206,574 0.27BMO Global Smaller Companies PLC 108,113 GBP 152,561 174,062 0.23Bodycote PLC 35,212 GBP 270,444 298,070 0.39Brewin Dolphin Holdings PLC 54,509 GBP 172,746 189,419 0.25Britvic PLC 50,035 GBP 410,293 468,828 0.61Bytes Technology Group PLC 37,896 GBP 159,192 175,458 0.23Cairn Energy PLC 92,281 GBP 194,977 134,453 0.17Caledonia Investments PLC 6,104 GBP 160,227 195,633 0.25
Xtrackers**
Xtrackers FTSE 250 UCITS ETF (continued)
Statement of Investmentsas at 30 June 2021(expressed in GBP)
** This includes synthetic ETFs.
The accompanying notes form an integral part of these financial statements.
84

Description QuantityCurrency
(local) Cost Market Value
% ofNet
Assets
Transferable securities and money market instruments admitted to an official stock exchange listing
Shares (continued)
United Kingdom (continued)Capita PLC 313,676 GBP 486,923 117,033 0.15Capital & Counties Properties REIT PLC 138,109 GBP 360,527 222,770 0.29Carnival PLC 25,032 GBP 337,968 415,731 0.54Centrica PLC 1,104,535 GBP 506,939 568,394 0.74Chemring Group PLC 52,896 GBP 111,181 152,076 0.20Cineworld Group PLC 189,669 GBP 332,473 146,880 0.19City of London Investment Trust PLC 83,134 GBP 325,054 324,223 0.42Civitas Social Housing REIT PLC 116,464 GBP 128,018 134,399 0.17Clarkson PLC 4,668 GBP 120,715 148,909 0.19Close Brothers Group PLC 28,178 GBP 412,375 426,897 0.55CLS Holdings PLC 29,210 GBP 64,895 70,250 0.09CMC Markets PLC 144A 20,675 GBP 80,244 95,105 0.12Coats Group PLC 270,642 GBP 191,824 184,307 0.24Computacenter PLC 13,369 GBP 197,466 343,851 0.45ContourGlobal PLC 144A 32,363 GBP 69,843 62,461 0.08ConvaTec Group PLC 144A 300,593 GBP 596,181 723,227 0.94Countryside Properties PLC 144A 96,991 GBP 382,418 458,379 0.59Cranswick PLC 9,830 GBP 281,039 390,251 0.51Crest Nicholson Holdings PLC 46,476 GBP 186,828 194,920 0.25Dechra Pharmaceuticals PLC 19,711 GBP 479,930 861,371 1.12Derwent London REIT PLC 18,929 GBP 618,126 628,443 0.81Diploma PLC 22,820 GBP 387,230 662,693 0.86Direct Line Insurance Group PLC 254,595 GBP 776,234 725,596 0.94Diversified Energy Co. PLC 127,685 GBP 137,628 134,325 0.17Dixons Carphone PLC 189,495 GBP 352,778 246,722 0.32Domino’s Pizza Group PLC 87,398 GBP 257,624 339,629 0.44Dr. Martens PLC 75,690 GBP 355,214 336,821 0.44Drax Group PLC 74,794 GBP 337,603 317,276 0.41Dunelm Group PLC 21,252 GBP 231,777 301,566 0.39easyJet PLC 62,501 GBP 500,630 559,259 0.72Edinburgh Investment Trust PLC 32,259 GBP 193,977 196,135 0.25Edinburgh Worldwide Investment Trust PLC 74,334 GBP 203,858 266,116 0.34Electrocomponents PLC 88,298 GBP 567,726 908,586 1.18Elementis PLC 107,350 GBP 131,028 161,776 0.21Energean PLC 22,314 GBP 172,234 159,322 0.21Essentra PLC 56,335 GBP 270,937 174,075 0.23Euromoney Institutional Investor PLC 19,966 GBP 233,358 203,254 0.26European Opportunities Trust PLC 19,262 GBP 143,416 144,465 0.19F&C Investment Trust PLC 100,244 GBP 639,309 848,064 1.10FDM Group Holdings PLC 16,004 GBP 143,750 163,241 0.21Ferrexpo PLC 54,804 GBP 117,551 234,452 0.30Fidelity China Special Situations PLC 64,971 GBP 158,218 270,279 0.35Fidelity European Trust PLC 77,351 GBP 175,815 234,760 0.30Fidelity Special Values PLC 39,032 GBP 102,943 113,388 0.15Finsbury Growth & Income Trust PLC 42,140 GBP 337,550 375,046 0.49Firstgroup PLC 229,149 GBP 248,953 187,673 0.24Frasers Group PLC 35,036 GBP 146,459 211,092 0.27Future PLC 21,253 GBP 310,773 665,644 0.86
Xtrackers**
Xtrackers FTSE 250 UCITS ETF (continued)
Statement of Investmentsas at 30 June 2021(expressed in GBP)
** This includes synthetic ETFs.
The accompanying notes form an integral part of these financial statements.
85
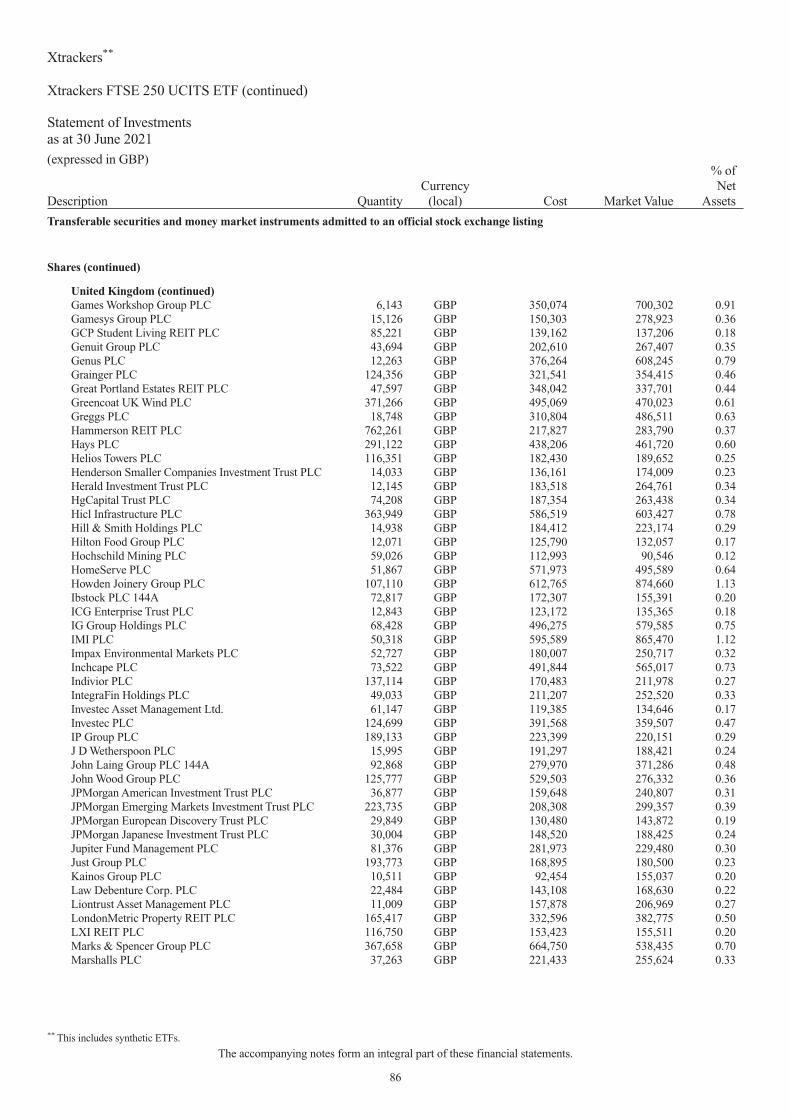
Description QuantityCurrency
(local) Cost Market Value
% ofNet
Assets
Transferable securities and money market instruments admitted to an official stock exchange listing
Shares (continued)
United Kingdom (continued)Games Workshop Group PLC 6,143 GBP 350,074 700,302 0.91Gamesys Group PLC 15,126 GBP 150,303 278,923 0.36GCP Student Living REIT PLC 85,221 GBP 139,162 137,206 0.18Genuit Group PLC 43,694 GBP 202,610 267,407 0.35Genus PLC 12,263 GBP 376,264 608,245 0.79Grainger PLC 124,356 GBP 321,541 354,415 0.46Great Portland Estates REIT PLC 47,597 GBP 348,042 337,701 0.44Greencoat UK Wind PLC 371,266 GBP 495,069 470,023 0.61Greggs PLC 18,748 GBP 310,804 486,511 0.63Hammerson REIT PLC 762,261 GBP 217,827 283,790 0.37Hays PLC 291,122 GBP 438,206 461,720 0.60Helios Towers PLC 116,351 GBP 182,430 189,652 0.25Henderson Smaller Companies Investment Trust PLC 14,033 GBP 136,161 174,009 0.23Herald Investment Trust PLC 12,145 GBP 183,518 264,761 0.34HgCapital Trust PLC 74,208 GBP 187,354 263,438 0.34Hicl Infrastructure PLC 363,949 GBP 586,519 603,427 0.78Hill & Smith Holdings PLC 14,938 GBP 184,412 223,174 0.29Hilton Food Group PLC 12,071 GBP 125,790 132,057 0.17Hochschild Mining PLC 59,026 GBP 112,993 90,546 0.12HomeServe PLC 51,867 GBP 571,973 495,589 0.64Howden Joinery Group PLC 107,110 GBP 612,765 874,660 1.13Ibstock PLC 144A 72,817 GBP 172,307 155,391 0.20ICG Enterprise Trust PLC 12,843 GBP 123,172 135,365 0.18IG Group Holdings PLC 68,428 GBP 496,275 579,585 0.75IMI PLC 50,318 GBP 595,589 865,470 1.12Impax Environmental Markets PLC 52,727 GBP 180,007 250,717 0.32Inchcape PLC 73,522 GBP 491,844 565,017 0.73Indivior PLC 137,114 GBP 170,483 211,978 0.27IntegraFin Holdings PLC 49,033 GBP 211,207 252,520 0.33Investec Asset Management Ltd. 61,147 GBP 119,385 134,646 0.17Investec PLC 124,699 GBP 391,568 359,507 0.47IP Group PLC 189,133 GBP 223,399 220,151 0.29J D Wetherspoon PLC 15,995 GBP 191,297 188,421 0.24John Laing Group PLC 144A 92,868 GBP 279,970 371,286 0.48John Wood Group PLC 125,777 GBP 529,503 276,332 0.36JPMorgan American Investment Trust PLC 36,877 GBP 159,648 240,807 0.31JPMorgan Emerging Markets Investment Trust PLC 223,735 GBP 208,308 299,357 0.39JPMorgan European Discovery Trust PLC 29,849 GBP 130,480 143,872 0.19JPMorgan Japanese Investment Trust PLC 30,004 GBP 148,520 188,425 0.24Jupiter Fund Management PLC 81,376 GBP 281,973 229,480 0.30Just Group PLC 193,773 GBP 168,895 180,500 0.23Kainos Group PLC 10,511 GBP 92,454 155,037 0.20Law Debenture Corp. PLC 22,484 GBP 143,108 168,630 0.22Liontrust Asset Management PLC 11,009 GBP 157,878 206,969 0.27LondonMetric Property REIT PLC 165,417 GBP 332,596 382,775 0.50LXI REIT PLC 116,750 GBP 153,423 155,511 0.20Marks & Spencer Group PLC 367,658 GBP 664,750 538,435 0.70Marshalls PLC 37,263 GBP 221,433 255,624 0.33
Xtrackers**
Xtrackers FTSE 250 UCITS ETF (continued)
Statement of Investmentsas at 30 June 2021(expressed in GBP)
** This includes synthetic ETFs.
The accompanying notes form an integral part of these financial statements.
86

Description QuantityCurrency
(local) Cost Market Value
% ofNet
Assets
Transferable securities and money market instruments admitted to an official stock exchange listing
Shares (continued)
United Kingdom (continued)Mediclinic International PLC 73,475 GBP 303,491 218,368 0.28Meggitt PLC 146,423 GBP 523,115 675,303 0.87Mercantile Investment Trust PLC 148,719 GBP 321,556 383,695 0.50Micro Focus International PLC 61,974 GBP 567,245 338,998 0.44Mitchells & Butlers PLC 47,831 GBP 150,451 133,257 0.17Mitie Group PLC 246,069 GBP 154,735 167,327 0.22Moneysupermarket.com Group PLC 97,492 GBP 277,789 250,164 0.32Monks Investment Trust PLC 44,150 GBP 397,425 605,738 0.78Moonpig Group PLC 26,850 GBP 122,457 115,133 0.15Morgan Advanced Materials PLC 53,082 GBP 158,224 187,379 0.24Morgan Sindall Group PLC 7,592 GBP 138,158 163,608 0.21Murray Income Trust PLC 21,954 GBP 214,308 191,219 0.25Murray International Trust PLC-O- 23,332 GBP 257,881 275,784 0.36National Express Group PLC 101,113 GBP 313,069 269,567 0.35NCC Group PLC 49,917 GBP 142,292 146,756 0.19Network International Holdings PLC 144A 87,051 GBP 444,238 318,346 0.41OSB Group PLC 70,881 GBP 279,551 328,888 0.43Oxford Biomedica PLC 11,537 GBP 103,362 149,981 0.19Oxford Instruments PLC 9,974 GBP 149,527 230,399 0.30Pagegroup PLC 58,605 GBP 276,727 327,602 0.42Pantheon International PLC 10,112 GBP 226,767 273,024 0.35Paragon Banking Group PLC 47,609 GBP 207,929 242,568 0.31Pennon Group PLC 79,131 GBP 779,087 898,533 1.16Personal Assets Trust PLC 569 GBP 240,255 271,413 0.35Petropavlovsk PLC 568,988 GBP 130,566 134,623 0.17Pets at Home Group PLC 89,110 GBP 230,975 406,342 0.53Polar Capital Technology Trust PLC 25,612 GBP 362,166 606,492 0.79Premier Foods PLC 133,670 GBP 124,462 146,502 0.19Primary Health Properties REIT PLC 246,455 GBP 343,547 379,294 0.49PureTech Health PLC 28,953 GBP 90,681 98,730 0.13PZ Cussons PLC 35,251 GBP 93,994 86,189 0.11QinetiQ Group PLC 105,455 GBP 311,077 362,343 0.47Quilter PLC 144A 321,265 GBP 490,325 477,882 0.62Rank Group PLC 38,341 GBP 76,682 64,336 0.08Rathbone Brothers PLC 10,810 GBP 207,316 195,877 0.25Redde Northgate PLC 46,109 GBP 159,196 183,975 0.24Redrow PLC 42,757 GBP 235,970 261,587 0.34Renishaw PLC 6,421 GBP 337,176 316,298 0.41Restaurant Group PLC 138,455 GBP 177,794 177,499 0.23RIT Capital Partners PLC 24,009 GBP 458,939 583,419 0.76Rotork PLC 163,695 GBP 493,811 557,218 0.72Safestore Holdings REIT PLC 38,509 GBP 238,327 364,680 0.47Savills PLC 24,852 GBP 232,347 285,798 0.37Schroder AsiaPacific Fund PLC 31,340 GBP 156,659 192,741 0.25Scottish American Investment Co. PLC 31,849 GBP 139,970 156,379 0.20Serco Group PLC 224,805 GBP 367,552 305,060 0.40Shaftesbury REIT PLC 52,261 GBP 367,596 297,626 0.39Smithson Investment Trust PLC 28,302 GBP 391,573 503,776 0.65
Xtrackers**
Xtrackers FTSE 250 UCITS ETF (continued)
Statement of Investmentsas at 30 June 2021(expressed in GBP)
** This includes synthetic ETFs.
The accompanying notes form an integral part of these financial statements.
87

Description QuantityCurrency
(local) Cost Market Value
% ofNet
Assets
Transferable securities and money market instruments admitted to an official stock exchange listing
Shares (continued)
United Kingdom (continued)Softcat PLC 23,295 GBP 229,777 413,719 0.54Spectris PLC 21,640 GBP 584,321 700,703 0.91Spire Healthcare Group PLC 144A 52,664 GBP 133,458 129,553 0.17Spirent Communications PLC 113,322 GBP 217,031 279,225 0.36SSP Group PLC 147,584 GBP 510,401 393,164 0.51St Modwen Properties PLC 33,240 GBP 139,905 185,147 0.24Synthomer PLC 62,460 GBP 219,609 307,053 0.40Tate & Lyle PLC 87,945 GBP 622,020 649,386 0.84Telecom Plus PLC 11,843 GBP 165,699 134,536 0.17Temple Bar Investment Trust PLC 12,513 GBP 142,507 133,639 0.17Templeton Emerging Markets Investment TrustPLC-O- 44,419 GBP 337,531 445,078 0.58TI Fluid Systems PLC 144A 52,437 GBP 129,803 160,982 0.21TR Property Investment Trust PLC - Ordinary Shares 59,629 GBP 218,656 264,753 0.34Trainline PLC 144A 86,606 GBP 394,098 254,275 0.33Travis Perkins PLC 42,314 GBP 592,793 714,683 0.93Tritax Big Box REIT PLC 323,011 GBP 485,558 634,071 0.82Trustpilot Group PLC 144A 33,549 GBP 122,865 114,536 0.15Tullow Oil PLC 265,472 GBP 145,512 157,850 0.20Tyman PLC 36,846 GBP 181,406 165,807 0.21Ultra Electronics Holdings PLC 13,108 GBP 256,843 300,173 0.39UNITE Group REIT PLC 59,788 GBP 555,319 642,123 0.83Vectura Group PLC 110,848 GBP 135,316 151,197 0.20Vesuvius PLC 39,963 GBP 189,744 211,005 0.27Victrex PLC 15,441 GBP 331,183 393,128 0.51Virgin Money UK PLC 233,138 GBP 495,920 462,896 0.60Vistry Group PLC 41,328 GBP 446,969 486,224 0.63Vivo Energy PLC 144A 72,309 GBP 84,142 69,706 0.09Volution Group PLC 35,144 GBP 160,353 147,078 0.19Watches of Switzerland Group PLC 144A 43,495 GBP 230,433 363,618 0.47WH Smith PLC 23,534 GBP 407,908 378,544 0.49Wickes Group PLC 47,247 GBP 107,004 116,228 0.15Witan Investment Trust PLC 145,628 GBP 282,850 351,692 0.46Wm Morrison Supermarkets PLC 417,592 GBP 756,657 1,030,199 1.33Workspace Group REIT PLC 25,074 GBP 215,644 209,117 0.27Worldwide Healthcare Trust PLC 12,074 GBP 346,475 463,038 0.60
59,210,929 66,680,540 86.37
Total - Shares 68,736,678 77,049,495 99.80
Total Transferable securities and money market instruments admitted to an officialstock exchange listing 68,736,678 77,049,495 99.80
Xtrackers**
Xtrackers FTSE 250 UCITS ETF (continued)
Statement of Investmentsas at 30 June 2021(expressed in GBP)
** This includes synthetic ETFs.
The accompanying notes form an integral part of these financial statements.
88

Description QuantityCurrency
(local) Cost Market Value
% ofNet
Assets
Other transferable securities and money market instruments
Shares
United KingdomFinablr PLC 144A 24,440 GBP 39,937 147 0.00
39,937 147 0.00
Total - Shares 39,937 147 0.00
Total Other transferable securities and money market instruments 39,937 147 0.00
TOTAL INVESTMENT PORTFOLIO 68,776,615 77,049,642 99.80
Xtrackers**
Xtrackers FTSE 250 UCITS ETF (continued)
Statement of Investmentsas at 30 June 2021(expressed in GBP)
** This includes synthetic ETFs.
The accompanying notes form an integral part of these financial statements.
89

Description QuantityCurrency
(local) Cost Market Value
% ofNet
Assets
Transferable securities and money market instruments admitted to an official stock exchange listing
Shares
GuernseySirius Real Estate Ltd. 40,378 GBP 41,662 44,658 0.10
41,662 44,658 0.10IrelandDCC PLC 3,990 GBP 207,962 236,128 0.55Grafton Group PLC 9,220 GBP 77,612 105,753 0.25Greencore Group PLC 21,256 GBP 34,066 26,698 0.06
319,640 368,579 0.86JerseyFerguson PLC 9,130 GBP 635,213 917,565 2.13
635,213 917,565 2.13SwitzerlandCoca-Cola HBC AG 8,131 GBP 165,439 212,545 0.49
165,439 212,545 0.49United Kingdom3i Group PLC 39,474 GBP 362,546 463,030 1.07Advanced Medical Solutions Group PLC 7,829 GBP 21,779 22,234 0.05AJ Bell PLC 12,428 GBP 50,543 53,913 0.13Antofagasta PLC 16,000 GBP 200,493 229,680 0.53AO World PLC 12,558 GBP 28,566 31,772 0.07Ashmore Group PLC 18,744 GBP 72,093 72,164 0.17Ashtead Group PLC 18,223 GBP 963,497 977,482 2.27ASOS PLC 2,834 GBP 126,361 140,566 0.33Associated British Foods PLC 14,421 GBP 361,443 319,569 0.74AstraZeneca PLC 53,243 GBP 3,591,917 4,623,090 10.72Avast PLC 144A 27,132 GBP 119,677 132,893 0.31Aviva PLC 159,328 GBP 645,409 646,712 1.50Barclays PLC 704,098 GBP 1,264,131 1,204,852 2.79Barratt Developments PLC 41,323 GBP 242,801 287,277 0.67Bellway PLC 5,008 GBP 132,731 162,259 0.38Berkeley Group Holdings PLC 4,980 GBP 193,683 228,831 0.53Big Yellow Group REIT PLC 6,763 GBP 67,437 88,392 0.20Brewin Dolphin Holdings PLC 12,252 GBP 37,740 42,576 0.10British Land REIT Co. PLC 35,737 GBP 206,298 176,862 0.41Britvic PLC 10,831 GBP 86,468 101,486 0.24BT Group PLC 361,961 GBP 823,007 702,204 1.63Burberry Group PLC 16,413 GBP 283,476 339,093 0.79Capita PLC 67,378 GBP 153,478 25,139 0.06Close Brothers Group PLC 6,114 GBP 86,323 92,627 0.21ConvaTec Group PLC 144A 65,017 GBP 146,053 156,431 0.36Countryside Properties PLC 144A 20,216 GBP 101,244 95,541 0.22Cranswick PLC 2,129 GBP 64,459 84,521 0.20Crest Nicholson Holdings PLC 10,372 GBP 39,487 43,500 0.10Croda International PLC 5,656 GBP 298,146 416,734 0.97CVS Group PLC 2,712 GBP 59,860 65,495 0.15Dechra Pharmaceuticals PLC 4,378 GBP 117,704 191,319 0.44Derwent London REIT PLC 4,087 GBP 140,716 135,688 0.31Dunelm Group PLC 4,926 GBP 55,694 69,900 0.16Elementis PLC 23,448 GBP 36,768 35,336 0.08
Xtrackers**
Xtrackers MSCI UK ESG UCITS ETF
Statement of Investmentsas at 30 June 2021(expressed in GBP)
** This includes synthetic ETFs.
The accompanying notes form an integral part of these financial statements.
90

Description QuantityCurrency
(local) Cost Market Value
% ofNet
Assets
Transferable securities and money market instruments admitted to an official stock exchange listing
Shares (continued)
United Kingdom (continued)EMIS Group PLC 2,300 GBP 27,497 26,450 0.06GB Group PLC 7,559 GBP 68,091 62,400 0.14Genuit Group PLC 9,979 GBP 45,925 61,071 0.14GlaxoSmithKline PLC 204,069 GBP 2,763,487 2,896,555 6.72Grainger PLC 27,276 GBP 71,988 77,737 0.18Great Portland Estates REIT PLC 9,261 GBP 62,897 65,707 0.15Greggs PLC 4,116 GBP 62,655 106,810 0.25Halfords Group PLC 8,038 GBP 24,358 34,660 0.08Hammerson REIT PLC 122,848 GBP 78,360 45,736 0.11Hill & Smith Holdings PLC 3,215 GBP 39,433 48,032 0.11Hochschild Mining PLC 13,485 GBP 25,493 20,686 0.05HomeServe PLC 12,269 GBP 112,103 117,230 0.27Howden Joinery Group PLC 24,236 GBP 143,257 197,911 0.46Ideagen PLC 8,652 GBP 23,399 23,274 0.05IG Group Holdings PLC 15,012 GBP 113,137 127,152 0.29IMI PLC 11,020 GBP 144,525 189,544 0.44Inchcape PLC 15,956 GBP 103,856 122,622 0.28Informa PLC 60,905 GBP 351,074 305,499 0.71InterContinental Hotels Group PLC 7,410 GBP 310,893 356,421 0.83Intertek Group PLC 6,542 GBP 323,438 361,773 0.84Investec PLC 28,174 GBP 75,619 81,226 0.19ITV PLC 146,657 GBP 202,694 184,128 0.43J Sainsbury PLC 67,536 GBP 171,118 183,563 0.43John Laing Group PLC 144A 19,965 GBP 62,079 79,820 0.19John Wood Group PLC 27,899 GBP 140,384 61,294 0.14Johnson Matthey PLC 7,834 GBP 221,880 240,739 0.56Jupiter Fund Management PLC 17,863 GBP 57,491 50,374 0.12Keller Group PLC 2,916 GBP 24,672 23,386 0.05Kingfisher PLC 85,645 GBP 274,331 312,176 0.72Legal & General Group PLC 242,028 GBP 611,091 623,464 1.45Lloyds Banking Group PLC 2,873,700 GBP 1,432,465 1,341,731 3.11London Stock Exchange Group PLC 13,170 GBP 834,478 1,049,649 2.43Marks & Spencer Group PLC 79,350 GBP 182,036 116,208 0.27Marshalls PLC 8,076 GBP 45,630 55,401 0.13Mediclinic International PLC 16,370 GBP 75,443 48,652 0.11Micro Focus International PLC 13,577 GBP 123,501 74,266 0.17Mitie Group PLC 57,303 GBP 39,414 38,966 0.09Morgan Advanced Materials PLC 11,521 GBP 36,314 40,669 0.09Natwest Group PLC 197,419 GBP 427,098 401,155 0.93NCC Group PLC 11,329 GBP 26,122 33,307 0.08Network International Holdings PLC 144A 18,917 GBP 78,006 69,179 0.16Next PLC 5,394 GBP 367,449 423,753 0.98Ocado Group PLC 19,741 GBP 333,185 395,412 0.92Paragon Banking Group PLC 10,364 GBP 46,930 52,805 0.12Pennon Group PLC 17,086 GBP 183,638 194,012 0.45Pets at Home Group PLC 20,285 GBP 69,773 92,500 0.21Phoenix Group Holdings PLC 26,189 GBP 179,170 177,142 0.41Premier Foods PLC 24,144 GBP 22,771 26,462 0.06
Xtrackers**
Xtrackers MSCI UK ESG UCITS ETF (continued)
Statement of Investmentsas at 30 June 2021(expressed in GBP)
** This includes synthetic ETFs.
The accompanying notes form an integral part of these financial statements.
91

Description QuantityCurrency
(local) Cost Market Value
% ofNet
Assets
Transferable securities and money market instruments admitted to an official stock exchange listing
Shares (continued)
United Kingdom (continued)Rathbone Brothers PLC 2,322 GBP 41,613 42,075 0.10Reckitt Benckiser Group PLC 28,911 GBP 1,772,318 1,849,437 4.29Redde Northgate PLC 9,439 GBP 30,805 37,662 0.09RELX PLC 78,369 GBP 1,302,334 1,503,901 3.49Renishaw PLC 1,477 GBP 84,406 72,757 0.17Rentokil Initial PLC 75,200 GBP 286,665 372,240 0.86Rightmove PLC 35,344 GBP 215,078 229,524 0.53Rio Tinto PLC 45,519 GBP 2,130,542 2,707,925 6.28Sage Group PLC 44,469 GBP 245,332 304,257 0.71Savills PLC 5,799 GBP 71,458 66,689 0.15Schroders PLC 5,033 GBP 157,119 176,809 0.41Segro REIT PLC 48,331 GBP 371,410 528,983 1.23Severn Trent PLC 9,690 GBP 239,574 242,347 0.56Softcat PLC 4,843 GBP 46,122 86,012 0.20Spectris PLC 4,706 GBP 127,530 152,380 0.35Spirax-Sarco Engineering PLC 2,991 GBP 258,572 407,225 0.94Spire Healthcare Group PLC 144A 11,334 GBP 28,027 27,882 0.06Spirent Communications PLC 24,697 GBP 58,730 60,853 0.14St James’s Place PLC 21,838 GBP 234,011 322,547 0.75Standard Chartered PLC 108,821 GBP 704,901 501,665 1.16Standard Life Aberdeen PLC 88,343 GBP 313,585 239,410 0.56Synthomer PLC 13,775 GBP 56,653 67,718 0.16Taylor Wimpey PLC 147,887 GBP 224,365 235,066 0.54Travis Perkins PLC 9,125 GBP 132,730 154,121 0.36Unilever PLC 106,643 GBP 4,427,182 4,511,532 10.46UNITE Group REIT PLC 13,702 GBP 129,327 147,159 0.34United Utilities Group PLC 27,604 GBP 274,885 268,973 0.62Victrex PLC 3,512 GBP 84,880 89,416 0.21Vistry Group PLC 9,018 GBP 90,262 106,097 0.25Vodafone Group PLC 1,088,297 GBP 1,817,084 1,320,540 3.06WH Smith PLC 5,297 GBP 83,206 85,202 0.20Whitbread PLC 8,190 GBP 264,874 255,692 0.59Wm Morrison Supermarkets PLC 97,762 GBP 195,966 241,179 0.56
38,924,222 41,593,152 96.43
Total - Shares 40,086,176 43,136,499 100.01
Total Transferable securities and money market instruments admitted to an officialstock exchange listing 40,086,176 43,136,499 100.01
Other transferable securities and money market instruments
Shares
United KingdomFinablr PLC 144A 3,571 GBP 5,812 21 0.00
Xtrackers**
Xtrackers MSCI UK ESG UCITS ETF (continued)
Statement of Investmentsas at 30 June 2021(expressed in GBP)
** This includes synthetic ETFs.
The accompanying notes form an integral part of these financial statements.
92

Description QuantityCurrency
(local) Cost Market Value
% ofNet
Assets
Other transferable securities and money market instruments
Shares (continued)
United Kingdom (continued)Intu Properties REIT PLC(1) 26,390 GBP 52,828 3 0.00NMC Health PLC(1) 2,715 GBP 37,971 — 0.00
96,611 24 0.00
Total - Shares 96,611 24 0.00
Total Other transferable securities and money market instruments 96,611 24 0.00
TOTAL INVESTMENT PORTFOLIO 40,182,787 43,136,523 100.01
(1) The security is fair valued.
Xtrackers**
Xtrackers MSCI UK ESG UCITS ETF (continued)
Statement of Investmentsas at 30 June 2021(expressed in GBP)
** This includes synthetic ETFs.
The accompanying notes form an integral part of these financial statements.
93
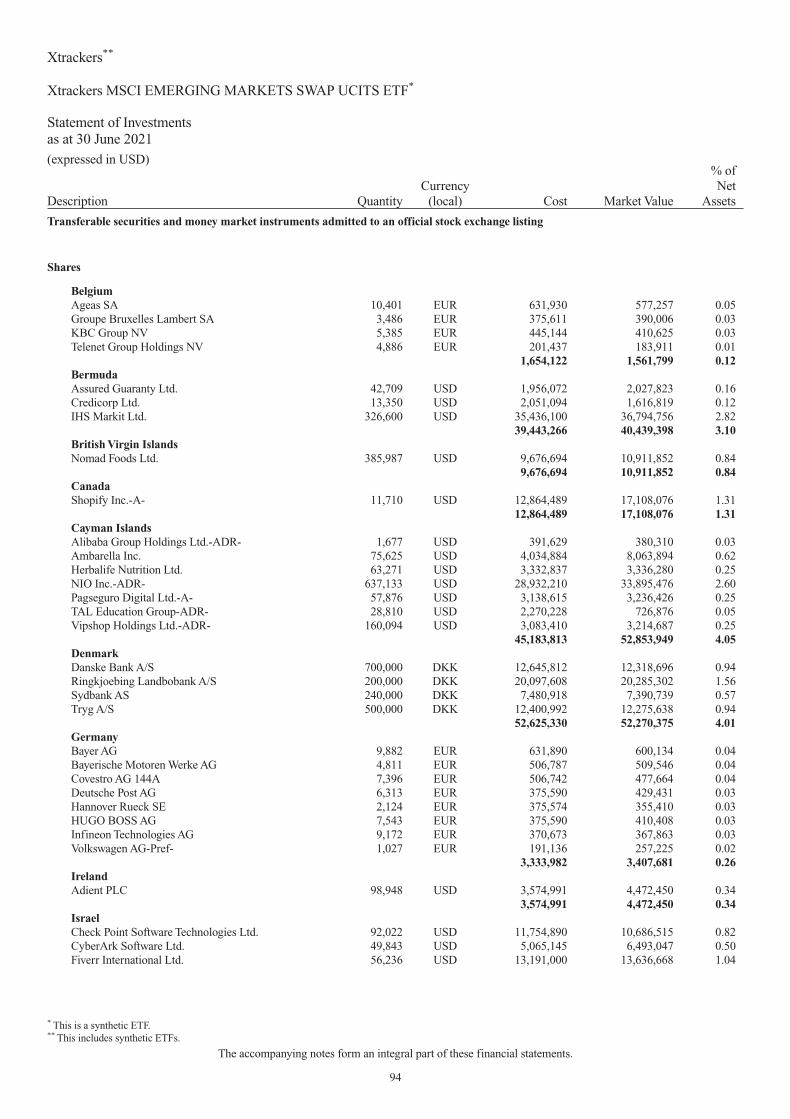
Description QuantityCurrency
(local) Cost Market Value
% ofNet
Assets
Transferable securities and money market instruments admitted to an official stock exchange listing
Shares
BelgiumAgeas SA 10,401 EUR 631,930 577,257 0.05Groupe Bruxelles Lambert SA 3,486 EUR 375,611 390,006 0.03KBC Group NV 5,385 EUR 445,144 410,625 0.03Telenet Group Holdings NV 4,886 EUR 201,437 183,911 0.01
1,654,122 1,561,799 0.12BermudaAssured Guaranty Ltd. 42,709 USD 1,956,072 2,027,823 0.16Credicorp Ltd. 13,350 USD 2,051,094 1,616,819 0.12IHS Markit Ltd. 326,600 USD 35,436,100 36,794,756 2.82
39,443,266 40,439,398 3.10British Virgin IslandsNomad Foods Ltd. 385,987 USD 9,676,694 10,911,852 0.84
9,676,694 10,911,852 0.84CanadaShopify Inc.-A- 11,710 USD 12,864,489 17,108,076 1.31
12,864,489 17,108,076 1.31Cayman IslandsAlibaba Group Holdings Ltd.-ADR- 1,677 USD 391,629 380,310 0.03Ambarella Inc. 75,625 USD 4,034,884 8,063,894 0.62Herbalife Nutrition Ltd. 63,271 USD 3,332,837 3,336,280 0.25NIO Inc.-ADR- 637,133 USD 28,932,210 33,895,476 2.60Pagseguro Digital Ltd.-A- 57,876 USD 3,138,615 3,236,426 0.25TAL Education Group-ADR- 28,810 USD 2,270,228 726,876 0.05Vipshop Holdings Ltd.-ADR- 160,094 USD 3,083,410 3,214,687 0.25
45,183,813 52,853,949 4.05DenmarkDanske Bank A/S 700,000 DKK 12,645,812 12,318,696 0.94Ringkjoebing Landbobank A/S 200,000 DKK 20,097,608 20,285,302 1.56Sydbank AS 240,000 DKK 7,480,918 7,390,739 0.57Tryg A/S 500,000 DKK 12,400,992 12,275,638 0.94
52,625,330 52,270,375 4.01GermanyBayer AG 9,882 EUR 631,890 600,134 0.04Bayerische Motoren Werke AG 4,811 EUR 506,787 509,546 0.04Covestro AG 144A 7,396 EUR 506,742 477,664 0.04Deutsche Post AG 6,313 EUR 375,590 429,431 0.03Hannover Rueck SE 2,124 EUR 375,574 355,410 0.03HUGO BOSS AG 7,543 EUR 375,590 410,408 0.03Infineon Technologies AG 9,172 EUR 370,673 367,863 0.03Volkswagen AG-Pref- 1,027 EUR 191,136 257,225 0.02
3,333,982 3,407,681 0.26IrelandAdient PLC 98,948 USD 3,574,991 4,472,450 0.34
3,574,991 4,472,450 0.34IsraelCheck Point Software Technologies Ltd. 92,022 USD 11,754,890 10,686,515 0.82CyberArk Software Ltd. 49,843 USD 5,065,145 6,493,047 0.50Fiverr International Ltd. 56,236 USD 13,191,000 13,636,668 1.04
Xtrackers**
Xtrackers MSCI EMERGING MARKETS SWAP UCITS ETF*
Statement of Investmentsas at 30 June 2021(expressed in USD)
* This is a synthetic ETF.** This includes synthetic ETFs.
The accompanying notes form an integral part of these financial statements.
94

Description QuantityCurrency
(local) Cost Market Value
% ofNet
Assets
Transferable securities and money market instruments admitted to an official stock exchange listing
Shares (continued)
Israel (continued)Nice Ltd.-ADR- 5,681 USD 1,309,641 1,405,820 0.11Wix.com Ltd. 10,878 USD 3,013,859 3,157,666 0.24
34,334,535 35,379,716 2.71NetherlandsAkzo Nobel NV 4,825 EUR 588,495 596,229 0.05ASML Holdings NV 807 EUR 508,719 554,499 0.04Koninklijke Ahold Delhaize NV 7,168 EUR 198,809 213,108 0.02Koninklijke KPN NV 60,285 EUR 198,800 188,310 0.01Koninklijke Philips NV 6,911 EUR 375,579 342,501 0.03Signify NV 144A 8,295 EUR 506,721 524,708 0.04Wolters Kluwer NV 6,434 EUR 588,517 646,421 0.05
2,965,640 3,065,776 0.24NorwayNorsk Hydro ASA 83,321 NOK 505,581 531,964 0.04Norwegian Finans Holdings ASA 1,200,000 NOK 13,745,121 13,519,732 1.04Orkla ASA 57,092 NOK 588,349 581,854 0.04
14,839,051 14,633,550 1.12SingaporeFlex Ltd. 25,514 USD 402,900 455,935 0.03
402,900 455,935 0.03SwedenAvanza Bank Holdings AB 600,000 SEK 18,398,409 18,725,116 1.44L E Lundbergforetagen AB-B- 100,000 SEK 6,468,301 6,456,856 0.50Svenska Handelsbanken AB-A- 17,273 SEK 198,102 195,025 0.01
25,064,812 25,376,997 1.95SwitzerlandUBS Group AG 12,448 CHF 198,637 190,689 0.01
198,637 190,689 0.01United KingdomAstraZeneca PLC-ADR- 5,274 USD 297,137 315,913 0.03Atlassian Corp. PLC-A- 93,536 USD 19,992,435 24,025,657 1.84International Game Technology PLC 52,418 USD 1,241,258 1,255,935 0.10Royal Dutch Shell PLC-B--ADR- 7,964 USD 297,137 309,242 0.02
21,827,967 25,906,747 1.99United StatesA10 Networks Inc. 143,555 USD 1,415,423 1,616,429 0.12Affiliated Managers Group Inc. 101,934 USD 16,660,093 15,719,242 1.21Alliance Data Systems Corp. 13,009 USD 1,485,238 1,355,408 0.10Alphabet Inc.-A- 17,152 USD 32,139,069 41,881,582 3.21Alphabet Inc.-C- 20,000 USD 45,816,720 50,126,400 3.84Amazon.com Inc. 1,132 USD 3,427,145 3,894,261 0.30American Campus Communities REIT Inc. 36,164 USD 1,688,497 1,689,582 0.13Apple Inc. 775,345 USD 98,736,225 106,191,251 8.14Array Technologies Inc. 36,848 USD 563,774 574,829 0.04Astronics Corp. 70,473 USD 1,298,817 1,233,982 0.09Axos Financial Inc. 31,318 USD 1,423,090 1,452,842 0.11AZEK Co. Inc. 30,210 USD 1,291,780 1,282,717 0.10Bank of New York Mellon Corp. 180,239 USD 8,750,603 9,233,644 0.71
Xtrackers**
Xtrackers MSCI EMERGING MARKETS SWAP UCITS ETF* (continued)
Statement of Investmentsas at 30 June 2021(expressed in USD)
* This is a synthetic ETF.** This includes synthetic ETFs.
The accompanying notes form an integral part of these financial statements.
95

Description QuantityCurrency
(local) Cost Market Value
% ofNet
Assets
Transferable securities and money market instruments admitted to an official stock exchange listing
Shares (continued)
United States (continued)Berkshire Hathaway Inc.-B- 2,990 USD 700,822 830,981 0.06Biogen Inc. 8,899 USD 2,471,430 3,081,457 0.24BlackRock Inc. 19,724 USD 17,446,273 17,257,908 1.32Blackstone Group Inc.-A- 101,000 USD 9,929,310 9,811,140 0.75Boeing Co. 3,328 USD 697,920 797,256 0.06Booking Holdings Inc. 214 USD 509,949 468,251 0.04Calix Inc. 89,997 USD 2,280,524 4,274,857 0.33Capital One Financial Corp. 103,969 USD 16,918,875 16,082,965 1.23Cedar Fair LP 200,427 USD 9,838,961 8,985,142 0.69Central Garden & Pet Co.-A- 5,595 USD 208,022 270,239 0.02Charter Communications Inc.-A- 3,193 USD 2,062,662 2,303,590 0.18Chatham Lodging Trust REIT 35,006 USD 206,885 450,527 0.03Chevron Corp. 4,737 USD 515,054 496,153 0.04Children’s Place Inc. 13,242 USD 1,235,214 1,232,301 0.09Churchill Downs Inc. 4,960 USD 1,178,248 983,370 0.08Cirrus Logic Inc. 33,213 USD 2,590,614 2,827,091 0.22Citigroup Inc. 7,047 USD 509,710 498,575 0.04Cloudflare Inc.-A- 32,401 USD 2,483,861 3,429,322 0.26CorePoint Lodging REIT Inc. 30,009 USD 112,310 321,096 0.02Costco Wholesale Corp. 23,085 USD 8,756,602 9,134,042 0.70Customers Bancorp Inc. 57,412 USD 1,811,923 2,238,494 0.17CVS Health Corp. 5,159 USD 445,841 430,467 0.03Discovery Inc.-A- 10,963 USD 475,685 336,345 0.03Domo Inc.-B- 19,984 USD 1,255,395 1,615,307 0.12Dropbox Inc.-A- 63,740 USD 1,473,031 1,931,959 0.15Energy Transfer LP 2,111,116 USD 20,118,936 22,441,163 1.72Enphase Energy Inc. 1,642 USD 316,298 301,520 0.02Enterprise Products Partners LP 1,387,000 USD 31,831,650 33,468,310 2.57Etsy Inc. 1,741 USD 366,115 358,367 0.03Eventbrite Inc.-A- 4,171 USD 39,610 79,249 0.01Exxon Mobil Corp. 8,289 USD 514,996 522,870 0.04F5 Networks Inc. 6,200 USD 881,950 1,157,292 0.09Facebook Inc.-A- 2,686 USD 697,195 933,949 0.07Fair Isaac Corp. 5,586 USD 2,593,412 2,807,970 0.22FireEye Inc. 60,877 USD 1,321,031 1,230,933 0.09First Solar Inc. 30,674 USD 2,984,273 2,776,304 0.21Generac Holdings Inc. 890 USD 308,163 369,484 0.03GoDaddy Inc.-A- 8,741 USD 614,317 760,117 0.06Griffon Corp. 20,023 USD 513,390 513,189 0.04Guardant Health Inc. 78,222 USD 8,978,321 9,714,390 0.75Healthcare Realty Trust REIT Inc. 51,417 USD 1,578,502 1,552,793 0.12Hershey Co. 5,488 USD 958,863 955,900 0.07Honeywell International Inc. 6,959 USD 1,559,094 1,526,457 0.12Howmet Aerospace Inc. 102,948 USD 3,301,542 3,548,618 0.27Inari Medical Inc. 24,330 USD 2,128,875 2,269,502 0.17Insulet Corp. 34,541 USD 9,611,724 9,481,850 0.73Intel Corp. 232,030 USD 13,273,966 13,026,164 1.00Jack in the Box Inc. 23,095 USD 2,613,430 2,573,707 0.20
Xtrackers**
Xtrackers MSCI EMERGING MARKETS SWAP UCITS ETF* (continued)
Statement of Investmentsas at 30 June 2021(expressed in USD)
* This is a synthetic ETF.** This includes synthetic ETFs.
The accompanying notes form an integral part of these financial statements.
96

Description QuantityCurrency
(local) Cost Market Value
% ofNet
Assets
Transferable securities and money market instruments admitted to an official stock exchange listing
Shares (continued)
United States (continued)Johnson & Johnson 2,986 USD 507,859 491,914 0.04KeyCorp 560,065 USD 12,735,878 11,565,342 0.89Laredo Petroleum Inc. 25,839 USD 1,322,957 2,397,601 0.18LendingClub Corp. 123,501 USD 2,642,921 2,239,073 0.17Lockheed Martin Corp. 70,000 USD 26,734,400 26,484,500 2.03M&T Bank Corp. 102,199 USD 16,396,808 14,850,537 1.14Manhattan Associates Inc. 6,449 USD 752,018 934,073 0.07Masimo Corp. 13,818 USD 3,648,781 3,350,174 0.26Match Group Inc. 10,836 USD 1,626,375 1,747,305 0.13Maxim Integrated Products Inc. 783,347 USD 70,910,343 82,533,440 6.33Micron Technology Inc. 480,944 USD 24,465,899 40,870,621 3.13Microsoft Corp. 171,835 USD 43,590,796 46,550,101 3.57Molina Healthcare Inc. 10,584 USD 2,244,443 2,678,387 0.21MPLX LP 2,348,549 USD 66,440,451 69,540,536 5.33National Vision Holdings Inc. 21,896 USD 1,095,457 1,119,542 0.09Netflix Inc. 702 USD 374,758 370,803 0.03NIKE Inc.-B- 3,820 USD 497,708 590,152 0.05NRG Energy Inc. 593,449 USD 21,091,177 23,915,995 1.83NVIDIA Corp. 468 USD 356,260 374,447 0.03Oak Street Health Inc. 20,676 USD 1,321,610 1,210,993 0.09PACCAR Inc. 175,631 USD 16,417,986 15,675,067 1.20Parsons Corp. 6,043 USD 243,110 237,852 0.02PayPal Holdings Inc. 9,068 USD 1,649,292 2,643,141 0.20Pfizer Inc. 1,857,809 USD 72,801,305 72,751,800 5.58Pinterest Inc.-A- 45,595 USD 3,368,103 3,599,725 0.28Plains All American Pipeline LP 148,506 USD 1,627,626 1,687,028 0.13Planet Fitness Inc.-A- 57,152 USD 4,697,894 4,300,688 0.33PNM Resources Inc. 274,485 USD 13,597,987 13,386,633 1.03Procter & Gamble Co. 3,789 USD 509,772 511,250 0.04Progyny Inc. 27,379 USD 1,332,536 1,615,361 0.12Proofpoint Inc. 33,043 USD 4,660,422 5,741,552 0.44QUALCOMM Inc. 78,562 USD 10,515,200 11,228,867 0.86Regeneron Pharmaceuticals Inc. 809 USD 372,399 451,859 0.04RingCentral Inc.-A- 2,491 USD 1,003,250 723,835 0.06Roku Inc. 1,595 USD 677,987 732,504 0.06Rush Enterprises Inc.-A- 16,114 USD 766,060 696,769 0.05Sabra Health Care REIT Inc. 91,504 USD 1,598,575 1,665,373 0.13Schrodinger Inc. 31,066 USD 2,926,107 2,348,900 0.18ServiceNow Inc. 10,865 USD 5,312,442 5,970,861 0.46Shockwave Medical Inc. 65,564 USD 11,548,443 12,439,458 0.95SkyWest Inc. 4,700 USD 153,549 202,429 0.02Snap Inc.-A- 90,661 USD 4,831,325 6,177,641 0.47Starbucks Corp. 148,508 USD 16,561,612 16,604,679 1.27Sunnova Energy International Inc. 42,028 USD 1,913,115 1,582,774 0.12Sunrun Inc. 40,474 USD 2,882,558 2,257,640 0.17Tenable Holdings Inc. 32,863 USD 926,647 1,358,885 0.10TopBuild Corp. 14,512 USD 2,900,514 2,870,183 0.22Uber Technologies Inc. 72,931 USD 3,726,498 3,655,302 0.28
Xtrackers**
Xtrackers MSCI EMERGING MARKETS SWAP UCITS ETF* (continued)
Statement of Investmentsas at 30 June 2021(expressed in USD)
* This is a synthetic ETF.** This includes synthetic ETFs.
The accompanying notes form an integral part of these financial statements.
97
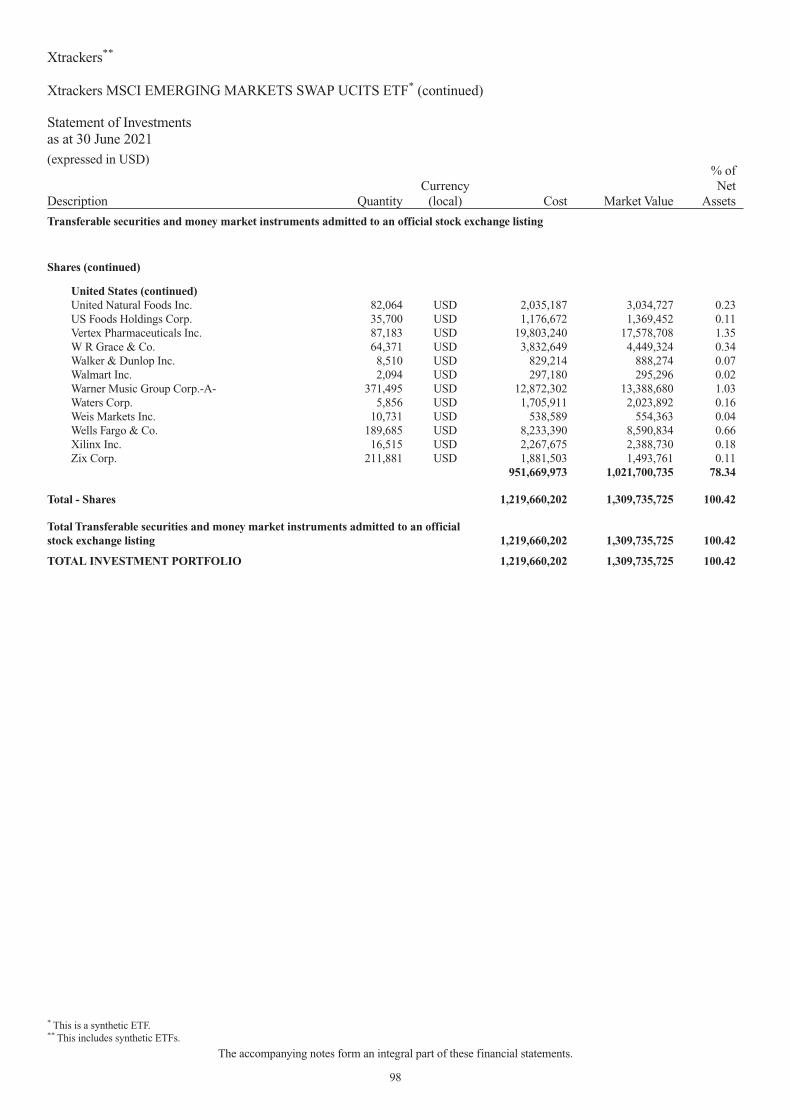
Description QuantityCurrency
(local) Cost Market Value
% ofNet
Assets
Transferable securities and money market instruments admitted to an official stock exchange listing
Shares (continued)
United States (continued)United Natural Foods Inc. 82,064 USD 2,035,187 3,034,727 0.23US Foods Holdings Corp. 35,700 USD 1,176,672 1,369,452 0.11Vertex Pharmaceuticals Inc. 87,183 USD 19,803,240 17,578,708 1.35W R Grace & Co. 64,371 USD 3,832,649 4,449,324 0.34Walker & Dunlop Inc. 8,510 USD 829,214 888,274 0.07Walmart Inc. 2,094 USD 297,180 295,296 0.02Warner Music Group Corp.-A- 371,495 USD 12,872,302 13,388,680 1.03Waters Corp. 5,856 USD 1,705,911 2,023,892 0.16Weis Markets Inc. 10,731 USD 538,589 554,363 0.04Wells Fargo & Co. 189,685 USD 8,233,390 8,590,834 0.66Xilinx Inc. 16,515 USD 2,267,675 2,388,730 0.18Zix Corp. 211,881 USD 1,881,503 1,493,761 0.11
951,669,973 1,021,700,735 78.34
Total - Shares 1,219,660,202 1,309,735,725 100.42
Total Transferable securities and money market instruments admitted to an officialstock exchange listing 1,219,660,202 1,309,735,725 100.42
TOTAL INVESTMENT PORTFOLIO 1,219,660,202 1,309,735,725 100.42
Xtrackers**
Xtrackers MSCI EMERGING MARKETS SWAP UCITS ETF* (continued)
Statement of Investmentsas at 30 June 2021(expressed in USD)
* This is a synthetic ETF.** This includes synthetic ETFs.
The accompanying notes form an integral part of these financial statements.
98

Description QuantityCurrency
(local) Cost Market Value
% ofNet
Assets
Transferable securities and money market instruments admitted to an official stock exchange listing
Shares
BermudaAthene Holdings Ltd.-A- 184,601 USD 9,608,482 12,460,568 1.72IHS Markit Ltd. 437,000 USD 47,414,500 49,232,420 6.79Liberty Latin America Ltd.-C- 344,014 USD 3,619,027 4,850,597 0.67
60,642,009 66,543,585 9.18CanadaIMAX Corp. 48,952 USD 570,291 1,052,468 0.14
570,291 1,052,468 0.14Cayman Islands51job Inc.-ADR- 726 USD 49,266 56,461 0.01Daqo New Energy Corp.-ADR- 92,691 USD 4,477,902 6,026,769 0.83Ichor Holdings Ltd. 33,855 USD 1,943,616 1,821,399 0.25NIO Inc.-ADR- 200,000 USD 9,082,000 10,640,000 1.47Pagseguro Digital Ltd.-A- 45,620 USD 2,148,702 2,551,070 0.35TAL Education Group-ADR- 11,782 USD 1,028,451 297,260 0.04
18,729,937 21,392,959 2.95IrelandAccenture PLC-A- 58,419 USD 16,739,380 17,221,337 2.38
16,739,380 17,221,337 2.38IsraelWix.com Ltd. 21,981 USD 7,330,663 6,380,645 0.88
7,330,663 6,380,645 0.88NetherlandsAerCap Holdings NV 202,328 USD 8,453,264 10,361,217 1.43
8,453,264 10,361,217 1.43South AfricaAngloGold Ashanti Ltd.-ADR- 96,334 USD 2,052,878 1,789,886 0.25
2,052,878 1,789,886 0.25SwedenInvestor AB-B- 623,869 SEK 14,674,426 14,389,149 1.99
14,674,426 14,389,149 1.99United KingdomLiberty Global PLC-C- 238,662 USD 5,819,773 6,453,420 0.89
5,819,773 6,453,420 0.89United States3M Co. 198 USD 39,939 39,329 0.01Abbott Laboratories 3,343 USD 365,357 387,554 0.05AbbVie Inc. 116,212 USD 13,329,516 13,090,120 1.81Adaptive Biotechnologies Corp. 47,560 USD 2,063,628 1,943,302 0.27Advanced Micro Devices Inc. 4,479 USD 365,397 420,712 0.06Aerojet Rocketdyne Holdings Inc. 46,704 USD 2,237,122 2,255,336 0.31Alexion Pharmaceuticals Inc. 264 USD 46,490 48,499 0.01Align Technology Inc. 12,054 USD 6,703,350 7,364,994 1.02Allstate Corp. 222 USD 30,250 28,958 0.00Alphabet Inc.-C- 3,967 USD 9,230,178 9,942,571 1.37Altice USA Inc.-A- 259 USD 8,493 8,842 0.00Amazon.com Inc. 699 USD 2,376,600 2,404,672 0.33Ameresco Inc.-A- 38,420 USD 1,970,946 2,409,702 0.33Anthem Inc. 1,312 USD 504,372 500,922 0.07
Xtrackers**
Xtrackers MSCI EM ASIA SWAP UCITS ETF*
Statement of Investmentsas at 30 June 2021(expressed in USD)
* This is a synthetic ETF.** This includes synthetic ETFs.
The accompanying notes form an integral part of these financial statements.
99
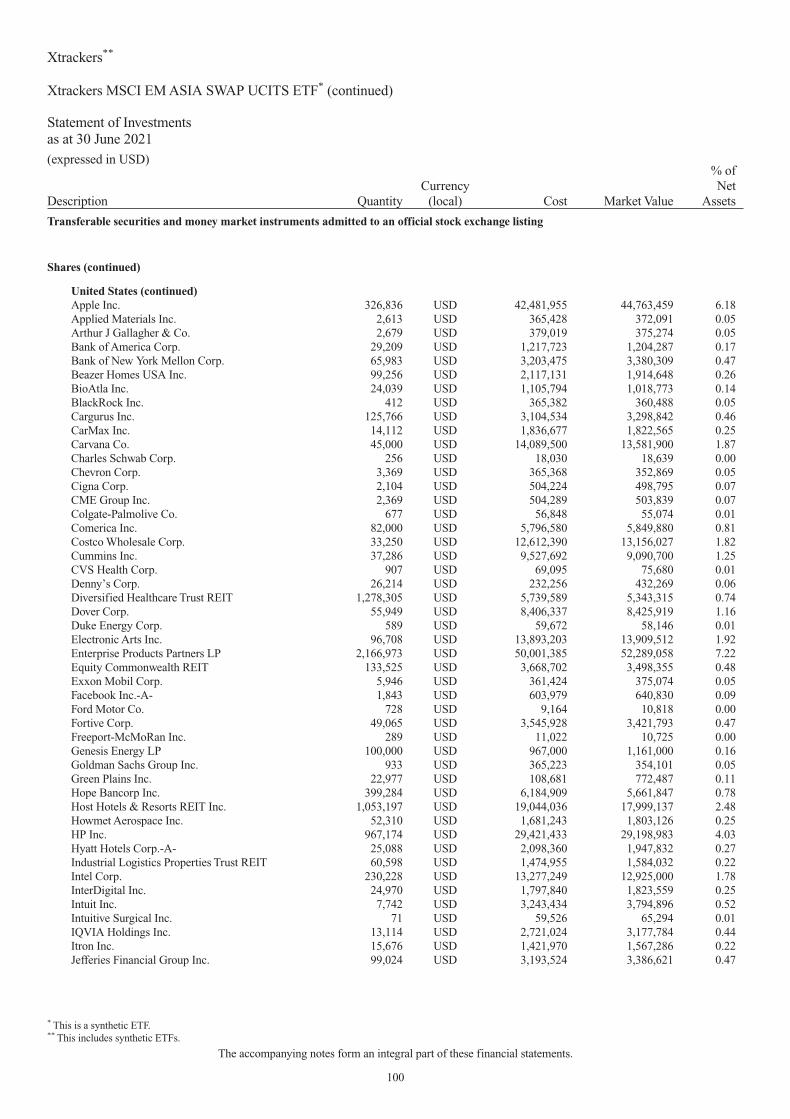
Description QuantityCurrency
(local) Cost Market Value
% ofNet
Assets
Transferable securities and money market instruments admitted to an official stock exchange listing
Shares (continued)
United States (continued)Apple Inc. 326,836 USD 42,481,955 44,763,459 6.18Applied Materials Inc. 2,613 USD 365,428 372,091 0.05Arthur J Gallagher & Co. 2,679 USD 379,019 375,274 0.05Bank of America Corp. 29,209 USD 1,217,723 1,204,287 0.17Bank of New York Mellon Corp. 65,983 USD 3,203,475 3,380,309 0.47Beazer Homes USA Inc. 99,256 USD 2,117,131 1,914,648 0.26BioAtla Inc. 24,039 USD 1,105,794 1,018,773 0.14BlackRock Inc. 412 USD 365,382 360,488 0.05Cargurus Inc. 125,766 USD 3,104,534 3,298,842 0.46CarMax Inc. 14,112 USD 1,836,677 1,822,565 0.25Carvana Co. 45,000 USD 14,089,500 13,581,900 1.87Charles Schwab Corp. 256 USD 18,030 18,639 0.00Chevron Corp. 3,369 USD 365,368 352,869 0.05Cigna Corp. 2,104 USD 504,224 498,795 0.07CME Group Inc. 2,369 USD 504,289 503,839 0.07Colgate-Palmolive Co. 677 USD 56,848 55,074 0.01Comerica Inc. 82,000 USD 5,796,580 5,849,880 0.81Costco Wholesale Corp. 33,250 USD 12,612,390 13,156,027 1.82Cummins Inc. 37,286 USD 9,527,692 9,090,700 1.25CVS Health Corp. 907 USD 69,095 75,680 0.01Denny’s Corp. 26,214 USD 232,256 432,269 0.06Diversified Healthcare Trust REIT 1,278,305 USD 5,739,589 5,343,315 0.74Dover Corp. 55,949 USD 8,406,337 8,425,919 1.16Duke Energy Corp. 589 USD 59,672 58,146 0.01Electronic Arts Inc. 96,708 USD 13,893,203 13,909,512 1.92Enterprise Products Partners LP 2,166,973 USD 50,001,385 52,289,058 7.22Equity Commonwealth REIT 133,525 USD 3,668,702 3,498,355 0.48Exxon Mobil Corp. 5,946 USD 361,424 375,074 0.05Facebook Inc.-A- 1,843 USD 603,979 640,830 0.09Ford Motor Co. 728 USD 9,164 10,818 0.00Fortive Corp. 49,065 USD 3,545,928 3,421,793 0.47Freeport-McMoRan Inc. 289 USD 11,022 10,725 0.00Genesis Energy LP 100,000 USD 967,000 1,161,000 0.16Goldman Sachs Group Inc. 933 USD 365,223 354,101 0.05Green Plains Inc. 22,977 USD 108,681 772,487 0.11Hope Bancorp Inc. 399,284 USD 6,184,909 5,661,847 0.78Host Hotels & Resorts REIT Inc. 1,053,197 USD 19,044,036 17,999,137 2.48Howmet Aerospace Inc. 52,310 USD 1,681,243 1,803,126 0.25HP Inc. 967,174 USD 29,421,433 29,198,983 4.03Hyatt Hotels Corp.-A- 25,088 USD 2,098,360 1,947,832 0.27Industrial Logistics Properties Trust REIT 60,598 USD 1,474,955 1,584,032 0.22Intel Corp. 230,228 USD 13,277,249 12,925,000 1.78InterDigital Inc. 24,970 USD 1,797,840 1,823,559 0.25Intuit Inc. 7,742 USD 3,243,434 3,794,896 0.52Intuitive Surgical Inc. 71 USD 59,526 65,294 0.01IQVIA Holdings Inc. 13,114 USD 2,721,024 3,177,784 0.44Itron Inc. 15,676 USD 1,421,970 1,567,286 0.22Jefferies Financial Group Inc. 99,024 USD 3,193,524 3,386,621 0.47
Xtrackers**
Xtrackers MSCI EM ASIA SWAP UCITS ETF* (continued)
Statement of Investmentsas at 30 June 2021(expressed in USD)
* This is a synthetic ETF.** This includes synthetic ETFs.
The accompanying notes form an integral part of these financial statements.
100

Description QuantityCurrency
(local) Cost Market Value
% ofNet
Assets
Transferable securities and money market instruments admitted to an official stock exchange listing
Shares (continued)
United States (continued)Johnson & Johnson 72,000 USD 12,279,600 11,861,280 1.64Kansas City Southern 100,000 USD 28,364,000 28,337,000 3.91Kimco Realty REIT Corp. 189,957 USD 4,209,447 3,960,603 0.55Kohl’s Corp. 213,556 USD 11,696,462 11,769,071 1.62Laureate Education Inc.-A- 379,395 USD 4,064,145 5,505,021 0.76McDonald’s Corp. 1,566 USD 365,473 361,730 0.05McKesson Corp. 34,215 USD 6,563,463 6,543,277 0.90Meritor Inc. 37,000 USD 1,161,430 866,540 0.12Micron Technology Inc. 219,795 USD 17,207,901 18,678,179 2.58Microsoft Corp. 34,847 USD 8,959,207 9,440,052 1.30Monster Beverage Corp. 23,703 USD 2,272,881 2,165,269 0.30Morgan Stanley 3,889 USD 365,410 356,582 0.05National Instruments Corp. 50,425 USD 2,039,691 2,131,969 0.29National Vision Holdings Inc. 17,089 USD 421,744 873,761 0.12Netflix Inc. 45,670 USD 24,247,925 24,123,351 3.33NIKE Inc.-B- 2,732 USD 365,378 422,067 0.06nLight Inc. 19,999 USD 633,768 725,564 0.10Nutanix Inc.-A- 107,702 USD 2,937,034 4,116,370 0.57ODP Corp. 46,063 USD 1,980,709 2,211,485 0.31OneSpan Inc. 70,796 USD 1,288,487 1,808,130 0.25Oshkosh Corp. 72,001 USD 9,858,377 8,974,205 1.24PepsiCo Inc. 4,119 USD 608,953 610,312 0.08Pfizer Inc. 253 USD 9,956 9,907 0.00Plains All American Pipeline LP 104,828 USD 1,265,274 1,190,846 0.16Procter & Gamble Co. 1,349 USD 181,759 182,021 0.02Prudential Financial Inc. 94 USD 9,995 9,632 0.00Qorvo Inc. 10,883 USD 2,094,107 2,129,259 0.29QUALCOMM Inc. 2,720 USD 365,405 388,770 0.05Repligen Corp. 10,482 USD 2,231,199 2,092,417 0.29Ryman Hospitality Properties REIT Inc. 37,670 USD 1,539,196 2,974,423 0.41salesforce.com Inc. 2,100 USD 502,549 512,967 0.07Selectquote Inc. 74,529 USD 2,403,560 1,435,429 0.20ServiceNow Inc. 6,503 USD 3,462,587 3,573,724 0.49Sunstone Hotel Investors REIT Inc. 155,697 USD 1,415,774 1,933,757 0.27T-Mobile US Inc. 6,627 USD 787,553 959,788 0.13Twitter Inc. 28,459 USD 2,061,855 1,958,264 0.27Uber Technologies Inc. 250,000 USD 12,627,500 12,530,000 1.73Union Pacific Corp. 53,556 USD 11,991,188 11,778,571 1.63United Community Banks Inc. 97,417 USD 3,094,938 3,118,318 0.43Virtu Financial Inc.-A- 10,231 USD 295,267 282,683 0.04Walmart Inc. 69,877 USD 9,578,035 9,854,055 1.36Welbilt Inc. 315,539 USD 7,683,375 7,304,728 1.01Wells Fargo & Co. 12,968 USD 608,977 587,321 0.08Western Digital Corp. 161,400 USD 8,402,484 11,486,838 1.58Workday Inc.-A- 3,096 USD 732,823 739,139 0.10Xilinx Inc. 235,329 USD 30,950,470 34,037,987 4.70
Xtrackers**
Xtrackers MSCI EM ASIA SWAP UCITS ETF* (continued)
Statement of Investmentsas at 30 June 2021(expressed in USD)
* This is a synthetic ETF.** This includes synthetic ETFs.
The accompanying notes form an integral part of these financial statements.
101

Description QuantityCurrency
(local) Cost Market Value
% ofNet
Assets
Transferable securities and money market instruments admitted to an official stock exchange listing
Shares (continued)
United States (continued)Zoetis Inc. 354 USD 59,851 65,971 0.01Zscaler Inc. 58 USD 10,894 12,531 0.00
558,843,896 575,169,615 79.37
Total - Shares 693,856,517 720,754,281 99.46
Total Transferable securities and money market instruments admitted to an officialstock exchange listing 693,856,517 720,754,281 99.46
TOTAL INVESTMENT PORTFOLIO 693,856,517 720,754,281 99.46
Xtrackers**
Xtrackers MSCI EM ASIA SWAP UCITS ETF* (continued)
Statement of Investmentsas at 30 June 2021(expressed in USD)
* This is a synthetic ETF.** This includes synthetic ETFs.
The accompanying notes form an integral part of these financial statements.
102

Description QuantityCurrency
(local) Cost Market Value
% ofNet
Assets
Transferable securities and money market instruments admitted to an official stock exchange listing
Shares
BelgiumColruyt SA 83,312 EUR 4,978,191 4,659,396 3.85KBC Group NV 108,680 EUR 8,688,518 8,287,221 6.85
13,666,709 12,946,617 10.70FinlandKesko OYJ-B- 137,601 EUR 4,327,559 5,083,092 4.20Orion OYJ-B- 114,251 EUR 4,928,059 4,911,524 4.06Stora Enso OYJ-R- 254,151 EUR 4,904,944 4,637,005 3.83
14,160,562 14,631,621 12.09Germanyadidas AG 3,250 EUR 1,135,701 1,209,826 1.00Bayerische Motoren Werke AG 51,684 EUR 5,408,327 5,473,996 4.52Beiersdorf AG 44,972 EUR 4,979,021 5,426,564 4.48Delivery Hero SE 144A 77,356 EUR 11,443,471 10,219,449 8.45Henkel AG & Co. KGaA 104,921 EUR 10,620,541 9,661,669 7.99Merck KGaA 30,481 EUR 5,319,335 5,845,041 4.83Muenchener Rueckversicherungs-Gesellschaft AG 20,764 EUR 5,856,729 5,686,922 4.70SAP SE 41,971 EUR 5,856,635 5,915,075 4.89Siemens AG 60,009 EUR 9,959,645 9,509,028 7.86Symrise AG 39,038 EUR 5,098,303 5,439,685 4.50
65,677,708 64,387,255 53.22NetherlandsASML Holdings NV 8,294 EUR 5,046,803 5,698,897 4.71Koninklijke Ahold Delhaize NV 365,656 EUR 10,100,097 10,871,146 8.98Koninklijke Vopak NV 39,884 EUR 1,849,670 1,811,531 1.50NN Group NV 118,665 EUR 5,994,440 5,598,036 4.63Prosus NV 57,676 EUR 6,313,505 5,640,783 4.66
29,304,515 29,620,393 24.48PortugalJeronimo Martins SGPS SA 33,067 EUR 624,051 603,114 0.50
624,051 603,114 0.50SwedenTelia Co. AB 1,173,456 EUR 4,904,949 5,211,550 4.31
4,904,949 5,211,550 4.31
Total - Shares 128,338,494 127,400,550 105.30
Total Transferable securities and money market instruments admitted to an officialstock exchange listing 128,338,494 127,400,550 105.30
TOTAL INVESTMENT PORTFOLIO 128,338,494 127,400,550 105.30
(B) During the period ending 30 June 2021 this Sub-Fund changed its name. Please see point 6 in the significant events of the period section of the Notes to theFinancial Statements of this semi-annual report for further information.
Xtrackers**
Xtrackers MSCI EM LATIN AMERICA ESG SWAP UCITS ETF*(B)
Statement of Investmentsas at 30 June 2021(expressed in USD)
* This is a synthetic ETF.** This includes synthetic ETFs.
The accompanying notes form an integral part of these financial statements.
103

Description QuantityCurrency
(local) Cost Market Value
% ofNet
Assets
Transferable securities and money market instruments admitted to an official stock exchange listing
Shares
BermudaArch Capital Group Ltd. 10,572 USD 427,320 411,673 0.81IHS Markit Ltd. 20,006 USD 2,170,651 2,253,876 4.46
2,597,971 2,665,549 5.27IrelandJazz Pharmaceuticals PLC 1,575 USD 258,788 279,783 0.56Willis Towers Watson PLC 8,250 USD 2,145,428 1,897,665 3.75
2,404,216 2,177,448 4.31SwedenSkandinaviska Enskilda Banken AB-A- 35,982 SEK 464,303 465,124 0.92Svenska Handelsbanken AB-A- 188,412 SEK 2,137,194 2,127,309 4.21
2,601,497 2,592,433 5.13United KingdomLiberty Global PLC-C- 80,000 USD 2,011,600 2,163,200 4.28
2,011,600 2,163,200 4.28United StatesAbbVie Inc. 18,316 USD 2,140,957 2,063,114 4.08Alphabet Inc.-C- 1,865 USD 4,293,976 4,674,287 9.25Autodesk Inc. 5,699 USD 1,565,971 1,663,538 3.29Citizens Financial Group Inc. 17,855 USD 874,716 819,009 1.62CME Group Inc. 10,577 USD 2,228,680 2,249,516 4.45Coca-Cola Co. 41,150 USD 2,212,636 2,226,627 4.40eBay Inc. 38,170 USD 2,342,493 2,679,916 5.30Electronic Arts Inc. 16,380 USD 2,352,496 2,355,935 4.66Gilead Sciences Inc. 33,350 USD 2,221,443 2,296,481 4.54Intel Corp. 31,796 USD 1,770,083 1,785,027 3.53KeyCorp 91,278 USD 2,112,173 1,884,891 3.73LKQ Corp. 45,002 USD 1,618,272 2,214,999 4.38Microsoft Corp. 18,066 USD 4,553,737 4,894,079 9.68PACCAR Inc. 20,000 USD 1,895,200 1,785,000 3.53Rockwell Automation Inc. 5,100 USD 1,351,194 1,458,702 2.89Stanley Black & Decker Inc. 7,119 USD 1,486,874 1,459,324 2.89Waters Corp. 7,100 USD 1,921,899 2,453,831 4.85Welltower REIT Inc. 27,463 USD 2,007,396 2,282,175 4.51
38,950,196 41,246,451 81.58
Total - Shares 48,565,480 50,845,081 100.57
Total Transferable securities and money market instruments admitted to an officialstock exchange listing 48,565,480 50,845,081 100.57
TOTAL INVESTMENT PORTFOLIO 48,565,480 50,845,081 100.57
(C) During the period ending 30 June 2021 this Sub-Fund changed its name. Please see point 5 in the significant events of the period section of the Notes to theFinancial Statements of this semi-annual report for further information.
Xtrackers**
Xtrackers MSCI EM EUROPE, MIDDLE EAST & AFRICA ESG SWAP UCITS ETF*(C)
Statement of Investmentsas at 30 June 2021(expressed in USD)
* This is a synthetic ETF.** This includes synthetic ETFs.
The accompanying notes form an integral part of these financial statements.
104

Description QuantityCurrency
(local) Cost Market Value
% ofNet
Assets
Transferable securities and money market instruments admitted to an official stock exchange listing
Shares
Cayman IslandsAirtac International Group 23,617 TWD 525,133 911,198 0.53Chailease Holdings Co. Ltd. 222,089 TWD 1,023,350 1,614,106 0.93Silergy Corp. 14,083 TWD 946,194 1,915,642 1.11Zhen Ding Technology Holdings Ltd. 119,000 TWD 507,129 448,452 0.26
3,001,806 4,889,398 2.83TaiwanAccton Technology Corp. 89,446 TWD 681,827 1,060,992 0.61Acer Inc. 516,229 TWD 368,072 542,863 0.31Advantech Co. Ltd. 68,832 TWD 680,791 852,294 0.49ASE Technology Holdings Co. Ltd. 582,188 TWD 1,510,583 2,340,244 1.36Asia Cement Corp. 390,000 TWD 559,850 709,664 0.41ASMedia Technology Inc. 5,068 TWD 288,090 244,646 0.14Asustek Computer Inc. 125,444 TWD 1,075,341 1,672,587 0.97AU Optronics Corp. 1,459,000 TWD 551,424 1,186,051 0.69Catcher Technology Co. Ltd. 122,690 TWD 913,187 801,421 0.46Cathay Financial Holdings Co. Ltd. 1,408,788 TWD 2,009,710 2,725,300 1.58Chang Hwa Commercial Bank Ltd. 741,214 TWD 466,726 429,631 0.25Cheng Shin Rubber Industry Co. Ltd. 318,000 TWD 430,537 533,567 0.31China Development Financial Holdings Corp. 2,404,000 TWD 739,762 1,134,593 0.66China Life Insurance Co. Ltd. 337,154 TWD 239,822 318,852 0.18China Steel Corp. 2,106,290 TWD 1,609,292 2,993,597 1.73Chunghwa Telecom Co. Ltd. 678,000 TWD 2,519,736 2,774,051 1.61Compal Electronics Inc. 747,000 TWD 477,061 599,209 0.35CTBC Financial Holdings Co. Ltd. 3,304,150 TWD 2,245,174 2,691,941 1.56Delta Electronics Inc. 347,400 TWD 2,331,380 3,777,917 2.19E.Sun Financial Holdings Co. Ltd. 2,017,049 TWD 1,716,059 1,903,935 1.10Eclat Textile Co. Ltd. 34,232 TWD 438,839 805,965 0.47Evergreen Marine Corp. Taiwan Ltd. 465,739 TWD 297,900 3,292,977 1.91Far Eastern New Century Corp. 525,340 TWD 492,102 603,351 0.35Far EasTone Telecommunications Co. Ltd. 285,000 TWD 629,955 660,781 0.38Feng TAY Enterprise Co. Ltd. 78,665 TWD 432,449 690,304 0.40First Financial Holdings Co. Ltd. 1,831,624 TWD 1,344,694 1,492,252 0.86Formosa Chemicals & Fibre Corp. 627,000 TWD 1,680,327 1,906,035 1.10Formosa Petrochemical Corp. 204,000 TWD 625,157 779,758 0.45Formosa Plastics Corp. 682,015 TWD 2,028,599 2,521,222 1.46Foxconn Technology Co. Ltd. 163,923 TWD 334,211 386,532 0.22Fubon Financial Holdings Co. Ltd. 1,187,000 TWD 1,818,250 3,148,292 1.82Giant Manufacturing Co. Ltd. 53,539 TWD 513,093 612,012 0.35Globalwafers Co. Ltd. 39,101 TWD 577,897 1,289,684 0.75Hiwin Technologies Corp. 47,596 TWD 485,446 674,757 0.39Hon Hai Precision Industry Co. Ltd. 2,225,242 TWD 6,647,765 8,944,894 5.18Hotai Motor Co. Ltd. 53,644 TWD 1,107,615 1,182,141 0.68Hua Nan Financial Holdings Co. Ltd. 1,490,647 TWD 942,036 987,077 0.57Innolux Corp. 1,561,000 TWD 517,477 1,162,521 0.67Inventec Corp. 479,000 TWD 387,365 451,279 0.26Largan Precision Co. Ltd. 17,948 TWD 2,274,992 1,996,906 1.16Lite-On Technology Corp. 377,039 TWD 612,198 779,451 0.45MediaTek Inc. 269,562 TWD 5,702,514 9,307,085 5.39
Xtrackers**
Xtrackers MSCI TAIWAN UCITS ETF
Statement of Investmentsas at 30 June 2021(expressed in USD)
** This includes synthetic ETFs.
The accompanying notes form an integral part of these financial statements.
105

Description QuantityCurrency
(local) Cost Market Value
% ofNet
Assets
Transferable securities and money market instruments admitted to an official stock exchange listing
Shares (continued)
Taiwan (continued)Mega Financial Holdings Co. Ltd. 1,941,230 TWD 1,964,795 2,288,718 1.33Micro-Star International Co. Ltd. 120,759 TWD 508,236 682,622 0.40Nan Ya Plastics Corp. 920,000 TWD 2,092,316 2,747,205 1.59Nan Ya Printed Circuit Board Corp. 40,501 TWD 436,581 566,178 0.33Nanya Technology Corp. 221,000 TWD 507,502 632,165 0.37Nien Made Enterprise Co. Ltd. 28,855 TWD 323,312 428,229 0.25Novatek Microelectronics Corp. 103,050 TWD 948,620 1,845,561 1.07Oneness Biotech Co. Ltd. 40,423 TWD 390,866 336,586 0.19Pegatron Corp. 357,000 TWD 797,537 881,529 0.51Phison Electronics Corp. 27,916 TWD 321,963 480,922 0.28Pou Chen Corp. 420,274 TWD 440,348 592,796 0.34Powertech Technology Inc. 124,454 TWD 397,294 480,172 0.28President Chain Store Corp. 101,836 TWD 968,013 961,251 0.56Quanta Computer Inc. 482,000 TWD 1,222,154 1,513,683 0.88Realtek Semiconductor Corp. 82,257 TWD 954,159 1,490,885 0.86Ruentex Development Co. Ltd. 147,407 TWD 180,018 299,443 0.17Shanghai Commercial & Savings Bank Ltd. 639,424 TWD 956,139 1,038,454 0.60Shin Kong Financial Holdings Co. Ltd. 1,959,437 TWD 593,910 670,200 0.39SinoPac Financial Holdings Co. Ltd. 1,809,525 TWD 694,353 892,991 0.52Synnex Technology International Corp. 238,100 TWD 347,099 434,968 0.25Taishin Financial Holdings Co. Ltd. 1,752,432 TWD 790,975 959,160 0.56Taiwan Business Bank 1,003,509 TWD 349,663 340,356 0.20Taiwan Cement Corp. 880,983 TWD 1,241,828 1,612,566 0.93Taiwan Cooperative Financial Holdings Co. Ltd. 1,665,247 TWD 1,122,676 1,270,040 0.74Taiwan High Speed Rail Corp. 351,000 TWD 389,885 376,668 0.22Taiwan Mobile Co. Ltd. 295,000 TWD 1,046,490 1,079,946 0.63Taiwan Semiconductor Manufacturing Co. Ltd. 2,450,282 TWD 34,283,254 52,325,448 30.31Unimicron Technology Corp. 215,000 TWD 683,451 995,424 0.58Uni-President Enterprises Corp. 862,520 TWD 2,014,740 2,266,001 1.31United Microelectronics Corp. 2,106,000 TWD 1,985,478 4,013,588 2.33Vanguard International Semiconductor Corp. 160,000 TWD 495,378 677,613 0.39Walsin Technology Corp. 56,306 TWD 394,276 459,744 0.27Wan Hai Lines Ltd. 98,706 TWD 523,133 1,137,178 0.66Win Semiconductors Corp. 60,242 TWD 645,585 810,794 0.47Winbond Electronics Corp. 532,000 TWD 310,837 665,418 0.39Wistron Corp. 480,550 TWD 504,585 534,663 0.31Wiwynn Corp. 14,019 TWD 340,112 501,640 0.29WPG Holdings Ltd. 284,219 TWD 396,831 521,259 0.30Yageo Corp. 66,417 TWD 922,693 1,322,977 0.77Yang Ming Marine Transport Corp. 282,489 TWD 1,049,186 1,850,309 1.07Yuanta Financial Holdings Co. Ltd. 1,731,605 TWD 1,075,829 1,668,680 0.97
116,917,405 167,622,661 97.10
Total - Shares 119,919,211 172,512,059 99.93
Total Transferable securities and money market instruments admitted to an officialstock exchange listing 119,919,211 172,512,059 99.93
TOTAL INVESTMENT PORTFOLIO 119,919,211 172,512,059 99.93
Xtrackers**
Xtrackers MSCI TAIWAN UCITS ETF (continued)
Statement of Investmentsas at 30 June 2021(expressed in USD)
** This includes synthetic ETFs.
The accompanying notes form an integral part of these financial statements.
106
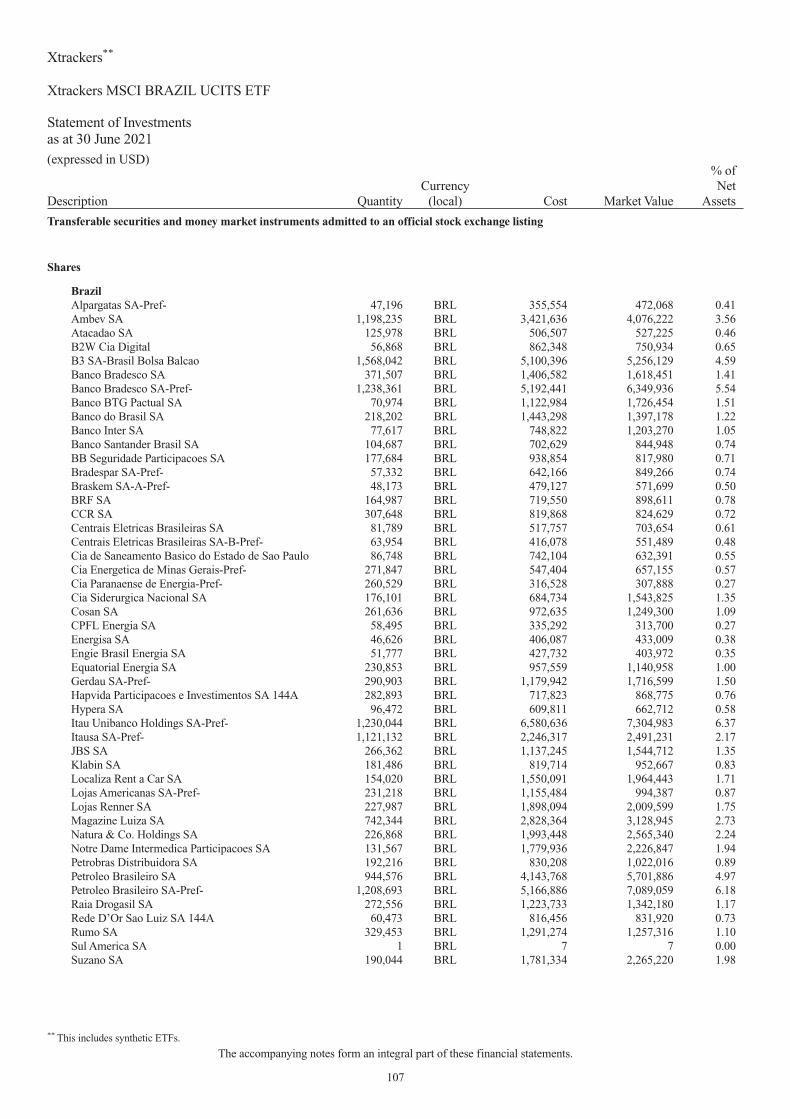
Description QuantityCurrency
(local) Cost Market Value
% ofNet
Assets
Transferable securities and money market instruments admitted to an official stock exchange listing
Shares
BrazilAlpargatas SA-Pref- 47,196 BRL 355,554 472,068 0.41Ambev SA 1,198,235 BRL 3,421,636 4,076,222 3.56Atacadao SA 125,978 BRL 506,507 527,225 0.46B2W Cia Digital 56,868 BRL 862,348 750,934 0.65B3 SA-Brasil Bolsa Balcao 1,568,042 BRL 5,100,396 5,256,129 4.59Banco Bradesco SA 371,507 BRL 1,406,582 1,618,451 1.41Banco Bradesco SA-Pref- 1,238,361 BRL 5,192,441 6,349,936 5.54Banco BTG Pactual SA 70,974 BRL 1,122,984 1,726,454 1.51Banco do Brasil SA 218,202 BRL 1,443,298 1,397,178 1.22Banco Inter SA 77,617 BRL 748,822 1,203,270 1.05Banco Santander Brasil SA 104,687 BRL 702,629 844,948 0.74BB Seguridade Participacoes SA 177,684 BRL 938,854 817,980 0.71Bradespar SA-Pref- 57,332 BRL 642,166 849,266 0.74Braskem SA-A-Pref- 48,173 BRL 479,127 571,699 0.50BRF SA 164,987 BRL 719,550 898,611 0.78CCR SA 307,648 BRL 819,868 824,629 0.72Centrais Eletricas Brasileiras SA 81,789 BRL 517,757 703,654 0.61Centrais Eletricas Brasileiras SA-B-Pref- 63,954 BRL 416,078 551,489 0.48Cia de Saneamento Basico do Estado de Sao Paulo 86,748 BRL 742,104 632,391 0.55Cia Energetica de Minas Gerais-Pref- 271,847 BRL 547,404 657,155 0.57Cia Paranaense de Energia-Pref- 260,529 BRL 316,528 307,888 0.27Cia Siderurgica Nacional SA 176,101 BRL 684,734 1,543,825 1.35Cosan SA 261,636 BRL 972,635 1,249,300 1.09CPFL Energia SA 58,495 BRL 335,292 313,700 0.27Energisa SA 46,626 BRL 406,087 433,009 0.38Engie Brasil Energia SA 51,777 BRL 427,732 403,972 0.35Equatorial Energia SA 230,853 BRL 957,559 1,140,958 1.00Gerdau SA-Pref- 290,903 BRL 1,179,942 1,716,599 1.50Hapvida Participacoes e Investimentos SA 144A 282,893 BRL 717,823 868,775 0.76Hypera SA 96,472 BRL 609,811 662,712 0.58Itau Unibanco Holdings SA-Pref- 1,230,044 BRL 6,580,636 7,304,983 6.37Itausa SA-Pref- 1,121,132 BRL 2,246,317 2,491,231 2.17JBS SA 266,362 BRL 1,137,245 1,544,712 1.35Klabin SA 181,486 BRL 819,714 952,667 0.83Localiza Rent a Car SA 154,020 BRL 1,550,091 1,964,443 1.71Lojas Americanas SA-Pref- 231,218 BRL 1,155,484 994,387 0.87Lojas Renner SA 227,987 BRL 1,898,094 2,009,599 1.75Magazine Luiza SA 742,344 BRL 2,828,364 3,128,945 2.73Natura & Co. Holdings SA 226,868 BRL 1,993,448 2,565,340 2.24Notre Dame Intermedica Participacoes SA 131,567 BRL 1,779,936 2,226,847 1.94Petrobras Distribuidora SA 192,216 BRL 830,208 1,022,016 0.89Petroleo Brasileiro SA 944,576 BRL 4,143,768 5,701,886 4.97Petroleo Brasileiro SA-Pref- 1,208,693 BRL 5,166,886 7,089,059 6.18Raia Drogasil SA 272,556 BRL 1,223,733 1,342,180 1.17Rede D’Or Sao Luiz SA 144A 60,473 BRL 816,456 831,920 0.73Rumo SA 329,453 BRL 1,291,274 1,257,316 1.10Sul America SA 1 BRL 7 7 0.00Suzano SA 190,044 BRL 1,781,334 2,265,220 1.98
Xtrackers**
Xtrackers MSCI BRAZIL UCITS ETF
Statement of Investmentsas at 30 June 2021(expressed in USD)
** This includes synthetic ETFs.
The accompanying notes form an integral part of these financial statements.
107

Description QuantityCurrency
(local) Cost Market Value
% ofNet
Assets
Transferable securities and money market instruments admitted to an official stock exchange listing
Shares (continued)
Brazil (continued)Telefonica Brasil SA 128,770 BRL 1,182,391 1,077,820 0.94TIM SA 215,070 BRL 570,280 494,187 0.43TOTVS SA 124,691 BRL 650,466 935,583 0.82Ultrapar Participacoes SA 183,980 BRL 764,941 674,271 0.59Vale SA 1,006,037 BRL 13,183,436 22,705,679 19.81Via Varejo S/A 324,370 BRL 1,097,995 1,020,717 0.89WEG SA 426,169 BRL 2,548,062 2,861,312 2.50
90,534,814 113,832,754 99.31
Total - Shares 90,534,814 113,832,754 99.31
Rights
BrazilUltrapar Participacoes SA-Rights- 26.07.21 226,944 BRL — 1,809 0.00
— 1,809 0.00
Total - Rights — 1,809 0.00
Total Transferable securities and money market instruments admitted to an officialstock exchange listing 90,534,814 113,834,563 99.31
TOTAL INVESTMENT PORTFOLIO 90,534,814 113,834,563 99.31
Xtrackers**
Xtrackers MSCI BRAZIL UCITS ETF (continued)
Statement of Investmentsas at 30 June 2021(expressed in USD)
** This includes synthetic ETFs.
The accompanying notes form an integral part of these financial statements.
108

Description QuantityCurrency
(local) Cost Market Value
% ofNet
Assets
Transferable securities and money market instruments admitted to an official stock exchange listing
Shares
BelgiumKBC Group NV 59,279 EUR 4,901,590 4,520,226 3.21Proximus SADP 9,314 EUR 194,992 179,931 0.13
5,096,582 4,700,157 3.34FinlandNokia OYJ 606,388 EUR 3,156,129 3,247,168 2.31
3,156,129 3,247,168 2.31Germanyadidas AG 22,444 EUR 8,266,788 8,354,873 5.94Allianz SE 18,645 EUR 4,891,746 4,649,968 3.31BASF SE 44,798 EUR 3,645,101 3,529,690 2.51Bayer AG 154,139 EUR 9,754,247 9,360,857 6.66Commerzbank AG 1,568 EUR 9,670 11,123 0.01Deutsche Boerse AG 8,571 EUR 1,402,157 1,496,193 1.07Deutsche Post AG 65,906 EUR 4,520,095 4,483,141 3.19Fraport AG Frankfurt Airport Services Worldwide 1,278 EUR 73,929 87,085 0.06Fresenius SE & Co. KGaA 109,993 EUR 5,990,851 5,738,741 4.08Muenchener Rueckversicherungs-Gesellschaft AG 16,949 EUR 4,919,747 4,642,056 3.30Porsche Automobil Holdings SE-Pref- 41,473 EUR 4,773,666 4,444,163 3.16RWE AG 129,461 EUR 4,922,200 4,691,812 3.34SAP SE 67,758 EUR 9,560,438 9,549,299 6.79Siemens AG 14,177 EUR 2,335,282 2,246,488 1.60TAG Immobilien AG 128,802 EUR 4,088,051 4,087,493 2.91Volkswagen AG-Pref- 15,387 EUR 4,206,661 3,853,862 2.74
73,360,629 71,226,844 50.67LuxembourgAllegro.eu SA 117,270 PLN 1,756,173 2,021,344 1.44
1,756,173 2,021,344 1.44NetherlandsAdyen NV 144A 2 EUR 4,818 4,887 0.00ASML Holdings NV 6,370 EUR 4,281,115 4,376,896 3.11ING Groep NV 345,838 EUR 4,860,558 4,568,842 3.25JDE Peet’s NV 810 EUR 31,490 29,394 0.02Koninklijke KPN NV 6 EUR 20 19 0.00Koninklijke Philips NV 84,400 EUR 4,744,586 4,182,761 2.98
13,922,587 13,162,799 9.36PolandBank Polska Kasa Opieki SA 46,792 PLN 820,753 1,143,067 0.81Dino Polska SA 144A 7,366 PLN 476,491 541,566 0.39PGE Polska Grupa Energetyczna SA 397,893 PLN 687,011 983,497 0.70Polski Koncern Naftowy ORLEN SA 86,504 PLN 1,425,837 1,744,622 1.24Powszechna Kasa Oszczednosci Bank Polski SA 354,295 PLN 2,945,946 3,520,615 2.51Powszechny Zaklad Ubezpieczen SA 204,180 PLN 1,756,178 1,968,323 1.40
8,112,216 9,901,690 7.05United StatesAdobe Inc. 3,344 USD 1,553,172 1,958,380 1.39Advanced Micro Devices Inc. 22,555 USD 1,827,110 2,118,591 1.51Alphabet Inc.-A- 760 USD 1,514,216 1,855,760 1.32Amazon.com Inc. 1,088 USD 3,459,393 3,742,894 2.66
Xtrackers**
Xtrackers NIFTY 50 SWAP UCITS ETF*
Statement of Investmentsas at 30 June 2021(expressed in USD)
* This is a synthetic ETF.** This includes synthetic ETFs.
The accompanying notes form an integral part of these financial statements.
109
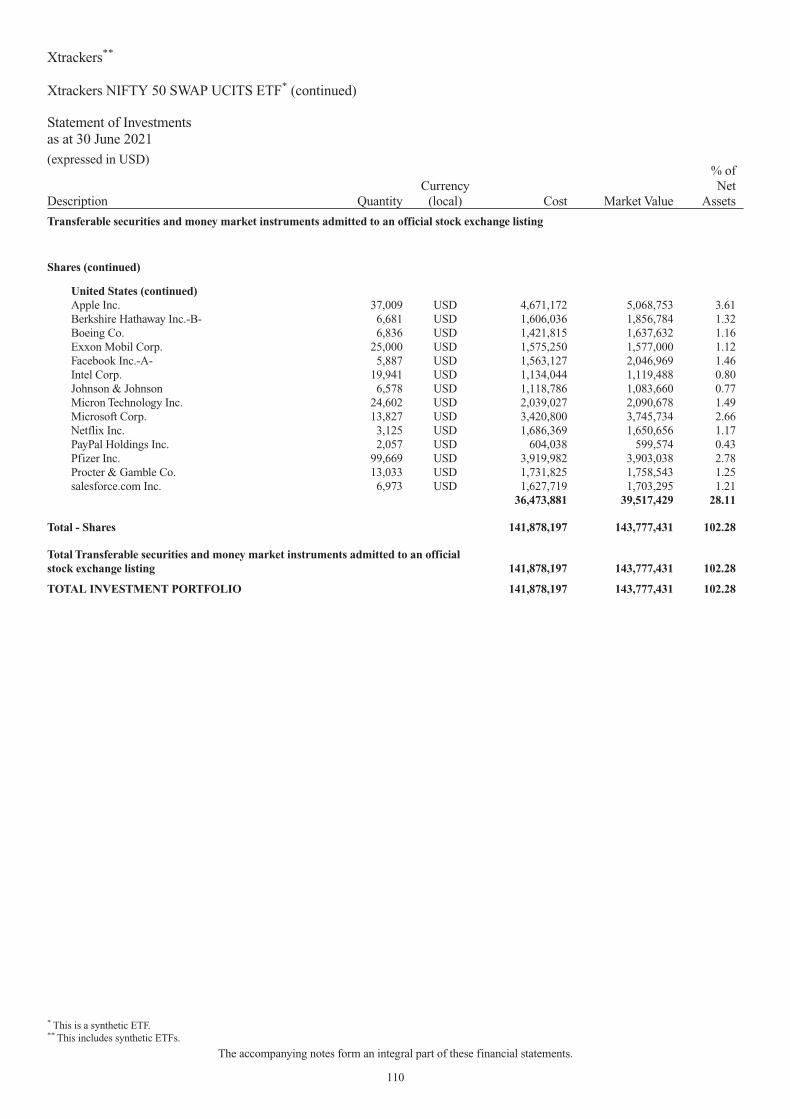
Description QuantityCurrency
(local) Cost Market Value
% ofNet
Assets
Transferable securities and money market instruments admitted to an official stock exchange listing
Shares (continued)
United States (continued)Apple Inc. 37,009 USD 4,671,172 5,068,753 3.61Berkshire Hathaway Inc.-B- 6,681 USD 1,606,036 1,856,784 1.32Boeing Co. 6,836 USD 1,421,815 1,637,632 1.16Exxon Mobil Corp. 25,000 USD 1,575,250 1,577,000 1.12Facebook Inc.-A- 5,887 USD 1,563,127 2,046,969 1.46Intel Corp. 19,941 USD 1,134,044 1,119,488 0.80Johnson & Johnson 6,578 USD 1,118,786 1,083,660 0.77Micron Technology Inc. 24,602 USD 2,039,027 2,090,678 1.49Microsoft Corp. 13,827 USD 3,420,800 3,745,734 2.66Netflix Inc. 3,125 USD 1,686,369 1,650,656 1.17PayPal Holdings Inc. 2,057 USD 604,038 599,574 0.43Pfizer Inc. 99,669 USD 3,919,982 3,903,038 2.78Procter & Gamble Co. 13,033 USD 1,731,825 1,758,543 1.25salesforce.com Inc. 6,973 USD 1,627,719 1,703,295 1.21
36,473,881 39,517,429 28.11
Total - Shares 141,878,197 143,777,431 102.28
Total Transferable securities and money market instruments admitted to an officialstock exchange listing 141,878,197 143,777,431 102.28
TOTAL INVESTMENT PORTFOLIO 141,878,197 143,777,431 102.28
Xtrackers**
Xtrackers NIFTY 50 SWAP UCITS ETF* (continued)
Statement of Investmentsas at 30 June 2021(expressed in USD)
* This is a synthetic ETF.** This includes synthetic ETFs.
The accompanying notes form an integral part of these financial statements.
110

Description QuantityCurrency
(local) Cost Market Value
% ofNet
Assets
Transferable securities and money market instruments admitted to an official stock exchange listing(A)
Shares
KoreaAlteogen Inc. 3,857 KRW 434,384 286,668 0.19Amorepacific Corp. 4,529 KRW 938,160 1,013,460 0.67AMOREPACIFIC Group 4,065 KRW 321,670 231,017 0.15BGF retail Co. Ltd. 1,096 KRW 157,199 174,694 0.12Celltrion Healthcare Co. Ltd. 11,774 KRW 973,805 1,209,654 0.81Celltrion Inc. 13,578 KRW 2,156,507 3,237,307 2.15Celltrion Pharm Inc. 2,270 KRW 214,316 316,871 0.21Cheil Worldwide Inc. 9,723 KRW 186,329 217,141 0.14CJ CheilJedang Corp. 1,166 KRW 377,010 477,313 0.32CJ Corp. 2,055 KRW 229,444 195,254 0.13CJ ENM Co. Ltd. 1,514 KRW 253,021 245,623 0.16CJ Logistics Corp. 1,285 KRW 192,477 201,967 0.13Coway Co. Ltd. 7,797 KRW 567,019 544,886 0.36Daewoo Shipbuilding & Marine Engineering Co. Ltd. 5,290 KRW 130,559 168,168 0.11DB Insurance Co. Ltd. 6,483 KRW 311,196 315,472 0.21Doosan Bobcat Inc. 7,061 KRW 204,981 300,962 0.20Doosan Heavy Industries & Construction Co. Ltd. 29,756 KRW 435,415 630,183 0.42Douzone Bizon Co. Ltd. 2,764 KRW 262,270 203,714 0.14E-MART Inc. 2,749 KRW 438,955 390,570 0.26Fila Holdings Corp. 6,846 KRW 280,180 353,805 0.24Green Cross Corp. 823 KRW 262,104 240,071 0.16GS Engineering & Construction Corp. 9,010 KRW 268,229 343,230 0.23GS Holdings Corp. 6,544 KRW 251,091 268,756 0.18Hana Financial Group Inc. 42,293 KRW 1,358,756 1,729,426 1.15Hankook Tire & Technology Co. Ltd. 10,470 KRW 388,847 480,663 0.32Hanmi Pharm Co. Ltd. 936 KRW 274,915 278,020 0.19Hanon Systems 26,318 KRW 273,459 386,772 0.26Hanwha Solutions Corp. 16,928 KRW 445,747 669,664 0.45HLB Inc. 12,717 KRW 572,823 377,168 0.25HMM Co. Ltd. 36,440 KRW 1,649,500 1,420,518 0.95Hotel Shilla Co. Ltd. 4,423 KRW 373,140 380,971 0.25HYBE Co. Ltd. 1,333 KRW 301,601 346,226 0.23Hyundai Engineering & Construction Co. Ltd. 10,980 KRW 446,848 568,427 0.38Hyundai Glovis Co. Ltd. 2,641 KRW 460,547 490,138 0.33Hyundai Heavy Industries Holdings Co. Ltd. 6,676 KRW 363,618 419,714 0.28Hyundai Mobis Co. Ltd. 9,373 KRW 2,066,450 2,430,330 1.62Hyundai Motor Co. 19,564 KRW 2,920,627 4,160,705 2.77Hyundai Motor Co.-Pref- 5,140 KRW 453,652 524,886 0.35Hyundai Motor Co.-Pref- 3,259 KRW 276,434 334,249 0.22Hyundai Steel Co. 12,219 KRW 521,356 582,658 0.39Industrial Bank of Korea 36,418 KRW 402,025 339,554 0.23Kakao Corp. 43,721 KRW 1,972,787 6,328,218 4.21Kangwon Land Inc. 13,561 KRW 353,188 323,927 0.22KB Financial Group Inc. 55,644 KRW 2,159,232 2,757,124 1.83Kia Corp. 37,116 KRW 1,658,472 2,953,064 1.97KMW Co. Ltd. 3,646 KRW 188,619 175,153 0.12Korea Aerospace Industries Ltd. 10,298 KRW 352,056 300,852 0.20Korea Electric Power Corp. 36,172 KRW 1,079,916 798,183 0.53
Xtrackers**
Xtrackers MSCI KOREA UCITS ETF
Statement of Investmentsas at 30 June 2021(expressed in USD)
** This includes synthetic ETFs.
The accompanying notes form an integral part of these financial statements.
111
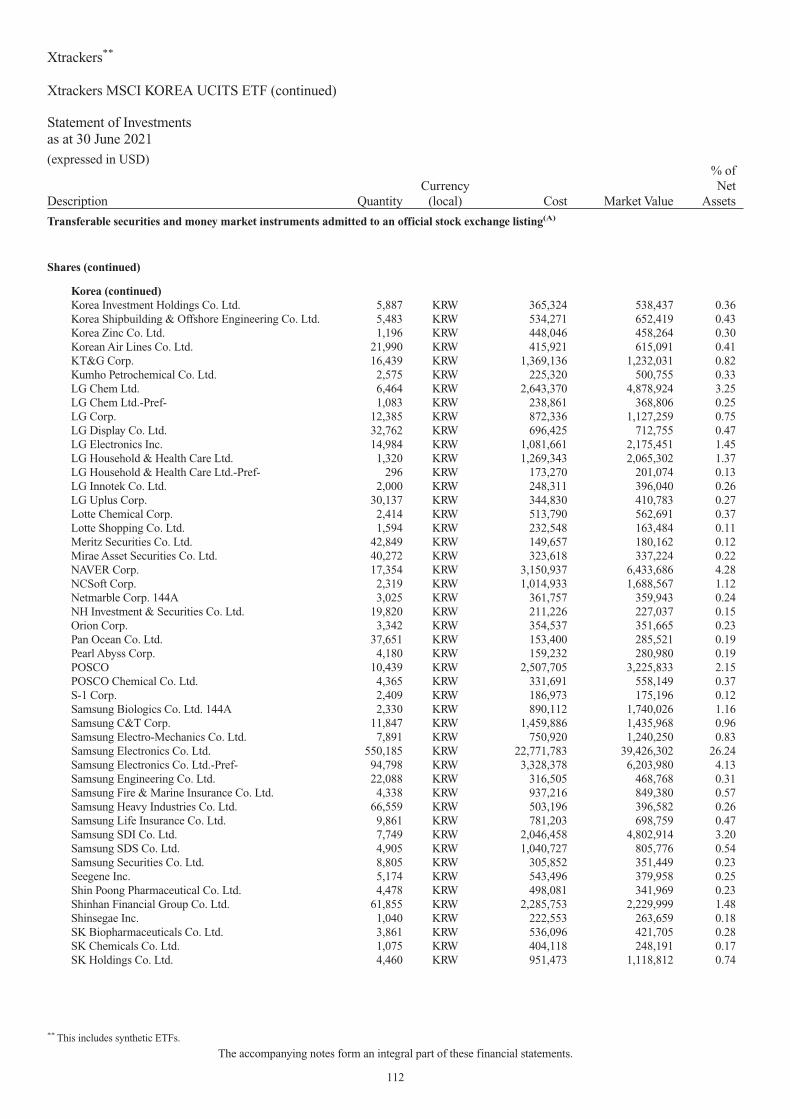
Description QuantityCurrency
(local) Cost Market Value
% ofNet
Assets
Transferable securities and money market instruments admitted to an official stock exchange listing(A)
Shares (continued)
Korea (continued)Korea Investment Holdings Co. Ltd. 5,887 KRW 365,324 538,437 0.36Korea Shipbuilding & Offshore Engineering Co. Ltd. 5,483 KRW 534,271 652,419 0.43Korea Zinc Co. Ltd. 1,196 KRW 448,046 458,264 0.30Korean Air Lines Co. Ltd. 21,990 KRW 415,921 615,091 0.41KT&G Corp. 16,439 KRW 1,369,136 1,232,031 0.82Kumho Petrochemical Co. Ltd. 2,575 KRW 225,320 500,755 0.33LG Chem Ltd. 6,464 KRW 2,643,370 4,878,924 3.25LG Chem Ltd.-Pref- 1,083 KRW 238,861 368,806 0.25LG Corp. 12,385 KRW 872,336 1,127,259 0.75LG Display Co. Ltd. 32,762 KRW 696,425 712,755 0.47LG Electronics Inc. 14,984 KRW 1,081,661 2,175,451 1.45LG Household & Health Care Ltd. 1,320 KRW 1,269,343 2,065,302 1.37LG Household & Health Care Ltd.-Pref- 296 KRW 173,270 201,074 0.13LG Innotek Co. Ltd. 2,000 KRW 248,311 396,040 0.26LG Uplus Corp. 30,137 KRW 344,830 410,783 0.27Lotte Chemical Corp. 2,414 KRW 513,790 562,691 0.37Lotte Shopping Co. Ltd. 1,594 KRW 232,548 163,484 0.11Meritz Securities Co. Ltd. 42,849 KRW 149,657 180,162 0.12Mirae Asset Securities Co. Ltd. 40,272 KRW 323,618 337,224 0.22NAVER Corp. 17,354 KRW 3,150,937 6,433,686 4.28NCSoft Corp. 2,319 KRW 1,014,933 1,688,567 1.12Netmarble Corp. 144A 3,025 KRW 361,757 359,943 0.24NH Investment & Securities Co. Ltd. 19,820 KRW 211,226 227,037 0.15Orion Corp. 3,342 KRW 354,537 351,665 0.23Pan Ocean Co. Ltd. 37,651 KRW 153,400 285,521 0.19Pearl Abyss Corp. 4,180 KRW 159,232 280,980 0.19POSCO 10,439 KRW 2,507,705 3,225,833 2.15POSCO Chemical Co. Ltd. 4,365 KRW 331,691 558,149 0.37S-1 Corp. 2,409 KRW 186,973 175,196 0.12Samsung Biologics Co. Ltd. 144A 2,330 KRW 890,112 1,740,026 1.16Samsung C&T Corp. 11,847 KRW 1,459,886 1,435,968 0.96Samsung Electro-Mechanics Co. Ltd. 7,891 KRW 750,920 1,240,250 0.83Samsung Electronics Co. Ltd. 550,185 KRW 22,771,783 39,426,302 26.24Samsung Electronics Co. Ltd.-Pref- 94,798 KRW 3,328,378 6,203,980 4.13Samsung Engineering Co. Ltd. 22,088 KRW 316,505 468,768 0.31Samsung Fire & Marine Insurance Co. Ltd. 4,338 KRW 937,216 849,380 0.57Samsung Heavy Industries Co. Ltd. 66,559 KRW 503,196 396,582 0.26Samsung Life Insurance Co. Ltd. 9,861 KRW 781,203 698,759 0.47Samsung SDI Co. Ltd. 7,749 KRW 2,046,458 4,802,914 3.20Samsung SDS Co. Ltd. 4,905 KRW 1,040,727 805,776 0.54Samsung Securities Co. Ltd. 8,805 KRW 305,852 351,449 0.23Seegene Inc. 5,174 KRW 543,496 379,958 0.25Shin Poong Pharmaceutical Co. Ltd. 4,478 KRW 498,081 341,969 0.23Shinhan Financial Group Co. Ltd. 61,855 KRW 2,285,753 2,229,999 1.48Shinsegae Inc. 1,040 KRW 222,553 263,659 0.18SK Biopharmaceuticals Co. Ltd. 3,861 KRW 536,096 421,705 0.28SK Chemicals Co. Ltd. 1,075 KRW 404,118 248,191 0.17SK Holdings Co. Ltd. 4,460 KRW 951,473 1,118,812 0.74
Xtrackers**
Xtrackers MSCI KOREA UCITS ETF (continued)
Statement of Investmentsas at 30 June 2021(expressed in USD)
** This includes synthetic ETFs.
The accompanying notes form an integral part of these financial statements.
112

Description QuantityCurrency
(local) Cost Market Value
% ofNet
Assets
Transferable securities and money market instruments admitted to an official stock exchange listing(A)
Shares (continued)
Korea (continued)SK Hynix Inc. 76,912 KRW 5,055,771 8,707,792 5.80SK Innovation Co. Ltd. 7,164 KRW 938,687 1,879,822 1.25SK Telecom Co. Ltd. 5,573 KRW 1,195,943 1,583,590 1.05SKC Co. Ltd. 2,934 KRW 349,296 412,946 0.27S-Oil Corp. 6,344 KRW 396,067 577,419 0.38Woori Financial Group Inc. 71,219 KRW 750,794 724,111 0.48Yuhan Corp. 6,900 KRW 286,860 386,618 0.26
101,286,589 149,983,670 99.82
Total - Shares 101,286,589 149,983,670 99.82
Total Transferable securities and money market instruments admitted to an officialstock exchange listing 101,286,589 149,983,670 99.82
TOTAL INVESTMENT PORTFOLIO 101,286,589 149,983,670 99.82(A) Any duplicate securities appearing herein with the same name are either quoted on different stock exchanges or have different ISINs.
Xtrackers**
Xtrackers MSCI KOREA UCITS ETF (continued)
Statement of Investmentsas at 30 June 2021(expressed in USD)
** This includes synthetic ETFs.
The accompanying notes form an integral part of these financial statements.
113

Description QuantityCurrency
(local) Cost Market Value
% ofNet
Assets
Transferable securities and money market instruments admitted to an official stock exchange listing(A)
Shares
BermudaAlibaba Health Information Technology Ltd. 698,000 HKD 2,020,846 1,547,746 1.14
2,020,846 1,547,746 1.14Cayman IslandsAlibaba Group Holdings Ltd. 464,600 HKD 14,666,650 13,161,727 9.64ANTA Sports Products Ltd. 167,123 HKD 1,729,269 3,933,901 2.88China Resources Land Ltd. 407,812 HKD 1,405,685 1,651,550 1.21Country Garden Holdings Co. Ltd. 1,107,224 HKD 1,246,091 1,240,411 0.91Haidilao International Holdings Ltd. 144A 135,529 HKD 900,914 713,784 0.52Hansoh Pharmaceutical Group Co. Ltd. 144A 143,352 HKD 725,088 627,616 0.46JD Health International Inc. 29,000 HKD 420,181 415,627 0.30JD.com Inc.-A- 157,900 HKD 6,648,375 6,209,579 4.55Kuaishou Technology 144A 39,600 HKD 1,883,822 993,334 0.73Longfor Group Holdings Ltd. 144A 271,898 HKD 1,054,331 1,523,022 1.12Meituan-B- 144A 310,340 HKD 6,101,350 12,803,870 9.38NetEase Inc. 209,600 HKD 3,967,217 4,747,534 3.48Shenzhou International Group Holdings Ltd. 111,652 HKD 2,443,738 2,819,390 2.06Smoore International Holdings Ltd. 144A 259,000 HKD 1,728,237 1,435,767 1.05Tencent Holdings Ltd. 159,892 HKD 6,936,844 12,024,045 8.80Wuxi Biologics Cayman Inc. 144A 381,917 HKD 3,729,383 6,998,176 5.12Xiaomi Corp.-B- 144A 1,620,400 HKD 6,016,399 5,633,743 4.13
61,603,574 76,933,076 56.34ChinaAgricultural Bank of China Ltd.-H- 4,549,515 HKD 2,070,073 1,581,757 1.16Anhui Conch Cement Co. Ltd.-H- 174,721 HKD 829,543 926,944 0.68Bank of China Ltd.-H- 11,259,326 HKD 5,173,479 4,045,085 2.96Bank of Communications Co. Ltd.-H- 1,077,365 HKD 818,515 724,176 0.53BYD Co. Ltd.-H- 116,919 HKD 2,208,208 3,495,894 2.56China CITIC Bank Corp. Ltd.-H- 1,376,515 HKD 878,642 652,289 0.48China Construction Bank Corp.-H- 10,195,654 HKD 8,243,641 8,021,716 5.87China Everbright Bank Co. Ltd.-H- 456,245 HKD 223,881 186,238 0.14China International Capital Corp. Ltd.-H- 144A 218,000 HKD 524,489 586,697 0.43China Life Insurance Co. Ltd.-H- 1,100,605 HKD 3,200,021 2,182,545 1.60China Merchants Bank Co. Ltd.-H- 539,909 HKD 2,082,536 4,605,931 3.37China Merchants Securities Co. Ltd.-H- 144A 174,800 HKD 288,318 243,095 0.18China Minsheng Banking Corp. Ltd.-H- 942,938 HKD 779,383 451,687 0.33China Pacific Insurance Group Co. Ltd.-H- 381,307 HKD 1,573,908 1,200,507 0.88China Petroleum & Chemical Corp.-H- 3,774,253 HKD 2,752,001 1,910,005 1.40China Tower Corp. Ltd.-H- 144A 6,904,083 HKD 1,235,398 951,263 0.70China Vanke Co. Ltd.-H- 279,685 HKD 884,077 875,158 0.64CITIC Securities Co. Ltd.-H- 336,703 HKD 906,463 844,592 0.62COSCO SHIPPING Holdings Co. Ltd.-H- 369,500 HKD 964,688 930,667 0.68CSC Financial Co. Ltd.-H- 144A 132,770 HKD 117,317 160,879 0.12Great Wall Motor Co. Ltd.-H- 458,000 HKD 1,500,467 1,480,302 1.08Haier Smart Home Co. Ltd.-H- 333,600 HKD 1,354,064 1,164,143 0.85Industrial & Commercial Bank of China Ltd.-H- 9,430,961 HKD 6,533,079 5,537,730 4.05People’s Insurance Co. Group of China Ltd.-H- 1,208,090 HKD 540,823 402,912 0.29PetroChina Co. Ltd.-H- 3,073,008 HKD 2,499,832 1,495,776 1.10Ping An Insurance Group Co. of China Ltd.-H- 651,036 HKD 5,619,844 6,375,514 4.67
Xtrackers**
Xtrackers FTSE CHINA 50 UCITS ETF
Statement of Investmentsas at 30 June 2021(expressed in USD)
** This includes synthetic ETFs.
The accompanying notes form an integral part of these financial statements.
114

Description QuantityCurrency
(local) Cost Market Value
% ofNet
Assets
Transferable securities and money market instruments admitted to an official stock exchange listing(A)
Shares (continued)
China (continued)Ping An Insurance Group Co. of China Ltd.-H- 499,514 HKD 1,131,546 978,979 0.72Postal Savings Bank of China Co. Ltd.-H- 144A 1,384,389 HKD 873,809 932,333 0.68WuXi AppTec Co. Ltd.-H- 144A 47,780 HKD 494,024 1,115,462 0.82Zijin Mining Group Co. Ltd.-H- 848,000 HKD 927,820 1,140,007 0.83
57,229,889 55,200,283 40.42Hong KongChina Resources Beer Holdings Co. Ltd. 232,667 HKD 2,224,113 2,089,729 1.53CITIC Ltd. 726,000 HKD 784,473 782,480 0.57
3,008,586 2,872,209 2.10
Total - Shares 123,862,895 136,553,314 100.00
Total Transferable securities and money market instruments admitted to an officialstock exchange listing 123,862,895 136,553,314 100.00
Other transferable securities and money market instruments(A)
Shares
Hong KongChina Com Rich Rene Ene Invest(1) 8,766,000 HKD 7,746,093 11 0.00
7,746,093 11 0.00
Total - Shares 7,746,093 11 0.00
Total Other transferable securities and money market instruments 7,746,093 11 0.00
TOTAL INVESTMENT PORTFOLIO 131,608,988 136,553,325 100.00(A) Any duplicate securities appearing herein with the same name are either quoted on different stock exchanges or have different ISINs.
(1) The security is fair valued.
Xtrackers**
Xtrackers FTSE CHINA 50 UCITS ETF (continued)
Statement of Investmentsas at 30 June 2021(expressed in USD)
** This includes synthetic ETFs.
The accompanying notes form an integral part of these financial statements.
115
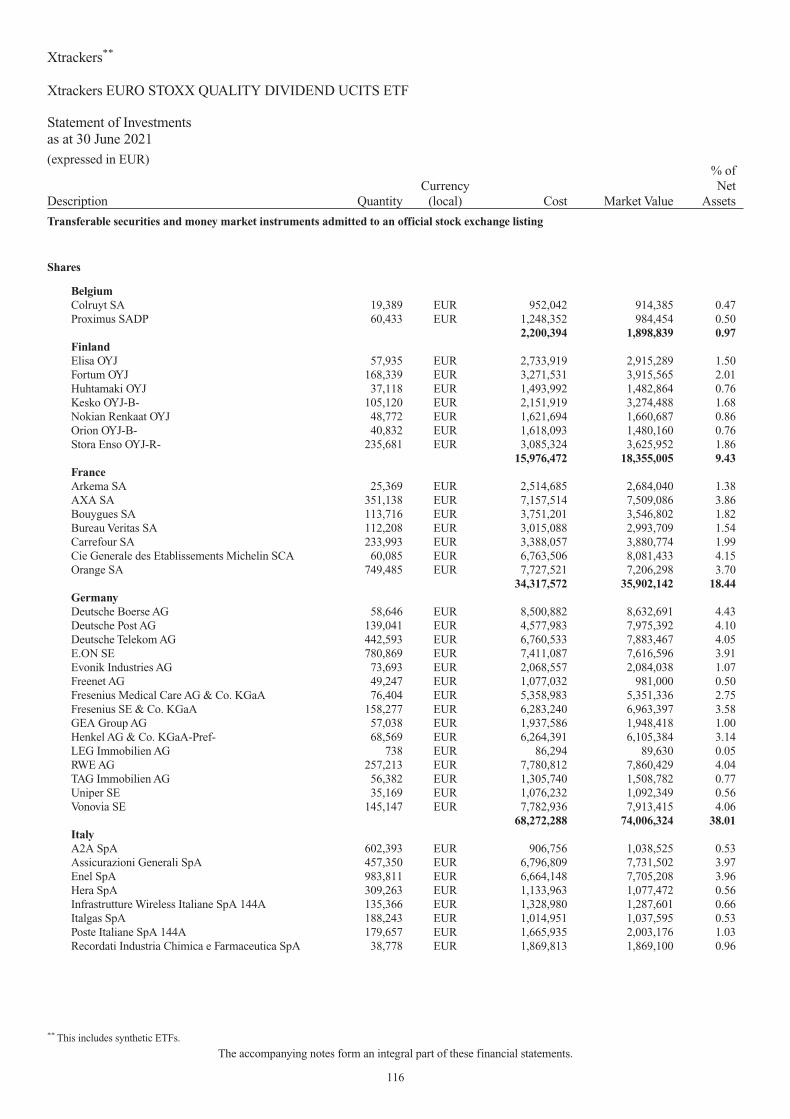
Description QuantityCurrency
(local) Cost Market Value
% ofNet
Assets
Transferable securities and money market instruments admitted to an official stock exchange listing
Shares
BelgiumColruyt SA 19,389 EUR 952,042 914,385 0.47Proximus SADP 60,433 EUR 1,248,352 984,454 0.50
2,200,394 1,898,839 0.97FinlandElisa OYJ 57,935 EUR 2,733,919 2,915,289 1.50Fortum OYJ 168,339 EUR 3,271,531 3,915,565 2.01Huhtamaki OYJ 37,118 EUR 1,493,992 1,482,864 0.76Kesko OYJ-B- 105,120 EUR 2,151,919 3,274,488 1.68Nokian Renkaat OYJ 48,772 EUR 1,621,694 1,660,687 0.86Orion OYJ-B- 40,832 EUR 1,618,093 1,480,160 0.76Stora Enso OYJ-R- 235,681 EUR 3,085,324 3,625,952 1.86
15,976,472 18,355,005 9.43FranceArkema SA 25,369 EUR 2,514,685 2,684,040 1.38AXA SA 351,138 EUR 7,157,514 7,509,086 3.86Bouygues SA 113,716 EUR 3,751,201 3,546,802 1.82Bureau Veritas SA 112,208 EUR 3,015,088 2,993,709 1.54Carrefour SA 233,993 EUR 3,388,057 3,880,774 1.99Cie Generale des Etablissements Michelin SCA 60,085 EUR 6,763,506 8,081,433 4.15Orange SA 749,485 EUR 7,727,521 7,206,298 3.70
34,317,572 35,902,142 18.44GermanyDeutsche Boerse AG 58,646 EUR 8,500,882 8,632,691 4.43Deutsche Post AG 139,041 EUR 4,577,983 7,975,392 4.10Deutsche Telekom AG 442,593 EUR 6,760,533 7,883,467 4.05E.ON SE 780,869 EUR 7,411,087 7,616,596 3.91Evonik Industries AG 73,693 EUR 2,068,557 2,084,038 1.07Freenet AG 49,247 EUR 1,077,032 981,000 0.50Fresenius Medical Care AG & Co. KGaA 76,404 EUR 5,358,983 5,351,336 2.75Fresenius SE & Co. KGaA 158,277 EUR 6,283,240 6,963,397 3.58GEA Group AG 57,038 EUR 1,937,586 1,948,418 1.00Henkel AG & Co. KGaA-Pref- 68,569 EUR 6,264,391 6,105,384 3.14LEG Immobilien AG 738 EUR 86,294 89,630 0.05RWE AG 257,213 EUR 7,780,812 7,860,429 4.04TAG Immobilien AG 56,382 EUR 1,305,740 1,508,782 0.77Uniper SE 35,169 EUR 1,076,232 1,092,349 0.56Vonovia SE 145,147 EUR 7,782,936 7,913,415 4.06
68,272,288 74,006,324 38.01ItalyA2A SpA 602,393 EUR 906,756 1,038,525 0.53Assicurazioni Generali SpA 457,350 EUR 6,796,809 7,731,502 3.97Enel SpA 983,811 EUR 6,664,148 7,705,208 3.96Hera SpA 309,263 EUR 1,133,963 1,077,472 0.56Infrastrutture Wireless Italiane SpA 144A 135,366 EUR 1,328,980 1,287,601 0.66Italgas SpA 188,243 EUR 1,014,951 1,037,595 0.53Poste Italiane SpA 144A 179,657 EUR 1,665,935 2,003,176 1.03Recordati Industria Chimica e Farmaceutica SpA 38,778 EUR 1,869,813 1,869,100 0.96
Xtrackers**
Xtrackers EURO STOXX QUALITY DIVIDEND UCITS ETF
Statement of Investmentsas at 30 June 2021(expressed in EUR)
** This includes synthetic ETFs.
The accompanying notes form an integral part of these financial statements.
116

Description QuantityCurrency
(local) Cost Market Value
% ofNet
Assets
Transferable securities and money market instruments admitted to an official stock exchange listing
Shares (continued)
Italy (continued)Snam SpA 791,481 EUR 3,476,312 3,858,470 1.98Terna Rete Elettrica Nazionale SpA 542,665 EUR 3,539,463 3,410,107 1.75
28,397,130 31,018,756 15.93NetherlandsKoninklijke Ahold Delhaize NV 317,476 EUR 7,185,443 7,959,123 4.09Koninklijke KPN NV 1,293,697 EUR 3,214,313 3,407,598 1.75Koninklijke Vopak NV 24,685 EUR 954,075 945,436 0.48NN Group NV 122,341 EUR 4,353,098 4,866,725 2.50
15,706,929 17,178,882 8.82PortugalEDP - Energias de Portugal SA 1,125,917 EUR 5,143,163 5,032,849 2.59Jeronimo Martins SGPS SA 94,116 EUR 1,355,887 1,447,504 0.74
6,499,050 6,480,353 3.33SpainEnagas SA 90,748 EUR 1,879,496 1,768,225 0.91Endesa SA 121,835 EUR 2,741,862 2,492,744 1.28Grifols SA 113,048 EUR 2,700,364 2,582,016 1.32Red Electrica Corp. SA 166,596 EUR 2,871,091 2,608,061 1.34
10,192,813 9,451,046 4.85
Total - Shares 181,562,648 194,291,347 99.78
Total Transferable securities and money market instruments admitted to an officialstock exchange listing 181,562,648 194,291,347 99.78
TOTAL INVESTMENT PORTFOLIO 181,562,648 194,291,347 99.78
Xtrackers**
Xtrackers EURO STOXX QUALITY DIVIDEND UCITS ETF (continued)
Statement of Investmentsas at 30 June 2021(expressed in EUR)
** This includes synthetic ETFs.
The accompanying notes form an integral part of these financial statements.
117

Description QuantityCurrency
(local) Cost Market Value
% ofNet
Assets
Transferable securities and money market instruments admitted to an official stock exchange listing(A)
Shares
AustriaEVN AG 421,599 EUR 7,462,302 8,381,388 1.32
7,462,302 8,381,388 1.32BelgiumGimv NV 75,001 EUR 3,855,051 4,050,054 0.64
3,855,051 4,050,054 0.64BermudaAxalta Coating Systems Ltd. 603,919 USD 16,265,377 15,527,010 2.44IHS Markit Ltd. 179,090 USD 16,149,655 17,013,466 2.68
32,415,032 32,540,476 5.12CanadaAgnico Eagle Mines Ltd. 151,160 USD 8,660,502 7,705,218 1.21Sun Life Financial Inc. 201,850 USD 8,780,867 8,772,530 1.38
17,441,369 16,477,748 2.59Cayman IslandsNIO Inc.-ADR- 45,452 USD 1,730,580 2,038,996 0.32Pagseguro Digital Ltd.-A- 195,497 USD 7,648,161 9,218,473 1.45
9,378,741 11,257,469 1.77GermanyKWS Saat SE & Co. KGaA 43,000 EUR 2,967,000 2,984,200 0.47Siemens Healthineers AG 144A 208,750 EUR 9,916,669 10,788,200 1.69
12,883,669 13,772,400 2.16NetherlandsMerus NV 39,231 USD 478,854 697,021 0.11
478,854 697,021 0.11SwitzerlandSiemens Energy AG 45,679 EUR 1,202,500 1,161,160 0.18
1,202,500 1,161,160 0.18United KingdomDialog Semiconductor PLC 320,000 EUR 16,010,400 20,979,200 3.30
16,010,400 20,979,200 3.30United States8x8 Inc. 225,700 USD 3,252,651 5,283,269 0.83Abbott Laboratories 113,635 USD 10,180,662 11,108,609 1.75AbbVie Inc. 152,561 USD 13,497,253 14,490,651 2.28Activision Blizzard Inc. 79,580 USD 6,428,230 6,404,513 1.01Adtalem Global Education Inc. 461 USD 15,984 13,854 0.00Aerie Pharmaceuticals Inc. 9,316 USD 110,796 125,769 0.02Akero Therapeutics Inc. 19,399 USD 465,563 405,843 0.06Allstate Corp. 112,960 USD 12,466,243 12,424,737 1.95Alpha Metallurgical Resources Inc. 59,514 USD 792,483 1,286,232 0.20Amazon.com Inc. 4,077 USD 10,598,505 11,826,904 1.86Anaplan Inc. 101,032 USD 3,946,315 4,540,857 0.71ANGI Homeservices Inc.-A- 3,794 USD 43,507 43,254 0.01Apartment Income REIT Corp. 44,034 USD 1,611,655 1,761,136 0.28Atara Biotherapeutics Inc. 213,369 USD 2,919,805 2,797,779 0.44Avaya Holdings Corp. 13,922 USD 220,029 315,795 0.05Axcelis Technologies Inc. 94 USD 1,337 3,204 0.00Bandwidth Inc.-A- 394 USD 23,774 45,822 0.01
Xtrackers**
Xtrackers STOXX GLOBAL SELECT DIVIDEND 100 SWAP UCITS ETF*
Statement of Investmentsas at 30 June 2021(expressed in EUR)
* This is a synthetic ETF.** This includes synthetic ETFs.
The accompanying notes form an integral part of these financial statements.
118

Description QuantityCurrency
(local) Cost Market Value
% ofNet
Assets
Transferable securities and money market instruments admitted to an official stock exchange listing(A)
Shares (continued)
United States (continued)Becton Dickinson and Co. 8,533 USD 1,675,367 1,749,843 0.27Berkshire Hathaway Inc.-B- 46,882 USD 10,944,727 10,986,963 1.73Berkshire Hathaway Inc.-B- 1,513 EUR 333,314 354,647 0.06Biogen Inc. 620 USD 135,500 181,033 0.03BlueLinx Holdings Inc. 5,882 USD 176,550 249,386 0.04Booking Holdings Inc. 64 USD 127,145 118,086 0.02Bright Horizons Family Solutions Inc. 394 USD 35,973 48,875 0.01Brightcove Inc. 3,173 USD 20,036 38,395 0.01Brighthouse Financial Inc. 723 USD 31,513 27,764 0.00Cargurus Inc. 412,300 USD 8,436,315 9,119,339 1.43Cigna Corp. 144,917 USD 29,443,600 28,969,944 4.55Citigroup Inc. 528,768 USD 34,533,264 31,545,929 4.96Cognizant Technology Solutions Corp.-A- 202,749 USD 11,860,370 11,841,124 1.86Colfax Corp. 510,083 USD 18,875,194 19,703,930 3.10Duke Realty REIT Corp. 132,403 USD 4,864,402 5,286,516 0.83elf Beauty Inc. 227,869 USD 4,430,759 5,214,910 0.82Enanta Pharmaceuticals Inc. 4,575 USD 168,184 169,783 0.03Enterprise Products Partners LP 712,104 USD 13,582,768 14,489,469 2.28Eventbrite Inc.-A- 244,351 USD 3,824,905 3,914,889 0.62Exelon Corp. 86,433 USD 3,189,642 3,229,483 0.51Fortive Corp. 314,415 USD 18,653,510 18,490,000 2.91Haemonetics Corp. 82,939 USD 8,410,710 4,660,639 0.73Hologic Inc. 114,951 USD 5,941,599 6,467,263 1.02International Money Express Inc. 220,200 USD 3,091,639 2,757,373 0.43Intuitive Surgical Inc. 14,360 USD 8,805,090 11,135,866 1.75Invitation Homes REIT Inc. 77,914 USD 2,394,353 2,449,963 0.39Kite Realty Group Trust REIT 573,671 USD 9,518,192 10,647,181 1.67Knight-Swift Transportation Holdings Inc. 202,724 USD 7,781,912 7,771,168 1.22Liberty Oilfield Services Inc.-A- 1,039,080 USD 12,548,247 12,406,919 1.95LPL Financial Holdings Inc. 137,391 USD 16,265,309 15,637,936 2.46Magnachip Semiconductor Corp. 146,566 USD 1,683,222 2,948,868 0.46Mettler-Toledo International Inc. 3,762 USD 3,405,337 4,394,676 0.69Microsoft Corp. 15,785 USD 3,612,486 3,605,830 0.57Molecular Templates Inc. 9,031 USD 127,775 59,552 0.01MPLX LP 47,460 USD 1,135,568 1,184,999 0.19Northrop Grumman Corp. 23,578 USD 7,194,225 7,225,692 1.14PayPal Holdings Inc. 86,942 USD 17,942,654 21,369,290 3.36Pinterest Inc.-A- 135,085 USD 6,843,348 8,993,132 1.41Planet Fitness Inc.-A- 234,008 USD 14,476,465 14,848,717 2.33PNM Resources Inc. 411,966 USD 16,962,097 16,942,046 2.66PPD Inc. 300,000 USD 11,477,055 11,659,493 1.83QUALCOMM Inc. 67,864 USD 7,482,543 8,179,270 1.29Regions Financial Corp. 410,132 USD 7,575,653 6,979,054 1.10Ross Stores Inc. 146,801 USD 14,489,143 15,349,789 2.41SBA Communications REIT Corp. 49,319 USD 11,860,279 13,254,033 2.08Scientific Games Corp. 309,030 USD 10,391,514 20,179,839 3.17SeaWorld Entertainment Inc. 2,535 USD 58,930 106,753 0.02Southern Co. 158,917 USD 8,381,234 8,108,662 1.27
Xtrackers**
Xtrackers STOXX GLOBAL SELECT DIVIDEND 100 SWAP UCITS ETF* (continued)
Statement of Investmentsas at 30 June 2021(expressed in EUR)
* This is a synthetic ETF.** This includes synthetic ETFs.
The accompanying notes form an integral part of these financial statements.
119

Description QuantityCurrency
(local) Cost Market Value
% ofNet
Assets
Transferable securities and money market instruments admitted to an official stock exchange listing(A)
Shares (continued)
United States (continued)Square Inc.-A- 79,813 USD 13,783,682 16,408,129 2.58Teledyne Technologies Inc. 35,567 USD 11,860,245 12,561,362 1.97Texas Instruments Inc. 56,296 USD 8,331,632 9,128,692 1.44T-Mobile US Inc. 33,806 USD 3,776,533 4,128,612 0.65Union Pacific Corp. 58,918 USD 10,829,324 10,926,578 1.72Weyerhaeuser REIT Co. 109,951 USD 3,220,982 3,191,257 0.50Xilinx Inc. 120,000 USD 13,305,636 14,635,965 2.30
516,882,443 548,913,134 86.30
Total - Shares 618,010,361 658,230,050 103.49
Total Transferable securities and money market instruments admitted to an officialstock exchange listing 618,010,361 658,230,050 103.49
TOTAL INVESTMENT PORTFOLIO 618,010,361 658,230,050 103.49(A) Any duplicate securities appearing herein with the same name are either quoted on different stock exchanges or have different ISINs.
Xtrackers**
Xtrackers STOXX GLOBAL SELECT DIVIDEND 100 SWAP UCITS ETF* (continued)
Statement of Investmentsas at 30 June 2021(expressed in EUR)
* This is a synthetic ETF.** This includes synthetic ETFs.
The accompanying notes form an integral part of these financial statements.
120

Description QuantityCurrency
(local) Cost Market Value
% ofNet
Assets
Transferable securities and money market instruments admitted to an official stock exchange listing
Shares
BelgiumColruyt SA 73,024 EUR 3,589,865 3,443,812 2.78KBC Group NV 92,315 EUR 6,260,474 5,935,854 4.79
9,850,339 9,379,666 7.57GermanyBASF SE 45,558 EUR 3,062,469 3,026,874 2.44Bayer AG 56,523 EUR 3,044,460 2,894,543 2.33Covestro AG 144A 54,414 EUR 3,075,115 2,963,386 2.39Daimler AG 40,279 EUR 3,099,469 3,033,009 2.45Delivery Hero SE 144A 27,523 EUR 3,259,313 3,066,062 2.47HeidelbergCement AG 40,378 EUR 2,929,828 2,920,945 2.36Merck KGaA 20,536 EUR 2,978,839 3,320,671 2.68Muenchener Rueckversicherungs-Gesellschaft AG 13,016 EUR 3,146,853 3,006,045 2.42RWE AG 105,916 EUR 3,326,795 3,236,793 2.61SAP SE 25,042 EUR 2,854,788 2,975,991 2.40Volkswagen AG-Pref- 13,345 EUR 3,065,998 2,818,464 2.27
33,843,927 33,262,783 26.82NetherlandsASML Holdings NV 5,106 EUR 2,594,869 2,958,416 2.39ASR Nederland NV 176,924 EUR 6,198,999 5,765,953 4.65BE Semiconductor Industries NV 19,576 EUR 1,387,547 1,400,467 1.13Koninklijke Ahold Delhaize NV 134,952 EUR 3,246,270 3,383,247 2.73NN Group NV 72,792 EUR 2,929,878 2,895,666 2.33Prosus NV 36,035 EUR 3,324,646 2,971,806 2.40Signify NV 144A 33,134 EUR 1,741,523 1,767,368 1.42
21,423,732 21,142,923 17.05United States3M Co. 15,443 USD 2,549,627 2,586,594 2.09Allstate Corp. 27,142 USD 3,040,547 2,985,412 2.41Alphabet Inc.-C- 1,100 USD 1,426,881 2,324,775 1.87Altice USA Inc.-A- 30 USD 817 864 0.00Amazon.com Inc. 1,106 USD 3,010,174 3,208,378 2.59Amgen Inc. 13,666 USD 2,798,534 2,808,909 2.26Arthur J Gallagher & Co. 21,389 USD 2,514,868 2,526,494 2.04AutoZone Inc. 2,385 USD 2,874,916 3,001,048 2.42CarMax Inc. 23,480 USD 2,600,355 2,557,079 2.06Charles Schwab Corp. 17,738 USD 1,039,961 1,089,049 0.88Charter Communications Inc.-A- 5,045 USD 2,897,048 3,069,157 2.47CVS Health Corp. 44,424 USD 2,759,987 3,125,674 2.52Duke Energy Corp. 424 USD 35,159 35,296 0.03Facebook Inc.-A- 10,648 USD 2,742,316 3,122,029 2.52HCA Healthcare Inc. 15,879 USD 2,775,210 2,768,212 2.23Intel Corp. 31,231 USD 1,397,017 1,478,461 1.19Lowe’s Cos Inc. 16,654 USD 2,695,823 2,723,986 2.20Microsoft Corp. 13,122 USD 2,671,473 2,997,511 2.42MSCI Inc. 5,272 USD 1,992,850 2,369,843 1.91Old Dominion Freight Line Inc. 8,268 USD 1,737,773 1,769,472 1.43Oracle Corp. 45,626 USD 2,816,590 2,994,794 2.41PayPal Holdings Inc. 13,848 USD 2,885,302 3,403,671 2.74
Xtrackers**
Xtrackers STOXX EUROPE 600 BASIC RESOURCES SWAP UCITS ETF*
Statement of Investmentsas at 30 June 2021(expressed in EUR)
* This is a synthetic ETF.** This includes synthetic ETFs.
The accompanying notes form an integral part of these financial statements.
121
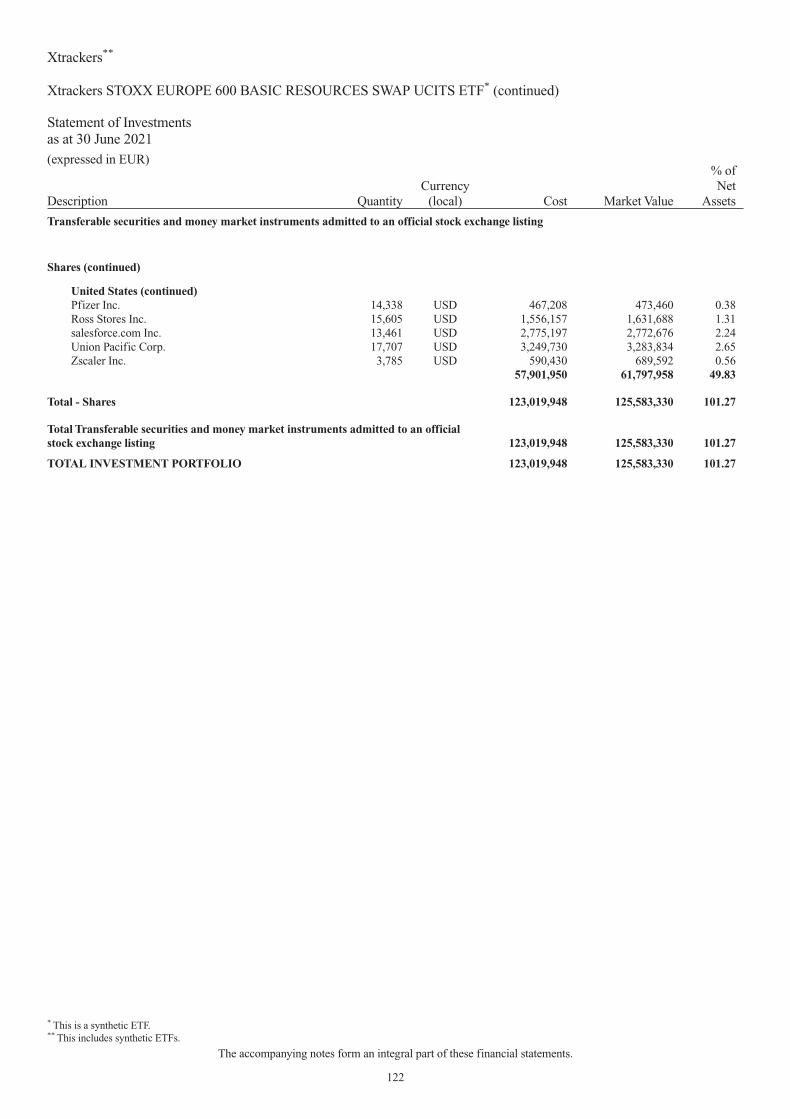
Description QuantityCurrency
(local) Cost Market Value
% ofNet
Assets
Transferable securities and money market instruments admitted to an official stock exchange listing
Shares (continued)
United States (continued)Pfizer Inc. 14,338 USD 467,208 473,460 0.38Ross Stores Inc. 15,605 USD 1,556,157 1,631,688 1.31salesforce.com Inc. 13,461 USD 2,775,197 2,772,676 2.24Union Pacific Corp. 17,707 USD 3,249,730 3,283,834 2.65Zscaler Inc. 3,785 USD 590,430 689,592 0.56
57,901,950 61,797,958 49.83
Total - Shares 123,019,948 125,583,330 101.27
Total Transferable securities and money market instruments admitted to an officialstock exchange listing 123,019,948 125,583,330 101.27
TOTAL INVESTMENT PORTFOLIO 123,019,948 125,583,330 101.27
Xtrackers**
Xtrackers STOXX EUROPE 600 BASIC RESOURCES SWAP UCITS ETF* (continued)
Statement of Investmentsas at 30 June 2021(expressed in EUR)
* This is a synthetic ETF.** This includes synthetic ETFs.
The accompanying notes form an integral part of these financial statements.
122

Description QuantityCurrency
(local) Cost Market Value
% ofNet
Assets
Transferable securities and money market instruments admitted to an official stock exchange listing
Shares
FinlandElisa OYJ 52,931 EUR 2,537,512 2,663,488 7.04Fortum OYJ 67,130 EUR 1,504,383 1,561,444 4.13Kesko OYJ-B- 72,778 EUR 1,876,833 2,267,035 5.99Nokian Renkaat OYJ 41,000 EUR 1,299,290 1,396,050 3.69Sampo OYJ-A- 41,531 EUR 1,637,983 1,609,741 4.26
8,856,001 9,497,758 25.11GermanyBeiersdorf AG 10,576 EUR 959,243 1,076,108 2.84Commerzbank AG 254,048 EUR 1,456,183 1,519,715 4.02Henkel AG & Co. KGaA 12,599 EUR 1,062,096 978,312 2.59KION Group AG 19,200 EUR 1,592,448 1,725,696 4.56Knorr-Bremse AG 17,567 EUR 1,811,535 1,703,999 4.50Porsche Automobil Holdings SE-Pref- 10,301 EUR 865,284 930,798 2.46Puma SE 18,000 EUR 1,619,640 1,809,900 4.78Siemens Healthineers AG 144A 25,000 EUR 1,171,000 1,292,000 3.42Symrise AG 16,117 EUR 1,727,216 1,893,748 5.01TAG Immobilien AG 67,800 EUR 1,598,046 1,814,328 4.80Uniper SE 45,995 EUR 1,364,282 1,428,605 3.78Wacker Chemie AG 11,635 EUR 1,512,550 1,513,132 4.00
16,739,523 17,686,341 46.76LuxembourgeDreams ODIGEO SA 246,980 EUR 493,960 1,676,994 4.44
493,960 1,676,994 4.44NetherlandsSligro Food Group NV 57,983 EUR 756,386 1,435,079 3.80
756,386 1,435,079 3.80PortugalEDP - Energias de Portugal SA 640,000 EUR 3,035,520 2,860,800 7.56
3,035,520 2,860,800 7.56SwedenSkandinaviska Enskilda Banken AB-A- 56,681 SEK 603,954 617,835 1.63
603,954 617,835 1.63SwitzerlandEFG International AG 20,763 CHF 139,367 143,763 0.38Siemens Energy AG 56,533 EUR 1,067,060 1,437,069 3.80
1,206,427 1,580,832 4.18United KingdomDialog Semiconductor PLC 36,814 EUR 1,808,009 2,413,526 6.38
1,808,009 2,413,526 6.38United StatesDCP Midstream LP 17,585 USD 430,479 455,084 1.20
430,479 455,084 1.20
Total - Shares 33,930,259 38,224,249 101.06
Total Transferable securities and money market instruments admitted to an officialstock exchange listing 33,930,259 38,224,249 101.06
TOTAL INVESTMENT PORTFOLIO 33,930,259 38,224,249 101.06
Xtrackers**
Xtrackers STOXX EUROPE 600 OIL & GAS SWAP UCITS ETF*
Statement of Investmentsas at 30 June 2021(expressed in EUR)
* This is a synthetic ETF.** This includes synthetic ETFs.
The accompanying notes form an integral part of these financial statements.
123

Description QuantityCurrency
(local) Cost Market Value
% ofNet
Assets
Transferable securities and money market instruments admitted to an official stock exchange listing
Shares
BermudaSignet Jewelers Ltd. 9,541 USD 382,530 649,985 0.67
382,530 649,985 0.67CanadaCelestica Inc. 116,994 USD 637,658 774,435 0.80Rogers Communications Inc.-B- 124,700 USD 5,383,321 5,587,785 5.80
6,020,979 6,362,220 6.60Cayman Islands51job Inc.-ADR- 67,599 USD 3,779,385 4,433,065 4.60Afya Ltd.-A- 91,518 USD 1,751,131 1,989,487 2.06Burgundy Technology Acquisition Corp.-A- 70,400 USD 647,667 584,737 0.61Farfetch Ltd.-A- 46,072 USD 2,281,847 1,956,476 2.03
8,460,030 8,963,765 9.30NetherlandsElastic NV 42,857 USD 5,747,421 5,267,589 5.46
5,747,421 5,267,589 5.46SwitzerlandCRISPR Therapeutics AG 251 USD 35,170 34,265 0.04
35,170 34,265 0.04United StatesActivision Blizzard Inc. 33,932 USD 2,601,671 2,730,811 2.83AECOM 103,918 USD 5,449,855 5,548,600 5.76Amazon.com Inc. 908 USD 2,303,479 2,634,002 2.73AmerisourceBergen Corp. 27,175 USD 2,601,708 2,623,547 2.72Amicus Therapeutics Inc. 255,696 USD 2,486,095 2,078,513 2.16ANGI Homeservices Inc.-A- 74,250 USD 1,109,070 846,496 0.88Avantor Inc. 134,772 USD 3,490,385 4,035,544 4.19Bank of America Corp. 262 USD 8,530 9,109 0.01Berkshire Hathaway Inc.-B- 11,502 USD 2,561,642 2,695,534 2.80Biogen Inc. 810 USD 188,069 236,511 0.25Bio-Rad Laboratories Inc.-A- 217 USD 111,041 117,894 0.12Blackstone Group Inc.-A- 52,761 USD 3,983,396 4,321,782 4.48Bottomline Technologies DE Inc. 24,549 USD 957,678 767,583 0.80Caesars Entertainment Inc. 2 USD 164 175 0.00Capital One Financial Corp. 30,407 USD 3,905,826 3,966,318 4.11Colfax Corp. 483 USD 17,873 18,658 0.02Crowdstrike Holdings Inc.-A- 1,919 USD 394,578 406,665 0.42Discovery Inc.-C- 46,547 USD 1,002,623 1,137,475 1.18Edwards Lifesciences Corp. 35,285 USD 2,601,711 3,081,597 3.20eHealth Inc. 2,249 USD 105,149 110,752 0.11Fiserv Inc. 27,313 USD 2,453,347 2,461,831 2.55GreenSky Inc.-A- 1,502 USD 8,364 7,029 0.01GrowGeneration Corp. 221 USD 8,392 8,964 0.01Incyte Corp. 55,098 USD 3,874,658 3,908,755 4.06KLA Corp. 10,812 USD 2,601,500 2,955,862 3.07Marsh & McLennan Cos Inc. 12,833 USD 1,412,538 1,522,342 1.58MercadoLibre Inc. 2,183 USD 2,910,729 2,867,572 2.97Micron Technology Inc. 35,224 USD 2,561,746 2,524,103 2.62Mr Cooper Group Inc. 143,248 USD 4,285,281 3,993,403 4.14
Xtrackers**
Xtrackers STOXX EUROPE 600 HEALTH CARE SWAP UCITS ETF*
Statement of Investmentsas at 30 June 2021(expressed in EUR)
* This is a synthetic ETF.** This includes synthetic ETFs.
The accompanying notes form an integral part of these financial statements.
124

Description QuantityCurrency
(local) Cost Market Value
% ofNet
Assets
Transferable securities and money market instruments admitted to an official stock exchange listing
Shares (continued)
United States (continued)NMI Holdings Inc.-A- 56,853 USD 1,039,612 1,077,709 1.12Privia Health Group Inc. 148,361 USD 5,766,618 5,550,868 5.76Rubicon Project Inc. 55,764 USD 2,543,459 1,591,241 1.65salesforce.com Inc. 13,517 USD 2,561,696 2,784,211 2.89Snowflake Inc.-A- 20,660 USD 3,983,332 4,212,484 4.37Tracon Pharmaceuticals Inc. 253,617 USD 2,184,782 1,387,953 1.44Vanda Pharmaceuticals Inc. 87,893 USD 1,045,603 1,594,213 1.65Y-mAbs Therapeutics Inc. 4,498 USD 115,744 128,200 0.13
75,237,944 75,944,306 78.79
Total - Shares 95,884,074 97,222,130 100.86
Total Transferable securities and money market instruments admitted to an officialstock exchange listing 95,884,074 97,222,130 100.86
TOTAL INVESTMENT PORTFOLIO 95,884,074 97,222,130 100.86
Xtrackers**
Xtrackers STOXX EUROPE 600 HEALTH CARE SWAP UCITS ETF* (continued)
Statement of Investmentsas at 30 June 2021(expressed in EUR)
* This is a synthetic ETF.** This includes synthetic ETFs.
The accompanying notes form an integral part of these financial statements.
125

Description QuantityCurrency
(local) Cost Market Value
% ofNet
Assets
Transferable securities and money market instruments admitted to an official stock exchange listing
Shares
BermudaIBEX Holdings Ltd. 14,978 USD 279,866 246,539 0.53
279,866 246,539 0.53CanadaSun Life Financial Inc. 63,963 USD 2,831,215 2,779,873 6.02
2,831,215 2,779,873 6.02Cayman IslandsAmbarella Inc. 89 USD 8,307 8,002 0.02Apollo Strategic Growth Capital-A- 78,221 USD 705,758 645,081 1.40
714,065 653,083 1.42United StatesAclaris Therapeutics Inc. 13,400 USD 234,263 198,418 0.43Alcoa Corp. 45,738 USD 941,676 1,420,851 3.08Align Technology Inc. 18 USD 8,441 9,274 0.02Aligos Therapeutics Inc. 13,752 USD 317,912 236,390 0.51Amazon.com Inc. 332 USD 900,041 963,093 2.09APA Corp. 8,848 USD 167,153 161,381 0.35Apollo Global Management Inc. 16,155 USD 793,834 847,323 1.83Arvinas Inc. 21,028 USD 1,231,895 1,365,339 2.96Aspen Group Inc. 39,500 USD 323,797 217,168 0.47Avantor Inc. 80,630 USD 2,088,191 2,414,343 5.23Barnes & Noble Education Inc. 13,300 USD 70,784 80,861 0.17Berkshire Hathaway Inc.-B- 8,867 USD 2,131,390 2,078,013 4.50Blackstone Group Inc.-A- 27,658 USD 2,088,148 2,265,534 4.91Booking Holdings Inc. 730 USD 1,251,953 1,346,914 2.92Caterpillar Inc. 10,718 USD 2,124,120 1,966,909 4.26CBRE Group Inc.-A- 539 USD 38,519 38,965 0.08Centennial Resource Development Inc.-A- 30,986 USD 113,292 177,152 0.38Charles River Laboratories International Inc. 36 USD 8,310 11,229 0.02CIRCOR International Inc. 4,478 USD 126,525 123,099 0.27Citigroup Inc. 21,622 USD 1,335,016 1,289,953 2.79Clear Channel Outdoor Holdings Inc. 922,199 USD 1,527,722 2,052,959 4.45Clearside Biomedical Inc. 104,527 USD 279,875 429,249 0.93Conx Corp.-A- 32,822 USD 279,871 272,894 0.59CorePoint Lodging REIT Inc. 42,312 USD 317,915 381,768 0.83Ducommun Inc. 7,792 USD 359,621 358,488 0.78DXC Technology Co. 719 USD 13,209 23,609 0.05Exagen Inc. 86,069 USD 1,211,730 1,087,928 2.36Five Point Holdings LLC-A- 36,789 USD 202,161 250,658 0.54Floor & Decor Holdings Inc.-A- 108 USD 8,346 9,626 0.02GMS Inc. 9,585 USD 279,859 389,090 0.84Harrow Health Inc. 38,770 USD 245,307 303,713 0.66Hemisphere Media Group Inc. 31,454 USD 279,868 312,975 0.68IAC Via InterActiveCorp 10,644 USD 1,363,799 1,383,746 3.00Lowe’s Cos Inc. 8,591 USD 1,364,309 1,405,174 3.04Marchex Inc.-B- 108,882 USD 279,875 280,950 0.61Meritor Inc. 34,170 USD 860,809 674,813 1.46Micron Technology Inc. 18,818 USD 1,314,254 1,348,472 2.92Microsoft Corp. 6,129 USD 1,352,769 1,400,072 3.03
Xtrackers**
Xtrackers STOXX EUROPE 600 BANKS SWAP UCITS ETF*
Statement of Investmentsas at 30 June 2021(expressed in EUR)
* This is a synthetic ETF.** This includes synthetic ETFs.
The accompanying notes form an integral part of these financial statements.
126

Description QuantityCurrency
(local) Cost Market Value
% ofNet
Assets
Transferable securities and money market instruments admitted to an official stock exchange listing
Shares (continued)
United States (continued)Oil States International Inc. 57,517 USD 359,659 380,730 0.82Penn National Gaming Inc. 33,210 USD 2,466,596 2,142,028 4.64Perdoceo Education Corp. 78,121 USD 860,806 808,284 1.75Privia Health Group Inc. 35,087 USD 1,363,790 1,312,766 2.84PROG Holdings Inc. 196 USD 8,250 7,955 0.02Purple Innovation Inc. 25,796 USD 814,509 574,477 1.24Quantum Corp. 32,069 USD 214,005 186,319 0.40Republic First Bancorp Inc. 246,064 USD 680,136 827,890 1.79Scientific Games Corp. 36,766 USD 1,270,085 2,400,841 5.20Snowflake Inc.-A- 10,830 USD 2,088,068 2,208,190 4.78Sports Entertainment Acquisition Corp.-A- 33,240 USD 279,875 282,536 0.61Square Inc.-A- 6,938 USD 1,363,753 1,426,329 3.09T-Mobile US Inc. 76 USD 8,386 9,282 0.02Twitter Inc. 186 USD 8,361 10,792 0.02
39,622,838 42,156,812 91.28
Total - Shares 43,447,984 45,836,307 99.25
Total Transferable securities and money market instruments admitted to an officialstock exchange listing 43,447,984 45,836,307 99.25
TOTAL INVESTMENT PORTFOLIO 43,447,984 45,836,307 99.25
Xtrackers**
Xtrackers STOXX EUROPE 600 BANKS SWAP UCITS ETF* (continued)
Statement of Investmentsas at 30 June 2021(expressed in EUR)
* This is a synthetic ETF.** This includes synthetic ETFs.
The accompanying notes form an integral part of these financial statements.
127
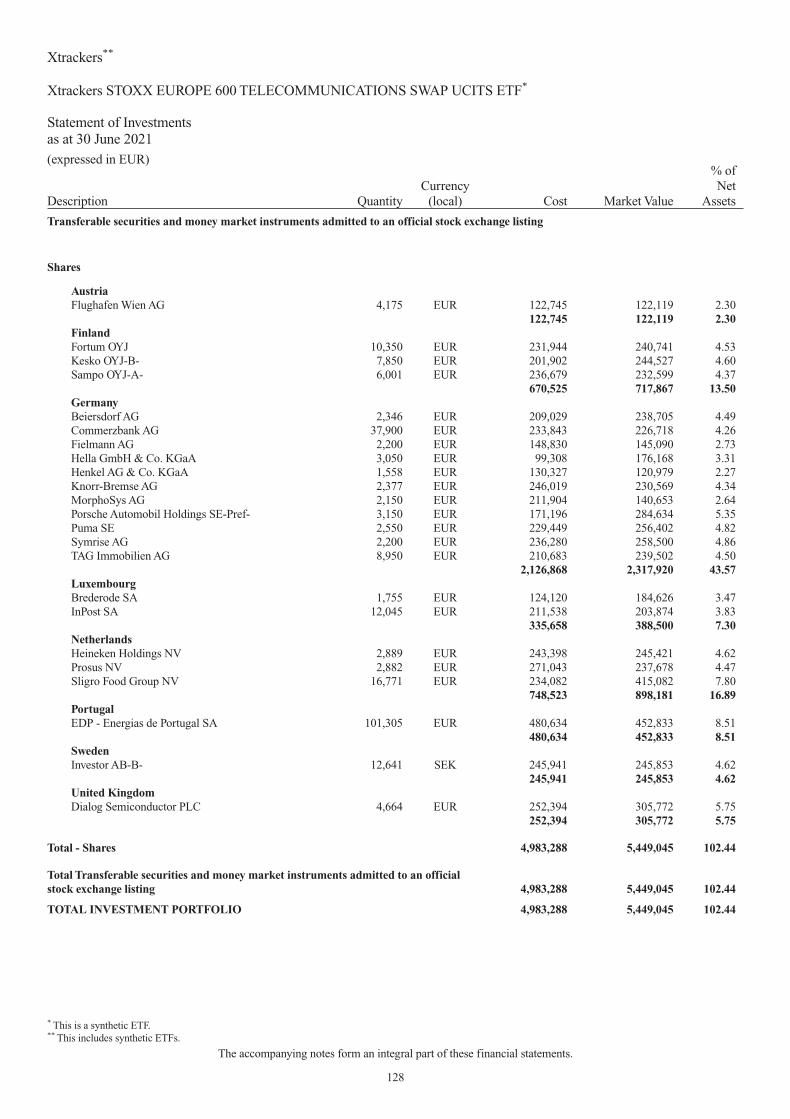
Description QuantityCurrency
(local) Cost Market Value
% ofNet
Assets
Transferable securities and money market instruments admitted to an official stock exchange listing
Shares
AustriaFlughafen Wien AG 4,175 EUR 122,745 122,119 2.30
122,745 122,119 2.30FinlandFortum OYJ 10,350 EUR 231,944 240,741 4.53Kesko OYJ-B- 7,850 EUR 201,902 244,527 4.60Sampo OYJ-A- 6,001 EUR 236,679 232,599 4.37
670,525 717,867 13.50GermanyBeiersdorf AG 2,346 EUR 209,029 238,705 4.49Commerzbank AG 37,900 EUR 233,843 226,718 4.26Fielmann AG 2,200 EUR 148,830 145,090 2.73Hella GmbH & Co. KGaA 3,050 EUR 99,308 176,168 3.31Henkel AG & Co. KGaA 1,558 EUR 130,327 120,979 2.27Knorr-Bremse AG 2,377 EUR 246,019 230,569 4.34MorphoSys AG 2,150 EUR 211,904 140,653 2.64Porsche Automobil Holdings SE-Pref- 3,150 EUR 171,196 284,634 5.35Puma SE 2,550 EUR 229,449 256,402 4.82Symrise AG 2,200 EUR 236,280 258,500 4.86TAG Immobilien AG 8,950 EUR 210,683 239,502 4.50
2,126,868 2,317,920 43.57LuxembourgBrederode SA 1,755 EUR 124,120 184,626 3.47InPost SA 12,045 EUR 211,538 203,874 3.83
335,658 388,500 7.30NetherlandsHeineken Holdings NV 2,889 EUR 243,398 245,421 4.62Prosus NV 2,882 EUR 271,043 237,678 4.47Sligro Food Group NV 16,771 EUR 234,082 415,082 7.80
748,523 898,181 16.89PortugalEDP - Energias de Portugal SA 101,305 EUR 480,634 452,833 8.51
480,634 452,833 8.51SwedenInvestor AB-B- 12,641 SEK 245,941 245,853 4.62
245,941 245,853 4.62United KingdomDialog Semiconductor PLC 4,664 EUR 252,394 305,772 5.75
252,394 305,772 5.75
Total - Shares 4,983,288 5,449,045 102.44
Total Transferable securities and money market instruments admitted to an officialstock exchange listing 4,983,288 5,449,045 102.44
TOTAL INVESTMENT PORTFOLIO 4,983,288 5,449,045 102.44
Xtrackers**
Xtrackers STOXX EUROPE 600 TELECOMMUNICATIONS SWAP UCITS ETF*
Statement of Investmentsas at 30 June 2021(expressed in EUR)
* This is a synthetic ETF.** This includes synthetic ETFs.
The accompanying notes form an integral part of these financial statements.
128

Description QuantityCurrency
(local) Cost Market Value
% ofNet
Assets
Transferable securities and money market instruments admitted to an official stock exchange listing
Shares
AustriaFlughafen Wien AG 65,000 EUR 1,911,000 1,901,250 4.47
1,911,000 1,901,250 4.47Cayman IslandsSea Ltd.-ADR- 5,660 USD 1,340,136 1,310,596 3.08
1,340,136 1,310,596 3.08FinlandElisa OYJ 37,305 EUR 1,818,246 1,877,188 4.41Fortum OYJ 79,471 EUR 1,803,197 1,848,496 4.34Kesko OYJ-B- 70,000 EUR 1,800,400 2,180,500 5.12Musti Group OYJ 30,000 EUR 781,800 936,600 2.20Nokia OYJ 434,243 EUR 1,519,850 1,960,824 4.61Nokian Renkaat OYJ 102,109 EUR 3,156,189 3,476,811 8.17Nordea Bank Abp 300,000 EUR 2,269,800 2,819,400 6.63
13,149,482 15,099,819 35.48GermanyFielmann AG 13,096 EUR 853,859 863,681 2.03GEA Group AG 33,113 EUR 1,187,763 1,131,140 2.66Henkel AG & Co. KGaA 24,100 EUR 2,015,965 1,871,365 4.40Puma SE 21,100 EUR 1,898,578 2,121,605 4.99Symrise AG 12,602 EUR 1,353,455 1,480,735 3.48Uniper SE 61,310 EUR 1,818,455 1,904,289 4.47
9,128,075 9,372,815 22.03NetherlandsHeineken Holdings NV 4,143 EUR 352,155 351,948 0.83TomTom NV 79,675 EUR 776,831 562,904 1.32
1,128,986 914,852 2.15PortugalEDP - Energias de Portugal SA 429,534 EUR 2,056,244 1,920,017 4.51
2,056,244 1,920,017 4.51United KingdomDialog Semiconductor PLC 28,222 EUR 1,816,368 1,850,234 4.35
1,816,368 1,850,234 4.35United StatesBrunswick Corp. 18,958 USD 1,645,297 1,592,542 3.74CME Group Inc. 4,856 USD 858,936 870,877 2.05Enterprise Products Partners LP 94,235 USD 1,840,139 1,917,438 4.51Healthpeak Properties REIT Inc. 23,719 USD 646,820 665,828 1.56Hilltop Holdings Inc. 130,000 USD 3,932,397 3,990,216 9.38Public Storage REIT 4,285 USD 1,084,699 1,086,479 2.55
10,008,288 10,123,380 23.79
Total - Shares 40,538,579 42,492,963 99.86
Total Transferable securities and money market instruments admitted to an officialstock exchange listing 40,538,579 42,492,963 99.86
TOTAL INVESTMENT PORTFOLIO 40,538,579 42,492,963 99.86
Xtrackers**
Xtrackers STOXX EUROPE 600 TECHNOLOGY SWAP UCITS ETF*
Statement of Investmentsas at 30 June 2021(expressed in EUR)
* This is a synthetic ETF.** This includes synthetic ETFs.
The accompanying notes form an integral part of these financial statements.
129

Description QuantityCurrency
(local) Cost Market Value
% ofNet
Assets
Transferable securities and money market instruments admitted to an official stock exchange listing
Shares
CanadaAgnico Eagle Mines Ltd. 9,182 USD 480,561 468,042 2.92Magna International Inc. 6,167 USD 480,526 481,753 3.00TELUS Corp. 20,664 USD 388,105 390,837 2.44
1,349,192 1,340,632 8.36SwitzerlandCRISPR Therapeutics AG 939 USD 131,573 128,185 0.80
131,573 128,185 0.80United StatesAdobe Inc. 280 USD 113,369 138,274 0.86Allegiant Travel Co. 5,787 USD 1,020,000 946,688 5.90Alpine Immune Sciences Inc. 46,533 USD 443,919 353,147 2.20American Superconductor Corp. 29,135 USD 469,708 427,234 2.66Amphastar Pharmaceuticals Inc. 35,481 USD 552,708 603,168 3.76Antero Resources Corp. 70,896 USD 614,888 898,530 5.60Aspen Group Inc. 108,337 USD 552,716 595,629 3.71Balchem Corp. 5,183 USD 552,698 573,674 3.58Bank of America Corp. 3,542 USD 123,150 123,144 0.77Berkshire Hathaway Inc.-B- 950 USD 223,713 222,636 1.39Bio-Rad Laboratories Inc.-A- 17 USD 8,699 9,236 0.06Blackstone Group Inc.-A- 9,758 USD 736,718 799,301 4.98Bottomline Technologies DE Inc. 14,365 USD 552,711 449,156 2.80Casper Sleep Inc. 65,874 USD 520,079 457,713 2.85Catalyst Biosciences Inc. 42,464 USD 213,027 155,046 0.97CBIZ Inc. 19,902 USD 552,697 549,952 3.43Clear Channel Outdoor Holdings Inc. 46,565 USD 77,739 103,661 0.65Cross Country Healthcare Inc. 44,205 USD 343,807 615,418 3.84Digi International Inc. 28,178 USD 573,267 477,831 2.98DXC Technology Co. 24,348 USD 484,280 799,486 4.98GS Acquisition Holdings Corp. II-A- 57,268 USD 573,274 502,224 3.13Hawaiian Holdings Inc. 467 USD 10,139 9,597 0.06Incyte Corp. 11,194 USD 787,196 794,123 4.95Kadmon Holdings Inc. 145,197 USD 615,236 473,828 2.95MercadoLibre Inc. 648 USD 735,798 851,208 5.31Micron Technology Inc. 6,915 USD 482,945 495,519 3.09Net 1 UEPS Technologies Inc. 241,331 USD 981,424 958,486 5.98Paya Holdings Inc. 5,354 USD 52,406 49,752 0.31Performance Food Group Co. 787 USD 33,356 32,179 0.20Playtika Holdings Corp. 323 USD 8,237 6,493 0.04Purple Innovation Inc. 263 USD 8,304 5,857 0.04Quotient Technology Inc. 34,292 USD 281,509 312,587 1.95
Xtrackers**
Xtrackers STOXX EUROPE 600 UTILITIES SWAP UCITS ETF*
Statement of Investmentsas at 30 June 2021(expressed in EUR)
* This is a synthetic ETF.** This includes synthetic ETFs.
The accompanying notes form an integral part of these financial statements.
130

Description QuantityCurrency
(local) Cost Market Value
% ofNet
Assets
Transferable securities and money market instruments admitted to an official stock exchange listing
Shares (continued)
United States (continued)Snowflake Inc.-A- 3,821 USD 736,704 779,085 4.86VeriSign Inc. 151 USD 27,763 28,992 0.18
14,064,184 14,598,854 91.02
Total - Shares 15,544,949 16,067,671 100.18
Total Transferable securities and money market instruments admitted to an officialstock exchange listing 15,544,949 16,067,671 100.18
TOTAL INVESTMENT PORTFOLIO 15,544,949 16,067,671 100.18
Xtrackers**
Xtrackers STOXX EUROPE 600 UTILITIES SWAP UCITS ETF* (continued)
Statement of Investmentsas at 30 June 2021(expressed in EUR)
* This is a synthetic ETF.** This includes synthetic ETFs.
The accompanying notes form an integral part of these financial statements.
131

Description QuantityCurrency
(local) Cost Market Value
% ofNet
Assets
Transferable securities and money market instruments admitted to an official stock exchange listing
Shares
CanadaMagna International Inc. 34,015 USD 2,650,412 2,657,178 3.90Royal Bank of Canada 4,135 USD 346,132 353,248 0.52Shopify Inc.-A- 960 USD 974,340 1,182,680 1.74TELUS Corp. 141,120 USD 2,650,475 2,669,129 3.92Waste Connections Inc. 13,489 USD 1,333,277 1,358,454 1.99
7,954,636 8,220,689 12.07Cayman IslandsFarfetch Ltd.-A- 18,242 USD 1,019,853 774,658 1.14StoneCo Ltd.-A- 1,888 USD 110,149 106,762 0.15
1,130,002 881,420 1.29GermanyAllianz SE 5,580 EUR 1,208,628 1,173,474 1.72BASF SE 18,191 EUR 1,168,590 1,208,610 1.77Bayer AG 40,800 EUR 2,173,784 2,089,368 3.07Deutsche Bank AG 94,823 EUR 997,917 1,041,725 1.53Deutsche Post AG 21,000 EUR 1,204,770 1,204,560 1.77Infineon Technologies AG 31,600 EUR 1,065,552 1,068,712 1.57Muenchener Rueckversicherungs-Gesellschaft AG 3,530 EUR 820,019 815,254 1.20RWE AG 36,579 EUR 1,154,067 1,117,854 1.64SAP SE 10,176 EUR 1,180,806 1,209,316 1.77Siemens AG 7,600 EUR 1,070,384 1,015,512 1.49Siemens Healthineers AG 144A 22,515 EUR 1,006,421 1,163,575 1.71
13,050,938 13,107,960 19.24LuxembourgAllegro.eu SA 36,366 PLN 530,823 528,568 0.78
530,823 528,568 0.78NetherlandsAirbus SE 10,214 EUR 612,840 1,107,606 1.62ING Groep NV 106,352 EUR 1,159,146 1,184,761 1.74Prosus NV 12,120 EUR 1,105,758 999,537 1.47
2,877,744 3,291,904 4.83PolandBank Polska Kasa Opieki SA 50,800 PLN 852,358 1,046,443 1.54Cyfrowy Polsat SA 169,885 PLN 1,115,582 1,126,615 1.65Dino Polska SA 144A 8,522 PLN 471,020 528,340 0.78Polski Koncern Naftowy ORLEN SA 114,261 PLN 1,394,218 1,943,189 2.85Powszechna Kasa Oszczednosci Bank Polski SA 231,829 PLN 1,463,167 1,942,553 2.85Powszechny Zaklad Ubezpieczen SA 258,814 PLN 1,638,139 2,103,888 3.09
6,934,484 8,691,028 12.76United States8x8 Inc. 69,852 USD 1,333,291 1,635,121 2.40Activision Blizzard Inc. 23,553 USD 1,870,584 1,895,520 2.78Adobe Inc. 1,639 USD 653,271 809,397 1.19Advantage Solutions Inc. 258,828 USD 2,555,870 2,354,965 3.46Align Technology Inc. 381 USD 178,675 196,299 0.29Alphabet Inc.-C- 1,027 USD 1,380,370 2,170,494 3.19Alpine Immune Sciences Inc. 80,629 USD 769,190 611,907 0.90Amazon.com Inc. 1 USD 2,632 2,901 0.00
Xtrackers**
Xtrackers STOXX EUROPE 600 FOOD & BEVERAGE SWAP UCITS ETF*
Statement of Investmentsas at 30 June 2021(expressed in EUR)
* This is a synthetic ETF.** This includes synthetic ETFs.
The accompanying notes form an integral part of these financial statements.
132

Description QuantityCurrency
(local) Cost Market Value
% ofNet
Assets
Transferable securities and money market instruments admitted to an official stock exchange listing
Shares (continued)
United States (continued)Berkshire Hathaway Inc.-B- 4,956 USD 1,156,991 1,161,456 1.70BGC Partners Inc.-A- 310,869 USD 1,333,295 1,486,320 2.18Bio-Rad Laboratories Inc.-A- 1,894 USD 894,069 1,028,995 1.51Blackstone Group Inc.-A- 31,744 USD 2,650,457 2,600,228 3.82Booking Holdings Inc. 969 USD 1,868,797 1,787,890 2.62Casper Sleep Inc. 129,182 USD 1,019,899 897,596 1.32Catalyst Biosciences Inc. 152,469 USD 764,884 556,700 0.82Centene Corp. 1,510 USD 73,313 92,861 0.14CF Industries Holdings Inc. 43,080 USD 1,870,612 1,869,015 2.74Chesapeake Energy Corp. 32,294 USD 1,333,259 1,413,866 2.07Clear Channel Outdoor Holdings Inc. 610,910 USD 1,019,900 1,359,981 2.00Enphase Energy Inc. 56 USD 8,286 8,671 0.01FleetCor Technologies Inc. 1,951 USD 467,385 421,261 0.62Hawaiian Holdings Inc. 46,975 USD 1,019,894 965,326 1.42Ingersoll Rand Inc. 4,119 USD 148,948 169,532 0.25Inogen Inc. 23,499 USD 1,149,304 1,291,364 1.90MercadoLibre Inc. 1,685 USD 1,869,628 2,213,403 3.25Microsoft Corp. 4,009 USD 884,851 915,792 1.34Netflix Inc. 21 USD 8,718 9,354 0.01Open Lending Corp.-A- 76,407 USD 2,626,953 2,776,268 4.07O’Reilly Automotive Inc. 4,372 USD 1,921,510 2,087,418 3.06Snowflake Inc.-A- 1,024 USD 199,848 208,789 0.31
33,034,684 34,998,690 51.37
Total - Shares 65,513,311 69,720,259 102.34
Total Transferable securities and money market instruments admitted to an officialstock exchange listing 65,513,311 69,720,259 102.34
TOTAL INVESTMENT PORTFOLIO 65,513,311 69,720,259 102.34
Xtrackers**
Xtrackers STOXX EUROPE 600 FOOD & BEVERAGE SWAP UCITS ETF* (continued)
Statement of Investmentsas at 30 June 2021(expressed in EUR)
* This is a synthetic ETF.** This includes synthetic ETFs.
The accompanying notes form an integral part of these financial statements.
133

Description QuantityCurrency
(local) Cost Market Value
% ofNet
Assets
Transferable securities and money market instruments admitted to an official stock exchange listing
Shares
AustriaEVN AG 68,280 EUR 1,331,460 1,357,406 4.40Zumtobel Group AG 197,000 EUR 1,327,780 1,674,500 5.42
2,659,240 3,031,906 9.82BelgiumGimv NV 8,833 EUR 454,016 476,982 1.54
454,016 476,982 1.54FinlandElisa OYJ 27,700 EUR 1,350,098 1,393,864 4.51Fortum OYJ 64,259 EUR 1,440,044 1,494,664 4.84Kesko OYJ-B- 55,160 EUR 1,418,716 1,718,234 5.57
4,208,858 4,606,762 14.92GermanyBeiersdorf AG 25,073 EUR 2,234,004 2,551,178 8.26Commerzbank AG 211,203 EUR 1,241,766 1,263,416 4.09Deutsche Wohnen SE 26,420 EUR 1,363,272 1,362,744 4.41KION Group AG 15,700 EUR 1,347,060 1,411,116 4.57LANXESS AG 30,000 EUR 1,729,200 1,734,600 5.62Porsche Automobil Holdings SE-Pref- 15,036 EUR 900,356 1,358,653 4.40Puma SE 14,138 EUR 1,272,137 1,421,576 4.61Siemens Healthineers AG 144A 16,741 EUR 769,919 865,175 2.80TAG Immobilien AG 55,710 EUR 1,350,410 1,490,799 4.83Uniper SE 46,462 EUR 1,378,063 1,443,110 4.68Wacker Chemie AG 10,684 EUR 1,350,458 1,389,454 4.50
14,936,645 16,291,821 52.77LuxembourgBrederode SA 6,418 EUR 623,316 675,174 2.19
623,316 675,174 2.19NetherlandsAegon NV 350,000 EUR 1,221,500 1,224,650 3.97Amsterdam Commodities NV 63,000 EUR 1,323,000 1,442,700 4.67Heineken Holdings NV 16,000 EUR 1,358,400 1,359,200 4.40OCI NV 49,942 EUR 1,051,279 1,024,810 3.32
4,954,179 5,051,360 16.36PortugalEDP - Energias de Portugal SA 285,750 EUR 1,346,168 1,277,302 4.14
1,346,168 1,277,302 4.14SpainRealia Business SA 180,920 EUR 128,453 127,368 0.41
128,453 127,368 0.41
Total - Shares 29,310,875 31,538,675 102.15
Total Transferable securities and money market instruments admitted to an officialstock exchange listing 29,310,875 31,538,675 102.15
TOTAL INVESTMENT PORTFOLIO 29,310,875 31,538,675 102.15
Xtrackers**
Xtrackers STOXX EUROPE 600 INDUSTRIAL GOODS SWAP UCITS ETF*
Statement of Investmentsas at 30 June 2021(expressed in EUR)
* This is a synthetic ETF.** This includes synthetic ETFs.
The accompanying notes form an integral part of these financial statements.
134

DescriptionNominal
ValueCurrency
(local) Cost Market Value
% ofNet
Assets
Transferable securities and money market instruments admitted to an official stock exchange listing
Bonds
AustraliaSouth Australian Government Financing Authority2.75% 19 - 24.05.30 2,450,000 AUD 2,125,223 2,001,163 0.51
2,125,223 2,001,163 0.51CanadaCanada 5.00% 04 - 01.06.37 876,000 CAD 1,074,000 1,042,838 0.26Canada 5.75% 98 - 01.06.29 1,200,000 CAD 1,310,619 1,296,748 0.33
2,384,619 2,339,586 0.59FranceFrance OAT Zero Coupon 09 - 25.04.32 3,450,000 EUR 4,165,346 4,010,675 1.01France OAT Zero Coupon 09 - 25.04.34 5,800,000 EUR 6,869,346 6,569,391 1.66France OAT Zero Coupon 09 - 25.04.36 6,300,000 EUR 7,319,012 6,939,600 1.75
18,353,704 17,519,666 4.42GermanyDeutsche Bundesrepublik Coupon Strips Zero Coupon94 - 04.01.24 3,800,000 EUR 4,697,266 4,570,864 1.15Kreditanstalt fuer Wiederaufbau 0.375% 15 - 23.04.30 5,500,000 EUR 6,999,034 6,773,201 1.71
11,696,300 11,344,065 2.86SupranationalsEuropean Investment Bank 1.00% 16 - 14.04.32 1,200,000 EUR 1,640,119 1,564,843 0.39
1,640,119 1,564,843 0.39United KingdomUnited Kingdom Gilt 1.25% 20 - 22.10.41 2,000,000 GBP 2,795,435 2,783,512 0.70United Kingdom Gilt 1.50% 16 - 22.07.47 54,000,000 GBP 78,520,571 78,918,297 19.91United Kingdom Gilt 1.75% 18 - 22.01.49 2,700,000 GBP 4,197,462 4,181,907 1.06United Kingdom Gilt 3.25% 12 - 22.01.44 4,000,000 GBP 7,776,057 7,733,027 1.95United Kingdom Gilt 3.50% 14 - 22.01.45 44,800,000 GBP 90,422,567 90,758,314 22.90United Kingdom Gilt 4.25% 00 - 07.06.32 2,500,000 GBP 4,705,086 4,682,080 1.18United Kingdom Gilt 4.25% 03 - 07.03.36 3,800,000 GBP 7,590,592 7,547,589 1.90United Kingdom Gilt 5.00% 01 - 07.03.25 4,800,000 GBP 7,851,470 7,792,108 1.97United Kingdom Inflation-Linked Gilt 0.125% 11 -22.03.29 42,999,120 GBP 74,591,170 74,080,351 18.69United Kingdom Inflation-Linked Gilt 0.125% 14 -22.03.58 3,995,170 GBP 12,351,204 12,099,364 3.05United Kingdom Inflation-Linked Gilt 0.125% 15 -22.03.46 6,998,280 GBP 16,944,401 16,767,499 4.23United Kingdom Inflation-Linked Gilt 0.125% 16 -22.11.56 1,135,140 GBP 3,391,746 3,331,449 0.84United Kingdom Inflation-Linked Gilt 0.125% 18 -10.08.41 3,220,950 GBP 7,205,262 7,147,408 1.80United Kingdom Inflation-Linked Gilt 0.625% 09 -22.11.42 4,245,600 GBP 10,540,918 10,443,487 2.64
Xtrackers**
Xtrackers BLOOMBERG COMMODITY EX-AGRICULTURE & LIVESTOCK SWAP UCITS ETF*(D)
Statement of Investmentsas at 30 June 2021(expressed in USD)(E)
* This is a synthetic ETF.** This includes synthetic ETFs.
The accompanying notes form an integral part of these financial statements.
135

DescriptionNominal
ValueCurrency
(local) Cost Market Value
% ofNet
Assets
Transferable securities and money market instruments admitted to an official stock exchange listing
Bonds (continued)
United Kingdom (continued)United Kingdom Inflation-Linked Gilt 1.125% 07 -22.11.37 5,500,901 GBP 13,069,257 12,991,780 3.28United Kingdom Inflation-Linked Gilt 1.25% 05 -22.11.55 4,693,230 GBP 17,478,111 17,220,986 4.34
359,431,309 358,479,158 90.44
Total - Bonds 395,631,274 393,248,481 99.21
Total Transferable securities and money market instruments admitted to an officialstock exchange listing 395,631,274 393,248,481 99.21
TOTAL INVESTMENT PORTFOLIO 395,631,274 393,248,481 99.21
TOTAL INVESTMENT PORTFOLIO INCLUDING ACCRUED INTEREST 395,095,167 99.68
(D) During the period ending 30 June 2021 this Sub-Fund changed its name. Please see point 3 in the significant events of the period section of the Notes to theFinancial Statements of this semi-annual report for further information.
(E) During the period ending 30 June 2021 this Sub-Fund changed its currency. Please see point 3 in the significant events of the period section of the Notes to theFinancial Statements of this semi-annual report for further information
Xtrackers**
Xtrackers BLOOMBERG COMMODITY EX-AGRICULTURE & LIVESTOCK SWAP UCITS ETF*(D) (continued)
Statement of Investmentsas at 30 June 2021(expressed in USD)(E)
* This is a synthetic ETF.** This includes synthetic ETFs.
The accompanying notes form an integral part of these financial statements.
136

Description QuantityCurrency
(local) Cost Market Value
% ofNet
Assets
Transferable securities and money market instruments admitted to an official stock exchange listing
Shares
CanadaKinross Gold Corp. 1,534,057 USD 9,133,436 8,214,232 2.72Sun Life Financial Inc. 204,344 USD 8,889,361 8,880,921 2.94
18,022,797 17,095,153 5.66NetherlandsElastic NV 158,315 USD 21,231,139 19,458,625 6.44Playa Hotels & Resorts NV 1,135,969 USD 6,242,724 7,117,164 2.36
27,473,863 26,575,789 8.80United StatesAbbott Laboratories 198,203 USD 17,757,185 19,375,717 6.41Advantage Solutions Inc. 576,381 USD 6,032,065 5,244,243 1.74Anaplan Inc. 190,444 USD 9,225,088 8,559,457 2.83Apartment Income REIT Corp. 273,700 USD 11,245,270 10,946,610 3.62Apple Inc. 146,571 USD 15,282,179 16,927,527 5.60Arvinas Inc. 138,171 USD 7,409,190 8,971,382 2.97Ashford Hospitality Trust REIT Inc. 50,692 USD 131,974 194,920 0.07Avidity Biosciences Inc. 128,174 USD 2,356,398 2,670,696 0.88AZEK Co. Inc. 62,905 USD 2,076,788 2,252,251 0.75Berkeley Lights Inc. 214,632 USD 12,789,984 8,110,005 2.68Berkshire Hathaway Inc.-B- 40,780 USD 9,179,674 9,556,937 3.16Centene Corp. 180,752 USD 9,225,095 11,115,808 3.68Colfax Corp. 242,234 USD 9,015,120 9,357,226 3.10Customers Bancorp Inc. 36,961 USD 887,713 1,215,202 0.40DXC Technology Co. 400,848 USD 9,225,121 13,162,166 4.36E2open Parent Holdings Inc. 490,884 USD 5,512,970 4,727,121 1.57Exelixis Inc. 489,885 USD 9,225,112 7,526,520 2.49Facebook Inc.-A- 32,944 USD 8,072,727 9,659,290 3.20Gannett Co. Inc. 234,108 USD 1,056,231 1,083,778 0.36Globus Medical Inc.-A- 12,987 USD 663,081 849,044 0.28Gritstone bio Inc. 792,087 USD 6,764,085 6,098,112 2.02Immunovant Inc. 101,535 USD 1,156,804 904,987 0.30Impinj Inc. 171,800 USD 8,367,334 7,473,782 2.47Inari Medical Inc. 93,926 USD 8,421,527 7,387,986 2.45John B Sanfilippo & Son Inc. 18,184 USD 1,378,906 1,358,088 0.45Madison Square Garden Sports Corp. 44,700 USD 6,369,241 6,504,659 2.15MercadoLibre Inc. 1,581 USD 2,534,767 2,076,790 0.69Mr Cooper Group Inc. 231,914 USD 6,764,077 6,465,193 2.14NMI Holdings Inc.-A- 458,133 USD 9,105,389 8,684,396 2.87Orion Energy Systems Inc. 150,218 USD 1,237,046 725,819 0.24Paya Holdings Inc. 937,737 USD 9,178,815 8,713,936 2.88Performance Food Group Co. 300,658 USD 12,743,142 12,293,532 4.07Scientific Games Corp. 288,434 USD 9,754,961 18,834,908 6.23T-Mobile US Inc. 1,223 USD 134,947 149,361 0.05
Xtrackers**
Xtrackers SHORTDAX DAILY SWAP UCITS ETF*
Statement of Investmentsas at 30 June 2021(expressed in EUR)
* This is a synthetic ETF.** This includes synthetic ETFs.
The accompanying notes form an integral part of these financial statements.
137

Description QuantityCurrency
(local) Cost Market Value
% ofNet
Assets
Transferable securities and money market instruments admitted to an official stock exchange listing
Shares (continued)
United States (continued)Wendy’s Co. 615,270 USD 12,743,151 12,150,785 4.02Zogenix Inc. 522,400 USD 8,597,380 7,611,997 2.52
251,620,537 258,940,231 85.70
Total - Shares 297,117,197 302,611,173 100.16
Total Transferable securities and money market instruments admitted to an officialstock exchange listing 297,117,197 302,611,173 100.16
TOTAL INVESTMENT PORTFOLIO 297,117,197 302,611,173 100.16
Xtrackers**
Xtrackers SHORTDAX DAILY SWAP UCITS ETF* (continued)
Statement of Investmentsas at 30 June 2021(expressed in EUR)
* This is a synthetic ETF.** This includes synthetic ETFs.
The accompanying notes form an integral part of these financial statements.
138

Description QuantityCurrency
(local) Cost Market Value
% ofNet
Assets
Transferable securities and money market instruments admitted to an official stock exchange listing
Shares
CanadaAgnico Eagle Mines Ltd. 147,956 USD 7,743,608 7,541,897 5.69Magna International Inc. 99,380 USD 7,743,583 7,763,352 5.85
15,487,191 15,305,249 11.54Cayman IslandsAmbarella Inc. 89 USD 8,307 8,002 0.01
8,307 8,002 0.01NetherlandsPlaya Hotels & Resorts NV 684,182 USD 4,070,030 4,286,592 3.23
4,070,030 4,286,592 3.23SwitzerlandCRISPR Therapeutics AG 60 USD 8,407 8,191 0.01
8,407 8,191 0.01United StatesActivision Blizzard Inc. 66,363 USD 5,270,562 5,340,823 4.03Aerie Pharmaceuticals Inc. 20,412 USD 290,405 275,568 0.21Alpha Metallurgical Resources Inc. 56,800 USD 713,627 1,227,577 0.93Amazon.com Inc. 2,002 USD 5,269,569 5,807,570 4.38Amicus Therapeutics Inc. 41,918 USD 656,047 340,745 0.26Antares Pharma Inc. 306,878 USD 1,130,124 1,128,246 0.85Apple Inc. 13,324 USD 1,493,664 1,538,793 1.16Avantor Inc. 78,804 USD 1,794,482 2,359,667 1.78Avidity Biosciences Inc. 93,400 USD 2,054,730 1,946,128 1.47Babcock & Wilcox Enterprises Inc. 362,200 USD 1,986,820 2,406,724 1.81Barnes & Noble Education Inc. 119,396 USD 579,069 725,900 0.55Berkshire Hathaway Inc.-B- 16,893 USD 3,762,287 3,958,934 2.99Blackstone Group Inc.-A- 92,743 USD 7,322,243 7,596,804 5.73Booking Holdings Inc. 2,732 USD 5,268,890 5,040,778 3.80Centennial Resource Development Inc.-A- 47,192 USD 172,545 269,805 0.20CF Industries Holdings Inc. 121,380 USD 5,270,540 5,266,041 3.97Clear Channel Outdoor Holdings Inc. 411,047 USD 676,998 915,055 0.69Dollar Tree Inc. 587 USD 47,819 49,251 0.04DXC Technology Co. 131,470 USD 3,478,737 4,316,923 3.26Floor & Decor Holdings Inc.-A- 107 USD 8,269 9,537 0.01Groupon Inc. 37,104 USD 1,130,116 1,350,373 1.02Interactive Brokers Group Inc.-A- 141,909 USD 7,844,341 7,865,481 5.93Kadmon Holdings Inc. 508,800 USD 2,021,303 1,660,389 1.25Kraton Corp. 72,000 USD 1,673,295 1,960,434 1.48MACOM Technology Solutions Holdings Inc. 51,910 USD 2,534,527 2,804,951 2.11MercadoLibre Inc. 4,750 USD 5,270,464 6,239,564 4.71NanoString Technologies Inc. 46,999 USD 2,711,109 2,567,724 1.94NMI Holdings Inc.-A- 138,733 USD 2,711,110 2,629,831 1.98Paya Holdings Inc. 212,754 USD 2,063,612 1,977,020 1.49PBF Energy Inc.-A- 110,800 USD 776,723 1,429,496 1.08Peabody Energy Corp. 149,815 USD 539,374 1,001,798 0.75Purple Innovation Inc. 662 USD 20,903 14,743 0.01Repro-Med Systems Inc. 323,525 USD 1,138,615 1,263,108 0.95RR Donnelley & Sons Co. 305,018 USD 854,392 1,615,239 1.22Scientific Games Corp. 26,950 USD 930,990 1,759,851 1.33
Xtrackers**
Xtrackers EURO STOXX 50 SHORT DAILY SWAP UCITS ETF*
Statement of Investmentsas at 30 June 2021(expressed in EUR)
* This is a synthetic ETF.** This includes synthetic ETFs.
The accompanying notes form an integral part of these financial statements.
139

Description QuantityCurrency
(local) Cost Market Value
% ofNet
Assets
Transferable securities and money market instruments admitted to an official stock exchange listing
Shares (continued)
United States (continued)Sesen Bio Inc. 523,567 USD 1,130,125 2,039,698 1.54Silk Road Medical Inc. 17,860 USD 803,244 720,785 0.54Snowflake Inc.-A- 21,787 USD 4,202,454 4,442,275 3.35Sonos Inc. 77,178 USD 2,609,684 2,292,756 1.73SPS Commerce Inc. 18,600 USD 1,522,328 1,566,076 1.18Synopsys Inc. 16,783 USD 3,497,586 3,903,011 2.94Taylor Morrison Home Corp. 978 USD 21,029 21,788 0.02WillScot Mobile Mini Holdings Corp. 167,490 USD 3,871,798 3,936,204 2.97XPEL Inc. 29,710 USD 1,130,096 2,101,169 1.58Zogenix Inc. 166,953 USD 2,711,102 2,432,706 1.83
100,967,747 110,117,339 83.05
Total - Shares 120,541,682 129,725,373 97.84
Total Transferable securities and money market instruments admitted to an officialstock exchange listing 120,541,682 129,725,373 97.84
TOTAL INVESTMENT PORTFOLIO 120,541,682 129,725,373 97.84
Xtrackers**
Xtrackers EURO STOXX 50 SHORT DAILY SWAP UCITS ETF* (continued)
Statement of Investmentsas at 30 June 2021(expressed in EUR)
* This is a synthetic ETF.** This includes synthetic ETFs.
The accompanying notes form an integral part of these financial statements.
140

Description QuantityCurrency
(local) Cost Market Value
% ofNet
Assets
Transferable securities and money market instruments admitted to an official stock exchange listing
Shares
Austriaams AG 37,074 CHF 702,883 688,094 0.58
702,883 688,094 0.58SwitzerlandABB Ltd. 169,670 CHF 3,799,824 5,325,941 4.52Adecco Group AG 22,052 CHF 1,212,008 1,386,189 1.18Alcon Inc. 67,555 CHF 3,827,018 4,376,213 3.71Cie Financiere Richemont SA 45,772 CHF 3,301,863 5,124,175 4.34Clariant AG 30,406 CHF 506,713 559,470 0.47Credit Suisse Group AG 340,341 CHF 3,679,519 3,298,585 2.80Geberit AG 5,008 CHF 2,471,173 3,475,552 2.95Givaudan SA 1,075 CHF 3,285,740 4,625,725 3.92Holcim Ltd. 76,274 CHF 3,460,795 4,233,207 3.59Julius Baer Group Ltd. 30,257 CHF 1,349,492 1,826,918 1.55Kuehne & Nagel International AG 7,685 CHF 1,373,118 2,433,071 2.06Logitech International SA 23,403 CHF 1,399,846 2,623,476 2.22Lonza Group AG 8,032 CHF 3,334,037 5,267,386 4.47Nestle SA 92,278 CHF 9,076,038 10,632,271 9.02Novartis AG 125,605 CHF 9,893,947 10,591,014 8.98Partners Group Holdings AG 3,067 CHF 2,589,762 4,298,400 3.64Roche Holdings AG 30,801 CHF 8,963,055 10,735,689 9.10Schindler Holdings AG 5,504 CHF 1,263,370 1,557,632 1.32SGS SA 829 CHF 2,038,650 2,365,966 2.01Sika AG 17,965 CHF 3,336,287 5,434,412 4.61Sonova Holdings AG 7,306 CHF 1,496,731 2,542,488 2.16Straumann Holdings AG 1,526 CHF 1,520,484 2,250,850 1.91Swatch Group AG 3,912 CHF 1,055,078 1,241,669 1.05Swiss Life Holdings AG 4,328 CHF 1,638,492 1,945,869 1.65Swiss Re AG 39,064 CHF 3,329,355 3,261,063 2.76Swisscom AG 3,435 CHF 1,662,879 1,814,367 1.54Temenos AG 9,025 CHF 1,228,088 1,341,115 1.14UBS Group AG 360,682 CHF 4,260,232 5,107,257 4.33Zurich Insurance Group AG 20,341 CHF 6,993,276 7,550,579 6.40
93,346,870 117,226,549 99.40
Total - Shares 94,049,753 117,914,643 99.98
Total Transferable securities and money market instruments admitted to an officialstock exchange listing 94,049,753 117,914,643 99.98
TOTAL INVESTMENT PORTFOLIO 94,049,753 117,914,643 99.98
Xtrackers**
Xtrackers SLI UCITS ETF
Statement of Investmentsas at 30 June 2021(expressed in CHF)
** This includes synthetic ETFs.
The accompanying notes form an integral part of these financial statements.
141

Description QuantityCurrency
(local) Cost Market Value
% ofNet
Assets
Transferable securities and money market instruments admitted to an official stock exchange listing
Shares
AustriaBAWAG Group AG 144A 11,998 EUR 440,091 462,248 4.26
440,091 462,248 4.26BelgiumGimv NV 10,000 EUR 441,649 463,561 4.28
441,649 463,561 4.28FinlandFortum OYJ 22,465 EUR 437,904 448,569 4.14Kesko OYJ-B- 7,580 EUR 169,477 202,694 1.87Kone OYJ-B- 7,938 EUR 457,936 468,827 4.32Sampo OYJ-A- 18,050 EUR 614,109 600,584 5.54
1,679,426 1,720,674 15.87Germanyalstria office REIT-AG 37,437 EUR 488,116 501,026 4.62Beiersdorf AG 4,971 EUR 382,311 434,202 4.00Knorr-Bremse AG 7,064 EUR 633,429 588,214 5.43Porsche Automobil Holdings SE-Pref- 6,162 EUR 348,862 477,981 4.41ProSiebenSat.1 Media SE 35,500 EUR 552,777 511,216 4.72Puma SE 6,000 EUR 464,266 517,901 4.78Siemens Healthineers AG 144A 23,682 EUR 937,241 1,050,640 9.69TAG Immobilien AG 26,040 EUR 541,384 598,191 5.52Uniper SE 18,237 EUR 466,581 486,259 4.49Wacker Chemie AG 3,840 EUR 429,223 428,701 3.95
5,244,190 5,594,331 51.61PortugalEDP - Energias de Portugal SA 259,980 EUR 1,052,037 997,609 9.20
1,052,037 997,609 9.20SpainCorp Financiera Alba SA 13,039 EUR 424,545 514,891 4.75Realia Business SA 138,930 EUR 88,910 83,961 0.78
513,455 598,852 5.53United KingdomDialog Semiconductor PLC 8,100 EUR 449,241 455,866 4.21
449,241 455,866 4.21United StatesUnited Community Banks Inc. 19,876 USD 456,472 460,553 4.25
456,472 460,553 4.25
Total - Shares 10,276,561 10,753,694 99.21
Total Transferable securities and money market instruments admitted to an officialstock exchange listing 10,276,561 10,753,694 99.21
TOTAL INVESTMENT PORTFOLIO 10,276,561 10,753,694 99.21
Xtrackers**
Xtrackers FTSE 100 SHORT DAILY SWAP UCITS ETF*
Statement of Investmentsas at 30 June 2021(expressed in GBP)
* This is a synthetic ETF.** This includes synthetic ETFs.
The accompanying notes form an integral part of these financial statements.
142

Description QuantityCurrency
(local) Cost Market Value
% ofNet
Assets
Transferable securities and money market instruments admitted to an official stock exchange listing
Shares
BelgiumGroupe Bruxelles Lambert SA 35,000 EUR 3,865,633 3,915,725 1.61
3,865,633 3,915,725 1.61GermanyBayer AG 146,000 EUR 9,856,297 8,866,576 3.64Beiersdorf AG 71,000 EUR 8,606,274 8,567,242 3.52LEG Immobilien AG 16,000 EUR 2,326,256 2,304,442 0.95Puma SE 79,000 EUR 8,903,629 9,420,142 3.87RWE AG 173,572 EUR 6,540,579 6,290,444 2.58Siemens AG 30,000 EUR 4,971,568 4,753,801 1.95Symrise AG 8,199 EUR 1,029,545 1,142,476 0.47TeamViewer AG 144A 121,724 EUR 5,704,551 4,578,863 1.88Volkswagen AG-Pref- 26,881 EUR 7,172,109 6,732,675 2.76
55,110,808 52,656,661 21.62NetherlandsASR Nederland NV 40,000 EUR 1,695,456 1,545,940 0.64Koninklijke Ahold Delhaize NV 430,001 EUR 12,486,808 12,784,157 5.25Koninklijke DSM NV 70,000 EUR 12,673,305 13,066,253 5.36
26,855,569 27,396,350 11.25United StatesAlphabet Inc.-A- 3,562 USD 7,271,218 8,697,656 3.57Altria Group Inc. 100,000 USD 4,737,000 4,768,000 1.96Amazon.com Inc. 2,500 USD 8,538,125 8,600,400 3.53Apple Inc. 77,003 USD 9,808,653 10,546,331 4.33Applied Materials Inc. 58,000 USD 8,011,540 8,259,200 3.39Capital One Financial Corp. 25,000 USD 3,952,750 3,867,250 1.59Chevron Corp. 119,000 USD 12,351,010 12,464,060 5.12Coca-Cola Co. 200,000 USD 10,844,000 10,822,000 4.44ConocoPhillips 20,000 USD 1,130,400 1,218,000 0.50Dominion Energy Inc. 28,442 USD 2,175,813 2,092,478 0.86DuPont de Nemours Inc. 15,890 USD 1,344,135 1,230,045 0.50Exxon Mobil Corp. 175,000 USD 10,200,083 11,039,000 4.53Facebook Inc.-A- 37,126 USD 10,789,929 12,909,081 5.30Hershey Co. 20,200 USD 3,516,416 3,518,436 1.44Merck & Co. Inc. 44,975 USD 3,445,535 3,497,706 1.44Micron Technology Inc. 60,000 USD 5,124,000 5,098,800 2.09Microsoft Corp. 47,825 USD 12,035,161 12,955,793 5.32Netflix Inc. 4,000 USD 2,012,720 2,112,840 0.87Oracle Corp. 49,000 USD 3,730,850 3,814,160 1.57PepsiCo Inc. 14,555 USD 2,151,811 2,156,614 0.88Procter & Gamble Co. 77,900 USD 10,453,156 10,511,047 4.31salesforce.com Inc. 10,000 USD 2,171,800 2,442,700 1.00Southern Co. 95,000 USD 6,087,600 5,748,450 2.36Texas Instruments Inc. 20,000 USD 3,754,600 3,846,000 1.58Thermo Fisher Scientific Inc. 15,000 USD 7,026,300 7,567,050 3.11
Xtrackers**
Xtrackers S&P 500 INVERSE DAILY SWAP UCITS ETF*
Statement of Investmentsas at 30 June 2021(expressed in USD)
* This is a synthetic ETF.** This includes synthetic ETFs.
The accompanying notes form an integral part of these financial statements.
143

Description QuantityCurrency
(local) Cost Market Value
% ofNet
Assets
Transferable securities and money market instruments admitted to an official stock exchange listing
Shares (continued)
United States (continued)United Technologies Corp. 63,611 USD 5,487,085 5,426,654 2.23Waste Management Inc. 17,000 USD 2,392,750 2,381,870 0.98
160,544,440 167,591,621 68.80
Total - Shares 246,376,450 251,560,357 103.28
Total Transferable securities and money market instruments admitted to an officialstock exchange listing 246,376,450 251,560,357 103.28
TOTAL INVESTMENT PORTFOLIO 246,376,450 251,560,357 103.28
Xtrackers**
Xtrackers S&P 500 INVERSE DAILY SWAP UCITS ETF* (continued)
Statement of Investmentsas at 30 June 2021(expressed in USD)
* This is a synthetic ETF.** This includes synthetic ETFs.
The accompanying notes form an integral part of these financial statements.
144

Description QuantityCurrency
(local) Cost Market Value
% ofNet
Assets
Transferable securities and money market instruments admitted to an official stock exchange listing
Shares
IrelandXtrackers iBoxx EUR Corporate Bond Yield PlusUCITS ETF 1,349,486 EUR 22,051,482 22,536,146 4.69Xtrackers JPX-Nikkei 400 UCITS ETF 1,995,309 EUR 24,129,760 27,577,621 5.74Xtrackers MSCI Emerging Markets UCITS ETF 760,383 USD 33,156,587 42,613,999 8.87Xtrackers MSCI USA UCITS ETF 701,011 USD 46,292,844 72,328,942 15.05Xtrackers MSCI World Value UCITS ETF 1,247,693 EUR 33,198,320 39,703,088 8.26Xtrackers Russell 2000 UCITS ETF 87,238 USD 16,155,055 24,066,311 5.01
174,984,048 228,826,107 47.62LuxembourgXtrackers II EUR Corporate Bond UCITS ETF 220,904 EUR 34,277,363 35,939,247 7.48Xtrackers II Eurozone Inflation-Linked Bond UCITSETF 231,280 EUR 52,481,642 55,018,482 11.45Xtrackers II Harvest China Government Bond UCITSETF 478,878 USD 9,334,014 9,298,079 1.93Xtrackers II iBoxx Eurozone Government Bond YieldPlus UCITS ETF 1C 184,098 EUR 34,810,157 35,660,004 7.42Xtrackers MSCI EMU UCITS ETF 1,085,742 EUR 39,637,108 50,547,696 10.52Xtrackers MSCI Europe Small Cap UCITS ETF 506,415 EUR 21,863,332 29,734,390 6.19Xtrackers MSCI Europe UCITS ETF 1C 494,505 USD 27,949,627 35,537,749 7.40
220,353,243 251,735,647 52.39
Total - Shares 395,337,291 480,561,754 100.01
Total Transferable securities and money market instruments admitted to an officialstock exchange listing 395,337,291 480,561,754 100.01
TOTAL INVESTMENT PORTFOLIO 395,337,291 480,561,754 100.01
Xtrackers**
Xtrackers PORTFOLIO UCITS ETF
Statement of Investmentsas at 30 June 2021(expressed in EUR)
** This includes synthetic ETFs.
The accompanying notes form an integral part of these financial statements.
145

Description QuantityCurrency
(local) Cost Market Value
% ofNet
Assets
Transferable securities and money market instruments admitted to an official stock exchange listing
Shares
BermudaArch Capital Group Ltd. 2,089 USD 82,309 81,346 0.01IHS Markit Ltd. 375,420 USD 40,733,070 42,294,817 6.34
40,815,379 42,376,163 6.35Cayman Islands21Vianet Group Inc.-ADR- 7,499 USD 251,366 172,102 0.03Alibaba Group Holdings Ltd.-ADR- 12 USD 2,598 2,721 0.00Daqo New Energy Corp.-ADR- 89,000 USD 5,465,490 5,786,780 0.87DouYu International Holdings Ltd.-ADR- 152,884 USD 1,261,293 1,045,727 0.16iQIYI Inc.-ADR- 78,370 USD 1,108,935 1,221,005 0.18Momo Inc.-ADR- 60,340 USD 862,259 923,805 0.14NIO Inc.-ADR- 570,017 USD 31,646,297 30,324,904 4.54Pinduoduo Inc.-ADR- 137,782 USD 17,306,797 17,501,070 2.62
57,905,035 56,978,114 8.54FinlandNordea Bank Abp 2,814,116 SEK 31,402,053 31,345,649 4.70
31,402,053 31,345,649 4.70SingaporeFlex Ltd. 789,000 USD 14,194,110 14,099,430 2.11
14,194,110 14,099,430 2.11SwedenInvestor AB-B- 156,642 SEK 3,546,636 3,612,850 0.54Skandinaviska Enskilda Banken AB-A- 836,921 SEK 10,897,474 10,818,521 1.62
14,444,110 14,431,371 2.16United StatesAmazon.com Inc. 5,931 USD 19,969,023 20,403,589 3.06Ambac Financial Group Inc. 256,056 USD 3,712,812 4,009,837 0.60American Tower REIT Corp. 39,348 USD 10,604,679 10,629,469 1.59Apple Inc. 26,836 USD 3,449,085 3,675,458 0.55Arrow Electronics Inc. 96,300 USD 10,292,544 10,961,829 1.64Baker Hughes Co. 876,078 USD 22,033,362 20,035,904 3.00Beazer Homes USA Inc. 2,048 USD 18,596 39,506 0.01Chart Industries Inc. 878 USD 121,164 128,469 0.02Cimarex Energy Co. 41,955 USD 2,774,904 3,039,640 0.45Coherent Inc. 42,238 USD 8,107,162 11,165,193 1.67Darden Restaurants Inc. 50,577 USD 7,237,569 7,383,736 1.11DuPont de Nemours Inc. 36,089 USD 3,054,212 2,793,649 0.42Gilead Sciences Inc. 110,087 USD 7,400,048 7,580,591 1.14Goldman Sachs Group Inc. 22,649 USD 8,713,070 8,595,975 1.29HCA Healthcare Inc. 207,000 USD 42,892,470 42,795,180 6.41Host Hotels & Resorts REIT Inc. 1,060,500 USD 19,534,410 18,123,945 2.72Intel Corp. 535,821 USD 30,643,603 30,080,991 4.51KeyCorp 416,675 USD 9,475,189 8,604,339 1.29Lululemon Athletica Inc. 11,806 USD 3,734,120 4,308,836 0.65M/I Homes Inc. 35,980 USD 1,254,019 2,110,946 0.32Macquarie Infrastructure Corp. 6,138 USD 179,291 234,901 0.03Magellan Health Inc. 67,062 USD 6,283,709 6,317,240 0.95Maxim Integrated Products Inc. 577,883 USD 50,935,078 60,885,753 9.12McDonald’s Corp. 14,328 USD 3,341,863 3,309,625 0.50
Xtrackers**
Xtrackers MSCI AC ASIA EX JAPAN SWAP UCITS ETF*
Statement of Investmentsas at 30 June 2021(expressed in USD)
* This is a synthetic ETF.** This includes synthetic ETFs.
The accompanying notes form an integral part of these financial statements.
146

Description QuantityCurrency
(local) Cost Market Value
% ofNet
Assets
Transferable securities and money market instruments admitted to an official stock exchange listing
Shares (continued)
United States (continued)Meritage Homes Corp. 30,200 USD 2,187,056 2,841,216 0.43Micron Technology Inc. 120,568 USD 9,840,760 10,245,869 1.53Microsoft Corp. 115,000 USD 30,533,650 31,153,500 4.67Molson Coors Beverage Co.-B- 1,185 USD 60,020 63,623 0.01NextEra Energy Inc. 364,506 USD 26,288,173 26,711,000 4.00NuStar Energy LP 39,895 USD 750,425 720,105 0.11PPG Industries Inc. 31,166 USD 5,580,896 5,291,052 0.79SolarEdge Technologies Inc. 32,242 USD 9,899,906 8,910,721 1.33Union Pacific Corp. 100,342 USD 22,466,574 22,068,216 3.31United Parcel Service Inc.-B- 81,969 USD 17,494,644 17,047,093 2.55United Technologies Corp. 328,811 USD 28,435,575 28,050,866 4.20Vonage Holdings Corp. 1,716,182 USD 20,792,100 24,730,183 3.71Vornado Realty Trust REIT 69,433 USD 3,436,933 3,240,438 0.48Vroom Inc. 21,838 USD 802,328 914,139 0.14Xilinx Inc. 257,821 USD 33,337,358 37,291,229 5.59
487,668,380 506,493,851 75.90
Total - Shares 646,429,067 665,724,578 99.76
Total Transferable securities and money market instruments admitted to an officialstock exchange listing 646,429,067 665,724,578 99.76
TOTAL INVESTMENT PORTFOLIO 646,429,067 665,724,578 99.76
Xtrackers**
Xtrackers MSCI AC ASIA EX JAPAN SWAP UCITS ETF* (continued)
Statement of Investmentsas at 30 June 2021(expressed in USD)
* This is a synthetic ETF.** This includes synthetic ETFs.
The accompanying notes form an integral part of these financial statements.
147

Description QuantityCurrency
(local) Cost Market Value
% ofNet
Assets
Transferable securities and money market instruments admitted to an official stock exchange listing(A)
Shares
AustraliaAfterpay Ltd. 78,138 AUD 3,486,459 6,932,102 0.97AGL Energy Ltd. 224,955 AUD 2,826,666 1,384,857 0.19Ampol Ltd. 85,552 AUD 1,916,234 1,811,877 0.25APA Group 425,772 AUD 2,982,603 2,844,871 0.40Aristocrat Leisure Ltd. 206,941 AUD 3,442,831 6,694,505 0.93ASX Ltd. 69,770 AUD 3,173,073 4,070,437 0.57Aurizon Holdings Ltd. 665,989 AUD 2,329,943 1,859,968 0.26AusNet Services 687,371 AUD 859,937 903,077 0.13Australia & New Zealand Banking Group Ltd. 1,024,533 AUD 21,617,299 21,652,089 3.02BHP Group Ltd. 1,060,397 AUD 28,097,221 38,666,249 5.39BlueScope Steel Ltd. 181,778 AUD 1,863,924 2,996,878 0.42Brambles Ltd. 529,688 AUD 4,241,403 4,549,269 0.63Cochlear Ltd. 23,685 AUD 2,790,042 4,475,075 0.62Coles Group Ltd. 480,374 AUD 5,096,333 6,163,352 0.86Commonwealth Bank of Australia 638,612 AUD 38,296,885 47,881,481 6.67Computershare Ltd. 194,681 AUD 2,115,182 2,470,050 0.34Crown Resorts Ltd. 134,197 AUD 1,252,195 1,199,914 0.17CSL Ltd. 163,797 AUD 22,418,108 35,069,994 4.89Dexus REIT 391,770 AUD 2,815,146 3,138,275 0.44Domino’s Pizza Enterprises Ltd. 21,806 AUD 1,797,705 1,972,852 0.27Endeavour Group Ltd. 455,372 AUD 1,744,175 2,150,366 0.30Evolution Mining Ltd. 613,817 AUD 2,438,156 2,073,705 0.29Fortescue Metals Group Ltd. 609,300 AUD 4,696,623 10,676,465 1.49Goodman Group REIT 598,544 AUD 5,125,578 9,512,888 1.32GPT Group REIT 699,536 AUD 2,549,995 2,573,366 0.36Insurance Australia Group Ltd. 889,064 AUD 4,207,023 3,444,119 0.48Lendlease Corp. Ltd. 247,196 AUD 2,685,149 2,126,775 0.30Macquarie Group Ltd. 123,700 AUD 10,068,504 14,527,310 2.02Magellan Financial Group Ltd. 49,526 AUD 1,784,773 2,002,604 0.28Medibank Pvt Ltd. 989,013 AUD 2,019,735 2,346,305 0.33Mirvac Group REIT 1,420,504 AUD 2,444,492 3,114,015 0.43National Australia Bank Ltd. 1,187,044 AUD 23,374,860 23,366,569 3.25Newcrest Mining Ltd. 294,042 AUD 4,744,663 5,580,613 0.78Northern Star Resources Ltd. 397,861 AUD 3,788,460 2,921,229 0.41Orica Ltd. 146,720 AUD 1,997,585 1,462,793 0.20Origin Energy Ltd. 632,482 AUD 3,642,162 2,141,510 0.30Qantas Airways Ltd. 331,883 AUD 1,361,921 1,161,091 0.16QBE Insurance Group Ltd. 531,513 AUD 4,332,723 4,305,571 0.60Ramsay Health Care Ltd. 66,057 AUD 3,076,835 3,121,836 0.43REA Group Ltd. 18,978 AUD 1,210,444 2,408,295 0.33Reece Ltd. 104,628 AUD 1,654,329 1,854,553 0.26Rio Tinto Ltd. 133,600 AUD 8,380,392 12,702,020 1.77Santos Ltd. 675,886 AUD 3,433,423 3,597,619 0.50Scentre Group REIT 1,870,908 AUD 4,993,251 3,848,562 0.54SEEK Ltd. 121,029 AUD 1,869,976 3,011,185 0.42Sonic Healthcare Ltd. 163,530 AUD 3,176,470 4,714,375 0.66South32 Ltd. 1,723,156 AUD 3,467,720 3,790,423 0.53Stockland REIT 861,255 AUD 2,742,893 3,013,097 0.42
Xtrackers**
Xtrackers MSCI PACIFIC EX JAPAN UCITS ETF
Statement of Investmentsas at 30 June 2021(expressed in USD)
** This includes synthetic ETFs.
The accompanying notes form an integral part of these financial statements.
148

Description QuantityCurrency
(local) Cost Market Value
% ofNet
Assets
Transferable securities and money market instruments admitted to an official stock exchange listing(A)
Shares (continued)
Australia (continued)Suncorp Group Ltd. 461,625 AUD 4,468,707 3,850,338 0.54Sydney Airport 474,885 AUD 2,109,420 2,064,251 0.29Tabcorp Holdings Ltd. 799,864 AUD 2,598,404 3,110,580 0.43Telstra Corp. Ltd. 1,500,174 AUD 4,742,637 4,234,722 0.59Transurban Group 985,523 AUD 8,731,821 10,528,515 1.47Treasury Wine Estates Ltd. 259,082 AUD 2,098,287 2,271,828 0.32Vicinity Centres REIT 1,396,130 AUD 2,374,094 1,619,384 0.22Washington H Soul Pattinson & Co. Ltd. 38,807 AUD 729,244 982,702 0.14Wesfarmers Ltd. 408,333 AUD 11,844,926 18,117,464 2.52Westpac Banking Corp. 1,320,672 AUD 27,595,105 25,590,480 3.56WiseTech Global Ltd. 52,571 AUD 976,876 1,260,203 0.17Woodside Petroleum Ltd. 346,538 AUD 8,111,195 5,778,231 0.80Woolworths Group Ltd. 455,372 AUD 9,850,564 13,035,527 1.82
356,662,779 426,730,656 59.45BermudaCK Infrastructure Holdings Ltd. 237,997 HKD 1,693,385 1,418,938 0.20Hongkong Land Holdings Ltd. 419,094 USD 2,500,338 1,994,888 0.28Jardine Matheson Holdings Ltd. 77,800 USD 4,515,229 4,972,976 0.69
8,708,952 8,386,802 1.17Cayman IslandsBudweiser Brewing Co. APAC Ltd. 144A 618,340 HKD 2,195,818 1,950,763 0.27Chow Tai Fook Jewellery Group Ltd. 719,000 HKD 1,333,903 1,642,455 0.23CK Asset Holdings Ltd. 721,291 HKD 4,993,400 4,978,360 0.69CK Hutchison Holdings Ltd. 971,884 HKD 9,621,107 7,571,481 1.06ESR Cayman Ltd. 144A 714,600 HKD 2,197,914 2,410,878 0.34Futu Holdings Ltd.-ADR- 18,043 USD 2,548,228 3,231,321 0.45Melco Resorts & Entertainment Ltd.-ADR- 77,206 USD 1,499,647 1,279,303 0.18Sands China Ltd. 875,267 HKD 4,275,421 3,685,525 0.51Sea Ltd.-ADR- 4,981 USD 1,298,074 1,367,783 0.19WH Group Ltd. 144A 3,457,696 HKD 3,011,046 3,107,801 0.43Wharf Real Estate Investment Co. Ltd. 602,979 HKD 2,777,257 3,505,669 0.49Wynn Macau Ltd. 562,809 HKD 1,415,258 885,611 0.12Xinyi Glass Holdings Ltd. 656,000 HKD 1,578,799 2,673,552 0.37
38,745,872 38,290,502 5.33Hong KongAIA Group Ltd. 4,353,854 HKD 37,397,882 54,101,858 7.54Bank of East Asia Ltd. 470,636 HKD 1,543,499 873,899 0.12BOC Hong Kong Holdings Ltd. 1,332,945 HKD 4,873,556 4,522,763 0.63CLP Holdings Ltd. 591,318 HKD 5,795,958 5,847,811 0.82Galaxy Entertainment Group Ltd. 782,026 HKD 5,417,464 6,258,544 0.87Hang Lung Properties Ltd. 726,979 HKD 1,841,809 1,765,528 0.25Hang Seng Bank Ltd. 275,349 HKD 5,438,443 5,499,286 0.77Henderson Land Development Co. Ltd. 524,379 HKD 2,331,818 2,484,872 0.35HK Electric Investments & HK Electric InvestmentsLtd. 950,477 HKD 883,713 963,224 0.13HKT Trust & HKT Ltd. 1,359,979 HKD 1,872,573 1,852,801 0.26Hong Kong & China Gas Co. Ltd. 4,030,872 HKD 5,963,332 6,259,755 0.87Hong Kong Exchanges & Clearing Ltd. 433,557 HKD 15,657,000 25,837,504 3.60
Xtrackers**
Xtrackers MSCI PACIFIC EX JAPAN UCITS ETF (continued)
Statement of Investmentsas at 30 June 2021(expressed in USD)
** This includes synthetic ETFs.
The accompanying notes form an integral part of these financial statements.
149

Description QuantityCurrency
(local) Cost Market Value
% ofNet
Assets
Transferable securities and money market instruments admitted to an official stock exchange listing(A)
Shares (continued)
Hong Kong (continued)Link REIT 749,213 HKD 6,134,629 7,259,769 1.01MTR Corp. Ltd. 557,286 HKD 2,862,030 3,103,668 0.43New World Development Co. Ltd. 548,810 HKD 2,829,137 2,851,521 0.40Power Assets Holdings Ltd. 498,394 HKD 3,815,426 3,058,065 0.43Sino Land Co. Ltd. 1,184,806 HKD 1,813,604 1,867,410 0.26SJM Holdings Ltd. 712,982 HKD 929,081 778,548 0.11Sun Hung Kai Properties Ltd. 469,371 HKD 6,894,216 6,992,953 0.97Swire Pacific Ltd.-A- 178,997 HKD 1,795,900 1,213,543 0.17Swire Properties Ltd. 420,223 HKD 1,334,879 1,252,685 0.17Techtronic Industries Co. Ltd. 494,988 HKD 3,838,948 8,643,017 1.20
121,264,897 153,289,024 21.36IrelandJames Hardie Industries PLC 159,963 AUD 2,811,957 5,436,576 0.76
2,811,957 5,436,576 0.76New Zealanda2 Milk Co. Ltd. 266,683 NZD 2,265,699 1,200,060 0.17Auckland International Airport Ltd. 449,526 NZD 1,948,648 2,283,553 0.32Fisher & Paykel Healthcare Corp. Ltd. 207,621 NZD 2,839,988 4,514,739 0.63Mercury NZ Ltd. 244,858 NZD 810,584 1,141,200 0.16Meridian Energy Ltd. 463,375 NZD 1,200,652 1,725,765 0.24Ryman Healthcare Ltd. 152,685 NZD 1,212,355 1,400,822 0.19Spark New Zealand Ltd. 665,041 NZD 1,810,523 2,230,548 0.31Xero Ltd. 47,586 AUD 4,670,299 4,897,925 0.68
16,758,748 19,394,612 2.70Papua New GuineaOil Search Ltd. 708,884 AUD 2,639,088 2,027,662 0.28
2,639,088 2,027,662 0.28SingaporeAscendas Real Estate Investment Trust REIT 1,155,144 SGD 2,320,861 2,535,095 0.35CapitaLand Integrated Commercial Trust REIT 1,627,336 SGD 2,510,475 2,530,228 0.35CapitaLand Ltd. 947,554 SGD 2,296,033 2,615,255 0.36City Developments Ltd. 146,897 SGD 990,633 796,667 0.11DBS Group Holdings Ltd. 648,867 SGD 11,061,290 14,389,767 2.00Genting Singapore Ltd. 2,178,546 SGD 1,567,977 1,353,285 0.19Keppel Corp. Ltd. 523,002 SGD 2,706,442 2,128,270 0.30Mapletree Commercial Trust REIT 776,800 SGD 1,293,034 1,248,243 0.17Mapletree Logistics Trust REIT 1,076,962 SGD 1,559,305 1,642,443 0.23Oversea-Chinese Banking Corp. Ltd. 1,207,901 SGD 9,394,025 10,738,296 1.50Singapore Airlines Ltd. 481,235 SGD 1,858,767 1,736,341 0.24Singapore Exchange Ltd. 288,694 SGD 1,728,750 2,401,130 0.33Singapore Technologies Engineering Ltd. 562,085 SGD 1,493,273 1,618,263 0.23Singapore Telecommunications Ltd. 30,100 SGD 72,882 51,055 0.01Singapore Telecommunications Ltd. 2,943,519 SGD 7,053,212 5,014,625 0.70United Overseas Bank Ltd. 424,360 SGD 7,492,748 8,151,298 1.14UOL Group Ltd. 167,104 SGD 875,118 907,498 0.13
Xtrackers**
Xtrackers MSCI PACIFIC EX JAPAN UCITS ETF (continued)
Statement of Investmentsas at 30 June 2021(expressed in USD)
** This includes synthetic ETFs.
The accompanying notes form an integral part of these financial statements.
150

Description QuantityCurrency
(local) Cost Market Value
% ofNet
Assets
Transferable securities and money market instruments admitted to an official stock exchange listing(A)
Shares (continued)
Singapore (continued)Venture Corp. Ltd. 99,300 SGD 1,436,111 1,419,099 0.20Wilmar International Ltd. 689,882 SGD 1,938,485 2,309,529 0.32
59,649,421 63,586,387 8.86
Total - Shares 607,241,714 717,142,221 99.91
Total Transferable securities and money market instruments admitted to an officialstock exchange listing 607,241,714 717,142,221 99.91
TOTAL INVESTMENT PORTFOLIO 607,241,714 717,142,221 99.91(A) Any duplicate securities appearing herein with the same name are either quoted on different stock exchanges or have different ISINs.
Xtrackers**
Xtrackers MSCI PACIFIC EX JAPAN UCITS ETF (continued)
Statement of Investmentsas at 30 June 2021(expressed in USD)
** This includes synthetic ETFs.
The accompanying notes form an integral part of these financial statements.
151

Description QuantityCurrency
(local) Cost Market Value
% ofNet
Assets
Transferable securities and money market instruments admitted to an official stock exchange listing
Shares
BermudaAssured Guaranty Ltd. 2,860 USD 130,988 135,793 0.09
130,988 135,793 0.09Cayman IslandsHerbalife Nutrition Ltd. 2,515 USD 131,384 132,616 0.09NIO Inc.-ADR- 5,374 USD 244,033 285,897 0.19Sea Ltd.-ADR- 1,100 USD 310,739 302,060 0.21
686,156 720,573 0.49IrelandWillis Towers Watson PLC 1,293 USD 337,938 297,416 0.20
337,938 297,416 0.20LuxembourgAllegro.eu SA 340,126 PLN 6,778,691 5,862,639 4.02
6,778,691 5,862,639 4.02PolandBank Polska Kasa Opieki SA 239,700 PLN 3,192,533 5,855,556 4.01CD Projekt SA 188,214 PLN 9,143,200 9,147,191 6.27Cyfrowy Polsat SA 618,623 PLN 4,921,943 4,865,136 3.33Dino Polska SA 144A 119,367 PLN 5,970,909 8,776,155 6.02Orange Polska SA 2,075,838 PLN 3,407,096 3,661,479 2.51PGE Polska Grupa Energetyczna SA 2,013,420 PLN 3,626,320 4,976,696 3.41Polski Koncern Naftowy ORLEN SA 316,246 PLN 6,066,276 6,378,085 4.37Powszechna Kasa Oszczednosci Bank Polski SA 537,466 PLN 2,884,263 5,340,777 3.66Powszechny Zaklad Ubezpieczen SA 531,003 PLN 3,710,160 5,118,942 3.51Santander Bank Polska SA 94,308 PLN 6,045,467 6,302,063 4.32
48,968,167 60,422,080 41.41SwedenSkandinaviska Enskilda Banken AB-A- 4,492 SEK 58,490 58,066 0.04
58,490 58,066 0.04United StatesAbbVie Inc. 53,551 USD 6,104,069 6,031,985 4.13Adobe Inc. 8,119 USD 3,967,999 4,754,811 3.26Alphabet Inc.-A- 2,367 USD 3,276,733 5,779,717 3.96Amazon.com Inc. 3,498 USD 10,976,776 12,033,680 8.25Ameren Corp. 3,532 USD 299,337 282,701 0.19American Campus Communities REIT Inc. 2,815 USD 131,432 131,517 0.09Apple Inc. 49,987 USD 6,173,666 6,846,219 4.69AZEK Co. Inc. 3,188 USD 136,319 135,362 0.09Bank of New York Mellon Corp. 2,977 USD 153,139 152,512 0.10Berkshire Hathaway Inc.-B- 16,035 USD 3,483,841 4,456,447 3.05Boeing Co. 17,742 USD 3,293,719 4,250,274 2.91Celanese Corp. 222 USD 36,663 33,655 0.02Compass Diversified Holdings 10,600 USD 274,756 270,300 0.19Entegris Inc. 350 USD 40,177 43,039 0.03Enterprise Products Partners LP 7,710 USD 185,307 186,042 0.13Facebook Inc.-A- 18,197 USD 3,525,150 6,327,279 4.34FirstEnergy Corp. 1,278 USD 47,542 47,554 0.03Gilead Sciences Inc. 4,750 USD 316,397 327,085 0.22Host Hotels & Resorts REIT Inc. 2,000 USD 36,560 34,180 0.02
Xtrackers**
Xtrackers MSCI RUSSIA CAPPED SWAP UCITS ETF*
Statement of Investmentsas at 30 June 2021(expressed in USD)
* This is a synthetic ETF.** This includes synthetic ETFs.
The accompanying notes form an integral part of these financial statements.
152

Description QuantityCurrency
(local) Cost Market Value
% ofNet
Assets
Transferable securities and money market instruments admitted to an official stock exchange listing
Shares (continued)
United States (continued)Howard Hughes Corp. 380 USD 40,827 37,035 0.03Inari Medical Inc. 3,000 USD 262,500 279,840 0.19Intel Corp. 894 USD 51,128 50,189 0.03Intuitive Surgical Inc. 50 USD 43,440 45,982 0.03Jack in the Box Inc. 2,200 USD 248,952 245,168 0.17Johnson & Johnson 238 USD 40,591 39,208 0.03Juniper Networks Inc. 9,969 USD 262,782 272,652 0.19Kansas City Southern 1,141 USD 321,351 323,325 0.22Lockheed Martin Corp. 768 USD 293,446 290,573 0.20Match Group Inc. 152 USD 22,253 24,510 0.02McDonald’s Corp. 1,515 USD 353,856 349,950 0.24McKesson Corp. 1,432 USD 275,222 273,856 0.19Microsoft Corp. 25,103 USD 6,218,173 6,800,403 4.66National Vision Holdings Inc. 790 USD 40,567 40,393 0.03Netflix Inc. 8,994 USD 4,450,677 4,750,721 3.26PPD Inc. 6,028 USD 278,854 277,831 0.19Procter & Gamble Co. 28,018 USD 3,723,032 3,780,469 2.59Rush Enterprises Inc.-A- 2,765 USD 131,448 119,559 0.08Sabra Health Care REIT Inc. 7,515 USD 131,287 136,773 0.09salesforce.com Inc. 24,350 USD 5,271,775 5,947,974 4.08Selectquote Inc. 1,290 USD 40,583 24,845 0.02Twitter Inc. 41,625 USD 1,941,734 2,864,216 1.96UnitedHealth Group Inc. 824 USD 320,841 329,963 0.23Walker & Dunlop Inc. 2,600 USD 253,344 271,388 0.19Warner Music Group Corp.-A- 3,710 USD 128,842 133,708 0.09Welbilt Inc. 10,800 USD 263,466 250,020 0.17Xilinx Inc. 3,810 USD 488,526 551,078 0.38
68,359,079 80,635,988 55.26
Total - Shares 125,319,509 148,132,555 101.51
Total Transferable securities and money market instruments admitted to an officialstock exchange listing 125,319,509 148,132,555 101.51
TOTAL INVESTMENT PORTFOLIO 125,319,509 148,132,555 101.51
Xtrackers**
Xtrackers MSCI RUSSIA CAPPED SWAP UCITS ETF* (continued)
Statement of Investmentsas at 30 June 2021(expressed in USD)
* This is a synthetic ETF.** This includes synthetic ETFs.
The accompanying notes form an integral part of these financial statements.
153

Description QuantityCurrency
(local) Cost Market Value
% ofNet
Assets
Transferable securities and money market instruments admitted to an official stock exchange listing
Shares
BelgiumAgeas SA 300,000 EUR 18,175,264 16,650,044 3.64Groupe Bruxelles Lambert SA 36,448 EUR 3,927,213 4,077,724 0.89KBC Group NV 61,202 EUR 5,059,181 4,666,861 1.02Telenet Group Holdings NV 96,918 EUR 3,982,680 3,648,041 0.79
31,144,338 29,042,670 6.34Cayman IslandsAlibaba Group Holdings Ltd.-ADR- 52,987 USD 11,612,945 12,016,392 2.63
11,612,945 12,016,392 2.63GermanyBayer AG 118,416 EUR 7,571,934 7,191,400 1.57Bayerische Motoren Werke AG 85,590 EUR 9,015,990 9,065,075 1.98Covestro AG 144A 131,590 EUR 9,015,987 8,498,628 1.86Deutsche Post AG 66,009 EUR 3,927,181 4,490,147 0.98Hannover Rueck SE 22,209 EUR 3,927,078 3,716,245 0.81Infineon Technologies AG 128,956 EUR 5,211,564 5,172,059 1.13Volkswagen AG-Pref- 18,296 EUR 5,059,211 4,582,456 1.00
43,728,945 42,716,010 9.33NetherlandsASML Holdings NV 18,576 EUR 12,087,620 12,763,770 2.79ING Groep NV 1,398,213 EUR 14,735,823 18,471,698 4.03Koninklijke Ahold Delhaize NV 700,000 EUR 19,414,949 20,811,369 4.55Koninklijke KPN NV 6,000,000 EUR 19,786,043 18,741,973 4.09QIAGEN NV 51,010 USD 2,816,262 2,467,864 0.54
68,840,697 73,256,674 16.00NorwayNorsk Hydro ASA 1,482,459 NOK 8,995,366 9,464,777 2.07
8,995,366 9,464,777 2.07SwedenSvenska Handelsbanken AB-A- 211,646 SEK 2,427,344 2,389,637 0.52
2,427,344 2,389,637 0.52SwitzerlandUBS Group AG 152,528 CHF 2,433,940 2,336,557 0.51
2,433,940 2,336,557 0.51United KingdomAstraZeneca PLC-ADR- 89,076 USD 5,040,063 5,335,653 1.17Royal Dutch Shell PLC-B--ADR- 75,423 USD 2,814,032 2,928,675 0.64
7,854,095 8,264,328 1.81United StatesAdobe Inc. 8,898 USD 3,517,623 5,211,025 1.14Alphabet Inc.-A- 9,010 USD 14,928,145 22,000,528 4.81Amazon.com Inc. 4,933 USD 14,122,893 16,970,309 3.71Apple Inc. 60,114 USD 7,567,462 8,233,213 1.80Berkshire Hathaway Inc.-B- 13,884 USD 3,376,802 3,858,641 0.84BioMarin Pharmaceutical Inc. 25,458 USD 2,119,124 2,124,216 0.46Boeing Co. 19,262 USD 4,075,596 4,614,405 1.01Booking Holdings Inc. 2,507 USD 5,974,031 5,485,542 1.20Chevron Corp. 34,664 USD 3,769,017 3,630,707 0.79Ciena Corp. 36,546 USD 1,764,806 2,079,102 0.45
Xtrackers**
Xtrackers FTSE VIETNAM SWAP UCITS ETF*
Statement of Investmentsas at 30 June 2021(expressed in USD)
* This is a synthetic ETF.** This includes synthetic ETFs.
The accompanying notes form an integral part of these financial statements.
154

Description QuantityCurrency
(local) Cost Market Value
% ofNet
Assets
Transferable securities and money market instruments admitted to an official stock exchange listing
Shares (continued)
United States (continued)Cirrus Logic Inc. 22,354 USD 2,000,012 1,902,772 0.42Citigroup Inc. 82,583 USD 5,973,228 5,842,747 1.28Cloudflare Inc.-A- 28,752 USD 2,144,037 3,043,112 0.66CommScope Holdings Co. Inc. 118,532 USD 1,531,434 2,525,917 0.55CVS Health Corp. 58,638 USD 5,067,496 4,892,755 1.07Discovery Inc.-A- 146,539 USD 4,948,772 4,495,817 0.98Exxon Mobil Corp. 60,663 USD 3,768,992 3,826,622 0.84Facebook Inc.-A- 69,568 USD 15,717,535 24,189,489 5.28Fiserv Inc. 38,352 USD 4,496,820 4,099,445 0.90Health Catalyst Inc. 41,653 USD 2,144,713 2,312,158 0.50Hostess Brands Inc. 138,422 USD 1,926,142 2,241,052 0.49Intel Corp. 87,779 USD 5,067,482 4,927,913 1.08Johnson & Johnson 53,127 USD 9,035,840 8,752,142 1.91Masimo Corp. 2,815 USD 763,850 682,497 0.15Medallia Inc. 72,038 USD 3,421,805 2,431,283 0.53Micron Technology Inc. 105,594 USD 8,060,955 8,973,378 1.96Microsoft Corp. 20,326 USD 5,067,475 5,506,313 1.20MRC Global Inc. 205,151 USD 1,799,174 1,928,419 0.42Netflix Inc. 21,000 USD 10,857,906 11,092,410 2.42New Relic Inc. 15,192 USD 973,352 1,017,408 0.22NIKE Inc.-B- 18,988 USD 2,473,947 2,933,456 0.64NVIDIA Corp. 5,459 USD 4,155,609 4,367,746 0.95O’Reilly Automotive Inc. 4,282 USD 1,895,984 2,424,511 0.53PayPal Holdings Inc. 73,641 USD 17,038,492 21,464,879 4.69Peloton Interactive Inc.-A- 22,280 USD 2,634,610 2,763,166 0.60Pfizer Inc. 131,113 USD 5,067,518 5,134,385 1.12Procter & Gamble Co. 44,397 USD 5,973,172 5,990,487 1.31PROS Holdings Inc. 30,696 USD 979,202 1,398,817 0.31Pulse Evolution Group Inc. 72,980 USD 1,889,452 2,343,388 0.51QUALCOMM Inc. 18,247 USD 2,473,928 2,608,044 0.57Regeneron Pharmaceuticals Inc. 11,375 USD 5,236,140 6,353,392 1.39Roku Inc. 15,908 USD 5,018,976 7,305,749 1.60salesforce.com Inc. 33,687 USD 7,942,949 8,228,723 1.80Sirius XM Holdings Inc. 364,964 USD 2,500,003 2,386,865 0.52Sonos Inc. 73,028 USD 2,999,990 2,572,776 0.56Stride Inc. 83,518 USD 1,847,418 2,683,433 0.59Teradata Corp. 42,445 USD 2,000,008 2,120,977 0.46Tyler Technologies Inc. 5,146 USD 2,302,526 2,327,896 0.51Uber Technologies Inc. 58,709 USD 2,971,850 2,942,495 0.64Walmart Inc. 35,765 USD 5,072,103 5,043,580 1.10Walt Disney Co. 17,189 USD 2,971,806 3,021,311 0.66
Xtrackers**
Xtrackers FTSE VIETNAM SWAP UCITS ETF* (continued)
Statement of Investmentsas at 30 June 2021(expressed in USD)
* This is a synthetic ETF.** This includes synthetic ETFs.
The accompanying notes form an integral part of these financial statements.
155

Description QuantityCurrency
(local) Cost Market Value
% ofNet
Assets
Transferable securities and money market instruments admitted to an official stock exchange listing
Shares (continued)
United States (continued)Wells Fargo & Co. 89,597 USD 4,155,509 4,057,848 0.89Zoom Video Communications Inc.-A- 13,558 USD 4,709,561 5,247,353 1.15
250,293,272 284,612,614 62.17
Total - Shares 427,330,942 464,099,659 101.38
Total Transferable securities and money market instruments admitted to an officialstock exchange listing 427,330,942 464,099,659 101.38
TOTAL INVESTMENT PORTFOLIO 427,330,942 464,099,659 101.38
Xtrackers**
Xtrackers FTSE VIETNAM SWAP UCITS ETF* (continued)
Statement of Investmentsas at 30 June 2021(expressed in USD)
* This is a synthetic ETF.** This includes synthetic ETFs.
The accompanying notes form an integral part of these financial statements.
156

Description QuantityCurrency
(local) Cost Market Value
% ofNet
Assets
Transferable securities and money market instruments admitted to an official stock exchange listing
Shares
CanadaMagna International Inc. 162,121 USD 12,653,914 12,664,543 4.84Manulife Financial Corp. 894,230 USD 15,036,129 14,854,813 5.67
27,690,043 27,519,356 10.51NetherlandsQIAGEN NV 109,200 USD 4,920,487 4,454,923 1.70
4,920,487 4,454,923 1.70SwitzerlandTE Connectivity Ltd. 106,345 USD 11,988,351 12,124,884 4.63
11,988,351 12,124,884 4.63United StatesAcceleron Pharma Inc. 47,711 USD 5,642,786 5,048,698 1.93Adobe Inc. 27,177 USD 11,285,377 13,420,972 5.13Align Technology Inc. 12,192 USD 5,642,778 6,281,565 2.40Alphabet Inc.-C- 4 USD 8,420 8,454 0.00Amazon.com Inc. 1,970 USD 5,131,742 5,714,741 2.18Amicus Therapeutics Inc. 992 USD 8,382 8,064 0.00Anaplan Inc. 231,356 USD 10,814,462 10,398,237 3.97APA Corp. 337,991 USD 5,747,420 6,164,720 2.35Apollo Global Management Inc. 197,716 USD 9,285,024 10,370,123 3.96BigCommerce Holdings Inc. 284 USD 13,993 15,547 0.01Biogen Inc. 15,944 USD 3,890,535 4,655,474 1.78Blackstone Group Inc.-A- 142,561 USD 10,763,196 11,677,518 4.46Booking Holdings Inc. 3,334 USD 5,757,246 6,151,521 2.35Boston Scientific Corp. 203,989 USD 5,955,531 7,355,228 2.81Ciena Corp. 80,200 USD 3,593,977 3,847,353 1.47Cigna Corp. 43 USD 8,533 8,596 0.00Cinemark Holdings Inc. 77,287 USD 1,503,438 1,430,516 0.55Citigroup Inc. 3,683 USD 241,113 219,725 0.08Clear Channel Outdoor Holdings Inc. 750,250 USD 1,165,473 1,670,174 0.64CommScope Holdings Co. Inc. 346,436 USD 4,880,605 6,225,270 2.38Concentrix Corp. 60,447 USD 5,859,630 8,196,199 3.13Corteva Inc. 939 USD 34,462 35,117 0.01CTI BioPharma Corp. 970,429 USD 2,073,812 2,045,764 0.78Denbury Inc. 8,675 USD 285,516 561,655 0.22Driven Brands Holdings Inc. 19,082 USD 490,095 497,525 0.19Exagen Inc. 91,245 USD 1,381,122 1,153,354 0.44Facebook Inc.-A- 17,394 USD 3,598,362 5,099,979 1.95Fate Therapeutics Inc. 121 USD 8,374 8,855 0.00Hartford Financial Services Group Inc. 138,979 USD 7,497,681 7,262,437 2.77HealthStream Inc. 30,477 USD 751,350 718,043 0.28Inari Medical Inc. 95 USD 8,518 7,473 0.00Intuit Inc. 22 USD 8,646 9,093 0.00Luna Innovations Inc. 165,267 USD 1,503,443 1,509,268 0.58Mastercard Inc.-A- 8,372 USD 2,694,316 2,577,394 0.98MercadoLibre Inc. 9,478 USD 10,762,184 12,450,229 4.75Microsoft Corp. 39 USD 8,405 8,909 0.00Okta Inc. 45 USD 8,411 9,285 0.00Otis Worldwide Corp. 125 USD 8,440 8,619 0.00
Xtrackers**
Xtrackers LPX PRIVATE EQUITY SWAP UCITS ETF*
Statement of Investmentsas at 30 June 2021(expressed in EUR)
* This is a synthetic ETF.** This includes synthetic ETFs.
The accompanying notes form an integral part of these financial statements.
157

Description QuantityCurrency
(local) Cost Market Value
% ofNet
Assets
Transferable securities and money market instruments admitted to an official stock exchange listing
Shares (continued)
United States (continued)Paya Holdings Inc. 104,553 USD 1,127,469 971,560 0.37Procter & Gamble Co. 63,008 USD 7,012,770 7,168,956 2.74SBA Communications REIT Corp. 32 USD 8,502 8,600 0.00Scientific Games Corp. 71,771 USD 2,427,326 4,686,688 1.79Sesen Bio Inc. 2,348 USD 8,376 9,147 0.00Silvergate Capital Corp.-A- 24,600 USD 3,285,731 2,350,679 0.90Snap Inc.-A- 198,763 USD 9,870,135 11,420,612 4.36Snowflake Inc.-A- 55,824 USD 10,763,095 11,382,272 4.35Synopsys Inc. 51,646 USD 10,752,552 12,010,661 4.59Turtle Beach Corp. 15,472 USD 424,352 416,448 0.16Vectrus Inc. 38,018 USD 1,757,518 1,525,656 0.58Walgreens Boots Alliance Inc. 188 USD 8,392 8,340 0.00Westlake Chemical Corp. 182,927 USD 15,812,019 13,896,522 5.31Zogenix Inc. 131,638 USD 2,238,258 1,918,124 0.73
193,819,293 210,605,959 80.41
Total - Shares 238,418,174 254,705,122 97.25
Total Transferable securities and money market instruments admitted to an officialstock exchange listing 238,418,174 254,705,122 97.25
TOTAL INVESTMENT PORTFOLIO 238,418,174 254,705,122 97.25
Xtrackers**
Xtrackers LPX PRIVATE EQUITY SWAP UCITS ETF* (continued)
Statement of Investmentsas at 30 June 2021(expressed in EUR)
* This is a synthetic ETF.** This includes synthetic ETFs.
The accompanying notes form an integral part of these financial statements.
158

Description QuantityCurrency
(local) Cost Market Value
% ofNet
Assets
Transferable securities and money market instruments admitted to an official stock exchange listing
Shares
AustraliaAbacus Property Group REIT 20,262 AUD 62,870 63,825 0.06Adbri Ltd. 18,712 AUD 77,441 64,931 0.06Afterpay Ltd. 11,986 AUD 313,873 1,416,386 1.36AGL Energy Ltd. 31,374 AUD 565,075 257,267 0.25ALS Ltd. 24,411 AUD 159,608 318,319 0.30Altium Ltd. 6,161 AUD 96,052 226,047 0.22Alumina Ltd. 118,580 AUD 195,247 195,064 0.19AMP Ltd. 173,172 AUD 683,882 194,818 0.19Ampol Ltd. 12,059 AUD 364,686 340,184 0.33Ansell Ltd. 6,497 AUD 155,553 282,684 0.27APA Group 59,632 AUD 524,172 530,725 0.51Appen Ltd. 5,749 AUD 108,032 78,186 0.07ARB Corp. Ltd. 3,830 AUD 61,105 165,418 0.16Aristocrat Leisure Ltd. 32,269 AUD 524,213 1,390,471 1.33ASX Ltd. 9,781 AUD 521,602 760,082 0.73Atlas Arteria Ltd. 48,470 AUD 277,595 308,754 0.30AUB Group Ltd. 3,789 AUD 61,999 84,836 0.08Aurizon Holdings Ltd. 93,049 AUD 455,607 346,142 0.33AusNet Services 94,213 AUD 150,532 164,873 0.16Australia & New Zealand Banking Group Ltd. 143,822 AUD 3,966,928 4,048,589 3.88Bank of Queensland Ltd. 32,347 AUD 308,411 294,681 0.28Bapcor Ltd. 17,124 AUD 87,920 145,554 0.14Beach Energy Ltd. 81,820 AUD 102,755 101,457 0.10Bega Cheese Ltd. 15,224 AUD 85,292 89,669 0.09Bendigo & Adelaide Bank Ltd. 27,600 AUD 287,158 289,524 0.28BHP Group Ltd. 148,866 AUD 4,498,670 7,230,422 6.92Bingo Industries Ltd. 22,578 AUD 65,600 77,443 0.07Blackmores Ltd. 791 AUD 88,991 58,115 0.06BlueScope Steel Ltd. 25,436 AUD 224,103 558,575 0.53Boral Ltd. 51,619 AUD 269,734 379,400 0.36Brambles Ltd. 72,997 AUD 763,553 835,086 0.80Breville Group Ltd. 4,788 AUD 57,062 143,209 0.14Brickworks Ltd. 4,265 AUD 65,960 106,924 0.10BWP Trust REIT 24,612 AUD 76,827 104,847 0.10carsales.com Ltd. 13,708 AUD 186,502 270,870 0.26Centuria Industrial REIT 23,446 AUD 79,156 87,219 0.08Chalice Mining Ltd. 15,374 AUD 110,861 114,075 0.11Challenger Ltd. 29,096 AUD 233,544 157,409 0.15Champion Iron Ltd. 17,139 AUD 97,151 109,347 0.10Charter Hall Group REIT 23,547 AUD 151,032 365,449 0.35Charter Hall Long Wale REIT 27,901 AUD 133,082 132,530 0.13Charter Hall Retail REIT 25,894 AUD 99,974 98,397 0.09CIMIC Group Ltd. 3,627 AUD 104,109 71,742 0.07Cleanaway Waste Management Ltd. 104,274 AUD 147,129 275,283 0.26Clinuvel Pharmaceuticals Ltd. 2,119 AUD 74,849 65,053 0.06Cochlear Ltd. 3,319 AUD 450,812 835,293 0.80Codan Ltd. 6,011 AUD 90,646 108,378 0.10Coles Group Ltd. 67,415 AUD 902,545 1,152,122 1.10
Xtrackers**
Xtrackers S&P ASX 200 UCITS ETF
Statement of Investmentsas at 30 June 2021(expressed in AUD)
** This includes synthetic ETFs.
The accompanying notes form an integral part of these financial statements.
159

Description QuantityCurrency
(local) Cost Market Value
% ofNet
Assets
Transferable securities and money market instruments admitted to an official stock exchange listing
Shares (continued)
Australia (continued)Collins Foods Ltd. 5,461 AUD 51,722 62,638 0.06Commonwealth Bank of Australia 89,656 AUD 6,935,458 8,953,945 8.58Computershare Ltd. 28,668 AUD 373,805 484,489 0.46Corporate Travel Management Ltd. 5,505 AUD 84,222 118,302 0.11Costa Group Holdings Ltd. 20,158 AUD 70,545 66,723 0.06Credit Corp. Group Ltd. 3,394 AUD 53,880 100,904 0.10Cromwell Property Group REIT 95,461 AUD 96,745 83,528 0.08Crown Resorts Ltd. 18,112 AUD 230,273 215,714 0.21CSL Ltd. 23,000 AUD 3,350,341 6,559,370 6.28CSR Ltd. 24,571 AUD 93,103 141,529 0.14Deterra Royalties Ltd. 21,267 AUD 85,563 95,702 0.09Dexus REIT 54,355 AUD 494,172 579,968 0.56Domain Holdings Australia Ltd. 12,065 AUD 35,543 62,255 0.06Domino’s Pizza Enterprises Ltd. 3,189 AUD 142,253 384,306 0.37Downer EDI Ltd. 35,495 AUD 177,911 198,417 0.19Eagers Automotive Ltd. 8,721 AUD 84,781 144,420 0.14Elders Ltd. 7,905 AUD 56,856 91,303 0.09EML Payments Ltd. 17,264 AUD 72,235 60,079 0.06Endeavour Group Ltd. 63,997 AUD 300,813 402,541 0.39Evolution Mining Ltd. 86,450 AUD 254,457 389,025 0.37Flight Centre Travel Group Ltd. 7,800 AUD 170,645 115,830 0.11Fortescue Metals Group Ltd. 84,002 AUD 513,014 1,960,607 1.88G8 Education Ltd. 43,373 AUD 92,458 43,590 0.04Gold Road Resources Ltd. 44,368 AUD 59,705 55,904 0.05Goodman Group REIT 84,947 AUD 755,684 1,798,328 1.72GPT Group REIT 97,257 AUD 455,924 476,559 0.46GrainCorp Ltd.-A- 11,706 AUD 60,543 60,403 0.06Growthpoint Properties Australia REIT Ltd. 14,826 AUD 50,230 60,342 0.06GUD Holdings Ltd. 4,813 AUD 44,658 57,708 0.06Harvey Norman Holdings Ltd. 34,549 AUD 118,789 189,329 0.18Healius Ltd. 26,489 AUD 93,236 122,644 0.12HUB24 Ltd. 3,277 AUD 80,676 93,427 0.09IDP Education Ltd. 8,470 AUD 106,052 207,854 0.20IGO Ltd. 34,146 AUD 157,694 260,534 0.25Iluka Resources Ltd. 21,371 AUD 90,395 195,545 0.19Incitec Pivot Ltd. 98,430 AUD 285,347 234,263 0.22Ingenia Communities Group REIT 14,910 AUD 69,922 91,547 0.09Inghams Group Ltd. 18,828 AUD 67,345 74,935 0.07Insurance Australia Group Ltd. 124,505 AUD 760,946 642,446 0.62InvoCare Ltd. 7,216 AUD 88,149 83,489 0.08IOOF Holdings Ltd. 30,821 AUD 177,556 131,606 0.13IPH Ltd. 10,974 AUD 71,127 85,597 0.08IRESS Ltd. 9,733 AUD 105,756 125,653 0.12JB Hi-Fi Ltd. 5,801 AUD 149,991 293,415 0.28Kogan.com Ltd. 4,303 AUD 77,626 49,829 0.05Lendlease Corp. Ltd. 34,795 AUD 471,123 398,751 0.38Link Administration Holdings Ltd. 27,043 AUD 183,387 136,297 0.13Lynas Rare Earths Ltd. 45,543 AUD 95,427 260,051 0.25
Xtrackers**
Xtrackers S&P ASX 200 UCITS ETF (continued)
Statement of Investmentsas at 30 June 2021(expressed in AUD)
** This includes synthetic ETFs.
The accompanying notes form an integral part of these financial statements.
160

Description QuantityCurrency
(local) Cost Market Value
% ofNet
Assets
Transferable securities and money market instruments admitted to an official stock exchange listing
Shares (continued)
Australia (continued)Macquarie Group Ltd. 17,183 AUD 1,514,228 2,687,937 2.57Magellan Financial Group Ltd. 7,252 AUD 216,980 390,593 0.37Medibank Pvt Ltd. 139,318 AUD 374,409 440,245 0.42Megaport Ltd. 7,147 AUD 93,143 131,719 0.13Mesoblast Ltd. 28,691 AUD 115,434 56,808 0.05Metcash Ltd. 51,712 AUD 129,712 206,331 0.20Mineral Resources Ltd. 8,398 AUD 105,109 451,225 0.43Mirvac Group REIT 198,844 AUD 436,377 580,624 0.56Monadelphous Group Ltd. 4,854 AUD 64,201 50,724 0.05Nanosonics Ltd. 13,509 AUD 53,687 79,298 0.08National Australia Bank Ltd. 166,719 AUD 4,431,229 4,371,372 4.19National Storage REIT 54,646 AUD 94,019 108,199 0.10Nearmap Ltd. 25,336 AUD 72,703 47,125 0.05Netwealth Group Ltd. 4,498 AUD 41,422 77,141 0.07Newcrest Mining Ltd. 41,286 AUD 813,963 1,043,710 1.00NEXTDC Ltd. 23,103 AUD 154,232 274,002 0.26nib holdings Ltd. 23,151 AUD 131,200 150,713 0.14Nickel Mines Ltd. 68,216 AUD 94,820 67,534 0.06Nine Entertainment Co. Holdings Ltd. 74,014 AUD 128,166 215,381 0.21Northern Star Resources Ltd. 58,775 AUD 515,939 574,819 0.55NRW Holdings Ltd. 23,139 AUD 62,988 33,899 0.03Nufarm Ltd. 16,017 AUD 97,863 73,358 0.07Nuix Ltd. 10,106 AUD 53,865 22,334 0.02Omni Bridgeway Ltd. 13,469 AUD 67,920 50,509 0.05Orica Ltd. 20,526 AUD 386,911 272,585 0.26Origin Energy Ltd. 88,970 AUD 689,896 401,255 0.38Orocobre Ltd. 15,299 AUD 90,683 98,985 0.09Orora Ltd. 45,418 AUD 126,227 151,242 0.14OZ Minerals Ltd. 16,796 AUD 125,144 377,574 0.36Pendal Group Ltd. 15,817 AUD 139,011 127,485 0.12Perpetual Ltd. 2,853 AUD 117,750 114,263 0.11Perseus Mining Ltd. 61,603 AUD 69,172 89,940 0.09Pilbara Minerals Ltd. 115,890 AUD 123,705 168,040 0.16Platinum Asset Management Ltd. 15,088 AUD 81,228 74,082 0.07PointsBet Holdings Ltd. 8,187 AUD 127,520 104,630 0.10PolyNovo Ltd. 33,387 AUD 74,719 94,151 0.09Premier Investments Ltd. 5,063 AUD 67,904 144,549 0.14Pro Medicus Ltd. 2,435 AUD 67,837 142,983 0.14Qantas Airways Ltd. 95,264 AUD 336,429 443,930 0.43QBE Insurance Group Ltd. 74,553 AUD 810,125 804,427 0.77Qube Holdings Ltd. 96,079 AUD 240,720 304,570 0.29Ramelius Resources Ltd. 41,392 AUD 101,514 70,159 0.07Ramsay Health Care Ltd. 9,361 AUD 575,585 589,275 0.56REA Group Ltd. 2,535 AUD 171,517 428,491 0.41Redbubble Ltd. 12,302 AUD 67,056 44,410 0.04Reece Ltd. 14,379 AUD 225,494 339,488 0.33Regis Resources Ltd. 38,032 AUD 116,617 89,756 0.09Reliance Worldwide Corp. Ltd. 40,021 AUD 145,539 210,510 0.20
Xtrackers**
Xtrackers S&P ASX 200 UCITS ETF (continued)
Statement of Investmentsas at 30 June 2021(expressed in AUD)
** This includes synthetic ETFs.
The accompanying notes form an integral part of these financial statements.
161

Description QuantityCurrency
(local) Cost Market Value
% ofNet
Assets
Transferable securities and money market instruments admitted to an official stock exchange listing
Shares (continued)
Australia (continued)Rio Tinto Ltd. 18,755 AUD 1,291,479 2,375,133 2.27Santos Ltd. 94,626 AUD 580,168 670,898 0.64Scentre Group REIT 262,185 AUD 935,554 718,387 0.69SEEK Ltd. 17,845 AUD 307,640 591,383 0.57Seven Group Holdings Ltd. 7,844 AUD 108,711 159,625 0.15Shopping Centres Australasia Property Group REIT 54,624 AUD 123,099 137,652 0.13Silver Lake Resources Ltd. 44,506 AUD 51,119 73,880 0.07Sims Ltd. 8,457 AUD 85,263 140,386 0.13Sonic Healthcare Ltd. 24,123 AUD 535,364 926,323 0.89South32 Ltd. 238,412 AUD 550,907 698,547 0.67Spark Infrastructure Group 88,487 AUD 180,349 199,096 0.19St Barbara Ltd. 35,420 AUD 99,225 60,391 0.06Star Entertainment Group Ltd. 43,235 AUD 174,778 159,537 0.15Steadfast Group Ltd. 44,077 AUD 104,660 193,939 0.19Stockland REIT 120,600 AUD 498,352 561,996 0.54Suncorp Group Ltd. 64,851 AUD 828,103 720,495 0.69Super Retail Group Ltd. 8,078 AUD 70,057 104,287 0.10Sydney Airport 136,405 AUD 787,677 789,785 0.76Tabcorp Holdings Ltd. 112,265 AUD 487,009 581,533 0.56Technology One Ltd. 13,597 AUD 76,522 126,588 0.12Telstra Corp. Ltd. 601,258 AUD 2,755,046 2,260,730 2.17TPG Telecom Ltd. 18,673 AUD 132,148 116,893 0.11Transurban Group 138,407 AUD 1,568,675 1,969,532 1.89Treasury Wine Estates Ltd. 36,495 AUD 344,962 426,262 0.41United Malt Group Ltd. 13,916 AUD 48,337 62,344 0.06Uniti Group Ltd. 34,169 AUD 113,045 113,099 0.11Vicinity Centres REIT 195,184 AUD 459,305 301,559 0.29Viva Energy Group Ltd. 144A 44,327 AUD 106,579 85,551 0.08Washington H Soul Pattinson & Co. Ltd. 6,283 AUD 117,764 211,926 0.20Waypoint REIT 39,652 AUD 98,583 103,888 0.10Webjet Ltd. 18,940 AUD 102,710 92,995 0.09Wesfarmers Ltd. 57,311 AUD 1,892,945 3,387,080 3.24Westgold Resources Ltd. 21,774 AUD 53,090 40,935 0.04Westpac Banking Corp. 185,415 AUD 5,285,376 4,785,561 4.58Whitehaven Coal Ltd. 45,654 AUD 101,503 88,569 0.08WiseTech Global Ltd. 7,898 AUD 146,910 252,183 0.24Woodside Petroleum Ltd. 48,665 AUD 1,525,865 1,080,850 1.04Woolworths Group Ltd. 64,071 AUD 1,701,709 2,443,027 2.34Worley Ltd. 16,154 AUD 208,174 193,202 0.18Zip Co. Ltd. 20,371 AUD 127,093 154,208 0.15
77,375,350 99,029,950 94.85FranceUnibail-Rodamco-Westfield 10,703 AUD 117,906 60,793 0.06
117,906 60,793 0.06IrelandJames Hardie Industries PLC 22,442 AUD 409,972 1,015,949 0.97
409,972 1,015,949 0.97
Xtrackers**
Xtrackers S&P ASX 200 UCITS ETF (continued)
Statement of Investmentsas at 30 June 2021(expressed in AUD)
** This includes synthetic ETFs.
The accompanying notes form an integral part of these financial statements.
162

Description QuantityCurrency
(local) Cost Market Value
% ofNet
Assets
Transferable securities and money market instruments admitted to an official stock exchange listing
Shares (continued)
JerseyAmcor PLC 41,174 AUD 548,615 622,963 0.60Janus Henderson Group PLC 1,416 AUD 58,953 72,570 0.07
607,568 695,533 0.67New Zealanda2 Milk Co. Ltd. 37,543 AUD 249,963 225,258 0.22Auckland International Airport Ltd. 10,968 AUD 72,761 74,144 0.07Chorus Ltd. 22,601 AUD 150,873 134,024 0.13Fisher & Paykel Healthcare Corp. Ltd. 6,387 AUD 85,003 184,712 0.18Fletcher Building Ltd. 18,189 AUD 104,642 128,051 0.12SKYCITY Entertainment Group Ltd. 17,509 AUD 60,978 56,904 0.05Spark New Zealand Ltd. 11,683 AUD 39,997 52,106 0.05Xero Ltd. 6,129 AUD 313,485 840,286 0.81
1,077,702 1,695,485 1.63Papua New GuineaOil Search Ltd. 93,511 AUD 518,144 356,277 0.34
518,144 356,277 0.34United KingdomVirgin Money UK PLC 43,572 AUD 163,275 160,345 0.15
163,275 160,345 0.15United StatesNews Corp.-B- 2,440 AUD 45,954 78,470 0.07ResMed Inc. 17,806 AUD 220,571 583,325 0.56
266,525 661,795 0.63
Total - Shares 80,536,442 103,676,127 99.30
Rights
AustraliaCosta Group Holdings Ltd.-Rights- 19.07.21 3,184 AUD — 923 0.00
— 923 0.00
Total - Rights — 923 0.00
Total Transferable securities and money market instruments admitted to an officialstock exchange listing 80,536,442 103,677,050 99.30
TOTAL INVESTMENT PORTFOLIO 80,536,442 103,677,050 99.30
Xtrackers**
Xtrackers S&P ASX 200 UCITS ETF (continued)
Statement of Investmentsas at 30 June 2021(expressed in AUD)
** This includes synthetic ETFs.
The accompanying notes form an integral part of these financial statements.
163

Description QuantityCurrency
(local) Cost Market Value
% ofNet
Assets
Transferable securities and money market instruments admitted to an official stock exchange listing(A)
Shares
Austriaams AG 43,191 CHF 786,726 731,285 0.05ANDRITZ AG 11,218 EUR 474,274 531,509 0.03BAWAG Group AG 144A 10,974 EUR 294,460 492,513 0.03Erste Group Bank AG 46,930 EUR 1,248,769 1,452,014 0.09OMV AG 22,689 EUR 848,368 1,088,391 0.07Raiffeisen Bank International AG 21,335 EUR 431,789 407,499 0.02Verbund AG 10,516 EUR 439,626 816,567 0.05voestalpine AG 17,471 EUR 479,601 599,954 0.04Wienerberger AG 18,365 EUR 369,161 596,863 0.04
5,372,774 6,716,595 0.42BelgiumAckermans & van Haaren NV 3,534 EUR 450,610 503,242 0.03Aedifica REIT SA 5,282 EUR 525,222 587,887 0.04Ageas SA 28,650 EUR 1,113,622 1,340,820 0.08Anheuser-Busch InBev SA 134,148 EUR 10,621,721 8,157,540 0.51Cofinimmo REIT SA 4,333 EUR 523,064 556,357 0.04Colruyt SA 7,973 EUR 399,943 376,007 0.02Elia Group SA 5,194 EUR 406,498 462,266 0.03Galapagos NV 6,909 EUR 708,003 404,038 0.03Groupe Bruxelles Lambert SA 15,391 EUR 1,222,193 1,451,987 0.09KBC Group NV 39,551 EUR 2,284,270 2,543,129 0.16Proximus SADP 24,745 EUR 625,428 403,096 0.03Sofina SA 2,472 EUR 469,406 899,313 0.06Solvay SA 11,674 EUR 1,178,189 1,251,453 0.08UCB SA 20,044 EUR 1,393,427 1,767,079 0.11Umicore SA 32,120 EUR 1,066,486 1,654,180 0.10Warehouses De Pauw REIT CVA 22,220 EUR 510,125 715,484 0.05
23,498,207 23,073,878 1.46BermudaHiscox Ltd. 55,735 GBP 709,896 539,920 0.03
709,896 539,920 0.03DenmarkAmbu A/S-B- 29,478 DKK 612,838 955,743 0.06AP Moller-Maersk A/S-B- 970 DKK 1,309,699 2,351,219 0.15Carlsberg AS-B- 16,000 DKK 1,580,103 2,515,247 0.16Chr Hansen Holdings A/S 16,337 DKK 1,030,830 1,243,469 0.08Coloplast A/S-B- 18,891 DKK 1,662,386 2,614,065 0.16Danske Bank A/S 107,516 DKK 2,281,278 1,595,480 0.10Demant A/S 15,993 DKK 400,436 759,190 0.05DSV PANALPINA A/S 31,573 DKK 2,283,199 6,209,517 0.39Genmab A/S 10,397 DKK 1,775,441 3,587,656 0.23GN Store Nord AS 20,486 DKK 703,631 1,509,125 0.10ISS A/S 24,266 DKK 667,241 480,344 0.03Netcompany Group A/S 144A 7,148 DKK 430,343 684,882 0.04Novo Nordisk A/S-B- 262,278 DKK 11,759,618 18,530,964 1.17Novozymes A/S-B- 33,157 DKK 1,368,940 2,107,691 0.13Orsted AS 144A 29,890 DKK 2,054,107 3,537,160 0.22Pandora A/S 15,874 DKK 1,049,942 1,799,534 0.11
Xtrackers**
Xtrackers STOXX EUROPE 600 UCITS ETF
Statement of Investmentsas at 30 June 2021(expressed in EUR)
** This includes synthetic ETFs.
The accompanying notes form an integral part of these financial statements.
164

Description QuantityCurrency
(local) Cost Market Value
% ofNet
Assets
Transferable securities and money market instruments admitted to an official stock exchange listing(A)
Shares (continued)
Denmark (continued)ROCKWOOL International A/S-B- 1,366 DKK 343,785 560,820 0.04Royal Unibrew A/S 6,656 DKK 481,808 714,986 0.05SimCorp A/S 6,433 DKK 468,820 680,996 0.04Tryg A/S 57,154 DKK 1,046,656 1,183,239 0.07Vestas Wind Systems A/S 160,002 DKK 2,327,150 5,267,237 0.33
35,638,251 58,888,564 3.71Faeroe IslandsBakkafrost P/F 7,979 NOK 514,405 555,915 0.04
514,405 555,915 0.04FinlandElisa OYJ 23,962 EUR 934,427 1,205,768 0.08Fortum OYJ 69,437 EUR 1,240,371 1,615,104 0.10Huhtamaki OYJ 15,269 EUR 494,650 609,996 0.04Kesko OYJ-B- 43,445 EUR 569,342 1,353,312 0.09Kojamo OYJ 32,698 EUR 531,872 630,090 0.04Kone OYJ-B- 64,040 EUR 2,988,007 4,405,952 0.28Metso Outotec OYJ 111,892 EUR 658,074 1,096,094 0.07Neste OYJ 68,047 EUR 1,431,673 3,513,947 0.22Nokia OYJ 852,564 EUR 3,965,683 3,849,753 0.24Nokian Renkaat OYJ 19,955 EUR 569,626 679,468 0.04Nordea Bank Abp 565,297 SEK 4,900,495 5,309,623 0.33Orion OYJ-B- 16,706 EUR 592,636 605,592 0.04Sampo OYJ-A- 80,751 EUR 3,096,249 3,129,909 0.20Stora Enso OYJ-R- 97,259 EUR 1,072,112 1,496,330 0.09UPM-Kymmene OYJ 84,563 EUR 1,961,186 2,697,560 0.17Valmet OYJ 21,206 EUR 437,071 779,957 0.05Wartsila OYJ Abp 77,259 EUR 921,759 966,896 0.06
26,365,233 33,945,351 2.14FranceAccor SA 26,239 EUR 968,648 826,266 0.05Aeroports de Paris 4,402 EUR 597,454 483,560 0.03Air Liquide SA 75,022 EUR 7,526,862 11,077,748 0.70Alstom SA 48,601 EUR 1,749,577 2,069,917 0.13Alten SA 4,595 EUR 426,399 513,721 0.03Amundi SA 144A 9,760 EUR 596,041 725,656 0.05Arkema SA 10,446 EUR 875,648 1,105,187 0.07Atos SE 17,486 EUR 1,204,911 897,032 0.06AXA SA 325,817 EUR 7,053,548 6,967,596 0.44BioMerieux 7,718 EUR 647,635 756,364 0.05BNP Paribas SA 182,663 EUR 9,490,204 9,657,393 0.61Bollore SA 142,775 EUR 534,008 645,343 0.04Bouygues SA 46,820 EUR 1,587,893 1,460,316 0.09Bureau Veritas SA 46,302 EUR 953,192 1,235,337 0.08Capgemini SE 26,738 EUR 2,405,353 4,331,556 0.27Carrefour SA 96,336 EUR 1,781,780 1,597,732 0.10Christian Dior SE 711 EUR 491,705 482,769 0.03Cie de Saint-Gobain 84,379 EUR 3,312,859 4,686,410 0.30Cie Generale des Etablissements Michelin SCA 26,828 EUR 2,662,761 3,608,366 0.23
Xtrackers**
Xtrackers STOXX EUROPE 600 UCITS ETF (continued)
Statement of Investmentsas at 30 June 2021(expressed in EUR)
** This includes synthetic ETFs.
The accompanying notes form an integral part of these financial statements.
165

Description QuantityCurrency
(local) Cost Market Value
% ofNet
Assets
Transferable securities and money market instruments admitted to an official stock exchange listing(A)
Shares (continued)
France (continued)Covivio REIT 7,394 EUR 606,770 533,255 0.03Credit Agricole SA 206,654 EUR 2,362,553 2,441,410 0.15Danone SA 102,931 EUR 6,411,198 6,111,013 0.38Dassault Aviation SA 366 EUR 429,147 363,072 0.02Dassault Systemes SE 22,551 EUR 2,338,201 4,611,679 0.29Edenred 39,135 EUR 1,256,272 1,880,437 0.12Eiffage SA 15,914 EUR 1,223,077 1,365,421 0.09Electricite de France SA 80,233 EUR 915,343 924,284 0.06Elis SA 28,574 EUR 524,788 454,041 0.03Engie SA 294,955 EUR 4,216,147 3,407,910 0.21EssilorLuxottica SA 47,223 EUR 5,326,294 7,349,788 0.46Eurazeo SE 7,321 EUR 414,312 538,093 0.03Faurecia SE 14,934 EUR 662,001 617,820 0.04Faurecia SE 5,752 EUR 172,174 237,270 0.01Gecina REIT SA 7,501 EUR 981,125 969,129 0.06Getlink SE 69,571 EUR 828,254 914,859 0.06Hermes International 5,588 EUR 2,879,224 6,864,858 0.43Ipsen SA 5,764 EUR 469,942 505,618 0.03Kering SA 11,600 EUR 4,119,848 8,549,200 0.54Klepierre REIT SA 33,809 EUR 975,210 734,670 0.05La Francaise des Jeux SAEM 144A 17,713 EUR 375,459 878,210 0.06Legrand SA 42,399 EUR 2,435,535 3,784,535 0.24L’Oreal SA 38,803 EUR 7,840,688 14,582,167 0.92LVMH Moet Hennessy Louis Vuitton SE 41,986 EUR 11,433,701 27,765,342 1.75Natixis SA 146,545 EUR 710,951 586,180 0.04Orange SA 325,013 EUR 4,165,320 3,125,000 0.20Orpea SA 8,252 EUR 780,164 885,027 0.06Pernod Ricard SA 32,497 EUR 4,074,939 6,083,438 0.38Publicis Groupe SA 35,381 EUR 1,759,613 1,908,451 0.12Remy Cointreau SA 3,393 EUR 400,669 590,721 0.04Renault SA 32,915 EUR 1,903,632 1,121,908 0.07Rexel SA 38,440 EUR 551,943 678,082 0.04Rubis SCA 14,742 EUR 644,726 552,678 0.03Safran SA 60,074 EUR 5,549,254 7,023,852 0.44Sanofi 180,946 EUR 14,575,144 15,988,388 1.01Sartorius Stedim Biotech 3,829 EUR 587,981 1,527,388 0.10Schneider Electric SE 89,807 EUR 6,695,523 11,915,593 0.75SCOR SE 27,161 EUR 817,551 728,458 0.05SEB SA 5,132 EUR 572,568 782,117 0.05Societe Generale SA 135,230 EUR 4,441,081 3,361,818 0.21Sodexo SA 13,401 EUR 1,164,928 1,054,659 0.07SOITEC 3,661 EUR 490,255 680,580 0.04Sopra Steria Group 2,514 EUR 374,456 407,771 0.03SPIE SA 23,877 EUR 482,089 463,214 0.03Suez SA 65,958 EUR 923,061 1,322,458 0.08Teleperformance 9,307 EUR 1,361,895 3,185,786 0.20Thales SA 16,840 EUR 1,309,875 1,448,914 0.09TotalEnergies SE 416,527 EUR 18,135,207 15,892,588 1.00
Xtrackers**
Xtrackers STOXX EUROPE 600 UCITS ETF (continued)
Statement of Investmentsas at 30 June 2021(expressed in EUR)
** This includes synthetic ETFs.
The accompanying notes form an integral part of these financial statements.
166
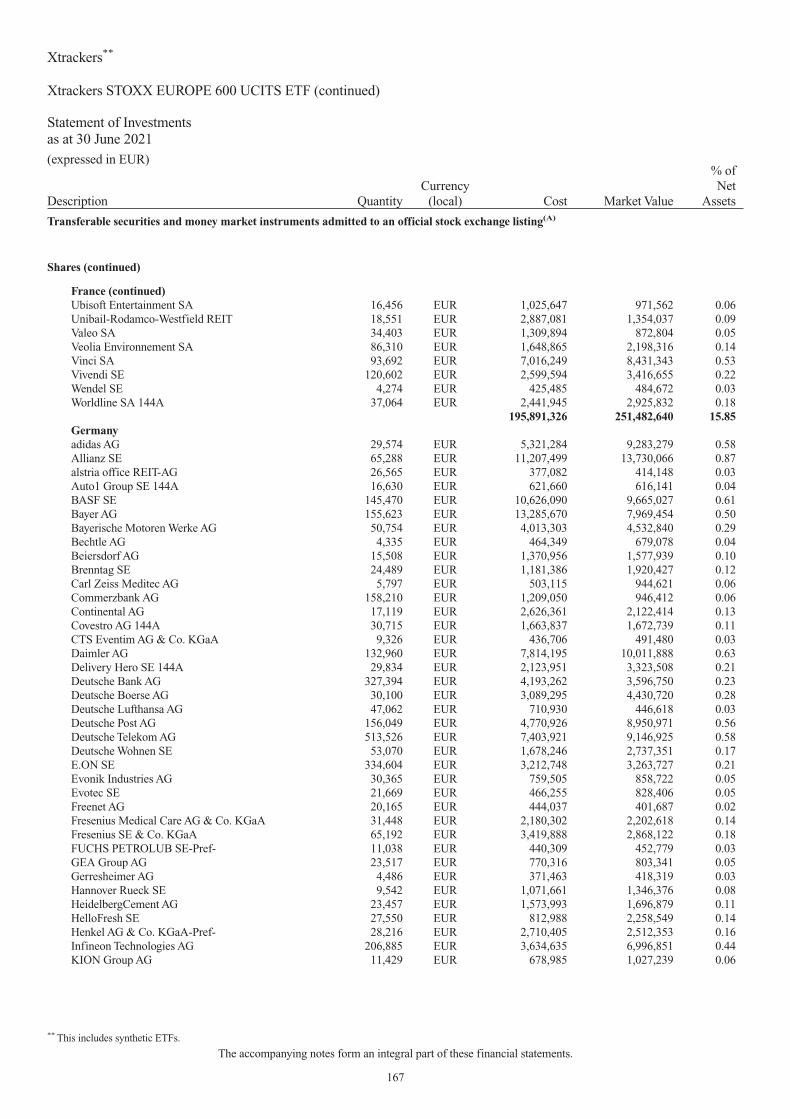
Description QuantityCurrency
(local) Cost Market Value
% ofNet
Assets
Transferable securities and money market instruments admitted to an official stock exchange listing(A)
Shares (continued)
France (continued)Ubisoft Entertainment SA 16,456 EUR 1,025,647 971,562 0.06Unibail-Rodamco-Westfield REIT 18,551 EUR 2,887,081 1,354,037 0.09Valeo SA 34,403 EUR 1,309,894 872,804 0.05Veolia Environnement SA 86,310 EUR 1,648,865 2,198,316 0.14Vinci SA 93,692 EUR 7,016,249 8,431,343 0.53Vivendi SE 120,602 EUR 2,599,594 3,416,655 0.22Wendel SE 4,274 EUR 425,485 484,672 0.03Worldline SA 144A 37,064 EUR 2,441,945 2,925,832 0.18
195,891,326 251,482,640 15.85Germanyadidas AG 29,574 EUR 5,321,284 9,283,279 0.58Allianz SE 65,288 EUR 11,207,499 13,730,066 0.87alstria office REIT-AG 26,565 EUR 377,082 414,148 0.03Auto1 Group SE 144A 16,630 EUR 621,660 616,141 0.04BASF SE 145,470 EUR 10,626,090 9,665,027 0.61Bayer AG 155,623 EUR 13,285,670 7,969,454 0.50Bayerische Motoren Werke AG 50,754 EUR 4,013,303 4,532,840 0.29Bechtle AG 4,335 EUR 464,349 679,078 0.04Beiersdorf AG 15,508 EUR 1,370,956 1,577,939 0.10Brenntag SE 24,489 EUR 1,181,386 1,920,427 0.12Carl Zeiss Meditec AG 5,797 EUR 503,115 944,621 0.06Commerzbank AG 158,210 EUR 1,209,050 946,412 0.06Continental AG 17,119 EUR 2,626,361 2,122,414 0.13Covestro AG 144A 30,715 EUR 1,663,837 1,672,739 0.11CTS Eventim AG & Co. KGaA 9,326 EUR 436,706 491,480 0.03Daimler AG 132,960 EUR 7,814,195 10,011,888 0.63Delivery Hero SE 144A 29,834 EUR 2,123,951 3,323,508 0.21Deutsche Bank AG 327,394 EUR 4,193,262 3,596,750 0.23Deutsche Boerse AG 30,100 EUR 3,089,295 4,430,720 0.28Deutsche Lufthansa AG 47,062 EUR 710,930 446,618 0.03Deutsche Post AG 156,049 EUR 4,770,926 8,950,971 0.56Deutsche Telekom AG 513,526 EUR 7,403,921 9,146,925 0.58Deutsche Wohnen SE 53,070 EUR 1,678,246 2,737,351 0.17E.ON SE 334,604 EUR 3,212,748 3,263,727 0.21Evonik Industries AG 30,365 EUR 759,505 858,722 0.05Evotec SE 21,669 EUR 466,255 828,406 0.05Freenet AG 20,165 EUR 444,037 401,687 0.02Fresenius Medical Care AG & Co. KGaA 31,448 EUR 2,180,302 2,202,618 0.14Fresenius SE & Co. KGaA 65,192 EUR 3,419,888 2,868,122 0.18FUCHS PETROLUB SE-Pref- 11,038 EUR 440,309 452,779 0.03GEA Group AG 23,517 EUR 770,316 803,341 0.05Gerresheimer AG 4,486 EUR 371,463 418,319 0.03Hannover Rueck SE 9,542 EUR 1,071,661 1,346,376 0.08HeidelbergCement AG 23,457 EUR 1,573,993 1,696,879 0.11HelloFresh SE 27,550 EUR 812,988 2,258,549 0.14Henkel AG & Co. KGaA-Pref- 28,216 EUR 2,710,405 2,512,353 0.16Infineon Technologies AG 206,885 EUR 3,634,635 6,996,851 0.44KION Group AG 11,429 EUR 678,985 1,027,239 0.06
Xtrackers**
Xtrackers STOXX EUROPE 600 UCITS ETF (continued)
Statement of Investmentsas at 30 June 2021(expressed in EUR)
** This includes synthetic ETFs.
The accompanying notes form an integral part of these financial statements.
167

Description QuantityCurrency
(local) Cost Market Value
% ofNet
Assets
Transferable securities and money market instruments admitted to an official stock exchange listing(A)
Shares (continued)
Germany (continued)Knorr-Bremse AG 10,512 EUR 951,445 1,019,664 0.06LANXESS AG 13,157 EUR 697,650 760,738 0.05LEG Immobilien AG 11,455 EUR 1,064,253 1,391,210 0.09Merck KGaA 20,477 EUR 1,930,468 3,311,131 0.21MorphoSys AG 5,179 EUR 517,116 338,810 0.02MTU Aero Engines AG 8,464 EUR 1,256,611 1,768,130 0.11Muenchener Rueckversicherungs-Gesellschaft AG 22,191 EUR 4,346,437 5,125,011 0.32Nemetschek SE 8,808 EUR 415,406 568,292 0.04Porsche Automobil Holdings SE-Pref- 24,264 EUR 1,498,579 2,192,495 0.14ProSiebenSat.1 Media SE 32,147 EUR 865,799 539,266 0.03Puma SE 14,723 EUR 830,033 1,480,398 0.09Rational AG 803 EUR 401,022 613,492 0.04Rheinmetall AG 6,859 EUR 558,593 571,355 0.04RWE AG 107,252 EUR 2,580,303 3,277,621 0.21SAP SE 172,991 EUR 15,707,363 20,558,250 1.30Sartorius AG-Pref- 3,898 EUR 591,511 1,711,222 0.11Scout24 AG 144A 13,514 EUR 635,586 961,116 0.06Siemens AG 118,487 EUR 11,174,228 15,832,233 1.00Siemens Healthineers AG 144A 44,041 EUR 1,819,903 2,276,039 0.14Siltronic AG 3,296 EUR 437,127 463,088 0.03Symrise AG 19,263 EUR 1,370,140 2,263,402 0.14TAG Immobilien AG 23,284 EUR 485,559 623,080 0.04TeamViewer AG 144A 25,533 EUR 978,899 809,907 0.05thyssenkrupp AG 77,510 EUR 1,283,250 681,313 0.04TUI AG 119,329 GBP 353,707 513,626 0.03Uniper SE 14,401 EUR 345,252 447,295 0.03United Internet AG 15,971 EUR 590,849 550,680 0.03Volkswagen AG-Pref- 28,995 EUR 4,592,085 6,123,744 0.39Vonovia SE 85,509 EUR 3,509,941 4,661,951 0.29Zalando SE 144A 21,203 EUR 1,029,222 2,161,646 0.14Zalando SE 144A 7,451 SEK — 759,629 0.05
172,058,901 211,502,598 13.33IrelandBank of Ireland Group PLC 147,273 EUR 948,285 665,232 0.04CRH PLC 125,913 EUR 3,612,343 5,351,302 0.34DCC PLC 16,063 GBP 1,102,031 1,107,359 0.07Flutter Entertainment PLC 26,586 EUR 3,066,310 4,059,682 0.26Glanbia PLC 31,182 EUR 425,148 426,882 0.03Grafton Group PLC 34,779 GBP 480,837 464,694 0.03Kerry Group PLC-A- 24,625 EUR 2,129,042 2,900,825 0.18Kingspan Group PLC 24,830 EUR 947,893 1,977,461 0.13Linde PLC 82,259 EUR 12,430,436 20,017,728 1.26Ryanair Holdings PLC 89,736 EUR 1,167,675 1,432,187 0.09Smurfit Kappa Group PLC 38,782 EUR 1,115,355 1,774,277 0.11United Drug PLC 40,854 GBP 388,042 508,744 0.03
27,813,397 40,686,373 2.57
Xtrackers**
Xtrackers STOXX EUROPE 600 UCITS ETF (continued)
Statement of Investmentsas at 30 June 2021(expressed in EUR)
** This includes synthetic ETFs.
The accompanying notes form an integral part of these financial statements.
168

Description QuantityCurrency
(local) Cost Market Value
% ofNet
Assets
Transferable securities and money market instruments admitted to an official stock exchange listing(A)
Shares (continued)
Isle Of ManGVC Holdings PLC 92,971 GBP 895,425 1,890,402 0.12
895,425 1,890,402 0.12ItalyA2A SpA 246,661 EUR 357,117 425,244 0.03Amplifon SpA 20,817 EUR 483,203 866,820 0.06Assicurazioni Generali SpA 203,833 EUR 3,204,406 3,445,797 0.22Atlantia SpA 73,231 EUR 1,483,487 1,118,237 0.07Banco BPM SpA 240,518 EUR 835,927 652,525 0.04DiaSorin SpA 4,111 EUR 450,134 655,705 0.04Enel SpA 1,230,273 EUR 6,518,080 9,635,498 0.61Eni SpA 397,866 EUR 5,447,064 4,086,084 0.26FinecoBank Banca Fineco SpA 96,958 EUR 920,644 1,425,283 0.09Hera SpA 126,633 EUR 414,905 441,189 0.03Infrastrutture Wireless Italiane SpA 144A 55,384 EUR 517,280 526,813 0.03Interpump Group SpA 13,093 EUR 351,916 653,864 0.04Intesa Sanpaolo SpA 2,888,867 EUR 6,636,182 6,729,616 0.42Italgas SpA 77,695 EUR 389,056 428,255 0.03Leonardo SpA 63,545 EUR 664,680 432,869 0.03Mediobanca Banca di Credito Finanziario SpA 104,065 EUR 843,606 1,025,040 0.06Moncler SpA 34,698 EUR 1,132,246 1,979,868 0.13Nexi SpA 144A 79,646 EUR 1,043,479 1,474,247 0.09Poste Italiane SpA 144A 73,965 EUR 587,278 824,710 0.05Prysmian SpA 42,644 EUR 904,235 1,289,128 0.08Recordati Industria Chimica e Farmaceutica SpA 15,992 EUR 537,194 770,814 0.05Reply SpA 3,549 EUR 495,936 491,891 0.03Snam SpA 325,752 EUR 1,299,419 1,588,041 0.10Telecom Italia SpA 1,615,882 EUR 1,093,139 676,893 0.04Terna Rete Elettrica Nazionale SpA 223,912 EUR 1,089,467 1,407,063 0.09UniCredit SpA 355,442 EUR 5,726,201 3,536,648 0.22
43,426,281 46,588,142 2.94JerseyExperian PLC 153,611 GBP 3,368,511 4,985,289 0.31Ferguson PLC 36,773 GBP 2,364,962 4,305,088 0.27Glencore PLC 1,725,050 GBP 4,832,686 6,218,407 0.39IWG PLC 121,297 GBP 455,639 424,743 0.03Man Group PLC 227,556 GBP 411,475 477,010 0.03Polymetal International PLC 57,111 GBP 790,949 1,034,183 0.07Wizz Air Holdings PLC 144A 6,742 GBP 385,725 366,690 0.02WPP PLC 191,005 GBP 2,679,567 2,167,603 0.14
15,289,514 19,979,013 1.26LuxembourgAllegro.eu SA 61,189 PLN 1,106,936 889,362 0.06ArcelorMittal SA 112,447 EUR 2,030,125 2,906,755 0.18Aroundtown SA 154,813 EUR 1,092,889 1,018,670 0.07B&M European Value Retail SA 141,650 GBP 650,762 945,823 0.06Eurofins Scientific SE 20,131 EUR 931,984 1,940,628 0.12Grand City Properties SA 15,934 EUR 326,872 362,977 0.02InPost SA 42,500 EUR 710,884 719,355 0.05
Xtrackers**
Xtrackers STOXX EUROPE 600 UCITS ETF (continued)
Statement of Investmentsas at 30 June 2021(expressed in EUR)
** This includes synthetic ETFs.
The accompanying notes form an integral part of these financial statements.
169

Description QuantityCurrency
(local) Cost Market Value
% ofNet
Assets
Transferable securities and money market instruments admitted to an official stock exchange listing(A)
Shares (continued)
Luxembourg (continued)Millicom International Cellular SA 16,020 SEK 539,788 535,158 0.03SES SA 60,381 EUR 1,029,214 388,974 0.03Tenaris SA 74,195 EUR 760,174 682,000 0.04
9,179,628 10,389,702 0.66MaltaKindred Group PLC 36,237 SEK 511,337 479,313 0.03
511,337 479,313 0.03NetherlandsAalberts NV 15,224 EUR 507,149 689,952 0.04ABN AMRO Bank NV 144A 74,744 EUR 1,312,894 761,791 0.05Adyen NV 144A 4,437 EUR 3,643,865 9,142,439 0.58Aegon NV 287,607 EUR 1,339,082 1,006,337 0.06Airbus SE 92,219 EUR 7,429,562 10,000,228 0.63Akzo Nobel NV 30,205 EUR 2,160,466 3,147,361 0.20Argenx SE 6,848 EUR 665,831 1,746,925 0.11Argenx SE 1,289 EUR 297,566 328,824 0.02ASM International NV 7,476 EUR 563,675 2,070,852 0.13ASML Holdings NV 66,442 EUR 11,999,806 38,496,495 2.43ASR Nederland NV 22,363 EUR 711,245 728,810 0.05BE Semiconductor Industries NV 11,528 EUR 343,659 824,713 0.05CNH Industrial NV 158,061 EUR 1,317,806 2,200,999 0.14Corbion NV 8,014 EUR 296,117 386,275 0.02Davide Campari-Milano NV 73,802 EUR 496,025 833,594 0.05Euronext NV 144A 12,252 EUR 760,901 1,123,508 0.07EXOR NV 18,007 EUR 919,891 1,216,553 0.08Ferrari NV 19,258 EUR 1,918,086 3,350,892 0.21Heineken Holdings NV 16,062 EUR 1,175,444 1,364,467 0.09Heineken NV 37,736 EUR 2,996,364 3,856,619 0.24IMCD NV 9,053 EUR 623,780 1,214,007 0.08ING Groep NV 618,172 EUR 6,805,498 6,886,436 0.43JDE Peet’s NV 17,411 EUR 602,625 532,777 0.03Just Eat Takeaway.com NV 144A 28,535 EUR 2,254,298 2,222,020 0.14Koninklijke Ahold Delhaize NV 165,621 EUR 3,158,658 4,152,119 0.26Koninklijke DSM NV 27,681 EUR 2,365,460 4,356,989 0.28Koninklijke KPN NV 533,696 EUR 1,388,011 1,405,755 0.09Koninklijke Philips NV 144,295 EUR 4,673,430 6,030,088 0.38Koninklijke Vopak NV 10,195 EUR 447,156 390,469 0.02NN Group NV 50,351 EUR 1,559,477 2,002,963 0.13Prosus NV 70,437 EUR 4,474,498 5,808,939 0.37QIAGEN NV 36,688 EUR 1,083,661 1,495,403 0.09Randstad NV 19,868 EUR 953,673 1,281,486 0.08Signify NV 144A 20,348 EUR 572,399 1,085,362 0.07Stellantis NV 329,133 EUR 3,287,569 5,448,468 0.34STMicroelectronics NV 104,766 EUR 1,711,330 3,206,363 0.20Wolters Kluwer NV 42,376 EUR 1,998,321 3,590,095 0.23
78,815,278 134,387,373 8.47NorwayAdevinta ASA 43,919 NOK 430,535 710,112 0.04
Xtrackers**
Xtrackers STOXX EUROPE 600 UCITS ETF (continued)
Statement of Investmentsas at 30 June 2021(expressed in EUR)
** This includes synthetic ETFs.
The accompanying notes form an integral part of these financial statements.
170

Description QuantityCurrency
(local) Cost Market Value
% ofNet
Assets
Transferable securities and money market instruments admitted to an official stock exchange listing(A)
Shares (continued)
Norway (continued)Aker BP ASA 17,012 NOK 390,422 457,436 0.03DNB ASA 141,308 NOK 2,038,568 2,597,708 0.16Entra ASA 144A 26,091 NOK 256,390 503,161 0.03Equinor ASA 170,373 NOK 2,795,287 3,041,531 0.19Gjensidige Forsikring ASA 29,729 NOK 477,081 552,926 0.04Mowi ASA 71,617 NOK 1,162,464 1,536,919 0.10NEL ASA 229,473 NOK 401,899 451,529 0.03Nordic Semiconductor ASA 27,603 NOK 399,022 590,204 0.04Norsk Hydro ASA 216,215 NOK 851,664 1,164,033 0.07Orkla ASA 119,225 NOK 924,745 1,024,608 0.06Salmar ASA 8,481 NOK 384,109 474,707 0.03Scatec ASA 144A 18,677 NOK 544,692 417,285 0.03Schibsted ASA-A- 11,955 NOK 253,882 486,873 0.03Storebrand ASA 74,592 NOK 409,733 570,135 0.04Telenor ASA 102,277 NOK 1,631,724 1,454,240 0.09TOMRA Systems ASA 18,619 NOK 450,465 866,644 0.05Yara International ASA 27,213 NOK 983,416 1,208,529 0.08
14,786,098 18,108,580 1.14PolandBank Polska Kasa Opieki SA 27,774 PLN 631,886 572,124 0.03CD Projekt SA 11,112 PLN 570,124 455,386 0.03Dino Polska SA 144A 7,540 PLN 403,482 467,458 0.03KGHM Polska Miedz SA 21,682 PLN 458,238 901,191 0.06Polski Koncern Naftowy ORLEN SA 49,230 PLN 982,894 837,234 0.05Powszechna Kasa Oszczednosci Bank Polski SA 140,415 PLN 1,191,741 1,176,572 0.07Powszechny Zaklad Ubezpieczen SA 90,135 PLN 773,332 732,704 0.05
5,011,697 5,142,669 0.32PortugalEDP - Energias de Portugal SA 463,616 EUR 1,616,496 2,072,364 0.13Galp Energia SGPS SA 78,056 EUR 980,314 714,368 0.04Jeronimo Martins SGPS SA 38,507 EUR 534,398 592,238 0.04
3,131,208 3,378,970 0.21SpainAcciona SA 3,877 EUR 424,579 493,542 0.03ACS Actividades de Construccion y Servicios SA 39,409 EUR 1,093,229 890,249 0.06Aena SME SA 144A 11,672 EUR 1,583,937 1,614,238 0.10Amadeus IT Group SA 71,370 EUR 3,653,743 4,233,668 0.27Banco Bilbao Vizcaya Argentaria SA 1,056,275 EUR 6,366,562 5,522,206 0.35Banco de Sabadell SA 886,049 EUR 1,257,633 508,769 0.03Banco Santander SA 2,746,764 EUR 11,863,169 8,843,207 0.56Bankinter SA 101,229 EUR 434,729 429,110 0.03CaixaBank SA 687,357 EUR 2,114,596 1,783,004 0.11Cellnex Telecom SA 144A 90,874 EUR 3,339,465 4,881,751 0.31EDP Renovaveis SA 38,138 EUR 688,694 745,217 0.05Enagas SA 37,409 EUR 840,536 728,914 0.05Endesa SA 50,150 EUR 1,001,219 1,026,069 0.06Ferrovial SA 83,153 EUR 1,675,799 2,058,037 0.13Fluidra SA 15,270 EUR 516,393 510,782 0.03
Xtrackers**
Xtrackers STOXX EUROPE 600 UCITS ETF (continued)
Statement of Investmentsas at 30 June 2021(expressed in EUR)
** This includes synthetic ETFs.
The accompanying notes form an integral part of these financial statements.
171

Description QuantityCurrency
(local) Cost Market Value
% ofNet
Assets
Transferable securities and money market instruments admitted to an official stock exchange listing(A)
Shares (continued)
Spain (continued)Grifols SA 46,684 EUR 1,130,536 1,066,263 0.07Iberdrola SA 928,073 EUR 6,801,456 9,540,590 0.60Industria de Diseno Textil SA 176,024 EUR 4,887,373 5,229,673 0.33Inmobiliaria Colonial Socimi REIT SA 42,096 EUR 408,675 358,447 0.02International Consolidated Airlines Group SA 394,564 GBP 672,578 800,760 0.05Merlin Properties Socimi REIT SA 52,861 EUR 541,762 461,794 0.03Naturgy Energy Group SA 51,830 EUR 1,049,816 1,123,674 0.07Red Electrica Corp. SA 68,730 EUR 1,170,847 1,075,968 0.07Repsol SA 223,101 EUR 2,865,327 2,354,608 0.15Siemens Gamesa Renewable Energy SA 35,581 EUR 518,412 1,001,961 0.06Telefonica SA 862,427 EUR 6,430,250 3,398,825 0.21
63,331,315 60,681,326 3.83SwedenAAK AB 27,974 SEK 422,042 529,029 0.03AddTech AB-B- 41,473 SEK 377,191 580,671 0.04AFRY AB 15,099 SEK 369,115 419,235 0.03Alfa Laval AB 47,145 SEK 898,087 1,405,239 0.09Assa Abloy AB-B- 157,000 SEK 2,796,903 3,990,791 0.25Atlas Copco AB-A- 102,076 SEK 2,727,533 5,273,893 0.33Avanza Bank Holdings AB 19,481 SEK 502,986 512,668 0.03Beijer Ref AB 39,015 SEK 414,032 586,648 0.04BillerudKorsnas AB 28,850 SEK 376,297 483,156 0.03Boliden AB 43,483 SEK 971,881 1,410,561 0.09Castellum AB 36,262 SEK 572,948 778,728 0.05Dometic Group AB 144A 46,583 SEK 389,884 669,441 0.04Electrolux AB-Series B- 36,578 SEK 675,007 855,843 0.05Elekta AB-B- 58,496 SEK 577,884 715,195 0.04Epiroc AB-A- 99,676 SEK 839,546 1,916,468 0.12EQT AB 100,175 SEK 1,144,343 3,067,872 0.19Essity AB-B- 95,853 SEK 2,325,922 2,682,221 0.17Evolution AB 144A 27,615 SEK 1,296,514 3,682,363 0.23Fabege AB 44,670 SEK 464,579 604,732 0.04Fastighets AB Balder 16,619 SEK 519,627 879,945 0.06Getinge AB-B- 34,527 SEK 535,408 1,098,927 0.07Hennes & Mauritz AB-B- 118,448 SEK 2,705,455 2,370,829 0.15Hexagon AB-B- 313,913 SEK 1,889,019 3,924,686 0.25Hexpol AB 40,766 SEK 340,729 424,864 0.03Holmen AB-B- 15,141 SEK 429,407 576,708 0.04Husqvarna AB-B- 66,098 SEK 437,583 741,012 0.05ICA Gruppen AB 14,701 SEK 512,071 577,343 0.04Industrivarden AB-A- 27,377 SEK 536,135 898,350 0.06Indutrade AB 42,354 SEK 426,185 914,566 0.06Investment AB Latour-B- 22,931 SEK 388,862 634,887 0.04Investor AB-B- 288,389 SEK 2,845,724 5,608,828 0.35Kinnevik AB-B- 38,329 SEK 813,860 1,294,766 0.08L E Lundbergforetagen AB-B- 11,596 SEK 396,152 631,366 0.04Lifco AB-B- 35,829 SEK 418,977 706,547 0.04Lundin Energy AB 30,307 SEK 656,092 904,847 0.06
Xtrackers**
Xtrackers STOXX EUROPE 600 UCITS ETF (continued)
Statement of Investmentsas at 30 June 2021(expressed in EUR)
** This includes synthetic ETFs.
The accompanying notes form an integral part of these financial statements.
172

Description QuantityCurrency
(local) Cost Market Value
% ofNet
Assets
Transferable securities and money market instruments admitted to an official stock exchange listing(A)
Shares (continued)
Sweden (continued)Nibe Industrier AB-B- 223,548 SEK 695,191 1,984,203 0.12Nordic Entertainment Group AB-B- 11,174 SEK 488,703 415,362 0.03Sagax AB-B- 26,335 SEK 408,864 660,063 0.04Samhallsbyggnadsbolaget i Norden AB 166,922 SEK 252,526 590,201 0.04Sandvik AB 173,435 SEK 2,360,529 3,738,207 0.24Securitas AB-B- 51,076 SEK 670,314 680,375 0.04Sinch AB 144A 84,546 SEK 748,112 1,200,416 0.08Skandinaviska Enskilda Banken AB-A- 254,141 SEK 2,345,094 2,770,192 0.17Skanska AB-B- 63,425 SEK 1,149,626 1,419,589 0.09SKF AB-B- 60,105 SEK 1,058,171 1,291,351 0.08Svenska Cellulosa AB SCA-B- 88,595 SEK 745,072 1,225,148 0.08Svenska Handelsbanken AB-A- 242,698 SEK 2,638,383 2,310,680 0.15Sweco AB-B- 32,523 SEK 415,351 499,293 0.03Swedbank AB-A- 146,577 SEK 2,567,839 2,301,412 0.14Swedish Match AB 250,426 SEK 968,271 1,802,020 0.11Swedish Orphan Biovitrum AB 30,900 SEK 455,402 475,443 0.03Tele2 AB-B- 79,511 SEK 843,997 914,118 0.06Telefonaktiebolaget LM Ericsson-B- 486,644 SEK 3,867,157 5,161,056 0.32Telia Co. AB 393,337 SEK 1,650,947 1,472,978 0.09Thule Group AB 144A 16,687 SEK 386,250 624,241 0.04Trelleborg AB-B- 38,619 SEK 624,075 756,616 0.05Volvo AB-B- 251,607 SEK 3,272,470 5,108,054 0.32Wallenstam AB-B- 33,180 SEK 362,722 442,967 0.03Wihlborgs Fastigheter AB 21,706 SEK 256,947 397,437 0.02
61,225,993 90,594,647 5.71SwitzerlandABB Ltd. 278,575 CHF 5,403,168 7,977,168 0.50Adecco Group AG 25,927 CHF 1,429,752 1,486,764 0.09Alcon Inc. 79,157 CHF 3,572,500 4,677,842 0.30Allreal Holdings AG 2,290 CHF 391,460 380,627 0.02Baloise Holdings AG 7,761 CHF 988,781 1,021,643 0.06Barry Callebaut AG 565 CHF 909,373 1,108,159 0.07Belimo Holdings AG 1,559 CHF 419,150 601,592 0.04Bucher Industries AG 1,046 CHF 450,832 461,650 0.03Cembra Money Bank AG 4,724 CHF 400,153 446,893 0.03Chocoladefabriken Lindt & Spruengli AG 17 CHF 1,053,735 1,502,754 0.10Cie Financiere Richemont SA 82,687 CHF 5,678,976 8,444,552 0.53Clariant AG 35,731 CHF 522,468 599,761 0.04Coca-Cola HBC AG 31,896 GBP 707,324 971,245 0.06Credit Suisse Group AG 382,991 CHF 4,716,173 3,386,236 0.21Dufry AG 12,147 CHF 612,846 607,246 0.04EMS-Chemie Holdings AG 1,082 CHF 567,744 897,235 0.06Flughafen Zurich AG 2,980 CHF 405,576 415,933 0.03Galenica AG 144A 7,873 CHF 401,892 468,995 0.03Geberit AG 5,869 CHF 2,238,109 3,715,685 0.23Georg Fischer AG 653 CHF 548,814 817,898 0.05Givaudan SA 1,260 CHF 2,646,481 4,946,035 0.31Helvetia Holdings AG 5,503 CHF 521,420 499,503 0.03
Xtrackers**
Xtrackers STOXX EUROPE 600 UCITS ETF (continued)
Statement of Investmentsas at 30 June 2021(expressed in EUR)
** This includes synthetic ETFs.
The accompanying notes form an integral part of these financial statements.
173

Description QuantityCurrency
(local) Cost Market Value
% ofNet
Assets
Transferable securities and money market instruments admitted to an official stock exchange listing(A)
Shares (continued)
Switzerland (continued)Holcim Ltd. 89,629 CHF 3,815,949 4,537,920 0.29Idorsia Ltd. 17,265 CHF 464,319 400,681 0.03Julius Baer Group Ltd. 35,476 CHF 1,345,511 1,954,083 0.12Kuehne & Nagel International AG 8,985 CHF 1,241,094 2,595,041 0.16Logitech International SA 27,432 CHF 935,635 2,805,294 0.18Lonza Group AG 11,798 CHF 2,804,410 7,058,218 0.45Nestle SA 456,268 CHF 34,812,534 47,958,230 3.02Novartis AG 390,725 CHF 27,093,907 30,055,023 1.90Partners Group Holdings AG 3,594 CHF 2,266,442 4,595,010 0.29PSP Swiss Property AG 7,289 CHF 700,155 781,306 0.05Roche Holdings AG 111,273 CHF 27,081,148 35,381,004 2.23Schindler Holdings AG 6,464 CHF 1,153,179 1,668,795 0.11SGS SA 972 CHF 1,992,120 2,530,670 0.16Siegfried Holdings AG 692 CHF 430,993 547,634 0.04Siemens Energy AG 74,747 EUR 1,774,569 1,900,069 0.12SIG Combibloc Group AG 50,757 CHF 795,552 1,164,063 0.07Sika AG 21,268 CHF 2,633,120 5,869,043 0.37Sonova Holdings AG 8,555 CHF 1,336,929 2,715,905 0.17Stadler Rail AG 9,210 CHF 331,933 341,787 0.02Straumann Holdings AG 1,810 CHF 1,065,074 2,435,487 0.15Swatch Group AG 4,602 CHF 1,411,332 1,332,505 0.08Swiss Life Holdings AG 5,071 CHF 1,426,831 2,079,865 0.13Swiss Prime Site AG 12,116 CHF 870,763 1,014,652 0.06Swiss Re AG 45,770 CHF 3,526,983 3,485,609 0.22Swisscom AG 4,029 CHF 1,802,238 1,941,382 0.12Tecan Group AG 1,529 CHF 385,156 639,392 0.04Temenos AG 10,568 CHF 1,032,726 1,432,606 0.09UBS Group AG 551,294 CHF 6,304,609 7,121,341 0.45VAT Group AG 144A 4,294 CHF 536,159 1,204,935 0.08Vifor Pharma AG 7,510 CHF 918,574 820,410 0.05Zur Rose Group AG 1,507 CHF 384,409 487,354 0.03Zurich Insurance Group AG 23,826 CHF 6,439,261 8,068,158 0.51
173,700,341 232,358,888 14.65United Kingdom3i Group PLC 154,173 GBP 1,725,182 2,106,654 0.13Admiral Group PLC 37,891 GBP 895,607 1,387,732 0.09Allfunds UK Ltd. 55,025 EUR 812,207 807,657 0.05Anglo American PLC 201,085 GBP 3,936,904 6,728,630 0.42Antofagasta PLC 61,530 GBP 641,636 1,028,909 0.06Ashmore Group PLC 77,429 GBP 422,950 347,257 0.02Ashtead Group PLC 71,511 GBP 1,570,968 4,468,364 0.28Associated British Foods PLC 57,092 GBP 1,779,956 1,473,778 0.09Assura REIT PLC 421,304 GBP 380,279 363,419 0.02AstraZeneca PLC 207,922 GBP 13,905,413 21,030,867 1.33Auto Trader Group PLC 144A 154,223 GBP 825,727 1,137,926 0.07Avast PLC 144A 105,915 GBP 559,689 604,315 0.04AVEVA Group PLC 19,773 GBP 693,937 854,081 0.05Aviva PLC 622,347 GBP 3,283,512 2,942,650 0.19
Xtrackers**
Xtrackers STOXX EUROPE 600 UCITS ETF (continued)
Statement of Investmentsas at 30 June 2021(expressed in EUR)
** This includes synthetic ETFs.
The accompanying notes form an integral part of these financial statements.
174

Description QuantityCurrency
(local) Cost Market Value
% ofNet
Assets
Transferable securities and money market instruments admitted to an official stock exchange listing(A)
Shares (continued)
United Kingdom (continued)BAE Systems PLC 511,249 GBP 3,234,567 3,108,779 0.20Barclays PLC 2,530,791 GBP 5,855,863 5,044,800 0.32Barratt Developments PLC 161,951 GBP 1,094,221 1,311,536 0.08Bellway PLC 19,573 GBP 666,239 738,736 0.05Berkeley Group Holdings PLC 19,271 GBP 850,498 1,031,518 0.07BHP Group PLC 334,493 GBP 6,203,051 8,299,531 0.52BP PLC 3,205,537 GBP 16,577,459 11,762,463 0.74British American Tobacco PLC 339,501 GBP 14,985,586 11,073,528 0.70British Land REIT Co. PLC 137,025 GBP 999,154 789,958 0.05Britvic PLC 42,061 GBP 386,361 459,099 0.03BT Group PLC 1,390,640 GBP 4,726,694 3,142,703 0.20Bunzl PLC 53,517 GBP 1,260,430 1,489,343 0.09Burberry Group PLC 64,310 GBP 1,317,860 1,547,732 0.10Carnival PLC 24,940 GBP 952,825 482,504 0.03Centrica PLC 925,951 GBP 1,945,980 555,066 0.03Close Brothers Group PLC 23,944 GBP 397,435 422,568 0.03Compass Group PLC 282,864 GBP 4,687,130 5,015,096 0.32ConvaTec Group PLC 144A 254,858 GBP 711,212 714,300 0.05Countryside Properties PLC 144A 74,878 GBP 364,928 412,226 0.03Croda International PLC 22,643 GBP 1,121,398 1,943,437 0.12Dechra Pharmaceuticals PLC 17,236 GBP 554,088 877,415 0.06Deliveroo PLC 144A 174,885 GBP 532,750 587,536 0.04Derwent London REIT PLC 16,253 GBP 622,077 628,577 0.04Diageo PLC 370,411 GBP 10,741,935 14,933,872 0.94Dialog Semiconductor PLC 11,222 EUR 464,315 735,714 0.05Diploma PLC 19,614 GBP 454,269 663,513 0.04Direct Line Insurance Group PLC 213,128 GBP 808,044 707,575 0.04Dr. Martens PLC 89,897 GBP 444,392 466,007 0.03DS Smith PLC 218,230 GBP 960,825 1,062,365 0.07easyJet PLC 35,961 GBP 428,616 374,839 0.02Electrocomponents PLC 74,823 GBP 544,757 896,886 0.06Evraz PLC 91,711 GBP 484,995 632,456 0.04Future PLC 17,932 GBP 595,332 654,241 0.04Games Workshop Group PLC 5,203 GBP 262,509 690,948 0.04Genus PLC 10,410 GBP 338,120 601,477 0.04GlaxoSmithKline PLC 796,913 GBP 14,612,735 13,176,578 0.83Greggs PLC 15,990 GBP 473,067 483,362 0.03Halma PLC 60,274 GBP 1,040,066 1,890,131 0.12Hargreaves Lansdown PLC 56,192 GBP 1,016,846 1,040,125 0.07Hays PLC 264,874 GBP 476,908 489,361 0.03Hikma Pharmaceuticals PLC 27,098 GBP 629,666 772,113 0.05HomeServe PLC 46,491 GBP 514,691 517,472 0.03Howden Joinery Group PLC 96,022 GBP 609,414 913,413 0.06HSBC Holdings PLC 3,286,746 GBP 23,207,505 15,977,229 1.01IG Group Holdings PLC 58,309 GBP 486,412 575,315 0.04IMI PLC 42,807 GBP 595,289 857,690 0.05Imperial Brands PLC 150,123 GBP 4,314,065 2,722,844 0.17Inchcape PLC 57,858 GBP 437,166 517,958 0.03
Xtrackers**
Xtrackers STOXX EUROPE 600 UCITS ETF (continued)
Statement of Investmentsas at 30 June 2021(expressed in EUR)
** This includes synthetic ETFs.
The accompanying notes form an integral part of these financial statements.
175

Description QuantityCurrency
(local) Cost Market Value
% ofNet
Assets
Transferable securities and money market instruments admitted to an official stock exchange listing(A)
Shares (continued)
United Kingdom (continued)Informa PLC 238,876 GBP 1,623,243 1,395,780 0.09InterContinental Hotels Group PLC 29,816 GBP 1,421,805 1,670,634 0.11Intermediate Capital Group PLC 46,761 GBP 611,380 1,156,978 0.07Intertek Group PLC 25,618 GBP 1,311,990 1,650,279 0.10ITV PLC 578,177 GBP 1,105,451 845,599 0.05J Sainsbury PLC 266,203 GBP 769,841 842,848 0.05JD Sports Fashion PLC 78,960 GBP 596,925 845,298 0.05Johnson Matthey PLC 31,538 GBP 1,113,023 1,128,973 0.07Kingfisher PLC 335,323 GBP 1,085,846 1,423,796 0.09Land Securities Group REIT PLC 110,290 GBP 1,286,466 867,729 0.05Legal & General Group PLC 945,399 GBP 2,848,961 2,836,926 0.18Lloyds Banking Group PLC 11,241,008 GBP 8,386,616 6,113,868 0.39London Stock Exchange Group PLC 51,086 GBP 2,832,682 4,742,935 0.30LondonMetric Property REIT PLC 144,274 GBP 361,108 388,900 0.02M&G PLC 413,592 GBP 1,039,251 1,102,821 0.07Marks & Spencer Group PLC 308,083 GBP 992,200 525,586 0.03Meggitt PLC 123,034 GBP 722,702 661,000 0.04Melrose Industries PLC 731,697 GBP 1,680,347 1,321,996 0.08Mondi PLC 76,942 GBP 1,466,355 1,703,855 0.11National Grid PLC 543,340 GBP 6,025,048 5,828,059 0.37Natwest Group PLC 861,820 GBP 2,415,243 2,039,986 0.13Next PLC 21,098 GBP 1,510,211 1,930,766 0.12Ocado Group PLC 100,714 GBP 1,171,224 2,349,945 0.15Pearson PLC 119,934 GBP 1,183,477 1,159,598 0.07Pennon Group PLC 67,244 GBP 710,588 889,462 0.06Persimmon PLC 50,663 GBP 1,314,117 1,745,726 0.11Phoenix Group Holdings PLC 114,408 GBP 896,571 901,461 0.06Primary Health Properties REIT PLC 209,462 GBP 356,882 375,518 0.02Prudential PLC 414,280 GBP 6,508,375 6,628,413 0.42Quilter PLC 144A 245,426 GBP 395,460 425,270 0.03Reckitt Benckiser Group PLC 116,662 GBP 8,524,092 8,693,461 0.55RELX PLC 314,119 GBP 5,507,016 7,021,924 0.44Rentokil Initial PLC 294,490 GBP 1,111,288 1,698,098 0.11Rightmove PLC 138,857 GBP 795,628 1,050,430 0.07Rio Tinto PLC 169,955 GBP 7,428,572 11,777,818 0.74Rolls-Royce Holdings PLC 1,326,035 GBP 3,868,637 1,528,009 0.10Rotork PLC 139,034 GBP 467,526 551,312 0.03Royal Dutch Shell PLC-A- 649,547 EUR 15,363,207 11,044,897 0.70Royal Mail PLC 134,408 GBP 649,143 904,042 0.06S4 Capital PLC 72,296 GBP 504,263 528,885 0.03Sage Group PLC 178,040 GBP 1,280,415 1,419,017 0.09Schroders PLC 20,377 GBP 709,754 833,883 0.05Segro REIT PLC 190,162 GBP 1,464,745 2,424,524 0.15Severn Trent PLC 40,155 GBP 1,044,788 1,169,877 0.07Smith & Nephew PLC 140,227 GBP 2,236,540 2,552,341 0.16Smiths Group PLC 63,066 GBP 1,053,248 1,168,098 0.07Softcat PLC 21,112 GBP 468,323 436,777 0.03Spectris PLC 19,035 GBP 553,554 717,987 0.05
Xtrackers**
Xtrackers STOXX EUROPE 600 UCITS ETF (continued)
Statement of Investmentsas at 30 June 2021(expressed in EUR)
** This includes synthetic ETFs.
The accompanying notes form an integral part of these financial statements.
176

Description QuantityCurrency
(local) Cost Market Value
% ofNet
Assets
Transferable securities and money market instruments admitted to an official stock exchange listing(A)
Shares (continued)
United Kingdom (continued)Spirax-Sarco Engineering PLC 11,665 GBP 883,522 1,850,075 0.12SSE PLC 166,232 GBP 2,761,937 2,905,612 0.18St James’s Place PLC 85,531 GBP 1,016,450 1,471,604 0.09Standard Chartered PLC 413,375 GBP 3,562,892 2,219,893 0.14Standard Life Aberdeen PLC 347,000 GBP 1,568,350 1,095,433 0.07Tate & Lyle PLC 74,692 GBP 603,202 642,470 0.04Taylor Wimpey PLC 579,460 GBP 1,093,867 1,072,929 0.07TechnipFMC PLC 66,841 EUR 1,030,566 505,585 0.03Tesco PLC 1,224,731 GBP 4,184,455 3,180,791 0.20THG PLC 135,625 GBP 1,019,019 963,733 0.06Travis Perkins PLC 35,535 GBP 607,761 699,154 0.04Tritax Big Box REIT PLC 273,927 GBP 447,151 626,386 0.04Unilever PLC 416,407 GBP 18,322,038 20,520,912 1.29UNITE Group REIT PLC 51,861 GBP 620,105 648,832 0.04United Utilities Group PLC 108,396 GBP 1,126,347 1,230,375 0.08Victrex PLC 13,627 GBP 348,160 404,153 0.03Virgin Money UK PLC 197,111 GBP 445,659 455,898 0.03Vistry Group PLC 34,997 GBP 503,763 479,634 0.03Vodafone Group PLC 4,564,445 GBP 9,783,171 6,451,770 0.41Weir Group PLC 41,315 GBP 787,334 890,843 0.06WH Smith PLC 20,613 GBP 447,350 386,233 0.02Whitbread PLC 32,091 GBP 1,205,778 1,167,087 0.07Wm Morrison Supermarkets PLC 382,441 GBP 925,322 1,099,058 0.07
326,492,038 331,064,019 20.87
Total - Shares 1,283,658,543 1,582,434,878 99.76
Rights
SpainACS Actividades de Construccion y ServiciosSA-Rights- 09.07.21 39,409 EUR — 46,503 0.00
— 46,503 0.00
Total - Rights — 46,503 0.00
Total Transferable securities and money market instruments admitted to an officialstock exchange listing 1,283,658,543 1,582,481,381 99.76
Xtrackers**
Xtrackers STOXX EUROPE 600 UCITS ETF (continued)
Statement of Investmentsas at 30 June 2021(expressed in EUR)
** This includes synthetic ETFs.
The accompanying notes form an integral part of these financial statements.
177

Description QuantityCurrency
(local) Cost Market Value
% ofNet
Assets
Other transferable securities and money market instruments(A)
Shares
PortugalBanco Espirito Santo SA(1) 263,789 EUR 269,287 26 0.00
269,287 26 0.00United KingdomNMC Health PLC(1) 15,285 GBP 477,667 2 0.00
477,667 2 0.00
Total - Shares 746,954 28 0.00
Total Other transferable securities and money market instruments 746,954 28 0.00
TOTAL INVESTMENT PORTFOLIO 1,284,405,497 1,582,481,409 99.76(A) Any duplicate securities appearing herein with the same name are either quoted on different stock exchanges or have different ISINs.
(1) The security is fair valued.
Xtrackers**
Xtrackers STOXX EUROPE 600 UCITS ETF (continued)
Statement of Investmentsas at 30 June 2021(expressed in EUR)
** This includes synthetic ETFs.
The accompanying notes form an integral part of these financial statements.
178

Description QuantityCurrency
(local) Cost Market Value
% ofNet
Assets
Transferable securities and money market instruments admitted to an official stock exchange listing
Shares
AustraliaAfterpay Ltd. 12,000 AUD 1,054,738 1,064,594 0.45
1,054,738 1,064,594 0.45CanadaAgnico Eagle Mines Ltd. 119,233 USD 7,458,024 7,207,635 3.01BCE Inc. 99,575 USD 4,903,073 4,911,039 2.05Canopy Growth Corp. 225,630 USD 5,577,574 5,455,733 2.28CGI Inc. 82,092 USD 7,458,058 7,437,535 3.11Kinross Gold Corp. 260,594 USD 1,683,437 1,654,772 0.69Magna International Inc. 157,559 USD 14,916,110 14,596,266 6.10Manulife Financial Corp. 760,252 USD 14,916,144 14,976,964 6.26Rogers Communications Inc.-B- 142,520 USD 7,458,072 7,573,513 3.17Royal Bank of Canada 4,495 USD 459,704 455,388 0.19Shopify Inc.-A- 6,262 USD 7,764,880 9,148,657 3.83Sun Life Financial Inc. 145,694 USD 7,458,076 7,509,069 3.14TELUS Corp. 333,993 USD 7,458,064 7,491,463 3.13Thomson Reuters Corp. 93,052 USD 8,998,128 9,241,925 3.87Waste Connections Inc. 62,093 USD 7,457,990 7,415,767 3.10
103,967,334 105,075,726 43.93NetherlandsPlaya Hotels & Resorts NV 837,200 USD 5,927,376 6,220,396 2.60
5,927,376 6,220,396 2.60United States8x8 Inc. 405,084 USD 9,446,559 11,245,132 4.70Align Technology Inc. 2,436 USD 1,257,804 1,488,396 0.62Alimera Sciences Inc. 29,316 USD 231,890 266,776 0.11Allegiant Travel Co. 45,329 USD 9,724,884 8,793,826 3.68Alphabet Inc.-C- 2,626 USD 4,118,855 6,581,596 2.75Amazon.com Inc. 2,307 USD 7,307,330 7,936,449 3.32Baxter International Inc. 118,092 USD 9,724,876 9,506,406 3.98BGC Partners Inc.-A- 1,802,779 USD 9,446,562 10,221,757 4.27Bio-Rad Laboratories Inc.-A- 17 USD 10,480 10,953 0.00Cadence Design Systems Inc. 165,072 USD 20,665,364 22,585,151 9.44Casper Sleep Inc. 36,561 USD 299,435 301,263 0.13Caterpillar Inc. 59,649 USD 14,374,812 12,981,412 5.43CBRE Group Inc.-A- 59,509 USD 5,171,332 5,101,707 2.13DXC Technology Co. 189,994 USD 6,134,906 7,398,366 3.09FleetCor Technologies Inc. 2,625 USD 753,270 672,158 0.28Karyopharm Therapeutics Inc. 110,042 USD 1,779,929 1,135,633 0.48Livent Corp. 474,616 USD 9,724,882 9,188,566 3.84Micron Technology Inc. 156 USD 10,012 13,257 0.01Mosaic Co. 278,251 USD 9,724,872 8,878,989 3.71
Xtrackers**
Xtrackers S&P GLOBAL INFRASTRUCTURE SWAP UCITS ETF*
Statement of Investmentsas at 30 June 2021(expressed in USD)
* This is a synthetic ETF.** This includes synthetic ETFs.
The accompanying notes form an integral part of these financial statements.
179
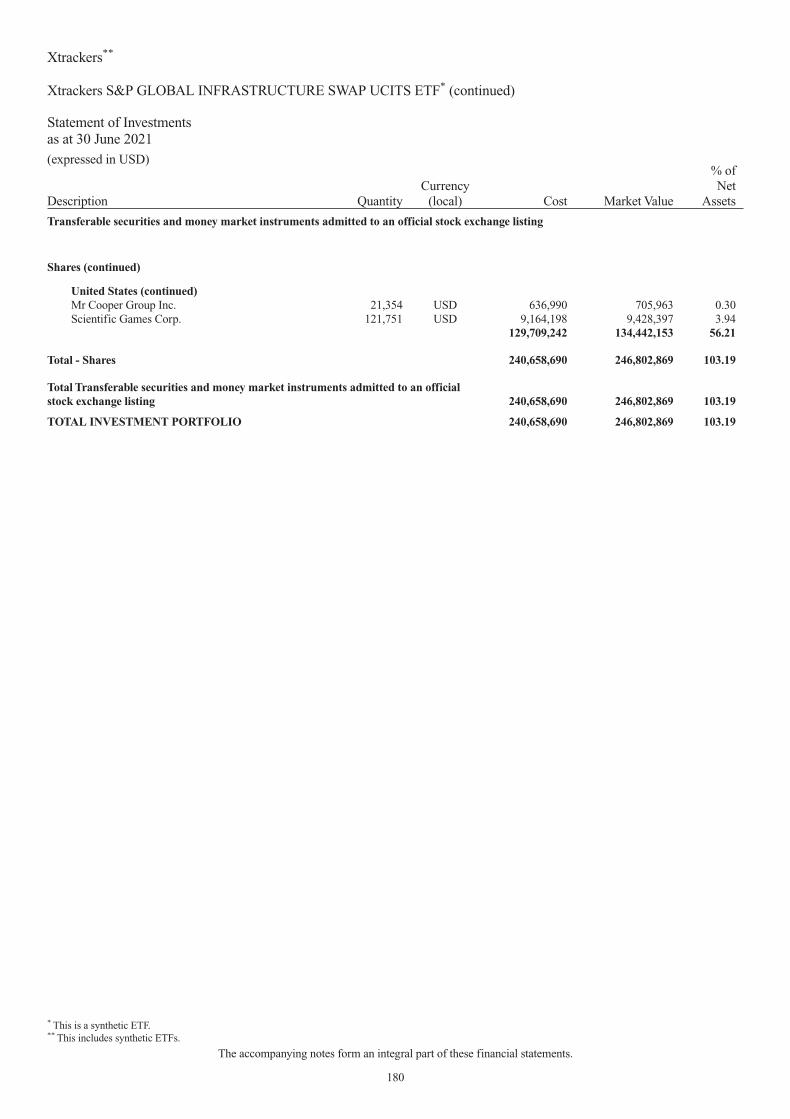
Description QuantityCurrency
(local) Cost Market Value
% ofNet
Assets
Transferable securities and money market instruments admitted to an official stock exchange listing
Shares (continued)
United States (continued)Mr Cooper Group Inc. 21,354 USD 636,990 705,963 0.30Scientific Games Corp. 121,751 USD 9,164,198 9,428,397 3.94
129,709,242 134,442,153 56.21
Total - Shares 240,658,690 246,802,869 103.19
Total Transferable securities and money market instruments admitted to an officialstock exchange listing 240,658,690 246,802,869 103.19
TOTAL INVESTMENT PORTFOLIO 240,658,690 246,802,869 103.19
Xtrackers**
Xtrackers S&P GLOBAL INFRASTRUCTURE SWAP UCITS ETF* (continued)
Statement of Investmentsas at 30 June 2021(expressed in USD)
* This is a synthetic ETF.** This includes synthetic ETFs.
The accompanying notes form an integral part of these financial statements.
180

Description QuantityCurrency
(local) Cost Market Value
% ofNet
Assets
Transferable securities and money market instruments admitted to an official stock exchange listing
Shares
FranceAir Liquide SA 46,092 EUR 4,459,531 6,805,945 4.66Alstom SA 30,714 EUR 1,287,296 1,308,109 0.90Atos SE 9,636 EUR 741,200 494,327 0.34AXA SA 188,276 EUR 4,012,775 4,026,282 2.76BNP Paribas SA 109,491 EUR 5,505,511 5,788,789 3.96Bouygues SA 22,198 EUR 762,811 692,356 0.47Capgemini SE 15,669 EUR 1,354,753 2,538,378 1.74Carrefour SA 59,690 EUR 1,132,796 989,959 0.68Cie de Saint-Gobain 47,718 EUR 1,793,768 2,650,258 1.82Cie Generale des Etablissements Michelin SCA 17,389 EUR 1,693,965 2,338,820 1.60Credit Agricole SA 112,319 EUR 1,244,606 1,326,937 0.91Danone SA 63,496 EUR 3,887,531 3,769,757 2.58Dassault Systemes SE 12,861 EUR 1,673,175 2,630,074 1.80Engie SA 177,793 EUR 2,371,089 2,054,220 1.41EssilorLuxottica SA 29,815 EUR 3,236,340 4,640,407 3.18Hermes International 3,083 EUR 1,854,411 3,787,465 2.59Kering SA 7,376 EUR 2,446,124 5,436,112 3.72Legrand SA 25,991 EUR 1,455,571 2,319,957 1.59L’Oreal SA 24,498 EUR 4,802,997 9,206,348 6.31LVMH Moet Hennessy Louis Vuitton SE 27,023 EUR 6,941,493 17,870,310 12.24Orange SA 181,255 EUR 2,336,498 1,742,767 1.19Pernod Ricard SA 19,119 EUR 2,308,164 3,579,077 2.45Publicis Groupe SA 21,088 EUR 1,021,976 1,137,487 0.78Renault SA 20,150 EUR 1,205,749 686,813 0.47Safran SA 31,193 EUR 2,502,472 3,647,086 2.50Sanofi 110,292 EUR 8,651,922 9,745,401 6.67Schneider Electric SE 52,440 EUR 3,623,396 6,957,739 4.77Societe Generale SA 78,914 EUR 2,601,173 1,961,802 1.34Teleperformance 5,717 EUR 1,251,762 1,956,929 1.34Thales SA 10,372 EUR 994,501 892,407 0.61TotalEnergies SE 245,348 EUR 10,245,165 9,361,253 6.41Unibail-Rodamco-Westfield REIT 11,458 EUR 1,772,521 836,319 0.57Veolia Environnement SA 52,457 EUR 978,623 1,336,080 0.91Vinci SA 47,689 EUR 3,489,149 4,291,533 2.94Vivendi SE 75,040 EUR 1,536,605 2,125,883 1.46Worldline SA 144A 23,457 EUR 1,431,913 1,851,696 1.27
98,609,332 132,785,082 90.94LuxembourgArcelorMittal SA 69,776 EUR 1,266,537 1,803,710 1.23
1,266,537 1,803,710 1.23NetherlandsAirbus SE 57,242 EUR 4,181,239 6,207,322 4.25
Xtrackers**
Xtrackers CAC 40 UCITS ETF
Statement of Investmentsas at 30 June 2021(expressed in EUR)
** This includes synthetic ETFs.
The accompanying notes form an integral part of these financial statements.
181
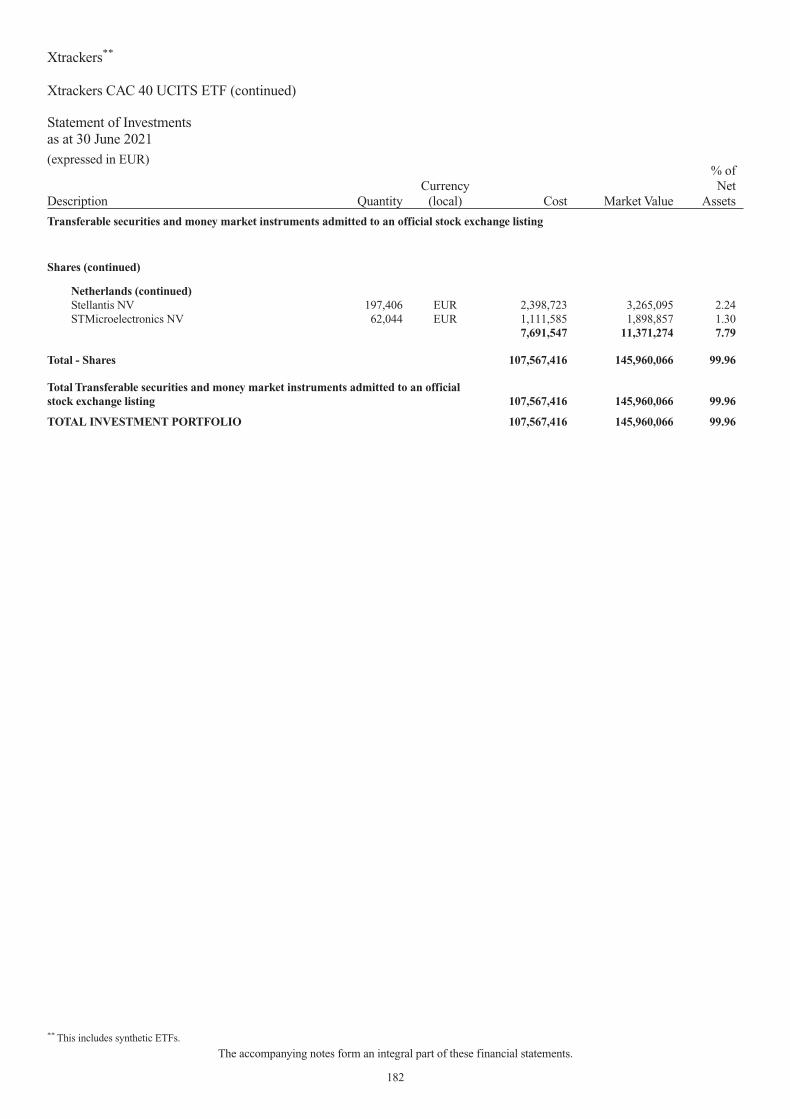
Description QuantityCurrency
(local) Cost Market Value
% ofNet
Assets
Transferable securities and money market instruments admitted to an official stock exchange listing
Shares (continued)
Netherlands (continued)Stellantis NV 197,406 EUR 2,398,723 3,265,095 2.24STMicroelectronics NV 62,044 EUR 1,111,585 1,898,857 1.30
7,691,547 11,371,274 7.79
Total - Shares 107,567,416 145,960,066 99.96
Total Transferable securities and money market instruments admitted to an officialstock exchange listing 107,567,416 145,960,066 99.96
TOTAL INVESTMENT PORTFOLIO 107,567,416 145,960,066 99.96
Xtrackers**
Xtrackers CAC 40 UCITS ETF (continued)
Statement of Investmentsas at 30 June 2021(expressed in EUR)
** This includes synthetic ETFs.
The accompanying notes form an integral part of these financial statements.
182

Description QuantityCurrency
(local) Cost Market Value
% ofNet
Assets
Transferable securities and money market instruments admitted to an official stock exchange listing(A)
Shares
AustriaErste Group Bank AG 6,566 EUR 160,335 240,918 0.45OMV AG 3,461 EUR 145,300 196,888 0.37Raiffeisen Bank International AG 3,465 EUR 92,316 78,485 0.15Verbund AG 1,600 EUR 78,370 147,336 0.28voestalpine AG 2,728 EUR 113,271 111,095 0.21
589,592 774,722 1.46BelgiumAgeas SA 4,115 EUR 194,915 228,383 0.43Colruyt SA 1,275 EUR 71,585 71,307 0.13Elia Group SA 727 EUR 83,870 76,732 0.15Proximus SADP 3,560 EUR 109,987 68,773 0.13Sofina SA 363 EUR 104,262 156,609 0.30Solvay SA 1,742 EUR 223,923 221,458 0.42Umicore SA 4,633 EUR 179,920 282,955 0.53
968,462 1,106,217 2.09DenmarkAmbu A/S-B- 3,936 DKK 140,869 151,338 0.28Chr Hansen Holdings A/S 2,479 DKK 197,290 223,763 0.42Danske Bank A/S 16,211 DKK 221,733 285,283 0.54Demant A/S 2,546 DKK 69,637 143,327 0.27Genmab A/S 1,540 DKK 320,078 630,190 1.19GN Store Nord AS 3,009 DKK 177,677 262,869 0.50Novozymes A/S-B- 4,892 DKK 248,554 368,779 0.70Pandora A/S 2,350 DKK 217,037 315,929 0.60ROCKWOOL International A/S-B- 203 DKK 77,562 98,836 0.19Tryg A/S 8,462 DKK 177,331 207,753 0.39
1,847,768 2,688,067 5.08FinlandElisa OYJ 3,343 EUR 139,932 199,492 0.38Kesko OYJ-B- 6,419 EUR 173,082 237,123 0.45Orion OYJ-B- 2,496 EUR 98,734 107,300 0.20Stora Enso OYJ-R- 13,672 EUR 182,366 249,447 0.47UPM-Kymmene OYJ 12,544 EUR 324,007 474,543 0.90Wartsila OYJ Abp 11,125 EUR 180,864 165,112 0.31
1,098,985 1,433,017 2.71FranceAccor SA 3,993 EUR 180,198 149,115 0.28Aeroports de Paris 695 EUR 97,862 90,538 0.17Alstom SA 6,543 EUR 272,174 330,471 0.62Amundi SA 144A 1,430 EUR 121,775 126,085 0.24Arkema SA 1,443 EUR 152,773 181,051 0.34Atos SE 2,327 EUR 191,813 141,567 0.27BioMerieux 979 EUR 95,349 113,778 0.21Bollore SA 20,734 EUR 67,673 111,140 0.21Bouygues SA 5,369 EUR 219,654 198,590 0.37Bureau Veritas SA 6,908 EUR 180,907 218,568 0.41Capgemini SE 3,768 EUR 425,792 723,893 1.37Carrefour SA 14,412 EUR 292,701 283,457 0.54
Xtrackers**
Xtrackers MSCI EUROPE MID CAP UCITS ETF
Statement of Investmentsas at 30 June 2021(expressed in USD)
** This includes synthetic ETFs.
The accompanying notes form an integral part of these financial statements.
183

Description QuantityCurrency
(local) Cost Market Value
% ofNet
Assets
Transferable securities and money market instruments admitted to an official stock exchange listing(A)
Shares (continued)
France (continued)CNP Assurances 4,021 EUR 48,853 68,428 0.13Covivio REIT 1,229 EUR 111,873 105,113 0.20Dassault Aviation SA 59 EUR 73,530 69,408 0.13Edenred 5,795 EUR 213,619 330,214 0.62Eiffage SA 1,958 EUR 182,845 199,227 0.38Eurazeo SE 925 EUR 64,340 80,626 0.15Faurecia SE 2,758 EUR 175,885 135,309 0.26Gecina REIT SA 1,079 EUR 159,133 165,323 0.31Getlink SE 10,341 EUR 137,784 161,264 0.30Iliad SA 347 EUR 72,142 50,780 0.10Ipsen SA 883 EUR 104,051 91,856 0.17Klepierre REIT SA 4,851 EUR 137,542 125,008 0.24La Francaise des Jeux SAEM 144A 2,246 EUR 86,988 132,058 0.25Legrand SA 6,286 EUR 438,082 665,395 1.26Natixis SA 22,216 EUR 61,087 105,384 0.20Orpea SA 1,215 EUR 143,647 154,533 0.29Publicis Groupe SA 5,043 EUR 230,474 322,588 0.61Remy Cointreau SA 533 EUR 63,905 110,046 0.21Renault SA 4,518 EUR 120,956 182,624 0.34SCOR SE 3,729 EUR 135,500 118,604 0.22SEB SA 651 EUR 98,444 117,656 0.22Sodexo SA 2,079 EUR 221,051 194,034 0.37Suez SA 8,122 EUR 148,874 193,119 0.36Teleperformance 1,380 EUR 278,848 560,189 1.06Ubisoft Entertainment SA 2,177 EUR 173,360 152,424 0.29Unibail-Rodamco-Westfield REIT 2,929 EUR 171,011 253,531 0.48Valeo SA 5,397 EUR 266,434 162,376 0.31Veolia Environnement SA 12,665 EUR 287,662 382,545 0.72Wendel SE 628 EUR 89,358 84,454 0.16
6,795,949 8,142,369 15.37GermanyBechtle AG 644 EUR 137,641 119,637 0.23Brenntag SE 3,631 EUR 228,567 337,677 0.64Carl Zeiss Meditec AG 946 EUR 103,791 182,807 0.34Commerzbank AG 23,547 EUR 197,091 167,044 0.31Covestro AG 144A 4,541 EUR 332,957 293,277 0.55Delivery Hero SE 144A 3,691 EUR 301,921 487,616 0.92Deutsche Lufthansa AG 7,016 EUR 134,981 78,959 0.15Deutsche Wohnen SE 8,034 EUR 289,581 491,430 0.93FUCHS PETROLUB SE-Pref- 1,627 EUR 80,639 79,146 0.15GEA Group AG 3,606 EUR 154,246 146,080 0.28HeidelbergCement AG 3,497 EUR 199,333 300,001 0.57HelloFresh SE 3,882 EUR 254,873 377,409 0.71KION Group AG 1,696 EUR 147,396 180,775 0.34LANXESS AG 1,952 EUR 136,121 133,846 0.25LEG Immobilien AG 1,694 EUR 218,198 243,983 0.46MTU Aero Engines AG 1,254 EUR 243,674 310,659 0.59Nemetschek SE 1,355 EUR 103,732 103,677 0.20
Xtrackers**
Xtrackers MSCI EUROPE MID CAP UCITS ETF (continued)
Statement of Investmentsas at 30 June 2021(expressed in USD)
** This includes synthetic ETFs.
The accompanying notes form an integral part of these financial statements.
184
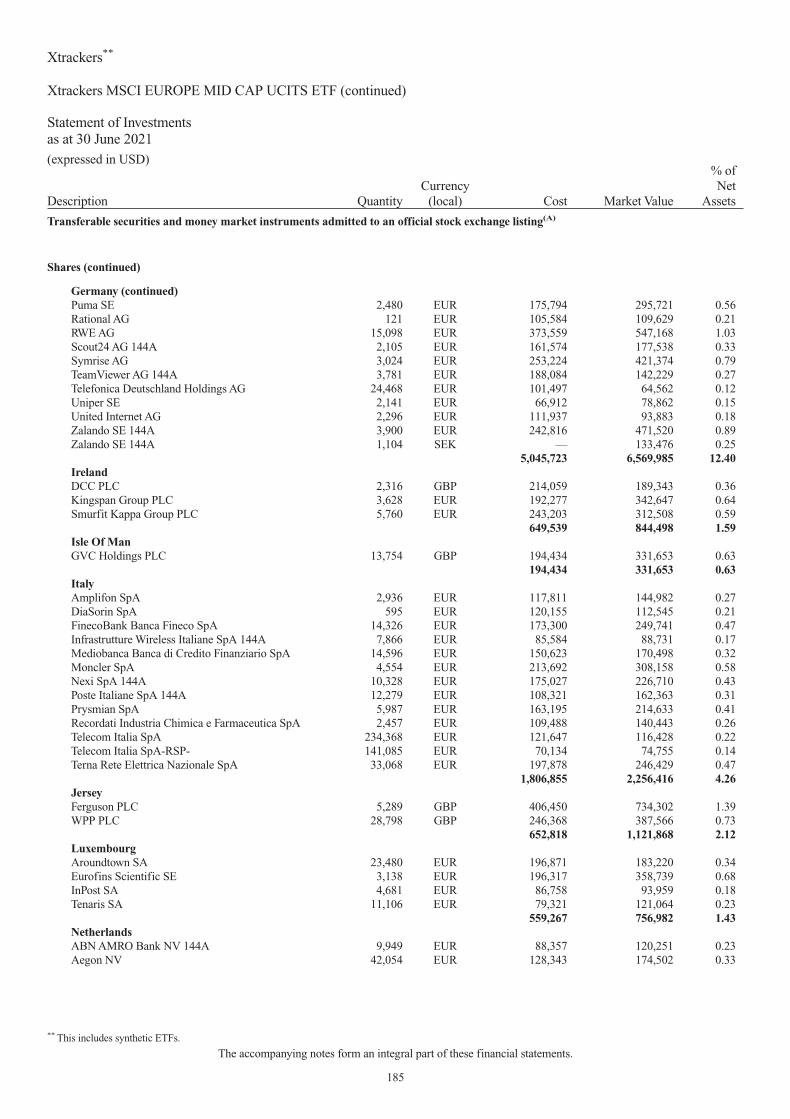
Description QuantityCurrency
(local) Cost Market Value
% ofNet
Assets
Transferable securities and money market instruments admitted to an official stock exchange listing(A)
Shares (continued)
Germany (continued)Puma SE 2,480 EUR 175,794 295,721 0.56Rational AG 121 EUR 105,584 109,629 0.21RWE AG 15,098 EUR 373,559 547,168 1.03Scout24 AG 144A 2,105 EUR 161,574 177,538 0.33Symrise AG 3,024 EUR 253,224 421,374 0.79TeamViewer AG 144A 3,781 EUR 188,084 142,229 0.27Telefonica Deutschland Holdings AG 24,468 EUR 101,497 64,562 0.12Uniper SE 2,141 EUR 66,912 78,862 0.15United Internet AG 2,296 EUR 111,937 93,883 0.18Zalando SE 144A 3,900 EUR 242,816 471,520 0.89Zalando SE 144A 1,104 SEK — 133,476 0.25
5,045,723 6,569,985 12.40IrelandDCC PLC 2,316 GBP 214,059 189,343 0.36Kingspan Group PLC 3,628 EUR 192,277 342,647 0.64Smurfit Kappa Group PLC 5,760 EUR 243,203 312,508 0.59
649,539 844,498 1.59Isle Of ManGVC Holdings PLC 13,754 GBP 194,434 331,653 0.63
194,434 331,653 0.63ItalyAmplifon SpA 2,936 EUR 117,811 144,982 0.27DiaSorin SpA 595 EUR 120,155 112,545 0.21FinecoBank Banca Fineco SpA 14,326 EUR 173,300 249,741 0.47Infrastrutture Wireless Italiane SpA 144A 7,866 EUR 85,584 88,731 0.17Mediobanca Banca di Credito Finanziario SpA 14,596 EUR 150,623 170,498 0.32Moncler SpA 4,554 EUR 213,692 308,158 0.58Nexi SpA 144A 10,328 EUR 175,027 226,710 0.43Poste Italiane SpA 144A 12,279 EUR 108,321 162,363 0.31Prysmian SpA 5,987 EUR 163,195 214,633 0.41Recordati Industria Chimica e Farmaceutica SpA 2,457 EUR 109,488 140,443 0.26Telecom Italia SpA 234,368 EUR 121,647 116,428 0.22Telecom Italia SpA-RSP- 141,085 EUR 70,134 74,755 0.14Terna Rete Elettrica Nazionale SpA 33,068 EUR 197,878 246,429 0.47
1,806,855 2,256,416 4.26JerseyFerguson PLC 5,289 GBP 406,450 734,302 1.39WPP PLC 28,798 GBP 246,368 387,566 0.73
652,818 1,121,868 2.12LuxembourgAroundtown SA 23,480 EUR 196,871 183,220 0.34Eurofins Scientific SE 3,138 EUR 196,317 358,739 0.68InPost SA 4,681 EUR 86,758 93,959 0.18Tenaris SA 11,106 EUR 79,321 121,064 0.23
559,267 756,982 1.43NetherlandsABN AMRO Bank NV 144A 9,949 EUR 88,357 120,251 0.23Aegon NV 42,054 EUR 128,343 174,502 0.33
Xtrackers**
Xtrackers MSCI EUROPE MID CAP UCITS ETF (continued)
Statement of Investmentsas at 30 June 2021(expressed in USD)
** This includes synthetic ETFs.
The accompanying notes form an integral part of these financial statements.
185

Description QuantityCurrency
(local) Cost Market Value
% ofNet
Assets
Transferable securities and money market instruments admitted to an official stock exchange listing(A)
Shares (continued)
Netherlands (continued)Argenx SE 77 EUR 18,067 23,294 0.04Argenx SE 1,000 EUR 247,111 302,523 0.57ASM International NV 1,112 EUR 299,669 365,286 0.69CNH Industrial NV 24,050 EUR 246,077 397,154 0.75Davide Campari-Milano NV 12,285 EUR 105,867 164,554 0.31EXOR NV 2,549 EUR 149,143 204,224 0.38Just Eat Takeaway.com NV 144A 4,210 EUR 414,790 388,777 0.73Koninklijke KPN NV 79,021 EUR 262,178 246,835 0.47Koninklijke Vopak NV 1,619 EUR 81,904 73,535 0.14NN Group NV 6,598 EUR 255,068 311,261 0.59QIAGEN NV 5,425 EUR 180,196 262,230 0.49Randstad NV 2,810 EUR 172,912 214,939 0.41
2,649,682 3,249,365 6.13NorwayAdevinta ASA 6,444 NOK 118,548 123,560 0.23Gjensidige Forsikring ASA 4,694 NOK 93,922 103,533 0.19Mowi ASA 10,330 NOK 191,312 262,896 0.50Norsk Hydro ASA 31,607 NOK 166,566 201,795 0.38Orkla ASA 17,652 NOK 160,974 179,900 0.34Schibsted ASA-A- 1,711 NOK 71,170 82,635 0.16Schibsted ASA-B- 2,279 NOK 60,067 94,972 0.18Yara International ASA 4,096 NOK 171,998 215,719 0.41
1,034,557 1,265,010 2.39PortugalGalp Energia SGPS SA 11,781 EUR 157,865 127,864 0.24Jeronimo Martins SGPS SA 5,947 EUR 101,814 108,468 0.21
259,679 236,332 0.45SpainACS Actividades de Construccion y Servicios SA 5,476 EUR 162,420 146,699 0.28Enagas SA 5,849 EUR 158,411 135,155 0.25Red Electrica Corp. SA 10,173 EUR 202,767 188,865 0.36Repsol SA 35,007 EUR 344,931 438,147 0.83Siemens Gamesa Renewable Energy SA 5,603 EUR 125,868 187,112 0.35
994,397 1,095,978 2.07SwedenAlfa Laval AB 7,394 SEK 186,654 261,362 0.49Boliden AB 6,428 SEK 162,305 247,284 0.47Electrolux AB-Series B- 5,301 SEK 123,999 147,089 0.28Embracer Group AB 6,027 SEK 173,485 163,146 0.31Epiroc AB-A- 15,488 SEK 193,973 353,146 0.67Epiroc AB-B- 9,165 SEK 105,539 179,985 0.34Fastighets AB Balder 2,472 SEK 125,798 155,220 0.29Husqvarna AB-B- 9,828 SEK 90,558 130,662 0.25ICA Gruppen AB 2,360 SEK 99,238 109,913 0.21Industrivarden AB-A- 2,506 SEK 80,597 97,519 0.18Industrivarden AB-C- 3,753 SEK 89,936 137,444 0.26Investment AB Latour-B- 3,473 SEK 67,973 114,032 0.22Kinnevik AB-B- 5,685 SEK 172,369 227,742 0.43
Xtrackers**
Xtrackers MSCI EUROPE MID CAP UCITS ETF (continued)
Statement of Investmentsas at 30 June 2021(expressed in USD)
** This includes synthetic ETFs.
The accompanying notes form an integral part of these financial statements.
186

Description QuantityCurrency
(local) Cost Market Value
% ofNet
Assets
Transferable securities and money market instruments admitted to an official stock exchange listing(A)
Shares (continued)
Sweden (continued)L E Lundbergforetagen AB-B- 1,797 SEK 68,404 116,030 0.22Lundin Energy AB 4,704 SEK 110,834 166,551 0.31Nibe Industrier AB-B- 33,504 SEK 221,283 352,663 0.67Securitas AB-B- 7,365 SEK 108,112 116,346 0.22Sinch AB 144A 11,890 SEK 206,251 200,202 0.38Skanska AB-B- 7,995 SEK 179,645 212,212 0.40SKF AB-B- 8,969 SEK 211,821 228,521 0.43Svenska Cellulosa AB SCA-B- 14,239 SEK 194,420 233,511 0.44Swedish Match AB 38,121 SEK 175,102 325,307 0.61Tele2 AB-B- 11,771 SEK 140,179 160,486 0.30
3,288,475 4,436,373 8.38SwitzerlandAdecco Group AG 3,642 CHF 262,953 247,672 0.47Baloise Holdings AG 1,090 CHF 158,421 170,160 0.32Banque Cantonale Vaudoise 708 CHF 69,666 63,650 0.12Barry Callebaut AG 84 CHF 152,523 195,380 0.37Clariant AG 5,100 CHF 110,152 101,520 0.19Coca-Cola HBC AG 4,709 GBP 117,115 170,047 0.32EMS-Chemie Holdings AG 165 CHF 99,411 162,260 0.31Geberit AG 871 CHF 386,843 653,945 1.24Julius Baer Group Ltd. 5,260 CHF 247,554 343,591 0.65Logitech International SA 4,068 CHF 289,600 493,344 0.93Sonova Holdings AG 1,295 CHF 234,461 487,543 0.92Straumann Holdings AG 243 CHF 184,549 387,759 0.73Swatch Group AG 680 CHF 174,228 233,496 0.44Swatch Group AG 1,234 CHF 61,240 81,501 0.15Swiss Life Holdings AG 752 CHF 241,895 365,770 0.69Swiss Prime Site AG 1,785 CHF 133,777 177,274 0.33Temenos AG 1,570 CHF 232,821 252,396 0.48Vifor Pharma AG 1,146 CHF 158,660 148,465 0.28
3,315,869 4,735,773 8.94United Kingdom3i Group PLC 22,872 GBP 245,528 370,627 0.70Admiral Group PLC 4,532 GBP 131,166 196,837 0.37Antofagasta PLC 9,268 GBP 113,621 183,791 0.35Ashtead Group PLC 10,560 GBP 295,751 782,506 1.48Auto Trader Group PLC 144A 22,707 GBP 141,317 198,689 0.37AVEVA Group PLC 2,702 GBP 124,293 138,408 0.26Barratt Developments PLC 23,933 GBP 213,137 229,849 0.43Berkeley Group Holdings PLC 2,885 GBP 145,992 183,133 0.35British Land REIT Co. PLC 20,691 GBP 190,642 141,460 0.27Bunzl PLC 7,920 GBP 227,084 261,383 0.49Burberry Group PLC 9,514 GBP 228,385 271,537 0.51Croda International PLC 3,279 GBP 196,546 333,754 0.63Direct Line Insurance Group PLC 32,070 GBP 149,145 126,264 0.24Evraz PLC 11,958 GBP 86,022 97,795 0.18Halma PLC 8,923 GBP 225,514 331,834 0.63Hargreaves Lansdown PLC 8,361 GBP 181,857 183,534 0.35
Xtrackers**
Xtrackers MSCI EUROPE MID CAP UCITS ETF (continued)
Statement of Investmentsas at 30 June 2021(expressed in USD)
** This includes synthetic ETFs.
The accompanying notes form an integral part of these financial statements.
187

Description QuantityCurrency
(local) Cost Market Value
% ofNet
Assets
Transferable securities and money market instruments admitted to an official stock exchange listing(A)
Shares (continued)
United Kingdom (continued)Hikma Pharmaceuticals PLC 4,063 GBP 127,283 137,290 0.26Informa PLC 35,304 GBP 332,734 244,634 0.46InterContinental Hotels Group PLC 4,293 GBP 241,643 285,260 0.54Intertek Group PLC 3,793 GBP 229,909 289,763 0.55J Sainsbury PLC 39,210 GBP 156,409 147,225 0.28JD Sports Fashion PLC 12,123 GBP 126,985 153,908 0.29Johnson Matthey PLC 4,548 GBP 204,175 193,072 0.36Kingfisher PLC 49,607 GBP 253,302 249,790 0.47Land Securities Group REIT PLC 16,555 GBP 230,423 154,463 0.29M&G PLC 61,104 GBP 170,120 193,219 0.36Melrose Industries PLC 114,180 GBP 323,794 244,645 0.46Mondi PLC 11,412 GBP 270,099 299,695 0.57Next PLC 3,125 GBP 228,052 339,146 0.64Ocado Group PLC 11,439 GBP 224,227 316,522 0.60Pearson PLC 17,713 GBP 172,492 203,098 0.38Persimmon PLC 7,499 GBP 231,892 306,434 0.58Phoenix Group Holdings PLC 15,261 GBP 148,334 142,601 0.27Rentokil Initial PLC 43,581 GBP 231,849 298,015 0.56Rolls-Royce Holdings PLC 196,658 GBP 231,308 268,739 0.51Sage Group PLC 25,763 GBP 214,579 243,509 0.46Schroders PLC 2,922 GBP 128,879 141,806 0.27Segro REIT PLC 28,005 GBP 239,733 423,435 0.80Severn Trent PLC 5,614 GBP 171,321 193,964 0.37Smith & Nephew PLC 20,614 GBP 365,332 444,957 0.84Smiths Group PLC 9,315 GBP 192,574 204,605 0.39Spirax-Sarco Engineering PLC 1,733 GBP 208,893 325,950 0.61St James’s Place PLC 12,649 GBP 189,347 258,090 0.49Standard Life Aberdeen PLC 51,289 GBP 298,421 192,012 0.36Taylor Wimpey PLC 85,680 GBP 219,154 188,137 0.35United Utilities Group PLC 16,026 GBP 199,763 215,724 0.41Whitbread PLC 4,744 GBP 220,267 204,603 0.39Wm Morrison Supermarkets PLC 56,634 GBP 168,489 193,011 0.36
9,847,782 11,728,723 22.14
Total - Shares 41,599,833 52,773,348 99.64
Rights
SpainACS Actividades de Construccion y ServiciosSA-Rights- 09.07.21 5,476 EUR — 7,663 0.02
— 7,663 0.02
Total - Rights — 7,663 0.02
Total Transferable securities and money market instruments admitted to an officialstock exchange listing 41,599,833 52,781,011 99.66
Xtrackers**
Xtrackers MSCI EUROPE MID CAP UCITS ETF (continued)
Statement of Investmentsas at 30 June 2021(expressed in USD)
** This includes synthetic ETFs.
The accompanying notes form an integral part of these financial statements.
188

Description QuantityCurrency
(local) Cost Market Value
% ofNet
Assets
Other transferable securities and money market instruments(A)
Shares
PortugalBanco Espirito Santo SA(1) 75,997 EUR 121,080 9 0.00
121,080 9 0.00United KingdomNMC Health PLC(1) 2,602 GBP 101,661 — 0.00
101,661 — 0.00
Total - Shares 222,741 9 0.00
Total Other transferable securities and money market instruments 222,741 9 0.00
TOTAL INVESTMENT PORTFOLIO 41,822,574 52,781,020 99.66(A) Any duplicate securities appearing herein with the same name are either quoted on different stock exchanges or have different ISINs.
(1) The security is fair valued.
Xtrackers**
Xtrackers MSCI EUROPE MID CAP UCITS ETF (continued)
Statement of Investmentsas at 30 June 2021(expressed in USD)
** This includes synthetic ETFs.
The accompanying notes form an integral part of these financial statements.
189

Description QuantityCurrency
(local) Cost Market Value
% ofNet
Assets
Transferable securities and money market instruments admitted to an official stock exchange listing(A)
Shares
Austriaams AG 222,817 CHF 5,155,977 4,473,937 0.31ANDRITZ AG 55,524 EUR 2,436,162 3,119,781 0.22AT&S Austria Technologie & Systemtechnik AG 20,399 EUR 505,662 882,978 0.06BAWAG Group AG 144A 58,274 EUR 2,560,137 3,101,530 0.22CA Immobilien Anlagen AG 53,091 EUR 1,791,394 2,213,067 0.16DO & Co. AG 5,364 EUR 372,734 484,085 0.03EVN AG 29,160 EUR 464,443 687,467 0.05IMMOFINANZ AG 67,461 EUR 1,419,084 1,516,039 0.11Lenzing AG 11,301 EUR 1,149,220 1,383,072 0.10Oesterreichische Post AG 24,328 EUR 959,456 1,293,949 0.09Palfinger AG 15,050 EUR 529,656 630,920 0.04S IMMO AG 36,769 EUR 734,876 880,808 0.06S&T AG 41,593 EUR 962,165 951,976 0.07Schoeller-Bleckmann Oilfield Equipment AG 10,016 EUR 434,295 421,074 0.03Semperit AG Holding 9,787 EUR 286,835 393,457 0.03Telekom Austria AG 155,665 EUR 1,207,086 1,329,143 0.09UNIQA Insurance Group AG 103,889 EUR 866,069 904,303 0.06Vienna Insurance Group AG Wiener VersicherungGruppe 36,470 EUR 923,641 1,001,233 0.07Wienerberger AG 94,258 EUR 2,573,670 3,632,870 0.26
25,332,562 29,301,689 2.06BelgiumAckermans & van Haaren NV 18,451 EUR 2,844,872 3,115,862 0.22Aedifica REIT SA 26,659 EUR 2,826,638 3,518,741 0.25AGFA-Gevaert NV 124,167 EUR 549,898 576,483 0.04Akka Technologies 8,030 EUR 373,385 223,976 0.02Barco NV 56,045 EUR 1,220,360 1,533,985 0.11Befimmo REIT SA 25,749 EUR 1,324,252 1,022,948 0.07Bekaert SA 31,387 EUR 1,139,222 1,398,798 0.10bpost SA 83,440 EUR 1,498,001 998,421 0.07Cie d’Entreprises CFE 7,114 EUR 801,658 742,412 0.05Cofinimmo REIT SA 20,291 EUR 2,790,436 3,089,703 0.22D’ieteren SA 18,218 EUR 1,223,834 2,203,683 0.15Econocom Group SA 123,497 EUR 592,132 468,657 0.03Euronav NV 148,974 EUR 1,373,870 1,385,080 0.10Fagron 50,245 EUR 1,103,446 1,121,996 0.08Galapagos NV 37,266 EUR 2,837,224 2,584,452 0.18Gimv NV 15,645 EUR 907,120 1,001,884 0.07Intervest Offices & Warehouses REIT NV 24,686 EUR 657,332 668,937 0.05Ion Beam Applications 15,038 EUR 378,699 297,107 0.02KBC Ancora 29,257 EUR 1,300,283 1,248,358 0.09Kinepolis Group NV 11,683 EUR 631,718 630,674 0.04Melexis NV 16,528 EUR 1,472,480 1,716,030 0.12Mithra Pharmaceuticals SA 17,158 EUR 529,327 483,257 0.03Montea REIT NV 9,033 EUR 867,685 1,062,654 0.07Ontex Group NV 55,409 EUR 1,106,464 689,950 0.05Recticel SA 38,434 EUR 495,358 647,220 0.05Retail Estates REIT NV 10,901 EUR 816,776 885,534 0.06
Xtrackers**
Xtrackers MSCI EUROPE SMALL CAP UCITS ETF
Statement of Investmentsas at 30 June 2021(expressed in USD)
** This includes synthetic ETFs.
The accompanying notes form an integral part of these financial statements.
190

Description QuantityCurrency
(local) Cost Market Value
% ofNet
Assets
Transferable securities and money market instruments admitted to an official stock exchange listing(A)
Shares (continued)
Belgium (continued)Telenet Group Holdings NV 35,837 EUR 1,538,570 1,348,922 0.09Tessenderlo Group SA 13,966 EUR 511,042 589,617 0.04VGP NV 4,694 EUR 911,891 926,285 0.07Warehouses De Pauw REIT CVA 107,785 EUR 2,899,382 4,115,878 0.29X-Fab Silicon Foundries SE 144A 29,987 EUR 160,449 284,493 0.02X-Fab Silicon Foundries SE 144A 22,075 EUR 187,861 209,430 0.01Xior Student Housing REIT NV 21,675 EUR 1,250,528 1,305,783 0.09
39,122,193 42,097,210 2.95BermudaBW LPG Ltd. 144A 70,144 NOK 349,353 453,215 0.03BW Offshore Ltd. 58,354 NOK 221,964 208,727 0.01FLEX LNG Ltd. 28,904 NOK 337,506 418,183 0.03Frontline Ltd. 77,889 NOK 610,117 703,474 0.05Golden Ocean Group Ltd. 110,214 NOK 804,504 1,218,025 0.08Hiscox Ltd. 280,460 GBP 4,109,837 3,221,964 0.23Lancashire Holdings Ltd. 196,800 GBP 1,829,114 1,665,200 0.12Stolt-Nielsen Ltd. 15,579 NOK 185,550 227,750 0.02
8,447,945 8,116,538 0.57DenmarkALK-Abello A/S 5,394 DKK 1,515,101 2,573,753 0.18Alm Brand A/S 41,827 DKK 341,269 302,836 0.02Bavarian Nordic A/S 47,888 DKK 1,399,305 1,976,448 0.14Better Collective A/S 24,987 SEK 521,691 593,109 0.04cBrain A/S 5,341 DKK 244,407 267,452 0.02Chemometec A/S 12,986 DKK 1,031,853 1,746,847 0.12D/S Norden A/S 23,959 DKK 462,308 762,265 0.05Dfds A/S 29,162 DKK 1,381,061 1,645,392 0.12Drilling Co. of 1972 A/S 16,528 DKK 629,404 690,583 0.05FLSmidth & Co. A/S 36,153 DKK 1,443,104 1,503,072 0.11H Lundbeck A/S 56,615 DKK 1,841,123 1,801,228 0.13ISS A/S 131,737 DKK 2,298,108 3,092,502 0.22Jyske Bank A/S 44,335 DKK 1,948,159 2,145,145 0.15Matas A/S 36,793 DKK 522,070 666,558 0.05Netcompany Group A/S 144A 33,220 DKK 2,277,118 3,774,669 0.26NeuroSearch A/S 4,246 DKK 224,670 255,279 0.02Nilfisk Holdings A/S 20,518 DKK 697,770 718,231 0.05NKT A/S 33,837 DKK 1,122,887 1,553,020 0.11Per Aarsleff Holdings A/S 20,639 DKK 853,229 928,180 0.06Ringkjoebing Landbobank A/S 22,827 DKK 1,796,169 2,315,263 0.16Royal Unibrew A/S 41,265 DKK 3,438,287 5,256,713 0.37Scandinavian Tobacco Group A/S 144A 54,013 DKK 869,505 1,102,561 0.08Schouw & Co. A/S 11,203 DKK 969,034 1,229,185 0.09SimCorp A/S 33,168 DKK 3,367,304 4,163,885 0.29Spar Nord Bank A/S 65,852 DKK 609,385 741,426 0.05Sydbank AS 43,266 DKK 1,131,149 1,332,366 0.09Topdanmark AS 36,323 DKK 1,587,062 1,890,716 0.13Zealand Pharma A/S 28,885 DKK 809,285 853,115 0.06
35,331,817 45,881,799 3.22
Xtrackers**
Xtrackers MSCI EUROPE SMALL CAP UCITS ETF (continued)
Statement of Investmentsas at 30 June 2021(expressed in USD)
** This includes synthetic ETFs.
The accompanying notes form an integral part of these financial statements.
191

Description QuantityCurrency
(local) Cost Market Value
% ofNet
Assets
Transferable securities and money market instruments admitted to an official stock exchange listing(A)
Shares (continued)
Faeroe IslandsBakkafrost P/F 42,474 NOK 2,601,304 3,509,391 0.25
2,601,304 3,509,391 0.25FinlandAdapteo OYJ 34,440 SEK 464,156 660,437 0.05Admicom OYJ 2,074 EUR 312,534 211,522 0.01Aktia Bank OYJ 51,646 EUR 561,085 660,243 0.05BasWare OYJ 11,730 EUR 518,966 552,947 0.04Cargotec OYJ-B- 31,571 EUR 1,412,432 1,632,387 0.11Caverion OYJ 79,261 EUR 619,234 648,100 0.05Citycon OYJ 56,896 EUR 604,674 484,794 0.03Finnair OYJ 546,871 EUR 650,332 451,121 0.03F-Secure OYJ 103,086 EUR 450,105 492,055 0.03Harvia OYJ 12,247 EUR 660,489 740,710 0.05Huhtamaki OYJ 78,195 EUR 3,414,448 3,704,623 0.26Kamux Corp. 27,458 EUR 504,554 533,699 0.04Kemira OYJ 85,385 EUR 1,221,688 1,344,708 0.09Kojamo OYJ 98,998 EUR 2,070,996 2,262,332 0.16Konecranes OYJ 48,597 EUR 1,766,600 2,047,061 0.14Metsa Board OYJ 147,641 EUR 1,331,405 1,518,885 0.11Metso Outotec OYJ 508,043 EUR 3,889,869 5,901,977 0.41Musti Group OYJ 26,876 EUR 708,689 995,052 0.07Neles OYJ 80,688 EUR 922,193 1,163,565 0.08Nokian Renkaat OYJ 106,305 EUR 3,081,433 4,292,587 0.30Outokumpu OYJ 260,122 EUR 1,394,040 1,558,435 0.11QT Group OYJ 14,346 EUR 1,872,958 1,679,176 0.12Remedy Entertainment OYJ 4,549 EUR 260,317 254,898 0.02Revenio Group OYJ 19,706 EUR 1,130,991 1,493,302 0.10Rovio Entertainment OYJ 144A 28,887 EUR 222,409 235,518 0.02Sanoma OYJ 64,393 EUR 807,457 1,067,565 0.07Talenom OYJ 14,614 EUR 235,730 247,483 0.02TietoEVRY OYJ 71,242 EUR 2,148,959 2,250,705 0.16Tokmanni Group Corp. 39,158 EUR 662,077 1,082,922 0.08Uponor OYJ 47,154 EUR 891,727 1,366,684 0.10Valmet OYJ 109,829 EUR 2,746,453 4,790,458 0.34YIT OYJ 131,298 EUR 874,015 804,223 0.06
38,413,015 47,130,174 3.31FranceAB Science SA 25,461 EUR 332,909 294,997 0.02Air France-KLM 225,808 EUR 1,620,243 1,089,888 0.08Albioma SA 25,877 EUR 1,117,829 1,059,334 0.07ALD SA 144A 84,329 EUR 1,217,951 1,264,073 0.09Altarea REIT SCA 1,799 EUR 410,365 378,045 0.03Alten SA 24,847 EUR 2,505,666 3,294,307 0.23Aubay 4,049 EUR 138,926 213,676 0.02Beneteau SA 36,036 EUR 521,248 570,086 0.04Bonduelle SCA 8,542 EUR 234,179 214,249 0.02Carmila REIT SA 43,748 EUR 715,072 599,742 0.04Casino Guichard Perrachon SA 31,782 EUR 911,929 1,008,215 0.07
Xtrackers**
Xtrackers MSCI EUROPE SMALL CAP UCITS ETF (continued)
Statement of Investmentsas at 30 June 2021(expressed in USD)
** This includes synthetic ETFs.
The accompanying notes form an integral part of these financial statements.
192

Description QuantityCurrency
(local) Cost Market Value
% ofNet
Assets
Transferable securities and money market instruments admitted to an official stock exchange listing(A)
Shares (continued)
France (continued)Cellectis SA 29,402 EUR 683,021 467,229 0.03CGG SA 588,927 EUR 969,039 524,226 0.04Chargeurs SA 12,369 EUR 327,857 343,241 0.02Cie des Alpes 29,078 EUR 526,519 466,908 0.03Cie Plastic Omnium SA 48,396 EUR 1,521,857 1,511,728 0.11Coface SA 86,915 EUR 942,113 1,053,401 0.07Derichebourg SA 80,596 EUR 547,906 814,332 0.06Elior Group SA 144A 101,844 EUR 1,015,509 760,894 0.05Elis SA 153,983 EUR 2,744,501 2,901,650 0.20Eramet 6,890 EUR 583,524 449,806 0.03Eutelsat Communications SA 138,963 EUR 1,531,209 1,623,903 0.11Fnac Darty SA 15,644 EUR 1,050,826 1,006,458 0.07Gaztransport Et Technigaz SA 17,996 EUR 1,542,798 1,453,354 0.10Guerbet 6,999 EUR 357,996 247,343 0.02ICADE REIT 24,684 EUR 1,856,753 2,131,058 0.15ID Logistics Group 2,108 EUR 488,169 589,971 0.04Imerys SA 25,818 EUR 1,080,217 1,206,333 0.09Interparfums SA 14,646 EUR 604,671 951,805 0.07IPSOS 31,441 EUR 962,219 1,325,514 0.09JCDecaux SA 52,925 EUR 1,248,828 1,467,417 0.10Kaufman & Broad SA 12,432 EUR 554,463 591,199 0.04Korian SA 60,888 EUR 2,098,844 2,248,530 0.16Lagardere SCA 27,310 EUR 683,520 674,944 0.05LISI 18,181 EUR 594,581 594,002 0.04Maisons du Monde SA 144A 27,488 EUR 746,196 681,299 0.05Manitou BF SA 5,809 EUR 202,891 186,000 0.01McPhy Energy SA 16,889 EUR 709,163 427,812 0.03Mercialys REIT SA 62,325 EUR 663,884 754,634 0.05Mersen SA 17,263 EUR 516,074 672,512 0.05Metropole Television SA 24,229 EUR 445,618 509,727 0.04Neoen SA 144A 34,242 EUR 1,931,138 1,538,216 0.11Nexans SA 20,318 EUR 1,234,192 1,851,711 0.13Nexity SA 33,654 EUR 1,515,326 1,683,416 0.12PEUGEOT INVEST 4,184 EUR 438,032 562,669 0.04Pharmagest Interactive 3,301 EUR 391,677 363,672 0.03Quadient SA 28,436 EUR 645,204 854,522 0.06Rexel SA 198,775 EUR 2,569,952 4,158,231 0.29Rubis SCA 74,048 EUR 3,649,851 3,292,131 0.23SMCP SA 144A 20,906 EUR 274,667 151,606 0.01Societe BIC SA 20,529 EUR 1,278,965 1,426,638 0.10SOITEC 17,613 EUR 2,278,151 3,882,943 0.27Sopra Steria Group 12,644 EUR 1,870,790 2,432,112 0.17SPIE SA 101,202 EUR 2,161,366 2,328,301 0.16Tarkett SA 28,688 EUR 772,870 680,422 0.05Technicolor SA 159,632 EUR 662,511 619,036 0.04Television Francaise 1 26,283 EUR 266,191 265,716 0.02Trigano SA 7,231 EUR 977,866 1,493,808 0.11Valneva SE 51,532 EUR 493,515 680,786 0.05
Xtrackers**
Xtrackers MSCI EUROPE SMALL CAP UCITS ETF (continued)
Statement of Investmentsas at 30 June 2021(expressed in USD)
** This includes synthetic ETFs.
The accompanying notes form an integral part of these financial statements.
193

Description QuantityCurrency
(local) Cost Market Value
% ofNet
Assets
Transferable securities and money market instruments admitted to an official stock exchange listing(A)
Shares (continued)
France (continued)Verallia SA 144A 46,336 EUR 1,629,289 1,717,734 0.12Vicat SA 17,727 EUR 861,710 856,665 0.06Vilmorin & Cie SA 4,104 EUR 242,009 272,548 0.02Virbac SA 3,489 EUR 820,085 1,195,768 0.08Voltalia SA 16,936 EUR 455,522 451,899 0.03
64,947,962 71,384,392 5.01Germany1&1 Drillisch AG 38,799 EUR 1,239,377 1,187,103 0.08Aareal Bank AG 47,318 EUR 1,351,894 1,092,548 0.08Adesso SE 1,657 EUR 190,569 277,070 0.02ADVA Optical Networking SE 41,291 EUR 455,429 571,935 0.04AIXTRON SE 91,571 EUR 1,320,127 2,481,375 0.17alstria office REIT-AG 127,152 EUR 1,997,060 2,350,810 0.16Amadeus Fire AG 4,828 EUR 676,698 882,876 0.06AURELIUS Equity Opportunities SE & Co. KGaA 25,581 EUR 747,536 786,323 0.05Aurubis AG 26,116 EUR 1,833,272 2,420,692 0.17Basler AG 3,276 EUR 289,192 405,595 0.03BayWa AG 9,748 EUR 327,584 420,790 0.03Bertrandt AG 3,085 EUR 237,379 206,340 0.01Bilfinger SE 24,106 EUR 989,893 721,544 0.05Borussia Dortmund GmbH & Co. KGaA 61,488 EUR 420,866 453,189 0.03CANCOM SE 32,791 EUR 1,733,350 1,983,230 0.14CECONOMY AG 134,242 EUR 1,019,386 655,258 0.05Cewe Stiftung & Co. KGAA 6,583 EUR 802,011 1,019,566 0.07CompuGroup Medical SE & Co. KgaA 21,665 EUR 1,617,705 1,696,992 0.12CropEnergies AG 17,798 EUR 210,369 228,374 0.02CTS Eventim AG & Co. KGaA 46,943 EUR 2,542,222 2,933,795 0.21Datagroup SE 2,513 EUR 155,394 193,711 0.01Dermapharm Holdings SE 15,447 EUR 880,208 1,231,926 0.09Deutsche Beteiligungs AG 12,111 EUR 493,510 489,759 0.03Deutsche EuroShop AG 42,655 EUR 1,189,039 1,011,692 0.07Deutsche Pfandbriefbank AG 144A 104,331 EUR 1,222,030 1,031,629 0.07Deutz AG 83,611 EUR 657,426 676,233 0.05DIC Asset AG 34,387 EUR 469,197 594,158 0.04Draegerwerk AG & Co. KGaA-Pref- 8,882 EUR 762,065 840,547 0.06Duerr AG 43,163 EUR 1,800,514 1,642,080 0.12Eckert & Ziegler Strahlen- und Medizintechnik AG 12,256 EUR 645,819 1,400,389 0.10Elmos Semiconductor SE 6,270 EUR 185,755 271,399 0.02ElringKlinger AG 25,598 EUR 501,688 455,654 0.03Encavis AG 79,360 EUR 1,325,304 1,500,162 0.11Evotec SE 106,964 EUR 2,840,247 4,849,425 0.34flatexDEGIRO AG 6,914 EUR 425,591 930,622 0.07Fraport AG Frankfurt Airport Services Worldwide 30,299 EUR 1,762,729 2,064,630 0.14Freenet AG 106,640 EUR 2,630,018 2,519,172 0.18Gerresheimer AG 24,829 EUR 2,304,339 2,745,721 0.19GRENKE AG 23,085 EUR 1,385,150 1,012,931 0.07Hamborner REIT AG 59,003 EUR 645,244 628,276 0.04Hamburger Hafen und Logistik AG 25,626 EUR 589,529 644,266 0.04
Xtrackers**
Xtrackers MSCI EUROPE SMALL CAP UCITS ETF (continued)
Statement of Investmentsas at 30 June 2021(expressed in USD)
** This includes synthetic ETFs.
The accompanying notes form an integral part of these financial statements.
194

Description QuantityCurrency
(local) Cost Market Value
% ofNet
Assets
Transferable securities and money market instruments admitted to an official stock exchange listing(A)
Shares (continued)
Germany (continued)Hensoldt AG 36,425 EUR 596,438 656,586 0.05HOCHTIEF AG 16,865 EUR 1,426,044 1,295,214 0.09Home24 SE 22,689 EUR 525,243 423,784 0.03Hornbach Baumarkt AG 4,224 EUR 144,286 185,592 0.01Hornbach Holdings AG & Co. KGaA 8,137 EUR 685,634 927,334 0.06HUGO BOSS AG 49,127 EUR 1,938,211 2,672,957 0.19Hypoport SE 2,959 EUR 1,098,180 1,529,959 0.11Indus Holdings AG 15,199 EUR 629,835 602,018 0.04Instone Real Estate Group AG 144A 32,939 EUR 1,047,771 992,184 0.07Jenoptik AG 39,578 EUR 1,195,035 1,082,334 0.08JOST Werke AG 144A 13,012 EUR 680,483 776,176 0.05Jungheinrich AG-Pref- 39,586 EUR 1,555,654 1,935,075 0.14K&S AG 155,997 EUR 1,916,556 2,123,765 0.15Kloeckner & Co. SE 58,881 EUR 604,225 805,804 0.06Koenig & Bauer AG 11,681 EUR 517,751 389,948 0.03Krones AG 10,932 EUR 1,031,330 976,857 0.07KWS Saat SE & Co. KGaA 9,408 EUR 733,944 774,293 0.05LPKF Laser & Electronics AG 18,944 EUR 489,493 551,758 0.04MBB SE 1,206 EUR 135,248 187,928 0.01Medios AG 6,681 EUR 300,328 266,213 0.02METRO AG 102,262 EUR 1,025,466 1,266,086 0.09MLP SE 52,822 EUR 355,406 436,612 0.03MorphoSys AG 26,933 EUR 2,765,930 2,089,506 0.15Nagarro SE 7,542 EUR 669,628 925,710 0.06New Work SE 2,371 EUR 717,642 745,119 0.05Nordex SE 62,536 EUR 1,338,051 1,518,827 0.11Norma Group SE 23,908 EUR 1,172,530 1,224,261 0.09Northern Bitcoin AG 3,727 EUR 421,099 360,660 0.03PATRIZIA AG 40,228 EUR 944,589 1,049,541 0.07Pfeiffer Vacuum Technology AG 3,585 EUR 579,722 681,083 0.05ProSiebenSat.1 Media SE 132,198 EUR 2,195,139 2,629,879 0.18Rheinmetall AG 35,406 EUR 3,483,023 3,497,600 0.25SAF-Holland SE 35,430 EUR 564,331 492,853 0.03Salzgitter AG 31,294 EUR 928,032 930,016 0.07Secunet Security Networks AG 942 EUR 429,869 418,919 0.03SGL Carbon SE 56,835 EUR 598,863 545,271 0.04Siltronic AG 13,282 EUR 1,589,197 2,213,034 0.16Sixt SE 10,427 EUR 1,094,907 1,404,708 0.10Sixt SE-Pref- 15,587 EUR 947,827 1,256,955 0.09SMA Solar Technology AG 8,767 EUR 439,217 502,997 0.04Software AG 43,559 EUR 1,750,084 1,959,853 0.14Steico SE 3,688 EUR 446,557 483,720 0.03STO SE & Co. KGaA-Pref- 2,782 EUR 385,277 607,048 0.04STRATEC SE 6,606 EUR 752,243 922,852 0.06Stroeer SE & Co. KGaA 23,809 EUR 1,815,234 1,907,281 0.13Suedzucker AG 53,854 EUR 923,512 862,184 0.06TAG Immobilien AG 118,916 EUR 2,849,082 3,773,764 0.26Takkt AG 30,898 EUR 507,442 513,720 0.04
Xtrackers**
Xtrackers MSCI EUROPE SMALL CAP UCITS ETF (continued)
Statement of Investmentsas at 30 June 2021(expressed in USD)
** This includes synthetic ETFs.
The accompanying notes form an integral part of these financial statements.
195

Description QuantityCurrency
(local) Cost Market Value
% ofNet
Assets
Transferable securities and money market instruments admitted to an official stock exchange listing(A)
Shares (continued)
Germany (continued)thyssenkrupp AG 329,776 EUR 2,710,515 3,437,607 0.24TUI AG 626,589 GBP 2,498,296 3,198,397 0.22Varta AG 14,961 EUR 1,521,292 2,306,494 0.16VERBIO Vereinigte BioEnergie AG 17,538 EUR 332,105 888,504 0.06Vossloh AG 10,741 EUR 532,228 541,992 0.04Wacker Chemie AG 12,871 EUR 1,325,495 1,985,048 0.14Wacker Neuson SE 25,850 EUR 631,803 743,090 0.05Washtec AG 13,229 EUR 847,645 820,497 0.06Westwing Group AG 9,184 EUR 366,311 502,525 0.04Wuestenrot & Wuerttembergische AG 30,496 EUR 636,798 698,712 0.05Zeal Network SE 13,354 EUR 668,439 663,550 0.05zooplus AG 5,224 EUR 1,001,319 1,692,514 0.12
104,886,549 121,364,555 8.52Gibraltar888 Holdings PLC 292,585 GBP 950,599 1,551,287 0.11
950,599 1,551,287 0.11GuernseyBMO Commercial Property Trust REIT Ltd. 686,065 GBP 690,792 858,675 0.06Burford Capital Ltd. 152,009 GBP 1,808,766 1,562,347 0.11Picton Property Income REIT Ltd. 489,556 GBP 573,831 588,378 0.04Regional REIT Ltd. 144A 402,818 GBP 484,482 477,454 0.04Sirius Real Estate Ltd. 860,013 GBP 967,003 1,314,000 0.09UK Commercial Property REIT Ltd. 685,392 GBP 765,897 724,329 0.05
5,290,771 5,525,183 0.39IrelandAIB Group PLC 645,637 EUR 1,005,207 1,663,782 0.12Bank of Ireland Group PLC 790,066 EUR 2,277,715 4,232,157 0.30C&C Group PLC 337,617 GBP 1,155,885 1,133,355 0.08Cairn Homes PLC 528,400 EUR 758,672 667,987 0.05Dalata Hotel Group PLC 167,240 EUR 871,640 760,596 0.05Glanbia PLC 173,429 EUR 2,591,700 2,815,616 0.20Glenveagh Properties PLC 144A 708,191 EUR 692,021 806,250 0.06Grafton Group PLC 185,243 GBP 2,136,659 2,935,219 0.20Greencore Group PLC 439,966 GBP 903,112 763,386 0.05Hibernia REIT PLC 543,424 EUR 778,888 799,114 0.06Irish Residential Properties REIT PLC 325,120 EUR 524,208 586,822 0.04Origin Enterprises PLC 114,548 EUR 499,856 447,601 0.03Total Produce PLC 252,445 EUR 799,354 790,349 0.05Uniphar PLC 199,598 EUR 558,034 807,159 0.06United Drug PLC 216,605 GBP 2,157,821 3,198,758 0.22
17,710,772 22,408,151 1.57Isle Of ManKape Technologies PLC 44,174 GBP 179,595 181,852 0.01Playtech PLC 248,678 GBP 1,785,273 1,460,716 0.10Strix Group PLC 174,723 GBP 479,239 761,526 0.06
2,444,107 2,404,094 0.17
Xtrackers**
Xtrackers MSCI EUROPE SMALL CAP UCITS ETF (continued)
Statement of Investmentsas at 30 June 2021(expressed in USD)
** This includes synthetic ETFs.
The accompanying notes form an integral part of these financial statements.
196

Description QuantityCurrency
(local) Cost Market Value
% ofNet
Assets
Transferable securities and money market instruments admitted to an official stock exchange listing(A)
Shares (continued)
IsraelPlus500 Ltd. 73,079 GBP 1,028,171 1,347,749 0.09Tremor International Ltd. 84,009 GBP 956,156 826,306 0.06
1,984,327 2,174,055 0.15ItalyA2A SpA 1,235,877 EUR 1,980,349 2,526,741 0.18ACEA SpA 40,213 EUR 733,552 929,451 0.07Anima Holdings SpA 144A 214,494 EUR 1,096,652 1,066,059 0.07Autogrill SpA 158,596 EUR 1,102,270 1,162,329 0.08Azimut Holdings SpA 86,053 EUR 1,828,752 2,089,990 0.15Banca Farmafactoring SpA 144A 131,114 EUR 822,221 1,313,875 0.09Banca Generali SpA 47,888 EUR 1,530,219 2,043,319 0.14Banca IFIS SpA 15,230 EUR 251,616 242,021 0.02Banca Mediolanum SpA 182,968 EUR 1,620,480 1,780,119 0.12Banca Monte dei Paschi di Siena SpA 173,238 EUR 796,641 237,081 0.02Banca Popolare di Sondrio SCPA 372,520 EUR 1,116,189 1,616,001 0.11Banco BPM SpA 1,106,322 EUR 3,029,093 3,559,423 0.25Biesse SpA 13,408 EUR 427,047 448,078 0.03BPER Banca 846,646 EUR 1,894,996 1,842,912 0.13Brembo SpA 123,726 EUR 1,551,350 1,567,042 0.11Brunello Cucinelli SpA 25,721 EUR 872,334 1,504,386 0.11Buzzi Unicem SpA 74,457 EUR 1,727,795 1,975,240 0.14Carel Industries SpA 144A 30,814 EUR 484,673 739,982 0.05Cerved Group SpA 151,868 EUR 1,421,910 1,764,984 0.12CIR SpA-Compagnie Industriali 974,429 EUR 564,404 584,721 0.04Credito Emiliano SpA 85,777 EUR 487,315 513,701 0.04Danieli & C Officine Meccaniche SpA-RSP- 41,613 EUR 692,922 717,533 0.05Datalogic SpA 9,996 EUR 242,519 236,374 0.02De’ Longhi SpA 56,740 EUR 1,747,248 2,472,161 0.17doValue SpA 144A 50,261 EUR 667,870 553,130 0.04El.En. SpA 10,197 EUR 391,736 526,029 0.04Enav SpA 144A 234,503 EUR 1,069,582 1,056,770 0.07ERG SpA 52,385 EUR 1,121,594 1,553,085 0.11Esprinet SpA 28,365 EUR 477,958 498,516 0.03Falck Renewables SpA 92,949 EUR 444,025 612,869 0.04Fincantieri SpA 404,097 EUR 384,023 364,206 0.03Gruppo MutuiOnline SpA 22,626 EUR 756,750 1,078,654 0.08GVS SpA 144A 61,237 EUR 1,047,209 1,002,896 0.07Hera SpA 654,435 EUR 2,286,644 2,703,915 0.19Illimity Bank SpA 53,071 EUR 561,586 740,138 0.05Interpump Group SpA 58,460 EUR 2,164,740 3,462,228 0.24Iren SpA 568,599 EUR 1,453,072 1,622,370 0.11Italgas SpA 383,626 EUR 2,229,155 2,507,642 0.18Italmobiliare SpA 19,656 EUR 609,377 709,791 0.05Juventus Football Club SpA 520,460 EUR 510,839 445,628 0.03Leonardo SpA 331,132 EUR 2,451,811 2,675,002 0.19Maire Tecnimont SpA 145,219 EUR 527,885 531,112 0.04MARR SpA 28,451 EUR 530,190 678,175 0.05Mediaset SpA 208,544 EUR 710,864 752,819 0.05
Xtrackers**
Xtrackers MSCI EUROPE SMALL CAP UCITS ETF (continued)
Statement of Investmentsas at 30 June 2021(expressed in USD)
** This includes synthetic ETFs.
The accompanying notes form an integral part of these financial statements.
197

Description QuantityCurrency
(local) Cost Market Value
% ofNet
Assets
Transferable securities and money market instruments admitted to an official stock exchange listing(A)
Shares (continued)
Italy (continued)Piaggio & C SpA 155,287 EUR 503,817 610,658 0.04Pirelli & C SpA 144A 291,555 EUR 1,597,452 1,692,818 0.12RAI Way SpA 144A 97,207 EUR 528,849 585,612 0.04Reply SpA 17,176 EUR 1,474,074 2,823,147 0.20Saipem SpA 456,102 EUR 1,483,585 1,103,960 0.08Salvatore Ferragamo SpA 39,117 EUR 838,104 837,087 0.06Sanlorenzo SpA Via Ameglia 8,846 EUR 156,286 243,379 0.02Saras SpA 546,045 EUR 656,106 456,526 0.03Sesa SpA 6,964 EUR 571,548 1,164,464 0.08Societa Cattolica di Assicurazioni SC 106,014 EUR 735,338 880,683 0.06Tamburi Investment Partners SpA 82,906 EUR 622,179 813,092 0.06Technogym SpA 144A 111,694 EUR 1,242,804 1,425,248 0.10Tinexta Spa 15,242 EUR 277,611 593,238 0.04Tod’s SpA 8,893 EUR 560,159 604,298 0.04Unipol Gruppo SpA 316,808 EUR 1,556,731 1,725,227 0.12Webuild SpA 242,007 EUR 620,778 642,298 0.04Zignago Vetro SpA 19,533 EUR 284,038 389,159 0.03
62,128,916 73,599,392 5.16Jerseyboohoo Group PLC 820,003 GBP 3,021,576 3,516,190 0.25Breedon Group PLC 1,252,204 GBP 1,442,484 1,864,786 0.13Centamin PLC 920,209 GBP 1,461,313 1,286,478 0.09IWG PLC 616,570 GBP 2,655,235 2,560,393 0.18Man Group PLC 1,178,511 GBP 2,372,941 2,929,683 0.20Petrofac Ltd. 255,615 GBP 942,883 389,138 0.03Sanne Group PLC 123,980 GBP 1,051,184 1,424,985 0.10TP ICAP Group PLC 618,381 GBP 2,245,015 1,669,229 0.12
15,192,631 15,640,882 1.10LiechtensteinImplantica AG 13,788 SEK 165,047 176,055 0.01Liechtensteinische Landesbank AG 8,907 CHF 580,008 508,779 0.04
745,055 684,834 0.05LuxembourgADO Properties SA 144A 66,396 EUR 2,054,547 1,746,432 0.12APERAM SA 39,279 EUR 1,556,749 2,012,764 0.14APERAM SA 485 EUR 15,861 24,945 0.00B&M European Value Retail SA 731,942 GBP 4,348,075 5,795,862 0.41B&S Group Sarl 144A 18,554 EUR 137,118 190,548 0.01Befesa SA 144A 30,297 EUR 1,650,407 2,328,214 0.16Corestate Capital Holdings SA 15,592 EUR 553,882 203,396 0.01eDreams ODIGEO SA 47,102 EUR 218,645 379,278 0.03Global Fashion Group SA 62,068 EUR 940,595 939,955 0.07Grand City Properties SA 82,134 EUR 1,894,195 2,218,835 0.16Millicom International Cellular SA 83,185 SEK 2,575,079 3,295,438 0.23SES SA 310,904 EUR 2,458,186 2,375,173 0.17Solutions 30 SE 72,033 EUR 914,696 498,022 0.04
Xtrackers**
Xtrackers MSCI EUROPE SMALL CAP UCITS ETF (continued)
Statement of Investmentsas at 30 June 2021(expressed in USD)
** This includes synthetic ETFs.
The accompanying notes form an integral part of these financial statements.
198

Description QuantityCurrency
(local) Cost Market Value
% ofNet
Assets
Transferable securities and money market instruments admitted to an official stock exchange listing(A)
Shares (continued)
Luxembourg (continued)Stabilus SA 20,764 EUR 1,500,288 1,687,978 0.12Subsea 7 SA 184,452 NOK 1,977,928 1,771,813 0.12
22,796,251 25,468,653 1.79MaltaKambi Group PLC 20,867 SEK 713,749 1,038,452 0.07Kindred Group PLC 188,412 SEK 1,921,883 2,955,452 0.21Media and Games Invest PLC 57,792 EUR 327,418 342,541 0.02
2,963,050 4,336,445 0.30NetherlandsAalberts NV 81,262 EUR 3,435,687 4,367,427 0.31Accell Group NV 21,299 EUR 787,066 1,144,210 0.08AerCap Holdings NV 105,632 USD 4,288,017 5,409,415 0.38Alfen Beheer BV 144A 17,015 EUR 1,150,875 1,589,025 0.11AMG Advanced Metallurgical Group NV 23,408 EUR 716,892 799,475 0.06Arcadis NV 58,887 EUR 1,584,046 2,410,674 0.17ASR Nederland NV 112,878 EUR 4,384,834 4,362,565 0.31Basic-Fit NV 144A 40,248 EUR 1,390,466 1,721,148 0.12BE Semiconductor Industries NV 53,754 EUR 2,410,551 4,560,453 0.32Boskalis Westminster 65,799 EUR 1,733,420 2,111,521 0.15Brunel International NV 13,643 EUR 217,638 176,677 0.01Cementir Holdings NV 53,470 EUR 479,885 545,327 0.04CM.com NV 8,328 EUR 247,550 325,420 0.02Corbion NV 48,635 EUR 2,024,662 2,779,997 0.19COSMO Pharmaceuticals NV 8,757 CHF 809,176 808,105 0.06Eurocommercial Properties NV 35,731 EUR 959,176 888,994 0.06Euronext NV 144A 64,556 EUR 5,194,677 7,020,277 0.49Fastned BV 3,735 EUR 275,259 239,184 0.02Flow Traders 144A 27,002 EUR 936,833 1,161,747 0.08Fugro NV 84,535 EUR 1,091,356 810,322 0.06IMCD NV 46,762 EUR 4,503,959 7,436,527 0.52Intertrust NV 144A 89,499 EUR 1,553,228 1,611,158 0.11Koninklijke BAM Groep NV 210,696 EUR 702,643 585,183 0.04Meltwater Holdings BV 89,636 NOK 521,392 478,065 0.03NSI REIT NV 19,610 EUR 805,792 756,967 0.05OCI NV 77,777 EUR 1,602,178 1,892,678 0.13Pharming Group NV 551,434 EUR 768,453 627,134 0.04PostNL NV 384,010 EUR 1,461,737 2,082,078 0.15RHI Magnesita NV 21,856 GBP 948,613 1,222,816 0.09SBM Offshore NV 120,345 EUR 2,096,134 1,828,921 0.13Shop Apotheke Europe NV 144A 11,079 EUR 1,688,914 2,081,153 0.15Signify NV 144A 104,508 EUR 3,959,755 6,610,752 0.46Sligro Food Group NV 20,710 EUR 470,046 607,860 0.04Technip Energies NV 83,537 EUR 1,196,674 1,145,210 0.08TKH Group NV 33,497 EUR 1,626,163 1,689,864 0.12TomTom NV 59,859 EUR 589,815 501,522 0.04Van Lanschot Kempen NV 24,455 EUR 618,582 622,076 0.04
Xtrackers**
Xtrackers MSCI EUROPE SMALL CAP UCITS ETF (continued)
Statement of Investmentsas at 30 June 2021(expressed in USD)
** This includes synthetic ETFs.
The accompanying notes form an integral part of these financial statements.
199

Description QuantityCurrency
(local) Cost Market Value
% ofNet
Assets
Transferable securities and money market instruments admitted to an official stock exchange listing(A)
Shares (continued)
Netherlands (continued)Vastned Retail REIT NV 8,306 EUR 198,903 243,297 0.02Wereldhave REIT NV 31,261 EUR 804,678 532,731 0.04
60,235,725 75,787,955 5.32NorwayAker ASA-A- 21,395 NOK 1,269,006 1,578,792 0.11Aker Carbon Capture ASA 220,371 NOK 477,042 506,931 0.04Aker Horizons Holdings ASA 105,022 NOK 333,269 348,316 0.02Aker Solutions ASA 212,851 NOK 385,586 396,257 0.03Atea ASA 72,477 NOK 965,515 1,409,921 0.10Atlantic Sapphire ASA 53,105 NOK 559,821 560,968 0.04Austevoll Seafood ASA 78,480 NOK 810,086 974,023 0.07Bonheur ASA 16,581 NOK 406,119 469,190 0.03Borregaard ASA 80,455 NOK 1,116,743 1,757,721 0.12Crayon Group Holdings ASA 144A 35,705 NOK 403,413 522,389 0.04DNO ASA 403,616 NOK 528,284 470,914 0.03Elkem ASA 144A 215,467 NOK 717,137 784,227 0.05Entra ASA 144A 97,903 NOK 1,634,456 2,239,031 0.16Europris ASA 144A 138,128 NOK 702,952 866,791 0.06Fjordkraft Holdings ASA 144A 89,619 NOK 771,388 532,703 0.04Grieg Seafood ASA 49,223 NOK 461,959 507,377 0.04Hexagon Composites ASA 103,743 NOK 433,998 449,683 0.03Hexagon Purus ASA 43,815 NOK 170,107 197,201 0.01Kahoot! ASA 196,379 NOK 1,509,657 1,346,437 0.09Kongsberg Gruppen ASA 70,319 NOK 1,055,972 1,810,846 0.13Leroy Seafood Group ASA 263,794 NOK 1,734,519 2,313,853 0.16LINK Mobility Group Holdings ASA 117,101 NOK 483,021 427,841 0.03NEL ASA 1,165,312 NOK 2,076,708 2,719,224 0.19Nordic Semiconductor ASA 142,077 NOK 1,827,329 3,602,613 0.25Norwegian Finans Holdings ASA 102,226 NOK 972,794 1,151,723 0.08Pexip Holdings ASA 62,872 NOK 511,859 561,853 0.04Protector Forsikring ASA 54,606 NOK 475,401 524,789 0.04Quantafuel ASA 102,023 NOK 529,799 455,032 0.03REC Silicon ASA 251,309 NOK 526,232 548,749 0.04Salmar ASA 47,648 NOK 2,329,407 3,162,801 0.22Scatec ASA 144A 100,026 NOK 2,266,257 2,650,250 0.19Selvaag Bolig ASA 25,330 NOK 135,207 175,142 0.01SpareBank 1 Nord Norge 107,518 NOK 876,768 1,065,784 0.07Sparebank 1 Oestlandet 46,125 NOK 520,974 637,856 0.04SpareBank 1 SMN 114,557 NOK 1,222,540 1,586,854 0.11SpareBank 1 SR-Bank ASA 149,618 NOK 1,606,213 1,976,894 0.14Storebrand ASA 375,615 NOK 2,728,304 3,404,682 0.24TGS ASA 98,105 NOK 1,841,113 1,251,223 0.09TOMRA Systems ASA 97,330 NOK 3,578,406 5,372,536 0.38Vaccibody AS 82,825 NOK 847,749 726,687 0.05Veidekke ASA 95,998 NOK 1,214,430 1,285,150 0.09Wallenius Wilhelmsen ASA 69,256 NOK 307,669 241,284 0.02XXL ASA 144A 103,585 NOK 239,806 219,684 0.02
43,565,015 53,792,222 3.77
Xtrackers**
Xtrackers MSCI EUROPE SMALL CAP UCITS ETF (continued)
Statement of Investmentsas at 30 June 2021(expressed in USD)
** This includes synthetic ETFs.
The accompanying notes form an integral part of these financial statements.
200

Description QuantityCurrency
(local) Cost Market Value
% ofNet
Assets
Transferable securities and money market instruments admitted to an official stock exchange listing(A)
Shares (continued)
PortugalAltri SGPS SA 70,453 EUR 453,749 437,803 0.03Banco Comercial Portugues SA-R- 6,966,056 EUR 1,334,687 1,115,242 0.08Corticeira Amorim SGPS SA 47,942 EUR 594,622 602,657 0.04CTT-Correios de Portugal SA 108,960 EUR 514,099 622,820 0.04Navigator Co. SA 134,089 EUR 439,627 458,285 0.03NOS SGPS SA 191,680 EUR 858,223 671,938 0.05REN - Redes Energeticas Nacionais SGPS SA 298,853 EUR 846,848 829,319 0.06Sonae SGPS SA 672,590 EUR 600,123 638,100 0.05
5,641,978 5,376,164 0.38SpainAcciona SA 20,098 EUR 2,445,525 3,034,097 0.21Acerinox SA 135,690 EUR 1,489,049 1,638,918 0.12Almirall SA 72,490 EUR 1,008,747 1,264,559 0.09Applus Services SA 122,005 EUR 1,284,613 1,192,211 0.08Atresmedia Corp. de Medios de Comunicacion SA 90,703 EUR 629,923 397,129 0.03Banco de Sabadell SA 4,591,650 EUR 1,818,576 3,126,657 0.22Bankinter SA 549,641 EUR 2,164,988 2,763,063 0.19Cia de Distribucion Integral Logista Holdings SA 50,588 EUR 1,083,054 1,040,267 0.07CIE Automotive SA 41,039 EUR 1,031,972 1,214,758 0.09Construcciones y Auxiliar de Ferrocarriles SA 19,184 EUR 818,182 808,774 0.06Corp Financiera Alba SA 14,942 EUR 778,340 815,107 0.06Ebro Foods SA 63,480 EUR 1,400,753 1,333,979 0.09Ence Energia y Celulosa SA 131,309 EUR 609,597 533,495 0.04Euskaltel SA 144A 70,015 EUR 741,980 911,679 0.06Faes Farma SA 243,463 EUR 987,018 971,841 0.07Fluidra SA 74,103 EUR 1,629,822 2,939,546 0.21Gestamp Automocion SA 144A 118,010 EUR 691,287 625,008 0.04Global Dominion Access SA 144A 100,602 EUR 429,422 521,358 0.04Grenergy Renovables SA 7,467 EUR 255,815 266,539 0.02Grupo Catalana Occidente SA 35,443 EUR 1,243,707 1,368,138 0.10Indra Sistemas SA 93,417 EUR 1,014,394 852,477 0.06Inmobiliaria Colonial Socimi REIT SA 238,941 EUR 2,303,192 2,412,813 0.17Laboratorios Farmaceuticos Rovi SA 13,502 EUR 920,697 935,103 0.07Lar Espana Real Estate Socimi REIT SA 42,868 EUR 323,517 249,356 0.02Liberbank SA 1,690,153 EUR 737,585 620,548 0.04Linea Directa Aseguradora SACia de Seguros yReaseguros 531,747 EUR 753,405 1,114,269 0.08Mapfre SA 865,147 EUR 1,705,204 1,828,806 0.13Mediaset Espana Comunicacion SA 143,105 EUR 874,651 897,757 0.06Melia Hotels International SA 101,687 EUR 859,401 752,486 0.05Merlin Properties Socimi REIT SA 290,231 EUR 3,097,605 3,006,801 0.21Metrovacesa SA 144A 44,826 EUR 392,826 354,040 0.02Neinor Homes SA 144A 33,751 EUR 472,694 454,688 0.03Pharma Mar SA 12,480 EUR 883,189 1,122,731 0.08Promotora de Informaciones SA-A- 77,721 EUR 133,560 70,970 0.00Prosegur Cash SA 144A 468,008 EUR 569,286 475,644 0.03Prosegur Cia de Seguridad SA 205,859 EUR 742,274 673,794 0.05Sacyr SA 281,003 EUR 671,207 713,804 0.05
Xtrackers**
Xtrackers MSCI EUROPE SMALL CAP UCITS ETF (continued)
Statement of Investmentsas at 30 June 2021(expressed in USD)
** This includes synthetic ETFs.
The accompanying notes form an integral part of these financial statements.
201

Description QuantityCurrency
(local) Cost Market Value
% ofNet
Assets
Transferable securities and money market instruments admitted to an official stock exchange listing(A)
Shares (continued)
Spain (continued)Solaria Energia y Medio Ambiente SA 62,561 EUR 880,878 1,130,673 0.08Solarpack Corp. Tecnologica SA 13,019 EUR 377,981 403,736 0.03Soltec Power Holdings SA 30,253 EUR 261,568 270,154 0.02Tecnicas Reunidas SA 32,900 EUR 709,833 416,302 0.03Unicaja Banco SA 144A 549,179 EUR 612,492 563,350 0.04Viscofan SA 33,463 EUR 2,152,413 2,333,407 0.16Zardoya Otis SA 142,061 EUR 1,094,181 978,812 0.07
45,086,403 49,399,644 3.47SwedenAAK AB 146,539 SEK 2,567,062 3,286,446 0.23AcadeMedia AB 144A 74,086 SEK 554,585 699,958 0.05AddTech AB-B- 214,961 SEK 2,470,172 3,569,215 0.25AFRY AB 81,030 SEK 1,949,746 2,668,107 0.19Alimak Group AB 144A 35,236 SEK 524,993 575,171 0.04Ambea AB 144A 63,141 SEK 496,393 470,301 0.03Arjo AB-B- 176,283 SEK 945,068 1,818,041 0.13Atrium Ljungberg AB-B- 38,450 SEK 749,636 876,260 0.06Attendo AB 144A 95,426 SEK 621,199 436,952 0.03Avanza Bank Holdings AB 101,600 SEK 1,804,597 3,170,786 0.22Axfood AB 86,128 SEK 1,770,288 2,383,786 0.17Bactiguard Holdings AB 12,744 SEK 236,792 262,267 0.02Beijer Alma AB 25,455 SEK 554,540 507,186 0.04Beijer Ref AB 202,809 SEK 2,362,414 3,616,444 0.25Betsson AB-B- 85,387 SEK 798,587 696,902 0.05BHG Group AB 79,647 SEK 1,456,732 1,541,318 0.11Bilia AB-A- 60,882 SEK 746,906 1,290,659 0.09BillerudKorsnas AB 140,232 SEK 2,234,344 2,785,078 0.20BioArctic AB 144A 21,100 SEK 213,294 339,982 0.02BioGaia AB-B- 14,044 SEK 726,876 781,668 0.05Biotage AB 53,500 SEK 793,363 1,267,412 0.09Bonava AB-B- 65,088 SEK 796,401 716,549 0.05BoneSupport Holdings AB 144A 41,080 SEK 358,048 361,221 0.03Boozt AB 144A 40,153 SEK 570,811 882,674 0.06Bravida Holdings AB 144A 171,166 SEK 1,778,896 2,477,781 0.17Bufab AB 23,995 SEK 442,681 664,957 0.05Bure Equity AB 45,703 SEK 1,073,373 1,976,225 0.14Calliditas Therapeutics AB-B- 18,486 SEK 317,795 270,195 0.02Camurus AB 25,698 SEK 445,603 643,040 0.04Castellum AB 189,678 SEK 3,850,044 4,830,583 0.34Catena AB 22,502 SEK 997,192 1,205,593 0.08Cellavision AB 12,836 SEK 394,061 553,235 0.04CELLINK AB-B- 21,826 SEK 646,725 1,082,604 0.08Cibus Nordic Real Estate AB 29,332 SEK 531,696 701,047 0.05Cint Group AB 61,781 SEK 663,442 694,952 0.05Clas Ohlson AB-B- 18,495 SEK 193,557 190,851 0.01Cloetta AB-B- 138,873 SEK 442,228 414,728 0.03Collector AB 41,110 SEK 128,085 175,359 0.01Coor Service Management Holdings AB 144A 71,017 SEK 481,451 563,011 0.04
Xtrackers**
Xtrackers MSCI EUROPE SMALL CAP UCITS ETF (continued)
Statement of Investmentsas at 30 June 2021(expressed in USD)
** This includes synthetic ETFs.
The accompanying notes form an integral part of these financial statements.
202

Description QuantityCurrency
(local) Cost Market Value
% ofNet
Assets
Transferable securities and money market instruments admitted to an official stock exchange listing(A)
Shares (continued)
Sweden (continued)Creades AB-A- 31,430 SEK 245,071 392,501 0.03Desenio Group AB 46,973 SEK 552,987 488,836 0.03Dios Fastigheter AB 75,082 SEK 627,832 778,286 0.05Dometic Group AB 144A 240,552 SEK 2,591,462 4,099,607 0.29Duni AB 33,269 SEK 394,698 431,027 0.03Dustin Group AB 144A 50,049 SEK 379,592 661,300 0.05Electrolux Professional AB-B- 187,922 SEK 742,099 1,332,702 0.09Elekta AB-B- 308,953 SEK 3,575,390 4,479,595 0.31Fabege AB 219,558 SEK 2,875,152 3,524,881 0.25Fagerhult AB 49,468 SEK 397,324 396,801 0.03Fingerprint Cards AB-B- 240,731 SEK 520,860 919,333 0.06Fortnox AB 39,316 SEK 1,135,737 1,934,505 0.14GARO AB 17,000 SEK 235,263 234,561 0.02Getinge AB-B- 185,191 SEK 3,331,523 6,990,015 0.49Granges AB 83,487 SEK 822,952 1,160,714 0.08Hansa Biopharma AB 28,991 SEK 701,481 508,486 0.04Hexatronic Group AB 27,796 SEK 485,054 416,673 0.03Hexpol AB 220,058 SEK 2,182,631 2,719,799 0.19HMS Networks AB 21,859 SEK 598,270 925,260 0.06Holmen AB-B- 76,262 SEK 2,488,374 3,444,749 0.24Hufvudstaden AB-A- 92,438 SEK 1,451,462 1,572,672 0.11Indutrade AB 225,763 SEK 3,230,184 5,781,248 0.41Instalco AB 34,708 SEK 911,277 1,440,730 0.10Intrum AB 55,654 SEK 1,588,892 1,822,780 0.13Investment AB Oresund 27,655 SEK 390,451 480,526 0.03INVISIO AB 36,150 SEK 867,832 797,214 0.06Inwido AB 36,668 SEK 429,938 634,561 0.04JM AB 45,620 SEK 1,405,055 1,578,429 0.11Karo Pharma AB 57,199 SEK 329,934 366,517 0.03K-fast Holdings AB 40,740 SEK 187,311 297,732 0.02Klovern AB-B- 544,980 SEK 879,729 1,090,960 0.08KNOW IT AB 18,008 SEK 604,263 590,640 0.04Kungsleden AB 142,567 SEK 1,278,930 1,727,044 0.12LeoVegas AB 144A 57,099 SEK 371,243 253,710 0.02Lifco AB-B- 191,475 SEK 2,772,678 4,477,821 0.31Lime Technologies AB 7,439 SEK 300,861 283,220 0.02Lindab International AB 57,579 SEK 757,657 1,344,519 0.09Loomis AB 61,629 SEK 1,893,447 1,929,115 0.14Mekonomen AB 34,613 SEK 542,819 572,286 0.04MIPS AB 21,675 SEK 1,092,280 1,865,355 0.13Modern Times Group MTG AB-B- 83,168 SEK 1,134,238 1,127,105 0.08Munters Group AB 144A 110,815 SEK 819,717 991,253 0.07Mycronic AB 60,250 SEK 1,125,112 1,819,022 0.13NCC AB-B- 63,379 SEK 1,140,629 1,082,730 0.08New Wave Group AB-B- 36,568 SEK 449,250 464,361 0.03Nobia AB 101,979 SEK 683,837 870,479 0.06Nobina AB 144A 71,929 SEK 501,855 653,506 0.05Nolato AB-B- 171,608 SEK 1,293,926 1,689,563 0.12
Xtrackers**
Xtrackers MSCI EUROPE SMALL CAP UCITS ETF (continued)
Statement of Investmentsas at 30 June 2021(expressed in USD)
** This includes synthetic ETFs.
The accompanying notes form an integral part of these financial statements.
203
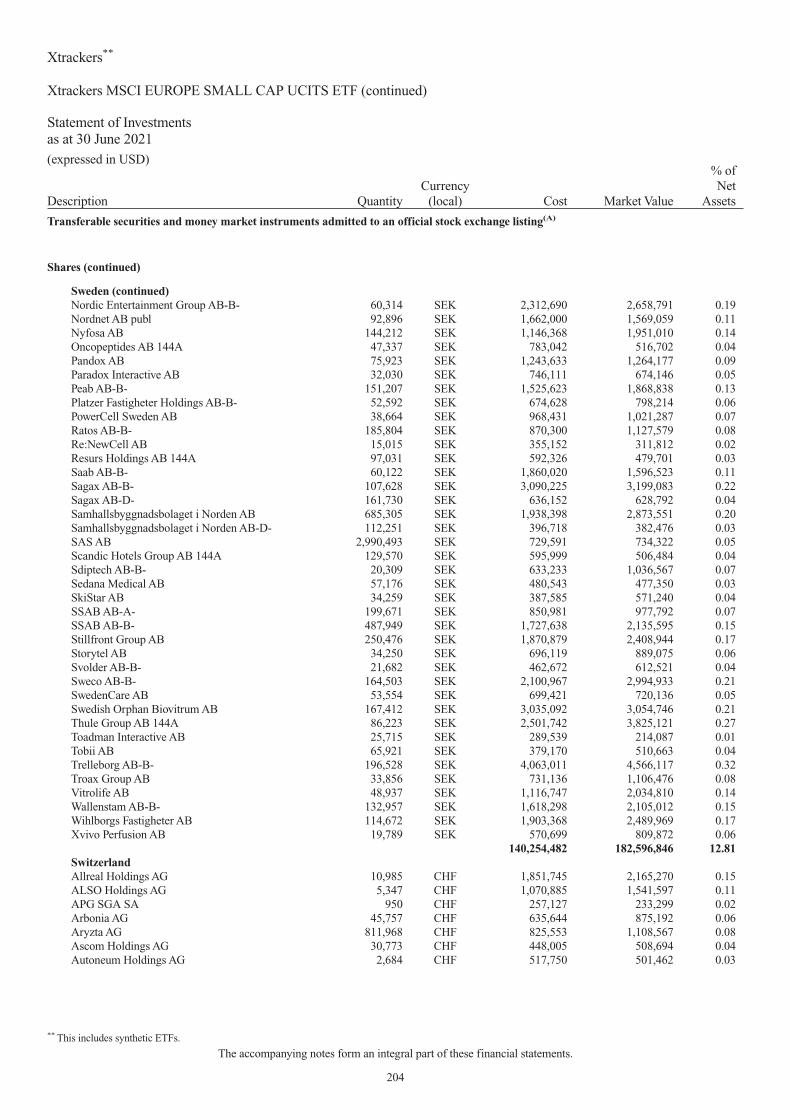
Description QuantityCurrency
(local) Cost Market Value
% ofNet
Assets
Transferable securities and money market instruments admitted to an official stock exchange listing(A)
Shares (continued)
Sweden (continued)Nordic Entertainment Group AB-B- 60,314 SEK 2,312,690 2,658,791 0.19Nordnet AB publ 92,896 SEK 1,662,000 1,569,059 0.11Nyfosa AB 144,212 SEK 1,146,368 1,951,010 0.14Oncopeptides AB 144A 47,337 SEK 783,042 516,702 0.04Pandox AB 75,923 SEK 1,243,633 1,264,177 0.09Paradox Interactive AB 32,030 SEK 746,111 674,146 0.05Peab AB-B- 151,207 SEK 1,525,623 1,868,838 0.13Platzer Fastigheter Holdings AB-B- 52,592 SEK 674,628 798,214 0.06PowerCell Sweden AB 38,664 SEK 968,431 1,021,287 0.07Ratos AB-B- 185,804 SEK 870,300 1,127,579 0.08Re:NewCell AB 15,015 SEK 355,152 311,812 0.02Resurs Holdings AB 144A 97,031 SEK 592,326 479,701 0.03Saab AB-B- 60,122 SEK 1,860,020 1,596,523 0.11Sagax AB-B- 107,628 SEK 3,090,225 3,199,083 0.22Sagax AB-D- 161,730 SEK 636,152 628,792 0.04Samhallsbyggnadsbolaget i Norden AB 685,305 SEK 1,938,398 2,873,551 0.20Samhallsbyggnadsbolaget i Norden AB-D- 112,251 SEK 396,718 382,476 0.03SAS AB 2,990,493 SEK 729,591 734,322 0.05Scandic Hotels Group AB 144A 129,570 SEK 595,999 506,484 0.04Sdiptech AB-B- 20,309 SEK 633,233 1,036,567 0.07Sedana Medical AB 57,176 SEK 480,543 477,350 0.03SkiStar AB 34,259 SEK 387,585 571,240 0.04SSAB AB-A- 199,671 SEK 850,981 977,792 0.07SSAB AB-B- 487,949 SEK 1,727,638 2,135,595 0.15Stillfront Group AB 250,476 SEK 1,870,879 2,408,944 0.17Storytel AB 34,250 SEK 696,119 889,075 0.06Svolder AB-B- 21,682 SEK 462,672 612,521 0.04Sweco AB-B- 164,503 SEK 2,100,967 2,994,933 0.21SwedenCare AB 53,554 SEK 699,421 720,136 0.05Swedish Orphan Biovitrum AB 167,412 SEK 3,035,092 3,054,746 0.21Thule Group AB 144A 86,223 SEK 2,501,742 3,825,121 0.27Toadman Interactive AB 25,715 SEK 289,539 214,087 0.01Tobii AB 65,921 SEK 379,170 510,663 0.04Trelleborg AB-B- 196,528 SEK 4,063,011 4,566,117 0.32Troax Group AB 33,856 SEK 731,136 1,106,476 0.08Vitrolife AB 48,937 SEK 1,116,747 2,034,810 0.14Wallenstam AB-B- 132,957 SEK 1,618,298 2,105,012 0.15Wihlborgs Fastigheter AB 114,672 SEK 1,903,368 2,489,969 0.17Xvivo Perfusion AB 19,789 SEK 570,699 809,872 0.06
140,254,482 182,596,846 12.81SwitzerlandAllreal Holdings AG 10,985 CHF 1,851,745 2,165,270 0.15ALSO Holdings AG 5,347 CHF 1,070,885 1,541,597 0.11APG SGA SA 950 CHF 257,127 233,299 0.02Arbonia AG 45,757 CHF 635,644 875,192 0.06Aryzta AG 811,968 CHF 825,553 1,108,567 0.08Ascom Holdings AG 30,773 CHF 448,005 508,694 0.04Autoneum Holdings AG 2,684 CHF 517,750 501,462 0.03
Xtrackers**
Xtrackers MSCI EUROPE SMALL CAP UCITS ETF (continued)
Statement of Investmentsas at 30 June 2021(expressed in USD)
** This includes synthetic ETFs.
The accompanying notes form an integral part of these financial statements.
204

Description QuantityCurrency
(local) Cost Market Value
% ofNet
Assets
Transferable securities and money market instruments admitted to an official stock exchange listing(A)
Shares (continued)
Switzerland (continued)Bachem Holdings AG-B- 4,251 CHF 1,218,753 2,520,201 0.18Basilea Pharmaceutica AG 10,649 CHF 546,728 520,728 0.04Belimo Holdings AG 7,906 CHF 2,970,905 3,617,935 0.25Bell Food Group AG 1,863 CHF 599,374 571,386 0.04BKW AG 16,607 CHF 1,370,140 1,730,139 0.12Bobst Group SA 7,484 CHF 524,191 599,141 0.04Bossard Holdings AG 4,402 CHF 864,401 1,345,340 0.09Bucher Industries AG 5,109 CHF 1,977,387 2,674,024 0.19Burckhardt Compression Holdings AG 3,055 CHF 967,283 1,237,732 0.09Cembra Money Bank AG 23,332 CHF 2,280,791 2,617,546 0.18Coltene Holdings AG 4,070 CHF 413,739 552,148 0.04Comet Holdings AG 5,539 CHF 843,652 1,525,045 0.11Conzzeta AG 1,168 CHF 1,258,301 1,579,488 0.11Daetwyler Holdings AG 5,910 CHF 1,285,137 1,998,026 0.14DKSH Holdings AG 27,774 CHF 1,832,979 2,127,332 0.15dormakaba Holdings AG 2,439 CHF 1,544,208 1,663,644 0.12Dufry AG 45,659 CHF 2,081,762 2,706,889 0.19EFG International AG 74,111 CHF 488,378 608,538 0.04Emmi AG 1,822 CHF 1,578,380 1,870,588 0.13Flughafen Zurich AG 16,413 CHF 2,864,370 2,716,708 0.19Forbo Holdings AG 756 CHF 1,193,672 1,432,912 0.10Galenica AG 144A 37,459 CHF 2,124,467 2,646,262 0.19GAM Holdings AG 106,457 CHF 1,088,221 231,491 0.02Georg Fischer AG 3,241 CHF 3,578,262 4,814,078 0.34Gurit Holdings AG 282 CHF 579,724 616,260 0.04Helvetia Holdings AG 29,370 CHF 3,291,536 3,161,481 0.22Huber & Suhner AG 11,398 CHF 821,428 963,038 0.07Idorsia Ltd. 87,704 CHF 2,318,732 2,413,793 0.17Implenia AG 9,169 CHF 309,911 238,859 0.02Inficon Holdings AG 1,473 CHF 1,149,906 1,705,101 0.12Interroll Holdings AG 534 CHF 1,424,577 2,120,171 0.15Intershop Holdings AG 1,057 CHF 619,365 695,252 0.05Kardex Holdings AG 4,424 CHF 692,069 1,024,218 0.07Komax Holdings AG 3,236 CHF 676,435 817,796 0.06Landis+Gyr Group AG 17,321 CHF 1,224,951 1,210,512 0.08LEM Holdings SA 469 CHF 844,250 984,324 0.07Leonteq AG 8,621 CHF 417,597 515,758 0.04Medacta Group SA 144A 5,965 CHF 534,871 783,416 0.05Medartis Holdings AG 144A 2,397 CHF 130,222 221,198 0.01Metall Zug AG 154 CHF 246,677 346,535 0.02Meyer Burger Technology AG 1,829,029 CHF 787,500 1,126,881 0.08Mobilezone Holdings AG 40,271 CHF 413,980 474,007 0.03Mobimo Holdings AG 5,964 CHF 1,623,882 1,961,439 0.14Molecular Partners AG 17,568 CHF 414,346 358,069 0.02OC Oerlikon Corp. AG 151,655 CHF 1,669,097 1,683,324 0.12Orior AG 7,583 CHF 636,349 685,821 0.05Peach Property Group AG 2,873 CHF 183,658 170,947 0.01PSP Swiss Property AG 36,865 CHF 4,144,637 4,686,144 0.33
Xtrackers**
Xtrackers MSCI EUROPE SMALL CAP UCITS ETF (continued)
Statement of Investmentsas at 30 June 2021(expressed in USD)
** This includes synthetic ETFs.
The accompanying notes form an integral part of these financial statements.
205

Description QuantityCurrency
(local) Cost Market Value
% ofNet
Assets
Transferable securities and money market instruments admitted to an official stock exchange listing(A)
Shares (continued)
Switzerland (continued)Relief Therapeutics Holdings AG 1,437,717 CHF 621,323 311,076 0.02Rieter Holdings AG 2,923 CHF 310,967 571,730 0.04Schweiter Technologies AG 851 CHF 1,110,727 1,248,397 0.09Sensirion Holdings AG 144A 9,022 CHF 510,207 724,220 0.05SFS Group AG 14,229 CHF 1,531,598 2,048,877 0.14Siegfried Holdings AG 3,181 CHF 1,782,463 2,985,360 0.21SIG Combibloc Group AG 261,956 CHF 4,593,090 7,124,546 0.50Softwareone Holdings AG 73,103 CHF 1,849,597 1,728,026 0.12St Galler Kantonalbank AG 2,271 CHF 1,010,268 1,009,770 0.07Stadler Rail AG 38,624 CHF 1,831,041 1,699,815 0.12Sulzer AG 15,235 CHF 1,606,240 2,106,381 0.15Swiss Steel Holdings AG 737,667 CHF 352,645 359,117 0.02Swissquote Group Holdings SA 7,265 CHF 495,159 1,098,769 0.08Tecan Group AG 9,688 CHF 3,329,377 4,804,435 0.34u-blox Holdings AG 6,256 CHF 575,610 460,224 0.03Valiant Holdings AG 12,446 CHF 1,264,626 1,234,704 0.09Valora Holdings AG 3,145 CHF 693,569 662,105 0.05VAT Group AG 144A 22,005 CHF 3,940,877 7,322,700 0.51Vetropack Holdings AG 11,928 CHF 701,579 720,055 0.05Vontobel Holdings AG 23,651 CHF 1,592,762 1,844,796 0.13VZ Holdings AG 12,220 CHF 891,268 1,036,456 0.07V-ZUG Holdings AG 1,307 CHF 113,742 201,349 0.01Ypsomed Holdings AG 3,251 CHF 509,575 507,161 0.04Zehnder Group AG 8,709 CHF 564,623 830,999 0.06Zur Rose Group AG 7,323 CHF 1,816,251 2,808,464 0.20
99,857,074 125,255,278 8.79United KingdomAB Dynamics PLC 15,191 GBP 473,975 430,205 0.03Abcam PLC 178,163 GBP 3,111,305 3,398,963 0.24Advanced Medical Solutions Group PLC 169,812 GBP 564,684 666,227 0.05AG Barr PLC 115,904 GBP 931,099 829,399 0.06Aggreko PLC 208,024 GBP 2,043,579 2,477,171 0.17Airtel Africa PLC 801,473 GBP 888,100 853,094 0.06AJ Bell PLC 251,610 GBP 1,370,458 1,507,831 0.11Alliance Pharma PLC 587,207 GBP 654,242 804,708 0.06Alpha FX Group PLC 25,585 GBP 470,838 542,537 0.04AO World PLC 262,596 GBP 879,630 917,791 0.06Argo Blockchain PLC 301,036 GBP 721,312 503,198 0.04Arrow Global Group PLC 132,769 GBP 577,553 560,329 0.04Ascential PLC 331,538 GBP 1,577,096 1,905,293 0.13Ashmore Group PLC 346,505 GBP 1,935,687 1,842,916 0.13ASOS PLC 56,914 GBP 3,312,040 3,899,743 0.27Assura REIT PLC 2,132,431 GBP 1,957,142 2,181,400 0.15Aston Martin Lagonda Global Holdings PLC 144A 55,895 GBP 1,438,279 1,449,733 0.10Auction Technology Group PLC 44,559 GBP 722,405 709,126 0.05Avacta Group PLC 207,729 GBP 406,514 506,784 0.04Avast PLC 144A 543,239 GBP 3,032,121 3,675,741 0.26Avon Rubber PLC 24,041 GBP 1,307,479 868,811 0.06
Xtrackers**
Xtrackers MSCI EUROPE SMALL CAP UCITS ETF (continued)
Statement of Investmentsas at 30 June 2021(expressed in USD)
** This includes synthetic ETFs.
The accompanying notes form an integral part of these financial statements.
206

Description QuantityCurrency
(local) Cost Market Value
% ofNet
Assets
Transferable securities and money market instruments admitted to an official stock exchange listing(A)
Shares (continued)
United Kingdom (continued)Babcock International Group PLC 198,096 GBP 1,011,010 793,613 0.06Bakkavor Group PLC 144A 100,213 GBP 195,188 178,864 0.01Balfour Beatty PLC 569,929 GBP 2,075,259 2,413,949 0.17Bank of Georgia Group PLC 34,308 GBP 680,080 636,986 0.04Beazley PLC 495,186 GBP 2,729,256 2,273,865 0.16Bellway PLC 100,308 GBP 4,044,153 4,489,684 0.31Biffa PLC 144A 256,290 GBP 830,319 1,150,669 0.08Big Yellow Group REIT PLC 137,910 GBP 1,881,025 2,490,041 0.17Blue Prism Group PLC 65,144 GBP 1,232,603 728,945 0.05Bodycote PLC 150,791 GBP 1,573,334 1,763,346 0.12Brewin Dolphin Holdings PLC 219,975 GBP 935,200 1,055,999 0.07Britvic PLC 224,531 GBP 2,460,804 2,906,371 0.20Bytes Technology Group PLC 178,644 GBP 994,749 1,142,627 0.08Cairn Energy PLC 432,195 GBP 1,097,256 869,910 0.06Capita PLC 1,357,262 GBP 1,599,072 699,559 0.05Capital & Counties Properties REIT PLC 607,324 GBP 1,648,317 1,353,287 0.09Carnival PLC 128,472 GBP 2,071,427 2,947,549 0.21Central Asia Metals PLC 174,072 GBP 589,540 572,323 0.04Centrica PLC 4,760,572 GBP 2,625,380 3,384,263 0.24Ceres Power Holdings PLC 72,701 GBP 777,970 1,061,575 0.07Chemring Group PLC 203,914 GBP 865,575 809,879 0.06Cineworld Group PLC 788,774 GBP 1,682,097 843,827 0.06Civitas Social Housing REIT PLC 598,327 GBP 800,244 953,849 0.07Clinigen Group PLC 100,693 GBP 1,091,352 861,044 0.06Clipper Logistics PLC 68,626 GBP 497,698 763,167 0.05Close Brothers Group PLC 123,307 GBP 2,460,059 2,580,689 0.18CLS Holdings PLC 82,034 GBP 286,653 272,549 0.02CMC Markets PLC 144A 111,023 GBP 460,928 705,515 0.05Coats Group PLC 1,249,382 GBP 1,208,522 1,175,378 0.08Computacenter PLC 63,331 GBP 1,559,815 2,250,207 0.16ContourGlobal PLC 144A 187,009 GBP 517,633 498,603 0.03ConvaTec Group PLC 144A 1,234,304 GBP 2,917,462 4,102,541 0.29Countryside Properties PLC 144A 406,771 GBP 2,140,548 2,655,699 0.19Craneware PLC 21,481 GBP 697,540 632,076 0.04Cranswick PLC 43,307 GBP 1,863,659 2,375,111 0.17Crest Nicholson Holdings PLC 215,377 GBP 1,202,302 1,247,852 0.09Custodian REIT PLC 481,496 GBP 616,789 647,203 0.05CVS Group PLC 55,682 GBP 1,022,999 1,857,664 0.13Dechra Pharmaceuticals PLC 87,049 GBP 3,428,100 5,255,093 0.37Derwent London REIT PLC 82,371 GBP 3,598,337 3,777,876 0.26Dialog Semiconductor PLC 58,990 EUR 2,997,860 4,586,333 0.32Diploma PLC 101,477 GBP 2,486,651 4,070,985 0.29Diversified Energy Co. PLC 661,031 GBP 1,061,546 960,667 0.07Dixons Carphone PLC 907,948 GBP 1,586,362 1,633,079 0.11Domino’s Pizza Group PLC 344,364 GBP 1,454,682 1,848,655 0.13dotdigital group PLC 164,458 GBP 511,009 524,810 0.04Dr. Martens PLC 344,562 GBP 2,356,396 2,118,179 0.15Draper Esprit PLC 117,968 GBP 1,185,366 1,473,221 0.10
Xtrackers**
Xtrackers MSCI EUROPE SMALL CAP UCITS ETF (continued)
Statement of Investmentsas at 30 June 2021(expressed in USD)
** This includes synthetic ETFs.
The accompanying notes form an integral part of these financial statements.
207

Description QuantityCurrency
(local) Cost Market Value
% ofNet
Assets
Transferable securities and money market instruments admitted to an official stock exchange listing(A)
Shares (continued)
United Kingdom (continued)Drax Group PLC 324,512 GBP 1,467,558 1,901,677 0.13DS Smith PLC 1,117,494 GBP 5,803,091 6,451,383 0.45Dunelm Group PLC 99,332 GBP 1,497,275 1,947,183 0.14easyJet PLC 148,244 GBP 1,511,897 1,832,476 0.13Electrocomponents PLC 367,830 GBP 3,485,155 5,228,748 0.37Elementis PLC 458,908 GBP 943,989 955,376 0.07EMIS Group PLC 46,803 GBP 679,442 743,544 0.05Empiric Student Property REIT PLC 561,467 GBP 630,068 667,825 0.05Energean PLC 95,287 GBP 988,736 939,869 0.07Equiniti Group PLC 144A 289,867 GBP 775,231 719,185 0.05Ergomed PLC 33,079 GBP 459,007 536,940 0.04Essentra PLC 258,490 GBP 1,362,303 1,103,411 0.08Eurasia Mining PLC 1,467,104 GBP 705,544 403,117 0.03Euromoney Institutional Investor PLC 97,707 GBP 1,444,668 1,374,069 0.10Ferrexpo PLC 228,717 GBP 802,195 1,351,682 0.09Fevertree Drinks PLC 85,549 GBP 2,464,946 3,040,815 0.21First Derivatives PLC 22,519 GBP 845,337 706,171 0.05Firstgroup PLC 1,013,151 GBP 1,301,350 1,146,287 0.08Forterra PLC 144A 203,306 GBP 746,410 758,314 0.05Frasers Group PLC 180,632 GBP 986,841 1,503,443 0.11Frontier Developments PLC 19,033 GBP 547,053 607,372 0.04Funding Circle Holdings PLC 144A 133,423 GBP 311,914 278,319 0.02Future PLC 93,941 GBP 1,746,575 4,064,547 0.29Games Workshop Group PLC 26,230 GBP 2,473,574 4,130,840 0.29Gamesys Group PLC 59,005 GBP 756,900 1,503,090 0.11Gamma Communications PLC 60,149 GBP 1,667,110 1,653,548 0.12GB Group PLC 161,692 GBP 1,529,202 1,843,915 0.13GCP Student Living REIT PLC 396,906 GBP 794,975 882,772 0.06Genuit Group PLC 192,014 GBP 1,191,698 1,623,378 0.11Genus PLC 53,247 GBP 2,472,935 3,648,481 0.26Go-Ahead Group PLC 34,688 GBP 805,935 535,743 0.04Grainger PLC 550,385 GBP 1,966,681 2,166,939 0.15Great Portland Estates REIT PLC 189,017 GBP 1,830,128 1,852,629 0.13Greatland Gold PLC 3,249,513 GBP 1,183,326 790,071 0.06Greggs PLC 83,253 GBP 1,912,228 2,984,506 0.21Halfords Group PLC 166,476 GBP 655,717 991,666 0.07Hammerson REIT PLC 2,493,963 GBP 1,524,579 1,282,680 0.09Harbour Energy PLC 191,310 GBP 1,141,629 996,357 0.07Hays PLC 1,374,766 GBP 2,782,469 3,012,085 0.21Helical PLC 92,019 GBP 472,294 552,971 0.04Hill & Smith Holdings PLC 64,380 GBP 1,157,090 1,328,730 0.09Hochschild Mining PLC 282,957 GBP 764,230 599,627 0.04HomeServe PLC 249,986 GBP 3,270,861 3,299,754 0.23Hotel Chocolat Group Ltd. 35,827 GBP 213,228 177,681 0.01Howden Joinery Group PLC 486,227 GBP 3,887,552 5,485,089 0.38Hunting PLC 135,480 GBP 490,620 412,685 0.03Ibstock PLC 144A 305,656 GBP 899,409 901,078 0.06Ideagen PLC 193,124 GBP 614,262 717,668 0.05
Xtrackers**
Xtrackers MSCI EUROPE SMALL CAP UCITS ETF (continued)
Statement of Investmentsas at 30 June 2021(expressed in USD)
** This includes synthetic ETFs.
The accompanying notes form an integral part of these financial statements.
208

Description QuantityCurrency
(local) Cost Market Value
% ofNet
Assets
Transferable securities and money market instruments admitted to an official stock exchange listing(A)
Shares (continued)
United Kingdom (continued)IG Design Group PLC 70,546 GBP 561,349 516,516 0.04IG Group Holdings PLC 297,963 GBP 3,051,863 3,486,430 0.24IMI PLC 219,372 GBP 3,399,240 5,212,486 0.37Inchcape PLC 320,154 GBP 2,972,764 3,398,897 0.24Indivior PLC 601,379 GBP 1,562,986 1,284,378 0.09IntegraFin Holdings PLC 232,565 GBP 1,462,117 1,654,576 0.12Intermediate Capital Group PLC 234,957 GBP 4,393,875 6,894,109 0.48Investec Asset Management Ltd. 275,068 GBP 703,293 836,744 0.06Investec PLC 568,037 GBP 1,908,091 2,262,333 0.16iomart Group PLC 89,222 GBP 401,981 330,325 0.02IP Group PLC 847,339 GBP 1,121,645 1,362,528 0.10IQE PLC 642,109 GBP 733,579 422,675 0.03ITM Power PLC 313,990 GBP 1,491,705 1,975,350 0.14ITV PLC 2,968,599 GBP 3,331,478 5,148,770 0.36J D Wetherspoon PLC 73,110 GBP 1,161,209 1,189,754 0.08JET2 PLC 131,289 GBP 2,021,762 2,146,505 0.15John Laing Group PLC 144A 405,713 GBP 1,685,930 2,240,768 0.16John Wood Group PLC 566,087 GBP 2,422,925 1,718,100 0.12Johnson Service Group PLC 314,920 GBP 768,775 763,071 0.05Judges Scientific PLC 3,473 GBP 258,312 275,392 0.02Jupiter Fund Management PLC 357,094 GBP 1,638,206 1,391,127 0.10Just Group PLC 872,835 GBP 1,232,195 1,123,182 0.08Kainos Group PLC 67,490 GBP 806,072 1,375,203 0.10Keller Group PLC 64,359 GBP 737,186 713,048 0.05Keywords Studios PLC 60,416 GBP 1,565,400 2,078,196 0.15Learning Technologies Group PLC 467,453 GBP 844,001 1,214,680 0.08Liontrust Asset Management PLC 51,610 GBP 941,315 1,340,377 0.09LondonMetric Property REIT PLC 689,443 GBP 1,898,212 2,203,926 0.15Luceco PLC 144A 54,707 GBP 288,737 314,014 0.02LXI REIT PLC 540,500 GBP 882,820 994,570 0.07Marks & Spencer Group PLC 1,588,858 GBP 2,449,422 3,214,472 0.23Marshalls PLC 166,185 GBP 1,360,659 1,574,893 0.11Marston’s PLC 500,474 GBP 685,407 608,069 0.04Mediclinic International PLC 375,408 GBP 1,572,480 1,541,301 0.11Meggitt PLC 637,807 GBP 2,934,342 4,063,627 0.28Micro Focus International PLC 274,252 GBP 1,494,912 2,072,394 0.15Mitchells & Butlers PLC 214,081 GBP 833,788 823,938 0.06Mitie Group PLC 1,144,922 GBP 1,101,803 1,075,524 0.08Moneysupermarket.com Group PLC 438,052 GBP 1,706,818 1,552,807 0.11Moonpig Group PLC 100,430 GBP 650,528 594,913 0.04Morgan Advanced Materials PLC 251,799 GBP 967,877 1,227,903 0.09Morgan Sindall Group PLC 29,937 GBP 621,143 891,232 0.06Naked Wines PLC 51,673 GBP 606,455 576,066 0.04National Express Group PLC 453,277 GBP 1,895,864 1,669,395 0.12NCC Group PLC 242,420 GBP 754,081 984,580 0.07Network International Holdings PLC 144A 384,165 GBP 2,176,380 1,940,787 0.14Numis Corp. PLC 71,827 GBP 317,680 352,250 0.02On the Beach Group PLC 144A 134,671 GBP 738,234 595,332 0.04
Xtrackers**
Xtrackers MSCI EUROPE SMALL CAP UCITS ETF (continued)
Statement of Investmentsas at 30 June 2021(expressed in USD)
** This includes synthetic ETFs.
The accompanying notes form an integral part of these financial statements.
209

Description QuantityCurrency
(local) Cost Market Value
% ofNet
Assets
Transferable securities and money market instruments admitted to an official stock exchange listing(A)
Shares (continued)
United Kingdom (continued)OSB Group PLC 374,858 GBP 1,983,535 2,402,813 0.17Oxford Biomedica PLC 53,165 GBP 612,381 954,782 0.07Pagegroup PLC 270,853 GBP 1,722,836 2,091,610 0.15Paragon Banking Group PLC 208,685 GBP 1,250,098 1,468,827 0.10Pennon Group PLC 346,428 GBP 4,223,826 5,434,197 0.38Petropavlovsk PLC 1,988,781 GBP 703,949 650,035 0.05Pets at Home Group PLC 407,509 GBP 1,641,433 2,567,067 0.18Polar Capital Holdings PLC 46,167 GBP 522,179 529,990 0.04Premier Foods PLC 505,222 GBP 462,624 764,941 0.05Primary Health Properties REIT PLC 1,031,896 GBP 1,889,814 2,193,864 0.15Provident Financial PLC 198,352 GBP 1,083,378 635,711 0.04PZ Cussons PLC 195,123 GBP 704,998 659,056 0.05QinetiQ Group PLC 463,429 GBP 1,818,570 2,199,741 0.15Quilter PLC 144A 1,473,267 GBP 2,965,759 3,027,427 0.21Rank Group PLC 193,072 GBP 504,354 447,555 0.03Rathbone Brothers PLC 41,576 GBP 1,128,336 1,040,725 0.07Reach PLC 248,718 GBP 847,813 944,877 0.07Redde Northgate PLC 200,061 GBP 775,933 1,102,733 0.08Redrow PLC 230,775 GBP 1,727,966 1,950,444 0.14Renalytix PLC 35,024 GBP 572,758 522,546 0.04Renishaw PLC 29,908 GBP 1,921,636 2,035,246 0.14Restaurant Group PLC 626,877 GBP 1,155,064 1,110,211 0.08Restore PLC 107,158 GBP 576,283 577,330 0.04Rightmove PLC 707,523 GBP 5,118,800 6,347,286 0.45Rotork PLC 713,815 GBP 2,910,995 3,356,684 0.24Royal Mail PLC 651,160 GBP 2,472,945 5,193,973 0.36RWS Holdings PLC 238,613 GBP 1,819,304 1,857,476 0.13S4 Capital PLC 228,078 GBP 1,501,603 1,978,692 0.14Sabre Insurance Group PLC 144A 203,825 GBP 719,196 718,014 0.05Safestore Holdings REIT PLC 172,665 GBP 1,521,567 2,258,861 0.16Saga PLC 89,855 GBP 490,580 493,790 0.03Savills PLC 126,944 GBP 1,677,838 2,016,718 0.14Secure Income REIT PLC 181,969 GBP 979,382 955,248 0.07Senior PLC 373,039 GBP 694,307 780,732 0.05Serco Group PLC 1,007,743 GBP 1,719,525 1,889,143 0.13Serica Energy PLC 187,511 GBP 315,210 359,025 0.02Shaftesbury REIT PLC 162,097 GBP 1,434,632 1,275,275 0.09SIG PLC 608,004 GBP 522,901 443,062 0.03Smart Metering Systems PLC 90,139 GBP 799,272 1,082,101 0.08Softcat PLC 97,864 GBP 1,470,121 2,401,050 0.17SolGold PLC 641,443 GBP 299,054 252,545 0.02Spectris PLC 93,700 GBP 3,463,565 4,191,328 0.29Spire Healthcare Group PLC 144A 253,344 GBP 718,848 860,956 0.06Spirent Communications PLC 500,879 GBP 1,585,468 1,704,939 0.12SSP Group PLC 617,489 GBP 2,876,032 2,272,473 0.16St Modwen Properties PLC 171,442 GBP 926,077 1,319,191 0.09Stagecoach Group PLC 385,881 GBP 744,577 437,655 0.03SThree PLC 75,683 GBP 470,396 482,509 0.03
Xtrackers**
Xtrackers MSCI EUROPE SMALL CAP UCITS ETF (continued)
Statement of Investmentsas at 30 June 2021(expressed in USD)
** This includes synthetic ETFs.
The accompanying notes form an integral part of these financial statements.
210

Description QuantityCurrency
(local) Cost Market Value
% ofNet
Assets
Transferable securities and money market instruments admitted to an official stock exchange listing(A)
Shares (continued)
United Kingdom (continued)Sumo Group PLC 93,627 GBP 498,267 472,741 0.03Synthomer PLC 280,383 GBP 1,539,666 1,904,140 0.13Tate & Lyle PLC 372,188 GBP 3,433,803 3,796,551 0.27TBC Bank Group PLC 38,016 GBP 614,393 609,200 0.04Team17 Group PLC 90,099 GBP 962,096 906,122 0.06Telecom Plus PLC 54,292 GBP 986,942 852,019 0.06TI Fluid Systems PLC 144A 164,585 GBP 496,702 698,014 0.05Trainline PLC 144A 380,296 GBP 2,275,513 1,542,457 0.11Travis Perkins PLC 183,464 GBP 3,023,138 4,280,709 0.30Tritax Big Box REIT PLC 1,374,212 GBP 2,861,071 3,726,570 0.26Tullow Oil PLC 986,488 GBP 1,423,252 810,311 0.06Ultra Electronics Holdings PLC 58,699 GBP 1,538,982 1,856,955 0.13UNITE Group REIT PLC 267,365 GBP 3,362,606 3,966,834 0.28Vectura Group PLC 495,664 GBP 811,156 933,979 0.07Vesuvius PLC 160,392 GBP 1,020,600 1,169,908 0.08Victoria PLC 54,475 GBP 481,966 805,223 0.06Victrex PLC 72,055 GBP 2,167,035 2,534,298 0.18Virgin Money UK PLC 1,056,403 GBP 2,653,917 2,897,575 0.20Vistry Group PLC 181,383 GBP 2,467,040 2,947,975 0.21Volex PLC 90,368 GBP 441,167 465,025 0.03Warehouse REIT PLC 344,077 GBP 570,460 712,988 0.05Watkin Jones PLC 192,034 GBP 520,957 570,364 0.04Weir Group PLC 211,430 GBP 3,813,969 5,406,401 0.38WH Smith PLC 106,666 GBP 2,414,611 2,370,185 0.17Wickes Group PLC 206,096 GBP 548,650 700,390 0.05Workspace Group REIT PLC 119,913 GBP 1,363,772 1,381,553 0.10Young & Co’s Brewery PLC-A- 14,660 GBP 333,480 330,109 0.02
349,740,706 406,678,475 28.54
Total - Shares 1,195,671,209 1,421,465,308 99.76
Total Transferable securities and money market instruments admitted to an officialstock exchange listing 1,195,671,209 1,421,465,308 99.76
Other transferable securities and money market instruments(A)
Shares
BermudaAfrican Minerals Ltd.(1) 139,811 USD 354,913 14 0.00
354,913 14 0.00ItalyAmco(1) 2,592 EUR 37,750 38,554 0.01
(1) The security is fair valued.
Xtrackers**
Xtrackers MSCI EUROPE SMALL CAP UCITS ETF (continued)
Statement of Investmentsas at 30 June 2021(expressed in USD)
** This includes synthetic ETFs.
The accompanying notes form an integral part of these financial statements.
211

Description QuantityCurrency
(local) Cost Market Value
% ofNet
Assets
Other transferable securities and money market instruments(A)
Shares (continued)
Italy (continued)Banca Carige SpA(1) 30,380 EUR 357,038 4 0.00Bio On Spa(1) 4,900 EUR 199,789 — 0.00
594,577 38,558 0.01SpainLet’s GOWEX SA(1) 11,914 EUR 377,753 1 0.00Sacyr SA 7,025 EUR — 17,845 0.00
377,753 17,846 0.00United KingdomFinablr PLC 144A 145,570 GBP 301,947 1,207 0.00Patisserie Holdings PLC(1) 36,176 GBP 218,546 5 0.00
520,493 1,212 0.00
Total - Shares 1,847,736 57,630 0.01
Total Other transferable securities and money market instruments 1,847,736 57,630 0.01
TOTAL INVESTMENT PORTFOLIO 1,197,518,945 1,421,522,938 99.77(A) Any duplicate securities appearing herein with the same name are either quoted on different stock exchanges or have different ISINs.
(1) The security is fair valued.
Xtrackers**
Xtrackers MSCI EUROPE SMALL CAP UCITS ETF (continued)
Statement of Investmentsas at 30 June 2021(expressed in USD)
** This includes synthetic ETFs.
The accompanying notes form an integral part of these financial statements.
212

Description QuantityCurrency
(local) Cost Market Value
% ofNet
Assets
Transferable securities and money market instruments admitted to an official stock exchange listing
Shares
BelgiumAgeas SA 36,926 EUR 2,243,501 2,049,398 2.09Groupe Bruxelles Lambert SA 17,391 EUR 1,873,852 1,945,668 1.99KBC Group NV 13,375 EUR 1,105,626 1,019,889 1.04Telenet Group Holdings NV 77,344 EUR 3,188,698 2,911,266 2.98
8,411,677 7,926,221 8.10Cayman IslandsAlibaba Group Holdings Ltd.-ADR- 11,947 USD 3,024,914 2,709,341 2.77
3,024,914 2,709,341 2.77GermanyBayer AG 35,085 EUR 2,243,458 2,130,711 2.18Bayerische Motoren Werke AG 8,553 EUR 900,967 905,872 0.93Covestro AG 144A 13,151 EUR 901,051 849,346 0.87Deutsche Post AG 31,497 EUR 1,873,902 2,142,529 2.19Hannover Rueck SE 10,598 EUR 1,873,978 1,773,369 1.81HUGO BOSS AG 37,634 EUR 1,873,916 2,047,633 2.09Infineon Technologies AG 25,468 EUR 1,029,251 1,021,449 1.04Volkswagen AG-Pref- 3,998 EUR 1,105,527 1,001,348 1.02
11,802,050 11,872,257 12.13NetherlandsAkzo Nobel NV 17,704 EUR 2,159,320 2,187,698 2.23ASML Holdings NV 2,005 EUR 1,263,917 1,377,657 1.41ING Groep NV 128,906 EUR 1,381,978 1,702,969 1.74Koninklijke Ahold Delhaize NV 39,884 EUR 1,106,208 1,185,772 1.21Koninklijke KPN NV 335,453 EUR 1,106,215 1,047,842 1.07Signify NV 144A 14,750 EUR 901,041 933,025 0.95
7,918,679 8,434,963 8.61NorwayNorsk Hydro ASA 148,150 NOK 898,955 945,865 0.97Orkla ASA 209,493 NOK 2,158,885 2,135,051 2.18
3,057,840 3,080,916 3.15SwedenSvenska Handelsbanken AB-A- 96,113 SEK 1,102,309 1,085,186 1.11
1,102,309 1,085,186 1.11SwitzerlandUBS Group AG 69,266 CHF 1,105,300 1,061,077 1.08
1,105,300 1,061,077 1.08United KingdomAstraZeneca PLC-ADR- 12,858 USD 724,420 770,194 0.79Royal Dutch Shell PLC-B--ADR- 19,416 USD 724,411 753,923 0.77
1,448,831 1,524,117 1.56United StatesAdobe Inc. 3,768 USD 1,542,852 2,206,692 2.25Alphabet Inc.-A- 2,630 USD 3,473,809 6,421,908 6.56Amazon.com Inc. 1,502 USD 3,461,845 5,167,120 5.28Apple Inc. 8,840 USD 1,107,475 1,210,726 1.24Berkshire Hathaway Inc.-B- 6,625 USD 1,800,712 1,841,220 1.88Booking Holdings Inc. 532 USD 1,267,724 1,164,064 1.19Chevron Corp. 18,884 USD 2,053,257 1,977,910 2.02
Xtrackers**
Xtrackers S&P SELECT FRONTIER SWAP UCITS ETF*
Statement of Investmentsas at 30 June 2021(expressed in USD)
* This is a synthetic ETF.** This includes synthetic ETFs.
The accompanying notes form an integral part of these financial statements.
213

Description QuantityCurrency
(local) Cost Market Value
% ofNet
Assets
Transferable securities and money market instruments admitted to an official stock exchange listing
Shares (continued)
United States (continued)Citigroup Inc. 17,515 USD 1,266,860 1,239,186 1.27CVS Health Corp. 12,815 USD 1,107,472 1,069,284 1.09Discovery Inc.-A- 47,438 USD 2,058,335 1,455,398 1.49Exxon Mobil Corp. 33,048 USD 2,053,272 2,084,668 2.13Facebook Inc.-A- 16,950 USD 3,460,242 5,893,685 6.02Fiserv Inc. 11,206 USD 1,286,561 1,197,809 1.22Intel Corp. 19,183 USD 1,107,435 1,076,934 1.10Johnson & Johnson 5,309 USD 902,955 874,605 0.89Micron Technology Inc. 11,308 USD 939,913 960,954 0.98Microsoft Corp. 4,442 USD 1,107,435 1,203,338 1.23Netflix Inc. 6,421 USD 2,882,345 3,391,636 3.46NIKE Inc.-B- 7,784 USD 1,014,177 1,202,550 1.23NVIDIA Corp. 2,985 USD 2,272,301 2,388,299 2.44PayPal Holdings Inc. 10,242 USD 1,613,627 2,985,338 3.05Pfizer Inc. 28,653 USD 1,107,439 1,122,051 1.15Procter & Gamble Co. 9,416 USD 1,266,829 1,270,501 1.30QUALCOMM Inc. 7,481 USD 1,014,274 1,069,259 1.09Regeneron Pharmaceuticals Inc. 2,246 USD 1,033,879 1,254,481 1.28Roku Inc. 4,012 USD 1,705,381 1,842,511 1.88salesforce.com Inc. 14,517 USD 3,461,288 3,546,068 3.62Uber Technologies Inc. 25,417 USD 1,286,609 1,273,900 1.30Walmart Inc. 5,104 USD 724,360 719,766 0.73Walt Disney Co. 7,442 USD 1,286,647 1,308,080 1.34Wells Fargo & Co. 48,987 USD 2,272,017 2,218,621 2.27Zoom Video Communications Inc.-A- 3,074 USD 1,135,280 1,189,730 1.21
54,074,607 63,828,292 65.19
Total - Shares 91,946,207 101,522,370 103.70
Total Transferable securities and money market instruments admitted to an officialstock exchange listing 91,946,207 101,522,370 103.70
TOTAL INVESTMENT PORTFOLIO 91,946,207 101,522,370 103.70
Xtrackers**
Xtrackers S&P SELECT FRONTIER SWAP UCITS ETF* (continued)
Statement of Investmentsas at 30 June 2021(expressed in USD)
* This is a synthetic ETF.** This includes synthetic ETFs.
The accompanying notes form an integral part of these financial statements.
214

DescriptionNominal
ValueCurrency
(local) Cost Market Value
% ofNet
Assets
Transferable securities and money market instruments admitted to an official stock exchange listing
Bonds
FranceFrance OAT Zero Coupon 09 - 25.04.31 1,140,000 EUR 1,184,894 1,337,826 16.08France OAT Zero Coupon 09 - 25.10.32 1,175,000 EUR 1,368,266 1,351,686 16.24
2,553,160 2,689,512 32.32GermanyDeutsche Bundesrepublik Coupon Strips Zero Coupon97 - 04.07.26 1,000,000 EUR 1,127,659 1,212,726 14.57
1,127,659 1,212,726 14.57ItalyItaly Buoni Poliennali del Tesoro Coupon Strip ZeroCoupon 98 - 01.05.23 150,000 EUR 179,385 178,712 2.15
179,385 178,712 2.15United KingdomUnited Kingdom Gilt 1.75% 18 - 22.01.49 100,000 GBP 153,913 154,886 1.86United Kingdom Inflation-Linked Gilt 0.125% 11 -22.03.29 950,723 GBP 1,649,143 1,637,937 19.68United Kingdom Inflation-Linked Gilt 0.125% 15 -22.03.46 583,730 GBP 1,414,429 1,398,585 16.81
3,217,485 3,191,408 38.35
Total - Bonds 7,077,689 7,272,358 87.39
Total Transferable securities and money market instruments admitted to an officialstock exchange listing 7,077,689 7,272,358 87.39
Transferable securities and money market instruments dealt in on another regulated market
Bonds
ItalyItaly Buoni Poliennali del Tesoro Coupon Strip ZeroCoupon 13 - 01.03.22 850,000 EUR 1,002,454 1,010,596 12.14
1,002,454 1,010,596 12.14
Total - Bonds 1,002,454 1,010,596 12.14
Total Transferable securities and money market instruments dealt in on anotherregulated market 1,002,454 1,010,596 12.14
TOTAL INVESTMENT PORTFOLIO 8,080,143 8,282,954 99.53
TOTAL INVESTMENT PORTFOLIO INCLUDING ACCRUED INTEREST 8,284,750 99.55
Xtrackers**
Xtrackers USD OVERNIGHT RATE SWAP UCITS ETF*
Statement of Investmentsas at 30 June 2021(expressed in USD)
* This is a synthetic ETF.** This includes synthetic ETFs.
The accompanying notes form an integral part of these financial statements.
215
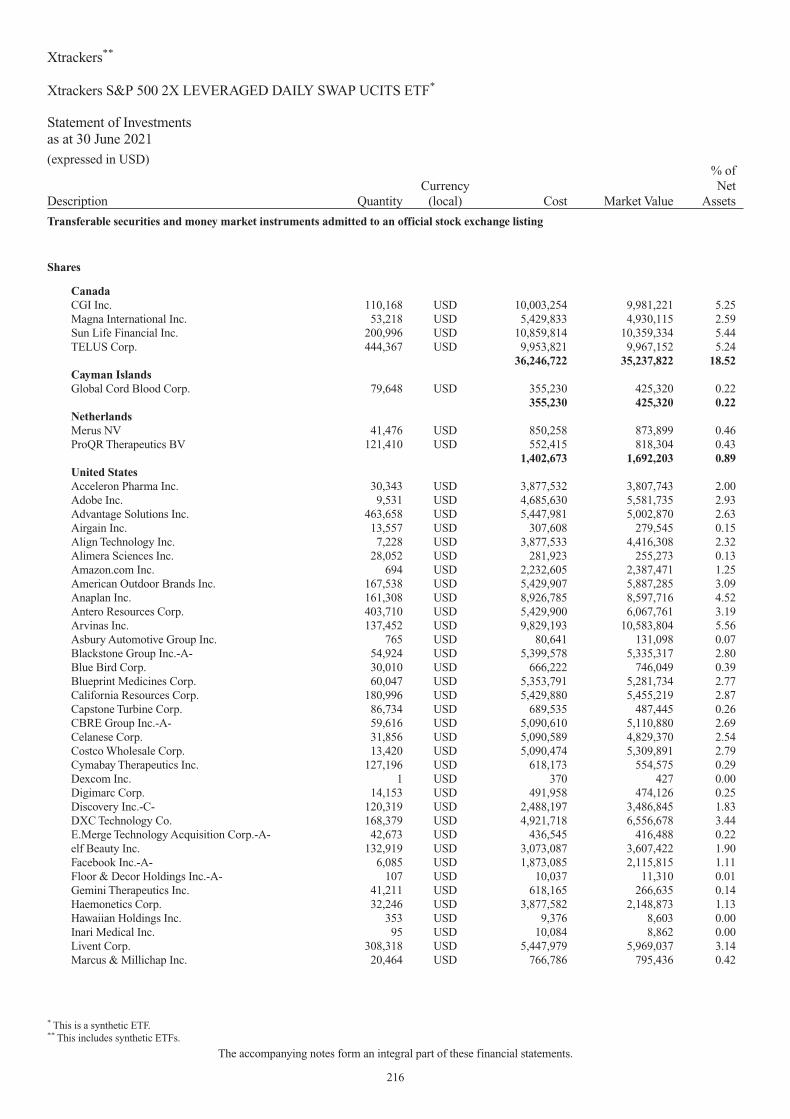
Description QuantityCurrency
(local) Cost Market Value
% ofNet
Assets
Transferable securities and money market instruments admitted to an official stock exchange listing
Shares
CanadaCGI Inc. 110,168 USD 10,003,254 9,981,221 5.25Magna International Inc. 53,218 USD 5,429,833 4,930,115 2.59Sun Life Financial Inc. 200,996 USD 10,859,814 10,359,334 5.44TELUS Corp. 444,367 USD 9,953,821 9,967,152 5.24
36,246,722 35,237,822 18.52Cayman IslandsGlobal Cord Blood Corp. 79,648 USD 355,230 425,320 0.22
355,230 425,320 0.22NetherlandsMerus NV 41,476 USD 850,258 873,899 0.46ProQR Therapeutics BV 121,410 USD 552,415 818,304 0.43
1,402,673 1,692,203 0.89United StatesAcceleron Pharma Inc. 30,343 USD 3,877,532 3,807,743 2.00Adobe Inc. 9,531 USD 4,685,630 5,581,735 2.93Advantage Solutions Inc. 463,658 USD 5,447,981 5,002,870 2.63Airgain Inc. 13,557 USD 307,608 279,545 0.15Align Technology Inc. 7,228 USD 3,877,533 4,416,308 2.32Alimera Sciences Inc. 28,052 USD 281,923 255,273 0.13Amazon.com Inc. 694 USD 2,232,605 2,387,471 1.25American Outdoor Brands Inc. 167,538 USD 5,429,907 5,887,285 3.09Anaplan Inc. 161,308 USD 8,926,785 8,597,716 4.52Antero Resources Corp. 403,710 USD 5,429,900 6,067,761 3.19Arvinas Inc. 137,452 USD 9,829,193 10,583,804 5.56Asbury Automotive Group Inc. 765 USD 80,641 131,098 0.07Blackstone Group Inc.-A- 54,924 USD 5,399,578 5,335,317 2.80Blue Bird Corp. 30,010 USD 666,222 746,049 0.39Blueprint Medicines Corp. 60,047 USD 5,353,791 5,281,734 2.77California Resources Corp. 180,996 USD 5,429,880 5,455,219 2.87Capstone Turbine Corp. 86,734 USD 689,535 487,445 0.26CBRE Group Inc.-A- 59,616 USD 5,090,610 5,110,880 2.69Celanese Corp. 31,856 USD 5,090,589 4,829,370 2.54Costco Wholesale Corp. 13,420 USD 5,090,474 5,309,891 2.79Cymabay Therapeutics Inc. 127,196 USD 618,173 554,575 0.29Dexcom Inc. 1 USD 370 427 0.00Digimarc Corp. 14,153 USD 491,958 474,126 0.25Discovery Inc.-C- 120,319 USD 2,488,197 3,486,845 1.83DXC Technology Co. 168,379 USD 4,921,718 6,556,678 3.44E.Merge Technology Acquisition Corp.-A- 42,673 USD 436,545 416,488 0.22elf Beauty Inc. 132,919 USD 3,073,087 3,607,422 1.90Facebook Inc.-A- 6,085 USD 1,873,085 2,115,815 1.11Floor & Decor Holdings Inc.-A- 107 USD 10,037 11,310 0.01Gemini Therapeutics Inc. 41,211 USD 618,165 266,635 0.14Haemonetics Corp. 32,246 USD 3,877,582 2,148,873 1.13Hawaiian Holdings Inc. 353 USD 9,376 8,603 0.00Inari Medical Inc. 95 USD 10,084 8,862 0.00Livent Corp. 308,318 USD 5,447,979 5,969,037 3.14Marcus & Millichap Inc. 20,464 USD 766,786 795,436 0.42
Xtrackers**
Xtrackers S&P 500 2X LEVERAGED DAILY SWAP UCITS ETF*
Statement of Investmentsas at 30 June 2021(expressed in USD)
* This is a synthetic ETF.** This includes synthetic ETFs.
The accompanying notes form an integral part of these financial statements.
216

Description QuantityCurrency
(local) Cost Market Value
% ofNet
Assets
Transferable securities and money market instruments admitted to an official stock exchange listing
Shares (continued)
United States (continued)Microsoft Corp. 20,582 USD 5,405,451 5,575,664 2.93Mr Cooper Group Inc. 106,726 USD 3,205,222 3,528,362 1.85Novume Solutions Inc. 60,350 USD 940,253 613,156 0.32Open Lending Corp.-A- 263,967 USD 10,798,890 11,374,338 5.98Organogenesis Holdings Inc. 42,618 USD 618,174 708,311 0.37Privia Health Group Inc. 117,794 USD 5,447,972 5,226,520 2.75Quantum Corp. 149,818 USD 1,252,478 1,032,246 0.54Scientific Games Corp. 250 USD 10,010 19,360 0.01SharpSpring Inc. 23,151 USD 491,959 391,020 0.21Smith Micro Software Inc. 101,552 USD 689,538 530,101 0.28Take-Two Interactive Software Inc. 307 USD 35,756 54,345 0.03Tapestry Inc. 17 USD 252 739 0.00USANA Health Sciences Inc. 41,606 USD 3,543,999 4,261,703 2.24Vocera Communications Inc. 8,100 USD 345,060 322,785 0.17
140,646,073 145,614,296 76.51
Total - Shares 178,650,698 182,969,641 96.14
Total Transferable securities and money market instruments admitted to an officialstock exchange listing 178,650,698 182,969,641 96.14
TOTAL INVESTMENT PORTFOLIO 178,650,698 182,969,641 96.14
Xtrackers**
Xtrackers S&P 500 2X LEVERAGED DAILY SWAP UCITS ETF* (continued)
Statement of Investmentsas at 30 June 2021(expressed in USD)
* This is a synthetic ETF.** This includes synthetic ETFs.
The accompanying notes form an integral part of these financial statements.
217

Description QuantityCurrency
(local) Cost Market Value
% ofNet
Assets
Transferable securities and money market instruments admitted to an official stock exchange listing
Shares
BelgiumKBC Group NV 70,000 EUR 4,741,800 4,501,000 3.42Proximus SADP 122,558 EUR 2,063,692 1,996,470 1.51
6,805,492 6,497,470 4.93FinlandNokia OYJ 1,521,781 EUR 6,428,401 6,871,602 5.21Sampo OYJ-A- 132,066 EUR 5,059,449 5,118,878 3.89
11,487,850 11,990,480 9.10Germanyadidas AG 32,155 EUR 9,672,224 10,093,454 7.66BASF SE 212 EUR 14,290 14,085 0.01Bayer AG 244,510 EUR 12,641,628 12,521,357 9.50Deutsche Post AG 105,072 EUR 5,892,438 6,026,930 4.57Fresenius SE & Co. KGaA 141,961 EUR 6,314,425 6,245,574 4.74HeidelbergCement AG 33,623 EUR 2,525,087 2,432,288 1.84Muenchener Rueckversicherungs-Gesellschaft AG 26,041 EUR 6,173,019 6,014,169 4.56Porsche Automobil Holdings SE-Pref- 46,977 EUR 4,522,625 4,244,842 3.22RWE AG 163,532 EUR 5,077,669 4,997,538 3.79SAP SE 50,716 EUR 5,801,910 6,027,089 4.57Siemens AG 45,574 EUR 6,138,009 6,089,598 4.62TAG Immobilien AG 216,513 EUR 5,612,017 5,793,888 4.40Volkswagen AG-Pref- 25,623 EUR 5,554,955 5,411,578 4.11
75,940,296 75,912,390 57.59NetherlandsAdyen NV 144A 6 EUR 11,995 12,363 0.01ING Groep NV 555,864 EUR 6,372,773 6,192,325 4.70JDE Peet’s NV 6,244 EUR 201,701 191,067 0.14Koninklijke Ahold Delhaize NV 242,986 EUR 5,751,479 6,091,659 4.62Koninklijke DSM NV 36,183 EUR 5,524,576 5,695,204 4.32Koninklijke KPN NV 13 EUR 36 34 0.00Koninklijke Philips NV 135,643 EUR 6,182,244 5,668,521 4.30
24,044,804 23,851,173 18.09United StatesApple Inc. 41,608 USD 4,321,715 4,805,320 3.65Intel Corp. 92,843 USD 4,321,654 4,395,146 3.33Johnson & Johnson 31,044 USD 4,321,639 4,312,493 3.27
12,965,008 13,512,959 10.25
Total - Shares 131,243,450 131,764,472 99.96
Total Transferable securities and money market instruments admitted to an officialstock exchange listing 131,243,450 131,764,472 99.96
TOTAL INVESTMENT PORTFOLIO 131,243,450 131,764,472 99.96
Xtrackers**
Xtrackers SHORTDAX X2 DAILY SWAP UCITS ETF*
Statement of Investmentsas at 30 June 2021(expressed in EUR)
* This is a synthetic ETF.** This includes synthetic ETFs.
The accompanying notes form an integral part of these financial statements.
218

Description QuantityCurrency
(local) Cost Market Value
% ofNet
Assets
Transferable securities and money market instruments admitted to an official stock exchange listing
Shares
BelgiumKBC Group NV 50,000 EUR 3,387,000 3,215,000 7.73Proximus SADP 105,770 EUR 1,806,124 1,722,993 4.14
5,193,124 4,937,993 11.87FinlandNokia OYJ 56,556 EUR 238,055 255,378 0.61
238,055 255,378 0.61Germanyadidas AG 11,839 EUR 3,561,171 3,716,262 8.93Allianz SE 6,001 EUR 1,332,822 1,262,010 3.03BASF SE 34,371 EUR 2,270,414 2,283,609 5.49Bayer AG 59,401 EUR 3,072,657 3,041,925 7.31Bayerische Motoren Werke AG 16,417 EUR 1,439,278 1,466,202 3.52Deutsche Boerse AG 10,839 EUR 1,448,090 1,595,501 3.83Deutsche Post AG 34,204 EUR 1,955,701 1,961,942 4.71Fresenius SE & Co. KGaA 68,093 EUR 3,028,777 2,995,752 7.20Muenchener Rueckversicherungs-Gesellschaft AG 6,316 EUR 1,497,208 1,458,680 3.51Porsche Automobil Holdings SE-Pref- 12,148 EUR 1,142,760 1,097,693 2.64RWE AG 55,532 EUR 1,724,269 1,697,058 4.08SAP SE 13,405 EUR 1,539,378 1,593,050 3.83Siemens AG 5,283 EUR 726,097 705,915 1.70TAG Immobilien AG 61,070 EUR 1,582,935 1,634,233 3.93Volkswagen AG-Pref- 7,619 EUR 1,736,451 1,609,133 3.87
28,058,008 28,118,965 67.58NetherlandsAdyen NV 144A 847 EUR 1,634,302 1,745,244 4.20ASML Holdings NV 2,713 EUR 1,583,021 1,571,912 3.78ING Groep NV 134,451 EUR 1,526,555 1,497,784 3.60Koninklijke KPN NV 7 EUR 19 18 0.00Koninklijke Philips NV 37,778 EUR 1,751,836 1,578,743 3.79
6,495,733 6,393,701 15.37United StatesApple Inc. 12,924 USD 1,342,382 1,492,597 3.59Intel Corp. 28,838 USD 1,342,351 1,365,178 3.28Johnson & Johnson 9,643 USD 1,342,403 1,339,562 3.22
4,027,136 4,197,337 10.09
Total - Shares 44,012,056 43,903,374 105.52
Total Transferable securities and money market instruments admitted to an officialstock exchange listing 44,012,056 43,903,374 105.52
TOTAL INVESTMENT PORTFOLIO 44,012,056 43,903,374 105.52
Xtrackers**
Xtrackers LEVDAX DAILY SWAP UCITS ETF*
Statement of Investmentsas at 30 June 2021(expressed in EUR)
* This is a synthetic ETF.** This includes synthetic ETFs.
The accompanying notes form an integral part of these financial statements.
219

DescriptionNominal
ValueCurrency
(local) Cost Market Value
% ofNet
Assets
Transferable securities and money market instruments admitted to an official stock exchange listing
Bonds
FranceFrance OAT Zero Coupon 09 - 25.04.30 300,000 EUR 372,420 355,514 2.49France OAT Zero Coupon 09 - 25.10.32 300,000 EUR 368,887 345,111 2.41France OAT Zero Coupon 09 - 25.04.42 900,000 EUR 907,933 907,716 6.35
1,649,240 1,608,341 11.25GermanyDeutsche Bundesrepublik Principal Strips ZeroCoupon 08 - 04.07.40 200,000 EUR 252,366 231,545 1.62
252,366 231,545 1.62United KingdomUnited Kingdom Gilt 0.625% 19 - 07.06.25 1,300,000 GBP 1,834,523 1,822,716 12.74United Kingdom Gilt 3.50% 13 - 22.07.68 1,000,000 GBP 2,589,060 2,583,021 18.06United Kingdom Gilt 3.50% 14 - 22.01.45 1,300,000 GBP 2,623,869 2,633,612 18.41United Kingdom Gilt 4.75% 07 - 07.12.30 700,000 GBP 1,327,904 1,322,248 9.25
8,375,356 8,361,597 58.46
Total - Bonds 10,276,962 10,201,483 71.33
Total Transferable securities and money market instruments admitted to an officialstock exchange listing 10,276,962 10,201,483 71.33
TOTAL INVESTMENT PORTFOLIO 10,276,962 10,201,483 71.33
TOTAL INVESTMENT PORTFOLIO INCLUDING ACCRUED INTEREST 10,254,383 71.69
(D) During the period ending 30 June 2021 this Sub-Fund changed its name. Please see point 3 in the significant events of the period section of the Notes to theFinancial Statements of this semi-annual report for further information.
(E) During the period ending 30 June 2021 this Sub-Fund changed its currency. Please see point 3 in the significant events of the period section of the Notes to theFinancial Statements of this semi-annual report for further information.
Xtrackers**
Xtrackers BLOOMBERG COMMODITY SWAP UCITS ETF*(D)
Statement of Investmentsas at 30 June 2021(expressed in USD)(E)
* This is a synthetic ETF.** This includes synthetic ETFs.
The accompanying notes form an integral part of these financial statements.
220

Description QuantityCurrency
(local) Cost Market Value
% ofNet
Assets
Transferable securities and money market instruments admitted to an official stock exchange listing
Shares
BelgiumKBC Group NV 21,863 EUR 1,807,781 1,667,128 2.29Proximus SADP 91,294 EUR 1,876,936 1,763,647 2.43
3,684,717 3,430,775 4.72Cayman IslandsAmbarella Inc. 89 USD 10,083 9,490 0.01
10,083 9,490 0.01FinlandNokia OYJ 356,085 EUR 1,838,434 1,906,812 2.62
1,838,434 1,906,812 2.62Germanyadidas AG 8,691 EUR 3,201,152 3,235,261 4.45BASF SE 16,342 EUR 1,339,539 1,287,607 1.77Bayer AG 50,371 EUR 3,187,585 3,059,029 4.21Bayerische Motoren Werke AG 14,883 EUR 1,607,100 1,576,300 2.17Deutsche Boerse AG 5,375 EUR 879,313 938,285 1.29Deutsche Post AG 19,175 EUR 1,316,746 1,304,346 1.80Fresenius SE & Co. KGaA 29,679 EUR 1,616,489 1,548,463 2.13Muenchener Rueckversicherungs-Gesellschaft AG 7,002 EUR 2,032,454 1,917,734 2.64Porsche Automobil Holdings SE-Pref- 12,026 EUR 1,384,229 1,288,682 1.77RWE AG 51,170 EUR 1,922,752 1,854,458 2.55SAP SE 9,425 EUR 1,320,280 1,328,288 1.83TAG Immobilien AG 50,704 EUR 1,609,296 1,609,076 2.22Volkswagen AG-Pref- 5,770 EUR 1,556,305 1,445,167 1.99
22,973,240 22,392,696 30.82NetherlandsASML Holdings NV 2,400 EUR 1,654,084 1,649,066 2.27ING Groep NV 96,450 EUR 1,321,608 1,274,194 1.76JDE Peet’s NV 16,869 EUR 657,267 612,152 0.84Koninklijke KPN NV 86,176 EUR 268,929 269,185 0.37Koninklijke Philips NV 35,901 EUR 1,988,696 1,779,210 2.45
5,890,584 5,583,807 7.69United States4D Molecular Therapeutics Inc. 4,497 USD 194,675 108,288 0.15A10 Networks Inc. 7,135 USD 47,676 80,340 0.11AbbVie Inc. 8,966 USD 977,563 1,009,930 1.39Alpha Metallurgical Resources Inc. 39,517 USD 602,634 1,012,821 1.39Ambac Financial Group Inc. 10,056 USD 183,019 157,477 0.22Apollo Global Management Inc. 3 USD 175 187 0.00Apple Inc. 11,308 USD 1,433,395 1,548,744 2.13Asbury Automotive Group Inc. 1,370 USD 148,152 234,777 0.32Atara Biotherapeutics Inc. 7,888 USD 104,989 122,658 0.17Atkore Inc. 2,450 USD 64,264 173,950 0.24Axogen Inc. 7,847 USD 104,993 169,574 0.23AXT Inc. 16,000 USD 203,680 175,680 0.24Berkshire Hathaway Inc.-B- 3,505 USD 993,740 974,109 1.34Biglari Holdings Inc.-B- 2,080 USD 250,598 331,698 0.46Booking Holdings Inc. 446 USD 1,052,502 975,888 1.34California Resources Corp. 38,400 USD 1,002,624 1,157,376 1.59
Xtrackers**
Xtrackers S&P 500 2X INVERSE DAILY SWAP UCITS ETF*
Statement of Investmentsas at 30 June 2021(expressed in USD)
* This is a synthetic ETF.** This includes synthetic ETFs.
The accompanying notes form an integral part of these financial statements.
221

Description QuantityCurrency
(local) Cost Market Value
% ofNet
Assets
Transferable securities and money market instruments admitted to an official stock exchange listing
Shares (continued)
United States (continued)Capital One Financial Corp. 81 USD 12,710 12,530 0.02CF Industries Holdings Inc. 27,438 USD 1,458,879 1,411,685 1.94Clear Channel Outdoor Holdings Inc. 297,617 USD 583,329 785,709 1.08Coastal Financial Corp/WA 9,700 USD 257,050 277,032 0.38Cohu Inc. 6,100 USD 262,971 224,419 0.31Crinetics Pharmaceuticals Inc. 66,166 USD 1,053,363 1,247,229 1.72Dawson Geophysical Co. 46,990 USD 140,970 122,644 0.17Discovery Inc.-C- 332 USD 10,026 9,621 0.01DSP Group Inc. 151,351 USD 2,460,967 2,239,995 3.08eHealth Inc. 179 USD 10,010 10,454 0.01Five Point Holdings LLC-A- 36,990 USD 246,723 298,879 0.41Floor & Decor Holdings Inc.-A- 4,368 USD 409,718 461,698 0.64GSI Technology Inc. 17,779 USD 142,232 99,918 0.14Heska Corp. 1,100 USD 209,561 252,703 0.35Hologic Inc. 1,530 USD 50,031 102,082 0.14Hope Bancorp Inc. 74,382 USD 1,133,582 1,054,737 1.45Infinity Pharmaceuticals Inc. 288,594 USD 1,053,368 862,896 1.19Ingersoll Rand Inc. 29,389 USD 1,199,365 1,434,477 1.97Inogen Inc. 1,133 USD 51,993 73,838 0.10Intel Corp. 22,507 USD 1,279,973 1,263,543 1.74IQVIA Holdings Inc. 6,074 USD 1,384,872 1,471,852 2.03Johnson & Johnson 7,526 USD 1,280,022 1,239,833 1.71KLA Corp. 4,603 USD 1,352,914 1,492,339 2.05KVH Industries Inc. 19,500 USD 267,735 239,850 0.33Lowe’s Cos Inc. 11,963 USD 2,259,572 2,320,463 3.19Lyra Therapeutics Inc. 76,441 USD 1,053,357 613,821 0.85MercadoLibre Inc. 1,073 USD 1,457,853 1,671,509 2.30Micron Technology Inc. 11,175 USD 977,589 949,651 1.31Microsoft Corp. 26 USD 6,828 7,043 0.01Mirum Pharmaceuticals Inc. 9,875 USD 184,860 170,739 0.24Monster Beverage Corp. 624 USD 50,045 57,002 0.08NanoString Technologies Inc. 13,695 USD 939,888 887,299 1.22Neuronetics Inc. 59,344 USD 1,053,356 950,691 1.31NGM Biopharmaceuticals Inc. 8,784 USD 225,485 173,220 0.24NMI Holdings Inc.-A- 40,426 USD 939,905 908,776 1.25Olema Pharmaceuticals Inc. 5,416 USD 225,468 151,540 0.21O’Reilly Automotive Inc. 17 USD 7,978 9,625 0.01Pennant Group Inc. 11,928 USD 673,574 487,855 0.67PlayAGS Inc. 20,659 USD 167,131 204,524 0.28PROG Holdings Inc. 196 USD 10,014 9,433 0.01salesforce.com Inc. 44 USD 10,030 10,748 0.02ServiceNow Inc. 145 USD 55,628 79,685 0.11Sesen Bio Inc. 541,889 USD 2,145,880 2,503,527 3.45Southwest Airlines Co. 168 USD 10,043 8,919 0.01TETRA Technologies Inc. 286,652 USD 713,764 1,244,070 1.71T-Mobile US Inc. 76 USD 10,132 11,007 0.02Townsquare Media Inc.-A- 19,162 USD 194,686 244,315 0.34Twitter Inc. 23,812 USD 1,315,207 1,638,504 2.26
Xtrackers**
Xtrackers S&P 500 2X INVERSE DAILY SWAP UCITS ETF* (continued)
Statement of Investmentsas at 30 June 2021(expressed in USD)
* This is a synthetic ETF.** This includes synthetic ETFs.
The accompanying notes form an integral part of these financial statements.
222

Description QuantityCurrency
(local) Cost Market Value
% ofNet
Assets
Transferable securities and money market instruments admitted to an official stock exchange listing
Shares (continued)
United States (continued)Tyler Technologies Inc. 3,618 USD 1,403,784 1,636,675 2.25VAALCO Energy Inc. 63,417 USD 194,690 206,105 0.28
39,963,790 42,080,206 57.92
Total - Shares 74,360,848 75,403,786 103.78
Total Transferable securities and money market instruments admitted to an officialstock exchange listing 74,360,848 75,403,786 103.78
TOTAL INVESTMENT PORTFOLIO 74,360,848 75,403,786 103.78
Xtrackers**
Xtrackers S&P 500 2X INVERSE DAILY SWAP UCITS ETF* (continued)
Statement of Investmentsas at 30 June 2021(expressed in USD)
* This is a synthetic ETF.** This includes synthetic ETFs.
The accompanying notes form an integral part of these financial statements.
223

Description QuantityCurrency
(local) Cost Market Value
% ofNet
Assets
Transferable securities and money market instruments admitted to an official stock exchange listing
Shares
AustriaFlughafen Wien AG 2,127 EUR 60,053 73,781 0.00
60,053 73,781 0.00BelgiumAgeas SA 440,684 EUR 26,774,491 24,458,027 1.30AGFA-Gevaert NV 55,360 EUR 225,164 257,025 0.01Colruyt SA 362,530 EUR 21,344,833 20,275,241 1.07Gimv NV 4,420 EUR 237,539 283,051 0.02Groupe Bruxelles Lambert SA 139,569 EUR 15,353,352 15,614,681 0.83KBC Group NV 388,269 EUR 30,987,200 29,606,835 1.57Telenet Group Holdings NV 442,797 EUR 18,273,294 16,667,094 0.88UCB SA 47,169 EUR 4,389,334 4,931,472 0.26
117,585,207 112,093,426 5.94BermudaAxalta Coating Systems Ltd. 157,256 USD 3,243,415 4,794,735 0.25
3,243,415 4,794,735 0.25Cayman IslandsAlibaba Group Holdings Ltd.-ADR- 56,962 USD 15,318,791 12,917,842 0.69Ambarella Inc. 23,817 USD 1,361,142 2,539,607 0.13Daqo New Energy Corp.-ADR- 124,579 USD 5,088,034 8,100,127 0.43JD.com Inc.-ADR- 62,035 USD 3,894,557 4,951,013 0.26Sea Ltd.-ADR- 3,500 USD 988,715 961,100 0.05StoneCo Ltd.-A- 29,026 USD 1,174,333 1,946,483 0.10Vipshop Holdings Ltd.-ADR- 53,410 USD 1,013,188 1,072,473 0.06
28,838,760 32,488,645 1.72FinlandBasWare OYJ 2,727 EUR 102,074 128,550 0.01
102,074 128,550 0.01GermanyAllianz SE 51,435 EUR 13,355,554 12,827,626 0.68BASF SE 117,227 EUR 9,484,036 9,236,460 0.49Bayer AG 588,560 EUR 37,838,005 35,743,231 1.89Bayerische Motoren Werke AG 90,006 EUR 9,511,875 9,532,786 0.51Covestro AG 144A 271,751 EUR 18,505,541 17,550,806 0.93Daimler AG 104,882 EUR 9,485,693 9,365,786 0.50Delivery Hero SE 144A 131,751 EUR 18,690,684 17,405,536 0.92Fielmann AG 7,114 EUR 521,066 556,387 0.03Hannover Rueck SE 47,610 EUR 8,418,577 7,966,608 0.42Henkel AG & Co. KGaA-Pref- 88,547 EUR 10,335,507 9,349,907 0.50Infineon Technologies AG 212,617 EUR 8,621,079 8,527,464 0.45Merck KGaA 54,342 EUR 9,483,992 10,420,629 0.55Muenchener Rueckversicherungs-Gesellschaft AG 37,098 EUR 10,646,278 10,160,539 0.54RWE AG 484,581 EUR 18,837,773 17,561,759 0.93Scout24 AG 144A 16,690 EUR 1,333,896 1,407,655 0.07Volkswagen AG-Pref- 37,457 EUR 8,094,488 9,381,563 0.50
193,164,044 186,994,742 9.91IrelandWillis Towers Watson PLC 1,780 USD 457,442 409,436 0.02
457,442 409,436 0.02
Xtrackers**
Xtrackers CSI300 SWAP UCITS ETF*
Statement of Investmentsas at 30 June 2021(expressed in USD)
* This is a synthetic ETF.** This includes synthetic ETFs.
The accompanying notes form an integral part of these financial statements.
224

Description QuantityCurrency
(local) Cost Market Value
% ofNet
Assets
Transferable securities and money market instruments admitted to an official stock exchange listing
Shares (continued)
IsraelCheck Point Software Technologies Ltd. 28,980 USD 2,664,421 3,365,447 0.18
2,664,421 3,365,447 0.18MexicoCemex SAB de CV-ADR- 24,332 USD 100,978 204,389 0.01
100,978 204,389 0.01NetherlandsAegon NV 820,847 EUR 3,500,844 3,406,077 0.18ASML Holdings NV 55,629 EUR 35,018,007 38,223,287 2.03ASR Nederland NV 262,087 EUR 10,468,239 10,129,269 0.54ING Groep NV 3,000,000 EUR 33,065,780 39,632,798 2.10Koninklijke Ahold Delhaize NV 633,020 EUR 17,526,569 18,820,019 1.00Koninklijke KPN NV 10,000,000 EUR 33,627,422 31,236,621 1.65QIAGEN NV 120,097 USD 5,709,221 5,810,293 0.31
138,916,082 147,258,364 7.81NorwayNorsk Hydro ASA 1,234,378 NOK 7,490,043 7,880,901 0.42Orkla ASA 1,234,717 NOK 12,724,114 12,583,633 0.67
20,214,157 20,464,534 1.09SpainIndra Sistemas SA 9,098 EUR 71,325 83,024 0.00
71,325 83,024 0.00SwedenInvestor AB-B- 83,102 SEK 1,935,895 1,916,696 0.10Svenska Handelsbanken AB-A- 247,508 SEK 2,838,641 2,794,545 0.15
4,774,536 4,711,241 0.25SwitzerlandTE Connectivity Ltd. 45,000 USD 5,947,650 6,084,450 0.32UBS Group AG 178,373 CHF 2,846,357 2,732,473 0.15
8,794,007 8,816,923 0.47United KingdomAstraZeneca PLC-ADR- 169,528 USD 9,594,347 10,154,727 0.54International Game Technology PLC 6,515 USD 113,817 156,099 0.01Royal Dutch Shell PLC-B--ADR- 137,555 USD 5,132,177 5,341,261 0.28
14,840,341 15,652,087 0.83United States3M Co. 96,691 USD 19,503,542 19,205,733 1.02Abbott Laboratories 1,684 USD 183,640 195,226 0.01AbbVie Inc. 5,600 USD 633,472 630,784 0.03Adobe Inc. 41,753 USD 20,463,250 24,452,227 1.30Advanced Energy Industries Inc. 63,670 USD 6,367,637 7,176,246 0.38Advanced Micro Devices Inc. 20,500 USD 1,662,755 1,925,565 0.10AGCO Corp. 49,027 USD 7,332,478 6,392,140 0.34Alexion Pharmaceuticals Inc. 30,074 USD 4,331,772 5,524,895 0.29Alphabet Inc.-A- 14,542 USD 24,553,277 35,508,510 1.88Alphabet Inc.-C- 5,313 USD 11,922,757 13,316,078 0.71Amazon.com Inc. 22,609 USD 73,975,042 77,778,577 4.12American Tower REIT Corp. 4,350 USD 1,156,839 1,175,109 0.06Ameriprise Financial Inc. 7,687 USD 2,030,137 1,913,141 0.10
Xtrackers**
Xtrackers CSI300 SWAP UCITS ETF* (continued)
Statement of Investmentsas at 30 June 2021(expressed in USD)
* This is a synthetic ETF.** This includes synthetic ETFs.
The accompanying notes form an integral part of these financial statements.
225

Description QuantityCurrency
(local) Cost Market Value
% ofNet
Assets
Transferable securities and money market instruments admitted to an official stock exchange listing
Shares (continued)
United States (continued)AmerisourceBergen Corp. 38,056 USD 4,364,262 4,357,031 0.23Apple Inc. 432,817 USD 54,629,339 59,278,616 3.14Autodesk Inc. 3,050 USD 704,581 890,295 0.05AutoZone Inc. 7,743 USD 11,723,754 11,554,259 0.61AZEK Co. Inc. 22,226 USD 743,237 943,716 0.05Barnes Group Inc. 21,750 USD 1,205,385 1,114,688 0.06Berkshire Hathaway Inc.-B- 97,897 USD 23,409,413 27,207,534 1.44Biogen Inc. 9,965 USD 2,820,669 3,450,581 0.18BioMarin Pharmaceutical Inc. 58,636 USD 4,800,014 4,892,588 0.26Boeing Co. 94,919 USD 19,241,980 22,738,796 1.21Booking Holdings Inc. 4,032 USD 9,608,014 8,822,379 0.47Boston Scientific Corp. 53,669 USD 1,885,392 2,294,886 0.12Broadcom Inc. 16,000 USD 7,466,560 7,629,440 0.40Cadence Design Systems Inc. 109,534 USD 14,524,208 14,986,442 0.79Cargurus Inc. 77,880 USD 1,797,470 2,042,792 0.11Carvana Co. 3,950 USD 1,162,564 1,192,189 0.06Caterpillar Inc. 9,733 USD 2,313,631 2,118,193 0.11Charles Schwab Corp. 260,509 USD 18,461,202 18,967,660 1.01Charter Communications Inc.-A- 7,151 USD 4,352,432 5,159,089 0.27Chevron Corp. 92,902 USD 10,101,234 9,730,555 0.52Citigroup Inc. 132,838 USD 9,608,173 9,398,289 0.50Cloudflare Inc.-A- 46,259 USD 3,409,741 4,896,053 0.26Coca-Cola Co. 21,605 USD 1,161,701 1,169,047 0.06Cognizant Technology Solutions Corp.-A- 79,000 USD 5,459,690 5,471,540 0.29CommScope Holdings Co. Inc. 57,241 USD 1,000,000 1,219,806 0.06ConocoPhillips 90,000 USD 5,247,000 5,481,000 0.29CVS Health Corp. 125,629 USD 10,682,115 10,482,484 0.56DCP Midstream LP 300,000 USD 6,969,000 9,207,000 0.49Dexcom Inc. 4,839 USD 1,953,156 2,066,253 0.11Discovery Inc.-A- 59,000 USD 2,560,010 1,810,120 0.10Discovery Inc.-C- 96,617 USD 3,912,989 2,799,961 0.15Diversified Healthcare Trust REIT 280,000 USD 1,257,200 1,170,400 0.06Dollar Tree Inc. 46,879 USD 5,089,653 4,664,461 0.25Dropbox Inc.-A- 129,326 USD 2,464,954 3,919,871 0.21Edwards Lifesciences Corp. 166,223 USD 13,128,624 17,215,716 0.91Electronic Arts Inc. 7,742 USD 1,111,906 1,113,532 0.06Eli Lilly & Co. 57,552 USD 11,253,143 13,209,335 0.70Enphase Energy Inc. 42,546 USD 7,694,019 7,812,722 0.41EOG Resources Inc. 63,000 USD 5,361,300 5,256,720 0.28Exelon Corp. 25,250 USD 1,138,523 1,118,828 0.06Exxon Mobil Corp. 465,862 USD 28,506,810 29,386,575 1.56Facebook Inc.-A- 174,822 USD 52,665,550 60,787,358 3.22Fiserv Inc. 115,255 USD 13,471,600 12,319,607 0.65Gilead Sciences Inc. 17,400 USD 1,159,014 1,198,164 0.06Glaukos Corp. 45,264 USD 3,999,980 3,839,745 0.20Global Payments Inc. 71,684 USD 13,854,367 13,443,617 0.71Health Catalyst Inc. 106,956 USD 5,435,283 5,937,128 0.31Hostess Brands Inc. 52,390 USD 799,995 848,194 0.05
Xtrackers**
Xtrackers CSI300 SWAP UCITS ETF* (continued)
Statement of Investmentsas at 30 June 2021(expressed in USD)
* This is a synthetic ETF.** This includes synthetic ETFs.
The accompanying notes form an integral part of these financial statements.
226

Description QuantityCurrency
(local) Cost Market Value
% ofNet
Assets
Transferable securities and money market instruments admitted to an official stock exchange listing
Shares (continued)
United States (continued)HubSpot Inc. 809 USD 338,963 471,420 0.03IDEXX Laboratories Inc. 6,873 USD 3,242,677 4,340,643 0.23Illumina Inc. 5,510 USD 1,946,793 2,607,387 0.14Intel Corp. 570,061 USD 31,735,120 32,003,225 1.70Intuit Inc. 5,219 USD 2,048,666 2,558,197 0.14IQVIA Holdings Inc. 55,173 USD 9,462,692 13,369,521 0.71Johnson & Johnson 78,140 USD 13,167,820 12,872,784 0.68Kansas City Southern 24,819 USD 7,031,184 7,032,960 0.37Kimberly-Clark Corp. 20,000 USD 2,621,600 2,675,600 0.14Kinder Morgan Inc. 910,628 USD 16,056,239 16,600,748 0.88KKR & Co. Inc. 20,948 USD 1,163,242 1,240,960 0.07L Brands Inc. 114,716 USD 7,587,316 8,266,435 0.44LendingTree Inc. 3,944 USD 831,671 835,655 0.04Magellan Midstream Partners LP 162,237 USD 8,061,557 7,935,012 0.42Maxim Integrated Products Inc. 118,253 USD 10,697,627 12,459,136 0.66Medallia Inc. 84,211 USD 4,000,023 2,842,121 0.15MercadoLibre Inc. 6,101 USD 9,355,334 9,504,077 0.50Merck & Co. Inc. 341,747 USD 26,112,082 26,577,664 1.41MetLife Inc. 25,357 USD 1,685,480 1,517,616 0.08Micron Technology Inc. 110,478 USD 7,411,860 9,388,420 0.50Microsoft Corp. 159,068 USD 40,721,273 43,091,521 2.28Moody’s Corp. 18,002 USD 5,974,504 6,523,385 0.35Netflix Inc. 85,018 USD 43,247,782 44,907,358 2.38NETGEAR Inc. 22,026 USD 877,075 844,036 0.04NetScout Systems Inc. 39,700 USD 1,209,659 1,133,038 0.06NIKE Inc.-B- 176,666 USD 23,180,793 27,293,130 1.45Norfolk Southern Corp. 9,000 USD 2,613,150 2,388,690 0.13NV5 Global Inc. 10,967 USD 1,023,989 1,036,491 0.06NVIDIA Corp. 41,372 USD 29,638,206 33,101,737 1.75NVR Inc. 1,419 USD 6,127,285 7,057,113 0.37OneSpan Inc. 38,100 USD 926,211 973,074 0.05Oracle Corp. 210,029 USD 15,798,381 16,348,657 0.87O’Reilly Automotive Inc. 2,412 USD 1,262,076 1,365,699 0.07PACCAR Inc. 78,607 USD 7,373,337 7,015,675 0.37PagerDuty Inc. 82,764 USD 3,999,984 3,524,091 0.19Parker-Hannifin Corp. 9,100 USD 2,878,512 2,794,701 0.15PayPal Holdings Inc. 97,901 USD 23,055,536 28,536,183 1.51PepsiCo Inc. 84,793 USD 12,309,155 12,563,779 0.67Pfizer Inc. 826,028 USD 32,408,282 32,347,256 1.71Pinterest Inc.-A- 37,512 USD 826,764 2,961,572 0.16Plains All American Pipeline LP 697,093 USD 7,319,477 7,918,976 0.42Procter & Gamble Co. 71,415 USD 9,608,174 9,636,026 0.51Pulse Evolution Group Inc. 162,692 USD 4,212,096 5,224,040 0.28Qorvo Inc. 13,207 USD 2,329,319 2,583,950 0.14QUALCOMM Inc. 114,036 USD 15,461,001 16,299,165 0.86Rayonier Advanced Materials Inc. 370,903 USD 3,082,204 2,481,341 0.13RealReal Inc. 176,757 USD 4,000,011 3,492,718 0.19Regeneron Pharmaceuticals Inc. 18,754 USD 8,632,841 10,474,859 0.56
Xtrackers**
Xtrackers CSI300 SWAP UCITS ETF* (continued)
Statement of Investmentsas at 30 June 2021(expressed in USD)
* This is a synthetic ETF.** This includes synthetic ETFs.
The accompanying notes form an integral part of these financial statements.
227

Description QuantityCurrency
(local) Cost Market Value
% ofNet
Assets
Transferable securities and money market instruments admitted to an official stock exchange listing
Shares (continued)
United States (continued)Repligen Corp. 695 USD 87,070 138,736 0.01RingCentral Inc.-A- 4,020 USD 1,161,619 1,168,132 0.06Roku Inc. 21,309 USD 9,057,817 9,786,158 0.52salesforce.com Inc. 39,992 USD 9,079,341 9,768,846 0.52Selectquote Inc. 36,096 USD 1,046,784 695,209 0.04ServiceNow Inc. 6,527 USD 3,168,271 3,586,913 0.19Shell Midstream Partners LP 613,000 USD 9,115,310 9,054,010 0.48Sherwin-Williams Co. 53,729 USD 15,344,465 14,638,466 0.78Slack Technologies Inc.-A- 287,150 USD 12,089,015 12,720,745 0.67Sonos Inc. 137,646 USD 2,940,119 4,849,269 0.26Square Inc.-A- 18,236 USD 3,231,237 4,445,937 0.24Take-Two Interactive Software Inc. 11,347 USD 1,842,928 2,008,646 0.11Tempur Sealy International Inc. 294,169 USD 10,566,550 11,528,483 0.61Texas Instruments Inc. 32,435 USD 5,805,541 6,237,251 0.33Uber Technologies Inc. 157,686 USD 7,982,065 7,903,222 0.42UnitedHealth Group Inc. 31,147 USD 12,127,707 12,472,505 0.66Veeco Instruments Inc. 8,347 USD 171,447 200,662 0.01Vornado Realty Trust REIT 77,622 USD 3,459,613 3,622,619 0.19Walmart Inc. 238,492 USD 33,794,716 33,632,142 1.78Walt Disney Co. 142,208 USD 26,194,051 24,995,900 1.32Waters Corp. 21,827 USD 6,466,685 7,543,629 0.40Wells Fargo & Co. 223,803 USD 10,379,983 10,136,038 0.54West Pharmaceutical Services Inc. 30,604 USD 9,768,491 10,989,896 0.58Western Midstream Partners LP 400,000 USD 7,964,000 8,568,000 0.45Whirlpool Corp. 32,855 USD 7,720,925 7,163,047 0.38Xilinx Inc. 132,000 USD 15,623,034 19,092,480 1.01Yum China Holdings Inc. 137,755 USD 8,973,361 9,126,269 0.48Zoom Video Communications Inc.-A- 36,863 USD 15,951,328 14,267,087 0.76
1,315,555,931 1,411,167,625 74.80
Total - Shares 1,849,382,773 1,948,706,949 103.29
Total Transferable securities and money market instruments admitted to an officialstock exchange listing 1,849,382,773 1,948,706,949 103.29
TOTAL INVESTMENT PORTFOLIO 1,849,382,773 1,948,706,949 103.29
Xtrackers**
Xtrackers CSI300 SWAP UCITS ETF* (continued)
Statement of Investmentsas at 30 June 2021(expressed in USD)
* This is a synthetic ETF.** This includes synthetic ETFs.
The accompanying notes form an integral part of these financial statements.
228

Description QuantityCurrency
(local) Cost Market Value
% ofNet
Assets
Transferable securities and money market instruments admitted to an official stock exchange listing
Shares
CanadaAgnico Eagle Mines Ltd. 46,858 CAD 2,544,981 2,836,530 0.76Air Canada 31,614 CAD 783,718 651,019 0.17Algonquin Power & Utilities Corp. 115,089 CAD 1,626,639 1,716,623 0.46Alimentation Couche-Tard Inc.-B- 163,063 CAD 4,642,053 5,998,158 1.60AltaGas Ltd. 53,875 CAD 911,526 1,132,058 0.30Atco Ltd. - I - 14,703 CAD 491,176 521,961 0.14B2Gold Corp. 202,972 CAD 1,103,756 852,341 0.23Ballard Power Systems Inc. 45,807 CAD 1,228,077 831,577 0.22Bank of Montreal 124,802 CAD 9,014,711 12,805,735 3.42Bank of Nova Scotia 233,894 CAD 12,795,819 15,227,759 4.07Barrick Gold Corp. 343,019 CAD 6,187,316 7,102,485 1.90Bausch Health Cos Inc. 58,258 CAD 1,262,448 1,711,561 0.46BCE Inc. 13,945 CAD 623,930 688,410 0.18BlackBerry Ltd. 103,017 CAD 841,762 1,260,363 0.34Brookfield Asset Management Inc.-A- 247,544 CAD 8,009,405 12,642,076 3.38Brookfield Asset Management Reinsurance PartnersLtd.-A- 1,707 CAD 59,712 90,292 0.02Brookfield Renewable Corp.-A- 24,949 CAD 1,281,328 1,049,297 0.28CAE Inc. 54,527 CAD 1,127,587 1,681,209 0.45Cameco Corp. 76,478 CAD 849,805 1,467,429 0.39Canadian Apartment Properties REIT 16,159 CAD 650,014 758,428 0.20Canadian Imperial Bank of Commerce 86,401 CAD 7,184,181 9,845,793 2.63Canadian National Railway Co. 137,034 CAD 12,112,744 14,473,615 3.87Canadian Natural Resources Ltd. 227,853 CAD 6,381,441 8,280,211 2.21Canadian Pacific Railway Ltd. 128,581 CAD 5,941,980 9,897,715 2.65Canadian Tire Corp. Ltd.-A- 11,060 CAD 1,255,318 1,752,023 0.47Canadian Utilities Ltd.-A- 25,088 CAD 683,626 696,945 0.19Canopy Growth Corp. 43,578 CAD 1,395,672 1,055,050 0.28CCL Industries Inc.-B- 29,016 CAD 1,282,612 1,599,711 0.43Cenovus Energy Inc. 252,734 CAD 1,987,689 2,420,597 0.65CGI Inc. 43,363 CAD 2,882,857 3,935,692 1.05Constellation Software Inc. 3,884 CAD 3,452,151 5,888,606 1.58Dollarama Inc. 56,864 CAD 1,963,221 2,605,559 0.70Emera Inc. 48,492 CAD 2,010,304 2,202,366 0.59Empire Co. Ltd.-A- 32,594 CAD 725,538 1,029,173 0.28Enbridge Inc. 390,766 CAD 14,058,753 15,661,565 4.19Fairfax Financial Holdings Ltd. 5,228 CAD 2,293,633 2,295,034 0.61First Quantum Minerals Ltd. 113,323 CAD 1,267,077 2,614,583 0.70FirstService Corp. 7,603 CAD 1,054,447 1,305,398 0.35Fortis Inc. 90,032 CAD 3,398,104 3,989,385 1.07Franco-Nevada Corp. 36,815 CAD 3,631,380 5,348,179 1.43George Weston Ltd. 14,683 CAD 1,168,433 1,400,950 0.38GFL Environmental Inc. 30,288 CAD 847,363 969,079 0.26Gildan Activewear Inc. 38,314 CAD 1,077,378 1,415,232 0.38Great-West Lifeco Inc. 53,648 CAD 1,275,799 1,595,186 0.43Hydro One Ltd. 144A 63,349 CAD 1,175,552 1,532,695 0.41iA Financial Corp. Inc. 20,677 CAD 861,051 1,126,941 0.30IGM Financial Inc. 16,119 CAD 460,825 569,626 0.15
Xtrackers**
Xtrackers MSCI CANADA UCITS ETF
Statement of Investmentsas at 30 June 2021(expressed in USD)
** This includes synthetic ETFs.
The accompanying notes form an integral part of these financial statements.
229

Description QuantityCurrency
(local) Cost Market Value
% ofNet
Assets
Transferable securities and money market instruments admitted to an official stock exchange listing
Shares (continued)
Canada (continued)Imperial Oil Ltd. 49,518 CAD 1,295,979 1,510,773 0.40Intact Financial Corp. 30,542 CAD 2,958,165 4,153,742 1.11Inter Pipeline Ltd. 74,453 CAD 1,174,672 1,211,522 0.32Ivanhoe Mines Ltd.-A- 116,405 CAD 892,555 841,335 0.23Keyera Corp. 42,599 CAD 1,035,443 1,145,904 0.31Kinross Gold Corp. 242,521 CAD 1,231,086 1,539,381 0.41Kirkland Lake Gold Ltd. 51,470 CAD 1,953,969 1,985,562 0.53Lightspeed POS Inc. 18,578 CAD 1,358,480 1,556,543 0.42Loblaw Cos Ltd. 33,474 CAD 1,627,335 2,062,288 0.55Lundin Mining Corp. 127,582 CAD 777,454 1,151,875 0.31Magna International Inc. 55,080 CAD 3,008,701 5,105,008 1.37Manulife Financial Corp. 374,361 CAD 6,515,487 7,376,571 1.97Metro Inc. 47,818 CAD 1,839,536 2,294,940 0.61National Bank of Canada 64,974 CAD 3,192,997 4,867,672 1.30Northland Power Inc. 42,910 CAD 1,478,482 1,465,448 0.39Nutrien Ltd. 109,844 CAD 5,148,686 6,662,669 1.78Nuvei Corp. 144A 10,912 CAD 810,600 894,074 0.24Onex Corp. 14,782 CAD 928,052 1,074,479 0.29Open Text Corp. 52,627 CAD 2,060,824 2,675,337 0.72Pan American Silver Corp. 40,602 CAD 1,204,466 1,160,713 0.31Parkland Corp. 29,023 CAD 969,608 938,917 0.25Pembina Pipeline Corp. 106,097 CAD 3,375,264 3,374,918 0.90Power Corp. of Canada 108,104 CAD 2,425,561 3,420,427 0.92Quebecor Inc.-B- 32,801 CAD 781,833 875,718 0.23Restaurant Brands International Inc. 52,982 CAD 3,212,354 3,417,324 0.91RioCan Real Estate Investment Trust REIT 30,039 CAD 519,653 535,622 0.14Ritchie Bros Auctioneers Inc. 21,139 CAD 978,410 1,254,547 0.34Rogers Communications Inc.-B- 68,370 CAD 3,266,790 3,638,523 0.97Royal Bank of Canada 274,739 CAD 20,953,391 27,864,387 7.45Saputo Inc. 47,544 CAD 1,448,001 1,419,447 0.38Shaw Communications Inc.-B- 88,777 CAD 1,825,639 2,574,483 0.69Shopify Inc.-A- 21,675 CAD 10,998,195 31,732,179 8.49Sun Life Financial Inc. 112,886 CAD 4,537,128 5,827,080 1.56Suncor Energy Inc. 294,238 CAD 8,231,903 7,054,774 1.89Teck Resources Ltd.-B- 90,685 CAD 1,694,000 2,090,815 0.56TELUS Corp. 82,492 CAD 1,504,553 1,851,956 0.50Thomson Reuters Corp. 33,568 CAD 2,043,347 3,337,824 0.89TMX Group Ltd. 10,857 CAD 1,088,023 1,148,038 0.31Toromont Industries Ltd. 15,891 CAD 1,109,754 1,385,955 0.37Toronto-Dominion Bank 350,349 CAD 18,847,677 24,577,903 6.57TransCanada Corp. 181,347 CAD 8,517,890 8,983,142 2.40West Fraser Timber Co. Ltd. 16,309 CAD 1,091,659 1,172,041 0.31Wheaton Precious Metals Corp. 86,712 CAD 2,571,279 3,826,168 1.02
Xtrackers**
Xtrackers MSCI CANADA UCITS ETF (continued)
Statement of Investmentsas at 30 June 2021(expressed in USD)
** This includes synthetic ETFs.
The accompanying notes form an integral part of these financial statements.
230

Description QuantityCurrency
(local) Cost Market Value
% ofNet
Assets
Transferable securities and money market instruments admitted to an official stock exchange listing
Shares (continued)
Canada (continued)WSP Global Inc. 21,933 CAD 1,380,266 2,562,953 0.69Yamana Gold Inc. 185,845 CAD 988,562 783,422 0.21
282,718,601 372,916,619 99.73
Total - Shares 282,718,601 372,916,619 99.73
Total Transferable securities and money market instruments admitted to an officialstock exchange listing 282,718,601 372,916,619 99.73
Other transferable securities and money market instruments
Shares
CanadaBarrick Gold Corp. 338,728 USD — 47,422 0.01
— 47,422 0.01
Total - Shares — 47,422 0.01
Total Other transferable securities and money market instruments — 47,422 0.01
TOTAL INVESTMENT PORTFOLIO 282,718,601 372,964,041 99.74
Xtrackers**
Xtrackers MSCI CANADA UCITS ETF (continued)
Statement of Investmentsas at 30 June 2021(expressed in USD)
** This includes synthetic ETFs.
The accompanying notes form an integral part of these financial statements.
231

Description QuantityCurrency
(local) Cost Market Value
% ofNet
Assets
Transferable securities and money market instruments admitted to an official stock exchange listing
Shares
BelgiumAgeas SA 11,924 EUR 724,462 661,784 0.77Groupe Bruxelles Lambert SA 2,653 EUR 285,856 296,812 0.34KBC Group NV 51,268 EUR 4,238,376 3,909,359 4.51Proximus SADP 45,768 EUR 940,861 884,161 1.02Telenet Group Holdings NV 7,894 EUR 325,450 297,134 0.34
6,515,005 6,049,250 6.98Cayman IslandsAlibaba Group Holdings Ltd.-ADR- 4,362 USD 1,220,430 989,215 1.14
1,220,430 989,215 1.14FinlandElisa OYJ 1,407 EUR 82,044 83,962 0.10Nokia OYJ 547,422 EUR 2,849,329 2,931,409 3.38Nokian Renkaat OYJ 3,455 EUR 130,711 139,512 0.16Sampo OYJ-A- 29,429 EUR 1,383,503 1,352,719 1.56
4,445,587 4,507,602 5.20Germanyadidas AG 16,422 EUR 6,045,974 6,113,158 7.06Allianz SE 275 EUR 72,340 68,584 0.08BASF SE 1,125 EUR 94,705 88,640 0.10Bayer AG 113,819 EUR 7,212,438 6,912,224 7.98Bayerische Motoren Werke AG 27,239 EUR 2,915,857 2,884,958 3.33Deutsche Boerse AG 19,680 EUR 3,219,514 3,435,431 3.97Deutsche Post AG 41,761 EUR 2,867,726 2,840,719 3.28Fresenius SE & Co. KGaA 56,928 EUR 3,101,453 2,970,144 3.43HeidelbergCement AG 32,599 EUR 2,997,802 2,796,605 3.23Infineon Technologies AG 11,639 EUR 470,373 466,807 0.54Muenchener Rueckversicherungs-Gesellschaft AG 22,403 EUR 6,499,760 6,135,818 7.08Porsche Automobil Holdings SE-Pref- 20,535 EUR 2,363,640 2,200,489 2.54RWE AG 78,893 EUR 2,999,568 2,859,171 3.30SAP SE 21,219 EUR 2,970,053 2,990,445 3.45Siemens AG 10,377 EUR 1,719,479 1,644,340 1.90TAG Immobilien AG 90,184 EUR 2,862,353 2,861,962 3.31Volkswagen AG-Pref- 9,569 EUR 2,667,123 2,396,673 2.77Vonovia SE 1,500 EUR 101,014 96,983 0.11
51,181,172 49,763,151 57.46NetherlandsAdyen NV 144A 50 EUR 109,091 122,178 0.14Akzo Nobel NV 3,464 EUR 422,497 428,049 0.50ASML Holdings NV 987 EUR 634,536 678,178 0.78ING Groep NV 230,177 EUR 3,025,374 3,040,853 3.51JDE Peet’s NV 6,566 EUR 260,828 238,271 0.28Koninklijke Ahold Delhaize NV 10,313 EUR 288,969 306,611 0.35Koninklijke KPN NV 70,322 EUR 231,900 219,662 0.25Koninklijke Philips NV 56,432 EUR 3,184,667 2,796,701 3.23Prosus NV 624 EUR 70,265 61,028 0.07
8,228,127 7,891,531 9.11
Xtrackers**
Xtrackers MSCI INDONESIA SWAP UCITS ETF*
Statement of Investmentsas at 30 June 2021(expressed in USD)
* This is a synthetic ETF.** This includes synthetic ETFs.
The accompanying notes form an integral part of these financial statements.
232

Description QuantityCurrency
(local) Cost Market Value
% ofNet
Assets
Transferable securities and money market instruments admitted to an official stock exchange listing
Shares (continued)
NorwayNorsk Hydro ASA 30,240 NOK 183,492 193,068 0.23Orkla ASA 40,992 NOK 422,435 417,770 0.48
605,927 610,838 0.71SwitzerlandUBS Group AG 14,517 CHF 231,652 222,384 0.26
231,652 222,384 0.26United KingdomAstraZeneca PLC-ADR- 2,986 USD 168,231 178,861 0.21Royal Dutch Shell PLC-A- 4,979 EUR 98,461 100,402 0.11Royal Dutch Shell PLC-B--ADR- 4,509 USD 168,231 175,085 0.20
434,923 454,348 0.52United StatesAdobe Inc. 2,083 USD 798,845 1,219,888 1.41Alphabet Inc.-A- 539 USD 805,989 1,316,125 1.52Amazon.com Inc. 300 USD 796,183 1,032,048 1.19Apple Inc. 22,808 USD 2,890,067 3,123,784 3.61Berkshire Hathaway Inc.-B- 1,010 USD 274,817 280,699 0.32Booking Holdings Inc. 165 USD 393,185 361,035 0.42Chevron Corp. 2,836 USD 308,358 297,043 0.34Citigroup Inc. 5,438 USD 393,331 384,738 0.44CVS Health Corp. 3,820 USD 330,124 318,741 0.37Discovery Inc.-A- 5,160 USD 223,892 158,309 0.18Exxon Mobil Corp. 4,962 USD 308,289 313,003 0.36Facebook Inc.-A- 3,408 USD 793,512 1,184,996 1.37Fiserv Inc. 2,082 USD 239,034 222,545 0.26Intel Corp. 5,719 USD 330,158 321,065 0.37Micron Technology Inc. 2,995 USD 256,758 254,515 0.29Microsoft Corp. 1,324 USD 330,087 358,672 0.41Netflix Inc. 1,103 USD 464,685 582,616 0.67NIKE Inc.-B- 1,797 USD 234,131 277,618 0.32NVIDIA Corp. 430 USD 327,333 344,043 0.40PayPal Holdings Inc. 4,125 USD 688,110 1,202,355 1.39Pfizer Inc. 8,542 USD 330,148 334,505 0.39Procter & Gamble Co. 2,923 USD 393,260 394,400 0.46QUALCOMM Inc. 1,726 USD 234,011 246,697 0.29Regeneron Pharmaceuticals Inc. 1,027 USD 472,749 573,620 0.66Roku Inc. 2,368 USD 1,006,566 1,087,504 1.26salesforce.com Inc. 2,571 USD 613,004 628,018 0.73Uber Technologies Inc. 4,721 USD 238,977 236,616 0.27Walmart Inc. 1,185 USD 168,175 167,109 0.19Walt Disney Co. 1,382 USD 238,934 242,914 0.28
Xtrackers**
Xtrackers MSCI INDONESIA SWAP UCITS ETF* (continued)
Statement of Investmentsas at 30 June 2021(expressed in USD)
* This is a synthetic ETF.** This includes synthetic ETFs.
The accompanying notes form an integral part of these financial statements.
233

Description QuantityCurrency
(local) Cost Market Value
% ofNet
Assets
Transferable securities and money market instruments admitted to an official stock exchange listing
Shares (continued)
United States (continued)Wells Fargo & Co. 7,058 USD 327,350 319,657 0.37Zoom Video Communications Inc.-A- 814 USD 277,481 315,042 0.36
15,487,543 18,099,920 20.90
Total - Shares 88,350,366 88,588,239 102.28
Total Transferable securities and money market instruments admitted to an officialstock exchange listing 88,350,366 88,588,239 102.28
TOTAL INVESTMENT PORTFOLIO 88,350,366 88,588,239 102.28
Xtrackers**
Xtrackers MSCI INDONESIA SWAP UCITS ETF* (continued)
Statement of Investmentsas at 30 June 2021(expressed in USD)
* This is a synthetic ETF.** This includes synthetic ETFs.
The accompanying notes form an integral part of these financial statements.
234

Description QuantityCurrency
(local) Cost Market Value
% ofNet
Assets
Transferable securities and money market instruments admitted to an official stock exchange listing
Shares
MexicoAmerica Movil SAB de CV-Series L- 26,252,986 MXN 18,734,345 19,778,247 17.21Arca Continental SAB de CV 338,401 MXN 1,707,755 1,965,090 1.71Becle SAB de CV 420,595 MXN 897,025 1,107,757 0.96Cemex SAB de CV 11,610,085 MXN 6,432,960 9,807,972 8.53Coca-Cola Femsa SAB de CV 402,773 MXN 1,985,358 2,133,571 1.86Fibra Uno Administracion SAde CV REIT 2,423,067 MXN 2,746,555 2,620,157 2.28Fomento Economico Mexicano SAB de CV 1,491,921 MXN 11,425,454 12,598,211 10.96Gruma SAB de CV-B- 166,756 MXN 1,822,486 1,866,096 1.62Grupo Aeroportuario del Pacifico SAB de CV-B- 310,871 MXN 3,040,194 3,312,387 2.88Grupo Aeroportuario del Sureste SAB de CV-B- 159,359 MXN 2,560,555 2,944,506 2.56Grupo Bimbo SAB de CV-Series A- 1,211,248 MXN 2,393,743 2,670,032 2.32Grupo Carso SAB de CV-A1- 347,377 MXN 966,827 1,086,769 0.95Grupo Financiero Banorte SAB de CV-O- 1,990,400 MXN 10,585,011 12,871,797 11.20Grupo Financiero Inbursa SAB de CV-O- 1,751,249 MXN 1,795,459 1,734,493 1.51Grupo Mexico SAB de CV-Series B- 2,388,429 MXN 9,032,970 11,247,287 9.78Grupo Televisa SAB 1,843,680 MXN 3,522,805 5,279,960 4.59Industrias Penoles SAB de CV 106,727 MXN 1,479,982 1,474,951 1.28Infraestructura Energetica Nova SAB de CV 3 MXN 12 12 0.00Kimberly-Clark de Mexico SAB de CV-A- 1,167,444 MXN 1,991,639 2,073,905 1.80Megacable Holdings SAB de CV 229,819 MXN 847,415 814,215 0.71Orbia Advance Corp. SAB de CV 805,583 MXN 1,836,834 2,109,595 1.84Promotora y Operadora de Infraestructura SAB de CV 174,983 MXN 1,439,707 1,401,499 1.22Telesites SAB de CV 1,013,041 MXN 1,033,558 938,222 0.82Wal-Mart de Mexico SAB de CV 4,017,668 MXN 11,452,661 13,130,241 11.42
99,731,310 114,966,972 100.01
Total - Shares 99,731,310 114,966,972 100.01
Total Transferable securities and money market instruments admitted to an officialstock exchange listing 99,731,310 114,966,972 100.01
TOTAL INVESTMENT PORTFOLIO 99,731,310 114,966,972 100.01
Xtrackers**
Xtrackers MSCI MEXICO UCITS ETF
Statement of Investmentsas at 30 June 2021(expressed in USD)
** This includes synthetic ETFs.
The accompanying notes form an integral part of these financial statements.
235

Description QuantityCurrency
(local) Cost Market Value
% ofNet
Assets
Transferable securities and money market instruments admitted to an official stock exchange listing
Shares
AustriaOMV AG 481 EUR 17,056 23,073 0.12Raiffeisen Bank International AG 981 EUR 17,773 18,737 0.10voestalpine AG 429 EUR 13,534 14,732 0.08
48,363 56,542 0.30BelgiumProximus SADP 329 EUR 5,535 5,360 0.03Solvay SA 222 EUR 21,673 23,798 0.12UCB SA 512 EUR 38,422 45,138 0.24
65,630 74,296 0.39DenmarkAP Moller-Maersk A/S-A- 26 DKK 35,742 60,907 0.32AP Moller-Maersk A/S-B- 56 DKK 89,546 135,741 0.72Danske Bank A/S 3,143 DKK 47,170 46,640 0.25
172,458 243,288 1.29FinlandFortum OYJ 2,529 EUR 50,152 58,825 0.31Nokia OYJ 84,675 EUR 309,393 382,350 2.04Stora Enso OYJ-R- 1,609 EUR 20,075 24,754 0.13
379,620 465,929 2.48FranceArkema SA 200 EUR 18,016 21,160 0.11Atos SE 2,380 EUR 155,456 122,094 0.65AXA SA 7,799 EUR 157,998 166,782 0.89BNP Paribas SA 6,041 EUR 274,958 319,388 1.70Bouygues SA 2,157 EUR 72,602 67,277 0.36Capgemini SE 1,995 EUR 221,684 323,190 1.72Carrefour SA 7,989 EUR 134,395 132,498 0.70Cie de Saint-Gobain 4,941 EUR 199,477 274,423 1.46Cie Generale des Etablissements Michelin SCA 940 EUR 100,381 126,430 0.67CNP Assurances 1,140 EUR 15,425 16,359 0.09Credit Agricole SA 6,198 EUR 64,269 73,223 0.39Dassault Aviation SA 13 EUR 12,906 12,896 0.07Eiffage SA 575 EUR 48,366 49,335 0.26Electricite de France SA 6,614 EUR 68,181 76,193 0.40Engie SA 18,709 EUR 233,456 216,164 1.15Faurecia SE 905 EUR 33,285 37,440 0.20Ipsen SA 188 EUR 14,642 16,491 0.09Klepierre REIT SA 2,329 EUR 51,874 50,609 0.27Natixis SA 3,174 EUR 8,842 12,696 0.07Orange SA 10,098 EUR 115,513 97,092 0.52Publicis Groupe SA 1,015 EUR 42,688 54,749 0.29Renault SA 1,095 EUR 37,572 37,323 0.20Sanofi 5,222 EUR 402,164 461,416 2.45Schneider Electric SE 2,106 EUR 203,101 279,424 1.49SCOR SE 322 EUR 8,552 8,636 0.05Societe Generale SA 6,364 EUR 156,791 158,209 0.84Thales SA 458 EUR 36,819 39,406 0.21TotalEnergies SE 5,098 EUR 199,367 194,514 1.03
Xtrackers**
Xtrackers MSCI EUROPE VALUE UCITS ETF
Statement of Investmentsas at 30 June 2021(expressed in EUR)
** This includes synthetic ETFs.
The accompanying notes form an integral part of these financial statements.
236

Description QuantityCurrency
(local) Cost Market Value
% ofNet
Assets
Transferable securities and money market instruments admitted to an official stock exchange listing
Shares (continued)
France (continued)Valeo SA 1,143 EUR 37,121 28,998 0.15Vinci SA 2,860 EUR 228,388 257,372 1.37
3,354,289 3,731,787 19.85GermanyBayer AG 6,812 EUR 423,019 348,843 1.86Bayerische Motoren Werke AG 2,483 EUR 183,356 221,757 1.18Bayerische Motoren Werke AG-Pref- 535 EUR 32,170 40,553 0.22Brenntag SE 521 EUR 36,923 40,857 0.22Commerzbank AG 6,597 EUR 39,563 39,463 0.21Continental AG 548 EUR 59,768 67,941 0.36Covestro AG 144A 648 EUR 35,683 35,290 0.19Daimler AG 6,005 EUR 359,427 452,177 2.40Deutsche Bank AG 9,673 EUR 98,696 106,268 0.57Deutsche Post AG 3,695 EUR 178,259 211,945 1.13Evonik Industries AG 623 EUR 16,873 17,618 0.09Fresenius Medical Care AG & Co. KGaA 942 EUR 64,943 65,978 0.35Fresenius SE & Co. KGaA 2,562 EUR 107,748 112,715 0.60HeidelbergCement AG 854 EUR 57,486 61,778 0.33Infineon Technologies AG 7,669 EUR 217,670 259,366 1.38LANXESS AG 203 EUR 12,332 11,737 0.06Merck KGaA 321 EUR 37,041 51,906 0.28Porsche Automobil Holdings SE-Pref- 1,767 EUR 107,799 159,666 0.85RWE AG 2,455 EUR 76,400 75,025 0.40Siemens AG 3,713 EUR 408,704 496,131 2.64Uniper SE 1,171 EUR 32,605 36,371 0.19Volkswagen AG 281 EUR 50,274 77,781 0.41Volkswagen AG-Pref- 1,642 EUR 261,116 346,790 1.84
2,897,855 3,337,956 17.76IrelandDCC PLC 419 GBP 28,576 28,885 0.15
28,576 28,885 0.15ItalyAtlantia SpA 2,407 EUR 39,111 36,755 0.19Enel SpA 34,871 EUR 235,584 273,110 1.45Eni SpA 5,323 EUR 60,790 54,667 0.29Intesa Sanpaolo SpA 60,290 EUR 117,849 140,446 0.75Mediobanca Banca di Credito Finanziario SpA 2,057 EUR 15,017 20,261 0.11Prysmian SpA 1,260 EUR 29,056 38,090 0.20Telecom Italia SpA 83,755 EUR 41,810 35,085 0.19Telecom Italia SpA-RSP- 49,643 EUR 23,885 22,180 0.12UniCredit SpA 16,244 EUR 160,493 161,628 0.86
723,595 782,222 4.16JerseyGlencore PLC 46,500 GBP 126,487 167,622 0.89WPP PLC 4,444 GBP 41,518 50,432 0.27
168,005 218,054 1.16
Xtrackers**
Xtrackers MSCI EUROPE VALUE UCITS ETF (continued)
Statement of Investmentsas at 30 June 2021(expressed in EUR)
** This includes synthetic ETFs.
The accompanying notes form an integral part of these financial statements.
237

Description QuantityCurrency
(local) Cost Market Value
% ofNet
Assets
Transferable securities and money market instruments admitted to an official stock exchange listing
Shares (continued)
LuxembourgArcelorMittal SA 5,443 EUR 102,003 140,701 0.75
102,003 140,701 0.75NetherlandsABN AMRO Bank NV 144A 1,727 EUR 14,307 17,602 0.09Aegon NV 15,136 EUR 55,106 52,961 0.28CNH Industrial NV 5,125 EUR 50,832 71,366 0.38EXOR NV 306 EUR 18,484 20,673 0.11ING Groep NV 17,601 EUR 160,025 196,075 1.04Koninklijke Ahold Delhaize NV 14,429 EUR 307,858 361,735 1.93Koninklijke Philips NV 2,210 EUR 83,276 92,356 0.49NN Group NV 2,192 EUR 74,080 87,198 0.46Randstad NV 813 EUR 41,198 52,438 0.28Stellantis NV 28,225 EUR 301,021 467,237 2.49STMicroelectronics NV 6,959 EUR 159,851 212,980 1.13
1,266,038 1,632,621 8.68NorwayNorsk Hydro ASA 5,616 NOK 22,791 30,235 0.16Yara International ASA 639 NOK 22,743 28,378 0.15
45,534 58,613 0.31SpainACS Actividades de Construccion y Servicios SA 2,386 EUR 59,244 53,900 0.29Banco Bilbao Vizcaya Argentaria SA 31,193 EUR 137,196 163,077 0.87Banco Santander SA 85,601 EUR 262,064 275,592 1.47CaixaBank SA 17,980 EUR 42,132 46,640 0.25Enagas SA 1,154 EUR 22,294 22,486 0.12Naturgy Energy Group SA 1,176 EUR 21,959 25,496 0.13Red Electrica Corp. SA 1,146 EUR 18,838 17,941 0.09Repsol SA 5,687 EUR 53,811 60,020 0.32Telefonica SA 27,588 EUR 131,986 108,724 0.58
749,524 773,876 4.12SwedenBoliden AB 1,058 SEK 26,847 34,321 0.18Fastighets AB Balder 333 SEK 17,232 17,632 0.09ICA Gruppen AB 552 SEK 20,304 21,678 0.12Securitas AB-B- 1,373 SEK 18,718 18,290 0.10Skanska AB-B- 2,037 SEK 39,337 45,593 0.24SKF AB-B- 2,193 SEK 39,553 47,116 0.25Telefonaktiebolaget LM Ericsson-B- 21,880 SEK 219,585 232,046 1.24Telia Co. AB 6,163 SEK 22,553 23,079 0.12Volvo AB-B- 8,306 SEK 135,221 168,626 0.90
539,350 608,381 3.24SwitzerlandAdecco Group AG 913 CHF 45,309 52,355 0.28Credit Suisse Group AG 13,083 CHF 131,209 115,674 0.61Holcim Ltd. 1,879 CHF 78,459 95,134 0.51Novartis AG 8,141 CHF 573,895 626,215 3.33Roche Holdings AG 1,698 CHF 479,025 539,906 2.87
Xtrackers**
Xtrackers MSCI EUROPE VALUE UCITS ETF (continued)
Statement of Investmentsas at 30 June 2021(expressed in EUR)
** This includes synthetic ETFs.
The accompanying notes form an integral part of these financial statements.
238

Description QuantityCurrency
(local) Cost Market Value
% ofNet
Assets
Transferable securities and money market instruments admitted to an official stock exchange listing
Shares (continued)
Switzerland (continued)Siemens Energy AG 2,353 EUR 61,765 59,813 0.32Swatch Group AG 188 CHF 10,477 10,471 0.06
1,380,139 1,499,568 7.98United Kingdom3i Group PLC 3,494 GBP 40,011 47,743 0.25Anglo American PLC 6,750 GBP 154,739 225,866 1.20Associated British Foods PLC 2,001 GBP 48,178 51,654 0.28Aviva PLC 20,494 GBP 80,657 96,902 0.52BAE Systems PLC 16,715 GBP 96,985 101,640 0.54Barclays PLC 114,400 GBP 213,740 228,041 1.21Barratt Developments PLC 5,363 GBP 36,660 43,431 0.23Berkeley Group Holdings PLC 612 GBP 27,024 32,758 0.17BHP Group PLC 7,959 GBP 156,546 197,481 1.05BP PLC 39,722 GBP 161,045 145,757 0.78British American Tobacco PLC 36,643 GBP 1,178,559 1,195,187 6.36British Land REIT Co. PLC 15,456 GBP 85,071 89,105 0.47BT Group PLC 55,088 GBP 101,985 124,493 0.66Evraz PLC 2,481 GBP 13,446 17,109 0.09GlaxoSmithKline PLC 15,547 GBP 241,137 257,062 1.37Hikma Pharmaceuticals PLC 280 GBP 8,032 7,978 0.04Imperial Brands PLC 16,889 GBP 398,754 306,323 1.63J Sainsbury PLC 34,160 GBP 93,156 108,157 0.58Kingfisher PLC 14,112 GBP 46,278 59,920 0.32Land Securities Group REIT PLC 9,946 GBP 82,971 78,252 0.42Lloyds Banking Group PLC 307,581 GBP 165,908 167,290 0.89M&G PLC 9,860 GBP 23,362 26,291 0.14Melrose Industries PLC 32,451 GBP 58,427 58,631 0.31Natwest Group PLC 22,302 GBP 47,517 52,790 0.28Persimmon PLC 1,503 GBP 41,744 51,790 0.28Phoenix Group Holdings PLC 1,155 GBP 9,904 9,101 0.05Rio Tinto PLC 5,285 GBP 276,297 366,249 1.95Royal Dutch Shell PLC-A- 11,517 GBP 210,814 194,104 1.03Royal Dutch Shell PLC-B- 10,893 GBP 193,665 177,522 0.94Standard Chartered PLC 15,889 GBP 97,306 85,327 0.45Taylor Wimpey PLC 18,949 GBP 34,978 35,086 0.19Tesco PLC 67,351 GBP 204,206 174,920 0.93Vodafone Group PLC 141,526 GBP 248,048 200,045 1.06Wm Morrison Supermarkets PLC 32,562 GBP 72,298 93,577 0.50
4,949,448 5,107,582 27.17
Total - Shares 16,870,427 18,760,301 99.79
Xtrackers**
Xtrackers MSCI EUROPE VALUE UCITS ETF (continued)
Statement of Investmentsas at 30 June 2021(expressed in EUR)
** This includes synthetic ETFs.
The accompanying notes form an integral part of these financial statements.
239

Description QuantityCurrency
(local) Cost Market Value
% ofNet
Assets
Transferable securities and money market instruments admitted to an official stock exchange listing
Rights
SpainACS Actividades de Construccion y ServiciosSA-Rights- 09.07.21 2,386 EUR — 2,815 0.02
— 2,815 0.02
Total - Rights — 2,815 0.02
Total Transferable securities and money market instruments admitted to an officialstock exchange listing 16,870,427 18,763,116 99.81
TOTAL INVESTMENT PORTFOLIO 16,870,427 18,763,116 99.81
Xtrackers**
Xtrackers MSCI EUROPE VALUE UCITS ETF (continued)
Statement of Investmentsas at 30 June 2021(expressed in EUR)
** This includes synthetic ETFs.
The accompanying notes form an integral part of these financial statements.
240

Description QuantityCurrency
(local) Cost Market Value
% ofNet
Assets
Transferable securities and money market instruments admitted to an official stock exchange listing
Shares
BermudaAthene Holdings Ltd.-A- 146,412 USD 8,269,238 9,882,810 0.12Axalta Coating Systems Ltd. 295,341 USD 8,773,983 9,004,947 0.10Bunge Ltd. 60,808 USD 5,227,664 4,752,145 0.06Lazard Ltd.-A- 177,277 USD 8,170,697 8,021,785 0.09
30,441,582 31,661,687 0.37BrazilBRF SA-ADR- 80,927 USD 337,466 442,671 0.01Embraer SA-ADR- 343 USD 2,867 5,193 0.00
340,333 447,864 0.01CanadaCameco Corp. 173,758 USD 2,990,375 3,332,678 0.04IMAX Corp. 107,000 USD 2,264,120 2,300,500 0.03Masonite International Corp. 27,600 USD 1,108,692 3,085,404 0.03Sandstorm Gold Ltd. 174,239 USD 832,862 1,374,746 0.02Shopify Inc.-A- 21,923 USD 25,360,925 32,029,065 0.37
32,556,974 42,122,393 0.49Cayman Islands21Vianet Group Inc.-ADR- 153,871 USD 4,719,224 3,531,339 0.04Ambarella Inc. 16,100 USD 1,384,117 1,716,743 0.02Cambium Networks Corp. 38,809 USD 973,718 1,876,415 0.02CC Neuberger Principal Holdings II-A- 88,759 USD 888,478 877,826 0.01Cohn Robbins Holdings Corp.-A- 87,300 USD 969,030 859,905 0.01DouYu International Holdings Ltd.-ADR- 416,400 USD 4,230,624 2,848,176 0.03Farfetch Ltd.-A- 221,439 USD 9,204,543 11,151,668 0.13Futu Holdings Ltd.-ADR- 145,000 USD 21,473,050 25,968,050 0.30Genetron Holdings Ltd.-ADR- 40,844 USD 814,838 822,598 0.01Herbalife Nutrition Ltd. 416,450 USD 19,685,591 21,959,408 0.26Horizon Acquisition Corp. II-A- 123,640 USD 1,250,000 1,207,963 0.01I-Mab-ADR- 91,776 USD 5,305,928 7,704,595 0.09iQIYI Inc.-ADR- 131,712 USD 1,871,627 2,052,073 0.02JinkoSolar Holdings Co. Ltd.-ADR- 44,100 USD 1,670,508 2,470,482 0.03Kingsoft Cloud Holdings Ltd.-ADR- 64,277 USD 4,631,801 2,180,919 0.03NIO Inc.-ADR- 197,062 USD 11,876,927 10,483,698 0.12Pagseguro Digital Ltd.-A- 673,415 USD 31,466,747 37,657,367 0.44RLX Technology Inc.-ADR- 636,412 USD 5,727,708 5,555,877 0.07Sea Ltd.-ADR- 17,434 USD 4,530,982 4,787,376 0.06StoneCo Ltd.-A- 102,893 USD 6,760,243 6,900,005 0.08TAL Education Group-ADR- 94,131 USD 4,080,859 2,374,925 0.03Tencent Music Entertainment Group-ADR- 1,300,574 USD 33,178,812 20,132,886 0.23Vipshop Holdings Ltd.-ADR- 776,033 USD 19,996,916 15,582,743 0.18XP Inc.-A- 64,898 USD 2,616,038 2,826,308 0.03
199,308,309 193,529,345 2.25DenmarkDanske Bank A/S 2,888,793 DKK 54,413,084 50,837,376 0.59Tryg A/S 400,000 DKK 9,981,894 9,820,510 0.12
64,394,978 60,657,886 0.71
Xtrackers**
Xtrackers S&P 500 SWAP UCITS ETF*
Statement of Investmentsas at 30 June 2021(expressed in USD)
* This is a synthetic ETF.** This includes synthetic ETFs.
The accompanying notes form an integral part of these financial statements.
241

Description QuantityCurrency
(local) Cost Market Value
% ofNet
Assets
Transferable securities and money market instruments admitted to an official stock exchange listing
Shares (continued)
FinlandNordea Bank Abp 9,186,000 SEK 102,272,789 102,320,277 1.19
102,272,789 102,320,277 1.19FranceConstellium SE 75,950 USD 1,310,137 1,439,253 0.02Criteo SA-ADR- 103,601 USD 4,554,300 4,685,873 0.05
5,864,437 6,125,126 0.07GermanyJumia Technologies AG-ADR- 111,681 USD 3,622,932 3,387,285 0.04
3,622,932 3,387,285 0.04IrelandWillis Towers Watson PLC 374,698 USD 97,323,238 86,188,034 1.00
97,323,238 86,188,034 1.00IsraelAllot Ltd. 14,535 USD 201,019 288,229 0.00AudioCodes Ltd. 23,000 USD 713,690 761,070 0.01Check Point Software Technologies Ltd. 177,666 USD 21,777,270 20,632,353 0.24Inmode Ltd. 53,214 USD 4,508,822 5,038,301 0.06Kornit Digital Ltd. 5,057 USD 550,581 628,737 0.01Perion Network Ltd. 175,299 USD 3,020,402 3,754,905 0.04Radware Ltd. 69,343 USD 1,396,348 2,134,377 0.02Teva Pharmaceutical Industries Ltd.-ADR- 612,649 USD 6,463,447 6,065,225 0.07Wix.com Ltd. 396,036 USD 100,491,019 114,961,330 1.34
139,122,598 154,264,527 1.79JerseyNovocure Ltd. 42,087 USD 8,838,691 9,335,738 0.11
8,838,691 9,335,738 0.11Marshall IslandsDorian LPG Ltd. 117,700 USD 1,518,330 1,661,924 0.02
1,518,330 1,661,924 0.02NetherlandsElastic NV 446,224 USD 47,290,819 65,041,610 0.76LyondellBasell Industries NV-A- 34,722 USD 3,949,975 3,571,852 0.04Merus NV 221,774 USD 4,289,000 4,672,778 0.05Playa Hotels & Resorts NV 641,697 USD 4,562,466 4,767,809 0.06ProQR Therapeutics BV 56,844 USD 223,397 383,129 0.00Sensata Technologies Holdings NV 52,300 USD 3,048,567 3,031,831 0.04
63,364,224 81,469,009 0.95RussiaMMC Norilsk Nickel PJSC-ADR- 143,720 USD 5,172,483 4,874,982 0.06
5,172,483 4,874,982 0.06SingaporeFlex Ltd. 251,642 USD 4,391,153 4,496,843 0.05
4,391,153 4,496,843 0.05SwedenInvestor AB-B- 4,211,522 SEK 97,846,528 97,136,125 1.13L E Lundbergforetagen AB-B- 150,000 SEK 9,736,236 9,685,284 0.11Skandinaviska Enskilda Banken AB-A- 4,800,000 SEK 62,289,973 62,047,555 0.72
Xtrackers**
Xtrackers S&P 500 SWAP UCITS ETF* (continued)
Statement of Investmentsas at 30 June 2021(expressed in USD)
* This is a synthetic ETF.** This includes synthetic ETFs.
The accompanying notes form an integral part of these financial statements.
242

Description QuantityCurrency
(local) Cost Market Value
% ofNet
Assets
Transferable securities and money market instruments admitted to an official stock exchange listing
Shares (continued)
Sweden (continued)Svenska Handelsbanken AB-A- 5,299,990 SEK 60,741,235 59,840,746 0.70Swedbank AB-A- 1,800,000 SEK 33,457,190 33,515,783 0.39
264,071,162 262,225,493 3.05SwitzerlandBaloise Holdings AG 170,000 CHF 27,055,752 26,538,649 0.31Banque Cantonale Vaudoise 270,000 CHF 24,499,945 24,273,273 0.28EFG International AG 1,000,000 CHF 7,961,610 8,211,175 0.10Julius Baer Group Ltd. 300,000 CHF 20,070,710 19,596,473 0.23Luzerner Kantonalbank AG 30,000 CHF 14,020,068 13,907,070 0.16St Galler Kantonalbank AG 26,000 CHF 11,682,844 11,560,556 0.13Swiss Life Holdings AG 174,000 CHF 87,648,746 84,632,877 0.98Swiss Re AG 290,000 CHF 26,676,530 26,190,512 0.31Swissquote Group Holdings SA 45,000 CHF 7,332,315 6,805,864 0.08UBS Group AG 9,000,000 CHF 140,201,251 137,869,855 1.60Zurich Insurance Group AG 180,000 CHF 73,781,887 72,284,308 0.84
440,931,658 431,870,612 5.02United KingdomAtlassian Corp. PLC-A- 3,981 USD 717,615 1,022,559 0.01Coca-Cola Europacific Partners PLC 54,721 USD 3,369,172 3,246,050 0.04Liberty Global PLC-C- 225,000 USD 5,735,250 6,084,000 0.07
9,822,037 10,352,609 0.12United States10X Genomics Inc.-A- 23,173 USD 4,334,510 4,537,737 0.051Life Healthcare Inc. 36,773 USD 1,516,519 1,215,715 0.013D Systems Corp. 184,640 USD 5,749,690 7,380,061 0.093M Co. 43,061 USD 8,766,789 8,553,206 0.1089bio Inc. 66,739 USD 1,779,929 1,248,019 0.019 Meters Biopharma Inc. 2,912,436 USD 3,407,550 3,203,680 0.04A O Smith Corp. 935 USD 66,591 67,376 0.00Abbott Laboratories 37,675 USD 4,065,133 4,367,663 0.05ABIOMED Inc. 20,797 USD 6,013,868 6,490,952 0.08ACM Research Inc.-A- 969 USD 89,419 99,051 0.00Acuity Brands Inc. 40,200 USD 6,885,858 7,518,606 0.09Adaptive Biotechnologies Corp. 34,610 USD 2,222,308 1,414,165 0.02Adobe Inc. 300,684 USD 163,370,638 176,092,578 2.05AdvanSix Inc. 9,939 USD 289,324 296,779 0.00Adverum Biotechnologies Inc. 18 USD 215 63 0.00Aerie Pharmaceuticals Inc. 256,492 USD 3,596,769 4,106,437 0.05Aerojet Rocketdyne Holdings Inc. 416,032 USD 19,871,951 20,090,185 0.23AeroVironment Inc. 30,234 USD 3,975,166 3,027,935 0.04AES Corp. 419,075 USD 11,461,701 10,925,285 0.13Aflac Inc. 86,039 USD 4,797,535 4,616,853 0.05Akamai Technologies Inc. 14,217 USD 1,601,829 1,657,702 0.02Alcoa Corp. 158,487 USD 5,225,316 5,838,661 0.07Alexion Pharmaceuticals Inc. 176,526 USD 27,432,997 32,429,591 0.38Align Technology Inc. 171,906 USD 98,546,834 105,034,566 1.22Allegiant Travel Co. 13,340 USD 2,948,140 2,587,960 0.03Alliance Data Systems Corp. 185,296 USD 22,346,698 19,305,990 0.22
Xtrackers**
Xtrackers S&P 500 SWAP UCITS ETF* (continued)
Statement of Investmentsas at 30 June 2021(expressed in USD)
* This is a synthetic ETF.** This includes synthetic ETFs.
The accompanying notes form an integral part of these financial statements.
243

Description QuantityCurrency
(local) Cost Market Value
% ofNet
Assets
Transferable securities and money market instruments admitted to an official stock exchange listing
Shares (continued)
United States (continued)AllianceBernstein Holdings LP 172,919 USD 7,715,646 8,051,109 0.09Ally Financial Inc. 64,907 USD 3,335,571 3,234,965 0.04Alphabet Inc.-A- 36,002 USD 81,427,757 87,909,324 1.02Alphabet Inc.-C- 26,329 USD 56,306,700 65,988,899 0.77Alphatec Holdings Inc. 243,000 USD 2,563,650 3,722,760 0.04Alta Equipment Group Inc. 73,134 USD 962,443 971,951 0.01Altice USA Inc.-A- 173,983 USD 6,147,446 5,939,780 0.07Amazon.com Inc. 106,142 USD 344,656,658 365,145,463 4.25American Electric Power Co. Inc. 226,878 USD 19,781,493 19,191,610 0.22American Superconductor Corp. 56,523 USD 1,368,422 982,935 0.01Ameriprise Financial Inc. 88,001 USD 23,377,466 21,901,689 0.25Amicus Therapeutics Inc. 4,867,765 USD 72,011,081 46,925,255 0.55ANGI Homeservices Inc.-A- 265,609 USD 3,073,096 3,591,034 0.04Antero Midstream Corp. 307,844 USD 2,702,870 3,198,499 0.04Antero Resources Corp. 699,862 USD 6,516,655 10,518,926 0.12Anthem Inc. 97,973 USD 37,608,896 37,406,091 0.44API Group Corp. 144A 90,302 USD 1,446,094 1,886,409 0.02Apple Inc. 169,536 USD 22,937,276 23,219,651 0.27Applied Materials Inc. 293,832 USD 40,189,616 41,841,677 0.49Arch Coal Inc.-A- 35,287 USD 1,806,342 2,010,653 0.02Arlo Technologies Inc. 395,550 USD 3,244,029 2,677,873 0.03Arrow Electronics Inc. 10,879 USD 1,208,176 1,238,357 0.01Arvinas Inc. 621,749 USD 48,863,254 47,874,673 0.56Asbury Automotive Group Inc. 6,000 USD 1,249,260 1,028,220 0.01Aspen Group Inc. 101,100 USD 977,637 659,172 0.01Astronics Corp. 50,050 USD 677,177 876,375 0.01Atkore Inc. 46,020 USD 3,846,352 3,267,420 0.04Autodesk Inc. 27,419 USD 8,162,884 8,003,606 0.09AutoZone Inc. 3,572 USD 5,318,172 5,330,210 0.06Avid Technology Inc. 60,200 USD 1,344,868 2,356,830 0.03Axon Enterprise Inc. 13,191 USD 1,879,190 2,332,169 0.03Axonics Inc. 71,655 USD 4,209,731 4,543,644 0.05Balchem Corp. 13,322 USD 1,770,627 1,748,646 0.02Bank of America Corp. 903,437 USD 39,073,650 37,248,707 0.43Bank of New York Mellon Corp. 64,962 USD 3,263,041 3,328,003 0.04Banner Corp. 84,000 USD 4,819,080 4,553,640 0.05Beacon Roofing Supply Inc. 692 USD 29,230 36,849 0.00Benefitfocus Inc. 436,653 USD 5,995,246 6,156,807 0.07Berkeley Lights Inc. 27,700 USD 1,327,661 1,241,237 0.01Berkshire Hathaway Inc.-B- 82,435 USD 22,852,745 22,910,335 0.27Berry Global Group Inc. 222,074 USD 12,297,039 14,483,666 0.17BGC Partners Inc.-A- 561,121 USD 2,985,164 3,181,556 0.04Biogen Inc. 25,179 USD 7,016,966 8,718,732 0.10BioLife Solutions Inc. 77 USD 1,592 3,427 0.00Blackstone Group Inc.-A- 984,900 USD 96,953,533 95,673,186 1.11Bloom Energy Corp.-A- 13,684 USD 414,899 367,689 0.00Bloomin’ Brands Inc. 76,000 USD 2,140,160 2,062,640 0.02Boeing Co. 11,495 USD 2,775,353 2,753,742 0.03
Xtrackers**
Xtrackers S&P 500 SWAP UCITS ETF* (continued)
Statement of Investmentsas at 30 June 2021(expressed in USD)
* This is a synthetic ETF.** This includes synthetic ETFs.
The accompanying notes form an integral part of these financial statements.
244

Description QuantityCurrency
(local) Cost Market Value
% ofNet
Assets
Transferable securities and money market instruments admitted to an official stock exchange listing
Shares (continued)
United States (continued)Booking Holdings Inc. 2,245 USD 5,132,926 4,912,262 0.06Boot Barn Holdings Inc. 37,126 USD 2,552,041 3,120,440 0.04Bottomline Technologies DE Inc. 22,379 USD 853,759 829,813 0.01BP Midstream Partners LP 238,945 USD 3,158,853 3,459,924 0.04Brink’s Co. 79,846 USD 6,279,888 6,135,367 0.07Brookdale Senior Living Inc. 823,076 USD 2,983,284 6,502,300 0.08Caesars Entertainment Inc. 4 USD 402 415 0.00Callaway Golf Co. 903,637 USD 31,021,858 30,479,676 0.35Cargurus Inc. 758,801 USD 18,271,928 19,903,350 0.23Carvana Co. 24,443 USD 5,576,670 7,377,386 0.09Caterpillar Inc. 96,374 USD 23,158,358 20,973,874 0.24CBRE Group Inc.-A- 57,971 USD 4,388,154 4,969,854 0.06Cedar Fair LP 89,200 USD 4,398,452 3,998,836 0.05Celanese Corp. 65,964 USD 10,406,481 10,000,142 0.12Century Aluminum Co. 66,883 USD 1,018,963 862,122 0.01CEVA Inc. 18,197 USD 934,780 860,718 0.01Cheniere Energy Inc. 231,391 USD 17,104,126 20,070,855 0.23Chevron Corp. 160,340 USD 17,026,716 16,794,012 0.20Chico’s FAS Inc. 509,924 USD 1,499,177 3,355,300 0.04Churchill Downs Inc. 2,146 USD 446,416 425,466 0.00Ciena Corp. 277,399 USD 15,436,123 15,781,229 0.18Cigna Corp. 564,869 USD 133,868,304 133,913,494 1.56Cirrus Logic Inc. 14,198 USD 1,234,516 1,208,534 0.01Citigroup Inc. 464,992 USD 35,365,583 32,898,184 0.38Clear Channel Outdoor Holdings Inc. 916,396 USD 1,741,152 2,419,285 0.03Clearwater Paper Corp. 33,600 USD 1,213,296 973,392 0.01CME Group Inc. 50,000 USD 10,800,500 10,634,000 0.12CNX Resources Corp. 106,600 USD 1,466,816 1,456,156 0.02Coca-Cola Consolidated Inc. 5,525 USD 1,737,668 2,221,768 0.03Cognizant Technology Solutions Corp.-A- 274,483 USD 19,416,927 19,010,693 0.22Columbia Banking System Inc. 70,325 USD 3,019,756 2,711,732 0.03CommScope Holdings Co. Inc. 74,100 USD 1,231,542 1,579,071 0.02CommVault Systems Inc. 53,740 USD 1,950,506 4,200,856 0.05Concentrix Corp. 25,621 USD 3,962,544 4,119,857 0.05Conduent Inc. 193,163 USD 620,053 1,448,722 0.02ConocoPhillips 444,359 USD 25,115,171 27,061,463 0.31Consolidated Edison Inc. 42,669 USD 3,327,329 3,060,221 0.04Constellation Brands Inc.-A- 48,263 USD 11,568,641 11,288,233 0.13Cooper-Standard Holdings Inc. 67,882 USD 1,942,104 1,968,578 0.02Corcept Therapeutics Inc. 293,049 USD 2,962,725 6,447,078 0.08CoreCivic REIT Inc. 100,376 USD 864,237 1,050,937 0.01Corteva Inc. 125,653 USD 5,631,767 5,572,711 0.06Costco Wholesale Corp. 34,802 USD 13,021,459 13,770,107 0.16Coupa Software Inc. 415,562 USD 112,775,216 108,922,956 1.27Cree Inc. 83,701 USD 7,980,053 8,196,839 0.10Crowdstrike Holdings Inc.-A- 42,143 USD 6,935,642 10,590,957 0.12Crown Holdings Inc. 150,289 USD 16,646,010 15,361,039 0.18CVS Health Corp. 350,093 USD 26,581,527 29,211,760 0.34
Xtrackers**
Xtrackers S&P 500 SWAP UCITS ETF* (continued)
Statement of Investmentsas at 30 June 2021(expressed in USD)
* This is a synthetic ETF.** This includes synthetic ETFs.
The accompanying notes form an integral part of these financial statements.
245

Description QuantityCurrency
(local) Cost Market Value
% ofNet
Assets
Transferable securities and money market instruments admitted to an official stock exchange listing
Shares (continued)
United States (continued)Daktronics Inc. 347,103 USD 2,238,814 2,287,409 0.03Darling Ingredients Inc. 22,258 USD 511,934 1,502,415 0.02DASAN Zhone Solutions Inc. 56,000 USD 977,760 1,162,000 0.01DCP Midstream LP 507,590 USD 11,791,316 15,577,937 0.18Deckers Outdoor Corp. 15,432 USD 4,853,784 5,926,968 0.07Denbury Inc. 26,100 USD 1,469,917 2,003,958 0.02Dexcom Inc. 14,661 USD 5,717,057 6,260,247 0.07Digi International Inc. 148,287 USD 2,596,505 2,982,052 0.03Digital Turbine Inc. 56,465 USD 3,457,352 4,293,034 0.05Discover Financial Services 45,841 USD 5,256,587 5,422,532 0.06DocuSign Inc. 8,112 USD 1,593,765 2,267,872 0.03Dollar Tree Inc. 15,403 USD 1,747,516 1,532,598 0.02Domo Inc.-B- 74,725 USD 4,635,939 6,040,022 0.07DR Horton Inc. 283,251 USD 29,421,281 25,597,393 0.30DraftKings Inc.-A- 92,692 USD 5,566,612 4,835,742 0.06Drive Shack Inc. 726,386 USD 2,469,712 2,404,338 0.03Driven Brands Holdings Inc. 835,481 USD 25,858,137 25,833,072 0.30Dropbox Inc.-A- 684,100 USD 14,913,507 20,735,071 0.24Ducommun Inc. 10,614 USD 493,869 579,100 0.01Duke Energy Corp. 302,916 USD 31,218,523 29,903,867 0.35DuPont de Nemours Inc. 182,312 USD 15,563,975 14,112,772 0.16Dynatrace Inc. 66,665 USD 3,599,243 3,894,569 0.05Eagle Bancorp Inc. 49,514 USD 2,574,233 2,776,745 0.03Echo Global Logistics Inc. 48,448 USD 1,699,071 1,489,292 0.02Edwards Lifesciences Corp. 217,892 USD 19,898,909 22,567,074 0.26Elanco Animal Health Inc. 17,755 USD 547,035 615,921 0.01EMCOR Group Inc. 61,500 USD 7,375,695 7,576,185 0.09Emerson Electric Co. 63,523 USD 5,927,966 6,113,454 0.07Employers Holdings Inc. 18,013 USD 748,981 770,956 0.01EnLink Midstream LLC 2,336,707 USD 10,737,964 14,931,558 0.17Enphase Energy Inc. 19,320 USD 1,449,327 3,547,732 0.04Entegris Inc. 88,408 USD 9,845,115 10,871,532 0.13Enterprise Products Partners LP 520,407 USD 12,163,777 12,557,421 0.15EPAM Systems Inc. 4,200 USD 1,525,692 2,146,032 0.02Equinix REIT Inc. 3,528 USD 2,523,790 2,831,573 0.03Eventbrite Inc.-A- 430,926 USD 7,791,142 8,187,594 0.10Evo Payments Inc.-A- 33,453 USD 930,328 927,986 0.01EW Scripps Co.-A- 55,900 USD 1,217,502 1,139,801 0.01Exagen Inc. 122,017 USD 1,821,714 1,829,035 0.02Exelon Corp. 600,000 USD 27,054,000 26,586,000 0.31Extreme Networks Inc. 254,284 USD 1,981,922 2,837,809 0.03Exxon Mobil Corp. 261,662 USD 15,863,281 16,505,639 0.19Facebook Inc.-A- 1,035,449 USD 294,081,063 360,035,972 4.19Fair Isaac Corp. 3,150 USD 1,563,534 1,583,442 0.02Fastenal Co. 202,954 USD 10,537,372 10,553,608 0.12Fastly Inc.-A- 96,906 USD 5,446,117 5,775,598 0.07Fate Therapeutics Inc. 642,009 USD 53,062,044 55,719,961 0.65Fathom Holdings Inc. 41,131 USD 1,314,958 1,348,685 0.02
Xtrackers**
Xtrackers S&P 500 SWAP UCITS ETF* (continued)
Statement of Investmentsas at 30 June 2021(expressed in USD)
* This is a synthetic ETF.** This includes synthetic ETFs.
The accompanying notes form an integral part of these financial statements.
246

Description QuantityCurrency
(local) Cost Market Value
% ofNet
Assets
Transferable securities and money market instruments admitted to an official stock exchange listing
Shares (continued)
United States (continued)Fidelity National Information Services Inc. 151,839 USD 22,148,755 21,511,031 0.25Floor & Decor Holdings Inc.-A- 39,401 USD 3,782,209 4,164,686 0.05Fluor Corp. 70,800 USD 1,411,752 1,253,160 0.01Foghorn Therapeutics Inc. 93,810 USD 1,635,108 1,000,953 0.01Ford Motor Co. 1,954,941 USD 23,714,201 29,050,423 0.34Forterra Inc. 50,810 USD 1,188,954 1,194,543 0.01Fortinet Inc. 13,804 USD 2,095,723 3,287,975 0.04Fortive Corp. 269,818 USD 19,499,747 18,817,107 0.22Franklin Electric Co. Inc. 29,988 USD 2,569,672 2,417,633 0.03Freeport-McMoRan Inc. 373,700 USD 14,252,918 13,868,007 0.16frontdoor Inc. 1,600 USD 70,086 79,712 0.00FTI Consulting Inc. 177 USD 18,962 24,180 0.00Gartner Inc. 12,664 USD 2,930,830 3,067,221 0.04General Mills Inc. 179,354 USD 11,089,458 10,928,039 0.13Genworth Financial Inc.-A- 1,435,700 USD 4,954,459 5,599,230 0.07Gilead Sciences Inc. 183,876 USD 12,328,886 12,661,701 0.15Glacier Bancorp Inc. 21,900 USD 1,317,723 1,206,252 0.01GMS Inc. 26,692 USD 1,091,436 1,284,953 0.01Goodyear Tire & Rubber Co. 21,520 USD 294,286 369,068 0.00Goosehead Insurance Inc.-A- 48,111 USD 5,531,206 6,124,530 0.07Green Dot Corp.-A- 64,744 USD 2,881,755 3,033,256 0.04Grid Dynamics Holdings Inc. 79,238 USD 1,141,027 1,190,947 0.01GrowGeneration Corp. 22,291 USD 906,129 1,072,197 0.01Hain Celestial Group Inc. 117,646 USD 4,732,235 4,719,958 0.05Hanger Inc. 118,561 USD 3,080,215 2,997,222 0.03Harmony Biosciences Holdings Inc. 68,898 USD 1,888,494 1,944,991 0.02Harrow Health Inc. 200,693 USD 1,651,703 1,864,438 0.02HC2 Holdings Inc. 293,046 USD 1,207,350 1,166,323 0.01HealthStream Inc. 137,730 USD 2,703,759 3,848,176 0.04Herc Holdings Inc. 18,238 USD 2,017,670 2,043,933 0.02Hersha Hospitality Trust REIT 92,966 USD 1,037,501 1,000,314 0.01Hilltop Holdings Inc. 71,346 USD 2,543,485 2,596,994 0.03Hologic Inc. 65,949 USD 4,297,237 4,400,117 0.05Home Depot Inc. 89,134 USD 27,417,618 28,423,941 0.33Home Point Capital Inc. 280,708 USD 2,167,066 1,664,598 0.02Honeywell International Inc. 118,909 USD 26,435,849 26,082,689 0.30Hookipa Pharma Inc. 109,429 USD 1,663,321 1,002,370 0.01Host Hotels & Resorts REIT Inc. 1,370,043 USD 22,278,740 23,414,035 0.27Howmet Aerospace Inc. 180,243 USD 5,290,314 6,212,976 0.07IAA Inc. 108,817 USD 4,632,340 5,934,879 0.07iCAD Inc. 173,787 USD 2,097,609 3,008,253 0.03ICU Medical Inc. 65,109 USD 12,894,837 13,399,432 0.16IDACORP Inc. 29,900 USD 3,054,584 2,915,250 0.03IDEXX Laboratories Inc. 21,916 USD 11,303,124 13,841,050 0.16ImmunoGen Inc. 1,707,191 USD 8,978,436 11,250,389 0.13Inari Medical Inc. 32,928 USD 3,158,454 3,071,524 0.04Infrastructure and Energy Alternatives Inc. 85,920 USD 1,055,098 1,104,931 0.01Inhibrx Inc. 53,371 USD 897,700 1,468,770 0.02
Xtrackers**
Xtrackers S&P 500 SWAP UCITS ETF* (continued)
Statement of Investmentsas at 30 June 2021(expressed in USD)
* This is a synthetic ETF.** This includes synthetic ETFs.
The accompanying notes form an integral part of these financial statements.
247

Description QuantityCurrency
(local) Cost Market Value
% ofNet
Assets
Transferable securities and money market instruments admitted to an official stock exchange listing
Shares (continued)
United States (continued)Inspire Medical Systems Inc. 20,435 USD 3,435,532 3,949,268 0.05Intel Corp. 732,527 USD 40,411,004 41,124,066 0.48International Business Machines Corp. 193,608 USD 28,162,220 28,380,997 0.33Intuitive Surgical Inc. 17,275 USD 14,483,360 15,886,781 0.18Investors Bancorp Inc. 1,966,713 USD 28,910,681 28,045,327 0.33IQVIA Holdings Inc. 172,646 USD 39,018,608 41,835,579 0.49IVERIC bio Inc. 394,888 USD 2,490,981 2,491,743 0.03Johnson & Johnson 601,171 USD 102,529,714 99,036,911 1.15Kansas City Southern 15,413 USD 4,371,589 4,367,582 0.05KB Home 72,798 USD 3,591,125 2,964,335 0.03Kelly Services Inc.-A- 71,821 USD 1,710,776 1,721,549 0.02KeyCorp 570,000 USD 11,719,200 11,770,500 0.14Kezar Life Sciences Inc. 492,590 USD 2,709,245 2,674,764 0.03Kimball Electronics Inc. 100,050 USD 1,933,967 2,175,087 0.03Kimco Realty REIT Corp. 233,347 USD 4,986,625 4,865,285 0.06Kinder Morgan Inc. 151,720 USD 2,618,687 2,765,856 0.03KKR & Co. Inc. 554,393 USD 30,765,093 32,842,241 0.38KLA Corp. 69,835 USD 21,613,573 22,641,205 0.26Kraton Corp. 74,042 USD 2,097,610 2,390,816 0.03Laboratory Corp. of America Holdings 19,012 USD 4,829,999 5,244,460 0.06Laredo Petroleum Inc. 33,117 USD 685,492 3,072,926 0.04Lattice Semiconductor Corp. 107,935 USD 5,570,380 6,063,788 0.07Lazydays Holdings Inc. 66,685 USD 1,532,421 1,467,070 0.02LendingTree Inc. 10,344 USD 1,998,357 2,191,687 0.03Liberty Media Corp-Liberty SiriusXM 276,361 USD 10,492,322 12,820,387 0.15Life Storage REIT Inc. 107,331 USD 9,853,975 11,521,983 0.13Lifevantage Corp. 224,618 USD 2,287,565 1,650,942 0.02Littelfuse Inc. 19,309 USD 4,921,478 4,919,740 0.06LKQ Corp. 281,330 USD 11,018,050 13,847,063 0.16Lumber Liquidators Holdings Inc. 48,600 USD 1,335,042 1,025,460 0.01Mack-Cali Realty REIT Corp. 656,579 USD 8,892,467 11,260,330 0.13Macquarie Infrastructure Corp. 187,301 USD 6,510,583 7,168,009 0.08Madison Square Garden Sports Corp. 27,553 USD 4,838,550 4,754,821 0.06Magellan Midstream Partners LP 785,216 USD 37,651,107 38,404,915 0.45Manhattan Associates Inc. 19,900 USD 2,462,227 2,882,316 0.03Marathon Oil Corp. 1,037,946 USD 12,050,553 14,136,824 0.16MarineMax Inc. 27,300 USD 1,343,979 1,330,602 0.02Marvell Technology Inc. 91,596 USD 4,646,665 5,342,795 0.06Mastercard Inc.-A- 34,129 USD 12,460,488 12,460,157 0.14Match Group Inc. 14,214 USD 2,053,781 2,292,007 0.03Maxim Integrated Products Inc. 546,702 USD 50,619,977 57,600,523 0.67McDonald’s Corp. 126,584 USD 29,524,452 29,239,638 0.34MediaAlpha Inc.-A- 31,030 USD 1,295,813 1,306,363 0.02Medpace Holdings Inc. 15,000 USD 2,485,950 2,649,450 0.03MercadoLibre Inc. 195,248 USD 292,553,180 304,155,382 3.54Meritage Homes Corp. 29,544 USD 2,740,373 2,779,500 0.03Mesabi Trust 14,079 USD 528,103 498,397 0.01Micron Technology Inc. 1,894,900 USD 150,547,669 161,028,602 1.87
Xtrackers**
Xtrackers S&P 500 SWAP UCITS ETF* (continued)
Statement of Investmentsas at 30 June 2021(expressed in USD)
* This is a synthetic ETF.** This includes synthetic ETFs.
The accompanying notes form an integral part of these financial statements.
248

Description QuantityCurrency
(local) Cost Market Value
% ofNet
Assets
Transferable securities and money market instruments admitted to an official stock exchange listing
Shares (continued)
United States (continued)Microsoft Corp. 743,965 USD 187,472,047 201,540,118 2.34Midwest Holdings Inc. 20,090 USD 906,059 785,921 0.01Mirati Therapeutics Inc. 359,459 USD 54,195,633 58,063,412 0.68Mirum Pharmaceuticals Inc. 68,073 USD 1,635,113 1,176,982 0.01Molina Healthcare Inc. 191,937 USD 39,921,520 48,571,577 0.57Monarch Casino & Resort Inc. 16,400 USD 990,068 1,085,188 0.01MoneyGram International Inc. 241,800 USD 1,692,600 2,437,344 0.03Monster Beverage Corp. 946,757 USD 75,929,911 86,486,252 1.01Morgan Stanley 100,081 USD 8,538,167 9,176,427 0.11Morphic Holdings Inc. 32,255 USD 964,425 1,851,114 0.02Mr Cooper Group Inc. 102,431 USD 2,649,890 3,386,369 0.04MRC Global Inc. 74,327 USD 471,233 698,674 0.01MSG Networks Inc.-A- 80,400 USD 1,267,104 1,172,232 0.01MYR Group Inc. 7,404 USD 423,361 673,172 0.01National Presto Industries Inc. 18,138 USD 1,906,122 1,843,728 0.02National Western Life Group Inc.-A- 3,565 USD 707,367 799,950 0.01NetApp Inc. 243,015 USD 17,905,345 19,883,487 0.23NextEra Energy Partners LP 24,906 USD 1,745,662 1,901,822 0.02NMI Holdings Inc.-A- 821 USD 23,378 18,456 0.00Norfolk Southern Corp. 91,884 USD 26,628,902 24,386,932 0.28NuStar Energy LP 474,075 USD 8,632,906 8,557,054 0.10Nutanix Inc.-A- 88,500 USD 2,419,590 3,382,470 0.04NVIDIA Corp. 65,666 USD 45,593,874 52,539,367 0.61NVR Inc. 1,397 USD 6,897,630 6,947,700 0.08Oil States International Inc. 243,890 USD 948,732 1,914,536 0.02Olin Corp. 274,063 USD 12,754,892 12,678,154 0.15Omega Healthcare Investors REIT Inc. 236,974 USD 9,016,861 8,599,786 0.10Omeros Corp. 174,014 USD 3,055,686 2,582,368 0.03Oracle Corp. 44,295 USD 3,347,816 3,447,923 0.04Organogenesis Holdings Inc. 321,629 USD 6,641,639 5,345,474 0.06Orthofix Medical Inc. 52,864 USD 1,779,931 2,120,375 0.02OSI Systems Inc. 386 USD 25,804 39,233 0.00Otis Worldwide Corp. 1,787,364 USD 144,115,159 146,152,754 1.70Pacific Biosciences of California Inc. 160,125 USD 4,579,575 5,599,571 0.07Pacira BioSciences Inc. 21,789 USD 1,364,947 1,322,157 0.02PAE Inc. 453,808 USD 3,911,825 4,038,891 0.05Park Hotels & Resorts REIT Inc. 310,452 USD 6,607,826 6,398,416 0.07Parker-Hannifin Corp. 10,612 USD 3,387,987 3,259,051 0.04Party City Holdco Inc. 87,798 USD 399,481 819,155 0.01PayPal Holdings Inc. 94,786 USD 23,226,289 27,628,223 0.32Peloton Interactive Inc.-A- 205,742 USD 7,726,367 25,516,123 0.30Penn National Gaming Inc. 93,912 USD 8,098,109 7,183,329 0.08Pennant Group Inc. 52,809 USD 2,074,866 2,159,888 0.03People’s United Financial Inc. 88,433 USD 1,603,290 1,515,742 0.02PepsiCo Inc. 422,331 USD 62,365,619 62,576,784 0.73Perdoceo Education Corp. 152,766 USD 1,831,664 1,874,439 0.02Perficient Inc. 178,648 USD 9,715,787 14,366,872 0.17PG&E Corp. 615,000 USD 6,642,000 6,254,550 0.07
Xtrackers**
Xtrackers S&P 500 SWAP UCITS ETF* (continued)
Statement of Investmentsas at 30 June 2021(expressed in USD)
* This is a synthetic ETF.** This includes synthetic ETFs.
The accompanying notes form an integral part of these financial statements.
249

Description QuantityCurrency
(local) Cost Market Value
% ofNet
Assets
Transferable securities and money market instruments admitted to an official stock exchange listing
Shares (continued)
United States (continued)Phillips 66 Partners LP 601,351 USD 21,287,825 23,729,310 0.28Pilgrim’s Pride Corp. 75,118 USD 1,799,827 1,666,117 0.02Ping Identity Holdings Corp. 17,258 USD 557,088 395,208 0.00Pinterest Inc.-A- 801,257 USD 47,234,100 63,259,240 0.74Plains All American Pipeline LP 1,693,027 USD 15,626,639 19,232,787 0.22Planet Fitness Inc.-A- 64,716 USD 5,263,628 4,869,879 0.06Pool Corp. 38,156 USD 16,707,368 17,500,631 0.20PPD Inc. 343,822 USD 13,654,686 15,846,756 0.18Procter & Gamble Co. 196,070 USD 26,126,816 26,455,725 0.31Prologis REIT Inc. 719,000 USD 88,537,660 85,942,070 1.00Proofpoint Inc. 22,779 USD 3,893,236 3,958,079 0.05pSivida Corp. 203,042 USD 1,943,112 1,825,348 0.02Qorvo Inc. 38,104 USD 6,984,463 7,455,048 0.09QUALCOMM Inc. 112,416 USD 14,938,962 16,067,619 0.19Qurate Retail Inc.-Series A- 278,443 USD 3,369,160 3,644,819 0.04Rambus Inc. 3,460 USD 37,610 82,037 0.00RealReal Inc. 121,000 USD 2,947,560 2,390,960 0.03Replimune Group Inc. 69,815 USD 2,961,552 2,682,292 0.03Rimini Street Inc. 635,436 USD 4,918,275 3,914,286 0.05salesforce.com Inc. 61,958 USD 15,144,394 15,134,481 0.18Schnitzer Steel Industries Inc.-A- 26,925 USD 1,451,527 1,320,671 0.02Scientific Games Corp. 1,971 USD 104,759 152,634 0.00Seagen Inc. 45,315 USD 6,166,012 7,154,332 0.08SeaWorld Entertainment Inc. 50,309 USD 1,833,260 2,512,431 0.03Sensient Technologies Corp. 23,906 USD 2,000,693 2,069,303 0.02ServiceNow Inc. 314,323 USD 146,069,041 172,736,205 2.01Sharps Compliance Corp. 218,635 USD 3,445,688 2,251,940 0.03Shell Midstream Partners LP 588,663 USD 8,753,419 8,694,552 0.10Silvergate Capital Corp.-A- 238,059 USD 23,410,758 26,976,846 0.31SiTime Corp. 8,800 USD 974,600 1,113,992 0.01Six Flags Entertainment Corp. 57,000 USD 2,724,600 2,466,960 0.03SkyWest Inc. 96,601 USD 4,754,701 4,160,605 0.05SM Energy Co. 434,067 USD 6,810,511 10,691,070 0.12SmileDirectClub Inc. 269,402 USD 2,863,743 2,338,409 0.03Smith Micro Software Inc. 576,348 USD 2,772,234 3,008,537 0.04Snap Inc.-A- 49,951 USD 3,140,419 3,403,661 0.04Snowflake Inc.-A- 414,317 USD 83,669,000 100,181,851 1.17SolarEdge Technologies Inc. 23,430 USD 5,807,676 6,475,349 0.08Sonos Inc. 1,519,438 USD 57,115,674 53,529,801 0.62Sotera Health Co. 41,952 USD 987,550 1,016,497 0.01Southwest Airlines Co. 693,768 USD 32,655,862 36,832,143 0.43Splunk Inc. 243,471 USD 31,015,771 35,201,037 0.41Sportsman’s Warehouse Holdings Inc. 133,400 USD 2,335,834 2,370,518 0.03Sprouts Farmers Market Inc. 10,322 USD 259,172 256,502 0.00SPS Commerce Inc. 46,690 USD 1,777,955 4,661,996 0.05Square Inc.-A- 218,197 USD 34,978,329 53,196,429 0.62Sterling Construction Co. Inc. 132,475 USD 2,935,224 3,196,622 0.04StoneMor Inc. 397,929 USD 962,988 1,042,574 0.01
Xtrackers**
Xtrackers S&P 500 SWAP UCITS ETF* (continued)
Statement of Investmentsas at 30 June 2021(expressed in USD)
* This is a synthetic ETF.** This includes synthetic ETFs.
The accompanying notes form an integral part of these financial statements.
250
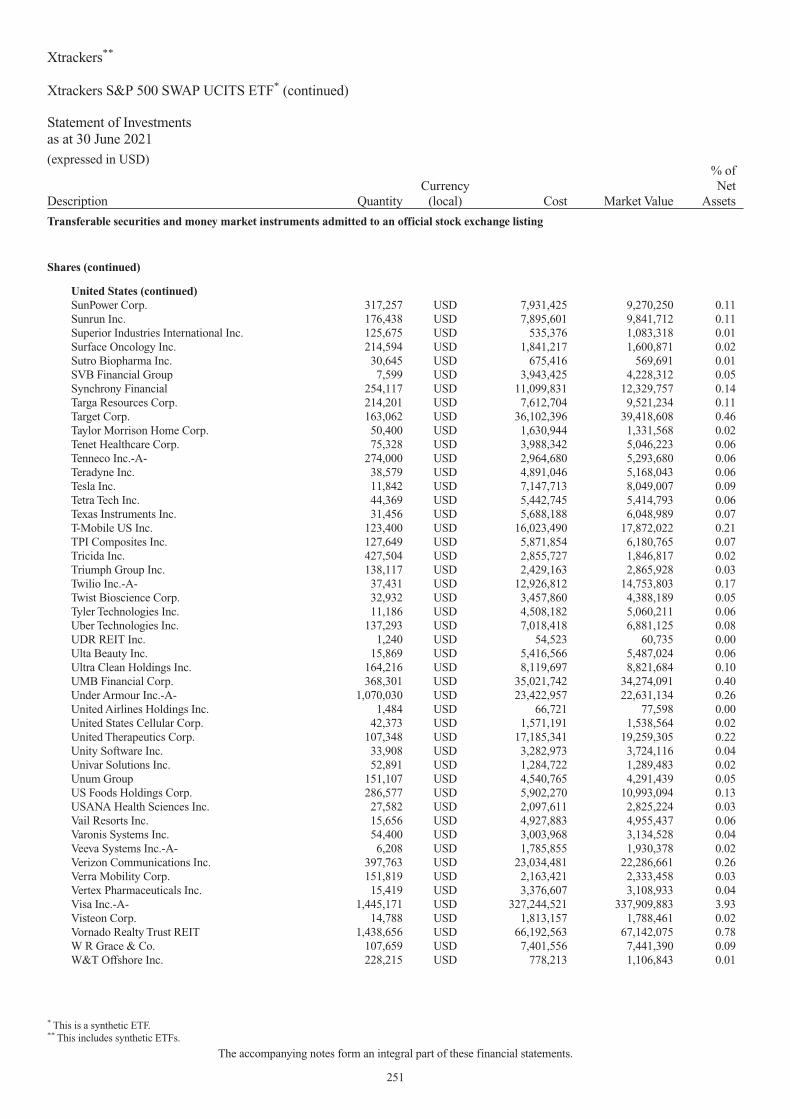
Description QuantityCurrency
(local) Cost Market Value
% ofNet
Assets
Transferable securities and money market instruments admitted to an official stock exchange listing
Shares (continued)
United States (continued)SunPower Corp. 317,257 USD 7,931,425 9,270,250 0.11Sunrun Inc. 176,438 USD 7,895,601 9,841,712 0.11Superior Industries International Inc. 125,675 USD 535,376 1,083,318 0.01Surface Oncology Inc. 214,594 USD 1,841,217 1,600,871 0.02Sutro Biopharma Inc. 30,645 USD 675,416 569,691 0.01SVB Financial Group 7,599 USD 3,943,425 4,228,312 0.05Synchrony Financial 254,117 USD 11,099,831 12,329,757 0.14Targa Resources Corp. 214,201 USD 7,612,704 9,521,234 0.11Target Corp. 163,062 USD 36,102,396 39,418,608 0.46Taylor Morrison Home Corp. 50,400 USD 1,630,944 1,331,568 0.02Tenet Healthcare Corp. 75,328 USD 3,988,342 5,046,223 0.06Tenneco Inc.-A- 274,000 USD 2,964,680 5,293,680 0.06Teradyne Inc. 38,579 USD 4,891,046 5,168,043 0.06Tesla Inc. 11,842 USD 7,147,713 8,049,007 0.09Tetra Tech Inc. 44,369 USD 5,442,745 5,414,793 0.06Texas Instruments Inc. 31,456 USD 5,688,188 6,048,989 0.07T-Mobile US Inc. 123,400 USD 16,023,490 17,872,022 0.21TPI Composites Inc. 127,649 USD 5,871,854 6,180,765 0.07Tricida Inc. 427,504 USD 2,855,727 1,846,817 0.02Triumph Group Inc. 138,117 USD 2,429,163 2,865,928 0.03Twilio Inc.-A- 37,431 USD 12,926,812 14,753,803 0.17Twist Bioscience Corp. 32,932 USD 3,457,860 4,388,189 0.05Tyler Technologies Inc. 11,186 USD 4,508,182 5,060,211 0.06Uber Technologies Inc. 137,293 USD 7,018,418 6,881,125 0.08UDR REIT Inc. 1,240 USD 54,523 60,735 0.00Ulta Beauty Inc. 15,869 USD 5,416,566 5,487,024 0.06Ultra Clean Holdings Inc. 164,216 USD 8,119,697 8,821,684 0.10UMB Financial Corp. 368,301 USD 35,021,742 34,274,091 0.40Under Armour Inc.-A- 1,070,030 USD 23,422,957 22,631,134 0.26United Airlines Holdings Inc. 1,484 USD 66,721 77,598 0.00United States Cellular Corp. 42,373 USD 1,571,191 1,538,564 0.02United Therapeutics Corp. 107,348 USD 17,185,341 19,259,305 0.22Unity Software Inc. 33,908 USD 3,282,973 3,724,116 0.04Univar Solutions Inc. 52,891 USD 1,284,722 1,289,483 0.02Unum Group 151,107 USD 4,540,765 4,291,439 0.05US Foods Holdings Corp. 286,577 USD 5,902,270 10,993,094 0.13USANA Health Sciences Inc. 27,582 USD 2,097,611 2,825,224 0.03Vail Resorts Inc. 15,656 USD 4,927,883 4,955,437 0.06Varonis Systems Inc. 54,400 USD 3,003,968 3,134,528 0.04Veeva Systems Inc.-A- 6,208 USD 1,785,855 1,930,378 0.02Verizon Communications Inc. 397,763 USD 23,034,481 22,286,661 0.26Verra Mobility Corp. 151,819 USD 2,163,421 2,333,458 0.03Vertex Pharmaceuticals Inc. 15,419 USD 3,376,607 3,108,933 0.04Visa Inc.-A- 1,445,171 USD 327,244,521 337,909,883 3.93Visteon Corp. 14,788 USD 1,813,157 1,788,461 0.02Vornado Realty Trust REIT 1,438,656 USD 66,192,563 67,142,075 0.78W R Grace & Co. 107,659 USD 7,401,556 7,441,390 0.09W&T Offshore Inc. 228,215 USD 778,213 1,106,843 0.01
Xtrackers**
Xtrackers S&P 500 SWAP UCITS ETF* (continued)
Statement of Investmentsas at 30 June 2021(expressed in USD)
* This is a synthetic ETF.** This includes synthetic ETFs.
The accompanying notes form an integral part of these financial statements.
251

Description QuantityCurrency
(local) Cost Market Value
% ofNet
Assets
Transferable securities and money market instruments admitted to an official stock exchange listing
Shares (continued)
United States (continued)Waste Management Inc. 134,978 USD 18,975,207 18,911,768 0.22Watsco Inc. 4,600 USD 1,304,928 1,318,544 0.02Welbilt Inc. 880,585 USD 19,317,961 20,385,543 0.24Wells Fargo & Co. 1,090,109 USD 51,081,656 49,371,037 0.57Westamerica BanCorp 37,705 USD 2,402,563 2,188,021 0.03Western Digital Corp. 91,431 USD 6,833,642 6,507,144 0.08Western Midstream Partners LP 421,251 USD 8,387,107 9,023,196 0.10Westrock Co. 43,988 USD 2,571,099 2,341,041 0.03Weyerhaeuser REIT Co. 113,891 USD 4,133,104 3,920,128 0.05Whole Earth Brands Inc. 67,000 USD 890,430 971,500 0.01Williams Cos Inc. 927,289 USD 25,769,361 24,619,523 0.29Workday Inc.-A- 122,716 USD 29,612,283 29,297,218 0.34WW International Inc. 158,923 USD 4,683,434 5,743,477 0.07Wynn Resorts Ltd. 12,826 USD 1,639,291 1,568,620 0.02Xenia Hotels & Resorts REIT Inc. 30,800 USD 547,008 576,884 0.01Xilinx Inc. 772,644 USD 105,146,513 111,755,228 1.30Xylem Inc. 61,942 USD 7,418,174 7,430,562 0.09Yelp Inc. 15,100 USD 340,460 603,396 0.01Zebra Technologies Corp.-A- 2,744 USD 1,310,672 1,452,921 0.02Zendesk Inc. 2,327 USD 341,720 335,879 0.00Zillow Group Inc.-C- 19,570 USD 1,620,983 2,391,845 0.03Zoetis Inc. 9,448 USD 1,597,373 1,760,729 0.02Zscaler Inc. 13,170 USD 2,261,453 2,845,510 0.03Zumiez Inc. 55,400 USD 2,531,780 2,714,046 0.03
6,647,232,897 7,083,462,745 82.40
Total - Shares 8,120,590,805 8,570,454,379 99.70
Total Transferable securities and money market instruments admitted to an officialstock exchange listing 8,120,590,805 8,570,454,379 99.70
TOTAL INVESTMENT PORTFOLIO 8,120,590,805 8,570,454,379 99.70
Xtrackers**
Xtrackers S&P 500 SWAP UCITS ETF* (continued)
Statement of Investmentsas at 30 June 2021(expressed in USD)
* This is a synthetic ETF.** This includes synthetic ETFs.
The accompanying notes form an integral part of these financial statements.
252

Description QuantityCurrency
(local) Cost Market Value
% ofNet
Assets
Transferable securities and money market instruments admitted to an official stock exchange listing
Shares
AustriaCA Immobilien Anlagen AG 185,067 EUR 5,355,012 6,505,105 0.97
5,355,012 6,505,105 0.97BelgiumAedifica REIT SA 89,194 EUR 8,157,378 9,927,292 1.47Ascencio REIT 12,786 EUR 694,002 615,646 0.09Befimmo REIT SA 53,283 EUR 2,632,636 1,784,981 0.27Cofinimmo REIT SA 73,168 EUR 8,805,514 9,394,771 1.39Intervest Offices & Warehouses REIT NV 56,752 EUR 1,294,696 1,296,783 0.19Leasinvest Real Estate REIT SCA 6,032 EUR 576,390 405,350 0.06Montea REIT NV 29,936 EUR 2,258,420 2,969,651 0.44Retail Estates REIT NV 24,931 EUR 1,834,931 1,707,774 0.25Warehouses De Pauw REIT CVA 345,523 EUR 7,330,227 11,125,841 1.65Xior Student Housing REIT NV 49,950 EUR 2,223,087 2,537,460 0.38
35,807,281 41,765,549 6.19FinlandCitycon OYJ 190,403 EUR 1,792,300 1,368,045 0.21Kojamo OYJ 483,843 EUR 7,607,027 9,323,655 1.38
9,399,327 10,691,700 1.59FranceCarmila REIT SA 96,665 EUR 1,646,380 1,117,447 0.17Covivio REIT 124,291 EUR 10,197,931 8,963,867 1.33Gecina REIT SA 127,913 EUR 17,315,434 16,526,360 2.45ICADE REIT 78,944 EUR 5,871,451 5,747,123 0.85Klepierre REIT SA 456,228 EUR 13,060,271 9,913,834 1.47Mercialys REIT SA 151,765 EUR 1,914,657 1,549,521 0.23Unibail-Rodamco-Westfield REIT 334,893 EUR 48,862,532 24,443,840 3.62
98,868,656 68,261,992 10.12Germanyalstria office REIT-AG 441,777 EUR 6,075,457 6,887,303 1.02Deutsche EuroShop AG 126,713 EUR 3,506,352 2,534,260 0.38Deutsche Wohnen SE 854,181 EUR 31,077,515 44,058,656 6.54Hamborner REIT AG 175,127 EUR 1,652,895 1,572,465 0.23LEG Immobilien AG 179,110 EUR 18,300,018 21,752,910 3.23TAG Immobilien AG 313,183 EUR 6,082,073 8,380,777 1.24TLG Immobilien AG 17,970 EUR 413,302 501,363 0.07Vonovia SE 1,405,889 EUR 63,842,234 76,649,068 11.37
130,949,846 162,336,802 24.08GuernseyBMO Commercial Property Trust REIT Ltd. 1,305,793 GBP 1,706,336 1,378,128 0.21BMO Real Estate Investments REIT Ltd. 594,989 GBP 606,102 492,101 0.07Picton Property Income REIT Ltd. 1,357,231 GBP 1,312,679 1,375,498 0.20Regional REIT Ltd. 144A 912,506 GBP 1,032,990 912,032 0.14Schroder Real Estate Investment Trust REIT Ltd. 1,218,041 GBP 752,144 692,418 0.10Sirius Real Estate Ltd. 2,400,296 GBP 2,077,568 3,092,480 0.46Standard Life Investment Property Income Trust REITLtd. 984,482 GBP 938,606 802,773 0.12UK Commercial Property REIT Ltd. 1,825,492 GBP 1,682,425 1,626,778 0.24
10,108,850 10,372,208 1.54
Xtrackers**
Xtrackers FTSE DEVELOPED EUROPE REAL ESTATE UCITS ETF
Statement of Investmentsas at 30 June 2021(expressed in EUR)
** This includes synthetic ETFs.
The accompanying notes form an integral part of these financial statements.
253

Description QuantityCurrency
(local) Cost Market Value
% ofNet
Assets
Transferable securities and money market instruments admitted to an official stock exchange listing
Shares (continued)
IrelandHibernia REIT PLC 1,642,918 EUR 2,190,289 2,037,218 0.30Irish Residential Properties REIT PLC 1,097,863 EUR 1,619,888 1,670,948 0.25
3,810,177 3,708,166 0.55ItalyImmobiliare Grande Distribuzione SIIQ REIT SpA 161,829 EUR 863,787 657,026 0.10
863,787 657,026 0.10JerseyPhoenix Spree Deutschland Ltd. 204,550 GBP 764,549 950,735 0.14
764,549 950,735 0.14LuxembourgADO Properties SA 144A 226,341 EUR 5,928,349 5,020,243 0.74Aroundtown SA 2,978,320 EUR 20,646,493 19,597,346 2.91Grand City Properties SA 236,764 EUR 4,796,699 5,393,484 0.80Shurgard Self Storage SA 62,263 EUR 2,378,927 2,534,104 0.38
33,750,468 32,545,177 4.83NetherlandsEurocommercial Properties NV 118,593 EUR 3,120,469 2,488,081 0.37NSI REIT NV 45,709 EUR 1,612,230 1,487,828 0.22Vastned Retail REIT NV 42,528 EUR 1,324,680 1,050,442 0.16Wereldhave REIT NV 99,971 EUR 2,712,849 1,436,583 0.21
8,770,228 6,462,934 0.96NorwayEntra ASA 144A 414,034 NOK 5,720,360 7,984,576 1.18
5,720,360 7,984,576 1.18SpainInmobiliaria Colonial Socimi REIT SA 801,874 EUR 7,015,929 6,827,957 1.01Lar Espana Real Estate Socimi REIT SA 148,679 EUR 969,112 729,270 0.11Merlin Properties Socimi REIT SA 823,504 EUR 8,323,478 7,194,131 1.07
16,308,519 14,751,358 2.19SwedenAtrium Ljungberg AB-B- 111,171 SEK 2,024,751 2,136,386 0.32Castellum AB 673,589 SEK 11,234,710 14,465,361 2.14Catena AB 67,454 SEK 2,068,204 3,047,468 0.45Corem Property Group AB-B- 1,439,669 SEK 2,859,907 2,751,014 0.41Dios Fastigheter AB 208,016 SEK 1,365,393 1,818,243 0.27Fabege AB 639,415 SEK 7,051,975 8,656,249 1.28Fastighets AB Balder 249,807 SEK 7,917,030 13,226,815 1.96Hufvudstaden AB-A- 266,034 SEK 3,702,782 3,816,599 0.57K-fast Holdings AB 152,767 SEK 1,027,994 941,426 0.14Klovern AB-B- 285,200 SEK 365,568 481,426 0.07Kungsleden AB 467,317 SEK 3,502,106 4,773,619 0.71Nyfosa AB 435,879 SEK 2,585,768 4,972,511 0.74Pandox AB 218,875 SEK 3,399,162 3,073,141 0.46Platzer Fastigheter Holdings AB-B- 133,732 SEK 1,671,810 1,711,538 0.25Sagax AB-B- 426,526 SEK 8,146,050 10,690,486 1.59Samhallsbyggnadsbolaget i Norden AB 2,466,995 SEK 5,934,905 8,722,781 1.29
Xtrackers**
Xtrackers FTSE DEVELOPED EUROPE REAL ESTATE UCITS ETF (continued)
Statement of Investmentsas at 30 June 2021(expressed in EUR)
** This includes synthetic ETFs.
The accompanying notes form an integral part of these financial statements.
254
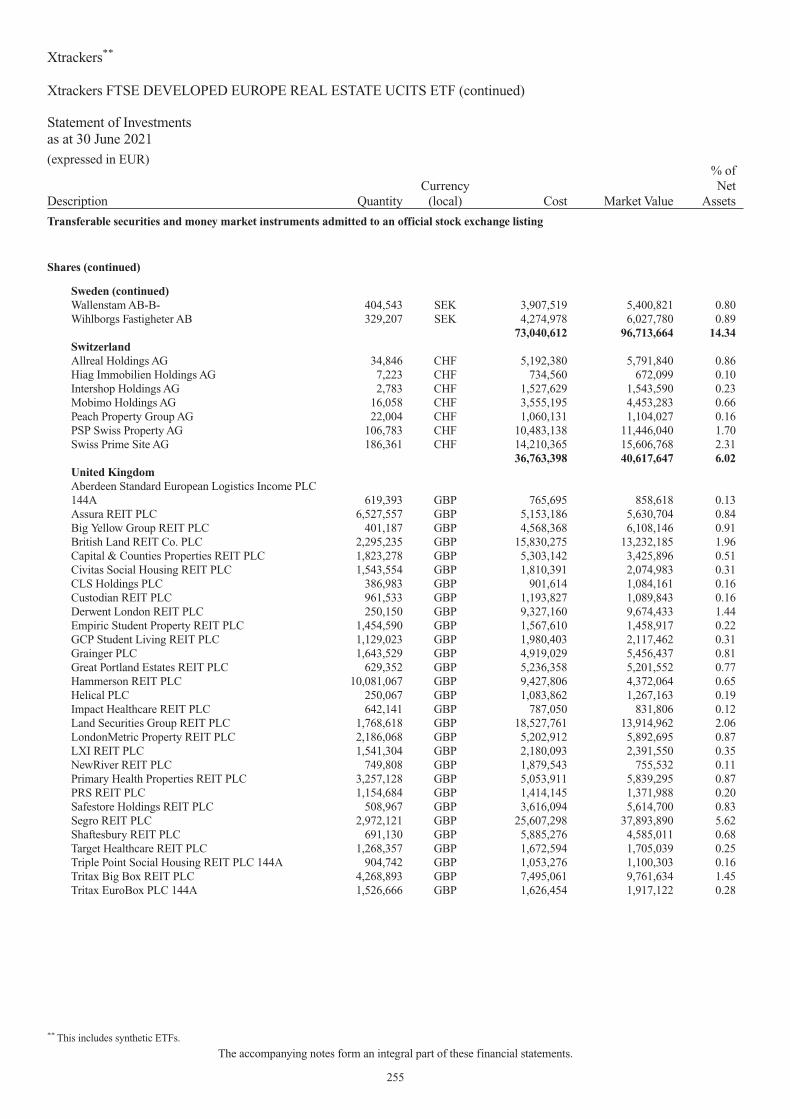
Description QuantityCurrency
(local) Cost Market Value
% ofNet
Assets
Transferable securities and money market instruments admitted to an official stock exchange listing
Shares (continued)
Sweden (continued)Wallenstam AB-B- 404,543 SEK 3,907,519 5,400,821 0.80Wihlborgs Fastigheter AB 329,207 SEK 4,274,978 6,027,780 0.89
73,040,612 96,713,664 14.34SwitzerlandAllreal Holdings AG 34,846 CHF 5,192,380 5,791,840 0.86Hiag Immobilien Holdings AG 7,223 CHF 734,560 672,099 0.10Intershop Holdings AG 2,783 CHF 1,527,629 1,543,590 0.23Mobimo Holdings AG 16,058 CHF 3,555,195 4,453,283 0.66Peach Property Group AG 22,004 CHF 1,060,131 1,104,027 0.16PSP Swiss Property AG 106,783 CHF 10,483,138 11,446,040 1.70Swiss Prime Site AG 186,361 CHF 14,210,365 15,606,768 2.31
36,763,398 40,617,647 6.02United KingdomAberdeen Standard European Logistics Income PLC144A 619,393 GBP 765,695 858,618 0.13Assura REIT PLC 6,527,557 GBP 5,153,186 5,630,704 0.84Big Yellow Group REIT PLC 401,187 GBP 4,568,368 6,108,146 0.91British Land REIT Co. PLC 2,295,235 GBP 15,830,275 13,232,185 1.96Capital & Counties Properties REIT PLC 1,823,278 GBP 5,303,142 3,425,896 0.51Civitas Social Housing REIT PLC 1,543,554 GBP 1,810,391 2,074,983 0.31CLS Holdings PLC 386,983 GBP 901,614 1,084,161 0.16Custodian REIT PLC 961,533 GBP 1,193,827 1,089,843 0.16Derwent London REIT PLC 250,150 GBP 9,327,160 9,674,433 1.44Empiric Student Property REIT PLC 1,454,590 GBP 1,567,610 1,458,917 0.22GCP Student Living REIT PLC 1,129,023 GBP 1,980,403 2,117,462 0.31Grainger PLC 1,643,529 GBP 4,919,029 5,456,437 0.81Great Portland Estates REIT PLC 629,352 GBP 5,236,358 5,201,552 0.77Hammerson REIT PLC 10,081,067 GBP 9,427,806 4,372,064 0.65Helical PLC 250,067 GBP 1,083,862 1,267,163 0.19Impact Healthcare REIT PLC 642,141 GBP 787,050 831,806 0.12Land Securities Group REIT PLC 1,768,618 GBP 18,527,761 13,914,962 2.06LondonMetric Property REIT PLC 2,186,068 GBP 5,202,912 5,892,695 0.87LXI REIT PLC 1,541,304 GBP 2,180,093 2,391,550 0.35NewRiver REIT PLC 749,808 GBP 1,879,543 755,532 0.11Primary Health Properties REIT PLC 3,257,128 GBP 5,053,911 5,839,295 0.87PRS REIT PLC 1,154,684 GBP 1,414,145 1,371,988 0.20Safestore Holdings REIT PLC 508,967 GBP 3,616,094 5,614,700 0.83Segro REIT PLC 2,972,121 GBP 25,607,298 37,893,890 5.62Shaftesbury REIT PLC 691,130 GBP 5,885,276 4,585,011 0.68Target Healthcare REIT PLC 1,268,357 GBP 1,672,594 1,705,039 0.25Triple Point Social Housing REIT PLC 144A 904,742 GBP 1,053,276 1,100,303 0.16Tritax Big Box REIT PLC 4,268,893 GBP 7,495,061 9,761,634 1.45Tritax EuroBox PLC 144A 1,526,666 GBP 1,626,454 1,917,122 0.28
Xtrackers**
Xtrackers FTSE DEVELOPED EUROPE REAL ESTATE UCITS ETF (continued)
Statement of Investmentsas at 30 June 2021(expressed in EUR)
** This includes synthetic ETFs.
The accompanying notes form an integral part of these financial statements.
255

Description QuantityCurrency
(local) Cost Market Value
% ofNet
Assets
Transferable securities and money market instruments admitted to an official stock exchange listing
Shares (continued)
United Kingdom (continued)UNITE Group REIT PLC 790,073 GBP 8,464,332 9,884,585 1.47Workspace Group REIT PLC 331,015 GBP 3,451,846 3,215,886 0.48
162,986,372 169,728,562 25.17
Total - Shares 633,267,442 674,053,201 99.97
Total Transferable securities and money market instruments admitted to an officialstock exchange listing 633,267,442 674,053,201 99.97
TOTAL INVESTMENT PORTFOLIO 633,267,442 674,053,201 99.97
Xtrackers**
Xtrackers FTSE DEVELOPED EUROPE REAL ESTATE UCITS ETF (continued)
Statement of Investmentsas at 30 June 2021(expressed in EUR)
** This includes synthetic ETFs.
The accompanying notes form an integral part of these financial statements.
256

Description QuantityCurrency
(local) Cost Market Value
% ofNet
Assets
Transferable securities and money market instruments admitted to an official stock exchange listing(A)
Shares
BermudaAlibaba Health Information Technology Ltd. 2,697,726 HKD 5,318,022 5,981,939 0.28Alibaba Pictures Group Ltd. 8,043,705 HKD 1,225,163 1,118,641 0.05Beijing Enterprises Water Group Ltd. 3,018,923 HKD 1,420,325 1,142,906 0.05Brilliance China Automotive Holdings Ltd. 2,117,221 HKD 2,482,036 1,990,215 0.09China Gas Holdings Ltd. 2,069,995 HKD 7,248,697 6,317,258 0.29China Resources Gas Group Ltd. 618,435 HKD 2,855,988 3,711,000 0.17China Youzan Ltd. 9,228,000 HKD 2,539,132 1,758,654 0.08COSCO SHIPPING Ports Ltd. 1,220,993 HKD 976,758 952,789 0.04GOME Retail Holdings Ltd. 7,967,413 HKD 1,023,918 1,025,955 0.05HengTen Networks Group Ltd. 1,876,000 HKD 2,192,837 1,500,153 0.07Hopson Development Holdings Ltd. 439,700 HKD 1,161,005 2,015,661 0.09Kunlun Energy Co. Ltd. 2,603,595 HKD 2,255,202 2,400,477 0.11Nine Dragons Paper Holdings Ltd. 1,095,535 HKD 1,301,458 1,405,066 0.07Shenzhen International Holdings Ltd. 745,558 HKD 1,351,604 1,031,090 0.05
33,352,145 32,351,804 1.49Cayman Islands21Vianet Group Inc.-ADR- 59,827 USD 2,200,271 1,373,030 0.06360 DigiTech Inc.-ADR- 57,493 USD 1,712,136 2,405,507 0.113SBio Inc. 144A 849,550 HKD 1,141,440 1,050,198 0.0551job Inc.-ADR- 20,277 USD 1,576,008 1,576,942 0.07AAC Technologies Holdings Inc. 484,619 HKD 3,937,248 3,625,664 0.17Agile Group Holdings Ltd. 784,232 HKD 1,090,991 1,015,906 0.05Agora Inc.-ADR- 32,363 USD 1,355,325 1,357,951 0.06Akeso Inc. 144A 193,000 HKD 1,507,326 1,557,003 0.07Alibaba Group Holdings Ltd. 10,159,772 HKD 273,722,699 287,817,797 13.30ANTA Sports Products Ltd. 725,267 HKD 6,688,465 17,072,028 0.79Autohome Inc.-ADR- 45,951 USD 3,875,882 2,939,026 0.14Baidu Inc.-ADR- 180,620 USD 29,289,406 36,828,418 1.70Baozun Inc.-ADR- 41,534 USD 1,603,030 1,471,965 0.07BeiGene Ltd.-ADR- 30,636 USD 7,953,977 10,513,969 0.49Bilibili Inc.-ADR- 108,136 USD 6,688,455 13,175,290 0.61Bosideng International Holdings Ltd. 2,162,461 HKD 827,586 1,545,440 0.07Burning Rock Biotech Ltd.-ADR- 29,153 USD 842,950 858,847 0.04China Aoyuan Group Ltd. 840,373 HKD 951,377 708,801 0.03China Conch Venture Holdings Ltd. 1,086,394 HKD 4,278,569 4,574,526 0.21China East Education Holdings Ltd. 144A 366,487 HKD 720,206 575,744 0.03China Education Group Holdings Ltd. 533,581 HKD 931,059 1,190,034 0.06China Evergrande Group 1,338,115 HKD 3,226,041 1,743,753 0.08China Feihe Ltd. 144A 2,387,000 HKD 5,978,867 5,151,544 0.24China Hongqiao Group Ltd. 1,523,527 HKD 1,336,467 2,063,844 0.10China Lesso Group Holdings Ltd. 725,000 HKD 1,003,144 1,788,729 0.08China Literature Ltd. 144A 271,509 HKD 1,998,051 3,018,962 0.14China Medical System Holdings Ltd. 909,622 HKD 1,233,071 2,395,330 0.11China Meidong Auto Holdings Ltd. 378,000 HKD 1,595,711 2,061,371 0.10China Mengniu Dairy Co. Ltd. 2,116,351 HKD 8,922,361 12,794,823 0.59China Overseas Property Holdings Ltd. 890,000 HKD 800,169 951,216 0.04China Resources Cement Holdings Ltd. 1,638,919 HKD 1,943,688 1,557,489 0.07China Resources Land Ltd. 2,152,768 HKD 8,940,385 8,718,241 0.40
Xtrackers**
Xtrackers MSCI CHINA UCITS ETF
Statement of Investmentsas at 30 June 2021(expressed in USD)
** This includes synthetic ETFs.
The accompanying notes form an integral part of these financial statements.
257

Description QuantityCurrency
(local) Cost Market Value
% ofNet
Assets
Transferable securities and money market instruments admitted to an official stock exchange listing(A)
Shares (continued)
Cayman Islands (continued)China Resources Mixc Lifestyle Services Ltd. 144A 229,400 HKD 1,354,463 1,570,029 0.07China State Construction International Holdings Ltd. 1,347,647 HKD 1,215,234 919,736 0.04China Yuhua Education Corp. Ltd. 144A 1,014,000 HKD 972,132 917,919 0.04Chindata Group Holdings Ltd.-ADR- 57,587 USD 930,960 868,988 0.04CIFI Holdings Group Co. Ltd. 2,206,879 HKD 1,651,487 1,722,115 0.08Country Garden Holdings Co. Ltd. 5,190,107 HKD 7,053,136 5,814,422 0.27Country Garden Services Holdings Co. Ltd. 986,174 HKD 4,304,671 10,654,339 0.49Dada Nexus Ltd.-ADR- 39,618 USD 1,014,028 1,149,318 0.05Dali Foods Group Co. Ltd. 144A 1,372,099 HKD 943,734 818,045 0.04Daqo New Energy Corp.-ADR- 34,837 USD 3,608,411 2,265,102 0.10DouYu International Holdings Ltd.-ADR- 64,712 USD 849,688 442,630 0.02ENN Energy Holdings Ltd. 529,980 HKD 5,799,221 10,086,603 0.47Ever Sunshine Lifestyle Services Group Ltd. 504,000 HKD 1,261,178 1,251,263 0.06Gaotu Techedu Inc.-ADR- 83,981 USD 3,068,000 1,240,399 0.06GDS Holdings Ltd.-ADR- 59,644 USD 3,832,488 4,681,458 0.22Geely Automobile Holdings Ltd. 3,950,488 HKD 9,051,098 12,437,715 0.57Genscript Biotech Corp. 754,852 HKD 1,695,379 3,295,130 0.15Greentown China Holdings Ltd. 584,500 HKD 847,646 900,174 0.04Greentown Service Group Co. Ltd. 965,064 HKD 1,035,700 1,498,699 0.07Haidilao International Holdings Ltd. 144A 713,692 HKD 4,141,928 3,758,765 0.17Haitian International Holdings Ltd. 424,900 HKD 1,060,983 1,425,297 0.07Hansoh Pharmaceutical Group Co. Ltd. 144A 789,268 HKD 3,444,334 3,455,528 0.16Hengan International Group Co. Ltd. 436,785 HKD 3,422,089 2,924,705 0.14Huazhu Group Ltd.-ADR- 119,437 USD 4,982,480 6,307,468 0.29Hutchmed China Ltd.-ADR- 48,646 USD 1,383,905 1,910,328 0.09HUYA Inc.-ADR- 52,671 USD 1,141,618 929,643 0.04I-Mab-ADR- 21,644 USD 1,627,274 1,817,014 0.08Innovent Biologics Inc. 144A 779,000 HKD 4,947,044 9,083,159 0.42iQIYI Inc.-ADR- 189,700 USD 3,972,936 2,955,526 0.14JD Health International Inc. 191,600 HKD 3,935,864 2,746,007 0.13JD.com Inc.-ADR- 579,527 USD 31,987,575 46,252,050 2.14Jinxin Fertility Group Ltd. 144A 836,000 HKD 1,489,232 2,109,956 0.10Jiumaojiu International Holdings Ltd. 144A 483,000 HKD 1,922,694 1,974,703 0.09JOYY Inc.-ADR- 38,900 USD 3,023,169 2,566,233 0.12Kaisa Group Holdings Ltd. 1,876,298 HKD 767,404 710,330 0.03KE Holdings Inc.-ADR- 238,186 USD 12,704,603 11,356,709 0.52Kingboard Holdings Ltd. 444,055 HKD 1,626,107 2,464,479 0.11Kingboard Laminates Holdings Ltd. 626,019 HKD 827,906 1,404,257 0.07Kingdee International Software Group Co. Ltd. 1,737,081 HKD 3,447,647 5,894,021 0.27Kingsoft Cloud Holdings Ltd.-ADR- 36,436 USD 1,498,069 1,236,273 0.06Kingsoft Corp. Ltd. 642,106 HKD 2,751,546 3,848,907 0.18Kuaishou Technology 144A 181,600 HKD 6,639,282 4,555,288 0.21KWG Group Holdings Ltd. 849,960 HKD 964,462 1,138,264 0.05Lee & Man Paper Manufacturing Ltd. 873,723 HKD 743,240 664,924 0.03Li Auto Inc.-ADR- 316,750 USD 7,749,963 11,067,245 0.51Li Ning Co. Ltd. 1,500,031 HKD 5,599,556 18,311,317 0.85Logan Group Co. Ltd. 922,979 HKD 1,409,516 1,381,049 0.06Longfor Group Holdings Ltd. 144A 1,222,061 HKD 5,451,274 6,845,310 0.32
Xtrackers**
Xtrackers MSCI CHINA UCITS ETF (continued)
Statement of Investmentsas at 30 June 2021(expressed in USD)
** This includes synthetic ETFs.
The accompanying notes form an integral part of these financial statements.
258

Description QuantityCurrency
(local) Cost Market Value
% ofNet
Assets
Transferable securities and money market instruments admitted to an official stock exchange listing(A)
Shares (continued)
Cayman Islands (continued)Lufax Holdings Ltd.-ADR- 115,219 USD 1,984,261 1,301,975 0.06Meituan-B- 144A 2,418,828 HKD 60,064,139 99,794,934 4.61Microport Scientific Corp. 423,000 HKD 1,962,458 3,793,783 0.18Ming Yuan Cloud Group Holdings Ltd. 259,000 HKD 1,472,849 1,285,687 0.06Minth Group Ltd. 506,000 HKD 2,515,787 2,404,296 0.11Momo Inc.-ADR- 107,023 USD 2,735,777 1,638,522 0.08NetEase Inc.-ADR- 269,266 USD 19,735,376 31,032,907 1.43New Oriental Education & TechnologyGroup Inc.-ADR- 1,033,195 USD 12,805,632 8,461,867 0.39NIO Inc.-ADR- 866,587 USD 21,184,387 46,102,428 2.13Noah Holdings Ltd.-ADR- 22,565 USD 877,555 1,065,068 0.05OneConnect Financial Technology Co. Ltd.-ADR- 78,211 USD 1,265,069 940,096 0.04Perennial Energy Holdings Ltd. 525,000 HKD 951,701 124,391 0.01Pinduoduo Inc.-ADR- 294,068 USD 28,089,725 37,352,517 1.73Ping An Healthcare and Technology Co. Ltd. 144A 307,000 HKD 3,282,871 3,822,750 0.18Powerlong Real Estate Holdings Ltd. 969,000 HKD 1,009,668 832,263 0.04RLX Technology Inc.-ADR- 89,560 USD 2,127,408 781,859 0.04Sany Heavy Equipment International Holdings Co.Ltd. 734,000 HKD 871,904 743,844 0.03Seazen Group Ltd. 1,477,777 HKD 1,213,930 1,400,547 0.06Shenzhou International Group Holdings Ltd. 554,431 HKD 7,874,296 14,000,260 0.65Shimao Group Holdings Ltd. 834,350 HKD 2,682,966 2,045,626 0.09Shimao Services Holdings Ltd. 144A 394,000 HKD 1,077,061 1,362,233 0.06Sino Biopharmaceutical Ltd. 6,932,959 HKD 5,860,715 6,802,752 0.31Smoore International Holdings Ltd. 144A 792,000 HKD 5,470,912 4,390,453 0.20SSY Group Ltd. 905,771 HKD 710,776 809,448 0.04Sunac China Holdings Ltd. 1,724,086 HKD 7,117,678 5,916,531 0.27Sunac Services Holdings Ltd. 144A 414,000 HKD 1,271,237 1,538,003 0.07Sunny Optical Technology Group Co. Ltd. 477,627 HKD 7,763,736 15,092,960 0.70TAL Education Group-ADR- 277,548 USD 13,814,917 7,002,536 0.32Tencent Holdings Ltd. 3,859,988 HKD 220,790,984 290,275,114 13.41Tencent Music Entertainment Group-ADR- 446,545 USD 6,756,039 6,912,517 0.32Tingyi Cayman Islands Holdings Corp. 1,316,049 HKD 2,205,270 2,626,726 0.12Tongcheng-Elong Holdings Ltd. 656,000 HKD 1,251,235 1,642,144 0.08Topsports International Holdings Ltd. 144A 1,035,000 HKD 1,364,922 1,695,268 0.08Trip.com Group Ltd.-ADR- 339,004 USD 11,648,462 12,021,082 0.56Uni-President China Holdings Ltd. 867,976 HKD 848,783 957,855 0.04Up Fintech Holdings Ltd.-ADR- 53,101 USD 1,182,003 1,538,867 0.07Vinda International Holdings Ltd. 242,000 HKD 731,012 744,774 0.03Vipshop Holdings Ltd.-ADR- 298,868 USD 4,768,614 6,001,269 0.28Want Want China Holdings Ltd. 3,244,218 HKD 2,482,914 2,297,649 0.11Weibo Corp.-ADR- 41,676 USD 2,316,533 2,192,991 0.10Weimob Inc. 144A 1,143,000 HKD 3,260,550 2,519,771 0.12Wuxi Biologics Cayman Inc. 144A 2,257,236 HKD 16,115,203 41,361,175 1.91Xiaomi Corp.-B- 144A 9,617,871 HKD 23,666,071 33,439,033 1.55Xinyi Solar Holdings Ltd. 3,197,087 HKD 3,550,330 6,899,847 0.32XPeng Inc.-ADR- 217,353 USD 7,313,496 9,654,820 0.45Yadea Group Holdings Ltd. 144A 802,000 HKD 1,527,294 1,724,653 0.08
Xtrackers**
Xtrackers MSCI CHINA UCITS ETF (continued)
Statement of Investmentsas at 30 June 2021(expressed in USD)
** This includes synthetic ETFs.
The accompanying notes form an integral part of these financial statements.
259

Description QuantityCurrency
(local) Cost Market Value
% ofNet
Assets
Transferable securities and money market instruments admitted to an official stock exchange listing(A)
Shares (continued)
Cayman Islands (continued)Yihai International Holdings Ltd. 315,304 HKD 2,339,395 2,117,360 0.10Zai Lab Ltd.-ADR- 50,466 USD 4,484,667 8,931,977 0.41Zhenro Properties Group Ltd. 877,000 HKD 567,226 490,118 0.02Zhongsheng Group Holdings Ltd. 380,657 HKD 1,841,203 3,166,484 0.15ZTO Express Cayman Inc.-ADR- 295,138 USD 7,814,433 8,957,438 0.41
1,111,646,145 1,409,117,695 65.12China360 Security Technology Inc.-A- 191,100 CNY 511,432 361,149 0.02Addsino Co. Ltd.-A- 66,700 CNY 161,750 194,809 0.01AECC Aero-Engine Control Co. Ltd.-A- 47,528 CNY 109,799 153,232 0.01AECC Aviation Power Co. Ltd.-A- 108,100 CNY 864,739 889,951 0.04Agricultural Bank of China Ltd.-A- 2,987,629 CNY 1,502,593 1,401,134 0.06Agricultural Bank of China Ltd.-H- 17,466,305 HKD 7,289,075 6,072,616 0.28Aier Eye Hospital Group Co. Ltd.-A- 214,430 CNY 1,005,541 2,355,765 0.11Air China Ltd.-A- 266,300 CNY 296,311 320,672 0.01Air China Ltd.-H- 1,221,433 HKD 1,080,063 898,084 0.04A-Living Smart City Services Co. Ltd. 144A 380,250 HKD 1,584,082 1,892,473 0.09Aluminum Corp. of China Ltd.-A- 524,500 CNY 274,774 430,261 0.02Aluminum Corp. of China Ltd.-H- 2,636,223 HKD 963,871 1,571,716 0.07Angel Yeast Co. Ltd.-A- 33,020 CNY 183,805 277,924 0.01Anhui Conch Cement Co. Ltd.-A- 160,436 CNY 1,143,247 1,019,355 0.05Anhui Conch Cement Co. Ltd.-H- 825,211 HKD 5,025,363 4,377,974 0.20Anhui Gujing Distillery Co. Ltd.-A- 15,100 CNY 387,658 559,748 0.03Anhui Gujing Distillery Co. Ltd.-B- 72,100 HKD 827,556 998,056 0.05Anhui Honglu Steel Construction Group Co. Ltd.-A- 21,200 CNY 182,359 191,464 0.01Anhui Kouzi Distillery Co. Ltd.-A- 24,423 CNY 199,031 255,879 0.01Apeloa Pharmaceutical Co. Ltd.-A- 48,900 CNY 142,033 222,519 0.01Asymchem Laboratories Tianjin Co. Ltd.-A- 9,600 CNY 241,106 553,636 0.03Autobio Diagnostics Co. Ltd.-A- 25,200 CNY 347,905 295,534 0.01Avary Holdings Shenzhen Co. Ltd.-A- 61,900 CNY 314,182 343,758 0.02AVIC Aircraft Co. Ltd.-A- 116,200 CNY 352,972 472,652 0.02Avic Aviation High-Technology Co. Ltd.-A- 58,000 CNY 265,226 276,317 0.01AVIC Electromechanical Systems Co. Ltd.-A- 156,998 CNY 191,210 244,700 0.01AVIC Industry-Finance Holdings Co. Ltd.-A- 373,394 CNY 252,706 223,660 0.01AVIC Jonhon Optronic Technology Co. Ltd.-A- 44,900 CNY 294,132 549,153 0.02AVIC Shenyang Aircraft Co. Ltd.-A- 65,420 CNY 300,473 610,574 0.03Avic Sunda Holdings Co. Ltd.-A- 43,885 CNY 199,910 116,694 0.01AviChina Industry & Technology Co. Ltd.-H- 1,659,850 HKD 951,703 1,098,609 0.05AVICOPTER PLC-A- 23,900 CNY 166,969 195,096 0.01Bank of Beijing Co. Ltd.-A- 847,912 CNY 657,291 639,131 0.03Bank of Chengdu Co. Ltd.-A- 146,279 CNY 205,755 286,180 0.01Bank of China Ltd.-A- 1,408,926 CNY 721,117 671,660 0.03Bank of China Ltd.-H- 53,221,360 HKD 21,658,244 19,120,585 0.88Bank of Communications Co. Ltd.-A- 1,574,468 CNY 1,211,568 1,194,099 0.05Bank of Communications Co. Ltd.-H- 5,850,722 HKD 3,865,054 3,932,701 0.18Bank of Hangzhou Co. Ltd.-A- 237,640 CNY 362,838 542,528 0.02Bank of Jiangsu Co. Ltd.-A- 592,291 CNY 528,005 650,884 0.03Bank of Nanjing Co. Ltd.-A- 401,173 CNY 475,677 653,217 0.03
Xtrackers**
Xtrackers MSCI CHINA UCITS ETF (continued)
Statement of Investmentsas at 30 June 2021(expressed in USD)
** This includes synthetic ETFs.
The accompanying notes form an integral part of these financial statements.
260

Description QuantityCurrency
(local) Cost Market Value
% ofNet
Assets
Transferable securities and money market instruments admitted to an official stock exchange listing(A)
Shares (continued)
China (continued)Bank of Ningbo Co. Ltd.-A- 240,753 CNY 999,526 1,452,153 0.07Bank of Shanghai Co. Ltd.-A- 569,988 CNY 719,535 723,419 0.03Baoshan Iron & Steel Co. Ltd.-A- 893,435 CNY 840,673 1,056,493 0.05BBMG Corp.-A- 346,295 CNY 167,351 144,181 0.01Beijing BDStar Navigation Co. Ltd.-A- 20,600 CNY 171,948 137,326 0.01Beijing Capital International Airport Co. Ltd.-H- 1,257,858 HKD 1,174,314 834,161 0.04Beijing Dabeinong Technology Group Co. Ltd.-A- 176,600 CNY 171,318 185,870 0.01Beijing E-Hualu Information Technology Co. Ltd.-A- 26,960 CNY 141,300 112,291 0.00Beijing Enlight Media Co. Ltd.-A- 121,800 CNY 200,351 203,790 0.01Beijing New Building Materials PLC-A- 67,700 CNY 300,942 411,281 0.02Beijing Originwater Technology Co. Ltd.-A- 132,300 CNY 155,082 149,688 0.01Beijing Shiji Information Technology Co. Ltd.-A- 45,160 CNY 168,714 164,330 0.01Beijing Shunxin Agriculture Co. Ltd.-A- 30,800 CNY 247,337 201,079 0.01Beijing Sinnet Technology Co. Ltd.-A- 64,100 CNY 188,216 142,767 0.01Beijing Tiantan Biological Products Corp. Ltd.-A- 55,253 CNY 261,252 292,905 0.01Beijing United Information Technology Co. Ltd.-A- 13,600 CNY 201,837 210,435 0.01Beijing Yanjing Brewery Co. Ltd.-A- 116,600 CNY 115,526 130,661 0.01Beijing Yuanliu Hongyuan Electronic Technology Co.Ltd.-A- 9,100 CNY 178,641 180,173 0.01Beijing-Shanghai High Speed Railway Co. Ltd.-A- 1,641,500 CNY 1,504,281 1,344,024 0.06Betta Pharmaceuticals Co. Ltd.-A- 16,900 CNY 254,054 283,129 0.01BGI Genomics Co. Ltd.-A- 16,800 CNY 294,760 308,393 0.01BOC International China Co. Ltd.-A- 74,100 CNY 188,950 236,148 0.01BOE Technology Group Co. Ltd.-A- 1,358,191 CNY 873,246 1,311,764 0.06BYD Co. Ltd.-A- 73,177 CNY 1,029,930 2,842,881 0.13BYD Co. Ltd.-H- 526,525 HKD 8,888,821 15,743,171 0.73By-health Co. Ltd.-A- 68,103 CNY 197,278 346,795 0.02C&S Paper Co. Ltd.-A- 53,800 CNY 162,847 229,411 0.01Caitong Securities Co. Ltd.-A- 148,800 CNY 245,367 241,595 0.01CanSino Biologics Inc.-A- 3,777 CNY 344,037 454,683 0.02CanSino Biologics Inc.-H- 144A 53,400 HKD 1,347,138 2,837,145 0.13CGN Power Co. Ltd.-H- 144A 7,094,000 HKD 1,544,541 1,580,332 0.07Chacha Food Co. Ltd.-A- 20,200 CNY 168,691 134,753 0.01Changchun High & New Technology IndustryGroup Inc.-A- 16,500 CNY 842,992 988,337 0.05Changjiang Securities Co. Ltd.-A- 220,945 CNY 233,833 250,326 0.01Changzhou Xingyu Automotive Lighting Systems Co.Ltd.-A- 10,900 CNY 173,781 380,809 0.02Chaozhou Three-Circle Group Co. Ltd.-A- 72,100 CNY 252,304 473,387 0.02Chifeng Jilong Gold Mining Co. Ltd.-A- 69,300 CNY 182,582 160,785 0.01China Avionics Systems Co. Ltd.-A- 80,639 CNY 186,819 206,563 0.01China Bohai Bank Co. Ltd.-H- 144A 1,657,500 HKD 1,091,440 574,139 0.03China Cinda Asset Management Co. Ltd.-H- 5,894,056 HKD 1,466,922 1,123,277 0.05China CITIC Bank Corp. Ltd.-H- 5,967,158 HKD 3,237,865 2,827,655 0.13China Communications Services Corp. Ltd.-H- 1,594,745 HKD 1,051,364 796,772 0.04China Construction Bank Corp.-A- 384,842 CNY 384,281 396,109 0.02China Construction Bank Corp.-H- 64,466,979 HKD 52,966,392 50,721,201 2.34China CSSC Holdings Ltd.-A- 179,600 CNY 509,033 458,948 0.02
Xtrackers**
Xtrackers MSCI CHINA UCITS ETF (continued)
Statement of Investmentsas at 30 June 2021(expressed in USD)
** This includes synthetic ETFs.
The accompanying notes form an integral part of these financial statements.
261
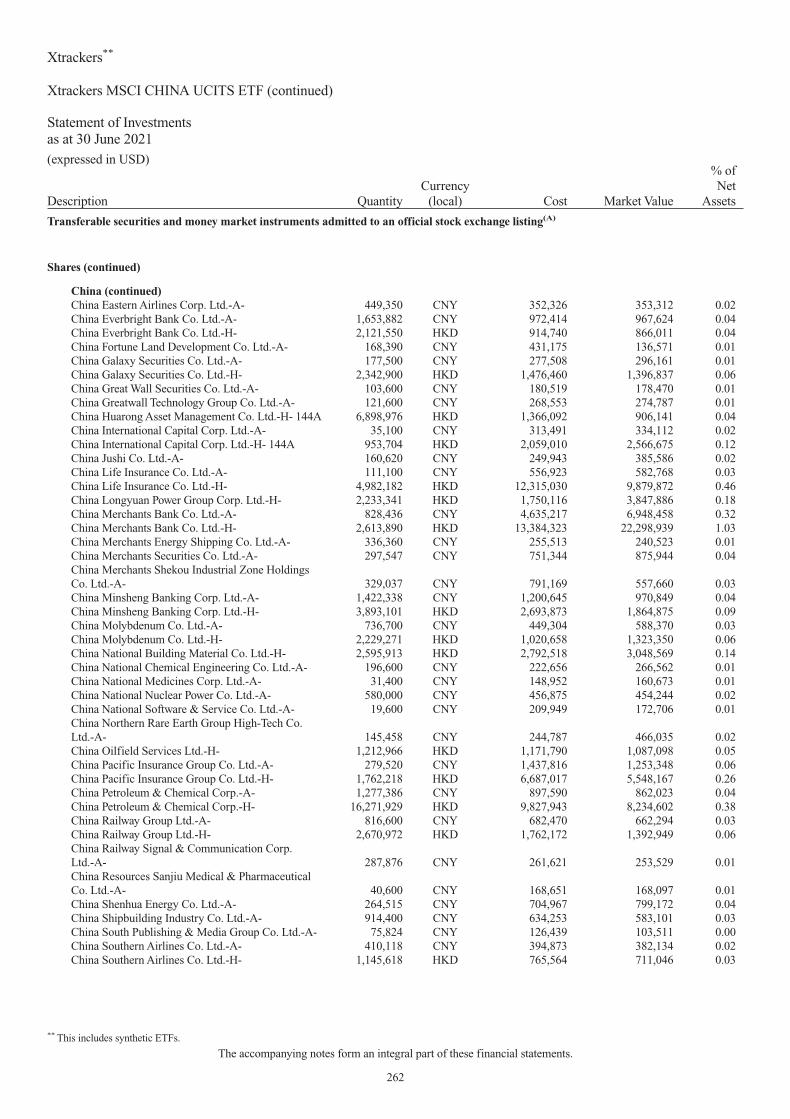
Description QuantityCurrency
(local) Cost Market Value
% ofNet
Assets
Transferable securities and money market instruments admitted to an official stock exchange listing(A)
Shares (continued)
China (continued)China Eastern Airlines Corp. Ltd.-A- 449,350 CNY 352,326 353,312 0.02China Everbright Bank Co. Ltd.-A- 1,653,882 CNY 972,414 967,624 0.04China Everbright Bank Co. Ltd.-H- 2,121,550 HKD 914,740 866,011 0.04China Fortune Land Development Co. Ltd.-A- 168,390 CNY 431,175 136,571 0.01China Galaxy Securities Co. Ltd.-A- 177,500 CNY 277,508 296,161 0.01China Galaxy Securities Co. Ltd.-H- 2,342,900 HKD 1,476,460 1,396,837 0.06China Great Wall Securities Co. Ltd.-A- 103,600 CNY 180,519 178,470 0.01China Greatwall Technology Group Co. Ltd.-A- 121,600 CNY 268,553 274,787 0.01China Huarong Asset Management Co. Ltd.-H- 144A 6,898,976 HKD 1,366,092 906,141 0.04China International Capital Corp. Ltd.-A- 35,100 CNY 313,491 334,112 0.02China International Capital Corp. Ltd.-H- 144A 953,704 HKD 2,059,010 2,566,675 0.12China Jushi Co. Ltd.-A- 160,620 CNY 249,943 385,586 0.02China Life Insurance Co. Ltd.-A- 111,100 CNY 556,923 582,768 0.03China Life Insurance Co. Ltd.-H- 4,982,182 HKD 12,315,030 9,879,872 0.46China Longyuan Power Group Corp. Ltd.-H- 2,233,341 HKD 1,750,116 3,847,886 0.18China Merchants Bank Co. Ltd.-A- 828,436 CNY 4,635,217 6,948,458 0.32China Merchants Bank Co. Ltd.-H- 2,613,890 HKD 13,384,323 22,298,939 1.03China Merchants Energy Shipping Co. Ltd.-A- 336,360 CNY 255,513 240,523 0.01China Merchants Securities Co. Ltd.-A- 297,547 CNY 751,344 875,944 0.04China Merchants Shekou Industrial Zone HoldingsCo. Ltd.-A- 329,037 CNY 791,169 557,660 0.03China Minsheng Banking Corp. Ltd.-A- 1,422,338 CNY 1,200,645 970,849 0.04China Minsheng Banking Corp. Ltd.-H- 3,893,101 HKD 2,693,873 1,864,875 0.09China Molybdenum Co. Ltd.-A- 736,700 CNY 449,304 588,370 0.03China Molybdenum Co. Ltd.-H- 2,229,271 HKD 1,020,658 1,323,350 0.06China National Building Material Co. Ltd.-H- 2,595,913 HKD 2,792,518 3,048,569 0.14China National Chemical Engineering Co. Ltd.-A- 196,600 CNY 222,656 266,562 0.01China National Medicines Corp. Ltd.-A- 31,400 CNY 148,952 160,673 0.01China National Nuclear Power Co. Ltd.-A- 580,000 CNY 456,875 454,244 0.02China National Software & Service Co. Ltd.-A- 19,600 CNY 209,949 172,706 0.01China Northern Rare Earth Group High-Tech Co.Ltd.-A- 145,458 CNY 244,787 466,035 0.02China Oilfield Services Ltd.-H- 1,212,966 HKD 1,171,790 1,087,098 0.05China Pacific Insurance Group Co. Ltd.-A- 279,520 CNY 1,437,816 1,253,348 0.06China Pacific Insurance Group Co. Ltd.-H- 1,762,218 HKD 6,687,017 5,548,167 0.26China Petroleum & Chemical Corp.-A- 1,277,386 CNY 897,590 862,023 0.04China Petroleum & Chemical Corp.-H- 16,271,929 HKD 9,827,943 8,234,602 0.38China Railway Group Ltd.-A- 816,600 CNY 682,470 662,294 0.03China Railway Group Ltd.-H- 2,670,972 HKD 1,762,172 1,392,949 0.06China Railway Signal & Communication Corp.Ltd.-A- 287,876 CNY 261,621 253,529 0.01China Resources Sanjiu Medical & PharmaceuticalCo. Ltd.-A- 40,600 CNY 168,651 168,097 0.01China Shenhua Energy Co. Ltd.-A- 264,515 CNY 704,967 799,172 0.04China Shipbuilding Industry Co. Ltd.-A- 914,400 CNY 634,253 583,101 0.03China South Publishing & Media Group Co. Ltd.-A- 75,824 CNY 126,439 103,511 0.00China Southern Airlines Co. Ltd.-A- 410,118 CNY 394,873 382,134 0.02China Southern Airlines Co. Ltd.-H- 1,145,618 HKD 765,564 711,046 0.03
Xtrackers**
Xtrackers MSCI CHINA UCITS ETF (continued)
Statement of Investmentsas at 30 June 2021(expressed in USD)
** This includes synthetic ETFs.
The accompanying notes form an integral part of these financial statements.
262

Description QuantityCurrency
(local) Cost Market Value
% ofNet
Assets
Transferable securities and money market instruments admitted to an official stock exchange listing(A)
Shares (continued)
China (continued)China State Construction Engineering Corp. Ltd.-A- 1,673,800 CNY 1,277,636 1,204,667 0.06China Tourism Group Duty Free Corp. Ltd.-A- 78,885 CNY 1,681,009 3,664,129 0.17China Tower Corp. Ltd.-H- 144A 28,070,086 HKD 5,058,494 3,867,573 0.18China TransInfo Technology Co. Ltd.-A- 66,100 CNY 195,092 170,855 0.01China Vanke Co. Ltd.-A- 390,025 CNY 1,606,134 1,437,349 0.07China Vanke Co. Ltd.-H- 1,141,328 HKD 4,057,613 3,571,312 0.16China Yangtze Power Co. Ltd.-A- 912,043 CNY 2,479,472 2,913,636 0.13China Zheshang Bank Co. Ltd.-A- 670,600 CNY 422,251 412,064 0.02Chongqing Brewery Co. Ltd.-A- 19,600 CNY 244,999 600,512 0.03Chongqing Fuling Zhacai Group Co. Ltd.-A- 35,600 CNY 179,019 207,511 0.01Chongqing Rural Commercial Bank Co. Ltd.-A- 369,500 CNY 252,823 228,191 0.01Chongqing Rural Commercial Bank Co. Ltd.-H- 1,513,736 HKD 781,311 598,411 0.03Chongqing Zhifei Biological Products Co. Ltd.-A- 64,200 CNY 825,727 1,855,494 0.09CITIC Securities Co. Ltd.-A- 426,987 CNY 1,574,570 1,648,244 0.08CITIC Securities Co. Ltd.-H- 1,522,159 HKD 3,345,491 3,818,211 0.18Contemporary Amperex Technology Co. Ltd.-A- 93,600 CNY 2,332,746 7,747,786 0.36COSCO SHIPPING Energy Transportation Co.Ltd.-A- 146,300 CNY 141,582 139,488 0.01COSCO SHIPPING Holdings Co. Ltd.-A- 390,091 CNY 353,457 1,843,934 0.08COSCO SHIPPING Holdings Co. Ltd.-H- 1,726,061 HKD 1,063,471 4,347,464 0.20CSC Financial Co. Ltd.-A- 173,500 CNY 865,730 844,023 0.04Da An Gene Co. Ltd.of Sun Yat-Sen University-A- 59,416 CNY 133,234 195,330 0.01DaShenLin Pharmaceutical Group Co. Ltd.-A- 31,940 CNY 356,856 252,669 0.01DHC Software Co. Ltd.-A- 130,100 CNY 178,303 159,684 0.01Dong-E-E-Jiao Co. Ltd.-A- 26,900 CNY 150,835 149,513 0.01Dongfang Electric Corp. Ltd.-A- 113,000 CNY 164,999 191,865 0.01Dongfeng Motor Group Co. Ltd.-H- 1,824,940 HKD 1,786,399 1,640,269 0.08Dongxing Securities Co. Ltd.-A- 113,900 CNY 200,127 192,688 0.01East Money Information Co. Ltd.-A- 418,228 CNY 936,266 2,122,584 0.10Ecovacs Robotics Co. Ltd.-A- 19,300 CNY 324,415 681,326 0.03ENN Natural Gas Co. Ltd.-A- 75,900 CNY 202,810 193,954 0.01Eve Energy Co. Ltd.-A- 76,129 CNY 482,507 1,224,620 0.06Everbright Securities Co. Ltd.-A- 156,818 CNY 329,495 434,227 0.02Fangda Carbon New Material Co. Ltd.-A- 158,078 CNY 175,770 182,035 0.01FAW Jiefang Group Co. Ltd.-A- 127,000 CNY 245,975 212,687 0.01Fiberhome Telecommunication Technologies Co.Ltd.-A- 48,300 CNY 183,222 139,274 0.01Financial Street Holdings Co. Ltd.-A- 124,400 CNY 132,309 129,967 0.01First Capital Securities Co. Ltd.-A- 174,474 CNY 227,040 192,814 0.01Flat Glass Group Co. Ltd.-A- 45,200 CNY 204,877 276,551 0.01Flat Glass Group Co. Ltd.-H- 272,000 HKD 767,194 1,120,805 0.05Focus Media Information Technology Co. Ltd.-A- 588,641 CNY 618,055 857,335 0.04Foshan Haitian Flavouring & Food Co. Ltd.-A- 140,642 CNY 1,916,781 2,807,028 0.13Founder Securities Co. Ltd.-A- 330,090 CNY 374,543 478,210 0.02Foxconn Industrial Internet Co. Ltd.-A- 292,200 CNY 617,402 561,258 0.03Fu Jian Anjoy Foods Co. Ltd.-A- 9,500 CNY 236,330 373,510 0.02Fujian Sunner Development Co. Ltd.-A- 50,800 CNY 185,028 187,762 0.01Fuyao Glass Industry Group Co. Ltd.-A- 81,683 CNY 361,611 706,098 0.03
Xtrackers**
Xtrackers MSCI CHINA UCITS ETF (continued)
Statement of Investmentsas at 30 June 2021(expressed in USD)
** This includes synthetic ETFs.
The accompanying notes form an integral part of these financial statements.
263

Description QuantityCurrency
(local) Cost Market Value
% ofNet
Assets
Transferable securities and money market instruments admitted to an official stock exchange listing(A)
Shares (continued)
China (continued)Fuyao Glass Industry Group Co. Ltd.-H- 144A 405,195 HKD 1,667,524 2,854,055 0.13Ganfeng Lithium Co. Ltd.-A- 44,550 CNY 294,492 834,961 0.04Ganfeng Lithium Co. Ltd.-H- 144A 173,400 HKD 2,329,172 2,590,109 0.12G-bits Network Technology Xiamen Co. Ltd.-A- 2,800 CNY 138,918 229,691 0.01GCL System Integration Technology Co. Ltd.-A- 234,700 CNY 165,301 126,416 0.01GEM Co. Ltd.-A- 193,400 CNY 135,099 279,884 0.01Gemdale Corp.-A- 196,496 CNY 368,729 311,433 0.01GF Securities Co. Ltd.-A- 237,274 CNY 516,192 556,015 0.03GF Securities Co. Ltd.-H- 739,129 HKD 1,102,568 957,479 0.04Giant Network Group Co. Ltd.-A- 70,063 CNY 185,012 144,228 0.01Gigadevice Semiconductor Beijing Inc.-A- 26,692 CNY 497,210 776,280 0.04GoerTek Inc.-A- 136,900 CNY 489,935 905,625 0.04Gotion High-tech Co. Ltd.-A- 52,200 CNY 163,066 351,940 0.02Great Wall Motor Co. Ltd.-A- 90,800 CNY 394,803 612,609 0.03Great Wall Motor Co. Ltd.-H- 2,076,484 HKD 2,703,540 6,711,403 0.31Greenland Holdings Corp. Ltd.-A- 340,486 CNY 320,855 287,214 0.01GRG Banking Equipment Co. Ltd.-A- 100,900 CNY 159,849 203,491 0.01Guangdong Haid Group Co. Ltd.-A- 66,600 CNY 429,982 841,152 0.04Guangdong Hongda Blasting Co. Ltd.-A- 30,900 CNY 163,587 132,814 0.01Guangdong Kinlong Hardware Products Co. Ltd.-A- 12,700 CNY 247,819 381,441 0.02Guangdong Xinbao Electrical Appliances HoldingsCo. Ltd.-A- 33,100 CNY 204,653 134,483 0.01Guanghui Energy Co. Ltd.-A- 282,900 CNY 135,654 145,810 0.01Guangzhou Automobile Group Co. Ltd.-H- 1,982,517 HKD 2,234,831 1,779,347 0.08Guangzhou Baiyunshan Pharmaceutical Holdings Co.Ltd.-A- 58,162 CNY 289,168 304,725 0.01Guangzhou Haige Communications Group Inc. Co.-A- 96,100 CNY 150,310 140,710 0.01Guangzhou Kingmed Diagnostics Group Co. Ltd.-A- 18,600 CNY 248,389 459,958 0.02Guangzhou R&F Properties Co. Ltd.-H- 1,141,330 HKD 1,746,025 1,302,135 0.06Guangzhou Shiyuan Electronic Technology Co.Ltd.-A- 26,866 CNY 372,970 516,832 0.02Guangzhou Tinci Materials Technology Co. Ltd.-A- 37,150 CNY 271,837 612,837 0.03Guangzhou Wondfo Biotech Co. Ltd.-A- 19,090 CNY 174,928 191,141 0.01Guangzhou Yuexiu Financial Holdings Group Co.Ltd.-A- 77,000 CNY 190,562 150,881 0.01Guolian Securities Co. Ltd.-A- 66,900 CNY 194,409 159,462 0.01Guosen Securities Co. Ltd.-A- 257,074 CNY 463,084 427,737 0.02Guotai Junan Securities Co. Ltd.-A- 301,300 CNY 773,121 799,319 0.04Guoyuan Securities Co. Ltd.-A- 181,655 CNY 220,605 224,087 0.01Haier Smart Home Co. Ltd.-A- 259,015 CNY 776,845 1,038,730 0.05Haier Smart Home Co. Ltd.-H- 1,309,161 HKD 2,709,424 4,568,497 0.21Haitong Securities Co. Ltd.-A- 387,236 CNY 764,618 689,261 0.03Haitong Securities Co. Ltd.-H- 1,823,319 HKD 2,023,831 1,596,550 0.07Hang Zhou Great Star Industrial Co. Ltd.-A- 45,700 CNY 258,760 241,061 0.01Hangzhou First Applied Material Co. Ltd.-A- 37,000 CNY 362,583 602,059 0.03Hangzhou Oxygen Plant Group Co. Ltd.-A- 38,600 CNY 205,963 206,656 0.01Hangzhou Robam Appliances Co. Ltd.-A- 39,400 CNY 183,728 283,569 0.01Hangzhou Silan Microelectronics Co. Ltd.-A- 52,300 CNY 133,099 456,148 0.02
Xtrackers**
Xtrackers MSCI CHINA UCITS ETF (continued)
Statement of Investmentsas at 30 June 2021(expressed in USD)
** This includes synthetic ETFs.
The accompanying notes form an integral part of these financial statements.
264

Description QuantityCurrency
(local) Cost Market Value
% ofNet
Assets
Transferable securities and money market instruments admitted to an official stock exchange listing(A)
Shares (continued)
China (continued)Hangzhou Tigermed Consulting Co. Ltd.-A- 14,800 CNY 158,547 442,796 0.02Hangzhou Tigermed Consulting Co. Ltd.-H- 144A 82,500 HKD 1,455,617 1,933,465 0.09Hefei Meiya Optoelectronic Technology Inc.-A- 27,888 CNY 171,125 240,686 0.01Heilongjiang Agriculture Co. Ltd.-A- 73,800 CNY 138,593 170,883 0.01Henan Shuanghui Investment & Development Co.Ltd.-A- 115,975 CNY 627,058 570,823 0.03Hengli Petrochemical Co. Ltd.-A- 239,212 CNY 621,699 971,532 0.04Hengyi Petrochemical Co. Ltd.-A- 152,980 CNY 246,626 282,952 0.01Hesteel Co. Ltd.-A- 442,361 CNY 158,705 168,431 0.01Hithink RoyalFlush Information Network Co. Ltd.-A- 21,600 CNY 384,848 377,048 0.02Hongfa Technology Co. Ltd.-A- 31,000 CNY 168,303 300,843 0.01Huaan Securities Co. Ltd.-A- 195,097 CNY 185,548 168,196 0.01Huadian Power International Corp. Ltd.-A- 281,839 CNY 152,138 150,062 0.01Huadong Medicine Co. Ltd.-A- 70,083 CNY 279,370 499,086 0.02Huagong Tech Co. Ltd.-A- 41,900 CNY 126,014 152,532 0.01Hualan Biological Engineering Inc.-A- 73,010 CNY 362,558 414,498 0.02Huaneng Power International Inc.-A- 307,798 CNY 239,255 201,043 0.01Huaneng Power International Inc.-H- 2,359,863 HKD 1,198,711 923,786 0.04Huatai Securities Co. Ltd.-A- 295,091 CNY 809,621 721,645 0.03Huatai Securities Co. Ltd.-H- 144A 1,034,216 HKD 1,807,921 1,518,193 0.07Huaxi Securities Co. Ltd.-A- 110,600 CNY 184,575 164,851 0.01Huaxia Bank Co. Ltd.-A- 514,358 CNY 527,731 492,795 0.02Huaxin Cement Co. Ltd.-A- 56,183 CNY 191,113 152,787 0.01Huayu Automotive Systems Co. Ltd.-A- 128,996 CNY 491,084 524,501 0.02Hubei Biocause Pharmaceutical Co. Ltd.-A- 207,603 CNY 179,295 116,320 0.00Huizhou Desay Sv Automotive Co. Ltd.-A- 18,600 CNY 317,060 316,907 0.01Humanwell Healthcare Group Co. Ltd.-A- 65,500 CNY 324,398 286,601 0.01Hunan Valin Steel Co. Ltd.-A- 254,500 CNY 174,482 259,981 0.01Hundsun Technologies Inc.-A- 41,769 CNY 407,433 602,856 0.03Iflytek Co. Ltd.-A- 89,307 CNY 470,163 934,144 0.04Industrial & Commercial Bank of China Ltd.-A- 2,523,244 CNY 2,001,746 2,019,111 0.09Industrial & Commercial Bank of China Ltd.-H- 37,795,442 HKD 26,077,632 22,192,962 1.03Industrial Bank Co. Ltd.-A- 836,669 CNY 2,267,779 2,661,190 0.12Industrial Securities Co. Ltd.-A- 268,427 CNY 280,985 401,341 0.02Ingenic Semiconductor Co. Ltd.-A- 19,000 CNY 266,441 296,784 0.01Inner Mongolia BaoTou Steel Union Co. Ltd.-A- 1,828,155 CNY 359,815 438,586 0.02Inner Mongolia Junzheng Energy & ChemicalIndustry Group Co. Ltd.-A- 338,195 CNY 220,417 266,437 0.01Inner Mongolia Yili Industrial Group Co. Ltd.-A- 244,153 CNY 1,190,274 1,391,791 0.06Inspur Electronic Information Industry Co. Ltd.-A- 60,364 CNY 263,099 262,820 0.01Intco Medical Technology Co. Ltd.-A- 15,300 CNY 321,182 295,540 0.01JA Solar Technology Co. Ltd.-A- 44,100 CNY 222,391 334,461 0.02Jafron Biomedical Co. Ltd.-A- 32,198 CNY 255,934 430,380 0.02Jason Furniture Hangzhou Co. Ltd.-A- 25,600 CNY 297,239 306,209 0.01JCET Group Co. Ltd.-A- 71,300 CNY 432,179 415,825 0.02Jiangsu Changshu Rural Commercial Bank Co.Ltd.-A- 112,900 CNY 129,334 108,342 0.00Jiangsu Eastern Shenghong Co. Ltd.-A- 129,300 CNY 372,304 418,268 0.02
Xtrackers**
Xtrackers MSCI CHINA UCITS ETF (continued)
Statement of Investmentsas at 30 June 2021(expressed in USD)
** This includes synthetic ETFs.
The accompanying notes form an integral part of these financial statements.
265

Description QuantityCurrency
(local) Cost Market Value
% ofNet
Assets
Transferable securities and money market instruments admitted to an official stock exchange listing(A)
Shares (continued)
China (continued)Jiangsu Expressway Co. Ltd.-H- 814,452 HKD 1,037,821 921,861 0.04Jiangsu Hengli Hydraulic Co. Ltd.-A- 53,487 CNY 438,931 711,300 0.03Jiangsu Hengrui Medicine Co. Ltd.-A- 256,621 CNY 2,364,235 2,699,727 0.12Jiangsu King’s Luck Brewery JSC Ltd.-A- 51,300 CNY 291,747 430,038 0.02Jiangsu Shagang Co. Ltd.-A- 91,600 CNY 176,778 154,679 0.01Jiangsu Yanghe Brewery Joint-Stock Co. Ltd.-A- 60,559 CNY 1,207,013 1,942,132 0.09Jiangsu Yangnong Chemical Co. Ltd.-A- 12,900 CNY 133,922 223,165 0.01Jiangsu Yoke Technology Co. Ltd.-A- 18,800 CNY 204,959 235,697 0.01Jiangsu Yuyue Medical Equipment & Supply Co.Ltd.-A- 42,300 CNY 148,054 249,642 0.01Jiangsu Zhongnan Construction Group Co. Ltd.-A- 174,683 CNY 221,470 160,060 0.01Jiangsu Zhongtian Technology Co. Ltd.-A- 127,300 CNY 175,505 197,033 0.01Jiangxi Copper Co. Ltd.-A- 85,727 CNY 200,773 296,953 0.01Jiangxi Copper Co. Ltd.-H- 740,616 HKD 1,028,241 1,516,356 0.07Jiangxi Zhengbang Technology Co. Ltd.-A- 125,900 CNY 304,238 232,865 0.01Jilin Aodong Pharmaceutical Group Co. Ltd.-A- 48,900 CNY 116,490 117,239 0.01Jinke Properties Group Co. Ltd.-A- 223,000 CNY 231,913 199,845 0.01JiuGui Liquor Co. Ltd.-A- 12,800 CNY 207,419 506,385 0.02Joincare Pharmaceutical Group Industry Co. Ltd.-A- 80,700 CNY 144,992 171,496 0.01Joinn Laboratories China Co. Ltd.-A- 9,000 CNY 245,158 255,965 0.01Jointown Pharmaceutical Group Co. Ltd.-A- 77,139 CNY 177,727 183,509 0.01Jonjee Hi-Tech Industrial And Commercial HoldingsCo. Ltd.-A- 32,100 CNY 241,475 208,772 0.01Joyoung Co. Ltd.-A- 31,900 CNY 155,348 160,417 0.01Juewei Food Co. Ltd.-A- 24,832 CNY 219,133 323,965 0.01Kingfa Sci & Tech Co. Ltd.-A- 103,100 CNY 277,031 332,877 0.02Kuang-Chi Technologies Co. Ltd.-A- 88,400 CNY 279,848 284,731 0.01Kunlun Tech Co. Ltd.-A- 48,100 CNY 158,646 121,946 0.01Kweichow Moutai Co. Ltd.-A- 50,659 CNY 10,505,141 16,126,418 0.74Lakala Payment Co. Ltd.-A- 33,200 CNY 167,729 145,064 0.01Laobaixing Pharmacy Chain JSC-A- 16,480 CNY 149,171 134,373 0.01Lens Technology Co. Ltd.-A- 199,427 CNY 792,373 907,798 0.04Leo Group Co. Ltd.-A- 280,500 CNY 152,770 101,592 0.00Lepu Medical Technology Beijing Co. Ltd.-A- 71,400 CNY 318,698 354,964 0.02Leyard Optoelectronic Co. Ltd.-A- 106,900 CNY 105,468 129,388 0.01Liaoning Cheng Da Co. Ltd.-A- 61,319 CNY 178,135 197,505 0.01Lingyi iTech Guangdong Co.-A- 283,200 CNY 468,216 402,827 0.02Livzon Pharmaceutical Group Inc.-A- 25,400 CNY 142,637 196,647 0.01Lomon Billions Group Co. Ltd.-A- 89,962 CNY 321,669 481,498 0.02LONGi Green Energy Technology Co. Ltd.-A- 211,988 CNY 1,001,333 2,914,944 0.13Luxi Chemical Group Co. Ltd.-A- 76,200 CNY 192,786 220,904 0.01Luxshare Precision Industry Co. Ltd.-A- 280,751 CNY 1,428,292 1,998,893 0.09Luzhou Laojiao Co. Ltd.-A- 58,842 CNY 1,039,314 2,148,817 0.10Maccura Biotechnology Co. Ltd.-A- 22,200 CNY 142,787 144,625 0.01Mango Excellent Media Co. Ltd.-A- 71,351 CNY 481,931 757,590 0.03Maxscend Microelectronics Co. Ltd.-A- 13,160 CNY 519,538 1,094,825 0.05Meinian Onehealth Healthcare Holdings Co. Ltd.-A- 165,292 CNY 321,535 233,067 0.01Metallurgical Corp. of China Ltd.-A- 716,034 CNY 296,164 330,263 0.01
Xtrackers**
Xtrackers MSCI CHINA UCITS ETF (continued)
Statement of Investmentsas at 30 June 2021(expressed in USD)
** This includes synthetic ETFs.
The accompanying notes form an integral part of these financial statements.
266

Description QuantityCurrency
(local) Cost Market Value
% ofNet
Assets
Transferable securities and money market instruments admitted to an official stock exchange listing(A)
Shares (continued)
China (continued)Midea Group Co. Ltd.-A- 142,500 CNY 2,037,198 1,574,131 0.07Ming Yang Smart Energy Group Ltd.-A- 78,000 CNY 188,704 195,457 0.01Montage Technology Co. Ltd.-A- 29,776 CNY 279,639 287,490 0.01Muyuan Foodstuff Co. Ltd.-A- 211,282 CNY 1,362,906 1,988,929 0.09NanJi E-Commerce Co. Ltd.-A- 101,900 CNY 190,025 154,092 0.01Nanjing King-Friend Biochemical Pharmaceutical Co.Ltd.-A- 32,320 CNY 166,997 208,852 0.01Nanjing Securities Co. Ltd.-A- 153,200 CNY 247,317 249,451 0.01NARI Technology Co. Ltd.-A- 222,548 CNY 573,281 800,516 0.04NAURA Technology Group Co. Ltd.-A- 20,100 CNY 423,513 862,942 0.04NavInfo Co. Ltd.-A- 91,600 CNY 216,103 208,412 0.01New China Life Insurance Co. Ltd.-A- 86,904 CNY 662,624 617,529 0.03New China Life Insurance Co. Ltd.-H- 587,560 HKD 2,575,164 2,004,976 0.09New Hope Liuhe Co. Ltd.-A- 180,948 CNY 595,415 410,860 0.02Ninestar Corp.-A- 44,100 CNY 186,864 219,788 0.01Ningbo Joyson Electronic Corp.-A- 61,500 CNY 183,009 242,922 0.01Ningbo Tuopu Group Co. Ltd.-A- 45,000 CNY 182,249 260,701 0.01Ningxia Baofeng Energy Group Co. Ltd.-A- 245,300 CNY 584,951 519,390 0.02Nongfu Spring Co. Ltd.-H- 144A 269,000 HKD 1,736,802 1,349,183 0.06Northeast Securities Co. Ltd.-A- 97,700 CNY 123,853 127,780 0.01Offcn Education Technology Co. Ltd.-A- 97,500 CNY 428,758 315,249 0.01Offshore Oil Engineering Co. Ltd.-A- 183,700 CNY 145,975 127,948 0.01OFILM Group Co. Ltd.-A- 112,700 CNY 225,792 154,899 0.01Oppein Home Group Inc.-A- 20,252 CNY 359,961 444,984 0.02Orient Securities Co. Ltd.-A- 239,130 CNY 368,841 369,751 0.02Ovctek China Inc.-A- 34,380 CNY 188,508 551,019 0.03Pacific Securities Co. Ltd.-A- 283,900 CNY 147,001 148,962 0.01Pangang Group Vanadium Titanium & Resources Co.Ltd.-A- 358,790 CNY 132,776 127,170 0.01People’s Insurance Co. Group of China Ltd.-A- 245,900 CNY 241,146 225,696 0.01People’s Insurance Co. Group of China Ltd.-H- 5,540,735 HKD 2,142,157 1,847,899 0.09Perfect World Co. Ltd.-A- 80,700 CNY 304,754 298,651 0.01PetroChina Co. Ltd.-A- 866,051 CNY 660,312 709,103 0.03PetroChina Co. Ltd.-H- 14,105,688 HKD 6,954,047 6,865,894 0.32Pharmaron Beijing Co. Ltd.-A- 26,600 CNY 793,104 893,371 0.04Pharmaron Beijing Co. Ltd.-H- 144A 89,700 HKD 1,177,482 2,390,968 0.11PICC Property & Casualty Co. Ltd.-H- 4,610,973 HKD 4,629,681 4,037,500 0.19Ping An Bank Co. Ltd.-A- 778,367 CNY 1,785,056 2,725,131 0.13Ping An Insurance Group Co. of China Ltd.-A- 435,872 CNY 5,142,061 4,336,558 0.20Ping An Insurance Group Co. of China Ltd.-H- 4,244,958 HKD 45,196,798 41,570,344 1.92Ping An Insurance Group Co. of China Ltd.-H- 2,271,638 HKD 4,754,664 4,452,099 0.21Postal Savings Bank of China Co. Ltd.-A- 1,066,700 CNY 897,392 828,813 0.04Postal Savings Bank of China Co. Ltd.-H- 144A 5,307,653 HKD 3,193,756 3,574,499 0.16Power Construction Corp. of China Ltd.-A- 613,700 CNY 381,075 367,602 0.02Proya Cosmetics Co. Ltd.-A- 7,900 CNY 178,284 240,527 0.01Qianhe Condiment and Food Co. Ltd.-A- 32,460 CNY 147,346 132,084 0.01Qingdao Rural Commercial Bank Corp.-A- 230,700 CNY 151,220 152,828 0.01Raytron Technology Co. Ltd.-A- 17,573 CNY 269,907 271,530 0.01
Xtrackers**
Xtrackers MSCI CHINA UCITS ETF (continued)
Statement of Investmentsas at 30 June 2021(expressed in USD)
** This includes synthetic ETFs.
The accompanying notes form an integral part of these financial statements.
267

Description QuantityCurrency
(local) Cost Market Value
% ofNet
Assets
Transferable securities and money market instruments admitted to an official stock exchange listing(A)
Shares (continued)
China (continued)RiseSun Real Estate Development Co. Ltd.-A- 190,243 CNY 216,490 166,073 0.01Riyue Heavy Industry Co. Ltd.-A- 38,700 CNY 161,121 162,207 0.01Rongsheng Petro Chemical Co. Ltd.-A- 406,424 CNY 716,910 1,086,381 0.05SAIC Motor Corp. Ltd.-A- 321,980 CNY 1,144,806 1,094,887 0.05Sailun Group Co. Ltd.-A- 123,000 CNY 217,976 190,187 0.01Sanan Optoelectronics Co. Ltd.-A- 179,911 CNY 535,607 892,475 0.04Sangfor Technologies Inc.-A- 16,865 CNY 500,242 677,330 0.03Sany Heavy Industry Co. Ltd.-A- 346,200 CNY 1,027,051 1,557,695 0.07SDIC Capital Co. Ltd.-A- 257,608 CNY 331,613 338,515 0.02SDIC Power Holdings Co. Ltd.-A- 282,600 CNY 358,339 420,345 0.02Sealand Securities Co. Ltd.-A- 227,360 CNY 167,240 149,207 0.01Seazen Holdings Co. Ltd.-A- 93,799 CNY 464,391 603,951 0.03SF Holdings Co. Ltd.-A- 182,900 CNY 1,872,991 1,916,517 0.09SG Micro Corp.-A- 9,300 CNY 217,541 363,789 0.02Shaanxi Coal Industry Co. Ltd.-A- 400,889 CNY 555,396 735,280 0.03Shandong Buchang Pharmaceuticals Co. Ltd.-A- 47,348 CNY 155,358 164,817 0.01Shandong Gold Mining Co. Ltd.-A- 144,766 CNY 478,713 430,656 0.02Shandong Gold Mining Co. Ltd.-H- 144A 430,250 HKD 967,761 761,235 0.03Shandong Hualu Hengsheng Chemical Co. Ltd.-A- 85,050 CNY 242,777 407,423 0.02Shandong Linglong Tyre Co. Ltd.-A- 57,000 CNY 256,333 385,890 0.02Shandong Nanshan Aluminum Co. Ltd.-A- 479,400 CNY 172,426 267,123 0.01Shandong Pharmaceutical Glass Co. Ltd.-A- 23,900 CNY 158,897 125,588 0.01Shandong Sinocera Functional Material Co. Ltd.-A- 40,005 CNY 165,532 301,856 0.01Shandong Sun Paper Industry JSC Ltd.-A- 109,100 CNY 189,286 225,432 0.01Shandong Weigao Group Medical Polymer Co.Ltd.-H- 1,657,887 HKD 2,361,850 3,868,335 0.18Shanghai Bailian Group Co. Ltd.-A- 64,400 CNY 206,278 200,850 0.01Shanghai Bairun Investment Holdings Group Co.Ltd.-A- 30,180 CNY 270,347 442,784 0.02Shanghai Baosight Software Co. Ltd.-A- 45,503 CNY 251,211 358,483 0.02Shanghai Construction Group Co. Ltd.-A- 370,600 CNY 178,134 158,316 0.01Shanghai Electric Group Co. Ltd.-A- 426,500 CNY 328,939 279,895 0.01Shanghai Fosun Pharmaceutical Group Co. Ltd.-A- 80,419 CNY 451,233 897,811 0.04Shanghai Fosun Pharmaceutical Group Co. Ltd.-H- 331,816 HKD 1,323,313 2,679,019 0.12Shanghai International Airport Co. Ltd.-A- 40,000 CNY 418,178 297,979 0.01Shanghai International Port Group Co. Ltd.-A- 384,900 CNY 301,640 284,169 0.01Shanghai Jahwa United Co. Ltd.-A- 27,600 CNY 139,924 256,911 0.01Shanghai Jinjiang International Hotels Co. Ltd.-A- 36,625 CNY 193,693 322,836 0.01Shanghai Lingang Holdings Corp. Ltd.-A- 64,800 CNY 177,067 179,531 0.01Shanghai Lujiazui Finance & Trade ZoneDevelopment Co. Ltd.-B- 736,008 USD 735,247 683,751 0.03Shanghai M&G Stationery Inc.-A- 37,100 CNY 310,099 485,567 0.02Shanghai Pharmaceuticals Holdings Co. Ltd.-A- 76,980 CNY 220,577 251,761 0.01Shanghai Pharmaceuticals Holdings Co. Ltd.-H- 522,195 HKD 1,053,143 1,140,432 0.05Shanghai Pudong Development Bank Co. Ltd.-A- 1,177,141 CNY 1,847,709 1,821,960 0.08Shanghai Putailai New Energy Technology Co.Ltd.-A- 27,806 CNY 301,732 587,895 0.03Shanghai RAAS Blood Products Co. Ltd.-A- 270,200 CNY 340,177 313,240 0.01
Xtrackers**
Xtrackers MSCI CHINA UCITS ETF (continued)
Statement of Investmentsas at 30 June 2021(expressed in USD)
** This includes synthetic ETFs.
The accompanying notes form an integral part of these financial statements.
268

Description QuantityCurrency
(local) Cost Market Value
% ofNet
Assets
Transferable securities and money market instruments admitted to an official stock exchange listing(A)
Shares (continued)
China (continued)Shanghai Yuyuan Tourist Mart Group Co. Ltd.-A- 134,400 CNY 163,001 241,098 0.01Shanghai Zhangjiang High-Tech Park DevelopmentCo. Ltd.-A- 64,600 CNY 156,336 182,676 0.01Shanxi Coking Coal Energy Group Co. Ltd.-A- 171,780 CNY 120,208 220,945 0.01Shanxi Lu’an Environmental Energy Development Co.Ltd.-A- 124,500 CNY 127,425 227,578 0.01Shanxi Meijin Energy Co. Ltd.-A- 171,900 CNY 188,416 201,144 0.01Shanxi Securities Co. Ltd.-A- 147,120 CNY 165,910 152,793 0.01Shanxi Taigang Stainless Steel Co. Ltd.-A- 234,400 CNY 127,757 271,738 0.01Shanxi Xinghuacun Fen Wine Factory Co. Ltd.-A- 34,930 CNY 763,192 2,422,071 0.11Shenergy Co. Ltd.-A- 195,200 CNY 159,087 185,506 0.01Shenghe Resources Holdings Co. Ltd.-A- 70,300 CNY 189,812 188,893 0.01Shengyi Technology Co. Ltd.-A- 95,200 CNY 339,208 344,944 0.02Shennan Circuits Co. Ltd.-A- 19,800 CNY 329,790 340,570 0.02Shenwan Hongyuan Group Co. Ltd.-A- 903,917 CNY 654,740 654,764 0.03Shenzhen Capchem Technology Co. Ltd.-A- 16,600 CNY 208,382 257,189 0.01Shenzhen Energy Group Co. Ltd.-A- 165,760 CNY 125,795 235,266 0.01Shenzhen Goodix Technology Co. Ltd.-A- 18,551 CNY 526,174 372,206 0.02Shenzhen Hepalink Pharmaceutical Group Co. Ltd.-A- 43,500 CNY 120,202 107,254 0.00Shenzhen Inovance Technology Co. Ltd.-A- 103,350 CNY 433,809 1,187,889 0.05Shenzhen Kaifa Technology Co. Ltd.-A- 61,100 CNY 194,461 181,006 0.01Shenzhen Kangtai Biological Products Co. Ltd.-A- 28,000 CNY 486,213 645,735 0.03Shenzhen Mindray Bio-Medical Electronics Co.Ltd.-A- 49,000 CNY 2,212,986 3,640,767 0.17Shenzhen MTC Co. Ltd.-A- 186,700 CNY 162,273 175,406 0.01Shenzhen Overseas Chinese Town Co. Ltd.-A- 338,984 CNY 347,823 390,357 0.02Shenzhen Salubris Pharmaceuticals Co. Ltd.-A- 43,400 CNY 153,334 221,002 0.01Shenzhen SC New Energy Technology Corp.-A- 13,700 CNY 224,952 245,995 0.01Shenzhen Sunlord Electronics Co. Ltd.-A- 32,300 CNY 162,750 193,824 0.01Shenzhen Sunway Communication Co. Ltd.-A- 40,000 CNY 245,361 191,182 0.01Shijiazhuang Yiling Pharmaceutical Co. Ltd.-A- 48,996 CNY 145,055 221,136 0.01Sichuan Chuantou Energy Co. Ltd.-A- 147,349 CNY 208,157 281,203 0.01Sichuan Kelun Pharmaceutical Co. Ltd.-A- 59,744 CNY 210,162 184,479 0.01Sichuan Road & Bridge Co. Ltd.-A- 191,700 CNY 226,431 186,037 0.01Sichuan Swellfun Co. Ltd.-A- 20,400 CNY 193,889 398,948 0.02Sinolink Securities Co. Ltd.-A- 124,700 CNY 230,052 244,928 0.01Sinoma Science & Technology Co. Ltd.-A- 69,900 CNY 202,966 283,133 0.01Sinopec Shanghai Petrochemical Co. Ltd.-A- 254,600 CNY 150,112 148,169 0.01Sinopharm Group Co. Ltd.-H- 897,219 HKD 2,975,848 2,668,833 0.12Sinotrans Ltd.-A- 181,800 CNY 111,959 142,101 0.01Skshu Paint Co. Ltd.-A- 15,260 CNY 227,986 415,698 0.02Songcheng Performance Development Co. Ltd.-A- 108,522 CNY 220,354 282,187 0.01SooChow Securities Co. Ltd.-A- 156,400 CNY 213,121 201,889 0.01Southwest Securities Co. Ltd.-A- 262,620 CNY 192,832 197,955 0.01Spring Airlines Co. Ltd.-A- 37,003 CNY 231,912 325,881 0.01Sungrow Power Supply Co. Ltd.-A- 58,500 CNY 451,843 1,041,815 0.05Suning.com Co. Ltd.-A- 367,607 CNY 544,443 318,058 0.01Sunwoda Electronic Co. Ltd.-A- 65,600 CNY 200,320 330,597 0.01
Xtrackers**
Xtrackers MSCI CHINA UCITS ETF (continued)
Statement of Investmentsas at 30 June 2021(expressed in USD)
** This includes synthetic ETFs.
The accompanying notes form an integral part of these financial statements.
269

Description QuantityCurrency
(local) Cost Market Value
% ofNet
Assets
Transferable securities and money market instruments admitted to an official stock exchange listing(A)
Shares (continued)
China (continued)Suofeiya Home Collection Co. Ltd.-A- 24,000 CNY 85,027 89,895 0.00Suzhou Dongshan Precision Manufacturing Co.Ltd.-A- 71,000 CNY 237,476 229,016 0.01Suzhou Gold Mantis Construction Decoration Co.Ltd.-A- 112,100 CNY 166,962 137,417 0.01Suzhou Maxwell Technologies Co. Ltd.-A- 4,100 CNY 223,405 288,549 0.01Tangshan Jidong Cement Co. Ltd.-A- 52,100 CNY 122,073 99,590 0.00TBEA Co. Ltd.-A- 154,471 CNY 173,831 307,228 0.01TCL Technology Group Corp.-A- 581,932 CNY 427,584 689,039 0.03Thunder Software Technology Co. Ltd.-A- 17,200 CNY 218,353 418,123 0.02Tianfeng Securities Co. Ltd.-A- 347,700 CNY 285,060 261,548 0.01Tianjin 712 Communication & Broadcasting Co.Ltd.-A- 32,100 CNY 154,159 179,359 0.01Tianjin Zhonghuan Semiconductor Co. Ltd.-A- 121,800 CNY 297,973 727,688 0.03Tianma Microelectronics Co. Ltd.-A- 103,034 CNY 223,422 226,135 0.01Tianshui Huatian Technology Co. Ltd.-A- 112,900 CNY 226,444 268,932 0.01Toly Bread Co. Ltd.-A- 38,060 CNY 212,379 183,795 0.01TongFu Microelectronics Co. Ltd.-A- 54,700 CNY 196,658 203,532 0.01Tonghua Dongbao Pharmaceutical Co. Ltd.-A- 83,864 CNY 178,026 154,985 0.01Tongkun Group Co. Ltd.-A- 91,800 CNY 237,990 342,287 0.02Tongling Nonferrous Metals Group Co. Ltd.-A- 438,067 CNY 147,898 184,425 0.01Tongwei Co. Ltd.-A- 183,635 CNY 576,284 1,229,852 0.06Topchoice Medical Corp.-A- 12,700 CNY 240,857 807,897 0.04Topsec Technologies Group Inc.-A- 48,300 CNY 167,725 147,797 0.01Transfar Zhilian Co. Ltd.-A- 136,500 CNY 128,563 162,891 0.01TravelSky Technology Ltd.-H- 623,441 HKD 1,497,447 1,345,490 0.06Tsingtao Brewery Co. Ltd.-A- 28,500 CNY 264,054 510,153 0.02Tsingtao Brewery Co. Ltd.-H- 354,497 HKD 2,732,163 3,816,189 0.18Unigroup Guoxin Microelectronics Co. Ltd.-A- 24,700 CNY 273,600 589,472 0.03Unisplendour Corp. Ltd.-A- 118,542 CNY 397,072 401,449 0.02Universal Scientific Industrial Shanghai Co. Ltd.-A- 60,400 CNY 163,641 157,150 0.01Venus MedTech Hangzhou Inc.-H- 144A 144,500 HKD 1,337,069 1,204,810 0.06Walvax Biotechnology Co. Ltd.-A- 62,000 CNY 328,153 592,089 0.03Wangfujing Group Co. Ltd.-A- 32,100 CNY 167,226 143,487 0.01Wanhua Chemical Group Co. Ltd.-A- 126,000 CNY 1,166,032 2,122,216 0.10Weichai Power Co. Ltd.-A- 273,790 CNY 582,761 757,273 0.03Weichai Power Co. Ltd.-H- 1,298,611 HKD 2,230,869 2,886,230 0.13Weifu High-Technology Group Co. Ltd.-A- 41,000 CNY 127,230 132,185 0.01Weihai Guangwei Composites Co. Ltd.-A- 20,700 CNY 176,366 243,337 0.01Wens Foodstuffs Group Co. Ltd.-A- 255,680 CNY 978,817 568,675 0.03Western Securities Co. Ltd.-A- 179,484 CNY 253,681 229,187 0.01Will Semiconductor Co. Ltd.-A- 34,800 CNY 967,797 1,734,385 0.08Wingtech Technology Co. Ltd.-A- 50,200 CNY 890,868 752,901 0.03Winning Health Technology Group Co. Ltd.-A- 88,401 CNY 190,976 222,615 0.01Wuchan Zhongda Group Co. Ltd.-A- 209,800 CNY 151,988 255,559 0.01Wuhan Guide Infrared Co. Ltd.-A- 94,107 CNY 221,642 401,723 0.02Wuhu Sanqi Interactive Entertainment NetworkTechnology Group Co. Ltd.-A- 87,434 CNY 313,201 325,060 0.01
Xtrackers**
Xtrackers MSCI CHINA UCITS ETF (continued)
Statement of Investmentsas at 30 June 2021(expressed in USD)
** This includes synthetic ETFs.
The accompanying notes form an integral part of these financial statements.
270

Description QuantityCurrency
(local) Cost Market Value
% ofNet
Assets
Transferable securities and money market instruments admitted to an official stock exchange listing(A)
Shares (continued)
China (continued)Wuhu Token Science Co. Ltd.-A- 101,300 CNY 136,610 129,509 0.01Wuliangye Yibin Co. Ltd.-A- 155,829 CNY 3,963,969 7,184,798 0.33WUS Printed Circuit Kunshan Co. Ltd.-A- 68,300 CNY 211,336 163,539 0.01WuXi AppTec Co. Ltd.-A- 102,684 CNY 1,071,005 2,488,726 0.11WuXi AppTec Co. Ltd.-H- 144A 227,423 HKD 2,330,017 5,309,372 0.24Wuxi Lead Intelligent Equipment Co. Ltd.-A- 29,140 CNY 125,119 271,246 0.01Wuxi Shangji Automation Co. Ltd.-A- 10,900 CNY 254,187 301,904 0.01XCMG Construction Machinery Co. Ltd.-A- 312,400 CNY 228,526 308,007 0.01Xiamen C & D Inc.-A- 117,400 CNY 148,428 147,185 0.01Xiamen Intretech Inc.-A- 26,260 CNY 128,808 158,149 0.01Xiamen Tungsten Co. Ltd.-A- 58,203 CNY 114,517 187,648 0.01Xinjiang Goldwind Science & Technology Co. Ltd.-A- 143,967 CNY 249,531 270,961 0.01Xinjiang Goldwind Science & Technology Co. Ltd.-H- 517,093 HKD 668,149 808,348 0.04Yango Group Co. Ltd.-A- 173,400 CNY 178,770 139,561 0.01Yantai Eddie Precision Machinery Co. Ltd.-A- 33,540 CNY 199,119 222,550 0.01Yantai Jereh Oilfield Services Group Co. Ltd.-A- 39,700 CNY 184,452 274,668 0.01Yanzhou Coal Mining Co. Ltd.-A- 103,500 CNY 151,874 246,060 0.01Yanzhou Coal Mining Co. Ltd.-H- 1,020,876 HKD 909,970 1,372,412 0.06Yealink Network Technology Corp. Ltd.-A- 36,150 CNY 325,116 468,881 0.02Yifan Pharmaceutical Co. Ltd.-A- 52,300 CNY 148,319 139,637 0.01Yifeng Pharmacy Chain Co. Ltd.-A- 27,527 CNY 241,107 238,976 0.01Yihai Kerry Arawana Holdings Co. Ltd.-A- 51,000 CNY 717,536 670,649 0.03Yintai Gold Co. Ltd.-A- 115,320 CNY 161,033 169,744 0.01Yixintang Pharmaceutical Group Co. Ltd.-A- 24,000 CNY 143,454 122,993 0.01Yonghui Superstores Co. Ltd.-A- 395,068 CNY 492,905 289,230 0.01Yonyou Network Technology Co. Ltd.-A- 131,135 CNY 599,506 675,074 0.03Youngor Group Co. Ltd.-A- 193,174 CNY 183,003 197,035 0.01YTO Express Group Co. Ltd.-A- 130,900 CNY 256,112 202,808 0.01Yuan Longping High-tech Agriculture Co. Ltd.-A- 54,100 CNY 130,280 134,311 0.01Yunda Holdings Co. Ltd.-A- 119,950 CNY 390,132 251,193 0.01Yunnan Aluminium Co. Ltd.-A- 125,500 CNY 264,677 231,154 0.01Yunnan Baiyao Group Co. Ltd.-A- 51,400 CNY 719,289 920,623 0.04Yunnan Energy New Material Co. Ltd.-A- 35,800 CNY 369,602 1,297,164 0.06Yutong Bus Co. Ltd.-A- 94,900 CNY 211,106 183,459 0.01Zhangzhou Pientzehuang Pharmaceutical Co. Ltd.-A- 24,300 CNY 624,342 1,686,108 0.08Zhaojin Mining Industry Co. Ltd.-H- 696,916 HKD 764,162 662,289 0.03Zhefu Holdings Group Co. Ltd.-A- 215,600 CNY 177,598 166,517 0.01Zhejiang Century Huatong Group Co. Ltd.-A- 310,020 CNY 450,392 308,060 0.01Zhejiang China Commodities City Group Co. Ltd.-A- 220,300 CNY 180,014 175,603 0.01Zhejiang Chint Electrics Co. Ltd.-A- 86,401 CNY 343,120 446,391 0.02Zhejiang Dahua Technology Co. Ltd.-A- 120,300 CNY 328,062 392,879 0.02Zhejiang Dingli Machinery Co. Ltd.-A- 21,966 CNY 236,617 199,538 0.01Zhejiang Expressway Co. Ltd.-H- 953,912 HKD 807,252 848,784 0.04Zhejiang HangKe Technology Inc. Co.-A- 15,835 CNY 202,031 208,328 0.01Zhejiang Huafeng Spandex Co. Ltd.-A- 186,000 CNY 381,883 408,801 0.02Zhejiang Huahai Pharmaceutical Co. Ltd.-A- 60,390 CNY 203,844 195,167 0.01Zhejiang Huayou Cobalt Co. Ltd.-A- 48,908 CNY 311,002 864,483 0.04
Xtrackers**
Xtrackers MSCI CHINA UCITS ETF (continued)
Statement of Investmentsas at 30 June 2021(expressed in USD)
** This includes synthetic ETFs.
The accompanying notes form an integral part of these financial statements.
271
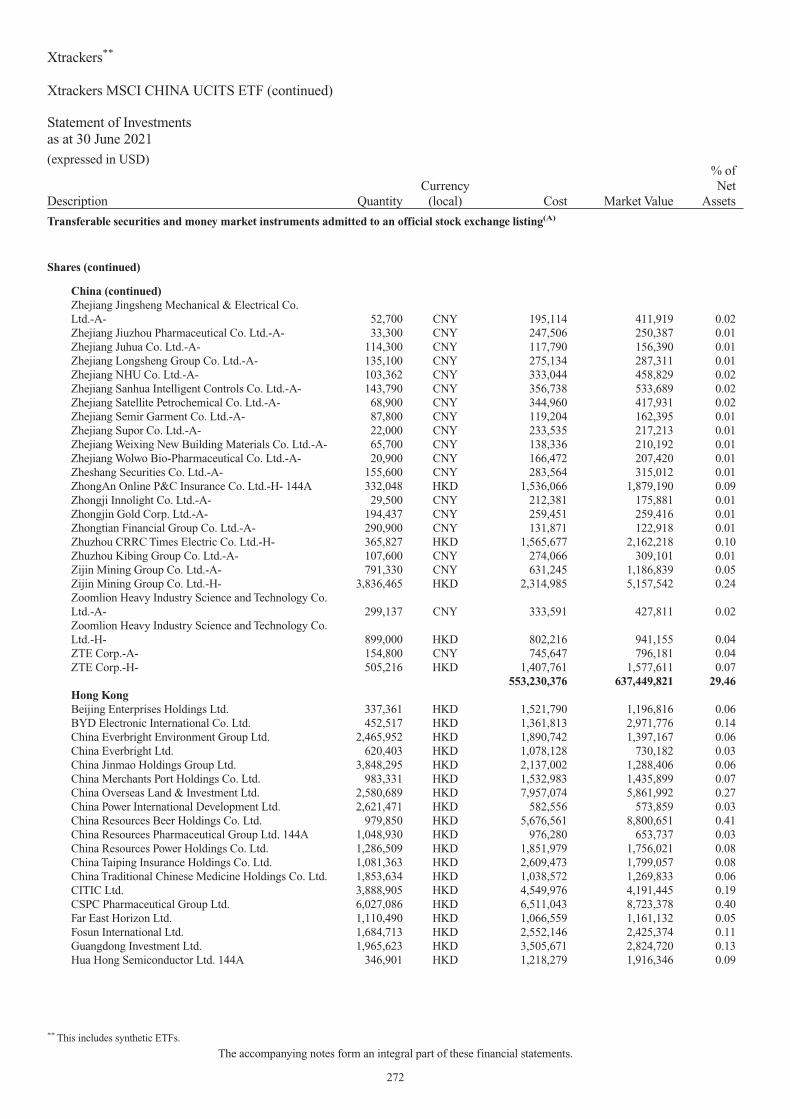
Description QuantityCurrency
(local) Cost Market Value
% ofNet
Assets
Transferable securities and money market instruments admitted to an official stock exchange listing(A)
Shares (continued)
China (continued)Zhejiang Jingsheng Mechanical & Electrical Co.Ltd.-A- 52,700 CNY 195,114 411,919 0.02Zhejiang Jiuzhou Pharmaceutical Co. Ltd.-A- 33,300 CNY 247,506 250,387 0.01Zhejiang Juhua Co. Ltd.-A- 114,300 CNY 117,790 156,390 0.01Zhejiang Longsheng Group Co. Ltd.-A- 135,100 CNY 275,134 287,311 0.01Zhejiang NHU Co. Ltd.-A- 103,362 CNY 333,044 458,829 0.02Zhejiang Sanhua Intelligent Controls Co. Ltd.-A- 143,790 CNY 356,738 533,689 0.02Zhejiang Satellite Petrochemical Co. Ltd.-A- 68,900 CNY 344,960 417,931 0.02Zhejiang Semir Garment Co. Ltd.-A- 87,800 CNY 119,204 162,395 0.01Zhejiang Supor Co. Ltd.-A- 22,000 CNY 233,535 217,213 0.01Zhejiang Weixing New Building Materials Co. Ltd.-A- 65,700 CNY 138,336 210,192 0.01Zhejiang Wolwo Bio-Pharmaceutical Co. Ltd.-A- 20,900 CNY 166,472 207,420 0.01Zheshang Securities Co. Ltd.-A- 155,600 CNY 283,564 315,012 0.01ZhongAn Online P&C Insurance Co. Ltd.-H- 144A 332,048 HKD 1,536,066 1,879,190 0.09Zhongji Innolight Co. Ltd.-A- 29,500 CNY 212,381 175,881 0.01Zhongjin Gold Corp. Ltd.-A- 194,437 CNY 259,451 259,416 0.01Zhongtian Financial Group Co. Ltd.-A- 290,900 CNY 131,871 122,918 0.01Zhuzhou CRRC Times Electric Co. Ltd.-H- 365,827 HKD 1,565,677 2,162,218 0.10Zhuzhou Kibing Group Co. Ltd.-A- 107,600 CNY 274,066 309,101 0.01Zijin Mining Group Co. Ltd.-A- 791,330 CNY 631,245 1,186,839 0.05Zijin Mining Group Co. Ltd.-H- 3,836,465 HKD 2,314,985 5,157,542 0.24Zoomlion Heavy Industry Science and Technology Co.Ltd.-A- 299,137 CNY 333,591 427,811 0.02Zoomlion Heavy Industry Science and Technology Co.Ltd.-H- 899,000 HKD 802,216 941,155 0.04ZTE Corp.-A- 154,800 CNY 745,647 796,181 0.04ZTE Corp.-H- 505,216 HKD 1,407,761 1,577,611 0.07
553,230,376 637,449,821 29.46Hong KongBeijing Enterprises Holdings Ltd. 337,361 HKD 1,521,790 1,196,816 0.06BYD Electronic International Co. Ltd. 452,517 HKD 1,361,813 2,971,776 0.14China Everbright Environment Group Ltd. 2,465,952 HKD 1,890,742 1,397,167 0.06China Everbright Ltd. 620,403 HKD 1,078,128 730,182 0.03China Jinmao Holdings Group Ltd. 3,848,295 HKD 2,137,002 1,288,406 0.06China Merchants Port Holdings Co. Ltd. 983,331 HKD 1,532,983 1,435,899 0.07China Overseas Land & Investment Ltd. 2,580,689 HKD 7,957,074 5,861,992 0.27China Power International Development Ltd. 2,621,471 HKD 582,556 573,859 0.03China Resources Beer Holdings Co. Ltd. 979,850 HKD 5,676,561 8,800,651 0.41China Resources Pharmaceutical Group Ltd. 144A 1,048,930 HKD 976,280 653,737 0.03China Resources Power Holdings Co. Ltd. 1,286,509 HKD 1,851,979 1,756,021 0.08China Taiping Insurance Holdings Co. Ltd. 1,081,363 HKD 2,609,473 1,799,057 0.08China Traditional Chinese Medicine Holdings Co. Ltd. 1,853,634 HKD 1,038,572 1,269,833 0.06CITIC Ltd. 3,888,905 HKD 4,549,976 4,191,445 0.19CSPC Pharmaceutical Group Ltd. 6,027,086 HKD 6,511,043 8,723,378 0.40Far East Horizon Ltd. 1,110,490 HKD 1,066,559 1,161,132 0.05Fosun International Ltd. 1,684,713 HKD 2,552,146 2,425,374 0.11Guangdong Investment Ltd. 1,965,623 HKD 3,505,671 2,824,720 0.13Hua Hong Semiconductor Ltd. 144A 346,901 HKD 1,218,279 1,916,346 0.09
Xtrackers**
Xtrackers MSCI CHINA UCITS ETF (continued)
Statement of Investmentsas at 30 June 2021(expressed in USD)
** This includes synthetic ETFs.
The accompanying notes form an integral part of these financial statements.
272

Description QuantityCurrency
(local) Cost Market Value
% ofNet
Assets
Transferable securities and money market instruments admitted to an official stock exchange listing(A)
Shares (continued)
Hong Kong (continued)Lenovo Group Ltd. 4,824,772 HKD 3,463,054 5,548,036 0.26MMG Ltd. 2,076,000 HKD 1,176,430 914,249 0.04Shenzhen Investment Ltd. 1,787,301 HKD 632,075 550,056 0.03Sinotruk Hong Kong Ltd. 461,668 HKD 925,442 989,223 0.05Sun Art Retail Group Ltd. 1,275,767 HKD 1,451,830 949,533 0.04Wharf Holdings Ltd. 919,000 HKD 2,060,891 3,502,823 0.16Yuexiu Property Co. Ltd. 922,649 HKD 952,234 971,854 0.05Yuexiu Property Co. Ltd. 8,400 HKD 8,938 8,956 0.00
60,289,521 64,412,521 2.98SingaporeBOC Aviation Ltd. 144A 139,005 HKD 1,075,203 1,172,419 0.05
1,075,203 1,172,419 0.05United StatesYum China Holdings Inc. 281,655 USD 13,585,110 18,659,644 0.86
13,585,110 18,659,644 0.86
Total - Shares 1,773,178,500 2,163,163,904 99.96
Total Transferable securities and money market instruments admitted to an officialstock exchange listing 1,773,178,500 2,163,163,904 99.96
Other transferable securities and money market instruments(A)
Shares
Hong KongChina Com Rich Rene Ene Invest(1)(2) 3,746,600 HKD 1,499,752 5 0.00Huishan Dairy(1) 604,445 HKD 170,368 8 0.00
1,670,120 13 0.00
Total - Shares 1,670,120 13 0.00
Total Other transferable securities and money market instruments 1,670,120 13 0.00
TOTAL INVESTMENT PORTFOLIO 1,774,848,620 2,163,163,917 99.96(A) Any duplicate securities appearing herein with the same name are either quoted on different stock exchanges or have different ISINs.
(1) The security is fair valued.(2) This security was added to the portfolio as a result of share swap between companies with the same parent company.
Xtrackers**
Xtrackers MSCI CHINA UCITS ETF (continued)
Statement of Investmentsas at 30 June 2021(expressed in USD)
** This includes synthetic ETFs.
The accompanying notes form an integral part of these financial statements.
273

Description QuantityCurrency
(local) Cost Market Value
% ofNet
Assets
Transferable securities and money market instruments admitted to an official stock exchange listing
Shares
BelgiumAgeas SA 2,395 EUR 145,710 132,923 0.17Groupe Bruxelles Lambert SA 1,291 EUR 139,374 144,434 0.18KBC Group NV 47,668 EUR 3,940,061 3,634,848 4.50Proximus SADP 1,737 EUR 37,400 33,556 0.04Telenet Group Holdings NV 8,033 EUR 331,425 302,366 0.37
4,593,970 4,248,127 5.26Cayman IslandsAlibaba Group Holdings Ltd.-ADR- 503 USD 86,093 114,070 0.14
86,093 114,070 0.14FinlandNokia OYJ 596,713 EUR 3,126,523 3,195,359 3.95
3,126,523 3,195,359 3.95Germanyadidas AG 18,453 EUR 6,795,121 6,869,207 8.50BASF SE 42,759 EUR 3,569,319 3,369,034 4.17Bayer AG 112,016 EUR 7,105,718 6,802,728 8.42Commerzbank AG 16,082 EUR 124,068 114,087 0.14Deutsche Post AG 54,338 EUR 3,709,332 3,696,248 4.57Fresenius SE & Co. KGaA 86,232 EUR 4,695,541 4,499,042 5.57Hannover Rueck SE 786 EUR 139,254 131,522 0.16HeidelbergCement AG 35,810 EUR 3,292,279 3,072,070 3.80HUGO BOSS AG 2,793 EUR 139,343 151,965 0.19Infineon Technologies AG 3,285 EUR 133,012 131,752 0.16Muenchener Rueckversicherungs-Gesellschaft AG 12,000 EUR 3,482,359 3,286,605 4.07Porsche Automobil Holdings SE-Pref- 28,500 EUR 3,279,632 3,054,002 3.78RWE AG 94,000 EUR 3,573,073 3,406,665 4.21SAP SE 44,857 EUR 6,327,873 6,321,806 7.82Siemens AG 205 EUR 33,771 32,484 0.04TAG Immobilien AG 98,349 EUR 3,120,738 3,121,076 3.86Volkswagen AG-Pref- 12,892 EUR 3,603,459 3,228,959 4.00
53,123,892 51,289,252 63.46NetherlandsAkzo Nobel NV 2,345 EUR 285,884 289,774 0.36ASML Holdings NV 2,267 EUR 1,481,587 1,557,680 1.93ING Groep NV 293,773 EUR 3,988,785 3,881,015 4.80JDE Peet’s NV 6,997 EUR 278,225 253,911 0.31Koninklijke Ahold Delhaize NV 2,000 EUR 55,444 59,461 0.07Koninklijke KPN NV 16,825 EUR 55,456 52,556 0.07Koninklijke Philips NV 70,792 EUR 3,913,520 3,508,365 4.34Signify NV 144A 1,102 EUR 67,384 69,708 0.09Wolters Kluwer NV 3,126 EUR 285,805 314,068 0.39
10,412,090 9,986,538 12.36NorwayNorsk Hydro ASA 11,073 NOK 67,348 70,696 0.09Orkla ASA 27,744 NOK 286,312 282,753 0.35
353,660 353,449 0.44
Xtrackers**
Xtrackers MSCI INDIA SWAP UCITS ETF*
Statement of Investmentsas at 30 June 2021(expressed in USD)
* This is a synthetic ETF.** This includes synthetic ETFs.
The accompanying notes form an integral part of these financial statements.
274

Description QuantityCurrency
(local) Cost Market Value
% ofNet
Assets
Transferable securities and money market instruments admitted to an official stock exchange listing
Shares (continued)
SwedenSvenska Handelsbanken AB-A- 4,819 SEK 55,298 54,410 0.07
55,298 54,410 0.07SwitzerlandUBS Group AG 21,622 CHF 335,994 331,225 0.41
335,994 331,225 0.41United KingdomAstraZeneca PLC-ADR- 1,323 USD 74,538 79,248 0.10Royal Dutch Shell PLC-A- 1 EUR 20 20 0.00Royal Dutch Shell PLC-B--ADR- 1,997 USD 74,508 77,543 0.09
149,066 156,811 0.19United StatesAdobe Inc. 726 USD 294,808 425,175 0.53Alphabet Inc.-A- 109 USD 143,925 266,155 0.33Amazon.com Inc. 68 USD 156,563 233,931 0.29Apple Inc. 23,822 USD 3,021,186 3,262,661 4.04Berkshire Hathaway Inc.-B- 154 USD 38,985 42,800 0.05Boeing Co. 1,404 USD 285,231 336,342 0.42Booking Holdings Inc. 62 USD 147,742 135,662 0.17Chevron Corp. 1,192 USD 129,606 124,850 0.15Citigroup Inc. 2,045 USD 147,915 144,684 0.18CVS Health Corp. 1,634 USD 141,210 136,341 0.17Exxon Mobil Corp. 2,087 USD 129,665 131,648 0.16Facebook Inc.-A- 850 USD 173,322 295,553 0.36Fiserv Inc. 688 USD 78,989 73,540 0.09Intel Corp. 53,088 USD 3,021,218 2,980,360 3.69Johnson & Johnson 16,933 USD 2,879,965 2,789,542 3.45Micron Technology Inc. 2,811 USD 227,972 238,879 0.29Microsoft Corp. 566 USD 141,110 153,329 0.19Netflix Inc. 177 USD 73,503 93,493 0.11NIKE Inc.-B- 867 USD 112,961 133,943 0.17NVIDIA Corp. 149 USD 113,425 119,215 0.15PayPal Holdings Inc. 543 USD 85,550 158,274 0.20Pfizer Inc. 3,654 USD 141,227 143,091 0.18Procter & Gamble Co. 1,099 USD 147,860 148,288 0.18QUALCOMM Inc. 833 USD 112,938 119,061 0.15Regeneron Pharmaceuticals Inc. 290 USD 133,493 161,977 0.20Roku Inc. 931 USD 395,740 427,562 0.53salesforce.com Inc. 911 USD 217,210 222,530 0.27Uber Technologies Inc. 1,560 USD 78,967 78,187 0.10Walmart Inc. 525 USD 74,508 74,035 0.09Walt Disney Co. 457 USD 79,011 80,327 0.10
Xtrackers**
Xtrackers MSCI INDIA SWAP UCITS ETF* (continued)
Statement of Investmentsas at 30 June 2021(expressed in USD)
* This is a synthetic ETF.** This includes synthetic ETFs.
The accompanying notes form an integral part of these financial statements.
275

Description QuantityCurrency
(local) Cost Market Value
% ofNet
Assets
Transferable securities and money market instruments admitted to an official stock exchange listing
Shares (continued)
United States (continued)Wells Fargo & Co. 2,452 USD 113,724 111,051 0.14Zoom Video Communications Inc.-A- 543 USD 227,837 210,157 0.26
13,267,366 14,052,643 17.39
Total - Shares 85,503,952 83,781,884 103.67
Total Transferable securities and money market instruments admitted to an officialstock exchange listing 85,503,952 83,781,884 103.67
TOTAL INVESTMENT PORTFOLIO 85,503,952 83,781,884 103.67
Xtrackers**
Xtrackers MSCI INDIA SWAP UCITS ETF* (continued)
Statement of Investmentsas at 30 June 2021(expressed in USD)
* This is a synthetic ETF.** This includes synthetic ETFs.
The accompanying notes form an integral part of these financial statements.
276

Description QuantityCurrency
(local) Cost Market Value
% ofNet
Assets
Transferable securities and money market instruments admitted to an official stock exchange listing
Shares
MalaysiaAMMB Holdings Bhd 681,748 MYR 557,731 484,441 1.22Axiata Group Bhd 1,029,639 MYR 1,004,843 927,580 2.33CIMB Group Holdings Bhd 2,413,447 MYR 2,606,893 2,679,993 6.74Dialog Group Bhd 1,479,106 MYR 1,117,005 1,029,656 2.59DiGi.Com Bhd 1,164,049 MYR 1,240,836 1,158,021 2.91Fraser & Neave Holdings Bhd 47,995 MYR 354,763 305,207 0.77Genting Bhd 798,052 MYR 1,075,610 947,705 2.38Genting Malaysia Bhd 1,111,109 MYR 834,882 741,364 1.86HAP Seng Consolidated Bhd 233,080 MYR 488,505 437,920 1.10Hartalega Holdings Bhd 641,324 MYR 1,340,786 1,135,428 2.86Hong Leong Bank Bhd 243,275 MYR 1,062,143 1,096,979 2.76Hong Leong Financial Group Bhd 85,810 MYR 366,315 367,920 0.93IHH Healthcare Bhd 656,579 MYR 864,996 865,106 2.18IOI Corp. Bhd 941,106 MYR 964,486 852,357 2.14Kossan Rubber Industries 478,500 MYR 661,922 371,136 0.93Kuala Lumpur Kepong Bhd 161,738 MYR 896,842 793,204 1.99Malayan Banking Bhd 1,494,813 MYR 3,096,338 2,920,133 7.34Malaysia Airports Holdings Bhd 403,432 MYR 612,694 583,064 1.47Maxis Bhd 878,122 MYR 1,072,683 928,569 2.34MISC Bhd 501,332 MYR 855,095 818,748 2.06Nestle Malaysia Bhd 26,330 MYR 883,697 845,427 2.13Petronas Chemicals Group Bhd 898,072 MYR 1,737,485 1,743,577 4.39Petronas Dagangan Bhd 111,529 MYR 575,179 499,684 1.26Petronas Gas Bhd 296,181 MYR 1,190,881 1,105,818 2.78PPB Group Bhd 239,635 MYR 1,053,055 1,056,322 2.66Press Metal Aluminium Holdings Bhd 1,208,600 MYR 1,245,069 1,391,571 3.50Public Bank Bhd 5,447,770 MYR 5,608,798 5,393,312 13.57QL Resources Bhd 410,009 MYR 565,066 558,003 1.40RHB Bank Bhd 664,138 MYR 857,535 863,867 2.17Sime Darby Bhd 1,018,801 MYR 563,961 534,984 1.35Sime Darby Plantation Bhd 643,724 MYR 736,052 617,131 1.55Supermax Corp. Bhd 559,900 MYR 981,736 445,061 1.12Telekom Malaysia Bhd 423,773 MYR 526,892 619,608 1.56Tenaga Nasional Bhd 853,809 MYR 2,313,952 2,013,439 5.06Top Glove Corp. Bhd 1,995,009 MYR 2,074,175 2,003,899 5.04Westports Holdings Bhd 382,406 MYR 378,995 387,795 0.98
42,367,896 39,524,029 99.42
Total - Shares 42,367,896 39,524,029 99.42
Total Transferable securities and money market instruments admitted to an officialstock exchange listing 42,367,896 39,524,029 99.42
TOTAL INVESTMENT PORTFOLIO 42,367,896 39,524,029 99.42
Xtrackers**
Xtrackers MSCI MALAYSIA UCITS ETF
Statement of Investmentsas at 30 June 2021(expressed in USD)
** This includes synthetic ETFs.
The accompanying notes form an integral part of these financial statements.
277

Description QuantityCurrency
(local) Cost Market Value
% ofNet
Assets
Transferable securities and money market instruments admitted to an official stock exchange listing
Shares
ThailandAdvanced Info Service PCL-NVDR- 595,214 THB 3,477,844 3,175,713 4.61Airports of Thailand PCL-NVDR- 2,144,619 THB 4,309,446 4,148,717 6.02Asset World Corp. PCL-NVDR- 4,003,500 THB 611,648 542,128 0.79B Grimm Power PCL-NVDR- 391,300 THB 604,883 512,780 0.74Bangkok Bank PCL 286,571 THB 1,222,409 1,010,375 1.47Bangkok Commercial Asset ManagementPCL-NVDR- 891,200 THB 638,299 517,202 0.75Bangkok Dusit Medical Services PCL-NVDR- 4,771,528 THB 3,382,295 3,424,185 4.97Bangkok Expressway & Metro PCL-NVDR- 3,822,614 THB 1,048,372 972,053 1.41Berli Jucker PCL-NVDR- 602,293 THB 783,193 653,032 0.95BTS Group Holdings PCL-NVDR- 3,951,908 THB 1,260,139 1,152,897 1.67Bumrungrad Hospital PCL-NVDR- 238,622 THB 1,051,459 956,722 1.39Carabao Group PCL-NVDR- 150,000 THB 614,719 662,246 0.96Central Pattana PCL-NVDR- 1,010,712 THB 1,812,018 1,655,612 2.40Central Retail Corp. PCL-NVDR- 887,158 THB 947,518 927,295 1.35Charoen Pokphand Foods PCL-NVDR- 1,939,200 THB 1,709,024 1,603,395 2.33CP ALL PCL-NVDR- 2,921,525 THB 6,247,046 5,469,314 7.94Delta Electronics Thailand PCL-NVDR- 156,100 THB 1,604,755 2,815,158 4.08Electricity Generating PCL-NVDR- 131,652 THB 936,451 718,849 1.04Energy Absolute PCL-NVDR- 746,579 THB 1,187,249 1,420,946 2.06Global Power Synergy PCL-NVDR- 352,400 THB 847,976 802,658 1.16Gulf Energy Development PCL-NVDR- 1,467,906 THB 1,459,165 1,568,667 2.28Home Product Center PCL-NVDR- 2,961,147 THB 1,350,383 1,330,437 1.93Indorama Ventures PCL-NVDR- 842,377 THB 1,025,628 1,071,041 1.55Intouch Holdings PCL-NVDR- 962,423 THB 1,750,713 1,951,872 2.83Krung Thai Bank PCL-NVDR- 1,748,018 THB 737,724 583,582 0.85Krungthai Card PCL-NVDR- 451,600 THB 831,039 944,062 1.37Land & Houses PCL-NVDR- 4,184,534 THB 1,164,230 1,037,973 1.51Minor International PCL-NVDR- 1,559,123 THB 1,433,159 1,459,398 2.12Muangthai Capital PCL-NVDR- 371,500 THB 685,124 666,498 0.97Osotspa PCL-NVDR- 600,400 THB 713,916 707,179 1.03PTT Exploration & Production PCL-NVDR- 695,196 THB 2,335,229 2,537,845 3.68PTT Global Chemical PCL-NVDR- 1,128,007 THB 2,090,517 2,076,518 3.01PTT Oil & Retail Business PCL-NVDR- 1,501,400 THB 1,488,108 1,428,789 2.07PTT PCL-NVDR- 5,002,554 THB 6,416,715 6,126,373 8.89Ratch Group PCL-NVDR- 399,021 THB 713,916 569,585 0.83Robinson PCL(1) 11,200 THB 23,905 20,268 0.03SCG Packaging PCL-NVDR- 644,400 THB 1,144,919 1,246,577 1.81Siam Cement PCL-NVDR- 390,279 THB 4,903,123 5,260,547 7.63Siam Commercial Bank PCL-NVDR- 425,100 THB 1,389,265 1,299,838 1.89Sri Trang Gloves Thailand PCL-NVDR- 499,700 THB 654,308 650,935 0.94Srisawad Corp. PCL-NVDR- 378,300 THB 811,979 811,486 1.18Thai Oil PCL-NVDR- 561,611 THB 1,031,666 955,002 1.39
(1) The security is fair valued.
Xtrackers**
Xtrackers MSCI THAILAND UCITS ETF
Statement of Investmentsas at 30 June 2021(expressed in USD)
** This includes synthetic ETFs.
The accompanying notes form an integral part of these financial statements.
278

Description QuantityCurrency
(local) Cost Market Value
% ofNet
Assets
Transferable securities and money market instruments admitted to an official stock exchange listing
Shares (continued)
Thailand (continued)Thai Union Group PCL-NVDR- 1,432,031 THB 694,985 884,687 1.28True Corp. PCL-NVDR- 5,840,606 THB 722,340 579,505 0.84
69,868,799 68,909,941 100.00
Total - Shares 69,868,799 68,909,941 100.00
Warrants
ThailandMinor International PCL-Warrants- 05.05.23 1 THB — — 0.00
— — 0.00
Total - Warrants — — 0.00
Total Transferable securities and money market instruments admitted to an officialstock exchange listing 69,868,799 68,909,941 100.00
TOTAL INVESTMENT PORTFOLIO 69,868,799 68,909,941 100.00
Xtrackers**
Xtrackers MSCI THAILAND UCITS ETF (continued)
Statement of Investmentsas at 30 June 2021(expressed in USD)
** This includes synthetic ETFs.
The accompanying notes form an integral part of these financial statements.
279

Description QuantityCurrency
(local) Cost Market Value
% ofNet
Assets
Transferable securities and money market instruments admitted to an official stock exchange listing
Shares
PhilippinesAboitiz Equity Ventures Inc. 906,061 PHP 1,063,985 782,351 2.69AC Energy Corp. 2,970,068 PHP 331,141 501,958 1.73AllHome Corp. 604,900 PHP 69,272 97,894 0.34Alliance Global Group Inc. 1,335,803 PHP 364,443 278,024 0.96Ayala Corp. 129,848 PHP 2,150,360 2,128,002 7.33Ayala Land Inc. 3,726,283 PHP 2,877,889 2,751,869 9.48Bank of the Philippine Islands 830,352 PHP 1,458,136 1,508,803 5.20BDO Unibank Inc. 907,460 PHP 2,108,115 2,104,363 7.25Bloomberry Resorts Corp. 1,764,003 PHP 283,819 235,249 0.81Cebu Air Inc. 96,892 PHP 151,659 107,581 0.37Century Pacific Food Inc. 570,100 PHP 274,513 273,284 0.94Cosco Capital Inc. 829,278 PHP 118,231 90,717 0.31D&L Industries Inc. 986,152 PHP 179,731 165,049 0.57DMCI Holdings Inc. 1,832,100 PHP 148,569 236,073 0.81DoubleDragon Properties Corp. 327,645 PHP 173,581 81,215 0.28Filinvest Land Inc. 3,915,291 PHP 118,328 88,227 0.30First Gen Corp. 248,603 PHP 117,675 152,783 0.53Globe Telecom Inc. 12,279 PHP 483,623 462,836 1.59GT Capital Holdings Inc. 44,566 PHP 836,051 554,165 1.91International Container Terminal Services Inc. 469,808 PHP 1,012,488 1,575,491 5.42JG Summit Holdings Inc. 1,383,714 PHP 1,757,193 1,761,709 6.07Jollibee Foods Corp. 203,841 PHP 923,650 891,948 3.07Manila Electric Co. 103,623 PHP 659,476 588,432 2.03Manila Water Co. Inc. 475,202 PHP 233,852 178,146 0.61Megaworld Corp. 5,129,321 PHP 463,239 339,398 1.17Metro Pacific Investments Corp. 5,639,071 PHP 562,755 449,370 1.55Metropolitan Bank & Trust Co. 827,475 PHP 1,024,451 825,526 2.84PLDT Inc. 34,784 PHP 1,194,012 921,350 3.17Puregold Price Club Inc. 464,090 PHP 422,051 385,038 1.33Robinsons Land Corp. 955,138 PHP 426,430 338,109 1.16Robinsons Retail Holdings Inc. 214,380 PHP 226,566 235,833 0.81Security Bank Corp. 208,024 PHP 629,496 502,854 1.73Semirara Mining & Power Corp. 391,900 PHP 153,077 118,337 0.41SM Investments Corp. 110,799 PHP 1,829,997 2,268,639 7.81SM Prime Holdings Inc. 4,648,736 PHP 2,967,377 3,475,957 11.97Universal Robina Corp. 405,566 PHP 1,264,611 1,200,538 4.13Vista Land & Lifescapes Inc. 1,463,384 PHP 164,762 113,917 0.39Wilcon Depot Inc. 659,900 PHP 173,588 272,395 0.94
29,398,192 29,043,430 100.01
Total - Shares 29,398,192 29,043,430 100.01
Total Transferable securities and money market instruments admitted to an officialstock exchange listing 29,398,192 29,043,430 100.01
TOTAL INVESTMENT PORTFOLIO 29,398,192 29,043,430 100.01
Xtrackers**
Xtrackers MSCI PHILIPPINES UCITS ETF
Statement of Investmentsas at 30 June 2021(expressed in USD)
** This includes synthetic ETFs.
The accompanying notes form an integral part of these financial statements.
280

Description QuantityCurrency
(local) Cost Market Value
% ofNet
Assets
Transferable securities and money market instruments admitted to an official stock exchange listing
Shares
ArgentinaPampa Energia SA-ADR- 25,000 USD 375,250 379,250 0.97
375,250 379,250 0.97BelgiumAgeas SA 14,268 EUR 868,052 791,876 2.04Groupe Bruxelles Lambert SA 3,772 EUR 407,218 422,003 1.08KBC Group NV 5,772 EUR 476,508 440,135 1.13Telenet Group Holdings NV 54,964 EUR 2,267,704 2,068,872 5.32
4,019,482 3,722,886 9.57Cayman IslandsAlibaba Group Holdings Ltd.-ADR- 1,196 USD 321,640 271,229 0.70
321,640 271,229 0.70GermanyBayer AG 13,557 EUR 868,058 823,316 2.12Bayerische Motoren Werke AG 4,262 EUR 449,397 451,400 1.16Covestro AG 144A 6,553 EUR 449,424 423,220 1.09Deutsche Post AG 6,831 EUR 407,199 464,667 1.19Hannover Rueck SE 2,298 EUR 407,132 384,526 0.99HUGO BOSS AG 8,162 EUR 407,203 444,087 1.14Infineon Technologies AG 10,661 EUR 431,672 427,583 1.10
3,420,085 3,418,799 8.79NetherlandsAkzo Nobel NV 8,942 EUR 1,090,141 1,104,970 2.84ASML Holdings NV 3,666 EUR 2,273,801 2,518,948 6.48ING Groep NV 72,634 EUR 808,769 959,563 2.47Koninklijke Ahold Delhaize NV 22,062 EUR 611,599 655,915 1.69Koninklijke Philips NV 7,478 EUR 407,183 370,601 0.95Signify NV 144A 7,350 EUR 449,434 464,931 1.19Wolters Kluwer NV 11,923 EUR 1,090,099 1,197,898 3.08
6,731,026 7,272,826 18.70NorwayNorsk Hydro ASA 73,825 NOK 449,018 471,336 1.21Orkla ASA 105,805 NOK 1,091,886 1,078,313 2.77
1,540,904 1,549,649 3.98SwitzerlandUBS Group AG 38,315 CHF 610,637 586,943 1.51
610,637 586,943 1.51United KingdomAstraZeneca PLC-ADR- 14,368 USD 826,013 860,643 2.21Royal Dutch Shell PLC-B--ADR- 11,719 USD 437,236 455,049 1.17
1,263,249 1,315,692 3.38United StatesAdobe Inc. 2,173 USD 893,342 1,272,596 3.27Alphabet Inc.-A- 715 USD 988,451 1,745,880 4.49Amazon.com Inc. 581 USD 1,338,672 1,998,733 5.14Apple Inc. 3,815 USD 477,943 522,502 1.34Berkshire Hathaway Inc.-B- 1,693 USD 428,583 470,519 1.21Boeing Co. 1,167 USD 236,574 279,567 0.72Booking Holdings Inc. 147 USD 350,292 321,649 0.83
Xtrackers**
Xtrackers MSCI AFRICA TOP 50 SWAP UCITS ETF*
Statement of Investmentsas at 30 June 2021(expressed in USD)
* This is a synthetic ETF.** This includes synthetic ETFs.
The accompanying notes form an integral part of these financial statements.
281

Description QuantityCurrency
(local) Cost Market Value
% ofNet
Assets
Transferable securities and money market instruments admitted to an official stock exchange listing
Shares (continued)
United States (continued)Chevron Corp. 7,506 USD 816,127 786,178 2.02Citigroup Inc. 4,836 USD 349,788 342,147 0.88CVS Health Corp. 5,530 USD 477,903 461,423 1.19Discovery Inc.-A- 14,211 USD 616,615 435,993 1.12Exxon Mobil Corp. 13,136 USD 816,140 828,619 2.13Facebook Inc.-A- 4,071 USD 913,605 1,415,527 3.64Fiserv Inc. 3,569 USD 409,757 381,490 0.98Intel Corp. 8,278 USD 477,889 464,727 1.19Johnson & Johnson 2,646 USD 450,032 435,902 1.12Micron Technology Inc. 2,462 USD 199,668 209,221 0.54Microsoft Corp. 1,917 USD 477,927 519,315 1.34Netflix Inc. 2,840 USD 1,272,108 1,500,116 3.86NVIDIA Corp. 885 USD 673,697 708,089 1.82PayPal Holdings Inc. 4,259 USD 716,670 1,241,413 3.19Pfizer Inc. 12,365 USD 477,907 484,213 1.25Procter & Gamble Co. 2,600 USD 349,804 350,818 0.90Regeneron Pharmaceuticals Inc. 940 USD 432,701 525,028 1.35Roku Inc. 1,438 USD 611,251 660,402 1.70salesforce.com Inc. 2,873 USD 685,009 701,788 1.80Uber Technologies Inc. 8,095 USD 409,769 405,721 1.04Walmart Inc. 3,081 USD 437,256 434,483 1.12Walt Disney Co. 2,370 USD 409,749 416,575 1.07Wells Fargo & Co. 14,530 USD 673,901 658,064 1.69Zoom Video Communications Inc.-A- 476 USD 199,725 184,226 0.47
18,068,855 21,162,924 54.41
Total - Shares 36,351,128 39,680,198 102.01
Total Transferable securities and money market instruments admitted to an officialstock exchange listing 36,351,128 39,680,198 102.01
TOTAL INVESTMENT PORTFOLIO 36,351,128 39,680,198 102.01
Xtrackers**
Xtrackers MSCI AFRICA TOP 50 SWAP UCITS ETF* (continued)
Statement of Investmentsas at 30 June 2021(expressed in USD)
* This is a synthetic ETF.** This includes synthetic ETFs.
The accompanying notes form an integral part of these financial statements.
282
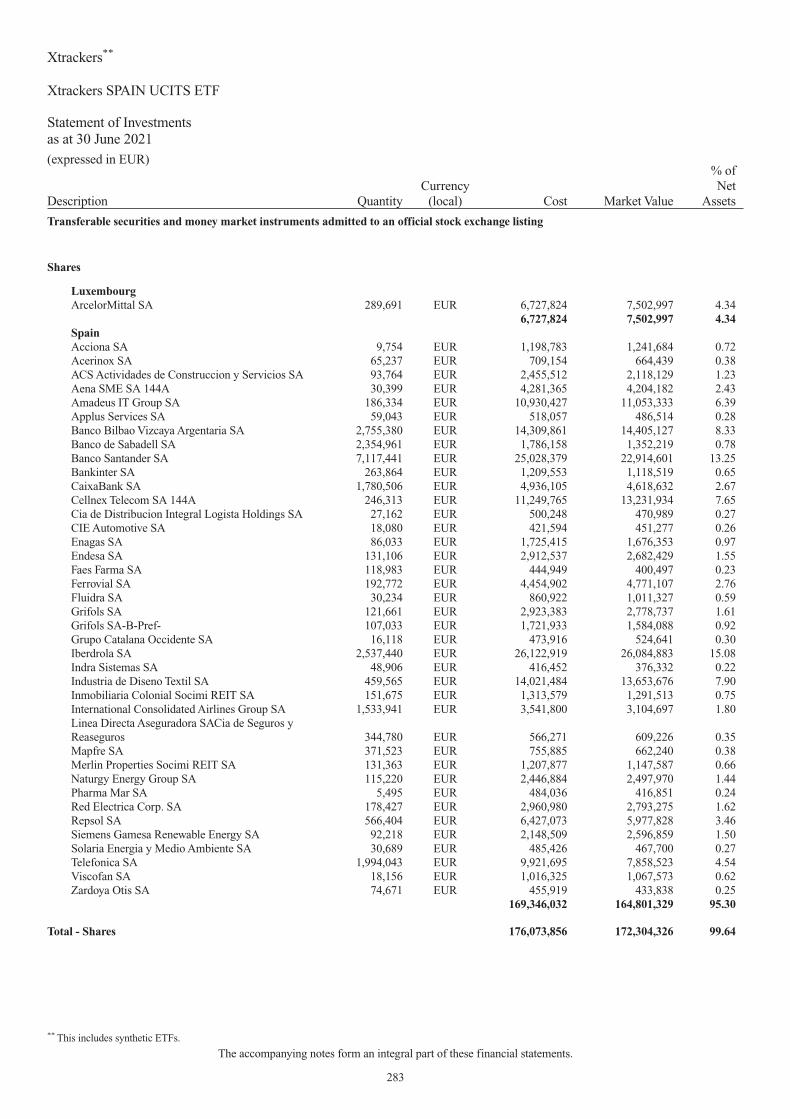
Description QuantityCurrency
(local) Cost Market Value
% ofNet
Assets
Transferable securities and money market instruments admitted to an official stock exchange listing
Shares
LuxembourgArcelorMittal SA 289,691 EUR 6,727,824 7,502,997 4.34
6,727,824 7,502,997 4.34SpainAcciona SA 9,754 EUR 1,198,783 1,241,684 0.72Acerinox SA 65,237 EUR 709,154 664,439 0.38ACS Actividades de Construccion y Servicios SA 93,764 EUR 2,455,512 2,118,129 1.23Aena SME SA 144A 30,399 EUR 4,281,365 4,204,182 2.43Amadeus IT Group SA 186,334 EUR 10,930,427 11,053,333 6.39Applus Services SA 59,043 EUR 518,057 486,514 0.28Banco Bilbao Vizcaya Argentaria SA 2,755,380 EUR 14,309,861 14,405,127 8.33Banco de Sabadell SA 2,354,961 EUR 1,786,158 1,352,219 0.78Banco Santander SA 7,117,441 EUR 25,028,379 22,914,601 13.25Bankinter SA 263,864 EUR 1,209,553 1,118,519 0.65CaixaBank SA 1,780,506 EUR 4,936,105 4,618,632 2.67Cellnex Telecom SA 144A 246,313 EUR 11,249,765 13,231,934 7.65Cia de Distribucion Integral Logista Holdings SA 27,162 EUR 500,248 470,989 0.27CIE Automotive SA 18,080 EUR 421,594 451,277 0.26Enagas SA 86,033 EUR 1,725,415 1,676,353 0.97Endesa SA 131,106 EUR 2,912,537 2,682,429 1.55Faes Farma SA 118,983 EUR 444,949 400,497 0.23Ferrovial SA 192,772 EUR 4,454,902 4,771,107 2.76Fluidra SA 30,234 EUR 860,922 1,011,327 0.59Grifols SA 121,661 EUR 2,923,383 2,778,737 1.61Grifols SA-B-Pref- 107,033 EUR 1,721,933 1,584,088 0.92Grupo Catalana Occidente SA 16,118 EUR 473,916 524,641 0.30Iberdrola SA 2,537,440 EUR 26,122,919 26,084,883 15.08Indra Sistemas SA 48,906 EUR 416,452 376,332 0.22Industria de Diseno Textil SA 459,565 EUR 14,021,484 13,653,676 7.90Inmobiliaria Colonial Socimi REIT SA 151,675 EUR 1,313,579 1,291,513 0.75International Consolidated Airlines Group SA 1,533,941 EUR 3,541,800 3,104,697 1.80Linea Directa Aseguradora SACia de Seguros yReaseguros 344,780 EUR 566,271 609,226 0.35Mapfre SA 371,523 EUR 755,885 662,240 0.38Merlin Properties Socimi REIT SA 131,363 EUR 1,207,877 1,147,587 0.66Naturgy Energy Group SA 115,220 EUR 2,446,884 2,497,970 1.44Pharma Mar SA 5,495 EUR 484,036 416,851 0.24Red Electrica Corp. SA 178,427 EUR 2,960,980 2,793,275 1.62Repsol SA 566,404 EUR 6,427,073 5,977,828 3.46Siemens Gamesa Renewable Energy SA 92,218 EUR 2,148,509 2,596,859 1.50Solaria Energia y Medio Ambiente SA 30,689 EUR 485,426 467,700 0.27Telefonica SA 1,994,043 EUR 9,921,695 7,858,523 4.54Viscofan SA 18,156 EUR 1,016,325 1,067,573 0.62Zardoya Otis SA 74,671 EUR 455,919 433,838 0.25
169,346,032 164,801,329 95.30
Total - Shares 176,073,856 172,304,326 99.64
Xtrackers**
Xtrackers SPAIN UCITS ETF
Statement of Investmentsas at 30 June 2021(expressed in EUR)
** This includes synthetic ETFs.
The accompanying notes form an integral part of these financial statements.
283

Description QuantityCurrency
(local) Cost Market Value
% ofNet
Assets
Transferable securities and money market instruments admitted to an official stock exchange listing
Rights
SpainACS Actividades de Construccion y ServiciosSA-Rights- 09.07.21 93,599 EUR — 110,447 0.06
— 110,447 0.06
Total - Rights — 110,447 0.06
Total Transferable securities and money market instruments admitted to an officialstock exchange listing 176,073,856 172,414,773 99.70
TOTAL INVESTMENT PORTFOLIO 176,073,856 172,414,773 99.70
Xtrackers**
Xtrackers SPAIN UCITS ETF (continued)
Statement of Investmentsas at 30 June 2021(expressed in EUR)
** This includes synthetic ETFs.
The accompanying notes form an integral part of these financial statements.
284
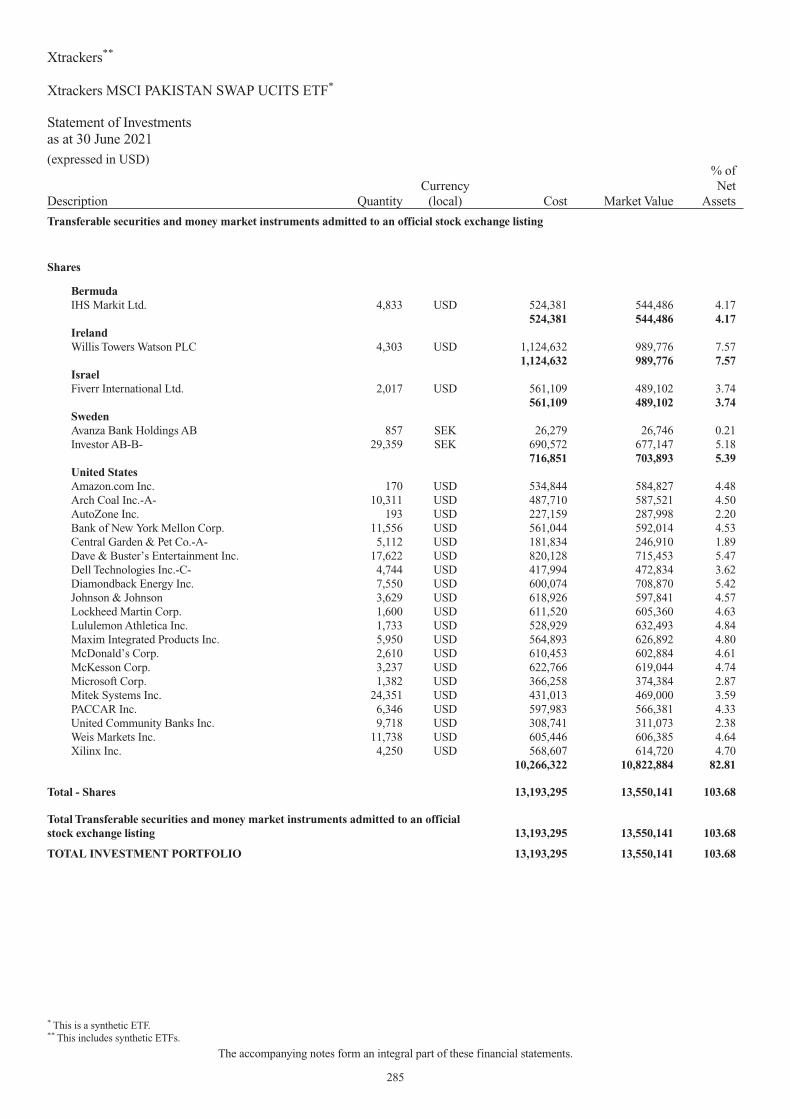
Description QuantityCurrency
(local) Cost Market Value
% ofNet
Assets
Transferable securities and money market instruments admitted to an official stock exchange listing
Shares
BermudaIHS Markit Ltd. 4,833 USD 524,381 544,486 4.17
524,381 544,486 4.17IrelandWillis Towers Watson PLC 4,303 USD 1,124,632 989,776 7.57
1,124,632 989,776 7.57IsraelFiverr International Ltd. 2,017 USD 561,109 489,102 3.74
561,109 489,102 3.74SwedenAvanza Bank Holdings AB 857 SEK 26,279 26,746 0.21Investor AB-B- 29,359 SEK 690,572 677,147 5.18
716,851 703,893 5.39United StatesAmazon.com Inc. 170 USD 534,844 584,827 4.48Arch Coal Inc.-A- 10,311 USD 487,710 587,521 4.50AutoZone Inc. 193 USD 227,159 287,998 2.20Bank of New York Mellon Corp. 11,556 USD 561,044 592,014 4.53Central Garden & Pet Co.-A- 5,112 USD 181,834 246,910 1.89Dave & Buster’s Entertainment Inc. 17,622 USD 820,128 715,453 5.47Dell Technologies Inc.-C- 4,744 USD 417,994 472,834 3.62Diamondback Energy Inc. 7,550 USD 600,074 708,870 5.42Johnson & Johnson 3,629 USD 618,926 597,841 4.57Lockheed Martin Corp. 1,600 USD 611,520 605,360 4.63Lululemon Athletica Inc. 1,733 USD 528,929 632,493 4.84Maxim Integrated Products Inc. 5,950 USD 564,893 626,892 4.80McDonald’s Corp. 2,610 USD 610,453 602,884 4.61McKesson Corp. 3,237 USD 622,766 619,044 4.74Microsoft Corp. 1,382 USD 366,258 374,384 2.87Mitek Systems Inc. 24,351 USD 431,013 469,000 3.59PACCAR Inc. 6,346 USD 597,983 566,381 4.33United Community Banks Inc. 9,718 USD 308,741 311,073 2.38Weis Markets Inc. 11,738 USD 605,446 606,385 4.64Xilinx Inc. 4,250 USD 568,607 614,720 4.70
10,266,322 10,822,884 82.81
Total - Shares 13,193,295 13,550,141 103.68
Total Transferable securities and money market instruments admitted to an officialstock exchange listing 13,193,295 13,550,141 103.68
TOTAL INVESTMENT PORTFOLIO 13,193,295 13,550,141 103.68
Xtrackers**
Xtrackers MSCI PAKISTAN SWAP UCITS ETF*
Statement of Investmentsas at 30 June 2021(expressed in USD)
* This is a synthetic ETF.** This includes synthetic ETFs.
The accompanying notes form an integral part of these financial statements.
285

Description QuantityCurrency
(local) Cost Market Value
% ofNet
Assets
Transferable securities and money market instruments admitted to an official stock exchange listing(A)
Shares
BermudaMedtecs International Corp. Ltd. 90,400 SGD 70,938 57,500 0.11Silverlake Axis Ltd. 180,037 SGD 53,896 31,475 0.06
124,834 88,975 0.17Cayman IslandsRazer Inc. 144A 44,000 HKD 14,834 11,955 0.02Sea Ltd.-ADR- 2,989 USD 785,165 820,779 1.58
799,999 832,734 1.60MauritiusGolden Agri-Resources Ltd. 1,392,407 SGD 253,765 238,249 0.46
253,765 238,249 0.46SingaporeAEM Holdings Ltd. 54,100 SGD 144,318 154,146 0.30AIMS APAC REIT 114,500 SGD 105,335 125,216 0.24ARA LOGOS Logistics Trust REIT 249,310 SGD 128,173 154,868 0.30Ascendas India Trust 187,100 SGD 189,651 193,475 0.37Ascendas Real Estate Investment Trust REIT 697,681 SGD 1,423,424 1,531,140 2.95Ascott Residence Trust 404,552 SGD 297,946 300,961 0.58CapitaLand China Trust REIT 228,270 SGD 226,999 232,651 0.45CapitaLand Integrated Commercial Trust REIT 982,470 SGD 1,484,993 1,527,572 2.94CapitaLand Ltd. 572,313 SGD 1,374,705 1,579,587 3.04CDL Hospitality Trusts 172,601 SGD 161,370 157,937 0.30China Aviation Oil Singapore Corp. Ltd. 56,063 SGD 50,951 42,959 0.08City Developments Ltd. 88,778 SGD 577,492 481,470 0.93ComfortDelGro Corp. Ltd. 469,878 SGD 683,335 573,278 1.10COSCO SHIPPING International Singapore Co. Ltd. 241,846 SGD 54,490 53,076 0.10Cromwell European Real Estate Investment TrustREIT 60,880 EUR 157,985 179,772 0.35DBS Group Holdings Ltd. 390,982 SGD 6,671,829 8,670,714 16.68ESR-REIT 542,624 SGD 176,843 165,508 0.32Far East Hospitality Trust 190,881 SGD 84,229 82,362 0.16First Resources Ltd. 119,724 SGD 136,175 119,350 0.23Frasers Centrepoint Trust REIT 221,181 SGD 374,083 399,844 0.77Frasers Hospitality Trust 166,400 SGD 70,231 63,752 0.12Frasers Logistics & Commercial Trust REIT 557,707 SGD 452,027 597,454 1.15Genting Singapore Ltd. 1,311,219 SGD 872,330 814,513 1.57Haw Par Corp. Ltd. 26,386 SGD 273,984 268,924 0.52Hutchison Port Holdings Trust-U- 1,133,126 USD 272,270 254,953 0.49iFAST Corp. Ltd. 29,900 SGD 182,105 181,286 0.35Japfa Ltd. 89,282 SGD 40,617 54,797 0.10Keppel Corp. Ltd. 315,937 SGD 1,447,200 1,285,653 2.47Keppel DC REIT 283,614 SGD 422,404 525,367 1.01Keppel Infrastructure Trust 756,745 SGD 283,894 312,449 0.60Keppel Pacific Oak US REIT 164,630 USD 121,015 129,235 0.25Keppel REIT 370,727 SGD 305,509 325,441 0.63Lendlease Global Commercial REIT 190,700 SGD 93,994 116,332 0.22Manulife US Real Estate Investment Trust REIT 309,475 USD 250,059 244,485 0.47Mapletree Commercial Trust REIT 467,556 SGD 635,607 751,317 1.44Mapletree Industrial Trust REIT 401,719 SGD 710,556 845,756 1.63
Xtrackers**
Xtrackers MSCI SINGAPORE UCITS ETF
Statement of Investmentsas at 30 June 2021(expressed in USD)
** This includes synthetic ETFs.
The accompanying notes form an integral part of these financial statements.
286

Description QuantityCurrency
(local) Cost Market Value
% ofNet
Assets
Transferable securities and money market instruments admitted to an official stock exchange listing(A)
Shares (continued)
Singapore (continued)Mapletree Logistics Trust REIT 650,094 SGD 770,301 991,439 1.91Mapletree North Asia Commercial Trust REIT 484,090 SGD 364,379 374,538 0.72Nanofilm Technologies International Ltd. 57,500 SGD 234,754 234,842 0.45NetLink NBN Trust 675,767 SGD 441,139 477,592 0.92Olam International Ltd. 142,000 SGD 188,914 169,022 0.32OUE Commercial Real Estate Investment Trust REIT 470,794 SGD 157,023 141,848 0.27OUE Ltd. 62,772 SGD 67,284 62,109 0.12Oversea-Chinese Banking Corp. Ltd. 727,928 SGD 5,556,007 6,471,314 12.45Oxley Holdings Ltd. 184,200 SGD 36,361 32,203 0.06Parkway Life Real Estate Investment Trust REIT 85,137 SGD 196,537 290,715 0.56Prime US REIT 102,800 USD 88,003 88,922 0.17Raffles Medical Group Ltd. 202,082 SGD 154,497 177,397 0.34Riverstone Holdings Ltd. 112,200 SGD 125,088 102,668 0.20Sasseur Real Estate Investment Trust REIT 117,200 SGD 69,670 82,394 0.16SATS Ltd. 146,344 SGD 441,359 427,862 0.82Sembcorp Industries Ltd. 213,190 SGD 219,581 339,404 0.65Sembcorp Marine Ltd. 1,633,716 SGD 312,479 145,846 0.28Sheng Siong Group Ltd. 146,728 SGD 134,880 172,467 0.33SIA Engineering Co. Ltd. 61,414 SGD 110,304 98,230 0.19Singapore Airlines Ltd. 290,662 SGD 990,357 1,048,736 2.02Singapore Exchange Ltd. 174,259 SGD 1,096,666 1,449,350 2.79Singapore Post Ltd. 321,298 SGD 233,449 170,903 0.33Singapore Press Holdings Ltd. 350,843 SGD 566,012 446,319 0.86Singapore Technologies Engineering Ltd. 338,670 SGD 871,359 975,043 1.88Singapore Telecommunications Ltd. 2,900 SGD 6,937 4,919 0.01Singapore Telecommunications Ltd. 1,787,454 SGD 3,917,082 3,045,134 5.86SPH REIT 210,112 SGD 139,023 135,990 0.26Starhill Global REIT 310,573 SGD 140,755 129,386 0.25StarHub Ltd. 131,447 SGD 177,109 119,302 0.23Suntec Real Estate Investment Trust REIT 430,671 SGD 510,072 467,772 0.90United Overseas Bank Ltd. 255,625 SGD 4,385,602 4,910,160 9.45UOL Group Ltd. 100,679 SGD 528,080 546,761 1.05Venture Corp. Ltd. 59,968 SGD 707,345 857,004 1.65Wilmar International Ltd. 416,656 SGD 1,131,493 1,394,846 2.68Yangzijiang Shipbuilding Holdings Ltd. 516,572 SGD 434,825 541,859 1.04Yanlord Land Group Ltd. 126,777 SGD 118,865 115,063 0.22
46,561,719 50,736,959 97.61
Total - Shares 47,740,317 51,896,917 99.84
Xtrackers**
Xtrackers MSCI SINGAPORE UCITS ETF (continued)
Statement of Investmentsas at 30 June 2021(expressed in USD)
** This includes synthetic ETFs.
The accompanying notes form an integral part of these financial statements.
287

Description QuantityCurrency
(local) Cost Market Value
% ofNet
Assets
Transferable securities and money market instruments admitted to an official stock exchange listing(A)
Rights
SingaporeOlam International Ltd.-Rights- 19.07.21 21,300 SGD — 5,546 0.01
— 5,546 0.01
Total - Rights — 5,546 0.01
Total Transferable securities and money market instruments admitted to an officialstock exchange listing 47,740,317 51,902,463 99.85
Other transferable securities and money market instruments(A)
Shares
SingaporeBest World International Ltd.(1) 56,968 SGD 69,416 4 0.00Eagle Hospitality Trust(1) 63,346 USD 33,827 7 0.00
103,243 11 0.00
Total - Shares 103,243 11 0.00
Total Other transferable securities and money market instruments 103,243 11 0.00
TOTAL INVESTMENT PORTFOLIO 47,843,560 51,902,474 99.85(A) Any duplicate securities appearing herein with the same name are either quoted on different stock exchanges or have different ISINs.
(1) The security is fair valued.
Xtrackers**
Xtrackers MSCI SINGAPORE UCITS ETF (continued)
Statement of Investmentsas at 30 June 2021(expressed in USD)
** This includes synthetic ETFs.
The accompanying notes form an integral part of these financial statements.
288

Description QuantityCurrency
(local) Cost Market Value
% ofNet
Assets
Transferable securities and money market instruments admitted to an official stock exchange listing
Shares
AustriaANDRITZ AG 98,928 EUR 4,008,480 4,687,209 6.20AT&S Austria Technologie & Systemtechnik AG 36,955 EUR 811,162 1,348,858 1.78BAWAG Group AG 144A 96,908 EUR 3,639,249 4,349,231 5.75CA Immobilien Anlagen AG 86,773 EUR 2,400,092 3,050,071 4.03DO & Co. AG 9,269 EUR 623,602 705,371 0.93Erste Group Bank AG 408,839 EUR 10,936,833 12,649,479 16.73EVN AG 73,331 EUR 1,399,942 1,457,820 1.93IMMOFINANZ AG 117,281 EUR 2,141,199 2,222,475 2.94Lenzing AG 18,039 EUR 1,700,151 1,861,625 2.46Mayr Melnhof Karton AG 13,589 EUR 1,668,187 2,440,584 3.23Oesterreichische Post AG 45,899 EUR 1,578,602 2,058,570 2.72OMV AG 222,366 EUR 8,437,555 10,666,897 14.10Raiffeisen Bank International AG 223,498 EUR 4,365,254 4,268,812 5.64S IMMO AG 60,016 EUR 1,028,782 1,212,323 1.60Schoeller-Bleckmann Oilfield Equipment AG 15,220 EUR 811,089 539,549 0.71UNIQA Insurance Group AG 167,960 EUR 1,252,208 1,232,826 1.63Verbund AG 92,532 EUR 3,599,876 7,185,110 9.50Vienna Insurance Group AG Wiener VersicherungGruppe 52,182 EUR 1,248,557 1,208,013 1.60voestalpine AG 169,841 EUR 5,443,662 5,832,340 7.71Wienerberger AG 156,529 EUR 3,373,064 5,087,192 6.73
60,467,546 74,064,355 97.92
Total - Shares 60,467,546 74,064,355 97.92
Total Transferable securities and money market instruments admitted to an officialstock exchange listing 60,467,546 74,064,355 97.92
TOTAL INVESTMENT PORTFOLIO 60,467,546 74,064,355 97.92
Xtrackers**
Xtrackers ATX UCITS ETF
Statement of Investmentsas at 30 June 2021(expressed in EUR)
** This includes synthetic ETFs.
The accompanying notes form an integral part of these financial statements.
289

Description QuantityCurrency
(local) Cost Market Value
% ofNet
Assets
Transferable securities and money market instruments admitted to an official stock exchange listing(A)
Shares
AustriaErste Group Bank AG 122,156 EUR 3,623,214 3,779,507 0.18OMV AG 64,366 EUR 2,637,148 3,087,637 0.15Raiffeisen Bank International AG 64,719 EUR 1,424,277 1,236,133 0.06Verbund AG 29,773 EUR 1,263,852 2,311,873 0.11voestalpine AG 50,747 EUR 1,626,304 1,742,652 0.08
10,574,795 12,157,802 0.58BelgiumAgeas SA 76,630 EUR 3,225,764 3,586,284 0.17Anheuser-Busch InBev SA 333,771 EUR 26,103,299 20,296,615 0.97Colruyt SA 23,813 EUR 1,161,923 1,123,021 0.05Elia Group SA 13,504 EUR 1,402,556 1,201,856 0.06Groupe Bruxelles Lambert SA 49,385 EUR 4,021,066 4,658,981 0.22KBC Group NV 109,621 EUR 6,806,061 7,048,630 0.34Proximus SADP 66,507 EUR 1,680,377 1,083,399 0.05Sofina SA 6,740 EUR 1,677,311 2,452,012 0.12Solvay SA 32,410 EUR 3,278,304 3,474,352 0.17UCB SA 55,277 EUR 4,116,474 4,873,220 0.23Umicore SA 86,187 EUR 3,133,546 4,438,631 0.21
56,606,681 54,237,001 2.59FinlandElisa OYJ 62,116 EUR 2,556,150 3,125,677 0.15Fortum OYJ 194,115 EUR 3,519,983 4,515,115 0.21Kesko OYJ-B- 119,377 EUR 2,638,564 3,718,594 0.18Kone OYJ-B- 149,085 EUR 7,572,182 10,257,048 0.49Neste OYJ 185,455 EUR 5,017,277 9,576,896 0.46Nokia OYJ 2,364,185 EUR 10,508,559 10,675,477 0.51Orion OYJ-B- 46,387 EUR 1,703,471 1,681,529 0.08Sampo OYJ-A- 218,621 EUR 8,661,702 8,473,750 0.40Stora Enso OYJ-R- 254,364 EUR 3,010,263 3,913,390 0.19UPM-Kymmene OYJ 233,996 EUR 5,973,569 7,464,472 0.36Wartsila OYJ Abp 207,028 EUR 2,677,683 2,590,956 0.12
53,839,403 65,992,904 3.15FranceAccor SA 74,265 EUR 2,757,950 2,338,605 0.11Aeroports de Paris 12,978 EUR 1,826,514 1,425,633 0.07Air Liquide SA 207,492 EUR 22,579,212 30,638,269 1.46Alstom SA 121,749 EUR 4,448,799 5,185,290 0.25Amundi SA 144A 26,569 EUR 1,815,658 1,975,405 0.09Arkema SA 26,830 EUR 2,404,842 2,838,614 0.14Atos SE 43,280 EUR 3,189,929 2,220,264 0.11AXA SA 847,293 EUR 19,088,604 18,119,361 0.87BioMerieux 18,118 EUR 1,500,671 1,775,564 0.09BNP Paribas SA 492,438 EUR 25,188,737 26,035,197 1.24Bollore SA 386,466 EUR 1,501,418 1,746,826 0.08Bouygues SA 99,818 EUR 3,540,489 3,113,323 0.15Bureau Veritas SA 128,402 EUR 2,718,373 3,425,765 0.16Capgemini SE 70,320 EUR 7,191,128 11,391,840 0.54Carrefour SA 268,009 EUR 4,731,688 4,444,929 0.21
Xtrackers**
Xtrackers MSCI EMU UCITS ETF
Statement of Investmentsas at 30 June 2021(expressed in EUR)
** This includes synthetic ETFs.
The accompanying notes form an integral part of these financial statements.
290

Description QuantityCurrency
(local) Cost Market Value
% ofNet
Assets
Transferable securities and money market instruments admitted to an official stock exchange listing(A)
Shares (continued)
France (continued)Cie de Saint-Gobain 221,831 EUR 8,701,802 12,320,494 0.59Cie Generale des Etablissements Michelin SCA 74,257 EUR 7,937,776 9,987,566 0.48CNP Assurances 75,054 EUR 1,278,527 1,077,025 0.05Covivio REIT 22,747 EUR 1,894,237 1,640,514 0.08Credit Agricole SA 510,142 EUR 6,011,492 6,026,818 0.29Danone SA 285,815 EUR 18,666,188 16,968,837 0.81Dassault Aviation SA 1,093 EUR 1,275,775 1,084,256 0.05Dassault Systemes SE 57,942 EUR 6,968,522 11,849,139 0.57Edenred 108,152 EUR 3,834,708 5,196,704 0.25Eiffage SA 36,408 EUR 3,144,134 3,123,806 0.15Electricite de France SA 203,088 EUR 2,200,742 2,339,574 0.11Engie SA 800,565 EUR 10,789,701 9,249,728 0.44EssilorLuxottica SA 124,980 EUR 14,764,823 19,451,887 0.93Eurazeo SE 17,271 EUR 1,015,294 1,269,418 0.06Faurecia SE 35,114 EUR 1,763,058 1,452,666 0.07Faurecia SE 16,189 EUR 540,785 667,796 0.03Gecina REIT SA 20,090 EUR 2,688,019 2,595,628 0.12Getlink SE 192,671 EUR 2,408,375 2,533,624 0.12Hermes International 13,879 EUR 8,109,297 17,050,351 0.81Iliad SA 6,482 EUR 996,069 799,879 0.04Ipsen SA 16,488 EUR 1,600,349 1,446,327 0.07Kering SA 32,836 EUR 13,678,849 24,200,132 1.16Klepierre REIT SA 90,264 EUR 2,556,450 1,961,437 0.09La Francaise des Jeux SAEM 144A 41,771 EUR 1,372,226 2,071,006 0.10Legrand SA 117,220 EUR 7,363,169 10,463,057 0.50L’Oreal SA 110,332 EUR 24,907,527 41,462,766 1.98LVMH Moet Hennessy Louis Vuitton SE 121,584 EUR 38,858,028 80,403,499 3.84Natixis SA 413,981 EUR 1,971,293 1,655,924 0.08Orange SA 874,535 EUR 11,658,783 8,408,654 0.40Orpea SA 22,607 EUR 2,398,425 2,424,601 0.12Pernod Ricard SA 91,798 EUR 12,775,805 17,184,586 0.82Publicis Groupe SA 93,771 EUR 4,514,303 5,058,008 0.24Remy Cointreau SA 9,978 EUR 1,101,995 1,737,170 0.08Renault SA 84,047 EUR 5,015,094 2,864,742 0.14Safran SA 149,741 EUR 15,493,020 17,507,718 0.84Sanofi 496,216 EUR 40,362,426 43,845,646 2.10Sartorius Stedim Biotech 12,095 EUR 1,777,573 4,824,695 0.23Schneider Electric SE 235,976 EUR 18,854,441 31,309,296 1.50SCOR SE 69,332 EUR 2,322,888 1,859,484 0.09SEB SA 12,105 EUR 1,594,069 1,844,802 0.09Societe Generale SA 355,360 EUR 10,997,044 8,834,250 0.42Sodexo SA 38,683 EUR 3,578,216 3,044,352 0.15Suez SA 151,137 EUR 2,096,192 3,030,297 0.15Teleperformance 25,744 EUR 4,547,042 8,812,171 0.42Thales SA 46,944 EUR 4,136,442 4,039,062 0.19TotalEnergies SE 1,094,123 EUR 47,665,202 41,746,263 2.00Ubisoft Entertainment SA 40,491 EUR 2,784,317 2,390,589 0.11Unibail-Rodamco-Westfield REIT 54,476 EUR 8,300,123 3,976,203 0.19
Xtrackers**
Xtrackers MSCI EMU UCITS ETF (continued)
Statement of Investmentsas at 30 June 2021(expressed in EUR)
** This includes synthetic ETFs.
The accompanying notes form an integral part of these financial statements.
291

Description QuantityCurrency
(local) Cost Market Value
% ofNet
Assets
Transferable securities and money market instruments admitted to an official stock exchange listing(A)
Shares (continued)
France (continued)Valeo SA 100,410 EUR 3,969,466 2,547,402 0.12Veolia Environnement SA 235,635 EUR 4,861,602 6,001,623 0.29Vinci SA 233,118 EUR 19,359,918 20,978,289 1.00Vivendi SE 312,022 EUR 7,164,204 8,839,583 0.42Wendel SE 11,728 EUR 1,340,693 1,329,955 0.06Worldline SA 144A 103,951 EUR 6,903,482 8,205,892 0.39
547,353,992 669,670,076 32.00Germanyadidas AG 83,360 EUR 17,852,742 26,166,704 1.25Allianz SE 180,570 EUR 34,190,911 37,973,871 1.81BASF SE 402,111 EUR 28,872,712 26,716,255 1.28Bayer AG 430,177 EUR 34,392,465 22,029,364 1.05Bayerische Motoren Werke AG 145,116 EUR 11,026,037 12,960,310 0.62Bayerische Motoren Werke AG-Pref- 24,862 EUR 1,561,621 1,884,540 0.09Bechtle AG 11,932 EUR 2,169,864 1,869,148 0.09Beiersdorf AG 44,073 EUR 4,156,116 4,484,428 0.21Brenntag SE 67,558 EUR 3,373,400 5,297,898 0.25Carl Zeiss Meditec AG 17,587 EUR 1,663,824 2,865,802 0.14Commerzbank AG 438,069 EUR 3,456,096 2,620,529 0.13Continental AG 48,095 EUR 7,467,425 5,962,818 0.28Covestro AG 144A 84,486 EUR 4,844,789 4,601,107 0.22Daimler AG 374,907 EUR 21,743,824 28,230,497 1.35Delivery Hero SE 144A 68,705 EUR 4,651,865 7,653,737 0.37Deutsche Bank AG 905,850 EUR 10,437,597 9,951,668 0.48Deutsche Boerse AG 83,314 EUR 9,744,150 12,263,821 0.59Deutsche Lufthansa AG 130,682 EUR 2,011,023 1,240,172 0.06Deutsche Post AG 434,009 EUR 14,275,003 24,894,756 1.19Deutsche Telekom AG 1,459,302 EUR 21,930,499 25,993,087 1.24Deutsche Wohnen SE 149,865 EUR 5,385,075 7,730,037 0.37E.ON SE 982,452 EUR 9,036,560 9,582,837 0.46Evonik Industries AG 91,688 EUR 2,487,725 2,592,937 0.12Fresenius Medical Care AG & Co. KGaA 89,904 EUR 6,705,647 6,296,876 0.30Fresenius SE & Co. KGaA 183,307 EUR 9,943,410 8,064,591 0.39FUCHS PETROLUB SE-Pref- 30,388 EUR 1,261,279 1,246,516 0.06GEA Group AG 67,082 EUR 2,143,755 2,291,521 0.11Hannover Rueck SE 26,357 EUR 3,419,801 3,718,973 0.18HeidelbergCement AG 65,041 EUR 4,507,944 4,705,066 0.22HelloFresh SE 72,248 EUR 3,819,264 5,922,891 0.28Henkel AG & Co. KGaA 45,506 EUR 4,027,215 3,533,541 0.17Henkel AG & Co. KGaA-Pref- 78,113 EUR 7,703,161 6,955,181 0.33Infineon Technologies AG 572,108 EUR 11,585,663 19,348,692 0.92KION Group AG 31,550 EUR 2,053,100 2,835,714 0.14Knorr-Bremse AG 31,720 EUR 3,129,977 3,076,840 0.15LANXESS AG 36,323 EUR 2,061,245 2,100,196 0.10LEG Immobilien AG 31,529 EUR 3,586,972 3,829,197 0.18Merck KGaA 56,651 EUR 5,754,750 9,160,467 0.44MTU Aero Engines AG 23,326 EUR 4,172,627 4,872,801 0.23Muenchener Rueckversicherungs-Gesellschaft AG 61,413 EUR 12,865,067 14,183,332 0.68
Xtrackers**
Xtrackers MSCI EMU UCITS ETF (continued)
Statement of Investmentsas at 30 June 2021(expressed in EUR)
** This includes synthetic ETFs.
The accompanying notes form an integral part of these financial statements.
292

Description QuantityCurrency
(local) Cost Market Value
% ofNet
Assets
Transferable securities and money market instruments admitted to an official stock exchange listing(A)
Shares (continued)
Germany (continued)Nemetschek SE 25,255 EUR 1,753,596 1,629,453 0.08Porsche Automobil Holdings SE-Pref- 67,201 EUR 4,063,096 6,072,282 0.29Puma SE 46,162 EUR 2,631,082 4,641,589 0.22Rational AG 2,234 EUR 1,666,954 1,706,776 0.08RWE AG 281,603 EUR 6,934,466 8,605,788 0.41SAP SE 457,264 EUR 46,407,191 54,341,254 2.60Sartorius AG-Pref- 11,498 EUR 2,236,485 5,047,622 0.24Scout24 AG 144A 39,167 EUR 2,693,876 2,785,557 0.13Siemens AG 335,019 EUR 32,840,462 44,765,239 2.14Siemens Healthineers AG 144A 117,511 EUR 4,435,765 6,072,968 0.29Symrise AG 56,414 EUR 4,497,518 6,628,645 0.32TeamViewer AG 144A 70,393 EUR 3,143,052 2,232,866 0.11Telefonica Deutschland Holdings AG 455,213 EUR 1,459,076 1,012,849 0.05Uniper SE 39,843 EUR 1,055,361 1,237,524 0.06United Internet AG 42,400 EUR 1,714,812 1,461,952 0.07Volkswagen AG 14,184 EUR 2,293,429 3,926,131 0.19Volkswagen AG-Pref- 81,308 EUR 12,693,721 17,172,250 0.82Vonovia SE 235,712 EUR 10,447,658 12,851,018 0.61Zalando SE 144A 72,562 EUR 3,733,136 7,397,696 0.35
492,172,936 577,298,177 27.59IrelandCRH PLC 344,052 EUR 10,547,082 14,622,210 0.70Flutter Entertainment PLC 72,984 EUR 8,502,933 11,144,657 0.53Kerry Group PLC-A- 69,715 EUR 6,639,916 8,212,427 0.39Kingspan Group PLC 67,502 EUR 3,165,275 5,375,859 0.26Smurfit Kappa Group PLC 107,109 EUR 3,552,011 4,900,237 0.24
32,407,217 44,255,390 2.12ItalyAmplifon SpA 54,423 EUR 1,836,278 2,266,174 0.11Assicurazioni Generali SpA 483,631 EUR 7,561,891 8,175,782 0.39Atlantia SpA 216,646 EUR 4,659,367 3,308,184 0.16DiaSorin SpA 11,013 EUR 2,031,537 1,756,574 0.08Enel SpA 3,560,717 EUR 21,150,884 27,887,536 1.33Eni SpA 1,106,074 EUR 14,409,002 11,359,380 0.54FinecoBank Banca Fineco SpA 266,690 EUR 2,773,873 3,920,343 0.19Infrastrutture Wireless Italiane SpA 144A 146,945 EUR 1,396,680 1,397,741 0.07Intesa Sanpaolo SpA 7,238,402 EUR 16,803,062 16,861,857 0.81Mediobanca Banca di Credito Finanziario SpA 271,557 EUR 2,359,787 2,674,836 0.13Moncler SpA 84,724 EUR 3,204,602 4,834,351 0.23Nexi SpA 144A 192,148 EUR 2,880,864 3,556,660 0.17Poste Italiane SpA 144A 228,437 EUR 1,826,123 2,547,073 0.12Prysmian SpA 111,400 EUR 2,460,668 3,367,622 0.16Recordati Industria Chimica e Farmaceutica SpA 45,716 EUR 1,704,082 2,203,511 0.10Snam SpA 881,710 EUR 3,716,290 4,298,336 0.21Telecom Italia SpA 4,359,128 EUR 2,609,782 1,826,039 0.09Telecom Italia SpA-RSP- 2,635,621 EUR 1,467,570 1,177,595 0.06
Xtrackers**
Xtrackers MSCI EMU UCITS ETF (continued)
Statement of Investmentsas at 30 June 2021(expressed in EUR)
** This includes synthetic ETFs.
The accompanying notes form an integral part of these financial statements.
293

Description QuantityCurrency
(local) Cost Market Value
% ofNet
Assets
Transferable securities and money market instruments admitted to an official stock exchange listing(A)
Shares (continued)
Italy (continued)Terna Rete Elettrica Nazionale SpA 615,201 EUR 3,278,802 3,865,923 0.18UniCredit SpA 931,581 EUR 12,120,728 9,269,231 0.44
110,251,872 116,554,748 5.57LuxembourgArcelorMittal SA 314,248 EUR 5,583,142 8,123,311 0.39Aroundtown SA 437,149 EUR 3,172,414 2,876,440 0.14Eurofins Scientific SE 58,403 EUR 2,997,405 5,630,049 0.27InPost SA 87,739 EUR 1,332,755 1,485,070 0.07Tenaris SA 206,477 EUR 2,241,782 1,897,937 0.09
15,327,498 20,012,807 0.96NetherlandsABN AMRO Bank NV 144A 184,957 EUR 3,342,610 1,885,082 0.09Adyen NV 144A 8,645 EUR 9,420,201 17,813,022 0.85Aegon NV 782,050 EUR 3,476,478 2,736,393 0.13Airbus SE 257,473 EUR 23,637,258 27,920,372 1.33Akzo Nobel NV 83,536 EUR 6,494,220 8,704,451 0.42Argenx SE 789 EUR 204,056 201,274 0.01Argenx SE 19,253 EUR 3,799,645 4,911,440 0.23ASM International NV 20,748 EUR 4,657,324 5,747,196 0.27ASML Holdings NV 183,719 EUR 39,018,577 106,446,789 5.09CNH Industrial NV 447,432 EUR 4,062,531 6,230,491 0.30Davide Campari-Milano NV 228,474 EUR 1,707,491 2,580,614 0.12EXOR NV 47,344 EUR 2,618,978 3,198,561 0.15Ferrari NV 55,252 EUR 6,468,147 9,613,848 0.46Heineken Holdings NV 50,376 EUR 4,011,261 4,279,441 0.20Heineken NV 113,592 EUR 9,802,355 11,609,102 0.55ING Groep NV 1,708,883 EUR 19,336,124 19,036,957 0.91JDE Peet’s NV 32,774 EUR 1,060,155 1,002,884 0.05Just Eat Takeaway.com NV 144A 78,669 EUR 6,837,324 6,125,955 0.29Koninklijke Ahold Delhaize NV 458,466 EUR 9,450,628 11,493,743 0.55Koninklijke DSM NV 75,532 EUR 7,139,210 11,888,737 0.57Koninklijke KPN NV 1,469,834 EUR 3,931,213 3,871,543 0.19Koninklijke Philips NV 399,169 EUR 14,199,344 16,681,272 0.80Koninklijke Vopak NV 30,236 EUR 1,298,765 1,158,039 0.06NN Group NV 122,725 EUR 4,151,884 4,882,000 0.23Prosus NV 213,540 EUR 15,562,138 17,610,644 0.84QIAGEN NV 100,932 EUR 3,244,448 4,113,988 0.20Randstad NV 52,281 EUR 2,631,223 3,372,124 0.16Stellantis NV 888,714 EUR 9,844,177 14,711,772 0.70STMicroelectronics NV 299,340 EUR 5,894,661 9,161,301 0.44Wolters Kluwer NV 117,354 EUR 6,308,002 9,942,231 0.48
233,610,428 348,931,266 16.67PortugalEDP - Energias de Portugal SA 1,213,785 EUR 4,312,797 5,425,619 0.26Galp Energia SGPS SA 219,171 EUR 2,880,367 2,005,853 0.10Jeronimo Martins SGPS SA 110,060 EUR 1,615,736 1,692,723 0.08
8,808,900 9,124,195 0.44
Xtrackers**
Xtrackers MSCI EMU UCITS ETF (continued)
Statement of Investmentsas at 30 June 2021(expressed in EUR)
** This includes synthetic ETFs.
The accompanying notes form an integral part of these financial statements.
294
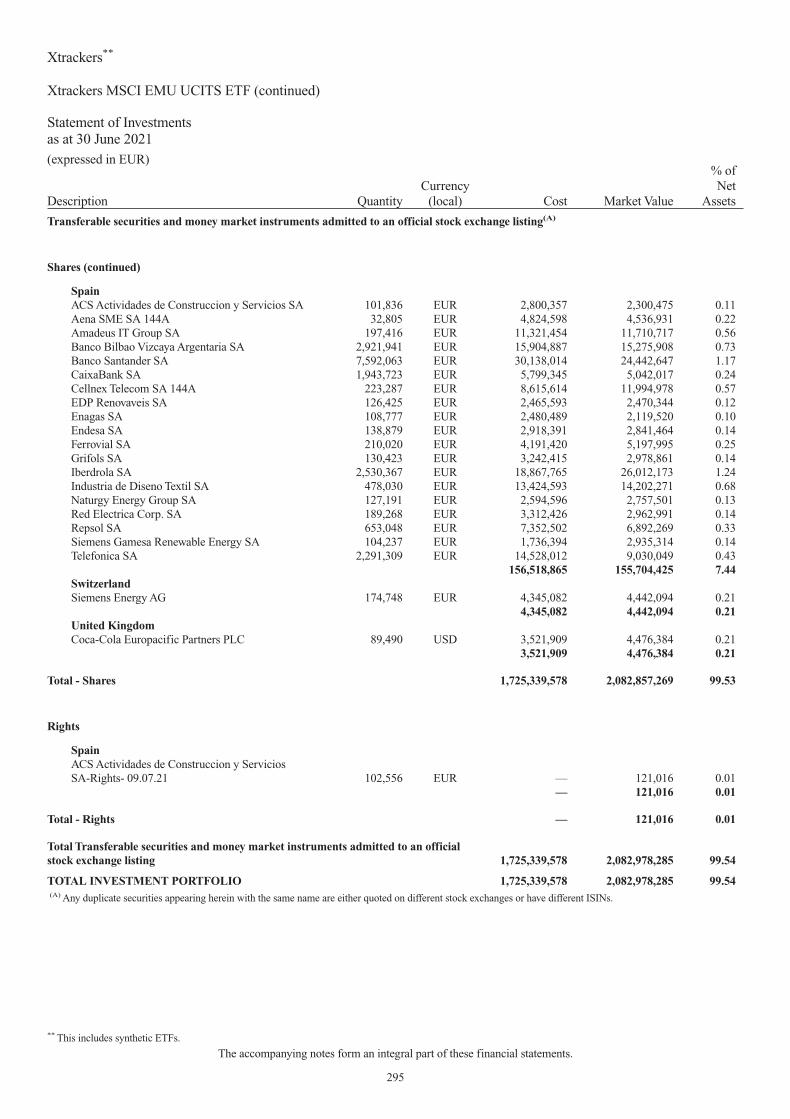
Description QuantityCurrency
(local) Cost Market Value
% ofNet
Assets
Transferable securities and money market instruments admitted to an official stock exchange listing(A)
Shares (continued)
SpainACS Actividades de Construccion y Servicios SA 101,836 EUR 2,800,357 2,300,475 0.11Aena SME SA 144A 32,805 EUR 4,824,598 4,536,931 0.22Amadeus IT Group SA 197,416 EUR 11,321,454 11,710,717 0.56Banco Bilbao Vizcaya Argentaria SA 2,921,941 EUR 15,904,887 15,275,908 0.73Banco Santander SA 7,592,063 EUR 30,138,014 24,442,647 1.17CaixaBank SA 1,943,723 EUR 5,799,345 5,042,017 0.24Cellnex Telecom SA 144A 223,287 EUR 8,615,614 11,994,978 0.57EDP Renovaveis SA 126,425 EUR 2,465,593 2,470,344 0.12Enagas SA 108,777 EUR 2,480,489 2,119,520 0.10Endesa SA 138,879 EUR 2,918,391 2,841,464 0.14Ferrovial SA 210,020 EUR 4,191,420 5,197,995 0.25Grifols SA 130,423 EUR 3,242,415 2,978,861 0.14Iberdrola SA 2,530,367 EUR 18,867,765 26,012,173 1.24Industria de Diseno Textil SA 478,030 EUR 13,424,593 14,202,271 0.68Naturgy Energy Group SA 127,191 EUR 2,594,596 2,757,501 0.13Red Electrica Corp. SA 189,268 EUR 3,312,426 2,962,991 0.14Repsol SA 653,048 EUR 7,352,502 6,892,269 0.33Siemens Gamesa Renewable Energy SA 104,237 EUR 1,736,394 2,935,314 0.14Telefonica SA 2,291,309 EUR 14,528,012 9,030,049 0.43
156,518,865 155,704,425 7.44SwitzerlandSiemens Energy AG 174,748 EUR 4,345,082 4,442,094 0.21
4,345,082 4,442,094 0.21United KingdomCoca-Cola Europacific Partners PLC 89,490 USD 3,521,909 4,476,384 0.21
3,521,909 4,476,384 0.21
Total - Shares 1,725,339,578 2,082,857,269 99.53
Rights
SpainACS Actividades de Construccion y ServiciosSA-Rights- 09.07.21 102,556 EUR — 121,016 0.01
— 121,016 0.01
Total - Rights — 121,016 0.01
Total Transferable securities and money market instruments admitted to an officialstock exchange listing 1,725,339,578 2,082,978,285 99.54
TOTAL INVESTMENT PORTFOLIO 1,725,339,578 2,082,978,285 99.54(A) Any duplicate securities appearing herein with the same name are either quoted on different stock exchanges or have different ISINs.
Xtrackers**
Xtrackers MSCI EMU UCITS ETF (continued)
Statement of Investmentsas at 30 June 2021(expressed in EUR)
** This includes synthetic ETFs.
The accompanying notes form an integral part of these financial statements.
295

Description QuantityCurrency
(local) Cost Market Value
% ofNet
Assets
Transferable securities and money market instruments admitted to an official stock exchange listing
Shares
Germanyadidas AG 90,538 EUR 18,747,398 28,419,878 4.73Allianz SE 205,777 EUR 37,037,859 43,274,903 7.20BASF SE 458,686 EUR 31,569,215 30,475,098 5.07Bayer AG 490,623 EUR 35,747,690 25,124,804 4.18Bayerische Motoren Werke AG 160,028 EUR 12,027,133 14,292,101 2.38Continental AG 53,940 EUR 7,904,648 6,687,481 1.11Covestro AG 144A 96,469 EUR 5,620,714 5,253,702 0.87Daimler AG 419,304 EUR 24,477,672 31,573,591 5.26Delivery Hero SE 144A 94,050 EUR 9,795,598 10,477,170 1.74Deutsche Bank AG 1,031,837 EUR 11,664,165 11,335,761 1.89Deutsche Boerse AG 91,654 EUR 10,389,834 13,491,469 2.25Deutsche Post AG 490,699 EUR 16,797,596 28,146,495 4.69Deutsche Telekom AG 1,610,058 EUR 23,937,698 28,678,353 4.77Deutsche Wohnen SE 149,412 EUR 6,137,972 7,706,671 1.28E.ON SE 1,037,979 EUR 9,683,099 10,124,447 1.69Fresenius Medical Care AG & Co. KGaA 99,148 EUR 7,158,307 6,944,326 1.16Fresenius SE & Co. KGaA 205,464 EUR 10,268,673 9,039,389 1.50HeidelbergCement AG 73,789 EUR 4,896,525 5,337,896 0.89Henkel AG & Co. KGaA-Pref- 87,130 EUR 8,229,348 7,758,055 1.29Infineon Technologies AG 649,893 EUR 13,815,747 21,979,381 3.66Merck KGaA 64,545 EUR 6,861,788 10,436,926 1.74MTU Aero Engines AG 26,637 EUR 5,609,343 5,564,469 0.93Muenchener Rueckversicherungs-Gesellschaft AG 69,963 EUR 14,266,080 16,157,955 2.69RWE AG 337,702 EUR 8,730,328 10,320,173 1.72SAP SE 504,473 EUR 50,066,037 59,951,571 9.98Siemens AG 375,377 EUR 38,546,020 50,157,875 8.35Volkswagen AG-Pref- 91,425 EUR 14,096,437 19,308,960 3.21Vonovia SE 269,528 EUR 12,332,303 14,694,667 2.45
456,415,227 532,713,567 88.68IrelandLinde PLC 249,806 EUR 41,196,890 60,790,290 10.12
41,196,890 60,790,290 10.12SwitzerlandSiemens Energy AG 235,516 EUR 6,973,735 5,986,817 1.00
6,973,735 5,986,817 1.00
Total - Shares 504,585,852 599,490,674 99.80
Total Transferable securities and money market instruments admitted to an officialstock exchange listing 504,585,852 599,490,674 99.80
TOTAL INVESTMENT PORTFOLIO 504,585,852 599,490,674 99.80
Xtrackers**
Xtrackers DAX INCOME UCITS ETF
Statement of Investmentsas at 30 June 2021(expressed in EUR)
** This includes synthetic ETFs.
The accompanying notes form an integral part of these financial statements.
296

Description QuantityCurrency
(local) Cost Market Value
% ofNet
Assets
Transferable securities and money market instruments admitted to an official stock exchange listing
Shares
GuernseyPershing Square Holdings Ltd. 6,750 GBP 163,487 178,537 0.22
163,487 178,537 0.22IrelandCRH PLC 32,820 GBP 773,426 1,200,227 1.51DCC PLC 4,122 GBP 256,326 243,940 0.31Flutter Entertainment PLC 6,935 GBP 791,939 911,606 1.14Smurfit Kappa Group PLC 10,863 GBP 255,034 426,699 0.54
2,076,725 2,782,472 3.50Isle Of ManGVC Holdings PLC 24,392 GBP 200,927 425,762 0.53
200,927 425,762 0.53JerseyExperian PLC 38,262 GBP 632,364 1,065,979 1.34Ferguson PLC 9,366 GBP 480,738 941,283 1.18Glencore PLC 503,548 GBP 1,279,406 1,558,229 1.96Polymetal International PLC 14,920 GBP 186,642 231,932 0.29WPP PLC 49,030 GBP 649,002 477,650 0.60
3,228,152 4,275,073 5.37LuxembourgB&M European Value Retail SA 37,251 GBP 173,790 213,523 0.27
173,790 213,523 0.27NetherlandsJust Eat Takeaway.com NV 144A 7,555 GBP 520,628 505,581 0.64
520,628 505,581 0.64SpainInternational Consolidated Airlines Group SA 155,685 GBP 342,166 271,234 0.34
342,166 271,234 0.34SwitzerlandCoca-Cola HBC AG 8,156 GBP 144,658 213,198 0.27
144,658 213,198 0.27United Kingdom3i Group PLC 39,839 GBP 296,183 467,311 0.59Admiral Group PLC 8,772 GBP 171,640 275,792 0.35Anglo American PLC 51,448 GBP 806,161 1,477,844 1.86Antofagasta PLC 14,460 GBP 127,269 207,573 0.26Ashtead Group PLC 18,700 GBP 316,648 1,003,068 1.26Associated British Foods PLC 14,524 GBP 382,922 321,852 0.40AstraZeneca PLC 54,944 GBP 2,886,975 4,770,787 6.00Auto Trader Group PLC 144A 39,533 GBP 184,545 250,402 0.31Avast PLC 144A 23,117 GBP 117,707 113,227 0.14AVEVA Group PLC 4,954 GBP 156,846 183,694 0.23Aviva PLC 163,893 GBP 746,249 665,242 0.84BAE Systems PLC 135,262 GBP 707,305 706,068 0.89Barclays PLC 708,594 GBP 1,399,445 1,212,546 1.52Barratt Developments PLC 42,287 GBP 228,027 293,979 0.37Berkeley Group Holdings PLC 4,716 GBP 174,098 216,700 0.27BHP Group PLC 86,975 GBP 1,325,250 1,852,567 2.33BP PLC 832,565 GBP 3,576,964 2,622,580 3.30
Xtrackers**
Xtrackers FTSE 100 UCITS ETF
Statement of Investmentsas at 30 June 2021(expressed in GBP)
** This includes synthetic ETFs.
The accompanying notes form an integral part of these financial statements.
297
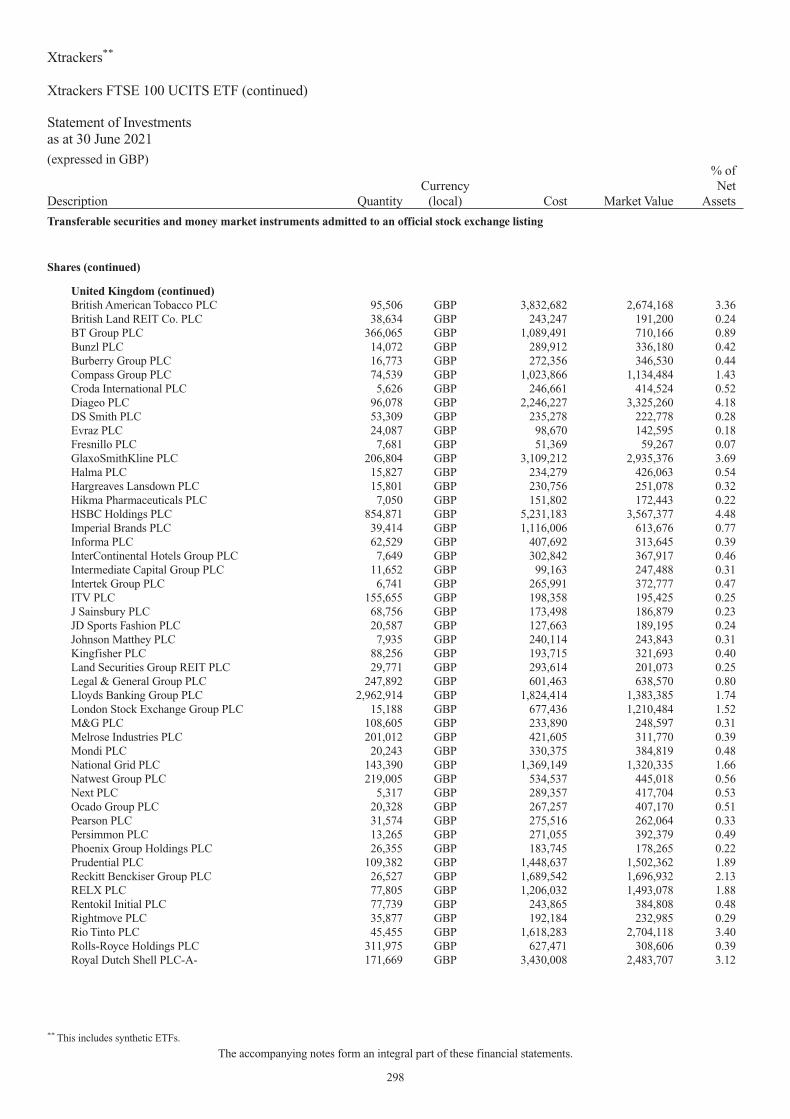
Description QuantityCurrency
(local) Cost Market Value
% ofNet
Assets
Transferable securities and money market instruments admitted to an official stock exchange listing
Shares (continued)
United Kingdom (continued)British American Tobacco PLC 95,506 GBP 3,832,682 2,674,168 3.36British Land REIT Co. PLC 38,634 GBP 243,247 191,200 0.24BT Group PLC 366,065 GBP 1,089,491 710,166 0.89Bunzl PLC 14,072 GBP 289,912 336,180 0.42Burberry Group PLC 16,773 GBP 272,356 346,530 0.44Compass Group PLC 74,539 GBP 1,023,866 1,134,484 1.43Croda International PLC 5,626 GBP 246,661 414,524 0.52Diageo PLC 96,078 GBP 2,246,227 3,325,260 4.18DS Smith PLC 53,309 GBP 235,278 222,778 0.28Evraz PLC 24,087 GBP 98,670 142,595 0.18Fresnillo PLC 7,681 GBP 51,369 59,267 0.07GlaxoSmithKline PLC 206,804 GBP 3,109,212 2,935,376 3.69Halma PLC 15,827 GBP 234,279 426,063 0.54Hargreaves Lansdown PLC 15,801 GBP 230,756 251,078 0.32Hikma Pharmaceuticals PLC 7,050 GBP 151,802 172,443 0.22HSBC Holdings PLC 854,871 GBP 5,231,183 3,567,377 4.48Imperial Brands PLC 39,414 GBP 1,116,006 613,676 0.77Informa PLC 62,529 GBP 407,692 313,645 0.39InterContinental Hotels Group PLC 7,649 GBP 302,842 367,917 0.46Intermediate Capital Group PLC 11,652 GBP 99,163 247,488 0.31Intertek Group PLC 6,741 GBP 265,991 372,777 0.47ITV PLC 155,655 GBP 198,358 195,425 0.25J Sainsbury PLC 68,756 GBP 173,498 186,879 0.23JD Sports Fashion PLC 20,587 GBP 127,663 189,195 0.24Johnson Matthey PLC 7,935 GBP 240,114 243,843 0.31Kingfisher PLC 88,256 GBP 193,715 321,693 0.40Land Securities Group REIT PLC 29,771 GBP 293,614 201,073 0.25Legal & General Group PLC 247,892 GBP 601,463 638,570 0.80Lloyds Banking Group PLC 2,962,914 GBP 1,824,414 1,383,385 1.74London Stock Exchange Group PLC 15,188 GBP 677,436 1,210,484 1.52M&G PLC 108,605 GBP 233,890 248,597 0.31Melrose Industries PLC 201,012 GBP 421,605 311,770 0.39Mondi PLC 20,243 GBP 330,375 384,819 0.48National Grid PLC 143,390 GBP 1,369,149 1,320,335 1.66Natwest Group PLC 219,005 GBP 534,537 445,018 0.56Next PLC 5,317 GBP 289,357 417,704 0.53Ocado Group PLC 20,328 GBP 267,257 407,170 0.51Pearson PLC 31,574 GBP 275,516 262,064 0.33Persimmon PLC 13,265 GBP 271,055 392,379 0.49Phoenix Group Holdings PLC 26,355 GBP 183,745 178,265 0.22Prudential PLC 109,382 GBP 1,448,637 1,502,362 1.89Reckitt Benckiser Group PLC 26,527 GBP 1,689,542 1,696,932 2.13RELX PLC 77,805 GBP 1,206,032 1,493,078 1.88Rentokil Initial PLC 77,739 GBP 243,865 384,808 0.48Rightmove PLC 35,877 GBP 192,184 232,985 0.29Rio Tinto PLC 45,455 GBP 1,618,283 2,704,118 3.40Rolls-Royce Holdings PLC 311,975 GBP 627,471 308,606 0.39Royal Dutch Shell PLC-A- 171,669 GBP 3,430,008 2,483,707 3.12
Xtrackers**
Xtrackers FTSE 100 UCITS ETF (continued)
Statement of Investmentsas at 30 June 2021(expressed in GBP)
** This includes synthetic ETFs.
The accompanying notes form an integral part of these financial statements.
298

Description QuantityCurrency
(local) Cost Market Value
% ofNet
Assets
Transferable securities and money market instruments admitted to an official stock exchange listing
Shares (continued)
United Kingdom (continued)Royal Dutch Shell PLC-B- 155,137 GBP 3,055,582 2,170,367 2.73Royal Mail PLC 38,286 GBP 229,173 221,063 0.28Sage Group PLC 45,114 GBP 265,473 308,670 0.39Schroders PLC 4,665 GBP 137,274 163,881 0.21Scottish Mortgage Investment Trust PLC 59,464 GBP 305,596 791,466 0.99Segro REIT PLC 50,076 GBP 319,004 548,082 0.69Severn Trent PLC 10,033 GBP 217,824 250,925 0.32Smith & Nephew PLC 36,881 GBP 469,531 576,266 0.72Smiths Group PLC 16,567 GBP 224,452 263,415 0.33Spirax-Sarco Engineering PLC 3,070 GBP 211,534 417,980 0.53SSE PLC 43,754 GBP 617,543 656,529 0.83St James’s Place PLC 22,260 GBP 223,188 328,780 0.41Standard Chartered PLC 106,827 GBP 804,826 492,472 0.62Standard Life Aberdeen PLC 89,772 GBP 353,695 243,282 0.31Taylor Wimpey PLC 151,196 GBP 242,037 240,326 0.30Tesco PLC 319,433 GBP 853,214 712,176 0.90Unilever PLC 109,187 GBP 4,543,454 4,619,156 5.81United Utilities Group PLC 28,504 GBP 253,504 277,743 0.35Vodafone Group PLC 1,174,226 GBP 2,225,431 1,424,806 1.79Weir Group PLC 10,822 GBP 190,606 200,315 0.25Whitbread PLC 8,429 GBP 267,801 263,153 0.33
69,356,444 70,382,341 88.47
Total - Shares 76,206,977 79,247,721 99.61
Total Transferable securities and money market instruments admitted to an officialstock exchange listing 76,206,977 79,247,721 99.61
Other transferable securities and money market instruments
Shares
United KingdomNMC Health PLC(1) 4,193 GBP 103,837 1 0.00
103,837 1 0.00
Total - Shares 103,837 1 0.00
Total Other transferable securities and money market instruments 103,837 1 0.00
TOTAL INVESTMENT PORTFOLIO 76,310,814 79,247,722 99.61
(1) The security is fair valued.
Xtrackers**
Xtrackers FTSE 100 UCITS ETF (continued)
Statement of Investmentsas at 30 June 2021(expressed in GBP)
** This includes synthetic ETFs.
The accompanying notes form an integral part of these financial statements.
299

Description QuantityCurrency
(local) Cost Market Value
% ofNet
Assets
Transferable securities and money market instruments admitted to an official stock exchange listing
Shares
JapanAdvantest Corp. 548,539 JPY 2,853,526,182 5,490,875,390 2.50Aeon Co. Ltd. 274,041 JPY 691,389,932 818,012,385 0.37AGC Inc. 54,941 JPY 209,701,665 256,025,060 0.12Ajinomoto Co. Inc. 274,042 JPY 568,691,208 790,337,128 0.36Alps Alpine Co. Ltd. 274,934 JPY 560,421,181 322,497,582 0.15Amada Co. Ltd. 275,122 JPY 317,852,972 308,962,006 0.14ANA Holdings Inc. 28,247 JPY 88,208,932 73,781,164 0.03Aozora Bank Ltd. 28,445 JPY 77,868,868 70,685,825 0.03Asahi Group Holdings Ltd. 273,928 JPY 1,264,823,992 1,421,960,248 0.65Asahi Kasei Corp. 275,578 JPY 319,442,636 336,342,949 0.15Astellas Pharma Inc. 1,370,726 JPY 2,299,544,617 2,651,669,447 1.21Bandai Namco Holdings Inc. 274,076 JPY 1,949,308,042 2,112,577,808 0.96Bridgestone Corp. 274,028 JPY 1,117,129,185 1,385,211,540 0.63Canon Inc. 412,235 JPY 1,133,054,053 1,035,946,555 0.47Casio Computer Co. Ltd. 273,523 JPY 495,538,810 507,932,211 0.23Central Japan Railway Co. 27,453 JPY 521,370,364 462,583,050 0.21Chiba Bank Ltd. 279,109 JPY 180,876,885 186,723,921 0.08Chubu Electric Power Co. Inc. 27,343 JPY 39,956,743 37,131,794 0.02Chugai Pharmaceutical Co. Ltd. 822,170 JPY 2,922,954,800 3,619,192,340 1.65Citizen Watch Co. Ltd. 283,030 JPY 142,699,804 116,042,300 0.05COMSYS Holdings Corp. 273,732 JPY 828,398,079 841,725,900 0.38Concordia Financial Group Ltd. 273,187 JPY 122,094,586 111,187,109 0.05Credit Saison Co. Ltd. 274,443 JPY 413,873,359 371,595,822 0.17CyberAgent Inc. 219,536 JPY 310,471,696 523,593,360 0.24Dai Nippon Printing Co. Ltd. 137,487 JPY 327,870,223 322,956,963 0.15Dai-ichi Life Holdings Inc. 28,543 JPY 51,836,484 58,056,462 0.03Daiichi Sankyo Co. Ltd. 821,264 JPY 2,015,081,181 1,966,516,648 0.89Daikin Industries Ltd. 274,231 JPY 4,732,314,858 5,673,839,390 2.58Daiwa House Industry Co. Ltd. 274,836 JPY 906,649,661 916,578,060 0.42Daiwa Securities Group Inc. 279,662 JPY 154,506,931 170,621,786 0.08DeNA Co. Ltd. 82,375 JPY 159,096,369 194,487,375 0.09Denka Co. Ltd. 55,108 JPY 189,597,254 203,624,060 0.09Denso Corp. 273,835 JPY 1,451,852,478 2,075,395,465 0.94Dentsu Group Inc. 274,428 JPY 1,081,168,010 1,090,851,300 0.50DIC Corp. 28,890 JPY 85,696,120 81,036,450 0.04Dowa Holdings Co. Ltd. 55,141 JPY 207,615,622 241,241,875 0.11East Japan Railway Co. 27,751 JPY 243,320,140 219,982,177 0.10Ebara Corp. 55,510 JPY 187,604,625 303,639,700 0.14Eisai Co. Ltd. 273,928 JPY 2,146,742,459 2,992,663,400 1.36ENEOS Holdings Inc. 273,230 JPY 138,030,125 127,024,627 0.06FANUC Corp. 274,260 JPY 6,196,135,591 7,348,796,700 3.34Fast Retailing Co. Ltd. 274,168 JPY 18,479,158,769 22,928,669,840 10.43Fuji Electric Co. Ltd. 55,550 JPY 203,354,005 288,304,500 0.13FUJIFILM Holdings Corp. 274,534 JPY 1,439,453,317 2,261,885,626 1.03Fujikura Ltd. 273,016 JPY 135,087,153 140,876,256 0.06Fujitsu Ltd. 27,264 JPY 298,404,187 567,091,200 0.26Fukuoka Financial Group Inc. 54,519 JPY 121,208,035 105,712,341 0.05Furukawa Electric Co. Ltd. 27,342 JPY 85,132,474 75,655,314 0.03
Xtrackers**
Xtrackers NIKKEI 225 UCITS ETF
Statement of Investmentsas at 30 June 2021(expressed in JPY)
** This includes synthetic ETFs.
The accompanying notes form an integral part of these financial statements.
300

Description QuantityCurrency
(local) Cost Market Value
% ofNet
Assets
Transferable securities and money market instruments admitted to an official stock exchange listing
Shares (continued)
Japan (continued)GS Yuasa Corp. 54,463 JPY 130,839,320 154,402,605 0.07Haseko Corp. 54,231 JPY 73,490,495 82,539,582 0.04Hino Motors Ltd. 273,622 JPY 275,887,269 267,328,694 0.12Hitachi Construction Machinery Co. Ltd. 273,330 JPY 848,769,057 927,955,350 0.42Hitachi Ltd. 55,004 JPY 221,020,998 349,880,444 0.16Hitachi Zosen Corp. 54,229 JPY 25,775,787 38,882,193 0.02Honda Motor Co. Ltd. 548,605 JPY 1,685,654,551 1,947,547,750 0.89Idemitsu Kosan Co. Ltd. 109,742 JPY 337,662,157 294,437,786 0.13IHI Corp. 27,245 JPY 68,700,844 71,817,820 0.03Inpex Corp. 108,864 JPY 100,337,266 90,248,256 0.04Isetan Mitsukoshi Holdings Ltd. 272,013 JPY 243,284,219 210,538,062 0.10Isuzu Motors Ltd. 137,274 JPY 168,913,102 201,380,958 0.09ITOCHU Corp. 273,967 JPY 672,061,474 876,694,400 0.40J Front Retailing Co. Ltd. 136,275 JPY 167,946,548 134,230,875 0.06Japan Exchange Group Inc. 274,285 JPY 737,248,955 677,483,950 0.31Japan Post Holdings Co. Ltd. 273,901 JPY 278,950,703 249,332,080 0.11Japan Steel Works Ltd. 54,033 JPY 132,002,192 154,210,182 0.07Japan Tobacco Inc. 274,540 JPY 687,180,136 576,122,190 0.26JFE Holdings Inc. 27,343 JPY 40,452,537 35,573,243 0.02JGC Holdings Corp. 274,924 JPY 413,226,252 284,546,340 0.13JTEKT Corp. 275,019 JPY 336,432,231 313,246,641 0.14Kajima Corp. 137,417 JPY 203,235,180 193,345,719 0.09Kansai Electric Power Co. Inc. 27,343 JPY 33,726,131 28,969,909 0.01Kao Corp. 274,129 JPY 2,201,573,890 1,873,671,715 0.85Kawasaki Heavy Industries Ltd. 28,245 JPY 71,112,299 67,081,875 0.03Kawasaki Kisen Kaisha Ltd. 28,045 JPY 54,807,917 112,039,775 0.05KDDI Corp. 1,644,706 JPY 4,963,107,670 5,698,906,290 2.59Keio Corp. 54,439 JPY 362,819,688 355,486,670 0.16Keisei Electric Railway Co. Ltd. 136,988 JPY 511,880,824 485,622,460 0.22Kikkoman Corp. 274,227 JPY 1,572,078,380 2,010,083,910 0.91Kirin Holdings Co. Ltd. 273,740 JPY 644,182,229 592,920,840 0.27Kobe Steel Ltd. 27,243 JPY 18,962,455 19,424,259 0.01Komatsu Ltd. 274,237 JPY 763,876,051 757,031,239 0.34Konami Holdings Corp. 274,226 JPY 1,374,408,715 1,829,087,420 0.83Konica Minolta Inc. 272,844 JPY 186,686,052 167,526,216 0.08Kubota Corp. 274,141 JPY 523,551,711 615,994,827 0.28Kuraray Co. Ltd. 276,221 JPY 368,635,702 294,727,807 0.13Kyocera Corp. 547,901 JPY 3,592,167,416 3,762,984,068 1.71Kyowa Kirin Co. Ltd. 274,436 JPY 675,463,581 1,081,277,840 0.49M3 Inc. 658,246 JPY 3,279,173,172 5,340,349,798 2.43Marubeni Corp. 273,984 JPY 204,457,130 264,695,942 0.12Maruha Nichiro Corp. 27,343 JPY 77,083,699 64,556,823 0.03Marui Group Co. Ltd. 273,733 JPY 585,591,907 571,554,504 0.26Matsui Securities Co. Ltd. 276,216 JPY 259,492,619 223,734,960 0.10Mazda Motor Corp. 54,230 JPY 54,411,975 56,616,120 0.03MEIJI Holdings Co. Ltd. 54,743 JPY 428,944,067 364,040,950 0.17MINEBEA MITSUMI Inc. 274,035 JPY 562,386,506 805,388,865 0.37Mitsubishi Chemical Holdings Corp. 136,248 JPY 106,798,605 127,187,508 0.06
Xtrackers**
Xtrackers NIKKEI 225 UCITS ETF (continued)
Statement of Investmentsas at 30 June 2021(expressed in JPY)
** This includes synthetic ETFs.
The accompanying notes form an integral part of these financial statements.
301

Description QuantityCurrency
(local) Cost Market Value
% ofNet
Assets
Transferable securities and money market instruments admitted to an official stock exchange listing
Shares (continued)
Japan (continued)Mitsubishi Corp. 273,338 JPY 759,081,744 827,667,464 0.38Mitsubishi Electric Corp. 274,548 JPY 419,428,582 442,708,650 0.20Mitsubishi Estate Co. Ltd. 272,842 JPY 516,254,050 490,160,653 0.22Mitsubishi Heavy Industries Ltd. 27,553 JPY 98,975,983 90,070,757 0.04Mitsubishi Logistics Corp. 137,283 JPY 404,543,798 451,661,070 0.21Mitsubishi Materials Corp. 27,342 JPY 75,599,824 60,562,530 0.03Mitsubishi Motors Corp. 27,442 JPY 12,561,342 8,561,904 0.00Mitsubishi UFJ Financial Group Inc. 280,782 JPY 158,098,738 168,497,278 0.08Mitsui & Co. Ltd. 273,741 JPY 512,584,491 684,489,371 0.31Mitsui Chemicals Inc. 55,134 JPY 153,926,007 211,438,890 0.10Mitsui E&S Holdings Co. Ltd. 27,445 JPY 26,500,093 14,243,955 0.01Mitsui Fudosan Co. Ltd. 274,325 JPY 668,980,628 705,838,225 0.32Mitsui Mining & Smelting Co. Ltd. 28,045 JPY 90,830,347 86,378,600 0.04Mitsui OSK Lines Ltd. 27,945 JPY 80,910,569 149,226,300 0.07Mizuho Financial Group Inc. 27,116 JPY 44,223,673 43,046,650 0.02MS&AD Insurance Group Holdings Inc. 82,234 JPY 273,824,636 263,806,672 0.12NEC Corp. 27,753 JPY 130,164,557 158,747,160 0.07Nexon Co. Ltd. 547,075 JPY 1,626,687,490 1,354,557,700 0.62NGK Insulators Ltd. 274,122 JPY 483,963,258 510,963,408 0.23NH Foods Ltd. 136,893 JPY 621,722,003 591,377,760 0.27Nichirei Corp. 137,087 JPY 375,647,881 400,156,953 0.18Nikon Corp. 274,421 JPY 351,991,898 325,188,885 0.15Nippon Electric Glass Co. Ltd. 81,821 JPY 212,150,677 213,552,810 0.10Nippon Express Co. Ltd. 27,136 JPY 180,670,560 229,570,560 0.10Nippon Light Metal Holdings Co. Ltd. 27,116 JPY 58,608,722 50,706,920 0.02Nippon Paper Industries Co. Ltd. 27,343 JPY 45,900,548 34,014,692 0.02Nippon Sheet Glass Co. Ltd. 27,243 JPY 18,637,332 17,299,305 0.01Nippon Steel Corp. 27,343 JPY 46,860,429 51,227,111 0.02Nippon Suisan Kaisha Ltd. 271,680 JPY 150,064,149 143,718,720 0.07Nippon Telegraph & Telephone Corp. 109,857 JPY 282,678,659 317,981,087 0.14Nippon Yusen KK 27,345 JPY 61,973,765 153,952,350 0.07Nissan Chemical Corp. 273,927 JPY 1,437,161,327 1,490,162,880 0.68Nissan Motor Co. Ltd. 270,821 JPY 190,860,725 149,303,617 0.07Nisshin Seifun Group Inc. 274,634 JPY 533,555,777 446,280,250 0.20Nisshinbo Holdings Inc. 274,151 JPY 261,270,122 262,910,809 0.12Nitto Denko Corp. 273,927 JPY 2,043,433,059 2,270,854,830 1.03Nomura Holdings Inc. 277,382 JPY 148,367,623 157,497,500 0.07NSK Ltd. 275,522 JPY 290,216,776 258,715,158 0.12NTN Corp. 268,536 JPY 88,594,912 77,875,440 0.04NTT Data Corp. 1,370,909 JPY 1,903,994,550 2,375,785,297 1.08Obayashi Corp. 274,812 JPY 288,277,483 242,658,996 0.11Odakyu Electric Railway Co. Ltd. 137,088 JPY 375,336,041 384,668,928 0.17Oji Holdings Corp. 270,769 JPY 159,875,596 172,750,622 0.08Oki Electric Industry Co. Ltd. 27,243 JPY 34,729,231 27,733,374 0.01OKUMA Corp. 54,846 JPY 321,225,278 297,813,780 0.14Olympus Corp. 1,096,784 JPY 1,833,419,208 2,421,699,072 1.10Omron Corp. 273,910 JPY 1,895,702,781 2,413,147,100 1.10Osaka Gas Co. Ltd. 56,768 JPY 119,679,647 117,452,992 0.05
Xtrackers**
Xtrackers NIKKEI 225 UCITS ETF (continued)
Statement of Investmentsas at 30 June 2021(expressed in JPY)
** This includes synthetic ETFs.
The accompanying notes form an integral part of these financial statements.
302
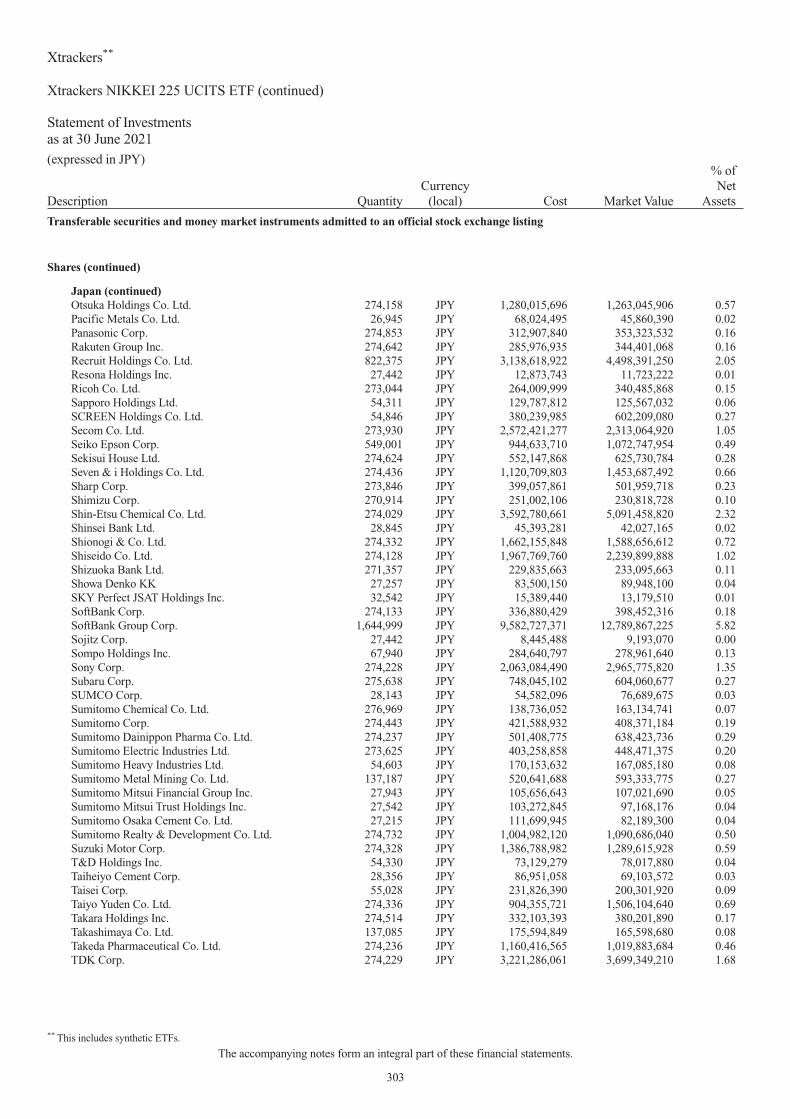
Description QuantityCurrency
(local) Cost Market Value
% ofNet
Assets
Transferable securities and money market instruments admitted to an official stock exchange listing
Shares (continued)
Japan (continued)Otsuka Holdings Co. Ltd. 274,158 JPY 1,280,015,696 1,263,045,906 0.57Pacific Metals Co. Ltd. 26,945 JPY 68,024,495 45,860,390 0.02Panasonic Corp. 274,853 JPY 312,907,840 353,323,532 0.16Rakuten Group Inc. 274,642 JPY 285,976,935 344,401,068 0.16Recruit Holdings Co. Ltd. 822,375 JPY 3,138,618,922 4,498,391,250 2.05Resona Holdings Inc. 27,442 JPY 12,873,743 11,723,222 0.01Ricoh Co. Ltd. 273,044 JPY 264,009,999 340,485,868 0.15Sapporo Holdings Ltd. 54,311 JPY 129,787,812 125,567,032 0.06SCREEN Holdings Co. Ltd. 54,846 JPY 380,239,985 602,209,080 0.27Secom Co. Ltd. 273,930 JPY 2,572,421,277 2,313,064,920 1.05Seiko Epson Corp. 549,001 JPY 944,633,710 1,072,747,954 0.49Sekisui House Ltd. 274,624 JPY 552,147,868 625,730,784 0.28Seven & i Holdings Co. Ltd. 274,436 JPY 1,120,709,803 1,453,687,492 0.66Sharp Corp. 273,846 JPY 399,057,861 501,959,718 0.23Shimizu Corp. 270,914 JPY 251,002,106 230,818,728 0.10Shin-Etsu Chemical Co. Ltd. 274,029 JPY 3,592,780,661 5,091,458,820 2.32Shinsei Bank Ltd. 28,845 JPY 45,393,281 42,027,165 0.02Shionogi & Co. Ltd. 274,332 JPY 1,662,155,848 1,588,656,612 0.72Shiseido Co. Ltd. 274,128 JPY 1,967,769,760 2,239,899,888 1.02Shizuoka Bank Ltd. 271,357 JPY 229,835,663 233,095,663 0.11Showa Denko KK 27,257 JPY 83,500,150 89,948,100 0.04SKY Perfect JSAT Holdings Inc. 32,542 JPY 15,389,440 13,179,510 0.01SoftBank Corp. 274,133 JPY 336,880,429 398,452,316 0.18SoftBank Group Corp. 1,644,999 JPY 9,582,727,371 12,789,867,225 5.82Sojitz Corp. 27,442 JPY 8,445,488 9,193,070 0.00Sompo Holdings Inc. 67,940 JPY 284,640,797 278,961,640 0.13Sony Corp. 274,228 JPY 2,063,084,490 2,965,775,820 1.35Subaru Corp. 275,638 JPY 748,045,102 604,060,677 0.27SUMCO Corp. 28,143 JPY 54,582,096 76,689,675 0.03Sumitomo Chemical Co. Ltd. 276,969 JPY 138,736,052 163,134,741 0.07Sumitomo Corp. 274,443 JPY 421,588,932 408,371,184 0.19Sumitomo Dainippon Pharma Co. Ltd. 274,237 JPY 501,408,775 638,423,736 0.29Sumitomo Electric Industries Ltd. 273,625 JPY 403,258,858 448,471,375 0.20Sumitomo Heavy Industries Ltd. 54,603 JPY 170,153,632 167,085,180 0.08Sumitomo Metal Mining Co. Ltd. 137,187 JPY 520,641,688 593,333,775 0.27Sumitomo Mitsui Financial Group Inc. 27,943 JPY 105,656,643 107,021,690 0.05Sumitomo Mitsui Trust Holdings Inc. 27,542 JPY 103,272,845 97,168,176 0.04Sumitomo Osaka Cement Co. Ltd. 27,215 JPY 111,699,945 82,189,300 0.04Sumitomo Realty & Development Co. Ltd. 274,732 JPY 1,004,982,120 1,090,686,040 0.50Suzuki Motor Corp. 274,328 JPY 1,386,788,982 1,289,615,928 0.59T&D Holdings Inc. 54,330 JPY 73,129,279 78,017,880 0.04Taiheiyo Cement Corp. 28,356 JPY 86,951,058 69,103,572 0.03Taisei Corp. 55,028 JPY 231,826,390 200,301,920 0.09Taiyo Yuden Co. Ltd. 274,336 JPY 904,355,721 1,506,104,640 0.69Takara Holdings Inc. 274,514 JPY 332,103,393 380,201,890 0.17Takashimaya Co. Ltd. 137,085 JPY 175,594,849 165,598,680 0.08Takeda Pharmaceutical Co. Ltd. 274,236 JPY 1,160,416,565 1,019,883,684 0.46TDK Corp. 274,229 JPY 3,221,286,061 3,699,349,210 1.68
Xtrackers**
Xtrackers NIKKEI 225 UCITS ETF (continued)
Statement of Investmentsas at 30 June 2021(expressed in JPY)
** This includes synthetic ETFs.
The accompanying notes form an integral part of these financial statements.
303

Description QuantityCurrency
(local) Cost Market Value
% ofNet
Assets
Transferable securities and money market instruments admitted to an official stock exchange listing
Shares (continued)
Japan (continued)Teijin Ltd. 57,030 JPY 111,945,079 96,551,790 0.04Terumo Corp. 1,096,922 JPY 3,997,062,026 4,938,342,844 2.25Tobu Railway Co. Ltd. 54,103 JPY 181,562,873 155,383,816 0.07Toho Co. Ltd. 27,244 JPY 113,114,671 124,777,520 0.06Toho Zinc Co. Ltd. 27,345 JPY 76,144,110 51,435,945 0.02Tokai Carbon Co. Ltd. 275,419 JPY 356,188,764 421,941,908 0.19Tokio Marine Holdings Inc. 136,989 JPY 733,342,923 699,739,812 0.32Tokuyama Corp. 54,261 JPY 143,214,739 122,738,382 0.06Tokyo Electric Power Co. Holdings Inc. 27,442 JPY 11,864,528 9,055,860 0.00Tokyo Electron Ltd. 274,230 JPY 7,056,882,324 13,184,978,400 6.00Tokyo Gas Co. Ltd. 54,732 JPY 140,517,158 114,773,004 0.05Tokyo Tatemono Co. Ltd. 136,174 JPY 197,338,026 215,699,616 0.10Tokyu Corp. 136,035 JPY 231,737,999 205,548,885 0.09Tokyu Fudosan Holdings Corp. 278,084 JPY 177,228,985 185,760,112 0.08TOPPAN Inc. 137,187 JPY 242,772,179 244,878,795 0.11Toray Industries Inc. 274,459 JPY 199,902,983 202,852,647 0.09Tosoh Corp. 137,295 JPY 233,625,337 263,057,220 0.12TOTO Ltd. 137,186 JPY 691,342,503 788,819,500 0.36Toyo Seikan Group Holdings Ltd. 274,620 JPY 443,308,012 416,598,540 0.19Toyobo Co. Ltd. 27,345 JPY 42,438,349 36,450,885 0.02Toyota Motor Corp. 273,928 JPY 1,999,855,804 2,659,840,880 1.21Toyota Tsusho Corp. 274,230 JPY 1,015,987,100 1,439,707,500 0.65Trend Micro Inc. 274,127 JPY 1,578,574,209 1,595,419,140 0.73Ube Industries Ltd. 27,345 JPY 62,267,231 61,498,905 0.03Unitika Ltd. 27,545 JPY 12,657,425 9,695,840 0.00West Japan Railway Co. 27,363 JPY 196,703,919 173,317,242 0.08Yamaha Corp. 274,427 JPY 1,475,258,184 1,654,794,810 0.75Yamaha Motor Co. Ltd. 273,837 JPY 617,175,316 826,987,740 0.38Yamato Holdings Co. Ltd. 273,132 JPY 687,054,123 863,097,120 0.39Yaskawa Electric Corp. 274,027 JPY 1,143,870,388 1,487,966,610 0.68Yokogawa Electric Corp. 273,323 JPY 539,378,910 453,716,180 0.21Yokohama Rubber Co. Ltd. 136,891 JPY 272,697,740 325,663,689 0.15Z Holdings Corp. 117,665 JPY 57,536,983 65,515,872 0.03
181,144,374,211 219,234,445,889 99.73
Total - Shares 181,144,374,211 219,234,445,889 99.73
Total Transferable securities and money market instruments admitted to an officialstock exchange listing 181,144,374,211 219,234,445,889 99.73
TOTAL INVESTMENT PORTFOLIO 181,144,374,211 219,234,445,889 99.73
Xtrackers**
Xtrackers NIKKEI 225 UCITS ETF (continued)
Statement of Investmentsas at 30 June 2021(expressed in JPY)
** This includes synthetic ETFs.
The accompanying notes form an integral part of these financial statements.
304

Description QuantityCurrency
(local) Cost Market Value
% ofNet
Assets
Transferable securities and money market instruments admitted to an official stock exchange listing(A)
Shares
Cayman IslandsChina Resources Microelectronics Ltd.-A- 65,900 CNY 751,109 928,761 0.13
751,109 928,761 0.13China360 Security Technology Inc.-A- 98,900 CNY 364,078 186,979 0.03360 Security Technology Inc.-A- 442,400 CNY 1,175,503 836,397 0.11Agricultural Bank of China Ltd.-A- 1,510,200 CNY 758,766 708,531 0.10Agricultural Bank of China Ltd.-A- 5,055,200 CNY 2,620,162 2,371,716 0.33Aier Eye Hospital Group Co. Ltd.-A- 123,478 CNY 544,071 1,357,086 0.19Aier Eye Hospital Group Co. Ltd.-A- 471,513 CNY 2,457,175 5,182,168 0.71Air China Ltd.-A- 632,214 CNY 815,311 761,597 0.10Air China Ltd.-A- 93,300 CNY 107,981 112,394 0.02Aluminum Corp. of China Ltd.-A- 492,757 CNY 349,500 404,381 0.06Aluminum Corp. of China Ltd.-A- 991,370 CNY 541,320 813,567 0.11Anhui Conch Cement Co. Ltd.-A- 121,537 CNY 671,054 772,509 0.11Anhui Conch Cement Co. Ltd.-A- 443,712 CNY 3,061,897 2,820,305 0.39Anhui Gujing Distillery Co. Ltd.-A- 5,300 CNY 91,033 196,546 0.03Anhui Gujing Distillery Co. Ltd.-A- 21,400 CNY 427,646 793,599 0.11Asymchem Laboratories Tianjin Co. Ltd.-A- 6,700 CNY 281,031 386,544 0.05Asymchem Laboratories Tianjin Co. Ltd.-A- 27,900 CNY 1,182,496 1,609,640 0.22Autobio Diagnostics Co. Ltd.-A- 34,200 CNY 612,204 401,241 0.05Autobio Diagnostics Co. Ltd.-A- 8,060 CNY 145,586 94,561 0.01Avary Holdings Shenzhen Co. Ltd.-A- 49,152 CNY 201,525 273,071 0.04Avary Holdings Shenzhen Co. Ltd.-A- 127,325 CNY 988,093 707,372 0.10AVIC Aircraft Co. Ltd.-A- 83,749 CNY 300,745 340,790 0.05AVIC Aircraft Co. Ltd.-A- 296,784 CNY 1,010,999 1,207,668 0.17AVIC Industry-Finance Holdings Co. Ltd.-A- 978,993 CNY 697,478 586,641 0.08AVIC Industry-Finance Holdings Co. Ltd.-A- 212,900 CNY 210,760 127,576 0.02AVIC Jonhon Optronic Technology Co. Ltd.-A- 44,200 CNY 225,656 540,805 0.07AVIC Jonhon Optronic Technology Co. Ltd.-A- 88,487 CNY 659,945 1,082,675 0.15AVIC Shenyang Aircraft Co. Ltd.-A- 36,400 CNY 131,630 339,860 0.05AVIC Shenyang Aircraft Co. Ltd.-A- 116,775 CNY 676,636 1,090,307 0.15Bank of Beijing Co. Ltd.-A- 758,611 CNY 709,653 572,045 0.08Bank of Beijing Co. Ltd.-A- 2,624,470 CNY 2,131,426 1,979,030 0.27Bank of Chengdu Co. Ltd.-A- 100,500 CNY 130,460 196,696 0.03Bank of Chengdu Co. Ltd.-A- 384,417 CNY 519,295 752,370 0.10Bank of China Ltd.-A- 1,045,600 CNY 588,569 498,653 0.07Bank of China Ltd.-A- 3,876,006 CNY 2,022,268 1,848,489 0.25Bank of Communications Co. Ltd.-A- 1,392,612 CNY 1,199,243 1,056,594 0.14Bank of Communications Co. Ltd.-A- 4,804,500 CNY 3,858,906 3,645,239 0.50Bank of Hangzhou Co. Ltd.-A- 151,984 CNY 234,635 347,114 0.05Bank of Hangzhou Co. Ltd.-A- 521,152 CNY 826,412 1,190,250 0.16Bank of Jiangsu Co. Ltd.-A- 587,830 CNY 600,407 646,237 0.09Bank of Jiangsu Co. Ltd.-A- 2,071,672 CNY 1,871,333 2,277,514 0.31Bank of Nanjing Co. Ltd.-A- 259,156 CNY 290,198 422,142 0.06Bank of Nanjing Co. Ltd.-A- 895,617 CNY 1,050,321 1,458,881 0.20Bank of Ningbo Co. Ltd.-A- 180,099 CNY 541,075 1,086,735 0.15Bank of Ningbo Co. Ltd.-A- 624,730 CNY 2,586,226 3,769,681 0.52Bank of Shanghai Co. Ltd.-A- 489,691 CNY 632,395 621,753 0.09
Xtrackers**
Xtrackers HARVEST CSI300 UCITS ETF
Statement of Investmentsas at 30 June 2021(expressed in USD)
** This includes synthetic ETFs.
The accompanying notes form an integral part of these financial statements.
305

Description QuantityCurrency
(local) Cost Market Value
% ofNet
Assets
Transferable securities and money market instruments admitted to an official stock exchange listing(A)
Shares (continued)
China (continued)Bank of Shanghai Co. Ltd.-A- 1,767,732 CNY 2,220,247 2,244,461 0.31Baoshan Iron & Steel Co. Ltd.-A- 509,740 CNY 516,303 603,009 0.08Baoshan Iron & Steel Co. Ltd.-A- 1,506,873 CNY 1,455,268 1,782,591 0.24Beijing Kingsoft Office Software Inc.-A- 43,700 CNY 2,864,831 2,671,409 0.37Beijing New Building Materials PLC-A- 48,200 CNY 179,580 292,933 0.04Beijing New Building Materials PLC-A- 181,905 CNY 759,641 1,105,519 0.15Beijing Oriental Yuhong Waterproof Technology Co.Ltd.-A- 140,300 CNY 300,227 1,201,771 0.16Beijing Oriental Yuhong Waterproof Technology Co.Ltd.-A- 265,726 CNY 1,235,970 2,276,135 0.31Beijing Roborock Technology Co. Ltd.-A- 6,300 CNY 1,335,515 1,230,092 0.17Beijing Shiji Information Technology Co. Ltd.-A- 27,095 CNY 109,463 98,633 0.01Beijing Shiji Information Technology Co. Ltd.-A- 93,129 CNY 319,926 339,015 0.05Beijing Shunxin Agriculture Co. Ltd.-A- 90,500 CNY 749,531 591,067 0.08Beijing Shunxin Agriculture Co. Ltd.-A- 21,200 CNY 178,340 138,460 0.02Beijing Tiantan Biological Products Corp. Ltd.-A- 32,500 CNY 197,962 172,356 0.02Beijing Tiantan Biological Products Corp. Ltd.-A- 122,700 CNY 737,614 650,709 0.09Beijing Tongrentang Co. Ltd.-A- 54,250 CNY 246,977 343,142 0.05Beijing Tongrentang Co. Ltd.-A- 99,620 CNY 418,235 630,116 0.09Beijing Wantai Biological Pharmacy Enterprise Co.Ltd.-A- 16,140 CNY 344,331 647,719 0.09Beijing-Shanghai High Speed Railway Co. Ltd.-A- 947,600 CNY 872,488 776,180 0.11Beijing-Shanghai High Speed Railway Co. Ltd.-A- 3,622,300 CNY 3,260,692 2,967,030 0.41Betta Pharmaceuticals Co. Ltd.-A- 43,211 CNY 750,276 724,209 0.10Betta Pharmaceuticals Co. Ltd.-A- 11,700 CNY 203,877 196,090 0.03BGI Genomics Co. Ltd.-A- 35,500 CNY 711,015 651,921 0.09BGI Genomics Co. Ltd.-A- 9,700 CNY 192,268 178,130 0.02Bloomage Biotechnology Corp. Ltd.-A- 17,728 CNY 640,181 762,724 0.10Bluestar Adisseo Co.-A- 26,000 CNY 45,638 48,149 0.01Bluestar Adisseo Co.-A- 100,500 CNY 179,764 186,114 0.03BOC International China Co. Ltd.-A- 76,100 CNY 299,404 242,618 0.03BOC International China Co. Ltd.-A- 105,800 CNY 271,227 337,306 0.05BOE Technology Group Co. Ltd.-A- 1,676,900 CNY 1,047,841 1,620,218 0.22BOE Technology Group Co. Ltd.-A- 5,957,300 CNY 4,022,094 5,755,935 0.79BYD Co. Ltd.-A- 43,928 CNY 486,744 1,707,249 0.23BYD Co. Ltd.-A- 157,877 CNY 2,114,312 6,135,845 0.84Caitong Securities Co. Ltd.-A- 54,700 CNY 96,640 88,847 0.01Caitong Securities Co. Ltd.-A- 489,308 CNY 805,746 794,767 0.11CGN Power Co. Ltd.-A- 589,900 CNY 251,995 243,877 0.03CGN Power Co. Ltd.-A- 2,366,500 CNY 1,018,348 978,362 0.13Changchun High & New Technology IndustryGroup Inc.-A- 17,200 CNY 465,116 1,030,674 0.14Changchun High & New Technology IndustryGroup Inc.-A- 44,690 CNY 1,725,003 2,677,954 0.37Changjiang Securities Co. Ltd.-A- 196,439 CNY 257,900 222,649 0.03Changjiang Securities Co. Ltd.-A- 685,000 CNY 721,349 776,396 0.11Changzhou Xingyu Automotive Lighting Systems Co.Ltd.-A- 27,100 CNY 884,215 947,155 0.13
Xtrackers**
Xtrackers HARVEST CSI300 UCITS ETF (continued)
Statement of Investmentsas at 30 June 2021(expressed in USD)
** This includes synthetic ETFs.
The accompanying notes form an integral part of these financial statements.
306

Description QuantityCurrency
(local) Cost Market Value
% ofNet
Assets
Transferable securities and money market instruments admitted to an official stock exchange listing(A)
Shares (continued)
China (continued)Changzhou Xingyu Automotive Lighting Systems Co.Ltd.-A- 6,800 CNY 222,184 237,663 0.03Chaozhou Three-Circle Group Co. Ltd.-A- 215,928 CNY 784,055 1,418,278 0.19Chaozhou Three-Circle Group Co. Ltd.-A- 52,200 CNY 233,350 342,865 0.05Chengdu Kanghong Pharmaceutical Group Co.Ltd.-A- 16,170 CNY 77,762 57,912 0.01Chengdu Kanghong Pharmaceutical Group Co.Ltd.-A- 61,370 CNY 372,301 219,793 0.03China CITIC Bank Corp. Ltd.-A- 354,287 CNY 319,603 279,774 0.04China CITIC Bank Corp. Ltd.-A- 494,989 CNY 399,908 390,884 0.05China Construction Bank Corp.-A- 353,047 CNY 343,621 363,526 0.05China Construction Bank Corp.-A- 1,220,629 CNY 1,216,847 1,256,861 0.17China CSSC Holdings Ltd.-A- 89,300 CNY 247,368 228,287 0.03China CSSC Holdings Ltd.-A- 343,260 CNY 943,056 877,510 0.12China Eastern Airlines Corp. Ltd.-A- 213,313 CNY 205,925 167,789 0.02China Eastern Airlines Corp. Ltd.-A- 857,513 CNY 659,068 674,507 0.09China Everbright Bank Co. Ltd.-A- 690,152 CNY 390,833 403,941 0.06China Everbright Bank Co. Ltd.-A- 3,117,200 CNY 1,825,048 1,824,476 0.25China Fortune Land Development Co. Ltd.-A- 91,676 CNY 251,688 74,382 0.01China Fortune Land Development Co. Ltd.-A- 320,649 CNY 810,857 260,161 0.04China Galaxy Securities Co. Ltd.-A- 105,200 CNY 179,832 175,597 0.02China Galaxy Securities Co. Ltd.-A- 212,570 CNY 327,265 354,815 0.05China Great Wall Securities Co. Ltd.-A- 53,600 CNY 107,462 92,372 0.01China Great Wall Securities Co. Ltd.-A- 147,100 CNY 267,704 253,507 0.03China Greatwall Technology Group Co. Ltd.-A- 85,500 CNY 164,979 193,286 0.03China Greatwall Technology Group Co. Ltd.-A- 332,336 CNY 705,144 751,298 0.10China International Capital Corp. Ltd.-A- 46,300 CNY 436,594 440,898 0.06China International Capital Corp. Ltd.-A- 12,400 CNY 116,392 118,081 0.02China Jushi Co. Ltd.-A- 74,780 CNY 152,918 179,589 0.02China Jushi Co. Ltd.-A- 474,145 CNY 718,523 1,138,688 0.16China Life Insurance Co. Ltd.-A- 84,621 CNY 351,080 444,050 0.06China Life Insurance Co. Ltd.-A- 291,302 CNY 1,325,976 1,528,610 0.21China Merchants Bank Co. Ltd.-A- 606,399 CNY 3,715,211 5,088,144 0.70China Merchants Bank Co. Ltd.-A- 2,118,851 CNY 10,753,493 17,778,755 2.44China Merchants Energy Shipping Co. Ltd.-A- 150,000 CNY 107,595 107,304 0.01China Merchants Energy Shipping Co. Ltd.-A- 570,558 CNY 413,386 408,154 0.06China Merchants Securities Co. Ltd.-A- 184,600 CNY 412,738 543,656 0.07China Merchants Securities Co. Ltd.-A- 649,727 CNY 1,668,418 1,913,477 0.26China Merchants Shekou Industrial Zone HoldingsCo. Ltd.-A- 309,911 CNY 804,707 525,452 0.07China Merchants Shekou Industrial Zone HoldingsCo. Ltd.-A- 480,875 CNY 1,175,434 815,320 0.11China Minsheng Banking Corp. Ltd.-A- 936,028 CNY 836,934 639,159 0.09China Minsheng Banking Corp. Ltd.-A- 3,865,460 CNY 3,380,877 2,639,499 0.36China Molybdenum Co. Ltd.-A- 268,900 CNY 220,846 214,844 0.03China Molybdenum Co. Ltd.-A- 1,353,550 CNY 840,746 1,081,448 0.15China National Nuclear Power Co. Ltd.-A- 295,450 CNY 271,330 231,482 0.03China National Nuclear Power Co. Ltd.-A- 1,048,100 CNY 792,185 821,174 0.11
Xtrackers**
Xtrackers HARVEST CSI300 UCITS ETF (continued)
Statement of Investmentsas at 30 June 2021(expressed in USD)
** This includes synthetic ETFs.
The accompanying notes form an integral part of these financial statements.
307

Description QuantityCurrency
(local) Cost Market Value
% ofNet
Assets
Transferable securities and money market instruments admitted to an official stock exchange listing(A)
Shares (continued)
China (continued)China Northern Rare Earth Group High-Tech Co.Ltd.-A- 107,532 CNY 217,759 344,659 0.05China Northern Rare Earth Group High-Tech Co.Ltd.-A- 381,556 CNY 690,979 1,222,955 0.17China Oilfield Services Ltd.-A- 28,500 CNY 61,371 63,370 0.01China Oilfield Services Ltd.-A- 110,548 CNY 182,973 245,803 0.03China Pacific Insurance Group Co. Ltd.-A- 169,844 CNY 759,314 761,869 0.10China Pacific Insurance Group Co. Ltd.-A- 590,865 CNY 3,000,470 2,650,443 0.36China Petroleum & Chemical Corp.-A- 699,700 CNY 563,575 472,368 0.06China Petroleum & Chemical Corp.-A- 2,479,600 CNY 1,840,663 1,673,979 0.23China Railway Group Ltd.-A- 816,900 CNY 897,725 662,799 0.09China Railway Group Ltd.-A- 1,843,083 CNY 1,635,362 1,495,402 0.20China Railway Signal & Communication Corp.Ltd.-A- 917,456 CNY 849,925 808,313 0.11China Railway Signal & Communication Corp.Ltd.-A- 112,050 CNY 98,694 98,720 0.01China Shenhua Energy Co. Ltd.-A- 164,900 CNY 438,863 498,405 0.07China Shenhua Energy Co. Ltd.-A- 607,932 CNY 1,671,205 1,837,455 0.25China Shipbuilding Industry Co. Ltd.-A- 433,700 CNY 422,612 276,674 0.04China Shipbuilding Industry Co. Ltd.-A- 2,101,845 CNY 1,440,864 1,340,848 0.18China Shipbuilding Industry Group Power Co. Ltd.-A- 190,006 CNY 578,281 512,504 0.07China Shipbuilding Industry Group Power Co. Ltd.-A- 2,100 CNY 6,885 5,664 0.00China Southern Airlines Co. Ltd.-A- 460,374 CNY 499,558 429,130 0.06China Southern Airlines Co. Ltd.-A- 1,054,900 CNY 995,780 983,308 0.13China Tourism Group Duty Free Corp. Ltd.-A- 48,129 CNY 476,582 2,236,426 0.31China Tourism Group Duty Free Corp. Ltd.-A- 168,787 CNY 3,201,097 7,843,082 1.08China Vanke Co. Ltd.-A- 343,575 CNY 1,221,880 1,266,668 0.17China Vanke Co. Ltd.-A- 1,183,148 CNY 4,788,717 4,361,946 0.60China Yangtze Power Co. Ltd.-A- 556,296 CNY 1,411,728 1,777,859 0.24China Yangtze Power Co. Ltd.-A- 2,000,530 CNY 5,365,945 6,393,469 0.88China Zheshang Bank Co. Ltd.-A- 1,654,915 CNY 1,007,391 1,017,298 0.14China Zheshang Bank Co. Ltd.-A- 314,300 CNY 196,766 193,204 0.03Chinalin Securities Co. Ltd.-A- 59,500 CNY 126,990 127,323 0.02Chongqing Brewery Co. Ltd.-A- 11,200 CNY 303,550 343,285 0.05Chongqing Brewery Co. Ltd.-A- 41,300 CNY 1,119,570 1,265,865 0.17Chongqing Changan Automobile Co. Ltd.-A- 113,000 CNY 270,471 459,818 0.06Chongqing Changan Automobile Co. Ltd.-A- 392,661 CNY 716,233 1,597,809 0.22Chongqing Rural Commercial Bank Co. Ltd.-A- 1,075,400 CNY 728,838 664,393 0.09Chongqing Rural Commercial Bank Co. Ltd.-A- 282,000 CNY 191,603 174,222 0.02Chongqing Zhifei Biological Products Co. Ltd.-A- 36,766 CNY 497,362 1,063,022 0.15Chongqing Zhifei Biological Products Co. Ltd.-A- 140,283 CNY 2,047,819 4,056,028 0.56Citic Pacific Special Steel Group Co. Ltd.-A- 49,000 CNY 140,126 158,116 0.02Citic Pacific Special Steel Group Co. Ltd.-A- 188,902 CNY 579,402 609,559 0.08CITIC Securities Co. Ltd.-A- 424,500 CNY 1,369,773 1,639,291 0.22CITIC Securities Co. Ltd.-A- 1,470,494 CNY 4,988,980 5,678,603 0.78COSCO SHIPPING Holdings Co. Ltd.-A- 224,899 CNY 278,503 1,063,502 0.15COSCO SHIPPING Holdings Co. Ltd.-A- 857,452 CNY 824,104 4,054,718 0.56CSC Financial Co. Ltd.-A- 176,899 CNY 1,004,046 860,898 0.12
Xtrackers**
Xtrackers HARVEST CSI300 UCITS ETF (continued)
Statement of Investmentsas at 30 June 2021(expressed in USD)
** This includes synthetic ETFs.
The accompanying notes form an integral part of these financial statements.
308

Description QuantityCurrency
(local) Cost Market Value
% ofNet
Assets
Transferable securities and money market instruments admitted to an official stock exchange listing(A)
Shares (continued)
China (continued)CSC Financial Co. Ltd.-A- 46,200 CNY 100,425 224,837 0.03Daqin Railway Co. Ltd.-A- 306,179 CNY 362,604 311,949 0.04Daqin Railway Co. Ltd.-A- 1,262,829 CNY 1,397,535 1,286,626 0.18DaShenLin Pharmaceutical Group Co. Ltd.-A- 47,395 CNY 413,510 375,077 0.05DaShenLin Pharmaceutical Group Co. Ltd.-A- 12,720 CNY 110,892 100,664 0.01East Money Information Co. Ltd.-A- 401,401 CNY 858,183 2,037,988 0.28East Money Information Co. Ltd.-A- 1,433,047 CNY 2,970,858 7,275,848 1.00Eve Energy Co. Ltd.-A- 52,886 CNY 389,241 851,066 0.12Eve Energy Co. Ltd.-A- 201,269 CNY 1,621,425 3,238,915 0.44Everbright Securities Co. Ltd.-A- 96,778 CNY 294,816 268,083 0.04Everbright Securities Co. Ltd.-A- 330,900 CNY 675,293 916,619 0.13FAW Jiefang Group Co. Ltd.-A- 56,400 CNY 97,667 94,491 0.01FAW Jiefang Group Co. Ltd.-A- 218,849 CNY 378,823 366,652 0.05Focus Media Information Technology Co. Ltd.-A- 486,643 CNY 672,944 709,058 0.10Focus Media Information Technology Co. Ltd.-A- 1,819,588 CNY 1,902,148 2,651,212 0.36Foshan Haitian Flavouring & Food Co. Ltd.-A- 36,786 CNY 641,335 734,490 0.10Foshan Haitian Flavouring & Food Co. Ltd.-A- 248,701 CNY 2,884,820 4,965,702 0.68Founder Securities Co. Ltd.-A- 444,692 CNY 551,093 644,491 0.09Founder Securities Co. Ltd.-A- 470,800 CNY 540,158 682,329 0.09Foxconn Industrial Internet Co. Ltd.-A- 212,400 CNY 387,028 408,139 0.06Foxconn Industrial Internet Co. Ltd.-A- 608,850 CNY 1,276,018 1,169,941 0.16Fuyao Glass Industry Group Co. Ltd.-A- 60,209 CNY 212,926 520,675 0.07Fuyao Glass Industry Group Co. Ltd.-A- 260,903 CNY 1,109,037 2,256,233 0.31Gan & Lee Pharmaceuticals Co. Ltd.-A- 14,260 CNY 246,054 235,330 0.03Gan & Lee Pharmaceuticals Co. Ltd.-A- 1,200 CNY 30,807 19,803 0.00Ganfeng Lithium Co. Ltd.-A- 37,000 CNY 301,250 693,732 0.09Ganfeng Lithium Co. Ltd.-A- 141,891 CNY 984,930 2,660,388 0.36GD Power Development Co. Ltd.-A- 1,394,000 CNY 558,512 524,506 0.07GD Power Development Co. Ltd.-A- 1,623,200 CNY 566,908 610,745 0.08Gemdale Corp.-A- 115,038 CNY 217,210 182,399 0.02Gemdale Corp.-A- 407,143 CNY 730,334 645,548 0.09GF Securities Co. Ltd.-A- 153,357 CNY 366,538 359,510 0.05GF Securities Co. Ltd.-A- 534,061 CNY 1,157,365 1,251,983 0.17Giant Network Group Co. Ltd.-A- 124,396 CNY 455,726 256,177 0.03Giant Network Group Co. Ltd.-A- 203,300 CNY 504,090 418,669 0.06Gigadevice Semiconductor Beijing Inc.-A- 63,928 CNY 542,243 1,859,943 0.25Gigadevice Semiconductor Beijing Inc.-A- 59,408 CNY 1,298,047 1,728,437 0.24Glodon Co. Ltd.-A- 48,800 CNY 351,655 515,331 0.07Glodon Co. Ltd.-A- 173,680 CNY 1,234,132 1,834,070 0.25GoerTek Inc.-A- 134,330 CNY 373,885 888,975 0.12GoerTek Inc.-A- 404,785 CNY 1,386,450 2,678,803 0.37Gongniu Group Co. Ltd.-A- 16,000 CNY 481,769 500,441 0.07Gongniu Group Co. Ltd.-A- 4,025 CNY 125,507 125,892 0.02Great Wall Motor Co. Ltd.-A- 48,176 CNY 97,913 325,162 0.04Great Wall Motor Co. Ltd.-A- 227,717 CNY 477,594 1,536,965 0.21Gree Electric Appliances Inc. of Zhuhai-A- 292,856 CNY 2,199,426 2,362,510 0.32Gree Electric Appliances Inc. of Zhuhai-A- 784,791 CNY 5,803,764 6,331,018 0.87Greenland Holdings Corp. Ltd.-A- 188,200 CNY 225,574 158,817 0.02
Xtrackers**
Xtrackers HARVEST CSI300 UCITS ETF (continued)
Statement of Investmentsas at 30 June 2021(expressed in USD)
** This includes synthetic ETFs.
The accompanying notes form an integral part of these financial statements.
309

Description QuantityCurrency
(local) Cost Market Value
% ofNet
Assets
Transferable securities and money market instruments admitted to an official stock exchange listing(A)
Shares (continued)
China (continued)Greenland Holdings Corp. Ltd.-A- 705,100 CNY 669,119 595,017 0.08Guangdong Haid Group Co. Ltd.-A- 70,295 CNY 302,453 888,171 0.12Guangdong Haid Group Co. Ltd.-A- 122,067 CNY 776,733 1,542,305 0.21Guangzhou Automobile Group Co. Ltd.-A- 105,620 CNY 196,692 211,786 0.03Guangzhou Automobile Group Co. Ltd.-A- 405,225 CNY 721,292 812,546 0.11Guangzhou Baiyunshan Pharmaceutical Holdings Co.Ltd.-A- 36,576 CNY 169,340 191,706 0.03Guangzhou Baiyunshan Pharmaceutical Holdings Co.Ltd.-A- 139,072 CNY 687,927 728,921 0.10Guangzhou Kingmed Diagnostics Group Co. Ltd.-A- 49,050 CNY 1,105,202 1,213,434 0.17Guangzhou Kingmed Diagnostics Group Co. Ltd.-A- 13,100 CNY 295,691 324,077 0.04Guangzhou Shiyuan Electronic Technology Co.Ltd.-A- 16,500 CNY 241,976 317,543 0.04Guangzhou Shiyuan Electronic Technology Co.Ltd.-A- 62,284 CNY 934,160 1,198,656 0.16Guosen Securities Co. Ltd.-A- 149,992 CNY 375,447 249,665 0.03Guosen Securities Co. Ltd.-A- 530,212 CNY 952,049 882,551 0.12Guotai Junan Securities Co. Ltd.-A- 230,496 CNY 638,090 611,725 0.08Guotai Junan Securities Co. Ltd.-A- 795,385 CNY 2,024,041 2,110,911 0.29Guoyuan Securities Co. Ltd.-A- 151,803 CNY 217,808 187,336 0.03Guoyuan Securities Co. Ltd.-A- 536,185 CNY 645,082 661,690 0.09Haier Smart Home Co. Ltd.-A- 191,082 CNY 600,283 766,600 0.10Haier Smart Home Co. Ltd.-A- 672,123 CNY 1,915,405 2,696,485 0.37Haitong Securities Co. Ltd.-A- 478,812 CNY 960,274 852,599 0.12Haitong Securities Co. Ltd.-A- 1,677,139 CNY 3,175,763 2,986,405 0.41Hangzhou First Applied Material Co. Ltd.-A- 71,240 CNY 982,592 1,159,665 0.16Hangzhou First Applied Material Co. Ltd.-A- 18,600 CNY 252,617 302,776 0.04Hangzhou Robam Appliances Co. Ltd.-A- 106,581 CNY 499,750 767,387 0.11Hangzhou Robam Appliances Co. Ltd.-A- 7,611 CNY 45,829 54,799 0.01Hangzhou Tigermed Consulting Co. Ltd.-A- 24,500 CNY 301,118 733,297 0.10Hangzhou Tigermed Consulting Co. Ltd.-A- 94,650 CNY 1,174,266 2,832,920 0.39Han’s Laser Technology Industry Group Co. Ltd.-A- 44,400 CNY 195,529 277,676 0.04Han’s Laser Technology Industry Group Co. Ltd.-A- 154,951 CNY 875,301 969,059 0.13Henan Shuanghui Investment & Development Co.Ltd.-A- 91,176 CNY 378,756 448,941 0.06Henan Shuanghui Investment & Development Co.Ltd.-A- 234,429 CNY 1,296,011 1,154,304 0.16Hengli Petrochemical Co. Ltd.-A- 74,500 CNY 246,518 302,693 0.04Hengli Petrochemical Co. Ltd.-A- 405,930 CNY 964,699 1,649,289 0.23Hengyi Petrochemical Co. Ltd.-A- 104,690 CNY 169,236 193,711 0.03Hengyi Petrochemical Co. Ltd.-A- 401,351 CNY 645,244 742,633 0.10Hithink RoyalFlush Information Network Co. Ltd.-A- 11,100 CNY 182,460 193,837 0.03Hithink RoyalFlush Information Network Co. Ltd.-A- 35,330 CNY 596,515 616,961 0.08Hongta Securities Co. Ltd.-A- 74,100 CNY 172,803 155,582 0.02Hongta Securities Co. Ltd.-A- 92,000 CNY 246,088 193,165 0.03Huadong Medicine Co. Ltd.-A- 46,397 CNY 168,179 330,540 0.05Huadong Medicine Co. Ltd.-A- 150,304 CNY 599,576 1,070,791 0.15Hualan Biological Engineering Inc.-A- 55,588 CNY 206,233 315,713 0.04
Xtrackers**
Xtrackers HARVEST CSI300 UCITS ETF (continued)
Statement of Investmentsas at 30 June 2021(expressed in USD)
** This includes synthetic ETFs.
The accompanying notes form an integral part of these financial statements.
310

Description QuantityCurrency
(local) Cost Market Value
% ofNet
Assets
Transferable securities and money market instruments admitted to an official stock exchange listing(A)
Shares (continued)
China (continued)Hualan Biological Engineering Inc.-A- 190,619 CNY 864,979 1,082,623 0.15Huaneng Lancang River Hydropower Inc.-A- 102,800 CNY 56,994 92,162 0.01Huaneng Lancang River Hydropower Inc.-A- 397,400 CNY 241,155 356,277 0.05Huaneng Power International Inc.-A- 209,600 CNY 189,813 136,957 0.02Huaneng Power International Inc.-A- 847,623 CNY 721,941 553,856 0.08Huatai Securities Co. Ltd.-A- 253,989 CNY 691,961 621,375 0.09Huatai Securities Co. Ltd.-A- 909,875 CNY 2,506,511 2,225,977 0.31Huaxia Bank Co. Ltd.-A- 317,832 CNY 363,404 304,628 0.04Huaxia Bank Co. Ltd.-A- 1,135,905 CNY 1,204,911 1,088,716 0.15Huayu Automotive Systems Co. Ltd.-A- 81,417 CNY 238,659 331,175 0.05Huayu Automotive Systems Co. Ltd.-A- 288,530 CNY 1,041,489 1,173,634 0.16Humanwell Healthcare Group Co. Ltd.-A- 45,600 CNY 191,999 199,605 0.03Humanwell Healthcare Group Co. Ltd.-A- 175,300 CNY 738,406 767,343 0.11Hundsun Technologies Inc.-A- 41,906 CNY 355,467 605,072 0.08Hundsun Technologies Inc.-A- 151,633 CNY 1,387,676 2,189,396 0.30Iflytek Co. Ltd.-A- 89,084 CNY 375,867 932,180 0.13Iflytek Co. Ltd.-A- 317,450 CNY 1,632,890 3,321,814 0.46Industrial & Commercial Bank of China Ltd.-A- 1,715,149 CNY 1,301,817 1,373,012 0.19Industrial & Commercial Bank of China Ltd.-A- 6,138,057 CNY 4,797,606 4,913,639 0.67Industrial Bank Co. Ltd.-A- 714,354 CNY 1,879,224 2,273,040 0.31Industrial Bank Co. Ltd.-A- 2,489,579 CNY 6,570,186 7,921,721 1.09Industrial Securities Co. Ltd.-A- 603,348 CNY 739,722 902,458 0.12Industrial Securities Co. Ltd.-A- 585,430 CNY 645,030 875,657 0.12Inner Mongolia BaoTou Steel Union Co. Ltd.-A- 1,102,940 CNY 291,110 264,707 0.04Inner Mongolia BaoTou Steel Union Co. Ltd.-A- 3,951,722 CNY 811,975 948,418 0.13Inner Mongolia Junzheng Energy & ChemicalIndustry Group Co. Ltd.-A- 342,600 CNY 227,407 270,014 0.04Inner Mongolia Junzheng Energy & ChemicalIndustry Group Co. Ltd.-A- 414,500 CNY 263,787 326,681 0.04Inner Mongolia Yili Industrial Group Co. Ltd.-A- 240,891 CNY 1,076,198 1,373,739 0.19Inner Mongolia Yili Industrial Group Co. Ltd.-A- 1,114,927 CNY 5,127,687 6,358,138 0.87Inspur Electronic Information Industry Co. Ltd.-A- 51,300 CNY 273,092 223,444 0.03Inspur Electronic Information Industry Co. Ltd.-A- 194,549 CNY 1,006,081 847,385 0.12Intco Medical Technology Co. Ltd.-A- 40,212 CNY 633,953 777,056 0.11Intco Medical Technology Co. Ltd.-A- 6,500 CNY 102,554 125,606 0.02Jafron Biomedical Co. Ltd.-A- 74,123 CNY 788,514 991,168 0.14Jafron Biomedical Co. Ltd.-A- 19,200 CNY 202,778 256,741 0.04JCET Group Co. Ltd.-A- 236,700 CNY 1,513,921 1,380,991 0.19JCET Group Co. Ltd.-A- 57,767 CNY 375,648 337,033 0.05Jiangsu Hengli Hydraulic Co. Ltd.-A- 25,548 CNY 231,870 339,886 0.05Jiangsu Hengli Hydraulic Co. Ltd.-A- 98,576 CNY 1,014,670 1,311,436 0.18Jiangsu Hengrui Medicine Co. Ltd.-A- 215,061 CNY 1,247,598 2,263,397 0.31Jiangsu Hengrui Medicine Co. Ltd.-A- 773,620 CNY 6,177,185 8,141,918 1.12Jiangsu King’s Luck Brewery JSC Ltd.-A- 110,118 CNY 689,523 923,461 0.13Jiangsu King’s Luck Brewery JSC Ltd.-A- 29,300 CNY 171,409 245,713 0.03Jiangsu Yanghe Brewery Joint-Stock Co. Ltd.-A- 29,825 CNY 467,190 956,868 0.13Jiangsu Yanghe Brewery Joint-Stock Co. Ltd.-A- 107,308 CNY 2,135,402 3,442,735 0.47Jiangsu Zhongtian Technology Co. Ltd.-A- 120,600 CNY 196,495 186,736 0.03
Xtrackers**
Xtrackers HARVEST CSI300 UCITS ETF (continued)
Statement of Investmentsas at 30 June 2021(expressed in USD)
** This includes synthetic ETFs.
The accompanying notes form an integral part of these financial statements.
311

Description QuantityCurrency
(local) Cost Market Value
% ofNet
Assets
Transferable securities and money market instruments admitted to an official stock exchange listing(A)
Shares (continued)
China (continued)Jiangsu Zhongtian Technology Co. Ltd.-A- 481,646 CNY 731,219 745,778 0.10Jiangxi Copper Co. Ltd.-A- 53,436 CNY 105,729 185,172 0.03Jiangxi Copper Co. Ltd.-A- 181,241 CNY 450,096 628,056 0.09Jiangxi Zhengbang Technology Co. Ltd.-A- 285,303 CNY 694,170 527,905 0.07Jiangxi Zhengbang Technology Co. Ltd.-A- 61,600 CNY 141,348 113,980 0.02Jinke Properties Group Co. Ltd.-A- 150,100 CNY 153,416 134,568 0.02Jinke Properties Group Co. Ltd.-A- 572,374 CNY 608,795 513,145 0.07Jonjee Hi-Tech Industrial And Commercial HoldingsCo. Ltd.-A- 26,200 CNY 271,425 170,467 0.02Jonjee Hi-Tech Industrial And Commercial HoldingsCo. Ltd.-A- 101,351 CNY 1,052,819 659,426 0.09Juewei Food Co. Ltd.-A- 56,316 CNY 704,672 735,004 0.10Juewei Food Co. Ltd.-A- 14,900 CNY 187,132 194,466 0.03Kingfa Sci & Tech Co. Ltd.-A- 84,400 CNY 272,320 272,608 0.04Kingfa Sci & Tech Co. Ltd.-A- 323,417 CNY 1,046,838 1,044,621 0.14Kweichow Moutai Co. Ltd.-A- 30,792 CNY 5,753,583 9,805,972 1.34Kweichow Moutai Co. Ltd.-A- 107,367 CNY 20,597,659 34,191,925 4.69Lens Technology Co. Ltd.-A- 269,610 CNY 745,685 1,227,758 0.17Lens Technology Co. Ltd.-A- 85,303 CNY 380,347 388,455 0.05Lepu Medical Technology Beijing Co. Ltd.-A- 59,300 CNY 236,901 294,925 0.04Lepu Medical Technology Beijing Co. Ltd.-A- 226,474 CNY 981,976 1,126,356 0.15Lingyi iTech Guangdong Co.-A- 137,000 CNY 290,765 194,948 0.03Lingyi iTech Guangdong Co.-A- 585,600 CNY 1,204,921 833,294 0.11Lomon Billions Group Co. Ltd.-A- 63,400 CNY 209,578 339,466 0.05Lomon Billions Group Co. Ltd.-A- 243,098 CNY 847,536 1,301,632 0.18LONGi Green Energy Technology Co. Ltd.-A- 199,640 CNY 774,469 2,746,236 0.38LONGi Green Energy Technology Co. Ltd.-A- 759,388 CNY 3,458,297 10,446,097 1.43Luxshare Precision Industry Co. Ltd.-A- 237,245 CNY 795,027 1,689,805 0.23Luxshare Precision Industry Co. Ltd.-A- 858,651 CNY 3,761,602 6,115,843 0.84Luzhou Laojiao Co. Ltd.-A- 57,495 CNY 512,833 2,100,455 0.29Luzhou Laojiao Co. Ltd.-A- 104,112 CNY 1,780,084 3,803,506 0.52Mango Excellent Media Co. Ltd.-A- 128,212 CNY 865,630 1,361,867 0.19Mango Excellent Media Co. Ltd.-A- 33,762 CNY 225,223 358,620 0.05Meinian Onehealth Healthcare Holdings Co. Ltd.-A- 509,603 CNY 949,353 718,840 0.10Meinian Onehealth Healthcare Holdings Co. Ltd.-A- 98,236 CNY 185,055 138,571 0.02Metallurgical Corp. of China Ltd.-A- 417,400 CNY 219,371 192,597 0.03Metallurgical Corp. of China Ltd.-A- 1,483,600 CNY 669,286 684,565 0.09Midea Group Co. Ltd.-A- 350,322 CNY 2,848,508 3,871,372 0.53Midea Group Co. Ltd.-A- 746,671 CNY 6,437,700 8,251,383 1.13Montage Technology Co. Ltd.-A- 102,800 CNY 1,455,080 992,934 0.14Montage Technology Co. Ltd.-A- 2,800 CNY 28,004 27,045 0.00Muyuan Foodstuff Co. Ltd.-A- 125,530 CNY 455,590 1,182,159 0.16Muyuan Foodstuff Co. Ltd.-A- 457,791 CNY 2,757,097 4,311,173 0.59Nanjing Securities Co. Ltd.-A- 310,819 CNY 591,630 506,297 0.07Nanjing Securities Co. Ltd.-A- 82,100 CNY 151,003 133,734 0.02NARI Technology Co. Ltd.-A- 138,529 CNY 328,623 498,492 0.07NARI Technology Co. Ltd.-A- 503,901 CNY 1,301,835 1,813,273 0.25National Silicon Industry Group Co. Ltd.-A- 123,600 CNY 549,507 558,452 0.08
Xtrackers**
Xtrackers HARVEST CSI300 UCITS ETF (continued)
Statement of Investmentsas at 30 June 2021(expressed in USD)
** This includes synthetic ETFs.
The accompanying notes form an integral part of these financial statements.
312

Description QuantityCurrency
(local) Cost Market Value
% ofNet
Assets
Transferable securities and money market instruments admitted to an official stock exchange listing(A)
Shares (continued)
China (continued)NAURA Technology Group Co. Ltd.-A- 12,000 CNY 279,434 515,393 0.07NAURA Technology Group Co. Ltd.-A- 44,377 CNY 1,081,211 1,905,965 0.26New China Life Insurance Co. Ltd.-A- 37,216 CNY 269,204 264,557 0.04New China Life Insurance Co. Ltd.-A- 152,628 CNY 1,137,402 1,084,984 0.15New Hope Liuhe Co. Ltd.-A- 111,062 CNY 248,162 252,277 0.03New Hope Liuhe Co. Ltd.-A- 384,508 CNY 1,097,707 873,408 0.12Ningxia Baofeng Energy Group Co. Ltd.-A- 144,800 CNY 196,786 306,716 0.04Ningxia Baofeng Energy Group Co. Ltd.-A- 364,000 CNY 792,011 771,026 0.11Offcn Education Technology Co. Ltd.-A- 86,333 CNY 328,956 279,253 0.04Offcn Education Technology Co. Ltd.-A- 329,041 CNY 1,288,723 1,064,315 0.15OFILM Group Co. Ltd.-A- 116,857 CNY 248,287 160,675 0.02OFILM Group Co. Ltd.-A- 411,455 CNY 820,423 565,740 0.08Oppein Home Group Inc.-A- 160 CNY 1,982 3,517 0.00Oppein Home Group Inc.-A- 46,069 CNY 629,773 1,012,643 0.14Orient Securities Co. Ltd.-A- 205,600 CNY 499,842 318,032 0.04Orient Securities Co. Ltd.-A- 727,121 CNY 1,124,722 1,124,745 0.15Ovctek China Inc.-A- 92,620 CNY 1,549,169 1,485,035 0.20Ovctek China Inc.-A- 24,039 CNY 402,002 385,432 0.05People’s Insurance Co. Group of China Ltd.-A- 94,100 CNY 87,287 86,402 0.01People’s Insurance Co. Group of China Ltd.-A- 603,700 CNY 629,961 554,316 0.08Perfect World Co. Ltd.-A- 56,600 CNY 213,407 209,545 0.03Perfect World Co. Ltd.-A- 215,983 CNY 796,903 799,615 0.11PetroChina Co. Ltd.-A- 481,100 CNY 521,350 394,070 0.05PetroChina Co. Ltd.-A- 1,885,932 CNY 1,589,020 1,544,769 0.21Ping An Bank Co. Ltd.-A- 479,583 CNY 878,263 1,679,725 0.23Ping An Bank Co. Ltd.-A- 1,669,385 CNY 3,446,426 5,846,970 0.80Ping An Insurance Group Co. of China Ltd.-A- 536,141 CNY 4,474,121 5,336,256 0.73Ping An Insurance Group Co. of China Ltd.-A- 1,841,129 CNY 20,117,455 18,324,911 2.51Poly Developments and Holdings Group Co. Ltd.-A- 368,247 CNY 611,644 686,511 0.09Poly Developments and Holdings Group Co. Ltd.-A- 1,272,261 CNY 2,641,826 2,371,835 0.33Postal Savings Bank of China Co. Ltd.-A- 517,400 CNY 415,923 402,172 0.05Postal Savings Bank of China Co. Ltd.-A- 1,975,100 CNY 1,559,992 1,535,234 0.21Power Construction Corp. of China Ltd.-A- 381,200 CNY 314,265 228,426 0.03Power Construction Corp. of China Ltd.-A- 1,769,228 CNY 1,195,476 1,060,173 0.15Rongsheng Petro Chemical Co. Ltd.-A- 238,750 CNY 351,003 638,436 0.09Rongsheng Petro Chemical Co. Ltd.-A- 458,494 CNY 778,859 1,226,049 0.17SAIC Motor Corp. Ltd.-A- 182,951 CNY 633,844 622,367 0.09SAIC Motor Corp. Ltd.-A- 635,481 CNY 2,377,478 2,161,795 0.30Sanan Optoelectronics Co. Ltd.-A- 138,600 CNY 396,276 687,817 0.09Sanan Optoelectronics Co. Ltd.-A- 480,376 CNY 1,492,589 2,383,917 0.33Sany Heavy Industry Co. Ltd.-A- 291,300 CNY 513,646 1,311,195 0.18Sany Heavy Industry Co. Ltd.-A- 1,041,385 CNY 2,855,404 4,687,466 0.64SDIC Capital Co. Ltd.-A- 91,960 CNY 119,849 120,889 0.02SDIC Capital Co. Ltd.-A- 509,481 CNY 652,958 669,757 0.09SDIC Power Holdings Co. Ltd.-A- 147,645 CNY 166,101 219,697 0.03SDIC Power Holdings Co. Ltd.-A- 545,956 CNY 673,048 812,387 0.11Seazen Holdings Co. Ltd.-A- 42,893 CNY 145,692 276,288 0.04Seazen Holdings Co. Ltd.-A- 164,550 CNY 792,689 1,059,920 0.15
Xtrackers**
Xtrackers HARVEST CSI300 UCITS ETF (continued)
Statement of Investmentsas at 30 June 2021(expressed in USD)
** This includes synthetic ETFs.
The accompanying notes form an integral part of these financial statements.
313

Description QuantityCurrency
(local) Cost Market Value
% ofNet
Assets
Transferable securities and money market instruments admitted to an official stock exchange listing(A)
Shares (continued)
China (continued)SF Holdings Co. Ltd.-A- 176,760 CNY 1,175,045 1,852,911 0.25SF Holdings Co. Ltd.-A- 229,568 CNY 2,357,418 2,406,478 0.33Shaanxi Coal Industry Co. Ltd.-A- 197,700 CNY 241,186 362,750 0.05Shaanxi Coal Industry Co. Ltd.-A- 738,128 CNY 965,654 1,354,353 0.19Shandong Gold Mining Co. Ltd.-A- 92,880 CNY 237,694 276,412 0.04Shandong Gold Mining Co. Ltd.-A- 325,147 CNY 1,026,202 967,642 0.13Shandong Hualu Hengsheng Chemical Co. Ltd.-A- 69,700 CNY 372,089 334,022 0.05Shandong Hualu Hengsheng Chemical Co. Ltd.-A- 264,725 CNY 1,418,985 1,268,637 0.17Shanghai Baosight Software Co. Ltd.-A- 91,997 CNY 684,806 725,059 0.10Shanghai Baosight Software Co. Ltd.-A- 23,870 CNY 181,935 188,127 0.03Shanghai Electric Group Co. Ltd.-A- 714,278 CNY 718,492 468,937 0.06Shanghai Electric Group Co. Ltd.-A- 655,600 CNY 500,736 430,414 0.06Shanghai Fosun Pharmaceutical Group Co. Ltd.-A- 59,968 CNY 283,089 669,757 0.09Shanghai Fosun Pharmaceutical Group Co. Ltd.-A- 207,572 CNY 1,109,846 2,318,283 0.32Shanghai International Airport Co. Ltd.-A- 49,335 CNY 326,183 367,665 0.05Shanghai International Airport Co. Ltd.-A- 191,072 CNY 1,867,581 1,423,950 0.20Shanghai International Port Group Co. Ltd.-A- 261,600 CNY 204,852 193,214 0.03Shanghai International Port Group Co. Ltd.-A- 734,431 CNY 582,370 542,439 0.07Shanghai Lingang Holdings Corp. Ltd.-A- 47,040 CNY 134,626 130,377 0.02Shanghai Lingang Holdings Corp. Ltd.-A- 181,160 CNY 495,798 502,108 0.07Shanghai M&G Stationery Inc.-A- 17,800 CNY 138,940 233,059 0.03Shanghai M&G Stationery Inc.-A- 74,557 CNY 690,375 976,192 0.13Shanghai Pharmaceuticals Holdings Co. Ltd.-A- 59,223 CNY 167,682 193,763 0.03Shanghai Pharmaceuticals Holdings Co. Ltd.-A- 212,115 CNY 616,650 693,989 0.10Shanghai Pudong Development Bank Co. Ltd.-A- 592,913 CNY 931,104 918,064 0.13Shanghai Pudong Development Bank Co. Ltd.-A- 2,055,852 CNY 3,229,167 3,183,271 0.44Shanghai Putailai New Energy Technology Co.Ltd.-A- 36,160 CNY 662,669 764,823 0.10Shanghai Putailai New Energy Technology Co.Ltd.-A- 9,900 CNY 181,189 209,396 0.03Shanghai RAAS Blood Products Co. Ltd.-A- 328,238 CNY 732,305 380,673 0.05Shanghai RAAS Blood Products Co. Ltd.-A- 480,785 CNY 571,462 557,589 0.08Shanghai Yuyuan Tourist Mart Group Co. Ltd.-A- 72,400 CNY 93,119 129,928 0.02Shanghai Yuyuan Tourist Mart Group Co. Ltd.-A- 275,600 CNY 332,731 494,589 0.07Shanxi Xinghuacun Fen Wine Factory Co. Ltd.-A- 16,100 CNY 386,108 1,116,826 0.15Shanxi Xinghuacun Fen Wine Factory Co. Ltd.-A- 62,654 CNY 1,705,393 4,346,189 0.60Shengyi Technology Co. Ltd.-A- 55,300 CNY 196,740 200,451 0.03Shengyi Technology Co. Ltd.-A- 238,158 CNY 898,337 863,273 0.12Shennan Circuits Co. Ltd.-A- 10,000 CNY 168,988 172,073 0.02Shennan Circuits Co. Ltd.-A- 41,695 CNY 702,204 717,459 0.10Shenwan Hongyuan Group Co. Ltd.-A- 1,867,987 CNY 1,378,924 1,353,635 0.19Shenwan Hongyuan Group Co. Ltd.-A- 269,355 CNY 211,291 195,188 0.03Shenzhen Goodix Technology Co. Ltd.-A- 11,400 CNY 199,912 228,819 0.03Shenzhen Goodix Technology Co. Ltd.-A- 42,520 CNY 1,093,412 853,455 0.12Shenzhen Inovance Technology Co. Ltd.-A- 79,577 CNY 265,377 915,007 0.13Shenzhen Inovance Technology Co. Ltd.-A- 271,144 CNY 1,200,757 3,117,717 0.43Shenzhen Kangtai Biological Products Co. Ltd.-A- 72,674 CNY 1,602,494 1,676,668 0.23Shenzhen Kangtai Biological Products Co. Ltd.-A- 19,100 CNY 415,621 440,658 0.06
Xtrackers**
Xtrackers HARVEST CSI300 UCITS ETF (continued)
Statement of Investmentsas at 30 June 2021(expressed in USD)
** This includes synthetic ETFs.
The accompanying notes form an integral part of these financial statements.
314

Description QuantityCurrency
(local) Cost Market Value
% ofNet
Assets
Transferable securities and money market instruments admitted to an official stock exchange listing(A)
Shares (continued)
China (continued)Shenzhen Overseas Chinese Town Co. Ltd.-A- 207,900 CNY 228,467 239,502 0.03Shenzhen Overseas Chinese Town Co. Ltd.-A- 730,689 CNY 746,612 841,758 0.12Shenzhen Sunway Communication Co. Ltd.-A- 48,061 CNY 313,139 229,801 0.03Shenzhen Sunway Communication Co. Ltd.-A- 185,247 CNY 934,881 885,748 0.12Shenzhen Transsion Holdings Co. Ltd.-A- 50,129 CNY 1,146,201 1,626,128 0.22Sinolink Securities Co. Ltd.-A- 110,558 CNY 230,259 217,237 0.03Sinolink Securities Co. Ltd.-A- 421,103 CNY 701,848 827,431 0.11Songcheng Performance Development Co. Ltd.-A- 80,820 CNY 185,246 210,237 0.03Songcheng Performance Development Co. Ltd.-A- 279,455 CNY 605,912 726,947 0.10SooChow Securities Co. Ltd.-A- 309,730 CNY 517,710 399,973 0.05SooChow Securities Co. Ltd.-A- 362,260 CNY 474,487 467,809 0.06Spring Airlines Co. Ltd.-A- 16,348 CNY 120,908 144,032 0.02Spring Airlines Co. Ltd.-A- 69,682 CNY 430,088 613,924 0.08Sungrow Power Supply Co. Ltd.-A- 178,687 CNY 2,606,662 3,183,458 0.44Sungrow Power Supply Co. Ltd.-A- 47,300 CNY 685,105 842,689 0.12Suning.com Co. Ltd.-A- 194,907 CNY 314,403 168,702 0.02Suning.com Co. Ltd.-A- 747,585 CNY 1,118,900 647,074 0.09Suzhou Dongshan Precision Manufacturing Co.Ltd.-A- 71,300 CNY 290,705 230,075 0.03Suzhou Dongshan Precision Manufacturing Co.Ltd.-A- 274,700 CNY 1,134,716 886,417 0.12TCL Technology Group Corp.-A- 678,200 CNY 450,009 803,343 0.11TCL Technology Group Corp.-A- 2,447,500 CNY 1,760,216 2,899,118 0.40Tianfeng Securities Co. Ltd.-A- 231,330 CNY 239,703 174,080 0.02Tianfeng Securities Co. Ltd.-A- 704,140 CNY 608,894 529,879 0.07Tianjin Zhonghuan Semiconductor Co. Ltd.-A- 103,600 CNY 335,959 619,197 0.08Tianjin Zhonghuan Semiconductor Co. Ltd.-A- 396,800 CNY 1,272,758 2,371,596 0.33Tongwei Co. Ltd.-A- 474,547 CNY 1,320,094 3,179,420 0.44Tongwei Co. Ltd.-A- 124,700 CNY 268,339 835,478 0.11Topchoice Medical Corp.-A- 10,400 CNY 403,263 661,846 0.09Topchoice Medical Corp.-A- 38,300 CNY 1,437,457 2,437,375 0.33Tsingtao Brewery Co. Ltd.-A- 16,600 CNY 251,963 297,259 0.04Tsingtao Brewery Co. Ltd.-A- 62,900 CNY 967,441 1,126,362 0.15Unigroup Guoxin Microelectronics Co. Ltd.-A- 20,400 CNY 356,629 487,044 0.07Unigroup Guoxin Microelectronics Co. Ltd.-A- 78,000 CNY 1,348,454 1,862,227 0.26Unisplendour Corp. Ltd.-A- 157,969 CNY 512,170 535,181 0.07Unisplendour Corp. Ltd.-A- 193,790 CNY 681,015 656,539 0.09Universal Scientific Industrial Shanghai Co. Ltd.-A- 34,200 CNY 94,035 89,018 0.01Universal Scientific Industrial Shanghai Co. Ltd.-A- 149,063 CNY 442,026 387,989 0.05Walvax Biotechnology Co. Ltd.-A- 135,546 CNY 502,161 1,294,952 0.18Walvax Biotechnology Co. Ltd.-A- 210,772 CNY 1,224,449 2,013,631 0.28Wanda Film Holdings Co. Ltd.-A- 68,800 CNY 191,628 168,210 0.02Wanda Film Holdings Co. Ltd.-A- 142,100 CNY 383,695 347,423 0.05Wanhua Chemical Group Co. Ltd.-A- 78,284 CNY 456,489 1,319,057 0.18Wanhua Chemical Group Co. Ltd.-A- 271,760 CNY 2,206,415 4,579,057 0.63Weichai Power Co. Ltd.-A- 242,784 CNY 353,233 671,779 0.09Weichai Power Co. Ltd.-A- 835,533 CNY 1,604,186 2,311,905 0.32Wens Foodstuffs Group Co. Ltd.-A- 164,500 CNY 508,498 366,020 0.05
Xtrackers**
Xtrackers HARVEST CSI300 UCITS ETF (continued)
Statement of Investmentsas at 30 June 2021(expressed in USD)
** This includes synthetic ETFs.
The accompanying notes form an integral part of these financial statements.
315

Description QuantityCurrency
(local) Cost Market Value
% ofNet
Assets
Transferable securities and money market instruments admitted to an official stock exchange listing(A)
Shares (continued)
China (continued)Wens Foodstuffs Group Co. Ltd.-A- 842,298 CNY 3,508,034 1,874,150 0.26Western Securities Co. Ltd.-A- 91,800 CNY 210,396 117,268 0.02Western Securities Co. Ltd.-A- 326,322 CNY 455,472 416,852 0.06Will Semiconductor Co. Ltd.-A- 24,500 CNY 819,932 1,221,529 0.17Will Semiconductor Co. Ltd.-A- 94,394 CNY 3,137,989 4,706,326 0.65Wingtech Technology Co. Ltd.-A- 29,900 CNY 480,413 448,618 0.06Wingtech Technology Co. Ltd.-A- 112,549 CNY 1,785,899 1,688,679 0.23Wuhan Guide Infrared Co. Ltd.-A- 197,846 CNY 846,103 844,896 0.12Wuhan Guide Infrared Co. Ltd.-A- 44,320 CNY 185,487 189,267 0.03Wuhu Sanqi Interactive Entertainment NetworkTechnology Group Co. Ltd.-A- 238,656 CNY 630,227 887,620 0.12Wuhu Sanqi Interactive Entertainment NetworkTechnology Group Co. Ltd.-A- 66,704 CNY 316,648 248,089 0.03Wuliangye Yibin Co. Ltd.-A- 96,514 CNY 1,417,684 4,451,722 0.61Wuliangye Yibin Co. Ltd.-A- 330,028 CNY 7,090,330 15,222,588 2.09WUS Printed Circuit Kunshan Co. Ltd.-A- 62,000 CNY 198,685 148,513 0.02WUS Printed Circuit Kunshan Co. Ltd.-A- 268,200 CNY 852,364 642,438 0.09WuXi AppTec Co. Ltd.-A- 82,721 CNY 1,021,280 2,005,680 0.27WuXi AppTec Co. Ltd.-A- 316,830 CNY 3,736,472 7,681,961 1.05Wuxi Lead Intelligent Equipment Co. Ltd.-A- 186,099 CNY 1,737,331 1,732,963 0.24Wuxi Lead Intelligent Equipment Co. Ltd.-A- 49,200 CNY 455,202 458,153 0.06XCMG Construction Machinery Co. Ltd.-A- 246,903 CNY 176,000 243,527 0.03XCMG Construction Machinery Co. Ltd.-A- 862,900 CNY 619,633 851,102 0.12Xinjiang Goldwind Science & Technology Co. Ltd.-A- 142,746 CNY 245,326 268,769 0.04Xinjiang Goldwind Science & Technology Co. Ltd.-A- 506,297 CNY 882,928 953,281 0.13Yealink Network Technology Corp. Ltd.-A- 57,832 CNY 555,128 750,402 0.10Yealink Network Technology Corp. Ltd.-A- 13,400 CNY 126,398 173,872 0.02Yifeng Pharmacy Chain Co. Ltd.-A- 67,400 CNY 634,577 585,366 0.08Yifeng Pharmacy Chain Co. Ltd.-A- 17,700 CNY 166,414 153,724 0.02Yonghui Superstores Co. Ltd.-A- 195,284 CNY 192,118 143,024 0.02Yonghui Superstores Co. Ltd.-A- 736,566 CNY 924,237 539,454 0.07Yonyou Network Technology Co. Ltd.-A- 135,766 CNY 314,672 699,190 0.10Yonyou Network Technology Co. Ltd.-A- 247,372 CNY 1,163,726 1,273,956 0.17YTO Express Group Co. Ltd.-A- 69,300 CNY 166,001 107,411 0.01YTO Express Group Co. Ltd.-A- 230,800 CNY 425,466 357,727 0.05Yunda Holdings Co. Ltd.-A- 97,727 CNY 312,371 204,736 0.03Yunda Holdings Co. Ltd.-A- 162,722 CNY 509,529 340,899 0.05Yunnan Baiyao Group Co. Ltd.-A- 93,048 CNY 1,106,544 1,667,237 0.23Yunnan Baiyao Group Co. Ltd.-A- 22,982 CNY 389,908 411,792 0.06Yunnan Energy New Material Co. Ltd.-A- 21,200 CNY 396,375 768,456 0.11Yunnan Energy New Material Co. Ltd.-A- 98,841 CNY 1,782,500 3,582,782 0.49Zhangzhou Pientzehuang Pharmaceutical Co. Ltd.-A- 14,000 CNY 244,195 971,804 0.13Zhangzhou Pientzehuang Pharmaceutical Co. Ltd.-A- 52,507 CNY 1,217,535 3,644,750 0.50Zhejiang Century Huatong Group Co. Ltd.-A- 559,921 CNY 767,816 556,600 0.08Zhejiang Century Huatong Group Co. Ltd.-A- 328,746 CNY 388,576 326,796 0.04Zhejiang Chint Electrics Co. Ltd.-A- 58,457 CNY 225,026 302,138 0.04Zhejiang Chint Electrics Co. Ltd.-A- 215,010 CNY 904,682 1,111,288 0.15Zhejiang Dahua Technology Co. Ltd.-A- 94,050 CNY 243,573 307,272 0.04
Xtrackers**
Xtrackers HARVEST CSI300 UCITS ETF (continued)
Statement of Investmentsas at 30 June 2021(expressed in USD)
** This includes synthetic ETFs.
The accompanying notes form an integral part of these financial statements.
316

Description QuantityCurrency
(local) Cost Market Value
% ofNet
Assets
Transferable securities and money market instruments admitted to an official stock exchange listing(A)
Shares (continued)
China (continued)Zhejiang Dahua Technology Co. Ltd.-A- 345,085 CNY 919,469 1,127,432 0.15Zhejiang Dingli Machinery Co. Ltd.-A- 12,000 CNY 113,004 109,050 0.01Zhejiang Dingli Machinery Co. Ltd.-A- 44,515 CNY 419,480 404,531 0.06Zhejiang Huahai Pharmaceutical Co. Ltd.-A- 39,800 CNY 131,189 128,675 0.02Zhejiang Huahai Pharmaceutical Co. Ltd.-A- 152,094 CNY 500,450 491,727 0.07Zhejiang Huayou Cobalt Co. Ltd.-A- 46,890 CNY 377,035 829,141 0.11Zhejiang Huayou Cobalt Co. Ltd.-A- 141,614 CNY 982,474 2,504,114 0.34Zhejiang Longsheng Group Co. Ltd.-A- 132,682 CNY 264,561 282,280 0.04Zhejiang Longsheng Group Co. Ltd.-A- 484,888 CNY 942,220 1,031,597 0.14Zhejiang NHU Co. Ltd.-A- 75,356 CNY 194,121 334,641 0.05Zhejiang NHU Co. Ltd.-A- 278,192 CNY 859,601 1,235,394 0.17Zhejiang Sanhua Intelligent Controls Co. Ltd.-A- 84,995 CNY 227,252 315,591 0.04Zhejiang Sanhua Intelligent Controls Co. Ltd.-A- 352,095 CNY 729,873 1,307,347 0.18Zhejiang Supor Co. Ltd.-A- 8,800 CNY 82,411 86,919 0.01Zhejiang Supor Co. Ltd.-A- 39,776 CNY 420,337 392,876 0.05Zheshang Securities Co. Ltd.-A- 75,200 CNY 156,090 152,303 0.02Zheshang Securities Co. Ltd.-A- 268,800 CNY 480,533 544,401 0.07Zhongjin Gold Corp. Ltd.-A- 100,084 CNY 138,578 133,584 0.02Zhongjin Gold Corp. Ltd.-A- 350,016 CNY 458,144 467,172 0.06Zhongtai Securities Co. Ltd.-A- 156,100 CNY 374,181 261,524 0.04Zhongtai Securities Co. Ltd.-A- 13,800 CNY 34,468 23,120 0.00Zijin Mining Group Co. Ltd.-A- 1,190,909 CNY 675,991 1,786,834 0.24Zijin Mining Group Co. Ltd.-A- 1,878,700 CNY 1,616,727 2,818,792 0.39Zoomlion Heavy Industry Science and Technology Co.Ltd.-A- 219,700 CNY 204,972 314,329 0.04Zoomlion Heavy Industry Science and Technology Co.Ltd.-A- 761,490 CNY 728,990 1,089,477 0.15ZTE Corp.-A- 158,215 CNY 596,747 814,066 0.11ZTE Corp.-A- 556,653 CNY 2,579,896 2,864,156 0.39
546,002,387 724,933,342 99.42
Total - Shares 546,753,496 725,862,103 99.55
Total Transferable securities and money market instruments admitted to an officialstock exchange listing 546,753,496 725,862,103 99.55
TOTAL INVESTMENT PORTFOLIO 546,753,496 725,862,103 99.55(A) Any duplicate securities appearing herein with the same name are either quoted on different stock exchanges or have different ISINs.
Xtrackers**
Xtrackers HARVEST CSI300 UCITS ETF (continued)
Statement of Investmentsas at 30 June 2021(expressed in USD)
** This includes synthetic ETFs.
The accompanying notes form an integral part of these financial statements.
317

Description QuantityCurrency
(local) Cost Market Value
% ofNet
Assets
Transferable securities and money market instruments admitted to an official stock exchange listing(A)
Shares
ChinaAgricultural Bank of China Ltd.-H- 730,729 HKD 296,773 254,173 1.61Aier Eye Hospital Group Co. Ltd.-A- 21,134 CNY 172,774 226,657 1.44Anhui Conch Cement Co. Ltd.-H- 30,886 HKD 202,953 164,928 1.05Bank of China Ltd.-H- 371,782 HKD 155,709 133,629 0.85Bank of Communications Co. Ltd.-H- 302,959 HKD 199,254 202,954 1.29Beijing-Shanghai High Speed Railway Co. Ltd.-A- 34,400 CNY 30,755 28,179 0.18BYD Co. Ltd.-H- 12,580 HKD 310,699 383,447 2.44China CITIC Bank Corp. Ltd.-H- 55,453 HKD 30,983 26,218 0.17China Construction Bank Corp.-H- 155,506 HKD 125,918 122,405 0.78China Life Insurance Co. Ltd.-H- 50,512 HKD 122,719 100,864 0.64China Merchants Bank Co. Ltd.-H- 155,483 HKD 706,714 1,330,027 8.45China Pacific Insurance Group Co. Ltd.-H- 54,579 HKD 204,976 171,212 1.09China Petroleum & Chemical Corp.-H- 172,769 HKD 100,989 87,917 0.56China Tourism Group Duty Free Corp. Ltd.-A- 10,300 CNY 167,348 481,271 3.06China Vanke Co. Ltd.-H- 103,148 HKD 388,742 328,222 2.09China Yangtze Power Co. Ltd.-A- 54,100 CNY 134,699 171,734 1.09Chongqing Zhifei Biological Products Co. Ltd.-A- 4,600 CNY 128,342 131,882 0.84CITIC Securities Co. Ltd.-H- 167,153 HKD 361,444 428,095 2.72Contemporary Amperex Technology Co. Ltd.-A- 2,000 CNY 24,911 157,483 1.00Contemporary Amperex Technology Co. Ltd.-A- 1,100 CNY 31,856 86,616 0.55CSC Financial Co. Ltd.-H- 144A 21,598 HKD 19,835 26,210 0.17East Money Information Co. Ltd.-A- 76,500 CNY 242,425 376,106 2.39Foshan Haitian Flavouring & Food Co. Ltd.-A- 5,594 CNY 62,279 112,028 0.71Foxconn Industrial Internet Co. Ltd.-A- 8,800 CNY 30,953 16,911 0.11Foxconn Industrial Internet Co. Ltd.-A- 6,100 CNY 13,443 11,722 0.07Gree Electric Appliances Inc. of Zhuhai-A- 500 CNY 4,940 3,962 0.02Gree Electric Appliances Inc. of Zhuhai-A- 30,283 CNY 259,828 239,949 1.52Industrial & Commercial Bank of China Ltd.-H- 354,214 HKD 239,632 210,366 1.34Industrial Bank Co. Ltd.-A- 183,000 CNY 474,609 557,675 3.54Inner Mongolia Yili Industrial Group Co. Ltd.-A- 65,841 CNY 322,087 380,286 2.42Jiangsu Hengrui Medicine Co. Ltd.-A- 12,580 CNY 41,786 132,853 0.84Jiangsu Hengrui Medicine Co. Ltd.-A- 26,254 CNY 224,078 277,259 1.76Jiangsu Yanghe Brewery Joint-Stock Co. Ltd.-A- 1,600 CNY 17,403 51,162 0.32Jiangsu Yanghe Brewery Joint-Stock Co. Ltd.-A- 4,200 CNY 77,902 134,300 0.85Kweichow Moutai Co. Ltd.-A- 5,860 CNY 848,344 1,871,077 11.89LONGi Green Energy Technology Co. Ltd.-A- 36,078 CNY 280,795 496,090 3.15Luxshare Precision Industry Co. Ltd.-A- 34,656 CNY 172,318 254,851 1.62Luzhou Laojiao Co. Ltd.-A- 8,800 CNY 276,820 310,891 1.98Midea Group Co. Ltd.-A- 13,550 CNY 66,984 149,937 0.95Midea Group Co. Ltd.-A- 5,100 CNY 51,736 56,434 0.36Muyuan Foodstuff Co. Ltd.-A- 18,485 CNY 113,203 178,526 1.13PetroChina Co. Ltd.-H- 164,982 HKD 75,704 78,641 0.50Ping An Bank Co. Ltd.-A- 35,200 CNY 48,486 121,767 0.77Ping An Bank Co. Ltd.-A- 72,500 CNY 162,368 250,799 1.59Ping An Insurance Group Co. of China Ltd.-H- 124,872 HKD 1,462,225 1,232,263 7.83Ping An Insurance Group Co. of China Ltd.-H- 37,047 HKD 75,744 81,708 0.52SAIC Motor Corp. Ltd.-A- 35,800 CNY 130,794 120,572 0.77Sany Heavy Industry Co. Ltd.-A- 52,700 CNY 291,982 227,433 1.44
Xtrackers**
Xtrackers HARVEST FTSE CHINA A-H 50 UCITS ETF
Statement of Investmentsas at 30 June 2021(expressed in USD)
** This includes synthetic ETFs.
The accompanying notes form an integral part of these financial statements.
318

Description QuantityCurrency
(local) Cost Market Value
% ofNet
Assets
Transferable securities and money market instruments admitted to an official stock exchange listing(A)
Shares (continued)
China (continued)SF Holdings Co. Ltd.-A- 9,739 CNY 69,696 101,704 0.65Shanghai Pudong Development Bank Co. Ltd.-A- 189,995 CNY 327,195 293,615 1.87Shanxi Xinghuacun Fen Wine Factory Co. Ltd.-A- 3,400 CNY 208,004 236,233 1.50Shenzhen Mindray Bio-Medical Electronics Co.Ltd.-A- 3,400 CNY 110,446 251,575 1.60Wanhua Chemical Group Co. Ltd.-A- 18,768 CNY 221,799 313,200 1.99Wuliangye Yibin Co. Ltd.-A- 9,000 CNY 46,435 416,069 2.64Wuliangye Yibin Co. Ltd.-A- 14,300 CNY 336,546 661,087 4.20WuXi AppTec Co. Ltd.-H- 144A 3,576 HKD 54,086 82,924 0.53Yihai Kerry Arawana Holdings Co. Ltd.-A- 4,700 CNY 63,851 61,352 0.39Zijin Mining Group Co. Ltd.-H- 178,850 HKD 246,491 238,242 1.51
11,671,810 15,635,692 99.34
Total - Shares 11,671,810 15,635,692 99.34
Total Transferable securities and money market instruments admitted to an officialstock exchange listing 11,671,810 15,635,692 99.34
TOTAL INVESTMENT PORTFOLIO 11,671,810 15,635,692 99.34(A) Any duplicate securities appearing herein with the same name are either quoted on different stock exchanges or have different ISINs.
Xtrackers**
Xtrackers HARVEST FTSE CHINA A-H 50 UCITS ETF (continued)
Statement of Investmentsas at 30 June 2021(expressed in USD)
** This includes synthetic ETFs.
The accompanying notes form an integral part of these financial statements.
319

1. General
a) The Company
Xtrackers** (the “Company”) is registered in the Grand Duchy of Luxembourg as an undertaking for collective investment pursuant toPart I of the Luxembourg law of 17 December 2010, relating to undertakings for collective investment, as may be amended (the “Law”).
The Company is an investment company that has been incorporated under the laws of the Grand Duchy of Luxembourg as a sociétéd’investissement à capital variable (“SICAV”) under the name �db x-trackers� on 2 October 2006 for an unlimited period. It changed itsname to �Xtrackers� on 16 February 2018. The minimum capital required by Luxembourg law is Euro 1,250,000.
The Articles of Incorporation have been deposited with the Luxembourg Trade and Companies’Register (“Registre de Commerce et desSociétés de Luxembourg”) and were published in the Memorial of the Grand Duchy of Luxembourg (the “Mémorial”) on 16 October2006. The Articles of Incorporation were last amended by an extraordinary general meeting of shareholders on 6 May 2020 and theminutes of such meeting were published in the Recueil Electronique des Sociétés et Associations (Luxembourg) (the �RESA�) on 11 May2020. The Company is registered with the Luxembourg Trade and Companies’ Register under number B-119.899.
The Company is presently structured as an umbrella fund to provide both institutional and retail investors with a variety of sub-funds (the�Sub-Funds� or individually a �Sub-Fund�) of which the performance may be linked partially or in full to the performance of anunderlying asset, such as, for instance, a basket of securities or an index.
As at 30 June 2021, all Sub-Funds of the Company are exchange traded funds (“ETF”).
As at 30 June 2021, the Company has 79 active Sub-Funds:
Sub-Fund Launch DateXtrackers MSCI WORLD SWAP UCITS ETF* 19 December 2006Xtrackers EURO STOXX 50 UCITS ETF 4 January 2007Xtrackers FTSE MIB UCITS ETF 4 January 2007Xtrackers MSCI USA SWAP UCITS ETF* 8 January 2007Xtrackers MSCI JAPAN UCITS ETF 9 January 2007Xtrackers DAX UCITS ETF 10 January 2007Xtrackers MSCI EUROPE UCITS ETF 10 January 2007Xtrackers SWITZERLAND UCITS ETF 22 January 2007Xtrackers EURO STOXX QUALITY DIVIDEND UCITS ETF 1 June 2007Xtrackers STOXX GLOBAL SELECT DIVIDEND 100 SWAP UCITS ETF* 1 June 2007Xtrackers EURO STOXX 50 SHORT DAILY SWAP UCITS ETF* 5 June 2007Xtrackers FTSE 100 INCOME UCITS ETF 5 June 2007Xtrackers SHORTDAX DAILY SWAP UCITS ETF* 5 June 2007Xtrackers FTSE 250 UCITS ETF 15 June 2007Xtrackers MSCI UK ESG UCITS ETF 15 June 2007Xtrackers FTSE CHINA 50 UCITS ETF 19 June 2007Xtrackers MSCI EM EUROPE, MIDDLE EAST & AFRICA ESG SWAP UCITS ETF*(1) 19 June 2007Xtrackers MSCI TAIWAN UCITS ETF 19 June 2007Xtrackers MSCI EM ASIA SWAP UCITS ETF* 21 June 2007Xtrackers MSCI BRAZIL UCITS ETF 22 June 2007Xtrackers MSCI EM LATIN AMERICA ESG SWAP UCITS ETF*(2) 22 June 2007Xtrackers MSCI EMERGING MARKETS SWAP UCITS ETF* 22 June 2007Xtrackers STOXX EUROPE 600 BANKS SWAP UCITS ETF* 26 June 2007Xtrackers STOXX EUROPE 600 BASIC RESOURCES SWAP UCITS ETF* 26 June 2007Xtrackers STOXX EUROPE 600 HEALTH CARE SWAP UCITS ETF* 26 June 2007Xtrackers STOXX EUROPE 600 OIL & GAS SWAP UCITS ETF* 26 June 2007Xtrackers BLOOMBERG COMMODITY EX-AGRICULTURE & LIVESTOCK SWAP UCITS ETF*(3) 29 June 2007
(1)During the period ending 30 June 2021 this Sub-Fund changed its name. Please see point 5 in the significant events of the period section of the Notes to the FinancialStatements of this semi-annual report for further information.(2)During the period ending 30 June 2021 this Sub-Fund changed its name. Please see point 6 in the significant events of the period section of the Notes to the FinancialStatements of this semi-annual report for further information.(3)During the period ending 30 June 2021 this Sub-Fund changed its name. Please see point 3 in the significant events of the period section of the Notes to the FinancialStatements of this semi-annual report for further information.
Xtrackers**
Notes to the Financial Statements
* This is a synthetic ETF.** This includes synthetic ETFs.
320

1. General (continued)
a) The Company (continued)
Sub-Fund Launch DateXtrackers STOXX EUROPE 600 TECHNOLOGY SWAP UCITS ETF* 29 June 2007Xtrackers STOXX EUROPE 600 TELECOMMUNICATIONS SWAP UCITS ETF* 29 June 2007Xtrackers STOXX EUROPE 600 FOOD & BEVERAGE SWAP UCITS ETF* 3 July 2007Xtrackers STOXX EUROPE 600 INDUSTRIAL GOODS SWAP UCITS ETF* 3 July 2007Xtrackers STOXX EUROPE 600 UTILITIES SWAP UCITS ETF* 3 July 2007Xtrackers MSCI KOREA UCITS ETF 5 July 2007Xtrackers NIFTY 50 SWAP UCITS ETF* 5 July 2007Xtrackers MSCI RUSSIA CAPPED SWAP UCITS ETF* 7 December 2007Xtrackers FTSE VIETNAM SWAP UCITS ETF* 15 January 2008Xtrackers S&P 500 INVERSE DAILY SWAP UCITS ETF* 15 January 2008Xtrackers S&P GLOBAL INFRASTRUCTURE SWAP UCITS ETF* 15 January 2008Xtrackers S&P SELECT FRONTIER SWAP UCITS ETF* 15 January 2008Xtrackers LPX PRIVATE EQUITY SWAP UCITS ETF* 17 January 2008Xtrackers MSCI EUROPE MID CAP UCITS ETF 17 January 2008Xtrackers MSCI EUROPE SMALL CAP UCITS ETF 17 January 2008Xtrackers S&P ASX 200 UCITS ETF 17 January 2008Xtrackers SLI UCITS ETF 25 January 2008Xtrackers USD OVERNIGHT RATE SWAP UCITS ETF* 9 April 2008Xtrackers FTSE 100 SHORT DAILY SWAP UCITS ETF* 2 June 2008Xtrackers CAC 40 UCITS ETF 9 July 2008Xtrackers PORTFOLIO UCITS ETF 27 November 2008Xtrackers MSCI AC ASIA EX JAPAN SWAP UCITS ETF* 20 January 2009Xtrackers MSCI PACIFIC EX JAPAN UCITS ETF 20 January 2009Xtrackers STOXX EUROPE 600 UCITS ETF 20 January 2009Xtrackers BLOOMBERG COMMODITY SWAP UCITS ETF*(3) 9 July 2009Xtrackers CSI300 SWAP UCITS ETF* 24 February 2010Xtrackers MSCI INDONESIA SWAP UCITS ETF* 2 March 2010Xtrackers LEVDAX DAILY SWAP UCITS ETF* 18 March 2010Xtrackers S&P 500 2X INVERSE DAILY SWAP UCITS ETF* 18 March 2010Xtrackers S&P 500 2X LEVERAGED DAILY SWAP UCITS ETF* 18 March 2010Xtrackers SHORTDAX X2 DAILY SWAP UCITS ETF* 18 March 2010Xtrackers FTSE DEVELOPED EUROPE REAL ESTATE UCITS ETF 25 March 2010Xtrackers MSCI CANADA UCITS ETF 26 March 2010Xtrackers MSCI EUROPE VALUE UCITS ETF 26 March 2010Xtrackers MSCI MEXICO UCITS ETF 26 March 2010Xtrackers S&P 500 SWAP UCITS ETF* 26 March 2010Xtrackers MSCI CHINA UCITS ETF 24 June 2010Xtrackers MSCI INDIA SWAP UCITS ETF* 24 June 2010Xtrackers MSCI MALAYSIA UCITS ETF 24 June 2010Xtrackers MSCI THAILAND UCITS ETF 24 June 2010Xtrackers MSCI PHILIPPINES UCITS ETF 12 April 2011Xtrackers SPAIN UCITS ETF 27 April 2011Xtrackers MSCI AFRICA TOP 50 SWAP UCITS ETF* 9 May 2011Xtrackers MSCI PAKISTAN SWAP UCITS ETF* 19 September 2011Xtrackers MSCI SINGAPORE UCITS ETF 19 September 2011Xtrackers ATX UCITS ETF 11 November 2011Xtrackers DAX INCOME UCITS ETF 28 November 2012
(3)During the period ending 30 June 2021 this Sub-Fund changed its name. Please see point 3 in the significant events of the period section of the Notes to the FinancialStatements of this semi-annual report for further information.
Xtrackers**
Notes to the Financial Statements (continued)
* This is a synthetic ETF.** This includes synthetic ETFs.
321

1. General (continued)
a) The Company (continued)
Sub-Fund Launch DateXtrackers FTSE 100 UCITS ETF 28 November 2012Xtrackers MSCI EMU UCITS ETF 28 November 2012Xtrackers NIKKEI 225 UCITS ETF 25 January 2013Xtrackers HARVEST CSI300 UCITS ETF 8 January 2014Xtrackers HARVEST FTSE CHINA A-H 50 UCITS ETF 22 March 2016
The liabilities of each Sub-Fund shall be segregated on a Sub-Fund by Sub-Fund basis with third party creditors having recourse only tothe assets of the Sub-Fund concerned.
Significant events of the period:
1. During the annual general meeting of Shareholders held on 23 April 2021, Julien Boulliat was newly elected to the Board ofDirectors.
2. The annual general meeting of Shareholders held on 23 April 2021 approved the election of KPMG Luxembourg SociétéCoopérative as approved statutory auditor of the Company until the next annual general meeting of shareholders of the Companythat will approve the annual accounts for the financial year ending on 31 December 2021.
3. On 9 February 2021, the Company informed Shareholders of XTRACKERS DBLCI COMMODITY OPTIMUM YIELD SWAPUCITS ETF* and XTRACKERS DB BLOOMBERG COMMODITY OPTIMUM YIELD SWAP UCITS ETF* of certain changes,as set out in the table below.
Sub-Fund’sold name
Sub-Fund’s newname
Old ReferenceIndex
NewReference
Index
Old IndexAdministrator
New IndexAdministrator
XTRACKERSDBLCICOMMODITYOPTIMUMYIELD SWAPUCITS ETF*
XTRACKERSBLOOMBERGCOMMODITYEX-AGRICULTURE& LIVESTOCKSWAP UCITSETF*
Deutsche BankLiquidCommodityIndex-OptimumYieldBalancedIndex
Bloombergex-Agriculture& Livestock15/30 Capped3 MonthForward Index
Deutsche BankAG
BloombergIndex ServicesLimited
XTRACKERSDBBLOOMBERGCOMMODITYOPTIMUMYIELD SWAPUCITS ETF*
XTRACKERSBLOOMBERGCOMMODITYSWAP UCITSETF*
Deutsche BankCommodityBooster –BloombergEUR Index
BloombergCommodityIndex TotalReturn3 MonthForward
Deutsche BankAG
BloombergIndex ServicesLimited
The notice further informed Shareholders that, as of the effective dates (as described below) a new currency hedging methodologywould be implemented in relation to currency hedged share classes of the Sub-Funds as further described in the prospectus wherebyState Street Bank &Trust Company, London Branch would be appointed as Currency Hedging Manager for the Sub-Fund in relationto such share classes. Due to the hedging changes, the applicable Cut-off Time for the Sub-Funds was going to be amended from5.00 p.m. to 3.30 p.m. Luxembourg time on the relevant Transaction Day. The base currency of the Sub-Funds was going to beamended from EUR to USD. The Management Company Fee in respect of the Share Classes 1C-EUR Hedged (LU0292106167)and 3C-GBP Hedged (LU0460391906) of XTRACKERS DBLCI COMMODITY OPTIMUM YIELD SWAP UCITS ETF* wasalso going to be reduced from “up to 0.40% per annum” to “up to 0.24% per annum”.
Further to the above, on 7 May 2021, the Company informed Shareholders of XTRACKERS DB BLOOMBERG COMMODITYOPTIMUM YIELD SWAP UCITS ETF* that these changes were effective as of 14 May 2021.
Further to the above, on 14 May 2021, the Company informed Shareholders of XTRACKERS DBLCI COMMODITY OPTIMUMYIELD SWAP UCITS ETF* that these changes were effective as of 21 May 2021.
4. On 22 February 2021, the Company informed Shareholders of XTRACKERS MSCI WORLD SWAP UCITS ETF* that the shareclass 4C-EUR Hedged of the Sub-Fund (the “Currency Hedged Share Class”) would change its Investment Objective to track the
Xtrackers**
Notes to the Financial Statements (continued)
* This is a synthetic ETF.** This includes synthetic ETFs.
322

1. General (continued)
a) The Company (continued)
MSCI Total Return Net World Index (the “Reference Index”), instead of the MSCI World monthly Euro Hedged Index, a currencyhedged version of the Reference Index that the Currency Hedged Share Class was previously tracking and a new currency hedgingmethodology would be implemented as further described in the prospectus whereby State Street Bank & Trust Company, LondonBranch would be appointed as Currency Hedging Manager for the Sub-Fund in relation to the Currency Hedged Share Class.
Further to the above, on 12 May 2021, the Company informed Shareholders that these changes were effective as of 19 May 2021.
5. On 23 February 2021, the Company informed Shareholders of XTRACKERS MSCI EM EUROPE, MIDDLE EAST & AFRICASWAP UCITS ETF* that, with effect from 25 March 2021, the Reference Index of the Sub-Fund changed from MSCI Total ReturnNet Emerging Markets EMEA Index (administered by MSCI Inc.) to MSCI EM EMEA Low Carbon SRI Leaders Index(administered by MSCI Limited). As a result, the name of the Sub-Fund changed from XTRACKERS MSCI EM EUROPE,MIDDLE EAST & AFRICA SWAP UCITS ETF* to XTRACKERS MSCI EM EUROPE, MIDDLE EAST & AFRICA ESGSWAP UCITS ETF*.
6. On 23 February 2021, the Company informed Shareholders of XTRACKERS MSCI EM LATIN AMERICA SWAP UCITS ETF*that, with effect from 25 March 2021, the Reference Index of the Sub-Fund changed from MSCITotal Return Net Emerging MarketsLatin America Index (administered by MSCI Inc.) to MSCI EM Latin America Low Carbon SRI Leaders Index (administered byMSCI Limited). As a result, the name of the Sub-Fund changed from XTRACKERS MSCI EM LATIN AMERICA SWAP UCITSETF* to XTRACKERS MSCI EM LATIN AMERICA ESG SWAP UCITS ETF*.
7. On 26 May 2021, the Company informed Shareholders about a change to the Note “11. Transaction Costs” to the section “Notes tothe Financial Statements” of the Audited Annual Report of the Company for the financial year ending 31 December 2020.
8. The Covid-19 coronavirus has spread since January 2020 and has subsequently led to a serious economic crisis. The rapidproliferation of the virus was reflected in, among other things, significant price market distortions and substantially increasedvolatility at the same time. Restrictions on freedom of movement, repeated lockdown measures, production stoppages, as well asdisrupted supply chains, are exerting major pressure on downstream economic processes, which caused global economic prospectsto deteriorate considerably. Even though gradual recovery or a return to a certain �normality� was to be observed again in the marketsin the interim – due, among other things, to assistance programs in the context of monetary and fiscal policy as well as extensivevaccination campaigns – the actual or possible mid- to long-term effects of the crisis on the economy, individual markets and sectors,as well as the social implications, cannot be reliably evaluated or adequately forecast at the time of preparing this report in light of thepace of the global spread of the virus and the associated high degree of uncertainty. Consequently, there may still be a materialimpact on the respective Sub-Funds assets. A high level of uncertainty exists in relation to the financial implications of thepandemic, as these are dependent on external factors such as the spread of the virus, emerging variants and the measures taken byindividual governments and central banks, the successful stemming of the development of infection rates and the speedy andsustainable restart of the economy.
The Management Company is therefore continuing its efforts, within the framework of its risk management strategy, to assess theseuncertainties and their possible impact on the activities, liquidity and performance of the respective Sub-Funds. The Board ofDirectors is ensuring that the Management Company is taking all measures deemed appropriate to protect investor interests to thegreatest possible extent. In coordination with the service providers, the Board of Directors observed the consequences of theCovid-19 coronavirus crisis and adequately included its impact on the respective Sub-Funds and the markets in which the respectiveSub-Funds invest into its decision-making processes. As of the date of this report, no significant redemption requests had been madein respect of the respective Sub-Funds; the effects on the respective Sub-Funds’ share certificate transactions are continuouslymonitored by the Management Company; the performance capability of the most important service providers did not experience anysignificant impairment. In this context, the Board of Directors satisfied itself in line with numerous national guidelines andfollowing discussions with the most important service providers (especially the Depositary, the portfolio management and the fundadministration) that the measures taken and the business continuity plans put in place (including extensive hygiene measures on thepremises, restrictions on business travel and events, precautions to ensure the reliable and smooth running of business processes inthe event of a suspected case of Covid-19 coronavirus infection, expansion of the technical options for mobile working) will curb thecurrently foreseeable or ongoing operational risks and will ensure that the respective Sub-Funds’ activities will not be disrupted.
At the time of preparing this report, the Board of Directors is of the opinion that there are no signs indicating any doubt on the abilityof the respective Sub-Funds to continue as a going concern, nor were there any liquidity problems for the respective Sub-Funds.
b) Investment Objectives and Policies
A Sub-Fund may carry out its Investment Objective via an Indirect Investment Policy and/or a Direct Investment Policy as more fullydescribed in the following paragraphs.
Xtrackers**
Notes to the Financial Statements (continued)
** This includes synthetic ETFs.
323
1. General (continued)
b) Investment Objectives and Policies (continued)
Sub-Funds with an Indirect Investment Policy
Sub-Funds with an Indirect Investment Policy are identified by the reference �SWAP� in their name.
Sub-Funds with an Indirect Investment Policy (“Indirect Replication Funds”) may not invest directly in the constituents of the ReferenceIndex. Instead, the exposure to the performance of the Reference Index will be achieved by way of derivative transactions and/orinstruments (the “Derivative Transaction(s)”). In particular, an Indirect Replication Fund will conclude OTC swap transactionsnegotiated at arm’s length with one or more Swap Counterparties (the “OTC Swap Transaction(s)”). For the avoidance of doubt, the OTCSwap Transactions would qualify as total return swaps within the meaning of Regulation (EU) 2015/2365 of the European Parliamentand of the Council of 25 November 2015 on transparency of securities financing transactions and of reuse and amending Regulation(EU) No 648/2012 (the �SFTR Regulation�). Indirect Replication Funds do not currently provide for the possibility to enter intosecurities lending agreements, buy-sell or sell-buy back transactions, margin lending transactions or repurchase agreements (and/orreverse repurchase agreements), as covered by the SFTR Regulation.
In order to achieve its Investment Objective and in accordance with the Investment Restrictions, an Indirect Replication Fund may at anytime invest part or all of the net proceeds of any issue of its Shares:
(a) in Invested Assets and use one or more Derivative Transactions the purpose of which is to exchange all or part of theperformance and/or income of such Invested Assets to gain exposure to the Reference Index (an “Unfunded Swap”) (refer toNote 4); and/or,
(b) in one or more Derivative Transactions the purpose of which is to exchange all or part of the invested proceeds to gain exposureto the Reference Index (a “Funded Swap”).
The InvestedAssets that can be subject to an Unfunded Swap are equity securities of issuers listed or traded on an official stock exchangeof an OECD Member State unless otherwise specified in the relevant Product Annex. These Invested Assets may also contain a limitedamount of UCITS eligible securities that do not fall into this description which are disclosed in the Statement of Investments.
For Funded Swaps, the maximum proportion of Net Asset Value that is subject to Derivative Transactions is 110 percent, excluding theimpact of fees and foreign exchange (�FX�) hedging arrangements, as applicable; whilst the expected proportion of Net Asset Value thatis subject to Derivative Transactions is 100 percent of the Net Asset Value, excluding the impact of fees and FX hedging arrangements,as applicable, unless otherwise specified in the relevant Product Annex.
For Unfunded Swaps, the maximum proportion of the Net Asset Value that is subject to Derivatives Transactions in relation to theReference Index is 110 percent of the Net Asset Value, excluding the impact of fees and FX hedging arrangements, as applicable; whilstthe expected proportion of the Net Asset Value that is subject to Derivative Transactions in relation to the Reference Index is 100 percentof the Net Asset Value, excluding the impact of fees and FX hedging arrangements, as applicable, unless otherwise specified in therelevant Product Annex.
For Unfunded Swaps, the maximum and expected proportion of the Net Asset Value that is subject to Derivatives Transactions in relationto Invested Assets is the same proportion as the proportion of the value of Invested Assets to the Net Asset Value of the relevantSub-Fund.
An Indirect Replication Fund may, with due regard to the best interests of its Shareholders and subject to any conditions set forth in eachspecific ProductAnnex, decide from time to time to switch partially or totally from a Funded Swap to an Unfunded Swap, and vice versa.
The Invested Assets, Derivative Transactions and any techniques used to link the Invested Assets to the Reference Index or the DerivativeTransactions or the invested proceeds to the Reference Index will be managed by the relevant Investment Manager and/or Sub-PortfolioManager. The management of the Invested Assets will generally not involve the active buying and selling of securities on the basis ofinvestment judgement and economic, financial and market analysis.
In principle, the return that the Shareholder will receive will largely be dependent on the performance of the Invested Assets, theperformance of the Reference Index and the performance of any techniques used to link the Invested Assets and/or the net proceeds fromthe issue of Shares to the Reference Index.
Depending on the value of the Derivative Transactions and its chosen policy, an Indirect Replication Fund may be at any time fully orpartially exposed to one or more counterparties (including one or more Swap Counterparties), in which case appropriate collateral orother counterparty risk mitigation arrangements compliant with the Regulations and EMIR will be taken/implemented and/or paymentwill be received from the Derivative Transactions counterparties so that the percentage of the counterparty risk exposure remains withinthe limits set out in the Regulations and EMIR (refer to Note 9).
Xtrackers**
Notes to the Financial Statements (continued)
** This includes synthetic ETFs.
324

1. General (continued)
b) Investment Objectives and Policies (continued)
Sub-Funds with a Direct Investment Policy
Sub-Funds with a Direct Investment Policy (�Direct Replication Funds�) may carry out their investment objective by investing in aportfolio of transferable securities or other eligible assets that may comprise either:
(i) all, or a substantial number of, the constituents of the Reference Index (such Sub-Fund a �Full Replication Fund�), or
(ii) an optimised sample of the constituents of the Index, or unrelated transferable securities or other eligible assets (such Sub-Fund an�Optimised Replication Fund�).
Optimised Replication Funds may not hold every constituent or the exact weighting of a constituent in the Reference Index but will seekto provide a return similar to that of its Reference Index by (i) investing either in a sub-set of the constituents of the Reference Index,(ii) seeking to gain exposure to the Reference Index by utilising optimisation techniques and/or (iii) by investing in securities that are notpart of that Reference Index. Use of these investment techniques, the implementation of which is subject to a number of constraintsdetailed in the �Investment Restrictions� section of the Prospectus, may not produce the intended results.
Full Replication Funds may from time to time not contain all of the constituents of the Reference Index, and accordingly such Sub-Fundsmay hold other transferable securities or other eligible assets in accordance with the Investment Restrictions. The extent to which a FullReplication Fund does not contain all of the constituents of the Reference Index will vary, and will be dependent on a number of factorswhich may include, but are not limited to; the nature and number of the constituents of the Reference Index (for example, where aReference Index comprises a large number of securities, contains a number of illiquid securities or where the availability of constituentsecurities for purchase is limited), legal or regulatory restrictions, the size of the Sub-Fund, and the utilisation of efficient portfoliomanagement techniques.
A Direct Investment Policy provides for the possibility to enter into securities lending agreements but does not currently provide for thepossibility to enter into margin lending transactions or repurchase agreements (and/or reverse repurchase agreements), buy-sell orsell-buy back transactions or total return swaps as covered by the SFTR Regulation. Should the Board of Directors decide to provide forsuch possibility, the Prospectus will be updated prior to the entry into force of such decision in order for the Company to comply with therelevant disclosure requirements of the SFTR Regulation for these Direct Replication Funds.
The types of securities in which Direct Replication Funds may invest include American depositary receipts (�ADRs�), global depositaryreceipts (�GDRs�), and/or non-voting depositary receipts (�NVDRs�). Direct Replication Funds may receive income in respect of thesecurities held by them. Taxes may be imposed on income received from securities held by a Sub-Fund.
Direct Replication Funds may from time to time invest temporary cash balances (such as subscription proceeds which are pendinginvestment or any other temporary cash balances) in FDIs to gain market exposure and to seek to reduce Tracking Error.
In addition, the Investment Manager reserve the right to exclude from the portfolios of the Sub-Funds any securities which do not complywith the Investment Manager’s policies. This will include those securities which have been identified as parties involved in theproduction or manufacturing of controversial conventional weapons, production of delivery devices and the deliberate and knowingproduction of primary key components of controversial conventional weapons, each as determined by the DWS ControversialConventional Weapons identification methodology.
Notwithstanding the foregoing, it should be noted that due to exceptional circumstances, such as, but not limited to, disruptive marketconditions or extremely volatile markets, instances may arise which cause a Direct Replication Fund’s tracking accuracy to divergesubstantially from the Reference Index. Due to various factors, including the Sub-Fund’s fees and expenses involved, the concentrationlimits described in the Investment Restrictions, other legal or regulatory restrictions, and, in certain instances, certain securities beingilliquid, it may not be possible or practicable to purchase all of the constituents in proportion to their weighting in the Reference Index orpurchase certain of them at all.
c) The Shares
The Shares will be issued by the Company exclusively in relation to Sub-Funds with the aforementioned Investment Policies and may besubscribed in cash or in kind (or a combination of both in cash and in kind).
The Shares may be differentiated between Distribution Shares (identified by the letter “D”) and Capitalisation Shares (identified by theletter “C”). Other Classes may be offered with specific features such as fee structures, minimum subscription amount, investor eligibilitycriteria or other specific features. The Shares will be listed for trading on one or more stock exchanges unless otherwise specified in therelevant Product Annex of the Prospectus.
Xtrackers**
Notes to the Financial Statements (continued)
** This includes synthetic ETFs.
325

2. Accounting policies
The financial statements of the Company have been prepared according to accounting principles generally accepted in Luxembourg andapplicable for investment funds. The significant accounting policies used are as follows:
a) Valuation of investments
The Net Asset Value of the Company is at any time equal to the total of the Net Asset Values of the Sub-Funds.
The Net Asset Value of the Sub-Funds shall be determined in accordance with the following rules:
(i) the value of any cash on hand or on deposit, bills and demand notes and accounts receivable, prepaid expenses,cash dividends and interest declared or accrued and not yet received is deemed to be the full amount thereof,unless in any case the same is unlikely to be paid or received in full, in which case the value thereof shall bedetermined after making such discount as may be considered appropriate in such case to reflect the true valuethereof;
(ii) the value of all securities which are listed or traded on an official stock exchange or traded on any otherRegulated Market will be valued on the basis of the last available prices on the Business Day immediatelypreceding the Valuation Day or on the basis of the last available prices on the main market on which theinvestments of the Sub-Funds are principally traded. The Board of Directors will approve a pricing servicewhich will supply the above prices. If, in the opinion of the Board of Directors, such prices do not truly reflectthe fair market value of the relevant securities, the value of such securities will be determined in good faith bythe Board of Directors either by reference to any other publicly available source or by reference to such othersources as it deems in its discretion appropriate;
(iii) securities not listed or traded on a stock exchange or a Regulated Market will be valued on the basis of theprobable sales price determined prudently and in good faith by the Board of Directors;
(iv) securities issued by open-ended investment funds shall be valued at their last available net asset value or inaccordance with item (ii) above where such securities are listed;
(v) the liquidating value of futures, forward or options contracts that are not traded on exchanges or on otherorganised markets shall be determined pursuant to the policies established by the Board of Directors, on a basisconsistently applied. The liquidating value of futures, forward or options contracts traded on exchanges or onother organised markets shall be based upon the last available settlement prices of these contracts on exchangesand organised markets on which the particular futures, forward or options contracts are traded; provided that ifa futures, forward or options contract could not be liquidated on such Business Day with respect to which a NetAsset Value is being determined, then the basis for determining the liquidating value of such contract shall besuch value as the Board of Directors may deem fair and reasonable. The net realised gain / (loss) on forwardforeign exchange is included in the financial statements as “Net realised gain / (loss) on foreign exchange”;
(vi) liquid assets and money market instruments may be valued at nominal value plus any accrued interest or usingan amortised cost method; this amortised cost method may result in periods during which the value deviatesfrom the price the relevant Sub-Fund would receive if it sold the investment. The Management Company may,from time to time, assess this method of valuation and recommend changes, where necessary, to ensure thatsuch assets will be valued at their fair value as determined in good faith pursuant to procedures established bythe Board of Directors. If the Board of Directors believes that a deviation from the amortised cost per Sharemay result in material dilution or other unfair results to Shareholders, the Board of Directors shall take suchcorrective action, if any, as it deems appropriate, to eliminate or reduce, to the extent reasonably practicable, thedilution or unfair results;
(vii) the total return swaps (TRS) transactions will be consistently valued based on a calculation of the net presentvalue of their expected cash flows. TRS are marked to market at each NAV Date;
(viii) all other securities and other permissible assets as well as any of the above mentioned assets for which thevaluation in accordance with the above sub-paragraphs would not be possible or practicable, or would not berepresentative of their fair value, will be valued at fair market value, as determined in good faith pursuant toprocedures established by the Board of Directors.
b) Investment transactions
The net realised gain / (loss) on sale of investments is determined on the basis of the average cost of investments sold. Investmenttransactions are accounted for on a trade date basis.The net realised gain / (loss) on sale of investments is disclosed in the financial statements as “Net realised gain / (loss) on investments”.
Xtrackers**
Notes to the Financial Statements (continued)
** This includes synthetic ETFs.
326

2. Accounting policies (continued)
c) Conversion of foreign currencies
Accounting records are kept for each Sub-Fund in its reference currency. The combined statement of net assets and statement ofoperations and changes in net assets of the Company are presented in Euro based on the exchange rate prevailing at the date of theStatement of Net Assets.
Income and expenses in currencies other than the reference currency of a Sub-Fund are translated into the reference currency of therelevant Sub-Fund at the exchange rates prevailing at the transaction date.
Assets and liabilities in currencies other than the reference currency of a Sub-Fund are translated into the reference currency of therelevant Sub-Fund at the exchange rates prevailing at the date of the Statement of Net Assets.
The purchase price of the securities purchased in currencies other than the reference currency of the Sub-Fund are translated into thereference currency of the relevant Sub-Fund at the exchange rates prevailing at the date of the purchase of the securities.
The exchange rates used as at 30 June 2021 are:
1 Euro = 1.579621 AUD1 Euro = 5.950671 BRL1 Euro = 1.468501 CAD1 Euro = 1.096187 CHF1 Euro = 7.661926 CNH1 Euro = 7.662637 CNY1 Euro = 25.507002 CZK1 Euro = 7.436249 DKK1 Euro = 0.858446 GBP1 Euro = 9.209526 HKD1 Euro = 3.864257 ILS1 Euro = 131.623107 JPY1 Euro = 1335.501950 KRW
1 Euro = 23.611874 MXN1 Euro = 4.923266 MYR1 Euro = 10.204912 NOK1 Euro = 1.697174 NZD1 Euro = 57.889737 PHP1 Euro = 4.514724 PLN1 Euro = 10.142000 SEK1 Euro = 1.594088 SGD1 Euro = 38.008114 THB1 Euro = 33.042155 TWD1 Euro = 1.185901 USD1 Euro = 16.933178 ZAR
d) Income
Interest is recorded on an accrual basis net of withholding tax and includes amortization on a straight line basis of premiums andaccretion of discounts that are disclosed in the financial statements as “Accretion of discount or Amortization of premium”. Dividendsare accounted for on the ex-date, net of withholding tax.
e) Cross Sub-Fund investments
Xtrackers PORTFOLIO UCITS ETF held cross investments as at 30 June 2021, the market value of which represents 0.21% of thecombined net assets. These investments are included for presentation purposes within the combined Statement of Net Assets.
f) Net Asset Value
This semi-annual report is prepared on the basis of the last available official net asset value of the Sub-Funds as at 30 June 2021.
3. Taxation of the Company
Under current law and practice, the Company is not liable to any Luxembourg income taxes, stamp or other tax. Investment income andcapital gains, if any, received or realised by the Company may, however, be subject to taxation in the country of origin at varying rates,which normally cannot be recovered by the Company.
Although the Company is, in principle, subject in Luxembourg to a subscription tax (“Taxe d’Abonnement”) at an annual rate of 0.05%or 0.01% for the category of shares reserved to institutional investors, all Sub-Funds which are index-tracking ETFs are exempt fromsuch tax as (i) their Shares are listed or traded on at least one stock exchange or another regulated market operating regularly, recognisedand open to the public; and (ii) their exclusive objective is to reflect the performance of one or more indices, it being understood that thiscondition of exclusive objective does not prevent the management of liquid assets, if any, on an ancillary basis, or the use of techniquesand instruments used for hedging or for purposes of efficient portfolio management. A Grand-Ducal regulation may determineadditional or alternative criteria with respect to the indices under that exemption.
Xtrackers**
Notes to the Financial Statements (continued)
** This includes synthetic ETFs.
327
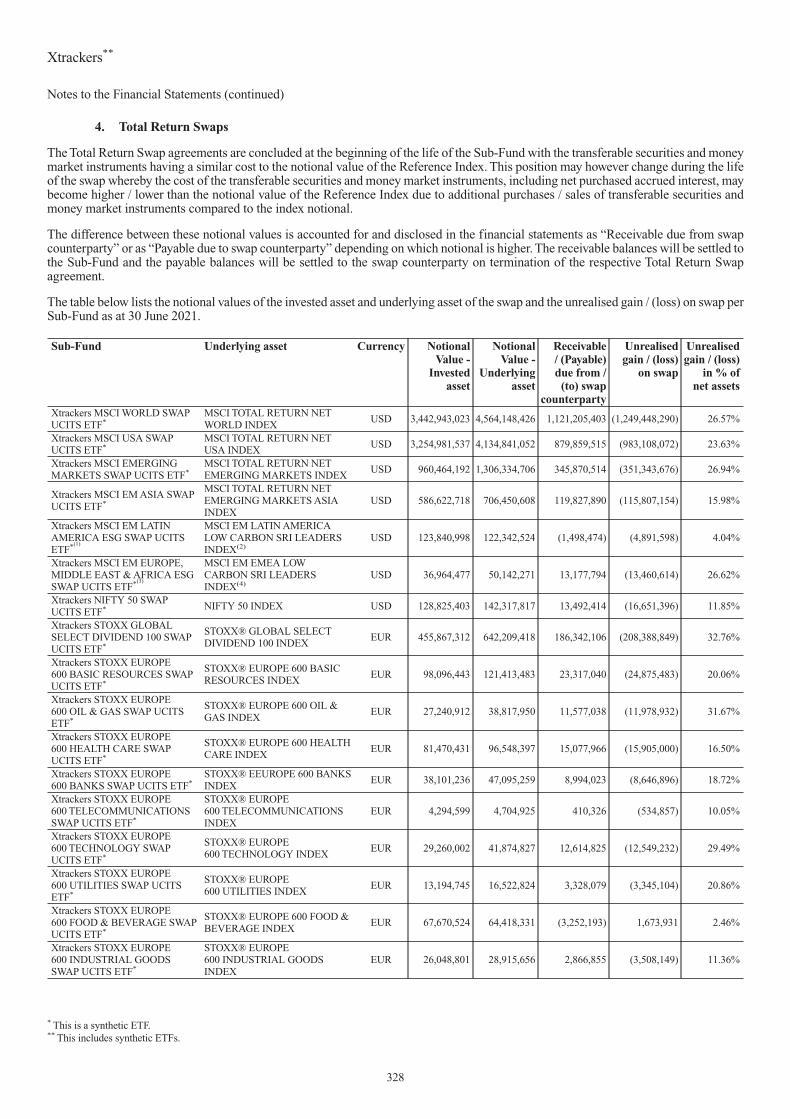
4. Total Return Swaps
The Total Return Swap agreements are concluded at the beginning of the life of the Sub-Fund with the transferable securities and moneymarket instruments having a similar cost to the notional value of the Reference Index. This position may however change during the lifeof the swap whereby the cost of the transferable securities and money market instruments, including net purchased accrued interest, maybecome higher / lower than the notional value of the Reference Index due to additional purchases / sales of transferable securities andmoney market instruments compared to the index notional.
The difference between these notional values is accounted for and disclosed in the financial statements as “Receivable due from swapcounterparty” or as “Payable due to swap counterparty” depending on which notional is higher. The receivable balances will be settled tothe Sub-Fund and the payable balances will be settled to the swap counterparty on termination of the respective Total Return Swapagreement.
The table below lists the notional values of the invested asset and underlying asset of the swap and the unrealised gain / (loss) on swap perSub-Fund as at 30 June 2021.
Sub-Fund Underlying asset Currency NotionalValue -
Investedasset
NotionalValue -
Underlyingasset
Receivable/ (Payable)due from /
(to) swapcounterparty
Unrealisedgain / (loss)
on swap
Unrealisedgain / (loss)
in % ofnet assets
Xtrackers MSCI WORLD SWAPUCITS ETF*
MSCI TOTAL RETURN NETWORLD INDEX
USD 3,442,943,023 4,564,148,426 1,121,205,403 (1,249,448,290) 26.57%
Xtrackers MSCI USA SWAPUCITS ETF*
MSCI TOTAL RETURN NETUSA INDEX
USD 3,254,981,537 4,134,841,052 879,859,515 (983,108,072) 23.63%
Xtrackers MSCI EMERGINGMARKETS SWAP UCITS ETF*
MSCI TOTAL RETURN NETEMERGING MARKETS INDEX
USD 960,464,192 1,306,334,706 345,870,514 (351,343,676) 26.94%
Xtrackers MSCI EM ASIA SWAPUCITS ETF*
MSCI TOTAL RETURN NETEMERGING MARKETS ASIAINDEX
USD 586,622,718 706,450,608 119,827,890 (115,807,154) 15.98%
Xtrackers MSCI EM LATINAMERICA ESG SWAP UCITSETF*(1)
MSCI EM LATIN AMERICALOW CARBON SRI LEADERSINDEX(2)
USD 123,840,998 122,342,524 (1,498,474) (4,891,598) 4.04%
Xtrackers MSCI EM EUROPE,MIDDLE EAST & AFRICA ESGSWAP UCITS ETF*(3)
MSCI EM EMEA LOWCARBON SRI LEADERSINDEX(4)
USD 36,964,477 50,142,271 13,177,794 (13,460,614) 26.62%
Xtrackers NIFTY 50 SWAPUCITS ETF* NIFTY 50 INDEX USD 128,825,403 142,317,817 13,492,414 (16,651,396) 11.85%
Xtrackers STOXX GLOBALSELECT DIVIDEND 100 SWAPUCITS ETF*
STOXX® GLOBAL SELECTDIVIDEND 100 INDEX
EUR 455,867,312 642,209,418 186,342,106 (208,388,849) 32.76%
Xtrackers STOXX EUROPE600 BASIC RESOURCES SWAPUCITS ETF*
STOXX® EUROPE 600 BASICRESOURCES INDEX
EUR 98,096,443 121,413,483 23,317,040 (24,875,483) 20.06%
Xtrackers STOXX EUROPE600 OIL & GAS SWAP UCITSETF*
STOXX® EUROPE 600 OIL &GAS INDEX
EUR 27,240,912 38,817,950 11,577,038 (11,978,932) 31.67%
Xtrackers STOXX EUROPE600 HEALTH CARE SWAPUCITS ETF*
STOXX® EUROPE 600 HEALTHCARE INDEX
EUR 81,470,431 96,548,397 15,077,966 (15,905,000) 16.50%
Xtrackers STOXX EUROPE600 BANKS SWAP UCITS ETF*
STOXX® EEUROPE 600 BANKSINDEX
EUR 38,101,236 47,095,259 8,994,023 (8,646,896) 18.72%
Xtrackers STOXX EUROPE600 TELECOMMUNICATIONSSWAP UCITS ETF*
STOXX® EUROPE600 TELECOMMUNICATIONSINDEX
EUR 4,294,599 4,704,925 410,326 (534,857) 10.05%
Xtrackers STOXX EUROPE600 TECHNOLOGY SWAPUCITS ETF*
STOXX® EUROPE600 TECHNOLOGY INDEX
EUR 29,260,002 41,874,827 12,614,825 (12,549,232) 29.49%
Xtrackers STOXX EUROPE600 UTILITIES SWAP UCITSETF*
STOXX® EUROPE600 UTILITIES INDEX
EUR 13,194,745 16,522,824 3,328,079 (3,345,104) 20.86%
Xtrackers STOXX EUROPE600 FOOD & BEVERAGE SWAPUCITS ETF*
STOXX® EUROPE 600 FOOD &BEVERAGE INDEX
EUR 67,670,524 64,418,331 (3,252,193) 1,673,931 2.46%
Xtrackers STOXX EUROPE600 INDUSTRIAL GOODSSWAP UCITS ETF*
STOXX® EUROPE600 INDUSTRIAL GOODSINDEX
EUR 26,048,801 28,915,656 2,866,855 (3,508,149) 11.36%
Xtrackers**
Notes to the Financial Statements (continued)
* This is a synthetic ETF.** This includes synthetic ETFs.
328

4. Total Return Swaps (continued)
Sub-Fund Underlying asset Currency NotionalValue -
Investedasset
NotionalValue -
Underlyingasset
Receivable/ (Payable)due from /
(to) swapcounterparty
Unrealisedgain / (loss)
on swap
Unrealisedgain / (loss)
in % ofnet assets
Xtrackers BLOOMBERGCOMMODITYEX-AGRICULTURE &LIVESTOCK SWAP UCITSETF*(5)
BLOOMBERGEX-AGRICULTURE &LIVESTOCK 15/30 CAPPED3 MONTH FORWARD INDEX(6)
USD(7)
407,899,686 399,564,678 (8,335,008) 17,997,785 4.54%
Xtrackers SHORTDAX DAILYSWAP UCITS ETF* SHORTDAX® INDEX EUR 259,343,699 299,099,032 39,755,333 (40,233,208) 13.32%
Xtrackers EURO STOXX50 SHORT DAILY SWAP UCITSETF*
EURO STOXX 50® SHORTINDEX
EUR 116,309,398 131,209,814 14,900,416 (12,038,767) 9.08%
Xtrackers FTSE 100 SHORTDAILY SWAP UCITS ETF* FTSE 100 DAILY SHORT INDEX GBP 8,197,731 10,812,706 2,614,975 (2,527,972) 23.32%
Xtrackers S&P 500 INVERSEDAILY SWAP UCITS ETF*
S&P 500 INVERSE DAILYINDEX
USD 231,986,822 251,346,313 19,359,491 (27,314,135) 11.21%
Xtrackers MSCI AC ASIA EXJAPAN SWAP UCITS ETF*
MSCI AC ASIA EX JAPAN TRNINDEX
USD 508,189,093 651,401,437 143,212,344 (141,427,402) 21.19%
Xtrackers MSCI RUSSIACAPPED SWAP UCITS ETF*
MSCI RUSSIA ISSUERSCAPPED 25% INDEX
USD 118,294,573 146,398,827 28,104,254 (30,271,992) 20.74%
Xtrackers FTSE VIETNAM SWAPUCITS ETF* FTSE VIETNAM INDEX USD 374,014,538 417,102,594 43,088,056 (49,234,931) 10.76%
Xtrackers LPX PRIVATEEQUITY SWAP UCITS ETF* LPX MAJOR MARKET® INDEX EUR 198,396,780 264,341,388 65,944,608 (58,727,175) 22.42%
Xtrackers S&P GLOBALINFRASTRUCTURE SWAPUCITS ETF*
S&P GLOBALINFRASTRUCTURE INDEX
USD 205,064,540 242,329,203 37,264,663 (44,877,556) 18.76%
Xtrackers S&P SELECTFRONTIER SWAP UCITS ETF*
S&P SELECT FRONTIERINDEX
USD 87,886,071 98,427,549 10,541,478 (14,135,114) 14.44%
Xtrackers USD OVERNIGHTRATE SWAP UCITS ETF*
FED FUNDS EFFECTIVE RATETOTAL RETURN INDEX®
USD 8,008,652 8,122,346 113,694 (72,011) 0.87%
Xtrackers S&P 500 2XLEVERAGED DAILY SWAPUCITS ETF*
S&P 500 2X LEVERAGEDDAILY INDEX
USD 143,658,472 189,429,074 45,770,602 (38,800,675) 20.39%
Xtrackers SHORTDAX X2 DAILYSWAP UCITS ETF* SHORTDAX® X2 INDEX EUR 122,886,977 130,360,467 7,473,490 (7,679,210) 5.83%
Xtrackers LEVDAX DAILYSWAP UCITS ETF* LEVDAX® INDEX EUR 43,437,493 42,388,549 (1,048,944) (1,328,282) 3.19%
Xtrackers BLOOMBERGCOMMODITY SWAP UCITSETF*(5)
BLOOMBERG COMMODITYINDEX TOTAL RETURN3 MONTH FORWARD(6)
USD(7)
12,078,610 14,304,844 2,226,234 2,290,438 16.01%
Xtrackers S&P 500 2X INVERSEDAILY SWAP UCITS ETF*
S&P 500 2X INVERSE DAILYINDEX
USD 69,629,882 77,149,540 7,519,658 (10,409,215) 14.33%
Xtrackers CSI300 SWAP UCITSETF* CSI300 INDEX USD 1,429,635,448 1,839,875,802 410,240,354 (472,388,952) 25.04%
Xtrackers MSCI INDONESIASWAP UCITS ETF* MSCI INDONESIA TRN INDEX USD 77,540,856 93,489,275 15,948,419 (17,900,638) 20.67%
Xtrackers S&P 500 SWAP UCITSETF* S&P 500 INDEX USD 5,760,610,559 8,561,553,268 2,800,942,709 (2,775,029,558) 32.28%
Xtrackers MSCI INDIA SWAPUCITS ETF* MSCI INDIA TRN INDEX USD 82,870,936 80,485,316 (2,385,620) (557,691) 0.69%
Xtrackers MSCI AFRICA TOP50 SWAP UCITS ETF*
MSCI EFM AFRICA TOP50 CAPPED TRN INDEX
USD 33,096,255 38,704,701 5,608,446 (6,384,568) 16.41%
Xtrackers**
Notes to the Financial Statements (continued)
* This is a synthetic ETF.** This includes synthetic ETFs.
329
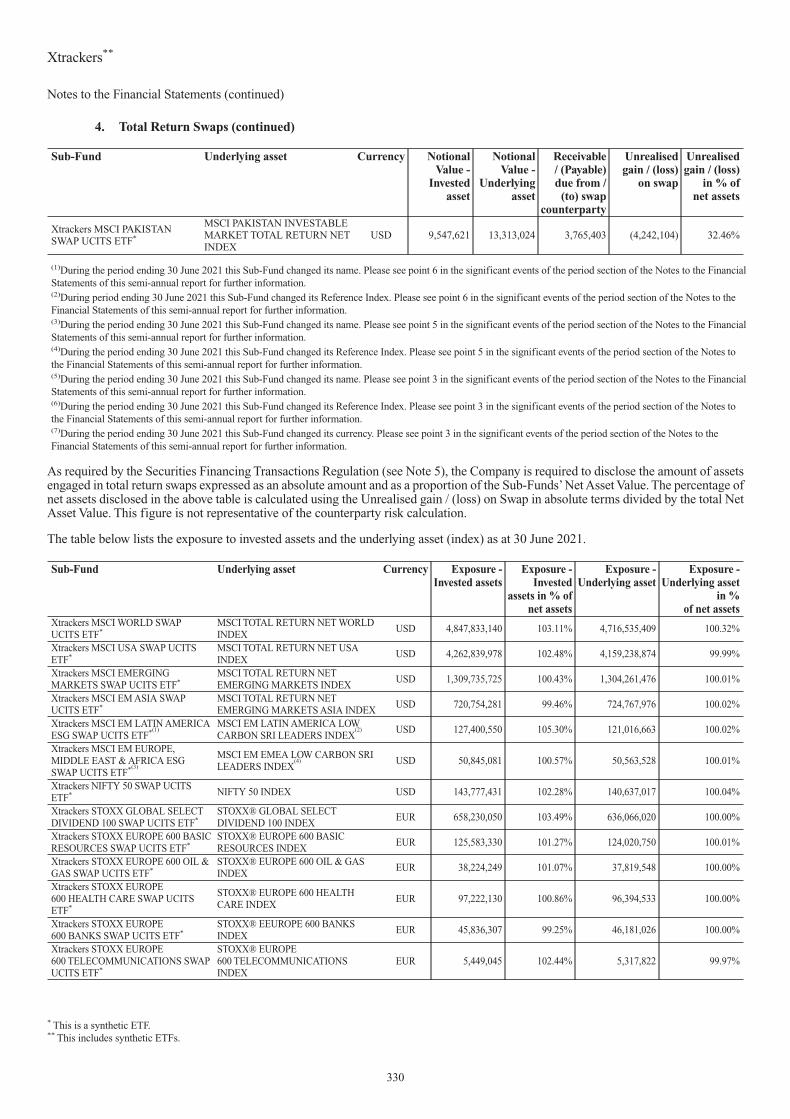
4. Total Return Swaps (continued)
Sub-Fund Underlying asset Currency NotionalValue -
Investedasset
NotionalValue -
Underlyingasset
Receivable/ (Payable)due from /
(to) swapcounterparty
Unrealisedgain / (loss)
on swap
Unrealisedgain / (loss)
in % ofnet assets
Xtrackers MSCI PAKISTANSWAP UCITS ETF*
MSCI PAKISTAN INVESTABLEMARKET TOTAL RETURN NETINDEX
USD 9,547,621 13,313,024 3,765,403 (4,242,104) 32.46%
(1)During the period ending 30 June 2021 this Sub-Fund changed its name. Please see point 6 in the significant events of the period section of the Notes to the FinancialStatements of this semi-annual report for further information.(2)During period ending 30 June 2021 this Sub-Fund changed its Reference Index. Please see point 6 in the significant events of the period section of the Notes to theFinancial Statements of this semi-annual report for further information.(3)During the period ending 30 June 2021 this Sub-Fund changed its name. Please see point 5 in the significant events of the period section of the Notes to the FinancialStatements of this semi-annual report for further information.(4)During the period ending 30 June 2021 this Sub-Fund changed its Reference Index. Please see point 5 in the significant events of the period section of the Notes tothe Financial Statements of this semi-annual report for further information.(5)During the period ending 30 June 2021 this Sub-Fund changed its name. Please see point 3 in the significant events of the period section of the Notes to the FinancialStatements of this semi-annual report for further information.(6)During the period ending 30 June 2021 this Sub-Fund changed its Reference Index. Please see point 3 in the significant events of the period section of the Notes tothe Financial Statements of this semi-annual report for further information.(7)During the period ending 30 June 2021 this Sub-Fund changed its currency. Please see point 3 in the significant events of the period section of the Notes to theFinancial Statements of this semi-annual report for further information.
As required by the Securities Financing Transactions Regulation (see Note 5), the Company is required to disclose the amount of assetsengaged in total return swaps expressed as an absolute amount and as a proportion of the Sub-Funds’Net Asset Value. The percentage ofnet assets disclosed in the above table is calculated using the Unrealised gain / (loss) on Swap in absolute terms divided by the total NetAsset Value. This figure is not representative of the counterparty risk calculation.
The table below lists the exposure to invested assets and the underlying asset (index) as at 30 June 2021.
Sub-Fund Underlying asset Currency Exposure -Invested assets
Exposure -Invested
assets in % ofnet assets
Exposure -Underlying asset
Exposure -Underlying asset
in %of net assets
Xtrackers MSCI WORLD SWAPUCITS ETF*
MSCI TOTAL RETURN NET WORLDINDEX
USD 4,847,833,140 103.11% 4,716,535,409 100.32%
Xtrackers MSCI USA SWAP UCITSETF*
MSCI TOTAL RETURN NET USAINDEX
USD 4,262,839,978 102.48% 4,159,238,874 99.99%
Xtrackers MSCI EMERGINGMARKETS SWAP UCITS ETF*
MSCI TOTAL RETURN NETEMERGING MARKETS INDEX
USD 1,309,735,725 100.43% 1,304,261,476 100.01%
Xtrackers MSCI EM ASIA SWAPUCITS ETF*
MSCI TOTAL RETURN NETEMERGING MARKETS ASIA INDEX
USD 720,754,281 99.46% 724,767,976 100.02%
Xtrackers MSCI EM LATIN AMERICAESG SWAP UCITS ETF*(1)
MSCI EM LATIN AMERICA LOWCARBON SRI LEADERS INDEX
(2) USD 127,400,550 105.30% 121,016,663 100.02%
Xtrackers MSCI EM EUROPE,MIDDLE EAST & AFRICA ESGSWAP UCITS ETF*(3)
MSCI EM EMEA LOW CARBON SRILEADERS INDEX
(4) USD 50,845,081 100.57% 50,563,528 100.01%
Xtrackers NIFTY 50 SWAP UCITSETF* NIFTY 50 INDEX USD 143,777,431 102.28% 140,637,017 100.04%
Xtrackers STOXX GLOBAL SELECTDIVIDEND 100 SWAP UCITS ETF*
STOXX® GLOBAL SELECTDIVIDEND 100 INDEX
EUR 658,230,050 103.49% 636,066,020 100.00%
Xtrackers STOXX EUROPE 600 BASICRESOURCES SWAP UCITS ETF*
STOXX® EUROPE 600 BASICRESOURCES INDEX
EUR 125,583,330 101.27% 124,020,750 100.01%
Xtrackers STOXX EUROPE 600 OIL &GAS SWAP UCITS ETF*
STOXX® EUROPE 600 OIL & GASINDEX
EUR 38,224,249 101.07% 37,819,548 100.00%
Xtrackers STOXX EUROPE600 HEALTH CARE SWAP UCITSETF*
STOXX® EUROPE 600 HEALTHCARE INDEX
EUR 97,222,130 100.86% 96,394,533 100.00%
Xtrackers STOXX EUROPE600 BANKS SWAP UCITS ETF*
STOXX® EEUROPE 600 BANKSINDEX
EUR 45,836,307 99.25% 46,181,026 100.00%
Xtrackers STOXX EUROPE600 TELECOMMUNICATIONS SWAPUCITS ETF*
STOXX® EUROPE600 TELECOMMUNICATIONSINDEX
EUR 5,449,045 102.44% 5,317,822 99.97%
Xtrackers**
Notes to the Financial Statements (continued)
* This is a synthetic ETF.** This includes synthetic ETFs.
330

4. Total Return Swaps (continued)
Sub-Fund Underlying asset Currency Exposure -Invested assets
Exposure -Invested
assets in % ofnet assets
Exposure -Underlying asset
Exposure -Underlying asset
in %of net assets
Xtrackers STOXX EUROPE600 TECHNOLOGY SWAP UCITSETF*
STOXX® EUROPE600 TECHNOLOGY INDEX
EUR 42,492,963 99.86% 42,557,393 100.01%
Xtrackers STOXX EUROPE600 UTILITIES SWAP UCITS ETF*
STOXX® EUROPE 600 UTILITIESINDEX
EUR 16,067,671 100.17% 16,033,756 99.96%
Xtrackers STOXX EUROPE 600 FOOD& BEVERAGE SWAP UCITS ETF*
STOXX® EUROPE 600 FOOD &BEVERAGE INDEX
EUR 69,720,259 102.34% 68,122,012 100.00%
Xtrackers STOXX EUROPE600 INDUSTRIAL GOODS SWAPUCITS ETF*
STOXX® EUROPE 600 INDUSTRIALGOODS INDEX
EUR 31,538,675 102.15% 30,880,610 100.02%
Xtrackers BLOOMBERGCOMMODITY EX-AGRICULTURE &LIVESTOCK SWAP UCITS ETF*(5)
BLOOMBERG EX-AGRICULTURE &LIVESTOCK 15/30 CAPPED3 MONTH FORWARD INDEX
(6)USD
(7)395,095,167 99.68% 404,768,867 102.12%
Xtrackers SHORTDAX DAILY SWAPUCITS ETF* SHORTDAX® INDEX EUR 302,611,173 100.16% 302,130,306 100.00%
Xtrackers EURO STOXX 50 SHORTDAILY SWAP UCITS ETF* EURO STOXX 50® SHORT INDEX EUR 129,725,373 97.84% 132,585,455 100.00%
Xtrackers FTSE 100 SHORT DAILYSWAP UCITS ETF* FTSE 100 DAILY SHORT INDEX GBP 10,753,694 99.21% 10,839,736 100.00%
Xtrackers S&P 500 INVERSE DAILYSWAP UCITS ETF* S&P 500 INVERSE DAILY INDEX USD 251,560,357 103.28% 243,556,491 100.00%
Xtrackers MSCI AC ASIA EX JAPANSWAP UCITS ETF*
MSCI AC ASIA EX JAPAN TRNINDEX
USD 665,724,578 99.76% 667,505,719 100.02%
Xtrackers MSCI RUSSIA CAPPEDSWAP UCITS ETF*
MSCI RUSSIA ISSUERS CAPPED25% INDEX
USD 148,132,555 101.51% 145,963,616 100.02%
Xtrackers FTSE VIETNAM SWAPUCITS ETF* FTSE VIETNAM INDEX USD 464,099,659 101.38% 458,233,247 100.10%
Xtrackers LPX PRIVATE EQUITYSWAP UCITS ETF* LPX MAJOR MARKET® INDEX EUR 254,705,122 97.25% 261,918,069 100.00%
Xtrackers S&P GLOBALINFRASTRUCTURE SWAP UCITSETF*
S&P GLOBAL INFRASTRUCTUREINDEX
USD 246,802,869 103.19% 239,180,822 100.00%
Xtrackers S&P SELECT FRONTIERSWAP UCITS ETF* S&P SELECT FRONTIER INDEX USD 101,522,370 103.70% 97,932,152 100.03%
Xtrackers USD OVERNIGHT RATESWAP UCITS ETF*
FED FUNDS EFFECTIVE RATETOTAL RETURN INDEX®
USD 8,284,750 99.55% 8,326,433 100.05%
Xtrackers S&P 500 2X LEVERAGEDDAILY SWAP UCITS ETF*
S&P 500 2X LEVERAGED DAILYINDEX
USD 182,969,641 96.14% 189,939,042 99.80%
Xtrackers SHORTDAX X2 DAILYSWAP UCITS ETF* SHORTDAX® X2 INDEX EUR 131,764,472 99.97% 131,553,863 99.81%
Xtrackers LEVDAX DAILY SWAPUCITS ETF* LEVDAX® INDEX EUR 43,903,374 105.52% 41,527,067 99.81%
Xtrackers BLOOMBERGCOMMODITY SWAP UCITS ETF*(5)
BLOOMBERG COMMODITY INDEXTOTAL RETURN 3 MONTHFORWARD
(6)USD
(7)10,254,383 71.69% 14,771,887 103.28%
Xtrackers S&P 500 2X INVERSEDAILY SWAP UCITS ETF* S&P 500 2X INVERSE DAILY INDEX USD 75,403,786 103.78% 72,496,425 99.78%
Xtrackers CSI300 SWAP UCITS ETF* CSI300 INDEX USD 1,948,706,949 103.29% 1,884,593,039 99.89%Xtrackers MSCI INDONESIA SWAPUCITS ETF* MSCI INDONESIA TRN INDEX USD 88,588,239 102.28% 86,641,288 100.04%
Xtrackers S&P 500 SWAP UCITS ETF* S&P 500 INDEX USD 8,570,454,379 99.70% 8,596,125,333 100.00%Xtrackers MSCI INDIA SWAP UCITSETF* MSCI INDIA TRN INDEX USD 83,781,884 103.67% 80,854,520 100.05%
Xtrackers MSCI AFRICA TOP50 SWAP UCITS ETF*
MSCI EFM AFRICA TOP 50 CAPPEDTRN INDEX
USD 39,680,198 102.01% 38,904,420 100.02%
Xtrackers**
Notes to the Financial Statements (continued)
* This is a synthetic ETF.** This includes synthetic ETFs.
331

4. Total Return Swaps (continued)
Sub-Fund Underlying asset Currency Exposure -Invested assets
Exposure -Invested
assets in % ofnet assets
Exposure -Underlying asset
Exposure -Underlying asset
in %of net assets
Xtrackers MSCI PAKISTAN SWAPUCITS ETF*
MSCI PAKISTAN INVESTABLEMARKET TOTAL RETURN NETINDEX
USD 13,550,141 103.68% 13,078,616 100.07%
(1)During the period ending 30 June 2021 this Sub-Fund changed its name. Please see point 6 in the significant events of the period section of the Notes to the FinancialStatements of this semi-annual report for further information.(2)During period ending 30 June 2021 this Sub-Fund changed its Reference Index. Please see point 6 in the significant events of the period section of the Notes to theFinancial Statements of this semi-annual report for further information.(3)During the period ending 30 June 2021 this Sub-Fund changed its name. Please see point 5 in the significant events of the period section of the Notes to the FinancialStatements of this semi-annual report for further information.(4)During the period ending 30 June 2021 this Sub-Fund changed its Reference Index. Please see point 5 in the significant events of the period section of the Notes tothe Financial Statements of this semi-annual report for further information.(5)During the period ending 30 June 2021 this Sub-Fund changed its name. Please see point 3 in the significant events of the period section of the Notes to the FinancialStatements of this semi-annual report for further information.(6)During the period ending 30 June 2021 this Sub-Fund changed its Reference Index. Please see point 3 in the significant events of the period section of the Notes tothe Financial Statements of this semi-annual report for further information.(7)During the period ending 30 June 2021 this Sub-Fund changed its currency. Please see point 3 in the significant events of the period section of the Notes to theFinancial Statements of this semi-annual report for further information.
As required by the Securities Financing Transactions Regulation (see Note 5), the Company is required to disclose the top10 counterparties of the total return swaps separately.
Deutsche BankAG is the counterparty to the swap positions entered into by the Company except for the following Sub-Funds which havedifferent counterparties and/or have multiple swap counterparties.
Sub-Fund Underlyingasset
Currency Counterparty NotionalValue -
Investedasset
NotionalValue -
Underlyingasset
Receivable /(Payable)
due from /(to) swap
counterparty
Unrealisedgain / (loss)
on swap
Xtrackers MSCI WORLDSWAP UCITS ETF*
MSCI TOTAL RETURN NETWORLD INDEX
USDBarclays CapitalSecurities Ltd.(United Kingdom)
(475,506,054) 792,305,072 316,799,018 (355,812,439)
USDCitigroup GlobalMarkets Limited(United Kingdom)
(534,601,010) 605,725,111 71,124,101 (88,533,704)
USDMorgan StanleyCapital ServicesLLC (United States)
(2,432,835,959) 3,166,118,243 733,282,284 (805,102,147)
Total (3,442,943,023) 4,564,148,426 1,121,205,403 (1,249,448,290)
Xtrackers MSCI USA SWAPUCITS ETF*
MSCI TOTAL RETURN NETUSA INDEX
USDBank of America(United States)
(730,863,949) 702,990,312 (27,873,637) 17,599,299
USDBarclays CapitalSecurities Ltd.(United Kingdom)
(1,878,713,381) 2,768,624,542 889,911,161 (973,611,761)
USDGoldman SachsInternational(United Kingdom)
(645,404,207) 663,226,198 17,821,991 (27,095,610)
Total (3,254,981,537) 4,134,841,052 879,859,515 (983,108,072)
Xtrackers MSCI EMERGINGMARKETS SWAP UCITSETF*
MSCI TOTAL RETURN NETEMERGING MARKETSINDEX
USDHSBC Bank PLC(United Kingdom)
(21,523,917) 23,736,068 2,212,151 (3,477,229)
USDJP MorganSecurities PLC(United States)
(938,940,275) 1,282,598,638 343,658,363 (347,866,447)
Total (960,464,192) 1,306,334,706 345,870,514 (351,343,676)
Xtrackers**
Notes to the Financial Statements (continued)
* This is a synthetic ETF.** This includes synthetic ETFs.
332

4. Total Return Swaps (continued)
Sub-Fund Underlyingasset
Currency Counterparty NotionalValue -
Investedasset
NotionalValue -
Underlyingasset
Receivable /(Payable)
due from /(to) swap
counterparty
Unrealisedgain / (loss)
on swap
Xtrackers MSCI EM ASIASWAP UCITS ETF*
MSCI TOTAL RETURN NETEMERGING MARKETS ASIAINDEX
USDBarclays CapitalSecurities Ltd.(United Kingdom)
(10,759,242) 11,211,355 452,113 (254,262)
USDJP MorganSecurities PLC(United States)
(575,863,476) 695,239,253 119,375,777 (115,552,892)
Total (586,622,718) 706,450,608 119,827,890 (115,807,154)Xtrackers MSCI EM LATINAMERICA ESG SWAP UCITSETF*(1)
MSCI EM LATIN AMERICALOW CARBON SRILEADERS INDEX
(2)
USDBank of America(United States)
(123,840,998) 122,342,524 (1,498,474) (4,891,598)
Total (123,840,998) 122,342,524 (1,498,474) (4,891,598)
Xtrackers MSCI EM EUROPE,MIDDLE EAST & AFRICAESG SWAP UCITS ETF*(3)
MSCI EM EMEA LOWCARBON SRI LEADERSINDEX
(4)
USDJP MorganSecurities PLC(United States)
(36,964,477) 50,142,271 13,177,794 (13,460,614)
Total (36,964,477) 50,142,271 13,177,794 (13,460,614)
Xtrackers NIFTY 50 SWAPUCITS ETF* NIFTY 50 INDEX
USDBNP ParibasArbitrage (France)
(89,852,649) 98,811,367 8,958,718 (10,816,090)
USDSociete Generale(France)
(38,972,754) 43,506,450 4,533,696 (5,835,306)
Total (128,825,403) 142,317,817 13,492,414 (16,651,396)
Xtrackers STOXX GLOBALSELECT DIVIDEND100 SWAP UCITS ETF*
STOXX® GLOBAL SELECTDIVIDEND 100 INDEX
EURJP MorganSecurities PLC(United States)
(254,072,484) 320,113,881 66,041,397 (73,998,096)
EURMorgan StanleyCapital ServicesLLC (United States)
(201,794,828) 322,095,537 120,300,709 (134,390,753)
Total (455,867,312) 642,209,418 186,342,106 (208,388,849)
Xtrackers STOXX EUROPE600 BASIC RESOURCESSWAP UCITS ETF*
STOXX® EUROPE600 BASIC RESOURCESINDEX
EURBank of America(United States)
(59,197,624) 60,185,994 988,370 (2,857,226)
EURBarclays CapitalSecurities Ltd.(United Kingdom)
(38,898,819) 61,227,489 22,328,670 (22,018,257)
Total (98,096,443) 121,413,483 23,317,040 (24,875,483)
Xtrackers STOXX EUROPE600 OIL & GAS SWAP UCITSETF*
STOXX® EUROPE 600 OIL &GAS INDEX
EURJP MorganSecurities PLC(United States)
(27,240,912) 38,817,950 11,577,038 (11,978,932)
Total (27,240,912) 38,817,950 11,577,038 (11,978,932)
Xtrackers STOXX EUROPE600 HEALTH CARE SWAPUCITS ETF*
STOXX® EUROPE600 HEALTH CARE INDEX
EURMorgan StanleyCapital ServicesLLC (United States)
(81,470,431) 96,548,397 15,077,966 (15,905,000)
Total (81,470,431) 96,548,397 15,077,966 (15,905,000)
Xtrackers STOXX EUROPE600 BANKS SWAP UCITSETF*
STOXX® EEUROPE600 BANKS INDEX
EURMorgan StanleyCapital ServicesLLC (United States)
(38,101,236) 47,095,259 8,994,023 (8,646,896)
Total (38,101,236) 47,095,259 8,994,023 (8,646,896)
Xtrackers STOXX EUROPE600 TELECOMMUNICATIONSSWAP UCITS ETF*
STOXX® EUROPE600 TELECOMMUNICATIONSINDEX
EURJP MorganSecurities PLC(United States)
(4,294,599) 4,704,925 410,326 (534,857)
Total (4,294,599) 4,704,925 410,326 (534,857)
Xtrackers STOXX EUROPE600 TECHNOLOGY SWAPUCITS ETF*
STOXX® EUROPE600 TECHNOLOGY INDEX
EURJP MorganSecurities PLC(United States)
(29,260,002) 41,874,827 12,614,825 (12,549,232)
Total (29,260,002) 41,874,827 12,614,825 (12,549,232)
Xtrackers STOXX EUROPE600 UTILITIES SWAP UCITSETF*
STOXX® EUROPE600 UTILITIES INDEX
EURMorgan StanleyCapital ServicesLLC (United States)
(13,194,745) 16,522,824 3,328,079 (3,345,104)
Total (13,194,745) 16,522,824 3,328,079 (3,345,104)
Xtrackers**
Notes to the Financial Statements (continued)
* This is a synthetic ETF.** This includes synthetic ETFs.
333

4. Total Return Swaps (continued)
Sub-Fund Underlyingasset
Currency Counterparty NotionalValue -
Investedasset
NotionalValue -
Underlyingasset
Receivable /(Payable)
due from /(to) swap
counterparty
Unrealisedgain / (loss)
on swap
Xtrackers STOXX EUROPE600 FOOD & BEVERAGESWAP UCITS ETF*
STOXX® EUROPE 600 FOOD& BEVERAGE INDEX
EURMorgan StanleyCapital ServicesLLC (United States)
(36,361,370) 42,051,424 5,690,054 (6,748,285)
EURSociete Generale(France)
(31,309,154) 22,366,907 (8,942,247) 8,422,216
Total (67,670,524) 64,418,331 (3,252,193) 1,673,931
Xtrackers STOXX EUROPE600 INDUSTRIAL GOODSSWAP UCITS ETF*
STOXX® EUROPE600 INDUSTRIAL GOODSINDEX
EURJP MorganSecurities PLC(United States)
(26,048,801) 28,915,656 2,866,855 (3,508,149)
Total (26,048,801) 28,915,656 2,866,855 (3,508,149)
Xtrackers SHORTDAX DAILYSWAP UCITS ETF* SHORTDAX® INDEX
EURMorgan StanleyCapital ServicesLLC (United States)
(259,343,699) 299,099,032 39,755,333 (40,233,208)
Total (259,343,699) 299,099,032 39,755,333 (40,233,208)
Xtrackers EURO STOXX50 SHORT DAILY SWAPUCITS ETF*
EURO STOXX 50® SHORTINDEX
EURMorgan StanleyCapital ServicesLLC (United States)
(116,309,398) 131,209,814 14,900,416 (12,038,767)
Total (116,309,398) 131,209,814 14,900,416 (12,038,767)
Xtrackers FTSE 100 SHORTDAILY SWAP UCITS ETF*
FTSE 100 DAILY SHORTINDEX
GBPJP MorganSecurities PLC(United States)
(8,197,731) 10,812,706 2,614,975 (2,527,972)
Total (8,197,731) 10,812,706 2,614,975 (2,527,972)
Xtrackers S&P 500 INVERSEDAILY SWAP UCITS ETF*
S&P 500 INVERSE DAILYINDEX
USDCitigroup GlobalMarkets Limited(United Kingdom)
(231,986,822) 251,346,313 19,359,491 (27,314,135)
Total (231,986,822) 251,346,313 19,359,491 (27,314,135)
Xtrackers MSCI AC ASIA EXJAPAN SWAP UCITS ETF*
MSCI AC ASIA EX JAPANTRN INDEX
USDJP MorganSecurities PLC(United States)
(508,189,093) 651,401,437 143,212,344 (141,427,402)
Total (508,189,093) 651,401,437 143,212,344 (141,427,402)
Xtrackers MSCI RUSSIACAPPED SWAP UCITS ETF*
MSCI RUSSIA ISSUERSCAPPED 25% INDEX
USDJP MorganSecurities PLC(United States)
(7,511,005) 7,129,835 (381,170) (31,338)
USDSociete Generale(France)
(110,783,568) 139,268,992 28,485,424 (30,240,654)
Total (118,294,573) 146,398,827 28,104,254 (30,271,992)
Xtrackers FTSE VIETNAMSWAP UCITS ETF* FTSE VIETNAM INDEX
USDDeutsche Bank AG -London branch(United Kingdom)
(33,988,442) 53,420,752 19,432,310 (23,080,245)
USDHSBC Bank PLC(United Kingdom)
(340,026,096) 363,681,842 23,655,746 (26,154,686)
Total (374,014,538) 417,102,594 43,088,056 (49,234,931)
Xtrackers LPX PRIVATEEQUITY SWAP UCITS ETF*
LPX MAJOR MARKET®INDEX
EURMorgan StanleyCapital ServicesLLC (United States)
(198,396,780) 264,341,388 65,944,608 (58,727,175)
Total (198,396,780) 264,341,388 65,944,608 (58,727,175)
Xtrackers S&P GLOBALINFRASTRUCTURE SWAPUCITS ETF*
S&P GLOBALINFRASTRUCTURE INDEX
USDMorgan StanleyCapital ServicesLLC (United States)
(205,064,540) 242,329,203 37,264,663 (44,877,556)
Total (205,064,540) 242,329,203 37,264,663 (44,877,556)Xtrackers S&P SELECTFRONTIER SWAP UCITSETF*
S&P SELECT FRONTIERINDEX
USDHSBC Bank PLC(United Kingdom)
(87,886,071) 98,427,549 10,541,478 (14,135,114)
Total (87,886,071) 98,427,549 10,541,478 (14,135,114)
Xtrackers S&P 500 2XLEVERAGED DAILY SWAPUCITS ETF*
S&P 500 2X LEVERAGEDDAILY INDEX
USDMorgan StanleyCapital ServicesLLC (United States)
(143,658,472) 189,429,074 45,770,602 (38,800,675)
Total (143,658,472) 189,429,074 45,770,602 (38,800,675)
Xtrackers SHORTDAXX2 DAILY SWAP UCITS ETF* SHORTDAX® X2 INDEX
EURBNP ParibasArbitrage (France)
(122,886,977) 130,360,467 7,473,490 (7,679,210)
Total (122,886,977) 130,360,467 7,473,490 (7,679,210)
Xtrackers**
Notes to the Financial Statements (continued)
* This is a synthetic ETF.** This includes synthetic ETFs.
334

4. Total Return Swaps (continued)
Sub-Fund Underlyingasset
Currency Counterparty NotionalValue -
Investedasset
NotionalValue -
Underlyingasset
Receivable /(Payable)
due from /(to) swap
counterparty
Unrealisedgain / (loss)
on swap
Xtrackers LEVDAX DAILYSWAP UCITS ETF* LEVDAX® INDEX
EURBNP ParibasArbitrage (France)
(43,437,493) 42,388,549 (1,048,944) (1,328,282)
Total (43,437,493) 42,388,549 (1,048,944) (1,328,282)
Xtrackers S&P 500 2XINVERSE DAILY SWAPUCITS ETF*
S&P 500 2X INVERSE DAILYINDEX
USDBNP ParibasArbitrage (France)
(33,669,457) 38,887,419 5,217,962 (5,866,393)
USDMorgan StanleyCapital ServicesLLC (United States)
(35,960,425) 38,262,121 2,301,696 (4,542,822)
Total (69,629,882) 77,149,540 7,519,658 (10,409,215)
Xtrackers CSI300 SWAPUCITS ETF* CSI300 INDEX
USDBank of America(United States)
(186,834,794) 215,983,435 29,148,641 (33,607,863)
USDBarclays CapitalSecurities Ltd.(United Kingdom)
(302,928,272) 414,464,607 111,536,335 (122,840,237)
USDCitigroup GlobalMarkets Limited(United Kingdom)
(155,209,595) 152,972,906 (2,236,689) (2,452,721)
USDDeutsche Bank AG -London branch(United Kingdom)
(53,534,048) 114,936,540 61,402,492 (75,220,248)
USDHSBC Bank PLC(United Kingdom)
(537,731,047) 657,446,769 119,715,722 (132,698,277)
USDJP MorganSecurities PLC(United States)
(193,397,692) 284,071,545 90,673,853 (105,569,606)
Total (1,429,635,448) 1,839,875,802 410,240,354 (472,388,952)
Xtrackers MSCI INDONESIASWAP UCITS ETF*
MSCI INDONESIA TRNINDEX
USDBNP ParibasArbitrage (France)
(60,612,845) 70,676,843 10,063,998 (10,929,494)
USDHSBC Bank PLC(United Kingdom)
(16,928,011) 22,812,432 5,884,421 (6,971,144)
Total (77,540,856) 93,489,275 15,948,419 (17,900,638)
Xtrackers S&P 500 SWAPUCITS ETF* S&P 500 INDEX
USDBarclays CapitalSecurities Ltd.(United Kingdom)
(658,364,523) 662,168,943 3,804,420 (23,235,089)
USDJP MorganSecurities PLC(United States)
(2,606,419,779) 3,831,487,906 1,225,068,127 (1,220,922,040)
USDMorgan StanleyCapital ServicesLLC (United States)
(2,495,826,257) 4,067,896,419 1,572,070,162 (1,530,872,429)
Total (5,760,610,559) 8,561,553,268 2,800,942,709 (2,775,029,558)
Xtrackers MSCI INDIA SWAPUCITS ETF* MSCI INDIA TRN INDEX
USDBNP ParibasArbitrage (France)
(75,815,964) 72,016,429 (3,799,535) 1,206,597
USDHSBC Bank PLC(United Kingdom)
(7,054,972) 8,468,887 1,413,915 (1,764,288)
Total (82,870,936) 80,485,316 (2,385,620) (557,691)
Xtrackers MSCI AFRICA TOP50 SWAP UCITS ETF*
MSCI EFM AFRICA TOP50 CAPPED TRN INDEX
USDHSBC Bank PLC(United Kingdom)
(33,096,255) 38,704,701 5,608,446 (6,384,568)
Total (33,096,255) 38,704,701 5,608,446 (6,384,568)
Xtrackers**
Notes to the Financial Statements (continued)
* This is a synthetic ETF.** This includes synthetic ETFs.
335

4. Total Return Swaps (continued)
Sub-Fund Underlyingasset
Currency Counterparty NotionalValue -
Investedasset
NotionalValue -
Underlyingasset
Receivable /(Payable)
due from /(to) swap
counterparty
Unrealisedgain / (loss)
on swap
Xtrackers MSCI PAKISTANSWAP UCITS ETF*
MSCI PAKISTANINVESTABLE MARKETTOTAL RETURN NET INDEX
USDJP MorganSecurities PLC(United States)
(9,547,621) 13,313,024 3,765,403 (4,242,104)
Total (9,547,621) 13,313,024 3,765,403 (4,242,104)
(1) During the period ending 30 June 2021 this Sub-Fund changed its name. Please see point 6 in the significant events of the period section of the Notes to the FinancialStatements of this semi-annual report for further information.
(2) During the period ending 30 June 2021 this Sub-Fund changed its Reference Index. Please see point 6 in the significant events of the period section of the Notes to theFinancial Statements of this semi-annual report for further information.
(3) During the period ending 30 June 2021 this Sub-Fund changed its name. Please see point 5 in the significant events of the period section of the Notes to the FinancialStatements of this semi-annual report for further information.
(4) During the period ending 30 June 2021 this Sub-Fund changed its Reference Index. Please see point 5 in the significant events of the period section of the Notes to theFinancial Statements of this semi-annual report for further information.
For all the Sub-Funds, there are no maturities for the above swap agreements.All trades open at the end of the financial period ended 30 June 2021 have been transacted through bilateral settlement.
5. Securities financing transactions
The Company is subject to the Regulation (EU) 2015/2365 of the European Parliament and of the Council on transparency of securitiesfinancing transactions and of reuse and amending Regulation (EU) No 648/2012 of the European Parliament (“SFTR”).
A Securities Financing Transaction (“SFT”) is defined in Article 3(11) of the SFTR as:
� a repurchase transaction or a reverse repurchase transaction;� a securities or commodities lending and securities or commodities borrowing;� a buy-sell back transaction or sell-buy back transaction;� a margin lending transaction.
As at 30 June 2021, the Company executed securities lending transactions (refer to Note 8 and Note 9.2).
The SFTR also covers transactions that are commonly referred to as total return swaps (“TRS”) (refer to Note 4).The Company held totalreturn swaps as at 30 June 2021.
6. Futures Contracts
As at 30 June 2021, the following Direct Replication Sub-Funds had the following futures contracts outstanding:
Description Number ofcontracts
Currency Commitment Maturity date Unrealised gain / (loss)(in Sub-Fund’s
currency)
Xtrackers MSCI EUROPE UCITS ETF
STOXX EUROPE 600 Index 25,150 EUR 13,457,220 17/09/2021 (17,787)
Xtrackers MSCI JAPAN UCITS ETF
TOPIX Index 630,000 JPY 1,224,090,000 09/09/2021 11,403,000
Xtrackers EURO STOXX 50 UCITS ETF
EURO STOXX 50® 7,250 EUR 29,402,375 17/09/2021 (195,750)
Xtrackers FTSE 100 INCOME UCITS ETF
FTSE 100 Index 40 GBP 279,220 17/09/2021 (2,295)
Xtrackers FTSE 250 UCITS ETF
FTSE 250 Index 6 GBP 133,944 17/09/2021 (1,987)
Xtrackers MSCI BRAZIL UCITS ETF
MSCI Brazil Index 1,300 USD 726,509 17/09/2021 (6,683)
Xtrackers**
Notes to the Financial Statements (continued)
* This is a synthetic ETF.** This includes synthetic ETFs.
336

6. Futures Contracts (continued)
Description Number ofcontracts
Currency Commitment Maturity date Unrealised gain / (loss)(in Sub-Fund’s
currency)
Xtrackers MSCI KOREA UCITS ETF
KOSPI 2 Index 750,000 KRW 292,268 09/09/2021 1,632
Xtrackers EURO STOXX QUALITY DIVIDEND UCITS ETF
EURO STOXX 50® 90 EUR 364,995 17/09/2021 (3,080)
Xtrackers MSCI PACIFIC EX JAPAN UCITS ETF
SPI 200 100 AUD 542,267 16/09/2021 (3,829)
Xtrackers S&P ASX 200 UCITS ETF
SPI 200 100 AUD 722,300 16/09/2021 (3,550)
Xtrackers STOXX EUROPE 600 UCITS ETF
STOXX EUROPE 600 Index 8,600 EUR 3,880,320 17/09/2021 (520)
Xtrackers MSCI EUROPE MID CAP UCITS ETF
STOXX EUROPE 600 Index 300 EUR 160,524 17/09/2021 (395)
Xtrackers MSCI EUROPE SMALL CAP UCITS ETF
STOXX EUROPE 600 Index 5,450 EUR 2,916,177 17/09/2021 (8,406)
Xtrackers MSCI CANADA UCITS ETF
S&P/TSX 60 Index 1,000 CAD 971,251 16/09/2021 10,033
Xtrackers MSCI EUROPE VALUE UCITS ETF
STOXX EUROPE 600 Index 50 EUR 22,560 17/09/2021 13
Xtrackers MSCI MALAYSIA UCITS ETF
FTSE KLCI Index 600 MYR 220,619 30/09/2021 (5,193)
Xtrackers SPAIN UCITS ETF
IBEX 35 Index 70 EUR 615,181 16/07/2021 (29,279)
Xtrackers MSCI SINGAPORE UCITS ETF
MSCI Singapore Index 200 SGD 52,886 29/07/2021 245
Xtrackers ATX UCITS ETF
ATX Index 460 EUR 1,560,550 17/09/2021 (48,295)
Xtrackers MSCI EMU UCITS ETF
EURO STOXX 50® 980 EUR 3,974,390 17/09/2021 (26,460)
Xtrackers FTSE 100 UCITS ETF
FTSE 100 Index 40 GBP 279,220 17/09/2021 (1,260)
Xtrackers NIKKEI 225 UCITS ETF
Nikkei 225 Index 24,000 JPY 690,720,000 09/09/2021 10,305,932
7. Forward Foreign Exchange Contracts
All forward foreign exchange contracts are for hedging purposes.
As at 30 June 2021, the Sub-Fund Xtrackers MSCI WORLD SWAP UCITS ETF* had the following forward foreign exchange contracts:
Purchased currency Purchased amount Sold currency Sold amount Maturity Unrealised gain / (loss)USD
AUD 25,143,823 EUR 15,897,814 02/07/2021 23,503
CHF 22,773,433 EUR 20,774,797 02/07/2021 396
DKK 41,032,713 EUR 5,518,019 02/07/2021 (104)
EUR 15,936,761 AUD 25,143,821 02/07/2021 22,685
EUR 20,724,029 CHF 22,773,433 02/07/2021 (60,601)
Xtrackers**
Notes to the Financial Statements (continued)
* This is a synthetic ETF.** This includes synthetic ETFs.
337

7. Forward Foreign Exchange Contracts (continued)
Purchased currency Purchased amount Sold currency Sold amount Maturity Unrealised gain / (loss)USD
EUR 5,517,207 DKK 41,032,713 02/07/2021 (860)
EUR 31,353,289 GBP 27,084,376 02/07/2021 (233,831)
EUR 701,611 ILS 2,797,531 02/07/2021 (26,492)
EUR 51,304,639 JPY 6,813,855,989 02/07/2021 (549,418)
EUR 1,427,680 NOK 14,490,662 02/07/2021 9,144
EUR 529,323 NZD 900,135 02/07/2021 (1,242)
EUR 8,217,629 SEK 83,628,515 02/07/2021 (33,363)
EUR 2,251,823 SGD 3,664,659 02/07/2021 (55,836)
EUR 474,810,187 USD 579,944,856 02/07/2021 (16,867,176)
GBP 27,084,376 EUR 31,517,028 02/07/2021 39,654
ILS 2,797,530 EUR 720,772 02/07/2021 3,769
JPY 6,813,855,989 EUR 51,748,094 02/07/2021 23,524
NOK 14,490,664 EUR 1,419,670 02/07/2021 355
NZD 900,135 EUR 529,350 02/07/2021 1,213
SEK 83,628,514 EUR 8,237,721 02/07/2021 9,535
SGD 3,664,658 EUR 2,289,234 02/07/2021 11,469
USD 579,944,855 EUR 487,283,155 02/07/2021 2,075,474
CAD 35,938,178 EUR 24,395,976 05/07/2021 89,004
EUR 24,272,978 CAD 35,938,178 05/07/2021 (234,878)
EUR 6,681,446 HKD 63,378,820 05/07/2021 (237,174)
HKD 63,378,819 EUR 6,851,295 05/07/2021 35,737
EUR 16,597,919 CHF 18,195,228 03/08/2021 (4,567)
EUR 4,359,405 DKK 32,419,357 03/08/2021 37
EUR 24,482,577 GBP 21,076,475 03/08/2021 (65,599)
EUR 5,229,626 HKD 48,341,401 03/08/2021 (19,327)
EUR 557,943 ILS 2,165,602 03/08/2021 (2,677)
EUR 39,624,184 JPY 5,215,612,890 03/08/2021 17,249
EUR 1,084,940 NOK 11,073,704 03/08/2021 413
EUR 402,924 NZD 686,116 03/08/2021 (1,251)
EUR 6,403,563 SEK 65,035,338 03/08/2021 (7,827)
EUR 1,748,019 SGD 2,798,535 03/08/2021 (7,428)
EUR 386,315,688 USD 459,988,793 03/08/2021 (1,554,224)
EUR 12,055,681 AUD 19,077,327 04/08/2021 (18,086)
EUR 19,316,119 CAD 28,468,838 04/08/2021 (67,308)
Net unrealised depreciation (17,686,108)
State Street Bank and Trust Company is the counterparty to these open forward foreign exchange contracts.
As at 30 June 2021, the Sub-Fund Xtrackers MSCI EUROPE UCITS ETF had the following forward foreign exchange contracts:
Purchased currency Purchased amount Sold currency Sold amount Maturity Unrealised gain / (loss)USD
CHF 21,590,400 USD 23,449,536 02/07/2021 (92,150)
DKK 38,475,200 USD 6,161,459 02/07/2021 (25,602)
EUR 68,142,200 USD 81,127,906 02/07/2021 (318,031)
GBP 25,605,000 USD 35,433,574 02/07/2021 (61,542)
NOK 13,410,200 USD 1,567,358 02/07/2021 (8,976)
Xtrackers**
Notes to the Financial Statements (continued)
** This includes synthetic ETFs.
338

7. Forward Foreign Exchange Contracts (continued)
Purchased currency Purchased amount Sold currency Sold amount Maturity Unrealised gain / (loss)USD
SEK 77,950,900 USD 9,146,301 02/07/2021 (31,528)
USD 24,038,099 CHF 21,590,400 02/07/2021 680,713
USD 6,302,972 DKK 38,475,200 02/07/2021 167,115
USD 83,032,414 EUR 68,142,200 02/07/2021 2,222,540
USD 36,280,364 GBP 25,605,000 02/07/2021 908,332
USD 1,605,733 NOK 13,410,200 02/07/2021 47,348
USD 9,388,237 SEK 77,950,900 02/07/2021 273,466
USD 23,330,156 CHF 21,463,100 03/08/2021 90,789
USD 6,066,738 DKK 37,871,300 03/08/2021 23,565
USD 79,705,671 EUR 66,907,700 03/08/2021 307,387
USD 34,293,576 GBP 24,788,500 03/08/2021 46,468
USD 1,521,341 NOK 13,013,500 03/08/2021 8,815
USD 8,972,339 SEK 76,443,200 03/08/2021 31,191
Net unrealised appreciation 4,269,900
Barclays Bank Ireland PLC, BNP Paribas SA, BofA Securities Europe SA, Citigroup Global Markets Europe AG, HSBC France, J.P.Morgan AG and Royal Bank of Canada (UK) are the counterparties to these open forward foreign exchange contracts.
As at 30 June 2021, the Sub-Fund Xtrackers MSCI JAPAN UCITS ETF had the following forward foreign exchange contracts:
Purchased currency Purchased amount Sold currency Sold amount Maturity Unrealised gain / (loss)JPY
CHF 39,348,830 JPY 4,810,426,831 02/07/2021 (85,672,669)
EUR 469,493,595 JPY 62,843,289,761 02/07/2021 (1,047,082,648)
GBP 15,593,599 JPY 2,423,062,623 02/07/2021 (32,140,325)
JPY 4,736,300,060 CHF 39,348,830 02/07/2021 11,545,897
JPY 61,779,945,141 EUR 469,493,594 02/07/2021 (16,261,973)
JPY 2,395,205,238 GBP 15,593,600 02/07/2021 4,282,941
JPY 7,173,508,731 USD 64,962,396 02/07/2021 (36,667,431)
USD 64,962,396 JPY 7,129,243,048 02/07/2021 80,933,115
CHF 30,277,601 JPY 3,635,861,448 03/08/2021 1,803,311
EUR 441,926,450 JPY 58,159,774,622 03/08/2021 31,028,941
GBP 9,509,039 JPY 1,453,331,644 03/08/2021 4,406,744
USD 40,927,271 JPY 4,521,403,449 03/08/2021 19,917,133
Net unrealised depreciation (1,063,906,964)
Barclays Bank Ireland PLC, BNP Paribas SA, BofA Securities Europe SA, Citigroup Global Markets Europe AG, HSBC France, J.P.Morgan AG, Royal Bank of Canada (UK) and State Street Bank London are the counterparties to these open forward foreign exchangecontracts.
As at 30 June 2021, the Sub-Fund Xtrackers FTSE 100 INCOME UCITS ETF had the following forward foreign exchange contract:
Purchased currency Purchased amount Sold currency Sold amount Maturity Unrealised gain / (loss)GBP
GBP 40,233 EUR 47,000 12/08/2021 (144)
Net unrealised depreciation (144)
Barclays Bank Ireland PLC is the counterparty to this open forward foreign exchange contract.
Xtrackers**
Notes to the Financial Statements (continued)
** This includes synthetic ETFs.
339

7. Forward Foreign Exchange Contracts (continued)
As at 30 June 2021, the Sub-Fund Xtrackers MSCI TAIWAN UCITS ETF had the following forward foreign exchange contract:
Purchased currency Purchased amount Sold currency Sold amount Maturity Unrealised gain / (loss)USD
USD 234,742 TWD 6,500,000 23/07/2021 1,445
Net unrealised appreciation 1,445
State Street Bank London is the counterparty to this open forward foreign exchange contract.
As at 30 June 2021, the Sub-Fund Xtrackers MSCI BRAZIL UCITS ETF had the following forward foreign exchange contract:
Purchased currency Purchased amount Sold currency Sold amount Maturity Unrealised gain / (loss)USD
USD 647,580 BRL 3,285,500 19/08/2021 (3,655)
Net unrealised depreciation (3,655)
BNP Paribas SA is the counterparty to this open forward foreign exchange contract.
As at 30 June 2021, the Sub-Fund Xtrackers FTSE CHINA 50 UCITS ETF had the following forward foreign exchange contract:
Purchased currency Purchased amount Sold currency Sold amount Maturity Unrealised gain / (loss)USD
USD 193,291 HKD 1,500,000 08/07/2021 137
Net unrealised appreciation 137
J.P. Morgan AG is the counterparty to this open forward foreign exchange contract.
As at 30 June 2021, the Sub-Fund Xtrackers BLOOMBERG COMMODITY EX-AGRICULTURE & LIVESTOCK SWAP UCITSETF* had the following forward foreign exchange contracts:
Purchased currency Purchased amount Sold currency Sold amount Maturity Unrealised gain / (loss)USD
EUR 253,907,235 USD 309,333,979 02/07/2021 (8,225,238)
GBP 8,468,375 USD 11,986,898 02/07/2021 (288,261)
USD 19,796,478 EUR 16,561,563 02/07/2021 156,111
USD 538,299 GBP 386,245 02/07/2021 4,721
Net unrealised depreciation (8,352,667)
State Street Bank and Trust Company is the counterparty to these open forward foreign exchange contracts.
As at 30 June 2021, the Sub-Fund Xtrackers STOXX EUROPE 600 UCITS ETF had the following forward foreign exchange contracts:
Purchased currency Purchased amount Sold currency Sold amount Maturity Unrealised gain / (loss)EUR
CHF 1,183,700 EUR 1,081,245 02/07/2021 (1,411)
DKK 2,035,200 EUR 273,688 02/07/2021 (1)
EUR 1,080,950 CHF 1,183,700 02/07/2021 1,117
EUR 273,643 DKK 2,035,200 02/07/2021 (44)
EUR 1,649,469 GBP 1,418,900 02/07/2021 (3,401)
EUR 89,475 NOK 910,500 02/07/2021 252
EUR 28,455 PLN 127,700 02/07/2021 171
EUR 460,102 SEK 4,653,300 02/07/2021 1,288
GBP 1,418,900 EUR 1,649,158 02/07/2021 3,711
Xtrackers**
Notes to the Financial Statements (continued)
* This is a synthetic ETF.** This includes synthetic ETFs.
340

7. Forward Foreign Exchange Contracts (continued)
Purchased currency Purchased amount Sold currency Sold amount Maturity Unrealised gain / (loss)EUR
NOK 910,500 EUR 89,435 02/07/2021 (213)
PLN 127,700 EUR 28,287 02/07/2021 (2)
SEK 4,653,300 EUR 458,684 02/07/2021 131
EUR 389,925 DKK 2,900,000 08/07/2021 (48)
EUR 862,565 CHF 945,300 03/08/2021 50
EUR 218,231 DKK 1,622,900 03/08/2021 2
EUR 1,315,542 GBP 1,132,800 03/08/2021 (3,297)
EUR 71,176 NOK 725,300 03/08/2021 137
EUR 22,492 PLN 101,600 03/08/2021 0
EUR 365,951 SEK 3,714,300 03/08/2021 (147)
Net unrealised depreciation (1,705)
Barclays Bank Ireland PLC, BNP Paribas SA, BofA Securities Europe SA, Citigroup Global Markets Europe AG, HSBC France, J.P.Morgan AG and Royal Bank of Canada (UK) are the counterparties to these open forward foreign exchange contracts.
As at 30 June 2021, the Sub-Fund Xtrackers MSCI EUROPE SMALL CAP UCITS ETF had the following forward foreign exchangecontract:
Purchased currency Purchased amount Sold currency Sold amount Maturity Unrealised gain / (loss)USD
EUR 238,011 GBP 205,000 01/07/2021 (939)
Net unrealised depreciation (939)
Citigroup Global Markets Europe AG is the counterparty to this open forward foreign exchange contract.
As at 30 June 2021, the Sub-Fund Xtrackers BLOOMBERG COMMODITY SWAP UCITS ETF* had the following forward foreignexchange contracts:
Purchased currency Purchased amount Sold currency Sold amount Maturity Unrealised gain / (loss)USD
EUR 27,213,784 USD 33,055,248 02/07/2021 (782,406)
USD 18,496,881 EUR 15,332,836 02/07/2021 313,662
Net unrealised depreciation (468,744)
State Street Bank and Trust Company is the counterparty to these open forward foreign exchange contracts.
As at 30 June 2021, the Sub-Fund Xtrackers MSCI EMU UCITS ETF had the following forward foreign exchange contracts:
Purchased currency Purchased amount Sold currency Sold amount Maturity Unrealised gain / (loss)EUR
CHF 17,642,320 EUR 16,109,034 02/07/2021 (14,777)
CHF 38,830 USD 43,273 02/07/2021 (1,067)
EUR 16,095,389 CHF 17,642,319 02/07/2021 1,132
EUR 87,632,553 GBP 75,413,168 02/07/2021 (215,901)
EUR 181,508,684 USD 216,095,581 02/07/2021 (711,969)
GBP 75,413,169 EUR 87,671,301 02/07/2021 177,155
GBP 165,810 USD 235,258 02/07/2021 (5,229)
USD 42,205 CHF 38,830 02/07/2021 166
USD 216,095,582 EUR 177,070,333 02/07/2021 5,150,321
USD 229,548 GBP 165,809 02/07/2021 413
Xtrackers**
Notes to the Financial Statements (continued)
* This is a synthetic ETF.** This includes synthetic ETFs.
341

7. Forward Foreign Exchange Contracts (continued)
Purchased currency Purchased amount Sold currency Sold amount Maturity Unrealised gain / (loss)EUR
CHF 17,446,073 EUR 15,919,141 03/08/2021 (920)
CHF 37,202 USD 40,440 03/08/2021 (133)
GBP 74,576,373 EUR 86,606,944 03/08/2021 217,077
GBP 159,215 USD 220,266 03/08/2021 (252)
USD 210,502,449 EUR 176,703,045 03/08/2021 684,097
Net unrealised appreciation 5,280,113
Barclays Bank Ireland PLC, BofA Securities Europe SA, Citigroup Global Markets Europe AG, HSBC France, J.P. Morgan AG andRoyal Bank of Canada (UK) are the counterparties to these open forward foreign exchange contracts.
As at 30 June 2021, the Sub-Fund Xtrackers DAX INCOME UCITS ETF had the following forward foreign exchange contracts:
Purchased currency Purchased amount Sold currency Sold amount Maturity Unrealised gain / (loss)EUR
CHF 8,213,853 EUR 7,500,031 02/07/2021 (6,919)
EUR 7,493,746 CHF 8,213,852 02/07/2021 635
EUR 41,036,936 USD 48,856,061 02/07/2021 (160,498)
USD 48,856,061 EUR 40,369,403 02/07/2021 828,031
CHF 7,975,747 EUR 7,277,686 03/08/2021 (421)
USD 47,821,599 EUR 40,143,106 03/08/2021 155,412
Net unrealised appreciation 816,240
Barclays Bank Ireland PLC, BNP Paribas SA, Citigroup Global Markets Europe AG, HSBC France and J.P. Morgan AG are thecounterparties to these open forward foreign exchange contracts.
As at 30 June 2021, the Sub-Fund Xtrackers FTSE 100 UCITS ETF had the following forward foreign exchange contract:
Purchased currency Purchased amount Sold currency Sold amount Maturity Unrealised gain / (loss)GBP
GBP 44,513 EUR 52,000 12/08/2021 (159)
Net unrealised depreciation (159)
Barclays Bank Ireland PLC is the counterparty to this open forward foreign exchange contract.
As at 30 June 2021, the Sub-Fund Xtrackers NIKKEI 225 UCITS ETF had the following forward foreign exchange contracts:
Purchased currency Purchased amount Sold currency Sold amount Maturity Unrealised gain / (loss)JPY
EUR 79,730,864 JPY 10,659,871,494 02/07/2021 (165,447,185)
JPY 10,491,889,167 EUR 79,730,864 02/07/2021 (2,535,142)
EUR 66,476,931 JPY 8,748,703,132 03/08/2021 4,667,539
Net unrealised depreciation (163,314,788)
Barclays Bank Ireland PLC, BofA Securities Europe SA, HSBC France, J.P. Morgan AG and Royal Bank of Canada (UK) are thecounterparties to these open forward foreign exchange contracts.
All forward foreign exchange contracts are for hedging purposes.
Xtrackers**
Notes to the Financial Statements (continued)
** This includes synthetic ETFs.
342

8. Securities lending
Sub-Funds with a Direct Investment Policy may enter into securities lending transactions (“Securities Lending Transactions”) for up to49% (or up to 30% for Authorised Sub-Funds with a Direct Investment Policy and up to 25% for Sub-Funds with a Direct InvestmentPolicy eligible for investment in a PEA(1)) of their assets to generate additional income and therewith offset part or all of their costs. Suchtransactions are strictly regulated and must, amongst other things, be able to be terminated at any time at the initiative of the Company.Securities Lending Transactions nonetheless give rise to certain risks including valuation and operational risks and market andcounterparty risks.
Depending on the value of the Securities Lending Transactions and its chosen policy, a Sub-Fund may be at any time fully or partiallyexposed to one or more counterparties, in which case appropriate collateral or other counterparty risk mitigation arrangements compliantwith, (i) Part I of the Luxembourg law of 17 December 2010, as amended, (ii) any amendment or replacement legislation thereto for thetime being in force, (iii) any regulation of any type taken in pursuance of (i) and (ii), (iv) the Directive 2014/91/EU of the EuropeanParliament and of the Council of 23 July 2014 as regards depositary functions, remunerations policies and sanctions, including itsmandatory implementing legislations on an EU or Home Member State level, (v) any sub-custodian agreement entered into between theSecurities Lending Agent (as defined below), the Company, the Management Company and State Street Bank International GmbH,Luxembourg Branch (“SSBL”) as well as (vi) any rule, guideline and general or specific position from time to time adopted by the CSSFpursuant thereto (the “Regulations”) will be taken/implemented and/or payment will be received from the Securities LendingTransactions counterparties so that the percentage of the counterparty risk exposure remains within the limits set out in the Regulations.
For the Sub-Funds with a Direct Investment Policy, the Company has appointed Deutsche Bank AG, acting through its Frankfurt amMain head office and its London and New York branches as the Securities Lending Agent (the “Securities Lending Agent”). TheSecurities LendingAgent has been authorised (i) to enter into Securities LendingTransactions on behalf of the Company and (ii) to investany cash received/held on behalf of the Company as collateral pursuant to such Securities Lending Transactions, in accordance with andwithin the limits set forth in the Agency Securities Lending and Repurchase Agreement, the rules set out in the Prospectus and theRegulations.
The Depositary has delegated the safekeeping function of certain non-cash collateral received by the Sub-Funds to Deutsche Bank AG.
Any income generated by Securities Lending Transactions (reduced by any applicable direct or indirect operational costs and fees arisingtherefrom and paid to the Securities Lending Agent and, as the case may be, to the relevant Investment Manager and/or the Sub-PortfolioManager) will be payable to the relevant Sub-Fund. Unless otherwise specified in the relevant Product Annex and to the extent theSecurities Lending Agent undertakes Securities Lending Transactions in relation to a Sub-Fund, the Securities Lending Agent, therelevant Investment Manager and/or the Sub-Portfolio Manager, as the case may be, shall receive a fee for the services provided in thisrespect.
For the period ended 30 June 2021, the Sub-Funds earned net income which is included in the Statement of Operations and Changes inNet Assets as “Income on securities lending, net”.
During the financial period ending 30 June 2021, the Securities Lending Agent and DWS Investments UK Limited (“DWS UK”)received the following portions of the gross lending revenues generated, in order to cover their estimated direct or indirect operationalcosts and fees associated with the services provided in this respect and the oversight of the Securities Lending Transactions.
(1) As defined below in paragraph 3 of the entitled Information for Shareholders.
All securities lending transactions are settled in a bilateral way.
Sub-Fund SecuritiesLending
Agent
DWSUK
Sub-Fund
Xtrackers MSCI EUROPE UCITS ETF 15% 15% 70%Xtrackers MSCI JAPAN UCITS ETF 15% 15% 70%Xtrackers EURO STOXX 50 UCITS ETF 15% 15% 70%Xtrackers DAX UCITS ETF 10% 0% 90%Xtrackers FTSE MIB UCITS ETF 15% 15% 70%Xtrackers SWITZERLAND UCITS ETF 15% 15% 70%Xtrackers FTSE 100 INCOME UCITS ETF 15% 15% 70%Xtrackers FTSE 250 UCITS ETF 15% 15% 70%Xtrackers MSCI TAIWAN UCITS ETF 15% 15% 70%Xtrackers MSCI BRAZIL UCITS ETF 15% 15% 70%Xtrackers MSCI KOREA UCITS ETF 15% 15% 70%Xtrackers FTSE CHINA 50 UCITS ETF 15% 15% 70%Xtrackers EURO STOXX QUALITY DIVIDEND UCITS ETF 15% 15% 70%Xtrackers SLI UCITS ETF 15% 15% 70%
Xtrackers**
Notes to the Financial Statements (continued)
** This includes synthetic ETFs.
343

8. Securities lending (continued)
Sub-Fund SecuritiesLending
Agent
DWSUK
Sub-Fund
Xtrackers PORTFOLIO UCITS ETF 15% 15% 70%Xtrackers MSCI PACIFIC EX JAPAN UCITS ETF 15% 15% 70%Xtrackers S&P ASX 200 UCITS ETF 15% 15% 70%Xtrackers STOXX EUROPE 600 UCITS ETF 15% 15% 70%Xtrackers CAC 40 UCITS ETF 15% 15% 70%Xtrackers MSCI EUROPE MID CAP UCITS ETF 15% 15% 70%Xtrackers MSCI EUROPE SMALL CAP UCITS ETF 15% 15% 70%Xtrackers MSCI CANADA UCITS ETF 15% 15% 70%Xtrackers MSCI MEXICO UCITS ETF 15% 15% 70%Xtrackers MSCI EUROPE VALUE UCITS ETF 15% 15% 70%Xtrackers FTSE DEVELOPED EUROPE REAL ESTATE UCITS ETF 15% 15% 70%Xtrackers MSCI CHINA UCITS ETF 15% 15% 70%Xtrackers MSCI MALAYSIA UCITS ETF 15% 15% 70%Xtrackers MSCI THAILAND UCITS ETF 15% 15% 70%Xtrackers MSCI PHILIPPINES UCITS ETF 15% 15% 70%Xtrackers SPAIN UCITS ETF 15% 15% 70%Xtrackers MSCI SINGAPORE UCITS ETF 15% 15% 70%Xtrackers ATX UCITS ETF 15% 15% 70%Xtrackers MSCI EMU UCITS ETF 15% 15% 70%Xtrackers DAX INCOME UCITS ETF 10% 0% 90%Xtrackers FTSE 100 UCITS ETF 15% 15% 70%Xtrackers NIKKEI 225 UCITS ETF 15% 15% 70%
The value of the securities lent and the market value of the cash collateral and non-cash collateral received for each Sub-Fund as at30 June 2021 is detailed in the following table:
Sub-Fund Sub-FundCurrency
MarketValue of
SecuritiesLent as at
30 June2021 (in EUR)
Market Valueof Collateral
Receivedas at
30 June2021 (in EUR)
Collateral asa Percentage of
the Market Valueof Securities
Lent as at30 June
2021
Xtrackers MSCI EUROPE UCITS ETF USD 86,913,629 94,498,525 108.73%
Xtrackers MSCI JAPAN UCITS ETF JPY 377,763,113 413,099,500 109.35%
Xtrackers EURO STOXX 50 UCITS ETF EUR 118,799,457 128,958,671 108.55%
Xtrackers DAX UCITS ETF EUR 74,334,622 80,934,794 108.88%
Xtrackers FTSE MIB UCITS ETF EUR 499,852 558,859 111.80%
Xtrackers SWITZERLAND UCITS ETF CHF 107,594,021 113,265,907 105.27%
Xtrackers FTSE 250 UCITS ETF GBP 1,280,836 1,514,476 118.24%
Xtrackers MSCI KOREA UCITS ETF USD 1,287,298 1,356,427 105.37%
Xtrackers FTSE CHINA 50 UCITS ETF USD 2,893,896 3,067,833 106.01%
Xtrackers EURO STOXX QUALITY DIVIDEND UCITS ETF EUR 1,803,552 2,031,252 112.63%
Xtrackers SLI UCITS ETF CHF 4,341,471 4,735,180 109.07%
Xtrackers PORTFOLIO UCITS ETF EUR 12,163,780 12,807,245 105.29%
Xtrackers MSCI PACIFIC EX JAPAN UCITS ETF USD 21,195,644 22,595,206 106.60%
Xtrackers STOXX EUROPE 600 UCITS ETF EUR 49,928,958 52,963,970 106.08%
Xtrackers CAC 40 UCITS ETF EUR 2,937,674 3,144,632 107.04%
Xtrackers MSCI EUROPE MID CAP UCITS ETF USD 537,642 568,948 105.82%
Xtrackers MSCI EUROPE SMALL CAP UCITS ETF USD 71,901,398 77,771,724 108.16%
Xtrackers**
Notes to the Financial Statements (continued)
** This includes synthetic ETFs.
344
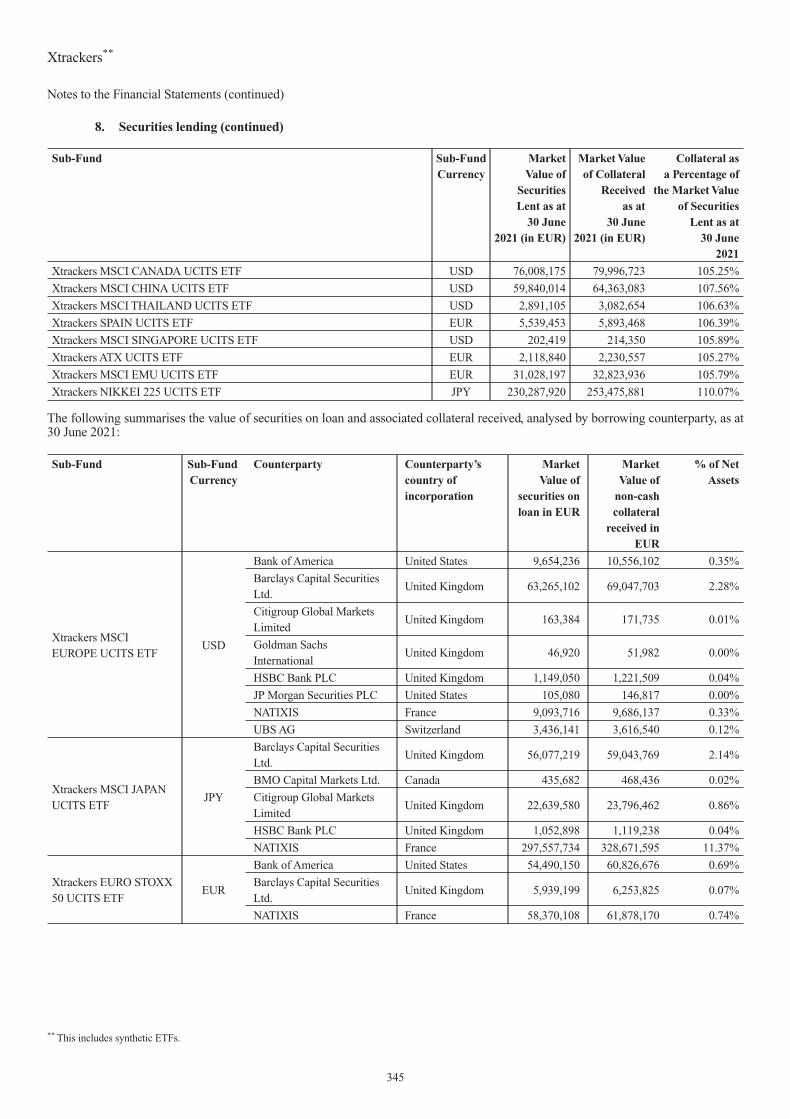
8. Securities lending (continued)
Sub-Fund Sub-FundCurrency
MarketValue of
SecuritiesLent as at
30 June2021 (in EUR)
Market Valueof Collateral
Receivedas at
30 June2021 (in EUR)
Collateral asa Percentage of
the Market Valueof Securities
Lent as at30 June
2021
Xtrackers MSCI CANADA UCITS ETF USD 76,008,175 79,996,723 105.25%
Xtrackers MSCI CHINA UCITS ETF USD 59,840,014 64,363,083 107.56%
Xtrackers MSCI THAILAND UCITS ETF USD 2,891,105 3,082,654 106.63%
Xtrackers SPAIN UCITS ETF EUR 5,539,453 5,893,468 106.39%
Xtrackers MSCI SINGAPORE UCITS ETF USD 202,419 214,350 105.89%
Xtrackers ATX UCITS ETF EUR 2,118,840 2,230,557 105.27%
Xtrackers MSCI EMU UCITS ETF EUR 31,028,197 32,823,936 105.79%
Xtrackers NIKKEI 225 UCITS ETF JPY 230,287,920 253,475,881 110.07%
The following summarises the value of securities on loan and associated collateral received, analysed by borrowing counterparty, as at30 June 2021:
Sub-Fund Sub-FundCurrency
Counterparty Counterparty’scountry ofincorporation
MarketValue of
securities onloan in EUR
MarketValue of
non-cashcollateral
received inEUR
% of NetAssets
Xtrackers MSCIEUROPE UCITS ETF
USD
Bank of America United States 9,654,236 10,556,102 0.35%
Barclays Capital SecuritiesLtd.
United Kingdom 63,265,102 69,047,703 2.28%
Citigroup Global MarketsLimited
United Kingdom 163,384 171,735 0.01%
Goldman SachsInternational
United Kingdom 46,920 51,982 0.00%
HSBC Bank PLC United Kingdom 1,149,050 1,221,509 0.04%
JP Morgan Securities PLC United States 105,080 146,817 0.00%
NATIXIS France 9,093,716 9,686,137 0.33%
UBS AG Switzerland 3,436,141 3,616,540 0.12%
Xtrackers MSCI JAPANUCITS ETF
JPY
Barclays Capital SecuritiesLtd.
United Kingdom 56,077,219 59,043,769 2.14%
BMO Capital Markets Ltd. Canada 435,682 468,436 0.02%
Citigroup Global MarketsLimited
United Kingdom 22,639,580 23,796,462 0.86%
HSBC Bank PLC United Kingdom 1,052,898 1,119,238 0.04%
NATIXIS France 297,557,734 328,671,595 11.37%
Xtrackers EURO STOXX50 UCITS ETF
EUR
Bank of America United States 54,490,150 60,826,676 0.69%
Barclays Capital SecuritiesLtd.
United Kingdom 5,939,199 6,253,825 0.07%
NATIXIS France 58,370,108 61,878,170 0.74%
Xtrackers**
Notes to the Financial Statements (continued)
** This includes synthetic ETFs.
345

8. Securities lending (continued)
Sub-Fund Sub-FundCurrency
Counterparty Counterparty’scountry ofincorporation
MarketValue of
securities onloan in EUR
MarketValue of
non-cashcollateral
received inEUR
% of NetAssets
Xtrackers DAX UCITSETF
EUR
Bank of America United States 64,240,762 70,241,822 1.56%
Barclays Capital SecuritiesLtd.
United Kingdom 3,647,480 3,840,432 0.09%
HSBC Bank PLC United Kingdom 6,446,380 6,852,540 0.15%
Xtrackers FTSE MIBUCITS ETF
EUR
Barclays Capital SecuritiesLtd.
United Kingdom 182,650 192,354 0.40%
JP Morgan Securities PLC United States 89,702 125,333 0.20%
NATIXIS France 227,500 241,172 0.50%
XtrackersSWITZERLAND UCITSETF
CHF
Barclays Capital SecuritiesLtd.
United Kingdom 96,293,908 101,372,537 8.69%
UBS AG Switzerland 11,300,113 11,893,370 1.02%
Xtrackers FTSE250 UCITS ETF
GBP
Barclays Capital SecuritiesLtd.
United Kingdom 302,807 359,827 0.34%
JP Morgan Securities PLC United States 254,619 272,366 0.29%
Morgan Stanley & Co.International PLC
United States 424,381 447,807 0.47%
UBS AG Switzerland 299,029 434,476 0.33%
Xtrackers MSCI KOREAUCITS ETF
USDBarclays Capital SecuritiesLtd.
United Kingdom 1,287,298 1,356,427 1.02%
Xtrackers FTSE CHINA50 UCITS ETF
USD NATIXIS France 2,893,896 3,067,833 2.52%
Xtrackers EURO STOXXQUALITY DIVIDENDUCITS ETF
EURBank of America United States 1,490,352 1,682,659 0.77%
NATIXIS France 313,200 348,593 0.16%
Xtrackers SLI UCITSETF
CHFBank of America United States 4,051,725 4,430,221 3.77%
UBS AG Switzerland 289,746 304,959 0.27%
Xtrackers PORTFOLIOUCITS ETF
EURBarclays Capital SecuritiesLtd.
United Kingdom 12,163,780 12,807,245 2.53%
Xtrackers MSCIPACIFIC EX JAPANUCITS ETF
USD NATIXIS France 21,195,644 22,595,206 3.51%
Xtrackers STOXXEUROPE 600 UCITSETF
EUR
Bank of America United States 6,459,466 7,062,888 0.41%
Barclays Capital SecuritiesLtd.
United Kingdom 35,896,034 37,794,933 2.26%
BNP Paribas Arbitrage France 432,500 466,191 0.03%
Citigroup Global MarketsLimited
United Kingdom 89,148 93,704 0.01%
JP Morgan Securities PLC United States 108,213 115,784 0.01%
Morgan Stanley & Co.International PLC
United States 717,771 757,393 0.04%
NATIXIS France 4,576,206 4,851,237 0.29%
UBS AG Switzerland 1,320,972 1,475,866 0.08%
Unicredit Bank AG Germany 328,648 345,974 0.02%
Xtrackers**
Notes to the Financial Statements (continued)
** This includes synthetic ETFs.
346

8. Securities lending (continued)
Sub-Fund Sub-FundCurrency
Counterparty Counterparty’scountry ofincorporation
MarketValue of
securities onloan in EUR
MarketValue of
non-cashcollateral
received inEUR
% of NetAssets
Xtrackers CAC40 UCITS ETF
EURBank of America United States 468,626 519,636 0.32%
NATIXIS France 2,469,048 2,624,996 1.69%
Xtrackers MSCIEUROPE MID CAPUCITS ETF
USD
Barclays Capital SecuritiesLtd.
United Kingdom 311,902 328,401 0.70%
Bofa Securities Europe SA France 119,934 129,243 0.27%
Citigroup Global MarketsLimited
United Kingdom 42,190 44,348 0.10%
UBS AG Switzerland 63,616 66,956 0.14%
Xtrackers MSCIEUROPE SMALL CAPUCITS ETF
USD
Barclays Capital SecuritiesLtd.
United Kingdom 40,270,600 42,886,421 3.36%
BNP Paribas Arbitrage France 1,544,034 1,664,220 0.13%
Bofa Securities Europe SA France 3,488,834 3,758,173 0.29%
Citigroup Global MarketsLimited
United Kingdom 746,156 784,285 0.06%
Credit Suisse Securities(Europe) Ltd.
Switzerland 80 304,840 0.00%
Deutsche Bank AG -London branch
United Kingdom 51,179 53,841 0.00%
Goldman SachsInternational
United Kingdom 528,050 585,027 0.04%
HSBC Bank PLC United Kingdom 2,428,387 2,581,392 0.20%
JP Morgan Securities PLC United States 2,098,418 2,521,181 0.18%
LiechtensteinischeLandesbank AG
Liechtenstein 110,400 226,695 0.01%
Morgan Stanley & Co.International PLC
United States 7,005,479 7,801,192 0.59%
NATIXIS France 3,685,459 3,912,247 0.31%
Societe Generale France 812,791 980,458 0.07%
UBS AG Switzerland 7,232,554 7,712,890 0.60%
Unicredit Bank AG Germany 1,898,977 1,998,862 0.16%
Xtrackers MSCICANADA UCITS ETF
USD UBS AG Switzerland 76,008,175 79,996,723 24.16%
Xtrackers MSCI CHINAUCITS ETF
USD
Barclays Capital SecuritiesLtd.
United Kingdom 61,376 65,132 0.00%
Citigroup Global MarketsLimited
United Kingdom 5,083,889 5,343,677 0.28%
Goldman SachsInternational
United Kingdom 700,593 776,110 0.04%
NATIXIS France 52,500,762 56,606,365 2.89%
UBS AG Switzerland 1,493,394 1,571,799 0.08%
Xtrackers**
Notes to the Financial Statements (continued)
** This includes synthetic ETFs.
347

8. Securities lending (continued)
Sub-Fund Sub-FundCurrency
Counterparty Counterparty’scountry ofincorporation
MarketValue of
securities onloan in EUR
MarketValue of
non-cashcollateral
received inEUR
% of NetAssets
Xtrackers MSCITHAILAND UCITS ETF
USD
Citigroup Global MarketsLimited
United Kingdom 366,845 385,591 0.63%
Goldman SachsInternational
United Kingdom 660,823 732,127 1.14%
Morgan Stanley & Co.International PLC
United States 43,647 49,606 0.08%
UBS AG Switzerland 1,819,790 1,915,330 3.14%
Xtrackers SPAIN UCITSETF
EUR
Barclays Capital SecuritiesLtd.
United Kingdom 2,354,527 2,479,918 1.36%
Bofa Securities Europe SA France 2,042,918 2,200,631 1.18%
HSBC Bank PLC United Kingdom 756,358 804,090 0.44%
NATIXIS France 385,650 408,829 0.22%
Xtrackers MSCISINGAPORE UCITSETF
USD
Barclays Capital SecuritiesLtd.
United Kingdom 99,951 105,840 0.23%
Citigroup Global MarketsLimited
United Kingdom 13,017 13,682 0.03%
NATIXIS France 89,451 94,828 0.20%
Xtrackers ATX UCITSETF
EUR
Barclays Capital SecuritiesLtd.
United Kingdom 439,040 462,566 0.58%
UBS AG Switzerland 1,679,800 1,767,991 2.22%
Xtrackers MSCI EMUUCITS ETF
EUR
Barclays Capital SecuritiesLtd.
United Kingdom 6,748,281 7,105,265 0.32%
BNP Paribas Arbitrage France 692,000 745,906 0.03%
Citigroup Global MarketsLimited
United Kingdom 150,144 157,817 0.01%
Deutsche Bank AG -London branch
United Kingdom 6,573,085 6,914,687 0.31%
NATIXIS France 15,007,801 15,909,844 0.72%
Societe Generale France 225,175 271,664 0.01%
UBS AG Switzerland 1,199,211 1,263,502 0.06%
Unicredit Bank AG Germany 432,500 455,251 0.02%
Xtrackers NIKKEI225 UCITS ETF
JPY
Barclays Capital SecuritiesLtd.
United Kingdom 5,542,784 5,835,997 0.33%
BMO Capital Markets Ltd. Canada 328,672 353,389 0.02%
Citigroup Global MarketsLimited
United Kingdom 33,886,047 35,616,980 2.03%
NATIXIS France 190,197,818 211,268,300 11.36%
Societe Generale France 332,599 401,215 0.02%
Xtrackers**
Notes to the Financial Statements (continued)
** This includes synthetic ETFs.
348

8. Securities lending (continued)
For all Sub-Funds, the maturity tenor of the securities on loan is open as they are all equities. Please refer to Note 9.2 in order to seematurity tenor of collateral received.
Please, refer to Note 9.2 in order to see market value on securities on loan by maturity tenor.
The following summarises the value of collateral received (analysed by currency), as at 30 June 2021:
Sub-Fund Sub-FundCurrency
SecurityCurrency
Non-cash collateral receivedin EUR
XTRACKERS MSCI EUROPE UCITS ETF USD DKK 830,964
XTRACKERS MSCI EUROPE UCITS ETF USD EUR 92,704,696
XTRACKERS MSCI EUROPE UCITS ETF USD USD 962,865
XTRACKERS MSCI JAPAN UCITS ETF JPY AUD 52,793,699
XTRACKERS MSCI JAPAN UCITS ETF JPY CAD 1,118,789
XTRACKERS MSCI JAPAN UCITS ETF JPY EUR 153,225,479
XTRACKERS MSCI JAPAN UCITS ETF JPY USD 205,961,533
XTRACKERS EURO STOXX 50 UCITS ETF EUR AUD 37,526,766
XTRACKERS EURO STOXX 50 UCITS ETF EUR EUR 91,431,905
XTRACKERS DAX UCITS ETF EUR EUR 37,458,489
XTRACKERS DAX UCITS ETF EUR GBP 9,784,283
XTRACKERS DAX UCITS ETF EUR JPY 3,782,498
XTRACKERS DAX UCITS ETF EUR NOK 8,841,652
XTRACKERS DAX UCITS ETF EUR SEK 16,361,409
XTRACKERS DAX UCITS ETF EUR USD 4,706,463
XTRACKERS FTSE MIB UCITS ETF EUR EUR 558,859
XTRACKERS SWITZERLAND UCITS ETF CHF EUR 113,265,907
XTRACKERS FTSE 250 UCITS ETF GBP EUR 1,514,476
XTRACKERS MSCI KOREA UCITS ETF USD EUR 1,356,427
XTRACKERS FTSE CHINA 50 UCITS ETF USD EUR 3,067,833
XTRACKERS EURO STOXX QUALITY DIVIDEND UCITS ETF EUR EUR 1,682,659
XTRACKERS EURO STOXX QUALITY DIVIDEND UCITS ETF EUR USD 348,593
XTRACKERS SLI UCITS ETF CHF EUR 4,735,180
XTRACKERS PORTFOLIO UCITS ETF EUR EUR 12,807,245
XTRACKERS MSCI PACIFIC EX JAPAN UCITS ETF USD EUR 19,948,410
XTRACKERS MSCI PACIFIC EX JAPAN UCITS ETF USD SEK 844,175
XTRACKERS MSCI PACIFIC EX JAPAN UCITS ETF USD USD 1,658,970
XTRACKERS MSCI PACIFIC EX JAPAN UCITS ETF USD ZAR 143,651
XTRACKERS STOXX EUROPE 600 UCITS ETF EUR EUR 52,963,970
XTRACKERS CAC 40 UCITS ETF EUR EUR 3,144,632
XTRACKERS MSCI EUROPE MID CAP UCITS ETF USD EUR 568,948
XTRACKERS MSCI EUROPE SMALL CAP UCITS ETF USD EUR 77,660,421
XTRACKERS MSCI EUROPE SMALL CAP UCITS ETF USD SEK 111,303
XTRACKERS MSCI CANADA UCITS ETF USD EUR 79,996,723
XTRACKERS MSCI CHINA UCITS ETF USD EUR 44,348,530
XTRACKERS MSCI CHINA UCITS ETF USD GBP 10,840,921
XTRACKERS MSCI CHINA UCITS ETF USD SEK 3,500,628
XTRACKERS MSCI CHINA UCITS ETF USD USD 5,673,004
XTRACKERS MSCI THAILAND UCITS ETF USD EUR 3,082,654
XTRACKERS SPAIN UCITS ETF EUR EUR 5,893,468
XTRACKERS MSCI SINGAPORE UCITS ETF USD EUR 214,350
Xtrackers**
Notes to the Financial Statements (continued)
** This includes synthetic ETFs.
349
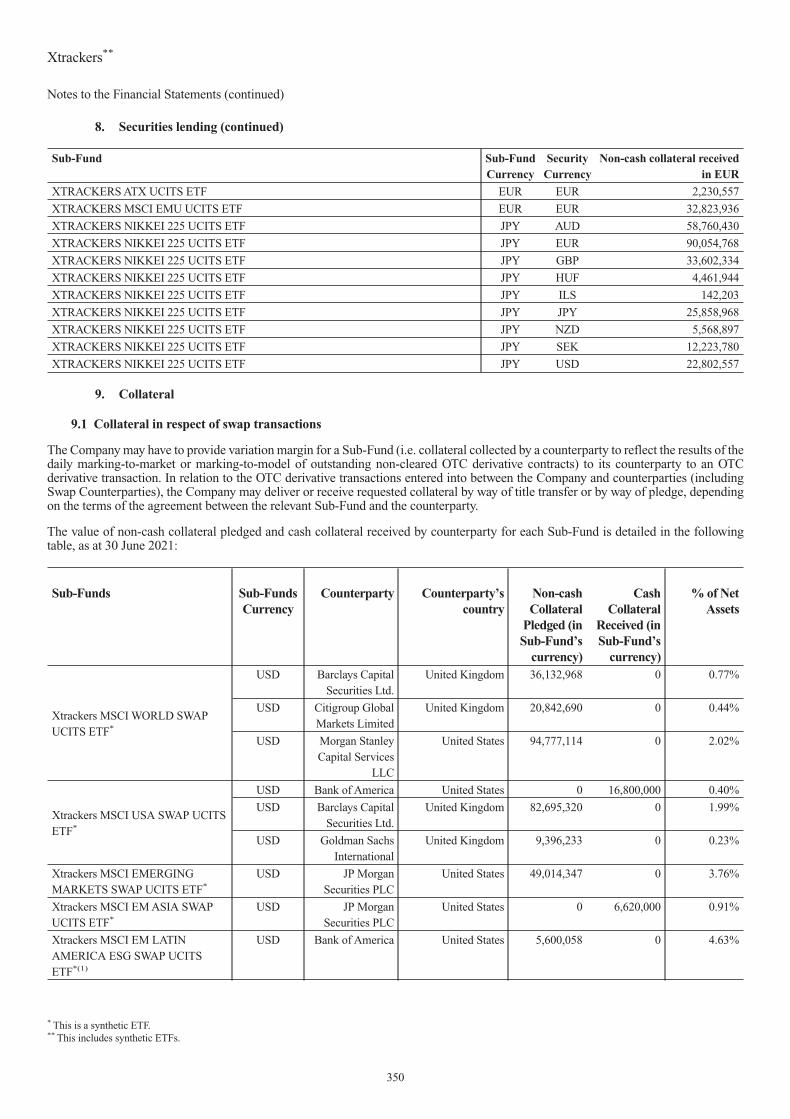
8. Securities lending (continued)
Sub-Fund Sub-FundCurrency
SecurityCurrency
Non-cash collateral receivedin EUR
XTRACKERS ATX UCITS ETF EUR EUR 2,230,557
XTRACKERS MSCI EMU UCITS ETF EUR EUR 32,823,936
XTRACKERS NIKKEI 225 UCITS ETF JPY AUD 58,760,430
XTRACKERS NIKKEI 225 UCITS ETF JPY EUR 90,054,768
XTRACKERS NIKKEI 225 UCITS ETF JPY GBP 33,602,334
XTRACKERS NIKKEI 225 UCITS ETF JPY HUF 4,461,944
XTRACKERS NIKKEI 225 UCITS ETF JPY ILS 142,203
XTRACKERS NIKKEI 225 UCITS ETF JPY JPY 25,858,968
XTRACKERS NIKKEI 225 UCITS ETF JPY NZD 5,568,897
XTRACKERS NIKKEI 225 UCITS ETF JPY SEK 12,223,780
XTRACKERS NIKKEI 225 UCITS ETF JPY USD 22,802,557
9. Collateral
9.1 Collateral in respect of swap transactions
The Company may have to provide variation margin for a Sub-Fund (i.e. collateral collected by a counterparty to reflect the results of thedaily marking-to-market or marking-to-model of outstanding non-cleared OTC derivative contracts) to its counterparty to an OTCderivative transaction. In relation to the OTC derivative transactions entered into between the Company and counterparties (includingSwap Counterparties), the Company may deliver or receive requested collateral by way of title transfer or by way of pledge, dependingon the terms of the agreement between the relevant Sub-Fund and the counterparty.
The value of non-cash collateral pledged and cash collateral received by counterparty for each Sub-Fund is detailed in the followingtable, as at 30 June 2021:
Sub-Funds Sub-FundsCurrency
Counterparty Counterparty’scountry
Non-cashCollateral
Pledged (inSub-Fund’s
currency)
CashCollateral
Received (inSub-Fund’s
currency)
% of NetAssets
Xtrackers MSCI WORLD SWAPUCITS ETF*
USD Barclays CapitalSecurities Ltd.
United Kingdom 36,132,968 0 0.77%
USD Citigroup GlobalMarkets Limited
United Kingdom 20,842,690 0 0.44%
USD Morgan StanleyCapital Services
LLC
United States 94,777,114 0 2.02%
Xtrackers MSCI USA SWAP UCITSETF*
USD Bank of America United States 0 16,800,000 0.40%
USD Barclays CapitalSecurities Ltd.
United Kingdom 82,695,320 0 1.99%
USD Goldman SachsInternational
United Kingdom 9,396,233 0 0.23%
Xtrackers MSCI EMERGINGMARKETS SWAP UCITS ETF*
USD JP MorganSecurities PLC
United States 49,014,347 0 3.76%
Xtrackers MSCI EM ASIA SWAPUCITS ETF*
USD JP MorganSecurities PLC
United States 0 6,620,000 0.91%
Xtrackers MSCI EM LATINAMERICA ESG SWAP UCITSETF*(1)
USD Bank of America United States 5,600,058 0 4.63%
Xtrackers**
Notes to the Financial Statements (continued)
* This is a synthetic ETF.** This includes synthetic ETFs.
350
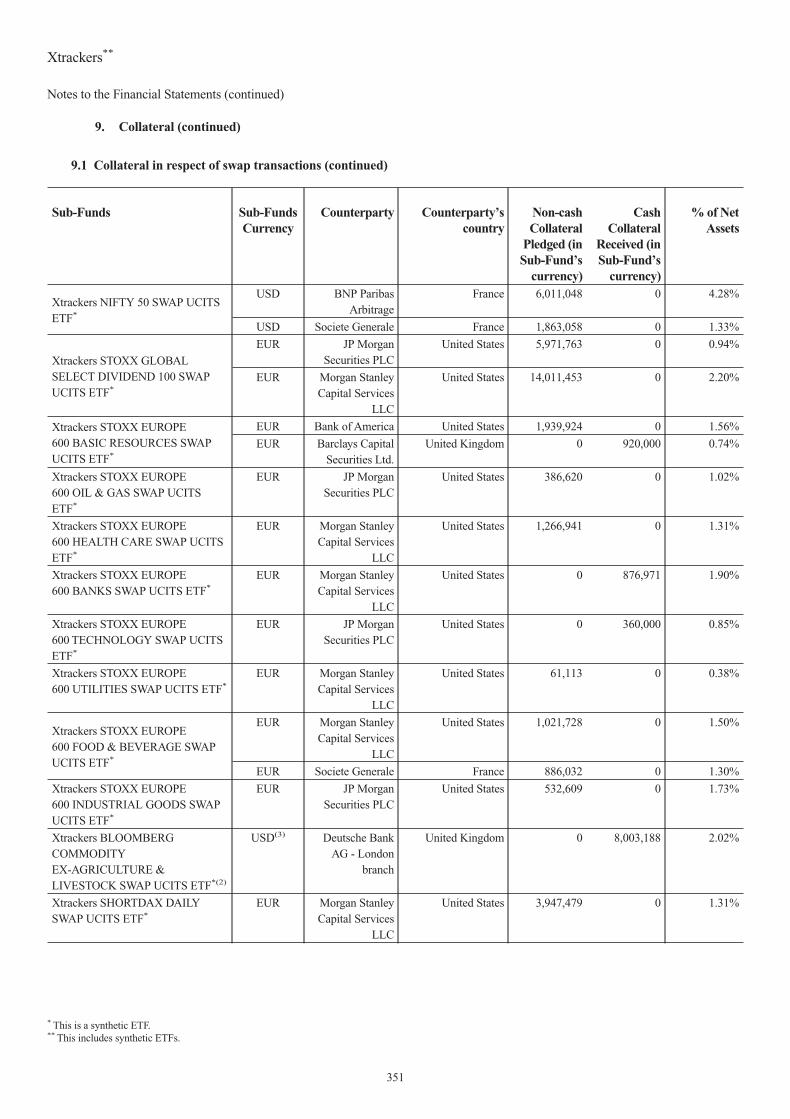
9. Collateral (continued)
9.1 Collateral in respect of swap transactions (continued)
Sub-Funds Sub-FundsCurrency
Counterparty Counterparty’scountry
Non-cashCollateral
Pledged (inSub-Fund’s
currency)
CashCollateral
Received (inSub-Fund’s
currency)
% of NetAssets
Xtrackers NIFTY 50 SWAP UCITSETF*
USD BNP ParibasArbitrage
France 6,011,048 0 4.28%
USD Societe Generale France 1,863,058 0 1.33%
Xtrackers STOXX GLOBALSELECT DIVIDEND 100 SWAPUCITS ETF*
EUR JP MorganSecurities PLC
United States 5,971,763 0 0.94%
EUR Morgan StanleyCapital Services
LLC
United States 14,011,453 0 2.20%
Xtrackers STOXX EUROPE600 BASIC RESOURCES SWAPUCITS ETF*
EUR Bank of America United States 1,939,924 0 1.56%
EUR Barclays CapitalSecurities Ltd.
United Kingdom 0 920,000 0.74%
Xtrackers STOXX EUROPE600 OIL & GAS SWAP UCITSETF*
EUR JP MorganSecurities PLC
United States 386,620 0 1.02%
Xtrackers STOXX EUROPE600 HEALTH CARE SWAP UCITSETF*
EUR Morgan StanleyCapital Services
LLC
United States 1,266,941 0 1.31%
Xtrackers STOXX EUROPE600 BANKS SWAP UCITS ETF*
EUR Morgan StanleyCapital Services
LLC
United States 0 876,971 1.90%
Xtrackers STOXX EUROPE600 TECHNOLOGY SWAP UCITSETF*
EUR JP MorganSecurities PLC
United States 0 360,000 0.85%
Xtrackers STOXX EUROPE600 UTILITIES SWAP UCITS ETF*
EUR Morgan StanleyCapital Services
LLC
United States 61,113 0 0.38%
Xtrackers STOXX EUROPE600 FOOD & BEVERAGE SWAPUCITS ETF*
EUR Morgan StanleyCapital Services
LLC
United States 1,021,728 0 1.50%
EUR Societe Generale France 886,032 0 1.30%
Xtrackers STOXX EUROPE600 INDUSTRIAL GOODS SWAPUCITS ETF*
EUR JP MorganSecurities PLC
United States 532,609 0 1.73%
Xtrackers BLOOMBERGCOMMODITYEX-AGRICULTURE &LIVESTOCK SWAP UCITS ETF*(2)
USD(3) Deutsche BankAG - London
branch
United Kingdom 0 8,003,188 2.02%
Xtrackers SHORTDAX DAILYSWAP UCITS ETF*
EUR Morgan StanleyCapital Services
LLC
United States 3,947,479 0 1.31%
Xtrackers**
Notes to the Financial Statements (continued)
* This is a synthetic ETF.** This includes synthetic ETFs.
351

9. Collateral (continued)
9.1 Collateral in respect of swap transactions (continued)
Sub-Funds Sub-FundsCurrency
Counterparty Counterparty’scountry
Non-cashCollateral
Pledged (inSub-Fund’s
currency)
CashCollateral
Received (inSub-Fund’s
currency)
% of NetAssets
Xtrackers EURO STOXX 50 SHORTDAILY SWAP UCITS ETF*
EUR Morgan StanleyCapital Services
LLC
United States 151,498 0 0.11%
Xtrackers FTSE 100 SHORT DAILYSWAP UCITS ETF*
GBP JP MorganSecurities PLC
United States 196,096 0 1.81%
Xtrackers S&P 500 INVERSEDAILY SWAP UCITS ETF*
USD Citigroup GlobalMarkets Limited
United Kingdom 8,008,460 0 3.29%
Xtrackers MSCI AC ASIA EXJAPAN SWAP UCITS ETF*
USD JP MorganSecurities PLC
United States 0 3,770,000 0.56%
Xtrackers MSCI RUSSIA CAPPEDSWAP UCITS ETF*
USD JP MorganSecurities PLC
United States 401,587 0 0.28%
USD Societe Generale France 8,454,316 0 5.79%
Xtrackers FTSE VIETNAM SWAPUCITS ETF*
USD Deutsche BankAG - London
branch
United Kingdom 7,617,149 0 1.66%
Xtrackers LPX PRIVATE EQUITYSWAP UCITS ETF*
EUR Morgan StanleyCapital Services
LLC
United States 0 7,428,953 2.84%
Xtrackers S&P GLOBALINFRASTRUCTURE SWAP UCITSETF*
USD Morgan StanleyCapital Services
LLC
United States 8,463,176 0 3.54%
Xtrackers S&P 500 2XLEVERAGED DAILY SWAPUCITS ETF*
USD Morgan StanleyCapital Services
LLC
United States 0 8,400,000 4.41%
Xtrackers SHORTDAX X2 DAILYSWAP UCITS ETF*
EUR BNP ParibasArbitrage
France 12,107,601 0 9.19%
Xtrackers LEVDAX DAILY SWAPUCITS ETF*
EUR BNP ParibasArbitrage
France 247,771 0 0.60%
Xtrackers BLOOMBERGCOMMODITY SWAP UCITSETF*(2)
USD(3) Deutsche BankAG - London
branch
United Kingdom 0 502,822 3.52%
Xtrackers S&P 500 2X INVERSEDAILY SWAP UCITS ETF*
USD BNP ParibasArbitrage
France 2,280,684 0 3.14%
USD Morgan StanleyCapital Services
LLC
United States 1,971,648 0 2.71%
Xtrackers**
Notes to the Financial Statements (continued)
* This is a synthetic ETF.** This includes synthetic ETFs.
352
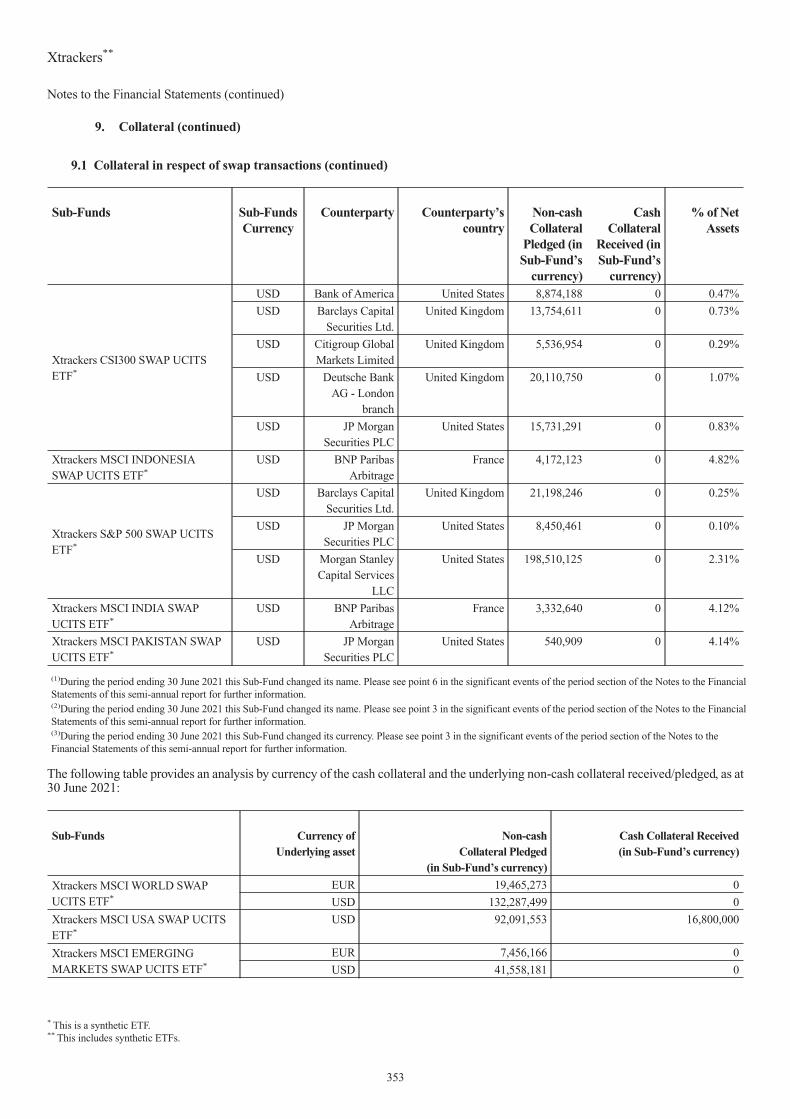
9. Collateral (continued)
9.1 Collateral in respect of swap transactions (continued)
Sub-Funds Sub-FundsCurrency
Counterparty Counterparty’scountry
Non-cashCollateral
Pledged (inSub-Fund’s
currency)
CashCollateral
Received (inSub-Fund’s
currency)
% of NetAssets
Xtrackers CSI300 SWAP UCITSETF*
USD Bank of America United States 8,874,188 0 0.47%
USD Barclays CapitalSecurities Ltd.
United Kingdom 13,754,611 0 0.73%
USD Citigroup GlobalMarkets Limited
United Kingdom 5,536,954 0 0.29%
USD Deutsche BankAG - London
branch
United Kingdom 20,110,750 0 1.07%
USD JP MorganSecurities PLC
United States 15,731,291 0 0.83%
Xtrackers MSCI INDONESIASWAP UCITS ETF*
USD BNP ParibasArbitrage
France 4,172,123 0 4.82%
Xtrackers S&P 500 SWAP UCITSETF*
USD Barclays CapitalSecurities Ltd.
United Kingdom 21,198,246 0 0.25%
USD JP MorganSecurities PLC
United States 8,450,461 0 0.10%
USD Morgan StanleyCapital Services
LLC
United States 198,510,125 0 2.31%
Xtrackers MSCI INDIA SWAPUCITS ETF*
USD BNP ParibasArbitrage
France 3,332,640 0 4.12%
Xtrackers MSCI PAKISTAN SWAPUCITS ETF*
USD JP MorganSecurities PLC
United States 540,909 0 4.14%
(1)During the period ending 30 June 2021 this Sub-Fund changed its name. Please see point 6 in the significant events of the period section of the Notes to the FinancialStatements of this semi-annual report for further information.(2)During the period ending 30 June 2021 this Sub-Fund changed its name. Please see point 3 in the significant events of the period section of the Notes to the FinancialStatements of this semi-annual report for further information.(3)During the period ending 30 June 2021 this Sub-Fund changed its currency. Please see point 3 in the significant events of the period section of the Notes to theFinancial Statements of this semi-annual report for further information.
The following table provides an analysis by currency of the cash collateral and the underlying non-cash collateral received/pledged, as at30 June 2021:
Sub-Funds Currency ofUnderlying asset
Non-cashCollateral Pledged
(in Sub-Fund’s currency)
Cash Collateral Received(in Sub-Fund’s currency)
Xtrackers MSCI WORLD SWAPUCITS ETF*
EUR 19,465,273 0
USD 132,287,499 0
Xtrackers MSCI USA SWAP UCITSETF*
USD 92,091,553 16,800,000
Xtrackers MSCI EMERGINGMARKETS SWAP UCITS ETF*
EUR 7,456,166 0
USD 41,558,181 0
Xtrackers**
Notes to the Financial Statements (continued)
* This is a synthetic ETF.** This includes synthetic ETFs.
353

9. Collateral (continued)
9.1 Collateral in respect of swap transactions (continued)
Sub-Funds Currency ofUnderlying asset
Non-cashCollateral Pledged
(in Sub-Fund’s currency)
Cash Collateral Received(in Sub-Fund’s currency)
Xtrackers MSCI EM ASIA SWAPUCITS ETF*
USD 0 6,620,000
Xtrackers MSCI EM LATINAMERICA ESG SWAP UCITSETF*(1)
EUR 5,600,058 0
Xtrackers NIFTY 50 SWAP UCITSETF*
USD 7,874,106 0
Xtrackers STOXX GLOBAL SELECTDIVIDEND 100 SWAP UCITS ETF*
EUR 287,678 0
USD 19,695,538 0
Xtrackers STOXX EUROPE600 BASIC RESOURCES SWAPUCITS ETF*
EUR 0 920,000
USD 1,939,924 0
Xtrackers STOXX EUROPE 600 OIL& GAS SWAP UCITS ETF*
EUR 386,620 0
Xtrackers STOXX EUROPE600 HEALTH CARE SWAP UCITSETF*
USD 1,266,941 0
Xtrackers STOXX EUROPE600 BANKS SWAP UCITS ETF*
USD 0 876,971
Xtrackers STOXX EUROPE600 TECHNOLOGY SWAP UCITSETF*
EUR 0 360,000
Xtrackers STOXX EUROPE600 UTILITIES SWAP UCITS ETF*
USD 61,113 0
Xtrackers STOXX EUROPE600 FOOD & BEVERAGE SWAPUCITS ETF*
USD 1,907,760 0
Xtrackers STOXX EUROPE600 INDUSTRIAL GOODS SWAPUCITS ETF*
EUR 532,609 0
Xtrackers BLOOMBERGCOMMODITY EX-AGRICULTURE& LIVESTOCK SWAP UCITSETF*(2)
EUR 0 8,003,188
Xtrackers SHORTDAX DAILY SWAPUCITS ETF*
USD 3,947,479 0
Xtrackers EURO STOXX 50 SHORTDAILY SWAP UCITS ETF*
USD 151,498 0
Xtrackers FTSE 100 SHORT DAILYSWAP UCITS ETF*
EUR 196,096 0
Xtrackers S&P 500 INVERSE DAILYSWAP UCITS ETF*
USD 8,008,460 0
Xtrackers MSCI AC ASIA EX JAPANSWAP UCITS ETF*
USD 0 3,770,000
Xtrackers**
Notes to the Financial Statements (continued)
* This is a synthetic ETF.** This includes synthetic ETFs.
354

9. Collateral (continued)
9.1 Collateral in respect of swap transactions (continued)
Sub-Funds Currency ofUnderlying asset
Non-cashCollateral Pledged
(in Sub-Fund’s currency)
Cash Collateral Received(in Sub-Fund’s currency)
Xtrackers MSCI RUSSIA CAPPEDSWAP UCITS ETF*
USD 8,855,903 0
Xtrackers FTSE VIETNAM SWAPUCITS ETF*
USD 7,617,149 0
Xtrackers LPX PRIVATE EQUITYSWAP UCITS ETF*
USD 0 7,428,953
Xtrackers S&P GLOBALINFRASTRUCTURE SWAP UCITSETF*
USD 8,463,176 0
Xtrackers S&P 500 2X LEVERAGEDDAILY SWAP UCITS ETF*
USD 0 8,400,000
Xtrackers SHORTDAX X2 DAILYSWAP UCITS ETF*
EUR 6,757,234 0
USD 5,350,367 0
Xtrackers LEVDAX DAILY SWAPUCITS ETF*
EUR 143,338 0
USD 104,433 0
Xtrackers BLOOMBERGCOMMODITY SWAP UCITS ETF*(2)
EUR 0 502,822
Xtrackers S&P 500 2X INVERSEDAILY SWAP UCITS ETF*
USD 4,252,332 0
Xtrackers CSI300 SWAP UCITS ETF* USD 64,007,794 0
Xtrackers MSCI INDONESIA SWAPUCITS ETF*
USD 4,172,123 0
Xtrackers S&P 500 SWAP UCITSETF*
USD 228,158,832 0
Xtrackers MSCI INDIA SWAP UCITSETF*
EUR 2,360,099 0
USD 972,541 0
Xtrackers MSCI PAKISTAN SWAPUCITS ETF*
USD 540,909 0
(1)During the period ending 30 June 2021 this Sub-Fund changed its name. Please see point 6 in the significant events of the period section of the Notes to the FinancialStatements of this semi-annual report for further information.(2)During the period ending 30 June 2021 this Sub-Fund changed its name. Please see point 3 in the significant events of the period section of the Notes to the FinancialStatements of this semi-annual report for further information.
As at 30 June 2021, none of the cash collateral received in respect of the swap transactions is re-used.
The Depositary has delegated the safekeeping function of certain non-cash collateral received by the Sub-Funds to State Street Bank andTrust Company. State Street Bank and Trust Company as global sub-custodian has appointed local sub-custodians within the State StreetGlobal Custody Network.
The following table provides an analysis of the maturity tenor of cash collateral and non-cash collateral received/pledged in respect ofswap transactions, as at 30 June 2021:
Xtrackers**
Notes to the Financial Statements (continued)
* This is a synthetic ETF.** This includes synthetic ETFs.
355

9. Collateral (continued)
9.1 Collateral in respect of swap transactions (continued)
Sub-Funds Sub-FundsCurrency
Maturity tenor Non-CashCollateral Pledged
(in Sub-Fund’scurrency)
Cash CollateralReceived
(in Sub-Fund’scurrency)
Xtrackers MSCI WORLD SWAP UCITS ETF* USD Open transactions 151,752,772 0
Xtrackers MSCI USA SWAP UCITS ETF* USD Open transactions 92,091,553 16,800,000
Xtrackers MSCI EMERGING MARKETSSWAP UCITS ETF*
USD Open transactions 49,014,347 0
Xtrackers MSCI EM ASIA SWAP UCITSETF*
USD Open transactions 0 6,620,000
Xtrackers MSCI EM LATIN AMERICA ESGSWAP UCITS ETF*(1)
USD Open transactions 5,600,058 0
Xtrackers NIFTY 50 SWAP UCITS ETF* USD Open transactions 7,874,106 0
Xtrackers STOXX GLOBAL SELECTDIVIDEND 100 SWAP UCITS ETF*
EUR Open transactions 19,983,216 0
Xtrackers STOXX EUROPE 600 BASICRESOURCES SWAP UCITS ETF*
EUR Open transactions 1,939,924 920,000
Xtrackers STOXX EUROPE 600 OIL & GASSWAP UCITS ETF*
EUR Open transactions 386,620 0
Xtrackers STOXX EUROPE 600 HEALTHCARE SWAP UCITS ETF*
EUR Open transactions 1,266,941 0
Xtrackers STOXX EUROPE 600 BANKSSWAP UCITS ETF*
EUR Open transactions 0 876,971
Xtrackers STOXX EUROPE600 TECHNOLOGY SWAP UCITS ETF*
EUR Open transactions 0 360,000
Xtrackers STOXX EUROPE 600 UTILITIESSWAP UCITS ETF*
EUR Open transactions 61,113 0
Xtrackers STOXX EUROPE 600 FOOD &BEVERAGE SWAP UCITS ETF*
EUR Open transactions 1,907,760 0
Xtrackers STOXX EUROPE600 INDUSTRIAL GOODS SWAP UCITSETF*
EUR Open transactions 532,609 0
Xtrackers BLOOMBERG COMMODITYEX-AGRICULTURE & LIVESTOCK SWAPUCITS ETF*(2)
USD(3) Open transactions 0 8,003,188
Xtrackers SHORTDAX DAILY SWAP UCITSETF*
EUR Open transactions 3,947,479 0
Xtrackers EURO STOXX 50 SHORT DAILYSWAP UCITS ETF*
EUR Open transactions 151,498 0
Xtrackers FTSE 100 SHORT DAILY SWAPUCITS ETF*
GBP Open transactions 196,096 0
Xtrackers S&P 500 INVERSE DAILY SWAPUCITS ETF*
USD Open transactions 8,008,460 0
Xtrackers MSCI AC ASIA EX JAPAN SWAPUCITS ETF*
USD Open transactions 0 3,770,000
Xtrackers MSCI RUSSIA CAPPED SWAPUCITS ETF*
USD Open transactions 8,855,903 0
Xtrackers**
Notes to the Financial Statements (continued)
* This is a synthetic ETF.** This includes synthetic ETFs.
356

9. Collateral (continued)
9.1 Collateral in respect of swap transactions (continued)
Sub-Funds Sub-FundsCurrency
Maturity tenor Non-CashCollateral Pledged
(in Sub-Fund’scurrency)
Cash CollateralReceived
(in Sub-Fund’scurrency)
Xtrackers FTSE VIETNAM SWAP UCITSETF*
USD Open transactions 7,617,149 0
Xtrackers LPX PRIVATE EQUITY SWAPUCITS ETF*
EUR Open transactions 0 7,428,953
Xtrackers S&P GLOBALINFRASTRUCTURE SWAP UCITS ETF*
USD Open transactions 8,463,176 0
Xtrackers S&P 500 2X LEVERAGED DAILYSWAP UCITS ETF*
USD Open transactions 0 8,400,000
Xtrackers SHORTDAX X2 DAILY SWAPUCITS ETF*
EUR Open transactions 12,107,601 0
Xtrackers LEVDAX DAILY SWAP UCITSETF*
EUR Open transactions 247,771 0
Xtrackers BLOOMBERG COMMODITYSWAP UCITS ETF*(2)
USD(3) Open transactions 0 502,822
Xtrackers S&P 500 2X INVERSE DAILYSWAP UCITS ETF*
USD Open transactions 4,252,332 0
Xtrackers CSI300 SWAP UCITS ETF* USD Open transactions 64,007,794 0
Xtrackers MSCI INDONESIA SWAP UCITSETF*
USD Open transactions 4,172,123 0
Xtrackers S&P 500 SWAP UCITS ETF* USD Open transactions 228,158,832 0
Xtrackers MSCI INDIA SWAP UCITS ETF* USD Open transactions 3,332,640 0
Xtrackers MSCI PAKISTAN SWAP UCITSETF*
USD Open transactions 540,909 0
(1)During the period ending 30 June 2021 this Sub-Fund changed its name. Please see point 6 in the significant events of the period section of the Notes to the FinancialStatements of this semi-annual report for further information.(2)During the period ending 30 June 2021 this Sub-Fund changed its name. Please see point 3 in the significant events of the period section of the Notes to the FinancialStatements of this semi-annual report for further information.(3)During the period ending 30 June 2021 this Sub-Fund changed its currency. Please see point 3 in the significant events of the period section of the Notes to theFinancial Statements of this semi-annual report for further information.
As at 30 June 2021, there was no non-cash collateral received by the Sub-Funds by way of title transfer collateral arrangement acrossswap transactions.As a consequence, there is no need to disclose the ten largest issuers by value of non-cash collateral received and creditrating of non-cash collateral received.
Xtrackers**
Notes to the Financial Statements (continued)
* This is a synthetic ETF.** This includes synthetic ETFs.
357

9. Collateral (continued)
9.2 Collateral received in respect of securities lending transactions
The following table provides an analysis of the maturity tenor of associated cash collateral and non-cash collateral received as at 30 June2021:
Sub-Fund Maturity tenor Non-cash collateral received(in EUR)
Xtrackers MSCI EUROPE UCITS ETF
8 to 30 days 822,766
31 to 90 days 17,761
91 to 365 days 1,307,431
More than 365 days 73,017,016
Open Transactions 19,333,551
Total 94,498,525
Xtrackers MSCI JAPAN UCITS ETF
91 to 365 days 12,353,043
More than 365 days 133,569,715
Open Transactions 267,176,742
Total 413,099,500
Xtrackers EURO STOXX 50 UCITS ETF
91 to 365 days 990,799
More than 365 days 5,263,026
Open Transactions 122,704,846
Total 128,958,671
Xtrackers DAX UCITS ETF
91 to 365 days 1,015,766
More than 365 days 2,824,666
Open Transactions 77,094,362
Total 80,934,794
Xtrackers FTSE MIB UCITS ETF
91 to 365 days 21,726
More than 365 days 537,133
Total 558,859
Xtrackers SWITZERLAND UCITS ETFMore than 365 days 113,265,907
Total 113,265,907
Xtrackers FTSE 250 UCITS ETFMore than 365 days 1,514,476
Total 1,514,476
Xtrackers MSCI KOREA UCITS ETF
31 to 90 days 58,031
More than 365 days 1,298,396
Total 1,356,427
Xtrackers FTSE CHINA 50 UCITS ETF
More than 365 days 1,458,372
Open Transactions 1,609,461
Total 3,067,833
Xtrackers EURO STOXX QUALITY DIVIDEND UCITS ETFOpen Transactions 2,031,252
Total 2,031,252
Xtrackers SLI UCITS ETF
91 to 365 days 21,494
More than 365 days 283,465
Open Transactions 4,430,221
Total 4,735,180
Xtrackers PORTFOLIO UCITS ETFMore than 365 days 12,807,245
Total 12,807,245
Xtrackers MSCI PACIFIC EX JAPAN UCITS ETFOpen Transactions 22,595,206
Total 22,595,206
Xtrackers**
Notes to the Financial Statements (continued)
** This includes synthetic ETFs.
358

9. Collateral (continued)
9.2 Collateral received in respect of securities lending transactions (continued)
Sub-Fund Maturity tenor Non-cash collateral received(in EUR)
Xtrackers STOXX EUROPE 600 UCITS ETF
31 to 90 days 2,253,901
91 to 365 days 2,363,111
More than 365 days 39,980,369
Open Transactions 8,366,589
Total 52,963,970
Xtrackers CAC 40 UCITS ETF
More than 365 days 1,922,335
Open Transactions 1,222,297
Total 3,144,632
Xtrackers MSCI EUROPE MID CAP UCITS ETF
91 to 365 days 27,957
More than 365 days 540,991
Total 568,948
Xtrackers MSCI EUROPE SMALL CAP UCITS ETF
31 to 90 days 47,750
91 to 365 days 5,891,334
More than 365 days 65,378,348
Open Transactions 6,454,292
Total 77,771,724
Xtrackers MSCI CANADA UCITS ETFMore than 365 days 79,996,723
Total 79,996,723
Xtrackers MSCI CHINA UCITS ETF
31 to 90 days 8,290
91 to 365 days 417,750
More than 365 days 7,264,854
Open Transactions 56,672,189
Total 64,363,083
Xtrackers MSCI THAILAND UCITS ETF
91 to 365 days 114,494
More than 365 days 2,968,160
Total 3,082,654
Xtrackers SPAIN UCITS ETF
8 to 30 days 191,588
91 to 365 days 69,315
More than 365 days 4,966,078
Open Transactions 666,487
Total 5,893,468
Xtrackers MSCI SINGAPORE UCITS ETF
91 to 365 days 8,276
More than 365 days 206,074
Total 214,350
Xtrackers ATX UCITS ETF
91 to 365 days 654,192
More than 365 days 1,576,365
Total 2,230,557
Xtrackers MSCI EMU UCITS ETF
31 to 90 days 1,289,128
91 to 365 days 71,888
More than 365 days 15,257,867
Open Transactions 16,205,053
Total 32,823,936
Xtrackers**
Notes to the Financial Statements (continued)
** This includes synthetic ETFs.
359

9. Collateral (continued)
9.2 Collateral received in respect of securities lending transactions (continued)
Sub-Fund Maturity tenor Non-cash collateral received(in EUR)
Xtrackers NIKKEI 225 UCITS ETF
More than 365 days 41,806,366
Open Transactions 211,669,515
Total 253,475,881
The following table lists the ten largest issuers by value of non-cash collateral received by the Sub-Funds by way of title transfer collateralarrangement across securities lending transactions, as at 30 June 2021:
Sub-Fund Type of Collateral Issuer of CollateralMarket Value of
Collateral (in EUR)% of Net Assets
Xtrackers MSCI EUROPE UCITSETF
Fixed Income Austria Government Bond 49,344,724 1.77%
Fixed Income France Government Bond 15,051,930 0.54%
Fixed Income Germany Government Bond 10,768,320 0.39%
Equity OSRAM Licht AG 4,521,423 0.16%
Equity Credit Agricole SA 3,306,500 0.12%
Equity Instone Real Estate Group AG 2,667,391 0.10%
Equity BASF SE 2,416,680 0.09%
Equity Royal Dutch Shell PLC 1,692,661 0.06%
Equity Siltronic AG 1,509,603 0.05%
Equity Accenture PLC 962,865 0.03%
Xtrackers MSCI JAPAN UCITSETF
Fixed Income United States Government Bond 62,614,091 2.39%
Equity Airbus SE 54,761,492 2.09%
Fixed Income France Government Bond 40,558,090 1.55%
Fixed Income Germany Government Bond 24,382,496 0.93%
Equity SAP SE 14,500,335 0.55%
Equity Schlumberger NV 13,916,095 0.53%
Equity Macy’s Inc. 12,650,928 0.48%
Equity Incitec Pivot Ltd. 11,298,506 0.43%
Equity PRA Health Sciences Inc. 10,804,392 0.41%
Equity Starbucks Corp. 7,987,690 0.31%
Xtrackers EURO STOXX50 UCITS ETF
Equity Unilever PLC 33,315,306 0.42%
Equity SAP SE 28,562,864 0.36%
Equity GrandVision NV 4,706,474 0.06%
Equity Bigtincan Holdings Ltd. 4,706,472 0.06%
Equity Red 5 Ltd. 3,991,934 0.05%
Equity PPK Group Ltd. 3,570,450 0.05%
Equity De Grey Mining Ltd. 3,471,094 0.04%
Equity Opthea Ltd. 3,168,978 0.04%
Equity Somfy SA 3,031,544 0.04%
Equity Objective Corp. Ltd. 2,512,194 0.03%
Xtrackers**
Notes to the Financial Statements (continued)
** This includes synthetic ETFs.
360
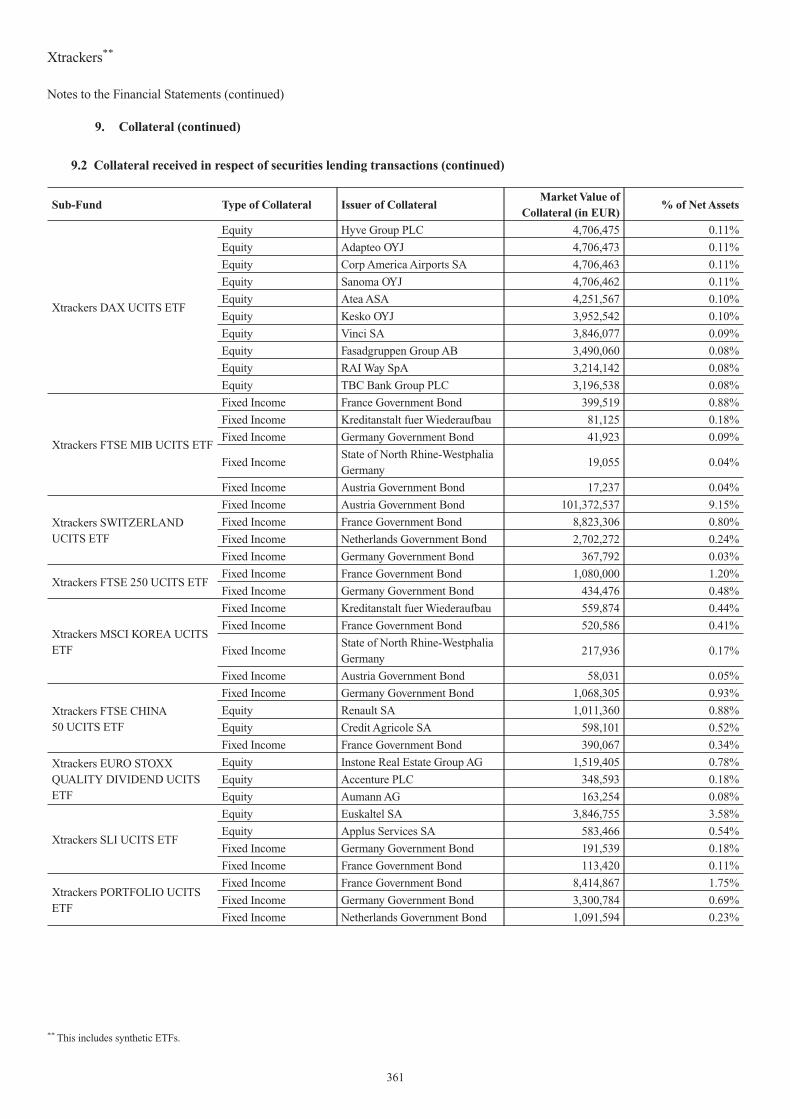
9. Collateral (continued)
9.2 Collateral received in respect of securities lending transactions (continued)
Sub-Fund Type of Collateral Issuer of CollateralMarket Value of
Collateral (in EUR)% of Net Assets
Xtrackers DAX UCITS ETF
Equity Hyve Group PLC 4,706,475 0.11%
Equity Adapteo OYJ 4,706,473 0.11%
Equity Corp America Airports SA 4,706,463 0.11%
Equity Sanoma OYJ 4,706,462 0.11%
Equity Atea ASA 4,251,567 0.10%
Equity Kesko OYJ 3,952,542 0.10%
Equity Vinci SA 3,846,077 0.09%
Equity Fasadgruppen Group AB 3,490,060 0.08%
Equity RAI Way SpA 3,214,142 0.08%
Equity TBC Bank Group PLC 3,196,538 0.08%
Xtrackers FTSE MIB UCITS ETF
Fixed Income France Government Bond 399,519 0.88%
Fixed Income Kreditanstalt fuer Wiederaufbau 81,125 0.18%
Fixed Income Germany Government Bond 41,923 0.09%
Fixed IncomeState of North Rhine-WestphaliaGermany
19,055 0.04%
Fixed Income Austria Government Bond 17,237 0.04%
Xtrackers SWITZERLANDUCITS ETF
Fixed Income Austria Government Bond 101,372,537 9.15%
Fixed Income France Government Bond 8,823,306 0.80%
Fixed Income Netherlands Government Bond 2,702,272 0.24%
Fixed Income Germany Government Bond 367,792 0.03%
Xtrackers FTSE 250 UCITS ETFFixed Income France Government Bond 1,080,000 1.20%
Fixed Income Germany Government Bond 434,476 0.48%
Xtrackers MSCI KOREA UCITSETF
Fixed Income Kreditanstalt fuer Wiederaufbau 559,874 0.44%
Fixed Income France Government Bond 520,586 0.41%
Fixed IncomeState of North Rhine-WestphaliaGermany
217,936 0.17%
Fixed Income Austria Government Bond 58,031 0.05%
Xtrackers FTSE CHINA50 UCITS ETF
Fixed Income Germany Government Bond 1,068,305 0.93%
Equity Renault SA 1,011,360 0.88%
Equity Credit Agricole SA 598,101 0.52%
Fixed Income France Government Bond 390,067 0.34%
Xtrackers EURO STOXXQUALITY DIVIDEND UCITSETF
Equity Instone Real Estate Group AG 1,519,405 0.78%
Equity Accenture PLC 348,593 0.18%
Equity Aumann AG 163,254 0.08%
Xtrackers SLI UCITS ETF
Equity Euskaltel SA 3,846,755 3.58%
Equity Applus Services SA 583,466 0.54%
Fixed Income Germany Government Bond 191,539 0.18%
Fixed Income France Government Bond 113,420 0.11%
Xtrackers PORTFOLIO UCITSETF
Fixed Income France Government Bond 8,414,867 1.75%
Fixed Income Germany Government Bond 3,300,784 0.69%
Fixed Income Netherlands Government Bond 1,091,594 0.23%
Xtrackers**
Notes to the Financial Statements (continued)
** This includes synthetic ETFs.
361
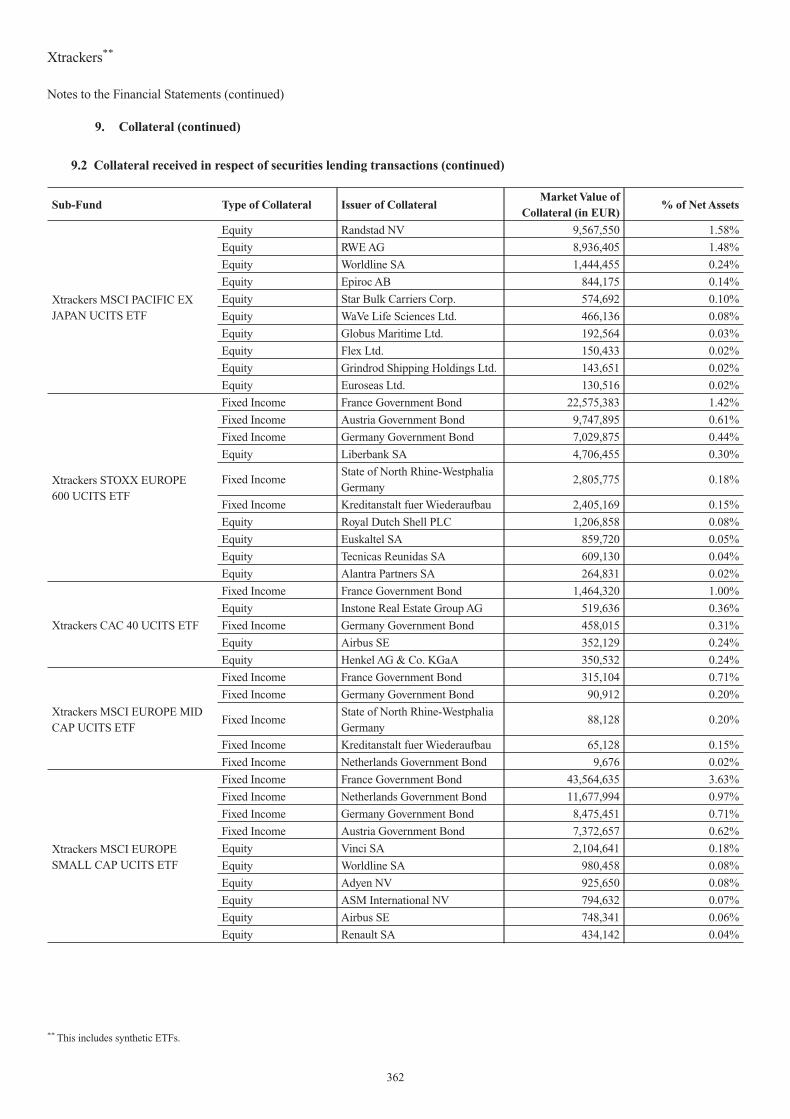
9. Collateral (continued)
9.2 Collateral received in respect of securities lending transactions (continued)
Sub-Fund Type of Collateral Issuer of CollateralMarket Value of
Collateral (in EUR)% of Net Assets
Xtrackers MSCI PACIFIC EXJAPAN UCITS ETF
Equity Randstad NV 9,567,550 1.58%
Equity RWE AG 8,936,405 1.48%
Equity Worldline SA 1,444,455 0.24%
Equity Epiroc AB 844,175 0.14%
Equity Star Bulk Carriers Corp. 574,692 0.10%
Equity WaVe Life Sciences Ltd. 466,136 0.08%
Equity Globus Maritime Ltd. 192,564 0.03%
Equity Flex Ltd. 150,433 0.02%
Equity Grindrod Shipping Holdings Ltd. 143,651 0.02%
Equity Euroseas Ltd. 130,516 0.02%
Xtrackers STOXX EUROPE600 UCITS ETF
Fixed Income France Government Bond 22,575,383 1.42%
Fixed Income Austria Government Bond 9,747,895 0.61%
Fixed Income Germany Government Bond 7,029,875 0.44%
Equity Liberbank SA 4,706,455 0.30%
Fixed IncomeState of North Rhine-WestphaliaGermany
2,805,775 0.18%
Fixed Income Kreditanstalt fuer Wiederaufbau 2,405,169 0.15%
Equity Royal Dutch Shell PLC 1,206,858 0.08%
Equity Euskaltel SA 859,720 0.05%
Equity Tecnicas Reunidas SA 609,130 0.04%
Equity Alantra Partners SA 264,831 0.02%
Xtrackers CAC 40 UCITS ETF
Fixed Income France Government Bond 1,464,320 1.00%
Equity Instone Real Estate Group AG 519,636 0.36%
Fixed Income Germany Government Bond 458,015 0.31%
Equity Airbus SE 352,129 0.24%
Equity Henkel AG & Co. KGaA 350,532 0.24%
Xtrackers MSCI EUROPE MIDCAP UCITS ETF
Fixed Income France Government Bond 315,104 0.71%
Fixed Income Germany Government Bond 90,912 0.20%
Fixed IncomeState of North Rhine-WestphaliaGermany
88,128 0.20%
Fixed Income Kreditanstalt fuer Wiederaufbau 65,128 0.15%
Fixed Income Netherlands Government Bond 9,676 0.02%
Xtrackers MSCI EUROPESMALL CAP UCITS ETF
Fixed Income France Government Bond 43,564,635 3.63%
Fixed Income Netherlands Government Bond 11,677,994 0.97%
Fixed Income Germany Government Bond 8,475,451 0.71%
Fixed Income Austria Government Bond 7,372,657 0.62%
Equity Vinci SA 2,104,641 0.18%
Equity Worldline SA 980,458 0.08%
Equity Adyen NV 925,650 0.08%
Equity ASM International NV 794,632 0.07%
Equity Airbus SE 748,341 0.06%
Equity Renault SA 434,142 0.04%
Xtrackers**
Notes to the Financial Statements (continued)
** This includes synthetic ETFs.
362

9. Collateral (continued)
9.2 Collateral received in respect of securities lending transactions (continued)
Sub-Fund Type of Collateral Issuer of CollateralMarket Value of
Collateral (in EUR)% of Net Assets
Xtrackers MSCI CANADAUCITS ETF
Fixed Income Germany Government Bond 40,422,690 12.85%
Fixed Income France Government Bond 39,060,753 12.42%
Fixed Income Netherlands Government Bond 513,280 0.16%
Xtrackers MSCI CHINA UCITSETF
Equity Volkswagen AG 19,457,999 1.07%
Equity Adyen NV 16,295,554 0.90%
Fixed Income Germany Government Bond 4,112,277 0.23%
Equity Accenture PLC 3,404,761 0.19%
Equity Melrose Industries PLC 3,269,627 0.18%
Fixed Income France Government Bond 3,248,598 0.18%
Equity Superdry PLC 3,211,212 0.18%
Equity Ferguson PLC 2,489,611 0.14%
Equity Epiroc AB 2,181,123 0.12%
Equity Aptiv PLC 2,116,864 0.12%
Xtrackers MSCI THAILANDUCITS ETF
Fixed Income France Government Bond 2,953,590 5.10%
Fixed Income Germany Government Bond 129,064 0.22%
Xtrackers SPAIN UCITS ETF
Fixed Income France Government Bond 3,289,662 1.90%
Fixed Income Kreditanstalt fuer Wiederaufbau 1,140,313 0.66%
Equity Vinci SA 537,114 0.31%
Fixed IncomeState of North Rhine-WestphaliaGermany
394,190 0.23%
Fixed Income Germany Government Bond 264,572 0.15%
Fixed Income Netherlands Government Bond 138,244 0.08%
Equity Airbus SE 129,373 0.07%
Xtrackers MSCI SINGAPOREUCITS ETF
Fixed Income France Government Bond 111,290 0.25%
Fixed Income Germany Government Bond 56,541 0.13%
Fixed Income Kreditanstalt fuer Wiederaufbau 41,132 0.09%
Fixed Income Austria Government Bond 5,387 0.01%
Xtrackers ATX UCITS ETF
Fixed Income Germany Government Bond 1,089,579 1.44%
Fixed Income France Government Bond 909,172 1.20%
Fixed Income Kreditanstalt fuer Wiederaufbau 89,123 0.12%
Fixed Income Netherlands Government Bond 83,443 0.11%
Fixed Income Austria Government Bond 43,758 0.06%
Fixed IncomeState of North Rhine-WestphaliaGermany
15,482 0.02%
Xtrackers MSCI EMU UCITSETF
Fixed Income Germany Government Bond 8,335,966 0.40%
Equity MTU Aero Engines AG 6,260,999 0.30%
Equity Worldline SA 4,956,656 0.24%
Equity Air Liquide SA 4,492,831 0.21%
Fixed Income France Government Bond 3,629,485 0.17%
Fixed Income Kreditanstalt fuer Wiederaufbau 2,873,634 0.14%
Fixed Income Austria Government Bond 1,361,016 0.07%
Fixed Income Netherlands Government Bond 418,782 0.02%
Equity Credit Agricole SA 296,502 0.01%
Equity Adyen NV 104,907 0.01%
Xtrackers**
Notes to the Financial Statements (continued)
** This includes synthetic ETFs.
363

9. Collateral (continued)
9.2 Collateral received in respect of securities lending transactions (continued)
Sub-Fund Type of Collateral Issuer of CollateralMarket Value of
Collateral (in EUR)% of Net Assets
Xtrackers NIKKEI 225 UCITSETF
Fixed Income France Government Bond 38,333,966 2.29%
Equity Danone SA 31,721,167 1.89%
Equity Unilever PLC 5,691,345 0.34%
Equity Aptiv PLC 5,500,124 0.33%
Equity Ferguson PLC 5,500,110 0.33%
Equity Elastic NV 5,500,063 0.33%
Equity Accenture PLC 5,500,058 0.33%
Equity Catena AB 5,500,027 0.33%
Equity Epiroc AB 5,500,016 0.33%
Equity Superdry PLC 5,500,005 0.33%
Fixed Income securities are those issued by an entity with a minimum investment grade credit rating from at least one globally recognisedcredit rating agency: Standard & Poor’s, Moody’s or Fitch.
10. Management Company Fee and Fixed Fee
a) Management Company Fee
In accordance with and subject to the terms of the Management CompanyAgreement, the annual Management Company Fee will accrueon each calendar day and will be calculated on each Valuation Day on the basis of a percentage of (i) the last available Net Asset Value ofeach Sub-Fund or Class of Shares or (ii) the Initial Issue Price multiplied by the number of outstanding Shares of each Sub-Fund or Classof Shares (as indicated for each Sub-Fund or Class of Shares in the relevant Product Annex).
The Management Company is also entitled to receive reimbursement for any reasonable expenses that were made in its capacity asmanagement company of the Company in the context of the execution of the Management Company Agreement and that were notreasonably foreseeable in the ordinary course of business.
Notwithstanding the above, the Management Company and the Company may agree on a different fee structure in respect of a certainSub-Fund or Class of Shares, as indicated in the relevant Product Annex.
The Management Company may pay a Distribution Fee to the Distributor out of the Management Company Fee. A Distributor mayre-allocate an amount of the Distribution Fee to a sub-distributor (as applicable).The Management Company shall remunerate theInvestment Managers out of the Management Company Fee as agreed from time to time between the two parties. Each InvestmentManager shall remunerate out of the applicable Investment Management Fee any appointed Sub-Portfolio Manager, as agreed from timeto time between the parties.
The table hereafter reflects the maximum Management Company Fee’s annual rate applied to related UCITS in which XtrackersPORTFOLIO UCITS ETF invests as at 30 June 2021.
ISIN Sub-Fund ManagementCompany Fee in %
p.a.
IE00BYPHT736 Xtrackers IBOXX EUR CORPORATE BOND YIELD PLUS UCITS ETF up to 0.15
IE00BPVLQD13 Xtrackers JPX-NIKKEI 400 UCITS ETF up to 0.10
IE00BTJRMP35 Xtrackers MSCI EMERGING MARKETS UCITS ETF* up to 0.08
IE00BJ0KDR00 Xtrackers MSCI USA UCITS ETF* up to 0.01
IE00BL25JM42 Xtrackers MSCI WORLD VALUE UCITS ETF up to 0.15
IE00BJZ2DD79 Xtrackers RUSSELL 2000 UCITS ETF up to 0.15
LU0478205379 Xtrackers II EUR CORPORATE BOND UCITS ETF up to 0.02
LU0290358224 Xtrackers II EUROZONE INFLATION-LINKED BOND UCITS ETF up to 0.10
LU1094612022 Xtrackers II HARVEST CHINA GOVERNMENT BOND UCITS ETF up to 0.20
Xtrackers**
Notes to the Financial Statements (continued)
* This is a synthetic ETF.** This includes synthetic ETFs.
364

10. Management Company Fee and Fixed Fee (continued)
a) Management Company Fee (continued)
ISIN Sub-Fund ManagementCompany Fee in %
p.a.
LU0524480265 Xtrackers II IBOXX EUROZONE GOVERNMENT BOND YIELD PLUS UCITS ETF up to 0.05
LU0846194776 Xtrackers MSCI EMU UCITS ETF up to 0.02
LU0322253906 Xtrackers MSCI EUROPE SMALL CAP UCITS ETF up to 0.20
LU0274209237 Xtrackers MSCI EUROPE UCITS ETF up to 0.02
b) Fixed Fee
Under the terms of an arrangement between the Company and DWS Investments UK Limited(1) (the �Fixed Fee Agent�), the Fixed FeeAgent will, in exchange for the payment of a Fixed Fee calculated on the average daily NetAssetValue per Sub-Fund or per Class at a rateas specified in the table below and payable periodically, pay certain fees and expenses, unless otherwise specified in the relevant ProductAnnex.
The fees and expenses covered by the arrangement are the Administrative Agent Fee, the Depositary Fee, the Registrar, Transfer Agentand Listing Agent Fee, the annual tax in Luxembourg (if any) (the �Taxe d’Abonnement�), the formation expenses and certain OtherAdministrative Expenses.
The Fixed Fee does not include the following fees, expenses and costs:
- the Investment Management Fee;
- the Management Company Fee;
- the costs of any marketing agencies appointed by the Company or the Management Company to provide certain marketing anddistribution services to the Company or the Management Company;
- any taxes or fiscal charges which the Company may be required to pay, except the Taxe d’Abonnement, if any, or if it should bepayable, any value added tax or similar sales or services tax payable by the Company (VAT) (all such taxes or fiscal charges), unlessotherwise specified in the relevant Product Annex;
- expenses arising out of any advertising or promotional activities in connection with the Company; nor,
- any costs and expenses incurred outside of the Company’s ordinary course of business such as extraordinary expenses (e.g. legal feesincurred in prosecuting or defending, a claim or allegation, by or against, the Company).
In particular, the Fixed Fee Agent will pay the invoices of legal advisers, local paying agents and translators provided and to the extentthat these invoices do not in aggregate exceed the overall threshold of Euro ten million (10,000,000) per financial year and the Companywill be liable to pay for any amount that exceeds this threshold. The Company will pay this amount out of the relevant Sub-Fund’s assetsto which the specific costs are attributed.
Sub-Fund ManagementCompany Fee
in % p.a.
Fixed Feein % p.a.
Xtrackers MSCI WORLD SWAP UCITS ETF* for Share Classes 1C and 2C up to 0.35% 0.10%
Xtrackers MSCI WORLD SWAP UCITS ETF*for Share Class 1D(1) up to 0.19% 0.10%
Xtrackers MSCI WORLD SWAP UCITS ETF* for Share Class 4C-EUR Hedged up to 0.29% 0.10%
Xtrackers MSCI EUROPE UCITS ETF for Share Class 1C and 1D up to 0.02% 0.10%
Xtrackers MSCI EUROPE UCITS ETF for Share Class 2C-USD Hedged up to 0.15% 0.15%
Xtrackers MSCI JAPAN UCITS ETF for Share Class 1C up to 0.10% 0.10%
Xtrackers MSCI JAPAN UCITS ETF for Share Classes 2D-USD Hedged, 4C-EUR Hedged, 6C-GBPHedged and 7C-CHF Hedged
up to 0.30% 0.10%
Xtrackers MSCI USA SWAP UCITS ETF* up to 0.05% 0.10%
Xtrackers EURO STOXX 50 UCITS ETF up to 0.01% 0.08%
Xtrackers DAX UCITS ETF 0.01% 0.08%
(1) The share class was launched on 3 March 2021. Please see point 1 in the other significant events of the financial period section of the Information for Shareholdersof this semi-annual report for further information.
Xtrackers**
Notes to the Financial Statements (continued)
(1)Please refer to note 11. Related Parties.
* This is a synthetic ETF.** This includes synthetic ETFs.
365

10. Management Company Fee and Fixed Fee (continued)
b) Fixed Fee (continued)
Sub-Fund ManagementCompany Fee
in % p.a.
Fixed Feein % p.a.
Xtrackers FTSE MIB UCITS ETF up to 0.20% 0.10%
Xtrackers SWITZERLAND UCITS ETF up to 0.20% 0.10%
Xtrackers FTSE 100 INCOME UCITS ETF up to 0.01% 0.08%
Xtrackers FTSE 250 UCITS ETF up to 0.05% 0.10%
Xtrackers MSCI UK ESG UCITS ETF up to 0.08% 0.10%
Xtrackers MSCI EMERGING MARKETS SWAP UCITS ETF* up to 0.29% 0.20%
Xtrackers MSCI EM ASIA SWAP UCITS ETF* for Share Class 1C up to 0.45% 0.20%
Xtrackers MSCI EM ASIA SWAP UCITS ETF* for Share Class 1D(1) up to 0.15% 0.20%
Xtrackers MSCI EM LATIN AMERICA ESG SWAP UCITS ETF*(2) up to 0.45% 0.20%
Xtrackers MSCI EM EUROPE, MIDDLE EAST & AFRICA ESG SWAP UCITS ETF*(3) up to 0.45% 0.20%
Xtrackers MSCI TAIWAN UCITS ETF up to 0.45% 0.20%
Xtrackers MSCI BRAZIL UCITS ETF up to 0.45% 0.20%
Xtrackers NIFTY 50 SWAP UCITS ETF* up to 0.65% 0.20%
Xtrackers MSCI KOREA UCITS ETF up to 0.45% 0.20%
Xtrackers FTSE CHINA 50 UCITS ETF up to 0.40% 0.20%
Xtrackers EURO STOXX QUALITY DIVIDEND UCITS ETF up to 0.20% 0.10%
Xtrackers STOXX GLOBAL SELECT DIVIDEND 100 SWAP UCITS ETF* up to 0.40% 0.10%
Xtrackers STOXX EUROPE 600 BASIC RESOURCES SWAP UCITS ETF* up to 0.15% 0.15%
Xtrackers STOXX EUROPE 600 OIL & GAS SWAP UCITS ETF* up to 0.15% 0.15%
Xtrackers STOXX EUROPE 600 HEALTH CARE SWAP UCITS ETF* up to 0.15% 0.15%
Xtrackers STOXX EUROPE 600 BANKS SWAP UCITS ETF* up to 0.15% 0.15%
Xtrackers STOXX EUROPE 600 TELECOMMUNICATIONS SWAP UCITS ETF* up to 0.15% 0.15%
Xtrackers STOXX EUROPE 600 TECHNOLOGY SWAP UCITS ETF* up to 0.15% 0.15%
Xtrackers STOXX EUROPE 600 UTILITIES SWAP UCITS ETF* up to 0.15% 0.15%
Xtrackers STOXX EUROPE 600 FOOD & BEVERAGE SWAP UCITS ETF* up to 0.15% 0.15%
Xtrackers STOXX EUROPE 600 INDUSTRIAL GOODS SWAP UCITS ETF* up to 0.15% 0.15%
Xtrackers BLOOMBERG COMMODITY EX-AGRICULTURE & LIVESTOCK SWAP UCITSETF* for Share Classes 1C-EUR Hedged and 3C-GBP Hedged(4)
up to 0.24% (5) 0.15%
Xtrackers BLOOMBERG COMMODITY EX-AGRICULTURE & LIVESTOCK SWAP UCITSETF* for Share Class 2C(4)
up to 0.14% 0.15%
Xtrackers SHORTDAX DAILY SWAP UCITS ETF* up to 0.30% 0.10%
Xtrackers EURO STOXX 50 SHORT DAILY SWAP UCITS ETF* up to 0.30% 0.10%
Xtrackers SLI UCITS ETF up to 0.15% 0.10%
Xtrackers FTSE 100 SHORT DAILY SWAP UCITS ETF* up to 0.30% 0.20%
Xtrackers S&P 500 INVERSE DAILY SWAP UCITS ETF* up to 0.30% 0.20%
Xtrackers PORTFOLIO UCITS ETF up to 0.40% 0.30%
Xtrackers MSCI AC ASIA EX JAPAN SWAP UCITS ETF* up to 0.45% 0.20%
(1) The share class was launched on 3 March 2021. Please see point 1 in the other significant events of the financial period section of the Information for Shareholdersof this semi-annual report for further information.(2) During the period ending 30 June 2021 this Sub-Fund changed its name. Please see point 6 in the significant events of the period section of the Notes to theFinancial Statements of this semi-annual report for further information.(3) During the period ending 30 June 2021 this Sub-Fund changed its name. Please see point 5 in the significant events of the period section of the Notes to theFinancial Statements of this semi-annual report for further information.(4) During the period ending 30 June 2021 this Sub-Fund changed its name. Please see point 3 in the significant events of the period section of the Notes to theFinancial Statements of this semi-annual report for further information.(5) Reduction from 0.40% to 0.24% with effect from 21 May 2021.
Xtrackers**
Notes to the Financial Statements (continued)
* This is a synthetic ETF.** This includes synthetic ETFs.
366

10. Management Company Fee and Fixed Fee (continued)
b) Fixed Fee (continued)
Sub-Fund ManagementCompany Fee
in % p.a.
Fixed Feein % p.a.
Xtrackers MSCI PACIFIC EX JAPAN UCITS ETF up to 0.10% 0.15%
Xtrackers MSCI RUSSIA CAPPED SWAP UCITS ETF* up to 0.45% 0.20%
Xtrackers FTSE VIETNAM SWAP UCITS ETF* up to 0.65% 0.20%
Xtrackers LPX PRIVATE EQUITY SWAP UCITS ETF* up to 0.50% 0.20%
Xtrackers S&P ASX 200 UCITS ETF up to 0.30% 0.20%
Xtrackers STOXX EUROPE 600 UCITS ETF for Share Class 1C up to 0.10% 0.10%
Xtrackers STOXX EUROPE 600 UCITS ETF for Share Class 2C-EUR Hedged up to 0.15% 0.10%
Xtrackers S&P GLOBAL INFRASTRUCTURE SWAP UCITS ETF* up to 0.40% 0.20%
Xtrackers CAC 40 UCITS ETF up to 0.10% 0.10%
Xtrackers MSCI EUROPE MID CAP UCITS ETF up to 0.15% 0.10%
Xtrackers MSCI EUROPE SMALL CAP UCITS ETF up to 0.20% 0.10%
Xtrackers S&P SELECT FRONTIER SWAP UCITS ETF* up to 0.75% 0.20%
Xtrackers USD OVERNIGHT RATE SWAP UCITS ETF* up to 0.05% 0.10%
Xtrackers S&P 500 2X LEVERAGED DAILY SWAP UCITS ETF* up to 0.40% 0.20%
Xtrackers SHORTDAX X2 DAILY SWAP UCITS ETF* up to 0.40% 0.20%
Xtrackers LEVDAX DAILY SWAP UCITS ETF* up to 0.15% 0.20%
Xtrackers BLOOMBERG COMMODITY SWAP UCITS ETF*(4) up to 0.09% 0.15%
Xtrackers S&P 500 2X INVERSE DAILY SWAP UCITS ETF* up to 0.50% 0.20%
Xtrackers CSI300 SWAP UCITS ETF* up to 0.30% 0.20%
Xtrackers MSCI CANADA UCITS ETF up to 0.15% 0.20%
Xtrackers MSCI INDONESIA SWAP UCITS ETF* up to 0.45% 0.20%
Xtrackers MSCI MEXICO UCITS ETF up to 0.45% 0.20%
Xtrackers MSCI EUROPE VALUE UCITS ETF up to 0.05% 0.10%
Xtrackers S&P 500 SWAP UCITS ETF* up to 0.05% 0.10%
Xtrackers FTSE DEVELOPED EUROPE REAL ESTATE UCITS ETF up to 0.13% 0.20%
Xtrackers MSCI CHINA UCITS ETF up to 0.45% 0.20%
Xtrackers MSCI INDIA SWAP UCITS ETF* up to 0.55% 0.20%
Xtrackers MSCI MALAYSIA UCITS ETF up to 0.30% 0.20%
Xtrackers MSCI THAILAND UCITS ETF up to 0.30% 0.20%
Xtrackers MSCI PHILIPPINES UCITS ETF up to 0.45% 0.20%
Xtrackers MSCI AFRICA TOP 50 SWAP UCITS ETF* up to 0.45% 0.20%
Xtrackers SPAIN UCITS ETF up to 0.10% 0.20%
Xtrackers MSCI PAKISTAN SWAP UCITS ETF* up to 0.65% 0.20%
Xtrackers MSCI SINGAPORE UCITS ETF up to 0.30% 0.20%
Xtrackers ATX UCITS ETF up to 0.10% 0.15%
Xtrackers MSCI EMU UCITS ETF for Share Class 1D up to 0.02% 0.10%
Xtrackers MSCI EMU UCITS ETF for Share Classes 1C-USD Hedged, 2C-GBP Hedged and3C-CHF Hedged
up to 0.07% 0.10%
Xtrackers DAX INCOME UCITS ETF for Share Class 1D 0.01% 0.08%
Xtrackers DAX INCOME UCITS ETF for Share Classes 2C-USD Hedged and 4C-CHF Hedged up to 0.09% 0.10%
Xtrackers FTSE 100 UCITS ETF 0.01% 0.08%
(4) During the period ending 30 June 2021 this Sub-Fund changed its name. Please see point 3 in the significant events of the period section of the Notes to theFinancial Statements of this semi-annual report for further information.
Xtrackers**
Notes to the Financial Statements (continued)
* This is a synthetic ETF.** This includes synthetic ETFs.
367

10. Management Company Fee and Fixed Fee (continued)
b) Fixed Fee (continued)
Sub-Fund ManagementCompany Fee
in % p.a.
Fixed Feein % p.a.
Xtrackers NIKKEI 225 UCITS ETF for Share Classes 1C and 1D 0.01% 0.08%
Xtrackers NIKKEI 225 UCITS ETF for Share Class 2D-EUR Hedged 0.11% 0.08%
Xtrackers HARVEST CSI300 UCITS ETF up to 0.45% 0.20%
Xtrackers HARVEST FTSE CHINA A-H 50 UCITS ETF up to 0.45% 0.20%
11. Related Parties
DWS Investment S.A. has been appointed to act as Management Company under the Management Company Agreement and isresponsible for providing investment management services, administration services and distribution and marketing services to thevarious Sub-Funds unless otherwise indicated in the relevant Product Annex. DWS Investment S.A. is entitled to receive ManagementCompany Fees as further detailed in Note 10, as a compensation for its services to the Company.
The Fixed Fee Agent is entitled to receive Fixed Fees as further detailed in Note 10.
DWS Investments UK Limited, DWS Investment GmbH and DWS Investments Hong Kong Limited are acting as Investment Managerand/or Sub-Portfolio Manager with respect to certain Sub-Funds as further detailed in Note 12.
The Management Company shall remunerate the Investment Managers out of the Management Company Fee as agreed from time totime between the parties. Each Investment Manager shall remunerate out of the applicable Investment Management Fee any appointedSub-Portfolio Manager or provider of best execution services, as agreed from time to time between the parties.
DWS Investment GmbH provides best execution services with respect to Indirect Replication Funds.
DWS Investments UK Limited, as agreed from time to time, has been appointed to provide certain services including, but not limited to,legal, regulatory and tax advice, relationship management, marketing, assistance in relation to structuring and restructuring andassistance in relation to the registrations of the Company.
During the period ending 30 June 2021, Deutsche Bank AG was the counterparty to certain swap positions entered into by the Company.
Deutsche Bank AG, acting through its Frankfurt am Main head office and its London and New York branches as the Securities LendingAgent is entitled to receive fees covering direct or indirect operational costs and fees arising from Securities Lending Transactions asfurther detailed in Note 8.
In the normal course of its operations, each Sub-Fund may enter into transactions on securities or other investments with Deutsche BankAG or other Deutsche Bank AG affiliates.
DWS Investments UK Limited is entitled to receive fees arising from Securities Lending Transactions as further detailed in Note 8.
Deutsche Bank AG, acting through its London Branch has been appointed with regards to the position reporting services.
12. Appointed Investment Managers and Sub-Portfolio Managers
As at 30 June 2021, DWS Investments UK Limited is acting as Investment Manager for the following Sub-Funds:
- Xtrackers MSCI EM LATIN AMERICA ESG SWAP UCITS ETF*(1)
- Xtrackers MSCI AC ASIA EX JAPAN SWAP UCITS ETF*
- Xtrackers STOXX GLOBAL SELECT DIVIDEND 100 SWAP UCITS ETF*
- Xtrackers STOXX EUROPE 600 HEALTH CARE SWAP UCITS ETF*
- Xtrackers MSCI USA SWAP UCITS ETF*
- Xtrackers MSCI WORLD SWAP UCITS ETF*
- Xtrackers MSCI EM ASIA SWAP UCITS ETF*
- Xtrackers MSCI EMERGING MARKETS SWAP UCITS ETF*
- Xtrackers LPX PRIVATE EQUITY SWAP UCITS ETF*
- Xtrackers FTSE VIETNAM SWAP UCITS ETF*
Xtrackers**
Notes to the Financial Statements (continued)
* This is a synthetic ETF.** This includes synthetic ETFs.
368

12. Appointed Investment Managers and Sub-Portfolio Managers (continued)
- Xtrackers MSCI INDIA SWAP UCITS ETF*
- Xtrackers MSCI RUSSIA CAPPED SWAP UCITS ETF*
- Xtrackers S&P SELECT FRONTIER SWAP UCITS ETF*
- Xtrackers S&P GLOBAL INFRASTRUCTURE SWAP UCITS ETF*
- Xtrackers MSCI EM EUROPE, MIDDLE EAST & AFRICA ESG SWAP UCITS ETF*(2)
- Xtrackers NIFTY 50 SWAP UCITS ETF*
- Xtrackers EURO STOXX 50 SHORT DAILY SWAP UCITS ETF*
- Xtrackers SHORTDAX DAILY SWAP UCITS ETF*
- Xtrackers S&P 500 2X INVERSE DAILY SWAP UCITS ETF*
- Xtrackers BLOOMBERG COMMODITY EX-AGRICULTURE & LIVESTOCK SWAP UCITS ETF*(3)
- Xtrackers BLOOMBERG COMMODITY SWAP UCITS ETF*(3)
- Xtrackers MSCI INDONESIA SWAP UCITS ETF*
- Xtrackers STOXX EUROPE 600 BANKS SWAP UCITS ETF*
- Xtrackers CSI300 SWAP UCITS ETF*
- Xtrackers MSCI AFRICA TOP 50 SWAP UCITS ETF*
- Xtrackers STOXX EUROPE 600 FOOD & BEVERAGE SWAP UCITS ETF*
- Xtrackers STOXX EUROPE 600 OIL & GAS SWAP UCITS ETF*
- Xtrackers SHORTDAX X2 DAILY SWAP UCITS ETF*
- Xtrackers LEVDAX DAILY SWAP UCITS ETF*
- Xtrackers FTSE 100 SHORT DAILY SWAP UCITS ETF*
- Xtrackers S&P 500 2X LEVERAGED DAILY SWAP UCITS ETF*
- Xtrackers STOXX EUROPE 600 BASIC RESOURCES SWAP UCITS ETF*
- Xtrackers STOXX EUROPE 600 TECHNOLOGY SWAP UCITS ETF*
- Xtrackers STOXX EUROPE 600 INDUSTRIAL GOODS SWAP UCITS ETF*
- Xtrackers STOXX EUROPE 600 TELECOMMUNICATIONS SWAP UCITS ETF*
- Xtrackers STOXX EUROPE 600 UTILITIES SWAP UCITS ETF*
- Xtrackers MSCI PAKISTAN SWAP UCITS ETF*
- Xtrackers USD OVERNIGHT RATE SWAP UCITS ETF*
- Xtrackers S&P 500 INVERSE DAILY SWAP UCITS ETF*
- Xtrackers S&P 500 SWAP UCITS ETF*
(1) During the period ending 30 June 2021 this Sub-Fund changed its name. Please see point 6 in the significant events of the period section of the Notes to theFinancial Statements of this semi-annual report for further information.(2) During the period ending 30 June 2021 this Sub-Fund changed its name. Please see point 5 in the significant events of the period section of the Notes to theFinancial Statements of this semi-annual report for further information.(3) During the period ending 30 June 2021 this Sub-Fund changed its name. Please see point 3 in the significant events of the period section of the Notes to theFinancial Statements of this semi-annual report for further information.
As at 30 June 2021, DWS Investment GmbH is acting as Investment Manager for the following Sub-Funds:
- Xtrackers FTSE 250 UCITS ETF
- Xtrackers FTSE 100 UCITS ETF
- Xtrackers FTSE 100 INCOME UCITS ETF
- Xtrackers EURO STOXX 50 UCITS ETF
- Xtrackers MSCI EUROPE SMALL CAP UCITS ETF
- Xtrackers MSCI EMU UCITS ETF
- Xtrackers MSCI EUROPE UCITS ETF
- Xtrackers DAX UCITS ETF
- Xtrackers DAX INCOME UCITS ETF
- Xtrackers MSCI JAPAN UCITS ETF
Xtrackers**
Notes to the Financial Statements (continued)
* This is a synthetic ETF.** This includes synthetic ETFs.
369

12. Appointed Investment Managers and Sub-Portfolio Managers (continued)
- Xtrackers EURO STOXX QUALITY DIVIDEND UCITS ETF
- Xtrackers STOXX EUROPE 600 UCITS ETF
- Xtrackers MSCI UK ESG UCITS ETF
- Xtrackers FTSE MIB UCITS ETF
- Xtrackers FTSE DEVELOPED EUROPE REAL ESTATE UCITS ETF
- Xtrackers SWITZERLAND UCITS ETF
- Xtrackers SPAIN UCITS ETF
- Xtrackers ATX UCITS ETF
- Xtrackers CAC 40 UCITS ETF
- Xtrackers S&P ASX 200 UCITS ETF
- Xtrackers NIKKEI 225 UCITS ETF
- Xtrackers MSCI EUROPE MID CAP UCITS ETF
- Xtrackers MSCI PACIFIC EX JAPAN UCITS ETF
- Xtrackers MSCI SINGAPORE UCITS ETF
- Xtrackers MSCI MEXICO UCITS ETF
- Xtrackers FTSE CHINA 50 UCITS ETF
- Xtrackers MSCI CHINA UCITS ETF
- Xtrackers MSCI BRAZIL UCITS ETF
- Xtrackers MSCI KOREA UCITS ETF
- Xtrackers MSCI PHILIPPINES UCITS ETF
- Xtrackers MSCI CANADA UCITS ETF
- Xtrackers MSCI EUROPE VALUE UCITS ETF
- Xtrackers SLI UCITS ETF
- Xtrackers MSCI THAILAND UCITS ETF
- Xtrackers MSCI TAIWAN UCITS ETF
- Xtrackers MSCI MALAYSIA UCITS ETF
- Xtrackers PORTFOLIO UCITS ETF
As at 30 June 2021, Harvest Global Investments Limited is acting as Investment Manager for Xtrackers HARVEST CSI300 UCITS ETFand Xtrackers HARVEST FTSE CHINA A-H 50 UCITS ETF.
DWS Investments UK Limited has appointed DWS Investment GmbH to provide best execution services in respect to IndirectReplication Funds.
Unless otherwise provided in the relevant Product Annex, DWS Investments UK Limited and DWS Investments Hong Kong Limitedmay act as Sub-Portfolio Manager with respect to Direct Replication Funds for which DWS Investment GmbH is acting as InvestmentManager.
13. Dividends distributed
During the period ending 30 June 2021, the Company resolved to pay to the Shareholders of the Distribution Shares of the Sub-Fundsmentioned below, annual dividends as follows:
Sub-FundShareClass
Ex-dividenddate
Share Classcurrency
DividendPer Share
Xtrackers MSCI EUROPE UCITS ETF 1D 28 April 2021 USD 1.2780
Xtrackers MSCI JAPAN UCITS ETF 2D - USD Hedged 28 April 2021 USD 0.4526
Xtrackers EURO STOXX 50 UCITS ETF 1D 28 April 2021 EUR 0.7387
Xtrackers FTSE MIB UCITS ETF 1D 28 April 2021 EUR 0.2590
Xtrackers SWITZERLAND UCITS ETF 1D 28 April 2021 CHF 1.7480
Xtrackers**
Notes to the Financial Statements (continued)
** This includes synthetic ETFs.
370

13. Dividends distributed (continued)
Sub-FundShareClass
Ex-dividenddate
Share Classcurrency
DividendPer Share
Xtrackers FTSE 100 INCOME UCITS ETF 1D 28 April 2021 GBP 0.2073
Xtrackers FTSE 250 UCITS ETF 1D 28 April 2021 GBP 0.3156
Xtrackers MSCI UK ESG UCITS ETF 1D 28 April 2021 GBP 0.1007
Xtrackers EURO STOXX QUALITY DIVIDEND UCITS ETF 1D 28 April 2021 EUR 0.5488
Xtrackers SLI UCITS ETF 1D 28 April 2021 CHF 2.5109
Xtrackers S&P ASX 200 UCITS ETF 1D 28 April 2021 AUD 1.2926
Xtrackers CAC 40 UCITS ETF 1D 28 April 2021 EUR 1.0495
Xtrackers SPAIN UCITS ETF 1D 28 April 2021 EUR 0.3049
Xtrackers MSCI EMU UCITS ETF 1D 28 April 2021 EUR 0.6998
Xtrackers DAX INCOME UCITS ETF 1D 28 April 2021 EUR 2.5203
Xtrackers NIKKEI 225 UCITS ETF 1D 28 April 2021 JPY 35.1527
Xtrackers NIKKEI 225 UCITS ETF 2D - EUR Hedged 28 April 2021 EUR 0.4384
Xtrackers HARVEST CSI300 UCITS ETF 1D 28 April 2021 USD 0.1467
Xtrackers HARVEST FTSE CHINA A-H 50 UCITS ETF 1D 28 April 2021 USD 0.6415
During the period ending 30 June 2021, the Company resolved to pay to the Shareholders of the Distribution Shares of the Sub-Fundsmentioned below, interim dividends as follows:
Sub-FundShareClass
Ex-dividenddate
Share Classcurrency
DividentPer Share
Xtrackers STOXX GLOBAL SELECT DIVIDEND 100 SWAP UCITS ETF* 1D 21 May 2021 EUR 1.4288
Xtrackers MSCI RUSSIA CAPPED SWAP UCITS ETF* 2D 21 May 2021 USD 0.1904
Xtrackers CSI300 SWAP UCITS ETF* 2D 21 May 2021 USD 0.0237
14. Transactions with Connected Persons for the Sub-Funds distributed in Hong Kong
Connected Persons of the Management Company, the applicable Investment Manager and/or Sub-Portfolio Manager, Depositary (StateStreet Bank International GmbH, Luxembourg Branch) and the Directors of the Company are those as defined in the SFC Code. Alltransactions entered into during the period between the Authorised Sub-Funds and the Management Company, Investment Managersand/or Sub-Portfolio Managers, Depositary and the Directors of the Company and their respective Connected Persons were carried outin the normal course of business and on normal commercial terms.
Security investments, currency transactions and derivatives through a broker who is a Connected Person of the Management Company,Investment Managers and/or Sub-Portfolio Managers, Depositary and the Directors of the Company were as follows:
Sub-Fund Currency TotalPurchases
& Salesthrough broker
who is aConnectedPerson (a)
Percentage of(a) on
Portfolio’sTotal
Transactionsfor the period
Commissions AverageRate
ofCommissions
(in %)
Xtrackers MSCI WORLD SWAP UCITS ETF* USD 2,185,968,696 7.46% 0 0.00%Xtrackers MSCI TAIWAN UCITS ETF USD 138,644,939 45.45% 0 0.00%Xtrackers MSCI BRAZIL UCITS ETF USD 135,629,895 49.13% 15 0.00%Xtrackers MSCI KOREA UCITS ETF USD 34,780,228 42.66% 682 0.00%Xtrackers MSCI PACIFIC EX JAPAN UCITS ETF USD 3,989,619 0.97% 6 0.00%Xtrackers FTSE VIETNAM SWAP UCITS ETF* USD 37,737,325 2.39% 170,586 0.45%Xtrackers CSI300 SWAP UCITS ETF* USD 4,144 0.00% 10 0.25%Xtrackers MSCI CHINA UCITS ETF USD 2,069,285 0.16% 9 0.00%Xtrackers MSCI MALAYSIA UCITS ETF USD 26,594,564 48.77% 262 0.00%Xtrackers MSCI THAILAND UCITS ETF USD 14,648,021 20.04% 0 0.00%
Xtrackers**
Notes to the Financial Statements (continued)
* This is a synthetic ETF.** This includes synthetic ETFs.
371

14. Transactions with Connected Persons for the Sub-Funds distributed in Hong Kong (continued)
Sub-Fund Currency TotalPurchases
& Salesthrough broker
who is aConnectedPerson (a)
Percentage of(a) on
Portfolio’sTotal
Transactionsfor the period
Commissions AverageRate
ofCommissions
(in %)
Xtrackers MSCI PHILIPPINES UCITS ETF USD 11,482,927 46.09% 0 0.00%Xtrackers MSCI SINGAPORE UCITS ETF USD 2,362,436 10.79% 300 0.01%
For Sub-Funds with a Direct Investment Policy, the Company has appointed Deutsche Bank AG, acting through its Frankfurt am Mainhead office and its London and New York branches, which is a Connected Person of the Company, as the Securities Lending Agent.Please refer to Note 8 for the details of the Securities Lending Transactions including the portion of the gross lending revenues generatedfrom such transactions received by the Securities Lending Agent, the Management Company and each relevant Investment and/orSub-Portfolio Manager.
No Directors of the Company or their respective Connected Persons profit from transactions in Shares of the Authorised Sub-Funds orfrom management of the Authorised Sub-Funds.
DWS Investments Hong Kong Limited is appointed as Hong Kong Administrative Agent and Hong Kong Representative.
15. Soft Commissions
No soft commission arrangements were entered into by the Management Company or the applicable Investment Manager and/orSub-Portfolio Manager with brokers during the financial period ending 30 June 2021.
Xtrackers**
Notes to the Financial Statements (continued)
** This includes synthetic ETFs.
372

1. Online publication of investment portfolios, collateral holdings and swap exposures
Shareholders can view the swap exposures and investment portfolios or collateral holdings for each Sub-Fund on www.etf.dws.com. Theinformation is available under the “ETF Information” tab section for each Sub-Fund.
2. Adjustment to OTC Swap Transactions to reflect index replication costs
As per the Prospectus, each of the Swap Counterparties may enter into hedging transactions in respect of the OTC Swap Transaction(s).According to the OTC Swap Transaction(s) entered into between the Sub-Funds and the Swap Counterparty, the Sub-Funds shall receivethe performance of the Reference Index adjusted to reflect certain index replication costs, taxes and any other transaction costs or chargesincurred by the Swap Counterparty in relation to the OTC Swap Transaction. These costs may include, amongst other things, costs, taxesor other duties associated with the buying, selling, custody, holding or any other transactions relating to investments in transferablesecurities and/or OTC Swap Transactions and/or collateral. The nature of these costs may differ depending on the Reference Index whoseperformance the Sub-Funds aim to reflect.
•Situation 1: the Reference Index is �long� (i.e. its objective is to reflect the performance of its constituents). Then the index replicationcosts will be associated with (i) the buying and selling by the Swap Counterparty of the constituents of the Reference Index in order toreflect the Reference Index performance; or (ii) custody or other related costs incurred by the Swap Counterparty in relation to holdingthe constituents of the Reference Index; or (iii) taxes or other duties imposed on the buying or selling of the constituents of the ReferenceIndex; or (iv) taxes imposed on any income derived from the constituents of the Reference Index; or (v) any other transactions performedby the Swap Counterparty in relation to the constituents of the Reference Index.
•Situation 2: the Reference Index is �leveraged� (i.e. its objective is to reflect the daily leveraged performance of the long version of theReference Index). Then the index replication costs will be associated with (i) the buying and selling and any borrowing and/or financingof the constituents of the Reference Index in order to reflect the Reference Index performance, (ii) custody or other related costs incurredby the Swap Counterparty in relation to holding the constituents of the Reference Index, (iii) financing charges incurred to safeguardagainst severe market movements of the constituents of the Reference Index, (iv) unexpected financing costs in the event of severemarket movements, (v) taxes imposed on any income derived from the constituents of the Reference Index, or (vi) any other transactionsperformed by the Swap Counterparty in relation to the constituents of the Reference Index.
•Situation 3: the Reference Index is �short� (i.e. its objective is to reflect the daily inverse performance of the long version of theReference Index) or �short and leveraged� (i.e. its objective is to reflect the leveraged daily inverse performance of the long version of theReference Index). Then the index replication costs will be associated with (i) the borrowing and/or financing of the constituents of theReference Index in order to reflect the Reference Index performance, (ii) financing charges incurred to safeguard against severe marketmovements of the constituents of the Reference Index, (iii) unexpected financing costs in the event of severe market movements or(iv) any other transactions performed by the Swap Counterparty in relation to the constituents of the Reference Index.
In addition, from time to time each Swap Counterparty may achieve certain benefits or enhancements as a result of its hedging activities.In certain circumstances, the Swap Counterparty may, in its absolute and sole discretion, decide to pay some or all of such benefits orenhancements to the Sub-Fund under the OTC Swap Transaction(s) in addition to any payments contractually due under the OTC SwapTransaction(s). The OTC Swap Transactions of the following Sub-Funds were adjusted by the below figures in the valuation of the swapsprevailing as at 30 June 2021. A positive figure in the table means that the OTC Swap Transactions of the relevant Sub-Fund were subjectto a negative adjustment. These figures are netted against the benefits or enhancements as a result of a Swap Counterparty’s hedgingactivities that were received under the OTC Swap Transaction(s), if any. These costs may vary over time in accordance with marketconditions and market practice.
Sub-Fund Share Class ISIN AdjustmentXtrackers MSCI WORLD SWAP UCITS ETF* 1C LU0274208692 (41) bps
Xtrackers MSCI WORLD SWAP UCITS ETF* 2C LU0455009851 (41) bps
Xtrackers MSCI WORLD SWAP UCITS ETF* 4C - EURHedged
LU0659579733 (35) bps
Xtrackers MSCI USA SWAP UCITS ETF* 1C LU0274210672 (45) bps
Xtrackers MSCI EMERGING MARKETS SWAP UCITS ETF* 1C LU0292107645 (3) bps
Xtrackers MSCI EM ASIA SWAP UCITS ETF* 1C LU0292107991 (5) bps
Xtrackers NIFTY 50 SWAP UCITS ETF* 1C LU0292109690 74 bps
Xtrackers STOXX GLOBAL SELECT DIVIDEND 100 SWAP UCITS ETF* 1D LU0292096186 (60) bps
Xtrackers**
Information for Shareholders
* This is a synthetic ETF.** This includes synthetic ETFs.
373

2. Adjustment to OTC Swap Transactions to reflect index replication costs (continued)
Sub-Fund Share Class ISIN AdjustmentXtrackers STOXX EUROPE 600 BASIC RESOURCES SWAP UCITS ETF* 1C LU0292100806 (13) bps
Xtrackers STOXX EUROPE 600 OIL & GAS SWAP UCITS ETF* 1C LU0292101796 (65) bps
Xtrackers STOXX EUROPE 600 HEALTH CARE SWAP UCITS ETF* 1C LU0292103222 (21) bps
Xtrackers STOXX EUROPE 600 BANKS SWAP UCITS ETF* 1C LU0292103651 (46) bps
Xtrackers STOXX EUROPE 600 TELECOMMUNICATIONS SWAP UCITSETF*
1C LU0292104030 (40) bps
Xtrackers STOXX EUROPE 600 TECHNOLOGY SWAP UCITS ETF* 1C LU0292104469 (10) bps
Xtrackers STOXX EUROPE 600 FOOD & BEVERAGE SWAP UCITS ETF* 1C LU0292105359 (21) bps
Xtrackers STOXX EUROPE 600 INDUSTRIAL GOODS SWAP UCITSETF*
1C LU0292106084 (24) bps
Xtrackers BLOOMBERG COMMODITY EX-AGRICULTURE &LIVESTOCK SWAP UCITS ETF*(1)
2C LU0460391732 20 bps
Xtrackers BLOOMBERG COMMODITY EX-AGRICULTURE &LIVESTOCK SWAP UCITS ETF*(1)
1C - EURHedged
LU0292106167 29 bps
Xtrackers BLOOMBERG COMMODITY EX-AGRICULTURE &LIVESTOCK SWAP UCITS ETF*(1)
3C - GBPHedged
LU0460391906 29 bps
Xtrackers SHORTDAX DAILY SWAP UCITS ETF* 1C LU0292106241 (36) bps
Xtrackers EURO STOXX 50 SHORT DAILY SWAP UCITS ETF* 1C LU0292106753 (43) bps
Xtrackers FTSE 100 SHORT DAILY SWAP UCITS ETF* 1C LU0328473581 (40) bps
Xtrackers S&P 500 INVERSE DAILY SWAP UCITS ETF* 1C LU0322251520 (71) bps
Xtrackers MSCI AC ASIA EX JAPAN SWAP UCITS ETF* 1C LU0322252171 (3) bps
Xtrackers MSCI RUSSIA CAPPED SWAP UCITS ETF* 1C LU0322252502 (2) bps
Xtrackers MSCI RUSSIA CAPPED SWAP UCITS ETF* 2D LU0455009265 (2) bps
Xtrackers FTSE VIETNAM SWAP UCITS ETF* 1C LU0322252924 49 bps
Xtrackers LPX PRIVATE EQUITY SWAP UCITS ETF* 1C LU0322250712 (61) bps
Xtrackers S&P GLOBAL INFRASTRUCTURE SWAP UCITS ETF* 1C LU0322253229 (68) bps
Xtrackers S&P SELECT FRONTIER SWAP UCITS ETF* 1C LU0328476410 249 bps
Xtrackers S&P 500 2X LEVERAGED DAILY SWAP UCITS ETF* 1C LU0411078552 (10) bps
Xtrackers SHORTDAX X2 DAILY SWAP UCITS ETF* 1C LU0411075020 (45) bps
Xtrackers LEVDAX DAILY SWAP UCITS ETF* 1C LU0411075376 78 bps
Xtrackers BLOOMBERG COMMODITY SWAP UCITS ETF*(1) 2C - EURHedged
LU0429790743 30 bps
Xtrackers S&P 500 2X INVERSE DAILY SWAP UCITS ETF* 1C LU0411078636 (83) bps
Xtrackers CSI300 SWAP UCITS ETF* 1C LU0779800910 (465) bps
Xtrackers CSI300 SWAP UCITS ETF* 2D LU0455008887 (465) bps
Xtrackers MSCI INDONESIA SWAP UCITS ETF* 1C LU0476289623 13 bps
Xtrackers MSCI INDONESIA SWAP UCITS ETF* 2C LU0476289896 13 bps
Xtrackers S&P 500 SWAP UCITS ETF* 1C LU0490618542 (44) bps
Xtrackers MSCI INDIA SWAP UCITS ETF* 1C LU0514695187 55 bps
Xtrackers MSCI AFRICA TOP 50 SWAP UCITS ETF* 1C LU0592217524 154 bps
Xtrackers MSCI PAKISTAN SWAP UCITS ETF* 1C LU0659579147 200 bps(1) During the period ending 30 June 2021 this Sub-Fund changed its name. Please see point 3 in the significant events of the period section of the Notes to theFinancial Statements of this semi-annual report for further information.
3. French Savings Plan (“Plan d’épargne en actions”)
During the period ending 30 June 2021, the following Sub-Funds were eligible for investment in a “plan d’épargne en actions” (“PEA”):
Xtrackers CAC 40 UCITS ETF, Xtrackers EURO STOXX QUALITY DIVIDEND UCITS ETF and Xtrackers MSCI EMU UCITS ETF.
Xtrackers**
Information for Shareholders (continued)
* This is a synthetic ETF.** This includes synthetic ETFs.
374

4. Determination of the Global Exposure
For all Sub-Funds, the methodology used in order to calculate the Global Exposure resulting from the use of financial derivativeinstruments is the commitment approach in accordance with the CSSF Circular 11/512.
5. Other significant events of the period
1. During the period ending 30 June 2021, the following Share Classes have been launched:Sub-Fund Share Class ISIN Launch dateXTRACKERS MSCI WORLD SWAP UCITS ETF* 1D LU2263803533 3 March 2021XTRACKERS MSCI EM ASIA SWAP UCITS ETF* 1D LU2296661775 3 March 2021
2. During the period ending 30 June 2021, the following Share Class has been terminated:Sub-Fund Share Class ISIN Termination dateXTRACKERS CSI300 SWAP UCITS ETF* 1D LU0432553047 16 March 2021
3. On 25 January 2021, the Company informed Shareholders holding Shares in “D” Classes that the Paragraph ‘I.c: Dividend policy’of the section entitled ‘GENERAL INFORMATION ON THE COMPANYAND THE SHARES’of the Prospectus was amended asfollows:The sentence “Dividends will generally be paid within 10 Luxembourg Banking Days of the date of Declaration” was deleted andreplaced with “Dividends will be paid within the period disclosed in the dividend announcements.”
4. The following share classes were delisted from the SIX Swiss Exchange with effect from 30 April 2021.Sub-Fund Share Class ISINXTRACKERS DBLCI COMMODITY OPTIMUM YIELD SWAP UCITSETF*
3C - GBP Hedged LU0460391906
XTRACKERS MSCI EMU UCITS ETF 2C – GBP Hedged LU1127516455XTRACKERS MSCI EUROPE UCITS ETF 1D LU1242369327
5. The following share classes were delisted from the Borsa Italiana with effect from 19 May 2021.Sub-Fund Share Class ISIN
XTRACKERS MSCI EM LATIN AMERICA SWAP UCITS ETF* 1C LU0292108619
XTRACKERS CAC 40 UCITS ETF 1D LU0322250985
XTRACKERS LEVDAX DAILY SWAP UCITS ETF* 1C LU0411075376
XTRACKERS SHORTDAX X2 DAILY SWAP UCITS ETF* 1C LU0411075020
6. On 18 February 2021, the Company informed Shareholders of XTRACKERS CSI300 SWAP UCITS ETF* and XTRACKERSHARVEST CSI300 UCITS ETF that, with effect from 14 December 2020, the selection universe of the Reference Index of eachSub-Fund was updated to include all A shares and Chinese Depositary Receipts (CDRs) issued by Red-Chip companies (companiesthat are incorporated outside mainland China and listed on the Hong Kong Stock Exchange), listed on the Shanghai Stock Exchangeor the Shenzhen Stock Exchange satisfying certain conditions.
7. During the period ending 30 June 2021, the following Sub-Funds were deregistered from Ireland with effect from 25 May 2021.Sub-Fund Share Class Share ClassXTRACKERS SHORTDAX DAILY SWAP UCITS ETF* 1C LU0292106241XTRACKERS SHORTDAX X2 DAILY SWAP UCITS ETF* 1C LU0411075020XTRACKERS PORTFOLIO UCITS ETF 1C LU0397221945XTRACKERS S&P 500 2X INVERSE DAILY SWAP UCITS ETF* 1C LU0411078636XTRACKERS LEVDAX DAILY SWAP UCITS ETF* 1C LU0411075376
8. During the period ending 30 June 2021, the Share Class 2D - USD Hedged (ISIN: LU0927735406) of XTRACKERS MSCI JAPANUCITS ETF was deregistered from Austria with effect from 25 May 2021.
Xtrackers**
Information for Shareholders (continued)
* This is a synthetic ETF.** This includes synthetic ETFs.
375

6. Subsequent events
1. On 30 July 2021, the Company informed Shareholders of the below Sub-Funds that the Sub-Funds’ names, the relevant Reference Indices, Index Administrator and IndustryClassifications will change as set out in the table below.
Current Sub-Fund name New Sub-Fund name Current Reference Index /BloombergTicker
New Reference Index /BloombergTicker
CurrentIndex
Administrator
New IndexAdministrator
Current IndustryClassification
New IndustryClassification
XTRACKERS STOXXEUROPE 600 BANKS SWAPUCITS ETF*
XTRACKERS MSCIEUROPE FINANCIALSESG SCREENEDUCITS ETF
STOXX® Europe600 Banks Index (SX7R)
MSCI Europe FinancialsESG Screened20-35 Select Index(NE734596)
STOXX Ltd MSCI Limited Banks Banks, AssetManagement & CustodyBanks, Mortgage REITsand insurances
XTRACKERS STOXXEUROPE 600 BASICRESOURCES SWAP UCITSETF*
XTRACKERS MSCIEUROPE MATERIALSESG SCREENEDUCITS ETF
STOXX® Europe600 Basic ResourcesIndex (SXPR)
MSCI Europe MaterialsESG Screened20-35 Select Index(NE734591)
STOXX Ltd MSCI Limited Forestry & Paper,Industrial Metals andMining
Chemicals, Forestry &Paper, Metals andMining
XTRACKERS STOXXEUROPE 600 FOOD &BEVERAGE SWAP UCITSETF*
XTRACKERS MSCIEUROPE CONSUMERSTAPLES ESGSCREENED UCITSETF
STOXX® Europe600 Food & BeverageIndex (SX3R)
MSCI Europe ConsumerStaples ESG Screened20-35 Select Index(NE734594)
STOXX Ltd MSCI Limited Brewers, Distillers &Vintners, Soft Drinks,Farming & Fishing andFood Products
Food and StaplesRetailing, Beverage,Tobacco, HouseholdProducts and PersonalProducts
XTRACKERS STOXXEUROPE 600 HEALTH CARESWAP UCITS ETF*
XTRACKERS MSCIEUROPE HEALTHCARE ESG SCREENEDUCITS ETF
STOXX® Europe600 Health Care Index(SXDR)
MSCI Europe HealthCare ESG Screened20-35 Select Index(NE734595)
STOXX Ltd MSCI Limited Health Care Providers,Medical Equipment,Medical Supplies,Biotechnology andPharmaceuticals.
Health Care Equipment& Services, Health CareTechnology,Biotechnology andPharmaceuticals
XTRACKERS STOXXEUROPE 600 INDUSTRIALGOODS SWAP UCITS ETF*
XTRACKERS MSCIEUROPEINDUSTRIALS ESGSCREENED UCITSETF
STOXX® Europe600 Industrial GoodsIndex (SXNR)
MSCI Europe IndustrialsESG Screened20-35 Select Index(NE734592)
STOXX Ltd MSCI Limited Aerospace, Defense,Containers & Packaging,Diversified Industrials,Electrical Components &Equipment, ElectronicEquipment, CommercialVehicles & Trucks,Industrial Machinery,Industrial Transportationand Support Services
Aerospace, Defense,Electrical Equipment,Machinery, TradingCompanies andDistributors
Xtrackers**
Information for Shareholders (continued)
* This is a synthetic ETF.** This includes synthetic ETFs.
376

6. Subsequent events (continued)
Current Sub-Fund name New Sub-Fund name Current Reference Index /BloombergTicker
New Reference Index /BloombergTicker
CurrentIndex
Administrator
New IndexAdministrator
Current IndustryClassification
New IndustryClassification
XTRACKERS STOXXEUROPE 600TELECOMMUNICATIONSSWAP UCITS ETF*
XTRACKERS MSCIEUROPECOMMUNICATIONSERVICES ESGSCREENED UCITSETF
STOXX® Europe600 TelecommunicationsIndex (SXKR)
MSCI EuropeCommunication ServicesESG Screened20-35 Select Index(NE734598)
STOXX Ltd MSCI Limited Fixed LineTelecommunications andMobileTelecommunications
DiversifiedTelecommunicationServices, WirelessTelecommunicationServices, Media andEntertainment
XTRACKERS STOXXEUROPE 600 UTILITIESSWAP UCITS ETF*
XTRACKERS MSCIEUROPE UTILITIESESG SCREENEDUCITS ETF
STOXX® Europe600 Utilities Index(SX6R)
MSCI Europe UtilitiesESG Screened20-35 Select Index(NE734599)
STOXX Ltd MSCI Limited Electricity, GasDistribution,Multiutilities and Water
Electric Utilities, GasDistribution,Multiutilities and WaterUtilities
XTRACKERS STOXXEUROPE 600 OIL & GASSWAP UCITS ETF*
XTRACKERS MSCIEUROPE ENERGY ESGSCREENED UCITSETF
STOXX® Europe600 Oil & Gas Index(SXER)
MSCI Europe EnergyESG Screened20-35 Select Index(NE734590)
STOXX Ltd MSCI Limited Exploration &Production, IntegratedOil & Gas, OilEquipment & Servicesand Pipelines
Energy Equipment &Services and Oil, Gas &Consumable Fuels
XTRACKERS STOXXEUROPE 600 TECHNOLOGYSWAP UCITS ETF*
XTRACKERS MSCIEUROPEINFORMATIONTECHNOLOGY ESGSCREENED UCITSETF
STOXX® Europe600 Technology Index(SX8R)
MSCI EuropeInformation TechnologyESG Screened20-35 Select Index(NE734597)
STOXX Ltd MSCI Limited Computer Services,Internet, Software,Computer Hardware,Electronic OfficeEquipment,Semiconductors andTelecommunicationsEquipment
IT Services, Software,Communications andElectronic Equipment,Technology Hardwareand Semiconductors &SemiconductorEquipment
The changes in relation to each Sub-Fund will be carried out on a date between 1 September 2021 and 30 November 2021 (each an �Effective Date�). The notice further informedShareholders that, from each Effective Date, the Sub-Funds will switch their investment policy from an Indirect Investment Policy to become a Full Replication Fund passively managed inaccordance with a Direct Investment Policy. With effect from each Effective Date, the Sub-Funds may start engaging in securities lending activities and the applicable Cut-off Time of theSub-Fund will be amended from 3:00 p.m. Luxembourg time on the relevant Transaction Day to 3.30 p.m. Luxembourg time on the relevant Transaction Day.
A notice will be published on the website of the Company on or around the relevant Effective Date confirming implementation of the Changes.
Xtrackers**
Information for Shareholders (continued)
* This is a synthetic ETF.** This includes synthetic ETFs.
377

7. Non-Transaction Days
The table below contains the days that were not considered Transaction Days due to significant markets being closed in relation to thementioned Sub-Funds and Share Classes.
Sub-Fund ISINShareClass JA
N
FE
B
MA
R
AP
R
MA
Y
JUN
Xtrackers MSCI WORLD SWAP UCITS ETF* LU0274208692 1C 1,4,6,11,18,
26
8,11,12,15,
23
23,28 1,2,5,6,14,
15,26,29,30
3,4,5,13,14,16,17,19,24,26,31
7,14,23,25
Xtrackers MSCI WORLD SWAP UCITS ETF* LU2263803533 1D(1) 1,4,6,11,18,
26
8,11,12,15,
23
23,28 1,2,5,6,14,
15,26,29,30
3,4,5,13,14,16,17,19,24,26,31
7,14,23,25
Xtrackers MSCI WORLD SWAP UCITS ETF* LU0455009851 2C 1,4,6,11,18,
26
8,11,12,15,
23
23,28 1,2,5,6,14,
15,26,29,30
3,4,5,13,14,16,17,19,24,26,31
7,14,23,25
Xtrackers MSCI WORLD SWAP UCITS ETF* LU0659579733 4C -EUR
Hedged
1,4,6,11,18,
26
8,11,12,15,
23
23,28 1,2,5,6,14,
15,26,29,30
3,4,5,13,14,16,17,19,24,26,31
7,14,23,25
Xtrackers MSCI USA SWAP UCITS ETF* LU0274210672 1C 1,18 15 - 2,5 3,13,24,31
23
Xtrackers MSCI EMERGING MARKETS SWAP UCITS ETF* LU0292107645 1C 1,3,6,7,8,11,15,18,22,25,26,28,
29
1,5,8,9,10,
11,12,15,16,17,19,23,25,26,28
1,5,7,8,11,
12,15,19,22,23,25,26,29
1,2,5,6,9,13,14,15,16,21,23,27,29,30
2,3,4,5,7,10,11,12,13,14,16,17,18,19,21,24,26,28,
31
1,3,4,7,11,
14,16,18,21,23,25,28,30
Xtrackers MSCI EM ASIA SWAP UCITS ETF* LU0292107991 1C 1,18,26,28
1,5,8,9,10,
11,12,15,16,17,25,
26
1,11,23,29
1,2,5,6,9,13,14,15,21,29,
30
3,4,5,7,10,
11,12,13,14,18,19,24,26,
31
1,3,7,14,23,
30
Xtrackers MSCI EM ASIA SWAP UCITS ETF* LU2296661775 1D(1) 1,18,26,28
1,5,8,9,10,
11,12,15,16,17,25,
26
1,11,23,29
1,2,5,6,9,13,14,15,21,29,
30
3,4,5,7,10,
11,12,13,14,18,19,24,26,
31
1,3,7,14,23,
30
Xtrackers MSCI EM LATIN AMERICA ESG SWAP UCITS ETF*(2) LU0292108619 1C 1,11,18,25
1,15,16
15,22 1,2,5,21
3,13,17,21,24,31
3,7,14,23,28
(1)The share class was launched on 3 March 2021. Please see point 1 in the other significant events of the period section of the Information for Shareholders of thissemi-annual report for further information.(2)During the period ending 30 June 2021 this Sub-Fund changed its name. Please see point 6 in the significant events of the period section of the Notes to the FinancialStatements of this semi-annual report for further information.
Xtrackers**
Information for Shareholders (continued)
* This is a synthetic ETF.** This includes synthetic ETFs.
378

7. Non-Transaction Days (continued)
Sub-Fund ISINShareClass JA
N
FE
B
MA
R
AP
R
MA
Y
JUN
Xtrackers MSCI EM EUROPE, MIDDLE EAST & AFRICA ESG SWAPUCITS ETF*(3)
LU0292109005 1C 1,3,6,7,8,15,18,22,28,29
5,9,12,15,19,23,25,26,28
5,7,8,11,12,15,19,22,25,
26
2,5,9,16,23,27,29,
30
2,3,7,11,12,13,14,16,19,21,24,28,31
3,4,11,16,18,21,23,25,30
Xtrackers NIFTY 50 SWAP UCITS ETF* LU0292109690 1C 1,26 - 11,29 2,5,14,21
3,13,24,31
23
Xtrackers STOXX GLOBAL SELECT DIVIDEND 100 SWAP UCITS ETF* LU0292096186 1D 1,4,6,11,18,
26
8,11,12,15,
23
- 2,5,6,26,29
3,4,5,13,19,24,26,
31
7,14,23,25
Xtrackers STOXX EUROPE 600 BASIC RESOURCES SWAP UCITS ETF* LU0292100806 1C 1,6 - - 1,2,5 3,13,17,24,
31
3,23,25
Xtrackers STOXX EUROPE 600 OIL & GAS SWAP UCITS ETF* LU0292101796 1C 1,6 - - 1,2,5,30
3,13,14,17,24,31
3,23,25
Xtrackers STOXX EUROPE 600 HEALTH CARE SWAP UCITS ETF* LU0292103222 1C 1,6 - - 1,2,5,30
3,13,14,24,
31
23,25
Xtrackers STOXX EUROPE 600 BANKS SWAP UCITS ETF* LU0292103651 1C 1,6 - - 1,2,5,30
3,13,14,17,24,31
3,23,25
Xtrackers STOXX EUROPE 600 TELECOMMUNICATIONS SWAP UCITSETF*
LU0292104030 1C 1,6 - - 1,2,5 3,13,17,24,
31
23,25
Xtrackers STOXX EUROPE 600 TECHNOLOGY SWAP UCITS ETF* LU0292104469 1C 1,6 - - 1,2,5,30
3,13,14,24,
31
23,25
Xtrackers STOXX EUROPE 600 UTILITIES SWAP UCITS ETF* LU0292104899 1C 1,6 - - 1,2,5,30
3,13,14,24,
31
23,25
Xtrackers STOXX EUROPE 600 FOOD & BEVERAGE SWAP UCITS ETF* LU0292105359 1C 1,6 - - 1,2,5,30
3,13,14,17,24,31
23,25
Xtrackers STOXX EUROPE 600 INDUSTRIAL GOODS SWAP UCITS ETF* LU0292106084 1C 1,6 - - 1,2,5,30
3,13,14,17,24,31
23,25
Xtrackers BLOOMBERG COMMODITY EX-AGRICULTURE & LIVE-STOCK SWAP UCITS ETF*(4)
LU0292106167 1C -EUR
Hedged
1,18 15 - 2,5 3,13,24,31
23
Xtrackers BLOOMBERG COMMODITY EX-AGRICULTURE & LIVE-STOCK SWAP UCITS ETF*(4)
LU0460391732 2C 1,18 15 - 2,5 3,13,24,31
23
Xtrackers BLOOMBERG COMMODITY EX-AGRICULTURE & LIVE-STOCK SWAP UCITS ETF*(4)
LU0460391906 3C -GBP
Hedged
1,18 15 - 2,5 3,13,24,31
23
Xtrackers SHORTDAX DAILY SWAP UCITS ETF* LU0292106241 1C 1 - - 2,5 3,13,24,31
23
Xtrackers EURO STOXX 50 SHORT DAILY SWAP UCITS ETF* LU0292106753 1C 1,6 - - 2,5 3,13,24,31
23,25
Xtrackers FTSE 100 SHORT DAILY SWAP UCITS ETF* LU0328473581 1C 1 - - 2,5 3,13,24,31
23
(3)During the period ending 30 June 2021 this Sub-Fund changed its name. Please see point 5 in the significant events of the period section of the Notes to the FinancialStatements of this semi-annual report for further information.(4)During the period ending 30 June 2021 this Sub-Fund changed its name. Please see point 3 in the significant events of the period section of the Notes to the FinancialStatements of this semi-annual report for further information.
Xtrackers**
Information for Shareholders (continued)
* This is a synthetic ETF.** This includes synthetic ETFs.
379

7. Non-Transaction Days (continued)
Sub-Fund ISINShareClass JA
N
FE
B
MA
R
AP
R
MA
Y
JUN
Xtrackers S&P 500 INVERSE DAILY SWAP UCITS ETF* LU0322251520 1C 1,18 15 - 2,5 3,13,24,31
23
Xtrackers MSCI AC ASIA EX JAPAN SWAP UCITS ETF* LU0322252171 1C 1,18,26,28
1,5,8,9,10,
11,12,15,16,17,25,
26
1,11,23,29
1,2,5,6,9,13,14,15,21,29,
30
3,4,5,7,10,
11,12,13,14,18,19,24,26,
31
1,3,7,14,23,
30
Xtrackers MSCI RUSSIA CAPPED SWAP UCITS ETF* LU0322252502 1C 1,7,18 15,23 8 2,5 3,13,24,31
23
Xtrackers MSCI RUSSIA CAPPED SWAP UCITS ETF* LU0455009265 2D 1,7,18 15,23 8 2,5 3,13,24,31
23
Xtrackers FTSE VIETNAM SWAP UCITS ETF* LU0322252924 1C 1 10,11,12,15,
16
- 2,5,21,30
3,13,24,31
23
Xtrackers LPX PRIVATE EQUITY SWAP UCITS ETF* LU0322250712 1C 1,11,18
11,15,23
- 2,5,29 3,4,5,13,24,
31
23
Xtrackers S&P GLOBAL INFRASTRUCTURE SWAP UCITS ETF* LU0322253229 1C 1,4,18,26
8,12,15
- 1,2,5,6,26,
30
3,13,14,19,24,26,
31
7,14,23
Xtrackers S&P SELECT FRONTIER SWAP UCITS ETF* LU0328476410 1C 1,3,8,11,15,18,22,
29
5,10,11,12,15,16,19,25,
26
5,11,12,19,
26
2,5,6,9,16,
21,23,30
3,7,11,12,13,14,16,19,21,24,28,
31
1,4,11,14,18,21,23,
25
Xtrackers USD OVERNIGHT RATE SWAP UCITS ETF* LU0356591882 1C 1,18 15 - 2,5 3,13,24,31
23
Xtrackers S&P 500 2X LEVERAGED DAILY SWAP UCITS ETF* LU0411078552 1C 1,18 15 - 2,5 3,13,24,31
23
Xtrackers SHORTDAX X2 DAILY SWAP UCITS ETF* LU0411075020 1C 1 - - 2,5 3,13,24,31
23
Xtrackers LEVDAX DAILY SWAP UCITS ETF* LU0411075376 1C 1 - - 2,5 3,13,24,31
23
Xtrackers BLOOMBERG COMMODITY SWAP UCITS ETF*(4) LU0429790743 2C -EUR
Hedged
1,18 15 - 2,5 3,13,14,24,
31
23
Xtrackers S&P 500 2X INVERSE DAILY SWAP UCITS ETF* LU0411078636 1C 1,18 15 - 2,5 3,13,24,31
23
Xtrackers CSI300 SWAP UCITS ETF* LU0779800910 1C 1 11,12,15,16,
17
- 2,5 3,4,5,13,24,
31
14,23
Xtrackers CSI300 SWAP UCITS ETF* LU0432553047 1D(5) 1 11,12,15,16,
17
- 2,5 3,4,5,13,24,
31
14,23
Xtrackers CSI300 SWAP UCITS ETF* LU0455008887 2D 1 11,12,15,16,
17
- 2,5 3,4,5,13,24,
31
14,23
(4)During the period ending 30 June 2021 this Sub-Fund changed its name. Please see point 3 in the significant events of the period section of the Notes to the FinancialStatements of this semi-annual report for further information.(5)During the period ending 30 June 2021 this share class was liquidated. Please see point 2 in the other significant events of the period section of Information forShareholders of this semi-annual report for further information.
Xtrackers**
Information for Shareholders (continued)
* This is a synthetic ETF.** This includes synthetic ETFs.
380

7. Non-Transaction Days (continued)
Sub-Fund ISINShareClass JA
N
FE
B
MA
R
AP
R
MA
Y
JUN
Xtrackers MSCI INDONESIA SWAP UCITS ETF* LU0476289623 1C 1 12 11 2,5 3,12,13,14,24,26,
31
1,23
Xtrackers MSCI INDONESIA SWAP UCITS ETF* LU0476289896 2C 1 12 11 2,5 3,12,13,14,24,26,
31
1,23
Xtrackers S&P 500 SWAP UCITS ETF* LU0490618542 1C 1,18 15 - 2,5 3,13,24,31
23
Xtrackers MSCI INDIA SWAP UCITS ETF* LU0514695187 1C 1,26 - 11,29 2,5,14,21
3,13,24,31
23
Xtrackers MSCI AFRICA TOP 50 SWAP UCITS ETF* LU0592217524 1C 1,7,28 - 22 2,5,27,29
2,3,12,13,14,16,24,
31
1,16,23,30
Xtrackers MSCI PAKISTAN SWAP UCITS ETF* LU0659579147 1C 1 5 23 2,5 3,7,10,11,12,13,14,24,31
23
8. Changes in the composition of the investment portfolio
Changes are made available to the Shareholders by the Depositary and Administrative Agent at the Company’s registered office. Theywill be sent free of charge to any interested Shareholder upon request.
Xtrackers**
Information for Shareholders (continued)
* This is a synthetic ETF.** This includes synthetic ETFs.
381

9. Performance table and Tracking Error
The table below contains tracking error levels realised over the period ending 30 June 2021 for all Sub-Funds and/or Share Classes which were launched before the beginning of the financialperiod ending 30 June 2021.
ISIN Sub-Fund Name Share Class Name Fund Currency Share ClassCurrency
Max All-InFee
IndexPerformance
Share ClassPerformance
PerformanceDifference
TrackingDifference
RealisedTracking Error
LU0274208692 Xtrackers MSCI WORLD SWAP UCITS ETF* 1C USD USD 0.45% 13.05% 13.02% -0.03% -0.03% 0.03%LU2263803533 Xtrackers MSCI WORLD SWAP UCITS ETF* 1D(1) USD USD 0.29% 10.72% 10.75% 0.03% 0.03% 0.09%LU0455009851 Xtrackers MSCI WORLD SWAP UCITS ETF* 2C USD USD 0.45% 13.05% 13.00% -0.05% -0.05% 0.03%LU0659579733 Xtrackers MSCI WORLD SWAP UCITS ETF* 4C - EUR Hedged(2) USD EUR 0.39% 13.05% 13.80% 0.75% -0.03% 0.03%LU0274209237 Xtrackers MSCI EUROPE UCITS ETF 1C USD USD 0.12% 11.80% 12.00% 0.20% 0.20% 0.06%LU1242369327 Xtrackers MSCI EUROPE UCITS ETF 1D USD USD 0.12% 11.80% 12.00% 0.20% 0.20% 0.06%LU1184092051 Xtrackers MSCI EUROPE UCITS ETF 2C - USD Hedged(2) USD USD 0.30% 11.80% 14.88% 3.08% 0.20% 0.06%LU0274209740 Xtrackers MSCI JAPAN UCITS ETF 1C JPY USD 0.20% 1.28% 1.20% -0.08% -0.08% 0.06%LU0927735406 Xtrackers MSCI JAPAN UCITS ETF 2D - USD Hedged(2) JPY USD 0.40% 1.28% 8.73% 7.45% -0.08% 0.06%LU0659580079 Xtrackers MSCI JAPAN UCITS ETF 4C - EUR Hedged(2) JPY EUR 0.40% 1.28% 8.44% 7.16% -0.08% 0.06%LU0659580236 Xtrackers MSCI JAPAN UCITS ETF 6C - GBP Hedged(2) JPY GBP 0.40% 1.28% 8.77% 7.49% -0.08% 0.06%LU1215827756 Xtrackers MSCI JAPAN UCITS ETF 7C - CHF Hedged(2) JPY CHF 0.40% 1.28% 8.26% 6.98% -0.08% 0.06%LU0274210672 Xtrackers MSCI USA SWAP UCITS ETF* 1C USD USD 0.15% 14.63% 14.81% 0.18% 0.17% 0.02%LU0380865021 Xtrackers EURO STOXX 50 UCITS ETF 1C EUR EUR 0.09% 16.06% 16.40% 0.34% 0.34% 0.11%LU0274211217 Xtrackers EURO STOXX 50 UCITS ETF 1D EUR EUR 0.09% 16.06% 16.39% 0.33% 0.34% 0.11%LU0274211480 Xtrackers DAX UCITS ETF 1C EUR EUR 0.09% 13.21% 12.83% -0.38% -0.38% 0.14%LU0274212538 Xtrackers FTSE MIB UCITS ETF 1D EUR EUR 0.30% 14.31% 14.59% 0.28% 0.29% 0.36%LU0943504760 Xtrackers SWITZERLAND UCITS ETF 1C CHF CHF 0.30% 13.61% 13.51% -0.10% -0.10% 0.02%LU0274221281 Xtrackers SWITZERLAND UCITS ETF 1D CHF CHF 0.30% 13.61% 13.51% -0.10% -0.11% 0.02%LU0292097234 Xtrackers FTSE 100 INCOME UCITS ETF 1D GBP GBP 0.09% 10.87% 10.82% -0.05% -0.06% 0.03%LU0292097317 Xtrackers FTSE 250 UCITS ETF 1D GBP GBP 0.15% 10.29% 10.20% -0.09% -0.08% 0.06%LU0292097747 Xtrackers MSCI UK ESG UCITS ETF 1D GBP GBP 0.18% 9.78% 9.59% -0.19% -0.20% 0.12%LU0292107645 Xtrackers MSCI EMERGING MARKETS SWAP UCITS ETF* 1C USD USD 0.49% 7.45% 7.21% -0.24% -0.24% 0.02%LU0292107991 Xtrackers MSCI EM ASIA SWAP UCITS ETF* 1C USD USD 0.65% 6.02% 5.70% -0.32% -0.31% 0.03%LU2296661775 Xtrackers MSCI EM ASIA SWAP UCITS ETF* 1D(1) USD USD 0.35% -2.39% -2.56% -0.17% -0.17% 0.09%LU0292108619 Xtrackers MSCI EM LATIN AMERICA ESG SWAP UCITS ETF*(3) 1C USD USD 0.65% 2.91% 2.31% -0.60% -0.60% 0.16%
LU0292109005Xtrackers MSCI EM EUROPE, MIDDLE EAST & AFRICA ESGSWAP UCITS ETF*(4) 1C USD USD 0.65% 11.68% 11.24% -0.44% -0.44% 0.05%
LU0292109187 Xtrackers MSCI TAIWAN UCITS ETF 1C USD USD 0.65% 20.36% 19.93% -0.43% -0.43% 0.10%LU0292109344 Xtrackers MSCI BRAZIL UCITS ETF 1C USD USD 0.65% 10.65% 10.29% -0.36% -0.36% 0.10%LU0455009182 Xtrackers MSCI BRAZIL UCITS ETF 2C USD USD 0.65% 10.65% 10.29% -0.36% -0.36% 0.10%LU0292109690 Xtrackers NIFTY 50 SWAP UCITS ETF* 1C USD USD 0.85% 11.30% 10.40% -0.90% -0.90% 0.43%LU0292100046 Xtrackers MSCI KOREA UCITS ETF 1C USD USD 0.65% 7.21% 7.31% 0.10% 0.10% 1.14%LU0292109856 Xtrackers FTSE CHINA 50 UCITS ETF 1C USD USD 0.60% -0.62% -0.95% -0.33% -0.33% 0.06%LU0292095535 Xtrackers EURO STOXX QUALITY DIVIDEND UCITS ETF 1D EUR EUR 0.30% 13.78% 14.24% 0.46% 0.46% 0.21%
LU0292096186Xtrackers STOXX GLOBAL SELECT DIVIDEND 100 SWAPUCITS ETF* 1D EUR EUR 0.50% 15.99% 15.90% -0.09% -0.10% 0.08%
Xtrackers**
Information for Shareholders (continued)
* This is a synthetic ETF.** This includes synthetic ETFs.
382

9. Performance table and Tracking Error (continued)
ISIN Sub-Fund Name Share Class Name Fund Currency Share ClassCurrency
Max All-InFee
IndexPerformance
Share ClassPerformance
PerformanceDifference
TrackingDifference
RealisedTracking Error
LU0292100806Xtrackers STOXX EUROPE 600 BASIC RESOURCES SWAPUCITS ETF* 1C EUR EUR 0.30% 19.31% 19.20% -0.11% -0.11% 0.02%
LU0292101796 Xtrackers STOXX EUROPE 600 OIL & GAS SWAP UCITS ETF* 1C EUR EUR 0.30% 12.18% 12.36% 0.18% 0.18% 0.03%
LU0292103222Xtrackers STOXX EUROPE 600 HEALTH CARE SWAP UCITSETF* 1C EUR EUR 0.30% 13.57% 13.52% -0.05% -0.05% 0.02%
LU0292103651 Xtrackers STOXX EUROPE 600 BANKS SWAP UCITS ETF* 1C EUR EUR 0.30% 25.65% 25.74% 0.09% 0.10% 0.03%
LU0292104030Xtrackers STOXX EUROPE 600 TELECOMMUNICATIONSSWAP UCITS ETF* 1C EUR EUR 0.30% 16.98% 17.03% 0.05% 0.05% 0.02%
LU0292104469Xtrackers STOXX EUROPE 600 TECHNOLOGY SWAP UCITSETF* 1C EUR EUR 0.30% 20.13% 20.00% -0.13% -0.12% 0.02%
LU0292104899 Xtrackers STOXX EUROPE 600 UTILITIES SWAP UCITS ETF* 1C EUR EUR 0.30% -0.82% -0.74% 0.08% 0.07% 0.03%
LU0292105359Xtrackers STOXX EUROPE 600 FOOD & BEVERAGE SWAPUCITS ETF* 1C EUR EUR 0.30% 13.57% 13.51% -0.06% -0.06% 0.02%
LU0292106084Xtrackers STOXX EUROPE 600 INDUSTRIAL GOODS SWAPUCITS ETF* 1C EUR EUR 0.30% 17.14% 17.10% -0.04% -0.04% 0.02%
LU0292106167Xtrackers BLOOMBERG COMMODITY EX-AGRICULTURE &LIVESTOCK SWAP UCITS ETF*(5) 1C - EUR Hedged(2) USD(6) EUR 0.39% 26.10% 24.99% -1.11% -0.24% 0.04%
LU0460391732Xtrackers BLOOMBERG COMMODITY EX-AGRICULTURE &LIVESTOCK SWAP UCITS ETF*(5) 2C USD(6) USD 0.29% 26.10% 25.86% -0.24% -0.24% 0.04%
LU0460391906Xtrackers BLOOMBERG COMMODITY EX-AGRICULTURE &LIVESTOCK SWAP UCITS ETF*(5) 3C - GBP Hedged(2) USD(6) GBP 0.39% 26.10% 25.37% -0.73% -0.24% 0.04%
LU0292106241 Xtrackers SHORTDAX DAILY SWAP UCITS ETF* 1C EUR EUR 0.40% -13.02% -13.05% -0.03% -0.03% 0.03%LU0292106753 Xtrackers EURO STOXX 50 SHORT DAILY SWAP UCITS ETF* 1C EUR EUR 0.40% -15.46% -15.46% - - 0.03%LU0322248146 Xtrackers SLI UCITS ETF 1D CHF CHF 0.25% 17.73% 16.74% -0.99% -0.98% 0.33%LU0328473581 Xtrackers FTSE 100 SHORT DAILY SWAP UCITS ETF* 1C GBP GBP 0.50% -10.64% -10.59% 0.05% 0.04% 0.04%LU0322251520 Xtrackers S&P 500 INVERSE DAILY SWAP UCITS ETF* 1C USD USD 0.50% -13.97% -13.88% 0.09% 0.09% 0.04%LU0397221945 Xtrackers PORTFOLIO UCITS ETF(7) 1C EUR EUR 0.70% - 9.96% - - -LU0322252171 Xtrackers MSCI AC ASIA EX JAPAN SWAP UCITS ETF* 1C USD USD 0.65% 6.40% 6.08% -0.32% -0.32% 0.03%LU0322252338 Xtrackers MSCI PACIFIC EX JAPAN UCITS ETF 1C USD USD 0.25% 9.60% 9.48% -0.12% -0.12% 0.03%LU0455009935 Xtrackers MSCI PACIFIC EX JAPAN UCITS ETF 2C USD USD 0.25% 9.60% 9.48% -0.12% -0.12% 0.04%LU0322252502 Xtrackers MSCI RUSSIA CAPPED SWAP UCITS ETF* 1C USD USD 0.65% 19.65% 19.26% -0.39% -0.39% 0.03%LU0455009265 Xtrackers MSCI RUSSIA CAPPED SWAP UCITS ETF* 2D USD USD 0.65% 19.65% 19.20% -0.45% -0.45% 0.09%LU0322252924 Xtrackers FTSE VIETNAM SWAP UCITS ETF* 1C USD USD 0.85% 28.77% 27.77% -1.00% -0.99% 0.06%LU0322250712 Xtrackers LPX PRIVATE EQUITY SWAP UCITS ETF* 1C EUR EUR 0.70% 34.67% 34.06% -0.61% -0.61% 0.24%LU0328474803 Xtrackers S&P ASX 200 UCITS ETF 1D AUD AUD 0.50% 12.90% 12.58% -0.32% -0.32% 0.10%LU0328475792 Xtrackers STOXX EUROPE 600 UCITS ETF 1C EUR EUR 0.20% 15.15% 15.30% 0.15% 0.15% 0.06%LU1772333404 Xtrackers STOXX EUROPE 600 UCITS ETF 2C - EUR Hedged(2) EUR EUR 0.25% 15.15% 14.36% -0.79% 0.15% 0.06%LU0322253229 Xtrackers S&P GLOBAL INFRASTRUCTURE SWAP UCITS ETF* 1C USD USD 0.60% 4.99% 4.73% -0.26% -0.26% 0.17%LU0322250985 Xtrackers CAC 40 UCITS ETF 1D EUR EUR 0.20% 18.91% 19.41% 0.50% 0.49% 0.20%LU0322253732 Xtrackers MSCI EUROPE MID CAP UCITS ETF 1C USD USD 0.25% 10.81% 10.94% 0.13% 0.14% 0.11%
Xtrackers**
Information for Shareholders (continued)
* This is a synthetic ETF.** This includes synthetic ETFs.
383

9. Performance table and Tracking Error (continued)
ISIN Sub-Fund Name Share Class Name Fund Currency Share ClassCurrency
Max All-InFee
IndexPerformance
Share ClassPerformance
PerformanceDifference
TrackingDifference
RealisedTracking Error
LU0322253906 Xtrackers MSCI EUROPE SMALL CAP UCITS ETF 1C USD USD 0.30% 11.91% 11.99% 0.08% 0.08% 0.11%LU0328476410 Xtrackers S&P SELECT FRONTIER SWAP UCITS ETF* 1C USD USD 0.95% 15.46% 13.53% -1.93% -1.93% 0.10%LU0356591882 Xtrackers USD OVERNIGHT RATE SWAP UCITS ETF* 1C USD USD 0.15% 0.04% -0.04% -0.08% -0.07% 0.01%LU0411078552 Xtrackers S&P 500 2X LEVERAGED DAILY SWAP UCITS ETF* 1C USD USD 0.60% 30.99% 30.72% -0.27% -0.27% 0.07%LU0411075020 Xtrackers SHORTDAX X2 DAILY SWAP UCITS ETF* 1C EUR EUR 0.60% -24.86% -24.82% 0.04% 0.04% 0.07%LU0411075376 Xtrackers LEVDAX DAILY SWAP UCITS ETF* 1C EUR EUR 0.35% 27.25% 26.49% -0.76% -0.77% 0.06%LU0429790743 Xtrackers BLOOMBERG COMMODITY SWAP UCITS ETF*(5) 2C - EUR Hedged(8) USD(6) EUR 0.24% 21.76% 20.56% -1.20% -1.20% 0.34%LU0411078636 Xtrackers S&P 500 2X INVERSE DAILY SWAP UCITS ETF* 1C USD USD 0.70% -26.67% -26.57% 0.10% 0.10% 0.14%LU0779800910 Xtrackers CSI300 SWAP UCITS ETF* 1C USD USD 0.50% 2.21% 4.16% 1.95% 1.95% 0.24%LU0432553047 Xtrackers CSI300 SWAP UCITS ETF* 1D(9) USD USD 0.50% -1.96% -1.76% 0.20% 0.20% 0.73%LU0455008887 Xtrackers CSI300 SWAP UCITS ETF* 2D USD USD 0.50% 2.21% 4.19% 1.98% 1.98% 0.25%LU0476289540 Xtrackers MSCI CANADA UCITS ETF 1C USD USD 0.35% 20.59% 20.60% 0.01% - 0.17%LU0476289623 Xtrackers MSCI INDONESIA SWAP UCITS ETF* 1C USD USD 0.65% -12.32% -12.73% -0.41% -0.41% 0.03%LU0476289896 Xtrackers MSCI INDONESIA SWAP UCITS ETF* 2C USD USD 0.65% -12.32% -12.75% -0.43% -0.43% 0.03%LU0476289466 Xtrackers MSCI MEXICO UCITS ETF 1C USD USD 0.65% 13.73% 13.44% -0.29% -0.29% 0.06%LU0486851024 Xtrackers MSCI EUROPE VALUE UCITS ETF 1C EUR EUR 0.15% 17.74% 17.97% 0.23% 0.23% 0.11%LU0490618542 Xtrackers S&P 500 SWAP UCITS ETF* 1C USD USD 0.15% 15.00% 15.21% 0.21% 0.21% 0.02%
LU0489337690Xtrackers FTSE DEVELOPED EUROPE REAL ESTATE UCITSETF
1C EUR EUR 0.33% 9.02% 9.19% 0.17% 0.18% 0.17%
LU0514695690 Xtrackers MSCI CHINA UCITS ETF 1C USD USD 0.65% 1.83% 1.63% -0.20% -0.20% 0.16%LU0514695856 Xtrackers MSCI CHINA UCITS ETF 2C USD USD 0.65% 1.83% 1.63% -0.20% -0.20% 0.16%LU0514695187 Xtrackers MSCI INDIA SWAP UCITS ETF* 1C USD USD 0.75% 12.38% 11.61% -0.77% -0.76% 0.04%LU0514694370 Xtrackers MSCI MALAYSIA UCITS ETF 1C USD USD 0.50% -8.12% -8.33% -0.21% -0.21% 0.05%LU0514694537 Xtrackers MSCI MALAYSIA UCITS ETF 2C USD USD 0.50% -8.12% -8.33% -0.21% -0.21% 0.05%LU0514694701 Xtrackers MSCI THAILAND UCITS ETF 1C USD USD 0.50% -0.76% -0.96% -0.20% -0.20% 0.03%LU0514694966 Xtrackers MSCI THAILAND UCITS ETF 2C USD USD 0.50% -0.76% -0.96% -0.20% -0.20% 0.03%LU0592215403 Xtrackers MSCI PHILIPPINES UCITS ETF 1C USD USD 0.65% -3.47% -3.78% -0.31% -0.31% 0.09%LU0592215668 Xtrackers MSCI PHILIPPINES UCITS ETF 2C USD USD 0.65% -3.47% -3.78% -0.31% -0.31% 0.08%LU0592217524 Xtrackers MSCI AFRICA TOP 50 SWAP UCITS ETF* 1C USD USD 0.65% 7.20% 6.06% -1.14% -1.14% 0.07%LU0592216393 Xtrackers SPAIN UCITS ETF 1C EUR EUR 0.30% 12.41% 12.28% -0.13% -0.13% 0.31%LU0994505336 Xtrackers SPAIN UCITS ETF 1D EUR EUR 0.30% 12.41% 12.27% -0.14% -0.13% 0.30%LU0659579147 Xtrackers MSCI PAKISTAN SWAP UCITS ETF* 1C USD USD 0.85% 4.40% 2.19% -2.21% -2.22% 1.08%LU0659578842 Xtrackers MSCI SINGAPORE UCITS ETF 1C USD USD 0.50% 8.58% 8.33% -0.25% -0.25% 0.05%LU0755279428 Xtrackers MSCI SINGAPORE UCITS ETF 2C USD USD 0.50% 8.58% 8.32% -0.26% -0.26% 0.06%LU0659579063 Xtrackers ATX UCITS ETF 1C EUR EUR 0.25% 23.96% 24.06% 0.10% 0.10% 0.15%LU1127514245 Xtrackers MSCI EMU UCITS ETF 1C - USD Hedged(2) EUR USD 0.17% 15.28% 15.90% 0.62% 0.29% 0.09%LU0846194776 Xtrackers MSCI EMU UCITS ETF 1D EUR EUR 0.12% 15.28% 15.56% 0.28% 0.29% 0.09%LU1127516455 Xtrackers MSCI EMU UCITS ETF 2C - GBP Hedged(2) EUR GBP 0.17% 15.28% 15.91% 0.63% 0.29% 0.09%LU1215828218 Xtrackers MSCI EMU UCITS ETF 3C - CHF Hedged(2) EUR CHF 0.17% 15.28% 15.34% 0.06% 0.29% 0.09%
Xtrackers**
Information for Shareholders (continued)
* This is a synthetic ETF.** This includes synthetic ETFs.
384

9. Performance table and Tracking Error (continued)
ISIN Sub-Fund Name Share Class Name Fund Currency Share ClassCurrency
Max All-InFee
IndexPerformance
Share ClassPerformance
PerformanceDifference
TrackingDifference
RealisedTracking Error
LU0838782315 Xtrackers DAX INCOME UCITS ETF 1D EUR EUR 0.09% 13.21% 12.83% -0.38% -0.38% 0.14%LU1221100792 Xtrackers DAX INCOME UCITS ETF 2C - USD Hedged(2) EUR USD 0.19% 13.21% 13.02% -0.19% -0.38% 0.14%LU1221102491 Xtrackers DAX INCOME UCITS ETF 4C - CHF Hedged(2) EUR CHF 0.19% 13.21% 12.63% -0.58% -0.38% 0.14%LU0838780707 Xtrackers FTSE 100 UCITS ETF 1C GBP GBP 0.09% 10.87% 10.83% -0.04% -0.05% 0.03%LU2196470426 Xtrackers NIKKEI 225 UCITS ETF 1C JPY JPY 0.09% 5.59% 5.60% 0.01% - 0.07%LU0839027447 Xtrackers NIKKEI 225 UCITS ETF 1D JPY JPY 0.09% 5.59% 5.59% - - 0.07%LU1875395870 Xtrackers NIKKEI 225 UCITS ETF 2D - EUR Hedged(2) JPY EUR 0.19% 5.59% 5.28% -0.31% - 0.07%LU0875160326 Xtrackers HARVEST CSI300 UCITS ETF 1D USD USD 0.65% 2.10% 1.78% -0.32% -0.32% 0.48%LU1310477036 Xtrackers HARVEST FTSE CHINA A-H 50 UCITS ETF 1D USD USD 0.65% 3.47% 2.99% -0.48% -0.48% 0.59%
(1)The share class was launched on 3 March 2021. Please see point 1 in the other significant events of the period section of the Information for Shareholders of this semi-annual report for further information.
(2)For FX hedged share classes:“Performance Difference is defined as the difference between the performance of the currency hedged share class of this Sub-Fund and the unhedged benchmark index”;“Tracking Difference is defined as the difference between the return of the unhedged share class of this Sub-Fund and the unhedged benchmark index”;“Tracking Error is defined as the volatility of the difference between the return of the unhedged share class of this Sub-Fund and the unhedged benchmark index” .
(3)During the period ending 30 June 2021 this Sub-Fund changed its name. Please see point 6 in the significant events of the period section of the Notes to the Financial Statements of this semi-annual report for further information.
(4)During the period ending 30 June 2021 this Sub-Fund changed its name. Please see point 5 in the significant events of the period section of the Notes to the Financial Statements of this semi-annual report for further information.
(5)During the period ending 30 June 2021 this Sub-Fund changed its name. Please see point 3 in the significant events of the period section of the Notes to the Financial Statements of this semi-annual report for further information.
(6)During the period ending 30 June 2021 this Sub-Fund changed its currency. Please see point 3 in the significant events of the period section of the Notes to the Financial Statements of this semi-annual report for further information.
(7)The Sub-Fund does not track an index.
(8)For this FX share class:�Performance Difference is defined as the difference between the performance of the currency hedged share class of this Sub-Fund and the unhedged benchmark index�;�Tracking Difference is defined as the difference between the return of the currency hedged share class of this Sub-Fund and the unhedged benchmark index�;�Tracking Error is defined as the volatility of the difference between the return of the currency hedged share class of this Sub-Fund and the unhedged benchmark index�.
(9)During the period ending 30 June 2021 this share class was liquidated. Please see point 2 in the other significant events of the period section of Information for Shareholders of this semi-annual report for further information.
Xtrackers**
Information for Shareholders (continued)
** This includes synthetic ETFs.
385