LTN20110727329.pdf - HKEXnews
441
If you are in any doubt as to any aspect of this Circular, you should consult your stockbroker or other registered dealer in securities, bank manager, solicitor, professional accountants or other professional adviser. If you have sold or transferred all your shares in Wing Hing International (Holdings) Limited, you should at once hand this Circular together with the enclosed form of proxy to the transferee or to the bank, stockbroker or other agent through whom the sale was effected for transmission to the transferee. Hong Kong Exchanges and Clearing Limited and The Stock Exchange of Hong Kong Limited take no responsibility for the contents of this Circular, make no representation as to its accuracy or completeness and expressly disclaims any liability whatsoever for any loss howsoever arising from or in reliance upon the whole or any part of the contents of this Circular. This Circular is for information purposes only and does not constitute an invitation or offer to acquire, purchase or subscribe for securities. (incorporated in Bermuda with limited liability) (Stock Code: 621) (1) VERY SUBSTANTIAL ACQUISITION OF UP TO 86.966% OF TAUNG GOLD LIMITED (2) ISSUE OF WING HING SHARES UNDER SPECIFIC MANDATE (3) GRANT OF OPTIONS UNDER ELECTRUM OPTION AGREEMENT AND TG OPTIONHOLDER AGREEMENT (4) PROPOSED INCREASE IN AUTHORISED SHARE CAPITAL (5) NOTICE OF SPECIAL GENERAL MEETING (6) PROPOSED CHANGE OF NAME Unless the context otherwise requires, all capitalised terms used in this Circular have the meanings set out in the section headed ‘‘Definitions’’ of this Circular. A letter from the Board is set out on pages 11 to 165 of this Circular. A notice convening a special general meeting ( SGM) of Wing Hing to be held at Unit 1901, 19/F, Nina Tower, No. 8 Yeung Uk Road, Tsuen Wan, New Territories, Hong Kong on 19 August 2011, Friday, at 11: 00 a.m. is set out on pages N-1 to N-5 of this Circular. Whether or not you are able to attend the SGM, you are requested to complete the accompanying form of proxy for use at the SGM in accordance with the instructions printed thereon and return the same to Wing Hing’s branch share registrar in Hong Kong, Tricor Tengis Limited, at 26th Floor, Tesbury Centre, 28 Queen’s Road East, Wanchai, Hong Kong, as soon as possible but in any event not less than 48 hours before the time appointed for the holding of the SGM or any adjournment thereof. Completion and return of the form of proxy will not preclude you from attending and voting in person at the SGM or any adjourned meeting thereof should you so wish. THIS CIRCULAR IS IMPORTANT AND REQUIRES YOUR IMMEDIATE ATTENTION 28 July 2011
-
Upload
khangminh22 -
Category
Documents
-
view
0 -
download
0
Transcript of LTN20110727329.pdf - HKEXnews

If you are in any doubt as to any aspect of this Circular, you should consult your stockbroker or other
registered dealer in securities, bank manager, solicitor, professional accountants or other
professional adviser.
If you have sold or transferred all your shares in Wing Hing International (Holdings) Limited, you
should at once hand this Circular together with the enclosed form of proxy to the transferee or to the
bank, stockbroker or other agent through whom the sale was effected for transmission to the
transferee.
Hong Kong Exchanges and Clearing Limited and The Stock Exchange of Hong Kong Limited take
no responsibility for the contents of this Circular, make no representation as to its accuracy or
completeness and expressly disclaims any liability whatsoever for any loss howsoever arising from or
in reliance upon the whole or any part of the contents of this Circular.
This Circular is for information purposes only and does not constitute an invitation or offer to
acquire, purchase or subscribe for securities.
(incorporated in Bermuda with limited liability)
(Stock Code: 621)
(1) VERY SUBSTANTIAL ACQUISITION OF UP TO 86.966% OF
TAUNG GOLD LIMITED
(2) ISSUE OF WING HING SHARES UNDER SPECIFIC MANDATE
(3) GRANT OF OPTIONS UNDER ELECTRUM OPTION AGREEMENT
AND TG OPTIONHOLDER AGREEMENT
(4) PROPOSED INCREASE IN AUTHORISED SHARE CAPITAL
(5) NOTICE OF SPECIAL GENERAL MEETING
(6) PROPOSED CHANGE OF NAME
Unless the context otherwise requires, all capitalised terms used in this Circular have the meanings
set out in the section headed ‘‘Definitions’’ of this Circular.
A letter from the Board is set out on pages 11 to 165 of this Circular.
A notice convening a special general meeting (SGM) of Wing Hing to be held at Unit 1901, 19/F,
Nina Tower, No. 8 Yeung Uk Road, Tsuen Wan, New Territories, Hong Kong on 19 August 2011,
Friday, at 11 : 00 a.m. is set out on pages N-1 to N-5 of this Circular.
Whether or not you are able to attend the SGM, you are requested to complete the accompanying
form of proxy for use at the SGM in accordance with the instructions printed thereon and return the
same to Wing Hing’s branch share registrar in Hong Kong, Tricor Tengis Limited, at 26th Floor,
Tesbury Centre, 28 Queen’s Road East, Wanchai, Hong Kong, as soon as possible but in any event
not less than 48 hours before the time appointed for the holding of the SGM or any adjournment
thereof. Completion and return of the form of proxy will not preclude you from attending and voting
in person at the SGM or any adjourned meeting thereof should you so wish.
THIS CIRCULAR IS IMPORTANT AND REQUIRES YOUR IMMEDIATE ATTENTION
28 July 2011
FORWARD-LOOKING INFORMATION
Certain information contained in this Circular constitutes forward-looking
information. Investors are cautioned that forward-looking information is inherently
uncertain and involves risks and uncertainties that could cause actual results,
performance or achievements of Wing Hing to be materially different from any future
results, performance or achievements expressed or implied by such forward-looking
information.
Such forward-looking information includes comments regarding the completion and
terms of the Transactions and the proposed business model and strategic plans of the Wing
Hing Group, the Taung Group or the Enlarged Group. Factors that could cause actual
results to differ materially include (without limitation) the ability to complete the
Transactions, the failure to receive regulatory or shareholders’ approvals with respect to
the Transactions and the Specific Mandate, and a change to the financial, political and
regulatory positions in Hong Kong and South Africa and other relevant jurisdictions. In
addition, specific reference is made to the section of this Circular headed ‘‘Part B — Risk
Factors — 1. Risks Associated with the Acquisition’’ in the letter from the Board. There can
be no assurance that future developments affecting the Wing Hing Group or the Taung
Group will be those anticipated by Wing Hing’s management.
While Wing Hing may elect to update the forward-looking information at any time,
Wing Hing does not undertake to update it at any particular time or in response to any
particular event. Investors and others should not assume that any forward-looking
information in this Circular represents an estimation by Wing Hing’s management as at any
date other than the Latest Practicable Date.
CURRENCY AND EXCHANGE RATES
For the purpose of illustration only, amounts denominated in US$ have been
translated into HK$ at the rate of US$1.00 = HK$7.8 and amounts denominated in ZAR
have been translated into US$ at the rate of US$1.00 = ZAR8.00, unless otherwise stated
and such translations have been rounded to the nearest two (2) decimal points. Such
translations should not be construed as a representation that the amounts quoted could
have been or could be or will be converted at the stated rate or at any other rates at all.
IMPORTANT
– i –
Page
IMPORTANT . . . . . . . . . . . . . . . . . . . . . . . . . . . . . . . . . . . . . . . . . . . . . . . . . . . . . . . . . . . . . . . . . . i
CONTENTS . . . . . . . . . . . . . . . . . . . . . . . . . . . . . . . . . . . . . . . . . . . . . . . . . . . . . . . . . . . . . . . . . . . ii
DEFINITIONS . . . . . . . . . . . . . . . . . . . . . . . . . . . . . . . . . . . . . . . . . . . . . . . . . . . . . . . . . . . . . . . . . 1
GLOSSARY . . . . . . . . . . . . . . . . . . . . . . . . . . . . . . . . . . . . . . . . . . . . . . . . . . . . . . . . . . . . . . . . . . . 10
LETTER FROM THE BOARD . . . . . . . . . . . . . . . . . . . . . . . . . . . . . . . . . . . . . . . . . . . . . . . . 11
APPENDIX I — ACCOUNTANT’S REPORT ON WING HING . . . . . . . . . . I-1
APPENDIX II — FINANCIAL INFORMATION OF
THE TAUNG GROUP . . . . . . . . . . . . . . . . . . . . . . . . . . . . . . . . . II-1
APPENDIX III — UNAUDITED PRO FORMA FINANCIAL
INFORMATION OF THE ENLARGED GROUP . . . . . . III-1
APPENDIX IV — THE COMPETENT PERSONS REPORT . . . . . . . . . . . . . . . IV-1
APPENDIX V — THE VALUATION REPORT . . . . . . . . . . . . . . . . . . . . . . . . . . . . V-1
APPENDIX VI — THE LOAN NOTE, PUT OPTION AGREEMENT,
ELECTRUM OPTION AGREEMENT
AND TG OPTIONHOLDER AGREEMENT . . . . . . . . . . . VI-1
APPENDIX VII — ADDITIONAL INFORMATION
ON THE TAUNG GROUP . . . . . . . . . . . . . . . . . . . . . . . . . . . . VII-1
APPENDIX VIII — STATUTORY AND GENERAL INFORMATION
ON WING HING . . . . . . . . . . . . . . . . . . . . . . . . . . . . . . . . . . . . . . VIII-1
APPENDIX IX — DOCUMENTS AVAILABLE FOR INSPECTION . . . . . . . IX-1
NOTICE OF SPECIAL GENERAL MEETING . . . . . . . . . . . . . . . . . . . . . . . . . . . . . . . . N-1
CONTENTS
– ii –

‘‘Accountant’s Report’’ Taung Group’s accountant’s report for the three years ended 28
February 2011, which is set out in Appendix II of this Circular
‘‘Acquisition’’ the acquisition of up to 86.966% of the issued share capital of
Taung Gold subject to the terms set out in the Acquisition
Agreement
‘‘Acquisition
Agreement’’
the conditional sale and purchase agreement dated 28 January
2011 entered into by Wing Hing, TG Sellers, Mandra and
GoldCom for the acquisition of the TG Sale Shares, the Other
TG Sale Shares and the Arctic Sale Shares, as amended by the
Amendment Agreement and the Second Amendment Agreement
‘‘Amendment
Agreement’’
the amendment agreement dated 22 March 2011 entered into by
Wing Hing, the TG Sellers (except for Easy Capital Holdings
Limited, Manford Capital (HK) Limited, Amplewood Resources
Limited, Hong Kong Sheen Smile International Investment
Limited and Sino Reach Investments Limited), Supreme Best
Limited, Mandra and GoldCom
‘‘Announcement’’ the announcement issued by Wing Hing on 4 April 2011 in
relation to the Acquisition
‘‘Arctic’’ Arctic Sun Trading 56 (Pty) Ltd, which will be the indirect legal
and beneficial owner of approximately 28.62% of Taung Gold as
at the First Completion Date and not less than 26.0% of Taung
Gold from Electrum Completion
‘‘Arctic Consideration
Shares’’
1,638,677,252 new Wing Hing Shares valued at HK$0.41 each to
be issued by Wing Hing to Mandra
‘‘Arctic Holdco’’ Taung Gold BEE Limited, which will be the legal and beneficial
owner of 49.90% of the issued capital of Arctic as at the First
Completion Date
‘‘Arctic Sale Shares’’ the entire issued share capital of Arctic Holdco, which in turn
will hold 49.90% of the issued capital of Arctic as at the First
Completion Date
‘‘associate(s)’’ has the meaning ascribed to it under the Listing Rules
DEFINITIONS
– 1 –

‘‘Bankable Feasibility
Study’’ or ‘‘feasibility
study’’
a comprehensive design and costing study of the selected option
for the development of a mineral project in which appropriate
assessments have been made of realistically assumed geological,
mining, metallurgical, economic, marketing, legal,
environmental, social, governmental, engineering, operational
and all other modifying factors, which are considered in
sufficient detail to demonstrate at the time of reporting that
extraction is reasonably justified (economically mineable) and
the factors reasonably serve as the basis for a final decision by a
proponent or financial institution to proceed with, or finance,
the development of the project. The overall confidence of the
study should be stated
‘‘BEE’’ broad-based black economic empowerment
‘‘BEE Shareholders’’ shareholders of SepGold who are historically disadvantaged
South Africans
‘‘Bless Luck’’ Bless Luck International Limited, a wholly-owned subsidiary of
Wing Hing
‘‘Board’’ the board of Directors
‘‘Business Day(s)’’ a day (excluding a Saturday, Sunday and public holiday) on
which commercial banks are generally open for business in Hong
Kong and South Africa and on which the Exchange is open for
the business of dealing in securities
‘‘Circular’’ this circular to be issued to the WH Shareholders
‘‘Competent Evaluator’’ BMI Appraisals Limited, a competent evaluator as defined under
Chapter 18 of the Listing Rules
‘‘Competent Person’’ has the meaning ascribed to it under Chapter 18 of the Listing
Rules
‘‘Competent Persons
Report’’
the independent competent persons report on the South African
gold assets of the Taung Group prepared by Venmyn Rand
Proprietary Limited, a third party independent of Wing Hing, in
accordance with the JORC Code, the SAMREC Code and the
Listing Rules, which is dated 11 February 2011
‘‘Conditions’’ the conditions precedent to First Completion
‘‘connected person(s)’’ has the meaning ascribed to it under the Listing Rules
‘‘Consideration’’ up to US$580,000,000, being the aggregate of the Loan Amount
and the total consideration for the TG Sale Shares, the Other TG
Sale Shares, the Arctic Sale Shares and the Electrum Option
Shares
DEFINITIONS
– 2 –

‘‘Dayan Licence’’ the mining rights licence no. 5200000711044 granted by the PRC
Ministry of Land and Resources in relation to the coal mine
located in Zhijin County in the southwestern part of Guizhou
Province
‘‘Deed of Adherence’’ the form of a deed of adherence contained in the Acquisition
Agreement which the Other TG Shareholders may enter into to
adhere to the terms and conditions of the Acquisition Agreement
‘‘Director(s)’’ the directors of Wing Hing
‘‘DMR’’ Department of Mineral Resources of the Republic of South
Africa
‘‘Earn-in Agreement’’ a series of nine agreements between Taung Gold and EGM
Limited dated 29 February 2008 under which EGM Limited is
obliged to transfer the mining rights under the Evander Project
to Taung Gold after certain works have been completed by
Taung Gold, the details of which are set out in the section of this
Circular headed ‘‘Part C — Information on the Taung Group
and its Primary Projects — 3.4 The Evander Project — (c)
Sufficient influence in decisions over exploration of gold
resources’’
‘‘EGM Limited’’ Evander Gold Mines Limited, a subsidiary of Harmony
‘‘Electrum’’ Electrum Strategic Exploration Limited
‘‘Electrum Completion’’ completion of the sale and purchase of the Electrum Option
Shares
‘‘Electrum Completion
Date’’
the date of completion of the sale and purchase of the Electrum
Option Shares in accordance with the terms and conditions of the
Acquisition Agreement and the Electrum Option Agreement
‘‘Electrum
Consideration
Shares’’
up to 1,147,523,915 new Wing Hing Shares to be issued by Wing
Hing to Electrum at the Issue Price
‘‘Electrum Option
Agreement’’
an option agreement which may be entered into between
Electrum and Wing Hing on or prior to the First Completion
Date
‘‘Electrum Option
Shares’’
up to 21,500,000 new TG Shares which Electrum is entitled to
acquire if it elects to exercise the Electrum TG Warrants
‘‘Electrum TG
Warrants’’
warrants in Taung Gold held by Electrum which if exercised, will
entitle Electrum to acquire the Electrum Option Shares,
representing approximately 9.09% of the entire issued share
capital of Taung Gold
DEFINITIONS
– 3 –

‘‘Enlarged Group’’ the Wing Hing Group immediately after First Completion
‘‘Evander Project’’ the gold project located in the Six Shaft area and the Twistdraai
area situated in the Mpumalanga Province of South Africa
‘‘Evander Subsidiaries’’ the subsidiaries to be established by EGM Limited for the
purpose of holding the rights to the Evander Project
‘‘Exchange’’ The Stock Exchange of Hong Kong Limited
‘‘First Completion’’ completion of the sale and purchase of all TG Shares (other than
those TG Shares to be acquired by Electrum upon its exercise of
the Electrum TG Warrants) and Arctic Sale Shares
‘‘First Completion
Date’’
the date of First Completion, being the tenth Business Day after
satisfaction or waiver of the Conditions (such date not being
later than the Long Stop Date) unless Wing Hing, the majority of
the TG Sellers (including any Other TG Shareholder who has
entered into a Deed of Adherence to sell the TG Shares held by it
to Wing Hing) and Mandra otherwise agree in writing to be
another day
‘‘Founders’’ Dr. David Twist and Mr. Christiaan Rudolph de Wet de Bruin
‘‘Future Material
Transaction’’
any agreement, arrangement or understanding outside the
ordinary course of business of Wing Hing and involving
expenditure or liability of more than US$15,000,000
(equivalent to approximately HK$116,250,000)
‘‘GoldCom’’ Gold Commercial Services Limited, a company incorporated
under the laws of the British Virgin Islands with limited liability,
whose principal business activities consist of investment holding
and related activities
‘‘GoldCom
Consideration
Shares’’
up to 1,134,348,686 new Wing Hing Shares to be issued by Wing
Hing to GoldCom at the Issue Price on the First Completion
Date
‘‘Greenfield Projects’’ early stage exploration projects of the Taung Group
‘‘Harmony’’ Harmony Gold Mining Company Limited
‘‘HK$’’ Hong Kong dollars, the lawful currency of Hong Kong
‘‘Hong Kong’’ the Hong Kong Special Administrative Region of the People’s
Republic of China
‘‘IFRS’’ International Financial Reporting Standards
‘‘Investment
Committee’’
a committee of the Board to be established on the First
Completion Date comprising five members, namely three (3)
directors from Taung Gold and two (2) existing Directors
DEFINITIONS
– 4 –

‘‘Issue Price’’ HK$0.41 per Wing Hing Share
‘‘Jeanette Project’’ the mineral exploration and mining operation located in the
Jeanette area within the Welkom goldfield in the Free State
Province of South Africa
‘‘JORC Code’’ has the meaning ascribed to it under the Listing Rules
‘‘Last Trading Day’’ 28 January 2011, being the last full trading day for Wing Hing
Shares prior to suspension of trading in the Wing Hing Shares
pending the issue of the Announcement
‘‘Latest Practicable
Date’’
25 July 2011
‘‘Listing Committee’’ the Listing Committee of the Exchange
‘‘Listing Rules’’ the Rules Governing the Listing of Securities on The Stock
Exchange of Hong Kong Limited
‘‘Loan Amount’’ approximately HK$464,480,706.98
‘‘Loan Note’’ the loan note having a principal amount of the Loan Amount to
be issued by GoldCom to Wing Hing in consideration for the
issue of new Wing Hing Shares
‘‘Lock-up Shares’’ the Wing Hing Shares held by the TG Sellers, the Other TG
Shareholders and Mandra directly or indirectly as at First
Completion, including all Wing Hing Shares held by the TG
Sellers, the Other TG Shareholders and Mandra through their
affiliates
‘‘Long Stop Date’’ 30 November 2011
‘‘Mandra’’ Mandra Materials Limited, which will be the legal and beneficial
owner of 100% of the issued capital of Arctic Holdco as at the
First Completion Date and whose principal business activity is
investment holding
‘‘Mining Right
No 107/2010’’
the new order mining right over an extensive mining area that
permits the mining of gold and associated minerals in the Six
Shaft and Twistdraai areas
‘‘Minxcon’’ Minxcon (Proprietary) Limited
‘‘MMR’’ the Minister of the Department of Mineral Resources of South
Africa
‘‘MPRDA’’ the Mineral and Petroleum Resources Development Act of South
Africa (28 of 2002)
DEFINITIONS
– 5 –
‘‘Other Consideration
Shares’’
up to 743,079,165 new Wing Hing Shares to be issued to the
Other TG Shareholders who have entered into Deeds of
Adherence to sell their Other TG Sale Shares on or before the
First Completion Date
‘‘Other TG Sale Shares’’ shares in Taung Gold held by those Other TG Shareholders
which may be purchased by Wing Hing on the First Completion
Date
‘‘Other TG
Shareholders’’
those shareholders of Taung Gold in respect of whom Wing Hing
offers to purchase the Other TG Sale Shares on or before the
First Completion Date
‘‘PRC Subsidiary’’ 貴州金億達礦業有限公司 (translated as Guizhou Jinyida Mining
Company Limited), a wholly foreign owned enterprise
established in the PRC and an indirect wholly-owned
subsidiary of Union Sense
‘‘PRC’’ the People’s Republic of China which, for the purposes of this
Circular, excludes Hong Kong, the Macau Special
Administrative Region of the PRC and Taiwan
‘‘Pre-Feasibility Study’’ has the meaning ascribed to it under the Listing Rules
‘‘Proposed Change of
Name’’
the proposed change of the English name of Wing Hing from
‘‘Wing Hing International (Holdings) Limited’’ to ‘‘Taung Gold
International Limited’’ and the change of the Chinese name ‘‘永
興國際(控股)有限公司’’ (which has been used for identification
purposes only) to ‘‘壇金礦業有限公司’’ for identification
purposes only
‘‘Proposed Increase in
Authorised Share
Capital’’
the grant of approval by the WH Shareholders for the increase in
the authorised share capital of Wing Hing from 15,000,000,000
Wing Hing Shares to 30,000,000,000 Wing Hing Shares by the
creation of 15,000,000,000 additional new Wing Hing Shares
‘‘Put Option
Agreements’’
the agreements that may be entered into on or prior to the First
Completion Date by each South African Shareholder, GoldCom
and Wing Hing pursuant to which GoldCom conditionally agrees
to grant a right to the relevant South African Shareholders to sell
their TG Shares (the SA Put Option)
‘‘Put Option
Consideration
Shares’’
such number of Wing Hing Shares as is calculated by multiplying
the Share Exchange Ratio by the number of TG Shares to be sold
by the relevant South African Shareholder
‘‘Qualified BEE
Company’’
a company controlled by historically disadvantaged South
Africans
‘‘RMB’’ Renminbi, the lawful currency of the People’s Republic of China
DEFINITIONS
– 6 –

‘‘Rs’’ Rupees, the lawful currency of India
‘‘Sale Agreement’’ an agreement (including amendments to it) between EGM
Limited and Pluriclox (Proprietary) Limited, a wholly-owned
subsidiary of Taung Gold, dated September 2010 pursuant to
which, Pluriclox (Proprietary) Limited agreed to acquire the
entire interest in the Evander Project, subject to the approval by
the MMR for the transfer of a subdivided portion of EGM
Limited’s new order mining right to Pluriclox (Proprietary)
Limited
‘‘SAMREC Code’’ has the meaning ascribed to it under the Listing Rules
‘‘SAMVAL Code’’ has the meaning ascribed to it under the Listing Rules
‘‘SARB’’ South African Reserve Bank
‘‘Scoping Study’’ has the meaning ascribed to it under the Listing Rules
‘‘Second Amendment
Agreement’’
the second amendment agreement dated 22 July 2011 entered
into by Wing Hing, the TG Sellers, Supreme Best Limited,
Mandra and GoldCom
‘‘SepGold’’ Sephaku Gold Holdings Limited
‘‘SFO’’ The Securities and Futures Ordinance (Chapter 571 of the Laws
of Hong Kong)
‘‘SGM’’ the special general meeting of Wing Hing to be convened to
approve the matter(s) referred to herein
‘‘Share Exchange
Ratio’’
means the ratio of 53.37320537 Wing Hing Shares for every 1
(one) TG Share. There shall be no issuance of fractional Wing
Hing Shares. This ratio applies to the TG Sale Shares, the Other
TG Sale Shares, the Arctic Sale Shares, the Electrum Option
Shares and the TG Shares held by the TG Optionholders
following the exercise of their options in Taung Gold
‘‘South Africa’’ the Republic of South Africa
‘‘South African
Shareholders’’
those shareholders of Taung Gold who are residents of South
Africa
‘‘Specific Mandate’’ the authority to allot and issue such number of Total
Consideration Shares and TG Optionholder Consideration
Shares pursuant to the resolutions of WH Shareholders to be
proposed at the SGM
‘‘State’’ the South African State
‘‘Takeovers Code’’ the Code on Takeovers and Mergers issued by the Securities and
Futures Commission of Hong Kong
DEFINITIONS
– 7 –

‘‘Taung Gold’’ Taung Gold Limited, a company incorporated under the laws of
South Africa with limited liability
‘‘Taung Group’’ Taung Gold and its subsidiaries
‘‘TG Consideration
Shares’’
6,314,000,985 new Wing Hing Shares to be issued by Wing Hing
to the TG Sellers at the Issue Price
‘‘TG Optionholder(s)’’ holder(s) of options in Taung Gold which entitle the TG
Optionholder to acquire TG Shares
‘‘TG Optionholder
Agreement(s)’’
optionholder agreement(s) that may be entered into between each
of the TG Optionholders, GoldCom, Taung Gold and Wing Hing
on or before the First Completion Date
‘‘TG Optionholder
Consideration
Shares’’
up to 1,009,616,519 new Wing Hing Shares to be issued to the
TG Optionholders who have entered into TG Optionholder
Agreements and who exercise their right to sell up to 80% of the
TG Shares held by them to Wing Hing following the First
Completion Date
‘‘TG Sale Shares’’ TG Shares held by TG Sellers on the First Completion Date,
representing 50.02% of the issued and outstanding capital of
Taung Gold
‘‘TG Sellers’’ Electrum;
David Twist;
Helena Twist;
Woo Foong Hong Limited;
Yi Star Investment Limited;
Lin, Hsin-Ho;
Able Union Limited;
ZNE Capital Limited;
Fully Global Investments Limited;
Grit Capital Limited;
Angelfly Investments Limited;
Mandra Esop Limited;
Montane Development Limited;
Hu, Xiang-Cheng;
Mui, Bing-Wah Grace;
Mandra;
Easy Capital Holdings Limited;
Manford Capital (HK) Limited:
Amplewood Resources Limited;
Hong Kong Sheen Smile International Investment Limited; and
Sino Reach Investments Limited
‘‘TG Shares’’ ordinary shares of ZAR0.001 each in the issued share capital of
Taung Gold from time to time
DEFINITIONS
– 8 –

‘‘Total Consideration
Shares’’
the TG Consideration Shares, the Arctic Consideration Shares,
the Other Consideration Shares, the GoldCom Consideration
Shares and the Electrum Consideration Shares
‘‘Transaction
Documents’’
the Acquisition Agreement (including the Amendment
Agreement and the Second Amendment Agreement), the Put
Option Agreement, the Electrum Option Agreement, the TG
Optionholder Agreement, the Deed of Adherence, the Lock-Up
Agreements, the Lock-in Agreement and any other agreement,
document or certificate entered into in connection with the
transactions contemplated under these documents
‘‘Transactions’’ the transactions contemplated under the Transaction Documents
‘‘Union Sense’’ Union Sense Development Limited, a non-wholly owned
subsidiary of the Wing Hing Group, of which 70% of the
issued share capital is beneficially owned by Bless Luck
‘‘United States’’ United States of America
‘‘US$’’ United States dollars, the lawful currency of the United States
‘‘Valuation Report’’ the valuation report prepared by the Competent Evaluator on
the material assets of the Taung Group
‘‘Venmyn’’ Venmyn Rand (Proprietary) Limited
‘‘WH Shareholders’’ the holders of ordinary share(s) of HK$0.01 each in the existing
issued share capital of Wing Hing
‘‘WH Warrants’’ the 236,348,000 warrants of Wing Hing in issue as at the Latest
Practicable Date, which if exercised in full, represent
approximately 9.7% of Wing Hing as at the Latest Practicable
Date (on a fully diluted basis)
‘‘Wing Hing’’ Wing Hing International (Holdings) Limited, a company
incorporated in Bermuda with limited liability, the shares of
which are listed on the Exchange
‘‘Wing Hing Group’’ Wing Hing and its subsidiaries from time to time
‘‘Wing Hing Shares’’ ordinary share(s) of HK$0.01 each in Wing Hing
‘‘Xinghe Licence’’ the mining rights licence no. 5200000711403 granted by the PRC
Ministry of Land and Resources in relation to the coal mine
located proximate to the township of Baimang, and
approximately 25 kilometres west of Duyun City
‘‘ZAR’’ or ‘‘R’’ South African Rand, the lawful currency of the Republic of
South Africa
‘‘%’’ per cent.
DEFINITIONS
– 9 –

‘‘g/t’’ gram per tonne
‘‘Indicated
Resource’’
that part of a mineral resource for which tonnage, densities, shape,
physical characteristics, quality, and mineral content can be estimated
with a reasonable level of confidence. It is based on exploration,
sampling, and testing information gathered through appropriate
techniques from locations such as outcrops, trenches, pits,
workings, and drill holes. The locations are too widely or
inappropriately spaced to confirm geological and/or quality
continuity but are spaced closely enough for continuity to be assumed
‘‘Inferred
Resource’’
that part of a mineral resource for which tonnage, quality and mineral
content can be estimated with a low level of confidence. It is inferred
from geological evidence and assumed but not verified geological and/
or quality continuity. It is based on information gathered through
appropriate techniques from locations such as outcrops, trenches,
pits, workings and drill holes which may be limited or of uncertain
quality and reliability
‘‘km’’ kilometre(s)
‘‘kt’’ kilotonne
‘‘MW’’ mega watt
‘‘m’’ metres
‘‘m3’’ cubic metre
‘‘Measured
Resource’’
that part of a mineral resource for which the nature, quality, amount
and distribution of data are such as to leave no reasonable doubt, in
the opinion of the Competent Person determining the mineral
resource, that the tonnage and grade of the mineralisation can be
estimated to within close limits, and that any variation from the
estimate would be unlikely to significantly affect potential economic
viability. This category requires a high level of confidence in, and
understanding of, the geology and controls of the mineral deposit.
Confidence in the estimate is sufficient to allow the application of
technical and economic parameters and to enable an evaluation of
economic viability that has a greater degree of certainty than an
evaluation based on an Indicated Mineral Resource
‘‘Mt’’ million tonnes
‘‘Mtpa’’ million tonnes per annum
‘‘oz’’ ounce
‘‘sq. km’’ square kilometre(s)
‘‘t’’ tonnes
‘‘tph’’ tonnes per hour
GLOSSARY
– 10 –
(incorporated in Bermuda with limited liability)
(Stock Code: 621)
Executive Directors:
Mr. Li Hok Yin
Ms. Cheung Pak Sum
Mr. Shen Junchen
Independent Non-executive Directors:
Mr. Chui Man Lung, Everett
Mr. Hui Wah Tat, Anthony
Mr. Li Kam Chung
Registered office:
Canon’s Court
22 Victoria Street
Hamilton, HM12
Bermuda
Principal office:
Unit 1901, 19/F, Nina Tower
8 Yeung Uk Road
Tsuen Wan,
New Territories
Hong Kong
To the WH Shareholders:
Dear Sir or Madam,
(1) VERY SUBSTANTIAL ACQUISITION OF UP TO 86.966% OF
TAUNG GOLD LIMITED
(2) ISSUE OF WING HING SHARES UNDER SPECIFIC MANDATE
(3) GRANT OPTIONS UNDER ELECTRUM OPTION AGREEMENT
AND TG OPTIONHOLDER AGREEMENT
(4) PROPOSED INCREASE IN AUTHORISED SHARE CAPITAL
(5) NOTICE OF SPECIAL GENERAL MEETING
(6) PROPOSED CHANGE OF NAME
INTRODUCTION
Wing Hing announced that on 28 January 2011, it had entered into the Acquisition
Agreement with the TG Sellers, Mandra and GoldCom relating to the sale and purchase of
up to 86.966% of the issued share capital of Taung Gold subject to the terms of the
Acquisition Agreement. The Acquisition Agreement has subsequently been amended by the
Amendment Agreement and the Second Amendment Agreement. The Consideration for the
Acquisition is up to US$580,000,000 (equivalent to HK$4,524,000,000) and will be satisfied
by the issue of up to 10,977,630,003 new Wing Hing Shares at the issue price of HK$0.41
each. Under the Acquisition Agreement, completion of the Transactions will take place in
two tranches.
LETTER FROM THE BOARD
– 11 –
Taung Gold was incorporated under the laws of South Africa and was founded by Dr.
David Twist and Mr. Christiaan Rudolph de Wet de Bruin. The Taung Group is engaged in
the acquisition, exploration and development of mineral assets in respect of gold (and
minerals associated with gold) located in South Africa. The primary assets of the Taung
Group are the Evander Project and the Jeanette Project. The Evander Project and Jeanette
Project are advanced gold exploration projects for which Scoping Studies have been
completed and for which Pre-Feasibility Studies and Bankable Feasibility Studies have been
commissioned.
The Board believes the Acquisition will strengthen Wing Hing’s commitment to and will
further develop its gold mining business. The Board believes that the Acquisition is in the
interest of Wing Hing and the WH Shareholders as a whole and it hopes that WH
Shareholders will support this exciting new phase in Wing Hing’s development by voting in
favour of the Transactions.
Benefits to WH Shareholders
The Board believes that the Acquisition brings the following benefits to Wing Hing and
for all WH Shareholders:
(a) the Acquisition represents a good opportunity to take advantage of the expected
rising trend in the global price of gold;
(b) the Acquisition will deliver to Wing Hing a substantial portfolio of Measured and
Indicated gold resources and Inferred gold resources exploration projects and
future growth opportunities;
(c) the Taung Group will develop into one of the lower-cost producers in the South
African gold mining industry when production of its projects commences;
(d) the Taung Group has a management team with extensive experience in gold
mining, exploration and investment and it is expected that they will remain in the
Enlarged Group following completion of the Transactions; and
(e) the Taung Group complies with the requirements for listing of a mineral company
under Chapter 18 of the Listing Rules.
Compliance with the requirements for listing under Chapter 18 of the Listing Rules
Both (i) an independent competent persons report on the South African gold assets of
the Taung Group addressed to Taung Gold and to Wing Hing (being the Competent
Persons Report); and (ii) an independent valuation report addressed to Wing Hing on the
material assets of the Taung Group, namely the Evander Project and the Jeanette Project
(being the Valuation Report), are appended to this Circular.
Neither the Evander Project nor the Jeanette Project are in production stage but are in
advanced exploration stage for which Scoping Studies have been completed and they have
proceeded to at least the Pre-Feasibility Study stage, with a clear plan to proceed to
LETTER FROM THE BOARD
– 12 –

production. According to the Competent Persons Report, the total estimated Measured and
Indicated gold resources of the Evander Project and the Jeanette Project amount to an
aggregate of approximately 11.725 million ounces.
The Listing Committee has also resolved that the Acquisition would not constitute a
reverse takeover for the purpose of Rule 14.06(6) of the Listing Rules.
Purpose of this Circular
As one or more of the applicable percentage ratios (as defined under Rule 14.07 of the
Listing Rules) in respect of the Transactions is or are greater than 100%, the Acquisition
constitutes a very substantial acquisition for Wing Hing under Chapter 14 of the Listing
Rules and will accordingly be subject to the shareholders’ approval requirements under
Chapter 14 of the Listing Rules.
The purpose of this Circular is to provide you with, among other things:
(a) further information on the structure of the Transactions, the Acquisition, the
satisfaction of the Consideration and the reasons for and benefits of the
Transactions;
(b) further information on the risks associated with the Acquisition, the Taung
Group’s business, the global gold mining industry, the South African gold mining
industry and on investing in South Africa;
(c) further information on the quality and nature of the assets and business of the
Taung Group;
(d) further information on the Loan Note, the Put Option Agreement, the Electrum
Option Agreement and the TG Optionholder Agreement;
(e) further information on the Proposed Increase in Authorised Share Capital;
(f) further information on the Total Consideration Shares, the TG Optionholder
Consideration Shares and the Specific Mandate;
(g) the financial information of the Wing Hing Group, the Taung Group and its
subsidiaries and the pro forma financial information of the Enlarged Group;
(h) the Competent Persons Report;
(i) the Valuation Report;
(j) further information on the Proposed Change of Name;
LETTER FROM THE BOARD
– 13 –

(k) the notice of the SGM at which ordinary resolutions will be proposed to consider
and, if thought fit, approve, among other things:
(i) the Acquisition Agreement and the transactions contemplated thereunder
(including the Loan Note, the issue of the Total Consideration Shares and
the issue of the TG Optionholder Consideration Shares);
(ii) the Put Option Agreement, the Electrum Option Agreement and the TG
Optionholder Agreements;
(iii) the Proposed Increase in Authorised Share Capital; and
(iv) the Specific Mandate; and
(l) the notice of the SGM at which a special resolution will be proposed to consider,
and if thought fit, approve the Proposed Change of Name.
Structure of this Circular
This letter from the Board is divided into eleven (11) parts and nine (9) appendices.
Part A : provides further information on the structure of the
Transactions, the Acquisition and the satisfaction of the
Consideration (including information on the Loan Note and
the Put Option Agreements, the grant of the put options under
the Electrum Option Agreement and the TG Optionholder
Agreement) and the reasons for and benefits of the Transactions
Part B : sets out the risks associated with the Acquisition, the business of
the Taung Group, the global gold mining industry, the South
African gold mining industry and on investing in South Africa
Part C : sets out further information on the Taung Group and its primary
projects (including an overview of the gold mining industry in
South Africa)
Part D : provides the financial information and management discussion
and analysis of the Taung Group
Part E : sets out further information on Mandra, Arctic and SepGold
Part F : provides further information on the Wing Hing Group and the
Enlarged Group
Part G : provides the financial information and management discussion
and analysis of the Wing Hing Group
LETTER FROM THE BOARD
– 14 –

Part H : sets out the Listing Rules implications (including information on
the Proposed Increase in Authorised Capital and the Specific
Mandate)
Part I : sets out further information on the Proposed Change of Name
Part J : sets out the additional information on the SGM
Part K : sets out the recommendations of the Board
Appendix I : provides the financial information of the Wing Hing Group for
the three years ended 31 March 2011
Appendix II : provides the financial information of the Taung Group for the
three years ended 28 February 2011
Appendix III : provides the unaudited pro forma financial information of the
Enlarged Group
Appendix IV : sets out the Competent Persons Report
Appendix V : sets out the Valuation Report
Appendix VI : provides further information on the Loan Note, the Put Option
Agreement, the Electrum Option Agreement and the TG
Optionholder Agreement
Appendix VII : provides additional general information on the Taung Group
Appendix VIII : sets out the statutory and general information on Wing Hing
Appendix IX : sets out the documents to be made available for inspection by
Wing Hing
This Circular also contains the notices convening the SGM.
LETTER FROM THE BOARD
– 15 –
PART A — STRUCTURE OF THE TRANSACTIONS, THE ACQUISITION AND THE
CONSIDERATION
As at the Latest Practicable Date, public shareholders hold 100% of Wing Hing. Upon
completion of the Acquisition, the shareholders of Taung Gold existing as at the First
Completion Date, GoldCom and Electrum will together hold approximately 81.73% of the
issued share capital of Wing Hing, and the shareholders of Wing Hing existing immediately
prior to the First Completion Date will together hold approximately 18.27% of the issued
share capital of Wing Hing. Wing Hing’s shareholding structures before and after
completion of the Transactions are set out in the section of this Circular headed ‘‘Part F
— Information on the Wing Hing Group and the Enlarged Group — 3. Shareholding
Structure of Wing Hing Before and After Completion of the Transactions’’.
1. THE ACQUISITION AGREEMENT
Date: 28 January 2011 (as amended by the Amendment Agreement dated 22
March 2011 and the Second Amendment Agreement dated 22 July
2011)
Parties: (a) Wing Hing
(b) TG Sellers
(c) Mandra
(d) GoldCom
1.1 The parties to the Acquisition Agreement and the Transactions
As at the Latest Practicable Date, Taung Gold is beneficially owned as to 31.10%
by Electrum, being its largest shareholder and a TG Seller, and its remaining
shareholding is held by a diverse group of shareholders which includes SepGold, some
of the TG Sellers (other than Electrum), all of the Other TG Shareholders and all of the
South African Shareholders. Electrum is part of a group of private companies based in
New York, the United States, whose business is to invest in and hold diversified
portfolios of precious metals exploration projects around the world.
The TG Sellers other than Electrum are a group of investors who are independent
of Electrum and of the other shareholders of Taung Gold and who invested in Taung
Gold through various rounds of financing. Further details of the TG Sellers are set out
in Appendix VII of this Circular. The Other TG Shareholders are shareholders of
Taung Gold who may enter into Deeds of Adherence to sell their TG Shares to Wing
Hing on the First Completion Date. The South African Shareholders are shareholders
of Taung Gold who are residents of South Africa and who may enter into the Put
Option Agreements with GoldCom and Wing Hing to sell their TG Shares to Wing
Hing. GoldCom was introduced to the Acquisition to subscribe for Wing Hing Shares
in consideration for the issuance of the Loan Note and to facilitate the arrangements
under the Put Option Agreements between Wing Hing and the South African
LETTER FROM THE BOARD
– 16 –

Shareholders. Further details of GoldCom are provided in this section of the Circular
headed ‘‘Part A — Structure of the Transactions, the Acquisition and the
Consideration — 1.13 GoldCom and the South African Shareholders’’.
Under South African laws and regulations, Taung Gold is a company primarily
engaged in the exploration and/or mining of mineral resources in South Africa and it
must have at least 26.0% of its shareholding beneficially owned either directly by
historically disadvantaged South Africans or by a Qualified BEE Company. As at the
Latest Practicable Date, SepGold holds approximately 16.00% of the issued share
capital of Taung Gold and it is 100% owned by Arctic. Arctic is a Qualified BEE
Company as at least 50.10% of its shares are controlled by historically disadvantaged
South Africans. 49.90% of Arctic’s shares are being transferred to Mandra (through its
100% interest in Arctic Holdco). Upon First Completion, Mandra’s interest in Arctic
will be acquired by Wing Hing. Further details regarding Mandra are provided in the
section of this Circular headed ‘‘Part E — Information on Mandra, Arctic and
SepGold’’.
1.2 Assets to be acquired under the Acquisition Agreement
The Acquisition Agreement provides for the acquisition of up to 86.966% of the
issued share capital of Taung Gold. The primary assets of the Taung Group are the
Evander Project and the Jeanette Project which are advanced gold exploration
projects. The Acquisition involves the following acquisitions of TG Shares by Wing
Hing:
(a) acquisition of the TG Sale Shares from the TG Sellers, representing
approximately 50.02% of the issued share capital of Taung Gold;
(b) acquisition of 100% of Arctic Holdco from Mandra through which Mandra
indirectly holds 12.982% of Taung Gold;
(c) acquisition of TG Shares held by the South African Shareholders,
representing approximately 8.99% of the issued share capital of Taung
Gold, through the Loan Note and the Put Option Agreements between Wing
Hing, GoldCom and the South African Shareholders;
(d) acquisition of the Other TG Sale Shares from the Other TG Shareholders,
representing approximately 5.89% of the issued share capital of Taung Gold;
and
(e) acquisition of TG Shares to be subscribed by Electrum upon the exercise of
the Electrum TG Warrants.
LETTER FROM THE BOARD
– 17 –

1.3 Interests in Taung Gold to be acquired
The various interests in Taung Gold to be acquired by Wing Hing under different
scenarios are illustrated below:
On the First Completion Date
(a) Assuming no Other TG Shareholders enter into any Deeds of Adherence
and no South African Shareholders sell any TG Shares, Wing Hing will
own 63.00% of the issued share capital of Taung Gold, on the First
Completion Date.
(b) Assuming all the Other TG Shareholders sell all the TG Shares they own
pursuant to the Deeds of Adherence and no South African Shareholders
sell any TG Shares, Wing Hing will own 68.89% of the issued share
capital of Taung Gold on the First Completion Date.
(c) Assuming all the South African Shareholders sell all the TG Shares they
own and no Other TG Shareholders enter into any Deeds of Adherence,
Wing Hing will own 71.99% of the issued share capital of Taung Gold
on the First Completion Date.
(d) Assuming all the Other TG Shareholders sell all the TG Shares they own
pursuant to the Deeds of Adherence and all the South African
Shareholders sell all the TG Shares they own to Wing Hing, Wing
Hing will own 77.88% of the issued share capital of Taung Gold on the
First Completion Date.
On the Electrum Completion Date
Assuming Electrum enters into the Electrum Option Agreement and sells the
Electrum Option Shares to Wing Hing, Wing Hing will own up to 86.966% of the
issued share capital of Taung Gold on the Electrum Completion Date.
LETTER FROM THE BOARD
– 18 –

After the Electrum Completion Date
Since Arctic’s indirect equity interest in Taung Gold held through SepGold
must not fall below 26.0% as required by South African laws, Taung Gold will,
for so long as such legal requirement remains in place, issue additional TG Shares
to SepGold upon the exercise by the TG Optionholders of their options to acquire
TG Shares, and the subscription price payable for such TG Shares will be
recorded as a loan to SepGold (the top-up arrangements). Further details of the
top-up arrangements are set out in the section in the Circular headed ‘‘Part E —
Information on Mandra, Arctic and SepGold’’. On the basis of this top-up
arrangement:
(a) assuming all the TG Optionholders exercise their options to acquire TG
Shares but do not sell any to Wing Hing, Wing Hing will own 78.16% of
the entire issued and outstanding capital of Taung Gold; and
(b) assuming all the TG Optionholders exercise their options to acquire TG
Shares and also sell 80% of such shares to Wing Hing, Wing Hing will
own 85.21% of the entire issued and outstanding share capital of Taung
Gold.
The above shareholding percentages of Taung Gold are calculated based on
the assumption that the Electrum TG Warrants are fully exercised.
In all of the scenarios illustrated above, Wing Hing will acquire a controlling
stake in Taung Gold and Taung Gold will become a subsidiary of Wing Hing.
The TG Sale Shares, the Other TG Sale Shares, the Arctic Sale Shares and
the Electrum Option Shares (if applicable) shall be transferred to Wing Hing or a
wholly-owned subsidiary of Wing Hing, and the Loan Note shall be executed for
the benefit of Wing Hing.
Wing Hing confirms that, to the best of the Directors’ knowledge,
information and belief, having made all reasonable enquiries, as at the date of
this Circular, the TG Sellers, Mandra, the Other TG Shareholders, the South
African Shareholders and GoldCom are third parties independent of Wing Hing
and each of them is not a connected person (as defined under the Listing Rules) of
Wing Hing or its subsidiaries or their respective associates. Where the TG Sellers,
Mandra, the Other TG Shareholders, the South African Shareholders and
GoldCom are not natural persons, the ultimate beneficial owners and substantial
shareholders of such TG Sellers, Mandra, the Other TG Shareholders, the South
African Shareholders and GoldCom are third parties independent of Wing Hing
or its subsidiaries or their respective associates.
LETTER FROM THE BOARD
– 19 –

1.4 Conditions precedent
The obligations of Wing Hing, the TG Sellers, Mandra and GoldCom to complete
the Acquisition are subject to the satisfaction or waiver of the following conditions
precedent (save for conditions (a) and (b) which cannot be waived):
(a) the grant of approval by the WH Shareholders at the SGM of:
(i) the Proposed Increase in Authorised Share Capital;
(ii) the Acquisition Agreement (including the Amendment Agreement and
the Second Amendment Agreement) and the transactions contemplated
thereunder, the Transaction Documents and the transactions
contemplated thereunder (including but not limited to the allotment
and issue of the Total Consideration Shares and the TG Optionholder
Consideration Shares pursuant to the Specific Mandate) in accordance
with the requirements of the Listing Rules;
(b) the Exchange granting or agreeing to grant a listing of and permission to deal
in the Total Consideration Shares and the TG Optionholder Consideration
Shares (subject to conditions to which neither the TG Sellers, Mandra,
GoldCom nor Wing Hing may reasonably object);
(c) the obtaining of a written legal opinion issued by Mr. Hannes Gouws of
Hannes Gouws and Partners Inc., Wing Hing’s appointed South African
attorney;
(d) the obtaining by Wing Hing of the Valuation Report;
(e) the obtaining by Wing Hing of the Competent Persons Report; and
(f) the completion of the due diligence on (i) the recent agreement(s) entered into
by Wing Hing and/or a subsidiary of Wing Hing to dispose of three coal
mining licenses owned by it; (ii) the business pertaining to the two coal
mining licenses owned by the PRC Subsidiary; and (iii) Wing Hing’s business
of providing guarantees to entities and individuals for obtaining bank
borrowings in the PRC, in each case to the reasonable satisfaction of (x) the
majority of the TG Sellers (which majority must include Electrum) and (y)
Mandra.
As of the date of this Circular, the Conditions (d) and (e) have been satisfied. It is
anticipated that the other Conditions will be satisfied by First Completion.
Legal opinion from Hannes Gouws and Partners Inc.
In relation to 1.4(c) above, the legal opinion will cover usual matters relating
to, among other things, the incorporation and valid existence of Taung Gold, that
all necessary licenses, approvals and consents have been obtained for Taung Gold
LETTER FROM THE BOARD
– 20 –

and its subsidiaries to conduct its business, the legality of Taung Gold’s
constitutive documents and the enforceability by Wing Hing of the obligations
of Taung Gold and its subsidiaries, the TG Sellers, GoldCom, the South African
Shareholders, Electrum and the TG Optionholders in terms of the Transaction
Documents under the laws of South Africa.
1.5 Completion of the Transactions
Under the Acquisition Agreement, completion of the Acquisition will take place
in two tranches, namely:
(a) First Completion. First Completion is conditional upon the satisfaction or
waiver of all the Conditions which will involve the completion of the sale and
purchase of potentially all TG Shares in issue (other than those TG Shares to
be acquired by Electrum upon its exercise of the Electrum TG Warrants and
those TG Shares held by SepGold) as well as the Arctic Sale Shares, and will
result in Wing Hing holding approximately 77.88% of the issued capital of
Taung Gold.
(b) Electrum Completion. Electrum Completion involves the completion of the
sale and purchase by Wing Hing of the TG Shares to be subscribed by
Electrum if and when it exercises the Electrum TG Warrants, that is, the
Electrum Option Shares. Electrum Completion shall take place not later than
one month after the First Completion Date.
After First Completion and Electrum Completion:
— Arctic will become an associate of Wing Hing as defined under the Listing
Rules; and
— Wing Hing will acquire up to approximately 86.966% of the equity interest in
Taung Gold and Taung Gold will become a non-wholly owned subsidiary of
Wing Hing.
1.6 Termination
At any time before First Completion, Wing Hing on the one hand and the TG
Sellers, the Other TG Shareholders and Mandra, on the other hand, may terminate the
Acquisition Agreement by giving notice to each other if, among others:
(a) there is a material adverse change (as defined in the Acquisition Agreement)
to Taung Gold or to Wing Hing (as the case may be); or
(b) any event, circumstance, effect, occurrence or state of affairs or any
combination of them (whether existing or occurring on or before the date
of the Acquisition Agreement or arising or occurring afterwards) occurs
which would constitute a breach of any of the warranties given by any of the
TG Sellers, Other TG Shareholders, and Mandra on the one hand and Wing
LETTER FROM THE BOARD
– 21 –

Hing on the other hand (as the case may be) in the Acquisition Agreement,
and in the case of termination by Wing Hing such breach of warranties being
material, if they were repeated at any time on or before the First Completion
Date by reference to the facts and circumstances then existing (on the basis
that references in such warranties to the date of the Acquisition Agreement
are references to the relevant date); or
(c) any material breach by any of the TG Sellers (including any Other TG
Shareholder who has entered into a Deed of Adherence), Mandra or
GoldCom of their obligations on the one hand or Wing Hing on the other
hand (as the case may be) under the Acquisition Agreement; or
(d) any breach of the warranties given by Wing Hing on the one hand or the TG
Sellers (including any Other TG Shareholder who has entered into a Deed of
Adherence) or Mandra on the other hand in the Acquisition Agreement
which will or is likely to cause a material adverse change to Wing Hing on the
one hand and Taung Gold on the other.
1.7 Post-Completion Undertakings
After completion of the Acquisition, three existing executive Directors and all of
the independent non-executive Directors will remain on the Board. It is expected that
after completion of the Acquisition, Mr. Neil Andrew Herrick, Mr. Christiaan
Rudolph de Wet de Bruin and Mr. Igor Levental will be appointed to the Board as
executive Directors and that Electrum will put forward one additional person for
appointment as an independent non-executive Director. As such, following completion
of the Acquisition, the existing Directors will continue to constitute a majority of the
Board.
Mr. Neil Andrew Herrick and Mr. Christiaan Rudolph de Wet de Bruin are South
African Shareholders and also TG Optionholders, and Mr. Igor Levental is a TG
Optionholder.
None of Mr. Neil Andrew Herrick, Mr. Christiaan Rudolph de Wet de Bruin or
Mr. Igor Levental is a substantial shareholder of Taung Gold. Mr. Igor Levental is an
employee of Electrum. Accordingly, the Transaction does not constitute a connected
transaction for the purposes of Rule 14A.13(1)(b)(i) of the Listing Rules.
In addition, Wing Hing agrees and undertakes that it shall, following the
Electrum Completion Date, subject to any requirements or conditions imposed by any
applicable regulators and to the extent permissible under the Listing Rules and
applicable laws from time to time:
(a) enter into an agreement to dispose of 100% of Wing Hing’s business of
providing guarantees to entities and individuals for obtaining bank
borrowings in the PRC, and the disposal of Guizhou Baoxin Investment
and Guaranty Co. Ltd. and of any other subsidiary of Wing Hing that
conducts such business within one (1) month after the Electrum Completion
LETTER FROM THE BOARD
– 22 –
Date. Wing Hing further agrees and undertakes that it has ceased to enter
into new business contracts in relation to the business of providing
guarantees to entities and individuals for obtaining bank borrowings in the
PRC from the date of the Acquisition Agreement; and
(b) enter into an agreement to, within one (1) month after the Electrum
Completion Date, either (i) dispose of 70% of the issued share capital of
Union Sense, a subsidiary of Wing Hing, and assign of all loans owing by
Union Sense to Bless Luck, also a subsidiary of Wing Hing; or (ii) procure
the disposal of the Dayan Licence and the Xinghe Licence held by the PRC
Subsidiary.
Wing Hing is currently in discussions with a potential purchaser in respect of (a)
and (b) above (the Potential Disposals). The Potential Disposals, when they
materialise, will constitute notifiable transactions of Wing Hing.
Wing Hing will issue further announcements to inform WH Shareholders and
potential investors of the above and comply with all applicable requirements under the
Listing Rules as and when the Potential Disposals materialise.
1.8 Deed of Adherence
The purpose of entering into a Deed of Adherence is to enable an Other TG
Shareholder to become a party to the Acquisition Agreement. A form of the Deed of
Adherence is attached as a schedule to the Acquisition Agreement. Under a Deed of
Adherence, an Other TG Shareholder:
— agrees to sell his TG Shares to Wing Hing; and
— undertakes that he will be bound by the Acquisition Agreement in all respects
as if he were a party to the Acquisition Agreement and was named as a party
on it.
In consideration, Wing Hing will, among other things, issue to such Other TG
Shareholder Wing Hing Shares in accordance with the Share Exchange Ratio.
1.9 Consideration and Consideration Shares
The Consideration for the Acquisition is up to US$580,000,000 (equivalent to
HK$4,524,000,000) which will be satisfied by the issue of up to 10,977,630,003 new
Wing Hing Shares at the issue price of HK$0.41 each (being the Total Consideration
Shares), respectively, in the following manner:
(a) Consideration for the TG Sale Shares (TG Consideration Shares). On the
First Completion Date, Wing Hing shall allot and issue to each TG Seller, the
TG Consideration Shares credited as fully paid at the Issue Price, as a
complete discharge of Wing Hing’s obligation to pay for the TG Sale Shares.
LETTER FROM THE BOARD
– 23 –
(b) Consideration for the Other TG Sale Shares (Other Consideration
Shares). On the First Completion Date, Wing Hing shall issue to each of
the Other TG Shareholders who has entered into a Deed of Adherence, the
Other Consideration Shares credited as fully paid at the Issue Price, as a
complete discharge of Wing Hing’s obligation to pay for the Other TG Sale
Shares held by such Other TG Shareholder.
(c) Consideration for the Loan Note and the delivery of the Put Option Agreements
(GoldCom Consideration Shares). On the First Completion Date, Wing
Hing shall issue to GoldCom the GoldCom Consideration Shares credited as
fully paid at the Issue Price.
(d) Consideration for the Arctic Sale Shares (Arctic Consideration Shares). On
the First Completion Date, Wing Hing shall issue to Mandra, the Arctic
Consideration Shares credited as fully paid at the Issue Price, as a complete
discharge of Wing Hing’s obligation to pay for the Arctic Sale Shares.
(e) Consideration for the Electrum Option Shares (Electrum Consideration
Shares). If Electrum exercises its right to sell the Electrum Option Shares
to Wing Hing, Wing Hing shall issue the Electrum Consideration Shares on
the Electrum Completion Date to Electrum as a complete discharge of Wing
Hing’s obligation to pay for the Electrum Option Shares.
In addition to the Total Consideration Shares, Wing Hing may issue up to
1,009,616,519 new Wing Hing Shares to GoldCom or the TG Optionholders in
consideration for the TG Shares to be subscribed for by GoldCom or the TG
Optionholders, being the TG Optionholder Consideration Shares. For further details
regarding the TG Optionholders and the TG Optionholder Consideration Shares,
please refer to the section of the Circular headed ‘‘Part A — Structure of the
Transactions, the Acquisition and the Consideration — 1. The Acquisition Agreement
— 1.12 Warrants and Options to be granted by Wing Hing pursuant to the
Transactions — TG Optionholder Agreements’’’ and ‘‘Section 3 — TG Optionholder
Agreements’’ of Appendix VI.
The Total Consideration Shares and the TG Optionholder Consideration Shares
will be issued at the issue price of HK$0.41 per Wing Hing Share, credited as fully paid
and when allotted and issued, they will rank pari passu in all respects with Wing Hing
Shares then in issue and be entitled to all dividends, distributions and other rights
carried by the Wing Hing Shares. The Total Consideration Shares and the TG
Optionholder Consideration Shares will be issued pursuant to the Specific Mandate.
The maximum number of the Total Consideration Shares and the TG
Optionholder Consideration Shares that will be issued represent:
— approximately 5.45 times the existing issued share capital of Wing Hing
(assuming no WH Warrants are exercised);
LETTER FROM THE BOARD
– 24 –

— approximately 4.92 times the existing issued share capital of Wing Hing
(assuming the WH Warrants are exercised in full);
— approximately 84.51% of the issued share capital of Wing Hing as enlarged
by the allotment and issue of the Total Consideration Shares and the TG
Optionholder Consideration Shares (assuming no WH Warrants are
exercised); and
— approximately 83.12% of the issued share capital of Wing Hing as enlarged
by the allotment and issue of the Total Consideration Shares and the TG
Optionholder Consideration Shares (assuming the WH Warrants are
exercised in full).
1.10 Basis of the Consideration, the Issue Price and the Share Exchange Ratio
The Consideration was arrived at after arm’s length negotiations between Wing
Hing, the Founders, Mandra and Electrum taking into account various factors,
including but not limited to, (i) the market price of gold; (ii) the future prospects of the
gold mining industry; (iii) the existence and findings of the Competent Persons Report
and Scoping Studies for the Evander Project and the Jeanette Project; and (iv) the
findings of the Valuation Report. The Consideration will be satisfied by the issue of up
to 10,977,630,003 new Wing Hing Shares at the issue price of HK$0.41 each (being the
Total Consideration Shares), credited as fully paid and will rank pari passu in all
respects with the Wing Hing Shares then in issue and be entitled to all dividends,
distributions and other rights carried by the Wing Hing Shares. Dealing with these
factors in turn:
(a) The upward trend in the price of gold. The valuation of gold mines is largely
related to the market price of gold and the prospects of the gold price. To the
best knowledge of the Directors, as at the Latest Practicable Date, the spot
price of gold as quoted by the London Bullion Market Association was
approximately US$1,613.50 (equivalent to approximately HK$12,585.3) per
ounce. As demonstrated in ‘‘Part C — Information on the Taung Group and
its Primary Projects — 1.4 Historical market price of gold and its
fluctuation’’ the price of gold has followed an upward trend in the past
year and demand for gold has also reached a 10-year high in 2011. After
applying a significant discount to take into account the estimated Life of
Mine production costs (as the Taung Group’s assets are not yet in
production) (as further detailed in the section of this Circular headed ‘‘Part
C — Information on the Taung Group and its Primary Projects — 3. Nature
and Quality of Taung Group’s Assets and Businesses’’) and other costs, the
parties have agreed on an arm’s length basis to the Consideration of
US$580,000,000 (equivalent to approximately HK$4,524,000,000). Taking
into account the upward trend in gold prices and in the demand for gold, and
that since 86.966% of the net assets value of Taung Gold with the fair value
adjustment made by reference to the valuation report of the Primary
LETTER FROM THE BOARD
– 25 –

Projects, is higher than the Consideration of US$580,000,000, the Directors
are of the view that the Consideration represents a fair and reasonable
consideration.
(b) Prospects of the gold mining industry. According to the Competent Persons
Report, the global demand for gold averaged approximately 4,041t per
annum during the four years from 2006 to 2009. The gold price has been
experiencing a steady increase since 2001. The average price of gold in 2001
was US$271 (equivalent to approximately HK$2,113.8) per ounce and it
soared to US$918 (equivalent to approximately HK$7,160.4) per ounce in
2009. The devaluation of the US dollar, market concern over the
effectiveness of financial stimulus packages and fears of inflation further
drove the gold price to US$1,000 (equivalent to approximately HK$7,800)
per ounce in September 2009. From 2009 to 2010, the average price of gold
(London PM Fix: US dollars/troy ounce) increased from US$972/oz to
US$1,225/oz. In light of the expected growing demand for gold, the Directors
consider that the gold price will continue to rise and that the Consideration
payable is fair and reasonable.
(c) Competent Persons Report. A copy of the Competent Persons Report, being
an independent competent persons report on the South African gold assets of
the Taung Group, is set out in Appendix IV of this Circular. The Competent
Persons Report describes and documents all of Taung Group’s projects,
including the assets of the Taung Group’s primary projects, namely the
Evander Project in the Mpumalanga Province of South Africa and the
Jeanette Project in the Free State Province of South Africa. In particular, the
Competent Persons Report states that the total estimated Measured and
Indicated gold resources of the Evander Project and the Jeanette Project
amount to an aggregate of 11.725 million ounces. The estimated Measured
and Indicated gold resources of each project is set out below (determined in
accordance with the JORC Code and SAMREC Code):
MINERAL RESOURCE
CATEGORY
MINING
TONNES
MINING
GRADE GOLD GOLD
(t) (g/t) (kg) (oz)
EVANDER*
Measured 140,078 10.63 1,489 47,873
Indicated 15,433,000 9.24 142,601 4,584,726
Total Measured and
Indicated 15,573,078 9.25 144,090 4,632,599
JEANETTE
Indicated 23,030,000 9.58 220,580 7,092,000
TOTAL (EVANDER
AND JEANETTE) 38,603,078 — 364,670 11,724,599
* Subject to obtaining s11 consent in terms of the Sale Agreement
LETTER FROM THE BOARD
– 26 –

Since the date of the Competent Persons Report, there has been no material
change in the estimated Measured and Indicated gold resources of each
project.
(d) Scoping Studies for the Evander Project and the Jeanette Project. The
Evander Project and the Jeanette Project are advanced exploration projects
for which Scoping Studies have been completed and Pre-Feasibility Studies
and Bankable Feasibility Studies have been commissioned. The Competent
Persons Report is based upon the information contained in the Scoping
Studies for the Evander Project and the Jeanette Project. Taung Gold
completed a Scoping Study for the Evander Project on 9 April 2010 and it
was recommended that Phase 1 of the Evander Project proceed to Bankable
Feasibility Study and Phases 2 and 3 of the Evander Project proceed to Pre-
Feasibility Study. Scoping Studies for the Jeanette Project were completed in
June 2010 by Taung Gold and presented a sound business case for advancing
the Jeanette Project to Pre-Feasibility Study stage. The individual Scoping
Studies for the Evander Project and the Jeanette Project are available on
Wing Hing’s website.
(e) Valuation Report. Based on the Valuation Report, the fair market value of a
100% interest of the Evander Project and the Jeanette Project was
approximately US$605,000,000 (which is equivalent to the value of
approximately HK$4,726,800,000) as at 30 April 2011 (the Valuation). As
advised by the Competent Evaluator, the discounted cash flow method in
estimating the Valuation was used based on certain assumptions. The
Valuation Report is set out in Appendix V of this Circular. Furthermore, as
advised by the Competent Evaluator, the prospects for gold prices remain
stable as well as positive and in its view, there is no material change to its
outlook regarding gold prices for the near future. Having regard to the view
of the Competent Evaluator, the Directors are of the view that there has been
no material change in the estimated valuation of the Evander Project and the
Jeanette Project since the date of the Valuation Report. Moreover, regarding
the possible fluctuation of the gold price and its effect on the valuation, a
sensitivity analysis has been performed and included in the valuation report
as set out in Appendix V of this circular.
The unaudited pro forma financial information takes into account an impairment
of estimated goodwill arising from the Acquisition of approximately
HK$1,097,459,000 immediately upon completion of the Acquisition which comprises
a pro forma adjustment of HK$1,262,577,000 relating to a deferred tax liability that is
required to be made in accordance with the applicable Hong Kong accounting
principles. Further details of the goodwill impairment and deferred tax liability
adjustments are set out in the section headed ‘‘Part A — Structure of the Transactions,
the Acquisition and the Consideration — 6. Financial Effects of the Acquisition’’.
Notwithstanding such goodwill impairment and deferred tax liability, the Directors are
of the view that (a) since the deferred tax liability is a non-cash accounting item and
does not affect the future cash flows of the Enlarged Group (which is the basis of the
LETTER FROM THE BOARD
– 27 –
Competent Evaluator’s valuation in the Valuation Report) it should not be taken into
account in determining the Consideration; and (b) taking into account all of the above
factors regarding the gold price trend, the prospects of the gold mining industry and
the quality of the Primary Projects, the Directors (including the Independent Non-
executive Directors) are of the opinion that the Consideration, including its form of
payment, is fair and reasonable.
In addition, the issue price of HK$0.41 per Wing Hing Share was determined after
arm’s length negotiations between Wing Hing, Electrum, Mandra and the Founders
taking into account similar factors. The Board concluded that Taung Gold is an
appropriate investment in line with Wing Hing’s existing business and focus on the
gold mining business with attractive future growth prospects and the Board considers
that notwithstanding that the Issue Price represents a discount of over 30% to the
market price of Wing Hing Shares immediately prior to the suspension of trading of
Wing Hing Shares on 31 January 2011, the potential benefits the Transactions
presented to Wing Hing justify such discount and the Issue Price is therefore fair and
reasonable.
The Issue Price represents:
(a) a discount of approximately 31.67% to the closing price of HK$0.60 per
Wing Hing Share as quoted on the Exchange on the Last Trading Day;
(b) a discount of approximately 18.00% to the average closing price of
approximately HK$0.50 per Wing Hing Share as quoted on the Exchange
for the ten consecutive trading days up to and including the Last Trading
Day;
(c) a discount of approximately 14.58% to the average closing price of
approximately HK$0.48 per Wing Hing Share as quoted on the Exchange
for the 30 consecutive trading days up to and including the Last Trading
Day;
(d) a discount of approximately 24.07% to the average closing price of
approximately HK$0.54 per Wing Hing Share as quoted on the Exchange
for the 60 consecutive trading days up to and including the Last Trading
Day;
(e) a discount of approximately 22.64% to the average closing price of
approximately HK$0.53 per Wing Hing Share as quoted on the Exchange
for the 90 consecutive trading days up to and including the Last Trading
Day;
(f) a discount of approximately 36.92% to the closing price of approximately
HK$0.65 per Wing Hing Share as quoted on the Exchange on the Latest
Practicable Date; and
LETTER FROM THE BOARD
– 28 –

(g) a premium of approximately 69.09% over the audited net assets attributable
to equity holders of Wing Hing as at 31 March 2011 of approximately
HK$0.242 per Wing Hing Share.
The number of new Wing Hing Shares to be issued in consideration for TG Shares
is determined by applying the Share Exchange Ratio of 53.37320537 Wing Hing Shares
for every one TG Share.
1.11 Outstanding Warrants and Options in Taung Gold
As at the date of this Circular, Taung Gold has the following options and
warrants outstanding:
(a) Electrum TG Warrants. Taung Gold has issued 21,500,000 Electrum TG
Warrants to Electrum (which if exercised, will entitle Electrum to subscribe
for 21,500,000 TG Shares), exercisable at any time prior to June 2014 at an
exercise price of ZAR5.00 per TG Share. When exercised, the TG Shares
acquired by Electrum may be sold to Wing Hing pursuant to the Electrum
Option Agreement.
(b) TG Optionholder options. Taung Gold has further issued a total of
23,645,210 options to the TG Optionholders, which are vested as of the
date of this Circular and exercisable within five years of their respective dates
of issue at the following exercise prices:
Round Exercise Price Vesting Date Number of options
(ZAR)
Round 1 4.95 26 May 2010 6,737,312
Round 2 4.95 26 July 2010 6,238,000
Round 3 7.425 1 September 2010 7,964,737
Round 4 9.90 1 November 2010 2,705,161
When exercised, 80% of the TG Shares acquired by the TG Optionholders
may be sold to Wing Hing pursuant to the TG Optionholder Agreement.
(c) Other warrants. Taung Gold has granted 2,926,351 warrants to the original
shareholders of African Precious Minerals Limited (including SepGold). It is
expected that these warrants will be fully exercised prior to First Completion.
1.12 Warrants and Options to be granted by Wing Hing pursuant to the Transactions
(a) Electrum Option Agreement. On or prior to the First Completion Date,
Wing Hing and Electrum may enter into the Electrum Option Agreement
pursuant to which upon the exercise of the Electrum TG Warrants, Electrum
may sell up to 21,500,000 TG Shares acquired by it to Wing Hing in
consideration for the Electrum Consideration Shares. The Electrum Option
Agreement is entered into in accordance with the requirements under
LETTER FROM THE BOARD
– 29 –

Chapter 15 of the Listing Rules. All disclosure requirements under Chapter
15 are complied with and set out in ‘‘2. Electrum Option Agreement’’ of
Appendix VI of this Circular. The terms of the Electrum Option Agreement
are subject to the approval of the Exchange and the WH Shareholders at the
SGM. The Electrum Option Agreement does not constitute a share option
scheme of Wing Hing and accordingly, it does not fall within the
requirements under Chapter 17 of the Listing Rules.
(b) TG Optionholder Agreements. Pursuant to the TG Optionholder
Agreement, Wing Hing and GoldCom will grant to the TG Optionholders
the right to sell a maximum number of 18,916,168 TG Shares to Wing Hing
or to Wing Hing through GoldCom for a maximum of 1,009,616,519 new
Wing Hing Shares or cash after the First Completion Date upon their
exercise of the TG Optionholder options as disclosed in the section of this
Circular headed ‘‘Part A — Structure of the Transactions, the Acquisition
and the Consideration — 1.11 Outstanding Warrants and Options in Taung
Gold’’. The TG Optionholder Agreement is entered into in accordance with
the requirements under Chapter 15 of the Listing Rules. All disclosure
requirements under Chapter 15 are complied with and set out in ‘‘3. TG
Optionholder Agreement’’ of Appendix VI of this Circular. The terms of the
TG Optionholder Agreement are subject to the approval of the Exchange and
the WH Shareholders at the SGM. The TG Optionholder Agreement does
not constitute a share option scheme of Wing Hing and accordingly, it does
not fall within the requirements under Chapter 17 of the Listing Rules.
1.13 GoldCom and the South African Shareholders
The South African Shareholders are shareholders of Taung Gold who are
residents of South Africa. As a result of foreign exchange control restrictions, the
South African Shareholders would be restricted from on-selling, transferring or
otherwise dealing in Wing Hing Shares. Accordingly, rather than receiving Wing Hing
Shares as consideration, GoldCom, a company incorporated in the British Virgin
Islands, will subscribe for Wing Hing Shares (being the GoldCom Consideration
Shares) in consideration for the Loan Note. GoldCom, Wing Hing and the South
African Shareholders will enter into the Put Option Agreements pursuant to which the
South African Shareholders may sell their TG Shares to Wing Hing through GoldCom
in consideration for cash derived from the sale of the GoldCom Consideration Shares
on-market. Such right to sell TG Shares to Wing Hing through GoldCom may be
exercised by the South African Shareholders at any time within three years from (and
including) the First Completion Date.
GoldCom is a third party whose principal business is to engage in investment
holding and related activities and whose sole shareholder and sole director is Mr.
Michael J. Yates, who is an Other TG Shareholder.
LETTER FROM THE BOARD
– 30 –
The principal amount of the Loan Note is HK$464,480,706.98 (nil interest) and it
will reduce accordingly upon the transfer of TG Shares to Wing Hing by the South
African Shareholder (through GoldCom). Payment shall be made on written demand
by Wing Hing (provided that Wing Hing may not demand repayment prior to the sale
of any GoldCom Consideration Shares and GoldCom’s receipt of cash proceeds from
such sale). The risk of any reduction in value of the GoldCom Consideration Shares
shall be borne by Wing Hing. Please see the section headed ‘‘Part B — Risk Factors
— 1. Risks Associated with the Acquisition — 1.6 The risk of any reduction in value of
the GoldCom Consideration Shares is borne by Wing Hing.’’
Further details of the Loan Note and the Put Option Agreements are set out in ‘‘1.
The Loan Note and The Put Option Agreements’’ of Appendix VI of this Circular.
1.14 Lock-up Agreement
Each TG Seller (and any Other TG Shareholder who has entered into a Deed of
Adherence), GoldCom and Mandra will enter into a lock-up agreement with Wing
Hing on or prior to the First Completion Date to undertake not to, without the prior
consent of Wing Hing:
(a) during the period commencing from (and including) the First Completion
Date and ending on the date which is ninety (90) days from the First
Completion Date, directly sell, transfer or otherwise dispose of any Wing
Hing Shares held by them (or by their affiliates) as at the First Completion
Date (the Lock-up Shares); and
(b) during the period commencing from the date which is ninety (90) days from
the First Completion Date and ending on the date which is one hundred and
eighty (180) days from the First Completion Date, effect a sale, transfer or
disposition of an aggregate of more than 7.5% of the Lock-up Shares,
The above restrictions shall not apply to the sale, transfer or disposition of any
Lock-up Shares by the relevant holder of Wing Hing Shares (or its affiliate) to any
affiliate or any pledge of any Lock-up Shares by such holder of Wing Hing Shares (or
its affiliate) to any banking institution(s) as collateral.
LETTER FROM THE BOARD
– 31 –

2. CORPORATE STRUCTURE OF TAUNG GOLD BEFORE AND AFTER FIRST
COMPLETION
2.1 Corporate structure of Taung Gold immediately before First Completion
ARCTIC
SEPGOLD
TAUNG GOLD
ARCTIC HOLDCO
MANDRA
BEESHAREHOLDERS
TG SELLERS(EXCLUDING ELECTRUM)
AND OTHER TG SHAREHOLDERSELECTRUM
SOUTH AFRICANSHAREHOLDERS
41.49%28.62%
100%
49.90%
100%
50.10%
19.99% 9.90%
2.2 Corporate structure of Taung Gold immediately after First Completion
EXISTING PUBLICSHAREHOLDERS
TG SELLERS(EXCL ELECTRUM)
AND OTHER TGSHAREHOLDERS
GOLDCOMELECTRUM
MANDRA(AS 100% OWNER
OF ARCTICHOLDCO)
WING HING
TAUNG GOLD
BEESHAREHOLDERS
ARCTIC
SEPGOLD
ARCTIC HOLDCO
13.62% 19.08%
100%
100%
71.38% Note 1
28.62%
49.90%50.10%
9.43% 39.60% 18.27%
Note 1 : Assuming all the Other TG Shareholders and all South African Shareholders sell all
their TG Shares to Wing Hing.
LETTER FROM THE BOARD
– 32 –

3. APPLICATION FOR LISTING
Application will be made by Wing Hing to the Listing Committee for the listing of, and
permission to deal in the Total Consideration Shares and the TG Optionholder
Consideration Shares.
4. REASONS FOR AND BENEFITS OF THE ACQUISITION
The Acquisition demonstrates Wing Hing’s commitment to continue operating in the
gold mining business following the completion in July 2010 of its major transaction to
acquire a gold mining licence, namely the Long Men Sou Mining Licence, located in Hebei
province in the PRC. Since then, production at the Long Men Sou Mine has commenced
and revenue from gold mining has been derived from the sale of gold concentrates produced
from the Long Men Sou Mine to customers in the PRC. The mine produces a maximum of
approximately 5 kilograms of gold concentrates per month. As a result of the Board’s
general optimism about the global gold mining industry, the Board sought further
opportunities to develop its gold mining business and expand into the gold mining business
outside of China.
For the reasons set out below, the Board believes that the Acquisition will strengthen
Wing Hing’s further development in the gold mining business and will benefit Wing Hing
and all WH Shareholders:
4.1 The Acquisition represents a good opportunity to take advantage of the expected
rising trend in the global gold price.
Gold is a precious metal and as disclosed in Wing Hing’s annual report for the
year ended 31 March 2011, it is a risk-resistant investment tool and as a result of
potential for the quantitative easing monetary policy of the United States which has
potentially triggered worsening inflation on a global scale, there is expected to be
increasing demand for commodities such as gold. Owners of gold, among others, will
benefit from expected further increases in the value of gold. As such, the Directors seek
to strategically focus on gold resources sectors which they believe will bring new
prospects and opportunities to the future of the Wing Hing Group. Based on market
analysis, the Directors believe that given the remaining uncertainties with respect to
the Euro-zone debt situation, the general low interest rate environment and the
tendency for central banks to be net buyers of gold in recent years, the upward trend in
the gold price will continue for at least the next two years and the Directors therefore
consider the Acquisition a good opportunity to take advantage of the expected rising
trend in gold prices. As such, it is the intention and development strategy of Wing Hing
to allocate its resources to the development of its gold mining related business where
the Board considers that there are suitable opportunities.
LETTER FROM THE BOARD
– 33 –
4.2 The Acquisition will deliver a meaningful portfolio of Measured and Indicated gold
resources, exploration projects and future growth opportunities to Wing Hing.
The Board has taken into account the fact that it is rare to find a company that
has a large amount of gold resources similar to the Taung Group. According to the
Competent Persons Report, the total estimated Measured and Indicated gold resources
of the Evander Project and the Jeanette Project amount to an aggregate of
approximately 11.725 million ounces. The Taung Group also has a portfolio of early
exploration projects (that is, the Greenfield Projects) throughout South Africa and it is
expected that these projects will provide attractive gold deposits for the Taung Group’s
future production. Given the attractive resource profile of the Taung Group, the Board
is of the view that the Acquisition is the appropriate channel for Wing Hing’s further
development of its gold mining related business.
4.3 The Taung Group will be one of the lower-cost producers in the South African gold
mining industry when production of its projects commences.
According to the Competent Persons Report, the total capital cost of the Evander
Project is estimated to be US$1,034.3 million (equivalent to approximately
HK$8,067.5 million) and the Evander Project is estimated to have a Life of Mine
average operating cost of US$83.6/t milled. According to the Competent Persons
Report, the total capital cost for developing the Jeanette Project, including plant
construction, is US$1,067.8 million (equivalent to approximately HK$8,328.8 million)
and it is estimated that the Jeanette Project could achieve a Life of Mine average
operating cost of US$72.06/t when producing at 145ktpm. Compared to other major
producers in the South African gold mining industry, the Board is of the view that the
Taung Group will be one of the lower-cost producers in that industry when production
of these projects commences.
4.4 The Taung Group has a management team with extensive experience in gold mining,
exploration and investment and it is expected that they will remain in the Enlarged
Group following completion of the Transactions.
Taung Gold’s directors and key management, taken together, have sufficient
experience relevant to the exploration activities of Taung Gold and certain key senior
management members of Taung Gold possess more than five years of relevant
experience in gold mining exploration and/or extraction activities. It is expected that
all of the directors and senior management of Taung Gold will remain in their
positions after completion of the Transactions and the details of their relevant
experience are set out in the section of this Circular headed ‘‘Part C — Information on
the Taung Group and its Primary Projects — 5. Directors and Senior Management of
Taung Gold’’.
Mr. Neil Andrew Herrick, Mr. Igor Levental and Mr. Christiaan Rudolph de Wet
de Bruin will be put forward for appointment to the Board after the First Completion
Date. In particular, Mr. Neil Andrew Herrick, the chief executive officer of Taung
Gold has managed gold mines since the 1990s and Dr. David Twist, one of the
Founders and a director of Taung Gold, has been involved in geological research with
LETTER FROM THE BOARD
– 34 –

respect to gold and has provided geological consulting advice to gold mining
companies for over 20 years, with extensive experience in gold exploration projects
in Africa.
Mr. Igor Levental has worked in investments and investor relations positions for
gold mining companies since 1989 and is currently the president of the Electrum group
of companies, managing Electrum’s portfolios of gold exploration and development
projects and having been executive vice president from 2007 to February 2010.
Dr. Dawid Strydom, a director of Taung Gold, has worked in gold mining and
exploration projects since the 1990s as exploration manager. He joined Taung Gold in
2007 and he has focused on the exploration and management of the Evander Project
and Jeanette Project since then.
The Board believes that the Taung Group’s success depends to a significant extent
on its pool of talented and experienced senior management and key employees. The
extensive experience of the management of the Taung Group will significantly reduce
the execution risks associated with the business.
4.5 The Taung Group complies with the requirements for listing of a mineral company
under Chapter 18 of the Listing Rules.
Although the Evander Project and the Jeanette Project are not yet in production,
they are advanced exploration projects for which Scoping Studies have been completed
and for which Pre-Feasibility Studies and Bankable Feasibility Studies have been
commissioned, with a clear plan to proceed to production.
Notwithstanding that the mining right covering the Evander Project is not held by
Taung Gold as at the date of this Circular, Taung Gold has sufficient influence in
decisions over the exploration of gold resources in the Evander Project through a joint
venture arrangement with EGM Limited under which Taung Gold:
— is entitled to up to 52% of the Evander mining right following the completion
of a Pre-Feasibility Study and a Bankable Feasibility Study on the Evander
Project; and
— has the sole and absolute right to conduct exploration over the Evander
Project area and to conduct the works necessary to complete the relevant
Scoping Study, the Pre-Feasibility Study and the Bankable Feasibility Study.
Consent to the transfer of the prospecting right to a subsidiary of Taung Gold was
given by the DMR on 29 September 2010 and the prospecting right is valid for five
years commencing from 29 June 2010. The prospecting right allows the exploration of
gold, silver, uranium and associated minerals in the Jeanette area. All permits to
conduct exploration over the mining area under the Jeanette Project have been
obtained.
LETTER FROM THE BOARD
– 35 –

As stated in this section of the Circular, the Evander Project and the Jeanette
Project have a meaningful portfolio of Measured and Indicated gold resources and
Taung Gold’s directors and key management, taken together, have sufficient
experience relevant to the exploration activities of the Taung Group.
Further details of the Evander Project and the Jeanette Project are provided in the
section headed ‘‘Part C — Information on the Taung Group and its Primary Projects
— 3. Nature and Quality of the Taung Group’s Assets and Businesses ’’ of this
Circular.
5. DUE DILIGENCE MEASURES ON THE TAUNG GROUP
Prior to Wing Hing entering into the Acquisition Agreement, the Board reviewed the
Competent Persons Report prepared by Venmyn and the Valuation Report in respect of the
resources of the Evander Project and the Jeanette Project. Wing Hing also negotiated to
include in the Acquisition Agreement conditions precedent to First Completion, including
that Wing Hing would obtain (i) the Competent Persons Report; (ii) the Valuation Report;
and (iii) a legal opinion to be issued by a practising South African attorney, Mr. Hannes
Gouws of Hannes Gouws and Partners Inc., the details of which are set out in this part of
the Circular under the section headed ‘‘Part A — Structure of the Transactions, the
Acquisition and the Consideration — 1.4 Conditions precedent — (c) the obtaining of a
written legal opinion issued by Mr. Hannes Gouws of Hannes Gouws and Partners Inc.,
Wing Hing’s appointed South African attorney.’’.
Following the signing of the Acquisition Agreement, the Board discussed with Taung
Gold’s management the background information, financial information, projected
production and future business plan of the Taung Group, and reviewed and studied
certain research materials covering a general overview of the global and South African gold
mining industry.
The Board has since reviewed the Competent Persons Report, the Valuation Report
and the Accountant’s Report set out in this Circular, as well as a draft of the legal opinion
on Taung Gold prepared by Hannes Gouws and Partners Inc. Wing Hing is of the view that
the above due diligence measures are adequate to protect the interests of Wing Hing and the
WH Shareholders as a whole.
The Board is aware of the risks associated with the Transactions as set out in the
section of this Circular headed ‘‘Part B — Risk Factors’’ and has balanced the risks
associated with the Transactions and the prospects of the gold mining business of the
Enlarged Group and has taken into account all the relevant factors. The Board, including
the Independent Non-executive Directors, considers that the terms of the Acquisition
Agreement and the Transactions are on normal commercial terms, fair and reasonable, and
in the interests of Wing Hing and WH Shareholders as a whole.
LETTER FROM THE BOARD
– 36 –
6. FINANCIAL EFFECTS OF THE ACQUISITION
After First Completion and Electrum Completion, the Taung Group will become a
non-wholly owned subsidiary of Wing Hing and the financial information of the Taung
Group will be consolidated into the consolidated financial statements of Wing Hing. As
referred to in the annual report of the Wing Hing Group for the year ended 31 March 2011,
the audited consolidated net assets of the Wing Hing Group (including non-controlling
interests) as of 31 March 2011 were approximately HK$532.9 million comprising total
assets of approximately HK$593.2 million and total liabilities of approximately HK$60.3
million, and the net loss of the Wing Hing Group for the year ended 31 March 2011
attributable to owners of Wing Hing was approximately HK$21.4 million.
According to the unaudited pro forma financial information of the Enlarged Group as
set out in Appendix III to this Circular, upon First Completion and Electrum Completion,
the unaudited pro forma net assets of the Enlarged Group would be approximately
HK$4.27 billion, comprising unaudited pro forma total assets of approximately HK$5.61
billion and unaudited pro forma total liabilities of approximately HK$1.34 billion, and the
unaudited pro forma net loss of the Enlarged Group would be approximately HK$1.22
billion. The professional fees and other expenses of the Acquisition would be approximately
HK$24 million.
The unaudited pro forma financial information had also taken into account an
impairment of estimated goodwill arising from the Acquisition of approximately
HK$1,097,459,000 immediately upon completion of the Acquisition. The Directors have
considered the requirements under the relevant accounting principles in determining the
factors to be taken into account when performing the goodwill impairment test. An
impairment test is performed in accordance with the requirements of Hong Kong
Accounting Standards 36 ‘‘Impairment of Assets’’ issued by the Hong Kong Institute of
Certified Public Accountants, resulting in a full impairment of goodwill arising from the
Acquisition immediately upon completion of the Acquisition. Under Hong Kong
Accounting Standard 36, the recoverable amount of an asset or a cash-generating unit is
the higher of its fair value less costs to sell and its value in use. A cash-generating unit is the
smallest identifiable group of assets that generates cash inflows that are largely independent
of the cash inflows from other assets or groups of assets. Fair value less costs to sell is the
amount obtainable from the sale of an asset or cash-generating unit in an arm’s length
transaction between knowledgeable, willing parties, less the costs of disposal. Value in use is
the present value of the future cash flows expected to be derived from an asset or cash-
generating unit. If, and only if, the recoverable amount of an asset is less than its carrying
amount, the carrying amount of the asset shall be reduced to its recoverable amount. That
reduction is an impairment loss. For the purpose of impairment testing, goodwill arising
from the Acquisition is allocated to the operations carried out by Taung Gold as a cash-
generating unit as this unit is expected to generate cash inflows that are largely independent
of the cash inflows from other assets of the Wing Hing Group. The recoverable amount of
the cash-generating unit is determined based on a value in use calculation which involves
discounting estimated future cash flows at a discount rate of 13.04% per annum, being the
discount rate applied in the Valuation Report by the Competent Evaluator.
LETTER FROM THE BOARD
– 37 –

The estimated goodwill is measured as the excess of the estimated fair value of the
Consideration of approximately HK$4,030,343,000 over 77.88% of the adjusted net amount
of identifiable assets and liabilities of Taung Gold as if the Acquisition had been completed
at the date it was reported on. The adjusted net amount of identifiable assets and liabilities
of Taung Gold of approximately HK$3,765,902,000 represents (i) the carrying amount of
the net assets of Taung Gold of approximately HK$519,275,000 as at 28 February 2011 as
adjusted for the fair value adjustment on intangible assets of Taung Gold of approximately
HK$4,509,204,000 and (ii) the corresponding deferred tax effect calculated at the South
African tax rate of 28% of approximately HK$1,262,577,000.
The deferred tax liability of approximately HK$1,262,577,000 is required to be made
under paragraph 19 of the Hong Kong Accounting Standard 12 ‘‘Income Taxes’’, which
Wing Hing complies with. Consequently, the pro forma adjustment on the deferred tax
liability directly affected the amount of goodwill arising from the Acquisition in the
unaudited pro forma financial information. The aforesaid deferred tax liability is a non-
cash accounting item and does not have any effect on the future cash flows of the Enlarged
Group. In future periods subsequent to the Acquisition, the fair value of the intangible
assets would be amortised to profit or loss as expenses whilst the corresponding deferred tax
liability would be released to profit or loss as deferred tax income. In the event that no
deferred tax liability was recognized on the fair value adjustment on intangible assets, the
goodwill arising from the Acquisition of approximately HK$1,097,459,000 would decrease
to approximately HK$114,164,000.
As stated in the unaudited pro forma financial information of the Enlarged Group as
set out in Appendix III to this Circular, the Enlarged Group has unaudited consolidated
pro forma cash and cash equivalents of approximately HK$0.43 billion. The unaudited pro
forma consolidated statement of financial position of the Enlarged Group as at the First
Completion and Electrum Completion is prepared based on (i) the audited consolidated
statement of financial position of the Wing Hing Group as at 31 March 2011, as set out in
Appendix I; and (ii) the audited statement of financial position of Taung Gold as at 28
February 2011 as set out in Appendix II, after incorporating the unaudited pro forma
adjustments described in the accompanying notes, as if the Acquisition were completed on
31 March 2011.
LETTER FROM THE BOARD
– 38 –

PART B — RISK FACTORS
WH Shareholders should carefully consider all of the information set out in this
Circular, including the risks and uncertainties associated with the Acquisition and the assets
and business of the Taung Group and the industry in which it operates before making a
decision on how to vote on the resolution relating to the Transactions at the SGM. The
business, financial condition and results of operations of the Wing Hing Group, the Taung
Group and the Enlarged Group could be materially and adversely affected by any of these
risks.
To the best of the Directors’ knowledge, the Directors consider the following risks to be
the most significant in respect of the assets and business of the Taung Group for the WH
Shareholders and potential investors of Wing Hing. However, the risks listed below do not
purport to comprise all those risks associated with the Transactions and are not set out in
any particular order of priority. Additional risks and uncertainties not currently known to
the Directors may also have an adverse effect on the Transactions, the Wing Hing Group
and the Enlarged Group. If any of the following risks actually occurs, the Transactions, the
Wing Hing Group’s and/or the Enlarged Group’s business, financial condition, capital
resources, results and/or future operations could be materially and adversely affected.
1. RISKS ASSOCIATED WITH THE ACQUISITION
1.1 Risks relating to the significant expansion of the Wing Hing Group’s gold mining
business and risks relating to investing in South Africa
The Acquisition constitutes a significant expansion of the Wing Hing Group’s
gold mining business, a relatively new business of the Wing Hing Group and involves
the exploration, development and ultimate production of gold in South Africa, a
country which the Wing Hing Group has not previously had exposure to or experience
in. Although the Wing Hing Group currently operates the Long Men Sou Mine in the
Hebei province in the PRC, this mine is relatively small in scale and produces a
maximum of approximately 5 kilograms of gold concentrates per month. While the
Wing Hing Group is currently engaging in gold exploration and production, the
Acquisition constitutes an investment in a significantly larger gold mine located in
another country.
There are risks beyond the Wing Hing Group’s control associated with investing
in mineral exploration, mine development and mining in foreign jurisdictions. These
risks include, but are not limited to, health and safety issues; crime; business and
regulatory environment and changes to that environment; political stability;
government policy changes; expropriation of assets; ability to repatriate funds;
corruption; quality and comprehensiveness of the legal regimes in relation to mining or
generally the effectiveness of the judiciary; actions of non-government organisations;
and adverse changes in attitude by host governments or host communities.
LETTER FROM THE BOARD
– 39 –

The Taung Group has not yet commenced production at the Evander Project or
the Jeanette Project and has not recorded any revenue during the three years ended 28
February 2011. Accordingly, its limited operating history makes the prediction of its
future operating results, operating costs and prospects difficult. WH Shareholders and
prospective investors should consider the Enlarged Group’s businesses and prospects
in light of the potential risks, uncertainties, expenses and challenges that it may face as
a developing company. In addition, the Enlarged Group may encounter risks and
uncertainties frequently experienced by companies in the early stages of mine
development, including those relating to its ability to:
— manage large-scale mining operations to maintain effective control over
construction and operating costs and expenses and to ramp up to design
capacities and according to its production plans;
— implement, monitor and enhance its internal control system, including
systems and procedures to ensure compliance with the extensive regulatory
requirements applicable to the mining industry in South Africa; and
— manage the logistics, utility and supply needs of its expanded operations.
The Wing Hing Group has not previously invested in the African continent and
this will be its first venture into Africa. Political, legal and economic uncertainties may
exist in South Africa where the Taung Group’s exploration and planned mining
projects are located and any change in the political and economic conditions in South
Africa may also adversely affect the financial and operational results of the Taung
Group. The Taung Group’s mineral exploration and mining activities may be adversely
affected by political instability and changes to government regulations relating to the
exploration and mining industry. There can be no assurance that changes in the laws of
South Africa or changes in the regulatory environment for mining companies or for
non-domiciled companies in South Africa will not be made that would adversely affect
the Enlarged Group. There can be no assurance that possible future social unrest in
South Africa will not adversely affect the Enlarged Group’s operations. Consequently,
the Wing Hing Group is not in a position to assure the timing and amount of any
return or benefits that may be received from the assets acquired. If the Taung Group’s
business does not develop or progress as planned, the Enlarged Group may not recover
the funds and resources it has spent, and this may adversely affect the profitability,
prospects and financial conditions of the Enlarged Group.
1.2 Risks relating to completion of the Acquisition
Completion of the Acquisition is subject to satisfaction of the conditions
precedent of the Acquisition Agreement, not all of which are within the control of
the Wing Hing Group. For example, there is no assurance that the Acquisition
Agreement and the transactions contemplated under it will be approved by the
requisite majority of the relevant WH Shareholders at the SGM as required under the
Listing Rules, and even if such approval were obtained, there is no assurance that such
approval will not be or be proposed to be revoked. As such, there is a risk that the
Acquisition may not be completed.
LETTER FROM THE BOARD
– 40 –
1.3 After completion of the Transactions, the Enlarged Group will be substantially
dependent on the gold mining business.
After completion of the Transactions, the Enlarged Group’s main business will be
gold mining. The Enlarged Group will be subject to the operating risks associated with
the Evander Project and the Jeanette Project, and if there is any disruption for a
sustained period to the exploration or operation of these projects or their supporting
infrastructure, or if there are adverse changes in the gold mining industry in South
Africa or globally, the financial condition and results of operations of the Enlarged
Group would be materially and adversely affected.
1.4 The resources, production rates and operating costs of the Evander Project and the
Jeanette Project contained in the Competent Persons Report are estimates and
based on a number of assumptions. Taung Group’s actual mining results may differ
materially from such estimates.
The information presented in the Competent Persons Report on the resources,
production rates and operating costs of the Evander Project and the Jeanette Project
has been assessed and classified in accordance with the JORC Code, the SAMREC
Code and Chapter 18 of the Listing Rules. Resource estimates involve expressions of
judgment based on various factors such as knowledge, experience and industry
practice, and the accuracy of these estimates may be affected by many factors,
including quality of the results of exploration drilling and analysis of gold samples, as
well as the procedures adopted by and the experience of the person making the
estimates.
As the Taung Group has not commenced production, the estimates on the
resources, production rates and operating costs of the Evander Project and the Jeanette
Project may differ materially from the Taung Group’s actual mining results. There are
various factors, assumptions and variables beyond the Taung Group’s control that
could result in inherent uncertainties in estimating the resources and reserves and
operating costs. If any of these factors, assumptions and variables proves to be
incorrect, the actual amounts of the resources and reserves may be adjusted
accordingly and the actual operating costs may materially deviate from the
estimates. Such adjustment and deviation could materially and adversely affect the
operational results of the Evander Project and the Jeanette Project and the Enlarged
Group’s financial condition.
Estimates of resources at the Taung Group’s projects may also change when new
information becomes available or new factors arise, and interpretations and deductions
on which resources estimates are based may potentially be inaccurate. Should the
Taung Group encounter mineralisation different from that predicted by past drilling,
sampling and similar examination, resource estimates may have to be adjusted. Any
adjustment could materially affect the Taung Group’s development and mining plans,
which could materially and adversely affect the Enlarged Group’s business and results
of operations.
LETTER FROM THE BOARD
– 41 –
The resource estimates are estimates only and should not be regarded as a full
representation that all these amounts can be economically exploited. In particular, the
grade of the resources ultimately mined may differ from that indicated by drilling
results. There can be no assurance that gold recovered from exploration assay tests will
be duplicated under on-site conditions or in production-scale operations. Material
changes in resources resulting from unexpected changes to the gold price, grades,
production costs, and recovery rates may affect their economic viability. Nothing
contained in this Circular (including, without limitation, the estimated Life of Mine of
the Evander Project and the Jeanette Project) should be interpreted as assurance of the
economic lives of the Taung Group’s gold resources or the profitability of the Enlarged
Group’s future operations.
1.5 The accuracy of facts and other statistics with respect to certain information
obtained from official government publications contained in this Circular cannot be
guaranteed.
Certain facts and statistics in this Circular are derived from various official
government publications. While the Directors have taken reasonable care to ensure
that the facts and statistics presented are accurately reproduced from such sources,
such information has not been independently verified by the Wing Hing Group or the
Taung Group and may be inconsistent, inaccurate, incomplete or out of date. None of
the Wing Hing Group, the Taung Group, their respective directors and advisers or any
other parties involved in the Acquisition make any representation as to the accuracy or
completeness of such facts and statistics and, accordingly, such facts and statistics
should not be unduly relied upon. Furthermore, the statistics may not be comparable
to statistics available for other nations’ economies, and there can be no assurance that
the statistics are stated or compiled on the same basis or with the same degree of
accuracy as may be the case elsewhere.
1.6 The risk of any reduction in value of the GoldCom Consideration Shares is borne by
Wing Hing.
Upon First Completion, GoldCom will subscribe for and Wing Hing will issue
1,134,348,686 new Wing Hing Shares to GoldCom in consideration of the Loan Note.
When a South African Shareholder exercises his SA Put Option, and transfers TG
Shares to GoldCom, GoldCom will on-transfer such TG Shares to Wing Hing and the
transfer will constitute partial repayment of the Loan Note to the extent of the value of
the TG Shares as at the date of the Acquisition Agreement. If any South African
Shareholder has not exercised his SA Put Option in full within the three year exercise
period, GoldCom shall sell or procure the sale of its remaining Wing Hing Shares and
the cash proceeds from such sale shall be paid to Wing Hing in partial repayment of the
Loan Note. If the trading price of the Wing Hing Shares at the time GoldCom sells
such Wing Hing Shares is below the Issue Price, the cash proceeds from the sale of such
Wing Hing Shares, combined with the previous repayments may not be sufficient to
repay the Loan Note in full. As GoldCom is unlikely to have any further assets, Wing
Hing will incur a loss by writing down the unsettled Loan Amount. The Board has
approved the Loan Note and it is satisfied that on First Completion when the
LETTER FROM THE BOARD
– 42 –
GoldCom Consideration Shares are issued and the Loan Note is granted to Wing Hing,
there is no reason to believe that Wing Hing is or would be unable to pay its liabilities
as they become due. For further details of the South African Shareholders, the Loan
Note and the Put Option Agreement, please refer to Appendix VI.
2. RISKS ASSOCIATED WITH THE BUSINESS OF THE TAUNG GROUP
2.1 Taung Gold’s business requires substantial capital investment and is subject to
construction risks.
The gold mining business is capital intensive and the development and
exploitation of gold resources, the conversion of resources into reserves, the
acquisition of machinery and equipment, the expansion of production capacity and
rehabilitation of the environment require substantial capital expenditure. According to
the Competent Persons Report, the total capital cost of the Evander Project is
estimated to be US$1,034.3 million (equivalent to approximately HK$8,067.5 million)
and the total capital cost for developing the Jeanette Project, including plant
construction, is US$1,067.8 million (equivalent to approximately HK$8,328.8
million). After completion of the Transactions, the Enlarged Group intends to invest
significant capital to maintain or increase the Taung Group’s resources.
Some of Taung Group’s expansion plans and exploration prospects may require
greater investment than currently planned, and it may not be able to access the
necessary debt or equity funding for capital expenditure when needed, on acceptable
terms or at all, which could prevent Taung Group from undertaking such expansion or
exploration. In the event that Taung Group is unable to obtain adequate financing on
acceptable terms, or at all, to satisfy its development, operating and expansion plans,
the Evander Project and the Jeanette Project may not be completed in the time
planned, may exceed the original budgets and may not achieve the intended economic
results or commercial viability, all of which could have a material adverse effect on the
Enlarged Group’s business, results of operations and financial condition and the price
of Wing Hing Shares.
2.2 The Enlarged Group will be dependent on future cash flows generated from its
business and its ability to obtain additional debt or equity financing to support its
business operations and expansion plans to continue as a going concern.
If the Enlarged Group is unable to generate sufficient revenue and cash from its
operations following Completion or secure additional financing to meet its obligations,
it may be forced to reduce expenditures or not be able to continue as a going concern.
Reduction of expenditures could have a negative impact on the business and would
make it more difficult for the Enlarged Group to execute its strategy, including its
expansion plans in accordance with its expectations.
LETTER FROM THE BOARD
– 43 –
The Enlarged Group’s ability to obtain additional financial resources on
acceptable terms is subject to uncertainties with respect to, among others:
— conditions in the capital and financial markets in which the Enlarged Group
may seek to raise funds;
— the Enlarged Group’s future results of operations, financial condition and
cash flows;
— exchange control regulations that may be imposed by the South African
Reserve Board; and
— economic, political and other conditions in South Africa, China and the rest
of the world.
In addition, if the Enlarged Group raise additional funding by issuing additional
Wing Hing Shares, such financing may substantially dilute the interests of WH
Shareholders.
2.3 Taung Group’s planned mining activities are subject to exploration, development and
operating risks that may adversely affect the cash flows and overall profitability of
the Enlarged Group following completion of the Transactions. In particular, the
Basal Reef at the Jeanette Project is overlain by a succession of quartzite and shale
which has historically been a limiting factor in the mining of the reefs in the region.
Companies engaged in mining activities are subject to all of the hazards and risks
inherent in exploring for and developing natural resource projects. Mining activities
may encounter unusual or unexpected geological structures and formations or other
geological or grade problems, unusual or unexpected ground conditions, cave-ins and
rock bursts. The Khaki Shale which overlies the Basal Reef at the Jeanette Project may
contribute to such hazards or risks. The thickness of the Khaki Shale in this area can
be up to 2.8 metres. The proximity of the Khaki Shale to the Basal Reef varies across
the property and may result in unfavourable geotechnical conditions. There are
challenges at the Jeanette Project with mining under the Khaki Shale, which may alter
the overall risk profile of the project and it is considered by the Competent Person to
be the single most important technical risk to be managed. Notwithstanding such risks,
neighbouring mines do mine under similar conditions and the Competent Person is of
the view that the technical issues of mining below the Khaki Shale have been
independently assessed as surmountable and have been successfully managed at
adjacent properties.
Other hazards and risks may include unanticipated metallurgical characteristics,
less than expected mineral recovery, unusual or unexpected water conditions, flooding,
environmental hazards, industrial accidents, labour disputes, social unrest and
periodic interruptions due to inclement or hazardous weather conditions and other
acts of God or unfavourable operating conditions and losses.
LETTER FROM THE BOARD
– 44 –

The Evander Project and the Jeanette Project have not commenced production
and the future production phase may involve additional capital expenditures or
significant risks and hazards, including environmental hazards, industrial incidents,
labour disputes, discharge of toxic chemicals, fire, drought, flooding and other
occurrences outside the Enlarged Group’s control. The occurrence of any of these risks
and hazards can delay or interrupt exploration and production, increase exploration
and production costs and result in liability to the Enlarged Group.
These risks and hazards could delay the production, increase the cost of mining,
result in liability to the Enlarged Group and adversely affect the Enlarged Group’s
financial condition and results of operations.
2.4 Economic returns and development costs could differ materially from Taung Group’s
expectations.
Taung Group’s results of operations depend, in part, on the actual economic
returns and the actual costs of developing mines, which may differ from its current
estimates. The development of the Evander Project and the Jeanette Project may be
subject to unexpected problems and delays. Generally, a mining company’s decision to
develop a mineral property is typically based on the results of a feasibility study.
Feasibility studies derive estimates of expected or anticipated project economic
returns. These estimates are based on assumptions about: future gold prices;
anticipated tonnage, grades and metallurgical characteristics of ore to be mined and
processed; anticipated recovery rates of gold from the ore; anticipated capital
expenditure and cash operating costs; and the anticipated return on investment.
Both the Evander Project and the Jeanette Project are proceeding to the Pre-Feasibility
Study stage.
Actual cash operating costs, production and economic returns may differ from
those anticipated by such studies and estimates. There are a number of uncertainties
inherent in the development and construction of any new mine. These uncertainties
include, in addition to those discussed immediately above: the timing and cost of the
construction of mining and processing facilities; the availability and cost of skilled
labour, power, water, consumables, such as cyanide, lubricants and fuel, and
transportation facilities; unexpected labour shortages or strikes; natural phenomena,
such as inclement weather conditions including heavy rain, water availability, floods,
and earthquakes; harsh climatic conditions; equipment breakdowns and the need to
upgrade outdated machinery periodically; the availability and cost of appropriate
refining arrangements; the need to obtain necessary environmental and other
governmental permits, and the timing of those permits; and the availability of funds
to finance construction and development activities.
Any one of the above factors can result in unexpected problems and delays to
Taung Group’s mining operations during development, construction, mine start-up
and commencement of mineral production, any of which could have a material adverse
impact on the Enlarged Group’s revenue and profitability and on the price of Wing
Hing Shares.
LETTER FROM THE BOARD
– 45 –

2.5 Taung Group may be unable to obtain or renew the prospecting rights and mining
rights required for its operations.
As at the Latest Practicable Date, Taung Group has had sufficient influence in
decisions over the exploration for gold resources in the Evander Project through a
series of joint venture arrangements, details of which are further set out in the section
of this Circular headed ‘‘Part C — Information on the Taung Group and its Primary
Projects — 3. Nature and Quality of the Taung Group’s Assets and Businesses — 3.4
The Evander Project — (c) Sufficient influence in decisions over exploration of gold
resources’’. Following the completion of the Pre-Feasibility Study and the Bankable
Feasibility Study, Taung Gold is entitled to earn-in up to a 52% ownership interest in
the Evander Project. The registration of Taung Gold’s interest in the Evander Project
will be subject to the consent of the MMR to be given pursuant to Section 11 of the
MPRDA. Although Taung Gold has received a legal opinion from its legal counsel on
South African law stating that the rights of MMR to refuse an application under the
MPRDA are extremely limited and provided that the applicant complies with the
requirements set out in the MPRDA, the MMR is obliged to give her consent, if Taung
Gold is unable to either (i) complete the Pre-Feasibility Study and the Bankable
Feasibility Study on the Evander Project within the time prescribed under the joint
venture arrangements; or (ii) the MMR fails to give her consent under Section 11 of the
MPRDA, the value, profitability and future prospects of the Enlarged Group may be
negatively affected.
Taung Gold entered into an agreement with Harmony to acquire the single
prospecting right for the Jeanette area in 2008. Consent to the transfer of the
prospecting right to a subsidiary of Taung Gold was given by the DMR on 29
September 2010 and the prospecting right is valid for five years commencing from 29
June 2010. This prospecting right can be renewed for a further period of three years by
submitting a renewal application not later than 60 working days prior to the date of
expiry of the right. The Jeanette Project prospecting right may or may not be
successfully renewed upon its expiry. If this right cannot be renewed successfully, the
value, profitability and future prospects of the Enlarged Group may be negatively
affected.
Further, the mining right over the Evander Project and the prospecting right over
the Jeanette Project are granted subject to conditions and can be suspended or
cancelled if Taung Gold breaches its obligations under any of the conditions and fails
to rectify such breach upon notice. The most commonly cited reasons for the MMR
refusing to renew a prospecting or mining right are the holder’s failure to carry out the
agreed exploration work programme or for failing to comply with environmental
regulations. Any suspension or cancellation of prospecting or mining rights may limit
Taung Group’s ability to operate the Evander Project or the Jeanette Project and will
have a material adverse effect on the Enlarged Group’s business, operations or
financial condition following completion of the Transactions.
LETTER FROM THE BOARD
– 46 –

2.6 Taung Group’s insurance coverage could prove inadequate to satisfy potential
claims.
While the Directors believe that the Taung Group has taken out insurance within
ranges of coverage consistent with industry practice in South Africa, in the course of
exploration, development and production of mineral properties, a variety of risks (and
in particular, unexpected or unusual geological or operating conditions) may occur. It
is not possible to fully insure against many of the risks, and the Taung Group may
decide not to take out insurance against such risks as a result of high premiums or
other reasons. Should such liabilities arise, they could reduce or eliminate any future
profitability and result in an increase in costs and a decline in the value of our
securities.
In particular, the Taung Group may be subject to liability for pollution (excluding
sudden and accidental pollution) or other hazards against which it has not insured or
cannot insure, including those in respect of past mining activities. Further, insurance
policies contain exclusions and limitations on coverage.
As a result, in the future, Taung Group’s insurance coverage may not cover the
extent of claims against the Enlarged Group for environmental or industrial accidents
or pollution. In the event that Taung Group suffers a significant liability for which it is
not insured or insurance coverage is inadequate to cover the entire liability, the
Enlarged Group’s business and results of operation could be materially and adversely
affected.
2.7 If the Enlarged Group is unable to retain its key personnel, the Enlarged Group’s
business and results of operations could be materially and adversely affected.
The Directors believe the Taung Group’s success depends to a significant extent
on its pool of talented and experienced senior management and key employees, the
details of which are set out in the section headed ‘‘Part C — Information on the Taung
Group and its Primary Projects — 5. Directors and Senior Management of Taung
Gold’’. Although it is expected that all such senior management and key employees will
remain in Taung Gold following completion of the Transactions, the Enlarged Group
cannot prevent such senior management and key employees from terminating their
services with Taung Gold in accordance with the relevant agreed conditions. In
addition, it is critical that the Taung Group is able to recruit, develop and retain skilled
employees who are historically disadvantaged South Africans in order to meet the
broad-base black economic initiatives stipulated under the MPRDA and the Mining
Charter, further details of which are set out in the section of this Circular headed ‘‘Part
C — Information on the Taung Group and its Primary Projects — 2. Laws and
Regulations relating to the Mining Industry in South Africa — 2.3 Broad-based Socio-
Economic Charter (the Mining Charter)’’.
The Taung Group’s success further depends on the ability of its key personnel to
operate effectively, both individually and as a group. All of the Taung Group’s key
management and technical personnel are important to its success; however none of the
key personnel are irreplaceable. If the Enlarged Group is not successful in retaining or
LETTER FROM THE BOARD
– 47 –

attracting such personnel after completion of the Transactions, the Enlarged Group’s
business may be harmed. The global shortage of key mining industry human resource
skills, including geologists, mining engineers, metallurgists and skilled artisans has
been exacerbated in the current environment of increased mining activity across the
globe. There can be no assurance that the Taung Group will be able to attract and
retain skilled and experienced employees and, should the Taung Group loses any of its
key personnel, the Enlarged Group’s business may be harmed and its results of
operations and financial condition could be adversely affected.
2.8 Disputes between Taung Gold and its joint venture partner, EGM Limited could
adversely affect the Enlarged Group’s future financial condition.
As discussed in the section headed ‘‘Part C — Information on the Taung Group
and its Primary Projects — 3. Nature and Quality of the Taung Group’s Assets and
Businesses — 3.4 The Evander Project — (c) Sufficient influence in decisions over
exploration of gold resources’’ below, Taung Gold gained sufficient influence over the
exploration rights of the Evander Project with a joint venture arrangement with EGM
Limited, a wholly-owned subsidiary of Harmony.
Harmony is a large gold producer in South Africa. Conflicts of interest may arise,
and there is no guarantee that Harmony will continue to agree with Taung Gold on its
access or management rights over the Evander Project or other matters. Any such
disagreement could result in a potential dispute which could affect the viability of the
Evander Project and would divert management’s attention or financial resources away
from the Taung Group’s other projects. If any such disputes occur following
completion of the Transactions, the Enlarged Group’s business, financial condition
and results of operations could be materially and adversely affected.
2.9 The Taung Group competes with companies with greater financial resources.
The Taung Group operates in an industry with other more well-established
companies which have greater financial resources or access to financing. Accordingly,
the Taung Group faces strong competition from other mining companies in connection
with exploration and the acquisition of properties producing, or capable of producing,
base and precious metals as well as for access to financial resources. Many of these
companies have greater financial resources, operational experience and technical
capabilities than the Taung Group. As a result of this competition, the Taung Group
may be unable to maintain or acquire attractive mining properties on terms it considers
acceptable or at all. Consequently, its revenues, operations and financial condition
could be materially adversely affected.
LETTER FROM THE BOARD
– 48 –
3. RISKS RELATING TO THE GLOBAL GOLD MINING INDUSTRY
The Enlarged Group’s results of operations will be affected by changes in the market
price for gold.
Substantially all of the revenues and cash flows of the Enlarged Group will be
derived from the sale of gold produced from the Evander Project and the Jeanette
Project. As such, the commercial viability and profitability of the Evander Project and
the Jeanette Project are sensitive to the market price for gold, which can fluctuate
widely. These fluctuations are caused by numerous factors beyond the Enlarged
Group’s control, including: financial market expectations regarding the rate of
inflation; the strength of the US dollar (the currency in which the gold price trades
internationally) relative to other currencies; speculative positions taken by investors or
traders in gold; changes in the demand for gold use in jewellery, for industrial uses and
for investment; changes in the supply of gold from production, disinvestment, scrap
and hedging; changes in interest rates; actual or expected gold sales by central banks;
gold sales by gold producers in forward transactions; global or regional political or
economic events; and costs of gold production.
The price of gold is often subject to sharp, short-term changes resulting from
speculative activities. While the overall supply of and demand for gold can affect its
market price, because of the considerable size of aboveground stocks of the metal, in
comparison to other commodities, these factors typically do not affect the price in the
same manner or degree as the supply of and demand for other commodities tend to
affect their market price.
There is no assurance that the global demand for gold and associated mineral
products will continue to grow or that the internal demand for such products will not
experience excess supply. According to the London Bullion Market Association and
based on the London pm fix price, the gold price reached a record high of US$1,421.00
per troy ounce in 2010. The gold price ranged from US$712.50 to US$1,011.25 per troy
ounce in 2008, from US$810.00 to US$1,212.50 per troy ounce in 2009 and from
US$1,058.00 to US$1,421.00 per troy ounce in 2010. The market price of gold on the
Latest Practicable Date was US$1,613.50 per troy ounce, compared with the 2010
average price for gold of US$1,224.52 per troy ounce. These prices are significantly
above the historic average price of gold and may decline significantly in the future.
Future prolonged reductions or declines in world gold prices could have a material
adverse effect on the Enlarged Group’s revenue and profitability and on the price of
Wing Hing Shares.
In the case of a significant and prolonged reduction in the price of gold, the
Enlarged Group may determine that it is not economically feasible to continue
commercial production at some or all of its operations or the development of some or
all of its current prospects, as applicable. In such a circumstance, the Enlarged Group
may curtail or suspend some or all of its exploration and production activities and/or
LETTER FROM THE BOARD
– 49 –

be required to draw down (without replacement) and/or restate downwards its
resources, which could have a material adverse effect on the Enlarged Group’s revenue
and profitability and on the price of Wing Hing Shares.
4. RISKS RELATING TO THE SOUTH AFRICAN GOLD MINING INDUSTRY
4.1 The supply of electricity and increases in the cost of power may adversely affect the
Taung Group’s results of operations and the Enlarged Group’s financial condition.
The Evander Project and the Jeanette Project are dependent on electrical power
generated by the South African State utility Eskom, which holds a monopoly on the
generation and distribution of electricity in the South African market. As a result of an
increase in demand exceeding available generating capacity, South Africa has been
subject to disruptions in electrical power supply.
Electricity supply to the Evander Project would be established through new
temporary and permanent agreements with Eskom. Electricity supply to the Jeanette
Project would be supplied in the same manner. Generators would supplement the
temporary supplies at the initial mining phases and upon full production phase, Eskom
will supply power to the Evander and Jeanette Projects. Applications have been
submitted to Eskom for temporary and permanent power allocations to the Evander
Project. Any shortfalls in electricity will be supplied by diesel generation. The
application for a similar arrangement with Eskom regarding the Jeanette Project will
commence during the first quarter of 2012. The Competent Persons Report has
provided for the capital expenditure estimate required to provide 7.5MW of self
generated power but if Eskom is unable to allocate sufficient electricity to the Evander
Project and/or the Jeanette Project during the early construction stages, this will
increase the Taung Group’s capital costs due to the use of diesel generated power.
The National Energy Regulator South Africa (NERSA) has approved imposing an
average 25% per annum tariff increase for the three year multi-year price
determination period as a result of Eskom’s planned capital expansion program to
deal with the current power constraints. The first increase became effective on 1 April
2010. As a result of the increasing constraints on power in South Africa and Eskom’s
monopoly status, the Wing Hing Group is not in a position to predict whether there
will be any further tariff increases after completion of the Transactions. If the
electricity tariff continues to increase, the profitability and results of operations of the
Enlarged Group may be adversely affected which may in turn have a material and
adverse impact on the price of Wing Hing Shares.
4.2 The Taung Group’s planned mining projects will rely on significant amounts of
water, the bulk of which will be supplied by local water authorities who may increase
costs or impose restrictive requirements on their conditions of supply.
The Evander Project is expected to consume approximately 3,000m3/day of water
at full production, the majority of which will be supplied by the fissure water which is
being made inside the mine. Any supplemental water required will be supplied from the
Vaal River Water Scheme. Water supply to the Evander Project is unlikely to be a
LETTER FROM THE BOARD
– 50 –

future limiting factor since most of the current mining operations in the Evander
Project were planned for greater production profiles than are currently maintained,
with a 160Mm3 per annum water pipeline, delivering water from the Vaal River, having
recently been completed. The Jeanette Project is estimated to consume approximately
3t/t (tons of water per ton total rock broken). Water will be supplied to the Jeanette
Project by the Rand Water Board and potable water will be sent underground and used
as drinking water, service water and makeup water for the refrigeration plants. All
water will be supplied to the mining blocks by means of a network of underground
piping. Water costs for these projects were approximately US$0.56/m3 in 2010 and are
expected to increase to US$0.75/m3 in 2013. As the balance of the water requirements
will be provided by the local authorities (with the remainder being underground
sources from adjacent mines), any increases in costs by the local water boards or if the
local water boards impose restrictive requirements on their conditions of supply, this
may have an increased cost impact on the Enlarged Group’s profitability and results of
operations which may in turn have an impact on the price of Wing Hing Shares.
4.3 The Taung Group’s operations are subject to environmental laws and regulations.
As a gold mining company, the Taung Group is subject to environmental
legislation and regulation in South Africa, specifically the MPRDA and the National
Environmental Management Act, 1998 (NEMA). This legislation and regulation could
impose unexpected costs and burdens on the Taung Group, the full extent of which
cannot always be predicted. Details of these regulations are set out in the section of
this Circular headed ‘‘Part C — Information on the Taung Group and its Primary
Projects — 2. Laws and Regulations relating to the Mining Industry in South Africa —
2.7 Environmental Legislation’’.
In particular, the NEMA requires, among other things, that every person who
causes, has caused or may cause significant pollution or degradation of the
environment must take reasonable steps to prevent such pollution or degradation
from occurring, continuing or recurring. The reach of the NEMA remains subject to
interpretation by South African courts. In addition, the MPRDA requires companies
that undertake mining activities to make financial provision for rehabilitation
liabilities to the satisfaction of the DMR. Directors of mining companies may be
held jointly and severally liable for any unacceptable negative impact on the
environment, including damages caused by the company which they represent.
Under the National Water Act, 1998, owners, controllers and occupiers of land on
which any activity or process is or was performed or undertaken or on which any
situation exists that causes, has caused or is likely to cause the pollution of a water
resource, must take all reasonable measures to prevent such pollution from occurring,
continuing or recurring.
Violation of these laws and regulations may result in the Taung Group having to
pay penalties and incur other liabilities. In extreme cases the authorities may have the
right to suspend or cancel licenses where the holder is found to be in breach of health
and safety and environmental laws and regulations and fails to rectify the same despite
written notification to do so.
LETTER FROM THE BOARD
– 51 –

The MPRDA, certain other environmental legislation and the administrative
policies of the South African government regulate the impact of the Taung Group’s
prospecting and mining operations on the environment. The Taung Group has yet to
obtain approval of the DMR with respect to the compliance with environmental
control measures in respect of certain of its projects, including the Evander Project and
the Jeanette Project. Before commencing work on a project site, a detailed
environmental update study will be required, for which site visits have to be
conducted and various documents have to be submitted. There can be no assurance
that the Taung Group will be able to obtain all the necessary approvals. If the Taung
Group is unable to obtain any of such approvals, the development and operations of
the Evander Project and the Jeanette Project may be adversely affected.
Mining operations have inherent risks and liabilities associated with safety and
damage to the environment and the disposal of waste products occurring as a result of
mineral exploration and production. The occurrence of any such safety or
environmental incident could delay production and/or increase production costs and
may impact on the Taung Group’s ongoing compliance with environmental legislation,
regulations and the conditions of the prospecting rights or mining rights granted.
Liabilities could be imposed on the Taung Group for damages, clean up costs or
penalties in the event of certain discharges into the environment, environmental
damage caused by previous operations or non-compliance with environmental laws or
regulations. Current legislation requires the establishment of an Environmental Trust
Fund by all mining companies in South Africa, which makes provision during Life of
Mine for rehabilitation at mine closure. Changes to legislation may cause a shortfall of
funding at mine closure.
In the future, the Taung Group may incur unexpected costs associated with
complying with the requirements being imposed under new legislation and regulations.
This may include the need to increase and accelerate expenditure on environmental
rehabilitation and to alter provisions for this expenditure, which could have a material
adverse effect on the Enlarged Group’s results and financial condition. The Taung
Group may also face increased pumping costs should other mines in the vicinity of its
mines fail to meet their obligations with regard to the pumping or treatment of water.
4.4 The Taung Group’s planned mining activities may employ processes and chemicals
that may be harmful to the environment and may be subject to compliance, clean-up
and other costs.
Mining activities are generally subject to environmental and safety hazards as a
result of the processes and chemicals used in the extraction and production methods.
In addition, environmental hazards may exist on the Taung Group’s properties, or may
be encountered while its products are in transit, which are currently unknown to it or
may arise irrespective of such compliance.
The Taung Group may be liable for losses associated with environmental hazards
and rehabilitation, have its licences and permits withdrawn or suspended, face negative
reputational consequences or be forced to undertake extensive remedial clean-up
LETTER FROM THE BOARD
– 52 –
action or to pay for government-ordered remedial clean-up actions, even in cases where
such hazards have been caused by any previous or subsequent owners or operators of
the property, by any past or present owners of adjacent properties or by acts of
vandalism by trespassers. Any such losses, withdrawals, suspensions, reputational
consequences, actions or payments may have a material adverse effect on the Enlarged
Group’s business, results of operations and financial condition and the price of Wing
Hing Shares.
4.5 The Taung Group is subject to a significant number of laws and governmental
regulations, and the costs of compliance or changes to applicable laws and
regulations may negatively affect the Enlarged Group’s business, financial condition
and results of operations.
In addition to environmental laws and regulations, the Evander Project and the
Jeanette Project are subject to extensive laws, governmental regulations, policies,
controls, standards and requirements in South Africa. There can be no assurance that
the relevant government authorities will not change such laws and regulations, revoke
the approvals granted or impose additional or more stringent conditions, laws or
regulations or that the Taung Group would be able to comply with any such new laws
or regulations applicable to the Evander Project and the Jeanette Project economically
or at all. Failure to continue to obtain approvals or to comply with the relevant
conditions, laws and regulations applicable to mine development and natural resources
production projects may adversely affect the Taung Group’s capacity to operate and
negatively affect the Enlarged Group’s business, financial condition and results of
operations.
4.6 Fluctuations in currencies may adversely affect the Enlarged Group’s business,
results of operations and financial condition.
The Evander Project and the Jeanette Project will generate revenue in South
African Rand (ZAR) from the sale of gold and construction and operating costs will be
incurred in South African Rand (ZAR) and other foreign currencies. As the reporting
currency of the Enlarged Group will be HK$, movements in the currency exchange
rates may adversely affect the Enlarged Group’s results or operations and cash flows.
Neither the Wing Hing Group nor the Taung Group currently undertakes any hedging
activities in relation to currency fluctuation risk and accordingly, is fully exposed to
any adverse fluctuations in the relevant exchange rates.
5. RISKS RELATING TO INVESTING IN SOUTH AFRICA
Following completion of the Transactions, the Enlarged Group’s primary assets and
businesses will be in South Africa and accordingly, WH Shareholders and potential
investors in Wing Hing Shares should consider the following risks relating to operating a
mining business in South Africa.
LETTER FROM THE BOARD
– 53 –

5.1 Changes or instability to the socio-economic framework in South Africa or its
neighbouring countries may have an adverse effect on the Enlarged Group’s
operations and profits.
Countries neighbouring South Africa such as Zimbabwe have recently been
subject to major instability and socio-economic changes. Changes or instability to the
economic or political environment in any of South Africa or its neighbouring countries
could affect the attractiveness of South Africa as a country to invest in or do business
with which may adversely affect Taung Group’s operations and profits and the
attractiveness of Wing Hing Shares. It is difficult to predict the future political, social
and economic direction in these countries, or any other country in which the Taung
Group operates, and the impact government decisions may have on the Taung Group’s
business.
5.2 HIV and AIDS pose risks to South African mining companies in terms of
productivity and costs.
HIV/AIDS is prevalent in South Africa. Some of Taung Group’s employees may
have or could contract this potentially deadly virus. The prevalence of HIV/AIDS in
South Africa poses risks to mining companies in South Africa, including the Taung
Group, in terms of potentially reduced productivity, and increased medical and other
costs. These risks may limit or disrupt the Taung Group’s exploration activities or
development of future mining operations, restrict the movement of funds, or result in
expropriation without fair compensation. If a significant increase in the incidence of
HIV and AIDS infection and HIV and AIDS-related diseases among the workforce
over the next several years occurs, this may have an adverse impact on the Enlarged
Group’s operations, projects and financial condition.
5.3 The Enlarged Group’s financial flexibility could be materially constrained by
exchange control regulations as imposed by the South African Reserve Board.
South African law provides for exchange control regulations which restrict the
export of capital by residents from the common monetary area, which includes South
Africa. These regulations apply to transactions involving South African residents,
including both natural persons and legal entities. In particular, Taung Gold is
generally not permitted (i) to export capital from South Africa if the export is not in
line with current exchange control rulings; (ii) to hold foreign currency for a period of
longer than six months offshore; or (iii) to incur indebtedness denominated in foreign
currencies without the approval of the South African exchange control authorities,
which may affect Taung Gold’s ability to borrow funds from members of the Enlarged
Group for use in South Africa and to repay these borrowings from South Africa.
If Taung Gold were to have an offshore subsidiary or offshore operations, it could
raise capital and retain dividends offshore and use the capital for any purpose on
condition that (i) there is no recourse to South Africa; (ii) the dividends may not be re-
invested in the Common Monetary Area; and (iii) it is annually reported to SARB.
Taung Gold is permitted to acquire an interest in a foreign venture with the approval
of SARB.
LETTER FROM THE BOARD
– 54 –
Since 1995, certain exchange controls in South Africa have been relaxed.
Although the government has expressed an intention to gradually relax exchange
control regulations with a view to ultimately eliminating exchange controls, there is no
certainty that exchange control regulations will be reduced or eliminated.
5.4 The cost of occupational healthcare services may increase in the future.
The Taung Group’s operations in South Africa are subject to health and safety
regulations which could impose significant costs and burdens. South African
legislation has granted the relevant authorities broad powers to among other things,
close unsafe mines and order corrective action relating to health and safety matters.
The legislation also sets out prescriptive provisions to govern the payment of
compensation and medical costs related to certain illnesses contracted by persons
employed in mines or at sites where activities ancillary to mining are conducted.
Occupational healthcare services are available to the Taung Group’s employees from
existing healthcare facilities in South Africa. The costs associated with providing such
services and implementing the various programs could potentially increase in the
future as a result of (a) changes in the nature of underlying legislation and (b) the
profile of our employees. Given the uncertain nature of this risk, it is not possible for
the Taung Group to accurately assess such potential costs. South African legislation
also mandatorily requires the Taung Group to apply medical surveillance on all
employees to monitor their medical condition throughout their work history. The
latter serves to make employers liable for that part of medical deterioration for which a
company is responsible during an employee’s work tenure.
5.5 Laws governing mineral rights affect the Taung Group’s business.
Although all of the old order prospecting rights in respect of both the Evander
Project and Jeanette Project have been converted into new order prospecting rights,
such new order prospecting rights may be suspended or cancelled if the DMR, having
followed the requisite procedures under the MPRDA, determines that the holder is in
breach of the provisions of the MPRDA or the terms under which such new order
prospecting rights were granted. As at the Latest Practicable Date, the Taung Group
has not committed any material breach of the MPRDA or of the terms under which its
new order prospecting rights for the Jeanette Project have been granted. The same
holds true for EGM Limited in respect of itself and for the Evander Project.
Part of the procedure for converting each old order mining or prospecting right
into a new order mining or prospecting right in respect of the Jeanette Project and
Evander Project was the approval by the MMR of an environmental management
programme, for which the former holder had to, amongst other things, investigate,
assess and evaluate the impact of its proposed prospecting operations on the
environment and on the socio-economic conditions of any person who might be
directly affected by those operations. In subsequently taking transfer or exercising
control over these licenses, the Taung Group is continually assessing and evaluating
the impact which its operations exert. Furthermore, in applying for each new order
prospecting right under the MPRDA for the Greenfield Projects, the Taung Group was
LETTER FROM THE BOARD
– 55 –
also required to consult with the landowner or lawful occupier and any other affected
party with respect to the land over which it sought to be granted new order prospecting
rights. The Taung Group therefore has experience in dealing with the concerns of
parties that may be affected by its operations, for example local communities and local
municipalities.
Under the MPRDA, tenure over established mining operations is secured for up
to 30 years (and renewable for periods not exceeding 30 years each thereafter),
provided that mining companies applied for new order mining rights over existing
operations within five years of 1 May 2004 or before the existing right expired,
whichever was the earlier date, and fulfil the requirements specified in the MPRDA
and the Broad-Based Socio-Economic Empowerment Charter for the South African
mining industry as amended in 2010 (the Mining Charter). Details of the MPRDA and
the Mining Charter are set out in the section of this Circular headed ‘‘Part C —
Information on the Taung Group and its Primary Projects — 2. Laws and Regulations
relating to the Mining Industry in South Africa — 2.3 Broad-based Socio-Economic
Charter (the Mining Charter)’’.
The Mining Charter was designed to facilitate the participation of historically
disadvantaged South Africans in South African’s mining industry. Non-compliance
with the provisions of the Mining Charter could lead to loss of mining and related
rights. The Mining Charter has a number of objectives which include, among other
things:
— the expansion of opportunities for persons disadvantaged by unfair
discrimination under the previous political dispensation;
— the expansion of the skills base of such persons;
— the promotion of employment and advancement of the social and economic
welfare of mining communities; and
— the promotion of beneficiation within South Africa.
The Mining Charter contains principles relating to the transfer, over a 10-year
period, of 26% of South Africa’s mining assets (as equity or attributable units of
production) to historically disadvantaged South Africans.
5.6 WH Shareholders and potential investors in Wing Hing may have difficulty bringing
actions, and enforcing judgments, against the Taung Group, its directors and
executive officers
Taung Gold is incorporated in South Africa and forms the primary asset of the
Enlarged Group. All of the Taung Group’s assets are located in South Africa. The
directors and senior management of the Taung Group reside outside of Hong Kong.
Substantially all of the assets of these persons and substantially all of the Enlarged
Group’s assets will be located outside of Hong Kong following completion of the
Transactions. As a result, it may not be possible for investors to enforce a judgment
LETTER FROM THE BOARD
– 56 –
against these persons or Taung Gold obtained in a court of Hong Kong. A foreign
judgment is not directly enforceable in South Africa, but constitutes a cause of action
which will be enforced by South African courts provided that:
— the court that pronounced the judgment had jurisdiction to entertain the case
according to the principles recognized by South African law with reference to
the jurisdiction of foreign courts;
— the judgment is final and conclusive;
— the judgment has not lapsed;
— the recognition and enforcement of the judgment by South African courts
would not be contrary to public policy, including observance of the rules of
natural justice which require that the documents initiating the Hong Kong
proceeding were properly served on the defendant and that the defendant was
given the right to be heard and represented by counsel in a free and fair trial
before an impartial tribunal;
— the judgment does not involve the enforcement of a penal or revenue law; and
— the enforcement of the judgment is not otherwise precluded by the provisions
of the Protection of Business Act 99 of 1978, as amended, of South Africa.
5.7 Taung Gold may not pay dividends or make similar payments to Wing Hing in the
future
Payment of any future dividends is at the discretion of Taung Gold’s board of
directors after taking into account many factors including Taung Gold’s operating
results, financial condition and Taung Gold’s anticipated cash needs. Under South
African law, Taung Gold is only entitled to pay a dividend or similar payment to
shareholders if it meets the solvency and liquidity tests set out in the Companies Act of
South Africa and Taung Gold’s articles of association. Cash dividends or other similar
payments may not be paid in the future.
In February 2007, the South African government announced a proposal to replace
Secondary Tax on Companies with a 10% withholding tax on dividends and other
distributions payable to shareholders. The amendments will be implemented in phases
and are expected to become effective in the near future. Although this may reduce the
tax payable on Taung Gold’s South African operations, thereby increasing
distributable earnings, the withholding tax will generally reduce the amount of
dividends or other distributions received by shareholders.
LETTER FROM THE BOARD
– 57 –

PART C — INFORMATION ON THE TAUNG GROUP AND ITS PRIMARY
PROJECTS
1. INDUSTRY OVERVIEW
1.1 General background and gold industry characteristics
Gold is a commodity for which there are multiple uses, including selected
industrial applications, jewellery manufacture and financial investment. Gold remains
a strong hedge against inflation and can act as a ‘store of financial value’. Primary gold
supply consists of mine production. Secondary gold supply consists of scrap metal
recycle and sales by Government Central Banks of reserve stocks.
In the recent past, gold demand has consistently exceeded gold supply and the
price of gold has appreciated in dollar terms every year since 2001. The price of gold is
inherently volatile and driven by many factors that could include investment demand
for currency hedged assets, availability of primary and secondary supply, interest rates
and bond yields, global economic cycles and equity and bond market performance and
volatility. Historically, the most significant driver of gold demand has been the
jewellery sector. However, financial investment is now increasingly significant to gold
demand.
Central Bank activity has a significant impact on the gold market. The European
Central Bank and fourteen other central banks continue to abide by the terms of the
Central Bank Gold Agreement (CBGA). This current agreement is the third such
agreement, with the first agreement being initiated in September 1999. CBGAs were
introduced to place a ceiling on the level of gold sold over a certain period of time.
Under the current agreement, all participating central banks have agreed to a
maximum level of sales of 400 tonnes per annum, amongst all participants, with an
overall total of no more than 2,000 tonnes sold over a five year period. Central banks
have recently become net purchasers of gold for the first time in over two decades, with
large purchases coming from China, India and Russia.
According to the United States Geological Survey (U.S. Geological Survey), South
Africa (6,000 tonnes), Australia (5,800 tonnes) and Russia (5,000 tonnes) hold the
largest gold reserves in the world. However, China is by far the largest producer. U.S.
Geological Survey estimates that China produced 11.09 million troy ounces in 2010, an
increase of 8% year-on-year.
LETTER FROM THE BOARD
– 58 –
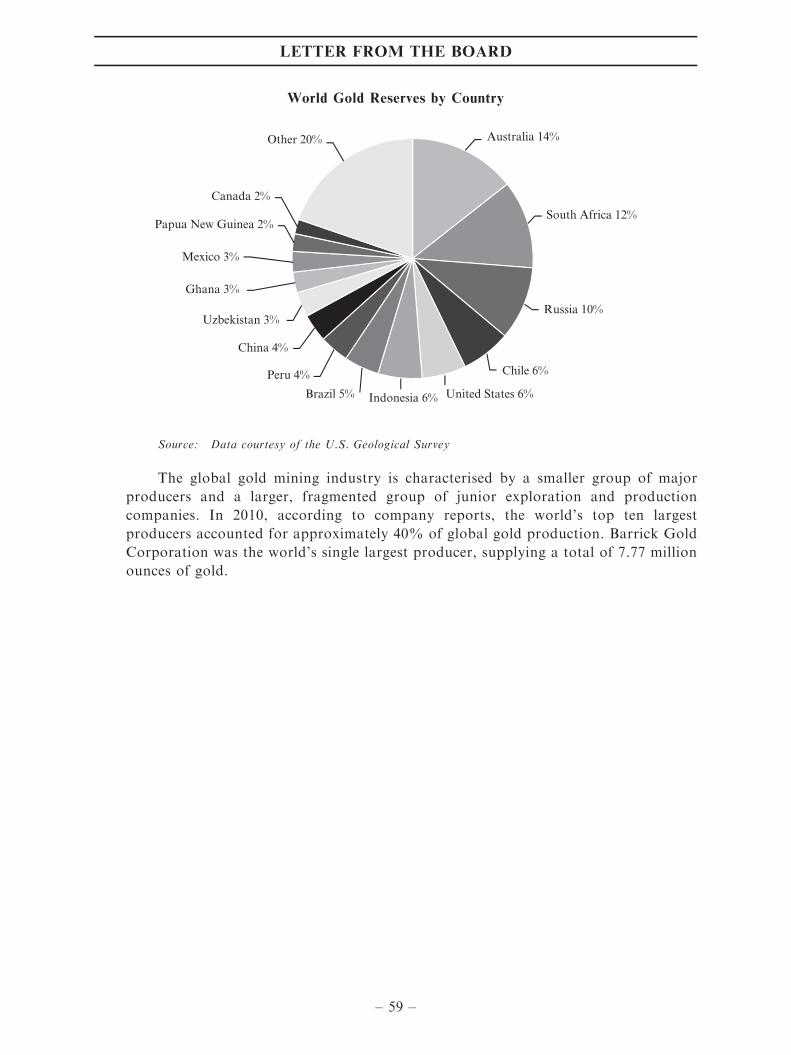
World Gold Reserves by Country
Australia 14%
South Africa 12%
Russia 10%
Chile 6%
United States 6%Indonesia 6%Brazil 5%
Peru 4%
China 4%
Uzbekistan 3%
Ghana 3%
Mexico 3%
Papua New Guinea 2%
Canada 2%
Other 20%
Source: Data courtesy of the U.S. Geological Survey
The global gold mining industry is characterised by a smaller group of major
producers and a larger, fragmented group of junior exploration and production
companies. In 2010, according to company reports, the world’s top ten largest
producers accounted for approximately 40% of global gold production. Barrick Gold
Corporation was the world’s single largest producer, supplying a total of 7.77 million
ounces of gold.
LETTER FROM THE BOARD
– 59 –

Top 10 World’s Largest Gold Producers
0
1
2
3
4
5
6
7
8
9
Bar
rick
New
mon
t
Ang
loG
old
Gol
dFie
lds
Gol
dcor
p
Kin
ross
Fre
epor
t
New
cres
t
Pol
yus
Bue
nave
ntur
a
2010
Min
e P
rodu
ctio
n (M
oz.)
Source: 2010 Company Annual Reports
The traditional gold regions of North America, South Africa and Australia
remain an important source of global primary supply. Increasingly significant are new
gold mining regions including recent exploration and mine development activities in
South America, West Africa and Papua New Guinea. The main contributors to mine
production growth in 2010 were increased Chinese production, Newmont’s
Boddington mine in Australia, and Barrick Gold’s Veladero and Cortez Hills mines
in Argentina and the United States respectively.
Gold sector companies continue to be significant participants in global mergers
and acquisitions activity in the metals and mining industry. In August 2010,
Australia’s Newcrest Mining acquired Lihir Gold Limited for a total consideration
of AUD9.5 billion. At the time, these two companies controlled the world’s 9th and
10th largest gold resources respectively. In September 2010, Kinross Gold, the world’s
6th largest producer, acquired Red Back Mining for US$7.1 billion. Red Back’s
principal gold assets are located in the greenstone belts of Ghana and Mauritania in
West Africa.
1.2 Historical and current gold demand
In 2010, the total demand for gold reached a 10-year high of 4,312 tonnes. This
represents an increase of 1% year-on-year after an increase of 8% in 2009. From 2009
to 2010, the average price of gold (London PM Fix: US dollars/troy ounce) increased
from US$972/oz to US$1,225/oz. This represents an increase of 26% year-on-year. In
value terms, a 26% rise in the US dollar price of gold combined with a 1% rise in
volume demand resulted in pushing up the value demand in 2010 to US$170 billion
against US$134 billion in 2009, an increase of 27%.
LETTER FROM THE BOARD
– 60 –

Global Gold Supply and Demand
*Q4 component of 2010 numbers provisional at time of print
2000 2001 2002 2003 2004 2005 2006 2007 2008 2009 2010
Supply
Mine Production 2,620 2,646 2,618 2,623 2,494 2,549 2,483 2,473 2,409 2,572 2,659Official sector sales 479 520 547 620 479 663 365 484 232 41Old gold scrap 620 749 874 986 881 902 1,133 982 1,316 1,674 1,653Implied net
disinvestment 299 12
Total Supply 4,018 3,915 4,038 4,228 3,866 4,115 3,981 3,939 3,957 4,287 4,312
Demand
Fabrication
Jewellery 3,205 3,009 2,662 2,484 2,616 2,718 2,298 2,417 2,193 1,759 2,060Other 557 474 481 515 555 581 650 672 696 658 420Total Fabrication 3,762 3,483 3,143 2,999 3,172 3,299 2,948 3,089 2,889 2,417 2,479Bar Hoarding 242 261 264 180 257 264 235 236 386 187 713Net producer de-hedging 15 151 412 289 438 92 434 444 352 254 116Implied net investment 20 220 760 459 365 169 330 1,429 916Official sector purchases 87
Total Demand 4,018 3,915 4,038 4,228 3,866 4,115 3,981 3,939 3,957 4,287 4,312
Source: WGC and GFMS Ltd
* The totals may not add up due to independent rounding.
Demand for gold in the jewellery sector exhibited strong recovery in 2010, with
annual demand increasing by 17% year-on-year to a total of 2,059.6 tonnes. Indian
and Chinese jewellery demand increased by 69% and 13% year-on-year in tonnes,
respectively. Total bar and coin demand increased by 34% year-on-year in tonnes after
declining by 14% in 2009. Demand for Exchange Traded Funds (ETFs) and similar
investment products decreased by 45% year-on-year in tonnes after increasing by 92%
in 2009. In 2010, industrial demand for gold increased by 13% year-on-year in tonnes.
Gold Demand by Category in Tonnes
*Q4 component of 2010 numbers provisional at time of print
0
500
1,000
1,500
2,000
2,500
3,000
3,500
4,000
4,500
2000 2001 2002 2003 2004 2005 2006 2007 2008 2009 2010
Ton
nes
Industrial Demand Investment Demand Jewellery Demand
Source: WGC and GFMS Ltd
LETTER FROM THE BOARD
– 61 –

Significant demand drivers of the gold price include:
— Investment demand;
— Jewellery demand; and
— Industrial demand.
(a) Investment Demand
Total investment demand, including bar and coin demand, ETFs and similar
products, and over-the-counter (OTC) investment and stock flows, remained
stable in 2010 and accounted for 1,629 tonnes of gold demand, compared to 1,616
tonnes in 2009. Total bar and coin investment increased to a record 995 tonnes in
2010, a 34% year-on-year increase. This is after a 14% decline from 2008 to 2009.
Growth in this sector in 2010 was dominated by China, where investors continued
to purchase more physical gold resulting in an increase of 70% from 105.5 tonnes
in 2009 to 179.9 tonnes in 2010.
This makes China the second largest gold bar and coin investment market
surpassing the United States and Germany, and falling just behind India. The
main driving factors for this demand were continued concerns over domestic
inflation and poor performance of alternative asset classes, combined with
expectations of further gold price gains. In local currency terms, a 25% rise in the
Renminbi price of gold combined with a 70% rise in volume demand resulted in a
rise in the value demand in 2010 to RMB48 billion against RMB23 billion in 2009.
This represents an annual increase of more than 100%.
India continued to be the largest gold bar and coin investment market in
2010, with annual demand of 217.4 tonnes, compared to 136.1 tonnes in 2009, an
increase of 60%. In local currency terms, a 20% rise in the rupee price of gold
combined with a 60% rise in volume demand resulted in a rise in the value demand
in 2010 to Rs391 billion against Rs206 billion in 2009, an annual increase of close
to 100%. Across other Asian markets, bar and coin investment demand grew
almost universally.
Thailand was a notable market in 2010, reversing a net negative investment in
2009 of 9.9 tonnes to a positive annual investment of 51.2 tonnes. There was also
an increase for gold bars and coins in Europe’s two largest gold investment
markets; Germany and Switzerland. This was mainly as a result of fresh concerns
over sovereign debt issues in the region and reflected investors’ conviction that
gold offers security in uncertain times. Investors in the remainder of the Western
markets were generally unable to sustain levels of investment in gold bars and
coins seen in 2009.
LETTER FROM THE BOARD
– 62 –

Total Bar and Coin Investment Demand (Tonnes)
*Q4 component of 2010 numbers provisional at time of print
US, 114.3
Switzerland,97.3
US, 104.7
China, 105.5
Germany, 133.9
India, 217.4Middle East, 26.3Turkey, 40.5
Thailand, 51.2India, 136.1
Vietnam, 58.2
Thailand, 9.9
Turkey, 31.8 Middle East, 19.6
Vietnam, 67
Switzerland,91.7
China, 179.9
Germany, 126.9
2009 2010
Source: WGC and GFMS Ltd
ETFs and similar products experienced a significant drop off in 2010 to total
holdings of 338 tonnes, a year-on-year decline of 45% in tonnes. This comes after
a surge in demand for ETFs and similar products in 2009 to a level of 617 tonnes,
compared to 321 tonnes in 2008, a year-on-year increase of 92%. In value terms, a
26% rise in the US dollar price of gold combined with a 45% decline in volume
demand resulted in a fall in the value demand in 2010 to US$13 billion against
US$19 billion in 2009, an annual decline of 31%.
OTC investment and stock flows were estimated at 296 tonnes for 2010,
compared to 540.6 tonnes in 2009, a decline of 45% year-on-year. This data is
largely reflective of the opaque OTC market with additional occasional effects
from short term changes to fabrication inventories.
(b) Jewellery Demand
Jewellery demand for gold peaked in 1997 and remained stable for a period of
approximately 4 years. Since 2001, jewellery demand for gold has generally been
falling, with the exception of 2010 where jewellery demand increased 17% to
2,059.6 tonnes.
Key geographies in the gold jewellery sector are India, China and the United
States. Over the past three years, these three geographies collectively accounted
for 46%, 54% and 62% respectively of the total annual jewellery demand for gold.
India was the main contributor to the growth in jewellery demand for growth in
2010 with a year-on-year increase of 69% from 442.4 tonnes in 2009 to 745.7
tonnes in 2010. This represented a record year for Indian jewellery demand, 13%
above the previous peak in 1998. In local currency terms, Indian jewellery demand
LETTER FROM THE BOARD
– 63 –

more than doubled between 2009 and 2010. A 20% rise in the rupee price of gold
combined with a 69% rise in volume demand resulted in a rise in the value demand
in 2010 to Rs1,342 billion against Rs669 billion in 2009.
Chinese jewellery demand expanded to 399.7 tonnes in 2010, an increase of
13% year-on-year. Between 2000 and 2004, Chinese jewellery demand remained
steady around 200 tonnes per annum. From 2004, demand has grown at an annual
compound growth rate of 10%. This has predominantly been driven by the rising
level of wealth within China’s middle class. In local currency terms, a 25% rise in
the Renminbi price of gold combined with a 13% rise in volume demand resulted
in a rise in the value demand in 2010 to RMB106 billion against RMB75 billion in
2009, an increase of 41%.
Proportion of Total Jewellery Demand Represented by India, China & United States
*Q4 component of 2010 numbers provisional at time of print
0%
10%
20%
30%
40%
50%
60%
70%
United States China India
2001 2002 2003 2004 2005 2006 2007 2008 2009 2010
Source: WGC and GFMS Ltd
Hong Kong’s jewellery demand for gold increased by 26% in 2010 to 20.6
tonnes. This is near the previous peaks in demand experienced in 2000 and 2001.
In the United States, the demand for gold jewellery has continued its recent
decline after reaching peaks of approximately 390 tonnes in the early 2000s. Gold
jewellery demand dropped to a level of 128.6 tonnes in 2010, a decrease of 14%
year-on-year. Generally, demand for gold jewellery in Europe remained steady
between 2009 and 2010 after a sharp decline between 2008 and 2009.
LETTER FROM THE BOARD
– 64 –

Historic Indian and Chinese Demand for Gold Jewellery
*Q4 component of 2010 numbers provisional at time of print
0
100
200
300
400
500
600
700
80020
01
2002
2003
2004
2005
2006
2007
2008
2009
2010
India (tonnes)
0
100
200
300
400
500
600
700
800
2001
2002
2003
2004
2005
2006
2007
2008
2009
2010
China (tonnes)
Source: WGC and GFMS Ltd
(c) Industrial Demand
In 2010, the annual industrial demand for gold increased by 12% to 419.6
tonnes. In value terms, the annual industrial demand increased by 41% to a record
US$17 billion. The majority of this increase in demand came from the electronics
sector. The annual electronics sector demand for gold increased by 16% year-on-
year in 2010 to 287.0 tonnes. Electronics demand has experienced double-digit
growth in the previous four consecutive quarters as the sector recovered from the
challenging economic environment of early 2009.
1.3 Historical and current gold supply
Primary gold supply consists of mine production. Secondary supply consists of
scrap metal recycle and sales by Government Central Banks of reserve stocks. Official
reserve stock sales, once a large component of gold supply, have been largely reduced
as a secondary supply source since early 2009. However, rising mine production and
gold scrap supply have increased. Global gold mine production increased by
approximately 7% and 3% in 2008–2009 and 2009–2010 respectively.
LETTER FROM THE BOARD
– 65 –
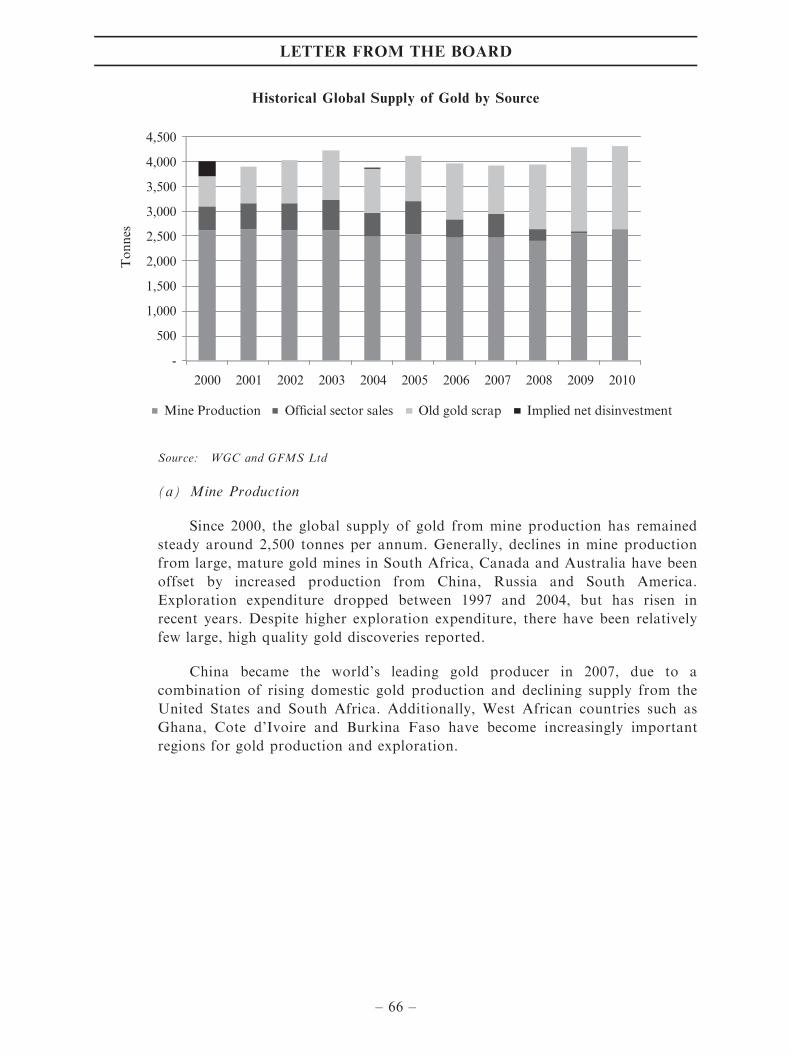
Historical Global Supply of Gold by Source
2000 2001 2002 2003 2004 2005 2006 2007 2008 2009 2010
-
500
1,000
1,500
2,000
2,500
3,000
3,500
4,000
4,500T
onne
s
Mine Production Official sector sales Old gold scrap Implied net disinvestment
Source: WGC and GFMS Ltd
(a) Mine Production
Since 2000, the global supply of gold from mine production has remained
steady around 2,500 tonnes per annum. Generally, declines in mine production
from large, mature gold mines in South Africa, Canada and Australia have been
offset by increased production from China, Russia and South America.
Exploration expenditure dropped between 1997 and 2004, but has risen in
recent years. Despite higher exploration expenditure, there have been relatively
few large, high quality gold discoveries reported.
China became the world’s leading gold producer in 2007, due to a
combination of rising domestic gold production and declining supply from the
United States and South Africa. Additionally, West African countries such as
Ghana, Cote d’Ivoire and Burkina Faso have become increasingly important
regions for gold production and exploration.
LETTER FROM THE BOARD
– 66 –

World Mine Production by Country
- 2 4 6 8 10 12
ChinaAustralia
United StatesSouth Africa
RussiaPeru
IndonesiaGhana
UzbekistanCanada
BrazilMexico
Papua New GuineaChile
2009 Mine Production (Moz.) 2010e Mine Production (Moz.)
Source: Data courtesy of the U.S. Geological Survey
(b) Gold Scrap
Gold scrap supply is generally sourced from old jewellery stocks.
Historically, jewellery scrap sales account for approximately double the
proportion of total supply as central bank sales. Gold scrap sales are generally
considered to be a highly variable source of supply, thought to be correlated to the
prevailing gold spot price. Because gold jewellery typically retails for a lower
premium in emerging economies, scrap supply is far more mobile in these markets
than in developed economies. Rising gold prices encouraged an increase of
approximately 27% in gold scrap supply between 2008 and 2009. Despite falling
1% between 2009 and 2010, scrap supply remained at historically high levels.
(c) Official Sector Sales
Central banks in developed markets hold large gold stocks, perhaps as a
legacy of the gold standard and Bretton Woods agreement. Over the past twenty
years, official sector sales of these gold stocks have comprised an important
portion of global supply. This historical supply position was reversed in early
2009, as the official sector became a net buyer of gold, and continued through
2010. Net central bank purchases totalled approximately 87 tonnes in 2010. The
Russian central bank, alone, accounted for net purchases of 140 tonnes of gold.
Other important official sector buyers include Thailand, Bangladesh and
Venezuela. Sales by signatories to the third Central Bank Gold Agreement
(CBGA3) were minimal, totalling less than 7 tonnes in 2010.
LETTER FROM THE BOARD
– 67 –

The International Monetary Fund (the IMF) recently completed the sale of
one-eighth of its gold portfolio, totalling 403.3 tonnes. The first stage of these
gold sales was executed in off-market deals with central banks, thus leaving the
total official sector gold holdings unchanged. The IMF sold a total of 222 tonnes
of gold to four central banks during this stage. In February 2010, the second
phase of the programme commenced with on-market sales of approximately 18
tonnes per month, eventually concluding in December 2010.
1.4 Historical market price of gold and its fluctuation
10 Year Gold Price Chart
US
dolla
r pe
r ou
nce
Source: www.kitco.com
Over the last 10 year period, the price of gold in US dollar currency has
appreciated by 446% and exhibited a volatility of 51% (measured as a standard
deviation from the mean and based on London PM fix).
LETTER FROM THE BOARD
– 68 –

5 Year Gold Price Chart
US
dolla
r pe
r ou
nce
Source: www.kitco.com
Over the last 5 year period, the price of gold in US dollar currency has appreciated
129% and exhibited a volatility of 27% (measured as standard deviation from the
mean and based on London PM fix).
1 Year Gold Price Chart
US
dolla
r pe
r ou
nce
Source: www.kitco.com
Over the last 1 year period, the price of gold in US dollar currency has appreciated
32% and exhibited a volatility of 7% (measured as standard deviation from the mean
and based on London PM fix).
LETTER FROM THE BOARD
– 69 –

6 Month Gold Price Chart
US
dolla
r pe
r ou
nce
Source: www.kitco.com
Over the last 6 month period, the price of gold in US dollar currency has
appreciated 15% and exhibited a volatility of 3% (measured as standard deviation
from the mean and based on London PM fix).
60 Day Gold Price Chart
US
dolla
r pe
r ou
nce
Source: www.kitco.com
Over the last 60 day period, the price of gold in US dollar currency has
appreciated by 7% and exhibited a volatility of 3% (measured as a standard deviation
from the mean and based on London PM fix).
LETTER FROM THE BOARD
– 70 –
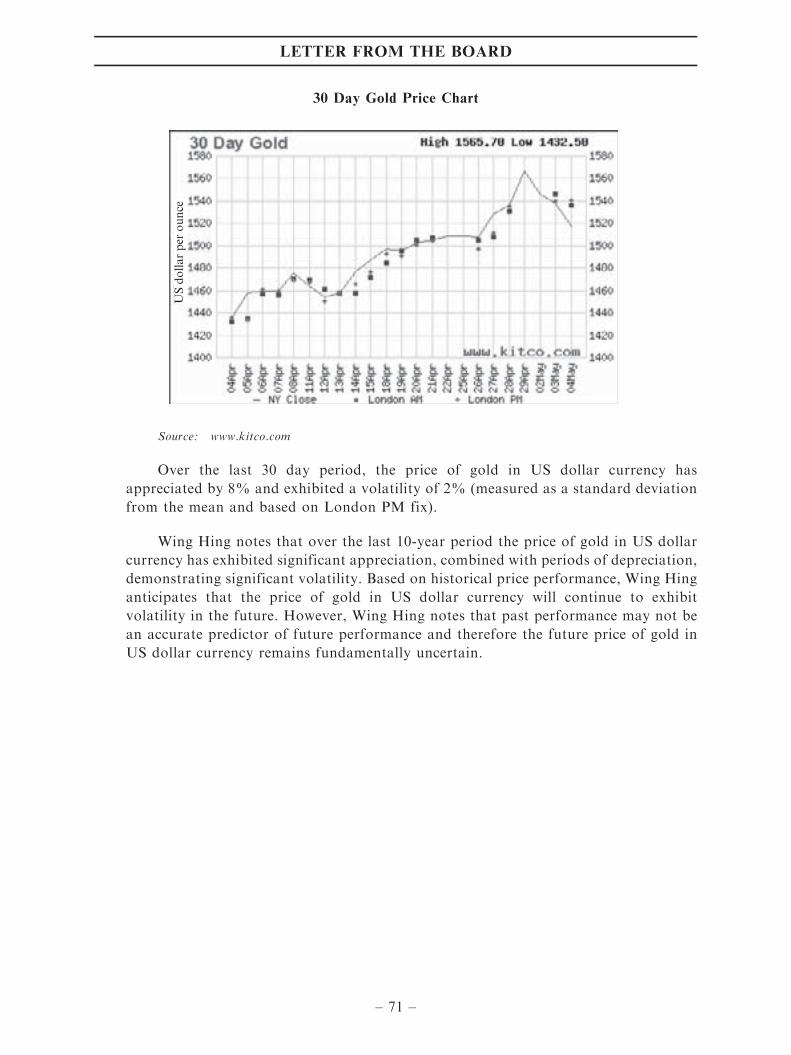
30 Day Gold Price Chart
US
dolla
r pe
r ou
nce
Source: www.kitco.com
Over the last 30 day period, the price of gold in US dollar currency has
appreciated by 8% and exhibited a volatility of 2% (measured as a standard deviation
from the mean and based on London PM fix).
Wing Hing notes that over the last 10-year period the price of gold in US dollar
currency has exhibited significant appreciation, combined with periods of depreciation,
demonstrating significant volatility. Based on historical price performance, Wing Hing
anticipates that the price of gold in US dollar currency will continue to exhibit
volatility in the future. However, Wing Hing notes that past performance may not be
an accurate predictor of future performance and therefore the future price of gold in
US dollar currency remains fundamentally uncertain.
LETTER FROM THE BOARD
– 71 –

1.5 Major market participants, extent of competition, entry/exit barriers, future
opportunities and challenges
The ten largest gold producing companies (ranked by gold production) as at 31
December 2010 were:
Rank: Name: 2010 Production (Moz.):
1 Barrick 7.77
2 Newmont 5.39
3 AngloGold 4.52
4 Gold Fields 3.50
5 Goldcorp 2.52
6 Kinross 2.33
7 Freeport 1.89
8 Newcrest 1.76
9 Polyus 1.39
10 Buenaventura 1.10
Source: 2010 Company Annual Reports
Barrick Gold Corporation is a Canadian company with a primary listing on the
Toronto Stock Exchange (TSX) and operations in North America, South America,
Africa and Asia-Pacific regions.
Newmont Mining Corporation is an American company with a primary listing on
the New York Stock Exchange (NYSE) and operations in the United States, Indonesia,
Australia, New Zealand, Ghana and Peru.
AngloGold Ashanti Limited is a South African company with a primary listing on
the Johannesburg Stock Exchange (JSE) and operations in the United States, Brazil,
Argentina, Namibia, South Africa, Guinea, Mali, Ghana, Tanzania and Australia.
Gold Fields Limited is a South African company with a primary listing on the JSE
and operations in South Africa, Ghana, Peru and Australia.
Goldcorp Incorporated is a Canadian company with a primary listing on the TSX
and operations in Canada, the United States, Mexico, Guatemala, Argentina, the
Dominican Republic and Chile.
Kinross Gold Corporation is a Canadian company with a primary listing on the
TSX and operations in Canada, the United States, Brazil, Chile, Ecuador, Russia,
Ghana and Mauritania.
Freeport-McMoRan Copper & Gold Incorporated is an American registered
company with a primary listing on the NYSE and operations in the United States,
Chile, Peru, Spain, the Democratic Republic of Congo and Indonesia.
LETTER FROM THE BOARD
– 72 –
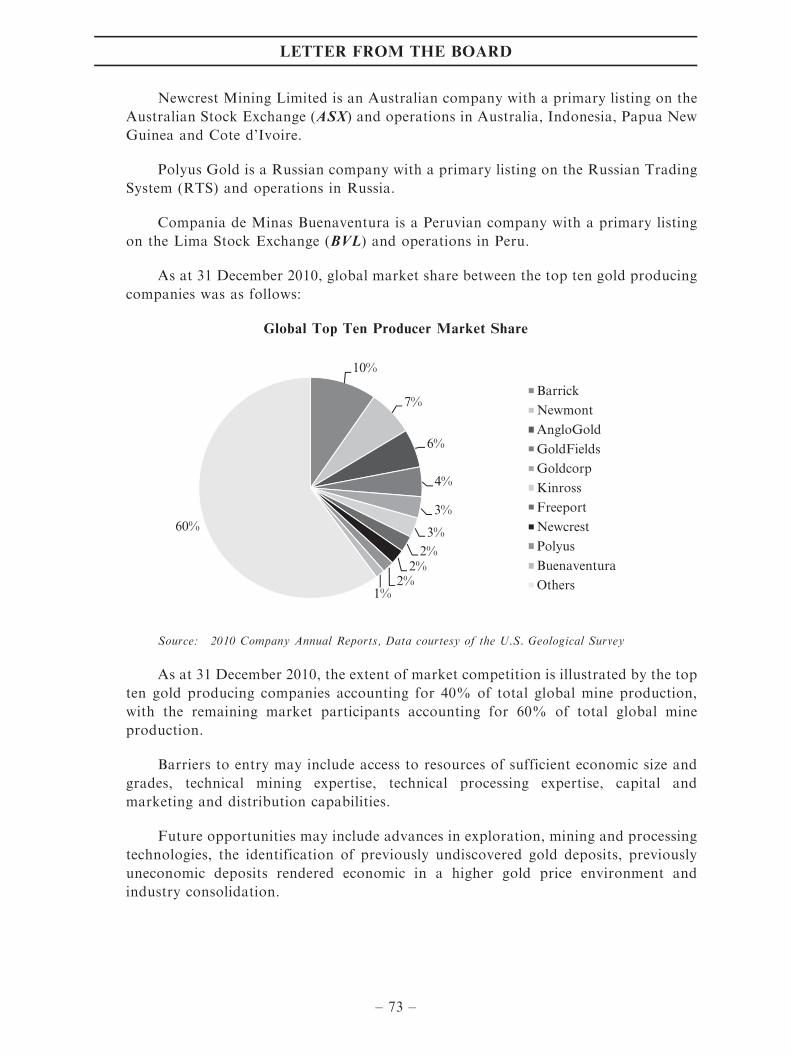
Newcrest Mining Limited is an Australian company with a primary listing on the
Australian Stock Exchange (ASX) and operations in Australia, Indonesia, Papua New
Guinea and Cote d’Ivoire.
Polyus Gold is a Russian company with a primary listing on the Russian Trading
System (RTS) and operations in Russia.
Compania de Minas Buenaventura is a Peruvian company with a primary listing
on the Lima Stock Exchange (BVL) and operations in Peru.
As at 31 December 2010, global market share between the top ten gold producing
companies was as follows:
Global Top Ten Producer Market Share
10%
7%
6%
4%
3%
3%2%
2%2%
1%
60%
Barrick
Newmont
AngloGold
GoldFields
Goldcorp
Kinross
Freeport
Newcrest
Polyus
Buenaventura
Others
Source: 2010 Company Annual Reports, Data courtesy of the U.S. Geological Survey
As at 31 December 2010, the extent of market competition is illustrated by the top
ten gold producing companies accounting for 40% of total global mine production,
with the remaining market participants accounting for 60% of total global mine
production.
Barriers to entry may include access to resources of sufficient economic size and
grades, technical mining expertise, technical processing expertise, capital and
marketing and distribution capabilities.
Future opportunities may include advances in exploration, mining and processing
technologies, the identification of previously undiscovered gold deposits, previously
uneconomic deposits rendered economic in a higher gold price environment and
industry consolidation.
LETTER FROM THE BOARD
– 73 –

Future challenges may include a decrease in the gold price, increasing costs of
labour, materials and other inputs, a decline in the demand of gold, an increase in the
supply of gold (from either primary or secondary supply sources) and the lack of
available technical mining expertise or technical processing expertise and the lack of
available capital.
1.6 Specific market environment for gold mining exploration and exploitation in South
Africa
Historically, the South African gold mining industry is thought to have produced
an estimated 40% of the world’s total gold supply. A significant component of this
production has been sourced from the gold reefs of the Witswatersrand Basin.
Discovered over a century ago, these resources were a major factor in the initial
colonisation and economic development of South Africa. Over 100 years of production
from this region has resulted in ore reserve depletion, deepening mine shafts and
declining ore grades. AngloGold Ashanti’s TauTona and Savuka gold mines in South
Africa are currently the deepest mining operations in the world, reaching nearly 4
kilometres in depth below the surface. Over the past decade, South Africa’s share of
the world gold market has declined. However, the gold mining industry remains an
important component of the South African economy.
South Africa’s largest gold companies are AngloGold Ashanti, Gold Fields and
Harmony. Of these three companies, Harmony has the greatest proportion of its
producing assets located in South Africa. Other large South African gold mining
companies include DRD Gold, Great Basin Gold and Pan-African Resources.
2. LAWS AND REGULATIONS RELATING TO THE MINING INDUSTRY IN
SOUTH AFRICA
2.1 Overview
The mining industry in South Africa is subject to extensive laws and regulations.
These laws and regulations cover a range of areas including, but not limited to,
prospecting rights, mining rights, production rights, health and safety issues and
environmental matters.
The key regulator overseeing the mining industry in South Africa is the South
African Department of Mineral Resources (the DMR) and the key laws and regulations
which the Taung Group’s assets and businesses are subject to are set out below.
2.2 Mineral and Petroleum Resources Development Act 28 of 2002
In terms of the current regulatory regime which became effective on 1 May 2004
with the implementation of the MPRDA, the State became the custodian of all the
mineral and petroleum resources in South Africa for the benefit of all South Africans.
LETTER FROM THE BOARD
– 74 –
The objectives of the MPRDA are inter alia to recognise the internationally
accepted right of the State to exercise sovereignty over the mineral and petroleum
resources within the Republic of South Africa, to give effect to the principle of the
State’s custodianship over mineral and petroleum resources, to promote economic
growth and the development of mineral and petroleum resources, to expand
opportunities for historically disadvantaged persons, to promote employment, to
advance the social and economic development of all South Africans, to ensure that the
holders of mining and production rights contribute towards the socio-economic
development of the areas in which they operate and to provide for the security of
tenure in respect of prospecting, exploration, mining and production operations.
The State regulates the mineral industry through the MMR and the MMR has the
right to inter alia grant, issue, administer and manage prospecting and mining rights.
A prospecting or mining right granted in terms of the MPRDA is a limited real
right in respect of the mineral and the land to which such right relates.
In order to protect the rights of existing holders of inter alia prospecting permits
or mining authorizations issued in terms of the Minerals Act, 1991 (Old Order Rights),
certain transitional provisions were included in the MPRDA which allowed for the
conversion of such Old Order Rights into the new order rights introduced by the
MPRDA. The MPRDA established a ‘‘use-it or lose-it’’ principle, and the holders of
the Old Order Rights had to apply for the conversion of these Old Order Rights into
new order rights within certain timeframes, failing which these rights have lapsed.
Once the DMR has granted the conversion of an Old Order Right or has granted a
new order right to an applicant who submitted an application after the implementation
of the MPRDA, a notarial agreement is entered into between the MMR and the holder
of the new order right. This notarial agreement is registered with the Mineral and
Petroleum Registrations Office and inter alia sets out the terms and conditions under
which the right was granted, its duration and renewal.
If any material term of the right has been breached the MMR has the right to
suspend or cancel the right after, inter alia, notice to this effect has been given to the
holder of the right in which the reasons for the MMR’s intention to cancel or suspend
the right were provided. The MMR must also give directions to the holder to remedy
the breach and the MMR may only cancel or suspend the right if the holder did not
take the measures directed by the MMR to remedy the breach and after the holder’s
representations have been considered.
The holders of prospecting and mining rights also have to comply with the
approved environmental management plans and programmes submitted and approved
during the application processes of the said rights.
LETTER FROM THE BOARD
– 75 –

The different types of new order rights and permits applicable to the mining
industry in South Africa, as provided for in the MPRDA, are listed below.
LICENCE TYPE PURPOSE DURATION REQUIREMENTS CONDITIONS
Reconnaissance
Permission
Exploration at the
reconnaissance
stage
2 years (non
renewable)
Financial ability;
technical ability;
and
reconnaissance
work programme
Holder does not have
the exclusive right to
apply for a
Prospecting Right or
Mining Right.
Reconnaissance
Permission may not
be transferred, ceded,
let, sublet, alienated,
disposed of or
encumbered by
mortgage.
Prospecting Right Exploration at
target-definition
stage
Up to 5 years
initially.
Renewable once
for 3 years
Financial ability;
technical ability;
expenditure is
compatible with
work programme;
prospecting work
programme;
environmental
plan
Payment of Prospecting
fees. Holder has the
exclusive right to
apply for a Mining
Right. A prospecting
right may be ceded,
transferred, let,
sublet, assigned,
alienated and
otherwise disposed of
with the approval of
the MMR.
Retention Permit Hold on to legal
rights between
prospecting and
mining stages
3 years initially.
Renewable once
for 2 years
Prospecting stage
complete;
feasibility study
complete; project
not currently
feasible due to
market
conditions.
May not result in
exclusion of
competition, unfair
competition or result
in concentration of
minerals in hands of
applicant. Holder has
exclusive right to be
granted a mining
right. Retention
Permit may not be
transferred, ceded,
let, sublet, alienated,
disposed of or
mortgaged or
encumbered in any
way.
LETTER FROM THE BOARD
– 76 –

LICENCE TYPE PURPOSE DURATION REQUIREMENTS CONDITIONS
Mining Right Development and
production stage
30 years initially.
Renewable for
further periods of
30 years,
effectively for the
length of the
mine.
Financial ability;
technical ability;
prospecting
complete;
financing is
compatible with
intended
operations,
mining work
programme; social
plan; labour plan;
and completed
EMP
Payment of royalties
(from 2010).
Compliance with
inter alia EMP,
Mining Charter and
Codes of Good
Practice on broad-
based BEE (BBBEE.).
A mining right may
be ceded, transferred,
let, sublet, assigned,
alienated and
otherwise disposed of
with the approval of
the MMR
Mining Permit Small-scale mining 2 years initially.
Renewable for 3
further periods of
1 year each.
Life of project must
be 52 years;
areas must be
51.5Ha; and
completed EMP
Payment of royalties
(from 2010).
May not be
transferred, ceded,
let, sublet, alienated
or disposed of but
may be mortgaged.
The Evander Project is the subject of a mining right whilst the Jeanette Project is
the subject of a prospecting right.
2.3 Broad-based Socio-Economic Charter (the Mining Charter)
Sections 2(d) and 2(f) of the MPRDA, are commonly known as the ‘‘empowerment
objectives’’ of the MPRDA and they specifically provide:
‘‘2(d) [an objective of the MPRDA is to] substantially and meaningfully expand
opportunities for historically disadvantaged persons, including women, to enter the
mineral and petroleum industries and to benefit from the exploitation of the nation’s
mineral and petroleum resources;’’ and
‘‘2(f) [an objective of the MPRDA is to] promote employment and advance the
social and economic welfare of all South Africans’’.
The significance of the empowerment objectives is that an old order mining right
holder (right holder) had to submit as part of its application for the conversion of its
old order mining right an undertaking that, and the manner in which, the right holder
would give effect to the objects referred to in section 2(d) and 2(f) of the MPRDA,
being the empowerment objectives.
LETTER FROM THE BOARD
– 77 –

Section 100(2)(a) of the MPRDA, provides that:
‘‘To ensure the attainment of Government’s objectives of redressing historical,
social and economic inequalities as stated in the Constitution, the Minister must
within six months from the date on which this Act (the MPRDA) takes effect,
develop a broad-based socio-economic empowerment Charter that will set the
framework-targets and timetable for effecting the entry of historically
disadvantaged South African into the mining industry, and allow such South
Africans to benefit from the exploitation of mining and mineral resources.’’
Such Mining Charter has been gazetted. The Mining Charter amplifies the
empowerment objectives by indicating the specific steps which applicants for
conversion of Old Order Rights must take to convert those rights, alternatively
which steps new applicants for prospecting and mining rights must take to ensure
the granting of those rights.
The Mining Charter suggests broadly that certain criteria would be
holistically considered by the DMR when considering an application for a
prospecting right and a mining right, namely:
— Ownership: 26% ownership by historically disadvantaged South
African’s (HDSAs) must be facilitated within ten years of 1 May 2004;
— Procurement: procurement has been broken down to three levels
namely capital goods, services and consumables and stakeholders
undertook to give HDSAs a preferred supplier status in all three levels
of procurement. It is also noted that the Preferential Procurement
Framework Act No. 5 of 2000 would assist socio-economic
empowerment.
— Employment: companies will be expected to comply with obligations
under the Employment Equity Act No. 55 of 1998 which promotes
affirmative action in South Africa. The objective was to achieve a base
line of 40% HDSA participation in management within five years of 1
May 2004 and a base line of 10% of women participation in the mining
industry within five years;
— Upliftment: applicants of rights undertook to inter alia ensure that
employees are functionally literate.
To provide the mining industry with an indication as to how the criteria
referred to in the Charter for conversions will be evaluated, the DMR circulated a
‘‘scorecard for the broad based socio-economic empowerment Charter for the South
African mining industry’’.
LETTER FROM THE BOARD
– 78 –

In addition, a clarification document was issued by the DMR on 14 July 2004
seeking to clarify misconceptions that may have arisen as a result of the
interpretation and application of the MPRDA and the Charter with regard to
unused rights and pending applications.
An amendment of the Mining Charter was published by the DMR in
September 2010. The amended Mining Charter effectively retained the 26%
HDSA ownership targets set for 2014 and also introduced a target of 26%
‘‘meaningful economic participation’’ as defined by 2014. The value of
beneficiation as provided for in the MPRDA can be offset to a maximum of
11% of the ownership target. With regard to employment equity a minimum of
40% HDSA representation is required at all management levels by 2014 and the
mining industry must invest a certain percentage of payroll in essential skills
development activities.
2.4 Promotion of Beneficiation Bill
This is still in the process of being finalised, and is expected to provide incentives
for upstream companies that facilitate downstream investments, in order to reduce the
exporting of unprocessed mineral products and to promote local value addition.
2.5 Mineral and Petroleum Resources Royalty Act, 28 of 2008 (the MPRRA)
The MPRRA incorporates the government’s intention to impose royalties on
revenues derived from mineral production in South Africa. The main purpose of the
MPRRA was to provide legislation for the collection of royalties from mines,
developed and operated in terms of the new order mining and other right granted in
terms of the MPRDA.
The MPRRA came into operation on 1 May 2010 and provides for the payment of
royalties on the transfer of mineral resources to the South African government. A
transfer of a mineral resource is defined as inter alia the disposal or export of mineral
resources recovered.
The royalties payable are formulae based and take into account the profitability
of the mining company.
There are a number of challenges with the administration of the MPRRA, in that
it needs to be linked to existing tax legislation, which clearly defines mining and
industrial tax rates based on a profitability formula. The intention is not to facilitate
double taxation.
The MPRRA distinguishes between refined and unrefined mineral resources,
where refined minerals have been refined beyond a condition specified by the MPRRA,
and unrefined minerals have undergone limited beneficiation as specified by the
MPRRA.
LETTER FROM THE BOARD
– 79 –

The royalty is determined by multiplying the gross sales value of the extractor, in
respect of that mineral resource, in a specified year, by the percentage determined by
the royalty formula.
Both direct operating expenditure (Opex) and capital expenditure (Capex)
incurred is deductable for the determination of earnings before interest and tax
(EBIT). The quantum of the revenue royalty on all minerals is dependent on the
profitability of the company based on the following formula. For Refined Mineral
Resources the formula is:
Royalty Rate = 0.5 +EBIT
x 100Gross Sales (refined) x 12.5
The maximum percentage for Refined Mineral Resources is 5%.
For Unrefined Mineral Resources the formula is:
Royalty Rate = 0.5 +EBIT
x 100Gross Sales (unrefined) x 9
The maximum percentage for Unrefined Mineral Resources is 7%.
The EBIT in the above formula shall be zero before the cumulative cashflow of the
projects becomes positive. Capex incurred is deductable for the determination of EBIT,
as stated above.
2.6 Taxation
Gold mining companies are taxed according to a formula, as shown in the table
below, and such companies may elect whether to pay Secondary Tax on Companies
(STC) separately. For companies that elect to pay STC separately, STC is only payable
if dividends are declared. If no dividends are declared, no STC is payable.
COMPANIES ELECTING TO
PAY STC SEPARATELY
COMPANIES ELECTING TO
NOT PAY STC SEPARATELY
Y = 34–(170/X) Y = 43–(215/X)
Y = % tax rate
X = ratio expressed as a percentage which the taxable income from gold mining
bears to the total turnover from gold mining
LETTER FROM THE BOARD
– 80 –
2.7 Environmental Legislation
The key environmental legislation applicable in South Africa is as follows:
— National Environmental Management Act (107 of 1998) as regulated by the
Department of Environmental Affairs and relevant Provincial Departments
of Environmental Affairs;
— MPRDA and its Regulations as regulated by the DMR; and
— Mine Health and Safety Act (Act 29 of 1996) as regulated by the DMR. This
deals with the protection of the health and safety of persons in the mining
industry but also has implications for environmental issues related to
environmental health monitoring within mines.
Additional relevant legislation includes the following:
— National Water Act (36 of 1998);
— Atmospheric Pollution Prevention Act (45 of 1965);
— Environment Conservation Act (73 of 1989);
— National Heritage Resources Act (25 of 1999);
— Hazardous Substances Act (15 of 1973);
— National Forest Acts (84 of 1998).
2.8 Exchange controls
The export of capital from South Africa is restricted. In particular, Taung Gold is
generally not permitted (i) to export capital from South Africa if the export is not in
line with current exchange control rulings; (ii) to hold foreign currency for a period of
longer than six months offshore; or (iii) incur indebtedness denominated in foreign
currencies without the approval of the South African exchange control authorities.
If Taung Gold were to have an offshore subsidiary or offshore operations, it could
raise capital and retain dividends offshore and use the capital for any purpose on
condition that (i) there is no recourse to South Africa; (ii) the dividends may not be re-
invested in the Common Monetary Area; and (iii) it is annually reported to SARB.
Taung Gold is permitted to acquire an interest in a foreign venture with the approval
of SARB.
LETTER FROM THE BOARD
– 81 –
3. NATURE AND QUALITY OF THE TAUNG GROUP’S ASSETS AND
BUSINESSES
3.1 Overview
The Taung Group is engaged in the acquisition, exploration and development of
mineral assets in respect of gold (and minerals associated with gold) located in South
Africa. On the First Completion Date, Arctic will hold no less than 26.0% of the issued
share capital of Taung Gold. Taung Gold holds via its wholly-owned subsidiaries
various rights with respect to, among others, the Evander Project and the Jeanette
Project, which are the primary projects of the Taung Group.
(a) Competent Persons Report
The Competent Persons Report is set out in Appendix IV of this Circular and
is prepared by Venmyn. Venmyn is an independent advisory company whose
consultants have extensive experience in preparing competent persons reports,
technical advisors reports and valuation reports for mining and exploration
companies. Venmyn has experience in preparing competent persons reports and
technical reports for companies listed on the Toronto Stock Exchange, the
Australian Stock Exchange, the London Stock Exchange and the Alternative
Investment Market of the London Stock Exchange, as well as the Johannesburg
Stock Exchange.
The signatories to the Competent Persons Report are qualified to express
their professional opinions on the technical and economic aspects of the mineral
assets described and their relevant competent persons’ certificates are appended to
the Competent Persons Report.
The techno-economic review of the gold assets in the Evander Project and
Jeanette Project was compiled in accordance with Chapter 18 of the Listing Rules
and also in accordance with:
— the JORC Code; and
— the SAMREC Code.
The Competent Persons Report describes and documents the Evander
Project, Jeanette Project and the Greenfield Projects of the Taung Group.
According to the Competent Persons Report, the total estimated Measured and
Indicated gold resources of the Evander Project and the Jeanette Project amount
to an aggregate of approximately 11.725 million ounces.
The effective date of the Competent Persons Report is 11 February 2011. There
have not occurred any material changes since the effective date of the Competent
Persons Report.
LETTER FROM THE BOARD
– 82 –
(b) Valuation Report
The Valuation Report is set out in Appendix V of this Circular and is
prepared by BMI. The Valuation Report is an independent valuation report on
the material assets of the Taung Group. The valuation to be included in the
Valuation Report is prepared in accordance with the VALMIN Code, which
complies with the requirements under Chapter 18 of the Listing Rules. The
methodology adopted is the discounted cash flow methodology and Inferred
Resources of the Taung Group’s projects will be excluded from the valuation. The
date of valuation of the Valuation Report is 30 April 2011. The Valuation Report
only takes into account the Evander Project and the Jeanette Project and value
has been attached only to the reserves for the Evander Project and the Jeanette
Project.
3.2 The locations of the Evander Project and the Jeanette Project
The Evander Project comprises the Six Shaft area and the Twistdraai area in the
eastern Highveld and on the north-eastern limb of the Witwatersrand Basin of the
Mpumalanga Province of South Africa, covering an area of approximately 5,129
hectares. The Jeanette Project, in the Jeanette area within the southwest margin of the
Witwatersrand Basin, northeast of Welkom, in the Free State Province of South
Africa, covers an area of approximately 3,886 hectares. The following map shows the
location of the Evander Project and the Jeanette Project.
LETTER FROM THE BOARD
– 83 –

LETTER FROM THE BOARD
– 84 –
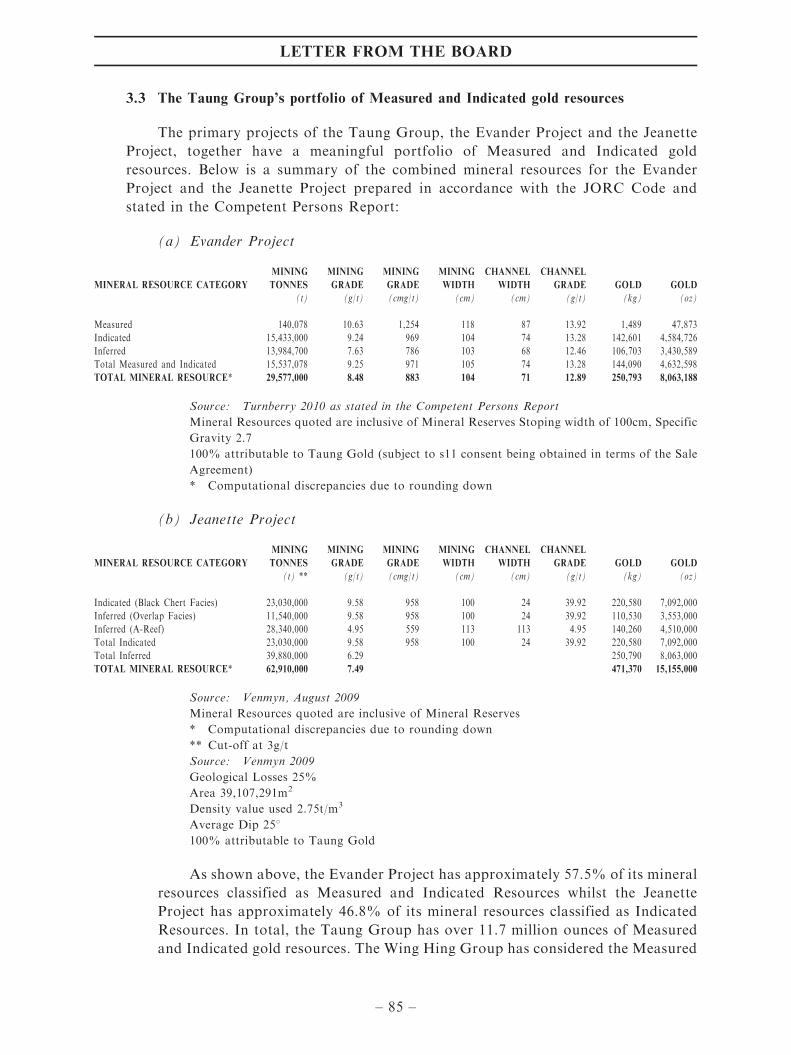
3.3 The Taung Group’s portfolio of Measured and Indicated gold resources
The primary projects of the Taung Group, the Evander Project and the Jeanette
Project, together have a meaningful portfolio of Measured and Indicated gold
resources. Below is a summary of the combined mineral resources for the Evander
Project and the Jeanette Project prepared in accordance with the JORC Code and
stated in the Competent Persons Report:
(a) Evander Project
MINERAL RESOURCE CATEGORY
MINING
TONNES
MINING
GRADE
MINING
GRADE
MINING
WIDTH
CHANNEL
WIDTH
CHANNEL
GRADE GOLD GOLD
(t) (g/t) (cmg/t) (cm) (cm) (g/t) (kg) (oz)
Measured 140,078 10.63 1,254 118 87 13.92 1,489 47,873
Indicated 15,433,000 9.24 969 104 74 13.28 142,601 4,584,726
Inferred 13,984,700 7.63 786 103 68 12.46 106,703 3,430,589
Total Measured and Indicated 15,537,078 9.25 971 105 74 13.28 144,090 4,632,598
TOTAL MINERAL RESOURCE* 29,577,000 8.48 883 104 71 12.89 250,793 8,063,188
Source: Turnberry 2010 as stated in the Competent Persons Report
Mineral Resources quoted are inclusive of Mineral Reserves Stoping width of 100cm, Specific
Gravity 2.7
100% attributable to Taung Gold (subject to s11 consent being obtained in terms of the Sale
Agreement)
* Computational discrepancies due to rounding down
(b) Jeanette Project
MINERAL RESOURCE CATEGORY
MINING
TONNES
MINING
GRADE
MINING
GRADE
MINING
WIDTH
CHANNEL
WIDTH
CHANNEL
GRADE GOLD GOLD
(t) ** (g/t) (cmg/t) (cm) (cm) (g/t) (kg) (oz)
Indicated (Black Chert Facies) 23,030,000 9.58 958 100 24 39.92 220,580 7,092,000
Inferred (Overlap Facies) 11,540,000 9.58 958 100 24 39.92 110,530 3,553,000
Inferred (A-Reef) 28,340,000 4.95 559 113 113 4.95 140,260 4,510,000
Total Indicated 23,030,000 9.58 958 100 24 39.92 220,580 7,092,000
Total Inferred 39,880,000 6.29 250,790 8,063,000
TOTAL MINERAL RESOURCE* 62,910,000 7.49 471,370 15,155,000
Source: Venmyn, August 2009
Mineral Resources quoted are inclusive of Mineral Reserves
* Computational discrepancies due to rounding down
** Cut-off at 3g/t
Source: Venmyn 2009
Geological Losses 25%
Area 39,107,291m2
Density value used 2.75t/m3
Average Dip 258100% attributable to Taung Gold
As shown above, the Evander Project has approximately 57.5% of its mineral
resources classified as Measured and Indicated Resources whilst the Jeanette
Project has approximately 46.8% of its mineral resources classified as Indicated
Resources. In total, the Taung Group has over 11.7 million ounces of Measured
and Indicated gold resources. The Wing Hing Group has considered the Measured
LETTER FROM THE BOARD
– 85 –

and Indicated Resource position of a number of publicly listed companies whose
business is in the exploration and development of gold globally with a market
capitalisation of over US$200 million and the Taung Group’s portfolio of
Measured and Indicated Resources is substantial when compared to the average
of those considered companies. This data was collected from a variety of market
sources including market data, company disclosures, and analyst research. The
resources referred to are all compliant with the JORC, NI 43-101 or SAMREC
industry standards and assessed as such by the relevant Competent Persons.
3.4 The Evander Project
(a) Infrastructure and planned infrastructure of the Evander Project
The Evander Project is situated in well developed industrial and mining areas
of South Africa with other operating mines in the immediate vicinity. Gold and
coal mining has been conducted in the Evander Project area for 50 years and
consequently, access and mining related infrastructure is well developed. Access
to Six Shaft is by well-maintained paved roads and the area has well established
rail links and an air field. The map below shows the railway, power lines and road
route of the area near the Six Shaft and Twistdraai areas.
LETTER FROM THE BOARD
– 86 –

LETTER FROM THE BOARD
– 87 –

Six Shaft is a surface shaft system which began reef production in 1986 but
was decommissioned in 1998. It is a vertical shaft complex, comprising an 8.5
metre diameter man, material and rock hoisting shaft and a 6.0 metre diameter
ventilation shaft. The main shaft is 1,377 metres deep below surface and services
mining operations is from above 17 level which is 1,300 metres below surface. The
ventilation shaft (780 metres deep) is equipped with a brattice wall, buntons and
guides for an emergency cage. The mine was in production for a period of 13 years
from 1986 to 1998 processing a total of 2.3 million tonnes of reef at an estimated
mill feed grade of 6.0g/t gold. At mine closure, the shaft had not reached its
planned depth and was unable to exploit the deeper steep reserves or any of the
flat dipping reserves. The Six Shaft shaft winders, headgear, pumps and ancillary
equipment were sold to a third party. The original design capacity of the shaft was
200,000tpm, although mining and ventilation constraints resulted in historically
lower production rates. The shaft complex is equipped with three main surface
ventilation fans, rated to circulate 450kg/s of air. There is limited cooling plant
installation which includes a 450kg/s bulk air cooler.
No access exists either from surface or neighbouring shafts into the
Twistdraai area.
Electrical and water supply infrastructure is very well established in this
portion of the Mpumalanga Province. Electrical supply is provided through an
agreement with Eskom (the electrical service parastatal in South Africa). Water is
supplied by a parastatal organisation from the Vaal River, and water supply to
the Evander Project area is unlikely to be a future limiting factor since most of the
current mining operations were planned with greater production profiles than are
currently operable. A 160Mm3 per annum water pipeline, delivering water from
the Vaal River has recently been completed.
LETTER FROM THE BOARD
– 88 –

(b) Prospecting rights and approvals
The mining right which covers the Evander Project is currently held by EGM
Limited, a subsidiary of Harmony. EGM Limited was granted the Mining Right
No 107/2010 on 29 April 2008 over an extensive mining area which includes the
Six Shaft and Twistdraai areas. The Mining Right No 107/2010 permits the
mining of gold and associated minerals in the Six Shaft and Twistdraai area. The
details of the Mining Right No 107/2010 are set out below:
Six Shaft
PROJECT FARM SIZE MINING RIGHT
COMMENCEMENT
DATE
EXPIRY
DATE MINERAL HELD BY
(HA)
Six Shaft Driefontein 137IS 2,453 MP30/5/1/2/2/1
26MR Mining
Right 107/2010
29 April 2008 30 Years Gold and
associated
minerals
New order
Mining Right
held by EGM
Limited
Holfontein 138 IS
Linana 493 IS
Czanik 534 IS
TOTAL 2,453
Twistdraai
PROJECT FARM SIZE MINING RIGHT
COMMENCEMENT
DATE
EXPIRY
DATE MINERAL HELD BY
(HA)
Twistdraai Goedehoop 290IS 2,677 MP30/5/1/2/2/1
26MR Mining
Right 107/2010
29 April 2008 30 Years Gold and
associated
minerals
New order
Mining Right
held by EGM
Limited
Twisdraai 285IS
Ferdi 486IS
Sasolkraai 289IS
Goedehoop 533IS
TOTAL 2,677
All governmental requirements to conduct exploration over the mining area
under the Evander Project have been met. Prior to the granting of the Mining
Right No 107/2010, EGM Limited has to obtain three approvals: (1) approval of
the mine works programme; (2) approval of the environmental management
programme; and (3) approval of the social and labour plan. These approvals have
all been obtained by EGM Limited. There are no legal proceedings or claims that
would affect the Taung Group’s ability to proceed with further investigation and
exploration activities at the Evander Project or that may have an influence on the
Taung Group’s right to explore or mine the Evander Project.
The Mining Right No 107/2010 is a converted mining right granted on 29
April 2008, registered on 15 October 2010 in respect of a mining area measuring
36,898 hectares, of which the Evander Project area (Six Shaft and Twistdraai),
measuring 5,129 hectares, forms part. It is valid for thirty years ending on 28
April 2038, and can be renewed for a further thirty years by submitting a renewal
application not later than 60 working days prior to the date of expiry of the right.
The Mining Right No 107/2010 was granted on condition that the holder honours
or carries out any agreement, arrangement or undertaking made in terms of the
LETTER FROM THE BOARD
– 89 –

approved mining work programme, environmental management programme and
social and labour plan. The right does not require production capacity to be met
by the holder of the right as this is not a requirement of the MPRDA.
The Mining Right No 107/2010 covers both exploration and exploitation in
the Evander Project areas. From the perspective of the MPRDA, so long as a
party is granted a mining right, this right will also give the holder a right to
conduct exploration on the area covered by that licence.
(c) Sufficient influence in decisions over exploration of gold resources
Although the mining right covering the Evander Project is not held by Taung
Gold as at the Latest Practicable Date, Taung Gold has sufficient influence in
decisions over the exploration of gold resources in the Evander Project through a
joint venture arrangement with EGM Limited whereby Taung Gold contributed
the financial resources and the technical expertise to actively explore the Evander
Project and EGM Limited contributed the Mining Right No 107/2010.
Taung Gold entered into a series of nine agreements with EGM Limited on
29 February 2008 (being the Earn-in Agreement) under which EGM Limited is
obliged to transfer the mining rights to Taung Gold after certain works have been
completed by Taung Gold. Through the Earn-in Agreement, Taung Gold gains
sufficient influence in decisions over the gold exploration activities in the Evander
Project and can still exercise (and is exercising) its rights to conduct exploration
over the mining area under the Evander Project.
The Earn-in ‘‘points’’
Under the Earn-in Agreement, in order for Taung Gold to ‘‘earn-in’’ an
interest in the Evander Project, Taung Gold is obliged to complete a Scoping
Study, a Pre-Feasibility Study and a Bankable Feasibility Study. As at the
Latest Practicable Date, Taung Gold has already completed the Scoping
Study for the Evander Project. The ‘‘earn-in’’ points in the Earn-in
Agreement are as follows:
— First ‘‘earn-in’’ point — Completion of the Pre-Feasibility
Study. When Taung Gold completes the Pre-Feasibility Study, it
will earn a 25% interest in Six Shaft and Twistdraai. Following
completion of the Pre-Feasibility Study, Taung Gold will assign its
right to the Pre-Feasibility Study to EGM Limited in return for an
allotment and issuance to Taung Gold of shares representing a total
of 25% interest in the rights to the Six Shaft and the Twistdraai
areas and certain assets under the Evander Project (the Sale
Assets).
— Second ‘‘earn-in’’ point — Completion of the Bankable Feasibility
Study. When Taung Gold completes the Bankable Feasibility
Study, it will earn an aggregate of 52% interest in Six Shaft and
LETTER FROM THE BOARD
– 90 –

Twistdraai. Upon successful completion of the Bankable Feasibility
Study and assignment of all rights in the Bankable Feasibility
Study to EGM Limited, EGM Limited will allot and issue further
shares representing a total of 52% interest in the rights to the Six
Shaft and the Twistdraai areas and certain assets under the
Evander Project.
Nature of Earn-In Agreements
Earn-in agreements are common in South Africa and in the exploration
industry. They are used globally and not just in South Africa. They are
mainly used when one party (the exploration licence holder or mining licence
holder) has a project which it believes is geologically prospective and another
party (the third party) wishes to secure an interest in this project. Rather than
acquiring a portion of the project, the third party agrees to fund (and
normally manage) exploration over the project. Generally, the greater the
portion of the capital expenditure committed by the third party, the greater
the interest such party can ‘‘earn-in’’ on the licence. An earn-in agreement is
effectively a joint venture agreement. In any mining joint venture there are
essentially three elements that need to be combined: a licence (prospecting or
mining), technical expertise and the money for the exploration. In many cases
a party may have the technical expertise and the licence but lack the money to
actively explore. In such cases, a third party may provide the funds in order
to ‘‘earn-in’’ on the project. Taung Gold has both the financial resources and
the technical expertise to actively explore the Evander Project. EGM
Limited’s ‘‘contribution’’ to this joint venture is the licence and Taung
Gold is contributing the funds and the expertise.
Taung Gold’s sole and exclusive right to conduct exploration
In order for Taung Gold to ‘‘earn-in’’ an interest in the Evander Project,
it must complete certain works. All required licenses, permits and approvals
have been obtained for Taung Gold to legally operate its exploration
activities in the Evander Project area and it is not required to separately
apply for an exploration licence for its operations to complete the Scoping
Study, the Pre-Feasibility Study and the Bankable Feasibility Study. Further,
Taung Gold has the sole and exclusive right to conduct the Scoping Study,
the Pre-Feasibility Study and the Bankable Feasibility Study:
— entirely at Taung Gold’s own cost and expense; and
— in accordance with industry best practice and in compliance with all
applicable laws, including environmental laws.
LETTER FROM THE BOARD
– 91 –

In achieving this goal, the contractual provisions in the Earn-in
Agreement have given Taung Gold:
— Scoping Study: the sole and absolute right to conduct exploration
over the Evander Project area and to conduct the works necessary
to complete the Scoping Study, upon completion of which the
Technical Committee shall determine whether the Scoping Study
should proceed to the Pre-Feasibility Study stage;
— Pre-Feasibility Study: the sole and absolute right to conduct
exploration over the Evander Project area and complete the works
necessary to complete the Pre-Feasibility Study; and
— Bankable Feasibility Study: the sole and absolute right to conduct
exploration over the Evander Project area and complete the works
necessary to complete the Bankable Feasibility Study.
Under the Earn-in Agreement, only Taung Gold has the right to conduct
exploration over the Evander Project and to complete the Scoping Study, the
Pre-Feasibility Study and the Bankable Feasibility Study. EGM Limited has
no unilateral right to terminate the Earn-in Agreement except in the event
that Taung Gold fails to complete the Scoping Study, the Pre-Feasibility
Study and the Bankable Feasibility Study by their due dates. The due date for
completion of the Scoping Study was 9 April 2010. The other due dates have
been extended in terms of an addendum to the Sale Agreement from April
2012 (Pre-Feasibility Study) and from April 2013 (Bankable Feasibility
Study) to the following new due dates:
Pre-Feasibility Study 9 July 2012
Bankable Feasibility Study 9 July 2013
There is also a standard provision for termination of the Earn-in
Agreement by either party in case either party commits any breach of the
Earn-in Agreement and fails to remedy such breach within ten business days
of written notice requiring the breach to be remedied. Neither party shall be
entitled to terminate the Earn-in Agreement under this provision unless the
breach is a material breach.
There are no other termination events to the Earn-in Agreement and
accordingly, unless there is a material breach of the Earn-in Agreement on
the part of Taung Gold, and provided Taung Gold delivers the Scoping
Study, the Pre-Feasibility Study and the Bankable Feasibility Study in
accordance with the above timeframe, EGM Limited is obliged to, upon
submission of the Pre-Feasibility Study, grant to Taung Gold a 25% interest
in the Evander Project and, upon submission of the Bankable Feasibility
Study, grant to Taung Gold a 52% interest in the Evander Project in the
manner as specified above.
LETTER FROM THE BOARD
– 92 –
In the event that Taung Gold chooses not to commission the Bankable
Feasibility Study or does not complete the Bankable Feasibility Study by the
requisite time, Taung Gold shall be deemed to have assigned all of its rights
in the incomplete Bankable Feasibility Study to EGM Limited for no
additional cost.
Taung Gold’s management of the Evander Project
The Pre-Feasibility Study and the Bankable Feasibility Study must yield
certain standards in order to be considered completed. As demonstrated
below, Taung Gold has significant influence over the management and
execution of the Pre-Feasibility Study and the Bankable Feasibility Study. In
determining whether the Scoping Study, the Pre-Feasibility Study and the
Bankable Feasibility Study yield positive results, Taung Gold and EGM
Limited has established two committees — the Technical Committee and the
Gatekeeper Committee. Taung Gold and EGM Limited each have two
members on the Technical Committee and Taung Gold appointees constitute
a majority on the Gatekeeper Committee. Taung Gold has also been
appointed project manager of the Evander Project.
— The Technical Committee. The Technical Committee has input
into the day-to-day running of the exploration of the Evander
Project and the Gatekeeper Committee has a supervisory/auditor
role to ensure that the Scoping Study, Pre-Feasibility Study and the
Bankable Feasibility Study produced are robust enough to
demonstrate that the project will be economically viable. Other
than the Technical Committee and the Gatekeeper Committee,
there are no other committees that can be established pursuant to
the Earn-in Agreement.
The Technical Committee comprises four members — two
appointed by Taung Gold and two appointed by EGM Limited.
Roles and Responsibilities of the Technical Committee
The Technical Committee is responsible for, among other things:
. appointing a project manager in respect of the Evander Project who
is responsible for executing the Scoping Study and managing and
executing the Pre-Feasibility Study and the Bankable Feasibility
Study. Under the Earn-in Agreement, Taung Gold was appointed
as the project manager;
. providing written reports on the progress of the Scoping Study, the
Pre-Feasibility Study and the Bankable Feasibility Study to EGM
Limited, Taung Gold and the Gatekeeper Committee on a quarterly
basis;
LETTER FROM THE BOARD
– 93 –

. providing a copy of the Scoping Study, the Pre-Feasibility Study
and the Bankable Feasibility Study to each of EGM Limited,
Taung Gold and the Gatekeeper Committee upon completion of
the Scoping Study, the Pre-Feasibility Study and the Bankable
Feasibility Study; and
. giving Taung Gold and EGM Limited its recommendation on
whether the project should proceed to the next stage.
Decision-making process of the Technical Committee
Decisions of the Technical Committee are made by way of a simple
majority. Unanimous approval is not required for a resolution to be passed
at the Technical Committee. In the event of a deadlock, the issue will be
decided by an independent consulting firm who shall act as an expert and not
as an arbitrator. In the agreement an independent consulting firm means a
firm agreed to between EGM Limited and Taung Gold and, failing such
agreement within ten days of written request by a party for such agreement,
any of the following, in descending order of preference (depending on
availability and willingness to determine the relevant issue on an expeditious
basis):
. SRK Consulting (Proprietary) Limited
. Mineral Corporation Consultancy (Proprietary) Limited
. Turgis Consulting (Proprietary) Limited
. Snowdens (Proprietary) Limited
EGM Limited does not have any veto rights in respect of any decisions
to be made by the Technical Committee.
Gatekeeper Committee
Taung Gold has four members on the Gatekeeper Committee while
EGM Limited only has two. Decisions of the Gatekeeper Committee shall be
way of simple majority. Unanimous approval is not required for a resolution
to be passed at the Gatekeeper Committee.
The purpose of the Gatekeeper Committee is to assess the Scoping
Study, the Pre-Feasibility Study and the Bankable Feasibility Study from a
technical perspective so as to ensure that the requisite technical standards are
met.
The Gatekeeper Committee has the right to reject the Scoping Study, the
Pre-Feasibility Study and the Bankable Feasibility Study on technical
grounds. It does not have the right to reject the Scoping Study, the Pre-
LETTER FROM THE BOARD
– 94 –

Feasibility Study and the Bankable Feasibility Study merely because the
study has not complied with the mining modus operandi preferred by EGM
Limited. In the event of any deadlock arising in respect of any matter to be
determined by the Gatekeeper Committee, such deadlock may at the request
of either party be referred for determination by an independent consulting
firm, acting as an expert and not as an arbitrator.
EGM Limited does not have any veto rights in respect of any decisions
to be made by the Gatekeeper Committee.
Role of the Project Manager
Taung Gold has been appointed as project manager of the Evander
Project.
The project manager is responsible for executing the Scoping Study and
managing and executing the Pre-Feasibility Study and the Bankable
Feasibility Study subject to the direction, policies, rules and procedures
from time to time determined by the Technical Committee.
The project manager submits to the Technical Committee a proposed
programme for the Scoping Study, the Pre-Feasibility Study and the
Bankable Feasibility Study together with a budget showing in detail the
estimated expenditure in respect thereof.
The project manager also has the right to appoint skilled and qualified
contractors and consultants of its choice to assist Taung Gold in carrying out
the Scoping Study, the Pre-Feasibility Study and the Bankable Feasibility
Study.
(d) The Sale Assets
The following sets out the Sale Assets to be transferred by EGM Limited to
the Evander Subsidiaries upon completion of the Phase 1 Bankable Feasibility
Study and the obtaining of the consent from the MMR for (1) the transfer of the
Sale Assets from EGM Limited to the Evander Subsidiaries; and (2) for Taung
Gold to ‘‘earn-in’’ on its interest in the Evander Subsidiaries.
Six Shaft Area. In relation to the Six Shaft area:
— the Evander Six Shaft;
— the infrastructure and equipment owned by EGM Limited and situated
on the area comprising the Six Shaft mining area;
— all geological data in respect of Evander Six Shaft and the mining area
including all available reports and drill cores;
— the Evander Six Shaft mining right; and
LETTER FROM THE BOARD
– 95 –
— the Surface Right Permit,
excluding the headgear and winder building at Evander Six Shaft, which have
been disposed of to, and are accordingly owned by, a third party. However, Taung
Gold has subsequently purchased this headgear and winder building from the
relevant third party.
Twistdraai Area. In relation to the Twistdraai area:
— all geological data in respect of Twistdraai and the mining area
including all available reports and drill cores; and
— the Twistdraai mining right.
There is no infrastructure on the Twistdraai area.
(e) Development costs
The development costs incurred in the Evander Project before Taung Gold
acquires an interest in the Evander Subsidiaries will be capitalised as intangible
assets in Taung Gold’s financial accounts. Once shares in the Evander
Subsidiaries are issued and allotted to Taung Gold, the capitalised costs will be
transferred from intangible assets to investment cost in the accounts of Taung
Gold and to intangible assets in the accounts of the Evander Subsidiary.
(f) Current Status of the Evander Project
The Scoping Study for the Evander Project was completed and delivered to
EGM Limited in April 2010. The Scoping Study was, in the opinion of the
Gatekeeper Committee, the Technical Committee and Taung Gold, positive and it
therefore proceeded to conduct the Pre-Feasibility Study. Taung Gold is confident
that the Pre-Feasibility Study will be delivered before 9 April 2012, being the
original due date for delivery of same, notwithstanding the fact that this due date
has now been extended to 9 July 2012 by an addendum to the Sale Agreement.
Taung Gold expects to complete the Pre-Feasibility Study by the first quarter of
2012. The Scoping Study, Pre-Feasibility Study and Bankable Feasibility Study
were carried out and are to be carried out in accordance with industry best
practice and in compliance with all applicable laws.
(g) Consent from the MMR
Save for the consent of the MMR to be given pursuant to Section 11 of the
MPRDA, there are no other regulatory requirements to be met as a condition for
the allotment and issuance of shares in the Evander Subsidiaries to Taung Gold
and the transfer of assets to the Evander Subsidiaries.
LETTER FROM THE BOARD
– 96 –
Taung Gold has received a legal opinion from its legal counsel on South
African law stating that the rights of MMR to refuse an application under the
MPRDA are extremely limited and provided that the applicant complies with the
requirements set out in the MPRDA, the MMR is obliged to give her consent.
(h) Following completion of the Pre-Feasibility Study and the Bankable Feasibility
Study
Following completion of the Pre-Feasibility Study and the Bankable
Feasibility Study and if EGM Limited and Taung Gold agree to proceed with
mining for minerals over the Evander Project areas, they will establish a joint
venture to conduct such mining activities and will share their costs and profits on
a pro rata basis.
(i) The Sale Agreement
Following the signing of the Earn-in Agreement, Taung Gold came to the
conclusion that greater value could be achieved if it owned 100% of the Evander
Project. Accordingly, negotiations were initiated with EGM Limited resulting in
the signing of the sale agreement between EGM Limited and a wholly-owned
subsidiary of Taung Gold in September 2010 to acquire the entire interest in the
Evander Project (the Sale Agreement), subject to the approval by the MMR for
the transfer of a subdivided portion of EGM Limited’s new order mining right to
a wholly-owned subsidiary of Taung Gold. This subdivided portion covers the
entire Evander Project. Completion of the Acquisition Agreement is not
conditional to the completion of the Sale Agreement.
Consideration under the Sale Agreement
The consideration under the Sale Agreement is ZAR225 million (or
approximately US$28.13 million). A ZAR20 million (or approximately
US$2.5 million) deposit has been placed in an escrow account with EGM
Limited’s attorneys, pending transfer of the Sale Assets. A prepayment of
ZAR100 million towards the total consideration payable has also been made
directly to Harmony pursuant to the terms of an addendum to the Sale
Agreement.
An addendum to the Sale Agreement was entered into on 19 July 2011
which extended the date for fulfilment of the outstanding conditions
precedent including the date by which the MMR must give her consent for
the transfer of the Sale Assets from EGM Limited to Pluriclox in accordance
with Section 11 of the MPRDA from 31 December 2011 to 31 January 2012.
Under Section 11 of the MPRDA, a prospecting right or mining right or an
interest in any such right, or a controlling interest in Wing Hing or closed
corporation, may not be ceded, transferred, let, sublet, assigned, alienated or
otherwise disposed of without the written consent of the MMR. Accordingly,
in order for Taung Gold to obtain proprietary interest in the Mining Right
No 107/2010 (be it the 52% interest under the Earn-in Agreement or the
LETTER FROM THE BOARD
– 97 –
100% interest in the Sale Agreement), it is a pre-requisite that such consent
under Section 11 of the MPRDA is obtained. The rights of the South African
Minister of Minerals and Energy to refuse such an application are limited
and provided the applicant complies with the MPRDA, the MMR is obliged
to give such consent.
Relationship between the Earn-in Agreement and the Sale Agreement
When the Sale Agreement becomes unconditional, the Earn-in
Agreement will terminate. Upon completion of the Sale Agreement, Taung
Gold will have a 100% interest in the Evander Project, regardless whether the
Pre-Feasibility Study or the Bankable Feasibility Study has been completed.
Notwithstanding the signing of the Sale Agreement, Taung Gold is still
proceeding towards completing the Bankable Feasibility Study so as to
‘‘earn-in’’ the 52% interest under the Earn-in Agreement. Accordingly, in the
unlikely event that the MMR does not grant her approval, Taung Gold will
still have the right to ‘‘earn-in’’ on 52% of the Evander Project. Further, even
when the Sale Agreement is completed and Taung Gold holds 100% of the
interest in the Evander Project, Taung Gold will continue with the Bankable
Feasibility Study (that is, the further exploration and drilling of the areas
underlying the Evander Projects) with a view to increase the value of the
Evander Project of which it owns 100%.
If the Sale Agreement becomes unconditional prior to completion of the
Bankable Feasibility Study, Taung Gold will own 100% of the Evander
Project upon project implementation.
Acquisition of the Sale Assets
Upon completion of the Sale Agreement, whether or not Taung Gold
has completed the Bankable Feasibility Study, Taung Gold will acquire all of
the Sale Assets.
LETTER FROM THE BOARD
– 98 –

(j) The Surface Right Permits
There are two Surface Right Permits to the area covered by the Evander
Project, the details of which are as follows:
1. Permit No. 5/1997
Re-Registration No. 626/2005
Diagram RMB No. O 10/96
Purposes mine road, mine railway line, electric power
lines, underground electric cables and
water pipe lines with fencing
Total surface area 18.5483 hectares
2. Permit No. 135/1993
Re-Registration No. 627/2005
Diagram RMB No. O 133/93
Purposes shaft equipment and purposes incidental to
fencing
Total surface area 41.5208 hectares
These Surface Right Permits allow the holder to construct and maintain
infrastructure on the sites covered by them.
These Surface Right Permits are currently in the name of Winkelhaak Mines
Limited. Winkelhaak Mines Limited has subsequently changed its name and is
now EGM Limited. Taung Gold does not currently have these Surface Right
Permits but they will be transferred to Taung Gold upon Taung Gold taking
cession of the Evander Project.
(k) Path to Commercial Production of the Evander Project
The Evander Project has a clear path to commercial production. A due
diligence review of historic data has been completed and a sedimentological
interpretation of the evolution and depositional trends has been developed. The
study recognised certain depositional and channel trends and suggested
identification of high grade ore zones in both the Six Shaft and Twistdraai areas.
As at the Latest Practicable Date, the Evander Project is at the exploration
stage and the Pre-Feasibility Study is currently being conducted. Taung Gold is
currently carrying out a US$5.7 million drilling programme in order to complete
the Pre-Feasibility Study. Taung Gold is confident that the Pre-Feasibility Study
will be delivered before 9 April 2012. Taung Gold expects to complete the Phase 2
Pre-Feasibility Study by the first quarter of 2012 and the Phase 3 Bankable
Feasibility Study by the first quarter of 2013.
LETTER FROM THE BOARD
– 99 –

Key works and capital costs to commercial production
— Study stage. The study stage of the Evander Project has been dividedinto three phases due to the different stages of completion of the projectand due to the different timetables for each stage.
Phase 1 — Bankable Feasibility Study of the main shaft at the Six Shaftarea. Taung Gold has started work on the Bankable Feasibility Studyfor this main shaft in January 2011. The lead consultant appointed isTurnberry Projects and the estimated costs of completing this BankableFeasibility Study is ZAR19.0 million (approximately US$2.38 million).
Phases 2 & 3 — Pre-Feasibility Study of the sub-vertical shaft of the SixShaft area and Twistdraai. Surface exploration drilling commenced on17 February 2011 to convert Inferred resources into Indicated resources.The cost of drilling is estimated to be ZAR49.5 million (approximatelyUS$6.19 million). The consultancy costs for the required studies forPhases 2 and 3 are estimated at ZAR61.0 million (approximatelyUS$7.63 million).
— Mine rehabilitation stage — Six Shaft. Six Shaft is a vertical shaftcomplex, currently non-functional and the main shaft is 1,576 metresdeep. It is estimated to be flooded to 645 metres below surface and as aresult, a key work to be completed before production phase is torehabilitate the Six Shaft mine, dewater the mine and re-equip theexisting shaft system. The mine rehabilitation stage will also involveinstallation of surface winding plant, deepening of the surfaceventilation shaft with an aim to achieve production from above 17level, which is at 1,300 metres below surface at Six Shaft. The cost of thisrehabilitation phase and commencement of production above 17 level isestimated to be US$132 million.
— Sinking and establishment stage — Six Shaft. In order to achieve fullproduction, the Six Shaft will involve the sinking and equipping of asub-vertical shaft and further developing and equipping this shaft toramp up to full production. The cost of this stage is estimated to beUS$449 million.
— Twistdraai — Twistdraai is a sub-incline (decline) shaft complex. A costof US$195 million is estimated to be required to develop the Twistdraaisub-incline shaft locations, sinking of the Twistdraai sub-incline shaftsand develop the Twistdraai complex to full production.
The expected costs for each stage of the plans to proceed to commercialproduction
According to the Competent Persons Report, the total capital cost of theEvander Project is estimated to be US$1,034.3 million (equivalent toapproximately HK$8,067.5 million). The peak funding requirement isapproximately US$315 million (equivalent to approximately HK$2,457million) in year five after commencement in gold production.
LETTER FROM THE BOARD
– 100 –
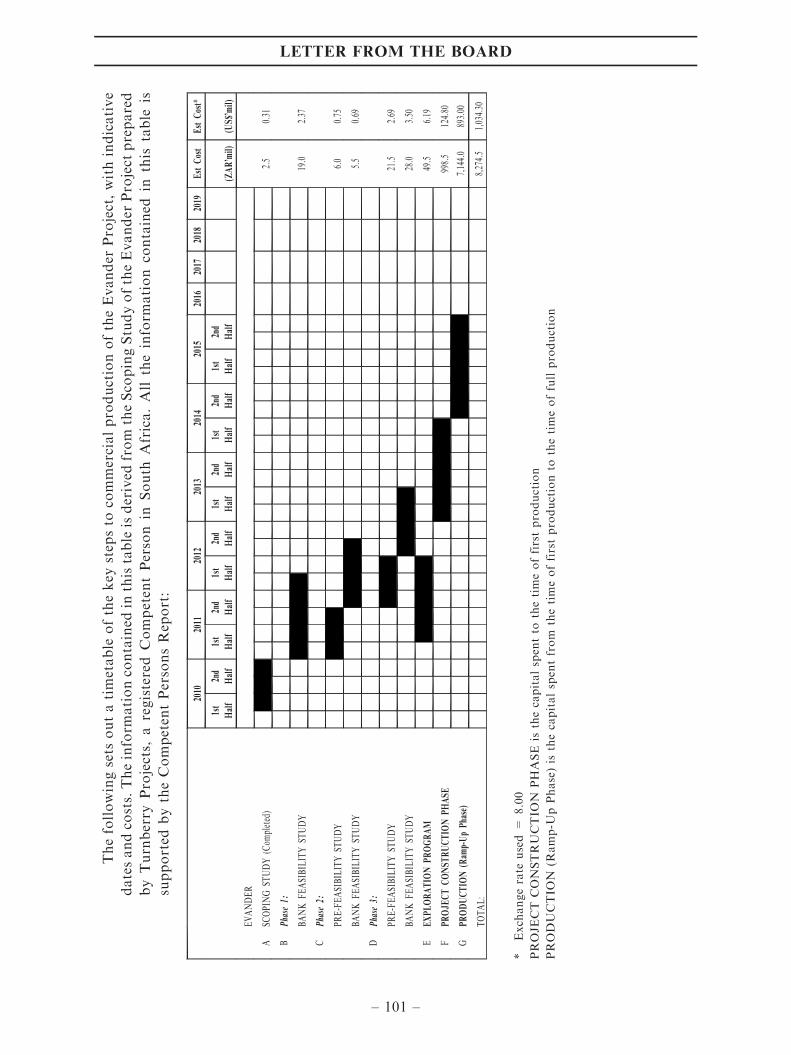
Thefollowingsets
outatimetable
ofthekey
step
sto
commercialproductionoftheEvander
Project,withindicative
datesandco
sts.Theinform
ationco
ntained
inthistable
isderived
from
theSco
pingStudyoftheEvander
Pro
ject
prepared
byTurnberry
Projects,
aregistered
Competen
tPerson
inSouth
Africa.All
theinform
ation
contained
inthis
table
is
supported
bytheCompeten
tPersonsRep
ort:
2010
2011
2012
2013
2014
2015
2016
2017
2018
2019
Est
Cost
Est
Cost*
1st
Half
2nd
Half
1st
Half
2nd
Half
1st
Half
2nd
Half
1st
Half
2nd
Half
1st
Half
2nd
Half
1st
Half
2nd
Half
(ZAR’m
il)(U
S$’mil)
EVANDER
ASC
OPI
NG
STUDY
(Com
pleted
)2.5
0.31
BPha
se1:
BANK
FEASI
BIL
ITY
STUDY
19.0
2.37
CPha
se2:
PRE-F
EASI
BIL
ITY
STUDY
6.0
0.75
BANK
FEASI
BIL
ITY
STUDY
5.5
0.69
DPha
se3:
PRE-F
EASI
BIL
ITY
STUDY
21.5
2.69
BANK
FEASI
BIL
ITY
STUDY
28.0
3.50
EEXPLORATIO
NPROGRAM
49.5
6.19
FPROJE
CT
CONSTRUCTIO
NPHASE
998.5
124.80
GPRODUCTIO
N(R
amp-Up
Pha
se)
7,14
4.0
893.00
TOTAL:
8,27
4.5
1,03
4.30
*Exch
angerate
used=
8.00
PROJE
CT
CONSTRUCTIO
NPHASE
isthecapitalspen
tto
thetimeoffirstproduction
PRODUCTIO
N(R
amp-U
pPhase)is
thecapitalspen
tfrom
thetimeoffirstproductionto
thetimeoffullproduction
LETTER FROM THE BOARD
– 101 –
Timetable to commercial production
According to the Competent Persons Report and Turnberry Projects,
the independent consultant that managed the advanced Scoping Study for the
Evander Project, there exists an opportunity to fast track the production
start date if the dewatering and re-equipping of the main shaft at Six Shaft
are accelerated.
There are two possible timetable options for the Evander Project
— Scenario 1 — dewatering of the main shaft at Six Shaft to
commence immediately upon successful completion of the Pre-
Feasibility Study. This will accelerate production start date of the
Evander Project to 2014
— Scenario 2 — dewatering of the main shaft at Six Shaft to
commence immediately (before successful completion of the Pre-
Feasibility Study). This scenario will accelerate production start
date to 2012
Currently, Taung Gold expects actual production to commence in the
third quarter of 2014 or early 2015. Whether the Evander Project can be
accelerated will depend on whether it can obtain the necessary financing.
Construction of the processing plant will take place concurrently with the
sinking of the Twistdraai sub-shaft and is not on the critical path.
Evander Project scheduling
Based on the Competent Persons Report, it is envisaged that the
development plan of the Evander Project will be staged over 32 years, as
follows:
— the first two years for sinking, refurbishment and establishing
construction;
— seven years for mine ramp up to full production;
— 21 years for full tonnage profile production; and
— the remaining two years for mine closing down.
LETTER FROM THE BOARD
– 102 –
(l) Economic viability of the mineral resources of the Evander Project, as
assessed by the Scoping Study and reported by the Competent Persons
Report
Parameter Indicator
Peak Annual Production
(20 years)
267,000 oz
Average Recovered Grade 6.55 g/t
Average Cash Cost US$397/oz (equivalent to approximately
HK$3,096.6 per ounce), calculated
based on an average operating cost of
US$83.6/t milled (equivalent to
approximately HK$652.1/t milled)
Anticipated Construction
Start Date
July 2013
Life Of Mine 30 Years
3.5 The Jeanette Project
(a) Infrastructure and planned infrastructure
The Jeanette Project is a historic mine with two unequipped shafts that were
sunk during the 1950s which are available for early mine access. Similar to the
Evander Project, the Jeanette Project is situated in well developed industrial and
mining areas of South Africa with other operating mines in the immediate vicinity.
There is access to the Jeanette Project by the tarred national road R30 linking
Welkom and Bothaville, which lie immediately south and north of the property,
respectively. The western portions of the Jeanette Project are accessed through 2
kilometres of tarred road from the town of Allanridge. Well-maintained
secondary roads traverse the central and southern portions of the Jeanette
Project area and in the future, access to drill sites is expected to be through farm
tracks. The most proximal populated centre to the project area is the town of
Odendaalsrus, located about 2 kilometres to the south of the Jeanette Project. A
local airport is maintained at Welkom with tarred runways and hangars. The
Taung Group is planning to construct a short, tar access road of 4 kilometres at a
cost of approximately ZAR1 million per km. This road will be ready to serve the
commencement of onsite construction. The map shows the railway, power lines
and road route of the area near the Jeanette Project.
LETTER FROM THE BOARD
– 103 –

LETTER FROM THE BOARD
– 104 –

In terms of power, the Jeanette Project has access to the national Eskom
power lines which are situated on the western side of the prospecting area. The
Jeanette Project will be using diesel generation during the de-watering process as a
supplement to line power and the diesel generation capacity will be retained as
permanent backup power.
(b) Prospecting rights and approvals
Taung Gold entered into an agreement with a subsidiary of Harmony to
acquire the single prospecting right for the Jeanette area in 2008. Consent to the
transfer of the prospecting right of the Jeanette Project to Taung Gold was given
by the DMR on 29 September 2010 and the prospecting right is valid for five years
commencing from 29 June 2010. The prospecting right permits the exploration of
gold, silver, uranium and associated minerals in the Jeanette area. All permits to
conduct exploration over the mining area under the Jeanette Project have been
granted and there are no legal obstacles to commence exploration. The
prospecting right can be renewed for a further period of three years by
submitting a renewal application not later than 60 working days prior to the
date of expiry of the right.
The prospecting right was granted on condition that the new holder honours
or carries out any agreement, arrangement, or undertaking made in terms of the
approved prospecting work programme and environmental management
programme.
The details of the Jeanette prospecting right are set out below:
FARM SIZE
PROSPECTING
RIGHT
COMMENCEMENT
DATE EXPIRY DATE MINERAL
EFFECTIVE
INTEREST
(HA)
Philadelphia 273 3,886 FS30/5/1/1/2/
895PR
29 June 2010 5 Years from
commencement
date
Gold, silver,
uranium and
associated
minerals
On 29 Sept 2010
Section 11 consent
to the transfer of
the prospecting right
to Taung Gold
Freestate (Pty) Ltd
from ARMgold/
Harmony was
granted by the
DMR under FS30/5/
1/1/2/895PR
My Betty 351
Wesselsrust 58
Vriendskap 234
Roodepoort 235
Rustoord 33
Heldenmoet 117
Zoeten Inval 268
Paardevley 251
Martina 226
Aanleg 50
Goud Rand 272
Jeanette 371
De Erf 140
Allanridge 425
Uitkyk 258
(c) Control over a majority of the assets of the Jeanette Project and adequate
rights over the exploration for gold resources
Notarial execution of the transfer of the right to a subsidiary of Taung Gold
took place on 21 February 2011 and cession of this right has been executed. An
application for the registration of the right has been filed with the Mining Titles
LETTER FROM THE BOARD
– 105 –
Registration Office. Taung Gold has been informed that there is a reasonable
possibility of the right being registered before the SGM. The registration process
is merely an administrative procedure and does not affect Taung Gold’s right to
prospect over the Jeanette Project area. Taung Gold has obtained a legal opinion
from its South African legal counsel confirming that there is no legal impediment
in completing the registration of the rights for the Jeanette Project.
As a holder of the prospecting right (whether or not such right is registered),
Taung Gold enjoys all the rights which are granted to the holder of a prospecting
right. These are set out in Section 5 and 19 of the MPRDA, and include, amongst
others, the right to:
— enter the land to which such right relates together with its employees,
and to bring onto that land any plant, machinery or equipment and
build, construct or lay down any surface, underground or under sea
infrastructure which may be required for the purpose of prospecting;
— prospect for its account on or under that land for minerals for which
such prospecting right has been granted;
— remove and dispose of any such mineral during the course of
prospecting;
— use water from any natural spring, lake, river or stream situated on or
flowing through such land or from any excavation previously made and
used for prospecting, mining, exploration or production purposes or
sink a well or borehole required for use relating to prospecting, mining,
exploration or production on such land;
— carry out any other activity incidental to prospecting operations;
— apply for and be granted a renewal of the prospecting right; and
— apply for and be granted a mining right.
The same applies to the prospecting rights held by Taung Gold.
The Taung Group conducted ground geophysical surveys over the right in
2010. The Taung Group intends to conduct further intrusive exploration over the
right, including a geophysical survey and drilling programme in 2011. The Taung
Group is currently in the process of drilling in the project area.
Further, Taung Gold has established a Technical Committee, which includes
independent industry specialists, to further review the mining strategy for
identified areas of the Basal Reef to mitigate any risk associated with the
mining thereof. The Basal Reef at the Jeanette Project is the horizon of main
economic interest and is a narrow tabular orebody, ranging in thickness from 0.05
to 0.77 metres, which is overlain by a succession of quartzite and shale. The layer
LETTER FROM THE BOARD
– 106 –

of shale is prevalent in the Northern Free State goldfield and is known locally as
the ‘‘Khaki Shale’’. It is of variable thickness, is geotechnically weak and is
separated from the Basal Reef by a layer of quartzite which is also of varying
thickness but which is geotechnically competent. The thickness of the Khaki Shale
in this area can be up to 2.8 metres. The proximity of the Khaki Shale to the Basal
Reef varies across the property and may result in unfavourable geotechnical
conditions. Notwithstanding this, neighbouring mines are successfully extracting
the Basal Reef under similar conditions.
(d) Path to Commercial Production for the Jeanette Project
The Jeanette Project is still at the exploration stage. A Scoping Study for the
Jeanette Project was completed in June 2010 and the results were positive. Since
then, the Jeanette Project has proceeded to the ‘‘resource upgrade stage’’ through
drilling. This refers to the process whereby the Taung Group is improving the
certainty that it has in respect of the gold resources in the area under the Jeanette
Project through further exploration, mainly drilling.
The Jeanette gold mine prospect area has been evaluated at various stages
over the past 60 years. During this time a substantial database of geological
information has been acquired through drilling, underground sampling, and
extrapolation of geological information from adjacent mining operations. The
Taung Group has been investigating and evaluating the Jeanette Project for the
past two years. The Scoping Study on the Jeanette Project has been compiled in an
iterative manner — that is the results of one phase of the study determines the
direction of the study and may necessitate revision of the inputs so that an
increasingly accurate study is presented. The Jeanette Scoping Study has
advanced through several phases, as the economic implications of certain input
options are investigated. The final version of the Jeanette Scoping Study was
completed by Minxcon in June 2010, who presented a positive business case for a
mining operation. Minxcon recommended that the project progress through to
Pre-Feasibility Study stage. After completion of the Scoping Study in June 2010,
further information over the Jeanette Project became available to Taung Gold. As
such, the board of directors of Taung Gold considers it to be appropriate to
commission an advanced study to improve confidence in the Scoping Study. It is
expected that the advanced study will complete by the third quarter of 2011 and
the total cost (including costs of the Scoping Study) is estimated to be ZAR14.10
million (or approximately US$1.76 million).
LETTER FROM THE BOARD
– 107 –
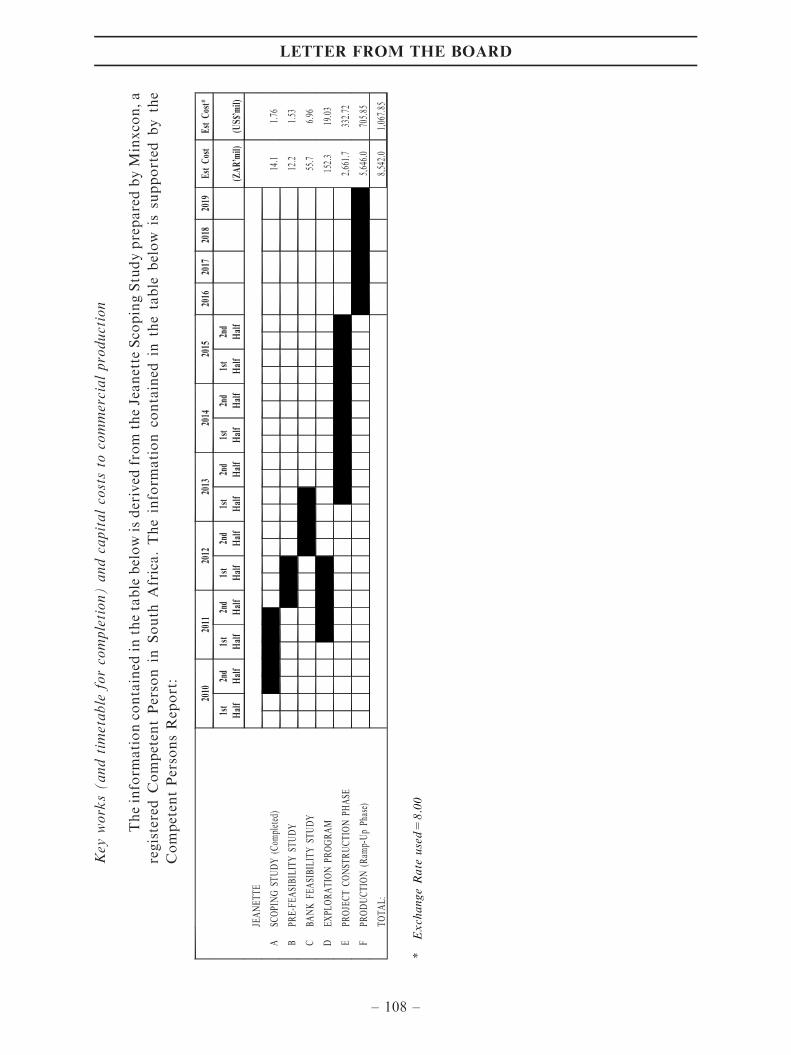
Key
works(andtimetable
forco
mpletion)andcapitalcoststo
commercialproduction
Theinform
ationco
ntained
inthetable
belowisderived
from
theJeanette
Sco
pingStudypreparedbyM
inxco
n,a
registered
Competen
tPerson
inSouth
Africa.Theinform
ation
contained
inthetable
below
issupported
bythe
Competen
tPersonsRep
ort:
2010
2011
2012
2013
2014
2015
2016
2017
2018
2019
Est
Cost
Est
Cost*
1st
Half
2nd
Half
1st
Half
2nd
Half
1st
Half
2nd
Half
1st
Half
2nd
Half
1st
Half
2nd
Half
1st
Half
2nd
Half
(ZAR’m
il)(U
S$’mil)
JEANETTE
ASC
OPI
NG
STUDY
(Com
pleted
)14
.11.76
BPR
E-F
EASI
BIL
ITY
STUDY
12.2
1.53
CBANK
FEASI
BIL
ITY
STUDY
55.7
6.96
DEXPL
ORATIO
NPR
OGRAM
152.3
19.03
EPR
OJE
CT
CONST
RUCTIO
NPH
ASE
2,66
1.7
332.72
FPR
ODUCTIO
N(R
amp-Up
Phase)
5,64
6.0
705.85
TOTAL:
8,54
2.0
1,06
7.85
*ExchangeRate
used=
8.00
LETTER FROM THE BOARD
– 108 –

The Jeanette Project has significant Indicated Resources. The path to
commercial production includes:
— Exploration. Further drilling to upgrade the confidence in the
independently generated mineral resource estimates. The Taung
Group commenced further drilling at the Jeanette Project in
February 2011. ZAR21.1 million (or approximately US$2.64
million) has been allocated for this work. The drilling is
scheduled for completion by early 2012. New data on gold grades
will be included in an updated geological database, and presented
to independent consultants for mineral resource estimate revision.
The Taung Group plans to drill not less than four (and as many as
eight) boreholes over the coming two to three years for the
purposes of upgrading confidence in the geology of the mineral
resource.
— 3D Seismic Study. A 3D structural model will be constructed with
additional drilling. The 3D structural model of the Jeanette Project
will be assisted by information gained from a 3D seismic survey
over the mineral resource area, which is scheduled to commence in
August 2011. This 3D Seismic Study will cost approximately
ZAR72 million (or approximately US$9.01 million) and will be
completed by December 2011. The 3D seismic survey will be
interpreted at the Pre-Feasibility Study and Bankable Feasibility
Study stages. The interpretation of the geologic structure is a key
process during the Pre-Feasibility Study and Bankable Feasibility
Study stages and such interpretation must be based on a sound
exploration programme. A 3D Seismic Study will provide reliable
positions of major faults, and relevant depths to target mineralised
horizons, and positions of sills and other structures which provide
more accurate data for the Pre-Feasibility Study and Bankable
Feasibility Study.
— Pre-Feasibility Study. When the Pre-Feasibility Study is at an
advanced stage, an application to convert the existing prospecting
right into a mining right will be made. The estimated cost for the
Pre-Feasibility Study is ZAR12.2 million (or approximately
US$1.53 million).
— Bankable Feasibility Study. Upon completion of the Bankable
Feasibility Study and the grant of a mining right, shaft sinking of
the main shaft will commence. The estimated cost of the Bankable
Feasibility Study is ZAR55.7 million (or approximately US$6.96
million).
— Sink main shaft and Refurbish existing Vent Shaft. The existing 5.5
metre vent shaft at the Jeanette Project will be refurbished and
deepened to provide the required ventilation and a second outlet
LETTER FROM THE BOARD
– 109 –

infrastructure for the mining operation. This will be refurbished at
the same time as the sinking of the new Main shaft. The estimated
cost for completing this part of the project is ZAR2.7 billion (or
approximately US$0.33 billion).
— Access development to Reef. Access development to reef will
require tunnelling of various sizes and at various inclinations on
different levels. The estimated costs or this access development is
ZAR304.6 million (approximately US$38.1 million).
— Production. Gold production at the Jeanette Project is expected to
take place in 2016.
After First Completion, Taung Gold plans to conduct the Pre-
Feasibility Study and the Bankable Feasibility Study in collaboration with
independent consultants. Physical implementation of the mining plan and
commencement of construction will be contingent on the granting of mining
rights for the area. It is estimated that preparation for sinking construction
will begin in March 2013.
The expected costs for each stage of the plans to proceed to commercial
production
The Jeanette Project does not currently have a dedicated processing
plant. According to the Competent Persons Report, the total capital cost for
developing the Jeanette Project, including plant construction, is US$1,067.8
million (equivalent to approximately HK$8,328.8 million). The peak funding
requirement for the Jeanette Project is estimated to be US$603 million
(equivalent to approximately HK$4,703.4 million), expected to be required in
year one after commencement of gold production.
Jeanette Project scheduling
It is envisaged that the development of the Jeanette Project will be
staged over 37 years, as follows:
— the first five years for feasibility studies, establishment, shaft
sinking and construction;
— three years for mine ramp up to full production;
— 15 years for full tonnage profile production at a rate of 145ktpm;
— four years for mine ramp down; and
— the remaining ten years for mining remnant blocks and pillars.
LETTER FROM THE BOARD
– 110 –

Thetimetable
forthekey
phasesto
commercialproductionfortheJeanette
Project
issetoutbelow:
2010
2011
20
12
2013
20
14
2015
20
1620
1720
1820
19Es
t Cos
t Es
t C
ost*
1st
Hal
f2nd
Hal
f1st
Hal
f2nd
Hal
f1st
Hal
f2nd
Hal
f1st
Hal
f2nd
Hal
f1st
Hal
f 2nd
Hal
f1st
Hal
f2nd
Hal
f(Z
AR
'mil)
(US$
'mil)
JEA
NET
TE
ASC
OPI
NG
STU
DY
(Com
plet
ed)
14.1
1.76
BPR
E-FE
ASI
BIL
ITY
STU
DY
12.2
1.53
CB
AN
K F
EASI
BIL
ITY
STU
DY
55
.76.
96D
PRO
JEC
T C
ON
STR
UC
TIO
N P
HA
SE *
*
2,81
4.0
351.
75
EPR
OD
UC
TIO
N (R
amp-
Up
Phas
e) *
**
5,64
6.0
705.
85
TOTA
L:
8,54
2.0
1,06
7.85
*Exchangerate
used=
8.00
**
PROJECT
CONSTRUCTIO
NPHASE
isthecapitalspentto
thetimeoffirstproduction
***
PRODUCTIO
N(Ramp-U
pPhase)is
thecapitalspentfrom
thetimeoffirstproductionto
thetimeoffullproduction
LETTER FROM THE BOARD
– 111 –

(e) Economic viability of the mineral resources of the Jeanette Project, as assessed
by the Scoping Study
Parameter Indicator
Peak Annual Production 380,000 oz
Average Recovered Grade 6.96 g/t
Average Cash Cost US$322/oz (equivalent to approximately
HK$2,511.6 per ounce) (calculated
based on an average operating cost of
US$72.1/t milled (equivalent to
approximately HK$562.4/t milled)
Anticipated Construction
Start Date
2013
Life Of Mine 30 Years
4. LEGAL PROCEEDINGS
To the best of the Directors’ knowledge, information and belief, the Taung Group is
not and has not been involved in any legal claims or proceedings, including any legal claims
that may have an influence on its exploration rights over the Evander Project and Jeanette
Project.
5. DIRECTORS AND SENIOR MANAGEMENT OF TAUNG GOLD
As at the Latest Practicable Date, Taung Gold has ten directors and two alternate
directors. Taung Gold also has seven senior management members and together with the
directors, they form Taung Gold’s core management team. Taung Gold’s core management
team, taken together, have sufficient experience relevant to the exploration activities of
Taung Gold and certain key senior management members of Taung Gold possess more than
five years of relevant experience in the gold mining exploration and/or mining activities. It
is expected that all of the directors and senior management of Taung Gold will remain in
their positions after completion of the Transactions.
The details of Taung Gold’s directors, senior management and key employees are set
out below.
5.1 Directors
Dr. Lelau Mohuba, aged 54, is a director and chairman of Taung Gold. He is the
co-founder and chairman of Sephaku Holdings Ltd. His commercial experience
includes holding the positions of chairman and chief executive officer of Shikisha Tyre
and Rubber (Proprietary) Limited, a joint venture with Goodyear Holdings Limited, as
well as co-founding Kiba Investment Holdings (Proprietary) Limited, a mining
LETTER FROM THE BOARD
– 112 –
beneficiation company. Prior to joining Sephaku Holdings, he was an executive
director of Boynton Platinum and a founder and the chairman of Lekgotla Investments
(Proprietary) Limited. Dr. Lelau Mohuba received a Bachelor of Medicine degree and
Bachelor of Surgery degree at the University of Natal (later renamed Nelson Mandela
School of Medicine) in 1980.
Mr. Neil Andrew Herrick, aged 47, is a director and chief executive officer of
Taung Gold. Mr. Herrick has over 20 years of experience in the gold mining industry,
having joined the Gold Division of Anglo American in 1988 and became section
manager at Anglogold Limited from 1994 to 1997 responsible for an underground
section of a mine and a shaft system. He became production manager at Anglogold
Limited from 1997 to 1999 and was responsible for an entire shaft complex. From 1999
to 2002 he was the general manager of the North West Operations of Durban
Roodepoort Deep Limited. In 2002, he joined Gold Fields Limited as senior manager
and was responsible for the completion of two pre-feasibility studies for the
exploitation of below infrastructure resources at Kloof mine and later as Senior
Manager in charge of Kloof mine’s underground operations. From 2006 to 2007, he
was a mine manager at Anglo Platinum Limited, after which he joined Norilsk Nickel
Africa (Pty) Limited as a mining executive. He is registered as a professional engineer
with the Engineering Council of South Africa, and is a past president and council
member of the Association of Mine Managers of South Africa. He is a former
Chairman of the Mines Professional Associations Committee of Management. He
graduated from the University of Newcastle upon Tyne with a Bachelor of Engineering
degree (Honours) in Mining Engineering in 1987.
Mr. Stefanus David Steyn, aged 46, is a director and chief financial officer of
Taung Gold. Mr Steyn joined the South African Revenue Services for two years in
1990 before being appointed as a practising assistant in an auditing practice. From
1995 to 1998 he was financial manager for two different companies and re-joined
private practice in 1998. He was appointed as director in 2000 and acted as auditor of a
number of listed companies between 2000 and 2007. He has been employed by Taung
Gold since 2007. He graduated from the University of Pretoria in 1988 with a Bachelor
of Commerce (Accounting) degree, and received a Bachelor of Commerce degree
(Honours) from the University of South Africa in 1990. Mr Steyn qualified as a
Chartered Accountant in South Africa in 1991.
Dr. Dawid Strydom, aged 57, is a director of Taung Gold. Currently Dr Strydom is
a consulting exploration geologist for Taung Gold. Between 1990 and 1996, Dr.
Strydom worked at the gold division of Anglo American on gold mining and gold
exploration projects, specialising in examining the geological structure and continuity
of gold reefs in exploration projects and on existing gold mines. Dr. Strydom was also
responsible for delineating additional gold resources on the existing mines and was
involved in the projects designed to ascertain the origin of the gold within the
Witwatersrand basin and assisted in providing structural interpretations to seismic
surveys conducted over various gold projects. Between 1997 and 1998, Dr. Strydom
was seconded to the Anglo American Corporation Limited Head Office Division of the
Geo-Physical Survey Department where Dr. Strydom worked on gold projects in West
LETTER FROM THE BOARD
– 113 –

Africa, such as the Sadiola Gold Mine. In addition to his work in Africa during this
period, Dr. Strydom also conducted structural evaluations over gold projects in two
provinces in Brazil for Anglo American Corporation Limited. Between 1999 and 2002,
Dr. Strydom was country manager for Anglo American in Ghana and in Togo. He was
responsible for the exploration programme which focused on gold exploration initially
then shifted to base metal exploration in these countries. Prior to joining Taung Gold,
Dr. Strydom was an exploration manager for Platmin Limited. Dr. Strydom received
his Master of Science degree (Cum Laude) in 1978 and PhD in 1985. He was a lecturer,
researcher and senior lecturer at the University of Free State and Natal between 1978
and 1990.
Mr. Christiaan Rudolph de Wet de Bruin, aged 58, a director of Taung Gold, is the
co-founder of Taung Gold, Platmin Ltd and Sephaku Holdings Ltd. Mr. de Bruin
received a Bachelor of Commerce degree (Cum Laude) from the University of the Free
State in 1975 and a Bachelor of Law degree (Cum Laude) from the Rand Afrikaans
University in 1977 and practiced as an advocate at the Pretoria Bar from 1979 to 1989,
specialising in commercial law and mineral law cases. Mr. de Bruin left the Bar in 1989
and focused on finding, acquiring and developing mineral exploration and mining
projects in various African countries. Mr. de Bruin was involved in aspects of law
relating to minerals, companies, stock exchange and international finance. He also
acted as a consultant to a number of South African companies, becoming involved in
their management, including the management of their systems, human resources,
customers and financing activities. Between 1999 and 2005, he was a co-founder
member of the Platmin Group of companies, which developed the Pilanesberg
Platinum Mine and is currently listed on the Toronto Stock Exchange, the
Johannesburg Stock Exchange and the Alternative Investment Market of the
London Stock Exchange. His role was to engineer the acquisition of mineral projects
including supervising the execution of over 300 mineral rights agreements and the
conversion of the Platmin Group’s old order rights into new order rights and the
acquisition of new mining rights. Mr. de Bruin was also involved with the applications
for new mining rights and the management of the operational aspects, including
logistics, human resources and administration during his time with the Platmin Group.
Dr. David Twist, aged 57, a director of Taung Gold, is the co-founder of Taung
Gold, Platmin Ltd and Sephaku Holdings Ltd. He is a registered member of the South
African Council of Natural Scientists, a member of the Geological Society of London
and a member of the Society of Economic Geologists. Dr. Twist was a geologist at the
Impala Platinum Mines, Rustenburg from 1980 to 1981. From 1981 to 1990, Dr. Twist
worked as a post-doctoral research geologist at the University of Pretoria in South
Africa researching on various geological issues relating to gold and was also involved
in numerous consulting assignments on gold. In particular, he was contracted by Anglo
American to assist in its regional exploration programme for gold in the Bushveld
Complex of South Africa, and by Gold Fields of South Africa in its exploration of the
granophyres of the Rooiberg fragment. He was also commissioned by the Atomic
Energy Corporation of South Africa to report on the causes of copper-gold-uranium
mineralisation at the Olympic Dam discovery in Australia. In the 1990s, Dr. Twist
began focusing on mineral exploration opportunities, including gold exploration
LETTER FROM THE BOARD
– 114 –

opportunities, in Africa. In mid to late 1990s, Dr. Twist acted as an executive director
and exploration manager of Coronation International Mining Corporation, where he
focused on gold exploration projects in West Africa and undertook investigations of
gold prospects in Nigeria, Benin, Togo, Niger and Burkina Faso. In Benin, Niger and
Burkina Faso, Dr. Twist helped identify gold targets and planned, implemented and
supervised regional gold exploration programs. During the 2000s, Dr. Twist continued
to be involved in precious metal exploration. He was a founding member and executive
director of African Precious Minerals Limited, which engaged in gold exploration of
targeted Archaean greenstone belts primarily in Tanzania and Mozambique. Dr. Twist
is a founding member and an executive director of Taung Gold and has been involved
in the target generation and exploration planning of Taung Gold’s South African
Witwatersrand gold projects for the past six years. Dr. Twist received a Bachelor of
Science degree (Honours) in Geology from the University of Reading in 1975 and a
Doctoral degree in geology from the University of Newcastle-upon-Tyne in 1980.
Mr. Igor Levental, aged 55, is a director of Taung Gold. He is also the director of
Gabriel Resources Ltd., Sunward Resources Ltd and NovaGold Resources Inc. He
worked at International Corona Corporation, a gold producer, from 1986 to 1992, as
director of investor relations from 1986 to 1989 and vice president of investments and
investor relations from 1989 to 1992. He joined Homestake Mining Corporation, a
gold mining company with interest in the United States, Canada, Australia and South
America, after its acquisition of International Corona Corporation, serving in various
positions including senior consultant, manager of the corporate department and vice
president of the investor relations, from 1992 to 2002. In 2007, he joined Electrum
(USA) Limited as executive vice president and in March 2010 became the president of
the Electrum group of companies, which holds a portfolio of gold exploration and
development projects globally. He is a registered professional engineer in Canada and
a member of the National Investor Relations Institute. He graduated from the
University of Alberta with a Bachelor of Science degree in Chemical Engineering in
1978 and received his MBA degree from the University of Alberta in 1982.
Mr. Marcel F. DeGuire, aged 62, is a director of Taung Gold. He held positions as
president of Resurrection Mining Company, chairman and president of Dawn Mining
Company and president of Idarado Mining Company. He was a vice president of
Newmont Mining Corporation between 1989 and 1996 and was responsible for
environmental affairs, metallurgical research, project development and country
manager for the CIS. He was also a vice president and a senior vice president at
Apex Silver Mines Corporation and was a senior vice president responsible for project
development and marketing from 2004 to 2007. Since 2007, Mr. DeGuire has acted as
the chief executive officer of Electrum USA Ltd, a global gold exploration company.
He is a member of Canadian Institute of Mining, Metallurgy and Petroleum, a member
of Mining and Metallurgical Society of America and a member of Prospectors and
Development Association of Canada. He graduated from the Michigan Technological
University with a Bachelor of Science degree in 1971 and received a Master of Science
degree from University of Nevada in 1974.
LETTER FROM THE BOARD
– 115 –

Mr. Neil Robus Crafford-Lazarus, aged 52, is a director of Taung Gold. He started
his career in mining finance when he joined Anglo American Corporation as a tax
advisor in 1988. In 1990, he joined Gencor Ltd. and held senior management positions
in taxation, business development and corporate finance and worked on various gold
mining projects. In 1998, he joined Xstrata SA (Proprietary) Limited as financial
director. In October 2005, he joined Platmin Limited, a Canadian platinum
exploration company, as the chief financial officer. He is a chartered accountant in
South Africa and is a member of South Africa Institute of Chartered Accountants. He
graduated from the University of South Africa with a Bachelor of Computing degree
(Honours).
Mr. Derek Kyle, aged 73, is a director of Taung Gold. He worked as a mine
geologist and field exploration geologist and co-founded a consulting firm in mining,
mineral exploration, engineering geology, remote sensing and mining feasibility studies
during the period from 1959 to 1975. From 1975 to 1995, he worked for Anglovaal
Limited, first serving as a chief consulting geologist and later as a general manager,
responsible for group mining geology, mineral exploration and new business. He was a
director of Avmin Limited from 1995 to 1997 and was responsible for mineral
exploration and new business matters. In 1997, he founded the Mineral Corporation as
advisers to the minerals industry for mineral acquisition, geological exploration,
engineering geology and was the managing director and chairman. He has been an
independent mineral advisor since 2005 advising on all aspects of exploration, ore
resources evaluation, mining feasibility studies and project technical risk analysis. He
is a fellow of the Geological Society of South Africa, a member of the Society of
Economic Geologists, and a member of the American Society of Engineering
Geologists. Mr. Kyle graduated from Kearsney College with a Bachelor of Science
in 1957 and received his Master of Science degree from Rhodes University in 1972.
5.2 Alternate Directors
Mr. Kweku Andoh Awotwi, aged 50, is an alternate director of Taung Gold. He has
been a principal of Gold Coast Ventures since 2004 and is currently a director of
African Precious Minerals Limited, a company holding mineral properties in Africa.
He acted as the Chairman of African Precious Minerals Limited from 2007 to 2010. He
was a director at Ashanti Goldfields focusing on strategic planning from 1998 to 2004.
Mr. Awotwi held various board memberships including Takoradi Power Company
Ltd, Ghana Chamber of Mines, West African Gas Pipeline Company and the UN
Global Compact Advisory Board. He graduated from Yale University with a Bachelor
of Science degree in 1984 and received his MBA degree from Stanford Graduate School
of Business in 1990.
Ms. Sonja Hester Rosser, aged 41, is an alternate director of Taung Gold. In 2001,
she was employed as executive assistant to a senior director at Couzyn Herzon &
Horak Attorneys. Since 2004, she has been working at Taung Gold Limited responsible
for client relations and managing the preparation and lodgement of all documents
pertaining to applications for prospecting rights at the Department of Mineral
LETTER FROM THE BOARD
– 116 –

Resources of South Africa. She completed an executive secretarial course from
Technicon Pretoria in 1989. In 1992, she joined the collections department at Koos
Grey Attorneys and two years later she joined Whiteside’s Attorneys.
5.3 Senior management
Mr. Jacques Du Plessis, aged 54, is a senior mining engineer of Taung Gold. He
was mine manager in various mining companies, such as Samancor Manganese Mines-
Hotazel, St. Helena Gold Mines and Oryx Mine. In 2001, he was employed by Murray
& Roberts RUC Mining Contractors as a managing director of the mining division. In
2003, he worked as a mining consultant to closed and ailing mines in the Barberton
Mountain Land to improve their operations. He was a member of Engineering Council
of South Africa, a member of Association of Mine Managers of South Africa and a
member of the Commission of Examiners for Mine Manager’s Certificate. Mr. Du
Plessis graduated from the University of Pretoria with a Bachelor of Science
(Engineering) degree in 1981 and received an MBA degree from Potchefstroom
University in 1995.
Mr. Gert Adriaan Du Plessis, aged 51, is the Chief Operating Officer (Technical)
of Taung Gold. He started his career as a mine geologist at Anglo American
Corporation in 1981. He spent 16 years with Anglo American Corporation until he
joined African Rainbow Minerals in 1998 as the company chief geologist and a
member of the Business Engineering Unit conducting feasibility studies on potential
business. From 2002 to August 2003, Mr. Du Plessis worked at Modikwa Platinum
Mine and was responsible for geology, evaluation and ground water management, after
which he became a managing director of ITEC Project Impact (Pty) Limited and
consultant in providing services with respect to geotechnical engineering and project
management until 2006. In August 2006, he joined Platinum Group Metals (Pty)
Limited, a mine exploration company, as a project manager until October 2007. He
graduated from the Potchefstroom University with a Bachelor of Science degree in
1982 and obtained a Graduate Diploma in Engineering at the Witwatersrand
University in 2002.
Mr. Chris Hendrik Mulder, aged 53, is the company secretary of Taung Gold. He
started his legal career as a public prosecutor in the regional court for the Department
of Justice. In 1987, he joined Eskom, an electricity supply company, as a property
lawyer. From 1994 to 1996, he was employed as a mining rights lawyer at Gencor
Limited, a mining holding company. He was appointed as a corporate legal adviser of
Kelgran Group of Companies, a company engaged in granite mining listed on the
Johannesburg Stock Exchange, in 1996 responsible for compliance with the rules and
regulations of the Johannesburg Stock Exchange. He graduated from the University of
Pretoria with a Bachelor of Law degree in 1982 and was admitted as attorney of the
high court of South Africa in 1985.
Mr. Arthur Hanbury Godfrey Griffin, aged 51, is the project manager and senior
geologist of Taung Gold. He had been a mine geologist in a number of mining
companies since his graduation and has worked on gold, platinum and chrome mines.
LETTER FROM THE BOARD
– 117 –

In 1992, he joined Consolidated Modderfontein Mines as a senior mine geologist.
From 1994 to 2007, he was employed by Pretoria Portland Cement Company as an
exploration geologist. He was an exploration manager of Caledonia Mining
Corporation before joining Taung Gold. He graduated from the University of Natal
with a Bachelor of Science degree in 1981 and received a Bachelor of Science degree
(Honours) at the University of Natal in 1982.
Mr. Herbert Robertson, aged 46, is the Safety, Health, Environment and Quality
manager of Taung Gold. From 2005 to 2007, he was a field manager at Boynton
Platinum. Since 2007, he has been a senior safety coordinator of Sephaku Management
and Taung Gold responsible for management review, communication and awareness,
auditing and logistics. He holds a Postgraduate Degree in Safety from the University of
Southern Queensland.
Mr. Peter Warring, aged 50, is the Chief Operating Officer (Legal) of Taung Gold.
In 1990 he joined British American Tobacco as head of their legal department and as
assistant public affairs manager, before joining a division of Anglovaal Industries as
head of their legal department in 1995. From 2001 Mr. Warring was Commercial
Manager for Anglo American’s Base Metal Division (Africa), charged with negotiating
joint venture and other agreements whilst travelling extensively across the continent.
He joined Taung Gold as Chief Operating Officer (Legal) in May 2007. He holds a
Bachelor of Arts degree in Economic History & Legal Theory (BA) and Bachelor of
Law degree (LLB) from Rhodes University and a higher diploma in labour from Rand
Afrikaans University.
Mr. James Donald Edwin Wilson, aged 48, is a project manager and senior
geologist of Taung Gold since June 2008. He is responsible for steering the Jeanette
project through scoping study towards feasibility study evaluation. He worked at a
number of mining companies as a geologist from 1985 to 2004, including Anglovaal
Limited. From 2004 to 2008, he was employed by Boynton Platinum Limited, part of
the Platmin Group, as a senior project geologist and a project manager responsible for
managing the exploration work and conducting a pre-feasibility study programme on a
platinum project. He is a registered member with the South African Council for
Natural Scientists, a member of the Geological Society of South Africa and a fellow of
the Geological Society of London. He graduated from Trinity College Dublin with a
Bachelor of Arts in Natural Sciences in 1985 and received his MBA degree from
Durham University Business School in 1992.
LETTER FROM THE BOARD
– 118 –

PART D — FINANCIAL INFORMATION AND MANAGEMENT DISCUSSION AND
ANALYSIS OF THE TAUNG GROUP
1. OVERVIEW
Set out below is the management’s discussion and analysis of the Taung Group for the
three years ended 28 February 2011. This section should be read in conjunction with the
consolidated financial statements and the related notes of the Taung Group included in
Appendix II to this Circular. All the companies in the Taung Group are registered in South
Africa. The assets of the Taung Group are held through its subsidiaries.
1.1 Significant factors affecting the results and operations of the Taung Group
Since the incorporation of Taung Gold and each of its subsidiaries, the Taung
Group has been engaged in the acquisition, exploration and development of gold and
associated minerals located in South Africa. The mineral assets have been consolidated
into a focused entity with the strategy of developing two flagship projects — the
Evander Project and the Jeanette Project, whilst conducting further exploration on
greenfields exploration assets. Scoping studies have been completed on both of the
flagship projects which returned positive results. At present a Pre-Feasibility Study is
being conducted over the Evander Project, and the Jeanette Project has advanced to
the ‘‘resource upgrade stage’’ through drilling. Consequently the Taung Group has not
generated any revenue during the three years ended 28 February 2011 save for interest
received on excess funds. The historical operating results are therefore not indicative of
its future operating results after it commences commercial production and sale of gold
and related minerals.
The financial position of the Taung Group and its operating results reflect the
costs associated with the acquisition of prospecting and mining rights, various studies,
staff costs and other cost normally incurred by exploration companies. All qualifying
expenditure, including administration and other overhead costs directly associated
with the specific project, are capitalised. Once technical and commercial feasibility of
the project has been established, the relevant exploration assets will be transferred to
development costs. To the extent that the Taung Group continues to engage in
exploration and development activities, results of its operations will continue to be
affected by these and other costs associated with exploration and pre-production stages
of development. It is estimated that the Taung Group will spend a further ZAR342.2
million for the period May 2011 up to February 2012 (including the settlement of the
purchase price of the Evander Project) and ZAR131.9 million in the ensuing financial
year on the further development of both flagship projects, when it is anticipated that
the Bankable Feasibility Studies on both projects will be completed. Immediately after
Electrum Completion it is anticipated that the Taung Group will have cash resources
of ZAR687.8 million which will be sufficient to fund the operations of the Taung
Group until February 2013.
LETTER FROM THE BOARD
– 119 –

1.2 Critical accounting policies
In preparing the Taung Group financial statements, management is required to
select appropriate accounting policies and to make estimates and assumptions that
affect the amounts represented in the Taung Group financial statements and related
disclosures. Critical accounting policies are those considered by management to
require significant judgement and estimates and/or these where a diverse range of
accounting treatment is permitted by IFRS. The critical accounting policies and
estimates adopted by the Taung Group are described below. For more information
regarding the Taung Group’s critical accounting estimates and judgements, see
‘‘Appendix II — Financial Information of the Taung Group — note 1.2’’ of this
Circular.
Impairment testing
The Taung Group reviews and tests the carrying value of assets when events or
changes in circumstances suggest that the carrying amount may not be recoverable.
Assets are grouped at the lowest level for which identifiable cash flows are largely
independent of cash flows of other assets and liabilities. If there are indications that
impairment may have occurred, estimates are prepared of expected future cash flows
for each group of assets. Expected future cash flows used to determine the value in use
of goodwill and tangible assets are inherently uncertain and could materially change
over time.
Taxation
Judgement is required in determining the provision for income taxes due to the
complexity of legislation. There are many transactions and calculations for which the
ultimate tax determination is uncertain during the ordinary course of business. The
Taung Group recognises liabilities for anticipated tax audit issues based on estimates
of whether additional taxes will be due. Where the final tax outcome of these matters is
different from the amounts that were initially recorded, such differences will impact the
income tax and deferred tax provisions in the period in which such determination is
made.
The Taung Group recognises the net future tax benefit related to deferred income
tax assets to the extent that it is probable that the deductible temporary differences will
reverse in the foreseeable future. Assessing the recoverability of deferred income tax
assets requires the Taung Group to make significant estimates related to expectations
of future taxable income. Estimates of future taxable income are based on forecast cash
flows from operations and the application of existing tax laws in each jurisdiction. To
the extent that future cash flows and taxable income differ significantly from estimates,
the ability of the Taung Group to realise the net deferred tax assets recorded at the end
of the reporting period could be impacted. Due to the nature of the potential cash
generating units, there is not enough evidence to prove that it will be probable that
taxable profits will be generated against which the deductible temporary differences
LETTER FROM THE BOARD
– 120 –

can be utilised. Due to the fact that it is not probable that the deductible temporary
differences will reverse in the foreseeable future, no provision for a deferred tax asset
was made by any of the Companies within the Group.
Exploration expenses capitalised
Exploration and evaluation expenses are those expenses incurred in connection
with acquisition of rights to explore, investigate, examine and evaluate an area of
mineralization including related overhead costs. The directors of Taung Gold exercise
judgment to determine if the costs associated with a specific project must be capitalised
against the specific project or written off.
Exploration assets are reviewed at reporting date and where the directors of
Taung Gold consider there to be indicators of impairment, impairment tests will be
performed on the capitalised costs and any impairments will be recognised through the
income statement.
Intangible assets
Intangible assets are initially recognised at cost and are subsequently carried at
cost less any accumulated amortisation and any impairment losses. All costs, including
administration and other general overhead costs directly associated with the specific
project are capitalised. The directors of Taung Gold evaluate each project at each
period end to determine if the carrying value should be impaired. To determine
whether expenditure meet the criteria to be capitalised, the directors of Taung Gold use
information from several sources, depending on the level of exploration. Purchased
exploration and evaluation assets are recognised at cost of acquisition or at the fair
value if purchased as part of a business combination. Exploration assets are not
amortised as they will only be available for use once transferred to the development
cost of the project. This will occur once technical and commercial feasibility of the
project has been established. No further exploration cost will be capitalised. The cost
transferred to development cost will be amortised over the life of the project based on
the expected flow of economic resources associated with the project.
Cash and cash equivalents
Cash and cash equivalents comprise cash on hand and demand deposits, and other
short-term highly liquid investments that are readily convertible to a known amount of
cash and are subject to an insignificant risk of changes in value. These are initially and
subsequently recorded at fair value.
Share based payments
Goods or services received or acquired in a share-based payment transaction are
recognised when the goods are received or as the services are rendered. A
corresponding increase in equity is recognised if the goods or services were received
in an equity-settled share-based payment transaction or a liability if the goods or
services were acquired in a cash-settled share-based payment transaction.
LETTER FROM THE BOARD
– 121 –
When the goods or services received or acquired in a share-based payment
transaction do not qualify for recognition as assets, they are recognised as expenses.
For equity-settled share-based payment transactions the goods or services
received and the corresponding increase in equity are measured, directly, at the fair
value of the goods or services received provided that the fair value can be estimated
reliably.
If the fair value of the goods or services received cannot be estimated reliably,
their value and the corresponding increase in equity, indirectly, are measured by
reference to the fair value of the equity instruments granted.
For cash-settled share-based payment transactions, the goods or services acquired
and the liability incurred are measured at the fair value of the liability. Until the
liability is settled, the fair value of the liability is re-measured at each reporting date
and at the date of settlement, with any changes in fair value recognised in profit or loss
for the period.
If the share-based payments granted do not vest until the counterparty completes
a specified period of service, the Taung Group accounts for those services as they are
rendered by the counterparty during the vesting period, (or on a straight line basis over
the vesting period).
If the share-based payments vest immediately the services received are recognised
in full.
For share-based payment transactions in which the terms of the arrangement
provide either the entity or the counterparty with the choice of whether the entity
settles the transaction in cash (or other assets) or by issuing equity instruments, the
components of that transaction are recorded, as a cash-settled share-based payment
transaction if, and to the extent that, a liability to settle in cash or other assets has been
incurred, or as an equity-settled share-based payment transaction if, and to the extent
that, no such liability has been incurred.
2. DESCRIPTION OF SELECTED LINE ITEMS FROM THE TAUNG GROUP’S
CONSOLIDATED STATEMENT OF COMPREHENSIVE INCOME.
Other income
Other income mainly consists of profits realised on foreign currency received from
investors subscribing for ordinary shares.
Interest received
Surplus funds are invested in various term investments with banks and interest is
earned from this.
LETTER FROM THE BOARD
– 122 –

Employees, remuneration and share incentive scheme
Taung Gold presently has 38 employees. For the two financial years ended 28
February 2010, Taung Gold had 16 and 22 employees respectively. A remuneration
committee, comprising two directors of Taung Gold, ensures that employees and
executive directors are fairly rewarded for their individual contributions and Taung
Gold’s overall performance. Remuneration packages are structured to be competitive
against remuneration paid in the market so as to attract and retain the services of
suitably qualified employees and to keep the employees motivated and incentivised.
Taung Gold is not contractually bound to pay any bonuses and the granting of bonuses
is entirely at the discretion of the remuneration committee.
Taung Gold operates a share incentive scheme. The policy allocates 10% of the
issued share capital of Taung Gold to employees. Employees have been awarded
options to subscribe for shares in Taung Gold within a period of up to 5 years at the
market value of the shares at the date the options are awarded less between 1% and
5%. The remuneration committee allocates the options to employees based on their
individual contributions. Details of all outstanding options in Taung Gold are set in
‘‘Part A — Structure of the Transactions, the Acquisition and the Consideration —
1.11 Outstanding Warrants and Options in Taung Gold’’. This share incentive scheme
will lapse when all the outstanding options issued to the TG Optionsholders are
exercised.
Training needs are identified by management and training is done as and when
deemed necessary. Employees are also encouraged to assess their own needs for
training and Taung Gold will accommodate any such needs as necessary.
Employee costs and employee costs capitalised and recouped
All costs relating to staff remuneration is allocated on a time basis to either
overheads or, where the cost relates directly to a specific project, to that project. Where
time is allocated to other entities, these costs are reallocated to these entities on a cost
basis.
Pre-granting costs written off
Costs are only capitalised to projects once legal rights to explore has been
acquired. Costs incurred before legal rights have been secured which relate to
exploration assets, are expensed through the statement of comprehensive income.
Share based payments — Options to staff
The fair value of options granted to employees is determined by using the Cox
Cross Rubinstein bi-nominal tree model. Costs are allocated to either projects or
overheads based on the time allocated to the various cost centres over the preceding
twelve month period.
LETTER FROM THE BOARD
– 123 –

Administration and other costs
Administration and other costs consist mainly of consulting fees not directly
attributable to projects, depreciation and other various administration costs.
Taxation
No provision has been made for taxation as a result of the losses incurred to date.
Due to the exploration and future developed activities of the Taung Group, it is not
probable that the Taung Group will be in a profitable position in the foreseeable
future. Therefore, the deferred asset recognised is limited to the amount of the deferred
liability recognised.
Results of operations
The table below sets forth data from the consolidated statement of comprehensive
income:
Year ended 28 February
2011 2010 2009
ZAR’000 ZAR’000 ZAR’000
Revenue — — —
Other income 1,172 89 57
Net interest received 5,571 1,843 136
Employee costs (9,480) (4,099) (1,952)
Pre-granting costs and impairment of
exploration assets (5,569) (1,485) (1,146)
Share-based payments — options to staff (64,146) — —
Administration and other costs (8,924) (4,417) (4,381)
Loss before taxation (81,376) (8,069) (7,286)
Taxation — — —
Loss after tax (81,376) (8,069) (7,286)
Years ended 28 February 2009, 2010 and 2011
Other income
The profit on the conversion of foreign exchange increased substantially in 2011.
This is due to the fact that the profit was realised on the receipt of foreign currency on
the subscription for shares in Taung Gold.
Net interest received
The increased interest received in 2010 and 2011 relates mainly to the increase in
cash balances during these years.
LETTER FROM THE BOARD
– 124 –

Employee costs
The gross cost of salaries before any of these costs were capitalised to exploration
assets amounted to ZAR18.57 million, ZAR10.35 million and ZAR6.51 million in for
2011, 2010 and 2009 respectively. The costs capitalised to exploration assets or
recouped from other companies over the corresponding period amounted to ZAR9.09
million, ZAR6.25 million and ZAR4.56 million respectively. This is mainly due to the
increased activities in Taung Gold and the concomitant increase in the number of
employees.
Pre-granting costs and impairment of exploration assets
The increase in the pre-granting costs to ZAR5.57 million in 2011 from ZAR1.49
million and ZAR1.15 million in 2010 and 2009 respectively reflects the increased
activities and applications for exploration rights.
Share-based payments
Options were only granted to staff during the 2011 financial year. All options vest
immediately and are accounted for in full at granting. The total value of the options as
determined using the Cox Cross Rubinstein bi-nominal tree model amounts to
ZAR93.23 million. An amount of ZAR29.08 million was capitalised to the various
projects based on the time allocated directly to these projects over the preceding twelve
month period. In determining the fair value of the options the expected volatility was
estimated to be between 74.77% and 77.82%. It was assumed that no dividends will be
paid over the life of the options and the share price was between ZAR5.00 and
ZAR10.00 on date of granting of the options. It was further assumed that non-
managerial staff would exercise their options within one year from granting and that
managerial staff would exercise their options over a three year period.
Administration and other costs
The increase in the administration fee was due to the following major items:
(a) Consulting fees amounted to ZAR0.02 million in 2009. In 2010 the consulting
charges amounted to ZAR0.78 million and in 2011 this increased to ZAR3.18
million; and
(b) Travel and accommodation costs increased from ZAR0.06 million in 2009 to
ZAR0.52 million in 2010 and ZAR1.63 million in 2011.
(c) In 2009 the costs associated with the initial capital raising amounted to
ZAR2.04 million.
LETTER FROM THE BOARD
– 125 –

3. DESCRIPTION OF SELECTED ITEMS FROM THE TAUNG GROUP’S
CONSOLIDATED STATEMENT OF FINANCIAL POSITION
Intangible assets
The carrying amount of the intangible assets, which mainly consists of the
exploration assets, increased from ZAR36.95 million on 28 February 2009 to
ZAR193.46 million at 28 February 2011. This reflects the acquisition price paid for
the Jeanette project of ZAR75.00 million as well as the continuing exploration
activities undertaken during the period.
Liquidity and capital resources
Historically the Taung Group has financed its capital expenditure and working
capital requirements through capital contributions from shareholders. As at 28
February 2011 the net current assets increased to ZAR260.68 million from a net
current liability position of ZAR17.01 million in 2009. The Taung Group has not
loaned any funds from any banking or similar institutions.
The Taung Group intends to finance its future capital expenditure and meet its
working capital requirements through its cash at bank as well as from the proceeds of
the exercise of warrants before First Completion and Electrum Completion which is
expected to increase the cash at bank by ZAR415.50 million. In addition, it is
anticipated that a further ZAR28.08 million will be received on the exercise of existing
warrants which will be exercised before First Completion but for which payment will
only be received 9 months after First Completion.
The following table sets forth the current assets and current liabilities of the
Taung Group at the dates as indicated:
As at 28 February
2011 2010 2009
ZAR’000 ZAR’000 ZAR’000
Current assets
Trade and other receivables 2,024 4,807 2,029
Short-term deposits 2,469 26,819 —
Cash and cash equivalents 270,228 1,744 2,381
Total current assets 274,721 33,370 4,410
Current liabilities
Loans from shareholders 5,315 5,270 8,655
Trade and other payables 8,730 10,119 12,766
Total current liabilities 14,045 15,389 21,421
Net current assets/(liabilities) 260,676 17,981 (17,011)
LETTER FROM THE BOARD
– 126 –

Cashflows
As at 28 February
Selected cash flow statement data 2011 2010 2009
ZAR’000 ZAR’000 ZAR’000
Net cash used in operating activities (18,685) (7,397) (4,003)
Net cash used in investing activities (82,026) (39,339) (27,699)
Net cash flows from financing
activities 369,195 46,099 29,572
Net cash movement for the year 268,484 (637) (2,130)
Cash and cash equivalents at the end of
the year 270,228 1,744 2,381
Operating Costs
Net cash used in operating activities for the year ended 28 February 2011 was
ZAR18.69 million and cash outflow before working capital changes was ZAR22.03
million. The net decrease of ZAR2.25 million in working capital reflects a decrease in
trade and other payables of ZAR1.38 million and an increase in other receivables of
ZAR0.87 million.
Net cash used in operating activities for the year ended 28 February 2010 was
ZAR7.40 million and cash outflow before working capital changes was ZAR8.35
million. The net decrease of ZAR0.82 million reflects a decrease of ZAR1.96 million in
trade and other payables and an increase of ZAR2.77 million in other receivables.
Net cash used in operating activities for the year ended 28 February 2009 was
ZAR4.00 million and cash outflow before working capital changes was ZAR6.27
million. Working capital was increased by the reduction of other receivables of
ZAR0.65 million and the increase in trade and other payables of ZAR1.71 million.
Investing activities
Cash utilised in investing activities amounted to ZAR82.03 million in 2011,
ZAR39.34 million in 2010 and ZAR27.70 million in 2009. The outflow of funds related
mainly to:
(a) acquisition of fixed assets of ZAR1.98 million in 2011 and ZAR0.69 million
in 2010; and
(b) cost capitalised to mainly exploration assets of: ZAR84.39 million in 2011,
ZAR11.84 million in 2010 and ZAR22.70 million in 2009; and
(c) deposits paid for the acquisition of the Evander Project and the Jeanette
Project in 2011 of ZAR20.00 million and ZAR5.00 million in 2009; and
LETTER FROM THE BOARD
– 127 –

(d) the short-term deposits were reduced by ZAR24.35 million in 2011 and
increased by ZAR26.82 million in 2010.
Financing activities
The funds generated from financing activities are mainly made up of the
following:
(a) proceeds from share issued ZAR369.15 million in 2011, ZAR54.09 million in
2010 and ZAR22.82 million in 2009; and
(b) proceeds/(repayments) of shareholder loans and advances of ZAR0.05
million in 2011, ZAR(7.99 million) in 2010 and ZAR6.75 million in 2009.
Taung Gold has not raised any debt financing from third party lenders and
accordingly, it does not have a gearing ratio.
Contingencies and guarantees
As of 28 February 2011 the Taung Group had no bank overdrafts or other forms
of financing from any financial institutions. Guarantees totalling ZAR1.26 million
were provided to the DMR, for the provision of possible rehabilitation or management
of negative environment impacts, and a further amount of ZAR1.34 million was
deposited in cash for the same purpose. As far as the Taung Group is aware, no
possible liabilities exist in relation to any exploration undertaken.
Pursuant to the Sale Agreement, subject to the approval of the MMR, Taung
Gold is obliged to pay a total acquisition price of ZAR225 million (or equivalent to
HK$219.38 million). A deposit of ZAR20 million (or equivalent to HK$19.5 million)
was paid to EGM Limited prior to 28 February 2011. So far as the Directors are aware,
other than as mentioned, Taung Gold has no other contingent liabilities. There were no
further contingent liabilities for the three financial years ended 28 February 2011.
Charge on assets
For the previous three years, and at present, all fixed assets have been the
exclusive property of the Taung Group and there have not been, nor are there at
present any encumbrances, liens or other charges against the property.
LETTER FROM THE BOARD
– 128 –

Capital expenditure
As at 28 February 2011, capital expenditure of the Taung Group totalled
ZAR195.83 million. Set out below is a breakdown of the aggregate capital expenditure
for the Taung Group:
At carrying value 28 February 2011
ZAR’000
Tangible assets 2,374
— Computer equipment 292
— Computer software 12
— Field equipment 25
— Furniture and fixtures 119
— Motor vehicles 533
— Office equipment 19
— Plant and machinery 1,374
Intangible assets 193,456
— Computer software 398
— Exploration assets 193,058
Total assets 195,830
Market risks
Taung Gold is exposed to various types of market risks, including capital risk
management, liquidity risk and interest rate risk in the normal course of business.
Capital risk management
The objectives when managing capital are to safeguard the Taung Group’s ability
to continue as a going concern in order to provide returns for shareholders and
benefits for other stakeholders. The further exploration and development of the
exploration assets will require additional capital. The continuing development of the
mineral resources and reserves will depend on the ability of directors to raise
additional funds. The Taung Group also strives to achieve an optional weighted
average cost of capital while continuing to safeguard the Taung Group’s ability to meet
its liquidity requirements. There are no externally imposed capital requirements.
Liquidity risk
The Taung Group’s risk to liquidity is a result of the funds available to cover
future commitments. The Taung Group manages liquidity risk through an ongoing
review of future commitments and credit facilities.
Cash flow forecast are prepared and adequate utilised borrowing facilities are
monitored.
LETTER FROM THE BOARD
– 129 –

Interest rate risk
The Taung Group has limited exposure to interest rate risk as the Taung Group
has no interest bearing liabilities. Cash funds are deposited with reputable financial
institutions until such time as the funds are required. No other assets or liabilities are
exposed to any interest rate risks.
The company is sensitive to movement in the South African interest rates which
are the primary interest rate to which the company is exposed. The funds deposited
with financial institutions are the only asset or liability exposed to the interest rate risk
and the interest earned is linked to the prime rate of lending.
Subsequent events after 28 February 2011
No material events have occurred between 28 February 2011 and the date of this
Circular.
LETTER FROM THE BOARD
– 130 –

PART E — INFORMATION ON MANDRA, ARCTIC AND SEPGOLD
1. BACKGROUND
Under the Broad-Based Socio-Economic Empowerment Charter for the South African
Mining Industry pursuant to the provisions of Section 100(2) of the MPRDA, Taung Gold
is a company primarily engaged in the exploration and/or mining activities of mineral
resources in South Africa and it must by 2014 have at least 26.0% of its shareholding
beneficially owned either directly by historically disadvantaged South Africans or by a
Qualified BEE Company. As at the Latest Practicable Date, SepGold holds approximately
16% of the issued share capital of Taung Gold and it is 100% owned by Arctic. Arctic is a
Qualified BEE Company with more than 50% of its shares being controlled by historically
disadvantaged South Africans. 49.90% of Arctic’s shares are being transferred to Mandra
(through its 100% interest in Arctic Holdco). Upon First Completion, Mandra’s interest in
Arctic will be acquired by Wing Hing. The shareholding structure of Mandra, Arctic and
SepGold immediately before First Completion and immediately after First Completion is
set out below.
1.1 Shareholding Structure of Mandra, Arctic and SepGold immediately before First
Completion
49.90%
100%
BEE SHAREHOLDERS MANDRA
ARCTIC ARCTIC HOLDCO
SEPGOLD
TAUNG GOLD
50.10%
100%
28.62%
LETTER FROM THE BOARD
– 131 –

1.2 Shareholding Structure of Mandra, Arctic and SepGold immediately after First
Completion
49.90%
100%
13.62%
BEE SHAREHOLDERS WING HING
ARCTIC ARCTIC HOLDCO
MANDRA(as 100% owner of
ARCTIC HOLDCO)
SEPGOLD
TAUNG GOLD
50.10%
100%
28.62%
2. INVESTMENT IN ARCTIC BY MANDRA
Mandra is principally an investment holding company ultimately beneficially owned as
to 50% by Mr. Zhang Songyi and as to 50% by Ms. Mui Bing How, the wife of Mr. Zhang
Songyi. Mandra holds 100% of Arctic Holdco’s equity interest which will be the legal and
beneficial owner of 49.90% of the issued share capital of Arctic immediately prior to First
Completion.
In December 2009 (and later as amended in February 2010), Mandra Capital, an
affiliate of Mandra and Mr. MS Wu, a historically disadvantaged South African, entered
into an agreement with SepGold’s then owner, Sephaku Holdings Limited, to acquire the
entire issued share capital of SepGold using Arctic as the acquiring vehicle. As at the Latest
Practicable Date, Arctic is 100% owned by Mr. MS Wu. Before First Completion, Arctic
will be held by Mandra as to 49.90% and by BEE Shareholders as to 50.10%. Mr. MS Wu is
LETTER FROM THE BOARD
– 132 –

in the process of transferring shares in Arctic to other BEE Shareholders, and on or before
First Completion, the BEE Shareholders in Arctic will consist of Mr. MS Wu as to 40.1%,
Mr. Vika Khumlo as to 5% and Mr. Lelau Mohuba as to 5%.
As at the Latest Practicable Date, Arctic has an aggregate interest of approximately
16% in the issued and outstanding capital of Taung Gold held through SepGold. As a result
of the vendor financing arrangements to ensure SepGold holds no less than 26.0% of the
issued shares in Taung Gold (further details are set out in the following section below
headed ‘‘3. Vendor Financing and Top-Up Arrangements’’), Arctic (through SepGold) will
be interested in approximately 28.62% of Taung Gold immediately before and after First
Completion. Immediately after the Electrum Completion, Arctic’s indirect interest in the
issued and outstanding capital of Taung Gold will reduce to 26.02% held through SepGold.
3. VENDOR FINANCING AND TOP-UP ARRANGEMENTS
As mentioned above, SepGold must hold no less than 26.0% of the issued share capital
of Taung Gold at all times for so long as this is required by South African laws (the BEE
Requirement). On 22 July 2011, Taung Gold and SepGold entered into a vendor financing
agreement for the purpose of complying with the BEE Requirement pursuant to which
Taung Gold will, subject to conditions, grant a loan to SepGold to enable SepGold to (i)
exercise its warrants held in Taung Gold and thereby subscribe for the corresponding
number of TG Shares; and (ii) to subscribe for such number of additional TG Shares (Top-
Up Shares) as are necessary to bring SepGold’s shareholding in Taung Gold to at least
26.0% by First Completion (the Loan). The Loan will be interest free and will be repayable
on or before 31 December 2014. However, if the Loan is not repaid in full by this date, it
shall accrue interest at the prime rate quoted by ABSA Bank from time to time plus 4%
compounded annually in arrears. 50% of any dividends declared by Taung Gold in any
financial year shall be applied in repayment of the Loan. The TG Shares acquired by
SepGold pursuant to the Loan shall be pledged to Taung Gold as security for repayment of
the Loan.
For so long as the BEE Requirement is in place, and upon the exercise by the TG
Optionholders of their options to acquire TG Shares, Taung Gold will make further loans
to SepGold on substantially the same terms as the Loan, to enable SepGold to subscribe for
the necessary number of TG Shares so as to prevent dilution of SepGold’s shareholding in
Taung Gold and thereby maintain such shareholding at a minimum of 26.0%.
4. ASSETS OF ARCTIC
Other than its indirect interest in Taung Gold through SepGold, Arctic does not have
any other assets or liabilities. Since Arctic is an investment holding company and was only
incorporated on 19 March 2009, no financial information is available on Arctic.
LETTER FROM THE BOARD
– 133 –
PART F — INFORMATION ON THE WING HING GROUP AND THE ENLARGED
GROUP
1. INFORMATION ON THE WING HING GROUP
The Wing Hing Group is an investment holding company and its subsidiaries are
principally engaged in operating coal and gold mines in the PRC and the sale of minerals.
Wing Hing is a company incorporated in Bermuda and the Wing Hing Shares are listed on
the Main Board of the Exchange.
2. BUSINESS MODEL AND STRATEGIC PLANS OF THE ENLARGED GROUP
2.1 The Enlarged Group’s PRC operations
Wing Hing currently engages in the gold mining business through its operations in
the Long Men Sou Mine, located in Hebei province in the PRC. Production at the
Long Men Sou Mine has commenced and this mine produces a maximum of
approximately 5 kilograms of gold concentrates per month. Revenue from Wing
Hing’s gold mine for the year ended 31 March 2011 amounted to HK$4.9 million and
was derived from the sale of gold products to customers in the PRC. For the reasons
stated in the section of this Circular headed ‘‘Part A: Structure of the Transactions, the
Acquisition and the Consideration — 4. Reasons for and Benefits of the Acquisition’’,
the Board remains optimistic about Wing Hing’s gold mining business. Following
completion of the Acquisition, the Enlarged Group will continue its operations of the
Long Men Sou Mine at their existing levels. Although there are currently no concrete
plans to further expand the operations at the Long Men Sou Mine, the Board believes
that the geographical area in which the Long Men Sou Mine is located has good
geological potential. As such, following completion of the Acquisition, the Enlarged
Group will consider further strategies to explore the areas around the Long Men Sou
Mine.
Wing Hing also engages in the coal mining business through its operations in the
Xinghe Coal Mine and the Dayan Coal Mine. The Board has been aware of the
limitations in Wing Hing’s coal mining business for some time. In particular, due to the
occurrence in succession of several coal mine accidents in the PRC, the Department of
Energy of China has pointed out that it will initiate the formulation of coal regulations
and policies, including some directions, among others, strengthening the management
of coal resources, the improvement of coal planning and the protection of rights and
interests of the miners and accordingly, the Board came to the view that the costs in the
construction of coal mines and the production of coal will increase in order to comply
with these new regulations and policies. As such, the Wing Hing Group is cautious
about its coal mining business, particularly since its coal mining business has not
generated satisfactory income, and has undertaken in the Acquisition Agreement to
dispose of the Dayan Licence and the Xinghe Licence after completion of the
Acquisition.
LETTER FROM THE BOARD
– 134 –

2.2 The Enlarged Group’s South African operations
As a result of Wing Hing’s optimism on global gold prices, the Board searched for
more opportunities in the gold mining business and also sought to expand its gold
mining business outside of the PRC through its acquisition of Taung Gold. The
Evander Project has proceeded to Pre-Feasibility stage and the Jeanette Project is at
‘‘resource upgrading stage’’ and upon their completion, will progress to Bankable
Feasibility Studies. It is anticipated that the Bankable Feasibility Studies for the
Evander Project and the Jeanette Project will be completed before the end of February
2013, in preparation for investment decisions during the second quarter of 2013. The
path to production for the Evander Project and the Jeanette Project (including
indicative costs and expected date to commence commercial production) are clearly
stated in the section of this Circular headed ‘‘Part C — Information on the Taung
Group and its Primary Projects — 3. Nature and Quality of the Taung Group’s assets
and businesses — 3.4 The Evander Project/3.5 The Jeanette Project’’.
2.3 Capital expenditures, funding requirements and future financing plans
Anticipated exploration expenditure of US$0.5 million will be incurred in the
PRC over the next two years and will be covered by existing cash resources, income
from operations and receivables. Save as disclosed, the Wing Hing Group does not
expect any need for substantial capital expenditures for the next 12 months in respect
of the Long Men Sou Mine given that there is no significant expansion planned for this
mine.
For the Enlarged Group’s South African operations, it is expected that the
Evander Project and the Jeanette Project will require approximately US$71.8 million
to the end of February 2013. The Taung Group’s Greenfield Projects will also be
progressed in the next two years in accordance with their respective prospecting and
mining permits. Capital expenditure of US$6.1 million is expected for the Greenfield
Projects of the Taung Group for the period ended 28 February 2013. The total
expected expenditure for Taung Group for the period ended 28 February 2013 is
expected to be about US$84.0 million. Taung Gold will, by Electrum Completion, have
up to US$86.0 million in cash which will cover the expected capital expenditure of the
Taung Group for the next two years.
Accordingly, the Board believes that the Enlarged Group will not have immediate
pressure to raise funds to support the operation of the Enlarged Group in the short
term after completion of the Transactions. In the long run, the Directors will from time
to time assess the financial position of Wing Hing and, if appropriate, consider the
feasibility of fund raising methods, including but not limited to debt financing and
equity financing, to support future capital expenditures and operating costs of the
Enlarged Group.
The peak funding requirement for the Evander Project and the Jeanette Project is
approximately US$315 million (equivalent to approximately HK$2,457.01 million) and
approximately US$603 million (equivalent to approximately HK$4,703.40 million)
LETTER FROM THE BOARD
– 135 –
respectively in 2018 and 2016. It is currently expected that actual gold production will
begin at the Evander Project in the third quarter of 2014 or early 2015 and in 2016 for
the Jeanette Project.
As at the Latest Practicable Date, the Wing Hing Group has no concrete plans to
further raise capital (whether by equity or by debt). However, in anticipation of the
additional funding requirement after commencement of gold production, following
completion of the Acquisition, the Enlarged Group will consider its future funding
needs and possible capital raising option to meet the funding requirements of the two
projects.
3. SHAREHOLDING STRUCTURE OF WING HING BEFORE AND AFTER
COMPLETION OF THE TRANSACTIONS
A. Before and After First Completion. The following table sets out the shareholding
structure of Wing Hing
(i) as at the date of this Circular and before First Completion;
(ii) immediately after First Completion and the allotment and issue of the TG
Consideration Shares, Other Consideration Shares, Arctic Consideration
Shares and the GoldCom Consideration Shares (assuming no WH Warrants
are exercised); and
LETTER FROM THE BOARD
– 136 –
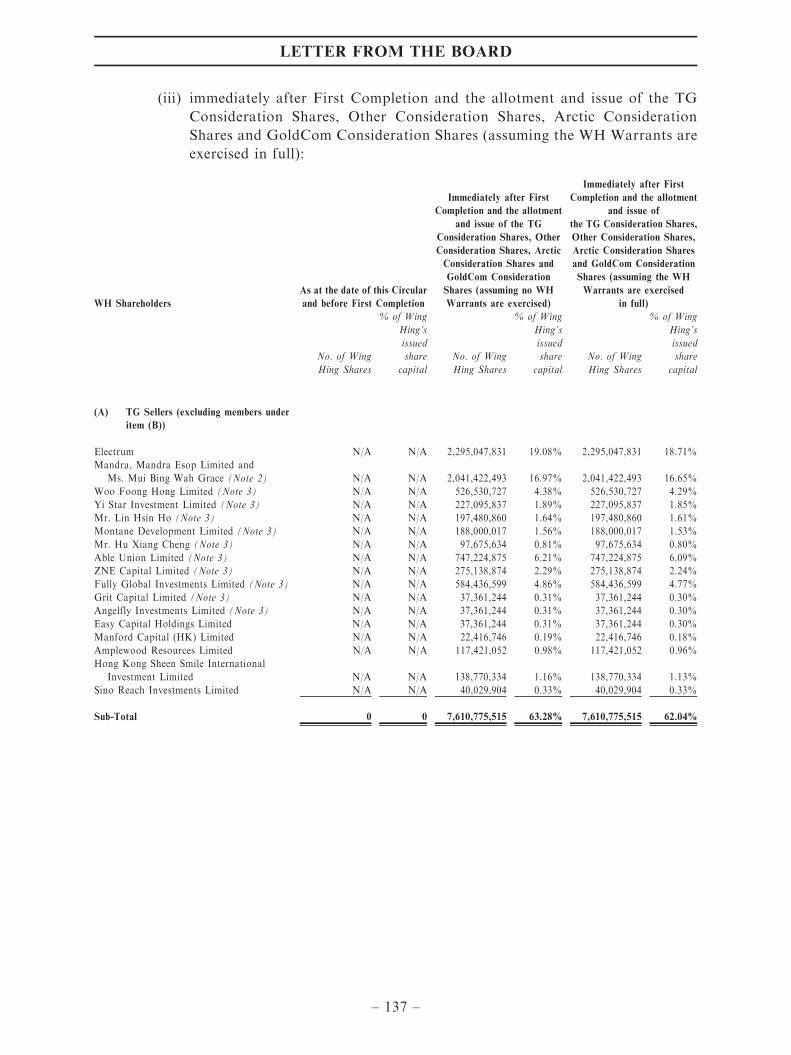
(iii) immediately after First Completion and the allotment and issue of the TG
Consideration Shares, Other Consideration Shares, Arctic Consideration
Shares and GoldCom Consideration Shares (assuming the WH Warrants are
exercised in full):
WH Shareholders
As at the date of this Circular
and before First Completion
Immediately after First
Completion and the allotment
and issue of the TG
Consideration Shares, Other
Consideration Shares, Arctic
Consideration Shares and
GoldCom Consideration
Shares (assuming no WH
Warrants are exercised)
Immediately after First
Completion and the allotment
and issue of
the TG Consideration Shares,
Other Consideration Shares,
Arctic Consideration Shares
and GoldCom Consideration
Shares (assuming the WH
Warrants are exercised
in full)
No. of Wing
Hing Shares
% of Wing
Hing’s
issued
share
capital
No. of Wing
Hing Shares
% of Wing
Hing’s
issued
share
capital
No. of Wing
Hing Shares
% of Wing
Hing’s
issued
share
capital
(A) TG Sellers (excluding members under
item (B))
Electrum N/A N/A 2,295,047,831 19.08% 2,295,047,831 18.71%
Mandra, Mandra Esop Limited and
Ms. Mui Bing Wah Grace (Note 2) N/A N/A 2,041,422,493 16.97% 2,041,422,493 16.65%
Woo Foong Hong Limited (Note 3) N/A N/A 526,530,727 4.38% 526,530,727 4.29%
Yi Star Investment Limited (Note 3) N/A N/A 227,095,837 1.89% 227,095,837 1.85%
Mr. Lin Hsin Ho (Note 3) N/A N/A 197,480,860 1.64% 197,480,860 1.61%
Montane Development Limited (Note 3) N/A N/A 188,000,017 1.56% 188,000,017 1.53%
Mr. Hu Xiang Cheng (Note 3) N/A N/A 97,675,634 0.81% 97,675,634 0.80%
Able Union Limited (Note 3) N/A N/A 747,224,875 6.21% 747,224,875 6.09%
ZNE Capital Limited (Note 3) N/A N/A 275,138,874 2.29% 275,138,874 2.24%
Fully Global Investments Limited (Note 3) N/A N/A 584,436,599 4.86% 584,436,599 4.77%
Grit Capital Limited (Note 3) N/A N/A 37,361,244 0.31% 37,361,244 0.30%
Angelfly Investments Limited (Note 3) N/A N/A 37,361,244 0.31% 37,361,244 0.30%
Easy Capital Holdings Limited N/A N/A 37,361,244 0.31% 37,361,244 0.30%
Manford Capital (HK) Limited N/A N/A 22,416,746 0.19% 22,416,746 0.18%
Amplewood Resources Limited N/A N/A 117,421,052 0.98% 117,421,052 0.96%
Hong Kong Sheen Smile International
Investment Limited N/A N/A 138,770,334 1.16% 138,770,334 1.13%
Sino Reach Investments Limited N/A N/A 40,029,904 0.33% 40,029,904 0.33%
Sub-Total 0 0 7,610,775,515 63.28% 7,610,775,515 62.04%
LETTER FROM THE BOARD
– 137 –

WH Shareholders
As at the date of this Circular
and before First Completion
Immediately after First
Completion and the allotment
and issue of the TG
Consideration Shares, Other
Consideration Shares, Arctic
Consideration Shares and
GoldCom Consideration
Shares (assuming no WH
Warrants are exercised)
Immediately after First
Completion and the allotment
and issue of
the TG Consideration Shares,
Other Consideration Shares,
Arctic Consideration Shares
and GoldCom Consideration
Shares (assuming the WH
Warrants are exercised
in full)
No. of Wing
Hing Shares
% of Wing
Hing’s
issued
share
capital
No. of Wing
Hing Shares
% of Wing
Hing’s
issued
share
capital
No. of Wing
Hing Shares
% of Wing
Hing’s
issued
share
capital
(B) TG Sellers and Other TG
Shareholders who are parties acting in
concert
African Precious Minerals Limited, Dr.
David Twist and Mrs. Helena Twist, Mr.
Kweku A. Awotwi, Mr. Michael J. Yates
and family and GoldCom (Note 1) N/A N/A 1,521,798,821 12.65% 1,521,798,821 12.41%
Mr. Claude de Bruin and Mr. Marcel de
Bruin (Note 3) N/A N/A 39,856,975 0.33% 39,856,975 0.33%
Geologic Resource Funds Limited and its LP
and Geologic Resource Opportunities
Fund Limited and its LP (Note 3) N/A N/A 130,354,607 1.08% 130,354,607 1.06%
Mr. James F. M. Johnson and Ms. Marina
L. Johnson (Note 3) N/A N/A 1,067,517 0.01% 1,067,517 0.01%
Mr. Qian Hai Ming and Mr. Qian Wei Qi
(Note 3) N/A N/A 69,385,167 0.58% 69,385,167 0.57%
Sub-Total 0 0 1,762,463,087 14.65% 1,762,463,087 14.38%
(C) Other TG Shareholders (excluding
members under item (B)) N/A N/A 456,867,486 3.80% 456,867,486 3.73%
(D) Existing public WH Shareholders 2,197,909,600 100.00% 2,197,909,600 18.27% 2,434,257,600 19.85%
(E) TG Optionholders N/A N/A N/A N/A N/A N/A
TOTAL PUBLIC SHAREHOLDERS
(Note 4) 2,197,909,600 100.00% 7,426,826,275 61.75% 7,663,174,275 62.48%
TOTAL NUMBER OF WING HING
SHARES 2,197,909,600 100.00% 12,028,015,688 100.00% 12,264,363,688 100.00%
Notes:
1. Michael J. Yates, his family and GoldCom are not connected persons of Wing Hing and
accordingly forms part of Wing Hing’s public float.
2. Mandra will become a substantial shareholder of Wing Hing following the First Completion
Date. Accordingly, Mandra, along with its associates, Mandra Esop Limited and Ms. Mui
Bing Wah Grace are connected persons of Wing Hing following the First Completion Date.
3. As these shareholders are not connected persons of Wing Hing, they will be counted towards
the public float.
LETTER FROM THE BOARD
– 138 –

4. Excludes shareholding in Wing Hing by connected persons of Wing Hing (e.g. Directors,
substantial shareholders (as defined in the Listing Rules) of Wing Hing and their associates (as
defined by the Listing Rules)).
B. Before and After Electrum Completion. The following table sets out the
shareholding structure of Wing Hing:
(i) immediately after Electrum Completion and the allotment and issue of the
Electrum Consideration Shares (assuming no WH Warrants are exercised
and no TG Optionholder exercises their options/warrants);
(ii) immediately after Electrum Completion and the allotment and issue of the
Electrum Consideration Shares (assuming the WH Warrants are exercised in
full and no TG Optionholder exercises their options/warrants);
(iii) immediately after the allotment and issue of the Total Consideration Shares
and TG Optionholder Consideration Shares (assuming no WH Warrants are
exercised); and
(iv) immediately after the allotment and issue of the Total Consideration Shares
and TG Optionholder Consideration Shares (assuming the WH Warrants are
exercised in full):
Shareholders
Immediately after Electrum
Completion and the allotment and
issue of the Electrum
Consideration Shares (assuming no
WH Warrants are exercised)
Immediately after Electrum
Completion and the allotment and
issue of the Electrum
Consideration Shares
(assuming the WH Warrants are
exercised in full)
Immediately after the allotment
and issue of the Total
Consideration Shares and TG
Optionholder Consideration Shares
(assuming no WH Warrants are
exercised)
Immediately after the allotment
and issue of the Total
Consideration Shares and TG
Optionholder Consideration Shares
(assuming the WH Warrants are
exercised in full)
No. of Wing
Hing Shares
% of Wing
Hing’s issued
share capital
No. of Wing
Hing Shares
% of Wing
Hing’s issued
share capital
No. of Wing
Hing Shares
% of Wing
Hing’s issued
share capital
No. of Wing
Hing Shares
% of Wing
Hing’s issued
share capital
(A) TG Sellers (excluding members
under item (B))
Electrum 3,442,571,746 26.13% 3,442,571,746 25.67% 3,442,571,746 24.27% 3,442,571,746 23.87%
Mandra, Mandra Esop Limited and Ms.
Mui Bing Wah Grace
(Note 2) 2,041,422,493 15.49% 2,041,422,493 15.22% 2,041,422,493 14.39% 2,041,422,493 14.16%
Woo Foong Hong Limited (Note 3) 526,530,727 4.00% 526,530,727 3.93% 526,530,727 3.71% 526,530,727 3.65%
Yi Star Investment Limited (Note 3) 227,095,837 1.72% 227,095,837 1.69% 227,095,837 1.60% 227,095,837 1.58%
Mr. Lin Hsin Ho (Note 3) 197,480,860 1.50% 197,480,860 1.47% 197,480,860 1.39% 197,480,860 1.37%
Montane Development Limited (Note 3) 188,000,017 1.43% 188,000,017 1.40% 188,000,017 1.33% 188,000,017 1.30%
Mr. Hu Xiang Cheng (Note 3) 97,675,634 0.74% 97,675,634 0.73% 97,675,634 0.69% 97,675,634 0.68%
Able Union Limited (Note 3) 747,224,875 5.67% 747,224,875 5.57% 747,224,875 5.27% 747,224,875 5.18%
ZNE Capital Limited (Note 3) 275,138,874 2.09% 275,138,874 2.05% 275,138,874 1.94% 275,138,874 1.91%
Fully Global Investments Limited (Note 3) 584,436,599 4.44% 584,436,599 4.36% 584,436,599 4.12% 584,436,599 4.05%
Grit Capital Limited (Note 3) 37,361,244 0.28% 37,361,244 0.28% 37,361,244 0.26% 37,361,244 0.26%
Angelfly Investments Limited (Note 3) 37,361,244 0.28% 37,361,244 0.28% 37,361,244 0.26% 37,361,244 0.26%
Easy Capital Holdings Limited 37,361,244 0.28% 37,361,244 0.28% 37,361,244 0.26% 37,361,244 0.26%
Manford Capital (HK) Limited 22,416,746 0.17% 22,416,746 0.17% 22,416,746 0.16% 22,416,746 0.15%
Amplewood Resources Limited 117,421,052 0.89% 117,421,052 0.87% 117,421,052 0.83% 117,421,052 0.81%
Hong Kong Sheen Smile International
Investment Limited 138,770,334 1.06% 138,770,334 1.03% 138,770,334 0.98% 138,770,334 0.96%
Sino Reach Investments Limited 40,029,904 0.30% 40,029,904 0.30% 40,029,904 0.28% 40,029,904 0.28%
Sub-Total 8,758,299,430 66.47% 8,758,299,430 65.30% 8,758,299,430 61.74% 8,758,299,430 60.73%
LETTER FROM THE BOARD
– 139 –

Shareholders
Immediately after Electrum
Completion and the allotment and
issue of the Electrum
Consideration Shares (assuming no
WH Warrants are exercised)
Immediately after Electrum
Completion and the allotment and
issue of the Electrum
Consideration Shares
(assuming the WH Warrants are
exercised in full)
Immediately after the allotment
and issue of the Total
Consideration Shares and TG
Optionholder Consideration Shares
(assuming no WH Warrants are
exercised)
Immediately after the allotment
and issue of the Total
Consideration Shares and TG
Optionholder Consideration Shares
(assuming the WH Warrants are
exercised in full)
No. of Wing
Hing Shares
% of Wing
Hing’s issued
share capital
No. of Wing
Hing Shares
% of Wing
Hing’s issued
share capital
No. of Wing
Hing Shares
% of Wing
Hing’s issued
share capital
No. of Wing
Hing Shares
% of Wing
Hing’s issued
share capital
(B) TG Sellers and Other TG
Shareholders who are parties
acting in concert
African Precious Minerals Limited, Dr.
David Twist and Mrs. Helena Twist,
Mr. Kweku A. Awotwi, Mr. Michael J.
Yates and family and GoldCom
(Note 1) 1,521,798,821 11.55% 1,521,798,821 11.35% 1,521,798,821 10.73% 1,521,798,821 10.55%
Mr. Claude de Bruin and Mr. Marcel de
Bruin (Note 3) 39,856,975 0.30% 39,856,975 0.30% 39,856,975 0.28% 39,856,975 0.28%
Geologic Resource Funds Limited and its
LP and Geologic Resource
Opportunities Fund Limited and its LP
(Note 3) 130,354,607 0.99% 130,354,607 0.97% 130,354,607 0.92% 130,354,607 0.90%
Mr. James F. M. Johnson and Ms. Marina
L. Johnson (Note 3) 1,067,517 0.01% 1,067,517 0.01% 1,067,517 0.01% 1,067,517 0.01%
Mr. Qian Hai Ming and Mr. Qian Wei Qi
(Note 3) 69,385,167 0.53% 69,385,167 0.52% 69,385,167 0.49% 69,385,167 0.48%
Sub-Total 1,762,463,087 13.38% 1,762,463,087 13.15% 1,762,463,087 12.43% 1,762,463,087 12.22%
(C) Other TG Shareholders (excluding
members under item (B)) 456,867,486 3.47% 456,867,486 3.40% 456,867,486 3.22% 456,867,486 3.17%
(D) Existing Public Shareholders 2,197,909,600 16.68% 2,434,257,600 18.15% 2,197,909,600 15.49% 2,434,257,600 16.88%
(E) TG Optionholders N/A N/A N/A N/A 1,009,616,519 7.12% 1,009,616,519 7.00%
TOTAL PUBLIC SHAREHOLDERS
(Note 4) 7,426,826,275 56.37% 7,663,174,275 57.14% 8,436,442,794 59.47% 8,672,790,794 60.14%
Total number of Wing Hing Shares 13,175,539,603 100.00% 13,411,887,603 100.00% 14,185,156,122 100.00% 14,421,504,122 100.00%
Notes:
1. Michael J. Yates, his family and GoldCom are not connected persons of Wing Hing and
accordingly form part of Wing Hing’s public float.
2. Mandra will become a substantial shareholder of Wing Hing following the First Completion
Date. Accordingly, Mandra, along with its associates, Mandra Esop Limited and Ms. Mui
Bing Wah Grace are connected persons of Wing Hing following the First Completion Date.
3. As these shareholders are not connected persons of Wing Hing, they will be counted towards
the public float.
4. Excludes shareholding in Wing Hing by connected persons of Wing Hing (e.g. Directors,
substantial shareholders (as defined in the Listing Rules) of Wing Hing and their associates (as
defined by the Listing Rules)).
LETTER FROM THE BOARD
– 140 –

4. DIRECTORS AND SENIOR MANAGEMENT OF WING HING
The biographical details of each of the Directors are set out as follows:
Mr. Li Hok Yin, aged 33, is the Chairman, Chief Executive Officer and an
Executive Director of the Company. He was previously the Investment Manager of
Cheever Capital Management (Asia) Ltd., a substantial shareholder (as defined in the
Listing Rules) of the Company, from September 2007 to December 2009. He was the
Territory Manager of Ecolab Ltd, a company listed on the New York Stock Exchange,
from March 2004 to July 2007. He also obtained a Bachelor of Engineering degree
from The Chinese University of Hong Kong. Mr. Li was appointed as an Executive
Director of the Company on 8 January 2010 and becomes the chairman on 1 September
2010.
Mr. Shen Junchen, aged 40, is an Executive Director. Mr. Shen holds a master of
business administration degree from Asia International Open University (Macau). He
has over 16 years of experience in coal mining industry. Mr. Shen was appointed as an
Executive Director of the Company on 1 April 2009.
Ms. Cheung Pak Sum, aged 34, was appointed as an Executive Director of the
Company on 20 April 2010. She is the Head of Human Resources and Administration
of the Company and the legal representative of two subsidiaries of the Company. She is
well experienced in the areas of Human Resources and Administration. She was the
senior administration officer of Pineview Industries Limited, a listed company on the
Stock Exchange, from May 2006 to May 2008.
Mr. Hui Wah Tat, Anthony, aged 49, is an Independent Non-Executive Director of
the Company. He is a member of The Hong Kong Institute of Directors. He is a
President of Lions Club of Hong Kong (Mainland), vice-chairman of Hong Kong
Hunan Youth Exchange Promotion Association Limited and a consultant of City
Junior Chamber. Mr. Hui is also an executive committee member of Hunan Province
Youth Federation (湖南省青年聯合會), Chinese People’s Political Consultative
Conference Guangxi Fang Cheng Gang City Committee (廣西壯族自治區防城港市政
協) and Vice President of Guangxi Fang Cheng Gang City Overseas Friendship
Association (廣西省防城港市海外聯誼會副會長). Mr. Hui was appointed as an
Independent Non-Executive Director of the Company on 7 March 2008.
Mr. Li Kam Chung, aged 59, is an Independent Non-Executive Director. Mr. Li
has over 10 years experience in trading businesses between Mainland, China and Hong
Kong. Mr. Li is currently the vice chairman of Tai Po Shuen Wan Joint Villages Office
Association and a member of Tai Po District Council Environment, Housing and
Works Committee. Mr. Li was appointed as an Independent Non-Executive Director
of the Company on 1 April 2009.
Mr. Chui Man Lung, Everett, aged 47, was appointed as an independent non-
executive Director of Wing Hing in April 2010. Mr. Chui is a fellow member of both
the Hong Kong Institute of Certified Public Accountants and the Association of
Chartered Certified Accountants. He is a member of the Institute of Chartered
LETTER FROM THE BOARD
– 141 –

Accountants in England and Wales. He is currently the director and shareholder of
Cen-1 Partners Limited, an independent consultancy company specializing in financial
engineering and corporate structuring. He was the financial controller and company
secretary of Yau Lee Holdings Ltd., a company listed on the Exchange, from February
1995 to May 2008. He is well experienced in the areas of finance, audit and accounting.
Mr. Chui graduated from the University of Southampton in the United Kingdom with
a bachelor degree in social sciences in business, economics and accounting. Mr. Chui
was appointed as an Independent Non-executive Director of Duoyuan Printing, Inc., a
listed company in the New York Stock Exchange, on 26 November 2010.
The biographical details of the senior management of Wing Hing are set out as
follows:
Mr. Chen Yifei, aged 72, is the general manager and senior geological
engineer of the Long Men Sou Mine. He was the general manager of China
Langfang Dashan Geology and Mining Corporation Limited and the former
director of both Research Center of Mining Tail Materials Disposal and
Utilization and Chinese Academy of Geological Sciences. Mr. Chen was also
the former director and general engineer of the Regional Geological Survey Team
of the Hebei Geology & Resources Bureau.
Mr. Liu Guodong, aged 75, is the senior consultant of the Long Men Sou
Mine. He was the senior consultant of China Langfang Dashan Geology and
Mining Corporation Limited and a research fellow of the Institute of Geology of
Chinese Academy of Sciences. He is a geophysicist and the former director of the
Northeast Institute of Geology and the former deputy director of Institute of
Geology of National Seismic Bureau. He has published 105 scientific papers and
three publications and gained one national basic sciences award and three
achievement department awards for his scientific achievements.
5. MANAGEMENT OF THE ENLARGED GROUP
Following completion of the Transactions, the board of the Enlarged Group is
expected to comprise the existing Directors of Wing Hing, three current directors of Taung
Gold and a new Independent Non-Executive Director to be recommended by Electrum. The
senior management team of the Enlarged Group will comprise the existing senior
management team of Wing Hing, including Mr. Chen Yifei and Mr. Liu Guodong, and
the senior management team of Taung Gold.
The Board believes that the combination of the existing Wing Hing management team
and the Taung Gold management team will bring synergistic values to the Enlarged Group
given the diverse but complimentary skill sets of its members. In particular, the Taung Gold
team has strong technical expertise in gold mining whilst the existing Wing Hing team has
extensive knowledge in mining and investments in China as well as experience in managing
a listed company in Hong Kong. The Board is of the view that the combination of these
skills will be beneficial to the Enlarged Group as a whole.
LETTER FROM THE BOARD
– 142 –

To ensure that there is appropriate allocation of management resources aftercompletion of the Transactions, the following arrangements have been proposed byTaung Gold and Wing Hing:
— Financial management: The Enlarged Group’s board expects to establish anexecutive committee (the Proposed Executive Committee) comprising the chiefexecutive officer and chief financial officer of the Enlarged Group and othermembers equally represented by the existing Board and the Taung Goldmanagement team. This executive committee will report to the Board onbudgetary and financial planning and operational matters for the EnlargedGroup.
— Long Men Sou Mine: Long Men Sou Mine will be managed by a businessdevelopment/operations executive in the Proposed Executive Committee who willreport directly to the chief executive officer of the Enlarged Group. The strategyfor managing the Long Men Sou Mine with a view to integrate the operation ofthe mine in the PRC with the South African operations of the Enlarged Group inthe most effective and efficient manner will be devised as a matter of priority afterFirst Completion. It is expected the Long Men Sou Mine will continue to bemanaged under the guidance and management of Mr. Chen Yifei and Mr. LiuGuodong, with technical input from the Taung Gold management team, Mr. ShenJunchen, Mr. Chen Yifei and Mr. Liu Guodong. Mr. Shen Junchen has over 15years of experience in coal mining. Both Mr. Chen and Mr. Liu are involved in themanagement of the Long Men Sou Mine and they are professionally qualified asgeologist and geophysicist.
— South African operations: The mining and projects executive and the mineralresources executive in the Proposed Executive Committee will be responsible formanaging the Enlarged Group’s South African operations and both of which willbe reporting directly to the chief executive officer of the Enlarged Group. It isexpected that such executive roles will be filled by Taung Gold’s current seniormanagement who will continue to manage Taung Gold’s South Africanoperations.
— Business development and investments: Business development initiatives andinvestment plans are expected to be managed by an investment committee to beestablished comprising members from the existing Board and the Taung Goldmanagement team. The investment committee will report to the Board directly.
— Regulatory matters and investor relations: Given the experience of the Wing Hingmanagement team in managing a Hong Kong-listed company, the EnlargedGroup’s regulatory compliance and investor relations matter are expected to bemanaged by Wing Hing’s existing management team.
For details on the biographies of the directors and senior management of Taung Gold,please refer to the section headed ‘‘Part C — Information on the Taung Group and itsPrimary Projects — 5. Directors and Senior Management of Taung Gold’’ of this Circular.For details on the biographies of the directors and senior management of Wing Hing, pleaserefer to the section headed ‘‘Part F — Information on the Wing Hing Group and theEnlarged Group — 4. Directors and Senior Management of Wing Hing’’.
LETTER FROM THE BOARD
– 143 –

PART G — FINANCIAL INFORMATION AND MANAGEMENT DISCUSSION AND
ANALYSIS OF THE WING HING GROUP
1. OVERVIEW
Wing Hing is an investment holding company and its subsidiaries are principally
engaged in operating coal and gold mines in the PRC and the sale of minerals. The Wing
Hing Group’s revenue represents income from the sale of minerals, leasing of mining
licenses and gold mining operations. In July 2010, the Wing Hing Group completed the
acquisition of Long Men Sou Mine in the PRC and the Board is optimistic about gold
mining due to the expected growing demand for gold. Please refer to the section headed
‘‘Part C — Information on the Taung Group and its Primary Projects — 1. Industry
Overview’’ of this Circular for discussion of the market outlook of gold. Other than the
Long Men Sou Mine, Wing Hing’s other lines of business for the three financial years ended
31 March 2009, 2010 and 2011, include operation of coal mines, sale of minerals and
provision of guarantee services. Wing Hing had previously engaged in various discontinued
lines of business and the relevant figures for the financial years ended 31 March 2009 has
been restated to reflect the continuing operations of Wing Hing.
Unless otherwise indicated, all references to ‘‘FY’’ in this section refer to a financial
year ended 31 March. ‘‘FY2009’’, ‘‘FY2010’’ and ‘‘FY2011’’ refer to the financial years
ended 31 March 2009, 2010 and 2011, respectively.
2. SIGNIFICANT FACTORS AFFECTING THE WING HING GROUP’S RESULTS
OF OPERATIONS
The following factors have had a significant effect on the Wing Hing Group’s results of
operations:
— Demand for gold — Demand for gold will affect the selling price of gold
concentrates produced by Long Men Sou Mine in the same manner.
— Weather conditions — Poor weather conditions will adversely affect the operation
of the loading port and discharging port, in turn increasing the operating cost
incurred in the trading of minerals.
— Seasonality — Cold climate will slow down or suspend the normal operation of
mine, in turn increasing the operating cost of incurred in the trading of minerals.
— Events beyond control — The operation of the mine could be interrupted by
mechanical and electrical equipment failure.
LETTER FROM THE BOARD
– 144 –
3. CRITICAL ACCOUNTING POLICIES
The Wing Hing Group’s financial statements are prepared in accordance with the
Hong Kong Financial Reporting Standards which requires the use of certain critical
accounting estimates. In the application of the Wing Hing Group’s accounting policies,
which are described in note 3 of the Wing Hing Group’s audited financial information, the
Directors are required to make judgments, estimates and assumptions about the carrying
amounts of assets and liabilities that are not readily apparent from other sources. The
estimates and associated assumptions are based on historical experience and other factors
that are considered to be relevant. Actual results may differ from these estimates. The
selection of critical accounting policies, as well as the judgements and other uncertainties
affecting the application of those critical accounting policies are factors to be considered
when reviewing the Wing Hing Group’s financial information. The following are the key
assumptions concerning the future and involving the most significant judgement and
estimates used in the preparation of its financial statements:
3.1 Impairment of mining rights
The Wing Hing Group assesses whether there are any indicators of impairment for
mining rights at each reporting date. Mining rights are tested for impairment when
there are indicators that the carrying amounts may not be recoverable. When value in
use calculations are undertaken, management must estimate the expected future cash
flows from the asset or cash-generating unit and choose a suitable discount rate in
order to calculate the present values of those cash flows.
3.2 Impairment loss of trade and other receivables
The Wing Hing Group’s policy for doubtful receivables is based on the on-going
evaluation of the collectability and aging analysis of the trade and other receivables
and on management’s judgements. Considerable judgement is required in assessing the
ultimate realization of these receivables, including the current creditworthiness and the
past collection history of each debtor, and the present values of the estimated future
cash flows discounted at the effective interest rates. If the financial conditions of the
Wing Hing Group’s debtors were to deteriorate, resulting in an impairment of their
ability to make payments, additional impairment loss of trade and other receivables
may be required.
3.3 Expected useful lives of mining rights and mineral reserves
The Wing Hing Group’s management has determined the estimated useful lives of
its mining rights based on the proven and probable mineral reserves. The Directors are
of the opinion that the Wing Hing Group will be able to continuously renew the mining
rights and the business licenses of respective mining subsidiaries at minimal charges.
Accordingly, the Wing Hing Group has used the proven and probable mineral reserves
as a basis for estimation of the useful lives of its mining rights.
LETTER FROM THE BOARD
– 145 –

Amortization rate is determined based on estimated proven and probable mineral
reserve quantities with reference to the independent technical assessment report. The
capitalized costs of the mining rights are amortized using the unit-of-production
method. Any change to the estimated proven and probable mineral reserves will affect
the amortization charge of the mining rights.
Proven and probable mineral reserve estimates are updated at regular basis taking
into account production and technical information about the mines. In addition, as
prices and cost levels change from year to year, the estimate of proven and probable
mineral reserves also changes. This change is considered a change in estimate for
accounting purposes and is reflected on a prospective basis in relation to amortization
rate.
3.4 Description of selected line items from the Wing Hing Group’s consolidated income
statements
(a) Revenue
The Wing Hing Group’s revenue represents mainly income from sale of
minerals, leasing of mining licenses and gold mining operation. The table below
sets forth a breakdown of the Wing Hing Group’s revenue for the continuing
operations for the years indicated.
FY2011 FY2010 FY2009
HK$’000 HK$’000 HK$’000
(restated)
Sale of minerals 34,410 18,398 —
Leasing of mining licenses 4,340 7,872 2,624
Gold mining operation 4,925 — —
Loan guarantee service operations 230 — —
Total 43,905 26,270 2,624
LETTER FROM THE BOARD
– 146 –

(b) Cost of sales
The Wing Hing Group’s cost of sales primarily consists of costs of trading
and amortisation of mining rights. The table below sets forth the Wing Hing
Group’s cost of sales for the continuing operations for years indicated.
FY2011 FY2010 FY2009
HK$’000 HK$’000 HK$’000
(restated)
Sale of minerals 28,979 17,774 —
Leasing of mining licenses 2,761 1,375 1,407
Gold mining operation 3,653 — —
Loan guarantee service operations 33 — —
Total 35,426 19,149 1,407
(c) Other income and other gains and losses
Other income consists of, among other things, management fee income,
interest income on bank deposits, effective interest income on promissory note
receivable, loss on disposal of property, plant and equipment, gain on disposal of
subsidiaries and impairment losses recognised in respect of mining rights.
(d) Administrative and operating expenses
Administrative and operating expenses primarily consist of legal,
professional, consultancy and secretarial fees, salaries, allowances and
provident fund contributions and directors’ remunerations.
(e) Share of profits of associates and jointly-controlled entities
Share of profits of associates and jointly-controlled entities consist of profits
generated by associates and jointly-controlled entities of Club Ace Holdings
Limited. The Wing Hing Group disposed the entire issued share capital of Club
Ace Holdings Limited in October 2009.
(f) Finance costs
Finance costs primarily consist of interest expenses on promissory note
payable.
(g) Income tax expense
Income tax expenses consists of PRC Enterprise Income Tax expenses and
deferred tax.
LETTER FROM THE BOARD
– 147 –

(h) Loss for the year from discontinued operations
Loss for the year from discontinued operations was incurred in the financial
years ended 31 March 2009 and 2010 due to the disposal of the entire issued share
capital of Club Ace Holdings Limited and the shareholder’s loan to Mr. Ng Tat
Leung, George (a former executive director of Wing Hing) in October 2009. Club
Ace Holdings Limited and its subsidiaries, associates and jointly-controlled
entities previously carried on all of the Wing Hing Group’s construction
operations.
(i) Results of operations
The table below sets forth the Wing Hing Group’s consolidated income
statement for the continuing operations and discontinued operations for years
indicated.
FY2011 FY2010 FY2009
HK$’000 HK$’000 HK$’000
(restated)
Continuing operations
Revenue 43,905 26,270 2,624
Cost of sales (35,426) (19,149) (1,407)
Gross profit 8,479 7,121 1,217
Other income 224 1 2,208
Other gains and losses — (76) 8,917
Administrative and operating expenses (32,266) (16,743) (18,051)
Share of profits of associates — — 156
Share of profits of jointly-controlled
entities — — 427
Finance costs (408) (568) (21,991)
Loss before tax (23,971) (10,265) (27,117)
Income tax expense (162) (1,901) (591)
Loss for the year from continuing
operations (24,133) (12,166) (27,708)
Discontinued operations
Loss for the year from discontinued
operations — (22) (45,961)
Loss for the year (24,133) (12,188) (73,669)
LETTER FROM THE BOARD
– 148 –

3.5 Years ended 31 March 2011 and 2010
(a) Revenue
Revenue increased by 67%, or HK$17.6 million, from HK$26.3 million for
FY2010 to HK$43.9 million for FY2011. This increase was primarily due to the
increase in sale of minerals in FY2011.
(b) Cost of sales
Cost of sales increased by 85%, or HK$16.3 million, from HK$19.1 million
for FY2010 to HK$35.4 million for FY2011. This increase was mainly due to the
increase in sale of minerals in FY2011.
(c) Gross profit
Gross profit increased by 19%, or HK$1.4 million, from HK$7.1 million for
FY2010 to HK$8.5 million for FY2011. The increase was mainly due to the
increase in sale of minerals, which was offset in part by a decrease in gross profit
of leasing of mining licenses as a result of the expiration of leasing agreements
during the year ended 31 March 2011.
(d) Other income
Other income increased by more than 100% from HK$1,000 for FY2010 to
HK$0.2 million for FY2011. The increase was primarily due to the interest income
on interest bearing receivable in FY2011.
(e) Other gains and losses
Other gains and losses increased by 100% from a loss of HK$76,000 for
FY2010 to HK$nil for FY2011. The increase was mainly due to the absence of
loss on disposal of property, plant and equipment in FY2011.
(f) Administrative and operating expenses
Administrative and operating expenses increased by 93%, or HK$15.5
million, from HK$16.7 million for FY2010 to HK$32.2 million for FY2011. The
increase was mainly due to the increase in legal and professional fee incurred for
very substantial acquisition and impairment for deposits paid for purchase of
goods in FY2011.
(g) Finance costs
Finance costs decreased by 28%, or HK$0.2 million, from HK$0.6 million
for FY2010 to HK$0.4 million for FY2011. The decrease was mainly due to the
early settlement of a promissory note issued in FY2011.
LETTER FROM THE BOARD
– 149 –

(h) Income tax expense
Income tax expense decreased by 91%, or HK$1.7 million, from HK$1.9
million for FY2010 to HK$0.2 million for FY2011. The decrease was mainly due
to the decrease in PRC Enterprise Income Tax generated by the decrease in profit
from the leasing of mining licences in FY2011.
(i) Loss for the year from continuing operations
The Wing Hing Group’s loss from continuing operations was HK$24.1
million for FY2011, compared to a loss from continuing operations of HK$12.2
million for FY2010. This change was due to the reasons noted above.
(j) Loss for the year from discontinued operations
The Wing Hing Group has not discontinued operations in FY2011 compared
to a loss from discontinued operations of HK$22,000 for FY2010. The change was
due to the disposal of Club Ace Holdings Limited by the Wing Hing Group in
October 2009.
(k) Loss for the year
For the reasons noted above, the Wing Hing Group’s loss increased by 98%,
or HK$11.9 million, from HK$12.2 million for FY2010 to HK$24.1 million for
FY2011.
3.6 Years ended 31 March 2010 and 2009
(a) Revenue
Revenue increased by 901%, or HK$23.6 million, from HK$2.6 million for
FY 2009 to HK$26.3 million for FY2010. This increase was primarily due to the
sale of minerals in FY2010 but not in FY2009.
(b) Cost of sales
Cost of sales increased by 1,261%, or HK$17.7 million, from HK$1.4 million
for FY2009 to HK$19.1 million for FY2010. This increase was mainly due to the
sale of minerals in FY2010 but not in FY2009.
(c) Gross profit
Gross profit increased by 485%, or HK$5.9 million, from HK$1.2 million for
FY2009 to HK$7.1 million for FY2010. The increase was mainly due to full year’s
leasing of mining rights in FY2010 while 4-month only in FY2009.
LETTER FROM THE BOARD
– 150 –

(d) Other income
Other income decreased by almost 100% from HK$2.2 million for FY2009 to
HK$1,000 for FY2010. The decrease was primarily due to the absence of service
fee income and the absence of interest income on a promissory note receivable.
(e) Other gains and losses
Other gains and losses decreased by more than 100% from a gain of HK$8.9
million for FY2009 to a loss of HK$76,000 for FY2010. The decrease was mainly
due to the absence of gain on disposal of subsidiary in FY2010.
(f) Administrative and operating expenses
Administrative and operating expenses decreased by 7%, or HK$1.3 million,
from HK$18 million for FY2009 to HK$16.7 million for FY2010. The increase
was mainly due to the decrease in amortisation of prepaid lease payment.
(g) Share of profits of associated and jointly-controlled entities
The Wing Hing Group disposed of Club Ace Holdings Limited in October
2009 and as such, no profit was recorded from associates and jointly-controlled
entities for FY2010.
(h) Finance costs
Finance costs decreased by 97%, or HK$21.4 million, from HK$22 million
for FY2009 to HK$0.6 million for FY2010. The decrease was mainly due to
settlement of a promissory note issued by Wing Hing in FY2010.
(i) Income tax expense
Income tax expense increased by 222%, or HK$1.3 million, from HK$0.6
million for FY2009 to HK$1.9 million for FY2010. The increase was mainly due
to the increase in PRC Enterprise Income Tax generated by the increase in
revenue generated by the leasing of mining licences.
(j) Loss for the year from continuing operations
The Wing Hing Group’s loss from continuing operations was HK$27.7
million for FY2009, compared to a loss from continuing operations of HK$12.1
million for FY2010. This change was due to the reasons noted above.
(k) Loss for the year from discontinued operations
The Wing Hing Group recorded a loss from discontinued operations of
HK$45.9 million for FY2009 compared to a loss from discontinued operations of
HK$22,000 for FY2010. The change was due to the disposal of Club Ace Holdings
Limited by the Wing Hing Group in October 2009.
LETTER FROM THE BOARD
– 151 –

(l) Loss for the year
For the reasons noted above, the Wing Hing Group’s loss decreased by 83%,
or HK$61.5 million, from HK$73.7 million for FY2009 to HK$12.2 million for
FY2010.
4. LIQUIDITY AND CAPITAL RESOURCES
For FY2009, FY2010 and FY2011, the Wing Hing Group has met its working capital
and cash requirements primarily through cash generated from financing activities such as
the issuance of new shares.
On 7 August 2009, Wing Hing entered into subscription agreements with Galaxy Asset
Management (HK) Limited and VMS Investment Group Limited in respect of the
subscription of 10,350,000 and 3,450,000 new shares of HK$1.00 each in the capital of the
Company, respectively, at the subscription price of HK$1.46 per share. The new shares were
issued and allotted on 1 September 2009. The net proceeds amounted to HK$20.0 million
and had been utilised in full as general working capital and funding for investments.
On 25 September 2009, Wing Hing entered into a subscription agreement with Cheever
Capital Management (Asia) Limited relating to the issuance and allotment of 12,000,000
new shares of HK$1.00 each in the capital of the Company to Cheever Capital Management
(Asia) Limited at the subscription price of HK$1.78 per share. The new shares were issued
and allotted on 13 October 2009. The net proceeds amounted to HK$21.2 million and had
been utilised in full as general working capital and funding for investments.
On 13 November 2009, Wing Hing entered into an underwriting agreement with China
Everbright Securities (HK) Limited relating to the issuance and allotment of 46,264,000
offer shares of HK$0.10 each in the capital of the Company at a subscription price of
HK$1.80 per offer share by way of an open offer. The proceeds amounted to HK$83.3
million and had been utilised in full as general working capital and funding for investments.
In April 2010, Wing Hing entered into a placing agreement over the possible placing of
shares of up to 80,000,000 Wing Hing Shares at the issue price of HK$0.50 per Wing Hing
Share. The placing was completed in May 2010 and 80,000,000 Wing Hing shares were
allotted and issued. The proceeds from the placing amounted to HK$39.5 million and had
been utilised fully as general working capital and funding for investments.
LETTER FROM THE BOARD
– 152 –

During FY2009, FY2010 and FY2011, the Wing Hing Group did not have any bank
borrowings. As of 31 March 2009, 2010 and 2011, the Wing Hing Group had net current
(liabilities)/assets of HK$(5.2) million, HK$98.2 million and HK$264.1 million respectively.
FY2011 FY2010 FY2009
HK$’000 HK$’000 HK$’000
Current assets:
Inventories 15 — —
Loan receivable — — 1,000
Trade and other receivables 48,412 56,814 113,489
Pledged bank deposits 5,921 — 24,362
Cash and bank balances 156,069 45,907 22,082
Assets classified as held for sale 87,360 — —
297,777 102,721 160,933
Current liabilities:
Trade and other payables 30,757 2,021 165,575
Current tax liabilities 2,944 2,492 591
33,701 4,513 166,166
Net current assets/(liabilities) 264,076 98,208 (5,233)
4.1 Cash flows
Selected Statement of Cash Flows Data FY2011 FY2010 FY2009
HK$’000 HK$’000 HK$’000
Net cash used in operating activities (18,107) (20,284) (33,258)
Net cash used in investing activities (41,521) (59,782) (18,421)
Net cash generated by financing activities 168,070 103,891 15,142
Net increase/(decrease) in cash and cash
equivalents 108,442 23,825 (36,537)
Effects of change in foreign exchange rates 1,720 — —
Cash and cash equivalents at the end of the
financial year 156,069 45,907 22,082
LETTER FROM THE BOARD
– 153 –

(a) Operating activities
In FY2011, the Wing Hing Group’s net cash used in operating activities
amounted to HK$18.1 million and operating cash flows before movements in
working capital was HK$(11.4) million. The net decrease of HK$6.7 million in
working capital primarily reflected an increase in trade receivables of HK$31.9
million and prepayments, deposits and other receivables of HK$1.9 million, offset
by the HK$27.5 million increase in trade payables and accruals.
In FY2010, the Wing Hing Group’s net cash used in operating activities
amounted to HK$20.3 million and operating cash flows before movements in
working capital was HK$2.7 million. The net decrease of HK$23.0 million in
working capital primarily reflected the following working capital changes: (i) an
HK$19.2 million decrease in trade and loan receivables; (ii) an HK$19.2 million
increase in prepayments, deposits and other receivables; (iii) an HK$19.9 million
decrease in trade payables; and (iv) an HK$1.9 million increase in net amount due
from jointly-controlled entities, associates and related companies.
In FY2009, the Wing Hing Group’s net cash used in operating activities
amounted to HK$33.3 million and operating cash flows before movements in
working capital was HK$(28.3) million. The net decrease of HK$5.0 million in
working capital primarily reflected the following working capital changes: (i) an
HK$7.0 million increase in trade receivables; (ii) an HK$39.5 million increase in
prepayments, deposits and other receivables; (iii) an HK$7.0 million increase in
net amount due from jointly-controlled entities, associates and related companies;
and (iv) an HK$47.8 million increase in trade and other payables and accruals.
(b) Investing activities
In FY2011, the Wing Hing Group’s net cash used in investing activities
amounted to HK$41.5 million, which primarily reflected the payments of
HK$12.0 million for the purchase of property, plant and equipment, the
increase in pledged bank deposits of HK$5.9 million and payment of HK$31.7
million for acquisition of subsidiaries, offset by the deposit refunded of HK$8.0
million for acquisition of subsidiaries.
In FY2010, the Wing Hing Group’s net cash used in investing activities
amounted to HK$59.8 million, which primarily reflected the decrease in pledged
bank deposits of HK$24.4 million, offset by payments of HK$2.7 million for the
purchases of property, plant and equipment, HK$33 million of deposits paid for
acquisition of subsidiaries and HK$48.5 million relating to the disposal of
subsidiary.
In FY2009, the Wing Hing Group’s net cash used in investing activities
amounted to HK$18.4 million, which primarily reflected payments of HK$175.6
million for the acquisition of subsidiaries and acquisition of assets through
acquisition of subsidiary, HK$23.7 million of amounts advanced to a jointly-
LETTER FROM THE BOARD
– 154 –
controlled entity, partially offset by HK$45.3 million of proceeds for disposal of
subsidiary and HK$121 million of proceeds from repayment of promissory note
receivable.
(c) Financing activities
In FY2011, the Wing Hing Group’s net cash generated from financing
activities was HK$168.1 million, which consisted of the net proceeds from shares
issued upon placing of shares, the exercise of warrants by a warrants holder and
the exercise of share options by employees of the Wing Hing Group, offset by the
repayment of a promissory note of HK$30 million.
In FY2010, the Wing Hing Group’s net cash generated from financing
activities was HK$103.9 million, primarily consisted of the net proceeds from
shares issued upon placing and open offer of shares, the exercise of share options
by employees of the Wing Hing Group and partially offset by HK$20.3 million in
repayment of promissory note.
In FY2009, the Wing Hing Group’s net cash generated from financing
activities was HK$15.1 million, primarily consisted of the net proceeds from the
issuance of shares.
4.3 Liquidity and financial resources
For the year ended 31 March 2011
As at 31 March 2011, the Wing Hing Group did not have any outstanding
borrowings and any charge over the assets of the Wing Hing Group.
The Wing Hing Group’s gearing ratio as at 31 March 2011 was zero,
calculated based on the Wing Hing Group’s total zero borrowings over the Wing
Hing Group’s total assets of approximately HK$593,231,000.
The Wing Hing Group continues to adopt a policy of dealing principally with
clients with whom the Wing Hing Group has enjoyed a long working relationship
so as to minimise risks in its business.
For the year ended 31 March 2010
As at 31 March 2010, the Wing Hing Group did not have any outstanding
borrowings and any charge over the assets of the Wing Hing Group.
The Wing Hing Group’s gearing ratio as at 31 March 2010 was nil, calculated
based on the Wing Hing Group’s total borrowings of approximately zero over the
Wing Hing Group’s total assets of approximately HK$346,796,000.
The Wing Hing Group continues to adopt a policy of dealing principally with
clients with whom the Wing Hing Group has enjoyed a long working relationship
so as to minimise risks in its business.
LETTER FROM THE BOARD
– 155 –

For the year ended 31 March 2009
As at 31 March 2009, apart from a promissory note payable of approximately
HK$20,267,000, the Wing Hing Group did not have any outstanding borrowings.
As at 31 March 2009, the Wing Hing Group’s banking facilities were supported by
(i) pledged deposits of approximately HK$24,362,000 of the Wing Hing Group;
(ii) corporate guarantees to the extent of approximately HK$44,600,000 in
aggregate executed by the Company in respect of the banking facilities granted to
certain subsidiaries of the Company; and (iii) cross guarantees amongst certain
subsidiaries of the Company. As at 31 March 2009, the Wing Hing Group did not
have any charge over the assets of the Wing Hing Group.
The Wing Hing Group’s gearing ratio as at 31 March 2009 was 0.049,
calculated based on the Wing Hing Group’s total borrowings of approximately
HK$20,267,000 over the Wing Hing Group’s total assets of approximately
HK$412,001,000.
The Wing Hing Group continues to adopt a policy of dealing principally with
clients with whom the Wing Hing Group has enjoyed a long working relationship
so as to minimise risks in its business.
4.4 Employees
The Wing Hing Group employed approximately 10, 20 and 60 staff, excluding
workers under exclusive subcontracting arrangements, for the years ended 31 March
2009, 2010 and 2011 respectively. Total staff costs for the year ended 31 March 2009,
2010 and 2011, excluding Directors’ remuneration, amounted to approximately
HK$4,135,000, HK$1,605,000 and HK$2,848,000. The remuneration packages of the
Wing Hing Group’s employees are mainly based on their performance and experience,
taking into account current industry practices. The remuneration policy and packages
of the Wing Hing Group’s employees are reviewed regularly.
The Wing Hing Group operates a defined contribution Mandatory Provident
Fund retirement benefits scheme (the MPF Scheme) under the Mandatory Provident
Fund Schemes Ordinance, for all its employees who are eligible to participate in the
MPF Scheme. Contributions are made based on a percentage of the employees’ basic
salaries. The assets of the MPF Scheme are held separately from those of the Wing
Hing Group in an independently administered fund. The Wing Hing Group’s employer
contributions vest fully with the employees when contributed into the MPF Scheme in
accordance with the rules of the MPF Scheme.
In addition to the provision of the MPF Scheme, a share option scheme (the 2002
Share Option Scheme) is also available to employees based on their performance. The
Company operates the Scheme for the purpose of providing incentives or rewards to
eligible participants for their contribution to the Wing Hing Group and/or to enable
the Wing Hing Group to recruit and retain high-calibre employees and attract human
resources that are valuable to the Wing Hing Group and any entity in which the Wing
Hing Group holds an equity interest (the Invested Entity). Eligible participants of the
LETTER FROM THE BOARD
– 156 –

2002 Share Option Scheme include the Directors and employees of the Company, its
subsidiaries or any Invested Entity, suppliers and customers of the Wing Hing Group
or any Invested Entity, any technical, financial and legal professional advisers engaged
by the Wing Hing Group or any Invested Entity, and any shareholder of any member
of the Wing Hing Group or any Invested Entity or any holder of any securities issued
by any member of the Wing Hing Group or any Invested Entity. The 2002 Share
Option Scheme became effective on 29 August 2002 and was terminated by the
shareholders of the Company on 4 January 2010 and a new share option scheme (the
New Share Option Scheme) was adopted. The New Share Option Scheme became
effective on 4 January 2010 and, unless otherwise cancelled or amend, will remain in
force for 10 years from that date.
Share options do not confer rights on the holders to dividends or to vote at
shareholders’ meetings. No share options were granted under the 2002 Share Option
Scheme as at 31 March 2009 and 2010.
During the year ended 31 March 2010, the 97,154,400 of shares in respect of which
options had been granted under the New Share Option Scheme. During the year ended
31 March 2011, no additional shares in respect of which options had been granted
under the New Share Option Scheme.
4.5 Exposure to fluctuations in exchange rates
Since the functional currencies of the Wing Hing Group’s operations are mainly
Hong Kong dollars, United States dollars and Renminbi, the Directors consider that
the potential foreign exchange exposure of the Wing Hing Group during each of the
three years ended 31 March 2009, 2010 and 2011 is limited.
4.6 Material acquisitions and disposals of subsidiaries and associated companies
Save as disclosed below, there were no material acquisitions and disposals of
subsidiaries, jointly-controlled entities and associated companies during each of the
three years ended 31 March 2009, 2010 and 2011.
The Wing Hing Group has acquired the 70% equity interest in Union Sense
Development Limited, a company incorporated in the British Virgin Islands, and a
subsidiary of which is principally engaged in the operation of coal mines and leasing of
mining licenses in the People’s Republic of China during the year ended 31 March
2009.
The Wing Hing Group has disposed its equity interests in Wing Hing Group (BVI)
Limited and its subsidiaries to a connected person during the year ended 31 March
2009.
The Wing Hing Group has disposed its equity interests in Farrell Global Limited
and its subsidiaries to an Independent Third Party during the year ended 31 March
2009.
LETTER FROM THE BOARD
– 157 –

During the year ended 31 March 2010, the Wing Hing Group disposed of the
entire issued share capital of Club Ace Holdings Limited, a company and its
subsidiaries involved in the construction business, to Ng Tat Leung, George, a
connected person of the Wing Hing Group.
During the year ended 31 March 2011, the Wing Hing Group acquired the entire
equity interests in Bestkin International Limited (Bestkin), a BVI company, through its
subsidiary to be involved in the holding of gold mining rights to conduct mining
activities at a gold mine situated in Long Men Sou, District of the Chicheng County,
Hebei Province, the PRC.
4.7 Significant investments or capital assets
Save as those disclosed under the paragraph headed ‘‘4.6 Material acquisitions
and disposals of subsidiaries and associated companies’’, there were no significant
investment or capital assets for each of the years ended 31 March 2009, 2010 and 2011.
4.8 Future plans for material investments or capital assets
The Wing Hing Group generally finances its material investments or capital assets
with internally generated cash flows.
Save for the Acquisition as disclosed in this Circular or as otherwise disclosed
herein, there were no future plans for material investments or capital assets for the
three (3) years ended 31 March 2009, 2010 and 2011.
4.9 Contingent liabilities
At 31 March 2009 and 2010, the Wing Hing Group had executed guarantees in
respect of performance bonds in favour of contract customers of approximately
HK$28,583,000 and HK$nil respectively. At 31 March 2011, the Wing Hing Group had
contingent liabilities of approximately HK$22,760,000 in relation to the provision of
loan guarantee services in the PRC.
At 31 March 2009, 2010 and 2011, the Company had executed guarantees for
approximately HK$36,000,000, HK$nil and HK$nil respectively, in respect of the
general banking facilities granted to CHEC-CWF Limited (a jointly-controlled entity
in which the Wing Hing Group has 30% equity interests).
At 31 March 2009, 2010 and 2011, the Company had executed guarantees for
approximately HK$44,620,000, HK$nil and HK$nil respectively, in respect of the
general banking facilities granted to W. Hing Construction Company Limited and
CWF Piling & Civil Engineering Company Limited (wholly-owned subsidiaries of the
Company).
LETTER FROM THE BOARD
– 158 –
The Wing Hing Group has a contingent liability in respect of possible future long
service payments to employees under the Hong Kong Employment Ordinance, with a
maximum possible amount of approximately HK$2.8 million, HK$nil and HK$nil as
at 31 March 2009, 2010 and 2011 respectively. The contingent liability has arisen
because, at the balance sheet date, a number of current employees have achieved the
required number of years of service to the Wing Hing Group in order to be eligible for
long service payments under the Employment Ordinance if their employment is
terminated under certain circumstances. A provision has not be recognised in the
financial statements of the Wing Hing Group for the year ended 31 March 2009 in
respect of such possible payments, as it is not considered probable that the situation
will result in a material future outflow of resources from the Wing Hing Group.
4.10 Indebtedness
Save as disclosed under the section headed ‘‘8. Indebtedness’’ as set out in
Appendix VIII ‘‘Statutory and General Information on Wing Hing’’ or as otherwise
disclosed herein, and apart from intra-group liabilities and normal trade payables, the
Wing Hing Group did not have any outstanding borrowings, bank overdrafts, loans or
other similar indebtedness under acceptances (other than normal trade bill) or
acceptance credits, debentures or other loan capital, mortgages, charges, hire purchase
or finance lease commitments, guarantees, capital commitments or other contingent
liabilities at the close of business on 31 May 2011.
The Directors have confirmed that there has not been any material change in the
indebtedness and contingent liabilities of the Wing Hing Group since 31 May 2011.
4.11 Market risks
The Wing Hing Group is exposed to various types of market risks, including
foreign currency risk, cash flow and fair value interest rate risk in the normal course of
business.
Foreign currency risk
Certain of the assets of Wing Hing Group are principally denominated in US
dollars and Renminbi. The Wing Hing Group does not have a foreign currency
hedging policy currently as the Directors consider that the currency risk is not
significant.
Cash flow and fair value interest rate risk
Except for cash and cash equivalents, the Wing Hing Group has no other
significant interest-bearing assets. Wing Hing Group’s income and operating cash
flows are substantially independent of changes in market interest rates. The Wing
Hing Group does not anticipate significant impact on interest-bearing assets
resulting from changes in interest rates because the interest rates of its bank
deposits are not expected to change significantly.
LETTER FROM THE BOARD
– 159 –
5. FUND RAISING ACTIVITIES WITHIN THE LAST 12 MONTHS
On 18 January 2011, Wing Hing announced the proposed placing of up to 346,000,000
shares at the issue price of HK$0.40 per Wing Hing Share. The Placing was completed on 27
January 2011 and 346,000,000 Shares were allotted and issued. The net proceeds in the
amount of approximately HK$135.5 million were intended to be used as general working
capital of the Wing Hing Group and to fund potential investments. As at the date of this
Circular, approximately of HK$56 million of net proceeds has been utilised as the general
working capital of the Wing Hing Group of which HK$30 million was used to repay a
promissory note.
Save as disclosed in this Circular, Wing Hing has not conducted any fund raising
activities in the past twelve months prior to the date of this Circular.
LETTER FROM THE BOARD
– 160 –
PART H — LISTING RULES IMPLICATIONS
1. VERY SUBSTANTIAL ACQUISITION
As the applicable percentage ratios calculated pursuant to Rule 14.07 of the Listing
Rules in respect of the Acquisition exceed 100%, the Acquisition constitutes a very
substantial acquisition of Wing Hing under Rule 14.06(5) of the Listing Rules.
Pursuant to Rule 14.49 of the Listing Rules, the Transactions are therefore subject to
the approval of the WH Shareholders at the SGM.
2. PROPOSED INCREASE IN AUTHORISED SHARE CAPITAL
The Board proposes to increase Wing Hing’s authorized share capital from
15,000,000,000 Wing Hing Shares to 30,000,000,000 Wing Hing Shares by the creation of
15,000,000,000 additional new Wing Hing Shares. The Proposed Increase in Authorised
Share Capital is determined by taking into account the maximum number of the Total
Consideration Shares and TG Optionholder Consideration Shares which may be allotted
and issued and Wing Hing’s need for flexibility to issue new Wing Hing Shares for future
investments and developments respectively. An ordinary resolution will be put forward at
the SGM for the Proposed Increase in Authorised Share Capital. Wing Hing has no present
intention of issuing any part of the increased authorised share capital in the near term,
other than under the Transactions.
The Board is of the view that the Proposed Increase in Authorised Share Capital is
necessary for proceeding with the Transactions as (i) First Completion is conditional upon
the success of the Proposed Increase in Authorised Share Capital; and (ii) payment of the
Consideration involves the issue of the Total Consideration Shares. It will also provide
flexibility to Wing Hing in fund raising through the issue of new equity securities for
implementation of its future business plan as adopted from time to time, and is therefore in
the interests of the WH Shareholders. No WH Shareholder is required to abstain from
voting on the resolution to be proposed at the SGM regarding the Proposed Increase in
Authorised Share Capital.
3. SPECIFIC MANDATE
The Total Consideration Shares and TG Optionholder Consideration Shares will be
issued under the Specific Mandate subject to WH Shareholders’ approval at the SGM. The
issue of the Total Consideration Shares and TG Optionholder Consideration Shares will
result in the issue of 10,977,630,003 and 1,009,616,519 new Wing Hing Shares respectively,
which will cause a significant dilution of the existing WH Shareholders.
4. SUFFICIENCY OF PUBLIC FLOAT
Wing Hing will maintain the listing status of the Wing Hing Shares on the Exchange
and the 25% minimum public float requirement upon the issue of the Total Consideration
Shares and the TG Optionholder Consideration Shares.
LETTER FROM THE BOARD
– 161 –

For the purpose of determining the public float of Wing Hing, the Exchange will not
regard any connected person of Wing Hing as a member of ‘‘the public’’ or shares held by a
connected person as being ‘‘in public hands’’. In addition the Exchange will not recognize as
a member of ‘‘the public’’:
(a) any person whose acquisition of securities has been financed directly or indirectly
by a connected person;
(b) any person who is accustomed to take instructions from a connected person in
relation to the acquisition, disposal, voting or other disposition of securities of the
issuer registered in his name or otherwise held by him.
Wing Hing will be able to maintain the 25% public float requirement at all times
immediately before and after First Completion and immediately before and after the
Electrum Completion.
5. NO CHANGE IN CONTROLLING SHAREHOLDER
Based on the fact that there have been no controlling shareholders of Wing Hing
during the 24 months prior to and immediately before entering into the Acquisition
Agreement, currently there is not and nor will there be any controlling shareholder (as
defined in the Listing Rules) of Wing Hing as a result of the Transactions. Following the
completion of the Transactions, the existing Directors, including the Independent Non-
executive Directors, will continue to constitute a majority of the Board.
LETTER FROM THE BOARD
– 162 –

PART I — PROPOSED CHANGE OF NAME
1. PROPOSED CHANGE OF NAME
The Board proposes to change the English name of Wing Hing from ‘‘Wing Hing
International (Holdings) Limited’’ to ‘‘Taung Gold International Limited’’. Subject to the
new English name of Wing Hing becoming effective, Wing Hing will adopt ‘‘壇金礦業有限公
司’’ as its new Chinese name for identification purposes only. The Proposed Change of
Name is subject to, among other things, the approval of the WH Shareholders at the SGM,
the completion of the Acquisition and the approval by the Registrar of Companies in
Bermuda of the use of the new English name by Wing Hing. Wing Hing will issue a further
announcement regarding the effective date of the change of name and the trading
arrangement of the change of Wing Hing’s stock short name.
The Board believes that the Proposed Change of Name will provide Wing Hing with a
new corporate identity that reflects the new development focus of the Wing Hing Group of
the gold mining business in South Africa, which is in the interests of Wing Hing and the WH
Shareholders as a whole.
2. CONDITIONS
The Proposed Change of Name is subject to the following conditions being fulfilled:
(a) the passing of the necessary resolution by the WH Shareholders at the SGM;
(b) the completion of the Acquisition; and
(c) the Registrar of Companies in Bermuda approving the use of the new English
name by Wing Hing.
The Proposed Change of Name will take effect from the date on which the new English
name is entered onto the register by the Registrar of Companies in Bermuda in place of the
existing name. Upon the Proposed Change of Name becoming effective, all existing share
certificates bearing the current name of ‘‘Wing Hing International (Holdings) Limited’’ will
continue to be evidence of title to shares of Wing Hing and will continue to be valid for
trading, settlement and registration purposes and the rights of the WH Shareholders will
not be affected as a result of the Proposed Change of Name. There will not be any free
exchange of the existing share certificates of Wing Hing for new share certificates under the
new name of Wing Hing. If the Proposed Change of Name becomes effective, any issue of
share certificates thereafter will be in the new name of Wing Hing and the securities of Wing
Hing will be traded on the Exchange in the new name of Wing Hing.
LETTER FROM THE BOARD
– 163 –

PART J — SPECIAL GENERAL MEETING
A notice convening the SGM is set out on pages N-1 to N-5 of this Circular. The SGM
will be held at Unit 1901, 19/F, Nina Tower, No. 8 Yeung Uk Road, Tsuen Wan, New
Territories, Hong Kong on Friday, 19 August 2011 at 11 : 00 a.m. (or any adjournment
thereof) to consider, and, if thought fit, approve, among other things, the necessary
resolutions relating to (1) the transactions contemplated under the Acquisition Agreement;
(2) the Put Option Agreement and the Loan Note; (3) the Electrum Option Agreement; (4)
the TG Optionholder Agreement; (5) the issue of Total Consideration Shares and the TG
Optionholder Consideration Shares under the Specific Mandate.
In addition, application will be made by Wing Hing to the Listing Committee for the
listing of, and permission to deal in the Total Consideration Shares and the TG
Optionholder Consideration Shares.
To the best of the Directors’ knowledge, information and belief and having made all
reasonable enquiries, no WH Shareholder has a material interest in the Acquisition
Agreement, the Electrum Option Agreement, the Put Option Agreements, the Loan Note,
the TG Optionholder Agreements, the Proposed Increase in Authorised Share Capital or
the Specific Mandate which is materially different from the other WH Shareholders.
Accordingly, no WH Shareholders are required under the Listing Rules to abstain from
voting at the SGM.
A form of proxy for use at the SGM is sent to the WH Shareholders together with this
Circular. Whether or not the WH Shareholders are able to attend the SGM, the WH
Shareholders are requested to complete and return the enclosed form of proxy in
accordance with the instructions printed thereon as soon as possible and in any event not
less than 48 hours before the time for holding of the SGM or adjournment thereof.
Completion and return of the form of proxy will not preclude the WH Shareholders from
attending and voting at the SGM or any adjourned meeting thereof should the WH
Shareholders so wish.
LETTER FROM THE BOARD
– 164 –

PART K — RECOMMENDATION
For the reasons set out in the sections headed ‘‘1.10 Basis of the Consideration, the
Issue Price and the Share Exchange Ratio’’ and ‘‘4. Reasons for and benefits of the
Acquisition’’ of Part A — Structure of the Transactions, the Acquisition and the
Consideration of this letter from the Board, the Board, including the Independent Non-
executive Directors, considers that the terms of the Acquisition Agreement and the
Transactions are on normal commercial terms, fair and reasonable, and in the interests of
Wing Hing and WH Shareholders as a whole. Accordingly, the Board recommends the WH
Shareholders to vote in favour of all the resolutions to be proposed at the SGM.
LETTER FROM THE BOARD
– 165 –

1. FINANCIAL SUMMARY AND AUDITORS’ REPORTS
A summary of the published results, assets and liabilities of the Wing Hing Group for
the three years ended 31 March 2009, 2010 and 2011 as extracted from the respective annual
reports of the Company is set out below. No qualified opinion has been expressed by the
auditors of the Company on the audited financial statements of the Wing Hing Group for
each of the years ended 31 March 2009, 2010 and 2011.
For the year ended 31 March
2011 2010 2009
(Audited) (Audited) (Audited)
HK$’000 HK$’000 HK$’000
(restated)
Continuing operations
Revenue 43,905 26,270 2,624
Cost of sales (35,426) (19,149) (1,407)
Gross profit 8,479 7,121 1,217
Other income 224 1 2,208
Other gains and losses — (76) 8,917
Administrative and operating expenses (32,266) (16,743) (18,051)
Share of profits of associates — — 156
Share of profits of jointly-controlled
entities — — 427
Finance costs (408) (568) (21,991)
Loss before tax (23,971) (10,265) (27,117)
Income tax expense (162) (1,901) (591)
Loss for the year from continuing
operations (24,133) (12,166) (27,708)
Discontinued operations
Loss for the year from discontinued
operations — (22) (45,961)
APPENDIX I ACCOUNTANT’S REPORT ON WING HING
– I-1 –

For the year ended 31 March
2011 2010 2009
(Audited) (Audited) (Audited)
HK$’000 HK$’000 HK$’000
(restated)
Loss for the year (24,133) (12,188) (73,669)
Other comprehensive income, net of income
tax
Exchange differences on translating foreign
operations 16,725 — 12,651
Gain arising on revaluation of property,
plant and equipment — — 2,796
Total comprehensive expense for the year (7,408) (12,188) (58,222)
(Loss)/Profit attributable to:
Owners of the Company (21,359) (14,404) (69,184)
Non-controlling interests (2,774) 2,216 (4,485)
(24,133) (12,188) (73,669)
Total comprehensive (expense)/income
attributable to:
Owners of the Company (8,234) (14,404) (59,087)
Non-controlling interests 826 2,216 865
(7,408) (12,188) (58,222)
Loss per share
From continuing and discontinued
operations
— Basic and diluted
(HK cents per share) (1.17) (1.17) (8.14)
From continuing operations
— Basic and diluted
(HK cents per share) (1.17) (1.17) (2.73)
APPENDIX I ACCOUNTANT’S REPORT ON WING HING
– I-2 –

There were no extraordinary or exceptional items for the three years ended 31 March
2009, 2010 and 2011.
Information regarding rates of dividend paid or proposed on each class of shares and
amounts absorbed thereby has not been disclosed as no dividends were paid or proposed in
respect of the three years ended 31 March 2009, 2010 and 2011.
As at 31 March
2011 2010 2009
(Audited) (Audited) (Audited)
HK$’000 HK$’000 HK$’000
Non-current assets
Property, plant and equipment 12,924 2,545 6,481
Mining rights 281,120 241,530 242,906
Interests in associates — — 2,804
Interests in jointly-controlled entities — — (12,540)
Contract retention receivables — — 11,417
Prepayments 1,410 — —
295,454 244,075 251,068
Current assets
Inventories 15 — —
Loan receivable — — 1,000
Trade and other receivables 48,412 56,814 113,489
Pledged bank deposits 5,921 — 24,362
Cash and bank balances 156,069 45,907 22,082
210,417 102,721 160,933
Assets classified as held for sale 87,360 — —
297,777 102,721 160,933
Current liabilities
Trade and other payables 30,757 2,021 165,575
Current tax liabilities 2,944 2,492 591
33,701 4,513 166,166
Net current assets/(liabilities) 264,076 98,208 (5,233)
Total assets less current liabilities 559,530 342,283 245,835
APPENDIX I ACCOUNTANT’S REPORT ON WING HING
– I-3 –
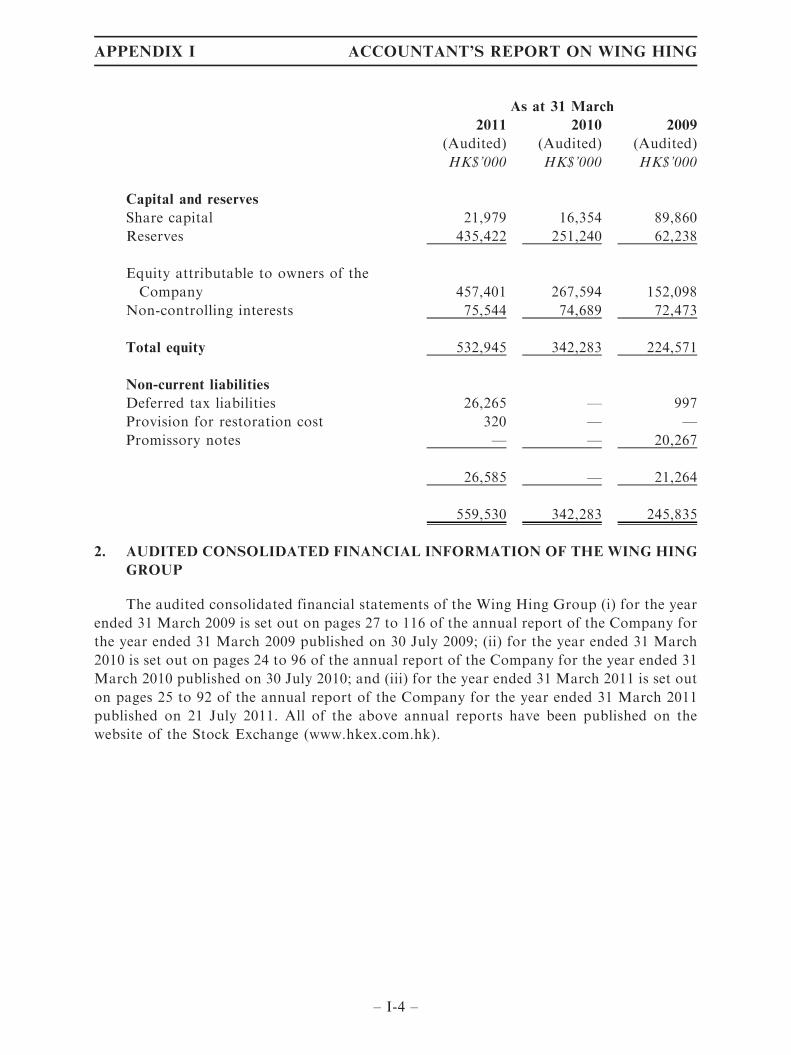
As at 31 March
2011 2010 2009
(Audited) (Audited) (Audited)
HK$’000 HK$’000 HK$’000
Capital and reserves
Share capital 21,979 16,354 89,860
Reserves 435,422 251,240 62,238
Equity attributable to owners of the
Company 457,401 267,594 152,098
Non-controlling interests 75,544 74,689 72,473
Total equity 532,945 342,283 224,571
Non-current liabilities
Deferred tax liabilities 26,265 — 997
Provision for restoration cost 320 — —
Promissory notes — — 20,267
26,585 — 21,264
559,530 342,283 245,835
2. AUDITED CONSOLIDATED FINANCIAL INFORMATION OF THE WING HING
GROUP
The audited consolidated financial statements of the Wing Hing Group (i) for the year
ended 31 March 2009 is set out on pages 27 to 116 of the annual report of the Company for
the year ended 31 March 2009 published on 30 July 2009; (ii) for the year ended 31 March
2010 is set out on pages 24 to 96 of the annual report of the Company for the year ended 31
March 2010 published on 30 July 2010; and (iii) for the year ended 31 March 2011 is set out
on pages 25 to 92 of the annual report of the Company for the year ended 31 March 2011
published on 21 July 2011. All of the above annual reports have been published on the
website of the Stock Exchange (www.hkex.com.hk).
APPENDIX I ACCOUNTANT’S REPORT ON WING HING
– I-4 –
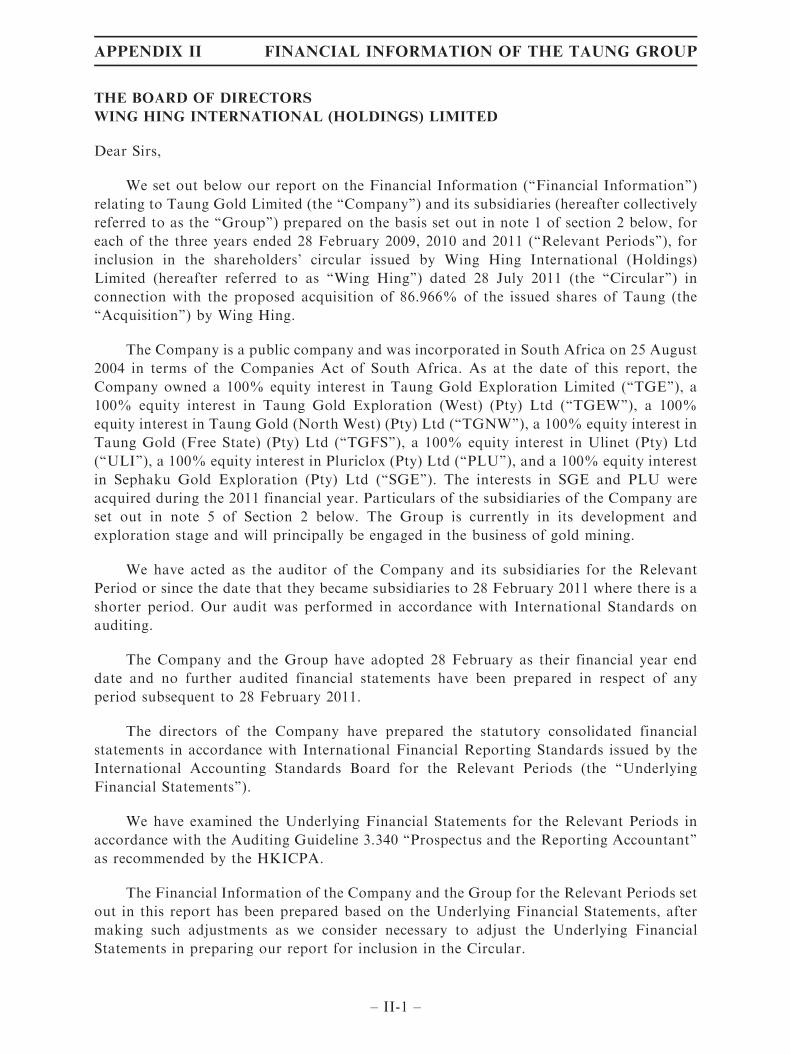
THE BOARD OF DIRECTORS
WING HING INTERNATIONAL (HOLDINGS) LIMITED
Dear Sirs,
We set out below our report on the Financial Information (‘‘Financial Information’’)
relating to Taung Gold Limited (the ‘‘Company’’) and its subsidiaries (hereafter collectively
referred to as the ‘‘Group’’) prepared on the basis set out in note 1 of section 2 below, for
each of the three years ended 28 February 2009, 2010 and 2011 (‘‘Relevant Periods’’), for
inclusion in the shareholders’ circular issued by Wing Hing International (Holdings)
Limited (hereafter referred to as ‘‘Wing Hing’’) dated 28 July 2011 (the ‘‘Circular’’) in
connection with the proposed acquisition of 86.966% of the issued shares of Taung (the
‘‘Acquisition’’) by Wing Hing.
The Company is a public company and was incorporated in South Africa on 25 August
2004 in terms of the Companies Act of South Africa. As at the date of this report, the
Company owned a 100% equity interest in Taung Gold Exploration Limited (‘‘TGE’’), a
100% equity interest in Taung Gold Exploration (West) (Pty) Ltd (‘‘TGEW’’), a 100%
equity interest in Taung Gold (North West) (Pty) Ltd (‘‘TGNW’’), a 100% equity interest in
Taung Gold (Free State) (Pty) Ltd (‘‘TGFS’’), a 100% equity interest in Ulinet (Pty) Ltd
(‘‘ULI’’), a 100% equity interest in Pluriclox (Pty) Ltd (‘‘PLU’’), and a 100% equity interest
in Sephaku Gold Exploration (Pty) Ltd (‘‘SGE’’). The interests in SGE and PLU were
acquired during the 2011 financial year. Particulars of the subsidiaries of the Company are
set out in note 5 of Section 2 below. The Group is currently in its development and
exploration stage and will principally be engaged in the business of gold mining.
We have acted as the auditor of the Company and its subsidiaries for the Relevant
Period or since the date that they became subsidiaries to 28 February 2011 where there is a
shorter period. Our audit was performed in accordance with International Standards on
auditing.
The Company and the Group have adopted 28 February as their financial year end
date and no further audited financial statements have been prepared in respect of any
period subsequent to 28 February 2011.
The directors of the Company have prepared the statutory consolidated financial
statements in accordance with International Financial Reporting Standards issued by the
International Accounting Standards Board for the Relevant Periods (the ‘‘Underlying
Financial Statements’’).
We have examined the Underlying Financial Statements for the Relevant Periods in
accordance with the Auditing Guideline 3.340 ‘‘Prospectus and the Reporting Accountant’’
as recommended by the HKICPA.
The Financial Information of the Company and the Group for the Relevant Periods set
out in this report has been prepared based on the Underlying Financial Statements, after
making such adjustments as we consider necessary to adjust the Underlying Financial
Statements in preparing our report for inclusion in the Circular.
APPENDIX II FINANCIAL INFORMATION OF THE TAUNG GROUP
– II-1 –
The Underlying Financial Statements are the responsibility of the directors of the
Company who approve their issue. The directors of Wing Hing are responsible for the
contents of the Circular in which this report is included. It is our responsibility to compile
the Financial Information set out in this report from the Underlying Financial Statements,
to form an independent opinion on the Financial Information and to report our opinion to
you.
In our opinion, the Financial Information is prepared on the basis of preparation set
out in note 1 of Section 2 below gives, for the purpose of this report, a true and fair view of
the results and cash flows of the Company and the Group for each of the Relevant Periods
and of the state of affairs of the Company and the Group as at 28 February 2009, 2010 and
2011.
APPENDIX II FINANCIAL INFORMATION OF THE TAUNG GROUP
– II-2 –

1. FINANCIAL INFORMATION
Presented in South African Rands (R)
Statement of Financial Position
As at 28 February 2011
Group Company
2011 2010 2009 2011 2010 2009
Notes R R R R R R
Assets
Non-Current Assets
Property, plant and equipment 3 2,373,725 612,042 — 999,360 612,042 —
Intangible assets 4 193,456,581 47,291,539 36,947,882 118,369,490 12,917,646 7,277,487
Investments in subsidiaries 5 — — — 38,985,412 8,290,742 2,670,954
Deposits 6 21,340,350 5,962,550 5,886,550 20,000,000 5,000,000 5,000,000
Loans to group companies 7 — — — 76,835,423 67,363,277 36,389,178
217,170,656 53,866,131 42,834,432 255,189,685 94,183,707 51,337,619
Current Assets
Other receivables 8 2,023,409 4,806,517 2,028,953 2,848,971 4,994,851 1,141,459
Short-term deposits 9 2,469,118 26,818,892 — 517,156 160,000 —
Cash and cash equivalents 10 270,228,046 1,744,678 2,381,479 270,158,109 1,675,251 1,821,249
274,720,573 33,370,087 4,410,432 273,524,236 6,830,102 2,962,708
Current Liabilities
Loans from shareholders 11 5,314,683 5,269,653 8,655,023 5,314,683 5,269,653 8,655,023
Trade and other payables 12 8,730,011 10,119,450 12,765,929 6,757,060 6,963,200 12,320,019
14,044,694 15,389,103 21,420,952 12,071,743 12,232,853 20,975,042
Net Current assets/(liabilities) 260,675,879 17,980,984 (17,010,520) 261,452,493 (5,402,751) (18,012,334)
Total Assets less Current
Liabilities 477,846,535 71,847,115 25,823,912 516,642,178 88,780,956 33,325,285
Equity and Liabilities
Equity
Share capital 13 483,809,185 89,659,185 35,567,040 483,809,185 89,659,185 35,567,040
Reserves 14 93,225,735 — — 93,225,735 — —
Retained income/
(accumulated loss) (99,188,385) (17,812,070) (9,743,128) (60,392,742) (878,229) (2,241,755)
Total shareholders’ interest 477,846,535 71,847,115 25,823,912 516,642,178 88,780,956 33,325,285
APPENDIX II FINANCIAL INFORMATION OF THE TAUNG GROUP
– II-3 –

Statement of Comprehensive Income
For the three years ended 28 February 2011
Group Company
2011 2010 2009 2011 2010 2009
Notes R R R R R R
Other income 1,171,716 88,855 57,077 1,171,716 88,855 57,077
Operating expenses (88,118,810) (10,000,605) (7,479,114) (71,079,478) (2,280,629) (2,397,628)
Operating loss 15 (86,947,094) (9,911,750) (7,422,037) (69,907,762) (2,191,774) (2,340,551)
Interest received 16 5,571,207 1,843,053 135,711 10,393,670 3,555,443 131,313
Finance costs (428) (245) (55) (421) (143) —
Profit/(loss) before taxation (81,376,315) (8,068,942) (7,286,381) (59,514,513) 1,363,526 (2,209,238)
Taxation 17 — — — — — —
Profit (loss) for the year (81,376,315) (8,068,942) (7,286,381) (59,514,513) 1,363,526 (2,209,238)
Other comprehensive income — — — — — —
Total comprehensive
income/(loss) (81,376,315) (8,068,942) (7,286,381) (59,514,513) 1,363,526 (2,209,238)
Total comprehensive (loss)/
income attributable to:
Owners of the parent (81,376,315) (8,068,942) (7,286,381) (59,514,513) 1,363,526 (2,209,238)
Non-controlling interest — — — — — —
(81,376,315) (8,068,942) (7,286,381) (59,514,513) 1,363,526 (2,209,238)
APPENDIX II FINANCIAL INFORMATION OF THE TAUNG GROUP
– II-4 –
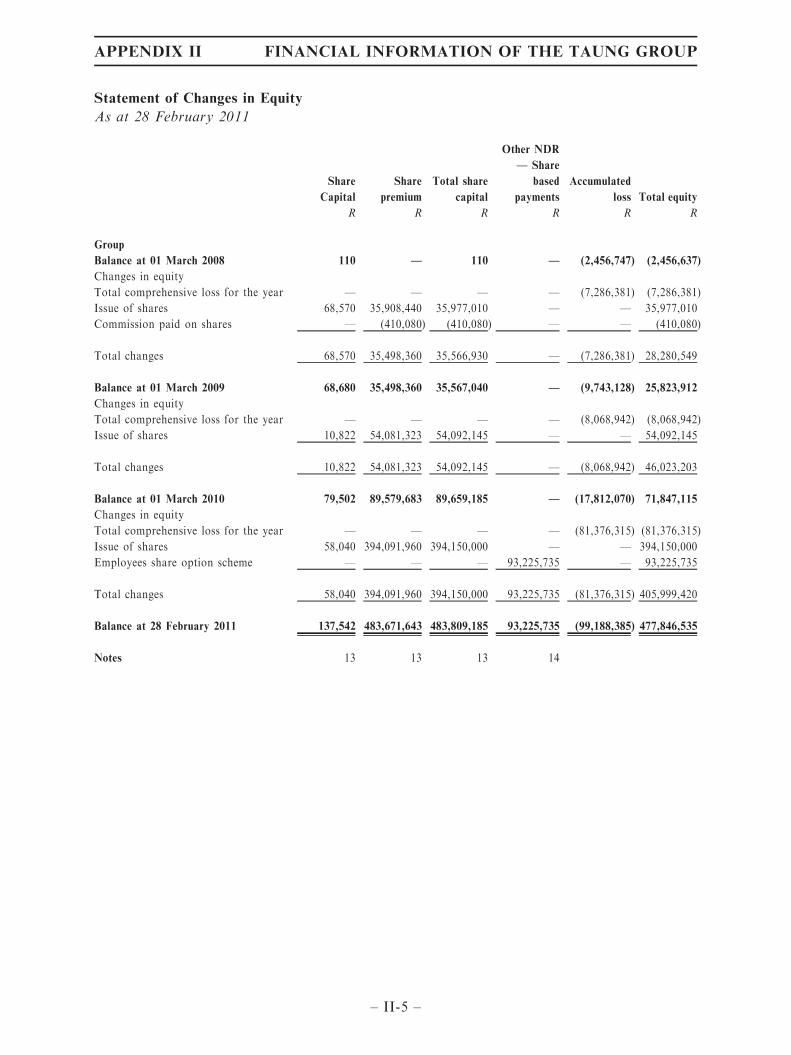
Statement of Changes in Equity
As at 28 February 2011
Share
Capital
Share
premium
Total share
capital
Other NDR
— Share
based
payments
Accumulated
loss Total equity
R R R R R R
Group
Balance at 01 March 2008 110 — 110 — (2,456,747) (2,456,637)
Changes in equity
Total comprehensive loss for the year — — — — (7,286,381) (7,286,381)
Issue of shares 68,570 35,908,440 35,977,010 — — 35,977,010
Commission paid on shares — (410,080) (410,080) — — (410,080)
Total changes 68,570 35,498,360 35,566,930 — (7,286,381) 28,280,549
Balance at 01 March 2009 68,680 35,498,360 35,567,040 — (9,743,128) 25,823,912
Changes in equity
Total comprehensive loss for the year — — — — (8,068,942) (8,068,942)
Issue of shares 10,822 54,081,323 54,092,145 — — 54,092,145
Total changes 10,822 54,081,323 54,092,145 — (8,068,942) 46,023,203
Balance at 01 March 2010 79,502 89,579,683 89,659,185 — (17,812,070) 71,847,115
Changes in equity
Total comprehensive loss for the year — — — — (81,376,315) (81,376,315)
Issue of shares 58,040 394,091,960 394,150,000 — — 394,150,000
Employees share option scheme — — — 93,225,735 — 93,225,735
Total changes 58,040 394,091,960 394,150,000 93,225,735 (81,376,315) 405,999,420
Balance at 28 February 2011 137,542 483,671,643 483,809,185 93,225,735 (99,188,385) 477,846,535
Notes 13 13 13 14
APPENDIX II FINANCIAL INFORMATION OF THE TAUNG GROUP
– II-5 –

Share
Capital
Share
premium
Total share
capital
Other NDR
— Share
based
payments
Accumulated
loss Total equity
R R R R R R
Company
Balance at 01 March 2008 110 — 110 — (32,517) (32,407)
Changes in equity
Total comprehensive loss for the year — — — — (2,209,238) (2,209,238)
Issue of shares 68,570 35,908,440 35,977,010 — — 35,977,010
Commission paid on shares — (410,080) (410,080) — — (410,080)
Total changes 68,570 35,498,360 35,566,930 — (2,209,238) 33,357,692
Balance at 01 March 2009 68,680 35,498,360 35,567,040 — (2,241,755) 33,325,285
Changes in equity
Total comprehensive income for the
year — — — — 1,363,526 1,363,526
Issue of shares 10,822 54,081,323 54,092,145 — — 54,092,145
Total changes 10,822 54,081,323 54,092,145 — 1,363,526 55,455,671
Balance at 01 March 2010 79,502 89,579,683 89,659,185 — (878,229) 88,780,956
Changes in equity
Total comprehensive loss for the year — — — — (59,514,513) (59,514,513)
Issue of shares 58,040 394,091,960 394,150,000 — — 394,150,000
Employees share option scheme — — — 93,225,735 — 93,225,735
Total changes 58,040 394,091,960 394,150,000 93,225,735 (59,514,513) 427,861,222
Balance at 28 February 2011 137,542 483,671,643 483,809,185 93,225,735 (60,392,742) 516,642,178
Notes 13 13 13 14
APPENDIX II FINANCIAL INFORMATION OF THE TAUNG GROUP
– II-6 –

Statement of Cash Flows
For the three years ended 28 February 2011
Group Company
2011 2010 2009 2011 2010 2009
Notes R R R R R R
Cash flows from operating activities
Cash used in operations 18 (24,281,385) (9,163,556) (3,901,983) (7,297,360) (6,720,043) (1,673,549)
Interest income 16 5,571,207 1,843,053 135,711 4,773,982 900,439 131,313
Finance costs (428) (245) (55) (421) (143) —
Deposits — (76,000) (237,100) — — —
VAT movement 25,482 — — 54,742 — —
Net cash from operating activities (18,685,124) (7,396,748) (4,003,427) (2,469,057) (5,819,747) (1,542,236)
Cash flows from investing activities
Purchase of property, plant and
equipment 3 (1,982,806) (685,120) — (608,441) (685,120) —
Cost capitalised in intangible assets 4 (84,393,913) (11,835,052) (22,698,860) (71,351,666) (5,641,259) (6,604,306)
Subsidiary acquired 19 407 — — (100) (100) —
Loans advanced to group
companies — — — (5,925,752) (33,938,783) (20,491,670)
Deposit on acquisition of projects (20,000,000) — (5,000,000) (20,000,000) — (5,000,000)
Movement in short-term deposits 24,349,774 (26,818,892) — (357,156) (160,000) —
Net cash from investing activities (82,026,538) (39,339,064) (27,698,860) (98,243,115) (40,425,262) (32,095,976)
Cash flows from financing activities
Proceeds on share issue 13 369,150,000 54,092,145 22,821,699 369,150,000 54,092,145 22,821,699
Proceeds from/(repayment of)
shareholders loan 45,030 (3,385,370) 13,324,453 45,030 (3,385,370) 19,211,420
Repayment of advances — African
Precious Minerals Limited — (4,607,764) (6,573,658) — (4,607,764) (6,573,658)
Net cash from financing activities 369,195,030 46,099,011 29,572,494 369,195,030 46,099,011 35,459,461
Total cash movement for the period 268,483,368 (636,801) (2,129,793) 268,482,858 (145,998) 1,821,249
Cash at the beginning of the period 1,744,678 2,381,479 4,511,272 1,675,251 1,821,249 —
Total cash at end of the period 10 270,228,046 1,744,678 2,381,479 270,158,109 1,675,251 1,821,249
APPENDIX II FINANCIAL INFORMATION OF THE TAUNG GROUP
– II-7 –
2. NOTES TO THE FINANCIAL INFORMATION
For the three years ending 28 February 2011
The Company is a public company incorporated in South Africa and its shares are not listed on any stock
exchange. The Company does not have a holding company.
The Company and the Group is engaged in exploration, development and mining of gold and associated
minerals.
The Company’s registered address and principal place of business is:
Block C, Ground Floor
Little Fourways Office Park
1 Leslie Avenue East
Fourways
South Africa 2055
1. PRESENTATION OF GROUP FINANCIAL STATEMENTS
The Group financial statements have been prepared in accordance with International Financial Reporting
Standards. The Group financial statements have been prepared on the historical cost basis, except for the
measurement of certain financial instruments and share based payments at fair value, and incorporate the
principal accounting policies set out below.
These accounting policies have been consistently applied.
They are presented in South African Rands, which is also the functional currency of the Company and the
Group.
1.1 Consolidation
Basis of consolidation
The consolidated Group financial statements incorporate the financial statements of the Company
and all entities, including special purpose entities, which are controlled by the Company.
Control exists when the Company has the power to govern the financial and operating policies of an
entity so as to obtain benefits from its activities.
The results of subsidiaries are included in the consolidated Group financial statements from the
effective date of acquisition to the effective date of disposal.
Adjustments are made when necessary to the financial statements of the subsidiaries to bring their
accounting policies in line with those of the Group. All intra-group transactions, balances, income and
expenses are eliminated in full on consolidation.
APPENDIX II FINANCIAL INFORMATION OF THE TAUNG GROUP
– II-8 –

Non-controlling interests in the net assets of consolidated subsidiaries are identified and recognised
separately from the Group’s interest therein, and are recognised within equity. Losses of subsidiaries
attributable to non-controlling interests are allocated to the non-controlling interest even if this results in
a debit balance being recognised for non-controlling interest.
The difference between the fair value of consideration paid or received and the movement in non-
controlling interest for such transactions is recognised in equity attributable to the owners of the parent.
Where a subsidiary is disposed of and a non-controlling shareholding is retained, the remaining
investment is measured to fair value with the adjustment to fair value recognised in profit or loss as part of
the gain or loss on disposal of the controlling interest.
1.2 Critical accounting estimates and judgements
In preparing the Group financial statements, management is required to make estimates and assumptions
that affect the amounts represented in the Group financial statements and related disclosures. Use of available
information and the application of judgement is inherent in the formation of estimates. Actual results in the
future could differ from these estimates which may be material to the Group financial statements. Significant
judgements include:
Critical accounting estimates and assumptions
Impairment testing
The Group reviews and tests the carrying value of assets when events or changes in circumstances
suggest that the carrying amount may not be recoverable. Assets are grouped at the lowest level for which
identifiable cash flows are largely independent of cash flows of other assets and liabilities. If there are
indications that impairment may have occurred, estimates are prepared of expected future cash flows for
each group of assets. Expected future cash flows used to determine the value in use of goodwill and
tangible assets are inherently uncertain and could materially change over time.
Taxation
Judgement is required in determining the provision for income taxes due to the complexity of
legislation. There are many transactions and calculations for which the ultimate tax determination is
uncertain during the ordinary course of business. The Group recognises liabilities for anticipated tax audit
issues based on estimates of whether additional taxes will be due. Where the final tax outcome of these
matters is different from the amounts that were initially recorded, such differences will impact the income
tax and deferred tax provisions in the period in which such determination is made.
The Group recognises the net future tax benefit related to deferred income tax assets to the extent
that it is probable that the deductible temporary differences will reverse in the foreseeable future.
Assessing the recoverability of deferred income tax assets requires the Group to make significant estimates
related to expectations of future taxable income. Estimates of future taxable income are based on forecast
cash flows from operations and the application of existing tax laws in each jurisdiction. To the extent that
future cash flows and taxable income differ significantly from estimates, the ability of the Group to realise
the net deferred tax assets recorded at the end of the reporting period could be impacted. Due to the
nature of the potential cash generating units, there is not enough evidence to prove that it will be probable
that taxable profits will be generated against which the deductible temporary differences can be utilised.
APPENDIX II FINANCIAL INFORMATION OF THE TAUNG GROUP
– II-9 –
Critical judgements in applying the entities accounting policies
Exploration expenses capitalised
Exploration and evaluation expenses are those expenses incurred in connection with acquisition of
rights to explore, investigate, examine and evaluate an area of mineralization including related overhead
costs. The directors exercise judgment to determine if the costs associated with a specific project must be
capitalised against the specific project or written off.
Exploration assets are reviewed at reporting date and where the directors consider there to be
indicators of impairment, impairment tests will be performed on the capitalised costs and any impairments
will be recognised through the income statement.
1.3 Property, plant and equipment
The cost of an item of property, plant and equipment is recognised as an asset when:
. it is probable that future economic benefits associated with the item will flow to the Company; and
. the cost of the item can be measured reliably.
Property, plant and equipment is initially measured at cost.
Costs include costs incurred initially to acquire or construct an item of property, plant and equipment and
costs incurred subsequently to add to, replace part of, or service it. If a replacement cost is recognised in the
carrying amount of an item of property, plant and equipment, the carrying amount of the replaced part is
derecognised.
Property, plant and equipment are depreciated on the straight line basis over their expected useful lives to
their estimated residual value.
Property, plant and equipment is carried at cost less accumulated depreciation and any impairment losses.
Item Average useful life
Computer equipment 3 years
Computer software 3 years
Field equipment 6 years
Furniture and fixtures 6 years
Motor vehicles 5 years
Office equipment 6 years
Plant & Machinery 10 years
The residual value, useful life and depreciation method of each asset are reviewed at the end of each
reporting period. If the expectations differ from previous estimates, the change is accounted for as a change in
accounting estimate.
APPENDIX II FINANCIAL INFORMATION OF THE TAUNG GROUP
– II-10 –

The depreciation charge for each period is recognised in profit or loss unless it is included in the carrying
amount of another asset.
The gain or loss arising from the derecognition of an item of property, plant and equipment is included in
profit or loss when the item is derecognised. The gain or loss arising from the derecognition of an item of
property, plant and equipment is determined as the difference between the net disposal proceeds, if any, and the
carrying amount of the item.
1.4 Site restoration
Provision for future site restoration costs are based on the estimates made of the expenditure needed to
settle the present obligation arising.
1.5 Intangible assets
Intangible assets are initially recognised at cost.
Intangible assets are carried at cost less any accumulated amortisation and any impairment losses.
Exploration assets are carried at cost less any impairment losses. All costs, including administration and
other general overhead costs directly associated with the specific project are capitalised. The directors evaluate
each project at each period end to determine if the carrying value should be written off. In determining whether
expenditure meet the criteria to be capitalised, the directors use information from several sources, depending on
the level of exploration. Purchased exploration and evaluation assets are recognised at the cost of acquisition or
at the fair value if purchased as part of a business combination. Exploration assets are not amortised as they will
only be available for use once transferred to the development cost of the project.
An intangible asset is regarded as having an indefinite useful life when, based on all relevant factors, there
is no foreseeable limit to the period over which the asset is expected to generate net cash inflows. Amortisation is
not provided for these intangible assets, but they are tested for impairment annually and whenever there is an
indication that the assets may be impaired. For all other intangible assets amortisation is provided on a straight
line basis over their useful life.
When the technical and commercial feasibility of a project has been established, the relevant exploration
assets are transferred to development costs. No further exploration costs for the project will be capitalised. The
costs transferred to development costs will be amortised over the life of the project based on the expected flow of
economic resources associated with the project.
The amortisation period and the amortisation method for intangible assets are reviewed every period-end.
Amortisation is provided to write down the intangible assets, on a straight line basis, to their residual
values as follows:
Item Useful life
Computer software 3 years
Exploration assets Not amortised
APPENDIX II FINANCIAL INFORMATION OF THE TAUNG GROUP
– II-11 –

1.6 Investments in subsidiaries
Company financial statements
In the Company’s separate annual financial statements, investments in subsidiaries are carried at
cost less any accumulated impairment.
The cost of an investment in a subsidiary is the aggregate of:
. the fair value, at the date of exchange, of assets given, liabilities incurred or assumed, and
equity instruments issued by the Company; plus
. any costs directly attributable to the purchase of the subsidiary.
Where the consideration the Company transfers in a business combination includes assets or
liabilities resulting from a contingent consideration arrangement, the contingent consideration is
measured at its acquisition-date fair value and considered as part of the consideration transferred in a
business combination. Changes in the fair value of the contingent consideration that qualify as
measurement period adjustments are adjusted retrospectively. Measurement period adjustments are
adjustments that arise from additional information obtained during the measurement period about facts
and circumstances that existed as of the acquisition date. A measurement period does not exceed one year
from the acquisition date.
1.7 Financial instruments
Classification
The Group classifies financial assets and financial liabilities into the following categories:
. Loans and receivables and other financial liabilities
Classification depends on the purpose for which the financial instruments were obtained/incurred
and takes place at initial recognition.
Initial recognition and measurement
Financial instruments are recognised initially when the Group becomes a party to the contractual
provisions of the instruments.
The Group classifies financial instruments, or their component parts, on initial recognition as a
financial liability or an equity instrument in accordance with the substance of the contractual
arrangement.
Subsequent measurement
Loans and receivables are subsequently measured at amortised cost, using the effective interest
method, less accumulated impairment losses.
APPENDIX II FINANCIAL INFORMATION OF THE TAUNG GROUP
– II-12 –
Impairment of financial assets
At each reporting date the Group assesses all financial assets, other than those at fair value through
profit or loss, to determine whether there is objective evidence that a financial asset or group of financial
assets has been impaired.
Impairment losses are recognised in profit or loss.
Loans to (from) Group companies
These include loans to and from subsidiaries and are recognised initially at fair value plus direct
transaction costs.
Loans from Group companies are classified as financial liabilities measured at amortised cost.
Loans to (from) shareholders
These financial assets are classified as loans and receivables.
Other receivables
Other receivables are measured at initial recognition at fair value, and are subsequently measured at
amortised cost using the effective interest rate method. Appropriate allowances for estimated
irrecoverable amounts are recognised in profit or loss when there is objective evidence that the asset is
impaired. Significant financial difficulties of the debtor, probability that the debtor will enter bankruptcy
or financial reorganisation, and default or delinquency in payments (more than 180 days overdue) are
considered indicators that the receivable is impaired. The allowance recognised is measured as the
difference between the asset’s carrying amount and the present value of estimated future cash flows
discounted at the effective interest rate computed at initial recognition.
The carrying amount of the asset is reduced through the use of an allowance account, and the
amount of the loss is recognised in profit or loss within operating expenses. When a receivable is
uncollectible, it is written off against the allowance account for receivables. Subsequent recoveries of
amounts previously written off are credited against operating expenses in profit or loss.
Other receivables are classified as loans and receivables.
Trade and other payables
Trade payables are initially measured at fair value, and are subsequently measured at amortised
cost, using the effective interest rate method.
Cash and cash equivalents
Cash and cash equivalents comprise cash on hand and demand deposits, and other short-term highly
liquid investments that are readily convertible to a known amount of cash and are subject to an
insignificant risk of changes in value. These are initially and subsequently recorded at fair value.
APPENDIX II FINANCIAL INFORMATION OF THE TAUNG GROUP
– II-13 –

Share capital and equity
An equity instrument is any contract that evidences a residual interest in the assets of an entity after
deducting all of its liabilities.
If the Group reacquires its own equity instruments, the consideration paid, including any directly
attributable incremental costs (net of income taxes) on those instruments is deducted from equity until the
shares are cancelled or reissued. No gain or loss is recognised in profit or loss on the purchase, sale, issue
or cancellation of the Group’s own equity instruments. Consideration paid or received shall be recognised
directly in equity. Incremental costs directly attributable to the issue of new shares or options are shown in
equity as a deduction, net of tax, from the proceeds.
1.8 Tax
Deferred tax assets and liabilities
A deferred tax liability is recognised for all taxable temporary differences, except to the extent that
the deferred tax liability arises from the initial recognition of an asset or liability in a transaction which at
the time of the transaction, affects neither accounting profit nor taxable profit.
A deferred tax asset is recognised for all deductible temporary differences to the extent that it is
probable that taxable profit will be available against which the deductible temporary difference can be
utilised. A deferred tax asset is not recognised when it arises from the initial recognition of an asset or
liability in a transaction at the time of the transaction, affects neither accounting profit nor taxable profit.
A deferred tax asset is recognised for the carry forward of unused tax losses and unused STC credits
to the extent that it is probable that future taxable profit will be available against which the unused tax
losses and unused STC credits can be utilised.
Deferred tax assets and liabilities are measured at the tax rates that are expected to apply in the
period when the asset is realised or the liability is settled, based on tax rates (and tax laws) that have been
enacted or substantively enacted by the end of the reporting period.
1.9 Impairment of assets
The Group assesses at each end of the reporting period whether there is any indication that an asset may
be impaired. If any such indication exists, the Group estimates the recoverable amount of the asset.
Irrespective of whether there is any indication of impairment, the Group also:
. tests intangible assets with an indefinite useful life or intangible assets not yet available for use for
impairment annually by comparing their carrying amounts with their recoverable amounts. This
impairment test is performed during the annual period and at the same time every period.
APPENDIX II FINANCIAL INFORMATION OF THE TAUNG GROUP
– II-14 –

If there is any indication that an asset may be impaired, the recoverable amount is estimated for the
individual asset. If it is not possible to estimate the recoverable amount of the individual asset, the recoverable
amount of the cash-generating unit to which the asset belongs is determined.
The recoverable amount of an asset or a cash-generating unit is the higher of its fair value less costs to sell
and its value in use.
If the recoverable amount of an asset is less than its carrying amount, the carrying amount of the asset is
reduced to its recoverable amount. That reduction is an impairment loss.
An impairment loss of assets carried at cost less any accumulated depreciation or amortisation is
recognised immediately in profit or loss.
An impairment loss is recognised for cash-generating units if the recoverable amount of the unit is less
than the carrying amount of the units. The impairment loss is allocated to reduce the carrying amount of the
assets of the unit in the following order:
. first, to reduce the carrying amount of any goodwill allocated to the cash-generating unit and
. then, to the other assets of the unit, pro rata on the basis of the carrying amount of each asset in the
unit.
An entity assesses at each reporting date whether there is any indication that an impairment loss
recognised in prior periods for assets other than goodwill may no longer exist or may have decreased. If any
such indication exists, the recoverable amounts of those assets are estimated.
The increased carrying amount of an asset other than goodwill attributable to a reversal of an impairment
loss does not exceed the carrying amount that would have been determined had no impairment loss been
recognised for the asset in prior periods.
A reversal of an impairment loss of assets carried at cost less accumulated depreciation or amortisation
other than goodwill is recognised immediately in profit or loss.
1.10 Share-based payments
Goods or services received or acquired in a share-based payment transaction are recognised when the
goods are received or as the services are rendered. A corresponding increase in equity is recognised if the goods
or services were received in an equity-settled share-based payment transaction or a liability if the goods or
services were acquired in a cash-settled share-based payment transaction.
When the goods or services received or acquired in a share-based payment transaction do not qualify for
recognition as assets, they are recognised as expenses.
APPENDIX II FINANCIAL INFORMATION OF THE TAUNG GROUP
– II-15 –

For equity-settled share-based payment transactions, the goods or services received and the corresponding
increase in equity are measured, directly, at the fair value of the goods or services received provided that the fair
value can be estimated reliably. If the fair value of the goods or services received cannot be estimated reliably,
their value and the corresponding increase in equity, indirectly, are measured by reference to the fair value of the
equity instruments granted.
For cash-settled share-based payment transactions, the goods or services acquired and the liability
incurred are measured at the fair value of the liability. Until the liability is settled, the fair value of the liability is
re-measured at each reporting date and at the date of settlement, with any changes in fair value recognised in
profit or loss for the period.
If the share-based payments granted do not vest until the counterparty completes a specified period of
service, the Group accounts for those services as they are rendered by the counterparty during the vesting
period, (or on a straight line basis over the vesting period).
If the share-based payments vest immediately, the services received are recognised in full.
For share-based payment transactions in which the terms of the arrangement provide either the entity or
the counterparty with the choice of whether the entity settles the transaction in cash (or other assets) or by
issuing equity instruments, the components of that transaction are recorded, as a cash-settled share-based
payment transaction if, and to the extent that, a liability to settle in cash or other assets has been incurred, or as
an equity-settled share-based payment transaction if, and to the extent that, no such liability has been incurred.
1.11 Employee benefits
Short-term employee benefits
The cost of short-term employee benefits, (those payable within 12 months after the service is
rendered, such as paid vacation leave and sick leave, bonuses, and non-monetary benefits such as medical
care), are recognised in the period in which the service is rendered and are not discounted.
The expected cost of compensated absences is recognised as an expense as the employees render
services that increase their entitlement or, in the case of non-accumulating absences, when the absence
occurs.
The expected cost of profit sharing and bonus payments is recognised as an expense when there is a
legal or constructive obligation to make such payments as a result of past performance.
APPENDIX II FINANCIAL INFORMATION OF THE TAUNG GROUP
– II-16 –
1.12 Provisions and contingencies
Provisions are recognised when:
. the Group has a present obligation as a result of a past event;
. it is probable that an outflow of resources embodying economic benefits will be required to settle the
obligation; and
. a reliable estimate can be made of the obligation.
The amount of a provision is the present value of the expenditure expected to be required to settle the
obligation using a pre-tax rate reflects current market assessments of the time value of money and the risk
specific to the obligation.
Where some or all of the expenditure required to settle a provision is expected to be reimbursed by another
party, the reimbursement shall be recognised when, and only when, it is virtually certain that reimbursement will
be received if the entity settles the obligation. The reimbursement shall be treated as a separate asset. The
amount recognised for the reimbursement shall not exceed the amount of the provision.
Provisions are not recognised for future operating losses.
If an entity has a contract that is onerous, the present obligation under the contract shall be recognised
and measured as a provision.
A constructive obligation to restructure arises only when an entity:
. has a detailed formal plan for the restructuring, identifying at least:
— the business or part of a business concerned;
— the principal locations affected;
— the location, function, and approximate number of employees who will be compensated for
terminating their services;
— the expenditures that will be undertaken; and
— when the plan will be implemented; and
. has raised a valid expectation in those affected that it will carry out the restructuring by starting to
implement that plan or announcing its main features to those affected by it.
APPENDIX II FINANCIAL INFORMATION OF THE TAUNG GROUP
– II-17 –

After their initial recognition, contingent liabilities recognised in business combinations that are
recognised separately are subsequently measured at the higher of:
. the amount that would be recognised as a provision; and
. the amount initially recognised less cumulative amortisation.
1.13 Revenue
Revenue is measured at the fair value of the consideration received or receivable and represents the
amounts receivable for goods and services provided in the normal course of business, net of trade discounts and
volume rebates, and value added tax.
Interest is recognised, in profit or loss, using the effective interest rate method.
1.14 Translation of foreign currencies
Foreign currency transactions
A foreign currency transaction is recorded, on initial recognition in Rand, by applying to the foreign
currency amount the spot exchange rate between the functional currency and the foreign currency at the
date of the transaction.
At the end of the reporting period:
. foreign currency monetary items are translated using the closing rate;
. non-monetary items that are measured in terms of historical cost in a foreign currency are
translated using the exchange rate at the date of the transaction; and
. non-monetary items that are measured at fair value in a foreign currency are translated using
the exchange rates at the date when the fair value was determined.
Exchange differences arising on the settlement of monetary items or on translating monetary items
at rates different from those at which they were translated on initial recognition during the period or in
previous Group financial statements are recognised in profit or loss in the period in which they arise.
When a gain or loss on a non-monetary item is recognised to other comprehensive income and
accumulated in equity, any exchange component of that gain or loss is recognised to other comprehensive
income and accumulated in equity. When a gain or loss on a non-monetary item is recognised in profit or
loss, any exchange component of that gain or loss is recognised in profit or loss.
Cash flows arising from transactions in a foreign currency are recorded in Rand by applying to the
foreign currency amount the exchange rate between the Rand and the foreign currency at the date of the
cash flow.
APPENDIX II FINANCIAL INFORMATION OF THE TAUNG GROUP
– II-18 –

2. NEW STANDARDS AND INTERPRETATIONS
2.1 Standards and interpretations not yet effective
The Group and the Company have adopted all of the new and revised standards and interpretations issued
by the International Accounting Standards Board (‘‘IASB’’) and the International Financial Reporting
Committee of the IASB that are effective for the preparation of its Financial Information throughout the
Relevant Periods.
In addition, the Group and the Company has not early applied the new and revised standards and
interpretation that have been issued but are not yet effective throughout the Relevant Periods. The directors of
the Company anticipate that the application of these new and revised standards and interpretation will have no
material impact on the results and the financial position of the Group on the Company.
3. PROPERTY, PLANT AND EQUIPMENT
Group
2011 2010
Cost/
Valuation
Accumulated
depreciation
Carrying
value
Cost/
Valuation
Accumulated
depreciation
Carrying
value
Computer equipment 378,582 (86,159) 292,423 99,259 (10,656) 88,603
Computer software 16,698 (5,210) 11,488 4,307 (893) 3,414
Field equipment 29,504 (4,640) 24,864 — — —
Furniture and fixtures 145,665 (26,791) 118,874 58,442 (5,934) 52,508
Motor vehicles 690,315 (157,281) 533,034 490,315 (49,218) 441,097
Office equipment 32,797 (14,120) 18,677 32,797 (6,377) 26,420
Plant & Machinery 1,374,365 — 1,374,365 — — —
Total 2,667,926 (294,201) 2,373,725 685,120 (73,078) 612,042
Company
2011 2010
Cost/
Valuation
Accumulated
depreciation
Carrying
value
Cost/
Valuation
Accumulated
depreciation
Carrying
value
Computer equipment 378,582 (86,159) 292,423 99,259 (10,656) 88,603
Computer software 16,698 (5,210) 11,488 4,307 (893) 3,414
Field equipment 29,504 (4,640) 24,864 — — —
Furniture and fixtures 145,665 (26,791) 118,874 58,442 (5,934) 52,508
Motor vehicles 690,315 (157,281) 533,034 490,315 (49,218) 441,097
Office equipment 32,797 (14,120) 18,677 32,797 (6,377) 26,420
Total 1,293,561 (294,201) 999,360 685,120 (73,078) 612,042
APPENDIX II FINANCIAL INFORMATION OF THE TAUNG GROUP
– II-19 –

Reconciliation of property, plant and equipment — Group 2011
Opening
balance Additions Depreciation Total
Computer equipment 88,603 279,323 (75,503) 292,423
Computer software 3,414 12,391 (4,317) 11,488
Field equipment — 29,504 (4,640) 24,864
Furniture and fixtures 52,508 87,223 (20,857) 118,874
Motor vehicles 441,097 200,000 (108,063) 533,034
Office equipment 26,420 — (7,743) 18,677
Plant & Machinery — 1,374,365 — 1,374,365
612,042 1,982,806 (221,123) 2,373,725
Reconciliation of property, plant and equipment — Group 2010
Opening
balance Additions Depreciation Total
Computer equipment — 99,259 (10,656) 88,603
Computer software — 4,307 (893) 3,414
Field equipment — — — —
Furniture and fixtures — 58,442 (5,934) 52,508
Motor vehicles — 490,315 (49,218) 441,097
Office equipment — 32,797 (6,377) 26,420
Total — 685,120 (73,078) 612,042
Reconciliation of property, plant and equipment — Company 2011
Opening
balance Additions Depreciation Total
Computer equipment 88,603 279,323 (75,503) 292,423
Computer software 3,414 12,391 (4,317) 11,488
Field equipment — 29,504 (4,640) 24,864
Furniture and fixtures 52,508 87,223 (20,857) 118,874
Motor vehicles 441,097 200,000 (108,063) 533,034
Office equipment 26,420 — (7,743) 18,677
612,042 608,441 (221,123) 999,360
APPENDIX II FINANCIAL INFORMATION OF THE TAUNG GROUP
– II-20 –

Reconciliation of property, plant and equipment — Company 2010
Opening
balance Additions Depreciation Total
Computer equipment — 99,259 (10,656) 88,603
Computer software — 4,307 (893) 3,414
Field equipment — — — —
Furniture and fixtures — 58,442 (5,934) 52,508
Motor vehicles — 490,315 (49,218) 441,097
Office equipment — 32,797 (6,377) 26,420
Total — 685,120 (73,078) 612,042
4. INTANGIBLE ASSETS
Group
2011
Cost/
Valuation
Accumulated
depreciation Carrying value
Computer software 486,806 (88,789) 398,017
Exploration assets 193,058,564 — 193,058,564
Total 193,545,370 (88,789) 193,456,581
2010
Cost/
Valuation
Accumulated
depreciation Carrying value
Computer software 20,158 (10,760) 9,398
Exploration assets 47,282,141 — 47,282,141
Total 47,302,299 (10,760) 47,291,539
2009
Cost/
Valuation
Accumulated
depreciation Carrying value
Computer software 14,500 (4,830) 9,670
Exploration assets 36,938,212 — 36,938,212
Total 36,952,712 (4,830) 36,947,882
APPENDIX II FINANCIAL INFORMATION OF THE TAUNG GROUP
– II-21 –

Company
2011
Cost/
Valuation
Accumulated
depreciation Carrying value
Computer software 486,806 (88,789) 398,017
Exploration assets 117,971,473 — 117,971,473
Total 118,458,279 (88,789) 118,369,490
2010
Cost/
Valuation
Accumulated
depreciation Carrying value
Computer software 20,158 (10,760) 9,398
Exploration assets 12,908,248 — 12,908,248
Total 12,928,406 (10,760) 12,917,646
2009
Cost/
Valuation
Accumulated
depreciation Carrying value
Exploration assets 7,277,487 — 7,277,487
Total 7,277,487 — 7,277,487
Reconciliation of intangible assets — Group 2011
Opening
balance Additions Amortisation
Impairment
loss Total
Computer software 9,398 466,648 (78,029) — 398,017
Exploration assets 47,282,141 146,347,046 — (570,623) 193,058,564
47,291,539 146,813,694 (78,029) (570,623) 193,456,581
Reconciliation of intangible assets — Group 2010
Opening
balance Additions Amortisation
Impairment
loss Total
Computer software 9,670 5,658 (5,930) — 9,398
Exploration assets 36,938,212 10,343,929 — — 47,282,141
36,947,882 10,349,587 (5,930) — 47,291,539
APPENDIX II FINANCIAL INFORMATION OF THE TAUNG GROUP
– II-22 –

Reconciliation of intangible assets — Group 2009
Opening
balance Additions Amortisation
Impairment
loss Total
Computer software 14,500 — (4,830) — 9,670
Exploration assets 15,385,402 22,698,860 — (1,146,050) 36,938,212
15,399,902 22,698,860 (4,830) (1,146,050) 36,947,882
Reconciliation of intangible assets — Company 2011
Opening
balance Additions Amortisation
Impairment
loss Total
Computer software 9,398 466,648 (78,029) — 398,017
Exploration assets 12,908,248 105,063,225 — — 117,971,473
12,917,646 105,529,873 (78,029) — 118,369,490
Reconciliation of intangible assets — Company 2010
Opening
balance Additions
Other
changes
movements
Impairment
loss Total
Computer software — 20,158 (9,660) (1,100) 9,398
Exploration assets 7,277,487 5,630,761 — — 12,908,248
7,277,487 5,650,919 (9,660) (1,100) 12,917,646
Reconciliation of intangible assets — Company 2009
Opening
balance Additions Amortisation
Impairment
loss Total
Exploration assets 673,181 6,604,306 — — 7,277,487
APPENDIX II FINANCIAL INFORMATION OF THE TAUNG GROUP
– II-23 –

5. INVESTMENTS IN SUBSIDIARIES
Name of company
Place &
date of
incorporation
% holding
2011
% holding
2010
% holding
2009
Carrying
amount
2011
Carrying
amount
2010
Carrying
amount
2009
Taung Gold Exploration
(West) (Pty) Ltd
South Africa
23/09/2004
100.00% 100.00% 100.00% 7,875 7,875 7,875
Taung Gold Exploration
Limited
South Africa
28/04/1993
100.00% 100.00% 100.00% 7,875 7,875 7,875
Taung Gold (North
West) (Pty) Ltd
South Africa
31/01/2005
100.00% 100.00% 100.00% 100 100 100
Taung Gold (Free State)
(Pty) Ltd
South Africa
04/02/2005
100.00% 100.00% 100.00% 100 100 100
Ulinet (Pty) Ltd South Africa
27/03/2009
100.00% 100.00% — 100 100 —
Pluriclox (Pty) Ltd South Africa
12/07/2010
100.00% — — 100 — —
Sephaku Gold
Exploration (Pty) Ltd
South Africa
25/10/2004
100.00% — — 25,000,000 — —
25,016,150 16,050 15,950
Capitalized as a result of
imputed interest
13,969,262 8,274,692 2,655,004
38,985,412 8,290,742 2,670,954
All the subsidiaries are registered and operate within South Africa and principal activities of all the
subsidiaries are the exploration, development and mining of gold and associated minerals. Refer to note 7 for
information regarding loans to subsidiaries.
6. DEPOSITS FOR REHABILITATION
Deposits amounting to R20,000,000 (2010 : R5,000,000; 2009 : R5,000,000) were held in escrow or as
guarantees until the fulfilment of certain suspensive conditions in terms of agreements to acquire certain rights
and projects.
In terms of section 41 of the Minerals and Petroleum Development Act an applicant for a prospecting
right, mining right or mining permit must make the prescribed financial provision for the rehabilitation or
management of negative environmental impacts. The Group made deposits to the amount of R1,340,350 (2010 :
R962,550; 2009 : R886,550), with the Department of Mineral Resources in compliance therewith.
In addition the Group also provided guarantees to the value of R1,256,522 (2010 : R1,107,317; 2009 :
RNil) to the Department of Mineral Resources. The funds are held for security in a short-term deposit account
as per note 9.
APPENDIX II FINANCIAL INFORMATION OF THE TAUNG GROUP
– II-24 –

7. LOANS TO GROUP COMPANIES
Group Company
Subsidiaries 2011 2010 2009 2011 2010 2009
R R R R R R
Taung Gold (West) (Pty) Ltd — — — 2,767,162 1,494,259 721,488
Taung Gold Exploration Limited — — — 63,163,380 66,440,783 34,803,799
Taung Gold (North West) (Pty) Ltd — — — 4,232,082 2,036,092 1,121,952
Taung Gold (Free State) (Pty) Ltd — — — 5,531,621 2,763,831 2,396,943
Ulinet (Pty) Ltd — — — 1,425,752 248,000 —
Sephaku Gold Exploration (Pty) Ltd — — — 3,843,190 — —
Pluriclox (Pty) Ltd — — — 1,566,806 — —
— — — 82,529,993 72,982,965 39,044,182
Imputed interest — — — (5,694,570) (5,619,688) (2,655,004)
— — — 76,835,423 67,363,277 36,389,178
These unsecured loans are interest free and have no fixed terms of repayment. In the opinion of the
directors, the loans are not repayable within twelve months since the end of the reporting period.
8. OTHER RECEIVABLES
Group Company
2011 2010 2009 2011 2010 2009
R R R R R R
Deposits 349,895 — — 349,895 — —
VAT 640,577 663,959 881,419 296,383 351,119 270,546
Other receivables 1,032,937 4,142,558 1,147,534 2,202,693 4,643,732 870,913
2,023,409 4,806,517 2,028,953 2,848,971 4,994,851 1,141,459
9. SHORT-TERM DEPOSITS
Group Company
2011 2010 2009 2011 2010 2009
R R R R R R
Short-term deposits 2,469,118 26,818,892 — 517,156 160,000 —
The short-term deposits are held for guarantees provided to the Department of Mineral Resources. In the
2010 financial year a further guarantee of R25,000,000 was held for Harmony Gold Mines Company Limited as
deposit for the acquisition of the Jeanette Project.
APPENDIX II FINANCIAL INFORMATION OF THE TAUNG GROUP
– II-25 –

10. CASH AND CASH EQUIVALENTS
Group Company
2011 2010 2009 2011 2010 2009
R R R R R R
Cash and cash equivalents
consist of:
Cash on hand 97,554 34,332 41,906 53,200 5,110 2,110
Bank balances 245,140,044 132,012 2,339,573 245,114,461 91,807 1,819,139
Call account 24,990,448 1,578,334 — 24,990,448 1,578,334 —
270,228,046 1,744,678 2,381,479 270,158,109 1,675,251 1,821,249
Credit quality of cash at bank and short term deposits, excluding cash on hand
The credit quality of cash at bank and short term deposits, excluding cash on hand that are neither
past due nor impaired have been assessed by reference to external credit ratings of The Fitch Ratings of
January 2011 :
Group Company
2011 2010 2009 2011 2010 2009
R R R R R R
Credit rating
F1+ (zaf) 272,599,610 28,529,238 2,339,573 270,622,065 1,830,141 1,819,139
11. LOANS FROM SHAREHOLDERS
Group Company
2011 2010 2009 2011 2010 2009
R R R R R R
D Twist 45,030 — 423,179 45,030 — 423,179
CRD de Bruin — — 220,400 — — 220,400
JG Barkhuizen — — 185,060 — — 185,060
Sephaku Gold Holdings (Pty) Ltd 5,269,653 5,269,653 7,826,384 5,269,653 5,269,653 7,826,384
5,314,683 5,269,653 8,655,023 5,314,683 5,269,653 8,655,023
The loans are unsecured, bear no interest and are repayable on demand.
12. TRADE AND OTHER PAYABLES
Group Company
2011 2010 2009 2011 2010 2009
R R R R R R
Trade payables 2,352,253 3,953,506 2,145,648 1,351,890 1,159,544 1,908,599
Advances — African Precious
Minerals Limited 5,404,810 5,803,656 10,411,420 5,405,170 5,803,656 10,411,420
Accrued leave pay 972,948 362,288 208,861 — — —
8,730,011 10,119,450 12,765,929 6,757,060 6,963,200 12,320,019
APPENDIX II FINANCIAL INFORMATION OF THE TAUNG GROUP
– II-26 –

The amount due to African Precious Minerals Limited is unsecured, bears no interest and has no fixed
terms of repayment.
The average credit period on purchases is 30 days. The Company and the Group have financial risk
management policies in place to ensure that all payables are paid within the pre-agreed credit terms.
The following is an aged analysis of trade payable presented based on the invoice date at the end of the
period.
0–60 days 2,352,253 3,953,506 2,145,648 1,351,890 1,159,544 1,908,599
13. SHARE CAPITAL
Group Company
2011 2010 2009 2011 2010 2009
R R R R R R
Authorised
500,000,000 ordinary shares of
R0.001 each 500,000 500,000 500,000 500,000 500,000 500,000
Reconciliation of number of shares
issued:
Reported as at beginning of
the period 79,501,582 68,680,153 110,000 79,501,582 68,680,153 110,000
Issue of shares — ordinary shares 58,040,000 10,821,429 68,570,153 58,040,000 10,821,429 68,570,153
137,541,582 79,501,582 68,680,153 137,541,582 79,501,582 68,680,153
The unissued ordinary shares are under the control of the directors until the next annual general meeting
of the Company.
Group Company
2011 2010 2009 2011 2010 2009
R R R R R R
Issued
Ordinary 137,542 79,502 68,680 137,542 79,502 68,680
Share premium 483,671,643 89,579,683 35,498,360 483,671,643 89,579,683 35,498,360
483,809,185 89,659,185 35,567,040 483,809,185 89,659,185 35,567,040
During the 2010 financial year, 10,821,429 shares were issued at R5-00. Commission amounting to
R15,000 was paid on the capital raised. During the period under review, 32,250,000 shares were issued (see
below) at R5-00. 5,000,000 shares were issued at R5-00 for the acquisition of Sephaku Gold Exploration (Pty)
Ltd. A further 20,790,000 shares were issued at R10-00 each (2010 : 10,821,429 shares at R5-00; 2009 :
62,627,297 shares at R0-10 and 5,942,856 shares at R5-00). During the period under review no commission was
paid on the capital raised (2010 : R15,000; 2009 : R410,080). Subsequent to year end a further 710,000 shares
were issued at R10-00 each. Commission will become payable once the transaction whereby Wing Hing
International (Holdings) Limited (‘‘Wing Hing’’) acquires up to 86.966% of the issued shares of the Company is
approved by the shareholders of Wing Hing. The commission will be settled by the issue of 4,500,000 shares. The
Company is in the process of finalising the issue of 30,800,000 warrants which will enable the holders of the
warrants to subscribe for 30,800,000 shares of the Company at R10-00 each on or before the date on which Wing
Hing acquires the controlling interest in the Company. The capital was raised to provide working capital for the
Group.
APPENDIX II FINANCIAL INFORMATION OF THE TAUNG GROUP
– II-27 –

During the 2011 financial year, a total of 23,645,210 options were granted to staff with exercise prices
ranging from R4-95 to R9-90 and exercisable for a period of five years from the date of granting.
The Company entered into a subscription agreement with Electrum Strategic Exploration Limited
(‘Electrum’) in May 2009 in terms of which Electrum undertook to subscribe for 21.5 million units (‘Units’).
Each Unit comprises one ordinary share in the share capital of the Company and two warrants, each of which
entitles the holder to subscribe for one ordinary share in the share capital of the Company at a price of R5.00
each. The 43 million warrants referred to above are divided into 21.5 million ‘‘P’’ Warrants and 21.5 million
‘‘Harmony’’ Warrants. Electrum subscribed for half of the Units in June 2009, purchasing 10.75 million shares
for R53.75 million. All conditions precedent were met during June 2010 and Electrum subscribed for the
remaining 10.75 million shares and exercised the Harmony options at R5-00 per share. The 21.5 million P
Warrants are to be exercised at a future date but no later than 5 years after the closing date set out in the May
2009 agreement between Taung and Electrum. As the warrants confer a right to a fixed number of shares for a
fixed amount of cash, the warrants are classified as equity and will only be accounted for once the warrants are
exercised.
14. RESERVES — SHARE BASED PAYMENTS
The Company has a share option scheme for management and staff. In accordance with the terms of the
plan, all management and staff may be granted options to purchase ordinary shares at an exercise price that is
between 1% and 5% less than the market value of the shares at the date options are awarded.
Each employee’s share option converts to one ordinary share of the Company on exercise. No amounts are
paid or are payable by the recipient on receipt of the option. The option carry neither rights to dividends nor
voting rights. All options vested on the date of grant and options may be exercised within 5 years from the date
of grant.
Share Option — Group and Company Number
Weighted Fair
value Total value
Granted May 2010 and July 2010 to staff 3,036,000 2.19 6,657,032
Granted May 2010 and July 2010 to management 9,939,312 3.38 33,592,498
Granted September 2010 to staff 1,908,000 3.27 6,248,275
Granted September 2010 to management 6,056,737 5.00 30,313,001
Granted November 2010 to staff 679,000 4.36 2,960,053
Granted November 2010 to management 2,026,161 6.64 13,454,876
23,645,210 93,225,735
Weighted average share price at vesting date of options was R 5-00 to R10-00.
Outstanding options
Exercise date
within one year
Exercise date
from two to
five years
Exercise date
after five years
Options with exercise price of R4-95 12,975,312 — —
Options with exercise price of R7-425 7,964,737 — —
Options with exercise price of R9-90 2,705,161 — —
23,645,210 — —
All options were granted during the 2011 financial year and no options have been exercised or have lapsed
to date.
APPENDIX II FINANCIAL INFORMATION OF THE TAUNG GROUP
– II-28 –

Information on options granted during the year
Fair value was determined by using the Cox Cross Rubinstein bi-nominal tree model. The following
inputs were used:
. Weighted average share price, R5-00 to R10-00
. Exercise price, R4-95 to R9-90
. Expected volatility, 74.77% to 77.82%
. Option life, 5 years
. Expected dividends, Nil
. For early exercise it was assumed that non-managerial staff would exercise their options
within one year and managerial staff would exercise their options over three years.
Total expenses of R93,225,735 (2010 : RNil; 2009 : RNil) related to equity-settled share based
payments transactions were recognised in 2011, 2010 and 2009 respectively. Of this R29,079,741 (2010 :
RNil; 2009 : RNil) was capitalised against intangible assets and R64,145,994 (2010 : RNil; 2009 : RNil) was
expensed through the statement of comprehensive income, based on the actual time allocated of each
employee over the past 12 months to either intangible assets or expenses.
15. OPERATING LOSS
Operating loss for the three years ended 28 February 2011 is stated after accounting for the following:
Group Company
2011 2010 2009 2011 2010 2009
R R R R R R
Administration expenses 1,463,640 689,333 2,498,452 1,255,217 515,562 2,256,451
Amortisation on intangible assets 78,029 5,930 4,830 78,029 1,100 —
Auditor’s remuneration 554,144 140,986 60,000 425,144 81,656 20,000
Consulting fees 3,183,808 778,511 21,943 3,183,168 724,573 10,270
Travel & accommodation 1,633,265 521,597 — 1,581,919 490,247 —
Depreciation on property, plant
and equipment 122,657 73,078 — 122,657 73,078 —
Employee costs 18,571,902 10,348,486 6,511,900 — 8,255 4,500
Employee cost capitalised and
recouped (9,091,695) (6,249,902) (4,559,980) — — —
Pre-granting costs written off 4,998,565 1,485,467 — — — —
Impairment exploration assets 570,623 — 1,146,050 — — —
Share-based payments — Options
to staff 64,145,994 — — 64,145,994 — —
Overheads charged by African
Nickel 687,736 524,271 — 39,818 179,558 —
Overheads charged by Sephaku
Management 1,200,142 1,682,848 1,795,919 247,532 206,600 106,407
Profit on foreign exchange
difference (1,171,716) (88,855) (57,077) (1,171,716) (88,855) (57,077)
APPENDIX II FINANCIAL INFORMATION OF THE TAUNG GROUP
– II-29 –

The overheads charged by Sephaku Management and African Nickel include a charge for the leasing of
the offices by the Company. The amount was not separately determined and therefore cannot be disclosed as a
separate line item.
16. INTEREST RECEIVED
Group Company
2011 2010 2009 2011 2010 2009
R R R R R R
Banks and financial institutions 5,571,207 1,843,053 135,711 4,773,982 900,439 131,313
Imputed interest — — — 5,619,688 2,655,004 —
5,571,207 1,843,053 135,711 10,393,670 3,555,443 131,313
17. TAXATION
No provision has been made for 2011 tax as the Group has no taxable income. The estimated tax loss
available for set off against future taxable income is R32,891,259 (2010 : R17,384,039; 2009 : R9,855,363). In
addition an estimated capital allowance of R90,584,944 (2010 : R47,169,908; 2009 : R36,825,979) will be
available to the Group for set-off against future mining income. The cumulative loss of the Company available
for the Company to set-off against future income amounts to R658,195 (2010 : R3,153,818; 2009 : R2,241,755).
The estimated capital allowance of the Company which will be available for deduction against future mining
income amounts to R42,971,473 (2010 : R12,908,248; 2009 : R7,277,487). Due to the exploration activities of the
Group, it is not probable that the Group will be in a profitable position in the foreseeable future. Therefore, the
deferred asset recognised is limited to the amount of the deferred tax liability recognised. Excluded from the
estimated capital allowance is an amount of R75,000,000 which was paid for the acquisition of the Jeanette
project. In terms of current legislation, a portion of this amount will be allowed as a capital allowance. As at
reporting date, the amount allowed as a deduction has not yet been determined.
The income tax expense can be reconciled as follows:
Group Company
2011 2010 2009 2011 2010 2009
R R R R R R
Profit/(Loss) before taxation (81,376,315) (8,068,942) (7,286,381) (59,514,513) 1,363,526 (2,209,238)
Income tax expense at 28% (22,785,368) (2,259,303) (2,040,186) (16,664,064) 381,787 (618,587)
Tax effect of loss not recognised 22,785,368 2,259,303 2,040,186 16,664,064 (381,787) 618,587
Taxation — — — — — —
APPENDIX II FINANCIAL INFORMATION OF THE TAUNG GROUP
– II-30 –

18. CASH USED IN OPERATIONS
Group Company
2011 2010 2009 2011 2010 2009
R R R R R R
Profit/(Loss) before taxation (81,376,315) (8,068,942) (7,286,381) (59,514,513) 1,363,526 (2,209,238)
Adjustments for:
Depreciation and amortisation 200,686 79,008 4,830 200,686 74,178 —
Interest received (5,571,207) (1,843,053) (135,711) (10,393,670) (3,555,443) (131,313)
Finance costs 428 245 55 421 143 —
Impairment of exploration assets 570,623 1,485,467 1,146,050 — — —
Share-based payments — Options
to staff 64,145,994 — — 64,145,994 — —
Changes in working capital:
Trade and other receivables (874,645) (2,773,005) 658,817 (1,534,697) (4,102,105) (1,084,196)
Trade and other payables (1,376,949) 1,956,724 1,710,357 (201,581) (500,342) 1,751,198
(24,281,385) (9,163,556) (3,901,983) (7,297,360) (6,720,043) (1,673,549)
19. ACQUISITION OF ASSETS THROUGH PURCHASE OF SUBSIDIARIES
Group Company
2011 2010 2009 2011 2010 2009
R R R R R R
Net assets acquired
Intangible assets 24,999,593 — — — — —
Cash 507 100 — — — —
25,000,100 100 — — — —
Satisfied by
Cash (100) (100) — — — —
Equity — 5,000,000 ordinary
shares (25,000,000) — — — — —
(25,000,100) (100) — — — —
Net cash outflow on acquisition
Cash consideration paid (100) (100) — (100) (100) —
Cash acquired 507 100 — — — —
407 — — (100) (100) —
APPENDIX II FINANCIAL INFORMATION OF THE TAUNG GROUP
– II-31 –
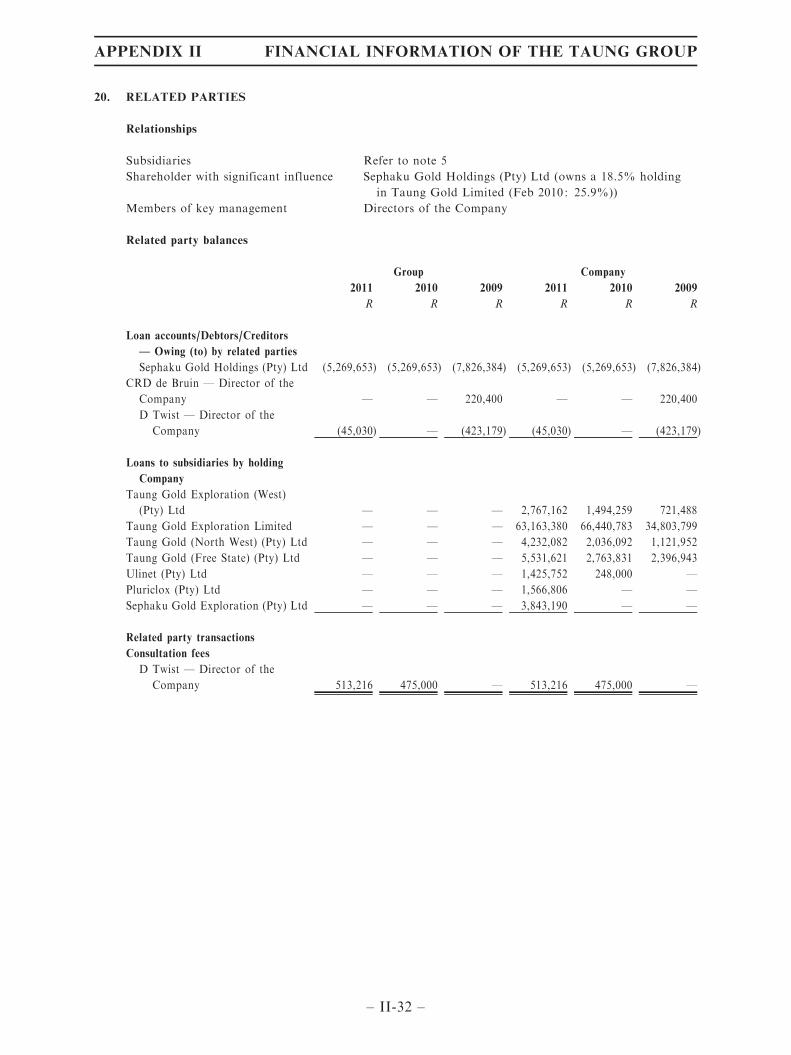
20. RELATED PARTIES
Relationships
Subsidiaries Refer to note 5
Shareholder with significant influence Sephaku Gold Holdings (Pty) Ltd (owns a 18.5% holding
in Taung Gold Limited (Feb 2010 : 25.9%))
Members of key management Directors of the Company
Related party balances
Group Company
2011 2010 2009 2011 2010 2009
R R R R R R
Loan accounts/Debtors/Creditors
— Owing (to) by related parties
Sephaku Gold Holdings (Pty) Ltd (5,269,653) (5,269,653) (7,826,384) (5,269,653) (5,269,653) (7,826,384)
CRD de Bruin — Director of the
Company — — 220,400 — — 220,400
D Twist — Director of the
Company (45,030) — (423,179) (45,030) — (423,179)
Loans to subsidiaries by holding
Company
Taung Gold Exploration (West)
(Pty) Ltd — — — 2,767,162 1,494,259 721,488
Taung Gold Exploration Limited — — — 63,163,380 66,440,783 34,803,799
Taung Gold (North West) (Pty) Ltd — — — 4,232,082 2,036,092 1,121,952
Taung Gold (Free State) (Pty) Ltd — — — 5,531,621 2,763,831 2,396,943
Ulinet (Pty) Ltd — — — 1,425,752 248,000 —
Pluriclox (Pty) Ltd — — — 1,566,806 — —
Sephaku Gold Exploration (Pty) Ltd — — — 3,843,190 — —
Related party transactions
Consultation fees
D Twist — Director of the
Company 513,216 475,000 — 513,216 475,000 —
APPENDIX II FINANCIAL INFORMATION OF THE TAUNG GROUP
– II-32 –

21. DIRECTORS’ EMOLUMENTS
The amounts below comprise of the gross remuneration paid to directors of the Company. Remuneration
directly attributable to exploration expenses have been capitalised against the relevant projects. Remuneration
paid to non-executive directors comprises amounts charged to the Company relating to the allocation of the
directors remuneration on a time basis, paid by other entities. Costs allocated to non-group entities comprise
costs allocated on a time basis to entities not part of the Group.
Executive
2011 Remuneration
Allocated to
non-group
entities*
Charged by
non-group
entities**
Gain on
exercise of
options Total
In connection with the affairs
of the Company or its
subsidiaries 5,513,136 1,016,540 118,616 — 6,648,292
Salary Bonus Options
Expenses and
allowances Total
SH Rosser 537,417 44,660 20,850 — 602,927
SD Steyn 1,154,386 96,074 58,086 — 1,308,546
D Twist — 42,768 75,550 — 118,318
D Strydom 1,130,217 104,060 107,300 120,000 1,461,577
CRD de Bruin 1,042,126 287,822 109,337 163,754 1,603,039
NA Herrick 1,294,332 97,222 126,500 35,831 1,553,885
5,158,478 672,606 497,623 319,585 6,648,292
2010 Remuneration
Allocated to
non-group
entities*
Charged by
non-group
entities**
Gain on
exercise of
options Total
In connection with the affairs
of the Company or its
subsidiaries 2,195,070 435,203 324,453 — 2,954,726
Salary Bonus Options
Expenses and
allowances Total
SH Rosser 258,105 21,384 — — 279,489
SD Steyn 989,577 87,340 — 60,000 1,136,917
D Twist — 39,333 — — 39,333
D Strydom 1,015,200 39,334 — 120,000 1,174,534
CRD de Bruin 324,453 — — — 324,453
2,587,335 187,391 — 180,000 2,954,726
APPENDIX II FINANCIAL INFORMATION OF THE TAUNG GROUP
– II-33 –

2009 Remuneration
Allocated to
non-group
entities*
Charged by
non-group
entities**
Gain on
exercise of
options Total
In connection with the affairs
of the Company or its
subsidiaries 403,593 91,779 558,827 — 1,054,199
Salary Bonus Options
Expenses and
allowances Total
SH Rosser 234,657 20,572 — 19,432 274,661
JH de Bruin 132,721 — — 2,736 135,457
SD Steyn 80,254 — — 5,000 85,254
D Strydom 260,834 — — — 260,834
CRD de Bruin 297,993 — — — 297,993
1,006,459 20,572 — 27,168 1,054,199
Non-executive
2011 Remuneration
Allocated to
non-group
entities*
Charged by
non-group
entities**
Gain on
exercise of
options Total
In connection with the affairs
of the Company or its
subsidiaries 161,998 — 292,443 — 454,441
Salary Bonus Options
Expenses and
allowances Total
L Mohuba 292,443 30,323 24,925 — 347,691
DL Kyle — — 10,500 — 10,500
MF DeGuire — — 48,125 — 48,125
I Levental — — 48,125 — 48,125
292,443 30,323 131,675 — 454,441
APPENDIX II FINANCIAL INFORMATION OF THE TAUNG GROUP
– II-34 –

2010 Remuneration
Allocated to
non-group
entities*
Charged by
non-group
entities**
Gain on
exercise of
options Total
In connection with the affairs
of the Company or its
subsidiaries — — 264,250 — 264,250
Salary Bonus Options
Expenses and
allowances Total
L Mohuba 264,250 — — — 264,250
2009 Remuneration
Allocated to
non-group
entities*
Charged by
non-group
entities**
Gain on
exercise of
options Total
In connection with the affairs
of the Company or its
subsidiaries 13,667 — 280,604 — 294,271
Salary Bonus Options
Expenses and
allowances Total
L Mohuba 175,826 13,667 — — 189,493
NR Crafford-Lazarus 104,778 — — — 104,778
280,604 13,667 — — 294,271
* Represents amounts allocated to other companies outside the Taung group on a time basis.
** Represents costs paid by Sephaku Management and allocated to Taung on a time basis.
22. EMPLOYEE’S EMOLUMENTS
Of the five individuals with the highest emoluments in the Group, three (2010 : two; 2009 : none) are
directors of the Company whose emoluments are included in the above disclosures. The amount for the
remaining individuals are disclosed below.
2011 2010 2009
Salaries and other benefits 3,754,654 3,027,404 3,899,728
Bonuses 326,073 254,076 373,560
Options 293,849 — —
4,374,576 3,281,480 4,273,288
APPENDIX II FINANCIAL INFORMATION OF THE TAUNG GROUP
– II-35 –

Their emoluments are within the following bands:
Number of employees
2011 2010 2009
RNil to R1,000,000 — 1 4
R1,000,000 to R1,500,000 2 2 1
23. RISK MANAGEMENT
Capital risk management
The Group’s and Company’s objectives when managing capital are to safeguard the Group’s and
Company’s ability to continue as a going concern in order to provide returns for shareholders and benefits
for other stakeholders. The further exploration and development of the exploration assets will require
additional capital. The continuing development of the Group’s and the Company’s mineral resources and
reserves will depend on the ability of directors to raise additional funds.
The capital structure of the Company and the Group consists of cash and cash equivalents disclosed
in note 10, and equity as disclosed in the statement of financial position.
The Company’s and the Group’s capital management objective is to achieve an optimal weighted
average cost of capital while continuing to safeguard the Company’s ability to meet its liquidity
requirements (including its commitments in respect of capital expenditure).
There are no externally imposed capital requirements.
Liquidity risk
The Group’s and the Company’s risk to liquidity is a result of the funds available to cover future
commitments. The Company and the Group manage liquidity risk through an ongoing review of future
commitments and credit facilities.
Cash flow forecasts are prepared and adequate utilised borrowing facilities are monitored.
APPENDIX II FINANCIAL INFORMATION OF THE TAUNG GROUP
– II-36 –
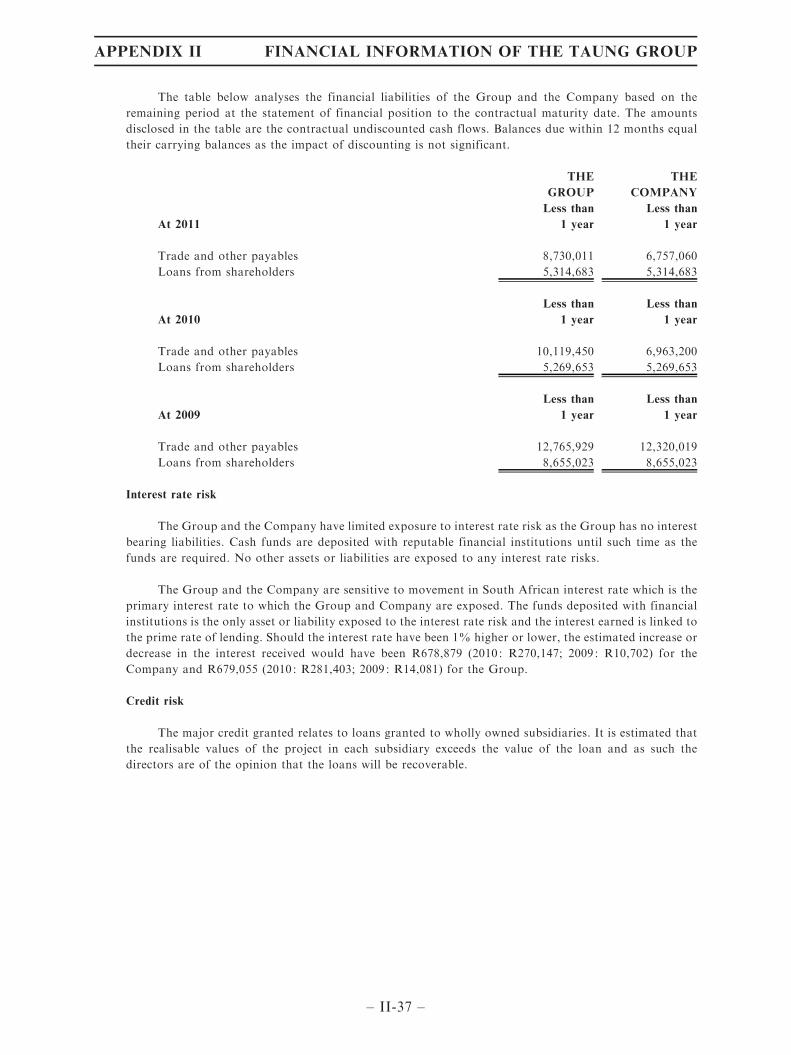
The table below analyses the financial liabilities of the Group and the Company based on the
remaining period at the statement of financial position to the contractual maturity date. The amounts
disclosed in the table are the contractual undiscounted cash flows. Balances due within 12 months equal
their carrying balances as the impact of discounting is not significant.
THE
GROUP
THE
COMPANY
At 2011
Less than
1 year
Less than
1 year
Trade and other payables 8,730,011 6,757,060
Loans from shareholders 5,314,683 5,314,683
At 2010
Less than
1 year
Less than
1 year
Trade and other payables 10,119,450 6,963,200
Loans from shareholders 5,269,653 5,269,653
At 2009
Less than
1 year
Less than
1 year
Trade and other payables 12,765,929 12,320,019
Loans from shareholders 8,655,023 8,655,023
Interest rate risk
The Group and the Company have limited exposure to interest rate risk as the Group has no interest
bearing liabilities. Cash funds are deposited with reputable financial institutions until such time as the
funds are required. No other assets or liabilities are exposed to any interest rate risks.
The Group and the Company are sensitive to movement in South African interest rate which is the
primary interest rate to which the Group and Company are exposed. The funds deposited with financial
institutions is the only asset or liability exposed to the interest rate risk and the interest earned is linked to
the prime rate of lending. Should the interest rate have been 1% higher or lower, the estimated increase or
decrease in the interest received would have been R678,879 (2010 : R270,147; 2009 : R10,702) for the
Company and R679,055 (2010 : R281,403; 2009 : R14,081) for the Group.
Credit risk
The major credit granted relates to loans granted to wholly owned subsidiaries. It is estimated that
the realisable values of the project in each subsidiary exceeds the value of the loan and as such the
directors are of the opinion that the loans will be recoverable.
APPENDIX II FINANCIAL INFORMATION OF THE TAUNG GROUP
– II-37 –
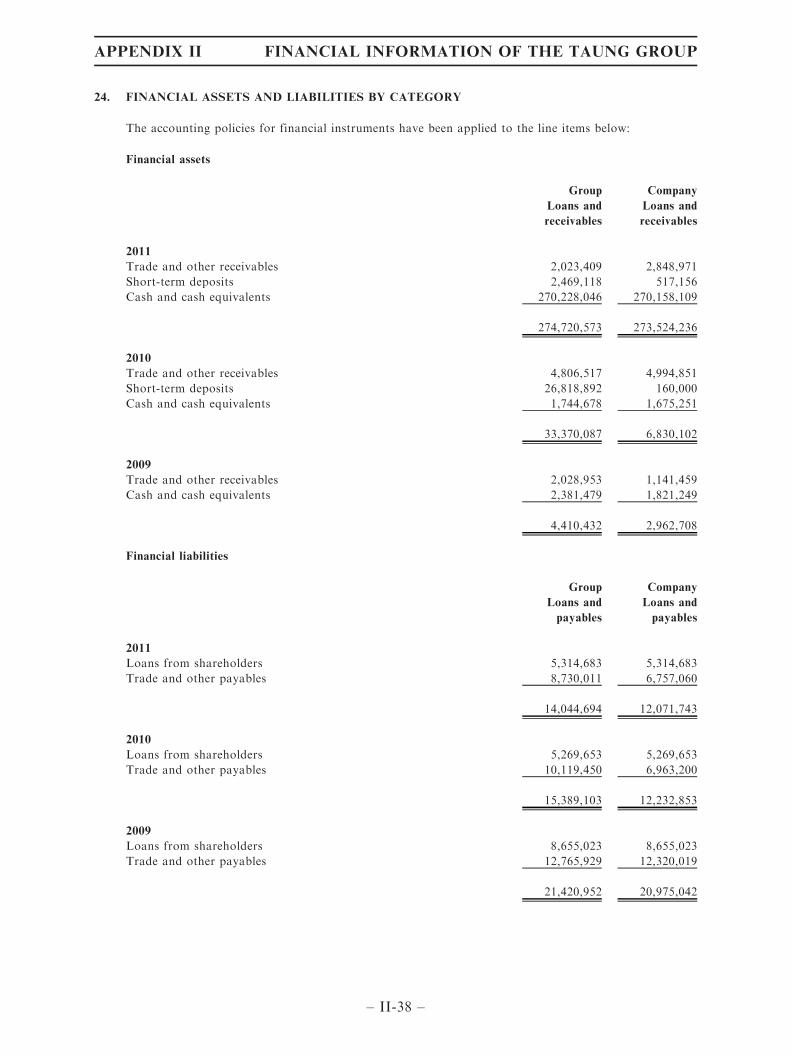
24. FINANCIAL ASSETS AND LIABILITIES BY CATEGORY
The accounting policies for financial instruments have been applied to the line items below:
Financial assets
Group
Loans and
receivables
Company
Loans and
receivables
2011
Trade and other receivables 2,023,409 2,848,971
Short-term deposits 2,469,118 517,156
Cash and cash equivalents 270,228,046 270,158,109
274,720,573 273,524,236
2010
Trade and other receivables 4,806,517 4,994,851
Short-term deposits 26,818,892 160,000
Cash and cash equivalents 1,744,678 1,675,251
33,370,087 6,830,102
2009
Trade and other receivables 2,028,953 1,141,459
Cash and cash equivalents 2,381,479 1,821,249
4,410,432 2,962,708
Financial liabilities
Group
Loans and
payables
Company
Loans and
payables
2011
Loans from shareholders 5,314,683 5,314,683
Trade and other payables 8,730,011 6,757,060
14,044,694 12,071,743
2010
Loans from shareholders 5,269,653 5,269,653
Trade and other payables 10,119,450 6,963,200
15,389,103 12,232,853
2009
Loans from shareholders 8,655,023 8,655,023
Trade and other payables 12,765,929 12,320,019
21,420,952 20,975,042
APPENDIX II FINANCIAL INFORMATION OF THE TAUNG GROUP
– II-38 –

25. EARNINGS/(LOSS) PER SHARE
No earnings/(loss) per share information is presented as its inclusion, for the purpose of this report, is not
considered meaningful.
26. CRITICAL ACCOUNTING ESTIMATES AND JUDGEMENTS
In preparing the Group financial statements, management is required to make estimates and assumptions
that affect the amounts represented in the Group financial statements and related disclosures. Use of available
information and the application of judgement is inherent in the formation of estimates. Actual results in the
future could differ from these estimates which may be material to the Group financial statements. Significant
judgements include:
Critical accounting estimates and assumptions
Impairment testing
The Group reviews and tests the carrying value of assets when events or changes in circumstances
suggest that the carrying amount may not be recoverable. Assets are grouped at the lowest level for which
identifiable cash flows are largely independent of cash flows of other assets and liabilities. If there are
indications that impairment may have occurred, estimates are prepared of expected future cash flows for
each group of assets. Expected future cash flows used to determine the value in use of intangible assets are
inherently uncertain and could materially change over time.
Taxation
Judgement is required in determining the provision for income taxes due to the complexity of
legislation. There are many transactions and calculations for which the ultimate tax determination is
uncertain during the ordinary course of business. The Group recognises liabilities for anticipated tax audit
issues based on estimates of whether additional taxes will be due. Where the final tax outcome of these
matters is different from the amounts that were initially recorded, such differences will impact the income
tax and deferred tax provisions in the period in which such determination is made.
The Group recognises the net future tax benefit related to deferred income tax assets to the extent
that it is probable that the deductible temporary differences will reverse in the foreseeable future.
Assessing the recoverability of deferred income tax assets requires the Group to make significant estimates
related to expectations of future taxable income. Estimates of future taxable income are based on
forecasted cash flows from operations and the application of existing tax laws in each jurisdiction. To the
extent that future cash flows and taxable income differ significantly from estimates, the ability of the
Group to realise the net deferred tax assets recorded at the end of the reporting period could be impacted.
Due to the nature of the potential cash generating units, there is not enough evidence to prove that it will
be probable that taxable profits will be generated against which the deductible temporary differences can
be utilised. Due to the fact that it is not probable that the deductible temporary differences will reverse in
the foreseeable future, no provision for a deferred tax asset was made by any of the Companies within the
Group.
Critical judgements in applying the entities accounting policies
Exploration expenses capitalised
Exploration and evaluation expenses are those expenses incurred in connection with acquisition of
rights to explore, investigate, examine and evaluate an area of mineralization including related overhead
costs. The directors exercise judgment to determine if the costs associated with a specific project must be
capitalised against the specific project or written off.
APPENDIX II FINANCIAL INFORMATION OF THE TAUNG GROUP
– II-39 –
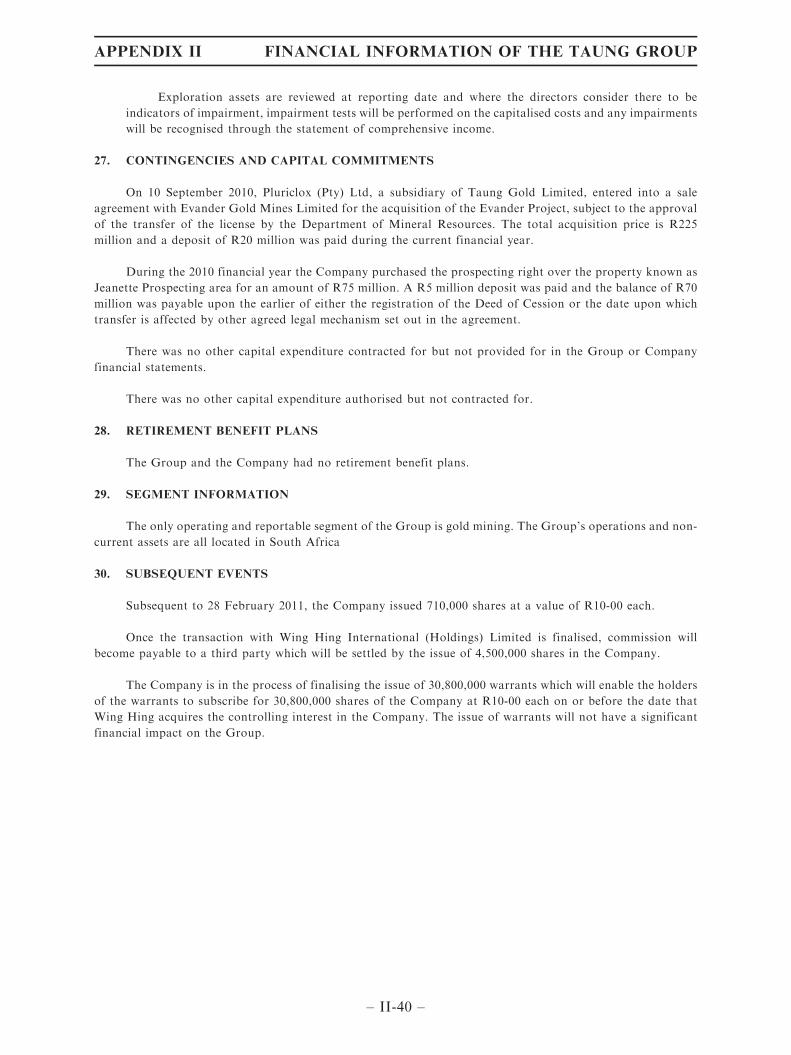
Exploration assets are reviewed at reporting date and where the directors consider there to be
indicators of impairment, impairment tests will be performed on the capitalised costs and any impairments
will be recognised through the statement of comprehensive income.
27. CONTINGENCIES AND CAPITAL COMMITMENTS
On 10 September 2010, Pluriclox (Pty) Ltd, a subsidiary of Taung Gold Limited, entered into a sale
agreement with Evander Gold Mines Limited for the acquisition of the Evander Project, subject to the approval
of the transfer of the license by the Department of Mineral Resources. The total acquisition price is R225
million and a deposit of R20 million was paid during the current financial year.
During the 2010 financial year the Company purchased the prospecting right over the property known as
Jeanette Prospecting area for an amount of R75 million. A R5 million deposit was paid and the balance of R70
million was payable upon the earlier of either the registration of the Deed of Cession or the date upon which
transfer is affected by other agreed legal mechanism set out in the agreement.
There was no other capital expenditure contracted for but not provided for in the Group or Company
financial statements.
There was no other capital expenditure authorised but not contracted for.
28. RETIREMENT BENEFIT PLANS
The Group and the Company had no retirement benefit plans.
29. SEGMENT INFORMATION
The only operating and reportable segment of the Group is gold mining. The Group’s operations and non-
current assets are all located in South Africa
30. SUBSEQUENT EVENTS
Subsequent to 28 February 2011, the Company issued 710,000 shares at a value of R10-00 each.
Once the transaction with Wing Hing International (Holdings) Limited is finalised, commission will
become payable to a third party which will be settled by the issue of 4,500,000 shares in the Company.
The Company is in the process of finalising the issue of 30,800,000 warrants which will enable the holders
of the warrants to subscribe for 30,800,000 shares of the Company at R10-00 each on or before the date that
Wing Hing acquires the controlling interest in the Company. The issue of warrants will not have a significant
financial impact on the Group.
APPENDIX II FINANCIAL INFORMATION OF THE TAUNG GROUP
– II-40 –

3. SUBSEQUENT FINANCIAL STATEMENTS
No audited financial statements have been prepared by the Company and the Group
subsequent to 28 February 2011.
Deloitte & Touche
Registered Auditors
Per BG Joubert
Johannesburg
South Africa
28 July 2011
APPENDIX II FINANCIAL INFORMATION OF THE TAUNG GROUP
– II-41 –
A. UNAUDITED PRO FORMA FINANCIAL INFORMATION OF THE ENLARGED
GROUP
Unaudited Pro Forma Consolidated Statement of Financial Position
The unaudited pro forma consolidated statement of financial position of the Enlarged
Group (the ‘‘Unaudited Pro Forma Consolidated Statement of Financial Position’’) has
been prepared in accordance with Rule 4.29 of the Listing Rules for the purpose of
illustrating the effects of the Acquisition as if the Acquisition had been completed at the
date reported on (i.e. 31 March 2011).
The Unaudited Pro Forma Consolidated Statement of Financial Position is based on
the consolidated statement of financial position of the Wing Hing Group at 31 March 2011
(as extracted from Wing Hing’s annual report for the year ended 31 March 2011) and the
audited consolidated statement of financial position of Taung Gold at 28 February 2011 (as
extracted from the financial information of Taung Gold as shown in Appendix II), after
making pro forma adjustments relating to the Acquisition that are (i) directly attributable
to the transaction concerned and not relating to future events or decisions; and (ii) factually
supportable.
The Unaudited Pro Forma Consolidated Statement of Financial Position should be
read in conjunction with the historical financial information of the Wing Hing Group and
other financial information included elsewhere in this circular. The Unaudited Pro Forma
Consolidated Statement of Financial Position does not take account of any trading or other
transactions subsequent to the date of the financial statements included in the Unaudited
Pro Forma Consolidated Statement of Financial Position.
The Unaudited Pro Forma Consolidated Statement of Financial Position has been
prepared by the Directors for illustrative purposes only and because of its hypothetical
nature, it may not give a true picture of the financial position of the Wing Hing Group at 31
March 2011 or any future date.
APPENDIX III UNAUDITED PRO FORMA FINANCIAL INFORMATIONOF THE ENLARGED GROUP
– III-1 –

WingHing
Group
TaungGold
TaungGold
Aggregated
Pro
form
a
adjustment
Pro
form
a
adjustment
Pro
form
a
adjustment
Pro
form
a
adjustment
Pro
form
a
adjustment
Pro
form
a
adjustment
Pro
form
a
adjustment
Pro
form
a
adjustment
Pro
form
a
Enlarged
Groupupon
First
Completion
Pro
form
a
adjustment
Pro
form
a
Enlarged
Groupupon
Electrum
Completion
Asat
31-M
ar-11
Asat
28-Feb-11
Asat
28-Feb-11
HK$’000
ZAR
HK$’000
HK$’000
HK$’000
HK$’000
HK$’000
HK$’000
HK$’000
HK$’000
HK$’000
HK$’000
HK$’000
HK$’000
HK$’000
Note
1Note
2Note
3Note
4Note
5(i)
Note
5(ii)
Note
5(iii)
Note
5(iv)
Note
6Note
7Note
8
Non-currentassets
Property,plantandeq
uipmen
t12,924
2,373,725
2,579
15,503
15,503
15,503
Goodwill
——
——
2,588,740
304,662
465,083
671,858
(2,932,884)
(1,097,459)
——
Intangible
assets
281,120
——
281,120
281,120
281,120
Intangible
assets—
Computer
software
—398,017
433
433
433
433
Intangible
assets—
Explorationassets
—193,058,564
209,796
209,796
4,509,204
4,719,000
4,719,000
Dep
osits
—21,340,350
23,191
23,191
23,191
23,191
Prepaymen
ts1,410
——
1,410
1,410
1,410
295,454
217,170,656
235,999
531,453
5,040,657
5,040,657
Currentassets
Inven
tories
15
——
15
15
15
Tradeandother
receivables
48,412
2,023,409
2,199
50,611
50,611
50,611
Pledged
bankdep
osits
5,921
——
5,921
5,921
5,921
Short-term
dep
osits
—2,469,118
2,683
2,683
2,683
2,683
Cash
andbankbalances
156,069
270,228,046
293,657
449,726
(24,000)
425,726
425,726
210,417
274,720,573
298,539
508,956
484,956
484,956
Assetsclassifiedasheldforsale
87,360
——
87,360
87,360
87,360
297,777
274,720,573
298,539
596,316
572,316
572,316
Currentliabilities
Loansfrom
shareholders
—5,314,683
5,776
5,776
5,776
5,776
Tradeandother
payables
30,757
8,730,011
9,487
40,244
40,244
40,244
Curren
ttaxliabilities
2,944
——
2,944
2,944
2,944
33,701
14,044,694
15,263
48,964
48,964
48,964
Non-currentliabilities
Deferredtaxliabilities
26,265
——
26,265
1,262,577
1,288,842
1,288,842
Provisionforrestorationco
st320
——
320
320
320
26,585
——
26,585
1,289,162
1,289,162
Net
assets
532,945
477,846,535
519,275
1,052,220
4,274,847
4,274,847
Capitalandreserves
Share
capital
21,979
137,542
149
22,128
63,140
7,431
11,343
16,387
(149)
120,280
11,475
131,755
Share
premium
274,183
483,671,643
525,606
799,789
2,525,600
297,231
453,740
655,471
(525,606)
4,206,225
459,010
4,665,235
Other
reserves
162,250
93,225,735
101,308
263,558
(101,308)
162,250
(128,164)
34,086
Accumulatedlosses
(1,011)(99,188,385)
(107,788)
(108,799)
(24,000)
107,788
(1,097,459)
(1,122,470)
(1,122,470)
Equityattributable
toowners
of
WingHing
457,401
477,846,535
519,275
976,676
3,366,285
3,708,606
Non-controllinginterests—
WingHingGroup
75,544
——
75,544
75,544
75,544
Non-controllinginterests—
TaungGold
——
——
833,018
833,018
(342,321)
490,697
Totalequity
532,945
477,846,535
519,275
1,052,220
4,274,847
4,274,847
APPENDIX III UNAUDITED PRO FORMA FINANCIAL INFORMATIONOF THE ENLARGED GROUP
– III-2 –

Notes to the Unaudited Pro Forma Consolidated Statement of Financial Position:
1. The balances have been extracted from the audited consolidated statement of financial position of
the Wing Hing Group at 31 March 2011 as disclosed in the published annual report of Wing Hing
for the year ended 31 March 2011.
2. The adjustments represent the inclusion of the assets, liabilities and equity of Taung Gold, as if the
Acquisition had taken place at the date reported on (i.e. 31 March 2011). The balances have been
extracted from the audited consolidated statement of financial position of Taung Gold at 28
February 2011 as disclosed in Appendix II to this circular. The Directors considered that no
adjustment is necessary to the financial information of Taung Gold (which has been prepared in
accordance with International Financial Reporting Standards) to align with the accounting policies
of Wing Hing which comply with Hong Kong Financial Reporting Standards (‘‘HKFRSs’’) issued
by the Hong Kong Institute of Certified Public Accountants (‘‘HKICPA’’). For the purpose of the
pro forma financial information, the financial information of Taung Gold has been translated into
HK$ at the exchange rate of ZAR1 to HK$1.0867.
3. The adjustments represent payment for estimated acquisition-related costs (including fees to legal
advisers, financial adviser, reporting accountants, valuer, printer and other expenses) of
approximately HK$24,000,000 in cash, which would be expensed in the consolidated statement of
comprehensive income upon completion of the Acquisition in accordance with Hong Kong
Financial Reporting Standard 3 (Revised) ‘‘Business Combinations’’ (‘‘HKFRS 3 (Revised)’’) issued
by the HKICPA.
4. The adjustments represent fair value adjustment on intangible assets of Taung Gold of
approximately HK$4,509,204,000 and the recognition of deferred tax on fair value adjustment at
the South African tax rate of 28%. The estimated fair value of the intangible assets of Taung Gold is
based on a professional valuation conducted by BMI Appraisals Limited which stated that a fair
market value of the 100% interest in the Gold Mines as at 30 April 2011 was US$605,000,000
(equivalent to HK$4,719,000,000).
5. The adjustments represent the settlement of the Consideration for the Acquisition on the First
Completion Date which shall be satisfied by the issue of up to 9,830,106,088 new Wing Hing Shares
at the Issue Price of HK$0.41 each and resulted in the Wing Hing Group holding 77.88% of the
issued capital of Taung Gold, in the following manner:
(i) Wing Hing shall allot and issue to the TG Sellers, the TG Consideration Shares (6,314,000,985
new Wing Hing Shares) credited as fully paid at the Issue Price, as a complete discharge of
Wing Hing’s obligation to pay for the TG Sale Shares.
(ii) Wing Hing shall issue to each of the Other TG Shareholders who has entered into a Deed of
Adherence, the Other Consideration Shares (up to 743,079,165 new Wing Hing Shares)
credited as fully paid at the Issue Price, as a complete discharge of Wing Hing’s obligation to
pay for the Other TG Sale Shares held by such Other TG Shareholders.
(iii) Wing Hing shall issue to GoldCom the GoldCom Consideration Shares (up to 1,134,348,686
new Wing Hing Shares) credited as fully paid at the Issue Price for the Loan Note and delivery
of the Put Option Agreements.
(iv) Wing Hing shall issue to Mandra, the Arctic Consideration Shares (1,638,677,252 new Wing
Hing Shares) credited as fully paid at the Issue Price, as a complete discharge of Wing Hing’s
obligation to pay for the Arctic Sale Shares.
APPENDIX III UNAUDITED PRO FORMA FINANCIAL INFORMATIONOF THE ENLARGED GROUP
– III-3 –

For the purpose of the preparation of the Unaudited Pro Forma Consolidated Statement of
Financial Position, it has been assumed that the Issue Price of new Wing Hing Share approximated
its fair value at the date of exchange.
6. The adjustments reflect:
(i) the estimated goodwill arising from the Acquisition of approximately HK$1,097,459,000;
(ii) elimination of the share capital and pre-acquisition reserves of Taung Gold, as if the
Acquisition had been completed at the date reported on; and
(iii) recognition of 22.12% non-controlling interest of Taung Gold.
For the purpose of the preparation of the Unaudited Pro Forma Consolidated Statement of
Financial Position, it has been assumed that:
(i) the fair value of the identifiable assets and liabilities (except intangible assets and deferred tax)
of Taung Gold as at 28 February 2011 is assumed to be the same as their carrying amounts.
(ii) the estimated goodwill is measured as the excess of the estimated fair value of the
consideration of approximately HK$4,030,343,000 over 77.88% of the adjusted net amount
of identifiable assets and liabilities of Taung Gold, as if the Acquisition had been completed at
the date reported on. The adjusted net amount of identifiable assets and liabilities of Taung
Gold of approximately HK$3,765,902,000 represents the carrying amount of the net assets of
Taung Gold of approximately HK$519,275,000 as at 28 February 2011 as adjusted for the fair
value adjustment on intangible assets of Taung Gold of approximately HK$4,509,204,000 and
the corresponding deferred tax effect of approximately HK$1,262,577,000. The estimated fair
value of the consideration is based on 9,830,106,088 new Wing Hing Shares at the Issue Price
of HK$0.41 each.
(iii) the amount of the 22.12% non-controlling interests of Taung Gold of approximately
HK$833,018,000 has been calculated at 22.12% of the adjusted net amount of identifiable
assets and liabilities of Taung Gold.
Upon First Completion, 77.88% equity interests in Taung Gold would have been exchanged for
Wing Hing’s Shares and become legally held by Wing Hing whilst 22.12% equity interests in Taung
Gold would not be exchanged for Wing Hing’s Shares and would be held by the non-controlling
shareholders.
Since the actual fair value of the consideration shares and the actual fair values of the assets,
liabilities and contingent liabilities of Taung Gold on the date of completion of the Acquisition
would be different from their estimated fair values used in the preparation of the Unaudited Pro
Forma Consolidated Statement of Financial Position presented above, the actual financial position
and amount of goodwill arising from the Acquisition might be materially different from the
estimated amounts shown in this Appendix.
7. The adjustments represent the impairment of goodwill arising from the Acquisition which would be
charged to the consolidated statement of comprehensive income upon completion of the
Acquisition.
For the purpose of the preparation of the Pro Forma Financial Information, the Directors
performed an impairment test of goodwill in accordance with the requirements of Hong Kong
Accounting Standard 36 ‘‘Impairment of Assets’’ (‘‘HKAS 36’’) issued by the HKICPA, resulting in
APPENDIX III UNAUDITED PRO FORMA FINANCIAL INFORMATIONOF THE ENLARGED GROUP
– III-4 –

a full impairment of goodwill arising from the Acquisition immediately upon completion of the
Acquisition. After completion of the Acquisition, in preparation of the consolidated financial
statements of the Group for the next financial year, the Group will perform impairment testing on
the cash-generating unit to which the goodwill has been allocated in accordance with the
requirements of HKAS 36 and adopt the consistent accounting policies and principal assumptions
for the above impairment test of the goodwill arising from the Acquisition. The reporting
accountants (who are also the Company’s auditors for the time being) concurred with the Directors’
assessment of impairment of goodwill in the Pro Forma Financial Information and adoption of
consistent accounting policies and principal assumptions in the preparation of the consolidated
financial statements of the Enlarged Group after completion of the Acquisition.
8. The adjustments reflect the acquisition of an additional of 9.09% equity interests in Taung Gold by
the Wing Hing Group on the Electrum Completion Date, representing:
(i) Electrum exercises its right to sell the Electrum Option Shares to Wing Hing, Wing Hing shall
issue the Electrum Consideration Shares (up to 1,147,523,915 new Wing Hing Shares) on the
Electrum Completion Date to Electrum as a complete discharge of Wing Hing’s obligation to
pay for the Electrum Option Shares;
(ii) the adjustment to non-controlling interests amounting to approximately HK$342,321,000; and
(iii) the recognition of other reserves amounting to approximately HK$128,164,000 being the
difference between the estimated fair value of the Electrum Consideration Shares amounting
to approximately HK$470,485,000 and adjustment to non-controlling interests amounting to
approximately HK$342,321,000.
Upon Electrum Completion, 86.97% equity interests in Taung Gold would have been exchanged for
Wing Hing’s Shares and become legally held by Wing Hing whilst 13.03% equity interests in Taung
Gold would not be exchanged for Wing Hing’s Shares and would be held by the non-controlling
shareholders. Therefore, the non-controlling interest upon Electrum Completion would be 13.03%.
Accordingly, a pro forma adjustment of approximately HK$342,321,000 is made to adjust the non-
controlling interest from 22.12% to 13.03% of the adjusted net amount of identifiable assets and
liabilities of Taung Gold (i.e. HK$490,697,000 or 13.03% of HK$3,765,902,000).
APPENDIX III UNAUDITED PRO FORMA FINANCIAL INFORMATIONOF THE ENLARGED GROUP
– III-5 –

Unaudited Pro Forma Consolidated Statement of Comprehensive Income
The unaudited pro forma consolidated statement of comprehensive income of the
Enlarged Group (the ‘‘Unaudited Pro Forma Consolidated Statement of Comprehensive
Income’’) has been prepared in accordance with Rule 4.29 of the Listing Rules for the
purpose of illustrating the effects of the Acquisition as if the Acquisition had been
completed at the commencement of the period being reported on (i.e. 1 April 2010).
The Unaudited Pro Forma Consolidated Statement of Comprehensive Income is based
on the audited consolidated statement of comprehensive income of the Wing Hing Group
for the year ended 31 March 2011 (as extracted from Wing Hing’s annual report for the year
ended 31 March 2011) and the audited consolidated statement of comprehensive income of
Taung Gold for the year ended 28 February 2011 (as extracted from the financial
information of Taung Gold as shown in Appendix II), after making pro forma adjustments
relating to the Acquisition that are (i) directly attributable to the transaction concerned and
not relating to future events or decisions; and (ii) factually supportable.
The Unaudited Pro Forma Consolidated Statement of Comprehensive Income should
be read in conjunction with the historical financial information of the Wing Hing Group
and other financial information included elsewhere in this circular. The Unaudited Pro
Forma Consolidated Statement of Comprehensive Income does not take account of any
trading or other transactions subsequent to the date of the financial statements included in
the Unaudited Pro Forma Consolidated Statement of Comprehensive Income.
APPENDIX III UNAUDITED PRO FORMA FINANCIAL INFORMATIONOF THE ENLARGED GROUP
– III-6 –

The Unaudited Pro Forma Consolidated Statement of Comprehensive Income has
been prepared by the Directors for illustrative purposes only and because of its hypothetical
nature, it may not give a true picture of the results of the Wing Hing Group for the year
ended 31 March 2011 or for any future period.
Wing Hing
Group Taung Gold Taung Gold Aggregated
Pro forma
adjustment
Pro forma
adjustment
Pro forma
Enlarged
Group upon
First
Completion
Pro forma
adjustment
Pro forma
Enlarged
Group upon
Electrum
Completion
Year ended
31-Mar-11
Year ended
28-Feb-11
Year ended
28-Feb-11
HK$’000 ZAR HK$’000 HK$’000 HK$’000 HK$’000 HK$’000 HK$’000 HK$’000
Note 9 Note 10 Note 11 Note 12 Note 13
Revenue 43,905 — — 43,905 43,905 43,905
Cost of sales (35,426) — — (35,426) (35,426) (35,426)
Gross profit 8,479 — — 8,479 8,479 8,479
Other income 224 6,742,923 7,328 7,552 7,552 7,552
Administrative and operating expenses (32,266) (88,118,810) (95,759) (128,025) (128,025) (128,025)
Payment for acquisition-related costs — — — — (24,000) (24,000) (24,000)
Impairment of goodwill arising from the
Acquisition — — — — (1,097,459) (1,097,459) (1,097,459)
Finance costs (408) (428) — (408) (408) (408)
Loss before tax (23,971) (81,376,315) (88,431) (112,402) (1,233,861) (1,233,861)
Income tax expense (162) — — (162) (162) (162)
Loss for the year (24,133) (81,376,315) (88,431) (112,564) (1,234,023) (1,234,023)
Other comprehensive income, net of
income tax
Exchange differences on translating
foreign operation 16,725 — — 16,725 16,725 16,725
Total comprehensive expense for the
year (7,408) (81,376,315) (88,431) (95,839) (1,217,298) (1,217,298)
Notes to the Unaudited Pro Forma Consolidated Statement of Comprehensive Income:
9. The balances have been extracted from the audited consolidated statement of comprehensive income
of the Wing Hing Group for the year ended 31 March 2011 as disclosed in the published annual
report of Wing Hing for the year ended 31 March 2011.
10. The adjustments represent the inclusion of items of comprehensive income of Taung Gold, as if the
Acquisition had taken place at the commencement of the period being reported on (i.e. 1 April
2010). The balances have been extracted from the audited consolidated statement of comprehensive
income of Taung Gold for the year ended 28 February 2011 as disclosed in Appendix II to this
circular. The Directors considered that no adjustment is necessary to the financial information of
Taung Gold (which has been prepared in accordance with International Financial Reporting
Standards) to align with the accounting policies of Wing Hing which comply with HKFRSs. For the
purpose of the pro forma financial information, the financial information of Taung Gold has been
translated into HK$ at the exchange rate of ZAR1 to HK$1.0867.
11. The adjustments represent payment for estimated acquisition-related costs of approximately
HK$24,000,000 in cash, which would be expensed in the consolidated statement of comprehensive
income upon completion of the Acquisition in accordance with HKFRS 3 (Revised). This
adjustment is not expected to have a continuing effect on the Enlarged Group.
APPENDIX III UNAUDITED PRO FORMA FINANCIAL INFORMATIONOF THE ENLARGED GROUP
– III-7 –

12. The adjustments represent the impairment of goodwill arising from the Acquisition which would be
charged to the consolidated statement of comprehensive income upon completion of the
Acquisition, further details of which are set out in Note 7 above. The basis of calculation of the
goodwill is set out in Note 6 above. This adjustment is not expected to have a continuing effect on
the Enlarged Group.
13. As explained in Notes 6 and 8 above, the non-controlling interest upon First Completion would be
22.12%. Upon Electrum Completion, the non-controlling interest would be reduced from 22.12% to
13.03%. The aforesaid reduction in non-controlling interest is not expected to have any effect on the
Unaudited Pro Forma Consolidated Statement of Comprehensive Income and accordingly, no pro
forma adjustment has been made.
Unaudited Pro Forma Consolidated Statement of Cash Flows
The unaudited pro forma consolidated statement of cash flows of the Enlarged Group
(the ‘‘Unaudited Pro Forma Consolidated Statement of Cash Flows’’) has been prepared in
accordance with Rule 4.29 of the Listing Rules for the purpose of illustrating the effects of
the Acquisition as if the Acquisition had been completed at the commencement of the
period being reported on (i.e. 1 April 2010).
The Unaudited Pro Forma Consolidated Statement of Cash Flows is based on the
audited consolidated statement of cash flows of the Wing Hing Group for the year ended 31
March 2011 (as extracted from Wing Hing’s annual report for the year ended 31 March
2011) and the audited consolidated statement of cash flows of Taung Gold for the year
ended 28 February 2011 (as extracted from the financial information of Taung Gold as
shown in Appendix II), after making pro forma adjustments relating to the Acquisition that
are (i) directly attributable to the transaction concerned and not relating to future events or
decisions; and (ii) factually supportable.
The Unaudited Pro Forma Consolidated Statement of Cash Flows should be read in
conjunction with the historical financial information of the Wing Hing Group and other
financial information included elsewhere in this circular. The Unaudited Pro Forma
Consolidated Statement of Cash Flows does not take account of any trading or other
transactions subsequent to the date of the financial statements included in the Unaudited
Pro Forma Consolidated Statement of Cash Flows.
The Unaudited Pro Forma Consolidated Statement of Cash Flows has been prepared
by the Directors for illustrative purposes only and because of its hypothetical nature, it may
not give a true picture of the cash flows of the Wing Hing Group for the year ended 31
March 2011 or for any future period.
APPENDIX III UNAUDITED PRO FORMA FINANCIAL INFORMATIONOF THE ENLARGED GROUP
– III-8 –
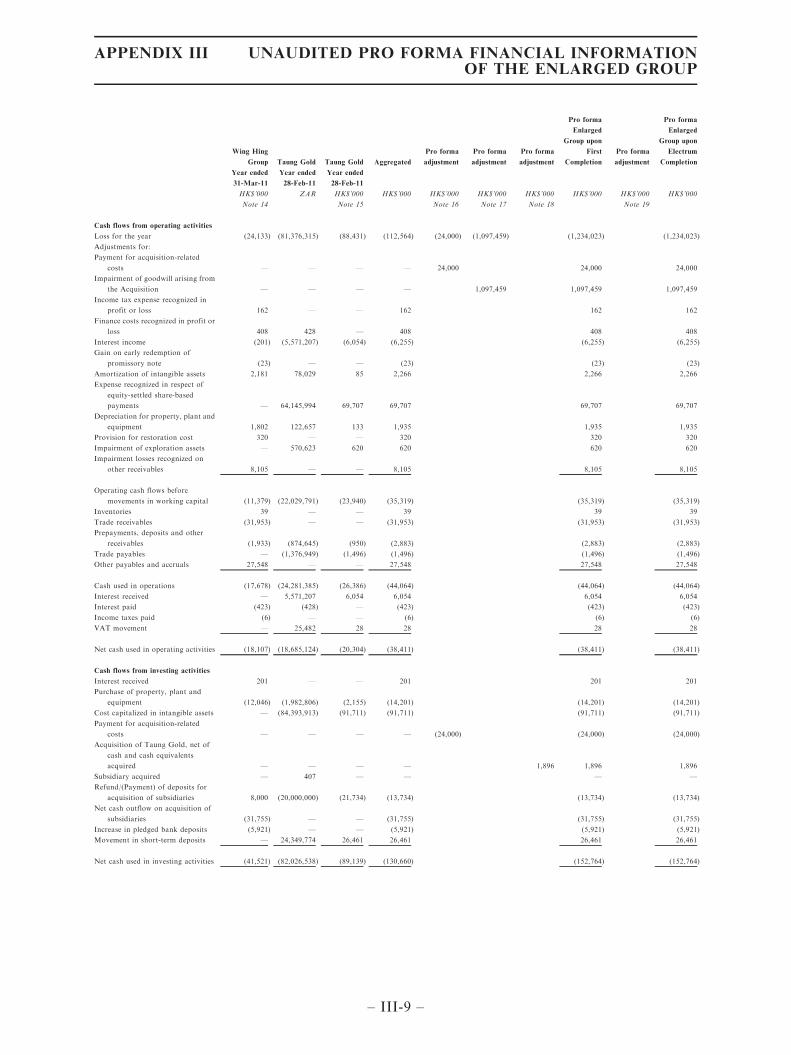
Wing Hing
Group Taung Gold Taung Gold Aggregated
Pro forma
adjustment
Pro forma
adjustment
Pro forma
adjustment
Pro forma
Enlarged
Group upon
First
Completion
Pro forma
adjustment
Pro forma
Enlarged
Group upon
Electrum
Completion
Year ended
31-Mar-11
Year ended
28-Feb-11
Year ended
28-Feb-11
HK$’000 ZAR HK$’000 HK$’000 HK$’000 HK$’000 HK$’000 HK$’000 HK$’000 HK$’000
Note 14 Note 15 Note 16 Note 17 Note 18 Note 19
Cash flows from operating activities
Loss for the year (24,133) (81,376,315) (88,431) (112,564) (24,000) (1,097,459) (1,234,023) (1,234,023)
Adjustments for:
Payment for acquisition-related
costs — — — — 24,000 24,000 24,000
Impairment of goodwill arising from
the Acquisition — — — — 1,097,459 1,097,459 1,097,459
Income tax expense recognized in
profit or loss 162 — — 162 162 162
Finance costs recognized in profit or
loss 408 428 — 408 408 408
Interest income (201) (5,571,207) (6,054) (6,255) (6,255) (6,255)
Gain on early redemption of
promissory note (23) — — (23) (23) (23)
Amortization of intangible assets 2,181 78,029 85 2,266 2,266 2,266
Expense recognized in respect of
equity-settled share-based
payments — 64,145,994 69,707 69,707 69,707 69,707
Depreciation for property, plant and
equipment 1,802 122,657 133 1,935 1,935 1,935
Provision for restoration cost 320 — — 320 320 320
Impairment of exploration assets — 570,623 620 620 620 620
Impairment losses recognized on
other receivables 8,105 — — 8,105 8,105 8,105
Operating cash flows before
movements in working capital (11,379) (22,029,791) (23,940) (35,319) (35,319) (35,319)
Inventories 39 — — 39 39 39
Trade receivables (31,953) — — (31,953) (31,953) (31,953)
Prepayments, deposits and other
receivables (1,933) (874,645) (950) (2,883) (2,883) (2,883)
Trade payables — (1,376,949) (1,496) (1,496) (1,496) (1,496)
Other payables and accruals 27,548 — — 27,548 27,548 27,548
Cash used in operations (17,678) (24,281,385) (26,386) (44,064) (44,064) (44,064)
Interest received — 5,571,207 6,054 6,054 6,054 6,054
Interest paid (423) (428) — (423) (423) (423)
Income taxes paid (6) — — (6) (6) (6)
VAT movement — 25,482 28 28 28 28
Net cash used in operating activities (18,107) (18,685,124) (20,304) (38,411) (38,411) (38,411)
Cash flows from investing activities
Interest received 201 — — 201 201 201
Purchase of property, plant and
equipment (12,046) (1,982,806) (2,155) (14,201) (14,201) (14,201)
Cost capitalized in intangible assets — (84,393,913) (91,711) (91,711) (91,711) (91,711)
Payment for acquisition-related
costs — — — — (24,000) (24,000) (24,000)
Acquisition of Taung Gold, net of
cash and cash equivalents
acquired — — — — 1,896 1,896 1,896
Subsidiary acquired — 407 — — — —
Refund/(Payment) of deposits for
acquisition of subsidiaries 8,000 (20,000,000) (21,734) (13,734) (13,734) (13,734)
Net cash outflow on acquisition of
subsidiaries (31,755) — — (31,755) (31,755) (31,755)
Increase in pledged bank deposits (5,921) — — (5,921) (5,921) (5,921)
Movement in short-term deposits — 24,349,774 26,461 26,461 26,461 26,461
Net cash used in investing activities (41,521) (82,026,538) (89,139) (130,660) (152,764) (152,764)
APPENDIX III UNAUDITED PRO FORMA FINANCIAL INFORMATIONOF THE ENLARGED GROUP
– III-9 –

Wing Hing
Group Taung Gold Taung Gold Aggregated
Pro forma
adjustment
Pro forma
adjustment
Pro forma
adjustment
Pro forma
Enlarged
Group upon
First
Completion
Pro forma
adjustment
Pro forma
Enlarged
Group upon
Electrum
Completion
Year ended
31-Mar-11
Year ended
28-Feb-11
Year ended
28-Feb-11
HK$’000 ZAR HK$’000 HK$’000 HK$’000 HK$’000 HK$’000 HK$’000 HK$’000 HK$’000
Note 14 Note 15 Note 16 Note 17 Note 18 Note 19
Cash flows from financing activities
Proceeds from issue of ordinary
shares 178,400 369,150,000 401,155 579,555 579,555 579,555
Share issue expenses (3,371) — — (3,371) (3,371) (3,371)
Proceeds from shareholders loan — 45,030 49 49 49 49
Repayment of promissory note (30,000) — — (30,000) (30,000) (30,000)
Proceeds from exercise of options 9,041 — — 9,041 9,041 9,041
Proceeds from exercise of warrants 14,000 — — 14,000 14,000 14,000
Net cash generated by financing
activities 168,070 369,195,030 401,204 569,274 569,274 569,274
Net increase in cash and cash
equivalents 108,442 268,483,368 291,761 400,203 378,099 378,099
Cash and cash equivalents at
beginning of the year 45,907 1,744,678 1,896 47,803 (1,896) 45,907 45,907
Effects of exchange rate changes on
the balance of cash held in
foreign currencies 1,720 — — 1,720 1,720 1,720
Cash and cash equivalents at end of
the year 156,069 270,228,046 293,657 449,726 425,726 425,726
Notes to the Unaudited Pro Forma Consolidated Statement of Cash Flows:
14. The balances have been extracted from the audited consolidated statement of cash flows of the Wing
Hing Group for the year ended 31 March 2011 as disclosed in the published annual report of Wing
Hing for the year ended 31 March 2011.
15. The adjustments represent the inclusion of items of cash flows of Taung Gold, as if the Acquisition
had taken place at the commencement of the period being reported on (i.e. 1 April 2010). The
balances have been extracted from the audited consolidated statement of cash flows of Taung Gold
for the year ended 28 February 2011 as disclosed in Appendix II to this circular. The Directors
considered that no adjustment is necessary to the financial information of Taung Gold (which has
been prepared in accordance with International Financial Reporting Standards) to align with the
accounting policies of Wing Hing which comply with HKFRSs. For the purpose of the pro forma
financial information, the financial information of Taung Gold has been translated into HK$ at the
exchange rate of ZAR1 to HK$1.0867.
16. The adjustments represent a reclassification of payment for estimated acquisition-related costs of
approximately HK$24,000,000 in cash under investing activities. This adjustment is not expected to
have a continuing effect on the Enlarged Group.
APPENDIX III UNAUDITED PRO FORMA FINANCIAL INFORMATIONOF THE ENLARGED GROUP
– III-10 –
17. The adjustments represent the impairment of goodwill arising from the Acquisition which would be
charged to the consolidated statement of comprehensive income upon completion of the
Acquisition, further details of which are set out in Note 7 above. The basis of calculation of the
goodwill is set out in Note 6 above. The impairment charge has been added back as a non-cash item.
This adjustment is not expected to have a continuing effect on the Enlarged Group.
18. The adjustments represent a reclassification of the opening balances of cash and cash equivalents of
Taung Gold under investing activities, as if the Acquisition had taken place at the commencement of
the period being reported on (i.e. 1 April 2010).
19. As explained in Notes 6 and 8 above, the non-controlling interest upon First Completion would be
22.12%. Upon Electrum Completion, the non-controlling interest would be reduced from 22.12% to
13.03%. The aforesaid reduction in non-controlling interest is not expected to have any effect on the
Unaudited Pro Forma Consolidated Statement of Cash Flows and accordingly, no pro forma
adjustment has been made.
APPENDIX III UNAUDITED PRO FORMA FINANCIAL INFORMATIONOF THE ENLARGED GROUP
– III-11 –

B. REPORT ON THE UNAUDITED PRO FORMA FINANCIAL INFORMATION OF
THE ENLARGED GROUP
The following is the text of a report, prepared for the sole purpose of inclusion in this
circular, received from the auditors of the Company, HLB Hodgson Impey Cheng, Chartered
Accountants, Certified Public Accountants, Hong Kong.
31/F, Gloucester TowerThe Landmark11 Pedder StreetCentralHong Kong
28 July 2011
The Board of Directors
Wing Hing International (Holdings) Limited
Dear Sirs,
REPORT ON THE UNAUDITED PRO FORMA FINANCIAL INFORMATION OF THE
ENLARGED GROUP
Introduction
We report on the unaudited pro forma financial information of Wing Hing
International (Holdings) Limited (‘‘Wing Hing’’) and its subsidiaries (hereinafter
collectively referred to as the ‘‘Wing Hing Group’’) as set out in Section A entitled
‘‘Unaudited Pro Forma Financial Information of the Enlarged Group’’ of Appendix III (the
‘‘Unaudited Pro Forma Financial Information’’) to Wing Hing’s circular dated 28 July 2011
(the ‘‘Circular’’). The Unaudited Pro Forma Financial Information has been prepared by
the directors of Wing Hing for illustrative purposes only, to provide information about how
the Acquisition (as defined in the Circular) might have affected the financial information
presented. The basis of preparation of the Unaudited Pro Forma Financial Information is
set out in Section A of Appendix III of the Circular.
Respective responsibilities of the directors of Wing Hing and the reporting accountants
It is the responsibility solely of the directors of Wing Hing to prepare the Unaudited
Pro Forma Financial Information in accordance with Rule 4.29 of the Rules Governing the
Listing of Securities on The Stock Exchange of Hong Kong Limited (the ‘‘Listing Rules’’)
and with reference to Accounting Guideline 7 ‘‘Preparation of Pro Forma Financial
Information for Inclusion in Investment Circulars’’ issued by the Hong Kong Institute of
Certified Public Accountants.
APPENDIX III UNAUDITED PRO FORMA FINANCIAL INFORMATIONOF THE ENLARGED GROUP
– III-12 –

It is our responsibility to form an opinion, as required by Rule 4.29(7) of the Listing
Rules, on the Unaudited Pro Forma Financial Information and to report our opinion to
you. We do not accept any responsibility for any reports previously given by us on any
financial information used in the compilation of the Unaudited Pro Forma Financial
Information beyond that owed to those to whom those reports were addressed by us at the
dates of their issue.
Basis of opinion
We conducted our engagement in accordance with Hong Kong Standard on
Investment Circular Reporting Engagements (HKSIR) 300 ‘‘Accountants’ Reports on Pro
Forma Financial Information in Investment Circulars’’ issued by the Hong Kong Institute
of Certified Public Accountants. Our work consisted primarily of comparing the unadjusted
financial information with source documents, considering the evidence supporting the
adjustments and discussing the Unaudited Pro Forma Financial Information with the
directors of Wing Hing. This engagement did not involve independent examination of any
of the underlying financial information.
We planned and performed our work so as to obtain the information and explanations
we considered necessary in order to provide us with sufficient evidence to give reasonable
assurance that the Unaudited Pro Forma Financial Information has been properly compiled
by the directors of Wing Hing on the basis stated, that such basis is consistent with the
accounting policies of the Wing Hing Group and that the adjustments are appropriate for
the purposes of the Unaudited Pro Forma Financial Information as disclosed pursuant to
Rule 4.29(1) of the Listing Rules.
The Unaudited Pro Forma Financial Information has been prepared for illustrative
purposes only, based on the judgments and assumptions of the directors of Wing Hing, and,
because of its hypothetical nature, does not provide any assurance or indication that any
event will take place in the future and may not be indicative of:
. the financial position of the Wing Hing Group as at 31 March 2011 or any future
date; or
. the results or cash flows of the Wing Hing Group for the year ended 31 March
2011 or for any future periods.
APPENDIX III UNAUDITED PRO FORMA FINANCIAL INFORMATIONOF THE ENLARGED GROUP
– III-13 –

Opinion
In our opinion:
a. the Unaudited Pro Forma Financial Information has been properly compiled by
the directors of Wing Hing on the basis stated;
b. such basis is consistent with the accounting policies of the Wing Hing Group; and
c. the adjustments are appropriate for the purposes of the Unaudited Pro Forma
Financial Information as disclosed pursuant to Rule 4.29(1) of the Listing Rules.
Yours faithfully,
HLB Hodgson Impey Cheng
Chartered Accountants
Certified Public Accountants
Hong Kong
APPENDIX III UNAUDITED PRO FORMA FINANCIAL INFORMATIONOF THE ENLARGED GROUP
– III-14 –

The following is the text of the Competent Persons Report received from Venmyn
Rand (Proprietary) Limited prepared for the purpose of incorporation in this Circular in
respect of the South African gold assets of the Taung Group. A copy in full color of the
Competent Persons Report is also available on the website of Wing Hing
(www.whih.com.hk).
APPENDIX IV THE COMPETENT PERSONS REPORT
– IV-1 –
Directors: A N Clay (British); S E Conquest, E de V Greyling; N McKenna; C A Telfer
First Floor, Block G
Rochester Place
173 Rivonia Road
Sandton 2146
PO Box 782761
Sandton 2146
Republic of South Africa
Tel: +27 11 783 9903
Fax: +27 11 783 9953
www.venmyn.com
Venmyn Rand (Pty) Ltd. trading as Venmyn Reg. No. 1988/004918/07
INDEPENDENT COMPETENT PERSONS REPORT
ON THE SOUTH AFRICAN
GOLD ASSETS OF
TAUNG GOLD LIMITED BY
VENMYN RAND (PTY) LIMITED
Our Ref. D861R Effective Date 11th February 2011
– IV-2 –
ii
Taung Gold CPR February 2011
Taung Gold Limited Ground Floor, Block C Little Fourways Office Park 1 Leslie Avenue East East Fourways 2101 South Africa Wing Hing International (Holdings) Limited Room 1901,19th Floor, Nina Tower 8 Yeung UK Road Tsuen Wan, Hong Kong Dear Sirs
SYNOPSIS
PURPOSE AND PROJECT OUTLINE
Taung Gold Limited (‘Taung’) holds prospecting rights in respect of various gold exploration projects in Mpumalanga, Limpopo, Gauteng, North West and Free State Provinces of South Africa. The mineral assets have been consolidated into a focused entity whose intention is to develop its two highly prospective flagship projects, Jeanette and Evander, whilst conducting further exploration on its greenfields and brownfield exploration projects. Taung’s vision is to become a significant role player in the South African gold exploration, development and mining sector. Taung has implemented a sound business strategy ensuring steady value growth of its assets. Building on the technical strength and extensive industry experience of its management team, Taung has prepared detailed plans to grow the company and move it up the value curve. Taung’s strategy is to generate shareholder value through securing competitive assets, conducting effective historical data investigation and exploration and thereafter, fast-tracking project proposal and development of the most attractive projects. The technical team, with the assistance of independent consultancy companies, has utilised historical and current exploration data and mining knowledge to add significant value to its flagship projects. The technical documentation in support of a ‘Very Substantial Acquisition’ (‘VSA’) between Wing Hing International (Holdings) Limited (‘Wing Hing’) and Taung on the Hong Kong Exchange (HKeX), has been prepared for Taung and Wing Hing in the form of this Competent Persons Report (‘CPR’). The CPR describes and documents Taung’s flagship mineral assets, namely the Jeanette project in the Free State Province and the Evander project in the Mpumalanga Province. The Evander and Jeanette projects are advanced exploration projects for which Scoping Studies have been completed and for which Pre-Feasibility Studies (‘PFS’) are being commissioned. These flagship projects represent a sound and attractive base from which to accelerate through PFS to Bankable Feasibility Study (‘BFS’) and development phases. The CPR also includes greenfields projects in several provinces, which are at various exploration stages and for which, in the most part, insufficient information is available to define Mineral Resources. The brownfields and greenfields projects form an attractive pipeline of prospective properties for future exploration. The techno-economic review of the gold assets was compiled according to comprehensive checklists that ensure compliance with the following:-
Australasian Code for Reporting of Exploration Results, Mineral Resources and Ore Reserves (‘JORC Code’);
reporting in compliance with the South African Code for the Reporting of Exploration Results, Mineral Resources and Mineral Reserves (‘SAMREC Code’);
the South African Code for the Reporting of Mineral Asset Valuation (‘SAMVAL Code); and
full compliance with the Hong Kong Exchange Listing Rules for Mineral and Exploration companies.
– IV-3 –

iii
Taung Gold CPR February 2011
CORPORATE STRUCTURE FOR TAUNG
Taung was incorporated in 2004 for the purpose of holding the South African gold assets of African Precious Minerals Limited (‘APM’), an exploration company incorporated in the British Virgin Islands. Taung was originally incorporated under the name Midnight Masquerade Properties 151 (Pty) Limited. The company changed its name to Taung Gold Holdings (Pty) Limited in 2005. Taung was converted from a private to a public company called Taung Gold Holdings Limited and the company name was then changed to Taung Gold Limited. Taung’s Black Economic Empowerment (‘BEE’) partner is Sephaku Gold Holdings (Pty) Limited (‘Sephaku’). Sephaku has undertaken to maintain its shareholding in Taung at the 26% level required by law. TAUNG ASSETS
Taung holds various prospecting rights clustered into a total of 13 project areas located in Mpumalanga, Limpopo, Gauteng, Northwest and Free State Provinces of South Africa. The majority of these projects are located within the world renowned Witwatersrand Basin and are summarised in Table A and illustrated overleaf:- Table A : Summary of Taung Mineral Assets
PROVINCE PROJECT PROPERTY SIZE (ha) HELD BY TYPE OF RIGHT
Mpumalanga Evander Six Shaft 2,452 Evander Gold Mines Limited New Order Mining Right
Twistdraai 2,677 Evander Gold Mines Limited New Order Mining Right
Free State Jeanette Jeanette 3,886 Taung Gold Free State (Pty) Limited New Order Prospecting Right
Various Greenfields Various 96,401 Various New Order Prospecting Rights Source: Taung
THE EVANDER PROJECT
Location, Project Description, Legal Aspects and Tenure
The Evander project (‘Evander’) consists of two adjacent properties, namely the Six Shaft area (‘Six Shaft’) and the Twistdraai area (‘Twistdraai’), located in the eastern Highveld of the Mpumalanga Province, of South Africa. The project comprises a dormant gold mine, which was part of Harmony Gold Mining Company Limited (‘Harmony’) portfolio of mines in the Witwatersrand Basin, 120km east-southeast of Johannesburg. The Witwatersrand Basin is the largest gold province globally and contains numerous gold deposits, which are grouped geographically into goldfields, separated by gaps where no economic deposits have been found. The Evander project is located within the eastern Evander Goldfield on the northeastern limb of the Witwatersrand Basin. Gold and coal mining have been conducted in the Evander Goldfield area for 50 years and, consequently, access and mining related infrastructure is well developed. The Evander project properties are held by Evander Gold Mines Limited (‘EGM’), a subsidiary of Harmony. EGM currently operates one mine in the Evander Goldfield, namely No 8 Shaft (Leslie Mine). EGM recently closed a further three shafts within their operational area, namely No 2 Shaft, No 5 Shaft (originally known as Winkelhaak Mine) and No 7 Shaft (Kinross Mine). The Six Shaft area is largely unmined except for a small area in the vicinity of No 6 Shaft where approximately 2Mt of Kimberley Reef was mined between September 1986 and June 1998 at a reported grade of 7.82g/t Au over a width of 147cm (88cm channel width). No 6 Shaft was closed in 1998 primarily as a result of the poor prevailing gold price. The Twistdraai project area is situated directly south of Six Shaft, some 12km east of the town of Evander. The proximity to Six Shaft means that much of the geological and structural control discussed for Six Shaft is directly applicable to Twistdraai. The legal tenure of mineral properties within South Africa is governed by the Mineral and Petroleum Resources Development Act, No 28 of 2002 (‘MPRDA’) and administered by the Department of Mineral Resources (‘DMR’). EGM holds a new order Mining Right granted on the 29th April 2008 and valid for 30 years, over an extensive mining area, which includes the Six Shaft and Twistdraai areas.
– IV-4 –
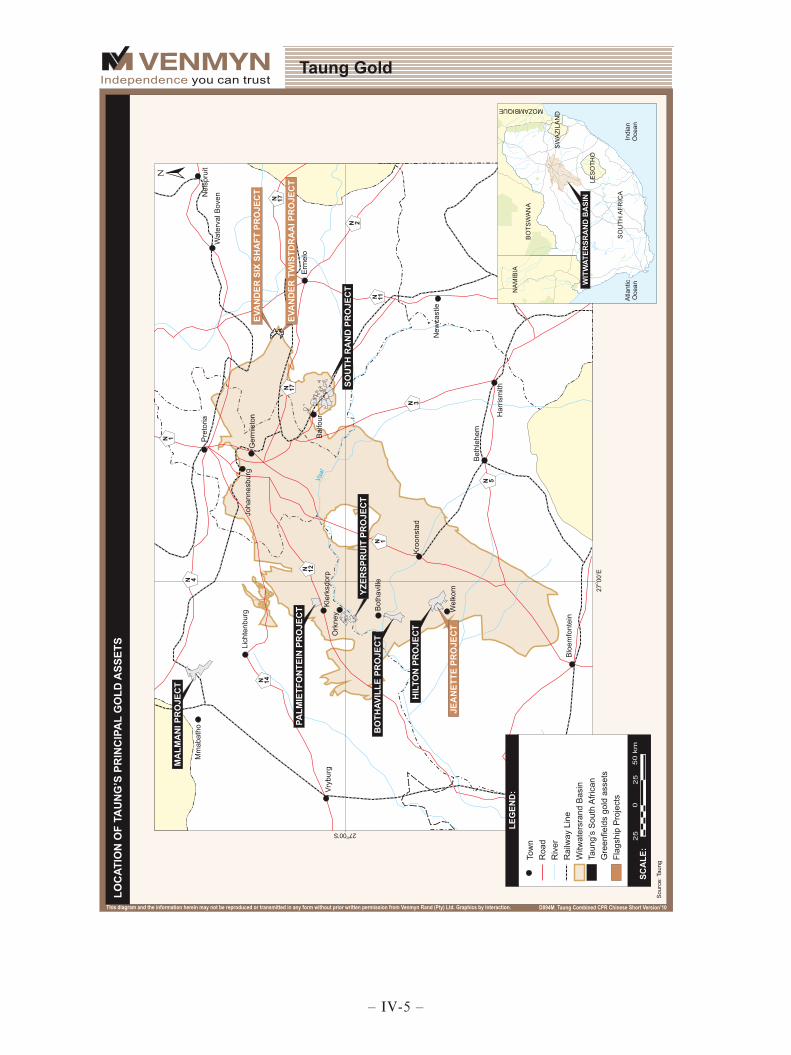
– IV-5 –

v
Taung Gold CPR February 2011
In 2007, EGM’s parent company, Harmony, adopted a strategy to extract optimal value from assets which, though prospective, did not form part of Harmony’s overall strategy. This would be achieved through Harmony entering into agreements to joint venture, sell or re-capitalize these assets. In line with this strategy, Harmony, entered into a series of agreements with Taung over the Six Shaft and Twistdraai projects in early 2008. The earn-in agreements unlocked value for Harmony and at the same time presented Taung with attractive assets to explore and, eventually mine. Accordingly, on 29th February 2008, Taung entered into a series of agreements with EGM in terms of which Taung could “earn-in” on the Six Shaft and Twistdraai Projects by completing a Scoping Study, a Pre Feasibility Study (‘PFS’) and a Bankable Feasibility Study (‘BFS’). Provision was made in the agreements for the mining right to be transferred into subsidiaries of Harmony, with Taung enjoying the right to earn a majority interest by completing a BFS over the Six Shaft and Twistdraai Projects. Six Shaft and Twistdraai areas are separate projects from a contractual perspective. However the areas were treated as a single entity for the purposes of the Scoping Study commissioned by Taung. The results of the consolidated Scoping Study both the Six Shaft and Twistdraai areas are presented in this CPR. Taung completed a Scoping Study on the project on 9th April 2010. Taung is required to complete the PFS by 9th April 2012 and the BFS by 9th April 2013. The Scoping Study recommended that the project proceed to the PFS stage. Upon completion of a PFS Taung will ‘earn-in’ 25% shareholding in the subsidiaries (and therefore the projects), and upon completion of a BFS, an aggregate of 52% in the subsidiaries. Subsequent to the decision to proceed to a PFS, Taung independently of Harmony, commissioned a further Scoping Study by Turnberry, which was completed in August 2010 (the Turnberry 2010 Scoping Study) and which forms the basis of the Evander portion of this CPR. On 10th September 2010, a subsidiary of Taung, Pluriclox (Proprietary) Limited (‘Pluriclox’) entered into a sale agreement with EGM whereby, subject to certain conditions precedent being met, Pluriclox will acquire a 100% interest in the Evander Project. The acquisition cost is USD28.125m. The conclusion of the Sale Agreement does not entail cancellation of the existing earn-in agreements with EGM and the rights and obligations in terms of the 2008 earn-in agreements will continue. More specifically Taung will continue to be obliged to complete the PFS and BFS. Once the Sale Agreement becomes unconditional, the 2008 earn-in agreements will terminate. Regional Geological Setting, Local Geology and Exploration Results - Evander
The Witwatersrand Basin is located on the Kaapvaal Craton in South Africa and is an oval shaped basin, with a 160km long axis through Welkom and Johannesburg and a short axis of approximately 80km. Only a small proportion of the late Archaean Witwatersrand Basin is exposed at surface and the vast majority of the basin is covered by younger sediments and volcanics. The Evander project is located within the eastern Evander Goldfield on the northeastern limb of the Witwatersrand Basin. The Evander Goldfield hosts several operating and two defunct gold mines, all of which produce or produced gold from the Kimberley Reef (‘Kimberley Reef’), situated within sediments of the Central Rand Group of the Witwatersrand Supergroup. The Evander Goldfield is arcuate in shape and characterised by basin margin faulting. The northeastern margin of the basin is dominated by a northwest striking asymmetrical fold structure with strata overturned to the west and thrust faulted. The Kimberley Reef varies between a few centimetres to 300cm in width and dips 60º to 90º in the steep, western fold limb and 25º in the east of the project area. The Kimberley Reef sub-crops against the overlying Transvaal Supergroup at 200m in the east, progressively deepening to the west. Historically, a total of 39 surface exploration boreholes with 124 associated reef deflections were drilled in the Six Shaft area, the last of which was drilled in 1988. In addition, in excess of 400 underground diamond drill holes were drilled from underground excavations for reef and structural intersections during the Six Shaft mining operations. The historical exploration efforts on Twistdraai included 19 boreholes with 89 reef sections. A full independent review of the data provided confidence in the reliability of the historic data and a statistical evaluation showed that the data density is sufficient for estimation of Indicated and Inferred Mineral Resources.
– IV-6 –
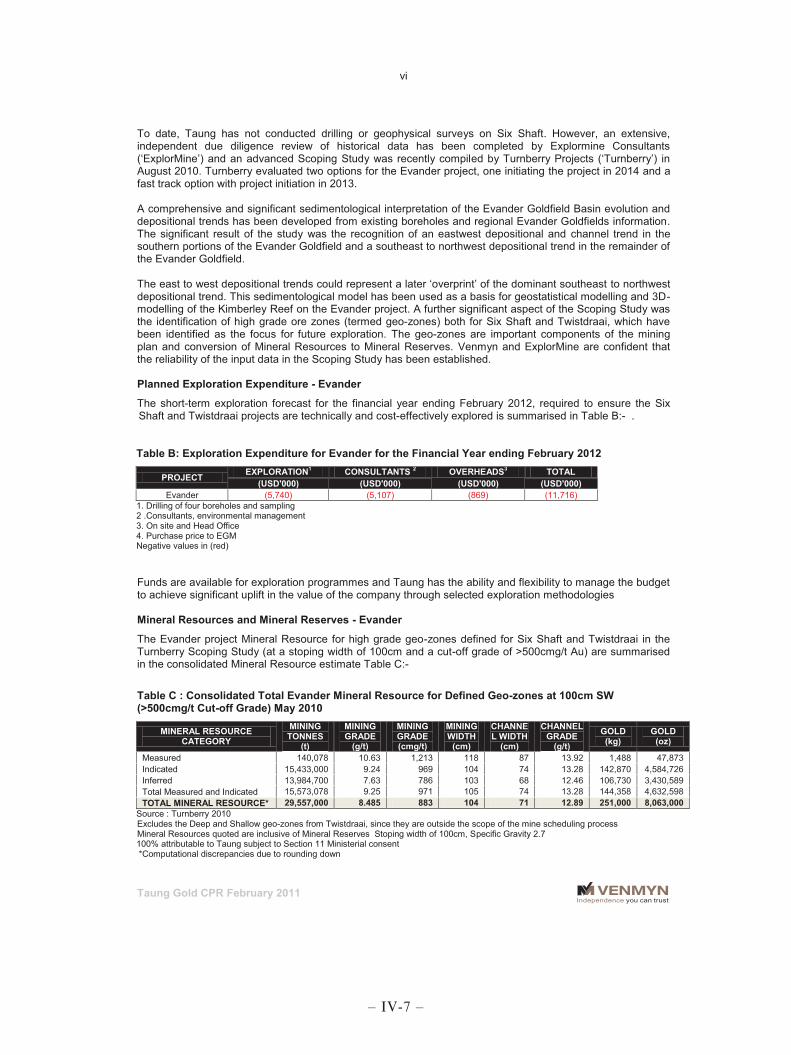
vi
Taung Gold CPR February 2011
To date, Taung has not conducted drilling or geophysical surveys on Six Shaft. However, an extensive, independent due diligence review of historical data has been completed by Explormine Consultants (‘ExplorMine’) and an advanced Scoping Study was recently compiled by Turnberry Projects (‘Turnberry’) in August 2010. Turnberry evaluated two options for the Evander project, one initiating the project in 2014 and a fast track option with project initiation in 2013. A comprehensive and significant sedimentological interpretation of the Evander Goldfield Basin evolution and depositional trends has been developed from existing boreholes and regional Evander Goldfields information. The significant result of the study was the recognition of an eastwest depositional and channel trend in the southern portions of the Evander Goldfield and a southeast to northwest depositional trend in the remainder of the Evander Goldfield. The east to west depositional trends could represent a later ‘overprint’ of the dominant southeast to northwest depositional trend. This sedimentological model has been used as a basis for geostatistical modelling and 3D-modelling of the Kimberley Reef on the Evander project. A further significant aspect of the Scoping Study was the identification of high grade ore zones (termed geo-zones) both for Six Shaft and Twistdraai, which have been identified as the focus for future exploration. The geo-zones are important components of the mining plan and conversion of Mineral Resources to Mineral Reserves. Venmyn and ExplorMine are confident that the reliability of the input data in the Scoping Study has been established. Planned Exploration Expenditure - Evander
The short-term exploration forecast for the financial year ending February 2012, required to ensure the Six Shaft and Twistdraai projects are technically and cost-effectively explored is summarised in Table B:- . Table B: Exploration Expenditure for Evander for the Financial Year ending February 2012
PROJECT EXPLORATION1 CONSULTANTS 2 OVERHEADS3 TOTAL (USD'000) (USD'000) (USD'000) (USD'000)
Evander (5,740) (5,107) (869) (11,716) 1. Drilling of four boreholes and sampling 2 .Consultants, environmental management 3. On site and Head Office 4. Purchase price to EGM Negative values in (red) Funds are available for exploration programmes and Taung has the ability and flexibility to manage the budget to achieve significant uplift in the value of the company through selected exploration methodologies Mineral Resources and Mineral Reserves - Evander
The Evander project Mineral Resource for high grade geo-zones defined for Six Shaft and Twistdraai in the Turnberry Scoping Study (at a stoping width of 100cm and a cut-off grade of >500cmg/t Au) are summarised in the consolidated Mineral Resource estimate Table C:-
Table C : Consolidated Total Evander Mineral Resource for Defined Geo-zones at 100cm SW (>500cmg/t Cut-off Grade) May 2010
MINERAL RESOURCE CATEGORY
MINING TONNES
(t)
MINING GRADE
(g/t)
MINING GRADE (cmg/t)
MINING WIDTH
(cm)
CHANNEL WIDTH
(cm)
CHANNEL GRADE
(g/t) GOLD (kg)
GOLD (oz)
Measured 140,078 10.63 1,213 118 87 13.92 1,488 47,873 Indicated 15,433,000 9.24 969 104 74 13.28 142,870 4,584,726 Inferred 13,984,700 7.63 786 103 68 12.46 106,730 3,430,589 Total Measured and Indicated 15,573,078 9.25 971 105 74 13.28 144,358 4,632,598 TOTAL MINERAL RESOURCE* 29,557,000 8.485 883 104 71 12.89 251,000 8,063,000
Source : Turnberry 2010 Excludes the Deep and Shallow geo-zones from Twistdraai, since they are outside the scope of the mine scheduling process Mineral Resources quoted are inclusive of Mineral Reserves Stoping width of 100cm, Specific Gravity 2.7 100% attributable to Taung subject to Section 11 Ministerial consent *Computational discrepancies due to rounding down
– IV-7 –

vii
Taung Gold CPR February 2011
Only a specific portion of the total defined Mineral Resources for Evander was selected for conversion to Mineral Reserves. A suite of modifying factors was applied to the Mineral Resources from the selected Shaft geo-zone only, in order to convert the Mineral Resources to Mineral Reserves. The final Mineral Reserves for the Shaft geo-zone of the Evander project are presented in Table D below:- Table D : Probable Mineral Reserves for the Shaft Geo-zone at Six Shaft
PARAMETER TONNES MINING GRADE MINING WIDTH GOLD GOLD
(t) (g/t) (cm) (kg) (oz) Total Resource 9,550,000 10.41 104 99,373 3,195,000 Resources outside design areas (1,135,000) 9.90 104 (11,233) (361,000) Mining Tonnes 8,415,000 10.47 104 88,141 2,834,000 Pillar loss (Bracket pillars) (290,000) 10.49 104 (3,048) (98,000) Pillar loss (Stope pillars) (643,000) 10.46 104 (6,728) (216,000) Mineable Tonnage 7,481,000 10.48 104 78,365 2,519 ,000 Mining loss (150,000) 10.48 - (1,568) (50,000) Dilution (on-reef development) 691,000 - - - - Dilution (minor structures) 618,000 - - - - Diluted Mineable Tonnage Resource 8,640,000 8.89 104 76,797 2,469,000 Mine Call Factor (MCF) (864,000) - - (7,680) (247,000) PROBABLE RESERVES* 8,640,000 8.00 104 69,000 2,222,000
Source: Turnberry 2010 100% attributable to Taung subject to Section 11 Ministerial consent No Inferred Mineral Resources are included in the Mineral Reserve estimation All figures in (red) are negative *Computational discrepancies due to rounding down Inferred Mineral Resources – Evander
The Evander project is situated in an historical mining area where 50 years of mining the Kimberley Reef has led to confidence in the understanding of the geology of the ore horizon. Taung has classified the Kimberley Reef into high grade geo-zones, many of which are classified as Indicated Mineral Resources. The remaining geo-zones are classified as Inferred Mineral Resources, as a consequence of insufficient data points within the zone, leading to lack of confidence in the grade distribution. However, the confidence levels for the remaining resource classification parameters exceed those required for classification in the Inferred category. In the context of the high confidence levels applicable to grade distribution in the Kimberley Reef in the Evander Goldfields area, Taung is confident that, the Inferred Mineral Resources will be rapidly upgraded to the Indicated category through the proposed exploration programme. It is this confidence in the upgrade of the Inferred Mineral Resources that is the basis for Taung’s motivation to include the Inferred Resources in the Scoping Study. The Turnberry (2010) Scoping Study applied modifying factors to the Inferred and Indicated Mineral Resources for Evander. The Indicated Mineral Resources were converted to Probable Mineral Reserves (Table D). Since no category exists for modified Inferred Resources in international reporting codes, these modified Mineral Resources have not been termed Mineral Reserves but are termed ‘Economic Inferred Mineral Resources’ for the purposes of reporting the Scoping Study results. In order to comply with international reporting standards, both the Mineral Reserves alone and the ‘Mineral Reserves plus Economic Inferred Resources’ are presented in Table E:- Table E : Probable Reserves and ‘Economic Inferred Mineral Resources’ – Evander (Turnberry 2010)
REEF CATEGORY TONNES REC
GRADE (g/t)
MINING WIDTH GOLD GOLD
(t) (cm) (kg) (oz)
Kimberley Reef Probable Reserves + Economic Inferred Mineral Resources 28,222,000 6.80 104 191,000 6,170,000
Kimberley Reef Probable Reserve only 8,640,000 8.00 104 69,000 2,222,000 Source: Turnberry 2010 and Includes Inferred Mineral Resources
– IV-8 –

viii
Taung Gold CPR February 2011
Scoping Study – Evander Project
The Scoping Study proposed that conventional breast mining methodology be used, as is common throughout the Witwatersrand Basin. No 6 Shaft is a 160ktpm vertical shaft complex, comprising an 8.5m diameter, man, material and rock hoisting shaft and a 6.0m diameter ventilation shaft sunk to a depth of 1,576m. The shaft was closed in 1998, as a result of adverse economic conditions and the winders and ancillary equipment were sold. Electrical and water supply infrastructure is established, with electrical supply provided through an existing agreement with Eskom (the para-statal electrical service) and water is supplied by a para-statal organisation from the Vaal River. Water supply to the Evander Goldfield is unlikely to be a future limiting factor since most of the current mining operations in the goldfield were planned for greater production profiles than are currently maintained. No 6 Shaft did not originally feed to a dedicated processing plant and therefore the Scoping Study included provision for a new processing plant. The mining studies carried out to date have progressed from a conceptual Scoping Study, prepared in 2008 by Turnberry, to detailed mine design completed in 2010 by Turnberry Projects (Pty) Limited (‘Turnberry’) and Ukwazi Group (‘Ukwazi’), with the Shaft geo-zone mine design and scheduling parameters having been completed to PFS level. The mine design and schedule showed that the Evander project has a 30 year production life with the following key phases:-.
2 years – sinking and establishment;
7 years – mine ramp up to full production;
21 years – full tonnage profile production; and
2 years – mine closing down cycle.
Approximately 94% of the first 10 years production is projected to be sourced from areas of the ore body, which are currently at the Indicated Mineral Resource level of confidence. A Life of Mine (‘LoM’) production rate of 1.2Mtpa over 30 years has been proposed, resulting in the production of 266,922oz per annum over the LoM. The peak production is projected to be 102ktpm with a peak shaft head grade of 7.43g/t Au. A total of 5,94Moz Au will be produced over the LoM. During the first 10 years of the mine’s life the following project activities will occur:-
the existing No 6 Shaft will be de-watered and re-equipped to 18 Level elevation;
the ventilation (‘vent’) shaft will be sunk to 18 Level elevation;
production will commence on the upper levels;
the 6 sub-vertical shaft and sub-vent shaft infrastructure will be sunk and developed, along with the haulages and return air ways (‘RAW’s’) from the upper levels towards the Twistdraai area; and
the Twistdraai mining complex design that comprises 3 twin incline shafts will be developed during the latter part of the first 10 years. (Mining at Twistdraai will occur during the second half of the mine’s life).
The projected production statistics for the Evander Project are shown in Table F below. The project implementation is anticipated to commence during January 2013. Mineral Processing – Evander
No 6 Shaft does not have a dedicated processing plant and the EGM plants in the region do not have sufficient capacity to accommodate No 6 Shafts’ ore.
– IV-9 –

ix
Taung Gold CPR February 2011
A new, conventional Witwatersrand gold mine carbon-in-pulp/carbon-in-leach (‘CIP/CIL’) plant dedicated to No 6 Shaft is to be built. The plant design is such that it is to be completed in several modules with an initial plant of 25ktpm and two modules thereafter, each with capacities of 100ktpm. The plants are to be positioned in the vicinity of No 6 Shaft. The CIP/CIL adopted by Turnberry in the mining complex is a plant with known design parameters and proven recovery parameters at a cost of (USD38.75m (Turnberry 2010). The planned plant utilizes proven, effective technology with a known recovery factor of 95%. The Evander project ore body has the same metallurgical characteristics as Evander Gold mines where a similar plant is achieving such recoveries. Table F : Scheduled Forecast Production Statistics – Evander
ITEM LoM SUMMARY* LoM SUMMARY** CAPEX Including Plant and Ongoing CAPEX (USDm) (1,023.00) (623) OPEX Life Average Cost/tonne milled (USD/t) (83.60) (80.88) Cash Cost Total Cash Cost/oz Au produced (USD/oz) (396.71) (325.85)
Production
Annual Ore Production (tonnes per annum – tpa)) 1,229,000 1,150,000 Monthly Ore Production (tonnes per month- tpm) 102,417 95,833 Annual Gold Production (kg gold per annum ) 8,302 4,649 Annual PeakGold Production (ounces per annum) 291,094 286,185 Average Production Gold ounces pa 266,922 149,480 Head Grade (g/t) 6.801 7.99 Yield (g/t) 6.55 7.72 Total Gold (kg) 184,853 66,699 Total Gold (ounces) 5,943,148 2,144,441 Total Waste Tonnes (LOM) 9,627,007 1,908,796 Reef: Waste Ratio 2.93 4.53 Sustaining Waste Tonnes (LOM) 5,120,663 969,150 Reef: Waste Ratio 5.51 8.91 Mine Call Factor 90% 90%
Source: Turnberry 2010 *Total Ore body including both Indicated and Inferred Mineral Resources **Indicated Mineral Resources only Negative figures in (red) There is no tailings dam at Six Shaft. An area of approximately 115ha will be required for a 30m high tailings dam and return water facility, estimated at a cost USD10.31m. Waste rock-dump areas are already established and no additional sites will be required. No metallurgical test work has been conducted on the Evander Project ore. However more than 2Mt of reef has been treated through the EGM No 2 Shaft gold plant with recoveries at approximately 96.5%. Estimates of Capital Expenditure (‘CAPEX’) – Evander
The total capital cost of the project was revised by Taung in February 2011 to USD1,034m, including sustaining capital expenditure of USD56.25m (see Table G). The peak funding requirement is approximately USD315m in year five after commencement of gold production. Table G : Evander Project – Revised Phased Capital Estimate
DESCRIPTION COST (USD'000)* COST (USD'000)** Phase 0 – Studies (10,310) (10,310) Phase 1 – Dewater Mine and Upper Level Steep Production (132,114) (132,114) Phase 2 – Sub-vertical Shaft (442,402) (438,878) Phase 3 – Twistdraai Incline Shaft (194,862) 0 Possible savings on second hand equipment -31,250 -20,000 Exploration drilling programme (6,190) (6,190) Project Development Capital Estimate (223,421) (40,867) Sustaining Capital – Engineering and Projects (56,250) (21,563) Total Capital Expenditure (1,034,300) (629,922)
Source: Taung 2011 *Total Ore body including both Indicated and Inferred Mineral Resources Negative figures in (red) **Indicated Mineral Resources only
– IV-10 –

x
Taung Gold CPR February 2011
Estimates of Operating Costs - Evander
The Evander project is estimated to have an operating cost of USD83.5/t milled (including the full recent electricity tariff price increase), as detailed in Table H:- Table H : Evander Project – Estimated Operating Costs
TOTAL PROJECT (ZAR /t milled) COST* (USD/t) COST** (USD/t) Mining Cost (55.73) (52.71 ) Processing Cost (Excluding services) (4.88) (4.88) Analytical Cost (Excluding services) (0.19) (0.19) Smelting and Treatment Charges (0.49) (0.58) Services (11.73) (11.28) Administration and Overhead Costs (10.58) (11.24) TOTAL (83.60) (80.88)
Source: Turnberry 2010 *Total Ore body including both Indicated and Inferred Mineral Resources **Indicated Mineral Resources only Negative figures in (red) A 7 year production ramp up period has been estimated for the Evander project and the mine will operate at full production for 21 years with an annual production of 267,000oz Au. Total gold production is estimated to be 184.9t Au (5.9Moz Au). The estimated LoM average operating costs will be USD83.6/t milled. All costs are expressed in December 2009 money terms. Project Risks and Potential - Evander
The areas of potential technical risk to the Evander operation at Scoping Study level have been reviewed, in particular those areas where the risk component could materially impact the proposed mine development and projected cashflows. The applicable mitigation implementations will be addressed during the PFS and BFS stage. The project risks are not materially different to those of any historical or current South African gold project with similar depth, geology and mineralogy. The up-side potential of the Evander project can be summarised as:-
additional drilling to upgrade Inferred Mineral Resources into the Indicated Mineral Resource category;
definition of Mineral Reserves from the newly defined Indicated Resources;
exploration to identify additional economic reef zones that are theoretically present;
stoping width reduction to within a maximum of 35cm over and above the channel width;
improved gold plant recovery as a result of higher head grade and process optimisation;
reviewing the optimal mining and plant throughput rate during PFS and BFS;
additional tonnage processed through the plant as a result of improved availability and control;
a geological and structural regime that is simpler in reality than that proposed by the current interpretation;
increased mechanisation in the stoping environment to reduce costs; and
a project start date earlier than January 2013.
Recommendations and Conclusions – Evander
Twistdraai is structurally complex, although no more complex than other Witwatersrand mines located along the basin margin. A suitable exploration programme should be designed to expand on the current geological and geostatistical information. The new exploration data will provide the basis for expanding upon, and upgrading, the current Inferred Mineral Resource estimate to the Indicated Mineral Resource category in order that a conversion to Mineral Reserves can be undertaken.
– IV-11 –
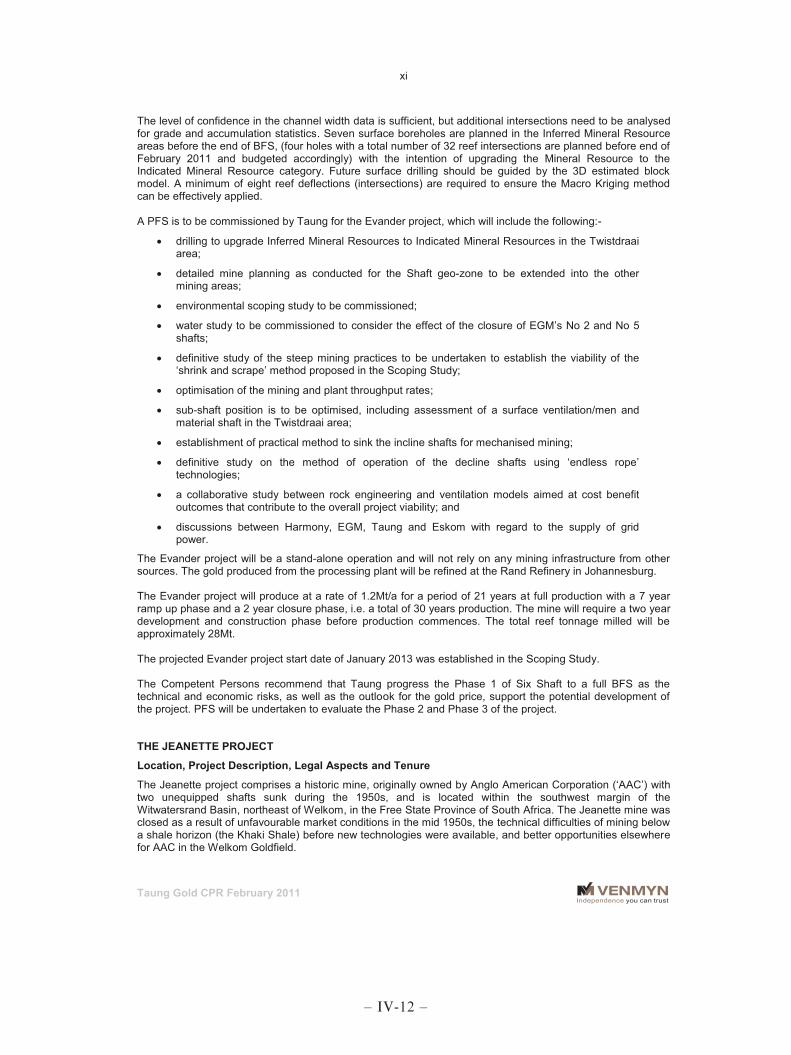
xi
Taung Gold CPR February 2011
The level of confidence in the channel width data is sufficient, but additional intersections need to be analysed for grade and accumulation statistics. Seven surface boreholes are planned in the Inferred Mineral Resource areas before the end of BFS, (four holes with a total number of 32 reef intersections are planned before end of February 2011 and budgeted accordingly) with the intention of upgrading the Mineral Resource to the Indicated Mineral Resource category. Future surface drilling should be guided by the 3D estimated block model. A minimum of eight reef deflections (intersections) are required to ensure the Macro Kriging method can be effectively applied. A PFS is to be commissioned by Taung for the Evander project, which will include the following:-
drilling to upgrade Inferred Mineral Resources to Indicated Mineral Resources in the Twistdraai area;
detailed mine planning as conducted for the Shaft geo-zone to be extended into the other mining areas;
environmental scoping study to be commissioned;
water study to be commissioned to consider the effect of the closure of EGM’s No 2 and No 5 shafts;
definitive study of the steep mining practices to be undertaken to establish the viability of the ‘shrink and scrape’ method proposed in the Scoping Study;
optimisation of the mining and plant throughput rates;
sub-shaft position is to be optimised, including assessment of a surface ventilation/men and material shaft in the Twistdraai area;
establishment of practical method to sink the incline shafts for mechanised mining;
definitive study on the method of operation of the decline shafts using ‘endless rope’ technologies;
a collaborative study between rock engineering and ventilation models aimed at cost benefit outcomes that contribute to the overall project viability; and
discussions between Harmony, EGM, Taung and Eskom with regard to the supply of grid power.
The Evander project will be a stand-alone operation and will not rely on any mining infrastructure from other sources. The gold produced from the processing plant will be refined at the Rand Refinery in Johannesburg. The Evander project will produce at a rate of 1.2Mt/a for a period of 21 years at full production with a 7 year ramp up phase and a 2 year closure phase, i.e. a total of 30 years production. The mine will require a two year development and construction phase before production commences. The total reef tonnage milled will be approximately 28Mt. The projected Evander project start date of January 2013 was established in the Scoping Study. The Competent Persons recommend that Taung progress the Phase 1 of Six Shaft to a full BFS as the technical and economic risks, as well as the outlook for the gold price, support the potential development of the project. PFS will be undertaken to evaluate the Phase 2 and Phase 3 of the project. THE JEANETTE PROJECT
Location, Project Description, Legal Aspects and Tenure
The Jeanette project comprises a historic mine, originally owned by Anglo American Corporation (‘AAC’) with two unequipped shafts sunk during the 1950s, and is located within the southwest margin of the Witwatersrand Basin, northeast of Welkom, in the Free State Province of South Africa. The Jeanette mine was closed as a result of unfavourable market conditions in the mid 1950s, the technical difficulties of mining below a shale horizon (the Khaki Shale) before new technologies were available, and better opportunities elsewhere for AAC in the Welkom Goldfield.
– IV-12 –
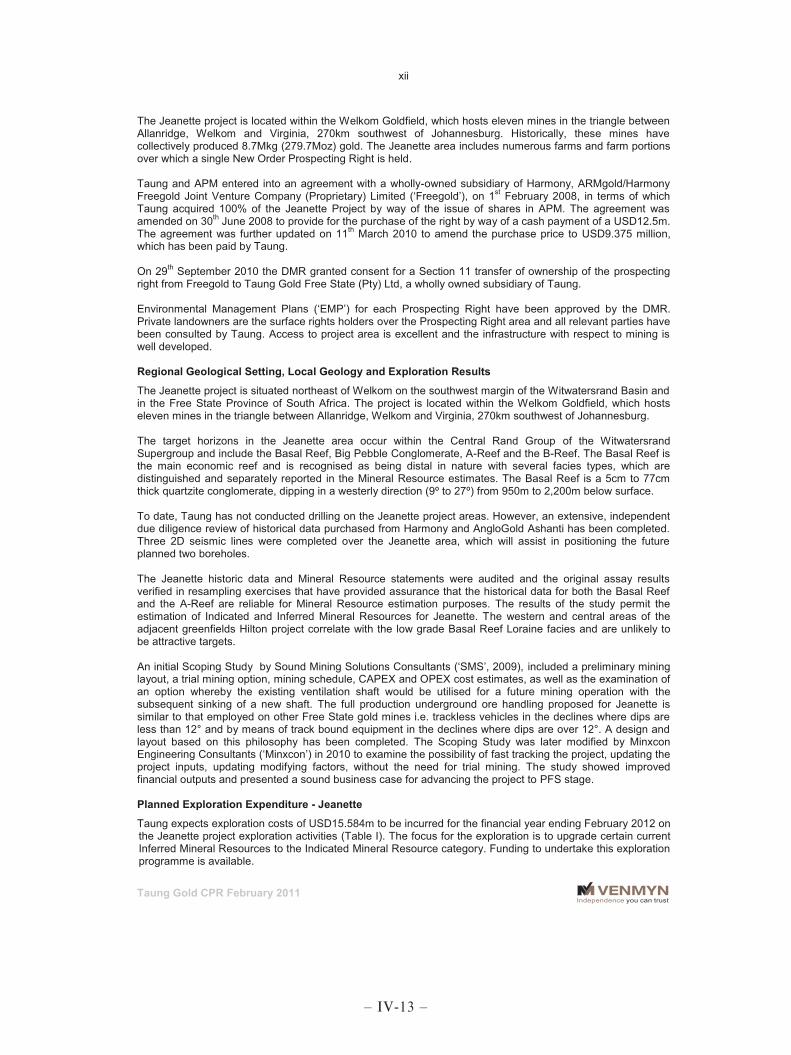
xii
Taung Gold CPR February 2011
The Jeanette project is located within the Welkom Goldfield, which hosts eleven mines in the triangle between Allanridge, Welkom and Virginia, 270km southwest of Johannesburg. Historically, these mines have collectively produced 8.7Mkg (279.7Moz) gold. The Jeanette area includes numerous farms and farm portions over which a single New Order Prospecting Right is held. Taung and APM entered into an agreement with a wholly-owned subsidiary of Harmony, ARMgold/Harmony Freegold Joint Venture Company (Proprietary) Limited (‘Freegold’), on 1st February 2008, in terms of which Taung acquired 100% of the Jeanette Project by way of the issue of shares in APM. The agreement was amended on 30th June 2008 to provide for the purchase of the right by way of a cash payment of a USD12.5m. The agreement was further updated on 11th March 2010 to amend the purchase price to USD9.375 million, which has been paid by Taung. On 29th September 2010 the DMR granted consent for a Section 11 transfer of ownership of the prospecting right from Freegold to Taung Gold Free State (Pty) Ltd, a wholly owned subsidiary of Taung. Environmental Management Plans (‘EMP’) for each Prospecting Right have been approved by the DMR. Private landowners are the surface rights holders over the Prospecting Right area and all relevant parties have been consulted by Taung. Access to project area is excellent and the infrastructure with respect to mining is well developed. Regional Geological Setting, Local Geology and Exploration Results
The Jeanette project is situated northeast of Welkom on the southwest margin of the Witwatersrand Basin and in the Free State Province of South Africa. The project is located within the Welkom Goldfield, which hosts eleven mines in the triangle between Allanridge, Welkom and Virginia, 270km southwest of Johannesburg. The target horizons in the Jeanette area occur within the Central Rand Group of the Witwatersrand Supergroup and include the Basal Reef, Big Pebble Conglomerate, A-Reef and the B-Reef. The Basal Reef is the main economic reef and is recognised as being distal in nature with several facies types, which are distinguished and separately reported in the Mineral Resource estimates. The Basal Reef is a 5cm to 77cm thick quartzite conglomerate, dipping in a westerly direction (9º to 27º) from 950m to 2,200m below surface. To date, Taung has not conducted drilling on the Jeanette project areas. However, an extensive, independent due diligence review of historical data purchased from Harmony and AngloGold Ashanti has been completed. Three 2D seismic lines were completed over the Jeanette area, which will assist in positioning the future planned two boreholes. The Jeanette historic data and Mineral Resource statements were audited and the original assay results verified in resampling exercises that have provided assurance that the historical data for both the Basal Reef and the A-Reef are reliable for Mineral Resource estimation purposes. The results of the study permit the estimation of Indicated and Inferred Mineral Resources for Jeanette. The western and central areas of the adjacent greenfields Hilton project correlate with the low grade Basal Reef Loraine facies and are unlikely to be attractive targets. An initial Scoping Study by Sound Mining Solutions Consultants (‘SMS’, 2009), included a preliminary mining layout, a trial mining option, mining schedule, CAPEX and OPEX cost estimates, as well as the examination of an option whereby the existing ventilation shaft would be utilised for a future mining operation with the subsequent sinking of a new shaft. The full production underground ore handling proposed for Jeanette is similar to that employed on other Free State gold mines i.e. trackless vehicles in the declines where dips are less than 12° and by means of track bound equipment in the declines where dips are over 12°. A design and layout based on this philosophy has been completed. The Scoping Study was later modified by Minxcon Engineering Consultants (‘Minxcon’) in 2010 to examine the possibility of fast tracking the project, updating the project inputs, updating modifying factors, without the need for trial mining. The study showed improved financial outputs and presented a sound business case for advancing the project to PFS stage. Planned Exploration Expenditure - Jeanette
Taung expects exploration costs of USD15.584m to be incurred for the financial year ending February 2012 on the Jeanette project exploration activities (Table I). The focus for the exploration is to upgrade certain current Inferred Mineral Resources to the Indicated Mineral Resource category. Funding to undertake this exploration programme is available.
– IV-13 –
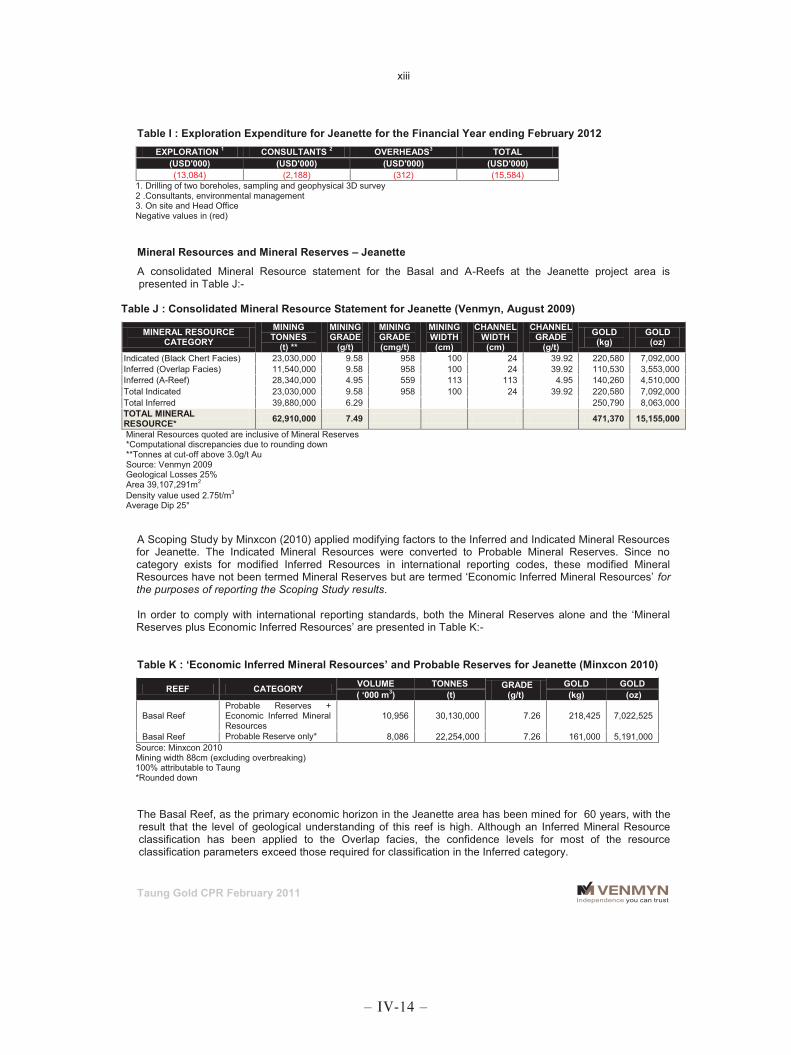
xiii
Taung Gold CPR February 2011
Table I : Exploration Expenditure for Jeanette for the Financial Year ending February 2012
EXPLORATION 1 CONSULTANTS 2 OVERHEADS3 TOTAL (USD'000) (USD'000) (USD'000) (USD'000) (13,084) (2,188) (312) (15,584)
1. Drilling of two boreholes, sampling and geophysical 3D survey 2 .Consultants, environmental management 3. On site and Head Office Negative values in (red) Mineral Resources and Mineral Reserves – Jeanette
A consolidated Mineral Resource statement for the Basal and A-Reefs at the Jeanette project area is presented in Table J:-
Table J : Consolidated Mineral Resource Statement for Jeanette (Venmyn, August 2009)
MINERAL RESOURCE CATEGORY
MINING TONNES
(t) **
MINING GRADE
(g/t)
MINING GRADE (cmg/t)
MINING WIDTH
(cm)
CHANNEL WIDTH
(cm)
CHANNEL GRADE
(g/t) GOLD (kg)
GOLD (oz)
Indicated (Black Chert Facies) 23,030,000 9.58 958 100 24 39.92 220,580 7,092,000 Inferred (Overlap Facies) 11,540,000 9.58 958 100 24 39.92 110,530 3,553,000 Inferred (A-Reef) 28,340,000 4.95 559 113 113 4.95 140,260 4,510,000 Total Indicated 23,030,000 9.58 958 100 24 39.92 220,580 7,092,000 Total Inferred 39,880,000 6.29 250,790 8,063,000 TOTAL MINERAL RESOURCE* 62,910,000 7.49 471,370 15,155,000
Mineral Resources quoted are inclusive of Mineral Reserves *Computational discrepancies due to rounding down **Tonnes at cut-off above 3.0g/t Au Source: Venmyn 2009 Geological Losses 25% Area 39,107,291m2 Density value used 2.75t/m3 Average Dip 25°
A Scoping Study by Minxcon (2010) applied modifying factors to the Inferred and Indicated Mineral Resources for Jeanette. The Indicated Mineral Resources were converted to Probable Mineral Reserves. Since no category exists for modified Inferred Resources in international reporting codes, these modified Mineral Resources have not been termed Mineral Reserves but are termed ‘Economic Inferred Mineral Resources’ for the purposes of reporting the Scoping Study results. In order to comply with international reporting standards, both the Mineral Reserves alone and the ‘Mineral Reserves plus Economic Inferred Resources’ are presented in Table K:- Table K : ‘Economic Inferred Mineral Resources’ and Probable Reserves for Jeanette (Minxcon 2010)
REEF CATEGORY VOLUME TONNES GRADE (g/t)
GOLD GOLD ( ‘000 m3) (t) (kg) (oz)
Basal Reef Probable Reserves + Economic Inferred Mineral Resources
10,956 30,130,000 7.26 218,425 7,022,525
Basal Reef Probable Reserve only* 8,086 22,254,000 7.26 161,000 5,191,000 Source: Minxcon 2010 Mining width 88cm (excluding overbreaking) 100% attributable to Taung *Rounded down The Basal Reef, as the primary economic horizon in the Jeanette area has been mined for 60 years, with the result that the level of geological understanding of this reef is high. Although an Inferred Mineral Resource classification has been applied to the Overlap facies, the confidence levels for most of the resource classification parameters exceed those required for classification in the Inferred category.
– IV-14 –

xiv
Taung Gold CPR February 2011
In the context of the high confidence levels applicable to grade distribution in Basal Reef in the Welkom goldfields area, Taung is confident that the Overlap facies Inferred Mineral Resources will be rapidly upgraded to the Indicated category through the proposed exploration programme. It is this confidence in the upgrade of the Inferred Mineral Resources that is the basis for Taung’s motivation to include the Inferred Resources in the Scoping Study. Scoping Study – Jeanette
Jeanette is a historic mine with two unequipped shafts that were sunk during the 1950s which can provide early access. The area has a well developed infrastructure with a rail link and a national road (R30) between Odendaalsrus and Bothaville. Eskom power lines (part of a major grid) are situated close to the western boundary of the prospect area. The No 1 Shaft is a seven compartment vertical shaft, which was concrete lined to a depth of 240m, followed by 4m concrete strips to a depth of 382m. Below this elevation, the shaft walls had been improved sufficiently to allow for normal strip support in conjunction with steel buntons. The 5,5m diameter No 2B Ventilation Shaft is developed to a depth of 1,547m and reef development was conducted on 49 Level at No 2B Shaft. The total development tunnel infrastructure included 3,556m, of which 762m was on the Basal Reef. Taung has recovered the sampling data collected from this development. The Scoping Study on the Basal Reef at Jeanette proposed a conventional/scattered breast mining methodology. The mine design and schedule revealed that Jeanette has a 37 year production life as summarised below:-
5 years – sinking and establishment;
3 years – mine ramp up to full production;
15 years – full tonnage profile production;
4 years – mine ramp down; and
10 years – mining remnant blocks and pillars. Potential exists to optimise the operation and add additional Mineral Resources.
A production rate of 145ktpm is planned for a 15 year steady state production period. The schedule is based on LoM mining of 30.13Mt of ore at an average recovered grade of 6.96g/t Au, and development of 7Mt of waste to access the ore. The total anticipated production over the LoM will be 209t Au or 6.7Moz Au. The new shaft design entails the sinking of a new vertical shaft to a depth of over 1,900m, complete with the necessary infrastructure, within close proximity to the existing ventilation shaft. The new shaft and existing ventilation shaft would be designed to service a production level of 145ktpm. The portions of the ore body originally planned to be accessed from the existing rectangular shaft will be accessed via twin declines and horizontal haulages from the new shaft. The aim is to maximise the mining for as long as possible in order to optimise infrastructural capital expenditure towards steady state of approximately 145ktpm. The ranking of the various mining blocks generated by the 3D geological model was undertaken prior to designing the access from the shaft system so that the most prospective mining blocks could be targeted first in the production sequencing and scheduling studies. The ranking was based on the location and mineralisation available in each block. The mining blocks requiring the least access development were prioritised. An in-situ grade of 11.98g/t Au, over a channel width of 80cm was used for all of the blocks within the payable area (i.e. 64% of the total Mineral Resource area). The projected production statistics for the Jeanette project are shown in Table L:-
– IV-15 –

xv
Taung Gold CPR February 2011
Table L : Jeanette Forecast Production Statistics Schedule
ITEM LoM SUMMARY* (USD)
LoM SUMMARY** (USD)
CAPEX Including Plant and Ongoing CAPEX (1,057,000) (1,024,000) OPEX Life Average cost/tonne milled (72.06) (74.48) Cash Cost Total Cash Cost/oz Au produced (322.03) (330.94)
Production
Annual Ore Production (tonnes per annum – tpa)) 1,720,000 1,63,0000 Monthly Ore Production (tonnes per month- tpm) 145,000 135,000 Annual Gold Production (kg gold per annum ) 11,000 9,600 Annual Peak Gold Production (ounces per annum) 411,000 380,000 Average Production Gold ounces pa 380,000 290,000 Stoping Width (cm) 88 88 Head Grade (g/t) 7.25 7.26 Mine Call Factor 79.90 79.90
Metallurgical
Yield (g/t) 6.96 7.00 Total Gold (kg) 209,518 154,845 Total Gold (ounces) 6,736,149 4,978,381 Total Waste Tonnes (LoM) 7,965,000 6,994,000 Reef: Waste Ratio 3.86 3.18
Figures in (red) are negative Source: Minxcon 2010 *Total Ore body including both Indicated and Inferred Mineral Resources **Indicated Mineral Resources only Mineral Processing – Jeanette
The Jeanette project does not currently have a dedicated processing plant and a new, conventional CIP/CIL plant could be built at an estimated cost of USD92.0m (Minxcon 2010). The cost estimate includes provision for tailings and a rock-dump. The Jeanette project is at a Scoping Study stage of evaluation and Taung has not conducted metallurgical or mineral processing studies. Metallurgical test work will be undertaken at the full BFS stage of the project evaluation. The Basal Reef, A-Reef and B-Reef are mined on surrounding mines with good recoveries in similar facies type and it is anticipated that data from these operations would be appropriate for profiling the metallurgical response of these reefs. Historical and current plant recoveries of 95% to 96% are achieved on adjacent operating mines processing the Basal Reef, A-Reef and B-Reef ores. The capital costs of a new plant have been included in the economic evaluation. However; capital sensitivity studies should be completed to determine if toll treatment or the purchase of an existing plant would be more viable options. Jeanette Project Capital and Operating Expenditure
Capital and operational cost estimates were broadly defined in the Scoping Study from industry benchmarks and known costs of operating mines in the vicinity. These costs are included as examples only and will be defined more accurately during the PFS, when the actual mine design will be developed. The LoM capital for mining and surface facilities was estimated by Minxcon in the 2010 Scoping Study to within 30% accuracy as summarised in Table M. Table M : Jeanette LoM Capital Estimate
TOTAL CAPITAL OVER LoM USD* USD** Feasibility Studies (10,244,625) (10,244,625) Exploration Drilling and 3D Seismic Survey (19,033,638) (19,033,638) Mining Capex (651,724,320) (651,724,320) Plant and Other Infrastructure (181,381,025) (181,381,118) Contingency (73,391,362) (73,391,362) Ongoing Capex (132,080,387) (98,303,408) TOTAL (1,067,855,357) (1,034,078,471)
Source:Minxcon 2010 *Total Ore body including both Indicated and Inferred Mineral Resources **Indicated Mineral Resources only Negative figures in (red)
– IV-16 –

xvi
Taung Gold CPR February 2011
The peak funding requirement for the Jeanette project is estimated to be USD603m in year 2 after commencement of gold prodcution. A LoM total cost of USD118/t could be achieved at a production rate of 145ktpm and includes a USD52.13/t direct operating cost at steady state. The operating cost for the overall LoM is summarised in Table N:- Table N : Estimated Operating Costs for the overall LoM – Jeanette
Cost*(USD/t) Cost **(USD/t) Mining Cost (54.12) (54.37) Processing Costs (9.12) (11.31) Analytical costs (0.08) (0.08) Smelting/treatment charges (0.10 (0.10) Administration/overheads and services (8.64) (8.62) TOTAL (72.06) (74.48)
Source: Minxcon 2010 *Total Ore body including both Indicated and Inferred Mineral Resources Negative figures in (red) **Indicated Mineral Resources only
Project Risks and Potential – Jeanette
At Scoping Study level the following primary risks have been identified and the appropriate mitigating processes will be addressed during the PFS and BFS stages:-
the Basal Reef at the Jeanette Project is overlain by a succession of quartzite and shale. The layer of shale is prevalent in the Northern Free State goldfield and is known locally as the “Khaki Shale”. The shale horizon is of variable thickness and is geotechnically weak. The Khaki Shale is separated from the Basal Reef by a layer of quartzite, also of varying thickness, but which is geotechnically competent;
reef cut assumptions require verification. Whilst the risk associated with conventional mining is low, the challenge at Jeanette is mining under the Khaki Shale, although neighbouring mines do mine under similar conditions. The undercutting of the Khaki Shale alters the overall risk profile so that it becomes the single most important technical risk to be ameliorated or managed;
mining is affected by mostly north-south trending faults with displacements of up to 300m. The final access strategy and timing of the development must be carefully planned to ensure the availability of the stope faces;
operating cost estimates are a risk and their accuracy will be reviewed during the PFS;
operating a conveyor system over a total distance of approximately 26km for all of the blocks combined, notwithstanding the provision of suitable storage systems, will require innovative design and management to maintain daily production rates of 700tpd (reef and waste). If the conveyor system has to be loaded from more than one location (i.e. different mining blocks, advancing waste development, etc.), the efficiency and productivity will be adversely affected unless suitable storage is always available;
developing and operating in decline systems are invariably less efficient and more costly than on horizontal systems. The system of declines will have to rely on trackless vehicles operating at an angle over long distances. A trade-off study between chairlift versus trackless systems will determine the best option; and
training and equipment management in mechanised mining have a major influence on costs.
Recommendations and Conclusions - Jeanette
A focused infill exploration-drilling programme should be designed to improve confidence in the area centred on the Jeanette shaft and underground development. Providing that the inter-borehole sample variance is unaffected by further drilling, an additional 2 boreholes could upgrade the Inferred Resource to an Indicated Resource.
– IV-17 –

xvii
Taung Gold CPR February 2011
It is recommended that a 3D reflective seismic survey planned across a selected surface area of Jeanette and Hilton will provide invaluable structural information upon which the drilling strategy and mine planning can be designed. A fast-tracked PFS is to be commissioned by Taung for the Jeanette project, which will include the following:-
the Inferred Mineral Resources to be upgraded to Indicated Mineral Resources;
a test of the northern high grade ore body area for grade continuity;
an environmental Scoping Study is to be commissioned;
investigation into the use of the ‘rail-veyor system’ for transporting ore and waste;
shaft positions to be optimised;
reviewing the optimal mining and plant throughput rate during PFS and BFS;
working costs need to be defined within a 30% accuracy level;
additional geotechnical studies on under-cutting the Khaki Shale to be undertaken;
geological confidence needs to be improved to determine if reef cut assumptions are valid;
sensitivity studies with regard to the toll treating of ore should be considered; and
application for a mining right towards the end of the PFS.
Taung plans to investigate the economic potential of the other reefs present on the adjacent, Greenfields Hilton project, as well as further examine the Melkkraal facies of the Basal Reef which was excluded from the previous study. Additional 3D modelling exercises will deepen the understanding of the structure and highlight the potential for hitherto unidentified shallow mineralised reef development. Grade distribution models will determine if potentially economic deposits occur on adjacent properties. The technical review of the Jeanette project area has highlighted the following:-
the Jeanette Gold Mine has been investigated on an ongoing basis for the past 60 years. The mine has been dormant since 1955 due to historic economic and geotechnical issues, which may now no longer be valid due to better in the gold price and mining technologies respectively;
the prevailing gold price and market drivers present an opportunity to improve project economics and this, together with advances in mining practices and support technologies, will result in amelioration of the two historical factors, which prevented progress in the past;
the substantial historic Jeanette Mine Basal Reef and Kimberley Formation reef information has been verified and permits the classification of an Indicated Mineral Resource for the Black Chert facies of the Basal Reef. The total Indicated Mineral Resource for the Black Chert facies is estimated to be 23.03Mt (above a 3g/t Au cut-off) at 9.58g/t Au for 7.092Moz contained gold, over a mining width of 100cm;
the consolidated JORC compliant Mineral Resource estimate for the Basal and A Reefs over the Jeanette project at a cutoff grade of 3g/t Au, is:-
o Indicated Mineral Resources 23.03Mt for 7.09Moz contained gold (over a mining width of 100cm); and
o Inferred Mineral Resources 39.88Mt for 8.06Moz contained gold (over a maximum width of 113cm).
upside potential exists for the definition of improved reef development in the northern portion of the lease area where the Basal Reef Loraine facies has been reclassified as the thicker Melkkraal facies;
a sophisticated 3D structural model will be constructed with additional drilling and 3D seismic survey interpretation at the PFS and BFS stages;
– IV-18 –
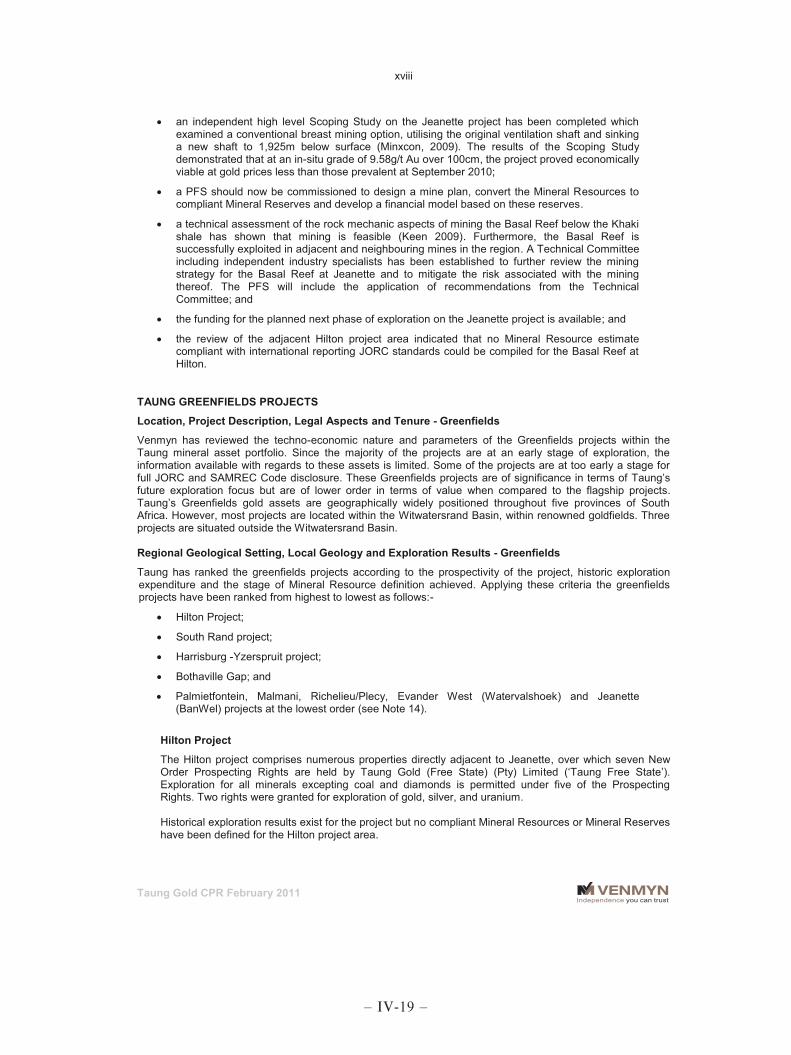
xviii
Taung Gold CPR February 2011
an independent high level Scoping Study on the Jeanette project has been completed which examined a conventional breast mining option, utilising the original ventilation shaft and sinking a new shaft to 1,925m below surface (Minxcon, 2009). The results of the Scoping Study demonstrated that at an in-situ grade of 9.58g/t Au over 100cm, the project proved economically viable at gold prices less than those prevalent at September 2010;
a PFS should now be commissioned to design a mine plan, convert the Mineral Resources to compliant Mineral Reserves and develop a financial model based on these reserves.
a technical assessment of the rock mechanic aspects of mining the Basal Reef below the Khaki shale has shown that mining is feasible (Keen 2009). Furthermore, the Basal Reef is successfully exploited in adjacent and neighbouring mines in the region. A Technical Committee including independent industry specialists has been established to further review the mining strategy for the Basal Reef at Jeanette and to mitigate the risk associated with the mining thereof. The PFS will include the application of recommendations from the Technical Committee; and
the funding for the planned next phase of exploration on the Jeanette project is available; and
the review of the adjacent Hilton project area indicated that no Mineral Resource estimate compliant with international reporting JORC standards could be compiled for the Basal Reef at Hilton.
TAUNG GREENFIELDS PROJECTS
Location, Project Description, Legal Aspects and Tenure - Greenfields
Venmyn has reviewed the techno-economic nature and parameters of the Greenfields projects within the Taung mineral asset portfolio. Since the majority of the projects are at an early stage of exploration, the information available with regards to these assets is limited. Some of the projects are at too early a stage for full JORC and SAMREC Code disclosure. These Greenfields projects are of significance in terms of Taung’s future exploration focus but are of lower order in terms of value when compared to the flagship projects. Taung’s Greenfields gold assets are geographically widely positioned throughout five provinces of South Africa. However, most projects are located within the Witwatersrand Basin, within renowned goldfields. Three projects are situated outside the Witwatersrand Basin. Regional Geological Setting, Local Geology and Exploration Results - Greenfields
Taung has ranked the greenfields projects according to the prospectivity of the project, historic exploration expenditure and the stage of Mineral Resource definition achieved. Applying these criteria the greenfields projects have been ranked from highest to lowest as follows:-
Hilton Project;
South Rand project;
Harrisburg -Yzerspruit project;
Bothaville Gap; and
Palmietfontein, Malmani, Richelieu/Plecy, Evander West (Watervalshoek) and Jeanette (BanWel) projects at the lowest order (see Note 14).
Hilton Project
The Hilton project comprises numerous properties directly adjacent to Jeanette, over which seven New Order Prospecting Rights are held by Taung Gold (Free State) (Pty) Limited (‘Taung Free State’). Exploration for all minerals excepting coal and diamonds is permitted under five of the Prospecting Rights. Two rights were granted for exploration of gold, silver, and uranium. Historical exploration results exist for the project but no compliant Mineral Resources or Mineral Reserves have been defined for the Hilton project area.
– IV-19 –

xix
Taung Gold CPR February 2011
The historic exploration results permit the definition of an exploration target or “deposit” (as defined by the SAMREC Code) for both north and south blocks at 0g/t Au cut-off grade, of 36.4Mt at 2.31g/t Au, potentially yielding 2.71Moz of gold. No ranges have been provided as the statistics required to do this would be speculative and could lead to an unrealistic presentation of technical quantities. The Hilton project represents considerable upside potential for Taung and Venmyn recommends that exploration programmes be designed to upgrade the exploration target or “deposit” to the Inferred and Indicated Mineral Resource categories. Taung’s planned exploration expenditure for the Hilton project for the financial year 2012 is USD0.40m. South Rand Project
The South Rand project consists of numerous Prospecting Rights within the South Rand Basin, in the eastern part of the Witwatersrand Basin. The project area is located 80km southeast of Johannesburg in the Mpumalanga Province of South Africa. The South Rand project has been divided into six prospect regions but sufficient information is available for full evaluation of only three of these regions, namely: Balfour, Witpoort and Roodepoort. The project is accessed via the N3, Johannesburg to Durban highway and the prospect regions are accessible via a network of gravel roads. The Balfour region consists of five Prospecting Rights adjacent to Great Basin Gold Limited’s (‘GBG’) Burnstone project, which has reported Mineral Resources of 10.9Moz at a mean grade of 6.9g/t Au (7.7Moz of which are in the Measured category). The Burnstone project is forecast to produce 254,000oz Au per annum over a 19 year LoM. The Witpoort region consists of five Prospecting Rights located to the southeast of the Balfour region. A drilling programme (11 surface boreholes) clarified the stratigraphy and identified regional marker horizons. Kimberley Reef was identified in two facies types, as channel deposits and as thin grit deposits on palaeo basement highs. The Kimberley Reef channel width varies from 13cm to 95cm and the assay values reported range from zero to 18.12g/t Au. No compliant Mineral Resource can be defined at this stage of the exploration programme. Yzerspruit Project
The Yzerspruit project comprises two areas, namely the Yzerspruit and Harrisburg areas. The Yzerspruit portion of the project is located 20km southwest of the town of Orkney, and 40km southwest of Klerksdorp. The Yzerspruit portion is located in the North West Province of South Africa and is bounded by the Vaal River to the south. The Harrisburg area is situated adjacent and to the south of the Yzerspruit area and is bounded by the Vaal River to the north. Taung has identified 29 boreholes drilled by previous exploration companies which are considered close to, or on, Taung’s project areas and Taung has commissioned geological consultants who have an intimate geological knowledge of the area, to develop geological models and assess the Mineral Resource potential. The historical results show that significant gold mineralisation was intersected on the VCR and Elsburg Reef horizons in the project area and potential exists to define a Mineral Resource base over these project areas. Insufficient data exists at present to define a compliant Mineral Resource for Yzerspruit but historical data suggests that an exploration target or “deposit” (as defined by the SAMREC code) exists over portions of Harrisburg with grades of 6.28g/t Au for the VCR and 4.85g/t Au for the Elsburg reefs. Bothaville Gap Project
The Bothaville Gap project is located between the Klerksdorp and Free State goldfields, near the town of Bothaville, in the Free State Province of South Africa.
– IV-20 –
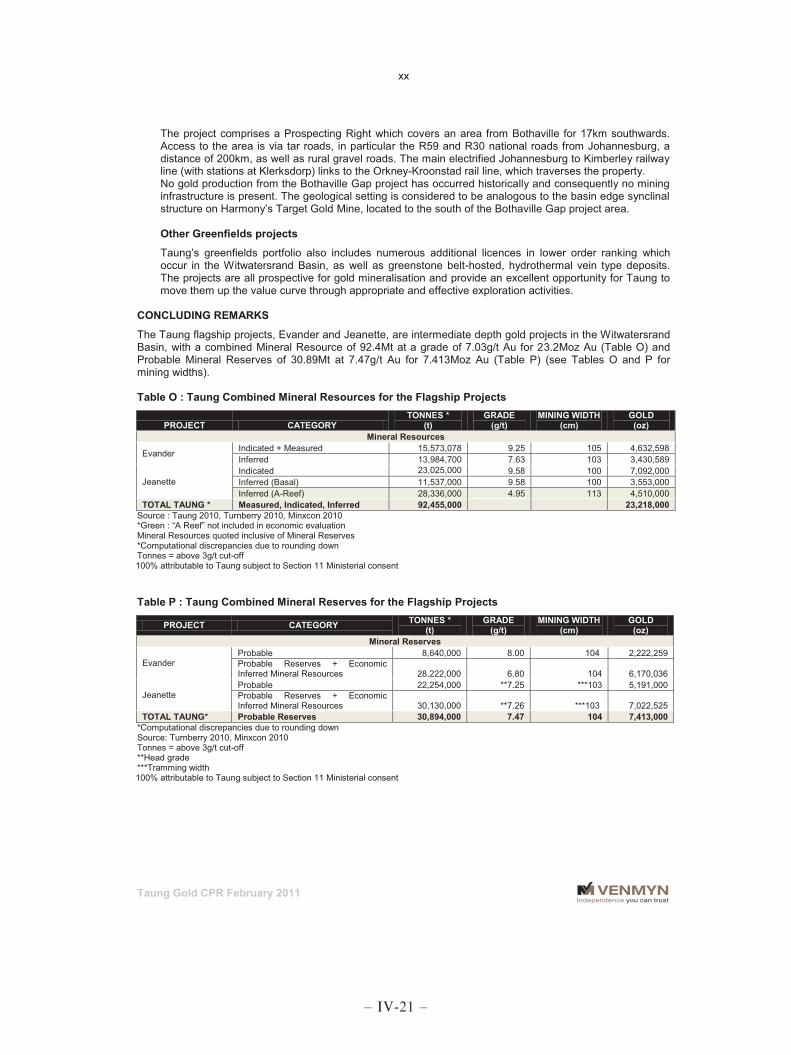
xx
Taung Gold CPR February 2011
The project comprises a Prospecting Right which covers an area from Bothaville for 17km southwards. Access to the area is via tar roads, in particular the R59 and R30 national roads from Johannesburg, a distance of 200km, as well as rural gravel roads. The main electrified Johannesburg to Kimberley railway line (with stations at Klerksdorp) links to the Orkney-Kroonstad rail line, which traverses the property. No gold production from the Bothaville Gap project has occurred historically and consequently no mining infrastructure is present. The geological setting is considered to be analogous to the basin edge synclinal structure on Harmony’s Target Gold Mine, located to the south of the Bothaville Gap project area. Other Greenfields projects
Taung’s greenfields portfolio also includes numerous additional licences in lower order ranking which occur in the Witwatersrand Basin, as well as greenstone belt-hosted, hydrothermal vein type deposits. The projects are all prospective for gold mineralisation and provide an excellent opportunity for Taung to move them up the value curve through appropriate and effective exploration activities.
CONCLUDING REMARKS
The Taung flagship projects, Evander and Jeanette, are intermediate depth gold projects in the Witwatersrand Basin, with a combined Mineral Resource of 92.4Mt at a grade of 7.03g/t Au for 23.2Moz Au (Table O) and Probable Mineral Reserves of 30.89Mt at 7.47g/t Au for 7.413Moz Au (Table P) (see Tables O and P for mining widths). Table O : Taung Combined Mineral Resources for the Flagship Projects
PROJECT CATEGORY TONNES *
(t) GRADE
(g/t) MINING WIDTH
(cm) GOLD (oz)
Mineral Resources
Evander Indicated + Measured 15,573,078 9.25 105 4,632,598 Inferred 13,984,700 7.63 103 3,430,589
Jeanette Indicated 23,025,000 9.58 100 7,092,000 Inferred (Basal) 11,537,000 9.58 100 3,553,000 Inferred (A-Reef) 28,336,000 4.95 113 4,510,000
TOTAL TAUNG * Measured, Indicated, Inferred 92,455,000 23,218,000 Source : Taung 2010, Turnberry 2010, Minxcon 2010 *Green : “A Reef” not included in economic evaluation Mineral Resources quoted inclusive of Mineral Reserves *Computational discrepancies due to rounding down Tonnes = above 3g/t cut-off 100% attributable to Taung subject to Section 11 Ministerial consent Table P : Taung Combined Mineral Reserves for the Flagship Projects
PROJECT CATEGORY TONNES * (t)
GRADE (g/t)
MINING WIDTH (cm)
GOLD (oz)
Mineral Reserves
Evander Probable 8,640,000 8.00 104 2,222,259 Probable Reserves + Economic Inferred Mineral Resources 28,222,000 6.80 104 6,170,036
Jeanette Probable 22,254,000 **7.25 ***103 5,191,000 Probable Reserves + Economic Inferred Mineral Resources 30,130,000 **7.26 ***103 7,022,525
TOTAL TAUNG* Probable Reserves 30,894,000 7.47 104 7,413,000 *Computational discrepancies due to rounding down Source: Turnberry 2010, Minxcon 2010 Tonnes = above 3g/t cut-off **Head grade ***Tramming width 100% attributable to Taung subject to Section 11 Ministerial consent
– IV-21 –

xxi
Taung Gold CPR February 2011
Both flagship projects are historic mines that were closed when higher grade, adjacent Witwatersrand Basin projects were deemed more attractive at that time. In addition, mining methods and support technology in the 1950s constrained effective mining below the Khaki Shale horizon at Jeanette, further motivating the development of other projects. Since 2006, the South African underground gold mining industry has been experiencing rising unit costs as a result of large fixed costs, declining volumes, increasing depths and declining grades. The large fixed costs base of existing older mines are by virtue of outdated and/or inefficient operations, transportation of ore over lomg distances to the shaft and mining ore bodies that have been preferentially depleted of high grade Mineral Reserves. Taung’s two flagship projects, Evander and Jeanette, are however, not constrained by these factors, and therefore represent a new generation of South African gold projects. Evander and Jeanette are, in the Witwatersrand Basin mines context, intermediate depth projects and are projected to produce gold at grades of 6.55g/t Au and 7.25g/t Au respectively. These grades are well above the current average of 5.7g/t Au for the three major Witwatersrand gold mining companies. Furthermore, Taung has a unique advantage over historic and current South African gold operations in that it is able to streamline and design its operations specifically to suit to its production profiles. The resultant average cash operating cost estimate of USD82.5/t reflects this ability in comparison to the current average operating cost of close to USD125.0/t for the three major South African mining companies. The Taung Mineral Reserves will be readily accessible to new shaft systems without the necessity of transporting ore over long distances and Taung will not be mining an ore body preferentially depleted of high grade Mineral Reserves, as is the case in many existing South African gold mines. Scoping Studies on the projects have indicated that the projects are economically robust under current economic parameters utilising modern, cost effective mining methods. The sound data base for the Taung projects enables the fast tracking of the Evander project to the PFS level in a time frame shorter than the industry norm, largely because computerised modelling can effectively optimise this valuable set of underground data. The technical issues of mining below the Khaki Shale at Jeanette have been independently assessed as surmountable, and are being successfully managed in adjacent properties. Both flagship projects can proceed from a platform of existing infrastructure and have the comfort of adjacent operations successfully mining and processing similar reefs under similar geological and structural environments. Taung has demonstrated through Scoping Studies that, with appropriate, modern infrastructure, the projects have the ability to produce a combined annual production of 700,000oz Au, which will commence ramp-up operations in 2013 to optimally benefit from the predicted increase in the gold price. Venmyn is of the opinion that the Taung flagship projects are based on sound geological information and interpretation, in historically well understood geological domains. Both flagship projects display demonstrable potential for increasing their Mineral Resource and Mineral Reserve base, and under the stewardship of the experienced Taung management team, should rapidly progress up the value curve, through the PFS stage to the BFS and development stages. In addition, Taung has a portfolio of prospective greenfields exploration projects that serves as a pipeline for future exploration efforts.
– IV-22 –

xxii
Taung Gold CPR February 2011
INDEPENDENT COMPETENT PERSONS REPORT
ON THE SOUTH AFRICAN
GOLD ASSETS OF
TAUNG GOLD LIMITED BY
VENMYN RAND (PTY) LIMITED
1 INTRODUCTION.......................................................................................................................................... 1
1.1 Competent Persons Declaration and Scope of the Opinion .................................................................... 1
1.2 Source of Information .............................................................................................................................. 2
1.3 Site Visits ................................................................................................................................................. 2
1.4 Reliance on Other Experts ...................................................................................................................... 2
2 TAUNG CORPORATE STRUCTURE ......................................................................................................... 3
3 LOCATION OF TAUNG’S GOLD ASSETS ................................................................................................. 3
4 EVANDER PROJECT .................................................................................................................................. 3
4.1 Property Description and Location .......................................................................................................... 3
4.2 Legal Aspects and Tenure ....................................................................................................................... 5
4.3 Material Agreements................................................................................................................................ 8 4.3.1 Subscription, Shareholder and Sale Agreements with EGM .......................................................... 8 4.3.2 Survey of Property Boundaries ....................................................................................................... 8 4.3.3 Surface Rights ................................................................................................................................ 8 4.3.4 Ore Concentrate and Treatment Agreements ................................................................................ 8 4.3.5 Permits to Conduct Work ................................................................................................................ 8 4.3.6 South African Mining Law ............................................................................................................... 8 4.3.7 Royalties and Taxes ....................................................................................................................... 8
4.4 Accessibility, Infrastructure, Climate and Physiography .......................................................................... 9 4.4.1 Property Access .............................................................................................................................. 9 4.4.2 Topography, Climate and Vegetation ............................................................................................. 9 4.4.3 Infrastructure with Respect to Mining ............................................................................................. 9
4.5 History ...................................................................................................................................................... 9 4.5.1 Historical Exploration ...................................................................................................................... 9
4.6 Regional Geology and Mineralisation of the Witwatersrand Basin ....................................................... 10 4.6.1 Stratigraphy of the Witwatersrand Basin ...................................................................................... 10 4.6.2 Mineralisation of the Witwatersrand Basin .................................................................................... 13 4.6.3 Structural Controls of the Witwatersrand Basin ............................................................................ 13
4.7 Geological Setting of the Evander Goldfield .......................................................................................... 13
4.8 Local Geology of the Evander Project ................................................................................................... 13
4.9 Deposit Type and Mineralisation ........................................................................................................... 16
4.10 Exploration ........................................................................................................................................ 16
4.11 Geological Data ................................................................................................................................. 18 4.11.1 Drilling ....................................................................................................................................... 18 4.11.2 Sampling Methodology ............................................................................................................. 18
– IV-23 –
xxiii
Taung Gold CPR February 2011
4.11.3 Data Management, Processing and Verification ...................................................................... 18
4.12 Mineral Resources and Mineral Reserves ........................................................................................ 18 4.12.1 Geological Modelling ................................................................................................................ 18 4.12.2 Conversion of Mineral Resources to Mineral Reserves ........................................................... 25 4.12.3 Logic for Inclusion of Inferred Mineral Resources in the Scoping Study .................................. 27 4.12.4 Logic for Classification of Evander Inferred Mineral Resources .............................................. 27
4.13 Techno-Economic Study – Mining .................................................................................................... 27 4.13.1 Overview ................................................................................................................................... 27 4.13.2 Geological Model and Mining Methodology in the Mine Design .............................................. 28 4.13.3 Evander Project Scheduling ..................................................................................................... 28 4.13.4 Mine Planning and Development/Stoping Scheduling ............................................................. 30 4.13.5 Production Schedule – Tonnage Sources and Profiles ............................................................ 30 4.13.6 Geotechnical and Hydrological Aspects ................................................................................... 30 4.13.7 Mining Infrastructure ................................................................................................................. 33 4.13.8 Ventilation Requirements ......................................................................................................... 34 4.13.9 Manpower ................................................................................................................................. 34 4.13.10 Capital Requirements and Costs .............................................................................................. 35 4.13.11 Working Capital ........................................................................................................................ 37 4.13.12 Project Risk Profile ................................................................................................................... 38 4.13.13 Gold Market Assessment ......................................................................................................... 39
4.14 Techno-Economic Study – Mineral Processing ................................................................................ 39 4.14.1 General ..................................................................................................................................... 39 4.14.2 Plant Design ............................................................................................................................. 39
4.15 Techno-Economic Study - Project Implementation ........................................................................... 39
4.16 Environmental Considerations .......................................................................................................... 39 4.16.1 Tailings Storage Facility ........................................................................................................... 40
4.17 Social, Community and Land Use ..................................................................................................... 40
4.18 Conclusions ....................................................................................................................................... 40
5 JEANETTE PROJECT ............................................................................................................................... 42
5.1 Property Description and Location ........................................................................................................ 42
5.2 Legal Aspects and Tenure ..................................................................................................................... 42
5.3 Material Agreements.............................................................................................................................. 44 5.3.1 Survey of Property Boundaries ..................................................................................................... 44 5.3.2 Surface Rights .............................................................................................................................. 44 5.3.3 Ore Concentrate and Treatment Agreement ................................................................................ 44 5.3.4 Permits to Conduct Work .............................................................................................................. 44 5.3.5 South African Mining Law , Royalties and Taxes ......................................................................... 44
5.4 Accessibility, Infrastructure, Climate and Physiography ........................................................................ 44 5.4.1 Property Access ............................................................................................................................ 44 5.4.2 Topography, Climate and Vegetation ........................................................................................... 44 5.4.3 Infrastructure with Respect to Mining ........................................................................................... 45
5.5 Historical ................................................................................................................................................ 45 5.5.1 Early Historical Exploration and Mine Development ..................................................................... 45
5.6 Regional Geology and Mineralisation .................................................................................................... 46 5.6.1 Regional Geology and Mineralisation of the Witwatersrand Basin ............................................... 46 5.6.2 Regional Geological Setting of the Welkom Goldfield .................................................................. 46
5.7 Local Geology of the Jeanette Project................................................................................................... 49 5.7.1 Structure of the Jeanette Region .................................................................................................. 49 5.7.2 Stratigraphy of the Jeanette Project ............................................................................................. 49 5.7.3 Mineralised Reefs of the Jeanette Project .................................................................................... 49
5.8 Deposit Type and Mineralisation ........................................................................................................... 52
– IV-24 –

xxiv
Taung Gold CPR February 2011
5.8.1 Widths of the Mineralised Zones and Basal Reef Hanging Wall .................................................. 52 5.8.2 Orientation of the Mineralised Zones ............................................................................................ 52
5.9 Recent Exploration ................................................................................................................................ 53
5.10 Geological Data ................................................................................................................................. 53 5.10.1 Drilling – Due Diligence of Historic Drilling and Re-sampling ................................................... 53 5.10.2 Sampling Methodology ............................................................................................................. 55
5.11 Mineral Resources and Mineral Reserves ........................................................................................ 57 5.11.1 Geological Modelling ................................................................................................................ 57 5.11.2 Mineral Resource and Reserve Estimates ............................................................................... 57 5.11.3 Summary of Mineral Resource Classification Logic for Jeanette ............................................. 61 5.11.4 Inclusion of Inferred Mineral Resources in the Scoping Study ................................................. 61 5.11.5 Modifying Factors ..................................................................................................................... 62 5.11.6 Jeanette Planned Exploration Expenditure .............................................................................. 63
5.12 Mining ................................................................................................................................................ 63 5.12.1 Overview ................................................................................................................................... 63 5.12.2 Mine Design in the Scoping Study............................................................................................ 64 5.12.3 Mine Planning and Scheduling ................................................................................................. 64 5.12.4 Manpower ................................................................................................................................. 68 5.12.5 Capital Requirements ............................................................................................................... 68 5.12.6 Working Capital ........................................................................................................................ 70 5.12.7 Project Risk Profile ................................................................................................................... 71
5.13 Processing ......................................................................................................................................... 71
5.14 Project Implementation ...................................................................................................................... 71 5.14.1 Contracting Strategy ................................................................................................................. 71 5.14.2 Status of Implementation .......................................................................................................... 71 5.14.3 Project Schedule....................................................................................................................... 71
5.15 Environmental Considerations .......................................................................................................... 72 5.15.1 Environmental Standards ......................................................................................................... 72
5.16 Social, Community and Land Use ..................................................................................................... 72
5.17 Conclusions ....................................................................................................................................... 72
6 GREENFIELDS PROJECTS ..................................................................................................................... 74
6.1 Hilton Project ......................................................................................................................................... 74 6.1.1 Property Description and Location ................................................................................................ 74 6.1.2 Property Accessibility, Climate and Physiography........................................................................ 76 6.1.3 Geology, Historical Exploration and Potential ............................................................................... 76
6.2 South Rand Project................................................................................................................................ 79 6.2.1 Property Description and Location ................................................................................................ 79 6.2.2 Property Accessibility, Climate and Physiography........................................................................ 81 6.2.3 Historical Exploration and Potential .............................................................................................. 81 6.2.4 Geology of the South Rand Basin ................................................................................................ 81
6.3 Bothaville Gap Project ........................................................................................................................... 82 6.3.1 Property Description and Location ................................................................................................ 82 6.3.2 Historical Exploration and Potential .............................................................................................. 88 6.3.3 Geology and Mineralisation .......................................................................................................... 88
6.4 Yzerspruit Project .................................................................................................................................. 88 6.4.1 Property Description and Location ................................................................................................ 88 6.4.2 Historical Exploration and Potential .............................................................................................. 91 6.4.3 Geology and Mineralisation .......................................................................................................... 91
6.5 Other Greenfield Projects ...................................................................................................................... 91
7 REFERENCES........................................................................................................................................... 92
– IV-25 –

xxv
Taung Gold CPR February 2011
LIST OF TABLES
Table 1 : Summary of Site Visits - Evander ...................................................................................................... 2 Table 2 : Reliance on Other Experts for Evander and Jeanette ........................................................................ 2 Table 3 : Summary of Taung's Gold Assets ...................................................................................................... 3 Table 4 : The Evander Project, Location, Extent and Rights Status ................................................................. 5 Table 5 : Legal Aspects and Tenure of Six Shaft .............................................................................................. 8 Table 6 : Legal Aspects and Tenure of Twistdraai ............................................................................................ 8 Table 7 : Stratigraphy of the Witwatersrand Basin .......................................................................................... 10 Table 8 : Mineral Resource Estimates for Six Shaft at Various Cut-off Grades, 2009 ................................... 21 Table 9 : Mineral Resource Estimates for Six Shaft Geo-zones at a Cut-off Grade of >500cmg/t Au (August
2009) ........................................................................................................................................... 22 Table 10 : Mineral Resource Estimates for Twistdraai at Various Cut-off Grades (August 2009) .................. 24 Table 11 : Mineral Resource Statement for Twistdraai Geo-zones at a Cut-off Grade of >500cmg/t Au ....... 24 Table 12 : Total Evander Mineral Resource in the Geo-zones at 100cm SW (>500cmg/t Cut-off Grade) May
2010 ............................................................................................................................................ 25 Table 13 : Modifying Factors for ‘Flats’ (Turnberry 2010) ............................................................................... 26 Table 14 : Modifying Factors for 'Steeps' (Turnberry 2010) ............................................................................ 26 Table 15 : Mineral Reserves for the Shaft Geo-zone, Six Shaft May 2010 ..................................................... 26 Table 16 : Probable Reserves and ‘Economic Inferred Mineral Resources’ for Evander (Turnberry 2010) ... 27 Table 17 : Ramp-up Production Schedule for Evander ................................................................................... 31 Table 18 : Evander Project Staffing Profile at Full Production ........................................................................ 35 Table 19 : Phased Capital Expenditure ........................................................................................................... 35 Table 20 : Revised LoM Capital Expenditure .................................................................................................. 36 Table 21 : Future Exploration Expenditure for the Evander Project for the Financial Year ending February 2012
.................................................................................................................................................... 36 Table 22 : Evander Operating Cost Estimate (Turnberry 2010) ...................................................................... 37 Table 23 : Production Parameters and Phases in Relation to Costs .............................................................. 38 Table 24 : Legal Aspects and Tenure of Jeanette ........................................................................................... 42 Table 25 : Historical Ownership and Exploration on Jeanette......................................................................... 45 Table 26: Borehole Values and Facies Type for the Basal Reef– Jeanette .................................................... 58 Table 27 : Grade Tonnage Data for the A Reef .............................................................................................. 60 Table 28: Consolidated Mineral Resource Estimate – Jeanette (Venmyn, August 2009) .............................. 61 Table 29: Design Criteria and Modifying Factors – Jeanette (Minxcon, 2010) ............................................... 62 Table 30: Probable Reserves and ‘Economic Inferred Mineral Resources’ for Jeanette (Minxcon 2010 ....... 63 Table 31 : Exploration Expenditure for Jeanette for the Financial Year 2012 ................................................. 63 Table 32 : Ramp-up Mining Production for Jeanette Scoping Study including Indicated and Inferred Mineral
Resources (Minxcon, 2010) ........................................................................................................ 65 Table 33 : Ramp-up Mining Production Schedule for Jeanette Scoping Study for Indicated Mineral Resources
Only (Minxcon 2010) ................................................................................................................... 65 Table 34 : Production Statistics for Jeanette ................................................................................................... 67 Table 35 : Mining Capex Estimates for Jeanette Mine .................................................................................... 69 Table 36 : Total LoM Capital for Jeanette ....................................................................................................... 69 Table 37 : EPCM Activity Costs ....................................................................................................................... 69 Table 38 : Process Plant and Infrastructure Capital ........................................................................................ 70 Table 39 : Operating Costs over LoM .............................................................................................................. 70 Table 40 : Summary of Taung's Greenfields Assets ....................................................................................... 74 Table 41 : Legal Aspects and Tenure of Hilton ............................................................................................... 76 Table 42 : Mineral Deposit Estimate of a Portion of the Hilton Area ............................................................... 77 Table 43 : Indicated Tonnage Estimates for Structural Blocks at Hilton ........................................................ 77 Table 44 : Legal Aspects and Tenure of Balfour Region ................................................................................. 79 Table 45 : Legal Aspects and Tenure of Witpoort Region............................................................................... 79 Table 46 : Legal Aspects and Tenure of Roodepoort Region ......................................................................... 79 Table 47 : Historical Exploration in the South Rand Region ........................................................................... 81 Table 48 : Legal Aspects and Tenure of the Bothaville Project....................................................................... 82 Table 49 : Mineral Resource Statements for Adjacent Properties .................................................................. 88 Table 50 : Legal Aspects and Tenure - Harrisburg Area of the project ........................................................... 89 Table 51 : Legal Aspects and Tenure - Yzerspruit Area of the project ........................................................... 89 Table 52 : Evander Project Schedule ............................................................................................................ 114
– IV-26 –
xxvi
Taung Gold CPR February 2011
LIST OF FIGURES
Figure 1 :Taung Corporate Structure ................................................................................................................. 4 Figure 2 : Location of Taung’s Principal Gold Assets ........................................................................................ 6 Figure 3 : Location and Infrastructure of Six Shaft ............................................................................................ 7 Figure 4 : Historical Boreholes and Reef Intersections - Six Shaft and Twistdraai ......................................... 11 Figure 5 : Interpreted Regional Geology of the Witwatersrand Basin (Pre-Ventersdorp Age) ........................ 12 Figure 6 : Local Geology, Structure and Stratigraphy of Evander Goldfield ................................................... 14 Figure 7 : Regional Structural Control of the Evander Goldfield ..................................................................... 15 Figure 8 : Schematic Representation of the Nature and Evolution of the Evander Goldfield ......................... 17 Figure 9 : 3D Geological Model and Geo-zones Defined by Gold Content and Structural Domain................ 20 Figure 10 : Geo-zones and Structural Blocks Defined for the Evander Ore Body .......................................... 23 Figure 11 : Geo-zone Mining Sequence .......................................................................................................... 29 Figure 12 : Six Shaft and Twistdraai Annual Production and Waste Schedule............................................... 32 Figure 13 : Locality and Infrastructure of Jeanette .......................................................................................... 43 Figure 14 : Historical Exploration on Jeanette ................................................................................................. 47 Figure 15: Regional Structural Controls of the Welkom Goldfield ................................................................... 48 Figure 16: Local Geology and Structural Controls – Jeanette ........................................................................ 50 Figure 17 : Mine Design Criteria and Preliminary 3D Model of the Basal Reef .............................................. 59 Figure 18 : Target Mining Blocks for Jeanette ................................................................................................. 66 Figure 19 : Locality, Infrastructure and Historical Exploration - Hilton ............................................................ 75 Figure 20 : Structural Features - Hilton ........................................................................................................... 78 Figure 21 : Locality and Exploration Regions of the South Rand Project ....................................................... 80 Figure 22 : Geology and Structure of the South Rand Basin .......................................................................... 83 Figure 23: Geology and Historical Exploration - Balfour Region ..................................................................... 84 Figure 24 : Geology and Exploration of the Witpoort Region .......................................................................... 85 Figure 25: Geology and Exploration of Roodepoort Region............................................................................ 86 Figure 26 : Locality of the Bothaville Project Relative to Other Exploration Projects ...................................... 87 Figure 27 : Locality and Infrastructure of the Yzerspruit Project ..................................................................... 90 Figure 28 : Spot Price Trends in Gold ........................................................................................................... 111
LIST OF’NOTES TO CPR’ Note 1 : Glossary and Abbreviation, Units of Measurement and Acronyms ................................................... 95 Note 2 : Legal Aspects and Tenure Evander ................................................................................................ 100 Note 3 : South African Mining and Environmental Law ................................................................................. 102 Note 4 : Global Gold Market .......................................................................................................................... 109 Note 5 : Sampling Protocols for Evander ...................................................................................................... 112 Note 6 : Production Schedule for Evander .................................................................................................... 113 Note 7: Risk Assessment Matrix - Evander ................................................................................................... 115 Note 8 : Surface Rights Owners of Jeanette and Hilton ................................................................................ 118 Note 9 : Historical Sampling Results for Jeanette ......................................................................................... 120 Note 10 : Sampling Protocols for Due Diligence of the Reefs at Jeanette .................................................... 122 Note 11 : Re-sampled Intervals and Re-sampling for Basal Reef at Jeanette .............................................. 124 Note 12 : Risk Assessment Matrix for Jeanette............................................................................................. 126 Note 13 : Jeanette Project Schedule ............................................................................................................. 129 Note 14 : Greenfields Project Locations, Status of Legal Tenure and Size of Rights ................................... 130 Note 15 : Competent Persons Certificates .................................................................................................... 132
– IV-27 –
xxvii
Taung Gold CPR February 2011
DISCLAIMER AND RISKS
This Independent Competent Persons Report has been prepared by Venmyn. In the preparation of the report, Venmyn has utilised information relating to operational methods and expectations provided to them by Taung. Where possible, Venmyn has verified this information from independent sources after making due enquiry of all material issues that are required in order to comply with the JORC Code. Venmyn and its directors accept no liability for any losses arising from reliance upon the information presented in this report.
OPERATIONAL RISKS The business of mining and mineral exploration, development and production by their nature contain significant operational risks. The business depends upon, amongst other things, successful prospecting programmes and competent management. Profitability and asset values can be affected by unforeseen changes in operating circumstances and technical issues.
POLITICAL AND ECONOMIC RISK Factors such as political and industrial disruption, currency fluctuation and interest rates could have an impact on Taung’s future operations, and potential revenue streams can also be affected by these factors. The majority of these factors are, and will be, beyond the control of Taung or any other operating entity.
COMPLIANCE AND “NOTES” TO THE CPR The techno-economic review of the Taung Assets has been compiled as a CPR, according to comprehensive checklists that ensure compliance with:-
Australasian Code for Reporting of Exploration Results, Mineral Resources and Ore Reserves (JORC Code);
reporting in compliance with the South African Code for the Reporting of Exploration Results, Mineral Resources and Mineral Reserves (SAMREC Code);
the South African Code for the Reporting of Mineral Asset Valuation (SAMVAL Code); and
full compliance with the Hong Kong Exchange Listing Rules for Mineral and Exploration companies (Chapter 18).
Portions of the CPR that are required for full compliance that either contain information strategic to Taung’s operation or are applicable to all the flagship projects, have been extracted from the main body of the CPR and are presented as Notes at the end of the technical sections.
– IV-28 –

1
Taung Gold CPR February 2011
1 INTRODUCTION Taung holds the Prospecting Rights in respect of various gold developmental and exploration projects in the Mpumalanga, Limpopo, North West, Gauteng and Free State provinces of South Africa. These gold assets are combined into a focused entity whose business will be to develop the highly prospective projects and to conduct further exploration on the greenfields and brownfield exploration projects within the portfolio. Taung’s vision is to become a significant role player in the South African gold exploration, development and mining sector. The Group has implemented a sound business strategy ensuring steady value growth of its assets. Building on the technical strength and extensive industry experience of its management team, Taung has prepared detailed plans to grow the company and move it up the value curve. Taung’s strategy is to generate shareholder value through securing competitive assets, conducting effective historical data investigation and exploration and thereafter, fast-tracking project proposal and development on the most attractive projects. The technical team, with the assistance of independent consultancy companies, has utilised historical and current exploration data and mining knowledge to add significant value to its flagship projects. Taung’s Black Economic Empowerment (‘BEE’) partner is Sephaku Gold Holdings (Pty) Ltd (‘Sephaku’). Sephaku has undertaken to maintain its shareholding in Taung at the levels required by law. The technical documentation in support of a ‘Very Substantial Acquisition’ (‘VSA’) between Wing Hing International (Holdings) Limited (‘Wing Hing’) and Taung on the Hong Kong Exchange (‘HKeX’), has been prepared for Taung and Wing Hing in the form of this Competent Persons Report (‘CPR’). The CPR describes and documents Taung’s flagship mineral assets, namely the Jeanette project in the Free State Province and the Evander project in the Mpumalanga Province. The Evander and Jeanette projects are advanced exploration projects for which Scoping Studies have been completed and for which Pre-Feasibility Studies (‘PFS’) are being commissioned. These flagship projects represent a sound and attractive base from which to accelerate through PFS to Bankable Feasibility Study (‘BFS’) and development phases. The CPR also includes the remaining Greenfields projects in various provinces, which are at an exploration stage and in respect of which no Mineral Resources have been reported. The CPR has been compiled by Venmyn according to propriety comprehensive checklists that ensure the following:-
reporting in compliance with the South African Code for the Reporting of Exploration Results, Mineral Resources and Mineral Reserves (‘SAMREC Code’);
the South African Code for the Reporting of Mineral Asset Valuation (‘SAMVAL Code’);
reporting in compliance with the ‘Australasian Code for Reporting of Exploration Results, Mineral Resources and Ore Reserves’ (‘JORC Code’); and
full compliance with the Hong Kong Exchange Listing Rules for Mineral and Exploration companies.
Throughout the CPR all monetary values are quoted in US dollars (‘USD’). An exchange rate of ZAR8.0:USD1.0 has been assumed (‘ZAR’ South African Rand). 1.1 Competent Persons Declaration and Scope of the Opinion
Venmyn is an independent advisory company and its consultants have extensive experience in preparing competent persons’, technical advisors’ and valuation reports for mining and exploration companies. Venmyn’s advisors have, collectively, more than 100 years of experience in the assessment and evaluation of mining projects and are members in good standing of appropriate professional institutions. The signatories to this report are qualified to express their professional opinions on the values of the mineral assets described and, to this end; Competent Persons Certificates are presented in Note 15. Neither Venmyn nor its staff have, or have had, any interest in this project capable of affecting their ability to give an unbiased opinion, and have not and will not receive any pecuniary or other benefits in connection with this assignment, other than normal consulting fees. In executing its mandate, Venmyn undertook a technical evaluation of the contributing gold assets and project components in order to identify all modifying factors of both a technical and economic nature. Venmyn also considered the strategic merits of the proposed projects and has defined the valuation outcomes on an open and transparent basis.
– IV-29 –

2
Taung Gold CPR February 2011
1.2 Source of Information
This CPR has been based upon historical and current technical information supplied by Taung and its subsidiary companies. Portions of the technical information were sourced from independent technical and due diligence exercises conducted by other consultants, whose information and expert opinions are partially used in this report with permission and referenced in the appropriate positions in the text. A summary of the extent of the reliance on these independent experts is presented in Section 1.4 and a list of the source documentation is presented in Section 7. Taung has warranted that it has openly provided all material information to Venmyn, which, to the best of its knowledge and understanding, is complete, accurate and true.
1.3 Site Visits
The Taung flagship projects have been visited by Venmyn in the course of 2008 and 2009. The site visits conducted by independent consultant, Mr. D. Kershaw of The Mineral Corporation (‘TMC’), were conducted on the 14th and 22nd April 2008. The site visits to Evander are summarised in Table 1.
Table 1 : Summary of Site Visits - Evander PROJECT DATE EXPERT COMPANY
Evander and Jeanette 2008,2009 Mr A.N.Clay Venmyn
Evander 6 Shaft March 2008, July 2008 Mr G. Mitchell Mr A. Deiss Mr K. Pienaar
ExplorMine Consultants
1.4 Reliance on Other Experts
Venmyn has relied upon the independent opinion of the following experts to the extent and in the context described in the summary below. The technical reports by independent consultants have been reviewed by Venmyn and, having made due enquiry, Venmyn is reasonably assured that they are based on accepted South African industry practice and fairly represent Taung’s assets. Venmyn has reviewed the legal title documentation and, whilst this does not constitute a legal opinion, the authors have satisfied themselves that the information presented herein is materially correct.
Table 2 : Reliance on Other Experts for Evander and Jeanette PROJECT EXPERT COMPANY TYPE OF STUDY DATE EXTENT OF RELIANCE
Evander
Six Shaft
Mitchell G. ExplorMine
Competent Persons Report ('CPR') of the Resource Estimate for the Six Shaft Mpumalanga Province, SA
2008 Reliance on data verification and mineral resource estimate
Mitchell, G. et al ExplorMine
CPR of the Resource Estimate for the Evander Six Shaft Area, Mpumalanga Province, SA
2009 Reliance on data verification and mineral resource estimate
Lemmer C. Geological and Geostatistical Services
Evander Upgrade Requirements: Additional Questions Addressed
2008 Reliance on statistical evaluation
Spindler, T et al
Turnberry/Ukwazi Group
Reserve and Preliminary Assessment -Mine Design Criteria
2009 Conversion of Mineral Resources to Mineral Reserves, Mine design
Twistdraai
Posley A. Stefan, Roberts and Kirsten Harmony CPR 2007 Reliance on data verification
Mitchell, G. et al Spindler et al
ExplorMine
CPR of the Resource Estimate for the Twistdraai Area, Evander Gold Mines, Mpumalanga Province, SA
2009/2010 Reliance on data verification and Mineral Resource estimation
Jeanette
Jeanette - The Mineral Corporation
Evaluation of the Basal Reef and Kimberley Formation reefs in terms of tonnage and grade, updated Mineral Resource
2008 & 2009
Reliance on Due Diligence of the re-sampling programme and mineral resource estimate
Jeanette Lemmer C. Geological and Geostatistical Services
Jeanette project Resource Upgrade Requirements 2008 Reliance on statistical evaluation
Jeanette Campbell D. Sound Mining Solutions (‘SMS’)
Jeanette Gold Mine project Scoping Study 2009 Reliance on conversion of mineral
resources to reserves, mine plan and
– IV-30 –

3
Taung Gold CPR February 2011
PROJECT EXPERT COMPANY TYPE OF STUDY DATE EXTENT OF RELIANCE scheduling
Jeanette Keen, J.E. Consulting Rock Engineering
A Technical Assessment of the Feasibility of proposed Mining of the Basal reef overlain by Khaki Shales
2008 Technical assessment of potential to safely mine below the shale
Jeanette Odendal, J. Minxcon Technical Review 2010 Greenfields Project
South Rand Mitchell G. ExplorMine Report on Stratigraphic Correlation of Boreholes 2007 Reliance on stratigraphic confirmation
Bothaville Gap Bargmann, C. Snowden
Geological Report on Sephaku’s Gold Explorations Bothaville Gap Project
2008 Due Diligence of Historical Data
Hilton - The Mineral Corporation
Technical review of historical data 2008
Reliance on due diligence of original borehole data and potential mineralisation estimate
Source: Taung
2 TAUNG CORPORATE STRUCTURE Taung was incorporated in 2004 for the purpose of holding the South African gold assets of APM, a gold exploration company registered in the British Virgin Islands. Originally incorporated under the name Midnight Masquerade Properties 151 (Pty) Limited, the company changed its name to Taung Gold Holdings (Pty) Limited in 2005. Taung was subsequently converted from a private to a public company called Taung Gold Holdings Limited and the company name changed to Taung Gold Limited. Taung ceased to be a subsidiary of APM in 2008. Sephaku is Taung’s Black Economic Empowerment (‘BEE’) partner and holds a 26% equity interest in Taung (Figure 1). Taung’s corporate structure is illustrated in the organizational structure in Figure 1.
3 LOCATION OF TAUNG’S GOLD ASSETS Taung holds prospecting and mining rights in respect of various gold assets in the Mpumalanga, Limpopo, Gauteng, North West and Free State Provinces of South Africa as summarised in Table 3. The majority of the assets, including Taung’s flagship projects are situated within the world renowned Witwatersrand Basin and the location of these assets is illustrated in Figure 2.
Table 3 : Summary of Taung's Gold Assets PROVINCE PROJECT PROPERTY SIZE (ha) HELD BY TYPE OF RIGHT
Mpumalanga Evander Six Shaft 2,452 Evander Gold Mines Limited New Order Mining Right Twistdraai 2,677 Evander Gold Mines Limited New Order Mining Right
Free State Jeanette Jeanette 3,886 Taung Gold Free State (Pty) Limited New Order Prospecting Right
Various Greenfields Various 96,401 Various New Order Prospecting Rights Source: Taung 2011
4 EVANDER PROJECT 4.1 Property Description and Location
The Evander project (‘Evander’) consists of two adjacent areas, namely Six Shaft area (‘Six Shaft’) and Twistdraai area (‘Twistdraai’), located in the eastern Highveld of the Mpumalanga Province of South Africa as summarised in Table 4 and illustrated in Figure 2 and Figure 3.
– IV-31 –

– IV-32 –
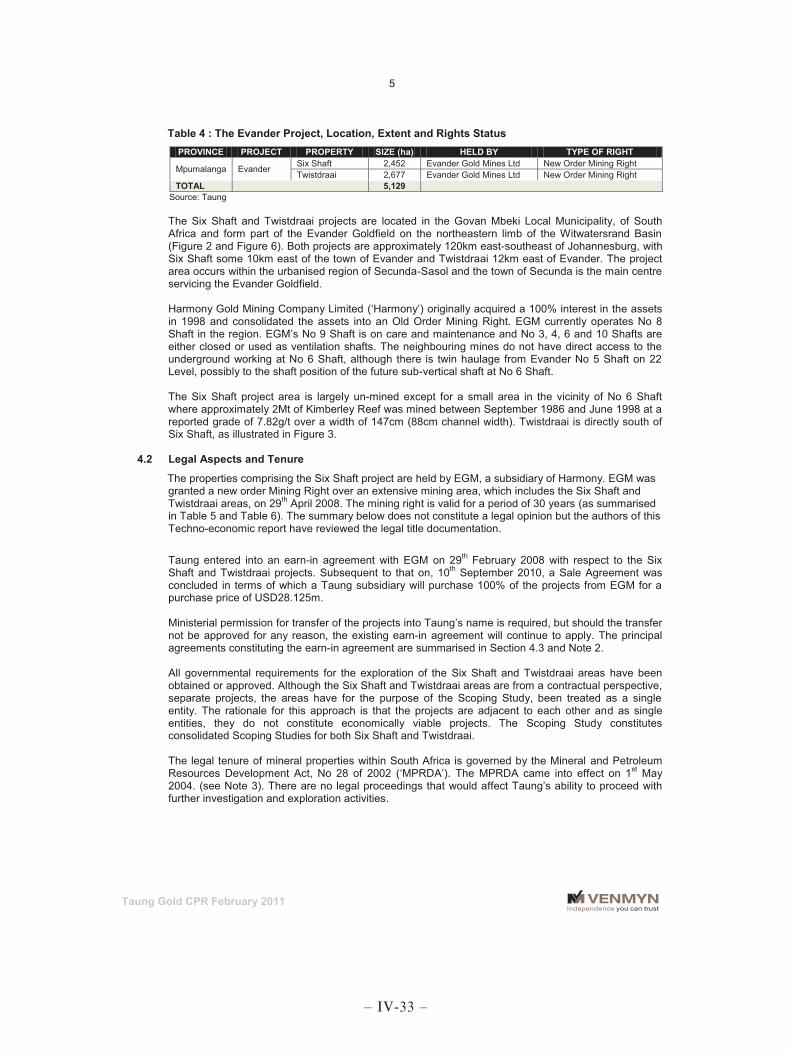
5
Taung Gold CPR February 2011
Table 4 : The Evander Project, Location, Extent and Rights Status PROVINCE PROJECT PROPERTY SIZE (ha) HELD BY TYPE OF RIGHT
Mpumalanga Evander Six Shaft 2,452 Evander Gold Mines Ltd New Order Mining Right Twistdraai 2,677 Evander Gold Mines Ltd New Order Mining Right
TOTAL 5,129 Source: Taung The Six Shaft and Twistdraai projects are located in the Govan Mbeki Local Municipality, of South Africa and form part of the Evander Goldfield on the northeastern limb of the Witwatersrand Basin (Figure 2 and Figure 6). Both projects are approximately 120km east-southeast of Johannesburg, with Six Shaft some 10km east of the town of Evander and Twistdraai 12km east of Evander. The project area occurs within the urbanised region of Secunda-Sasol and the town of Secunda is the main centre servicing the Evander Goldfield. Harmony Gold Mining Company Limited (‘Harmony’) originally acquired a 100% interest in the assets in 1998 and consolidated the assets into an Old Order Mining Right. EGM currently operates No 8 Shaft in the region. EGM’s No 9 Shaft is on care and maintenance and No 3, 4, 6 and 10 Shafts are either closed or used as ventilation shafts. The neighbouring mines do not have direct access to the underground working at No 6 Shaft, although there is twin haulage from Evander No 5 Shaft on 22 Level, possibly to the shaft position of the future sub-vertical shaft at No 6 Shaft. The Six Shaft project area is largely un-mined except for a small area in the vicinity of No 6 Shaft where approximately 2Mt of Kimberley Reef was mined between September 1986 and June 1998 at a reported grade of 7.82g/t over a width of 147cm (88cm channel width). Twistdraai is directly south of Six Shaft, as illustrated in Figure 3.
4.2 Legal Aspects and Tenure
The properties comprising the Six Shaft project are held by EGM, a subsidiary of Harmony. EGM was granted a new order Mining Right over an extensive mining area, which includes the Six Shaft and Twistdraai areas, on 29th April 2008. The mining right is valid for a period of 30 years (as summarised in Table 5 and Table 6). The summary below does not constitute a legal opinion but the authors of this Techno-economic report have reviewed the legal title documentation.
Taung entered into an earn-in agreement with EGM on 29th February 2008 with respect to the Six Shaft and Twistdraai projects. Subsequent to that on, 10th September 2010, a Sale Agreement was concluded in terms of which a Taung subsidiary will purchase 100% of the projects from EGM for a purchase price of USD28.125m. Ministerial permission for transfer of the projects into Taung’s name is required, but should the transfer not be approved for any reason, the existing earn-in agreement will continue to apply. The principal agreements constituting the earn-in agreement are summarised in Section 4.3 and Note 2. All governmental requirements for the exploration of the Six Shaft and Twistdraai areas have been obtained or approved. Although the Six Shaft and Twistdraai areas are from a contractual perspective, separate projects, the areas have for the purpose of the Scoping Study, been treated as a single entity. The rationale for this approach is that the projects are adjacent to each other and as single entities, they do not constitute economically viable projects. The Scoping Study constitutes consolidated Scoping Studies for both Six Shaft and Twistdraai. The legal tenure of mineral properties within South Africa is governed by the Mineral and Petroleum Resources Development Act, No 28 of 2002 (‘MPRDA’). The MPRDA came into effect on 1st May 2004. (see Note 3). There are no legal proceedings that would affect Taung’s ability to proceed with further investigation and exploration activities.
– IV-33 –

– IV-34 –

– IV-35 –

8
Taung Gold CPR February 2011
Table 5 : Legal Aspects and Tenure of Six Shaft
PROJECT FARM SIZE MINING COMMENCE- EXPIRY DATE MINERAL HELD BY (ha)) RIGHT MENT DATE
Six Shaft
Driefontein 137IS
2,453 MP30/5/1/2/2/126MR Mining Right 107/2010 29-Apr-08 30 years
Gold and associated minerals
New order Mining Right held by EGM. Section 11 Transfer pending.
Holfontein 138 IS Linana 493 IS Czanik 534 IS
TOTAL 2,453 Source: Taung
Table 6 : Legal Aspects and Tenure of Twistdraai
PROJECT FARM SIZE MINING COMMENCE- EXPIRY DATE MINERAL HELD BY (ha) RIGHT MENT DATE
Twistdraai
Goedehoop 290IS
2,677 MP30/5/1/2/2/126MR Mining Right 107/2010 29-Apr-08 30
years
Gold and associated minerals
New order Mining Right held by EGM Section 11 Transfer pending
Twistdraai 285IS Ferdi 486IS Sasolkraal 289IS Goedehoop 533IS
TOTAL 2,677 Source: Taung
Key provisions of the various agreements are summarised as follows:-
4.3 Material Agreements
4.3.1 Subscription, Shareholder and Sale Agreements with EGM
The historical agreements are summarised in Note 2.
4.3.2 Survey of Property Boundaries
The properties indicated in Table 5 and Table 6 are registered with the South African Deeds Office. Property boundaries and corner beacons have been interrogated as part of the Mining and Prospecting Right applications of previous and current right holders.
4.3.3 Surface Rights
Taung does not hold any surface rights in the Twistdraai area. The rights to the surface area at Six Shaft to be acquired from EGM in terms of the EGM Sale Agreement, is sufficient for the location of the proposed plant infrastructure and waste rock dumps.
4.3.4 Ore Concentrate and Treatment Agreements
Currently there are no agreements in place for the treating of ore, and such agreements will only be negotiated upon the favourable outcome of a complete PFS.
4.3.5 Permits to Conduct Work
All permits required to conduct exploration have been obtained and all governmental requirements have been met.
4.3.6 South African Mining Law
The mining law applicable to the South African minerals industry, including the Mining Charter and the Mineral and Petroleum Resources Royalty Act (MPRRA) are discussed in Note 3.
4.3.7 Royalties and Taxes
See Note 3 for the discussion and calculation of the royalties and taxes applicable under South African Mining Law. Taung will produce refined products and consequently will pay a 5% royalty.
– IV-36 –

9
Taung Gold CPR February 2011
4.4 Accessibility, Infrastructure, Climate and Physiography
4.4.1 Property Access
Gold and coal mining has been conducted in the Evander Goldfield area for 50 years and, consequently, access and mining related infrastructure is well developed (Figure 3). Access to Six Shaft is by well-maintained paved roads and the area has well established rail links and an airfield.
4.4.2 Topography, Climate and Vegetation
The southwestern part of the Mpumalanga Province is a gently undulating plain, with the immediate area of Six Shaft, approximately 1,620m (‘above mean sea level’) amsl. The area is extensively cultivated, while gold mining, coal mining, petrochemicals and agriculture are the main economic activities in the area. The surface is traversed by a number of small seasonal drainage canals. Mpumalanga has a varied subtropical climate with summer rainfall with hot and humid days. The winter months are mild but the temperatures in the Highveld are lower than the Lowveld areas. Summer temperatures range from 19°C to 33°C, while winter temperatures range from 6°C to 26°C. The area has a summer (October to April) rainfall, averaging around 600mm to 800mm per annum. The winters are generally very dry. Due to the underground nature of the operation at Six Shaft, the climate is not a risk factor that will affect operations, and exploration and mining activities will be feasible throughout the year.
4.4.3 Infrastructure with Respect to Mining
Six Shaft is a vertical shaft complex, comprising an 8.5m diameter man, material and rock hoisting shaft and a 6.0m diameter ventilation shaft. The main shaft is 1,576m deep (18 Level) and services mining operations above 17 Level. The ventilation shaft (780m deep) is equipped with a brattice wall, buntons and guides for an emergency cage. The Six Shaft shaft winders, headgear, pumps and ancillary equipment were sold to a third party. The original design capacity of the shaft was 200,000tpm, although mining and ventilation constraints resulted in historically lower production rates. The shaft complex is equipped with three main surface ventilation fans, rated to circulate 450kg/s of air. There is limited cooling plant installation which includes a 450kg/s bulk air cooler. The Kimberley Reef can be accessed from 4 to 17 Levels. These levels and related mine infrastructure were developed from 1986 until the shaft was closed in 1998. Electrical and water supply infrastructure is very well established in this portion of the Mpumalanga Province. Electrical supply is provided through an existing agreement with Eskom (the electrical service parastatal). Water is supplied by a parastatal organisation from the Vaal River, and water supply to the Evander Goldfield is unlikely to be a future limiting factor since most of the current mining operations in the Goldfield were planned with greater production profiles than are currently operable. A 160Mm3 per annum water pipeline, delivering water from the Vaal River to Secunda, has recently been completed.
4.5 History
4.5.1 Historical Exploration
Interest in gold-bearing reefs of the Central Rand Group in the Evander Goldfield started in 1902, but the first major advance in exploration occurred in August 1951, when boreholes, originally sited to intersect the Main Reef (at the base of the Central Rand Group), intersected gold-bearing conglomerates stratigraphically above the Main Reef. These conglomerates were assigned to the Kimberley and Elsburg Formations, and future exploration in that portion of the Witwatersrand Basin focused on the Kimberley Reef.
– IV-37 –
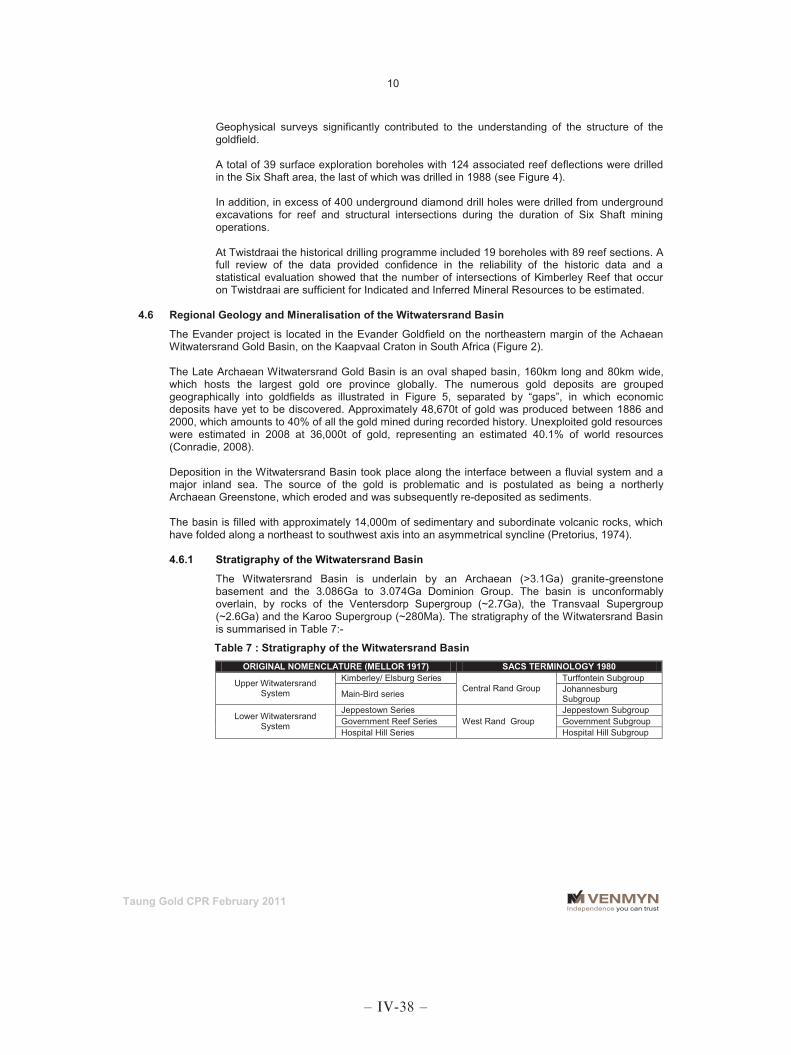
10
Taung Gold CPR February 2011
Geophysical surveys significantly contributed to the understanding of the structure of the goldfield. A total of 39 surface exploration boreholes with 124 associated reef deflections were drilled in the Six Shaft area, the last of which was drilled in 1988 (see Figure 4). In addition, in excess of 400 underground diamond drill holes were drilled from underground excavations for reef and structural intersections during the duration of Six Shaft mining operations. At Twistdraai the historical drilling programme included 19 boreholes with 89 reef sections. A full review of the data provided confidence in the reliability of the historic data and a statistical evaluation showed that the number of intersections of Kimberley Reef that occur on Twistdraai are sufficient for Indicated and Inferred Mineral Resources to be estimated.
4.6 Regional Geology and Mineralisation of the Witwatersrand Basin
The Evander project is located in the Evander Goldfield on the northeastern margin of the Achaean Witwatersrand Gold Basin, on the Kaapvaal Craton in South Africa (Figure 2). The Late Archaean Witwatersrand Gold Basin is an oval shaped basin, 160km long and 80km wide, which hosts the largest gold ore province globally. The numerous gold deposits are grouped geographically into goldfields as illustrated in Figure 5, separated by “gaps”, in which economic deposits have yet to be discovered. Approximately 48,670t of gold was produced between 1886 and 2000, which amounts to 40% of all the gold mined during recorded history. Unexploited gold resources were estimated in 2008 at 36,000t of gold, representing an estimated 40.1% of world resources (Conradie, 2008). Deposition in the Witwatersrand Basin took place along the interface between a fluvial system and a major inland sea. The source of the gold is problematic and is postulated as being a northerly Archaean Greenstone, which eroded and was subsequently re-deposited as sediments. The basin is filled with approximately 14,000m of sedimentary and subordinate volcanic rocks, which have folded along a northeast to southwest axis into an asymmetrical syncline (Pretorius, 1974).
4.6.1 Stratigraphy of the Witwatersrand Basin
The Witwatersrand Basin is underlain by an Archaean (>3.1Ga) granite-greenstone basement and the 3.086Ga to 3.074Ga Dominion Group. The basin is unconformably overlain, by rocks of the Ventersdorp Supergroup (~2.7Ga), the Transvaal Supergroup (~2.6Ga) and the Karoo Supergroup (~280Ma). The stratigraphy of the Witwatersrand Basin is summarised in Table 7:-
Table 7 : Stratigraphy of the Witwatersrand Basin ORIGINAL NOMENCLATURE (MELLOR 1917) SACS TERMINOLOGY 1980
Upper Witwatersrand System
Kimberley/ Elsburg Series Central Rand Group
Turffontein Subgroup
Main-Bird series Johannesburg Subgroup
Lower Witwatersrand System
Jeppestown Series West Rand Group
Jeppestown Subgroup Government Reef Series Government Subgroup Hospital Hill Series Hospital Hill Subgroup
– IV-38 –

– IV-39 –
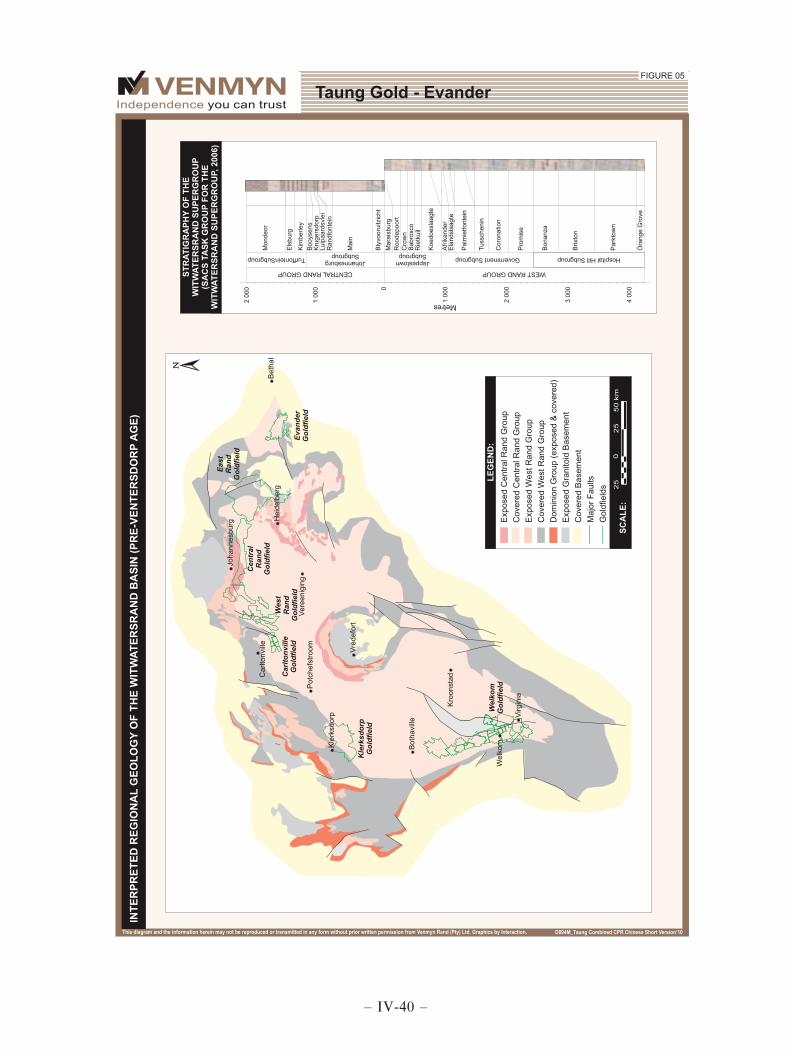
– IV-40 –

13
Taung Gold CPR February 2011
4.6.2 Mineralisation of the Witwatersrand Basin
The origin of the gold mineralisation in the Witwatersrand Basin has been the source of debate for over 100 years. The debate has been historically divided between the syngenetic or placer proponents and the epigenetic or hydrothermal model. At present, the most widely accepted model is the ‘modified placer model’ whereby, placer gold grains have been remobilised possibly during hydrothermal events. The majority of the economic reefs within the Witwatersrand Basin are located stratigraphically in the Central Rand Group but it is significant that the principal reefs of the geographically separated goldfields of the basin, do not all occur at the same stratigraphic level. Economic gold concentrations commonly extend for 10km to 30km down depositional dip, and for up to 10km to 12km along depositional strike and are postulated to represent mineralised channels within the postulated braid-plains.
4.6.3 Structural Controls of the Witwatersrand Basin
The Witwatersrand has been affected by several superimposed structural events which are differentiated as syn-deposition and post-deposition deformations. Syn-depositional deformation played a key role in the distribution of sediments, controlled the locality of auriferous conglomerates and the thickness of enclosing sedimentary sequences. Later faulting and folding of the sequence determined which parts of the basin remained buried, as well as the depths to mineable horizons, relative to the present-day surface. Extensional tectonics during and post-Ventersdorp times resulted in the ubiquitous development of normal and wrench faulting present throughout the basin (Stanistreet et al., 1986) and after the Transvaal Sequence was deposited, a high-strain event resulted in the formation of folds, bedding parallel faults and regional low-angle cleavage (McCarthy et al., 1986).
4.7 Geological Setting of the Evander Goldfield
The Evander Goldfield is arcuate in shape, lying between the towns of Leandra in the northeast, Kinross in the north, Trichardt in the east, and Secunda in the southeast. The southern and western margins are well defined by geological data from mining and exploration; however the northern and eastern limits, being at greater depth, are less well understood. The Evander Goldfield is characterised by basin margin faulting, thought to be syn-deposition (Witwatersrand) in age (Figure 7 and Figure 6). The northeastern margin of the basin is dominated by a northwest striking asymmetrical fold structure with strata overturned to the west and thrust faulted. The southern margin of the basin is fault-bounded by structure parallel to the Sugarbush Fault (Figure 4).
4.8 Local Geology of the Evander Project
The Evander project is located on the eastern margin of the Evander Basin, which is characterised by a northwest-striking asymmetrical fold structure, where strata are overturned to the west (Figure 6). The main gold-bearing horizon is the Kimberley Reef of the Evander Quartzite Formation within the Turffontein Subgroup of the Witwatersrand Supergroup (Figure 5). The Kimberley Reef varies in thickness from a “pencil line” thickness (referred to locally as “waste on contact” or “WOC”) to in excess of 300cm. The Kimberley Reef is a polymictic conglomerate, composed primarily of quartz and banded cherts. Pebble diameters vary from 4mm to 60mm, and are mostly well rounded. The Evander project is structurally complicated (Figure 4, Figure 6 and Figure 7). The dominant structure is an asymmetrical northwesterly plunging fold with a steep western dip between 60° and 90° and locally over turned. The eastern limb dips 25° to the east. The Kimberley Reef sub-crops against the Black Reef Formation and the Karoo Supergroup at approximately 200m below surface, whilst to the north, the reef sub-crops at progressively deeper levels against the Transvaal Supergroup.
– IV-41 –

– IV-42 –

– IV-43 –

16
Taung Gold CPR February 2011
Westerly verging thrust faulting, which is syn-Witwatersrand in age, is associated with the steep western limb, whilst relatively steeply-dipping, south down-throw normal faults (mid-Ventersdorp age) striking essentially northeast-southwest, displace the faults and the strata (Figure 7). Large losses of ground are associated with the normal faulting. There has been only minor lateral displacement along the normal faults, and “pay” channels can normally be traced across them.
4.9 Deposit Type and Mineralisation
The model of the evolution of the Evander Goldfield mineralisation is schematically represented in Figure 8. The gold-bearing Kimberley Reef includes a composite sequence of fluvial and channel sediments and was deposited on a palaeo-surface striking northwest-southeast and dipping to the northeast. The Kimberley Reef in the Evander Basin represents proximal to distal facies of a fluvial placer formed by a braided stream system (Figure 8). The sedimentological model has been used as a basis for the geostatistical modelling which contributed to the Mineral Resource evaluation. The theoretical palaeo-drainage pattern, indicated by the sedimentation suggests a broad depositional front striking northwest-southeast. In the Evander No 2, No 5 and No 6 Shaft areas specifically, it is evident from the facies distribution that the depositional front may be modified by material input from the eastern basin margin at approximately 70° to the depositional front (Figure 8). In the Six Shaft area, a significant east west depositional and channel trend (Thick Reef facies) in the southern portions of the goldfield is identified, which may represent an overprint on the dominant southeast to northwest (Thin Reef facies) depositional trend present in the remainder of the basin (Figure 8). This sedimentological model is the basis for the geostatistical modelling. In the Twistdraai area, Taung Gold geologists in consultation with EGM geologists have interpreted basin evolution and depositional trends as presented in Figure 8. The important feature in terms of the Twistdraai project area is the recognition of a southeast to northwest depositional and channel trend (‘Northern Thin Reef facies’) in the northern portions of the goldfield (No 5 Shaft areas and north-westwards). Gold occurs in the Kimberley Reef as free particles in the conglomerate matrix or as inclusions within compact detrital pyrite. The gold distribution corresponds to sedimentological controls within the Kimberley Reef and associated channels within the Evander Basin. The channels are braided with the gold distribution showing both lateral and vertical variation in response to the sedimentary processes during deposition. Nodular pyrite, chromite, rutile, zircon and leucoxene as well as minor quantities of gold, uraninite and osmiridium are present in the matrix of the Kimberley Reef.
4.10 Exploration
No exploration activities have been conducted by Taung on the Evander project. However, numerous Independent Due Diligence exercises on the historic exploration and mining data have been conducted by various independent consultants. The comprehensive audit by ExplorMine of the historical Six Shaft borehole data concluded that the data was reliable for Mineral Resource estimation. A complete sedimentological interpretation of the Evander Goldfield Basin evolution and depositional trends has been developed. The significant result of the study is the recognition of an east west depositional and channel trend in the southern portions of the Evander Goldfield and a southeast to northwest depositional trend in the remainder of the Evander Goldfield. The east to west depositional trends could represent a later ‘overprint’ of the dominant southeast to northwest depositional trend. This sedimentological model has been used as a basis for geostatistical modelling and 3D modelling of the Kimberley Reef. Future exploration efforts are intended to focus on the upgrading of the Inferred Mineral Resource to the Indicated Mineral Resource category and further delineate structural controls on the preservation of the Kimberley Reef in this area. The significant result of the study is the recognition of an east west depositional and channel trend in the southern portions of the Evander Goldfield and a southeast to northwest depositional trend in the
.dleifdloG rednavE eht fo redniamer
– IV-44 –
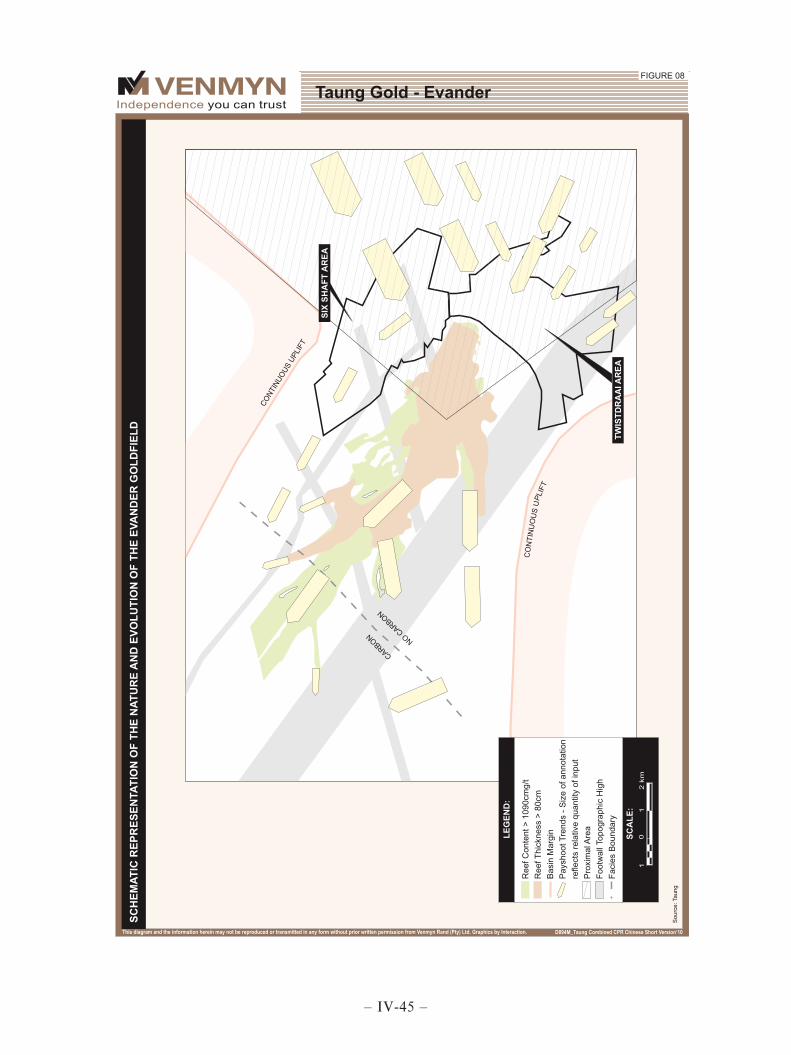
– IV-45 –
18
Taung Gold CPR February 2011
The east to west depositional trends could represent a later ‘overprint’ of the dominant southeast to northwest depositional trend. This sedimentological model has been used as a basis for geostatistical modelling and 3D modelling of the Kimberley Reef. Future exploration efforts are intended to focus on the upgrading of the Inferred Mineral Resource to the Indicated Mineral Resource category and further delineate structural controls on the preservation of the Kimberley Reef in this area.
4.11 Geological Data
4.11.1 Drilling
No drilling has been conducted by Taung to date on the Evander project. The historical surface drilling programmes comprised 39 surface exploration boreholes with 124 associated reef deflections. Underground borehole and stope face chip sampling data outweighs the surface borehole data by orders of magnitude. Underground diamond drilling was conducted using compressed air driven drill rigs, which typically drilled ‘A’ size (27mm diameter) core from short boreholes to depths rarely exceeding 300m in length, with 100% core recovery (ExplorMine 2009).
4.11.2 Sampling Methodology
The detailed historical sampling methodology, sample preparation and laboratory procedures for the sampling programme are described in detail in Note 5.
4.11.3 Data Management, Processing and Verification
Historical datasets have been independently reviewed by ExplorMine and electronically captured to form the basis for a geostatistical Mineral Resource estimation. The following data capture protocols were maintained during the data capture:-
imperial versus metric units were rationalised;
all local co-ordinate systems were converted toLO29 System based on the World Geodetic System (WGS84);
collar co-ordinates were transformed to be compatible with Datamine™;
magnetic declination was applied to all surface down-hole surveys;
all elevation (Z) values were referenced to mean sea level;
all datasets were de-surveyed utilising the Datamine™ De-survey option; and
underground borehole reef intersections were captured as point data.
Eight of the surface boreholes proved inadequate for incorporation in the database and, in total, 31 surface boreholes and 111 underground boreholes were finally used.
4.12 Mineral Resources and Mineral Reserves
The Mineral Resources and Mineral Reserves presented in this CPR are fully compliant with the SAMREC and JORC Codes. The statements were prepared by independent specialist consultants from nationally and internationally renowned consulting groups, in conjunction with Taung’s technical specialists. The Evander Mineral Resource estimates represent the total tonnage of in-situ mineralisation delineated within the drilled areas and above a defined cut-off. Taung Gold’s Evander Mineral Reserves represent those portions of the Mineral Resource which can be economically mined under defined parameters, and which are planned to be mined within a designed mine plan. The Mineral Resources are quoted as inclusive of Mineral Reserves.
4.12.1 Geological Modelling
A complete re-evaluation of the Six Shaft and Twistdraai historical Mineral Resources was undertaken by ExplorMine (2009). The 3D modelling of the ore body utilising Datamine™ software resulted in the geological model presented in Figure 9a.
– IV-46 –

19
Taung Gold CPR February 2011
4.12.1.1 Six Shaft – Methodology and Estimation Procedures
An initial geological model was constructed utilising geological sections perpendicular to strike. All the sections were interpreted in Datamine™ and the geological sections formed the basis of the geological wireframe model creation. In successive sections the same structural features were linked to create wireframe surfaces which were utilised as boundaries for the stratigraphic wireframe modelling. The Six Shaft area was divided according to identifiable and known reef facies types, into northern and southern facies areas and further split according to reef characteristics. An axial line parallel to the fold axis was constructed and used to divide the block models into ‘inclined’ and ‘flat’ models. Block sizes used were as follows:-
Measured Resource 30mx30mx10m;
Indicated Resource 60mx60mx10m; and
Inferred Resource 120mx120mx120m.
The resultant 3D models of the structure, reef morphology and grade distribution for the Kimberley Reef at Six Shaft are illustrated in Figure 9 and Figure 10 and clearly indicate the folding, faulting and sedimentologically controlled grade distributions, which will affect mining strategy and economics going forward. A Kriging process was applied to the 3D geological model, which produced a 2D spatial distribution of low and high grade regions in horizontal and incline planes, which permitted development of the single reef mining design.
4.12.1.2 Mineral Resource Classification – Six Shaft
Measured Mineral Resource was estimated utilising the search distance corresponding to the range at three quarters of the total variance on point variogram for each domain (Snowden, 1996) for the Au mg/t parameter and the channel width. A minimum number of five samples were accessed by the search volume. The Indicated Mineral Resource was defined by the search radius greater than that defining the Measured Mineral Resource but less than the range of the 60m regularised semi-variogram. A minimum number of three samples were accessed by the search volume. The Inferred Mineral Resource was defined by a search radius greater than that defining the Indicated Mineral Resource. Areas that were not estimated by the range of the 120m semi-variogram were then estimated by an unlimited search radius. The geostatistical methodology described above was applied to each domain individually. The Mineral Resource estimations at various cut-off grades are presented in Table 8. The Mineral Resource tabulation suggests that the Indicated Mineral Resource is the most sensitive to increases in cut-off grade and that the higher grade portions of the Inferred Mineral Resource should be targeted for exploration efforts to upgrade them to an Indicated classification.
– IV-47 –
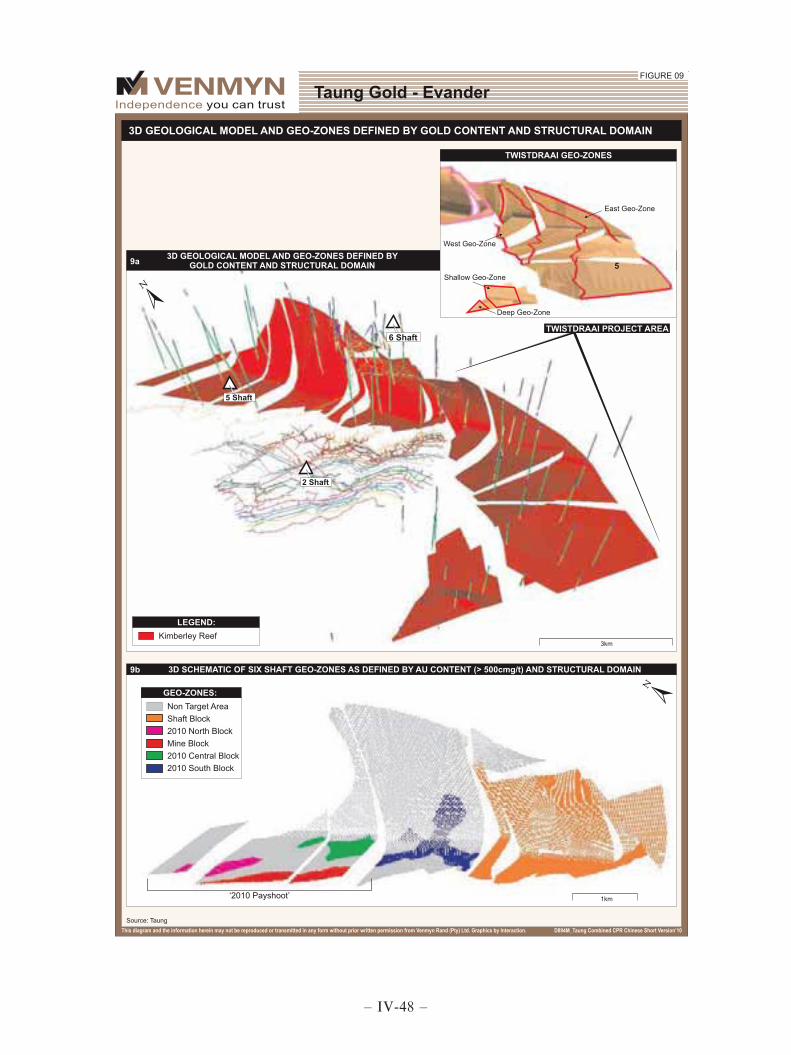
– IV-48 –

21
Taung Gold CPR February 2011
Table 8 : Mineral Resource Estimates for Six Shaft at Various Cut-off Grades, 2009
MINERAL RESOURCE CATEGORY
MINING TONNES
(t)
MINING GRADE
(g/t)
MINING WIDTH
(cm)
MINING GRADE (cmg/t)
CHANNEL WIDTH
(cm)
CHANNEL GRADE
(g/t)
GOLD GOLD
(kg) (oz) Six Shaft, Total Project Mineral Resources at a 300cmg/t Cut-off Grade
Measured 147,400 10.30 117 1,173 86 13.71 1,518 48,812 Indicated 16,794,900 7.70 102 793 59 13.55 129,321 4,157,758 Inferred 4,623,000 5.36 100 536 34 15.59 24,779 796,672 Total Measured and Indicated 16,942,300 7.72 103 796 59 13.56 130,839 4,206,569
Six Shaft, Total Project Mineral Resources at a 400cmg/t Cut-off Grade Measured 144,803 10.42 117 1,188 86 13.81 1,509 48,511 Indicated 13,029,300 8.90 103 919 66 13.92 115,961 3,728,225 Inferred 3,476,000 5.91 100 591 35 16.69 20,530 660,478 Total Measured and Indicated 13,174,103 8.91 103 922 66 13.92 117,470 3,776,736
Six Shaft, Total Project Mineral Resources at a 500cmg/t Cut-off Grade Measured 140,078 10.63 118 1,213 87 13.92 1,489 47,873 Indicated 10,972,700 9.73 104 1,008 71 14.20 106,764 3,432,554 Inferred 2,354,000 6.58 100 658 36 18.03 15,480 497,993 Total Measured and Indicated 11,112,778 9.74 104 1,011 71 14.20 108,269 3,480,427 TOTAL MINERAL RESOURCES* 13,466,000 9.19 103 949 65 14.57 123,749 3,978,000
Source: ExplorMine 2009 100% attributable to Taung subject to Section 11 Ministerial consent Mineral Resources inclusive of Mineral Reserves *Computational inconsistencies due to rounding down
In order to make the exploration decisions to upgrade Mineral Resources, a closer study of the structural characteristics of the ore body in terms of grade, tonnage, depth below surface and dip was required, the conclusions of which are discussed below.
4.12.1.3 Structural Blocks and Geo-zone Demarcation – Six Shaft
Explormine identified five high grade geological domains within the Six Shaft ore body. The high-grade geological domains are defined as ‘geo-zones’ by Taung and were incorporated in the mine design and mine plan completed by Turnberry 2010 (Figure 9). In addition, the Six Shaft ore body has been split into structural blocks based on the following criteria (Figure 9b and Figure 10):-
geological structure: position relative the major northsouth fault that splits the ore body into the East Orebody and West Orebody (Figure 10b);
reef morphology and dip: the ore body comprises a steep fold limb in the west (70º dip to vertical) which turns at depth into a shallow dipping reef (average 20º) as illustrated in Figure 6 and Figure 9;
geo-zone; defined as a high grade target area with grades of >500cmg/t Au. Five geo-zones have been identified, as illustrated in Figure 9b;
depth below surface; the Six Shaft ore body is split into north and south, above and below 17 level on either side of the ore body fold axis (Figure 10b).
The geographic distribution of the various geo-zones and structural blocks show a clear demarcation into the East Orebody and West Orebody across the central fault. The East Orebody contains the high grade mineralisation and is a result of the development of Thick Reef facies. In the West Orebody the Thin Reef facies is developed and, at this stage, the extent to which these facies types impinge upon each other is unknown (Figure 10). The Mineral Resources for each structural block (Figure 10b) were determined. Furthermore, a study of the distribution of gold content (>500cmg/t), grade and channel widths revealed that within the defined structural blocks, the following areas of note exist:-
– IV-49 –
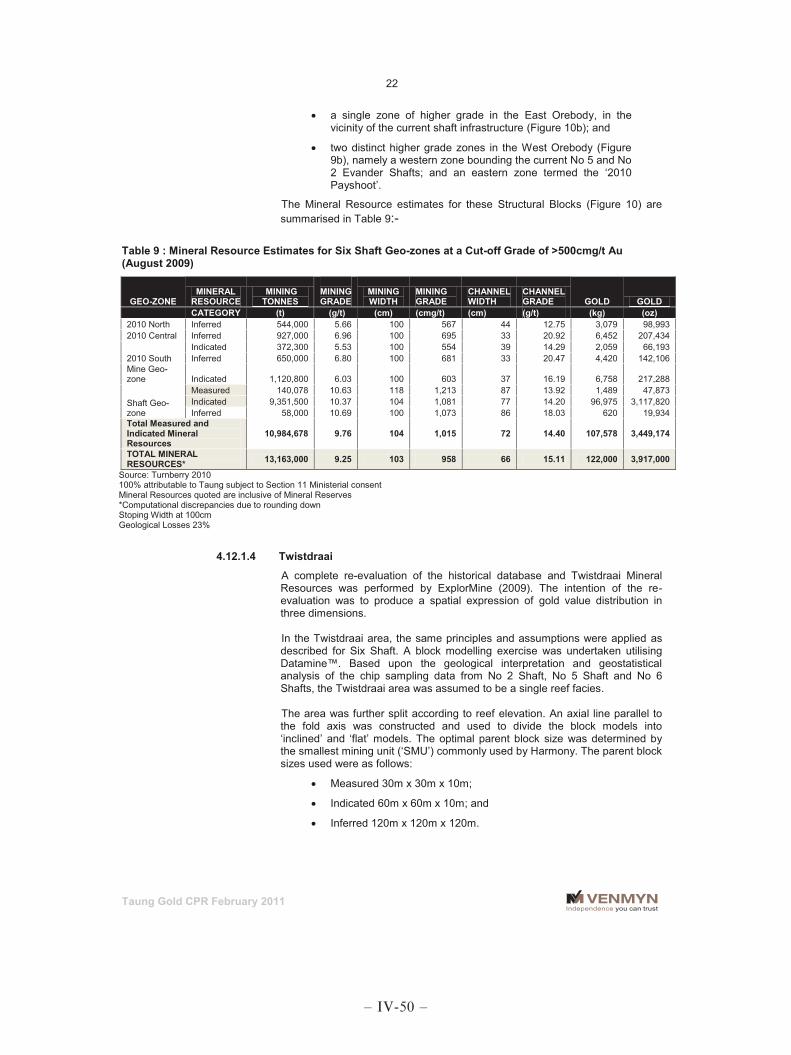
22
Taung Gold CPR February 2011
a single zone of higher grade in the East Orebody, in the vicinity of the current shaft infrastructure (Figure 10b); and
two distinct higher grade zones in the West Orebody (Figure 9b), namely a western zone bounding the current No 5 and No 2 Evander Shafts; and an eastern zone termed the ‘2010 Payshoot’.
The Mineral Resource estimates for these Structural Blocks (Figure 10) are summarised in Table 9:-
Table 9 : Mineral Resource Estimates for Six Shaft Geo-zones at a Cut-off Grade of >500cmg/t Au (August 2009)
GEO-ZONE MINERAL
RESOURCE MINING TONNES
MINING GRADE
MINING WIDTH
MINING GRADE
CHANNEL WIDTH
CHANNEL GRADE GOLD GOLD
CATEGORY (t) (g/t) (cm) (cmg/t) (cm) (g/t) (kg) (oz) 2010 North Inferred 544,000 5.66 100 567 44 12.75 3,079 98,993 2010 Central Inferred 927,000 6.96 100 695 33 20.92 6,452 207,434
2010 South Indicated 372,300 5.53 100 554 39 14.29 2,059 66,193 Inferred 650,000 6.80 100 681 33 20.47 4,420 142,106
Mine Geo-zone Indicated 1,120,800 6.03 100 603 37 16.19 6,758 217,288
Shaft Geo-zone
Measured 140,078 10.63 118 1,213 87 13.92 1,489 47,873 Indicated 9,351,500 10.37 104 1,081 77 14.20 96,975 3,117,820 Inferred 58,000 10.69 100 1,073 86 18.03 620 19,934
Total Measured and Indicated Mineral Resources
10,984,678 9.76 104 1,015 72 14.40 107,578 3,449,174
TOTAL MINERAL RESOURCES* 13,163,000 9.25 103 958 66 15.11 122,000 3,917,000
Source: Turnberry 2010 100% attributable to Taung subject to Section 11 Ministerial consent Mineral Resources quoted are inclusive of Mineral Reserves *Computational discrepancies due to rounding down Stoping Width at 100cm Geological Losses 23%
4.12.1.4 Twistdraai
A complete re-evaluation of the historical database and Twistdraai Mineral Resources was performed by ExplorMine (2009). The intention of the re-evaluation was to produce a spatial expression of gold value distribution in three dimensions. In the Twistdraai area, the same principles and assumptions were applied as described for Six Shaft. A block modelling exercise was undertaken utilising Datamine™. Based upon the geological interpretation and geostatistical analysis of the chip sampling data from No 2 Shaft, No 5 Shaft and No 6 Shafts, the Twistdraai area was assumed to be a single reef facies. The area was further split according to reef elevation. An axial line parallel to the fold axis was constructed and used to divide the block models into ‘inclined’ and ‘flat’ models. The optimal parent block size was determined by the smallest mining unit (‘SMU’) commonly used by Harmony. The parent block sizes used were as follows:
Measured 30m x 30m x 10m;
Indicated 60m x 60m x 10m; and
Inferred 120m x 120m x 120m.
– IV-50 –

– IV-51 –

24
Taung Gold CPR February 2011
A wireframe model was created by individually filling each reef surface block according to the classification criteria described above. A final 3D block model was populated with the estimated grades utilising a ‘nearest neighbour’ estimate per parent block size and facies models. A Kriging process was applied to the 3D geological model, which produced a 2D spatial distribution of low and high grade regions in horizontal and incline planes, which enabled the design of single reef mining. Ordinary point Kriging was applied to Measured Resources, while macro-Kriging was applied to the Indicated and Inferred Mineral Resource categories. The cut-off for the Mineral Resource estimates is 2.5mg/t Au (or 3g/t at a minimum of 1m block width). A cut-off of between 2.5mg/t and 3mg/t Au is in accordance with accepted Witwatersrand Basin gold mines’ norms. The Mineral Resource categorisation and totals for various cut-off grades are shown in Table 10.
Table 10 : Mineral Resource Estimates for Twistdraai at Various Cut-off Grades (August 2009)
MINERAL RESOURCE MINING TONNES
MINING GRADE
MINING WIDTH
MINING GRADE
CHANNEL WIDTH
CHANNEL GRADE GOLD GOLD
CATEGORY (t) (g/t) (cm) (cmg/t) (cm) (g/t) (kg) (oz) Mineral Resources-Twistdraai at 250cmg/t cut-off (Aug 2009)
Measured na na na na na na na na Indicated 11,686,400 5.58 103 583 63 9.29 65,220 2,096,872 Inferred 17,620,100 6.91 103 710 65 10.87 121,800 3,915,961 Total Measured and Indicated 11,686,400 5.58 103 583 63 9.29 65,220 2,096,872
Mineral Resources-Twistdraai at 300cmg/t cut-off (Aug 2009) Measured na na na na na na na na Indicated 10,470,300 5.91 103 618 64 9.7 61,840 1,988,202 Inferred 17,165,900 7.02 103 722 66 11 120,580 3,876,737 Total Measured and Indicated 10,470,300 5.91 103 618 64 9.7 61,840 1,988,202
Mineral Resources-Twistdraai at 500cmg/t cut-off (Aug 2009) Measured na na na na na na na na Indicated 5,525,900 7.61 106 813 72 11.32 42,050 1,351,939 Inferred 13,997,700 7.67 106 790 68 11.66 107,400 3,452,990 Total Measured and Indicated 5,525,900 7.61 106 813 72 11.32 42,050 1,352,939 TOTAL MINERAL RESOURCES* 19,523,000 7.65 104 797 69 11.56 149,000 4,804,000
Source: ExplorMine 2009 100% attributable to Taung subject to Section 11 Ministerial consent Mineral Resources quoted are inclusive of Mineral Reserves Computational discrepancies due to rounding August 2009 Specific Gravity = 2.70
The Twistdraai orebody was further evaluated in the Scoping Study on the basis of structure and grade distribution. Four geo-zones for the Twistdraai orebody were defined as illustrated in Figure 9a.
Table 11 : Mineral Resource Statement for Twistdraai Geo-zones at a Cut-off Grade of >500cmg/t Au
GEO-ZONE MINERAL
RESOURCE CATEGORY
MINING TONNES
(t)
MINING GRADE
(g/t)
MINING WIDTH
(cm)
MINING GRADE (cmg/t)
CHANNEL WIDTH
(cm)
CHANNEL GRADE
(g/t) GOLD (kg)
GOLD (oz)
East Indicated 2,525,100 6,47 100 649 64 10.14 16,330 525,022 Inferred 8,924,900 7.89 102 807 68 11.83 70,430 2,264,377
West Indicated 2,052,300 9.96 115 1,132 101 11.17 20,450 657,483 Inferred 2,880,800 7.54 107 809 83 9.71 21,730 698,636
Shallow Indicated 769,470 5.47 100 547 26 21.45 4,210 135,355 Inferred 1,495,900 7.27 100 727 41 17.62 10,880 349,800
Deep Inferred 660,000 6.32 100 631 54 11.59 4,170 134,069 TOTAL MINERAL RESOURCES* 19,309,000 7.67 104 799 96 12.04 148,200 4,764,000
Source : Turnberry 2010 100% attributable to Taung subject to Section 11 Ministerial consent Mineral Resources quoted are inclusive of Mineral Reserves Stoping width of 100cm *Computational discrepancies due to rounding
– IV-52 –
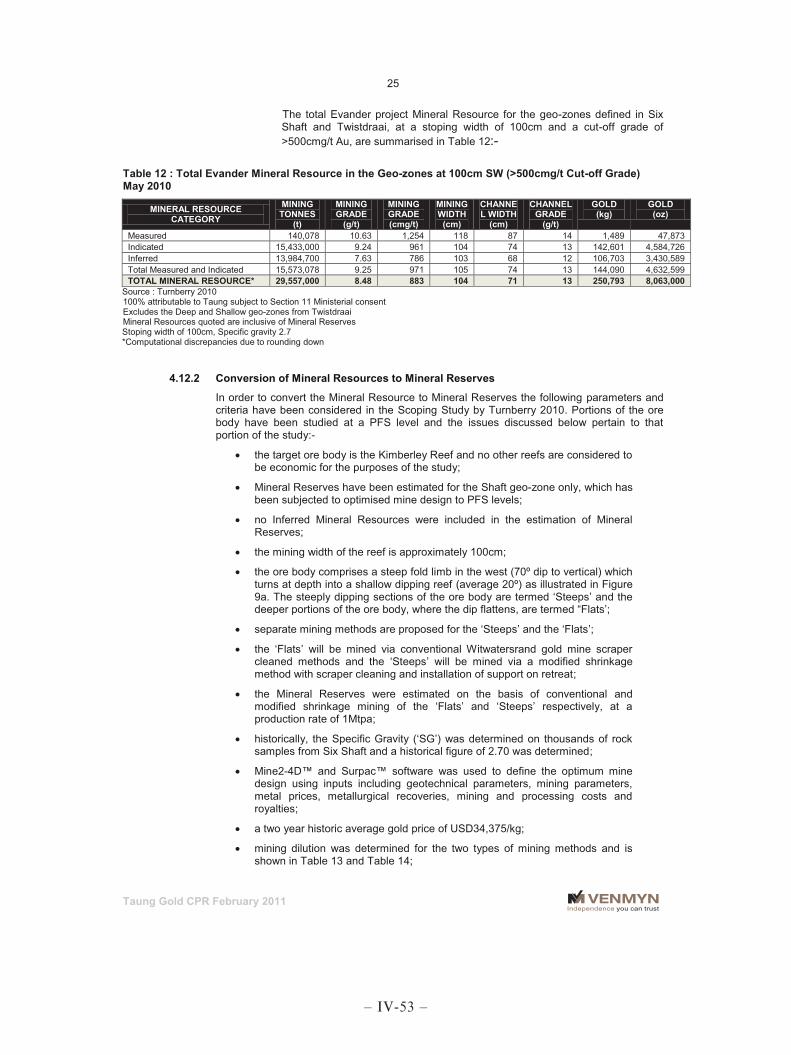
25
Taung Gold CPR February 2011
The total Evander project Mineral Resource for the geo-zones defined in Six Shaft and Twistdraai, at a stoping width of 100cm and a cut-off grade of >500cmg/t Au, are summarised in Table 12:-
Table 12 : Total Evander Mineral Resource in the Geo-zones at 100cm SW (>500cmg/t Cut-off Grade) May 2010
MINERAL RESOURCE CATEGORY
MINING TONNES
(t)
MINING GRADE
(g/t)
MINING GRADE (cmg/t)
MINING WIDTH
(cm)
CHANNEL WIDTH
(cm)
CHANNEL GRADE
(g/t)
GOLD (kg)
GOLD (oz)
Measured 140,078 10.63 1,254 118 87 14 1,489 47,873 Indicated 15,433,000 9.24 961 104 74 13 142,601 4,584,726 Inferred 13,984,700 7.63 786 103 68 12 106,703 3,430,589 Total Measured and Indicated 15,573,078 9.25 971 105 74 13 144,090 4,632,599 TOTAL MINERAL RESOURCE* 29,557,000 8.48 883 104 71 13 250,793 8,063,000
Source : Turnberry 2010 100% attributable to Taung subject to Section 11 Ministerial consent Excludes the Deep and Shallow geo-zones from Twistdraai Mineral Resources quoted are inclusive of Mineral Reserves Stoping width of 100cm, Specific gravity 2.7 *Computational discrepancies due to rounding down
4.12.2 Conversion of Mineral Resources to Mineral Reserves
In order to convert the Mineral Resource to Mineral Reserves the following parameters and criteria have been considered in the Scoping Study by Turnberry 2010. Portions of the ore body have been studied at a PFS level and the issues discussed below pertain to that portion of the study:-
the target ore body is the Kimberley Reef and no other reefs are considered to be economic for the purposes of the study;
Mineral Reserves have been estimated for the Shaft geo-zone only, which has been subjected to optimised mine design to PFS levels;
no Inferred Mineral Resources were included in the estimation of Mineral Reserves;
the mining width of the reef is approximately 100cm;
the ore body comprises a steep fold limb in the west (70º dip to vertical) which turns at depth into a shallow dipping reef (average 20º) as illustrated in Figure 9a. The steeply dipping sections of the ore body are termed ‘Steeps’ and the deeper portions of the ore body, where the dip flattens, are termed “Flats’;
separate mining methods are proposed for the ‘Steeps’ and the ‘Flats’;
the ‘Flats’ will be mined via conventional Witwatersrand gold mine scraper cleaned methods and the ‘Steeps’ will be mined via a modified shrinkage method with scraper cleaning and installation of support on retreat;
the Mineral Reserves were estimated on the basis of conventional and modified shrinkage mining of the ‘Flats’ and ‘Steeps’ respectively, at a production rate of 1Mtpa;
historically, the Specific Gravity (‘SG’) was determined on thousands of rock samples from Six Shaft and a historical figure of 2.70 was determined;
Mine2-4D™ and Surpac™ software was used to define the optimum mine design using inputs including geotechnical parameters, mining parameters, metal prices, metallurgical recoveries, mining and processing costs and royalties;
a two year historic average gold price of USD34,375/kg;
mining dilution was determined for the two types of mining methods and is shown in Table 13 and Table 14;
– IV-53 –
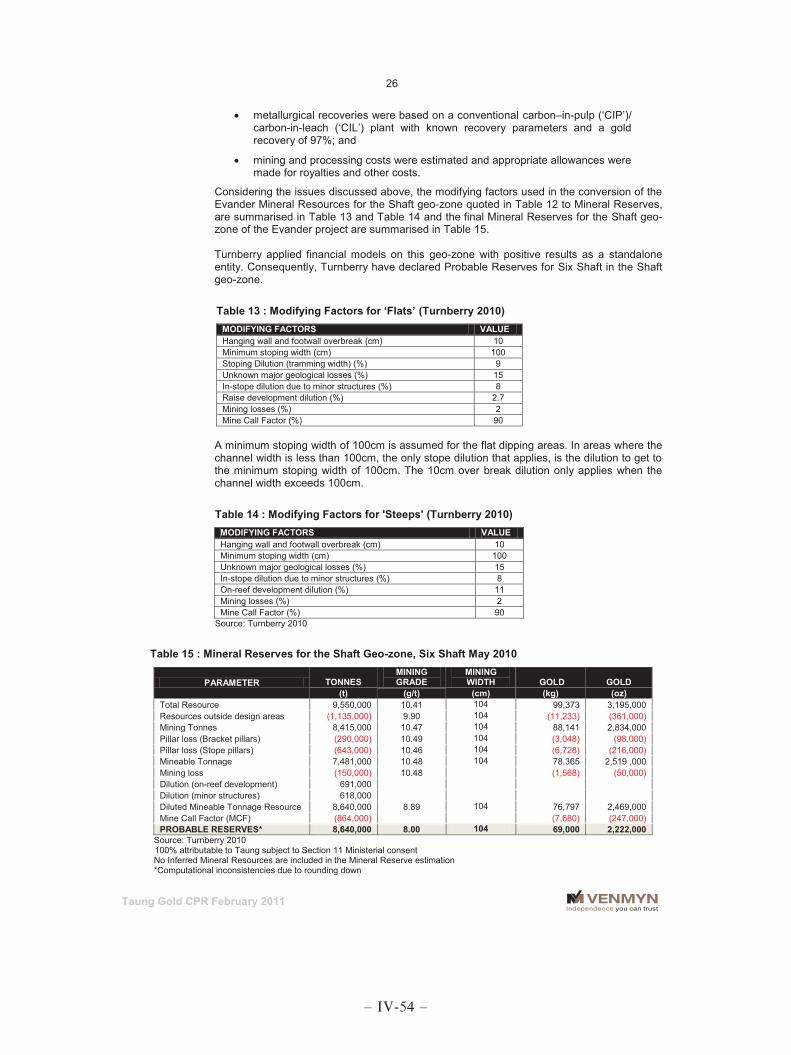
26
Taung Gold CPR February 2011
metallurgical recoveries were based on a conventional carbon–in-pulp (‘CIP’)/ carbon-in-leach (‘CIL’) plant with known recovery parameters and a gold recovery of 97%; and
mining and processing costs were estimated and appropriate allowances were made for royalties and other costs.
Considering the issues discussed above, the modifying factors used in the conversion of the Evander Mineral Resources for the Shaft geo-zone quoted in Table 12 to Mineral Reserves, are summarised in Table 13 and Table 14 and the final Mineral Reserves for the Shaft geo-zone of the Evander project are summarised in Table 15. Turnberry applied financial models on this geo-zone with positive results as a standalone entity. Consequently, Turnberry have declared Probable Reserves for Six Shaft in the Shaft geo-zone.
Table 13 : Modifying Factors for ‘Flats’ (Turnberry 2010) MODIFYING FACTORS VALUE Hanging wall and footwall overbreak (cm) 10 Minimum stoping width (cm) 100 Stoping Dilution (tramming width) (%) 9 Unknown major geological losses (%) 15 In-stope dilution due to minor structures (%) 8 Raise development dilution (%) 2.7 Mining losses (%) 2 Mine Call Factor (%) 90
A minimum stoping width of 100cm is assumed for the flat dipping areas. In areas where the channel width is less than 100cm, the only stope dilution that applies, is the dilution to get to the minimum stoping width of 100cm. The 10cm over break dilution only applies when the channel width exceeds 100cm.
Table 14 : Modifying Factors for 'Steeps' (Turnberry 2010) MODIFYING FACTORS VALUE Hanging wall and footwall overbreak (cm) 10 Minimum stoping width (cm) 100 Unknown major geological losses (%) 15 In-stope dilution due to minor structures (%) 8 On-reef development dilution (%) 11 Mining losses (%) 2 Mine Call Factor (%) 90
Source: Turnberry 2010
Table 15 : Mineral Reserves for the Shaft Geo-zone, Six Shaft May 2010
PARAMETER TONNES MINING GRADE
MINING WIDTH GOLD GOLD
(t) (g/t) (cm) (kg) (oz) Total Resource 9,550,000 10.41 104 99,373 3,195,000 Resources outside design areas (1,135,000) 9.90 104 (11,233) (361,000) Mining Tonnes 8,415,000 10.47 104 88,141 2,834,000 Pillar loss (Bracket pillars) (290,000) 10.49 104 (3,048) (98,000) Pillar loss (Stope pillars) (643,000) 10.46 104 (6,728) (216,000) Mineable Tonnage 7,481,000 10.48 104 78,365 2,519 ,000 Mining loss (150,000) 10.48 (1,568) (50,000) Dilution (on-reef development) 691,000 Dilution (minor structures) 618,000 Diluted Mineable Tonnage Resource 8,640,000 8.89 104 76,797 2,469,000 Mine Call Factor (MCF) (864,000) (7,680) (247,000) PROBABLE RESERVES* 8,640,000 8.00 104 69,000 2,222,000
Source: Turnberry 2010 100% attributable to Taung subject to Section 11 Ministerial consent No Inferred Mineral Resources are included in the Mineral Reserve estimation *Computational inconsistencies due to rounding down
– IV-54 –

27
Taung Gold CPR February 2011
4.12.3 Logic for Inclusion of Inferred Mineral Resources in the Scoping Study
As part of the economic evaluation at Scoping Study level, Turnberry 2010 included both the Indicated and some of Inferred Mineral Resources in the mine plan and scheduling. In terms of international reporting codes no category exists for modified Inferred Mineral Resources and consequently the resultant tonnages are not compliant Mineral Reserves but are referred to as “Economic Inferred Mineral Resources” for the purposes of reporting the Scoping Study results. In Canada, this is referred to as a “Preliminary Assessment”, whereby Inferred Mineral Resources can be evaluated economically. As discussed in Section 4.12.4, apart from grade continuity, there is a high level of detailed geological understanding of the Inferred Mineral Resources at Twistdraai, which would require only minimal exploration to be upgraded into the Indicated Mineral Resources category. Taung therefore, considered the inclusion of the Inferred Mineral Resources in the economic evaluation of Scoping Study to be reasonable and based on the sound expectation of upgrading the Inferred Mineral Resources to the Indicated category. The Scoping Study indicated that the mine is economic based on the Indicated Mineral Resources alone and the economic contribution of the ‘Inferred’ Mineral Resource is therefore an additional advantage. The Probable Reserves and ‘Economic Inferred Mineral Resources’ for Evander are summarised in Table 16:-
Table 16 : Probable Reserves and ‘Economic Inferred Mineral Resources’ for Evander (Turnberry 2010)
REEF CATEGORY TONNES REC
GRADE (g/t)
MINING WIDTH GOLD GOLD
(t) (cm) (kg) (oz)
Kimberley Reef Probable Reserves + Economic Inferred Mineral Resources 28,222,000 6.80 104 191,000 6,170,000
Kimberley Reef Probable Reserve only 8,640,000 8.00 104 69,000 2,222,000 Source: Turnberry 2010 Includes Inferred Mineral Resources from Twistdraai
4.12.4 Logic for Classification of Evander Inferred Mineral Resources
The Evander project is situated in an historical mining area where 50 years of mining the Kimberley Reef has led to confidence in the understanding of the ore horizon. Taung has classified the Kimberley Reef into high grade geo-zones, many of which are classified as Indicated Mineral Resources. The remaining geo-zones are classified as Inferred Mineral Resources, as a consequence of insufficient data points within the zone, leading to lack of confidence in the grade distribution. However, the confidence levels for the remaining resource classification parameters exceed those required for classification in the Inferred category. In the context of the very high confidence levels applicable to grade distribution in the Kimberley Reef in the Evander Goldfields area, Taung is confident that the Inferred Mineral Resources will be rapidly upgraded to the Indicated category through the proposed exploration programme. It is this confidence in the upgrade of the Inferred Mineral Resources that is the basis for Taung’s motivation in including the Inferred Resources in the Scoping Study.
4.13 Techno-Economic Study – Mining
4.13.1 Overview
Six Shaft is largely un-mined except for a small area in the vicinity of No 6 Shaft where approximately 2Mt of Kimberley Reef was mined between September 1986 and June 1998 at a reported grade of 7.82g/t Au over a width of 147cm (88cm channel width). No 6 Shaft is currently a non-functional shaft and the shaft complex comprises two shaft headgears.
– IV-55 –

28
Taung Gold CPR February 2011
The current mining studies have progressed from conceptual to detailed designs, in the 2010 Scoping Study by Turnberry/Ukwazi, with the Shaft geo-zone portion of the ore body designed to PFS level. The shaft designs propose that No 6 Shaft is likely to extend from a 1,000m below surface to a depth of 2,200m below surface.
4.13.2 Geological Model and Mining Methodology in the Mine Design
The existing tunnel infrastructure and the Kimberley Reef profile as used in the Scoping Study are illustrated in Figure 11. The basic geological and mining related parameters integral to the mine design were:-
the target ore body is the Kimberley Reef which has been mined extensively on neighbouring shafts in the Evander area and no other reefs are considered to be economic for the purposes of the study;
the mining width of the reef is approximately 100cm;
the ore body comprises a steep fold limb in the west (70º dip to vertical) which turns at depth into a shallow dipping reef (average 20º) as illustrated in Figure 9a. The steeply dipping sections of the ore body are termed ‘Steeps’ and the deeper portions of the ore body, where the dip flattens, are termed ‘Flats’;
the Six Shaft area is split into structural blocks namely the East Orebody and West Orebody, above and below 17 level (Figure 10b);
the ‘Twistdraai’ area is divided into four geo-zones ( East, West, Shallow and Deep, Figure 9b).The ore body in each of these areas is divided into flat and steep dipping sections, which are termed ‘Flats’ and ‘Steeps’ respectively, as in Six Shaft;
separate mining methods are proposed for the ‘Steeps’ and the ‘Flats’;
the ‘Flats’ will be mining via conventional Witwatersrand gold mine scraper cleaning methods;
the ‘Steeps’ will be mined via a modified shrinkage method with scraper cleaning and installation of support on retreat; and
historically, the Specific Gravity (‘SG’) was determined on thousands of rock samples from Six Shaft and a historical figure of 2.70 was determined.
In all the steep dipping areas, a shrinkage stope mining (‘shrinkage mining’) method is proposed, similar to that used at No 6 Shaft prior to mine closure in 1998. The original shrinkage mining methodology was to remove the ore material on a regular basis during the life of the stope. This approach resulted in excessive ore dilution due to slabbing and losses due to abandonment. The material difference to the original method is the proposal to scrape the shrink material only at the end of the stope’s life (‘scrape shrinkage mining’). Adopting this method could ensure that a Mine Call Factor (‘MCF’) of 90% is achieved. A MCF of 90% was applied in the Scoping Study and the additional labour and materials required for this method are catered for in the working and capital cost estimates. The flat dipping and intermediate areas are suitable for conventional ‘Witwatersrand gold mine’ stoping techniques, with associated footwall drives and crosscuts.
4.13.3 Evander Project Scheduling
The mine design and schedule indicates a 30 year production life for Evander as summarised below and presented in Note 6:-.
2 years – sinking and establishment;
7 years – mining ramp up to full production;
21 years – full tonnage profile production; and
2 years – mining closing down cycle.
– IV-56 –

– IV-57 –

30
Taung Gold CPR February 2011
4.13.4 Mine Planning and Development/Stoping Scheduling
The preliminary three-dimensional development and stoping designs for the Shaft geo-zone were undertaken at a PFS level of detail and accuracy. The development and stoping designs were completed using General Mine Planning (‘GMP’) software to comply with the mine design criteria. The stoping design process included allowances for bracket pillars, stope pillars and reef development. The dilutions and ore body losses applied were derived from the 3D geological and geo-zone model. The reef development designs were applied to each stope block and then scheduled to deliver the diluted reef tonnes from each stope. Preliminary waste development design layouts were created considering ventilation requirements, ore handling systems and people, material and equipment access.
4.13.5 Production Schedule – Tonnage Sources and Profiles
Approximately 92% of the tonnage for the first 10 years of production is derived largely from the Indicated Resources which have been modified to Probable Mineral Reserves. Two production planning schedules were applied to the ore body above a cut off grade of 500cmg/t Au. The first production schedule forms part of a PFS level study focused on the Shaft geo-zone and the second schedule forms part of a preliminary economic assessment of geo-zones above 500cmg/t Au. The combined Six Shaft and Twistdraai annual production and waste profiles for the ramp-up period are illustrated in Figure 12 and summarised in Table 17. The slight dip in production in 2017 and 2018 is a result of the insufficient stope face generation to maintain the same mining tonnages, as a consequence of the one-side mining approach to the primary access development. The peak production is 102ktpm with a peak shaft head grade of 7.43g/t Au.
4.13.6 Geotechnical and Hydrological Aspects
Rock Engineering
The geotechnical environment and factors that impact the mining and rock mechanics strategies to be adopted at Six Shaft and Twistdraai project areas have been derived from mining experience at EGM’s No’s 2, 5 and 6 Shafts, and from information gathered from exploration boreholes drilled in the target areas. A preliminary Shaft Pillar model exercise recommends a pillar 200m x 200m, with the shaft locality positioned at the dip midpoint of the un-mined block, and 50m and 100m from the dip faults defining the north and south strike limits of the block respectively. Water Contained in the Mine and Dewatering
The No 6 Shaft is estimated to be flooded to 645m below surface, between No 8 and 9 Levels on the Main Shaft. The implication is that the Ventilation Shaft is not flooded. No sampling for water quality has been undertaken. The volume of water in the old workings and shaft is estimated to be 800,000m3, based on the volume mined and the estimated volume of the haulages and other excavations. Based on historical pumping figures, No 6 Shaft historically generated some 4,000m3 per day of water from fissure and other sources. The ongoing pumping capacity to control the fissure inflow is estimated to be 4,000m3 per day. Considering both these parameters, the pumping installation on 7 Level requires a capacity of 12,000m3 per day. In the light of the power optimising strategy by Eskom (the local power provider) it is probably necessary to install a facility to manage 24,000m3 per day. To dewater the mine, at a pumping rate of 4,000m3/day for fissure water and 4,000m3/day to lower the water level, it will take approximately 10 months to dewater the mine.
– IV-58 –

31
Tabl
e 17
: R
amp-
up P
rodu
ctio
n Sc
hedu
le fo
r Eva
nder
Incl
udin
g In
ferr
ed M
iner
al R
esou
rces
IT
EM
UN
ITS
TOTA
L*
2013
20
14
2015
20
16
2017
20
18
2019
20
20
2021
20
22
Ree
f Min
ed
Mt
28.2
2 0
0.12
0.
21
0.2
0.2
0.25
0.
28
0.34
0.
7 1.
17
Was
te M
ined
M
t 9.
63
~ 0.
2 0.
2 0.
18
0.24
0.
41
0.44
0.
52
0.44
0.
41
Tota
l Min
ed
Mt
37.8
5 ~
0.5
0.3
0.4
0.38
0.
49
0.69
0.
78
1.22
1.
61
Ree
f Mill
ed
Mt
28.2
2 ~
0 0.
1 0.
21
0.21
0.
25
0.28
0.
34
0.7
1.17
H
ead
Gra
de
g/t A
u 6.
8 0
4.99
6.
43
7.45
7.
37
6.69
7.
67
8.03
7.
6 7.
51
Gol
d R
ecov
ered
%
96
.3
96.5
96
.5
96.5
96
.5
96.5
96
.5
96.5
96
.5
96.5
96
.5
Gol
d P
rodu
ctio
n kg
18
4,85
3 ~
10
608
1,48
1 1,
457
1,58
8 2,
064
2,63
4 5,
127
8,49
2 G
old
Pro
duct
ion
‘000
oz
5,94
3 ~
0 20
48
47
51
66
85
16
5 27
3 S
ourc
e : T
urnb
erry
201
0 *T
otal
for L
oM
Ex
clud
ing
Infe
rred
Min
eral
Res
ourc
es
ITEM
U
NIT
S TO
TAL*
20
13
2014
20
15
2016
20
17
2018
20
19
2020
20
21
2022
R
eef M
ined
M
t 8.
64
0.00
0.
00
0.09
0.
18
0.18
0.
17
0.19
0.
25
0.68
1.
09
Was
te M
ined
M
t 1.
91
0.00
0.
01
0.06
0.
06
0.03
0.
09
0.23
0.
26
0.31
0.
24
Tota
l Min
ed
Mt
10.5
5 0.
00
0.01
0.
16
0.24
0.
21
0.27
0.
42
0.52
0.
99
1.33
R
eef M
illed
M
t 8.
64
0.00
0.
00
0.09
0.
18
0.18
0.
17
0.19
0.
26
0.68
1.
10
Hea
d G
rade
g/
t Au
8.00
0.
00
4.99
6.
47
7.66
7.
61
7.25
8.
70
8.84
7.
67
7.67
G
old
Rec
vere
d %
96
.50
96.5
96
.5
96.5
96
.5
96.5
96
.5
96.5
96
.5
96.5
96
.5
Gol
d P
rodu
ctio
n kg
66
,700
0
10
568
1,33
1 1,
315
1,21
1 1,
578
2,17
5 4,
996
8,10
6 G
old
Pro
duct
ion
000o
z 2,
144
0 0
18
43
42
39
51
70
161
261
Sou
rce
: Tur
nber
ry 2
010
*Tot
al fo
r LoM
– IV-59 –

– IV-60 –

33
Taung Gold CPR February 2011
4.13.7 Mining Infrastructure
Access and drainage
The surface infrastructure at No 6 Shaft is non-functional and of limited value to Taung for further mine development. The shaft is accessed via 3.5km of good condition, secondary tarred road linking Evander and Secunda. The area immediately surrounding No 6 Shaft is flat and extensive earthworks have ensured that the site is prepared for construction. Power Supply
Electric power is a critical resource in South Africa since the regional power provider, Eskom (Electric Power generating authority in South Africa), has been forced to restrict power supplies to the mining industry and commercial consumers. New mining ventures have to consider the installation of alternative power generation capacity at considerable capital expenditure, as well as associated operating cost. No 6 Shaft was originally supplied by an 88kV Eskom supply but this entire infrastructure has been removed (including most of the foundations) and will need to be replaced entirely. The mine and processing plant will have a power requirement of approximately 40MVA, which will not be supplied by the national grid in the near future and additional supplies will not be available prior to 2015. Alternative prime power sources will be required to cater for all consumption requirements until this time. Eskom will be able to provide a portion of the construction power at perhaps 5MW, whilst the dewatering requirement will be approximately 10MW. The shortfall will be supplied by diesel generation (5MW) and possibly with heavy fuel oil (HFO) generation, subject to availability of the HFO. Provision has been made in the capital estimate for an initial 7.5MW of self generation, increasing to 10MW. Initial discussions and preliminary applications have been submitted to Eskom for the future Evander Project. Water Supply and Water Disposal
Surface water is a scarce resource in the region but pipelines are available to deliver water to new mines. It is assumed that the water supply line is still intact and could be reinstated readily. The mine water discard pipeline has been partly removed and will need to be reinstated for de-watering of the mine. Headgear
The headgears for both surface shafts are in position and in relatively good condition. The surface ventilation fans have been removed from site. Gold Processing Plant
No dedicated processing plant exists to serve ore from No 6 shaft. Until recently, EGM had two operating gold processing plants, one at Evander No 2 Shaft (Winkelhaak Plant) and the other at Evander No 7 Shaft (Kinross Plant). These plants had a maximum milling capacity of approximately 220,000tpm and were milling approximately 100,000tpm at the time of closure of the Evander No 2 Shaft plant. The No 2 Shaft plant was milling reef and pumping the slurry to the Evander No 7 Shaft plant, whilst the No 7 Shaft plant mills and processes the combined slurry. With the closure of the Evander No 2 Shaft plant, the Scoping Study has now incorporated a design and construction of a completely new metallurgical facility with an associated tailings dam. Waste Dumps
A waste rock dump on the No 6 Shaft property is being reprocessed. Elsewhere waste rock dumps are already established and no additional sites would be required in future.
– IV-61 –

34
Taung Gold CPR February 2011
Existing Underground Infrastructure
The main shaft is currently at a depth of 1,377m (18 Level) below surface and can only service mining operations on the levels above 17 Level. The shaft bottom is on 18 Level. The ventilation shaft is at a depth of 589m below surface (7 Level) with a raise bored pilot hole to 16 Level. The raise borehole has been surveyed and it is approximately 2m to 3m off vertical on 16 Level. The vent shaft was equipped with three main ventilation fans on surface, rated to air circulation of 560kg/s. Limited components items of the cooling plant remain such as a 450kg/s surface bulk air cooler. The main fans have been removed and only the cowlings and ducts remained on surface. Twin haulages from No 5 Shaft on 22 Level elevation were developed to a distance of 250m from the reef horizon proximal to No 6 Shaft when the mine stopped the development. It seems that this development may have intersected the future position of the sub-vertical shaft on 22 Level.
4.13.8 Ventilation Requirements
Using a basic ventilation design ratio of 4.0kg per second per 1,000t milled per month (kg/sec/ktpm), the shaft sizes were calculated for No 6 Sub-vertical shafts and Twistdraai Sub-incline (decline) shafts. The necessary surface refrigeration for the Sub-vertical shaft areas of 15MW was included. Each mining level will be accessed by twin haulages, one for intake and the other for return air. The interconnecting haulages from the No 6 Surface Shaft to Twistdraai Sub-incline shafts will require a cross sectional area of 54.7m2 at a flow of 6.0m/sec. Exhaust air from Twistdraai will require 21.9m2 of haulage for airflow of 15m/sec. This requires a total combined cross sectional area for air flow of 76.6m2 which can be made up of three 4m x 5m ends and one 4m x 4.15m. As a result of the depth of the mining blocks, refrigeration will be required from early in the mine’s life, initially with surface bulk air cooler installations and eventually with possible underground refrigeration plants and chilled water reticulation.
4.13.9 Manpower
The workforce will be accommodated in the surrounding urbanised areas of Evander and Secunda, in dwellings which they own or rent. Taung does not intend to house the workforce on site in purpose built accommodation. The workforce will thus be integrated into the local community and the strategy will be outlined in the Social and Labour Plan during the BFS. Due to the nature and orientation of the reef width, full scale mechanised mining would not be viable, thus the mine will be staffed in a similar manner to neighbouring mines in the Evander area. The production workforce profile (stoping, developing, ledging, equipping and tramming) at peak production was calculated on production level basis for the different mining methods. The support services workforce for underground and surface, (shafts, engineering, technical services, finance and administration) has been estimated, based on similar operations. Contracted plant staff will be approximately 120 outsourced members, not included in the overall staffing numbers. The maximum number of employees will be approximately 3,005, including 392 persons for leave and sick relief, of which 2,513 will be underground employees. At any one time, the maximum number of people underground will be approximately 2,200.
– IV-62 –

35
Taung Gold CPR February 2011
Table 18 : Evander Project Staffing Profile at Full Production EVANDER PROJECT STAFFING PROFILE – At Full Production Capacity
Section CAT 1 to 8 Miners Supervisors Management Total Stoping
2,037 50 50 20 2,157 Development Tramming Engineering 140 28 4 172 Shaft 48 16 64 Technical Services 100 20 120 Total Underground 2,325 78 90 20 2,513 Engineering 20 5 25 Stores/Admin 40 5 45 Gold Plant 0 0 0 0 Senior Staff 30 30 Total Surface 60 0 10 30 100 Total Workforce 2,613 Absentee allowance at 15% of workforce 392
TOTAL Mine Labour 3,005 Source ; Turnberry 2010
The employment profile will be verified by a detailed manning study in the next phase of the project. The mine is located in a region which has supplied labour to the mines for many decades. The available labour is expected to be sufficiently industrialised to provide trained manpower to the Evander project. This labour will be available to work with minimal additional training, without compromising safety. The region experiences a high level of unemployment. The Evander project will pay a gate wage, adequate to cover all accommodation expenses and thus no accommodation factor has been included in the capital schedules, but is included in the operating cost estimate.
4.13.10 Capital Requirements and Costs
The overall project capital expenditure was initially estimated by Turnberry 2010 as follows and was split into three phases as discussed below and summarised in Table 19:-
Table 19 : Phased Capital Expenditure DESCRIPTION COST (USD'000)* COST (USD'000)**
Phase 0 – Studies (3,978) (3,978) Phase 1 – Dewater Mine and Upper Level Steep Production (132,114) (132,114) Phase 2 – Sub-vertical Shaft (442,402) (438,878) Phase 3 – Twistdraai Incline Shaft (194,862) 0 Possible savings on second hand equipment -31,250 -20,000 Project Development Capital Estimate (225,676) (47,057) Sustaining Capital – Engineering and Projects (56,250) (21,563) Total Capital Expenditure (1,024,033) (623,590)
Source: Turnberry 2010 *Total Ore body including both Indicated and Inferred Mineral Resources Negative figures in (red) **Indicated Mineral Resources only
Phase 0: includes costs associated with the study phase of the overall project, as indicated in Table 19 was estimated to be USD3.978m. Subsequently Taung created a budget for the financial year ending February 2012 and the capital provision for the studies was increased as shown in Table 20;
Phase 1: estimated to be USD0.132bn and includes surface rehabilitation of the No 6 Shaft area, installation of the surface winding plant, dewatering and re-equipping of the existing shaft system, deepening of the surface ventilation shaft and commencement of production from above 17 Level;
– IV-63 –

36
Taung Gold CPR February 2011
Phase 2: estimated to be USD0.449bn and includes sinking and equipping of Evander No 6 sub-vertical shaft, development and equipping of 14 levels and the build up to full production from the Sub-vertical Shaft; and
Phase 3: estimated to be USD0.195bn and includes development to the Twistdraai sub-incline shaft locations, sinking of the Twistdraai sub-incline shafts and development to full production.
Table 20 : Revised LoM Capital Expenditure DESCRIPTION COST (USD'000)* COST (USD'000)**
Phase 0 – Studies (10,310) (10,310) Phase 1 – Dewater Mine and Upper Level Steep Production (132,114) (132,114) Phase 2 – Sub-vertical Shaft (442,402) (438,878) Phase 3 – Twistdraai Incline Shaft (194,862) 0 Possible savings on second hand equipment -31,250 -20,000 Exploration drilling programme*** (6,190) (6,190) Project Development Capital Estimate (223,421) (40,867) Sustaining Capital – Engineering and Projects (56,250) (21,563) Total Capital Expenditure (1,034,300) (629,922)
Source: Taung 2011 *Total Ore body including both Indicated and Inferred Mineral Resources Negative figures in (red) **Indicated Mineral Resources only
***Includes exploration expenditure up to and including Feb 2012, as quoted in Table B, Table 21
The total LoM capital for the Evander project was estimated by Turnberry (2010) in the Scoping Study Report to be USD1,024bn including an ongoing replacement capital expenditure of USD56.250m. 4.13.10.1 Processing Plant Costs
The new gold plant with an 100ktpm processing capability to be built for No 6 Shaft reef processing, is expected to cost approximately USD44.75m in December 2009 money terms), including all associated infrastructure and Engineering, Procurement, Construction, Management (‘EPCM’) costs. In addition, the tailings dam is expected to cost USD12.05m.
4.13.10.2 On-going Capital Costs and Exploration Costs
The On-going or Sustaining Capital Cost Requirement details the costs associated with upgrading the infrastructure during the production life of the mine and includes mining equipment and infrastructure upgrade. This value on ongoing replacement (sustaining) capital expenditure is estimated to be USD56.25m. The exploration forecast for the financial year ending February 2012 required to ensure the project is professionally and cost-effectively explored is summarised in Table 21. Funds are available for exploration undertakings. The aim of the drilling is to convert Inferred Resources into Indicated Resources. Venmyn considers the proposed exploration plan and budget for the financial year 2012, to be adequate for the next phase of the exploration programme:-
Table 21 : Future Exploration Expenditure for the Evander Project for the Financial Year ending February 2012
PROJECT EXPLORATION1 CONSULTANTS 2 OVERHEADS3 TOTAL (USD'000) (USD'000) (USD'000) (USD'000)
Evander (5,740) (5,107) (869) (11,716) 1. Drilling (four holes) and sampling 2 .Consultants, environmental management 3. On site and Head Office Negative figures in (red)
– IV-64 –
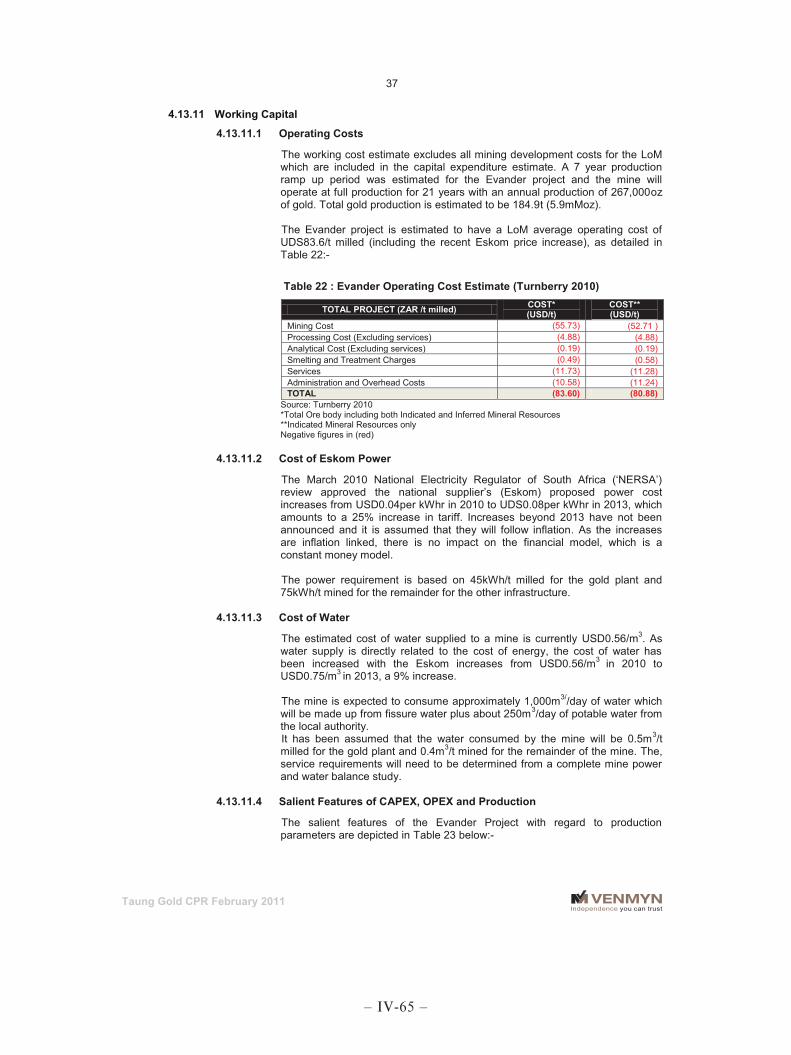
37
Taung Gold CPR February 2011
4.13.11 Working Capital
4.13.11.1 Operating Costs
The working cost estimate excludes all mining development costs for the LoM which are included in the capital expenditure estimate. A 7 year production ramp up period was estimated for the Evander project and the mine will operate at full production for 21 years with an annual production of 267,000oz of gold. Total gold production is estimated to be 184.9t (5.9mMoz). The Evander project is estimated to have a LoM average operating cost of UDS83.6/t milled (including the recent Eskom price increase), as detailed in Table 22:-
Table 22 : Evander Operating Cost Estimate (Turnberry 2010)
TOTAL PROJECT (ZAR /t milled) COST* (USD/t)
COST** (USD/t)
Mining Cost (55.73) (52.71 ) Processing Cost (Excluding services) (4.88) (4.88) Analytical Cost (Excluding services) (0.19) (0.19) Smelting and Treatment Charges (0.49) (0.58) Services (11.73) (11.28) Administration and Overhead Costs (10.58) (11.24) TOTAL (83.60) (80.88)
Source: Turnberry 2010 *Total Ore body including both Indicated and Inferred Mineral Resources **Indicated Mineral Resources only Negative figures in (red)
4.13.11.2 Cost of Eskom Power
The March 2010 National Electricity Regulator of South Africa (‘NERSA’) review approved the national supplier’s (Eskom) proposed power cost increases from USD0.04per kWhr in 2010 to UDS0.08per kWhr in 2013, which amounts to a 25% increase in tariff. Increases beyond 2013 have not been announced and it is assumed that they will follow inflation. As the increases are inflation linked, there is no impact on the financial model, which is a constant money model. The power requirement is based on 45kWh/t milled for the gold plant and 75kWh/t mined for the remainder for the other infrastructure.
4.13.11.3 Cost of Water
The estimated cost of water supplied to a mine is currently USD0.56/m3. As water supply is directly related to the cost of energy, the cost of water has been increased with the Eskom increases from USD0.56/m3 in 2010 to USD0.75/m3 in 2013, a 9% increase. The mine is expected to consume approximately 1,000m3//day of water which will be made up from fissure water plus about 250m3/day of potable water from the local authority. It has been assumed that the water consumed by the mine will be 0.5m3/t milled for the gold plant and 0.4m3/t mined for the remainder of the mine. The, service requirements will need to be determined from a complete mine power and water balance study.
4.13.11.4 Salient Features of CAPEX, OPEX and Production
The salient features of the Evander Project with regard to production parameters are depicted in Table 23 below:-
– IV-65 –

38
Taung Gold CPR February 2011
Table 23 : Production Parameters and Phases in Relation to Costs
ITEM LoM SUMMARY* (USDm)
LoM SUMMARY** (USDm)
CAPEX (Turnberry 2010) Including Plant and Ongoing CAPEX (1,023.00) (623.00) CAPEX (Revised by Taung Feb 2011) Including Plant and Ongoing CAPEX (1,034.30) (629.92)
OPEX Life Average Cost/tonne milled (83.60) (80.88) Cash Cost Total Cash Cost/oz Au produced (396.71) (325.85)
Production
Annual Ore Production (tonnes per annum – tpa)) 1,229,000 1,150,000 Monthly Ore Production (tonnes per month- tpm) 102,417 95,833 Annual Gold Production (kg gold per annum ) 8,302 4,649 Annual PeakGold Production (ounces per annum) 291,094 286,185 Average Production Gold ounces pa 266,922 149,480 Head Grade (g/t) 6.801 7.99 Yield (g/t) 6.55 7.72 Total Gold (kg) 184,853 66,699 Total Gold (ounces) 5,943,148 2,144,441 Total Waste Tonnes (LOM) 9,627,007 1,908,796 Reef: Waste Ratio 2.93 4.53 Sustaining Waste Tonnes (LOM) 5,120,663 969,150 Reef: Waste Ratio 5.51 8.91 Mine Call Factor 90% 90%
Source: Turnberry 2010 *Total Ore body including both Indicated and Inferred Mineral Resources **Indicated Mineral Resources only Negative figures in (red)
4.13.12 Project Risk Profile
4.13.12.1 Risk background
In comparison to industrial and commercial operations, mining is relatively high risk. Each orebody is unique and morphology, grade, mining and processing characteristics are estimates. Inherent inaccuracies can be expected when calculating estimates based on natural material. Mining project revenues are subject to variations in metal prices and exchange rates which are beyond the control of Taung. Estimations of project capital and operating costs are rarely more accurate than ±15%. The risks identified at Scoping Study level are presented in a matrix in Note 7. No formal risk analysis has been conducted for the Evander project; however there are a number of factors which combine to reduce some of the risks identified above. Principal amongst these are:-
all geological data is based on historical diamond drilling; core recoveries are historically reported to be good. The geology, though complex, has been soundly modelled and the mineralisation controls are well understood and this has greatly reduced the risk in the area where initial mining will be undertaken;
drilling to convert the Inferred Mineral Resources in Twistdraai to Indicated Mineral Resources will provide a valuable guide to mining in this area;
the production in the early years of the LoM is sourced from high grade geo-zones, providing an opportunity to optimise the ore feed in the initial years;
several independent CPRs have been compiled for the project;
the plant design is based on a known technologies which are currently operating throughout the Witwatersrand mining industry; and
– IV-66 –
39
Taung Gold CPR February 2011
local, regional and national regulatory agencies support the project’s development, in terms of gaining government approvals, access to land, and managing local employment and local community relations. There appear to be no irresolvable social or regulatory difficulties at this stage.
4.13.13 Gold Market Assessment
A review of the global gold market is presented in Note 4.
4.14 Techno-Economic Study – Mineral Processing
4.14.1 General
Currently there are no agreements in place for the treatment of the ore which will arise from the mining at Evander. Such agreements will only be negotiated upon the favourable outcome of a completed PFS. Taung has initiated a study to investigate the establishment of a “fit for purpose” plant adjacent to the No 6 Shaft and the initial costing and financial model by Turnberry are positive. No metallurgical test work has been conducted on the Kimberley Reef at the Evander project but more than 2Mt of reef has been processed through the EGM’s No 2 Shaft gold plant, without deleterious effect, at a reported recovery of approximately 96.5%. Based upon the consistency of the metallurgical performance of the neighbouring EGM mines, it is fair and reasonable to expect a similar high gold recovery at Evander.
4.14.2 Plant Design
The mineralogy of the Kimberley Reef from the Evander project is expected to be similar to that of neighbouring EGM mines, thus conventional gold processing using cyanide and CIP/CIL technology will be applicable. A new conventional Witwatersrand CIP/CIL plant, dedicated to No 6 Shaft complex, is to be built and operated according to the following modules and phases:-
with an initial 25ktpm plant to operate from until 2013 to 2030 (18 years);
Module 1: 100ktpm plant to operate from 2018 to 2045 (28 years); and
Module 2: 100ktpm plant from 2023 to 2045 (23 years).
4.15 Techno-Economic Study - Project Implementation
A detailed discussion of the project implementation is presented in Note 6.
4.16 Environmental Considerations
The South African Environmental legislation is summarised in Note 3, together with a discussion of the details of the Evander project in relation to the legislation. Evander project is located within the mining area of EGM. An integral part of the process of acquiring a mining title in South Africa is the requirement to compile a comprehensive EMPR for approval by the DMR. The EMPR incorporates environmental baseline studies, air quality and noise, surface hydrology, fauna and flora, freshwater ecosystems and many other topics. The Evander mining operations, sites and related infrastructure are the subject of an EMPR approved as part of the conversion to a ‘New Order’ Mining Right by all relevant interested and affected parties. The initial EMPR entitled “Evander Gold Mines Limited, Ref: MP30/5/1/2/3/2/1/126EM” was approved as part EGM’s successful application for a New Order Mining Right.
– IV-67 –
40
Taung Gold CPR February 2011
A revised EMPR was completed in February 2009 and is entitled; “Evander Gold Mines Limited, Ref: MP 30/5/1/2/3/2/1/126EM, Environmental Management Programme, Revised by: Shangoni Management Services (Pty) Limited”. Taung will undertake further environmental studies as part of the PFS and BFS process. 4.16.1 Tailings Storage Facility
Currently, the Evander project falls under the umbrella of the EGM’s EMPR and Taung is legally bound to abide by the conditions of this document. However, Taung will initiate comprehensive study by independent consultants to assess the tailings dam’s environmental requirements as part of the PFS and BFS processes. A 30Mt tailings storage facility (‘TSF’) will be required at Six Shaft, the location of which has not been determined at the Scoping Study level. There is a possibility that co-deposition with Harmony’s LIBRA Project tailings is possible, but this has not been included in the Scoping Study.
4.17 Social, Community and Land Use
The closest major urban areas to the Evander project are Evander and Secunda, 6km northeast of and 4km southwest of Evander project respectively. The population of the area is mainly a black ethnic group with a white minority. The estimated population of Secunda is 250,000 persons and of Evander, 30,000 persons. The local government is well established, with First World structures and, consequently, both towns are significant trading centres. The local per-capita income is one of the highest averages in South Africa. Two major employers, namely; Sasol (Sasol Mining and Sasol Synfuels) and EGM, provide employment in the area. The workforce will sourced from the local community, since this is a historical mining district and has the necessary skills. Skills training will be provided by Taung. No resettlement of the local community is planned.
4.18 Conclusions
The Evander project including Six Shaft and Twistdraai will produce Run of Mine (‘RoM’) at a rate of 1.2Mtpa for a period of 21 years at full production with a 7 year ramp up phase and a 2 year closure phase, i.e. a total of 30 years in production. The mine will require 2 years to develop before production can commence. The total reef tonnage milled over the LoM will be approximately 28Mt. The mine will be a stand-alone operation and will not rely on any mining infrastructure from other sources. The bullion produced from the processing plant will be refined at the Rand Refinery in Johannesburg. The estimated LoM Capital Cost for the Project is USD1,034.3m The project start date for Phase 1 in this Scoping Study is January 2013 with the proposed date of completion of the BFS in Feb 2013, as per the agreement with EGM. This will allow a period of 9 months for the review of the BFS with the necessary project financing being activated for the partners. It is not deemed essential for a PFS to be completed prior to a BFS as there are only limited access options to the ore body. Normally these options would be reviewed during the PFS phase of the project, but the BFS could commence immediately. A PFS and a BFS are based on at least Measured and Indicated Resource categories, whereas a Scoping Study can include Inferred Mineral Resource. It is recommended that additional drilling be completed on the geozones with Inferred Mineral Resources to upgrade these zones to an Indicated level for inclusion in a future study. The project is robust and is likely to be economically viable under the current cost and revenue scenarios. The unique skills associated with narrow, steep, shrinkage stoping has not been lost in the country, and should be revived with effective training and skills transferring programmes.
– IV-68 –
41
Taung Gold CPR February 2011
However, by concentrating on the steep reefs as low production, high grade areas the yield can be significantly improved. This can be achieved by implementing the ‘shrink & scrape’ stoping method to control dilution and minimize gold loss. Before other improvements can be planned, the method of mining, stoping and developing, will have to be reviewed. If substantial blocks of payable reef are concentrated in smaller areas, mechanisation of the development function could allow for greater capacity to build up production rates while still achieving reasonable utilisation from the costly machinery. Therefore, all production rate options only consider 20,000 reef tonnes per month from the upper section. This depletion rate also allows 6 years for the sinking and commissioning of the sub-vertical shaft without a drop in production. In order to achieve this production rate, the existing shaft system, re-equipped and deepened, where necessary, will be more than adequate and is easily able to service the sinking of the No 6 Sub-vertical shaft complex at the same time. The basic requirements are a rock winder hoisting from 18 Level, and a man winder able to deliver men and material to seven stations. The downcast compartment of the ventilation shaft must be equipped with a service winder as a second outlet and also to assist the movement of men between levels. The No 6 Sub-vertical shaft orebody has the capacity to produce approximately 110,000 reef tonnes per month applying industry norms. This will depend on the degree of faulting present as well as the ability to mine the narrow steep stopes at depth. The No 6 Shaft sub-vertical system was designed and costed to produce 102,500 reef tonnes per month. The detailed mine planning recently completed has confirmed this to be a realistic target production rate. The Twistdraai ore body will be exploited via three decline systems providing a total of 80ktpm during the latter phase of the LoM. A labour plan from first principles has been compiled for the expected peak production period when the No 6 Sub-vertical shafts are operating at full capacity. The maximum number of people employed by the mine is estimated to be 3,005. This includes a labour allocation for the processing plant. The operating cost at full production will be approximately USD83.6/t milled. This includes the recent Eskom increases. The cash costs are approximately USD397/oz for the Evander project. It is recommended by the Competent Persons that Taung progress the Evander Project to a full PFS, as the technical and economic risks, as well as the outlook for the gold price, support the potential development of the project, subject to additional drilling commencing as soon as possible. The up-side potential associated with the Evander project can be summarised as:-
additional drilling to bring Inferred Resources into the Indicated category;
additional economic reef zones identified;
the project has used a MFC factor of 90%, whilst some underground operations in the gold industry report MCFs in excess of 90% (others report as low as 75%);
stoping width reduction to better than 35cm more than the channel width;
improved gold plant recovery as a result of the high head grades and process optimisation;
additional tonnage processed through the plant as a result of improved availability and control;
simpler geology/structure than the current interpretation;
increased mechanisation in the stoping environment to reduce costs; and
earlier project start date than January 2014.
– IV-69 –

42
Taung Gold CPR February 2011
5 JEANETTE PROJECT 5.1 Property Description and Location
The Jeanette project area is situated northeast of Welkom in the Free State Province of South Africa. Jeanette consists of numerous farms and farm portions over which a single New Order Prospecting Right is in the process of being registered in the name of Taung Gold Free State (Pty) Limited. Harmony’s Tshepong Mine borders the project area to the south (originally the Freegold North operation) (Figure 13). Jeanette lies approximately 2km east of Allanridge and the southern boundary of the project is approximately 2km north of Odendaalsrus. Jeanette is centred on longitude 26°41’E and latitude 27°47’S and is 10km long in a north-south direction and 5km wide east-west. Jeanette is situated directly east of the previously mined Loraine Gold Mine property, with the western boundary forming a common boundary with the eastern margin of Loraine Gold Mine, now the property of Harmony (Figure 13).
5.2 Legal Aspects and Tenure
The Jeanette project comprises a portion of a single New Order Prospecting Right originally granted to Harmony Freegold Limited on 24th April 2008, and which consists of numerous farms and portions of farms as listed in Table 24 below and illustrated in Figure 13. Taung and African Precious Minerals Limited (‘APM’) entered into an agreement with a wholly-owned subsidiary of Harmony, ARMgold / Harmony Freegold Joint Venture Company (Proprietary) Limited on 1st February 2008, in terms of which Taung acquired a 100% of the Jeanette Project by way of the issue of shares in APM. As a consequence of exchange control issues, this agreement was terminated and replaced on 30th June 2008 by an agreement in which the Prospecting Right was acquired by Taung for a purchase consideration of USD12.5m. A deposit of USD0.625m was paid upon signature of this agreement. Regulatory issues in regard to the subdivision of the right became apparent and on the advice of the DMR, the parties entered into a new Sale Agreement on 17th December 2009 (later amended on 11th March 2010), in terms of which the purchase price was reduced to USD9.4m and the mode of transferring the right was amended. On the 29th September 2010 a Section 11 consent to the transfer of the Prospecting Right from Harmony Freegold to Taung Gold Freestate (Pty) Ltd, was granted by the DMR under the reference number FS30/5/1/1/2/895PR. The Prospecting Right is valid for a period of five years from date of execution of the new Prospecting Right. The balance of the purchase price of USD 8.76m was paid on 2nd July 2010.
Table 24 : Legal Aspects and Tenure of Jeanette
FARM SIZE (ha) PROSPECTING RIGHT NO.
COMMENCE-MENT DATE
EXPIRY DATE MINERALS EFFECTIVE
INTEREST Philadelphia 273
3,886 FS30/5/1/1/2/895PR 29 June 2010 Five Years
Gold, silver, uranium and associated minerals
On 29th Sept 2010 Section 11 transfer consent to the prospecting right to Taung Gold Freestate (Pty) Ltd from ARMgold/Harmony Freegold JV was granted by the DMR under FS30/5/1/1/2/895PR. Awaiting registration of the cession.
My Betty 351 Wesselsrust 58 Vriendskap 234 Roodepoort 235 Rustoord 33 Heldenmoet 117 Zoeten Inval 268 Paardevley 251 Martina 226 Aanleg 50 Goud Rand 272 Jeanette 371 De Erf 140 Allanridge 425 Uitkyk 258 TOTAL 3,886
– IV-70 –
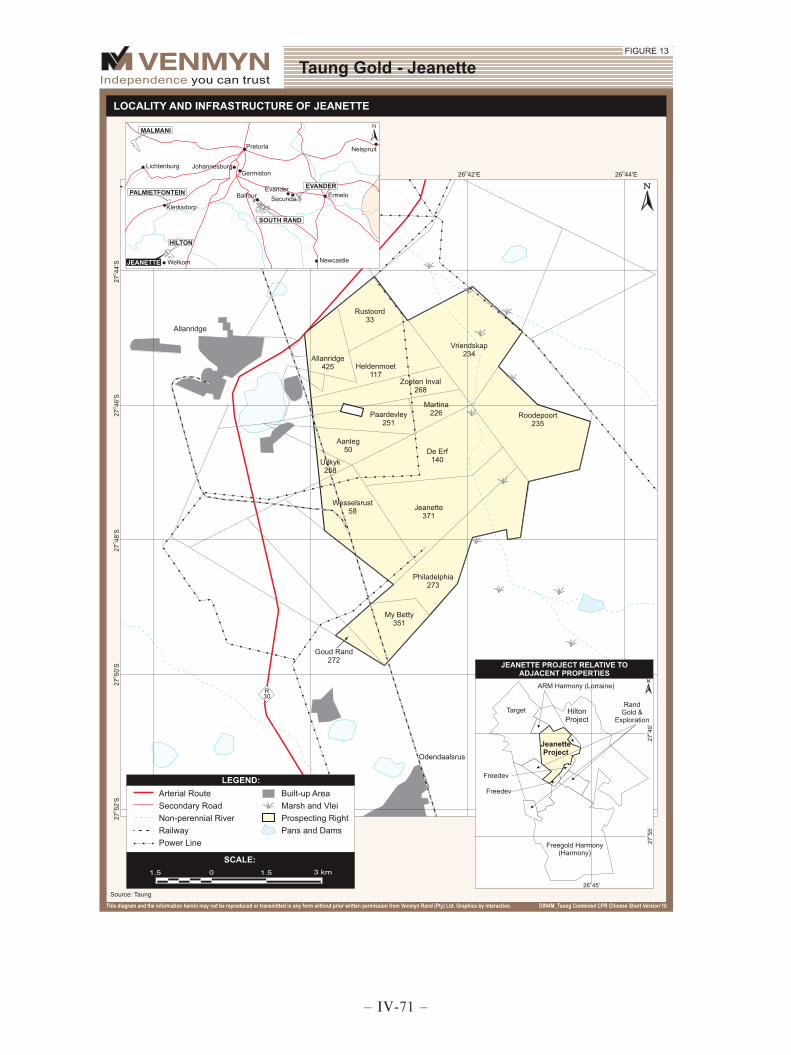
– IV-71 –
44
Taung Gold CPR February 2011
The surface area is sufficient for any future mining operations, storage areas, tailings facilities and plant sites. The right is are granted for exploration of the minerals shown in Table 24 and all requisite fees due to the DMR are paid.
5.3 Material Agreements
5.3.1 Survey of Property Boundaries
The farms, as shown in Table 24 and Figure 13 are registered with the South African Deeds Office and are located on the Government 1:50,000 Topo-Cadastral sheet 2726DC (1996). Property boundaries and corner beacons have been interrogated as part of the Mining and Prospecting Right applications of previous and current right holders.
5.3.2 Surface Rights
The surface rights at Jeanette and Hilton are held by numerous parties and Taung and associated companies do not hold any surface rights in this area. The surface rights holders and all relevant parties have been consulted by Taung. Taung will be the custodian responsible for all aspects of the EMP and for all specifics as set out in the EMP for the properties that form part of the Jeanette and Hilton prospects. All proposed exploration activities on the Jeanette property will be communicated to the surface right owners. The surface rights owners of the Jeanette and Hilton project areas are presented in Note 8.
5.3.3 Ore Concentrate and Treatment Agreement
Currently there are no agreements in place for the treating of ore on or off the Prospecting Right boundaries and such agreements will only be negotiated upon the favourable outcome of a PFS.
5.3.4 Permits to Conduct Work
All permits to conduct exploration have been obtained.
5.3.5 South African Mining Law , Royalties and Taxes
The South African Mining Law, royalties and taxes are discussed in Note 3. Taung will produce refined products and consequently will pay a 5% royalty.
5.4 Accessibility, Infrastructure, Climate and Physiography
5.4.1 Property Access
Access to Jeanette is excellent with the tarred national road R30 linking Welkom and Bothaville, which lie immediately south and north of the property, respectively. The western portions of Jeanette are accessed via 2km of tarred road from the town of Allanridge (see Figure 13). Well-maintained secondary roads traverse the central and southern portions of the area of interest and in the future, access to drill sites is expected to be via farm tracks. The most proximal populated centre to the project area is the town of Odendaalsrus, located about 2km to the south of Jeanette. A local airport is maintained at Welkom with tarred runways and hangars.
5.4.2 Topography, Climate and Vegetation
The majority of the Jeanette project region is flat, even terrain, overlain by a thick layer of aeolian Kalahari-type sands and loam. The elevation difference between the low and high levels at Jeanette is nominal, ranging between 1,300m and 1,360m amsl. The underlying siltstones and shales of the Ecca Group (Karoo Supergroup) form an impermeable barrier below the sands and as a result, the area is suited to wheat and maize farming and most of the area is consequently cultivated. Jeanette is located in drainage area nominated C340 by the Department of Water Affairs and Forestry’s surface water resources catchment area index system. The northern section of the area drains towards the Sandspruit, which is a small non-perennial north-south flowing stream with marshy ground developed on either side of the channel (Figure 13).
– IV-72 –

45
Taung Gold CPR February 2011
The regional climate is the typical Highveld climate with moderately wet, warm summers and cold dry winters with an average precipitation of 526mm per annum. The winds are seldom strong over the central interior but gusty winds of 100km/h are associated with thunderstorms and moderate to fresh winds occur with cold fronts. The rainy season occurs in the summer months from October to April with the highest rainfall in December and January. The annual average temperature is 17°C with an average maximum of 24°C, and an average minimum of 10°C. In summer (October to April), the days are moderate to hot, with afternoon showers or thunderstorms. During winter months (May to September), days are dry and sunny with moderate to cool temperatures, while evening temperatures drop sharply. The hottest months are generally December and January with June and July being the coldest. Natural vegetation in the Jeanette area consists of a variation of dry Cymbopogon themeda veld, which is typical for the inland central districts of South Africa. The dominant grass species is Themeda triandra (Red grass) and is typical grassland veld type Gm8 (Mucina and Rutherford 2006). The presence of Aristida congesta (Three-awn), Eragrostis lehmanniana (Lehmann’s Love Grass) and Tragus koelerioides indicates the arid nature of this veld type.
5.4.3 Infrastructure with Respect to Mining
A well developed infrastructure is available with the following key developments (see Figure 13):-
a rail link between Odendaalsrus and Allanridge to the south west of the prospect;
the R30 road linking Welkom and Bothaville;
Eskom power lines (part of a major grid), situated on the western side of the prospect; and
Odendaalsrus and Allanridge both situated nearby and both being centres of existing mining activities in the area and potential sources of unskilled and skilled labour.
5.5 Historical
5.5.1 Early Historical Exploration and Mine Development
The Jeanette Gold mine has been the subject of ongoing investigations since the early part of the last century. The historical operators in the Jeanette Gold Mine area since 1936 are summarised in Table 25 and the exploration programmes shown in Figure 14:-...
Table 25 : Historical Ownership and Exploration on Jeanette DATE COMPANY COMMODITY ACTIVITY 1936 Wits Extension Limited ('WEL') Gold Drilling
1937 Anglo American Corporation of South Africa on behalf of WEL Gold Drilling
1951 Jeanette Gold Mines Limited Gold Shaft sinking at Number 1 shaft initial construction 1951 Jeanette Gold Mines Limited Gold Suspension of shaft sinking at No 1 shaft
1951 Jeanette Gold Mines Limited Gold Commencement of Shaft sinking at Number 2B ventilation shaft to depth of 1546.86m
1954 Jeanette Gold Mines Limited Gold Underground work ex 2B ventilation shaft at 49 level for 3,556m of development.
1955 Jeanette Gold Mines Limited Gold Resumption of shaft sinking operations at No 1 shaft to depth of 1293.27m
1955 Jeanette Gold Mines Limited Gold Suspension of mining operations on the property due to adverse market conditions.
1972 Anglo American Corporation Gold and Uranium Review of available data and project
1974 Anglo American Corporation Gold and Uranium Drilling of additional diamond boreholes to test the gold bearing reefs in the Jeanette area.
1977 Anglo American Corporation Gold and Uranium Completion of this phase of drilling on the Jeanette project
1992- Anglo American Prospecting Services Gold Diamond drilling programme comprising 3 boreholes.
– IV-73 –

46
Taung Gold CPR February 2011
DATE COMPANY COMMODITY ACTIVITY
1998 AngloGold Gold Jeanette Gold mine becomes a wholly owned subsidiary of AngloGold
2001 Harmony/ARM Gold Purchase of Jeanette Gold Mine by Harmony/ARM
2008 Taung Gold Limited Gold Agreement of sale of Jeanette Gold Mine to Taung Gold Limited
5.6 Regional Geology and Mineralisation
5.6.1 Regional Geology and Mineralisation of the Witwatersrand Basin
Jeanette project is located in the Welkom Goldfield on the south-western margin of the Achaean Witwatersrand Gold Basin, located on the Kaapvaal Craton in South Africa (Figure 5). The description of the stratigraphy, structure and mineralisation controls of the Witwatersrand Basin is the same as discussed in the Evander section of this report (see Section 4.6).
5.6.2 Regional Geological Setting of the Welkom Goldfield
The Welkom Goldfield is host to eleven mines in the region between Allanridge, Welkom, and Virginia, in the Free State, located 270km southwest of Johannesburg, at an elevation of 1,370m amsl. These mines have collectively produced 8.7Mkg Au.
The Welkom Goldfield is entirely overlain by Karoo Supergroup formations and comprises two main stratigraphic groups; the lower West Rand Group and the Central Rand Group as illustrated in the stratigraphic column in Figure 16, with over 20 stratigraphically separate reef horizons. These reefs were derived from an Archaean source (2,6Ga) and were deposited into the southwestern corner of the Central Rand Group Basin.
The Welkom Goldfield has a complicated deformational history. The regional geological structure is dominated by a northeast trending synform that is split along its axis by two major faults that diverge in the area to the south of Hilton into the De Bron Fault and the Homestead Fault (Figure 15). The area between these two faults forms a regionally extensive horst block named the De Bron Horst, and divides the northern part of the Free State Goldfield into two structural domains, named the Odendaalsrus Graben to the west, and the Virginia Section to the east of the Hilton project area.
The western margin of the goldfield is a locally overturned syncline with easterly verging faults and the dominant structural features of the region are northerly striking normal faults as illustrated in Figure 15 (Johnson et al 2006). The main mineralised reefs of the Welkom Goldfield include the following from stratigraphically highest to lowest positions as illustrated in Figure 15:-
Eldorado Formation reefs;
A-Reef;
Big Pebble Reef;
B-Reef – locally mineralised conglomerate on the discontinuity between the Kimberley and Krugersdorp/Booysens Formations;
Leader Reef – sporadic mineralisation; and
Basal Reef – in the middle of the Central Rand Group with locally developed bituminous zones with uranium and gold mineralisation.
– IV-74 –

– IV-75 –
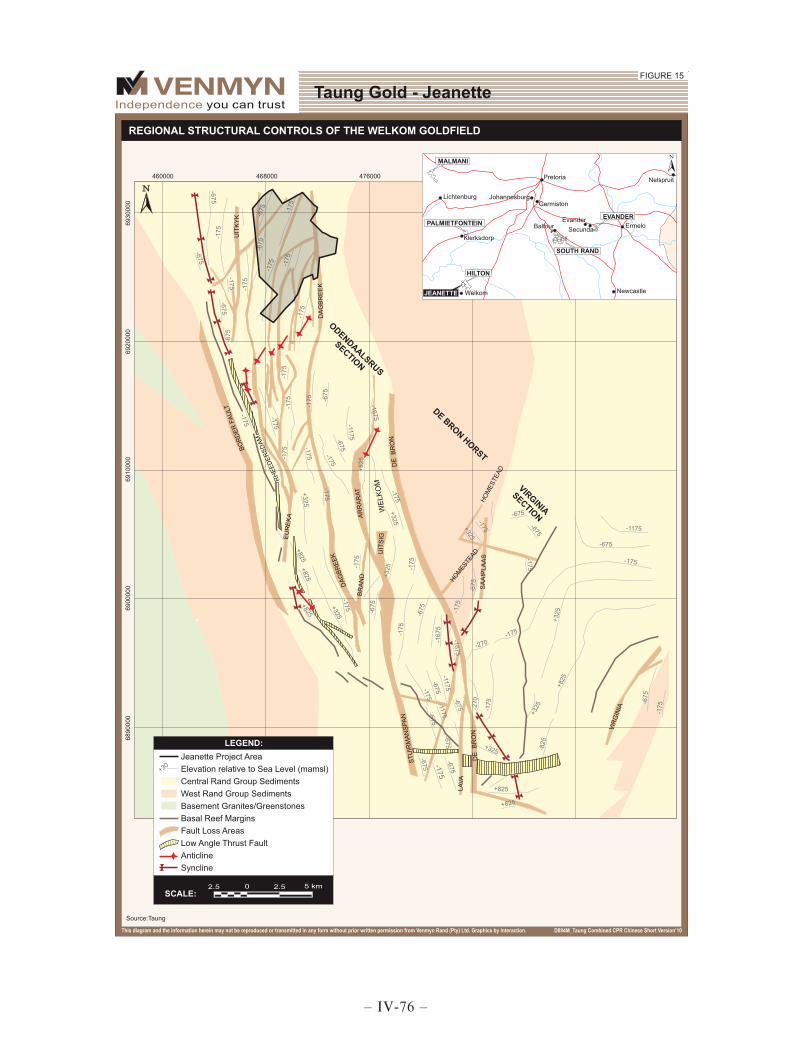
– IV-76 –
49
Taung Gold CPR February 2011
Historically the Basal Reef has been the prime economic target, with the Kimberley Formation’s (Turffontein Subgroup’s) reef horizons; A-Reef, Big Pebble Conglomerate and B-Reef, considered a secondary source of gold, due to their aerially discontinuous and more erratically developed nature, which have restricted large scale mining. The mineralisation of these reefs is described in detail in Section 5.8.
5.7 Local Geology of the Jeanette Project
5.7.1 Structure of the Jeanette Region
The Jeanette project area is located in the northern part of the Welkom Goldfield where the regional geological and structural setting is that of a graben, bounded towards the west by the Border Fault and to the east by the De Bron Fault, as illustrated in Figure 16. The dominant structural feature within the prospecting area is the Dagbreek Fault in the east, which strikes approximately northsouth (Figure 16). On the western, down-throw side of the Dagbreek Fault, a full succession of the Central Rand Group sediments is developed whilst on the eastern up-throw side of the fault, the Central Rand Group sediments subcrop against the Karoo sediments, with the subcrop of the Basal Reef occurring on the eastern edge of the Jeanette project area. The second most prominent structural feature in the area is the Damspruit Fault which traverses the area from the southwestern corner of the property, towards the east, where it abuts against the Dagbreek Fault (Figure 16). The structure of the Basal Reef in the Jeanette project area (Figure 16) is that of a westerly dipping body which has been faulted by north striking faults. The shallowest reef occurs on the eastern margin at 950m below surface while the deepest reef is developed along the western boundary at 2,200m below surface. The depth contours to the Basal Reef below mean sea level (mbmsl) are shown in Figure 16. A rotation component to the faulting results in the fault-bounded blocks displaying dips ranging from 9° to 27° with local dips steepening towards 68° approaching fault contacts. The Basal Reef (Black Chert facies) ranges in depth below surface from approximately 1,200m to 2,000m on the western side of the Dagbreek Fault and it is estimated that the downthrown displacement towards the west of this fault may be as much as 800m. Some of the subordinate (synthetic and antithetic) faults may have up to 300m down-throw towards the east.
5.7.2 Stratigraphy of the Jeanette Project
The stratigraphic nomenclature used for the Jeanette project is complicated by the change in historic terminology discussed in Section 4.6.1, as well as the variety of classifications used by the various mines in the region. The stratigraphic divisions and used in this report are illustrated in Figure 16.
5.7.3 Mineralised Reefs of the Jeanette Project
The Basal Reef has historically been the prime economic target, with the Kimberley Formation’s (Turffontein Subgroup’s) reef horizons; A-Reef, Big Pebble Conglomerate and B-Reef, only considered as a secondary source of gold, due to their aerial discontinuity and erratic development, which have restricted large scale mining.
Four of the Kimberley Formation’s reefs, have been mined to varying degrees on most of the Free State Goldfield’s mines but prior to production from Gold Fields’ Beatrix Mine, no operation was founded solely on the strength of the Kimberley Formation reefs.
– IV-77 –
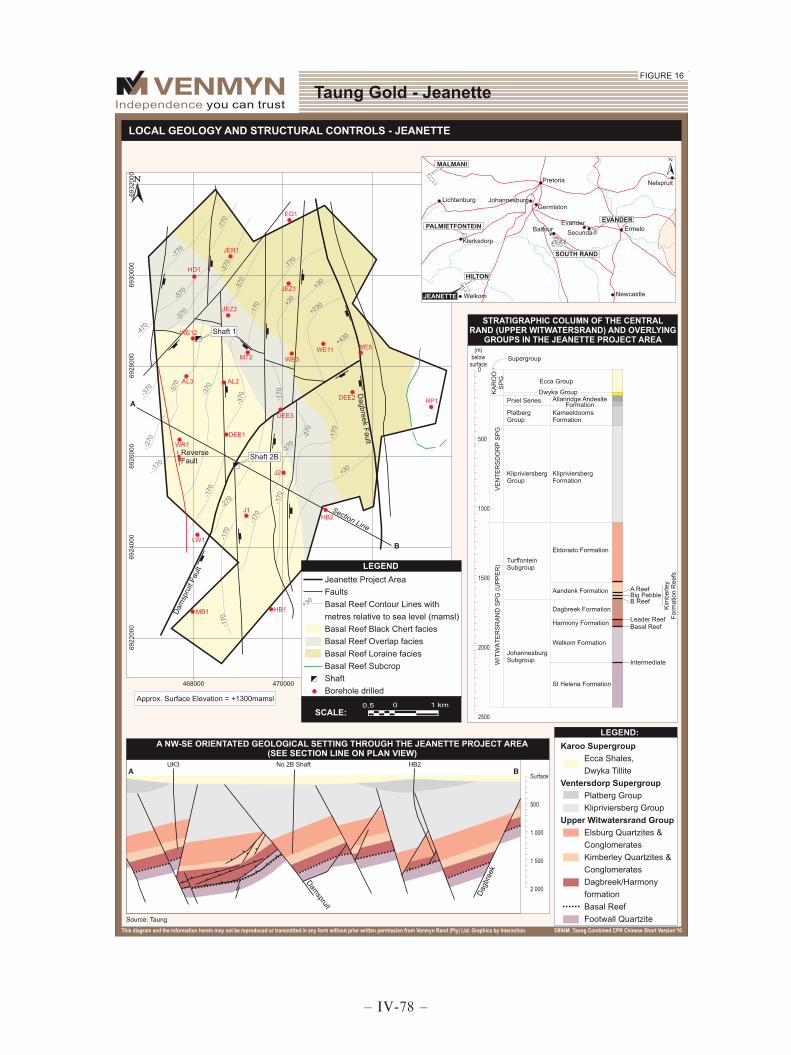
– IV-78 –

51
Taung Gold CPR February 2011
The need for replenishment of depleted Basal Reef Mineral Resources in recent years has led to exploration of the Kimberley Formation but in most cases the Kimberley Formation reefs do not represent stand alone Mineral Resources but rather are considered upside potential once underground development has reached the target horizon. The Basal Reef
The Basal Reef in the Jeanette area is represented by the Black Chert facies which constitutes 40% of the Basal Reef, the Overlap or Transition facies (20%) and the Loraine facies as illustrated in Figure 16. An additional block in the area dominated by the Loraine Facies may include the Melkkraal facies as an isolated occurrence. Exploration is required to more accurately delineate the boundaries between these four facies domains. Economically the Black Chert facies is the most important facies and spatially the higher economic potential exists in the southwest (Black Chert facies and Transition facies) of the Jeanette project area. The values in the Loraine facies will be of lower grade (Figure 16). Lithologically, the Basal Reef on Jeanette is composed of 5cm to 77cm of grey orthoquartzite overlying a poorly developed conglomerate bed. The quartzite is medium to coarse grained with small, white to greenish cream kaolinised feldspar grains scattered throughout. The quartzite is trough cross-bedded on a small scale and fine-grained pyrite nodules mark heavy mineral concentrations on the foresets and bottom-sets. The base of the reef is marked by a single layer of scattered small oligiomictic pebbles that rest as a lag deposit on a possible scour surface. This lag is associated with a sparse concentration of fine-grained nodular pyrite, scattered granules of carbon, and in some instances with a thin carbon seam up to a few millimetres thick. Fine grains of visible gold occur in this lag and very fine-grained disseminations of gold occur in the thin carbon seam. Within a sedimentary deposit, the indicators of the proximal or distal locations of deposition within the geometry of a sedimentological fan are pebble size, heavy mineral size and the mineralogical ratio between uranium and gold. In the case of the Basal Reef at Jeanette the pebble size is <6mm in diameter, the pyrite nodules are 0,135mm, the zircon grains are 0,149mm in diameter and the uranium/gold ratio is approximately 30. In comparison to other deposits, the values of these attributes indicate that the Basal Reef in this area is extremely distal (Knowles, 1978). The structure of the Basal Reef in the Jeanette project area is that of a westerly dipping body, which on the eastern margin of the basin occurs at 950m below surface, whilst along the northern boundary at 2,200m below surface as illustrated in Figure 16. The reef is faulted by the north striking faults. The A-Reef Zone
The A-Reef occurs in the Aandenk Formation and marks the base of the Earl’s Court member. The A-Reef consists of one or more tabular reef deposits, separated by argillaceous, coarse grained, immature quartzites. The A-Reef is a pebble supported, small to medium pebble conglomerate which can be significantly enriched in pyrite, with gold strongly associated with pyrite nodules occurring on the basal contact of the conglomerate unit. The individual reef bands are very similar in appearance and they are lenticular (discontinuous) in shape, typical of a braided stream deposit. The individual reef horizons have an oligomictic, small to medium (25mm) pebble conglomerate band/lag on the scoured base which comprises quartz and chert clasts with sulphide mineralisation and occasional carbon associations. Light grey, siliceous, upward fining orthoquartzite with pyritic stringers occur above the basal lag. Shale fragments may be present in the conglomerate. Correlation of the individual reefs, from borehole to borehole, is difficult. Gold mineralisation is restricted to channels and where mature conglomerates are developed the gold grades seem to be higher.
– IV-79 –

52
Taung Gold CPR February 2011
5.8 Deposit Type and Mineralisation
The deposition of gold deposits of the Witwatersrand Basin is considered to have taken place along the interface between a fluvial system and a major body of still water or an inland sea. The source of the gold is postulated as being a northerly Archaean Greenstone where plate interactions caused the development of mineralising hydrothermal activity and generated sedimentary environments where deposition could occur. The basin is filled with approximately 14,000m of sedimentary and subordinate volcanic rocks, which have folded along a northeast to southwest axis into an asymmetrical syncline (Pretorius, 1974). The gold bearing fan deposits are considered to represent major, diachronous, entry points of coarse-grained sediment into the basin where fluvial braid-plains have developed and coalesced laterally and gold was concentrated within conglomerates developed primarily on unconformities. Economic gold concentrations commonly extend for 10km to 30km down depositional dip, and for up to 10km to 12km along depositional strike and are postulated to represent mineralised channels within the postulated braid-plains. The gold mineralisation typically occurs in lenticular conglomeratic channel-like deposits, usually associated with regional unconformities. Conglomerates are described in terms of clast size and type, and as either proximal or distal depending on the sedimentological characteristics of the unit. The conglomerate horizons can vary significantly along strike and may appear similar to other horizons either higher or lower in the stratigraphic succession and for this reason, selected marker horizons are used for correlation purposes. Gold mineralisation in the ‘reef’ horizons (mineralised, potentially economic zone) is usually associated with pyrite and carbon and these reef horizons are principally conglomeratic with pebbles of quartz, quartzite and minor chert, shale and siltstone. The conglomerate matrix is hydrothermally altered and metamorphosed to greenschist facies, with quartz and phylosilicates being the most abundant constituents and pyrite and sericite present in appreciable quantities. Gold occurs as very fine grains and occasionally as veinlets within quartz pebbles, suggestive of post deposition mobilisation. In addition to gold, silver and base metals are present in the economic horizons and the proportion of gold to silver varies between reef horizons. Detailed descriptions for the nature of the economic reefs are presented in Sections 5.7.3
5.8.1 Widths of the Mineralised Zones and Basal Reef Hanging Wall
The mean reef width of the primary reef, the Basal Reef in the Jeanette area averages 21cm in width. The resource estimation in this area provided for a 100cm mining width. The mean width of the A Reef is 113cm. The Basal Reef at the Jeanette Project is overlain by a succession of quartzite and shale. The layer of shale is prevalent in the Northern Free State goldfield and is known locally as the “Khaki Shale”. The shale is of variable thickness and is geotechnically weak. The Khaki Shale is separated from the Basal Reef by a layer of quartzite, which is also of varying thickness, but which is geotechnically competent.
5.8.2 Orientation of the Mineralised Zones
The structure of the Basal Reef in the Jeanette project area is that of a westerly dipping body which has been displaced by north striking faults.
– IV-80 –

53
Taung Gold CPR February 2011
The shallowest reef occurs on the eastern margin at 950m below surface while the deepest reef is developed along the Loraine Gold Mines boundary at 2,200m below surface. There was rotation associated with faulting with the result that the fault-bounded blocks have dips ranging from 9° to 27°, with local dips steepening towards 68° approaching fault contacts. A structural plan of the Jeanette project area on the Basal Reef horizon is given in Figure 8 showing the orientation of Basal Reef, which is likely to be similar for the other potential economic horizons.
5.9 Recent Exploration
An extensive, independent Due Diligence review of data purchased from Harmony and AngloGold Ashanti was conducted on behalf of Taung by TMC in July 2008 and May 2009. The historic borehole drilling records and core, reports, resource statements and sampling data were examined and the original assay results verified in a resampling exercise. The Due Diligence and resampling exercises have been conducted for both the Basal Reef and the three reefs occurring in the Kimberley Formation. In addition, an independent, high level Scoping Study has been completed for the Jeanette project, which examined a conventional breast mining option, utilising the original ventilation shaft and sinking a new shaft to 1,925m below surface (SMS 2009). A further Scoping Study was conducted by Minxcon in 2010. The results of these Scoping Studies demonstrated that at an in-situ grade of 9.58g/t Au over 100cm and utilising 64% of the resource area, the project proved economically viable. A PFS should now be commissioned to design a mine plan, convert the Mineral Resources to compliant Mineral Reserves and develop a financial model based on these reserves. Site investigations for a 2D and 3D seismic survey have been completed, and the 2D survey will be finalised prior to the commencement of any drilling.
5.10 Geological Data
5.10.1 Drilling – Due Diligence of Historic Drilling and Re-sampling
Exploration in the Jeanette area was carried out in several drilling campaigns since the 1930s. Ownership changes in the intervening period have resulted in some difficulty in sourcing the majority of reported intersections on the Basal Reef. Taung located five boreholes out of a total of sixteen that reportedly intersected the Basal Reef, which represents approximately 30% of the total data set reported on the property. Four of these borehole intersections are located in the southern half of the area, hosted by the Black Chert facies, whilst the fifth intersection is located in the extreme north of the area, reportedly hosted by the Loraine facies. This has restricted the aerial extent for which the confirmatory sampling exercise can be applied. There is no available Basal Reef intersection data within 1,000m of the underground development around the shaft area (TMC 2008c). The available boreholes used in the confirmatory sampling exercise were therefore WR1, HB1, MB1, HB2 and JER1 (Figure 14). Although higher stratigraphic portions of borehole LW1 were available, no intersections of Basal Reef could be located. In addition, while some drill core from borehole AL2 was available, it was clearly representative of a highly faulted stratigraphic interval in the region of the Kimberley (Aandenk) Formation, and therefore of no value for the Due Diligence Review. Basal Reef intersections from the five boreholes reviewed displayed varying degrees of grinding and core loss, ranging from complete eradication of the hydrocarbon-rich bottom contact, to complete preservation. The nature of the review, which involved quartering of existing core, dictated that the deflections chosen for resampling were those that displayed minimal core loss.
– IV-81 –
54
Taung Gold CPR February 2011
The Kimberley Formation Reefs
Taung identified seven boreholes of the original ACC drilling programme with Kimberley Formation intersections (JEZ1, JEZ2, JER1, HB1, WR1, LW1, JEJ1) for resampling, which represents 30% of a possible eighteen intersections reportedly drilled on the Jeanette property. A central eastwest portion of the lease area with historic high value intersections is poorly represented by available core. 5.10.1.1 Establishment of Structural Continuity
The Basal Reef
The extensive drilling campaign of the late 1970s carried out by AAC enabled the compilation of a Basal Reef structure plan. In addition, the geological structure of the Jeanette area was well established from surrounding mining operations at Freegold North, Loraine and Melkkraal exploration ventures to the south, west and east respectively. The resultant structure map shown in Figure 16 has been collated from a combination of boreholes drilled in the Jeanette Mine property and through interpretation from surrounding operations and projects, and is considered to be of sufficient accuracy for a project at this stage of development.
5.10.1.2 Facies Variations
The Basal Reef
The stratigraphic succession in the Jeanette area is extremely well documented and the stratigraphic markers above and below the reef horizon are recognised in boreholes, in regional mining activities on the same horizon and in the underground development on the Jeanette property. Facies distribution maps have been compiled for the Basal Reef from the historic borehole data (Figure 16). The Black Chert facies is preferentially developed in the southern and western areas of the Jeanette area, including the 2B Shaft development area (Figure 16). The Black Chert facies is bordered to the east by a poorly constrained “overlap zone some 1,000m wide in which a reported mixed facies of Black Chert and Loraine facies is present. The Black Chert facies is significant in that high gold grades are associated with this facies. The Loraine facies represents a distal deposition of Basal Reef dominated by an insignificant pebble layer lying at the base of a thin siliceous quartzite, and carries a lower gold and uranium grade (TMC, 2008c). Borehole intersections constraining this zone are however widely separated with a reported low core recovery on the critical bottom reef contact (Figure 16). The Overlap facies zone is generally poorly understood and the absence of available borehole intersections gives only a low level of confidence in the continuity of the facies. The intersection of borehole HB2, reviewed during the Due Diligence Review, is reported to lie within the Overlap facies zone but displays similar characteristics to the Black Chert facies developed elsewhere on the property. The Overlap facies may not constitute a separate facies.
5.10.1.3 Confirmatory Sampling Programme
Two independent confirmatory sampling exercises were undertaken to confirm the presence of gold and uranium in the core and provide a value comparison with original data for the Basal Reef (TMC 2008c) and Kimberley Formation reefs (TMC 2009) at Jeanette. Essentially the methodology of both campaigns was similar and is summarised as follows.
– IV-82 –

55
Taung Gold CPR February 2011
Only one or two selected deflections from each borehole were identified for resampling. The selection criteria were based on core integrity and completeness. Structurally disturbed intersections were not considered and a sufficiently large number of intact reef intersections were available for sampling. The sampling protocols used in the resampling programme are presented in Note 10. The exercise included the insertion of appropriate Certified Reference Material (‘CRM’) and barren material (Blanks) into the sampling stream to check for laboratory accuracy and contamination respectively. CRM was obtained from African Mineral Standards. Of the CRM produced by the company, AMIS 0077 was considered to be the most representative of the rock type to be assayed from the Jeanette project, with reported concentrations of 12ppm (g/t) Au (±0.84ppm at 2 standard deviations) and 490ppm U3O8 (±50ppm at 2 standard deviations). Details of the results of the re-sampling on the Basal Reef are presented in Note 11 . Gold and uranium accumulations have been calculated on the basis of the reef assays and measured apparent dip angle and include values received from the immediate hangingwall sample, where this was identified as the siliceous Basal Reef quartzite. Footwall assays were excluded from reef calculations.
The Basal Reef
Comparisons between the two stages of sampling confirm the presence of gold and uranium accumulations in the borehole core. The spread of gold assay data indicates that in general there is no particular bias towards either the original or the re-sampled gold assay data set.
5.10.1.4 Capture of Historic Data and Data Management
The results of the drilling and the geological interpretation were digitally captured in MICROMINE geological modelling software and stored in GIS software ARCVIEW. Borehole locations, together with the results of the economic evaluation, were plotted on plan. The geometry of the deposit has been defined in historic sections drawn through the property. The width of the Basal Reef is well defined and has been estimated at an average width of 0.21m.
5.10.1.5 Borehole Surveys
Collar surveys were undertaken on all boreholes while down-hole survey information is available on the majority of the later boreholes drilled in the project area. The down-hole surveys were generally multishot surveys.
5.10.1.6 Borehole Core Logging
The historical borehole core at Jeanette was logged by professional geologists employed by Anglo American Corporation. The data has been captured digitally by Taung Gold and the original logging sheets/books are kept in Taung’s filing system. Standard logging conventions as applicable to Witwatersrand gold mining and exploration activities has been applied.
5.10.2 Sampling Methodology
The original core sampling was based on standard Anglo American Corporation sampling procedures as follows:-
– IV-83 –
56
Taung Gold CPR February 2011
core was logged and reef horizons identified;
sampling of the reefs entailed orientating the core so that the low point of the bedding was directed down the hole;
the core was halved with a diamond saw along the axis of this low point and further split into approximately 20cm sample lengths;
the samples extended to approximately 2cm above and below the top and bottom contacts respectively;
samples were labelled and the remaining half core is similarly labelled in the core box and retained for reference;
samples were submitted for analysis at appropriate laboratories where fire assay was the most common analytical method.
The borehole core is in good condition and is stored in robust core trays in a secure core shed at Welkom. As part of the due diligence of the project area, Taung Gold further sampled some of the historic zones, by halving the remaining reference core (thus quartering the core) and submitting it for analysis. The results provided the necessary confidence in the data to permit incorporation in Mineral Resource estimates. The detailed sampling protocols used in the re-sampling exercise for both the Basal Reef and the Kimberley Formation reefs are presented in Note 10. Details of all borehole sampling carried out during the due diligence review are compiled in the spreadsheet shown in Note 11. The samples taken for the resampling programme were taken under direct supervision of the TMC qualified person, stored in locked premises and transported to the laboratory. No other party had access to the samples during this process. 5.10.2.1 Sample Analysis
The samples were assayed by Set Point Laboratories (‘Set Point’), Isando, Johannesburg, South Africa, which issued a receipt on arrival of the samples. Set Point is an ISO accredited laboratory (ISO17025) specialising in gold and platinum group element analysis. The gold determinations were made by fire assay and Inductively Coupled Plasma (‘ICP’) and the laboratory is accredited to 0.01ppm to 50ppm levels. The U3O8 analyses were done using pressed powder discs and X-ray Fluorescence (‘XRF’) analysis accredited from 7ppm to 2040ppm levels.
5.10.2.2 Quality Assurance and Quality Control (‘QA/QC’)
An assessment of the laboratory accuracy and contamination was undertaken by incorporation of Certified Reference Materials (‘CRM’) and barren material (blanks) respectively. The CRM was sourced from African Mineral Standards and AMIS 0077 was considered the most appropriate for the Jeanette lithologies with 12ppm gold (±0.84ppm at 2 standard deviations) and 409ppm U3O8 (±50ppm at 2 standard deviations). The gold assays indicate a consistent under-evaluation of AMIS 00770 and a consistent over-evaluation of uranium relative to the certified value of AMIS 0077. With a single exception the Au and U3O8 assays of Blanks returned values of less than 0.06g/t and 7ppm respectively indicating reasonable laboratory control of contamination.
– IV-84 –

57
Taung Gold CPR February 2011
TMC and Venmyn are satisfied that the sample preparation, security and analytical procedures are adequate and are confident in the accuracy of the results. TMC concluded from the resampling programme that the historical dataset for Jeanette has been validated.
5.10.2.3 Data Verification
The entire resampling programme at Jeanette was aimed at the verification of the historical exploration data which included drilling results, borehole logs and assay results. The available borehole logs and core were reviewed by TMC in July 2008 and May 2009, and re-sampled and assayed. TMC has stated in writing that they are satisfied that the historical data for the Basal Reef and Kimberley Formation reefs have been verified and therefore may be used in Mineral Resource estimates. The spread of gold assay results about the X-axis indicates there is no bias toward either the original or the re-sampled data set. The grouping of the data above the X-axis for the U3O8 data set indicates that the original assays may have overestimated the U3O8 grade. An analysis of the deflection variance for the Basal Reef indicates an gold value of 1,224,942cmg/t which is higher than the total population variance of 1,046,997cmg/t (TMC, 2008). This would suggest a total nugget effect for the Basal Reef. The acceptable percentage mean deviation at the 90% confidence limits can be ascertained. None of the resampling data falls outside the acceptable limits (TMC 2008).
5.10.2.4 Rock Density
No relative density (‘RD’) measurements have been undertaken for the mineralised reefs at Jeanette. Standard South African gold mine density figures range from 2.74t/m3 to 2.77t/m3 based on weighted density calculations for rocks comprising 94% silica with accessory pyrite. In the resource calculations a theoretical density of 2.75t/m3 was used (TMC, 2009).
5.11 Mineral Resources and Mineral Reserves
5.11.1 Geological Modelling
A 3D geological modelling exercise was completed by Taung on the Jeanette ore body based on historic structural models. The model was refined to accommodate new interpretations as required by the 3D geometry and has been used to assist in developing the conceptual mine design for Jeanette. The model will require updating once additional data from the seismic surveys and drilling becomes available (Figure 17).
5.11.2 Mineral Resource and Reserve Estimates
The historical dataset, consisting mainly of exploration drilling data from AAC has been validated through the re-check sampling and reconciliation of the hardcopy log-sheet data and core (‘TMC’). In the classification process of the Mineral Resources the definitions and guidelines of the JORC and SAMREC Codes were considered, as well as direct geological experience of the ore body to the west and south of the project. Support for classification in the Indicated Mineral Resource category was based upon lateral continuity of reef facies between surface borehole intersections. Positions and orientations of major fault zones have been obtained from surrounding mine properties and confirmed by direct observations from drill core. Structural continuity has been established with a reasonable degree of confidence. The exploration data is further confirmed by un-validated underground sampling that suggests on a local level, that the mineralisation is continuous and of relatively low variability.
– IV-85 –

58
Taung Gold CPR February 2011
This conclusion would appear to be in conflict with the high nugget effect reported earlier which is interpreted as a sampling effect deriving from the loss of friable hydrocarbon mineralisation at the basal contact of the reef. Resource Estimation and Methodology for the Basal Reef - Jeanette
The stratigraphic persistence and grade of the Basal Reef has been well documented over a fifty year history of mining in the Welkom Goldfield. Two main facies to the Basal Reef have been noted for fifty years and the Black Chert facies has been extensively studied by Muntingh (AAC). Due to the clear geographical distribution of the two main facies of the Basal Reef (Figure 16) the evaluation of the zone dominated by the Black Chert facies in the south of Jeanette Mine and the lower grade Loraine facies in the north, were treated separately in the resource estimation process. The boundaries between the various facies are subjective, as they are based on widely spaced surface borehole intersections and are therefore open to re-interpretation. The 3D geological modelling exercise shows the elevation model of the base of the Basal Reef based on borehole information, historical mapping plans and interpreted geological structure. The various facies domains are illustrated in Figure 17. Reported gold values from the 15 historic boreholes together with deflection data (excluding the possible Melkkraal facies intersections), in addition to limited information from underground reef development, were used in the evaluation. A tabulation of the verified gold values by borehole and facies type is presented in Table 26 (TMC, 2008).
Table 26: Borehole Values and Facies Type for the Basal Reef– Jeanette BOREHOLE ID.NO. BASAL REEF (cmg/t) FACIES
MB1 312
Black Chert facies
HB1 1517 LW1 126 J1 1054
HB2 107 J2 133
DEE1 220 WR1 559 AL3 502 AL2 Faulted out
DEE3 264 WE12 1537 U/G 897 HD1 22
Overlap facies
MT2 stopped WE3 29
WE11 307 WE5 stopped DEE2 faulted RP1 beyond JER1 291* Melkkraal facies
The evaluation was conducted on arithmetic averages of borehole clusters and a single value for combined underground development sampling. TMC, an independent consultancy, prepared the Mineral Resource Statement presented in Table 28, which was reviewed by Venmyn. TMC is of the opinion that the current borehole spacing across the Jeanette Mine property is adequate to facilitate the division of the Basal Reef into separate facies, and to allow the definition of these facies into areas of reasonable geological confidence, but with a low degree of certainty in facies boundary definition. Similarly, the borehole intersection spacing is adequate to enable a broad structure plan to be developed with a reasonable degree of accuracy in relation to major faulting.
– IV-86 –

– IV-87 –

60
Taung Gold CPR February 2011
TMC believes that the historical dataset, consisting mainly of exploration drilling data from AAC and reports provided by Taung, has been validated and may be employed in Mineral Resource estimation. The data set was insufficient to allow for a full geostatistical analysis, consequently the classification of the Mineral Resources was based on the 90% confidence limits error expressed as a percentage (Mwasinga, 2001). Those reefs with an error of less than 10% were considered a Measured Mineral Resource; those between 10% and 25% were considered an Indicated Mineral Resource and those between 25% and 50% as Inferred. Resource Estimation and Methodology for the A Reef - Jeanette
The grade-tonnage relationship for the A Reef was determined, as well as the variance for 200m x 200m resource blocks. The parameters at a cut-off grade of 3g/t are indicated in Table 27 and according to the same geostatistical analysis that was applied to the Basal Reef, the Mineral Resources for the A Reef can be classified as Inferred Mineral Resources.
Table 27 : Grade Tonnage Data for the A Reef
CUT-OFF GRADE
VALUE ABOVE CUT-OFF
% ABOVE CUT-OFF
EVALUATION WIDTH
TONNAGE ABOVE CUT-
OFF CONTAINED
Au
(g/t) (g/t) (cm) (t) (oz) 0.00 2.55 100.00 113 100,948,000 8,265,000 0.50 2.60 97.75 113 98,677,000 8,249,000 1.00 2.89 84.24 113 85,039,000 7,901,000 1.50 3.34 66.26 113 66,888,000 7,183,000 2.00 3.85 50.17 113 50,646,000 6,269,000 2.50 4.39 37.53 113 37,886,000 5,347,000 3.00 4.95 28.07 113 28,336,000 4,510,000 3.50 5.51 21.09 113 21,290,000 3,772,000 4.00 6.08 15.96 113 16,111,000 3,149,000 4.50 6.66 12.18 113 12,295,000 2,633,000 5.00 7.23 9.37 113 9,459,000 2,199,000
Source: TMC 2009 Average Dip 25° Density value used 2.75tpm Area 39,107,291m2 Geological Losses 25% An accepted industry norm is that, for a primary ore body with deep level mining, if the percentage above the cut-off is less than 25%, then the economics of the underground development required, renders the ore body unviable. The A Reef has an estimated payability of 28.07% at the 3.0g/t cut-off. The A Reef occurs 225m above the primary target reef (Basal Reef) and can therefore be considered a mineable secondary reef. The A Reef could be defined by underground exploration at the time the Basal Reef is developed. The potential for the eventual economic extraction of the A Reef is apparent and therefore an Inferred Mineral Resource of 28.3Mt at a grade of 4.95g/t Au for 4.51Moz contained gold is defined at a cut-off grade of 3g/t Au over a width of 113cm. No compliant Mineral Resources can be estimated for the Big Pebble Conglomerate and B Reefs at this stage. Consolidated Mineral Resource Estimate - Jeanette
A consolidated Mineral Resource statement for the Basal and A Reefs at Jeanette is presented in Table 28 below. Rock Density
Bulk density measurements are well established from adjacent mining operations on the same reef. The accepted density of Basal Reef as utilised by TMC is 2.75g/cm3.
– IV-88 –

61
Taung Gold CPR February 2011
5.11.3 Summary of Mineral Resource Classification Logic for Jeanette
The Jeanette project is situated between the mined out Loraine Gold Mines to the west and the currently operating Tshepong Gold Mine to the south, both of which mined the Basal Reef as the primary economic horizon. In addition, this horizon has been the primary economic reef mined throughout the Welkom goldfield for the past 60 years, so that the level of geological understanding of this reef is high, with the Basal Reef classified and subdivided according to various facies, sub facies and geo-zones. As discussed in Sections 5.11.1 and 5.11.2, the Black Chert facies of the Basal Reef at Jeanette is classified as an Indicated Mineral Resource (Table 28). An Inferred Mineral Resource classification has been applied to the Overlap facies, which is a demonstrable, interpreted change in facies between the low grade Basal Reef-‘Loraine’ facies to the north and the higher grade Basal Reef-‘Black Chert’ facies in the south. However, apart from the grade distribution, the confidence levels for the resource classification parameters for the Overlap facies exceed those required for classification in the Inferred category. In the context of the high confidence levels applicable to grade distribution in the Basal Reef in the Welkom goldfields area, Taung is confident that the Overlap facies Inferred Mineral Resources will be rapidly upgraded to the Indicated category through the proposed exploration programme.
Table 28: Consolidated Mineral Resource Estimate – Jeanette (Venmyn, August 2009)
MINERAL RESOURCE CATEGORY
MINING TONNES
(t) **
MINING GRADE
(g/t)
MINING GRADE (cmg/t)
MINING WIDTH
(cm)
CHANNEL WIDTH
(cm)
CHANNEL GRADE
(g/t) GOLD (kg)
GOLD (oz)
Indicated (Black Chert Facies) 23,030,000 9.58 958 100 24 39.92 220,580 7,092,000
Inferred (Overlap Facies) 11,540,000 9.58 958 100 24 39.92 110,530 3,553,000 Inferred (A-Reef) 28,340,000 4.95 559 113 113 4.95 140,260 4,510,000 Total Indicated 23,030,000 9.58 958 100 24 39.92 220,580 7,092,000 Total Inferred 39,880,000 6.29 250,790 8,063,000 TOTAL MINERAL RESOURCE* 62,910,000 7.49 471,370 15,155,000
**Tonnes at cut-off greater than 3.0g/t Au *Computational inconsistencies due to rounding down Reported inclusive of Mineral Reserves Facies types are in accordance with AAC – Muntingh’s classification Density value used 2.75t/m3 Mineralised width of 100cm used to convert area to volume Geological Losses 25% Average Dip 25° Area 39,107,291m2
5.11.4 Inclusion of Inferred Mineral Resources in the Scoping Study
As discussed in Section 5.11.3, apart from grade continuity, there is a high level of detailed geological understanding of the Overlap facies-Inferred Mineral Resources at Jeanette, which would require only minimal exploration to be upgraded into the Indicated Mineral Resources category. Furthermore, when the Inferred Mineral Resources are viewed within the Witwatersrand Gold deposit context, the confidence level is typically greater than that in greenstone and shear hosted gold deposits. Taung therefore considered the inclusion of the Inferred Mineral Resources in the economic evaluation of Scoping Study to be reasonable and based on the sound expectation of upgrading the Inferred Mineral Resources to the Indicated category. The Scoping Study indicated that the mine is economic based on the Indicated Mineral Resources alone and the economic contribution of the ‘Inferred’ Mineral Resource is therefore an additional asset, providing that grade exceeds the current pay limit of 5.20g/t Au in situ. The average grade for the Overlap facies is likely to exceed that threshold, considering that it forms the transition zone from the Black Chert facies, which has grades of 9.58g/t Au.
– IV-89 –

62
Taung Gold CPR February 2011
5.11.5 Modifying Factors
As part of the economic evaluation at Scoping Study level, Minxcon 2010, included both the Indicated and some of Inferred Mineral Resources in the mine plan and scheduling. In terms of international reporting codes no category exists for modified Inferred Mineral Resources and consequently the resultant tonnages are not compliant Mineral Reserves but are referred to as “Economic Inferred Mineral Resources” for the purposes of reporting the Scoping Study results. The applied modifying factors are discussed below. Taung’s proposed exploration programme is specifically aimed at the upgrading of the Inferred Mineral Resources to the Indicated Mineral Resource category in order to permit the definition of compliant Probable Mineral Reserves. The following modifying factors were applied:-
the target ore body is the Basal Reef which has been mined for 60 years extensively on neighbouring properties and no other reefs were considered economic for the purposes of the study;
Inferred Mineral Resources were included in the estimation and the resultant tonnages are “Economic Inferred Mineral Resources”. The Indicated Mineral Resources were converted to Probable Reserves;
the selected mining width of the reef is approximately 88cm;
the specific gravity has not been determined but industry accepted Bulk Density of the Basal Reef is 2.75g/cm3;
an average dip of 18° was used in the mine design criteria; the average in-situ Mineral Resource grade of 9.58g/t Au over a mining cut of
100cm in the payable area translates to 11.89g/t Au over the selected mining cut of 88cm;
Mine2-4D™ and EPS Gant Chart software was used to define the optimum mine design using inputs including geotechnical parameters, mining parameters, metal prices, metallurgical recoveries, mining and processing costs and royalties;
a two year historic, average gold price of USD34,375/kg ;
the in-stope waste development will be minimised and dilution is expected to average between 10% and 15%, which assumes some waste storage underground;
a dilution of 11% was applied, with an average MCF of 79% over the LoM;
metallurgical recoveries were based on a conventional CIP/CIL plant with known recovery parameters and a gold recovery of 96%; and
mining and processing costs were estimated and appropriate allowances were made for royalties and other costs.
Additional modifying factors are presented in Table 29 and these factors are in line with the current design parameters used at Tshepong Gold mine for annual planning. The Scoping Study scheduled 30.13Mt at a shaft head grade of 7.25g/t Au.
Table 29: Design Criteria and Modifying Factors – Jeanette (Minxcon, 2010) REEF BLOCK INFORMATION AVERAGE STOPING PANEL
Block Width (m) 150.00 Panel Length (m) 25 Block Length (m) 180.00 Planned Stoping Height (m) 0.88 Block Height (m) 0.88 Overbreak (%) 11 Block RD 2.75 Max Possible ADV/Blast (m) 0.9 Block Grade (g/t Au) 10.89 Realistic ADV/Blast (m) 0.84 Geological Losses (%) 10.00 Max Possible Blasts/Period 23 Other Losses (%) 10.00 Current ADV/Period 16 Mine Call Factor (%) 79.00 m2/crew in Period 399
Source: Minxcon 2010
– IV-90 –
63
Taung Gold CPR February 2011
The application of the modifying factors to the Inferred and Indicated Mineral Resources in the Scoping Study (Section 5.11.5) is discussed above and the final estimated Probable Mineral Reserves and ‘Economic Inferred Mineral Resources’ is presented in Table 30. The logic for the inclusion of the Inferred Mineral Resources in the economic evaluation is summarised in Sections 5.11.3 and 5.11.4.
Table 30: Probable Reserves and ‘Economic Inferred Mineral Resources’ for Jeanette (Minxcon 2010
REEF CATEGORY VOLUME TONNES HEAD GRADE (g/t)
GOLD GOLD ( ‘000 m3) (t) (kg) (oz)
Basal Reef Probable Reserves + Economic Inferred Mineral Resources
10,956 30,130,000 7.26 218,425 7,022,525
Basal Reef Probable Reserves only 8,086 22,254,000 7.26 161,000 5,191,000 Source: Minxcon 2010 Includes Inferred Mineral Resources from Overlap facies Mining Width 88cm
International reporting standards requires that an economic evaluation of a project that includes Inferred Mineral Resources should be reported in two scenarios, the first being the evaluation based on Mineral Resources inclusive of Inferred Mineral Resources and the second based on evaluation of Indicated and Measured only. The purpose of this requirement is to highlight the extent to which the project viability hinges on the inclusion of Inferred Mineral Resources. In compliance with this requirement, the conversion of the Jeanette Indicated Mineral Resources only to Probable Mineral Reserves, is presented for completeness in Table 30. Future Reserve Potential
Potential exists for the definition of additional Mineral Reserves through the upgrading of adjacent Mineral Resources to the Indicated Mineral Resource category. In addition, Mineral Resources that are currently classed as Inferred may be upgraded to Indicated, thus presenting the opportunity to convert these to Mineral Reserves at a later stage. There is currently 4.514Moz Au Inferred Mineral Resource of A-Reef which could be upgraded to Mineral Reserves once mining has commenced.
5.11.6 Jeanette Planned Exploration Expenditure
Taung expects to outlay USD15.584m for the financial year ending February 2012 on the Jeanette project for exploration activities. The funding to undertake this exploration programme is available. The exploration expenditure has been planned to upgrade some current Inferred Mineral Resources to the Indicated Mineral Resource category.
Table 31 : Exploration Expenditure for Jeanette for the Financial Year 2012 EXPLORATION 1 CONSULTANTS 2 OVERHEADS3 TOTAL
(USD'000) (USD'000) (USD'000) (USD'000) (13,084) (2,188) (312) (15,584)
1. Drilling 2 boreholes, sampling and 3D reflective geophysical survey 2 .Consultants, environmental management 3. On site and Head Office
5.12 Mining
5.12.1 Overview
Jeanette is an historic mine with two unequipped shafts that were sunk during the 1950s which are available for early mine access.
– IV-91 –

64
Taung Gold CPR February 2011
The area has a well developed infrastructure with a rail link and a national road (R30) between Odendaalsrus and Bothaville and access to the national Eskom power lines which are situated on the western side of the prospect area (see Sections 5.1 and 5.4). Various Scoping Studies for Jeanette developed a conceptual design for mining the ore body. The conceptual design required the sinking of a new vertical shaft adjacent to the existing ventilation shaft. The ventilation shaft would then form part of a twin shaft system. The portions of the ore body which were originally planned to be accessed from the existing rectangular shaft, would in the current design, be accessed via twin declines and horizontal haulages from the new shaft. The new vertical shaft, with the entire necessary infrastructure and the existing ventilation shaft would have a handling capacity of 145ktpm. The aim would be to maximise the LoM in order to optimally service the infrastructural capital expenditure at a steady state of approximately 145ktpm.
5.12.2 Mine Design in the Scoping Study
The key properties of the ore body affecting the mine design and planning are as follows:-
the channel width which averages 24cm;
the proposed mining width of the reef will be approximately 88cm;
the orebody dip varies from 5° to 27°;
the two main facies types are the Black Chert facies and the Overlap facies; At Jeanette, the high grades are typically associated with Black Chert facies basal Reef; and
the thickness and competence of the hangingwall units.
For all areas, the conventional Witwatersrand Gold mine stoping techniques were applied as assumption criteria and for access development, footwall drives and crosscuts were used. The new 9m diameter service shaft would be sunk conventionally by means of drilling and blasting to a depth of 1,925mbsl, in close proximity of the current 5.5m diameter ventilation shaft. The new shaft would operate over six stations to access all of the mining blocks. During steady state, ore will be transported from the stopes using track bound equipment to a conveyor system feeding the shaft conveyances.
5.12.3 Mine Planning and Scheduling
Mining Tonnage
The full LoM and ramp-up mining production summary schedules were developed during the Scoping Study (Minxcon 2010). The planned mining blocks are illustrated in Figure 18. The planned production statistics are summarised in Table 34. The ramp-up production schedules for Jeanette based on Indicated and Inferred Mineral Resources combined, as well as Indicated Mineral Resources only, are presented in Table 32 and Table 33 respectively.
– IV-92 –

65
Taun
g G
old
CPR
Feb
ruar
y 21
011
Tabl
e 32
: R
amp-
up M
inin
g Pr
oduc
tion
for J
eane
tte S
copi
ng S
tudy
incl
udin
g In
dica
ted
and
Infe
rred
Min
eral
Res
ourc
es (M
inxc
on, 2
010)
PR
OD
UC
TIO
N
SUM
MAR
Y
UN
ITS
TOTA
LS/Y
ear*
20
10
2011
20
12
2013
20
14
2015
20
16
2017
20
18
2019
1
2
3
4
5
6
7
8
9
10
T
otal
m a
dvan
ced
m
24
1,83
4
584
1,
058
1,
307
5,
255
10
,039
14
,380
15
,822
17
,093
16
,377
15
,269
T
otal
m2 br
oken
m
2 10
,156
,746
0.
00
0.00
0.
00
0.00
0.
00
0.00
30
,803
.00
30
6,22
2.00
57
9,41
8.00
58
1,89
5.00
W
aste
tonn
es
t to
dum
p
7,96
4,92
7
102,
143
13
3,12
9
149,
625
28
8,33
0
506,
096
64
6,18
2
575,
208
58
9,84
5
517,
624
47
6,46
0
Ree
f Ton
nes
t
treat
ed
30,1
29,9
83.0
0 0.
00
0.00
0.
00
0.00
0.
00
6,28
3
132,
435
94
9,07
8
1,72
0,49
5
1,74
0,00
0
Hea
d G
rade
g/t
g
/t
7.25
0.
00
0.00
0.
00
0.00
0.
00
3.19
5.
97
7.05
7.
67
7.59
G
old
reco
vere
d
Oun
ces
7,
022,
525
0.
00
0.00
0.
00
0.00
0.
00
645.
06
25,4
25.5
5
215,
033.
22
424,
090.
39
426,
197.
42
Sou
rce:
Min
xcon
201
0 *T
otal
for L
oM
Tabl
e 33
: R
amp-
up M
inin
g Pr
oduc
tion
Sche
dule
for J
eane
tte S
copi
ng S
tudy
for I
ndic
ated
Min
eral
Res
ourc
es O
nly
(Min
xcon
201
0)
PRO
DU
CTI
ON
SU
MM
ARY
U
NIT
S
To
tals
/Yea
r*
2010
20
11
2012
20
13
2014
20
15
2016
20
17
2018
20
19
1 2
3 4
5 6
7 8
9 10
T
otal
m a
dvan
ced
m
20
4,35
8
584
1,
058
1,
307
5,
255
10
,039
14
,380
15
,822
17
,093
15
,230
14
,200
T
otal
m2 br
oken
m
2 7,
538,
885
0.
00
0.00
0.
00
0.00
0.
00
0.00
30
,803
.00
30
6,22
2.00
57
9,41
8.00
54
1,15
7.53
W
aste
tonn
es
t to
dum
p 6,
993,
629
10
2,14
3
133,
129
14
9,62
5
288,
330
50
6,09
6
646,
182
57
5,20
8
589,
845
48
1,35
0
443,
104
R
eef T
onne
s
t tre
ated
22
,254
,525
0.
00
0.00
0.
00
0.00
0.
00
6,
283
132
,435
920
,599
1
,599
,926
1
,618
,186
H
ead
Gra
de g
/t
g/t
7.
25
0.00
0.
00
0.00
0.
00
0.00
3.
19
5.97
7.
05
7.67
7.
62
Gol
d re
cove
red
O
unce
s
5,19
1,51
6
0.00
0.
00
0.00
0.
00
0.00
64
5.06
25
,425
.55
20
8,58
0.69
39
4,37
1.05
39
6,36
0.06
S
ourc
e: M
inxc
on 2
010
*Tot
al fo
r LoM
– IV-93 –

– IV-94 –

Taung Gold CPR February 2011
67
The mining method selected for the Jeanette area is conventional and scattered breast mining, which is appropriate for the prevalent geological conditions and would result in undercutting the Khaki Shale horizon. Historically the Khaki Shale has proven a limiting factor in the mining of the reefs in the region, however the Tshepong Gold Mine, to the south of Jeanette has been able to successfully implement conventional mining which entails undercutting the shale. The approach would be to ensure that the hangingwall quartzite remains in situ and intact as a suitable beam to provide stability to the incompetent shale above (Figure 17):-
Table 34 : Production Statistics for Jeanette
ITEM LoM SUMMARY* (USD)
LoM SUMMARY** (USD)
CAPEX Including Plant and Ongoing CAPEX (m) (1,057,000) (1,024,000) OPEX Life Average cost/tonne milled (USD/t) (72.06) (74.48) Cash Cost Total Cash Cost/oz Au produced (322.03) (330.94)
Production
Annual Ore Production (tonnes per annum – tpa)) 1,720,000 1,63,0000 Monthly Ore Production (tonnes per month- tpm) 145,000 135,000 Annual Gold Production (kg gold per annum ) 11,000 9,600 Annual Peak Gold Production (ounces per annum) 411,000
380,000
Average Production Gold ounces pa 380,000 290,000 Stoping Width (cm) 88 88 Head Grade (g/t) 7.25 7.26 Mine Call Factor 79.90 79.90
Metallurgical
Yield (g/t) 6.96 7.00 Total Gold (kg) 209,518 154,845 Total Gold (ounces) 6,736,149 4,978,381 Total Waste Tonnes (LoM) 7,965,000 6,994,000 Reef: Waste Ratio 3.86 3.18
Figures in (red) are negative Source: Minxcon June 2010 *Total Ore body including both Indicated and Inferred Mineral Resources **Indicated Mineral Resources only Ventilation Requirements
A more detailed ventilation and cooling design is necessary to facilitate a total rock breaking production rate of 145ktpm (excluding 40ktpm for waste) and an average reject wet bulb temperature of 27.5°C. Refrigeration is required due to the high virgin rock temperatures in the Witwatersrand Basin. Air can be used in more than one area and the potential for re-circulation will be addressed in the subsequent studies. The conceptual planning and associated cost estimate are benchmarked from similar projects based on the typical suite of design criteria. Comparison of Jeanette to similar operations suggests that a rule of thumb estimate to clear the mine of all contaminants for every 100ktpm of rock broken production would be a minimum of 400kg/s of air. Mine Scheduling
The designs utilised Mine2-4D software but the scheduling was undertaken in EPS, an underground mining scheduling package. Mining blocks were prioritised using a ranking exercise whereby each block was allocated with a delay to simulate the amount of development required to open up the first raise within that block. A steady state of 145ktpm for 15 years could be achieved at the new shaft. A two year exploration program and full feasibility study must be completed before shaft sinking can begin. In terms of timing it is estimated that the project would require the following:-
eighteen months for finalisation of the power supply from Eskom;
twelve months for EIA and EMPR to be completed;
six months to mobilise a shaft sinking contractor; and
– IV-95 –

Taung Gold CPR February 2011
68
six months to secure winders, a headgear and ropes etc.
It is accepted, however, that most, if not all of these activities could run concurrently. Geotechnical and Hydrological Aspects
Studies on geotechnical and hydrological aspects of the mine are at an early stage and will be incorporated into the mine design and layout at a later stage. Regional experience from other mines presents extensive input of the likely geotechnical and hydrological issues to be encountered at the mine. Power Supply
The power for the initial mining period would be supplied by generators and the full production phase would source power from Eskom, distributed from the sub-station, to the underground sub-stations (SMS 2009). Water Supply and Water Disposal
A conservative estimate of approximately 1t/t (tons of water per ton total rock broken) is assumed. Water will be supplied by the Rand Water Board. Potable water will be sent underground and used as drinking water, service water and makeup water for the refrigeration plants. All water will be supplied to the mining blocks in a common insulated pipe. Fissure and service water will be treated and recycled to minimise the water sent underground. A staged dirty water pumping system will be utilised for shaft bottom dewatering with stages at 272m intervals. At full production the service water and air-cooler water required within the mining blocks will drain to a main pump station and water treatment facility. Secondary bulk air cooler water will flow independently to the clear water dams. Gold Processing Plant
No dedicated processing plant exists to process ore from the Jeanette project. A number of operating gold plants exist on the surrounding mines and an opportunity to purchase one of these plants may arise in the future as ore bodies in adjacent mines become depleted and the current operating mines wind down operations. Existing Underground Infrastructure
The Jeanette vent shaft has been sunk to a depth of 1,546.86m, while the main shaft has been sunk to 1,293.27m. All shaft infrastructures have been removed. Access development out of the historic vent shaft totalled approximately 3,556m, of which 762m was on the Basal Reef. Re-equipping of this development will be required. Sampling results from these drives and raises have been used in the Mineral Resources estimates for the property.
5.12.4 Manpower
The workforce required on the mine is estimated at between 2,000 to 3,000 workers at peak production. The project area is located in an historic mining area and skilled labour is expected to be available locally, without the need to build accommodation for miners from outside of the region.
5.12.5 Capital Requirements
Capital estimates were broadly defined in the Scoping Study from industry benchmarks and known costs of operating mines will have to be defined more accurately during the PFS, when the optimised mine design will be applied. The LoM CAPEX for the Jeanette mine for various major capital expenditure categories is presented in Table 35, which were also based on 2008 benchmarke cost estimates and inflated by the annual CPI to give an estimate of 2010 costs.
– IV-96 –
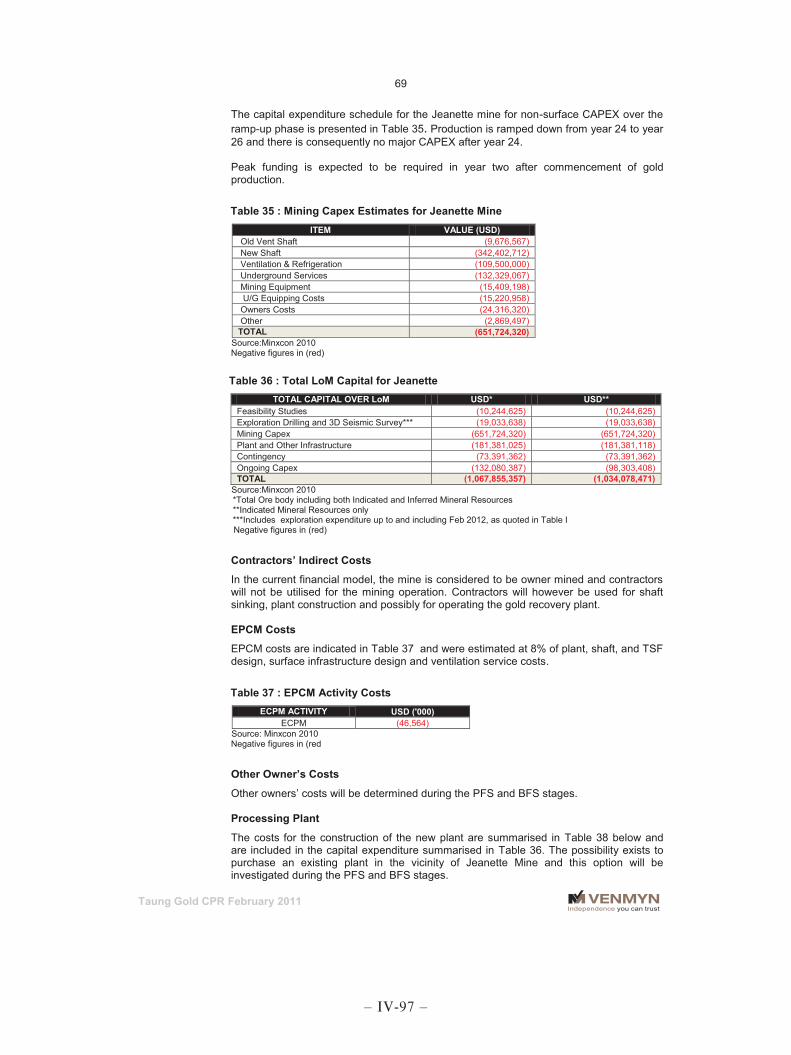
Taung Gold CPR February 2011
69
The capital expenditure schedule for the Jeanette mine for non-surface CAPEX over the ramp-up phase is presented in Table 35. Production is ramped down from year 24 to year 26 and there is consequently no major CAPEX after year 24. Peak funding is expected to be required in year two after commencement of gold production.
Table 35 : Mining Capex Estimates for Jeanette Mine ITEM VALUE (USD)
Old Vent Shaft (9,676,567) New Shaft (342,402,712) Ventilation & Refrigeration (109,500,000) Underground Services (132,329,067) Mining Equipment (15,409,198) U/G Equipping Costs (15,220,958) Owners Costs (24,316,320) Other (2,869,497) TOTAL (651,724,320)
Source:Minxcon 2010 Negative figures in (red)
Table 36 : Total LoM Capital for Jeanette TOTAL CAPITAL OVER LoM USD* USD**
Feasibility Studies (10,244,625) (10,244,625) Exploration Drilling and 3D Seismic Survey*** (19,033,638) (19,033,638) Mining Capex (651,724,320) (651,724,320) Plant and Other Infrastructure (181,381,025) (181,381,118) Contingency (73,391,362) (73,391,362) Ongoing Capex (132,080,387) (98,303,408) TOTAL (1,067,855,357) (1,034,078,471)
Source:Minxcon 2010 *Total Ore body including both Indicated and Inferred Mineral Resources **Indicated Mineral Resources only ***Includes exploration expenditure up to and including Feb 2012, as quoted in Table I Negative figures in (red)
Contractors’ Indirect Costs
In the current financial model, the mine is considered to be owner mined and contractors will not be utilised for the mining operation. Contractors will however be used for shaft sinking, plant construction and possibly for operating the gold recovery plant. EPCM Costs
EPCM costs are indicated in Table 37 and were estimated at 8% of plant, shaft, and TSF design, surface infrastructure design and ventilation service costs.
Table 37 : EPCM Activity Costs ECPM ACTIVITY USD ('000)
ECPM (46,564) Source: Minxcon 2010 Negative figures in (red
Other Owner’s Costs
Other owners’ costs will be determined during the PFS and BFS stages. Processing Plant
The costs for the construction of the new plant are summarised in Table 38 below and are included in the capital expenditure summarised in Table 36. The possibility exists to purchase an existing plant in the vicinity of Jeanette Mine and this option will be investigated during the PFS and BFS stages.
– IV-97 –
Taung Gold CPR February 2011
70
Table 38 : Process Plant and Infrastructure Capital PROCESS PLANT AND INFRASTRUCTURE CAPITAL
Item/Activity Cost (USD) Plant Infrastructure and Site Preparation (8,356,250) Civils (10,125,000) Mechanical Equipment Costs (41,186,250) Electrical and Instrumentation (11,875,000) Structural Steelwork (8,138,900) Piping fabrication and supply of valves (5,500,000) New Tailings storage facility study (625,000) New Tailings storage facility (6,250,000) Subtotal (6,875,000) TOTAL (92,056,400)
Source: Minxcon 2010 Negative figures in (red
Contingency and Deferred, Sustaining Capital
A contingency of 15% on plant Capex and 10% on mining Capex has been used. Ongoing Capex was allowed at approximately USD0.132b over the LoM (3% of Plant and 7.5% of mining operating costs).
5.12.6 Working Capital
Operating Costs
Operational cost estimates are based on figures from the Scoping Study and benchmarked against the operating costs of similar mines currently operating. It is estimated that a LoM mining operating cost of USD54.12/t could be achieved when producing at 145ktpm. The LoM operating cost is summarised in Table 39:- The total operating cash costs for Jeanette are USD322/oz Au.
Table 39 : Operating Costs over LoM Cost*(USD/t) Cost **(USD/t)
Mining Cost (54.12) (54.37) Processing Costs (9.12) (11.31) Analytical costs (0.08) (0.08) Smelting/treatment charges (0.10 (0.10) Administration/overheads and services (8.64) (8.62) TOTAL (72.06) (74.48)
Source: Minxcon 2010 *Total Ore body including both Indicated and Inferred Mineral Resources **Indicated Mineral Resources only Negative figures in (red Cost of Eskom Power
The March 2010 National Electricity Regulator of South Africa (‘NERSA’) review approved the national supplier’s (Eskom) proposed power cost increases from USD0.04per kWhr in 2010 to UDS0.08per kWhr in 2013, which amounts to a 25% increase in tariff. Increases beyond 2013 have not been announced and it is assumed that they will follow inflation. As the increases are inflation linked, there is no impact on the financial model, which is a constant money model. The power requirement is based on 45kWh/t milled for the gold plant and 75kWh/t mined for the remainder for the other infrastructure.
– IV-98 –
Taung Gold CPR February 2011
71
Cost of Water
The estimated cost of water supplied to a mine is currently USD0.56/m3. As water supply is directly related to the cost of energy, the cost of water has been increased with the Eskom increases from USD0.56/m3 in 2010 to USD0.75/m3 in 2013, a 9% increase.
5.12.7 Project Risk Profile
Risk Background
A detailed risk assessment will form part of the BFS. There are certain risks, which would need to be assessed, that are common to similar gold projects in South Africa and these, together with the risks that are specific to the Jeanette project, are presented in Note 12.
5.13 Processing
The Jeanette project is at a Scoping Study stage of evaluation and Taung has not conducted metallurgical or mineral processing studies. The Basal Reef and A-Reef horizons have been extensively mined in the region and the metallurgical characteristics are well understood. Historical and current plant recoveries on adjacent operating mines processing the same material are in the order of 95% to 96%. It is anticipated that data from these operations would suffice for profiling the metallurgical response of these reefs. In the event that metallurgical test work is considered warranted, it would probably be undertaken at the BFS stage of the evaluation.
Currently there are no agreements in place for the treating of ore, and such agreements will only be negotiated upon the favourable outcome of a completed PFS. As adjacent mines are ramping down production operations, it is highly likely that an existing adjacent processing plant could be purchased for treating Jeanette ore.
5.14 Project Implementation
5.14.1 Contracting Strategy
Taung has a strategy of contracting out the PFS and BFS stages of the project to competent, independent consultants of good industry standing. The orebody is expected to be owner mined. Contractors may be utilised to operate the plant. At the current stage of evaluation of the project, the optimal operating structure for the mine has not been established.
5.14.2 Status of Implementation
Implementation activities are at an early stage and a phase 2 Scoping Study has been completed, the results of which are expected to lead to a PFS in 2010. Physical implementation of the mine plan and commencement of construction will be contingent on the granting and execution of a mining right in respect of the project area.
5.14.3 Project Schedule
The major project milestones and the critical path of the design are summarised in the Project Schedule presented in Note 13. The realistic time that production will commence and the year during which full production is reached, are indicated. Preparations for shaft sinking begin in March 2013 and the project focus moves from site establishment to production. Jeanette will start production in the fifth year of the project and full production of 145ktpm will be reached in year 8. The starting date is conceptual and the milestone dates will be shifted to accommodate prevailing conditions. Fast-tracking Production Start-up
The production start up has not been optimized, and there may be some potential to fast track development up to steady state production through more rapid shaft sinking and development regimes. These options will be investigated during the PFS stage.
– IV-99 –

Taung Gold CPR February 2011
72
5.15 Environmental Considerations
5.15.1 Environmental Standards
An EMP was conducted and approved by the DMR and was submitted as part of the supporting documents for the Prospecting Right application. Key environmental legislation applicable in South Africa has been described in Note 3, as well as the relevance of the legislation with regards to the Jeanette project. The mining infrastructure in the region around the Jeanette Shafts is well established. Mitigation measures with respect to additional impacts on the environment will be investigated during the PFS. The Jeanette mining operations, sites and related infrastructure are the subject of an EMPR approved as part of the conversion to a ‘New Order’ Mining Right by all relevant interested and affected parties. The EMPR includes a detailed ‘Environmental Closure Assessment’ detailing all areas of environmental liability.
5.16 Social, Community and Land Use
Social Setting
According to an EIA conducted by Golder Associates on behalf of Harmony, dated April 2008, the land capability of the region can be summarised as follows:-approximately, 55% of the land in the region has had its capability permanently altered:-
15% by mining;
10% by infrastructure;
20% by urbanisation; and
10% by other activities.
Taung’s future exploration activities in the area will have a relatively minor impact on land use and will be addressed in the next phase of exploration. Resettlement
There are no community developments on the property which will require resettlement initiatives. Local Employment
Several townships are located adjacent to the project area and these will provide a source of skilled and semi-skilled labour. Many of the occupants of these townships have experience of working on the adjacent mines.
5.17 Conclusions
The techno-economic review of the Jeanette project has highlighted the following conclusions:-
the Jeanette Gold Mine has been investigated on an ongoing basis for the past 60 years;
a substantial database of information has been compiled which has been the platform from which the project has been evaluated;
the mine has been non-productive due to historic economic and geotechnical issues, which may now may no longer be valid due to improvements in gold price and mining technologies respectively;
a Due Diligence Review on selected Jeanette Mine Basal Reef and Kimberley Formation reef intersections has confirmed the presence of gold and uranium values comparable to those in the historical dataset. The conclusion is that the historical dataset has been validated and can be relied upon for Mineral Resource estimation;
the substantial database of historical information on the Basal Reef supports considerable lateral geological continuity, and on this basis an Indicated Mineral Resource for the Black Chert facies of the Basal Reef has been defined;
– IV-100 –

Taung Gold CPR February 2011
73
the total Indicated Mineral Resource for the Black Chert facies is estimated to be 23.03Mt (above a 3g/t Au cut-off) at 9.58g/t Au for 7.092Moz contained gold (over 100cm);
the consolidated JORC compliant Mineral Resource estimate for the Basal and A Reefs over the Jeanette project at a cut-off grade of 3g/t Au, is:-
o Indicated Mineral Resources 23.03Mt for 7.09Moz contained gold; and
o Inferred Mineral Resources 39.88Mt for 8.06Moz contained gold.
a scoping study with a conceptual mine design and schedule has demonstrated the potential economic viability of the Jeanette project at gold prices that are less than those prevalent at August 2010;
a steady state production rate of 145,000tpm or over 380,000oz/annum Au has been modelled;
the current structural model for the Jeanette project area may be acceptable for an inception model. A more sophisticated 3D structural model will be constructed with additional drilling and/or 3D seismic survey interpretation at the PFS and BFS stages;
the Scoping Study that has been completed and detailed in this CPR is designed to be accurate within 30%;
a PFS should now be commissioned to refine the mine design, convert the Inferred Mineral Resources to compliant Mineral Reserves and develop a financial model based on these reserves;
the PFS will be accurate to within 20% and there is a low technical risk of failing to achieve the projected capital and operating cost within the expected timeframes;
a technical assessment of the rock mechanic aspects of mining the Basal Reef below the Khaki shale has shown that mining is feasible (Keen 2009). . A Technical Committee including independent industry specialists has been established to further review the mining strategy for the Basal Reef at Jeanette and to mitigate the risk associated with the mining thereof. The PFS will include the application of recommendations from the Technical Committee.
further upside potential exists to define additional Basal Reef Mineral Resources both within the Jeanette project area and adjacent to Jeanette. An agreement to purchase the prospecting rights to the adjacent resources on Buitendachshoop, Weltevreden and Le Clusa is being concluded;
the Big Pebble Conglomerate has not been systematically sampled, despite highly attractive mineral and facies associations on this horizon. The implications of this are that the true extent of gold and uranium mineralisation in this horizon may not be fully realised;
additional upside potential therefore exists in definition of Mineral Resources for the Big Pebble Conglomerate and B reef at Jeanette;
a drilling programme should be undertaken to convert the Inferred Mineral Resource at Jeanette to the Indicated Mineral Resource category;
an additional drilling programme should be undertaken to test potential Mineral Resources in the northern portion of Jeanette;
the proposed mine schedule comprises a ramp up of 3 years, followed by 15 years at steady state production, with a 3 year ramp down over the LoM. Remnant and pillar mining is an option that could be carried out over a further period of 10 years but may not prove optimal for maximising project value. Should no additional Mineral Reserves be defined it is likely that the production profile would be cut shortly after ramp down; and
an environmental scoping study should be initiated.
– IV-101 –
Taung Gold CPR February 2011
74
6 GREENFIELDS PROJECTS Taung, by virtue of holdings in the subsidiary companies illustrated in Figure 1, is the holder or has an interest in numerous greenfields gold projects in the Free State, North West, Gauteng, Limpopo and Mpumalanga provinces of South Africa. The location, extent, nature and right status of the greenfields gold assets are summarised in Table 40 and illustrated in Figure 2. The early exploration stage of many of the greenfields assets means that available information is, often, limited, and consequently full compliant disclosure is not possible. The Greenfields projects, whilst providing an important pipeline of future exploration projects for Taung, are however, insignificant in terms of value, compared to the two flagship projects. Consequently, reporting for the portfolio is restricted to brief summaries of the legal tenure, potential mineralisation and available information for the four most prospective projects, namely Hilton, South Rand, Bothaville Gap and Yzerspruit projects and a summary of the legal aspects for the remaining projects (Note 14). The Hilton project is the most advanced of the greenfields projects.
Table 40 : Summary of Taung's Greenfields Assets
PROVINCE PROJECT PROPERTY SIZE (ha) HELD BY TYPE OF RIGHT
Gauteng South Rand Sugar Bush 13,685 Taung Gold Exploration Ltd
New Order Prospecting Rights
Mpumalanga South Rand
Balfour Region 1,812 Taung Gold Exploration Ltd Witpoort Region 3,150 Taung Gold Exploration Ltd
Roodepoort Region 2,589 Taung Gold Exploration Ltd and private members
Hexrivier Region 6,100 Taung Gold Exploration Ltd and private members
Drukfontein Region 9,385 Taung Gold Exploration Ltd Hartebeesfontein Region 1,354 Taung Gold Exploration Ltd
Evander (Watervalshoek) Various ,1 969 Taung Gold Exploration
(West) (Pty) Ltd (100% )
North West
Malmani Various ,21 252 Taung Gold (North West) (Pty) Limited
Palmietfontein Palmietfontein ,5 352 Taung Gold (North West) (Pty) Limited
Yzerspruit Various 15,231 Taung Gold (North West) (Pty) Ltd + 20% Private Ownership
Free State
Harrisburg Various ,2 280 Taung Gold (Free State) (Pty) Ltd + 20% Private Ownership
Bothaville Gap Various ,5 360 In process of being rolled up into Taung Gold Ltd (from Sephaku Gold Exploration)
Hilton Various 15,230 Taung Gold (Free State) (Pty) Ltd (100% )
Richelieu/Plecy Various 652 Taung Gold (Free State) (Pty) Ltd (100% )
TOTAL 96,401 Source: Taung 2011
6.1 Hilton Project
6.1.1 Property Description and Location
The Hilton project area is situated northeast of Welkom in the Free State Province of South Africa, directly adjacent to the flagship Jeanette project. The Hilton project lies with the Witwatersrand basin, approximately 2km east of Allanridge and comprises numerous properties, over which seven New Order Prospecting Rights are held by Taung Gold (Free State) (Pty) Limited (‘Taung Free State’). Exploration for all minerals excepting coal and diamonds is permitted under five of the Prospecting Rights. Two rights were granted for exploration of gold, silver, and uranium (Table 41, Figure 19 ).
– IV-102 –

– IV-103 –

Taung Gold CPR February 2011
76
Table 41 : Legal Aspects and Tenure of Hilton
FARM PORTION SIZE PROSPECTING COMMENCE- EXPIRY MINERALS HELD BY (ha) RIGHT MENT DATE DATE Bruintjieslaagte 243
2,059 FS30/5/1/2/369PR 29-Nov-06 28-Nov-11
All minerals, excluding diamonds and coal
Taung Gold (Free State) (Pty) Ltd (100% )
Stillewoning 283 Schaapplaats 100 Langverwacht 281, Pts RE, 1 Hilton 30 1,801 FS30/5/1/2/399PR 6-Feb-07 5-Feb-12 Melkkraal 450 Hilton 449
5,806 FS30/5/1/1/2/419PR 4-Jun-07 3-Jun-12
Emmanuel 433 Langkuil 66 Kameeldoorns 402 Dreyers 445 Leeuwbosch 285, Pts RE5, 8 Waterpan 263, Ptn RE
2,891 FS30/5/1/1/2/442PR 6-Jul-07 5-Jul-10*
Damspruit 184, Ptn RE Zooikraal 101, Ptn RE, 1, 2 Eerste Geluk 61, Pts RE, RE1, 2, 3 & 4 Vrede 201, Farm Grootkop 277, Pts RE, 8, 10 926 FS30/5/1/1/2/450PR 6-Jul-07 5-Jul-10*
Bandon 345, RE Weltevreden 59, 3 & 6 Leeuwbosch 285, 3
1,315 FS30/5/1/1/2/713PR 3 Dec 09 2 Dec 14 Gold, Silver and Uranium Ore
Damplaats 361, RE & 1 Katbosch 358, RE & 1 431 FS30/5/1/1/2/818PR 1 Mar 10 28 Feb 15 Gold and
Uranium Ore TOTAL 15,230
* Application for renewal has been submitted to the DMR
6.1.2 Property Accessibility, Climate and Physiography
The Hilton project is directly west and adjacent to Jeanette and the property access, local mining infrastructure, climate and physiography are identical to those described for Jeanette in Sections 5.4.1, 5.4.2 and 5.4.3. Two areas of Hilton, in the extreme north and south, have sufficient data to estimate potential mineralisation, termed a ‘deposit’ in the SAMREC Code, but no Mineral Resource estimate compliant with international reporting standards could be compiled for Hilton.
6.1.3 Geology, Historical Exploration and Potential
Hilton straddles the northward extension of the De Bron Horst (Figure 15) and is structurally complex. This complexity is a reflection of the regional tectonic history of the Welkom Goldfield. In the Hilton area, the structures resulting from these tectonic events are juxtaposed within a relatively small area, resulting in a more complex local structure than on Jeanette and on adjacent properties. The structure has been interpreted through historic seismic survey and drilling data, which are described in Section 5.10 and summarised in Figure 19. Six distinct structural domains are recognised in the Hilton project area, as shown in Figure 20, which is a structural plan based on the Basal Reef which is described in detail in Section 5.7.3 for Jeanette. Resource Estimation and Methodology for Hilton
According to TMC (2008a), the quality and confidence in the historic source information does not permit classification in a Mineral Resource category acceptable to international reporting codes.
– IV-104 –

Taung Gold CPR February 2011
77
The historic information can only be regarded as indicative of potential mineralisation and would require additional verification to improve confidence limits. The potential mineralisation is therefore described as a ‘deposit’ in terms of the SAMREC Code Mineral Resource classification scheme. A statement describing potential mineralisation at Hilton has been compiled by TMC (2008) which included the following factors and parameters:-
three Basal Reef facies reported by AAC have been combined;
for the estimation of the potential mineralisation a composite width of 100cm was applied to all intersections where the channel width was less than 100cm, or the actual channel width is greater than 100cm;
pay limit calculation and cut off grade;
a density of 2.75t/m3 has been used to convert volume to tonnage;
estimation of total gold resources, expressed at zero g/t cut-off;
at a 4.65g/t cut-off grade, derived using Harmony’s 2007 operating cost data, only 11% of the tonnage inventory lies above the cut-off grade, thus eliminating any resource potential for the project;
at a 3.0g/t cut-off grade, which could be considered a more realistic estimate, bearing in mind the shallower mining depths of the target horizon in the Waterpan Block, approximately 32% of the total tonnage inventory lies above the cut-off grade, with an average grade above cut-off of 4.55g/t Au; and
despite the higher borehole density in Waterpan Block, gold value continuity has not been firmly established.
Table 42 : Mineral Deposit Estimate of a Portion of the Hilton Area
BLOCK SURFACE
AREA (m2)
DIP (Deg)
DIP AREA (m2)
TRUE WIDTH (m)
GEOL. LOSS (%)
TONNES (t)
GRADE (g/t)
GOLD (Moz)
Waterpan No 1 6,007,444 23 6,526,249 1.3 25% 17,507,146 2.7 1,520,000 Waterpan No 2 1,632,842 23 1,773,855 1.3 25% 4,758,497 2.7 410,000 Langkuil 6,159,942 26 6,853,563 1 25% 14,135,475 1.69 770,000 TOTAL* 36,401,000 2.31 2,710,000
Source: The Mineral Corporation (2008) Note: Zero cut-off grade. No ranges have been provided as the statistics required to do this would be speculative. This could lead to an unrealistic presentation of technical quantities. *Computational inconsistencies due to rounding down
TMC derived tonnage estimates for the Basal Reef for the remainder of the blocks at Hilton and these indicative estimates are presented in Table 43:-
Table 43 : Indicated Tonnage Estimates for Structural Blocks at Hilton
BLOCK SURFACE AREA (m2)
DIP (Deg)
DIP AREA (m2)
TRUE WIDTH
(m) GEOL.
LOSS (%) TONNES
(t)
Grootkop pt1 614,084 23 667,117 100 25% 1,375,929 Grootkop pt2 3,520,278 23 3,624,291 100 25% 7,887,600 Grootkop pt3 1,271,750 23 1,381,579 100 25% 2,849,507 Grootkop pt4 5,846,288 23 6,351,176 100 25% 13,099,301 Dreyers 8,910,323 23 9,679,822 100 25% 19,964,633 Leeuwbosch 1 5,359,227 23 5,822,052 100 25% 12,007,982 Leeuwbosch 2 8,465,888 23 8,871,097 100 25% 18,296,638 TOTAL 75,481,590
– IV-105 –

– IV-106 –
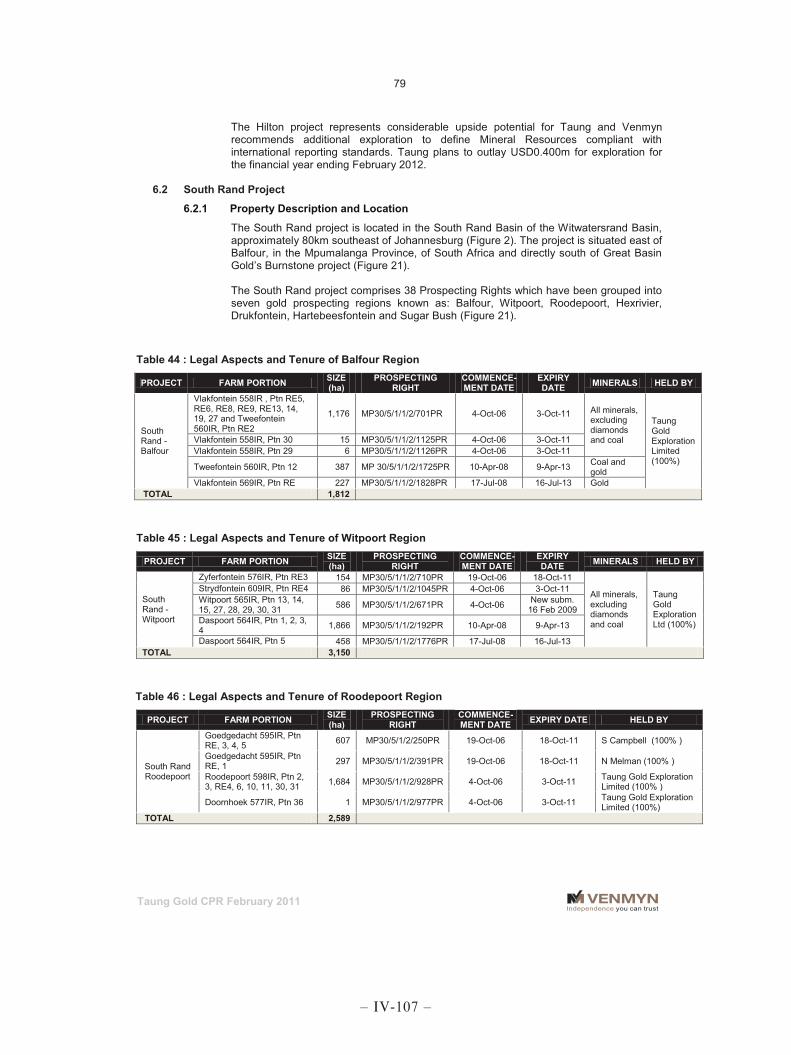
Taung Gold CPR February 2011
79
The Hilton project represents considerable upside potential for Taung and Venmyn recommends additional exploration to define Mineral Resources compliant with international reporting standards. Taung plans to outlay USD0.400m for exploration for the financial year ending February 2012.
6.2 South Rand Project
6.2.1 Property Description and Location
The South Rand project is located in the South Rand Basin of the Witwatersrand Basin, approximately 80km southeast of Johannesburg (Figure 2). The project is situated east of Balfour, in the Mpumalanga Province, of South Africa and directly south of Great Basin Gold’s Burnstone project (Figure 21). The South Rand project comprises 38 Prospecting Rights which have been grouped into seven gold prospecting regions known as: Balfour, Witpoort, Roodepoort, Hexrivier, Drukfontein, Hartebeesfontein and Sugar Bush (Figure 21).
Table 44 : Legal Aspects and Tenure of Balfour Region
PROJECT FARM PORTION SIZE (ha)
PROSPECTING RIGHT
COMMENCE-MENT DATE
EXPIRY DATE MINERALS HELD BY
South Rand - Balfour
Vlakfontein 558IR , Ptn RE5, RE6, RE8, RE9, RE13, 14, 19, 27 and Tweefontein 560IR, Ptn RE2
1,176 MP30/5/1/1/2/701PR 4-Oct-06 3-Oct-11 All minerals, excluding diamonds and coal
Taung Gold Exploration Limited (100%)
Vlakfontein 558IR, Ptn 30 15 MP30/5/1/1/2/1125PR 4-Oct-06 3-Oct-11 Vlakfontein 558IR, Ptn 29 6 MP30/5/1/1/2/1126PR 4-Oct-06 3-Oct-11
Tweefontein 560IR, Ptn 12 387 MP 30/5/1/1/2/1725PR 10-Apr-08 9-Apr-13 Coal and gold
Vlakfontein 569IR, Ptn RE 227 MP30/5/1/1/2/1828PR 17-Jul-08 16-Jul-13 Gold TOTAL 1,812
Table 45 : Legal Aspects and Tenure of Witpoort Region
PROJECT FARM PORTION SIZE (ha)
PROSPECTING RIGHT
COMMENCE-MENT DATE
EXPIRY DATE MINERALS HELD BY
South Rand - Witpoort
Zyferfontein 576IR, Ptn RE3 154 MP30/5/1/1/2/710PR 19-Oct-06 18-Oct-11
All minerals, excluding diamonds and coal
Taung Gold Exploration Ltd (100%)
Strydfontein 609IR, Ptn RE4 86 MP30/5/1/1/2/1045PR 4-Oct-06 3-Oct-11 Witpoort 565IR, Ptn 13, 14, 15, 27, 28, 29, 30, 31 586 MP30/5/1/1/2/671PR 4-Oct-06 New subm.
16 Feb 2009 Daspoort 564IR, Ptn 1, 2, 3, 4 1,866 MP30/5/1/1/2/192PR 10-Apr-08 9-Apr-13
Daspoort 564IR, Ptn 5 458 MP30/5/1/1/2/1776PR 17-Jul-08 16-Jul-13 TOTAL 3,150
Table 46 : Legal Aspects and Tenure of Roodepoort Region
PROJECT FARM PORTION SIZE (ha)
PROSPECTING RIGHT
COMMENCE-MENT DATE EXPIRY DATE HELD BY
South Rand Roodepoort
Goedgedacht 595IR, Ptn RE, 3, 4, 5 607 MP30/5/1/2/250PR 19-Oct-06 18-Oct-11 S Campbell (100% )
Goedgedacht 595IR, Ptn RE, 1 297 MP30/5/1/1/2/391PR 19-Oct-06 18-Oct-11 N Melman (100% )
Roodepoort 598IR, Ptn 2, 3, RE4, 6, 10, 11, 30, 31 1,684 MP30/5/1/1/2/928PR 4-Oct-06 3-Oct-11 Taung Gold Exploration
Limited (100% )
Doornhoek 577IR, Ptn 36 1 MP30/5/1/1/2/977PR 4-Oct-06 3-Oct-11 Taung Gold Exploration Limited (100%)
TOTAL 2,589
– IV-107 –

– IV-108 –

Taung Gold CPR February 2011
81
6.2.2 Property Accessibility, Climate and Physiography
The South Rand project terrain is a gently undulating surface with a <5% gradient, sloping towards the southwest. Inconspicuous hills are sporadically present in some of the regions. Drainage occurs towards the southwest on most parts of the project region and a non-perennial meandering stream network is typical. The vegetation is characterised by typical Mpumalanga Province grassland veld type Gm8. No endangered plant species are currently recorded in the area. Elevations range between 1,840m amsl on the isolated hilltops and 1,520m amsl in the agriculturally exploited valleys. The area is typical of the Highveld climatic zone with medium precipitation during summer season, and high summer temperatures. The rainy season occurs in the summer months from October to April with the highest rainfall in December and January. Total precipitation varies greatly from year to year, with an average of 600mm.
6.2.3 Historical Exploration and Potential
Several operators, including AAC, undertook exploration in the South Rand Basin (Table 47).
Table 47 : Historical Exploration in the South Rand Region DATE COMPANY EXPLORATION AREA
1892 to 1942 Heidelberg Roodepoort Mine Produced 209,475t ore from which 37,851oz Au recovered Burnstone
1908 to 1942 Kildare Mine Produced 5,301t ore recovered 670oz Au Burnstone
1974 to 1993
Union Corporation Limited Shallow decline holes and ruins of old gold mines South Rand Gencor South Rand
Anglovaal Limited Boreholes in unknown positions on farm Vlakfontein South Rand
1980 Southgold Limited Drilled in Burnstone area Burnstone 2002 Great Basin Gold 260 boreholes Burnstone
Historical production from the South Rand Basin totalled 267,969t of ore at mean grade of 5.31g/t Au.
6.2.4 Geology of the South Rand Basin
The South Rand project is located within the South Rand Goldfield, which is one of the eastern most extensions of the gold-bearing Witwatersrand Basin (Figure 2 and Figure 5). The regional geological controls in the Balfour, Witpoort and Roodepoort regions of the South Rand project are common to all properties. The mineralised reef horizon exploited in the project region is the Kimberley Reef, which occurs at the base of the Turffontein Subgroup. Interpretation of regional aeromagnetic data made it possible to delineate structural features and lithologies and attempt to predict the occurrence of Kimberley Reef beneath much younger Karoo lithologies and Ventersdorp lava, particularly in the southeastern part of the Balfour region (Figure 22).
Balfour Region
The Kimberley Reef is the principal economic reef in the Balfour region and can be traced for 2.5km along the southern section of portion 2 of the farm Tweefontein 560IR where it outcrops sporadically (Figure 23). Both the Intermediate Reef and Kimberley Reef occur on the farm Tweefontein. Assay results indicate weak gold mineralisation associated with the conglomeratic zones. Generally, anomalous gold values were reported on the Intermediate Reef with sporadic instances of low gold values occurring on the Kimberley Reef, of which borehole TW04 at 5.64g/t Au over a 24cm channel width is the best result. A well-developed Kimberley Reef with good sulphide mineralisation was intersected in borehole TW03 at a depth of 94m at the eastern end of the property.
– IV-109 –

Taung Gold CPR February 2011
82
Witpoort Region
The Kimberley reef occurs as a small pebble conglomerate overlying a shale footwall. Conglomerate lags and lenses occur in an orthoquartzite hangingwall and as scree on surface. The Kimberley Reef strike direction trends northwest to southeast and the dip is a gentle 15° to 20° degrees east. Eleven boreholes were drilled on the farm Witpoort 565IR, totalling 2,338m of core, which includes a number of deflections drilled for additional reef cuts. A Phase 1 exploration drill grid of 400m was planned and two lines of boreholes were completed (Figure 24). A well-developed Kimberley Reef erosional channel was intersected in two boreholes (WI01 and W104) with 6.52g/t gold over 93cm and 9.80g/t gold over a corrected width of 26cm respectively. Roodepoort Region
The consistent intersection of the Booysens Shale marker horizon in all 10 boreholes (Figure 25) permits the classification of the overlying quartzites as Kimberley Formation. The conclusion from the drilling programme is that the Roodepoort 589IR (portion 11) is not located in an area conducive to exploring for well-developed channelised and mineralised Kimberley Reef. The exploration programme conducted to date on the South Rand project, has not produced sufficient information at acceptable confidence levels to permit the calculation of a compliant Mineral Resource or a Mineral Reserve statement. Taung is convinced that a potentially economic resource exists, based on the active exploration northeast of the South Rand project where GBG identified 10.9Moz, at a mean grade of 6.9g/t Au in Indicated and Inferred categories, during 2007.
6.3 Bothaville Gap Project
6.3.1 Property Description and Location
The Bothaville project is located between the Klerksdorp and Free State Goldfields, near the town of Bothaville, in the Free State province. The project comprises a Prospecting Right which covers an area immediately south of Bothaville for 17km southwards (Figure 26). The Bothaville project is centred on Longitude 26°35'50.55"E and Latitude 27°29'06.30"S and comprises numerous farm portions as indicated in Table 48. The project comprises a single Prospecting Right granted on 7 May 2008 for all minerals except diamonds and coal, together with an approved EMP (Table 48).
Table 48 : Legal Aspects and Tenure of the Bothaville Project
PROJECT FARM PORTION PROSPECTING RIGHT
COMMENCE-MENT DATE
EXPIRY DATE MINERALS SIZE (ha) HELD BY
Bothaville Gap
Gladdedrift 487, Pts RE, 1
FS30/5/1/1/2/475PR 7-May-08 6-May-13 Gold & Uranium
424
Sephaku Gold Exploration (Pty) Ltd (100%). Section 11 transfer is pending.
Johannes Hoop 884, Pts RE, 1 649
Gelykvlakte 153 , Pts RE , 3 342
Klipkraal 54, Ptn RE 342 Middelplaats 348, Pts RE , 1 342
Holvley 246, Pts RE, 1 369 Doornkraal 229, Pts RE, 1, 2 342
Doornkraal Zuid 45, Pts RE, 1, 2 342
Hartebeestbult 237, Pts RE, 1, 2, 3 616
Nooitverwacht 248, Pts RE, 1, 2 685
Den Haag 3, Pts RE, 1, 2, 3, 616
Schaapplaats 67 , Ptn RE 292 TOTAL 5,360
– IV-110 –

– IV-111 –
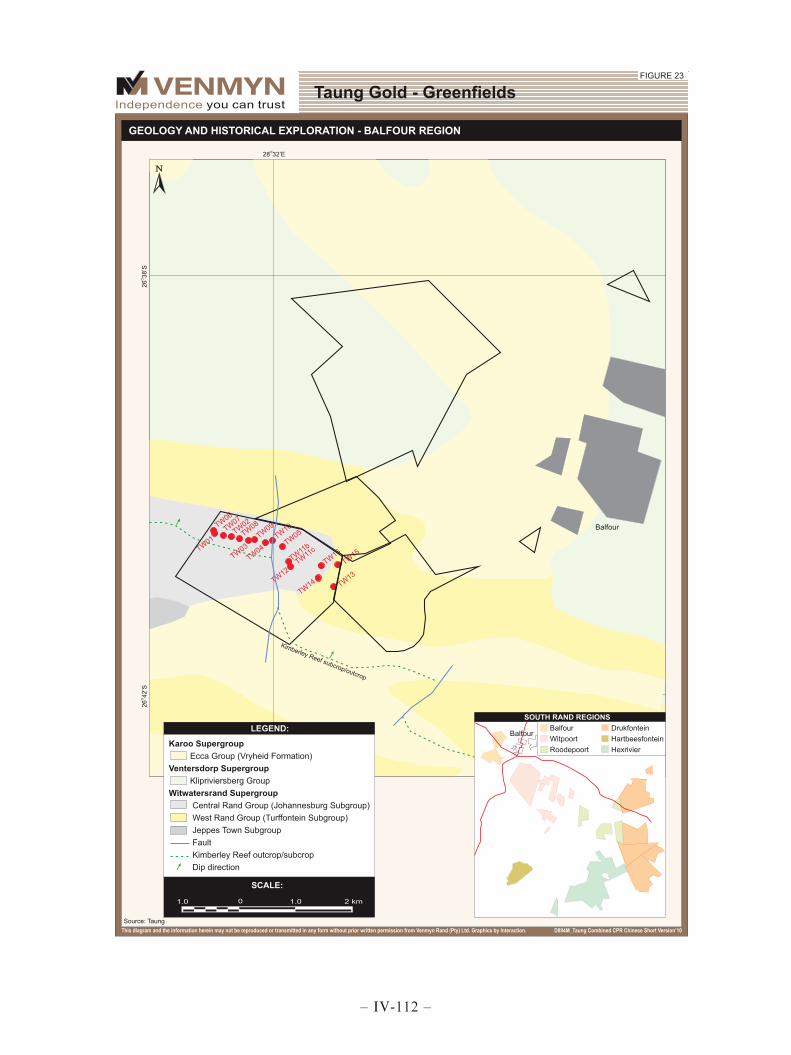
– IV-112 –

– IV-113 –

– IV-114 –

– IV-115 –

Taung Gold CPR February 2011
88
6.3.2 Historical Exploration and Potential
To-date only scoping studies have been conducted on the project. No drilling has been conducted and exploration in the future will likely be initiated by geophysical surveys. Mineral Resources and Mineral Reserves have been defined by Anglovaal and Harmony for the Target Mine (Figure 26), Target North (inclusive of Sun North and Sun South projects) and Oribi Projects, which are in the vicinity and to the south of the Bothaville project. The Mineral Resources and Mineral Reserves for these projects are summarised below:-
Table 49 : Mineral Resource Statements for Adjacent Properties MINERAL RESOURCE MINERAL RESERVE
PROJECT CATEGORY TONNES GRADE GOLD CATEGORY TONNES GRADE GOLD
('000t) (g/t) (Moz) ('000t) (g/t) (Moz)
Target Mine
Measured 9.9 9.0 2.9 Proven 7,388 7.9 1.9 Indicated 123,714 7.2 28.7 Probable 11,892 6.4 2.4 Subtotal 133,624 7.4 31.6 Total 19,281 7.0 4.3 Inferred 127,203 7.0 28.8
Target North Project
Indicated 108,300 7.3 25.3 Inferred 120,800 7.8 27.5
Oribi Project Inferred 52,000 6.5 10.9 Source: Snowden 2008
Published information and historical drilling results from projects to the north and south of the Bothaville project suggest that there is good potential for the preservation of mineralised conglomerates in the licence area. The depths to the target horizons vary between 3,000m and >4,300m. The shallower Ventersdorp Contact Reef (‘VCR’ see Section 6.3.3) in the north of the project area represents the initial exploration target. The historical drilling results published by Anglovaal for exploration on the Oribi project, north of the Bothaville project provide sufficient encouragement and evidence of economic mineralisation, to warrant further investigation.
6.3.3 Geology and Mineralisation
The main economic targets of the Bothaville project are the VCR (Ventersdorp Contact Reef), Eldorado Reefs and Basal Reefs hosted in the Central Rand Group and possibly the Big Pebble Reefs. The mineralised VCR and Eldorado conglomerates are developed in narrow northsouth trending zones, close to the sub-outcrop of the Central Rand Group. Little is known about the Basal Reef in the area. Depths to the target horizons within the Bothaville project vary between 3,000m and >4,300m and depth will be a limiting factor on the successful development of a mining operation and as a result the shallower reefs in the north of the project area represents the initial exploration target.
6.4 Yzerspruit Project
6.4.1 Property Description and Location
The Yzerspruit project is located 20km southwest of the town of Orkney, and 40km southwest of the town of Klerksdorp. The project comprises two areas adjacent to each other and separated by the Vaal River, with the Yzerspruit area situated in the North West Province and the Harrisburg in the Free State Province (Figure 27). These projects comprise numerous farms and portions, which are centred at longitude 26° 25’ 58’’ E and latitude 27° 07’ 02’’ S. The Harrisburg project comprises a single Prospecting Right which was granted on 11 March 2009 and Yzerspruit comprises four rights. Each licence comprises a cluster of multiple farms and farm portions as in the tables below:-
– IV-116 –
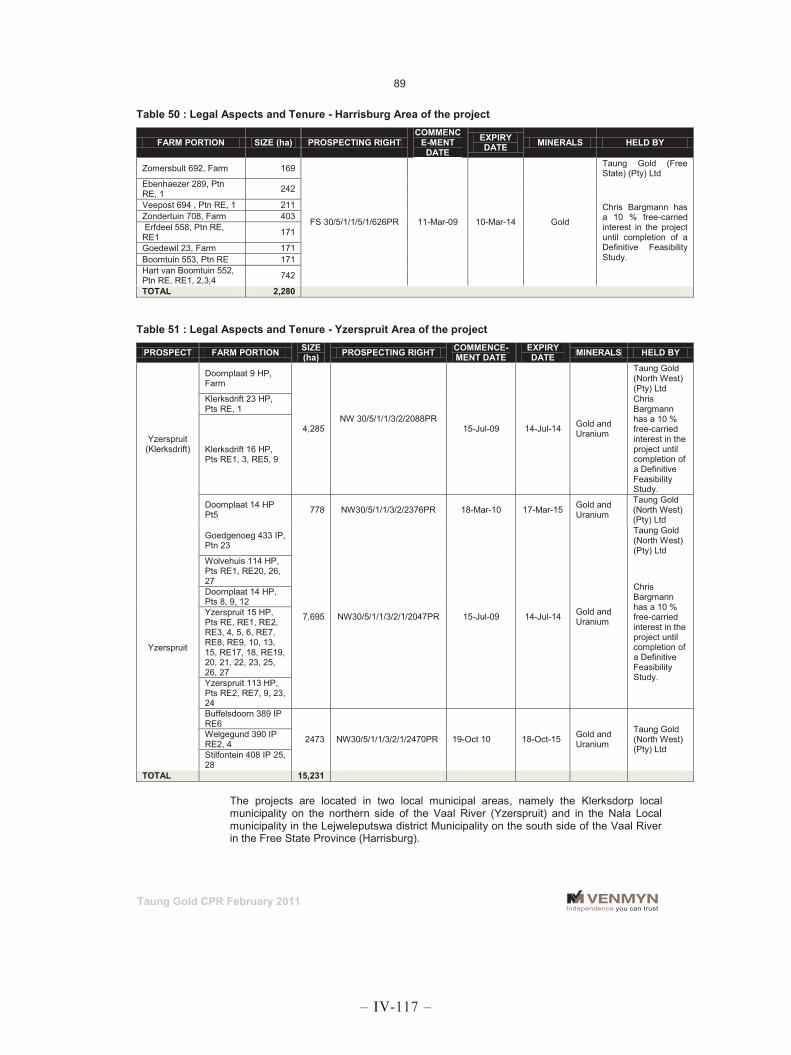
Taung Gold CPR February 2011
89
Table 50 : Legal Aspects and Tenure - Harrisburg Area of the project
FARM PORTION SIZE (ha) PROSPECTING RIGHT COMMENC
E-MENT DATE
EXPIRY DATE MINERALS HELD BY
Zomersbult 692, Farm 169
FS 30/5/1/1/5/1/626PR 11-Mar-09 10-Mar-14 Gold
Taung Gold (Free State) (Pty) Ltd
Ebenhaezer 289, Ptn RE, 1 242
Chris Bargmann has a 10 % free-carried interest in the project until completion of a Definitive Feasibility Study.
Veepost 694 , Ptn RE, 1 211 Zondertuin 708, Farm 403 Erfdeel 558, Ptn RE, RE1 171
Goedewil 23, Farm 171 Boomtuin 553, Ptn RE 171 Hart van Boomtuin 552, Ptn RE, RE1, 2,3,4 742
TOTAL 2,280
Table 51 : Legal Aspects and Tenure - Yzerspruit Area of the project
PROSPECT FARM PORTION SIZE (ha) PROSPECTING RIGHT COMMENCE-
MENT DATE EXPIRY DATE MINERALS HELD BY
Yzerspruit (Klerksdrift)
Doornplaat 9 HP, Farm
4,285 NW 30/5/1/1/3/2/2088PR
15-Jul-09 14-Jul-14 Gold and Uranium
Taung Gold (North West) (Pty) Ltd
Klerksdrift 23 HP, Pts RE, 1
Chris Bargmann has a 10 % free-carried interest in the project until completion of a Definitive Feasibility Study.
Klerksdrift 16 HP, Pts RE1, 3, RE5, 9
Doornplaat 14 HP Pt5 778 NW30/5/1/1/3/2/2376PR 18-Mar-10 17-Mar-15 Gold and
Uranium
Taung Gold (North West) (Pty) Ltd
Yzerspruit
Goedgenoeg 433 IP, Ptn 23
7,695 NW30/5/1/1/3/2/1/2047PR 15-Jul-09 14-Jul-14 Gold and Uranium
Taung Gold (North West) (Pty) Ltd
Wolvehuis 114 HP, Pts RE1, RE20, 26, 27 Chris
Bargmann has a 10 % free-carried interest in the project until completion of a Definitive Feasibility Study.
Doornplaat 14 HP, Pts 8, 9, 12 Yzerspruit 15 HP, Pts RE, RE1, RE2, RE3, 4, 5, 6, RE7, RE8, RE9, 10, 13, 15, RE17, 18, RE19, 20, 21, 22, 23, 25, 26, 27 Yzerspruit 113 HP, Pts RE2, RE7, 9, 23, 24 Buffelsdoorn 389 IP RE6
2473 NW30/5/1/1/3/2/1/2470PR 19-Oct 10 18-Oct-15 Gold and Uranium
Taung Gold (North West) (Pty) Ltd
Welgegund 390 IP RE2, 4 Stilfontein 408 IP 25, 28
TOTAL 15,231 The projects are located in two local municipal areas, namely the Klerksdorp local municipality on the northern side of the Vaal River (Yzerspruit) and in the Nala Local municipality in the Lejweleputswa district Municipality on the south side of the Vaal River in the Free State Province (Harrisburg).
– IV-117 –

– IV-118 –

Taung Gold CPR February 2011
91
6.4.2 Historical Exploration and Potential
The Witwatersrand Supergroup sediments were historically mined on at least 18 mines in the Klerksdorp-Orkney-Stilfontein-Hartbeesfontein (KOSH) region and some mines are still in operation. In excess of 4,800t of gold has been mined historically from the Klerksdorp Goldfield region. Taung has identified 29 boreholes drilled by previous exploration companies, which are considered sufficiently close to, or on Taung’s project area to provide relevant geological information.
6.4.3 Geology and Mineralisation
The Klerksdorp Goldfield is the most intricate of the Witwatersrand goldfields, with complex stratigraphic relationships. The West Rand and Central Rand Group sediments host the target reefs and occur at depths of 2,500m to 3,500m over the Harrisburg project area. The most favourable targets for gold mineralisation in the Central Rand Group is considered to be the VCR and the Elsburg Conglomerate reefs.
6.5 Other Greenfield Projects
Taung holds Prospecting Rights in respect of other greenfields projects in Mpumalanga, the North West, Limpopo, and Free State provinces of South Africa and the project locations, status of legal tenure and size of the rights are summarised in Note 14. In most cases the rights were recently granted or acquired by Taung and the projects are in the review and planning stages and limited exploration activities have been undertaken to date. Taung is in the process of acquiring and collating historical geological, exploration, logistical and infrastructure information pertinent to these rights, but is not presently in a position to report on these parameters in this CPR. Consequently it is not possible to complete a full JORC/SAMREC compliant report for these assets.
Yours faithfully
F. HARPER B.Sc.Hons (Geol.) Pr Sci Nat ; MGSSA MINERAL INDUSTRY ADVISOR
A.N.CLAY M.Sc. (Geol.), M.Sc. (Min. Eng.), Dip. Bus. M. Pr Sci Nat, MSAIMM, FAusIMM, FGSSA, MAIMA, M.Inst.D, AAPG MANAGING DIRECTOR Effective Date: 11th February 2011
– IV-119 –

Taung Gold CPR February 2011
92
7 REFERENCES
AUTHOR DATE TITLE SOURCE Antrobus, E.S., 1986 Witwatersrand Gold-100 Years Geological Society of South Africa
Anglo American Corporation Unknown
Area North and East of Jeanette Gold Mine Limited-An Investigation into the Uranium Values in the Intermediate Reefs
Report No 173/120
Anhaeusser, C.R. Maske, S., 1986 The Mineral Deposits of Southern Africa Geological Society of South Africa
Behre Dolbear and Company Ltd, 2006 Feasibility Study for the Burnstone Gold Project GBG Technical Report
Bush, D.A., 1996 Evaluation of the Global Ore Reserves of the Jeanette Mine Lease Area, AAPS Int. Co. Memo
Clay, A. 2008 SAMREC Compliant Technical Statement as at 23rd May 2008 Evander 6 Shaft Venmyn
Conradie, C 2008 South African Minerals Industry Department of Minerals and Energy
De Jager, J.A., 1992 Annual Report for the year ended March 31st 1992 Anglo American Prospecting Services (Pty) Limited. Rep No. 11/173/114
Dell, R.W., Winkler K.S., and Dukas, B.A.
1997 Geological Assessment and Evaluation of the Jeanette Contiguous Block
Anglo American Prospecting Services (Pty) Limited. Internal Report No. 11/173/120/car95/0699
Harmony 2007 Annual Report www.harmony.co.za
Harmony Gold Mining Company Limited
2002 Pre-Feasibility Study Evander 6 Shaft Project Internal Company Report. Harmony Gold Mining Company Limited
Irons, C., Kennedy J.F., Steenkamp W.H.B., Strydom, D.
1991 The De Bron Horst Report Anglo American Prospecting Services (Pty) Limited. Internal Report No. 11/173/1081/KDP.91/1822
Johnson, M.R., Anhaeusser, CR., 2006 The Geology of South Africa Geological Society of South Africa
Jordaan, M.J., 1986 Depositional Framework of the Kimberley Reefs in the Welkom Goldfield.
In: Geocongress 1986, extended abstracts, Geological Society South Africa
Kapwijk, P., 2007 Goldfields Mineral Services (GFMS) presentation, London Gold Survey 2007
The Mineral Corporation 2008a Technical Review of the Hilton Project Rep No. C-TAU-FSG-588-440
The Mineral Corporation 2008b
Preliminary Overview of Reef Potential in the Kimberley Formation at the Jeanette Gold Mine Project
Rep No. 2008-283
The Mineral Corporation 2008c Basal Reef Evaluation and Technical Due Diligence
of the Jeanette Mine Project The Mineral Corporation Rep no. C-TAU-FSG-588-483
Knowles, A.G. 1978 Jeanette Gold Mines- A Geological Assessment of the Lease Area
Anglo American Corporation of South Africa Internal Report No 173/520/103
Leeb du Toit, A., 1986 The Evander Goldfield In: Antrobus, E.S.A. (Ed.), Witwatersrand Gold-100 Years. Geological Society of South Africa
Lemmer, C., 2008 APM Evander Project Resource Upgrade Requirements-Additional Questions
Internal Company Report. African Precious Minerals (Pty) Ltd
Maree, D., 2006 Mineral Reserve Statement for Operation No.6 Shaft Internal Company Report. Harmony Gold Mining Company Limited
McCarthy, T.S., 2006 The Witwatersrand Supergroup In: The Geology of South Africa. Geological Society of South Africa
Miall, A.D., 1981 Alluvial sedimentary basins: Tectonic setting and basin architecture
In: Miall A.D. (Ed) Sedimentation and Tectonics in alluvial basins. Geological association of Canada special paper 23
Minter, W.E.L., Hill, W.C.N.,Kidger, R.J., Kingsley C.S., Snowden P.A.,
1986 The Welkom Goldfield Mineral Resources of Southern Africa
Mitchell, G et al 2008 Competent Persons Report of the Resource Estimate for the Evander Six Shaft Property, Mpumalanga Province, Republic of South Africa
ExplorMine
Mogilnicki, M.A. and Assibey-Bonsu, W., 1994
A case study of the impact of support and information effects of Resource/Reserve estimates to be used for medium term mine planning in the Witwatersrand type deposits
Proceedings of the conference on mining geostatistics, 1994
Muntingh 1991 A sedimentological assessment of the Basal Reef on the Jeanette Mine AAC Internal Report No 173/520/102
Mwasinga, P.P. 1996 Winkelhaak Six Shaft project Report No.153. Internal Company Report. Gencor Limited
– IV-120 –
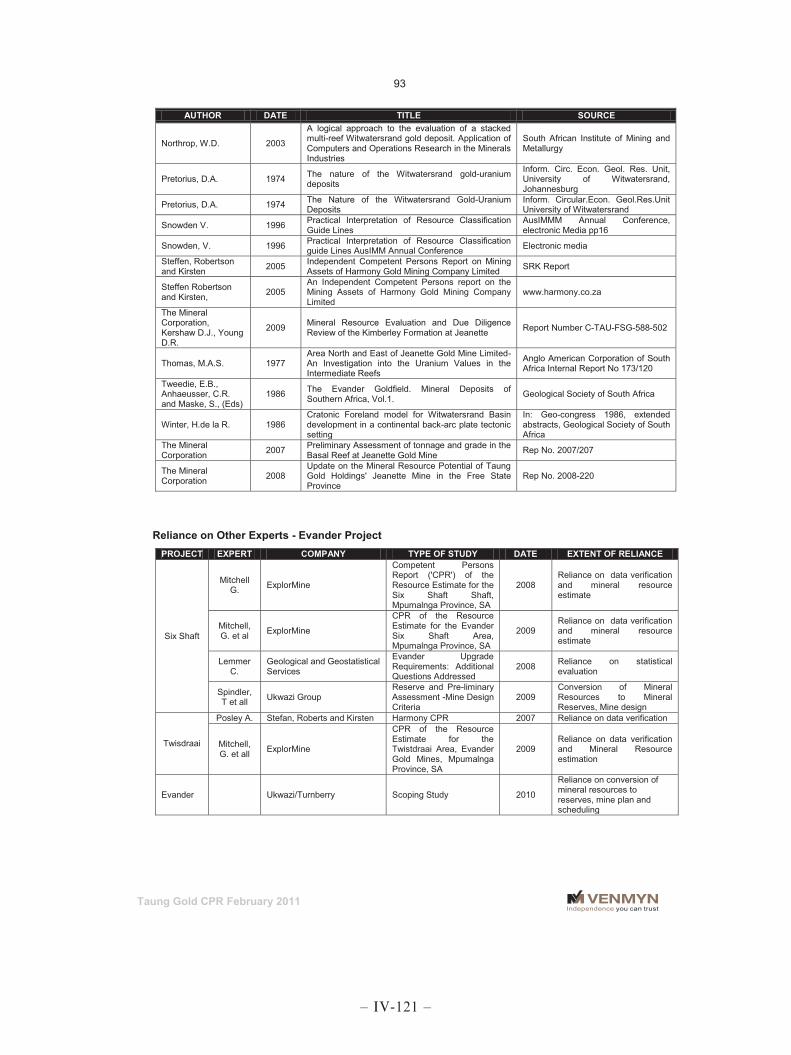
Taung Gold CPR February 2011
93
AUTHOR DATE TITLE SOURCE
Northrop, W.D. 2003
A logical approach to the evaluation of a stacked multi-reef Witwatersrand gold deposit. Application of Computers and Operations Research in the Minerals Industries
South African Institute of Mining and Metallurgy
Pretorius, D.A. 1974 The nature of the Witwatersrand gold-uranium deposits
Inform. Circ. Econ. Geol. Res. Unit, University of Witwatersrand, Johannesburg
Pretorius, D.A. 1974 The Nature of the Witwatersrand Gold-Uranium Deposits
Inform. Circular.Econ. Geol.Res.Unit University of Witwatersrand
Snowden V. 1996 Practical Interpretation of Resource Classification Guide Lines
AusIMMM Annual Conference, electronic Media pp16
Snowden, V. 1996 Practical Interpretation of Resource Classification guide Lines AusIMM Annual Conference Electronic media
Steffen, Robertson and Kirsten 2005 Independent Competent Persons Report on Mining
Assets of Harmony Gold Mining Company Limited SRK Report
Steffen Robertson and Kirsten, 2005
An Independent Competent Persons report on the Mining Assets of Harmony Gold Mining Company Limited
www.harmony.co.za
The Mineral Corporation, Kershaw D.J., Young D.R.
2009 Mineral Resource Evaluation and Due Diligence Review of the Kimberley Formation at Jeanette Report Number C-TAU-FSG-588-502
Thomas, M.A.S. 1977 Area North and East of Jeanette Gold Mine Limited-An Investigation into the Uranium Values in the Intermediate Reefs
Anglo American Corporation of South Africa Internal Report No 173/120
Tweedie, E.B., Anhaeusser, C.R. and Maske, S., (Eds)
1986 The Evander Goldfield. Mineral Deposits of Southern Africa, Vol.1. Geological Society of South Africa
Winter, H.de la R. 1986 Cratonic Foreland model for Witwatersrand Basin development in a continental back-arc plate tectonic setting
In: Geo-congress 1986, extended abstracts, Geological Society of South Africa
The Mineral Corporation 2007 Preliminary Assessment of tonnage and grade in the
Basal Reef at Jeanette Gold Mine Rep No. 2007/207
The Mineral Corporation 2008
Update on the Mineral Resource Potential of Taung Gold Holdings' Jeanette Mine in the Free State Province
Rep No. 2008-220
Reliance on Other Experts - Evander Project
PROJECT EXPERT COMPANY TYPE OF STUDY DATE EXTENT OF RELIANCE
Six Shaft
Mitchell G. ExplorMine
Competent Persons Report ('CPR') of the Resource Estimate for the Six Shaft Shaft, Mpumalnga Province, SA
2008 Reliance on data verification and mineral resource estimate
Mitchell, G. et al ExplorMine
CPR of the Resource Estimate for the Evander Six Shaft Area, Mpumalnga Province, SA
2009 Reliance on data verification and mineral resource estimate
Lemmer C.
Geological and Geostatistical Services
Evander Upgrade Requirements: Additional Questions Addressed
2008 Reliance on statistical evaluation
Spindler, T et all Ukwazi Group
Reserve and Pre-liminary Assessment -Mine Design Criteria
2009 Conversion of Mineral Resources to Mineral Reserves, Mine design
Twisdraai
Posley A. Stefan, Roberts and Kirsten Harmony CPR 2007 Reliance on data verification
Mitchell, G. et all ExplorMine
CPR of the Resource Estimate for the Twistdraai Area, Evander Gold Mines, Mpumalnga Province, SA
2009 Reliance on data verification and Mineral Resource estimation
Evander Ukwazi/Turnberry Scoping Study 2010
Reliance on conversion of mineral resources to reserves, mine plan and scheduling
– IV-121 –

Taung Gold CPR February 2011
94
Reliance on Other Experts – Jeanette Project
PROJECT EXPERT COMPANY TYPE OF STUDY DATE EXTENT OF RELIANCE
Jeanette - The Mineral Corporation
Evaluation of the Basal Reef and Kimberley Formation reefs in terms of tonnage and grade, updated Mineral Resource
2008 & 2009
Reliance on Due Diligence of the re-sampling programme and mineral resource estimate
Jeanette Lemmer C. Geological and Geostatistical Services
Jeanette project Resource Upgrade Requirements 2008 Reliance on statistical
evaluation
Jeanette Campbell D. Sound Mining Solutions (‘SMS’)
Jeanette Gold Mine project Scoping Study 2009
Reliance on conversion of mineral resources to reserves, mine plan and scheduling
Jeanette Keen, J.E. Consulting Rock Engineering
A Technical Assessment of the Feasibility of proposed Mining of the Basal reef overlain by Khaki Shales
2008 Technical assessment of potential to safely mine below the shale
Hilton - The Mineral Corporation Technical review of historical data 2008
Reliance on due diligence of original borehole data and potential mineralisation estimate
Jeanette Hilton Minxcon Scoping Study 0102
Reliance on conversion of mineral resources to reserves, mine plan and scheduling
Reliance on Other Experts – Greenfields Projects PROJECT EXPERT COMPANY TYPE OF STUDY DATE EXTENT OF RELIANCE
South Rand Mitchell G. ExplorMine Report on Stratigraphic Correlation of Boreholes 2007 Reliance on stratigraphic
confirmation
Bothaville Gap Bargmann, C. Snowden Geological Report on Sephaku’s Gold Explorations Bothaville Gap Project
2008 Due Diligence of Historical Data
– IV-122 –
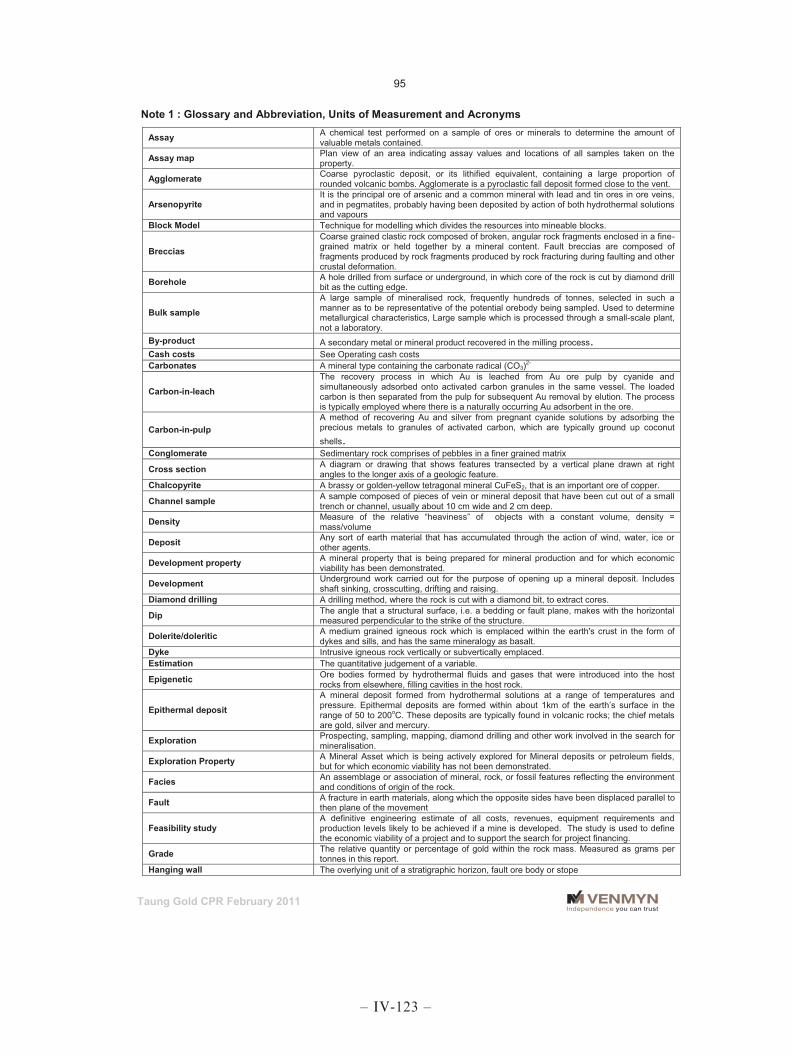
Taung Gold CPR February 2011
95
Note 1 : Glossary and Abbreviation, Units of Measurement and Acronyms
Assay A chemical test performed on a sample of ores or minerals to determine the amount of valuable metals contained.
Assay map Plan view of an area indicating assay values and locations of all samples taken on the property.
Agglomerate Coarse pyroclastic deposit, or its lithified equivalent, containing a large proportion of rounded volcanic bombs. Agglomerate is a pyroclastic fall deposit formed close to the vent.
Arsenopyrite It is the principal ore of arsenic and a common mineral with lead and tin ores in ore veins, and in pegmatites, probably having been deposited by action of both hydrothermal solutions and vapours
Block Model Technique for modelling which divides the resources into mineable blocks.
Breccias Coarse grained clastic rock composed of broken, angular rock fragments enclosed in a fine-grained matrix or held together by a mineral content. Fault breccias are composed of fragments produced by rock fragments produced by rock fracturing during faulting and other crustal deformation.
Borehole A hole drilled from surface or underground, in which core of the rock is cut by diamond drill bit as the cutting edge.
Bulk sample A large sample of mineralised rock, frequently hundreds of tonnes, selected in such a manner as to be representative of the potential orebody being sampled. Used to determine metallurgical characteristics, Large sample which is processed through a small-scale plant, not a laboratory.
By-product A secondary metal or mineral product recovered in the milling process. Cash costs See Operating cash costs Carbonates A mineral type containing the carbonate radical (CO3)2-
Carbon-in-leach The recovery process in which Au is leached from Au ore pulp by cyanide and simultaneously adsorbed onto activated carbon granules in the same vessel. The loaded carbon is then separated from the pulp for subsequent Au removal by elution. The process is typically employed where there is a naturally occurring Au adsorbent in the ore.
Carbon-in-pulp A method of recovering Au and silver from pregnant cyanide solutions by adsorbing the precious metals to granules of activated carbon, which are typically ground up coconut shells.
Conglomerate Sedimentary rock comprises of pebbles in a finer grained matrix
Cross section A diagram or drawing that shows features transected by a vertical plane drawn at right angles to the longer axis of a geologic feature.
Chalcopyrite A brassy or golden-yellow tetragonal mineral CuFeS2, that is an important ore of copper.
Channel sample A sample composed of pieces of vein or mineral deposit that have been cut out of a small trench or channel, usually about 10 cm wide and 2 cm deep.
Density Measure of the relative “heaviness” of objects with a constant volume, density = mass/volume
Deposit Any sort of earth material that has accumulated through the action of wind, water, ice or other agents.
Development property A mineral property that is being prepared for mineral production and for which economic viability has been demonstrated.
Development Underground work carried out for the purpose of opening up a mineral deposit. Includes shaft sinking, crosscutting, drifting and raising.
Diamond drilling A drilling method, where the rock is cut with a diamond bit, to extract cores.
Dip The angle that a structural surface, i.e. a bedding or fault plane, makes with the horizontal measured perpendicular to the strike of the structure.
Dolerite/doleritic A medium grained igneous rock which is emplaced within the earth's crust in the form of dykes and sills, and has the same mineralogy as basalt.
Dyke Intrusive igneous rock vertically or subvertically emplaced. Estimation The quantitative judgement of a variable.
Epigenetic Ore bodies formed by hydrothermal fluids and gases that were introduced into the host rocks from elsewhere, filling cavities in the host rock.
Epithermal deposit A mineral deposit formed from hydrothermal solutions at a range of temperatures and pressure. Epithermal deposits are formed within about 1km of the earth’s surface in the range of 50 to 200oC. These deposits are typically found in volcanic rocks; the chief metals are gold, silver and mercury.
Exploration Prospecting, sampling, mapping, diamond drilling and other work involved in the search for mineralisation.
Exploration Property A Mineral Asset which is being actively explored for Mineral deposits or petroleum fields, but for which economic viability has not been demonstrated.
Facies An assemblage or association of mineral, rock, or fossil features reflecting the environment and conditions of origin of the rock.
Fault A fracture in earth materials, along which the opposite sides have been displaced parallel to then plane of the movement
Feasibility study A definitive engineering estimate of all costs, revenues, equipment requirements and production levels likely to be achieved if a mine is developed. The study is used to define the economic viability of a project and to support the search for project financing.
Grade The relative quantity or percentage of gold within the rock mass. Measured as grams per tonnes in this report.
Hanging wall The overlying unit of a stratigraphic horizon, fault ore body or stope
– IV-123 –

Taung Gold CPR February 2011
96
In situ In its original place, most often used to refer to the location of the mineral resources.
Imbrication A sedimentary structure in which gravel, pebbles or grains are stacked with their flat surfaces dipping upstream.
Indicated Mineral Resource
That part of a mineral resource for which tonnage, densities, shape, physical characteristics, grade and average mineral content can be estimated with a reasonable level of confidence. It is based on exploration sampling and testing information gathered through appropriate techniques from locations such as outcrops, trenches, pits, workings and drill holes. The locations are too widely or inappropriately spaced to confirm geological and/or grade continuity but are spaced closely enough for continuity to be assumed and sufficient minerals have been recovered to allow a confident estimate of average mineral value.
Inferred Mineral Resource
That part of a mineral resource for which tonnage, grade and average mineral content can be estimated with a low level of confidence. It is inferred from geological evidence and assumed but not verified by geological and/or grade continuity. It is based on information gathered through appropriate techniques from locations such as outcrops, trenches, pits, workings and drill holes that may be limited or of uncertain quality and reliability.
Kaolinite Phyllosilicate clay minerals formed by the alteration of alkali feldspars and other aluminium-bearing minerals. Its largest deposits are beds of clay formed in lakes.
Lava Molten silicate material extruded by a volcano.
License, Permit, Lease or other similar entitlement
Any form of license, permit, lease or other entitlement granted by the relevant Government department in accordance with its mining legislation that confers on the holder certain rights to explore for and/or extract minerals that might be contained in the land, or ownership title that may prove ownership of the minerals.
Life-of-Mine/LoM Expected duration of time that it will take to extract accessible material. Liberation Release of Au from the host rock through processing.
Lithologies The description of the characteristics of rocks, as seen in hand-specimens and outcrops on the basis of colour, grain size and composition.
Lithosphere The solid outer shell of the earth’s crust, including the crust and uppermost rigid layer of the mantle. It is described as a strong or rigid zone above the asthenosphere, or weak zone.
Mining property A mineral asset which is in production. Matrix Fine grained rock which supports larger clasts or pebbles.
Mine call Factor/MCF The ratio, expressed as a percentage, of the total quantity of recovered and unrecovered mineral product after processing with the amount estimated in the ore based on sampling.
Mineable That portion of a resource for which extraction is technically and economically feasible.
Mineral Asset(s)
Any right to explore and / or mine which has been granted (“property”), or entity holding such property or the securities of such an entity, including but not limited to all corporeal and incorporeal property, mineral rights, mining titles, mining leases, intellectual property, personal property (including plant equipment and infrastructure), mining and exploration tenures and titles or any other right held or acquired in connection with the finding and removing of minerals and petroleum located in, on or near the earth’s crust. Mineral Assets can be classified as Dormant Properties, Exploration Properties, Development Properties, Mining Properties or Defunct Properties.
Mineral Reserve
The economically mineable material derived from a Measured and/or Indicated Mineral Resource. It is inclusive of diluting materials and allows for losses that may occur when the material is mined. Appropriate assessments, which may include feasibility studies, have been carried out, including consideration of and modification by, realistically assumed mining, metallurgical, economic, marketing, legal, environmental, social and governmental factors. These assessments demonstrate at the time of reporting that extraction is reasonably justified. Mineral Reserves are sub-divided in order of increasing confidence into Probable Mineral Reserves and Proved Mineral Reserve.
Mineral Resource
A concentration of material of economic interest in or on Earth’s crust in such form, quality and quantity that there are reasonable and realistic prospects for eventual economic extraction. The location, quantity, grade, continuity and other geological characteristics of a Mineral Resource are known, estimated from specific geological evidence and knowledge, or interpreted from a well constrained and portrayed geological model. Mineral Resources are subdivided, in order of increasing confidence in respect of geoscientific evidence, into Inferred, Indicated and Measured categories. A deposit is a concentration of material of possible economic interest in, on or near the Earth’s crust. Portions of a deposit that do not have reasonable and realistic prospects for eventual economic extraction must not be included in a Mineral resource.
Measured Mineral Resource
That part of a mineral resource for which tonnage, densities, shape, physical characteristics, grade and mineral content can be estimated with a high level of confidence. It is based on detailed and reliable exploration, sampling and testing information gathered through appropriate techniques from locations such as outcrops, trenches, pits, workings and drill-holes. The locations are spaced closely enough to confirm geological and grade continuity.
Mineralisation The presence of a target mineral in a mass of host rock. Mining Property a Mineral Asset which is in production.
National instrument 43-101 Canadian National Instrument on the reporting of exploration, mineral resources and mineral reserves for the TSX.
Opencast / Open pit Surface mining in which the ore is extracted from a pit. The geometry of the pit may vary with the characteristics of the ore body.
Operating Cash Costs A measure of the average cost of producing an ounce of gold calculated by the total cash working costs for a period/total Au produced in that period
– IV-124 –

Taung Gold CPR February 2011
97
Optimisation Creating the best mining scenario while taking into account the economic parameters of the deposit.
Orebody A continuous well defined mass of material of sufficient ore content to make extraction economically feasible.
Overburden The alluvium and rock that must be removed in order to expose an ore deposit. Placer An alluvial deposit of ore, usually a mineral bearing gravel or sand.
Probable reserves
Is the economically mineable material derived from a Measured and/or Indicated Mineral Resource. It is estimated with a lower level of confidence than a Proved Reserve. It is inclusive of diluting materials and allows for losses that may occur when the material is mined. Appropriate assessments, which may include feasibility studies, have been carried out, including consideration of, and modification by, realistically assumed mining, metallurgical, economic, marketing, legal, environmental, social and governmental factors. These assessments demonstrate at the time of reporting that extraction is reasonably justified.
Project capital Capital expenditure which is associated with specific projects of a non-routine nature. Prospect A deposit with the potential for economic extraction.
Pyrite Fool’s gold a common yellow sulphide mineral, FeS. Pyrite forms under a wide range of pressure-temperature conditions, and so is found in many geological environments.
Pyrophyllite A yellowish white, grey, or pale-green phyllosilicate.
Quartzite A metamorphic rock consisting primarily of quartz grains, formed by the recrystallisation of sandstone by thermal or regional metamorphism or a sandstone composed of quartz grains cemented by silica.
Recovered grade/Yield The actual grade of ore realised after the mining and treatment process. Reef Mineralised lode.
Rehabilitation The process of restoring mined land to a condition approximating to a greater or lesser degree its original state. Reclamation standards are determined by the Russia Federation Department of Mineral and Energy Affairs and address ground and surface water, topsoil, final slope gradients, waste handling and re-vegetation issues.
Sample The removal of a small amount of rock pertaining to the deposit which is used to estimate the grade of the deposit and other geological parameters.
Sampling Taking small pieces of rock at intervals along exposed mineralisation for assay (to determine the mineral content).
Sedimentary Formed by the deposition of solid fragmental or chemical material that originates from weathering of rocks and is transported from a source to a site of deposition.
Slimes dam A storage facility for all fine waste products from the processing plant. Specific gravity/S.G. Measure of quantity of mass per unit of volume, density. Stockpile A store of unprocessed ore or marginal grade material. Stripping Removal of waste overburden covering the mineral deposit. Stripping ratio Ratio of ore rock to waste rock.
Subduction The movement of one crustal plate (lithospheric plate) under another so that the descending plate is “consumed.
Tailings The waste products of the processing circuit. These may still contain very small quantities of the economic mineral.
Tailings dam Dams or dumps created from waste material from processed ore after the economically recoverable metal or mineral has been extracted.
Tonnage Quantities where the tonne is an appropriate unit of measure. Typically used to measure reserves of metal-bearing material in-situ or quantities of ore and waste material mined, transported or milled.
Trenching Making elongated open-air excavations for the purposed of mapping and sampling.
Trust Fund A fund required by law to be set up, to which annual contributions are paid so that the remaining environmental liability of the operation is covered.
Veins A tabular or sheet like body of one or more minerals deposited in openings of fissures, joints or faults, frequently with associated replacement of the host rock.
Yield/Recovered grade The actual grade of ore realised after the mining and treatment process.
% Percentage + Plus ± Approximately º Degrees μ Microns < Less than > Greater than / Per AAC Anglo American Corporation AAPS Anglo American Prospecting Services amsl Above mean sea level APM African Precious Minerals APPA Pollution Prevention Act AusIMM Australian Institute of Mining and Metallurgy ASG Advance Strike Gullies ASX Australian Stock Exchange
– IV-125 –
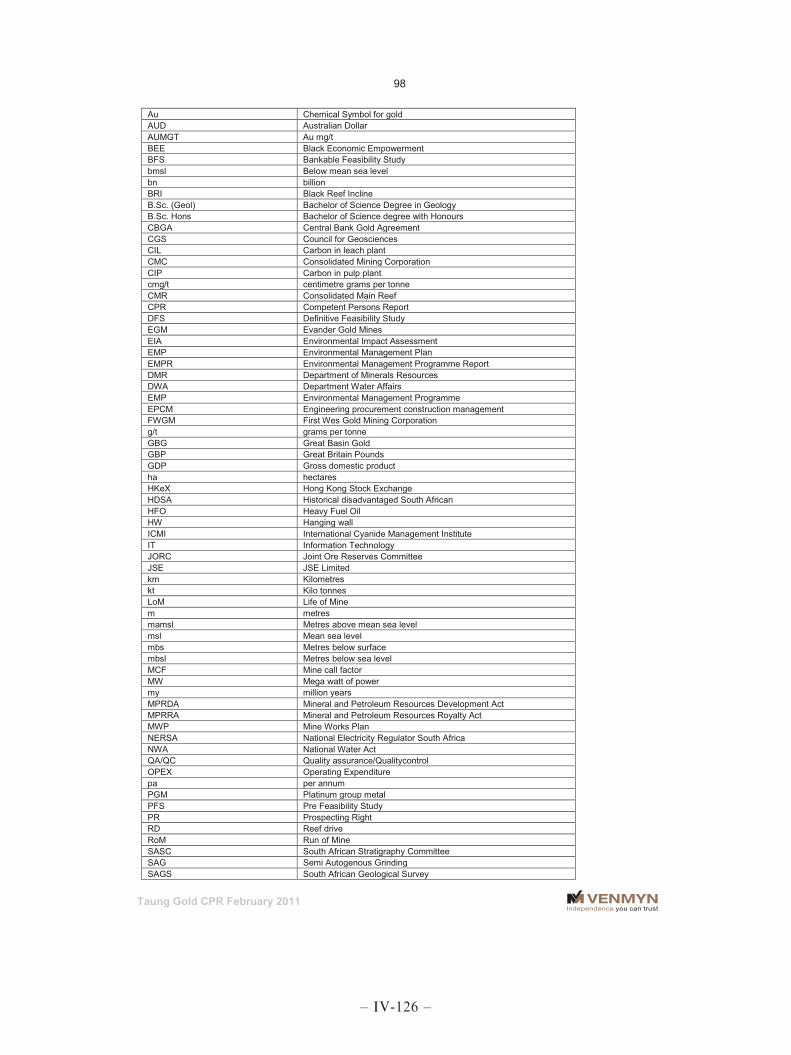
Taung Gold CPR February 2011
98
Au Chemical Symbol for gold AUD Australian Dollar AUMGT Au mg/t BEE Black Economic Empowerment BFS Bankable Feasibility Study bmsl Below mean sea level bn billion BRI Black Reef Incline B.Sc. (Geol) Bachelor of Science Degree in Geology B.Sc. Hons Bachelor of Science degree with Honours CBGA Central Bank Gold Agreement CGS Council for Geosciences CIL Carbon in leach plant CMC Consolidated Mining Corporation CIP Carbon in pulp plant cmg/t centimetre grams per tonne CMR Consolidated Main Reef CPR Competent Persons Report DFS Definitive Feasibility Study EGM Evander Gold Mines EIA Environmental Impact Assessment EMP Environmental Management Plan EMPR Environmental Management Programme Report DMR Department of Minerals Resources DWA Department Water Affairs EMP Environmental Management Programme EPCM Engineering procurement construction management FWGM First Wes Gold Mining Corporation g/t grams per tonne GBG Great Basin Gold GBP Great Britain Pounds GDP Gross domestic product ha hectares HKeX Hong Kong Stock Exchange HDSA Historical disadvantaged South African HFO Heavy Fuel Oil HW Hanging wall ICMI International Cyanide Management Institute IT Information Technology JORC Joint Ore Reserves Committee JSE JSE Limited km Kilometres kt Kilo tonnes LoM Life of Mine m metres mamsl Metres above mean sea level msl Mean sea level mbs Metres below surface mbsl Metres below sea level MCF Mine call factor MW Mega watt of power my million years MPRDA Mineral and Petroleum Resources Development Act MPRRA Mineral and Petroleum Resources Royalty Act MWP Mine Works Plan NERSA National Electricity Regulator South Africa NWA National Water Act QA/QC Quality assurance/Qualitycontrol OPEX Operating Expenditure pa per annum PGM Platinum group metal PFS Pre Feasibility Study PR Prospecting Right RD Reef drive RoM Run of Mine SASC South African Stratigraphy Committee SAG Semi Autogenous Grinding SAGS South African Geological Survey
– IV-126 –

Taung Gold CPR February 2011
99
SAIMM South African Institute of Mining and Metallurgy
SAMREC South African Code for the Reporting of Exploration Results, Mineral Resources and Mineral Reserves
SAMVAL South African Code for the Reporting of Mineral Asset Valuation SG Specific Gravity SLP Social and Labour Plan SMU Smallest Mining Unit SQL Standard query Language SRK Steffen Kirsten and Roberts Consulting t tonnage tph Ton/s per hour tpm Ton/s per month TMC The Minerals Corporation TSF Tailings storage facility RC Reverse circulation USD United States of America Dollar VCR Ventersdorp Contact Reef WOC Waste on contact WNA World Nuclear Association WRCM West Rand Consolidated Mines Limited WWML West Wits Mining Limited ZAR South African Rand 2D Two dimensional 3D Three dimensional
– IV-127 –

Taung Gold CPR February 2011
100
Note 2 : Legal Aspects and Tenure Evander
The Evander transaction is governed by two distinct sets of agreements. There is a pre-existing “earn-in agreement” in place. Over and above this, an agreement has been entered into in terms of which Taung will purchase 100% of the projects from EGM. If, for whatever reason, the parties are unable to give effect to the Sale Agreement, the terms of the existing earn-in agreement will continue to apply, as described below. Taung entered into an ‘earn-in agreement’ with EGM, a wholly owned subsidiary of Harmony, in respect of the Evander project properties on 29th February 2008. Agreements with EGM include a separate right of Access and Use, Sale of Assets, Subscription and Shareholder agreements and provide for the Mining Right to be transferred into subsidiaries of Harmony, with Taung enjoying the right to earn a majority interest in same by completing a Bankable Feasibility Study (‘BFS’) over the Six Shaft and Twistdraai projects. Taung completed a Scoping Study over the project on 9th April 2010, which was a requirement in order to “earn-in” on the project. Taung is required to complete PFS by 9th April 2012 and a BFS by 9th April 2013. The Scoping Study was approved by various Taung and EGM committees, which recommended that the project should proceed to the PFS stage. Upon completion of the PFS, Taung will earn a 25% shareholding in the subsidiaries (and therefore the project) and upon completion of the BFS, an aggregate of 52% in the subsidiaries. Historical Subscription and Shareholder Agreements
All of the conditions precedent in the Subscription Agreement have been fulfilled and the effective date of the Subscription Agreement is 9th April 2008. In terms of the agreements, Taung agreed to complete the following for both Twistdraai and Six Shaft:-
commission a Scoping Study by 9th April 2010, which has been completed;
on completion of a Scoping Study in its sole discretion, commission a PFS, and complete it within 4 years of the effective date, 9th April 2012; and
on completion of a PFS in its sole discretion, commission a BFS and complete it within 5 years of the effective date,by 9th April 2013.
In consideration for the assignment of all rights to the PFS and BFS by Taung to EGM, EGM will allot and issue shares in two tranches to Taung in new entities, which will be Harmony subsidiaries. These new entities will hold the Mining Right and ultimately EGM will hold 48% and Taung 52% of the shareholding in the new companies. On completion of the PFS and BFS, and after the issue of the first and second tranches of shares, the shareholding in the new entities will be as indicated in the table below:-.
STAGE SHAREHOLDER SHARES PERCENTAGE Completion of PFS and issue of first tranche of shares by EGM
EGM 75 75 Taung 25 25
TOTAL 100 100 Completion of BFS and issue of the second tranche of shares
EGM 75 48.08 Taung 81 51.92
TOTAL 156 100 The agreements provide for:-
the formation of a Technical Committee which will oversee the Scoping Study, PFS and BFS; and
the formation of a Gatekeeper Committee to ensure compliance of the Scoping Study, PFS and BFS to Harmony’s internal Gatekeeper Committee Policy.
– IV-128 –

Taung Gold CPR February 2011
101
In addition, the Gatekeeper Committee is to ensure that, on the completion of the PFS, the following criteria have been fulfilled:-
3/5 of an agreed minimum exploration work for the PFS has been completed; and
70% of the Mineral Resources during the pay-back period are in the Indicated Mineral Resource category.
At the completion of the BFS, the Gatekeeper Committee must also ensure that the study has complied with the following:-
the agreed minimum exploration work for the BFS has been completed; and
100% of the Mineral Resources during the payback period are in the Indicated Mineral Resource category.
The agreed minimum exploration work plan may only be changed by the Technical Committee. If any of the studies are not completed by Taung, all rights in any such incomplete study will be assigned to EGM. Right of Access and Use Agreement
EGM granted Taung the right of access to the relevant areas for exploration. Joint Venture Agreement
On the completion of the BFS by Taung and depending on a joint decision to develop and operate a mine, a joint venture will be entered into whereby all costs and revenue will be split according to the parties’ respective participation interests. The Mining Charter requires a 15% BEE stake holding by 30th April 2009, and an additional 11% by 2014. Both Taung and Harmony meet the Mining Charter requirement by virtue of the following :-
the 26% shareholding in Taung held by Sephaku ( a BEE company); and
the 2002 Harmony agreement entered into with African Rainbow Minerals (Pty) Ltd, (a BEE company).
As described above Taung entered into an earn-in agreement with EGM on 29th February 2008 with respect to the Six Shaft and Twistdraai projects. Subsequent to that, 10th September 2010, a Sale Agreement was concluded in terms of which a Taung subsidiary will purchase 100 % of the projects from EGM for a purchase price of USD28.125m. Ministerial permission for transfer of the projects into Taung’s name is required, but should the transfer not be approved for any reason, the existing earn-in agreement as described above will continue to apply.
– IV-129 –

Taung Gold CPR February 2011
102
Note 3 : South African Mining and Environmental Law
MINERAL AND PETROLEUM RESOURCES DEVELOPMENT ACT (MPRDA)
The South African Government enacted the MPRDA on the 1st May 2004. It defines the State’s legislation on mineral rights and mineral transactions in South Africa. The Act emphasises that the government did not accept the existence of the historical dual State and private ownership of mineral rights in South Africa and, as such, the Act legislated that all mineral and petroleum resources in South Africa now vest in the State. Additional objectives of the Act include the promotion of economic growth, the development of resources to expand opportunities for the historically disadvantaged, and the socio-economic development of the areas in which mining and prospecting companies are operating. It also provides for security of tenure relating to prospecting, exploration, mining and production. A further objective of the Act was to further BEE within South Africa’s minerals industry, by encouraging mineral exploration and mining companies to enter into equity partnerships with BEE companies. The Act also makes provision for the implementation of social responsibility procedures and programmes by mineral resource companies. The Act incorporated a "use-it or lose-it" principle, that has been applied to companies or individuals who owned mineral rights or the rights to prospect and mine prior to 2004 (Old Order Rights). These Old Order Rights were required to be transferred within specified timeframes, under the provisions of the Act, into New Order Rights to prospect and mine. Once the State has granted the conversion of the Old Order Rights to New Order Rights, or has granted a New Order Right to new applications submitted after the implementation of the MPRDA, a Notarial Agreement between the State and the holder of the New Order Right is entered into. This Agreement sets out all the conditions associated with the New Order Right. New Order Rights can be suspended or cancelled by the Minister if, upon notice of a breach from the Minister of its obligations to comply with the MPRDA, or the conditions prescribed as part of its New Order Right, a breaching entity fails to rectify such a breach. In addition, in terms of the MPRDA, mining and exploration companies have to comply with additional responsibilities relating to environmental management and to environmental damage, degradation or pollution, resulting from their prospecting or exploration activities. Types of rights and permits applicable to the mining industry in South Africa, as provided for in the MPRDA, are detailed below.
LICENCE TYPE PURPOSE DURATION REQUIREMENTS CONDITIONS
Reconnaissance Permission
Exploration at the reconnaissance stage.
2 years (non renewable)
Financial ability; technical ability; and work programme.
Holder does not have the exclusive right to apply for a Prospecting Right.
Prospecting Right Exploration at target-definition stage.
Up to 5 years initially. Renewable once for 3 years.
Financial ability; technical ability; economic programme; work programme; and environmental plan.
Payment of Prospecting fees. Holder has the exclusive right to apply for a Mining Right
Retention Permit Hold on to legal rights between prospecting and mining stages.
3 years initially. Renewable once for 2 years.
Prospecting stage complete; feasibility study complete; project not currently feasible; and completed Environmental Management Plan (EMP).
May not result in exclusion of competition, unfair competition or hoarding of rights. May not be transferred, ceded, leased, sold, mortgaged or encumbered in any way.
Mining Right Development and production stage.
30 years initially. Renewable for further periods of 30 years. Effective for LoM.
Financial ability; technical ability; prospecting complete; economic programme; work programme; social plan; labour plan; and completed EMP.
Payment of royalties (from 2010). Compliance with Mining Charter and Codes of Good Practice on broad-based BEE (BBBEE.)
Mining Permit Small-scale mining.
2 years initially. Renewable for 3 further periods of 1 year at a time.
Life of project must be <2 years; areas must be <1.5Ha; and completed EMP.
Payment of royalties (from 2010). May not be leased or sold, but can be mortgaged.
– IV-130 –
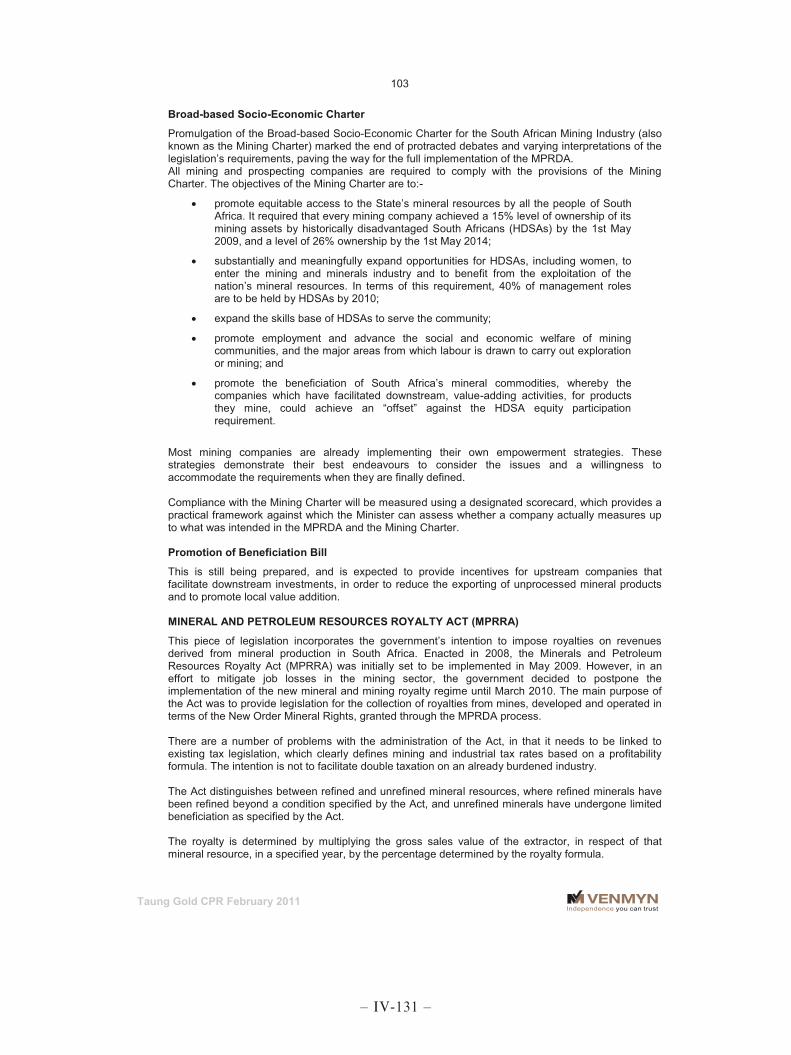
Taung Gold CPR February 2011
103
Broad-based Socio-Economic Charter
Promulgation of the Broad-based Socio-Economic Charter for the South African Mining Industry (also known as the Mining Charter) marked the end of protracted debates and varying interpretations of the legislation’s requirements, paving the way for the full implementation of the MPRDA. All mining and prospecting companies are required to comply with the provisions of the Mining Charter. The objectives of the Mining Charter are to:-
promote equitable access to the State’s mineral resources by all the people of South Africa. It required that every mining company achieved a 15% level of ownership of its mining assets by historically disadvantaged South Africans (HDSAs) by the 1st May 2009, and a level of 26% ownership by the 1st May 2014;
substantially and meaningfully expand opportunities for HDSAs, including women, to enter the mining and minerals industry and to benefit from the exploitation of the nation’s mineral resources. In terms of this requirement, 40% of management roles are to be held by HDSAs by 2010;
expand the skills base of HDSAs to serve the community;
promote employment and advance the social and economic welfare of mining communities, and the major areas from which labour is drawn to carry out exploration or mining; and
promote the beneficiation of South Africa’s mineral commodities, whereby the companies which have facilitated downstream, value-adding activities, for products they mine, could achieve an “offset” against the HDSA equity participation requirement.
Most mining companies are already implementing their own empowerment strategies. These strategies demonstrate their best endeavours to consider the issues and a willingness to accommodate the requirements when they are finally defined. Compliance with the Mining Charter will be measured using a designated scorecard, which provides a practical framework against which the Minister can assess whether a company actually measures up to what was intended in the MPRDA and the Mining Charter. Promotion of Beneficiation Bill
This is still being prepared, and is expected to provide incentives for upstream companies that facilitate downstream investments, in order to reduce the exporting of unprocessed mineral products and to promote local value addition. MINERAL AND PETROLEUM RESOURCES ROYALTY ACT (MPRRA)
This piece of legislation incorporates the government’s intention to impose royalties on revenues derived from mineral production in South Africa. Enacted in 2008, the Minerals and Petroleum Resources Royalty Act (MPRRA) was initially set to be implemented in May 2009. However, in an effort to mitigate job losses in the mining sector, the government decided to postpone the implementation of the new mineral and mining royalty regime until March 2010. The main purpose of the Act was to provide legislation for the collection of royalties from mines, developed and operated in terms of the New Order Mineral Rights, granted through the MPRDA process. There are a number of problems with the administration of the Act, in that it needs to be linked to existing tax legislation, which clearly defines mining and industrial tax rates based on a profitability formula. The intention is not to facilitate double taxation on an already burdened industry. The Act distinguishes between refined and unrefined mineral resources, where refined minerals have been refined beyond a condition specified by the Act, and unrefined minerals have undergone limited beneficiation as specified by the Act. The royalty is determined by multiplying the gross sales value of the extractor, in respect of that mineral resource, in a specified year, by the percentage determined by the royalty formula.
– IV-131 –

Taung Gold CPR February 2011
104
Both direct operating expenditure (Opex) and capital expenditure (Capex) incurred is deductable for the determination of earnings before interest and tax (EBIT). The quantum of the revenue royalty on all minerals is dependent on the profitability of the company based on the following formula. For Refined Mineral Resources the formula is:-
Royalty Rate = 0.5 + EBIT X 100 Gross Sales (refined) x 12.5
The maximum percentage for Refined Mineral Resources is 5%. For Unrefined Mineral Resources the formula is:-
Royalty Rate = 0.5 + EBIT X 100 Gross Sales (unrefined) x 9
The maximum percentage for Unrefined Mineral Resources is 7%. The EBIT in the above formula shall be zero before the cumulative cashflow of the projects becomes positive. Capex incurred is deductable for the determination of EBIT, as stated above. TAXATION
In addition to the Royalty payment detailed above, the Evander and Jeanette projects will be subject to corporate taxation. The corporate tax rate applicable to the Evander and Jeanette projects is based on a formula as discussed below and will apply when the cumulative cash flow of the projects becomes positive. Gold mining companies are taxed according to a formula, as shown in the table below, and such companies may elect whether to pay Secondary Tax on Companies (STC) separately. For companies that elect to pay STC separately, STC is only payable if dividends are declared. If no dividends are declared, no STC is payable.
COMPANIES ELECTING TO PAY STC SEPARATELY
COMPANIES ELECTING TO NOT PAY STC SEPARATELY
Y=34-(170/X) Y=43-(215/X) Y=% tax rate X=ratio expressed as a percentage which the taxable income from gold mining bears to the total turnover from gold mining
GENERAL ENVIRONMENTAL PERMITTING AND STANDARDS
Key environmental legislation, applicable in South Africa, is as follows:-
National Environmental Management Act (107 of 1998) (‘NEMA’) as regulated by the Department of Environmental Affairs and Tourism (‘DEAT’) and relevant Provincial Departments of Environment;
MPRDA as regulated by the DMR. The MPRDA replaces the Minerals Act, 1991 and makes provision for equitable access to, and sustainable development of, South Africa’s mineral and petroleum resources.
Regulations under the MPRDA set out the procedures for undertaking EIA’s;
The MPRDA also requires a Social and Labour Plan (‘SLP’), a mine works plan (‘MWP’), proof of technical and financial competence as well as an approved Environmental Management Plan (‘EMP’); and
Mine Health and Safety Act (Act 29 of 1996) as regulated by the DMR. This Act deals with the protection of the health and safety of persons in the mining industry but also has implications for environmental issues related to environmental health monitoring within mines.
Additional relevant legislation includes the following:-
– IV-132 –

Taung Gold CPR February 2011
105
National Water Act (36 of 1998) (‘NWA’) as regulated by the Department of Water Affairs (‘DWA’);
Atmospheric Pollution Prevention Act (45 of 1965) (‘APPA’) as regulated by DEAT;
Environment Conservation Act (73 of 1989) (‘ECA’) as regulated by the DEAT, DWAE and relevant Provincial Departments;
National Heritage Resources Act (25 of 1999) as regulated by South African Heritage Resource Agency (‘SAHRA‘) or relevant Provincial Departments where established;
Hazardous Substances Act (15 of 1973) as regulated by the Department of Health;
Forest Act (84 of 1998), Provincial Nature Conservation Acts and other Ordinances as regulated by Provincial conservation authorities; and
National Nuclear Regulatory Act of 1999 as regulated by the National Nuclear Regulator (‘NNR‘). This legislation has been replaced by the Certificate of Registration (‘COR’) system.
Environmental Legislation with Respect to Evander
Environmental liability provisioning in the South African mining industry is a requirement of the MPRDA and must be agreed with the relevant regulatory authorities (mainly the DMR and the DWAE). For existing mines such as the Evander operations, funds are accrued based on the estimated environmental rehabilitation costs, should the mine have to close and over the operating LoM. Contributions are made to an environmental trust fund, which are approved by the South African Revenue Service. The EMPR includes a detailed ‘Environmental Closure Assessment’ detailing all areas of environmental liability. It is understood that Evander Gold Mines Limited and therefore any Joint Venture or company resulting from such agreement, will ensure that the Rehabilitation Trust Fund is funded to cover the total environmental liability on closure of operations. The mining infrastructure in the immediate area surrounding the Evander Gold Mines Shafts, including Evander Six Shaft, is well established. Impacts due to new infrastructure planned will be assessed in detail at the PFS and BFS stage. Safety, Health, Environment and Community Aspects
Safety, Health, Environment and Community (‘SHEC’) aspects of the Evander project have not been evaluated or reviewed at the level of study to date, apart from the conclusion in the Scoping Study which predicts that the project will have the same safety and health concerns as the remainder of the mining industry in South Africa. The safety, community and health issues, yet to be formally identified for Evander, will be in accordance with the legal framework controlled by the DMR and the mine will adhere to all legal requirements stipulated in the appropriate Acts and Regulations as promulgated from time to time. The mine will be compelled to comply with the EMPR developed and approved for the project. The Social and Labour Plan (‘SLP’) will be developed for approval by the DMR and the mine will be compelled to comply with the outcomes detailed in the SLP during the operation. There are no significant relocation issues associated with the Six Shaft Project area. Taung is unaware of any negative environmental factors relating to the Evander properties Seismicity is not a threat to the project. The Evander project does not have a history of seismic events because it is located in the middle of the Kaapvaal Craton. Seismicity is limited to localised events associated with mining operations and has been evaluated as part of the geo-technical study. Other Environmental Legal Requirements
The Evander Project is a brown field’s site located near a number of similar mining sites in a heavily industrialised region with a strong gold and coal mining culture. A detailed environmental update study
– IV-133 –

Taung Gold CPR February 2011
106
will be required prior to development of the project site. The objectives of the environmental study will be to:-
identify the issues associated with the Evander Project, which are most likely to affect the biophysical and socio-economic aspects of the surrounding environment;
conduct a review of the applicable environmental legislation; and
determine and document the aspects of the project, which will require further detailed investigation.
In order to meet the objectives the following activities will need to be undertaken:-
site visits;
review of existing information;
review of the applicable legislation;
compilation of a Scoping Report according to the requirements of the MPRDA;
brief description of the environmental setting;
envisaged impacts on the environmental aspects of concern;
nature and extent of proposed specialist investigations; and
outline of the environmental processes and authorisations applicable to the Evander Project.
The environmental impact of the Evander project, both positive and negative, are to be addressed in the EMPR and the specific requirements to prevent unnecessary environmental degradation are to be included in these documents. The process is to be conducted in an open and transparent manner to ensure that all aspects and issues of concern are taken into account. No public participation meetings with the Interested and Affected Parties (‘IAP’) have been held at this stage of the project but will form an integral part of the PFS and BFS stages.
Ground Water Removal
The removal of ground water as the dewatering of the lower workings of the mine unlikely to result in the lowering of the water table in the immediate vicinity of the mine as the neighbouring EGM are currently dewatering. The neighbouring operations of Evander No 2 shaft and Evander No 5 shaft are to be closed down within the near future. The impact of the cessation of pumping from these shafts is to be investigated during the next phase of the Six Shaft project. No impact has been factored into the current financial model. Rehabilitation Fund
The potential funding of the requirements for the Mine’s Rehabilitation Fund has not been taken into account as a separate cost element within the current working cost model but is included in the administration and overheads provision of USD10.5/t milled. The rehabilitation fund may also be assisted with financing from the sale of assets at the end of the LoM and any gold recovered from plant clean up. Current Environmental Concerns
There are no current environmental concerns on the property apart from water disposal to Leeupan. The impact of the additional water on the pan remains to be investigated. No significant agricultural activities are practiced on the property. Cyanide Management
The International Cyanide Management Institute (‘ICMI’) guidelines for cyanide management require that cyanide be destroyed prior to disposal to storage facilities. The Weak Acid Dissociable (‘WAD’) cyanide content of water to be discharged is to be less than 0.5ppm, which can be achieved by the
– IV-134 –

Taung Gold CPR February 2011
107
use of improved technology cyanide destruction techniques. This technology will be included in the processing plant and tailings storage facility (‘TSF’) design at Six Shaft. Waste Rock Dump
A waste rock dump facility will be required with a capacity of 11.4Mt waste rock on a footprint of 30ha to 50ha, at a height of 30m. Such an area has previously been used at No 6 Shaft and this facility will be reinstated A smaller facility could be feasible if an agreement can be successfully arranged with a local producer of aggregate. Infrastructure
The disturbed surface area available will be adequate for the infrastructure required for the mine operation, the gold plant and the tailings dam. Environmental Legislation with Respect to Jeanette
Regulatory Framework, Safety. Health, Environment and Community Aspects
The information pertaining to SHEC aspects are the same for the Jeanette project as those discussed above for the Evander project. Other Environmental Legal Requirements
A detailed environmental update study will be required prior to work commencing on the project site. The objectives of the environmental study will be to:-
identify the issues associated with the Jeanette Project, which are most likely to affect the biophysical and socio-economic aspects of the surrounding environment;
conduct a review of the applicable environmental legislation; and
determine and document the aspects of the project, which will require further detailed investigation.
In order to meet the objectives the following activities will need to be undertaken:-
site visits;
review of existing information;
review of the applicable legislation;
compilation of a Scoping Report according to the requirements of the Minerals and Petroleum Resources Development Act;
compile a brief description of the environmental setting;
document the envisaged impacts on the environmental aspects of concern;
document the nature and extent of proposed specialist investigations; and
create an outline of the environmental processes and authorisations applicable to the Jeanette Project.
The environmental consequences of the proposed project, both positive and negative, are to be addressed in the EIA/EMPR. The specific requirements, which must be implemented, to prevent unnecessary environmental degradation, whilst promoting economical and social upliftment are to be included in these documents. The process is to be conducted in an open and transparent manner to ensure that all aspects and issues of concern are taken into account. No public participation meetings with the Interested and Affected Parties (IAP) have been held at this stage but will commence with the initiation of a Feasibility Study,whilst the engineering design is progressing and before activities have commenced on site. In addition to compliance with host country laws the SEIA should, if international funding is contemplated, be in compliance with the:-
– IV-135 –

Taung Gold CPR February 2011
108
International Finance Corporations (IFC) Performance Standards on Environmental and Social Sustainability (30 April, 2006);
the IFCs Mining-Specific Environmental, Health and Safety (EHS) Guidelines which include the environmental guidelines contained in Part III of the World Bank’s Pollution Prevention and Abatement Handbook (PPAH, 1 July 1998); and
a series of environmental, health and safety guidelines published on the IFC website.
The construction permit is contained within the execution of a Mining Right for the project. Once the Right has been executed, construction may start. Application for a mining right is typically started once the PFS has been completed and the financial viability of the project has been established. A mining right is usually granted within a year of application, execution of the granting may require a few extra months. Environmental and Community Issues
Applicants for a mining right in South Africa are required to conduct an EIA and submit an EMPR, whilst applicants for a PR, mining permit or reconnaissance permit have to submit an EMP. Prospecting and mining rights only become effective under the MPRDA on the date that the corresponding EMP has been approved. The Jeanette EMP was approved by the DMR on 24th April 2008 and a revised EMP was submitted to the DMR on 16th February 2010. There are no existing negative environmental issues relating to the Jeanette properties to the knowledge of Taung. Mining Right applicants also have to submit a Social and Labour Plan (‘SLP’) for the LoM which includes details such as the expected labour utilisation, training protocols, and re-skilling programmes. Requirements for financial provision for the remediation of environmental damage, as well as for the issuing of a closure certificate, are included in the MPRDA and include the requirement that financial provision must be in place before approval of the EMP. An application for a closure certificate now becomes compulsory upon lapsing of the right or cessation of activities. The surface rights at Jeanette are held by numerous parties and Taung and associated companies do not hold any surface rights in this area. Taung will be the custodian responsible for all aspects of the EMP and for all specifics as set out in the EMP for the properties that form part of the Jeanette prospects.
– IV-136 –

Taung Gold CPR February 2011
109
Note 4 : Global Gold Market
Gold is produced in numerous countries, and for most of the past century until 2006, South Africa was the world's largest gold producer. In March 2010 the South African Chamber of Mines released new statistics that indicate South Africa’s ranking as a global gold producer is now behind China, Australia Russia and the United States. Major reasons cited for the decrease in South African production are declining grades, as well as several mines reaching the end of their lives, combined with high production costs. Both China and Australia operate shallower mines, resulting in significantly cheaper production costs. The gold price has steadily increased over the past 10 years and when the world markets experienced a recession, with consequent decline in commodity prices, the price for gold remained relatively steady. The average price for gold in 2009 was USD972/oz and the average for the first quarter of 2010 was USD1109/oz (World Gold Council 2010). Investment demand for gold bars and coins almost doubled in 2011 to 366t and was driven by dips in prices in January 2011, high global inflation, concern over some European countries credit worthiness and political unrest in northern Africa and Middle East. Global Reserves and Production
The United States Geological Survey (USGS) estimates global gold reserves and global gold production as summarised below:- Estimated Global Gold Reserves - 2011
COUNTRY RESERVES (t) Australia 7,300 South Africa 6,000 Russia 5,000 Chile 3,400 United States 3,000 Indonesia 3,000 Brazil 2,400 Peru 2,000 China 1,900 Uzbekistan 1,700 Ghana 1,400 Mexico 1,400 Papua New Guinea 1,200 Canada 990 Other countries 10,000 WORLD TOTAL 51,000
Source : USGS (2011) Estimated Global Gold Production 2009 - 2010
COUNTRY 2009 (t Au) 2010 (t Au) China 320 345 Australia 222 255 United States 223 230 Russia 191 190 South Africa 198 190 Peru 182 170 Indonesia 130 120 Ghana 86 100 Canada 97 90 Uzbekistan 90 90 Brazil 60 65 Mexico 51 60 Papua New Guinea 66 60 Chile 41 40 Other countries 490 500 WORLD TOTAL 2,450 2,500
Source: USGS (2011)
– IV-137 –

Taung Gold CPR February 2011
110
Global Supply and Demand
Supply and demand figures for gold in the period 2006 to 2010 are summarised below (World Gold Council and USGS). Global Gold Supply and Demand
2006 (t) 2007 (t) 2008 (t) 2009 (t) 2010 (t) SUPPLY Mine production 2,483 2,473 2,409 2,572 2,659 Official sector sales 365 484 232 41 Old gold scrap 1,133 982 1,316 1,674 1,653 TOTAL SUPPLY 3,981 3,939 3,957 4,287 4,312 DEMAND Jewellery 2,298 2,417 2,193 1,759 2,060 Technology (Industrial & dental) 650 672 696 658 420 Total Fabrication including Jewellery 2,948 3,089 2,889 2,417 2,479 Bar Hoarding 235 236 386 187 713 Producer de-hedging 434 444 352 254 116 Implied net Investment 365 169 330 1,429 916
Official sector purchases 87 TOTAL DEMAND* 3,981 3,939 3,957 4,287 4,312
Source: World Gold Council (WGC), United States Geological Survey (USGS), GFMS Ltd *Computational discrepancies due to idendpendent rounding Primary production from mines still dominates world supply, while other sources include sector sales and old scrap (recycling). Total supply for 2010 amounted to 4,3t and reflects large increases in scarp supply amounting to 40% of the total gold supply. The increase was due to investor fears during the economic crisis and the conversion of jewellery to cash. Mine production fell between 2004 and 2008 but has returned to 2001 levels at 2,659t for 2010. The 2010 demand increase is attributable to the investment demand for gold bars and coins and an improvement in the jewellery trade. Gold Price
The gold spot price trend for gold in the period 1993-2010, is shown in Figure 28. The gold price has been experiencing a steady increase since 2001, with the average price increasing from USD271/oz in 2001 to USD1,200/oz at the end of 2010. The global financial crisis marked a strong upward trend starting in September 2008. In September 2009, gold reached the USD1,000/oz threshold, the primary driver of which was the devaluation of the USD, market concern over the effectiveness of the various financial stimulus packages and fears of inflation increases. The average annualised gold price volatility for the beginning of 2011 was lower than the historical average observed over the past twenty years (WGC 2011). Market Outlook
The outlook for gold will be driven by the uncertainties with respect to the global economy. The concerns over the US and various European economies, political unrest in northern Africa and Asia, and rising interest rates in China and India are driving the current strong investment demand. A growing demand for jewellery in China and India, an increase in European and US investment in gold due to continued economic instability and the threat of another recession, indicates that the demand for gold will continue to be strong. WGC is of the opinion that central banks, especially in emerging markets will continue with gold purchasing programmes. Mine supply will continue to increase in response to demand and the dramatic reduction in global producer hedging.
– IV-138 –

– IV-139 –
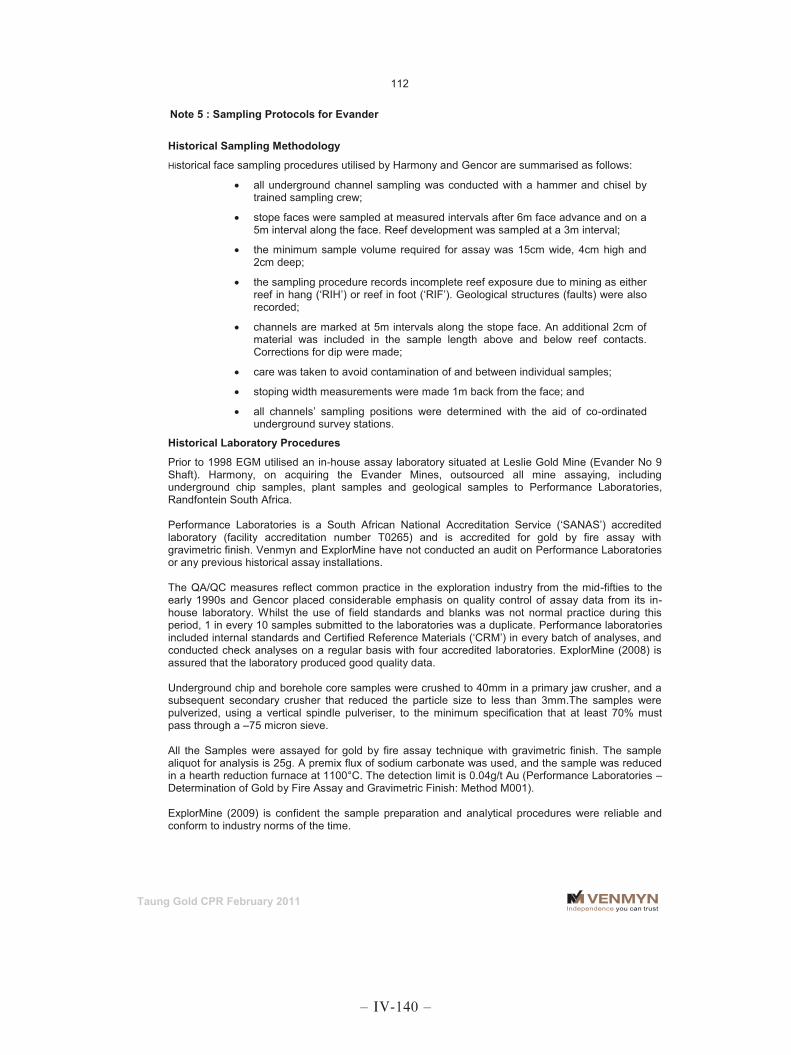
Taung Gold CPR February 2011
112
Note 5 : Sampling Protocols for Evander
Historical Sampling Methodology
Historical face sampling procedures utilised by Harmony and Gencor are summarised as follows:
all underground channel sampling was conducted with a hammer and chisel by trained sampling crew;
stope faces were sampled at measured intervals after 6m face advance and on a 5m interval along the face. Reef development was sampled at a 3m interval;
the minimum sample volume required for assay was 15cm wide, 4cm high and 2cm deep;
the sampling procedure records incomplete reef exposure due to mining as either reef in hang (‘RIH’) or reef in foot (‘RIF’). Geological structures (faults) were also recorded;
channels are marked at 5m intervals along the stope face. An additional 2cm of material was included in the sample length above and below reef contacts. Corrections for dip were made;
care was taken to avoid contamination of and between individual samples;
stoping width measurements were made 1m back from the face; and
all channels’ sampling positions were determined with the aid of co-ordinated underground survey stations.
Historical Laboratory Procedures
Prior to 1998 EGM utilised an in-house assay laboratory situated at Leslie Gold Mine (Evander No 9 Shaft). Harmony, on acquiring the Evander Mines, outsourced all mine assaying, including underground chip samples, plant samples and geological samples to Performance Laboratories, Randfontein South Africa. Performance Laboratories is a South African National Accreditation Service (‘SANAS’) accredited laboratory (facility accreditation number T0265) and is accredited for gold by fire assay with gravimetric finish. Venmyn and ExplorMine have not conducted an audit on Performance Laboratories or any previous historical assay installations. The QA/QC measures reflect common practice in the exploration industry from the mid-fifties to the early 1990s and Gencor placed considerable emphasis on quality control of assay data from its in-house laboratory. Whilst the use of field standards and blanks was not normal practice during this period, 1 in every 10 samples submitted to the laboratories was a duplicate. Performance laboratories included internal standards and Certified Reference Materials (‘CRM’) in every batch of analyses, and conducted check analyses on a regular basis with four accredited laboratories. ExplorMine (2008) is assured that the laboratory produced good quality data. Underground chip and borehole core samples were crushed to 40mm in a primary jaw crusher, and a subsequent secondary crusher that reduced the particle size to less than 3mm.The samples were pulverized, using a vertical spindle pulveriser, to the minimum specification that at least 70% must pass through a –75 micron sieve. All the Samples were assayed for gold by fire assay technique with gravimetric finish. The sample aliquot for analysis is 25g. A premix flux of sodium carbonate was used, and the sample was reduced in a hearth reduction furnace at 1100°C. The detection limit is 0.04g/t Au (Performance Laboratories – Determination of Gold by Fire Assay and Gravimetric Finish: Method M001). ExplorMine (2009) is confident the sample preparation and analytical procedures were reliable and conform to industry norms of the time.
– IV-140 –

Taung Gold CPR February 2011
113
Note 6 : Production Schedule for Evander
Fast-tracking the Production start-up date
There exists an opportunity, within the first phase of the project implementation, to fast-track the production start-up date of January 2016 by a number of years if the dewatering and re-equipping of the existing No 6 Shaft infrastructure is started sooner. Two possible scenarios exist in this regard;-
Scenario 1 – the dewatering commences immediately upon the successful completion of the PFS, this scenario will result in the production start-up date moving forward by two years to 2014; and
Scenario 2 – the dewatering commences immediately, that is before the successful completion of the PFS; this scenario will result in the production start-up date moving forward by four years to 2012.
The estimated capital expenditure to bring the mine into production, (excluding the consultants costs and surface drilling), was estimated by Turnberry to be in the order of USD137,000.
– IV-141 –

Taun
g G
old
CPR
Feb
ruar
y 20
11
114
Tabl
e 52
: Ev
ande
r Pro
ject
Sch
edul
e
PRO
JEC
T AC
TIVI
TY
2011
20
12
2013
20
14
2015
20
16
2017
>2
018
H1
H2
H1
H2
H1
H2
H1
H2
H1
H2
H1
H2
H1
H2
Con
duct
Pre
-Fea
sibi
lity
Stu
dy
Eva
luat
e P
re-F
easi
bilit
y S
tudy
C
ondu
ct D
efin
itive
Fea
sibi
lity
Stu
dy
Rev
iew
BFS
P
roje
ct F
inan
cing
P
RO
JEC
T A
CTI
VIT
IES
ON
SIT
E
App
oint
Sin
king
Con
tract
or
Pur
chas
e S
urfa
ce W
inde
rs
Inst
all T
empo
rary
Win
ders
P
repa
re to
dew
ater
the
min
e
D
ewat
er th
e m
ine
Intro
duce
saf
ety
mea
sure
s to
initi
ate
sink
ing
MIN
E P
RO
DU
CTI
ON
N
o 6
Sha
ft U
pper
Tw
istd
raai
Upp
er
Dee
peni
ng e
xist
ing
Ven
tilat
ion
Sha
ft
S
inki
ng N
o 6
Sub
-Ver
tical
Sha
fts
Sin
king
Tw
istd
raai
Dec
line
Sha
fts*
*Tot
al o
re b
ody
incl
udin
g bo
th In
dica
ted
and
Infe
rred
Min
eral
Res
ourc
es c
ase.
Not
app
licab
le fo
r Ind
icat
ed M
iner
al R
esou
rces
onl
y ca
se.
– IV-142 –
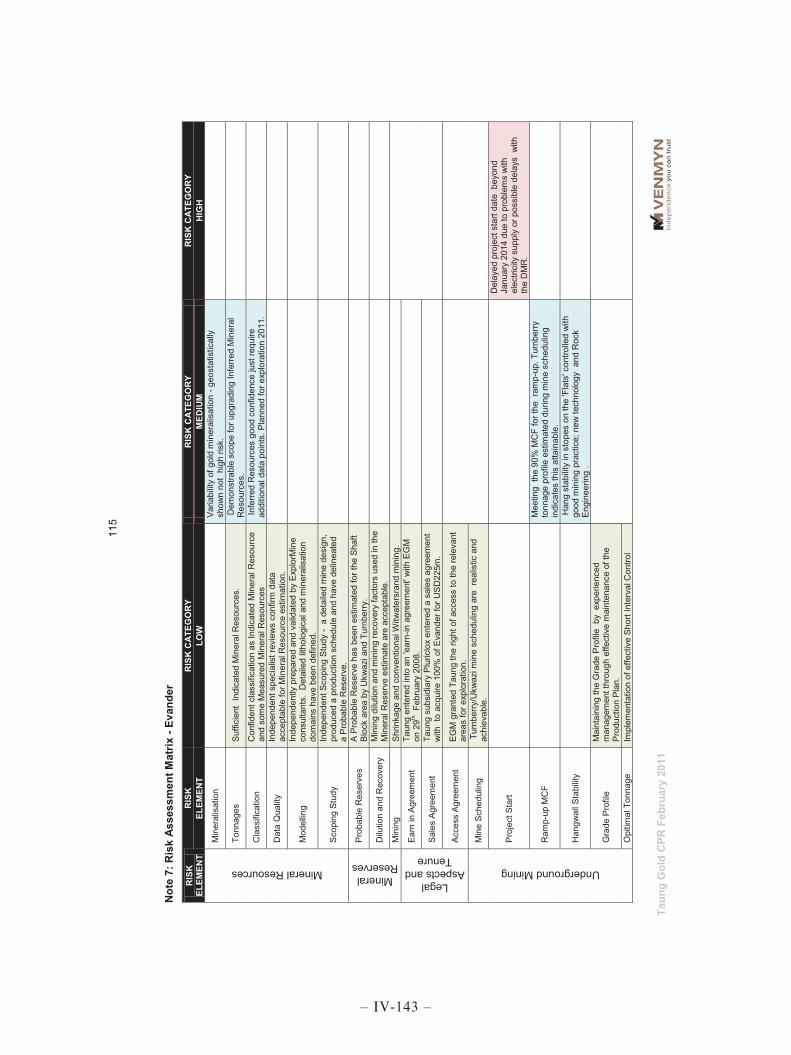
Taun
g G
old
CPR
Feb
ruar
y 20
11
115
Not
e 7:
Ris
k A
sses
smen
t Mat
rix -
Evan
der
RIS
K
ELEM
ENT
RIS
K
RIS
K C
ATEG
OR
Y R
ISK
CAT
EGO
RY
RIS
K C
ATEG
OR
Y EL
EMEN
T LO
W
MED
IUM
H
IGH
Mineral Resources
Min
eral
isat
ion
V
aria
bilit
y of
gol
d m
iner
alis
atio
n - g
eost
atis
tical
ly
show
n no
t hi
gh ri
sk.
Tonn
ages
S
uffic
ient
Ind
icat
ed M
iner
al R
esou
rces
. D
emon
stra
ble
scop
e fo
r upg
radi
ng In
ferre
d M
iner
al
Res
ourc
es.
Cla
ssifi
catio
n C
onfid
ent c
lass
ifica
tion
as In
dica
ted
Min
eral
Res
ourc
e an
d so
me
Mea
sure
d M
iner
al R
esou
rces
In
ferre
d R
esou
rces
goo
d co
nfid
ence
just
requ
ire
addi
tiona
l dat
a po
ints
. Pla
nned
for e
xplo
ratio
n 20
11.
Dat
a Q
ualit
y In
depe
nden
t spe
cial
ist r
evie
ws
conf
irm d
ata
acce
ptab
le fo
r Min
eral
Res
ourc
e es
timat
ion.
Mod
ellin
g In
depe
nden
tly p
repa
red
and
valid
ated
by
Exp
lorM
ine
cons
ulta
nts.
Det
aile
d lit
holo
gica
l and
min
eral
isat
ion
dom
ains
hav
e be
en d
efin
ed.
Sco
ping
Stu
dy
Inde
pend
ent S
copi
ng S
tudy
- a
det
aile
d m
ine
desi
gn,
prod
uced
a p
rodu
ctio
n sc
hedu
le a
nd h
ave
delin
eate
d a
Pro
babl
e R
eser
ve.
Mineral Reserves
Pro
babl
e R
eser
ves
A P
roba
ble
Res
erve
has
bee
n es
timat
ed fo
r the
Sha
ft B
lock
are
a by
Ukw
azi a
nd T
urnb
erry
.
Dilu
tion
and
Rec
over
y M
inin
g di
lutio
n an
d m
inin
g re
cove
ry fa
ctor
s us
ed in
the
Min
eral
Res
erve
est
imat
e ar
e ac
cept
able
.
M
inin
g S
hrin
kage
and
con
vent
iona
l Witw
ater
sran
d m
inin
g.
Legal Aspects and
Tenure
Ear
n in
Agr
eem
ent
Taun
g en
tere
d in
to a
n 'e
arn-
in a
gree
men
t' w
ith E
GM
on
29th
Feb
ruar
y 20
08.
Sal
es A
gree
men
t Ta
ung
subs
idia
ry P
luric
lox
ente
red
a sa
les
agre
emen
t w
ith t
o ac
quire
100
% o
f Eva
nder
for U
SD
225m
.
Acc
ess
Agr
eem
ent
EG
M g
rant
ed T
aung
the
right
of a
cces
s to
the
rele
vant
ar
eas
for e
xplo
ratio
n.
Underground Mining
Min
e S
ched
ulin
g T
urnb
erry
/Ukw
azi m
ine
sche
dulin
g ar
e re
alis
tic a
nd
achi
evab
le.
Pro
ject
Sta
rt
Del
ayed
pro
ject
sta
rt da
te b
eyon
d Ja
nuar
y 20
14 d
ue to
pro
blem
s w
ith
elec
trici
ty s
uppl
y or
pos
sibl
e de
lays
with
th
e D
MR
.
Ram
p-up
MC
F
Mee
ting
the
90%
MC
F fo
r the
ram
p-up
. Tur
nber
ry
tonn
age
prof
ile e
stim
ated
dur
ing
min
e sc
hedu
ling
indi
cate
s th
is a
ttain
able
.
Han
gwal
l Sta
bilit
y
Han
g st
abilit
y in
sto
pes
on th
e 'F
lats
' con
trolle
d w
ith
good
min
ing
prac
tice;
new
tech
nolo
gy a
nd R
ock
Eng
inee
ring
.
Gra
de P
rofil
e M
aint
aini
ng th
e G
rade
Pro
file
by
exp
erie
nced
m
anag
emen
t thr
ough
effe
ctiv
e m
aint
enan
ce o
f the
P
rodu
ctio
n P
lan.
O
pitim
al T
onna
ge
Impl
emen
tatio
n of
effe
ctiv
e S
hort
Inte
rval
Con
trol
– IV-143 –

Taun
g G
old
CPR
Feb
ruar
y 20
11
116
RIS
K
ELEM
ENT
RIS
K
RIS
K C
ATEG
OR
Y R
ISK
CAT
EGO
RY
RIS
K C
ATEG
OR
Y EL
EMEN
T LO
W
MED
IUM
H
IGH
E
xtra
ctio
n m
easu
res.
Ore
Dilu
tion
Man
agin
g th
e ha
ngin
g-w
all c
ut a
bove
the
reef
cha
nnel
by
impl
emen
ting
the
Rec
omm
ende
d G
eolo
gica
l Fac
e W
idth
Con
trol (
'RG
FC').
Human Resource
Labo
ur S
uppl
y A
vaila
bilit
y of
ski
lled
labo
ur
A
IDS
risk
with
the
impa
ct o
n th
e w
orkf
orce
. S
LP
SLP
app
rove
d by
DM
R
Gov
ernm
ent
Nat
iona
l, P
rovi
ncia
l and
loca
l gov
ernm
ent a
utho
ritie
s su
ppor
tive
of th
e pr
ojec
t.
Geology and Geo-Hydrology
Stru
ctur
e
Inte
rpre
tatio
n of
reef
blo
cks
mus
t be
bas
ed o
n so
und
expl
orat
ion
prog
ram
me
from
prim
ary
acce
ss
deve
lopm
ent t
o up
grad
e th
e st
ruct
ure
mod
el a
nd
conf
iden
ce.
Gra
de E
valu
atio
n
Sou
nd g
eost
atis
tical
eva
luat
ion
of e
xist
ing
data
. Fu
ture
dat
a w
ill h
ave
to b
e m
anag
ed in
the
sam
e m
anne
r.
Blo
ck F
acto
r
The
Blo
ck F
acto
r of 1
00%
not
bei
ng a
chie
ved
due
to
over
valu
atio
n of
the
drilli
ng re
sults
may
pos
e a
risk.
S
ound
geo
stat
istic
al a
pplic
atio
ns n
eed
to b
e im
plem
ente
d to
elim
inat
e th
is ri
sk.
M
iner
alog
y
Min
eral
ogic
al e
valu
atio
n w
ill be
don
e du
ring
the
PFS
.
Geo
-hyd
rolo
gica
l
Ris
k as
soci
ated
with
gro
und-
wat
er in
flow
s fro
m
fissu
res
and
othe
r sou
rces
. Pum
ping
acc
ount
ed fo
r in
min
e de
sign
.
Ore Processing
His
toric
al P
roce
ssin
g
The
proj
ect i
s ad
jace
nt to
a p
rodu
cing
min
e w
hich
has
tre
ated
sim
ilar o
re fo
r the
last
dec
ades
in a
co
nven
tiona
l CIP
/CIL
pla
nt w
ith a
ccep
tabl
e go
ld
reco
verie
s.
The
No
6 S
haft
ore
has
prev
ious
ly b
een
min
ed a
nd
treat
ed in
the
sam
e pl
ant w
ith g
ood
succ
ess.
Th
ere
is v
ery
little
car
bon
pres
ent i
n th
e or
e bo
dy
whi
ch c
ould
adv
erse
ly a
ffect
gol
d re
cove
ries.
Met
allu
rgic
al te
st w
ork
has
not b
een
cond
ucte
d , a
go
od d
atab
ase
of g
old
reco
verie
s is
ava
ilabl
e.
Infrastructure and Services
Esk
om S
uppl
y P
ara-
stat
al
is p
rese
ntly
incr
easi
ng it
s ge
nera
ting
pow
er c
apac
ity to
mat
ch d
eman
d. In
terru
pted
sup
ply
a ris
k un
til 2
015.
Taun
g ha
s pl
anne
d ac
cord
ingl
y.
Wat
er S
uppl
y Lo
w ri
sk fa
ctor
. The
bul
k of
the
wat
er w
ill b
e pr
ovid
ed
by th
e lo
cal a
utho
ritie
s, w
ith th
e re
mai
nder
bei
ng
unde
rgro
und
sour
ces
from
adj
acen
t min
es.
Acc
ess
Acc
ess
to th
e si
te is
via
tarre
d ro
ads
linke
d to
the
natio
nal g
rid. N
o co
nstra
ints
in te
rms
of lo
gist
ics
are
antic
ipat
ed.
– IV-144 –

Taun
g G
old
CPR
Feb
ruar
y 20
11
117
RIS
K
ELEM
ENT
RIS
K
RIS
K C
ATEG
OR
Y R
ISK
CAT
EGO
RY
RIS
K C
ATEG
OR
Y EL
EMEN
T LO
W
MED
IUM
H
IGH
Environmental S
urfa
ce W
ater
C
onta
min
atio
n
Exc
ess
tailin
gs d
ecan
t or t
ailin
gs s
eepa
ge ri
sk lo
w a
nd
the
pote
ntia
l im
pact
is re
duce
d du
e to
the
vario
us
desi
gn e
lem
ents
and
pro
pose
d in
frast
ruct
ure
layo
uts.
CIP
/CIL
Pla
nt
Envi
ronm
enta
l ris
k ar
e co
nsid
ered
to b
e re
lativ
ely
low
as
ther
e ar
e su
ffici
ent s
afeg
uard
s in
pla
ce in
the
desi
gn to
pre
vent
env
ironm
enta
l thr
eats
.
Capital and Operating
Costs Estimates
Ben
chm
arke
d C
APE
X
The
capi
tal c
osts
est
imat
es p
repa
red
in th
e Sc
opin
g S
tudy
by
Turn
berry
are
bas
ed o
n th
e in
form
atio
n an
d pr
ices
in
Sou
th A
frica
to b
e re
vise
d in
the
PFS.
Ben
chm
arke
d O
PE
X
Bas
ed o
n th
e cu
rrent
wor
king
cos
ts a
s at
Apr
il 20
10 fo
r co
mpa
rabe
l pro
ject
s. T
here
is a
n in
flatio
nary
risk
as
soci
ated
with
this
pro
ject
.
Country Political
Risk
Gov
ernm
ent
Reg
ulat
ions
Loca
l, re
gion
al a
nd n
atio
nal r
egul
ator
y ag
enci
es
supp
ort f
or th
e pr
ojec
t. G
over
nmen
t app
rova
ls,
acce
ss to
land
, ha
ve b
een
succ
essf
ully
obt
aine
d.
The
follo
win
g ite
ms
shou
ld b
e no
ted:
- Po
litic
al R
isk
and
Min
ing
Cha
rter,
Roy
alty
Bill,
'U
se it
or L
ose
it'
philo
soph
y/le
gisl
atio
n of
the
DM
R.
– IV-145 –

Taung Gold CPR February 2011
118
Note 8 : Surface Rights Owners of Jeanette and Hilton
The surface rights owners on the Jeanette project area:
FARM NAME AND NUMBER PORTION OWNER ADDRESS
Philadelphia 273 RE GH Jansen van Vuuren Farm Hilton, Odendaalsrus, 9480 PO Box 10, Odendaalsrus, 9480
My Betty 351 The farm Hester AG Jansen van Vuuren Farm Hilton, Odendaalsrus, 9480 PO Box 10, Odendaalsrus, 9480
Wesselsrust 58 RE LP Steyn & Seun (Pty) Ltd c/o GH Jansen van Vuuren
Farm Hilton, Odendaalsrus, 9480 PO Box 10, Odendaalsrus, 9480
Wesselsrust 58 Portion 1 Transnet Ltd c/o Willie de Beer 35 th Floor, Carlton Centre, 150 Commissioner Street, JHB. PO Box 99-106 JOHANNESBURG, 2001
Vriendskap 234 The farm Uysmar Trust IT 1438/98 To be determined Martina 226 The farm Uysmar Trust IT 1438/98 To be determined
Roodepoort 235 RE, 1 Bob Moolman Trust c/o Mrs. M van Heerden, PO Box 1080, Odendaalsrus. Farm de Erf, Odendaalsrus
De Erf 140 RE Bob Moolman Trust c/o Mrs. M van Heerden, PO Box 1080, Odendaalsrus. Farm de Erf, Odendaalsrus
De Erf 140 Portion 3 Goudveld Water 49 Malan Str, Hartswater. Rustoord 33 RE Wilhelmus H van Zyl 10 Janeke Str, Wesselsbron 9680 Heldenmoet 117 RE Wilhelmus H van Zyl 10 Janeke Str, Wesselsbron 9680 Heldenmoet 117 Portion 3 Matjhabeng Local Municipality Civic Centre, Welkom Zoeten Inval 268 RE Roelof Adriaan Buitendag PO Box 250, Odendaalsrus, 9480 Goudrand 272 The farm Jacobus M Joubert 58 Voortrekker Ave, Odendaalsrus. Paardevley 251 RE Nyakallong Farmers Trust Unknown Aanleg 50 RE Nyakallong Farmers Trust Unknown Jeanette 371 RE Nyakallong Farmers Trust Unknown Allanridge 425 RE Matjhabeng Local Municipality Civic Centre Welkom Uitkyk Ptn Matjhabeng Local Municipality Civic Centre Welkom
The surface rights owners on the Hilton project area:
OWNER CONTACT DETAILS FARM / PORTION
Pieter Viljoen Trust Mr Pieter Viljoen
Grootkop 277: Remaining Extent 1 Odendaalsrus Street Odendaalsrus, 9480
Langkuil Trust Mr HJ van Niekerk Snr & Jnr
Grootkop 277: Portion 8 P O Box 1398 Kroonstad, 9499
Michiel Rossouw Familie Trust
SDM Rossouw
Grootkop 277: Portion 10
P O Box 35 Odendaalsrus, 9480 Mr MJ Strydom 30 Badenhorst Street Welkom, 9459 Mr MJ Rossouw P O Box 35 Odendaalsrus, 9480
Mr JCF Taljaard PO Box 372 Zooikraal 101: re, portion 1 Odendaalsrus, 9480
Tweeling Trust PO Box 1082 Zooikraal 101: portion 2 Kroonstad, 9500
Pieter Viljoen Trust 1 Odendaalsrus Street Eerste Geluk 61: re, portion 2 Odendaalsrus, 9480
Chris Geel Familie Trust PO Box 108 Eerste Geluk 61: re 1 Odendaalsrus
Mr GJ Welman PO Box 1 Eerste Geluk 61: portion 3 Odendaalsrus
Mrs ECE Fourie PO Box 25124 Eerste Geluk 61: portion 4 Gezina, 0084
Langkuil Trust PO Box 1398 Vrede 201: farm Kroonstad, 9499
Leerike Trust 10 Badenhorst Street Damspruit 184: farm Welkom, 9459
– IV-146 –

Taung Gold CPR February 2011
119
OWNER CONTACT DETAILS FARM / PORTION
Welverdruk Trust PO Box 2308 Waterpan 263: farm Kroonstad, 9499
AMA Delport 76 Erasmus Street Bruintjieslaagte 243: farm Odendaalsrus Schaapplaats 100: farm PO Box 1080 Stillewoning 283: farm
JCF Taljaard Odendaalsrus Langverwacht 281: portion 1 PO Box 372 Langverwacht 281: re Odendaalsrus
Mrs AMA Delport 76 Erasmus Street Melkkraal 450: farm Odendaalsrus
Mr GH Jansen van Vuuren P O Box 10 Hilton 30: farm Odendaalsrus
AMA Delport 76 Erasmus Street Hilton 449: farm Odendaalsrus
Mr RPJ van Vuuren
P O Box 1241 Emmanuel 433: farm Odendaalsrus c/o Mr MM Vani Langkuil 66: re P O Box 1157K2 Dreyers 445: re Kutlwanong, 9480
– IV-147 –
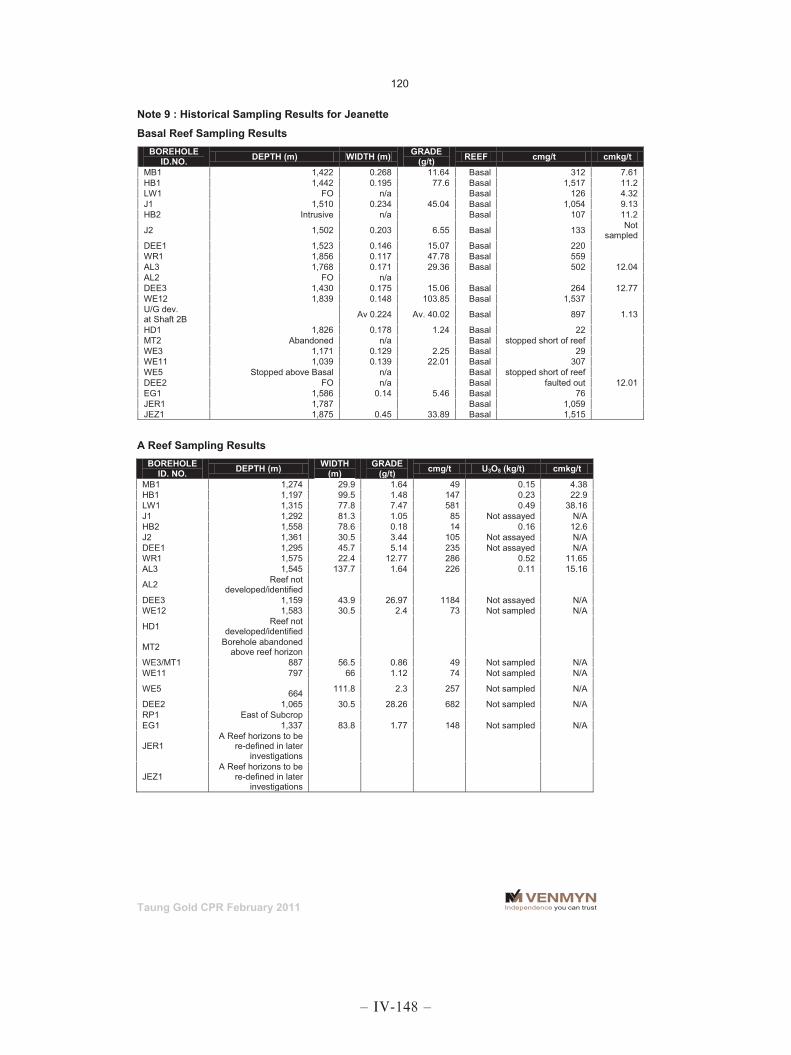
Taung Gold CPR February 2011
120
Note 9 : Historical Sampling Results for Jeanette
Basal Reef Sampling Results BOREHOLE
ID.NO. DEPTH (m) WIDTH (m) GRADE (g/t) REEF cmg/t cmkg/t
MB1 1,422 0.268 11.64 Basal 312 7.61 HB1 1,442 0.195 77.6 Basal 1,517 11.2 LW1 FO n/a Basal 126 4.32 J1 1,510 0.234 45.04 Basal 1,054 9.13 HB2 Intrusive n/a Basal 107 11.2
J2 1,502 0.203 6.55 Basal 133 Not sampled
DEE1 1,523 0.146 15.07 Basal 220 WR1 1,856 0.117 47.78 Basal 559 AL3 1,768 0.171 29.36 Basal 502 12.04 AL2 FO n/a DEE3 1,430 0.175 15.06 Basal 264 12.77 WE12 1,839 0.148 103.85 Basal 1,537 U/G dev. at Shaft 2B Av 0.224 Av. 40.02 Basal 897 1.13
HD1 1,826 0.178 1.24 Basal 22 MT2 Abandoned n/a Basal stopped short of reef WE3 1,171 0.129 2.25 Basal 29 WE11 1,039 0.139 22.01 Basal 307 WE5 Stopped above Basal n/a Basal stopped short of reef DEE2 FO n/a Basal faulted out 12.01 EG1 1,586 0.14 5.46 Basal 76 JER1 1,787 Basal 1,059 JEZ1 1,875 0.45 33.89 Basal 1,515
A Reef Sampling Results BOREHOLE
ID. NO. DEPTH (m) WIDTH (m)
GRADE (g/t) cmg/t U3O8 (kg/t) cmkg/t
MB1 1,274 29.9 1.64 49 0.15 4.38 HB1 1,197 99.5 1.48 147 0.23 22.9 LW1 1,315 77.8 7.47 581 0.49 38.16 J1 1,292 81.3 1.05 85 Not assayed N/A HB2 1,558 78.6 0.18 14 0.16 12.6 J2 1,361 30.5 3.44 105 Not assayed N/A DEE1 1,295 45.7 5.14 235 Not assayed N/A WR1 1,575 22.4 12.77 286 0.52 11.65 AL3 1,545 137.7 1.64 226 0.11 15.16
AL2 Reef not developed/identified
DEE3 1,159 43.9 26.97 1184 Not assayed N/A WE12 1,583 30.5 2.4 73 Not sampled N/A
HD1 Reef not developed/identified
MT2 Borehole abandoned above reef horizon
WE3/MT1 887 56.5 0.86 49 Not sampled N/A WE11 797 66 1.12 74 Not sampled N/A
WE5 664 111.8 2.3 257 Not sampled N/A
DEE2 1,065 30.5 28.26 682 Not sampled N/A RP1 East of Subcrop EG1 1,337 83.8 1.77 148 Not sampled N/A
JER1 A Reef horizons to be
re-defined in later investigations
JEZ1 A Reef horizons to be
re-defined in later investigations
– IV-148 –

Taung Gold CPR February 2011
121
Historical Sampling Results for Big Pebble Reef BOREHOLE
ID.NO. REEF cmg/t U3O8 (kg/t)
AL3 'Big Pebble Conglomerate B' 86 Not assayed DEE2 'Big Pebble Conglomerate B' 444 Not assayed DEE3 'Big Pebble Conglomerate B' 771 Not assayed J2 'Big Pebble Conglomerate B' 78 Not assayed JER1 'Big Pebble Conglomerate B' 194 Not assayed JEZ1A 'Big Pebble Conglomerate B' 922 Not assayed LW1 'Big Pebble Conglomerate B' 717 Not assayed WE3 'Big Pebble Conglomerate B' 1,177 Not assayed WE5 'Big Pebble Conglomerate B' 65 Not assayed WE11 'Big Pebble Conglomerate B' 154 Not assayed WE12 'Big Pebble Conglomerate B' 540 Not assayed
MT2 'Big Pebble Conglomerate B' BH ABANDONED Not assayed
WE3 'Big Pebble Conglomerate B' 1,177 Not assayed
Historical Sampling Results for B Reef BOREHOLE
ID.NO. DEPTH (m) WIDTH (m)
GRADE (g/t) REEF cmg/t U3O8 (kg/t) cmkg/t
AL2 1,564 NA FO 'B' FO Not assayed N/A DEE1 1,353 NA TR 'B' 26 Not assayed N/A DEE2 1,130 0.99 2.95 'B' 292 Not assayed N/A DEE3 1,227 0.12 178.44 'B' 2,177 Not assayed N/A EG1 1,381 0.28 24.19 'B' 675 Not assayed N/A HB1 1,266 1.68 1.46 'B' 245 Not assayed N/A HB2 1,555 0.51 1.07 'B' 55 Not assayed N/A HD1 1,703 0.63 4.8 'B' 305 Not assayed N/A J1 1,363 NA TR 'B' - Not assayed N/A J2 1,433 0.3 TR 'B' TR Not assayed N/A JER1 1,577 0.32 12.73 'B' 405 0.345 10.96 JEZ1A 1,330 0.31 0.77 'B' 24 0.261 5.51 JEZ2 1,659 0.18 18.45 'B' 334 1.517 35.19 LW1 1,352 0.01 TR 'B' TR Not assayed N/A MB1 1,333 0.78 0.96 'B' 75 0.108 8.42 WE3 985 0.01 TR 'B' TR Not assayed N/A WE5 723 0.86 2.81 'B' 243 Not assayed N/A WE11 837 0.94 0.51 'B' 48 Not assayed N/A WE12 1,631 0.15 1.2 'B' 18 Not assayed N/A WT4 1,500 0.76 10.2 'B' 775 Not assayed N/A HB4 1,401 0.34 40.14 'B' 1,389 Not assayed N/A
– IV-149 –

Taung Gold CPR February 2011
122
Note 10 : Sampling Protocols for Due Diligence of the Reefs at Jeanette
Due Diligence procedure for Boreholes at Jeanette
check that borehole intersection end depths concur with logging information, and any discrepancies noted;
check for core continuity, areas of loss recorded on the core, with appropriate written indication and depth check controls;
validation of start and end depths of each reported deflection against logs;
establish contact depths of the main lithological and stratigraphic zone boundaries within the Witwatersrand succession and compare with logged information (if available);
establish positions of main stratigraphic horizons from Leader Reef and Khaki Shale to the Basal Reef;
check of the original sampling of each reef intersection. For instance, the Anglo American sampling standard for the Basal Reef involves the inclusion of 2cm of hangingwall and footwall stratigraphy in the reef sample which should be adhered to; and
if reef horizons have not been sampled in previous campaigns, these are identified but no sampling is carried out unless approval is obtained from Taung staff.
Sampling protocols for the Re-sampling Exercise for the Basal Reef and Kimberley Formation Reefs at Jeanette
check end depths concur with geological log information, where available, but note if not available;
establish contacts of main lithological and stratigraphic zone boundaries and compare with logs (if available);
scan through core to check for core continuity and establish if areas of loss have been reported adequately, with appropriate marking on the resumed area of core and depth check controls;
establish position of main reef horizons from VS5 through to B Reef including Earls Court Marker, preliminary A Reef, B Reef and Spes Bona. Also the Leader Reef and Khaki Shale above the Basal Reef;
check briefly the appropriateness of original sampling of each of these reefs;
if notable reef horizons have not been sampled, mark them out for resampling using bedding low points and lithological boundaries as a guide to cutting, and make a note (for Taung) to follow up on this;
validate start and end depth of each reported deflection against logs, if available;
choose a representative deflection from each borehole where Basal Reef is fully developed with no notable losses near the contact;
decide on a start and depth for sampling (based on the ’2cm’ rule);
mark any full meter on the half core with a permanent marker. Mark the starting depth for sampling on the reverse side of the first piece of core (i.e. on the curved surface);
decide where each sample should start and stop, highlight the breaks in the core with a china marker;
mark the measured sample depth that corresponds to the end of each sample on the top side of the core;
write the sample ticket number roughly midway along the sample on the top side of the core;
– IV-150 –

Taung Gold CPR February 2011
123
place a black cutting mark on the cut surface down the centre of the entire length of core to be sampled, ensuring it aligns exactly parallel to the axis of the core and precisely bisects the core;
transfer the entire piece of half core to a clean separate box ensuring no mix-up occurs;
saw the core exactly down the black line marked on the flat surface of the half core as above;
replace both quarters of cut core back in their original positions in the core tray; ensuring that the piece to be sampled (i.e. the piece without marker labels) lies adjacent to the piece that will remain as a check;
take each piece of core to be sampled from its position in the core tray and place it in a new plastic bag;
take a pre-marked ticket from the ticket book and place 2 tickets in with the core sample;
record in the field book borehole number, deflection, depth from, depth to, stratigraphy, lithology, dip angle, sample ticket number, type of sample (H,R,F, Std, Blank);
remember to start each sequence with a ‘blank’ sample which should bear the first ticket number, followed by the hangingwall sample of core, followed by a standard (in the first batch). The standard should be placed adjacent to the reef sample;
between each reef cut place a blank. Standards should only be placed every 2nd or 3rd reef cut;
the order should be as follows: Blank, HW1,(HW2), Standard, reef-sample 1, Reef sample 2, FW1, FW2, Blank, HW1, HW2, Reef1, Reef2, Standard, FW1, FW2, Blank, Etc.;
the number of hangingwall, footwall and reef samples is variable, depending on reef thickness;
once all the sampling is complete, write the ticket number boldly on the outside of each bag in sequence and seal the bag;
the reef intersection will be photographed initially without marks, and then with all marks prior to cutting and after longitudinal cutting has taken place;
the remaining core is finally returned to its original place in the core tray;
choose a section for resampling;
validate start and end depths against available logs;
start sampling approximately 2cm into the hangingwall of the Basal Quartzite if possible, otherwise along already existing breaks, unless these clearly contravene the standards, i.e. within 2cm of major lithological contacts; and
end sampling approximately 2cm into the footwall of the Basal Reef if possible, otherwise along already existing breaks, unless these clearly contravene the standards, i.e. within 2cm of major lithological contacts.
– IV-151 –

Taung Gold CPR February 2011
124
Note 11 : Re-sampled Intervals and Re-sampling for Basal Reef at Jeanette
Comparison of Re-Sampling Data with original for Basal Reef (TMC 2008c) BORE-HOLE
DEFLEC-TION FROM TO AVER
Au Au U3O8 U3O8 AVE.
ACC.Au AVE.
ACC.U3O8 ORIGINAL
Au ORIGINAL
U3O8 ID NO NO (m) (m) (g/t) (cmg/t) (kg/t) (cmkg/t) (cm.g/t) (cmkg/t) (cmg/t) (cmkg/t) WR1 0 1,821.0 1,821.2 9.22 140.0 256 3.9
140 4 No record No record
WR1 0 1,821.2 1,821.3 0.81 14.0 22 0.4 No record No record WR1 2? - 0.2 39.00 686.0 1,895 33.3 686 33 No record No record WR1 0 1,654.1 1,654.4 0.27 0.3 13 0.3
33 4 No record No record
WR1 0 1,654.4 1,654.6 1.06 3.4 133 3.4 WR1 0 1,654.6 1,654.8 0.63 12.0 <7 Nd WR1 8 1,854.3 1,854.5 27.84 549.0 625 12.3
549 12 570 16 WR1 8 1,854.5 1,854.8 0.09 3.0 9 0.3 HB1 8 1,264.5 1,264.8 4.22 135.0 121 3.9
135 4 244 8 HB1 8 1,264.8 1,265.0 0.07 1.0 <7 Nd HB1 5 1,447.9 1,448.2 17.68 679.0 296 11.4
679 11 700 9 HB1 5 1,448.2 1,448.6 0.16 5.0 <7 Nd HB1 6 1,447.5 1,447.8 4.86 136.0 131 3.7
136 4 90 3 HB1 6 1,447.8 1,448.1 0.19 4.0 <7 Nd MB1 1 1,421.0 1,421.3 0.78 24.0 <7 Nd
211 4 395 7 MB1 1 1,421.3 421.5 7.35 187.0 150 3.8 MB1 1 1,421.5 1,421.8 0.10 3.0 <7 Nd JER1 0 1,767.8 1,768.1 0.88 29.0 254 8.2
874 91 428 35 JER1 0 1,768.1 1,768.5 23.92 846.0 2,354 83.2 JER1 0 1,768.5 1,768.7 0.13 3.0 10 0.2 JER1 6 1,785.8 1,786.1 0.28 8.0 105 3
286 32 No record No record JER1 6 1,786.1 1,786.4 8.06 278.0 835 28.8 JER1 6 1,786.4 1,786.8 0.15 6.0 16 0.6 JER1 23 1,788.9 1,789.2 0.19 6.0 14 0.4
387 43 No record No record JER1 23 1,789.2 1,789.4 13.67 381.0 1,515 42.3 JER1 23 1,789.4 1,789.8 0.07 2.0 <7 Nd HB2 12 1,594.1 1,594.4 0.16 5.0 25 0.8
9 10 19 9 HB2 12 1,594.4 1,594.6 0.18 4.0 375 8.9 HB2 12 1,594.6 1,595.0 0.13 4.0 40 1.3 HB2 18 1,588.8 1,589.2 0.13 5.0 13 0.5
315 11 245 20 HB2 18 1,589.2 1,589.5 8.88 310.0 302 10.6 HB2 18 1,589.5 1,589.9 0.15 5.0 14 0.5
– IV-152 –

Taun
g G
old
CPR
Feb
ruar
y 20
11
125
Com
paris
on o
f the
Re-
sam
plin
g D
ata
with
the
Orig
inal
for t
he K
imbe
rley
Form
atio
n R
eefs
(TM
C 2
009)
BO
RE-
D
EFLE
C-
REE
F FR
OM
TO
AV
ER A
u Au
U
3O8
AVER
.AC
CU
M.
AVER
.AC
CU
M.
OR
IGIN
AL
OR
IGIN
AL
TRU
E H
OLE
TI
ON
Au
U
3O8
Au
U3O
8 W
IDTH
ID
N
O
(m
) (m
) (g
/t)
(cm
g/t)
(cm
g/t)
(cm
g/t)
(cm
g/t)
(cm
g/t)
(cm
g/t)
(cm
) JE
Z2
0 A
1617
.25
1617
.54
0.03
0.
91
24.0
0 3.
14
174
nd
28.9
JE
Z2
0 A
1617
.54
1617
.77
0.65
14
.99
1.70
23
.0
JEZ2
0
A 16
17.7
7 16
18.0
5 0.
30
8.42
1.
44
28.0
JE
Z2
0 A
1618
.05
1618
.31
0.03
0.
84
26
.0
JEZ2
10
A
1594
.62
1595
.01
1.02
39
.92
8.31
73
.00
10.1
5 64
.00
39.0
JE
Z2
10
A 15
95.0
1 15
95.4
0 0.
88
34.2
6 1.
85
39.0
JE
Z2
10
BP
Bot
t 16
16.9
6 16
17.3
4 0.
31
11.8
8 1.
20
29.9
8 1.
89
54.0
0 38
.0
JEZ2
10
B
P B
ott
1617
.34
1617
.91
0.32
18
.10
0.68
57
.0
JEZ2
10
B
1658
.62
1659
.03
0.02
1.
02
1.12
32
.00
5.41
79
7.00
41
.0
JEZ2
10
B
1659
.03
1659
.38
0.92
32
.07
4.29
35
.0
JEZ1
8
A 12
84.7
1 12
84.9
9 4.
46
124.
50
14.6
1 15
8.00
17
.41
133
27.9
JE
Z1
8 A
1284
.99
1285
.36
0.85
31
.61
2.20
37
.0
JEZ1
8
BP
Bot
t 13
15.3
6 13
15.6
1 1.
63
40.7
8 3.
23
666.
00
39.0
0 10
85.0
0
25.0
JE
Z1
8 B
P B
ott
1315
.61
1315
.98
0.74
27
.36
3.59
37
.0
JEZ1
8
BP
Bot
t 13
15.9
8 13
16.2
1 13
.19
295.
27
17.0
8 22
.4
JEZ1
8
BP
Bot
t 13
16.2
1 13
16.4
6 5.
52
137.
26
7.26
24
.9
JEZ1
8
BP
Bot
t 13
16.4
6 13
16.7
2 6.
61
170.
63
7.84
25
.8
JEZ1
8
B 13
37.1
4 13
37.5
3 0.
32
12.3
5 12
.51
12.3
5 12
.51
8.00
39
.0
JER
1 0
A 15
10.7
0 15
11.4
1 2.
76
195.
99
21.8
1 25
3.00
26
.97
226
17
70.9
JE
R1
0 A
1511
.41
1511
.89
1.53
73
.35
5.16
48
.0
JER
1 0
BP
Bot
t 15
36.1
2 15
36.4
9 5.
12
188.
76
7.15
18
7.00
7.
15
179.
00
4.40
36
.9
JER
1 15
B
1576
.55
1576
.87
8.64
27
3.33
9.
36
273.
33
9.36
95
5.00
23
.00
31.6
JE
J1
1 B
P B
ott
1336
.83
1337
.11
0.68
18
.98
1.80
87
.00
5.00
14
1 nd
28
.0
JEJ1
1
BP
Bot
t 13
37.1
1 13
37.5
8 0.
22
10.5
6 1.
38
47.0
JE
J1
1 B
P B
ott
1337
.58
1337
.89
2.72
84
.18
3.48
31
.0
WR
1 0
BP
Bot
t 15
98.0
2 15
98.3
1 1.
30
37.7
5 3.
16
468.
00
20.7
4 nd
nd
28.9
W
R1
0 B
P B
ott
1598
.56
1598
.80
2.88
69
.11
0.19
24
.0
WR
1 0
BP
Bot
t 15
98.8
0 15
99.3
0 3.
66
182.
81
2.28
49
.9
WR
1 0
BP
Bot
t 15
99.3
0 15
99.7
5 1.
51
67.9
6 4.
71
45.0
W
R1
0 B
P B
ott
1599
.75
1600
.12
1.87
69
.14
6.69
37
.0
WR
1 0
BP
Bot
t 16
00.1
2 16
00.5
3 1.
40
57.3
8 3.
71
41.0
W
R1
2 A
1575
.06
1575
.49
10.8
6 45
8.68
21
.48
489.
00
25.9
6 nd
nd
42
.2
WR
1 2
A 15
75.4
9 15
75.8
9 0.
99
39.4
6 4.
48
40.0
H
B1
0?
A 0.
00
0.51
1.
22
61.9
7 6.
41
60.0
0 6.
41
na
na
50.9
H
B1
0?
BP
Bot
t 0.
00
0.33
0.
43
14.1
0 1.
42
123.
00
8.37
nd
nd
33.0
H
B1
0?
BP
Bot
t 0.
33
0.66
1.
00
33.1
0 0.
81
33.0
H
B1
0?
BP
Bot
t 0.
66
1.10
1.
44
63.3
0 1.
70
44.0
H
B1
0?
BP
Bot
t 1.
10
1.52
0.
41
17.1
8 4.
44
42.0
LW
1 2?
B
P B
ott?
13
14.7
8 13
15.2
2 4.
24
185.
96
15.8
3 56
1.00
27
.00
707
39
43.8
LW
1 2?
B
P B
ott?
13
15.2
2 13
15.6
3 10
.01
404.
34
12.9
8
40
.4
– IV-153 –

Taun
g G
old
CPR
Feb
ruar
y 20
11
126
Not
e 12
: R
isk
Ass
essm
ent M
atrix
for J
eane
tte
RIS
K
ELEM
ENT
RIS
K
RIS
K C
ATEG
OR
Y R
ISK
CAT
EGO
RY
RIS
K C
ATEG
OR
Y EL
EMEN
T LO
W
MED
IUM
H
IGH
Mineral Resources
Min
eral
isat
ion
V
aria
bilit
y of
gol
d m
iner
alis
atio
n - g
eost
atis
tical
ly s
how
n no
t hi
gh ri
sk.
Tonn
ages
S
uffic
ient
Ind
icat
ed M
iner
al R
esou
rces
. D
emon
stra
ble
scop
e fo
r upg
radi
ng In
ferre
d M
iner
al
Res
ourc
es.
Cla
ssifi
catio
n C
onfid
ent c
lass
ifica
tion
as In
dica
ted
Min
eral
R
esou
rces
In
ferre
d R
esou
rces
goo
d co
nfid
ence
just
reui
re a
dditi
onal
da
ta p
oint
s. P
lann
ed fo
r exp
lora
tion
2011
.
Dat
a Q
ualit
y In
depe
nden
t spe
cial
ist r
evie
ws
conf
irm d
ata
acce
ptab
le fo
r Min
eral
Res
ourc
e es
timat
ion.
Mod
ellin
g In
depe
nden
tly p
repa
red
and
valid
ated
by
Exp
lorM
ine
cons
ulta
nts.
Det
aile
d lit
holo
gica
l and
min
eral
isat
ion
faci
es d
omai
ns h
ave
been
def
ined
.
Sco
ping
Stu
dy
Inde
pend
ent S
copi
ng S
tudi
es b
y M
inxc
on a
nd S
MS
y -
a
deta
iled
min
e de
sign
, pro
duce
d a
prod
uctio
n sc
hedu
le a
nd h
ave
delin
eate
d a
Prob
able
Res
erve
an
d E
cono
mic
Infe
rred
Min
eral
reso
urce
.
Mineral Reserves
Pro
babl
e R
eser
ves
A P
roba
ble
Res
erve
has
bee
n es
timat
ed.
Dilu
tion
and
Rec
over
y M
inin
g di
lutio
n an
d m
inin
g re
cove
ry fa
ctor
s us
ed in
the
Min
eral
Res
erve
est
imat
e ar
e ac
cept
able
.
Min
ing
Shr
inka
ge a
nd c
onve
ntio
nal W
itwat
ersr
and
min
ing.
U
nder
cutti
ng th
e K
haki
Sha
le im
porta
nt ri
sk. E
ngin
eerin
g re
ports
favo
urab
le a
nd m
inin
g bl
eow
the
shal
e su
cces
sful
ly
unde
rtake
n in
oth
er o
pera
tions
Legal Tenure
Ear
n in
A
gree
men
t Ta
ung
purc
hase
d th
e P
rosp
ectin
g R
ight
from
H
arm
ony
Gol
d. T
aung
has
no
furth
er o
blig
atio
ns.
Underground Mining
Min
e S
ched
ulin
g M
inxc
on m
ine
sche
dulin
gs a
re r
ealis
tic a
nd
achi
evab
le.
Pro
ject
Sta
rt
Del
ayed
pro
ject
sta
rt da
te b
eyon
d Ja
nuar
y 20
14 d
ue to
pro
blem
s w
ith e
lect
ricity
sup
ply
or p
ossi
ble
dela
ys w
ith th
e D
MR
.
Ore
Sto
rage
an
d C
onve
yor
syst
em
Ope
ratin
g a
conv
eyor
sys
tem
ove
r a d
ista
nce
26k
m
requ
ires
good
des
ign
and
man
agem
ent t
o m
aint
ain
pr
oduc
tion
rate
s of
700
tpd.
Effi
cien
cy a
nd p
rodu
ctiv
ity w
ill
be a
dver
sely
affe
cted
unl
ess
suita
ble
stor
age
is a
lway
s av
aila
ble.
Ram
p-up
MC
F
Mee
ting
the
80%
MC
F fo
r the
ram
p-up
. M
inxc
on's
to
nnag
e pr
ofile
est
imat
ed d
urin
g m
ine
sche
dulin
g in
dica
tes
this
atta
inab
le.
Han
gwal
l
Han
g st
abilit
y m
ust c
ontro
lled
with
goo
d m
inin
g pr
actic
e;
– IV-154 –

Taun
g G
old
CPR
Feb
ruar
y 20
11
127
RIS
K
ELEM
ENT
RIS
K
RIS
K C
ATEG
OR
Y R
ISK
CAT
EGO
RY
RIS
K C
ATEG
OR
Y EL
EMEN
T LO
W
MED
IUM
H
IGH
S
tabi
lity
new
tech
nolo
gy a
nd R
ock
Eng
inee
ring
.
Gra
de P
rofil
e M
aint
aini
ng th
e G
rade
Pro
file
by
exp
erie
nced
m
anag
emen
t thr
ough
effe
ctiv
e m
aint
enan
ce o
f the
P
rodu
ctio
n P
lan.
Dev
elop
ing
and
oper
atin
g de
clin
e sy
stem
are
ofte
n le
ss
effic
ient
and
mor
e co
stly
than
hor
izon
tal s
yste
ms.
The
de
clin
e sy
stem
will
rely
on
track
less
veh
icle
s op
erat
ing
at
high
ang
les
over
long
dis
tanc
es.
Opi
timal
To
nnag
e E
xtra
ctio
n
Impl
emen
tatio
n of
effe
ctiv
e S
hort
Inte
rval
Con
trol
mea
sure
s. A
lso
depe
nden
t on
Mai
n an
d N
ew S
haft
airw
ay c
apac
ity a
nd a
new
ven
tilat
ion
shaf
t may
be
requ
ired
if pr
oduc
tion
exce
eds
145k
tpm
.
Ore
Dilu
tion
M
anag
ing
the
hang
ing-
wal
l cut
abo
ve th
e re
ef c
hann
el b
y im
plem
entin
g th
e R
ecom
men
ded
Geo
logi
cal F
ace
Wid
th
Con
trol (
'RG
FC').
Human Resources
Labo
ur S
uppl
y A
vaila
bilit
y of
ski
lled
labo
ur
A
IDS
risk
with
the
impa
ct o
n th
e w
orkf
orce
. S
LP
SLP
app
rove
d by
DM
R
Gov
ernm
ent
Nat
iona
l, P
rovi
ncia
l and
loca
l gov
ernm
ent a
utho
ritie
s su
ppor
tive
of th
e pr
ojec
t.
Geology and Geo-Hydrology
Stru
ctur
e
Inte
rpre
tatio
n of
reef
blo
cks
mus
t be
bas
ed o
n so
und
expl
orat
ion
prog
ram
me
from
prim
ary
acce
ss
deve
lopm
ent t
o up
grad
e th
e st
ruct
ure
mod
el a
nd
conf
iden
ce. R
isk
miti
gate
d by
3D
sei
smic
sur
vey.
Gra
de
Eva
luat
ion
Sou
nd g
eost
atis
tical
eva
luat
ion
of e
xist
ing
data
. Fu
ture
dat
a w
ill ha
ve to
be
man
aged
in th
e sa
me
man
ner.
Blo
ck F
acto
r
The
Blo
ck F
acto
r of 1
00%
not
bei
ng a
chie
ved
due
to
over
valu
atio
n of
the
drilli
ng re
sults
may
pos
e a
risk.
Sou
nd
geos
tatis
tical
app
licat
ions
nee
d to
be
impl
emen
ted
to
elim
inat
e th
is ri
sk.
Min
eral
ogy
M
iner
alog
ical
eva
luat
ion
will
be d
one
durin
g th
e P
FS.
G
eo-
hydr
olog
ical
Ris
k as
soci
ated
with
gro
und-
wat
er in
flow
s fro
m fi
ssur
es
and
othe
r sou
rces
. Pum
ping
acc
ount
ed fo
r in
min
e de
sign
.
Ore Processing
His
toric
al
Pro
cess
ing
The
proj
ect i
s ad
jace
nt to
a p
rodu
cing
min
e w
hich
has
tre
ated
sim
ilar o
re fo
r the
last
dec
ades
in a
co
nven
tiona
l CIP
/CIL
pla
nt w
ith a
ccep
tabl
e go
ld
reco
verie
s.
The
Bas
al R
eef h
as p
revi
ousl
y be
en m
ined
and
tre
ated
in th
e ad
jace
nt m
ine
plan
t with
goo
d su
cces
s.
Th
ere
is s
ome
carb
on p
rese
nt in
the
ore
body
whi
ch
coul
d ad
vers
ely
affe
ct g
old
reco
verie
s. A
ppro
pria
te
tech
nolo
gy s
ucce
ssfu
lly u
sed
on a
djac
ent m
ine.
Met
allu
rgic
al te
st w
ork
has
not b
een
cond
ucte
d , a
goo
d da
taba
se o
f gol
d re
cove
ries
is a
vaila
ble.
Infra-structure
Esk
om S
uppl
y P
ara-
stat
al
is p
rese
ntly
incr
easi
ng it
s ge
nera
ting
pow
er c
apac
ity to
mat
ch d
eman
d. In
terru
pted
sup
ply
a ris
k un
til 2
015.
Taun
g ha
s pl
anne
d ac
cord
ingl
y.
Wat
er S
uppl
y Lo
w ri
sk fa
ctor
. The
bul
k of
the
wat
er w
ill b
e pr
ovid
ed
– IV-155 –

Taun
g G
old
CPR
Feb
ruar
y 20
11
128
RIS
K
ELEM
ENT
RIS
K
RIS
K C
ATEG
OR
Y R
ISK
CAT
EGO
RY
RIS
K C
ATEG
OR
Y EL
EMEN
T LO
W
MED
IUM
H
IGH
by
the
loca
l aut
horit
ies,
with
the
rem
aind
er b
eing
un
derg
roun
d so
urce
s fro
m a
djac
ent m
ines
.
Acc
ess
Acc
ess
to th
e si
te is
via
tarre
d ro
ads
linke
d to
the
natio
nal g
rid. N
o co
nstra
ints
in te
rms
of lo
gist
ics
are
antic
ipat
ed.
Environmental Liability
Sur
face
Wat
er
Con
tam
inat
ion
E
xces
s ta
ilings
dec
ant o
r tai
lings
see
page
risk
low
and
the
pote
ntia
l im
pact
is re
duce
d du
e to
the
vario
us d
esig
n el
emen
ts a
nd p
ropo
sed
infra
stru
ctur
e la
yout
s.
CIP
/CIL
Pla
nt
Env
ironm
enta
l ris
k ar
e co
nsid
ered
to b
e re
lativ
ely
low
as
ther
e ar
e su
ffici
ent s
afeg
uard
s in
pla
ce in
the
desi
gn to
pre
vent
env
ironm
enta
l thr
eats
.
Capital and Operating
Costs Estimates
Ben
chm
arke
d C
AP
EX
Th
e ca
pita
l cos
ts e
stim
ates
pre
pare
d in
the
Scop
ing
Stu
dy
by M
inxc
on a
re b
ased
on
the
info
rmat
ion
and
pric
es i
n S
outh
Afri
ca to
be
revi
sed
in th
e PF
S.
Ben
chm
arke
d O
PE
X
Bas
ed o
n th
e cu
rrent
wor
king
cos
ts a
s at
Apr
il 20
10 fo
r co
mpa
rabe
l pro
ject
s. T
here
is a
n in
flatio
nary
risk
as
soci
ated
with
this
pro
ject
.
Political Risk
Gov
ernm
ent
Reg
ulat
ions
Loca
l, re
gion
al a
nd n
atio
nal r
egul
ator
y ag
enci
es
supp
ort f
or th
e pr
ojec
t. G
over
nmen
t app
rova
ls,
acce
ss to
land
, ha
ve b
een
succ
essf
ully
obt
aine
d.
The
follo
win
g ite
ms
shou
ld b
e no
ted:
- P
oliti
cal R
isk
and
Min
ing
Cha
rter,
Roy
alty
Bill
, 'U
se it
or L
ose
it'
philo
soph
y/le
gisl
atio
n of
the
DM
R.
– IV-156 –

Taun
g G
old
CPR
Feb
ruar
y 20
11
129
N
ote
13 :
Jean
ette
Pro
ject
Sch
edul
e
PRO
JEC
T AC
TIVI
TY
2011
20
12
2013
20
14
2015
20
16
2017
20
18
2019
H1
H2
H1
H2
H1
H2
H1
H2
H1
H2
H1
H2
H1
H2
H1
H2
H1
H2
Jean
ette
Exp
lora
tion
3D R
efle
ctiv
e S
eism
ic S
urve
y
Pre
-Fea
sibi
lity
Stu
dy
Full
Feas
ibilit
y S
tudy
App
licat
ion
for E
skom
Pow
er
Min
ing
Rig
ht A
pplic
atio
n -
Jean
ette
Gra
nt o
f Min
ing
Rig
ht
Sin
k M
ain
Sha
ft
Ref
urbi
sh O
ld V
ent S
haft
Acc
ess
deve
lopm
ent t
o fir
st re
ef
Pro
duct
ion
Ram
p U
p
Ste
ady
Stat
e P
rodu
ctio
n
– IV-157 –

Taun
g G
old
CPR
Feb
ruar
y 20
11
130
Not
e 14
: G
reen
field
s Pr
ojec
t Loc
atio
ns, S
tatu
s of
Leg
al T
enur
e an
d Si
ze o
f Rig
hts
PR
OVI
NC
E PR
OJE
CT
FAR
M P
OR
TIO
N
SIZE
(h
a)
PRO
SPEC
TIN
G
RIG
HT
CO
MM
ENC
E-M
ENT
DAT
E EX
PIR
Y D
ATE
MIN
ERAL
S H
ELD
BY
Mpu
mal
anga
Sou
th R
and
- H
exriv
ier
Hex
rivie
r 634
IR ,P
tn R
E1
1,12
3 M
P30
/5/1
/1/2
/207
PR
4-
Oct
-06
3-O
ct-1
1
All
min
eral
s ex
clud
ing
diam
onds
an
d co
al
Taun
g G
old
Exp
lora
tion
Ltd
(100
% )
Drie
font
ein
632I
R, P
ts R
E 2
1, 2
3 19
6 M
P30
/5/1
/1/2
/203
PR
4-
Oct
-06
3-O
ct-1
1 Ta
ung
Gol
d E
xplo
ratio
n Lt
d (1
00%
) D
riefo
ntei
n 63
2 IR
, Ptn
RE
25
328
MP
30/5
/1/1
/2/2
01P
R
4-O
ct-0
6 3-
Oct
-11
R. A
. Bey
ers
(100
% )
Drie
font
ein
632
IR, P
ts 1
0,11
,18,
19,
24, 2
6 96
2 M
P30
/5/1
/1/2
/202
PR
4-
Oct
-06
3-O
ct-1
1 S
ilver
Ban
k Fa
mily
Tru
st (
100%
)
Drie
font
ein
632
IR, P
tn 2
2 86
M
P30
/5/1
/1/2
/964
PR
4-
Oct
-06
3-O
ct-1
1 Ta
ung
Gol
d E
xplo
ratio
n Lt
d (1
00%
) D
riefo
ntei
n 63
2 IR
, Pts
RE
3, 1
6 32
8 M
P30
/5/1
/1/2
/673
PR
4-
Oct
-06
3-O
ct-1
1 Ta
ung
Gol
d E
xplo
ratio
n Lt
d (1
00%
) D
riefo
ntei
n 63
2 IR
, Ptn
RE
5 45
5 M
P30
/5/1
/1/2
/121
4PR
19
-Feb
-07
18-F
eb-1
2 Ta
ung
Gol
d E
xplo
ratio
n Lt
d (1
00%
) S
ilver
bank
611
IR, P
ts R
E 6,
RE
7, 1
1,
13
704
MP
30/5
/1/1
/2/2
08P
R
19-O
ct-0
6 18
-Oct
-11
J &
L S
ilver
bank
CK
(100
% )
Silv
erba
nk 6
11 IR
, Ptn
3
421
MP
30/5
/1/1
/2/6
06P
R
19-O
ct-0
6 18
-Oct
-11
Taun
g G
old
Exp
lora
tion
Ltd
(100
% )
Silv
erba
nk 6
11 IR
,Pts
RE
2,5,
8,9
1,19
7 M
P30
/1/1
/2/6
72P
R
4-O
ct-0
6 3-
Oct
-11
Taun
g G
old
Exp
lora
tion
Ltd
(100
% )
Bra
ndkr
aal 6
51IR
Ptn
5
301
MP
305/
5/1/
1/96
5PR
4-
Oct
-06
3-O
ct-1
1 Ta
ung
Gol
d E
xplo
ratio
n Lt
d (1
00%
) Su
btot
al
6,10
0
Sou
th R
and
- D
rukf
onte
in
De
Pan
615
IR, P
tn R
E, R
E1,
RE
2, 3
, R
E4,
RE
5, 6
, 7, 8
, 9, 1
0, 1
1, 1
2, 1
3,
14, 1
5, 1
6 2,
733
MP
30/5
/1/1
/2/7
02P
R
19-O
ct-0
6 18
-Oct
-11
All
min
eral
s ex
clud
ing
diam
onds
an
d co
al
Taun
g G
old
Exp
lora
tion
Ltd
(100
% )
Gro
otsp
ruit
617
IR, P
ts R
E 5
, 20
and
Dru
kfon
tein
613
IR, P
ts R
E, 1
, 2, 3
, 4,
5 an
d
Vog
elst
ruis
font
ein
593
IR, P
ts R
E 2
, 3,
7, 1
0, 1
1
3,42
5 M
P30
/5/1
/1/2
/733
PR
4-
Oct
-06
New
sub
m
10Fe
b200
9
Gro
otvl
ey 5
79 IR
, Pts
RE
1, R
E 2
, RE
4,
7, 1
0, R
E 1
1, 1
5, 1
7, 1
8, 1
9, 2
1 2,
381
MP
30/5
/1/1
/2/2
52P
R
19-F
eb-0
7 18
-Feb
-12
Gro
otvl
ey 5
79 IR
, Ptn
RE
5 16
9 M
P30
/5/1
/1/2
/692
PR
4-
Oct
-06
3-O
ct-1
1 G
root
vley
579
IR, P
ts R
E an
d 22
67
7 M
P30
/5/1
/1/2
/172
6PR
10
-Apr
-08
9-A
pr-1
3 Su
btot
al
9,38
5
Sou
th R
and
- H
artb
eesf
onte
in
Har
tebe
esfo
ntei
n 63
8 IR
, Pts
RE
7,
RE
9, 1
6
1,35
3 M
P30
/5/1
/1/2
/709
PR
19
-Oct
-06
18-O
ct-1
1
All
min
eral
s ex
clud
ing
diam
onds
an
d co
al
Taun
g G
old
Exp
lora
tion
Ltd
(100
% )
Roo
iwal
607
IR, P
tn 1
3 Su
btot
al
1,53
4
Eva
nder
Wes
t
Wat
erva
lsho
ek 3
50 IR
, Pts
1, 3
, 4, 1
9,
25, 2
6, 2
7, 2
8, 3
2, 3
5, 3
6, 4
6 1,
406
MP
30/5
/1/1
/2/8
21P
R
4-O
ct-0
6 3-
Oct
-11
All
min
eral
s ex
clud
ing
diam
onds
an
d co
al
Taun
g G
old
Exp
lora
tion
(Wes
t) (P
ty)
Ltd
(100
% )
Gro
uwat
er 3
53 IR
, Pts
5 ,
6 56
4 M
P30
/5/1
/1/2
/776
PR
4-
Oct
-06
Rev
ised
su
bmis
sion
16
Feb
09
Taun
g G
old
Exp
lora
tion
(Wes
t) (P
ty)
Ltd
(100
% )
Subt
otal
1,
969
G
aute
ng
Sou
th R
and
- D
e H
oek
411
IR, P
ts R
E1,
RE
4, R
E6,
1,
502
GP
30/5
/1/1
/2/4
76P
R
5-M
ay-0
9 To
be
Gol
d a
nd
Taun
g G
old
Exp
lora
tion
Ltd
(100
% )
– IV-158 –
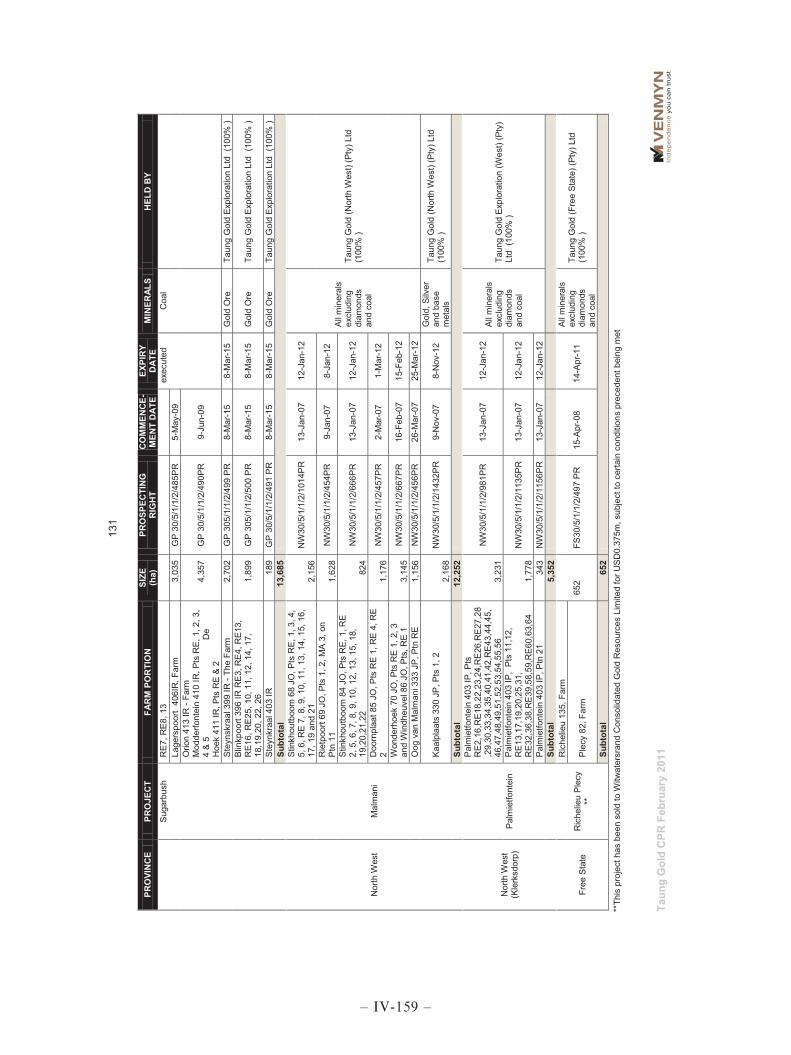
Taun
g G
old
CPR
Feb
ruar
y 20
11
131
PRO
VIN
CE
PRO
JEC
T FA
RM
PO
RTI
ON
SI
ZE
(ha)
PR
OSP
ECTI
NG
R
IGH
T C
OM
MEN
CE-
MEN
T D
ATE
EXPI
RY
DAT
E M
INER
ALS
HEL
D B
Y
Sug
arbu
sh
RE
7, R
E8,
13
exec
uted
C
oal
Lage
rspo
ort
406I
R, F
arm
3,
035
GP
30/5
/1/1
/2/4
85P
R
5-M
ay-0
9 O
rion
413
IR -
Farm
M
odde
rfont
ein
410
IR, P
ts R
E, 1
, 2, 3
, 4
& 5
D
e H
oek
411
IR, P
ts R
E &
2
4,35
7 G
P 30
/5/1
/1/2
/490
PR
9-
Jun-
09
Ste
ynsk
raal
399
IR -
The
Farm
2,
702
GP
305/
1/1/
2/49
9 P
R
8-M
ar-1
5 8-
Mar
-15
Gol
d O
re
Taun
g G
old
Exp
lora
tion
Ltd
(100
% )
Blin
kpoo
rt 39
6 IR
RE
3, R
E4,
RE
13,
RE
16, R
E25
, 10,
11,
12,
14,
17,
18
,19,
20, 2
2, 2
6 1,
899
GP
305/
1/1/
2/50
0 P
R
8-M
ar-1
5 8-
Mar
-15
Gol
d O
re
Taun
g G
old
Exp
lora
tion
Ltd
(100
% )
Ste
ynkr
aal 4
03 IR
18
9 G
P 30
/5/1
/1/2
/491
PR
8-
Mar
-15
8-M
ar-1
5 G
old
Ore
Ta
ung
Gol
d E
xplo
ratio
n Lt
d (1
00%
) Su
btot
al
13,6
85
Nor
th W
est
Mal
man
i
Stin
khou
tboo
m 6
8 JO
, Pts
RE,
1, 3
, 4,
5, 6
, RE
7, 8
, 9, 1
0, 1
1, 1
3, 1
4, 1
5, 1
6,
17, 1
9 an
d 21
2,
156
NW
30/5
/1/1
/2/1
014P
R
13-J
an-0
7 12
-Jan
-12
All
min
eral
s ex
clud
ing
diam
onds
an
d co
al
Taun
g G
old
(Nor
th W
est)
(Pty
) Ltd
(1
00%
)
Rie
tpoo
rt 69
JO
, Pts
1, 2
, MA
3, o
n P
tn 1
1 1,
628
NW
30/5
/1/1
/2/4
54P
R
9-Ja
n-07
8-
Jan-
12
Stin
khou
tboo
m 8
4 JO
, Pts
RE,
1, R
E
2, 5
, 6, 7
, 8, 9
, 10,
12,
13,
15,
18,
19
,20,
21,2
2 82
4 N
W30
/5/1
/1/2
/666
PR
13
-Jan
-07
12-J
an-1
2
Doo
rnpl
aat 8
5 JO
, Pts
RE
1, R
E 4
, RE
2 1,
176
NW
30/5
/1/1
/2/4
57P
R
2-M
ar-0
7 1-
Mar
-12
Won
derh
oek
70 J
O, P
ts R
E 1,
2, 3
an
d W
indh
euve
l 86
JO, P
ts, R
E 1
3,14
5 N
W30
/5/1
/1/2
/667
PR
16
-Feb
-07
15-F
eb-1
2
Oog
van
Mal
man
i 333
JP,
Ptn
RE
1,15
6 N
W30
/5/1
/1/2
/456
PR
26
-Mar
-07
25-M
ar-1
2
Kaa
lpla
ats
330
JP, P
ts 1
, 2
2,16
8 N
W30
/5/1
/1/2
/143
2PR
9-
Nov
-07
8-N
ov-1
2 G
old,
Silv
er
and
base
m
etal
s
Taun
g G
old
(Nor
th W
est)
(Pty
) Ltd
(1
00%
)
Subt
otal
12
,252
Nor
th W
est
(Kle
rksd
orp)
P
alm
ietfo
ntei
n
Pal
mie
tfont
ein
403
IP, P
ts
RE
2,16
,RE
18,2
2,23
,24,
RE
26,R
E27
,28
,29,
30,3
3,34
,35,
40,4
1,42
,RE
43,4
4,45
,46
,47,
48,4
9,51
,52,
53,5
4,55
,56
3,23
1
NW
30/5
/1/1
/2/9
81P
R
13-J
an-0
7 12
-Jan
-12
All
min
eral
s ex
clud
ing
diam
onds
an
d co
al
Taun
g G
old
Exp
lora
tion
(Wes
t) (P
ty)
Ltd
(100
% )
Pal
mie
tfont
ein
403
IP,
Pts
11,1
2,
RE
13,1
7,19
,20,
25,3
1,
RE
32,3
6,38
,RE
39,5
8,59
,RE
60,6
3,64
1,
778
NW
30/5
/1/1
/2/1
135P
R
13-J
an-0
7 12
-Jan
-12
Pal
mie
tfont
ein
403
IP, P
tn 2
1 34
3 N
W30
/5/1
/1/2
/115
6PR
13
-Jan
-07
12-J
an-1
2 Su
btot
al
5,35
2
Free
Sta
te
Ric
helie
u P
lecy
**
Ric
helie
u 13
5, F
arm
652
FS30
/5/1
/1/2
/497
PR
15
-Apr
-08
14-A
pr-1
1
All
min
eral
s ex
clud
ing
diam
onds
an
d co
al
Taun
g G
old
(Fre
e S
tate
) (Pt
y) L
td
(100
% )
Ple
cy 8
2, F
arm
Subt
otal
65
2
**Th
is p
roje
ct h
as b
een
sold
to W
itwat
ersr
and
Con
solid
ated
Gol
d R
esou
rces
Lim
ited
for U
SD
0.37
5m, s
ubje
ct to
cer
tain
con
ditio
ns p
rece
dent
bei
ng m
et
– IV-159 –

Taung Gold CPR February 2011
132
Note 15 : Competent Persons Certificates
Name of Firm: Venmyn Rand (Pty) Limited Name of Staff: Mr Andrew Clay Company Responsibility: Managing Director Profession: Geologist Date of Birth: 16th April 1955 Years with Firm/Entity: 21 years Nationality: British Membership in Professional Societies:
CLASS PROFESSIONAL SOCIETY YEAR OF REGISTRATION Member Canadian Institute of Mining, Metallurgy and Petroleum 2006 Advisor JSE Limited Listings Advisory Committee 2005 Issuer JSE Issuer Services 2008 Member JSE Issuer Mining Sub-committee 2009 Associate Member American Association of Petroleum Geologists 2005 Member South African Institute of Directors 2004 Fellow Geological Society of South Africa 2003 Member American Institute of Mineral Appraisers 2002 Member South African Institute of Mining and Metallurgy 1998 Fellow Australasian Institute of Mining and Metallurgy 1994 Member Natural Scientist Institute of South Africa 1988 Member Investment Analysts Society of South Africa 1990
Involvement in Code Writing:
Mr Clay currently has a special interest in incorporating oil and gas reporting procedures into the general application of mineral asset valuation. Involvement in Fund Management
Detailed Tasks Assigned:
YEAR CLIENT COMMODITY DOCUMENTATION 2009 Metorex Gold Independent Fairness Opinion 2009 Kivu Resources Pegmatites Independent prefeasibility study 2009 Kalagadi Manganese Manganese Independent Tehno-Economic Review 2009 Taung Gold Gold Independent Competent Person’s Report 2009 Sylvania Resources Platinum Independent Technical and Valuation Expert’s Report
2009 Ernst & Young Jordan Gold Independent Valuation Report on mineral assets of a Gold Mining Concession in Ethiopia
2009 Dwyka Resources Gold Independent Technical Statement on Tulu Kapi Gold Project 2009 G & B African Resources Pot Ash Independent Prospectivity Review
2009 Central African Gold Gold Information Memorandum in the form of NI 43-101 Compliant Technical Statement
2009 Braemore Resources Platinum Fairness Opinion
POSITION PROFESSIONAL CODE DATE OF INVOLVEMENT Chairman Venmyn Advisory Checklist 2000 - present Member South African (SAICA) extractive industries deliberations 2003 - present Initiator & Panel Member SAMREC / IAS Award 2002 - present Advisor JSE Listing Requirements (Section 3 On-going obligations) 2002 - present Working Group Member SAMREC Code (Oil & Gas) 2005 - present Working Group Member SAMVAL Code 2001 – present Working Group Member SAMREC Code (Re-write Sections 1 – 5) 2005 - present Working Group Member SAMREC Code (Re-write) 2003 - present Working Group Member SAMREC Code (First Version) 1996 - 2001 Advisory Committee Member JSE Limited 2005-present Advisor JSE Listing Requirements (Section 12) 1990 – present
POSITION FUND DATE OF INVOLVEMENT Member of Investment & Audit Committee New Africa Mining Fund (NAMF)
Director Strategic African Mineral Investment Fund (SAMI) 2008 - present
– IV-160 –
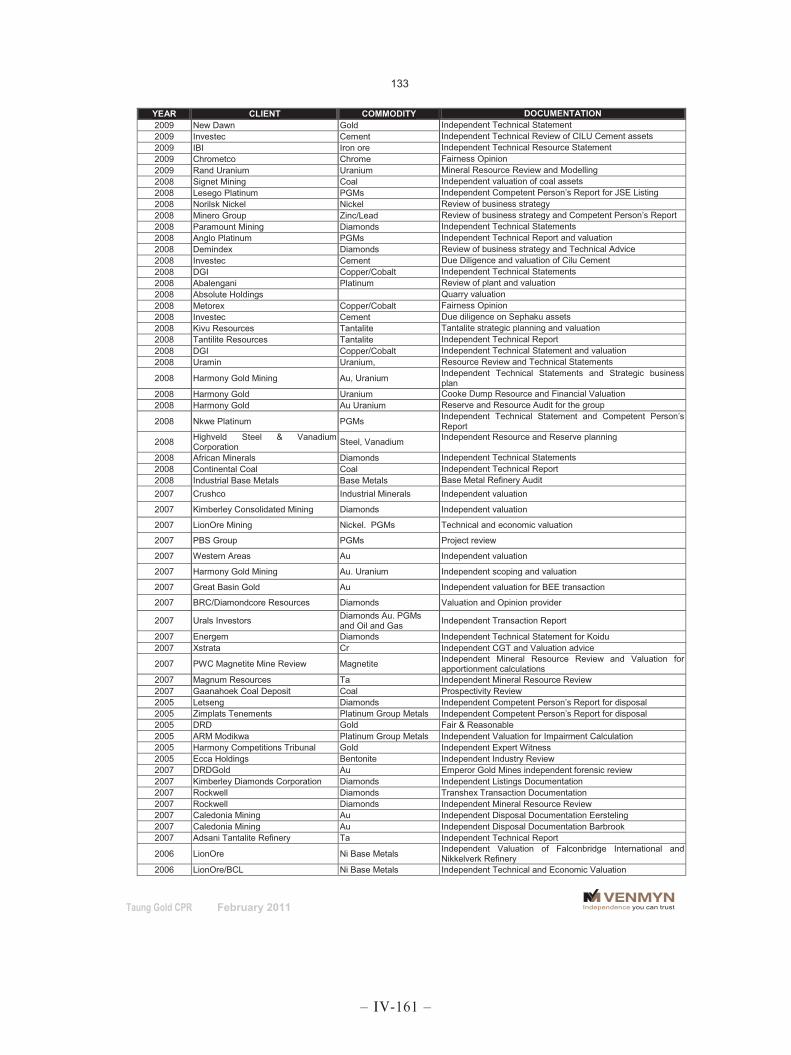
Taung Gold CPR February 2011
133
YEAR CLIENT COMMODITY DOCUMENTATION 2009 New Dawn Gold Independent Technical Statement 2009 Investec Cement Independent Technical Review of CILU Cement assets 2009 IBI Iron ore Independent Technical Resource Statement 2009 Chrometco Chrome Fairness Opinion 2009 Rand Uranium Uranium Mineral Resource Review and Modelling 2008 Signet Mining Coal Independent valuation of coal assets 2008 Lesego Platinum PGMs Independent Competent Person’s Report for JSE Listing 2008 Norilsk Nickel Nickel Review of business strategy 2008 Minero Group Zinc/Lead Review of business strategy and Competent Person’s Report 2008 Paramount Mining Diamonds Independent Technical Statements 2008 Anglo Platinum PGMs Independent Technical Report and valuation 2008 Demindex Diamonds Review of business strategy and Technical Advice 2008 Investec Cement Due Diligence and valuation of Cilu Cement 2008 DGI Copper/Cobalt Independent Technical Statements 2008 Abalengani Platinum Review of plant and valuation 2008 Absolute Holdings Quarry valuation 2008 Metorex Copper/Cobalt Fairness Opinion 2008 Investec Cement Due diligence on Sephaku assets 2008 Kivu Resources Tantalite Tantalite strategic planning and valuation 2008 Tantilite Resources Tantalite Independent Technical Report 2008 DGI Copper/Cobalt Independent Technical Statement and valuation 2008 Uramin Uranium, Resource Review and Technical Statements
2008 Harmony Gold Mining Au, Uranium Independent Technical Statements and Strategic business plan
2008 Harmony Gold Uranium Cooke Dump Resource and Financial Valuation 2008 Harmony Gold Au Uranium Reserve and Resource Audit for the group
2008 Nkwe Platinum PGMs Independent Technical Statement and Competent Person’s Report
2008 Highveld Steel & Vanadium Corporation Steel, Vanadium Independent Resource and Reserve planning
2008 African Minerals Diamonds Independent Technical Statements 2008 Continental Coal Coal Independent Technical Report 2008 Industrial Base Metals Base Metals Base Metal Refinery Audit 2007 Crushco Industrial Minerals Independent valuation
2007 Kimberley Consolidated Mining Diamonds Independent valuation
2007 LionOre Mining Nickel. PGMs Technical and economic valuation
2007 PBS Group PGMs Project review
2007 Western Areas Au Independent valuation
2007 Harmony Gold Mining Au. Uranium Independent scoping and valuation
2007 Great Basin Gold Au Independent valuation for BEE transaction
2007 BRC/Diamondcore Resources Diamonds Valuation and Opinion provider
2007 Urals Investors Diamonds Au. PGMs and Oil and Gas Independent Transaction Report
2007 Energem Diamonds Independent Technical Statement for Koidu 2007 Xstrata Cr Independent CGT and Valuation advice
2007 PWC Magnetite Mine Review Magnetite Independent Mineral Resource Review and Valuation for apportionment calculations
2007 Magnum Resources Ta Independent Mineral Resource Review 2007 Gaanahoek Coal Deposit Coal Prospectivity Review 2005 Letseng Diamonds Independent Competent Person’s Report for disposal 2005 Zimplats Tenements Platinum Group Metals Independent Competent Person’s Report for disposal 2005 DRD Gold Fair & Reasonable 2005 ARM Modikwa Platinum Group Metals Independent Valuation for Impairment Calculation 2005 Harmony Competitions Tribunal Gold Independent Expert Witness 2005 Ecca Holdings Bentonite Independent Industry Review 2007 DRDGold Au Emperor Gold Mines independent forensic review 2007 Kimberley Diamonds Corporation Diamonds Independent Listings Documentation 2007 Rockwell Diamonds Transhex Transaction Documentation 2007 Rockwell Diamonds Independent Mineral Resource Review 2007 Caledonia Mining Au Independent Disposal Documentation Eersteling 2007 Caledonia Mining Au Independent Disposal Documentation Barbrook 2007 Adsani Tantalite Refinery Ta Independent Technical Report
2006 LionOre Ni Base Metals Independent Valuation of Falconbridge International and Nikkelverk Refinery
2006 LionOre/BCL Ni Base Metals Independent Technical and Economic Valuation
– IV-161 –

Taung Gold CPR February 2011
134
YEAR CLIENT COMMODITY DOCUMENTATION 2006 Vanamin V Independent Report for disposal 2006 Kurils Islands Au Independent Technical Report NI43-101 2006 Mgart Armenia Au Independent Assessment and Valuation for AIM 2006 Zimbabwe Mining Bill All Preparation of industry submission to government 2006 Energem Oil & Gas Preparation of National Instrument Compliance 2006 Ncondedzi Coal Coal Technical & Corporate Listing Documentation 2006 Metallon International - Armenia Gold & Base Metals Prospectivity & Exploration Programme Preparation 2006 Hood Tantalite Tantalite Independent Techno Economic Valuation Report 2005 Harmony Randfontein 4 Shaft Gold Independent Valuation 2005 Gallery Gold Gold Independent Competent Person’s Report for disposal 2005 Stuart Coal Coal Independent Competent Person’s Report for disposal 2005 Elementis Chrome Chrome Independent Industry Review 2005 Diamond Core Diamonds Independent Competent Person’s Report 2005 Diamond Core Diamonds Fair & Reasonable Statement 2005 Kensington Resources Diamonds Independent Inspection & Certification of Laboratory
2005 Bayer Valuation Chrome Independent Valuation for Economic Empowerment Transaction
2005 Pangea Diamonds Diamonds Independent Competent Person’s Report 2005 LionOre International Nickel Tati Nickel Review of Mineral Resources.
Aquarius PSA2 Independent Competent Person’s Report 2005 Aquarius Platinum Marikana Mineral Resources Review. 2005 LionOre International Nickel Nkomati Due Diligence and Transaction Value Calculations. 2005 LionOre International Nickel World Nickel market study for group corporate work.
2004 Avgold Limited Gold Fair & Reasonable Opinion on the Methodologies applied and Values attributed to the Mineral Assets of ET Cons
2004 Aquarius Platinum Update of Independent Valuation of Mimosa
2004 Aquarius Platinum Independent Techno-Economic Report and Fair and Reasonable Opinion tot the PIC, DBSA and IDC on the 26% BEE Transaction for AQPSA – Document waived by the JSE.
2004 Mimosa Mining Company Platinum Mineral Resource and Ore Reserve Review 2004 Zimplats Platinum Zimplats Makwiro Valuation and Corporate Restructuring 2004 Assmang Manganese CGT Valuation 2004 Aquarius Platinum CGT Valuation 2004 Sishen South Iron CGT Valuation 2003 Unki Platinum Project Platinum CGT Valuation
2003 Hernic Ferrochrome (Pty) Ltd, Itochu Corporation Chromite Independent valuation of the Satellite Chromite Mine Joint
Venture.
2003 African Diamond Holdings (Pty) Ltd Diamonds Independent techno-economic due diligence and valuation of African Diamond Holdings marine diamond concessions and diamond cutting operation in Walvis Bay, Namibia.
2003 Unki Platinum Project, Zimbabwe Platinum Techno-Economic Valuation Report & Fair & Reasonable Opinion
2003 Transvaal Ferrochrome Ltd Ferrochrome Independent Competent Person’s Report and Valuation as a bankable Document for Australian Stock Exchange
2003 Aquarius Platinum (SA) (Pty) Ltd Platinum Independent Competent Person’s Report and Valuation for the Everest South Project
2002 Zimbabwe Platinum Mines Ltd Platinum Independent valuation of Zimplats relative to the value of the Impala Platinum Ltd/AurionGold Ltd transaction.
2002 Mitsubishi Corporation Ferrochrome Expansion Report and Valuation on Hernic Ferrochrome (Pty) Ltd.
2002 Aquarius Platinum Ltd Platinum Acquisition Report on ZCE Platinum Ltd including the due diligence and valuation of Mimosa Mine in Zimbabwe.
2002 Freddev Gold Valuation of Mineral Rights & Royalties 2002 Barnex Gold Valuation of Mineral Rights & Royalties 2002 Western Areas Gold WA4 Project : Valuation of Mineral Rights & Royalty
Agreement 2002 Mitsubishi Ferrochrome Expansion report and valuation 2002 Aquarius Platinum Acquisition Report 2001 Northam Platinum Valuation 2001 Mitsubishi Corporation Ferrochrome Due Diligence, Valuation and Acquisition Report 2001 Amcol Due Diligence Bentonite Independent due diligence and valuation on G&W 2001 Zimplats Impala Raising Platinum Circular to shareholders valuation report 2000 African Minerals Varied Independent competent person’s report 2000 Barnato Exploration Limited Varied Competent person’s report 2000 Durban Deep Gold Independent valuation report 2000 Iscor Limited Varied Independent valuation of exploration assets 1999 Harmony Gold Mining Co Ltd Gold Harmony / Kalgold / West Rand Cons 1999 Leighton Contractors Tin Pre-feasibility study Pemali Tin (Indonesia) 1999 Mitsubishi Ferro-Chrome Techno-economic valuation of Hernic Chrome
– IV-162 –

Taung Gold CPR February 2011
135
YEAR CLIENT COMMODITY DOCUMENTATION 1998 Barnex Ltd Wits Gold Due diligence 1998 Camco Diamonds Independent Competent Person’s Report and valuation 1998 Crown Mines and DRD Wits Gold Valuation 1998 Egyptian Government Phosphate Due diligence and valuation 1998 Great Fitzroy Mines Copper Competent Person’s Report and Valuation 1998 Iscor Mining Greenstone Gold Due diligence and valuation 1998 JCI Ltd Wits Gold Competent Person’s Report 1998 Randgold & Exploration Co Ltd Gold Competent Person’s Report 1998 Western Areas Wits Gold Competent Person’s Report 1997 CBR Mining Coal Due diligence 1997 Durban Roodepoort Deep Ltd Wits Gold Competent Person’s Report 1997 G&W Base Bentonite Due diligence 1997 JCI Ltd Wits Gold Competent Person’s Report 1997 Opaline Gold Greenstone Gold Competent Person’s Report 1997 Penumbra Coal Due diligence 1997 Randgold & Exploration Co Ltd Greenstone Gold Competent Person’s Report 1997 Rondebult Colliery Coal Due diligence 1996 African Mining Corporation* Alluvial Gold Project valuation 1996 Australian Platinum Mines NL Platinum Due diligence 1996 Benoni Gold Holdings Ltd Wits Gold Competent Person’s Report 1996 Consolidated Metallurgical Industries Ferrochrome Competent Person’s Report and valuation 1996 Durban Roodepoort Deep Ltd Wits Gold Competent Person’s Report 1996 Harmony Gold Mining Co Ltd Wits Gold Competent Person’s Report 1996 JCI Ltd Wits Gold Valuation 1996 Rand Leases Properties Ltd Wits Gold Competent Person’s Report and valuation 1996 Randgold & Exploration Co Ltd Wits Gold Due diligence 1995 African Mines Limited* Greenstone Gold Project valuation 1995 Barney-Seidle Arbitration Granite Project valuation arbitration 1995 Mopet Oil* Oil and Gas Market analysis facilitator 1995 Randgold & Exploration Co Ltd Wits Gold Competent Person’s Report and valuation 1995 Randgold Durban Deep Wits Gold Competent Person’s Report and valuation 1995 Randgold Harmony Unisel Merger Wits Gold Competent Person’s Report and valuation 1994 Aurora Exploration Varied - Industrials Competent Person’s Report and valuation 1994 Consolidated Mining Corp Wits Gold Due diligence and valuation 1994 CRA (Australia) Iron Ore Due diligence 1994 Durban Roodepoort Deep Ltd Wits Gold Competent Person’s Report and valuation 1994 Ghana Gold Mines* Greenstone Gold Due diligence and valuation 1994 Gold Fields of SA Ltd Wits Gold Competent Person’s Report and valuation 1994 Hernic Chrome Ferro-Chrome Valuation and Strategic Analysis 1994 Inca Magnesium Due diligence and valuation 1994 Mitsubishi Ferrochrome Due diligence and valuation 1994 Namco* Diamonds Competent Person’s Report and valuation 1994 Randgold & Exploration Co Ltd Wits Gold Due diligence 1993 Namibia Oil & Gas licence
applications Oil & Gas Working with Paul Blair licence applications
1993 Atomic Energy Commission Uranium Strategic Analysis 1993 Eskom Base metals Strategic Analysis 1993 JCI Wits Gold Financial Planning Analysis (Rehabilitation) 1993 Lonrho Platinum Financial Planning Analysis (Rehabilitation) 1993 Rand Mines Properties Varied Mineral rights evaluation 1992 Barbrook Gold Mines Greenstone Gold Ore resource modelling and mine valuation 1992 Rand Merchant Bank Copper Ore resource modelling and project valuation 1992 Rembrandt Platinum Mine valuation (Northam Platinum) 1992 West Rand Cons Wits Gold Ore resource modelling and mine valuation 1991 Rand Merchant Bank Wits Gold Ore reserve evaluation (Westonaria Gold Mine) 1991 Rembrandt (Gold Fields of SA) Varied Due diligence, valuation and strategic analysis 1991 Standard Merchant Bank Greenstone Gold Due diligence and valuation (Eersteling Gold Mine) 1990 Sequence Oil and Gas Oil & Gas Due Diligence Report 1990 Atomic Energy Corporation Nuclear Fuels Strategic analysis 1990 Consolidated Mining Corp Wits Gold Due diligence and valuation 1990 Eskom Copper/Zinc Strategic Market Analysis (Toll Smelter potential) 1990 Freddies Minerals Feldspar - Industrials Due diligence 1990 Industrial Machinery Supplies Coal Strategic analysis and valuation (Bricketting plant) 1990 Knights Gold Mine Wits Gold Competent Person’s Report 1990 Rand Merchant Bank Diamonds Due diligence and valuation (Alluvial Mine) 1990 Corex Oil & Gas Evaluation of prospectivity 1990 Rand Merchant Bank Lead/Zinc Due diligence and valuation (Miranda Mine)
– IV-163 –

Taung Gold CPR February 2011
136
YEAR CLIENT COMMODITY DOCUMENTATION 1990 Rand Mines Varied Corporate Strategic Analysis 1990 Rhogold Wits Gold Ore resource modelling 1990 Rice Rinaldi Coal Due diligence and valuation 1990 Sub Nigel Gold Mine Wits Gold Due diligence and valuation 1990 Zaaiplaats Tin Mine Tin Due diligence and valuation 1989 Avontuur Diamond Mines Diamonds Due diligence and valuation 1989 Granite Consolidated Mining Granite Due diligence and valuation 1989 Osprey Gold Mine Greenstone Gold Due diligence and valuation 1989 Rand Leases Gold Mine Wits Gold Ore resource modelling 1989 Rand Merchant Bank* Varied Mineral portfolio analysis (Swanson Rights) 1989 Rhovan Vanadium Competent Person’s Report and valuation 1989 Vanamin Severrin Mining Vanadium Due diligence and valuation 1989 Zimco Andalusite Competent Person’s Report and valuation 1988 Mullet Slate Slate Due diligence and valuation 1988 Rand Merchant Bank Wits Gold Risk assessment analysis (Peritus Exploration) 1988 Wit Nigel Gold Mine Wits Gold Ore resource modelling
Fair and Reasonable Opinions:
YEAR CLIENT SECURITIES EXCHANGE
JURISDICTION TRANSACTION
TYPE IMPLIED VALUE (US$m)
DESCRIPTION
2009 Chrometco JSE Acquisition of interest 8.3 Independent Professional Expert Report
2009 Metorex JSE Disposal of 6.3% interest 5.7 Independent Professional Expert Report
2009 Braemore Resources JSE Acquisition of interest 36.3 Independent Professional Expert Report
2007 Diamondcore/BRC JSE Acquisition 50 Independent F&R for Diamondcore
2006 LionOre International TSX Acquisition notification documentation.
650 Independent Technical and Valuation Fatal Flaws Report and F&R opinion for the Board of LionOre. Not published as an F&R.
2005 Diamond Core JSE Category I Merger 10.0 Independent CPR on the mineral assets of Samadi Resources SA (Pty) Ltd and Diamond Core Resources Limited.
2005 LionOre International TSX Acquisition notification documentation.
110.0 Tati Nickel Review of Mineral Resources.
2005 Aquarius JSE 26% BEE 150.0
Independent Techno-Economic Valuation and Fair and Reasonable Opinion on the PIC, IDC, DBSA 26% Empowerment Transaction. Documents waived for the secondary listing.
2004 Barplats JSE Offer to Barplats Minorities 60.0
Offer by Platinum Consortium to take out Implats. The SRP insisted our report be prepared in full. In the end Investec wrote the Fair and Reasonable but was fully reliant upon the Venmyn work as demonstrated in the circular.
2004 Zimplats ASX Collapse of the Makwiro Structure for shares to Implats.
38.0 Fair Value calculation in a corporate restructure.
2003 Amplats JSE Acquisition price calculation for Unki Platinum.
Confidential
Preparation of an Independent Techno-Economic Valuation Report and Fair and Reasonable Opinion. Document not used as the transaction became immaterial for reporting purposes.
2003 Aquarius Platinum (South Africa) (Pty) Ltd ASX
Opinion on the value of a Refinery Agreement.
10.0 Fair & Reasonable Opinions for Aquarius Platinum for the Impala Refinery Commitments.
2002 Consolidated African Mines Limited. JSE
CAM acquired 40% of the Letseng diamond mine for CAM shares.
10.0 Preparation of an Independent Techno-Economic Valuation Report and Fair and Reasonable Opinion. Document used in full.
2002 Zimplats ASX
Implats aquired a controlling interest in Zimplats by acquiring Aurion Gold shares.
50.0 Preparation of an Independent Techno-Economic Valuation Report and Fair and Reasonable Opinion. Document used in full.
2002 Aquarius ASX Aquarius acquires 65% in ZCE Platinum Limited.
50.0 Preparation of an Independent Techno-Economic Valuation Report and Fair and Reasonable Opinion. Document used in full.
– IV-164 –

Taung Gold CPR February 2011
137
2000 DiamondWorks TSX
Lyndhurst a South African Company takes control of Canadian junior Diamond works.
20.0
Preparation of an Independent Techno-Economic Valuation Report and Fair and Reasonable Opinion. Document used in full and special representation required in Toronto to explain the transaction and the assets.
1999 New Mining Corporation JSE
Listing and acquisition documentation.
50.0
Complicated transaction and full Independent Techno-Economic Valuation prepared with Fair and Reasonable Opinion included in our report. This satisfied the JSE and the SRP.
1996 West Witwatersrand Gold Holdings Limited JSE Section 440k Offer 20.0
Independent Competent Persons Report on the Offer by Durban Deep to West Wits under Section 440k. Document included in circulars to both shareholders. Our Fair and Reasonable Opinion was specifically requested by the SRP.
Key Qualifications and Description: Mr Clay has been a serving professional in the minerals industry since 1977 when he undertook field mapping and a professional apprenticeship within the Rhodesian Geological Survey. This was at a time when fieldwork and practical application of geological principals was still fundamental to the development of geology as a science. Following this, Mr Clay has dedicated his career to the commercial incorporation of first principles scientific process to the description, reporting and valuation of mineral assets. Having worked for a number of years with mining companies, both underground and in corporate, Mr Clay became a founding member of Venmyn in 1988. At this time the company was closely associated with Rand Merchant Bank. This relationship enabled him to pursue the process of linking technical and financial valuation. Since that time Mr Clay has been involved in growing Venmyn and is presently the Managing Director and major shareholder. He has been involved in developing a style of reporting at Venmyn which has become internationally recognised as compliant shorter form reporting. The emphasis of the work is on concise and graphical reporting, bullet points and descriptive graphics for ease of presentation and shareholder appreciation. He has been involved in the writing of numerous codes the South African Code for the Reporting of Mineral Resources and Reserves (SAMREC Code) and is currently on the committee writing the South African Code for the Valuation of mineral projects (SAMVAL Code). He is presently involved in the oil and gas industry where his expertise in valuation is being used to determine the relationship between the reporting methodologies in this industry relative to the rest of the mineral industry. Mr Clay’s key areas of expertise lie in the detailed financial valuation of mineral and mining projects using discounted cash flow models. In this regard he has undertaken over 25 valuations for eight different commodities over the last four years. Details of the valuations and other assignments are tabled above. These valuations have been used in listing and merger documentation both in local and international stock exchanges and for the private use of the companies concerned. Education:
DEGREE/DIPLOMA FIELD INSTITUTION YEAR B. Sc Hons. Geology University College Cardiff 1976
M. Sc. Econ. Geol. Economic Geology (awarded Corstorphine Medal for Best M.Sc. Thesis) University of the Witwatersrand 1981
GDE Graduate Diploma in Mining Engineering University of the Witwatersrand 1986 M. Sc. Mining Engineering University of the Witwatersrand 1988 Dip. Bus. M. Diploma in Business Management Damelin College 1983 Tax Mgmt Tax Management and Planning University of the Witwatersrand 1988
Employment Record:
POSITION COMPANY JOB DESCRIPTION DURATION
Managing Director and Founding partner
Venmyn Rand (Pty) Ltd
Mr Clay serves as the Managing Director of Venmyn and is responsible for the company’s strategic process as well as finances, budgeting and operations;
Venmyn operates as a techno-economic consultancy for the resources industry on a world wide basis;
Mr Clay has been a key member of the SAMREC Working Group, responsible for compiling the SAMREC Code;
1997 – present
– IV-165 –
Taung Gold CPR February 2011
138
POSITION COMPANY JOB DESCRIPTION DURATION Served on the JSE/SAMREC working committee for the
development of the JSE Section 12 requirements; Serves on the Readers Panel for the JSE; Mr Clay is director of the advisory business and provides
hands-on services to all the company’s major clients; His expertise in financial valuation is particularly appropriate
for ensuring market to market presentation of both the technical and financial issues of resources projects;
Course leader for the Witwatersrand University and Continuing Education programme on Compliance in the Minerals Industry; and
Mr Clay has a special interest in the proposed International Accounting Standards “IAS” Extractive Industries rules for determining NAV and NPV calculations in the minerals industry.
General Manager RMB Resources Rand Merchant Bank
Continuing business functions detailed below; Also valuing, managing and marketing investment projects
of the Resources division including deal structuring and corporate finance.
1996 – 1997
Managing Director and founding partner
Venmyn Rand (Pty) Ltd Techno-economic evaluation of a wide range of mineral resource projects using cashflow, market capitalisation, option pricing and other comparative methods.
1987 – 1996
Senior Geologist Rand Mines Ltd Resident senior gold mine geologist responsible for the development and implementation of modern computerised ore reserve evaluation techniques at Harmony Gold Mine and Durban Roodepoort Deep Gold Mine.
Transferred to head office where he was responsible for all gold mine ore reserve valuation functions. This computer work involved the development and planning of very large databases for orebody modelling.
1981 – 1988
Senior Geologist Zimro (Pty) Ltd (Industrial Minerals Division of AAC)
Market development and application of a wide range of industrial and base minerals.
1979 – 1981
Geologist Geological Survey of Zimbabwe
Mapped a 100 km² area of granite-greenstone terrain and assisted in the compilation of a Bulletin over the area.
Assisted the small mining sector with geological advice on gold, copper, gemstones and industrial minerals.
1975 – 1979
Languages: English: Excellent Afrikaans: Fair Certification: I, the undersigned, certify that to the best of my knowledge and belief, these data correctly describe my qualifications, and experience.
Date:11th February 2011 Full name of staff member: Andrew Neil Clay
– IV-166 –

Taung Gold CPR February 2011
139
COMPETENT PERSONS CERTIFICATES
Proposed Position: Advisor Name of Firm: Venmyn Rand (Pty) Ltd Name of Staff: Fiona Harper Profession: Geologist Date of Birth: 31 January 1957 Years with Firm/Entity: Joined May 2007 Nationality: British Membership in Professional Societies:
CLASS PROFESSIONAL SOCIETY YEAR OF REGISTRATION Member Geological Society of South Africa 2007 Member Professional Natural Scientist 2008
Detailed Tasks Assigned:
YEAR CLIENT COMMODITY TYPE OF STUDY PROJECT DESCRIPTION
2010 Colonial Resource Gold CPR and Valuation JORC, National Instrument 43-101 compliant CPR and Valuation
2009 Lithic Metals and Energy
Uranium, nickel, zinc CPR SAMREC compliant CPR on Togo, Zambia and
Mozambique assets for AIM listing 2009 Taung Gold Gold CPR and Valuation Taung Greenfield projects CPR for JSE Listing 2009 Taung Gold Gold CPR and Valuation Evander Gold Mine for JSE Listing 2009 Taung Gold Gold CPR and Valuation Jeanette Gold Mine CPR for JSE listing
2009 Lithic Metals and Energy
Uranium, nickel, zinc
Technical and Prospectivity Review
Independent review of assets in Togo, Zambia , Mozambique and South Africa
2009 G&B Resources
Potash, Phosphate, Uranium, nickel, zinc, coal
Technical and Prospectivity Review
Independent review of assets in Togo, Zambia , Mozambique and South Africa
2009 Sephaku Holdings Fluorspar CPR and Valuation SAMREC compliant CPR on Dinokeng Fluorspar project for JSE Listing
2009 Platmin Pty Ltd Platinum CPR and Valuation NI and SAMREC Compliant CPR on Mphahlele for JSE and TSX Listing
2009 Platmin Pty Ltd Platinum CPR and Valuation NI and SAMREC Compliant CPR on PPM for JSE and TSX Listing
2009 Platmin Pty Ltd Platinum CPR and Valuation NI and SAMREC Compliant CPR on Grootboom for JSE and TSX Listing
2009 Platmin Pty Ltd Platinum CPR and Valuation NI and SAMREC Compliant CPR for Loskop for JSE and TSX Listing
2009 Platmin Pty Ltd Platinum CPR and Valuation NI and SAMREC Compliant CPR on numerous platinum projects for JSE and TSX Listing
2009 African Precious Minerals Gold Technical Statement Summary Technical Statement for Monarch Gold Mine
Mozambique 2008 Abalengani Platinum CPR and Valuation CPR for listing of tailings re-treatment project 2008 Taung Gold Limited Gold CPR and Valuation Consolidated CPR of six mineral assets for JSE Listing
2008 African Minerals Diamonds Prospectivity review and valuation
Prospectivity Review and valuation of exploration licences
2008 African Minerals Diamonds CPR and Valuation CPR and valuation of operating alluvial mine 2008 Quinisele Resources Lead Zinc Due Diligence Due Diligence of a mine in Zambia
2008 African Mineral Trading and Exploration (Pty) Ltd
Tantalite Competent Persons Report
Preparation of CPR on mineral resources and refinery for proposed 2008 listing
2008 African Mineral Trading and Exploration (Pty) Ltd
Tantalite Sample Trail Audit Current- design of sample trail audit and exploration protocols for Mozambique tantalite operation
2008 Kimberley Consolidated Mining Limited
Diamonds Sample Trail Audit Current- design of an internationally compliant sample trail audit and exploration programme protocol for KCM's mining operations and resource defining exploration
2008 Kimberley Consolidated Mining Limited
Diamonds Presentation for JSE and Investor Panels
Preparation and presentation of technical and economic parameters of the KCM operation
2008 Ukuvula Diamonds Prospectivity Review Prospectivity of alluvial and primary kimberlite deposits in the Christiana and Warrenton area of South Africa
2008 Kimberley Consolidated Mining limited
Diamonds Prospectivity Review Alluvial diamond deposits on the Harts River South Africa
2008 CVS Management Copper and gold Prospectivity Review Copper and gold prospects in the Middle Atlas, Morocco
2008 Signature Brands Gold, uranium Prospectivity Review Prospectivity Report on six gold, uranium and base
– IV-167 –

Taung Gold CPR February 2011
140
YEAR CLIENT COMMODITY TYPE OF STUDY PROJECT DESCRIPTION Limited and base
metals metals prospects in greenstone belts, Uganda
2007 The Rohatyn Group Platinum Due Diligence
High level Due Diligence of the Wesizwe Platinum Project in the Bushveld Igneous Complex, South Africa. Examination of legal, technical, processing and economic studies to give comfort for proposed Rohatyn investment
2007 Lindhurst Mining Iron ore Prospectivity Review Prospectivity review of iron ore deposits in near Honde Mozambique
2007 Lindhurst Mining Iron ore Prospectivity Review Prospectivity review of iron ore prospects in Brazil
2007 Matterhorn Investments
Uranium and base metals Prospectivity Review Prospectivity Report on four uranium and base metals
prospects in Zambia
2007 Caledonia Mining Corporation Gold Information
Memorandum Information Memorandum for the Proposed Disposal by Caledonia Mining Corporation of the Barbrook Gold Mine
2007 Caledonia Mining Corporation Gold Information
Memorandum
Information Memorandum for the Proposed Disposal by Caledonia Mining Corporation of the Eersteling Gold Mine
2007 Uramin Gold and Base Metals Prospectivity Review Prospectivity Report on the Adjaria Gold and Base
Metals Prospect, Adjaria, Georgia
2007 Rockwell Diamonds Inc
Alluvial Diamonds NI43-101
Compilation and Conversion to NI41-101 of the Technical Advisors Report Trans Hex Group Limited’s Middle Orange River Operations South Africa.
2007 Energem Diamonds Competent Persons Report for AIM
Compilation of the Competent Persons Report on the Diamond and Oil and Gas Assets of Energem in CAR and Chad for listing on AIM
2007 Kimberley Consolidated Mining Diamonds Sampling protocols and
Exploration Programme
Sampling Protocols and Proposed Drilling Programme for The Shone Kimberlite in Cater Block for Kimberley Consolidated Mining
2007 Kimberley Consolidated Mining Diamonds
Competent Persons Report (SAMREC) for JSE
Compilation of Independent Techno-Economic Valuation Report in the Form of a Competent Person’s Report Prepared for the Mineral Assets of Kimberley Consolidated Mining Limited for listing on the JSE
1980 1984 De Beers Diamonds Research Report
Four year comprehensive research project on De Beers kimberlite pipes in Botswana including petrographic, mineralogical, mineral chemistry and whole rock geochemistry.
1982 De Beers Diamonds Research study Research project as part of a post graduate study on carbonatites in Namibia and their genetic relationship to kimberlites
Key Qualifications:
Fiona Harper studied at the University of the Witwatersrand and her major subjects were geology and geography. As part of her studies she undertook geochemical studies of chromitites in the Bushveld Igneous Complex. She worked for Anglo American Research Laboratories where she was responsible for all the geochemical and mineral chemistry analysis for the exploration teams and mine operations of De Beers in Botswana, as well as the forward looking research on the genesis and economic potential of all the kimberlites in Botswana. She undertook a three year research project on the geochemistry of carbonatites in Namibia. She joined Venmyn in 2007 as an Advisor and has specialised in creating compliant CPRs for listings on the JSE and international stock exchanges. Education:
DEGREE/DIPLOMA FIELD INSTITUTION YEAR B.Sc Geology and Geography University of the Witwatersrand 1977 B.Sc (Hons) Geology University of the Witwatersrand 1977
Employment Record:
POSITION COMPANY JOB DESCRIPTION DURATION
Senior Research Mineralogist
Anglo American Research Laboratories
Petrographic, mineral chemistry, geochemical analysis of samples for both base metal and diamonds exploration teams. Research project on 7kimberlites in Botswana Research project on carbonatites in Namibia
1978--1983
Languages:
English: Excellent Afrikaans: Fair
– IV-168 –

Taung Gold CPR February 2011
141
Certification:
I, the undersigned, certify that to the best of my knowledge and belief, the above summary correctly describes my qualifications, and experience.
Date: 11th February 2011 Full name of staff member: Fiona Jane Harper
– IV-169 –

The following is the text of a report prepared for the purpose of incorporation in this
circular received from BMI Appraisals Limited, an independent valuer, in connection with its
valuation as at 30 April 2011 of the fair market value of the 100% interest in the gold mine
projects named Evander Project and Jeanette Project, located in the Republic of South Africa.
www.bmi-appraisals.com
33rd Floor, Shui On Centre, Nos. 6-8 Harbour Road, Wanchai, Hong Kong香港灣仔港灣道6-8號瑞安中心33樓
28 July 2011
The Directors
Wing Hing International (Holdings) Limited
Unit 1901, 19/F, Nina Tower
8 Yeung Uk Road
Tsuen Wan
New Territories
Hong Kong
Dear Sirs,
INSTRUCTIONS
We refer to the instructions from Wing Hing International (Holdings) Limited
(referred to as the ‘‘Company’’) for us to provide our opinion on the fair market value of the
100% interest in the gold mine projects named Evander Project and Jeanette Project
(collectively referred to as the ‘‘Gold Mines’’), located in the Republic of South Africa
(referred to as ‘‘South Africa’’) as at 30 April 2011.
This report presents on the basis of valuation, the background of the Gold Mines, an
industry overview, the source of information, the scope of work and the valuation
assumptions. It also explains the valuation methodology utilized and presents our
conclusion of value.
BASIS OF VALUATION
Our valuation has been carried out in accordance with the ‘‘Code for the Technical
Assessment and Valuation of Mineral and Petroleum Assets and Securities for Independent
Expert Reports’’ (VALMIN Code).
APPENDIX V THE VALUATION REPORT
– V-1 –

The valuation has been carried out on the basis of fair market value. Fair market value
is defined as ‘‘the amount of money (or the cash equivalent of some other consideration)
determined for which an asset change hands on the valuation date in an open and
unrestricted market between a willing buyer and a willing seller in an arm’s length
transaction, with each party acting knowledgeably, prudently and without compulsion’’.
BACKGROUND OF THE GOLD MINES
The Evander Project and the Jeanette Project are the primary assets held by Taung
Gold Limited (referred to as ‘‘Taung’’). Taung is principally engaged in exploration and
development of gold and associated minerals in South Africa. Taung holds prospecting
rights in respect of various gold exploration projects in Mpumalanga, Limpopo, Gauteng,
North West and Free State Provinces of South Africa. The mineral assets have been
consolidated into a focused entity whose intention is to develop its two highly prospective
flagship projects, Evander Project and Jeanette Project. Evander Project and Jeanette
Project are gold exploration projects for which scoping studies (referred to as the ‘‘Scoping
Studies’’) have been completed and for which Pre-Feasibility Studies (referred to as the
‘‘PFS’’) and Bankable Feasibility Studies (referred to as the ‘‘BFS’’) have been
commissioned. As advised by the Company, the PFS is in progress and is expected to
meet the schedule to be finalized in the 1st quarter in year 2012.
Evander Project is located within the eastern Evander Goldfield on the northeastern
limb of the Witwatersrand Basin. Evander comprises of two adjacent areas, namely Six
Shaft Area and Twistdraai Area, which collectively occupies an area of 5,129 ha. According
to a technical report (referred to as the ‘‘Competent Person’s Report’’) prepared by an
independent technical advisor, Venmyn Rand (Pty) Ltd. (referred to as the ‘‘Competent
Person’’) dated 11 February 2011, Evander holds a mining right (mining right no.: MP30/5/
1/2/2/126MR Mining Right 107/2010). The total probable reserve of Evander was 8,640,000
tonnes.
Jeanette Project is situated northeast of Welkom on the southwest margin of the
Witwatersrand Basin and in the Free State Province of South Africa. According to
Competent Person’s Report, Jeanette holds a prospecting right (prospecting right no: FS30/
5/1/1/2/895PR) with an area of 3,886 ha. The total probable reserve of Jeanette was
22,254,000 tonnes.
Mining Area JORC Classification Tonnes (t)
Evander Project Probable 8,640,000
Jeanette Project Probable 22,254,000
Total: Probable 30,894,000
APPENDIX V THE VALUATION REPORT
– V-2 –

INDUSTRY OVERVIEW
Global Gold Industry
According to World Gold Council, the annual gold demand of 3,812 tonnes in year
2010 has reached a ten year high. Despite of the 26% increase in annual average gold price
as compared to the previous year, the full year demand in year 2010 was up 9% within the
same period.
The gold demand can be divided into three categories: jewellery, technology (including
electronics, other industrial and dentistry) and investment. Jewellery consistently accounts
for the largest share of final demand at around 54% of total gold demand in year 2010.
Technology accounts for about 11% and the remaining portion in year 2010 was investment
demand.
Based on the World Gold Council’s latest report for the year 2010, the average yearly
gold price of US$1,224.5 per ounce was 26% above the average of year 2009 and 40% above
that of year 2008. The growth in the previous year was due to a strong recovery growth in
jewellery demand of 17%, a solid growth in technology of 12% and a slight decline in
investment of 2%.
The annual supply of gold comes from mine production, recycled gold scraps and net
sales of gold by central banks, which together amount to 4,108 tonnes, of which around
2,543 tonnes of the total supply came from mine production.
Details of gold demand and supply are shown as below:
Unit: Tonnes 2009 2010 Q3’2009 Q4’2009 Q3’2010 Q4’2010
% Change
Q4’2010 vs
Q4’2009
% Change
2010 vs
2009
Supply
Mine production 2,584 2,659 682 676 702 695 3 3
Net producer
hedging -252 -116 -97 -125 -67 -37 — —
Total Mine Supply 2,332 2,543 586 552 635 658 19 9
Official Sector Sales 30 -87 -11 -13 -20 13 — —
Recycled Gold 1,672 1,653 297 403 384 470 17 1
Total Supply: 4,034 4,108 872 942 999 1,141 21 2
Demand
Jewellery 1,760 2,060 490 511 541 575 13 17
Technology 373 420 97 103 108 104 1 12
Investment 1,360 1,333 241 244 294 276 13 -2
Total Demand: 3,493 3,812 828 858 943 956 11 9
Source: GFMS
APPENDIX V THE VALUATION REPORT
– V-3 –
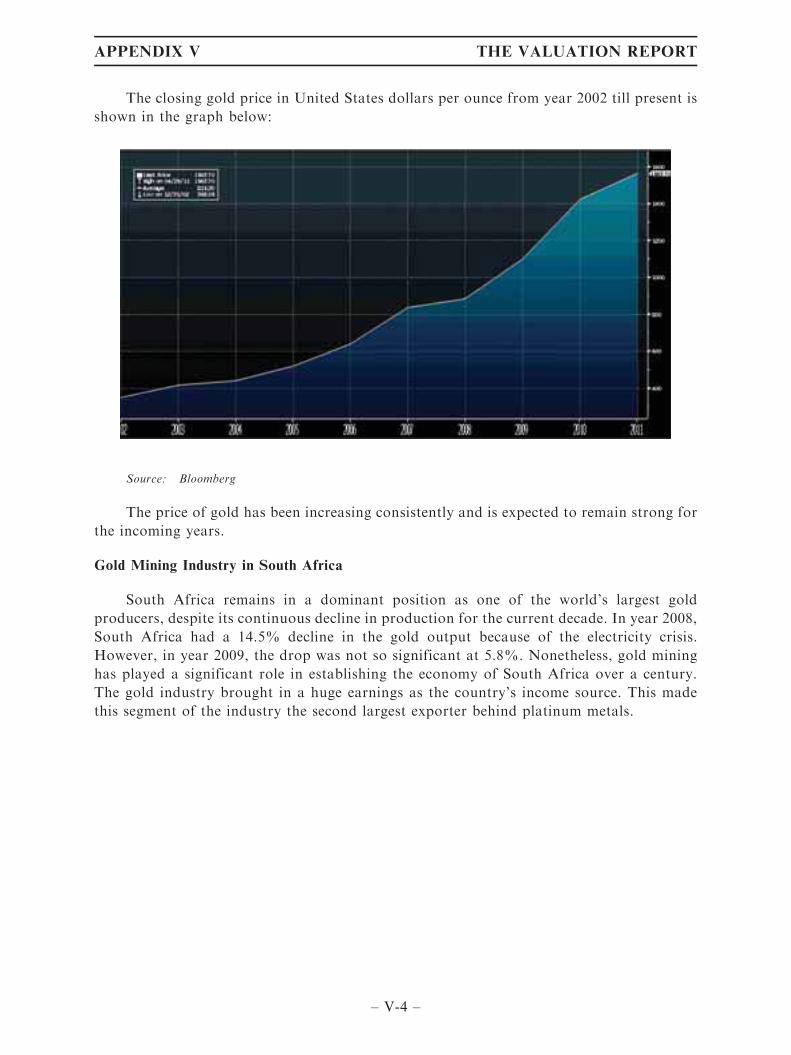
The closing gold price in United States dollars per ounce from year 2002 till present is
shown in the graph below:
Source: Bloomberg
The price of gold has been increasing consistently and is expected to remain strong for
the incoming years.
Gold Mining Industry in South Africa
South Africa remains in a dominant position as one of the world’s largest gold
producers, despite its continuous decline in production for the current decade. In year 2008,
South Africa had a 14.5% decline in the gold output because of the electricity crisis.
However, in year 2009, the drop was not so significant at 5.8%. Nonetheless, gold mining
has played a significant role in establishing the economy of South Africa over a century.
The gold industry brought in a huge earnings as the country’s income source. This made
this segment of the industry the second largest exporter behind platinum metals.
APPENDIX V THE VALUATION REPORT
– V-4 –

South Africa is also one of the countries with the top three amounts of reserves. The
following chart illustrates the global distribution of gold reserves:
National Distribution in Gold Reserves
Source: USGS, 2011
SOURCE OF INFORMATION
For the purpose of our valuation, we have been furnished with the information in
respect of the Gold Mines provided by the senior management of the Company. The
valuation required the consideration of all pertinent factors, including, but not limited to,
the following:
. The nature of the Gold Mines including the industry sector and the geographical
location in which the Gold Mines are currently exposed to or will be exposed to;
. The information in respect of the Gold Mines provided by the senior management
of the Company;
. The information in respect of the Gold Mines as stated in the Competent Person’s
Report;
. The specific economic environment and competition for the market in which the
Gold Mines are currently exposed to or will be exposed to; and
. The financial and business risks that will materially affect the operation of the
Gold Mines.
APPENDIX V THE VALUATION REPORT
– V-5 –

SCOPE OF WORK
In the course of our valuation work, the following processes have been conducted to
evaluate the reasonableness of the adopted basis and assumptions provided by the senior
management of the Company:
. Conducted on-site inspections to investigate the Gold Mines;
. Interviews with the senior management of the Company and Taung to obtain all
relevant information in respect of the Gold Mines;
. Examined the relevant bases and assumptions of the information in respect of the
Gold Mines provided by the senior management of the Company;
. Examined the relevant bases and assumptions of the information in respect of the
Gold Mines as stated in the Competent Person’s Report;
. Conducted appropriate research to obtain sufficient market data and statistical
figures and prepared the valuation based on generally accepted valuation
procedures and practices; and
. Presented the basis of valuation, the background of the Gold Mines, an industry
overview, the source of information, the scope of work, the valuation
assumptions, the valuation methodology and our conclusion of value in this
report.
VALUATION ASSUMPTIONS
Due to the changing environment in which the Gold Mines are currently exposed to or
will be exposed to, the following assumptions have been adopted in order to sufficiently
support our conclusion of value:
. All requisite licenses and permits issued by any authorized entities that will
materially affect the operation of the Gold Mines have been obtained or can be
obtained upon request;
. There will be no material change in the political, legal, fiscal, technological,
market and economic conditions in the jurisdiction where the Gold Mines are
currently exposed to or will be exposed to;
. The core operation of the Gold Mines will not differ materially from those of
present or expected;
. The information in respect of the Gold Mines has been prepared on a reasonable
basis after due and careful consideration by the senior management of the
Company;
APPENDIX V THE VALUATION REPORT
– V-6 –
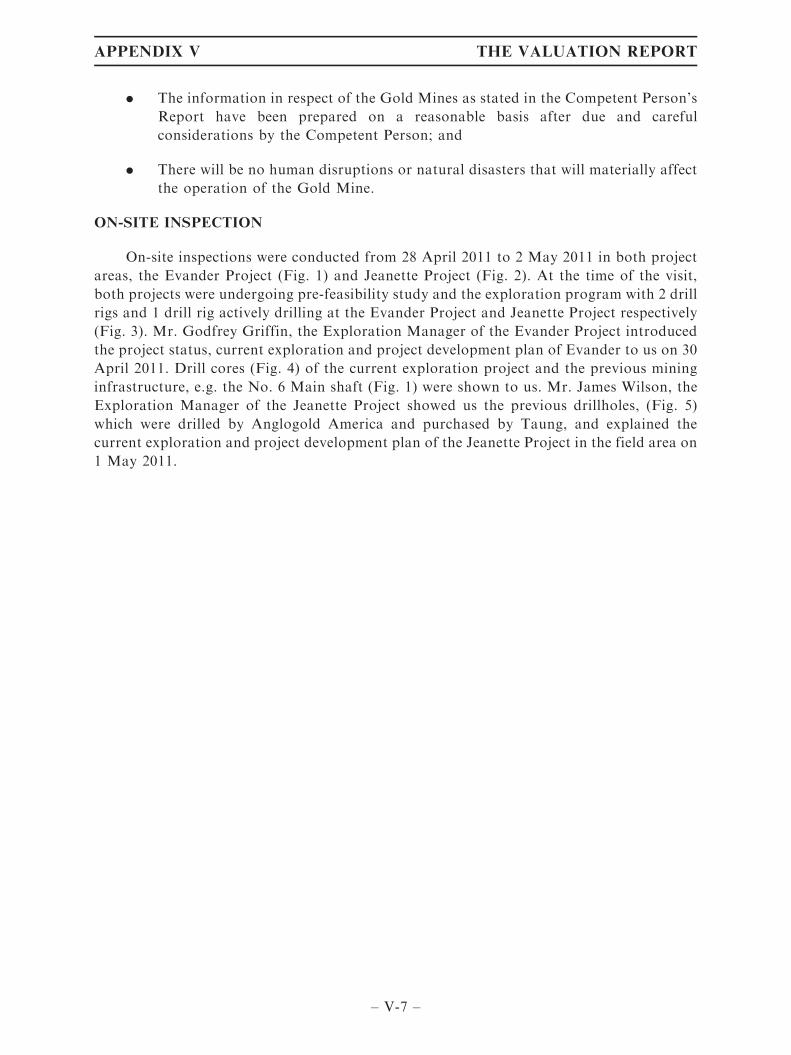
. The information in respect of the Gold Mines as stated in the Competent Person’s
Report have been prepared on a reasonable basis after due and careful
considerations by the Competent Person; and
. There will be no human disruptions or natural disasters that will materially affect
the operation of the Gold Mine.
ON-SITE INSPECTION
On-site inspections were conducted from 28 April 2011 to 2 May 2011 in both project
areas, the Evander Project (Fig. 1) and Jeanette Project (Fig. 2). At the time of the visit,
both projects were undergoing pre-feasibility study and the exploration program with 2 drill
rigs and 1 drill rig actively drilling at the Evander Project and Jeanette Project respectively
(Fig. 3). Mr. Godfrey Griffin, the Exploration Manager of the Evander Project introduced
the project status, current exploration and project development plan of Evander to us on 30
April 2011. Drill cores (Fig. 4) of the current exploration project and the previous mining
infrastructure, e.g. the No. 6 Main shaft (Fig. 1) were shown to us. Mr. James Wilson, the
Exploration Manager of the Jeanette Project showed us the previous drillholes, (Fig. 5)
which were drilled by Anglogold America and purchased by Taung, and explained the
current exploration and project development plan of the Jeanette Project in the field area on
1 May 2011.
APPENDIX V THE VALUATION REPORT
– V-7 –
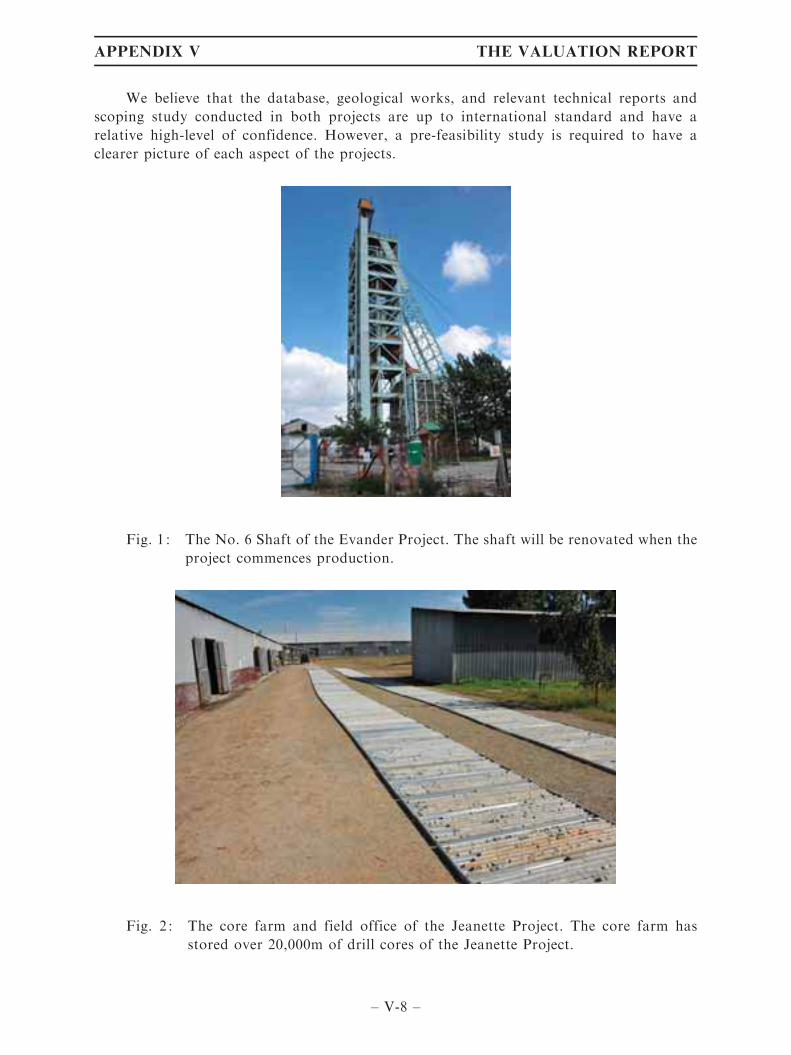
We believe that the database, geological works, and relevant technical reports and
scoping study conducted in both projects are up to international standard and have a
relative high-level of confidence. However, a pre-feasibility study is required to have a
clearer picture of each aspect of the projects.
Fig. 1 : The No. 6 Shaft of the Evander Project. The shaft will be renovated when the
project commences production.
Fig. 2 : The core farm and field office of the Jeanette Project. The core farm has
stored over 20,000m of drill cores of the Jeanette Project.
APPENDIX V THE VALUATION REPORT
– V-8 –
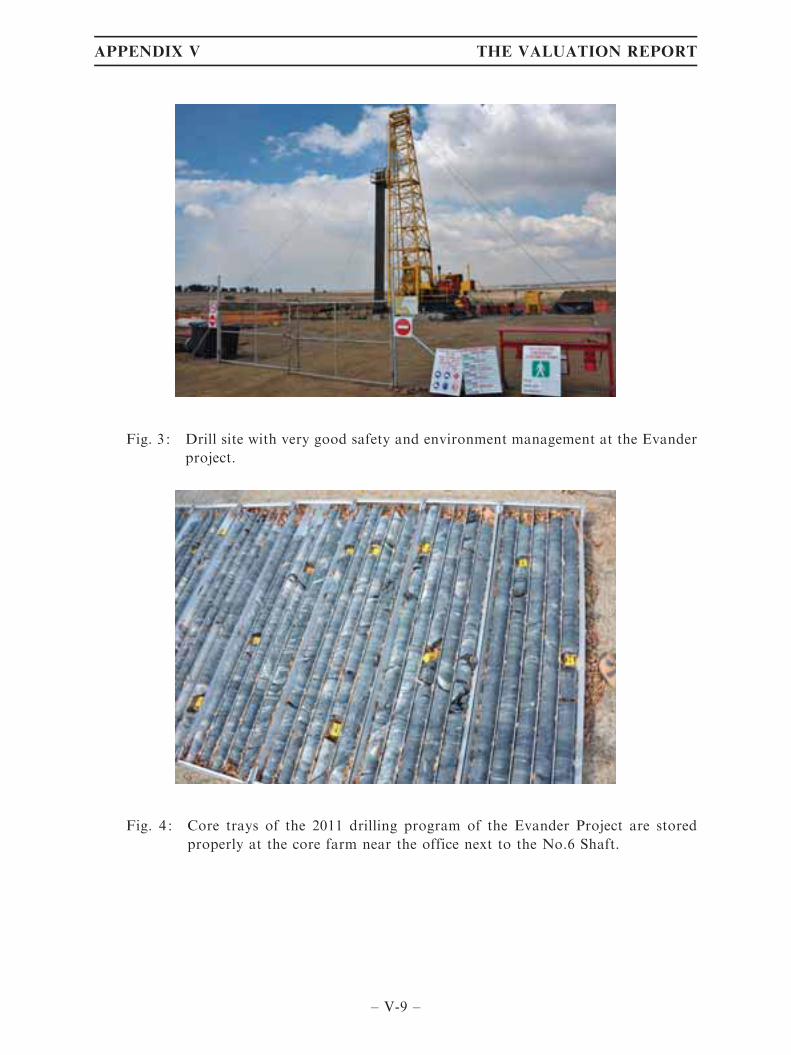
Fig. 3 : Drill site with very good safety and environment management at the Evander
project.
Fig. 4 : Core trays of the 2011 drilling program of the Evander Project are stored
properly at the core farm near the office next to the No.6 Shaft.
APPENDIX V THE VALUATION REPORT
– V-9 –

Fig. 5 : Mineralized intercept which obtains 50.4 g/t over a length of *20cm (i.e. 1m
at 10g/t roughly) from an old drillhole of the Jeanette Project.
VALUATION METHODOLOGY
The Valuation Approaches
The following generally accepted valuation approaches have been considered in the
valuation:
1. The cost approach provides an indication of value based on the principle that an
informed buyer would pay no more than the cost of producing a substitute asset
with equal utility as the subject asset;
2. The market approach provides an indication of value by comparing the subject
asset to similar assets that have been sold in the market, with appropriate
adjustments for the differences between the assets; and
3. The income approach provides an indication of value based on the principle that
an informed buyer would pay no more than the present value of anticipated future
economic benefits generated by the subject asset.
Among the three approaches, the cost approach was regarded not appropriate in the
valuation, as it only considers the costs of recreating the Gold Mines and the costs may not
represent the market value since it does not directly incorporate information about the
economic benefits contributed by the underlying asset. While for market approach, the
value mainly is determined by an approximate transaction price in the market as a
reference. As it is concerned that available public information in the market generally
involves specific buyers’ consideration involves a premium or discount under corresponding
APPENDIX V THE VALUATION REPORT
– V-10 –

unique circumstances. This makes it difficult to know if the price paid truly represents the
approximate value of the underlying asset. Thus, the income approach was considered to be
the most appropriate valuation approach in this valuation, as it takes the future growth
potential and asset-specific issues of the Gold Mines into consideration.
Under the income approach, the Discounted Cash Flow (DCF) method was adopted.
In applying the DCF method, the free cash flows for each year in the future were
determined. The results were then discounted using a discount rate, or the cost of capital, to
determine the present value of the expected cash flows.
Reserves
As stated in the Competent Person’s Report, Evander Project consists of measured
indicated and inferred resources while Jeanette Project consists of indicated and inferred
resources. The mineral resources were being converted to probable mineral reserves by
applying consideration factors such as pillar loss, mining loss, dilution and mine call factor
etc. Only measured and indicated resources are taken into account of the conversion from
mineral resources to probable reserves. And the amounts of estimated probable reserves as
stated in the Competent Person’s Report were adopted in the valuation.
The consolidated mineral resource estimate and the probable reserves estimate of
Evander and Jeanette are presented respectively in the table below:
Mining Area
Total Mineral
Resources
(Tonnes)
Probable Reserves
(Tonnes)
Evander Project 29,557,000 8,640,000
Jeanette Project 62,910,000 22,254,000
Total: 92,467,000 30,894,000
Production Schedule
According to the Competent Person’s Report, both Evander Project and Jeanette
Project are expected to start its production in year 2015. Based on the total estimated
reserve and the production capacity of the Gold Mines, the mine life would approximately
end in year 2027 and year 2030 for Evander Project and Jeanette Project respectively. The
following tables are the ore production schedule as extracted from the Competent Person’s
Report for Evander Project and Jeanette Project respectively:
(i) Production Schedule of Evander Project:
Year 2015 2016 2017 2018 2019 2020 2021 2022
Units
(Million Tonnes) 0.09 0.18 0.18 0.17 0.19 0.25 0.68 1.09
Source: Competent Person’s Report
APPENDIX V THE VALUATION REPORT
– V-11 –

With reference to the Competent Person’s Report, the average annual ore production
would be 1,150,000 tonnes per annum for years after 2022.
(ii) Production Schedule of Jeanette Project:
Year 2015 2016 2017 2018 2019
Units (Tonnes) 6,283 132,435 920,599 1,599,926 1,618,186
Source: Competent Person’s Report
With reference to the Competent Person’s Report, the average annual ore production
would be 1,630,000 tonnes per annum for years after 2019.
Operating Cost
According to the Competent Person’s Report, the estimated operating costs of Evander
Project is US$80.88 per tonne and that of Jeanette Project is US$74.48 per tonne. The
detailed breakdown of the corresponding operating costs as extracted from the Competent
Person’s Report please refers to the following tables:
(i) Operating Cost of Evander Project:
Description
Operating Cost
(US$/t)
Mining Costs 52.71
Processing Cost (Excluding Services) 4.88
Analytical Cost (Excluding Services) 0.19
Smelting and Treatment Charges 0.58
Services 11.28
Administration and Overhead Costs 11.24
Total Operating Cost: 80.88
Source: Competent Person’s Report
APPENDIX V THE VALUATION REPORT
– V-12 –
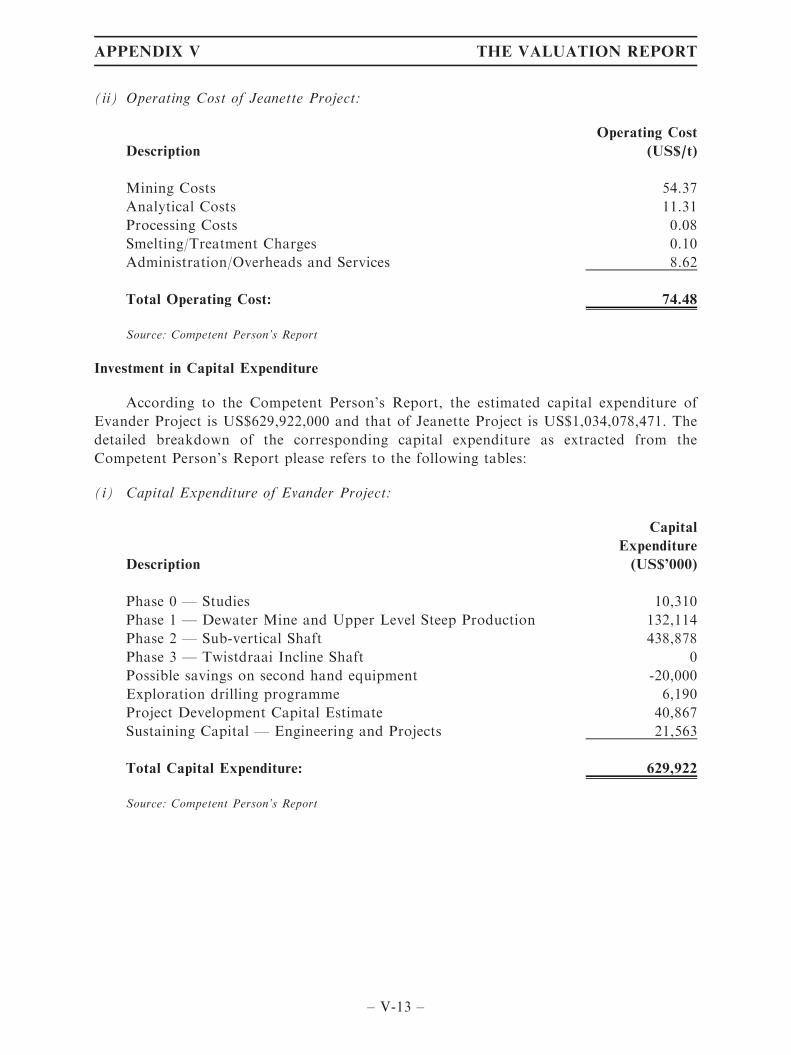
(ii) Operating Cost of Jeanette Project:
Description
Operating Cost
(US$/t)
Mining Costs 54.37
Analytical Costs 11.31
Processing Costs 0.08
Smelting/Treatment Charges 0.10
Administration/Overheads and Services 8.62
Total Operating Cost: 74.48
Source: Competent Person’s Report
Investment in Capital Expenditure
According to the Competent Person’s Report, the estimated capital expenditure of
Evander Project is US$629,922,000 and that of Jeanette Project is US$1,034,078,471. The
detailed breakdown of the corresponding capital expenditure as extracted from the
Competent Person’s Report please refers to the following tables:
(i) Capital Expenditure of Evander Project:
Description
Capital
Expenditure
(US$’000)
Phase 0 — Studies 10,310
Phase 1 — Dewater Mine and Upper Level Steep Production 132,114
Phase 2 — Sub-vertical Shaft 438,878
Phase 3 — Twistdraai Incline Shaft 0
Possible savings on second hand equipment -20,000
Exploration drilling programme 6,190
Project Development Capital Estimate 40,867
Sustaining Capital — Engineering and Projects 21,563
Total Capital Expenditure: 629,922
Source: Competent Person’s Report
APPENDIX V THE VALUATION REPORT
– V-13 –
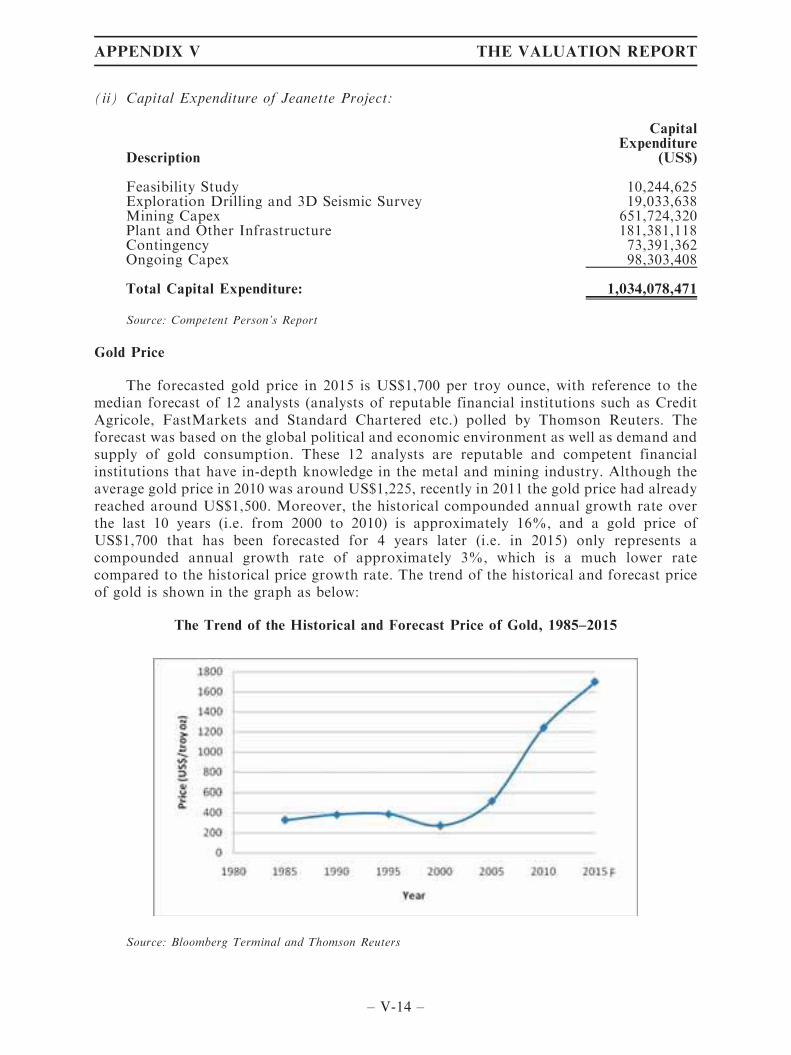
(ii) Capital Expenditure of Jeanette Project:
Description
CapitalExpenditure
(US$)
Feasibility Study 10,244,625Exploration Drilling and 3D Seismic Survey 19,033,638Mining Capex 651,724,320Plant and Other Infrastructure 181,381,118Contingency 73,391,362Ongoing Capex 98,303,408
Total Capital Expenditure: 1,034,078,471
Source: Competent Person’s Report
Gold Price
The forecasted gold price in 2015 is US$1,700 per troy ounce, with reference to themedian forecast of 12 analysts (analysts of reputable financial institutions such as CreditAgricole, FastMarkets and Standard Chartered etc.) polled by Thomson Reuters. Theforecast was based on the global political and economic environment as well as demand andsupply of gold consumption. These 12 analysts are reputable and competent financialinstitutions that have in-depth knowledge in the metal and mining industry. Although theaverage gold price in 2010 was around US$1,225, recently in 2011 the gold price had alreadyreached around US$1,500. Moreover, the historical compounded annual growth rate overthe last 10 years (i.e. from 2000 to 2010) is approximately 16%, and a gold price ofUS$1,700 that has been forecasted for 4 years later (i.e. in 2015) only represents acompounded annual growth rate of approximately 3%, which is a much lower ratecompared to the historical price growth rate. The trend of the historical and forecast priceof gold is shown in the graph as below:
The Trend of the Historical and Forecast Price of Gold, 1985–2015
Source: Bloomberg Terminal and Thomson Reuters
APPENDIX V THE VALUATION REPORT
– V-14 –
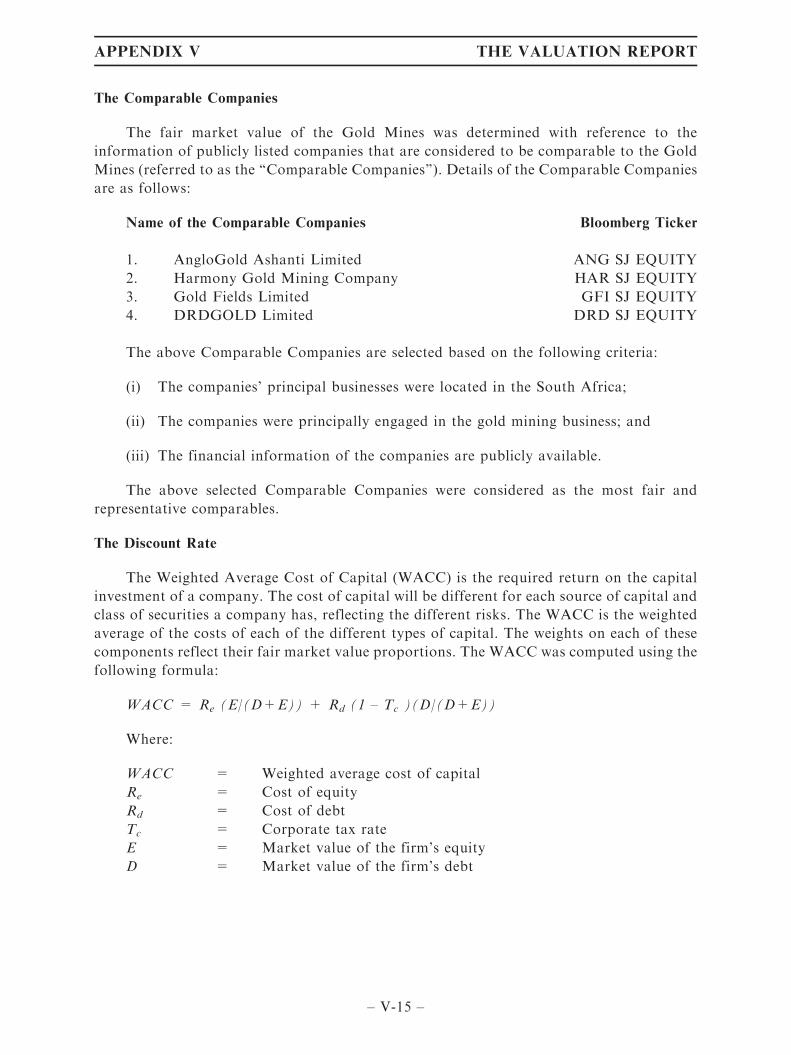
The Comparable Companies
The fair market value of the Gold Mines was determined with reference to the
information of publicly listed companies that are considered to be comparable to the Gold
Mines (referred to as the ‘‘Comparable Companies’’). Details of the Comparable Companies
are as follows:
Name of the Comparable Companies Bloomberg Ticker
1. AngloGold Ashanti Limited ANG SJ EQUITY
2. Harmony Gold Mining Company HAR SJ EQUITY
3. Gold Fields Limited GFI SJ EQUITY
4. DRDGOLD Limited DRD SJ EQUITY
The above Comparable Companies are selected based on the following criteria:
(i) The companies’ principal businesses were located in the South Africa;
(ii) The companies were principally engaged in the gold mining business; and
(iii) The financial information of the companies are publicly available.
The above selected Comparable Companies were considered as the most fair and
representative comparables.
The Discount Rate
The Weighted Average Cost of Capital (WACC) is the required return on the capital
investment of a company. The cost of capital will be different for each source of capital and
class of securities a company has, reflecting the different risks. The WACC is the weighted
average of the costs of each of the different types of capital. The weights on each of these
components reflect their fair market value proportions. The WACC was computed using the
following formula:
WACC = Re (E/(D+E)) + Rd (1 – Tc )(D/(D+E))
Where:
WACC = Weighted average cost of capital
Re = Cost of equity
Rd = Cost of debt
Tc = Corporate tax rate
E = Market value of the firm’s equity
D = Market value of the firm’s debt
APPENDIX V THE VALUATION REPORT
– V-15 –

The WACC comprises two components: the cost of equity and the cost of debt. The
cost of equity was determined using the Capital Asset Pricing Model (CAPM). The CAPM
describes the relationship between the risk of a particular asset, its market price and the
expected return to the investor, that investors required additional return to compensate
additional risk associated. The CAPM was computed using the following formula:
Re = Rf +b* MRP
Where:
Re = Cost of equity
Rf = Risk-free rate
b = Beta coefficient
MRP = Market risk premium
As the South Africa government bonds are not actually default-free, the yield rate of
the 10-year United States Treasury Bonds of 3.29% as extracted from Bloomberg was
adopted as the long term risk-free rate in the valuation of business or asset with long
projected life.
The beta coefficient measures the systematic risk of an asset relative to the overall
market. To determine the beta coefficient, the unlevered betas of the Comparable
Companies were calculated by removing the effects of financial leverage from the betas
as extracted from Bloomberg. The average of the unlevered betas of the Comparable
Companies was then being relevered based on the expected weight of debt applied in the
valuation. Thus, the beta coefficients were calculated as 0.458.
The market risk premium represents the additional return required by an investor as
compensation for investing in equities rather than a risk-free instrument. In the valuation,
the market risk premium of South Africa of 6.93%. The market risk premium of the United
States was determined with reference to the Risk Premia over Time Report 2010 published
by Ibbotson Associates and the country risk premium of South Africa was estimated with
reference to relative volatility between S&P 500 Index and equity index of South Africa.
Having considered that the Gold Mines are located in the South Africa, the principle of
purchasing power parity is applied to convert the cost of equity in terms of United States
dollars into a cost of equity in terms of local currency. Furthermore, an additional premium
of 3.50% was added to the cost of equity after careful consideration in respect of the
specific status, conditions and risk factors of the Gold Mines.
The cost of debt of 9.00% as extracted from Bloomberg was determined based on the
expected lending rate in South Africa. Since the interest paid on debts are tax-deductible
expense, the cost of the company to obtain debt funds is less than the required rate of return
of the suppliers of the debt capital. The after-tax cost of debt was calculated by multiplying
one minus the corporate tax rate of the tax rate of the Gold Mines by the cost of debt. The
after-tax cost of debt was 6.26%.
APPENDIX V THE VALUATION REPORT
– V-16 –
The weight of debt of 7.61% was determined by the average of the weights of debt of
the comparable companies, assuming the weight of debt of the Gold Mines moves toward
that of the average of the comparable companies over time as the average weight provides
an indication on capital structure of the industry.
As a result, the WACC of the Gold Mines was calculated as 13.04% and it was applied
on the estimated future cash flows to arrive at the present value of cash flows.
The Discount for the Lack of Marketability
The concept of marketability deals with the liquidity of an ownership interest, that is,
how quickly and easily it can be converted into cash if the owner chooses to sell. The
discount for lack of marketability is a downward adjustment factor applied on the present
value of cash flows to reflect the business’s or asset’s marketability in order to determine the
fair market value.
15% has been adopted as the discount for the lack of marketability for controlling
interest. The discount for lack of marketability is considered fair and reasonable after
considering i) the average rate obtained from relevant studies on discount on lack of
marketability for controlling interest; ii) the fact that gold mines in South Africa is
relatively marketable.
RISK FACTORS
. Reliance on the Reserves Estimate
The valuation is dependent, to a large extent on the amount of estimated reserves as
stated in the Competent Person’s Report as it is the only source of operating income of the
Gold Mines. Any change of the reserves amount requires relevant adjustments and the
valuation result would differ. As mentioned in the Competent Person’s Report, both PFS
on Evander Project and Jeanette Project have not been completed yet, the reserves
calculation is mainly relied on the Scoping Study. There is potential that the reserves maybe
adjusted after the PFS when a more detailed mine plan, more detailed investigations and
studies will be ready.
. Consideration on the Natural Barrier of Evander Project
There comes into concern that there is potential influx of underground water into the
Evander Project. Although there is a natural barrier present to prevent such issue, the
effectiveness of the natural barrier can only be more clearly addressed when the PFS or even
BFS is ready.
. Granting of the Mining License of Jeanette Project
Jeanette Project currently holds a prospecting right (prospecting right no: FS30/5/1/1/
2/895PR) with an area of 3,886 ha. The Company and legal opinion has advised that the
mining license of Jeanette Project could be obtained without substantial time and cost. Such
factor has been taken into account in the valuation.
APPENDIX V THE VALUATION REPORT
– V-17 –

. Potential Geotechnical Challenge at Jeanette Project
The targeted Basal Reef at Jeanette Project is overlain by a succession of quartzite and
Khaki Shale. The thickness of the Khaki Shale in the target area can be up to 2.8m. The
proximity of the Shale to the Basal Reef varies across the property and may result in
unfavourable geotechnical conditions. The Company is actively pursuing a risk mitigation
approach to this matter and the results of this work will be applied during the PFS and BFS.
UPSIDE POTENTIAL OF THE GOLD MINES
. Additional drilling is expected to upgrade the inferred resources to indicated category
upon full PFS and thus presenting potential for converting these to mineral reserves at
later stage;
. Additional economic reef zones might be identified upon full PFS;
. Additional tonnage processed might be resulted through the plant of improved
availability and control; and
. Costs might be able to be reduced due to increased mechanization in the stoping
environment, as stated in the Competent Person’s Report for Evander Project
SENSITIVITY ANALYSIS
The sensitivity analysis has been applied to determine the impact of changes in the gold
price on the fair market value of the Gold Mines. The assumed gold price used for the
central case of the sensitivity analysis was the forecasted gold price of US$1,700 per troy
ounce in 2015. 2015 is the estimated first production year as stated in the Competent
Person’s Report. The results of the sensitivity analysis were as follows:
Change in Price
(%)
Concluded Fair Market Value
(US$)
Change in Fair Market Value
(%)
-15% 382,000,000 -37%
-10% 455,000,000 -25%
-5% 527,000,000 -13%
— 605,000,000 0%
+5% 693,000,000 15%
+10% 781,000,000 29%
+15% 870,000,000 44%
REMARKS
For the purpose of our valuation and in arriving at our opinion of value, we have
referred to the information provided by the senior management of the Company to estimate
the value of the Gold Mines. We have also sought and received confirmation from the
Company that no material facts were omitted from the information supplied.
APPENDIX V THE VALUATION REPORT
– V-18 –

To the best of our knowledge, all data set forth in this report are true and accurate.
Although gathered from reliable sources, no guarantee is made nor liability assumed for the
accuracy of any data, opinions, or estimates identified as being furnished by others, which
have been used in formulating this analysis.
Unless otherwise stated, all money amounts stated herein are in United States Dollars
(US$).
CONCLUSION OF VALUE
Our conclusion of value is based on accepted valuation procedures and practices that
rely substantially on the use of numerous assumptions and the consideration of a lot of
uncertainties, not all of which can be easily ascertained or quantified.
Further, whilst the assumptions and consideration of such matters are considered by us
to be reasonable, they are inherently subject to significant business, economic and
competitive uncertainties and contingencies, many of which are beyond the control of the
Company, Taung, the Competent Person or us.
Based on our investigation and analysis outlined in this report, it is our opinion that
the fair market value of the 100% interest in the Gold Mines as at 30 April 2011 was
US$605,000,000 (UNITED STATES DOLLARS SIX HUNDRED AND FIVE MILLION
ONLY).
We hereby certify that we have neither present nor prospective interest in the
Company, Taung, the Competent Person, the Competent Person’s Report, the PFS, the
BFS, the Gold Mines or the result reported.
This report is subject to the limiting conditions attached.
Yours faithfully,
For and on behalf of
BMI APPRAISALS LIMITED
Marco T. C. SzeB.Eng(Hon), PGD(Eng), MBA(Acct),
CFA, AICPA/ABV, RBV, CIM
Director
Grant ThomasB.Sc (Hon), MAusIMM, CP Geology
Consultant
APPENDIX V THE VALUATION REPORT
– V-19 –
Analyzed and reported by:
Derek Chan — Technical Advisor
Paul Lau — Associate Director
Notes:
1. Mr. Marco T. C. Sze is a Chartered Financial Analyst, a member of the American Institute of Certified
Public Accountants (AICPA) and is accredited in Business Valuation by the AICPA. In addition, he is a
Registered Business Valuer under the Hong Kong Business Valuation Forum and a member of the
Canadian Institute of Mining, Metallurgy and Petroleum (CIM).
2. Mr. Grant Thomas took the role of the competent evaluator under Chapter 18 of the Listing Rules for this
valuation. He is a member of the Australasian Institute of Mining and Metallurgy (MAusIMM). He has
over 28 years’ experience in the mineral exploration and mining industry working on gold, coal, copper,
lead, zinc, nickel, uranium, phosphate and diamond commodities. He also has extensive experience in
mineral asset evaluation and valuation. He has previously explored and evaluated mineral projects in
Australia, Brazil, China, Laos and Cambodia. He has been associated with several major base and
precious metal and iron ore discoveries. He has held senior and executive positions in several exploration
and mining companies and has consulted on mineral asset evaluation and valuation and corporate
management.
APPENDIX V THE VALUATION REPORT
– V-20 –
1. THE LOAN NOTE AND THE PUT OPTION AGREEMENTS
The South African Shareholders are holders of TG Shares and are residents of South
Africa. Foreign investments by South African resident shareholders in overseas assets and
companies are subject to foreign exchange control restrictions. In particular, the sale
proceeds from South African assets received from non-residents are not eligible for
retransfer abroad by South African residents. As such, if the South African Shareholders
were issued Wing Hing Shares directly by Wing Hing in consideration for their TG Shares,
they would be restricted from on-selling, transferring or otherwise dealing in such Wing
Hing Shares.
In view of these restrictions, GoldCom, a company incorporated in the British Virgin
Islands, has been introduced to subscribe for Wing Shares and enter into the following
transactions with Wing Hing and the South African Shareholders:
(a) Subscription of Wing Hing Shares by GoldCom under the Acquisition Agreement.
Pursuant to the Acquisition Agreement, Wing Hing has conditionally agreed to
issue the GoldCom Consideration Shares to GoldCom in consideration for the
Loan Note on the First Completion Date.
(b) Grant of put options under the Put Option Agreements. GoldCom and Wing
Hing will, on or prior to First Completion, enter into the Put Option Agreement
with each South African Shareholder pursuant to which GoldCom will grant to
each South African Shareholder the SA Put Option, being a right to sell the TG
Shares owned by him to GoldCom.
(c) On-Market Sale. Under the Put Option Agreement, as and when a South
African Shareholder exercises his SA Put Option, GoldCom will sell on-market a
number of Wing Hing Shares representing the number of TG Shares being sold by
such South African Shareholder, multiplied by the Share Exchange Ratio.
GoldCom will deliver the cash proceeds from such on-market sale to the South
African Shareholder and will transfer the TG Shares to Wing Hing. The principal
amount outstanding under the Loan Note will reduce by the market value of the
corresponding number of Wing Hing Shares upon the transfer of TG Shares to
Wing Hing.
The South African Shareholders hold TG Shares which will represent approximately
8.99% of the issued share capital of Taung Gold as at First Completion.
GoldCom is a third party whose principal business is to engage in investment holding
and related activities and whose sole shareholder and sole director is Mr. Michael Yates,
who is an Other TG Shareholder.
APPENDIX VI THE LOAN NOTE, PUT OPTION AGREEMENT, ELECTRUMOPTION AGREEMENT AND TG OPTIONHOLDER AGREEMENT
– VI-1 –
The key terms of the Put Option Agreement and Loan Note are set out below.
1.2 The Put Option Agreement
Consideration The consideration payable by each South African
Shareholder for the grant of the SA Put Option is ZAR1.00.
Exercise Period The SA Put Option may be exercised at any time within
three years from (and including) the First Completion Date.
Exercise of the SA Put
Option
The SA Put Option shall be exercisable by the relevant
South African Shareholder delivering a put option notice to
GoldCom and an escrow agent (to be appointed by
GoldCom, Wing Hing and the South African Shareholder)
(with a copy to Wing Hing and Taung Gold). Upon the
exercise of the SA Put Option:
— the South African Shareholder shall, amongst other
things, irrevocably instruct GoldCom to sell or procure
the sale of a number of Wing Hing Shares equal to the
number of TG Shares being sold multiplied by the
Share Exchange Ratio, being the Put Option
Consideration Shares;
— GoldCom shall, after the sale of the Put Option
Consideration Shares, deposit the cash proceeds
raised from such sale into an escrow account.
Upon the deposit of the cash proceeds into an escrow
account, the escrow agent shall, amongst other things and in
accordance with joint instructions of Wing Hing and
GoldCom, deposit the cash proceeds into a bank account
of the relevant South African Shareholder.
Following exercise of the SA Put Options by the South
African Shareholders, the transfer of the TG Shares from
GoldCom to Wing Hing shall constitute partial repayment
of the Loan Note by an amount equal to the market value of
the corresponding number of Wing Hing shares.
APPENDIX VI THE LOAN NOTE, PUT OPTION AGREEMENT, ELECTRUMOPTION AGREEMENT AND TG OPTIONHOLDER AGREEMENT
– VI-2 –
Other material terms of
the Put Option
Agreement
The SA Put Options may not be transferred or transmitted
by the South African Shareholders without the prior written
consent of the other parties to the Put Option Agreement. If
any South African Shareholder has not exercised his SA Put
Option in full within the three year exercise period,
GoldCom shall sell or procure the sale of the remaining
Wing Hing Shares it then holds and the cash proceeds from
such sale shall be paid to Wing Hing in partial repayment of
the Loan Note. If the trading price of the Wing Hing Shares
at the time GoldCom sells such Wing Hing Shares is below
the Issue Price, the cash proceeds from the sale of such Wing
Hing Shares, combined with the previous repayments may
not be sufficient to repay the Loan Note in full. As
GoldCom will have no further assets, Wing Hing will
incur a loss by writing down the unsettled Loan Amount.
Wing Hing believes that it is unlikely that SA Put Options
will remain unexercised at the end of the exercise period. At
the First Completion Date, the South African Shareholders
are not holding options to acquire TG Shares; they are
holding issued TG Shares which are fully paid-up. The
exercise of the SA Put Option is the only opportunity for the
South African Shareholders to monetize their shareholdings
in Taung Gold. Accordingly, it is expected that before the
three year exercise period expires, all South African
Shareholders will elect to exercise the SA Put Option even
if the trading price of the Wing Hing Shares is below the
Issue Price. Whenever a South African Shareholder
exercises his SA Put Option, the Loan Note will be repaid
by an amount equal to the value of the TG Shares as at the
date of the Acquisition Agreement. Therefore if the SA Put
Option is exercised in full, Wing Hing will not have any
exposure to a fall in the Wing Hing share price as a result of
having entered into the Loan Note.
If any South African Shareholder wishes to sell all or part of
the TG Shares held by it to a third party during the term of
the Put Option Agreement, he shall first be required to offer
such TG Shares to Wing Hing through GoldCom and Wing
Hing shall, through GoldCom, indicate its acceptance of the
offer of such TG Shares within ten (10) Business Days from
the date of receipt of the offer.
APPENDIX VI THE LOAN NOTE, PUT OPTION AGREEMENT, ELECTRUMOPTION AGREEMENT AND TG OPTIONHOLDER AGREEMENT
– VI-3 –
1.3 The Loan Note
Principal amount HK$464,480,706.98
Payment On written demand, provided that Wing Hing may not
demand repayment of any amount outstanding thereunder
prior to the sale on the Exchange of Wing Hing Shares and
the receipt by GoldCom of an amount equivalent to the cash
proceeds from the sale of the relevant Put Option
Consideration Shares.
Interest Nil
Other material terms Other than its undertaking to sell Wing Hing Shares in
accordance with the terms of the Put Option Agreements,
GoldCom shall not be required to provide any additional
security for payment of the principal amount outstanding
on the Loan Note, and the risk of any reduction in value of
the Wing Hing Shares shall be borne by Wing Hing.
GoldCom may prepay the Loan Note in whole or in part, at
any time, with no penalty.
2. ELECTRUM OPTION AGREEMENT
In addition to the TG Shares held by it prior to First Completion, Electrum also holds
certain warrants giving it the right to acquire further TG Shares — the Electrum TG
Warrants. Pursuant to the Acquisition Agreement, Wing Hing has agreed to enter into the
Electrum Option Agreement with Electrum to conditionally grant Electrum the right to sell
to Wing Hing the TG Shares acquired by Electrum upon its exercise of the Electrum TG
Warrants (being Electrum Option Shares) in consideration for the issue to Electrum of the
Electrum Consideration Shares. Electrum Completion takes place upon completion of the
acquisition of the Electrum Option Shares by Wing Hing.
APPENDIX VI THE LOAN NOTE, PUT OPTION AGREEMENT, ELECTRUMOPTION AGREEMENT AND TG OPTIONHOLDER AGREEMENT
– VI-4 –
The Electrum Option Agreement is subject to the Conditions being satisfied or waived
in accordance with the terms of the Acquisition Agreement. The terms of the Electrum
Option Agreement are subject to the requirements under Chapter 15 of the Listing Rules
and will be subject to the approval of the Exchange and the WH Shareholders at the SGM.
The Electrum Option Agreement does not constitute a share option scheme of Wing Hing
and accordingly, it does not fall within the requirements under Chapter 17 of the Listing
Rules. The key terms of the Electrum Option Agreement are set out below.
Consideration The consideration payable by Electrum under the Electrum
Option Agreement is HK$1.00.
Term of the Electrum
Option Agreement
and the exercise
period
The Electrum Option Agreement automatically terminates
on the day which is one (1) month from (and including) the
First Completion Date in the event that Electrum has not
exercised its right to sell the Electrum Option Shares, or on
the date which is one (1) year from (and including) the date
on which Electrum has exercised its right to sell the
Electrum Option Shares, whichever is later.
Electrum may exercise its right to sell the Electrum Option
Shares to Wing Hing within one (1) month from the First
Completion Date.
Exercise of right to sell
under the Electrum
Option Agreement
Electrum may exercise its right to sell under the Electrum
Option Agreement by delivering to Wing Hing an Electrum
Option Notice. Upon the issue of the Electrum Option
Notice and delivery of the Electrum Option Shares to Wing
Hing, Wing Hing will issue the Electrum Consideration
Shares to Electrum.
Other material terms
under the Electrum
Option Agreement
The right to sell the Electrum Option Shares to Wing Hing
may not be transferred or transmitted by Electrum without
the prior written consent of the other parties to the Electrum
Option Agreement.
3. TG OPTIONHOLDER AGREEMENT
As at the date of the Acquisition Agreement, the TG Optionholders are holders of
options in Taung Gold which entitle them to acquire up to 23,645,210 new TG Shares.
Pursuant to the TG Optionholder Agreement, each TG Optionholder may sell to Wing
Hing or GoldCom up to 80% of the TG shares that can be issued to him following First
Completion. Accordingly, up to 18,916,168 TG Shares may be sold by TG Optionholders to
Wing Hing or GoldCom following First Completion. The Optionholder Agreement is
subject to the Conditions being satisfied or waived in accordance with the terms of the
Acquisition Agreement.
APPENDIX VI THE LOAN NOTE, PUT OPTION AGREEMENT, ELECTRUMOPTION AGREEMENT AND TG OPTIONHOLDER AGREEMENT
– VI-5 –
The right of the TG Optionholders to sell their TG Shares to Wing Hing or GoldCom
(the TG Optionholder Put Option) is granted in accordance with the requirements under
Chapter 15 of the Listing Rules and will be subject to the approval of the Exchange and the
WH Shareholders at the SGM. The Optionholder Agreements do not constitute share
option schemes of Wing Hing and accordingly, do not fall within the requirements under
Chapter 17 of the Listing Rules.
The key terms of the TG Optionholder Agreement are as follows:
Consideration The consideration payable by each TG Optionholder to
each of Wing Hing and GoldCom for the grant of the TG
Optionholder Put Option is ZAR1.00.
Exercise period The TG Optionholder Put Options may be exercised at any
time within three (3) years from (and including) the First
Completion Date.
Exercise of the TG
Optionholder Put
Options
Following the exercise of his options to acquire TG Shares,
the TG Optionholder may exercise the TG Optionholder Put
Option by means of a Share Exchange or an ‘‘On-Market
Sale’’ as described in the TG Optionholder Agreement.
Share exchange and
on-market sale
As some of the TG Optionholders are residents of South
Africa, the restrictions regarding foreign investments as
mentioned in the above section of this Appendix VI headed
‘‘1. The Loan Note and the Put Option Agreements’’ will
also apply to them. Accordingly, only the on-market sale
mechanism will be made available to these TG
Optionholders. Under this mechanic, the TG Optionholder
will transfer its TG Shares to GoldCom. GoldCom will
transfer the TG Shares to Wing Hing in consideration for
the issue of a corresponding number of Wing Hing Shares at
the Share Exchange Ratio. Those Wing Hing Shares will be
sold on-market by GoldCom and the proceeds will be
remitted to the TG Option Holder via the Escrow Agent.
If a TG Optionholder is not a resident of South Africa, he
may sell his TG Shares to Wing Hing and Wing Hing will
issue a corresponding number of Wing Hing Shares to such
TG Optionholder at the Share Exchange Ratio.
The aggregate number of Wing Hing Shares to be issued to
TG Optionholders and GoldCom will not exceed
1,009,616,519 Wing Hing Shares.
APPENDIX VI THE LOAN NOTE, PUT OPTION AGREEMENT, ELECTRUMOPTION AGREEMENT AND TG OPTIONHOLDER AGREEMENT
– VI-6 –

Other material terms of
the TG Optionholder
Agreement
The TG Optionholder Put Options may not be transferred
or transmitted without the prior written consent of the other
parties to the TG Optionholder Agreement.
The right of first refusal If, during the term of the TG Optionholder Agreement, an
Optionholder wishes to sell all or part of his TG Shares to a
third party, he shall first be required to offer such shares to
Wing Hing (if the Optionholder is not South African
resident) or to GoldCom (if the Optionholder is a South
African resident) by way of written notification.
In the event that Wing Hing declines or otherwise fails to
accept the offer, the TG Optionholder shall be free to offer
the TG Shares to the third party, provided that such offer to
the third party must be on the same terms as the offer to
Wing Hing (or to GoldCom).
The right of first refusal is applicable to any of the TG
Shares held by the TG Optionholder. The TG Optionholder
must set out the details of the offer in the notification to
Wing Hong and the terms of such offer may or may not be
the same as the terms of the TG Optionholder Put Option.
APPENDIX VI THE LOAN NOTE, PUT OPTION AGREEMENT, ELECTRUMOPTION AGREEMENT AND TG OPTIONHOLDER AGREEMENT
– VI-7 –

1. CORPORATE INFORMATION ON TAUNG GOLD
Registered Office Block C, Ground Floor, Little Fourways Office Park, 1
Leslie Avenue East, Fourways, South Africa 2055
Place of business in
Hong Kong
Not applicable
Financial advisor Renaissance Capital (Hong Kong) Limited, a corporation
licensed to carry out Type 1 (dealing in securities), Type 4
(advising on securities) and Type 6 (advising on corporate
finance) regulated activities under the SFO
Auditors Deloitte & Touche, South Africa
Company secretary Mr. Chris Hendrik Mulder
2. CHANGES IN ISSUED SHARE CAPITAL OF TAUNG GOLD SINCE ITS
ESTABLISHMENT
Taung Gold was founded in 2005 by Dr. David Twist and Mr. Christiaan Rudolph de
Wet de Bruin. Dr. David Twist and his wife, Mrs. Helena Twist, are TG Sellers while Mr.
Christiaan Rudolph de Wet de Bruin is a South African Shareholder in the Acquisition
Agreement. Subsequent to its establishment in 2005, Taung Gold raised funds through
several rounds of new issuances of TG Shares.
2.1 First round fund raising (2008–2009)
In August 2008, Taung Gold issued new shares to its employees and other investors.
During the second half of 2008 and the first half of 2009, Taung Gold placed additional TG
Shares to other individual and institutional/corporate investors. These investors are the
Other TG Shareholders and the South African Shareholders.
2.2 Electrum round fund raising
Electrum entered into a subscription agreement in May 2009 pursuant to which it
subscribed for 21,500,000 TG Shares and 43,000,000 Electrum TG Warrants. The initial
subscription of 10,750,000 TG Shares and 21,500,000 Electrum TG Warrants closed in June
2009. In June 2010, Electrum subscribed for an additional 10,750,000 TG Shares and an
additional 21,500,000 Electrum TG Warrants. Electrum also exercised its first tranche of
21,500,000 Electrum TG Warrants. Immediately prior to First Completion, Electrum will
hold 43,000,000 TG Shares and the Electrum TG Warrants to purchase 21,500,000
additional TG Shares.
APPENDIX VII ADDITIONAL INFORMATION ON THE TAUNG GROUP
– VII-1 –
2.3 Investment by Mandra
Mandra entered into share subscription agreements with Taung Gold in December
2010 and January 2011 to subscribe for 2,250,000 new TG Shares.
Mandra has also entered into a warrant purchase agreement with Taung Gold
pursuant to which Mandra has purchased warrants and will exercise the warrants and
subscribe for an additional 11,200,000 new TG Shares prior to First Completion. The
warrants will be exercised in full prior to First Completion.
Mandra and Montane Development Limited has agreed to transfer TG Shares to some
of the TG Sellers before First Completion (the Transfers). The following sets out further
details on the Transfers.
The Transfers
(a) Woo Foong Hong Limited: During 2010, Woo Foong Hong Limited purchased
TG Shares from existing offshore shareholders of Taung Gold. Mandra will also
transfer 4,994,049 TG Shares to Woo Foong Hong Limited prior to the First
Completion Date. Woo Foong Hong Limited is ultimately beneficially owned by
Moonchu Foundation Limited, a tax exempt charity established by Mr. Zhang
Songyi and his family.
(b) Mandra Esop Limited: Mandra will transfer 5,390,770 TG Shares to Mandra
Esop Limited prior to the First Completion Date. Mandra Esop Limited is
ultimately beneficially owned as to 50% by Mr. Zhang Songyi and as to 50% by
Mui Bing How, the wife of Mr. Zhang Songyi.
(c) Mr. Lin Hsin Ho: Mr. Lin Hsin Ho agreed to purchase 3,700,000 TG Shares from
Mandra in June 2010 and Mandra will transfer such shares to Mr. Lin Hsin Ho
prior to the First Completion Date.
(d) Montane Development Limited: Montane Development Limited will purchase
4,863,326 TG Shares from Mandra and will transfer 1,340,959 TG Shares to Yi
Star Investment Limited prior to the First Completion Date.
(e) Mr. Hu Xiang Cheng: Mr. Hu Xiang Cheng will purchase 1,830,050 TG Shares
from Mandra prior to the First Completion Date.
(f) Ms. Mui Bing Wah Grace: Ms. Mui Bing Wah Grace will purchase 150,000 TG
Shares from Mandra prior to the First Completion Date. Ms. Mui Bing Wah
Grace is the sister of Ms. Mui Bing How.
(g) Yi Star Investment Limited: Yi Star Investment Limited will purchase 1,340,959
TG Shares from Montane Development Limited prior to the First Completion
Date.
APPENDIX VII ADDITIONAL INFORMATION ON THE TAUNG GROUP
– VII-2 –

Mandra will have transferred a total of 20,928,195 TG Shares to the above-mentioned
TG Sellers immediately before First Completion.
2.4 Investment by various TG Sellers
The following TG Sellers entered into subscription agreements with Taung Gold
during 2011 to subscribe for new TG Shares:
(a) Able Union Limited: Able Union Limited has subscribed for and holds 11,200,000
TG Shares.
(b) ZNE Capital Limited has subscribed for and holds 3,500,000 TG Shares.
(c) Fully Global Investments Limited has subscribed for and holds 3,150,000 TG
Shares.
(d) Grit Capital Limited has subscribed for and holds 700,000 TG Shares.
(e) Angelfly Investments Limited has subscribed for and holds 700,000 TG Shares.
Before First Completion, the following TG Sellers will purchase warrants in Taung
Gold by entering into warrant purchase agreements with Taung Gold. All of the warrants
will be exercised in full prior to First Completion:
(a) ZNE Capital Limited will hold an additional 1,655,000 TG Shares following the
exercise of 1,655,000 warrants immediately prior to the First Completion Date.
(b) Able Union Limited will hold an additional 2,800,000 TG Shares following the
exercise of 2,800,000 warrants immediately prior to the First Completion Date.
(c) Fully Global Investments Limited will hold an additional 7,800,000 TG Shares
following the exercise of 7,800,000 warrants immediately prior to the First
Completion Date.
(d) Manford Capital (HK) Limited will hold an additional 420,000 TG Shares
following the exercise of 420,000 warrants immediately prior to the First
Completion Date.
(e) Amplewood Resources Limited will hold an additional 2,200,000 TG Shares
following the exercise of 2,200,000 warrants immediately prior to the First
Completion Date.
(f) Hong Kong Sheen Smile International Investment Limited will hold an additional
2,600,000 TG Shares following the exercise of 2,600,000 warrants immediately
prior to the First Completion Date.
APPENDIX VII ADDITIONAL INFORMATION ON THE TAUNG GROUP
– VII-3 –

(g) Woo Foong Hong Limited will hold an additional 675,000 TG Shares following
the exercise of 675,000 warrants immediately prior to the First Completion Date.
(h) Easy Capital Holdings Limited will hold an additional 700,000 TG Shares
following the exercise of 700,000 warrants immediately prior to the First
Completion Date.
(i) Sino Reach Investments Limited will hold an additional 750,000 TG Shares
following the exercise of 750,000 warrants immediately prior to the First
Completion Date.
APPENDIX VII ADDITIONAL INFORMATION ON THE TAUNG GROUP
– VII-4 –

1. RESPONSIBILITY STATEMENT
This Circular, for which the Directors collectively and individually accept full
responsibility, includes particulars given in compliance with the Listing Rules for the
purpose of giving information with regard to the Wing Hing Group and the Taung Group.
The Directors, having made all reasonable enquiries, confirm that to the best of their
knowledge and belief, the information contained in this Circular is accurate and complete in
all material respects and not misleading or deceptive, and there are no other matters the
omission of which would make any statement herein or this Circular misleading.
2. INFORMATION ON SHARE CAPITAL OF WING HING
The authorised share capital of Wing Hing is HK$150,000,000 divided into
15,000,000,000 ordinary shares of HK$0.01 each. 2,197,909,600 ordinary shares have
been issued and fully paid up as at the Latest Practicable Date.
Wing Hing has 236,348,000 warrants outstanding. Each of the warrants carries the
right to subscribe for one warrant share at the initial exercise price of HK$0.16 per warrant
share during the period from 10 March 2010 to 9 March 2015. The exercise in full of the
outstanding warrants would result in the issue of additional 236,348,000 shares of HK$0.01
each in the share capital of Wing Hing.
Wing Hing has 31,984,800 options outstanding. Each of the options carries the right to
subscribe for one option share at the initial exercise price of HK$0.1846 per option share
during the period from 2 March 2010 to 2 March 2012. The exercise in full of the
outstanding options would result in the issue of additional 31,984,800 shares of HK$0.01
each in the share capital of Wing Hing.
3. DIRECTORS’ INTERESTS
As at the Latest Practicable Date, none of the Directors nor any of their associates, nor
the Chief Executive, had any interests or short positions in the shares, underlying shares
and debentures of Wing Hing and the shares and debentures of its associated corporations
(within the meaning of Part XV of the SFO) which were required to be notified to Wing
Hing and the Exchange pursuant to Divisions 7 and 8 of Part XV of the SFO (including
interests or short positions which any such director or chief executive has taken or deemed
to have under such provisions of the SFO) or which were required, pursuant to section 352
of the SFO, to be entered in the register referred to therein, or which were required,
pursuant to the Model Code for Securities Transactions by Directors of Listed Issuers, to be
notified to Wing Hing and the Exchange.
3.1 Directors’ Interests in Competing Businesses
As at the Latest Practicable Date, none of the Directors nor their respective associates
had any interest in any business, which might compete with the business of the Wing Hing
Group.
APPENDIX VIII STATUTORY AND GENERAL INFORMATION ON WING HING
– VIII-1 –

3.2 Directors’ Interests in assets of the Enlarged Group
As at the Latest Practicable Date, none of the Directors had any direct or indirect
interests in any assets which have been acquired or disposed of by, or leased to, or which are
proposed to be acquired or disposed of by, or leased to, any member of the Enlarged Group
since 31 March 2011, this being the date on which the latest audited consolidated financial
statements of the Wing Hing Group were published.
3.3 Directors’ Interests in contracts of the Enlarged Group
As at the Latest Practicable Date, none of the Directors were materially interested in
any contract or arrangement, which was subsisting as at the Latest Practicable Date and
was significant in relation to the business of the Enlarged Group.
4. SUBSTANTIAL SHAREHOLDERS
As at the Latest Practicable Date, so far as was known to the Directors and the Chief
Executive of Wing Hing, the following persons had an interest or a long position in the
shares and underlying shares which would fall to be disclosed to Wing Hing under the
provisions of Divisions 2 and 3 of Part XV of the SFO, or, who was, directly or indirectly,
interested in 5% or more of the nominal value of any class of share capital carrying rights to
vote in all circumstances at general meetings of any other member of the Enlarged Group or
had options in respect of such capital:
Name of Shareholder
Number of
ordinary
shares
Underlying
shares of
equity
derivatives
(i.e. warrant) Total Interest
Percentage of
issued ordinary
shares as at
the Latest
Practicable
Date
Orient Best Holdings Limited — 236,348,000 236,348,000 10.75
5. DIRECTORS’ SERVICE CONTRACTS
As at the Latest Practicable Date, there was no existing or proposed service contract
between any of the Directors or proposed Directors and Wing Hing or any member of the
Enlarged Group (excluding contracts expiring or determinable by the Enlarged Group
within a year without payment of any compensation (other than statutory compensation)).
6. LITIGATION
On 4 July 2011, Lee Hing Mining Industry Limited, a subsidiary of Wing Hing,
commenced a lawsuit at a district court in Indonesia against a supplier in Indonesia
involving a claimed amount of approximately HK$27,800,000 in respect of the supplier’s
failure to supply certain minerals, in terms of quality and quantity specified in the supply
contract, and for recovery of down payment made to the supplier and potential loss arising
from the breach of contract by the supplier.
APPENDIX VIII STATUTORY AND GENERAL INFORMATION ON WING HING
– VIII-2 –

Save as disclosed above, as at the Latest Practicable Date, so far as the Directors were
aware, no member of the Enlarged Group was engaged in any litigation or arbitration or
claim of material importance and the Directors were not aware of any litigation or claims of
material importance pending or threatened against any member of the Enlarged Group.
7. WORKING CAPITAL OF THE ENLARGED GROUP
In determining the sufficiency of the working capital of the Enlarged Group, the
Directors have made the assumption that the Transactions will be completed.
The Directors are of the opinion that, after taking into account the financial resources
available to and the internal resources of the Enlarged Group and on the assumption that
the Transactions will be completed in due course as set out in the preceding paragraph, the
Enlarged Group has available sufficient working capital for 125% of the Enlarged Group’s
requirements for the next twelve months from the date of this Circular.
8. INDEBTEDNESS
As at the close of business on 31 May 2011, being the latest practicable date for the
purpose of this indebtedness statement prior to the printing of this Circular, the Enlarged
Group had no secured interest-bearing bank borrowings.
As at 31 May 2011, the Enlarged Group had pledged deposits of approximately US$0.8
million of the Enlarged Group for providing loan guarantee service to client in the PRC. As
at 31 May 2011, the Enlarged Group did not have any outstanding loan capital, bank
overdrafts, loans, mortgages, charges or other similar indebtedness, or hire purchase of
finance lease commitments, liabilities under acceptances or acceptance credits, guarantees
or other material contingent liabilities.
The Directors are not aware of any material adverse changes in the Enlarged Group’s
indebtedness position or contingent liabilities since 31 May 2011.
9. MATERIAL ADVERSE CHANGE
As at the Latest Practicable Date, the Directors were not aware of any material adverse
change in the financial or trading position of the Wing Hing Group since 31 March 2011,
being the date on which the latest audited consolidated financial statements of Wing Hing
were published.
APPENDIX VIII STATUTORY AND GENERAL INFORMATION ON WING HING
– VIII-3 –

10. EXPERTS AND CONSENTS
The following sets out the qualifications of the experts who have given opinion or
advice which are contained in this Circular:
Name Qualification
BMI Appraisals Limited Independent valuer
Deloitte & Touche, South Africa Certified public accountants registered
in South Africa
Hannes Gouws and Partners Inc. Licensed legal advisor on South African
law
HLB Hodgson Impey Cheng Certified public accountants
Venmyn Rand (Proprietary) Limited Independent technical adviser
Each of the above experts has given and has not withdrawn its written consent to the
issue of this Circular with the inclusion herein of its report and/or opinion and/or references
to its names in the form and context in which they appear.
The letters and reports from HLB Hodgson Impey Cheng were given on 28 July 2011
for incorporation in this Circular.
The letter and report from Deloitte & Touche South Africa were given on 28 July 2011
for incorporation in this circular.
The report from Venmyn Rand (Proprietary) Limited was effective on 11 February
2011 for incorporation in this Circular.
The report from BMI Appraisals Limited was given on 28 July 2011 for incorporation
in this Circular.
As at the Latest Practicable Date, none of the above experts was beneficially interested
in the share capital of any member of the Wing Hing Group, nor did any one of them have
any right (whether legally enforceable or not) to subscribe for or to nominate persons to
subscribe for securities in any member of the Wing Hing Group (including any company
which will become a subsidiary of Wing Hing by reason of an acquisition or which has been
agreed or proposed since 31 March 2011, being the date to which the audited consolidated
financial statements of Wing Hing have been made up).
APPENDIX VIII STATUTORY AND GENERAL INFORMATION ON WING HING
– VIII-4 –
11. MATERIAL CONTRACTS
Set out below are the material contracts (not being contracts entered into in the
ordinary course of business) entered or to be entered into by any member of the Enlarged
Group within the two years immediately preceding the Latest Practicable Date:
(a) the subscription agreement dated 7 August 2009 and entered into between Wing
Hing and Galaxy Asset Management (HK) Limited in respect of the subscription
of 10,350,000 new shares of HK$1 each in the capital of Wing Hing at the
subscription price of HK$1.46 per share;
(b) the subscription agreement dated 7 August 2009 and entered into between Wing
Hing and VMS Investment Group Limited in respect of the subscription of
3,450,000 new shares of HK$1 each in the capital of Wing Hing at the
subscription price of HK$1.46 per share;
(c) the sale and purchase agreement dated 7 September 2009 entered into between
Wing Hing and Mr. Ng Tat Leung, George in respect of Wing Hing disposing the
entire issued share capital of Club Ace Holdings Limited and the shareholder’s
loan to Mr. Ng Tat Leung, George for a consideration of HK$1,000,000;
(d) the subscription agreement dated 25 September 2009 in respect of the issuance and
allotment of 12,000,000 new shares of HK$1.00 each in the capital of Wing Hing
to Cheever Capital Management (Asia) Limited at the subscription price of
HK$1.78 per share;
(e) the memorandum of understanding, a supplemental memorandum of
understanding and a termination agreement dated 7 October 2009, 7 April 2010
and 27 May 2010 respectively entered into between Wing Hing and Ms. Ho Yuk
Ling in respect of Wing Hing acquiring the entire issued share capital of Richome
Enterprises Limited;
(f) the underwriting agreement dated 13 November 2009 entered into between Wing
Hing and China Everbright Securities (HK) Limited relating to the issuance and
allotment of 46,264,000 offer shares of HK$0.1 each in the capital of Wing Hing
at a subscription price of HK$1.80 per offer share by way of an open offer with an
underwriting commission of approximately HK$2.67 million;
(g) the acquisition agreement dated 8 February 2010, the first supplemental
agreement dated 14 May 2010 and the second supplemental agreement dated 2
July 2010 entered into between Longold Win Limited (a wholly-owned subsidiary
of Wing Hing) and Ms. Wong Kei Yan in respect of the acquisition of the entire
equity interests in Bestkin International Limited for an aggregate consideration of
HK$88,000,000. Bestkin International Limited through its subsidiaries holds
certain exploitation and exploration licenses to certain gold mines in the PRC;
APPENDIX VIII STATUTORY AND GENERAL INFORMATION ON WING HING
– VIII-5 –

(h) the warrant subscription agreement dated 26 February 2010 entered into between
Wing Hing and Orient Best Holdings Limited, under which Wing Hing agreed to
issue and the Orient Best Holdings Limited agreed to subscribe for 323,848,000
warrants at the issue price of HK$0.001 per warrant. Each of the warrants carries
the right to subscribe for one warrant share at the initial exercise price of HK$0.16
per warrant share during a period of five years commencing from (and inclusive
of) the date of issue of the warrants;
(i) the placing agreement dated 26 April 2010 entered into between Wing Hing and
VC Brokerage Limited as the placing agent in respect of the placing of an
aggregate of 80,000,000 shares of HK$0.01 each in the capital of Wing Hing to not
fewer than six placees, at the placing price of HK$0.50 per share;
(j) the sale and purchase agreement and a supplemental agreement dated on 31
December 2010 and on 30 June 2011 respectively, entered between Guizhou
Jinyida Mining Company Limited (an indirectly-owned subsidiary of Wing Hing)
and Mr. Cheng Wei in respect of the disposal of three coal mining licenses of the
Wing Hing Group at a total consideration of RMB76,600,000 (equivalent to
approximately HK$90,000,000);
(k) the placing agreement dated on 18 January 2011 entered between Wing Hing and
the Daily Growth Securities Limited in respect of the placing of up to 346,000,000
shares of Wing Hing to not fewer than six placees at a price of HK$0.40 per share;
and
(l) the Acquisition Agreement and Amendment Agreement and Second Amendment
Agreement.
Save as the aforesaid material contracts, there is no material contract (not being
entered into in the ordinary course of business) entered into by any member of the Enlarged
Group within the two years immediately preceding the issue of this Circular.
12. MISCELLANEOUS
(a) The branch share registrar of Wing Hing in Hong Kong is Tricor Tengis Limited
at 26/F, Tesbury Centre, 28 Queen’s Road East, Wanchai, Hong Kong.
(b) The secretary of Wing Hing is Mr. Choi Wing Koon, a fellow member of the
Association of Chartered Certified Accountants and a member of the Hong Kong
Institute of Certified Public Accountants.
(c) Save as otherwise disclosed in this Circular:
(i) None of the Directors or any of the parties listed in the section headed
‘‘Appendix VIII — 10. Experts and Consents’’ of this Circular is interested in
Wing Hing’s promotion, or in any assets which have, within the two years
APPENDIX VIII STATUTORY AND GENERAL INFORMATION ON WING HING
– VIII-6 –
immediately preceding the issue of this Circular, been acquired or disposed of
by or leased to Wing Hing, or are proposed to be acquired or disposed of by
or leased to any member of the Enlarged Group.
(ii) None of the Directors or any of the parties listed in the section headed
‘‘Appendix VIII — 10. Experts and Consents’’ of this Circular is materially
interested in any contract or arrangement subsisting at the date of this
Circular which is significant in relation to Wing Hing’s business.
(iii) No share or loan capital of any members of the Wing Hing Group is under
option or is agreed conditionally or unconditionally to be put under option.
(iv) Wing Hing has not issued nor agreed to issue any founder shares,
management shares or deferred shares.
(v) No commission has been paid or payable (except commissions to the
underwriters) for subscription, agreeing to subscribe, procuring subscription
or agreeing to procure subscription of any shares in Wing Hing within the
two years preceding the date of this Circular.
(vi) No amount or securities or benefit has been paid or allotted or given within
the two years preceding the date of this Circular to any of the promoters nor
is any such securities or amount or benefit intended to be paid or allotted or
given.
(vii) To the best of the Directors’ knowledge, information and belief having made
all reasonable enquiry, the TG Sellers and the ultimate beneficial owner of
the TG Sellers are third parties independent of Wing Hing and connected
persons of Wing Hing.
(viii)The Directors have confirmed, after performing all due diligence work which
they consider appropriate, that there has been no material adverse change in
Wing Hing’s financial or trading position since 31 March 2011.
(ix) None of the Directors or any of the persons whose names are listed in the
section headed ‘‘Appendix VIII — 10. Experts and Consents’’ of this Circular
had received any commissions, discounts, agency fee, brokerages or other
special terms in connection with the issue or sale of any capital of Wing Hing
from Wing Hing within the two years preceding the date of this Circular.
(x) There were no alterations in the capital of any member of the Wing Hing
Group within the two years preceding the date of this Circular.
(xi) There is no arrangement under which future dividends are waived or agreed
to be waived.
(xii) There are no restrictions affecting the remittance of profits or repatriation of
capital into Hong Kong from outside Hong Kong.
APPENDIX VIII STATUTORY AND GENERAL INFORMATION ON WING HING
– VIII-7 –
(d) The English text of this Circular shall prevail over the Chinese text.
APPENDIX VIII STATUTORY AND GENERAL INFORMATION ON WING HING
– VIII-8 –

Copies of the following documents will be available for inspection at the principal
place of business of Wing Hing, at Unit 1901, 19/F, Nina Tower, 8 Yeung Uk Road, Tsuen
Wan, New Territories, Hong Kong during normal business hours up to and including the
date which is 21 days from the date of this Circular:
(a) the memorandum of association and the by-laws of Wing Hing;
(b) the annual reports of the Wing Hing Group for the three years ended 31 March
2009, 2010 and 2011;
(c) the audited financial information of the Wing Hing Group for the three years
ended 31 March 2009, 2010 and 2011, the text of which is set out in Appendix I of
this Circular;
(d) the written statement of adjustments;
(e) the Financial Information of the Taung Group, the text of which is set out in
Appendix II of this Circular;
(f) the report in relation to unaudited pro forma financial information of the
Enlarged Group, the text of which is set out in Appendix III of this Circular;
(g) the Competent Persons Report, the text of which is set out in Appendix IV of this
Circular;
(h) the Valuation Report, the text of which is set out in Appendix V of this Circular;
(i) the written consents referred to in the section headed ‘‘Appendix VIII — Statutory
and General Information on Wing Hing — 10. Experts and Consents’’ of this
Circular; and
(j) the material contracts referred to in the section headed ‘‘Appendix VIII —
Statutory and General Information on Wing Hing — 11. Material Contracts’’ of
this Circular.
APPENDIX IX DOCUMENTS AVAILABLE FOR INSPECTION
– IX-1 –

Hong Kong Exchanges and Clearing Limited and The Stock Exchange of Hong Kong
Limited take no responsibility for the contents of this announcement, make no representation
as to its accuracy or completeness and expressly disclaim any liability whatsoever for any loss
howsoever arising from or in reliance upon the whole or any part of the contents of this
announcement.
(incorporated in Bermuda with limited liability)
(Stock Code: 621)
NOTICE OF SPECIAL GENERAL MEETING
NOTICE IS HEREBY GIVEN that a special general meeting (the SGM) of Wing Hing
International (Holdings) Limited (the Company) will be held at Unit 1901, 19/F, Nina
Tower, No. 8 Yeung Uk Road, Tsuen Wan, New Territories, Hong Kong on Friday, 19
August 2011 at 11 : 00 a.m. for the purpose of considering and, if thought fit, passing with or
without amendments the following resolutions:
ORDINARY RESOLUTIONS
‘‘1. THAT:
(a) the authorised share capital of the Company be and is hereby increased from
HK$150,000,000 divided into 15,000,000,000 ordinary shares (the Shares) of
HK$0.01 to HK$300,000,000 divided into 30,000,000,000 Shares by the
creation of 15,000,000,000 additional Shares (the Capital Increase);
(b) any one director of the Company be and is hereby authorised for and on
behalf of the Company to execute all such documents, instruments,
agreements and deeds and to do all such acts, matters and things as he/she
may in his/her discretion consider necessary or desirable for the purpose of or
in connection with the implementation of the Capital Increase and the
transactions contemplated thereunder.’’
‘‘2. THAT:
(a) the acquisition agreement dated 28 January 2011 (as amended by two
amendment agreements dated 22 March 2011 and 22 July 2011 and any other
subsequent amendment) (together, the Acquisition Agreement) entered into
by the Company (the Purchaser), the TG Sellers and Gold Commercial
Services Limited (a copy of which is tabled at this meeting and marked ‘‘[A]’’
and initialled by the chairman of this meeting for the purpose of
identification) and more particularly described in the circular of the
Company dated 28 July 2011, pursuant to which the parties agreed that,
subject to the satisfaction of the conditions precedent therein, the Purchaser
shall acquire and the TG Sellers shall sell or procure the sale of up to
86.966% of Taung Gold Limited (Taung Gold) in consideration for the
NOTICE OF SPECIAL GENERAL MEETING
– N-1 –

issuance of up to a total of 11,987,246,522 new Shares (the Consideration
Shares) and all transactions contemplated thereunder be and are hereby
approved, ratified and confirmed;
for the purpose of this resolution:
TG Sellers refers to, Electrum Strategic Exploration Limited, Mr. David
Twist, Mrs. Helena Twist, Woo Foong Hong Limited, Yi Star Investment
Limited, Mr. Lin, Hsin-Ho, Able Union Limited, ZNE Capital Limited,
Fully Global Investments Limited, Grit Capital Limited, Angelfly
Investments Limited, Mandra Esop Limited, Montane Development
Limited, Mr. Hu, Xiang-Cheng, Ms. Mui, Bing-Wah Grace, Mandra
Materials Limited, Easy Capital Holdings Limited, Manford Capital (HK)
Limited, Amplewood Resources Limited, Hong Kong Sheen Smile
International Investment Limited and Sino Reach Investments Limited;
(b) any one director of the Company be and is hereby authorised for and on
behalf of the Company to execute all such documents, instruments,
agreements and deeds and do all such acts, matters and things as he/she
may in his/her absolute discretion consider necessary or desirable for the
purpose of and in connection with the implementation of the Acquisition
Agreement and the transactions contemplated thereunder and to agree to
such variations of the terms of the Acquisition Agreement and the
transactions documents contemplated thereunder as he/she may in his/her
absolute discretion consider necessary or desirable; and
(c) subject to and conditional upon the passing of the resolutions numbered 2 (a)
and (b) and conditional upon the Listing Committee of The Stock Exchange
of Hong Kong Limited granting the listing of, and permission to deal in, the
Consideration Shares, the allotment and issue of the Consideration Shares
pursuant to the Acquisition Agreement upon the terms and subject to the
conditions therein contained be and is hereby approved; and that any one
director of the Company be and are hereby authorised, for and on behalf of
the Company, to do all such acts and things and to sign, seal and execute and
deliver all such documents and take all such steps which he/she may in his/
her absolute discretion consider necessary, desirable or expedient for the
implementation of and giving effect to the allotment and issue of the
Consideration Shares.’’
‘‘3. THAT:
(a) put option agreements annexed to the Acquisition Agreement (the Put Option
Agreements) relating to the grant of put options to each South African
resident shareholders of Taung Gold in relation to the sale to the Company
through Gold Commercial Services Limited (GoldCom) of such number of
shares of Taung Gold representing in aggregate approximately 8.99% of the
issued share capital of Taung Gold upon First Completion (as defined in the
NOTICE OF SPECIAL GENERAL MEETING
– N-2 –
circular of the Company dated 28 July 2011) for a consideration of
1,134,348,686 new Shares and involving the issue of a loan note by
GoldCom to the Company (the Loan Note) be and is hereby approved;
(b) Loan Note be and is hereby approved; and
(c) any one director of the Company be and is hereby authorised for and on
behalf of the Company to execute all such documents, instruments,
agreements and deeds and do all such acts, matters and things as he/she
may in his/her absolute discretion consider necessary or desirable for the
purpose of and in connection with the implementation of the Put Option
Agreements and the Loan Note and the transactions contemplated
thereunder and to agree to such variations of the terms of the Put Option
Agreements and the Loan Note and the transactions documents
contemplated thereunder as he/she may in his/her absolute discretion
consider necessary or desirable.’’
‘‘4. THAT
(a) the Electrum option agreement annexed to the Acquisition Agreement (the
Electrum Option Agreement) relating to the grant of put options to Electrum
Strategic Exploration Limited (Electrum) in relation to the sale of such
number of shares of Taung Gold acquired by Electrum upon the exercise of
warrants held by Electrum issued by Taung Gold to the Company for a
consideration of 1,147,523,915 new Shares be and is hereby approved; and
(b) any one director of the Company be and is hereby authorised for and on
behalf of the Company to execute all such documents, instruments,
agreements and deeds and do all such acts, matters and things as he/she
may in his/her absolute discretion consider necessary or desirable for the
purpose of and in connection with the implementation of the Electrum
Option Agreement and the transactions contemplated thereunder and to
agree to such variations of the terms of the Electrum Option Agreement and
the transactions documents contemplated thereunder as he/she may in his/
her absolute discretion consider necessary or desirable.’’
‘‘5. THAT
(a) the optionholder agreement annexed to the Acquisition Agreement (the TG
Optionholder Agreement) relating to the grant of put options to holders of
options in Taung Gold in relation to the sale to the Company directly or
through GoldCom of up to 18,916,168 shares of Taung Gold Limited
acquired pursuant to the exercise of options in Taung Gold for an aggregate
consideration of up to 1,009,616,519 new Shares be and is hereby approved;
and
NOTICE OF SPECIAL GENERAL MEETING
– N-3 –

(b) any one director of the Company be and is hereby authorised for and on
behalf of the Company to execute all such documents, instruments,
agreements and deeds and do all such acts, matters and things as he/she
may in his/her absolute discretion consider necessary or desirable for the
purpose of and in connection with the implementation of the TG
Optionholder Agreement and the transactions contemplated thereunder
and to agree to such variations of the terms of the TG Optionholder
Agreement and the transactions documents contemplated thereunder as he/
she may in his/her absolute discretion consider necessary or desirable.’’
SPECIAL RESOLUTION
‘‘6. THAT
(a) subject to the completion of the Acquisition Agreement and the approval of
the Registrar of the Companies in Bermuda, the name of the Company be
changed from ‘‘Wing Hing International (Holdings) Limited’’ to ‘‘Taung
Gold International Limited’’ and the Chinese name ‘‘壇金礦業有限公司’’ be
adopted by the Company for identification purposes only; and
(b) any one director of the Company be and is hereby authorised for and on
behalf of the Company to execute all such documents, instruments,
agreements and deeds and do all such acts, matters and things as he/she
may in his/her absolute discretion consider necessary or desirable to effect
such change of name and adoption of the Chinese name.
By order of the Board
Wing Hing International (Holdings) Limited
Li Hok Yin
Chairman
Hong Kong, 28 July 2011
Registered office:
Canon’s Court
22 Victoria Street
Hamilton HM 12
Bermuda
Head office and principal place of
business in Hong Kong:
Unit 1901, 19th Floor
Nina Tower
8 Yeung Uk Road
Tsuen Wan, New Territories
Hong Kong
Notes:
1. A member entitled to attend and vote at the SGM is entitled to appoint one or more
than one proxy to attend and, subject to the provisions of the bye-laws of the
Company, to vote on his behalf. A proxy need not be a member of the Company but
NOTICE OF SPECIAL GENERAL MEETING
– N-4 –
must be present in person at the SGM to represent the member. If more than one proxy
is so appointed, the appointment shall specify the number and class of shares in respect
of which each such proxy is so appointed.
2. A form of proxy for use at the SGM is enclosed. Whether or not you intend to attend
the SGM in person, you are encouraged to complete and return the enclosed form of
proxy in accordance with the instructions printed thereon. Completion and return of a
form of proxy will not preclude a member from attending in person and voting at the
SGM or any adjournment thereof, should he so wish.
3. In order to be valid, the form of proxy, together with a power of attorney or other
authority, if any, under which it is signed, or a certified copy of such power or
authority must be deposited at the Company’s branch share registrar in Hong Kong,
Tricor Tengis Limited, at 26th Floor, Tesbury Centre, 28 Queen’s Road East,
Wanchai, Hong Kong not less than 48 hours before the time appointed for holding the
SGM or any adjournment thereof.
4. In the case of joint holders of shares, any one of such holders may vote at the SGM,
either personally or by proxy, in respect of such share as if he was solely entitled
thereto, but if more than one of such joint holder are present at the SGM personally or
by proxy, that one of the said persons so present whose name stands first on the
register of members of the Company in respect of such shares shall alone be entitled to
vote in respect thereof.
5. As at the date hereof, the Board comprises six Directors. The Executive Directors are
Mr. Li Hok Yin, Ms. Cheung Pak Sum and Mr. Shen Junchen. The Independent Non-
executive Directors are Mr. Chui Man Lung, Everett, Mr. Hui Wah Tat, Anthony and
Mr. Li Kam Chung.
NOTICE OF SPECIAL GENERAL MEETING
– N-5 –