ltn20101121029.pdf - HKEXnews
593
If you are in any doubts to any aspect of this circular or as to the action to be taken, you should consult your licensed securities dealer, registered institution in securities, bank manager, solicitor, professional accountant or other professional adviser. If you have sold or transferred all your shares in Minmetals Resources Limited (the “Company”), you should at once hand this circular to the purchaser or the transferee or to the bank, licensed securities dealer, registered institution in securities or other agent through whom the sales or transfer was effected for transmission to the purchaser or the transferee. Hong Kong Exchanges and Clearing Limited and The Stock Exchange of Hong Kong Limited take no responsibility for the contents of this circular, make no representation as to its accuracy or completeness and expressly disclaim any liability whatsoever for any loss howsoever arising from or in reliance upon the whole or any part of the contents of this circular. This circular appears for information purposes only and does not constitute an invitation or offer to acquire, purchase or subscribe for securities of the Company. (Incorporated in Hong Kong with limited liability) (Stock code: 1208) (1) VERY SUBSTANTIAL ACQUISITION AND CONNECTED TRANSACTION IN RELATION TO THE ACQUISITION OF THE ENTIRE ISSUED SHARE CAPITAL OF ALBUM RESOURCES PRIVATE LIMITED (2) PROPOSED INCREASE IN AUTHORISED SHARE CAPITAL (3) SPECIFIC MANDATE TO ISSUE NEW SHARES AND (4) PROPOSED APPOINTMENT OF DIRECTORS Financial adviser to Minmetals Resources Limited Independent financial adviser to the Independent Board Committee and the Independent Shareholders of Minmetals Resources Limited A letter from the Board is set out from pages 16 to 41 of this circular. A letter from the Independent Board Committee containing its advice to the Independent Shareholders in connection with the Acquisition pursuant to the terms of the Share Sale Deed is set out on pages 42 and 43 of this circular. A letter from Somerley containing its advice to the Independent Board Committee and the Independent Shareholders in connection with the Acquisition pursuant to the terms of the Share Sale Deed is set out from pages 44 to 98 of this circular. A notice convening the extraordinary general meeting of the Company to be held at 10:30 a.m. on Thursday, 9 December 2010 at Fanling Room, Lower Level I, Kowloon Shangri-La Hotel, 64 Mody Road, Tsimshatsui East, Kowloon, Hong Kong or any adjournment is set out from pages EGM-1 to EGM-3 of this circular. Whether or not you are able to attend the meeting in person, you are requested to complete and return the accompanying form of proxy to the Company’s share registrar, Computershare Hong Kong Investor Services Limited at 17M Floor, Hopewell Centre, 183 Queen’s Road East, Hong Kong, as soon as possible and in any event not less than 48 hours before the time appointed for the holding of the extraordinary general meeting of the Company. Completion and return of the form of proxy shall not preclude you from attending and voting at the extraordinary general meeting of the Company should you so wish. This circular will remain on the “Listed Company Information” page of the website of the Stock Exchange and the website of the Company for at least seven days from the date of its posting. THIS CIRCULAR IS IMPORTANT AND REQUIRES YOUR IMMEDIATE ATTENTION 14A.58(3)(a) 14A.58(3)(b) 14.63(2) (b) 14A.58(3)(b) 14.58(1) 14A.59(1) 14.60(4) (a) App1 Part B1 13.51A 22 November 2010
-
Upload
khangminh22 -
Category
Documents
-
view
0 -
download
0
Transcript of ltn20101121029.pdf - HKEXnews
If you are in any doubts to any aspect of this circular or as to the action to be taken, you should consult your licensed securitiesdealer, registered institution in securities, bank manager, solicitor, professional accountant or other professional adviser.
If you have sold or transferred all your shares in Minmetals Resources Limited (the “Company”), you should at once hand this circularto the purchaser or the transferee or to the bank, licensed securities dealer, registered institution in securities or other agent throughwhom the sales or transfer was effected for transmission to the purchaser or the transferee.
Hong Kong Exchanges and Clearing Limited and The Stock Exchange of Hong Kong Limited take no responsibility for the contents ofthis circular, make no representation as to its accuracy or completeness and expressly disclaim any liability whatsoever for any losshowsoever arising from or in reliance upon the whole or any part of the contents of this circular.
This circular appears for information purposes only and does not constitute an invitation or offer to acquire, purchase or subscribe forsecurities of the Company.
(Incorporated in Hong Kong with limited liability)
(Stock code: 1208)
(1) VERY SUBSTANTIAL ACQUISITIONAND CONNECTED TRANSACTION
IN RELATION TOTHE ACQUISITION OF THE ENTIRE ISSUED SHARE CAPITAL OF
ALBUM RESOURCES PRIVATE LIMITED
(2) PROPOSED INCREASE IN AUTHORISED SHARE CAPITAL
(3) SPECIFIC MANDATE TO ISSUE NEW SHARES
AND
(4) PROPOSED APPOINTMENT OF DIRECTORS
Financial adviser to
Minmetals Resources Limited
Independent financial adviser to theIndependent Board Committee and the Independent Shareholders of
Minmetals Resources Limited
A letter from the Board is set out from pages 16 to 41 of this circular. A letter from the Independent Board Committee containing itsadvice to the Independent Shareholders in connection with the Acquisition pursuant to the terms of the Share Sale Deed is set out onpages 42 and 43 of this circular. A letter from Somerley containing its advice to the Independent Board Committee and the IndependentShareholders in connection with the Acquisition pursuant to the terms of the Share Sale Deed is set out from pages 44 to 98 of thiscircular.
A notice convening the extraordinary general meeting of the Company to be held at 10:30 a.m. on Thursday, 9 December 2010 at FanlingRoom, Lower Level I, Kowloon Shangri-La Hotel, 64 Mody Road, Tsimshatsui East, Kowloon, Hong Kong or any adjournment is setout from pages EGM-1 to EGM-3 of this circular. Whether or not you are able to attend the meeting in person, you are requested tocomplete and return the accompanying form of proxy to the Company’s share registrar, Computershare Hong Kong Investor ServicesLimited at 17M Floor, Hopewell Centre, 183 Queen’s Road East, Hong Kong, as soon as possible and in any event not less than 48 hoursbefore the time appointed for the holding of the extraordinary general meeting of the Company. Completion and return of the form ofproxy shall not preclude you from attending and voting at the extraordinary general meeting of the Company should you so wish.
This circular will remain on the “Listed Company Information” page of the website of the Stock Exchange and the website of theCompany for at least seven days from the date of its posting.
THIS CIRCULAR IS IMPORTANT AND REQUIRES YOUR IMMEDIATE ATTENTION 14A.58(3)(a)14A.58(3)(b)
14.63(2) (b)14A.58(3)(b)
14.58(1)14A.59(1)
14.60(4) (a)
App1 Part B1
13.51A
22 November 2010
This circular is not an offer of securities for sale or solicitation of an offer to purchase securities.
The securities described herein have not been and will not be registered under the US Securities Act
of 1933 (the “US Securities Act”), and may not be offered or sold in the United States absent
registration under the US Securities Act, or an applicable exemption from the registration
requirements thereof. There will be no public offering of the securities described herein in the United
States.
This circular is being made by the Company. The financial adviser to the Company nor any of
its directors, supervisors, officers, employees, advisers, consultants or agents makes any
representation or warranty, express or implied, as to the accuracy, reliability or completeness of the
information in this circular, or shall be responsible for the accuracy, reliability or completeness of any
such information and nothing in this circular is, or shall be relied upon as, a promise or representation
by the financial adviser to the Company or any of its directors, supervisors, officers, employees,
advisers, consultants or agents.
Forward-looking information
Certain information contained in this circular constitutes forward-looking information. Investors
and Shareholders are cautioned that forward-looking information is inherently uncertain and involves
risks and uncertainties that could cause actual results, performance or achievements of the Group or
the Target Group to be materially different from any future results, performance or achievements
expressed or implied by such forward-looking information. These forward-looking statements include,
without limitation, statements relating to the Completion and terms of the Acquisition, the proposed
strategies of the Group following Completion, the Placings and the use of proceeds from the Placings.
Factors that could cause actual results to differ materially include, without limitation, the ability to
complete the Acquisition, changes in the price of commodities generally or zinc, copper, lead, gold,
silver and nickel specifically, and changes in Hong Kong and other relevant securities markets. In
addition, specific reference is made to the section headed “Risk factors ” in this circular. There can
be no assurance that future developments affecting the Group or the Target Group will be those
anticipated by the management. While the Company may elect to update the forward-looking
information at any time, the Company does not undertake to update it at any particular time or in
response to any particular event. Investors and Shareholders should not assume that any
forward-looking information in this circular represents the management’s estimate as at any date other
than the date of this circular.
Currency and exchange rates
In this circular, for the purpose of illustration only, unless otherwise specified, conversion of
US$ into HK$ is based on the exchange rate of US$1.00 = HK$7.80. No representation is made and
there is no assurance that US$ or HK$ can be purchased or sold at such rate.
IMPORTANT
— i —
Page
Definitions . . . . . . . . . . . . . . . . . . . . . . . . . . . . . . . . . . . . . . . . . . . . . . . . . . . . . . . . . . . . 1
Glossary . . . . . . . . . . . . . . . . . . . . . . . . . . . . . . . . . . . . . . . . . . . . . . . . . . . . . . . . . . . . . 9
Expected timetable . . . . . . . . . . . . . . . . . . . . . . . . . . . . . . . . . . . . . . . . . . . . . . . . . . . . . 12
Letter from the Chairman . . . . . . . . . . . . . . . . . . . . . . . . . . . . . . . . . . . . . . . . . . . . . . . 13
Letter from the Board . . . . . . . . . . . . . . . . . . . . . . . . . . . . . . . . . . . . . . . . . . . . . . . . . . 16
Letter from the Independent Board Committee . . . . . . . . . . . . . . . . . . . . . . . . . . . . . . . 42
Letter from Somerley . . . . . . . . . . . . . . . . . . . . . . . . . . . . . . . . . . . . . . . . . . . . . . . . . . . 44
Risk factors . . . . . . . . . . . . . . . . . . . . . . . . . . . . . . . . . . . . . . . . . . . . . . . . . . . . . . . . . . . 99
Industry overview . . . . . . . . . . . . . . . . . . . . . . . . . . . . . . . . . . . . . . . . . . . . . . . . . . . . . . 109
Legal and regulatory regime in which the Target Group operates . . . . . . . . . . . . . . . . . 140
Information of the Target Group . . . . . . . . . . . . . . . . . . . . . . . . . . . . . . . . . . . . . . . . . . . 193
Strategies and competitive strengths of the Enlarged Group . . . . . . . . . . . . . . . . . . . . . 236
Proposed Directors and senior management of the Target Group . . . . . . . . . . . . . . . . . 240
Appendix I — Financial information of the Target Group . . . . . . . . . . . . . . . . . I-1
Appendix II — Financial information of the Group . . . . . . . . . . . . . . . . . . . . . . . II-1
Appendix III — Unaudited pro forma financial information
of the Enlarged Group . . . . . . . . . . . . . . . . . . . . . . . . . . . . . . . . III-1
Appendix IV — Competent Person’s Report . . . . . . . . . . . . . . . . . . . . . . . . . . . . . IV-1
Appendix V — Valuation Report . . . . . . . . . . . . . . . . . . . . . . . . . . . . . . . . . . . . . . V-1
Appendix VI — General information . . . . . . . . . . . . . . . . . . . . . . . . . . . . . . . . . . . VI-1
Notice of EGM . . . . . . . . . . . . . . . . . . . . . . . . . . . . . . . . . . . . . . . . . . . . . . . . . . . . . . . . EGM-1
CONTENTS
— ii —
In this circular, the following terms shall have the meanings set out below unless the context
requires otherwise:
“A$” Australian dollar(s), the lawful currency of Australia
“Acquisition” the proposed acquisition of the entire issued share capital of
the Target Company pursuant to the Share Sale Deed (which
is conditional upon, among others, the relevant Shareholders
as required under the Listing Rules having approved the
proposed increase in the authorised share capital of the
Company and the grant of the Specific Mandate by resolution
at an EGM)
“Album Enterprises” Album Enterprises Limited, a company incorporated on
19 January 2005 in Hong Kong with limited liability and
wholly-owned by CMN
“Album Investment” Album Investment Private Limited, a company incorporated
on 8 April 2009 in Singapore with limited liability and
wholly-owned by the Target Company
“All Glorious” All Glorious Limited, a company incorporated on
8 September 2010 in the British Virgin Islands with limited
liability and wholly-owned by the Company. All Glorious was
used by the Company as a special purpose vehicle for the
Acquisition
“associate” has the meaning ascribed to it under the Listing Rules
“Australia” the Commonwealth of Australia
“Australian Government” the Government of Australia
“Board” the board of Directors
“Business Day” a day on which banks are open for business in Hong Kong and
Singapore, other than a Saturday, Sunday or public holiday in
Hong Kong or Singapore
“C$” Canadian dollar(s), the lawful currency of Canada
“CAGR” compound annual growth rate
“CEO” chief executive officer
“CFO” chief financial officer
DEFINITIONS
— 1 —
14A.59(2)(a)
14A.59(2)(a)
“Chapter 18 Valuation” a valuation on the Target Company as at 30 June 2010
conducted by Grant Samuel as Competent Evaluator in
compliance with Chapter 18 of the Listing Rules
“CIS” the Commonwealth of Independent States
“CMC” 中國五礦集團公司(China Minmetals Corporation), formerly
known as 中國五金礦產進出口總公司 (China National
Metals and Minerals Import and Export Corporation), a
State-owned enterprise incorporated on 7 April 1950 under
the laws of the PRC and the ultimate controlling shareholder
of the Company
“CMC Group” CMC and its subsidiaries other than the Group
“CMN” 五礦有色金屬股份有限公司 (China Minmetals Non-Ferrous
Metals Company Limited), a joint stock limited company
incorporated on 27 December 2001 under the laws of the PRC
and owned as to approximately 91.57% by CMC as at the
Latest Practicable Date. CMN is a controlling Shareholder,
holding approximately 63.39% of the issued share capital of
the Company as at the Latest Practicable Date
“Companies Ordinance” the Companies Ordinance (Chapter 32 of the Laws of Hong
Kong)
“Company” Minmetals Resources Limited, a company incorporated on
29 July 1988 in Hong Kong with limited liability, the Shares
of which are listed and traded on the Main Board
“Competent Evaluator” has the meaning ascribed to it under Chapter 18 of the Listing
Rules
“Competent Person” has the meaning ascribed to it under Chapter 18 of the Listing
Rules
“Competent Person’s Report” has the meaning ascribed to it under Chapter 18 of the Listing
Rules
“Completion” the completion of the sale and purchase of the Sale Shares
pursuant to the Share Sale Deed
“Completion Date” the date on which the Completion occurs, which date shall be
the fifth Business Day after all the conditions precedent set
out in the paragraph headed “Letter from the Board — The
Acquisition — Conditions” in this circular have been satisfied
in full or waived, or such other place, time and date as the
Company may agree in writing
DEFINITIONS
— 2 —
14.58(2)

“connected person” has the meaning ascribed to it under the Listing Rules
“Consideration Share(s)” the new Share(s) to be allotted and issued to Album
Enterprises or its nominee to satisfy part of the Purchase Price
“controlling shareholder” has the meaning ascribed to it under the Listing Rules
“Conversion Price” HK$3.45 per Share, being the initial conversion price of the
PSCS (subject to adjustment in accordance with the terms of
the PSCS)
“Conversion Share(s)” the new Share(s) to be issued upon conversion of the PSCS
“Current Market Price” means, in respect of a Share at a particular date, the arithmetic
average of the closing prices for one Share (being a Share
carrying a full entitlement to dividends) for the 20
consecutive trading days ending on the trading day
immediately preceding such date
“Cut Off Date” 31 March 2011, or such other date as agreed between the
parties in writing
“DEEDI” Queensland Department of Employment, Economic
Development and Innovation
“Development Projects” (i) the High Lake zinc project located in Canada;
(ii) the Izok Lake zinc project located in Canada;
(iii) the Dugald River zinc project located in Queensland,
Australia; and
(iv) the Avebury nickel project located in Tasmania,
Australia
“Director(s)” the director(s) of the Company
“EBIT” profit before net financing expenses and income tax
“EBIT margin” EBIT divided by revenue
“EBITDA” profit before depreciation and amortisation expenses, net
financing expenses and income tax
“EBITDA margin” EBITDA divided by revenue
DEFINITIONS
— 3 —

“EGM” the extraordinary general meeting of the Company to be held
at 10:30 a.m. on Thursday, 9 December 2010 at Fanling
Room, Lower Level I, Kowloon Shangri-La Hotel, 64 Mody
Road, Tsimshatsui East, Kowloon, Hong Kong for the purpose
of considering and, if thought fit, passing the relevant
resolutions to approve the Share Sale Deed and the
transactions contemplated thereby including, but not limited
to, the proposed increase in the authorised share capital of the
Company and the grant of the Specific Mandate and any
adjournment thereof a notice of which is set out at the end of
this circular
“Enlarged Group” the Group immediately after Completion
“EPM” means an exploration permit for minerals issued pursuant to
the MRA
“Escrow Deed” the escrow deed dated 17 October 2010 entered into between
the Company, Album Enterprises, All Glorious and Freehills
Singapore
“FATA” the Foreign Acquisitions and Takeovers Act 1975 (Cth)
“GBP” pound sterling, the lawful currency of the United Kingdom
“GDP” gross domestic product
“Grant Samuel” Grant Samuel and Associates Pty Ltd, the Competent
Evaluator appointed by the Company in respect of the
Acquisition
“Group” the Company and its subsidiaries from time to time
“HK$” or “HK cent(s)” Hong Kong dollar(s) or cent(s), the lawful currency of Hong
Kong
“Hong Kong” the Hong Kong Special Administrative Region of the People’s
Republic of China
“HPM” high precious metal
“Independent Board Committee” a committee of the Board comprising all the independent
non-executive Directors, namely, Mr. Li Dongsheng,
Mr. Ting Leung Huel, Stephen and Mr. Loong Ping Kwan
DEFINITIONS
— 4 —
“Independent Financial Adviser”
or “Somerley”
Somerley Limited, a licensed corporation under the SFO for
carrying out Type 1 (dealing in securities), Type 4 (advising
on securities), Type 6 (advising on corporate finance) and
Type 9 (asset management) regulated activities, the
independent financial adviser appointed to advise the
Independent Board Committee and the Independent
Shareholders in respect of the Acquisition, including, but not
limited to, the proposed increase in the authorised share
capital of the Company and the grant of the Specific Mandate
“Independent Shareholders” the shareholders of the Company, except CMN and its
associates
“Independent Third Parties” parties which are independent of and not connected with any
director, chief executive or substantial shareholder of the
Company or any of its subsidiaries or any of their respective
associates within the meaning of the Listing Rules
“JORC Code” the Australasian Code for Reporting of Exploration Results,
Mineral Resources and Ore Reserves (2004 edition), as
published by the Joint Ore Reserves Committee, as amended
from time to time
“Laos” the Lao People’s Democratic Republic
“Last Trading Date” 18 October 2010, being the last trading date for the Shares
before the date of Share Sale Deed
“Latest Practicable Date” 18 November 2010, being the latest practicable date prior to
the printing of this circular for ascertaining certain
information contained herein
“LME” the London Metal Exchange
“Loan Agreement” the loan agreement dated 19 October 2010 entered into
between All Glorious (as borrower), the Company (as
guarantor) and Album Enterprises (as lender)
“Listing Rules” the Rules Governing the Listing of Securities on the Stock
Exchange
“Main Board” the main board of the stock exchange operated by the Stock
Exchange
“Market Valuation” an independent market valuation on the Target Company as at
30 June 2010 undertaken by Grant Samuel
DEFINITIONS
— 5 —
“MEPA” a Mineral Exploration and Production Agreement dated
15 June 1993 entered into between MMG Laos Holdings
Limited with the Government of Laos (as amended by the
Memorandum of Understanding dated 30 November 2004)
“MMG” Minerals and Metals Group, being the collective brand name
of the portfolio of international mining assets held by the
Target Group
“MMG Century” MMG Century Limited, a company incorporated on
25 November 1986 in Australia with limited liability and a
member of the Target Group
“MRA” the Mineral Resources Act 1989 (Queensland)
“NASDAQ” the National Association of Securities Dealers Automated
Quotations
“NGO” non-governmental organisation
“Nyrstar” Nyrstar Sales & Marketing AG, a company incorporated in
Switzerland and an Independent Third Party
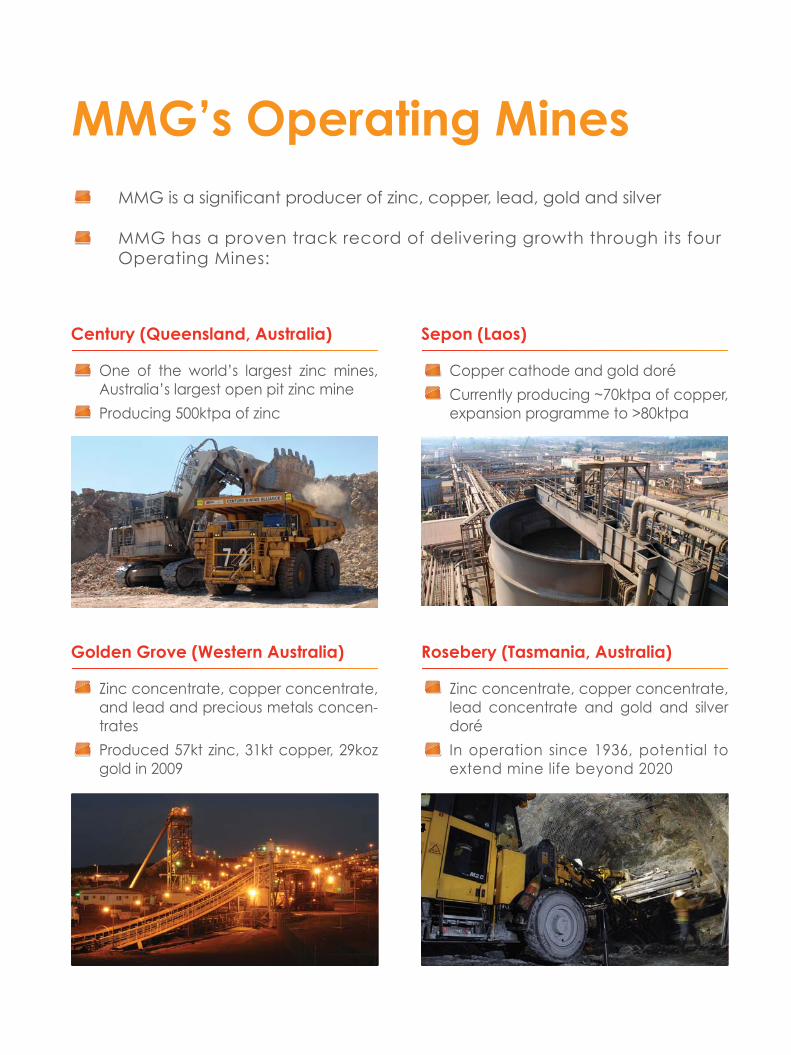
“Operating Mines” (i) the Sepon copper/gold mine located in Laos;
(ii) the Century zinc/lead/silver mine located in Queensland,
Australia;
(iii) the Golden Grove copper/zinc/lead/precious metals
mine located in Western Australia, Australia; and
(iv) the Rosebery lead/zinc/copper/precious metals mine
located in Tasmania, Australia
“Oxiana” Oxiana Limited, a company incorporated in Australia and
which acquired Zinifex on 1 July 2008 to form OZL
“OZL” OZ Mineral Limited, previously known as Oxiana. Oxiana
changed its name to OZL on 18 July 2008 subsequent to the
acquisition of Zinifex by Oxiana on 1 July 2008
“p.a.” per annum
“Parity Securities” in respect of the Company, any security issued or guaranteed
by the Company which ranks or is expressed to rank pari
passu with the PSCS
DEFINITIONS
— 6 —
“Placing(s)” one or more potential share placement(s) to be conducted by
the Company, where new Shares to be issued will be covered
by the Specific Mandate
“Purchase Price” an aggregate amount of US$1,846,000,000 (equivalent to
approximately HK$14,398,800,000), being the consideration
payable by All Glorious or its nominee to Album Enterprises
for the purchase of all of the Sale Shares pursuant to the Share
Sale Deed
“PRC” the People’s Republic of China (for the purpose of this
circular, excluding Hong Kong, the Macau Special
Administrative Region of the PRC and Taiwan)
“PSCS” the perpetual subordinated convertible securities to be issued
by the Company to satisfy part of the Purchase Price
“PSCS Holder(s)” (in relation to the PSCS) means the person(s) in whose names
the PSCS are registered
“Repatriation” the repatriation of US$340,000,000 (equivalent to
approximately HK$2,652,000,000) from the Target Group to
Album Enterprises, the details of are set out in the paragraph
headed “Letter from the Board — The Acquisition —
Repatriation” in this circular
“S$” Singapore dollar(s), the lawful currency of Singapore
“Sale Shares” 488,211,901 ordinary shares in the share capital of the Target
Company, representing all of the issued and paid-up share
capital of the Target Company amounting to S$488,211,901 as
at the Latest Practicable Date
“Senior Creditors” means, with respect to the Company, all creditors (including
subordinated creditors) of the Company other than the PSCS
Holder(s), the holder(s) of any Parity Securities and the
holder(s) of any class of shares of the Company
“SFO” the Securities and Futures Ordinance (Chapter 571 of the
Laws of Hong Kong)
“Share(s)” the ordinary share(s) of HK$0.05 each in the issued share
capital of the Company
“Share Sale Deed” the conditional share sale deed dated 19 October 2010 entered
into between Album Enterprises (as seller), All Glorious (as
buyer) and the Company (as guarantor and issuer of the
Consideration Shares and the PSCS) in relation to the
Acquisition
DEFINITIONS
— 7 —
“Shareholder(s)” holder(s) of the Shares
“Specific Mandate” a specific mandate for the Directors to issue up to
2,700,000,000 new Shares, the issue of the new Shares
pursuant to which will be conditional upon Completion and
further details of which are set out in the paragraph headed
“Letter from the Board — Specific Mandate” in this circular
“Stock Exchange” The Stock Exchange of Hong Kong Limited
“subsidiary” has the meaning ascribed to it under the Companies Ordinance
“Target Company” Album Resources Private Limited, a limited liability company
incorporated on 8 April 2009 under the laws of Singapore and
wholly-owned by Album Enterprises
“Target Group” or “MMG” the Target Company and its subsidiaries
“Top Create” Top Create Resources Limited, a company incorporated on
22 January 2004 in the British Virgin Islands with limited
liability and wholly-owned by CMN
“trading day” a day on which the Shares are traded on the Stock Exchange
“Treasurer” the Federal Treasurer of the Commonwealth of Australia
“US$” or “US¢” United States dollar(s) or cents(s), the lawful currency of the
United States of America
“Valuation Report” has the meaning ascribed to it under Chapter 18 of the Listing
Rules
“Wood Mackenzie/Brook Hunt
Report”
the industry report issued by Wood Mackenzie under the
brand name, Wood Mackenzie/Brook Hunt
“Zinifex” Zinifex Limited, a company incorporated on 9 August 2002
and which was acquired by Oxiana on 1 July 2008 to form
OZL
“%” percentage
DEFINITIONS
— 8 —
App1,part B31(2)(a)
This glossary of technical terms contains terms used in this circular in connection with the
Enlarged Group. As such, these terms and their meanings may not correspond to standard industry
meaning or usage of these terms
“¢/lb” US cents per pound
“g/t” grams per tonne
“ha” hectare(s)
“km” kilometre(s)
“koz” thousand ounces
“kt” thousand tonnes
“ktpa” thousand tonnes per annum
“kV” kilovolt
“lb” pound(s)
“m” metre(s)
“Mt” million tonnes
“moz” million ounces
“oz” ounce(s)
“t” tonne(s)
“Zn” zinc
“CIF” cost, insurance and freight, a term of sale whereby the seller
quotes a price that includes the price of the goods, insurance
and freight charges to the buyer’s destination
“FOB” free on board, a term of sale which means that the seller
fulfils its obligation to deliver goods when the goods pass
over the ship’s (or other mode of transport) rail at the named
point of shipment after which the buyer has to bear all
shipping and other costs and risks in respect of loss of, or
damage to, the goods from that point
GLOSSARY
— 9 —
“Indicated Resources” as defined under the JORC Code, that part of a Mineral
Resource for which tonnage, densities, shape, physical
characteristics, grade and mineral content can be estimated
with a reasonable level of confidence. It is based on
exploration, sampling and testing information gathered
through appropriate techniques from locations such as
outcrops, trenches, pits, workings and drill holes. The
locations are too widely or inappropriately spaced to confirm
geological and/or grade continuity but are spaced closely
enough for continuity to be assumed
“Inferred Resources” as defined under the JORC Code, that part of a Mineral
Resource for which tonnage, grade and mineral content can be
estimated with a low level of confidence. It is inferred from
geological evidence and assumed but not verified geological
and/or grade continuity
“Measured Resources” as defined under the JORC Code, that part of a Mineral
Resource for which tonnage, densities, shape, physical
characteristics, grade and mineral content can be estimated
with a high level of confidence. It is based on detailed and
reliable exploration, sampling and testing information
gathered through appropriate techniques from locations such
as outcrops, trenches, pits, workings and drill holes. The
locations are spaced closely enough to confirm geological and
grade continuity
“Mineral Resources” as defined under the JORC Code, a concentration or
occurrence of material of intrinsic economic interest in or on
the Earth’s crust in such form, quality and quantity that there
are reasonable prospects for eventual economic extraction.
The location, quantity, grade, geological characteristics and
continuity of a Mineral Resource are known, estimated or
interpreted from specific geological evidence and knowledge.
Mineral Resources are sub-divided, in order of increasing
geological confidence, into inferred, indicated and measured
categories
GLOSSARY
— 10 —
“Ore Reserves” as defined under the JORC Code, the economically mineable
part of a Measured Resource and/or Indicated Resource. It
includes diluting materials and allowances for losses which
may occur when the material is mined. Appropriate
assessments and studies have been carried out, and include
consideration of and modification by realistically assumed
mining, metallurgical, economic, marketing, legal,
environmental, social and governmental factors. These
assessments demonstrate at the time of reporting that
extraction could reasonably be justified. Ore Reserves are
subdivided into Probable Ore Reserves and Proved Ore
Reserves
“Probable Ore Reserve” as defined under the JORC Code, the economically mineable
part of an Indicated, and in some circumstances, a Measured
Resource
“Proved Ore Reserve” as defined under the JORC Code, the economically mineable
part of a Measured Resource
“Sx-Ew” solvent extraction - electrowinning
GLOSSARY
— 11 —
Set out below is the expected timetable, Shareholders should note that the timetable is subject
to change
Despatch of this circular on . . . . . . . . . . . . . . . . . . . . . . . . . . . . . . . . Monday, 22 November 2010
Latest time for lodging forms of proxy for
the EGM (Note 1) . . . . . . . . . . . . . . . . . . . . . . . . . . . . 10:30 a.m. on Tuesday, 7 December 2010
EGM to be held on . . . . . . . . . . . . . . . . . . . . . . . . . . . . 10:30 a.m. on Thursday, 9 December 2010
Announcement of results of the EGM on . . . . . . . . . . . . . . . . . . . . . . . . Friday, 10 December 2010
Expected Completion Date . . . . . . . . . . . . . . . . . . . . . . . . . . . . . . . . . . no later than 7 April 2011
Announcement of Completion . . . . . . . . . . . . . . . . . . . . . . . . . .one business day after Completion
Notes:
1. In order to be valid, forms of proxy must be lodged with the Company’s share registrar,
Computershare Hong Kong Investor Services Limited, by hand or by post, at 17M Floor,
Hopewell Centre, 183 Queen’s Road East, Wan Chai, Hong Kong, as soon as possible and in any
event not later than 48 hours before the time appointed for holding the EGM or any adjournment
thereof. Completion and return of the proxy form for the EGM will not preclude a Shareholder
from attending, and voting in person at the EGM or any adjournment thereof if he so wishes. In
such event, the returned form of proxy will be deemed to have been revoked.
2. All references in this circular to times and dates are references to Hong Kong times and dates.
EXPECTED TIMETABLE
— 12 —
(Incorporated in Hong Kong with limited liability)
(Stock code: 1208)
22 November 2010
To the Shareholders
Dear Sir or Madam,
I am writing to invite you to vote to support the creation of a powerful new force in international
resources mining. We believe that the Acquisition of Minerals and Metals Group (known as MMG)
from Album Enterprises, a wholly-owned subsidiary of CMN, will provide the Company with a suite
of high quality international base metals assets that can transform the Company and its subsidiaries
from a commodities-trading focused group into a leading internationally diversified upstream base
metals group.
I truly believe that the Acquisition is in the interests of the Company and the Shareholders
as a whole and I hope that you will support us, as the Independent Board Committee and
Independent Financial Adviser do, by voting in favour of this transaction.
Benefits to Shareholders
I believe that the growth potential that the Acquisition brings to the Company is good for all our
Shareholders. It is expected that the Acquisition will, in particular, enable the Company to:
• Derive an immediate substantial earnings and cashflow contribution from MMG;
• Deliver a more diversified and significant portfolio of assets, development projects and
future growth opportunities;
• Reposition the Company as CMC Group’s flagship international upstream base metals
platform;
• Expand institutional investors’ interest to support a market re-rating; and
• Combine capable and experienced boards and management teams.
LETTER FROM THE CHAIRMAN
— 13 —

About MMG
MMG, which is the collective brand name of the mining assets held by Album Resources, a
wholly-owned subsidiary of CMN, holds a large portfolio of international mining assets and is a
significant producer of zinc, copper, lead, gold and silver. It currently operates four producing mines
in Australia and Laos, with a revenue for the six months ended 30 June 2010 of US$844.7 million
(approximately HK$6,588.7 million) and EBITDA of US$403.9 million (approximately HK$3,150.4
million), representing an EBITDA margin of approximately 48%. It also has several other early-stage
development and exploration projects in Australia, Indonesia and Canada.
Board and management
Mr. Andrew Michelmore, the current managing director and CEO of MMG, and Mr. David
Lamont, the current CFO of MMG, will be joining the Board as an executive Director and CEO, and
an executive Director and CFO, respectively, upon completion of the Acquisition. At the same time,
Dr. Peter Cassidy, the current independent non-executive director of MMG and Mr. Jiao Jian, currently
a non-executive director of MMG (and the president of CMN), will also join the Board, respectively,
as an independent non-executive Director and non-executive Director.
The four appointments will bring to the Company a unique and complementary mix of PRC and
international corporate expertise, insight into the base metals market of the PRC, as well as significant
experience in managing mining operations and assessing and executing international mergers and
acquisitions opportunities.
Additionally, the senior management team of MMG will also become part of the Company,
bringing to the Enlarged Group many years experience in mining exploration, development and
operational management.
As we bring the two businesses together, integration and growth initiatives will be drivenwith a sharp focus on shareholder value and what is best for the Enlarged Group.
EGM proposal
Subject to Independent Shareholders’ approval at the EGM on 9 December 2010, as well as
pending regulatory approval(s), the Company will acquire MMG for US$1,846.0 million
(approximately HK$14,398.8 million) which will be satisfied through a combination of cash, and the
issuance of Consideration Shares and PSCS.
At the EGM, Independent Shareholders will be asked to vote on the following important proposal
that will enable the Acquisition to go ahead. The ordinary resolution (which will be voted on together
through one resolution at the EGM) concerns approval by the Independent Shareholders of the
Acquisition under the terms of the Share Sale Deed, which include:
(i) a proposed increase in the authorised share capital of the Company from HK$300.0 million
to HK$900.0 million; and
LETTER FROM THE CHAIRMAN
— 14 —
(ii) the granting of a specific mandate to issue not more than 2,700,000,000 new Shares
If you are the Shareholder on record of the Shares, and whether or not you are able to attend the
meeting in person, please complete and sign the accompanying form of proxy and turn the form in the
enclosed pre-paid envelope to the Company’s share registrar, Computershare Hong Kong Investor
Services Limited by no later than 10:30 a.m. on 7 December 2010.
Further information
Please refer to the “Letter from the Board”, the “Letter from the Independent Board
Committee”, the “Letter from Somerley” and the information set out in this circular for further
information.
I hope you share my enthusiasm and confidence about the future prospects of the Enlarged
Group and I look forward to reporting to you on our progress in the coming years.
Yours faithfully,
Li FuliChairman
Minmetals Resources Limited
LETTER FROM THE CHAIRMAN
— 15 —
(Incorporated in Hong Kong with limited liability)(Stock code: 1208)
Chairman:LI Fuli (Non-executive Director)
Executive Directors:HAO ChuanfuZHAN Wei
Non-executive Directors:SHEN LingWANG LixinZONG QingshengXU JiqingLI Liangang
Independent Non-executive Directors:LI DongshengTING Leung Huel, StephenLOONG Ping Kwan
Registered Office:12th FloorChina Minmetals Tower79 Chatham Road SouthTsimshatsuiKowloonHong Kong
22 November 2010
To the Shareholders
Dear Sir or Madam,
(1) VERY SUBSTANTIAL ACQUISITIONAND CONNECTED TRANSACTION
IN RELATION TOTHE ACQUISITION OF THE ENTIRE ISSUED SHARE CAPITAL OF
ALBUM RESOURCES PRIVATE LIMITED
(2) PROPOSED INCREASE IN AUTHORISED SHARE CAPITAL
(3) SPECIFIC MANDATE TO ISSUE NEW SHARES
AND
(4) PROPOSED APPOINTMENT OF DIRECTORS
INTRODUCTION
On 19 October 2010, the respective boards of directors of CMN and the Company announced that
Album Enterprises (as seller), All Glorious (as buyer), a wholly-owned subsidiary of the Company,
and the Company (as guarantor and issuer of the Consideration Shares and the PSCS) entered into the
LETTER FROM THE BOARD
— 16 —
2.14
14.60(1)
14.63(1)

Share Sale Deed, pursuant to which All Glorious conditionally agreed to buy, and Album Enterprises
conditionally agreed to sell, the Sale Shares, representing all of the issued share capital of
the Target Company, at the Purchase Price of US$1,846,000,000 (equivalent to approximately
HK$14,398,800,000).
THE ACQUISITION
Share Sale Deed dated 19 October 2010
Parties
Seller : Album Enterprises, a wholly-owned subsidiary of CMN, a non-ferrous
metals resource enterprise, which in turn is a controlling shareholder of
the Company holding approximately 63.39% of the issued share capital
of the Company as at the Latest Practicable Date. Album Enterprises is
an investment holding company;
Buyer : All Glorious; and
Guarantor and issuer of
the Consideration
Shares and the PSCS
: the Company.
Assets to be acquired
The Sale Shares, representing all of the issued share capital of the Target Company. The Target
Company is an investment holding company incorporated on 8 April 2009. The Target Company holds
a portfolio of international mining assets known as MMG. The Sale Shares are to be acquired free and
clear of all encumbrances. Please refer to the section headed “Information of the Target Group” in this
circular for further information.
Purchase Price
The Purchase Price of US$1,846,000,000 (equivalent to approximately HK$14,398,800,000) was
arrived at after arm’s length negotiations between the Company, All Glorious and Album Enterprises
and was determined with reference to the range of the Market Valuation and adjusted by the parties
for expectations on working capital changes until 31 December 2010, including, but not limited to, the
repatriation of US$340,000,000 (equivalent to approximately HK$2,652,000,000) from the Target
Group to Album Enterprises by way of dividend and has reflected the facts that subsequent to the
acquisition of the Operating Mines, the Development Projects and various exploration projects (which
are currently held through the Target Company) by CMN and its subsidiaries in June 2009, MMG has
undertaken significant additional capital expenditure at these assets and that there has also been a
general increase in commodity prices. Please refer to the paragraph headed “Letter from the Board —
The Acquisition — Repatriation” below for further details on the repatriation.
LETTER FROM THE BOARD
— 17 —
14A.58(1)14.58(3)14A.59(2)(a)
14A.59(2)(e)14A.59(2)(f)
14.58(2)
App1B31(2)(a)
14A.59(2)(c)14.58(4)14.58(5)
App 1B31(2)(b)
The Company has appointed Grant Samuel as the Competent Evaluator and commissioned Grant
Samuel to conduct the Chapter 18 Valuation and the Market Valuation. The Market Valuation, which
was prepared using methodologies in line with international market practices, is based primarily on
a discounted cashflow analysis on the estimated life of mine operational parameters, including, but not
limited to, Ore Reserves and Mineral Resources estimates, production profiles, operating and capital
costs, potential for reserve extension and future outlook of commodity prices, with secondary
consideration given to alternative valuation methodologies based on multiples of Ore Reserves and
Mineral Resources, comparable company analysis and comparable transaction analysis. The Market
Valuation seeks to evaluate the full market value of MMG and, accordingly, reflects the value
associated with Inferred Resources and the exploration potential of the Target Group’s assets, which
are specifically excluded from the Chapter 18 Valuation as required by the Listing Rules.
The Market Valuation differs from the Chapter 18 Valuation in the following aspects:
(i) the value of Inferred Resources has, in compliance with Rule 18.30(3) of the Listing Rules,
been excluded from the Chapter 18 Valuation. However, a portion of the value of the
Inferred Resources is included in the Market Valuation if the Competent Person is of the
view that such portion of the Inferred Resources have a reasonable likelihood of being
mined in the future;
(ii) the value of a portion of the Measured Resources and Indicated Resources which cannot be
assumed to convert to mineable resources according to the requirements of Chapter 18 of
the Listing Rules has been excluded from the Chapter 18 Valuation. However, the value of
such portion of Measured Resources and Indicated Resources is included in the Market
Valuation as the Competent Person is of the view that such portion of Measured Resources
and Indicated Resources have a reasonable likelihood of being mined in the future;
(iii) the value of a portion of the current Ore Reserves is excluded from the Chapter 18
Valuation, as the exclusion of Inferred Resources caused such Ore Reserves to become
theoretically uneconomically viable to extract due to mine scheduling constraints.
However, the value of such portion of Ore Reserves is included in the Market Valuation;
(iv) the Chapter 18 Valuation attributes no value to near-mine exploration, whereas some level
of success in near-mine exploration and the associated value have been included in the
Market Valuation; and
(v) the Chapter 18 Valuation attributes no value to the exploration and development projects
currently operated by MMG due to an absence of a currently-stated Ore Reserve. However,
some value has been ascribed to such exploration and development projects in the Market
Valuation.
Given the different assumptions and methods adopted in deriving the Chapter 18 Valuation and
the Market Valuation to which the Purchase Price was referenced, the value of the Inferred Resources
cannot be deduced by way of a simple mathematical deduction and an approximate proportion of the
Purchase Price which relates specifically to the Inferred Resources cannot be ascertained.
LETTER FROM THE BOARD
— 18 —
The Valuation Report on the Chapter 18 Valuation of the Target Company’s equity as set out in
Appendix V to this circular provides a valuation in the range of US$1,533 million to US$1,741 million
(equivalent to approximately HK$11,957 million to HK$13,580 million). This valuation has been
updated for changes, including, but not limited to, changes in commodity prices, changes in foreign
exchange rates and any material changes in the operational prospects for the relevant assets, since the
draft Competent Evaluator’s Chapter 18 Valuation of the Target Company’s equity in the range of
US$1,472 million to US$1,681 million (equivalent to approximately HK$11,482 million to
HK$13,112 million) as disclosed in the announcement of the Company dated 19 October 2010. The
Chapter 18 Valuation is based on the net debt position of the Target Company as at 30 June 2010 and
has not been adjusted for any distributions or working capital changes until 31 December 2010,
including, but not limited to, the repatriation of US$340 million (equivalent to approximately
HK$2,652 million) from the Target Group to Album Enterprises by way of dividend.
The Purchase Price shall be satisfied in the following manner:
(i) Cash:
(A) as to US$100,000,000 (equivalent to approximately HK$780,000,000) in cash, from
All Glorious or its nominee to Album Enterprises, payable as follows:
1. where the Completion Date falls on or prior to 31 December 2010, payment shall
be made on either (a) 31 December 2010 or (b) a date falling after the
Completion Date and prior to 31 December 2010, as may be agreed in writing
between All Glorious and Album Enterprises; or
2. where the Completion Date falls after 31 December 2010, payment shall be made
on the Completion Date; and
(B) as to US$694,161,888 (equivalent to approximately HK$5,414,462,726), from the
proceeds from a loan from Album Enterprises to All Glorious under the Loan
Agreement, payable on Completion;
(ii) Consideration Shares: as to US$361,838,112 (equivalent to approximately
HK$2,822,337,274) through the issuance by the Company of 940,779,090 Consideration
Shares to Album Enterprises or its nominee at an issue price of HK$3.00 per Share on
Completion; and
(iii) PSCS: as to US$690,000,000 (equivalent to approximately HK$5,382,000,000) through the
issuance by the Company of PSCS convertible into 1,560,000,000 Conversion Shares to
Album Enterprises or its nominee at an initial conversion price of HK$3.45 per Share on
Completion.
LETTER FROM THE BOARD
— 19 —
Cash
(A) Pursuant to the Share Sale Deed, US$100,000,000 (equivalent to approximately
HK$780,000,000) will be satisfied by cash. The cash consideration will be funded from the
internal resources of the Group and will be paid by All Glorious or its nominee as follows:
1. where the Completion Date falls on or prior to 31 December 2010, payment shall be made
on either (a) 31 December 2010 or (b) a date falling after the Completion Date and prior
to 31 December 2010, as may be agreed in writing between All Glorious and Album
Enterprises; or
2. where the Completion Date falls after 31 December 2010, payment shall be made on the
Completion Date.
(B) The Loan Agreement
The principal terms of the Loan Agreement are set out below:
Borrower : All Glorious
Guarantor : Company
Lender : Album Enterprises
Principal amount of
the loan
: US$694,161,888 (equivalent to approximately HK$5,414,462,726)
Funding date : the Completion Date
Maturity date : the date falling five years from the Completion Date
Interest rate : for any date falling within a period specified in the table below, the
rate per cent per annum shown in the table below for that period:
Period commencingon (and including)
Period ending on(but excluding)
Fixed interestrate
the Completion Date the date falling one
year after the
Completion Date
2% per annum
the date falling one
year after the
Completion Date
the date falling two
years after the
Completion Date
2% per annum
the date falling two
year after the
Completion Date
the date falling three
years after the
Completion Date
3% per annum
LETTER FROM THE BOARD
— 20 —
App1B31(2)(b)
14A.59(12)
14.58(9)
Period commencingon (and including)
Period ending on(but excluding)
Fixed interestrate
the date falling three
years after the
Completion Date
the date falling four
years after the
Completion Date
4% per annum
the date falling four
years after the
Completion Date
the maturity date (or,
if later, the first date
on which all
outstanding moneys
have been fully repaid)
5% per annum
All Glorious shall pay accrued interest to the lender at 12-monthly
intervals in arrears (or such shorter period that ends on the maturity
date)
Early repayment
option
: The Company, at its sole discretion, may repay the loan under the
Loan Agreement, in whole or in part, subject to prior written notice
of three business days. The minimum repayment amount is
US$500,000 or multiples thereof
Guarantee : The obligations of All Glorious under the Loan Agreement are
guaranteed by the Company
Conditions precedent : Conditions precedent include each condition precedent to the
Acquisition as set out in the Share Sale Deed (except any condition
precedent relating to the payment of the Purchase Price) being
satisfied or waived in writing prior to the proposed funding date
Freehills Singapore held the Loan Agreement in escrow pursuant to the Escrow Deed. The Loan
Agreement was dated and released on 19 October 2010 pursuant to receipt by Freehills Singapore of
the relevant release notice.
Consideration Shares
Pursuant to the Share Sale Deed, the Company will allot and issue 940,779,090 Consideration
Shares at an issue price of HK$3.00 per Share to Album Enterprises or its nominee on Completion.
Assuming no changes in the shareholding in the Company from the Latest Practicable Date other than
those contemplated under the Share Sale Deed, the 940,779,090 Consideration Shares represent
approximately 46.43% of the existing issued share capital of the Company as at the Latest Practicable
Date, approximately 31.71% of the enlarged issued share capital of the Company immediately after
Completion (assuming no conversion of the PSCS), approximately 20.78% of the enlarged issued
share capital of the Company immediately after Completion (assuming full conversion of the PSCS)
and approximately 13.02% of the enlarged issued share capital of the Company immediately after
Completion (assuming full conversion of the PSCS) and the issuance of all the new Shares under the
Specific Mandate.
LETTER FROM THE BOARD
— 21 —
14.59(1)
The issue price of the Consideration Shares of HK$3.00 per Share represents:
(i) a discount of approximately 48.6% to the price per Share as quoted on the Stock Exchange
of HK$5.84 per Share as at the Latest Practicable Date;
(ii) a discount of approximately 52.2% to the price per Share as quoted on the Stock Exchange
of HK$6.28 per Share on the Last Trading Date;
(iii) a discount of approximately 37.2% to the price per Share as quoted on the Stock Exchange
of HK$4.78 per Share on 24 September 2010, being the last trading day for the Shares
immediately before the date of the announcement in relation to price-sensitive information
regarding the Acquisition issued on 27 September 2010;
(iv) a discount of approximately 19.6% to the average closing price of HK$3.73 per Share as
quoted on the Stock Exchange for the last 30 consecutive trading days up to and including
24 September 2010;
(v) a discount of approximately 4.5% to the average closing price of HK$3.14 per Share as
quoted on the Stock Exchange for the last 90 consecutive trading days up to and including
24 September 2010;
(vi) a slight discount of approximately 0.7% to the average closing price of HK$3.02 per Share
as quoted on the Stock Exchange for the last 180 consecutive trading days up to and
including 24 September 2010;
(vii) a premium of approximately 6.8% over the average closing price of HK$2.81 per Share as
quoted on the Stock Exchange for the last one year up to and including 24 September 2010;
(viii) a price earnings ratio of 33.56 times the earnings per Share of HK8.94 cents for the year
ended 31 December 2009; and
(ix) a price to book value of 1.09 times the net asset value per Share of HK$2.75 as at 30 June
2010.
The PSCS
The principal terms of the PSCS are set out below:
Issuer : The Company
Maximum aggregate
principal amount of
the PSCS
: US$690,000,000 (equivalent to approximately HK$5,382,000,000)
LETTER FROM THE BOARD
— 22 —

Status and
subordination
: The PSCS constitutes direct, unsecured and subordinated
obligations of the Company and rank pari passu without any
preference or priority among themselves
In the event of the winding-up of the Company, the rights and
claims of the PSCS Holders shall (i) rank ahead of those persons
whose claims are in respect of any class of share capital (including
preference shares) of the Company, (ii) be subordinated in right of
payment to the claims of all other present and future Senior
Creditors of the Company, and (iii) pari passu with each other and
with claims of holders of Parity Securities
Issue price : 100% of principal amount of the PSCS
Form and
denomination
: The PSCS will be issued in registered form in the denomination of
US$500,000 each
Distribution(s) : The PSCS confers a right to receive distribution(s) from and
including the date of issue of the PSCS at the rate of distribution
payable annually in arrears on 31 July each year, subject to the
terms of the PSCS
Rate of distribution : 1% per annum on any outstanding principal amount
Optional deferral of
distributions
: The Company may, at its sole discretion, elect to defer a
distribution pursuant to the terms of the PSCS
Expected issue date : Upon Completion
Maturity date : There is no maturity date
Conversion period : Any time from the date of issue of the PSCS, subject to certain
conditions as provided in the terms of the PSCS
Conversion price : Initially HK$3.45 per Share, subject to adjustment as provided for
in the terms of the PSCS
Restriction on
conversion
: A holder of the PSCS may only convert such number of PSCS as
would not cause the Company to contravene the minimum public
float requirement under the rules and regulations of the stock
exchange on which the Shares are listed following conversion
Fractional Shares : Fractions of Shares will not be issued on conversion and no cash
adjustments will be made in respect thereof but (except in certain
cases where any such cash payment equals to or is less than
US$10.00) a cash payment will be made to the PSCS Holder(s) in
respect of such fraction
LETTER FROM THE BOARD
— 23 —

Conversion Price
adjustment
: The Conversion Price will be subject to adjustment for, among
other things, subdivision, reclassification or consolidation of
Shares, bonus issues, rights issues, capital distributions,
distributions and other dilutive events
Issuer’s option to
force conversion
: On or at any time after 12 months after the date of issue of the
PSCS, the Company may, at its sole discretion and subject to the
terms of the PSCS, elect to convert the PSCS in whole but not in
part into Shares. No such conversion may be made unless the
volume-weighted average price of the Shares as determined on the
terms of the PSCS for each of the 30 consecutive trading days
ending on a date which is no more than three business days
immediately prior to the date upon which notice of such conversion
is given (translated into US$ at the prevailing exchange rate set out
in the terms of the PSCS), was at least 200% of the applicable
Conversion Price then in effect (translated into US$ at the fixed
exchange rate set out in the terms of the PSCS). The Issuer’s right
to force conversion will only apply to such portion of the PSCS of
a PSCS Holder that if converted, would not cause the Company to
contravene the minimum public float requirement under the rules
and regulations of the stock exchange on which the Shares are
listed
Voting : The PSCS Holder(s) will not be entitled to receive notice of, attend
or vote at general meetings of the Company by reason only of its
being a PSCS Holder
Transferability : Subject to the terms of the PSCS, a PSCS may be transferred by
delivery of the certificate issued in respect of that PSCS, with the
form of transfer in the agreed form as set out in the terms of the
PSCS duly completed and signed, to the registered office of the
Company or the specified office of any registrar which the
Company may appoint. Upon a transfer of the PSCS, a new
certificate will be issued to the transferee. Where only part of a
principal amount of the PSCS in respect of which a certificate is
issued is to be transferred, a new certificate in respect of the PSCS
not so transferred will be issued to the transferor. No transfer of a
PSCS will be valid unless and until entered on the register of PSCS
Holder(s)
LETTER FROM THE BOARD
— 24 —
Pre-emption right : Not more than 20 nor less than 15 business days (as defined in the
terms of the PSCS) prior to the PSCS Holder delivering a
certificate under the terms of the PSCS to the Company or the
registrar (as the case may be) for the transfer of a PSCS, the PSCS
Holder must notify the Company of the PSCS Holder’s intention to
transfer the PSCS in writing. Following the receipt by the Company
of such notice, the Company may by no later than 15 business days
(as defined in the terms of the PSCS) after it has received the
notice, elect to purchase and cancel all or some of the PSCS the
subject of the relevant notice at the price specified in the notice.
The Company must complete the purchase of the relevant PSCS
within 15 business days (as defined in the terms of the PSCS) of it
informing the PSCS Holder that it has elected to purchase the
PSCS. The periods specified for the Company to elect to purchase
the relevant PSCS and to complete the purchase and cancellation of
the relevant PSCS shall be extended by any period during which the
Company is prohibited from doing so pursuant to the requirements
of any applicable laws and/or regulations
If the Company does not elect to purchase, or fails to complete the
purchase after so elected, the PSCS the subject of the notice
referred to above, the PSCS Holder may transfer those PSCS to the
purchaser specified in the above-mentioned notice for the purchase
price specified in the notice in accordance with the terms of the
PSCS
Based on the initial conversion price of HK$3.45 and assuming no changes in the shareholding
in the Company from the Latest Practicable Date other than those contemplated under the Share Sale
Deed, the Company will allot and issue 1,560,000,000 Conversion Shares credited as fully paid upon
full conversion of the PSCS. The 1,560,000,000 Conversion Shares represent approximately 76.99%
of the existing issued share capital of the Company as at the Latest Practicable Date, approximately
52.58% of the enlarged issued share capital of the Company immediately after Completion (assuming
no conversion of the PSCS), approximately 34.46% of the enlarged issued share capital of the
Company immediately after Completion (assuming full conversion of the PSCS) and approximately
21.59% of the enlarged issued share capital of the Company immediately after Completion (assuming
full conversion of the PSCS) and the issuance of all the new Shares under the Specific Mandate.
The initial Conversion Price of HK$3.45 per Share of the PSCS represents:
(i) a premium of 15% over the issue price of the Consideration Shares;
(ii) a discount of approximately 40.9% to the price per Share as quoted on the Stock Exchange
of HK$5.84 per Share as at the Latest Practicable Date;
(iii) a discount of approximately 45.1% to the price per Share as quoted on the Stock Exchange
of HK$6.28 per Share on the Last Trading Date;
LETTER FROM THE BOARD
— 25 —
(iv) a discount of approximately 27.8% to the price per Share as quoted on the Stock Exchange
of HK$4.78 per Share on 24 September 2010, being the last trading day for the Shares
immediately before the date of the announcement in relation to price-sensitive information
regarding the Acquisition issued on 27 September 2010;
(v) a discount of approximately 7.5% to the average closing price of HK$3.73 per Share as
quoted on the Stock Exchange for the last 30 consecutive trading days up to and including
24 September 2010;
(vi) a premium of approximately 9.9% over the average closing price of HK$3.14 per Share as
quoted on the Stock Exchange for the last 90 consecutive trading days up to and including
24 September 2010;
(vii) a premium of approximately 14.2% over the average closing price of HK$3.02 per Share
as quoted on the Stock Exchange for the last 180 consecutive trading days up to and
including 24 September 2010;
(viii) a premium of approximately 22.8% over the average closing price of HK$2.81 per Share
as quoted on the Stock Exchange for the last one year up to and including 24 September
2010;
(ix) a price earnings ratio of 38.59 times the earnings per Share of HK8.94 cents for the year
ended 31 December 2009; and
(x) a price to book value of 1.25 times the net asset value per Share of HK$2.75 as at 30 June
2010.
Application for listing
An application has been made by the Company to the Listing Committee of the Stock Exchange
for the listing of, and permission to deal in, the Consideration Shares and the Conversion Shares to
be issued pursuant to the PSCS.
No application will be made by the Company for the listing of the PSCS.
Conditions
Completion is subject to the following conditions having been satisfied or waived (as the case
may be):
(i) Approval by the Australian Government under the FATA
The Company receiving the appropriate form of approval from the Australian Government
under the FATA which allows the Acquisition to proceed under the conditions and undertakings
that are to the reasonable satisfaction of the Company;
LETTER FROM THE BOARD
— 26 —
14.60(4)(b)14.59(5)
14.67(1)
App1part B9(1)
(ii) The Australian Government agreeing to release CMN from its existing undertakings in
relation to MMG on and from Completion;
(iii) Shareholder approval
Such requisite majority of relevant shareholders of the Company as required under the
Listing Rules having approved by resolution at an EGM of the Company, the entry by the
Company into the Share Sale Deed and the transactions contemplated by the Share Sale Deed,
including, but not limited to, the proposed increase in the authorised share capital of the
Company from HK$300,000,000 to HK$900,000,000 and the granting of the Specific Mandate
to the Directors;
(iv) Approval from shareholders of CMN
The necessary approvals from the shareholders of CMN having been obtained for the entry
by Album Enterprises into the Share Sale Deed and the transactions contemplated by the Share
Sale Deed;
(v) Approvals
The Company having obtained such approval and consents from the Stock Exchange as are
reasonably necessary or appropriate in connection with the transactions contemplated by the
Share Sale Deed, including the Listing Committee of the Stock Exchange granting the listing of,
and permission to deal in, the Consideration Shares and the Conversion Shares;
(vi) Approval from regulatory authorities in the PRC
Album Enterprises obtaining such approvals, authorisations and consents from the relevant
PRC regulatory authorities as are reasonably necessary or appropriate in connection with the
transactions contemplated by the Share Sale Deed (if any);
(vii) Consent from certain existing creditors of the Target Group
Certain existing creditors of the Target Group having consented to the transactions
contemplated under the Share Sale Deed pursuant to the terms of their existing facility
agreements with the Target Group;
(viii) Loan Agreement
Each condition precedent to the funding of the loan as set out under the Loan Agreement
(other than any condition that is conditional on Completion) having been satisfied or waived; and
(ix) No material adverse effect on the market value of the Sale Shares or the members of the
Target Group occurs between the date of the Share Sale Deed and the date on which all the
conditions precedent set out in paragraphs (i) to (vii) above having been satisfied or
waived.
LETTER FROM THE BOARD
— 27 —
In the event that any of the conditions above (a) has not been fulfilled or waived on or before
the Cut Off Date, or (b) becomes incapable of satisfaction or the parties agree that any of such
conditions cannot be satisfied, the parties shall not be bound to proceed with Completion and either
party may terminate the Share Sale Deed by not less than two Business Days’ notice to the other,
except for any antecedent breaches of the terms of the Share Sale Deed.
The conditions set out in paragraphs (i) and (ix) may only be partly or entirely waived by written
notice from All Glorious to Album Enterprises. The conditions set out in paragraphs (ii), (iv) and (viii)
may only be partly or entirely waived by written notice from Album Enterprises to All Glorious. The
condition set out in paragraph (vii) may only be partly or entirely waived by written agreement
between All Glorious and Album Enterprises.
Repatriation
Prior to Completion, the relevant entity in the Target Group must have completed each of the
relevant steps required to complete the repatriation of US$340,000,000 (equivalent to approximately
HK$2,652,000,000) from the Target Group to Album Enterprises by way of dividend, and the
repatriation shall have occurred so long as such repatriation does not effect the validity or
enforceability (by any party) of the Share Sale Deed.
Completion
Subject to the fulfilment or waiver (as the case may be) of the relevant conditions above,
Completion shall take place on the Completion Date.
Guarantee
The obligations of All Glorious under the Share Sale Deed are guaranteed by the Company in
favour of Album Enterprises.
No variation to remuneration of sole director of All Glorious
There will be no variation to the aggregate of the remuneration payable to and benefits in kind
receivable by the sole director of All Glorious as a consequence of the Acquisition.
PROPOSED INCREASE IN AUTHORISED SHARE CAPITAL
The authorised share capital of the Company is HK$300,000,000 comprising 6,000,000,000
Shares, of which 2,026,216,799 Shares are in issue as at the Latest Practicable Date. As part of the
terms of the Acquisition, the Board proposes to increase the authorised share capital of the Company
from HK$300,000,000 to HK$900,000,000 by the creation of an additional 12,000,000,000 unissued
Shares to rank pari passu in all respects with the existing Shares in the capital of the Company. The
increase in authorised share capital of the Company is conditional upon the passing of an ordinary
resolution by the Shareholders at the EGM.
LETTER FROM THE BOARD
— 28 —
14.58(9)14A.59(12)
App 1B31(2)(c)
SPECIFIC MANDATE
The Board proposes to seek a Specific Mandate from the Independent Shareholders at the EGM
to issue not more than 2,700,000,000 new Shares (representing approximately 133.25% of the existing
issued share capital of the Company as at the Latest Practicable Date, approximately 91.00% of the
enlarged issued share capital of the Company immediately after Completion (assuming no conversion
of the PSCS), approximately 59.64% of the enlarged issued share capital of the Company immediately
after Completion (assuming full conversion of the PSCS), and approximately 37.36% of the enlarged
issued share capital of the Company immediately after Completion (assuming full conversion of the
PSCS) and the issuance of all the new Shares under the Specific Mandate. The major terms of the
proposed Specific Mandate are as follows:
(i) to issue not more than 2,700,000,000 new Shares;
(ii) the new Shares will be issued at a discount of not more than 20% to the higher of:
(a) the closing price on the date of any relevant placing agreement or other agreement
involving the proposed issue of securities under the Specific Mandate; and
(b) the average closing price in the five trading days immediately prior to the earlier of:
(A) the date of announcement of the placing or the proposed transaction or
arrangement involving the proposed issue of securities under the Specific
Mandate;
(B) the date of the placing agreement or other agreement involving the proposed
issue of securities under the Specific Mandate; and
(C) the date on which the placing or subscription price is fixed;
(iii) the grant of the Specific Mandate is part of the terms of the Acquisition and conditional
upon the passing of an ordinary resolution by the Independent Shareholders at the EGM
approving such grant. As set out in the paragraph headed “Letter from the Board — The
Acquisition — Conditions” above in this circular, the granting of the Specific Mandate to
the Directors is a condition to Completion;
(iv) the issue of the new Shares pursuant to the Specific Mandate will be conditional upon
Completion; and
(v) the proposed Specific Mandate is for the period from the passing of the relevant resolutions
at the EGM up to the earlier of: (a) 31 July 2011; or (b) the revocation or variation of the
authority given under the relevant resolution(s) at the EGM by ordinary resolution(s) of the
Independent Shareholders in a general meeting.
LETTER FROM THE BOARD
— 29 —
Depending on market conditions, the Directors may or may not exercise the proposed Specific
Mandate, if granted, to issue new Shares and, where the proposed Specific Mandate is exercised, may
issue less than 2,700,000,000 new Shares. It is currently intended that the Specific Mandate sought
will cover new Shares to be issued pursuant to one or more potential Placing(s) to be conducted by
the Company, subject to the then prevailing market conditions. If the Directors proceed to issue and
place new Shares pursuant to the proposed Specific Mandate, the Company will make (a) separate
announcement(s) as required by the Listing Rules.
Depending on market conditions, the Directors intend to raise net proceeds of up to US$1,600
million (equivalent to approximately HK$12,480 million) and apply such net proceeds from the
potential Placing(s) for (i) the full repayment of the loan of US$694,161,888 (equivalent to
approximately HK$5,414,462,726) under the Loan Agreement; and (ii) the remaining balance of
US$905,838,112 (equivalent to approximately HK$7,065,537,274) for (a) the deployment of funding
towards the exploration and development initiatives of the Target Group’s projects, including, but not
limited to, the development of the Dugald River zinc project located in Queensland, Australia (which
is in the final stages of a feasibility study and has an estimated pre-production capital cost of
approximately US$790 million (equivalent to approximately HK$6,162 million)), and (b) the other
exploration initiatives of the Target Group. The proposed issue of new Shares under the potential
Placing(s), if executed, will also enlarge each of the shareholder and capital bases of the Company and
strengthen the financial position of the Enlarged Group.
Having regard to the Acquisition and the potential Placing(s), CMN is committed to remaining
as the controlling shareholder of the Company and to hold no less than 51% of the issued share capital
of the Company.
Should the Directors, upon obtaining the proposed Specific Mandate, proceed to exercise the
proposed Specific Mandate to issue any new Shares, the Company will also apply to the Listing
Committee for the listing of, and permission to deal in, the new Shares to be issued and placed
pursuant to the potential Placing(s).
REASONS FOR AND BENEFITS OF THE ACQUISITION
The Board believes that there are strong commercial and strategic reasons for the Acquisition and
is therefore of the view that the Acquisition represents an excellent opportunity for the Group to
expand into other upstream base metals through the acquisition of a portfolio of quality international
mining assets, and to become a major international upstream base metals group listed on the Stock
Exchange. This is expected to enhance the Group’s strategic position in the international mining sector
and increase its overall competitiveness, business scale and shareholder value. The Board considers
that the terms of the Acquisition have been entered into on normal commercial terms, are fair and
reasonable and in the interest of the Company and the Shareholders as a whole.
LETTER FROM THE BOARD
— 30 —
14A.58(8)14A.58(1)14A.59(13)
It is expected that the Acquisition will enable the Group to:
(i) Derive an immediate substantial earnings and cash flow contribution from MMG
Through the Acquisition, the Company expects to derive an immediate substantial earnings and
cash flow contribution from MMG. MMG produced significant quantities of base metals including
318kt of zinc in concentrate, 15kt of copper in concentrate, 34kt of copper cathode, 26kt of lead in
concentrate, 4moz of silver and 92koz of gold in the six months ended 30 June 2010. Such production
resulted in MMG reporting a gross revenue of approximately US$844.7 million (equivalent to
approximately HK$6,588.7 million), EBITDA of approximately US$403.9 million (equivalent to
approximately HK$3,150.4 million), representing an EBITDA margin of approximately 48% and net
profit after tax attributable to its shareholder of approximately US$222.6 million (equivalent to
approximately HK$1,736.3 million) for the six months ended 30 June 2010.
(ii) Deliver a more diversified and significant portfolio of assets, development projects and
future growth opportunities
(a) MMG is a unique internationally diversified upstream base metals group with
exposure to multiple commodities, including zinc, copper, lead, gold, silver and nickel
MMG possesses a diversified portfolio of base metals projects in Australia, Asia and North
America, with producing assets in Australia and Laos. It is one of the world’s largest producers
of zinc as well as a substantial producer of copper, lead, gold and silver. Through the Acquisition,
the Company will acquire this diversified and significant portfolio of quality assets. It is
expected that the Acquisition will allow the Enlarged Group to deliver consistency and growth
in returns.
(b) MMG has a strong pipeline of prospective and sizeable projects to support organic
growth including on-going expansion programmes in existing assets and planned
exploration and development activities in Australia, Indonesia, and Canada
MMG has a portfolio of advanced and early stage exploration projects throughout Australia,
Indonesia and Canada. It is anticipated that these projects will provide attractive mineral
deposits for MMG’s future production.
MMG is also actively pursuing new opportunities globally. The strong pipeline of
prospective and sizeable projects is expected to serve as a key driver of the organic growth of
MMG and assist in building the Enlarged Group as a leading global diversified minerals and
metals company.
LETTER FROM THE BOARD
— 31 —
(iii) Reposition the Company as CMC Group’s flagship international upstream base metalsplatform
Currently, the Group is one of the largest importers and suppliers of imported alumina in the
PRC. The Group, together with its jointly-controlled companies, also engages in alumina production,
aluminium fabrication, copper fabrication and plica tubes production. In addition, the Group also
engages in port logistics services and other industrial operations.
The objective of CMC, the Company’s ultimate controlling Shareholder, is to transform the CMC
Group from a trading-focused group to a leading internationally diversified upstream base metals
group. It is expected that the Acquisition provides a good opportunity for the Company to operate a
more diversified and significant portfolio of producing and development projects, especially due to the
fact that MMG is a unique internationally diversified base metals group with exposure to multiple
commodities, including zinc, copper, lead, gold, silver and nickel across its various projects in
Australia, Asia and North America. It is currently intended that the Enlarged Group will continue to
pursue organic growth initiatives and acquisition opportunities to become a major international
diversified upstream base metals group. The Acquisition is expected to contribute to the achievement
of the CMC Group’s strategic objective.
(iv) Expand institutional investors’ interest to support a market re-rating
The Shares are currently characterised by relatively low levels of liquidity and institutional
interest. MMG owns and operates a portfolio of world-class base metal mining operations,
development projects and exploration fields. It is expected that the Acquisition represents a unique
opportunity for investors in the Company to participate in a sizeable international upstream base
metals mining group with a wide range of base metals, supported by one of the leading PRC
state-owned enterprises as its ultimate controlling Shareholder. MMG has a significant Ore Reserves
and Mineral Resources base, a reasonable range of mine lives, and one of the world’s largest producers
of zinc as well as a substantial producer of copper, lead, gold and silver.
It is believed that the scarcity of large international upstream base metals companies listed on
the Stock Exchange will make the Shares appealing to both institutional as well as retail investors
domestically and internationally.
(v) Combine capable and experienced boards and management teams
In connection with the Acquisition, so as to leverage on the expertise and experience of the
Target Group’s senior management team, the Company intends to adopt certain changes to the
directors and senior management of the Company (set out in the section headed “Proposed Directors
and senior management of the Target Group” in this circular). It is believed that such changes will
result in a unique mix of PRC and international management qualifications and expertise in the senior
management of the Company, providing the Enlarged Group with operational experience in MMG’s
international portfolio, insights into the base metals market of the PRC and significant experience in
identifying and executing international mergers and acquisitions. This will provide the Enlarged
Group with complementary human capital and enhance its talent pools.
LETTER FROM THE BOARD
— 32 —
14A.59(2)(a)
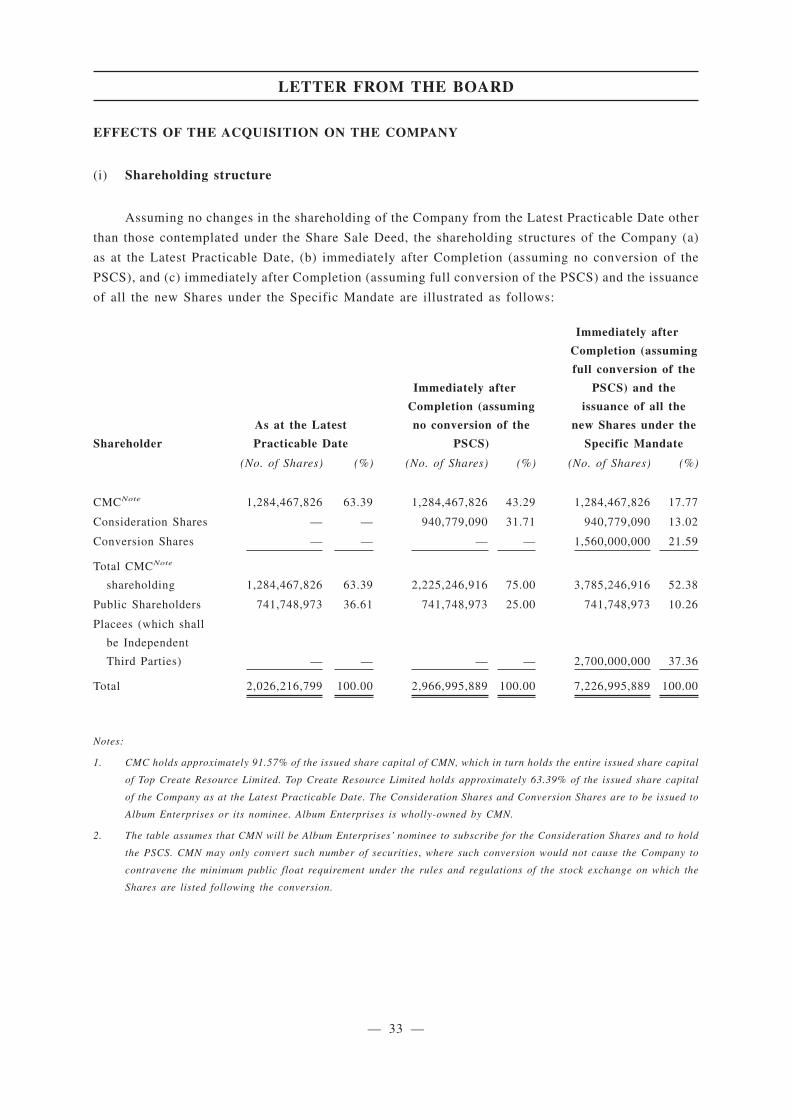
EFFECTS OF THE ACQUISITION ON THE COMPANY
(i) Shareholding structure
Assuming no changes in the shareholding of the Company from the Latest Practicable Date other
than those contemplated under the Share Sale Deed, the shareholding structures of the Company (a)
as at the Latest Practicable Date, (b) immediately after Completion (assuming no conversion of the
PSCS), and (c) immediately after Completion (assuming full conversion of the PSCS) and the issuance
of all the new Shares under the Specific Mandate are illustrated as follows:
Shareholder
As at the Latest
Practicable Date
Immediately after
Completion (assuming
no conversion of the
PSCS)
Immediately after
Completion (assuming
full conversion of the
PSCS) and the
issuance of all the
new Shares under the
Specific Mandate
(No. of Shares) (%) (No. of Shares) (%) (No. of Shares) (%)
CMCNote 1,284,467,826 63.39 1,284,467,826 43.29 1,284,467,826 17.77
Consideration Shares — — 940,779,090 31.71 940,779,090 13.02
Conversion Shares — — — — 1,560,000,000 21.59
Total CMCNote
shareholding 1,284,467,826 63.39 2,225,246,916 75.00 3,785,246,916 52.38
Public Shareholders 741,748,973 36.61 741,748,973 25.00 741,748,973 10.26
Placees (which shall
be Independent
Third Parties) — — — — 2,700,000,000 37.36
Total 2,026,216,799 100.00 2,966,995,889 100.00 7,226,995,889 100.00
Notes:
1. CMC holds approximately 91.57% of the issued share capital of CMN, which in turn holds the entire issued share capital
of Top Create Resource Limited. Top Create Resource Limited holds approximately 63.39% of the issued share capital
of the Company as at the Latest Practicable Date. The Consideration Shares and Conversion Shares are to be issued to
Album Enterprises or its nominee. Album Enterprises is wholly-owned by CMN.
2. The table assumes that CMN will be Album Enterprises’ nominee to subscribe for the Consideration Shares and to hold
the PSCS. CMN may only convert such number of securities, where such conversion would not cause the Company to
contravene the minimum public float requirement under the rules and regulations of the stock exchange on which the
Shares are listed following the conversion.
LETTER FROM THE BOARD
— 33 —
14.66(5)
14.66(6)(a)
14.67(3)
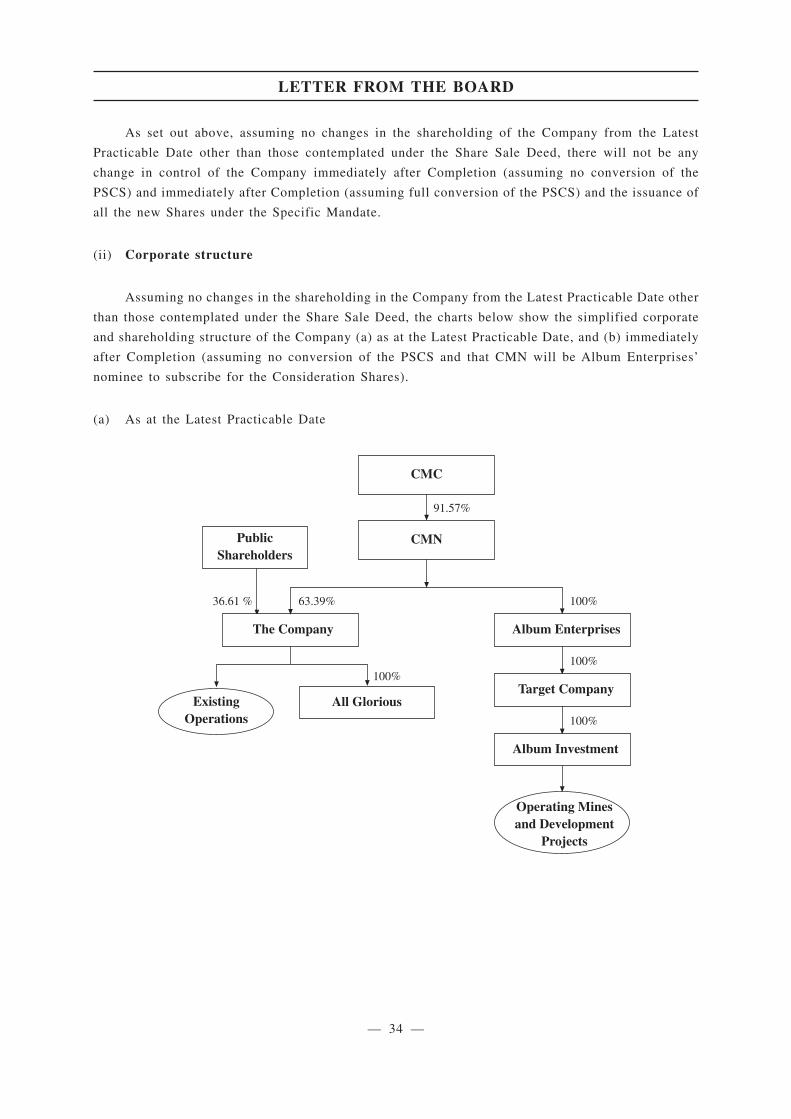
As set out above, assuming no changes in the shareholding of the Company from the Latest
Practicable Date other than those contemplated under the Share Sale Deed, there will not be any
change in control of the Company immediately after Completion (assuming no conversion of the
PSCS) and immediately after Completion (assuming full conversion of the PSCS) and the issuance of
all the new Shares under the Specific Mandate.
(ii) Corporate structure
Assuming no changes in the shareholding in the Company from the Latest Practicable Date other
than those contemplated under the Share Sale Deed, the charts below show the simplified corporate
and shareholding structure of the Company (a) as at the Latest Practicable Date, and (b) immediately
after Completion (assuming no conversion of the PSCS and that CMN will be Album Enterprises’
nominee to subscribe for the Consideration Shares).
(a) As at the Latest Practicable Date
36.61 % 63.39% 100%
100%
100%
100%
91.57%
Album Enterprises
Target Company
Album Investment
Operating Minesand Development
Projects
CMN
CMC
PublicShareholders
ExistingOperations
The Company
All Glorious
LETTER FROM THE BOARD
— 34 —
14.67(3)
14.67(3)
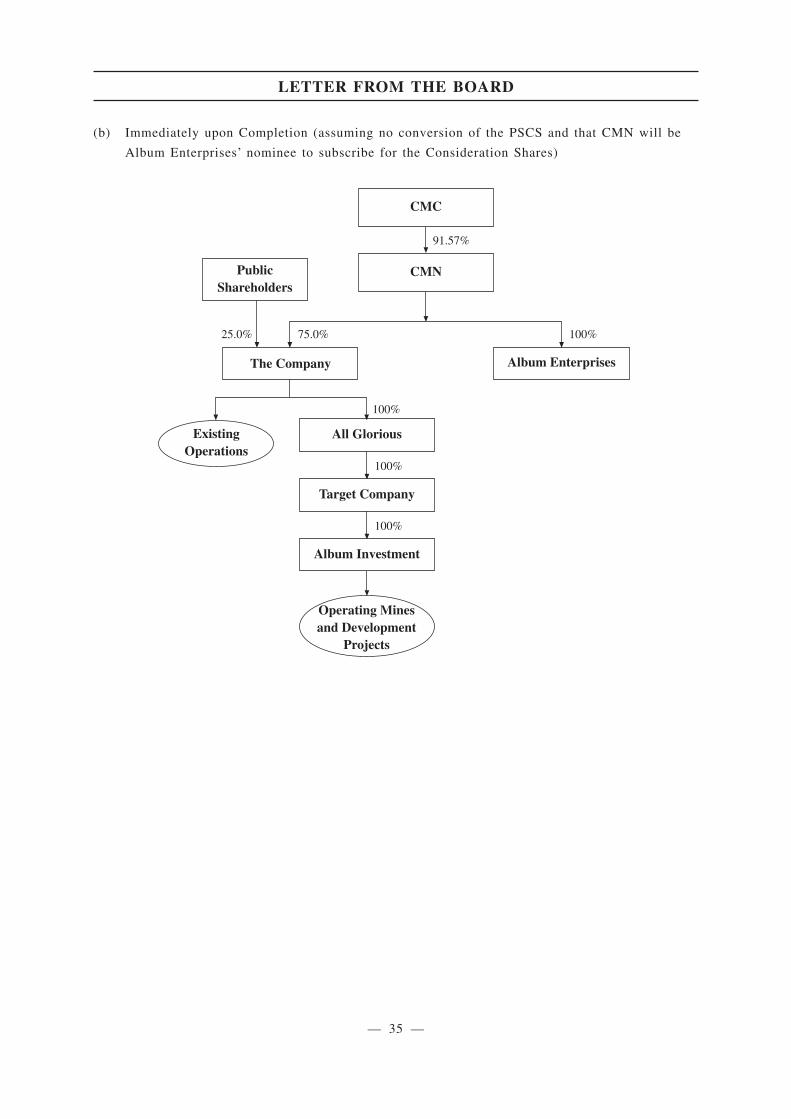
(b) Immediately upon Completion (assuming no conversion of the PSCS and that CMN will be
Album Enterprises’ nominee to subscribe for the Consideration Shares)
25.0% 75.0% 100%
100%
100%
100%
91.57%
Album Enterprises
Target Company
Album Investment
All Glorious
Operating Minesand Development
Projects
The Company
ExistingOperations
CMN
CMC
PublicShareholders
LETTER FROM THE BOARD
— 35 —
14.67(3)
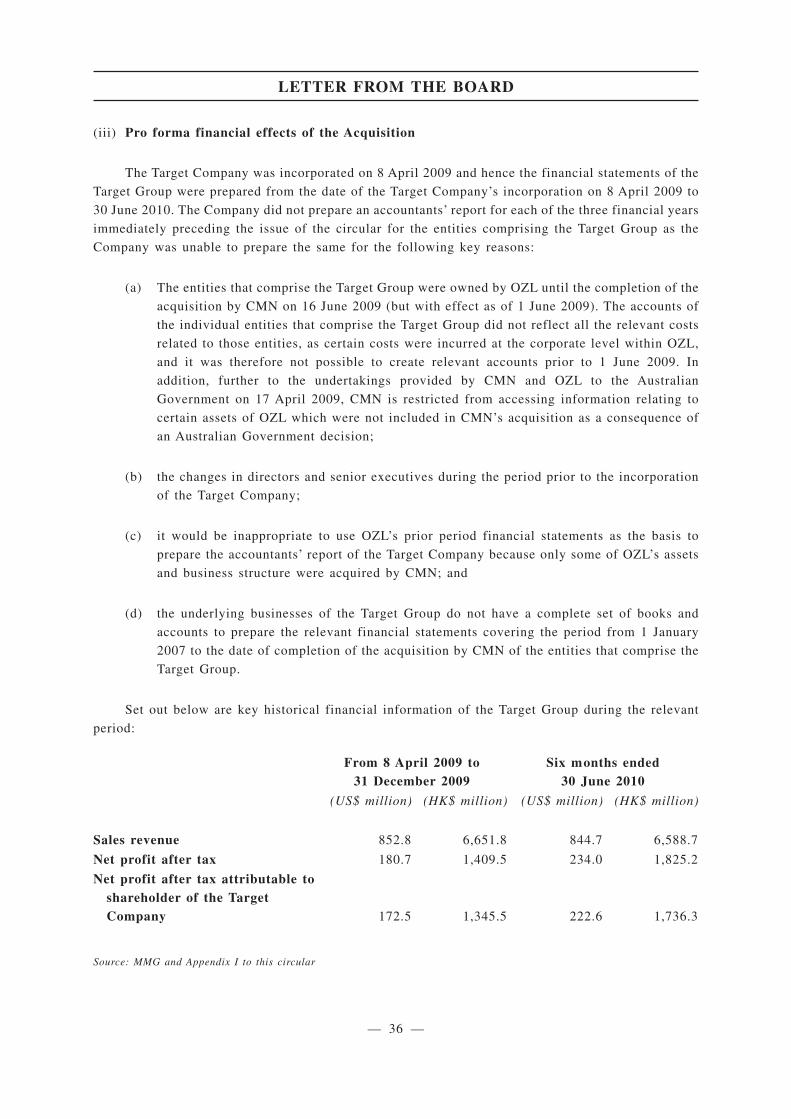
(iii) Pro forma financial effects of the Acquisition
The Target Company was incorporated on 8 April 2009 and hence the financial statements of the
Target Group were prepared from the date of the Target Company’s incorporation on 8 April 2009 to
30 June 2010. The Company did not prepare an accountants’ report for each of the three financial years
immediately preceding the issue of the circular for the entities comprising the Target Group as the
Company was unable to prepare the same for the following key reasons:
(a) The entities that comprise the Target Group were owned by OZL until the completion of the
acquisition by CMN on 16 June 2009 (but with effect as of 1 June 2009). The accounts of
the individual entities that comprise the Target Group did not reflect all the relevant costs
related to those entities, as certain costs were incurred at the corporate level within OZL,
and it was therefore not possible to create relevant accounts prior to 1 June 2009. In
addition, further to the undertakings provided by CMN and OZL to the Australian
Government on 17 April 2009, CMN is restricted from accessing information relating to
certain assets of OZL which were not included in CMN’s acquisition as a consequence of
an Australian Government decision;
(b) the changes in directors and senior executives during the period prior to the incorporation
of the Target Company;
(c) it would be inappropriate to use OZL’s prior period financial statements as the basis to
prepare the accountants’ report of the Target Company because only some of OZL’s assets
and business structure were acquired by CMN; and
(d) the underlying businesses of the Target Group do not have a complete set of books and
accounts to prepare the relevant financial statements covering the period from 1 January
2007 to the date of completion of the acquisition by CMN of the entities that comprise the
Target Group.
Set out below are key historical financial information of the Target Group during the relevant
period:
From 8 April 2009 to31 December 2009
Six months ended30 June 2010
(US$ million) (HK$ million) (US$ million) (HK$ million)
Sales revenue 852.8 6,651.8 844.7 6,588.7
Net profit after tax 180.7 1,409.5 234.0 1,825.2
Net profit after tax attributable toshareholder of the TargetCompany 172.5 1,345.5 222.6 1,736.3
Source: MMG and Appendix I to this circular
LETTER FROM THE BOARD
— 36 —
14A.58(2)
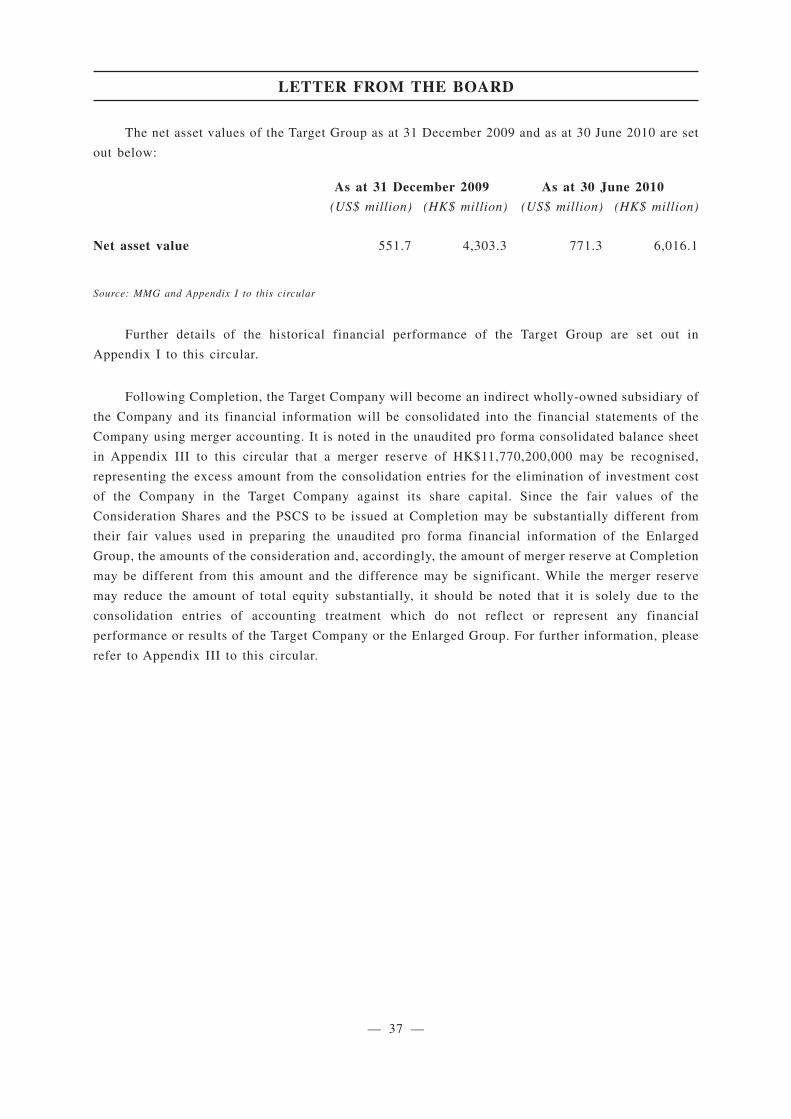
The net asset values of the Target Group as at 31 December 2009 and as at 30 June 2010 are set
out below:
As at 31 December 2009 As at 30 June 2010
(US$ million) (HK$ million) (US$ million) (HK$ million)
Net asset value 551.7 4,303.3 771.3 6,016.1
Source: MMG and Appendix I to this circular
Further details of the historical financial performance of the Target Group are set out in
Appendix I to this circular.
Following Completion, the Target Company will become an indirect wholly-owned subsidiary of
the Company and its financial information will be consolidated into the financial statements of the
Company using merger accounting. It is noted in the unaudited pro forma consolidated balance sheet
in Appendix III to this circular that a merger reserve of HK$11,770,200,000 may be recognised,
representing the excess amount from the consolidation entries for the elimination of investment cost
of the Company in the Target Company against its share capital. Since the fair values of the
Consideration Shares and the PSCS to be issued at Completion may be substantially different from
their fair values used in preparing the unaudited pro forma financial information of the Enlarged
Group, the amounts of the consideration and, accordingly, the amount of merger reserve at Completion
may be different from this amount and the difference may be significant. While the merger reserve
may reduce the amount of total equity substantially, it should be noted that it is solely due to the
consolidation entries of accounting treatment which do not reflect or represent any financial
performance or results of the Target Company or the Enlarged Group. For further information, please
refer to Appendix III to this circular.
LETTER FROM THE BOARD
— 37 —
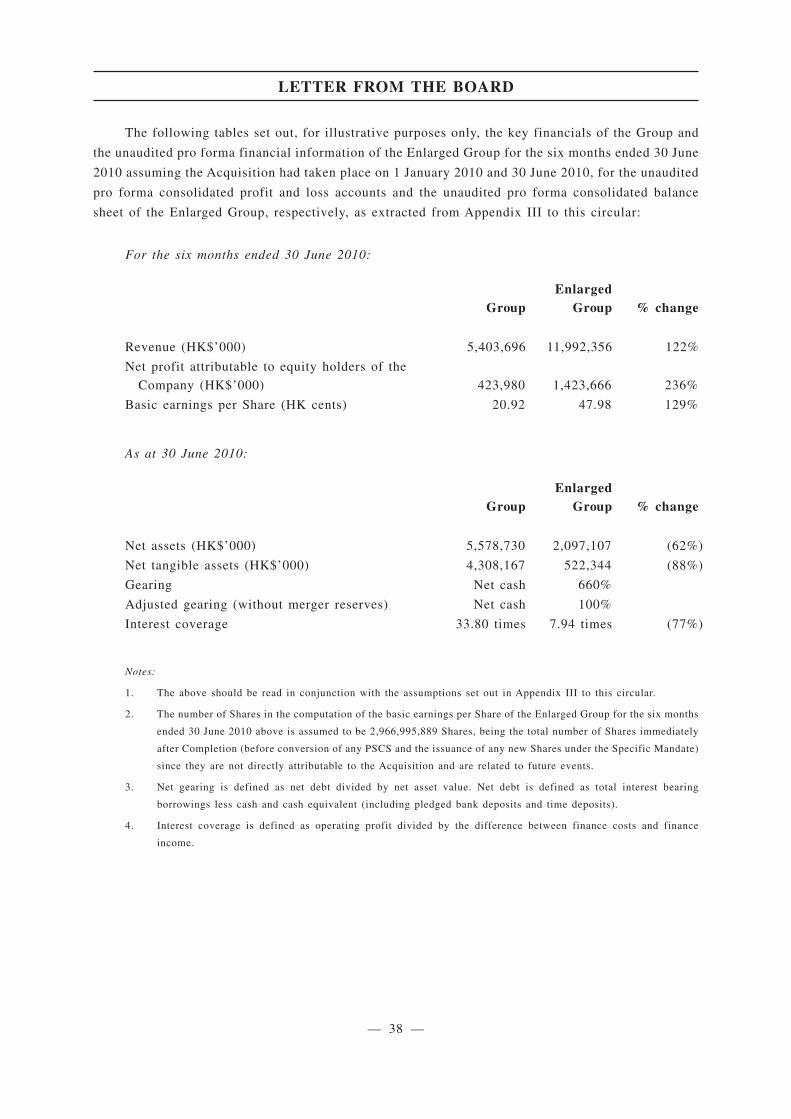
The following tables set out, for illustrative purposes only, the key financials of the Group and
the unaudited pro forma financial information of the Enlarged Group for the six months ended 30 June
2010 assuming the Acquisition had taken place on 1 January 2010 and 30 June 2010, for the unaudited
pro forma consolidated profit and loss accounts and the unaudited pro forma consolidated balance
sheet of the Enlarged Group, respectively, as extracted from Appendix III to this circular:
For the six months ended 30 June 2010:
GroupEnlarged
Group % change
Revenue (HK$’000) 5,403,696 11,992,356 122%
Net profit attributable to equity holders of the
Company (HK$’000) 423,980 1,423,666 236%
Basic earnings per Share (HK cents) 20.92 47.98 129%
As at 30 June 2010:
GroupEnlarged
Group % change
Net assets (HK$’000) 5,578,730 2,097,107 (62%)
Net tangible assets (HK$’000) 4,308,167 522,344 (88%)
Gearing Net cash 660%
Adjusted gearing (without merger reserves) Net cash 100%
Interest coverage 33.80 times 7.94 times (77%)
Notes:
1. The above should be read in conjunction with the assumptions set out in Appendix III to this circular.
2. The number of Shares in the computation of the basic earnings per Share of the Enlarged Group for the six months
ended 30 June 2010 above is assumed to be 2,966,995,889 Shares, being the total number of Shares immediately
after Completion (before conversion of any PSCS and the issuance of any new Shares under the Specific Mandate)
since they are not directly attributable to the Acquisition and are related to future events.
3. Net gearing is defined as net debt divided by net asset value. Net debt is defined as total interest bearing
borrowings less cash and cash equivalent (including pledged bank deposits and time deposits).
4. Interest coverage is defined as operating profit divided by the difference between finance costs and finance
income.
LETTER FROM THE BOARD
— 38 —
App.16(33)
THE GROUP’S INTENTION CONCERNING ITS EXISTING BUSINESS
There is currently no intention to dispose of, terminate or scale down the existing business of the
Group in the production of aluminium and the manufacture and distribution of aluminium and copper
products and no agreement, arrangement, understanding or negotiation has been put in place to this
effect.
WORKING CAPITAL MANAGEMENT POLICY OF THE ENLARGED GROUP
The Enlarged Group will centrally manage the cash management requirements of individual
operating entities within the Enlarged Group. Such cash management requirements include the short
term investment of cash surpluses and the raising of funds to cover expected cash demands. The
Enlarged Group will regularly monitor its liquidity requirements and its compliance with lending
covenants to ensure that it maintains sufficient cash and cash equivalents or has available funding
through an adequate amount of committed credit facilities to meet its working capital requirements.
IMPLICATIONS UNDER THE LISTING RULES
As the applicable percentage ratios calculated pursuant to Rule 14.07 of the Listing Rules in
respect of the Acquisition exceed 100%, the Acquisition constitutes a very substantial acquisition of
the Company under Rule 14.06(5) of the Listing Rules.
In addition, since Album Enterprises is a wholly-owned subsidiary of CMN (the controlling
Shareholder holding approximately 63.39% of the issued share capital of the Company as at the Latest
Practicable Date), Album Enterprises is a connected person of the Company. Accordingly, the
Acquisition constitutes a connected transaction of the Company under Chapter 14A of the Listing
Rules and is subject to the Independent Shareholders’ approval requirement under Rule 14A.48 of the
Listing Rules. Accordingly, CMN and its associates are required to abstain from voting on the
Acquisition at the EGM.
Mr. Xu Jiqing and Mr. Wang Lixin (being Directors) are directors of Album Enterprises. None
of the Directors have a material interest in the Acquisition which prohibits him/her from voting on the
Acquisition and therefore no Director abstained from approving the unanimously-passed relevant
Board resolutions approving the Acquisition.
Immediately following Completion, any on-going transactions of the Enlarged Group with
members of the CMC Group (including CMN) will constitute continuing connected transactions of the
Company under the Listing Rules. The Company will comply with the relevant requirements under the
Listing Rules as and when required.
LETTER FROM THE BOARD
— 39 —
14A.59(2)(d)14A.59(2)(e)14A.59(2)(f)2.17(1)14A.59(5)
14.63(2)(d)
14A.59(18)14A.59(2)(e)
The Independent Board Committee has been established to advise the Independent Shareholders
in respect of the Acquisition. None of the members of the Independent Board Committee has any
material interest in the Acquisition, the Specific Mandate or the proposed increase in the authorised
share capital of the Company. Somerley has been appointed as the independent financial adviser to
advise the Independent Board Committee and the Independent Shareholders in respect of the
Acquisition, including, but not limited to, the proposed increase in the authorised share capital of the
Company and the grant of the Specific Mandate. Somerley has reviewed and considered, among other
things, the Competent Person’s Report, the Valuation Report setting out the Chapter 18 Valuation, the
report on the Market Valuation, and the basis and differences between the Market Valuation and the
Chapter 18 Valuation in concluding their advice.
An application has been made to the Listing Committee of the Stock Exchange for the listing of,
and permission to deal in, the Consideration Shares and the Conversion Shares. Should the Directors,
upon obtaining the proposed Specific Mandate, proceed to exercise the proposed Specific Mandate to
issue any new Shares, the Company will also apply to the Listing Committee for the listing of, and
permission to deal in, the new Shares to be issued and placed pursuant to the potential Placing(s).
EGM
A notice convening the EGM is set out on pages EGM-1 to EGM-3 of this circular. The EGM will
be held at Fanling Room, Lower Level I, Kowloon Shangri-La Hotel, 64 Mody Road, Tsimshatsui
East, Kowloon, Hong Kong on Thursday, 9 December 2010 at 10:30 a.m. or any adjournment thereof.
An ordinary resolution will be proposed to consider and, if thought fit, approve, among other things,
the Share Sale Deed and all the transactions contemplated thereunder, including, but not limited to,
(i) the allotment and issuance by the Company of the Consideration Shares, (ii) the issuance by the
Company of the PSCS, (iii) the increase in the authorised share capital of the Company from
HK$300,000,000 divided into 6,000,000,000 Shares to HK$900,000,000 divided into 18,000,000,000
Shares by the creation of an additional 12,000,000,000 unissued Shares; and (iv) the grant of a specific
mandate for the Directors to issue up to 2,700,000,000 new Shares for the period from the passing of
the relevant resolution at the EGM up to the earlier of: (A) 31 July 2011 or (B) the revocation or
variation of the authority given under the relevant resolution at the EGM.
A proxy form for use in the EGM and is enclosed. Whether or not you propose to attend the
meeting, you are requested to complete the enclosed proxy form in accordance with the instructions
printed thereon and return the same to the Company’s share registrar, Computershare Hong Kong
Investor Services Limited at 17M Floor, Hopewell Centre, 183 Queen’s Road East, Wan Chai, Hong
Kong as soon as possible and in any event not later than 48 hours before the time appointed for holding
of the EGM or any adjournment thereof. Completion and return of the proxy form for the EGM will
not preclude you from attending, and voting in person at the EGM or any adjournment thereof should
you so wish.
LETTER FROM THE BOARD
— 40 —
RECOMMENDATION
The Directors (including the independent non-executive Directors) consider that the proposed
ordinary resolution for approval of the Share Sale Deed and all the transactions contemplated
thereunder, including, but not limited to, (i) the allotment and issuance by the Company of the
Consideration Shares, (ii) the issuance by the Company of the PSCS, (iii) the increase in the
authorised share capital of the Company from HK$300,000,000 divided into 6,000,000,000 Shares to
HK$900,000,000 divided into 18,000,000,000 Shares by the creation of an additional 12,000,000,000
unissued Shares; and (iv) the grant of a specific mandate for the Directors to issue up to 2,700,000,000
new Shares for the period from the passing of the relevant resolution at the EGM up to the earlier of:
(A) 31 July 2011 or (B) the revocation or variation of the authority given under the relevant resolution
at the EGM, are in the interests of the Company and the Shareholders as a whole. Accordingly, the
Directors (including the independent non-executive Directors) recommend the Shareholders to vote in
favour of the Share Sale Deed and all the transactions contemplated thereunder, including, but not
limited to, (i) the allotment and issuance by the Company of the Consideration Shares, (ii) the issuance
by the Company of the PSCS, (iii) the increase in the authorised share capital of the Company from
HK$300,000,000 divided into 6,000,000,000 Shares to HK$900,000,000 divided into 18,000,000,000
Shares by the creation of an additional 12,000,000,000 unissued Shares; and (iv) the grant of a specific
mandate for the Directors to issue up to 2,700,000,000 new Shares for the period from the passing of
the relevant resolution at the EGM up to the earlier of: (A) 31 July 2011 or (B) the revocation or
variation of the authority given under the relevant resolution at the EGM.
ADDITIONAL INFORMATION
Your attention is drawn to the information set out in the appendices to this circular.
By order of the Board
Minmetals Resources LimitedHao Chuanfu
Executive Director and President
LETTER FROM THE BOARD
— 41 —
14.63(2)(c)
(Incorporated in Hong Kong with limited liability)
(Stock code: 1208)
22 November 2010
To the Independent Shareholders
Dear Sir/Madam,
(1) VERY SUBSTANTIAL ACQUISITIONAND CONNECTED TRANSACTION
IN RELATION TOTHE ACQUISITION OF THE ENTIRE ISSUED SHARE CAPITAL OF
ALBUM RESOURCES PRIVATE LIMITED
(2) PROPOSED INCREASE IN AUTHORISED SHARE CAPITAL
AND
(3) SPECIFIC MANDATE TO ISSUE NEW SHARES
We refer to the circular of the Company (the “Circular”) dated 22 November 2010 of which this
letter forms part. Terms defined in the Circular shall have the same meanings herein unless the context
otherwise requires.
We have been appointed to establish the Independent Board Committee to give recommendations
in respect of the Acquisition together with the proposed increase in the authorised share capital of the
Company and the grant of the Specific Mandate as referred to in the Circular. Somerley has been
appointed as the independent financial adviser to advise the Independent Board Committee and the
Independent Shareholders in this regard.
Please refer to the letter from the Board set out on pages 16 to 41 of the Circular which contains,
inter alia, information in respect of the Acquisition together with the proposed increase in the
authorised share capital of the Company and the grant of the Specific Mandate and the letter from
Somerley set out on pages 44 to 98 of the Circular which contains its advice in respect of the
Acquisition together with the proposed increase in the authorised share capital of the Company and
the grant of the Specific Mandate.
LETTER FROM THE INDEPENDENT BOARD COMMITTEE
— 42 —
14A.58(3)(c)14A.59(7)

Having taken into account the opinion of Somerley, we consider that the Acquisition together
with the proposed increase in the authorised share capital of the Company and the grant of the Specific
Mandate, are on normal commercial terms which are fair and reasonable to the Independent
Shareholders and that the Acquisition together with the proposed increase in the authorised share
capital of the Company and the grant of the Specific Mandate, are in the interests of the Company and
the Independent Shareholders as a whole. Accordingly, we recommend the Independent Shareholders
to vote in favour of the ordinary resolution to be proposed at the EGM to approve the Acquisition
together with the proposed increase in the authorised share capital of the Company and the grant of
the Specific Mandate.
Yours faithfully,
For and on behalf of
the Independent Board Committee
Minmetals Resources LimitedMr. Li Dongsheng, Mr. Ting Leung Huel, Stephen and Mr. Loong Ping Kwan
Independent non-executive Directors
LETTER FROM THE INDEPENDENT BOARD COMMITTEE
— 43 —
The following is the text of a letter of advice dated 22 November 2010 to the Independent Board
Committee and the Independent Shareholders from Somerley in respect of the Share Sale Deed and the
transactions contemplated thereunder prepared for the purpose of incorporation in this circular.
SOMERLEY LIMITED10th Floor
The Hong Kong Club Building
3A Chater Road
Central
Hong Kong
22 November 2010
To: The Independent Board Committee and Independent Shareholders of
Minmetals Resources Limited
Dear Sirs,
(1) VERY SUBSTANTIAL ACQUISITIONAND CONNECTED TRANSACTION
IN RELATION TOTHE ACQUISITION OF THE ENTIRE ISSUED SHARE CAPITAL OF
ALBUM RESOURCES PRIVATE LIMITED
(2) PROPOSED INCREASE IN AUTHORISED SHARE CAPITAL
AND
(3) SPECIFIC MANDATE TO ISSUE NEW SHARES
INTRODUCTION
We refer to our appointment to advise the Independent Board Committee and Independent
Shareholders in connection with the Acquisition together with the proposed increase in the authorised
share capital of the Company and the grant of the Specific Mandate to the Directors (the
“Transactions”). Details of the Transactions are contained in the circular to Shareholders dated 22
November 2010 (the “Circular”), of which this letter forms a part. As the grant of the Specific
Mandate to the Directors forms an integral part of the Acquisition, we are also commissioned to
provide an opinion to the Independent Board Committee and Independent Shareholders in this regard.
Unless the context otherwise requires, capitalised terms used in this letter shall have the same
meanings as those defined in the Circular.
LETTER FROM SOMERLEY
— 44 —
14A.58(3)(d)14A.59(8)
The Acquisition constitutes a very substantial acquisition for the Company under the Listing
Rules. As CMN is interested in 63.39% of the issued share capital of the Company as at the Latest
Practicable Date and is accordingly a connected person of the Company under the Listing Rules, the
Acquisition also constitutes a connected transaction for the Company. The Acquisition is subject to the
Independent Shareholders’ approval under the Listing Rules.
The Independent Board Committee, comprising the three independent non-executive Directors,
namely Messrs. Mr. Li Dongsheng, Mr. Ting Leung Huel, Stephen and Mr. Loong Ping Kwan, has been
established to make a recommendation to the Independent Shareholders on whether the terms of the
Transactions are on normal commercial terms which are fair and reasonable to the Independent
Shareholders and whether the Transactions are in the interests of the Company and the Independent
Shareholders as a whole. We, Somerley Limited, have been appointed to advise the Independent Board
Committee and the Independent Shareholders in this regard.
We are not associated with the Company, CMN, their respective substantial shareholders or
associates, and accordingly, are considered eligible to give independent advice on the Transactions.
Apart from normal professional fees payable to us by the Company in connection with this
appointment, no arrangement exists whereby we will receive any other fees or benefits from the
Company, CMN, their substantial shareholders or associates. In formulating our opinion and
recommendation, we have reviewed, among other things, the Share Sale Deed, the Loan Agreement,
the annual reports of the Company for two years ended 31 December 2009, the interim report of the
Company for the six months ended 30 June 2010 (the “2010 Interim Report”), the Competent
Person’s Report, the Valuation Report, the report on the Market Valuation, financial information on
the Target Group and the Enlarged Group. We have discussed with the management of the Group and
the Target Group regarding the businesses and future prospects of the Enlarged Group. We have also
visited the Sepon and Century mines of the Target Group.
In addition, we have relied on the information and facts supplied, and the opinions expressed,
by the Directors and management of the Group and have assumed that they are true, accurate and
complete and will remain true, accurate and complete up to the time of the EGM. We have also sought
and received confirmation from the Directors that no material facts have been omitted from the
information supplied and opinions expressed to us. We have no reason to believe that any material
information has been withheld from us, or to doubt the truth or accuracy of the information provided.
We have relied on such information and consider that the information we have received is sufficient
for us to reach an informed view. We have not, however, conducted any independent investigation into
the business and affairs of the Group or the Target Group. We note that the Board in determining the
Purchase Price has made reference to the Market Valuation, which we have reviewed and considered
in forming our overall opinion herein. We have discussed with Grant Samuel the bases, assumptions
and methodology of the Market Valuation in the course of our review in assessing the fairness and
reasonableness thereof, but no reliance has been placed by us on such Market Valuation in forming our
overall opinion herein.
LETTER FROM SOMERLEY
— 45 —
PRINCIPAL FACTORS AND REASONS CONSIDERED
In formulating our opinion, we have taken into consideration the following principal factors and
reasons:
1. History and business of the Group
The Company was incorporated in 1988 and its shares have been listed on the main board of the
Stock Exchange since 1994. The Group, together with its jointly-controlled companies, is principally
engaged in the manufacturing and sales of alumina, aluminium products, copper products and plica
tubes. The Group also offers port logistics services and participates in other industrial operations.
The Company’s ultimate controlling shareholder is CMC. CMC achieved revenue of US$24.96
billion in 2009 and was ranked number 332 amongst the Fortune Global 500 by revenue in the year
2010. CMN is the intermediate holding company of the Company.
On 6 October 2005, the Company completed the acquisition of alumina and aluminium-related
businesses from CMC, which allowed the Group to enlarge the scale of alumina and aluminium
businesses and further integrate along aluminium supply chain, and also tap into other non-ferrous
metals and resources businesses. The Company also completed the acquisition of a 33% equity interest
in 廣西華銀鋁業有限公司 (Guangxi Huayin Aluminium Company Limited) (“Guangxi Huayin”) at
the end of April 2008. Guangxi Huayin is engaged in the up-stream bauxite resource exploration and
alumina production. Its four production lines with total annual production capacity of 1,600,000
tonnes of alumina commenced operation in mid-2008.
The Group’s business, including those of jointly-controlled entities, currently consists of three
key pillars, namely trading, fabrication and resources exploration businesses.
Trading
The Group is engaged in the trading of alumina and aluminium ingot, through 五礦鋁業有限公司(Minmetals Aluminium Company Limited) (“Minmetals Aluminium”), a wholly-owned subsidiary of
the Group. The Group imports alumina from both international and domestic suppliers as well as from
jointly-controlled company of the Group. Such alumina imports are then supplied to the Group’s
customers, which include all major aluminium smelters in the PRC as well as overseas markets.
Aluminium ingot is sourced from PRC aluminium smelters and sold to the Group’s aluminium
fabrication operation and other PRC customers.
LETTER FROM SOMERLEY
— 46 —
Fabrication
The Group’s fabrication business is mainly carried out by 華北鋁業有限公司 (North China
Aluminium Company Limited) (“North China Aluminium”), a 72.8%-owned subsidiary of the Group.
This joint venture is co-invested by the Group, 中國鋁業有限公司 (Aluminium Corporation of China)
and the Government of Hebei Province. North China Aluminium is principally engaged in the
production and sale of aluminium foil, plate, strip and extrusions. Its products are used in packaging,
transportation, construction, home appliances and printing sectors. Apart from aluminium fabrication,
the Group, including its jointly-controlled entities is engaged in copper fabrication and plica tubes
production through 常州金源銅業有限公司 (Changzhou Jinyuan Copper Company Limited) and 營口鑫源套管有限公司 (Yingkou Orienmet Plica Tube Company Limited) respectively. The former is a
jointly-controlled company owned as to 36.3% while the latter is a Sino-foreign equity joint venture
owned as to 51% by the Group according to the Company’s website. The Group also holds a 20% stake
in 青島美特容器有限公司 (Qingdao M.C. Packaging Limited), a Sino-foreign equity joint venture,
which is engaged in the manufacturing and sale of aluminium cans in the PRC.
Resources exploration
As mentioned in the above paragraph, the Group participates in the resources exploration and
production business through its 33% equity interest investment in Guangxi Huayin, where Guangxi
Huayin is one of the few integrated alumina plants in the PRC which has its own bauxite mine and
is amongst the lowest-cost alumina refinery plants in the PRC. Guangxi Huayin is co-invested by the
Group, 廣西投資集團有限公司 (Guangxi Investment Group Company Limited) and 中國鋁業股份有限公司 (Aluminium Corporation of China Limited). The ownership in Guangxi Huayin enables the
Group to move up-stream into bauxite resource exploration and alumina production thereby securing
a stable supply of alumina, which benefits its trading business. An additional funding of approximately
Chinese Renminbi 319.2 million (equivalent to approximately HK$367.1 million based on the
exchange rate of Chinese Renminbi 1.00 = HK$1.15) have been used to finance the construction of
infrastructure and technology enhancement projects in 2009 and early 2010 with an aim to drive
improvements in energy-saving, wastage reduction and production efficiency. The additional funding
can be seen as a way of reinforcing the Group’s investment decision in Guangxi Huayin where the
Directors are of the view that Guangxi Huayin provides the Group with access to (i) high-quality
bauxite upstream assets; and (ii) a stable, sizeable and low-cost alumina refinery business revenue
which serves to maximise returns as far as the Group and its Shareholder are concerned.
LETTER FROM SOMERLEY
— 47 —
2. Recent financial results and position of the Group
Financial statements of the Group for the three and a half years ended 30 June 2010 are set out
in Appendix II to the Circular, to which the Independent Shareholders’ attention is drawn. Some
principal points are summarised below.
(a) Financial results of the Group
The following are summaries of the annual results of the Group for each of the two years
ended 31 December 2009 and the interim results of the Group for the six months ended 30 June
2010 and 30 June 2009 respectively:
For the six months ended For the year ended
30 June2010
(unaudited)
30 June2009
(restated)
31 December2009
(audited andrestated)
31 December2008
(audited andrestated)
HK$ million HK$ million HK$ million HK$ million
Turnover 5,403.7 2,140.0 6,215.8 8,450.3
Profit attributable to the Shareholdersfor the period/year 424.0 310.6 338.5 137.7
Earnings per Share for profitattributable to the Shareholders forthe period/year HK20.92 cents HK15.33 cents HK16.71 cents HK6.70 cents
The consolidated unaudited revenue and profit attributable to the Shareholders for the six
months ended 30 June 2010 were approximately HK$5,403.7 million and HK$424.0 million
respectively, representing period-over-period increases of 152.5% and 36.5% respectively as
compared to that for the corresponding period in 2009. The improvements were a result of the
recovery of the non-ferrous metals market prices since the second half of 2009 as the world
recovered from the financial tsunami. Aluminium and alumina consumption in the PRC and
overseas markets increased in the first half of 2010 to bring about growth in both trading volume
as well as prices of alumina and non-ferrous metals, which led to the significant turnover and
profit growth for the Group. In addition, alumina and aluminium prices, although not yet caught
up with the pre-financial tsunami levels, rebounded significantly when compared to a year
before.
Although not shown as the consolidated revenue of the Group, Guangxi Huayin made
significant contribution to the Group’s share of post-tax profits of its jointly-controlled
companies for the six months period ended 30 June 2010. As shown from the 2010 Interim
Report, Guangxi Huayin achieved a turnaround from a loss of approximately HK$67.2 million
for the corresponding period in 2009 into a profit of approximately HK$199.1 million in the first
half of 2010 since the full operation of Guangxi Huayin in September 2009. Such profit
represents approximately 96.0% of the Group’s total share of post-tax profits less losses of
jointly-controlled companies. The significant profit contribution from Gunangxi Huayin is a
result of the rebound in alumina price and a lower unit production cost owing to full capacity
utilisation.
LETTER FROM SOMERLEY
— 48 —
Driven by the poor economic outlook as a result of the global financial crisis occurred in
early 2009, the Group’s revenue in 2009 dropped by 26.4% as compared to 2008. Profit
attributable to the Shareholders increased from HK$137.7 million in 2008 to HK$338.5 million
in 2009, which was largely due to the HK$325.6 million pre-tax gain as a result of the disposal
of its investment in Sino Gold Mining Limited, a Hong Kong listed gold mining company, in
2009.
Set out below is a breakdown of the segmental revenue and results for each of the six
months ended 30 June 2009 and 2010.
Trading Aluminium fabrication Other operations
For the six months ended
30 June2010
(unaudited)
30 June2009
(restated)
30 June2010
(unaudited)
30 June2009
(restated)
30 June2010
(unaudited)
30 June2009
(restated)
HK$ million HK$ million HK$ million HK$ million HK$ million HK$ million
External revenue 4,354.2 1,332.4 892.4 646.1 157.1 161.5
Segment results 248.1 37.1 3.3 9.7 6.6 5.7
As shown in the 2010 Interim Report, the trading business recorded revenue to external
parties of approximately HK$4,354.2 million, which accounted for 80.6% (2009: 62.3%) of that
of the Group for the six months ended 30 June 2010, while the fabrication business and other
operations accounted for the rest. On a period-to-period comparison, the trading volume of
alumina increased from approximately 620,000 tonnes in the first half of 2009 to approximately
988,300 tonnes in the first half of 2010 and that of aluminium ingots increased from
approximately 10,400 tonnes in the first half of 2009 to approximately 110,600 tonnes in the first
half of 2010. The aluminium fabrication business, contributing to a smaller share of the total
turnover of the Company, also benefited from the recovery of the broader economy. The sales of
aluminium fabrication products recorded an increase of 12.5% from approximately 36,900 tonnes
in the first half of 2009 to approximately 41,500 tonnes in the first half of 2010, which translated
into a period-to-period increase of 38.1% of the external revenue of the aluminium fabrication
business.
LETTER FROM SOMERLEY
— 49 —
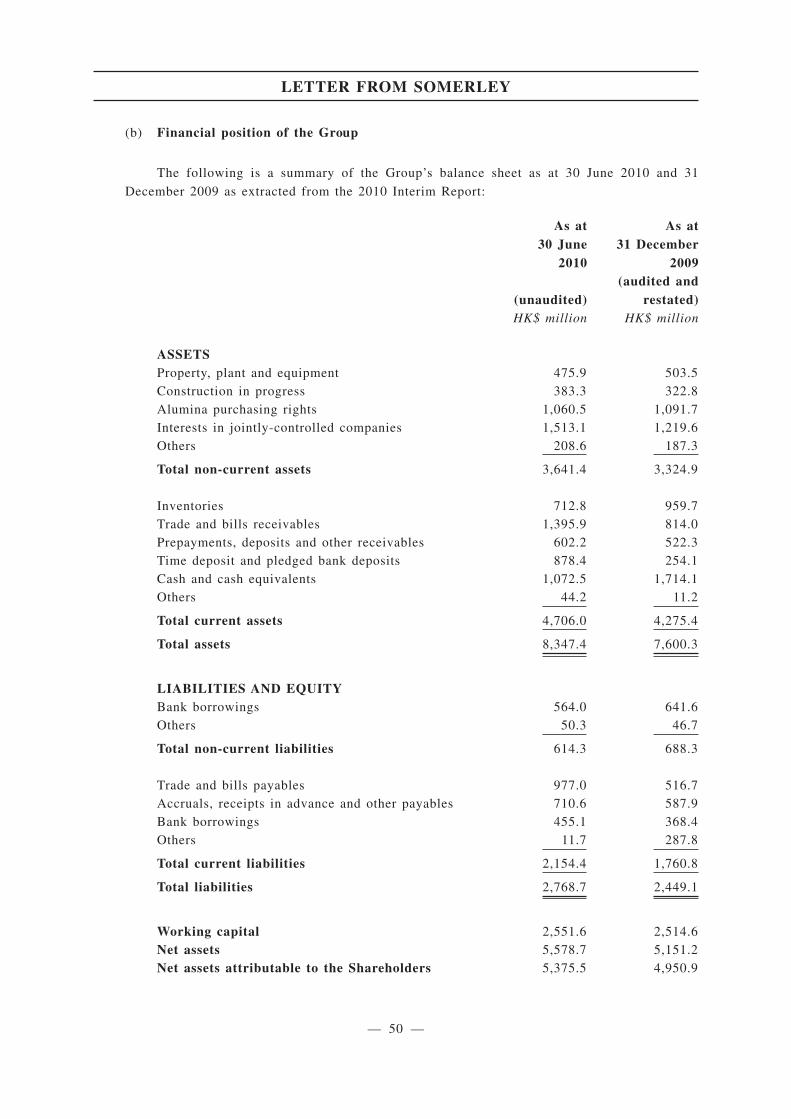
(b) Financial position of the Group
The following is a summary of the Group’s balance sheet as at 30 June 2010 and 31
December 2009 as extracted from the 2010 Interim Report:
As at30 June
2010
As at31 December
2009
(unaudited)(audited and
restated)HK$ million HK$ million
ASSETSProperty, plant and equipment 475.9 503.5Construction in progress 383.3 322.8Alumina purchasing rights 1,060.5 1,091.7Interests in jointly-controlled companies 1,513.1 1,219.6Others 208.6 187.3
Total non-current assets 3,641.4 3,324.9
Inventories 712.8 959.7Trade and bills receivables 1,395.9 814.0Prepayments, deposits and other receivables 602.2 522.3Time deposit and pledged bank deposits 878.4 254.1Cash and cash equivalents 1,072.5 1,714.1Others 44.2 11.2
Total current assets 4,706.0 4,275.4
Total assets 8,347.4 7,600.3
LIABILITIES AND EQUITYBank borrowings 564.0 641.6Others 50.3 46.7
Total non-current liabilities 614.3 688.3
Trade and bills payables 977.0 516.7Accruals, receipts in advance and other payables 710.6 587.9Bank borrowings 455.1 368.4Others 11.7 287.8
Total current liabilities 2,154.4 1,760.8
Total liabilities 2,768.7 2,449.1
Working capital 2,551.6 2,514.6Net assets 5,578.7 5,151.2Net assets attributable to the Shareholders 5,375.5 4,950.9
LETTER FROM SOMERLEY
— 50 —

As noted in the 2010 Interim Report, the Group has maintained sound liquidity and
financial positions throughout the six-month period ended 30 June 2010. The non-current assets
of the Group primarily include property, plant and equipment, construction in progress, alumina
purchasing rights and interests in jointly-controlled companies. Alumina rights, representing the
rights to purchase pre-determined quantities of alumina from an alumina supplier, has remained
stable at HK$1,060.5 million as at 30 June 2010 as compared to that as at 31 December 2009.
Interests in jointly-controlled companies chiefly consisted of the 33% interest in Guangxi
Huayin. The balance has increased by approximately 24.0% from HK$1,219.6 million as at 31
December 2009 to HK$1,513.1 million as at 30 June 2010 mainly due to the profit contribution
from Guangxi Huayin. Current assets principally comprise inventories, trade and bills
receivables as well as cash and bank deposits. Trade and bills receivables have increased from
approximately HK$814.0 million as at 31 December 2009 to approximately HK$1,395.9 million
as at 30 June 2010, representing an increase of 71.5% due to the significant increase in prices
and trading volume of aluminium and alumina. The major categories of the liabilities of the
Group are trade and bills payables, accrual, receipts in advance, other payables and banking
borrowings.
The working capital of the Group, being the total current assets less total current liabilities,
was stable as at 30 June 2010 when compared to the position as at 31 December 2009. In
addition, as at 30 June 2010, the Group had net cash of approximately HK$931.8 million,
representing cash and bank deposits of approximately HK$1,950.9 million less bank borrowings
of approximately HK$1,019.1 million, as compared to a net cash of approximately HK$958.2
million as at 31 December 2009.
3. Outlook of the Group
The Group’s trading business has improved considerably after the recent global financial crisis.
The Group experienced robust demand from key aluminium customers in the PRC. The price of
primary aluminium, based on London Metal Exchange’s cash settlement price, has moved up from
US$1,905 per metric tonne at the end of 2005 to US$2,293 per metric tonne at the end of 2009 with
a compounded annual growth rate of around 4.7%. The increase was mainly the result of demand from
China’s wide application and usage of aluminium in various industries. It is generally perceived that
the PRC’s economic growth will continue its momentum in the short to medium term.
As mentioned in the 2010 Interim report, certain factors may offset the aforesaid growth and
present uncertainties for the Group such as the further proliferation of refining capacity by local
producers diluting the market share of imported alumina, the potential negative impact on global
commodity prices as a result of the further worsening of the European sovereign debt crisis and the
potential tightening of policy stance of the PRC Government towards the domestic property sector. In
response to the aforesaid challenges, the Group will continue to implement flexible stocking of
alumina from local producers and foreign producers, overseas sales and marketing, active monitoring
of inventory level and liquidity management.
LETTER FROM SOMERLEY
— 51 —
Coupled with Guangxi Huayin reaching its full production capacity since September 2009 and
the significantly rebounding business environment of the non-ferrous metals industry after global
financial crisis, the Group has been looking for both substantial organic and inorganic growth. As
discussed with the management of the Group and as set out in the section headed “Reasons for and
benefits of the Acquisition” below, it is the intention of the Group to further integrate upstream and
to grow the business into more a diversified and significant portfolio with upstream mining assets,
exploration projects and future developmental opportunities that have substantial earnings and cash
flow generation ability. The Acquisition provides a good opportunity for the Company to reposition
itself as CMC Group’s flagship international upstream base metals platform. It was also stated in the
annual report of the Company for 2009 and the 2010 Interim Report that one of the Group’s strategies
is to capitalise on its status as CMC’s overseas platform for non-ferrous metals businesses and to
gradually develop itself into an international metals and mining conglomerate.
4. Reasons for and benefits of the Acquisition
The Group is principally engaged in the trading of non-ferrous metals and the manufacturing and
distribution of aluminium and copper products and, through its 33% interest in Guangxi Huayin,
engaged in bauxite exploration and production of alumina.
As set out in the letter from the Board in the Circular, the Board believes that there are strong
commercial and strategic reasons for the Acquisition and is therefore of the view that the Acquisition
represents an excellent opportunity for the Group to expand into other upstream base metals through
the acquisition of a portfolio of quality international mining assets, and to become a major
international upstream base metals group listed on the Stock Exchange. This is expected to enhance
the Group’s strategic position in the international mining sector and increase its overall
competitiveness, business scale and shareholder value. The Board considers that the terms of the
Acquisition have been entered into on normal commercial terms, are fair and reasonable and in the
interest of the Group and the Shareholders as a whole. Following Completion, the Target Company
will be consolidated with the Group. It is expected that the Acquisition will enable the Group to: (i)
derive an immediate substantial earnings and cash flow contribution from MMG; (ii) deliver a more
diversified and significant portfolio of assets, development projects and future growth opportunities;
(iii) reposition the Company as CMC Group’s flagship international up-stream base metals platform;
(iv) expand institutional investors’ interest to support a market re-rating; and (v) combine capable and
experience boards and management teams. Details of the reasons for and benefits of the Acquisition
are set out in the letter from the Board in the Circular.
5. Industry outlook
The demand for base metals have been rising mainly driven by the domestic consumption in
China, the world’s largest consumer of copper, lead, nickel and zinc. It is generally anticipated that
the demand for base metals consumption in various industries of China and other emerging economies
will continue to grow in the long run. Nevertheless, the world economic recovery may lead to surplus
of stock of certain metals as a result of the continuous development of new mines and expansion of
existing or previously closed operations. Accordingly, it is considered that long-term metal prices and
LETTER FROM SOMERLEY
— 52 —
market outlook to be cyclical and we concur with the Board’s observations. Further information on the
base metal industry, including the properties, usage, demand, consumption, supply and market outlook
of certain base metals, gold and silver, are set out in the section headed “Industry overview” in the
circular.
6. Principal terms of the Share Sale Deed
(a) The Share Sale Deed
Date: 19 October 2010
Parties
Seller: Album Enterprises, a wholly-owned subsidiary of CMN
Buyer: All Glorious, a special purpose vehicle wholly-owned by
the Company established for the purpose of the Acquisition
Guarantor and issuer of
the Consideration
Shares and the PSCS:
The Company
(b) Assets to be acquired
The Sale Shares, representing all of the issued share capital of the Target Company. The
Target Company is an investment holding company incorporated on 8 April 2009. The Target
Company holds a portfolio of international mining assets known as MMG. The Sale Shares are
to be acquired free and clear of all encumbrances.
MMG is a significant producer of zinc, copper, lead, gold and silver. MMG currently
operates four mines: (i) the Sepon copper and gold operations located in Laos; (ii) Century, one
of the world’s largest zinc mines, located in Queensland, Australia, also producing lead and
silver; (iii) Golden Grove, a zinc, lead, copper and precious metals mine located in Western
Australia; and (iv) Rosebery, a zinc, lead, copper and precious metals mine located in Tasmania,
Australia. In addition, MMG owns the Avebury nickel mine in Tasmania, Australia (which is
currently on care and maintenance) and has several other Development Projects and an active
minerals exploration programme in Australia, Indonesia and Canada. Further details of MMG are
set out in the sub-section headed “The Target Group’s key assets” below in this letter and the
section headed “Information of the Target Group” in the Circular.
(c) Purchase Price
As stated in the letter from the Board in the Circular, the Purchase Price of US$1,846.0
million (equivalent to approximately HK$14,398.8 million) was arrived at after arm’s length
negotiations between the Company, All Glorious and Album Enterprises and determined with
LETTER FROM SOMERLEY
— 53 —
reference to the range of the Market Valuation and was adjusted by the parties for expectations
on working capital changes until 31 December 2010, including, but not limited to, the
repatriation of US$340.0 million (equivalent to approximately HK$2,652.0 million) from the
Target Group to Album Enterprises by way of dividend.
The Company has appointed Grant Samuel as the Competent Evaluator and commissioned
Grant Samuel to conduct the Chapter 18 Valuation and the Market Valuation. The Market
Valuation, which was prepared using methodologies in line with international market practices,
is based primarily on a discounted cashflow analysis on the estimated life of mine operational
parameters, including, but not limited to, Ore Reserves and Mineral Resources estimates, the
production profiles, operating and capital costs, potential for reserve extension and future
outlook of commodity prices, with secondary consideration given to alternative valuation
methodologies based on multiples of Ore Reserves and Mineral Resources, comparable company
analysis and comparable transaction analysis. The Market Valuation seeks to evaluate the full
market value of MMG and accordingly, reflects the value associated with Inferred Resources and
the exploration potential of the Target Group’s assets, which are specifically excluded from the
Chapter 18 Valuation as required by the Listing Rules. The Valuation Report, which is prepared
in accordance with the requirements of the Chapter 18 of the Listing Rules, is set out in Appendix
V to the Circular and our analysis thereof is set out in the section headed “Analysis of the
Purchase Price” below.
The Purchase Price of US$1,846.0 million (equivalent to approximately HK$14,398.8
million) shall be satisfied in the following manner:
(i) Cash:
- as to US$100.0 million (equivalent to approximately HK$780.0 million) in cash,
from All Glorious or its nominee to Album Enterprises, payable on either (A) 31
December 2010 or (B) a date falling after the Completion Date and prior to 31
December 2010 if the Completion Date falls on or prior to 31 December 2010;
or on the Completion Date if the Completion Date falls after 31 December 2010.
- as to approximately US$694.2 million (equivalent to approximately HK$5,414.5
million), from the proceeds of a loan from Album Enterprises to All Glorious
under the Loan Agreement (the “Loan”), payable on Completion;
(ii) Consideration Shares:
- as to approximately US$361.8 million (equivalent to approximately HK$2,822.3
million) through the issuance by the Company of 940,779,090 Consideration
Shares to Album Enterprises or its nominee at an issue price of HK$3.00 per
Share on Completion; and
LETTER FROM SOMERLEY
— 54 —
(iii) PSCS:
- as to US$690.0 million (equivalent to approximately HK$5,382.0 million)
through the issuance by the Company of PSCS convertible into 1,560 million
Conversion Shares to Album Enterprises or its nominee at an initial conversion
price of HK$3.45 per Share on Completion.
Detailed analysis of the payment structure and terms of the Purchase Price is set out in the
section headed “Analysis of the payment structure” below.
(d) Conditions precedent
Completion is subject to the approval of the Acquisition, and including the grant of the
Specific Mandate to the Directors for the issue of up to 2,700 million new Shares, by the
Independent Shareholders. Our opinion on the Specific Mandate is set out in the section headed
“Specific Mandate” below. Completion is also subject to a number of regulatory approvals in
Australia and the PRC and a number of other conditions having been satisfied or waived (as the
case may be). Detailed conditions precedent are set out in the sub-section headed “Conditions”
in the letter from the Board in the Circular.
7. Information on MMG
(a) Background and business of MMG
The Target Company, a wholly-owned subsidiary of CMN, owns a portfolio of mining
assets and exploration interests collectively known as MMG. CMN acquired MMG from OZL in
June 2009. Completion of the acquisition by the CMN Group of the Operating Mines, the
Development Projects and various exploration projects (which are currently held through the
Target Company) took place on 16 June 2009 (but with effect as of 1 June 2009).
Although the Purchase Price is higher than the consideration paid by CMN, it should be
noted that MMG has since undertaken significant additional capital expenditure at the Operating
Mines, the Development Projects and the various exploration projects subsequent to its
acquisition by CMN. More importantly, there has also been a considerable increase in the base
metal prices since then. We therefore consider that the Purchaser Price, albeit higher than the
consideration paid by CMN back in June 2009, is fair and reasonable based on our analyses as
set out in the section headed “Analysis of the Purchase Price” below.
LETTER FROM SOMERLEY
— 55 —

MMG owns and operates a portfolio of world-class base metal mining operations,
development projects and exploration fields. MMG is one of the world’s largest producers of zinc
as well as a substantial producer of copper, lead, gold and silver.
(b) The Target Group’s key assets
The Target Group is the operator of the four Operating Mines and owner of the relevant
mineral tenements of the four Operating Mines, through wholly-owned subsidiaries (other than
the Sepon Project, where the Government of Laos holds a 10% shareholding in the relevant MMG
subsidiary and that subsidiary is party to the MEPA with the Government of Laos). In addition
to the mining operations located in Australia and Laos, the Target Group also has a large
portfolio of advanced and early stage exploration projects located in Australia, Indonesia and
North America. The Target Group’s key assets include:
(i) 90% interest in the Sepon copper/gold operations in Laos;
(ii) 100% interest in the Century zinc/lead/silver mine in Queensland, Australia;
(iii) 100% interest in the Golden Grove zinc/copper/gold/silver/lead metals mine in
Western Australia;
(iv) 100% interest in the Rosebery zinc/lead/copper/gold/silver metals mine in Tasmania,
Australia;
(v) 100% interest in the Avebury nickel project, currently on care and maintenance, in
Tasmania, Australia;
(vi) 100% interest in the Dugald River zinc/lead/silver project in Queensland, Australia;
and
(vii) various exploration projects in Australia, Indonesia and Canada.
LETTER FROM SOMERLEY
— 56 —
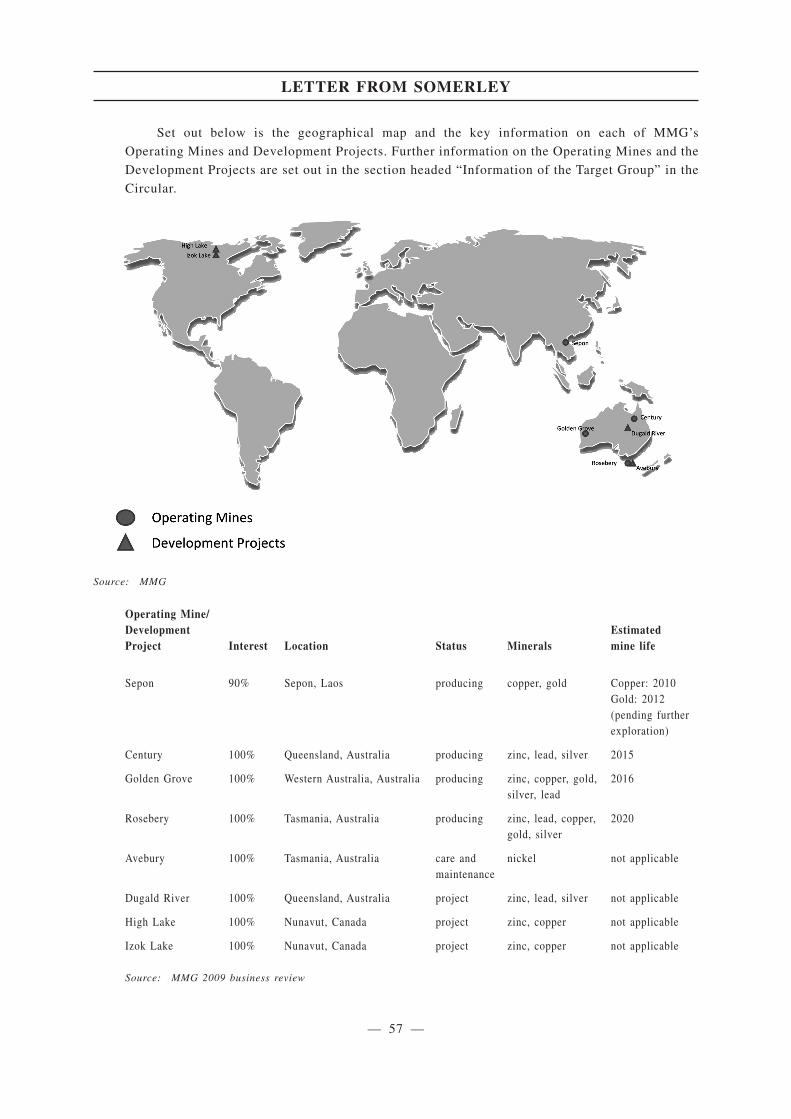
Set out below is the geographical map and the key information on each of MMG’s
Operating Mines and Development Projects. Further information on the Operating Mines and the
Development Projects are set out in the section headed “Information of the Target Group” in the
Circular.
Source: MMG
Operating Mine/DevelopmentProject Interest Location Status Minerals
Estimatedmine life
Sepon 90% Sepon, Laos producing copper, gold Copper: 2010Gold: 2012(pending furtherexploration)
Century 100% Queensland, Australia producing zinc, lead, silver 2015
Golden Grove 100% Western Australia, Australia producing zinc, copper, gold,silver, lead
2016
Rosebery 100% Tasmania, Australia producing zinc, lead, copper,gold, silver
2020
Avebury 100% Tasmania, Australia care andmaintenance
nickel not applicable
Dugald River 100% Queensland, Australia project zinc, lead, silver not applicable
High Lake 100% Nunavut, Canada project zinc, copper not applicable
Izok Lake 100% Nunavut, Canada project zinc, copper not applicable
Source: MMG 2009 business review
LETTER FROM SOMERLEY
— 57 —
(c) MMG’s Ore Reserves and Mineral Resources
The Ore Reserves and Mineral Resources (contained metal) of MMG as at 30 June 2009 and
the production volume for the seven months ended 31 December 2009 and the six months ended
30 June 2010 (on the basis of a 100% interest in Sepon) are set out below:
(i) Total MMG resources (contained metal)
Zinc(Mt)
Copper(Mt)
Lead(Mt)
Silver(moz)
Gold(moz)
Nickel(Mt)
Sepon — 1.6 — 14.5 3.2 —
Century 5.1 — 0.6 47.3 — —
Golden Grove 1.2 0.7 0.1 38.7 0.9 —
Rosebery 1.8 0.1 0.6 63.5 0.8 —
Avebury — — — — — 0.2
Dugald River 6.6 — 1.0 61.9 — —
Izok Lake 1.9 0.4 0.2 33.5 — —
High Lake 0.6 0.4 0.1 38.9 0.5 —
Total resources 17.1 3.2 2.5 298.3 5.4 0.2
Source: MMG
Note: Above figures are rounded according to JORC Code guidelines.
(ii) Total MMG reserves (contained metal)
Zinc(Mt)
Copper(Mt)
Lead(Mt)
Silver(moz)
Gold(moz)
Sepon — 0.8 — 0.3 0.2
Century 3.4 — 0.3 19.3 —
Golden Grove 0.3 0.1 0.0 7.8 0.2
Rosebery 0.5 0.0 0.1 13.2 0.2
Total reserves 4.1 0.9 0.5 40.6 0.5
Source: MMG
Note: Above figures are rounded according to JORC Code guidelines.
LETTER FROM SOMERLEY
— 58 —
(iii) Productions
Metal
For the sevenmonths ended31 December
2009
For the sixmonths ended
30 June2010
(000’s) (000’s)
Zinc (tonnes) 266.6 318.2
Copper (tonnes) 56.4 49.1
Lead (tonnes) 25.7 25.9
Silver (oz) 3,010.6 4,025.0
Gold (oz) 94.6 91.5
Source: MMG
(d) Financial information on the Target Group
(i) Financial results of the Target Group
Set out below are the summarised consolidated audited financial results of the Target
Company for the period from 8 April 2009 (date of incorporation) to 31 December 2009 and
for the six months ended 30 June 2010 as extracted from the accountants’ report of the
Target Company as set out in Appendix I to the Circular. As the Target Company was only
incorporated in April 2009 and the amalgamation of MMG from OZL was effective from 1
June 2009, the results for the period from 8 April 2009 to 31 December 2009 only reflected
the performance of these operations for seven months (the “Reporting Period”).
LETTER FROM SOMERLEY
— 59 —
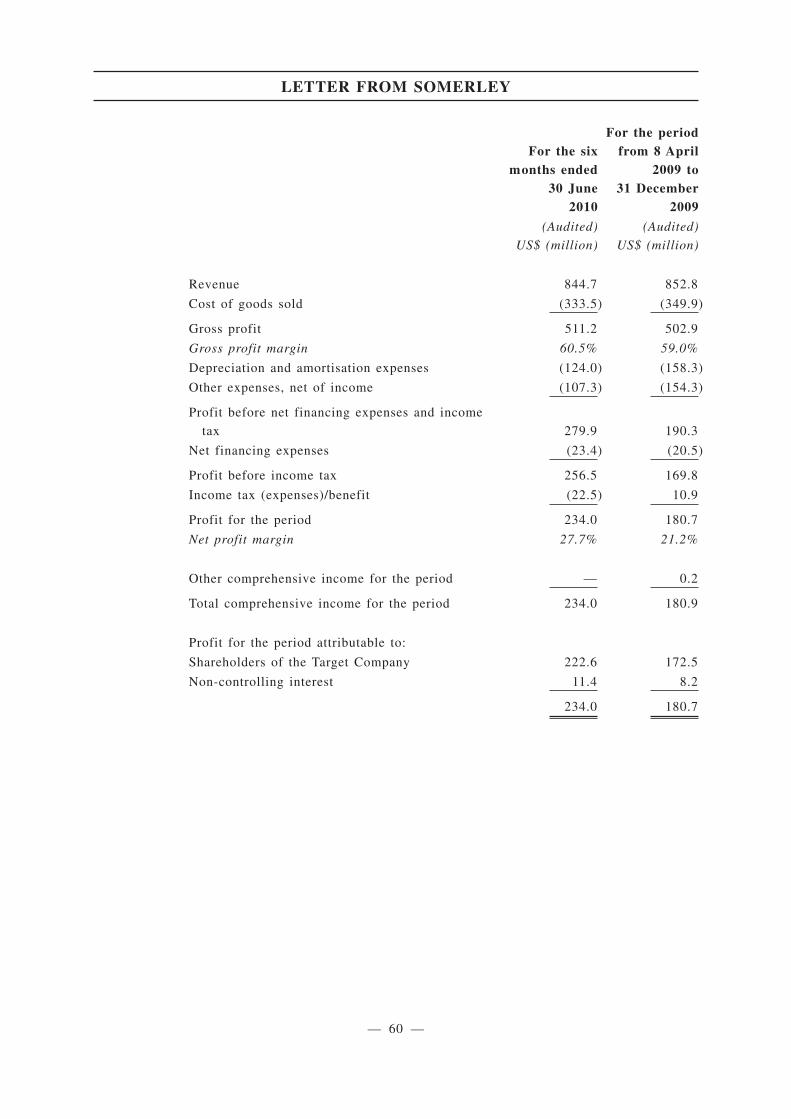
For the sixmonths ended
30 June2010
For the periodfrom 8 April
2009 to31 December
2009
(Audited)
US$ (million)
(Audited)
US$ (million)
Revenue 844.7 852.8
Cost of goods sold (333.5) (349.9)
Gross profit 511.2 502.9
Gross profit margin 60.5% 59.0%
Depreciation and amortisation expenses (124.0) (158.3)
Other expenses, net of income (107.3) (154.3)
Profit before net financing expenses and income
tax 279.9 190.3
Net financing expenses (23.4) (20.5)
Profit before income tax 256.5 169.8
Income tax (expenses)/benefit (22.5) 10.9
Profit for the period 234.0 180.7
Net profit margin 27.7% 21.2%
Other comprehensive income for the period — 0.2
Total comprehensive income for the period 234.0 180.9
Profit for the period attributable to:
Shareholders of the Target Company 222.6 172.5
Non-controlling interest 11.4 8.2
234.0 180.7
LETTER FROM SOMERLEY
— 60 —
A. Revenue
Revenue represents sales of metals, mainly consist of zinc, lead, copper and
gold, produced from four Operating Mines of MMG, namely Century, Sepon, Golden
Grove and Rosebery. Revenue for the Reporting Period reached US$852.8 million
with gross margin of 59.0%. Revenue for the first half of 2010, as compared to the
Reporting Period and on a pro rata basis, has increased mainly due to (i) a
strengthening of the market prices of the base metals, in particular copper and zinc;
and (ii) a lower production in the Reporting Period after a 11-week production
shutdown at Century due to a pipeline failure. The gross margin also edged up to
60.5% mainly as a result of the higher commodity prices and higher output volume.
B. Costs and expenses
Cost of goods sold mainly comprises employee wages, energy, stores and
consumables costs. Taken together with the depreciation charge of the property, plant
and equipment, they form the majority portion of the operating expenses.
C. Income tax (expenses)/benefit
The Target Group has recorded an income tax benefit for the Reporting Period
and a relatively low effective tax rate of approximately 8.8%, as compared to the
standard corporate tax rate of 30.0% in Australia, for the six months ended 30 June
2010. The relatively low effective tax rate was mainly due to the recognition of
significant deferred tax assets as a result of tax losses carried forward from prior year
operations and considerable amount of accelerated depreciation charge in relation to
the Target Group’s fixed assets.
D. Net profit
The consolidated net profit of the Target Company has increased from US$180.7
million for the Reporting Period to US$234.0 million for the six months ended 30 June
2010. The lower net profit for the previous period was partly attributable to the
pipeline failure at Century which resulted in addition post-tax expenses of US$38.3
million. Excluding the effects of this event, the net profit and its margin for the
previous period would still be slightly below those for the six-month period ended 30
June 2010 mainly due to the strengthening base metal prices in general.
LETTER FROM SOMERLEY
— 61 —
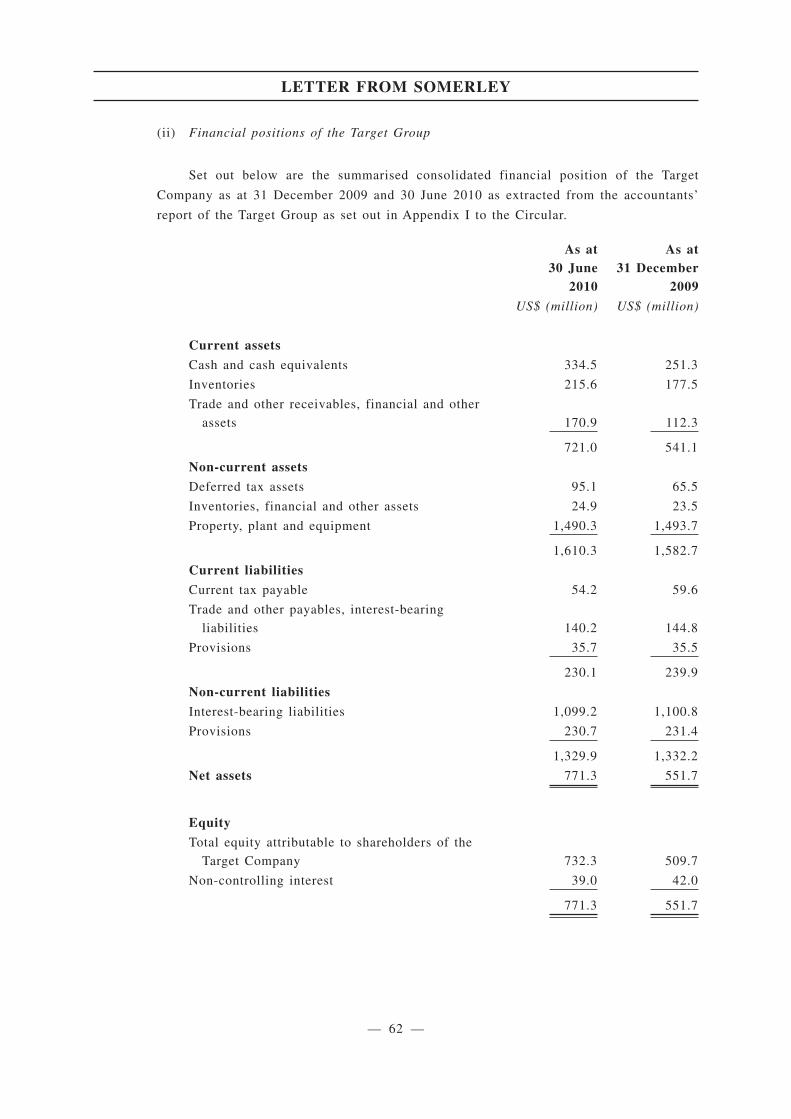
(ii) Financial positions of the Target Group
Set out below are the summarised consolidated financial position of the Target
Company as at 31 December 2009 and 30 June 2010 as extracted from the accountants’
report of the Target Group as set out in Appendix I to the Circular.
As at30 June
2010
As at31 December
2009
US$ (million) US$ (million)
Current assets
Cash and cash equivalents 334.5 251.3
Inventories 215.6 177.5
Trade and other receivables, financial and other
assets 170.9 112.3
721.0 541.1
Non-current assets
Deferred tax assets 95.1 65.5
Inventories, financial and other assets 24.9 23.5
Property, plant and equipment 1,490.3 1,493.7
1,610.3 1,582.7
Current liabilities
Current tax payable 54.2 59.6
Trade and other payables, interest-bearing
liabilities 140.2 144.8
Provisions 35.7 35.5
230.1 239.9
Non-current liabilities
Interest-bearing liabilities 1,099.2 1,100.8
Provisions 230.7 231.4
1,329.9 1,332.2
Net assets 771.3 551.7
Equity
Total equity attributable to shareholders of the
Target Company 732.3 509.7
Non-controlling interest 39.0 42.0
771.3 551.7
LETTER FROM SOMERLEY
— 62 —
A. Cash and cash equivalents
Cash and cash equivalents balance increased from US$251.3 million as at 31
December 2009 to US$334.5 million as at 30 June 2010. The increase was mainly
generated from the operating activities of US$334.5 million after payments for plant
and equipment and available-for-sale financial assets.
B. Inventories
Inventories comprise store and consumable, finished goods and consumable in
relation to the operations of the various mines.
C. Trade and other receivables, financial and other assets
The balance mainly includes trade and other receivables, prepayment and an
investment in marketable securities. Based on the recent prevailing market price of
such marketable securities, we note that their current market values are at premium
over both their book value on the balance sheet as at 30 June 2010 and the valuations
prepared by the Competent Evaluator.
D. Property, plant and equipment
Property, plant and equipment were totalled US$1,490.3 million as at 30 June
2010 and represented approximately 63.9% of the total assets. They mainly comprise
plant and equipment, mine property and development as well as capitalised
exploration and evaluation expenses and construction in progress directly related to
the operations of the various mines.
E. Interest-bearing liabilities and gearing
The interest-bearing liabilities mainly comprise bank borrowings of US$1,095.0
million (equivalent to approximately HK$8,541.0 million) carrying floating interest
rates ranging from the London Interbank Offered Rate (“LIBOR”) plus 1.2% to
LIBOR plus 2.0%. These bank borrowings have tenors ranging from three to seven
years and will mature partly in June 2012 and partly in June 2016.
The gearing, representing the net borrowings (cash and cash equivalent less
interest-bearing liabilities) divided by the total equity, was 154.2% and 99.3% as at
31 December 2009 and 30 June 2010 respectively. The high gearings of the Target
Company reflect the fact that the Target Company’s acquisition of MMG assets in June
2009 was mainly funded by bank borrowings. The improvement in gearing level as at
30 June 2010 was mainly due to the increase in the total equity as a result of the profit
generated from the mine operations for the six-month period ended on 30 June 2010.
LETTER FROM SOMERLEY
— 63 —
F. Provisions
Provisions relate mainly to estimated future expenses for mine rehabilitation,
restoration and dismantling.
G. Non-controlling interest
The non-controlling interest reflects the Lao government’s 10.0% interest in
Sepon mine.
Independent Shareholders are advised to read the management and discussion
analysis of the Target Group as set out in Appendix I in the Circular for further
information on the financial analysis of the Target Group.
8. Analysis of the Purchase Price
(a) Chapter 18 Valuation
The Purchase Price is US$1,846.0 million (equivalent to approximately HK$14,398.8
million), which was arrived at after arm’s length negotiations between the Company, All Glorious
and Album Enterprises and determined with reference to the range of the Market Valuation and
adjusted by the parties for projections of working capital changes until 31 December 2010,
including, but not limited to, the Repatriation of US$340.0 million (equivalent to approximately
HK$2,652.0 million) from the Target Group to Album Enterprises by way of dividend.
The Company has appointed Grant Samuel as the Competent Evaluator and commissioned
Grant Samuel to conduct the Chapter 18 Valuation and the Market Valuation. The Market
Valuation, which was prepared using methodologies in line with international market practices,
is based primarily on a discounted cashflow analysis on the estimated life of mine operational
parameters, including, but not limited to, Ore Reserves and Mineral Resources estimates,
production profiles, operating and capital costs, potential for reserve extension and future
outlook of commodity prices, with secondary consideration given to alternative valuation
methodologies based on multiples of Ore Reserves and Mineral Resources, comparable company
analysis and comparable transaction analysis. The Market Valuation seeks to evaluate the full
market value of MMG and accordingly, reflects the value associated with Inferred Resources and
the exploration potential of the Target Group’s assets, which are specifically excluded from the
Chapter 18 Valuation as required by the Listing Rules.
Based on our discussions with Grant Samuel, we understand that Grant Samuel has been
instructed by the management of the Company to analyse and provide opinion on the market
equity value of the Target Group (net of liabilities). The Target Group has been valued by Grant
Samuel as at 30 June 2010 in the range of US$1,533.0 million (equivalent to approximately
HK$11,957.4 million) to US$1,741.0 million (equivalent to approximately HK$13,579.8 million)
based on the requirements of Chapter 18 of the Listing Rules but before deducting the
Repatriation of US$340.0 million (equivalent to approximately HK$2,652.0 million) payable
before Completion. The text of the Valuation Report in relation to MMG as at 30 June 2010 is
set out in Appendix V to the Circular.
LETTER FROM SOMERLEY
— 64 —
As shown in the Valuation Report set out in Appendix V to the Circular, MMG has been
assessed by aggregating calculated values for MMG’s mineral assets and adjusting for net debt
and other assets and liabilities and its assessment of MMG’s mineral assets has been determined
having regard strictly to parameters stipulated in Chapter 18 of the Listing Rules. In particular,
Grant Samuel has valued MMG, pursuant to the requirements of Chapter 18 of the Listing Rules,
by taking into account the estimated value of measured and indicated resources that are
considered to be economically extractable, which will generally mean that the Chapter 18
Valuation will be limited to an estimate of the value of reserves (i.e. that portion of measured
and indicated resources that has been demonstrated to be economically extractable). Of particular
significance, Rule 18.30(3) of the Listing Rules states that valuations for inferred resources are
not permitted.
In assessing the Purchase Price, we have reviewed and discussed with Grant Samuel the
methodology of, and basis and assumptions adopted for, the Chapter 18 Valuation of MMG as
contained in the Valuation Report. In this connection, we understand that Grant Samuel has
considered the four principal methodologies commonly used for valuing operating businesses,
namely capitalisation of earnings or cash flow; discounting projected cash flows; industry rules
of thumb; and estimation of the aggregate proceeds from an orderly realisation of assets. Grant
Samuel has adopted the discounted cash flow (“DCF”) methodology for the purpose of its
valuation in the Valuation Report. The DCF methodology is widely used in the valuation of
resources assets. More importantly, in the context of the requirements for a Chapter 18 Valuation
it allows for the preparation of an estimate of value that only takes into account specified
mineralisation (i.e. reserves plus that portion of measured and indicated resources that are
economically extractable).
The DCF methodology involves the calculation of the net present values by discounting
expected future cash flows. Projected cash flows are discounted to present values using discount
rates that take into account the time value of money and the risks associated with the cash flows.
We consider that the DCF methodology is appropriate for assets such as mineral assets where
reserves are depleted over time and where significant capital expenditure is required. It is the
primary method of valuation in the mining industry.
Grant Samuel constructed cash flow models for each of the key mineral assets of MMG. The
financial models were constructed by Grant Samuel on the basis of operating models developed
by AMC Consultancy Pty Ltd (“AMC”), the Competent Person, based on life of mine plans
provided by MMG. The operating models developed by AMC had regard only to that portion of
measured and indicated resources that has been demonstrated to be economically extractable,
which generally corresponded to reserves. AMC reviewed each of the technical assumptions in
the operating models, including those regarding reserve estimates, production profiles, operating
overhead costs and capital costs. Grant Samuel determined the economic and financial
assumptions used in the cash flow models. The net present value of each mineral asset has been
calculated on an ungeared after tax basis as at 1 July 2010.
Based on our discussions with AMC and Grant Samuel and our review of the work
conducted by AMC and Grant Samuel, we consider that, the assumptions, the basis and the
methodology for the Chapter 18 Valuation of MMG are fair and reasonable.
LETTER FROM SOMERLEY
— 65 —
(b) Market Valuation
As explained in the sub-section headed “Chapter 18 Valuation” above, the Chapter 18
Valuation prepared by Grant Samuel in the Valuation Report in Appendix V to the Circular has
only taken into account the measured and indicated resources that are considered to be
economically extractable, which will generally be limited to an estimate of the aggregate value
of reserves (i.e. that portion of measured and indicated resources that has been demonstrated to
be economically extractable). In particular, the inferred resources are ignored.
In light of the above, the Company has commissioned Grant Samuel to prepare the Market
Valuation by way of market based valuation approach, which is commonly adopted by industry
participants for valuation of mineral resources asset (i.e. both Chapter 18 Valuation and Market
Valuation attempt to estimate fair market value and market participants’ assessment of value as
reflected in transaction prices). The approach generally takes into account, where appropriate,
measured, indicated and inferred resources, the potential for exploitation of additional
mineralisation not yet classified as resources, and broader exploration prospectivity. As
emphasised by Grant Samuel, the exclusion of these sources of potential value from the Chapter
18 Valuation means that Chapter 18 Valuation does not reflect a market value, i.e. it does not
represent an estimate of the value that might be realised through an arm’s length transaction.
Rather, the Chapter 18 Valuation is essentially an estimate of the value notionally attributable to
reserves only (based on a set of assumptions).
In fact, this is also consistent with AMC’s analysis as set out in Appendix IV to the Circular.
AMC has prepared production and capital and operating cost projections for use by Grant
Samuel. Three scenarios were prepared with scenario one, which took into account existing ore
reserves only, was used by Grant Samuel for its valuation in the Valuation Report. The other two
scenarios considered the mineral resources and exploration potential for which AMC judges there
is a high and reasonable confidence respectively of future conversion to ore reserves. Since these
possible ore reserves and specifically excluded in the Valuation Report pursuant to the
requirement of the Listing Rules, the valuation of “reserves only” case may understate the fair
market value of MMG.
As discussed with Grant Samuel, the quantum of the difference between fair market values
and values estimated for the purposes of a Chapter 18 Valuation will necessarily depend on the
nature of individual resources assets. For some assets, particularly those that are well explored
and tending towards the end of their economic lives, it is likely that there will be limited
opportunities to exploit mineralisation beyond current reserves. For such assets, the difference
between market value and values estimated for the purposes of a Chapter 18 Valuation may be
immaterial. However, for certain other assets (such as resources projects in the early stages of
their development or mines where it is impractical or uneconomic to prove up significant
reserves in advance of mining, but where the ore body being mined is such as to provide
reasonable grounds to expect that mining will continue for years into the future) the difference
between estimates of market value and estimates of value for the purpose of a Chapter 18
Valuation may be substantial.
LETTER FROM SOMERLEY
— 66 —
The market valuation approach and computation methodology used by Grant Samuel in the
valuation of MMG is similar to that used for the Chapter 18 Valuation, including but not limited
to the discount rates used. The key differences are (a) certain key assumptions, namely higher
long run gold and silver prices, higher exchange rate of Australian dollars to United States
dollars as well as higher long run inflation rates for both Australia and the United States of
America was not adopted in the Market Valuation (as compared to the Chapter 18 Valuation)
since the Market Valuation had not taken into account the historical commodity prices and
exchange rates from July to October 2010; and (b) the asset value of the Market Valuation has
been determined on the basis of fair market value after taking into account additional factors,
among other things, (i) the potential for reserve extensions i.e. conversion of measured, indicated
and inferred resources that are yet to be economically extractable; and (ii) option value inherent
in mining operations having regard to cost structure, mine life and other characteristics of each
of MMG’s mining operations. The conventional discounted cash flow methodology implicitly
assumes that the rate of output from a mining operation is pre-determined. This methodology
ignores the value inherent in management’s ability to vary production and other operating
parameters in reaction to changes in commodity prices or other circumstances. Management may
change the rate of production of a mine, close or re-open the mine or in certain circumstances
even abandon it. Accordingly, the market value of a mining asset often comprises the sum of its
Chapter 18 Valuation, the market value of inferred resources and an option (or series of options)
over the resources it contains.
In particular, the Market Valuation differs from the Chapter 18 Valuation in a number of
aspects:
(i) the value of Inferred Resources has, in compliance with Rule 18.30(3) of the Listing
Rules, been excluded from the Chapter 18 Valuation. However, a portion of the value
of the Inferred Resources is included in the Market Valuation if the Competent Person
is of the view that such portion of the Inferred Resources have a reasonable likelihood
of being converted to reserves and economically mined in the future;
(ii) the value of a portion of the Measured Resources and Indicated Resources which
cannot be assumed to convert to reserves according to the requirements of Chapter 18
of the Listing Rules has been excluded from the Chapter 18 Valuation. However, the
value of such portion of Measured Resources and Indicated Resources is included in
the Market Valuation as the Competent Person is of the view that such portion of
Measured Resources and Indicated Resources have a reasonable likelihood of being
mined in the future;
(iii) the value of a portion of the current Ore Reserves is excluded from the Chapter 18
Valuation, as the exclusion of Inferred Resources caused such Ore Reserves to become
theoretically uneconomically viable to extract due to mine scheduling constraints.
However, the value of such portion of Ore Reserves is included in the Market
Valuation;
LETTER FROM SOMERLEY
— 67 —
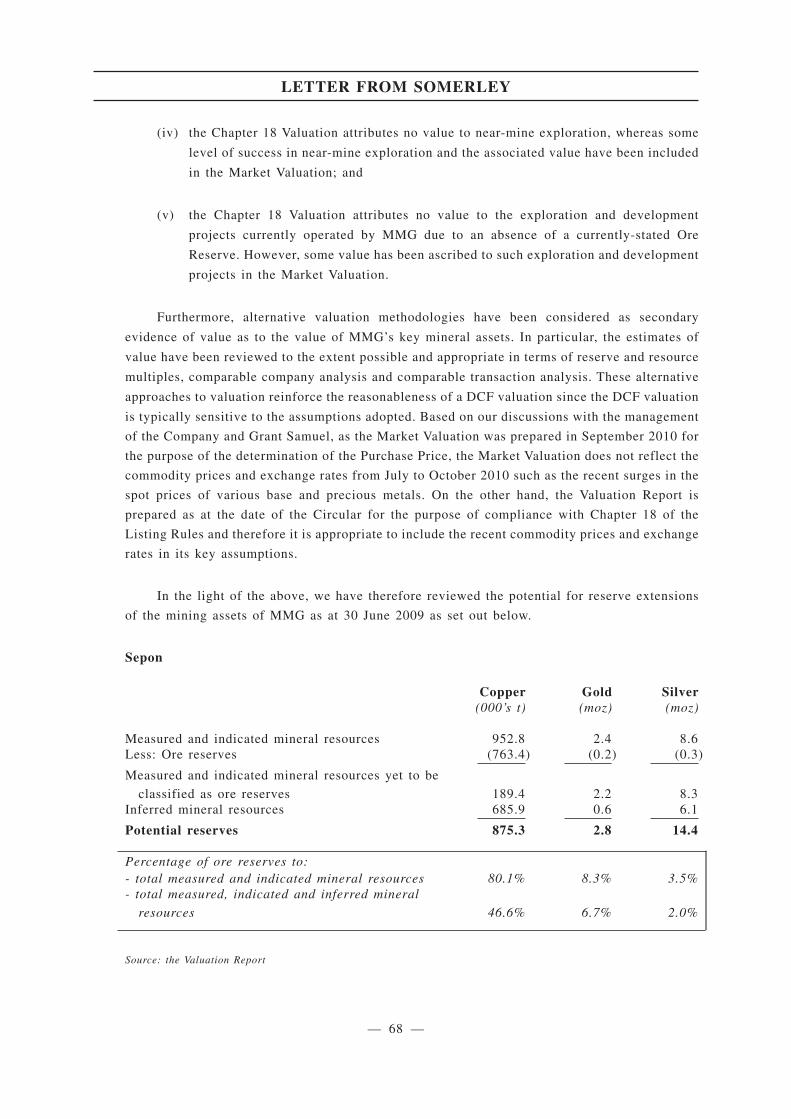
(iv) the Chapter 18 Valuation attributes no value to near-mine exploration, whereas some
level of success in near-mine exploration and the associated value have been included
in the Market Valuation; and
(v) the Chapter 18 Valuation attributes no value to the exploration and development
projects currently operated by MMG due to an absence of a currently-stated Ore
Reserve. However, some value has been ascribed to such exploration and development
projects in the Market Valuation.
Furthermore, alternative valuation methodologies have been considered as secondary
evidence of value as to the value of MMG’s key mineral assets. In particular, the estimates of
value have been reviewed to the extent possible and appropriate in terms of reserve and resource
multiples, comparable company analysis and comparable transaction analysis. These alternative
approaches to valuation reinforce the reasonableness of a DCF valuation since the DCF valuation
is typically sensitive to the assumptions adopted. Based on our discussions with the management
of the Company and Grant Samuel, as the Market Valuation was prepared in September 2010 for
the purpose of the determination of the Purchase Price, the Market Valuation does not reflect the
commodity prices and exchange rates from July to October 2010 such as the recent surges in the
spot prices of various base and precious metals. On the other hand, the Valuation Report is
prepared as at the date of the Circular for the purpose of compliance with Chapter 18 of the
Listing Rules and therefore it is appropriate to include the recent commodity prices and exchange
rates in its key assumptions.
In the light of the above, we have therefore reviewed the potential for reserve extensions
of the mining assets of MMG as at 30 June 2009 as set out below.
Sepon
Copper Gold Silver(000’s t) (moz) (moz)
Measured and indicated mineral resources 952.8 2.4 8.6Less: Ore reserves (763.4) (0.2) (0.3)
Measured and indicated mineral resources yet to be
classified as ore reserves 189.4 2.2 8.3Inferred mineral resources 685.9 0.6 6.1
Potential reserves 875.3 2.8 14.4
Percentage of ore reserves to:- total measured and indicated mineral resources 80.1% 8.3% 3.5%- total measured, indicated and inferred mineral
resources 46.6% 6.7% 2.0%
Source: the Valuation Report
LETTER FROM SOMERLEY
— 68 —
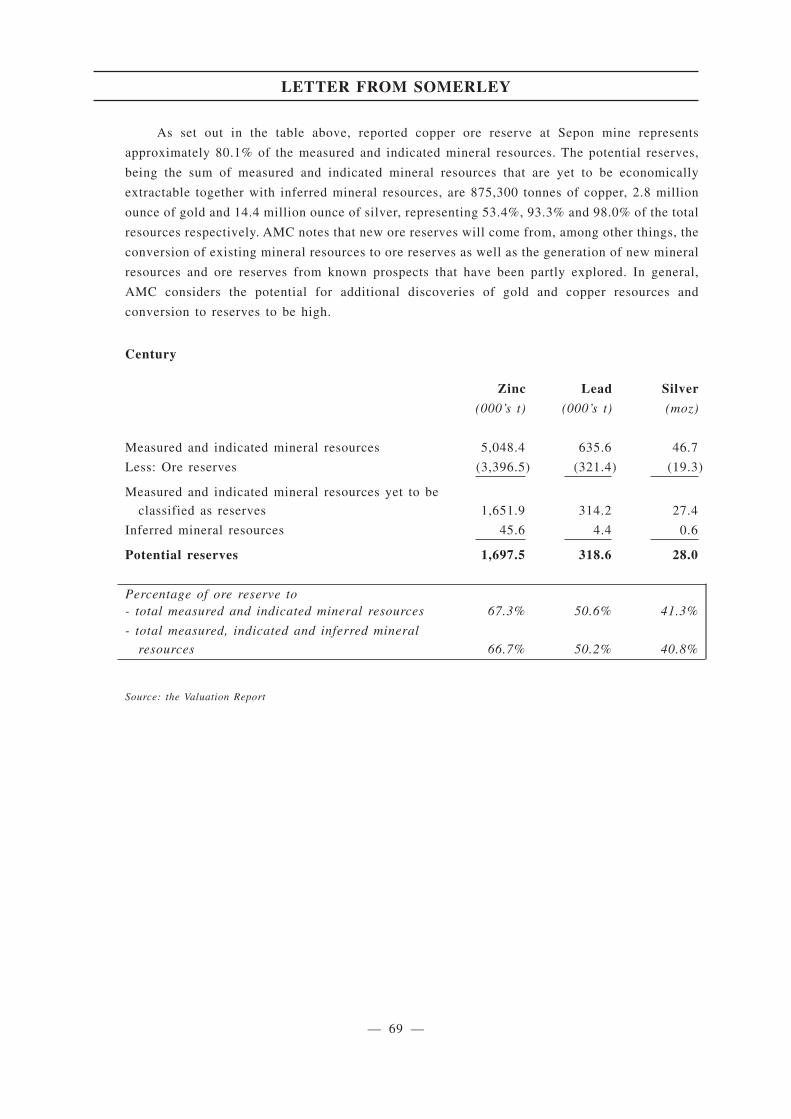
As set out in the table above, reported copper ore reserve at Sepon mine represents
approximately 80.1% of the measured and indicated mineral resources. The potential reserves,
being the sum of measured and indicated mineral resources that are yet to be economically
extractable together with inferred mineral resources, are 875,300 tonnes of copper, 2.8 million
ounce of gold and 14.4 million ounce of silver, representing 53.4%, 93.3% and 98.0% of the total
resources respectively. AMC notes that new ore reserves will come from, among other things, the
conversion of existing mineral resources to ore reserves as well as the generation of new mineral
resources and ore reserves from known prospects that have been partly explored. In general,
AMC considers the potential for additional discoveries of gold and copper resources and
conversion to reserves to be high.
Century
Zinc Lead Silver
(000’s t) (000’s t) (moz)
Measured and indicated mineral resources 5,048.4 635.6 46.7
Less: Ore reserves (3,396.5) (321.4) (19.3)
Measured and indicated mineral resources yet to be
classified as reserves 1,651.9 314.2 27.4
Inferred mineral resources 45.6 4.4 0.6
Potential reserves 1,697.5 318.6 28.0
Percentage of ore reserve to- total measured and indicated mineral resources 67.3% 50.6% 41.3%
- total measured, indicated and inferred mineral
resources 66.7% 50.2% 40.8%
Source: the Valuation Report
LETTER FROM SOMERLEY
— 69 —

As set out in the table above, reported ore reserve of zinc and lead at Century mine
represent approximately 67.3% and 50.6% respectively of the measured and indicated mineral
resources. The potential reserves, being the sum of measured and indicated mineral resources
that are yet to be economically extractable together with inferred mineral resources, are
1,697,500 tonnes of zinc, 318,600 tonnes of lead and 28.0 million ounce of silver, representing
33.3%, 49.8% and 59.2% of the total resources respectively. AMC is of the opinion that there is
a low likelihood that any discovery that might be made will materially impact the operations of
the Century mine.
Rosebery
Zinc Copper Lead Silver Gold
(000’s t) (000’s t) (000’s t) (moz) (moz)
Measured and indicated mineral
resources 992.1 33.5 261.1 30.0 0.5
Less: Ore reserves (453.1) (13.1) (116.2) (13.2) (0.2)
Measured and indicated mineral
resources yet to be classified as
reserves 539.0 20.4 144.9 16.8 0.3
Inferred mineral resources 822.6 22.2 289.0 33.5 0.4
Potential reserves 1,361.6 42.6 433.9 50.3 0.7
Percentage of ore reserve to- total measured and indicated mineral
resources 45.7% 39.1% 44.5% 44.0% 40.0%
- total measured, indicated and
inferred mineral resources 25.0% 23.5% 21.1% 20.8% 22.2%
Source: the Valuation Report
LETTER FROM SOMERLEY
— 70 —
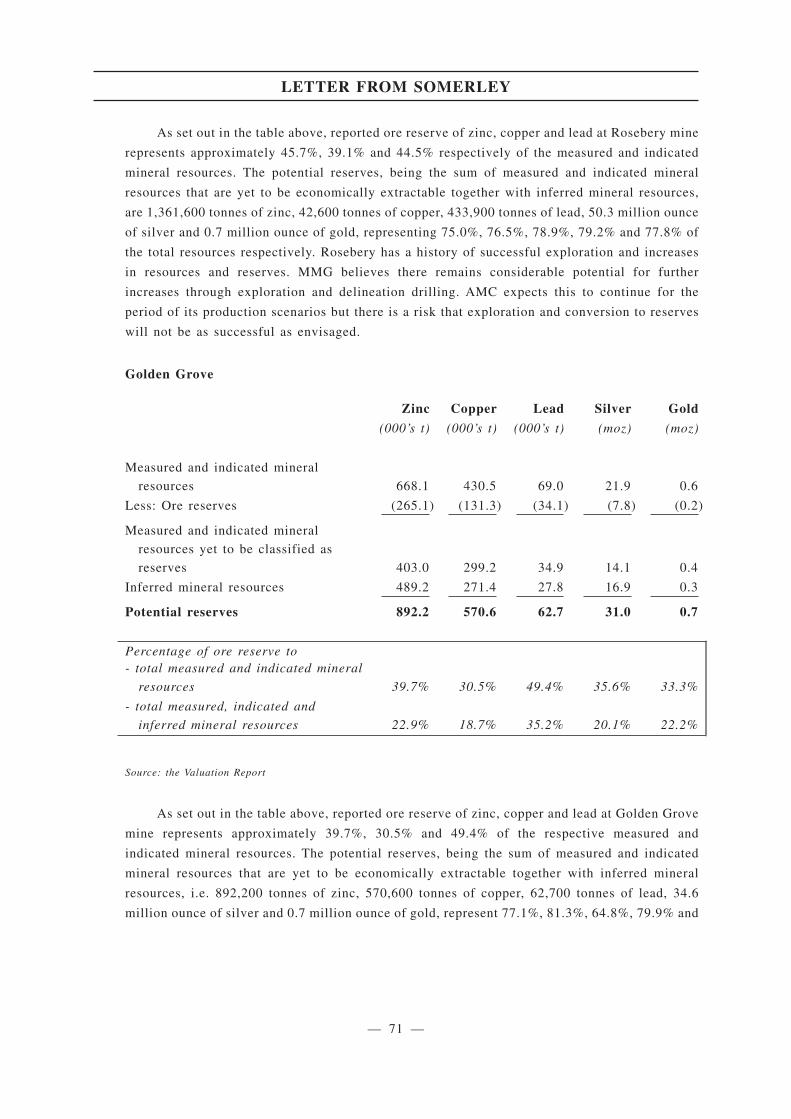
As set out in the table above, reported ore reserve of zinc, copper and lead at Rosebery mine
represents approximately 45.7%, 39.1% and 44.5% respectively of the measured and indicated
mineral resources. The potential reserves, being the sum of measured and indicated mineral
resources that are yet to be economically extractable together with inferred mineral resources,
are 1,361,600 tonnes of zinc, 42,600 tonnes of copper, 433,900 tonnes of lead, 50.3 million ounce
of silver and 0.7 million ounce of gold, representing 75.0%, 76.5%, 78.9%, 79.2% and 77.8% of
the total resources respectively. Rosebery has a history of successful exploration and increases
in resources and reserves. MMG believes there remains considerable potential for further
increases through exploration and delineation drilling. AMC expects this to continue for the
period of its production scenarios but there is a risk that exploration and conversion to reserves
will not be as successful as envisaged.
Golden Grove
Zinc Copper Lead Silver Gold
(000’s t) (000’s t) (000’s t) (moz) (moz)
Measured and indicated mineral
resources 668.1 430.5 69.0 21.9 0.6
Less: Ore reserves (265.1) (131.3) (34.1) (7.8) (0.2)
Measured and indicated mineral
resources yet to be classified as
reserves 403.0 299.2 34.9 14.1 0.4
Inferred mineral resources 489.2 271.4 27.8 16.9 0.3
Potential reserves 892.2 570.6 62.7 31.0 0.7
Percentage of ore reserve to- total measured and indicated mineral
resources 39.7% 30.5% 49.4% 35.6% 33.3%
- total measured, indicated and
inferred mineral resources 22.9% 18.7% 35.2% 20.1% 22.2%
Source: the Valuation Report
As set out in the table above, reported ore reserve of zinc, copper and lead at Golden Grove
mine represents approximately 39.7%, 30.5% and 49.4% of the respective measured and
indicated mineral resources. The potential reserves, being the sum of measured and indicated
mineral resources that are yet to be economically extractable together with inferred mineral
resources, i.e. 892,200 tonnes of zinc, 570,600 tonnes of copper, 62,700 tonnes of lead, 34.6
million ounce of silver and 0.7 million ounce of gold, represent 77.1%, 81.3%, 64.8%, 79.9% and
LETTER FROM SOMERLEY
— 71 —
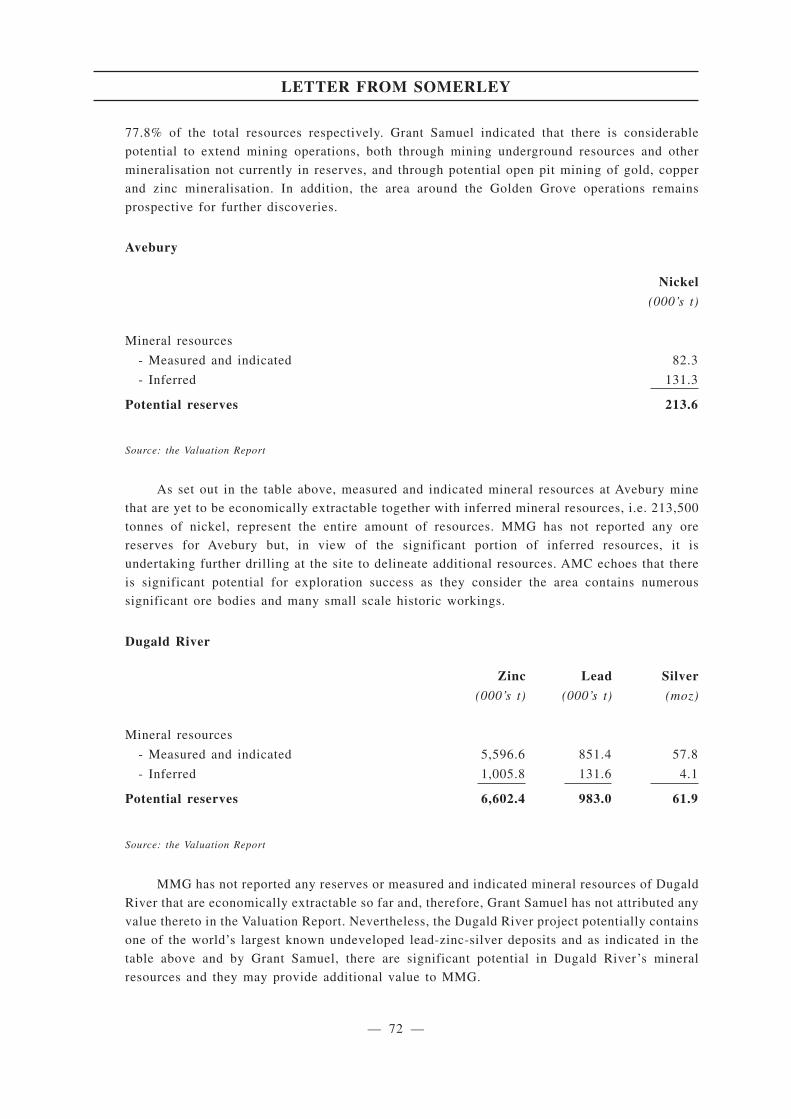
77.8% of the total resources respectively. Grant Samuel indicated that there is considerable
potential to extend mining operations, both through mining underground resources and other
mineralisation not currently in reserves, and through potential open pit mining of gold, copper
and zinc mineralisation. In addition, the area around the Golden Grove operations remains
prospective for further discoveries.
Avebury
Nickel
(000’s t)
Mineral resources
- Measured and indicated 82.3
- Inferred 131.3
Potential reserves 213.6
Source: the Valuation Report
As set out in the table above, measured and indicated mineral resources at Avebury mine
that are yet to be economically extractable together with inferred mineral resources, i.e. 213,500
tonnes of nickel, represent the entire amount of resources. MMG has not reported any ore
reserves for Avebury but, in view of the significant portion of inferred resources, it is
undertaking further drilling at the site to delineate additional resources. AMC echoes that there
is significant potential for exploration success as they consider the area contains numerous
significant ore bodies and many small scale historic workings.
Dugald River
Zinc Lead Silver
(000’s t) (000’s t) (moz)
Mineral resources
- Measured and indicated 5,596.6 851.4 57.8
- Inferred 1,005.8 131.6 4.1
Potential reserves 6,602.4 983.0 61.9
Source: the Valuation Report
MMG has not reported any reserves or measured and indicated mineral resources of Dugald
River that are economically extractable so far and, therefore, Grant Samuel has not attributed any
value thereto in the Valuation Report. Nevertheless, the Dugald River project potentially contains
one of the world’s largest known undeveloped lead-zinc-silver deposits and as indicated in the
table above and by Grant Samuel, there are significant potential in Dugald River’s mineral
resources and they may provide additional value to MMG.
LETTER FROM SOMERLEY
— 72 —
In addition to the above, we have also discussed with the management of MMG regarding
the track record of the discovery of new resources and conversion of resources to reserves. We
have been informed that MMG has successful results from recent exploration drilling programs
and that are likely to results in increases in both mineral resources and ore reserves of MMG.
Based on the amount of potential reserves owned by the Target Group as discussed above,
our discussion with AMC and Grant Samuel and our review of the work conducted by AMC and
Grant Samuel, we consider that, the assumptions, the basis and the methodology for the Market
Valuation are fair and reasonable.
We note from the letter from the Board in the Circular that the basis of determining the
Purchase Price was with reference to the range of the Market Valuation and adjusted by the
parties for expectations on working capital changes until 31 December 2010, including, but not
limited to, the Repatriation (the “Adjusted Market Valuation”).
As discussed in this section earlier, certain key assumptions adopted in the Market
Valuation were different from those in the Chapter 18 Valuation, namely lower long run gold and
silver prices, lower exchange rate of Australian dollars to United States dollars as well as lower
long run inflation rates for both Australia and the United States of America. In the event that the
abovementioned key assumptions were adjusted with reference to the recent commodity prices
and exchange rates similar to that of the Chapter 18 Valuation, it is expected that the Adjusted
Market Valuation would be adjusted upward.
(c) P/E multiples
Based on the Purchase Price of US$1,846.0 million (equivalent to approximately
HK$14,398.8 million) and the annualised net profit of the Target Group for the 13-month period
ended 30 June 2010, the implied price-to-earnings multiple (the “P/E multiple”) of the Target
Group is approximately 5.1 times.
For reference purpose only, we have compared the P/E multiple of the Target Group to the
P/E multiples of the peer companies which are engaged in trading, manufacturing and/or mining
of base metals and listed on the Stock Exchange and with market capitalisation of over HK$1.0
billion (the “Peer Companies”), comprising Aluminium Corporation of China Ltd. (stock code:
2600), China Molybdenum Co., Ltd. (stock code: 3993), CITIC Resources Holdings Ltd. (stock
code: 1205), Hunan Nonferrous Metals Corporation Ltd. (stock code: 2626), Jiangxi Copper Co.
Ltd. (stock code: 358), United Company RUSAL Plc (stock code: 486) and Xinjiang Xinxin
Mining Industry Co., Ltd. (stock code: 3833). As shown in the table below, the P/E multiple of
the Target Group is significantly lower than those of the Peer Companies, which are calculated
LETTER FROM SOMERLEY
— 73 —

based on their respective closing share price as at the Latest Practicable Date and the results for
latest 12 months, ranging from 6.2 times to 39.4 times with an average of 23.7 times and
therefore the Purchase Price is considered favourable to the Company on this basis.
Peer CompaniesP/E multiples
(times)
Aluminium Corporation of China Ltd. N/A (Note)
China Molybdenum Co., Ltd. 39.4
CITIC Resources Holdings Ltd. 17.0
Hunan Nonferrous Metals Corporation Ltd. N/A (Note)
Jiangxi Copper Co. Ltd. 26.9
United Company RUSAL Plc 6.2
Xinjiang Xinxin Mining Industry Co., Ltd. 29.2
Average 23.7
Maximum 39.4
Minimum 6.2
Sources: The respective Peer Companies’ financial statements
Note: The respective companies were loss making during the latest 12 months reporting period.
Although the Peer Companies may have different location of mines, mine life and metals
involved, we consider the Peer Companies, in general, serve as fair and representative samples
for the purposes of comparison with the Target Group. The P/E multiple analysis as shown in this
paragraph is for reference purpose only and our assessment on the Purchase Price is largely based
on the fairness and reasonableness of the assumptions, the bases and the methodology for the
Market Valuation as set out in this section above.
9. Analysis of the payment structure
The Purchase Price, being US$1,846.0 million (equivalent to approximately HK$14,398.8
million), is proposed to be settled by a combination of cash, the Loan, the Consideration Shares and
the PSCS as set out in the table below.
Purchase Price HK$ equivalent
US$ (million) HK$ (million)
Cash 100.0 780.0
Loan 694.2 5,414.5
Consideration Shares 361.8 2,822.3
PSCS 690.0 5,382.0
Total 1,846.0 14,398.8
LETTER FROM SOMERLEY
— 74 —
(a) Cash
The Company had net cash, being the sum of cash and cash equivalent, time deposits and
pledged bank deposits, less bank borrowings, of approximately HK$931.8 million as at 30 June
2010. Although the cash component of the Purchase Price of HK$100.0 million (equivalent to
approximately HK$780.0 million) represents a considerable portion of the net cash of the Group,
after reviewing and taking into account, among other things, (i) the composition of the internal
resources of the Group; (ii) the projected cash balance of the Target Group after the repatriation
of US$340.0 million (equivalent to approximately HK$2,652.0 million) to Album Enterprises;
(iii) the existing balances and maturity profiles of bank borrowings of the Enlarged Group; (iv)
the cash flow forecast of the Enlarged Group for the period ending 31 December 2011 (the “Cash
Flow Forecast”); (v) the banking facilities available to and the capital expenditure requirements
of the Enlarged Group (after completion of the Acquisition), we consider the Company has
sufficient internal resources to satisfy the payment of the cash component of the Purchase Price.
Further discussion on the gearing and liquidity of the Enlarged Group is set out in the section
headed “Financial effects of the Acquisition on the Group” below.
(b) Loan
Pursuant to the Share Sale Deed, approximately US$694.2 million (equivalent to
approximately HK$5,414.5 million) of the Purchase Price will be satisfied by the proceeds from
the Loan. The Loan has a maturity of five years and carries a fixed interest rate of 2.0% per
annum for the first two years, 3.0% per annum for the third year, 4.0% per annum for the fourth
year and 5.0% per annum for the last year. The Loan will be settled by a bullet payment at
maturity unless the Company exercises its option for early repayment of the Loan, either in
whole or in part. The early repayment of the Loan will not result in any penalty payment by the
Company.
The Loan can be considered as a deferred consideration for the Acquisition. Given its
five-year term, the availability of the Loan alleviates an immediate pressure on the Enlarged
Group’s liquidity as a result of the Acquisition, we consider this to be favourable to the Group.
It is the intention of the Group to use part of the Specific Mandate for the primary purpose of
repayment of the Loan. We are of the view that the tenor of five years shall provide the Company
with sufficient time to conduct appropriate equity raising exercises such as the issue of new
Shares under the Specific Mandate and, on top of the Specific Mandate, the issue of new Shares
under the existing general mandate of the Company granted by the Shareholders at the annual
general meeting of the Company held on 25 May 2010 (the “Existing General Mandate”).
LETTER FROM SOMERLEY
— 75 —
The fixed interest rate mechanism allows the Group with more certainty in terms of
payment and is beneficial to the Group amid a possible rising trend of the market interest rate
environment. In fact, the average interest rate of the Loan Note of 3.2% per annum is below the
5-year average historical effective borrowing rate of the Group in US dollars borrowings of
4.04%. Also, we estimate the future borrowing costs of the Group, which are determined based
on the Group’s current borrowing cost and the prevailing market forward rates in the coming five
years. We consider that the average interest rate of the Loan is lower than the anticipated future
borrowing costs of the Group.
It is noted that the annual interest expense of the Loan payable by the Group will increase
as mentioned above and maximum amount payable during the term of the Loan will be
approximately US$34.7 million (equivalent to approximately HK$270.7 million) in the fifth
year. Such interest expense only represents approximately 6.5% of the pro forma net cash flows
generated from operating activities of the Enlarged Group for the six months ended 30 June 2010
or 15.4 times interest coverage, both on an annualised basis. On such basis, we consider the terms
of the Loan will not represent an onerous burden on the Group.
(c) Consideration Shares
Pursuant to the Share Sale Deed, the Company will allot and issue 940,779,090
Consideration Shares at an issue price of HK$3.00 per Share (the “Issue Price”), totalling
approximately US$361.8 million (equivalent to approximately HK$2,822.3 million), to Album
Enterprises or its nominee on Completion. The 940,779,090 Consideration Shares represent
approximately 46.43% of the existing issued share capital of the Company as at the Latest
Practicable Date, approximately 31.71% of the enlarged issued share capital of the Company
immediately after Completion (assuming no conversion of the PSCS) and approximately 20.78%
of the enlarged issued share capital of the Company immediately after Completion (assuming full
conversion of the PSCS).
We have discussed with the Company and note that the issue of 940,779,000 Consideration
Shares to satisfy part of the Purchase Price has the benefit of preserving the internal resources
of the Company while maintaining the 25% minimum public float requirement under the Listing
Rules. As such, the management of the Group considers that the issue of the Consideration
Shares will strengthen the capital base of the Company and hence will be beneficial to the future
development and expansion of the Group.
LETTER FROM SOMERLEY
— 76 —
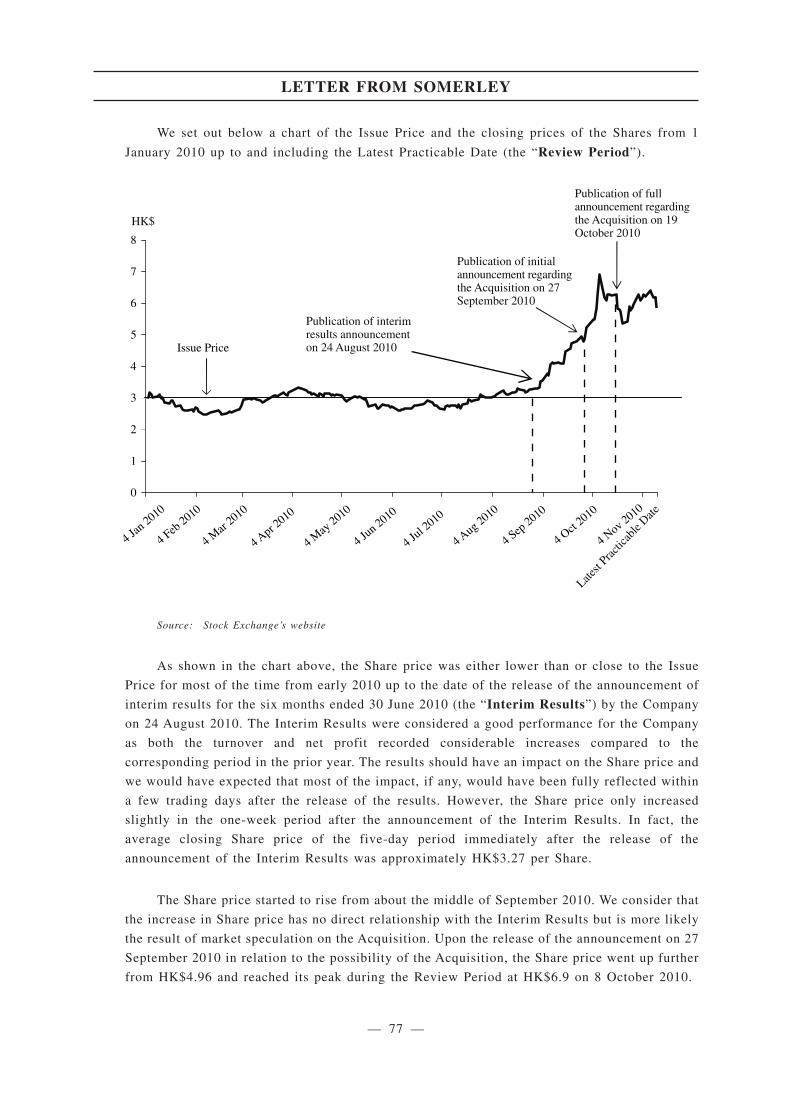
We set out below a chart of the Issue Price and the closing prices of the Shares from 1
January 2010 up to and including the Latest Practicable Date (the “Review Period”).
0
1
2
3
4
5
6
7
8
Issue Price
Publication of initial announcement regardingthe Acquisition on 27 September 2010
Publication of interim results announcement on 24 August 2010
HK$
Publication of full announcement regardingthe Acquisition on 19 October 2010
Latest
Practic
able
Date
4 Jan 2010
4 Feb 2010
4 Mar
2010
4 Apr 2
010
4 May
2010
4 Jun 2010
4 Jul 2
010
4 Aug 2010
4 Sep 2010
4 Oct
2010
4 Nov 2010
Source: Stock Exchange’s website
As shown in the chart above, the Share price was either lower than or close to the Issue
Price for most of the time from early 2010 up to the date of the release of the announcement of
interim results for the six months ended 30 June 2010 (the “Interim Results”) by the Company
on 24 August 2010. The Interim Results were considered a good performance for the Company
as both the turnover and net profit recorded considerable increases compared to the
corresponding period in the prior year. The results should have an impact on the Share price and
we would have expected that most of the impact, if any, would have been fully reflected within
a few trading days after the release of the results. However, the Share price only increased
slightly in the one-week period after the announcement of the Interim Results. In fact, the
average closing Share price of the five-day period immediately after the release of the
announcement of the Interim Results was approximately HK$3.27 per Share.
The Share price started to rise from about the middle of September 2010. We consider that
the increase in Share price has no direct relationship with the Interim Results but is more likely
the result of market speculation on the Acquisition. Upon the release of the announcement on 27
September 2010 in relation to the possibility of the Acquisition, the Share price went up further
from HK$4.96 and reached its peak during the Review Period at HK$6.9 on 8 October 2010.
LETTER FROM SOMERLEY
— 77 —
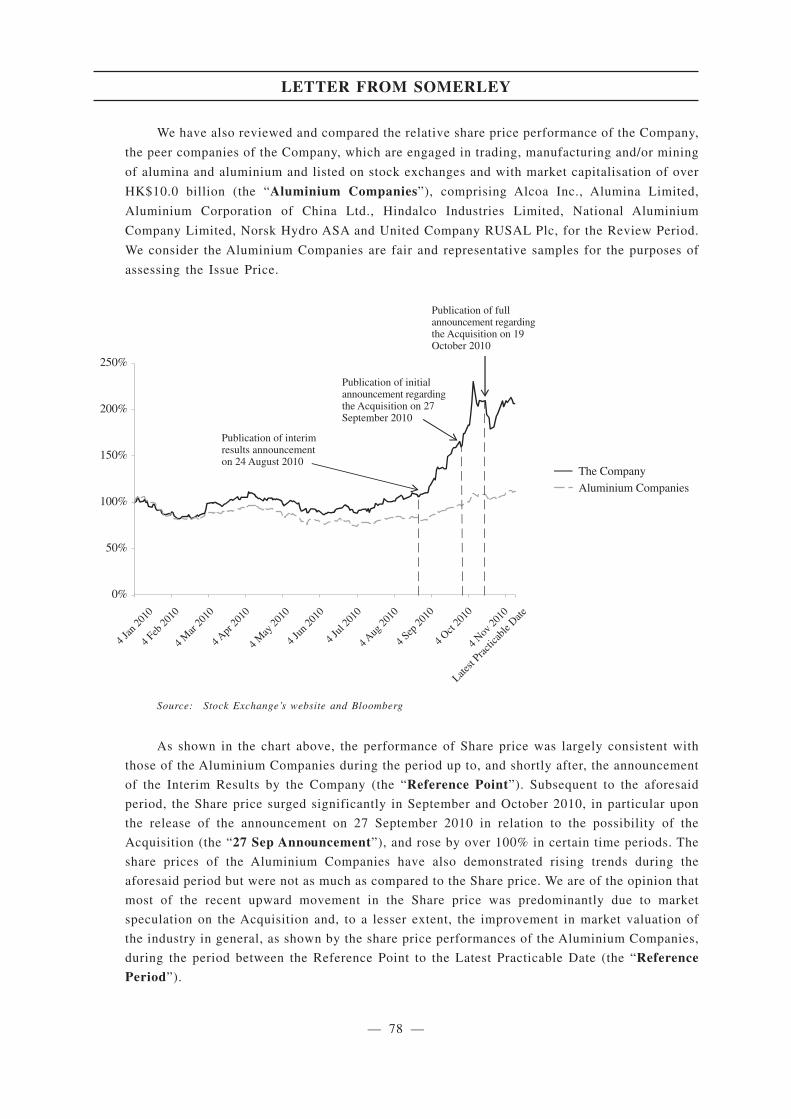
We have also reviewed and compared the relative share price performance of the Company,
the peer companies of the Company, which are engaged in trading, manufacturing and/or mining
of alumina and aluminium and listed on stock exchanges and with market capitalisation of over
HK$10.0 billion (the “Aluminium Companies”), comprising Alcoa Inc., Alumina Limited,
Aluminium Corporation of China Ltd., Hindalco Industries Limited, National Aluminium
Company Limited, Norsk Hydro ASA and United Company RUSAL Plc, for the Review Period.
We consider the Aluminium Companies are fair and representative samples for the purposes of
assessing the Issue Price.
50%
100%
150%
200%
250%
0%
The Company
Aluminium Companies
4 Jan 20
10
4 Nov20
10
4 Feb20
10
4 Mar
2010
4 Apr20
10
4 May
2010
4 Jun 20
10
4 Jul 2
010
4 Aug20
10
4 Sep20
10
4 Oct20
10
Publication of initialannouncement regardingthe Acquisition on 27September 2010
Publication of interimresults announcementon 24 August 2010
Publication of fullannouncement regardingthe Acquisition on 19October 2010
Latest
Practic
able
Date
Source: Stock Exchange’s website and Bloomberg
As shown in the chart above, the performance of Share price was largely consistent with
those of the Aluminium Companies during the period up to, and shortly after, the announcement
of the Interim Results by the Company (the “Reference Point”). Subsequent to the aforesaid
period, the Share price surged significantly in September and October 2010, in particular upon
the release of the announcement on 27 September 2010 in relation to the possibility of the
Acquisition (the “27 Sep Announcement”), and rose by over 100% in certain time periods. The
share prices of the Aluminium Companies have also demonstrated rising trends during the
aforesaid period but were not as much as compared to the Share price. We are of the opinion that
most of the recent upward movement in the Share price was predominantly due to market
speculation on the Acquisition and, to a lesser extent, the improvement in market valuation of
the industry in general, as shown by the share price performances of the Aluminium Companies,
during the period between the Reference Point to the Latest Practicable Date (the “Reference
Period”).
LETTER FROM SOMERLEY
— 78 —
Given the significant disparity between the increase in the market price of the Share and
that of the Aluminium Companies during the Reference Period, we consider the run up in the
Share price, in particular during the period after the release of the 27 Sep Announcement and up
to the Latest Practicable Date, as being largely affected by the speculation on the Acquisition.
Set out in the table below is a comparison of the share price performance of the Aluminium
Companies as compared to the Share price during the Reference Period.
Percentageincrease/(decrease) in
share price during theReference Period
(Note)
Alcoa Inc. 31.0%
Alumina Limited 22.1%
Aluminium Corporation of China Limited 17.7%
Hindalco Industries Limited 33.9%
National Aluminium Company Limited (3.0)%
Norsk Hydro ASA 26.4%
United Company RUSAL Plc 25.0%
Average 21.9%
Maximum 33.9%
Minimum 3.0%
The Company 77.6%
Source: Stock Exchange’s website and Bloomberg
Note: The percentage increase/decrease in share price during the Reference Period is calculated based on (i)
5-day average of the closing share price of the Aluminium Companies and the Company immediately after
the announcement of the Interim Results; and (ii) 5-day average of the closing share price of the
Aluminium Companies and the Company immediately (a) before (and including) the Latest Practicable
Date for Alumina Limited, Aluminium Corporation of China Limited and United Company RUSAL Plc; and
(b) before (but excluding) the Latest Practicable Date for Alcoa Inc., Hindalco Industries Limited,
National Aluminium Company Limited and Norsk Hydro ASA.
As shown in the table above, the average share prices of the Aluminium Companies has
increased by 21.9%. If we apply the average share prices increase of the Aluminium Companies
during the Reference Period to the average Share price of the five-day period immediately after
the release of the announcement of the Interim Results of approximately HK$3.27 per Share, the
Share price would be approximately HK$3.99 (the “Adjusted Share Price”). The Issue Price of
the Consideration Shares of HK$3.00 represents a discount of approximately 24.8% as compared
to the Adjusted Share Price. Another major part of the Purchase Price is to be satisfied by the
issue of the PSCS. We consider that the PSCS, when issued, forms part of the Company’s equity
and one of the chief purpose of having the PSCS as part of the Consideration is to ensure
compliance with the “public float” requirement under the Listing Rules as the PSCS, which have
LETTER FROM SOMERLEY
— 79 —
no voting rights at general meetings of the Company, are excluded from the “public float”
computation. We therefore consider that the analysis of the Issue Price shall be made in
conjunction with the analysis of the initial conversion price of the PSCS as set out in the next
sub-section.
(d) PSCS
Pursuant to the Acquisition, US$690.0 million (equivalent to approximately HK$5,382.0
million) of the Purchase Price will be satisfied by the issue of the PSCS, which is convertible
into 1,560 million Shares at the conversion price of HK$3.45 (the “Initial Conversion Price”).
(i) Conversion price
The initial conversion price of HK$3.45 per conversion share represents a 15%
premium over the Issue Price. The PSCS will be subject to customary conversion price
adjustments for, among other things, subdivision, reclassification or consolidation of
Shares, bonus issues, rights issues, capital distributions, distributions and other dilutive
events.
As discussed in the sub-section headed “Consideration Shares” immediately above,
we consider that the analysis of the Issue Price shall be made in conjunction with the
analysis of the initial conversion price of the PSCS. After allowing for the relative size of
the Consideration Shares and the PSCS, the “blended issue price” of the Consideration
Shares and the PSCS is approximately HK$3.30 per Share, which represents a discount to
the Adjusted Share Price of approximately 17.3%. Notwithstanding such discount, after
considering (i) the possible upward adjustments to the Adjusted Market Valuation due to the
recent commodity prices and exchange rates as analysed in the sub-section headed “Market
Valuation” above; (ii) the significantly lower implied P/E multiple of the Target Group as
compared to the Peers Companies as analysed in the sub-section headed “P/E multiples”
above; (iii) the effective P/E multiple of the Company of 14.8 times represented by the
“blended issue price” of HK$3.30 and the aggregate net profit of the Group for the 12
months ended 30 June 2010 (based on the interim results of the Group for the 6-month
periods ended 30 June 2009 and 2010, the audited net profit of the Group for the year ended
31 December 2009 and adjusted for restatement) is significantly higher than the 5.1 times
P/E multiple of the Target Group as discussed in the section headed “Analysis of the
Purchase Price” above; and (iv) the considerable anticipated enhancements of earnings per
Share of the Enlarged Group by as much as 129.3% as set out in the sub-section headed
“Financial effects of the Acquisition on the Group — Earnings” in below; and (v) the
positive industry outlook of the base metal industry as mentioned in the section headed
“Industry Outlook” above, we are of the view that the discount of the “blended issue price”
of the Consideration Shares and the PSCS to the Adjusted Share Price is acceptable.
LETTER FROM SOMERLEY
— 80 —
(ii) Distribution rate
The PSCS carries a fixed distribution rate of 1% per annum and any undistributed
amount will be accumulated. The payment of the distribution of the PSCS will be at the
discretion of the Company but it does impose a restriction on the dividend payment to the
Shareholders if the distribution of the PSCS is not made.
As discussed with the Company, the distribution rate of the PSCS was determined
based on, among other things, (i) the current borrowing rate of the Group; (ii) the pro forma
cash flow of the Enlarged Group; (iii) the repayment capability of the Enlarged Group; and
(iv) the quasi capital nature of the PSCS.
Based on our review of the Company’s borrowing costs, we noted that the distribution
rate of 1% is significantly lower than the best rates it can borrow from the capital markets.
The Company has no fixed dividend policy. Save for the dividend of HK3.0 cents per
Share for the financial year ended 31 December 2007, the Company has not declared any
dividend since the restructuring of the Company in 2005, mainly due to the lack of
distributable reserves of the Company. Based on the Share price immediately after the
announcement of annual results, including declaration of proposed dividends, for the
financial year ended 31 December 2007, the dividend yield was approximately 1.05%,
which is higher than the 1% distribution rate of the PSCS.
The annual distribution of the maximum principal amount of the PSCS is
approximately HK$53.8 million. Such distribution amount only represents approximately
1.9% of annualised net profit of the Enlarged Group for the six months ended 30 June 2010
and approximately 1.3% of the annualised pro forma net cash flows generated from
operating activities of the Enlarged Group based on the results for the six months ended 30
June 2010.
Based on (i) the healthy pro forma cash flow and net profit position of the Enlarged
Group (details of which will be discussed in the section headed “Effects of the Acquisition”
below) and the annual distribution only represents approximately 1.9% and 1.3% of the
annualised pro-forma net profit and operating cashflow of the Enlarged Group; (ii) the
non-redeemable nature of the PSCS; (iii) the option available to the Company to defer any
payment of distributions; and (iv) the Company will have control over MMG operating and
financing activities upon completion of the Acquisition and therefore the Company can
manage the cash flow of MMG in a way that would allow the Company to have sufficient
financial resources to pay for the distribution of PSCS, we consider that the Enlarged Group
will not suffer from excessive financial burden in relation to the payment of the fixed
distribution of the PSCS. We are therefore of the view that the distribution rate of 1% per
annum is fair and reasonable so far as the Independent Shareholders are concerned.
LETTER FROM SOMERLEY
— 81 —

(iii) Redemption
PSCS is perpetual in nature and none of the PSCS is redeemable by the issuer or the
holder(s) thereof in general. We consider that the non-redeemable nature of the PSCS is
favourable to the Company on the basis that (i) the issue of the PSCS will enhance the
capital base of the Company but avoiding any contravention of the “public float”
requirement under the Listing Rules as the PSCS are excluded from the “public float”
computation; and (ii) the non-redeemable nature of the PSCS will not put undue pressure
on the Enlarged Group’s liquidity.
(iv) Restriction on conversion
A holder of the PSCS may only convert such number of PSCS if such conversion
would not cause the Company to be not in compliance with the minimum public float
requirement under the rules and regulations of the stock exchange on which the Shares are
listed following conversion.
(v) Company’s option to force conversion
After the first anniversary of the date of issue of the PSCS, the Company may, at its
sole discretion and subject to the terms of the PSCS (which have been set out in detail in
the letter from the Board in the Circular), elect to convert the PSCS in whole but not in part
into Shares subject to certain requirements (including the restriction on conversion referred
in paragraph (iv) above). As the Company will have the right, but not obligation, to force
the conversion of the PSCS, we are of the view that the option is favourable to the
Company.
(vi) Pre-emption right
Prior to the PSCS Holder transferring a PSCS, the PSCS Holder must notify the
Company of the PSCS Holder’s intention to transfer the PSCS in writing. Following the
receipt by the Company of such notice, the Company may elect to purchase and cancel all
or some of the PSCS at the price specified in the notice. If the Company does not elect to
purchase, or fails to complete the purchase after so elected, the PSCS Holder may transfer
those PSCS to the purchaser for the purchase price specified in the notice in accordance
with the terms of the PSCS. As the Company will have the pre-emption right, but not
obligation, to purchase and cancel the PSCS proposed to be transferred, we are of the view
that the right is favourable to the Company.
Further details of the PSCS are contained in the letter from the Board in the Circular, the
Independent Shareholders are advised to read the relevant sections carefully.
LETTER FROM SOMERLEY
— 82 —

10. Specific Mandate
(a) Background
Under the existing general mandate granted by the Shareholders at the annual general
meeting of the Company held on 25 May 2010 (the “Existing General Mandate”), the Directors
have been authorised to allot and issue new Shares of not exceeding 20% of the issued share
capital of the Company as at 25 May 2010 (i.e. a maximum of 405,243,359 new Shares). As at
the Latest Practicable Date, the total number of Shares in issue remain 2,026,216,799 and
unchanged since the last annual general meeting of the Company. The Existing General Mandate
has not been utilised by the Company and no equity fund raising activities have been conducted
by the Company during the past 12 months immediately preceding the Latest Practicable Date.
As stated in the letter from the Board, the Board proposes to seek a Specific Mandate from
the Independent Shareholders at the EGM to issue not more than 2,700 million new Shares
(representing approximately 133.25% of the existing issued share capital of the Company as at
the date of this announcement, approximately 91.00% of the enlarged issued share capital of the
Company immediately after Completion (assuming no conversion of the PSCS), approximately
59.64% of the enlarged issued share capital of the Company immediately after Completion
(assuming full conversion of the PSCS), and approximately 37.36% of the enlarged issued share
capital of the Company immediately after Completion (assuming full conversion of the PSCS)
and the issuance of all the new Shares under the Specific Mandate. This Specific Mandate
amount is approximately 2.24 times of the normal 20% general mandate available to listed
issuers in Hong Kong on an enlarged basis.
The Board currently intends that the Specific Mandate sought will cover new Shares to be
issued pursuant to one or more potential Placing(s) in part to be conducted by the Company,
subject to the then prevailing market conditions. Depending on market conditions, the Directors
intend to raise net proceeds of up to US$1,600.0 million (equivalent to approximately
HK$12,480.0 million) and apply such net proceeds from the potential Placing(s) for the full
repayment of the Loan of approximately US$694.2 million (equivalent to approximately
HK$5,414.5 million) and deployment of funding towards the exploration and development
initiatives of the Target Group’s projects, including, but not limited to, the development of the
Dugald River zinc project located in Queensland, Australia (which is in the final stages of a
feasibility study and has an estimated pre-production capital cost of approximately US$790.0
million (equivalent to approximately HK$6,162.0 million)) and any remaining balance to the
other exploration initiatives of the Target Group. The proposed issue of new Shares under the
potential Placing(s), if executed, will also enlarge each of the shareholder and capital bases of
the Company and strengthen the financial position of the Enlarged Group.
LETTER FROM SOMERLEY
— 83 —
(b) Terms of the Specific Mandate
The major terms of the proposed Specific Mandate are as follows:
(i) to issue not more than 2,700,000,000 new Shares;
(ii) the new Shares will be issued at a discount of not more than 20% to the higher of:
(a) the closing price on the date of any relevant placing agreement or other
agreement involving the proposed issue of securities under the Specific
Mandate; and
(b) the average closing price in the five trading days immediately prior to the earlier
of:
(A) the date of announcement of the placing or the proposed transaction or
arrangement involving the proposed issue of securities under the Specific
Mandate;
(B) the date of the placing agreement or other agreement involving the
proposed issue of securities under the Specific Mandate; and
(C) the date on which the placing or subscription price is fixed;
(iii) the grant of the Specific Mandate is part of the terms of the Acquisition and
conditional upon the passing of an ordinary resolution by the Independent
Shareholders at the EGM approving such grant;
(iv) the issue of the new Shares pursuant to the Specific Mandate will be conditional upon
Completion; and
(v) the proposed Specific Mandate is for the period from the passing of the relevant
resolutions at the EGM up to the earlier of: (a) 31 July 2011; or (b) the revocation or
variation of the authority given under the relevant resolution(s) at the EGM by
ordinary resolution(s) of the Independent Shareholders in a general meeting.
We note that the pricing threshold of the Shares proposed to be issued under the Specific
Mandate is similar as the pricing threshold prescribed by the Listing Rules. We therefore
consider the pricing mechanism of the Specific Mandate to be fair and reasonable.
LETTER FROM SOMERLEY
— 84 —
We also consider that the new issue amount threshold of 2,700 million Shares, being the
maximum number of new Shares to be issued under the Specific Mandate, is acceptable primarily
because the position of the controlling Shareholder CMN is essentially the same as the other
Independent Shareholders in the context of the Specific Mandate. Following Completion, subject
to any conversion of the PSCS, CMN will suffer the same degree of dilution as the other
Independent Shareholders as a result of any new Shares issues pursuant to the Specific Mandate.
The grant of the Specific Mandate does not necessarily mean dilution as a result of the new Share
placement. The Company still retains the option to conduct various type of fund raising exercises
through, for example, rights issue, issues of convertibles and/or debt financing. Because of the
increase in the Enlarged Group’s gearing immediately after the Acquisition as discussed in the
section headed “Financial effects of the Acquisition on the Group” below, we consider that the
Specific Mandate, which is valid up to 31 July 2011, provides the Company with an additional
option to conduct new Share placement(s) on-market swiftly to deal with any unforeseen
cashflow requirements as a result of the Acquisition. Although conducting a rights issue may also
achieve similar effects but conducting a rights issue of this scale in Hong Kong takes a much
longer timetable as compared to new Share placement. In addition, a rights issue may attract
higher underwriting costs as compared to new Share placement. The option of having the rights
issue underwritten by the controlling Shareholder at lower underwriting fee may not be feasible
in this case because of the “public float” restriction. As mentioned in the section headed
“Financial effects of the Acquisition on the Group” below, earnings per Share will continue to
be accretive on the assumptions that (i) the new Share placement price at approximately
HK$4.67, being 20% discount to the Share price as at the Latest Practicable Date; and (ii) the
gross proceeds from the new Share placement fully cover the initial outstanding amount of the
Loan.
Based on the above, we consider the availability of the Specific Mandate is desirable and
the terms of the Specific Mandate are fair and reasonable and in the interests of the Independent
Shareholders as a whole.
11. Proposed increase in authorised share capital
The present authorised share capital of the Company is HK$300 million comprising 6,000
million Shares, of which 2,026,216,799 Shares are in issue as at the Latest Practicable Date. As part
of the terms of the Acquisition, the Board proposes to increase the authorised share capital of the
Company from HK$300 million to HK$900 million by the creation of an additional 12,000 million
unissued Shares to rank pari passu in all respects with the existing Shares, when issued, in the capital
of the Company. The increase in authorised share capital of the Company is conditional upon the
passing of an ordinary resolution by the Shareholders at the EGM.
As the increase in the authorised share capital of the Company is necessary for the issues of the
Consideration and the PSCS, we consider that the proposed increase is fair and reasonable.
LETTER FROM SOMERLEY
— 85 —
12. Potential dilution to shareholding of the Independent Shareholders
Assuming no changes in the shareholding in the Company from the Latest Practicable Date other
than those contemplated under the Share Sale Deed, the shareholding structures of the Company (i)
as at the Latest Practicable Date; (ii) immediately after Completion (assuming no conversion of the
PSCS); (iii) immediately after Completion (assuming full conversion of the PSCS); (iv) immediately
after Completion (assuming full conversion of the PSCS and the issuance of all the new Shares under
the Specific Mandate) are, and will be, as follows:
Shareholder
As at the Latest
Practicable Date
Immediately
after Completion
(assuming
no conversion
of the PSCS)
Immediately
after Completion
(assuming full
conversion of the PSCS)
and the issuance of all
the new Shares under
the Specific Mandate
No. of Shares % No. of Shares % No. of Shares %
CMC (Notes 1 and 2) 1,284,467,826 63.39 1,284,467,826 43.29 1,284,467,826 17.77
Consideration Shares — — 940,779,090 31.71 940,779,090 13.02
Conversion Shares — — — — 1,560,000,000 21.59
Total CMC
shareholding
(Notes 1 and 2) 1,284,467,826 63.39 2,225,246,916 75.00 3,785,246,916 52.38
Public Shareholders 741,748,973 36.61 741,748,973 25.00 741,748,973 10.26
Independent placees — — — — 2,700,000,000 37.36
Total 2,026,216,799 100.00% 2,966,995,889 100.00% 7,226,995,889 100.00%
Notes:
1. CMC holds approximately 91.57% of the issued share capital of CMN, which in turn holds the entire issued share capital
of Top Create Resource Limited. Top Create Resource Limited holds approximately 63.39% of the issued share capital
of the Company as at the Latest Practicable Date. The Consideration Shares and Conversion Shares are to be issued to
Album Enterprises or its nominee. Album Enterprises is wholly-owned by CMN.
2. The table assumes that CMN will be Album Enterprises’ nominee for the issuance of the Consideration Shares and to hold
the PSCS. CMN may only convert such number of securities, where such conversion would not cause the Company to
contravene the minimum public float requirement under the rules and regulations of the stock exchange on which the
Shares are listed following the conversion.
As shown above, 2,700 million Shares, representing 133.25% of the issued share capital of the
Company as at the Latest Practicable Date (assuming there is no change in the issued share capital of
the Company between the Latest Practicable Date and the date of the EGM), would be issued upon
being full utilisation of the Specific Mandate. Upon the Specific Mandate is fully utilised, the
shareholding of the existing public Shareholders will decrease to 10.26% immediately after
Completion (assuming full conversion of the PSCS) and the issuance of all the new Shares under the
Specific Mandate.
LETTER FROM SOMERLEY
— 86 —
13. Financial effects of the Acquisition on the Group
(a) Earnings
Upon Completion, the Target Company will become a wholly-owned subsidiary of the
Company and, accordingly, the financial results of the Target Group will be consolidated into the
financial statements of the Group. We set out below the earnings and pro forma earnings,
including on a per Share basis, of the Group and of the Enlarged Group for the six months ended
30 June 2010 respectively based on the unaudited pro forma consolidated income statement of
the Enlarged Group as set out in Appendix III to the Circular.
The Group Pro forma Enlarged Group
Immediately
after Completion
(assuming no
conversion
of the PSCS)
Immediately
after Completion
(assuming
full conversion
of the PSCS)
(Note)
Profit for the period attributable
to the Shareholders
(HK$ million) 424.0 1,423.7 1,423.7
Total number of Shares in issue 2,026,216,799 2,966,995,889 4,526,995,889
Earnings per Share (HK cents) 20.92 47.98 31.45
Earnings per Share accretion — 129.3% 50.3%
Note: This scenario may or may not exist as CMN may only convert such number of securities, where such
conversion would not cause the Company to contravene the minimum public float requirement under the
rules and regulations of the stock exchange on which the Shares are listed following the conversion.
As shown in the table above, earnings would increase from HK$424.0 million to
HK$1,423.7 million (which would further increase if the one-off estimated transaction costs,
substantially comprising stamp duties, of approximately HK$651.3 million in relation to the
Acquisition have been excluded) while earnings per Share immediately after Completion
(assuming no conversion of the PSCS and issue of Shares under the Specific Mandate) will be
enhanced by 129.3% to HK47.98 cents. In the event that the PSCS are fully converted, earnings
per Share will still improve to HK31.45 cents, representing an increase in earnings per Share of
50.3%.
As referred to in the section headed “Analysis of the payment structure — Loan”, the Loan
can be considered as a deferred consideration for the Acquisition and it is the intention of the
Group to use the Specific Mandate firstly for the purpose of repayment of the Loan. As the
Specific Mandate forms an integral part of the Acquisition, we also consider the potential
financial effects of the Acquisition upon the issue of new Shares under the Specific Mandate if
the Loan is fully settled by issuing new Shares pursuant to the Specific Mandate. Assuming (i)
LETTER FROM SOMERLEY
— 87 —
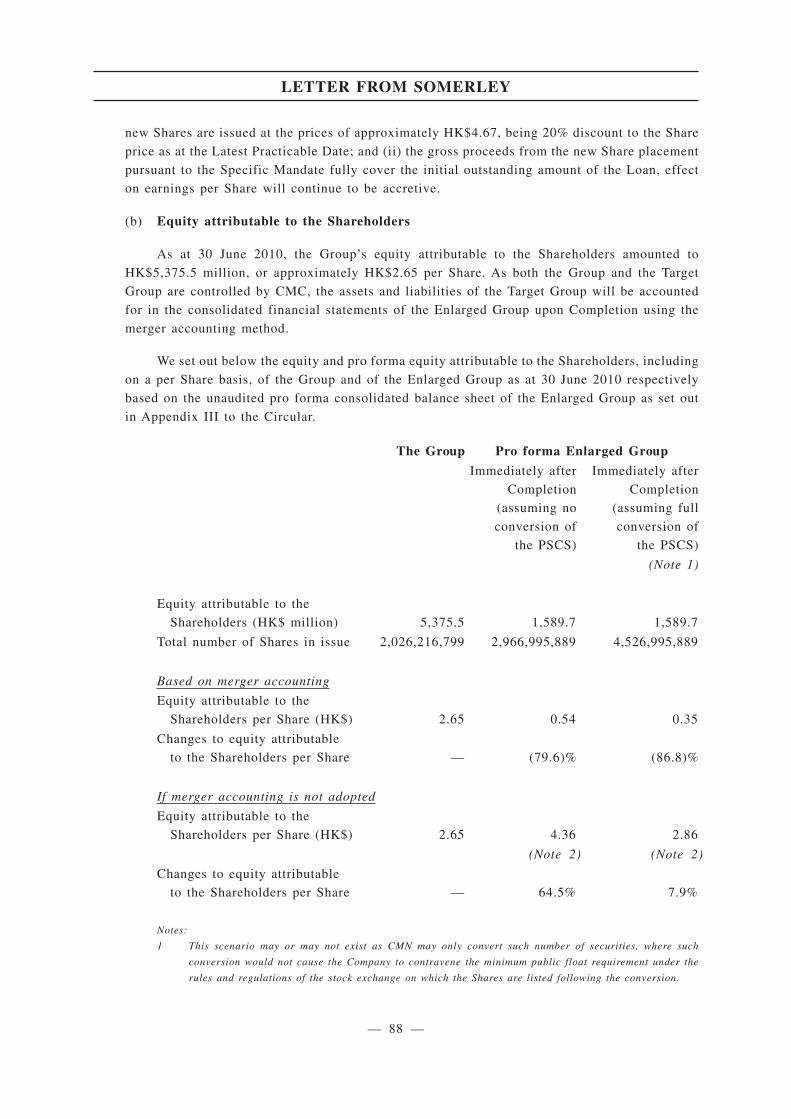
new Shares are issued at the prices of approximately HK$4.67, being 20% discount to the Share
price as at the Latest Practicable Date; and (ii) the gross proceeds from the new Share placement
pursuant to the Specific Mandate fully cover the initial outstanding amount of the Loan, effect
on earnings per Share will continue to be accretive.
(b) Equity attributable to the Shareholders
As at 30 June 2010, the Group’s equity attributable to the Shareholders amounted to
HK$5,375.5 million, or approximately HK$2.65 per Share. As both the Group and the Target
Group are controlled by CMC, the assets and liabilities of the Target Group will be accounted
for in the consolidated financial statements of the Enlarged Group upon Completion using the
merger accounting method.
We set out below the equity and pro forma equity attributable to the Shareholders, including
on a per Share basis, of the Group and of the Enlarged Group as at 30 June 2010 respectively
based on the unaudited pro forma consolidated balance sheet of the Enlarged Group as set out
in Appendix III to the Circular.
The Group Pro forma Enlarged Group
Immediately after
Completion
(assuming no
conversion of
the PSCS)
Immediately after
Completion
(assuming full
conversion of
the PSCS)
(Note 1)
Equity attributable to the
Shareholders (HK$ million) 5,375.5 1,589.7 1,589.7
Total number of Shares in issue 2,026,216,799 2,966,995,889 4,526,995,889
Based on merger accounting
Equity attributable to the
Shareholders per Share (HK$) 2.65 0.54 0.35
Changes to equity attributable
to the Shareholders per Share — (79.6)% (86.8)%
If merger accounting is not adopted
Equity attributable to the
Shareholders per Share (HK$) 2.65 4.36 2.86
(Note 2) (Note 2)
Changes to equity attributable
to the Shareholders per Share — 64.5% 7.9%
Notes:
1 This scenario may or may not exist as CMN may only convert such number of securities, where such
conversion would not cause the Company to contravene the minimum public float requirement under the
rules and regulations of the stock exchange on which the Shares are listed following the conversion.
LETTER FROM SOMERLEY
— 88 —
2 Assuming the fair value of the Target Group of HK$14,398.8 million is fully reflected in the books of the
Enlarged Group, the equity attributable to the Shareholders of pro forma the Enlarged Group is expected
to be enhanced by HK$11,338.9 million.
As shown in the various scenarios above, the pro forma equity attributable to the
Shareholders of the Enlarged Group would represent dilutions ranging from 79.6% to 86.8% to
the equity attributable to the Shareholders of the Group as at 30 June 2010.
As set out in note 6 to the unaudited pro forma financial information on the Enlarged Group
in the Appendix III to the Circular, the assets and liabilities of the Target Group will be
accounted for using merger accounting. Therefore, adjustments will be made for the elimination
of investment cost of the Company in the Target Company against its share capital and for the
recognition of that amount in merger reserve (the “Merger Reserve”). Given that the investment
cost of the Company in the Target Group, i.e. the Purchase Price, of US$1,846.0 million
(equivalent to approximately HK$14,398.8 million) considerably exceeds the share capital of the
Target Company of HK$2,628.6 million, the elimination of the investment cost of the Company
in the Target Company against its share capital would result in a significant deficit of
approximately HK$11,770.2 million charged to the merger reserve account, which significantly
reduce the equity attributable to the Shareholders of the Enlarged Group, as well as on a per
Share basis as shown in the table above.
We are of the view that the dilution of net asset value per Share as a result of the
consolidation of the Target Group by adopting the aforesaid merger accounting treatment is
purely notional as the underlying fair value of the Target Group of HK$14,398.8 million would
not be fully reflected in the books of the Enlarged Group. Should the fair value of the Target
Group of HK$14,398.8 million be fully reflected in the books of the Enlarged Group, the pro
forma net asset value per share of the Enlarged Group shall be enhanced by 64.5% (assuming no
conversion of PSCS) or enhanced by 7.9% (assuming full conversion of PSCS). If the fair value
of the Target Group is fully reflected in the books of the Enlarged Group, the effect of the pro
forma net asset value per share of the Enlarged Group is accretive if (i) new Shares are issued
at the prices of approximately HK$4.67, being 20% discount to the Share price as at the Latest
Practicable Date; and (ii) the gross proceeds from the new Share placement pursuant to the
Specific Mandate fully cover the initial outstanding amount of the Loan, (assuming no
conversion of the PSCS and merger accounting is not adopted).
(c) Gearing and liquidity
As at 30 June 2010, the Group had net cash position of HK$931.8 million, representing cash
and bank deposits of HK$1,950.9 million, less bank borrowings of HK$1,019.1 million.
Accordingly, the Group’s gearing ratio (defined as total borrowings less cash and bank deposits
divided by shareholders’ equity) is nil.
LETTER FROM SOMERLEY
— 89 —
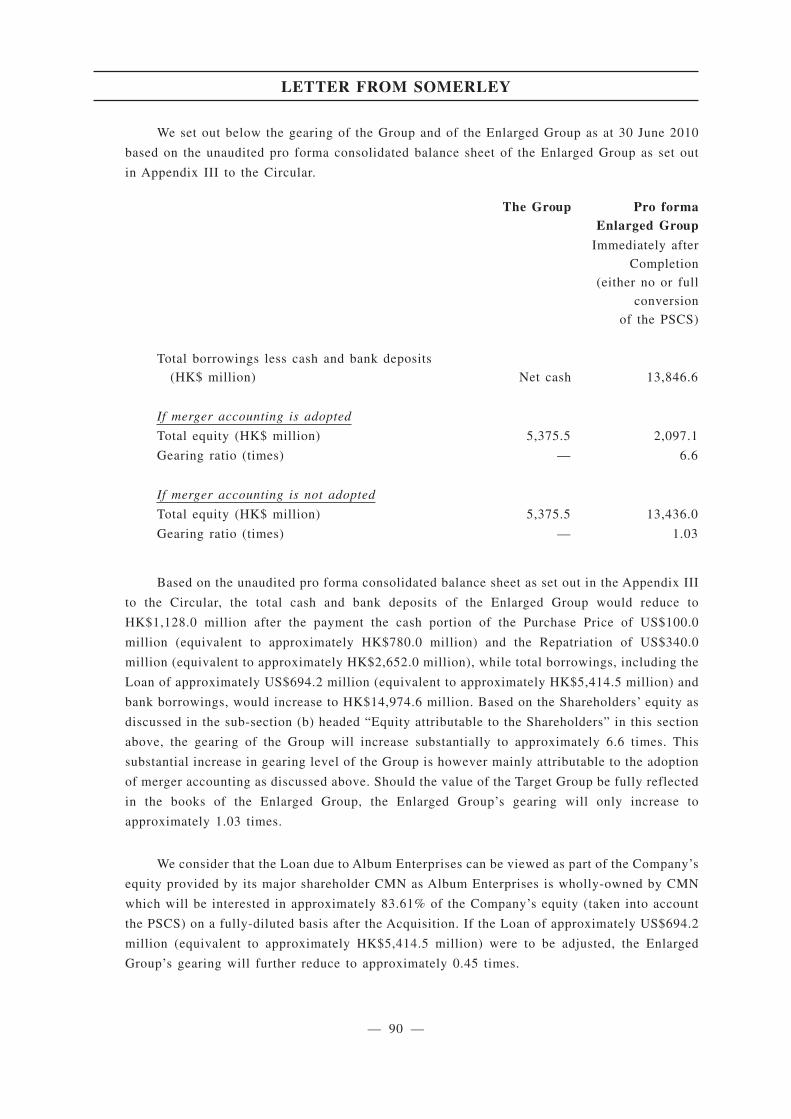
We set out below the gearing of the Group and of the Enlarged Group as at 30 June 2010
based on the unaudited pro forma consolidated balance sheet of the Enlarged Group as set out
in Appendix III to the Circular.
The Group Pro formaEnlarged Group
Immediately after
Completion
(either no or full
conversion
of the PSCS)
Total borrowings less cash and bank deposits
(HK$ million) Net cash 13,846.6
If merger accounting is adopted
Total equity (HK$ million) 5,375.5 2,097.1
Gearing ratio (times) — 6.6
If merger accounting is not adopted
Total equity (HK$ million) 5,375.5 13,436.0
Gearing ratio (times) — 1.03
Based on the unaudited pro forma consolidated balance sheet as set out in the Appendix III
to the Circular, the total cash and bank deposits of the Enlarged Group would reduce to
HK$1,128.0 million after the payment the cash portion of the Purchase Price of US$100.0
million (equivalent to approximately HK$780.0 million) and the Repatriation of US$340.0
million (equivalent to approximately HK$2,652.0 million), while total borrowings, including the
Loan of approximately US$694.2 million (equivalent to approximately HK$5,414.5 million) and
bank borrowings, would increase to HK$14,974.6 million. Based on the Shareholders’ equity as
discussed in the sub-section (b) headed “Equity attributable to the Shareholders” in this section
above, the gearing of the Group will increase substantially to approximately 6.6 times. This
substantial increase in gearing level of the Group is however mainly attributable to the adoption
of merger accounting as discussed above. Should the value of the Target Group be fully reflected
in the books of the Enlarged Group, the Enlarged Group’s gearing will only increase to
approximately 1.03 times.
We consider that the Loan due to Album Enterprises can be viewed as part of the Company’s
equity provided by its major shareholder CMN as Album Enterprises is wholly-owned by CMN
which will be interested in approximately 83.61% of the Company’s equity (taken into account
the PSCS) on a fully-diluted basis after the Acquisition. If the Loan of approximately US$694.2
million (equivalent to approximately HK$5,414.5 million) were to be adjusted, the Enlarged
Group’s gearing will further reduce to approximately 0.45 times.
LETTER FROM SOMERLEY
— 90 —

Further, if the Specific Mandate is utilised in full, the Enlarged Group’s gearing is expected
to be significantly reduced.
We also set out below the gearing ratio, calculated as total borrowings less cash and bank
deposits divided by shareholders’ equity, of each of the Peer Companies.
Peer Companies Gearing
Aluminium Corporation of China Ltd. 1.03 times
China Molybdenum Co., Ltd. Net cash
CITIC Resources Holdings Ltd. 1.09 times
Hunan Nonferrous Metals Corporation Ltd. 1.55 times
Jiangxi Copper Co. Ltd. 0.18 times
United Company RUSAL Plc 1.29 times
Xinjiang Xinxin Mining Industry Co., Ltd. Net cash
Sources: The respective Peer Companies’ financial statements
Among the Peer Companies, save for China Molybdenum and Xinjiang Xinxin which had
net cash positions, the gearing ratios of the Peer Companies were between 0.18 times and 1.55
times with an average of 1.03 times. We therefore consider, that the increase in the Enlarged
Group’s gearing immediately after the Acquisition as discussed above is acceptable.
We set out the maturity profile of the borrowings of the Enlarged Group as below:
The GroupThe Target
Group The Loan Total
(HK$
million)
(HK$
million)
(HK$
million)
(HK$
million)
On demand or within one year 455.1 — — 455.2
More than one year but not
exceeding two years 144.9 5,857.8 — 6,002.7
More than two years but not
exceeding five years 294.3 — 5,414.5 5,708.8
Over five years 124.8 2,683.2 — 2,808.0
1,019.1 8,541.0 5,414.5 14,974.6
After Completion, as shown in the table above, approximately 40.1% and 56.8% of the
borrowings will fall due within more than one year but not exceeding two years; and more than
two years respectively, and therefore the pressure for repayment of borrowings is not imminent.
LETTER FROM SOMERLEY
— 91 —
As at 30 June 2010, the Group had a net working capital, being current assets less current
liabilities, of HK$2,551.6 million. Based on the pro forma consolidated balance sheet of the
Enlarged Group, the working capital position would decrease by 10.0% to HK$2,297.3 million
mainly as a result of the payment of the cash portion of the Purchase Price of US$100.0 million
(equivalent to approximately HK$780.0 million). Given the relatively strong cash flow from
operating activities as shown in (i) the Cash Flow Forecast; (ii) the cash flow projection in the
DCF model prepared by Grant Samuel; and (iii) the Enlarged Group’s pro forma cash flow
statement as shown in Appendix III to the Circular, and also after considering the working capital
level of the Enlarged Group as discussed above and the availability of the banking facilities, we
consider that the liquidity of the Enlarged Group is healthy and we concur with the Directors’
opinion that the Enlarged Group has sufficient working capital for its present requirement for at
least the next twelve months.
After taking into account (i) our analysis on the Enlarged Group’s gearing immediately
after the Acquisition above; (ii) the strong net cash flow generated from the Enlarged Group’s
operating activities of approximately HK$2,085.8 million (after deducting a one-off estimated
transaction cost in relation to the Acquisition of approximately HK$651.3 million) for the
six-month period ended 30 June 2010; and (iii) the grant of the Specific Mandate and the Existing
General Mandate, we are of the view that the Enlarged Group would have the ability to generate
adequate working capital to gradually reduce its gearing from a relatively highly leveraged
position immediately after the Acquisition.
14. Management of MMG
Upon completion, MMG will continue to be managed by an experienced board and management
team. The board of MMG consists of eight members, including six representatives from the CMC
Group, of which three of them are also Directors, namely Mr. Li Fuli, Mr. Wang Lixin and Mr. Xu
Jiqing. The Target Group has an executive committee comprising six members, whose brief profiles
are set out in below. Two executive directors of MMG, namely Mr. Andrew Gordon Michelmore and
Mr. David Mark Lamont, are proposed to be appointed as executive Directors following the
Acquisition. Mr. Andrew Gordon Michelmore and Mr. David Mark Lamont will also become the CEO
and CFO of the Enlarged Group respectively following the Acquisition. In addition, each of Dr. Peter
William Cassidy, presently an independent non-executive director of MMG, and Mr. Jiao Jian,
presently a non-executive director of MMG, are proposed to be appointed as an independent
non-executive Director and a non-executive Director, respectively, following the Acquisition. Set out
below is a brief profile of the existing senior management of MMG. Further details have been set out
in the section headed “Proposed directors and senior management of the Target Group” in the Circular.
Mr. Andrew Gordon Michelmore
Mr. Andrew Gordon Michelmore, aged 58, joined MMG as managing director and CEO on 17
June 2009 after his tenure as CEO of Zinifex and then OZL. Prior to his tenure as CEO of Zinifex,
he spent two years working in London and Russia as CEO of EN+ Group. Mr. Michelmore has more
than 28 years experience in the metals and mining industry including 12 years at WMC Resources
Limited where he was CEO and prior to that, held senior roles in company’s nickel, gold, alumina,
copper, uranium, and fertilizer businesses.
LETTER FROM SOMERLEY
— 92 —
Mr. Michelmore holds a First Class Honours degree in Engineering (Chemical) from The
University of Melbourne and a Master of Arts in Politics, Philosophy and Economics from Oxford
University. Mr. Michelmore is a Fellow of the Institute of Chemical Engineers, the Institute of
Engineers Australia and the Australian Academy of Technological Sciences and Engineering. He is
also chairman of The Jean Hailes Foundation for Women’s Health, chairman of the Council of Ormond
College at The University of Melbourne and a member of each of the Minerals Council of Australia
and the Business Council of Australia. Mr. Michelmore is also a director of Century Aluminum
Company (listed on the NASDAQ and the Iceland Stock Exchange).
Mr. David Mark Lamont
Mr. David Mark Lamont, aged 45, joined MMG as CFO on its formation in June 2009. He was
previously CFO of OZL from October 2008. Mr. Lamont is a member of the Institute of Chartered
Accountants and was an Audit Supervisor at Deloitte Haskins and Sells before commencing a
corporate career. After progressing through a number of senior positions in the chemical and
agricultural industries, Mr. Lamont was appointed CFO at Incitec Limited in 1999. Mr. Lamont joined
BHP Billiton in 2001 where he held a number of senior positions including CFO of BHP Billiton’s
Energy Coal and Carbon Steel Materials Groups. Mr. Lamont joined OZL from PaperlinX Limited,
where he had served as CFO since 2006 and was appointed an executive director between February
2008 and September 2008. Mr. Lamont holds a Bachelor of Commerce degree and is a qualified
Chartered Accountant.
Mr. Brett Fletcher
Mr. Brett Fletcher, aged 46, was appointed as the Chief Operating Officer of Zinifex in April
2007. Mr. Fletcher has more than 21 years of experience in the metals and mining industry. Mr.
Fletcher commenced his career in the mining industry in 1989 at Pasminco Limited in Broken Hill,
New South Wales as a qualified mining engineer and he held various technical and management
positions. For the last seven years, Mr. Fletcher has held general manager positions at Rosebery Mine,
Century Mine and Hobart Smelter.
Mr. Michael Nossal
Mr. Michael Nossal, aged 52, joined MMG as the Executive General Manager of the Business
Development Department in January 2010. Mr. Nossal has 23 years of experience in the metals and
mining industry. Mr. Nossal has held senior business development and strategy roles at WMC,
Normandy Mining Limited and Macquarie Corporate Finance. Before joining MMG, Mr. Nossal was
the Deputy CEO of En+ where he was responsible for corporate finance, strategy and business
development and the execution of key mergers and acquisition projects.
LETTER FROM SOMERLEY
— 93 —
Mr. Steve Ryan
Mr. Steve Ryan, aged 47, joined MMG as an Executive General Manager of the Exploration
Department. Mr. Ryan has over 20 years of international experience in the mineral exploration
industry. Mr. Ryan worked for the CRA / Rio Tinto Group and held positions including Country
Exploration Manager positions in India, Papua New Guinea and Fiji and geologist positions in Russia,
Australia and other countries. Mr. Ryan worked for Oxiana and held positions as Asia Exploration
General Manager and China Country Exploration Manager. Mr. Ryan also has three years experience
in the venture capital industry as an Investment & Business Development Manager for an international
venture capital group. Mr. Ryan has degrees in Geology and an MBA in international business.
Mr. Tim Scully
Mr. Tim Scully, aged 62, joined MMG as an Executive General Manager of the Business Support
Department. Mr. Scully joined OZL in November 2008. Mr. Scully has 21 years of experience in the
metals and mining industry. Mr. Scully has experience in leadership development, talent management,
succession planning and the Human Resources systems and processes. Before joining OZL, Mr. Scully
was the General Manager of the Organisation Development at Intrepid Mines Limited. Prior to that,
Mr. Scully was the General Manager of the Organisation Development and Human Resources at Atlas
Group Holdings. Prior to his position at Atlas Group Holdings, he was the General Manager of Human
Resources at WMC where he worked from 1989 to 2005.
15. Risk factors
The Independent Shareholders may wish to bear in mind the following summarised risk factors
when considering the Acquisition:
• Risks relating to the Acquisition
1. Risks relating to investments in a new business and country risks
2. Risks relating to completion of the Acquisition
• Risks relating to the business of the Target Group
3. Risks associated with the MEPA
4. Risks relating to title
5. Risks associated with litigation
6. Risks relating to operation and development of mines
7. Risks relating to government policies and regulations
8. Risks relating to the environment
LETTER FROM SOMERLEY
— 94 —
9. Risks relating to commodity prices
10. Risks relating to foreign currency exchange rate fluctuations
11. Risks relating to the ability to attract, retain and train key personnel
12. Risks relating to changes in the estimates of the resources and reserves of the
Operating Mines and the Development Projects
13. Risks relating to changes in future plans
14. Risks relating to the requirement for significant and continuous capital investment
15. Risks relating to the borrowings and interest rate
16. Risks relating to limited insurance coverage that may not be adequate to satisfy all
potential claims
17. Risks relating to inclement weather
18. Risks relating to competition
19. Risks relating to economic and market conditions
20. Risks relating to funding requirements
21. Risks relating to mining contractors
22. Risks relating to customers and suppliers
Details of the risk factors in relation to the Acquisition are set out in the section headed
“Risk factors” in the Circular.
DISCUSSION AND ANALYSIS
The businesses and the recent financial results of the Group since its transformation in 2005 are
summarised above. Alumina and aluminium ingot trading has been the core business of the Group and
its financial performance has been therefore largely consistent with the general demand for alumina
and aluminium, which is a function of the ups and downs of the global economic growth. The
acquisition of a 33% equity interest in Guangxi Huayin in 2008 allowed the Group to move further
up-stream to participate in bauxite exploration and production. The acquisition began to pay off by
way of significant earnings contribution in the first half of 2010, upon commencement of full
production of Guangxi Huayin in late 2009 and the rebound of alumina and aluminium prices from the
global financial crisis. The earnings momentum of the Group is growing with more volatility as a
result of surging commodity prices in recent months and uncertain economic outlook in most of the
developed countries.
LETTER FROM SOMERLEY
— 95 —
MMG owns and operates a portfolio of world-class base metal mining operations, development
projects and exploration fields. It is one of the world’s largest producers of zinc as well as a
substantial producer of copper, lead, gold and silver. The Acquisition is in line with the stated strategy
of the Group to capitalise on its status as CMC’s overseas platform for non-ferrous metals businesses
and to gradually develop into an international metals and mining company. The Company is of the
view that there are strong commercial and strategic reasons for the Acquisition and there will be
benefits of the Acquisition for the Group. Nevertheless, the Independent Shareholders are reminded
of the additional risks that will be inherent in the businesses of the Enlarged Group resulting from the
Acquisition.
The Purchase Price of US$1,846.0 million (equivalent to approximately HK$14,398.8 million)
was arrived at after arm’s length negotiations between the Company, All Glorious and Album
Enterprises and determined with reference to the range of the Market Valuation and adjusted by the
parties for projections of working capital changes until 31 December 2010. The Market Valuation
seeks to evaluate the full market value of MMG and accordingly reflects the value associated with
Inferred Resources and the exploration potential of the Target Group’s assets, which are specifically
excluded from the Chapter 18 Valuation as required by the Listing Rules. As emphasised by Grant
Samuel, the exclusion of these sources of potential value from the Chapter 18 Valuation means that
Chapter 18 Valuation may not fully reflect a market value, i.e. it may not represent an estimate of the
value that might be realised through an arm’s length market based transaction. Based on the amount
of potential resources owned by the Target Group and the analysis and opinion of AMC and Grant
Samuel, we consider that the assumptions, the basis and the methodology for the valuation of MMG
under the fair market value approach are fair and reasonable. In fact, this is also consistent with the
analysis of AMC, which is of the opinion that there is a high to reasonable confidence of future
conversion to ore reserves for cases adopted by Grant Samuel for the use in the Market Valuation. On
the basis that the Market Valuation reflects the market value of the Target Group, we consider that it
is fair and reasonable and in the interests of the Company and the Shareholders as a whole to
determine the Purchase Price based on the Market Valuation. If certain key assumptions were also
adopted by the Market Valuation similar to that of the Chapter 18 Valuation, for example the
adjustment for the recent changes in commodity prices and exchange rates, it is expected that the
Adjusted Market Valuation would be revised upward.
The payment mechanism is divided into equity and cash/debt in a proportion of around 57%
against 43%. The equity portion is first settled by the issue of Consideration Shares up to the “public
float” limit as prescribed by the Listing Rules while the remaining equity portion is to be satisfied by
the issue of the PSCS. The cash component of the Purchase Price of US$100.0 million (equivalent to
approximately HK$780.0 million) is to be satisfied by the available net cash holding of the Group
whereas the Loan can be viewed as a deferred consideration.
LETTER FROM SOMERLEY
— 96 —
The five-year tenor and relative low interest rates of the Loan does not put immediate pressure
on the Enlarged Group’s liquidity with the effect that the Enlarged Group will have sufficient time to
reduce the gearing by replacing all or part of the Loan with equity. Availability of the Specific
Mandate provides the Enlarged Group with an additional option to conduct new Share placements
based on prevailing market condition for repayment of the Loan. The Enlarged Group retains the
option to conduct other means of fund raising, for example by rights issue, issue of convertibles and/or
debt financing if immediate dilution is a concern.
The PSCS is treated as the Company’s equity. Based on the relative size of the Consideration
Shares and the PSCS, the “blended issue price” of the Consideration Shares and the PSCS is
approximately HK$3.30 per Share. Such issue price represents a significant discount to the Share price
as at the Latest Practicable Date. We however consider that the significant increase in the Share price
during September to November 2010 is mainly attributable to market speculation on the Acquisition.
This can be evidenced by the significant disparity in trading price of the Shares against the share
prices of those closely correlated peers during the Reference Period. We consider that the Share price
shall be adjusted to around HK$3.99 on an “undisturbed” basis. The “blended issue price” of the
Consideration Shares and the PSCS of HK$3.30 therefore represents a discount of approximately
17.3% as compared to this Adjusted Share Price. Nevertheless, we consider the issue price of the
Consideration Shares and the initial conversion price of the PSCS is acceptable chiefly because of the
significant earnings accretion as a result of the Acquisition.
The shareholding dilution to the Independent Shareholders is significant and the existing
Independent Shareholders will only hold less than one-third of its original shareholding following the
Acquisition and the full utilisation of the Specific Mandate. The Enlarged Group however will become
over three times larger in terms of earnings on a pro forma basis (based on the half year earnings up
to 30 June 2010). Earnings per Share accretion amounts to approximately 50.3% on a pro forma basis
if the PSCS is fully converted into the Shares. Book dilution on net asset value per Share is mainly
due to the elimination of a significant amount of the Merger Reserve. We consider this notional as the
value of the Target Group would not be fully reflected in the books of the Enlarged Group under the
merger accounting treatment. The Enlarged Group’s gearing will increase immediately after the
Acquisition but is expected to gradually decline as a result of the strong cash flow generated by the
Target Group’s operations and the possible issue of new equity by utilising the Specific Mandate. After
reviewing the Cash Flow Forecast and the maturity profile of the Enlarged Group’s debt position, we
concur with the Directors that the Enlarged Group has sufficient working capital and should be able
to gradually deleverage from a relatively highly leveraged position immediately after the Acquisition.
Upon Completion, two senior executive officers of MMG will also be appointed as the executive
Directors following the Acquisition. We concur with the Directors’ view that such arrangement will
result in a unique mix of PRC and international management qualifications and expertise in the senior
management of the Company and can provide the Enlarged Group with operational experience in
MMG’s international portfolio and insights into the base metals market of the PRC.
LETTER FROM SOMERLEY
— 97 —
OPINION
Based on the above principal factors and reasons, we consider that the Transactions are on
normal commercial terms which are fair and reasonable to the Independent Shareholders and that the
Transactions are in the interests of the Company and the Independent Shareholders as a whole.
Accordingly, we advise the Independent Board Committee to recommend, and we ourselves
recommend, the Independent Shareholders to vote in favour of the ordinary resolution to be proposed
at the EGM to approve the Transactions.
Yours faithfully,
for and on behalf of
SOMERLEY LIMITED
Kenneth ChowManaging Director — Corporate Finance
Charles NgDirector
LETTER FROM SOMERLEY
— 98 —
Shareholders should carefully consider all of the information set out in this circular, including
the risks and uncertainties described below before making a decision on how to vote on the
resolution relating to the Share Sale Deed at the EGM. The business, financial condition and results
of operations of the Group and the Target Group could be materially and adversely affected by any
of these risks.
To the best of the Directors’ knowledge, the Directors consider the following risks to be the
most significant in respect of the Target Group for the Shareholders and potential investors of the
Company. However, the risks listed do not purport to comprise all those risks associated with the
Target Group and are not set out in any particular order of priority. Additional risks and
uncertainties not currently known to the Directors may also have an adverse effect on the Target
Group’s business. If any of the following risks actually occurs, the Enlarged Group’s business,
financial condition, capital resources, results and/or future operations could be materially and
adversely affected.
RISKS RELATING TO THE ACQUISITION
1. Risks relating to investments in a new business and country risks
The Acquisition constitutes an investment in a new business sector involving the development
and production of multiple commodities, including zinc, copper, lead, gold, silver and nickel, in
Australia, Laos, Canada and exploration on a worldwide basis, which the Company has not previously
had exposure to or experience in. There are risks beyond the Target Group’s control associated with
investing in mineral exploration, mine development and mining in developing and foreign
jurisdictions. These risks include, but not limited to, health and safety issues; unexploded ordinance;
civil instability; terrorism; religious ethnic or tribal issues; standard of living and wealth distribution;
crime; business and regulatory environment and changes to that environment; political stability;
government policy changes; expropriation of assets; ability to repatriate funds; corruption; quality and
comprehensiveness of the legal regimes in relation to mining or generally the effectiveness of the
judiciary; and actions of non-government organisations and adverse changes in attitude by host
governments or host communities. The more significant risks associated with the developing country
jurisdictions in which the Target Group operates including Laos are: transportation and infrastructure
failure (eg: road, transmission lines and air services) and associated safety and production impacts;
energy supply and availability; increased negative social issues in the local area including drug use,
violence and criminal activity; safety issues from unexploded ordinance; social unrest and civil
instability; regulatory changes with the evolution of the legal system and tension regarding the
government’s revenue share.
Transportation and infrastructure failure is a risk as the Sepon mine is located in a remote region
of the world. The mine relies on air charter services to transfer people to and from site. The mine also
relies upon roads being open and unimpacted, for example, by flooding and landslips, for inputs and
products to be transported. Currently, however, air and road services are unavailable from time to
time. Power transmission and the maintenance of power transmission lines is also not at the standard
of first world countries. As the country develops, this infrastructure is likely to be improved but
currently, however, the region where the Sepon mine is located is exposed to interruption of power
supply.
RISK FACTORS
— 99 —
18.05(5)18.05(6)(a)
The Target Group also does not place political risk insurance for any country in which it
currently operates.
If the Target Group is unable to address the above-mentioned risks and uncertainties, its financial
condition and operating results may be materially and adversely affected.
Any change in the political and economic conditions in the jurisdictions in which the Target
Group operates may also adversely affect the financial and operational results of the Target Group.
Consequently, the Target Group is not in a position to assure the timing and amount of any return or
benefits that may be received. If the business in the new mining sectors does not develop or progress
as planned, the Target Group may not recover the funds and resources it has spent, and this may
adversely affect the Target Group.
2. Risks relating to completion of the Acquisition
Completion of the Acquisition is subject to satisfaction of the conditions precedent of the Share
Sale Deed, not all of which are within the control of the Group. For example, there is no assurance
that the Share Sale Deed and the transactions contemplated under the Share Sale Deed will be
approved by the requisite majority of the relevant Shareholders at the EGM as required under the
Listing Rules, and even if such approval were obtained, there is no assurance that such approval will
not be or be proposed to be revoked. As such, there is a risk that the Acquisition may not be completed.
RISKS RELATING TO THE BUSINESS OF THE TARGET GROUP
3. Risks associated with the MEPA
The Target Group’s right to operate the Sepon mine is under the MEPA with the Government of
Laos dated 15 June 1993 (as amended from time to time). Whereas the Target Group (and the relevant
predecessor company) has been successfully operating under the MEPA for almost 20 years, if the
Target Group were to fail to comply with its obligations under the MEPA, it could be terminated.
It is also possible that government policy to foreign investment in Laos could change or that the
Government of Laos may seek to impose new or existing laws, decrees, taxes or regulations that are
either inconsistent with the MEPA, or would have the effect of over-riding the MEPA or rendering the
MEPA of no legal value. If any of these events materialises, the Target Group may have to seek
recourse to arbitration under the MEPA and to seek to enforce an arbitration award against the
Government of Laos.
4. Risks relating to title
The Target Group’s mining and exploration claims in Australia, Canada, Indonesia and other
jurisdictions in which the Target Group operates (whether held currently by the Target Group or by
joint venture partners) may be subject to prior unregistered agreements or transfers and title may be
affected by undetected defects or underlying landholdings. Accordingly other parties could potentially
dispute the Target Group’s title to its mining and exploration rights.
RISK FACTORS
— 100 —
18.05(6)(h)
18.05(6)(c)18.05(6)(f)
Indigenous title rights may also exist over exploration and mining tenements held by the Target
Group. For example, the Target Group operates the Century mine under the Gulf Communities
Agreement (“GCA”). If the local indigenous community perceives that the Target Group is not
meeting its obligations under the GCA then that group may take action impacting the Target Group’s
ability to operate the Century mine. The Target Group believes it is a welcome and valued member of
the communities in which it operates.
In addition, concessions held by the Group may not be renewed upon their expiry.
If these title risks materialise, the business, financial condition and operating results of the
Target Group may be materially and adversely affected.
5. Risks associated with litigation
As with any company, the Target Group is or will be exposed to risks of litigation. To the extent
such risks are not covered by insurance, an adverse outcome in litigation or the cost of responding to
potential or actual litigation may have a material adverse impact on financial performance.
6. Risks relating to operation and development of mines
Exploration drilling to establish productive reserves is inherently speculative. The techniques
presently available to technical specialists to identify the existence and location of resources are
indirect and subject to a wide variety of variables which are subjective in nature. Mineral exploration
is highly speculative in nature. The Target Group’s exploration projects involve many risks, and
success in exploration is dependent upon a number of factors, including, but not limited to, quality of
management, quality and availability of geological expertise and availability of exploration capital.
The Target Group cannot give any assurance that its future exploration efforts will result in the
discovery of a mineral resource or ore reserve, or that its current and future exploration programs will
result in the expansion or replacement of current production with new resources and reserves. The
Target Group cannot give assurance that its exploration programmes will be able to extend the life of
its existing mines or result in the discovery of new producing mines.
The production phase by its nature also involves significant risks and hazards, including
environmental pollution, accidents or spills, industrial and transportation accidents, unexpected labour
shortages and compensatory claims, disputes or strikes, cost increases for contracted and/or purchased
goods and services, shortages of required materials and supplies, electrical power interruptions,
mechanical and electrical equipment failure, changes in the regulatory environment, natural
phenomena such as inclement weather conditions, floods and earthquakes, encountering unusual or
unexpected climatic conditions which may or may not result from global warming, and encountering
unusual or unexpected geological conditions. The occurrence of any of these hazards can delay or
interrupt production, increase production costs and result in liability to the Target Group. The Target
Group could become subject to liability for pollution or other hazards against which it has not insured
or cannot insure, including those in respect of past activities for which it was not responsible.
RISK FACTORS
— 101 —

The current mining operations of the Target Group are focusing on four operating mines and the
relevant mineral tenements thereof and the operations at the four operating mines are expected to
continue in the future. Any significant operational or other difficulties in the mining, processing,
exploration and development of the four operating mines could reduce, disrupt, or halt the Target
Group’s production, which could materially and adversely affect the Target Group’s business,
prospects, financial condition and results of operation. Loss or damage to critical equipment may or
may not be covered by insurance depending on the cause of the loss.
The Avebury nickel mine located in Tasmania, Australia is currently on care and maintenance.
The principal tasks required to achieve the re-start of the project comprise further resource drilling,
resource interpretation and modeling, development of a new mine plan and mining schedule,
investigation of the use of backfill in the mining process, metallurgical test work to improve nickel
recovery and deal with arsenic in the ore, development of a long term tailings storage solution and
development of a viable re-start plan. Should the operation be re-started, risks include, but are not
limited to, the execution of the re-start plan, ramp up of the mine and plant to nameplate capacity and
achieving a stable and sustainable operation. At all stages, the project is exposed to the risks of nickel
price and exchange rate fluctuations.
7. Risks relating to government policies and regulations
The new business in mining sectors to be conducted by the Target Group as mentioned in
paragraph 1 above is subject to various applicable laws and regulations and extensive governmental
approvals, licences, regulations, policies and controls. There can be no assurance that the relevant
government will not change such laws and regulations or impose additional or more stringent laws or
regulations. Any failure to comply with the relevant laws and regulations and any failure or delay in
obtaining the required approvals or licences for the Target Group’s business may make it difficult or
even impossible for the Target Group to complete its exploration and development work programs and
to begin commercial production of the commodities, which may adversely affect the Target Group. In
addition, there can be no certainty that any approvals or licences once granted will not be withdrawn
or will be renewed. Also, any changes to government policies may increase the operating costs of the
Target Group which may adversely affect the operating results of the Target Group.
8. Risks relating to the environment
The Target Group’s mining and development operations are subject to the environmental risks
inherent in the exploration and production industry and the environmental laws and regulations in
connection with all of its operations.
In particular, the Target Group’s mining and development operations located in Australia are
subject to extensive health and safety and environmental laws, regulations and standards in each state
of Australia in which the Target Group operates which impose significant ongoing costs and
obligations on the Target Group and which include obligations to rehabilitate current and former
facilities and locations where operations are or were conducted. Wide ranging penalties apply in the
event of non-compliance with these Australian laws, regulations and standards. Changes to Australian
health and safety and environmental laws, regulations and standards beyond the control of the Target
Group may result in materially increased costs and obligations being imposed on the Target Group.
RISK FACTORS
— 102 —
Mining operations have inherent risks and liabilities associated with safety and damage to the
environment and the disposal of waste products occurring as a result of mineral exploration and
production. The occurrence of any such safety or environmental incident could delay production or
increase production costs. Events such as unpredictable rainfall or bushfires may impact on the Target
Group’s ongoing compliance with environmental legislation, regulations and licences. Significant
liabilities could be imposed on the Target Group for damages, clean up costs or penalties in the event
of certain discharges into the environment, environmental damage caused by previous operations or
non-compliance with environmental laws or regulations.
Environmental regulations and health guideline standards for certain products and by-products
produced by the Target Group are generally becoming more onerous and will likely to require stricter
standard and enforcement, increased fines and penalties for non-compliance, more stringent
environmental assessments of proposed projects and a heightened degree of responsibilities for mining
companies and officers. Any future changes in the environmental regulations, if any, could
significantly increase the operating costs of the Target Group and materially and adversely affect its
financial conditions, business and results of operations.
Further, the Target Group may require approval from the relevant authorities before it can
undertake activities which are likely to impact the environment. Failure to obtain such approvals will
prevent the Target Group from undertaking its desired activities. The Group is unable to predict the
effect of additional environmental laws and regulations which may be adopted in the future, including
whether any such laws or regulations would materially increase the cost of carrying on business by
the Target Group or affect the Target Group’s operations in any aspect.
9. Risks relating to commodity prices
The prices of zinc, copper, lead, gold, silver and nickel are affected by numerous factors and
events that are beyond the control of the Target Group. These factors and events include general
economic activity, global production level, global demand, forward selling activity, costs of
production by other metal producers and other matters such as inflationary expectations, interest rates,
currency exchange rates, speculative activity as well as general global economic conditions and
political trends.
The Target Group has no commodity price hedging in place at present.
10. Risks relating to foreign currency exchange rate fluctuations
The Target Group generates the majority of its revenue in United States dollars. However, a
significant portion of the Target Group’s operating costs are denominated in Australian dollars. Hence,
its cost competitiveness, profitability and financial position is affected by appreciation of the
Australian dollar against the US dollar without the offsetting improvements in US dollar-denominated
commodity prices. Further, mineral resource prices have historically fluctuated widely and have been
affected by numerous factors over which the Target Group does not have any control, including, but
not limited to, currency exchange fluctuations. The effect of currency exchange fluctuations is
impossible to predict with any degree of certainty and this may materially and adversely affect the
Target Group’s operations and financial performance.
RISK FACTORS
— 103 —
The Target Group has no currency hedging in place at present.
11. Risks relating to the ability to attract, retain and train key personnel
The future performance of the Target Group depends, to a significant extent, upon its ability to
continue to attract, retain and motivate key qualified personnel, key senior management and other
employees in the mining business. There is no assurance that these key qualified personnel will
continue to provide services to the Target Group or will honour the agreed terms and conditions of
their employment or service contracts. Moreover, the Target Group does not maintain insurance for the
loss of any key qualified personnel. Any loss of key qualified personnel or failure to recruit and retain
personnel may have a material adverse effect on the Target Group’s mining business, financial
condition, results of operations and future prospects.
In addition, the Target Group’s ability to train operating and maintenance personnel will be a key
factor for the success of its mining business activities. If the Target Group is not successful in
recruiting, training and retaining such personnel, its business and results of operations could be
materially and adversely affected.
12. Risks relating to changes in the estimates of the resources and reserves of the Operating
Mines and the Development Projects
The resource and reserve estimates of the Operating Mines and the Development Projects set out
in this circular and the Competent Person’s Report comply with the JORC Code, but no assurance can
be given that any particular level of recovery from ore reserves will in fact be realised or that an
identified mineral resource will qualify as a commercially mineable ore body that can be economically
exploited.
The estimation of mineral resources and ore reserves involves some interpretation and is a
partially subjective process. The accuracy of resource and reserve estimates is a function of the
quantity and quality of available data and the assumptions used and judgments made in interpreting
engineering and geological information. There is significant uncertainty in any resource or reserve
estimate and the actual deposits encountered and the economic viability of mining a deposit may differ
materially from the estimates set out in this circular and the Competent Person’s Report. The discovery
of mineral resources through exploration of mineral tenements is speculative in nature and is
frequently unsuccessful. The Target Group may be unable to successfully discover and exploit new
reserves to replace those it is mining to ensure the ongoing viability of the Target Group’s projects.
Estimated mineral resources or ore reserves may have to be re-calculated based on changes in
metals prices, further exploration or development activity or actual production experience. This could
have a material adverse effect on estimates of the volume or grade of mineralisation, estimated
recovery rates or other important factors that influence resource or reserve estimates. Market price
fluctuations for metals, increased production costs, reduced recovery rates or other factors may render
the present proven and probable ore reserves of the Operating Mines and the Development Projects
uneconomical or unprofitable to develop at a particular site or sites.
RISK FACTORS
— 104 —
13. Risks relating to changes in future plans
Whether the Target Group ultimately implements the production plans of the Target Group
described in this circular, and whether it achieves the objectives described in this circular, will depend
on a number of factors including, but not limited to, (i) the availability and cost of capital; (ii) current
and projected prices of metals; (iii) metal markets; (iv) costs and availability of drilling services, costs
and availability of heavy equipment, supplies and personnel; (v) success or failure of activities in
similar areas to those in which its projects are situated; and (vi) changes in estimates of project
completion costs. The Target Group will continue to gather information about its projects, and it is
possible that additional information will cause the Target Group to alter its schedule or determine that
a project should not be pursued at all. Accordingly, the Target Group’s plans and objectives may
change from those described in this circular.
14. Risks relating to the requirement for significant and continuous capital investment
The mining business requires significant and continuous capital investment. Natural resources
production projects may not be completed as planned or scheduled, may exceed the original budgets
and may not achieve the intended economic results or commercial viability. Thus, the actual capital
investment for operation and development of the Target Group may significantly exceed its budget
because of factors beyond the Target Group’s control.
15. Risks relating to the borrowings and interest rate
The Target Group is exposed to interest rate risk primarily through its cash and deposit balances
and its interest-bearing borrowings. The Target Group has not used any derivative financial
instruments to manage the interest rate risk.
16. Risks relating to limited insurance coverage that may not be adequate to satisfy all
potential claims
Exploration, development and production operations on mineral properties involve numerous
risks and hazards, including rock bursts, slides, earthquakes or other adverse environmental
occurrence, industrial accidents, labour disputes, political and social stability, technical difficulties
due to unusual or unexpected geological formation, failure of pit walls, and flooding and periodic
interruptions due to inclement or hazardous weather condition. These risks can result in, among
others, damage to, and destruction of, mineral properties or production facilities, personal injuries,
environmental damages, delays in mining, monetary losses and legal liability.
The Target Group has business interruption insurance in place. The level of cover provides for
loss against budgeted insurable profit under certain circumstances, subject to a substantial deductible
following property damage. The Target Group is therefore not fully insured against all risks to which
it is subject in planned operations or development projects.
RISK FACTORS
— 105 —
Should any liabilities arise for which the Target Group are not insured or insurance coverage is
inadequate to cover the entire liability, the Target Group may have to pay out of its funds for such
liabilities which could result in a reduction or elimination of its actual or prospectus profitability,
increasing costs and a decline in the value of the Shares, and could materially and adversely affect the
Target Group’s business and results of operations.
17. Risks relating to inclement weather
Inclement weather may cause evacuation of personnel, curtailment of operations, damage to
mineral properties, transportation routes and loading facilities. This could in turn result in temporary
suspension of operations and a general reduction in productivity. From time to time, Century and
Sepon can experience tropical weather events that can result in their inbound and outbound logistics
routes being cut off. Historically, these interruptions have typically not exceeded two weeks. Through
stockpiling of run-of-mine ore and appropriate management of site consumable inventories, plant
operations at Century and Sepon have generally continued through such periods, resulting in minimal
impact on production. There is no assurance that inclement weather will not cause significant losses
to the Target Group in the future. Any damage to the Target Group’s projects or delays to its operations
by prolonged periods of inclement weather could materially affect its business and results of its
operations.
18. Risks relating to competition
The markets for the commodities mined or contemplated to be mined by the Target Group,
including zinc, copper, lead, gold, silver and nickel, are intensely competitive and the Target Group
faces competition from Chinese, Mongolian, Australian and other foreign miners. Competition in these
markets is based on many factors, including, among others, price, production, capacity, quality,
transportation capabilities and costs, blending capability and brand name. Some of the Target Group’s
competitors may have greater production capacity as well as greater financial, marketing, distribution
and other resources, and may benefit from more established brand names in the international market.
The mineral commodities industry is also characterised by technological advancements and the
introduction of new production process using new technologies. Some of the Target Group’s
competitions may develop new technologies and processing methods that are more effective or less
costly than those currently used by the Target Group.
Competitive activities in the markets served by the Target Group could have a significant impact
on the prices realised for its products and can therefore have a material adverse effect on its results
of operations and financial condition. The Target Group’s future success will depend on its ability to
respond in an effective and timely manner to competitive pressure.
RISK FACTORS
— 106 —
19. Risks relating to economic and market conditions
The operating and financial performance of the Target Group is influenced by a variety of general
business cycles and economic conditions. Changes in business and economic factors, such as interest
rates, exchange rates, inflation, national demographics, government fiscal, monetary policies in
Australia, Laos or other countries, and accounting and financial reporting standards, can be expected
to impact on the Target Group’s business. Any future economic downturn that reduces the demand for
the commodities mined by the Target Group could materially and adversely affect the Target Group’s
business and results of operations.
20. Risks relating to funding requirements
It is currently intended that the Specific Mandate sought will cover new Shares to be issued
pursuant to one or more potential Placing(s) to be conducted by the Company, subject to the then
prevailing market conditions.
Depending on market conditions, the Directors intend to raise net proceeds of up to US$1,600
million (equivalent to approximately HK$12,480 million) and apply such net proceeds from the
potential Placing(s) for (i) the full repayment of the loan of US$694,161,888 (equivalent to
approximately HK$5,414,462,726) under the Loan Agreement; and (ii) the remaining balance of
US$905,838,112 (equivalent to approximately HK$7,065,537,274) for (a) the deployment of funding
towards the exploration and development initiatives of the Target Group’s projects, including, but not
limited to, the development of the Dugald River zinc project located in Queensland, Australia (which
is in the final stages of a feasibility study and has an estimated pre-production capital cost of
approximately US$790 million (equivalent to approximately HK$6,162 million)), and (b) the other
exploration initiatives of the Target Group.
In the event that the Company is not able to exercise the Specific Mandate or to raise sufficient
funds pursuant to the exercise of the Specific Mandate and the Company is not able to obtain
alternative sources of funding, the Target Group may be unable to pursue the above-mentioned
exploration and development initiatives of the Target Group’s projects and other exploration
initiatives of the Target Group which may result in our long term business prospects being adversely
affected.
21. Risks relating to mining contractors
The Target Group contracts with third parties to provide mining operation services in respect of
certain sites (eg: Rosebery). If such contractors are unable to provide the service to the required
standard for a sustained period, to the extent that the Target Group does not have stockpiles of
products, the ability to perform the services itself or access to alternative providers, this may
adversely affect the production and financial performance of the Target Group.
RISK FACTORS
— 107 —
22. Risks relating to customers and suppliers
The Target Group will have exposure to movements in prices charged by external suppliers,
including those that provide inputs to production, such as electricity and other energy providers,
explosives suppliers, sea freight and transport service providers. A significant increase in one or more
of these cost items for a sustained period could have an adverse impact on the financial performance
of the Target Group, especially in circumstances where alternative suppliers are not available. In
addition, unforeseen adverse changes in quality or reductions in the quantity of supplies provided may
also have an adverse impact on operations.
The Target Group sells a significant proportion of its zinc and lead concentrate to Nyrstar and
its subsidiaries under long-term contracts. The Target Group has credit exposure to Nyrstar and any
material adverse change in Nyrstar’s financial position may impact the Target Group.
RISK FACTORS
— 108 —
This section contains certain information which has been derived from official, market and
other third party sources including the Wood Mackenzie/Brook Hunt Report. The Directors believe
that the sources of such information are appropriate sources for the information. The Directors
have exercised reasonable care in selecting and identifying the named information sources and, in
compiling, extracting and reproducing such information, and have no reason to believe that such
information is false or misleading or that any fact has been omitted that would render such
information false or misleading. This information has not been independently verified by the
Directors or any of the Directors’ affiliates or advisers or any of their affiliates or advisers and
no representation is given as to its accuracy. This information may not be consistent with
information from other sources.
The Company has commissioned Wood Mackenzie, a provider of market intelligence, to
prepare and compile certain information and data relating to copper, nickel, zinc and lead to form
the Wood Mackenzie/Brook Hunt Report. Any party who wishes to extract or reproduce any
information or statistics from the Wood Mackenzie/Brook Hunt Report or extracts from it as
presented in this circular shall obtain the prior written consent from Wood Mackenzie.
MMG is a significant producer of zinc, copper, lead, gold and silver. MMG currently operates
four mines: (i) the Sepon copper and gold operations located in Laos; (ii) Century, one of the world’s
largest zinc mines, located in Queensland, Australia, also producing lead and silver; (iii) Golden
Grove, a zinc, copper, lead and precious metals mine located in Western Australia; and (iv) Rosebery,
a zinc, lead, copper and precious metals mine located in Tasmania, Australia. In addition, MMG owns
the Avebury nickel mine in Tasmania, Australia (which is currently on care and maintenance) and has
several other Development Projects and an active minerals exploration programme in Australia,
Indonesia and Canada. This section sets out an industry overview of copper, nickel, zinc, lead, gold
and silver, which are the minerals of MMG’s key assets.
The Company has commissioned Wood Mackenzie, a provider of market intelligence, to prepare
and compile certain information and data relating to copper, lead, nickel and zinc to form the Wood
Mackenzie/Brook Hunt Report. Information relating to gold and silver have been derived from other
official, market and third party sources.
COPPER
Introduction
Copper is a metal that is corrosion resistant, extremely malleable and ductile, and is one of the
best thermal and electrical conductors among the metals. Copper is also a highly recyclable metal
which allows for the recycling of all forms of copper. Due to its high conductivity properties, copper
is commonly used in copper wires, electromagnets, printed circuit boards as an electrical conductor
and heat exchangers as a thermal conductor. Copper is also used as a constituent of various metal
alloys, commonly in association zinc, tin and nickel.
Copper is often found in ore bodies in associated with other metals, most notably gold and silver
but also zinc, lead, nickel and molybdenum. Copper exists in two broad categories of ore types:
sulphide and oxide. The world’s major copper deposits are located in the Americas, particularly in
INDUSTRY OVERVIEW
— 109 —
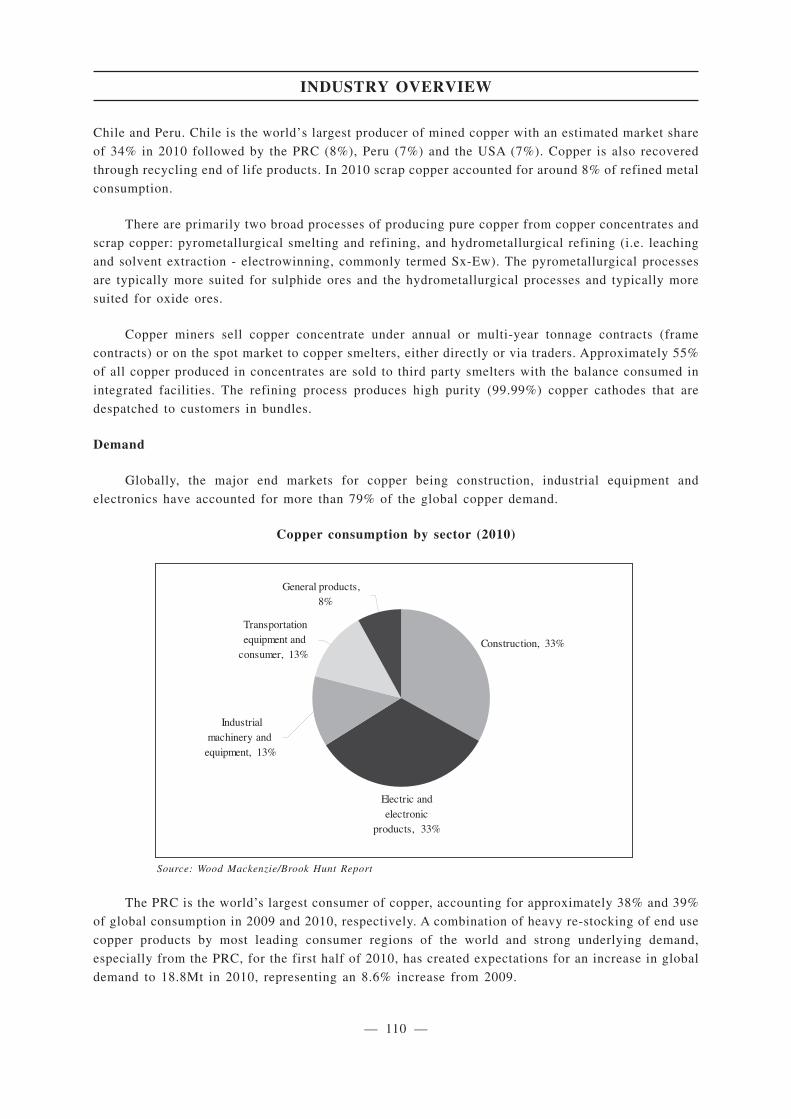
Chile and Peru. Chile is the world’s largest producer of mined copper with an estimated market share
of 34% in 2010 followed by the PRC (8%), Peru (7%) and the USA (7%). Copper is also recovered
through recycling end of life products. In 2010 scrap copper accounted for around 8% of refined metal
consumption.
There are primarily two broad processes of producing pure copper from copper concentrates and
scrap copper: pyrometallurgical smelting and refining, and hydrometallurgical refining (i.e. leaching
and solvent extraction - electrowinning, commonly termed Sx-Ew). The pyrometallurgical processes
are typically more suited for sulphide ores and the hydrometallurgical processes and typically more
suited for oxide ores.
Copper miners sell copper concentrate under annual or multi-year tonnage contracts (frame
contracts) or on the spot market to copper smelters, either directly or via traders. Approximately 55%
of all copper produced in concentrates are sold to third party smelters with the balance consumed in
integrated facilities. The refining process produces high purity (99.99%) copper cathodes that are
despatched to customers in bundles.
Demand
Globally, the major end markets for copper being construction, industrial equipment and
electronics have accounted for more than 79% of the global copper demand.
Copper consumption by sector (2010)
Construction,
Electric and electronic
products,
Transportation equipment and
consumer,
General products,
Industrial machinery and
equipment,
8%
33%
33%
13%
13%
Source: Wood Mackenzie/Brook Hunt Report
The PRC is the world’s largest consumer of copper, accounting for approximately 38% and 39%
of global consumption in 2009 and 2010, respectively. A combination of heavy re-stocking of end use
copper products by most leading consumer regions of the world and strong underlying demand,
especially from the PRC, for the first half of 2010, has created expectations for an increase in global
demand to 18.8Mt in 2010, representing an 8.6% increase from 2009.
INDUSTRY OVERVIEW
— 110 —

Notwithstanding anticipated dissipation of the impact from the Chinese government’s stimulus
packages, it is expected that continuing increase in investments, industrialisation and modernisation
will see the PRC continue to be the world’s largest consumer of copper in the foreseeable future. The
PRC’s demand for copper is expected to grow at approximate CAGR of 6% over the period 2009 and
2025. Demand for copper in Asia and Latin America is also expected to grow between 2010 and 2025
due to similar reasons for the PRC — rapid development in construction, automotive and other
developing industries in those regions.
Despite all the debate and concern regarding efforts to slow down the Chinese economy, Brook
Hunt remains confident that Chinese copper consumption will increase by 13% year-on-year to 7.4Mt
for 2010. In 2011, we forecast that lower demand from the reduction in the government’s stimulus
packages and reduced lending will be more than offset by strong growth in Chinese exports, which will
in turn lift Chinese copper consumption by a further 10% to approximately 8.1Mt.
Regional refined first-use copper consumption (kt)
2025 vs 20092009 2010 2011 2012 2013 2014 2025 Change CAGR
(%)
The PRC 6,520 7,368 8,105 8,834 9,452 9,972 16,536 10,016 6.0Europe 3,425 3,605 3,653 3,645 3,588 3,511 2,865 (560) (1.1)North America 1,774 1,851 1,888 1,873 1,790 1,738 1,226 (548) (2.3)Japan 876 990 1,002 1,005 1,018 929 473 (403) (3.8)Asia (excluding the
PRC & Japan) 3,466 3,661 3,846 4,051 4,270 4,454 6,650 3,184 4.2Latin America 777 825 872 920 984 1,041 1,623 846 4.7Others 473 492 515 539 572 608 955 482 4.5Global total 17,311 18,792 19,881 20,867 21,674 22,253 30,328 13,017 3.6Change year-on-year (3.6%) 8.6% 5.8% 5.0% 3.9% 2.7% 2.9
Source: Wood Mackenzie/Brook Hunt Report
The Wood Mackenzie/Brook Hunt Report forecasts that Chinese refined copper consumption will
grow at a CAGR of 6%, rising from approximately 6.5Mt at the end of 2009 to 16.5Mt by 2025. The
estimated 10Mt increase in refined copper consumption will result in the PRC’s share of global refined
copper consumption increasing from 38% in 2009 to a significant 55% by 2025.
INDUSTRY OVERVIEW
— 111 —
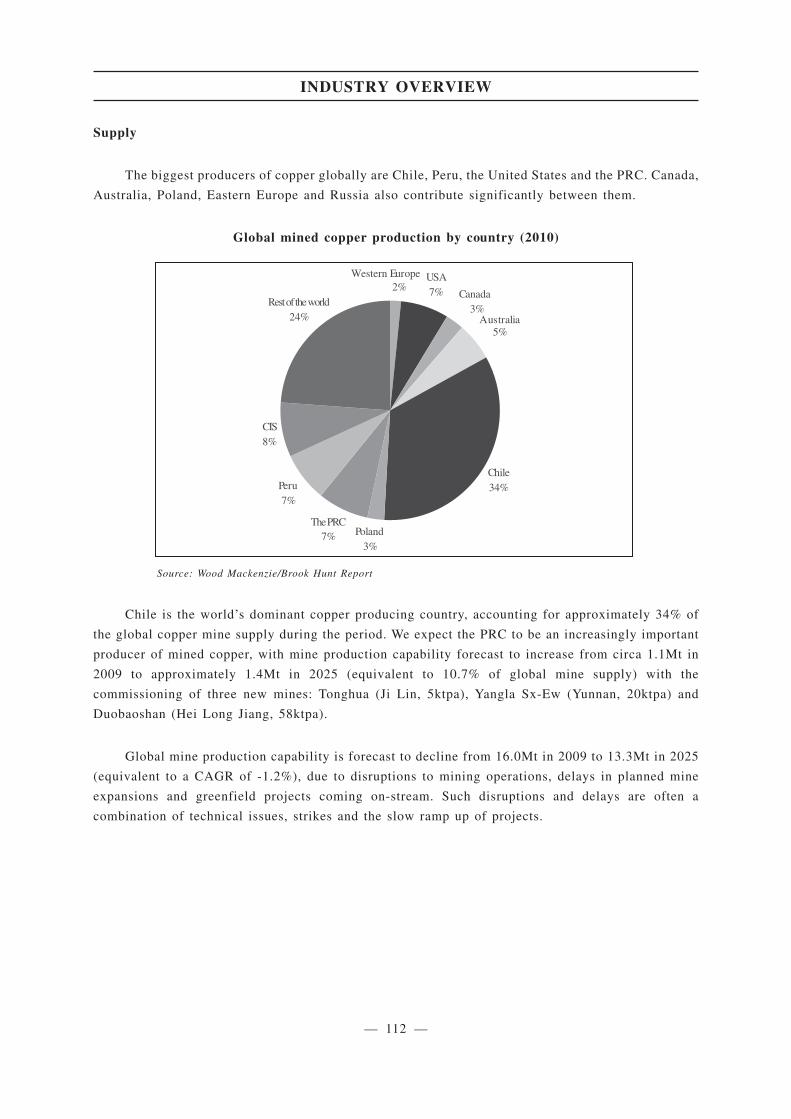
Supply
The biggest producers of copper globally are Chile, Peru, the United States and the PRC. Canada,
Australia, Poland, Eastern Europe and Russia also contribute significantly between them.
Global mined copper production by country (2010)
2% 7%
3%
5%
34%
3%7%
7%
8%
24%
Western Europe USA
Canada
Australia
Chile
PolandThe PRC
Peru
CIS
Rest of the world
Source: Wood Mackenzie/Brook Hunt Report
Chile is the world’s dominant copper producing country, accounting for approximately 34% of
the global copper mine supply during the period. We expect the PRC to be an increasingly important
producer of mined copper, with mine production capability forecast to increase from circa 1.1Mt in
2009 to approximately 1.4Mt in 2025 (equivalent to 10.7% of global mine supply) with the
commissioning of three new mines: Tonghua (Ji Lin, 5ktpa), Yangla Sx-Ew (Yunnan, 20ktpa) and
Duobaoshan (Hei Long Jiang, 58ktpa).
Global mine production capability is forecast to decline from 16.0Mt in 2009 to 13.3Mt in 2025
(equivalent to a CAGR of -1.2%), due to disruptions to mining operations, delays in planned mine
expansions and greenfield projects coming on-stream. Such disruptions and delays are often a
combination of technical issues, strikes and the slow ramp up of projects.
INDUSTRY OVERVIEW
— 112 —
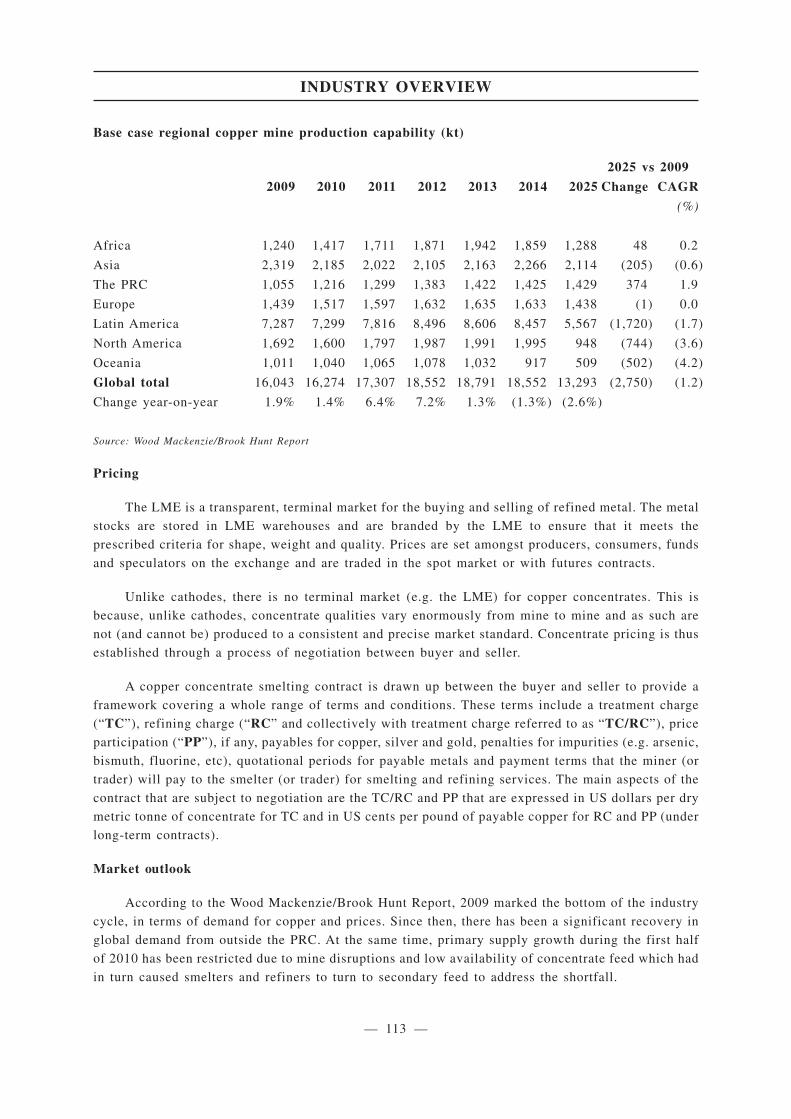
Base case regional copper mine production capability (kt)
2025 vs 2009
2009 2010 2011 2012 2013 2014 2025 Change CAGR
(%)
Africa 1,240 1,417 1,711 1,871 1,942 1,859 1,288 48 0.2
Asia 2,319 2,185 2,022 2,105 2,163 2,266 2,114 (205) (0.6)
The PRC 1,055 1,216 1,299 1,383 1,422 1,425 1,429 374 1.9
Europe 1,439 1,517 1,597 1,632 1,635 1,633 1,438 (1) 0.0
Latin America 7,287 7,299 7,816 8,496 8,606 8,457 5,567 (1,720) (1.7)
North America 1,692 1,600 1,797 1,987 1,991 1,995 948 (744) (3.6)
Oceania 1,011 1,040 1,065 1,078 1,032 917 509 (502) (4.2)
Global total 16,043 16,274 17,307 18,552 18,791 18,552 13,293 (2,750) (1.2)
Change year-on-year 1.9% 1.4% 6.4% 7.2% 1.3% (1.3%) (2.6%)
Source: Wood Mackenzie/Brook Hunt Report
Pricing
The LME is a transparent, terminal market for the buying and selling of refined metal. The metal
stocks are stored in LME warehouses and are branded by the LME to ensure that it meets the
prescribed criteria for shape, weight and quality. Prices are set amongst producers, consumers, funds
and speculators on the exchange and are traded in the spot market or with futures contracts.
Unlike cathodes, there is no terminal market (e.g. the LME) for copper concentrates. This is
because, unlike cathodes, concentrate qualities vary enormously from mine to mine and as such are
not (and cannot be) produced to a consistent and precise market standard. Concentrate pricing is thus
established through a process of negotiation between buyer and seller.
A copper concentrate smelting contract is drawn up between the buyer and seller to provide a
framework covering a whole range of terms and conditions. These terms include a treatment charge
(“TC”), refining charge (“RC” and collectively with treatment charge referred to as “TC/RC”), price
participation (“PP”), if any, payables for copper, silver and gold, penalties for impurities (e.g. arsenic,
bismuth, fluorine, etc), quotational periods for payable metals and payment terms that the miner (or
trader) will pay to the smelter (or trader) for smelting and refining services. The main aspects of the
contract that are subject to negotiation are the TC/RC and PP that are expressed in US dollars per dry
metric tonne of concentrate for TC and in US cents per pound of payable copper for RC and PP (under
long-term contracts).
Market outlook
According to the Wood Mackenzie/Brook Hunt Report, 2009 marked the bottom of the industry
cycle, in terms of demand for copper and prices. Since then, there has been a significant recovery in
global demand from outside the PRC. At the same time, primary supply growth during the first half
of 2010 has been restricted due to mine disruptions and low availability of concentrate feed which had
in turn caused smelters and refiners to turn to secondary feed to address the shortfall.
INDUSTRY OVERVIEW
— 113 —
The Wood Mackenzie/Brook Hunt Report anticipates that the market will move from a surplus
of refined copper in 2009 to a deficit in 2010 fuelled by strong recovery in demand. The shortfall in
supply will need to be satisfied by the reactivation of closed mines, exploitation of new ore
discoveries at currently producing mines, incremental expansions, or the development of greenfield
projects. The Wood Mackenzie/Brook Hunt Report anticipates that higher prices and refined
production will help the market return to balance in 2012.
Copper supply/demand balance (2000-2025)
-
5,000
10,000
15,000
20,000
25,000
30,000
2000 2005 2010 2015 2020 2025
kt
Highly Probable Projects
Base Case Mine Production (less disruptions)
Demand For Mine Production (net of scrap)
Source: Wood Mackenzie/Brook Hunt Report
INDUSTRY OVERVIEW
— 114 —

Due to the projected supply deficit, the Wood Mackenzie/Brook Hunt Report forecasts
prices to average US$3.28/lb this year, up almost 40% from last year’s average of
US$2.34/lb. By 2013, it is expected that a considerable supply response will outweigh
demand growth and generate a steady rise in metal stocks. This will push prices to the
cyclical low of US$1.70/lb by 2019.
Global metal balances and copper price (in 2010 US$ terms)
-1,500
-1,000
-500
-
500
1,000
1,500
2003 2008 2013 2018 2023
0
50
100
150
200
250
300
350
400Balance (LHS) Price (RHS)
kt c/lb
Source: Wood Mackenzie/Brook Hunt Report
Similar to previous cycles, an extended period of low copper prices will discourage companies
to develop new mines or expand existing operations. This will result in a market recovery between
2018 and 2021 which will coincide with a projected global economic recovery. During these years
prices are expected to rise sharply, reaching a cycle high point of US$3.42/lb (in 2010$) in 2021.
Similar to prior cycles, high prices will encourage new mine development which will result in metal
stocks rising above normal levels by 2024.
NICKEL
Introduction
Nickel is a metal that is hard with a high melting point and resistant to oxidation. These
properties make it suitable use as an alloying element in the production of stainless steel and
superalloys. Superalloys are nickel-based alloys containing less than 50% iron and have been
developed for use in high temperature applications such as aero-engines. Reflecting its properties,
nickel is widely used in a variety of everyday use products, including electronics, construction
materials and medical equipment.
INDUSTRY OVERVIEW
— 115 —
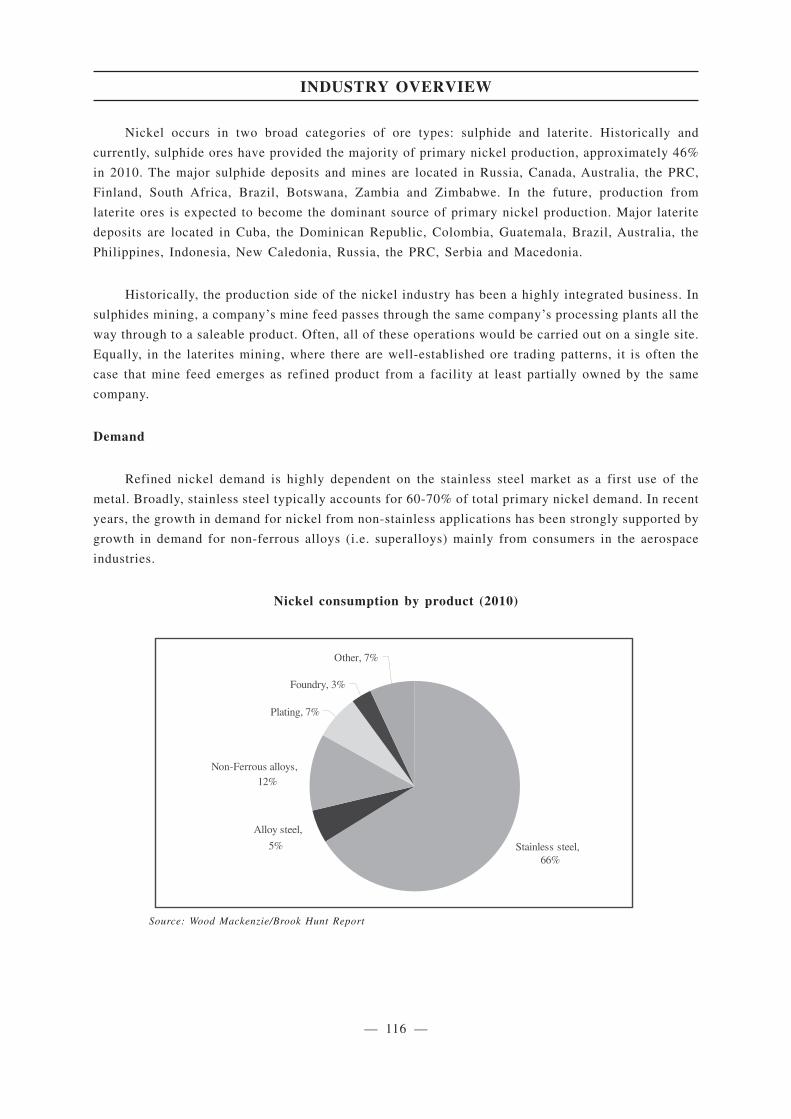
Nickel occurs in two broad categories of ore types: sulphide and laterite. Historically and
currently, sulphide ores have provided the majority of primary nickel production, approximately 46%
in 2010. The major sulphide deposits and mines are located in Russia, Canada, Australia, the PRC,
Finland, South Africa, Brazil, Botswana, Zambia and Zimbabwe. In the future, production from
laterite ores is expected to become the dominant source of primary nickel production. Major laterite
deposits are located in Cuba, the Dominican Republic, Colombia, Guatemala, Brazil, Australia, the
Philippines, Indonesia, New Caledonia, Russia, the PRC, Serbia and Macedonia.
Historically, the production side of the nickel industry has been a highly integrated business. In
sulphides mining, a company’s mine feed passes through the same company’s processing plants all the
way through to a saleable product. Often, all of these operations would be carried out on a single site.
Equally, in the laterites mining, where there are well-established ore trading patterns, it is often the
case that mine feed emerges as refined product from a facility at least partially owned by the same
company.
Demand
Refined nickel demand is highly dependent on the stainless steel market as a first use of the
metal. Broadly, stainless steel typically accounts for 60-70% of total primary nickel demand. In recent
years, the growth in demand for nickel from non-stainless applications has been strongly supported by
growth in demand for non-ferrous alloys (i.e. superalloys) mainly from consumers in the aerospace
industries.
Nickel consumption by product (2010)
Stainless steel, 66%
Alloy steel,
5%
Non-Ferrous alloys, 12%
Plating, 7%
Foundry, 3%
Other, 7%
Source: Wood Mackenzie/Brook Hunt Report
INDUSTRY OVERVIEW
— 116 —
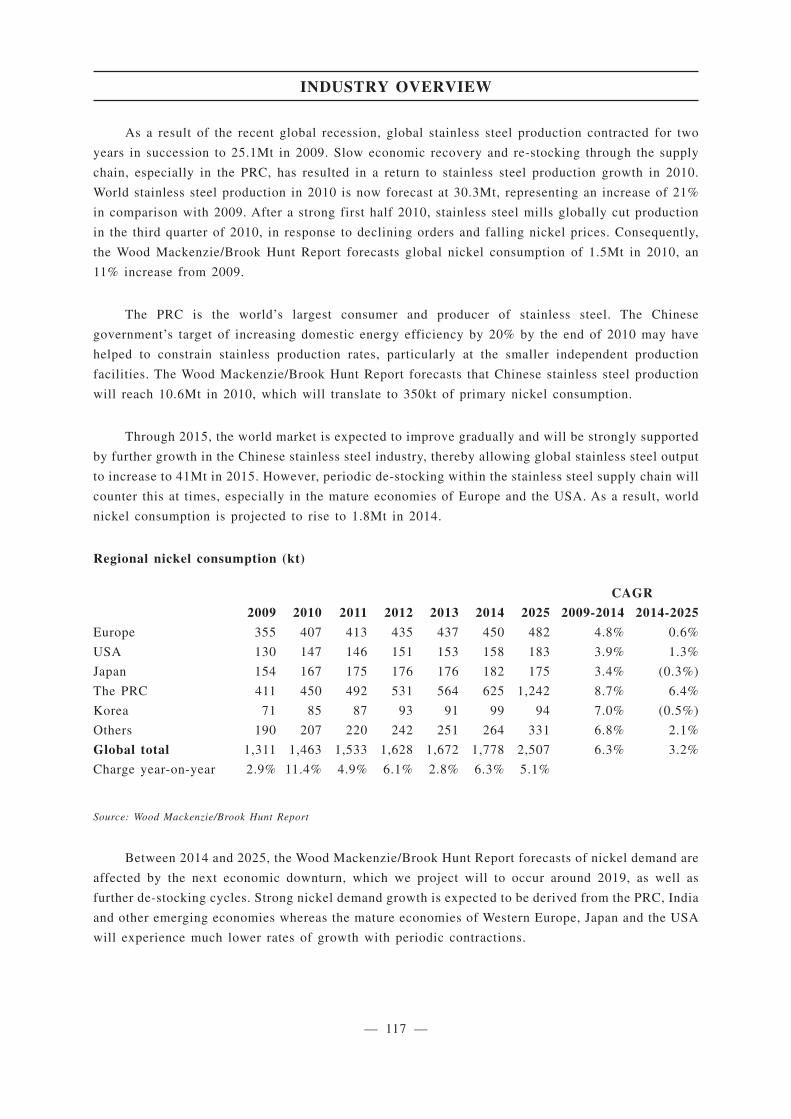
As a result of the recent global recession, global stainless steel production contracted for two
years in succession to 25.1Mt in 2009. Slow economic recovery and re-stocking through the supply
chain, especially in the PRC, has resulted in a return to stainless steel production growth in 2010.
World stainless steel production in 2010 is now forecast at 30.3Mt, representing an increase of 21%
in comparison with 2009. After a strong first half 2010, stainless steel mills globally cut production
in the third quarter of 2010, in response to declining orders and falling nickel prices. Consequently,
the Wood Mackenzie/Brook Hunt Report forecasts global nickel consumption of 1.5Mt in 2010, an
11% increase from 2009.
The PRC is the world’s largest consumer and producer of stainless steel. The Chinese
government’s target of increasing domestic energy efficiency by 20% by the end of 2010 may have
helped to constrain stainless production rates, particularly at the smaller independent production
facilities. The Wood Mackenzie/Brook Hunt Report forecasts that Chinese stainless steel production
will reach 10.6Mt in 2010, which will translate to 350kt of primary nickel consumption.
Through 2015, the world market is expected to improve gradually and will be strongly supported
by further growth in the Chinese stainless steel industry, thereby allowing global stainless steel output
to increase to 41Mt in 2015. However, periodic de-stocking within the stainless steel supply chain will
counter this at times, especially in the mature economies of Europe and the USA. As a result, world
nickel consumption is projected to rise to 1.8Mt in 2014.
Regional nickel consumption (kt)
CAGR
2009 2010 2011 2012 2013 2014 2025 2009-2014 2014-2025
Europe 355 407 413 435 437 450 482 4.8% 0.6%
USA 130 147 146 151 153 158 183 3.9% 1.3%
Japan 154 167 175 176 176 182 175 3.4% (0.3%)
The PRC 411 450 492 531 564 625 1,242 8.7% 6.4%
Korea 71 85 87 93 91 99 94 7.0% (0.5%)
Others 190 207 220 242 251 264 331 6.8% 2.1%
Global total 1,311 1,463 1,533 1,628 1,672 1,778 2,507 6.3% 3.2%
Charge year-on-year 2.9% 11.4% 4.9% 6.1% 2.8% 6.3% 5.1%
Source: Wood Mackenzie/Brook Hunt Report
Between 2014 and 2025, the Wood Mackenzie/Brook Hunt Report forecasts of nickel demand are
affected by the next economic downturn, which we project will to occur around 2019, as well as
further de-stocking cycles. Strong nickel demand growth is expected to be derived from the PRC, India
and other emerging economies whereas the mature economies of Western Europe, Japan and the USA
will experience much lower rates of growth with periodic contractions.
INDUSTRY OVERVIEW
— 117 —

Supply
The biggest producers of refined nickel in 2010 were the PRC, Russia, Japan, Australia, Norway
and Canada.
Global refined nickel production by country
26%6%
6%
12%8%
22%
20%
OthersNorway
Canada
JapanAustralia
The PRC
CIS
Source: Wood Mackenzie/Brook Hunt Report
After the year-on-year contractions in 2008 and 2009 largely due to worldwide recession, global
refined nickel output has returned to growth and is currently expected to increase by 5% to 1.4Mt in
2010.
Between 2010 and 2014, the Wood Mackenzie/Brook Hunt Report forecasts growth in world
refined nickel production of approximately 380kt, representing a 6% CAGR to reach a nickel output
of 1.9Mt by the end of that period. The forecast increase in production assumes that the high rate of
nickel-pig iron (“NPI”) production in 2010 will be sustained and that the major mine development
projects including Goro (New Caledonia, 60ktpa), Ambatovy (Madagascar, 60ktpa), Onça-Puma
(Brazil, 50ktpa), Barro Alto (Brazil, 36ktpa), Ramu (Papua New Guinea, 35ktpa) and Ravensthorpe
(Australia, 40ktpa) are commissioned by the end of 2011 as expected. Additional refined nickel supply
is also expected from other development projects within the 2012 and 2014 time frame, including
Koniambo (New Caledonia, 60ktpa), Voisey’s Bay (Canada, 50ktpa) and Taganito (Philippines,
30ktpa), which will supply intermediate nickel products to support the refinery expansion at Niihama,
Sumitomo Metal Mining’s refining complex in Japan. There remains the risk that eventual production
is below the forecast level due to mine closures, disruptions and delays in commissioning planned
projects.
The Wood Mackenzie/Brook Hunt Report’s forecast balance is premised on the base case refined
nickel output and first use consumption. The base case mine production table below is shown for
background information and to be consistent with the copper and zinc sections.
INDUSTRY OVERVIEW
— 118 —

Base case regional nickel mine production capability (kt)
Production change
2009 2010 2011 2012 2013 2014 2025 2009-2014 2014-2025
Indonesia 228 248 263 288 277 285 290 57 5
Canada 133 120 189 215 221 202 28 69 (174)
Australia 164 167 179 183 180 167 66 3 (101)
New Caledonia 93 120 147 171 188 196 192 103 (4)
CIS 256 267 267 268 267 263 256 7 (7)
Others 562 591 650 734 800 825 766 263 (59)
Global total 1,436 1,513 1,695 1,859 1,933 1,938 1,598 502 (340)
Change year-on-year (9.6%) 5.3% 12.0% 9.7% 3.9% 0.2% (1.2%)
Source: Wood Mackenzie/Brook Hunt Report
The medium-term growth of nickel production in the PRC is largely focused on NPI, which is
only consumed by stainless steel mills. The combination of strong NPI demand from Chinese stainless
steel mills and nickel prices that rallied to levels exceeding NPI production costs enabled the NPI
producers to raise output from an estimated 77kt (contained nickel) in 2008 to 97kt (contained nickel)
in 2009 and an anticipated 137kt (contained nickel) in 2010, with a further increase likely in 2011.
Base case regional nickel refinery production capability (kt)
Production change
2009 2010 2011 2012 2013 2014 2025 2009-2014 2014-2025
CIS 274 283 295 295 293 294 289 20 (5)
Japan 142 166 173 178 186 190 192 48 2
The PRC (incl NPI) 251 304 308 328 341 352 359 101 7
Australia 129 115 119 125 126 124 124 (5) 0
Canada 117 85 139 154 160 155 164 38 9
Norway 89 91 90 90 90 90 90 1 0
Others 332 365 427 516 560 585 583 253 (2)
Global total 1,334 1,409 1,551 1,686 1,756 1,790 1,801 456 11
Excludes highly probable projects, disruption allowance and market adjustment
Source: Wood Mackenzie/Brook Hunt Report
In the longer-term, the Wood Mackenzie/Brook Hunt Report projects that global production of
refined metal will need to increase by an average of a little under 3% per year, to around 2.5Mt in
2025, in order to keep pace with demand. As the Wood Mackenzie/Brook Hunt Report’s base case
refined nickel production forecast for 2025 stands at 1.8Mt the achievement of this long-term target
is dependent on new projects currently in our Probable and Possible Projects categories supplying
around 700kt of refined nickel to the market.
INDUSTRY OVERVIEW
— 119 —
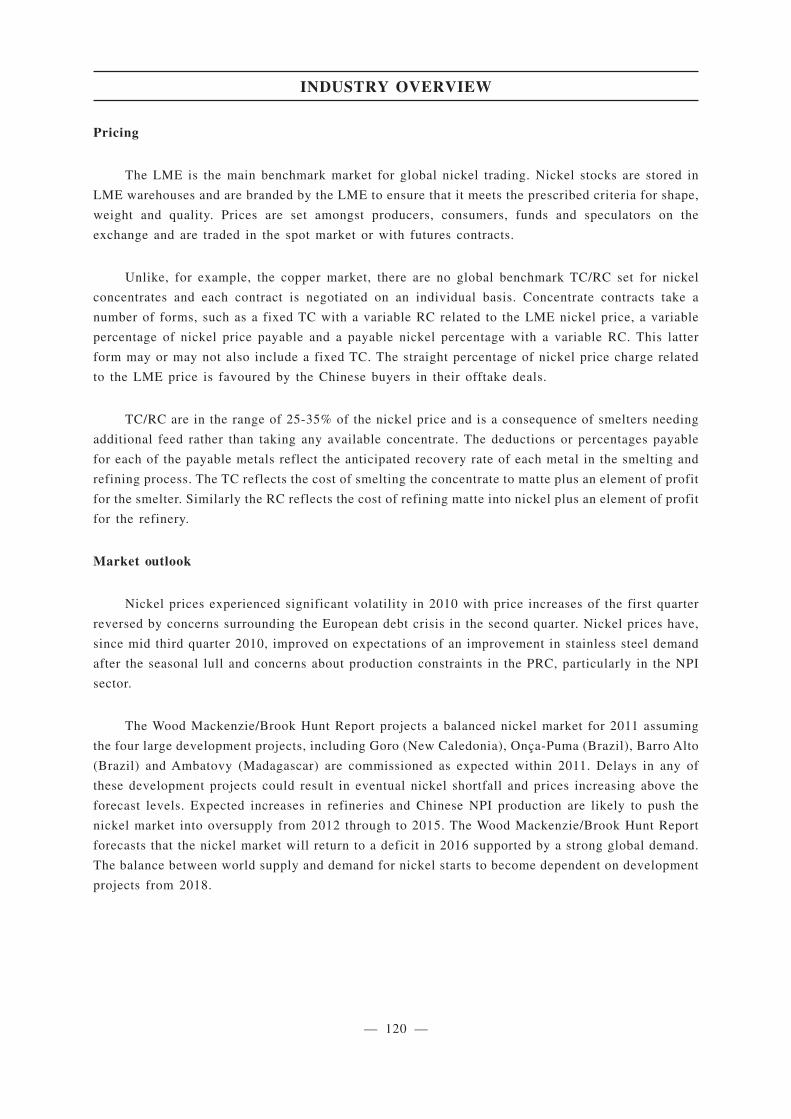
Pricing
The LME is the main benchmark market for global nickel trading. Nickel stocks are stored in
LME warehouses and are branded by the LME to ensure that it meets the prescribed criteria for shape,
weight and quality. Prices are set amongst producers, consumers, funds and speculators on the
exchange and are traded in the spot market or with futures contracts.
Unlike, for example, the copper market, there are no global benchmark TC/RC set for nickel
concentrates and each contract is negotiated on an individual basis. Concentrate contracts take a
number of forms, such as a fixed TC with a variable RC related to the LME nickel price, a variable
percentage of nickel price payable and a payable nickel percentage with a variable RC. This latter
form may or may not also include a fixed TC. The straight percentage of nickel price charge related
to the LME price is favoured by the Chinese buyers in their offtake deals.
TC/RC are in the range of 25-35% of the nickel price and is a consequence of smelters needing
additional feed rather than taking any available concentrate. The deductions or percentages payable
for each of the payable metals reflect the anticipated recovery rate of each metal in the smelting and
refining process. The TC reflects the cost of smelting the concentrate to matte plus an element of profit
for the smelter. Similarly the RC reflects the cost of refining matte into nickel plus an element of profit
for the refinery.
Market outlook
Nickel prices experienced significant volatility in 2010 with price increases of the first quarter
reversed by concerns surrounding the European debt crisis in the second quarter. Nickel prices have,
since mid third quarter 2010, improved on expectations of an improvement in stainless steel demand
after the seasonal lull and concerns about production constraints in the PRC, particularly in the NPI
sector.
The Wood Mackenzie/Brook Hunt Report projects a balanced nickel market for 2011 assuming
the four large development projects, including Goro (New Caledonia), Onça-Puma (Brazil), Barro Alto
(Brazil) and Ambatovy (Madagascar) are commissioned as expected within 2011. Delays in any of
these development projects could result in eventual nickel shortfall and prices increasing above the
forecast levels. Expected increases in refineries and Chinese NPI production are likely to push the
nickel market into oversupply from 2012 through to 2015. The Wood Mackenzie/Brook Hunt Report
forecasts that the nickel market will return to a deficit in 2016 supported by a strong global demand.
The balance between world supply and demand for nickel starts to become dependent on development
projects from 2018.
INDUSTRY OVERVIEW
— 120 —
Nickel supply-demand balance (2000-2025)
600
900
1,200
1,500
1,800
2,100
2,400
2000 2005 2010 2015 2020 2025
kt
Highly Probable Projects
Existing Supply
Nickel Consumption
Source: Wood Mackenzie/Brook Hunt Report
Notwithstanding that Brook Hunt is projecting a balanced market in 2011, we remain cautious
that nickel prices could potentially continue to be volatile. We forecast prices to remain in the 2010
range for the first half of 2011, before trading lower during the second half of 2011 to reach our
forecast average price of US$9.60/lb in 2011 as expectations of an oversupply in 2012 sets in. Brook
Hunt expects that nickel prices could fall to US$6.30-6.50/lb in 2013 and 2014, which will force
around metal refiners out of economic production.
Global metal balances and nickel price (in 2010 US$ terms)
-100
-50
0
50
100
150
300
500
700
900
1,100
1,300
1,500
1,700
1,900
c/lb
2003 2005 2007 2009 2011 2013 2015 2017 2019 2021 2023 2025
kt
Balance (LHS) Price (RHS)
Source: Wood Mackenzie/Brook Hunt Report
INDUSTRY OVERVIEW
— 121 —
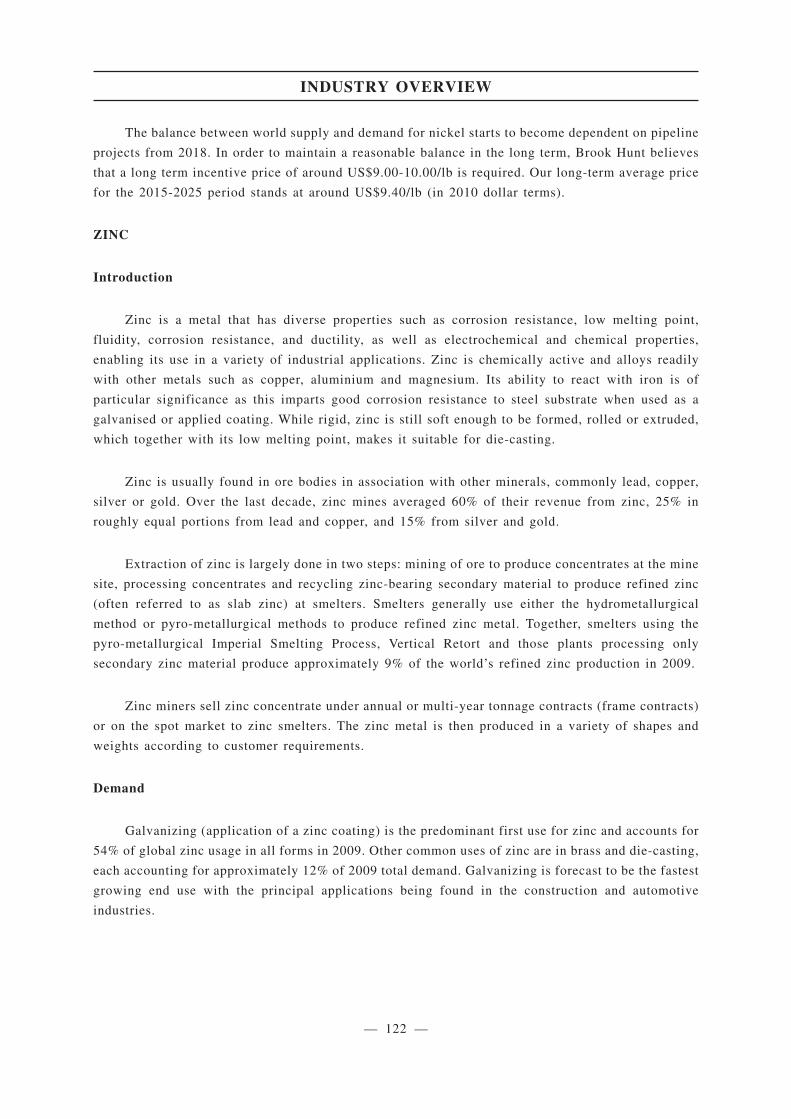
The balance between world supply and demand for nickel starts to become dependent on pipeline
projects from 2018. In order to maintain a reasonable balance in the long term, Brook Hunt believes
that a long term incentive price of around US$9.00-10.00/lb is required. Our long-term average price
for the 2015-2025 period stands at around US$9.40/lb (in 2010 dollar terms).
ZINC
Introduction
Zinc is a metal that has diverse properties such as corrosion resistance, low melting point,
fluidity, corrosion resistance, and ductility, as well as electrochemical and chemical properties,
enabling its use in a variety of industrial applications. Zinc is chemically active and alloys readily
with other metals such as copper, aluminium and magnesium. Its ability to react with iron is of
particular significance as this imparts good corrosion resistance to steel substrate when used as a
galvanised or applied coating. While rigid, zinc is still soft enough to be formed, rolled or extruded,
which together with its low melting point, makes it suitable for die-casting.
Zinc is usually found in ore bodies in association with other minerals, commonly lead, copper,
silver or gold. Over the last decade, zinc mines averaged 60% of their revenue from zinc, 25% in
roughly equal portions from lead and copper, and 15% from silver and gold.
Extraction of zinc is largely done in two steps: mining of ore to produce concentrates at the mine
site, processing concentrates and recycling zinc-bearing secondary material to produce refined zinc
(often referred to as slab zinc) at smelters. Smelters generally use either the hydrometallurgical
method or pyro-metallurgical methods to produce refined zinc metal. Together, smelters using the
pyro-metallurgical Imperial Smelting Process, Vertical Retort and those plants processing only
secondary zinc material produce approximately 9% of the world’s refined zinc production in 2009.
Zinc miners sell zinc concentrate under annual or multi-year tonnage contracts (frame contracts)
or on the spot market to zinc smelters. The zinc metal is then produced in a variety of shapes and
weights according to customer requirements.
Demand
Galvanizing (application of a zinc coating) is the predominant first use for zinc and accounts for
54% of global zinc usage in all forms in 2009. Other common uses of zinc are in brass and die-casting,
each accounting for approximately 12% of 2009 total demand. Galvanizing is forecast to be the fastest
growing end use with the principal applications being found in the construction and automotive
industries.
INDUSTRY OVERVIEW
— 122 —
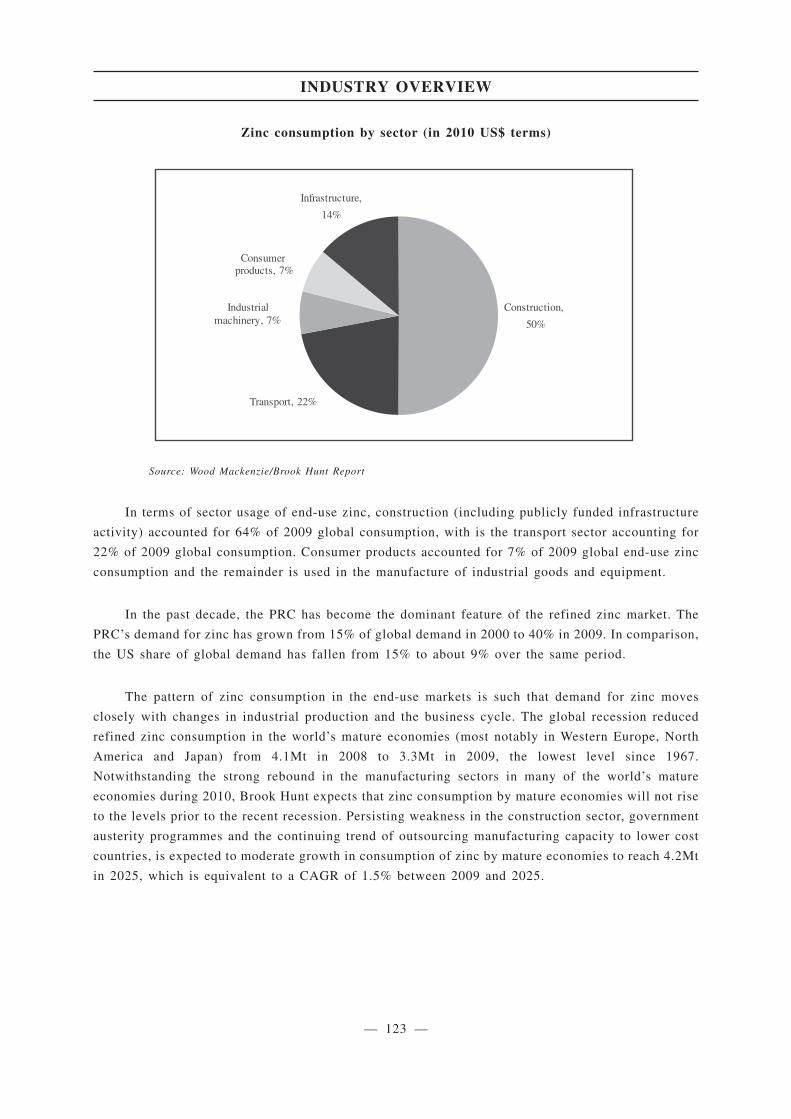
Zinc consumption by sector (in 2010 US$ terms)
50%
14%
Construction,
Transport, 22%
Industrial machinery, 7%
Consumer products, 7%
Infrastructure,
Source: Wood Mackenzie/Brook Hunt Report
In terms of sector usage of end-use zinc, construction (including publicly funded infrastructure
activity) accounted for 64% of 2009 global consumption, with is the transport sector accounting for
22% of 2009 global consumption. Consumer products accounted for 7% of 2009 global end-use zinc
consumption and the remainder is used in the manufacture of industrial goods and equipment.
In the past decade, the PRC has become the dominant feature of the refined zinc market. The
PRC’s demand for zinc has grown from 15% of global demand in 2000 to 40% in 2009. In comparison,
the US share of global demand has fallen from 15% to about 9% over the same period.
The pattern of zinc consumption in the end-use markets is such that demand for zinc moves
closely with changes in industrial production and the business cycle. The global recession reduced
refined zinc consumption in the world’s mature economies (most notably in Western Europe, North
America and Japan) from 4.1Mt in 2008 to 3.3Mt in 2009, the lowest level since 1967.
Notwithstanding the strong rebound in the manufacturing sectors in many of the world’s mature
economies during 2010, Brook Hunt expects that zinc consumption by mature economies will not rise
to the levels prior to the recent recession. Persisting weakness in the construction sector, government
austerity programmes and the continuing trend of outsourcing manufacturing capacity to lower cost
countries, is expected to moderate growth in consumption of zinc by mature economies to reach 4.2Mt
in 2025, which is equivalent to a CAGR of 1.5% between 2009 and 2025.
INDUSTRY OVERVIEW
— 123 —

Regional refined first-use zinc consumption (kt)
2025 versus 2009
2009 2010 2011 2012 2013 2014 2025 Change CAGR
The PRC 4,061 4,581 5,039 5,467 5,877 6,289 11,459 7,398 6.7%
Western Europe 1,630 1,843 1,894 1,938 1,980 2,010 2,051 421 1.4%
North America 1,021 1,075 1,111 1,141 1,179 1,196 1,353 332 1.8%
Other Asia 1,767 1,988 2,139 2,277 2,387 2,504 3,558 1,791 4.5%
Japan 421 496 503 508 514 523 510 89 1.2%
East and Central Europe 293 323 343 363 382 398 533 240 3.8%
Latin America 535 579 617 646 690 714 916 381 3.4%
Oceania 217 223 226 236 240 242 265 48 1.2%
Africa 153 165 173 177 188 194 231 78 2.6%
Global 10,098 11,273 12,045 12,753 13,437 14,070 20,876 10,778 4.6%
Change year-on-year (9.8%) 11.6% 6.8% 5.9% 5.4% 4.7% 4.1%
Source: Wood Mackenzie/Brook Hunt Report
The industrialisation and urbanisation of the developing economies have resulted in a much
greater zinc demand per unit of industrial production. Together with the ongoing trend of moving
manufacturing capacity from high cost to low cost economies, Brook Hunt forecasts that demand for
refined zinc in the PRC will reach 11.5Mt in 2025, representing a CAGR of 6.7% over the period 2009
to 2025.
The rapid expansion of zinc demand in the developing economies will be the primary driver
behind the forecast global CAGR of 4.6% over the period 2009 to 2025, presenting an average growth
of 0.7Mt of zinc per annum to reach a total demand of 20.9Mt in 2025.
Supply
Major zinc deposits are located in the PRC and South America, which account for 28% and 23%
of 2010 production respectively. In South America, Peru is the largest producer of zinc, producing as
much as all other countries combined. Other significant producers in 2010 were Australia (12%),
India, Canada and the US (each accounting for approximately 6%).
INDUSTRY OVERVIEW
— 124 —
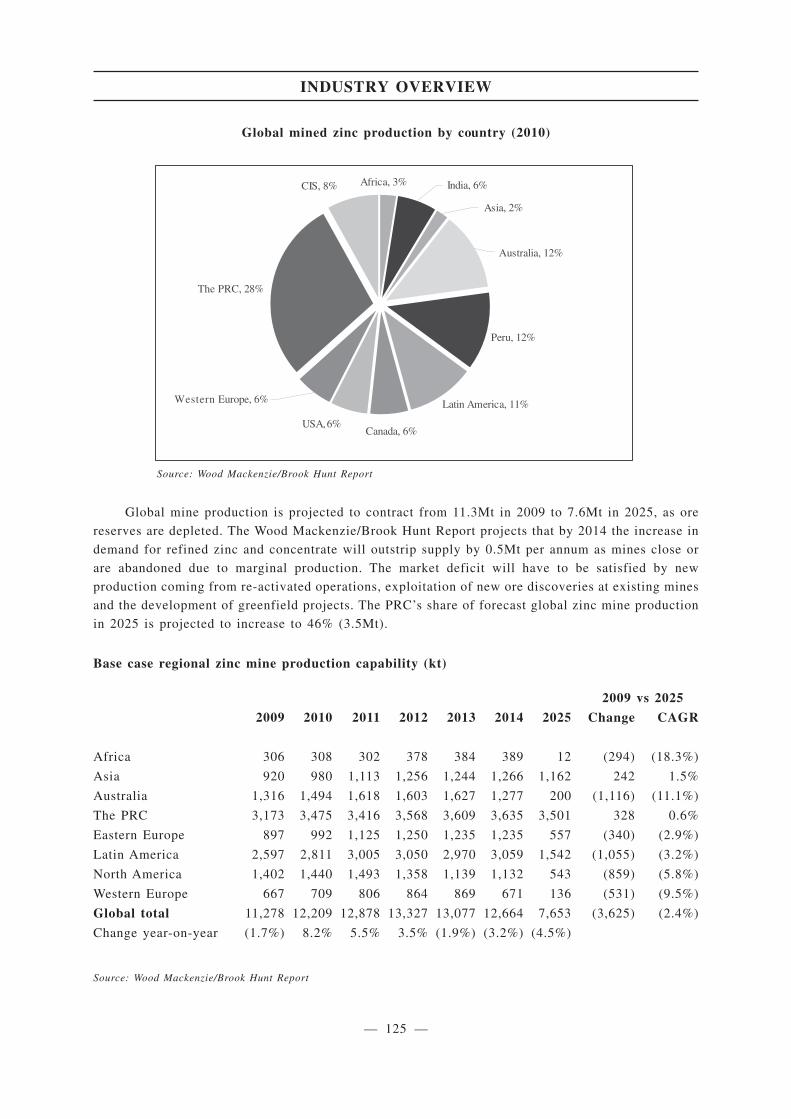
Global mined zinc production by country (2010)
Africa, 3%
Peru, 12%
Latin America, 11%
Canada, 6%USA, 6%
The PRC, 28%
CIS, 8%
Western Europe, 6%
India, 6%
Asia, 2%
Australia, 12%
Source: Wood Mackenzie/Brook Hunt Report
Global mine production is projected to contract from 11.3Mt in 2009 to 7.6Mt in 2025, as ore
reserves are depleted. The Wood Mackenzie/Brook Hunt Report projects that by 2014 the increase in
demand for refined zinc and concentrate will outstrip supply by 0.5Mt per annum as mines close or
are abandoned due to marginal production. The market deficit will have to be satisfied by new
production coming from re-activated operations, exploitation of new ore discoveries at existing mines
and the development of greenfield projects. The PRC’s share of forecast global zinc mine production
in 2025 is projected to increase to 46% (3.5Mt).
Base case regional zinc mine production capability (kt)
2009 vs 2025
2009 2010 2011 2012 2013 2014 2025 Change CAGR
Africa 306 308 302 378 384 389 12 (294) (18.3%)
Asia 920 980 1,113 1,256 1,244 1,266 1,162 242 1.5%
Australia 1,316 1,494 1,618 1,603 1,627 1,277 200 (1,116) (11.1%)
The PRC 3,173 3,475 3,416 3,568 3,609 3,635 3,501 328 0.6%
Eastern Europe 897 992 1,125 1,250 1,235 1,235 557 (340) (2.9%)
Latin America 2,597 2,811 3,005 3,050 2,970 3,059 1,542 (1,055) (3.2%)
North America 1,402 1,440 1,493 1,358 1,139 1,132 543 (859) (5.8%)
Western Europe 667 709 806 864 869 671 136 (531) (9.5%)
Global total 11,278 12,209 12,878 13,327 13,077 12,664 7,653 (3,625) (2.4%)
Change year-on-year (1.7%) 8.2% 5.5% 3.5% (1.9%) (3.2%) (4.5%)
Source: Wood Mackenzie/Brook Hunt Report
INDUSTRY OVERVIEW
— 125 —
Pricing
The LME is the main global trading platform for zinc. The LME sets the prescribed criteria for
shape, weight and quality and stocks are stored in LME warehouses. Prices are set amongst producers,
consumers, funds and speculators on the exchange and are traded in the spot market or with futures
contracts.
Zinc concentrate agreements are typically set out in contracts during annual negotiations. A
contract for the sale of concentrate from seller to buyer will typically contain details around payment
by the smelter to the mine for 85% of the zinc contained in the concentrate or, if lower an agreed
reduction in payment based on the zinc grade. The paid zinc is valued at the LME zinc price averaged
over an agreed quotational period.
There is also a payment by the mine to the smelter for TC. Typically this will comprise a base
TC and a PP clause. The TC contract may be agreed over 12 months in advance of the actual sale, at
a time when the future zinc price on which the concentrate value will be based is not known. The PP
clause will sometimes be expressed in terms relative to each US cent per lb movement in the zinc
price.
Market outlook
The global recession between October 2008 and February 2009 saw zinc prices decline to around
US$0.50/lb, causing a large number of mine production cuts and closures, and an unprecedented high
level of voluntary smelter production cuts to avoid building uneconomic inventory.
The Wood Mackenzie/Brook Hunt Report forecasts that increases in mine production of 8.2%
(0.9Mt contained zinc) and smelter production of 16.4% (1.8Mt contained zinc) against growth in
consumption of 11.6% (1.2Mt contained zinc) in 2010. The mismatch in growth rates between forecast
mine and smelter production and consumption is expected to widen between 2011 and 2013, thereby
creating an underlying structural surplus that must be removed before market fundamentals are
restored to be supportive of high zinc prices. The Wood Mackenzie/Brook Hunt Report forecasts that
this trend of surplus zinc production will be reversed by 2014 as the increase in demand for refined
zinc and concentrate will outstrip production by 1.6Mt per annum as mines close or are abandoned due
to marginal production.
INDUSTRY OVERVIEW
— 126 —

Zinc supply/demand balance (2000-2025)
2,000
4,000
6,000
8,000
10,000
12,000
14,000
16,000
18,000
20,000
22,000
1990 1995 2000 2005 2010 2015 2020 2025
kt
Probable A ProjectsBase Case Production CapabilityRequirement for Zinc Mine Production
Source: Wood Mackenzie/Brook Hunt Report
The Wood Mackenzie/Brook Hunt Report forecasts an average balanced market price of
US$0.89/lb in 2012, rising to US$1.92/lb in 2016 as the supply deficit reached a peak. At prices of
around US$1.00/lb, the Wood Mackenzie/Brook Hunt Report expects that virtually all of the world’s
zinc miners and smelters will be profitable, at least on a cash basis. Strong supply side response can
be expected with elevated prices, and there is a risk that the eventual surplus will be even greater than
forecast.
Higher prices will encourage the commissioning of new production capacity such that when the
low of the next global business cycle occurs, the concentrate and refined markets will have moved to
surplus. We estimate that 2019 marks the low point of the next price cycle and 2023 the subsequent
high point. Over the forecast period the zinc price is forecast to average US$1.10/lb (in 2010 US$
terms).
INDUSTRY OVERVIEW
— 127 —
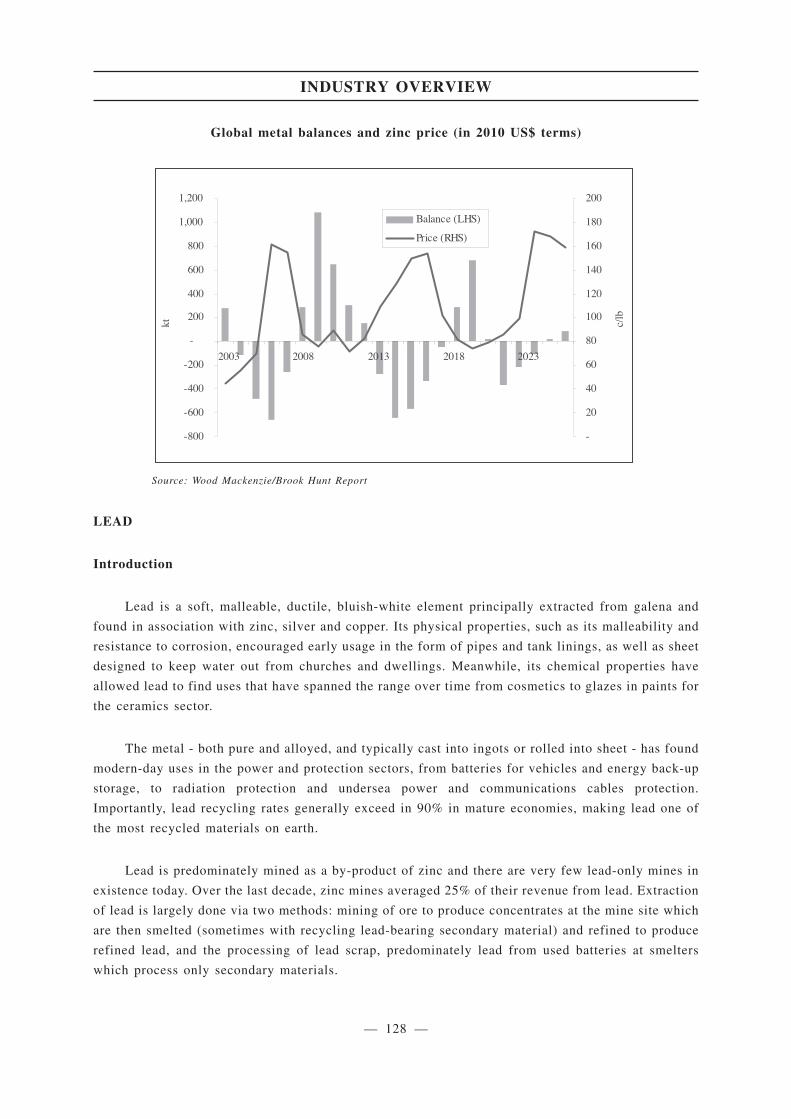
Global metal balances and zinc price (in 2010 US$ terms)
-800
-600
-400
-200
-
200
400
600
800
1,000
1,200
2003 2008 2013 2018 2023
-
20
40
60
80
100
120
140
160
180
200
c/lb
kt
Balance (LHS)
Price (RHS)
Source: Wood Mackenzie/Brook Hunt Report
LEAD
Introduction
Lead is a soft, malleable, ductile, bluish-white element principally extracted from galena and
found in association with zinc, silver and copper. Its physical properties, such as its malleability and
resistance to corrosion, encouraged early usage in the form of pipes and tank linings, as well as sheet
designed to keep water out from churches and dwellings. Meanwhile, its chemical properties have
allowed lead to find uses that have spanned the range over time from cosmetics to glazes in paints for
the ceramics sector.
The metal - both pure and alloyed, and typically cast into ingots or rolled into sheet - has found
modern-day uses in the power and protection sectors, from batteries for vehicles and energy back-up
storage, to radiation protection and undersea power and communications cables protection.
Importantly, lead recycling rates generally exceed in 90% in mature economies, making lead one of
the most recycled materials on earth.
Lead is predominately mined as a by-product of zinc and there are very few lead-only mines in
existence today. Over the last decade, zinc mines averaged 25% of their revenue from lead. Extraction
of lead is largely done via two methods: mining of ore to produce concentrates at the mine site which
are then smelted (sometimes with recycling lead-bearing secondary material) and refined to produce
refined lead, and the processing of lead scrap, predominately lead from used batteries at smelters
which process only secondary materials.
INDUSTRY OVERVIEW
— 128 —
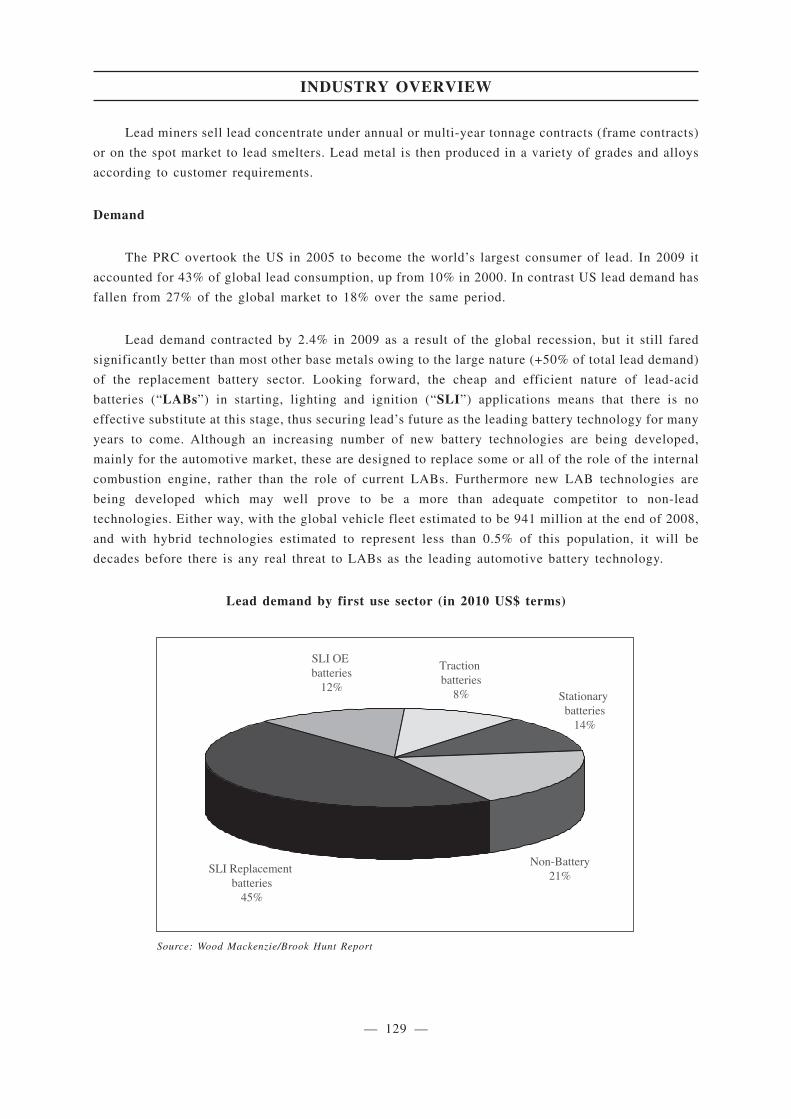
Lead miners sell lead concentrate under annual or multi-year tonnage contracts (frame contracts)
or on the spot market to lead smelters. Lead metal is then produced in a variety of grades and alloys
according to customer requirements.
Demand
The PRC overtook the US in 2005 to become the world’s largest consumer of lead. In 2009 it
accounted for 43% of global lead consumption, up from 10% in 2000. In contrast US lead demand has
fallen from 27% of the global market to 18% over the same period.
Lead demand contracted by 2.4% in 2009 as a result of the global recession, but it still fared
significantly better than most other base metals owing to the large nature (+50% of total lead demand)
of the replacement battery sector. Looking forward, the cheap and efficient nature of lead-acid
batteries (“LABs”) in starting, lighting and ignition (“SLI”) applications means that there is no
effective substitute at this stage, thus securing lead’s future as the leading battery technology for many
years to come. Although an increasing number of new battery technologies are being developed,
mainly for the automotive market, these are designed to replace some or all of the role of the internal
combustion engine, rather than the role of current LABs. Furthermore new LAB technologies are
being developed which may well prove to be a more than adequate competitor to non-lead
technologies. Either way, with the global vehicle fleet estimated to be 941 million at the end of 2008,
and with hybrid technologies estimated to represent less than 0.5% of this population, it will be
decades before there is any real threat to LABs as the leading automotive battery technology.
Lead demand by first use sector (in 2010 US$ terms)
SLI OE batteries
12%
Traction batteries
8% Stationary batteries
14%
Non-Battery21%
SLI Replacement batteries
45%
Source: Wood Mackenzie/Brook Hunt Report
INDUSTRY OVERVIEW
— 129 —
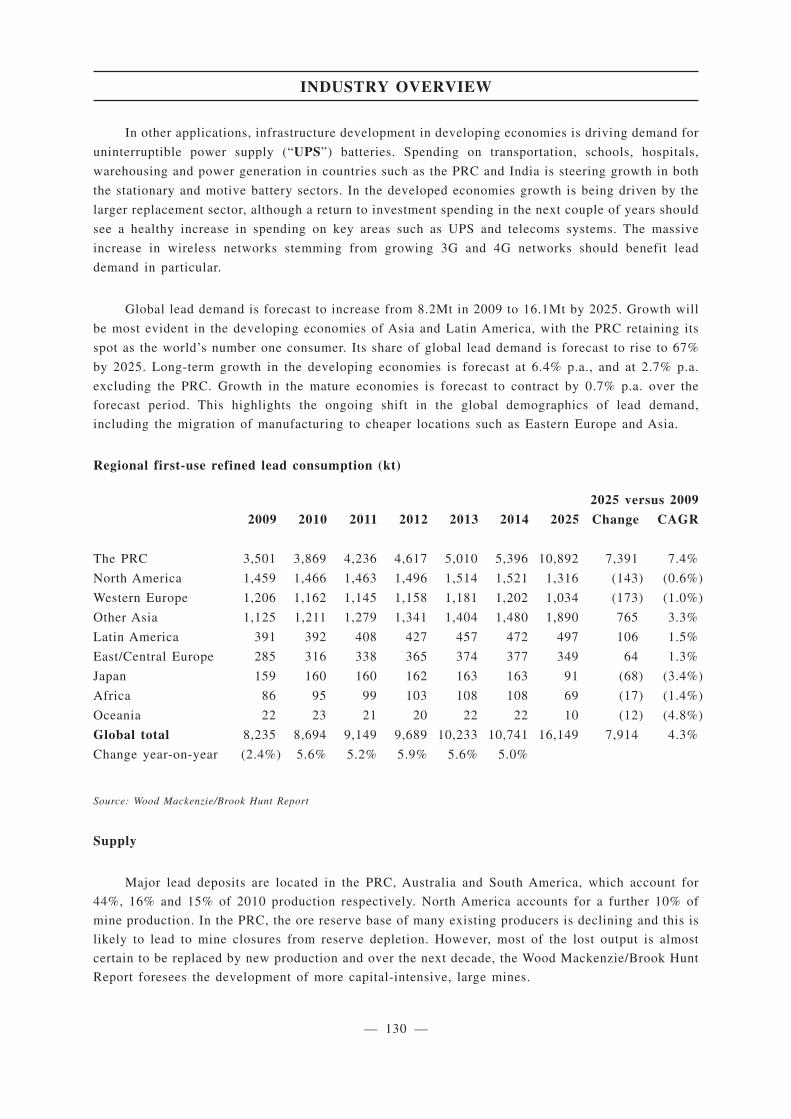
In other applications, infrastructure development in developing economies is driving demand for
uninterruptible power supply (“UPS”) batteries. Spending on transportation, schools, hospitals,
warehousing and power generation in countries such as the PRC and India is steering growth in both
the stationary and motive battery sectors. In the developed economies growth is being driven by the
larger replacement sector, although a return to investment spending in the next couple of years should
see a healthy increase in spending on key areas such as UPS and telecoms systems. The massive
increase in wireless networks stemming from growing 3G and 4G networks should benefit lead
demand in particular.
Global lead demand is forecast to increase from 8.2Mt in 2009 to 16.1Mt by 2025. Growth will
be most evident in the developing economies of Asia and Latin America, with the PRC retaining its
spot as the world’s number one consumer. Its share of global lead demand is forecast to rise to 67%
by 2025. Long-term growth in the developing economies is forecast at 6.4% p.a., and at 2.7% p.a.
excluding the PRC. Growth in the mature economies is forecast to contract by 0.7% p.a. over the
forecast period. This highlights the ongoing shift in the global demographics of lead demand,
including the migration of manufacturing to cheaper locations such as Eastern Europe and Asia.
Regional first-use refined lead consumption (kt)
2025 versus 2009
2009 2010 2011 2012 2013 2014 2025 Change CAGR
The PRC 3,501 3,869 4,236 4,617 5,010 5,396 10,892 7,391 7.4%
North America 1,459 1,466 1,463 1,496 1,514 1,521 1,316 (143) (0.6%)
Western Europe 1,206 1,162 1,145 1,158 1,181 1,202 1,034 (173) (1.0%)
Other Asia 1,125 1,211 1,279 1,341 1,404 1,480 1,890 765 3.3%
Latin America 391 392 408 427 457 472 497 106 1.5%
East/Central Europe 285 316 338 365 374 377 349 64 1.3%
Japan 159 160 160 162 163 163 91 (68) (3.4%)
Africa 86 95 99 103 108 108 69 (17) (1.4%)
Oceania 22 23 21 20 22 22 10 (12) (4.8%)
Global total 8,235 8,694 9,149 9,689 10,233 10,741 16,149 7,914 4.3%
Change year-on-year (2.4%) 5.6% 5.2% 5.9% 5.6% 5.0%
Source: Wood Mackenzie/Brook Hunt Report
Supply
Major lead deposits are located in the PRC, Australia and South America, which account for
44%, 16% and 15% of 2010 production respectively. North America accounts for a further 10% of
mine production. In the PRC, the ore reserve base of many existing producers is declining and this is
likely to lead to mine closures from reserve depletion. However, most of the lost output is almost
certain to be replaced by new production and over the next decade, the Wood Mackenzie/Brook Hunt
Report foresees the development of more capital-intensive, large mines.
INDUSTRY OVERVIEW
— 130 —
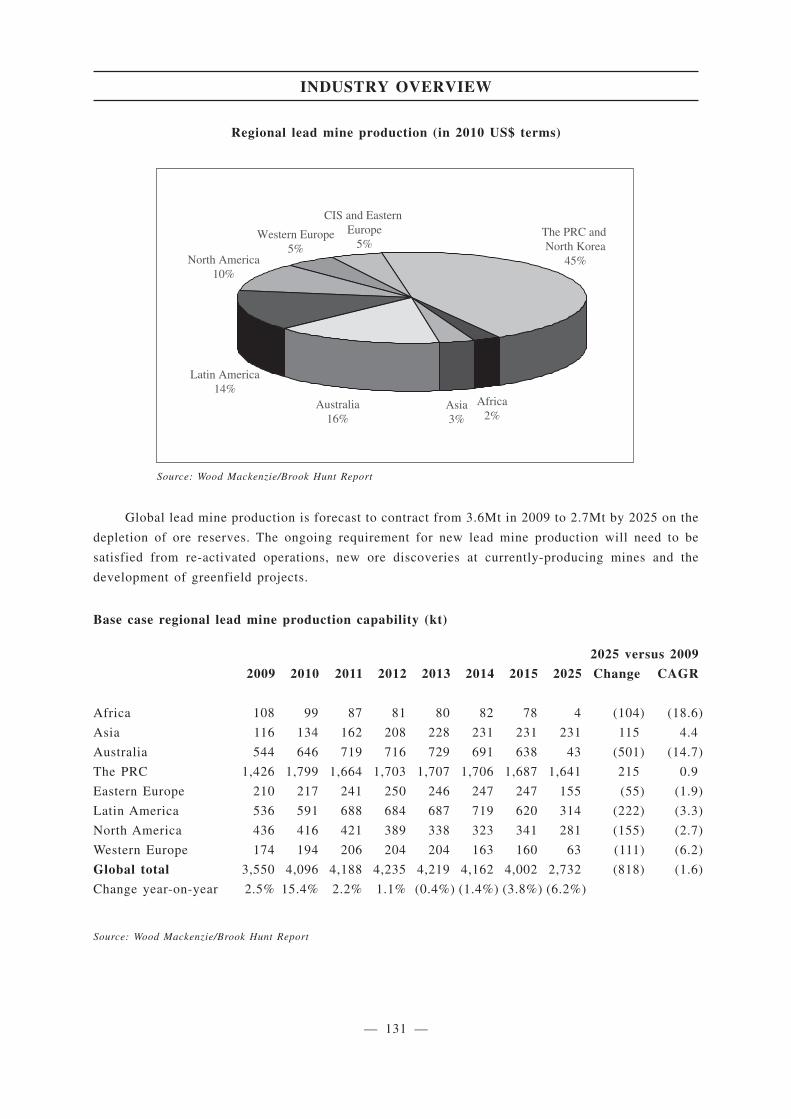
Regional lead mine production (in 2010 US$ terms)
The PRC and North Korea
45%
CIS and Eastern Europe
5%North America
10%
Western Europe5%
Latin America14%
Australia16%
Asia3%
Africa2%
Source: Wood Mackenzie/Brook Hunt Report
Global lead mine production is forecast to contract from 3.6Mt in 2009 to 2.7Mt by 2025 on the
depletion of ore reserves. The ongoing requirement for new lead mine production will need to be
satisfied from re-activated operations, new ore discoveries at currently-producing mines and the
development of greenfield projects.
Base case regional lead mine production capability (kt)
2025 versus 2009
2009 2010 2011 2012 2013 2014 2015 2025 Change CAGR
Africa 108 99 87 81 80 82 78 4 (104) (18.6)
Asia 116 134 162 208 228 231 231 231 115 4.4
Australia 544 646 719 716 729 691 638 43 (501) (14.7)
The PRC 1,426 1,799 1,664 1,703 1,707 1,706 1,687 1,641 215 0.9
Eastern Europe 210 217 241 250 246 247 247 155 (55) (1.9)
Latin America 536 591 688 684 687 719 620 314 (222) (3.3)
North America 436 416 421 389 338 323 341 281 (155) (2.7)
Western Europe 174 194 206 204 204 163 160 63 (111) (6.2)
Global total 3,550 4,096 4,188 4,235 4,219 4,162 4,002 2,732 (818) (1.6)
Change year-on-year 2.5% 15.4% 2.2% 1.1% (0.4%) (1.4%) (3.8%) (6.2%)
Source: Wood Mackenzie/Brook Hunt Report
INDUSTRY OVERVIEW
— 131 —
Global refined lead produced from primary smelters which process concentrates and small
amounts of scrap lead is forecast to increase from 4.5Mt in 2010 to 8.0Mt by 2025, including new
production not yet allocated to individual operations. Refined lead output from secondary smelters
which process scrap only is forecast to increase from 4.1Mt in 2009 to 8.1Mt by 2025. This is to meet
the ongoing requirement for refined lead in light of the forecast contraction of lead mine, and therefore
primary refined, output in the short term, and increasing demand in the longer term.
In 2009, 39% of global refined output came from concentrate with the remainder from scrap. The
Wood Mackenzie/Brook Hunt Report forecasts that refined output from already-identified concentrate
sources will account for less than 20% of total refined output by 2025.
Pricing
The LME is the main global trading platform for lead. The LME sets the prescribed criteria for
shape, weight and quality and stocks are stored in LME warehouses. Prices are set amongst producers,
consumers, funds and speculators on the exchange and are traded in the spot market or with futures
contracts.
Lead concentrate agreements are typically set out in contracts during annual negotiations. A
contract for the sale of concentrate from seller to buyer will typically contain details around payment
by the smelter to the mine for 95% of the lead contained in the concentrate or, if lower, an agreed
reduction in payment based on the lead grade. The paid lead is valued at the LME lead price averaged
over an agreed quotational period.
There is also a payment by the mine to the smelter for a treatment charge (“TC”). Typically this
will comprise a base TC and a price participation (“PP”) clause. The TC contract may be agreed over
12 months in advance of the actual sale, at a time when the future lead price on which the concentrate
value will be based is not known. The PP clause will sometimes be expressed in terms relative to each
US cent per lb movement in the lead price.
Market outlook
Following a substantial 253kt refined surplus in 2009 a further 110kt refined surplus is forecast
for 2010. Lead demand is expected to recover following a contraction of 2.4% last year, but a
year-on-year increase in global refined output will be more than adequate to meet requirements.
Global stocks will remain high, at over 1.1Mt, equivalent to 49 days of consumption at year end. The
Wood Mackenzie/Brook Hunt Report forecasts an average price for the year of US$1,995/t.
The Wood Mackenzie/Brook Hunt Report forecasts a further refined market surplus in 2011
before eroding to a large deficit in 2012. Refined stocks in days of consumption are forecast to
increase further in 2011 as demand growth slows on weaker economic conditions and is outpaced by
growth in refined output, mainly in the PRC. Brook Hunt forecasts an average cash lead price for the
year of US$1,756/t. In 2012 ongoing mine production cutbacks will continue to restrict refined output
INDUSTRY OVERVIEW
— 132 —

growth and, when combined with strong lead demand growth, will quickly erode the refined market
surplus of the previous year, returning the market to a large deficit. Refined stocks will fall to 46 days
of requirement at year end and prices will start to rise accordingly.
Global refined lead balance and price (2008-2025)
-300
-200
-100
100
200
300
400
500
1,500
2,000
2,500
3,000
0
2008 2011 2014 2017 2020 2023
Kt P
b
US$
/t
Refined Balance Price (2010)
Source: Wood Mackenzie/Brook Hunt Report
Forecast cutbacks in lead mine and therefore smelter production, coupled with a recovery in lead
demand, will result in a tight refined market from 2013 to 2015, with prices rising gradually over the
period to peak at US$3,500/t (159¢/lb) in 2015. As these cutbacks ease, and as more secondary output
comes on stream in the medium to long term, the refined market will return to surplus between 2016
and 2020. Prices will fall correspondingly over the period to a cyclical low of US$2,028/t (92¢/lb) in
2019, with refined stocks in days of requirement peaking at 50 days the same year as lead demand
contracts on a forecast economic downturn. From 2021-2025 the refined market will revert to deficit
as lead demand improves following the forecast low in 2019, again resulting in lower refined stock
days and higher prices. The Wood Mackenzie/Brook Hunt Report forecast long-term price over the
period 2010-2025 is US$2,156/t (98¢/lb).
GOLD
Introduction
Gold is a ductile and malleable yellow precious metal that is resistant to air and water corrosion.
It is principally used for the manufacture of jewellery, production of electronics and the storage of
wealth.
INDUSTRY OVERVIEW
— 133 —
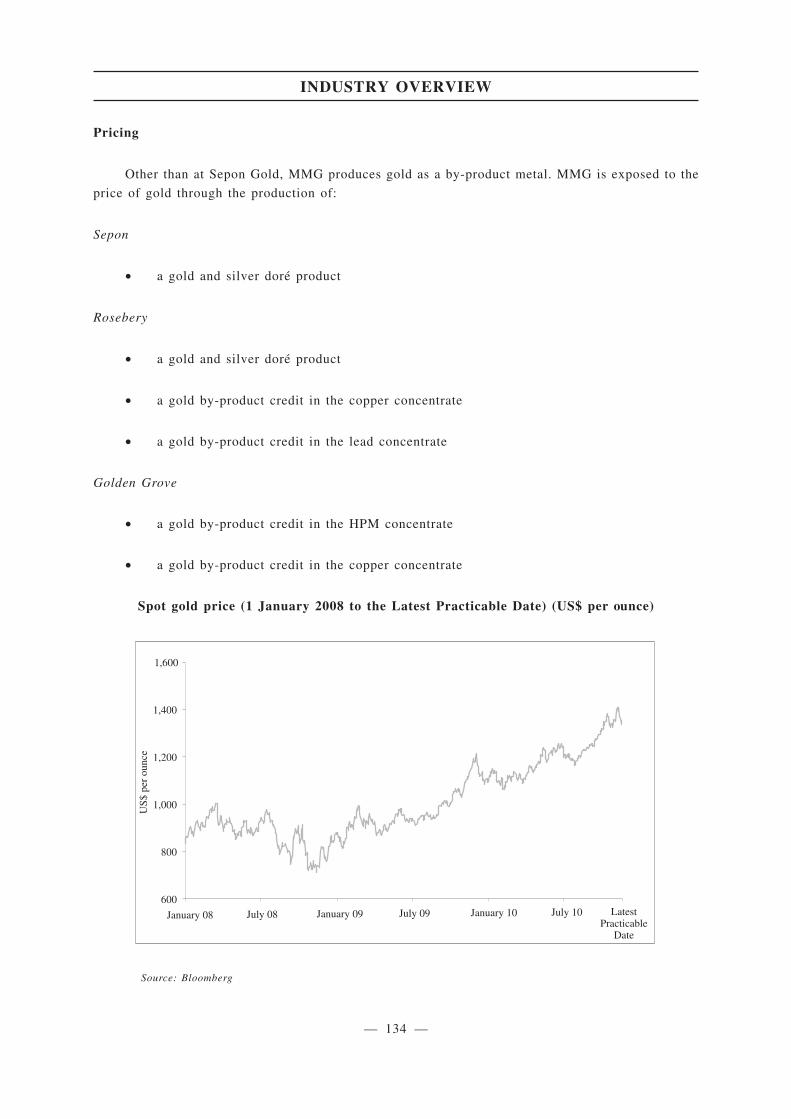
Pricing
Other than at Sepon Gold, MMG produces gold as a by-product metal. MMG is exposed to the
price of gold through the production of:
Sepon
• a gold and silver dore product
Rosebery
• a gold and silver dore product
• a gold by-product credit in the copper concentrate
• a gold by-product credit in the lead concentrate
Golden Grove
• a gold by-product credit in the HPM concentrate
• a gold by-product credit in the copper concentrate
Spot gold price (1 January 2008 to the Latest Practicable Date) (US$ per ounce)
600
800
1,000
1,200
1,400
1,600
January 08 July 08 January 09 July 09 January 10 July 10
US$
per
ounc
e
LatestPracticable
Date
Source: Bloomberg
INDUSTRY OVERVIEW
— 134 —
Like most commodities, the price of gold is driven by supply and demand as well as speculation.
However, unlike most commodities hoarding and disposal plays an important role in affecting the
price of gold. Therefore, the gold price is driven by a broad range of macro economic and policy
factors, particularly those of central banks.
Given the relative contribution of gold revenue to MMG’s overall revenue, which is dominated
by copper and zinc, and the complexity of the drivers of gold price, a detailed consideration of the
factors that drive the price of gold and outlook for gold have not be contemplated in this circular.
SILVER
Introduction
Silver is a soft, white and lustrous metal. Silver has the highest electrical and thermal
conductivity amongst all metals and is one kind of precious metals. It has been used for a variety of
purposes, such as manufacturing (for example the manufacture of jewellery and silverware), industrial
(for example its use in electronic and electrical applications) and investment purposes.
Pricing
Silver is a by-product metal that MMG produces. MMG is exposed to the price of silver through
the production of:
Sepon
• a gold and silver dore product
Century
• a silver by-product credit in the lead concentrate
Rosebery
• a gold and silver dore product
• a silver by-product credit in the lead concentrate
• a silver by-product credit in the copper concentrate
• a silver by-product credit in the zinc concentrate
Golden Grove
• a silver by-product credit in the HPM concentrate
• a silver by-product credit in the zinc concentrate
INDUSTRY OVERVIEW
— 135 —
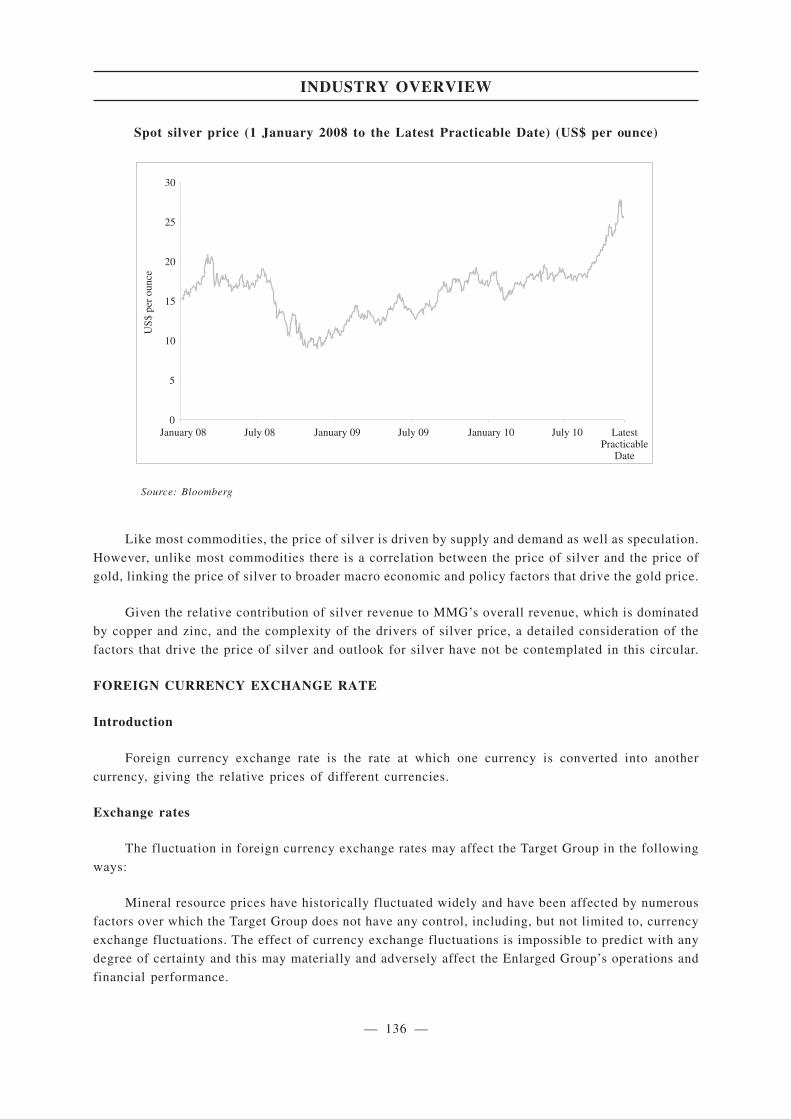
Spot silver price (1 January 2008 to the Latest Practicable Date) (US$ per ounce)
0
5
10
15
20
25
30
January 08 July 08 January 09 July 09 January 10 July 10
US$
per
ounc
e
LatestPracticable
Date
Source: Bloomberg
Like most commodities, the price of silver is driven by supply and demand as well as speculation.
However, unlike most commodities there is a correlation between the price of silver and the price of
gold, linking the price of silver to broader macro economic and policy factors that drive the gold price.
Given the relative contribution of silver revenue to MMG’s overall revenue, which is dominated
by copper and zinc, and the complexity of the drivers of silver price, a detailed consideration of the
factors that drive the price of silver and outlook for silver have not be contemplated in this circular.
FOREIGN CURRENCY EXCHANGE RATE
Introduction
Foreign currency exchange rate is the rate at which one currency is converted into another
currency, giving the relative prices of different currencies.
Exchange rates
The fluctuation in foreign currency exchange rates may affect the Target Group in the following
ways:
Mineral resource prices have historically fluctuated widely and have been affected by numerous
factors over which the Target Group does not have any control, including, but not limited to, currency
exchange fluctuations. The effect of currency exchange fluctuations is impossible to predict with any
degree of certainty and this may materially and adversely affect the Enlarged Group’s operations and
financial performance.
INDUSTRY OVERVIEW
— 136 —

The Target Group generates the majority of its revenue in United States dollars, while a
significant portion of the Target Group’s operating costs are denominated in Australian dollars. Hence,
the exchange rates of the Australian dollar against the United States dollar will impact on the cost
competitiveness, profitability and financial position of the Target Group, without the offsetting
improvement or deterioration in US dollar-denominated commodity prices. The appreciation of the
Australian dollar against the United States dollar may have an adverse impact while the depreciation
of the Australian dollar against the US dollar may have a favourable impact, in each case the Target
Group’s revenue and operating costs.
The Target Group has no currency hedging in place at present.
Exchange rates of the Australian dollar against the United States dollar
(1 January 2008 to the Latest Practicable Date) (US$/A$ exchange rate)
0.9
1
1.1
1.2
1.3
1.4
1.5
1.6
1.7
1.8
January 08 July 08 January 09 July 09 January 10 July 10
A$
per
US$
1
LatestPracticable
Date
Source: Bloomberg
INFORMATION AND DATA FROM THE WOOD MACKENZIE/BROOK HUNT REPORT
The Company commissioned Wood Mackenzie, a provider of market intelligence, to prepare and
compile certain information and data relating to copper, lead, nickel and zinc to form the Wood
Mackenzie/Brook Hunt Report, being a report issued by Wood Mackenzie under the brand name, Wood
Mackenzie/Brook Hunt.
Brook Hunt has been a subsidiary of Wood Mackenzie since 2008. Wood Mackenzie is well
known for a broadly analogous range of research and consulting services to the global energy industry.
INDUSTRY OVERVIEW
— 137 —
About Brook Hunt
Brook Hunt was formed in 1975 and is wholly focused on the analysis of the global base and
precious metals markets: aluminium, copper, lead, gold, nickel, silver and zinc. It has over 200
customers in 50 countries with four overlapping business activities:
• Competitive analysis of mines, refineries and smelters.
• Raw materials markets and flows.
• Market analysis and forecasts of metal and raw materials prices.
• Bespoke consultancy services: advisory, expert witness, IPOs, market studies, project
evaluation, strategy, and valuations
Brook Hunt has an excellent reputation for independent in-depth analysis of the metal and
mineral industries and markets. Its highly qualified and experienced team is drawn from the mining
and metals industry, with geologists, engineers, economists and statisticians. Since its formation in
1975 the company has invested continually in the development of its global industry data base.
About the Wood Mackenzie/Brook Hunt Report
The Company paid Wood Mackenzie a fee of GBP40,000, which the Directors consider as
reflecting market rates, to compile and prepare the information and data relating to copper, lead,
nickel and zinc which is included in this section. The information and data commissioned by the
Company has been compiled and prepared by Wood Mackenzie based on publicly available
governmental and industry information and its proprietary databases.
Parameters and assumptions used in preparing the Wood Mackenzie/Brook Hunt Report
The assumptions used in the Wood Mackenzie/Brook Hunt Report are based upon Wood
Mackenzie’s “business as usual” scenario and do not take into account unusual or infrequent market
events. The underlying assumptions rely on Wood Mackenzie’s in-house macroeconomics team’s
forecasts for Industrial Production, Gross Domestic Product and other variables relevant to the metal
industry.
The Wood Mackenzie/Brook Hunt Report and its data have been prepared by Wood Mackenzie’s
metal market experts, with experience of between 10 and 30 years in their respective metals. Forecast
data is based upon available historic industry data, in conjunction with Wood Mackenzie’s proprietary
research and are derived using Wood Mackenzie’s in-house model and expertise.
INDUSTRY OVERVIEW
— 138 —
The information upon which the Wood Mackenzie/Brook Hunt Report is based comes from Wood
Mackenzie’s own experience, knowledge and databases. The opinions expressed in the Wood
Mackenzie/Brook Hunt Report are those of Wood Mackenzie. They have been arrived at following
careful consideration and enquiry. Wood Mackenzie does not guarantee their fairness, completeness
or accuracy. The opinions, as of the Latest Practicable Date, are subject to change. Wood Mackenzie
does not accept any liability for the Shareholders’ reliance upon such information. Notwithstanding
the above, given that the opinions expressed in the Wood Mackenzie/Brook Hunt Report have been
arrived at following careful consideration and enquiry, the Directors believe that the Wood
Mackenzie/Brook Hunt Report is an appropriate source of the information contained therein and set
out in this circular, and have no reason to believe that such information is false or misleading or that
any fact has been omitted that would render such information false or misleading.
INDUSTRY OVERVIEW
— 139 —
A summary of the legal and regulatory regime in which the Operating Mines and Development Projects
are situated is set out below.
LAOS
LAWS AND REGULATIONS APPLICABLE TO THE MINING INDUSTRY & MMG
Current licence of MMG
Mining activities in Laos are primarily governed by the Mineral Law No.04/NA, dated 8
December 2008, (the “Mineral Law”), which replaced Law No.04/97/NA on Mining, dated 12 April
1997. Although the Mineral Law was promulgated on 8 December 2008 it was only made publicly
available in late 2009, but has been in effect since 18 March 2009.
Article 102 of the Mineral Law provides that “Individuals and organizations that have received
mining licences pursuant to the 1997 Mining Law or in accordance with contracts effective prior to
this Law coming into force may continue their mining business operations in accordance with the
terms and conditions of such contracts. Any person having been authorised to operate mining
activities in accordance with previously established contracts and wishing to apply this amended law
shall inform the concerned authority within one hundred and twenty days from the entry into force of
this Law”. Therefore the Mineral Law will not affect mining licences or concession agreements
obtained or entered into prior to the Mineral Law, unless the holder of such licence or agreement
advised the concerned authority of its desire to have the Mineral Law apply to its operations.
MMG Laos Holdings Limited entered into the MEPA prior to the effective date of the Mineral
Law. The MEPA sets out the terms and conditions for MMG’s operations in Laos and contains
provisions relating to the exploration and production of copper and gold. The MEPA, in essence, is
MMG’s mining licence and provides the terms in which MMG shall conduct such operations in Laos.
The Target Group (and the relevant predecessor company) has been successfully operating under the
MEPA for almost 20 years and has maintained a good relationship with the Government of Laos.
Future licence(s) of MMG
As regards any future mining licence(s) of MMG in Laos which are not covered under the MEPA,
the provisions of the Mineral Law shall apply.
Additional details regarding the implementation of the Mineral Law will be provided in a
supplementary decree. This decree is currently being drafted by the Government of Laos and a
timeline for its completion has not been provided.
Like other natural resources in Laos, all minerals are the property of the national community, to
be managed in a centralised and uniform manner by the Government of Laos. The Mineral Law is
administered by the Ministry of Energy and Mines (the “MEM”).
LEGAL AND REGULATORY REGIME IN WHICH THE TARGET GROUP OPERATES
— 140 —

The Mineral Law requires permission to be obtained from the MEM for various mining activities,
including (i) the gathering of basic geological data; (ii) the analysis of mineral samples in Laos or
overseas; (iii) the granting of licences for prospecting, exploration and mining activities; and (iv) the
establishment of a mineral processing plant.
Mineral exploration and exploitation activities are open to investment from both domestic and
foreign entities. Mining activities, including exploration and exploitation, are subject to the
negotiation of a concession agreement with the Government of Laos, per the requirements of the new
Law on the Promotion of Investment No. 02/NA, dated 8 July 2009 (the “New Investment Law”).
INVESTMENT APPLICATION
Laos law does not allow foreign companies or investors to engage directly in mineral exploration
and mining activities in Laos. Thus, in conjunction with the above mining activity approval, the
Mineral Law requires the establishment of a foreign invested entity incorporated in Laos under the
Enterprise Law No.11/NA, dated 9 November 2005 (the “Enterprise Law”), such as a limited
company, joint venture or partnership to conduct mining activities.
The following are the general application and licensing procedures which would be involved in
setting up a foreign-invested entity in Laos:
(i) Reservation of the company name with the Ministry of Industry and Commerce (“MoIC”);
(ii) Application for the foreign investment licence to the Ministry of Planning and Investment
(“MPI”) for the foreign investment licence;
(iii) Approval of the Articles of Association from MPI (including registration of such Articles);
(iv) Application to MoIC for the enterprise registration certificate;
(v) Application to the Ministry of Finance for the tax registration certificate;
(vi) Application to the MEM for business operating licences such as those required under the
Mineral Law and New Investment Law;
(vii) Application to the Ministry of Security for the company seal;
(viii) Application to the Ministry of Information & Culture for the company signage licence; and
(ix) Application to the Bank of Laos for the capital importation certificate (this can only be
obtained when the capital is paid into the Laos).
The above procedures are currently required by the Government of Laos to register and certify
a foreign invested entity under the Law on the Promotion and Management of Foreign Investment
No.11/NA, dated 22 October 2004 (“2004 Foreign Investment Law”). The New Investment Law,
when effective, will modify the above procedure. The Government of Laos has, however, instructed
companies to continue to follow the 2004 Foreign Investment Law for the indefinite future.
LEGAL AND REGULATORY REGIME IN WHICH THE TARGET GROUP OPERATES
— 141 —
Under either the 2004 Foreign Investment Law or New Investment Law, a concession agreement
with the Government of Laos is required in the mining sector.
CONCESSION AGREEMENT
Mining activities, including exploration and exploitation, currently require a concession right to
be granted from the Government of Laos. The MEPA is a form of concession agreement in the mining
sector covering both exploration and exploitation activities.
The Government of Laos may recommend a standardised concession form. However, the content
of the agreement is open to discussion and can encompass a range of business operating licences and
approvals and investment conditions.
Concession agreements can also include exemptions to or modifications from requirements of
Laos laws. Generally, all exemptions to Laos laws contained in the concession agreement should be
approved by the National Assembly or the National Assembly Standing Committee
ADDITIONAL COMPLIANCE
Mining activities will generally involve activities such as the use of explosives, import of
equipment and construction. Even though the MEPA approves these related activities in principle, the
project company (Lane Xang Minerals Limited) may still be required to obtain relevant
certificates/permits from the authorities who have the supervisory authority of such activity. For a
company who is licensed to undertake mining activities, the most common certificates/permits to be
obtained in addition to the ones mentioned in the paragraphs headed “Legal and regulatory regime in
which the Target Group operates — Laos — Investment application” and “Legal and regulatory regime
in which the Target Group operates — Laos — Concession agreement” above are: environmental
certificate from the Water Resource and Environment Authority, social security registration certificate
from the Social Security Organization, approval of health impact assessment from the Ministry of
Public Health, permit for construction from the Ministry of Public Works and Transportation, permit
for use of explosives from the Ministry of Defence and licence for import of equipment from the
MoIC.
AUSTRALIA
WESTERN AUSTRALIA
MINING LAW
In Australia, legislation regulating the exploration for and production of minerals is the
responsibility of the individual States. The Mining Act 1978 (WA) (“Mining Act”) and Mining
Regulations 1981 (WA) (“Mining Regulations”) are the principal means of regulating the exploration
for and mining of minerals within Western Australia.
LEGAL AND REGULATORY REGIME IN WHICH THE TARGET GROUP OPERATES
— 142 —
A mining title must be obtained before any exploration or mining operations may be undertaken
in respect of minerals which are the property of the Crown. Under the Mining Act, exploration and
mining tenements are granted by the Minister. There are a number of procedural steps which must be
followed before a tenement is granted.
The main types of tenements granted under the Mining Act are:
• prospecting licences;
• exploration licences;
• mining leases;
• general purpose leases; and
• miscellaneous licences.
Where a resource has been identified but is considered not to be capable of commercial
exploitation, a retention licence can be applied for, or an application can be made to convert the
relevant tenement to ‘retention status’.
Some of the basic features of these tenements are outlined below.
On 10 February 2006, the Mining Act was amended and the regime which applies to tenements
applied for on or after this date is slightly different to the regime which applies to certain tenements
granted or tenement applications in existence before 10 February 2006. Both regimes are outlined
below.
MINING TENEMENTS
Prospecting licence
General
A prospecting licence authorises the holder to enter the land to prospect for all minerals (except
iron ore unless expressly authorised by the Minister).
Term
Prospecting licences granted prior to 10 February 2006 have a term of four years with no
renewals. Those issued after that date have a term of four years with the provision to extend for one
further four year period. If a prospecting licence is granted ‘retention status’, there is an ability to
further extend the term.
LEGAL AND REGULATORY REGIME IN WHICH THE TARGET GROUP OPERATES
— 143 —
Rights
The holder of a prospecting licence has a priority right during its term to apply for one or more
mining leases over the whole or part of the area of the prospecting licence. Pending determination of
the application for a mining lease, the prospecting licence remains in force notwithstanding the expiry,
in the interim, of its four year term.
The holder of a prospecting licence may, in accordance with the licence conditions, extract or
disturb up to 500 tonnes of material from the ground, including overburden, and the Minister may
approve extraction of larger tonnages.
Exploration licence
General
In Western Australia, all large-scale exploration is carried out under an exploration licence. The
rights conferred by an exploration licence are substantially the same as those conferred by a
prospecting licence.
Term
An exploration licence granted or applied for before 10 February 2006 will remain in force for
five years from the date of grant and may be renewed by the Minister, in certain circumstances, for
up to a total further period of four years, after which one or more extensions of one year are available
in exceptional circumstances.
An exploration licence applied for on or after 10 February 2006 will remain in force for five
years from the date of grant and may be renewed by the Minister for five years (plus further renewals
of two years each if prescribed grounds exist).
Rights
The holder of an exploration licence has a priority right, during its term, to apply for one or more
mining leases over the whole or part of the area of the exploration licence. Pending determination of
the application, the exploration licence remains in force notwithstanding the expiry, in the interim, of
its term.
The holder of an exploration licence may, in accordance with the licence conditions, extract or
disturb up to 1,000 tonnes of material from the ground, including overburden, and the Minister may
approve extraction of larger tonnages.
If the exploration licence was applied for on or after 10 February 2006, the licensee will need
to provide a mining proposal detailing the planned mining operations or statement setting out the
likely mining operations, together with a mineralisation report containing details of the exploration
results in relation to the area the subject of the mining lease application.
LEGAL AND REGULATORY REGIME IN WHICH THE TARGET GROUP OPERATES
— 144 —
Retention licence and retention status
A retention licence may be granted in respect of the whole or any part of the land formerly within
a prospecting licence, exploration licence or mining lease. The purpose of a retention licence is to
permit the holder to retain title to an identified but marginal mineral resource and the size is
determined accordingly. The term of a retention licence is five years and is renewable for further
periods not exceeding five years.
From 10 February 2006, the holder of a prospecting licence or exploration licence may apply for
retention status for that licence, and not a separate retention licence. The licence will retain its identity
as a prospecting or exploration licence, but the annual expenditure commitment is replaced with a
work program based condition.
Mining lease
General
In Western Australia, all commercial mineral extraction activities must be carried out under a
mining lease.
Term
Based on the current provisions of the Mining Act, a mining lease will remain in force for an
initial term of 21 years and may be renewed, as of right, for a further term of 21 years. The Minister
may renew the term of a mining lease for further successive periods of 21 years.
Rights
The holder of a mining lease is entitled, subject to the Mining Act, to work and mine the land,
take and remove any minerals (except iron ore, unless expressly authorised by the Minister) and
dispose of them, take and divert water subject to the Rights in Water and Irrigation Act 1914 (WA),
and do all things necessary to effectually carry out mining operations in, on or under the land. The
rights conferred are exclusive rights for mining purposes in relation to the land in respect of which
the mining lease was granted.
However, the grant of a mining lease does not in itself confer authority to produce minerals.
Further approvals are generally required before production may commence, including approvals in
respect of environmental impact (please refer to the paragraph headed “Legal and regulatory regime
in which the Target Group operates — Australia — Western Australia — Environment” below).
The holder of a mining lease owns all minerals lawfully mined from the land in accordance with
the mining lease. However, a royalty is payable to the State in respect of all minerals recovered from
a mining lease at the rate prescribed for the relevant commodity in the Mining Act and the Mining
Regulations.
No other mining tenement (except a miscellaneous licence) may be granted over the land.
LEGAL AND REGULATORY REGIME IN WHICH THE TARGET GROUP OPERATES
— 145 —

General purpose lease
General
A general purpose lease is a surface lease which entitles the lessee to erect, place and operate
machinery used in connection with mining operations, to deposit or treat minerals or tailings obtained
from land on which mining operations are carried out and to use the land for any other specified
purpose directly connected with mining operations.
Term
A general purpose lease will remain in force for a term of 21 years and may be renewed, as of
right, for a further 21 years. The Minister may renew the term of a general purpose lease for further
successive periods of 21 years.
Rights
A general purpose lease may be granted pursuant to the Mining Act over any land where the use
of that land is directly connected with mining operations or is for a prescribed purpose under the
Mining Act (for example, depositing or treatment of minerals or tailings).
Miscellaneous licence
General
A miscellaneous licence is ancillary to a mining lease, exploration licence or prospecting licence.
A miscellaneous licence may be granted over any land, including any land the subject of an existing
mining title, whether held by the applicant or by another person.
Term
A miscellaneous licence that was applied for and granted after 6 June 1998 will remain in force
for a term of 21 years, and may be renewed, as of right, for a further 21 years. The Minister may renew
the term of a miscellaneous licence applied for and granted after 6 June 1998 for further successive
periods of 21 years.
Rights
A miscellaneous licence may be granted pursuant to the Mining Act over any land where the use
of that land is directly connected with mining operations and is for a prescribed purpose under the
Mining Regulations (for example, a road or pipeline).
A miscellaneous licence may be applied for over land that is the subject of an existing tenement,
irrespective of whether that existing tenement is held by the applicant for the miscellaneous licence.
The holder of a miscellaneous licence does not therefore have exclusive title to the land over which
the miscellaneous licence is granted.
LEGAL AND REGULATORY REGIME IN WHICH THE TARGET GROUP OPERATES
— 146 —
GENERAL PROVISIONS RELATING TO MINING TENEMENTS IN WESTERN AUSTRALIA
Conversion of prospecting licence and exploration licence to mining lease
The holder of a prospecting licence or an exploration licence may apply to convert such licence
or part thereof to a mining lease. If the underlying prospecting licence or exploration licence would
otherwise expire while the application for a mining lease is pending, it is automatically extended until
the application is determined or the mining lease is granted.
Requirement to meet annual expenditure
Prospecting licences, exploration licences and mining leases are subject to prescribed minimum
annual expenditure commitments. There is no prescribed annual expenditure for a retention licence,
however, the Minister may determine the level of expenditure by condition on grant.
If the minimum expenditure requirement has not been met and a full or partial exemption from
the expenditure requirements has not been applied for or granted, the tenement is liable to forfeiture.
An application for forfeiture may be made by any person (Plaintiff) to the Warden within 8 months
of the end of that tenement year. If the tenement is forfeited, the Plaintiff has an exclusive period in
which to apply for the tenement.
Bonds and securities
Before the Department of Mines and Petroleum (“Department”) grants final approval for mining
to be commenced on any land, the rehabilitation division will assess the level of financial security
required from the proponent to secure its future environmental obligations. Security is almost
invariably required, under the Department’s current practices, in the form of unconditional
performance bonds.
Royalties
When any minerals are produced or obtained from a mining tenement, a monthly production
report must be lodged and a royalty is payable on minerals, including iron ore.
Fees payable and rent
Charges are payable in respect of the various types of tenements on application and by way of
annual rent. Rent is payable annually in advance due on the anniversary date of the commencement
of the term of the tenement and must be paid not later than one month after that date.
Rates
Rates are payable to the Local Government on all tenements.
LEGAL AND REGULATORY REGIME IN WHICH THE TARGET GROUP OPERATES
— 147 —
Liability to pay compensation
Under the Mining Act, native title holders may recover compensation from the holder of a
tenement, rather than the State.
NATIVE TITLE LAW
Background
Until the decision in the Mabo case (please refer to the paragraph headed “Legal and regulatory
regime in which the Target Group operates — Australia — Westen Australia — Native title law — The
major decisions” below) in 1992, the Australian legal system did not recognise that Australia’s
indigenous inhabitants had any rights or interests in relation to land or waters. The Mabo decision
recognised the ‘native title’ rights of Aboriginal people in relation to land where those rights survived
the acquisition of sovereignty by non-indigenous people.
The content of the native title rights enjoyed by a particular group in relation to particular land
or waters will be a question of fact to be proved by evidence. The nature of the rights can vary
considerably from group to group.
The existence, content and ownership of native title rights to particular land or waters are
ascertained under procedures contained in the Native Title Act 1993 (Cth) (“NTA”).
Native title claims and determinations
Aboriginal people can lodge native title claims under the NTA by way of an application for a
determination of native title, filed in the Federal Court. If a claim passes the registration test under
the NTA and is entered on the Register of Native Title Claims, then the registered applicants will
receive the benefit of various procedural rights under the NTA (including the right to negotiate).
After the registration test has been applied, the Federal Court may refer the claim to the National
Native Title Tribunal (“NNTT”) to mediate an outcome satisfactory to both native title claimants and
other interested parties. If these processes are not successful, the Federal Court will list the claim for
a trial to determinate whether or not native title exists. Claims may be heard and determined by the
Federal Court regardless of whether or not the claim passed the registration test under the NTA.
The NTA recognises and protects native title rights and interests. It provides that both native title
holders and registered native title claimants have certain rights under the ‘future act’ provisions of the
NTA in respect of acts (such as the grant of mining and infrastructure titles) that will affect their native
title rights and interests.
A person who holds an interest in land or waters which is affected by a native title claim has a
right to be a respondent party in the Federal Court claim proceedings.
LEGAL AND REGULATORY REGIME IN WHICH THE TARGET GROUP OPERATES
— 148 —
The major decisions
In June 1992, the High Court of Australia delivered its judgment in what has come to be known
as the Mabo case. The Mabo case established that the common law of Australia recognises a form of
native title where certain preconditions can be made out. These preconditions include an ongoing
connection by the native title claimants with the land in question.
In December 1996, the High Court of Australia delivered its judgment in what has come to be
known as the Wik case. The Wik case recognised that some native title rights could co-exist with rights
held under a pastoral lease. In the event of conflicting rights, the rights of the pastoralist will prevail
over those of a native title holder.
In the Fejo case of September 1998, the High Court of Australia determined that the grant of a
freehold title normally extinguishes native title.
On 8 August 2002, the High Court of Australia handed down its decision in the Ben Ward case.
The findings of the High Court of Australia included the following:
• Native title is a bundle of rights deriving from traditional laws and customs acknowledged
and observed by Aboriginal people.
• Native title rights relate to land and waters, although connection does not need to be
established by showing continuous physical use or occupation.
• To determine whether native title has been extinguished requires the identification of and
comparison between the native title rights and interests and the legal nature and incidents
of rights granted under statute or asserted by legislation.
• There may be partial extinguishment of native title rights.
• The grant of a pastoral lease under WA legislation does not give a right of exclusive
possession and does not necessarily wholly extinguish all native title rights and interests.
Any native title right to control access to land or to be asked permission to use or have
access to land will have been extinguished.
• The High Court of Australia held that the evidence in the case did not establish any native
title right or interest in minerals or petroleum. The High Court of Australia also stated that
even if a right in minerals or petroleum had been established those rights would have been
extinguished by the operation of section 117 of the Mining Act 1904 (WA) and section 9 of
the Petroleum Act 1936 (WA). Under those Acts, the Crown in Right of the Commonwealth
of Australia (the “Crown”) took full dominium over minerals and petroleum. We note that
mining leases granted after 1994 do not extinguish native title.
• The High Court of Australia overturned the Full Court of the Federal Court’s finding that
the grant of a mining lease confers exclusive possession and wholly extinguishes native
title. The grant of a mining lease will partially extinguish native title (e.g. the native title
right to control access to the land). The precise extent of extinguishment by the grant of
mining leases will need to be reconsidered by the Full Court of the Federal Court.
LEGAL AND REGULATORY REGIME IN WHICH THE TARGET GROUP OPERATES
— 149 —

• The High Court of Australia held that the Racial Discrimination Act 1975 (Cth) did not
operate to invalidate the grant of mining leases, rather the holders of native title rights
affected may have an entitlement to compensation.
On 12 December 2002, the High Court of Australia handed down its decision in Yorta Yorta
Aboriginal Community v Victoria, clarifying the law with respect to the evidence required to prove
native title. The High Court of Australia held that in order to prove native title, claimants must
establish there has been an acknowledgment and observance of traditional laws and customs on a
substantially uninterrupted basis since sovereignty.
Most native title cases since these decisions are applying the principles set out above to various
factual situations.
Commonwealth legislation
In response to the Mabo case, the Commonwealth Government enacted the NTA, the substantive
provisions of which commenced on 1 January 1994. Its relevance to titles throughout Australia was
that the NTA:
• recognised native title rights and set down some basic principles in relation to native title
in Australia;
• provided for the validation of so called ‘past acts’, including the grant of certain titles and
the construction of valid public works before 1 January 1994, that might otherwise be
invalid because of the existence of native title;
• provided for the protection of native title in the doing of so called ‘future acts’, including
the grant of titles after 31 December 1993; and
• provided for procedures by which native title can be claimed and, if determined to exist,
registered and for compensation to be claimed for the extinguishment or impairment of
native title. The process of determination of the existence of native title does not directly
impact upon the grant or exercise of rights under existing, valid titles.
The NTA was amended with effect from 30 September 1998. From this date the NTA includes
provisions which:
• confirm the validity of certain titles granted by the Commonwealth between 1 January 1994
and 23 December 1996 (the date of the Wik decision), called ‘intermediate period acts’;
• confirm the extinguishment of native title by certain ‘exclusive possession tenures’ granted
by the Commonwealth;
• provide procedures for indigenous land use agreements (“ILUAs”) to be entered into with
indigenous groups which, once registered with the NNTT, will ensure the validity of the
grant of the titles sought; and
LEGAL AND REGULATORY REGIME IN WHICH THE TARGET GROUP OPERATES
— 150 —
• allows States to set up their own alternative processes (consistent with the NTA provisions)
to deal with the grant of mining titles.
Western Australian legislation
Western Australia has passed the Title (Validation) and Native Title (Effect of Past Acts) Act
1995 (WA) (“WA Native Title Act”) which is complementary to the NTA.
The WA Native Title Act validates all past acts attributable to the State of Western Australia,
provides for the extinguishment or suspension of native title in respect of such past acts in line with
the provisions of the NTA, and provides that any compensation claimed by native title claimants in
respect of past acts of the State is to be paid by the State in accordance with the principles of
compensation under the NTA.
The WA Native Title Act was updated in line with the 1998 amendments to the NTA to confirm
the extinguishment of native title by certain ‘exclusive possession tenures’ granted by the State on or
before 23 December 1996.
The WA Native Title Act also confirms the validity of certain titles granted by the State between
1 January 1994 and 23 December 1996.
Existence of native title
The existence of native title claims covering an area does not mean that native title will
ultimately be found to exist in that area. Conversely, the absence of native title claims in an area does
not mean that native title does not exist in that area.
Whether native title is found to exist in the area will not be determined until there is an approved
determination of native title by the Federal Court.
Extinguishment of native title
The NTA, in conjunction with the relevant State native title legislation, provides that native title
has been wholly extinguished over land that was the subject of ‘previous exclusive possession acts’
attributable to the Commonwealth or the State.
An act is a ‘previous exclusive possession act’ if it took place on or before 23 December 1996
and consists of the valid or validated grant or vesting of any of the following:
• a ‘Scheduled Interest’ (explained below);
• a freehold estate;
• a commercial lease;
• an exclusive agricultural or exclusive pastoral lease;
LEGAL AND REGULATORY REGIME IN WHICH THE TARGET GROUP OPERATES
— 151 —
• a residential lease;
• a community purpose lease;
• any lease (other than a mining lease) that confers a right of exclusive possession; and
• an act that consists of the construction of establishment and any public work that
commenced before 23 December 1996.
Of particular importance to each State are the ‘Scheduled Interests’. The NTA contains a
schedule which lists certain interests in the States and Territories in respect of which extinguishment
of native title may be confirmed by State/Territory legislation.
In addition, native title may otherwise have been extinguished at common law if the rights
conferred by or granted under statutes are wholly inconsistent with native title rights and interests.
The validity of titles
Pre 1994 titles - validation of past acts
All titles which were granted prior to 1 January 1994 and which would otherwise have been
invalid because of the existence of native title have been validated. Accordingly, those titles can be
regarded as valid and all rights granted thereunder are fully exercisable.
Even if a native title claim is subsequently made or native title is determined to exist over an area
of land the subject of such title, the title will remain valid for the duration of its term.
If native title is determined to exist on land the subject of a title that is a mining or other title
(other than freehold, certain leases and certain public works):
• the native title will be taken to have been suspended, not extinguished;
• native title holders will be entitled to receive compensation from the State Government; and
• upon expiry of the mining or other title, the native title rights will revive.
Titles granted after 1 January 1994
The grant of all titles affecting native title after 1 January 1994 are subject to the provisions of
the NTA.
The grant of a mining title is an act that is capable of affecting native title and must therefore
comply with the future act processes under the NTA. These processes may include the ‘right to
negotiate’ procedures which involve negotiation between the State, the applicant for the title and
native title claimants. If the issue cannot be resolved by negotiation it is referred to the NNTT for
determination.
LEGAL AND REGULATORY REGIME IN WHICH THE TARGET GROUP OPERATES
— 152 —
Certain titles granted between 1 January 1994 and 23 December 1996
The various States granted certain mining titles between 1 January 1994 and 23 December 1996
(the date of the decision of the Wik case) other than in compliance with the NTA. Titles were granted
over pastoral lease land on the assumption that the grant of pastoral leases had extinguished native
title. Those grants did not therefore comply with the provisions of the NTA.
The decision in the Wik case determined that the grant of a pastoral lease did not necessarily
extinguish native title. As such, there was a risk that titles granted over pastoral leases without
complying with the NTA were potentially invalid.
Amendments to the NTA in 1998 provided that grants that were made between 1 January 1994
and 23 December 1996 over land which had at any time:
• been the subject of a grant of a freehold estate or a lease (other than a mining lease); or
• on which there had been constructed or established a public work,
were ‘intermediate period acts’ and were validated.
Accordingly, mining titles granted other than in accordance with the NTA over pastoral lease
land between 1 January 1994 and 23 December 1996 have been validated.
Valid titles and the exercise of rights
The holder of a valid mining title may exercise all of the rights under that title without
interference from native title holders or claimants (confirmed in section 44H of the NTA).
The grant of future titles
The NTA provides that future acts can be invalid to the extent that they affect native title. A
future act that affects native title will not be invalid to any extent under the NTA if it is covered by
any of the provisions of Division 3 of the NTA. If the future act is not covered by any of those
provisions, the act will be invalid to the extent of any inconsistency with native title. Of course, if it
is not inconsistent with native title, it will not be invalid to any extent under the NTA.
Invalid titles and native title risk
If land titles are invalid or invalid to the extent of any inconsistency with native title, the native
title holders may be able to obtain injunctions to stop a potential trespass or other acts that may
infringe their native title rights. Native title claimants may apply for injunctions to preserve the
subject matter of their native title claim.
Native title holders may also be entitled to damages for the effect on their native title rights of
past operations and works.
LEGAL AND REGULATORY REGIME IN WHICH THE TARGET GROUP OPERATES
— 153 —
Aboriginal land
There are various statutory interests in land which give rise to additional procedural
requirements in relation to access and grant of overlapping tenure, for example the requirements of
the Aboriginal Affairs Planning Authority Act 1972 (WA) or Aboriginal Land Act 1991 (Qld).
Compensation
Under the NTA, if a determination is made that native title exists in relation to the land or waters
over which valid tenements have been granted, then the native title holders will be entitled to receive
compensation for the effect of the grant of those tenements on their native title rights and interests.
CULTURAL HERITAGE LAW
General overview
The States and the Commonwealth have implemented legislation directed at the protection of
Aboriginal and Torres Strait Islander heritage sites to protect areas and objects of archaeological
and/or cultural significance.
A place or object may be of cultural significance because it is of religious significance to
indigenous people, is a burial place, forms part of Aboriginal dreamtime stories, etc. Places that are
not necessarily of cultural significance to indigenous people, but are of archaeological significance,
are also protected.
Risk generally
Indigenous objectors who wish to stop or delay a project on indigenous heritage grounds have
recourse to a number of legal remedies not available to non-indigenous objectors as well as generally
available legal remedies, under environmental, planning and other laws.
The legal remedies specifically available to indigenous objectors in respect of indigenous
heritage issues are:
• emergency and permanent declarations under the Aboriginal and Torres Strait Islander
Heritage Protection Act 1984 (Cth);
• Supreme Court injunctions (interim and permanent) to prevent anticipated breaches or to
stop breaches of State legislation protecting Aboriginal or Torres Strait Islander heritage;
and
• Supreme Court injunctions (interim and permanent) to prevent anticipated breaches or to
stop breaches of any contractual obligations in relation to heritage.
These remedies will involve a claim that proposed operations are to be conducted on a site or
area of indigenous cultural significance, and will involve damage to or desecration of that site or area.
LEGAL AND REGULATORY REGIME IN WHICH THE TARGET GROUP OPERATES
— 154 —
Indigenous objectors may also be able to take action seeking damages for breach of contract
and/or loss or damage to sites or objects of significance, or ask for a place to be inscribed on the
National Heritage List under the Environment Protection and Biodiversity Conservation Act 1999
(Cth).
Certain breaches of indigenous heritage legislation constitute an offence the commission of
which may not only result in fines, but also give rise to significant reputational effects.
Commonwealth legislation
The Aboriginal and Torres Strait Islander Heritage Protection Act 1984 (Cth) (“CommonwealthHeritage Act”) provides for the preservation and protection of areas and objects throughout Australia
which are of particular significance to Aboriginals (including Torres Strait Islanders). This Act is
currently under review by the Commonwealth.
The areas to which the Commonwealth Heritage Act applies are ‘significant Aboriginal areas’.
A significant Aboriginal area is an area of land or water within Australia which is of ‘particular
significance to Aboriginals in accordance with Aboriginal custom’.
The Commonwealth Heritage Act does not automatically apply to sites within each State, even
if they are ‘significant Aboriginal areas’. The application of the Commonwealth Heritage Act is only
triggered when the Minister or an ‘authorised officer’ receives an application from an Aboriginal
group for a declaration in respect of a particular area or object. A declaration made in response to such
an application has the effect of prohibiting injury to, or the desecration of, the particular area, object
or class of objects specified in the declaration, wherever it is situated.
Section 9 of the Commonwealth Heritage Act permits the Minister to make an emergency
declaration following an application from an Aboriginal group or its representative requesting that a
particular area be protected or preserved. The Minister must be satisfied that:
• the area falls within the definition of ‘significant Aboriginal area’; and
• the area is under ‘serious and immediate threat of injury or desecration’.
The Minister can also make declarations which are effective for a longer period. However, the
Minister must first be satisfied that the area is a significant Aboriginal area under threat of injury or
desecration. The Minister must also commission and consider a report dealing with certain issues.
Western Australian legislation
The Aboriginal Heritage Act 1972 (WA) (“WA Heritage Act”) provides for the protection and
preservation of places and objects in Western Australia which are significant by reason of their
association with the cultural heritage of Aboriginal people. The places to which the WA Heritage Act
applies are described as ‘Aboriginal sites’ and include:
LEGAL AND REGULATORY REGIME IN WHICH THE TARGET GROUP OPERATES
— 155 —
• places where Aboriginals have (or appear to have) left objects associated with their cultural
life;
• sacred, ceremonial or ritual sites; and
• places which are (or were) associated with Aboriginals and should be preserved because of
their significance to the cultural heritage of the State.
The WA Heritage Act provides for the protection of, and regulates conduct which may impact
upon, Aboriginal sites and objects.
Environment Protection and Biodiversity Conservation Act 1999 (Cth) (“EPBC Act”)
There are also three areas of heritage protection in the EPBC Act:
• the World Heritage values of a declared World Heritage property;
• the National Heritage values of a National Heritage place; and
• places listed on the Commonwealth heritage register.
Declared world heritage properties
A property included in the World Heritage List is a ‘declared World Heritage property’.
A property specified in a declaration made under section 14 of the EPBC Act is a declared World
Heritage property for the period for which the declaration is enforceable.
National heritage list
A place may be included in the National Heritage List only if:
• the place is within the Australian jurisdiction; and
• the Minister is satisfied that the place has one or more National Heritage values.
A place has a National Heritage value if it meets one of the National Heritage criteria, which
includes ‘the place has outstanding heritage value to the nation because of the place’s importance as
part of indigenous tradition’.
ENVIRONMENT
The environment in Western Australia is regulated by a wide variety of laws. This overview
highlights the most significant of those that are relevant to mining operations in Western Australia.
LEGAL AND REGULATORY REGIME IN WHICH THE TARGET GROUP OPERATES
— 156 —
The Environmental Protection Act 1986 (WA) (“EP Act”) is the primary source of environmental
regulation in Western Australia. This overview is divided into two main parts, namely approvals and
compliance.
Approval of proposals
Background
The EP Act requires that a proposal that appears likely, if implemented, to have a significant
effect on the environment, is to be the subject of assessment by the Environmental Protection
Authority (“EPA”) and then subject to a decision by the Environment Minister by way of a Ministerial
Statement.
EPA review of proposal
An environmental review document, to be prepared by the proponent of a project, is generally
required to be submitted to the EPA for assessment.
Once a proposal is referred to the EPA and a decision is made that formal assessment is required,
all other decision-making authorities are prohibited from making a decision that could have the effect
of causing or allowing the proposal to be implemented until the Ministerial Statement is issued. The
proponent is also prohibited from proceeding with the proposal.
Public review
The proponent then releases for public comment a document which outlines the proposal, its
likely environmental impacts and how they are to be managed or mitigated.
During the public review period, any person may make submissions to the EPA regarding the
proposal.
EPA report
Following the public review process, the EPA prepares an assessment report to the Environment
Minister.
The EPA report provides a recommendation as to whether the proposal may proceed and, if so,
the conditions and procedures to which the proposal should be subject.
Ministerial statement
After appeals have been determined, the Environment Minister will make a decision, the
ministerial statement stating whether the proposal can proceed and if so imposing conditions.
LEGAL AND REGULATORY REGIME IN WHICH THE TARGET GROUP OPERATES
— 157 —

Secondary approvals
An EP Act works approval is required if work is to be carried out in relation to premises which
causes the premises to become a prescribed premises.
A works approval authorises construction work to be carried out on a prescribed premises.
Environmental licences under the EP Act manage the operation of prescribed premises with
respect to emissions. Generally, works approvals are for construction and licences are for operations.
Compliance and offences
Offences
The following is an overview of the main environmental offences under the EP Act. It is an
offence to:
• implement a proposal otherwise than in accordance with the conditions in the Ministerial
Statement.
• fail to comply with any condition in the works approval.
• cause or allow pollution to be caused.
• either:
• emit an unreasonable emission from any premises;
• cause an unreasonable emission to be emitted from any premises;
• either cause or allow to be caused material environmental harm or serious
environmental harm; or
• either cause or allow clearing of native vegetation unless properly authorised.
Penalties for offences are up to A$1 million for companies and A$500,000 and five years
imprisonment for individuals.
Enforcement
In addition to prosecution or amending approvals, the environmental regulator also has a range
of powers which enable it to intervene in the conduct of operations to protect the environment.
LEGAL AND REGULATORY REGIME IN WHICH THE TARGET GROUP OPERATES
— 158 —
EPBC Act
In addition to obtaining WA approval for a project, assessment and approval under the
Commonwealth EPBC Act is required to take an ‘action’ which will have a ‘significant impact’ upon
a matter of national environmental significance. It is an offence to take an ‘action’ that has, will have
or is likely to have a ‘significant impact’ on a matter of National Environmental Significance (“NES”).
The maximum penalty for a company for commission of this offence is A$5.5 million.
Matters of NES under the EPBC Act are:
1 World Heritage properties;
2 National Heritage places;
3 wetlands of international importance (Ramsar Wetlands);
4 listed threatened species and ecological communities;
5 listed migratory species;
6 the Commonwealth marine area; and
7 nuclear actions, including uranium mining.
A ‘controlled action’ is an action which will have or is likely to have a significant impact on a
matter of NES. A person proposing an action who thinks it may be a controlled action must refer the
proposal to the Commonwealth Environment Minister for a decision as to whether or not the action
requires assessment and approval from the Minister.
Like Western Australia, the Commonwealth requires a formal assessment. This can be done in
most cases in conjunction with the State system. At the end of the process, the Commonwealth
Minister grants an approval.
Other environmental laws
There are a range of other environmental statutes that must be considered for planning any new
mining operation in Western Australia. These are briefly summarised below.
The Wildlife Conservation Act 1950 (WA) (“WC Act”) provides for the conservation and
protection of wildlife in Western Australia.
The WC Act provides that all fauna is wholly protected throughout the State unless the Minister
declares otherwise. The WC Act creates offences for taking protected fauna.
The Minister may grant licences to take fauna. These are granted, if needed, following the issue
of a Ministerial Statement.
LEGAL AND REGULATORY REGIME IN WHICH THE TARGET GROUP OPERATES
— 159 —
Water
In Western Australia, the regulation, management, use and protection of water resources is
governed by the Rights in Water and Irrigation Act 1914 (WA) (“RIWI Act”). The right to the use and
control of most surface and ground water is vested in the Crown.
Under the RIWI Act, a licence is required to take water from any water sources to which the
RIWI Act applies. Licences grant limits of water that can be taken by a licensee.
Management of contaminated sites
The Contaminated Sites Act 2003 (WA) provides for the identification, recording, management
and remediation of contaminated sites in Western Australia. Invariably, a mine site will find its way
onto the Contaminated Sites Register and be subject to the obligations under the Act.
Dangerous goods
The Explosives and Dangerous Goods Act 1961 (WA) sets out various requirements in relation
to the storage of explosives and dangerous goods.
Controlled wastes
The Environmental Protection (Controlled Waste) Regulations 2004 (WA) (“CW Regs”) regulate
and impose obligations on the storage and transport of controlled wastes in Western Australia.
OCCUPATIONAL HEALTH AND SAFETY
Key Western Australian legislation
Prescriptive legislation regulates health and safety at mining workplaces in Western Australia.
The principal legislation is the:
• Mines Safety and Inspection Act 1994 (WA) (“MSI Act”); and
• Mines Safety and Inspection Regulations 1995 (WA) (“MSI Regulations”).
There also is a range of ancillary legislation with potential relevance, for example the Dangerous
Goods Safety Act 2004 (WA) and supporting regulations, and the Workers Compensation and Injury
Management Act 1981 (WA).
Duty holders
The MSI Act and MSI Regulations impose health and safety obligations on a range of duty
holders connected with mining workplaces, including employers, employees, persons in control of
mining workplaces, and designers, importers, suppliers and manufacturers of plant (which includes,
for example, machinery, equipment, tools) provided to mining workplaces. The MSI Act also provides
for specific duty holders to be appointed under the MSI Act for each operative mine.
LEGAL AND REGULATORY REGIME IN WHICH THE TARGET GROUP OPERATES
— 160 —
Duties include, for example, an employer’s duty to, so far as practicable, provide and maintain
at a mine a working environment in which their employees are not exposed to hazards.
Penalties
Penalties for breach of this legislation range up to $500,000 (and $625,000 for a subsequent
offence) for a corporation, and $250,000 (and imprisonment for 2 years) (and $312,500 for a
subsequent offence (and imprisonment for 2 years)) for an individual.
QUEENSLAND
MINING LAW
The Mineral Resources Act 1989 (Qld) (“Mineral Resources Act”) and Mineral Resources
Regulation 2003 (Qld) are the principal means of regulating the exploration for and mining of minerals
within Queensland.
With limited exceptions, minerals in Queensland are the property of the Crown in right of the
State.
Under the Mineral Resources Act, exploration and mining tenements are granted by the Mining
Registrar or the Minister. The grant of a tenement is a prerequisite to the conduct of exploration or
mining operations aimed at discovering and extracting minerals owned by the Crown.
There are a number of procedural steps which must be followed before a tenement is granted.
The main types of tenements granted under the Mineral Resources Act are:
• prospecting permits;
• exploration permits;
• mineral development licences;
• mining claims; and
• mining leases.
Some of the basic features of these tenements are outlined below.
LEGAL AND REGULATORY REGIME IN WHICH THE TARGET GROUP OPERATES
— 161 —

MINING TENEMENTS
Prospecting permit
General
A prospecting permit allows small scale prospecting for minerals (excluding coal). There are two
types of prospecting permit:
• a parcel prospecting permit, which is granted for a lot or lots owned by the same person;
and
• a district prospecting permit, which is granted for a mining district.
Security may be imposed by the Mining Registrar before the permit is granted.
Term
A parcel prospecting permit can be granted for a particular parcel of land for a term of three
months. A district prospecting permit can be granted for all available land within a mining district for
a term of 1 to 12 months.
Rights
A prospecting permit authorises entry onto land for the purposes of:
• marking out a mining claim;
• prospecting using metal detectors or other hand held instruments, or sampling using only
hand held implements; and
• mining for a mineral other than coal using non-mechanical manual equipment.
More than one prospecting permit may be issued over the same land. Land the subject of a
mineral development licence, mining claim or mining lease (or subject to an application for such a
tenement) not held by the prospecting permit holder is excluded from a prospecting permit except if
the licensee or lessee has consented.
Exploration permit
General
In Queensland, large-scale exploration is carried out under an exploration permit.
LEGAL AND REGULATORY REGIME IN WHICH THE TARGET GROUP OPERATES
— 162 —
The Minister must determine the amount of security to be deposited by an applicant for an
exploration permit, taking into consideration the program of work proposed and the conditions and
obligations imposed on the grant of the permit.
Term
The term of an exploration permit is for a period up to five years. It may be renewed for a further
term of not more than five years.
Rights
An exploration permit:
• allows the holder to take action to determine the existence, quality and quantity of minerals
on, in or under land by methods which include prospecting, geophysical surveys, drilling,
and sampling and testing of materials to determine mineral bearing capacity or properties
of mineralisation; and
• may eventually lead to an application for a mineral development licence or mining lease.
Mineral development licence
General
A mineral development licence is available as a retention and evaluation tenement at the
exploratory stage. The Minister must determine the amount of security to be deposited by an applicant
for a mineral development licence.
Term
The initial term of a mineral development licence is a period not greater than five years (or
longer, at the Minister’s discretion). It may be renewed for a further period not exceeding five years.
Rights
The Minister may specify the activities which must be carried out under a mineral development
licence. The activities specified by the Minister could include activities to evaluate and determine the
economics of developing an ore body including carrying out geological, geophysical and geochemical
programs, mining feasibility, environmental, marketing, engineering and design studies, and
metallurgical tests.
Mining claim
General
A mining claim is limited to small scale mining operations. The holder of a prospecting permit
may apply for a mining claim over any part of the land in the prospecting permit.
LEGAL AND REGULATORY REGIME IN WHICH THE TARGET GROUP OPERATES
— 163 —
The Mining Registrar must determine the amount of security to be deposited by an applicant for
a mining claim, taking into consideration the program of work.
Term
A mining claim must have an initial term not exceeding ten years. The term may be renewed, for
a period not exceeding 10 years, by making an application to the Mining Registrar.
Rights
A mining claim:
• entitles the holder to prospect and hand-mine for specified minerals; and
• cannot be granted in respect of coal.
Mining lease
General
In Queensland, all commercial mineral extraction activities must be carried out under a mining
lease.
The Minister must determine the amount of security to be deposited by an applicant for a mining
lease, taking into consideration the program of work proposed and the conditions and obligations
imposed on the grant of the permit.
Term
The Minister may approve the initial term for any period. On application, the Minister may
approve the renewal of the mining lease. Where a mining lease would otherwise expire while an
application for renewal is pending, the duration of the mining lease is automatically extended until the
application is determined.
Rights
A mining lease:
• entitles the holder to machine-mine specified minerals and carry out activities associated
with mining or promoting the activity of mining; and
• can be granted for those minerals specified in either the prospecting permit, exploration
permit or mineral development licence held prior to the grant of the lease.
LEGAL AND REGULATORY REGIME IN WHICH THE TARGET GROUP OPERATES
— 164 —

Infrastructure mining lease
The Mineral Resources Act provides for a special purpose mining lease called an infrastructure
mining lease. It may be granted to the holder of a current mining lease over land not covered by the
person’s current mining lease for the transportation of something through, over or under that land. The
infrastructure mining lease must be for the purpose associated with or arising from activities
performed under the mining lease.
Overlapping tenements
There is the possibility of overlap in Queensland between coal, petroleum, coal seam gas and oil
shale tenements. It may be necessary for tenement holders to enter into appropriate coordination
agreements.
GENERAL PROVISIONS RELATING TO MINING TENEMENTS IN QUEENSLAND
Conversion of prospecting permit, exploration permit or mineral development licence tomining lease
The holder of a prospecting permit, exploration permit or mineral development licence may
apply to convert such permit or part thereof to a mining lease. If the underlying permit would
otherwise expire while the application for a mining lease is pending, it is automatically extended until
the application is determined or the mining lease is granted.
Security
Security may take the form of a bond or a guarantee or indemnity by an insurance company, a
financial institution or another credit provider.
The Minister may use the security to rectify any damage to pre-existing improvements, remedy
any breach of the tenement or the Mineral Resources Act, or to pay any penalty imposed.
Cancellation
The Minister may cancel a tenement where the holder has carried out activities that are not bona
fide for the purposes for which the permit was granted, has failed to pay money due, has failed to
comply with a condition of the permit or (for an exploration permit) failed to report the discovery of
a mineral.
Environmental impact statement
An environmental authority (mining activities) granted under the Environmental Protection Act
1994 (Qld) is required for mining activities authorised under a tenement. The Environmental
Protection Agency must decide whether an environmental impact statement is required for the
application.
LEGAL AND REGULATORY REGIME IN WHICH THE TARGET GROUP OPERATES
— 165 —
Rehabilitation of land
A tenement will usually contain a condition that the holder will carry out ‘improvement
restoration’. After termination of the tenement, the Mining Registrar or the Minister may give
reasonable written directions as to restoration if satisfied that the holder has not carried out
improvement restoration.
Royalties
The holder of a prospecting permit, mining claim or mining lease must pay royalties in respect
of all minerals mined. The holder of an exploration permit or mineral development licence may only
dispose of minerals with the consent of the Minister who may require payment of royalties on those
minerals.
Fees payable and rent
Charges are payable in respect of the various types of tenements on application and by way of
rent. Rent is payable annually in advance. Failure to pay that rent may result in cancellation of the
tenement.
Rates
Payment of local rates and charges is a standard condition of tenements. These are paid to the
Local Government for the area.
Liability to pay compensation
The holder of a tenement is liable to pay compensation for damage or injury suffered or loss
incurred by the owner of the land in question or by the Crown.
Native title law
For a general overview of native title law and the Commonwealth native title legislation, please
refer to the paragraph headed “Legal and regulatory regime in which the Target Group operates —
Australia — Westen Australia — Native title law” above.
Queensland legislation
Queensland has passed the Native Title (Queensland) Act 1993 (“Qld Native Title Act”), which
is complementary to the NTA.
The Qld Native Title Act validates all ‘past acts’ and ‘intermediate period acts’ attributable to the
State of Queensland, provides for the extinguishment or suspension of native title in respect of such
acts in line with the provisions of the NTA, and provides that any compensation claimed by native title
holders in respect of past and intermediate period acts of the State is to be paid by the State in
accordance with the principles of compensation under the NTA (unless that compensation burden is
passed on by the State pursuant to certain legislation or contractual terms).
LEGAL AND REGULATORY REGIME IN WHICH THE TARGET GROUP OPERATES
— 166 —
The Qld Native Title Act was updated in line with the 1998 amendments to the NTA to confirm
the extinguishment of native title by certain ‘exclusive possession tenures’ granted by the State of
Queensland on or before 23 December 1996.
Alternative procedures
Queensland established its own alternative native title procedures for the determination of
mining tenement applications with the Land and Resources Tribunal replacing the NNTT. The
procedures were similar to that which are prescribed by the NTA.
The alternative procedures were inserted into the Mineral Resources Act by the Native Title
(Queensland) State Provisions Amendment Act (No. 2) 1998, the Native Title (Queensland) State
Provisions Amendment Act 1999 and the Native Title Resolution Act 2000.
The alternative State provisions provided for alternative procedures to the right to negotiate
under section 26A of the NTA for the granting of low impact exploration and mining and under section
43 of the NTA for the granting of high impact exploration and mining.
The validity of the alternative State procedures was the subject of court proceedings. On appeal,
the Full Federal Court upheld the validity of the alternative State procedures for low impact
exploration and mining tenements. In turn, the Full Federal Court overruled the decision of Justice
Wilcox in the Federal Court and held that the alternative State provisions with respect to high impact
exploration and mining tenements were valid and had always been valid.
Following the decision of the Full Federal Court, the Queensland Government commenced a
review of the alternative State provisions on 28 November 2002. This review culminated in the
decision being made to revert to the right to negotiate process under the NTA, which is described
below.
Accordingly, from 31 March 2003, the NTA applied to all new mining and exploration tenure
applications under the Mineral Resources Act. Applications made before 31 March 2003 continued to
proceed under the alternative State provisions.
Exclusion condition tenements
Some exploration permits granted under the Mineral Resources Act were granted subject to a
condition that excluded land which is subject to native title from the grant (“Exclusion Condition”).
The State imposed the Exclusion Condition between the period commencing 1 January 1994 (the date
of the commencement of the NTA) through to 23 December 1996 (the date of the Wik decision) as a
strategy for ‘dealing with native title’ by enabling the grant of exploration permit applications without
the need to comply with any native title procedural requirements imposed by the NTA.
Exploration permits subject to an Exclusion Condition do not convey exploration rights under the
exploration permit to the holder in relation to areas that have been excluded. A mining lease granted
out of such an exploration permit will pick up the excluded areas in the exploration permit (unless the
excluded land was added to the exploration permit in accordance with the future act provisions of the
NTA before the grant of the mining lease). Mining activities cannot be conducted in the excluded
areas.
LEGAL AND REGULATORY REGIME IN WHICH THE TARGET GROUP OPERATES
— 167 —

A holder of a tenement with excluded land may apply for the addition of the excluded land back
into their tenements. However, unless native title has been wholly extinguished within the area of the
excluded land since the grant of the tenement, such an application triggers the right to negotiate
provisions of the NTA. Alternatively, an ILUA can be negotiated and registered to validly add the
excluded land back into the tenement.
CULTURAL HERITAGE LAW
For a general overview of cultural heritage law and the Commonwealth cultural heritage
legislation, please refer to the paragraph headed “Legal and regulatory regime in which the Target
Group operates — Australia — Westen Australia — Cultural heritage law” above.
The principal legislation relating to the recognition, protection and conservation of Aboriginal
heritage in Queensland is the Aboriginal Cultural Heritage Act 2003 (Qld) (“ACHA”), which is
currently under review. The Torres Strait Islander Cultural Heritage Act 2003 (Qld) essentially
mirrors the ACHA in relation to Torres Strait Islander heritage.
Duty of care
The ACHA introduces a duty of care to take all reasonable and practicable measures to ensure
that any activity conducted does not harm Aboriginal cultural heritage (“Duty of Care”).
The Duty of Care will not be breached if the person acts:
• under the authority of another provision of the ACHA that applies to Aboriginal cultural
heritage;
• under an approved cultural heritage management plan;
• under a native title agreement or another agreement with an Aboriginal party (such as a
cultural heritage agreement);
• in compliance with the Cultural Heritage Duty of Care Guidelines; or
• with the consent of the owner of the Aboriginal cultural heritage.
Further, an object of Aboriginal cultural heritage cannot be harmed, excavated, relocated,
removed or unlawfully possessed where the person knows or ought to reasonably know that such
object is Aboriginal cultural heritage.
LEGAL AND REGULATORY REGIME IN WHICH THE TARGET GROUP OPERATES
— 168 —

Cultural heritage management plan (“CHMP”)
The relevant administering authority must not grant a lease, licence, permit, approval or other
authority for a project that requires an Environmental Impact Statement (“EIS”), or for a prescribed
project that requires an environmental assessment, unless:
• the project is already the subject of native title or other agreement with the relevant
Aboriginal parties that deals with cultural heritage;
• CHMP has been developed for the project and approved under the ACHA; or
• the authority is given subject to conditions to ensure that no excavation, construction or
other activity that may cause harm to Aboriginal cultural heritage takes place for the project
without a CHMP being developed and approved.
ENVIRONMENT
Legislative framework
The primary responsibility for regulating environmental management of mining in Queensland
rests with the Department of Environment and Resource Management (“DERM”). State legislation
provides for environmental licensing of mining operations. The primary legislation in Queensland is
the Environmental Protection Act 1994 (Qld) (“EPA”). Other Queensland environmental legislation
which may impact on mining operations include:
• State Development and Public Works Organisation Act 1971 (provides a framework for the
Coordinator-General to supervise significant projects and acquire land for the development
of infrastructure);
• Nature Conservation Act 1992 (may affect how mining projects operate in protected areas);
• Dangerous Goods Safety Management Act 2001 (may affect how mining projects handle any
hazardous materials on site);
• Coastal Protection & Management Act 1995 (may affect how coastal resources are dealt
with by mining operations);
• Water Act 2000 (all rights to use a watercourse, lake or spring in Queensland are vested in
the State);
• Fisheries Act 1994 (may affect offshore activities, in that fisheries resources must not be
taken from one area (whether in Queensland or elsewhere) to another area in Queensland
without an authority);
• Land Protection (Pest and Stock Route) Management Act 2002 (landowners may be required
to take reasonable steps to remove designated pests from the relevant property);
LEGAL AND REGULATORY REGIME IN WHICH THE TARGET GROUP OPERATES
— 169 —
• Sustainable Planning Act 2009 (mining projects may have to obtain a development approval
to undertake development in certain circumstances);
• Vegetation Management Act 1999 (may affect those parts of the mining operations not
located on mining leases); and
• numerous regulations accompanying the above legislation.
The EPA mandates that an operating mine have the following environmental requirements in
place before mining operations may commence:
• an Environmental Management Plan;
• a Plan of Operations;
• a Financial Assurance; and
• an Environmental Authority.
These requirements are summarised below.
Environmental management plans (“EMP”)
When applying for a mining lease, it is necessary to prepare an EMP which is then, if
satisfactory, approved by the DERM. The purpose of the EMP is to assist the DERM in preparing an
EA.
An EMP sets out the strategies and commitments for protecting the environment and managing
environmental impacts on and around the land to be covered by the proposed lease, as well as
strategies for progressive and final rehabilitation of the land.
Plan of operations (“POP”)
After a mining lease has been granted, the EPA requires that a POP be submitted for assessment
by the EPA at least 28 days before commencing mining activities.
The purpose of the POP is to give effect to the conditions of the EA. The POP must disclose the
location of planned activities, how the EMP will be implemented, the rehabilitation program
applicable for the location and any other matter which may be prescribed under an environmental
protection policy or regulation.
The POP must be accompanied by an audit statement confirming that the POP is compliant with
the EPA, the conditions of the EA, and that the stated financial assurance (set out below) is correct.
LEGAL AND REGULATORY REGIME IN WHICH THE TARGET GROUP OPERATES
— 170 —

Financial assurance (“FA”)
The DERM may require EA holders to lodge FA to ensure compliance with the mining conditions
and to further ensure the lease holders rectify actual damage caused by operations. The major issue
of concern is rehabilitation of disturbed surfaces, and an assessment of the need for financial
assurance will be primarily based on the degree of risk of environmental harm, the likelihood of action
being required to rectify any environmental damage, and the environmental record of the EA holder.
Environmental authority (“EA”)
As a brief overview:
• Mining activities are environmentally relevant activities (“ERAs”) and require an EA
issued under the EPA. ERAs must be conducted in accordance with the conditions of the EA
applicable to that activity.
• EAs for mining are either ‘code compliant’ or ‘non-code compliant’. Code compliant EAs
are issued for mining operations that can operate under a standard set of conditions known
as the Code of Compliance for Mining Lease Projects (“Code”). Mining projects operating
under a code compliant EA are known as ‘level 2 mining projects’ and are required to
provide the DERM with an annual report and an annual fee.
Any EA which has conditions other than those in the Code is considered to be a non-code
compliant EA. Mining operations with non-code compliant EAs are generally considered
‘level 1 mining projects’. However, in certain circumstances, mining operations which do
not comply with the standard conditions may still be determined to be Level 2 mining
projects, and subject to the applicable obligations.
• Operations associated with mining, such as mineral processing, the storage of regulated
waste or the operation of sewerage treatment facilities, are also considered ERAs, and may
in some cases be caught under the primary mining EA.
Pollution and environmental damage
The EPA also contains various mechanisms to regulate pollution and environmental damage. The
most significant of these are summarised below.
Environmental harm
The EPA places a general environmental duty on all persons to refrain from carrying out any
activity that causes or is likely to cause ‘environmental harm’ unless all reasonable steps have been
taken to prevent or minimise the harm. Environmental harm that is not permitted by an EA or a Code
is unlawful environmental harm, which attracts a maximum penalty of A$2,082,500 for a corporation,
or 5 years imprisonment. The EPA also prohibits environmental nuisance (an unreasonable
interference with an environmental value) which attracts a maximum fine of A$417,500.
LEGAL AND REGULATORY REGIME IN WHICH THE TARGET GROUP OPERATES
— 171 —
A duty to notify of environmental harm applies to different persons in different ways and arises
once a person who is carrying out an activity becomes aware that ‘serious or material environmental
harm’ is caused or threatened by themselves or a third party in carrying out the activity or an
associated activity.
Contaminated land
An ‘owner’ (including a lessee) or occupier of land must notify the DERM if it becomes aware
that:
• a ‘notifiable activity’ (an activity likely to cause contamination) is being carried out on the
land; or
• the land has been or is being ‘contaminated’ by a ‘hazardous contaminant’ as defined under
the EPA.
The EPA provides an order of liability for remediation costs, which the DERM must apply as
follows:
• The Polluter is primarily responsible, if known and still in existence.
• If the polluter is not held responsible or it is not in existence, the local government may be
held responsible.
• If neither the polluter nor local government are held responsible, the DERM may then
require the ‘owner’ of the land (this includes the registered proprietor of the land) to
remediate.
In addition to responsibility for remediation, the EPA imposes extensive criminal and civil
penalties for contamination of land. Individuals who caused the harm, corporations and their officers
may all be held liable for contamination.
OCCUPATIONAL HEALTH AND SAFETY
Key Queensland legislation
The principal legislation regulating mining workplaces (other than coal mining workplaces) in
Queensland is the:
• Mining and Quarrying Safety and Health Act 1999 (Qld) (“MQSH Act”);
• Mining and Quarrying Safety and Health Regulation 2001 (Qld) (“MQSH Regulations”).
LEGAL AND REGULATORY REGIME IN WHICH THE TARGET GROUP OPERATES
— 172 —

Duty holders
The MQSH Act and MQSH Regulation impose health and safety obligations on a range of duty
holders connected with mining workplaces, including workers, operators, contractors, designers,
manufacturers, importers and suppliers of plant for use at a mine, erectors and installers of plant at
a mine, manufacturers, importers and suppliers of substances for use at a mine, people who supply
services at a mine and other people who may affect safety and health at mines.
Penalties
Penalties for breach of this legislation range up to A$200,000 or 3 years imprisonment (if the
contravention caused multiple deaths) for a person on whom a safety and health obligation is imposed.
The MQSH Act does not differentiate between a corporation and an individual in prescribing penalties.
TASMANIA
INTRODUCTION
The primary law in respect of mineral tenements held in Tasmania is the Mineral Resources
Development Act 1995 (Tas) (“MRD Act”). The MRD Act sets out the legislative framework in regard
of mineral tenements granted in Tasmania.
With limited exceptions, minerals in Tasmania are the property of the Crown. The only minerals
that vest in the owner of the surface of the land are Category 3 minerals (set out below) or minerals
held in private ownership prior to the commencement of the MRD Act.
There are six categories of minerals under the MRD Act. The categories are:
• Category 1 minerals — any metallic mineral and atomic substance;
• Category 2 minerals — coal, peat, lignite and oil shale;
• Category 3 minerals — any rock, stone, gravel, sand and clay used in construction, bricks
and ceramics;
• Category 4 minerals — any petroleum products except oil shale;
• Category 5 minerals — any industrial mineral, prescribed precious stone and prescribed
semi-precious stone; and
• Category 6 minerals — any geothermal substance.
Due to the nature of the minerals that comprise these categories, there are differences in the
legislative regime governing the exploitation of each group.
LEGAL AND REGULATORY REGIME IN WHICH THE TARGET GROUP OPERATES
— 173 —

MINERAL TENEMENTS
The main types of tenements granted under the MRD Act are:
• mining leases;
• exploration licences;
• retention licences; and
• prospecting licences
Some of the basic features of these tenements are outlined below.
Exploration licence
General
An exploration licence authorises the licensee to explore the licence area for any minerals
specified in the licence. The licensee is not allowed to sell any mineral recovered during this
exploration without the approval of the Director of Mines. If any minerals are sold with the approval
of the Director of Mines, then the licensee must pay a royalty in respect of those minerals.
An application for an exploration licence is to be made to the Minister. Any person with an
interest in the land the subject of an application may object to the granting of that licence.
Once an exploration licence is granted, the licensee must pay rent in respect of the land over
which the licence is granted and must make the annual minimum expenditure that the Minister
determines.
Term
An exploration licence will remain in force for:
• a period of five years from the date on which the application is granted in respect of
Category 1, 2 and 3 minerals; and
• a period determined by the Minister from the date on which the application is granted in
respect of Category 4 minerals.
Although there is no prescribed term in the MRD Act for Category 5 or 6 minerals, Mineral
Resources Tasmania (“MRT”) has confirmed that an exploration licence in respect of these minerals
will be granted for a period of 5 years. The term of an exploration licence may be extended by the
Minister for any further period that the Minister determines. Where an exploration licence would
otherwise expire while an application for renewal is pending, the duration of the exploration licence
is automatically extended until the application is determined.
LEGAL AND REGULATORY REGIME IN WHICH THE TARGET GROUP OPERATES
— 174 —
Private land
If compensable loss is suffered, or likely to be suffered due to exploration activities, the
tenement holder is liable to pay compensation to the owner or occupier. For further discussion of
compensation, please refer to the paragraph headed “Legal and regulatory regime in which the Target
Group operates — Australia — Tasmania — General provisions relating to mineral tenements in
Tasmania — Compensation” below.
Rights
The holder of an exploration licence has the exclusive right to apply for a retention licence or
a mining lease in respect of the area of land and the minerals specified in that licence.
Revocation
The Minister may revoke an exploration licence in whole or in part if the licensee either fails to
comply with the MRD Act or a condition of the licence, or if the Minister is satisfied that any area
of land comprised in the licence is required for a public purpose. If the Minister revokes an
exploration licence because the land is required for a public purpose, then the licensee is entitled to
compensation.
Special exploration licence
A special exploration licence authorises the holder to explore for specified minerals in a
specified area of land. A special exploration licence may be granted in respect of a larger area of land
than that described above in respect of the relevant category of minerals and may also overlap an
existing mineral tenement provided that the mineral specified in the special exploration licence is not
the same as any mineral specified in the pre-existing mineral tenements.
A special exploration licence will remain in force for a period of 5 years, which may be extended
by the Minister up to a maximum of 10 years.
Standard conditions
It is a standard condition of exploration, retention and special exploration licences that the
licensee observe, perform and fulfil the conditions in the Schedules, as attached to the licences, and
as amended from time to time.
Retention licence
General
A retention licence permits the licensee to retain title to an identified mineral resource which
they do not intend to mine for economic or other reasons. A security deposit is required in respect of
each retention licence held.
LEGAL AND REGULATORY REGIME IN WHICH THE TARGET GROUP OPERATES
— 175 —
An application for a retention licence will only be granted where:
• the subject land is likely to be effectively and efficiently mined for the minerals to which
the licence is to relate;
• there is a sufficient quantity of minerals to justify mining;
• the applicant is justified for economic or other reasons not to proceed to mine; and
• the applicant has provided a security deposit.
An application for a retention licence is to be made to the Minister. Any person with an interest
in the land the subject of the application may object to the granting of that licence. Once a retention
licence is granted, the licensee must pay rent in respect of the land over which the licence is granted.
There is no minimum expenditure requirement.
Any minerals recovered whilst carrying out the activities authorised by the retention licence
cannot be sold without the approval of the Director of Mines. If any minerals are sold with the
approval of the Director of Mines, then the licensee must pay a royalty in respect of those minerals.
Term
The term of the licence is for a period, which the Minister determines, of no more than five years.
An application for an extension must be lodged before the licence ceases to be in force.
Private land
If compensable loss is suffered, or likely to be suffered due to exploration activities, the
tenement holder is liable to pay compensation to the owner or occupier. For further discussion of
compensation, please refer to the paragraph headed “Legal and regulatory regime in which the Target
Group operates — Australia — Tasmania — General provisions relating to mineral tenements in
Tasmania — Compensation” below.
Revocation
The Minister may revoke a retention licence in whole or in part if the licensee either fails to
comply with the MRD Act or a condition of the licence, or if the Minister is satisfied that any area
of land comprised in the licence is require for a public purpose.
Notice to apply
If the Minister is of the opinion that mining operations should commence on any area of land
comprised within a retention licence, subject to certain procedures, the licensee may be directed to
apply for a lease over the whole or part of the area. If the licence holder then does not apply for a
mining lease or, having applied, does not meet the requirements for the grant of a lease, the licence
may be revoked or amended to exclude the part in issue.
LEGAL AND REGULATORY REGIME IN WHICH THE TARGET GROUP OPERATES
— 176 —
Mining lease
General
The holder of an exploration licence or a retention licence has the exclusive right to apply for
a mining lease over the area the subject of the exploration licence or retention licence.
An application for a mining lease is made to the Minister and must be accompanied by six
months’ rent in advance and a security deposit. Any person with an interest in the land the subject of
the application may object to the granting of that licence. An application for a mining lease will only
be granted where the applicant:
• has demonstrated that there is a sufficient quantity of minerals to justify mining;
• intends to mine;
• intends to comply with the MRD Act;
• has an appropriate mining plan;
• is likely to have sufficient financial and technical resources to carry out the mining plan;
• has provided the Director of Mines with sufficient information regarding the likely impact
on the environment;
• has entered into a compensation agreement with any owner or occupier of the land (if
relevant); and
• has provided a security deposit.
Term
A mining lease is in force for the period that the Minister determines. A lessee may apply to the
Minister for a renewal of a mining lease for a term determined by the Minister of no greater than 20
years. The Minister must grant the renewal if satisfied that the lessee has submitted a mining plan for
the renewal period, the lessee has complied with the conditions of the lease and the MRD Act (or any
failure to comply with a condition of the lease has been exempted under the MRD Act), and that the
lessee has provided a security deposit.
Rights and obligations
The holder of a mining lease is entitled to carry out mining operations in respect of the minerals
specified in the lease.
The holder of a mining lease must pay an annual rent on 1 July each year. If the lessee fails to
pay the annual rent by 1 January in the following year, the Registrar will cancel the lease.
LEGAL AND REGULATORY REGIME IN WHICH THE TARGET GROUP OPERATES
— 177 —
A royalty is also payable to the owner of the minerals in respect of all minerals sold under a
mining lease.
Private land
An application for a mining lease cannot be granted unless the applicant has entered into a
compensation agreement with the owner or occupier of the land.
If compensable loss is suffered, or likely to be suffered due to mining operations, the tenement
holder is liable to pay compensation to the owner or occupier. For further discussion of compensation,
please refer to the paragraph headed “Legal and Regulatory Regime in which the Target Group
Operates — Australia — Tasmania — General provisions relating to mineral tenements in Tasmania
— Compensation” below.
Sublease
Subject to certain conditions and Ministerial approval, the holder of a mining lease may sublease
the whole or part of the lease area. If the mining lease is revoked or terminated for any reason not due
to the default of the holder of the sublease, then the Minister may grant the sublessee a mining lease
in respect of that area.
Revocation
The Minister may revoke a mining lease in whole or in part if:
• the lessee fails to comply with the MRD Act;
• the lessee fails to comply with a condition of the mining lease;
• any area of land comprised in the lease is require for a public purpose; or
• the Minister is satisfied that mining has not taken place for 12 months.
Prospecting licence
A prospecting licence authorises the holder to enter the land to prospect for all minerals by hand.
The holder of a prospecting licence may prospect on any Crown land not subject to a mineral
tenement, or any other land subject to a mineral tenement with the written consent of the tenement
holder.
An application for a prospecting licence is to be made to the Director of Mines, and any licence
granted has a term of not more than one year.
LEGAL AND REGULATORY REGIME IN WHICH THE TARGET GROUP OPERATES
— 178 —
GENERAL PROVISIONS RELATING TO MINERAL TENEMENTS IN TASMANIA
Use of surface water
The holder of an exploration licence or a retention licence may use surface water sufficient for
drilling.
In respect of a mining lease, the department or authority responsible for the Water Management
Act 1999 (Tas) is to ensure, as far as practicable, that a lessee has sufficient access to water for the
purposes of the mining lease.
Compensation
If compensable loss is suffered, or likely to be suffered due to exploration activities, the
tenement holder is liable to pay compensation to the owner or occupier. Compensation is payable at
a rate specified in a compensation agreement, or where there is no agreement, as determined by the
Mining Tribunal. Parties to a compensation agreement may also apply to the Mining Tribunal to
determine a dispute arising out of the agreement.
NATIVE TITLE LAW
For a general overview of native title law and the Commonwealth native title legislation, see the
paragraph headed “Legal and regulatory regime in which the Target Group operates — Australia —
Western Australia” above.
Cultural heritage law
For a general overview of cultural heritage law and the Commonwealth cultural heritage
legislation, please refer to the paragraph headed “Legal and regulatory regime in which the Target
Group operates — Australia — Western Australia — Cultural heritage law” above.
The Aboriginal Relics Act 1975 (Tas) (“Relics Act”) protects Aboriginal relics, protected sites
and protected objects.
Offences
Under sections 9 and 14 of the Relics Act, otherwise than in accordance with the terms of a
permit granted by the Minister, it is an offence to:
• destroy, damage, deface, conceal, or otherwise interfere with a relic;
• carry out an act which is likely to endanger a protected object;
• make a copy or replica of a carving or engraving that is a relic;
LEGAL AND REGULATORY REGIME IN WHICH THE TARGET GROUP OPERATES
— 179 —
• remove a relic from the place where it is found or abandoned or a protected object from a
protected site. A protected site is land which the Minister has declared to be protected that
contains a relic that requires protection, called a protected object
• sell or offer or expose for sale, exchange, or otherwise dispose of a relic or any other object
that so nearly resembles a relic as to be likely to deceive or be capable of being mistaken
for a relic;
• take a relic, or cause or permit a relic to be taken, out of Tasmania;
• cause an excavation to be made or any other work to be carried out on Crown land for the
purpose of searching for a relic; and
• destroy, damage, or deface, or otherwise interfere with any fencing or notice erected, or any
other work carried out, in or in respect of a protected site
ENVIRONMENT
The Environmental Management and Pollution Control Act 1994 (Tas) (“EMPC Act”) sets out
the primary legislative requirements for the management of the environment and pollution in
Tasmania. We note that environmental matters in Tasmania are also subject to the provisions of the
Commonwealth EPBC Act.
General environmental duty
The general environmental duty set out under the EMPC Act, is that a person must take such
steps as are practicable or reasonable to prevent or minimise environmental harm or environmental
nuisance caused, or likely to be caused, by an activity conducted by that person. Failure to comply
with the general environmental duty does not constitute a criminal offence, however, the Director of
Environmental Management or a council officer may serve an environment protection notice on the
occupier or person in charge of a place to secure compliance with the general environmental duty.
In addition to the general environmental duty, the EMPC Act creates offences of causing:
• serious environmental harm;
• material environmental harm;
• a pollutant to be deposited; and
• environmental nuisance.
Offences and criminal liability
Under the EMPC Act, a person will be liable for ‘polluting’ if that person’s actions cause
‘material environmental harm’ or ‘serious environmental harm’.
LEGAL AND REGULATORY REGIME IN WHICH THE TARGET GROUP OPERATES
— 180 —
The EMPC Act provides that ‘material environmental harm’ will be caused if the offending
activity involves actual or potential environmental harm or harm to the health and safety of humans
that is not trivial or negligible or results in an actual or potential property damage greater than $5,000.
In Tasmania, the commission of an environmental nuisance of a high impact or high scale will also
amount to ‘material environmental harm’.
‘Serious environmental harm’ will be caused if the offending activity involves actual or potential
environmental harm or harm to the health and safety of humans that is of a high impact or a wide scale
or results in an actual or potential property damage greater than A$50,000.
Under the EMPC Act, an occupier or a person in charge of a place from which a pollutant escapes
or is discharged will be presumed to have polluted the environment. An ‘occupier of a place’ is a
person who has any right at law to use or carry on operations at the place.
A corporation found guilty of ‘polluting’ that causes material environmental harm or serious
environmental harm may be punished by a fine up to A$120,000 or A$250,000 respectively. More
serious penalties (up to A$1 million) also apply if the polluting activities were undertaken
intentionally or recklessly and with the knowledge that they might result in serious or material
environmental harm.
In addition to criminal liability, environmental authorities have extensive powers to direct a
polluter to clean up the consequences of that pollution, cease a polluting activity or not commence an
activity which the EPA considers is likely to cause serious or material environmental harm.
Liability to report incidents
Persons responsible for activities, including environmentally relevant activities, must report
certain incidents involving the release of pollutants as a result of any incident in relation to that
activity.
Liability to report contamination under EMPC Act
Under the EMPC Act, an occupier of a contaminated site must notify the director of the EPA if
the occupier knows, reasonably believes or should in the circumstances reasonably believe that the
area of land is or is likely to be a contaminated site.
Liability to investigate, remediate or manage contamination under the EMPC Act
The director of the EPA has the power to issue notices requiring investigation, remediation or site
management where the Director of Mines reasonably believes the site is (or in the case of an
investigation notice, may be) a contaminated site.
LEGAL AND REGULATORY REGIME IN WHICH THE TARGET GROUP OPERATES
— 181 —
The director of the EPA may serve a notice on any person who the director of the EPA believes
is or may be wholly or partly responsible for contaminating or possibly contaminating the site. This
may include the owner or former owner or occupier or former occupier of the land if that person, while
the owner or occupier of the site, in the opinion of the Director of Mines:
• knew or reasonably suspected there was or possibly was a pollutant in the ground above the
background level, and
• allowed, or is likely to have allowed or possibly allowed the pollutant to escape or be
discharged or released onto or under that land.
Assessment of planning activities and environmental impact assessments
Under Part 3 of the EMPC Act, proposed activities under the Land Use Planning and Approvals
Act 1993 (“LUPA Act”) may be required to be assessed by the EPA board depending on the category
of the proposed activity. Such board may require the planning authority to impose certain conditions
in granting a planning permit for the activity.
Level 2 activities requiring approval by the Board include mineral works, extractive industries
and materials handling.
An environmental impact assessment may be required when an environmentally relevant activity
is proposed to be undertaken by the public or the private sector. Section 74 of the EMPC Act sets out
principles to be followed when conducting an Environmental Impact Assessment.
OCCUPATIONAL HEALTH AND SAFETY
Key Tasmanian legislation
The principal legislation regulating workplaces (including a mine) in Tasmania is:
• the Workplace Health and Safety Act 1995 (Tas) (“WHS Act”); and
• the Workplace Health and Safety Regulations 1998 (Tas) (“WHS Regulations”).
We note that this legislation applies to both the mining and non-mining workplace.
Duty holders
The WHS Act and WHS Regulations impose health and safety obligations on a range of duty
holders connected with their work, including employers, employees, responsible officers,
self-employed persons, designers, manufacturers, importers, suppliers and installers of plant or
structures, service providers and people in control of workplaces.
The WHS Act also provides for employers to appoint responsible officers under the WHS Act to
carry out its duties.
LEGAL AND REGULATORY REGIME IN WHICH THE TARGET GROUP OPERATES
— 182 —
Duties include, for example, an employer’s duty to, so far as practicable, provide and maintain
a safe working environment and safe system of work and any training or supervision necessary to
ensure that employees are safe from injury and risks to health.
Penalties
Penalties for breach of this legislation range up to A$195,000 for a corporation, and A$65,000
for an individual. The WHS Act does not differentiate between a corporation and an individual in
prescribing penalties.
CANADA
NUNAVUT
MINING LAW
Background
The Nunavut Land Claims Agreement (“NLCA”) was adopted in 1993 to settle the land claim of
the Inuit peoples in Canada’s Eastern Arctic. To fully implement the NLCA, and to give the Inuit a
form of self-government, the federal government established the new territory of Nunavut on April 1,
1999.
Lands in Nunavut are classified as Crown land, Surface Inuit Owned Lands (“IOL”), Subsurface
IOL, Commissioner’s land or municipal land. The legislation governing mining related activities
varies depending on which of these types of lands is impacted.
Crown land
The Crown retains control over approximately 80% of Nunavut’s total land mass. This land is
administered by Indian and Northern Affairs Canada (“INAC”), a department of federal government,
under the Territorial Lands Act (“TLA”). Surface and mineral rights on Crown land in Nunavut are
governed by the TLA and the Territorial Land Use Regulations (“TLUR”).
The Northwest Territories and Nunavut Mining Regulations (“NTNMR”) provide for exploration
rights on Crown land in the form of licences to prospect, prospecting permits, mineral claims and
mineral leases.
Inuit owned lands
In respect of IOL, there are three basic categories to consider:
• For Surface IOL in which the mineral rights are held by the Crown, mineral rights continue
to be administered by INAC, pursuant to the NTNMR. Permission to enter these lands for
the purpose of carrying out mining activities must be obtained from the appropriate
Regional Inuit Association (“RIA”) or the Nunavut Surface Rights Tribunal. Surface rights
that are issued by the RIAs generally take the form of Land Use Licences, Quarry Licences,
or Commercial Leases.
LEGAL AND REGULATORY REGIME IN WHICH THE TARGET GROUP OPERATES
— 183 —
• For Subsurface IOL, which is subject to pre-existing mineral rights grandfathered under the
NLCA, the holder of the mineral rights can continue to have the rights administered by
INAC under the NTNMR or may elect to come under the authority of the Nunavut
Tunngavik Incorporated (“NTI”), a body that represents beneficiaries under the NLCA, and
have the rights administered by it.
• For Subsurface IOL for which there are no pre-existing, grandfathered mineral rights, the
mineral rights are automatically administered by the NTI. Permission to enter these lands
for the purpose of carrying out mining activities must be obtained from the NTI. Generally,
these rights will be set forth in the form of Exploration Agreements and Production Leases.
Commissioner’s and municipal lands
Surface rights on Commissioner’s lands are governed by the Commissioner’s Land Act and INAC
is responsible for the administration of the subsurface rights on Commissioner’s lands. In the case of
municipal lands, municipal corporations are responsible for the administration of built-up areas within
their incorporated communities. The lzok Lake and High Lake claims are not located on
Commissioner’s or municipal land.
Some of the basic features of the above noted tenures are outlined below.
MINING TENURES
Crown lands
Licence to prospect
A licence to prospect is required to:
• prospect for minerals on territorial lands;
• make an application to record a claim;
• acquire any recorded claim or any interest in a recorded claim by transfer;
• submit an application for a certificate of work or a certificate of extension; or
• acquire a lease of a recorded claim.
Prospecting permits
Prospecting permits provide exclusive exploration rights within assigned boundaries, but do not
include mineral rights or surface rights.
LEGAL AND REGULATORY REGIME IN WHICH THE TARGET GROUP OPERATES
— 184 —
Mineral claims
The holder of a recorded claim has the exclusive right to prospect for minerals and to develop
any mine on the land within the boundaries of the claim. However, without a mineral lease, the claim
holder can not remove, sell or otherwise dispose of minerals or mineral-bearing substances exceeding
a gross value of C$100,000, other than for assay or testing purposes. In addition, the holder of a
recorded claim also must not erect any dwelling or any mill, concentrator or mine building without
a surface lease of the land which is subject to the claim.
Mining leases
(i) General
Mineral claims cannot be taken past the tenth year unless a lease is applied for. A mining lease
allows the holder to prospect, develop, extract and sell minerals from the land within the lease area,
but does not convey surface rights.
(ii) Term
Mining leases are issued for a 21-year period and may be renewed for additional 21-year periods,
provided all rents are paid. Annual rent is one dollar per acre during the first 21 year period, and two
dollars per acre in the subsequent renewal periods.
(iii) Rights
Once mineral tenure has been acquired, surface tenure is necessary in order to facilitate a number
of exploratory activities. Surface tenure on Crown land in Nunavut is administered by INAC pursuant
to the TLUR.
Land use permits
Class A land use permits are required for significant types of activities on land (e.g.,
establishment of certain campsites or petroleum fuel storage facilities, etc.) and are screened by the
Nunavut Impact Review Board (“NIRB”). Class B land use permits are required for lower-impact
activities.
The development of a mine site may require aggregates or other construction materials which are
subject to other legislation and operating conditions. Industrial minerals and building stones such as
construction stone, carving stone, limestone, soapstone, marble, gypsum, shale, clay, sand, gravel,
volcanic ash, earth, ochre, marl, and peat are specifically excluded from the NTNMR and are regulated
on Crown lands by the Territorial Quarrying Regulations pursuant to the TLA.
Land leases
If land use is anticipated to exceed two to three years, a lease is normally obtained. Surface
leases are issued under the authority of the Territorial Lands Regulations (“TLR”), and give the
lease-holder exclusive rights to the surface. Land leases may not exceed 30 years, but may be renewed
LEGAL AND REGULATORY REGIME IN WHICH THE TARGET GROUP OPERATES
— 185 —

for another maximum term of 30 years. Annual rent payable cannot be less than ten percent of the
appraised value of the land and must be at least C$150 per annum. In order to be binding on the Crown,
all surface leases must be approved by INAC’s Lands Administration Manager.
Inuit owned lands
Land use licence (surface)
For Surface IOL, in which mineral rights are held by the Crown, mineral rights continue to be
administered by INAC. Permission to enter these lands for the purpose of carrying out any exploration
activity, including prospecting and staking, however, must be obtained in advance in the form of a
Land Use Licence or lease from the appropriate RIA.
The land use licence conveys no subsurface rights to the recipient. There are three levels of land
use licence. The levels, and the application criteria for each, vary with respect to the proposed activity
(e.g., prospecting to establishment of campsites and use of explosives).
Quarry licence (surface)
To the extent any quarrying will take place on IOL, a quarry licence must be obtained from the
appropriate RIA.
Commercial lease (surface)
A person wishing to obtain an exclusive right of occupancy to a limited area of IOL for
commercial or public purposes is required to enter into a Commercial Lease with the appropriate RIA.
Exploration agreement
(i) General
An Exploration Agreement grants the right to conduct “Exploration Work” over a particular area.
(ii) Term
Exploration Agreements are granted for an initial term of one year, which will be extended
annually to a maximum of 20 years if annual work requirements are met.
(iii) Rights
An Exploration Agreement does not grant the right to use the surface for exploration purposes.
The NTI may require a deposit in order to provide security against a deficiency in Exploration
Work requirements.
LEGAL AND REGULATORY REGIME IN WHICH THE TARGET GROUP OPERATES
— 186 —
Within three months after each anniversary of an Exploration Agreement, the holder is required
to provide the NTI a written report that includes all data, analysis and interpretation of all Exploration
Work not previously reported. The NTI accepts a limited obligation to keep the information in
confidence.
If the holder of an Exploration Agreement wishes to develop the project beyond the exploration
stage, it will require a Production Lease. The Exploration Agreement provides that the holder is
entitled to a Production Lease if the holder:
• delivers three copies of a feasibility study that demonstrates that a resource exists and that
production of minerals from the Production Lease area at a profit is possible under
economic conditions that are specified and accepted as reasonable by the mining industry;
• applies for a Production Lease and pays the initial rent and application fee; and
• enters into an agreement with the NTI on the boundaries and description of the Production
Lease area.
Production lease
(i) General
The holder of a Production Lease has the exclusive right to explore for, develop, mine, extract
and produce minerals on IOL lands.
(ii) Term
A Production Lease is for an initial term of ten years. The Production Lease may be renewed,
without commercial production having been attained, for up to two five year terms following the
primary term if the lessee has met requirements determined by the NTI and specified in the Production
Lease, and has paid the application fee. Following the commencement of commercial production, the
lessee has the right to surrender the balance of the primary term or any renewal term and replace it
with a renewal term of 21 years if the lessee has met requirements determined by the NTI and specified
in the Production Lease, and has paid the application fee. If the level of commercial production
specified in the Production Lease has been achieved during the 21 year renewal term, the NTI will
grant a five year renewal term and, provided the specified level of production has been achieved in
the five-year renewal term, grant one or more additional five year renewal terms on the same basis.
Extensions are also available for final mill production, shut down of operations, abandonment and
reclamation.
(iii) Rights
The lessee is required to pay annual rent and a production royalty, the terms of which will be
specified in the Production Lease.
LEGAL AND REGULATORY REGIME IN WHICH THE TARGET GROUP OPERATES
— 187 —
It is noteworthy that under the NLCA, subject to one caveat discussed below, the RIAs and the
NTI are under no obligation to issue surface or subsurface rights on application being made. If they
do issue tenures, there is no obligation for them to follow the Guide or the Rules (each as defined
below) and the NTI and the RIAs do not adhere to them strictly.
As noted above, subject to any contractual commitments the RIAs and the NTI might make, they
are under no obligation to issue surface or subsurface rights on IOL. The exception is the circumstance
in which the land comprises Surface IOL and Crown mineral rights. Permission to enter these lands
for the purpose of carrying out mining activities must be obtained from the appropriate RIA but where
that cannot be obtained, application can be made to the Nunavut Surface Rights Tribunal for an order
permitting access on payment of appropriate compensation.
GENERAL PROVISIONS RELATING TO MINING TENURES
Crown lands
Representation work
In order to keep a mineral claim in good standing, the claim holder must satisfy minimum annual
requirements of “representation” work under the NTNMR. Adjacent and contiguous claims can be
grouped to a maximum of 5,165 acres. Work performed in one claim area can be applied to any or all
of the other areas within the group.
An extension of time is allowed to perform representation work due to illness or other reasons.
For an extension due to a reason other than illness, a deposit equivalent to the representation work
owing is required.
If a claim holder fails to file the required representation work, or apply for an extension, the
Mining Recorder will send a lapsing notice 30 days after the anniversary date of the claim. The claim
will lapse automatically if the required remedy is not made within 60 days.
Government royalty
The NTNMR provide for payment of an annual royalty based on the value of the output of a mine
on a sliding scale from 0% on the first C$10,000 up to 14% on any value over and above C$45 million.
Inuit owned lands
IOL Rights
The NTI has published “A Guide to Mineral Exploration and Development on Inuit Owned Lands
in Nunavut” (the “Guide”) and “Rules and Procedures for the Management of Inuit Owned Lands” (the
“Rules”). They set out the circumstances in which each form of surface tenure is appropriate and the
application procedure.
LEGAL AND REGULATORY REGIME IN WHICH THE TARGET GROUP OPERATES
— 188 —
The Guide and the Rules also define the forms of subsurface tenures that can be obtained, on
application, from the NTI. The description of subsurface tenures included herein is taken from the
Guide and the Rules. As noted above, subject to one exception, the RIAs and the NTI are under no
obligation to issue surface or subsurface rights on application being made and, if they do issue tenures,
there is no obligation for them to follow the Guide or the Rules. The Guide and the Rules state that
they are of no legal force or effect.
ABORIGINAL
Background
The NLCA granted the ownership of large tracts of land to the Inuit people in exchange for
Aboriginal title to the Inuit’s traditional land and water in Nunavut. These IOL include areas with high
mineral potential. Further, as a result of other rights granted to the Inuit in the NLCA, Inuit
organizations play an important role in the management and protection of natural resources and the
environment in Nunavut. These duties are shared among the federal and territorial governments and
Inuit organizations.
As discussed in the paragraph headed “Legal and regulatory regime in which the Target Group
operates — Canada — Nunavut — Mining law” above, mining projects in Nunavut often cover a
combination of Crown land, Surface IOL and Subsurface IOL.
Inuit Consultation and Inuit Impact and Benefit Agreements
Article 26 of the NLCA requires that an Inuit Impact and Benefit Agreement (“IIBA”) be signed
with the appropriate RIA before commencing a “major development project” involving the
development or exploitation of resources wholly or partly under IOL. The IIBA must be consistent
with the terms and conditions of project approvals and is intended to ensure that local employment,
training and business opportunities arising from all phases of the proposed project are accessible to
the Inuit. The IIBA also generally outlines the special considerations and compensation that the
proponent agrees to provide to the Inuit regarding traditional, social, wildlife, environmental and
cultural matters. Water compensation agreements are also required by Article 20 of the NLCA with
respect to any loss or damage that may be caused by the change in quality, quantity or flow of water
on IOL. Water compensation agreements may be negotiated alongside the IIBA or separately.
Finally, Article 27 of the NLCA requires the federal government to consult the Inuit before
developing any resources on Crown lands in Nunavut regarding, among other matters, Inuit
employment, training and business, as well as traditional, social, wildlife, environmental and cultural
matters. In general, the context of this Crown duty is proportionate to the anticipated impact of a
proposed mining project on the Inuit interests. This duty may also extend to accommodating the
interests of the Inuit by addressing potential effects on their rights. Although this duty is the duty of
the Crown, mining companies risk having government approvals invalidated by the courts where the
Crown has failed to discharge the duty. Therefore, it is important that mining companies ensure
adequate Crown consultations with potentially affected Inuit have taken place.
LEGAL AND REGULATORY REGIME IN WHICH THE TARGET GROUP OPERATES
— 189 —
ENVIRONMENT
Background
The environment in Nunavut is regulated by a wide variety of environmental laws and
regulations. This overview highlights the most significant of those that are relevant to mining
operations in Nunavut, which are derived from three overlapping sources: the federal government; the
NLCA; and the laws of the territory of Nunavut. Five key institutions created under the NLCA have
responsibilities to manage lands and resources in Nunavut: the Nunavut Planning Commission
(“NPC”); the NIRB; the Nunavut Water Board (“NWB”); the Nunavut Surface Rights Tribunal and the
Nunavut Wildlife Management Board.
Nunavut planning commission
The NPC’s role is to ensure proposed projects conform to approved land use plans prepared in
accordance with the NLCA. To date, only two regions in Nunavut have approved land use plans
pursuant to the NLCA (i.e., the North Baffin and the Keewatin). If a proposed project is located within
one of these land use planning regions, the proposed project will be reviewed by the NPC in
accordance with the NLCA. If the NPC determines that the project proposal is in conformity with the
approved land use plan, or a variance has been approved, the NPC will forward the proposal to the
NIRB for screening.
In the absence of an approved land use plan, all project proposals are referred directly to the
NIRB for screening in accordance with the NLCA. The federal and territorial governments and Inuit
organizations have been working with the NPC to formulate a draft territory-wide Nunavut Land Use
Plan as required by the NLCA. A working draft of such plan was released by the NPC for public
comment in June, 2010.
Environmental impact assessment
Mining operations in Nunavut are subject to an extensive environmental and socio-economic
impact assessment process administered by the NIRB. Under this regime, projects on lands in
Nunavut, or that may affect lands in Nunavut, are screened by the NIRB to determine whether they
pose a significant potential impact. On the basis of this initial screening, the NIRB and the federal
Minister of Indian Affairs and Northern Development (“Minister”) determine whether further review
is required in accordance with the NLCA. Most mining exploration projects are disposed of by the
NIRB with a screening level assessment, while the development and operation of mining projects
generally proceed to a full review by the NIRB, which includes a public consultation process,
technical review and public hearing.
After such hearing, the NIRB issues a report on the project proposal to the Minister. The report
contains the NIRB’s assessment of the project proposal and its impacts, and based on this assessment,
a determination of whether or not the proposed project should proceed. Where the NIRB concludes
that the proposed project should proceed, terms and conditions are included to ensure the integrity of
the development process. Although the NIRB makes a determination on proposed projects under
review, it is the Minister who makes the final decision.
LEGAL AND REGULATORY REGIME IN WHICH THE TARGET GROUP OPERATES
— 190 —
In the event that it has been determined that a proposed project should be permitted to proceed,
the NIRB will issue a project certificate to the proponent, including any terms and conditions.
Secondary approvals
In the event that the NIRB issues a project certificate for a proposed mining project, proponents
generally require numerous other regulatory licences and permits to build and operate the proposed
project from the federal and territorial governments and Inuit organizations such as water licences
from the NWB (which has the responsibility over the regulation, use and management of water in
Nunavut), land use permits from the RIAs, federal Fisheries Act approvals for tailings impoundment
areas, federal species at risk permits, etc.
Compliance and offences
Offences
As environmental protection is not exclusively a federal or territorial responsibility in Nunavut,
both levels of government have regulatory frameworks the may impose offence liability on the owners
and operators of mining operations. As a result, failing to comply with a condition in an environmental
approval or causing unlawful releases of contaminants into the environment may result in fines of up
to C$1 million per offence under several applicable environmental statutes.
Administrative orders
In addition to prosecution, federal and territorial environmental authorities also have a range of
powers that enable them to intervene in the conduct of the mining operations to protect the
environment as well as to order the remediation of contamination.
Greenhouse gases
Under the Copenhagen Accord, Canada has committed to reducing greenhouse gas emissions by
17%, relative to 2005 levels, by 2020, but this commitment is subject to future alignment with
reduction targets in the United States. Canada is currently developing new regulatory requirements to
address greenhouse gas emissions. As a result, new regulatory requirements and the additional costs
required to comply may ultimately have a material effect on mining operations in Nunavut.
Mine reclamation and financial assurance
Approved mine closure and reclamation plans (including appropriate financial assurance) are
generally required by the federal and territorial environmental authorities before mining activities are
permitted to commence in Nunavut. In general, these plans integrate the requirements associated with
leasing surface rights and water licensing. However, regulatory authority in Nunavut to require
financial assurance for mine reclamation is not contained in a single statute. As a result, financial
security has become an important multi-jurisdictional issue in Nunavut and co-ordination is an
important consideration for mining companies.
LEGAL AND REGULATORY REGIME IN WHICH THE TARGET GROUP OPERATES
— 191 —
OCCUPATIONAL HEALTH AND SAFETY
Key Nunavut legislation
Prescriptive legislation regulates health and safety at mining workplaces in Nunavut.
The principal legislation enacted by the Government of Nunavut consists of the following:
• Mine Health and Safety Act (Nunavut), R.S.N.W.T. 1994
• Mine Health and Safety Regulations (Nunavut), R-125-95
• Public Health Act, R.S.N.W.T. (Nu) 1988
• Camp Sanitation Regulations, R.R.N.W.T. (Nu) 1990, c. P-12
• Safety Act (Nunavut), R.S.N.W.T. (Nu) 1988, c. S-1
• General Safety Regulations (Nunavut), R.R.N.W.T. (Nu) 1990
• Work Site Hazardous Materials Information System Regulations (Nunavut), R.R.N.W.T. 1990
• Transportation of Dangerous Goods Act, 1990, R.S.N.W.T. (Nu) 1988
• Transportation of Dangerous Goods Regulations, 1991, N.W.T. Reg. (Nu.) 095-91
• Explosives Use Act, R.S.N.W.T. (Nu) 1988
• Workers’ Compensation Act, S.Nu 2007, c.15
Duty holders
The legislation imposes obligations principally on employers.
Enforcement
Substantial fines and imprisonment of corporate officials are possible.
LEGAL AND REGULATORY REGIME IN WHICH THE TARGET GROUP OPERATES
— 192 —
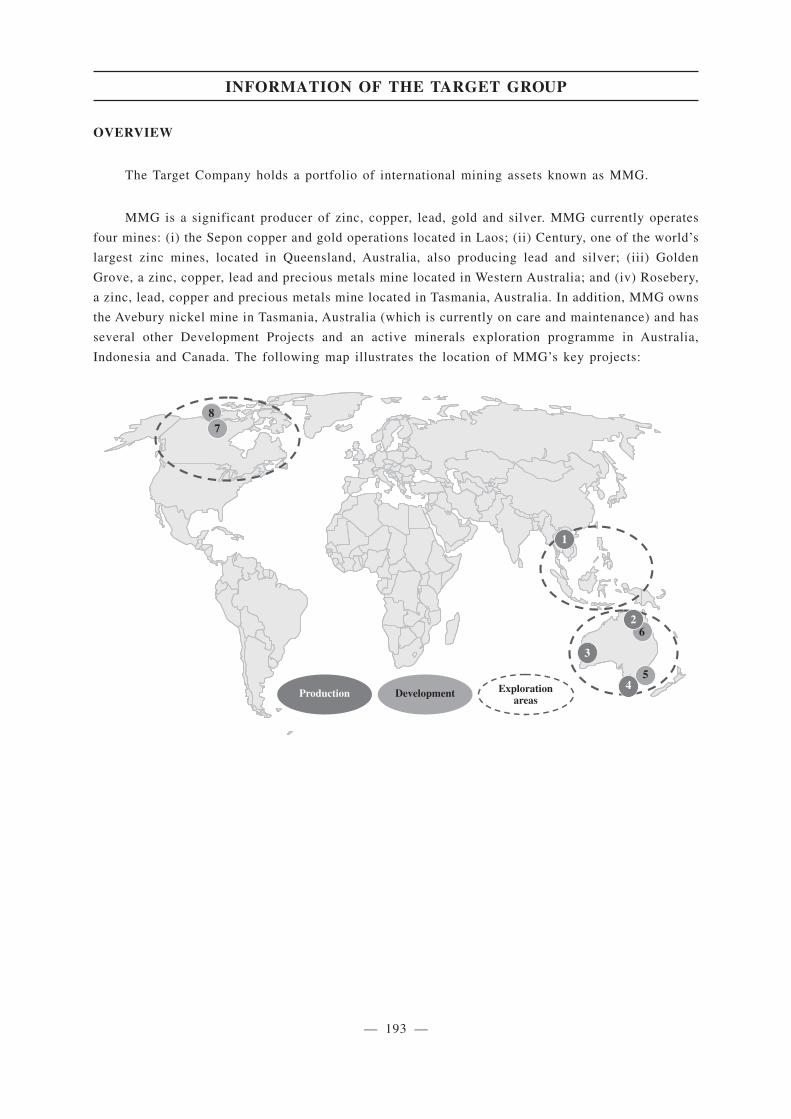
OVERVIEW
The Target Company holds a portfolio of international mining assets known as MMG.
MMG is a significant producer of zinc, copper, lead, gold and silver. MMG currently operates
four mines: (i) the Sepon copper and gold operations located in Laos; (ii) Century, one of the world’s
largest zinc mines, located in Queensland, Australia, also producing lead and silver; (iii) Golden
Grove, a zinc, copper, lead and precious metals mine located in Western Australia; and (iv) Rosebery,
a zinc, lead, copper and precious metals mine located in Tasmania, Australia. In addition, MMG owns
the Avebury nickel mine in Tasmania, Australia (which is currently on care and maintenance) and has
several other Development Projects and an active minerals exploration programme in Australia,
Indonesia and Canada. The following map illustrates the location of MMG’s key projects:
87
5
62
3
4
1
Development Explorationareas
Production
INFORMATION OF THE TARGET GROUP
— 193 —
14.60(2)14.59(2)14.58(2)App1,part B31(a)14A.59(2)(b)
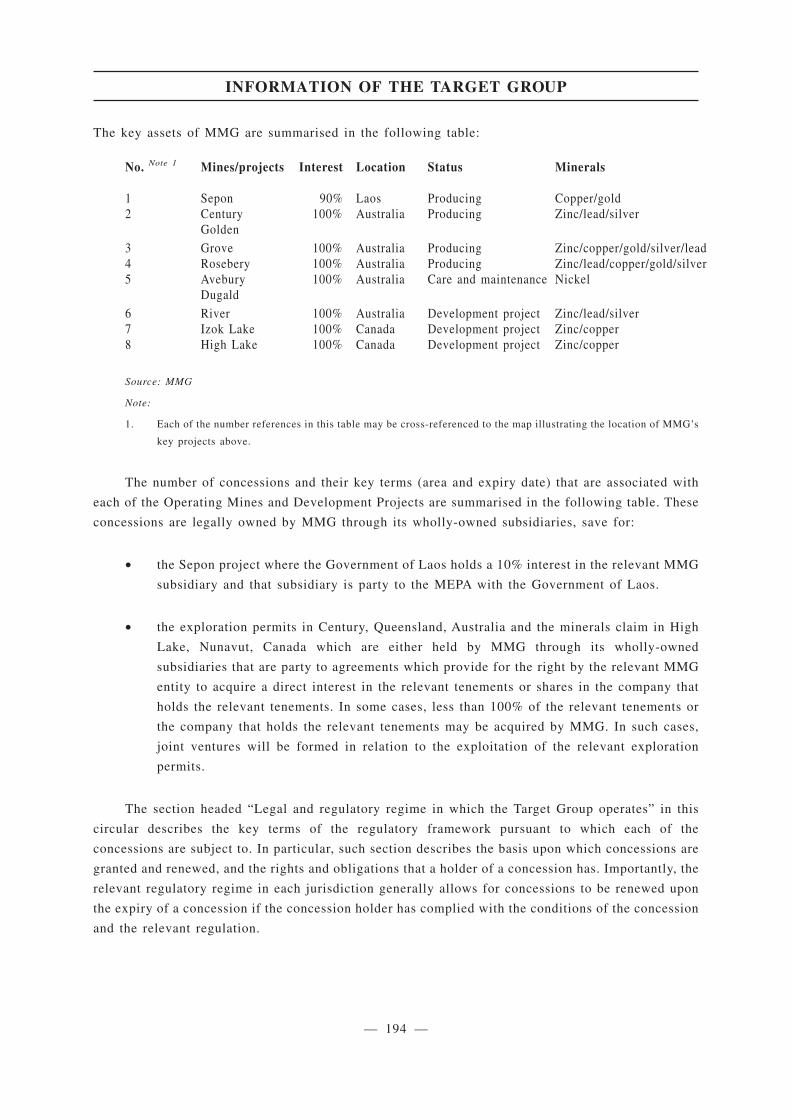
The key assets of MMG are summarised in the following table:
No. Note 1 Mines/projects Interest Location Status Minerals
1 Sepon 90% Laos Producing Copper/gold2 Century 100% Australia Producing Zinc/lead/silver
3
Golden
Grove 100% Australia Producing Zinc/copper/gold/silver/lead4 Rosebery 100% Australia Producing Zinc/lead/copper/gold/silver5 Avebury 100% Australia Care and maintenance Nickel
6
Dugald
River 100% Australia Development project Zinc/lead/silver7 Izok Lake 100% Canada Development project Zinc/copper8 High Lake 100% Canada Development project Zinc/copper
Source: MMG
Note:
1. Each of the number references in this table may be cross-referenced to the map illustrating the location of MMG’s
key projects above.
The number of concessions and their key terms (area and expiry date) that are associated with
each of the Operating Mines and Development Projects are summarised in the following table. These
concessions are legally owned by MMG through its wholly-owned subsidiaries, save for:
• the Sepon project where the Government of Laos holds a 10% interest in the relevant MMG
subsidiary and that subsidiary is party to the MEPA with the Government of Laos.
• the exploration permits in Century, Queensland, Australia and the minerals claim in High
Lake, Nunavut, Canada which are either held by MMG through its wholly-owned
subsidiaries that are party to agreements which provide for the right by the relevant MMG
entity to acquire a direct interest in the relevant tenements or shares in the company that
holds the relevant tenements. In some cases, less than 100% of the relevant tenements or
the company that holds the relevant tenements may be acquired by MMG. In such cases,
joint ventures will be formed in relation to the exploitation of the relevant exploration
permits.
The section headed “Legal and regulatory regime in which the Target Group operates” in this
circular describes the key terms of the regulatory framework pursuant to which each of the
concessions are subject to. In particular, such section describes the basis upon which concessions are
granted and renewed, and the rights and obligations that a holder of a concession has. Importantly, the
relevant regulatory regime in each jurisdiction generally allows for concessions to be renewed upon
the expiry of a concession if the concession holder has complied with the conditions of the concession
and the relevant regulation.
INFORMATION OF THE TARGET GROUP
— 194 —
18.05(3)
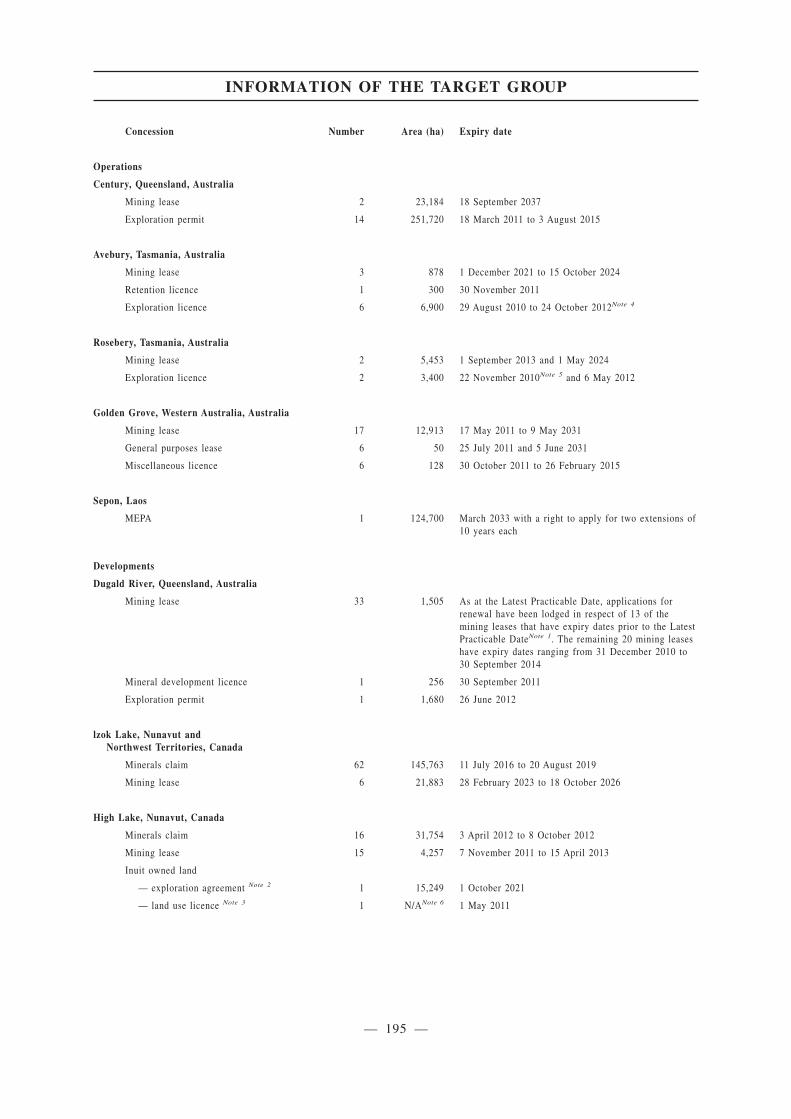
Concession Number Area (ha) Expiry date
Operations
Century, Queensland, Australia
Mining lease 2 23,184 18 September 2037
Exploration permit 14 251,720 18 March 2011 to 3 August 2015
Avebury, Tasmania, Australia
Mining lease 3 878 1 December 2021 to 15 October 2024
Retention licence 1 300 30 November 2011
Exploration licence 6 6,900 29 August 2010 to 24 October 2012Note 4
Rosebery, Tasmania, Australia
Mining lease 2 5,453 1 September 2013 and 1 May 2024
Exploration licence 2 3,400 22 November 2010Note 5 and 6 May 2012
Golden Grove, Western Australia, Australia
Mining lease 17 12,913 17 May 2011 to 9 May 2031
General purposes lease 6 50 25 July 2011 and 5 June 2031
Miscellaneous licence 6 128 30 October 2011 to 26 February 2015
Sepon, Laos
MEPA 1 124,700 March 2033 with a right to apply for two extensions of10 years each
Developments
Dugald River, Queensland, Australia
Mining lease 33 1,505 As at the Latest Practicable Date, applications forrenewal have been lodged in respect of 13 of themining leases that have expiry dates prior to the LatestPracticable DateNote 1. The remaining 20 mining leaseshave expiry dates ranging from 31 December 2010 to30 September 2014
Mineral development licence 1 256 30 September 2011
Exploration permit 1 1,680 26 June 2012
lzok Lake, Nunavut andNorthwest Territories, Canada
Minerals claim 62 145,763 11 July 2016 to 20 August 2019
Mining lease 6 21,883 28 February 2023 to 18 October 2026
High Lake, Nunavut, Canada
Minerals claim 16 31,754 3 April 2012 to 8 October 2012
Mining lease 15 4,257 7 November 2011 to 15 April 2013
Inuit owned land
— exploration agreement Note 2 1 15,249 1 October 2021
— land use licence Note 3 1 N/ANote 6 1 May 2011
INFORMATION OF THE TARGET GROUP
— 195 —
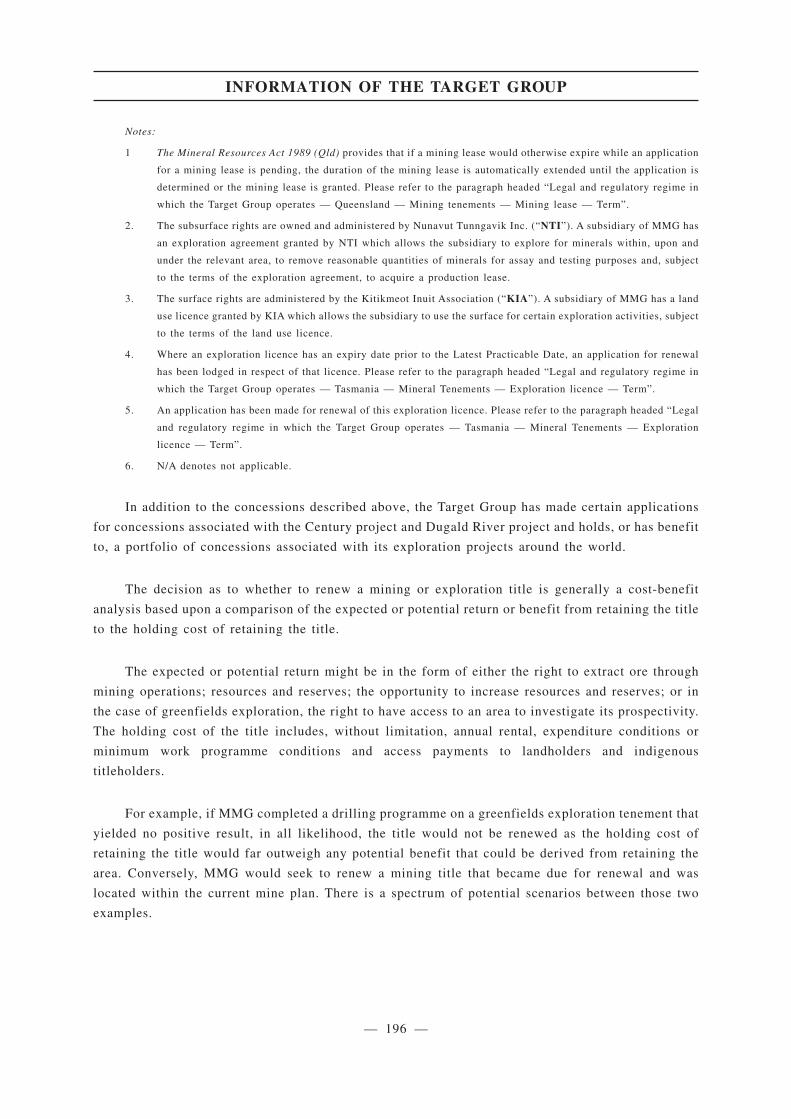
Notes:
1 The Mineral Resources Act 1989 (Qld) provides that if a mining lease would otherwise expire while an application
for a mining lease is pending, the duration of the mining lease is automatically extended until the application is
determined or the mining lease is granted. Please refer to the paragraph headed “Legal and regulatory regime in
which the Target Group operates — Queensland — Mining tenements — Mining lease — Term”.
2. The subsurface rights are owned and administered by Nunavut Tunngavik Inc. (“NTI”). A subsidiary of MMG has
an exploration agreement granted by NTI which allows the subsidiary to explore for minerals within, upon and
under the relevant area, to remove reasonable quantities of minerals for assay and testing purposes and, subject
to the terms of the exploration agreement, to acquire a production lease.
3. The surface rights are administered by the Kitikmeot Inuit Association (“KIA”). A subsidiary of MMG has a land
use licence granted by KIA which allows the subsidiary to use the surface for certain exploration activities, subject
to the terms of the land use licence.
4. Where an exploration licence has an expiry date prior to the Latest Practicable Date, an application for renewal
has been lodged in respect of that licence. Please refer to the paragraph headed “Legal and regulatory regime in
which the Target Group operates — Tasmania — Mineral Tenements — Exploration licence — Term”.
5. An application has been made for renewal of this exploration licence. Please refer to the paragraph headed “Legal
and regulatory regime in which the Target Group operates — Tasmania — Mineral Tenements — Exploration
licence — Term”.
6. N/A denotes not applicable.
In addition to the concessions described above, the Target Group has made certain applications
for concessions associated with the Century project and Dugald River project and holds, or has benefit
to, a portfolio of concessions associated with its exploration projects around the world.
The decision as to whether to renew a mining or exploration title is generally a cost-benefit
analysis based upon a comparison of the expected or potential return or benefit from retaining the title
to the holding cost of retaining the title.
The expected or potential return might be in the form of either the right to extract ore through
mining operations; resources and reserves; the opportunity to increase resources and reserves; or in
the case of greenfields exploration, the right to have access to an area to investigate its prospectivity.
The holding cost of the title includes, without limitation, annual rental, expenditure conditions or
minimum work programme conditions and access payments to landholders and indigenous
titleholders.
For example, if MMG completed a drilling programme on a greenfields exploration tenement that
yielded no positive result, in all likelihood, the title would not be renewed as the holding cost of
retaining the title would far outweigh any potential benefit that could be derived from retaining the
area. Conversely, MMG would seek to renew a mining title that became due for renewal and was
located within the current mine plan. There is a spectrum of potential scenarios between those two
examples.
INFORMATION OF THE TARGET GROUP
— 196 —
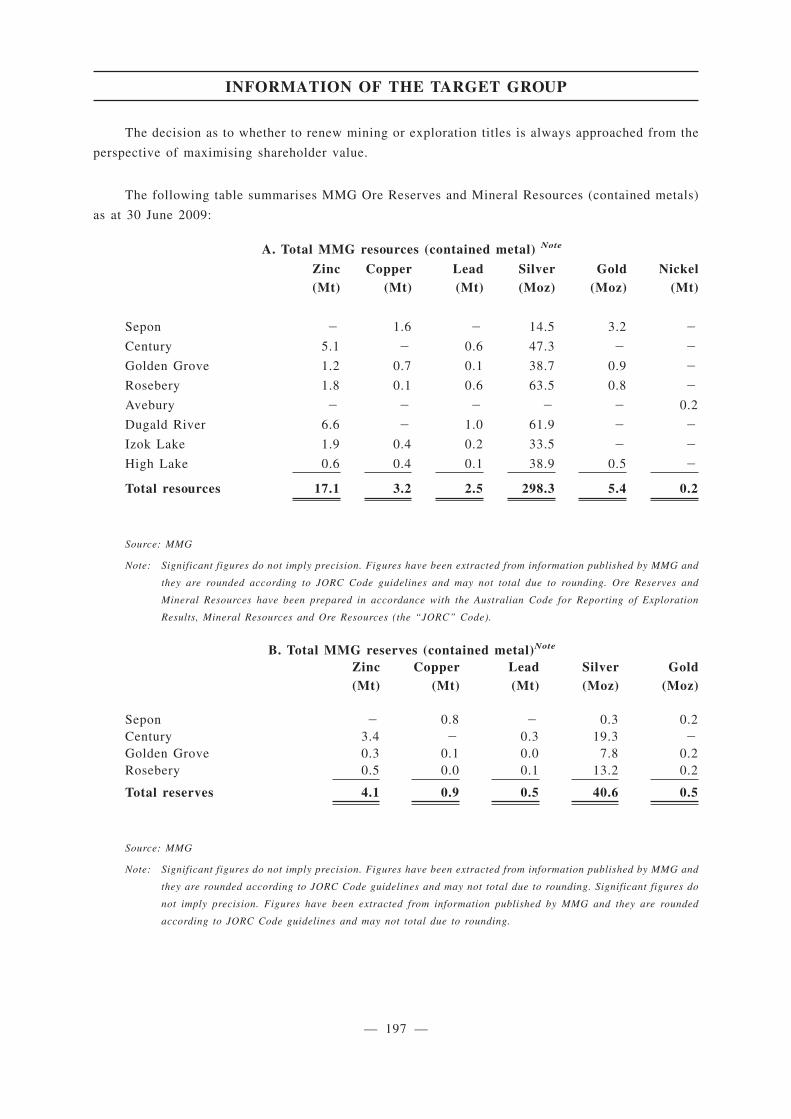
The decision as to whether to renew mining or exploration titles is always approached from the
perspective of maximising shareholder value.
The following table summarises MMG Ore Reserves and Mineral Resources (contained metals)
as at 30 June 2009:
A. Total MMG resources (contained metal) Note
Zinc(Mt)
Copper(Mt)
Lead(Mt)
Silver(Moz)
Gold(Moz)
Nickel(Mt)
Sepon � 1.6 � 14.5 3.2 �
Century 5.1 � 0.6 47.3 � �
Golden Grove 1.2 0.7 0.1 38.7 0.9 �
Rosebery 1.8 0.1 0.6 63.5 0.8 �
Avebury � � � � � 0.2
Dugald River 6.6 � 1.0 61.9 � �
Izok Lake 1.9 0.4 0.2 33.5 � �
High Lake 0.6 0.4 0.1 38.9 0.5 �
Total resources 17.1 3.2 2.5 298.3 5.4 0.2
Source: MMG
Note: Significant figures do not imply precision. Figures have been extracted from information published by MMG and
they are rounded according to JORC Code guidelines and may not total due to rounding. Ore Reserves and
Mineral Resources have been prepared in accordance with the Australian Code for Reporting of Exploration
Results, Mineral Resources and Ore Resources (the “JORC” Code).
B. Total MMG reserves (contained metal)Note
Zinc(Mt)
Copper(Mt)
Lead(Mt)
Silver(Moz)
Gold(Moz)
Sepon � 0.8 � 0.3 0.2Century 3.4 � 0.3 19.3 �
Golden Grove 0.3 0.1 0.0 7.8 0.2Rosebery 0.5 0.0 0.1 13.2 0.2
Total reserves 4.1 0.9 0.5 40.6 0.5
Source: MMG
Note: Significant figures do not imply precision. Figures have been extracted from information published by MMG and
they are rounded according to JORC Code guidelines and may not total due to rounding. Significant figures do
not imply precision. Figures have been extracted from information published by MMG and they are rounded
according to JORC Code guidelines and may not total due to rounding.
INFORMATION OF THE TARGET GROUP
— 197 —
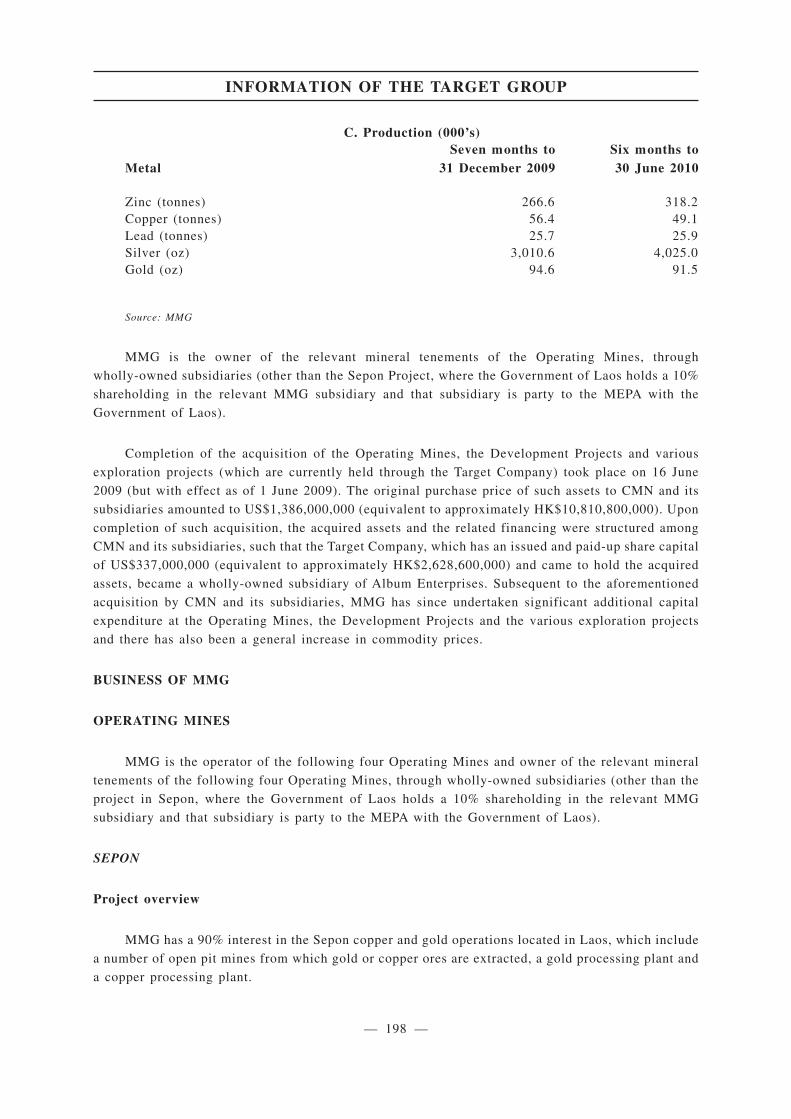
C. Production (000’s)
MetalSeven months to
31 December 2009Six months to30 June 2010
Zinc (tonnes) 266.6 318.2Copper (tonnes) 56.4 49.1Lead (tonnes) 25.7 25.9Silver (oz) 3,010.6 4,025.0Gold (oz) 94.6 91.5
Source: MMG
MMG is the owner of the relevant mineral tenements of the Operating Mines, through
wholly-owned subsidiaries (other than the Sepon Project, where the Government of Laos holds a 10%
shareholding in the relevant MMG subsidiary and that subsidiary is party to the MEPA with the
Government of Laos).
Completion of the acquisition of the Operating Mines, the Development Projects and various
exploration projects (which are currently held through the Target Company) took place on 16 June
2009 (but with effect as of 1 June 2009). The original purchase price of such assets to CMN and its
subsidiaries amounted to US$1,386,000,000 (equivalent to approximately HK$10,810,800,000). Upon
completion of such acquisition, the acquired assets and the related financing were structured among
CMN and its subsidiaries, such that the Target Company, which has an issued and paid-up share capital
of US$337,000,000 (equivalent to approximately HK$2,628,600,000) and came to hold the acquired
assets, became a wholly-owned subsidiary of Album Enterprises. Subsequent to the aforementioned
acquisition by CMN and its subsidiaries, MMG has since undertaken significant additional capital
expenditure at the Operating Mines, the Development Projects and the various exploration projects
and there has also been a general increase in commodity prices.
BUSINESS OF MMG
OPERATING MINES
MMG is the operator of the following four Operating Mines and owner of the relevant mineral
tenements of the following four Operating Mines, through wholly-owned subsidiaries (other than the
project in Sepon, where the Government of Laos holds a 10% shareholding in the relevant MMG
subsidiary and that subsidiary is party to the MEPA with the Government of Laos).
SEPON
Project overview
MMG has a 90% interest in the Sepon copper and gold operations located in Laos, which include
a number of open pit mines from which gold or copper ores are extracted, a gold processing plant and
a copper processing plant.
INFORMATION OF THE TARGET GROUP
— 198 —
14A.56(5)
14A.59(14)
14.63(2)(c)
14.58(2)AppI, part B31(2)(a)
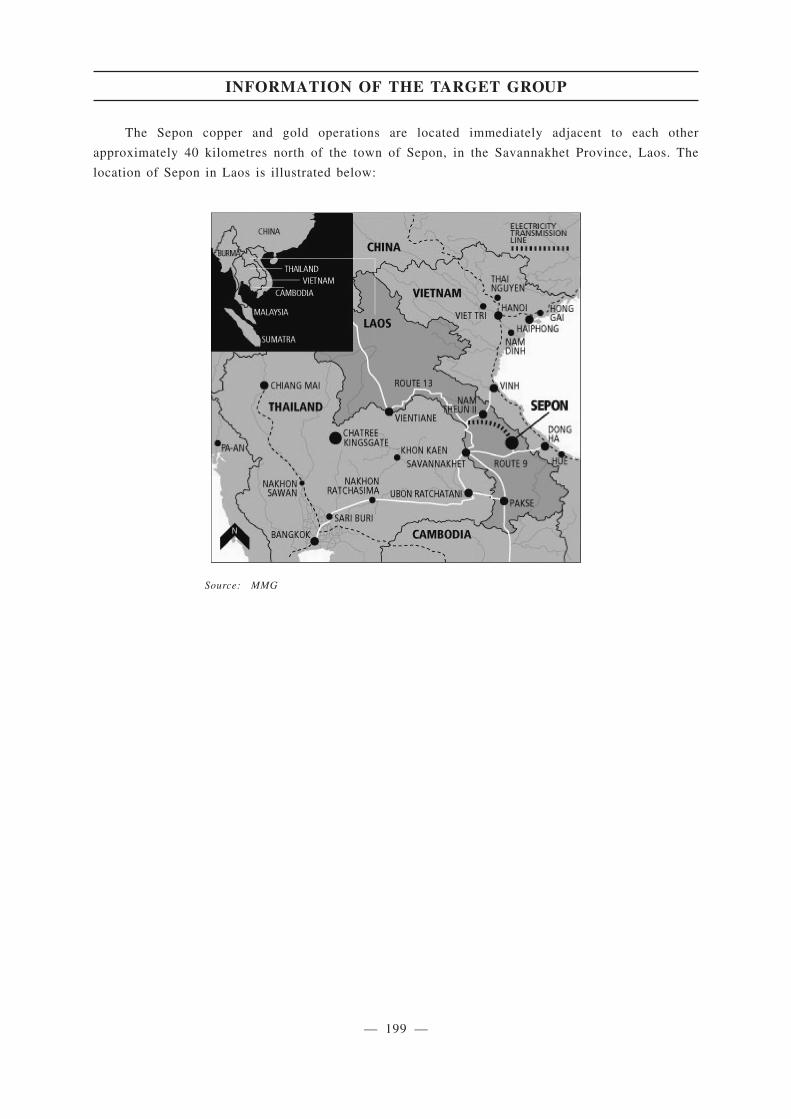
The Sepon copper and gold operations are located immediately adjacent to each other
approximately 40 kilometres north of the town of Sepon, in the Savannakhet Province, Laos. The
location of Sepon in Laos is illustrated below:
Source: MMG
INFORMATION OF THE TARGET GROUP
— 199 —
The Government of Laos holds the remaining 10% interest in the Sepon operations. MMG Laos
Holdings Limited is a party to the MEPA. Lane Xang Minerals Limited (“LXML”) has the title, rights
and interests in and to the contract area delineated in the MEPA, which includes the right to explore
for and mine minerals within the contract area delineated in the MEPA for a period of 30 years
commencing from the first day of the calendar month during which the average daily throughput
achieves the target specified in the MEPA, with a right to apply for two extensions, with each
extension being for a period of 10 years. The average daily throughput achieved the target specified
in the MEPA in March 2003. The Government of Laos exercised its right to purchase 10% of the
projects’ holding company LXML on 30 June 2007.
Exports from Sepon constitute a significant proportion of Lao’s total exports. Currently, around
a third of Laos’ total exports come from the Sepon copper and gold operation (although this was
almost 50% in 2006). Sepon’s share in Laos’ total government revenue has increased from 1% in 2003
to around 15% to 20% currently. As a share of Laos’ GDP, Sepon’s revenue has increased from 0.1%
in 2003 to 2.8% currently.
As at 30 September 2010, 1,599 employees and 2,065 contractors worked for the Sepon project.
Sepon copper operations (“Sepon Copper”)
Overview
Feasibility studies into the development of the Sepon Copper project began in 2002 and
construction commenced in 2003. Processing started in February 2005 and the first copper cathodes
were produced in March 2005. Current mine life is estimated to extend to approximately 2020. It is
one of the most modern and technically sophisticated plants of its kind in Asia.
INFORMATION OF THE TARGET GROUP
— 200 —
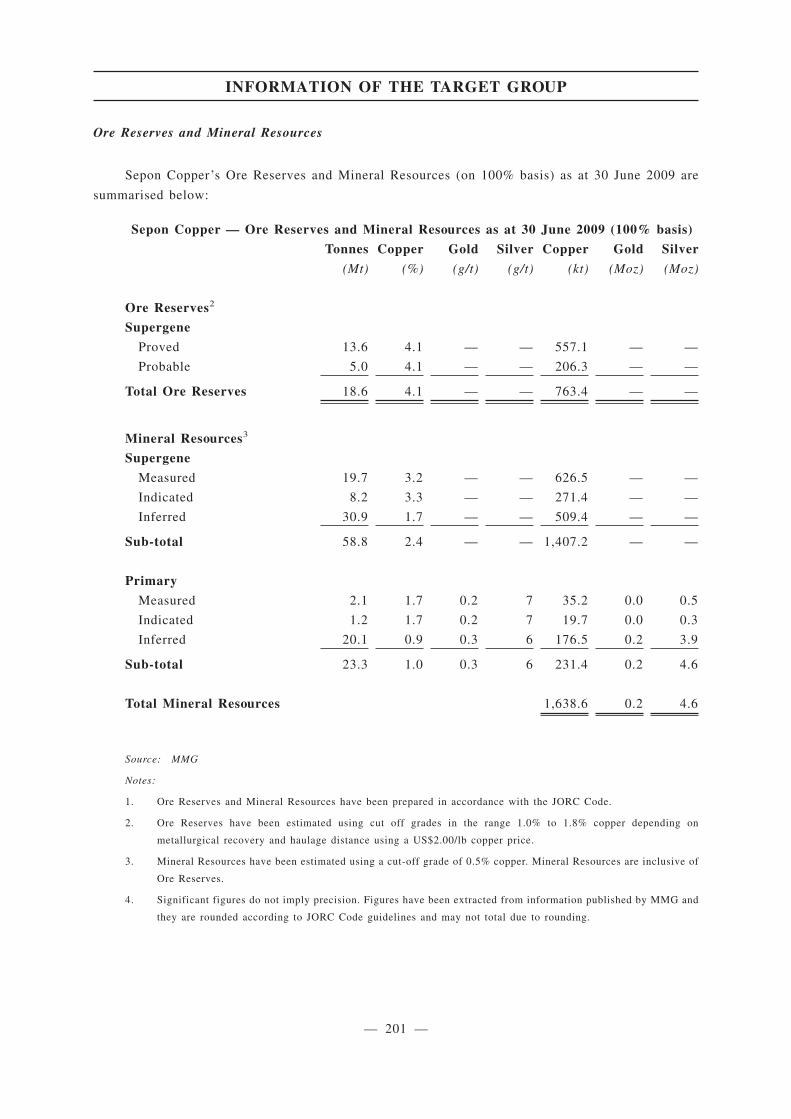
Ore Reserves and Mineral Resources
Sepon Copper’s Ore Reserves and Mineral Resources (on 100% basis) as at 30 June 2009 are
summarised below:
Sepon Copper — Ore Reserves and Mineral Resources as at 30 June 2009 (100% basis)
Tonnes Copper Gold Silver Copper Gold Silver
(Mt) (%) (g/t) (g/t) (kt) (Moz) (Moz)
Ore Reserves2
Supergene
Proved 13.6 4.1 — — 557.1 — —
Probable 5.0 4.1 — — 206.3 — —
Total Ore Reserves 18.6 4.1 — — 763.4 — —
Mineral Resources3
Supergene
Measured 19.7 3.2 — — 626.5 — —
Indicated 8.2 3.3 — — 271.4 — —
Inferred 30.9 1.7 — — 509.4 — —
Sub-total 58.8 2.4 — — 1,407.2 — —
Primary
Measured 2.1 1.7 0.2 7 35.2 0.0 0.5
Indicated 1.2 1.7 0.2 7 19.7 0.0 0.3
Inferred 20.1 0.9 0.3 6 176.5 0.2 3.9
Sub-total 23.3 1.0 0.3 6 231.4 0.2 4.6
Total Mineral Resources 1,638.6 0.2 4.6
Source: MMG
Notes:
1. Ore Reserves and Mineral Resources have been prepared in accordance with the JORC Code.
2. Ore Reserves have been estimated using cut off grades in the range 1.0% to 1.8% copper depending on
metallurgical recovery and haulage distance using a US$2.00/lb copper price.
3. Mineral Resources have been estimated using a cut-off grade of 0.5% copper. Mineral Resources are inclusive of
Ore Reserves.
4. Significant figures do not imply precision. Figures have been extracted from information published by MMG and
they are rounded according to JORC Code guidelines and may not total due to rounding.
INFORMATION OF THE TARGET GROUP
— 201 —
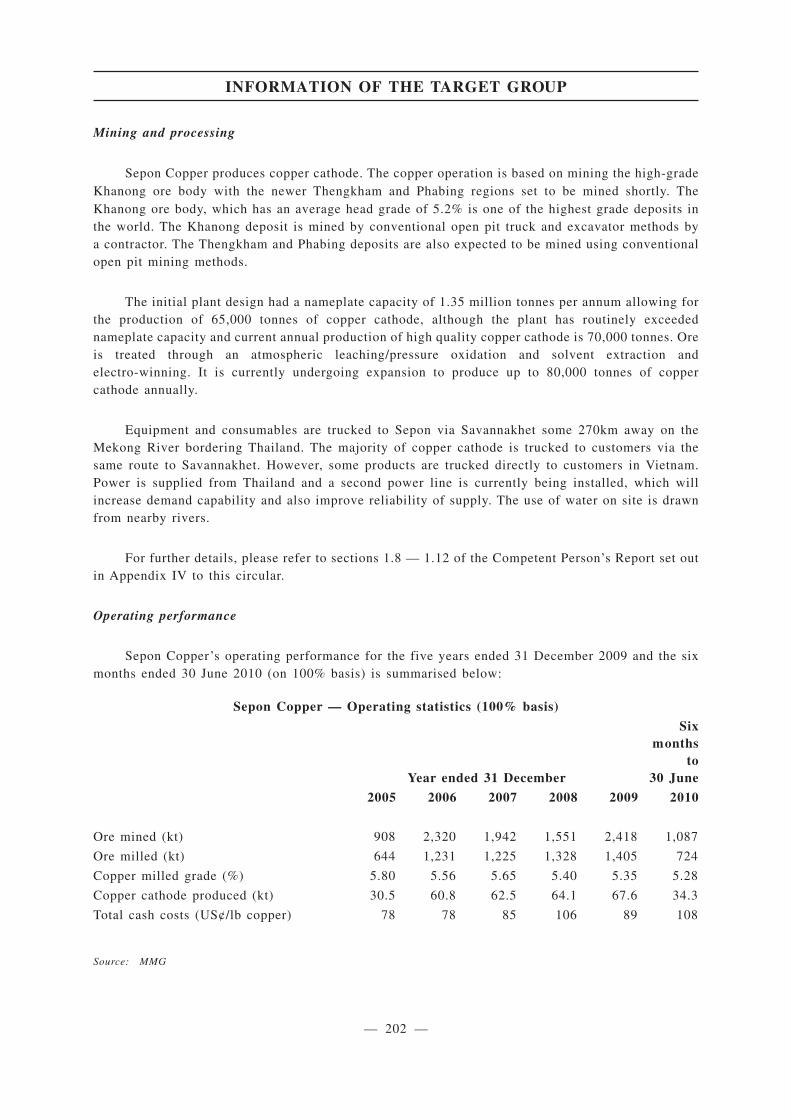
Mining and processing
Sepon Copper produces copper cathode. The copper operation is based on mining the high-gradeKhanong ore body with the newer Thengkham and Phabing regions set to be mined shortly. TheKhanong ore body, which has an average head grade of 5.2% is one of the highest grade deposits inthe world. The Khanong deposit is mined by conventional open pit truck and excavator methods bya contractor. The Thengkham and Phabing deposits are also expected to be mined using conventionalopen pit mining methods.
The initial plant design had a nameplate capacity of 1.35 million tonnes per annum allowing forthe production of 65,000 tonnes of copper cathode, although the plant has routinely exceedednameplate capacity and current annual production of high quality copper cathode is 70,000 tonnes. Oreis treated through an atmospheric leaching/pressure oxidation and solvent extraction andelectro-winning. It is currently undergoing expansion to produce up to 80,000 tonnes of coppercathode annually.
Equipment and consumables are trucked to Sepon via Savannakhet some 270km away on theMekong River bordering Thailand. The majority of copper cathode is trucked to customers via thesame route to Savannakhet. However, some products are trucked directly to customers in Vietnam.Power is supplied from Thailand and a second power line is currently being installed, which willincrease demand capability and also improve reliability of supply. The use of water on site is drawnfrom nearby rivers.
For further details, please refer to sections 1.8 — 1.12 of the Competent Person’s Report set outin Appendix IV to this circular.
Operating performance
Sepon Copper’s operating performance for the five years ended 31 December 2009 and the sixmonths ended 30 June 2010 (on 100% basis) is summarised below:
Sepon Copper — Operating statistics (100% basis)
Year ended 31 December
Sixmonths
to30 June
2005 2006 2007 2008 2009 2010
Ore mined (kt) 908 2,320 1,942 1,551 2,418 1,087
Ore milled (kt) 644 1,231 1,225 1,328 1,405 724
Copper milled grade (%) 5.80 5.56 5.65 5.40 5.35 5.28
Copper cathode produced (kt) 30.5 60.8 62.5 64.1 67.6 34.3
Total cash costs (US¢/lb copper) 78 78 85 106 89 108
Source: MMG
INFORMATION OF THE TARGET GROUP
— 202 —
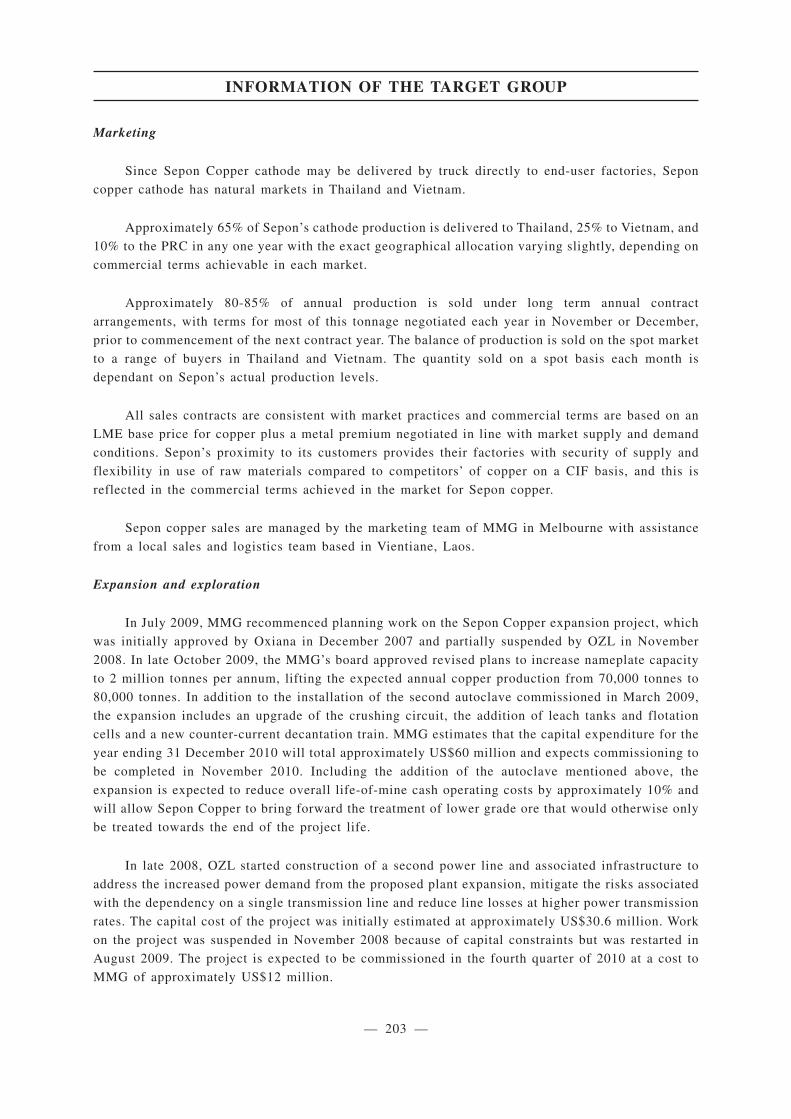
Marketing
Since Sepon Copper cathode may be delivered by truck directly to end-user factories, Sepon
copper cathode has natural markets in Thailand and Vietnam.
Approximately 65% of Sepon’s cathode production is delivered to Thailand, 25% to Vietnam, and
10% to the PRC in any one year with the exact geographical allocation varying slightly, depending on
commercial terms achievable in each market.
Approximately 80-85% of annual production is sold under long term annual contract
arrangements, with terms for most of this tonnage negotiated each year in November or December,
prior to commencement of the next contract year. The balance of production is sold on the spot market
to a range of buyers in Thailand and Vietnam. The quantity sold on a spot basis each month is
dependant on Sepon’s actual production levels.
All sales contracts are consistent with market practices and commercial terms are based on an
LME base price for copper plus a metal premium negotiated in line with market supply and demand
conditions. Sepon’s proximity to its customers provides their factories with security of supply and
flexibility in use of raw materials compared to competitors’ of copper on a CIF basis, and this is
reflected in the commercial terms achieved in the market for Sepon copper.
Sepon copper sales are managed by the marketing team of MMG in Melbourne with assistance
from a local sales and logistics team based in Vientiane, Laos.
Expansion and exploration
In July 2009, MMG recommenced planning work on the Sepon Copper expansion project, which
was initially approved by Oxiana in December 2007 and partially suspended by OZL in November
2008. In late October 2009, the MMG’s board approved revised plans to increase nameplate capacity
to 2 million tonnes per annum, lifting the expected annual copper production from 70,000 tonnes to
80,000 tonnes. In addition to the installation of the second autoclave commissioned in March 2009,
the expansion includes an upgrade of the crushing circuit, the addition of leach tanks and flotation
cells and a new counter-current decantation train. MMG estimates that the capital expenditure for the
year ending 31 December 2010 will total approximately US$60 million and expects commissioning to
be completed in November 2010. Including the addition of the autoclave mentioned above, the
expansion is expected to reduce overall life-of-mine cash operating costs by approximately 10% and
will allow Sepon Copper to bring forward the treatment of lower grade ore that would otherwise only
be treated towards the end of the project life.
In late 2008, OZL started construction of a second power line and associated infrastructure to
address the increased power demand from the proposed plant expansion, mitigate the risks associated
with the dependency on a single transmission line and reduce line losses at higher power transmission
rates. The capital cost of the project was initially estimated at approximately US$30.6 million. Work
on the project was suspended in November 2008 because of capital constraints but was restarted in
August 2009. The project is expected to be commissioned in the fourth quarter of 2010 at a cost to
MMG of approximately US$12 million.
INFORMATION OF THE TARGET GROUP
— 203 —
In 2009, copper exploration continued with a focus on the extensive Thengkham system of
deposits. Step out drilling programs continue to identify new zones of primary and supergene
copper-gold mineralisation and infill drilling programs have identified new extensions beneath and
lateral to existing resources. Recent exploration drilling has identified a number of primary copper
targets, with one copper deposit occurring in a horse shoe shape within a five square kilometre area.
Resource definition drilling is also ongoing at the known deposits.
For further details, please refer to section 1.7 of the Competent Person’s Report set out in
Appendix IV to this circular.
Closure
MMG reviews on an annual basis the closure cost estimates that are in place for its operational
sites. This involves an external review of existing closure plans and closure cost estimates. The aim
of these reviews is to identify key assumptions included in the plans and existing cost estimates as
well as any major gaps that have not been included.
Key issues that are addressed in the closure plan for Sepon include:
• Water quality
• Topsoil management
• Post closure maintenance and monitoring
• Rehabilitation of pits
• Groundwater
• Closure of roads and tracks
• Infrastructure decommissioning, decontamination and demolition
MMG’s closure cost estimate for Sepon is US$120.1 million (undiscounted, in dollars as of
December 2009, 80% confidence level).
Sepon gold operations (“Sepon Gold”)
Overview
Exploration between 1993 and 1999 resulted in the delineation of approximately 3Moz of gold
resources in various deposits at Sepon. Following further exploration and development, and Oxiana’s
acquisition of the project, production commenced in December 2002. Since then, the Sepon Gold
operation has produced over 1Moz.
INFORMATION OF THE TARGET GROUP
— 204 —
18.05(6)(d)
Ore Reserves and Mineral Resources
Sepon Gold’s Ore Reserves and Mineral Resources (on 100% basis) as at 30 June 2009 are
summarised below:
Sepon Gold — Ore Reserves and Mineral Resources as at 30 June 2009 (100% basis)Tonnes Gold Silver Gold Silver
(Mt) (g/t) (g/t) (Moz) (Moz)
Ore Reserves2
Oxide GoldProved 2.4 1.0 1 0.1 0.1Probable 1.2 2.1 5 0.1 0.2
Total Ore Reserves 3.5 1.4 2 0.2 0.3
Mineral Resources3
Oxide GoldMeasured 4.2 1.0 3 0.1 0.4Indicated 3.3 1.9 5 0.2 0.5Inferred 2.9 1.0 5 0.1 0.5
Sub-total 10.4 1.3 4 0.4 1.4Partial Oxide Gold
Measured 2.4 1.6 9 0.1 0.7Indicated 5.9 2.1 8 0.4 1.5Inferred 1.8 0.7 6 0.0 0.4
Sub-total 10.1 1.7 8 0.6 2.6Primary Gold
Measured 5.4 3.0 7 0.5 1.2Indicated 13.5 2.6 8 1.1 3.5Inferred 5.6 1.8 7 0.3 1.3
Sub-total 24.4 2.5 8 2.0 5.9Total Mineral Resources 3.0 9.9
Source: MMG
Notes:
1. Ore Reserves and Mineral Resources have been prepared in accordance with the JORC Code.
2. Ore Reserves have been estimated using cut off grades in the range 0.45g/t to 0.6g/t gold depending on
metallurgical recovery and haulage distance using a US$900/oz gold price.
3. Mineral Resources have been estimated using a cut-off grade of 0.5g/t for oxide and partial oxide gold and 1.0g/t
for primary gold. Mineral Resources are inclusive of Ore Reserves.
4. Significant figures do not imply precision. Figures have been extracted from information published by MMG and
they are rounded according to JORC Code guidelines and may not total due to rounding.
Mining and processing
The Sepon Gold operation is a conventional open pit oxide mining operation. Gold mining is
focused on the Houay Yeng and Dankoy pits. Ore is mined by a contractor from a number of open pits
and is treated in a conventional carbon-in-leach processing plant to produce a gold and silver doré.
In 2005, the capacity of the plant was increased to 2.5Mt per annum from the design capacity of
1.25Mt per annum.
INFORMATION OF THE TARGET GROUP
— 205 —
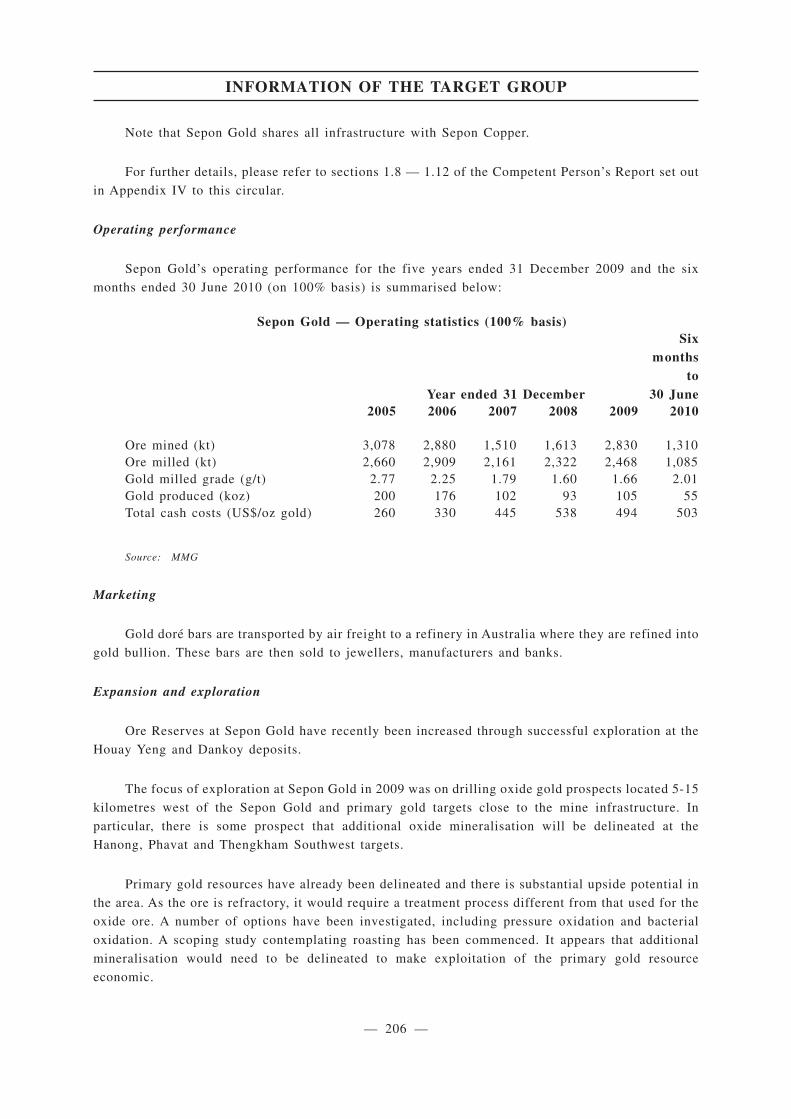
Note that Sepon Gold shares all infrastructure with Sepon Copper.
For further details, please refer to sections 1.8 — 1.12 of the Competent Person’s Report set out
in Appendix IV to this circular.
Operating performance
Sepon Gold’s operating performance for the five years ended 31 December 2009 and the six
months ended 30 June 2010 (on 100% basis) is summarised below:
Sepon Gold — Operating statistics (100% basis)
Year ended 31 December
Sixmonths
to30 June
2005 2006 2007 2008 2009 2010
Ore mined (kt) 3,078 2,880 1,510 1,613 2,830 1,310Ore milled (kt) 2,660 2,909 2,161 2,322 2,468 1,085Gold milled grade (g/t) 2.77 2.25 1.79 1.60 1.66 2.01Gold produced (koz) 200 176 102 93 105 55Total cash costs (US$/oz gold) 260 330 445 538 494 503
Source: MMG
Marketing
Gold doré bars are transported by air freight to a refinery in Australia where they are refined into
gold bullion. These bars are then sold to jewellers, manufacturers and banks.
Expansion and exploration
Ore Reserves at Sepon Gold have recently been increased through successful exploration at the
Houay Yeng and Dankoy deposits.
The focus of exploration at Sepon Gold in 2009 was on drilling oxide gold prospects located 5-15
kilometres west of the Sepon Gold and primary gold targets close to the mine infrastructure. In
particular, there is some prospect that additional oxide mineralisation will be delineated at the
Hanong, Phavat and Thengkham Southwest targets.
Primary gold resources have already been delineated and there is substantial upside potential in
the area. As the ore is refractory, it would require a treatment process different from that used for the
oxide ore. A number of options have been investigated, including pressure oxidation and bacterial
oxidation. A scoping study contemplating roasting has been commenced. It appears that additional
mineralisation would need to be delineated to make exploitation of the primary gold resource
economic.
INFORMATION OF THE TARGET GROUP
— 206 —
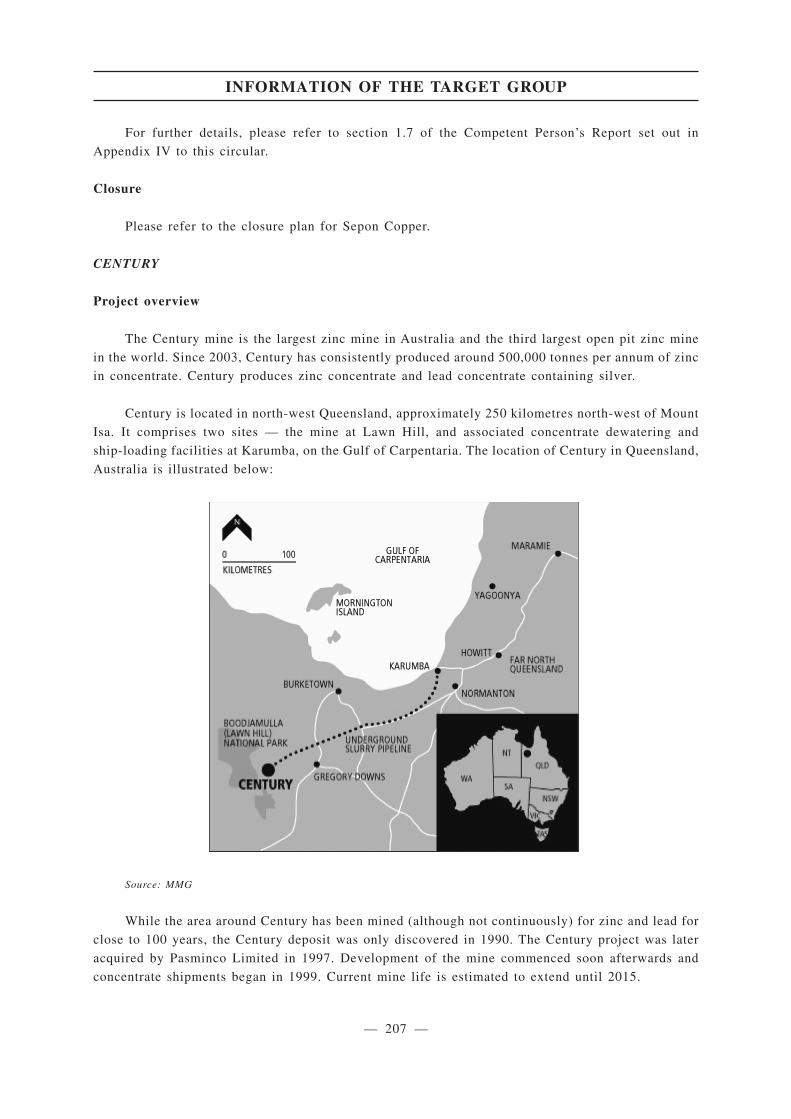
For further details, please refer to section 1.7 of the Competent Person’s Report set out in
Appendix IV to this circular.
Closure
Please refer to the closure plan for Sepon Copper.
CENTURY
Project overview
The Century mine is the largest zinc mine in Australia and the third largest open pit zinc mine
in the world. Since 2003, Century has consistently produced around 500,000 tonnes per annum of zinc
in concentrate. Century produces zinc concentrate and lead concentrate containing silver.
Century is located in north-west Queensland, approximately 250 kilometres north-west of Mount
Isa. It comprises two sites — the mine at Lawn Hill, and associated concentrate dewatering and
ship-loading facilities at Karumba, on the Gulf of Carpentaria. The location of Century in Queensland,
Australia is illustrated below:
Source: MMG
While the area around Century has been mined (although not continuously) for zinc and lead for
close to 100 years, the Century deposit was only discovered in 1990. The Century project was later
acquired by Pasminco Limited in 1997. Development of the mine commenced soon afterwards and
concentrate shipments began in 1999. Current mine life is estimated to extend until 2015.
INFORMATION OF THE TARGET GROUP
— 207 —
18.05(6)(d)
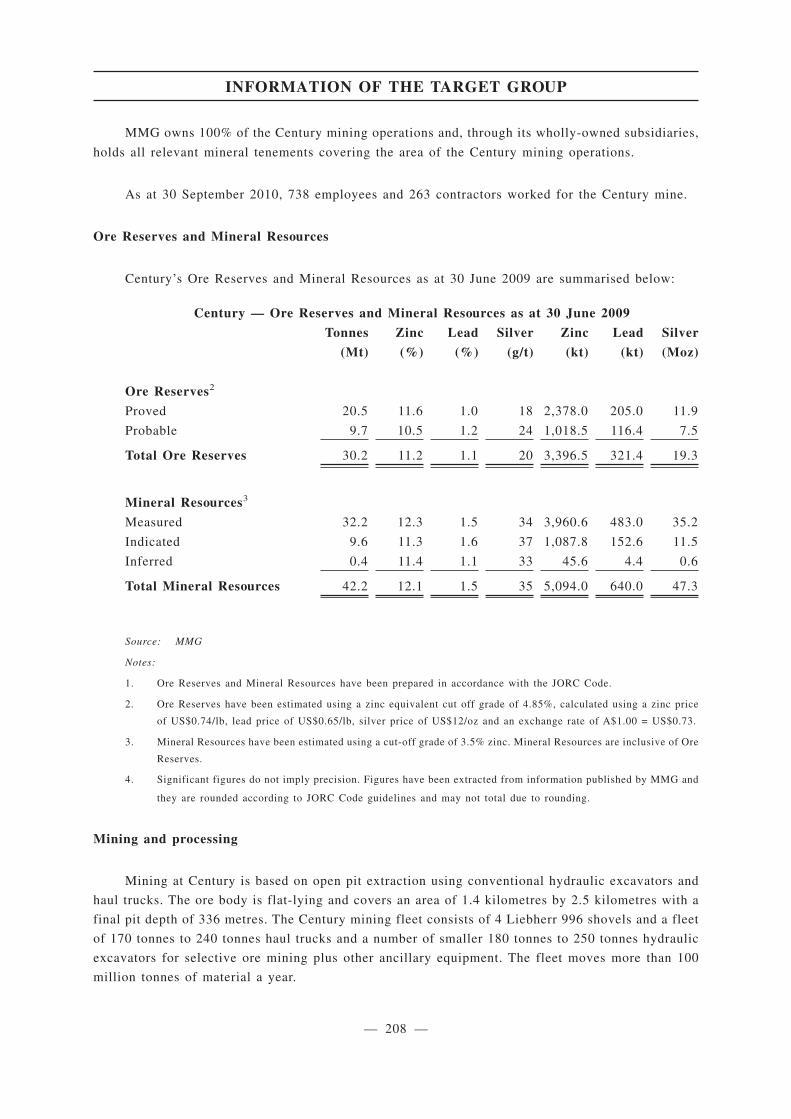
MMG owns 100% of the Century mining operations and, through its wholly-owned subsidiaries,
holds all relevant mineral tenements covering the area of the Century mining operations.
As at 30 September 2010, 738 employees and 263 contractors worked for the Century mine.
Ore Reserves and Mineral Resources
Century’s Ore Reserves and Mineral Resources as at 30 June 2009 are summarised below:
Century — Ore Reserves and Mineral Resources as at 30 June 2009
Tonnes Zinc Lead Silver Zinc Lead Silver
(Mt) (%) (%) (g/t) (kt) (kt) (Moz)
Ore Reserves2
Proved 20.5 11.6 1.0 18 2,378.0 205.0 11.9
Probable 9.7 10.5 1.2 24 1,018.5 116.4 7.5
Total Ore Reserves 30.2 11.2 1.1 20 3,396.5 321.4 19.3
Mineral Resources3
Measured 32.2 12.3 1.5 34 3,960.6 483.0 35.2
Indicated 9.6 11.3 1.6 37 1,087.8 152.6 11.5
Inferred 0.4 11.4 1.1 33 45.6 4.4 0.6
Total Mineral Resources 42.2 12.1 1.5 35 5,094.0 640.0 47.3
Source: MMG
Notes:
1. Ore Reserves and Mineral Resources have been prepared in accordance with the JORC Code.
2. Ore Reserves have been estimated using a zinc equivalent cut off grade of 4.85%, calculated using a zinc price
of US$0.74/lb, lead price of US$0.65/lb, silver price of US$12/oz and an exchange rate of A$1.00 = US$0.73.
3. Mineral Resources have been estimated using a cut-off grade of 3.5% zinc. Mineral Resources are inclusive of Ore
Reserves.
4. Significant figures do not imply precision. Figures have been extracted from information published by MMG and
they are rounded according to JORC Code guidelines and may not total due to rounding.
Mining and processing
Mining at Century is based on open pit extraction using conventional hydraulic excavators and
haul trucks. The ore body is flat-lying and covers an area of 1.4 kilometres by 2.5 kilometres with a
final pit depth of 336 metres. The Century mining fleet consists of 4 Liebherr 996 shovels and a fleet
of 170 tonnes to 240 tonnes haul trucks and a number of smaller 180 tonnes to 250 tonnes hydraulic
excavators for selective ore mining plus other ancillary equipment. The fleet moves more than 100
million tonnes of material a year.
INFORMATION OF THE TARGET GROUP
— 208 —
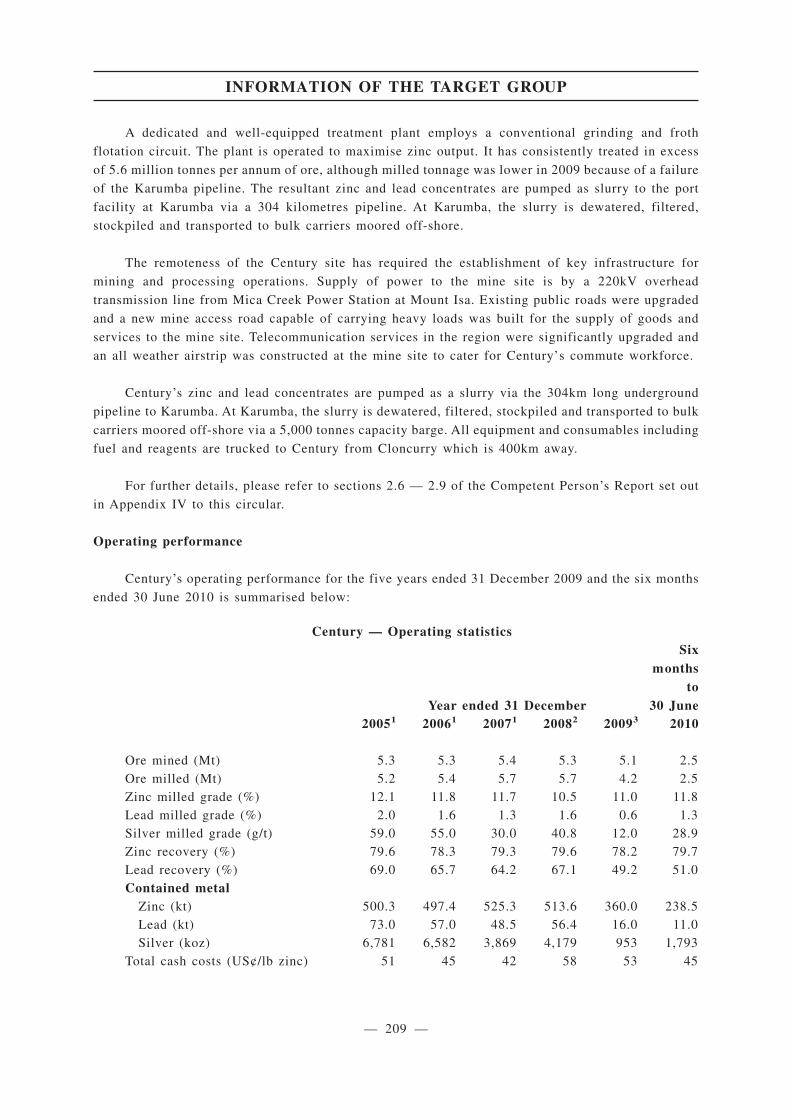
A dedicated and well-equipped treatment plant employs a conventional grinding and froth
flotation circuit. The plant is operated to maximise zinc output. It has consistently treated in excess
of 5.6 million tonnes per annum of ore, although milled tonnage was lower in 2009 because of a failure
of the Karumba pipeline. The resultant zinc and lead concentrates are pumped as slurry to the port
facility at Karumba via a 304 kilometres pipeline. At Karumba, the slurry is dewatered, filtered,
stockpiled and transported to bulk carriers moored off-shore.
The remoteness of the Century site has required the establishment of key infrastructure for
mining and processing operations. Supply of power to the mine site is by a 220kV overhead
transmission line from Mica Creek Power Station at Mount Isa. Existing public roads were upgraded
and a new mine access road capable of carrying heavy loads was built for the supply of goods and
services to the mine site. Telecommunication services in the region were significantly upgraded and
an all weather airstrip was constructed at the mine site to cater for Century’s commute workforce.
Century’s zinc and lead concentrates are pumped as a slurry via the 304km long underground
pipeline to Karumba. At Karumba, the slurry is dewatered, filtered, stockpiled and transported to bulk
carriers moored off-shore via a 5,000 tonnes capacity barge. All equipment and consumables including
fuel and reagents are trucked to Century from Cloncurry which is 400km away.
For further details, please refer to sections 2.6 — 2.9 of the Competent Person’s Report set out
in Appendix IV to this circular.
Operating performance
Century’s operating performance for the five years ended 31 December 2009 and the six months
ended 30 June 2010 is summarised below:
Century — Operating statistics
Year ended 31 December
Sixmonths
to30 June
20051 20061 20071 20082 20093 2010
Ore mined (Mt) 5.3 5.3 5.4 5.3 5.1 2.5Ore milled (Mt) 5.2 5.4 5.7 5.7 4.2 2.5Zinc milled grade (%) 12.1 11.8 11.7 10.5 11.0 11.8Lead milled grade (%) 2.0 1.6 1.3 1.6 0.6 1.3Silver milled grade (g/t) 59.0 55.0 30.0 40.8 12.0 28.9Zinc recovery (%) 79.6 78.3 79.3 79.6 78.2 79.7Lead recovery (%) 69.0 65.7 64.2 67.1 49.2 51.0Contained metal
Zinc (kt) 500.3 497.4 525.3 513.6 360.0 238.5Lead (kt) 73.0 57.0 48.5 56.4 16.0 11.0Silver (koz) 6,781 6,582 3,869 4,179 953 1,793
Total cash costs (US¢/lb zinc) 51 45 42 58 53 45
INFORMATION OF THE TARGET GROUP
— 209 —
Source: MMG
Notes:
1. As reported in Zinifex’s explanatory memorandum in relation to the merger with Oxiana.
2. As reported by OZL.
3. Century was operated by OZL until acquired by MMG in June 2009. The reported operating statistics is based on
the full year performance.
Marketing
Century zinc concentrates are shipped from Karumba to smelters in Australia, Europe, and the
PRC. Approximately 90% of Century’s zinc concentrate production is sold to Nyrstar under separate
life-of-mine sales contracts between MMG Century and Nyrstar’s zinc smelting operations in
Netherlands, Australia, and USA. The contracts with Nyrstar were established at the time Nyrstar was
formed in 2007 by Zinifex and price terms under each contract are annually negotiated referable to
international benchmark terms for zinc concentrates. Zinc concentrates not covered by the sales
contracts with Nyrstar are sold to external third parties under a combination of long-term and spot
contracts. MMG believes that, in the event that Nyrstar fails to perform its obligations under the
aforementioned sales contracts, it will be able to attract other customers.
All of Century’s lead concentrate production is committed under a life-of-mine sales contract to
Nyrstar’s Port Pirie lead smelter in South Australia at international benchmark terms.
Export vessels are chartered by MMG’s marketing team to carry Century concentrates to market
from Karumba port throughout each month using a combination of contractual and spot vessel
chartering arrangements.
Expansion and exploration
MMG has extensive holdings around Century and significant exploration has been conducted
with the objective of identifying satellite ore bodies to extend the life of Century operations. An
18-month diamond drilling program commenced in October 2009 to identify new zinc deposits within
the Century mine lease and on adjacent tenements. The key exploration target is shale-hosted zinc
mineralisation, similar to the Century ore body.
Phosphate deposits have also been identified within the Century exploration licences in the
Georgina Basin, approximately 15 kilometres from the Century mine. A 2008 conceptual study to
develop these phosphate deposits has confirmed the feasibility of utilising the existing processing
facilities (after modifications), the pipeline to port and the port facilities for a phosphate operation
following the completion of zinc mining and treatment. MMG intends to review and update the study
in 2011.
For further details, please refer to section 2.5 of the Competent Person’s Report set out in
Appendix IV to this circular.
INFORMATION OF THE TARGET GROUP
— 210 —
Closure
MMG reviews on an annual basis the closure cost estimates that are in place for its operational
sites. This involves an external review of existing closure plans and closure cost estimates. The aim
of these reviews is to identify key assumptions included in the plans and existing cost estimates as
well as any major gaps that have not been included.
Key issues that are addressed in the closure plan for Century include:
• Tailings dam closure
• Final landforms and water management of waste rock dumps
• Stakeholder transition
• Infrastructure decommissioning, decontamination and demolition
• Port facility and slurry pipeline
• Post closure maintenance and monitoring
• Final pit water quality.
MMG’s most recent closure cost estimate for Century is A$102.2 million (undiscounted, in
dollars as of June 2010).
INFORMATION OF THE TARGET GROUP
— 211 —
18.05(6)(d)
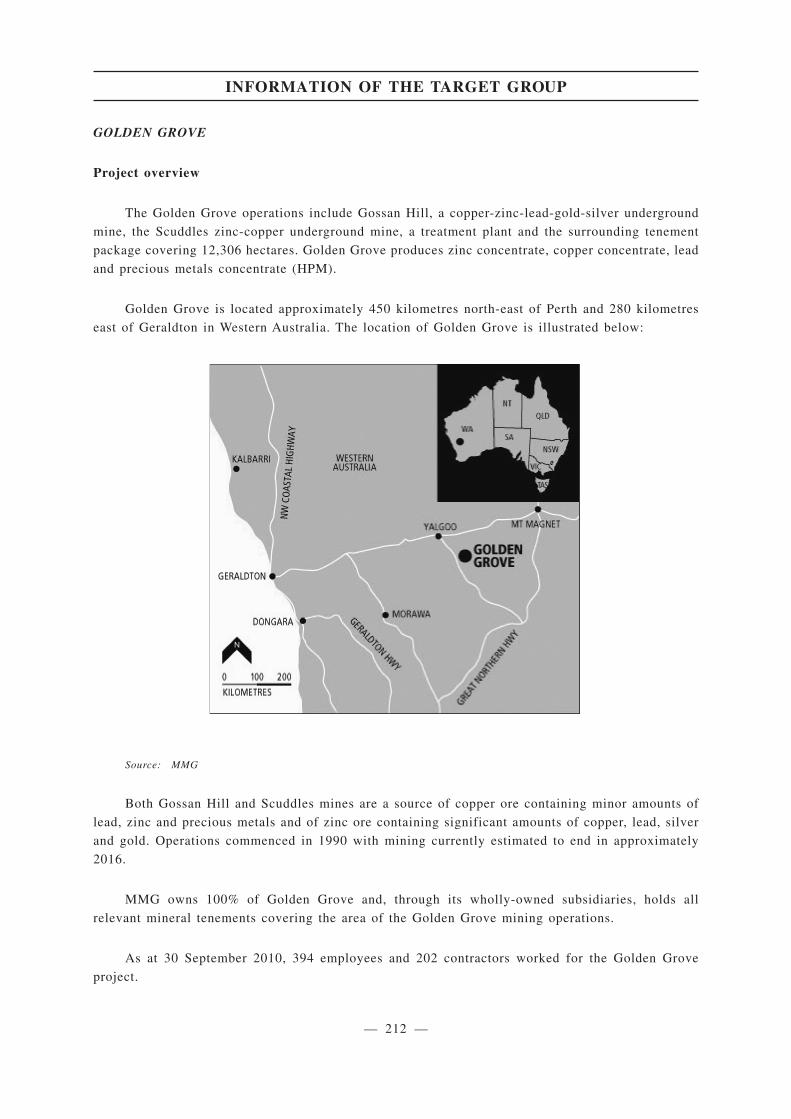
GOLDEN GROVE
Project overview
The Golden Grove operations include Gossan Hill, a copper-zinc-lead-gold-silver underground
mine, the Scuddles zinc-copper underground mine, a treatment plant and the surrounding tenement
package covering 12,306 hectares. Golden Grove produces zinc concentrate, copper concentrate, lead
and precious metals concentrate (HPM).
Golden Grove is located approximately 450 kilometres north-east of Perth and 280 kilometres
east of Geraldton in Western Australia. The location of Golden Grove is illustrated below:
Source: MMG
Both Gossan Hill and Scuddles mines are a source of copper ore containing minor amounts of
lead, zinc and precious metals and of zinc ore containing significant amounts of copper, lead, silver
and gold. Operations commenced in 1990 with mining currently estimated to end in approximately
2016.
MMG owns 100% of Golden Grove and, through its wholly-owned subsidiaries, holds all
relevant mineral tenements covering the area of the Golden Grove mining operations.
As at 30 September 2010, 394 employees and 202 contractors worked for the Golden Grove
project.
INFORMATION OF THE TARGET GROUP
— 212 —

Ore Reserves and Mineral Resources
Golden Grove’s Ore Reserves and Mineral Resources as at 30 June 2009 are summarised below:
Golden Grove — Ore Reserves and Mineral Resources as at 30 June 2009
Tonnes
(Mt)
Zinc
(%)
Copper
(%)
Lead
(%)
Silver
(g/t)
Gold
(g/t)
Zinc
(kt)
Copper
(kt)
Lead
(kt)
Silver
(Moz)
Gold
(Moz)
Ore Reserves2
Primary Zinc
Proved 1.2 12.5 0.4 1.5 73 1.6 148.2 4.7 17.6 2.8 0.1
Probable 0.9 11.0 0.4 1.7 95 2.0 101.2 3.2 15.5 2.8 0.1
Sub-total 2.1 11.8 0.4 1.6 82 1.7 249.4 8.0 33.1 5.6 0.1
Primary Copper
Proved 2.6 0.4 3.5 0.0 18 0.4 11.5 90.0 0.5 1.5 0.0
Probable 1.0 0.4 3.2 0.1 21 0.5 4.2 33.4 0.6 0.7 0.0
Sub-total 3.6 0.4 3.4 0.0 19 0.5 15.7 123.4 1.1 2.2 0.1
Total Ore Reserves 265.1 131.3 34.1 7.8 0.2
Mineral Resources3
Primary Copper
Measured 10.2 0.6 3.1 0.0 19 0.6 63.7 318.3 3.2 6.3 0.2
Indicated 3.2 0.4 2.8 — 14 0.5 12.7 89.0 — 1.4 0.1
Inferred 5.8 0.9 3.2 — 28 0.7 49.7 187.0 — 5.2 0.1
Sub-total 19.1 0.7 3.1 0.0 21 0.6 126.1 594.3 3.2 12.9 0.4
Oxide Copper
Measured — — — — — — — — — — —
Indicated — — — — — — — — — — —
Inferred 2.5 — 2.3 — — — — 58.0 — — —
Sub-total 2.5 — 2.3 — — — — 58.0 — — —
Zinc
Measured 4.1 12.1 0.4 1.2 84 1.6 495.4 18.3 49.2 11.1 0.2
Indicated 0.8 12.0 0.6 2.1 120 2.2 96.3 4.9 16.6 3.1 0.1
Inferred 4.0 11.1 0.7 0.7 64 1.0 439.5 26.4 27.8 8.1 0.1
Sub-total 8.9 11.6 0.6 1.1 78 1.4 1,031.2 49.7 93.6 22.3 0.4
Gold
Measured — — — — — — — — — — —
Indicated — — — — — — — — — — —
Inferred 1.1 — — — 100 3.2 — — — 3.6 0.1
Sub-total 1.1 — — — 100 3.2 — — — 3.6 0.1
Total Mineral
Resources 1,157.3 702.0 96.9 38.7 0.9
Source: MMG
Notes:
1. Ore Reserves and Mineral Resources have been prepared in accordance with the JORC Code.
INFORMATION OF THE TARGET GROUP
— 213 —

2. Ore Reserves have been estimated using a cut off grade based on nett smelter return values ranging from A$100/t
to A$110/t, using a copper price of US$2.00/lb, zinc price of US$0.90/lb, lead price of US$0.70/lb, silver price
of US$11/oz, gold price of US$750/oz and an exchange rate of A$1.00 = US$0.75.
3. Mineral Resources have been estimated using a cut-off grade based on the nett smelter return value of A$70/t.
Mineral Resources are inclusive of Ore Reserves.
4. Significant figures do not imply precision. Figures have been extracted from information published by MMG and
they are rounded according to JORC Code guidelines and may not total due to rounding.
Mining and processing
Underground mining at Golden Grove is by sublevel open stoping for the primary zinc ore body.
Ore from Gossan Hill is trucked to the surface where it is crushed and delivered to the mill via a three
kilometre overland conveyor.
Zinc and copper ores are treated separately on a batch basis using the same process plant, which
consists of a two stage grinding circuit followed by sequential flotation. Copper ore contains only
minimal amounts of other metals, which allows the copper ore to be floated in a single stage circuit,
although ore with high talc content requires a pre-float to remove the talc. Lead, gold and silver from
the zinc ore is recovered to a precious metal concentrate prior to zinc flotation. The plant has a
throughput capacity of 1.7Mt per annum. The fact that zinc and copper ores are found in distinct
deposits and are batch processed in the same plant affords MMG the flexibility to focus production
on one metal or the other.
Equipment and consumables for Golden Grove are trucked to the site from Geraldton (280km to
the west) and Perth (around 450km to the southwest). Zinc, copper and HPM concentrates produced
at site are trucked to the port of Geraldton where they are stockpiled and loaded onto bulk carriers.
Golden Grove is connected to the state grid by a 132kV transmission line with potable water sourced
from an onsite bore and raw water pumped from the underground operations.
For further details, please refer to sections 4.12 — 4.17 of the Competent Person’s Report set out
in Appendix IV to this circular.
INFORMATION OF THE TARGET GROUP
— 214 —
Operating performance
Golden Grove’s operating performance for the five years ended 31 December 2009 and the six
months ended 30 June 2010 is summarised below:
Golden Grove — Operating statistics
Year ended 31 December
Sixmonths
to30 June
2005 2006 2007 2008 2009 2010
Zinc ore mined (kt) 309 994 1,043 1,043 409 312
Zinc ore milled (kt) 306 1,004 1,021 1,051 398 323
Average zinc head grade (%) 13.8 15.1 14.0 14.5 16.8 13.6
Copper ore mined (kt) 326 386 404 751 1,140 234
Copper ore milled (kt) 352 363 432 611 1,012 487
Average copper head grade (%) 3.4 3.4 4.0 3.6 3.4 3.6
Contained metals inconcentrates:
Zinc (kt) 70.4 138.8 132.0 139.9 56.9 43.8
Copper (kt) 21.5 10.8 15.4 18.5 30.8 14.2
Gold (koz) 25.3 50.2 48.8 47.8 29.1 21.7
Silver (koz) 2,175 3,064 3,165 3,158 1,381 1,070.7
Lead (kt) 4.9 11.6 8.1 13.3 4.4 4.5
Total cash costs (US¢/lb zinc) 39 27 32 43 159 73
Source: MMG
Marketing
Golden Grove concentrates are shipped typically in parcels of 5,000 or 10,000 dry metric tonnes
from MMG’s storage facility at the port of Geraldton to smelters within the Asian region, with a
number of parcels often shipped on one vessel to minimise freight costs.
The PRC is the most common destination but concentrates are also shipped to smelters in Japan,
Korea, Thailand and Australia.
The concentrates are sold under a mixture of long term “frame” contracts and spot sales
contracts. Frame contracts typically cover several shipments per year and commercial terms are
negotiated annually in accordance with market conditions. Long term contracts are currently in place
with both smelters and a number of international trading companies.
Spot contracts can cover single or multiple shipments in any one year with no ongoing
commitment between the parties. Because the quantities of copper, zinc and lead concentrates
produced at Golden Grove can vary from year to year, significant production is sold on the spot market
to ensure that sales obligations are met in a timely fashion. The spot market has been particularly
attractive during 2010.
INFORMATION OF THE TARGET GROUP
— 215 —
Expansion and exploration
Construction of a new tailings storage facility started in late 2009 and is substantially completed
with total capital costs of US$24 million.
MMG is currently undertaking a feasibility study to assess development of an open pit copper
mine to supplement current underground operations at Golden Grove. The feasibility study
commenced in May 2010 and the project will be reviewed for approval by the end of 2010.
When approved, the open pit will produce approximately 240,000 tonnes of copper concentrate
containing 59,000 tonnes of copper metal in concentrate at 25% copper from 2011 to 2014. The current
processing plant throughput of 1.7 million tonnes per annum of ore will be maintained throughout the
project. Mining of the copper pit might also allow the subsequent recovery of zinc ore-bearing pillar
remnants from the top of the underground mining operation.
The open pit copper project will include development of an open pit mine, waste rock dump and
supporting infrastructure including haul and access roads. Concentrates produced will be transported
along with existing Golden Grove products through the Yalgoo Ninghan Road and Geraldton Mount
Magnet Road to the Port of Geraldton for export.
The area around the Golden Grove operations remains prospective for further discoveries.
Exploration at Golden Grove was suspended in late 2008 due to capital constraints but drilling
recommenced at Gossan Hill and Scuddles in October 2009 and at Gossan Valley, located 8-10
kilometres south of the Golden Grove operations, in the March 2010 quarter. At Gossan Hill,
underground exploration has been promising, including at Xantho Deeps, at Amity and between
Gossan Deeps and Hougoumont. At Scuddles, exploration is continuing and an update to resources is
expected soon. Ore from Scuddles is expected to contribute to production when the Gossan Hill mine
depletes. At Gossan Valley, MMG has had a number of promising results.
For further details, please refer to section 4.11 of the Competent Person’s Report set out in
Appendix IV to this circular.
Closure
MMG reviews on an annual basis the closure cost estimates that are in place for its operational
sites. This involves an external review of existing closure plans and closure cost estimates. The aim
of these reviews is to identify key assumptions included in the plans and existing cost estimates as
well as any major gaps that have not been included.
Key issues that are addressed in the closure plan for Golden Grove include:
• Tailings dam closure
• Waste rock dump closure
• Infrastructure decommissioning, decontamination and demolition
INFORMATION OF THE TARGET GROUP
— 216 —
18.05(6)(d)
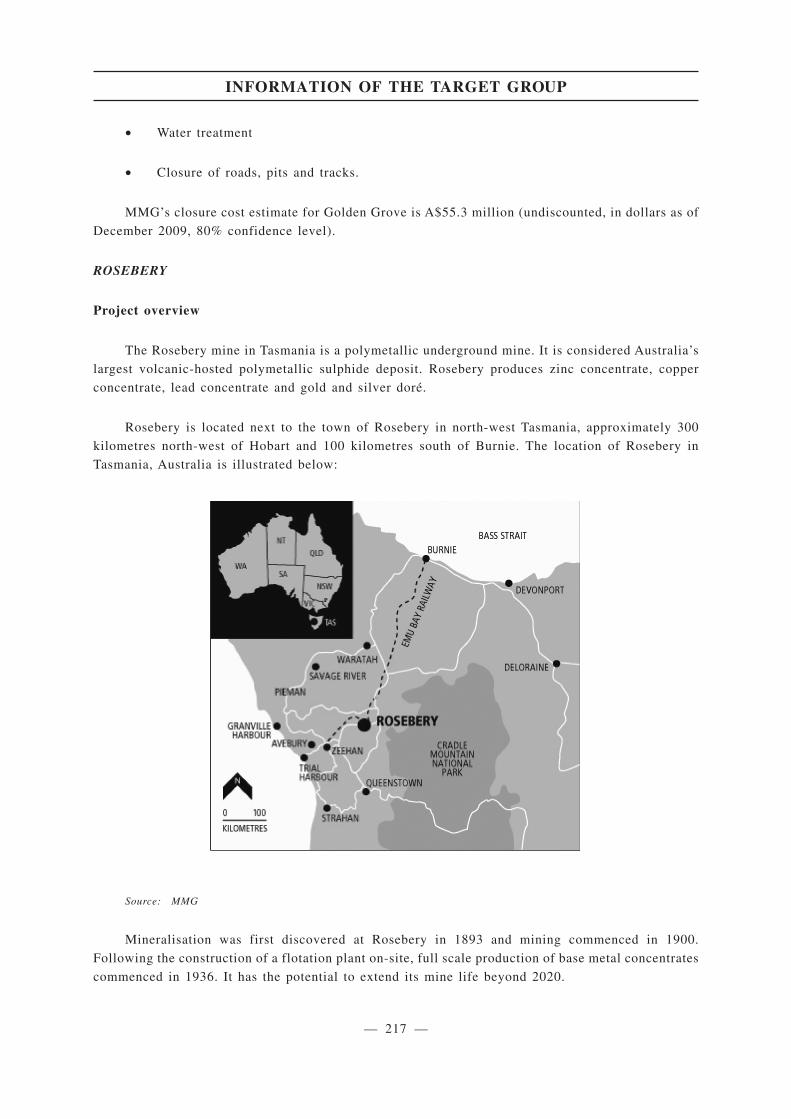
• Water treatment
• Closure of roads, pits and tracks.
MMG’s closure cost estimate for Golden Grove is A$55.3 million (undiscounted, in dollars as of
December 2009, 80% confidence level).
ROSEBERY
Project overview
The Rosebery mine in Tasmania is a polymetallic underground mine. It is considered Australia’s
largest volcanic-hosted polymetallic sulphide deposit. Rosebery produces zinc concentrate, copper
concentrate, lead concentrate and gold and silver doré.
Rosebery is located next to the town of Rosebery in north-west Tasmania, approximately 300
kilometres north-west of Hobart and 100 kilometres south of Burnie. The location of Rosebery in
Tasmania, Australia is illustrated below:
Source: MMG
Mineralisation was first discovered at Rosebery in 1893 and mining commenced in 1900.
Following the construction of a flotation plant on-site, full scale production of base metal concentrates
commenced in 1936. It has the potential to extend its mine life beyond 2020.
INFORMATION OF THE TARGET GROUP
— 217 —
MMG owns 100% of Rosebery and, through its wholly-owned subsidiaries, holds all relevant
mineral tenements covering the area of the Rosebery mining operations.
As at 30 September 2010, 232 employees and 218 contractors worked for the Rosebery mine.
Ore Reserves and Mineral Resources
Rosebery’s Ore Reserves and Mineral Resources as at 30 June 2009 are summarised below:
Rosebery — Ore Reserves and Mineral Resources as at 30 June 2009
Tonnes
(Mt)
Zinc
(%)
Copper
(%)
Lead
(%)
Silver
(g/t)
Gold
(g/t)
Zinc
(kt)
Copper
(kt)
Lead
(kt)
Silver
(Moz)
Gold
(Moz)
Ore Reserves2
Proved 1.7 13.3 0.4 3.6 131 1.8 229.9 6.6 62.2 7.3 0.1
Probable 1.4 15.7 0.5 3.8 129 1.8 223.1 6.5 54.0 5.9 0.1
Total Ore Reserves 3.2 14.4 0.4 3.7 130 1.8 453.1 13.1 116.2 13.2 0.2
Mineral Resources3
Measured 3.8 14.3 0.5 3.9 147 2.1 543.4 19.0 148.2 17.9 0.3
Indicated 2.9 15.5 0.5 3.9 130 2.1 448.7 14.5 112.9 12.1 0.2
Inferred 7.4 11.1 0.3 3.9 140 1.6 822.6 22.2 289.0 33.5 0.4
Total Mineral
Resources 14.1 12.9 0.4 3.9 140 1.9 1,814.7 55.7 550.1 63.5 0.8
Source: MMG
Notes:
1. Ore Reserves and Mineral Resources have been prepared in accordance with the JORC Code.
2. Ore Reserves have been estimated using a cut off grade based on nett smelter return of A$175/t, using a copper
price of US$2.00/lb, zinc price of US$0.90/lb, lead price of US$0.70/lb, silver price of US$11/oz, gold price of
US$750/oz and an exchange rate of A$1.00 = US$0.75.
3. The cut-off grade for the estimation of Mineral Resources is based on metallurgically recoverable total metal units
expressed as a dollar value (A$125/t). Mineral Resources are inclusive of Ore Reserves.
4. Significant figures do not imply precision. Figures have been extracted from information published by MMG and
they are rounded according to JORC Code guidelines and may not total due to rounding.
Mining and processing
Rosebery mine uses mechanised underground mining methods, notably bench stoping, and
sub-level open stoping with some mechanised cut and fill. Access to the mine is by a decline and all
ore is trucked directly to the surface. The mine is currently undergoing a major ventilation upgrade
with most mine production from depths of greater than 900 metres. It is estimated that the mineral
deposit extends to 1.5 kilometres underground.
The treatment plant produces zinc, lead and copper concentrates, as well as gold doré. The
relatively soft Rosebery ore is subjected to two stages of crushing and two stages of grinding, where
a single flotation feed is produced and subject to sequential flotation to produce the various
concentrates.
INFORMATION OF THE TARGET GROUP
— 218 —
Rosebery’s equipment and consumables are trucked from Burnie. Zinc, lead and copper
concentrates are railed to Burnie from the operations and then shipped to customers. Power at
Rosebery is sourced from the local power grid with water supplied by the nearby Pieman River.
For further details, please refer to sections 3.6 — 3.11 of the Competent Person’s Report set out
in Appendix IV to this circular.
Operating performance
Rosebery’s operating performance for the five years ended 31 December 2009 and the six months
ended 30 June 2010 is summarised below:
Rosebery — Operating statistics
Year ended 31 December
Sixmonths
to30 June
20051 20061 20071 20082 20093 2010
Ore mined (kt) 733 711 682 735 725 305
Ore milled (kt) 709 641 726 815 795 340
Zinc milled grade (%) 13.3 14.3 12.4 11.1 12.1 12.1
Lead milled grade (%) 4.4 4.7 3.8 4.1 4.0 4.0
Copper milled grade (%) 0.4 0.4 0.4 0.3 0.4 0.3
Silver milled grade (g/t) 130.9 153.4 156.0 123.2 134.9 124.9
Gold milled grade (g/t) 1.8 2.3 1.7 1.4 1.7 1.7
Zinc recovery (%) 89.9 89.7 89.7 88.6 88.6 87.6
Lead recovery (%) 81.3 81.2 77.8 79.2 79.0 77.6
Copper recovery (%) 65.0 60.2 60.2 53.0 53.6 55.6
Gold recovery (%) 79.3 80.9 71.6 24.7 21.3 25.0
Contained metals:
Zinc (kt) 88.8 86.8 84.2 84.9 85.1 35.9
Lead (kt) 25.1 24.4 21.6 28.7 25.0 10.4
Copper (kt) 1.7 1.4 1.7 2.1 1.9 0.6
Gold (koz) 33.2 37.7 27.9 30.7 34.1 15.2
Silver (koz) 2,694 2,812 3,033 2,985 3,088 1,143
Total cash costs (US¢/lb zinc) 41.0 41.0 49.1 40.2 32.1 24.9
Source: MMG
Notes:
1. As reported in Zinifex’s explanatory memorandum in relation to the merger with Oxiana.
2. As reported by OZL.
3. Rosebery was operated by OZL until acquired by MMG in June 2009. The reported operating statistics is based
on the full year performance.
INFORMATION OF THE TARGET GROUP
— 219 —
Marketing
100% of Rosebery’s zinc and lead concentrate production is sold on an FOB. Burnie Port basis
to Nyrstar Hobart and Port Pirie operations respectively, under life-of-mine contract arrangements
established with these operations at the time Nyrstar was formed in 2007 by Zinifex. These
concentrates are sold at terms negotiated each year referable to international benchmark settlements
for zinc and lead concentrates.
Shipment of Rosebery zinc and lead concentrates is made from Burnie Port in Tasmania on
vessels chartered by Nyrstar under the FOB terms of the contracts.
Rosebery’s production of copper concentrates is sold under a single multi-year sales contract
with the concentrates shipped to Asian copper smelting operations. The high precious metals content
of Rosebery copper concentrates restricts the available smelting outlets for this material, hence it is
committed on a longer term contract basis rather than on the spot market to ensure a single secure
outlet for this high value material. Shipment of Rosebery copper concentrates is arranged on vessels
chartered by MMG and effected twice yearly (in June and December) in bulk from Burnie Port in
Tasmania.
Rosebery’s total production of gold doré is delivered to The Perth Mint in Western Australia for
refining. Gold and silver is out-turned to a metals account held with a bank, and the refined fine gold
and fine silver is subsequently regularly sold at prevailing spot gold and silver prices.
Expansion and exploration
Historically, the Rosebery mine has operated with only around three years of reserves. In 2006,
Zinifex commenced a US$19 million exploration project, titled Project Horizons, with the objective
of extending the life of the mine to 2020. The project focussed on infill drilling and exploration of
the deeper K and PK Lenses. In May 2007, Zinifex announced that successful exploration drilling from
the initial stages of Project Horizons had increased the Rosebery resources by 65% and substantially
extended the life of the mine. Resources were further increased in 2008 but reserves have been
decreasing.
MMG believes there remains considerable potential for further increases at the Rosebery mine
through exploration and delineation drilling. A deep exploration drilling programme commenced in
November 2009 with two deep surface drill holes targeting prospective areas below the lower parts of
the Rosebery ore body. Drilling also commenced on the Jupiter prospect, approximately 7 kilometres
south of the Rosebery mine, and will further test a new mineralised horizon identified from drilling
during 2008.
A US$1 million study assessing the potential development of the Hercules deposit is expected
to be completed in 2011. Re-establishment of site access and bulk sampling is planned as part of a
staged approach to the potential extraction of the resource, which is subject to confirmation that the
South Hercules mineralisation is amenable to treatment through the Rosebery plant. The above
reported resource estimates do not include the South Hercules resources, which have been estimated
at 1 million tonnes at an average silver and gold grade of 133g/t and 2.4g/t respectively.
INFORMATION OF THE TARGET GROUP
— 220 —
No major expansions are planned at Rosebery but there is an ongoing continuous improvement
program to optimise the operations and reduce costs.
The processing plant at Rosebery was commissioned in the 1970s and no major upgrade has been
carried out in more than 20 years. In the past, the reserves were insufficient to justify major capital
spending on the concentrator. With Project Horizons extending the mine life, a prefeasibility study was
undertaken in 2008 for the replacement of the concentrator with a more modern plant. The new plant
was estimated to cost approximately US$140 million and was expected to have a throughput of 1Mt
per annum. However, MMG believes that greater value can be generated through the appropriate
optimisation of the crushing and grinding circuits.
For further details, please refer to section 3.5 of the Competent Person’s Report set out in
Appendix IV to this circular.
Closure
MMG reviews on an annual basis the closure cost estimates that are in place for its operational
sites. This involves an external review of existing closure plans and closure cost estimates. The aim
of these reviews is to identify key assumptions included in the plans and existing cost estimates as
well as any major gaps that have not been included.
Key issues that are addressed in the closure plan for Rosebery include:
• Final closure of tailings dams
• Soil contamination
• Groundwater
• Infrastructure decommissioning, decontamination and demolition
• Legacy sites.
MMG’s closure cost estimate for Rosebery, at the projected end of mine life is A$35.6 million
(undiscounted, in dollars as of December 2009, 80% confidence level).
DEVELOPMENT PROJECTS
MMG has a large portfolio of development, and advanced and early stage exploration projects
throughout Australia, Asia and Canada.
INFORMATION OF THE TARGET GROUP
— 221 —
18.05(6)(d)

MMG’s Development Projects include the following:
(i) a 100% interest in the Avebury nickel mine located in Tasmania, Australia, which is
currently on care and maintenance
Avebury is an underground nickel mine, which started production in July 2008 and has been
on care and maintenance since December 2008. MMG owns 100% of Avebury and, through its
wholly-owned subsidiaries, holds all relevant mineral tenements covering the Avebury nickel
mine.
(ii) a 100% interest in the Dugald River zinc project located in Queensland, Australia
The Dugald River deposit is an undeveloped zinc, lead and silver resource in north western
Queensland, Australia. A feasibility study completed in 2008 confirmed the resource to 53Mt at
12.5% zinc, 1.9% lead and 36g/t silver. Work has determined that Dugald River is a robust
project capable of an annual production of approximately 200,000 tonnes of zinc, 25,000 tonnes
of lead and one million ounces of silver for a period of 23 years. The project remains a very
attractive zinc deposit for MMG to bring on line in the future. Geological interpretation and
permitting are on-going and the project will be reviewed by MMG this year. MMG, through its
wholly-owned subsidiaries, holds all relevant mineral tenements covering the area of the
proposed Dugald River development. These mineral tenements are currently the subject of a
renewal application by the relevant MMG subsidiaries as part of the review being conducted by
MMG.
(iii) a 100% interest in the Nunavut projects located in Canada
MMG has several polymetallic base metals and gold assets in the Nunavut Territories of
northern Canada. Principal assets include the Izok Lake copper, zinc, lead and silver resource,
the High Lake copper, zinc, lead and silver resource, gold resources at Lupin and Ulu and base
metal deposits at Gondor and Hood. Assets also include gold mining and processing plant and
equipment on care and maintenance at Lupin mine.
MMG, through its wholly-owned subsidiaries, holds all relevant mineral tenements
covering the Izok Lake copper, zinc, lead and silver resource, the High Lake copper, zinc, lead
and silver resource, the gold resources at Lupin and Ulu and the base metal deposits at Gondor
and Hood.
INFORMATION OF THE TARGET GROUP
— 222 —
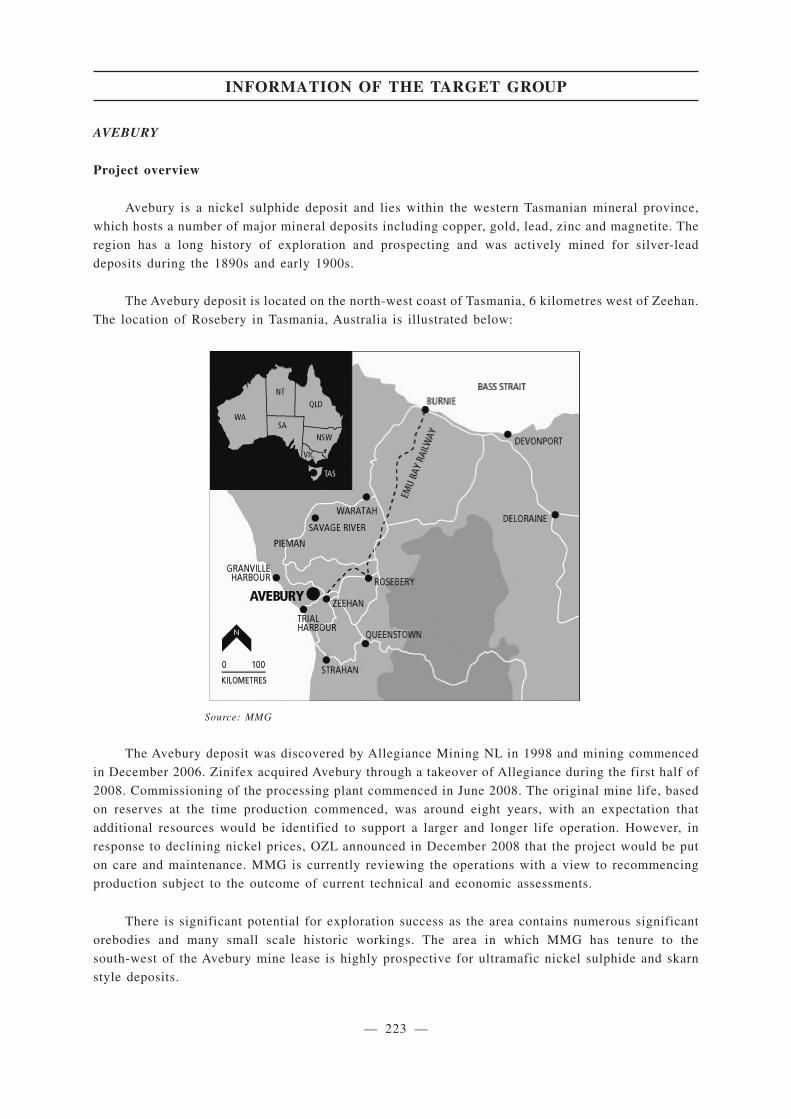
AVEBURY
Project overview
Avebury is a nickel sulphide deposit and lies within the western Tasmanian mineral province,
which hosts a number of major mineral deposits including copper, gold, lead, zinc and magnetite. The
region has a long history of exploration and prospecting and was actively mined for silver-lead
deposits during the 1890s and early 1900s.
The Avebury deposit is located on the north-west coast of Tasmania, 6 kilometres west of Zeehan.
The location of Rosebery in Tasmania, Australia is illustrated below:
Source: MMG
The Avebury deposit was discovered by Allegiance Mining NL in 1998 and mining commenced
in December 2006. Zinifex acquired Avebury through a takeover of Allegiance during the first half of
2008. Commissioning of the processing plant commenced in June 2008. The original mine life, based
on reserves at the time production commenced, was around eight years, with an expectation that
additional resources would be identified to support a larger and longer life operation. However, in
response to declining nickel prices, OZL announced in December 2008 that the project would be put
on care and maintenance. MMG is currently reviewing the operations with a view to recommencing
production subject to the outcome of current technical and economic assessments.
There is significant potential for exploration success as the area contains numerous significant
orebodies and many small scale historic workings. The area in which MMG has tenure to the
south-west of the Avebury mine lease is highly prospective for ultramafic nickel sulphide and skarn
style deposits.
INFORMATION OF THE TARGET GROUP
— 223 —
MMG owns 100% of Avebury and, through its wholly-owned subsidiaries, holds all relevant
mineral tenements covering the area of the Avebury project.
Mineral Resources
Avebury’s Mineral Resources as at 30 June 2009 are summarised below:
Avebury — Mineral Resources as at 30 June 2009
Tonnes(Mt)
Nickel(%)
Nickel(kt)
Mineral Resources2
Measured 3.4 1.1 37.9
Indicated 4.7 1.0 44.4
Inferred 14.0 0.9 131.3
Total Mineral Resources 22.0 1.0 213.5
Source: MMG
Notes:
1. Mineral Resources have been prepared in accordance with the JORC Code.
2. Mineral Resources have been estimated using a cut-off grade of 0.4% nickel.
3. Significant figures do not imply precision. Figures have been extracted from information published by MMG and
they are rounded according to JORC Code guidelines and may not total due to rounding.
Mining and processing
Mining at Avebury is by underground mining methods, primarily by transverse and longitudinal
open stoping methods. Access to the mineral deposits is through two declines: the North Avebury
decline to the North Avebury mineral deposit and further eastward extensions to the Avebury ore
systems, and the Viking decline to the Viking mineral deposit and westward extensions.
The conventional processing plant was designed with capacity to process 900,000 tonnes of ore
to produce approximately 8,500 tonnes of nickel per annum in a nickel concentrate grading around
20%. The process includes 3-stage crushing, milling and flash flotation before treatment through a
flotation circuit to produce nickel concentrates. The plant has the capacity to treat nickel sulphides
locked in magnetite, through a magnetic separator, regrind mill and retreat flotation cells.
Throughout its operation, the Avebury equipment and consumables were primarily trucked from
Burnie. The nickel concentrate was trucked to Burnie and loaded onto bulk carriers for export.
For further details, please refer to sections 5.6 — 5.9 of the Competent Person’s Report set out
in Appendix IV to this circular.
INFORMATION OF THE TARGET GROUP
— 224 —
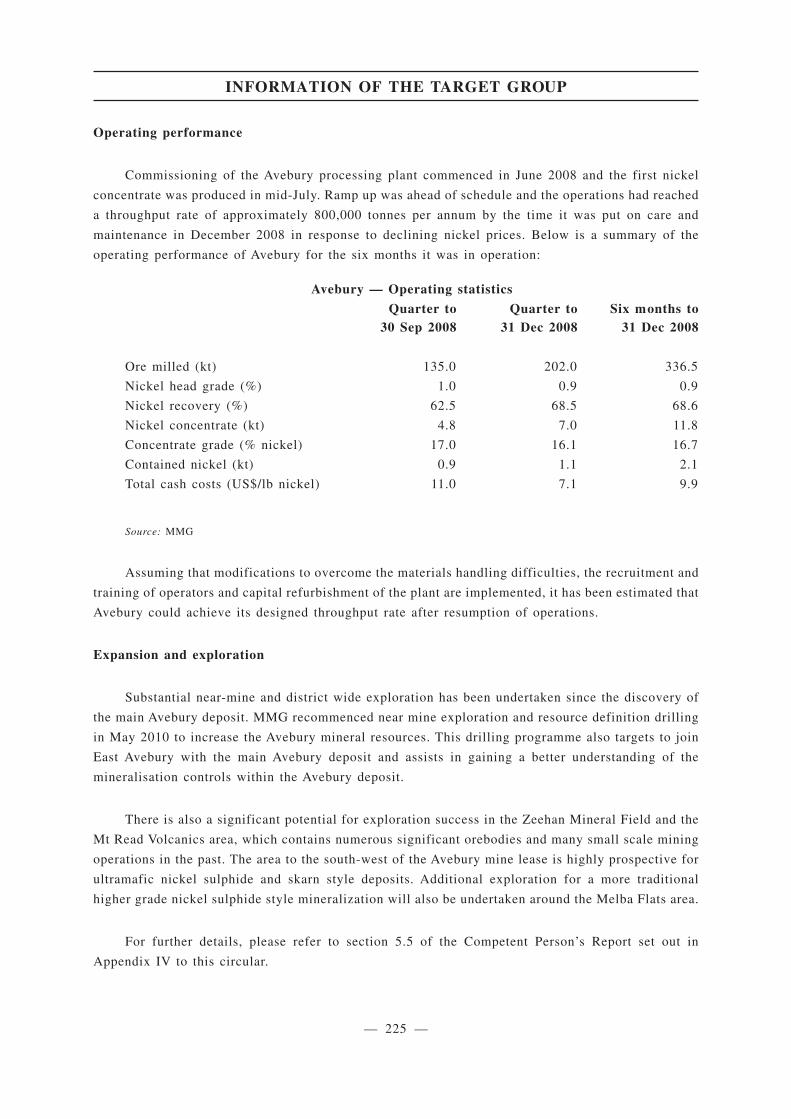
Operating performance
Commissioning of the Avebury processing plant commenced in June 2008 and the first nickel
concentrate was produced in mid-July. Ramp up was ahead of schedule and the operations had reached
a throughput rate of approximately 800,000 tonnes per annum by the time it was put on care and
maintenance in December 2008 in response to declining nickel prices. Below is a summary of the
operating performance of Avebury for the six months it was in operation:
Avebury — Operating statistics
Quarter to30 Sep 2008
Quarter to31 Dec 2008
Six months to31 Dec 2008
Ore milled (kt) 135.0 202.0 336.5
Nickel head grade (%) 1.0 0.9 0.9
Nickel recovery (%) 62.5 68.5 68.6
Nickel concentrate (kt) 4.8 7.0 11.8
Concentrate grade (% nickel) 17.0 16.1 16.7
Contained nickel (kt) 0.9 1.1 2.1
Total cash costs (US$/lb nickel) 11.0 7.1 9.9
Source: MMG
Assuming that modifications to overcome the materials handling difficulties, the recruitment and
training of operators and capital refurbishment of the plant are implemented, it has been estimated that
Avebury could achieve its designed throughput rate after resumption of operations.
Expansion and exploration
Substantial near-mine and district wide exploration has been undertaken since the discovery of
the main Avebury deposit. MMG recommenced near mine exploration and resource definition drilling
in May 2010 to increase the Avebury mineral resources. This drilling programme also targets to join
East Avebury with the main Avebury deposit and assists in gaining a better understanding of the
mineralisation controls within the Avebury deposit.
There is also a significant potential for exploration success in the Zeehan Mineral Field and the
Mt Read Volcanics area, which contains numerous significant orebodies and many small scale mining
operations in the past. The area to the south-west of the Avebury mine lease is highly prospective for
ultramafic nickel sulphide and skarn style deposits. Additional exploration for a more traditional
higher grade nickel sulphide style mineralization will also be undertaken around the Melba Flats area.
For further details, please refer to section 5.5 of the Competent Person’s Report set out in
Appendix IV to this circular.
INFORMATION OF THE TARGET GROUP
— 225 —
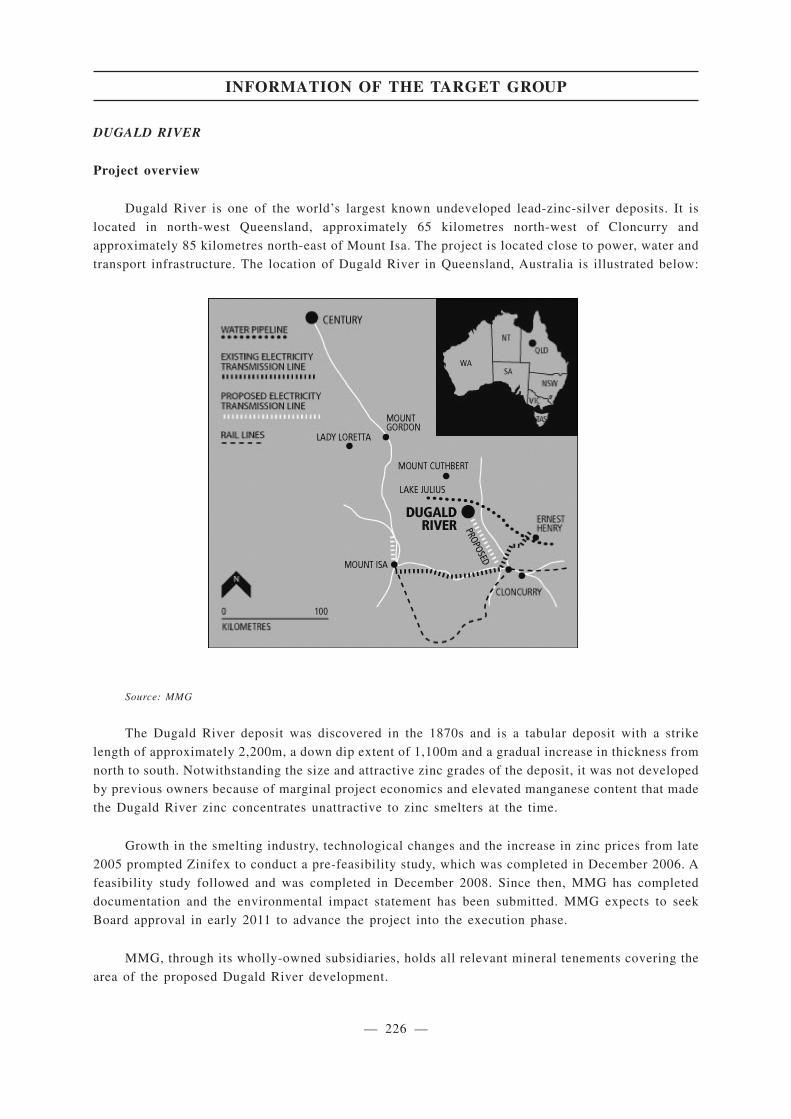
DUGALD RIVER
Project overview
Dugald River is one of the world’s largest known undeveloped lead-zinc-silver deposits. It is
located in north-west Queensland, approximately 65 kilometres north-west of Cloncurry and
approximately 85 kilometres north-east of Mount Isa. The project is located close to power, water and
transport infrastructure. The location of Dugald River in Queensland, Australia is illustrated below:
Source: MMG
The Dugald River deposit was discovered in the 1870s and is a tabular deposit with a strike
length of approximately 2,200m, a down dip extent of 1,100m and a gradual increase in thickness from
north to south. Notwithstanding the size and attractive zinc grades of the deposit, it was not developed
by previous owners because of marginal project economics and elevated manganese content that made
the Dugald River zinc concentrates unattractive to zinc smelters at the time.
Growth in the smelting industry, technological changes and the increase in zinc prices from late
2005 prompted Zinifex to conduct a pre-feasibility study, which was completed in December 2006. A
feasibility study followed and was completed in December 2008. Since then, MMG has completed
documentation and the environmental impact statement has been submitted. MMG expects to seek
Board approval in early 2011 to advance the project into the execution phase.
MMG, through its wholly-owned subsidiaries, holds all relevant mineral tenements covering the
area of the proposed Dugald River development.
INFORMATION OF THE TARGET GROUP
— 226 —
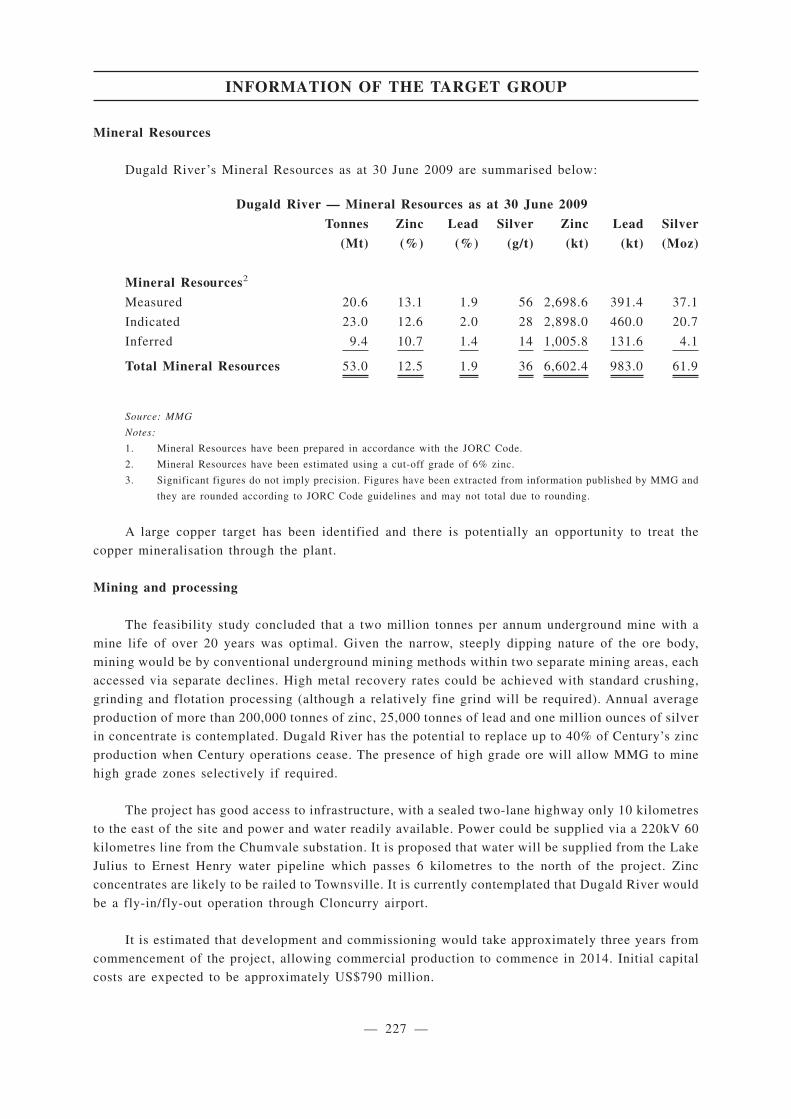
Mineral Resources
Dugald River’s Mineral Resources as at 30 June 2009 are summarised below:
Dugald River — Mineral Resources as at 30 June 2009
Tonnes Zinc Lead Silver Zinc Lead Silver
(Mt) (%) (%) (g/t) (kt) (kt) (Moz)
Mineral Resources2
Measured 20.6 13.1 1.9 56 2,698.6 391.4 37.1
Indicated 23.0 12.6 2.0 28 2,898.0 460.0 20.7
Inferred 9.4 10.7 1.4 14 1,005.8 131.6 4.1
Total Mineral Resources 53.0 12.5 1.9 36 6,602.4 983.0 61.9
Source: MMG
Notes:
1. Mineral Resources have been prepared in accordance with the JORC Code.
2. Mineral Resources have been estimated using a cut-off grade of 6% zinc.
3. Significant figures do not imply precision. Figures have been extracted from information published by MMG and
they are rounded according to JORC Code guidelines and may not total due to rounding.
A large copper target has been identified and there is potentially an opportunity to treat the
copper mineralisation through the plant.
Mining and processing
The feasibility study concluded that a two million tonnes per annum underground mine with a
mine life of over 20 years was optimal. Given the narrow, steeply dipping nature of the ore body,
mining would be by conventional underground mining methods within two separate mining areas, each
accessed via separate declines. High metal recovery rates could be achieved with standard crushing,
grinding and flotation processing (although a relatively fine grind will be required). Annual average
production of more than 200,000 tonnes of zinc, 25,000 tonnes of lead and one million ounces of silver
in concentrate is contemplated. Dugald River has the potential to replace up to 40% of Century’s zinc
production when Century operations cease. The presence of high grade ore will allow MMG to mine
high grade zones selectively if required.
The project has good access to infrastructure, with a sealed two-lane highway only 10 kilometres
to the east of the site and power and water readily available. Power could be supplied via a 220kV 60
kilometres line from the Chumvale substation. It is proposed that water will be supplied from the Lake
Julius to Ernest Henry water pipeline which passes 6 kilometres to the north of the project. Zinc
concentrates are likely to be railed to Townsville. It is currently contemplated that Dugald River would
be a fly-in/fly-out operation through Cloncurry airport.
It is estimated that development and commissioning would take approximately three years from
commencement of the project, allowing commercial production to commence in 2014. Initial capital
costs are expected to be approximately US$790 million.
INFORMATION OF THE TARGET GROUP
— 227 —
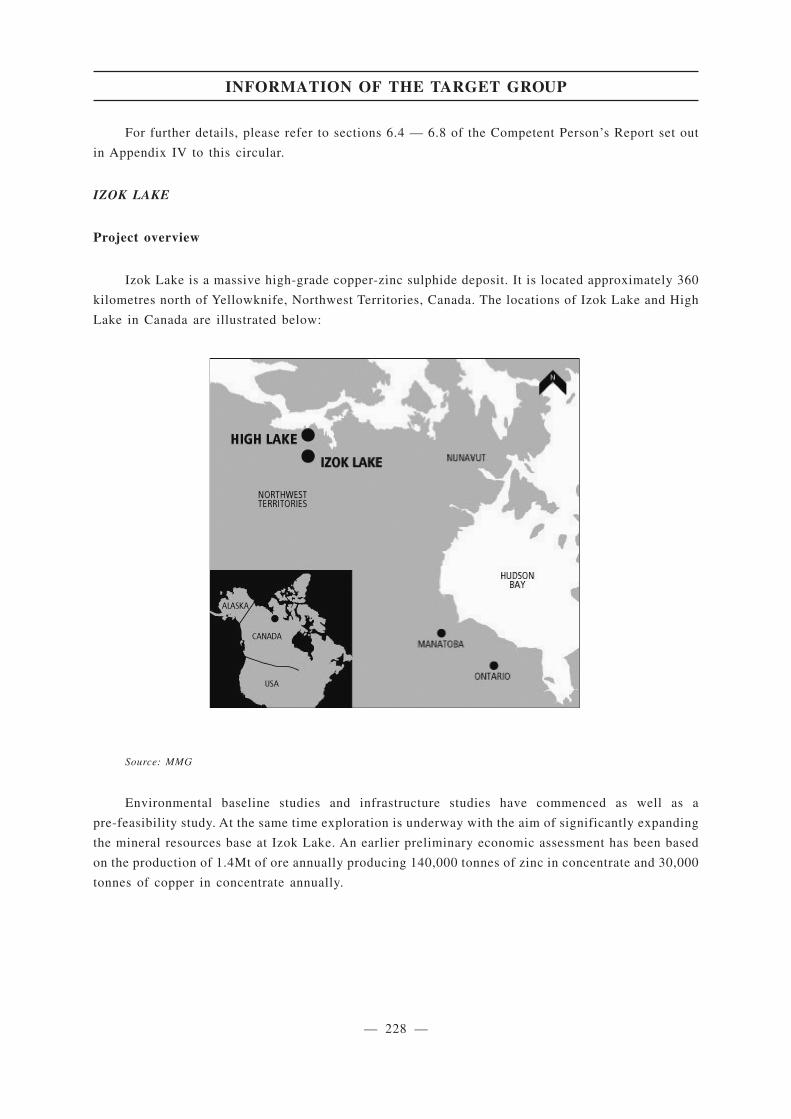
For further details, please refer to sections 6.4 — 6.8 of the Competent Person’s Report set out
in Appendix IV to this circular.
IZOK LAKE
Project overview
Izok Lake is a massive high-grade copper-zinc sulphide deposit. It is located approximately 360
kilometres north of Yellowknife, Northwest Territories, Canada. The locations of Izok Lake and High
Lake in Canada are illustrated below:
Source: MMG
Environmental baseline studies and infrastructure studies have commenced as well as a
pre-feasibility study. At the same time exploration is underway with the aim of significantly expanding
the mineral resources base at Izok Lake. An earlier preliminary economic assessment has been based
on the production of 1.4Mt of ore annually producing 140,000 tonnes of zinc in concentrate and 30,000
tonnes of copper in concentrate annually.
INFORMATION OF THE TARGET GROUP
— 228 —
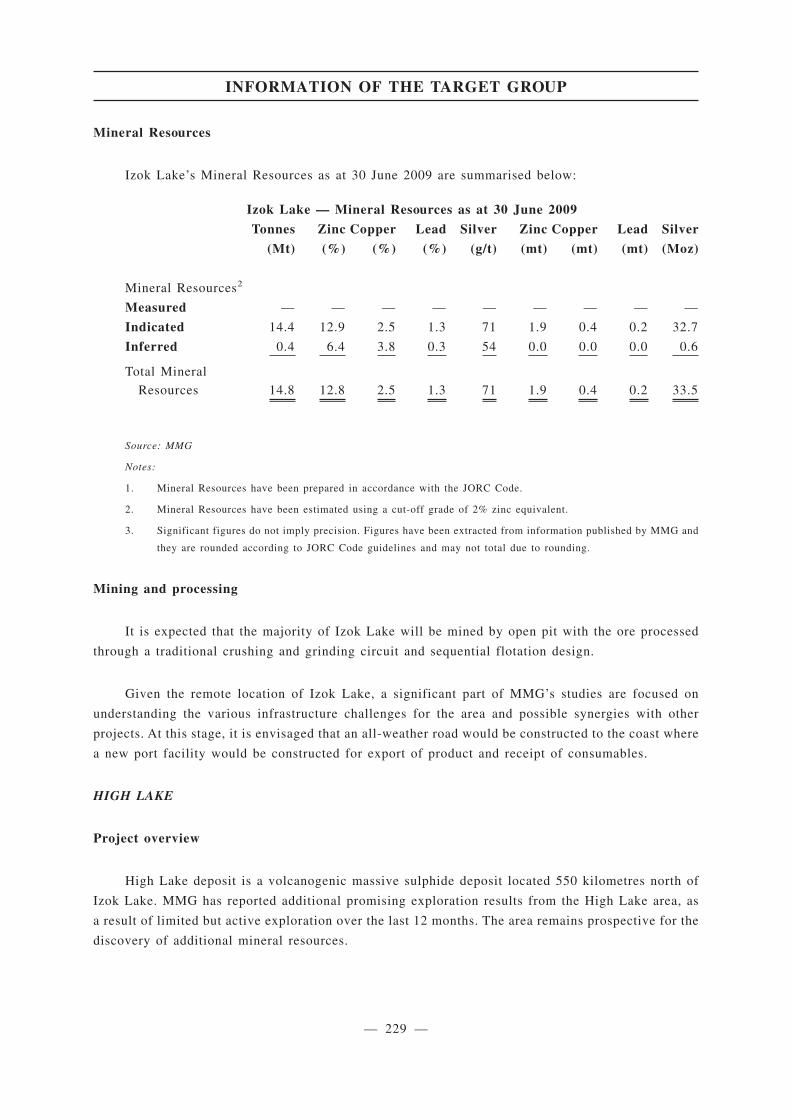
Mineral Resources
Izok Lake’s Mineral Resources as at 30 June 2009 are summarised below:
Izok Lake — Mineral Resources as at 30 June 2009
Tonnes Zinc Copper Lead Silver Zinc Copper Lead Silver
(Mt) (%) (%) (%) (g/t) (mt) (mt) (mt) (Moz)
Mineral Resources2
Measured — — — — — — — — —
Indicated 14.4 12.9 2.5 1.3 71 1.9 0.4 0.2 32.7
Inferred 0.4 6.4 3.8 0.3 54 0.0 0.0 0.0 0.6
Total Mineral
Resources 14.8 12.8 2.5 1.3 71 1.9 0.4 0.2 33.5
Source: MMG
Notes:
1. Mineral Resources have been prepared in accordance with the JORC Code.
2. Mineral Resources have been estimated using a cut-off grade of 2% zinc equivalent.
3. Significant figures do not imply precision. Figures have been extracted from information published by MMG and
they are rounded according to JORC Code guidelines and may not total due to rounding.
Mining and processing
It is expected that the majority of Izok Lake will be mined by open pit with the ore processed
through a traditional crushing and grinding circuit and sequential flotation design.
Given the remote location of Izok Lake, a significant part of MMG’s studies are focused on
understanding the various infrastructure challenges for the area and possible synergies with other
projects. At this stage, it is envisaged that an all-weather road would be constructed to the coast where
a new port facility would be constructed for export of product and receipt of consumables.
HIGH LAKE
Project overview
High Lake deposit is a volcanogenic massive sulphide deposit located 550 kilometres north of
Izok Lake. MMG has reported additional promising exploration results from the High Lake area, as
a result of limited but active exploration over the last 12 months. The area remains prospective for the
discovery of additional mineral resources.
INFORMATION OF THE TARGET GROUP
— 229 —
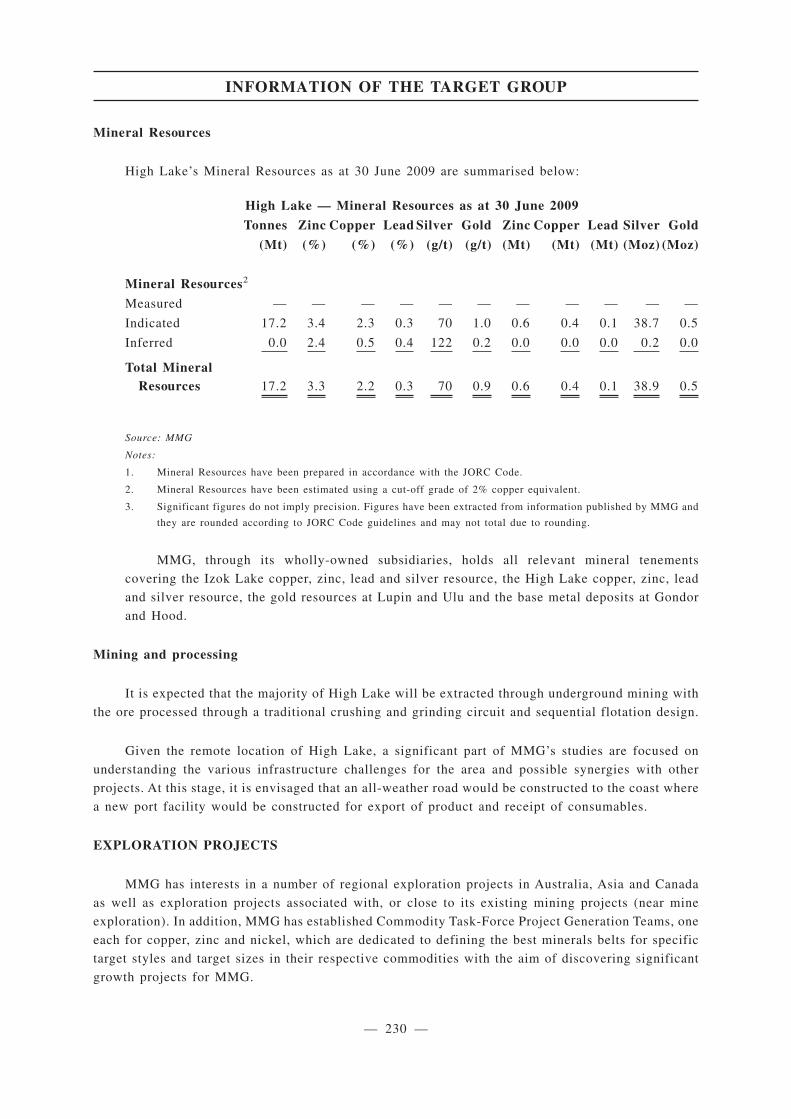
Mineral Resources
High Lake’s Mineral Resources as at 30 June 2009 are summarised below:
High Lake — Mineral Resources as at 30 June 2009
Tonnes Zinc Copper Lead Silver Gold Zinc Copper Lead Silver Gold
(Mt) (%) (%) (%) (g/t) (g/t) (Mt) (Mt) (Mt) (Moz) (Moz)
Mineral Resources2
Measured — — — — — — — — — — —
Indicated 17.2 3.4 2.3 0.3 70 1.0 0.6 0.4 0.1 38.7 0.5
Inferred 0.0 2.4 0.5 0.4 122 0.2 0.0 0.0 0.0 0.2 0.0
Total MineralResources 17.2 3.3 2.2 0.3 70 0.9 0.6 0.4 0.1 38.9 0.5
Source: MMG
Notes:
1. Mineral Resources have been prepared in accordance with the JORC Code.
2. Mineral Resources have been estimated using a cut-off grade of 2% copper equivalent.
3. Significant figures do not imply precision. Figures have been extracted from information published by MMG and
they are rounded according to JORC Code guidelines and may not total due to rounding.
MMG, through its wholly-owned subsidiaries, holds all relevant mineral tenements
covering the Izok Lake copper, zinc, lead and silver resource, the High Lake copper, zinc, lead
and silver resource, the gold resources at Lupin and Ulu and the base metal deposits at Gondor
and Hood.
Mining and processing
It is expected that the majority of High Lake will be extracted through underground mining with
the ore processed through a traditional crushing and grinding circuit and sequential flotation design.
Given the remote location of High Lake, a significant part of MMG’s studies are focused on
understanding the various infrastructure challenges for the area and possible synergies with other
projects. At this stage, it is envisaged that an all-weather road would be constructed to the coast where
a new port facility would be constructed for export of product and receipt of consumables.
EXPLORATION PROJECTS
MMG has interests in a number of regional exploration projects in Australia, Asia and Canada
as well as exploration projects associated with, or close to its existing mining projects (near mine
exploration). In addition, MMG has established Commodity Task-Force Project Generation Teams, one
each for copper, zinc and nickel, which are dedicated to defining the best minerals belts for specific
target styles and target sizes in their respective commodities with the aim of discovering significant
growth projects for MMG.
INFORMATION OF THE TARGET GROUP
— 230 —
MMG has a total global exploration budget for the year ending 31 December 2010 of US$38.8
million, which includes US$24.9 million for mine districts exploration, US$11.5 million for regional
exploration and US$2.4 million for project generation. The mine districts exploration budget includes
programmes at Sepon, Century, Avebury and Rosebery plus resource extension exploration
programmes on the Izok Lake and High Lake projects in Canada. While the exploration budget for
2011 is yet to be finalised, it is envisaged that the exploration budget for 2011 will be similar to that
of 2010, with the relative split between mine district and regional exploration roughly maintained. The
Enlarged Group will regularly monitor the funding requirements and maintain sufficient cash and cash
equivalents to cover any expected cash demands in connection with adjustments to the exploration
budget of MMG for 2011.
Mine district exploration is conducted to add further resources at MMG’s operating sites. Mine
district exploration success generally translates to mine life extensions at existing operations and
therefore has the potential to add incremental shareholder value. As such, It is a core part of MMG’s
business.
Regional exploration and project generation are focused on the discovery of new deposits remote
from existing operations. The proportionally lower spend on this compared to mine district exploration
reflects the lower likelihood of exploration success. However, this is still critical to the MMG business
as a regional discovery has the potential to create an entirely new mine operation for MMG and create
significant shareholder value.
MMG’s various exploration projects in Australia, Indonesia and Canada include the following:
(i) Australia
Near Cobar in New South Wales, MMG is exploring for Cobar-style copper-zinc-lead
mineralisation at the Wagga Tank project. Drilling in 2009 encountered minor copper-zinc
mineralisation. Further drilling to follow up on airborne electromagnetic survey targets is planned for
2010.
(ii) Indonesia
MMG is undertaking exploration in a number of areas in Indonesia including Sulawesi and Java
for copper-gold and nickel deposits in this highly mineralised, and under-explored region. In 2009
much work was undertaken to convert existing exploration licences to IUPs (new Indonesian Mining
Law exploration tenements) and conduct scout drilling programs at a number of prospects.
(iii) Canada
In the Nunavut Territories in Northern Canada, MMG has around 2,000 square kilometres of
exploration tenements. During the 2009 and 2010 field seasons, drilling and surface geochemical
sampling programs were undertaken. MMG is also exploring early stage nickel and copper projects
through joint ventures in Ontario and the Nunavut Territories.
INFORMATION OF THE TARGET GROUP
— 231 —
The mineral tenements covering the exploration tenements referred to above are either held by
MMG through its wholly-owned subsidiaries or through wholly-owned subsidiaries that are party to
agreements which provide for the right by the relevant MMG entity to acquire a direct interest in the
relevant tenements or shares in the company that holds the relevant tenements. In some cases, less than
100% of the relevant tenements or the company that holds the relevant tenements may be acquired.
In such cases, joint ventures will be formed in relation to the exploitation of the relevant mineral
tenements.
SUSTAINABILITY
MMG is a member of the International Council on Mining and Metals (“ICMM”) and the
Minerals Council of Australia, committing to the sustainability frameworks of each organisation,
respectively the Sustainable Development Framework and Enduring Value.
MMG’s key sustainability objectives are to:
• Protect the safety, health and wellbeing of its employees and contractors;
• Minimise its impact on the environment;
• Ensure that the communities in which it operates receive real benefit from its activities;
• Engage our key stakeholders and ensure they are aware and supportive of our aims and
objectives; and
• Be known for its integrity.
MMG supports the Extractive Industry Transparency Initiative (“EITI”) in its efforts to improve
transparency in countries rich in oil, gas and mineral resources. MMG contributes financially to EITI
through its membership of ICMM.
In addition, MMG is committed to public reporting on its participation in the following
programmes:
• Energy Efficiency Opportunities Assessment Programme
• National Pollutant Inventory
• National Greenhouse and Energy Reporting
INFORMATION OF THE TARGET GROUP
— 232 —
18.05(6)(b)
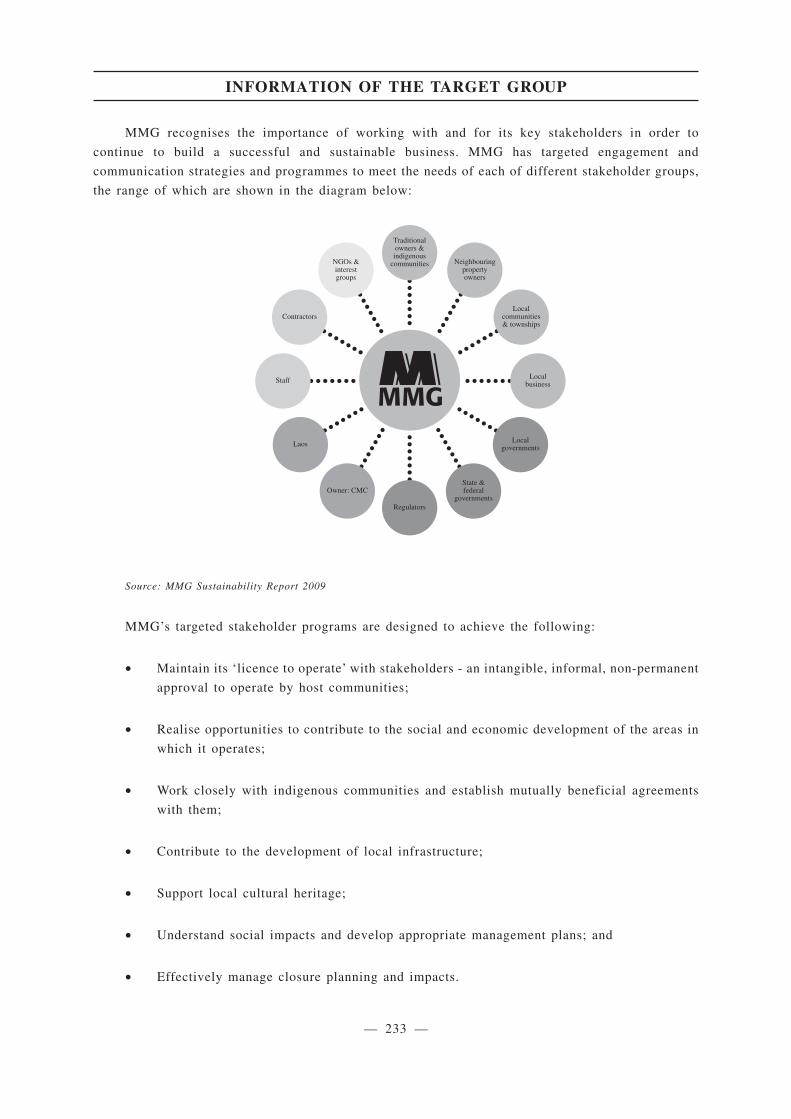
MMG recognises the importance of working with and for its key stakeholders in order to
continue to build a successful and sustainable business. MMG has targeted engagement and
communication strategies and programmes to meet the needs of each of different stakeholder groups,
the range of which are shown in the diagram below:
NGOs &interestgroups
Traditionalowners &indigenous
communities Neighbouringpropertyowners
Localcommunities& townships
Localbusiness
Localgovernments
State &federal
governmentsRegulators
Owner: CMC
Laos
Staff
Contractors
MMG
Source: MMG Sustainability Report 2009
MMG’s targeted stakeholder programs are designed to achieve the following:
• Maintain its ‘licence to operate’ with stakeholders - an intangible, informal, non-permanent
approval to operate by host communities;
• Realise opportunities to contribute to the social and economic development of the areas in
which it operates;
• Work closely with indigenous communities and establish mutually beneficial agreements
with them;
• Contribute to the development of local infrastructure;
• Support local cultural heritage;
• Understand social impacts and develop appropriate management plans; and
• Effectively manage closure planning and impacts.
INFORMATION OF THE TARGET GROUP
— 233 —
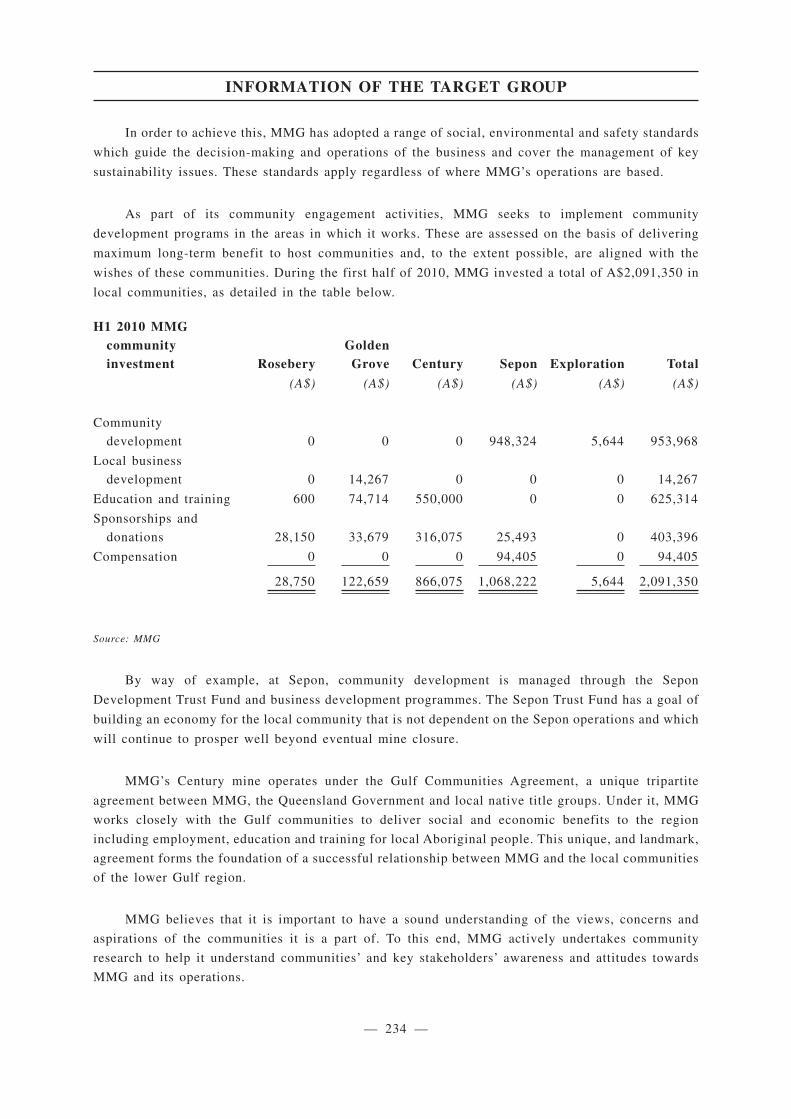
In order to achieve this, MMG has adopted a range of social, environmental and safety standards
which guide the decision-making and operations of the business and cover the management of key
sustainability issues. These standards apply regardless of where MMG’s operations are based.
As part of its community engagement activities, MMG seeks to implement community
development programs in the areas in which it works. These are assessed on the basis of delivering
maximum long-term benefit to host communities and, to the extent possible, are aligned with the
wishes of these communities. During the first half of 2010, MMG invested a total of A$2,091,350 in
local communities, as detailed in the table below.
H1 2010 MMGcommunityinvestment Rosebery
GoldenGrove Century Sepon Exploration Total
(A$) (A$) (A$) (A$) (A$) (A$)
Community
development 0 0 0 948,324 5,644 953,968
Local business
development 0 14,267 0 0 0 14,267
Education and training 600 74,714 550,000 0 0 625,314
Sponsorships and
donations 28,150 33,679 316,075 25,493 0 403,396
Compensation 0 0 0 94,405 0 94,405
28,750 122,659 866,075 1,068,222 5,644 2,091,350
Source: MMG
By way of example, at Sepon, community development is managed through the Sepon
Development Trust Fund and business development programmes. The Sepon Trust Fund has a goal of
building an economy for the local community that is not dependent on the Sepon operations and which
will continue to prosper well beyond eventual mine closure.
MMG’s Century mine operates under the Gulf Communities Agreement, a unique tripartite
agreement between MMG, the Queensland Government and local native title groups. Under it, MMG
works closely with the Gulf communities to deliver social and economic benefits to the region
including employment, education and training for local Aboriginal people. This unique, and landmark,
agreement forms the foundation of a successful relationship between MMG and the local communities
of the lower Gulf region.
MMG believes that it is important to have a sound understanding of the views, concerns and
aspirations of the communities it is a part of. To this end, MMG actively undertakes community
research to help it understand communities’ and key stakeholders’ awareness and attitudes towards
MMG and its operations.
INFORMATION OF THE TARGET GROUP
— 234 —
18.05(6)(g)
COMPETITION, OPPORTUNITIES AND CHALLENGES
MMG’s principal competitors are major international base metals producers, including, but not
limited to, Antofagasta, BHP Billiton, Equinox Minerals, First Quantum Minerals, Freeport McMoran,
Grupo Mexico, OZL, PanAust, Rio Tinto, Teck Resources, Vedanta and Xstrata. Major barriers to
entry into the upstream base metals business include the ability to secure mining tenements and
substantial capital expenditures and the time required to explore, develop and commission a mine.
The value of the payable metals contained in the products MMG produces is determined by
reference to prices of these metals established on international terminal markets, notably the LME.
Specific contract details are agreed by negotiation with customers. MMG competes with other
producers through its customer relationships, market knowledge, product quality, reliability and lead
time for supply.
The primary opportunity available and focus of a considerable effort at MMG is to create
shareholder value through well executed growth of its metals and mining business. MMG is already
a significant producer of base metals, including being the world’s third largest producer of mined zinc,
a strong platform from which to grow. It has a competitive pipeline of Development Projects which
includes Dugald River, one of the largest undeveloped zinc deposits in the world, and highly skilled
and well resourced teams focusing on growth through brownfield projects, greenfield developments,
exploration and targeted acquisition. Coupling this with the support of its ultimate controlling
shareholder, a major Chinese state owned enterprise in CMC, MMG is in a unique position to leverage
the strengthening commodities markets through further business growth.
As is the case with all base metals mining companies, increasing shareholder value through cost
control and cost reduction is both an opportunity and an ongoing challenge. MMG has a well
established business excellence programme aimed at improving productivity and efficiency in all parts
of the business. MMG has also recently introduced shared business services as part of its business
excellence strategy, with a focus on improving MMG’s efficiency in common business processes
through a centralised, standardised, simplified and systematised approach.
MMG’s operating site and head office management and operations teams are appropriately
staffed with suitably qualified people. The ability to continue to attract and retain high caliber
individuals is critical to the on-going success of the business and a challenge for all industry players.
MMG has a competitive remuneration policy and regularly benchmarks its employee pay and
conditions against its peers. MMG employs an established and dedicated in-house recruitment team to
manage turn over and other new hiring.
NO MATERIAL CHANGE
No material changes have occurred from the effective date (30 June 2010) of the Competent’s
Person Report up to the Latest Practicable Date.
INFORMATION OF THE TARGET GROUP
— 235 —
18.05(2)
STRATEGIES
It is envisaged that the Enlarged Group will pursue strategies that are designed to deliver
sustainable growth in long-term shareholder value, which may include the development, restructuring
or divestiture of existing assets, acquisition of new assets, and exploration.
The proposed strategy of the Enlarged Group is to maintain and expand its position as a leading
internationally diversified base metals group with exposure to multiple commodities across various
jurisdictions. It intends to pursue its strategy and enhance its competitive position across a range of
base metals by pursuing organic growth initiatives and value-enhancing acquisition opportunities, as
well as capitalising on its status as a member of the CMC Group of companies. The Enlarged Group
will consider pursuing a number of initiatives to achieve its strategy, including:
(i) Pursuing available organic growth opportunities
It is envisaged that the Enlarged Group will have a number of organic growth opportunities
available to it, and will invest in capital expenditure to increase the production capacities, efficiency
and mine lives of its Operating Mines (subject to project feasibility and economic fundamentals). Such
proposed investment is expected to enhance the asset value of the Operating Mines. It is also expected
that the Enlarged Group will invest, subject to project feasibility and economic fundamentals, in its
Development Projects and will continue to explore for new mineral deposits. It is expected that the
Enlarged Group will continue to focus on the on-going expansion of its Ore Reserves and Mineral
Resources.
(ii) Targeted value-focused acquisitions
It is envisaged that the Enlarged Group will also pursue, where appropriate, the acquisition and
consolidation of base metal projects and assets, in particular, copper, zinc and nickel projects. In
executing acquisition strategies, the Enlarged Group may consider acquiring mining operations and
project assets directly or consider acquiring equity interests in other companies. A dedicated and
experienced business development team will be established and responsible for identifying and
evaluating prospective and value-accretive assets. Potential acquisition or consolidation targets will
only include mines, projects or companies that satisfy the Enlarged Group’s assessment criteria.
(iii) Continuing to leverage on the expertise, experience and relationships of the Group’s
principal shareholder, CMC
CMC, the Company’s ultimate controlling shareholder, is one of the leading PRC state-owned
enterprises and a sizable international conglomerate. CMC is principally engaged in mining,
development, production and trading of metals and minerals. It is also engaged in finance, real estate
and logistics businesses. In 2009, CMC achieved revenue of US$26.8 billion (equivalent to
approximately HK$209.0 billion). CMN is committed to remaining as the controlling shareholder of
the Company and to hold no less than 51% of the issued share capital of the Company.
STRATEGIES AND COMPETITIVE STRENGTHS OF THE ENLARGED GROUP
— 236 —
The Enlarged Group intends to continue to leverage on the expertise, experience and
relationships of CMC, in particular, through the following ways:
(a) having access to and insights into the PRC base metals market. Since CMC is one of the
largest minerals and metals traders in the PRC, CMC has established distribution and
marketing channels in the base metals market in the PRC and, as a state-owned enterprise,
also has extensive relationships with other state-owned base metals consumers in the PRC.
It is expected that CMC will be able to provide the Enlarged Group with valuable insights
and marketing support in the largest base metals market in the world; and
(b) being able to access, through CMC, low-cost and competitive financing from domestic and
policy banks in the PRC so as to fund future mergers and acquisitions opportunities which
the Enlarged Group may undertake.
(iv) Commit to best practice in corporate governance, production standards, safety,operational excellence and environmental protection
MMG is one of the 19 members of the International Council of Mining and Metals (“ICMM”).
ICMM, an organisation which brings together leading companies to highlight the importance of the
minerals and metals sector in the world economy, to build a strong reputation for the industry and to
share best practices in sustainable development. The ICMM includes the largest mining companies in
the world (including BHP Billiton, Rio Tinto, Vale, Xstrata, Barrick, Newmont, Anglo American,
Goldcorp, Freeport-McMoRan). MMG is the only PRC-affiliated mining company to have committed
to the ICMM principles of sustainable development. Membership of ICMM requires members to
implement the ICMM Sustainable Development (“SD”) Framework throughout its business, which
includes implementation of 10 ICMM SD principles throughout its business, the preparation of a
sustainability report in line with the Global Reporting Initiative (“GRI”) G3 framework and an
independent audit of activities against the principles and content of the sustainability report.
Upon Completion, the Enlarged Group intends to continue as a member of the ICMM and to
continue its commitment to maintain the highest international standard to protect the health, safety and
wellbeing of its employees and contractors so as to achieve a fatality-free workplace. The Enlarged
Group intends to continue to achieve improvement in performance through the use of robust
management systems and effective governance and assurance processes, and to also minimise
environmental and social impact by involving communities, reducing waste, using energy, water and
other raw materials efficiently and effectively, planning for, managing and providing for closure of
mining operations when appropriate.
(v) Continue strong commitment to supporting local economies and communities
CMC and the Enlarged Group are committed to ensuring that local economies continue to receive
tangible benefits from the operations of the Enlarged Group and to building strong and trusted
partnerships with local communities through community development, local business development,
education, training, sponsorship and capacity building. The Enlarged Group intends to continue to
focus on attracting workforce from local communities to employment at its mine sites and to further
develop their skills through training. Currently, at the Sepon mine, approximately 50% of the
STRATEGIES AND COMPETITIVE STRENGTHS OF THE ENLARGED GROUP
— 237 —
workforce is drawn from local district communities and another 35% from other regions in Laos. At
the Century mine, approximately 20% of the workforce is from local indigenous communities,
supported by the MMG pre-employment training programs. At the Golden Grove mine, local
indigenous communities are supported by providing people with training and skills to help them find
future roles in mining and other industries.
COMPETITIVE STRENGTHS
(i) The Company will be a unique international diversified base metals group listed in HongKong after Completion
MMG is one of the world’s largest producers of zinc as well as a substantial producer of copper,
lead, gold and silver. In particular, the Century mine is one of the world’s largest open-pit zinc mines
producing approximately 0.5Mt of zinc in concentrate annually. As of the date of this circular, there
are no companies listed in Hong Kong which are engaged in the production of such a diversified range
of base metals through predominantly international mining assets. Thus, upon Completion, the
Enlarged Group will be uniquely positioned within the Hong Kong market, with a diversified portfolio
of operating assets in Australia and Laos and development projects in Australia, Asia and North
America. The Company believes that this unique position will attract the interest of investors building
a portfolio of upstream raw materials for a number of key commodities across several geographic
regions. In time, and by attracting the interest of external financing sources, the Company is expected
to have improved access to funding for its expansion plans. Such improved access to financing is
expected to give the Enlarged Group a competitive advantage and strengthen its leading market
position.
(ii) Strong financial performance
The table below highlights the strong financial performance of the Group which provides a
strong foundation for growth.
For the year ended 31 December
For thesix months
ended30 June
2007 2008 2009 2010(HK$ million)
(Restated Note)
(HK$ million)
(Restated Note)
(HK$ million)
(Restated Note)
(HK$ million)
Revenue 7,337.2 8,450.3 6,215.8 5,403.7Profit attributable to equity
holders 601.2 137.7 338.5 424.0
Note: The Group has changed its accounting treatment from the purchase method of accounting to merger accounting
in accordance with the requirements set out in Accounting Guideline 5 “Merger Accounting for Common Control
Combinations” to business combinations involving entities under the common control for the financial year
beginning on 1 January 2010. This change in accounting policy has been applied retrospectively and certain
previously reported figures are restated accordingly.
STRATEGIES AND COMPETITIVE STRENGTHS OF THE ENLARGED GROUP
— 238 —
The major financial and operating indicators, including revenue and net profit, of the Group in
the first half of 2010 significantly improved from those of the corresponding period of the previous
year. Even when compared with the second half of 2009, the Group still sustained healthy growth in
the period under review. Such growth reflected the prudent and pragmatic management strategy and
successful measures taken in response to the volatile non-ferrous metals market in 2009, which
resulted in a rapid resumption of sustainable growth momentum in the Group’s various principal
businesses.
The combination of low cost projects and robust commodity prices has supported strong
operational and financial performance. MMG produced 318kt of zinc in concentrate, 15kt of copper
in concentrate, 34kt of copper cathode, 26kt of lead in concentrate, 4moz of silver and 92koz of gold
in the six months ended 30 June 2010 and delivered revenue of US$844.7 million (equivalent to
approximately HK$6,588.7 million) and EBITDA of US$403.9 million (equivalent to approximately
HK$3,150.4 million), representing an EBITDA margin of approximately 48%, for the six months
ended 30 June 2010.
Through the Acquisition, it is expected that MMG’s performance will contribute and strengthen
the Enlarged Group’s scale of operations and performance and allow it to pursue the above-mentioned
strategies to develop into an international metals and mining conglomerate.
(iii) Significant organic growth potential
It is believed that the Enlarged Group has significant potential to expand and achieve long-term
sustainable growth through organic initiatives focusing on upstream mining operations. The Enlarged
Group will have a portfolio of quality assets with a wide resource base as set out in the section headed
“Information of the Target Group” in this circular.
The significant organic growth potential of MMG is supported by recent significant growth in
earnings. For the six months ended 30 June 2010, the Target Group achieved an EBITDA growth of
15.8% while revenue remained largely unchanged as compared to the seven months ended 31
December 2009.
(iv) Ability to leverage on the expertise, experience and relationships of the Enlarged
Group’s principal shareholder, CMC
CMC, the Company’s ultimate controlling Shareholder, is a sizable international conglomerate
principally engaged in development, production, trading and integration services of metals and
minerals. It is also engaged in finance, real estate and logistics businesses. The Enlarged Group aims
to leverage its expertise, experience and relationships as it seeks opportunities to expand its business
internationally.
STRATEGIES AND COMPETITIVE STRENGTHS OF THE ENLARGED GROUP
— 239 —
PROPOSED APPOINTMENT OF DIRECTORS
Upon Completion, the Board intends to appoint Mr. Andrew Gordon Michelmore as an executive
Director and CEO, and Mr. David Mark Lamont as an executive Director and CFO. Mr. Michelmore,
the current managing director and CEO of MMG, and Mr. Lamont, the current CFO of MMG. Both
Mr. Michelmore and Mr. Lamont have extensive experience in the mining industry and in the
management of listed companies. As such, the addition of Mr. Michelmore and Mr. Lamont to the
Board will bring to the Board the experience in addressing the challenges and risks associated with
MMG’s business. The Board also intends to appoint Dr. Peter William Cassidy (presently an
independent non-executive director of MMG) and Mr. Jiao Jian (presently a non-executive director of
MMG) as an independent non-executive Director and a non-executive Director, respectively, upon
Completion. Mr. Jiao is also the president of CMN.
The length of service of the proposed Directors is currently expected to be for a term of three
years until the next following annual general meeting of the Company where the proposed Directors
shall then be eligible for re-election at that meeting.
Brief biographical details of each of Mr. Andrew Michelmore, Mr. David Lamont, Dr. Peter
Cassidy and Mr. Jiao Jian are set out below:
Mr. Andrew Gordon Michelmore
Mr. Andrew Gordon Michelmore, aged 58, joined MMG as managing director and CEO on 17
June 2009 after his tenure as CEO of Zinifex and then OZL. Prior to his tenure as CEO of Zinifex,
he spent two years working in London and Russia as CEO of EN+ Group. Mr. Michelmore has more
than 28 years experience in the metals and mining industry including 12 years at WMC Resources
Limited where he was CEO and prior to that, held senior roles in the company’s nickel, gold, alumina,
copper, uranium, and fertilizer businesses.
Mr. Michelmore holds a First Class Honours degree in Engineering (Chemical) from The
University of Melbourne and a Master of Arts in Politics, Philosophy and Economics from Oxford
University. Mr. Michelmore is a Fellow of the Institution of Chemical Engineers, the Institution of
Engineers Australia and the Australian Academy of Technological Sciences and Engineering. He is
also chairman of The Jean Hailes Foundation for Women’s Health, chairman of the Council of Ormond
College at The University of Melbourne and a member of each of the Minerals Council of Australia
and the Business Council of Australia. Mr. Michelmore is a director of Century Aluminum Company
(listed on the NASDAQ and the Iceland Stock Exchange).
A brief summary of Mr. Michelmore’s relevant industry experience is set out below:
● June 2009 to present: managing director and CEO of MMG;
● June 2008 to June 2009: CEO of OZL;
● February 2008 to June 2008: CEO of Zinifex;
PROPOSED DIRECTORS AND SENIOR MANAGEMENT OF THE TARGET GROUP
— 240 —
● January 2006 to October 2007: CEO of EN+ Group;
● January 1993 to June 2005: senior roles in WMC Resources Limited (as CEO of WMC
Resources Limited during January 2003 to June 2005); and
● August 1989 to December 2002: general manager of Nabalco Pty. Ltd and CEO Alusuisse
Australia Limited.
The directors’ fee (including that for Mr. Michelmore) for the year ending 31 December 2010
will be proposed by the Board for approval by the Shareholders at the annual general meeting of the
Company in 2011. His emoluments will be determined by reference to his duties and responsibilities
with the Enlarged Group, his performance against agreed objectives, the Enlarged Group’s
performance and profitability, the Enlarged Group’s remuneration policy and the market pay-level for
similar positions.
Mr. David Mark Lamont
Mr. David Mark Lamont, aged 45, joined MMG as CFO on its formation in June 2009. He was
previously CFO of OZL from October 2008. Mr. Lamont is a member of the Institute of Chartered
Accountants and was an Audit Supervisor at Deloitte Haskins and Sells before commencing a
corporate career. After progressing through a number of senior roles in the chemical and agricultural
industries, Mr. Lamont was appointed CFO at Incitec Limited in 1999. Mr. Lamont joined BHP
Billiton in 2001 where he held a number of senior roles including CFO of BHP Billiton’s Energy Coal
and Carbon Steel Materials Groups. Mr. Lamont joined OZL from PaperlinX Limited, where he had
served as CFO since 2006 and was appointed an executive director in February 2008 resigning in
September 2008. Mr. Lamont holds a Bachelor of Commerce degree and is a qualified Chartered
Accountant.
A brief summary of Mr. Lamont’s relevant industry experience is set out below:
● June 2009 to present: CFO of MMG;
● October 2008 to June 2009: CFO of OZL; and
● 2001 to 2006: senior roles in BHP Billiton’s Energy Coal and Carbon Steel Materials
Groups (as CFO of BHP Billiton’s Energy Coal and Carbon Steel Materials Groups during
June 2001 to February 2006).
The directors’ fee (including that for Mr. Lamont) for the year ending 31 December 2010 will
be proposed by the Board for approval by the Shareholders at the annual general meeting of the
Company in 2011. His emoluments will be determined by reference to his duties and responsibilities
with the Enlarged Group, his performance against agreed objectives, the Enlarged Group’s
performance and profitability, the Enlarged Group’s remuneration policy and the market pay-level for
similar positions.
PROPOSED DIRECTORS AND SENIOR MANAGEMENT OF THE TARGET GROUP
— 241 —
Dr. Peter William Cassidy
Dr. Peter William Cassidy, aged 64, is a metallurgical engineer, with almost 40 years of
experience in the resource and energy sectors including almost 20 years as a director of major public
companies set out below. He has most recently been involved in the development and operation of
major mining and processing projects in Australia, the PRC, Laos, Papua New Guinea and Cote
d’Ivoire.
He was CEO of Goldfields Limited from 1995 until its merger with Delta Gold Limited in 2002
to form Aurion Gold Limited. Prior to 1995 he was “Executive Director — Operations” of RGC
Limited. He remained a director of AurionGold until January 2003.
Dr. Cassidy has been an independent non-executive director of each of Oxiana Limited (2002 to
2007), Zinifex Limited (2004 to 2008), Sino Gold Mining Limited (2002 to 2009), Lihir Gold Limited
(2003 to 2010), OZ Minerals Limited (2008 to 2009) and Energy Developments Limited (2003 to
2009). He was also non-executive chairman of Allegiance Mining NL (April to July 2008) and a
director of Eldorado Gold Corporation (2010). Since 2009, he has been an independent non-executive
director of Minerals and Metals Group.
The director’s fee (including that for Dr. Cassidy) for the year ending 31 December 2010 will
be proposed by the Board for approval by the Shareholders at the annual general meeting of the
Company in 2011. His emoluments will be determined by reference to his duties and responsibilities
with the Enlarged Group, his performance against agreed objectives, the Enlarged Group’s
performance and profitability, the Enlarged Group’s remuneration policy and the market pay-level for
similar positions.
Mr. Jiao Jian
Mr. Jiao Jian, aged 41, was appointed as the president of CMN in May 2010. Prior to that, he
was a vice president of CMN since 2007. Mr. Jiao is currently the chairman of the board of directors
of Shanxi Guanlv Co., Ltd. (山西關鋁股份有限公司), which is a company listed on the Shenzhen
Stock Exchange in the PRC. Mr. Jiao holds a Bachelor’s degree in International Economics from the
Nankai University in the PRC and a Master of Business Administration degree from the Saint Mary’s
University in Canada. Mr. Jiao joined the CMC Group in 1992 and is responsible for the copper and
aluminium business. Mr. Jiao has extensive experience in international trade, investment and
corporate management.
The directors’ fee (including that for Mr. Jiao) for the year ending 31 December 2010 will be
proposed by the Board for approval by the Shareholders at the annual general meeting of the Company
in 2011. His emoluments will be determined by reference to his duties and responsibilities with the
Enlarged Group, his performance against agreed objectives, the Enlarged Group’s performance and
profitability, the Enlarged Group’s remuneration policy and the market pay-level for similar positions.
Save as disclosed above, each of Mr. Michelmore, Mr. Lamont, Dr. Cassidy and Mr. Jiao do not
hold any directorships in any listed public companies in the last three years and do not hold any
position in any member of the Enlarged Group nor do they have any relationship with any other
Directors, senior management, substantial shareholders or controlling shareholders of the Company
and any interests in the shares of the Company within the meaning of Part XV of the SFO.
PROPOSED DIRECTORS AND SENIOR MANAGEMENT OF THE TARGET GROUP
— 242 —
Save as disclosed herein, there is no information to be disclosed pursuant to any of the
requirements under rules 13.51(2)(h) to 13.51(2)(v) of the Listing Rules, nor are there other matters
concerning them that need to be brought to the attention of the shareholders of the Company.
SENIOR MANAGEMENT OF THE TARGET GROUP
The existing management and technical teams of the Target Group will continue to manage the
operations of the Target Group after Completion. Brief biographical details of each of the senior
management of the Target Group are set out below:
Mr. Brett Fletcher
Mr. Brett Fletcher, aged 46, was appointed as the Chief Operating Officer of Zinifex in April
2007. Mr. Fletcher has more than 21 years of experience in the metals and mining industry. Mr.
Fletcher commenced his career in the mining industry in 1989 at Pasminco Limited in Broken Hill,
New South Wales as a qualified mining engineer and he held various technical and management roles.
For the last seven years, Mr. Fletcher has held general manager positions at Rosebery Mine, Century
Mine and Hobart Smelter.
A brief summary of Mr. Fletcher’s relevant industry experience is set out below:
• 2009 to present: COO of MMG
• 2007 to 2009: COO of Zinifex and OZL
• 2006 to 2007: General manager of Zinifex Hobart Zinc Smelter
• 2003 to 2006: General manager of Zinifex Century Mine
• 2000 to 2003: General manager of Pasminco Rosebery Mine
• 1996 to 2000: Manager of Pasminco Broken Hill Mine
• 1989 to 1996: Senior Mining Engineer of Pasminco Broken Hill Mine
Mr. Fletcher holds a Bachelor of Engineering in Mining from the University of New South Wales
(Sydney) and is a member of the Australian Institute of Company Directors.
Mr. Michael Nossal
Mr. Michael Nossal, aged 52, joined MMG as the Executive General Manager of the Business
Development Department in January 2010. Mr. Nossal has 23 years of experience in the metals and
mining industry. Mr. Nossal has held senior business development and strategy roles at WMC,
Normandy Mining Limited and Macquarie Corporate Finance. Before joining MMG, Mr. Nossal was
the Deputy CEO of En+ where he was responsible for corporate finance, strategy and business
development and the execution of key mergers and acquisition projects.
PROPOSED DIRECTORS AND SENIOR MANAGEMENT OF THE TARGET GROUP
— 243 —

A brief summary of Mr. Nossal’s relevant industry experience is set out below:
• 2010 to present: Executive General Manager of Business Development of MMG
• 2006 to 2009: Deputy CEO of En+ Group Ltd
• 2003 to 2005: Executive General Manager of WMC
• 1996 to 2000: Executive General Manager of Normandy Mining Limited
• 1993 to 1996: Associate Director, Macquarie Bank
• 1987 to 1993: CFO of Kenmare Resources plc
Mr. Nossal holds a BSc (Monash University) and an MBA (the Wharton School, University of
Pennsylvania) and is a member of the Institute of Directors, UK.
Mr. Steve Ryan
Mr. Steve Ryan, aged 47, joined MMG as an Executive General Manager of the Exploration
Department. Mr. Ryan has over 20 years of international experience in the mineral exploration
industry. Mr. Ryan worked for the CRA / Rio Tinto Group and held positions including Country
Exploration Manager positions in India, Papua New Guinea and Fiji and geologist positions in Russia,
Australia and other countries. Mr. Ryan worked for Oxiana and held positions as Asia Exploration
General Manager and China Country Exploration Manager. Mr. Ryan also has three years experience
in the venture capital industry as an Investment & Business Development Manager for an international
venture capital group. Mr. Ryan has degrees in Geology and an MBA in international business.
A brief summary of Mr. Ryan’s relevant industry experience is set out below:
• 2009 to present: Executive General Manager of Exploration in MMG
• 2008: General Manager of Exploration of Oxiana / OZL
• 2004 to 2007: Exploration Manager of Oxiana
• 2001 to 2003: Investment Manager of Zernike Australia Ltd (Zernike Group BV-
international venture capital group)
• 1988 to 2000: Exploration Manager of Rio Tinto
Mr. Ryan holds an MBA in International Business and a Bachelor of Science (Hons) Geology and
is a Member of the Australian Institute of Mining and Metallurgy (AusIMM).
PROPOSED DIRECTORS AND SENIOR MANAGEMENT OF THE TARGET GROUP
— 244 —
Mr. Tim Scully
Mr. Tim Scully, aged 62, joined MMG as an Executive General Manager of the Business Support
Department. Mr. Scully joined OZL in November 2008. Mr. Scully has 21 years of experience in the
metals and mining industry. Mr. Scully has experience in leadership development, talent management,
succession planning and the Human Resources systems and processes. Before joining OZL, Mr. Scully
was the General Manager of the Organisation Development at Intrepid Mines Limited. Prior to that,
Mr. Scully was the General Manager of the Organisation Development and Human Resources at Atlas
Group Holdings. Prior to his position at Atlas Group Holdings, he was the General Manager of Human
Resources at WMC where he worked from 1989 to 2005.
A brief summary of Mr. Scully’s relevant industry experience is set out below:
• June 2009 to present: Executive General Manager of Business Support at MMG
• December 2008: Executive General Manager of Human Resources at OZL
• January to September 2008: General Manager of Organisation Development at Intrepid
Mines Limited
• 2002 to 2005: General Manager of Human Resources at WMC
• 2001 to 2002: General Manager of Shared Services at WMC
• 1989 to 2000: Human Resources roles in WMC
Mr. Scully holds a BA (Hons) Melbourne University majoring in Economics and Politics.
RECRUITMENT STRATEGY
The Company will continue to seek qualified professionals to join the Enlarged Group by
offering competitive remuneration packages and benchmarking its employee pay and conditions
against its peers.
PROPOSED DIRECTORS AND SENIOR MANAGEMENT OF THE TARGET GROUP
— 245 —
1. ACCOUNTANT’S REPORT OF THE TARGET COMPANY
The following is the text of a report, prepared for the purpose sole of incorporation in this
circular, received from the reporting accountant, PricewaterhouseCoopers, Certified Public
Accountants, Hong Kong.
22 November 2010
The Directors
Minmetals Resources Limited
Dear Sirs
We report on the financial information of Album Resources Private Limited (the “Target
Company”) and its subsidiaries (together, the “Target Group”) which comprises the consolidated and
company statements of financial position of the Target Company as at 31 December 2009 and 30 June
2010, and the consolidated income statements, the consolidated statements of comprehensive income,
the consolidated statements of changes in equity and the consolidated statements of cash flows of the
Target Company for the period from 8 April 2009 (date of incorporation) to 31 December 2009 and
six months period ended 30 June 2010 (the “Relevant Periods”), and a summary of significant
accounting policies and other explanatory notes. This financial information has been prepared by the
directors of Minmetals Resources Limited (the “Company”) and is set out in Sections I to III below
for inclusion in Appendix I to the circular of the Company dated 22 November 2010 (the “Circular”)
in connection with the proposed acquisition of the entire issued share capital of the Target Company
by the Company.
The Target Company was incorporated in Singapore on 8 April 2009 as a company limited by
shares under the Singapore Companies Act and registered as a foreign company in Australia under the
Corporations Act 2001.
As at the date of this report, the Target Company has direct and indirect interests in the
subsidiaries as set out in Note 15 of Section II below.
APPENDIX I FINANCIAL INFORMATION OF THE TARGET GROUP
— I-1 —
App1,part B31(2),(3)(b)14, 67(6)(a)(i)
App1part B31(1)
14.69(4)(a)(i)
The consolidated financial statements of the Target Company for the period from 8 April 2009
(date of incorporation) to 31 December 2009 and six months period ended 30 June 2010, prepared in
accordance with Singapore Financial Reporting Standards (“SFRSs”) and International Financial
Reporting Standards (“IFRSs”) respectively, were audited by PricewaterhouseCoopers Singapore and
PricewaterhouseCoopers Melbourne in accordance with Singapore Standards on Auditing and
International Standards on Auditing respectively, pursuant to separate terms of engagement with the
Target Company.
The financial information has been prepared based on the audited consolidated financial
statements of the Target Company with no adjustment made thereon.
Directors’ responsibility for the financial information
The directors of the Target Company are responsible for the preparation and fair presentation of
the consolidated financial statements of the Target Company for the period from 8 April 2009 (date
of incorporation) to 31 December 2009 and six months period ended 30 June 2010 in accordance with
SFRSs and IFRSs respectively. This responsibility includes designing, implementing and maintaining
internal control relevant to the preparation and the fair presentation of the consolidated financial
statements that are free from material misstatement, whether due to fraud or error; selecting and
applying appropriate accounting policies; and making accounting estimates that are reasonable in the
circumstances.
The directors of the Company are responsible for the preparation and the true and fair
presentation of the financial information in accordance with the accounting policies as set out in Note
1 of Section II below which are in conformity with the accounting policies presently adopted by the
Company and its subsidiaries (together, the “Group”). This responsibility includes selecting and
applying appropriate accounting policies and making accounting estimates that are reasonable in the
circumstances.
Reporting accountant’s responsibility
Our responsibility is to express an opinion on the financial information and to report our opinion
to you. We carried out our procedures in accordance with the Auditing Guideline 3.340 “Prospectuses
and the Reporting Accountant” issued by the Hong Kong Institute of Certified Public Accountants.
Opinion
In our opinion, the financial information, for the purpose of this report, gives a true and fair view
of the state of affairs of the Target Company and of the Target Group as at 31 December 2009 and 30
June 2010 and of the Target Group’s results and cash flows for each of the Relevant Periods then
ended.
APPENDIX I FINANCIAL INFORMATION OF THE TARGET GROUP
— I-2 —
Review of stub period comparative financial information
We have reviewed the stub period comparative financial information set out in Sections I to III
below included in Appendix I to the Circular which comprises the consolidated income statement, the
consolidated statement of comprehensive income, the consolidated statement of changes in equity and
the consolidated statement of cash flows of the Target Company for the period from 8 April 2009 (date
of incorporation) to 30 June 2009 and a summary of significant accounting policies and other
explanatory notes (the “Stub Period Comparative Financial Information”).
The directors of the Company are responsible for the preparation and presentation of the Stub
Period Comparative Financial Information in accordance with the accounting policies set out in Note
1 of Section II below which are in conformity with the accounting policies presently adopted by the
Group.
Our responsibility is to express a conclusion on the Stub Period Comparative Financial
Information based on our review. We conducted our review in accordance with International Standard
on Review Engagements 2410, “Review of Interim Financial Information Performed by the
Independent Auditor of the Entity” issued by the International Auditing and Assurance Standards
Board. A review consists of making inquiries, primarily of persons responsible for financial and
accounting matters, and applying analytical and other review procedures. A review is substantially less
in scope that an audit conducted in accordance with International Standards on Auditing and
consequently does not enable us to obtain assurance that we would become aware of all significant
matters that might be identified in an audit. Accordingly, we do not express an audit opinion.
Based on our review, nothing has come to our attention that causes us to believe that the Stub
Period Comparative Financial Information, for the purpose of this report, has not been prepared, in all
material respects, in accordance with the accounting policies set out in Note 1 of Section II below
which are in conformity with the accounting policies presently adopted by the Group.
APPENDIX I FINANCIAL INFORMATION OF THE TARGET GROUP
— I-3 —
I. FINANCIAL INFORMATION OF THE TARGET GROUP
The following is the financial information of the Target Group as at 31 December 2009 and 30June 2010 and for each of the periods from 8 April 2009 (date of incorporation) to 31 December 2009,8 April 2009 (date of incorporation) to 30 June 2009 and 1 January 2010 to 30 June 2010:
Consolidated income statements
Notes
Period ended31 December
2009
Period ended30 June
2009
Period ended30 June
2010(US$m) (US$m) (US$m)
(unaudited)
Revenue 5 852.8 105.2 844.7Other income 6 0.7 — 4.1Cost of goods sold 7 (349.9) (46.7) (333.5)Depreciation and amortisation expenses 7 (158.3) (24.2) (124.0)Freight expenses 7 (55.1) (5.7) (35.3)Other expenses 7 (99.9) (9.6) (76.1)
Profit before net financing expensesand income tax 190.3 19.0 279.9
--------- --------- ---------
Financing income 8 1.1 — 1.8Financing expenses 8 (23.2) (3.0) (17.8)Net foreign exchange gain/(loss) 8 1.6 (4.8) (7.4)
Net financing expenses 8 (20.5) (7.8) (23.4)-------------------------------------------- -------------------------------------------- --------------------------------------------
Profit before income tax 169.8 11.2 256.5Income tax benefit/(expense) 10 10.9 (2.0) (22.5)
Profit for the period 180.7 9.2 234.0
Attributable to:Equity holders of the Target Company 172.5 8.5 222.6Non-controlling interest 21 8.2 0.7 11.4
Profit for the period 180.7 9.2 234.0
Information in the above consolidated income statements is for the periods from 8 April 2009(date of incorporation) to 31 December 2009, 8 April 2009 (date of incorporation) to 30 June 2009 and1 January 2010 to 30 June 2010.
APPENDIX I FINANCIAL INFORMATION OF THE TARGET GROUP
— I-4 —
14.58(7)
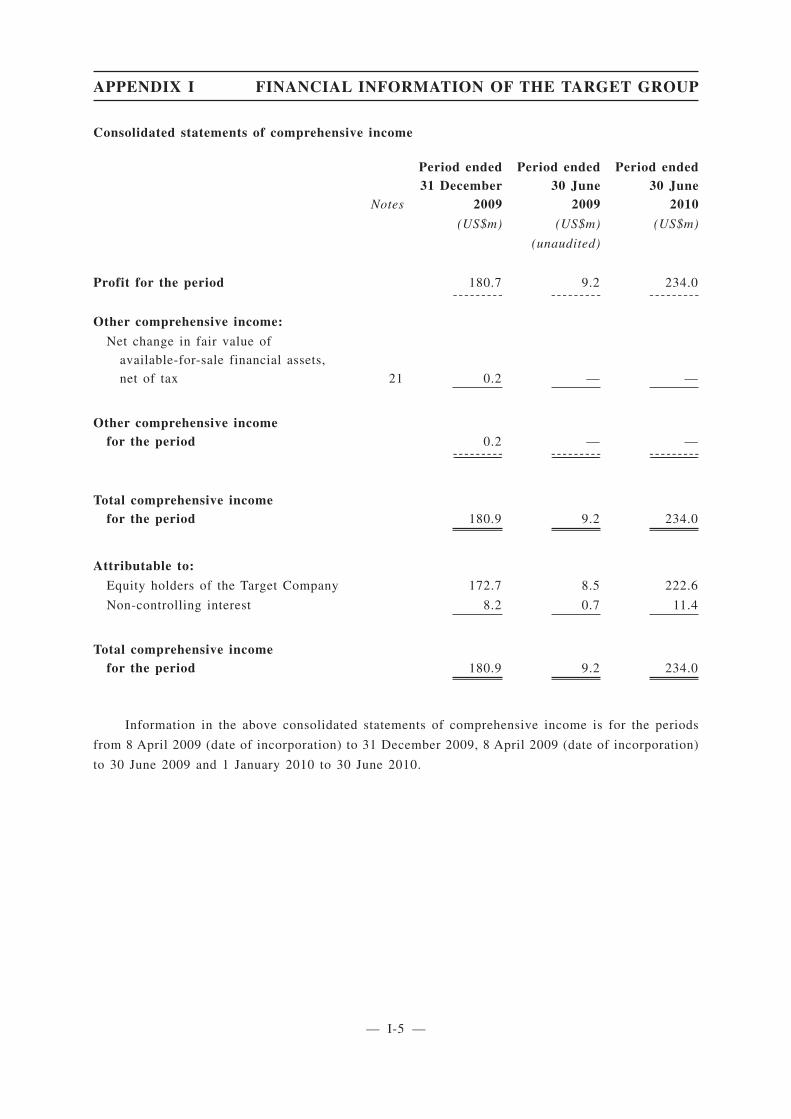
Consolidated statements of comprehensive income
Notes
Period ended31 December
2009
Period ended30 June
2009
Period ended30 June
2010
(US$m) (US$m) (US$m)
(unaudited)
Profit for the period 180.7 9.2 234.0--------- --------- ---------
Other comprehensive income:
Net change in fair value of
available-for-sale financial assets,
net of tax 21 0.2 — —
Other comprehensive incomefor the period 0.2 — —
-------------------------------------------- -------------------------------------------- --------------------------------------------
Total comprehensive incomefor the period 180.9 9.2 234.0
Attributable to:
Equity holders of the Target Company 172.7 8.5 222.6
Non-controlling interest 8.2 0.7 11.4
Total comprehensive incomefor the period 180.9 9.2 234.0
Information in the above consolidated statements of comprehensive income is for the periods
from 8 April 2009 (date of incorporation) to 31 December 2009, 8 April 2009 (date of incorporation)
to 30 June 2009 and 1 January 2010 to 30 June 2010.
APPENDIX I FINANCIAL INFORMATION OF THE TARGET GROUP
— I-5 —
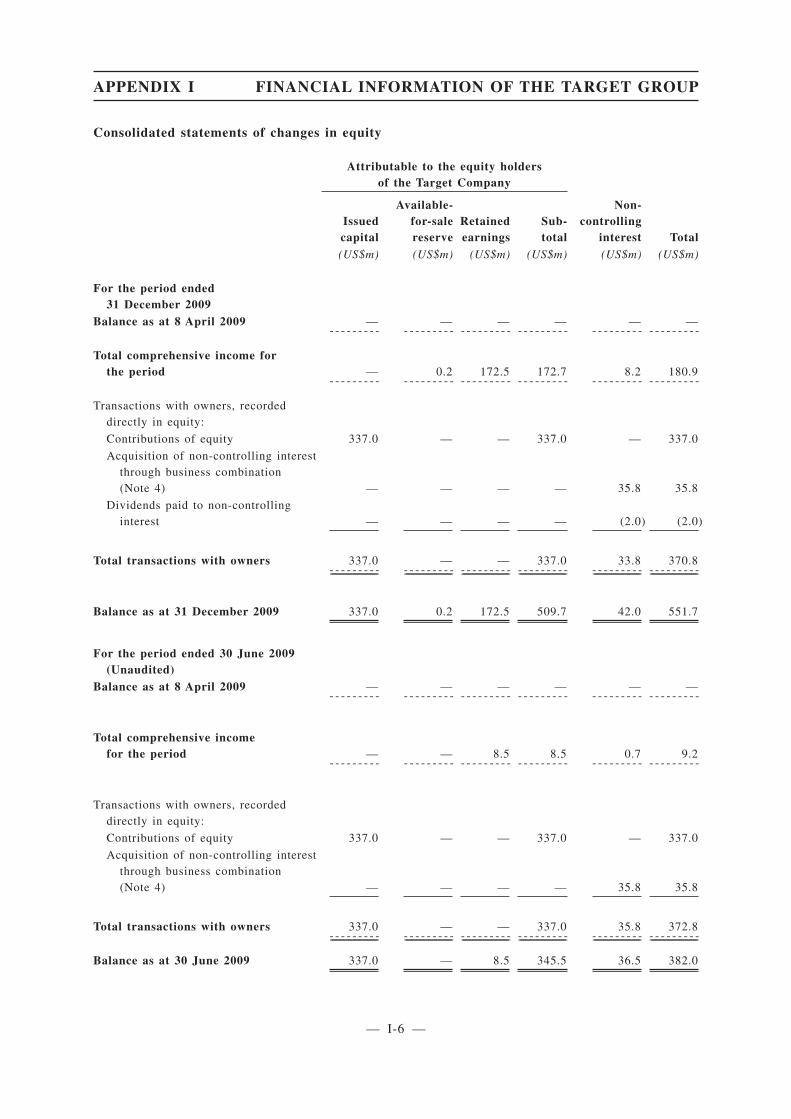
Consolidated statements of changes in equity
Attributable to the equity holdersof the Target Company
Issuedcapital
Available-for-salereserve
Retainedearnings
Sub-total
Non-controlling
interest Total(US$m) (US$m) (US$m) (US$m) (US$m) (US$m)
For the period ended31 December 2009
Balance as at 8 April 2009 — — — — — —- - - - - - - - - - - - - - - - - - - - - - - - - - - - - - - - - - - - - - - - - - - - - - - - - - - - - -
Total comprehensive income forthe period — 0.2 172.5 172.7 8.2 180.9
- - - - - - - - - - - - - - - - - - - - - - - - - - - - - - - - - - - - - - - - - - - - - - - - - - - - - -
Transactions with owners, recordeddirectly in equity:
Contributions of equity 337.0 — — 337.0 — 337.0
Acquisition of non-controlling interestthrough business combination(Note 4) — — — — 35.8 35.8
Dividends paid to non-controllinginterest — — — — (2.0) (2.0)
Total transactions with owners 337.0 — — 337.0 33.8 370.8- - - - - - - - ------------------------------------ - - - - - - - - ------------------------------------ - - - - - - - - ------------------------------------ - - - - - - - - ------------------------------------ - - - - - - - - ------------------------------------ - - - - - - - - ------------------------------------
Balance as at 31 December 2009 337.0 0.2 172.5 509.7 42.0 551.7
For the period ended 30 June 2009(Unaudited)
Balance as at 8 April 2009 — — — — — —- - - - - - - - - - - - - - - - - - - - - - - - - - - - - - - - - - - - - - - - - - - - - - - - - - - - - -
Total comprehensive incomefor the period — — 8.5 8.5 0.7 9.2
- - - - - - - - - - - - - - - - - - - - - - - - - - - - - - - - - - - - - - - - - - - - - - - - - - - - - -
Transactions with owners, recordeddirectly in equity:
Contributions of equity 337.0 — — 337.0 — 337.0
Acquisition of non-controlling interestthrough business combination(Note 4) — — — — 35.8 35.8
Total transactions with owners 337.0 — — 337.0 35.8 372.8- - - - - - - - ------------------------------------ - - - - - - - - ------------------------------------ - - - - - - - - ------------------------------------ - - - - - - - - ------------------------------------ - - - - - - - - ------------------------------------ - - - - - - - - ------------------------------------
Balance as at 30 June 2009 337.0 — 8.5 345.5 36.5 382.0
APPENDIX I FINANCIAL INFORMATION OF THE TARGET GROUP
— I-6 —

Attributable to the equity holdersof the Target Company
Issuedcapital
Available-for-salereserve
Retainedearnings
Sub-total
Non-controlling
interest Total(US$m) (US$m) (US$m) (US$m) (US$m) (US$m)
For the period ended 30 June 2010Balance as at 1 January 2010 337.0 0.2 172.5 509.7 42.0 551.7
- - - - - - - - - - - - - - - - - - - - - - - - - - - - - - - - - - - - - - - - - - - - - - - - - - - - - -
Total comprehensive incomefor the period — — 222.6 222.6 11.4 234.0
- - - - - - - - - - - - - - - - - - - - - - - - - - - - - - - - - - - - - - - - - - - - - - - - - - - - - -
Transactions with owners, recordeddirectly in equity:
Dividends paid to non-controllinginterest — — — — (14.4) (14.4)
Total transactions with owners — — — — (14.4) (14.4)- - - - - - - - ------------------------------------ - - - - - - - - ------------------------------------ - - - - - - - - ------------------------------------ - - - - - - - - ------------------------------------ - - - - - - - - ------------------------------------ - - - - - - - - ------------------------------------
Balance as at 30 June 2010 337.0 0.2 395.1 732.3 39.0 771.3
Information in the above consolidated statements of changes in equity is for the periods from 8
April 2009 (date of incorporation) to 31 December 2009, 8 April 2009 (date of incorporation) to 30
June 2009 and 1 January 2010 to 30 June 2010.
APPENDIX I FINANCIAL INFORMATION OF THE TARGET GROUP
— I-7 —
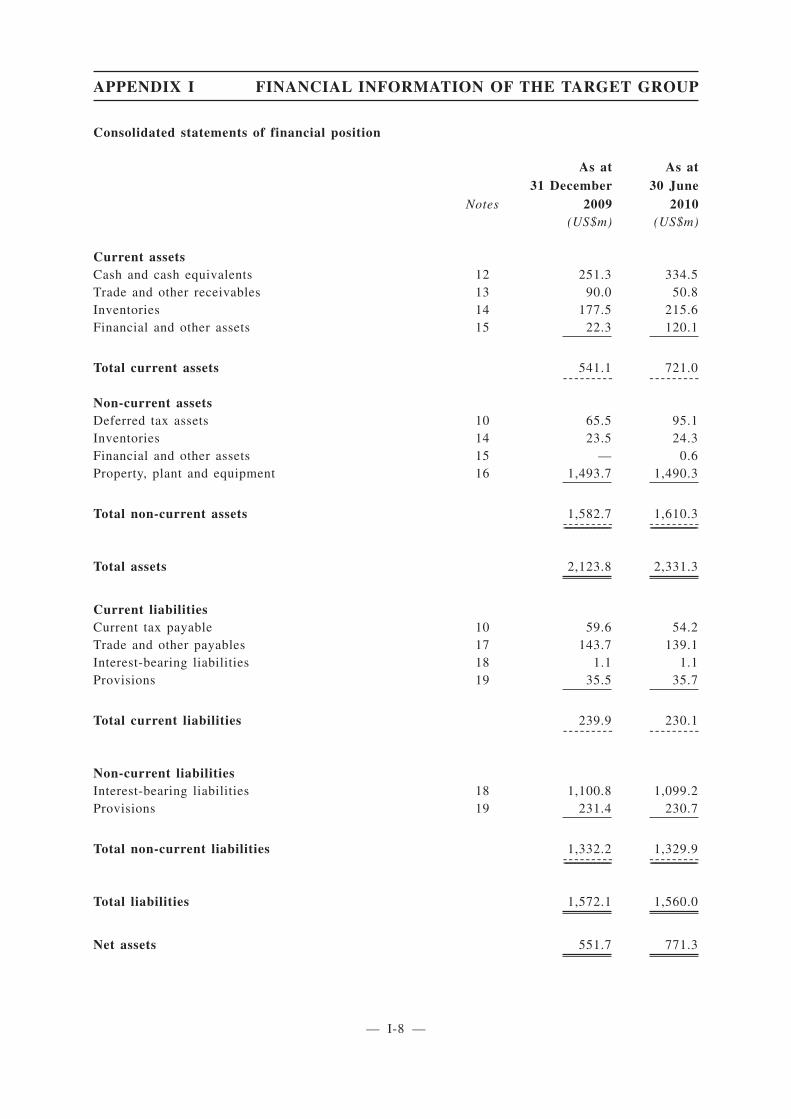
Consolidated statements of financial position
Notes
As at31 December
2009
As at30 June
2010(US$m) (US$m)
Current assetsCash and cash equivalents 12 251.3 334.5Trade and other receivables 13 90.0 50.8Inventories 14 177.5 215.6Financial and other assets 15 22.3 120.1
Total current assets 541.1 721.0--------- ---------
Non-current assetsDeferred tax assets 10 65.5 95.1Inventories 14 23.5 24.3Financial and other assets 15 — 0.6Property, plant and equipment 16 1,493.7 1,490.3
Total non-current assets 1,582.7 1,610.3-------------------------------------------- --------------------------------------------
Total assets 2,123.8 2,331.3
Current liabilitiesCurrent tax payable 10 59.6 54.2Trade and other payables 17 143.7 139.1Interest-bearing liabilities 18 1.1 1.1Provisions 19 35.5 35.7
Total current liabilities 239.9 230.1--------- ---------
Non-current liabilitiesInterest-bearing liabilities 18 1,100.8 1,099.2Provisions 19 231.4 230.7
Total non-current liabilities 1,332.2 1,329.9-------------------------------------------- --------------------------------------------
Total liabilities 1,572.1 1,560.0
Net assets 551.7 771.3
APPENDIX I FINANCIAL INFORMATION OF THE TARGET GROUP
— I-8 —
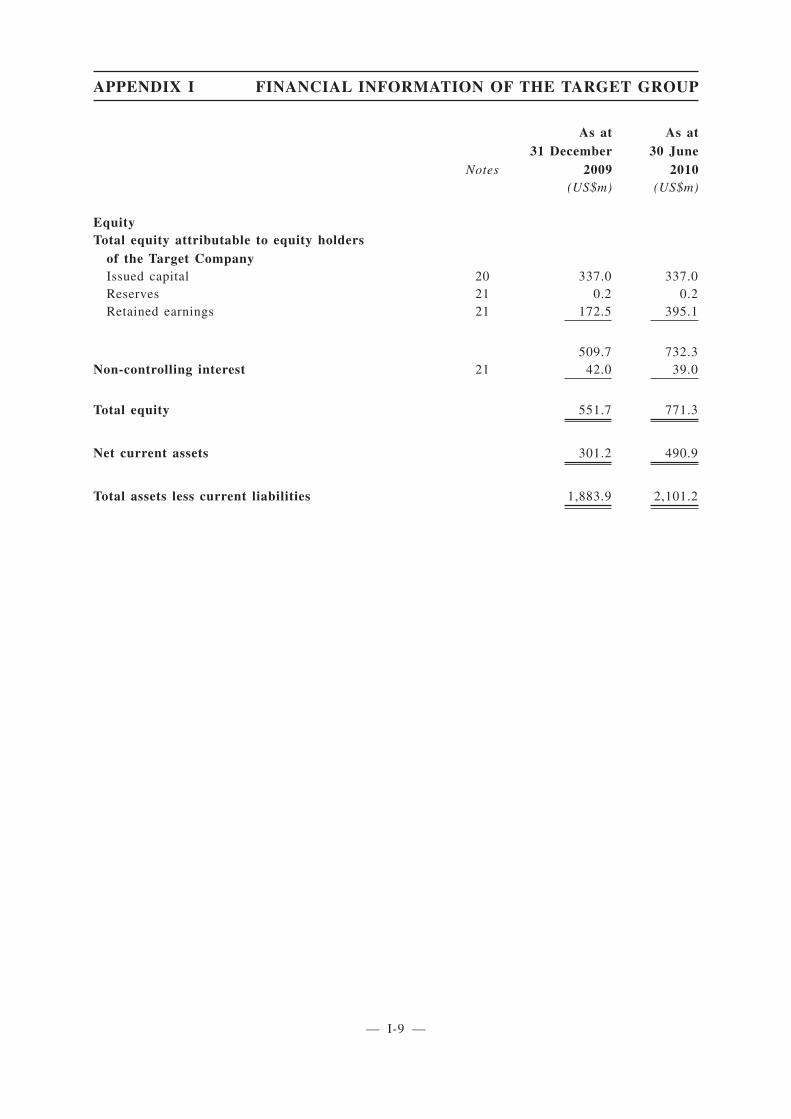
Notes
As at31 December
2009
As at30 June
2010(US$m) (US$m)
EquityTotal equity attributable to equity holders
of the Target CompanyIssued capital 20 337.0 337.0Reserves 21 0.2 0.2Retained earnings 21 172.5 395.1
509.7 732.3Non-controlling interest 21 42.0 39.0
Total equity 551.7 771.3
Net current assets 301.2 490.9
Total assets less current liabilities 1,883.9 2,101.2
APPENDIX I FINANCIAL INFORMATION OF THE TARGET GROUP
— I-9 —
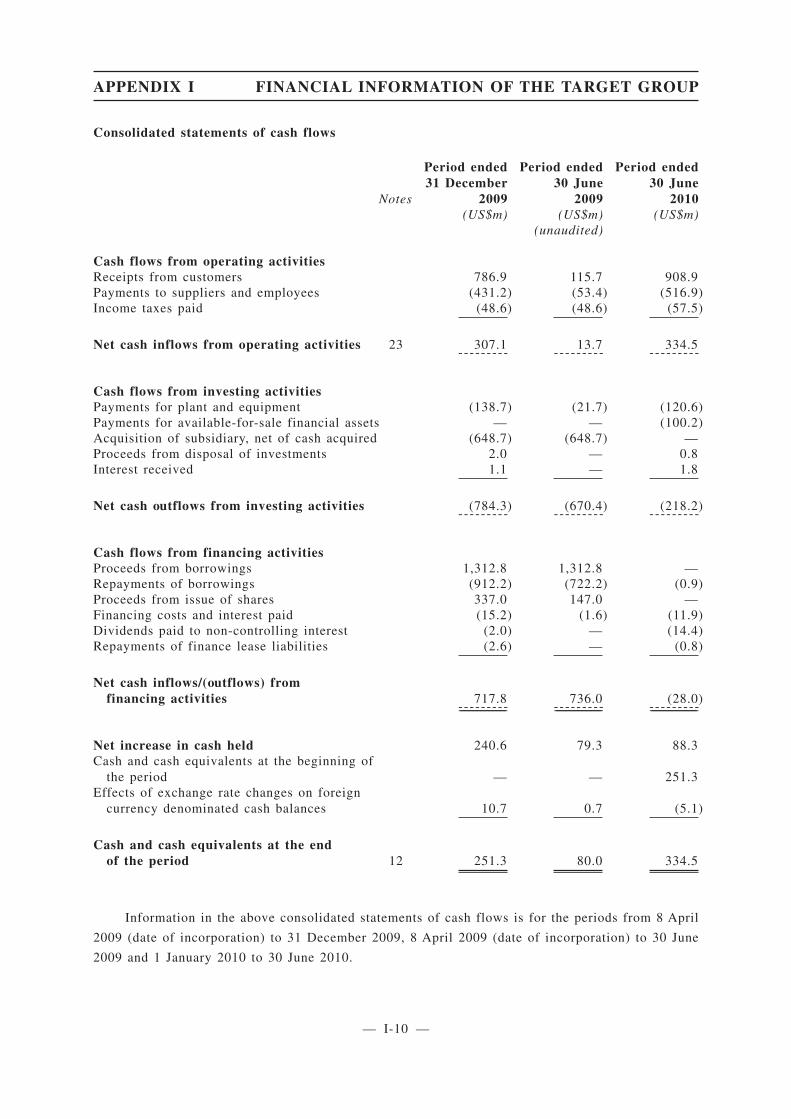
Consolidated statements of cash flows
Notes
Period ended31 December
2009
Period ended30 June
2009
Period ended30 June
2010(US$m) (US$m) (US$m)
(unaudited)
Cash flows from operating activitiesReceipts from customers 786.9 115.7 908.9Payments to suppliers and employees (431.2) (53.4) (516.9)Income taxes paid (48.6) (48.6) (57.5)
Net cash inflows from operating activities 23 307.1 13.7 334.5--------- --------- ---------
Cash flows from investing activitiesPayments for plant and equipment (138.7) (21.7) (120.6)Payments for available-for-sale financial assets — — (100.2)Acquisition of subsidiary, net of cash acquired (648.7) (648.7) —Proceeds from disposal of investments 2.0 — 0.8Interest received 1.1 — 1.8
Net cash outflows from investing activities (784.3) (670.4) (218.2)--------- --------- ---------
Cash flows from financing activitiesProceeds from borrowings 1,312.8 1,312.8 —Repayments of borrowings (912.2) (722.2) (0.9)Proceeds from issue of shares 337.0 147.0 —Financing costs and interest paid (15.2) (1.6) (11.9)Dividends paid to non-controlling interest (2.0) — (14.4)Repayments of finance lease liabilities (2.6) — (0.8)
Net cash inflows/(outflows) fromfinancing activities 717.8 736.0 (28.0)
-------------------------------------------- -------------------------------------------- --------------------------------------------
Net increase in cash held 240.6 79.3 88.3Cash and cash equivalents at the beginning of
the period — — 251.3Effects of exchange rate changes on foreign
currency denominated cash balances 10.7 0.7 (5.1)
Cash and cash equivalents at the endof the period 12 251.3 80.0 334.5
Information in the above consolidated statements of cash flows is for the periods from 8 April
2009 (date of incorporation) to 31 December 2009, 8 April 2009 (date of incorporation) to 30 June
2009 and 1 January 2010 to 30 June 2010.
APPENDIX I FINANCIAL INFORMATION OF THE TARGET GROUP
— I-10 —
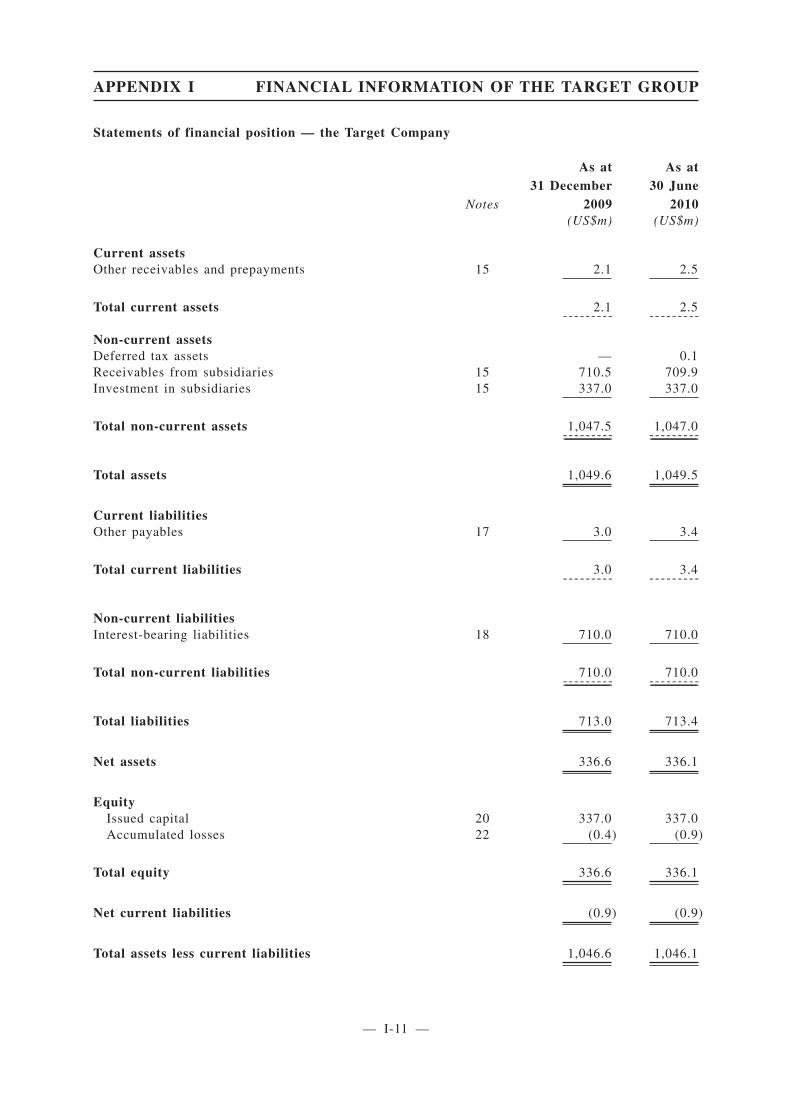
Statements of financial position — the Target Company
Notes
As at31 December
2009
As at30 June
2010(US$m) (US$m)
Current assetsOther receivables and prepayments 15 2.1 2.5
Total current assets 2.1 2.5--------- ---------
Non-current assetsDeferred tax assets — 0.1Receivables from subsidiaries 15 710.5 709.9Investment in subsidiaries 15 337.0 337.0
Total non-current assets 1,047.5 1,047.0-------------------------------------------- --------------------------------------------
Total assets 1,049.6 1,049.5
Current liabilitiesOther payables 17 3.0 3.4
Total current liabilities 3.0 3.4--------- ---------
Non-current liabilitiesInterest-bearing liabilities 18 710.0 710.0
Total non-current liabilities 710.0 710.0-------------------------------------------- --------------------------------------------
Total liabilities 713.0 713.4
Net assets 336.6 336.1
EquityIssued capital 20 337.0 337.0Accumulated losses 22 (0.4) (0.9)
Total equity 336.6 336.1
Net current liabilities (0.9) (0.9)
Total assets less current liabilities 1,046.6 1,046.1
APPENDIX I FINANCIAL INFORMATION OF THE TARGET GROUP
— I-11 —
II. NOTES TO THE FINANCIAL INFORMATION
1 Summary of significant accounting policies
(a) Reporting entity
Album Resources Private Limited (the “Target Company”) is a company incorporated in
Singapore under the Singapore Companies Act, Chapter 50 and registered in Australia as a foreign
company under the Corporations Act 2001. The registered address of the Company is One Marina
Boulevard #28-06, Singapore 018989. This consolidated financial information comprises the Target
Company and its subsidiaries (the “Target Group”). The Target Group is primarily involved in the
exploration for, and the mining, processing and sale of zinc, copper, lead, gold, silver and other
minerals into both metal and metal in concentrates.
(b) Statement of compliance
This financial information has been prepared in accordance with International Financial
Reporting Standards (IFRS) issued by the International Accounting Standards Board (IASB).
For the purpose of the Financial Information, no adjustments were considered necessary by the
directors of Minmetals Resources Limited (the “Company”) to comply with the accounting policies
presently adopted by the Company and its subsidiaries (together, the “Group”), including the new
accounting standards introduced that are effective for the six months ended 30 June 2010 and a change
in accounting policy for business combinations under common control that was recently adopted by
the Group, details of which are disclosed in the audited consolidated financial statements of the
Company for the year ended 31 December 2009 and the unaudited interim consolidated financial
information of the Company for the six months ended 30 June 2010, which could be found in the
Company’s Annual Report 2009 from pages 50 to 140 published on 20 April 2010 and Interim Report
2010 from pages 24 to 50 published on 6 September 2010 respectively. The accounting policies
presently adopted by the Group are in conformity with Hong Kong Financial Reporting Standards
issued by the Hong Kong Institute of Certified Public Accountants.
(c) Basis of preparation of financial information
(i) Historical costs
This financial information has been prepared on a going concern basis under the historical cost
convention, except for available-for-sale financial assets which are measured at fair value. The
methods used to measure fair values are discussed further in Note 1(e) and Note 1(k) respectively.
APPENDIX I FINANCIAL INFORMATION OF THE TARGET GROUP
— I-12 —
(ii) Issued standards not early adopted
The following standards and interpretations were available for early adoption but have not been
applied by the Target Group in this financial information:
• IFRS 9 Financial Instruments (effective for annual reporting periods beginning on or after
1 January 2013). IFRS 9 addresses the classification and measurement of financial assets
and is likely to affect the Target Group’s accounting for its financial assets. The standard
is not applicable until 1 January 2013 and the Target Group is yet to assess its full impact.
• Revised IAS 24 Related Party Disclosures (effective for annual reporting periods beginning
on or after 1 January 2011). In November 2009, the IASB issued a revised IAS 24 Related
Party Disclosures. It is effective for accounting periods beginning on or after 1 January
2011 and must be applied retrospectively. The amendment clarifies and simplifies the
definition of a related party and removes the requirement for government-related entities to
disclose details of all transactions with the government and other government-related
entities. The Target Group will apply the amended standard from 1 January 2011. It is not
expected to have a material effect on the Target Group’s or the Target Company’s related
party disclosures.
• IFRIC 14 Amendment — Prepayments of a Minimum Funding Requirement (effective 1
January 2011) In November 2009, the IASB made an amendment to Interpretation 14 The
Limit on a Defined Benefit Asset, Minimum Funding Requirements and their Interaction.
The amendment removes an unintended consequence of the interpretation related to
voluntary prepayments when there is a minimum funding requirement in regard to the
entity’s defined benefit scheme. It permits entities to recognise an asset for a prepayment
of contributions made to cover minimum funding requirements. The amendment is not
expected to have a material impact on the Target Group’s financial information.
• IFRIC 19 Extinguishing financial liabilities with equity instruments (effective 1 July 2010)
IFRIC 19 clarifies the accounting when an entity renegotiates the terms of its debt with the
result that the liability is extinguished by the debtor issuing its own equity instruments to
the creditor (debt for equity swap). It requires a gain or loss to be recognised in profit or
loss which is measured as the difference between the carrying value of the financial liability
and the fair value of the equity instruments issued. The Target Group will apply the
interpretation from 1 July 2010. It is not expected to have any impact on the Target Group
or the Target Company’s financial information since it is only retrospectively applied from
the beginning of the earliest period presented (1 July 2009) and the Target Group has not
entered into any debt for equity swaps since that date.
Other standards, amendments and interpretations issued and available for early adoption but not
applied by the Target Group have not been included above as they are not expected to have any
material impact on the financial information of the Target Group. The Target Group will adopt these
standards during the applicable mandatory annual reporting periods.
APPENDIX I FINANCIAL INFORMATION OF THE TARGET GROUP
— I-13 —
(iii) Critical accounting estimates and judgments
The preparation of this financial information in conformity with IFRS requires the use of certain
critical accounting estimates. It also requires management to exercise its judgement in the process of
applying the Target Group’s accounting policies. The estimates and underlying assumptions are
reviewed on an ongoing basis.
Revisions to accounting estimates are recognised in the period in which the estimate is revised
if the revision affects only that period or in the period of the revision and future periods if the revision
affects both current and future periods. Please refer to Note 2 for more detail on critical accounting
estimates and judgements.
(d) Basis of consolidation
(i) Subsidiaries
Subsidiaries are all those entities (including special purpose entities) over which the Target
Group has the power to govern the financial and operating policies, generally accompanying a
shareholding of more than one-half of the voting rights. The existence and effect of potential voting
rights that are currently exercisable or convertible are considered when assessing whether the Target
Group controls another entity.
For business combinations under common control the Target Group has elected to apply merger
accounting. The consolidated financial statements incorporate the financial statements items of the
combining entities or businesses as if they had been combined from the date when the combining
entities or businesses first came under the control of the controlling party. The net assets of the
combining entities or businesses are consolidated using the existing book values from the controlling
parties’ perspective. No amount is recognised in respect of goodwill or excess of acquirer’s interest
in the net fair value of acquiree’s identifiable assets, liabilities and contingent liabilities over cost at
the time of common control combination, to the extent of the continuation of the controlling party’s
interest. The consolidated income statement includes the results of each of the combining entities or
businesses from the earliest date presented or since the date when the combining entities or businesses
first came under the common control, where this is a shorter period, regardless of the date of the
common control combination.
Subsidiaries are consolidated from the date on which control is transferred to the Target Group
until the date that control ceases. Except for business combinations under common control, the
purchase method of accounting is used to account for the acquisition of subsidiaries by the Target
Group.
Intercompany transactions, balances and unrealised gains on transactions between Target Group
companies are eliminated. Unrealised losses are also eliminated unless the transaction provides
evidence of the impairment of the asset transferred.
APPENDIX I FINANCIAL INFORMATION OF THE TARGET GROUP
— I-14 —
Whilst the intercompany balances are eliminated on consolidation, any related foreign exchange
gains or losses arising between entities that do not have the same functional currency, will not be
eliminated. This is because the Target Group has a real exposure to a foreign currency since one of
the entities will need to obtain or sell foreign currency in order to settle the obligation or realise the
proceeds received.
Accounting policies of subsidiaries have been changed where necessary to ensure consistency
with the policies of the consolidated entity. Investments in subsidiaries are carried at their acquisition
cost in the individual financial statements of the Target Company, less any impairment. On disposal
of investments in subsidiaries, the difference between disposal proceeds and the carrying amounts of
the investments are recognised in profit or loss.
(ii) Joint ventures
Joint ventures are those entities over whose activities the Target Group has joint control,
established by contractual arrangement.
Jointly controlled assets
Where material, the proportionate interests in the assets, liabilities and expenses of a joint
venture operation have been incorporated in the financial statements under the appropriate headings.
Joint venture entities
Where material, the interest in a joint venture entity is accounted for in the consolidated financial
statements using the equity method and is carried at cost in the Target Company’s financial statements.
Under the equity method, the share of the profits or losses of the joint venture entities are recognised
in the income statement, and the share of movements in reserves is recognised in reserves in the
statement of financial position.
Profits or losses on transactions establishing the joint venture and transactions with the joint
venture are eliminated to the extent of the Target Group’s ownership interest until such time as they
are realised by the joint venture on consumption or sale, unless they relate to an unrealised loss that
provides evidence of the impairment of an asset transferred.
(iii) Transactions with non-controlling interests
The Target Group treats transactions with non-controlling interests that do not result in a loss of
control as transactions with equity owners of the group. A change in ownership interest results in an
adjustment between the carrying amounts of the controlling and non-controlling interests to reflect
their relative interests in the subsidiary. Any difference between the amount of the adjustment to
non-controlling interests and any consideration paid or received is recognised in a separate reserve
within equity attributable to owners of the Target Company.
APPENDIX I FINANCIAL INFORMATION OF THE TARGET GROUP
— I-15 —
When the Target Group ceases to have control, joint control or significant influence, any retained
interest in the entity is remeasured to its fair value with the change in carrying amount recognised in
profit or loss. The fair value is the initial carrying amount for the purposes of subsequently accounting
for the retained interest as an associate, jointly controlled entity or financial asset. In addition, any
amounts previously recognised in other comprehensive income in respect of that entity are accounted
for as if the group had directly disposed of the related assets or liabilities. This may mean that amounts
previously recognised in other comprehensive income are reclassified to profit or loss.
If the ownership interest in a jointly-controlled entity or an associate is reduced but joint control
or significant influence is retained, only a proportionate share of the amounts previously recognised
in other comprehensive income are reclassified to profit or loss, where appropriate.
(iv) Changes in accounting policy
The Target Group has changed its accounting policy for transactions with non-controlling
interests and the accounting for loss of control, joint control or significant influence from 1 January
2010 when a revised IAS 27 Consolidated and Separate Financial Statements became operative. The
revisions to IAS 27 contained consequential amendments to IAS 28 Investments in Associates and IAS
31 Interests in Joint Ventures.
Previously transactions with non-controlling interests were treated as transactions with parties
external to the Target Group. Disposals therefore resulted in gains or losses in profit or loss and
purchases resulted in the recognition of goodwill. On disposal or partial disposal, a proportionate
interest in reserves attributable to the subsidiary was reclassified to profit or loss or directly to
retained earnings.
Previously when the Target Group ceased to have control, joint control or significant influence
over an entity, the carrying amount of the investment at the date control, joint control or significant
influence ceased became its cost for the purposes of subsequently accounting for the retained interests
as associates, jointly controlled entity or financial assets.
The Target Group has applied the new policy prospectively to transactions occurring on or after
1 January 2010. As a consequence, no adjustments were necessary to any of the amounts recognised
prior to 31 December 2009.
(e) Financial assets
Classification
The Target Group classifies its financial assets in the following categories:
• Loans and receivables
• Available-for-sale financial assets.
APPENDIX I FINANCIAL INFORMATION OF THE TARGET GROUP
— I-16 —
The classification depends on the purpose for which the investments were acquired. Management
determines the classification of its investments at initial recognition.
(i) Loans and receivables
Loans and receivables are non-derivative financial assets with fixed or determinable payments
that are not quoted in an active market. They are presented as current assets, except for those maturing
later than twelve months after the reporting date which are presented as non-current assets. Loans and
receivables are presented as “trade and other receivables” and “receivables from subsidiaries” on the
statement of financial position.
Trade receivables are recognised initially at fair value and subsequently measured at amortised
cost using the effective interest method, less impairment. Trade receivables, other than concentrate
sales receivables, are due for settlement within 30 days from the date of recognition. Concentrate sales
receivables are recognised in accordance with Note 1(p).
(ii) Available-for-sale financial assets
The Target Group’s investment in equity securities are classified as available-for-sale financial
assets. Subsequent to initial recognition, they are measured at fair value and changes therein, other
than impairment losses, are recognised as a separate component of equity, net of related income tax.
Impairment losses are recognised in the income statement. When an investment is derecognised, the
cumulative gain or loss in equity is transferred to the income statement. Fair value is determined by
reference to the quoted price at the reporting date. Available-for-sale financial assets are presented as
non-current assets unless management intends to dispose of the assets within twelve months after the
reporting date.
Recognition and derecognition
Regular purchases and sales of investments and other financial assets are recognised on
trade-date being the date on which the Target Group commits to purchase or sell the asset. Financial
assets are initially recognised at fair value plus transaction costs. Financial assets are derecognised
when the rights to receive cash flows from the financial assets have expired or have been transferred
and the Target Group has transferred substantially all the risks and rewards of ownership. On disposal
of a financial asset, the difference between the carrying amount and the sale proceeds is recognised
in profit or loss. Any amount in the reserve relating to that asset is transferred to profit and loss as
gains or losses from financial assets.
Subsequent measurement
Loans and receivables are carried at amortised cost using the effective interest method.
Available-for-sale financial assets are subsequently carried at fair value. Please refer to Note 1(k).
APPENDIX I FINANCIAL INFORMATION OF THE TARGET GROUP
— I-17 —
Changes in the fair value of monetary securities denominated in a foreign currency and classified
as available-for-sale are analysed between translation differences resulting from changes in amortised
cost of the security and other changes in the carrying amount of the security. The translation
differences are recognised in the income statement and other changes are recognised in equity.
Changes in the fair value of other monetary and non-monetary securities classified as
available-for-sale are recognised in equity. Interest and dividend income on available-for-sale
financial assets are recognised separately in other income.
The Target Group assesses at each balance date whether there is objective evidence that a
financial asset or group of financial assets is impaired. Please refer to Note 1(k).
(f) Foreign exchange
(i) Functional and presentation currency
This financial information is presented in United States dollars (“US$” or “US dollars”), unless
otherwise stated. Items included in the financial information of each of the entities within the Target
Group are measured using the currency of the primary economic environment in which the entity
operates (the “functional currency”). The functional currency of the Target Company and the
majority of the entities it controls is US dollars.
(ii) Transactions and balances
Foreign currency transactions are translated into the functional currency using the exchange rates
prevailing at the dates of the transactions. Foreign exchange gains and losses resulting from the
settlement of such transactions and from the translation at year-end exchange rates of monetary assets
and liabilities denominated in foreign currencies are recognised in the income statement, except when
deferred in equity as qualifying cash flow hedges and qualifying net investment hedges.
Non-monetary assets and liabilities denominated in foreign currencies that are measured at fair
value are retranslated to the functional currency at the exchange rate at the date the fair value was
determined. Translation differences on non-monetary assets and liabilities are reported as part of the
fair value gain or loss. Translation differences on non-monetary items, such as equities classified as
available-for-sale financial assets, are included in the available-for-sale asset reserve in equity.
(iii) Group companies
The results and financial position of all entities within the Target Group (none of which has the
currency of a hyperinflationary economy) that have a functional currency different from the
presentation currency are translated into the presentation currency as follows:
• assets and liabilities for each statement of financial position presented are translated at the
closing rate at the reporting date;
APPENDIX I FINANCIAL INFORMATION OF THE TARGET GROUP
— I-18 —
• income and expenses for each income statement are translated at average exchange rates
(unless this is not a reasonable approximation of the cumulative effect of the rates
prevailing on the transaction dates, in which case income and expenses are translated at the
dates of the transactions);
• all resulting exchange differences are recognised as a separate component of equity in the
foreign currency translation reserve; and
• on consolidation, exchange differences arising from the translation of any net investment
in foreign entities, and of borrowings and other currency instruments designated as hedges
of such investments, are taken to equity. When a foreign operation is sold a proportionate
share of such exchange differences is recognised in the income statement as part of the gain
or loss on sale where applicable.
Whilst intercompany balances are eliminated on consolidation, any related foreign exchange
gains or losses arising between entities that do not have the same functional currency, will not be
eliminated. This is because the Target Group has a real exposure to a foreign currency since one of
the entities will need to obtain or sell foreign currency in order to settle the obligation or realise the
proceeds received. Goodwill and fair value adjustments arising on the acquisition of a foreign entity
are treated as assets and liabilities of the foreign entity and translated at the closing rate.
(g) Inventories
Inventories including raw materials, stores and consumables, work in progress and finished
goods are stated at the lower of cost and net realisable value. Cost comprises direct materials, direct
labour, other direct costs and an appropriate proportion of variable and fixed overhead expenditure,
the latter being allocated on the basis of normal operating capacity.
Net realisable value is the estimated selling price in the ordinary course of business less the
estimated costs of completion and the estimated costs necessary to make the sale.
Costs are assigned to individual items of inventory on the basis of weighted average costs. Cost
include the costs of direct materials, overburden removal, mining, processing, labour, related
transportation cost to the point of sale, mine rehabilitation costs incurred in the extraction process and
other fixed and variable costs directly related to mining activities.
(h) Income tax
Income tax expense or benefit for the period is the tax payable/recoverable on the current
period’s taxable income based on the national income tax rate for each jurisdiction adjusted by
changes in deferred tax assets and liabilities attributable to temporary differences between the tax
bases of assets and liabilities and their carrying amounts in the financial statements, and to unused tax
losses. Current and deferred tax expense attributable to amounts recognised directly in equity is also
recognised directly in equity.
APPENDIX I FINANCIAL INFORMATION OF THE TARGET GROUP
— I-19 —
The current income tax charge is calculated on the basis of the tax laws enacted or substantively
enacted at the end of the reporting period in the countries where the company’s subsidiaries and
associates operate and generate taxable income. Management periodically evaluates positions taken in
tax returns with respect to situations in which applicable tax regulation is subject to interpretation. It
establishes provisions where appropriate on the basis of amounts expected to be paid to the tax
authorities.
Deferred income tax is provided in full, using the liability method, on temporary differences
arising between the tax bases of assets and liabilities and their carrying amounts in the consolidated
financial information. However, the deferred income tax is not accounted for if it arises from initial
recognition of an asset or liability in a transaction other than a business combination that at the time
of the transaction affects neither accounting nor taxable profit or loss. Deferred income tax is
determined using tax rates (and laws) that have been enacted or substantially enacted by the reporting
date and are expected to apply when the related deferred tax asset is realised or the deferred tax
liability is settled.
Deferred tax assets and liabilities are recognised for temporary differences at the tax rates
expected to apply when the assets are recovered or liabilities are settled, based on those tax rates
which are enacted or substantively enacted for each jurisdiction. The relevant tax rates are applied to
the cumulative amounts of deductible and taxable temporary differences to measure the deferred tax
asset or liability.
Deferred tax assets are recognised for deductible temporary differences and unused tax losses
only if it is probable that future taxable amounts will be available to utilise those temporary
differences and losses.
Deferred tax liabilities and assets are not recognised for temporary differences between the
carrying amount and tax bases of investments in subsidiaries where the Target Company is able to
control the timing of the reversal of the temporary differences and it is probable that the differences
will not reverse in the foreseeable future.
Deferred tax assets and liabilities are offset when there is a legally enforceable right to offset
current tax assets and liabilities and when the deferred tax balances relate to the same taxation
authority. Current tax assets and tax liabilities are offset when the entity has a legally enforceable right
to offset and intends either to settle on a net basis, or to realise the asset and settle the liability
simultaneously.
Current and deferred tax is recognised in profit or loss, except to the extent that it relates to items
recognised in other comprehensive income or directly in equity.
Income taxes have not been provided on undistributed overseas earnings of subsidiaries to the
extent the earnings are intended to remain indefinitely invested in those entities.
APPENDIX I FINANCIAL INFORMATION OF THE TARGET GROUP
— I-20 —

Tax consolidation — Australia
The Australian subsidiaries of the Target Company elected to form an income tax consolidation
group as of 16 June 2009 and will be taxed as a single entity from this date. MMG Australia Limited,
a wholly-owned subsidiary of the Target Company, was elected to be the head company of the
Australian tax consolidated group.
The subsidiaries in the Australian tax consolidated group account for their own current and
deferred tax amounts. These tax amounts are measured as if each entity in the tax consolidated group
continues to be a stand alone tax payer in its own right. In addition to its own current and deferred
tax amounts, the head entity also recognises the current tax liabilities (or assets) and the deferred tax
assets arising from unused tax losses and unused tax credits assumed from the other entities in the tax
consolidated group.
Assets or liabilities arising under tax funding agreements between entities within the tax
consolidated group entities are recognised as amounts receivable from or payable to other entities
within the tax consolidated group.
(i) Leases
Leases of property, plant and equipment where the Target Group has substantially all the risks
and rewards of ownership are classified as finance leases. Finance leases are capitalised at the lease
inception at the lower of the fair value of the leased property and the present value of the minimum
lease payments. The corresponding rental obligations, net of finance charges, are included as
interest-bearing liabilities. Each lease payment is allocated between the liability and financing
expense. The financing expense is charged to the income statement over the lease period so as to
produce a constant periodic rate of interest on the remaining balance of the liability for each period.
Initial direct costs incurred by the Target Group in negotiating and arranging finance leases are added
to the carrying amount of the leased assets and recognised as an expense in profit or loss over the lease
term on the same basis as the lease expense. The property, plant and equipment acquired under a
finance lease are depreciated over the shorter of the asset’s useful life and the lease term. Leases in
which a significant portion of the risks and rewards of ownership are retained by the lessor are
classified as operating leases. Payments made under operating leases (net of any incentives received
from the lessor) are charged to the income statement on a straight-line basis over the period of the
lease account. Initial direct costs incurred by the Target Group in negotiating and arranging operating
leases are recognised in the profit or loss when incurred.
(j) Property, plant and equipment
Property, plant and equipment are stated at historical cost less accumulated depreciation and any
impairment losses recognised. Historical cost includes expenditure that is directly attributable to the
acquisition of the items and costs incurred in bringing the asset to the location and condition necessary
for it to be capable of operating in the manner intended by management. Cost also includes transfers
from equity of any gains/losses on qualifying cash flow hedges of foreign currency purchases of
property, plant and equipment and borrowing costs that are directly attributable to the acquisition,
construction or production of a qualifying asset.
APPENDIX I FINANCIAL INFORMATION OF THE TARGET GROUP
— I-21 —
Major spare parts and stand-by equipment are carried as property, plant and equipment when an
entity expects to use them during more than one period or when they can be used only in connection
with an item of property, plant and equipment.
Subsequent costs are included in the asset’s carrying amount or recognised as a separate asset,
as appropriate, only when it is probable that future economic benefits associated with the item will
flow to the Target Group and the cost of the item can be measured reliably. The carrying amount of
the replaced part is derecognised. All other repairs and maintenance are charged to the income
statement during the financial period in which they are incurred.
Mine property and development assets include costs transferred from exploration and evaluation
assets once technical feasibility and commercial viability of an area of interest are demonstrable, and
also includes subsequent costs to develop the mine to the production phase.
(i) Depreciation and amortisation
Amortisation of mine property and development assets and the major categories of property,
plant and equipment are calculated on the basis of units of production unless their useful life is less
than that of the mine. Amortisation is based on assessments of proven and probable reserves and a
proportion of resources available to be mined by the current production equipment to the extent that
such resources are considered to be economically recoverable.
The amortisation of mine, property and development assets commences when the mine starts
commercial production. All other items of property, plant and equipment are depreciated over the
shorter of the asset’s useful life and the life of mine on a straight-line basis, as follows:
• Freehold land and buildings — lower of life of mine and 20 years
• Plant and equipment — lower of life of mine and 3-5 years;
Gains and losses on disposals are determined by comparing proceeds with asset carrying
amounts. These are included in the income statement.
(ii) Overburden and waste removal
Overburden and other waste removal costs incurred in the development of a mine before
production commences are capitalised as part of the construction of the mine as mine property and
development assets. These costs include direct costs and an allocation of relevant overhead
expenditure. These costs are subsequently amortised over the life of mine on a units of production
basis upon commencement of commercial production.
Overburden and other waste costs incurred once an operation commences production activity
(production stripping costs) are capitalised as mine property and development assets. A proportion of
the costs is charged to the income statement as an operating cost on the basis of the quantity of ore
mined or the quantity of the minerals contained in the ore, as a proportion of the known mineral
reserves of the operation.
APPENDIX I FINANCIAL INFORMATION OF THE TARGET GROUP
— I-22 —
Changes in the technical and or other economic parameters that impact on reserves will also have
an impact on the depreciation and amortisation of capitalised mine property and development assets.
These changes are accounted for prospectively from the date of change.
(iii) Disposal of property, plant and equipment
On disposal of an item of property, plant and equipment, the difference between the disposal
proceeds and its carrying amount is recognised in profit or loss within other income.
(iv) Exploration and evaluation expenditure
Exploration and evaluation costs, including costs of acquiring licences, are capitalised as
exploration and evaluation assets on an area of interest basis. Costs incurred before the Target Group
has obtained the legal right to explore an area are recognised in the income statement.
Exploration and evaluation assets are classified as part of property plant and equipment. As the
assets are not yet ready for use they are not depreciated.
Exploration and evaluation assets are only recognised if the rights to the area of interest are
current and either:
• the expenditures are expected to be recouped through successful development and
exploitation of the area of interest, or alternatively by its sale; or
• activities in the area of interest have not at the reporting date, reached a stage which permits
a reasonable assessment of the existence or otherwise of economically recoverable reserves
and active and significant operations in, or in relation to, the area of interest are continuing.
Exploration and evaluation assets are assessed for impairment if:
• sufficient data exists to determine technical feasibility and commercial viability; and
• facts and circumstances suggest that the carrying amount exceeds the recoverable amount
(please see recoverable amount and fair value estimation accounting policy in Note 1(k)).
For the purposes of the impairment testing, exploration and evaluation assets are allocated to
cash-generating units to which the exploration activity relates. The cash generating units shall not be
larger than the area of interest. Please refer to Note 1(k) for further details.
Once the technical feasibility and commercial viability of the extraction of mineral reserves in
an area of interest are demonstrable, exploration and evaluation assets attributable to that area of
interest are first tested for impairment and then reclassified to mine property and development assets
within property, plant and equipment.
APPENDIX I FINANCIAL INFORMATION OF THE TARGET GROUP
— I-23 —
Acquired mineral rights comprise identifiable exploration and evaluation assets including
mineral reserves and mineral resources, which are acquired as part of a business combination and are
recognised at fair value at date of acquisition. The acquired mineral rights are reclassified as mine
property and development from commencement of development and amortised when commercial
production commences on a unit of production basis over the estimated economic reserve of the mine.
(k) Impairment of assets, recoverable amount and fair value estimation
Non-financial assets and liabilities
Goodwill is allocated to cash-generating units for the purpose of impairment testing. Goodwill
and intangible assets that have an indefinite useful life are not subject to amortisation and are tested
annually for impairment or more frequently if events or changes in circumstances indicate that they
might be impaired. Assets that have a finite life including property, plant and equipment are reviewed
for impairment whenever events or changes in circumstances indicate that the carrying amount may
not be recoverable.
An impairment loss is recognised for the amount by which the asset’s carrying amount exceeds
its recoverable amount. The recoverable amount is the higher of an asset’s fair value less costs to sell
and value in use.
The asset’s value in use is the net amount expected to be recovered through the cash flows arising
from its continued use and subsequent disposal. In assessing value in use, the estimated future cash
flows are discounted to their present value using a pre-tax discount rate that reflects current market
assessments of the time value of money and the risks specific to the asset. transaction between
knowledgeable, willing parties, less the costs of disposal.
The asset’s fair value less costs to sell is the amount obtainable from the sale of an asset or
cash-generating unit in an arm’s length transaction.
For the purposes of assessing impairment, assets are grouped at the lowest levels for which there
are separately identifiable cash inflows which are largely independent of the cash inflows from other
assets or groups of assets (cash-generating units). Non-financial assets other than goodwill that have
been impaired are reviewed for possible reversal of impairment at each reporting date. An impairment
write-down for an asset other than goodwill is reversed if, and only if, there has been a change in the
estimates used to determine the asset’s recoverable amount since the last impairment write-down was
recognised. The carrying amount of this asset is increased to its recoverable amount, provided that this
amount does not exceed the carrying amount that would have been determined (net of any accumulated
amortisation or depreciation) had no impairment loss been recognised for the asset in prior years.
Any impairment to the carrying amount of an asset is recognised as an expense in the income
statement in the reporting period in which the recoverable amount write down occurs. Where this
assessment of impairment indicates a loss in value of the assets of an operation, an appropriate write
down is made. No assets are carried in excess of their recoverable amount. The recoverable amount
of the Target Group’s operations is subject to variation because of changes in internationally
determined metal prices and exchange rates.
APPENDIX I FINANCIAL INFORMATION OF THE TARGET GROUP
— I-24 —
Financial assets and liabilities
The fair value of financial assets and financial liabilities must be estimated for recognition and
measurement or for disclosure purposes. The fair value of financial instruments traded in active
markets (such as available-for-sale securities), is based on quoted market prices at the balance sheet
date. The quoted market price used for financial assets held by the Target Group is the current bid
price; the appropriate quoted market price for financial liabilities is the current ask price.
The fair value of financial instruments that are not traded in an active market (for example,
over-the-counter derivatives) is determined using recognised valuation techniques. The Target Group
uses a variety of methods and makes assumptions that are based on market conditions existing at each
balance date. Option contracts are fair valued using an option pricing model and prevailing market
quoted economic variables existing at the balance date. Interest rate swaps are fair valued by
determining the theoretical gain or loss had the swap contracts been terminated on market at the
balance date. Other techniques, such as estimated discounted cash flows, are used to determine fair
value for the remaining financial instruments.
The nominal value less estimated credit adjustments of trade receivables and payables are
assumed to approximate their fair values. The fair value of financial liabilities for disclosure purposes
is estimated by discounting the future contractual cash flows at the current market interest rate that
is available to the Target Group for similar financial instruments. The fair values of current financial
assets and liabilities carried at amortised cost approximate their carrying amounts.
The Target Group assesses at each reporting date whether there is objective evidence that a
financial asset or group of financial assets is impaired.
In the case of loans and receivables, collectability is reviewed on an ongoing basis. Significant
financial difficulties of the debtor, probability that the debtor will enter bankruptcy and default or
significant delay in payments in excess of their agreed credit terms are objective evidence that these
financial assets are impaired. The carrying amount of loans and receivables is reduced through the use
of an impairment provision account which is calculated as the difference between the carrying amount
and the present value of estimated future cash flows, discounted at the original effective interest rate.
When the asset becomes uncollectible, it is written off against the provision account.
In the case of equity securities classified as available-for-sale, in addition to the objective
evidence of impairment for loans and receivables, a significant or prolonged decline in the fair value
of a security below its cost is considered objective evidence in determining whether the security is
impaired. If any such evidence exists for available-for-sale financial assets, the cumulative loss —
measured as the difference between the acquisition cost and the current fair value, less any impairment
loss on that financial asset previously recognised in the income statement — is removed from equity
and recognised in the income statement. Impairment losses recognised in the income statement on
equity instruments classified as available-for-sale are not reversed through the income statement.
APPENDIX I FINANCIAL INFORMATION OF THE TARGET GROUP
— I-25 —
(l) Employee benefits
(i) Wages and salaries and annual leave
Liabilities for wages and salaries, including non-monetary benefits and annual leave expected to
be settled within twelve months of the reporting date are recognised in provisions in respect of
employees’ services up to the reporting date and are measured at the amounts expected to be paid,
inclusive of on costs, when the liabilities are settled. The expense for non-accumulating sick leave is
recognised when the leave is taken and measured at the rates paid or payable.
(ii) Long-term employee benefits
Long service leave is a period of paid leave granted to an employee in recognition of a long
period of service to an employer. The liability for long service leave is recognised in the provision for
employee benefits and measured as the present value of expected future payments to be made in
respect of services provided by employees up to the reporting date using the projected unit credit
method. Consideration is given to expected future wage and salary levels, experience of employee
departures and periods of service. Expected future payments are discounted using market yields at the
reporting date on national government bonds with terms to maturity and currency that match, as
closely as possible, the estimated future cash outflows.
(iii) Defined contribution plans
Defined contribution plans are post-employment benefit plans under which the Target Group
pays fixed contributions on a mandatory, contractual or voluntary basis to individual defined
contribution superannuation plans for each Director and employee. The contributions are charged as
an expense in the income statement when incurred.
(iv) Employee bonuses
A provision is recognised for the amount expected to be paid under short-term or long-term
bonus entitlements if the Target Group has a present legal or constructive obligation to pay this
amount as a result of past service provided by the director or employee and the obligation can be
estimated reliably.
(m) Workers’ compensation
Provision is made for outstanding claims, including any incurred but not reported claims, where
any subsidiary self-insures for risks associated with workers’ compensation. Outstanding claims are
recognised when an incident occurs that may give rise to a claim and are measured at the cost that the
entity expects to incur in settling the claims, discounted using a rate that reflects current market
assessments of the time value of money and risks specific to the liability. An independent actuary
provides the calculation of the value of outstanding claims. Each period the impact of the unwind of
discounting is recognised in the income statement as a financing cost.
APPENDIX I FINANCIAL INFORMATION OF THE TARGET GROUP
— I-26 —
(n) Mine rehabilitation, restoration and dismantling obligations
Provisions are made for the estimated cost of rehabilitation, restoration and dismantling relating
to areas disturbed during the mine’s operations up to reporting date but not yet rehabilitated. Provision
has been made in full for all the disturbed areas at the reporting date based on current estimates of
costs to rehabilitate such areas, discounted to their present value based on expected future cash flows.
The estimated cost of rehabilitation includes the current cost of recontouring, topsoiling and
revegetation to meet legislative requirements. Changes in estimates are dealt with on a prospective
basis as they arise.
Significant uncertainty exists as to the amount of rehabilitation obligations which will be
incurred due to the impact of changes in environmental legislation, and many other factors, including
future developments, changes in technology, price increases and changes in interest rates. The amount
of the provision relating to mine rehabilitation, restoration and dismantling obligations is recognised
at the commencement of the mining project and/or construction of the assets where a legal or
constructive obligation exists at that time.
The provision is recognised as a liability, separated into current (estimated costs arising within
twelve months) and non-current components based on the expected timing of these cash flows. A
corresponding asset is included in mine property and development assets, only to the extent that it is
probable that future economic benefits associated with the restoration expenditure will flow to the
entity. The capitalised cost of this asset is recognised in property, plant and equipment and is
amortised over the life of the mine.
At each reporting date the rehabilitation liability is re-measured in line with changes in discount
rates, and timing or amounts of the costs to be incurred. Rehabilitation, restoration and dismantling
provisions are adjusted for changes in estimates. Adjustments to the estimated amount and timing of
future rehabilitation and restoration cash flows are a normal occurrence in light of the significant
judgements and estimates involved. Changes in the liability relating to mine rehabilitation, restoration
and dismantling obligations are added to or deducted from the related asset (where it is probable that
future economic benefits will flow to the entity), other than the unwinding of the discount which is
recognised as a finance cost in the income statement. Changes to capitalised cost result in an
adjustment to future depreciation charges.
The provisions referred to above do not include any amounts related to remediation costs
associated with unforeseen circumstances.
(o) Provisions
Provisions for legal claims and other liabilities are recognised when:
• The Target Group has a present legal or constructive obligation as a result of past events;
APPENDIX I FINANCIAL INFORMATION OF THE TARGET GROUP
— I-27 —
• It is more likely than not that an outflow of resources will be required to settle the
obligation; and
• The amount has been reliably estimated.
Provisions are not recognised for future operating losses. Where there are a number of similar
obligations, the likelihood that an outflow will be required in settlement is determined by considering
the class of obligations as a whole. A provision is recognised even if the likelihood of an outflow with
respect to any one item included in the same class of obligations may be small.
Provisions are measured at the present value of the best estimate of the expenditure required to
settle the present obligation at reporting date. The discount rate used to determine the present value
reflects current market assessments of the time value of money and the risks specific to the liability.
The increase in the provision due to the passage of time is recognised as a financing expense in the
income statement. Changes in the estimated timing or amount of the expenditure or discount rate are
recognised in profit or loss when the changes arise.
A provision for onerous contracts is recognised when the expected benefits to be derived by the
Target Group from a contract is lower than the unavoidable cost of meeting its obligations under the
contract. The provision is measured at the present value of the lower of the expected cost of
terminating the contract and the expected net cost of continuing with the contract.
(p) Sales revenue
Revenue from the sale of goods and disposal of other assets is recognised when persuasive
evidence of an arrangement exists, usually in the form of an executed sales agreement, indicating there
has been a transfer of risks and rewards to the customer, no further processing is required by the Target
Group, the quantity and quality of the goods has been determined with reasonable accuracy, the price
is fixed or determinable, and collectability is probable. This is generally when title passes, which for
the majority of commodity sales is the bill of lading date when the commodity is delivered for
shipment.
Revenue on provisionally priced sales is recognised at the estimated fair value of the total
consideration received or receivable. Contract terms for many of the Target Group’s zinc, copper, lead,
gold, silver and metal in concentrate sales allow for a price adjustment based on a final assay of the
goods by the customer to determine content. Recognition of the sales revenue for these commodities
is based on the most recently determined estimate of product specifications with a subsequent
adjustment made to revenue upon final determination.
The terms of concentrate sales contracts with third parties contain provisional pricing
arrangements whereby the selling price for metal in concentrate is based on prevailing spot prices on
a specified future date after shipment to the customer. Adjustments to the sales price occur based on
movements in quoted market prices up to the date of final settlement. The period between provisional
invoicing and final settlement is typically between 60 and 120 days.
APPENDIX I FINANCIAL INFORMATION OF THE TARGET GROUP
— I-28 —
The revenue adjustment mechanism embedded within provisionally priced sales arrangements
has the character of a commodity derivative. Accordingly, the fair value of the final sales price
adjustment is re-estimated continuously and changes in fair value are recognised as an adjustment to
revenue. In all cases, fair value is estimated by reference to forward market prices.
Revenue is reported net of discounts and pricing adjustments. Royalties paid and payable are
separately reported as expenses.
(q) Financing income and expenses
Financing income includes:
• Interest income on cash and cash equivalents; and
• Dividend income.
Interest income is recognised as it accrues using the effective interest method. Dividend income
is recognised when the right to receive payment is established.
Financing expenses includes:
• Interest on short-term and long-term borrowings;
• Amortisation of discounts or premiums relating to borrowings;
• Amortisation of ancillary costs incurred in connection with the arrangement of borrowings;
• Finance lease charges; and
• The impact of the unwind of discount on long-term provisions for mine rehabilitation,
restoration and dismantling and workers’ compensation.
Financing expenses are calculated using the effective interest method. Financing expenses
incurred for the construction of any qualifying asset are capitalised during the period of time that is
required to complete and prepare the asset for its intended use or sale. Other financing expenses are
expensed as incurred.
The capitalisation rate used to determine the amount of financing expenses to be capitalised is
the weighted average interest rate applicable to the Target Group’s outstanding interest-bearing
liabilities.
(r) Cash and cash equivalents
Cash and cash equivalents comprise cash balances and call deposits with an original maturity of
three months or less. Bank overdrafts are repayable on demand and are shown within interest-bearing
liabilities in current liabilities on the statement of financial position. For the purposes of the statement
APPENDIX I FINANCIAL INFORMATION OF THE TARGET GROUP
— I-29 —

of cash flows, cash includes cash on hand and deposits at call which are readily convertible to cash
and are subject to an insignificant risk of changes in value, net of any outstanding bank overdrafts
which are recognised at their principal amounts.
(s) Trade and other payables
These amounts represent liabilities for goods and services provided to the Target Group prior to
the end of the financial year which are unpaid. The amounts are non interest-bearing, unsecured and
are usually paid within 30 days of recognition. Trade and other payables are initially recognised at fair
value, and subsequently carried at amortised cost using the effective interest rate method.
(t) Interest-bearing loans and borrowings
Borrowings are initially recognised at fair value, net of transaction costs incurred. The fair value
is equal to the principal amount received, adjusted for the difference in the actual interest rate at
inception and the market interest rate for that instrument. The market interest rate is determined based
on debt issues of comparable companies. The difference between the fair value and the principal
amount received is recognised in equity.
Borrowings are subsequently measured at amortised cost. Any difference between the proceeds
(net of transaction costs) and the redemption amount is recognised in the income statement over the
period of the borrowings using the effective interest method.
Borrowings are removed from the statement of financial position when the obligation specified
in the contract is discharged, cancelled or expired. The difference between the carrying amount of a
financial liability that has been extinguished and the consideration paid, including any non-cash assets
transferred or liabilities assumed, is recognised in other income or other expenses.
Borrowings are classified as current liabilities unless the Target Group has an unconditional right
to defer settlement of the liability for at least twelve months after the reporting date.
(u) Financial guarantee contracts
A financial guarantee contract is a contract that requires the issuer to make specified payments
to reimburse the holder for a loss it incurs because a specified debtor fails to make payment when due
in accordance with the original or modified terms of a debt instrument. A financial guarantee contract
issued by the Target Group is recognised initially at its fair value less transaction costs that are
directly attributable to the issue of the financial guarantee contract. Subsequent to initial recognition,
the Target Group measures the financial guarantee contract at the higher of: (i) the amount determined
in accordance with IAS 37 “Provisions, Contingent Liabilities and Contingent Assets”; and (ii) the
amount initially recognised less, when appropriate, cumulative amortisation recognised in accordance
with IAS 18 “Revenue”.
APPENDIX I FINANCIAL INFORMATION OF THE TARGET GROUP
— I-30 —
(v) Issued capital
Ordinary shares are classified as equity. Incremental costs directly attributable to the issue of
new shares or options are shown in equity as a deduction, net of tax, from the proceeds. Incremental
costs directly attributable to the issue of new shares or options, for the acquisition of a business, are
included in the cost of the acquisition as part of the purchase consideration.
(w) Dividends payable
Provision is made for the amount of any dividend declared, being appropriately authorised and
no longer at the discretion of the entity, on or before the end of the financial period not distributed
at the reporting date.
(x) Goods and services tax
Revenues, expenses and assets are recognised net of the amount of goods and services tax
(“GST”), unless the GST incurred is not recoverable from taxation authorities. In this case it is
recognised as part of the cost of acquisition of the asset or as part of an item of the expense.
Receivables and payables are stated inclusive of the amount of GST receivable or payable. The
net amount of GST recoverable from, or payable to, taxation authorities is included with other
receivables or payables in the statement of financial position.
Cash flows are included in the statement of cash flows inclusive of GST. The GST components
of cash flows arising from investing and financing activities which are recoverable from, or payable
to, taxation authorities are classified as operating cash flows. Commitments and contingencies are
disclosed net of the amount of GST recoverable from, or payable to taxation authorities. The net GST
payable/receivable is remitted to/refunded by the appropriate tax body in accordance with legislative
requirements.
(y) Operating segments
Operating segments are components of the Target Group about which separate financial
information is available that is evaluated regularly by the Target Group’s Chief Operating Decision
Maker and the Executive Committee in deciding how to allocate resources and in assessing
performance.
Segment information that is evaluated by key management is prepared in conformity with the
accounting policies adopted for preparing the financial information of the Target Group.
The division of the Target Group’s results and assets into segments has been ascertained by
reference to direct identification of assets and revenue/cost centres and where interrelated segment
costs exist, an allocation has been calculated on a pro rata basis of the identifiable assets and/or costs.
APPENDIX I FINANCIAL INFORMATION OF THE TARGET GROUP
— I-31 —
The assets and liabilities of the reportable segments do not include receivables and payables to related
parties. It includes deferred tax assets and liabilities that are attributable to the segments. The
additions to mine, property, property, plant and equipment as presented in the segment note are
measured on an accruals basis.
(z) Business combinations
The purchase method of accounting is used to account for all business combinations, other than
business combinations involving entities or businesses under common control, regardless of whether
equity instruments or other assets are acquired. Cost is measured as the fair value of the assets given,
shares issued or liabilities and contingent liabilities assumed at the date of exchange plus costs
directly attributable to the acquisition. Where equity instruments are issued in an acquisition, the fair
value of the instruments is their published market price as at the date of exchange unless, in rare
circumstances, it can be demonstrated that the published price at the date of exchange is an unreliable
indicator of fair value and that other evidence and valuation methods provide a more reliable measure
of fair value. Transaction costs arising on the issue of equity instruments are recognised directly in
equity.
Identifiable assets acquired and liabilities and contingent liabilities assumed in a business
combination are measured initially at their fair values at the acquisition date, irrespective of the extent
of any non-controlling interest. The excess of the cost of acquisition over the fair value of the Target
Group’s share of the identifiable net assets acquired is recorded as goodwill. If the cost of acquisition
is less than the fair value of the net assets of the subsidiary acquired, the difference is recognised
directly in the income statement, but only after a reassessment of the identification and measurement
of the net assets acquired.
Where settlement of any part of cash consideration is deferred, the amounts payable in the future
are discounted to their present value as at the date of exchange. The discount rate used is the entity’s
incremental borrowing rate, being the rate at which a similar borrowing could be obtained from an
independent financier under comparable terms and conditions.
Non-controlling interests are that part of the net results of operations and of net assets of a
subsidiary attributable to the interests which are not owned directly or indirectly by the Target Group.
They are measured at the minorities’ share of fair value of the subsidiaries’ identifiable assets and
liabilities at the date of acquisition by the Target Group and the minorities’ share of changes in equity
since the date of acquisition, except when the minorities’ share of losses in a subsidiary exceeds its
interests in the equity of that subsidiary.
(aa) Rounding of amounts
Amounts in the financial report have been rounded off in millions of US dollars to one decimal
place except where rounding to the nearest one thousand dollars is required.
APPENDIX I FINANCIAL INFORMATION OF THE TARGET GROUP
— I-32 —
2 Critical accounting estimates and judgements
Estimates and judgements used in developing and applying the Target Group’s accounting
policies are continually evaluated and are based on experience and other factors, including
expectations of future events that may have a financial impact on the entity and that are believed to
be reasonable under the circumstances. The Target Group makes estimates and assumptions
concerning the future. The resulting accounting estimates will, by definition, seldom equal the related
actual results. The estimates and underlying assumptions are reviewed on an ongoing basis. The
critical estimates and judgements that have a significant risk of causing a material adjustment to the
carrying amounts of assets and liabilities within the next financial year are discussed below.
(a) Critical judgements in applying the Target Group’s accounting policies
Functional currency
An entity’s functional currency is the currency of the primary economic environment in which
the entity operates in accordance with accounting policy in Note 1(f). Determination of an entity’s
functional currency requires management judgement when considering a number of factors including
the currency that mainly influences sales prices, costs of production, and competitive forces and
regulations which impact sales prices. In addition, consideration must be given to the currency in
which financing and operating activities are undertaken. Applying the principles described above,
management have come to the conclusion that the functional currency of the majority of subsidiaries
within the Target Group is US dollars based on the following factors:
• Sales are predominantly denominated in US dollars;
• A significant portion of costs are denominated in US dollars;
• Debt and finance costs are denominated in US dollars; and
• Senior management and Board reporting is conducted in US dollars.
(b) Critical accounting estimates and assumptions
(i) Mine rehabilitation, restoration and dismantling obligations
Provision is made for the anticipated costs of future restoration, rehabilitation and dismantling
of mining areas from which natural resources have been extracted in accordance with the accounting
policy in Note 1(o). These provisions include future cost estimates associated with reclamation, plant
closures, waste site closures, monitoring, demolition, decontamination, water purification and
permanent storage of historical residues. These future cost estimates are discounted to their present
value. The calculation of these provision estimates requires assumptions such as application of
environmental legislation, plant closure dates, available technologies, engineering cost estimates and
discount rates. A change in any of the assumptions used may have a material impact on the carrying
value of mine rehabilitation, restoration and dismantling provisions.
APPENDIX I FINANCIAL INFORMATION OF THE TARGET GROUP
— I-33 —
(ii) Ore reserves and resources estimates
The estimated quantities of economically recoverable reserves and resources are based upon
interpretations of geological and geophysical models and require assumptions to be made regarding
factors such as estimates of short and long-term exchange rates, estimates of short and long-term
commodity prices, future capital requirements and future operating performance. Changes in reported
reserves and resources estimates can impact the carrying value of property, plant and equipment,
provisions for mine rehabilitation, restoration and dismantling obligations, the recognition of deferred
tax assets, as well as the amount of depreciation and amortisation charged to the income statement.
(iii) Recoverability of assets
The recoverable amount of each ‘cash-generating unit’ is determined as the higher of the asset’s
fair value less costs to sell and its value in use in accordance with the accounting policy in Note 1(k).
These value in use calculations require the use of estimates and assumptions including discount rates,
exchange rates, commodity prices, future capital requirements and future operating performance.
(iv) Determination of fair values in a business combination
The Target Group has applied estimates and judgements in order to determine the fair value of
assets acquired and liabilities and contingent liabilities assumed by way of a business combination.
The assets, liabilities and contingent liabilities recognised at acquisition date are recognised at
fair value. In determining fair value the Target Group has utilised valuation methodologies including
discounted cash flow analysis. The assumptions made in performing this valuation include
assumptions as to discount rates, foreign exchange rates, commodity prices, the timing of
development, capital costs, and future operating costs. Any significant change in key assumptions may
cause the acquisition accounting to be revised including recognition of goodwill or a discount on
acquisition. Additionally, the determination of the acquirer and the acquisition date also require
significant judgement to be made by the Target Group.
(v) Income tax, deferred tax assets and liabilities
The Target Group is subject to income taxes of Singapore and jurisdictions where it has
operations including Australia, Laos and Canada. Significant judgement is required in determining the
group provision for income taxes. There are transactions and calculations undertaken during the
ordinary course of business for which the ultimate tax determination is uncertain. The Target Group
recognises provisions for potential tax issues based on estimates of amounts that were initially
recorded. Where the final tax outcome of these matters is different from the amounts that were initially
recorded, such differences will impact the current and deferred tax provision in the period in which
the determination is made.
APPENDIX I FINANCIAL INFORMATION OF THE TARGET GROUP
— I-34 —
18.05(6)(c)
Deferred tax assets are recognised for deductible temporary differences and unused tax losses
only if it is probable that future taxable profits will be available to utilise those temporary differences
and losses, and the tax losses continue to be available having regard to the nature and timing of their
origination and compliance with the relevant tax legislation associated with their recoupment.
US$104.2 million and US$55.2 million of deferred tax assets are unbooked as at 31 December 2009
and 30 June 2010 respectively, based on management’s long-run forecasts and operations under care
and maintenance.
3 Operating segments
Management has determined the operating segments based on reports reviewed by the Executive
Committee. The Target Group’s operations are managed on a site-by-site basis and the operating
segments were as noted below. The Target Group has built a portfolio of exploration and development
projects in Australia, Canada, Tunisia, Sweden, Mexico, Laos, Thailand, Cambodia, Indonesia and the
People’s Republic of China (the “PRC”). These exploration and development projects, including the
Dugald River Project and the Canadian Project, are not required to be disclosed as a separate segment
at this stage, and accordingly these amounts are included within ‘other operations’. Other operations
also include the Avebury Mine, which remains on care and maintenance and other head office entities.
(a) Segments
Century Mine
The Century Mine is an open pit zinc and lead mine located approximately 250 kilometres north
of Mount Isa, near to the Gulf of Carpentaria in Queensland.
Sepon Mines
The Sepon operations include an open pit copper mine and open-cut gold mines which are located
approximately 40 kilometres north of the town of Sepon, in Savannakhet Province of Lao People’s
Democratic Republic (‘Laos’).
Golden Grove Mines
Golden Grove is a volcanic hosted massive sulphide base and precious metals deposit of zinc,
copper, lead, silver and gold, located approximately 450 kilometres north-east of Perth and 280
kilometres east of Geraldton in Western Australia.
APPENDIX I FINANCIAL INFORMATION OF THE TARGET GROUP
— I-35 —
Rosebery Mine
The Rosebery Mine is a medium-scale underground zinc, lead, silver, gold and copper mine
located on the west coast of Tasmania in Australia.
(b) Geographical areas
Although the Target Group’s divisions are managed on a site-by-site basis, they operate in two
main geographical areas:
Australia
The country of the Target Group’s Head Office and the area in which the Century, Golden Grove
and Rosebery mines operate. It also includes the Avebury Mine, Dugald River Project, corporate head
office and shared service operations.
Asia
Comprises the operations associated with the Sepon segment in Laos.
APPENDIX I FINANCIAL INFORMATION OF THE TARGET GROUP
— I-36 —

CenturyMine
SeponMines
GoldenGroveMines
RoseberyMine
Otheroperations Total
(US$m) (US$m) (US$m) (US$m) (US$m) (US$m)
For the period ended31 December 2009
Sales revenue � external revenue 233.8 281.4 159.2 151.5 — 825.9Sales revenue � related parties 13.7 6.4 6.8 — — 26.9
Total revenue 247.5 287.8 166.0 151.5 — 852.8Other income 0.7 — — — — 0.7Costs of goods sold (114.8) (93.1) (73.7) (68.3) — (349.9)Depreciation and amortisation
expenses (97.9) (22.2) (20.7) (16.0) (1.5) (158.3)Freight expenses (26.2) (15.4) (9.8) (3.6) (0.1) (55.1)Other expenses (17.7) (15.9) (6.1) (3.5) (56.7) (99.9)
(Loss)/profit before net financingexpenses and income tax (8.4) 141.2 55.7 60.1 (58.3) 190.3
--------- --------- --------- --------- --------- ---------
Financing income — — — — 1.1 1.1Financing expenses (9.0) (2.4) (5.9) (0.4) (5.5) (23.2)Net foreign exchange (loss)/gain (3.2) (2.1) (4.8) (1.8) 13.5 1.6
Net financing (expenses)/income (12.2) (4.5) (10.7) (2.2) 9.1 (20.5)-------------------------------------------- -------------------------------------------- -------------------------------------------- -------------------------------------------- -------------------------------------------- --------------------------------------------
(Loss)/profit before income tax (20.6) 136.7 45.0 57.9 (49.2) 169.8Income tax benefit 10.9
Profit for the period 180.7
Additions to property, plant &equipment 104.0 22.7 16.0 14.4 29.8 186.9
As at 31 December 2009Total assets 640.6 654.4 293.2 244.8 290.8 2,123.8
Total liabilities 447.8 259.0 212.7 24.5 628.1 1,572.1
Net assets 192.8 395.4 80.5 220.3 (337.3) 551.7
Australia Asia Total
Geographical areas (US$m) (US$m) (US$m)
Sales to external customers 565.0 287.8 852.8
Property, plant and equipment 1,020.1 473.6 1,493.7
APPENDIX I FINANCIAL INFORMATION OF THE TARGET GROUP
— I-37 —

CenturyMine
SeponMines
GoldenGroveMines
RoseberyMine
Otheroperations Total
(US$m) (US$m) (US$m) (US$m) (US$m) (US$m)
For the period ended30 June 2009 (unaudited)
Sales revenue � external revenue 26.4 35.9 13.4 29.5 — 105.2Sales revenue � related parties — — — — — —
Total revenue 26.4 35.9 13.4 29.5 — 105.2Other income — — — — — —Costs of goods sold (10.2) (18.7) (7.2) (10.6) — (46.7)Depreciation and amortisation
expenses (19.1) (4.3) (2.0) (1.7) 2.9 (24.2)Freight expenses (2.0) (2.2) (0.8) (0.7) — (5.7)Other expenses (2.3) — (2.1) (0.3) (4.9) (9.6)
(Loss)/profit before net financingexpenses and income tax (7.2) 10.7 1.3 16.2 (2.0) 19.0
--------- --------- --------- --------- --------- ---------
Financing income — — — — — —Financing expenses (1.2) 0.2 (0.2) (0.1) (1.7) (3.0)Net foreign exchange gain/(loss) 0.2 (0.5) (0.5) (1.5) (2.5) (4.8)
Net financing expenses (1.0) (0.3) (0.7) (1.6) (4.2) (7.8)-------------------------------------------- -------------------------------------------- -------------------------------------------- -------------------------------------------- -------------------------------------------- --------------------------------------------
(Loss)/profit before income tax (8.2) 10.4 0.6 14.6 (6.2) 11.2Income tax expense (2.0)
Profit for the period 9.2
Additions to property, plant &equipment 13.8 4.8 1.4 1.7 0.1 21.8
As at 30 June 2009 (unaudited)Total assets 626.3 510.6 234.0 223.1 492.0 2,086.0
Total liabilities 517.6 218.3 198.7 45.9 642.5 1,623.0
Net assets 108.7 292.3 35.3 177.2 (150.5) 463.0
Australia Asia TotalGeographical areas (US$m) (US$m) (US$m)
Sales to external customers 69.3 35.9 105.2Property, plant and equipment 1,083.7 418.6 1,502.3
APPENDIX I FINANCIAL INFORMATION OF THE TARGET GROUP
— I-38 —
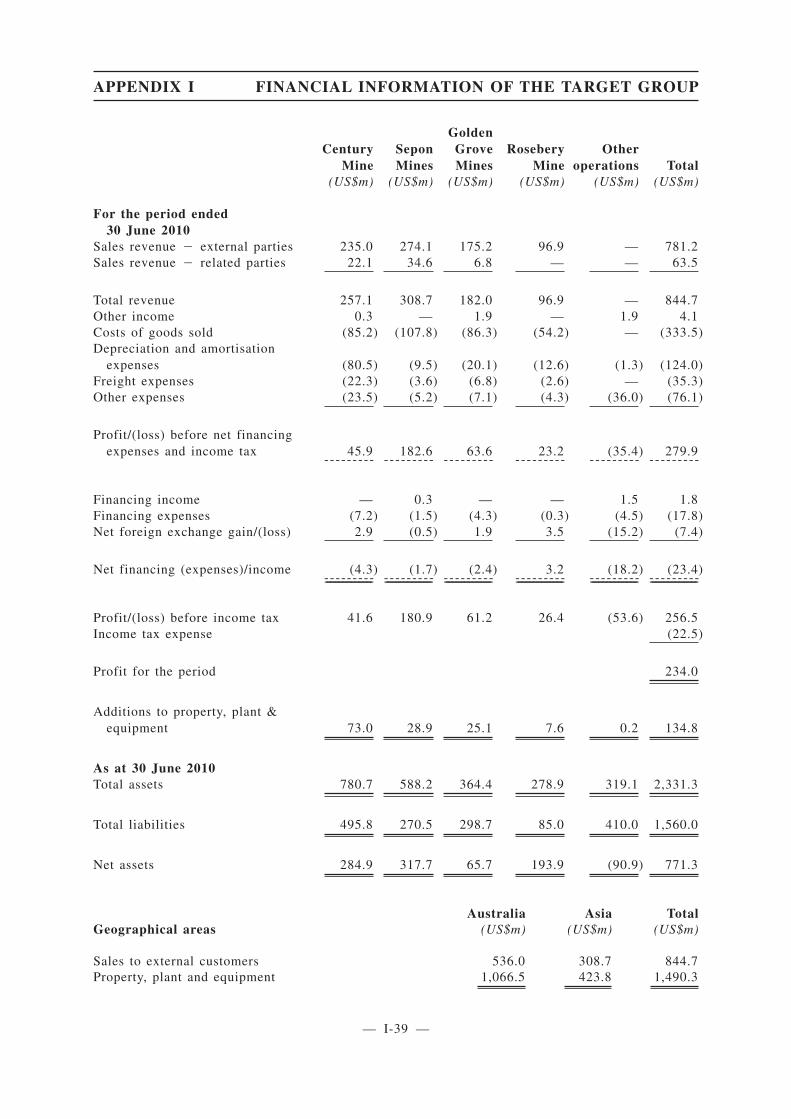
CenturyMine
SeponMines
GoldenGroveMines
RoseberyMine
Otheroperations Total
(US$m) (US$m) (US$m) (US$m) (US$m) (US$m)
For the period ended30 June 2010
Sales revenue � external parties 235.0 274.1 175.2 96.9 — 781.2Sales revenue � related parties 22.1 34.6 6.8 — — 63.5
Total revenue 257.1 308.7 182.0 96.9 — 844.7Other income 0.3 — 1.9 — 1.9 4.1Costs of goods sold (85.2) (107.8) (86.3) (54.2) — (333.5)Depreciation and amortisation
expenses (80.5) (9.5) (20.1) (12.6) (1.3) (124.0)Freight expenses (22.3) (3.6) (6.8) (2.6) — (35.3)Other expenses (23.5) (5.2) (7.1) (4.3) (36.0) (76.1)
Profit/(loss) before net financingexpenses and income tax 45.9 182.6 63.6 23.2 (35.4) 279.9
--------- --------- --------- --------- --------- ---------
Financing income — 0.3 — — 1.5 1.8Financing expenses (7.2) (1.5) (4.3) (0.3) (4.5) (17.8)Net foreign exchange gain/(loss) 2.9 (0.5) 1.9 3.5 (15.2) (7.4)
Net financing (expenses)/income (4.3) (1.7) (2.4) 3.2 (18.2) (23.4)-------------------------------------------- -------------------------------------------- -------------------------------------------- -------------------------------------------- -------------------------------------------- --------------------------------------------
Profit/(loss) before income tax 41.6 180.9 61.2 26.4 (53.6) 256.5Income tax expense (22.5)
Profit for the period 234.0
Additions to property, plant &equipment 73.0 28.9 25.1 7.6 0.2 134.8
As at 30 June 2010Total assets 780.7 588.2 364.4 278.9 319.1 2,331.3
Total liabilities 495.8 270.5 298.7 85.0 410.0 1,560.0
Net assets 284.9 317.7 65.7 193.9 (90.9) 771.3
Australia Asia TotalGeographical areas (US$m) (US$m) (US$m)
Sales to external customers 536.0 308.7 844.7Property, plant and equipment 1,066.5 423.8 1,490.3
APPENDIX I FINANCIAL INFORMATION OF THE TARGET GROUP
— I-39 —
4 Acquisition of business
Minerals and Metals Group
The Minerals and Metals Group (“MMG”) was formed on 16 June 2009, from the acquisition of
certain companies from OZ Mineral Limited (“OZL”) by a wholly-owned subsidiary of the Target
Company, Album Investment Private Limited (“Album Investment”). The acquisition resulted in the
formation of MMG creating a leading minerals and metals business with mining operations in
Australia and Laos and exploration and development projects in Australia, South-East Asia, the PRC
and North America. Consistent with the sale agreement on a ‘cash free, debt free’ basis and based on
normal levels of working capital, the actual amount paid by the Target Group at completion of the
transaction of US$661.2 million was subject to certain adjustments related to the working capital, net
debt and agreed tax liabilities of the assets acquired.
The assets acquired by the Target Group are listed below:
• Century mine
• Sepon Copper and Sepon Gold mines
• Golden Grove mines
• Rosebery mine
• Avebury mine (which was placed under care and maintenance in March 2009)
• The High Lake and Izok Lake projects
• The Dugald River project
• Certain other exploration and development assets
These assets were involved in mining of zinc, copper, lead, gold and silver and various
exploration and development projects.
The values of assets, liabilities and contingent liabilities recognised on acquisition are their fair
values at the date of acquisition. Where the initial accounting for a business combination is
incomplete, accounting standards permit up to twelve months for the accounting to be finalised
following the acquisition date if any subsequent information provides better evidence of the item’s fair
value at the date of acquisition. Please refer to Note 1(z) for the accounting policy for business
combinations.
APPENDIX I FINANCIAL INFORMATION OF THE TARGET GROUP
— I-40 —
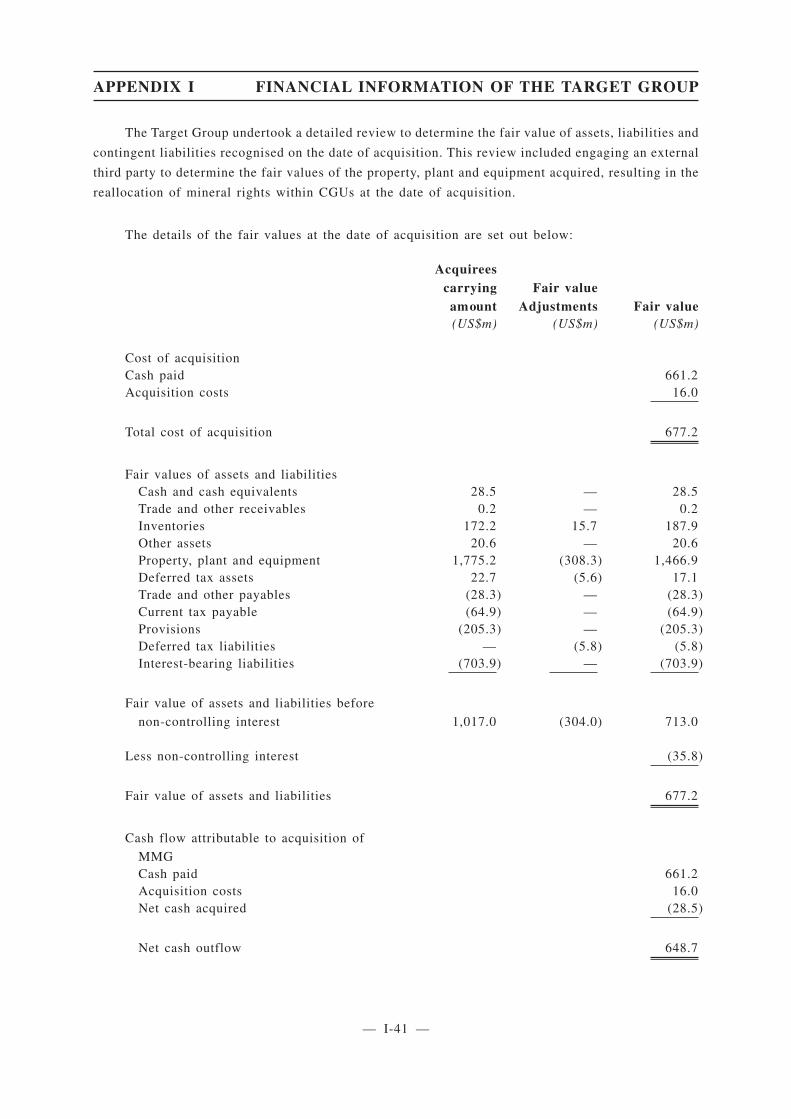
The Target Group undertook a detailed review to determine the fair value of assets, liabilities and
contingent liabilities recognised on the date of acquisition. This review included engaging an external
third party to determine the fair values of the property, plant and equipment acquired, resulting in the
reallocation of mineral rights within CGUs at the date of acquisition.
The details of the fair values at the date of acquisition are set out below:
Acquireescarryingamount
Fair valueAdjustments Fair value
(US$m) (US$m) (US$m)
Cost of acquisitionCash paid 661.2Acquisition costs 16.0
Total cost of acquisition 677.2
Fair values of assets and liabilitiesCash and cash equivalents 28.5 — 28.5Trade and other receivables 0.2 — 0.2Inventories 172.2 15.7 187.9Other assets 20.6 — 20.6Property, plant and equipment 1,775.2 (308.3) 1,466.9Deferred tax assets 22.7 (5.6) 17.1Trade and other payables (28.3) — (28.3)Current tax payable (64.9) — (64.9)Provisions (205.3) — (205.3)Deferred tax liabilities — (5.8) (5.8)Interest-bearing liabilities (703.9) — (703.9)
Fair value of assets and liabilities before
non-controlling interest 1,017.0 (304.0) 713.0
Less non-controlling interest (35.8)
Fair value of assets and liabilities 677.2
Cash flow attributable to acquisition of
MMGCash paid 661.2Acquisition costs 16.0Net cash acquired (28.5)
Net cash outflow 648.7
APPENDIX I FINANCIAL INFORMATION OF THE TARGET GROUP
— I-41 —
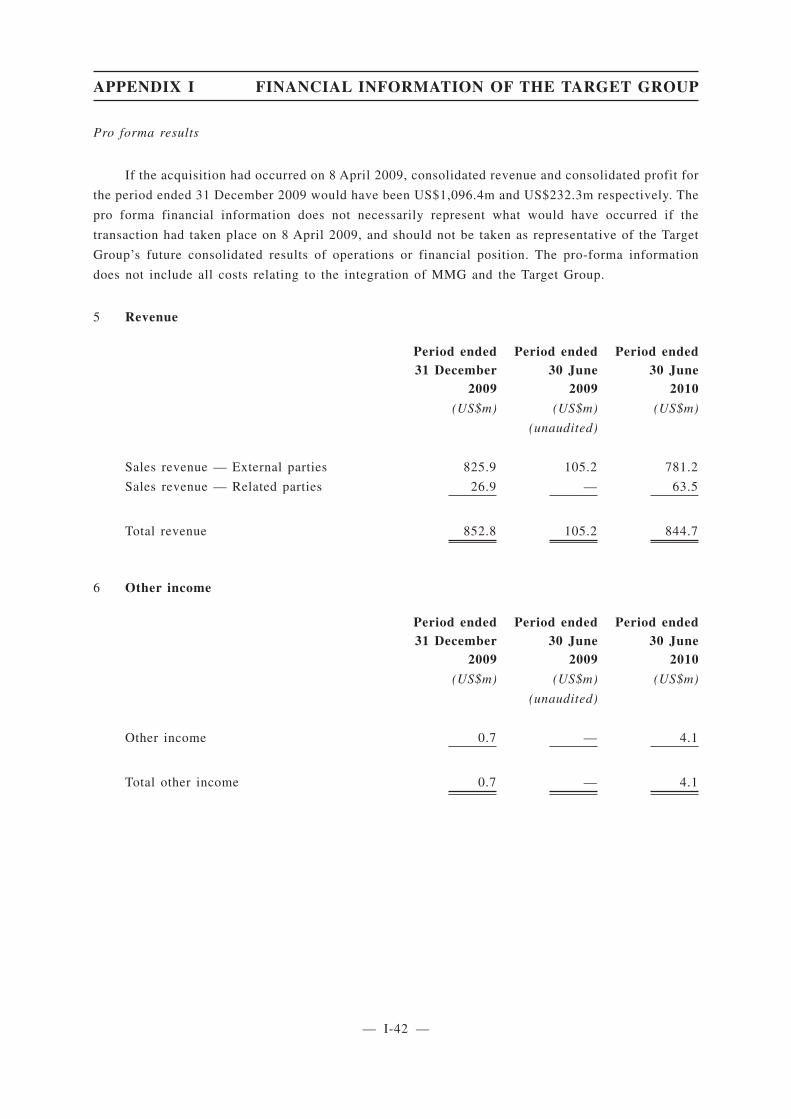
Pro forma results
If the acquisition had occurred on 8 April 2009, consolidated revenue and consolidated profit for
the period ended 31 December 2009 would have been US$1,096.4m and US$232.3m respectively. The
pro forma financial information does not necessarily represent what would have occurred if the
transaction had taken place on 8 April 2009, and should not be taken as representative of the Target
Group’s future consolidated results of operations or financial position. The pro-forma information
does not include all costs relating to the integration of MMG and the Target Group.
5 Revenue
Period ended31 December
2009
Period ended30 June
2009
Period ended30 June
2010
(US$m) (US$m) (US$m)
(unaudited)
Sales revenue — External parties 825.9 105.2 781.2
Sales revenue — Related parties 26.9 — 63.5
Total revenue 852.8 105.2 844.7
6 Other income
Period ended31 December
2009
Period ended30 June
2009
Period ended30 June
2010
(US$m) (US$m) (US$m)
(unaudited)
Other income 0.7 — 4.1
Total other income 0.7 — 4.1
APPENDIX I FINANCIAL INFORMATION OF THE TARGET GROUP
— I-42 —

7 Expenses
Profit before income tax includes the following specific expenses:
Period ended31 December
2009
Period ended30 June
2009
Period ended30 June
2010
(US$m) (US$m) (US$m)
(unaudited)
Changes in inventories of finished goods
and work in progress 31.1 3.8 38.5
Raw materials and other direct costs (10.1) (1.5) (5.8)
Employee benefit expenses (106.9) (9.7) (109.2)
Contracting and consulting expenses (27.2) (8.9) (29.1)
Royalties expense (37.0) (5.7) (35.1)
Energy costs (74.3) (10.0) (73.5)
Stores and consumables costs (115.4) (14.0) (108.3)
Exploration and evaluation expenditure (10.1) (0.7) (11.0)
Total cost of goods sold (349.9) (46.7) (333.5)--------- --------- ---------
Depreciation and amortisation expenses (158.3) (24.2) (124.0)--------- --------- ---------
Freight expenses (55.1) (5.7) (35.3)--------- --------- ---------
Auditor’s remuneration (0.8) — (0.6)
Contributions to defined contribution plans (5.9) (0.7) (5.2)
Operating lease expenses (11.9) (1.0) (3.7)
Other expenses (81.3) (7.9) (66.6)
Total other expenses (99.9) (9.6) (76.1)-------------------------------------------- -------------------------------------------- --------------------------------------------
Total expenses (663.2) (86.2) (568.9)
APPENDIX I FINANCIAL INFORMATION OF THE TARGET GROUP
— I-43 —
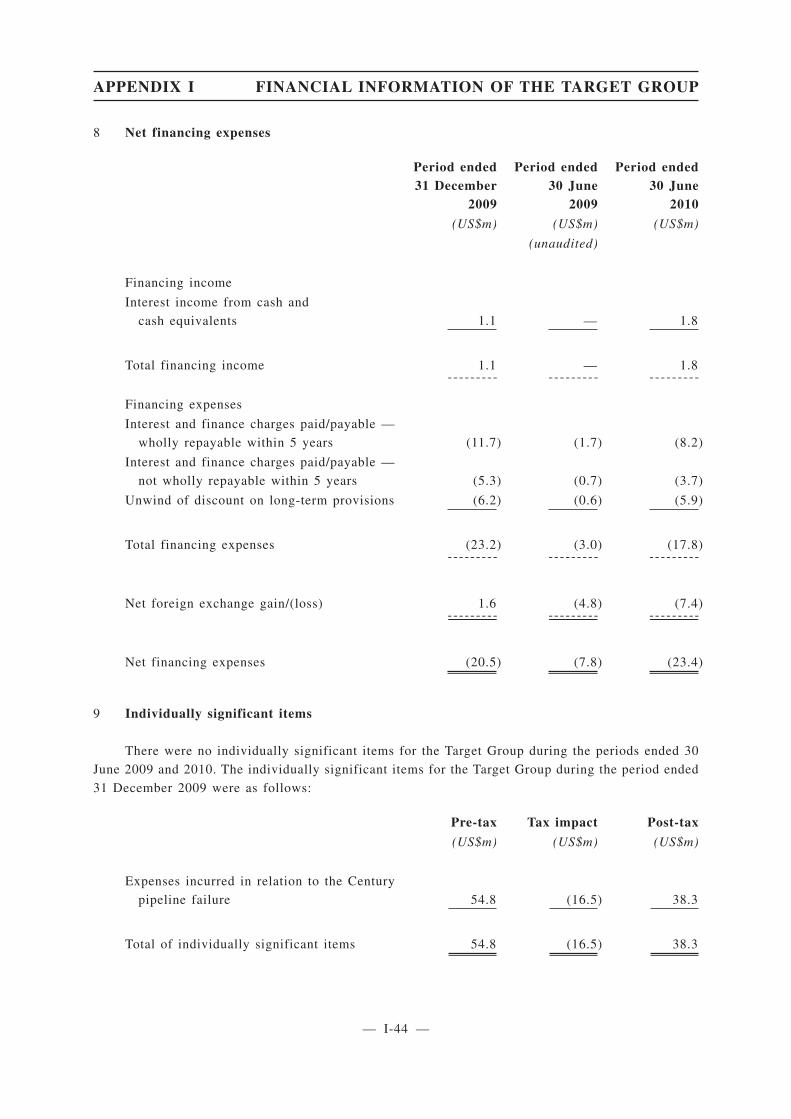
8 Net financing expenses
Period ended31 December
2009
Period ended30 June
2009
Period ended30 June
2010
(US$m) (US$m) (US$m)
(unaudited)
Financing income
Interest income from cash and
cash equivalents 1.1 — 1.8
Total financing income 1.1 — 1.8--------- --------- ---------
Financing expenses
Interest and finance charges paid/payable —
wholly repayable within 5 years (11.7) (1.7) (8.2)
Interest and finance charges paid/payable —
not wholly repayable within 5 years (5.3) (0.7) (3.7)
Unwind of discount on long-term provisions (6.2) (0.6) (5.9)
Total financing expenses (23.2) (3.0) (17.8)--------- --------- ---------
Net foreign exchange gain/(loss) 1.6 (4.8) (7.4)-------------------------------------------- -------------------------------------------- --------------------------------------------
Net financing expenses (20.5) (7.8) (23.4)
9 Individually significant items
There were no individually significant items for the Target Group during the periods ended 30
June 2009 and 2010. The individually significant items for the Target Group during the period ended
31 December 2009 were as follows:
Pre-tax Tax impact Post-tax
(US$m) (US$m) (US$m)
Expenses incurred in relation to the Century
pipeline failure 54.8 (16.5) 38.3
Total of individually significant items 54.8 (16.5) 38.3
APPENDIX I FINANCIAL INFORMATION OF THE TARGET GROUP
— I-44 —

On 5 October 2009, Century Mine detected a failure in the pipeline which transports concentrates
in a slurry form from the mine operations at Lawn Hill to the dewatering and port facilities at Karumba
on the Gulf of Carpentaria. Once the failure was detected, concentrate production was immediately
shutdown at the mine. Following repairs and installation of a bypass, the pipeline was recommissioned
and production resumed on 23 December 2009. During the period of the shutdown, the Target Group
incurred post-tax expenses of US$38.3 million in relation to contractor and consultants, stores and
consumables, property, insurance and other costs of idle-capacity. The individually significant items
are included in the income statement in the cost of goods sold, depreciation and amortisation expenses
and other expenses accounts.
10 Income tax
(a) Income tax benefit/(expense) recognised in the income statement
Period ended31 December
2009
Period ended30 June
2009
Period ended30 June
2010
(US$m) (US$m) (US$m)
(unaudited)
Current income tax (expense)/benefit (43.3) 3.6 (52.1)
Deferred income tax benefit/(expense) 54.2 (5.6) 29.6
Income tax benefit/(expense) 10.9 (2.0) (22.5)
Deferred income tax benefit/(expense)
included in income tax benefit/(expense)
comprises:
Increase/(decrease) in deferred tax assets 48.4 (5.6) 29.6
Decrease in deferred tax liabilities 5.8 — —
Total deferred income tax benefit/(expense) 54.2 (5.6) 29.6
APPENDIX I FINANCIAL INFORMATION OF THE TARGET GROUP
— I-45 —
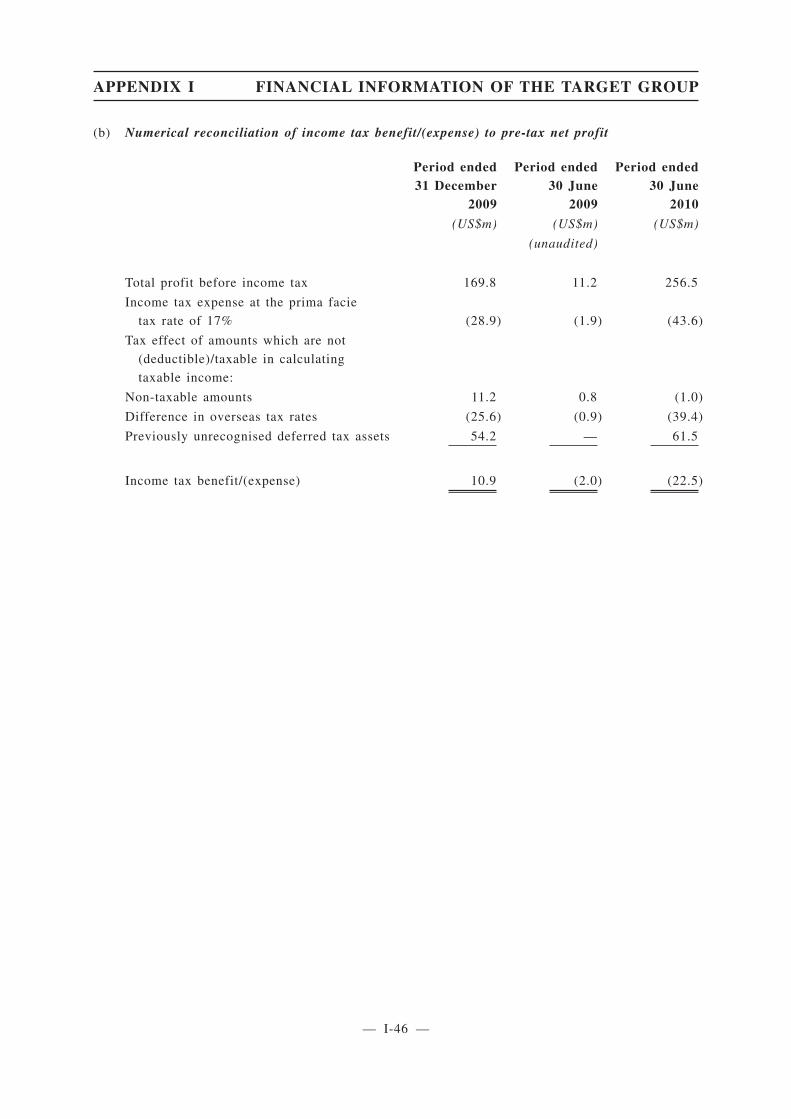
(b) Numerical reconciliation of income tax benefit/(expense) to pre-tax net profit
Period ended31 December
2009
Period ended30 June
2009
Period ended30 June
2010
(US$m) (US$m) (US$m)
(unaudited)
Total profit before income tax 169.8 11.2 256.5
Income tax expense at the prima facie
tax rate of 17% (28.9) (1.9) (43.6)
Tax effect of amounts which are not
(deductible)/taxable in calculating
taxable income:
Non-taxable amounts 11.2 0.8 (1.0)
Difference in overseas tax rates (25.6) (0.9) (39.4)
Previously unrecognised deferred tax assets 54.2 — 61.5
Income tax benefit/(expense) 10.9 (2.0) (22.5)
APPENDIX I FINANCIAL INFORMATION OF THE TARGET GROUP
— I-46 —
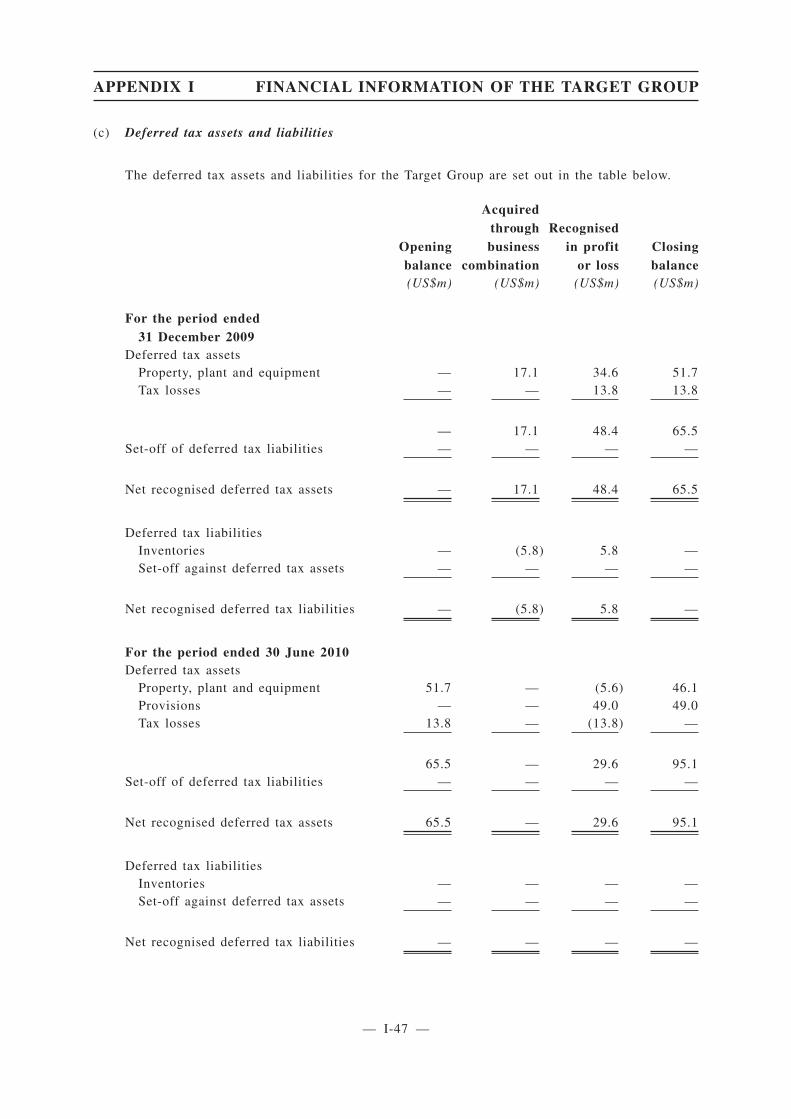
(c) Deferred tax assets and liabilities
The deferred tax assets and liabilities for the Target Group are set out in the table below.
Openingbalance
Acquiredthroughbusiness
combination
Recognisedin profit
or lossClosingbalance
(US$m) (US$m) (US$m) (US$m)
For the period ended31 December 2009
Deferred tax assetsProperty, plant and equipment — 17.1 34.6 51.7Tax losses — — 13.8 13.8
— 17.1 48.4 65.5Set-off of deferred tax liabilities — — — —
Net recognised deferred tax assets — 17.1 48.4 65.5
Deferred tax liabilitiesInventories — (5.8) 5.8 —Set-off against deferred tax assets — — — —
Net recognised deferred tax liabilities — (5.8) 5.8 —
For the period ended 30 June 2010Deferred tax assets
Property, plant and equipment 51.7 — (5.6) 46.1Provisions — — 49.0 49.0Tax losses 13.8 — (13.8) —
65.5 — 29.6 95.1Set-off of deferred tax liabilities — — — —
Net recognised deferred tax assets 65.5 — 29.6 95.1
Deferred tax liabilitiesInventories — — — —Set-off against deferred tax assets — — — —
Net recognised deferred tax liabilities — — — —
APPENDIX I FINANCIAL INFORMATION OF THE TARGET GROUP
— I-47 —
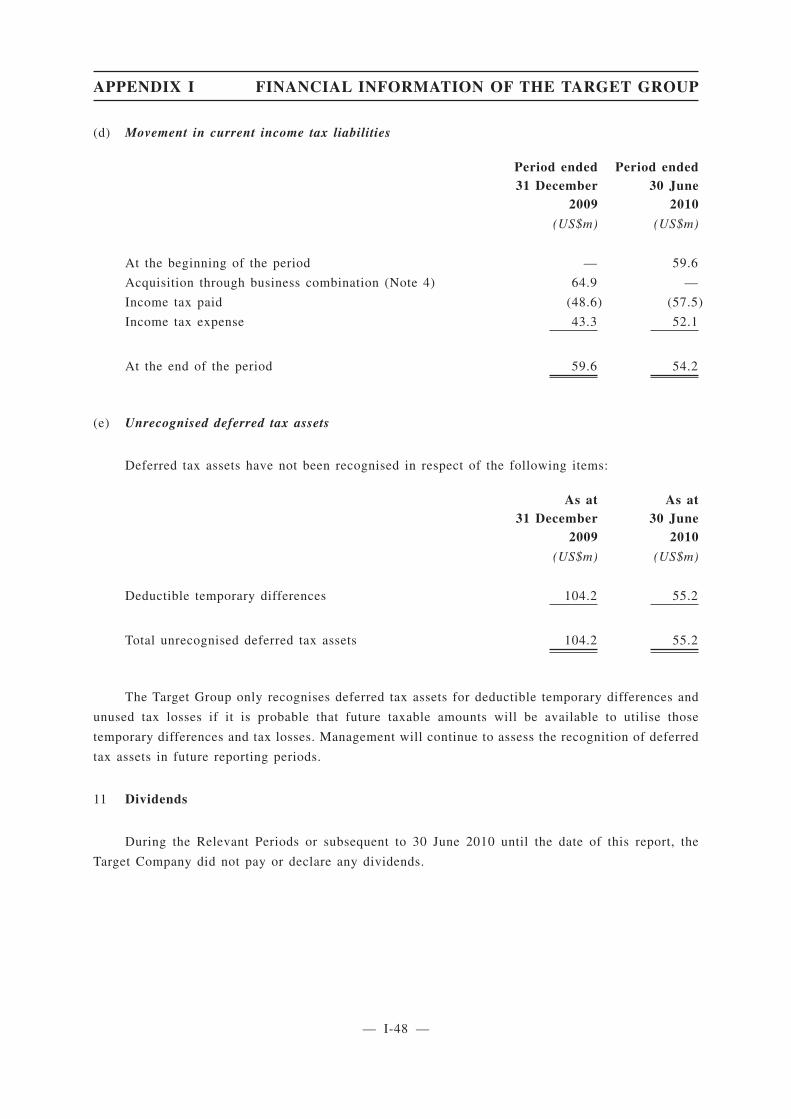
(d) Movement in current income tax liabilities
Period ended31 December
2009
Period ended30 June
2010
(US$m) (US$m)
At the beginning of the period — 59.6
Acquisition through business combination (Note 4) 64.9 —
Income tax paid (48.6) (57.5)
Income tax expense 43.3 52.1
At the end of the period 59.6 54.2
(e) Unrecognised deferred tax assets
Deferred tax assets have not been recognised in respect of the following items:
As at31 December
2009
As at30 June
2010
(US$m) (US$m)
Deductible temporary differences 104.2 55.2
Total unrecognised deferred tax assets 104.2 55.2
The Target Group only recognises deferred tax assets for deductible temporary differences and
unused tax losses if it is probable that future taxable amounts will be available to utilise those
temporary differences and tax losses. Management will continue to assess the recognition of deferred
tax assets in future reporting periods.
11 Dividends
During the Relevant Periods or subsequent to 30 June 2010 until the date of this report, the
Target Company did not pay or declare any dividends.
APPENDIX I FINANCIAL INFORMATION OF THE TARGET GROUP
— I-48 —
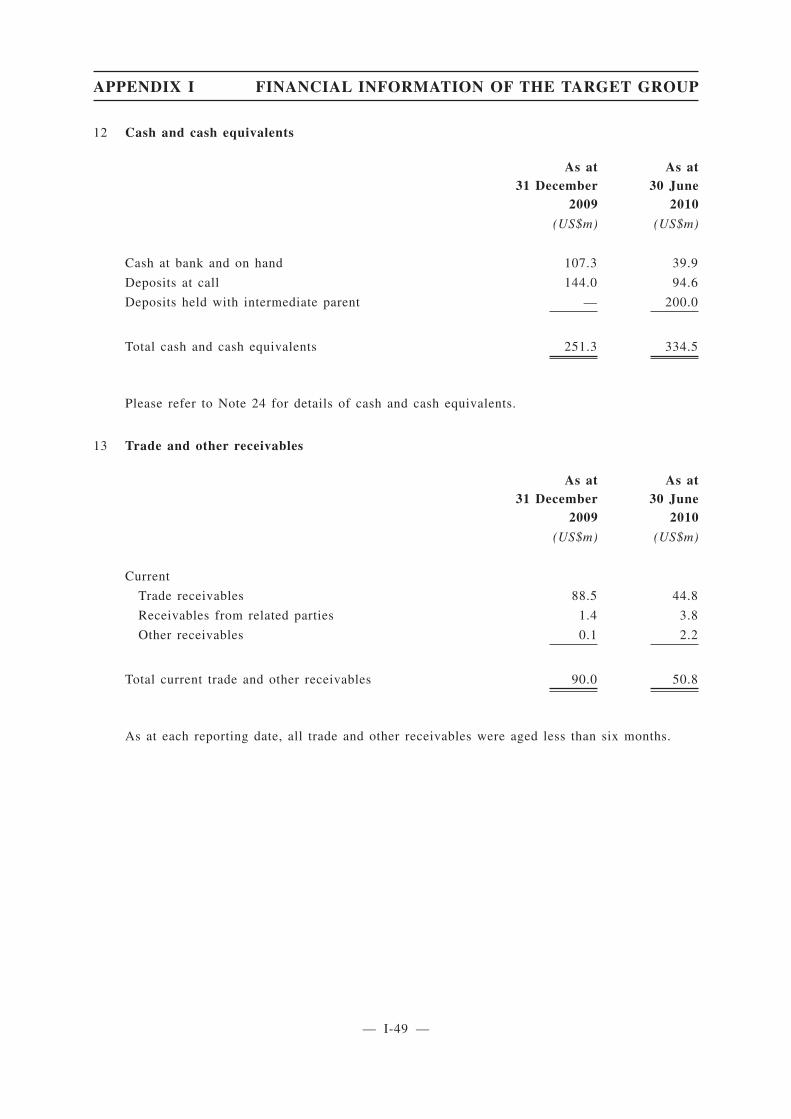
12 Cash and cash equivalents
As at31 December
2009
As at30 June
2010
(US$m) (US$m)
Cash at bank and on hand 107.3 39.9
Deposits at call 144.0 94.6
Deposits held with intermediate parent — 200.0
Total cash and cash equivalents 251.3 334.5
Please refer to Note 24 for details of cash and cash equivalents.
13 Trade and other receivables
As at31 December
2009
As at30 June
2010
(US$m) (US$m)
Current
Trade receivables 88.5 44.8
Receivables from related parties 1.4 3.8
Other receivables 0.1 2.2
Total current trade and other receivables 90.0 50.8
As at each reporting date, all trade and other receivables were aged less than six months.
APPENDIX I FINANCIAL INFORMATION OF THE TARGET GROUP
— I-49 —
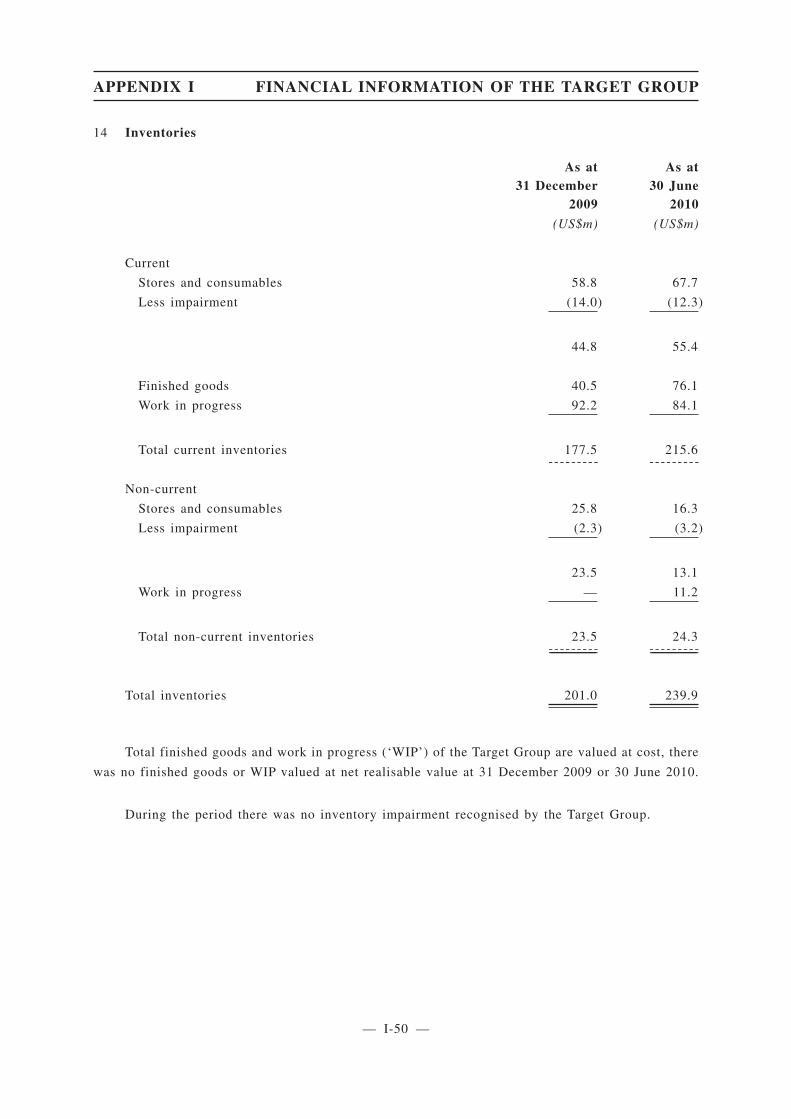
14 Inventories
As at31 December
2009
As at30 June
2010
(US$m) (US$m)
Current
Stores and consumables 58.8 67.7
Less impairment (14.0) (12.3)
44.8 55.4
Finished goods 40.5 76.1
Work in progress 92.2 84.1
Total current inventories 177.5 215.6--------- ---------
Non-current
Stores and consumables 25.8 16.3
Less impairment (2.3) (3.2)
23.5 13.1
Work in progress — 11.2
Total non-current inventories 23.5 24.3-------------------------------------------- --------------------------------------------
Total inventories 201.0 239.9
Total finished goods and work in progress (‘WIP’) of the Target Group are valued at cost, there
was no finished goods or WIP valued at net realisable value at 31 December 2009 or 30 June 2010.
During the period there was no inventory impairment recognised by the Target Group.
APPENDIX I FINANCIAL INFORMATION OF THE TARGET GROUP
— I-50 —
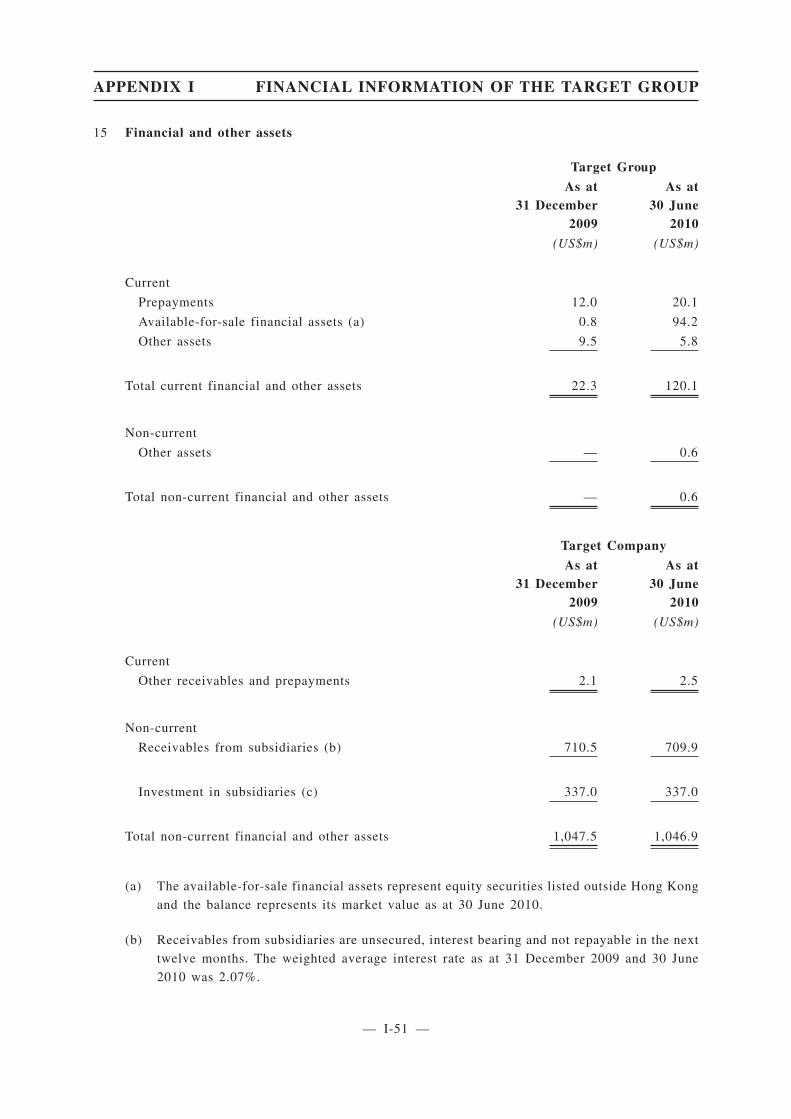
15 Financial and other assets
Target Group
As at31 December
2009
As at30 June
2010
(US$m) (US$m)
Current
Prepayments 12.0 20.1
Available-for-sale financial assets (a) 0.8 94.2
Other assets 9.5 5.8
Total current financial and other assets 22.3 120.1
Non-current
Other assets — 0.6
Total non-current financial and other assets — 0.6
Target Company
As at31 December
2009
As at30 June
2010
(US$m) (US$m)
Current
Other receivables and prepayments 2.1 2.5
Non-current
Receivables from subsidiaries (b) 710.5 709.9
Investment in subsidiaries (c) 337.0 337.0
Total non-current financial and other assets 1,047.5 1,046.9
(a) The available-for-sale financial assets represent equity securities listed outside Hong Kong
and the balance represents its market value as at 30 June 2010.
(b) Receivables from subsidiaries are unsecured, interest bearing and not repayable in the next
twelve months. The weighted average interest rate as at 31 December 2009 and 30 June
2010 was 2.07%.
APPENDIX I FINANCIAL INFORMATION OF THE TARGET GROUP
— I-51 —

(c) Unquoted investments of the Target Company in subsidiaries comprise the following:
Country of
incorporation Principal activity
Class
of share
Equity
holding
as at 31
December
2009
%
Equity
holding
as at 30
June
2010
%
Directly held:
Album Investment Private Limited Singapore Investment holding Ordinary 100 100
Indirectly held:
Allegiance Exploration Pty Ltd Australia Non-operating entity Ordinary 100 100
Allegiance Metals Pty Ltd Australia Mineral exploration
and production
Ordinary 100 100
Allegiance Mining Operations
Pty Ltd
Australia Non-operating entity Ordinary 100 100
Allegiance Mining Processing
Pty Ltd
Australia Non-operating entity Ordinary 100 100
Allegiance Mining Pty Ltd Australia Investment holding Ordinary 100 100
Aoning Minerals Company Limited the PRC Mineral exploration Ordinary 80 80
Chalcocite Pty Ltd Australia Investment holding Ordinary 100 100
Champa Mining Laos Pte Ltd Singapore Non-operating entity Ordinary 100 100
Eastern Pty Ltd Australia Non-operating entity Ordinary 100 100
Geothermal Energy Tasmania
Holdings Pty Ltd
Australia Non-operating entity Ordinary 100 100
Geothermal Energy Tasmania
Pty Ltd
Australia Non-operating entity Ordinary 100 100
Geothermal Energy Tasmania
West Coast Pty Ltd
Australia Non-operating entity Ordinary 100 100
Investment Co Pty Ltd Australia Provision of
infrastructure
Ordinary 100 100
Ionex Pty Ltd Australia Non-operating entity Ordinary 100 100
Lane Xang Minerals Limited Laos Mineral exploration
and production
Ordinary 90 90
Lupin Mines Inc. Canada Mineral exploration Ordinary 100 100
MMG Australia Limited Australia Mineral exploration
and production,
management and
employment services
Ordinary 100 100
MMG Canada Exploration Inc. Canada Mineral exploration Ordinary 100 100
MMG Canada Management Inc. Canada Investment holding Ordinary 100 100
MMG Canada Operations Inc. Canada Mineral exploration Ordinary 100 100
MMG Century Limited Australia Mineral exploration
and production
Ordinary 100 100
MMG Exploration Pty Ltd Australia Investment holding Ordinary 100 100
MMG Exploration Singapore
(Number One) Pte Ltd
Singapore Investment holding Ordinary 100 100
APPENDIX I FINANCIAL INFORMATION OF THE TARGET GROUP
— I-52 —
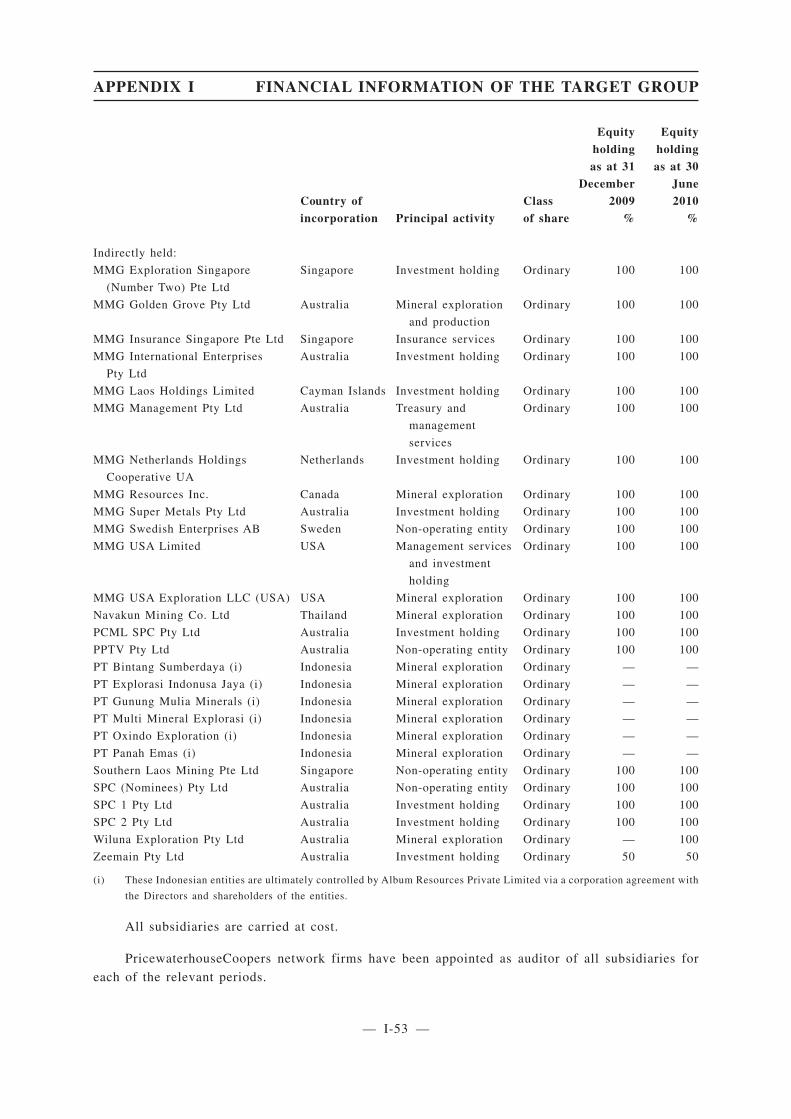
Country of
incorporation Principal activity
Class
of share
Equity
holding
as at 31
December
2009
%
Equity
holding
as at 30
June
2010
%
Indirectly held:
MMG Exploration Singapore
(Number Two) Pte Ltd
Singapore Investment holding Ordinary 100 100
MMG Golden Grove Pty Ltd Australia Mineral exploration
and production
Ordinary 100 100
MMG Insurance Singapore Pte Ltd Singapore Insurance services Ordinary 100 100
MMG International Enterprises
Pty Ltd
Australia Investment holding Ordinary 100 100
MMG Laos Holdings Limited Cayman Islands Investment holding Ordinary 100 100
MMG Management Pty Ltd Australia Treasury and
management
services
Ordinary 100 100
MMG Netherlands Holdings
Cooperative UA
Netherlands Investment holding Ordinary 100 100
MMG Resources Inc. Canada Mineral exploration Ordinary 100 100
MMG Super Metals Pty Ltd Australia Investment holding Ordinary 100 100
MMG Swedish Enterprises AB Sweden Non-operating entity Ordinary 100 100
MMG USA Limited USA Management services
and investment
holding
Ordinary 100 100
MMG USA Exploration LLC (USA) USA Mineral exploration Ordinary 100 100
Navakun Mining Co. Ltd Thailand Mineral exploration Ordinary 100 100
PCML SPC Pty Ltd Australia Investment holding Ordinary 100 100
PPTV Pty Ltd Australia Non-operating entity Ordinary 100 100
PT Bintang Sumberdaya (i) Indonesia Mineral exploration Ordinary — —
PT Explorasi Indonusa Jaya (i) Indonesia Mineral exploration Ordinary — —
PT Gunung Mulia Minerals (i) Indonesia Mineral exploration Ordinary — —
PT Multi Mineral Explorasi (i) Indonesia Mineral exploration Ordinary — —
PT Oxindo Exploration (i) Indonesia Mineral exploration Ordinary — —
PT Panah Emas (i) Indonesia Mineral exploration Ordinary — —
Southern Laos Mining Pte Ltd Singapore Non-operating entity Ordinary 100 100
SPC (Nominees) Pty Ltd Australia Non-operating entity Ordinary 100 100
SPC 1 Pty Ltd Australia Investment holding Ordinary 100 100
SPC 2 Pty Ltd Australia Investment holding Ordinary 100 100
Wiluna Exploration Pty Ltd Australia Mineral exploration Ordinary — 100
Zeemain Pty Ltd Australia Investment holding Ordinary 50 50
(i) These Indonesian entities are ultimately controlled by Album Resources Private Limited via a corporation agreement with
the Directors and shareholders of the entities.
All subsidiaries are carried at cost.
PricewaterhouseCoopers network firms have been appointed as auditor of all subsidiaries for
each of the relevant periods.
APPENDIX I FINANCIAL INFORMATION OF THE TARGET GROUP
— I-53 —
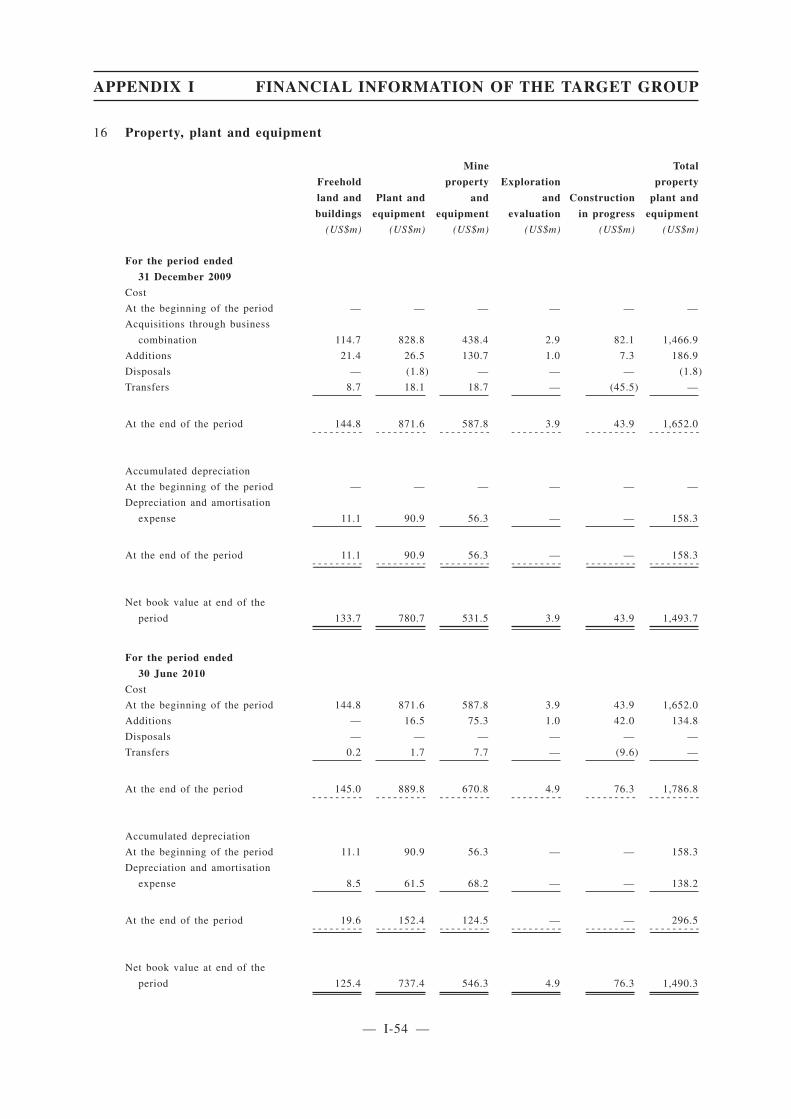
16 Property, plant and equipment
Freehold
land and
buildings
Plant and
equipment
Mine
property
and
equipment
Exploration
and
evaluation
Construction
in progress
Total
property
plant and
equipment
(US$m) (US$m) (US$m) (US$m) (US$m) (US$m)
For the period ended
31 December 2009
Cost
At the beginning of the period — — — — — —
Acquisitions through business
combination 114.7 828.8 438.4 2.9 82.1 1,466.9
Additions 21.4 26.5 130.7 1.0 7.3 186.9
Disposals — (1.8) — — — (1.8)
Transfers 8.7 18.1 18.7 — (45.5) —
At the end of the period 144.8 871.6 587.8 3.9 43.9 1,652.0- - - - - - - - - - - - - - - - - - - - - - - - - - - - - - - - - - - - - - - - - - - - - - - - - - - - - -
Accumulated depreciation
At the beginning of the period — — — — — —
Depreciation and amortisation
expense 11.1 90.9 56.3 — — 158.3
At the end of the period 11.1 90.9 56.3 — — 158.3- - - - - - - - ------------------------------------ - - - - - - - - ------------------------------------ - - - - - - - - ------------------------------------ - - - - - - - - ------------------------------------ - - - - - - - - ------------------------------------ - - - - - - - - ------------------------------------
Net book value at end of the
period 133.7 780.7 531.5 3.9 43.9 1,493.7
For the period ended
30 June 2010
Cost
At the beginning of the period 144.8 871.6 587.8 3.9 43.9 1,652.0
Additions — 16.5 75.3 1.0 42.0 134.8
Disposals — — — — — —
Transfers 0.2 1.7 7.7 — (9.6) —
At the end of the period 145.0 889.8 670.8 4.9 76.3 1,786.8- - - - - - - - - - - - - - - - - - - - - - - - - - - - - - - - - - - - - - - - - - - - - - - - - - - - - -
Accumulated depreciation
At the beginning of the period 11.1 90.9 56.3 — — 158.3
Depreciation and amortisation
expense 8.5 61.5 68.2 — — 138.2
At the end of the period 19.6 152.4 124.5 — — 296.5- - - - - - - - ------------------------------------ - - - - - - - - ------------------------------------ - - - - - - - - ------------------------------------ - - - - - - - - ------------------------------------ - - - - - - - - ------------------------------------ - - - - - - - - ------------------------------------
Net book value at end of the
period 125.4 737.4 546.3 4.9 76.3 1,490.3
APPENDIX I FINANCIAL INFORMATION OF THE TARGET GROUP
— I-54 —
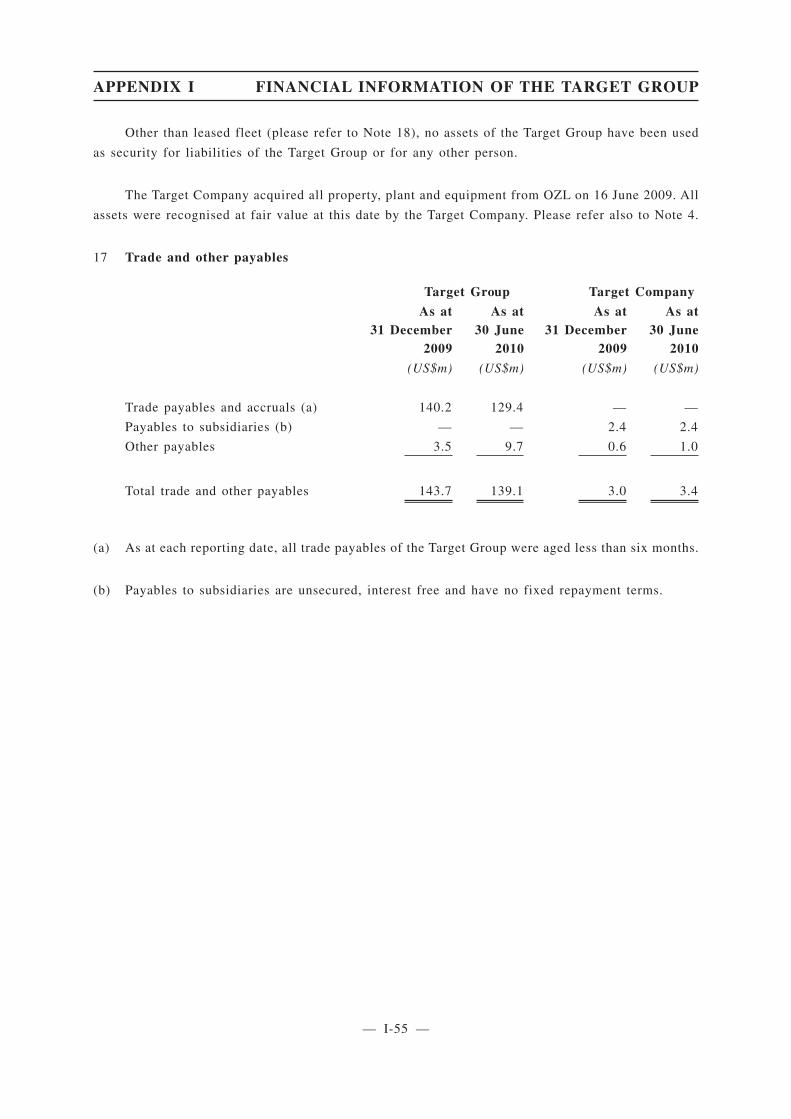
Other than leased fleet (please refer to Note 18), no assets of the Target Group have been used
as security for liabilities of the Target Group or for any other person.
The Target Company acquired all property, plant and equipment from OZL on 16 June 2009. All
assets were recognised at fair value at this date by the Target Company. Please refer also to Note 4.
17 Trade and other payables
Target Group Target Company
As at31 December
2009
As at30 June
2010
As at31 December
2009
As at30 June
2010
(US$m) (US$m) (US$m) (US$m)
Trade payables and accruals (a) 140.2 129.4 — —
Payables to subsidiaries (b) — — 2.4 2.4
Other payables 3.5 9.7 0.6 1.0
Total trade and other payables 143.7 139.1 3.0 3.4
(a) As at each reporting date, all trade payables of the Target Group were aged less than six months.
(b) Payables to subsidiaries are unsecured, interest free and have no fixed repayment terms.
APPENDIX I FINANCIAL INFORMATION OF THE TARGET GROUP
— I-55 —

18 Interest-bearing liabilities
Target Group Target Company
As at31 December
2009
As at30 June
2010
As at31 December
2009
As at30 June
2010
(US$m) (US$m) (US$m) (US$m)
Current
Lease liabilities — Secured 1.1 1.1 — —
Total current interest-bearing
liabilities 1.1 1.1 — —
Non-current
External bank loans 1,095.0 1,095.0 710.0 710.0
Lease liabilities — Secured 4.9 4.2 — —
Other loans 0.9 — — —
Total non-current interest-bearing
liabilities 1,100.8 1,099.2 710.0 710.0
Aggregate of current andnon-current interest-bearingliabilities
External bank loans (a) 1,095.0 1,095.0 710.0 710.0
Lease liabilities (b) 6.0 5.3 — —
Other loans 0.9 — — —
Aggregated interest-bearing
liabilities 1,101.9 1,100.3 710.0 710.0
APPENDIX I FINANCIAL INFORMATION OF THE TARGET GROUP
— I-56 —
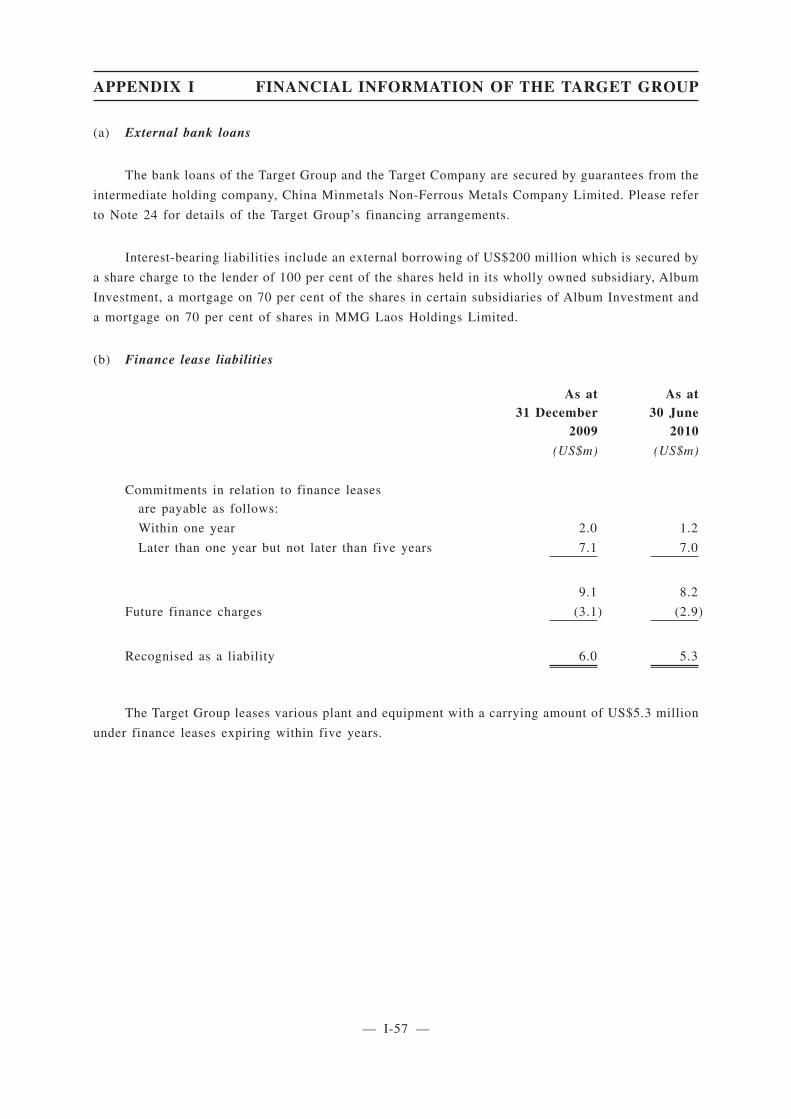
(a) External bank loans
The bank loans of the Target Group and the Target Company are secured by guarantees from the
intermediate holding company, China Minmetals Non-Ferrous Metals Company Limited. Please refer
to Note 24 for details of the Target Group’s financing arrangements.
Interest-bearing liabilities include an external borrowing of US$200 million which is secured by
a share charge to the lender of 100 per cent of the shares held in its wholly owned subsidiary, Album
Investment, a mortgage on 70 per cent of the shares in certain subsidiaries of Album Investment and
a mortgage on 70 per cent of shares in MMG Laos Holdings Limited.
(b) Finance lease liabilities
As at31 December
2009
As at30 June
2010
(US$m) (US$m)
Commitments in relation to finance leases
are payable as follows:
Within one year 2.0 1.2
Later than one year but not later than five years 7.1 7.0
9.1 8.2
Future finance charges (3.1) (2.9)
Recognised as a liability 6.0 5.3
The Target Group leases various plant and equipment with a carrying amount of US$5.3 million
under finance leases expiring within five years.
APPENDIX I FINANCIAL INFORMATION OF THE TARGET GROUP
— I-57 —
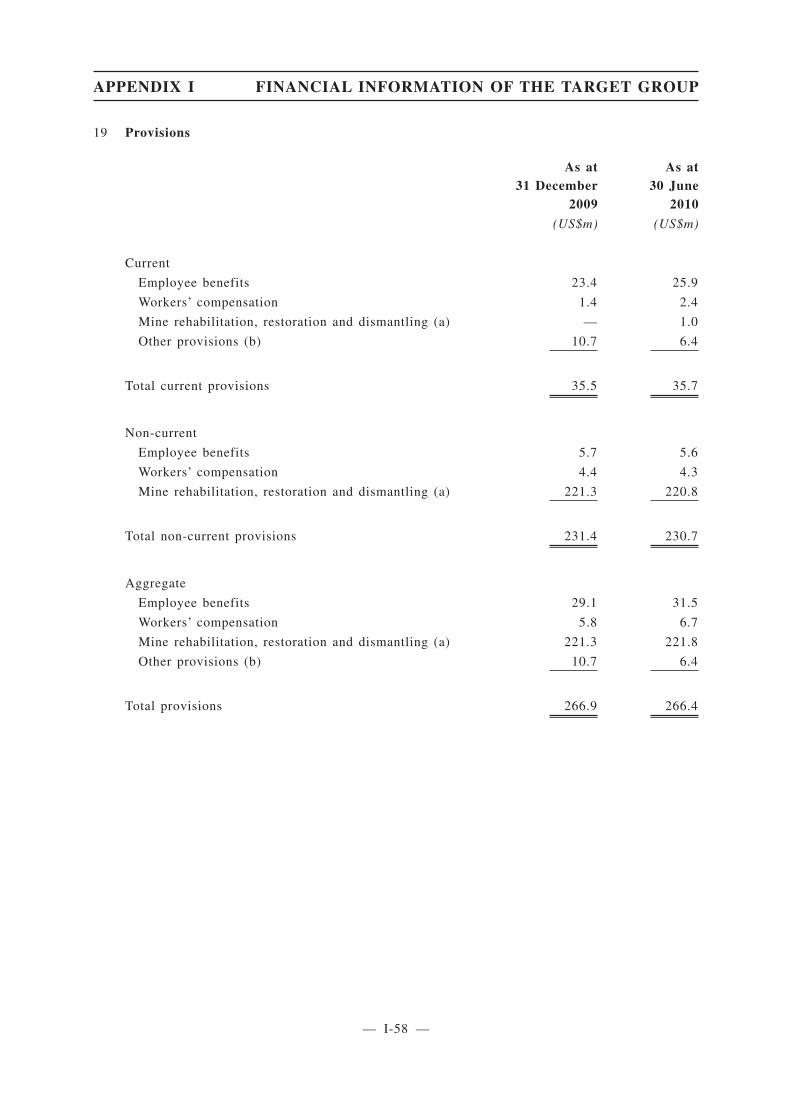
19 Provisions
As at31 December
2009
As at30 June
2010
(US$m) (US$m)
Current
Employee benefits 23.4 25.9
Workers’ compensation 1.4 2.4
Mine rehabilitation, restoration and dismantling (a) — 1.0
Other provisions (b) 10.7 6.4
Total current provisions 35.5 35.7
Non-current
Employee benefits 5.7 5.6
Workers’ compensation 4.4 4.3
Mine rehabilitation, restoration and dismantling (a) 221.3 220.8
Total non-current provisions 231.4 230.7
Aggregate
Employee benefits 29.1 31.5
Workers’ compensation 5.8 6.7
Mine rehabilitation, restoration and dismantling (a) 221.3 221.8
Other provisions (b) 10.7 6.4
Total provisions 266.9 266.4
APPENDIX I FINANCIAL INFORMATION OF THE TARGET GROUP
— I-58 —
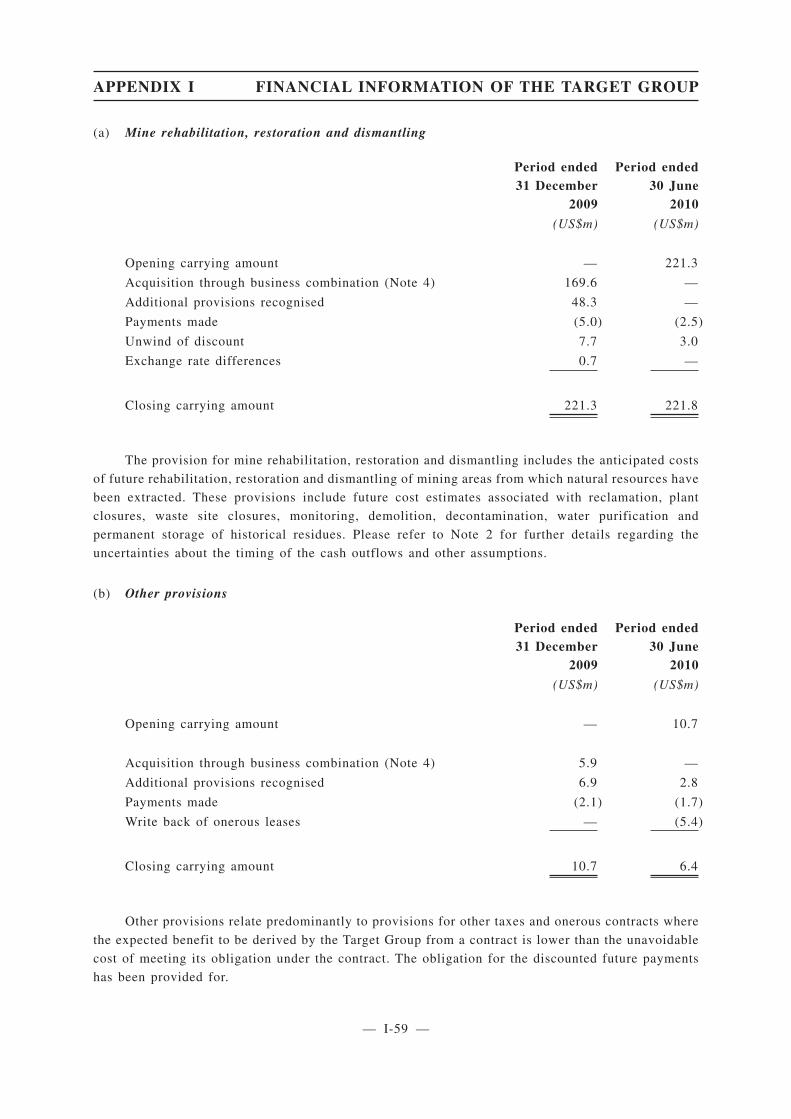
(a) Mine rehabilitation, restoration and dismantling
Period ended31 December
2009
Period ended30 June
2010
(US$m) (US$m)
Opening carrying amount — 221.3
Acquisition through business combination (Note 4) 169.6 —
Additional provisions recognised 48.3 —
Payments made (5.0) (2.5)
Unwind of discount 7.7 3.0
Exchange rate differences 0.7 —
Closing carrying amount 221.3 221.8
The provision for mine rehabilitation, restoration and dismantling includes the anticipated costs
of future rehabilitation, restoration and dismantling of mining areas from which natural resources have
been extracted. These provisions include future cost estimates associated with reclamation, plant
closures, waste site closures, monitoring, demolition, decontamination, water purification and
permanent storage of historical residues. Please refer to Note 2 for further details regarding the
uncertainties about the timing of the cash outflows and other assumptions.
(b) Other provisions
Period ended31 December
2009
Period ended30 June
2010
(US$m) (US$m)
Opening carrying amount — 10.7
Acquisition through business combination (Note 4) 5.9 —
Additional provisions recognised 6.9 2.8
Payments made (2.1) (1.7)
Write back of onerous leases — (5.4)
Closing carrying amount 10.7 6.4
Other provisions relate predominantly to provisions for other taxes and onerous contracts where
the expected benefit to be derived by the Target Group from a contract is lower than the unavoidable
cost of meeting its obligation under the contract. The obligation for the discounted future payments
has been provided for.
APPENDIX I FINANCIAL INFORMATION OF THE TARGET GROUP
— I-59 —
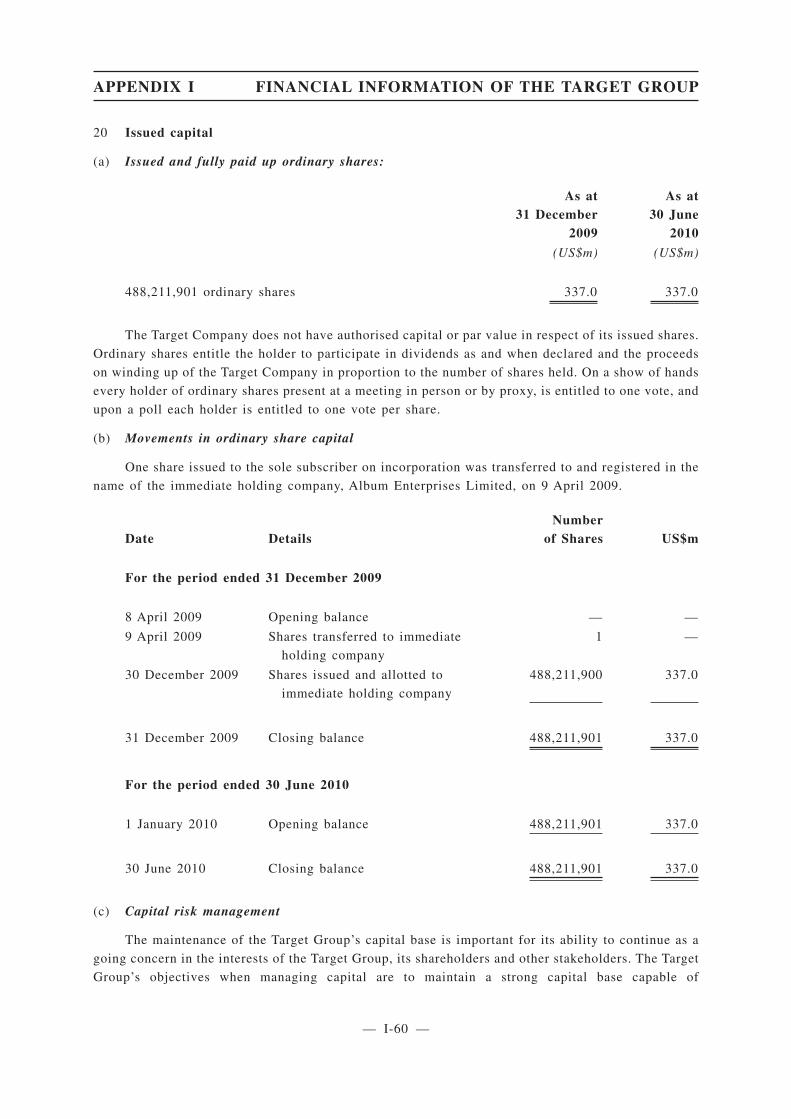
20 Issued capital
(a) Issued and fully paid up ordinary shares:
As at31 December
2009
As at30 June
2010
(US$m) (US$m)
488,211,901 ordinary shares 337.0 337.0
The Target Company does not have authorised capital or par value in respect of its issued shares.
Ordinary shares entitle the holder to participate in dividends as and when declared and the proceeds
on winding up of the Target Company in proportion to the number of shares held. On a show of hands
every holder of ordinary shares present at a meeting in person or by proxy, is entitled to one vote, and
upon a poll each holder is entitled to one vote per share.
(b) Movements in ordinary share capital
One share issued to the sole subscriber on incorporation was transferred to and registered in the
name of the immediate holding company, Album Enterprises Limited, on 9 April 2009.
Date DetailsNumber
of Shares US$m
For the period ended 31 December 2009
8 April 2009 Opening balance — —
9 April 2009 Shares transferred to immediate
holding company
1 —
30 December 2009 Shares issued and allotted to
immediate holding company
488,211,900 337.0
31 December 2009 Closing balance 488,211,901 337.0
For the period ended 30 June 2010
1 January 2010 Opening balance 488,211,901 337.0
30 June 2010 Closing balance 488,211,901 337.0
(c) Capital risk management
The maintenance of the Target Group’s capital base is important for its ability to continue as a
going concern in the interests of the Target Group, its shareholders and other stakeholders. The Target
Group’s objectives when managing capital are to maintain a strong capital base capable of
APPENDIX I FINANCIAL INFORMATION OF THE TARGET GROUP
— I-60 —
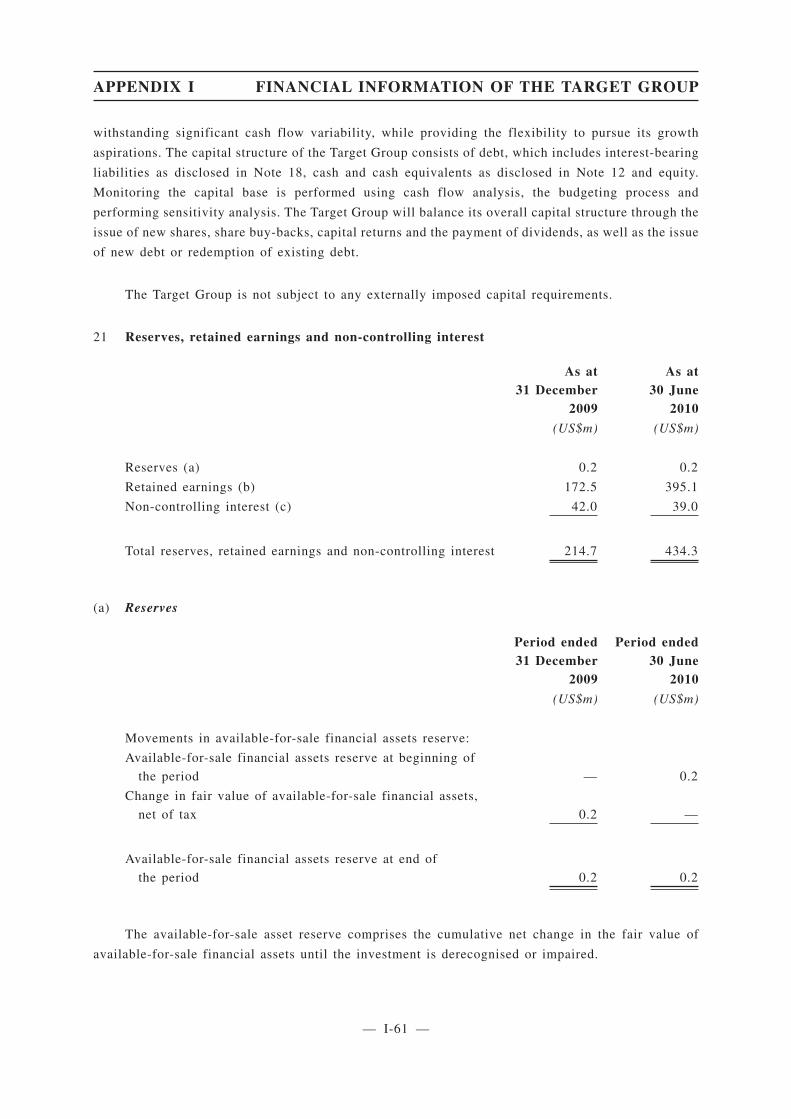
withstanding significant cash flow variability, while providing the flexibility to pursue its growth
aspirations. The capital structure of the Target Group consists of debt, which includes interest-bearing
liabilities as disclosed in Note 18, cash and cash equivalents as disclosed in Note 12 and equity.
Monitoring the capital base is performed using cash flow analysis, the budgeting process and
performing sensitivity analysis. The Target Group will balance its overall capital structure through the
issue of new shares, share buy-backs, capital returns and the payment of dividends, as well as the issue
of new debt or redemption of existing debt.
The Target Group is not subject to any externally imposed capital requirements.
21 Reserves, retained earnings and non-controlling interest
As at31 December
2009
As at30 June
2010
(US$m) (US$m)
Reserves (a) 0.2 0.2
Retained earnings (b) 172.5 395.1
Non-controlling interest (c) 42.0 39.0
Total reserves, retained earnings and non-controlling interest 214.7 434.3
(a) Reserves
Period ended31 December
2009
Period ended30 June
2010
(US$m) (US$m)
Movements in available-for-sale financial assets reserve:
Available-for-sale financial assets reserve at beginning of
the period — 0.2
Change in fair value of available-for-sale financial assets,
net of tax 0.2 —
Available-for-sale financial assets reserve at end of
the period 0.2 0.2
The available-for-sale asset reserve comprises the cumulative net change in the fair value of
available-for-sale financial assets until the investment is derecognised or impaired.
APPENDIX I FINANCIAL INFORMATION OF THE TARGET GROUP
— I-61 —
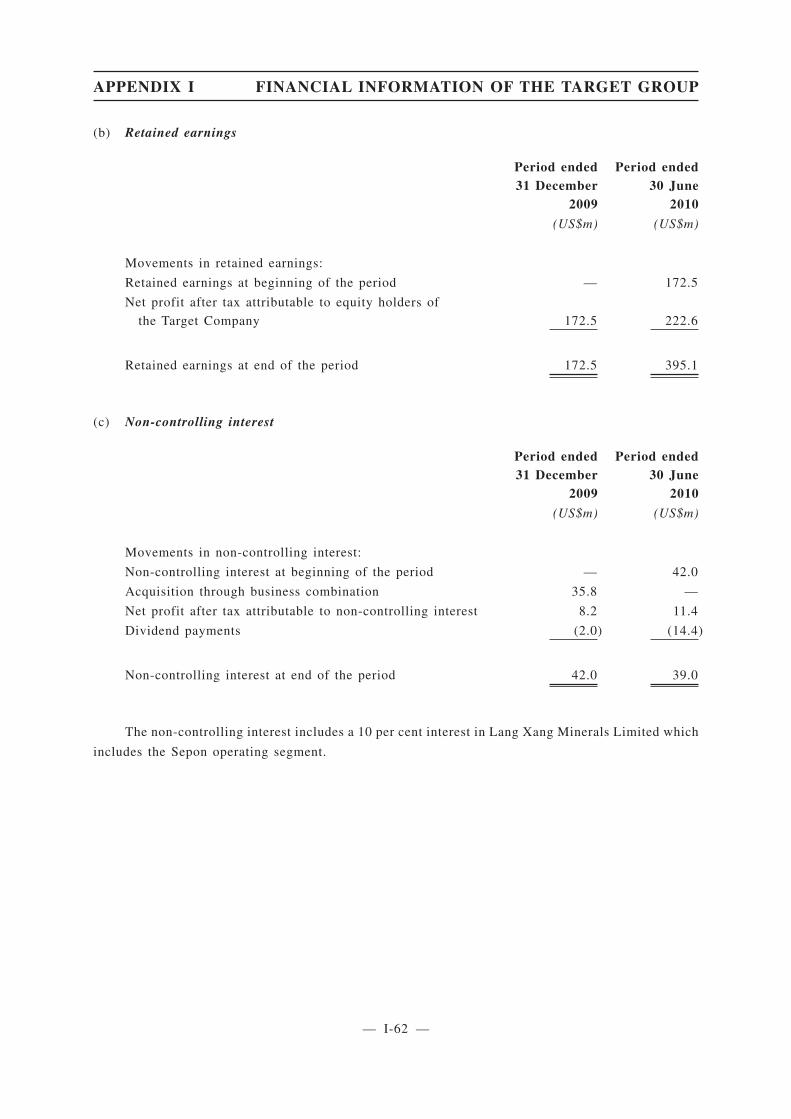
(b) Retained earnings
Period ended31 December
2009
Period ended30 June
2010
(US$m) (US$m)
Movements in retained earnings:
Retained earnings at beginning of the period — 172.5
Net profit after tax attributable to equity holders of
the Target Company 172.5 222.6
Retained earnings at end of the period 172.5 395.1
(c) Non-controlling interest
Period ended31 December
2009
Period ended30 June
2010
(US$m) (US$m)
Movements in non-controlling interest:
Non-controlling interest at beginning of the period — 42.0
Acquisition through business combination 35.8 —
Net profit after tax attributable to non-controlling interest 8.2 11.4
Dividend payments (2.0) (14.4)
Non-controlling interest at end of the period 42.0 39.0
The non-controlling interest includes a 10 per cent interest in Lang Xang Minerals Limited which
includes the Sepon operating segment.
APPENDIX I FINANCIAL INFORMATION OF THE TARGET GROUP
— I-62 —
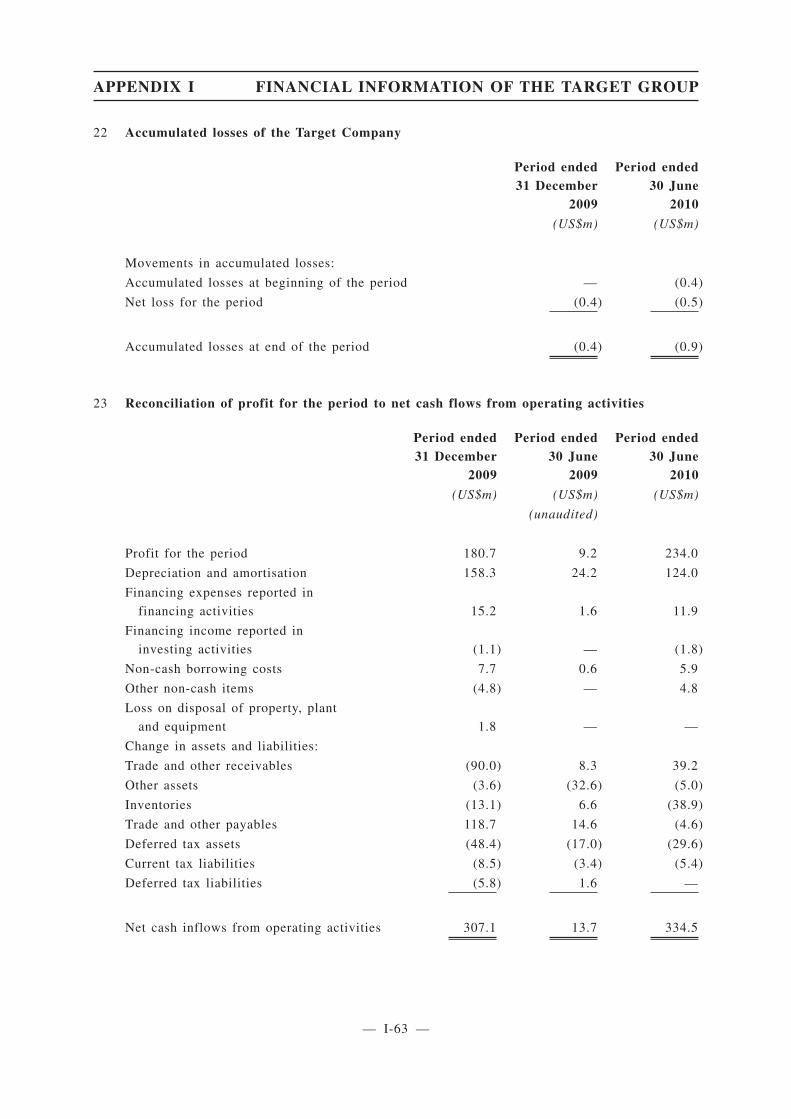
22 Accumulated losses of the Target Company
Period ended31 December
2009
Period ended30 June
2010
(US$m) (US$m)
Movements in accumulated losses:
Accumulated losses at beginning of the period — (0.4)
Net loss for the period (0.4) (0.5)
Accumulated losses at end of the period (0.4) (0.9)
23 Reconciliation of profit for the period to net cash flows from operating activities
Period ended31 December
2009
Period ended30 June
2009
Period ended30 June
2010
(US$m) (US$m) (US$m)
(unaudited)
Profit for the period 180.7 9.2 234.0
Depreciation and amortisation 158.3 24.2 124.0
Financing expenses reported in
financing activities 15.2 1.6 11.9
Financing income reported in
investing activities (1.1) — (1.8)
Non-cash borrowing costs 7.7 0.6 5.9
Other non-cash items (4.8) — 4.8
Loss on disposal of property, plant
and equipment 1.8 — —
Change in assets and liabilities:
Trade and other receivables (90.0) 8.3 39.2
Other assets (3.6) (32.6) (5.0)
Inventories (13.1) 6.6 (38.9)
Trade and other payables 118.7 14.6 (4.6)
Deferred tax assets (48.4) (17.0) (29.6)
Current tax liabilities (8.5) (3.4) (5.4)
Deferred tax liabilities (5.8) 1.6 —
Net cash inflows from operating activities 307.1 13.7 334.5
APPENDIX I FINANCIAL INFORMATION OF THE TARGET GROUP
— I-63 —

24 Financial risk management
The Target Group’s activities expose it to a variety of financial risks such as:
• Market risk consisting of commodity price risk, foreign currency exchange risk and interest
rate risk (please refer to (a) below);
• Credit risk (please refer to (b) below); and
• Liquidity risk (please refer to (c) below).
This note presents information about the Target Group’s exposure to each of the above financial
instrument risks, its objectives, policies and processes for measuring and managing risk and
quantitative disclosures.
Financial risk management is carried out by the Target Group’s Group Treasury function under
policies approved by the board of directors of the Target Company. Group Treasury identifies,
evaluates and manages financial risks in close co-operation with the Consolidated entity’s operating
units. The board of directors of the Target Company approves written principles for overall risk
management, as well as policies covering specific areas, such as those identified above.
The Target Group holds the following financial instruments at the reporting date:
Notes
As at31 December
2009
As at30 June
2010(US$m) (US$m)
Financial assets
Cash and cash equivalents 12 251.3 334.5Trade receivables 13 88.5 44.8Related party receivables 13 1.4 3.8Available for-sale financial assets 15 0.8 94.2
342.0 477.3
Financial liabilities
Trade payables 17 140.2 129.4Interest-bearing liabilities 18 1,101.9 1,100.3
1,242.1 1,229.7
APPENDIX I FINANCIAL INFORMATION OF THE TARGET GROUP
— I-64 —
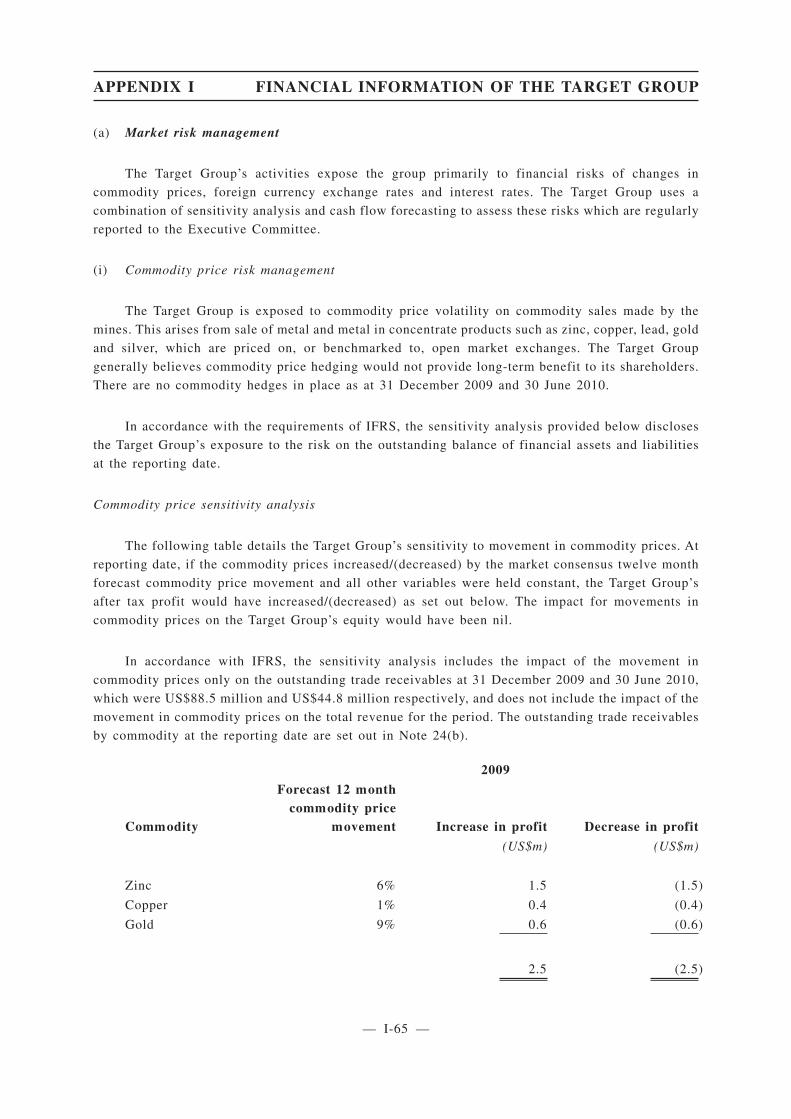
(a) Market risk management
The Target Group’s activities expose the group primarily to financial risks of changes in
commodity prices, foreign currency exchange rates and interest rates. The Target Group uses a
combination of sensitivity analysis and cash flow forecasting to assess these risks which are regularly
reported to the Executive Committee.
(i) Commodity price risk management
The Target Group is exposed to commodity price volatility on commodity sales made by the
mines. This arises from sale of metal and metal in concentrate products such as zinc, copper, lead, gold
and silver, which are priced on, or benchmarked to, open market exchanges. The Target Group
generally believes commodity price hedging would not provide long-term benefit to its shareholders.
There are no commodity hedges in place as at 31 December 2009 and 30 June 2010.
In accordance with the requirements of IFRS, the sensitivity analysis provided below discloses
the Target Group’s exposure to the risk on the outstanding balance of financial assets and liabilities
at the reporting date.
Commodity price sensitivity analysis
The following table details the Target Group’s sensitivity to movement in commodity prices. At
reporting date, if the commodity prices increased/(decreased) by the market consensus twelve month
forecast commodity price movement and all other variables were held constant, the Target Group’s
after tax profit would have increased/(decreased) as set out below. The impact for movements in
commodity prices on the Target Group’s equity would have been nil.
In accordance with IFRS, the sensitivity analysis includes the impact of the movement in
commodity prices only on the outstanding trade receivables at 31 December 2009 and 30 June 2010,
which were US$88.5 million and US$44.8 million respectively, and does not include the impact of the
movement in commodity prices on the total revenue for the period. The outstanding trade receivables
by commodity at the reporting date are set out in Note 24(b).
2009
Commodity
Forecast 12 monthcommodity price
movement Increase in profit Decrease in profit
(US$m) (US$m)
Zinc 6% 1.5 (1.5)
Copper 1% 0.4 (0.4)
Gold 9% 0.6 (0.6)
2.5 (2.5)
APPENDIX I FINANCIAL INFORMATION OF THE TARGET GROUP
— I-65 —
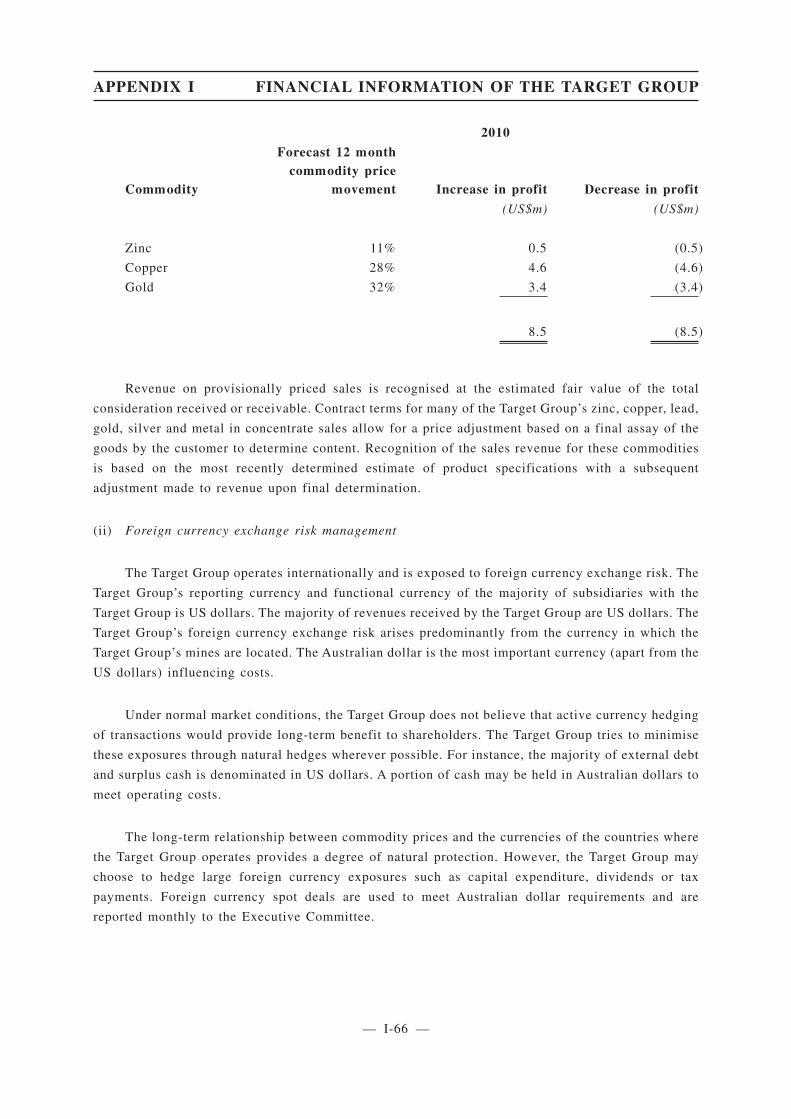
2010
Commodity
Forecast 12 monthcommodity price
movement Increase in profit Decrease in profit
(US$m) (US$m)
Zinc 11% 0.5 (0.5)
Copper 28% 4.6 (4.6)
Gold 32% 3.4 (3.4)
8.5 (8.5)
Revenue on provisionally priced sales is recognised at the estimated fair value of the total
consideration received or receivable. Contract terms for many of the Target Group’s zinc, copper, lead,
gold, silver and metal in concentrate sales allow for a price adjustment based on a final assay of the
goods by the customer to determine content. Recognition of the sales revenue for these commodities
is based on the most recently determined estimate of product specifications with a subsequent
adjustment made to revenue upon final determination.
(ii) Foreign currency exchange risk management
The Target Group operates internationally and is exposed to foreign currency exchange risk. The
Target Group’s reporting currency and functional currency of the majority of subsidiaries with the
Target Group is US dollars. The majority of revenues received by the Target Group are US dollars. The
Target Group’s foreign currency exchange risk arises predominantly from the currency in which the
Target Group’s mines are located. The Australian dollar is the most important currency (apart from the
US dollars) influencing costs.
Under normal market conditions, the Target Group does not believe that active currency hedging
of transactions would provide long-term benefit to shareholders. The Target Group tries to minimise
these exposures through natural hedges wherever possible. For instance, the majority of external debt
and surplus cash is denominated in US dollars. A portion of cash may be held in Australian dollars to
meet operating costs.
The long-term relationship between commodity prices and the currencies of the countries where
the Target Group operates provides a degree of natural protection. However, the Target Group may
choose to hedge large foreign currency exposures such as capital expenditure, dividends or tax
payments. Foreign currency spot deals are used to meet Australian dollar requirements and are
reported monthly to the Executive Committee.
APPENDIX I FINANCIAL INFORMATION OF THE TARGET GROUP
— I-66 —
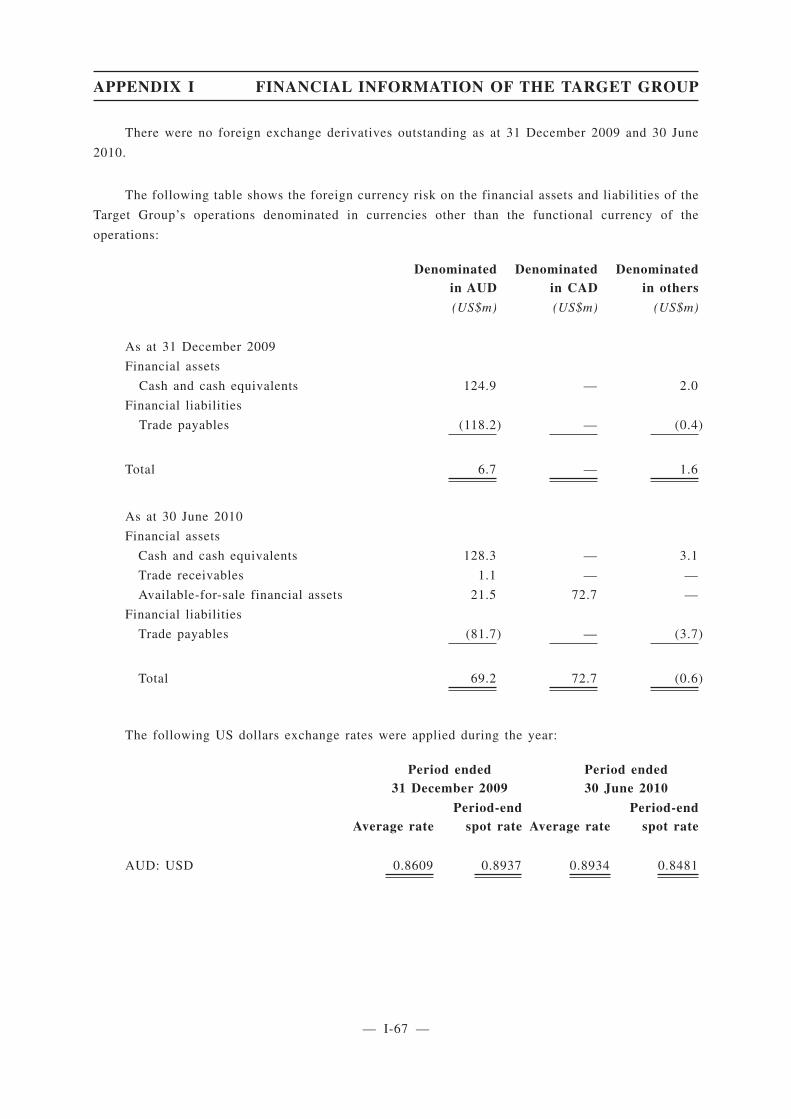
There were no foreign exchange derivatives outstanding as at 31 December 2009 and 30 June
2010.
The following table shows the foreign currency risk on the financial assets and liabilities of the
Target Group’s operations denominated in currencies other than the functional currency of the
operations:
Denominatedin AUD
Denominatedin CAD
Denominatedin others
(US$m) (US$m) (US$m)
As at 31 December 2009
Financial assets
Cash and cash equivalents 124.9 — 2.0
Financial liabilities
Trade payables (118.2) — (0.4)
Total 6.7 — 1.6
As at 30 June 2010
Financial assets
Cash and cash equivalents 128.3 — 3.1
Trade receivables 1.1 — —
Available-for-sale financial assets 21.5 72.7 —
Financial liabilities
Trade payables (81.7) — (3.7)
Total 69.2 72.7 (0.6)
The following US dollars exchange rates were applied during the year:
Period ended31 December 2009
Period ended30 June 2010
Average ratePeriod-end
spot rate Average ratePeriod-end
spot rate
AUD: USD 0.8609 0.8937 0.8934 0.8481
APPENDIX I FINANCIAL INFORMATION OF THE TARGET GROUP
— I-67 —
Foreign currency sensitivity analysis
The sensitivity analysis includes only outstanding foreign currency denominated monetary items
at the reporting date and adjusts their translation for a 5 per cent change in the AUD/USD and a 10
per cent change in the CAD/USD foreign exchange rate. This percentage change reflects the market
consensus twelve month forecast foreign exchange rate movement.
If the foreign currency exchange rates strengthened/(weakened) against the functional currency
by the above foreign exchange rate changes, and all other variables were held constant, the Target
Group’s after tax profit and equity for the periods ended 31 December 2009 and 30 June 2010 would
have increased/(decreased) by US$1 million and US$8 million respectively.
(iii) Interest rate risk management
The Consolidated entity is exposed to interest rate volatility on deposits and borrowings.
Deposits and borrowings at variable rates expose the Target Group to cash flow interest rate risk.
Deposits and borrowings at fixed rates expose the Target Group to fair value interest rate risk. Any
decision to hedge interest rate risk is assessed at the inception of each floating rate debt facility in
light of the overall Target Group’s exposure, the prevailing interest rate market and any funding
counterparty requirements.
It is the Target Group’s preference to borrow and invest at floating rates of interest. This
approach is based on historical correlation between interest rates and commodity prices. As at 31
December 2009 and 30 June 2010, all of the Target Group’s debt was floating rate debt. The interest
charged on floating rate debt is based on the relevant national inter-bank rates and repriced at least
semi-annually.
Monthly reporting is provided to the Executive Committee, which summarises the Target Group’s
debt and interest rates.
APPENDIX I FINANCIAL INFORMATION OF THE TARGET GROUP
— I-68 —
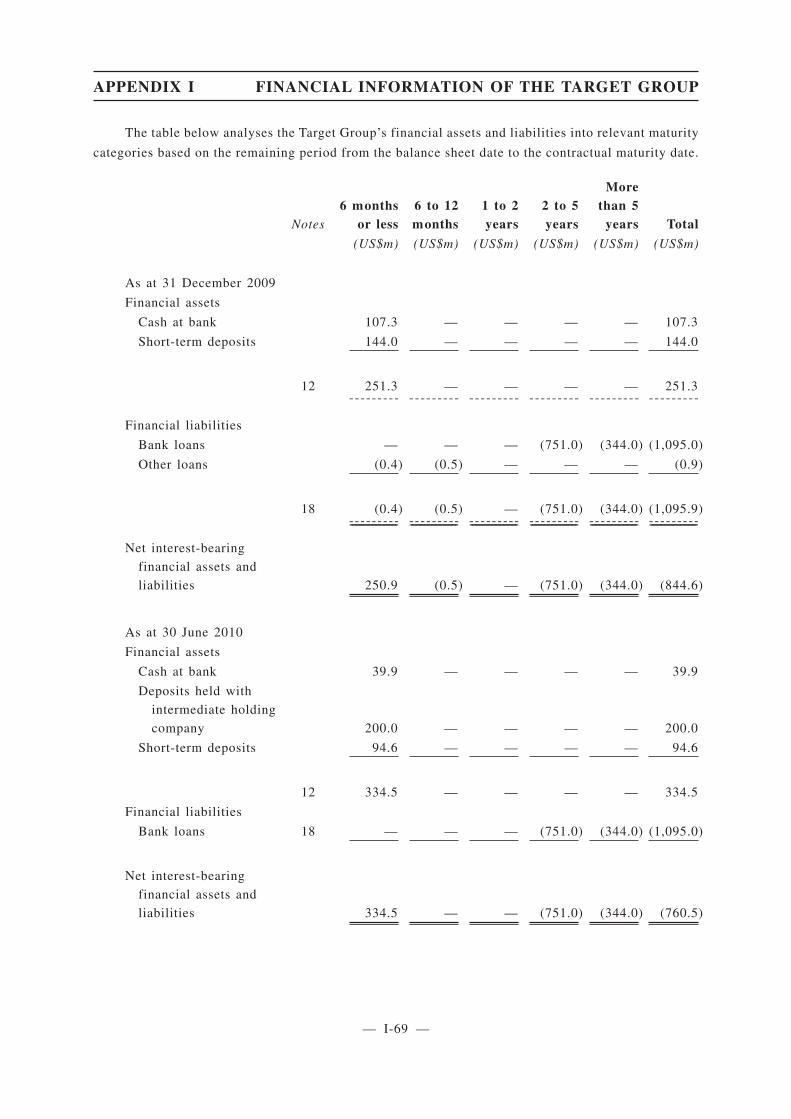
The table below analyses the Target Group’s financial assets and liabilities into relevant maturity
categories based on the remaining period from the balance sheet date to the contractual maturity date.
Notes
6 monthsor less
6 to 12months
1 to 2years
2 to 5years
Morethan 5
years Total
(US$m) (US$m) (US$m) (US$m) (US$m) (US$m)
As at 31 December 2009
Financial assets
Cash at bank 107.3 — — — — 107.3
Short-term deposits 144.0 — — — — 144.0
12 251.3 — — — — 251.3--------- --------- --------- --------- --------- ---------
Financial liabilities
Bank loans — — — (751.0) (344.0) (1,095.0)
Other loans (0.4) (0.5) — — — (0.9)
18 (0.4) (0.5) — (751.0) (344.0) (1,095.9)-------------------------------------------- -------------------------------------------- -------------------------------------------- -------------------------------------------- -------------------------------------------- --------------------------------------------
Net interest-bearing
financial assets and
liabilities 250.9 (0.5) — (751.0) (344.0) (844.6)
As at 30 June 2010
Financial assets
Cash at bank 39.9 — — — — 39.9
Deposits held with
intermediate holding
company 200.0 — — — — 200.0
Short-term deposits 94.6 — — — — 94.6
12 334.5 — — — — 334.5
Financial liabilities
Bank loans 18 — — — (751.0) (344.0) (1,095.0)
Net interest-bearing
financial assets and
liabilities 334.5 — — (751.0) (344.0) (760.5)
APPENDIX I FINANCIAL INFORMATION OF THE TARGET GROUP
— I-69 —
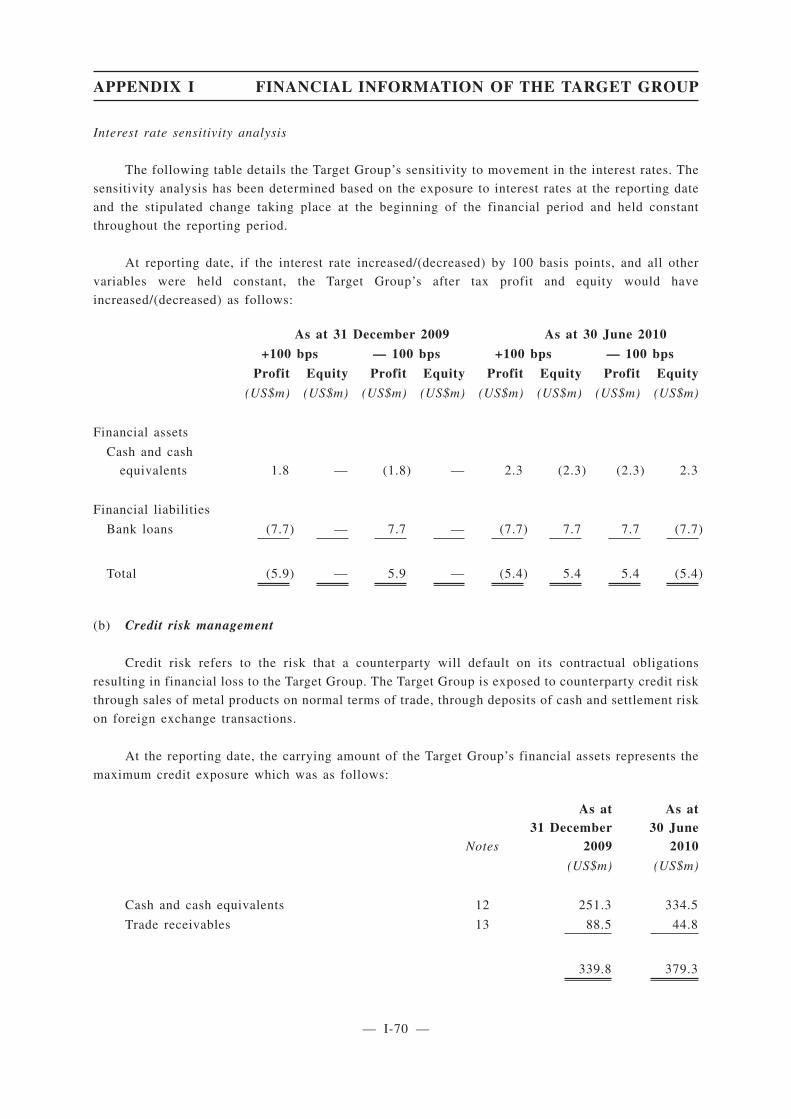
Interest rate sensitivity analysis
The following table details the Target Group’s sensitivity to movement in the interest rates. The
sensitivity analysis has been determined based on the exposure to interest rates at the reporting date
and the stipulated change taking place at the beginning of the financial period and held constant
throughout the reporting period.
At reporting date, if the interest rate increased/(decreased) by 100 basis points, and all other
variables were held constant, the Target Group’s after tax profit and equity would have
increased/(decreased) as follows:
As at 31 December 2009 As at 30 June 2010
+100 bps — 100 bps +100 bps — 100 bps
Profit Equity Profit Equity Profit Equity Profit Equity
(US$m) (US$m) (US$m) (US$m) (US$m) (US$m) (US$m) (US$m)
Financial assets
Cash and cash
equivalents 1.8 — (1.8) — 2.3 (2.3) (2.3) 2.3
Financial liabilities
Bank loans (7.7) — 7.7 — (7.7) 7.7 7.7 (7.7)
Total (5.9) — 5.9 — (5.4) 5.4 5.4 (5.4)
(b) Credit risk management
Credit risk refers to the risk that a counterparty will default on its contractual obligations
resulting in financial loss to the Target Group. The Target Group is exposed to counterparty credit risk
through sales of metal products on normal terms of trade, through deposits of cash and settlement risk
on foreign exchange transactions.
At the reporting date, the carrying amount of the Target Group’s financial assets represents the
maximum credit exposure which was as follows:
Notes
As at31 December
2009
As at30 June
2010
(US$m) (US$m)
Cash and cash equivalents 12 251.3 334.5
Trade receivables 13 88.5 44.8
339.8 379.3
APPENDIX I FINANCIAL INFORMATION OF THE TARGET GROUP
— I-70 —
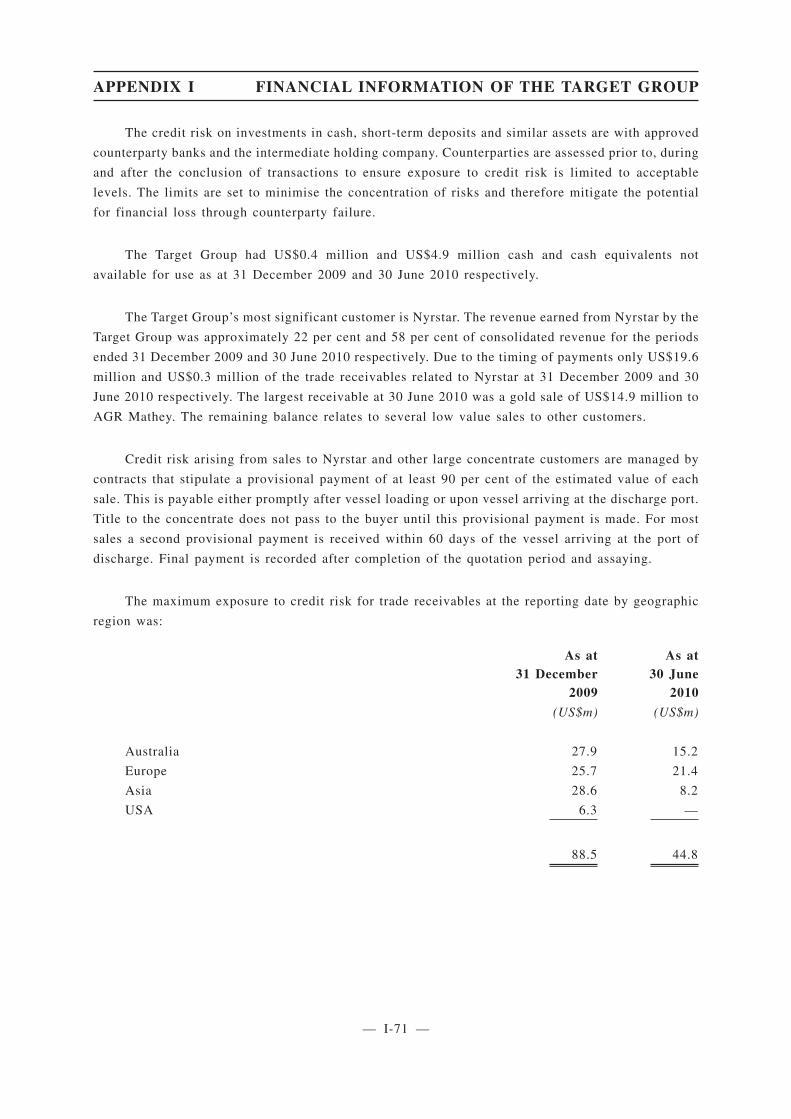
The credit risk on investments in cash, short-term deposits and similar assets are with approved
counterparty banks and the intermediate holding company. Counterparties are assessed prior to, during
and after the conclusion of transactions to ensure exposure to credit risk is limited to acceptable
levels. The limits are set to minimise the concentration of risks and therefore mitigate the potential
for financial loss through counterparty failure.
The Target Group had US$0.4 million and US$4.9 million cash and cash equivalents not
available for use as at 31 December 2009 and 30 June 2010 respectively.
The Target Group’s most significant customer is Nyrstar. The revenue earned from Nyrstar by the
Target Group was approximately 22 per cent and 58 per cent of consolidated revenue for the periods
ended 31 December 2009 and 30 June 2010 respectively. Due to the timing of payments only US$19.6
million and US$0.3 million of the trade receivables related to Nyrstar at 31 December 2009 and 30
June 2010 respectively. The largest receivable at 30 June 2010 was a gold sale of US$14.9 million to
AGR Mathey. The remaining balance relates to several low value sales to other customers.
Credit risk arising from sales to Nyrstar and other large concentrate customers are managed by
contracts that stipulate a provisional payment of at least 90 per cent of the estimated value of each
sale. This is payable either promptly after vessel loading or upon vessel arriving at the discharge port.
Title to the concentrate does not pass to the buyer until this provisional payment is made. For most
sales a second provisional payment is received within 60 days of the vessel arriving at the port of
discharge. Final payment is recorded after completion of the quotation period and assaying.
The maximum exposure to credit risk for trade receivables at the reporting date by geographic
region was:
As at31 December
2009
As at30 June
2010
(US$m) (US$m)
Australia 27.9 15.2
Europe 25.7 21.4
Asia 28.6 8.2
USA 6.3 —
88.5 44.8
APPENDIX I FINANCIAL INFORMATION OF THE TARGET GROUP
— I-71 —
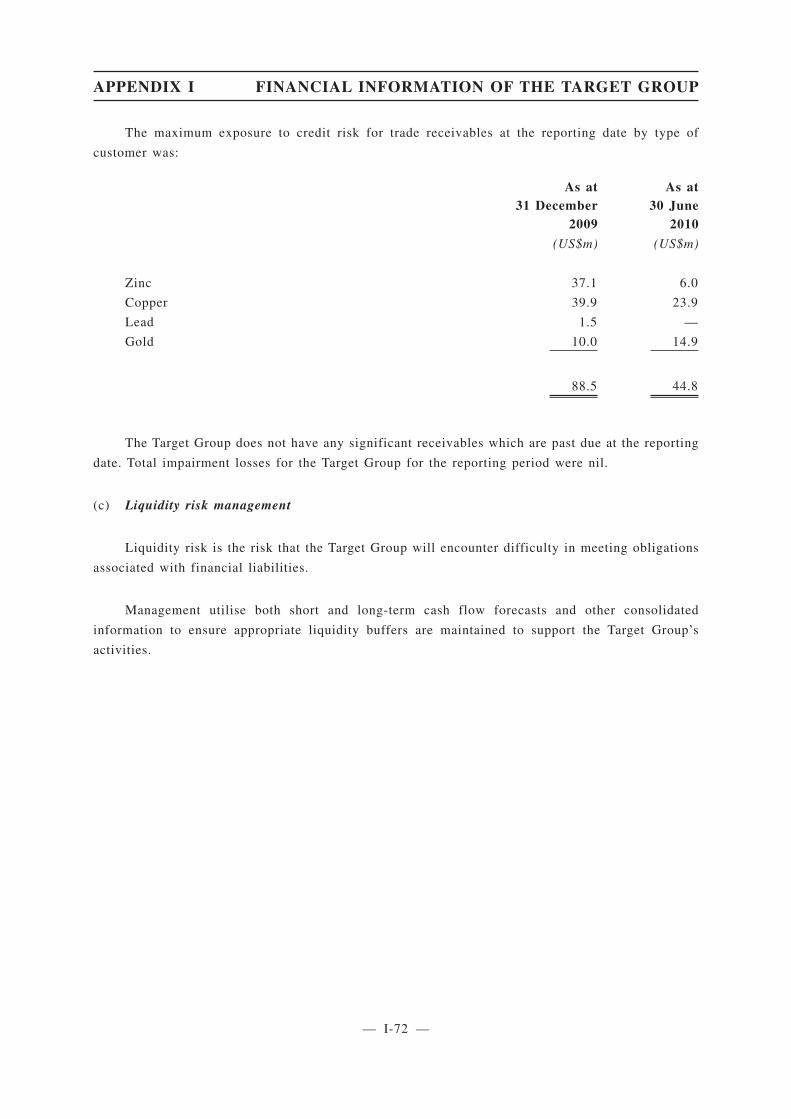
The maximum exposure to credit risk for trade receivables at the reporting date by type of
customer was:
As at31 December
2009
As at30 June
2010
(US$m) (US$m)
Zinc 37.1 6.0
Copper 39.9 23.9
Lead 1.5 —
Gold 10.0 14.9
88.5 44.8
The Target Group does not have any significant receivables which are past due at the reporting
date. Total impairment losses for the Target Group for the reporting period were nil.
(c) Liquidity risk management
Liquidity risk is the risk that the Target Group will encounter difficulty in meeting obligations
associated with financial liabilities.
Management utilise both short and long-term cash flow forecasts and other consolidated
information to ensure appropriate liquidity buffers are maintained to support the Target Group’s
activities.
APPENDIX I FINANCIAL INFORMATION OF THE TARGET GROUP
— I-72 —
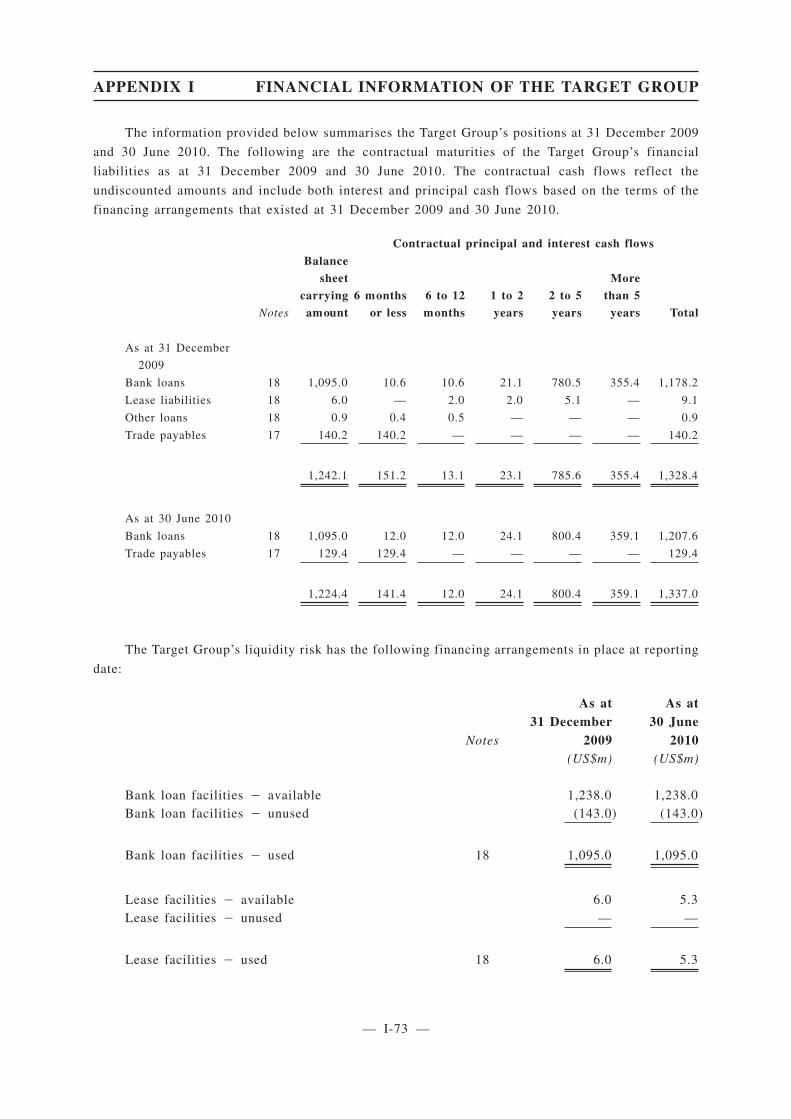
The information provided below summarises the Target Group’s positions at 31 December 2009
and 30 June 2010. The following are the contractual maturities of the Target Group’s financial
liabilities as at 31 December 2009 and 30 June 2010. The contractual cash flows reflect the
undiscounted amounts and include both interest and principal cash flows based on the terms of the
financing arrangements that existed at 31 December 2009 and 30 June 2010.
Contractual principal and interest cash flows
Notes
Balance
sheet
carrying
amount
6 months
or less
6 to 12
months
1 to 2
years
2 to 5
years
More
than 5
years Total
As at 31 December
2009
Bank loans 18 1,095.0 10.6 10.6 21.1 780.5 355.4 1,178.2
Lease liabilities 18 6.0 — 2.0 2.0 5.1 — 9.1
Other loans 18 0.9 0.4 0.5 — — — 0.9
Trade payables 17 140.2 140.2 — — — — 140.2
1,242.1 151.2 13.1 23.1 785.6 355.4 1,328.4
As at 30 June 2010
Bank loans 18 1,095.0 12.0 12.0 24.1 800.4 359.1 1,207.6
Trade payables 17 129.4 129.4 — — — — 129.4
1,224.4 141.4 12.0 24.1 800.4 359.1 1,337.0
The Target Group’s liquidity risk has the following financing arrangements in place at reporting
date:
Notes
As at31 December
2009
As at30 June
2010(US$m) (US$m)
Bank loan facilities � available 1,238.0 1,238.0Bank loan facilities � unused (143.0) (143.0)
Bank loan facilities � used 18 1,095.0 1,095.0
Lease facilities � available 6.0 5.3Lease facilities � unused — —
Lease facilities � used 18 6.0 5.3
APPENDIX I FINANCIAL INFORMATION OF THE TARGET GROUP
— I-73 —
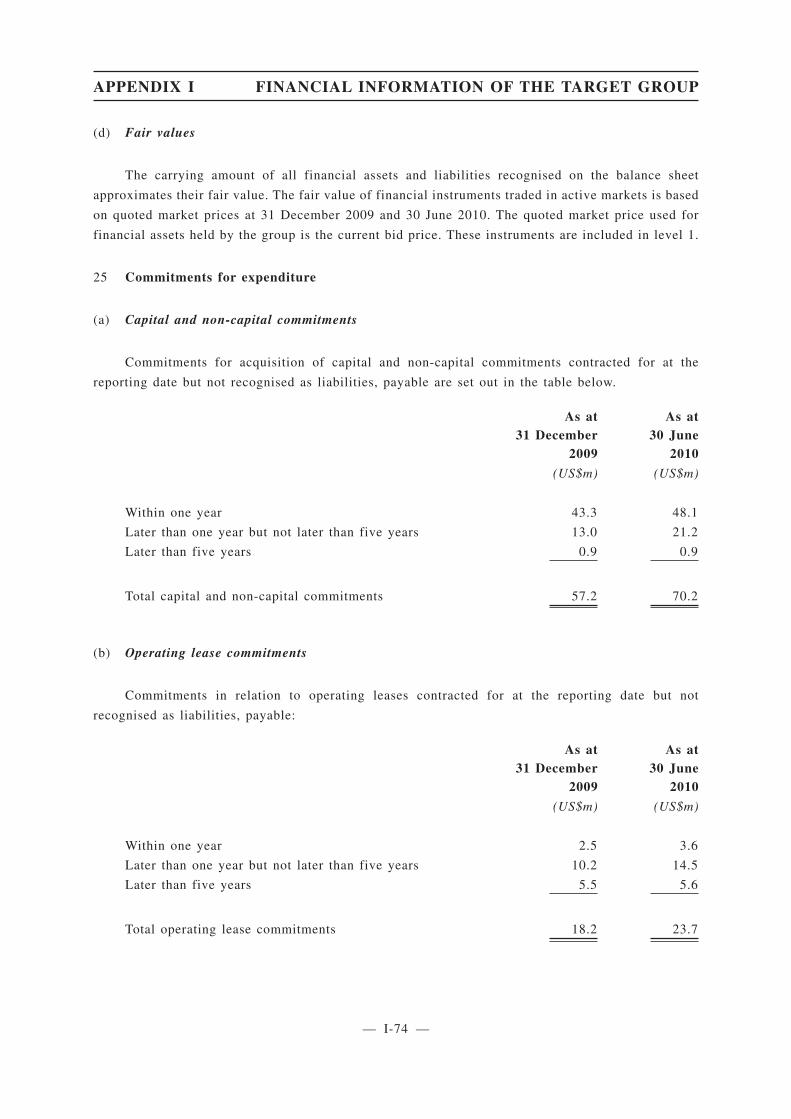
(d) Fair values
The carrying amount of all financial assets and liabilities recognised on the balance sheet
approximates their fair value. The fair value of financial instruments traded in active markets is based
on quoted market prices at 31 December 2009 and 30 June 2010. The quoted market price used for
financial assets held by the group is the current bid price. These instruments are included in level 1.
25 Commitments for expenditure
(a) Capital and non-capital commitments
Commitments for acquisition of capital and non-capital commitments contracted for at the
reporting date but not recognised as liabilities, payable are set out in the table below.
As at31 December
2009
As at30 June
2010
(US$m) (US$m)
Within one year 43.3 48.1
Later than one year but not later than five years 13.0 21.2
Later than five years 0.9 0.9
Total capital and non-capital commitments 57.2 70.2
(b) Operating lease commitments
Commitments in relation to operating leases contracted for at the reporting date but not
recognised as liabilities, payable:
As at31 December
2009
As at30 June
2010
(US$m) (US$m)
Within one year 2.5 3.6
Later than one year but not later than five years 10.2 14.5
Later than five years 5.5 5.6
Total operating lease commitments 18.2 23.7
APPENDIX I FINANCIAL INFORMATION OF THE TARGET GROUP
— I-74 —
26 Contingent liabilities
The Target Company and its subsidiaries are defendants from time to time in legal proceedings
arising from the conduct of their businesses. The Target Group does not consider that the outcome of
any of these proceedings ongoing at reporting date, either individually or in aggregate, is likely to
have a material effect on its financial position. Where appropriate, provisions have been made.
Certain bank guarantees have been provided in connection with the operations of certain of the
subsidiaries of the Target Company, primarily associated with the terms of mining leases or
exploration licences. At the end of the period, no claims have been made under these guarantees. The
amount of these guarantees may vary from time to time depending upon the requirements of the
relevant regulatory authority. These guarantees amount to US$95.4 million and US$89.8 million as at
31 December 2009 and 30 June 2010 respectively. Provision is made in the financial information for
the anticipated costs of the mine rehabilitation obligations under the mining leases and exploration
licences (please refer to Note 19).
27 Related parties
(a) Holding companies
The immediate holding company of the Target Company is Album Enterprises Limited, a
company incorporated in Hong Kong. The intermediate holding company of the Company is China
Minmetals Non-Ferrous Metals Company Limited, a company incorporated in the PRC and the
ultimate holding company is China Minmetals Corporation, a company incorporated in the PRC. China
Minmetals Corporation is a state-owned enterprise and is controlled by the PRC Government.
(b) Subsidiaries
The Company’s interest in subsidiaries is set out in Note 15.
APPENDIX I FINANCIAL INFORMATION OF THE TARGET GROUP
— I-75 —
(c) Key management personnel remuneration
The key management personnel remuneration for the Target Group were as follows:
Period ended31 December
2009
Period ended30 June
2009
Period ended30 June
2010
US$ US$ US$
(unaudited)
Short-term employee benefits 3,678,196 315,360 3,914,123
Other long-term benefits (ii) 358,465 51,207 69,956
Post-employment benefits 28,844 2,753 63,656
Total 4,065,505 369,320 4,047,735
(i) During the periods, no Director has entered into a material contract with the Target Group and there were no
material contracts involving directors’ interests existing at 31 December 2009 and 30 June 2010.
(ii) Other long-term benefits does not include the Long Term Incentive Plan (“LTIP”) payable to key management
personnel for the periods ended 31 December 2009 and 30 June 2010 as the amount payable could not be reliably
estimated at the reporting date. The performance conditions relevant to the 2010 financial period are expected to
be assessed in 2010 and if the conditions are met an amount will be paid to key management personnel after the
performance period ends on 30 June 2011. Amounts payable to key management personnel for the 2010 financial
period will be included in key management personnel remuneration in future periods.
(d) Transactions with related parties
A number of key management persons, or their related parties, hold positions in other entities
that result in them having control or significant influence over the financial or operating policies of
those entities. A number of these entities transacted with the Target Group during the reporting period.
The terms and conditions of the transactions with key management personnel and their related parties
were no more favourable than those available, or which might reasonably be expected to be available,
on similar transactions to non-key management personnel related entities on an arm’s length basis,
excluding the loan from related parties.
APPENDIX I FINANCIAL INFORMATION OF THE TARGET GROUP
— I-76 —
Transactions between the Target Group and other entities within China Minmetals Corporation
group during the period consisted of:
As at31 December
2009
As at30 June
2010
(US$m) (US$m)
Receivables from related parties (i) 13 1.4 3.8
Deposits held with intermediate parent 12 — 200.0
Period ended31 December
2009
Period ended30 June
2010
(US$m) (US$m)
Sales of goods to related parties
Sales of goods to fellow subsidiaries (ii) 5 26.9 63.5
(i) Receivables from other related parties relates to amounts payable by the intermediate holding company, China
Minmetals Non-Ferrous Metals Company Limited, in relation to sales of concentrates as summarised in (ii) below.
(ii) Sales of goods to fellow subsidiaries relates to the sales of concentrates between the Target Group and the ultimate
holding company, China Minmetals Non-Ferrous Metals Company Limited.
28 Events occurring after reporting date
There have been no other events that have occurred subsequent to the reporting date which have
significantly affected or may significantly affect the Target Group’s operations, results or state of
affairs in future years.
29 Earnings per share
No earnings per share information is presented as its inclusion, for the purpose of this
accountant’s report, is not considered meaningful.
APPENDIX I FINANCIAL INFORMATION OF THE TARGET GROUP
— I-77 —
30 Loss attributable to equity holders of the Target Company
The loss attributable to equity holders of the Target Company is dealt with in the financial
statements of the Target Company are as follows:
Period ended31 December
2009
Period ended30 June
2009
Period ended30 June
2010(US$m) (US$m) (US$m)
(unaudited)
Loss attributable to equity holders 0.4 — 0.5
31 Directors’ and senior management emoluments
(a) Directors’ Emoluments
The remuneration of every director is set out below:
Name of Director Fees SalariesOther
benefits (v)Discretionary
Bonuses TotalUS$’000 US$’000 US$’000 US$’000 US$’000
For the period ended31 December 2009
ZHOU Zhongshu (i) — — — — —CASSIDY Peter (i) 81.7 — — — 81.7WANG Lixin (i) — — — — —MICHELMORE
Andrew (ii) — 954.8 63.3 469.0 1,487.1XU Jiqing (i) — — — — —JIAN Jiao (i) — — — — —LI Fuli (iii) — — — — —LIU Mark (ii) — 280.0 10.1 109.8 399.9TIONG Eric Hin Won (iv) — — — — —GEOK Patricia
Neo Seet (ii) — — — — —
81.7 1,234.8 73.4 578.8 1,968.7
APPENDIX I FINANCIAL INFORMATION OF THE TARGET GROUP
— I-78 —
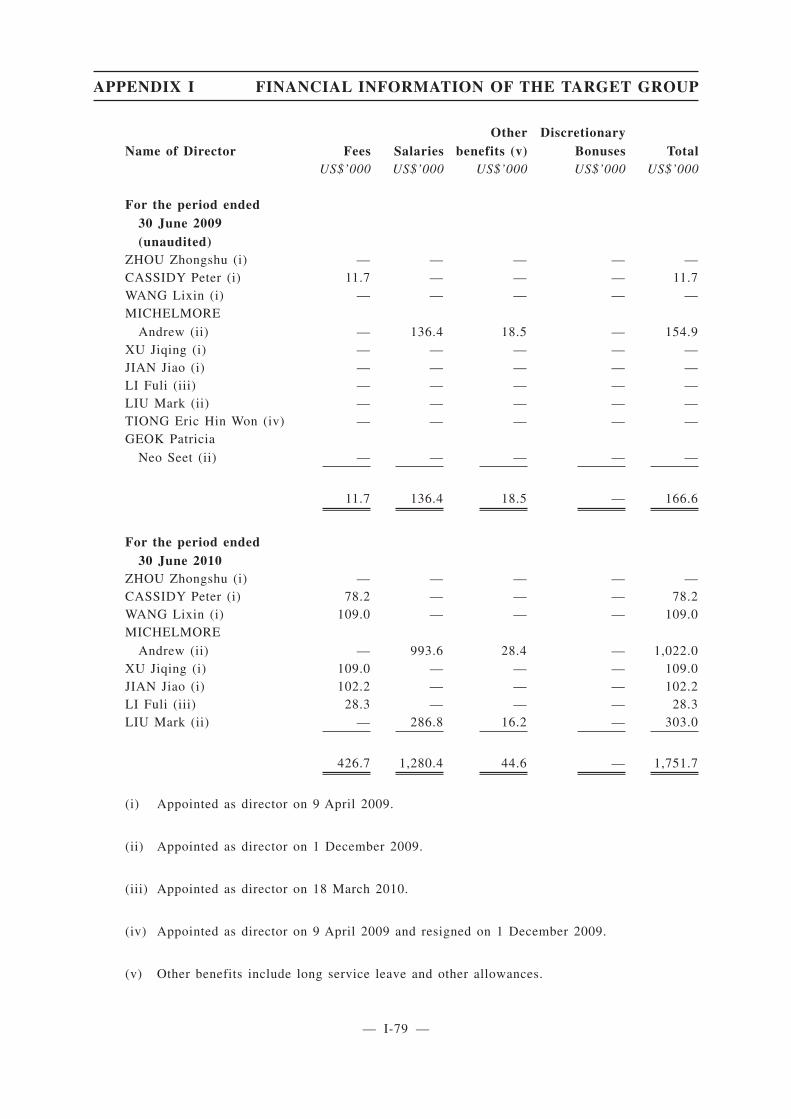
Name of Director Fees SalariesOther
benefits (v)Discretionary
Bonuses TotalUS$’000 US$’000 US$’000 US$’000 US$’000
For the period ended30 June 2009(unaudited)
ZHOU Zhongshu (i) — — — — —CASSIDY Peter (i) 11.7 — — — 11.7WANG Lixin (i) — — — — —MICHELMORE
Andrew (ii) — 136.4 18.5 — 154.9XU Jiqing (i) — — — — —JIAN Jiao (i) — — — — —LI Fuli (iii) — — — — —LIU Mark (ii) — — — — —TIONG Eric Hin Won (iv) — — — — —GEOK Patricia
Neo Seet (ii) — — — — —
11.7 136.4 18.5 — 166.6
For the period ended30 June 2010
ZHOU Zhongshu (i) — — — — —CASSIDY Peter (i) 78.2 — — — 78.2WANG Lixin (i) 109.0 — — — 109.0MICHELMORE
Andrew (ii) — 993.6 28.4 — 1,022.0XU Jiqing (i) 109.0 — — — 109.0JIAN Jiao (i) 102.2 — — — 102.2LI Fuli (iii) 28.3 — — — 28.3LIU Mark (ii) — 286.8 16.2 — 303.0
426.7 1,280.4 44.6 — 1,751.7
(i) Appointed as director on 9 April 2009.
(ii) Appointed as director on 1 December 2009.
(iii) Appointed as director on 18 March 2010.
(iv) Appointed as director on 9 April 2009 and resigned on 1 December 2009.
(v) Other benefits include long service leave and other allowances.
APPENDIX I FINANCIAL INFORMATION OF THE TARGET GROUP
— I-79 —
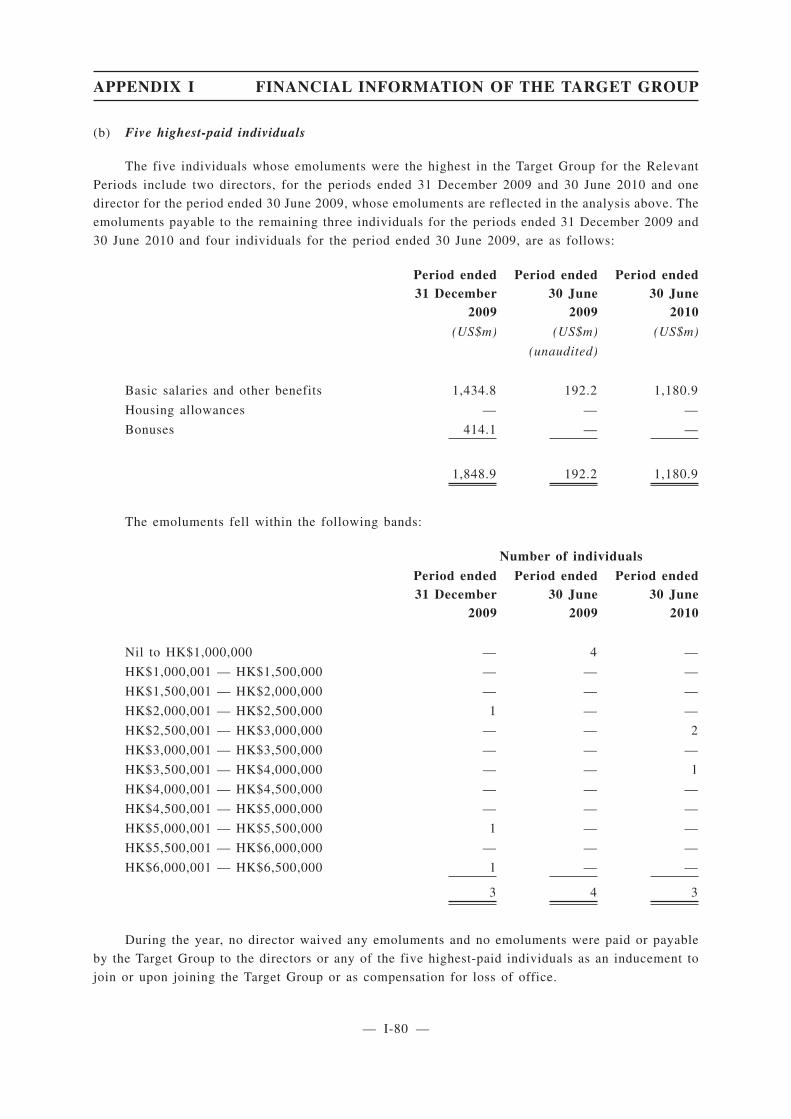
(b) Five highest-paid individuals
The five individuals whose emoluments were the highest in the Target Group for the Relevant
Periods include two directors, for the periods ended 31 December 2009 and 30 June 2010 and one
director for the period ended 30 June 2009, whose emoluments are reflected in the analysis above. The
emoluments payable to the remaining three individuals for the periods ended 31 December 2009 and
30 June 2010 and four individuals for the period ended 30 June 2009, are as follows:
Period ended31 December
2009
Period ended30 June
2009
Period ended30 June
2010
(US$m) (US$m) (US$m)
(unaudited)
Basic salaries and other benefits 1,434.8 192.2 1,180.9
Housing allowances — — —
Bonuses 414.1 — —
1,848.9 192.2 1,180.9
The emoluments fell within the following bands:
Number of individuals
Period ended31 December
2009
Period ended30 June
2009
Period ended30 June
2010
Nil to HK$1,000,000 — 4 —
HK$1,000,001 — HK$1,500,000 — — —
HK$1,500,001 — HK$2,000,000 — — —
HK$2,000,001 — HK$2,500,000 1 — —
HK$2,500,001 — HK$3,000,000 — — 2
HK$3,000,001 — HK$3,500,000 — — —
HK$3,500,001 — HK$4,000,000 — — 1
HK$4,000,001 — HK$4,500,000 — — —
HK$4,500,001 — HK$5,000,000 — — —
HK$5,000,001 — HK$5,500,000 1 — —
HK$5,500,001 — HK$6,000,000 — — —
HK$6,000,001 — HK$6,500,000 1 — —
3 4 3
During the year, no director waived any emoluments and no emoluments were paid or payable
by the Target Group to the directors or any of the five highest-paid individuals as an inducement to
join or upon joining the Target Group or as compensation for loss of office.
APPENDIX I FINANCIAL INFORMATION OF THE TARGET GROUP
— I-80 —
(c) Employees and Remuneration Policy
As at 30 June 2010 MMG employed 3,141 direct employees and 3,011 external contractors across
all operations.
MMG remuneration philosophy is to provide appropriately competitive remuneration to attract
and retain high quality executive talent to achieve its business objectives. MMG remuneration policy
is reviewed periodically and has been developed to enhance the alignment of business strategy with
shareholder value creation over the short, medium, and long term.
III. SUBSEQUENT FINANCIAL STATEMENTS
No audited financial statements have been prepared for the Target Company or any of its
subsidiaries in respect of any period subsequent to 30 June 2010. In addition, no dividend of
distribution has been declared, made or paid by the Target Company or any of its subsidiaries in
respect of any period subsequent to 30 June 2010.
Yours faithfully,
PricewaterhouseCoopersCertified Public Accountants
Hong Kong
APPENDIX I FINANCIAL INFORMATION OF THE TARGET GROUP
— I-81 —
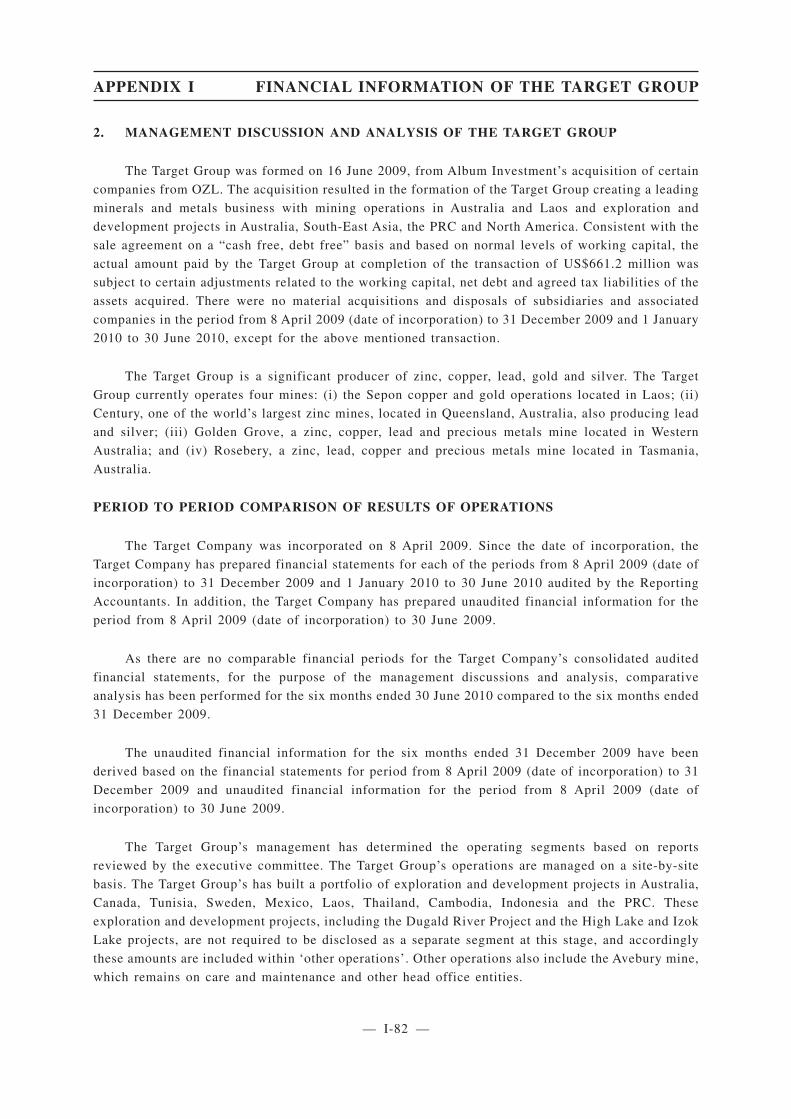
2. MANAGEMENT DISCUSSION AND ANALYSIS OF THE TARGET GROUP
The Target Group was formed on 16 June 2009, from Album Investment’s acquisition of certain
companies from OZL. The acquisition resulted in the formation of the Target Group creating a leading
minerals and metals business with mining operations in Australia and Laos and exploration and
development projects in Australia, South-East Asia, the PRC and North America. Consistent with the
sale agreement on a “cash free, debt free” basis and based on normal levels of working capital, the
actual amount paid by the Target Group at completion of the transaction of US$661.2 million was
subject to certain adjustments related to the working capital, net debt and agreed tax liabilities of the
assets acquired. There were no material acquisitions and disposals of subsidiaries and associated
companies in the period from 8 April 2009 (date of incorporation) to 31 December 2009 and 1 January
2010 to 30 June 2010, except for the above mentioned transaction.
The Target Group is a significant producer of zinc, copper, lead, gold and silver. The Target
Group currently operates four mines: (i) the Sepon copper and gold operations located in Laos; (ii)
Century, one of the world’s largest zinc mines, located in Queensland, Australia, also producing lead
and silver; (iii) Golden Grove, a zinc, copper, lead and precious metals mine located in Western
Australia; and (iv) Rosebery, a zinc, lead, copper and precious metals mine located in Tasmania,
Australia.
PERIOD TO PERIOD COMPARISON OF RESULTS OF OPERATIONS
The Target Company was incorporated on 8 April 2009. Since the date of incorporation, the
Target Company has prepared financial statements for each of the periods from 8 April 2009 (date of
incorporation) to 31 December 2009 and 1 January 2010 to 30 June 2010 audited by the Reporting
Accountants. In addition, the Target Company has prepared unaudited financial information for the
period from 8 April 2009 (date of incorporation) to 30 June 2009.
As there are no comparable financial periods for the Target Company’s consolidated audited
financial statements, for the purpose of the management discussions and analysis, comparative
analysis has been performed for the six months ended 30 June 2010 compared to the six months ended
31 December 2009.
The unaudited financial information for the six months ended 31 December 2009 have been
derived based on the financial statements for period from 8 April 2009 (date of incorporation) to 31
December 2009 and unaudited financial information for the period from 8 April 2009 (date of
incorporation) to 30 June 2009.
The Target Group’s management has determined the operating segments based on reports
reviewed by the executive committee. The Target Group’s operations are managed on a site-by-site
basis. The Target Group’s has built a portfolio of exploration and development projects in Australia,
Canada, Tunisia, Sweden, Mexico, Laos, Thailand, Cambodia, Indonesia and the PRC. These
exploration and development projects, including the Dugald River Project and the High Lake and Izok
Lake projects, are not required to be disclosed as a separate segment at this stage, and accordingly
these amounts are included within ‘other operations’. Other operations also include the Avebury mine,
which remains on care and maintenance and other head office entities.
APPENDIX I FINANCIAL INFORMATION OF THE TARGET GROUP
— I-82 —
14.67(7)
App 16 32(5)

The following table shows a breakdown of the Target Group’s revenue and profit/(loss) before
net financing income/(expenses) by segment for the six months ended 30 June 2010 and 31 December
2009.
Centurymine
(US$m)
Seponmines
(US$m)
GoldenGrovemines
(US$m)
Roseberymine
(US$m)
Otheroperations
(US$m)Total
(US$m)
For the six months ended30 June 2010
Sales revenue 257.1 308.7 182.0 96.9 — 844.7
Profit/(loss) before net
financing
(expenses)/income 45.9 182.6 63.6 23.2 (35.4) 279.9
For the six months ended31 December 2009
Sales revenue 221.1 251.9 152.6 122.0 — 747.6
(Loss)/profit before net
financing
(expenses)/income (1.2) 130.5 54.4 43.9 (56.3) 171.3
The following discussion and analysis of the financial information and results of operation of the
Target Group should be read in conjunction with the financial statements and information set forth in
this appendix.
SIX MONTHS ENDED 30 JUNE 2010 COMPARED TO SIX MONTHS ENDED 31 DECEMBER2009
Revenue
The Target Group generated revenue of US$844.7 million in the six months ended 30 June 2010
compared to US$747.6 million in the six months ended 31 December 2009, an increase of 13.0%.
The increase is primarily due to increase in zinc, lead and gold production offset by slight
decrease in copper production. The Target Group produced 318kt of zinc in concentrate, 15kt of
copper in concentrate, 34kt of copper cathode, 26kt of lead in concentrate and 92koz of gold in the
six months ended 30 June 2010 compared to 219kt of zinc in concentrate, 17kt of copper in
concentrate, 34kt of copper cathode, 21kt of lead in concentrate and 84koz of gold in the six months
ended 31 December 2009.
During 2009, a failure in the pipeline between the Century mine located at Lawn Hill and the port
facilities located at Karumba necessitated an 11 weeks production shutdown, with zinc production
impacted as a result. During this shutdown, mining operations continued to successfully stockpile
APPENDIX I FINANCIAL INFORMATION OF THE TARGET GROUP
— I-83 —
nearly 1,080,000 tonnes of ore. As a result, when production recommenced on 23 December 2009, the
concentrator was able to ramp back up to full capacity in a number of days. Expenses of US$54.8
million (US$38.3 million after tax) were incurred during 2009 in relation to the Century pipeline
failure.
Cost of goods sold
The Target Group cost of goods sold in the six months ended 30 June 2010 amounted to
US$333.5 million, an increase of 10.0% from US$303.2 million in the six months ended 31 December
2009. The increase was primarily due to growth in the production levels which resulted in an increase
in employee expenses by US$12.0 million, contracting and consulting expenses by US$10.8 million,
energy costs by US$9.2 million and stores and consumable costs by US$6.9 million, offset by increase
in inventories by US$11.2 million.
Depreciation and amortisation expenses
Depreciation expenses decreased by 7.5% from US$134.1 million in the six months ended 31
December 2009 to US$124.0 million in the six months ended 30 June 2010. This movement is based
on a shift in the life of the mines.
Freight expenses
Freight expenses decreased by 28.5% from US$49.4 million in the six months ended 31
December 2009 to US$35.3 million in the six months ended 30 June 2010. The decrease is due to
decrease in freight rate, offset by higher quantity shipped.
Other expenses
Other expenses decreased by 15.7% from US$90.3 million in the six months ended 31 December
2009 to US$76.1 million in the six months ended 30 June 2010. The decrease is due to decrease in
operating lease expenses by US$7.2 million and decrease in other expenses by US$7.0 million.
Financing expenses
Financing expenses increased from US$12.7 million in the six months ended 31 December 2009
to US$23.4 million in the six months ended 30 June 2010. The increase is primarily due to a foreign
exchange loss of US$7.4 million in the six months ended 30 June 2010 compared to a foreign exchange
gain of US$6.4 million in the six months ended 31 December 2009, offset by a lower interest expenses
on borrowings due to lower effective interest rate in the six months ended 30 June 2010.
Profit before income tax
As a result of the changes in the items described above, The Target Group’s profit before income
tax increased by 61.7% from US$158.6 million in the six months ended 31 December 2009 to
US$256.5 million in the six months ended 30 June 2010.
APPENDIX I FINANCIAL INFORMATION OF THE TARGET GROUP
— I-84 —
Income tax expenses/benefits
The Target Group had a US$22.5 million income tax expense in the six months ended 30 June
2010, which included a credit of US$61.5 million for previously unrecognised deferred tax assets.
This compares to a US$12.9 million income tax benefit in the six months ended 31 December 2009,
which included a credit of US$54.2 million for previously unrecognised deferred tax assets.
Profit after tax
The Target Group profit after tax increased 36.4% from US$171.5 million in the six months
ended 31 December 2009 to US$234.0 million in the six months ended 30 June 2010.
SEGMENTAL ANALYSIS
Century mine
For the six months ended 30 June 2010, Century mine accounted for approximately 30.4% of the
Target Group’s revenue compared to approximately 29.6% for the six months ended 31 December
2009.
Century mine recorded profit before net financing (expenses)/income of US$45.9 million in the
six months ended 30 June 2010 compared to a loss before net financing (expenses)/income of US$1.2
million in the six months ended 31 December 2009.
Century mine produced 238kt of zinc in concentrate and 11kt of lead in concentrate in the six
months ended 30 June 2010 compared 137kt of zinc in concentrate and 5kt of lead in concentrate
produced in the six months ended 31 December 2009.
Sepon mines
For the six months ended 30 June 2010, Sepon mines accounted for approximately 36.6% of the
Target Group’s revenue compared to approximately 33.7% for the six months ended 31 December
2009.
Sepon mines recorded profit before net financing (expenses)/income of US$182.6 million in the
six months ended 30 June 2010, an increase of approximately 40% compared to profit before net
financing (expenses)/income of US$130.5 million in the six months ended 31 December 2009.
Sepon mines produced 34kt of copper cathode and 55koz of gold in the six months ended 30 June
2010 compared 34kt of copper cathode and 49koz of gold in the six months ended 31 December 2009.
Golden Grove mines
For the six months ended 30 June 2010, Golden Grove mines accounted for approximately 21.5%
of the Target Group’s revenue compared to approximately 20.4% for the six months ended 31
December 2009.
APPENDIX I FINANCIAL INFORMATION OF THE TARGET GROUP
— I-85 —
App 1632(6)
Golden Grove mines recorded profit before net financing (expenses)/income of US$63.6 million
in the six months ended 30 June 2010, an increase of approximately 17% compared to profit before
net financing (expenses)/income of US$54.4 million in the six months ended 31 December 2009.
Golden Grove mines produced 44kt of zinc in concentrate, 14kt of copper in concentrate and
22koz of gold in the six months ended 30 June 2010 compared 36kt of zinc in concentrate, 16kt of
copper in concentrate and 16koz of gold produced in the six months ended 31 December 2009.
Rosebery mine
For the six months ended 30 June 2010, Rosebery mine accounted for approximately 11.5% of
the Target Group’s revenue compared to approximately 16.3% for the six months ended 31 December
2009.
Rosebery mine recorded profit before net financing (expenses)/income of US$23.2 million in the
six months ended 30 June 2010, a decrease of approximately 47% compared to profit before net
financing (expenses)/income of US$43.9 million in the six months ended 31 December 2009.
Rosebery mine produced 36kt of zinc in concentrate, 10kt of lead in concentrate and 15koz gold
in the six months ended 30 June 2010 compared 46kt of zinc in concentrate, 14kt of lead in concentrate
and 19koz of gold produced in the six months ended 31 December 2009.
LIQUIDITY AND CAPITAL RESOURCES
In the six months ended 30 June 2010 and the six months ended 31 December 2009, the Target
Group’s principal source of liquidity was cash generated from operating activities. The Target Group
may use funding from future debt financing, equity financing and cash generated from operating
activities for the provision of working capital, general exploration and development activities.
The Target Group had cash and cash equivalents of US$334.5 million as at 30 June 2010 and
US$251.3 million as at 31 December 2009.
The following table presents selected cash flow data from The Target Group’s cash flow
statements for the six months ended 30 June 2010 and the six months ended 31 December 2009.
Six months ended
Cash flows30 June
201031 December
2009
(US$m) (US$m)
(unaudited)
Cash generated from operating activities 334.5 293.4
Cash used in investing activities (218.2) (113.9)
Cash used in financing activities (28.0) (18.2)
APPENDIX I FINANCIAL INFORMATION OF THE TARGET GROUP
— I-86 —
App1632(1)
App 1632(9)
Operating activities
The net cash flows generated from operating activities in the six months ended 30 June 2010
amounted to US$334.5 million, attributable to receipts from customers of US$908.9 million, offset by
payment to suppliers and employees of US$516.9 million and tax payment amounted to US$57.5
million.
The net cash flows generated from operating activities in the six months ended 31 December
2009 amounted to US$293.4 million, attributable to receipts from customers of US$671.2 million,
offset by payment to suppliers and employees of US$377.8 million.
Investing activities
The net cash flows used in investing activities in the six months ended 30 June 2010 amounted
to US$218.2 million, primarily attributable to payment for plant and equipment of US$120.6 million
and payment for available-for-sale financial assets of US$100.2 million. The available-for-sale
financial assets represent equity securities listed outside Hong Kong and had a market value of
US$94.2 million as at 30 June 2010. There was no material change in the fair value of the
available-for-sale financial assets in the six months ended 30 June 2010. Other than the
available-for-sale financial assets, the Target Group had no other significant investment as at 30 June
2010.
The net cash flows used in investing activities in the six months ended 31 December 2009
amounted to US$113.9 million, primarily attributable to payment for plant and equipment of US$117.0
million. The Target Group had no significant available-for-sale financial assets or investments as at
31 December 2009.
Financing activities
The net cash flows used in financing activities in the six months ended 30 June 2010 amounted
to US$28.0 million, primarily attributable to dividend paid to non-controlling interest of US$14.4
million and financing costs and interest paid of US$11.9 million.
The net cash flows used in financing activities in the six months ended 31 December 2009
amounted to US$18.2 million, primarily attributable to financing costs and interest paid of US$13.6
million.
As at 30 June 2010, the Target Group was in a net debt position of approximately US$765.8
million, representing total interest bearing liabilities of approximately US$1,100.3 million and cash
and cash equivalents of US$334.5 million. This compares to a net debt position of approximately
US$850.6 million as at 31 December 2009, representing interest bearing liabilities of approximately
US$1,101.9 million and cash and cash equivalents of US$251.3 million. The Target Group’s gearing
ratio, which is the ratio of total interest-bearing liabilities to the total assets was approximately 47.2%.
and 51.9% as at 30 June 2010 and 31 December 2009, respectively.
APPENDIX I FINANCIAL INFORMATION OF THE TARGET GROUP
— I-87 —
App 1632(4)
App 1632 (10)
The Target Group’s cash and cash equivalents, amounting to US$334.5 million as at 30 June
2010, were mainly denominated in US dollars (60.7%) and Australian dollars (38.4%). The Target
Group’s cash and cash equivalents, amounting to US$251.3 million as at 31 December 2009, were
mainly denominated in US dollars (49.5%) and Australian dollars (49.7%).
As at 30 June 2010, the Target Group had net current assets of US$490.9 million, consisting of
US$721.0 million of current assets and US$230.1 million of current liabilities, which represented an
increase of US$189.7 million from 31 December 2009. This increase was mainly due to increase in
current assets from cash flow generated during the six months ended 30 June 2010. Current ratio
increased from 2.3 as at 31 December 2009 to 3.1 as at 30 June 2010.
INDEBTEDNESS
As at 30 June 2010, The Target Group’s total outstanding interest-bearing liabilities amounted
to US$1,100.3 million, consisting of US$1,095.0 million of external loans and US$5.3 million of lease
liabilities. As at 31 December 2009, the Target Group’s total outstanding interest-bearing liabilities
amounted to US$1,101.9 million, consisting of US$1,095.0 million of external loans and US$6.0
million of lease liabilities and US$0.9 million of other loans. All of the Target Group’s outstanding
interest-bearing liabilities are denominated in US dollars.
The bank loans of the Target Group and Album Enterprises are secured by guarantees from the
intermediate holding company of the Target Group, CMN.
Interest bearing liabilities include an external borrowing of US$200.0 million which is secured
by a share charge to the lender of 100 per cent of the shares held in the Target Group’s wholly owned
subsidiary, Album Investment, a mortgage over 70 per cent of the shares in certain subsidiaries of
Album Investment and a mortgage over 70 per cent of shares in MMG Laos Holdings Limited.
As at 30 June 2010 and 31 December 2009, all of the Target Group’s external bank loans were
in floating rates and approximately 68.6% were repayable between two and five years and
approximately 31.4% were repayable after five years.
The Target Group leases various plant and equipment under finance leases with a carrying
amount of US$5.3 million and US$6.0 million as at 30 June 2010 and 31 December 2009, respectively,
expiring within five years.
APPENDIX I FINANCIAL INFORMATION OF THE TARGET GROUP
— I-88 —
App 1632(2)

COMMITMENTS FOR EXPENDITURE
(a) Capital and non-capital commitments
Commitments for acquisition of capital and non-capital commitments contracted for as at 30 June
2010 and 31 December 2009 but not recognised as liabilities, payable are set out in the table below.
As at 30 June2010
As at 31December
2009
(US$m) (US$m)
Within one year 48.1 43.3
Later than one year but not later than five years 21.2 13.0
Later than five years 0.9 0.9
Total capital and non-capital commitments 70.2 57.2
(b) Operating lease commitments
Commitments in relation to operating leases contracted for as at 30 June 2010 and 31 December
2009 but not recognised as liabilities, payable:
As at 30 June2010
As at 31December
2009
(US$m) (US$m)
Within one year 3.6 2.5
Later than one year but not later than five years 14.5 10.2
Later than five years 5.6 5.5
Total operating lease commitments 23.7 18.2
As at 31 December 2009 and 30 June 2010, in addition to the capital and non-capital
commitments and operating lease commitments described above, the Target Group has future funding
requirements for the exploration and development initiatives of the Target Group’s projects, including,
but not limited to, the development of the Dugald River zinc project located in Queensland, Australia
(which is in the final stages of a feasibility study and has an estimated pre-production capital cost of
approximately US$790 million) and the other exploration initiatives of the Target Group. The Target
Group may use debt financing, equity financing and cash generated from operating activities for
funding the exploration and development initiatives of the Target Group’s projects.
APPENDIX I FINANCIAL INFORMATION OF THE TARGET GROUP
— I-89 —
App 1632(9)
CONTINGENT LIABILITIES
The Target Group and its subsidiaries are defendants from time to time in legal proceedings
arising from the conduct of their businesses. The Target Group does not consider that the outcome of
any of these proceedings ongoing as at 30 June 2010 and 31 December 2009, either individually or
in aggregate, is likely to have a material effect on its financial position. Where appropriate, provisions
have been made.
CHARGE ON ASSETS
Certain bank guarantees primarily associated with the terms of mining leases or exploration
licences have been provided in connection with the operations of the Target Group. As at 30 June 2010
and 31 December 2009, no claims have been made under these guarantees. The amount of these
guarantees may vary from time to time depending upon the requirements of the relevant regulatory
authority. These guarantees amount to US$89.8 million and US$95.4 million as at 30 June 2010 and
31 December 2009, respectively.
Interest bearing liabilities include an external borrowing of US$200.0 million which is secured
by a share charge to the lender of 100 per cent of the shares of Album Investment, a mortgage over
70 per cent of the shares in certain subsidiaries of Album Investment and a mortgage over 70 per cent
of shares in MMG Laos Holdings Limited.
FINANCIAL RISKS MANAGEMENT
The Target Group’s activities expose it to a variety of financial risks such as:
• Market risk consisting of commodity price risk, foreign currency exchange risk and interest
rate risk;
• Credit risk; and
• Liquidity risk.
Financial risk management is carried out by the Target Group’s treasury function under policies
approved by the board of directors. The Target Group’s treasury identifies, evaluates and manages
financial risks in close co-operation with the Target Group’s operating units. The board approves
written principles for overall risk management, as well as policies covering specific areas, such as
those identified above.
(a) Market risk
The Target Group’s activities expose the group primarily to financial risks of changes in
commodity prices, foreign currency exchange rates and interest rates. The Target Group uses a
combination of sensitivity analysis and cash flow forecasting to assess these risks which are regularly
reported to the executive committee of the Target Group.
APPENDIX I FINANCIAL INFORMATION OF THE TARGET GROUP
— I-90 —
App 1632(12)
App 1632(8)
App 1632(11)
(i) Commodity price risk
The Target Group is exposed to commodity price volatility on commodity sales made by the
mines. This arises from sale of metal and metal in concentrate products such as zinc, copper, lead, gold
and silver, which are priced on, or benchmarked to, open market exchanges. The Target Group
generally believes commodity price hedging would not provide long-term benefit to its shareholders.
There are no commodity hedges in place as at 30 June 2010 and 31 December 2009.
(ii) Foreign currency exchange risk
The Target Group operates internationally and is exposed to foreign currency exchange risk. The
Target Group’s reporting currency and functional currency of the majority of subsidiaries with the
Target Group is US dollars. The majority of revenues received by the Target Group are US dollars. The
Target Group’s foreign currency exchange risk arises predominantly from the currency in which the
Target Group’s mines are located. The Australian dollar is the most important currency (apart from the
US dollar) influencing costs.
Under normal market conditions, the Target Group does not believe that active currency hedging
of transactions would provide long-term benefit to shareholders. The Target Group tries to minimise
these exposures through natural hedges wherever possible. For instance, the majority of external debt
and surplus cash is denominated in US dollars. A portion of cash may be held in Australian dollars to
meet operating costs.
The long-term relationship between commodity prices and the currencies of the countries where
the Target Group operates provides a degree of natural protection. However, the Target Group may
choose to hedge large foreign currency exposures such as capital expenditure, dividends or tax
payments. Foreign currency spot deals are used to meet Australian dollar requirements and are
reported monthly to the executive committee of the Target Group.
There were no foreign exchange derivatives outstanding as at 30 June 2010 and 31 December
2009.
(iii) Interest rate risk
The Target Group is exposed to interest rate volatility on deposits and borrowings. Deposits and
borrowings at variable rates expose the Target Group to cash flow interest rate risk. Deposits and
borrowings at fixed rates expose the Target Group to fair value interest rate risk. Any decision to
hedge interest rate risk is assessed at the inception of each floating rate debt facility in light of the
overall Target Group’s exposure, the prevailing interest rate market and any funding counterparty
requirements.
It is the Target Group’s preference to borrow and invest at floating rates of interest. This
approach is based on historical correlation between interest rates and commodity prices. As at 30 June
2010 and 31 December 2009, all of the Target Group’s debt was floating rate debt. The interest charged
on floating rate debt is based on the relevant national inter-bank rates and repriced at least
semi-annually. Monthly reporting is provided to the executive committee of the Target Group, which
summarises the Target Group’s debt and interest rates.
APPENDIX I FINANCIAL INFORMATION OF THE TARGET GROUP
— I-91 —
(b) Credit risk
Credit risk refers to the risk that counterparty will default on its contractual obligations resulting
in financial loss to the Target Group. The Target Group is exposed to counterparty credit risk through
sales of metal products on normal terms of trade, through deposits of cash and settlement risk on
foreign exchange transactions.
The credit risk on investments in cash, short-term deposits and similar assets are with approved
counterparty banks and the intermediate holding company. Counterparties are assessed prior to, during
and after the conclusion of transactions to ensure exposure to credit risk is limited to acceptable
levels. The limits are set to minimise the concentration of risks and therefore mitigate the potential
for financial loss through counterparty failure.
Credit risk arising from sales to large concentrate customers are managed by contracts that
stipulate a provisional payment of at least 90 per cent of the estimated value of each sale. This is
payable either promptly after vessel loading or upon vessel arriving at the discharge port. Title to the
concentrate does not pass to the buyer until this provisional payment is made. For most sales a second
provisional payment is received within 60 days of the vessel arriving at the port of discharge. Final
payment is recorded after completion of the quotation period and assaying.
(c) Liquidity risk
Liquidity risk is the risk that the Target Group will encounter difficulty in meeting obligations
associated with financial liabilities.
Management utilise both short and long-term cash flow forecasts and other consolidated
information to ensure appropriate liquidity buffers are maintained to support the Target Group’s
activities.
HUMAN RESOURCES
As at 30 June 2010, the Target Group employed 3,141 direct employees and 3,011 external
contractors across all operations as compared to 2,843 direct employees and 1,829 external contractors
as at 31 December 2009.
The Target Group’s remuneration philosophy is to provide appropriately competitive
remuneration to attract and retain high quality executive talent to achieve its business objectives. The
Target Group’s remuneration policy is reviewed periodically and has been developed to enhance the
alignment of business strategy with shareholder value creation over the short, medium, and long term.
The Target Group recorded total employee benefit expenses and contracting and consulting
expenses of US$138.3 million in the six months ended 30 June 2010 compared to US$115.5 million
in the six months ended 31 December 2009.
APPENDIX I FINANCIAL INFORMATION OF THE TARGET GROUP
— I-92 —
App 1632(7)

1. INTRODUCTION
The following financial information is extracted from the unaudited consolidated financial
information of the Group for the six months ended 30 June 2010 and the audited consolidated financial
statements of the Group for each of the three years ended 31 December 2007, 2008 and 2009 together
with the relevant notes to the financial statements, which are incorporated by reference in this circular.
They could be found in the interim report and the annual reports of the Company published with the
title “Interim Report 2010” dated 6 September 2010 from pages 24 to 50, “Annual Report 2007” dated
11 April 2008 from pages 49 to 132, “Annual Report 2008” dated 20 April 2009 from pages 47 to 134
and “Annual Report 2009” dated 20 April 2010 from pages 50 to 140, all of which have been published
on the website of the Stock Exchange (www.hkexnews.hk) and the website of the Company
(www.minmetalsresources.com/html/ir_reports.php).
2. SUMMARY OF FINANCIAL INFORMATION
The following is a summary of the financial position and results of the Group as at and for each
of the three years ended 31 December 2007, 2008 and 2009 and for the six months ended 30 June 2010.
APPENDIX II FINANCIAL INFORMATION OF THE GROUP
— II-1 —
App1,part B31(1)(2)(3)
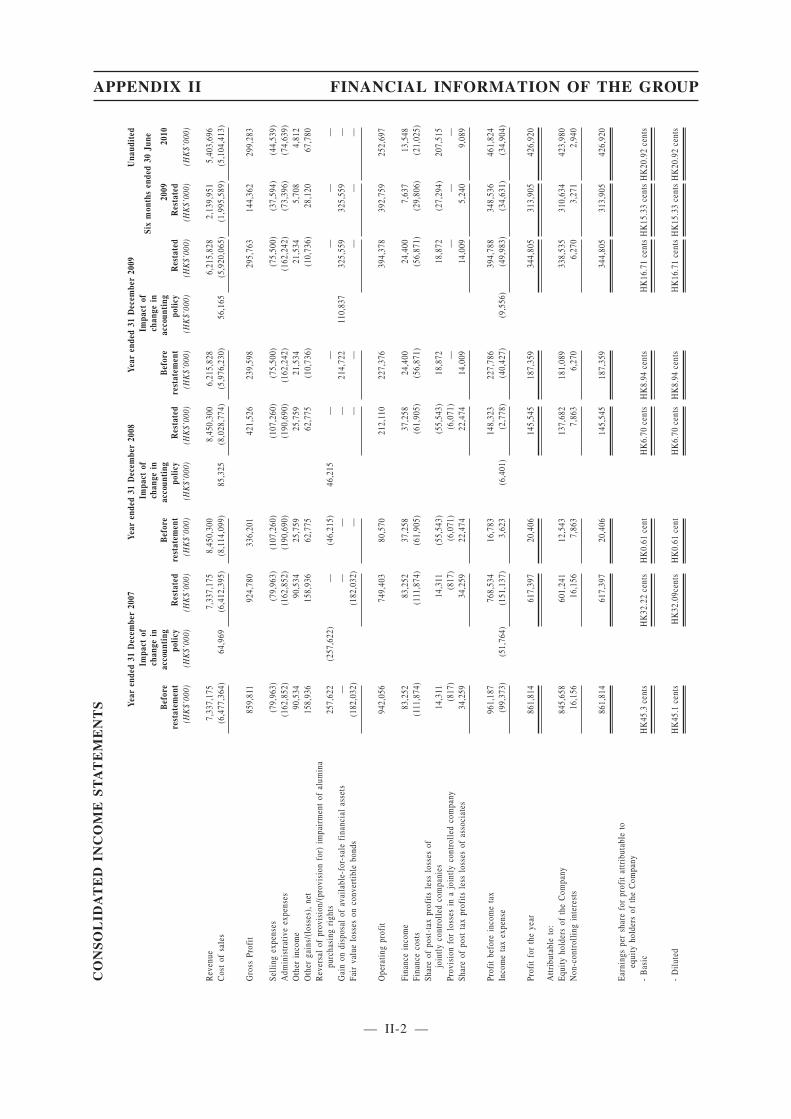
CO
NS
OL
IDA
TE
DIN
CO
ME
ST
AT
EM
EN
TS Ye
aren
ded
31D
ecem
ber
2007
Year
ende
d31
Dec
embe
r20
08Ye
aren
ded
31D
ecem
ber
2009
Una
udit
ed
Bef
ore
rest
atem
ent
Impa
ctof
chan
gein
acco
unti
ngpo
licy
Res
tate
dB
efor
ere
stat
emen
t
Impa
ctof
chan
gein
acco
unti
ngpo
licy
Res
tate
dB
efor
ere
stat
emen
t
Impa
ctof
chan
gein
acco
unti
ngpo
licy
Res
tate
d
Six
mon
ths
ende
d30
June
2009
Res
tate
d20
10
(HK
$’00
0)(H
K$’
000)
(HK
$’00
0)(H
K$’
000)
(HK
$’00
0)(H
K$’
000)
(HK
$’00
0)(H
K$’
000)
(HK
$’00
0)(H
K$’
000)
(HK
$’00
0)
Rev
enue
7,33
7,17
57,
337,
175
8,45
0,30
08,
450,
300
6,21
5,82
86,
215,
828
2,13
9,95
15,
403,
696
Cos
tof
sale
s(6
,477
,364
)64
,969
(6,4
12,3
95)
(8,1
14,0
99)
85,3
25(8
,028
,774
)(5
,976
,230
)56
,165
(5,9
20,0
65)
(1,9
95,5
89)
(5,1
04,4
13)
Gro
ssPr
ofit
859,
811
924,
780
336,
201
421,
526
239,
598
295,
763
144,
362
299,
283
Sell
ing
expe
nses
(79,
963)
(79,
963)
(107
,260
)(1
07,2
60)
(75,
500)
(75,
500)
(37,
594)
(44,
539)
Adm
inis
trat
ive
expe
nses
(162
,852
)(1
62,8
52)
(190
,690
)(1
90,6
90)
(162
,242
)(1
62,2
42)
(73,
396)
(74,
639)
Oth
erin
com
e90
,534
90,5
3425
,759
25,7
5921
,534
21,5
345,
708
4,81
2O
ther
gain
s/(l
osse
s),
net
158,
936
158,
936
62,7
7562
,775
(10,
736)
(10,
736)
28,1
2067
,780
Rev
ersa
lof
prov
isio
n/(p
rovi
sion
for)
impa
irm
ent
ofal
umin
apu
rcha
sing
righ
ts25
7,62
2(2
57,6
22)
—(4
6,21
5)46
,215
——
——
—G
ain
ondi
spos
alof
avai
labl
e-fo
r-sa
lefi
nanc
ial
asse
ts—
——
—21
4,72
211
0,83
732
5,55
932
5,55
9—
Fair
valu
elo
sses
onco
nver
tibl
ebo
nds
(182
,032
)(1
82,0
32)
——
——
——
Ope
rati
ngpr
ofit
942,
056
749,
403
80,5
7021
2,11
022
7,37
639
4,37
839
2,75
925
2,69
7
Fina
nce
inco
me
83,2
5283
,252
37,2
5837
,258
24,4
0024
,400
7,63
713
,548
Fina
nce
cost
s(1
11,8
74)
(111
,874
)(6
1,90
5)(6
1,90
5)(5
6,87
1)(5
6,87
1)(2
9,80
6)(2
1,02
5)Sh
are
ofpo
st-t
axpr
ofit
sle
sslo
sses
ofjo
intl
yco
ntro
lled
com
pani
es14
,311
14,3
11(5
5,54
3)(5
5,54
3)18
,872
18,8
72(2
7,29
4)20
7,51
5Pr
ovis
ion
for
loss
esin
ajo
intl
yco
ntro
lled
com
pany
(817
)(8
17)
(6,0
71)
(6,0
71)
——
——
Shar
eof
post
tax
prof
its
less
loss
esof
asso
ciat
es34
,259
34,2
5922
,474
22,4
7414
,009
14,0
095,
240
9,08
9
Prof
itbe
fore
inco
me
tax
961,
187
768,
534
16,7
8314
8,32
322
7,78
639
4,78
834
8,53
646
1,82
4In
com
eta
xex
pens
e(9
9,37
3)(5
1,76
4)(1
51,1
37)
3,62
3(6
,401
)(2
,778
)(4
0,42
7)(9
,556
)(4
9,98
3)(3
4,63
1)(3
4,90
4)
Prof
itfo
rth
eye
ar86
1,81
461
7,39
720
,406
145,
545
187,
359
344,
805
313,
905
426,
920
Att
ribu
tabl
eto
:E
quit
yho
lder
sof
the
Com
pany
845,
658
601,
241
12,5
4313
7,68
218
1,08
933
8,53
531
0,63
442
3,98
0N
on-c
ontr
olli
ngin
tere
sts
16,1
5616
,156
7,86
37,
863
6,27
06,
270
3,27
12,
940
861,
814
617,
397
20,4
0614
5,54
518
7,35
934
4,80
531
3,90
542
6,92
0
Ear
ning
spe
rsh
are
for
prof
itat
trib
utab
leto
equi
tyho
lder
sof
the
Com
pany
-B
asic
HK
45.3
cent
sH
K32
.22
cent
sH
K0.
61ce
ntH
K6.
70ce
nts
HK
8.94
cent
sH
K16
.71
cent
sH
K15
.33
cent
sH
K20
.92
cent
s
-D
ilut
edH
K45
.1ce
nts
HK
32.0
9cen
tsH
K0.
61ce
ntH
K6.
70ce
nts
HK
8.94
cent
sH
K16
.71
cent
sH
K15
.33
cent
sH
K20
.92
cent
s
APPENDIX II FINANCIAL INFORMATION OF THE GROUP
— II-2 —
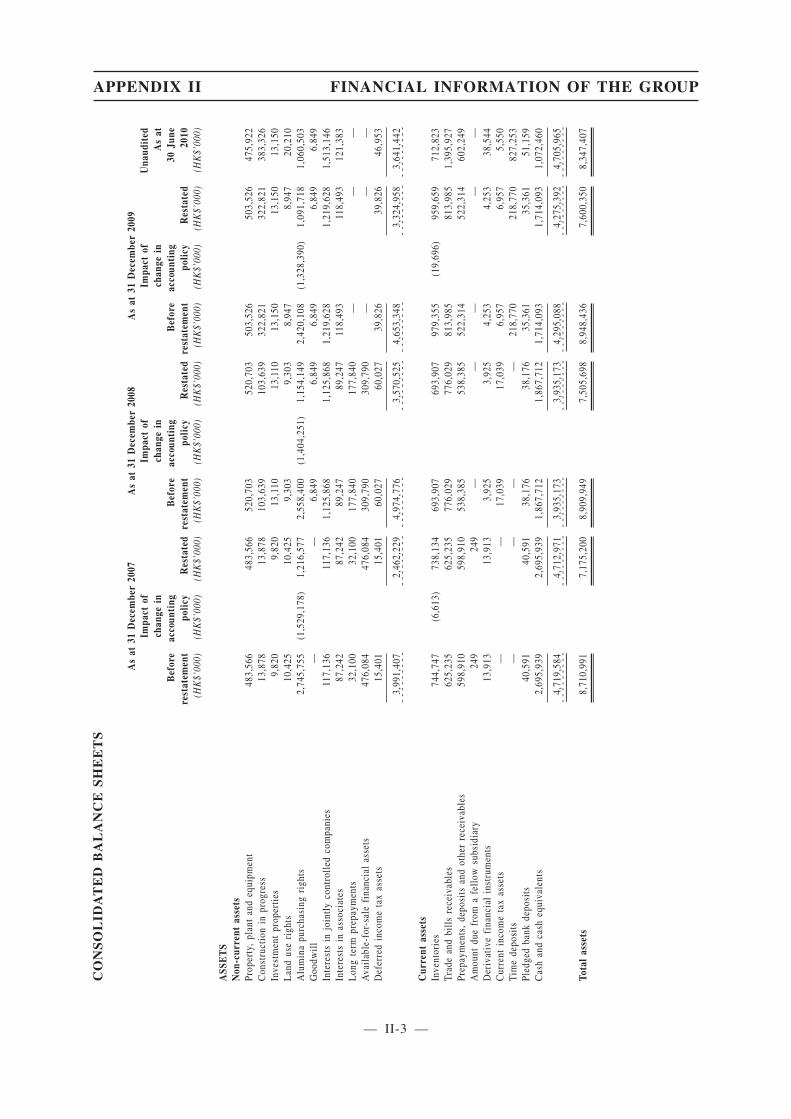
CO
NS
OL
IDA
TE
DB
AL
AN
CE
SH
EE
TS
As
at31
Dec
embe
r20
07A
sat
31D
ecem
ber
2008
As
at31
Dec
embe
r20
09
Bef
ore
rest
atem
ent
Impa
ctof
chan
gein
acco
unti
ngpo
licy
Res
tate
dB
efor
ere
stat
emen
t
Impa
ctof
chan
gein
acco
unti
ngpo
licy
Res
tate
dB
efor
ere
stat
emen
t
Impa
ctof
chan
gein
acco
unti
ngpo
licy
Res
tate
d
Una
udit
edA
sat
30Ju
ne20
10(H
K$’
000)
(HK
$’00
0)(H
K$’
000)
(HK
$’00
0)(H
K$’
000)
(HK
$’00
0)(H
K$’
000)
(HK
$’00
0)(H
K$’
000)
(HK
$’00
0)
ASS
ET
SN
on-c
urre
ntas
sets
Prop
erty
,pl
ant
and
equi
pmen
t48
3,56
648
3,56
652
0,70
352
0,70
350
3,52
650
3,52
647
5,92
2C
onst
ruct
ion
inpr
ogre
ss13
,878
13,8
7810
3,63
910
3,63
932
2,82
132
2,82
138
3,32
6In
vest
men
tpr
oper
ties
9,82
09,
820
13,1
1013
,110
13,1
5013
,150
13,1
50L
and
use
righ
ts10
,425
10,4
259,
303
9,30
38,
947
8,94
720
,210
Alu
min
apu
rcha
sing
righ
ts2,
745,
755
(1,5
29,1
78)
1,21
6,57
72,
558,
400
(1,4
04,2
51)
1,15
4,14
92,
420,
108
(1,3
28,3
90)
1,09
1,71
81,
060,
503
Goo
dwil
l—
—6,
849
6,84
96,
849
6,84
96,
849
Inte
rest
sin
join
tly
cont
roll
edco
mpa
nies
117,
136
117,
136
1,12
5,86
81,
125,
868
1,21
9,62
81,
219,
628
1,51
3,14
6In
tere
sts
inas
soci
ates
87,2
4287
,242
89,2
4789
,247
118,
493
118,
493
121,
383
Lon
gte
rmpr
epay
men
ts32
,100
32,1
0017
7,84
017
7,84
0—
——
Ava
ilab
le-f
or-s
ale
fina
ncia
las
sets
476,
084
476,
084
309,
790
309,
790
——
—D
efer
red
inco
me
tax
asse
ts15
,401
15,4
0160
,027
60,0
2739
,826
39,8
2646
,953
3,99
1,40
72,
462,
229
4,97
4,77
63,
570,
525
4,65
3,34
83,
324,
958
3,64
1,44
2--
----
---
----
----
---
----
---
----
----
---
----
---
----
----
---
----
---
Cur
rent
asse
tsIn
vent
orie
s74
4,74
7(6
,613
)73
8,13
469
3,90
769
3,90
797
9,35
5(1
9,69
6)95
9,65
971
2,82
3Tr
ade
and
bill
sre
ceiv
able
s62
5,23
562
5,23
577
6,02
977
6,02
981
3,98
581
3,98
51,
395,
927
Prep
aym
ents
,de
posi
tsan
dot
her
rece
ivab
les
598,
910
598,
910
538,
385
538,
385
522,
314
522,
314
602,
249
Am
ount
due
from
afe
llow
subs
idia
ry24
924
9—
——
——
Der
ivat
ive
fina
ncia
lin
stru
men
ts13
,913
13,9
133,
925
3,92
54,
253
4,25
338
,544
Cur
rent
inco
me
tax
asse
ts—
—17
,039
17,0
396,
957
6,95
75,
550
Tim
ede
posi
ts—
——
—21
8,77
021
8,77
082
7,25
3Pl
edge
dba
nkde
posi
ts40
,591
40,5
9138
,176
38,1
7635
,361
35,3
6151
,159
Cas
han
dca
sheq
uiva
lent
s2,
695,
939
2,69
5,93
91,
867,
712
1,86
7,71
21,
714,
093
1,71
4,09
31,
072,
460
4,71
9,58
44,
712,
971
3,93
5,17
33,
935,
173
4,29
5,08
84,
275,
392
4,70
5,96
5--
----
---
----------
----------
----------
------
----
----
------
----------
----------
----------
---
----
---
----------
----------
----------
------
----
----
------
----------
----------
----------
---
----
---
----------
----------
----------
------
----
----
------
----------
----------
----------
---
----
---
----------
----------
----------
------
Tota
las
sets
8,71
0,99
17,
175,
200
8,90
9,94
97,
505,
698
8,94
8,43
67,
600,
350
8,34
7,40
7
APPENDIX II FINANCIAL INFORMATION OF THE GROUP
— II-3 —
App1part B31(3)
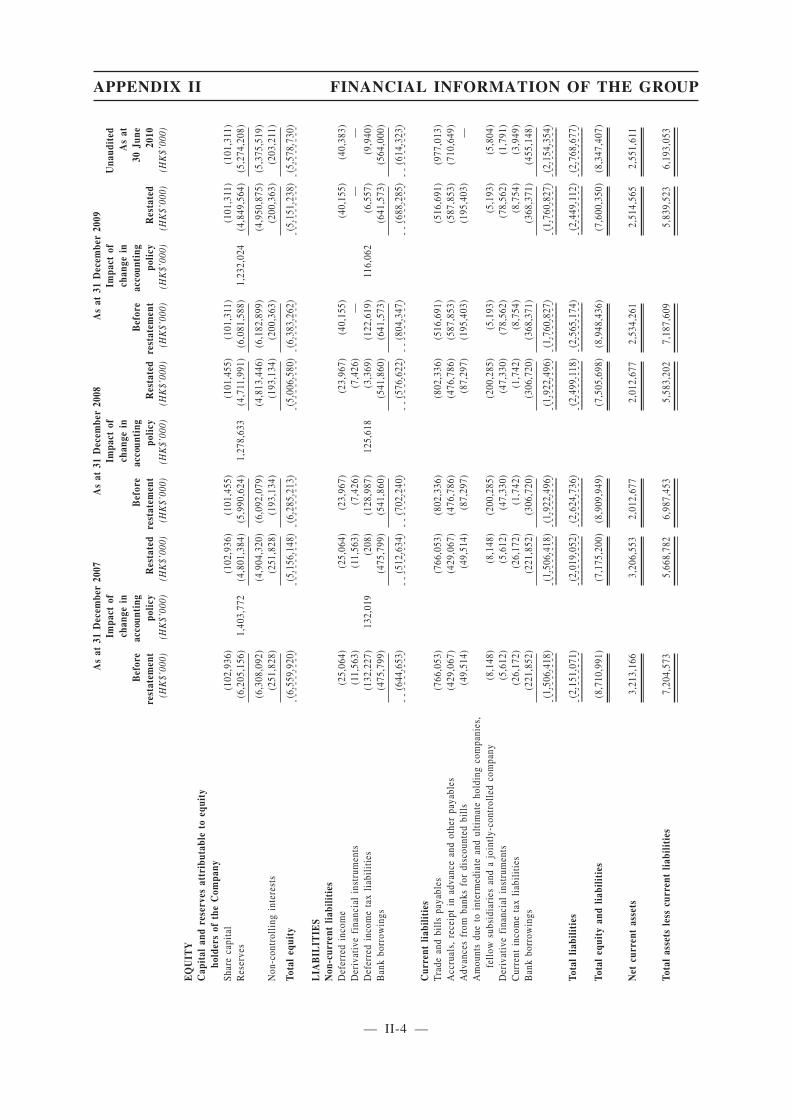
As
at31
Dec
embe
r20
07A
sat
31D
ecem
ber
2008
As
at31
Dec
embe
r20
09
Bef
ore
rest
atem
ent
Impa
ctof
chan
gein
acco
unti
ngpo
licy
Res
tate
dB
efor
ere
stat
emen
t
Impa
ctof
chan
gein
acco
unti
ngpo
licy
Res
tate
dB
efor
ere
stat
emen
t
Impa
ctof
chan
gein
acco
unti
ngpo
licy
Res
tate
d
Una
udit
edA
sat
30Ju
ne20
10(H
K$’
000)
(HK
$’00
0)(H
K$’
000)
(HK
$’00
0)(H
K$’
000)
(HK
$’00
0)(H
K$’
000)
(HK
$’00
0)(H
K$’
000)
(HK
$’00
0)
EQ
UIT
YC
apit
alan
dre
serv
esat
trib
utab
leto
equi
tyho
lder
sof
the
Com
pany
Shar
eca
pita
l(1
02,9
36)
(102
,936
)(1
01,4
55)
(101
,455
)(1
01,3
11)
(101
,311
)(1
01,3
11)
Res
erve
s(6
,205
,156
)1,
403,
772
(4,8
01,3
84)
(5,9
90,6
24)
1,27
8,63
3(4
,711
,991
)(6
,081
,588
)1,
232,
024
(4,8
49,5
64)
(5,2
74,2
08)
(6,3
08,0
92)
(4,9
04,3
20)
(6,0
92,0
79)
(4,8
13,4
46)
(6,1
82,8
99)
(4,9
50,8
75)
(5,3
75,5
19)
Non
-con
trol
ling
inte
rest
s(2
51,8
28)
(251
,828
)(1
93,1
34)
(193
,134
)(2
00,3
63)
(200
,363
)(2
03,2
11)
Tota
leq
uity
(6,5
59,9
20)
(5,1
56,1
48)
(6,2
85,2
13)
(5,0
06,5
80)
(6,3
83,2
62)
(5,1
51,2
38)
(5,5
78,7
30)
----
----
---
----
---
----
----
---
----
---
----
----
---
----
---
----
----
-
LIA
BIL
ITIE
SN
on-c
urre
ntlia
bilit
ies
Def
erre
din
com
e(2
5,06
4)(2
5,06
4)(2
3,96
7)(2
3,96
7)(4
0,15
5)(4
0,15
5)(4
0,38
3)D
eriv
ativ
efi
nanc
ial
inst
rum
ents
(11,
563)
(11,
563)
(7,4
26)
(7,4
26)
——
—D
efer
red
inco
me
tax
liab
ilit
ies
(132
,227
)13
2,01
9(2
08)
(128
,987
)12
5,61
8(3
,369
)(1
22,6
19)
116,
062
(6,5
57)
(9,9
40)
Ban
kbo
rrow
ings
(475
,799
)(4
75,7
99)
(541
,860
)(5
41,8
60)
(641
,573
)(6
41,5
73)
(564
,000
)
(644
,653
)(5
12,6
34)
(702
,240
)(5
76,6
22)
(804
,347
)(6
88,2
85)
(614
,323
)--
----
---
----
----
---
----
---
----
----
---
----
---
----
----
---
----
---
Cur
rent
liabi
litie
sTr
ade
and
bill
spa
yabl
es(7
66,0
53)
(766
,053
)(8
02,3
36)
(802
,336
)(5
16,6
91)
(516
,691
)(9
77,0
13)
Acc
rual
s,re
ceip
tin
adva
nce
and
othe
rpa
yabl
es(4
29,0
67)
(429
,067
)(4
76,7
86)
(476
,786
)(5
87,8
53)
(587
,853
)(7
10,6
49)
Adv
ance
sfr
omba
nks
for
disc
ount
edbi
lls
(49,
514)
(49,
514)
(87,
297)
(87,
297)
(195
,403
)(1
95,4
03)
—A
mou
nts
due
toin
term
edia
tean
dul
tim
ate
hold
ing
com
pani
es,
fell
owsu
bsid
iari
esan
da
join
tly-
cont
roll
edco
mpa
ny(8
,148
)(8
,148
)(2
00,2
85)
(200
,285
)(5
,193
)(5
,193
)(5
,804
)D
eriv
ativ
efi
nanc
ial
inst
rum
ents
(5,6
12)
(5,6
12)
(47,
330)
(47,
330)
(78,
562)
(78,
562)
(1,7
91)
Cur
rent
inco
me
tax
liab
ilit
ies
(26,
172)
(26,
172)
(1,7
42)
(1,7
42)
(8,7
54)
(8,7
54)
(3,9
49)
Ban
kbo
rrow
ings
(221
,852
)(2
21,8
52)
(306
,720
)(3
06,7
20)
(368
,371
)(3
68,3
71)
(455
,148
)
(1,5
06,4
18)
(1,5
06,4
18)
(1,9
22,4
96)
(1,9
22,4
96)
(1,7
60,8
27)
(1,7
60,8
27)
(2,1
54,3
54)
----
----
------
----------
----------
----------
---
----
---
----------
----------
----------
------
----
----
------
----------
----------
----------
---
----
---
----------
----------
----------
------
----
----
------
----------
----------
----------
---
----
---
----------
----------
----------
------
----
----
------
----------
----------
----------
-
Tota
llia
bilit
ies
(2,1
51,0
71)
(2,0
19,0
52)
(2,6
24,7
36)
(2,4
99,1
18)
(2,5
65,1
74)
(2,4
49,1
12)
(2,7
68,6
77)
----
----
------
----------
----------
----------
---
----
---
----------
----------
----------
------
----
----
------
----------
----------
----------
---
----
---
----------
----------
----------
------
----
----
------
----------
----------
----------
---
----
---
----------
----------
----------
------
----
----
------
----------
----------
----------
-
Tota
leq
uity
and
liabi
litie
s(8
,710
,991
)(7
,175
,200
)(8
,909
,949
)(7
,505
,698
)(8
,948
,436
)(7
,600
,350
)(8
,347
,407
)
Net
curr
ent
asse
ts3,
213,
166
3,20
6,55
32,
012,
677
2,01
2,67
72,
534,
261
2,51
4,56
52,
551,
611
Tota
las
sets
less
curr
ent
liabi
litie
s7,
204,
573
5,66
8,78
26,
987,
453
5,58
3,20
27,
187,
609
5,83
9,52
36,
193,
053
APPENDIX II FINANCIAL INFORMATION OF THE GROUP
— II-4 —
The amounts before restatement for each of the three years ended 31 December 2007, 2008 and
2009 above are extracted from the respective published annual reports of the Company while the
amounts for the six months ended 30 June 2010 above are extracted from the published interim report
of the Company.
As explained in Note 3 to the Interim Financial Information of the Company as extracted from
the published interim report of the Company for the six months ended 30 June 2010, the Group
changed its accounting policy for business combinations involving entities under common control on
1 January 2010 from purchase method of accounting to merger accounting in accordance with the
requirements set out in Accounting Guideline 5 “Merger Accounting for Common Control
Combinations”, which has been applied retrospectively to the summary of financial information of the
Group as at and for each of the three years ended 31 December 2007, 2008 and 2009 presented above.
3. MANAGEMENT DISCUSSION AND ANALYSIS OF THE GROUP
The Group is principally engaged in the trading of non-ferrous base metals and investment in the
downstream non-ferrous business including the production of alumina, aluminum and copper products.
In the last few years, there have been weakened demand and price slump in the alumina and
aluminium industry in which the Group principally operates in. To cope with the challenge, the Group
has stepped up its efforts in market exploitation and analysis, consolidated its operations in the value
chain and strengthened its management, operational and cost controls. The following is a summary of
the aluminium business chain that the Group operates:
The Group’s upstream businesses are operated through (i) a 33%-owned Guangxi Huayin
Aluminium Company Limited (“Guangxi Huayin”) and (ii) a 51%-owned Mincenco Limited
(“Mincenco”). Guangxi Huayin is one of the largest and the most advanced alumina plants in the PRC.
It is also one of a few integrated alumina plants with its own bauxite mine and is among the
lowest-cost alumina refinery plants in the PRC. The shareholders of Guangxi Huayin subscribed for
new shares in proportion to their respective shareholdings in 2009 and early 2010. Total additional
share capital amounted to approximately RMB319.2 million. The additional funding would be used to
finance construction of infrastructure and a technology enhancement project driving improvements in
energy-saving, wastage reduction and production efficiency. It is expected, with the success of these
enhancements, the efficiency and production capabilities of Guangxi Huayin will be further
strengthened. Micenco is the Group’s project for exploration of bauxite and establishment of an
alumina refinery facility in Jamaica. Further works undertaken as part of the feasibility study to
optimise project value are underway, with an aim to determine the plan for the advancement of the
project.
The Group’s midstream businesses comprises (i) trading of alumina and aluminium ingot by
Minmetals Aluminium Company Limited (“Minmetals Aluminium”), a wholly owned subsidiary of
the Company, which is one of the largest alumina importers / suppliers in the PRC; and (ii) supply of
400Ktpa of alumina until 2027 at prices which correlate to Alcoa’s production pursuant to the Alcoa
contract.
APPENDIX II FINANCIAL INFORMATION OF THE GROUP
— II-5 —
14.58(2)14.69(7)
14.69(6)
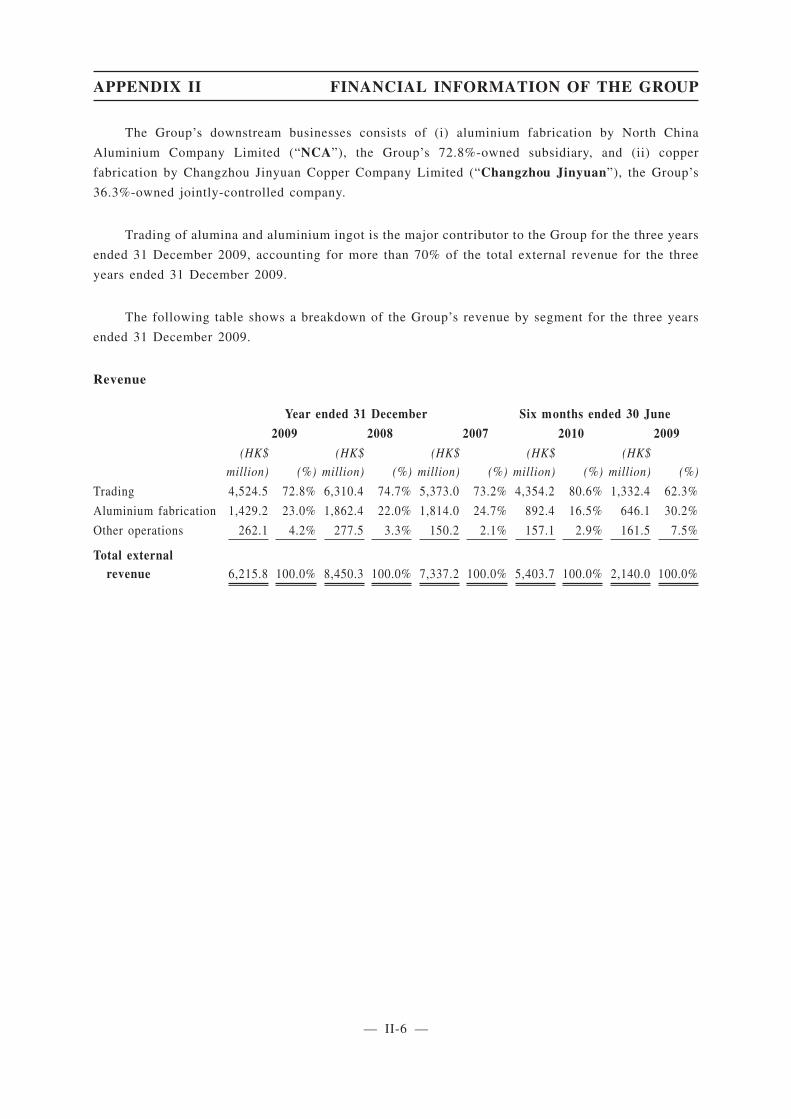
The Group’s downstream businesses consists of (i) aluminium fabrication by North China
Aluminium Company Limited (“NCA”), the Group’s 72.8%-owned subsidiary, and (ii) copper
fabrication by Changzhou Jinyuan Copper Company Limited (“Changzhou Jinyuan”), the Group’s
36.3%-owned jointly-controlled company.
Trading of alumina and aluminium ingot is the major contributor to the Group for the three years
ended 31 December 2009, accounting for more than 70% of the total external revenue for the three
years ended 31 December 2009.
The following table shows a breakdown of the Group’s revenue by segment for the three years
ended 31 December 2009.
Revenue
Year ended 31 December Six months ended 30 June
2009 2008 2007 2010 2009
(HK$
million) (%)
(HK$
million) (%)
(HK$
million) (%)
(HK$
million) (%)
(HK$
million) (%)
Trading 4,524.5 72.8% 6,310.4 74.7% 5,373.0 73.2% 4,354.2 80.6% 1,332.4 62.3%
Aluminium fabrication 1,429.2 23.0% 1,862.4 22.0% 1,814.0 24.7% 892.4 16.5% 646.1 30.2%
Other operations 262.1 4.2% 277.5 3.3% 150.2 2.1% 157.1 2.9% 161.5 7.5%
Total externalrevenue 6,215.8 100.0% 8,450.3 100.0% 7,337.2 100.0% 5,403.7 100.0% 2,140.0 100.0%
APPENDIX II FINANCIAL INFORMATION OF THE GROUP
— II-6 —
App16(6)
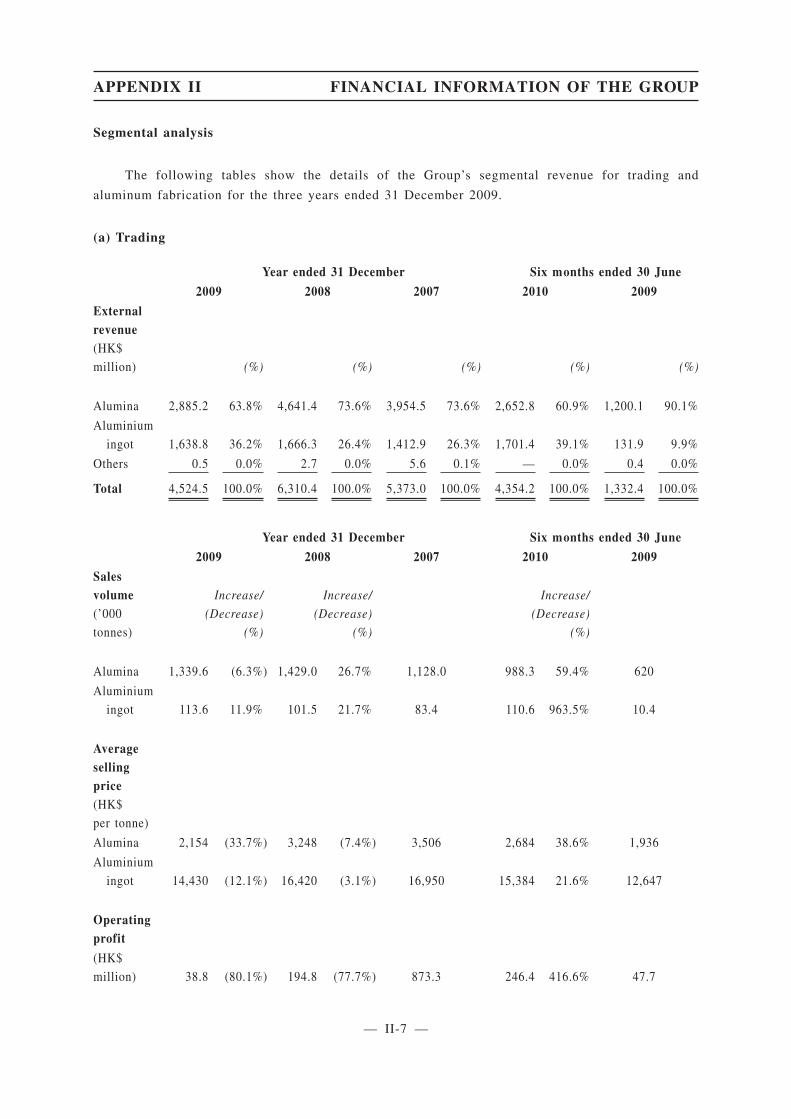
Segmental analysis
The following tables show the details of the Group’s segmental revenue for trading and
aluminum fabrication for the three years ended 31 December 2009.
(a) Trading
Year ended 31 December Six months ended 30 June
2009 2008 2007 2010 2009
Externalrevenue(HK$
million) (%) (%) (%) (%) (%)
Alumina 2,885.2 63.8% 4,641.4 73.6% 3,954.5 73.6% 2,652.8 60.9% 1,200.1 90.1%
Aluminium
ingot 1,638.8 36.2% 1,666.3 26.4% 1,412.9 26.3% 1,701.4 39.1% 131.9 9.9%
Others 0.5 0.0% 2.7 0.0% 5.6 0.1% — 0.0% 0.4 0.0%
Total 4,524.5 100.0% 6,310.4 100.0% 5,373.0 100.0% 4,354.2 100.0% 1,332.4 100.0%
Year ended 31 December Six months ended 30 June
2009 2008 2007 2010 2009
Salesvolume(’000
tonnes)
Increase/
(Decrease)
(%)
Increase/
(Decrease)
(%)
Increase/
(Decrease)
(%)
Alumina 1,339.6 (6.3%) 1,429.0 26.7% 1,128.0 988.3 59.4% 620
Aluminium
ingot 113.6 11.9% 101.5 21.7% 83.4 110.6 963.5% 10.4
Averagesellingprice(HK$
per tonne)
Alumina 2,154 (33.7%) 3,248 (7.4%) 3,506 2,684 38.6% 1,936
Aluminium
ingot 14,430 (12.1%) 16,420 (3.1%) 16,950 15,384 21.6% 12,647
Operatingprofit
(HK$
million) 38.8 (80.1%) 194.8 (77.7%) 873.3 246.4 416.6% 47.7
APPENDIX II FINANCIAL INFORMATION OF THE GROUP
— II-7 —
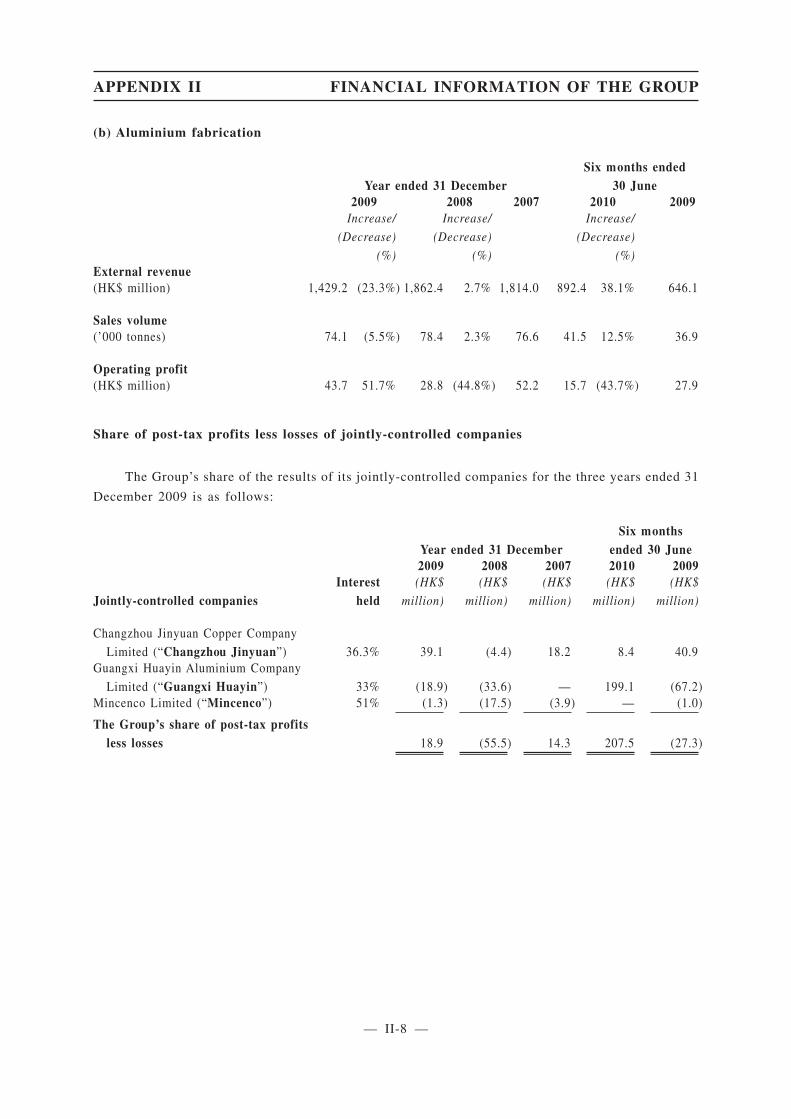
(b) Aluminium fabrication
Year ended 31 DecemberSix months ended
30 June2009 2008 2007 2010 2009
Increase/
(Decrease)
(%)
Increase/
(Decrease)
(%)
Increase/
(Decrease)
(%)External revenue(HK$ million) 1,429.2 (23.3%) 1,862.4 2.7% 1,814.0 892.4 38.1% 646.1
Sales volume(’000 tonnes) 74.1 (5.5%) 78.4 2.3% 76.6 41.5 12.5% 36.9
Operating profit(HK$ million) 43.7 51.7% 28.8 (44.8%) 52.2 15.7 (43.7%) 27.9
Share of post-tax profits less losses of jointly-controlled companies
The Group’s share of the results of its jointly-controlled companies for the three years ended 31
December 2009 is as follows:
Year ended 31 DecemberSix months
ended 30 June
Jointly-controlled companiesInterest
held
2009 2008 2007 2010 2009(HK$
million)
(HK$
million)
(HK$
million)
(HK$
million)
(HK$
million)
Changzhou Jinyuan Copper Company
Limited (“Changzhou Jinyuan”) 36.3% 39.1 (4.4) 18.2 8.4 40.9Guangxi Huayin Aluminium Company
Limited (“Guangxi Huayin”) 33% (18.9) (33.6) — 199.1 (67.2)Mincenco Limited (“Mincenco”) 51% (1.3) (17.5) (3.9) — (1.0)
The Group’s share of post-tax profitsless losses 18.9 (55.5) 14.3 207.5 (27.3)
APPENDIX II FINANCIAL INFORMATION OF THE GROUP
— II-8 —
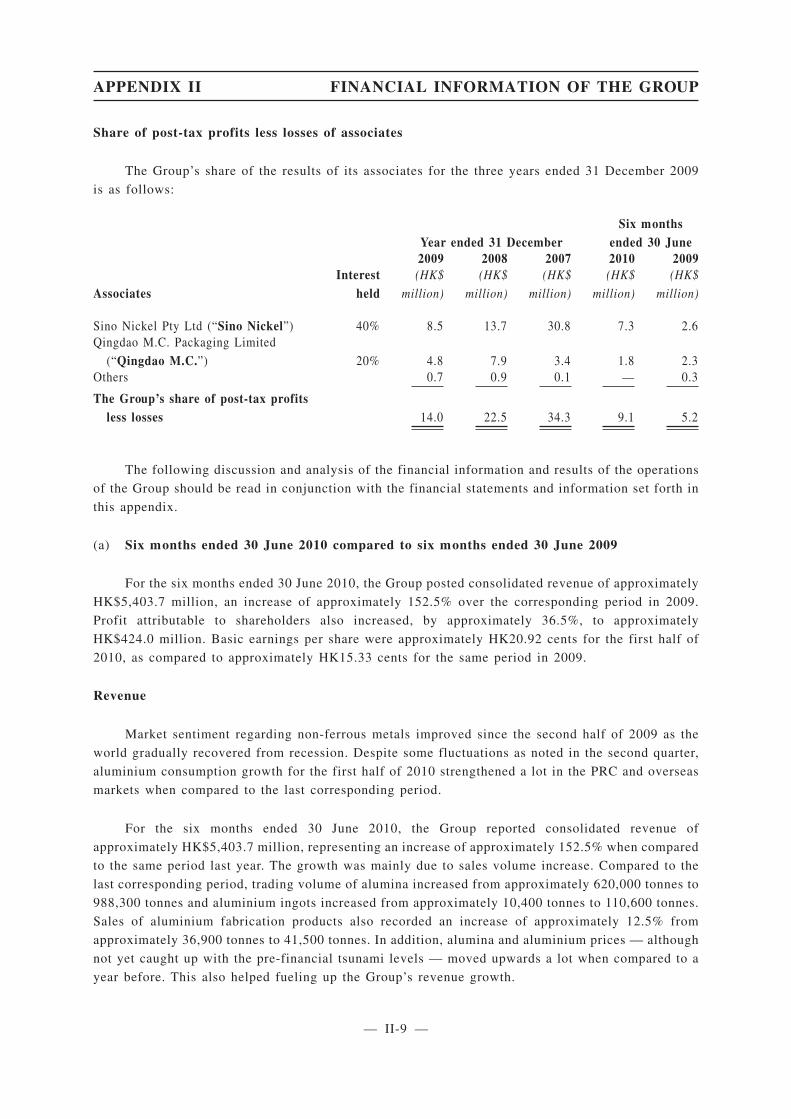
Share of post-tax profits less losses of associates
The Group’s share of the results of its associates for the three years ended 31 December 2009
is as follows:
AssociatesInterest
held
Year ended 31 DecemberSix months
ended 30 June2009 2008 2007 2010 2009(HK$
million)
(HK$
million)
(HK$
million)
(HK$
million)
(HK$
million)
Sino Nickel Pty Ltd (“Sino Nickel”) 40% 8.5 13.7 30.8 7.3 2.6Qingdao M.C. Packaging Limited
(“Qingdao M.C.”) 20% 4.8 7.9 3.4 1.8 2.3Others 0.7 0.9 0.1 — 0.3
The Group’s share of post-tax profitsless losses 14.0 22.5 34.3 9.1 5.2
The following discussion and analysis of the financial information and results of the operations
of the Group should be read in conjunction with the financial statements and information set forth in
this appendix.
(a) Six months ended 30 June 2010 compared to six months ended 30 June 2009
For the six months ended 30 June 2010, the Group posted consolidated revenue of approximately
HK$5,403.7 million, an increase of approximately 152.5% over the corresponding period in 2009.
Profit attributable to shareholders also increased, by approximately 36.5%, to approximately
HK$424.0 million. Basic earnings per share were approximately HK20.92 cents for the first half of
2010, as compared to approximately HK15.33 cents for the same period in 2009.
Revenue
Market sentiment regarding non-ferrous metals improved since the second half of 2009 as the
world gradually recovered from recession. Despite some fluctuations as noted in the second quarter,
aluminium consumption growth for the first half of 2010 strengthened a lot in the PRC and overseas
markets when compared to the last corresponding period.
For the six months ended 30 June 2010, the Group reported consolidated revenue of
approximately HK$5,403.7 million, representing an increase of approximately 152.5% when compared
to the same period last year. The growth was mainly due to sales volume increase. Compared to the
last corresponding period, trading volume of alumina increased from approximately 620,000 tonnes to
988,300 tonnes and aluminium ingots increased from approximately 10,400 tonnes to 110,600 tonnes.
Sales of aluminium fabrication products also recorded an increase of approximately 12.5% from
approximately 36,900 tonnes to 41,500 tonnes. In addition, alumina and aluminium prices — although
not yet caught up with the pre-financial tsunami levels — moved upwards a lot when compared to a
year before. This also helped fueling up the Group’s revenue growth.
APPENDIX II FINANCIAL INFORMATION OF THE GROUP
— II-9 —
Gross profit
Driven by the growth in sales volume, gross profit of the Group increased significantly by
approximately 107.3% to approximately HK$299.3 million (2009: approximately HK$144.4 million)
in the first six months of 2010. However, overall gross profit margin dropped to approximately 5.5%
(2009: approximately 6.7%). The decline was mainly due to: (i) profit contribution from aluminium
fabrication business reduced, mainly because of the lower processing charges than the first-half of last
year, particularly for the domestic sales in the PRC market; (ii) in the first half of 2010, trading
business accounted for a greater portion of the Group’s revenue than before; however, its profit margin
— although improved when compared to the last corresponding period — was lower than that of
aluminum fabrication business; and (iii) improvement in profit margin of trading business slowed
down in the second quarter of 2010 as commodities market sentiment turned more prudent than before
amid the European sovereign debt crisis and the various measures implemented by the PRC
Government to prevent overheating of the PRC property market.
Selling expenses
Selling expenses increased by approximately 18.5% to approximately HK$44.5 million (2009:
approximately HK$37.6 million) for the six months ended 30 June 2010. The increase was mainly due
to the higher transportation costs as a result of increase in sales volume. Because of the significant
revenue growth, selling expenses to revenue ratio decreased from approximately 1.8% to 0.8%.
Administrative expenses
During the period, the Group continued its efforts in keeping operating costs down. Overall
administrative costs remained stable, amounting to approximately HK$74.6 million (2009:
approximately HK$73.4 million). Administrative expenses to revenue ratio reduced from
approximately 3.4% to 1.4% as a result of the significant increase in sales revenue.
Other gains — net
Other gains — net increased by approximately HK$39.7 million to approximately HK$67.8
million (2009: approximately HK$28.1 million) in the first half of 2010. The major changes include:
(i) net gains on aluminium futures contracts, including both realised gains/losses and mark-to-market
fair value adjustments at period-end, increased from approximately HK$24.7 million in the first half
of 2009 to approximately HK$102.4 million in the first half of 2010; (ii) exchange losses of
approximately HK$17.8 million — mainly arising from the currency translation differences of the
Australian dollars bank deposits held by the Group — were recorded in the first half of 2010 compared
to exchange gains of approximately HK$4.6 million reported in the same period last year; (iii) a
fully-provided trade receivable of approximately HK$28.7 million was recovered from a former
associate of the Group; and (iv) having considered the recoverability of a receivable — amounting to
approximately HK$94.6 million and approximately HK$98.0 million as at 30 June 2010 and 31
December 2009 respectively — due from an aluminium smelter, a provision of approximately
HK$45.6 million — in addition to the provision of approximately HK$49.0 million made in 2009 —
was provided in the first half of 2010.
APPENDIX II FINANCIAL INFORMATION OF THE GROUP
— II-10 —
Finance income and finance costs
During the period, the Group’s finance income increased by approximately HK$5.9 million to
approximately HK$13.5 million (2009: approximately HK$7.6 million), mainly due to the increase in
average bank deposits held by the Group and the higher interest rate on Australian dollars bank
deposits.
Compared to the last interim period, the Group’s finance costs in the first half of 2010 decreased
by approximately HK$8.8 million to approximately HK$21.0 million (2009: approximately HK$29.8
million) because of the reduction in interest rate and reduced use of discounted bills as a source of
short-term financing.
Share of post-tax profits less losses of jointly-controlled companies
Changzhou Jinyuan — Sales volume of copper rods and wires increased by approximately 9.9%;
however, lower profit was recorded in the first half of 2010 than the same period last year, mainly due
to the factors stated below: (i) The PRC copper prices increased from about RMB28,100 to
RMB39,900 per tonne in the first half of 2009 and decreased from about RMB60,200 to RMB52,600
per tonne in the first half of 2010. These volatile price changes caused substantial differences on the
mark-to-market fair value adjustments on Changzhou Jinyuan’s copper futures contracts, which
increased the first-half profit of Changzhou Jinyuan in 2009 by approximately HK$136.3 million but
HK$6.0 million only in 2010; and (ii) Surging copper price increased the working capital requirement
of Changzhou Jinyuan, thus increased its finance costs and reduced its profit.
Guangxi Huayin — Turnaround from loss in the last interim period into profit in current interim
period; — Sales volume of alumina increased substantially from 452,300 tonnes in the first half of
2009 to 960,700 tonnes in the first half of 2010; — Increase in sales volume and alumina price as well
as higher production capacity utilisation rate contributed to the significantly improved profit
performance for the current period; and — In the first half of 2010, a capital injection of
approximately RMB216.1 million (equivalent to approximately HK$246.4 million) was made by
Guangxi Huayin’s shareholders in proportion to their respective shareholdings to provide additional
financial support to Guangxi Huayin for a technology enhancement project, which can improve
energy-saving, wastage reduction and production efficiency. When completed, production capabilities
of Guangxi Huayin will be further strengthened. For more details, please refer to the Company’s
announcement dated 28 January 2010.
Mincenco — The bauxite exploration and alumina refinery project in Jamaica is still in the
feasibility study phase. No significant changes in current interim period.
Share of post-tax profits of associates
Sino Nickel — Trading performance of nickel concentrate improved significantly as average
selling price of nickel concentrate increased by approximately 59% when compared to the same period
last year.
APPENDIX II FINANCIAL INFORMATION OF THE GROUP
— II-11 —
Qingdao M.C. — Profit lowered when compared to the last interim period; and — Sales volume
of aluminium cans grew by approximately 14.5% but could not offset the negative impact of margin
decrease caused by intense market competition.
SEGMENTAL ANALYSIS
Trading
For the six months ended 30 June 2010, trading business accounted for approximately 80.6%
(2009: approximately 62.3%) of the Group’s external revenue and contributed approximately
HK$246.4 million (2009: approximately HK$47.7 million) to the Group’s operating profit. Alumina
and aluminium ingots remained the Group’s major trading products during the period, representing
approximately 60.9% (2009: approximately 90.1%) and approximately 39.1% (2009: approximately
9.9%) respectively of the external revenue of this segment.
Alumina prices in the PRC market moved from about RMB2,900 per tonne (tax included,
similarly hereinafter) at the start of 2010 to about RMB2,500 per tonne towards the end of June, a drop
of approximately 14%. Prices weakened but remained much higher — at all times throughout the
entire period — than the corresponding ones in last year. Aluminium also followed similar price trend.
Spot prices in Shanghai Futures Exchange and London Metal Exchange slumped approximately 11%
and 13% respectively during the same period.
With the continued upturn of economy since the second half of last year, the Group made good
progress in expanding its trading business in the first quarter of 2010. However, the development was
not free of concerns as trading of alumina and aluminium ingot experienced setback afterwards.
European sovereign debt crisis squeezed the demand for the metals. Besides, the PRC’s curbs on
lending and property speculation also cooled the demand. Large inventory build-up and oversupply led
to the price slump in the second quarter and slowed down the growth momentum. Nevertheless, the
average prices of alumina and aluminium ingot sold by the Group in the first half of 2010 could still
be maintained at levels higher than the last interim period. This, together with the substantial increase
in sales volume — particularly the domestic trade in the PRC market, helped this segment delivering
encouraging first-half results in 2010.
Aluminium fabrication
Aluminium fabrication accounted for approximately 16.5% (2009: approximately 30.2%) of the
Group’s external revenue and contributed approximately HK$15.7 million (2009: approximately
HK$27.9 million) to the Group’s operating profit for the six months ended 30 June 2010. The Group
operated its aluminium fabrication business through a 72.8%-owned subsidiary, North China
Aluminium Company Limited (“NCA”).
Increased demand for aluminium fabrication products from both the PRC and overseas markets
added impetus to the revenue growth of NCA during the period. Because of improvement in production
efficiency and recovery in export sales, sales volume increased by 12.5% to 41,500 tonnes in the first
half of 2010. Nevertheless, this segment reported lower profit in current interim period than a year
APPENDIX II FINANCIAL INFORMATION OF THE GROUP
— II-12 —
App16(6)
before. This was mainly due to: (i) more and more competitors entered the market in recent years and
posed increasing pressure on the processing charges of certain product categories, particularly the
low-end products; and (ii) cost of inventories increased as a result of rising aluminium price — in
average when compared to the last corresponding period.
In view of the above, NCA has adopted several measures to strengthen its profit earning power
and competitive edge, which include: (i) realignment of its product mix by placing more emphasis on
high value-added products in its market development strategies; (ii) implementation of quality
enhancement and technology development programmes to improve its product competitiveness; and
(iii) more comprehensive controls over commodity price risk exposures so as to minimise the adverse
impact on operating profit caused by aluminium price fluctuation.
Other operations
Other operations of the Group include production and sale of aluminium processing equipment,
production and sale of plica tubes (flexible metals conduits) and port logistics services, which in
aggregate accounted for approximately 2.9% (2009: approximately 7.5%) of the Group’s external
revenue and contributed approximately HK$4.7 million (2009: approximately HK$4.3 million) to the
Group’s operating profit for the six months ended 30 June 2010.
Resources and liquidity
The Group remained in a strong liquidity and financial position throughout the six-month period
ended 30 June 2010. During the period, total assets increased by approximately 9.8% to approximately
HK$8,347.4 million and shareholders’ equity increased by approximately 8.6% to approximately
HK$5,375.5 million. Current ratio dropped slightly from approximately 2.4 at 31 December 2009 to
approximately 2.2 at 30 June 2010.
As at 30 June 2010, the Group was in a net cash position of approximately HK$931.8 million,
representing cash and bank deposits of approximately HK$1,950.9 million less bank borrowings of
approximately HK$1,019.1 million. Hence, gearing ratio (defined as total borrowings less cash and
bank deposits divided by shareholders’ equity) is not applicable.
The Group’s cash and bank deposits, amounting to HK$1,950.9 million at 30 June 2010, were
mainly denominated in US dollars (57%), Renminbi (21%) and Australian dollars (21%). As at 30 June
2010, the profile of the Group’s bank borrowings was as follows: (1) 60% were in Renminbi and 40%
were in US dollars; (2) 29% were in fixed rates and 71% were in floating rates; and (3) 45% were
repayable within 1 year, 14% were repayable between 1 and 2 years, 29% were repayable between 2
and 5 years and 12% were repayable after 5 years.
Material acquisitions and disposals
In January 2010, the Group provided cash contribution of approximately RMB71.3 million
(equivalent to approximately HK$81.3 million) to Guangxi Huayin to support its technology
enhancement project, which can enhance energy-saving, wastage reduction and production efficiency
of its manufacturing process. The above contribution was made in proportion to the Group’s equity
interest in Guangxi Huayin, that is, 33%.
APPENDIX II FINANCIAL INFORMATION OF THE GROUP
— II-13 —
App 16 32(1)
App 16 32(10)
App 16 32(2)
App 16 32(5)
In April 2010, an agreement was entered into by the Group to conditionally dispose 42% equity
interest in Yantai Penghui Copper Industry Company Limited — a non-current asset held for sale by
the Group — to an independent third party at a consideration of approximately RMB85.6 million
(equivalent to approximately HK$97.6 million). As full provision had already been made in respect
of this investment in prior years, it was expected that an estimated disposal gain of approximately
RMB85.6 million (equivalent to approximately HK$97.6 million) would be recognised in accordance
with the fulfillment of conditions as stipulated in the agreement and the transfer of significant risks
and rewards of the ownership concerned. For the six months ended 30 June 2010, a deposit of RMB8.6
million (equivalent to approximately HK$9.8 million) was received by the Group in accordance with
the agreement and no disposal gain has been recognised in this half year period.
Capital expenditure and commitments
The Group incurred capital expenditure of approximately HK$79.2 million for six months ended
30 June 2010, which was mainly related to the construction of a new aluminium foil production line
and the upgrade of other production facilities.
The Group’s capital commitments as at 30 June 2010 amounted to approximately HK$86.0
million, which were mainly related to the expansion and upgrade of its aluminium fabrication
production facilities.
Significant investments held
The Group did not hold any significant investments as at 30 June 2010.
Contingent liabilities
The Group had no material contingent liability as at 30 June 2010.
Charge on assets
As at 30 June 2010, the following assets of the Group were pledged to certain banks for the
banking facilities granted to the Group:
(1) All the equity interests of a wholly owned subsidiary, Sino Mining Alumina Limited (“Sino
Mining”) and all the assets of Sino Mining;
(2) Certain property, plant and equipment, land use rights as well as inventories of the Group
with a total carrying amount of approximately HK$422.2 million; and
(3) Bank deposits of approximately HK$51.2 million.
APPENDIX II FINANCIAL INFORMATION OF THE GROUP
— II-14 —
App16 32(4)
App 16 32(12)
App 16 32(8)
Risk management
Set out below are the major risk areas that the Group may enter into derivative contracts from
time to time to hedge against the risks.
(a) Commodity price risk
Same as last year, the Group has used aluminium futures contracts to mitigate the fluctuation of
commodity prices that may cause to its trading and aluminium fabrication businesses. As at 30 June
2010, the Group’s long and short positions in aluminium futures contracts amounted to approximately
29,915 tonnes and 35,660 tonnes respectively.
(b) Interest rate risk
Interest rate swaps of the Group with a notional principal amount of approximately HK$429.0
million as at 31 December 2009 expired in the current interim period and after that no interest rate
swap remained outstanding as at 30 June 2010. The Group will continue to closely monitor the impact
of interest rate movements on its results and financial positions and adjust its fixed-rate and
floating-rate loan balances accordingly; and if necessary, consider the use of derivative financial
instruments to hedge against this risk.
(c) Foreign exchange risk
Same as last year, the Group’s foreign exchange risk exposure primarily related to its operations
in Hong Kong, the PRC and Australia. The Group’s revenue is principally denominated in United
States dollars and Renminbi, while cost of sales and other expenses are mainly denominated in United
States dollars, Renminbi, Australian dollars and Hong Kong dollars. Given the exchange rate peg
between Hong Kong dollars and United States dollars, it is not foreseen that the Group will be exposed
to significant exchange risk for transactions conducted in these two currencies. However, exchange
rate fluctuations of Renminbi or Australian dollars against United States dollars or Hong Kong dollars
may affect the Group’s performance and asset value. In 2010, the Group has used foreign exchange
forward contracts to reduce its Australian dollars exchange exposures in relation to the sourcing cost
of alumina. The total notional principal amount of the Group’s outstanding foreign exchange forward
contracts as at 30 June 2010 was approximately Australian dollars 3.7 million (equivalent to
approximately HK$24.8 million) (2009: Nil).
Human resources
As at 30 June 2010, the Group employed a total of 2,532 full-time employees (not including the
employees of jointly-controlled companies and associates), of which 16 were based in Hong Kong, 13
were in Australia and the remaining ones were in the PRC. The total staff costs, including the
directors’ emoluments, for the six months ended 30 June 2010 amounted to approximately HK$78.0
million.
APPENDIX II FINANCIAL INFORMATION OF THE GROUP
— II-15 —
App 16 32(11)
App 16 32(7)
The Group has adopted salary policies in line with market practice and remunerated its
employees based on their performance and experience. Other employee benefits include
performance-related bonuses, insurance and medical coverage and share option scheme. Various forms
of training are provided to staff as and when necessary. For the six months ended 30 June 2010, a total
of 15,400,000 share options were granted to certain directors of the Company and employees of the
Group to recognise and acknowledge the contributions that they had made or may from time to time
make to the Group whether in the past or in the future.
(b) Year ended 31 December 2009 compared to year ended 31 December 2008
The Group’s revenue for the year of 2009 amounted to approximately HK$6,215.8 million,
representing a decrease of approximately 26.4% from 2008. However, with improved returns from the
aluminium fabrication business and jointly-controlled companies as well as the disposal gain of
non-core business, the Group recorded significant improvement in net profit during the year. The
profit attributable to the equity holders of the Company increased from approximately HK$137.7
million in 2008 to approximately HK$338.5 million in 2009, representing an increase by
approximately 145.9%.
Revenue
The Group recorded consolidated revenue of approximately HK$6,215.8 million in 2009,
representing a decrease of approximately 26.4% from 2008. Overall sales volume of the Group saw
no significant changes. For the trading business, the decline in alumina sales (approximately 89,400
tonnes or 6.3%) was largely offset by the increase in aluminium ingot sales (approximately 12,100
tonnes or 11.9%). For the aluminium fabrication, sales volume decreased by 5.5%. As such, the drop
in revenue was mainly attributable to the plunge in alumina and aluminium prices. Although
remarkable rebounds already occurred in 2009 — especially in the second half of the year, alumina
and aluminium prices still fell far behind the pre-financial tsunami level. The average alumina sales
price of the Group dropped by approximately 33.7% from HK$3,248 per tonne in 2008 to
approximately HK$2,154 per tonne in 2009.
Gross profit
Overall gross profit margin reduced slightly from approximately 5.0% in 2008 to 4.8% in 2009.
The Group recorded gross profit of approximately HK$295.8 million in 2009, a decrease of
approximately HK$125.8 million or 29.8% when compared to 2008. The decline was mainly due to
the drop in average selling price.
During 2009, trading business, the Group’s most important revenue and profit contributor, faced
significant pressures on both sales and cost sides. On the sales side, although recovery in alumina
price occurred in the second half of 2009, intensified competition and growing surplus limited the
growth momentum. On the cost side, as the cost of alumina sourced under a long-term supply contract
from a supplier was in some way correlated to the production cost of that supplier and therefore its
fluctuation might not fully match with the alumina price fluctuation in the spot market. Comparing the
situation in 2009 to 2008, the fall in the procurement cost of alumina under this contract could not
catch up with the corresponding fall in the market price of alumina.
APPENDIX II FINANCIAL INFORMATION OF THE GROUP
— II-16 —
Selling expenses
Sales volume of the Group for the year showed no significant changes but selling expenses
decreased by approximately 29.6% to approximately HK$75.5 million (2008: approximately
HK$107.3 million). This was mainly due to the decrease in transportation and port charges. However,
because of the drop in the Group’s revenue — mainly due to the substantial decrease in selling price,
selling expenses to revenue ratio only decreased slightly from approximately 1.3% to 1.2%.
Administrative expenses
To cope with the difficult economic situation, the Group further tightened its cost controls in
2009. The Group’s administrative expenses for the year decreased by approximately 14.9% to
approximately HK$162.2 million (2008: approximately HK$190.7 million). The decrease was mainly
due to the reduction in staff costs and professional fees. However, because of the drop in the Group’s
revenue — mainly due to the substantial decrease in selling price, administrative expenses to revenue
ratio increased from approximately 2.3% to 2.6%.
Other (losses)/gains — net
The Group reported other losses — net of approximately HK$10.7 million in 2009, compared to
other gains — net of approximately HK$62.8 million in 2008. The major changes in 2009 include: (i)
the increase in provision for impairment of other receivables of approximately HK$46.6 million; and
(ii) as Renminbi showed little appreciation during the year, exchange gain recorded in 2009 decreased
by approximately HK$23.7 million when compared to 2008, albeit remarkable exchange gains were
derived from the Group’s Australian dollars bank deposits in 2009.
The increase in provision for impairment of other receivables in 2009 was mainly related to the
Group’s trading business segment. During the year, the financial position of an aluminium smelter,
who entered into tolling arrangement with the Group, was severely affected because of the global
financial tsunami and the sudden reduction in its operating scale. This caused it failed to execute the
tolling contracts and repay other receivables owed to the Group, amounting to approximately HK$98.0
million at 31 December 2009, on schedule. In view of the uncertainty of the recoverability of these
receivables, specific provision for impairment of approximately HK$49.0 million was provided. As a
protective measure, a power generation unit of this aluminium smelter is pledged as collateral for
these receivables. Currently, this aluminium smelter is still in normal production. The Group will
continue to make every endeavour to recover these receivables so as to satisfactorily resolve the issue.
Although the results for 2009 have been affected to a certain extent, the Group remains in strong
liquidity and financial position. All business sections — trading as well as others — have been
operating normally.
Gain on disposal of available-for-sale financial assets
In the first half of 2009, the Group disposed its entire interest of approximately 11.5 million
shares in Sino Gold Mining Limited and recorded a net gain of approximately HK$325.6 million.
APPENDIX II FINANCIAL INFORMATION OF THE GROUP
— II-17 —

Finance costs — net
Finance costs — net increased by approximately HK$7.9 million from approximately HK$24.6million in 2008 to approximately HK$32.5 million in 2009, mainly due to the decrease in interestincome. Under a low interest rate environment, the Group’s interest income decreased byapproximately HK$12.9 million during the year.
Share of post-tax profits less losses of jointly-controlled companies
Changzhou Jinyuan — For the year ended 31 December 2009, Changzhou Jinyuan has a profitof approximately HK$39.1 million, as compared to the loss of approximately HK$4.4 million in 2008.The increase in profit in 2009 of Changzhou Jinyuan was mainly due to: i) Changzhou Jinyuan’s salesvolume of copper rods and wires increased by approximately 6.4% — the subsidy scheme for residentsbuying household appliances boosted the demand for magnet wires; ii) Proactive inventorymanagement helped Changzhou Jinyuan seized the opportunities in the commodity market andlowered its raw materials procurement costs in 2009; iii) Enhanced production efficiency and costcontrol; iv) Substantial rebound of copper prices caused the actual losses incurred on certain copperfutures contracts upon the execution of their corresponding physical contracts in 2009 were muchsmaller than the unrealised mark-to-market losses as previously recorded 2008, and thus boosted theprofit in current year; and v) Provision for certain manufacturing equipments made in the second halfof 2009 — in light of the migration to the new production line in next year — partly offset the abovepositive effect on profit.
Guangxi Huayin — In 2009, alumina sales and production volume was about 1.3 million tonnesand loss of HK$18.9 million for the year (2008: loss of HK$33.6 million) was mainly due to: i)Operating loss incurred in the first half of the year primarily as a result of the weak alumina price andunder-utilisation of production capacity; and ii) Situation improved in the second half of the year aseconomy gradually recovered. Guangxi Huayin resumed to operate at full production capacity in thethird quarter and earned positive monthly results in the following months. However, this could notfully recoup the lost ground previously made during the year.
Mincenco — The bauxite exploration and alumina refinery project in Jamaica is still in thefeasibility study phase, so no profit contribution was recorded in 2009.
Share of post-tax profits of associates
Sino Nickel — Sales volume grew by approximately 5.4% but with average selling price ofnickel concentrate slumped by about 40%, profit reduced significantly when compared to last year.
Qingdao M.C. — Sales volume of aluminium cans remained stable. Profit contribution reducedmainly due to decline in and downward pressure on selling price as a result of intense marketcompetition.
Segmental analysis
Trading
In 2009, trading business accounted for approximately 72.8% (2008: approximately 74.7%) ofthe Group’s external revenue and reported operating profit of approximately HK$38.8 million (2008:operating profit of approximately HK$194.8 million). Alumina and aluminium ingots remained themajor trading products during the year, representing approximately 63.8% (2008: approximately73.6%) and approximately 36.2% (2008: approximately 26.4%) respectively of the external revenueof this segment.
APPENDIX II FINANCIAL INFORMATION OF THE GROUP
— II-18 —
App16(6)
Notwithstanding the concerns about growing surplus and the sustainability of economic
recovery, the market prices of alumina and aluminium showed remarkable rebounds since early 2009.
As for the PRC alumina market, spot prices continued to slump at the beginning of 2009 and
dropped to about RMB1,800 per tonne (tax included, similarly hereinafter) in February. Then, some
signs of stabilisation and support were found in the latter months. In early April, prices jumped by
more than 20% to about RMB2,200 to RMB2,300 per tonne in response to the restart of idle capacity
by some aluminium smelters and the upsurge of aluminium prices after the buying of aluminium
reserve by the State Reserve Bureau. Attracted by the price jumps, certain alumina producers restarted
idle capacity but less-than-expected restart of capacity by local aluminium smelters lowered the
demand for alumina again. Prices thus eased back in June and traded around RMB2,000 per tonne.
Wider economic recovery fuelled up the price rises in the second half of the year. Alumina spot prices
moved steadily upward from July to September. After reaching RMB2,500 per tonne in September,
prices remained relatively flat in the following months. And near the year end, alumina prices rose
again and surged to about RMB2,900 per tonne as smelters started to stock materials before the Lunar
New Year holiday.
Because of the linkage between alumina and aluminium — alumina is the main raw material used
to produce aluminium, aluminium prices also showed similar rebounds during the year, increasing
from about RMB12,000 per tonne (tax included, similarly hereinafter) at the beginning of the year to
about RMB17,000 per tonne towards the year end.
Although alumina and aluminium prices showed notable rebounds in 2009 when compared to the
lowest level last year, the large inventory build-up and uncertainty on the sustainability of economic
recovery still raised concerns over the price outlook. Volatile price fluctuations and increasing
domestic alumina production posed significant challenges to alumina importers.
To meet with the market changes, the Group has flexibly adjusted the business focus in order to
optimise its value chain. During the year, it had strengthened its inventory controls, increased sourcing
of commodities from the domestic market and self-owned resources, and expanded the tolling
operation. Through these measures and by capitalising on the positive flow-on effects of the stimulus
package on alumina and aluminium consumption, the Group only posted slight decline in the trading
volume of alumina by approximately 6.3% and recorded approximately 11.9% increase in the trading
volume of aluminium ingot.
Nevertheless, the Group has experienced a plunge in its alumina selling price — dropped
approximately 33.7% on average when compared to 2008, trading revenue of the Group declined
sharply by approximately 28.3%. This, coupled with the provision for impairment of receivables of
approximately HK$49.0 million and the depressed trading margin, resulted in the Group’s trading
segment recording a relatively small operating profit of approximately HK$ 38.8 million in 2009.
Aluminium fabrication
Aluminium fabrication accounted for approximately 23.0% (2008: approximately 22.0%) of the
Group’s external revenue and contributed approximately HK$43.7 million (2008: approximately
HK$28.8 million) to the Group’s operating profit in 2009. The Group operated its aluminium
fabrication business through a 72.8%-owned subsidiary, NCA.
APPENDIX II FINANCIAL INFORMATION OF THE GROUP
— II-19 —

Demand for downstream aluminium products has shrunk substantially after the international
financial crisis, particularly in the overseas markets. Situation showed some improvements in the
second half of 2009 but export slowdown still triggered fierce competition among the PRC
manufacturers in the domestic market.
In 2009, sales volume and revenue of NCA decreased by approximately 5.5% and 23.3%
respectively when compared to last year. Sales volume declined mildly as the drop in aluminium foil
stock (which can be further processed into light gauge aluminium foil) and aluminium fin stock was
negated by the increase in other products, like hydrophilic fin stock and PS substrate. As exaggerated
by the drop in aluminium price, NCA recorded a higher percentage decline in revenue. As such, the
improvement in NCA’s operating profit was mainly derived from the cost side, including: (i) reduced
staff costs and various administrative expenses; and (ii) decrease in exchange losses.
Other operations
This segment mainly includes production and sale of aluminium processing equipment,
production and sale of plica tubes (flexible metals conduits) and port logistics services, which in
aggregate accounted for approximately 4.2% (2008: approximately 3.3%) of the Group’s external
revenue and contributed approximately HK$4.9 million (2008: approximately HK$11.7 million) to the
Group’s operating profit in 2009.
Resources and liquidity
The Group remained in a strong liquidity and financial position for the year ended 31 December
2009. During the year, total assets and shareholders’ equity increased by approximately 1.3% and 2.9%
respectively to approximately HK$7,600.4 million and HK$4,950.9 million respectively. Current ratio
improved from approximately 2.0 to 2.4.
As at 31 December 2009, the Group was in a net cash position of approximately HK$762.9
million, representing cash and bank deposits of approximately HK$1,968.2 million less total
borrowings of approximately HK$1,205.3 million (comprising bank borrowings of approximately
HK$1,009.9 million and advances from banks for discounted bills of approximately HK$195.4
million). Hence, gearing ratio (defined as total borrowings less cash and bank deposits divided by
shareholders’ equity) is not applicable.
The Group’s cash and bank deposits, amounting to approximately HK$1,968.2 million at 31
December 2009, were mainly denominated in US dollars (48%), Renminbi (30%) and Australian
dollars (21%).
As at 31 December 2009, the profile of the Group’s bank borrowings was approximately as
follows:
(1) 58% were in Renminbi and 42% were in US dollars;
(2) 24% were in fixed rates and 76% were in floating rates;
APPENDIX II FINANCIAL INFORMATION OF THE GROUP
— II-20 —
App 16 32(1)
App 16 32(10)
App 16 32(2)
(3) 37% were repayable within 1 year, 15% were repayable between 1 and 2 years, 24% were
repayable between 2 and 5 years and 24% were repayable after 5 years.
Material acquisitions and disposals
In March 2009, the Group increased its investments in its jointly-controlled company,
Changzhou Jinyuan, by a cash injection of approximately HK$42.4 million. The cash contribution
from the Group, together with those provided by other shareholders, was used by Changzhou Jinyuan
to finance the construction of a new copper rod production line with an annual capacity of 300,000
tonnes. After this cash injection, the Group’s interest in Changzhou Jinyuan increased slightly from
36% to approximately 36.3%.
In June 2009, the Group disposed its entire interest of 11,492,912 shares in Sino Gold Mining
Limited to certain independent third parties and recorded a net gain of approximately HK$214.7
million. The disposal represents a good opportunity to realise a gain from the investment and the net
proceeds of approximately HK$386.7 million would be used by the Group as general working capital
and to fund any potential investments available to the Group in the future.
During the year ended 31 December 2009, the Group provided the following cash contributions
to its jointly-controlled companies:
(1) Approximately HK$38.8 million was provided to Guangxi Huayin to support its
construction of transport system and other infrastructures; and
(2) Approximately HK$8.1 million was provided to Mincenco to support its daily operations in
the feasibility study stage.
After the completion of the capital injection of approximately HK$1.8 million in November
2009, the Group increased its equity interest in Yin Fa Transportation Company Limited (“Yin Fa”),
an associate owned as to 48.5% previously by the Group, to 65%. Yin Fa has been consolidated into
the Group’s consolidated financial statements since then. Prior to the capital injection, Yin Fa was
equity accounted for as an interest in an associate. The principal business of Yin Fa is provision of
transportation services.
Significant investments held
The Group did not hold any significant investments as at 31 December 2009.
Contingent liabilities
The Group had no material contingent liability as at 31 December 2009.
Capital expenditure and commitments
The Group incurred capital expenditure of approximately HK$266.5 million for year ended 31
December 2009, which was mainly related to the construction of a new aluminium foil production line
and the upgrade of other production facilities.
APPENDIX II FINANCIAL INFORMATION OF THE GROUP
— II-21 —
App16 32(4)
App 16 32(12)

The Group’s capital commitments as at 31 December 2009 amounted to approximately HK$54.8
million, which were mainly related to the upgrade and expansion of production facilities in the
Group’s aluminium fabrication business.
Charge on assets
As at 31 December 2009, the following assets of the Group were pledged to certain banks for the
banking facilities granted to the Group:
(1) All the equity interests of a wholly-owned subsidiary, Sino Mining and all the assets of Sino
Mining;
(2) Certain property, plant and equipment, land use rights as well as inventories of the Group
with a total carrying amount of approximately HK$366.5 million; and
(3) Bank deposits of approximately HK$35.4 million.
Risk management
The Group does not and is prohibited to enter into derivative contracts for speculative purpose.
Set out below are the risk areas that the Group may enter into derivative contracts or implement other
measures from time to time to hedge against the risks.
(a) Commodity price risk
In order to mitigate the price fluctuations of alumina and aluminium that may cause to its trading
and aluminium fabrication businesses, the Group has entered into certain aluminium futures contracts
in 2009. As at 31 December 2009, the Group’s long and short positions in aluminium futures contracts
amounted to approximately 5,625 tonnes and 37,595 tonnes respectively.
(b) Interest rate risk
The Group has used interest rate swaps to reduce the impact of interest rate fluctuation on its
operation. There was no new interest rate swap entered during the year and the outstanding principal
amount of the Group’s interest rate swaps amounted to approximately HK$429.0 million at 31
December 2009.
(c) Foreign exchange risk
The Group’s foreign exchange risk exposure primarily related to its operations in Hong Kong,
the PRC and Australia. The Group’s revenue is principally denominated in Renminbi and United States
dollars, while cost of sales and other expenses are mainly denominated in United States dollars,
Renminbi, Australian dollars and Hong Kong dollars. Given the exchange rate peg between Hong
Kong dollars and United States dollars, it is not foreseen that the Group will be exposed to significant
APPENDIX II FINANCIAL INFORMATION OF THE GROUP
— II-22 —
App1632(8)
App1632(11)
exchange risk for transactions conducted in these two currencies. However, exchange rate fluctuations
of Renminbi or Australian dollars against United States dollars or Hong Kong dollars may affect the
Group’s performance and asset value. The Group had not entered into any derivative contracts to
hedge against this risk for the year ended 31 December 2009.
Human Resources
As at 31 December 2009, the Group employed a total of 2,551 full-time employees (not including
the employees of jointly-controlled companies and associates), of which 15 were based in Hong Kong,
13 were in Australia and the remaining ones were in the PRC. The total staff costs, including the
directors’ emoluments, for the year ended 31 December 2009 amounted to HK$136.6 million.
The Group has adopted salary policies in line with market practice and remunerated its
employees based on their performance and experience. Other employee benefits include
performance-related bonuses, insurance and medical coverage and share option scheme. Whilst
pursuing a range of cost-saving measures to improve efficiency amid the difficult operating
environment during the year, the Group remains to see committed and competent workforce as a key
to corporate success. Various forms of training are provided to staff as and when necessary.
(c) Year ended 31 December 2008 compared to year ended 31 December 2007
The Group recorded consolidated revenue of approximately HK$8,450.3 million for the year
ended 31 December 2008, representing an approximately 15.2% year-on-year increase from the
consolidated revenue of HK$7,337.2 million for the year ended 31 December 2007. However, because
of margin erosion, write-down of inventories as well as the non-cash impairment provision for alumina
purchasing rights, the profit attributable to equity holders of the Company declined from
approximately HK$601.2 million in 2007 to HK$137.7 million in 2008.
Revenue
Despite the sustained decline in aluminium and alumina prices, the Group recorded
approximately 15.2% year-on-year revenue growth in 2008. Revenue from the Group’s core
operations, including trading and aluminium fabrication, increased by approximately 17.4% and 2.7%
respectively. The improvement was mainly driven by sales volume growth. This reflects the Group’s
success in widening its procurement sources of alumina supply in both international and the PRC
markets, and expanding further into different segments along the aluminium business chain.
Gross profit
Due to the decrease in gross profit margin and a write-down of inventories of approximately
HK$118.5 million at the year-end of 2008, the Group’s gross profit decreased from approximately
HK$924.8 million for the year ended 31 December 2007 to HK$421.5 million for the year ended 31
December 2008. Overall gross profit margin reduced from approximately 12.6% in 2007 to 5.0% in
2008, which was mainly due to the reduction in gross profit margin of the core businesses — trading
of alumina and aluminium ingots as well as the write-down of inventories as mentioned above.
APPENDIX II FINANCIAL INFORMATION OF THE GROUP
— II-23 —
App 16 32(7)
In 2008, the Group suffered pressure on both the sales and cost sides of its trading operation. The
adverse factors include: (i) the disruption in production of certain PRC aluminium smelters — because
of the snow storms in Southern China in early 2008 — has driven down the demand for alumina; (ii)
market sentiment turned even more negative with the hit of the financial tsunami — oversupply
continues to grow; and (iii) imported cost alumina remained high in most of the time throughout the
year because of rising fuel costs. The downturn of energy prices, though substantial in the last few
months of 2008, provided little immediate relief on the procurement cost for 2008.
Selling expenses
During the year, the Group’s selling expenses increased by approximately 34.1% to
approximately HK$107.3 million (2007: approximately HK$80.0 million). This was partly due to the
growth in turnover and partly due to the escalating transportation charge and other logistics costs.
Selling expenses to revenue ratio rose from approximately 1.1% to 1.3%.
Administrative expenses
During the year, the Group’s administrative expenses rose by approximately 17.1% to
approximately HK$190.7 million (2007: approximately HK$162.9 million). The increase was mainly
due to: (i) legal and other professional fees incurred for the investment projects undertaken during the
year; (ii) increased business expenses as a result of higher sales and production volume; and (iii)
inflated labour and other running costs. Administrative expenses to revenue ratio increased from
approximately 2.2% to 2.3%.
Other income
The Group recorded other income of approximately HK$25.8 million in 2008, as compared to
HK$90.5 million in 2007. The difference was mainly attributable to a tax refund granted to the Group
in 2007 as a result of its reinvestment in a PRC subsidiary.
Other gains — net
Other gains — net decreased from approximately HK$158.9 million in 2007 to approximately
HK$62.8 million in 2008. The decrease in other gains — net was mainly attributable to: (i) a decrease
in the net exchange gains from approximately HK$120.3 million in 2007 to approximately HK$67.2
million in 2008 as a result of the depreciation of Australian dollars and the slowing down of
appreciation of Renminbi against other currencies; and (ii) net losses of approximately HK$12.9
million were reported in respect of the realised gains/losses and mark-to-market fair value adjustments
on aluminium forward/futures contracts in 2008, compared to the net gains of approximately
HK$31.01 million in 2007.
Finance costs — net
Finance costs — net decreased by approximately HK$4.0 million to HK$24.6 million (2007:
HK$28.6 million) in 2008. The decrease was mainly attributable to: (i) no interest on convertible
bonds was recorded in 2008 (2007: approximately HK$47.0 million) as the conversion of outstanding
bonds had been completed in 2007; and (ii) decrease in interest income because of the reduction in
interest rates as well as cash surplus in 2008.
APPENDIX II FINANCIAL INFORMATION OF THE GROUP
— II-24 —
App1632(11)
Share of post-tax profits less losses of jointly-controlled companies
The Group’s share of the results of its jointly-controlled companies is as follows:
Changzhou Jinyuan — Sales volume and revenues of copper rods and copper wires decreased by
approximately 3.7% and 7.9% respectively because of weakened demand and severe market
competition. However, the most critical factor that caused the loss for 2008 was the significant decline
in copper price near the year end, bringing a mark-to-market loss in respect of outstanding copper
futures contracts, as opposite to a gain in 2007, to Changzhou Jinyuan.
Guangxi Huayin — Reported loss in 2008 because of write-down of inventories at the year end
in response to the substantial decline in alumina price at that time.
Mincenco — No revenue was derived in 2008 since the Jamaican bauxite exploration and
alumina refinery project was still in the exploration and feasibility study stage.
Share of post-tax profits less losses of associates
The Group’s share of the results of its associates is as follows:
Sino Nickel — Average selling price of nickel concentrate spiralled down by more than 30%
compared to 2007 and trading profit margin also lowered than before.
Qingdao M.C. — Profit from aluminum cans production improved due to reduced raw material
costs and sales growth.
SEGMENTAL ANALYSIS
Trading
In 2008, trading business accounted for approximately 74.7% (2007: approximately 73.2%) of
the Group’s external revenue and contributed approximately HK$194.8 million (2007: approximately
HK$873.3 million) to the Group’s operating profit. Alumina and aluminium ingots remained the major
trading products for the year, representing approximately 73.6% (2007: approximately 73.6%) and
approximately 26.4% (2007: approximately 26.3%) respectively of the external revenue of this
segment.
Weakening demand and negative market sentiment posed significant challenge to the Group’s
trading business. Compared to 2007, the market price of alumina in the PRC experienced much
volatile changes in 2008.
In 2007, alumina price rebounded to approximately RMB3,600 per tonne in the first quarter after
hitting a low level of approximately RMB2,500 per tonne by end of 2006. Price then showed some
ease back in the middle of the year. But in the last two months, price started to rise again and reached
the level of approximately RMB4,200 to RMB4,500 per tonne.
APPENDIX II FINANCIAL INFORMATION OF THE GROUP
— II-25 —
App16 32(6)
In 2008, except in the first few months, alumina price showed a continuous slide throughout the
year. Price began to lose its strength in the second quarter and dropped to approximately RMB3,900
per tonne at the quarter end. And in the next few months, price continued to decline and fall to
approximately RMB2,900 per tonne in October. The situation went from bad to worse by the end of
the year. Price plummeted even further to approximately RMB2,000 per tonne or lower amid the global
financial crisis.
Despite the sustained decline in alumina price, the Group still managed to achieve revenue
growth of approximately 17.4% in its trading business. During the year, the Group leveraged on its
competitive strengths in the imported alumina market and expanded into upstream operation. Through
the acquisition of 33% interest in Guangxi Huayin, it has secured a stable and long-term supply of the
PRC domestically produced alumina and strengthened its market position. Therefore, the trade volume
of alumina could still grow by approximately 26.7% under the difficult market situation in 2008.
To further diversify risk and expand its customer network, the Group also engaged in tolling,
sourcing and trading of aluminium ingots. Through the cooperation with aluminium smelters, the
Group could be more flexible in meeting the customers’ demand for alumina and aluminium ingots and
thus enhanced its marketing capabilities. Trading volume of aluminium ingots increased
approximately 21.7% in 2008 when compared to 2007.
However, climbing global energy prices increased the cost of imported alumina as well as
transportation cost. The downturn of these costs, which occurred in the last few months of the year,
offered no great help to the overall result for 2008. At the year end of 2008, due to the drastic decline
in the market prices of aluminium and alumina, the Group wrote down the aluminium and alumina
stocks of this segment by approximately HK$106.1 million. Significant decline in sales price, rising
procurement cost, massive write-down of inventories and provision for impairment of alumina
purchasing rights caused the contribution from the Group’s trading segment decreased sharply by
approximately HK$678.5 million to approximately HK$194.8 million in 2008.
Aluminium fabrication
Aluminium fabrication accounted for approximately 22.0% (2007: 24.7%) of the Group’s
external revenue and contributed approximately HK$28.8 million (2007: approximately HK$52.2
million) to the Group’s operating profit in 2008. The Group operated its aluminium fabrication
business through NCA, a subsidiary owned as to 72.8% by the Group as at 31 December 2008.
As compared to 2007, sales volume and external sales revenue in this segment recorded a slight
growth of approximately 2.3% and 2.7% respectively. However, significant decline in aluminium price
in the third quarter of 2008 severely undermined the growth momentum carried forward from the
first-half of 2008.
In 2008, NCA strived to expand its market share in the aluminium foil stock and PS plate market.
Improvement in product quality and reliability has gained widespread acceptance among different
customers. Besides, NCA also spared no effort in optimising its product mix so as to maintain and
improve its profit margin. However, surging operating costs, such as labour, repair and maintenance
as well as research and development expenses, caused a drop in the contribution from this segment
from approximately HK$52.2 million in 2007 to approximately HK$28.8 million in 2008.
APPENDIX II FINANCIAL INFORMATION OF THE GROUP
— II-26 —
The construction of a new aluminium foil production line is underway. It is anticipated that this
new production line, which can enhance NCA’s annual production capacity by 25,000 tonnes, can
commence production in the last quarter of 2009.
Other operations
This segment, which mainly included the production and sale of aluminium processing
equipment, production and sale of plica tubes (flexible metals conduits) and port logistics services,
accounted for approximately 3.3% (2007: approximately 2.1%) of the Group’s external revenue and
contributed approximately HK$12.2 million (2007: approximately HK$12.7 million) to the Group’s
operating profit in 2008.
Resources and liquidity
Notwithstanding the rapid downturn of the global economy and the volatile changes in the
commodity market, the Group has maintained a healthy financial and liquidity position in 2008.
During the year, total assets and shareholders’ equity increased by approximately 4.6% to
approximately HK$7,505.7 million and decreased by approximately 1.9% to approximately
HK$4,813.4 million respectively. The Group’s financial and liquidity position has been strong for
2007. Total assets and equity attributable to the Company’s equity holders increased to HK$7,175.2
million and HK$4,904.3 million respectively as at end of year 2007. As at 31 December 2008, the
Group’s current ratio was approximately 2.0 (2007: approximately 3.1).
As at 31 December 2008, the Group was in a net cash position of approximately HK$970.0
million, representing cash and bank deposits of approximately HK$1,905.9 million less total
borrowings of approximately HK$935.9 million (comprising bank borrowings of approximately
HK$848.6 million and advances from banks for discounted bills of approximately HK$87.3 million).
Hence, gearing ratio (defined as total borrowings less cash and bank deposits divided by shareholders’
equity) is not applicable. The Group’s cash and bank deposits, amounting to approximately
HK$1,905.9 million at 31 December 2008, were mainly denominated in Hong Kong dollars (14%),
Renminbi (30%) and US dollars (55%).
As at 31 December 2008, the profile of the Group’s bank borrowings was approximately as
follows:
(1) 44% were in Renminbi and 56% in US dollars;
(2) 28% were in fixed rates and 72% were in floating rates;
(3) 36% were repayable within 1 year, 12% were repayable between 1 and 2 years, 23% were
repayable between 2 and 5 years and 29% were repayable after 5 years.
As at 31 December 2007, the Group was in a net cash position of HK$1,248.6 million,
representing cash and bank deposits of HK$2,736.5 million less total borrowings of HK$747.2 million
(comprising bank borrowings of HK$697.7 million and advances from banks for discounted bills of
HK$49.5 million). Hence, gearing ratio (defined as total borrowings less cash and bank deposits
divided by shareholders’ equity) is not applicable.
APPENDIX II FINANCIAL INFORMATION OF THE GROUP
— II-27 —
App 16 32(1)
App 16 32(2)
App 16 32(10)
App 16 32(10)
The Group’s cash and bank deposits, amounting to HK$2,736.5 million as at 31 December 2007,
were mainly denominated in Hong Kong dollars (22%), Renminbi (55%), US dollars (22%) and others.
During the year, the Group’s total borrowings increased to HK$747.2 million, mainly due to the
increase in advances from banks for discounted bills. There is no particular seasonality of the Group’s
bank borrowings. As at 31 December 2007, the profile of the Group’s bank borrowings was as follows:
(1) 25% were in Renminbi and 75% were in US dollars;
(2) 25% were in fixed rate and 75% were in floating rate;
(3) 32% were repayable within 1 year, 7% were repayable between 1 and 2 years, 20% were
between 2 and 5 years and 41% were repayable after 5 years.
Material acquisitions and disposals
In June 2007, Riseup Dragon Limited, a wholly-owned subsidiary of the Company, entered into
an agreement to acquire 16.31% equity interest in NCA, a subsidiary engaged in aluminium
fabrication and owned as to 51% by the Group before this acquisition. The consideration was
approximately RMB72.9 million (equivalent to approximately HK$75.1 million). After this
acquisition, the Group will also provide a capital injection in cash of RMB98.8 million (equivalent to
approximately HK$101.8 million) to NCA to support the construction of a new production plant.
In mid-January 2008, the Group completed the acquisition of 16.31% interest in NCA, a
non-wholly owned subsidiary of the Group engaging in the production of aluminium foils and
extrusions, and increased its equity interest in NCA to 67.31%. Through a capital injection in
September 2008, for which the Group contributed approximately RMB98.8 million (equivalent to
approximately HK$112.6 million) of cash, the Group’s stake in NCA further increased to 72.8%.
In November 2007, the Company announced that the Group had entered into agreements in
relation to the acquisition of 33% equity interest in Guangxi Huayin for a consideration of
approximately RMB856.0 million (equivalent to approximately HK$890.2 million). This acquisition
has been approved by the Company’s independent shareholders in the extraordinary general meeting
held on 18 December 2007.
By the end of April 2008, the Group completed the acquisition of 33% interest in Guangxi
Huayin, a jointly-controlled company engaging in the production and sale of alumina and related
products. The total cost for this acquisition was approximately RMB920.4 million (equivalent to
approximately HK$1,012.5 million).
In October 2007, the Company announced that the Group had entered into agreements in relation
to the investment of 20% stake in Qinghai Province Investment Group Limited (“QinghaiInvestment”). The total equity contribution to be made by the Group is approximately RMB680.3
million (equivalent to approximately HK$700.7 million) and deposits of approximately US$28.7
million (equivalent to approximately HK$223.6 million) was made before the end of 2007.
APPENDIX II FINANCIAL INFORMATION OF THE GROUP
— II-28 —
App 16 32(5)
In light of the adverse and sustained volatile market conditions, the Company announced on 2
December 2008 the exit from the proposed investment in Qinghai Investment. Deposit of
approximately US$28.7 million (equivalent to approximately HK$223.6 million) previously made by
the Group to Qinghai Investment was refunded in December 2008.
In March 2007, the Group disposed certain investment properties located in Macau with a
carrying value of HK$2.2 million and realised a gain of HK$0.1 million.
In April 2007, the Group disposed its 30% equity interest in an associate, Huludao Orienmet
Copper Company Limited, and recognised a gain of HK$1.4 million. Since full provision had already
been made by the Group in previous years, the disposal of this investment did not have any adverse
impact on the Group’s result and financial position.
Except for the above, there was no material acquisition or disposal of investments by the Group
for the years ended 31 December 2007 and 2008, respectively.
Significant investments held
In 2007, the Group made no addition or disposal for the equity securities it held in Sino Gold
Limited (“Sino Gold”) (a gold mining company with primary listing in Australia and secondary listing
in Hong Kong). At 31 December 2007, the Group held approximately 10 million shares in Sino Gold,
with a market value of approximately HK$476.1 million, representing an appreciation of
approximately HK$25.2 million or 6% over previous year. These securities were classified as
available-for-sale financial assets in the Group’s consolidated balance sheet and their fair value
changes were recognised in equity.
Taking into account the additional shares acquired through the rights issue of shares made by
Sino Gold in 2008, the Group held approximately 11.5 million shares in Sino Gold, with a carrying
value of approximately HK$309.8 million as at 31 December 2008. Sino Gold is a gold mining
company with a primary listing in Australia and a secondary listing in Hong Kong.
Contingent liabilities
The Group had no material contingent liability as at 31 December 2007 and 2008.
Capital expenditure and commitments
The Group incurred capital expenditure of approximately HK$158.5 million for year ended 31
December 2008, mainly related to the construction of a new aluminium foil production line and the
upgrade of other production facilities. The total capital expenditure of the Group amounted to
approximately HK$24.3 million for 2007, which was mainly used in the expansion and upgrade of
production facilities in the Group’s fabrication businesses.
APPENDIX II FINANCIAL INFORMATION OF THE GROUP
— II-29 —
App 16 32(4)
App 16 32(12)
The Group’s capital commitments as at 31 December 2008 amounted to approximately HK$283.0
million, which were mainly related to the construction of a new aluminium foils production line as
well as the expansion of other production facilities in the Group’s aluminium fabrication business.
Charge on assets
The following assets of the Group were pledged to certain banks for the banking facilities
granted to the Group:
(1) All the equity interests of a wholly owned subsidiary, Sino Mining and all the assets of Sino
Mining as at 31 December 2007 and 2008;
(2) Certain property, plant and equipment, land use rights as well as inventories of the Group
with a total carrying amount of approximately HK$476.2 million as at 31 December 2008
(2007: approximately HK$400.0 million); and
(3) Bank deposits of approximately HK$38.2 million as at 31 December 2008 (2007:
approximately HK$41.1 million).
Risk management
Set out below are the major risk areas that the Group may enter into derivative contracts from
time to time to hedge against the risks.
(a) Commodity price risk
For the year ended 31 December 2008, to mitigate the price risk of the commodity cycle that may
cause to its trading and aluminium fabrication operations, the Group has entered into certain
aluminium forward/futures contracts in 2008. As at 31 December 2008, the Group’s long and short
positions in aluminium forward/futures contracts amounted to approximately 10,040 tonnes and 7,625
tonnes respectively.
The Group has used aluminium forward contracts from time to time to hedge against the
commodity price risk exposure on its alumina trading. At 31 December 2007, the Group had a short
position in aluminium forward contracts, with an amount of 13,000 tonnes of aluminium.
(b) Interest rate risk
To reduce the impact of interest rate fluctuations on its operation, the Group has arranged interest
rate swaps to manage the interest rate risk of its floating-rate bank borrowings. The outstanding
principal amount of the Group’s interest rate swaps as at 31 December 2008 amounted to
approximately HK$475.8 million (2007: approximately HK$534.0 million).
APPENDIX II FINANCIAL INFORMATION OF THE GROUP
— II-30 —
App 16 32(8)
App 16 32(11)
(c) Foreign exchange risk
The Group’s foreign exchange risk exposure primarily lies on its operations in Hong Kong, the
PRC and Australia. Given the exchange rate peg between Hong Kong dollars and United States dollars,
it is not foreseen that the Group will be exposed to significant risk for transactions conducted in these
two currencies. However, exchange rate fluctuations between Renminbi or Australian dollars and
Hong Kong dollars or US dollars may affect the Group’s performance and asset value. The Group had
not entered into any derivative contracts to hedge against this risk for the year ended 31 December
2007 and 2008.
Human resources
As at 31 December 2008, the Group’s total headcount stood at approximately 2,414 (2007: 2,400)
(not including the employees of jointly-controlled companies and associates), of which 18 (2007: 15)
were based in Hong Kong, 12 (2007: 12) were in Australia and the remaining ones were in the PRC.
The total staff costs, including the directors’ emoluments, for the year ended 31 December 2008
amounted to HK$148.5 million (2007: HK$105.5 million).
The Group adopts salary policies in line with market practice and motivates its staff with
performance-based remuneration package. Award such as discretionary bonuses and share options are
granted to eligible staff in accordance with individual and group performance. Training and
development programmes will be offered to staff at different levels as and when appropriate.
4. INDEBTEDNESS
As at the close of business on 30 September 2010, being the latest practicable date for this
indebtedness statement prior to the printing of this circular, the Enlarged Group had outstanding
borrowings of approximately HK$9,939 million, which comprised bank loans of approximately
HK$9,613 million, lease liabilities of approximately HK$39 million and advances from banks for
discounted bills of approximately HK$287 million.
As at 30 September 2010, bank loans of (i) approximately HK$394 million were secured by a
charge on the entire equity interest in a wholly-owned subsidiary, Sino Mining Alumina Limited, the
assets of Sino Mining Alumina Limited and pledged bank deposits; (ii) approximately HK$1,560
million were secured by a charge on entire share capital of a wholly-owned subsidiary, Album
Investments, a mortgage on 70% of the issued shares in certain wholly-owned subsidiaries of Album
Investments and a mortgage on 70% of issued shares in MMG Laos Holdings Limited, a 90%-owned
subsidiary of Album Investments; and (iii) approximately HK$228 million were secured by certain
property, plant and equipment, land use rights and inventories. Bank loans of approximately HK$8,541
million and HK$450 million were also secured by corporate guarantees given by the intermediate
holding company, CMN and ultimate holding company, CMC. As at 30 September 2010, all of the
Enlarged Group’s bank loans were secured and/or guaranteed.
As at the close of business on 30 September 2010, the Company provided a corporate guarantee
of approximately HK$41 million to a bank for a loan granted to a jointly-controlled company.
APPENDIX II FINANCIAL INFORMATION OF THE GROUP
— II-31 —
App 16 32(7)
App1 part B 28(1), (2)(3), (4)App1B 30
App 16 32(1)(2)

Save as disclosed aforesaid, and apart from the intra-group liabilities and normal trade debts
payable, the Enlarged Group did not have any outstanding mortgages, charges, debentures, loan capital
or overdraft, or other similar indebtedness, finance lease or hire-purchase commitments, liabilities
under acceptances or acceptance credits or any guarantees or other material contingent liabilities as
at 30 September 2010.
5. WORKING CAPITAL STATEMENT
The Directors are of the opinion that, in the absence of unforeseeable circumstances and after
taking into account the Enlarged Group’s present internal resources and available banking facilities,
the Enlarged Group has sufficient working capital for its present requirement for at least the next
twelve months from the date of this circular.
6. NO MATERIAL ADVERSE CHANGE
As at the Latest Practicable Date, the Directors were not aware of any material adverse change
in the financial or trading position of the Group since 31 December 2009, the date to which the latest
published audited financial statements of the Group were made up.
7. FINANCIAL AND TRADING PROSPECTS
The business environment of the non-ferrous metals industry improved in the first half of 2010
on the back of economic recovery. During the first half of 2010, the Company sustained an
encouraging growth year on year. This reflected the Group’s ability to timely capture business
opportunities upon market recovery through its focus on consolidating its businesses, with an aim to
expand them.
The policy promulgated by the Chinese government to strictly regulate the irrational capacity
expansion of aluminium smelters will be beneficial for a balanced development of industrial
production and market supply and demand in the long run. Such will also increase the advantages of
enterprises with strong fundamentals. The Group will continue to seize opportunities as and when it
arises.
The major tasks of the Group in the second half of 2010 include: actively implement technology
enhancement, enlarge production capacity, raise product quality, expand market coverage to increase
sales. All these tasks should help to strengthen the integrated competitiveness of the Group. The Group
will fully leverage on its competitive edges in alumina and aluminium ingot business operations to
maintain and consolidate its market position; the Group will continue with aluminium operation
integration to enhance its overall competitiveness.
However, other than the Acquisition, the Company currently has no present plans for material
investments or capital assets.
Regarding the prospects of the Target Group, there are two main factors which will influence the
outlook: the supply/demand balance for the metals produced and growth through continued progress
on the Development Projects. The overall outlook for the future demand for the main base metals
APPENDIX II FINANCIAL INFORMATION OF THE GROUP
— II-32 —
App1632(1)(2)
App 1B 30
App 1B 32
App1,part B29(1)(b)
App16 32(9)
produced by the Target Group is reasonable, as more fully discussed in the section headed “Industry
overview” in this circular. In general terms, the continued economic growth of the PRC and other
rapidly developing economies is expected to lead to ongoing demand for the metals produced while
these metals are tending to become more difficult and more expensive to discover and produce. The
focus of the Target Group in the near term will be to continue to operate its assets safely and
efficiently while also looking for growth. The major tasks in terms of growth for the Target Group for
the rest of 2010 and into 2011 include continuing the feasibility and permitting work on the
Development Projects. In particular, it is probable that the Dugald River project may be advanced to
the point of a decision to develop such project during the first half of 2011.
APPENDIX II FINANCIAL INFORMATION OF THE GROUP
— II-33 —
INTRODUCTION
The following is an illustrative and unaudited pro forma financial information of the Enlarged
Group (“Unaudited Pro Forma Financial Information”), including the unaudited pro forma
consolidated balance sheet, the unaudited pro forma consolidated income statement, the unaudited pro
forma consolidated statement of cash flows and the unaudited pro forma consolidated statement of
adjusted net tangible assets of the Enlarged Group, which have been prepared on the basis of the notes
set out below for the purpose of illustrating the effect of the Acquisition, as if it had taken place on
30 June 2010 for the unaudited pro forma consolidated balance sheet and the unaudited pro forma
consolidated statement of adjusted net tangible assets and on 1 January 2010 for the unaudited pro
forma consolidated income statement and the unaudited pro forma consolidated statement of cash
flows.
The Unaudited Pro Forma Financial Information has been prepared for illustrative purposes only
and because of its hypothetical nature, it may not give a true picture of the financial position, results
of operations and cash flows of the Group had the Acquisition been completed as at 30 June 2010 or
1 January 2010, where applicable, or at any future dates.
The Unaudited Pro Forma Financial Information should be read in conjunction with other
financial information included elsewhere in this circular.
APPENDIX III UNAUDITED PRO FORMA FINANCIAL INFORMATIONOF THE ENLARGED GROUP
— III-1 —
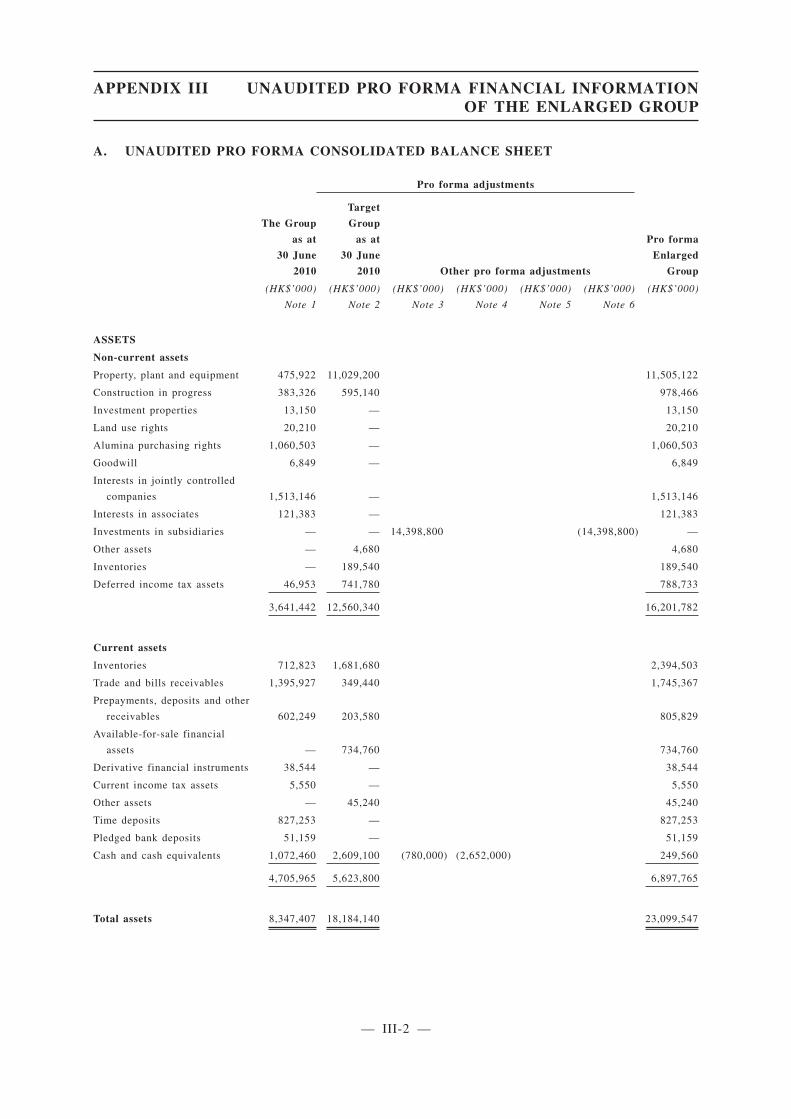
A. UNAUDITED PRO FORMA CONSOLIDATED BALANCE SHEET
Pro forma adjustments
The Group
as at
30 June
2010
Target
Group
as at
30 June
2010 Other pro forma adjustments
Pro forma
Enlarged
Group
(HK$’000)
Note 1
(HK$’000)
Note 2
(HK$’000)
Note 3
(HK$’000)
Note 4
(HK$’000)
Note 5
(HK$’000)
Note 6
(HK$’000)
ASSETS
Non-current assets
Property, plant and equipment 475,922 11,029,200 11,505,122
Construction in progress 383,326 595,140 978,466
Investment properties 13,150 — 13,150
Land use rights 20,210 — 20,210
Alumina purchasing rights 1,060,503 — 1,060,503
Goodwill 6,849 — 6,849
Interests in jointly controlled
companies 1,513,146 — 1,513,146
Interests in associates 121,383 — 121,383
Investments in subsidiaries — — 14,398,800 (14,398,800) —
Other assets — 4,680 4,680
Inventories — 189,540 189,540
Deferred income tax assets 46,953 741,780 788,733
3,641,442 12,560,340 16,201,782
Current assets
Inventories 712,823 1,681,680 2,394,503
Trade and bills receivables 1,395,927 349,440 1,745,367
Prepayments, deposits and other
receivables 602,249 203,580 805,829
Available-for-sale financial
assets — 734,760 734,760
Derivative financial instruments 38,544 — 38,544
Current income tax assets 5,550 — 5,550
Other assets — 45,240 45,240
Time deposits 827,253 — 827,253
Pledged bank deposits 51,159 — 51,159
Cash and cash equivalents 1,072,460 2,609,100 (780,000) (2,652,000) 249,560
4,705,965 5,623,800 6,897,765
Total assets 8,347,407 18,184,140 23,099,547
APPENDIX III UNAUDITED PRO FORMA FINANCIAL INFORMATIONOF THE ENLARGED GROUP
— III-2 —
14.67(6)(a)(ii)
14.69(4)(a)(ii)

Pro forma adjustments
The Group
as at
30 June
2010
Target
Group
as at
30 June
2010 Other pro forma adjustments
Pro forma
Enlarged
Group
(HK$’000)
Note 1
(HK$’000)
Note 2
(HK$’000)
Note 3
(HK$’000)
Note 4
(HK$’000)
Note 5
(HK$’000)
Note 6
(HK$’000)
EQUITY
Capital and reserves
attributable to the equity
holders of the Company
Share capital 101,311 2,628,600 47,039 (2,628,600) 148,350
Reserves 5,274,208 3,083,340 8,157,298 (2,652,000) (651,300) (11,770,200) 1,441,346
5,375,519 5,711,940 1,589,696
Non-controlling interests 203,211 304,200 507,411
Total equity 5,578,730 6,016,140 2,097,107
LIABILITIES
Non-current liabilities
Deferred income 40,383 — 40,383
Deferred income tax liabilities 9,940 — 9,940
Lease liabilities — 32,760 32,760
Provisions — 1,799,460 1,799,460
Long-term loan notes — — 5,414,463 5,414,463
Bank borrowings 564,000 8,541,000 9,105,000
614,323 10,373,220 16,402,006
Current liabilities
Trade and bills payables 977,013 1,009,320 1,986,333
Accruals, receipt in advance and
other payables 710,649 354,120 651,300 1,716,069
Amounts due to related
companies 5,804 — 5,804
Derivative financial instruments 1,791 — 1,791
Current income tax liabilities 3,949 422,760 426,709
Lease liabilities — 8,580 8,580
Bank borrowings 455,148 — 455,148
2,154,354 1,794,780 4,600,434
Total liabilities 2,768,677 12,168,000 21,002,440
Total equity and liabilities 8,347,407 18,184,140 23,099,547
APPENDIX III UNAUDITED PRO FORMA FINANCIAL INFORMATIONOF THE ENLARGED GROUP
— III-3 —
14.69(4)(a)(ii)

B. UNAUDITED PRO FORMA CONSOLIDATED INCOME STATEMENT
Pro forma adjustments
The Group for
the six months
period ended
30 June 2010
Target Group for
the six months
period ended
30 June 2010 Other pro forma adjustments
Pro forma
Enlarged
Group
(HK$’000)
Note 1
(HK$’000)
Note 2
(HK$’000)
Note 5
(HK$’000)
Note 7
(HK$’000)
Revenue 5,403,696 6,588,660 11,992,356
Cost of sales (5,104,413) (3,568,500) (8,672,913)
Gross Profits 299,283 3,020,160 3,319,443
Selling expenses (44,539) (275,340) (319,879)
Administrative expenses (74,639) (593,580) (668,219)
Other income 4,812 31,980 36,792
Other expenses — — (651,300) (651,300)
Other gain, net 67,780 (57,720) 10,060
Operating profit 252,697 2,125,500 1,726,897
Finance income 13,548 14,040 27,588
Finance costs (21,025) (138,840) (85,294) (245,159)
Share of post tax profits less
losses of jointly-controlled
companies 207,515 — 207,515
Share of post tax profits less
losses of associates 9,089 — 9,089
Profit before income tax 461,824 2,000,700 1,725,930
Income tax expense (34,904) (175,500) (210,404)
Profit for the period 426,920 1,825,200 1,515,526
Attributable to:
Equity holders of the
Company 423,980 1,736,280 1,423,666
Non-controlling interests 2,940 88,920 91,860
426,920 1,825,200 1,515,526
APPENDIX III UNAUDITED PRO FORMA FINANCIAL INFORMATIONOF THE ENLARGED GROUP
— III-4 —
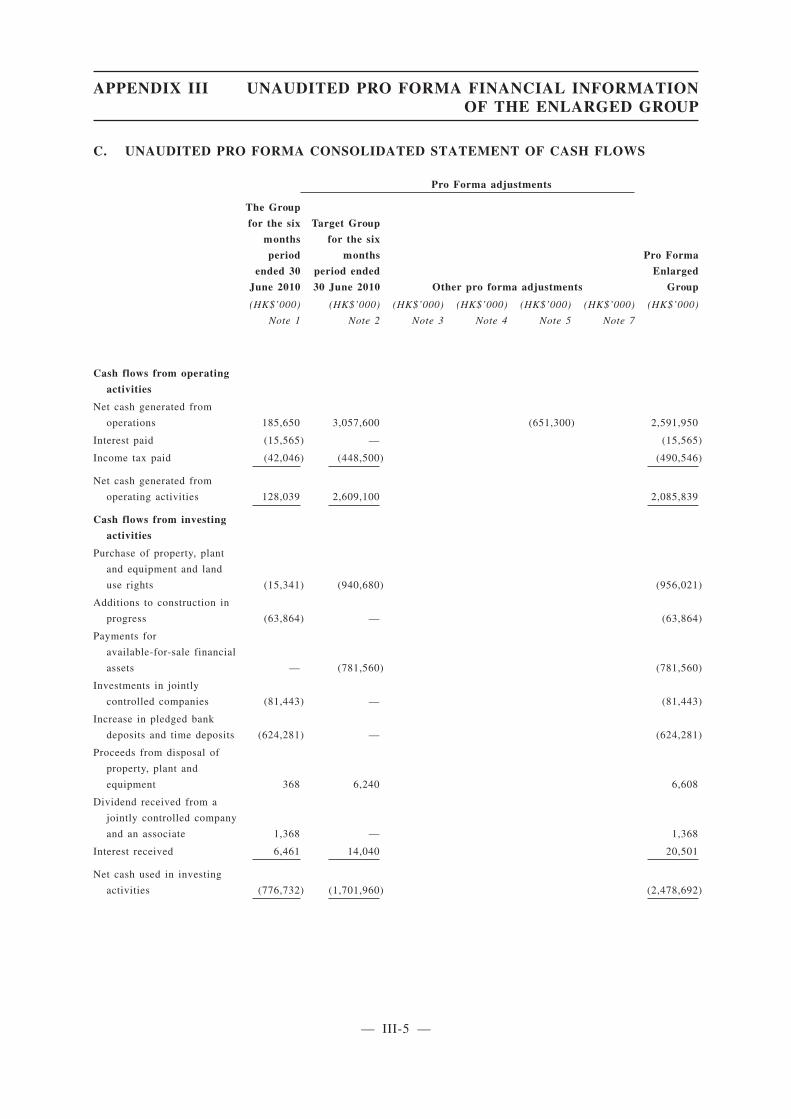
C. UNAUDITED PRO FORMA CONSOLIDATED STATEMENT OF CASH FLOWS
Pro Forma adjustments
The Group
for the six
months
period
ended 30
June 2010
Target Group
for the six
months
period ended
30 June 2010 Other pro forma adjustments
Pro Forma
Enlarged
Group
(HK$’000)
Note 1
(HK$’000)
Note 2
(HK$’000)
Note 3
(HK$’000)
Note 4
(HK$’000)
Note 5
(HK$’000)
Note 7
(HK$’000)
Cash flows from operating
activities
Net cash generated from
operations 185,650 3,057,600 (651,300) 2,591,950
Interest paid (15,565) — (15,565)
Income tax paid (42,046) (448,500) (490,546)
Net cash generated from
operating activities 128,039 2,609,100 2,085,839
Cash flows from investing
activities
Purchase of property, plant
and equipment and land
use rights (15,341) (940,680) (956,021)
Additions to construction in
progress (63,864) — (63,864)
Payments for
available-for-sale financial
assets — (781,560) (781,560)
Investments in jointly
controlled companies (81,443) — (81,443)
Increase in pledged bank
deposits and time deposits (624,281) — (624,281)
Proceeds from disposal of
property, plant and
equipment 368 6,240 6,608
Dividend received from a
jointly controlled company
and an associate 1,368 — 1,368
Interest received 6,461 14,040 20,501
Net cash used in investing
activities (776,732) (1,701,960) (2,478,692)
APPENDIX III UNAUDITED PRO FORMA FINANCIAL INFORMATIONOF THE ENLARGED GROUP
— III-5 —
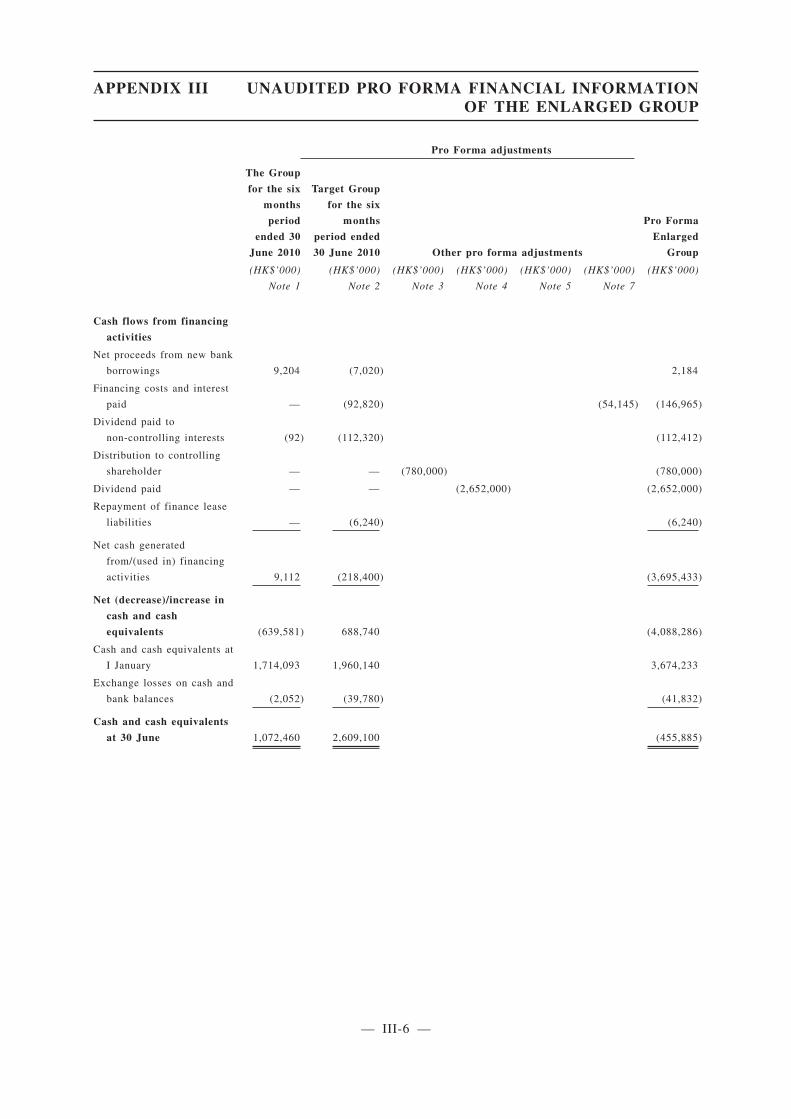
Pro Forma adjustments
The Group
for the six
months
period
ended 30
June 2010
Target Group
for the six
months
period ended
30 June 2010 Other pro forma adjustments
Pro Forma
Enlarged
Group
(HK$’000)
Note 1
(HK$’000)
Note 2
(HK$’000)
Note 3
(HK$’000)
Note 4
(HK$’000)
Note 5
(HK$’000)
Note 7
(HK$’000)
Cash flows from financing
activities
Net proceeds from new bank
borrowings 9,204 (7,020) 2,184
Financing costs and interest
paid — (92,820) (54,145) (146,965)
Dividend paid to
non-controlling interests (92) (112,320) (112,412)
Distribution to controlling
shareholder — — (780,000) (780,000)
Dividend paid — — (2,652,000) (2,652,000)
Repayment of finance lease
liabilities — (6,240) (6,240)
Net cash generated
from/(used in) financing
activities 9,112 (218,400) (3,695,433)
Net (decrease)/increase in
cash and cash
equivalents (639,581) 688,740 (4,088,286)
Cash and cash equivalents at
I January 1,714,093 1,960,140 3,674,233
Exchange losses on cash and
bank balances (2,052) (39,780) (41,832)
Cash and cash equivalents
at 30 June 1,072,460 2,609,100 (455,885)
APPENDIX III UNAUDITED PRO FORMA FINANCIAL INFORMATIONOF THE ENLARGED GROUP
— III-6 —
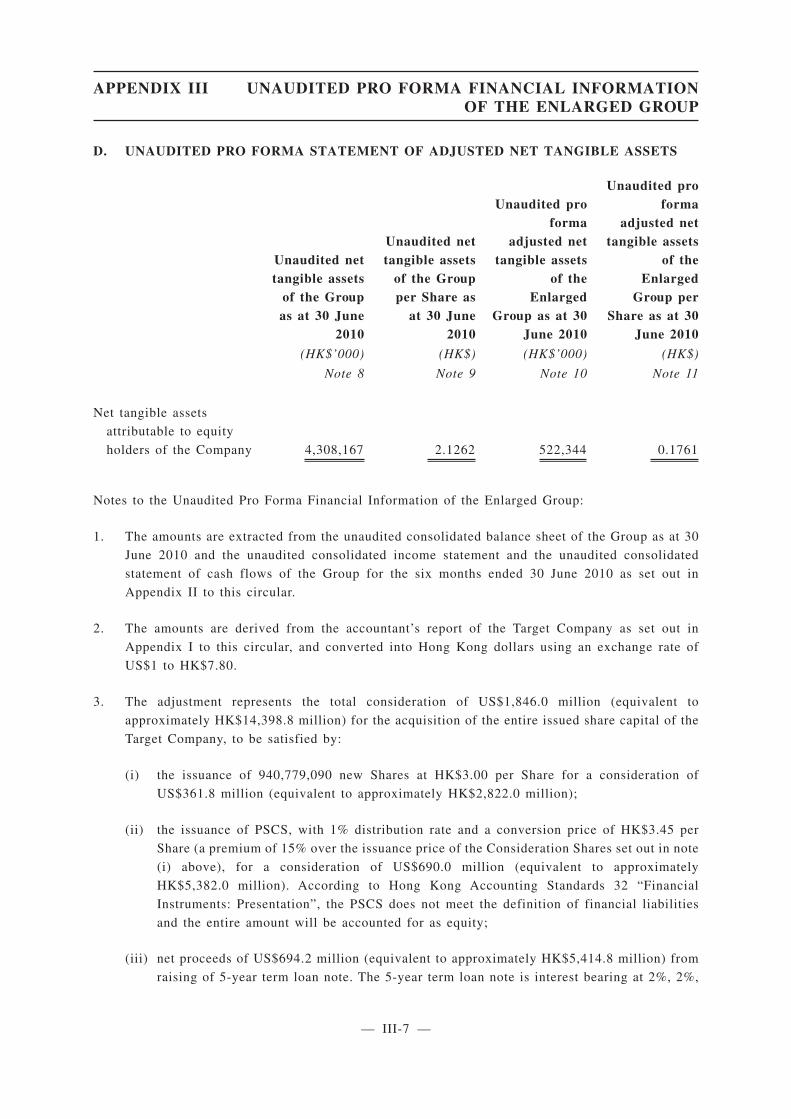
D. UNAUDITED PRO FORMA STATEMENT OF ADJUSTED NET TANGIBLE ASSETS
Unaudited nettangible assets
of the Groupas at 30 June
2010
Unaudited nettangible assets
of the Groupper Share as
at 30 June2010
Unaudited proforma
adjusted nettangible assets
of theEnlarged
Group as at 30June 2010
Unaudited proforma
adjusted nettangible assets
of theEnlarged
Group perShare as at 30
June 2010
(HK$’000) (HK$) (HK$’000) (HK$)
Note 8 Note 9 Note 10 Note 11
Net tangible assets
attributable to equity
holders of the Company 4,308,167 2.1262 522,344 0.1761
Notes to the Unaudited Pro Forma Financial Information of the Enlarged Group:
1. The amounts are extracted from the unaudited consolidated balance sheet of the Group as at 30
June 2010 and the unaudited consolidated income statement and the unaudited consolidated
statement of cash flows of the Group for the six months ended 30 June 2010 as set out in
Appendix II to this circular.
2. The amounts are derived from the accountant’s report of the Target Company as set out in
Appendix I to this circular, and converted into Hong Kong dollars using an exchange rate of
US$1 to HK$7.80.
3. The adjustment represents the total consideration of US$1,846.0 million (equivalent to
approximately HK$14,398.8 million) for the acquisition of the entire issued share capital of the
Target Company, to be satisfied by:
(i) the issuance of 940,779,090 new Shares at HK$3.00 per Share for a consideration of
US$361.8 million (equivalent to approximately HK$2,822.0 million);
(ii) the issuance of PSCS, with 1% distribution rate and a conversion price of HK$3.45 per
Share (a premium of 15% over the issuance price of the Consideration Shares set out in note
(i) above), for a consideration of US$690.0 million (equivalent to approximately
HK$5,382.0 million). According to Hong Kong Accounting Standards 32 “Financial
Instruments: Presentation”, the PSCS does not meet the definition of financial liabilities
and the entire amount will be accounted for as equity;
(iii) net proceeds of US$694.2 million (equivalent to approximately HK$5,414.8 million) from
raising of 5-year term loan note. The 5-year term loan note is interest bearing at 2%, 2%,
APPENDIX III UNAUDITED PRO FORMA FINANCIAL INFORMATIONOF THE ENLARGED GROUP
— III-7 —
3%, 4% and 5% per annum in the first, second, third, fourth and fifth year respectively. Forthe purpose of the preparation of the unaudited pro forma consolidated balance sheet, thecarrying value of the 5-year term loan note is assumed to approximate its fair value, as theimpact of discounting is considered not significant with reference to the Company’shistorical borrowing rate as at 30 June 2010; and
(iv) cash of US$100.0 million (equivalent to approximately HK$780.0 million) from theCompany’s internal resources.
This adjustment is not expected to have continuing effect on the Enlarged Group’s unaudited proforma consolidated income statement and unaudited pro forma consolidated statement of cashflows.
4. Repatriation of US$340.0 million (equivalent to approximately HK$2,652.0 million) from theTarget Group to Album Enterprises by way of dividend which will be completed prior toCompletion.
This adjustment is not expected to have continuing effect on the Enlarged Group’s unaudited proforma consolidated income statement and unaudited pro forma consolidated statement of cashflows.
5. The adjustment represents the estimated transaction costs of approximately US$83.5 million(equivalent to approximately HK$651.3 million) payable by the Company in connection with theAcquisition.
This adjustment is not expected to have continuing effect on the Enlarged Group’s unaudited proforma consolidated income statement and unaudited pro forma consolidated statement of cashflows.
6. Upon Completion, the assets and liabilities of the Target Group will be accounted for in theconsolidated financial statements of the Enlarged Group using the merger accounting inaccordance with Accounting Guideline 5 “Merger Accounting for Common ControlCombinations” issued by the Hong Kong Institute of Certified Public Accountants. Theadjustment represents consolidation entries for the elimination of investment cost of theCompany in the Target Company against its share capital, and the excess amount is recognisedas merger reserve.
Since the fair values of the Consideration Shares and PSCS to be issued at the Completion Datemay be substantially different from their fair values used in preparing this Unaudited Pro FormaFinancial Information, the amounts of the consideration and, accordingly, the amount of mergerreserve at the completion date may be different from the amounts presented above and thedifference may be significant.
7. The adjustment represents the interest expense on the 5-year term loan note of approximatelyHK$85.3 million for the six months period ended 30 June 2010 using the effective interest rateof 3.15% and the interest payment on the 5-year loan note of approximately HK$54.1 million forthe six months period ended 30 June 2010 pursuant to the loan agreement.
This adjustment is expected to have continuing effect on the Enlarged Group’s unaudited proforma consolidated income statement and unaudited pro forma consolidated statement of cashflows.
APPENDIX III UNAUDITED PRO FORMA FINANCIAL INFORMATIONOF THE ENLARGED GROUP
— III-8 —
8. The unaudited net tangible assets of the Group as at 30 June 2010 is calculated based on the
amount of the unaudited net assets attributable to the equity holders of the Group as at 30 June
2010 of approximately HK$5,375.5 million, less the amount of intangible assets of
approximately HK$1,067.4 million, as set out in the unaudited consolidated balance sheet of the
Group in Section A above.
9. The number of Shares used for the calculation of the unaudited net tangible assets of the Group
per Share is 2,026,216,799 Shares, being the number of Shares in issue as at 30 June 2010.
10. The unaudited pro forma adjusted net tangible assets of the Enlarged Group as at 30 June 2010
is calculated based on the amount of the unaudited pro forma adjusted net assets attributable to
the equity holders of the Enlarged Group as at 30 June 2010 of approximately HK$1,589.7
million, less the amount of intangible assets of HK$1,067.4 million, as set out in the unaudited
pro forma consolidated balance sheet of the Enlarged Group in Section A above.
11. The number of Shares used for the calculation of the unaudited pro forma adjusted net tangible
assets of the Enlarged Group per Share is 2,966,995,889 Shares, comprising 2,026,216,799
Shares in issue as at 30 June 2010 and 940,779,090 new Shares to be issued as described in note
3(i) above but have not taken into account of any Conversion Shares to be issued upon exercise
of the conversion of PSCS or any new Shares to be issued pursuant to the Specific Mandate.
12. Apart from the above, no adjustments have been made to the Unaudited Pro Forma Financial
Information to reflect any trading results or other transactions of the Enlarged Group entered into
subsequent to 30 June 2010.
APPENDIX III UNAUDITED PRO FORMA FINANCIAL INFORMATIONOF THE ENLARGED GROUP
— III-9 —
D. REPORT ON UNAUDITED PRO FORMA FINANCIAL INFORMATION
The following is the text of a report received from PricewaterhouseCoopers, Certified Public
Accountants, Hong Kong, for the sole purpose of incorporation in this circular.
ACCOUNTANT’S REPORT ON UNAUDITED PRO FORMA FINANCIAL INFORMATION
TO THE DIRECTORS OF MINMETALS RESOURCES LIMITED
We report on the unaudited pro forma financial information set out on pages III-1 to III-9 under
the heading of “Unaudited Pro Forma Financial Information” (the “Unaudited Pro Forma Financial
Information”) in Appendix III to the circular dated 22 November 2010 (the “Circular”) of Minmetals
Resources Limited (the “Company”), in connection with the proposed acquisition of the entire issued
share capital of Album Resources Private Limited (the “Acquisition”) by the Company. The Unaudited
Pro Forma Financial Information has been prepared by the directors of the Company, for illustrative
purposes only, to provide information about how the Acquisition might have affected the relevant
financial information of the Company and its subsidiaries (hereinafter collectively referred to as the
“Group”). The basis of preparation of the Unaudited Pro Forma Financial Information is set out on
pages III-1 to III-9 of the Circular.
Respective responsibilities of directors of the Company and the Reporting Accountant
It is the responsibility solely of the directors of the Company to prepare the Unaudited Pro Forma
Financial Information in accordance with Rule 4.29 of the Rules Governing the Listing of Securities
on The Stock Exchange of Hong Kong Limited (the “Listing Rules”) and Accounting Guideline 7
“Preparation of Pro Forma Financial Information for Inclusion in Investment Circulars” issued by the
Hong Kong Institute of Certified Public Accountants (the “HKICPA”).
It is our responsibility to form an opinion, as required by Rule 4.29(7) of the Listing Rules, on
the Unaudited Pro Forma Financial Information and to report our opinion to you. We do not accept
any responsibility for any reports previously given by us on any financial information used in the
compilation of the Unaudited Pro Forma Financial Information beyond that owed to those to whom
those reports were addressed by us at the dates of their issue.
APPENDIX III UNAUDITED PRO FORMA FINANCIAL INFORMATIONOF THE ENLARGED GROUP
— III-10 —
Basis of opinion
We conducted our engagement in accordance with Hong Kong Standard on Investment CircularReporting Engagements 300 “Accountants’ Reports on Pro Forma Financial Information in InvestmentCirculars” issued by the HKICPA. Our work, which involved no independent examination of any ofthe underlying financial information, consisted primarily of comparing the unaudited consolidated netassets and the unaudited consolidated balance sheet of the Group as at 30 June 2010, the unauditedconsolidated income statement and the unaudited consolidated statement of cash flows of the Groupfor the six months ended 30 June 2010 as set out in the “Unaudited Pro Forma Financial Information”section of the Circular with the published interim report of the Company for the six months ended 30June 2010, considering the evidence supporting the adjustments and discussing the Unaudited ProForma Financial Information with the directors of the Company.
We planned and performed our work so as to obtain the information and explanations weconsidered necessary in order to provide us with sufficient evidence to give reasonable assurance thatthe Unaudited Pro Forma Financial Information has been properly compiled by the directors of theCompany on the basis stated, that such basis is consistent with the accounting policies of the Groupand that the adjustments are appropriate for the purposes of the Unaudited Pro Forma FinancialInformation as disclosed pursuant to Rule 4.29(1) of the Listing Rules.
The Unaudited Pro Forma Financial Information is for illustrative purposes only, based on thejudgements and assumptions of the directors of the Company, and, because of its hypothetical nature,does not provide any assurance or indication that any event will take place in the future and may notbe indicative of:
— the financial position of the Group as at 30 June 2010 or any future date, or
— the results and cash flows of the Group for the six months ended 30 June 2010 or any futureperiods.
Opinion
In our opinion:
(a) the Unaudited Pro Forma Financial Information has been properly compiled by the directorsof the Company on the basis stated;
(b) such basis is consistent with the accounting policies of the Group; and
(c) the adjustments are appropriate for the purposes of the Unaudited Pro Forma FinancialInformation as disclosed pursuant to Rule 4.29(1) of the Listing Rules.
PricewaterhouseCoopersCertified Public Accountants
Hong Kong, 22 November 2010
APPENDIX III UNAUDITED PRO FORMA FINANCIAL INFORMATIONOF THE ENLARGED GROUP
— III-11 —
AMC Consultants Pty Ltd
ABN 58 008 129 164
Ground Floor, 9 Havelock Street WEST PERTH WA 6005
T +61 8 6330 1100 F +61 8 6330 1199 E [email protected]
ADELAIDE
+61 8 8201 1800
BRISBANE
+61 7 3839 0099
MELBOURNE
+61 3 8601 3300
PERTH
+61 8 6330 1100
UNITED KINGDOM
+44 1628 778 256
VANCOUVER
+1 604 669 0044
www.amcconsultants.com.au
COMPETENT PERSON’S REPORT ON MINERALS AND METALS GROUP
MINMETALS RESOURCES LIMITED
AMC 210063
November 2010
●
APPENDIX IV COMPETENT PERSON’S REPORT
AMC Consultants Pty Ltd
ABN 58 008 129 164
Ground Floor, 9 Havelock Street WEST PERTH WA 6005
T +61 8 6330 1100 F +61 8 6330 1199 E [email protected]
ADELAIDE
+61 8 8201 1800
BRISBANE
+61 7 3839 0099
MELBOURNE
+61 3 8601 3300
PERTH
+61 8 6330 1100
UNITED KINGDOM
+44 1628 778 256
VANCOUVER
+1 604 669 0044
www.amcconsultants.com.au
MINERALS AND METALS GROUP COMPETENT PERSON’S REPORT
MINMETALS RESOURCES LIMITED
D R A F T
AMC 210063
November 2010
— IV-1 —
The following is the text of a report from AMC Consultants, an independent technical specialist prepared for the sole purpose of incorporation in this circular.
— IV-1 —
MINMETALS RESOURCES LIMITED Competent Person’s Report on Minerals and Metals Group
AMC210063-10rpt_1 101122 ii
22 November 2010 The Directors Minmetals Resources Limited Twelfth Floor, China Minmetals Tower 79 Chatham Road South Tsimshatsui KOWLOON Hong Kong
Dear Sirs
COMPETENT PERSON’S REPORT ON MINERALS AND METALS GROUP
Minmetals Resources Limited (MMR), a Hong Kong-incorporated company, is considering a transaction whereby MMR will acquire, through a special purpose vehicle (SPV) All Glorious Limited, Album Resources Private Limited (Album Resources) from China Minmetals Non Ferrous Metals Co. Ltd (CMN) (the Transaction). The major assets of Album Resources are managed by Minerals and Metals Group (MMG). The assets are:
� the Sepon copper/gold operation in Laos
� the Century zinc/lead mine in Queensland
� the Golden Grove zinc/copper mine in Western Australia
� the Rosebery zinc/lead mine in Tasmania
� the Avebury nickel mine in Tasmania (currently on care and maintenance)
� the Dugald River zinc project in Queensland
� the Izok Lake and High Lake prospects in the Nunavut territories of northern Canada
� various exploration projects in Australia, Asia and Canada.
In connection with the Transaction, the Directors of MMR have requested that:
� Grant Samuel & Associates Pty Limited (Grant Samuel) prepare a report which includes:
- a valuation of Album Resources including a valuation of the Mineral Assets which complies with Chapter 18 of the Rules Governing the Listing of Securities on The Stock Exchange of Hong Kong Limited (the Listing Rules), including, but not limited to, Rules 18.24 and 18.34 of the Listing Rules
- a valuation of Album Resources which reflects a range of fair market values as a going concern, defined as the maximum price that could be realised in an open market over a reasonable period of time assuming that potential buyers have full information.
� AMC Consultants Pty Ltd (AMC) prepare:
- a competent person’s report in accordance with the Listing Rules (Competent Person’s Report)
- production and cost projections forecasts to be provided to Grant Samuel.
AMC has prepared the attached Report in the following form:
� Executive summary.
� Description of production assets.
� Description of development projects.
� Sources of information.
� Qualifications.
●
APPENDIX IV COMPETENT PERSON’S REPORT
— IV-2 —
MINMETALS RESOURCES LIMITED Competent Person’s Report on Minerals and Metals Group
AMC210063-10rpt_1 101122 iii
Summaries of the detailed production and cost projections provided to Grant Samuel are included in the Report.
AMC has completed its engagement as a specialist in accordance with the VALMIN Code1 and the Listing Rules.
AMC has visited MMG’s production assets. AMC did not visit the development projects and exploration properties, however, AMC has examined material relevant to these projects and properties at MMG’s head office in Melbourne.
In letters relating to AMC’s engagement, MMR has agreed to comply with the obligations of the commissioning entity under the VALMIN Code, including that to the best of its knowledge and understanding, complete, accurate and true disclosure of all relevant material information has been made.
AMC has reviewed material technical reports and management information and held discussions with management staff both on-site and in the Melbourne offices of MMG. AMC has not audited the information provided to it, but has aimed to satisfy itself that all of the information has been prepared in accordance with proper industry standards and is based on data that AMC considers to be of acceptable quality and reliability. Where AMC has not been satisfied, it has included comment in the Competent Person’s Report and where necessary adjusted the estimates and forecasts provided by AMC to Grant Samuel.
In preparing the Competent Person’s Report, AMC has relied on information provided by MMG and AMC has no reason to believe that information is materially misleading or incomplete or contains any material errors. MMG has been provided with drafts of AMC’s report relating to the Transaction to enable correction of any factual errors and notation of any material omissions. The views, statements, opinions and conclusions expressed by AMC are based on the assumption that all data provided to it by MMG are complete, factual and correct to the best of MMG’s knowledge.
AMC's use, in the Competent Person’s Report, of the terms mineral resources and ore reserves are in accordance with the JORC Code2 and are as estimated by MMG at 30 June 2009. AMC has not performed, nor does it accept the responsibilities of a Competent Person as defined by the JORC Code in respect of the mineral resources and ore reserves estimates presented in the Competent Person’s Report. In all cases, the mineral resources shown in the tables include mineral resources that have been converted to ore reserves.
AMC has not been commissioned to carry out an independent review of the status of MMG’s tenements but has been advised by MMG that a review of its exploration and mining tenements has been undertaken and that they are in good standing.
To a limited extent, AMC’s assessments and projections have relied on commercially sensitive information which, at MMG’s request and with Grant Samuel’s agreement, AMC has not detailed in its Competent Person’s Report. Such sensitive information included metal prices and terms and conditions of sale of mineral products.
AMC has prepared production and capital and operating cost projections (modelling scenarios) for use by Grant Samuel. Three cases (a Reserves Only Case, Planning Case 1, and Planning Case 2) have typically been prepared for the production assets.
1 Code for the Technical Assessment and Valuation of Mineral and Petroleum Assets and Securities for Independent Expert Reports, The VALMIN Code 2005 Edition, Prepared by The VALMIN Committee, a joint committee of the Australasian Institute of Mining and Metallurgy, the Australian Institute of Geoscientists and the Mineral industry Consultants Association with the participation of the Australian Securities and Investment Commission, the Australian Stock Exchange Limited, the Minerals Council of Australia, the Petroleum Exploration Society of Australia, the Securities Association of Australia and representatives from the Australian finance sector.
2 Australasian Code for Reporting of Exploration Results, Mineral Resources and Ore Reserves, The JORC Code 2004 Edition, Effective December 2004, Prepared by the Joint Ore Reserves Committee of the Australasian Institute of Mining and Metallurgy, Australian Institute of Geoscientists and Minerals Council of Australia (JORC).
●
APPENDIX IV COMPETENT PERSON’S REPORT
— IV-3 —
MINMETALS RESOURCES LIMITED Competent Person’s Report on Minerals and Metals Group
AMC210063-10rpt_1 101122 iv
Reserves Only Case is based only on ore reserves. AMC believes that the Reserves Only Cases complies with requirements of the Stock Exchange Of Hong Kong Ltd (HKEx) Listing Rules 18.30.
Planning Case 1 is typically based on ore reserve estimates and that part of other mineral resources and exploration potential for which AMC judges there is a high confidence of future conversion to ore reserves.
Planning Case 2 typically adds to Planning Case 1 tonnages from existing mineral resources and readily demonstrable exploration potential for which AMC has reasonable, but lesser confidence of future conversion to ore reserves than in Planning Case 1. In some cases, Planning Case 2 provides for a significant expansion of production and/or other technical upgrades and improvements. AMC believes that both Planning Case 1 and Planning Case 2 modelling scenarios are based on reasonable grounds.
In preparing its models, AMC has taken account of the estimated depletion of ore reserves by mining from 1 July 2009 to 30 June 2010. Estimates of future production and costs have been projected from this date. Production and costs are reported on a calendar (January to December) basis except where otherwise specified. AMC’s modelling scenarios present six months production and costs estimates to December 2010. AMC has assumed an even spread of production volumes and expenditure across the full year unless otherwise noted.
AMC's review of operating costs has been restricted to site based costs. State or third-party royalties, taxes, concentrate shipping costs, smelting and refining charges have not been reviewed and are not included in costs detailed in the Competent Person’s Report.
All monetary figures in the Report are expressed in 2010 Australian dollars (A$) or United States dollars (US$). Costs are presented on a cash cost basis unless otherwise specified. Historical costs are in nominal terms.
For definitions of abbreviations used in the Competent Person’s Report, refer to Appendix A.
Yours faithfully
A M Chuk L J Gillett M AusIMM M AusIMM (CP) Principal Consultant Director
●
APPENDIX IV COMPETENT PERSON’S REPORT
— IV-4 —
MINMETALS RESOURCES LIMITED Competent Person’s Report on Minerals and Metals Group
AMC210063-10rpt_1 101122 v
CONTENTS
EXECUTIVE SUMMARY 1 1 SEPON .............................................................................................................................................. 11
1.1 Introduction ............................................................................................................................. 11 1.2 Geological Setting ................................................................................................................... 12 1.3 Copper Mineral Resources ..................................................................................................... 13 1.4 Copper Ore Reserves ............................................................................................................. 14 1.5 Gold Mineral Resources .......................................................................................................... 14 1.6 Gold Ore Reserves ................................................................................................................. 15 1.7 Potential for Additional Reserves ............................................................................................ 15 1.8 Mining Operations ................................................................................................................... 16 1.9 Processing and Concentrate Handling ................................................................................... 16 1.10 Infrastructure ........................................................................................................................... 19 1.11 Environment ............................................................................................................................ 20 1.12 Operating and Capital Costs ................................................................................................... 20 1.13 AMC Modelling Scenarios ....................................................................................................... 21
1.13.1 Sepon Copper .......................................................................................................... 21 1.13.2 Sepon Gold .............................................................................................................. 22
1.14 Technical Risks and Opportunities ......................................................................................... 26 2 CENTURY ......................................................................................................................................... 27
2.1 Introduction ............................................................................................................................. 27 2.2 Geological Setting ................................................................................................................... 28 2.3 Mineral Resources .................................................................................................................. 29 2.4 Ore Reserves .......................................................................................................................... 31 2.5 Exploration and Potential for Additional Reserves .................................................................. 32 2.6 Mining Operations ................................................................................................................... 33 2.7 Processing and Concentrate Handling ................................................................................... 34 2.8 Environment ............................................................................................................................ 36 2.9 Operating and Capital Costs ................................................................................................... 37 2.10 AMC Modelling Scenarios ....................................................................................................... 37 2.11 Technical Risks and Opportunities ......................................................................................... 39
3 ROSEBERY ....................................................................................................................................... 40 3.1 Introduction ............................................................................................................................. 40 3.2 Geological Setting ................................................................................................................... 40 3.3 Mineral Resources .................................................................................................................. 40 3.4 Ore Reserves .......................................................................................................................... 41 3.5 Potential for Additional Reserves ............................................................................................ 42 3.6 Operating History .................................................................................................................... 44 3.7 Mining Operations ................................................................................................................... 44 3.8 Processing and Concentrate Handling ................................................................................... 45 3.9 Infrastructure ........................................................................................................................... 47 3.10 Environment ............................................................................................................................ 47 3.11 Operating and Capital Costs ................................................................................................... 48 3.12 AMC Modelling Scenarios ....................................................................................................... 48 3.13 Technical Risks and Opportunities ......................................................................................... 51
4 GOLDEN GROVE ............................................................................................................................. 52 4.1 Introduction ............................................................................................................................. 52 4.2 Geological Setting ................................................................................................................... 52 4.3 Zinc and Copper Mineralisation .............................................................................................. 53 4.4 Mineral Resources .................................................................................................................. 54 4.5 Zinc Mineral Resources .......................................................................................................... 55 4.6 Zinc Ore Reserves .................................................................................................................. 56 4.7 Copper Mineral Resources ..................................................................................................... 56 4.8 Copper Ore Reserves ............................................................................................................. 56 4.9 Gold Mineral Resources .......................................................................................................... 56 4.10 Gold Ore Reserves ................................................................................................................. 57 4.11 Potential for Additional Reserves ............................................................................................ 57 4.12 Operating History .................................................................................................................... 57 4.13 Mining Operations ................................................................................................................... 57
●
APPENDIX IV COMPETENT PERSON’S REPORT
— IV-5 —

MINMETALS RESOURCES LIMITED Competent Person’s Report on Minerals and Metals Group
AMC210063-10rpt_1 101122 vi
4.14 Processing and Concentrate Handling ................................................................................... 58 4.15 Infrastructure ........................................................................................................................... 59 4.16 Environment ............................................................................................................................ 59 4.17 Operating and Capital Costs ................................................................................................... 60 4.18 AMC Modelling Scenarios ....................................................................................................... 61 4.19 Technical Risks and Opportunities ......................................................................................... 63
5 AVEBURY ......................................................................................................................................... 64 5.1 Introduction ............................................................................................................................. 64 5.2 Geological Setting ................................................................................................................... 64 5.3 Mineral Resource .................................................................................................................... 66 5.4 Ore Reserves .......................................................................................................................... 66 5.5 Exploration and Potential for Future Reserves ....................................................................... 66 5.6 Mining Operations ................................................................................................................... 66 5.7 Processing and Concentrate Handling ................................................................................... 67 5.8 Environment ............................................................................................................................ 67 5.9 Operating and Capital Costs ................................................................................................... 68 5.10 AMC Modelling Scenarios ....................................................................................................... 68 5.11 Technical Risks and Opportunities ......................................................................................... 70
6 DUGALD RIVER PROJECT .............................................................................................................. 71 6.1 Introduction ............................................................................................................................. 71 6.2 Geological Setting ................................................................................................................... 71 6.3 Mineral Resources and Ore Reserves .................................................................................... 72 6.4 Mining ...................................................................................................................................... 73 6.5 Processing and Concentrate Handling ................................................................................... 73 6.6 Infrastructure ........................................................................................................................... 75 6.7 Environment ............................................................................................................................ 76 6.8 Capital and Operating Costs ................................................................................................... 76 6.9 AMC Modelling Scenarios ....................................................................................................... 77 6.10 Technical Risks and Opportunities ......................................................................................... 78
7 EXPLORATION ................................................................................................................................. 79 7.1 Introduction ............................................................................................................................. 79 7.2 Canadian Exploration Projects ................................................................................................ 79
7.2.1 Izok Lake.................................................................................................................. 80 7.2.2 High Lake ................................................................................................................. 81 7.2.3 Nunavut Gold Project ............................................................................................... 81 7.2.4 Nunavut Regional Exploration ................................................................................. 81 7.2.5 Ontario Nickel Copper PGE Exploration .................................................................. 82 7.2.6 Pelly Bay Nickel Project ........................................................................................... 82
7.3 Golden Grove Regional ........................................................................................................... 82 7.3.1 Wiluna Project .......................................................................................................... 82
7.4 Sepon ...................................................................................................................................... 82 7.4.1 Regional Exploration ................................................................................................ 83
7.5 Other Asian Exploration .......................................................................................................... 83 7.5.1 Indonesia ................................................................................................................. 83 7.5.2 Australia Regional .................................................................................................... 84
8 SOURCES OF INFORMATION ........................................................................................................ 85 9 QUALIFICATIONS ............................................................................................................................ 86
TABLES
Table 1.1� Sepon – Copper Mineral Resources as at 30 June 2009 ....................................................... 13�Table 1.2� Sepon – Copper Ore Reserves as at 30 June 2009 ............................................................... 14�Table 1.3� Sepon – Gold Mineral Resources as at 30 June 2009 ........................................................... 14�Table 1.4� Sepon – Gold Ore Reserves as at 30 June 2009 ................................................................... 15�Table 1.5� Sepon – Copper Processing Performance ............................................................................. 18�Table 1.6� Sepon – Gold Processing Performance .................................................................................. 19�Table 1.7� Sepon – Operating Costs for Sepon Copper .......................................................................... 21�Table 1.8� Sepon – Operating Costs for Sepon Gold .............................................................................. 21�Table 1.9� Sepon – AMC Modelling Scenario Copper Reserves Case ................................................... 23�
●
APPENDIX IV COMPETENT PERSON’S REPORT
— IV-6 —
MINMETALS RESOURCES LIMITED Competent Person’s Report on Minerals and Metals Group
AMC210063-10rpt_1 101122 vii
Table 1.10� Sepon – AMC Modelling Scenario Copper Planning Case 1 .................................................. 24�Table 1.11� Sepon – AMC Modelling Scenario Copper Planning Case 2 .................................................. 24�Table 1.12� Sepon – AMC Modelling Scenario Gold Reserve Case ......................................................... 25�Table 1.13� Sepon – AMC Modelling Scenario Gold Planning Case 1 ...................................................... 25�Table 1.14� Sepon – AMC Modelling Scenario Gold Planning Case 2 ...................................................... 25�Table 2.1� Century – Mineral Resources as at 30 June 2009 .................................................................. 30�Table 2.2� Century – Comparison of 2008 Model Depletion with Mill Production
(12 Months to December 2009) ............................................................................................. 31�Table 2.3� Century - MCF’s Calculated from a 36 Month Reconciliation of the 2009 Model ................... 31�Table 2.4� Century – MCF’s Comparison of 2009 Model Depletion with Mill Production
(12 Months to June 2010) ...................................................................................................... 31�Table 2.5� Century – Ore Reserves as at 30 June 2009 .......................................................................... 31�Table 2.6� Century – LOM Production Schedule (Version 3.9) ................................................................ 33�Table 2.7� Century – Mine Concentrator Performance Summary ............................................................ 35�Table 2.8� Century – AMC Modelling Scenario Reserves Case .............................................................. 38�Table 2.9� Century – AMC Modelling Scenario Planning Case 1 ............................................................ 39�Table 3.1� Rosebery – Mineral Resource as at 30 June 2009 ................................................................. 40�Table 3.2� Rosebery – Ore Reserves as at 30 June 2009 ....................................................................... 41�Table 3.3� Rosebery – Ore Production Statistics ..................................................................................... 44�Table 3.4� Rosebery – Historical Metallurgical Performance ................................................................... 44�Table 3.5� Rosebery – Historical Cost Performance ................................................................................ 48�Table 3.6� Rosebery Reserves Only Case ............................................................................................... 49�Table 3.7� Rosebery Planning Case 1 ..................................................................................................... 50�Table 3.8� Rosebery Planning Case 2 ..................................................................................................... 51�Table 4.1� Golden Grove – Zinc Mineral Resources as at 30 June 2009 ................................................ 55�Table 4.2� Golden Grove – Zinc Ore Reserves as at 30 June 2009 ........................................................ 56�Table 4.3� Golden Grove – Copper Mineral Resources as at 30 June 2009 ........................................... 56�Table 4.4� Golden Grove – Copper Ore Reserves as at 30 June 2009 ................................................... 56�Table 4.5� Golden Grove - Gold Mineral Resources as at 30 June 2009 ................................................ 56�Table 4.6� Gossan Valley Exploration Drilling Mineralisation Intersections ............................................. 57�Table 4.7� Golden Grove – Operating and Capital Costs ........................................................................ 60�Table 4.8� Golden Grove – AMC Modelling Scenario Reserve Case ...................................................... 62�Table 4.9� Golden Grove – AMC Modelling Scenario Planning Case 1 .................................................. 62�Table 4.10� Golden Grove – AMC Modelling Scenario Planning Case 2 .................................................. 63�Table 5.1� Avebury – Mineral Resource as at 30 June 2009 ................................................................... 66�Table 5.2� Avebury Planning Case 1 ........................................................................................................ 69�Table 5.3� Avebury Planning Case 2 ........................................................................................................ 69�Table 6.1� August 2008 Feasibility Study Mineral Resource at a 6% Zinc Cut-Off ................................. 72�Table 6.2� Dugald River – Mineral Resources as at 30 June 2009 ......................................................... 72�Table 6.3� Dugald River – Average Open Circuit Flotation Testwork Results ......................................... 74�Table 6.4� Dugald River – Operating Cost Projections ............................................................................ 76�Table 6.5� Dugald River – Capital Cost Projections ................................................................................. 76�Table 6.6� Dugald River – Planning Case 1 ............................................................................................. 78�Table 6.7� Dugald River – Planning Case 2 ............................................................................................. 78�Table 7.1� Canadian Exploration Projects – Izok Lake Mineral Resources ............................................. 80�Table 7.2� Canadian Exploration Projects – High Lake Mineral Resources ............................................ 81�
FIGURES
Figure 1.1� Sepon – Location Map ....................................................................................................... 11�Figure 1.2� Sepon – Contract Area ...................................................................................................... 12�Figure 1.3� Sepon – Copper and Gold Deposits .................................................................................. 13�Figure 1.4� Sepon – Copper Processing Simplified Block Flow Diagram ............................................ 17�Figure 2.1� Century – Location Map ..................................................................................................... 27�Figure 2.2� Century – Mining Leases ................................................................................................... 28�Figure 2.3� Century – Plan of Deposit Showing the Main Structural Features .................................... 29�Figure 2.4� Century – Regional Exploration Area ................................................................................ 32�Figure 2.5� Century – Process Plant Schematic Flowsheet ................................................................. 34�Figure 3.1� Rosebery – Total Mineral Resource, Ore Reserve and Production Levels
(1981 to 2008) .................................................................................................................... 42�
●
APPENDIX IV COMPETENT PERSON’S REPORT
— IV-7 —
MINMETALS RESOURCES LIMITED Competent Person’s Report on Minerals and Metals Group
AMC210063-10rpt_1 101122 viii
Figure 3.2� Rosebery – Diagram of the Mine Lease Exploration Programme ..................................... 43�Figure 3.3� Rosebery – Concentrator Flowsheet ................................................................................. 46�Figure 4.1� Golden Grove – Operations Map ....................................................................................... 52�Figure 4.2� Golden Grove – Longitudinal Projection Gossan Hill Orebodies ....................................... 54�Figure 4.3� Golden Grove – Longitudinal Projection Scuddles Orebodies .......................................... 55�Figure 5.1� Avebury – Deposit Long Projection ................................................................................... 65�Figure 5.2� Avebury – Deposit Cross Section 354,600E ...................................................................... 65�Figure 6.1� Dugald River – Location Map ............................................................................................. 71�Figure 6.2� Dugald River – 2008 Feasibility Study Process Flowsheet ............................................... 75�Figure 6.3� Dugald River – Infrastructure and Tenement Layout ......................................................... 77�Figure 7.1� Canadian Exploration Projects – Location of Projects ....................................................... 80�
APPENDICES
APPENDIX A ABBREVIATIONS�APPENDIX B SOURCES OF INFORMATION�APPENDIX C CONTRIBUTORS TO THE REPORT�
●
APPENDIX IV COMPETENT PERSON’S REPORT
— IV-8 —
MINMETALS RESOURCES LIMITED Competent Person’s Report on Minerals and Metals Group
AMC210063-10rpt_1 101122 1
EXECUTIVE SUMMARY
SEPON
The Sepon Copper and Gold operation, located in the Lao People’s Democratic Republic, commenced production of gold bullion in 2002 and copper cathode in 2005.
Supergene copper ore is mined from open pits and is derived from supergene resources. Ore is processed in a dedicated copper plant by crushing, grinding, and acid leaching at atmospheric pressure, followed by solvent extraction and electrowinning.
Oxide gold ore is mined from open pits and is processed in a dedicated gold plant using conventional carbon-in-leach technology.
Key Observations
AMC’s key observations for the Sepon operation are:
� 53% of the reported supergene copper Mineral Resource is currently classified as Inferred.
� Reported supergene copper Ore Reserve tonnages represent approximately 67% of the Measured and Indicated supergene copper Mineral Resources.
� Significant primary copper Mineral Resource tonnages have been reported none of which have been reported as Ore Reserves.
� 52% of the reported oxide gold Mineral Resource is currently classified as Inferred.
� Reported oxide gold Ore Reserve tonnages represent 22% of the Measured and Indicated oxide gold Mineral Resources.
� Significant primary gold Mineral Resource tonnages have been reported none of which have been reported as Ore Reserves.
� Approximately 40% of the reported total Mineral Resource is currently classified as Inferred.
� The Sepon copper plant is currently being expanded from a name plate capacity of 60 ktpa to 80 ktpa of copper production. The expansion is planned to be completed in October 2010, with annual copper cathode production to ramp-up after that.
� Current copper ore reserves are sufficient to sustain the copper plant until 2019 at the post-expansion production rate.
� Gold mining operations are planned to continue until early 2012, however, MMG have exploration plans in place with the goal of defining additional economic gold resources.
� After significant further study, exploration and investment, primary copper and gold resources at Sepon could prove to be economically extractable.
AMC Modelling Scenarios
AMC has developed three modelling scenarios for Sepon. Key aspects of AMC’s modelling cases include:
Reserves Only Case – Copper
This scenario is based on the 30 June 2009 Ore Reserve which has been depleted for production from 1 July 2009 to 30 June 2010.Total ore processed in this scenario is 16.9 Mt at 4.0% Cu with mining completed in 2018 and processing completed in 2019. Copper cathode production of up to 81 ktpa. An average copper recovery of 91% to recover a total of 617 kt of cathode copper.
Total capital expenditure is US$305M and average site operating costs of US$2,600 per tonne of cathode copper.
●
APPENDIX IV COMPETENT PERSON’S REPORT
— IV-9 —
MINMETALS RESOURCES LIMITED Competent Person’s Report on Minerals and Metals Group
AMC210063-10rpt_1 101122 2
Planning Case 1 – Copper
Planning Case 1 is based on the Reserves Only Case with the addition of 5.8 Mt at 3.6% Cu of Inferred material. In Planning Case 1, 3.5 Mt of the additional ore is sourced from pits designed on the Thengkham South Inferred resource. The remaining 2.3 Mt is sourced from Inferred material associated with the Khanong, Thengkham North and Pha Bing deposits. Total ore processed of 22.8 Mt at 3.9% Cu with mining completed in 2018 and processing completed in 2022. Total recovered cathode copper is 810 kt.
Total capital expenditure is US$336M and average site operating cost is US$2,500 per tonne of cathode copper.
Planning Case 2 – Copper
Planning Case 2 is based on Planning Case 1 with the addition of 2.8 Mt at 3.1% Cu of Inferred material and exploration upside. In Planning Case 2, 0.5 Mt of the inferred material is sourced from an AMC estimated mining inventory resulting from the Thengkham West Inferred Resource of 2.3 Mt. The remaining 2.3 Mt added to Planning Case 1 is sourced from Inferred material and exploration upside associated with the Khanong, Thengkham North, Thengkham South and Pha Bing deposits. Total ore processed is 25.5 Mtpa at 3.8% Cu with mining completed in 2021 and processing completed in 2023. Total recovered cathode copper is 886 kt.
Total capital expenditure is US$348M and average site operating cost is US$2,700 per tonne of cathode copper.
Reserves Only Case – Gold
This scenario is based on the 30 June 2009 Ore Reserve which has been depleted for production from 1 July 2009 to 30 June 2010. Total ore processed in this scenario is 1.4 Mt at 1.55 g/t Au with mining completed in 2010 and processing completed in 2010. The majority of ore treated in the Reserves Only case is from existing stockpiles.
Average gold recovery is 75% to recover a total of 52 koz of gold.
Average operating cost is US$224/oz gold.
Planning Case 1 – Gold
Planning Case 1 is based on the Reserves Only Case with the addition of 2.5 Mt at 1.24 g/t Au from a number of small pits currently planned to be mined in the life-of-mine plan. Total ore processed is 3.86 Mt at 1.35 g/t Au with mining completed in 2012 and processing completed in 2012.
Total gold recovered is 126 koz.
Average operating cost is US$548/oz gold.
Planning Case 2 – Gold
Planning Case 2 is based on Planning Case 1 with the addition of 2 Mt at 1.2g/t Au of ore that is added from an AMC estimate of the conversion of 3 Mt to 5.5 Mt of known exploration targets which are supported by drilling data. Total ore processed of 5.86 Mt at 1.30 g/t Au with mining completed in 2012 and processing completed in 2012.
Total gold recovered is 183 koz.
Average operating costs of US$616/oz gold.
●
APPENDIX IV COMPETENT PERSON’S REPORT
— IV-10 —
MINMETALS RESOURCES LIMITED Competent Person’s Report on Minerals and Metals Group
AMC210063-10rpt_1 101122 3
Technical Risk and Opportunities
Critical processing reagents such as limestone and pyrite are sourced on site. Interruptions to mining of these inputs could affect productivity. If the supply of such reagents is not sufficient to achieve forecast processing requirements copper production could be affected.
Damage to, or failure of, key equipment items in the processing plant, for example the rectiformer (which is part of the electrowinning cicuit), could cause delays to copper processing.
If MMG fail to continue to successfully manage community relations with local people interruptions to production could result.
If MMG fail to continue to implement effective environmental management plans production could be interrupted and costs could increase.
The significant prospectivity of the site and region, and the potential to make further discoveries of economic oxide gold and supergene copper deposits, could extend mine life or allow expansion of existing processing facilities.
The potential, after significant further study, exploration and investment, to establish primary gold and copper mining and processing operations. This potential is considered in AMC’s exploration section.
MMG could further expand or make modifications to the existing copper processing plant in order to increase ore throughput or copper recovery.
CENTURY MINE
The Century operation is situated in the north-west Queensland mineral province. The operation includes the Century mine, located approximately 250 km north-west of Mount Isa and a concentrate slurry pipeline to a dewatering, storage and ship loading facility at Karumba 250 km east-north-east.
The deposit was discovered in 1990 in an area adjacent to a small reef style lead zinc mining operation dating from the late 1800s. Development commenced in 1998 with first concentrate shipment in 1999.
The orebody which is mined by open pit methods is well defined, though as an outcropping sedimentary sequence bounded by faults, there is little opportunity to extend the resource. The mine is scheduled to close in the 2014 to 2015 period.
Key Observations
AMC’s key observations for the Century operation are:
� There is no reported Inferred Mineral Resource.
� Reported Ore Reserve tonnages represent approximately 72% of the Measured and Indicated Mineral Resources.
� It is unlikely that the Ore Reserve will be increased other than through increased conversion of the current resource.
� Mature operation with well established operating procedures.
AMC Modelling Scenarios
AMC has developed two modelling scenarios for Century Mine. The key aspects of AMC’s modelling scenarios are as follows:
Reserves Only Case
This scenario is based on reported Ore Reserve as at 30 June 2009 adjusted for depletion to 30 June 2010. Annual waste and ore tonnages and grades are based on the 2010 Century LOM plan prepared by MMG. The mining inventory is 26.0 Mt at grades of 11.0% Zn, 1.1% Pb and 19 g/t Ag. Mining continues until December 2014.The annual ore processing rate is 5.7 Mtpa.
●
APPENDIX IV COMPETENT PERSON’S REPORT
— IV-11 —

MINMETALS RESOURCES LIMITED Competent Person’s Report on Minerals and Metals Group
AMC210063-10rpt_1 101122 4
Zinc recovery is 79.1% and lead recovery is 61.2%, with zinc metal production averaging 496 ktpa, totalling 2,258 kt of metal over the remaining life.
Average site operating cost is estimated at A$67.54/t of ore processed over the remaining 4.5 year mine life. Total remaining capital expenditure of A$40M and closure/rehabilitation costs of A$103M.
Planning Case 1
Annual waste and ore tonnages and grade are based on a 3.9% Zn cut-off grade mining schedule prepared in August 2010 by MMG which increases the mining inventory to 29.9 Mt at grades of 10.5% Zn, 1.1% Pb and 18 g/t Ag. Mining continues until August 2015. Annual ore processing rate is 5.9 Mtpa.
Zinc recovery is 78.1% and lead recovery is 58.0%, with zinc metal production averaging 476 ktpa, totalling 2,444 kt over the remaining life.
Average site operating cost is estimated at A$64.69/t of ore processed over the remaining 5 year mine life. Capital expenditure remains unchanged from the Reserves Only Case.
Technical Risk and Opportunities
Century is a mature operation with mining and processing methods well developed through twelve years of operating experience. The operation is well equipped after a significant replacement and expansion programme implemented in recent years.
The deposit is constrained providing limited opportunities to expand the ore reserve. In the current life of mine plan, production concludes in December 2014.
Beyond possible impacts of commodity price changes, the only likely opportunity to expand the ore reserve is through the inclusion of marginal material within the current pit design. This may extend the mine life by up to one year.
Significant geotechnical issues have impacted the mining operation. AMC considers that geotechnical issues may impact planned production during the remaining life of the mine. Measures are being undertaken by MMG to minimise this risk.
Mine call factors (MCFs) are applied to the resource in the reserve estimation process. In recent periods observed factors have varied significantly from prior estimates. As Stage 8 and Stage 9, the final stages of the mine, are mined current MCF estimates may prove unreliable.
The rupture of the concentrate pipeline in 2009 occurred in a section that had previously failed in 2002. The concentrate pipeline was initially installed with a PVC liner and the 2002 failure was attributed to the ingress of concentrate slurry between the liner and the pipe due to a localised problem in the liner. In that instance, the repair was made by removing the failed liner and, leaving an unlined 1.2 km section of pipe. Pitting corrosion has occurred in that unlined section of pipe which contributed to a second failure in 2009. With a 304 km length of pipeline and numerous pipe segments, there is a risk that other sections of pipe could also fail. However, the remainder of the pipeline is lined except for several monitoring spools. MMG is acutely aware of the situation and have increased the monitoring and wear assessment programme for the pipeline. AMC considers that with the procedures that have been initiated, the risk of another pipeline failure will be low through to December 2014.
ROSEBERY MINE
The Rosebery Mine is located in Western Tasmania. The deposit was first discovered in 1893, operations commenced in 1936 and have operated continuously since.
The deposit is considered Australia’s largest volcanic-hosted polymetallic sulphide deposit and is located within the Mount Read Volcanic Arc. Zinc, lead, copper, silver and gold are recovered from the ore.
Mineralisation extends over a strike length of approximately 2.0 km and to a depth of 1.5 km.
●
APPENDIX IV COMPETENT PERSON’S REPORT
— IV-12 —
MINMETALS RESOURCES LIMITED Competent Person’s Report on Minerals and Metals Group
AMC210063-10rpt_1 101122 5
Key Observations
AMC’s key observations for the Rosebery operation are:
� 53% of the reported Mineral Resource (June 2009) is currently classified as Inferred.
� Reported Ore Reserve tonnages represent 47% of the Measured and Indicated Mineral Resources (June 2009).
� The mine produces some 720 ktpa of ore, and plans to maintain production at about this level to at least 2012.
� Mining and metallurgical processes are well established, and the mine ventilation system has recently been upgraded to provide enhanced operating conditions in the mine. However, Rosebery is a relatively deep mine with difficult operating conditions that are expected to become more difficult as the depth of mining increases.
AMC Modelling Scenarios
AMC has prepared three modelling scenarios for the Rosebery operation. Key aspects of the modelling scenarios are:
Reserves Only Case
This scenario is based on the 30 June 2009 Ore Reserve which has been depleted for production from 1 July 2009 to 30 June 2010. The current production rate of about 720 ktpa has been maintained for three full years. This scenario is based on the scheduled portion of the reported ore reserves that is able to be extracted continuously and within a given timeframe.
Mining head grades and metallurgical performances are generally in close agreement with those suggested in the MMG life of mine plan, with some minor changes to reflect recent historical performance. Operating costs are as presented by MMG in its plan and are consistent with historical performance.
Capital expenditure includes near mine exploration drilling and assumes that tailings storage facilities (TSF) upgrades and processing facility maintenance will occur.
Planning Case 1
Mining and processing inventory is based on the remaining Ore Reserves and that part of other Mineral Resources and exploration potential for which AMC judges there is a high confidence of future conversion to ore reserves. AMC considers that there is a historical basis of resource conversion which underpins the expectation of an expanded mining inventory. Haulage costs associated with the mining are forecast to increase by 50% over the life of mine in accordance with the increased depth of mining.
Capital expenditure will be required for near mine exploration drilling, processing facility maintenance and a new TSF.
Planning Case 2
The main differences in Planning Case 2 relative to Planning Case 1 are additions made to the mine production, sourced from areas which are currently exploration targets. AMC considers that there is a historical basis of exploration success which underpins the expectation of an expanded mining inventory.
The capital expenditure schedule considers additional near mine exploration drilling, additional ventilation upgrade, and mine haulage upgrade. The construction of a paste backfill plant is also included which will enable the mine to be less constrained and thereby achieve higher rates of production. This would allow the increased cost associated with the additional cement used in backfill to be offset by an improvement in productivity.
●
APPENDIX IV COMPETENT PERSON’S REPORT
— IV-13 —

MINMETALS RESOURCES LIMITED Competent Person’s Report on Minerals and Metals Group
AMC210063-10rpt_1 101122 6
Technical Risk and Opportunities
Rosebery has a long history of successfully and reliably converting exploration targets into resources and reserves. Although AMC expects this to continue for the period of the scenarios modelled there is a risk that exploration and conversion to reserves may not be as successful as envisaged.
Mining will continue to move deeper and further from existing accesses to surface, and working conditions are hot and increasingly difficult. Increased issues associated with access, ground control and ventilation may impact on the mine’s ability to achieve AMC’s production scenarios. There is risk that the issues associated with deeper mining will constrain future production capacity. For example the addition of more haulage trucks to accommodate the increased distances to surface will adversely impact costs and the mine ventilation over time. A review of the long term mine haulage system will be required as the mine gets deeper.
The plant has a nominal throughput rate of 850 ktpa. This rate has not been achieved on an annualised basis potentially due to high zinc feed grades. Opportunity exists to improve the plant’s performance and maintenance cost through upgrading or refurbishing the plant and reviewing operating procedures.
Acid drainage issues at Rosebery demand monitoring and action on the part of the mine operator and management of these issues requires modest capital and recurring expenditures. Decisions also need to be made regarding the future TSF requirement.
GOLDEN GROVE MINE
The Golden Grove base and precious metals operation is located approximately 450 km north-east of Perth and 280 km east of Geraldton in Western Australia. The operation consists of the Scuddles and Gossan Hill zinc and copper underground mines and the Scuddles concentrator.
Volcanic hosted massive sulphide (VHMS) mineralisation was discovered at Gossan Hill in 1971 and at Scuddles in 1979. Copper, zinc, lead, silver and gold are recovered from the ores mined at Golden Grove.
Scuddles underground operation, which commenced producing in 1990 was placed on care and maintenance in 2005, reopened in 2007 and was subsequently placed back on care and maintenance in January 2009. Production from Scuddles is currently scheduled to re-commence early in 2011.
Gossan Hill underground operations commenced production in 1998 and has operated continuously since that time.
The Gossan Hill deposit extends over a strike length of more than 2.2 km in multiple lenses and to a depth of approximately 1.5 km. Scuddles has a strike length of approximately 700m and extends to a depth of more than 1.4 km below surface.
Key Observations
AMC’s key observations for the Golden Grove operation are:
� Reported Ore Reserve tonnages represent approximately 43% of the Measured and Indicated zinc Mineral Resources, and 27% of Measured and Indicated copper Mineral Resources.
� Approximately 40% of the reported Mineral Resource is currently classified as Inferred.
� Exploration in the Gossan Valley area about 6.5 km south of the Gossan Hill mine site has been successful in intersecting zinc and copper massive sulphide mineralisation. The intersections suggest a coherent body of massive sulphide mineralisation that is being targeted for further drilling in 2010.
� Mining and metallurgical processes are well established.
� The production rate achieved in 2008 was approximately 1.7 Mtpa. This reduced to approximately 1.5 Mtpa in 2009, and forecast production for 2010 is approximately 1.7 Mtpa.
●
APPENDIX IV COMPETENT PERSON’S REPORT
— IV-14 —
MINMETALS RESOURCES LIMITED Competent Person’s Report on Minerals and Metals Group
AMC210063-10rpt_1 101122 7
AMC Modelling Scenarios
AMC has prepared three modelling scenarios for Golden Grove. Key aspects of the modelling scenarios are:
Reserves Only Case
This scenario is based on the 30 June 2009 Ore Reserve which has been depleted for production from July 2009 to June 2010. Production in the latter years of a reserve-only schedule tapers significantly beyond 2012 to a point where ongoing operation is impracticable. As a consequence not all reserves are included in the case modelled. This case generates a mine life to 2012 with annual production maintained at approximately 1.7 Mt until 2011, with a reduction in the production rate to approximately 1 Mt in 2012. In AMC’s opinion the Reserves only case undercalls the likely mine life.
Planning Case 1
A mining and processing inventory comprising the reported Ore Reserves for Scuddles and Gossan Hill depleted for mining to 30 June 2010 plus approximately 1.6 Mt of additional zinc and copper mineralization that AMC considers likely to be mined. The case also includes a copper oxide open pit mining inventory of 1.8 Mt which has been evaluated at a Scoping Study level. The copper oxide open pit inventory comprises mostly copper oxide material and some copper sulphide material and is based on Mineral Resources reported as Inferred in June 2009 that AMC considers are likely to be mined. This case generates a mine life to 2014 with annual production maintained at approximately 1.7 Mt until 2013, with production reducing to 0.9 Mt in 2014.
Planning Case 2
The main differences in Planning Case 2 relative to Planning Case 1 is the inclusion of additional underground production from Xantho Extended, upper areas of Amity copper and down dip extension of Hougoumont at Gossan Hill and potential production sourced from Gossan Valley, a potential resource containing both zinc and copper mineralization that is currently being drilled out. Planning Case 2 also includes a significantly larger open pit, targeting gold oxide, zinc sulphide and copper sulphide mining inventories totalling 2.9 Mt. This is in addition to the open pit inventory included in Planning Case 1. The case generates a mine life to 2020 and maintains the same annual production rate of 1.7 Mt as scheduled in the other Cases modelled until 2019, reducing to 1.4 Mt in 2020.
Technical Risk and Opportunities
Sustaining the current rate of production from the Golden Grove operations beyond 2013/14 is heavily dependent on:
� upgrading confidence of known orebody extensions that are not currently included in reserves
� delineation of new ore sources.
A factor that presents an additional challenge to production from Gossan Hill is that an increasing portion of future production will need to be mined from deeper parts of the deposit.
The planned recommencement of production at Scuddles will be a positive in that it is an additional ore source, but its likely production rate of 0.3 Mtpa will only partially offset the impact of depletion of mining inventory at Gossan Hill.
The proposed copper oxide pit will only provide an additional short term ore source throughout 2013 and 2014.
The outcome of the current exploration drilling programme at Gossan Valley will play a significant part in the possible extension of mine life at Golden Grove. Subject to defining the expected resources at Gossan Valley, timing of evaluation, approval and development of orebody access will be critical to maintaining the current production rate from Golden Grove.
●
APPENDIX IV COMPETENT PERSON’S REPORT
— IV-15 —
MINMETALS RESOURCES LIMITED Competent Person’s Report on Minerals and Metals Group
AMC210063-10rpt_1 101122 8
The site closure cost allowance has been significantly increased to adequately allow for rehabilitation of the large quantity of sulphidic waste in the run of mine (ROM) pad at Gossan Hill. This increase has mitigated the risk that closure costs may be higher than anticipated.
AVEBURY MINE
The Avebury Mine is an underground mining operation located on the north-west coast of Tasmania, 6 km west of Zeehan. The deposit was discovered during 1997 to 1998. An access decline was excavated in 2003 to 2004, ore development commenced in June 2007 and production stoping commenced in January 2008.
In response to low metal prices, mining operations were suspended in December 2008 and milling in January 2009. Mining operations had not reached full scale production at the time operations were suspended. The mine is currently on care and maintenance.
Key Observations
AMC’s key observations for the Avebury project are:
� Approximately 63% of the reported Mineral Resource is currently classified as Inferred.
� MMG did not report Ore Reserves for Avebury in 2009.
� The previously reported 2008 Ore Reserves included Proved and Probable Ore Reserves totalling 5.8 Mt at 1.0% Ni average grade and used a 0.7% Ni cut-off.
� MMG is considering options to improve the operating performance of the project which will enable it to resume operation.
AMC Modelling Scenarios
AMC has prepared two modelling scenarios for the Avebury operation based on MMG’s feasibility study. However, as there are no reported reserves for Avebury, only Planning Cases have been prepared by AMC. Key aspects of the modelling scenarios are:
Planning Case 1
This scenario is based on the scheduled portion of the reported mining inventory at full production.
The total tonnage and grades are underpinned by the Feasibility Study’s mining plan that has been adopted without modification, based on a planned production rate of about 900 ktpa. Forecast mining costs have however been substantially increased by AMC to be more in line with industry experience.
Metallurgical performances assumed by AMC have in some cases been moderated slightly to reflect recent historical performance. Processing costs have been adopted as presented by MMG.
Capital expenditure on upgrades about the processing facility is included.
Planning Case 2
In this scenario the mining plan has been extended by one full year on the assumption that there is no longer any constraint to mining due to the arsenic as a result of the installation of an arsenic leach plant.
Metallurgical performances assumed by AMC are increased to reflect the performance of a hydro metallurgical plant. Operating costs as presented by MMG have been increased nominally for the operation of the hydro metallurgical plant.
Capital expenditure for an arsenic leach plant is included.
●
APPENDIX IV COMPETENT PERSON’S REPORT
— IV-16 —
MINMETALS RESOURCES LIMITED Competent Person’s Report on Minerals and Metals Group
AMC210063-10rpt_1 101122 9
Technical Risk and Opportunities
Current risks relate principally to the management of arsenic in the ore. Lesser risks are related to the ability to achieve the production schedule, and the constraints on production that would occur if the mining system reverts to a predominantly uncemented or waste rock type of backfill.
Assuming the care and maintenance regime is sufficient, it should be straightforward to reopen the mine. The tenements also have significant exploration potential.
As the process plant has yet to achieve design capacity metal output, it has not yet proven that the planned metallurgical recoveries can be achieved. The planned performance of the proposed leach plant is based on limited test work and requires further investigation.
DUGALD RIVER PROJECT
The Dugald River Project is a zinc-lead-silver deposit located in Queensland, Australia, approximately 65 km north-west of Cloncurry in north central Queensland. The general region is host to a number of significant base metal mining operations.
Key Observations
AMC’s key observations for the Dugald River Project are:
� The project is a development opportunity; a Feasibility Study was completed in 2008 and the company is planning to consider an investment decision in regard to the project in the next 12 months.
� Planned mine operations would consist of a significant underground mine producing approximately 2 Mtpa.
� Capital expenditure required to establish the operation is in the order of A$800M.
� Approximately 17% of the reported Mineral Resource is currently classified as Inferred.
� MMG has not reported an Ore Reserve for the project.
AMC Modelling Scenarios
AMC has prepared two production scenarios for Dugald River. A Reserves Only Case has not been prepared as MMG has yet to report an Ore Reserve. Key aspects of the modelling scenarios are:
Planning Case 1
Planning Case 1 excludes Inferred Mineral Resource from the mining inventory and envisages that 39 Mt of ore at 12.3% Zn, 1.9% Pb and 42 g/t Ag will be mined. The production rate has been set at a maximum of 2.0 Mtpa. Costs in case 1 have been escalated by 5% from the estimates prepared in the 2008 Feasibility Study.
Planning Case 2
Planning Case 2 includes the Inferred Mineral Resource in the mining inventory and envisages that 43.5 Mt of ore at 12.2% Zn, 2% Pb and 40 g/t Ag will be mined. The production rate has been set at a maximum production of 2.2 Mtpa. Zinc metallurgical recovery has been increased from 83% to 86% over the first five years of operation to reflect possible opportunities in this regard. Costs have not been escalated from the 2008 estimates.
In both cases AMC has based its capital and operating cost estimates on those developed by MMG in the 2008 Feasibility Study. In Planning Case 1, AMC has reduced sustaining capital in line with the exclusion of Inferred Mineral Resource. AMC has increased the capital cost in Planning Case 2 to reflect the higher mined tonnage. In both cases, project approval has been assumed to occur in early 2011 with production commencing in 2014.
●
APPENDIX IV COMPETENT PERSON’S REPORT
— IV-17 —

MINMETALS RESOURCES LIMITED Competent Person’s Report on Minerals and Metals Group
AMC210063-10rpt_1 101122 10
Technical Risk and Opportunities
The project status is feasibility study complete (2008), investment decision pending.
Although an ore reserve estimate is yet to be reported, the mining inventory estimate in the 2008 Feasibility Study has been prepared in accordance with good industry practice. Confidence in the reserve and mining inventory will be further improved once the 2009 Resource model is incorporated into the reserve model.
MMG has received letters of intent from four smelters covering the total envisaged concentrate production albeit with certain penalties for excess manganese content. There is a risk that manganese content will be higher than envisaged resulting in increased penalties.
From a technical and permitting perspective, AMC believes it reasonable to assume that production could commence within three years of the project being approved by MMG.
There is potential for the mineralisation to continue with depth. Also copper mineralisation has been identified in the hangingwall and throughout the tenements. The potential for the copper mineralisation to constitute a mineral resource is being investigated, although AMC has not included it in its production scenarios.
EXPLORATION
MMG has interests in a number of regional exploration projects in Australia, Asia and Canada as well as exploration projects associated with, or close to its existing mining projects. In addition MMG has established Commodity Task-Force Project Generation Teams, one each for copper, zinc and nickel, which are dedicated to defining the best mineral belts for specific target styles and target sizes in their respective commodities with the aim of discovering significant growth projects for MMG.
MMG’s 2010 exploration budget is A$38M. In addition, US$4M to US$7M has been allocated for the Izok Lake update feasibility study, and a contingence of approximately A$6M has been established for emerging projects.
●
APPENDIX IV COMPETENT PERSON’S REPORT
— IV-18 —
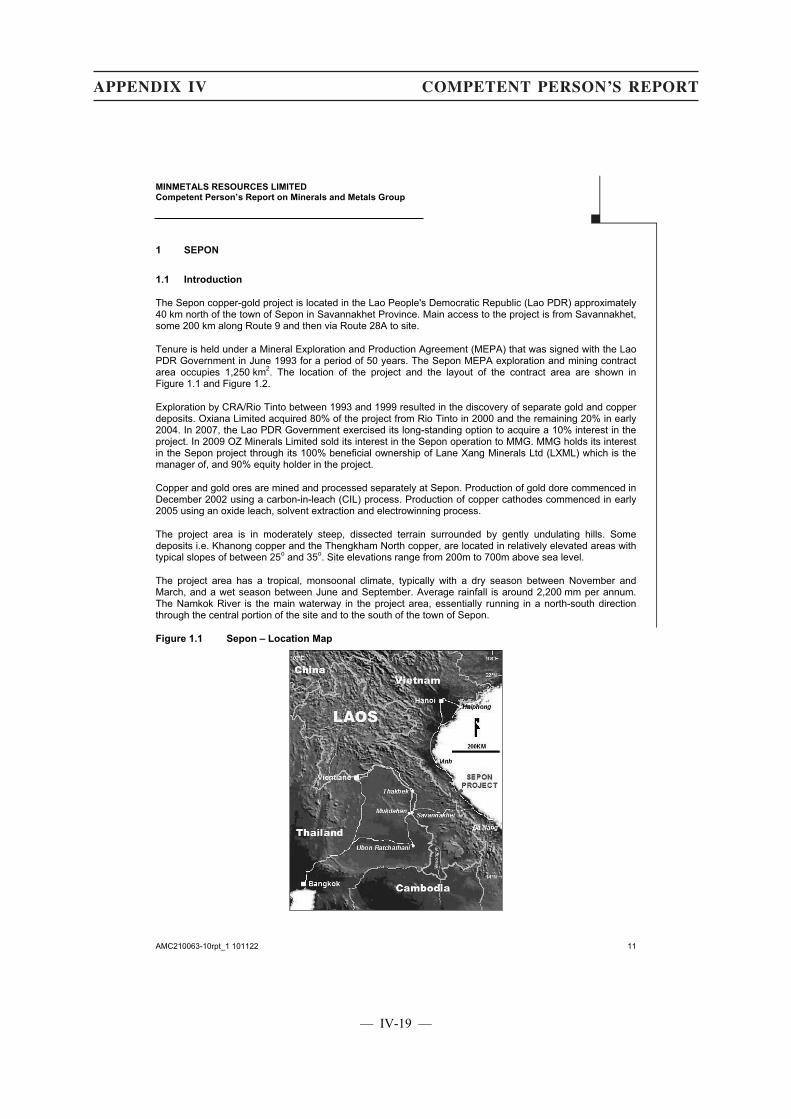
MINMETALS RESOURCES LIMITED Competent Person’s Report on Minerals and Metals Group
AMC210063-10rpt_1 101122 11
1 SEPON
1.1 Introduction
The Sepon copper-gold project is located in the Lao People's Democratic Republic (Lao PDR) approximately 40 km north of the town of Sepon in Savannakhet Province. Main access to the project is from Savannakhet, some 200 km along Route 9 and then via Route 28A to site.
Tenure is held under a Mineral Exploration and Production Agreement (MEPA) that was signed with the Lao PDR Government in June 1993 for a period of 50 years. The Sepon MEPA exploration and mining contract area occupies 1,250 km2. The location of the project and the layout of the contract area are shown in Figure 1.1 and Figure 1.2.
Exploration by CRA/Rio Tinto between 1993 and 1999 resulted in the discovery of separate gold and copper deposits. Oxiana Limited acquired 80% of the project from Rio Tinto in 2000 and the remaining 20% in early 2004. In 2007, the Lao PDR Government exercised its long-standing option to acquire a 10% interest in the project. In 2009 OZ Minerals Limited sold its interest in the Sepon operation to MMG. MMG holds its interest in the Sepon project through its 100% beneficial ownership of Lane Xang Minerals Ltd (LXML) which is the manager of, and 90% equity holder in the project.
Copper and gold ores are mined and processed separately at Sepon. Production of gold dore commenced in December 2002 using a carbon-in-leach (CIL) process. Production of copper cathodes commenced in early 2005 using an oxide leach, solvent extraction and electrowinning process.
The project area is in moderately steep, dissected terrain surrounded by gently undulating hills. Some deposits i.e. Khanong copper and the Thengkham North copper, are located in relatively elevated areas with typical slopes of between 25o and 35o. Site elevations range from 200m to 700m above sea level.
The project area has a tropical, monsoonal climate, typically with a dry season between November and March, and a wet season between June and September. Average rainfall is around 2,200 mm per annum. The Namkok River is the main waterway in the project area, essentially running in a north-south direction through the central portion of the site and to the south of the town of Sepon.
Figure 1.1 Sepon – Location Map
●
APPENDIX IV COMPETENT PERSON’S REPORT
— IV-19 —
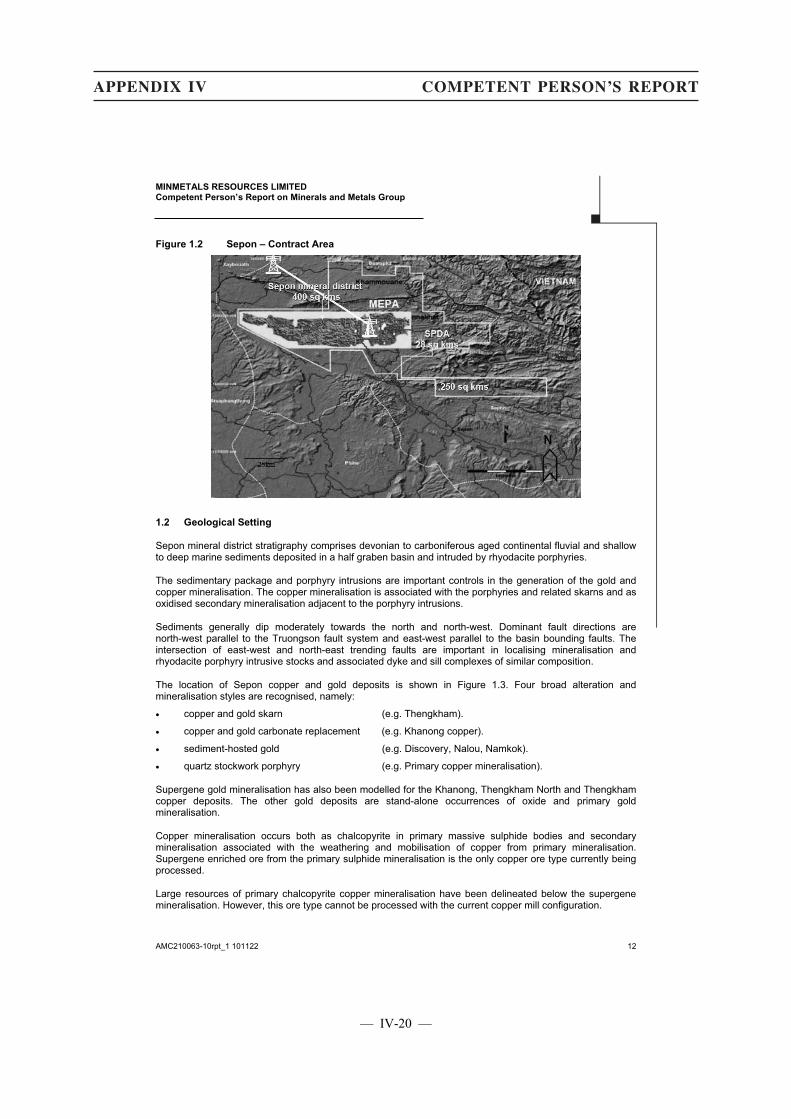
MINMETALS RESOURCES LIMITED Competent Person’s Report on Minerals and Metals Group
AMC210063-10rpt_1 101122 12
Figure 1.2 Sepon – Contract Area
1.2 Geological Setting
Sepon mineral district stratigraphy comprises devonian to carboniferous aged continental fluvial and shallow to deep marine sediments deposited in a half graben basin and intruded by rhyodacite porphyries.
The sedimentary package and porphyry intrusions are important controls in the generation of the gold and copper mineralisation. The copper mineralisation is associated with the porphyries and related skarns and as oxidised secondary mineralisation adjacent to the porphyry intrusions.
Sediments generally dip moderately towards the north and north-west. Dominant fault directions are north-west parallel to the Truongson fault system and east-west parallel to the basin bounding faults. The intersection of east-west and north-east trending faults are important in localising mineralisation and rhyodacite porphyry intrusive stocks and associated dyke and sill complexes of similar composition.
The location of Sepon copper and gold deposits is shown in Figure 1.3. Four broad alteration and mineralisation styles are recognised, namely:
� copper and gold skarn (e.g. Thengkham).
� copper and gold carbonate replacement (e.g. Khanong copper).
� sediment-hosted gold (e.g. Discovery, Nalou, Namkok).
� quartz stockwork porphyry (e.g. Primary copper mineralisation).
Supergene gold mineralisation has also been modelled for the Khanong, Thengkham North and Thengkham copper deposits. The other gold deposits are stand-alone occurrences of oxide and primary gold mineralisation.
Copper mineralisation occurs both as chalcopyrite in primary massive sulphide bodies and secondary mineralisation associated with the weathering and mobilisation of copper from primary mineralisation. Supergene enriched ore from the primary sulphide mineralisation is the only copper ore type currently being processed.
Large resources of primary chalcopyrite copper mineralisation have been delineated below the supergene mineralisation. However, this ore type cannot be processed with the current copper mill configuration.
●
APPENDIX IV COMPETENT PERSON’S REPORT
— IV-20 —
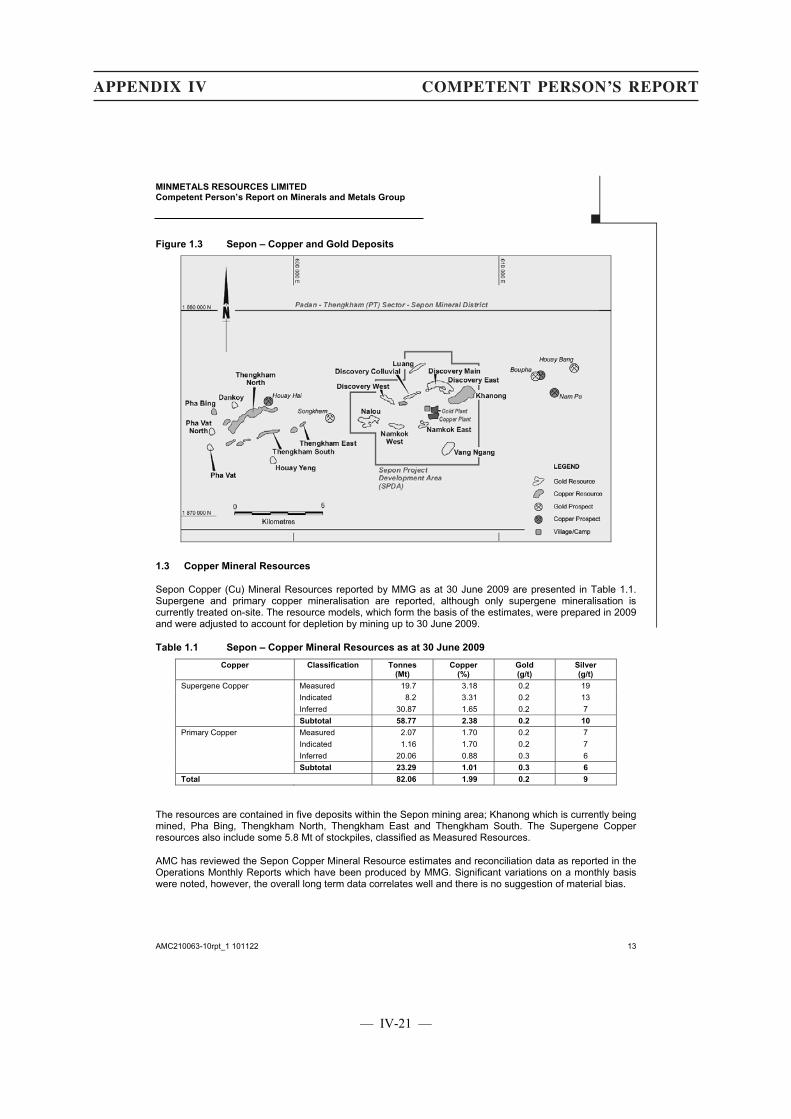
MINMETALS RESOURCES LIMITED Competent Person’s Report on Minerals and Metals Group
AMC210063-10rpt_1 101122 13
Figure 1.3 Sepon – Copper and Gold Deposits
1.3 Copper Mineral Resources
Sepon Copper (Cu) Mineral Resources reported by MMG as at 30 June 2009 are presented in Table 1.1. Supergene and primary copper mineralisation are reported, although only supergene mineralisation is currently treated on-site. The resource models, which form the basis of the estimates, were prepared in 2009 and were adjusted to account for depletion by mining up to 30 June 2009.
Table 1.1 Sepon – Copper Mineral Resources as at 30 June 2009
Copper Classification Tonnes (Mt)
Copper (%)
Gold (g/t)
Silver (g/t)
Supergene Copper Measured 19.7 3.18 0.2 19 Indicated 8.2 3.31 0.2 13 Inferred 30.87 1.65 0.2 7 Subtotal 58.77 2.38 0.2 10
Primary Copper Measured 2.07 1.70 0.2 7 Indicated 1.16 1.70 0.2 7 Inferred 20.06 0.88 0.3 6 Subtotal 23.29 1.01 0.3 6
Total 82.06 1.99 0.2 9
The resources are contained in five deposits within the Sepon mining area; Khanong which is currently being mined, Pha Bing, Thengkham North, Thengkham East and Thengkham South. The Supergene Copper resources also include some 5.8 Mt of stockpiles, classified as Measured Resources.
AMC has reviewed the Sepon Copper Mineral Resource estimates and reconciliation data as reported in the Operations Monthly Reports which have been produced by MMG. Significant variations on a monthly basis were noted, however, the overall long term data correlates well and there is no suggestion of material bias.
●
APPENDIX IV COMPETENT PERSON’S REPORT
— IV-21 —
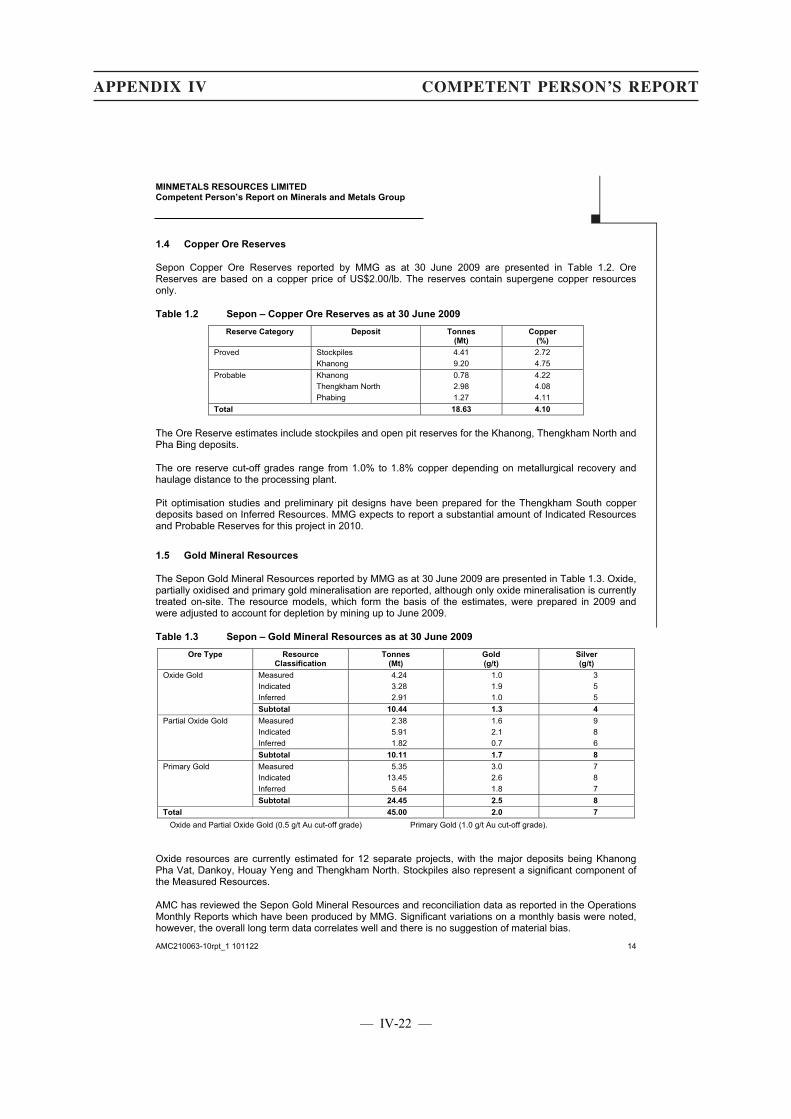
MINMETALS RESOURCES LIMITED Competent Person’s Report on Minerals and Metals Group
AMC210063-10rpt_1 101122 14
1.4 Copper Ore Reserves
Sepon Copper Ore Reserves reported by MMG as at 30 June 2009 are presented in Table 1.2. Ore Reserves are based on a copper price of US$2.00/lb. The reserves contain supergene copper resources only.
Table 1.2 Sepon – Copper Ore Reserves as at 30 June 2009
Reserve Category Deposit Tonnes (Mt)
Copper (%)
Proved Stockpiles 4.41 2.72 Khanong 9.20 4.75
Probable Khanong 0.78 4.22 Thengkham North 2.98 4.08
Phabing 1.27 4.11 Total 18.63 4.10
The Ore Reserve estimates include stockpiles and open pit reserves for the Khanong, Thengkham North and Pha Bing deposits.
The ore reserve cut-off grades range from 1.0% to 1.8% copper depending on metallurgical recovery and haulage distance to the processing plant.
Pit optimisation studies and preliminary pit designs have been prepared for the Thengkham South copper deposits based on Inferred Resources. MMG expects to report a substantial amount of Indicated Resources and Probable Reserves for this project in 2010.
1.5 Gold Mineral Resources
The Sepon Gold Mineral Resources reported by MMG as at 30 June 2009 are presented in Table 1.3. Oxide, partially oxidised and primary gold mineralisation are reported, although only oxide mineralisation is currently treated on-site. The resource models, which form the basis of the estimates, were prepared in 2009 and were adjusted to account for depletion by mining up to June 2009.
Table 1.3 Sepon – Gold Mineral Resources as at 30 June 2009
Ore Type Resource Classification
Tonnes (Mt)
Gold (g/t)
Silver (g/t)
Oxide Gold Measured 4.24 1.0 3 Indicated 3.28 1.9 5
Inferred 2.91 1.0 5 Subtotal 10.44 1.3 4
Partial Oxide Gold Measured 2.38 1.6 9 Indicated 5.91 2.1 8 Inferred 1.82 0.7 6
Subtotal 10.11 1.7 8
Primary Gold Measured 5.35 3.0 7 Indicated 13.45 2.6 8
Inferred 5.64 1.8 7 Subtotal 24.45 2.5 8
Total 45.00 2.0 7
Oxide and Partial Oxide Gold (0.5 g/t Au cut-off grade) Primary Gold (1.0 g/t Au cut-off grade).
Oxide resources are currently estimated for 12 separate projects, with the major deposits being Khanong Pha Vat, Dankoy, Houay Yeng and Thengkham North. Stockpiles also represent a significant component of the Measured Resources.
AMC has reviewed the Sepon Gold Mineral Resources and reconciliation data as reported in the Operations Monthly Reports which have been produced by MMG. Significant variations on a monthly basis were noted, however, the overall long term data correlates well and there is no suggestion of material bias.
●
APPENDIX IV COMPETENT PERSON’S REPORT
— IV-22 —
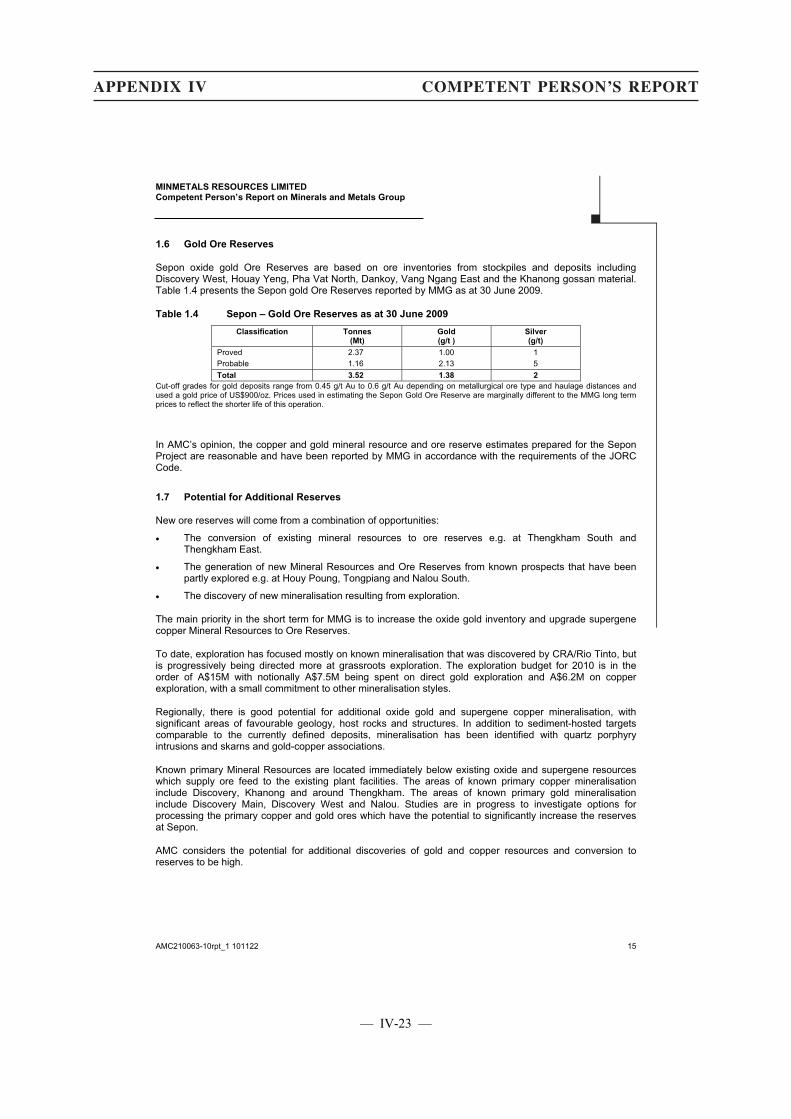
MINMETALS RESOURCES LIMITED Competent Person’s Report on Minerals and Metals Group
AMC210063-10rpt_1 101122 15
1.6 Gold Ore Reserves
Sepon oxide gold Ore Reserves are based on ore inventories from stockpiles and deposits including Discovery West, Houay Yeng, Pha Vat North, Dankoy, Vang Ngang East and the Khanong gossan material. Table 1.4 presents the Sepon gold Ore Reserves reported by MMG as at 30 June 2009.
Table 1.4 Sepon – Gold Ore Reserves as at 30 June 2009
Classification Tonnes (Mt)
Gold (g/t )
Silver (g/t)
Proved 2.37 1.00 1 Probable 1.16 2.13 5 Total 3.52 1.38 2
Cut-off grades for gold deposits range from 0.45 g/t Au to 0.6 g/t Au depending on metallurgical ore type and haulage distances and used a gold price of US$900/oz. Prices used in estimating the Sepon Gold Ore Reserve are marginally different to the MMG long term prices to reflect the shorter life of this operation.
In AMC’s opinion, the copper and gold mineral resource and ore reserve estimates prepared for the Sepon Project are reasonable and have been reported by MMG in accordance with the requirements of the JORC Code.
1.7 Potential for Additional Reserves
New ore reserves will come from a combination of opportunities:
� The conversion of existing mineral resources to ore reserves e.g. at Thengkham South and Thengkham East.
� The generation of new Mineral Resources and Ore Reserves from known prospects that have been partly explored e.g. at Houy Poung, Tongpiang and Nalou South.
� The discovery of new mineralisation resulting from exploration.
The main priority in the short term for MMG is to increase the oxide gold inventory and upgrade supergene copper Mineral Resources to Ore Reserves.
To date, exploration has focused mostly on known mineralisation that was discovered by CRA/Rio Tinto, but is progressively being directed more at grassroots exploration. The exploration budget for 2010 is in the order of A$15M with notionally A$7.5M being spent on direct gold exploration and A$6.2M on copper exploration, with a small commitment to other mineralisation styles.
Regionally, there is good potential for additional oxide gold and supergene copper mineralisation, with significant areas of favourable geology, host rocks and structures. In addition to sediment-hosted targets comparable to the currently defined deposits, mineralisation has been identified with quartz porphyry intrusions and skarns and gold-copper associations.
Known primary Mineral Resources are located immediately below existing oxide and supergene resources which supply ore feed to the existing plant facilities. The areas of known primary copper mineralisation include Discovery, Khanong and around Thengkham. The areas of known primary gold mineralisation include Discovery Main, Discovery West and Nalou. Studies are in progress to investigate options for processing the primary copper and gold ores which have the potential to significantly increase the reserves at Sepon.
AMC considers the potential for additional discoveries of gold and copper resources and conversion to reserves to be high.
●
APPENDIX IV COMPETENT PERSON’S REPORT
— IV-23 —
MINMETALS RESOURCES LIMITED Competent Person’s Report on Minerals and Metals Group
AMC210063-10rpt_1 101122 16
1.8 Mining Operations
Currently, copper ore is sourced from the Khanong Pit, and gold ore is sourced from Dankoy and Vang Nyang. On an annualised basis, gold and copper ore mining rates for the five months between January 2010 and May 2010 were nominally 2.1 Mtpa and 2.6 Mtpa respectively.
Copper ore production year-to-date is half of that budgeted. Forward mining in 2009, some negative reconciliations, contractor equipment utilisation, grade control assaying problems and most significantly UXO detection issues have adversely effected copper ore production.
Copper ore is stockpiled on the ROM pad by material type and grade. Significant stockpiles or copper ore allow for blending, as required by the processing schedule, and act as a buffer during periods of low mining productivity, for example due to high rainfall. Due to the large stockpiles of copper ore, AMC is advised that 2010 copper cathode production will not be affected by mining problems experienced during the first five months of 2010.
In the five month period between January 2010 and May 2010, open pit material movement for the gold and copper operations combined achieved a nominal annualised rate of 16 Mtpa (total ore and waste) with a strip ratio of 2.4t of waste to 1.0t of ore. The vast majority of material mined was weathered, but blasting was common. MMG plans to blast around 35% of material mined when developing life of mine (LOM) schedules.
Current LOM copper plans schedule ore mining to commence from Pha Bing in 2011, and from Thengkham in late 2014.
Geotechnical engineering planning and monitoring work for current and future pits is routinely undertaken and no significant pit wall failures were observed.
The primary mining fleet comprises 35t to 40t articulated haul trucks and backhoes ranging in size up to 80t class. The fleet has been found to be well-suited to the moderate material movement requirements, the steep topography, the wet environment and the high clay content of the material mined. Benches are blasted in 5m increments and excavated in 2.5m flitches.
Mining is carried out, by mining contractors, seven days per week, two shifts per day. Mine scheduling allows for lower productivity resulting from rain by reducing the number of days available for mining during periods of high average rain fall. The Khanong copper and the gold pits grade control is typically based on 1m sample intervals from 20m vertical reverse circulation (RC) grade control holes drilled on a 5m x 5m pattern.
1.9 Processing and Concentrate Handling
Copper Processing
The copper processing plant at Sepon produces copper cathodes in an integrated hydro-metallurgical processing facility. The processing route consists of atmospheric acid/ferric sulphate leaching, followed by conventional solvent extraction and electrowinning. The facility is novel in that it produces all of the ferric sulphate and most of the sulphuric acid to satisfy the internal needs of the copper leaching circuit. This is achieved by recovery of sulphides from leached residue by flotation, and subsequent oxidation of the sulphide concentrate in a pressure oxidation autoclave.
Construction of the plant commenced in 2003 and was successfully commissioned by March 2005. The design nameplate capacity of the original plant was 60,000 tpa of copper cathodes. An expansion of the plant is under currently implementation. The processing circuit is presented in a block flow diagram in Figure 1.4.
Run-of-mine (ROM) ore is crushed in a toothed roll crusher and conveyed to a primary ball mill where it is ground in acidic recycled process solution. Acidic ferric sulphate solution is added to the slurry and leaching occurs in a series of agitated tanks at atmospheric pressure and a target temperature of around 80�C to 85�C. Over 90% of the copper is leached from the ore by the end of this step.
●
APPENDIX IV COMPETENT PERSON’S REPORT
— IV-24 —
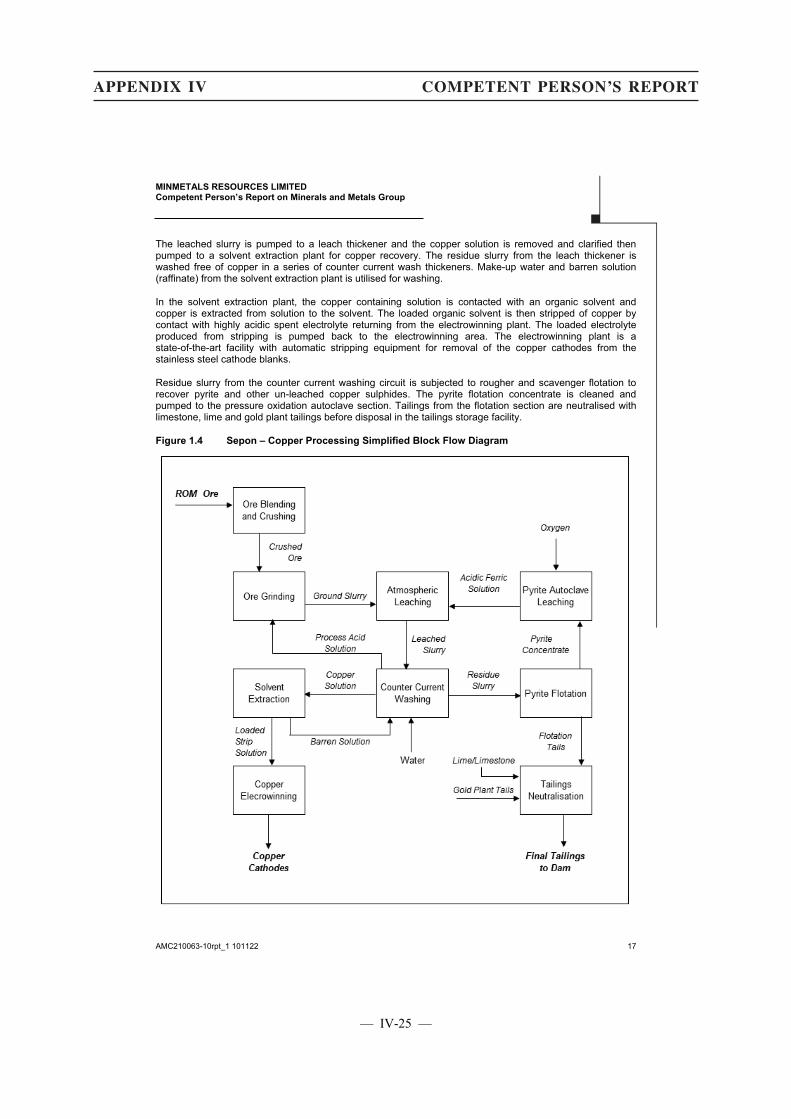
MINMETALS RESOURCES LIMITED Competent Person’s Report on Minerals and Metals Group
AMC210063-10rpt_1 101122 17
The leached slurry is pumped to a leach thickener and the copper solution is removed and clarified then pumped to a solvent extraction plant for copper recovery. The residue slurry from the leach thickener is washed free of copper in a series of counter current wash thickeners. Make-up water and barren solution (raffinate) from the solvent extraction plant is utilised for washing.
In the solvent extraction plant, the copper containing solution is contacted with an organic solvent and copper is extracted from solution to the solvent. The loaded organic solvent is then stripped of copper by contact with highly acidic spent electrolyte returning from the electrowinning plant. The loaded electrolyte produced from stripping is pumped back to the electrowinning area. The electrowinning plant is a state-of-the-art facility with automatic stripping equipment for removal of the copper cathodes from the stainless steel cathode blanks.
Residue slurry from the counter current washing circuit is subjected to rougher and scavenger flotation to recover pyrite and other un-leached copper sulphides. The pyrite flotation concentrate is cleaned and pumped to the pressure oxidation autoclave section. Tailings from the flotation section are neutralised with limestone, lime and gold plant tailings before disposal in the tailings storage facility.
Figure 1.4 Sepon – Copper Processing Simplified Block Flow Diagram
●
APPENDIX IV COMPETENT PERSON’S REPORT
— IV-25 —
MINMETALS RESOURCES LIMITED Competent Person’s Report on Minerals and Metals Group
AMC210063-10rpt_1 101122 18
The oxidation autoclave operates at a temperature of approximately 220�C and a total pressure of 3,000 kPa. Oxygen required for the process is produced in a dedicated oxygen plant located at the site. The oxidised slurry is subjected to a heat recovery step and then pumped to the concentrate atmospheric leach circuit, where the remaining copper is leached and ferric sulphate is solubilised for use in the main atmospheric copper leaching circuit.
Reported plant performance over the last four years is summarised in Table 1.5.
Table 1.5 Sepon – Copper Processing Performance
Year Ore Processed
(Mt)
Feed Grade
(Cu %)
Stripped Copper Cathode
(kt)
Plated Copper Recovery
(%)
2006 1.23 5.6 60.8 89.5 2007 1.23 5.7 62.5 91.2 2008 1.33 5.4 64.1 90.9 2009 1.41 5.4 67.6 90.5
Copper production has shown continuous improvement for operations to date. A number of plant production improvement projects have been completed over the last two years which have resulted in an increase in plant capacity above design. The current plant capacity is considered to be around 70 kt of cathode copper per annum. Plant copper recovery of 90% to 91% is being maintained. The standard of plant operation and housekeeping is considered by AMC to be high.
A significant plant expansion to facilitate a treatment rate of approximately 1.9 Mtpa of ore is currently underway. A second oxidation autoclave was commissioned in 2009. Other expanded sections of the plant are being commissioned as they are completed. The project expansion was initially commenced in early 2008 but was halted in late in the year as a result of the world downturn in the Global Financial Crisis (GFC). Construction recommenced in late 2009, and is planned for completion in October 2010. When completed the expansion will result in an increase of copper production capacity to approximately 80,000 tpa of cathode.
The key components of the expansion are as follows:
� Increased capacity of the ROM crusher.
� Increased atmospheric ore leaching capacity.
� Additional oxygen production facilities.
� Additional heat exchangers and cooling tower.
� Installation of a new eight thickener counter current washing train and clarifiers.
� Installation of a flotation feed deslime plant and additional pyrite flotation capacity.
� Installation of a second pressure oxidation autoclave (completed).
� Installation of 24 new electrowinning cells with a dedicated rectiformer.
Ore for the upgraded plant will initially come from the existing Khanong mine and later from the new copper deposits being developed at Pha Bing, Thengkham North and Thengkham South.
Metallurgical characterisation of samples from these new deposits have shown mineralogical similarities to that of equivalent ore types from Khanong. Ongoing testwork and ore characterisation studies will be undertaken to provide further understanding of these orebodies for ore blending purposes. Due to similarities in copper mineralogy (mineral type not necessarily quantity) the geometallurgical models used for predicting recovery are considered by AMC to be reasonably robust.
Some preliminary investigations have been undertaken to evaluate the primary copper deposit. This preliminary work was aimed at producing either a saleable copper concentrate, or a concentrate which could be processed through part of the current copper processing plant (hydrometallurgical treatment via total pressure oxidation). To AMC’s knowledge no detailed studies, or engineering work has commenced on this project.
●
APPENDIX IV COMPETENT PERSON’S REPORT
— IV-26 —
MINMETALS RESOURCES LIMITED Competent Person’s Report on Minerals and Metals Group
AMC210063-10rpt_1 101122 19
Gold Processing
The Sepon gold process plant utilises conventional CIL technology for recovery of gold. The initial processing facilities were installed in 2002. A major plant expansion consisting of an additional crushing and grinding circuit, and expanded leaching facilities was commenced in 2003. The upgraded plant was successfully commissioned early in 2005. The nameplate ore treatment capacity of the upgraded plant is 2.5 Mtpa.
Run-of-mine ore is fed to two parallel crushing and grinding circuits. Ground slurry from the milling circuits is combined and fed to the CIL tanks where the slurry is agitated in cyanide solution in the presence of granulated carbon. Gold is leached from the ore and adsorbed to the carbon. The gold is recovered from the carbon by elution, electrowinning and smelting techniques. The barren leached slurry is subjected to cyanide detoxification prior to being added to the copper plant tailings for neutralisation and disposal.
Reported plant performance over a four year period is summarised in Table 1.6.
Table 1.6 Sepon – Gold Processing Performance
Year Feed (Mt)
Head Grade (Au g/t)
Gold Produced (oz)
Gold Recovery (%)
2006 2.91 2.25 176,325 83.7 2007 2.16 1.79 102,386 81.5 2008 2.32 1.60 93,071 74.4 2009 2.47 1.66 105,036 81.3
Ore throughput in 2006 was well in excess of the name-plate capacity, but in latter years has decreased due to lack of ore from the mine as pits are exhausted. Current throughput typically requires operation of only one milling circuit which can operate at a rate of 2.4 Mtpa.
Plant recovery is variable and dependent on ore source and the amounts of transitional and carbonaceous ore periodically encountered in plant feed. The plant will continue to operate at a low production rate as current ore sources are exhausted.
Metallurgical testwork and preliminary engineering studies have been undertaken to establish the feasibility of installing a processing facility for treating ore from the Sepon primary gold resource. The carbonaceous primary mineralisation has been found to be refractory and preg-robbing. The preliminary studies evaluated flotation and pressure oxidation as the favoured treatment route. More recent investigations have been focused on whole ore roasting and further study work with this option is planned. Economic studies to date suggest that a larger gold resource than currently exists is required to make the project viable.
1.10 Infrastructure
Power consumption for the total operation is in the order of 25,000 MWh per month, and is supplied from neighbouring Thailand. A second power line is being installed to improve reliability of supply and increase maximum demand capability. The second line is due for completion by October 2010 at a cost of A$30M.
There are approximately 1,400 LXML employees and 3,100 contractor employees on-site with the majority of the local workers housed in the nearby town.
Expatriate employees account for 16% of the total workforce, and these employees regularly travel back to their country of origin as part of the work cycle. An air charter service is available to transport employees to site via an airstrip near the process plants. Whilst on site, employees are accommodated in two separate camps, Hinsom and Padan, which are close to the processing plants.
Water is drawn from nearby rivers for use in the plants and elsewhere. Water is recycled to the plant where possible.
●
APPENDIX IV COMPETENT PERSON’S REPORT
— IV-27 —
MINMETALS RESOURCES LIMITED Competent Person’s Report on Minerals and Metals Group
AMC210063-10rpt_1 101122 20
1.11 Environment
Environmental management at Sepon is mediated through approvals from the Lao PDR Government and involves 11 environmental management plans which are updated every two years. The copper project was incorporated into the approvals in 2002.
Emissions, especially to water, are managed to Lao, World Bank/International Finance Corporation and internally-imposed standards.
Acid mine drainage is a major environmental issue, and is being effectively managed by treatment of acidic drainage by addition of lime and caustic soda in engineered ponds prior to discharge to local streams. Exceedances of water-quality thresholds are detected through a sophisticated monitoring programme, and reported to government as required by conditions of the project approval documents; none of the exceedances are considered to have constituted a significant environmental hazard, because two-yearly aquatic biological monitoring continues to demonstrate the ecological integrity of downstream environments.
Considerable effort is put into identification of potentially acid-forming (PAF) mine waste in advance of extraction, so that such material can be properly managed by encapsulation with inert and/or acid-consuming material. There are sufficient amounts of inert and/or acid-consuming waste to also allow encapsulation of the operating tailings dam, which will have acid-producing copper tails on its surface. Detailed planning for closure of this dam is well advanced, based on geochemical testwork and modelling of the performance of an inert cover, possibly compacted, which would prevent moisture and oxygen reaching the sulphidic tailings at rates sufficient to cause significant acidification.
Impacts on groundwater, especially from acid drainage, require more intensive assessment and monitoring, but this is not considered by AMC to be a significant environmental issue; there has been no wide-scale impact on groundwater to date, and the demonstrably-high environmental performance at Sepon should provide for prompt and responsible management of issues that could arise in future.
An external Environmental and Social Audit was conducted in 2008, updating a 2007 study. While non-compliances were recorded, none is considered by AMC to be of sufficient importance or urgency to significantly affect project operations or impose significant unplanned costs. Importantly, in the context of the Equator Principles, the audit noted critical contributions to community development in the mine region, especially small business incentives and support.
A December 2009 closure and rehabilitation estimate of US$126.3 (95% confidence, raw costs) or US$68.3 (95% confidence, NPV, 8% discount rate) is considered by AMC to have been rigorously developed, using realistic unit rates and with appropriate allowance for post-decommissioning monitoring and management, especially of acid drainage. These closure costs are approximately 10% greater than those estimated in 2008, reflecting appropriate refinement of closure plans.
1.12 Operating and Capital Costs
Recent actual operating costs for Sepon copper and gold operations are presented in Table 1.7 and Table 1.8.
●
APPENDIX IV COMPETENT PERSON’S REPORT
— IV-28 —
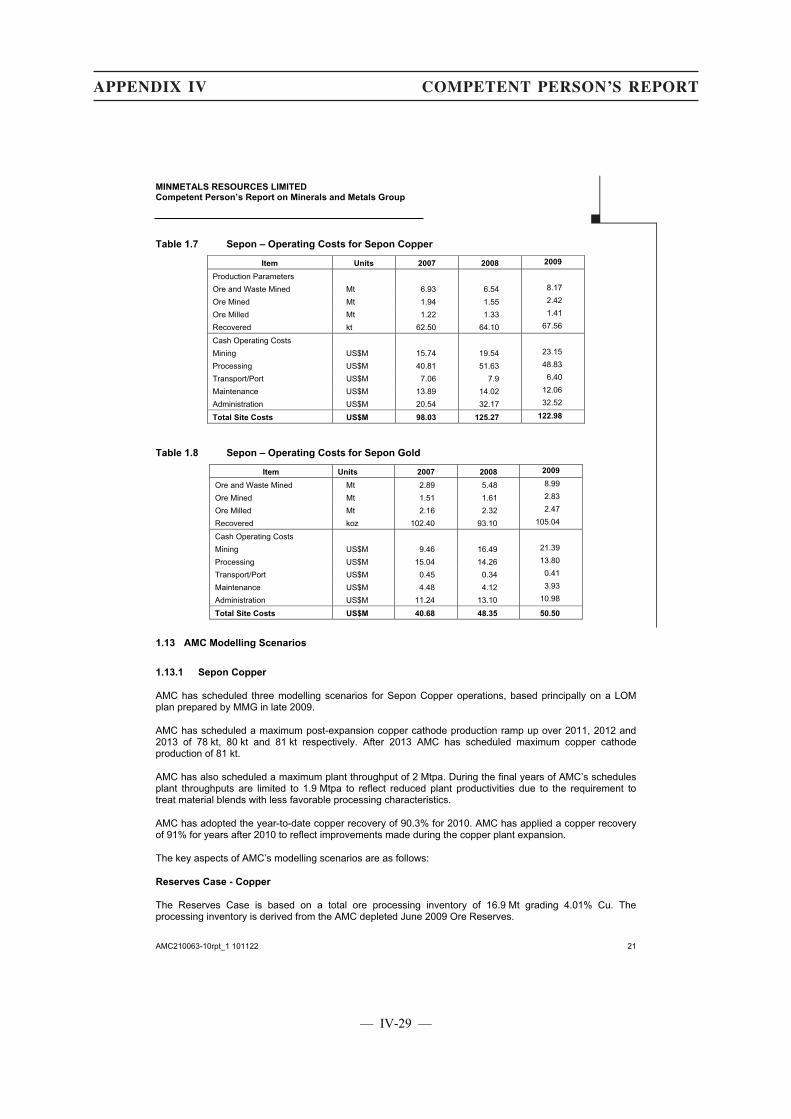
MINMETALS RESOURCES LIMITED Competent Person’s Report on Minerals and Metals Group
AMC210063-10rpt_1 101122 21
Table 1.7 Sepon – Operating Costs for Sepon Copper
Item Units 2007 2008 2009
Production Parameters
Ore and Waste Mined Mt 6.93 6.54 8.17
Ore Mined Mt 1.94 1.55 2.42
Ore Milled Mt 1.22 1.33 1.41
Recovered kt 62.50 64.10 67.56
Cash Operating Costs
Mining US$M 15.74 19.54 23.15
Processing US$M 40.81 51.63 48.83
Transport/Port US$M 7.06 7.9 6.40
Maintenance US$M 13.89 14.02 12.06
Administration US$M 20.54 32.17 32.52
Total Site Costs US$M 98.03 125.27 122.98
Table 1.8 Sepon – Operating Costs for Sepon Gold
Item Units 2007 2008 2009
Ore and Waste Mined Mt 2.89 5.48 8.99
Ore Mined Mt 1.51 1.61 2.83
Ore Milled Mt 2.16 2.32 2.47
Recovered koz 102.40 93.10 105.04
Cash Operating Costs
Mining US$M 9.46 16.49 21.39
Processing US$M 15.04 14.26 13.80
Transport/Port US$M 0.45 0.34 0.41
Maintenance US$M 4.48 4.12 3.93
Administration US$M 11.24 13.10 10.98
Total Site Costs US$M 40.68 48.35 50.50
1.13 AMC Modelling Scenarios
1.13.1 Sepon Copper
AMC has scheduled three modelling scenarios for Sepon Copper operations, based principally on a LOM plan prepared by MMG in late 2009.
AMC has scheduled a maximum post-expansion copper cathode production ramp up over 2011, 2012 and 2013 of 78 kt, 80 kt and 81 kt respectively. After 2013 AMC has scheduled maximum copper cathode production of 81 kt.
AMC has also scheduled a maximum plant throughput of 2 Mtpa. During the final years of AMC’s schedules plant throughputs are limited to 1.9 Mtpa to reflect reduced plant productivities due to the requirement to treat material blends with less favorable processing characteristics.
AMC has adopted the year-to-date copper recovery of 90.3% for 2010. AMC has applied a copper recovery of 91% for years after 2010 to reflect improvements made during the copper plant expansion.
The key aspects of AMC’s modelling scenarios are as follows:
Reserves Case - Copper
The Reserves Case is based on a total ore processing inventory of 16.9 Mt grading 4.01% Cu. The processing inventory is derived from the AMC depleted June 2009 Ore Reserves.
●
APPENDIX IV COMPETENT PERSON’S REPORT
— IV-29 —

MINMETALS RESOURCES LIMITED Competent Person’s Report on Minerals and Metals Group
AMC210063-10rpt_1 101122 22
Mining is completed in 2018 with ore processing ceasing in 2019 after production of 617 kt of copper cathode.
Capital and operating costs have been based on those estimated by MMG in its LOM plan.
Planning Case 1 – Copper
Planning Case 1 is based on a total ore processing inventory of 22.7 Mt grading 3.91% Cu. The processing inventory is derived from the AMC depleted June 2009 Ore Reserves with the addition of 5.8 Mt of Inferred material. In Case 1, 3.5 Mt of the additional ore is sourced from pits designed on the Thengkham South Inferred resource. The remaining 2.3 Mt is sourced from Inferred material associated with the Khanong, Thengkham North and Pha Bing deposits.
Mining is completed in 2018 with ore processing ceasing in 2022 after production of 810 kt of copper cathode.
Capital and operating costs have been based on those estimated by MMG in its LOM plan.
Planning Case 2 – Copper
Planning Case 2 is based on a total ore processing inventory of 25.5 Mt grading 3.82% Cu. The processing inventory is based on AMC’s Planning Case 1 with the addition of 2.8 Mt of Inferred material and exploration upside. In Planning Case 2, 0.5 Mt of the Inferred material is sourced from an AMC estimated mining inventory resulting from the Thengkham West inferred resource of 2.3 Mt. The remaining 2.3 Mt added to Planning Case 1 is sourced from Inferred material and exploration upside associated with the Khanong, Thengkham North, Thengkham South and Pha Bing deposits.
Mining is completed in 2021 with ore processing ceasing in 2023 after production of 886 kt of copper cathode.
Capital and operating costs have been based on those estimated by MMG in its LOM plan.
The Sepon Copper Reserves Case, Planning Case 1 and Planning Case 2 are summarised in Table 1.9, Table 1.10 and Table 1.11.
1.13.2 Sepon Gold
AMC has developed three modelling scenarios for Sepon Gold operations, based on a recent LOM plan provided by MMG. The key aspects of AMC’s modelling scenarios are as follows:
Reserves Case – Gold
The Reserves Case is based on a total ore processing inventory of 1.4 Mt grading 1.55 g/t Au and a gold recovery of 75%. The processing inventory is derived from the AMC depleted June 2009 Ore Reserves.
Mining is completed in 2010 with ore processing ceasing in 2010 after production of 52 koz of gold.
Capital and operating costs have been based on those estimated by MMG in its LOM plan.
Planning Case 1 – Gold
Planning Case 1 is based on a total ore processing inventory of 3.86 Mt grading 1.35 g/t Au and a gold recovery of 75%. The processing inventory is based on the MMG LOM plan.
Mining is completed in early 2012 with ore processing ceasing in early 2012 after production of 126 koz of gold. Additional ore is included from a number of pit designs, including, Thengkham South, Thengkham East, Houy Yang Stage 5, Dankoy and Namkok West.
Capital and operating costs have been based on those estimated by MMG in its LOM plan.
●
APPENDIX IV COMPETENT PERSON’S REPORT
— IV-30 —
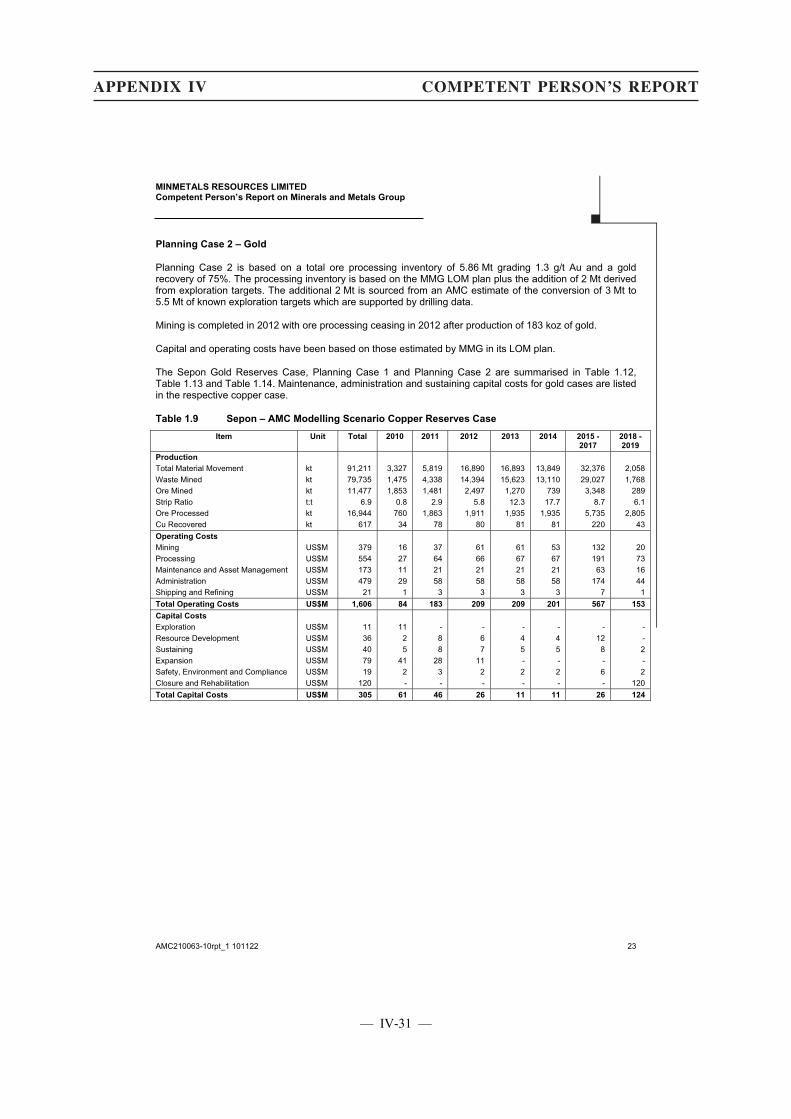
MINMETALS RESOURCES LIMITED Competent Person’s Report on Minerals and Metals Group
AMC210063-10rpt_1 101122 23
Planning Case 2 – Gold
Planning Case 2 is based on a total ore processing inventory of 5.86 Mt grading 1.3 g/t Au and a gold recovery of 75%. The processing inventory is based on the MMG LOM plan plus the addition of 2 Mt derived from exploration targets. The additional 2 Mt is sourced from an AMC estimate of the conversion of 3 Mt to 5.5 Mt of known exploration targets which are supported by drilling data.
Mining is completed in 2012 with ore processing ceasing in 2012 after production of 183 koz of gold.
Capital and operating costs have been based on those estimated by MMG in its LOM plan.
The Sepon Gold Reserves Case, Planning Case 1 and Planning Case 2 are summarised in Table 1.12, Table 1.13 and Table 1.14. Maintenance, administration and sustaining capital costs for gold cases are listed in the respective copper case.
Table 1.9 Sepon – AMC Modelling Scenario Copper Reserves Case
Item Unit Total 2010 2011 2012 2013 2014 2015 - 2017
2018 - 2019
Production
Total Material Movement kt 91,211 3,327 5,819 16,890 16,893 13,849 32,376 2,058 Waste Mined kt 79,735 1,475 4,338 14,394 15,623 13,110 29,027 1,768 Ore Mined kt 11,477 1,853 1,481 2,497 1,270 739 3,348 289 Strip Ratio t:t 6.9 0.8 2.9 5.8 12.3 17.7 8.7 6.1 Ore Processed kt 16,944 760 1,863 1,911 1,935 1,935 5,735 2,805 Cu Recovered kt 617 34 78 80 81 81 220 43 Operating Costs
Mining US$M 379 16 37 61 61 53 132 20 Processing US$M 554 27 64 66 67 67 191 73 Maintenance and Asset Management US$M 173 11 21 21 21 21 63 16 Administration US$M 479 29 58 58 58 58 174 44 Shipping and Refining US$M 21 1 3 3 3 3 7 1 Total Operating Costs US$M 1,606 84 183 209 209 201 567 153
Capital Costs
Exploration US$M 11 11 - - - - - - Resource Development US$M 36 2 8 6 4 4 12 - Sustaining US$M 40 5 8 7 5 5 8 2 Expansion US$M 79 41 28 11 - - - - Safety, Environment and Compliance US$M 19 2 3 2 2 2 6 2 Closure and Rehabilitation US$M 120 - - - - - - 120 Total Capital Costs US$M 305 61 46 26 11 11 26 124
●
APPENDIX IV COMPETENT PERSON’S REPORT
— IV-31 —

MINMETALS RESOURCES LIMITED Competent Person’s Report on Minerals and Metals Group
AMC210063-10rpt_1 101122 24
Table 1.10 Sepon – AMC Modelling Scenario Copper Planning Case 1
Item Unit Total 2010 2011 2012 2013 2014 2015 - 2017
2018 - 2020
2021 - 2022
Production
Total Material Movement kt 123,646 3,327 5,819 16,890 16,893 16,892 50,675 13,150 - Waste Mined kt 106,358 1,104 4,042 13,894 15,369 15,997 44,889 11,063 - Ore Mined kt 17,287 2,223 1,777 2,996 1,524 894 5,786 2,087 - Strip Ratio t:t 6.2 0.5 2.3 4.6 10.1 17.9 7.8 5.3 - Ore Processed kt 22,754 760 1,863 1,911 1,935 1,935 5,805 5,700 2,845 Cu Recovered kt 810 34 78 80 81 81 243 177 35 Operating Costs
Mining US$M 463 16 37 61 61 61 183 44 - Processing US$M 738 27 64 66 67 67 200 177 71 Maintenance and Asset Management US$M 214 11 21 21 21 21 63 53 4 Administration US$M 590 29 58 58 58 58 174 145 10 Shipping and Refining US$M 27 1 3 3 3 3 8 6 1 Total Operating Costs US$M 2,032 84 183 209 209 209 628 424 85
Capital Costs
Exploration US$M 11 11 - - - - - - - Resource Development US$M 36 2 8 6 4 4 12 - - Sustaining US$M 63 5 8 7 5 5 15 13 5 Expansion US$M 79 41 28 11 - - - - - Safety, Environment and Compliance US$M 27 2 3 2 2 2 6 6 4 Closure and Rehabilitation US$M 120 - - - - - - - 120 Total Capital Costs US$M 336 61 46 26 11 11 33 19 129
Table 1.11 Sepon – AMC Modelling Scenario Copper Planning Case 2
Item Unit Total 2010 2011 2012 2013 2014 2015 - 2017
2018 - 2020
2021 - 2023
Production
Total Material Movement kt 160,497 3,327 5,819 16,890 16,893 16,892 50,675 45,386 4,615 Waste Mined kt 140,455 1,104 4,042 13,894 15,369 15,997 44,889 41,045 4,115 Ore Mined kt 20,042 2,223 1,777 2,996 1,524 894 5,786 4,342 500 Strip Ratio t:t 7.0 0.5 2.3 4.6 10.1 17.9 7.8 9.5 8.23 Ore Processed kt 25,509 760 1,863 1,911 1,935 1,935 5,805 5,735 5,565 Cu Recovered kt 886 34 78 80 81 81 243 208 81 Operating Costs
Mining US$M 605 16 37 61 61 61 183 168 17 Processing US$M 821 27 64 66 67 67 200 187 143 Maintenance and Asset Management US$M 270 11 21 21 21 21 63 63 49 Administration US$M 677 29 58 58 58 58 174 174 68 Shipping and Refining US$M 30 1 3 3 3 3 8 7 3 Total Operating Costs US$M 2,401 84 183 209 209 209 628 600 279
Capital Costs
Exploration US$M 11 11 - - - - - - - Resource Development US$M 48 2 8 6 4 4 12 12 - Sustaining US$M 61 5 8 7 5 5 15 9 7 Expansion US$M 79 41 28 11 - - - - - Safety, Environment and Compliance US$M 29 2 3 2 2 2 6 6 6 Closure and Rehabilitation US$M 120 - - - - - - - 120 Total Capital Costs US$M 348 61 46 26 11 11 33 27 133
●
APPENDIX IV COMPETENT PERSON’S REPORT
— IV-32 —
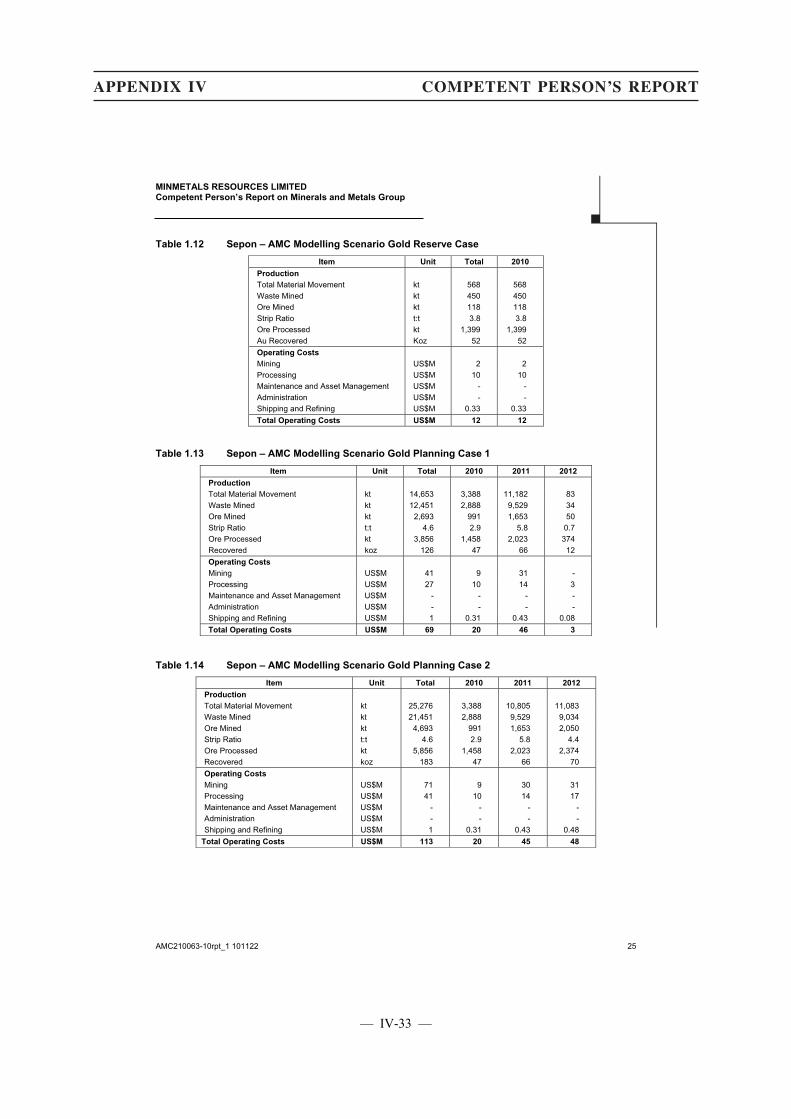
MINMETALS RESOURCES LIMITED Competent Person’s Report on Minerals and Metals Group
AMC210063-10rpt_1 101122 25
Table 1.12 Sepon – AMC Modelling Scenario Gold Reserve Case
Item Unit Total 2010
Production
Total Material Movement kt 568 568 Waste Mined kt 450 450 Ore Mined kt 118 118 Strip Ratio t:t 3.8 3.8 Ore Processed kt 1,399 1,399 Au Recovered Koz 52 52 Operating Costs
Mining US$M 2 2 Processing US$M 10 10 Maintenance and Asset Management US$M - - Administration US$M - - Shipping and Refining US$M 0.33 0.33 Total Operating Costs US$M 12 12
Table 1.13 Sepon – AMC Modelling Scenario Gold Planning Case 1
Item Unit Total 2010 2011 2012
Production
Total Material Movement kt 14,653 3,388 11,182 83 Waste Mined kt 12,451 2,888 9,529 34 Ore Mined kt 2,693 991 1,653 50 Strip Ratio t:t 4.6 2.9 5.8 0.7 Ore Processed kt 3,856 1,458 2,023 374 Recovered koz 126 47 66 12 Operating Costs
Mining US$M 41 9 31 - Processing US$M 27 10 14 3 Maintenance and Asset Management US$M - - - - Administration US$M - - - - Shipping and Refining US$M 1 0.31 0.43 0.08 Total Operating Costs US$M 69 20 46 3
Table 1.14 Sepon – AMC Modelling Scenario Gold Planning Case 2
Item Unit Total 2010 2011 2012
Production
Total Material Movement kt 25,276 3,388 10,805 11,083 Waste Mined kt 21,451 2,888 9,529 9,034 Ore Mined kt 4,693 991 1,653 2,050 Strip Ratio t:t 4.6 2.9 5.8 4.4 Ore Processed kt 5,856 1,458 2,023 2,374 Recovered koz 183 47 66 70 Operating Costs
Mining US$M 71 9 30 31 Processing US$M 41 10 14 17 Maintenance and Asset Management US$M - - - - Administration US$M - - - - Shipping and Refining US$M 1 0.31 0.43 0.48
Total Operating Costs US$M 113 20 45 48
●
APPENDIX IV COMPETENT PERSON’S REPORT
— IV-33 —
MINMETALS RESOURCES LIMITED Competent Person’s Report on Minerals and Metals Group
AMC210063-10rpt_1 101122 26
1.14 Technical Risks and Opportunities
In AMC’s opinion the main technical risks at Sepon are:
� If the supply of processing reagents is not sufficient to achieve forecast processing requirements copper production could be affected and operating costs could increase Sepon mines inputs for the processing of copper on site, including limestone and pyrite. Interruptions to mining of these inputs could affect productivity.
� Damage to, or failure of, key equipment items in the processing plant, for example the rectiformer (which is part of the electrowinning cicuit), could cause delays to copper processing.
� If MMG fail to continue to successfully manage community relations with local people interruptions to production could result.
� If MMG fail to continue to implement effective environmental management plans production could be interrupted and costs could increase.
In AMC’s opinion the main technical opportunities at Sepon are:
� The significant prospectivity of the site and region, and the potential to make further discoveries of economic oxide gold and supergene copper deposits, which in turn could allow for the extension or expansion of production for existing processing facilities.
� The potential, after significant further study, exploration and investment, to establish primary gold and copper mining and processing operations. This potential is considered in AMC’s exploration section.
� MMG could further expand or make modifications to the copper processing plant in order to increase ore throughput or copper recovery.
●
APPENDIX IV COMPETENT PERSON’S REPORT
— IV-34 —
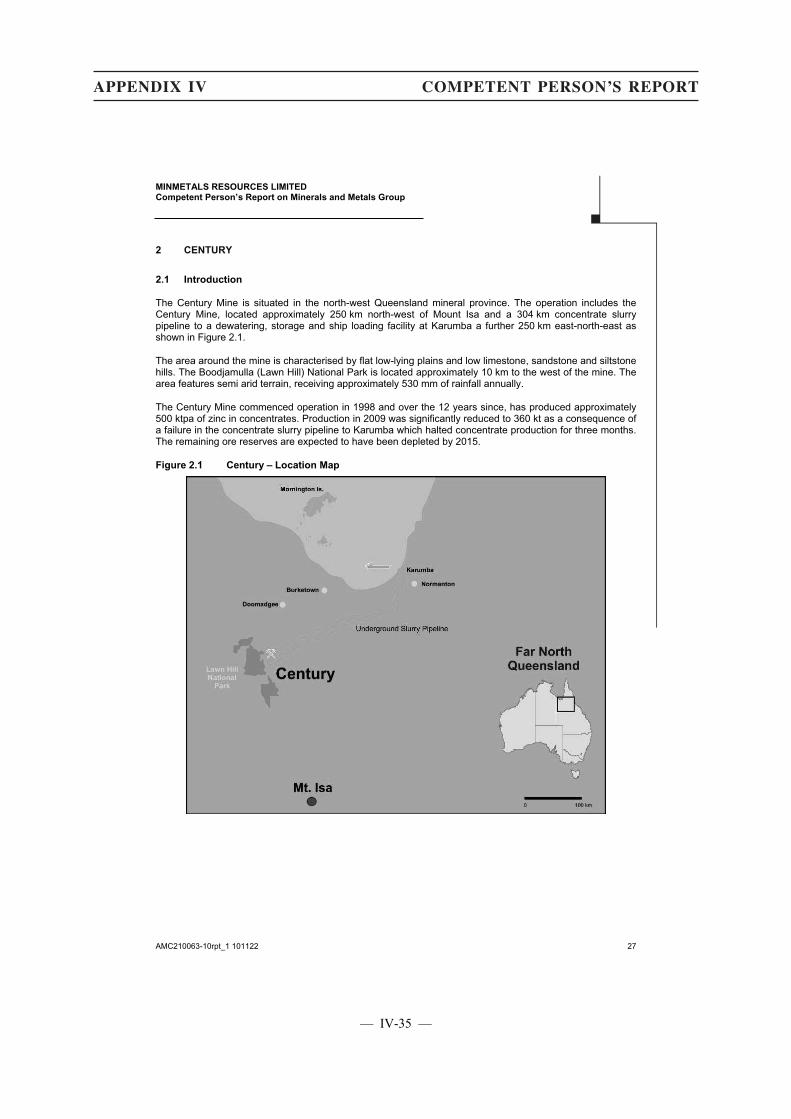
MINMETALS RESOURCES LIMITED Competent Person’s Report on Minerals and Metals Group
AMC210063-10rpt_1 101122 27
2 CENTURY
2.1 Introduction
The Century Mine is situated in the north-west Queensland mineral province. The operation includes the Century Mine, located approximately 250 km north-west of Mount Isa and a 304 km concentrate slurry pipeline to a dewatering, storage and ship loading facility at Karumba a further 250 km east-north-east as shown in Figure 2.1.
The area around the mine is characterised by flat low-lying plains and low limestone, sandstone and siltstone hills. The Boodjamulla (Lawn Hill) National Park is located approximately 10 km to the west of the mine. The area features semi arid terrain, receiving approximately 530 mm of rainfall annually.
The Century Mine commenced operation in 1998 and over the 12 years since, has produced approximately 500 ktpa of zinc in concentrates. Production in 2009 was significantly reduced to 360 kt as a consequence of a failure in the concentrate slurry pipeline to Karumba which halted concentrate production for three months. The remaining ore reserves are expected to have been depleted by 2015.
Figure 2.1 Century – Location Map
●
APPENDIX IV COMPETENT PERSON’S REPORT
— IV-35 —
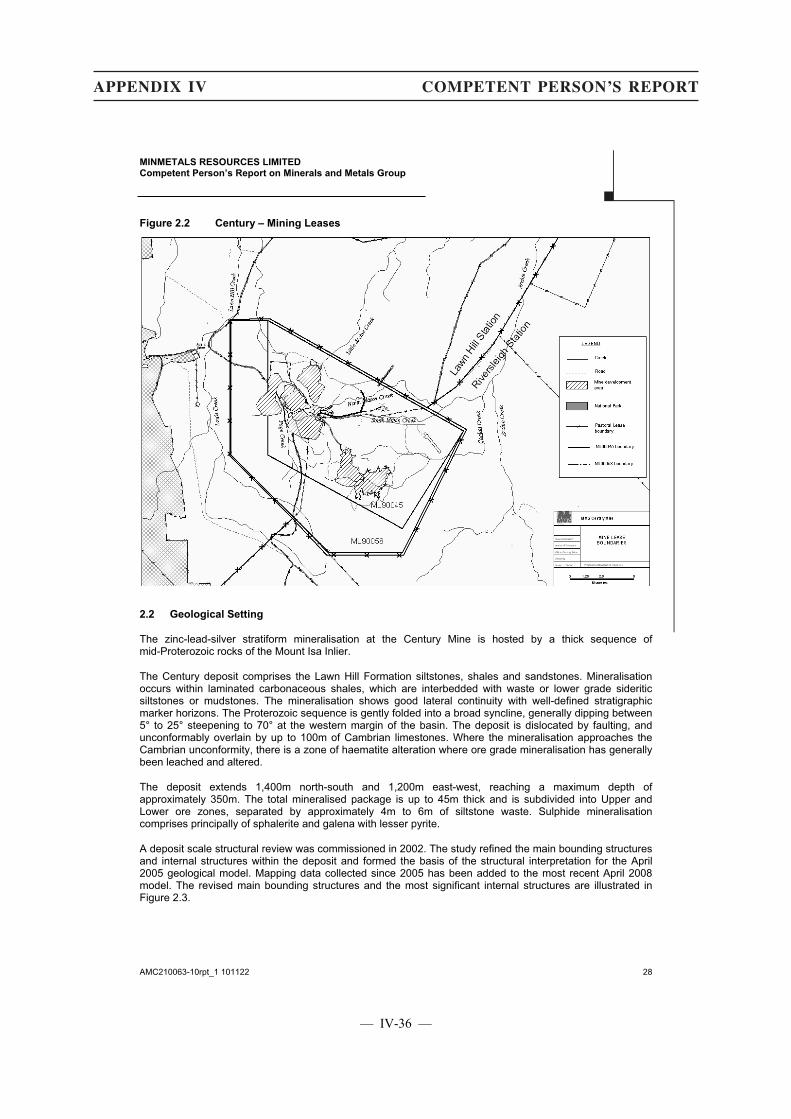
MINMETALS RESOURCES LIMITED Competent Person’s Report on Minerals and Metals Group
AMC210063-10rpt_1 101122 28
Figure 2.2 Century – Mining Leases
2.2 Geological Setting
The zinc-lead-silver stratiform mineralisation at the Century Mine is hosted by a thick sequence of mid-Proterozoic rocks of the Mount Isa Inlier.
The Century deposit comprises the Lawn Hill Formation siltstones, shales and sandstones. Mineralisation occurs within laminated carbonaceous shales, which are interbedded with waste or lower grade sideritic siltstones or mudstones. The mineralisation shows good lateral continuity with well-defined stratigraphic marker horizons. The Proterozoic sequence is gently folded into a broad syncline, generally dipping between 5° to 25° steepening to 70° at the western margin of the basin. The deposit is dislocated by faulting, and unconformably overlain by up to 100m of Cambrian limestones. Where the mineralisation approaches the Cambrian unconformity, there is a zone of haematite alteration where ore grade mineralisation has generally been leached and altered.
The deposit extends 1,400m north-south and 1,200m east-west, reaching a maximum depth of approximately 350m. The total mineralised package is up to 45m thick and is subdivided into Upper and Lower ore zones, separated by approximately 4m to 6m of siltstone waste. Sulphide mineralisation comprises principally of sphalerite and galena with lesser pyrite.
A deposit scale structural review was commissioned in 2002. The study refined the main bounding structures and internal structures within the deposit and formed the basis of the structural interpretation for the April 2005 geological model. Mapping data collected since 2005 has been added to the most recent April 2008 model. The revised main bounding structures and the most significant internal structures are illustrated in Figure 2.3.
●
APPENDIX IV COMPETENT PERSON’S REPORT
— IV-36 —
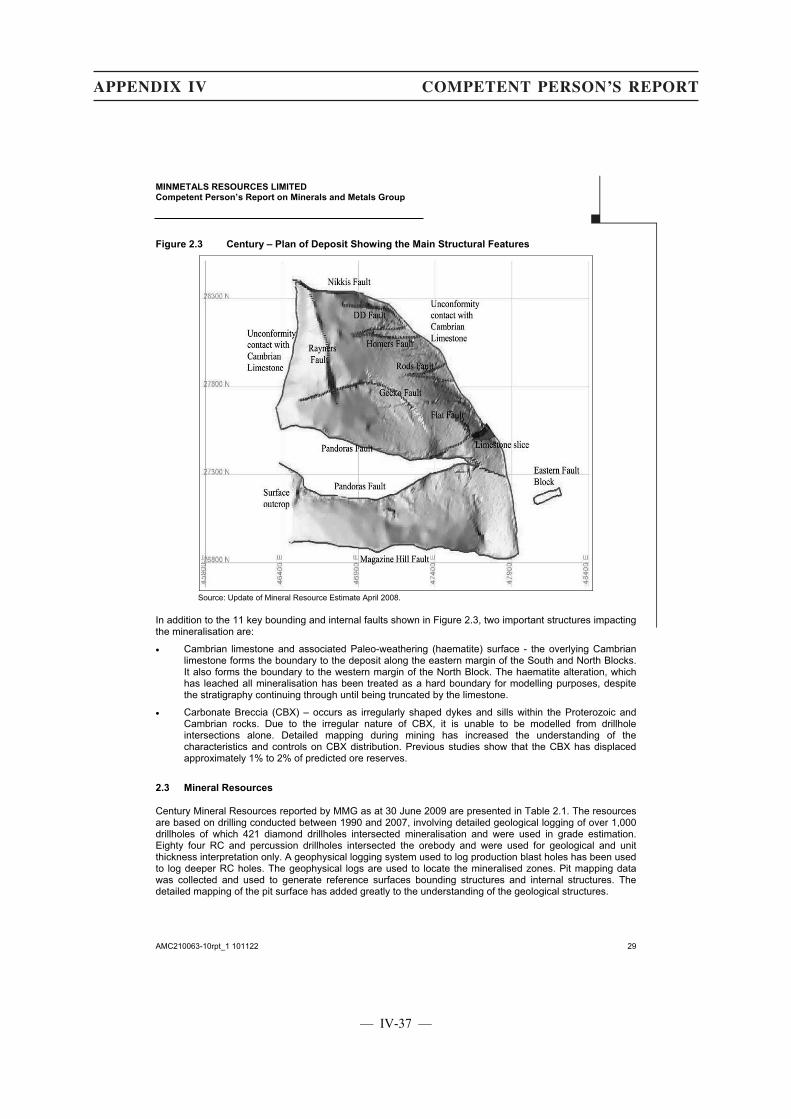
MINMETALS RESOURCES LIMITED Competent Person’s Report on Minerals and Metals Group
AMC210063-10rpt_1 101122 29
Figure 2.3 Century – Plan of Deposit Showing the Main Structural Features
Source: Update of Mineral Resource Estimate April 2008.
In addition to the 11 key bounding and internal faults shown in Figure 2.3, two important structures impacting the mineralisation are:
� Cambrian limestone and associated Paleo-weathering (haematite) surface - the overlying Cambrian limestone forms the boundary to the deposit along the eastern margin of the South and North Blocks. It also forms the boundary to the western margin of the North Block. The haematite alteration, which has leached all mineralisation has been treated as a hard boundary for modelling purposes, despite the stratigraphy continuing through until being truncated by the limestone.
� Carbonate Breccia (CBX) – occurs as irregularly shaped dykes and sills within the Proterozoic and Cambrian rocks. Due to the irregular nature of CBX, it is unable to be modelled from drillhole intersections alone. Detailed mapping during mining has increased the understanding of the characteristics and controls on CBX distribution. Previous studies show that the CBX has displaced approximately 1% to 2% of predicted ore reserves.
2.3 Mineral Resources
Century Mineral Resources reported by MMG as at 30 June 2009 are presented in Table 2.1. The resources are based on drilling conducted between 1990 and 2007, involving detailed geological logging of over 1,000 drillholes of which 421 diamond drillholes intersected mineralisation and were used in grade estimation. Eighty four RC and percussion drillholes intersected the orebody and were used for geological and unit thickness interpretation only. A geophysical logging system used to log production blast holes has been used to log deeper RC holes. The geophysical logs are used to locate the mineralised zones. Pit mapping data was collected and used to generate reference surfaces bounding structures and internal structures. The detailed mapping of the pit surface has added greatly to the understanding of the geological structures.
●
APPENDIX IV COMPETENT PERSON’S REPORT
— IV-37 —

MINMETALS RESOURCES LIMITED Competent Person’s Report on Minerals and Metals Group
AMC210063-10rpt_1 101122 30
A full quality assurance/quality control (QA/QC) programme of sample checks has been carried out throughout the series of drilling programmes, although the main focus was generally on the zinc grades, and in the latest drilling for lead and silver also. Good precision has been achieved and no biases have been detected in the drilling, sampling, and assay programmes. AMC has not reviewed the drilling results in detail but considers the procedures used for drilling, logging and sampling to be of a suitable standard and that the QA/QC programme is complete and appropriate.
Mineralisation in the Eastern Fault Block is poorly defined and currently is considered to be uneconomical and is not included in the resource estimate.
Table 2.1 Century – Mineral Resources as at 30 June 2009
Category Tonnes (Mt)
Zinc (%)
Lead (%)
Silver (g/t)
Measured 32.2 12.3 1.5 34 Indicated 9.4 11.3 1.6 37 Inferred 0.2 10.1 1.1 33 Total 41.8 12.1 1.5 35
Reported at a cut-off grade of 3.5% zinc.
The last independent mineral resource estimate was carried out by Snowden in June 2008. The 2009 model includes revised internal and bounding structural data collected during mining. The 2009 model was constructed by combining the estimated vertical thickness of each unit with the modelled reference surface and bounding structures. The vertical thickness of each unit was estimated using ordinary kriging from the vertical thickness of drillhole composites. Block grades were estimated by ordinary kriging using full seam composites.
The geological modelling and the grade estimation methods used for the 2009 resource estimate are slightly different to the 2008 method due to a new version of Vulcan software being used. The unfolding technique allowed the unfolding of composites in space to maintain the true spatial relationship between composites; this was completed using the projection unfolding technique not previously used due to complications with applied distances. This technique had little effect on the evenly distributed zinc grades but caused a minor change to both lead and silver grades.
New mapping data on the location of faults has resulted in the removal of 0.42 Mt from the April 2009 model due to the repositioning of bounding faults.
Bulk density has been estimated for each block based on an adjusted regression equation for the percentage zinc, lead, iron, manganese, and sulphur content. The calculated bulk density has been adjusted for rock type (shale or siltstone) based on correlation studies comparing the stoichiometric density versus the measured bulk density of grab samples. AMC considers that the bulk density values used in the resource and reserve estimates are suitable.
The North and South Block deposits comprise Measured and Indicated Mineral Resources with a minor component of Inferred. Measured Resources are located in the area that has been directly interpolated from drillhole data and where resources are greater than 5m from interpreted major internal structures (due to uncertainty in the exact location of these structures). Indicated Resources are located in the margins of the deposits, including the areas contained within the 5m boundary around major structures.
Reconciliation between the 2008 mineral resource model and the tonnage and grades milled after adjustments for changes in ROM stockpiles and other losses over a 12 month period to December 2009 show significant differences. The milled tonnes are 7% lower than the model but, more significantly, the milled grade is 18%, 23% and 19% lower than estimated for zinc, lead and silver respectively. Some of the difference may be due to difficulties in measuring the stockpiles.
●
APPENDIX IV COMPETENT PERSON’S REPORT
— IV-38 —
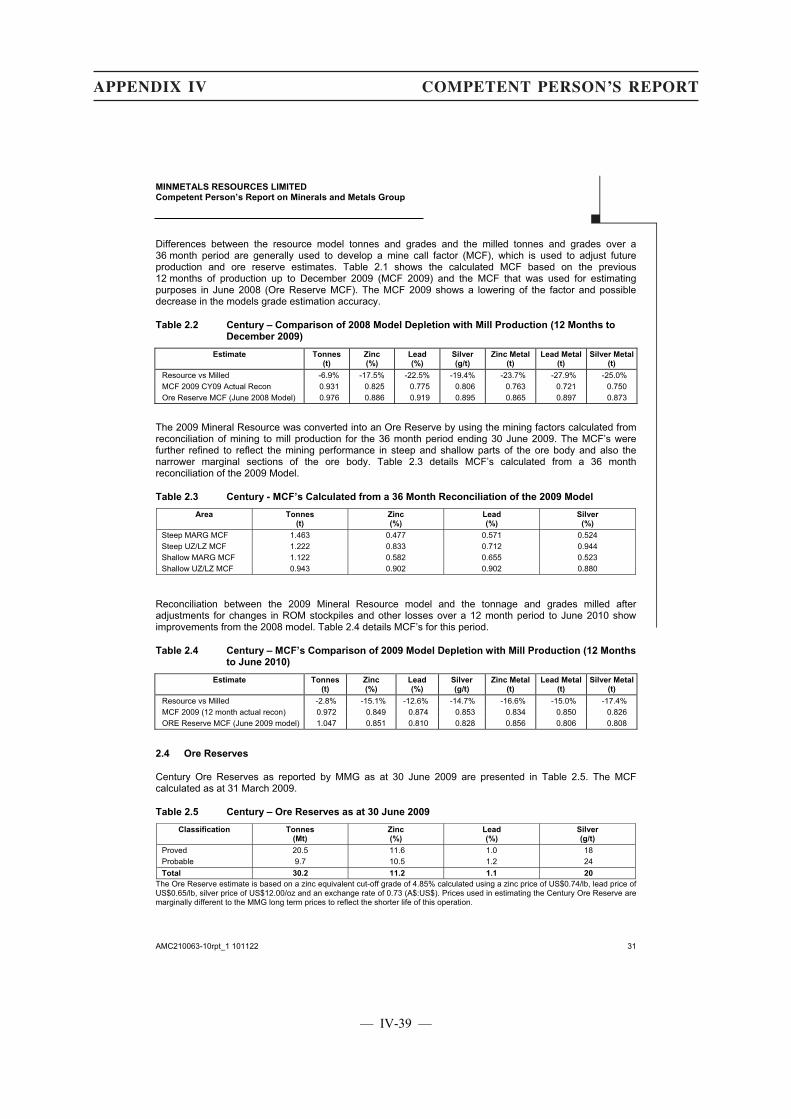
MINMETALS RESOURCES LIMITED Competent Person’s Report on Minerals and Metals Group
AMC210063-10rpt_1 101122 31
Differences between the resource model tonnes and grades and the milled tonnes and grades over a 36 month period are generally used to develop a mine call factor (MCF), which is used to adjust future production and ore reserve estimates. Table 2.1 shows the calculated MCF based on the previous 12 months of production up to December 2009 (MCF 2009) and the MCF that was used for estimating purposes in June 2008 (Ore Reserve MCF). The MCF 2009 shows a lowering of the factor and possible decrease in the models grade estimation accuracy.
Table 2.2 Century – Comparison of 2008 Model Depletion with Mill Production (12 Months to December 2009)
Estimate Tonnes (t)
Zinc (%)
Lead (%)
Silver (g/t)
Zinc Metal (t)
Lead Metal (t)
Silver Metal(t)
Resource vs Milled -6.9% -17.5% -22.5% -19.4% -23.7% -27.9% -25.0% MCF 2009 CY09 Actual Recon 0.931 0.825 0.775 0.806 0.763 0.721 0.750 Ore Reserve MCF (June 2008 Model) 0.976 0.886 0.919 0.895 0.865 0.897 0.873
The 2009 Mineral Resource was converted into an Ore Reserve by using the mining factors calculated from reconciliation of mining to mill production for the 36 month period ending 30 June 2009. The MCF’s were further refined to reflect the mining performance in steep and shallow parts of the ore body and also the narrower marginal sections of the ore body. Table 2.3 details MCF’s calculated from a 36 month reconciliation of the 2009 Model.
Table 2.3 Century - MCF’s Calculated from a 36 Month Reconciliation of the 2009 Model
Area Tonnes (t)
Zinc (%)
Lead (%)
Silver (%)
Steep MARG MCF 1.463 0.477 0.571 0.524 Steep UZ/LZ MCF 1.222 0.833 0.712 0.944 Shallow MARG MCF 1.122 0.582 0.655 0.523 Shallow UZ/LZ MCF 0.943 0.902 0.902 0.880
Reconciliation between the 2009 Mineral Resource model and the tonnage and grades milled after adjustments for changes in ROM stockpiles and other losses over a 12 month period to June 2010 show improvements from the 2008 model. Table 2.4 details MCF’s for this period.
Table 2.4 Century – MCF’s Comparison of 2009 Model Depletion with Mill Production (12 Months to June 2010)
Estimate Tonnes (t)
Zinc (%)
Lead (%)
Silver (g/t)
Zinc Metal (t)
Lead Metal (t)
Silver Metal(t)
Resource vs Milled -2.8% -15.1% -12.6% -14.7% -16.6% -15.0% -17.4% MCF 2009 (12 month actual recon) 0.972 0.849 0.874 0.853 0.834 0.850 0.826 ORE Reserve MCF (June 2009 model) 1.047 0.851 0.810 0.828 0.856 0.806 0.808
2.4 Ore Reserves
Century Ore Reserves as reported by MMG as at 30 June 2009 are presented in Table 2.5. The MCF calculated as at 31 March 2009.
Table 2.5 Century – Ore Reserves as at 30 June 2009
Classification Tonnes (Mt)
Zinc (%)
Lead (%)
Silver (g/t)
Proved 20.5 11.6 1.0 18 Probable 9.7 10.5 1.2 24 Total 30.2 11.2 1.1 20
The Ore Reserve estimate is based on a zinc equivalent cut-off grade of 4.85% calculated using a zinc price of US$0.74/lb, lead price of US$0.65/lb, silver price of US$12.00/oz and an exchange rate of 0.73 (A$:US$). Prices used in estimating the Century Ore Reserve are marginally different to the MMG long term prices to reflect the shorter life of this operation.
●
APPENDIX IV COMPETENT PERSON’S REPORT
— IV-39 —
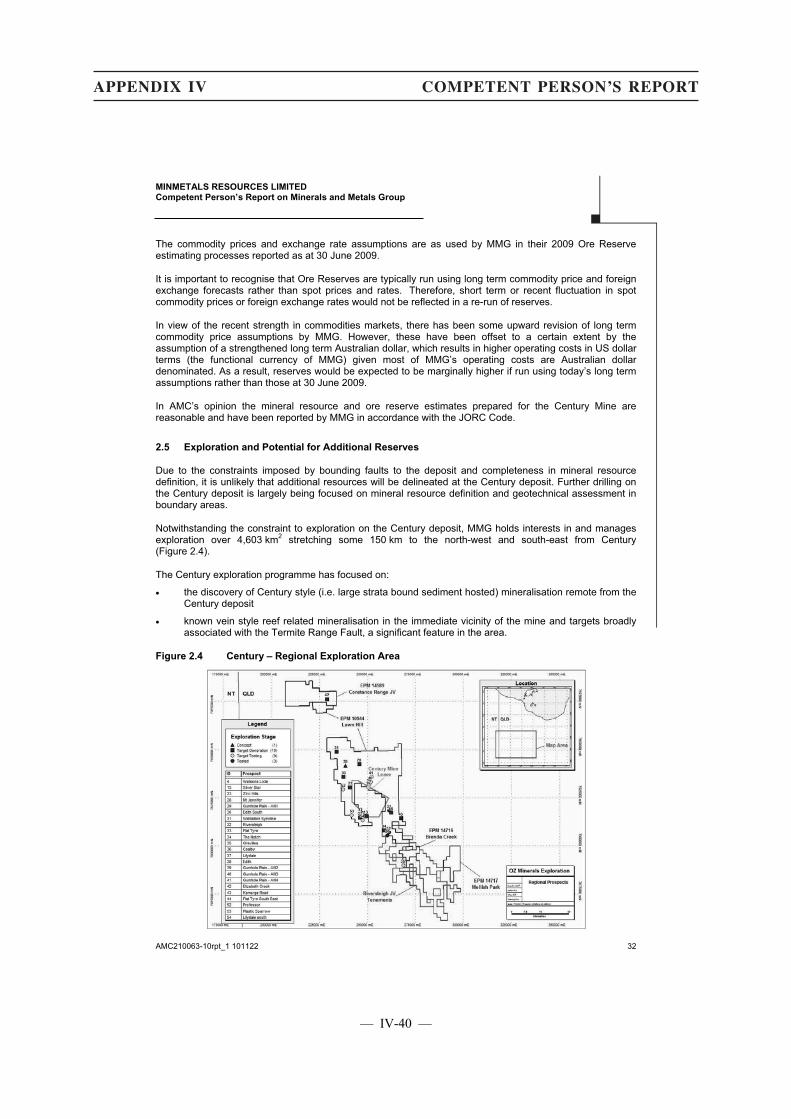
MINMETALS RESOURCES LIMITED Competent Person’s Report on Minerals and Metals Group
AMC210063-10rpt_1 101122 32
The commodity prices and exchange rate assumptions are as used by MMG in their 2009 Ore Reserve estimating processes reported as at 30 June 2009.
It is important to recognise that Ore Reserves are typically run using long term commodity price and foreign exchange forecasts rather than spot prices and rates. Therefore, short term or recent fluctuation in spot commodity prices or foreign exchange rates would not be reflected in a re-run of reserves.
In view of the recent strength in commodities markets, there has been some upward revision of long term commodity price assumptions by MMG. However, these have been offset to a certain extent by the assumption of a strengthened long term Australian dollar, which results in higher operating costs in US dollar terms (the functional currency of MMG) given most of MMG’s operating costs are Australian dollar denominated. As a result, reserves would be expected to be marginally higher if run using today’s long term assumptions rather than those at 30 June 2009.
In AMC’s opinion the mineral resource and ore reserve estimates prepared for the Century Mine are reasonable and have been reported by MMG in accordance with the JORC Code.
2.5 Exploration and Potential for Additional Reserves
Due to the constraints imposed by bounding faults to the deposit and completeness in mineral resource definition, it is unlikely that additional resources will be delineated at the Century deposit. Further drilling on the Century deposit is largely being focused on mineral resource definition and geotechnical assessment in boundary areas.
Notwithstanding the constraint to exploration on the Century deposit, MMG holds interests in and manages exploration over 4,603 km2 stretching some 150 km to the north-west and south-east from Century (Figure 2.4).
The Century exploration programme has focused on:
� the discovery of Century style (i.e. large strata bound sediment hosted) mineralisation remote from the Century deposit
� known vein style reef related mineralisation in the immediate vicinity of the mine and targets broadly associated with the Termite Range Fault, a significant feature in the area.
Figure 2.4 Century – Regional Exploration Area
●
APPENDIX IV COMPETENT PERSON’S REPORT
— IV-40 —
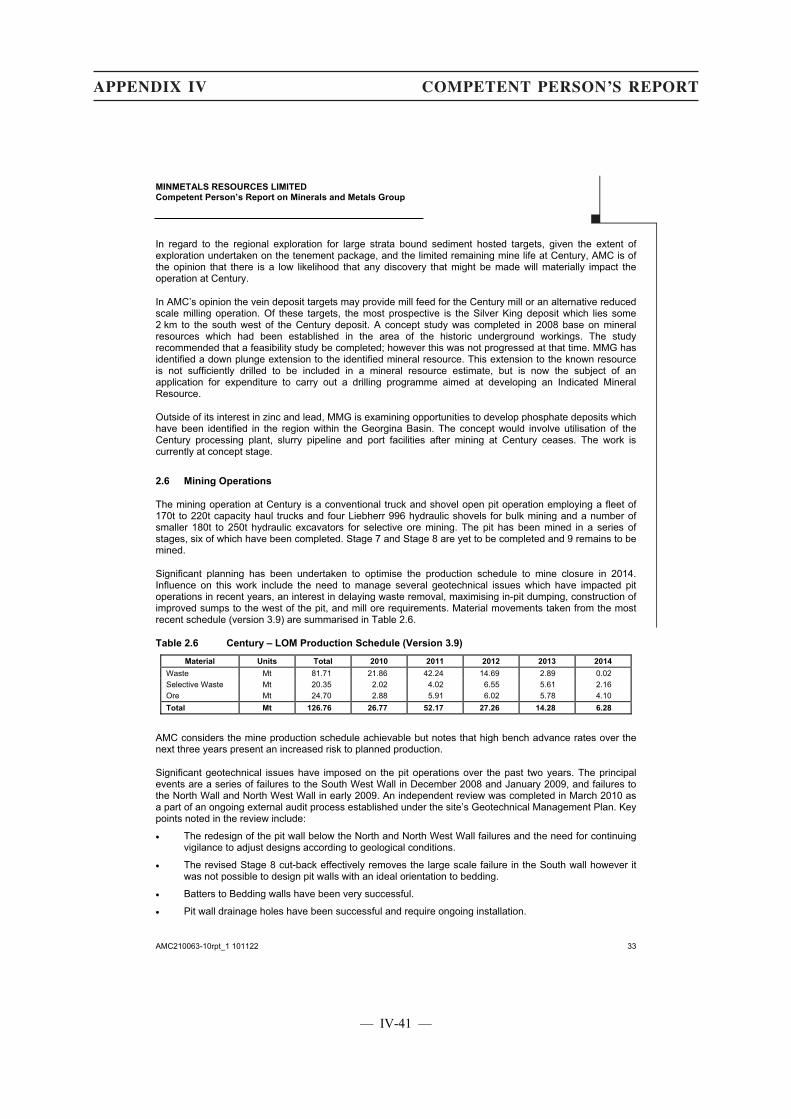
MINMETALS RESOURCES LIMITED Competent Person’s Report on Minerals and Metals Group
AMC210063-10rpt_1 101122 33
In regard to the regional exploration for large strata bound sediment hosted targets, given the extent of exploration undertaken on the tenement package, and the limited remaining mine life at Century, AMC is of the opinion that there is a low likelihood that any discovery that might be made will materially impact the operation at Century.
In AMC’s opinion the vein deposit targets may provide mill feed for the Century mill or an alternative reduced scale milling operation. Of these targets, the most prospective is the Silver King deposit which lies some 2 km to the south west of the Century deposit. A concept study was completed in 2008 base on mineral resources which had been established in the area of the historic underground workings. The study recommended that a feasibility study be completed; however this was not progressed at that time. MMG has identified a down plunge extension to the identified mineral resource. This extension to the known resource is not sufficiently drilled to be included in a mineral resource estimate, but is now the subject of an application for expenditure to carry out a drilling programme aimed at developing an Indicated Mineral Resource.
Outside of its interest in zinc and lead, MMG is examining opportunities to develop phosphate deposits which have been identified in the region within the Georgina Basin. The concept would involve utilisation of the Century processing plant, slurry pipeline and port facilities after mining at Century ceases. The work is currently at concept stage.
2.6 Mining Operations
The mining operation at Century is a conventional truck and shovel open pit operation employing a fleet of 170t to 220t capacity haul trucks and four Liebherr 996 hydraulic shovels for bulk mining and a number of smaller 180t to 250t hydraulic excavators for selective ore mining. The pit has been mined in a series of stages, six of which have been completed. Stage 7 and Stage 8 are yet to be completed and 9 remains to be mined.
Significant planning has been undertaken to optimise the production schedule to mine closure in 2014. Influence on this work include the need to manage several geotechnical issues which have impacted pit operations in recent years, an interest in delaying waste removal, maximising in-pit dumping, construction of improved sumps to the west of the pit, and mill ore requirements. Material movements taken from the most recent schedule (version 3.9) are summarised in Table 2.6.
Table 2.6 Century – LOM Production Schedule (Version 3.9)
Material Units Total 2010 2011 2012 2013 2014
Waste Mt 81.71 21.86 42.24 14.69 2.89 0.02 Selective Waste Mt 20.35 2.02 4.02 6.55 5.61 2.16 Ore Mt 24.70 2.88 5.91 6.02 5.78 4.10 Total Mt 126.76 26.77 52.17 27.26 14.28 6.28
AMC considers the mine production schedule achievable but notes that high bench advance rates over the next three years present an increased risk to planned production.
Significant geotechnical issues have imposed on the pit operations over the past two years. The principal events are a series of failures to the South West Wall in December 2008 and January 2009, and failures to the North Wall and North West Wall in early 2009. An independent review was completed in March 2010 as a part of an ongoing external audit process established under the site’s Geotechnical Management Plan. Key points noted in the review include:
� The redesign of the pit wall below the North and North West Wall failures and the need for continuing vigilance to adjust designs according to geological conditions.
� The revised Stage 8 cut-back effectively removes the large scale failure in the South wall however it was not possible to design pit walls with an ideal orientation to bedding.
� Batters to Bedding walls have been very successful.
� Pit wall drainage holes have been successful and require ongoing installation.
●
APPENDIX IV COMPETENT PERSON’S REPORT
— IV-41 —
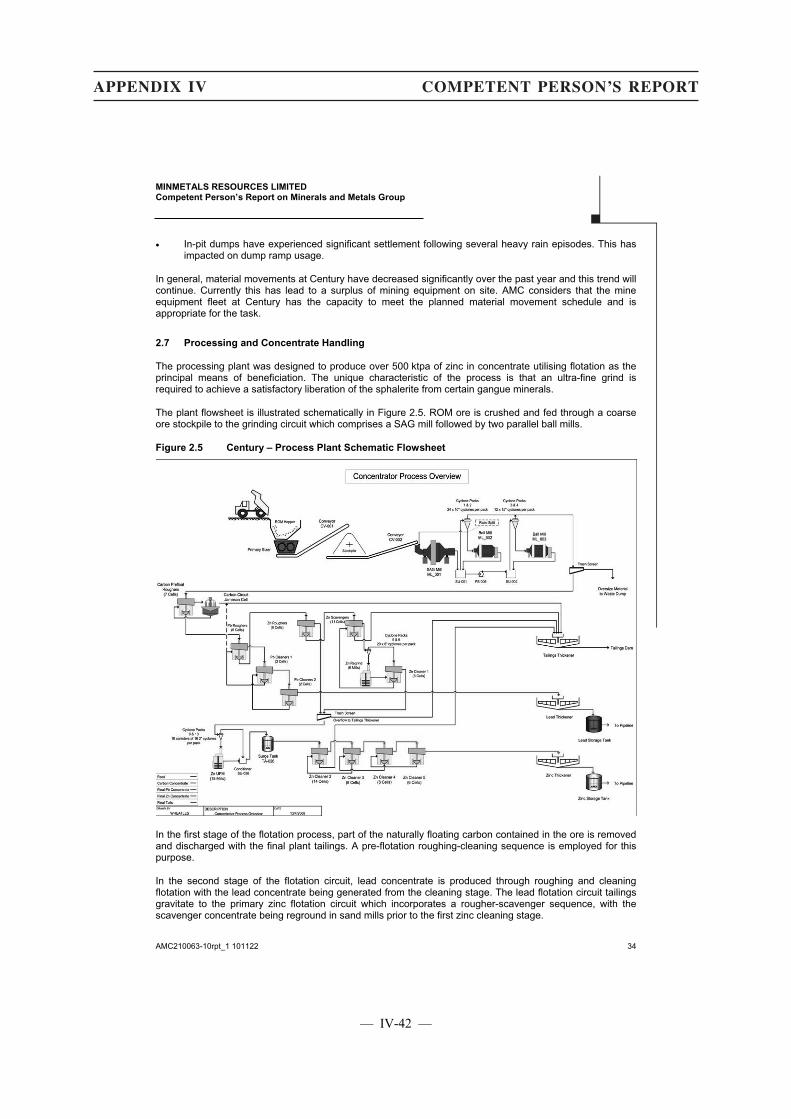
MINMETALS RESOURCES LIMITED Competent Person’s Report on Minerals and Metals Group
AMC210063-10rpt_1 101122 34
� In-pit dumps have experienced significant settlement following several heavy rain episodes. This has impacted on dump ramp usage.
In general, material movements at Century have decreased significantly over the past year and this trend will continue. Currently this has lead to a surplus of mining equipment on site. AMC considers that the mine equipment fleet at Century has the capacity to meet the planned material movement schedule and is appropriate for the task.
2.7 Processing and Concentrate Handling
The processing plant was designed to produce over 500 ktpa of zinc in concentrate utilising flotation as the principal means of beneficiation. The unique characteristic of the process is that an ultra-fine grind is required to achieve a satisfactory liberation of the sphalerite from certain gangue minerals.
The plant flowsheet is illustrated schematically in Figure 2.5. ROM ore is crushed and fed through a coarse ore stockpile to the grinding circuit which comprises a SAG mill followed by two parallel ball mills.
Figure 2.5 Century – Process Plant Schematic Flowsheet
In the first stage of the flotation process, part of the naturally floating carbon contained in the ore is removed and discharged with the final plant tailings. A pre-flotation roughing-cleaning sequence is employed for this purpose.
In the second stage of the flotation circuit, lead concentrate is produced through roughing and cleaning flotation with the lead concentrate being generated from the cleaning stage. The lead flotation circuit tailings gravitate to the primary zinc flotation circuit which incorporates a rougher-scavenger sequence, with the scavenger concentrate being reground in sand mills prior to the first zinc cleaning stage.
●
APPENDIX IV COMPETENT PERSON’S REPORT
— IV-42 —
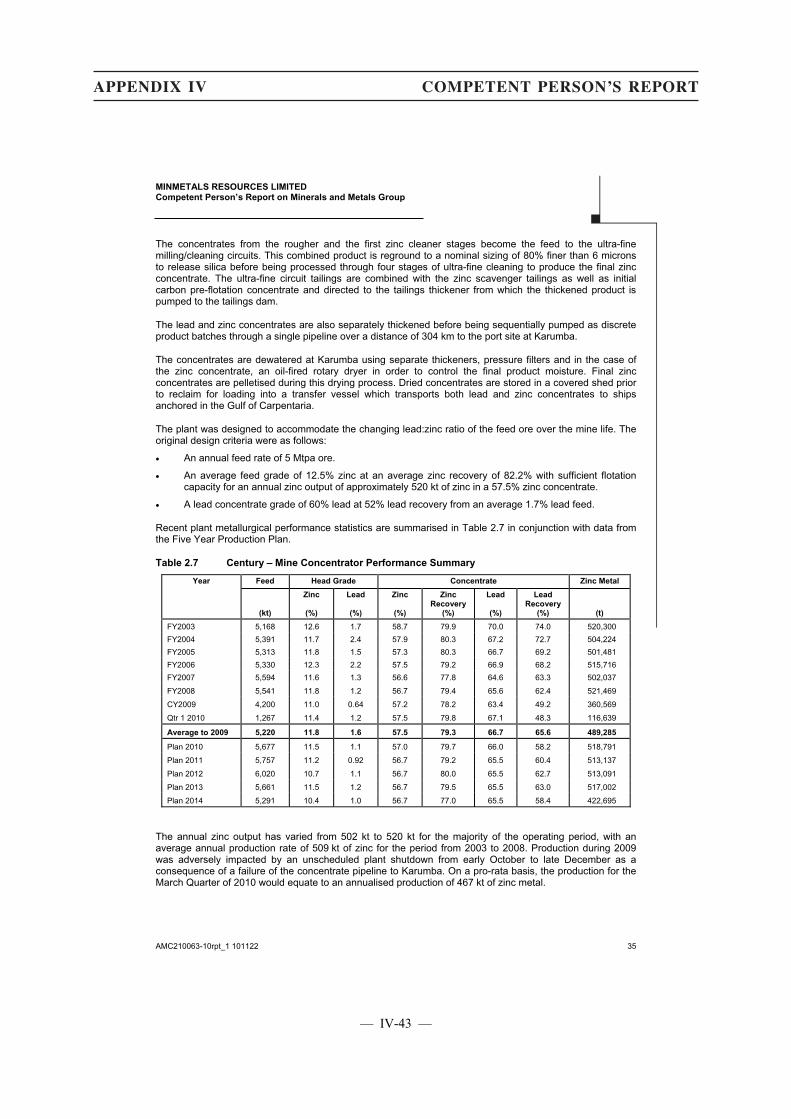
MINMETALS RESOURCES LIMITED Competent Person’s Report on Minerals and Metals Group
AMC210063-10rpt_1 101122 35
The concentrates from the rougher and the first zinc cleaner stages become the feed to the ultra-fine milling/cleaning circuits. This combined product is reground to a nominal sizing of 80% finer than 6 microns to release silica before being processed through four stages of ultra-fine cleaning to produce the final zinc concentrate. The ultra-fine circuit tailings are combined with the zinc scavenger tailings as well as initial carbon pre-flotation concentrate and directed to the tailings thickener from which the thickened product is pumped to the tailings dam.
The lead and zinc concentrates are also separately thickened before being sequentially pumped as discrete product batches through a single pipeline over a distance of 304 km to the port site at Karumba.
The concentrates are dewatered at Karumba using separate thickeners, pressure filters and in the case of the zinc concentrate, an oil-fired rotary dryer in order to control the final product moisture. Final zinc concentrates are pelletised during this drying process. Dried concentrates are stored in a covered shed prior to reclaim for loading into a transfer vessel which transports both lead and zinc concentrates to ships anchored in the Gulf of Carpentaria.
The plant was designed to accommodate the changing lead:zinc ratio of the feed ore over the mine life. The original design criteria were as follows:
� An annual feed rate of 5 Mtpa ore.
� An average feed grade of 12.5% zinc at an average zinc recovery of 82.2% with sufficient flotation capacity for an annual zinc output of approximately 520 kt of zinc in a 57.5% zinc concentrate.
� A lead concentrate grade of 60% lead at 52% lead recovery from an average 1.7% lead feed.
Recent plant metallurgical performance statistics are summarised in Table 2.7 in conjunction with data from the Five Year Production Plan.
Table 2.7 Century – Mine Concentrator Performance Summary
Year Feed Head Grade Concentrate Zinc Metal
(kt)
Zinc
(%)
Lead
(%)
Zinc
(%)
ZincRecovery
(%)
Lead
(%)
LeadRecovery
(%) (t)
FY2003 5,168 12.6 1.7 58.7 79.9 70.0 74.0 520,300 FY2004 5,391 11.7 2.4 57.9 80.3 67.2 72.7 504,224 FY2005 5,313 11.8 1.5 57.3 80.3 66.7 69.2 501,481 FY2006 5,330 12.3 2.2 57.5 79.2 66.9 68.2 515,716 FY2007 5,594 11.6 1.3 56.6 77.8 64.6 63.3 502,037
FY2008 5,541 11.8 1.2 56.7 79.4 65.6 62.4 521,469
CY2009 4,200 11.0 0.64 57.2 78.2 63.4 49.2 360,569
Qtr 1 2010 1,267 11.4 1.2 57.5 79.8 67.1 48.3 116,639
Average to 2009 5,220 11.8 1.6 57.5 79.3 66.7 65.6 489,285
Plan 2010 5,677 11.5 1.1 57.0 79.7 66.0 58.2 518,791
Plan 2011 5,757 11.2 0.92 56.7 79.2 65.5 60.4 513,137
Plan 2012 6,020 10.7 1.1 56.7 80.0 65.5 62.7 513,091
Plan 2013 5,661 11.5 1.2 56.7 79.5 65.5 63.0 517,002
Plan 2014 5,291 10.4 1.0 56.7 77.0 65.5 58.4 422,695
The annual zinc output has varied from 502 kt to 520 kt for the majority of the operating period, with an average annual production rate of 509 kt of zinc for the period from 2003 to 2008. Production during 2009 was adversely impacted by an unscheduled plant shutdown from early October to late December as a consequence of a failure of the concentrate pipeline to Karumba. On a pro-rata basis, the production for the March Quarter of 2010 would equate to an annualised production of 467 kt of zinc metal.
●
APPENDIX IV COMPETENT PERSON’S REPORT
— IV-43 —
MINMETALS RESOURCES LIMITED Competent Person’s Report on Minerals and Metals Group
AMC210063-10rpt_1 101122 36
Performance data suggest that the zinc flotation circuit has the capacity to recover approximately 510 ktpa of zinc in concentrate under normal operating conditions. It is noted that the Five Year Plan projects zinc output in excess of the long term average production rate. Although sufficient primary grinding capacity exists to accommodate the planned ore throughput rates, capacity constraints may exist in the flotation circuit which will limit the overall production of zinc metal to the long term annual average.
AMC notes that in relation to lead flotation, future lead grades are expected to be lower than the historical averages and a decrease in lead recovery will be a natural response to the lower feed grade.
2.8 Environment
Environmental management at Century is of a high standard, based on rigorous, risk-based assessment of potential impacts and implementation of sound environmental management plans and programmes to manage those impacts.
Some acid-generating mine waste is being backfilled into minded-out areas; this waste will likely be the only waste requiring rehabilitation at the time of decommissioning. Other potentially acid-generating mine waste is progressively encapsulated with limestone material in out-of-pit waste stockpiles, with limestone bunds surrounding the stockpiles during construction to neutralise any acid drainage. Limestone bases are constructed under stockpiles located over pre-existing surface drainage channels to ensure that drainage reporting to the broader environment is non-acidic. Final landform designs include an impermeable (10-6m/s) seal between acid-generating waste and overlying limestone, which will be up to 20m thick on the outer batters. Preliminary “store-and-release” trials for waste-stockpile covers were conducted in 2005, and additional trials are continuing through to 2010. AMC considers it unlikely that acid mine drainage will be a significant problem at Century, both during operations and after closure – the availability of large quantities of acid-consuming mine waste, and the rigorous planning and scheduling of management of potentially acid-forming waste, are the prime basis of this view.
Mine dewatering (up to 350 l/s) has been shown to have no impact on the nearby Boodjamulla (Lawn Hill) National Park, and the discharge of excess mine water to Little Archie Creek has been effected without significant exceedance of end-of-pipe thresholds imposed by the regulator (Queensland EPA). A rigorous water-monitoring programme, based on a comprehensive pre-operations baseline, provides for efficient assessment of potential impacts and operational performance. Water management studies in 2010 are aimed at assessment of how structures (waste stockpiles, TSFs, ponds etc.) might interact with the local and regional groundwater; these studies should provide a solid basis for planning cost-effective post-closure monitoring and management programmes.
An October 2009 failure of the slurry-transport pipeline to Karumba resulted in a large spill of concentrate causing potential impacts on grazing cattle, as well as ecological damage. The spill was cleaned up by removal of contaminated soil to the tailings storage facility at the mine, and recurrence appears to have been avoided.
A 1-in-200-year rainfall event in early 2009 resulted in contamination of Page Creek near the mine-site. In March 2010 the company was fined A$130,000 for this pollution event. As well as meeting the A$350,000 costs of immediate remediation, the company has committed A$8M to further protection of the creek, including improvement of water-management systems at the mine. AMC assumes that the improved systems have and will significantly reduce risks of recurrence.
A risk-based closure plan was developed in June 2010, with work requirements and closure standards well identified. A LOM closure estimate of A$102.2M is considered by AMC to be realistic, and based on unit rates that reflect current costs for equipment hire and rehabilitation activities. AMC has taken areas of disturbance by type (e.g., waste stockpile, TSF etc.) from the closure plan and applied unit rates for current closure activities in the Western Australian environment to derive a closure cost that is within 10% of the MMG estimate of June 2010. It is noted that closure plans exclude the Karumba facilities (potential future use by others) and the slurry pipeline that lies outside the Lawn Hill lease boundary. AMC considers this to be a realistic basis for assessing actual liabilities.
●
APPENDIX IV COMPETENT PERSON’S REPORT
— IV-44 —
MINMETALS RESOURCES LIMITED Competent Person’s Report on Minerals and Metals Group
AMC210063-10rpt_1 101122 37
A bank guarantee for A$54.07M is in place to indemnify the State of Queensland against closure liabilities. The fact that this provision is significantly less than likely actual closure costs is not unusual: in all Australian jurisdictions, it is common for such environmental (closure) bonds to cover only 40% to 70% of actual closure costs.
Karumba port operations involve the filtering of slurries prior to shed storage and shipment. Lead concentrate is stored after filtration at moisture contents of 11% to 13% and zinc concentrate are dried after filtration to below the 13% Transport Moisture Limit (TML). These near-TML moisture contents can reasonably be expected to minimise dust emissions, which have proven problematical at other ports, notably Esperance in Western Australia. Slurry-transport water is treated prior to its use in pasture irrigation as an environmental positive.
The legal status of the statutory environmental approval for operations at Karumba was investigated in 2008, following a Queensland EPA audit. Resolution of this technical issue (operations were unaffected) was complicated by legislation changes in January 2008. A new and comprehensive development application was resubmitted during Q3 2009. The operator remains in negotiation with the regulator and anticipates final resolution by the end of 2010. Concern at elevated levels of lead, cadmium and zinc in rainwater tanks in Karumba in early 2007 led to monitoring of blood lead levels of residents. Of 52 residents tested, only two, who worked in lead-risk jobs, showed lead levels above health trigger thresholds. Subsequent testing of residents showed none to have unacceptably-elevated blood lead levels. At the direction of the Queensland EPA, the Century operators undertook a programme of monitoring levels of heavy metals in rainwater tanks in Karumba in 2007 and 2008; some tanks required cleaning. AMC assumes this matter to now be resolved, but flags the risks, both technical and socio-political, involved; the lead-contamination issue at Esperance in Western Australia at about the same time is still hazarding the export of mineral concentrates through that port.
Sulphur dioxide emissions from Karumba port facilities caused complaints in 2007, but it appears that careful management of operations, together with ground-level air-quality monitoring, have successfully resolved this matter.
2.9 Operating and Capital Costs
Planned unit cash operating costs for 2010 as presented to AMC by MMG are:
� Mining (excluding deferred waste) A$7.15/t ore mined
� Processing A$23.97/t ore milled
� Maintenance/Asset Management A$7.99/t ore milled
� Port Costs A$5.04/t ore milled
� Administration A$12.05/t ore milled
� Total site operating cost A$56.67/t ore milled
Capital expenditure in 2010 is forecast at A$13.9M plus capitalised mine development costs of A$156.98M.
2.10 AMC Modelling Scenarios
AMC has developed two modelling scenarios for Century Mine. The key aspects of AMC’s modelling scenarios are as follows:
Reserves Only Case
� Annual waste and ore tonnages and grade are based on the 2010 Century LOM Plan (version 3.9) prepared by MMG. Ore reserves are based on reported reserves as at 30 June 2009 adjusted for depletion to June 2010.
� The mining inventory is 26.0 Mt at grades of 11.0% Zn, 1.1% Pb and 19 g/t Ag. Mining continues until December 2014.
� Annual ore processing rate of 5.7 Mtpa.
●
APPENDIX IV COMPETENT PERSON’S REPORT
— IV-45 —
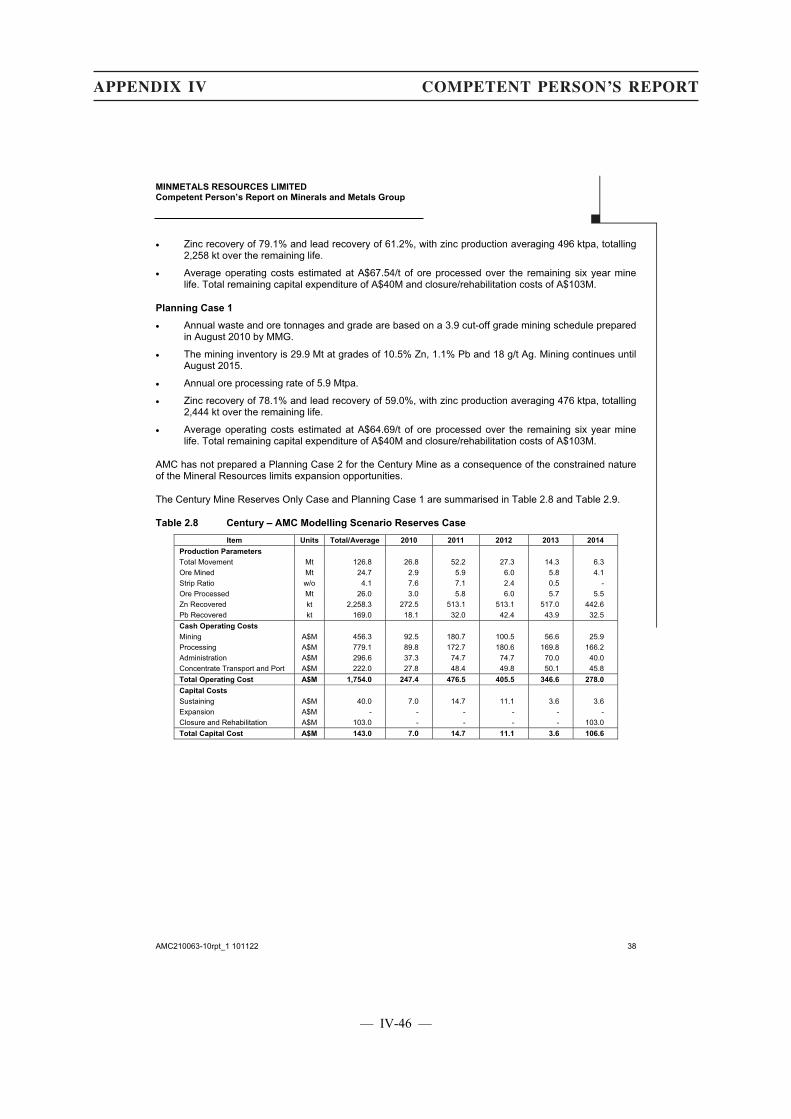
MINMETALS RESOURCES LIMITED Competent Person’s Report on Minerals and Metals Group
AMC210063-10rpt_1 101122 38
� Zinc recovery of 79.1% and lead recovery of 61.2%, with zinc production averaging 496 ktpa, totalling 2,258 kt over the remaining life.
� Average operating costs estimated at A$67.54/t of ore processed over the remaining six year mine life. Total remaining capital expenditure of A$40M and closure/rehabilitation costs of A$103M.
Planning Case 1
� Annual waste and ore tonnages and grade are based on a 3.9 cut-off grade mining schedule prepared in August 2010 by MMG.
� The mining inventory is 29.9 Mt at grades of 10.5% Zn, 1.1% Pb and 18 g/t Ag. Mining continues until August 2015.
� Annual ore processing rate of 5.9 Mtpa.
� Zinc recovery of 78.1% and lead recovery of 59.0%, with zinc production averaging 476 ktpa, totalling 2,444 kt over the remaining life.
� Average operating costs estimated at A$64.69/t of ore processed over the remaining six year mine life. Total remaining capital expenditure of A$40M and closure/rehabilitation costs of A$103M.
AMC has not prepared a Planning Case 2 for the Century Mine as a consequence of the constrained nature of the Mineral Resources limits expansion opportunities.
The Century Mine Reserves Only Case and Planning Case 1 are summarised in Table 2.8 and Table 2.9.
Table 2.8 Century – AMC Modelling Scenario Reserves Case
Item Units Total/Average 2010 2011 2012 2013 2014
Production Parameters Total Movement Mt 126.8 26.8 52.2 27.3 14.3 6.3 Ore Mined Mt 24.7 2.9 5.9 6.0 5.8 4.1 Strip Ratio w/o 4.1 7.6 7.1 2.4 0.5 - Ore Processed Mt 26.0 3.0 5.8 6.0 5.7 5.5 Zn Recovered kt 2,258.3 272.5 513.1 513.1 517.0 442.6 Pb Recovered kt 169.0 18.1 32.0 42.4 43.9 32.5 Cash Operating Costs Mining A$M 456.3 92.5 180.7 100.5 56.6 25.9 Processing A$M 779.1 89.8 172.7 180.6 169.8 166.2 Administration A$M 296.6 37.3 74.7 74.7 70.0 40.0 Concentrate Transport and Port A$M 222.0 27.8 48.4 49.8 50.1 45.8 Total Operating Cost A$M 1,754.0 247.4 476.5 405.5 346.6 278.0
Capital Costs Sustaining A$M 40.0 7.0 14.7 11.1 3.6 3.6 Expansion A$M - - - - - - Closure and Rehabilitation A$M 103.0 - - - - 103.0 Total Capital Cost A$M 143.0 7.0 14.7 11.1 3.6 106.6
●
APPENDIX IV COMPETENT PERSON’S REPORT
— IV-46 —
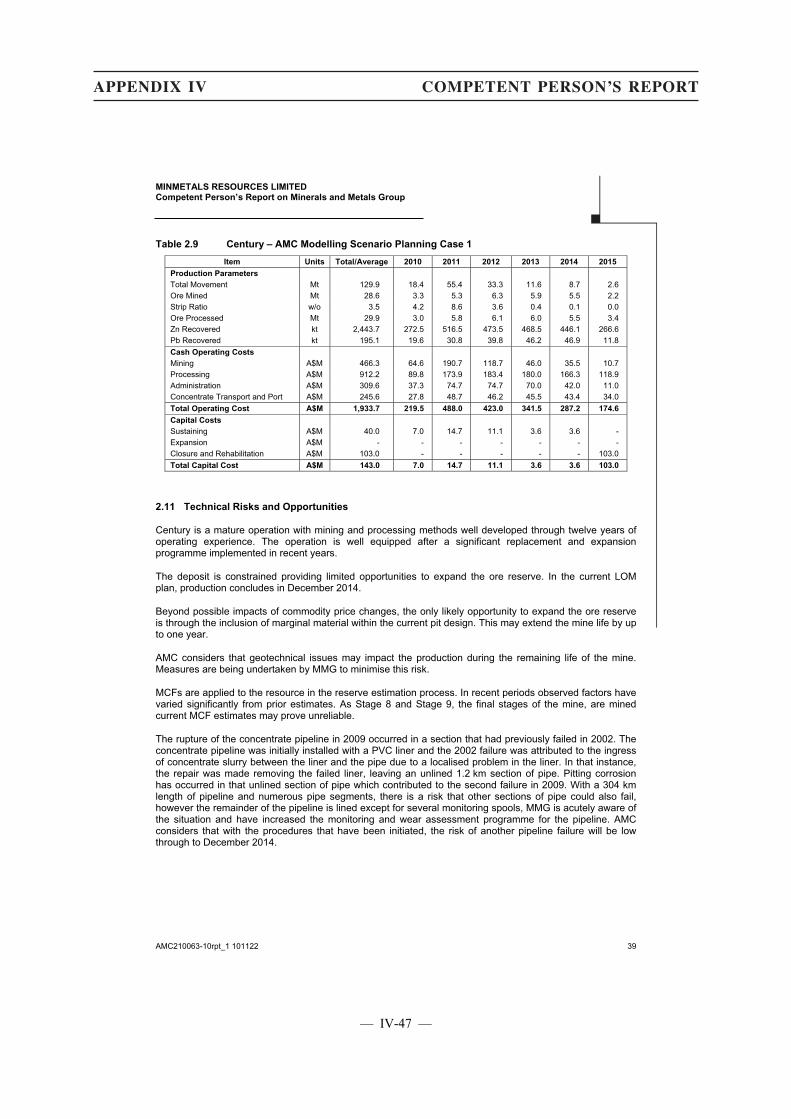
MINMETALS RESOURCES LIMITED Competent Person’s Report on Minerals and Metals Group
AMC210063-10rpt_1 101122 39
Table 2.9 Century – AMC Modelling Scenario Planning Case 1
Item Units Total/Average 2010 2011 2012 2013 2014 2015
Production Parameters Total Movement Mt 129.9 18.4 55.4 33.3 11.6 8.7 2.6 Ore Mined Mt 28.6 3.3 5.3 6.3 5.9 5.5 2.2 Strip Ratio w/o 3.5 4.2 8.6 3.6 0.4 0.1 0.0 Ore Processed Mt 29.9 3.0 5.8 6.1 6.0 5.5 3.4 Zn Recovered kt 2,443.7 272.5 516.5 473.5 468.5 446.1 266.6 Pb Recovered kt 195.1 19.6 30.8 39.8 46.2 46.9 11.8 Cash Operating Costs Mining A$M 466.3 64.6 190.7 118.7 46.0 35.5 10.7 Processing A$M 912.2 89.8 173.9 183.4 180.0 166.3 118.9 Administration A$M 309.6 37.3 74.7 74.7 70.0 42.0 11.0 Concentrate Transport and Port A$M 245.6 27.8 48.7 46.2 45.5 43.4 34.0 Total Operating Cost A$M 1,933.7 219.5 488.0 423.0 341.5 287.2 174.6
Capital Costs Sustaining A$M 40.0 7.0 14.7 11.1 3.6 3.6 - Expansion A$M - - - - - - - Closure and Rehabilitation A$M 103.0 - - - - - 103.0 Total Capital Cost A$M 143.0 7.0 14.7 11.1 3.6 3.6 103.0
2.11 Technical Risks and Opportunities
Century is a mature operation with mining and processing methods well developed through twelve years of operating experience. The operation is well equipped after a significant replacement and expansion programme implemented in recent years.
The deposit is constrained providing limited opportunities to expand the ore reserve. In the current LOM plan, production concludes in December 2014.
Beyond possible impacts of commodity price changes, the only likely opportunity to expand the ore reserve is through the inclusion of marginal material within the current pit design. This may extend the mine life by up to one year.
AMC considers that geotechnical issues may impact the production during the remaining life of the mine. Measures are being undertaken by MMG to minimise this risk.
MCFs are applied to the resource in the reserve estimation process. In recent periods observed factors have varied significantly from prior estimates. As Stage 8 and Stage 9, the final stages of the mine, are mined current MCF estimates may prove unreliable.
The rupture of the concentrate pipeline in 2009 occurred in a section that had previously failed in 2002. The concentrate pipeline was initially installed with a PVC liner and the 2002 failure was attributed to the ingress of concentrate slurry between the liner and the pipe due to a localised problem in the liner. In that instance, the repair was made removing the failed liner, leaving an unlined 1.2 km section of pipe. Pitting corrosion has occurred in that unlined section of pipe which contributed to the second failure in 2009. With a 304 km length of pipeline and numerous pipe segments, there is a risk that other sections of pipe could also fail, however the remainder of the pipeline is lined except for several monitoring spools, MMG is acutely aware of the situation and have increased the monitoring and wear assessment programme for the pipeline. AMC considers that with the procedures that have been initiated, the risk of another pipeline failure will be low through to December 2014.
●
APPENDIX IV COMPETENT PERSON’S REPORT
— IV-47 —

MINMETALS RESOURCES LIMITED Competent Person’s Report on Minerals and Metals Group
AMC210063-10rpt_1 101122 40
3 ROSEBERY
3.1 Introduction
The Rosebery deposit is considered Australia’s largest volcanic-hosted polymetallic sulphide deposit and is located within the Mount Read Volcanic Arc of Western Tasmania. The deposit was first discovered in 1893 and operations commenced in 1936. The mid-Cambrian Mount Read Volcanics are host to other significant deposits including Hercules, Que River, Hellyer and Mt Lyell.
The Rosebery Mine is an underground mining operation within Mining Lease ML 28M/2008 Zinc, lead, copper, silver and gold are recovered from the ore that extends over a strike length of approximately 2.0 km and to a depth of 1.5 km. The mine produces some 700 ktpa of ore, and plans to maintain production at about this level in the current plan to at least 2012.
3.2 Geological Setting
The Rosebery deposit is stratiform comprising of zinc-lead-silver-copper-gold mineralisation hosted by the mid-to-late Cambrian volcanic and pyroclastic rocks of the Mount Read Volcanics. The host sequence comprises well stratified volcaniclastic sandstone, siltstone, quartz pumice breccia, feldspar porphyry and black shale. Stacked ore lenses occur with a north-south strike, dipping 45° to the east. The ore bodies appear to plunge generally at 20° to 30° northward along strike.
The footwall rocks comprise more than 800m of rhyolitic volcanic tuffs, breccias and pumice. The hanging wall rocks comprise up to 300m of rhyolitic volcaniclastics, pumice breccias with black mudstone-shale.
The principal ore minerals at Rosebery include sphalerite and galena with lesser proportions of chalcopyrite and tetrahedrite together with minor arsenopyrite and pyrrhotite. Gold is generally free, being present with silver as electrum. The relative proportions of the sulphide minerals vary throughout the orebody with lead-zinc mineralisation being generally located in the hanging wall and with chalcopyrite and pyrite towards the footwall.
The texture of the sulphide mineralisation ranges from massive through to disseminated, with coarse grained mineralisation intersecting vein mineralisation in some instances.
3.3 Mineral Resources
The Rosebery Mineral Resource reported by MMG as at June 2009 are presented in Table 3.1. The mineral resources are inclusive of ore reserves.
Table 3.1 Rosebery – Mineral Resource as at 30 June 2009
Classification Tonnes (Mt)
Zinc (%)
Copper (%)
Lead (%)
Silver (g/t)
Gold (g/t)
Measured 3.80 14.3 0.5 3.9 146.9 2.1 Indicated 2.89 15.5 0.5 3.9 130.2 2.1 Inferred 7.41 11.1 0.3 3.9 140.4 1.6 Total 14.10 12.9 0.4 3.9 140.1 1.9
●
APPENDIX IV COMPETENT PERSON’S REPORT
— IV-48 —
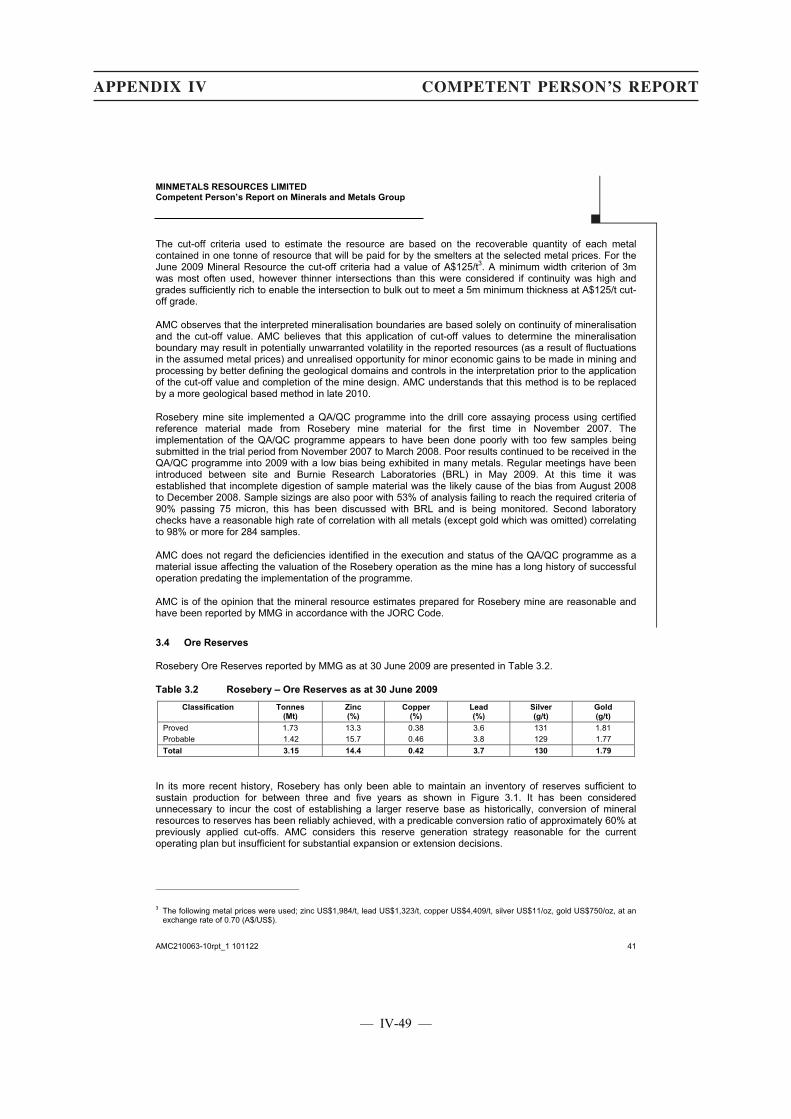
MINMETALS RESOURCES LIMITED Competent Person’s Report on Minerals and Metals Group
AMC210063-10rpt_1 101122 41
The cut-off criteria used to estimate the resource are based on the recoverable quantity of each metal contained in one tonne of resource that will be paid for by the smelters at the selected metal prices. For the June 2009 Mineral Resource the cut-off criteria had a value of A$125/t3. A minimum width criterion of 3m was most often used, however thinner intersections than this were considered if continuity was high and grades sufficiently rich to enable the intersection to bulk out to meet a 5m minimum thickness at A$125/t cut-off grade.
AMC observes that the interpreted mineralisation boundaries are based solely on continuity of mineralisation and the cut-off value. AMC believes that this application of cut-off values to determine the mineralisation boundary may result in potentially unwarranted volatility in the reported resources (as a result of fluctuations in the assumed metal prices) and unrealised opportunity for minor economic gains to be made in mining and processing by better defining the geological domains and controls in the interpretation prior to the application of the cut-off value and completion of the mine design. AMC understands that this method is to be replaced by a more geological based method in late 2010.
Rosebery mine site implemented a QA/QC programme into the drill core assaying process using certified reference material made from Rosebery mine material for the first time in November 2007. The implementation of the QA/QC programme appears to have been done poorly with too few samples being submitted in the trial period from November 2007 to March 2008. Poor results continued to be received in the QA/QC programme into 2009 with a low bias being exhibited in many metals. Regular meetings have been introduced between site and Burnie Research Laboratories (BRL) in May 2009. At this time it was established that incomplete digestion of sample material was the likely cause of the bias from August 2008 to December 2008. Sample sizings are also poor with 53% of analysis failing to reach the required criteria of 90% passing 75 micron, this has been discussed with BRL and is being monitored. Second laboratory checks have a reasonable high rate of correlation with all metals (except gold which was omitted) correlating to 98% or more for 284 samples.
AMC does not regard the deficiencies identified in the execution and status of the QA/QC programme as a material issue affecting the valuation of the Rosebery operation as the mine has a long history of successful operation predating the implementation of the programme.
AMC is of the opinion that the mineral resource estimates prepared for Rosebery mine are reasonable and have been reported by MMG in accordance with the JORC Code.
3.4 Ore Reserves
Rosebery Ore Reserves reported by MMG as at 30 June 2009 are presented in Table 3.2.
Table 3.2 Rosebery – Ore Reserves as at 30 June 2009
Classification Tonnes (Mt)
Zinc (%)
Copper (%)
Lead (%)
Silver (g/t)
Gold (g/t)
Proved 1.73 13.3 0.38 3.6 131 1.81 Probable 1.42 15.7 0.46 3.8 129 1.77Total 3.15 14.4 0.42 3.7 130 1.79
In its more recent history, Rosebery has only been able to maintain an inventory of reserves sufficient to sustain production for between three and five years as shown in Figure 3.1. It has been considered unnecessary to incur the cost of establishing a larger reserve base as historically, conversion of mineral resources to reserves has been reliably achieved, with a predicable conversion ratio of approximately 60% at previously applied cut-offs. AMC considers this reserve generation strategy reasonable for the current operating plan but insufficient for substantial expansion or extension decisions.
3 The following metal prices were used; zinc US$1,984/t, lead US$1,323/t, copper US$4,409/t, silver US$11/oz, gold US$750/oz, at an exchange rate of 0.70 (A$/US$).
●
APPENDIX IV COMPETENT PERSON’S REPORT
— IV-49 —
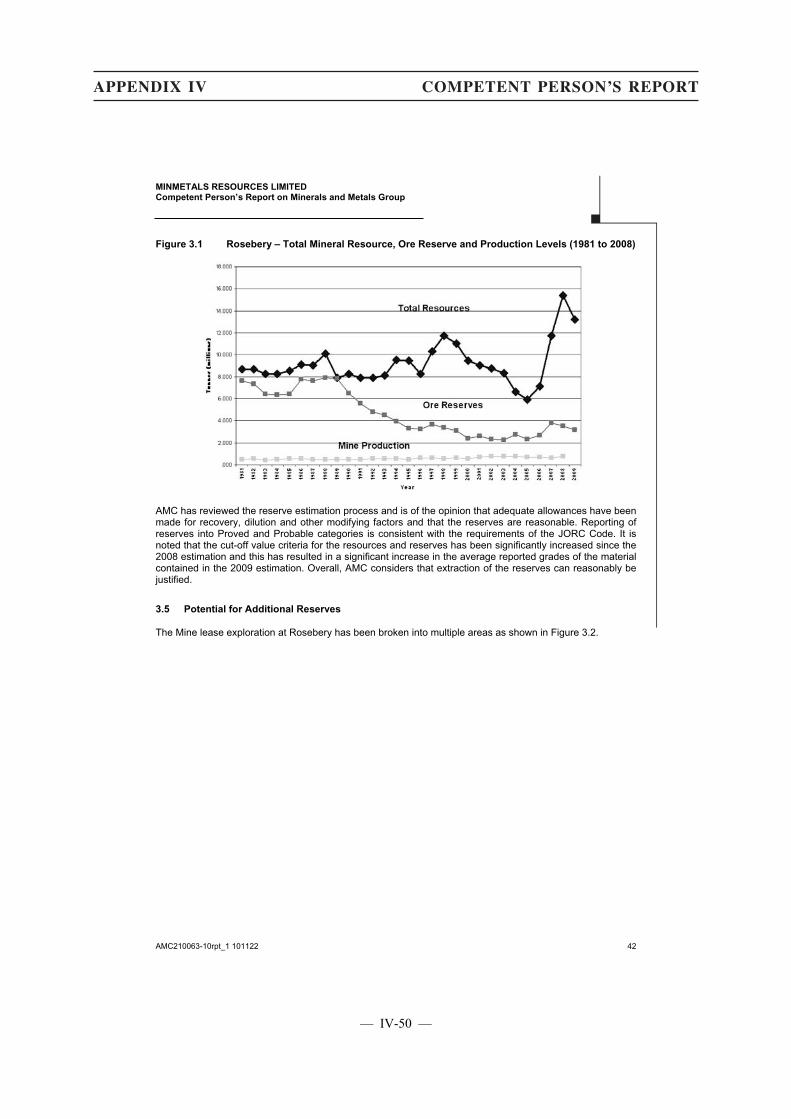
MINMETALS RESOURCES LIMITED Competent Person’s Report on Minerals and Metals Group
AMC210063-10rpt_1 101122 42
Figure 3.1 Rosebery – Total Mineral Resource, Ore Reserve and Production Levels (1981 to 2008)
AMC has reviewed the reserve estimation process and is of the opinion that adequate allowances have been made for recovery, dilution and other modifying factors and that the reserves are reasonable. Reporting of reserves into Proved and Probable categories is consistent with the requirements of the JORC Code. It is noted that the cut-off value criteria for the resources and reserves has been significantly increased since the 2008 estimation and this has resulted in a significant increase in the average reported grades of the material contained in the 2009 estimation. Overall, AMC considers that extraction of the reserves can reasonably be justified.
3.5 Potential for Additional Reserves
The Mine lease exploration at Rosebery has been broken into multiple areas as shown in Figure 3.2.
●
APPENDIX IV COMPETENT PERSON’S REPORT
— IV-50 —
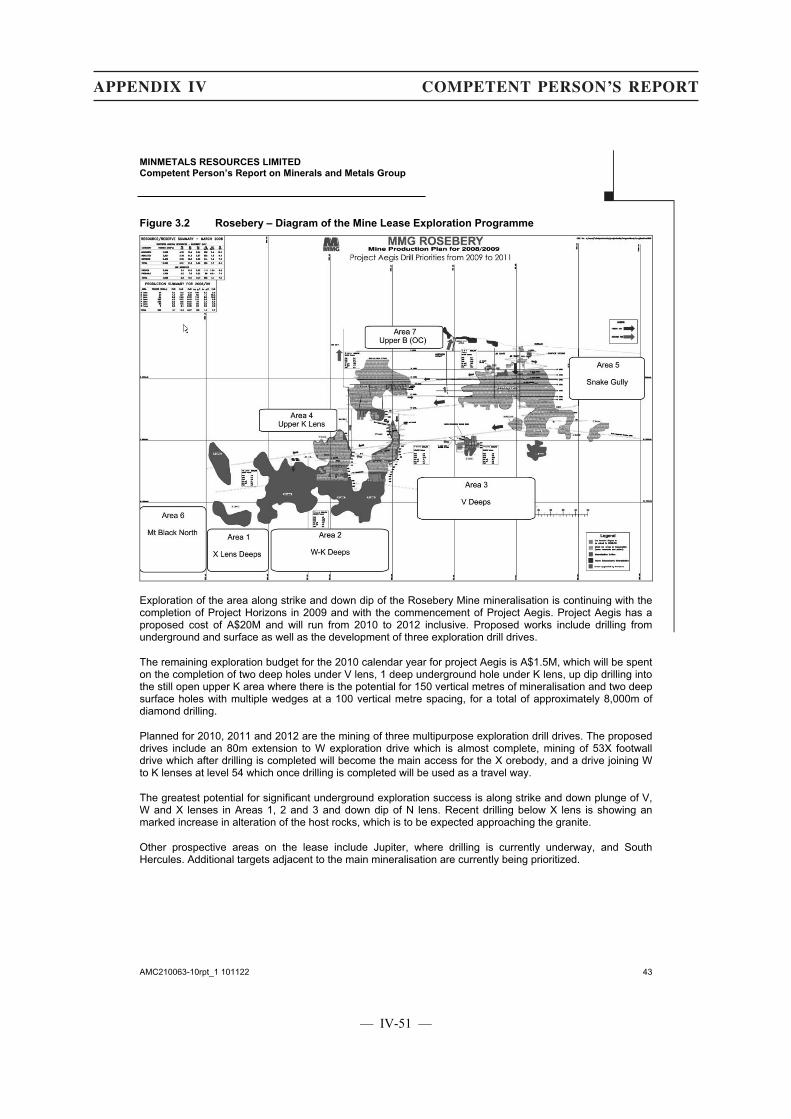
MINMETALS RESOURCES LIMITED Competent Person’s Report on Minerals and Metals Group
AMC210063-10rpt_1 101122 43
Figure 3.2 Rosebery – Diagram of the Mine Lease Exploration Programme
Exploration of the area along strike and down dip of the Rosebery Mine mineralisation is continuing with the completion of Project Horizons in 2009 and with the commencement of Project Aegis. Project Aegis has a proposed cost of A$20M and will run from 2010 to 2012 inclusive. Proposed works include drilling from underground and surface as well as the development of three exploration drill drives.
The remaining exploration budget for the 2010 calendar year for project Aegis is A$1.5M, which will be spent on the completion of two deep holes under V lens, 1 deep underground hole under K lens, up dip drilling into the still open upper K area where there is the potential for 150 vertical metres of mineralisation and two deep surface holes with multiple wedges at a 100 vertical metre spacing, for a total of approximately 8,000m of diamond drilling.
Planned for 2010, 2011 and 2012 are the mining of three multipurpose exploration drill drives. The proposed drives include an 80m extension to W exploration drive which is almost complete, mining of 53X footwall drive which after drilling is completed will become the main access for the X orebody, and a drive joining W to K lenses at level 54 which once drilling is completed will be used as a travel way.
The greatest potential for significant underground exploration success is along strike and down plunge of V, W and X lenses in Areas 1, 2 and 3 and down dip of N lens. Recent drilling below X lens is showing an marked increase in alteration of the host rocks, which is to be expected approaching the granite.
Other prospective areas on the lease include Jupiter, where drilling is currently underway, and South Hercules. Additional targets adjacent to the main mineralisation are currently being prioritized.
●
APPENDIX IV COMPETENT PERSON’S REPORT
— IV-51 —
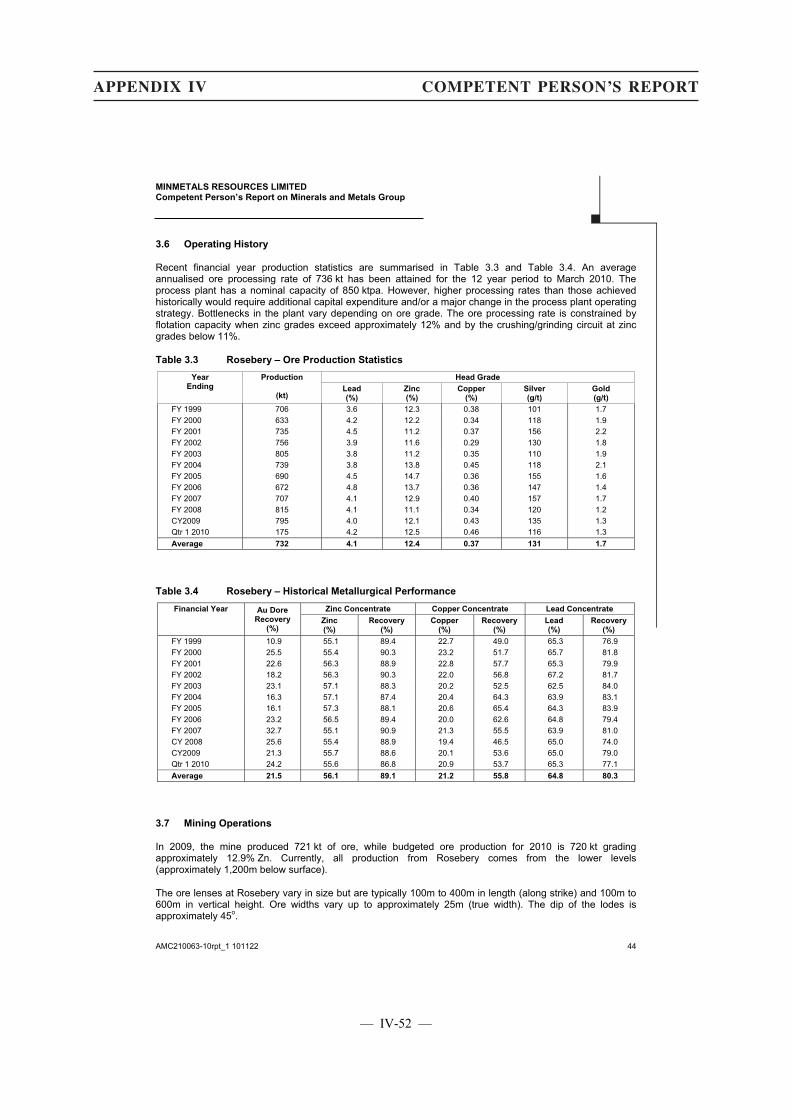
MINMETALS RESOURCES LIMITED Competent Person’s Report on Minerals and Metals Group
AMC210063-10rpt_1 101122 44
3.6 Operating History
Recent financial year production statistics are summarised in Table 3.3 and Table 3.4. An average annualised ore processing rate of 736 kt has been attained for the 12 year period to March 2010. The process plant has a nominal capacity of 850 ktpa. However, higher processing rates than those achieved historically would require additional capital expenditure and/or a major change in the process plant operating strategy. Bottlenecks in the plant vary depending on ore grade. The ore processing rate is constrained by flotation capacity when zinc grades exceed approximately 12% and by the crushing/grinding circuit at zinc grades below 11%.
Table 3.3 Rosebery – Ore Production Statistics
YearEnding
Production
(kt)
Head Grade
Lead (%)
Zinc (%)
Copper (%)
Silver (g/t)
Gold (g/t)
FY 1999 706 3.6 12.3 0.38 101 1.7 FY 2000 633 4.2 12.2 0.34 118 1.9 FY 2001 735 4.5 11.2 0.37 156 2.2 FY 2002 756 3.9 11.6 0.29 130 1.8 FY 2003 805 3.8 11.2 0.35 110 1.9 FY 2004 739 3.8 13.8 0.45 118 2.1 FY 2005 690 4.5 14.7 0.36 155 1.6 FY 2006 672 4.8 13.7 0.36 147 1.4 FY 2007 707 4.1 12.9 0.40 157 1.7 FY 2008 815 4.1 11.1 0.34 120 1.2 CY2009 795 4.0 12.1 0.43 135 1.3 Qtr 1 2010 175 4.2 12.5 0.46 116 1.3 Average 732 4.1 12.4 0.37 131 1.7
Table 3.4 Rosebery – Historical Metallurgical Performance
Financial Year Au Dore Recovery
(%)
Zinc Concentrate Copper Concentrate Lead Concentrate
Zinc (%)
Recovery (%)
Copper (%)
Recovery (%)
Lead (%)
Recovery (%)
FY 1999 10.9 55.1 89.4 22.7 49.0 65.3 76.9 FY 2000 25.5 55.4 90.3 23.2 51.7 65.7 81.8 FY 2001 22.6 56.3 88.9 22.8 57.7 65.3 79.9 FY 2002 18.2 56.3 90.3 22.0 56.8 67.2 81.7 FY 2003 23.1 57.1 88.3 20.2 52.5 62.5 84.0 FY 2004 16.3 57.1 87.4 20.4 64.3 63.9 83.1 FY 2005 16.1 57.3 88.1 20.6 65.4 64.3 83.9 FY 2006 23.2 56.5 89.4 20.0 62.6 64.8 79.4 FY 2007 32.7 55.1 90.9 21.3 55.5 63.9 81.0 CY 2008 25.6 55.4 88.9 19.4 46.5 65.0 74.0 CY2009 21.3 55.7 88.6 20.1 53.6 65.0 79.0 Qtr 1 2010 24.2 55.6 86.8 20.9 53.7 65.3 77.1 Average 21.5 56.1 89.1 21.2 55.8 64.8 80.3
3.7 Mining Operations
In 2009, the mine produced 721 kt of ore, while budgeted ore production for 2010 is 720 kt grading approximately 12.9% Zn. Currently, all production from Rosebery comes from the lower levels (approximately 1,200m below surface).
The ore lenses at Rosebery vary in size but are typically 100m to 400m in length (along strike) and 100m to 600m in vertical height. Ore widths vary up to approximately 25m (true width). The dip of the lodes is approximately 45o.
●
APPENDIX IV COMPETENT PERSON’S REPORT
— IV-52 —
MINMETALS RESOURCES LIMITED Competent Person’s Report on Minerals and Metals Group
AMC210063-10rpt_1 101122 45
Access to the underground workings is via a decline and trucks are used to haul ore to the surface. Mechanised mining methods are used, including bench stoping with fill, modified Avoca stoping, open stoping (longitudinal open stoping in narrow lodes and transverse stoping in the wider lodes), with some slashing of pillars. Remnant stoping is under consideration for remnant ore in the upper levels of the mine.
Backfill, using either uncemented or cemented rockfill is an important part of the stoping cycle. The backfill helps maintain stability of the ore zone which then helps ensure successful mining of the remaining stopes and pillars.
Truck haulage distances from production areas on the lower levels of the mine are considerable (approximately 6 km) and are a significant component of the overall mining costs.
Mining at Rosebery is carried out by a combination of contractor and owner operator miners. A total of 355 people were employed across the site as at 31 December 2009. Engineering services are performed by a mixture of original equipment manufacturers (OEM) and other contractors, as well as MMG employees.
The mine uses a fleet of modern rubber tyred equipment. The fleet consists of:
� Underground haulage trucks (Elphinstone AD55’s).
� Development jumbos (Atlas Copco drills).
� Production drills (Atlas Copco).
� Load haul dump (LHD) units with tele-remote and automated operation capabilities.
� Ancillary vehicles such as IT and light vehicles.
Overall, the geotechnical aspects of the project appear to be well analysed, understood and managed.
Rosebery is a deep mine with extensive underground workings. Currently, the primary intake air travels long distances before it reaches the lower working areas and hence is subject to an increase in temperature due to the high virgin rock temperatures at depth. Two refrigeration plants have been operated underground previously, and this is now reduced following implementation of the ventilation system upgrade in 2010 which reportedly has significantly improved the operating conditions underground.
Rosebery currently has a nominal surface exhaust capacity of 400 m3/s. A major ventilation upgrade including new surface ventilation shaft and internal extension shafts is currently near completion and a further ventilation fan upgrade to take the final capacity to 600 m3/s is yet to be completed.
3.8 Processing and Concentrate Handling
Sulphide mineralisation including chalcopyrite, galena, sphalerite and tetrahedrite as well as free gold occurs at Rosebery. Separate copper, lead and zinc flotation concentrates are produced. A proportion of the free gold is also recovered into a gravity concentrate using a Knelson concentrator from which a gold-silver doré is produced. The sphalerite and pyrite tend to exhibit a slightly coarser liberation size than the chalcopyrite. The principal sulphide gangue mineral is pyrite although non-sulphide gangue minerals dominate.
The Rosebery process plant flowsheet and operating plan for FY08 are illustrated in Figure 3.3.
●
APPENDIX IV COMPETENT PERSON’S REPORT
— IV-53 —
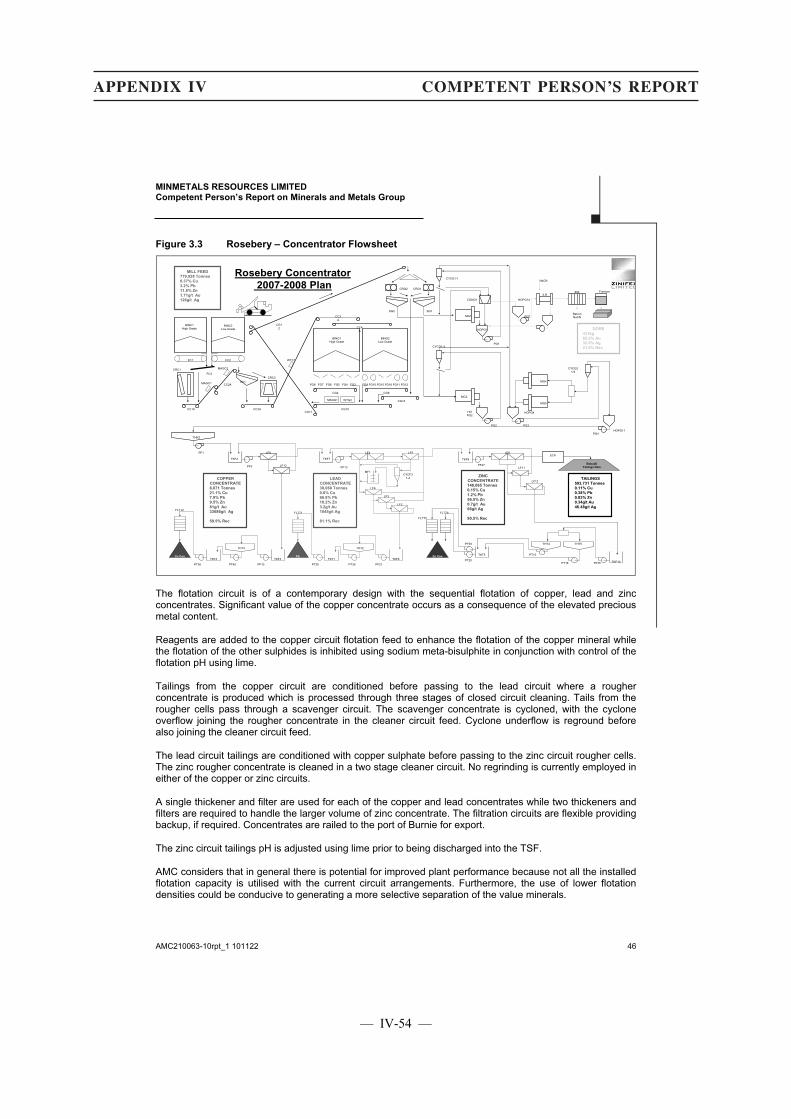
MINMETALS RESOURCES LIMITED Competent Person’s Report on Minerals and Metals Group
AMC210063-10rpt_1 101122 46
Figure 3.3 Rosebery – Concentrator Flowsheet
Zn ConCu Con
BobadilTailings Dam
LF8
LF13
TKF2
THK2
PF1
PF5
TKF7
TKF3
PF10
THT3
PF13
LF4 LF5
LF6
LF2
LF3
CYCF31-4
MF1
TKF9
PF27
LF9
LF11
LF12
TKF6
PF21
THT2
TKF10PF35
THT5THT4
PT18
PT15TKT5
PT20
PT59
FLTT6
FLTT5
TKT1
FLTT1
PT35PT40PT36
TKT4
FLTT2
MG4
MG5
MG1
MG2
CYCG1-1
CYCG1-2
HOPG2
HOPG1
PG1
PG2
CONG1
SG2 SG1
CRG1CRG2
PG3
ILR
PG4HOPG11
CYCG2 1/4
HOPG4
EW Furnace
Rosebery Concentrator2007-2008 Plan
NaCN
Barren NaCN
PT39
ETP
PbCon
BINC1High Grade
BINC2Low Grade
FC1 FC2
SC1CRC2
CRC1
CC1A
CC2A
CC3A
MAGC1
WTC1
BING1High Grade
FG8 FG7 FG9 FG10 FG15 FG16 FG11 FG12FG3FG4FG5FG6
BING2Low Grade
CG4 CG8
CG10
MAGG1 WTG2 CG13
CG11
CG12
MAGC2
CC3A
CC4A
FC3
HOPG14
PG7
COPPER CONCENTRATE8,071 Tonnes21.1% Cu7.9% Pb9.5% Zn81g/t Au33686g/t Ag
59.5% Rec
LEAD CONCENTRATE30,060 Tonnes0.8% Cu66.8% Pb10.2% Zn3.2g/t Au1045g/t Ag
81.1% Rec
ZINC CONCENTRATE148,065 Tonnes0.15% Cu1.2% Pb56.5% Zn0.7g/t Au66g/t Ag
90.5% Rec
DORE431kg65.0% Au32.0% Ag21.0% Rec
TAILINGS593,731 Tonnes0.11% Cu0.38% Pb0.83% Zn0.34g/t Au46.48g/t Ag
MILL FEED779,928 Tonnes0.37% Cu3.2% Pb11.8% Zn1.71g/t Au126g/t Ag
The flotation circuit is of a contemporary design with the sequential flotation of copper, lead and zinc concentrates. Significant value of the copper concentrate occurs as a consequence of the elevated precious metal content.
Reagents are added to the copper circuit flotation feed to enhance the flotation of the copper mineral while the flotation of the other sulphides is inhibited using sodium meta-bisulphite in conjunction with control of the flotation pH using lime.
Tailings from the copper circuit are conditioned before passing to the lead circuit where a rougher concentrate is produced which is processed through three stages of closed circuit cleaning. Tails from the rougher cells pass through a scavenger circuit. The scavenger concentrate is cycloned, with the cyclone overflow joining the rougher concentrate in the cleaner circuit feed. Cyclone underflow is reground before also joining the cleaner circuit feed.
The lead circuit tailings are conditioned with copper sulphate before passing to the zinc circuit rougher cells. The zinc rougher concentrate is cleaned in a two stage cleaner circuit. No regrinding is currently employed in either of the copper or zinc circuits.
A single thickener and filter are used for each of the copper and lead concentrates while two thickeners and filters are required to handle the larger volume of zinc concentrate. The filtration circuits are flexible providing backup, if required. Concentrates are railed to the port of Burnie for export.
The zinc circuit tailings pH is adjusted using lime prior to being discharged into the TSF.
AMC considers that in general there is potential for improved plant performance because not all the installed flotation capacity is utilised with the current circuit arrangements. Furthermore, the use of lower flotation densities could be conducive to generating a more selective separation of the value minerals.
●
APPENDIX IV COMPETENT PERSON’S REPORT
— IV-54 —
MINMETALS RESOURCES LIMITED Competent Person’s Report on Minerals and Metals Group
AMC210063-10rpt_1 101122 47
An asset management programme was put in place during 2008 to manage risks and improve the reliability of the processing plant. Mill availability has improved since the middle of 2008 reflecting the effectiveness of the maintenance planning and programmed maintenance effort. In the 6 month period July to December 2008, the plant processed 411 kt of ore with a plant availability of 93.7%. A total of 815 kt of ore was processed through CY2008 which as will be noted from the data provided in Table 3.3 represents the highest 12 month throughput tonnage recorded in the past 12 years of operation. The benefit of this continued maintenance effort is reflected in the fact that the ore treatment rate since 2008 has continued to exceed the long term average. Lower throughput rates of 720 kt are planned for the 2011 and 2012 years which should ease the maintenance pressures on the process plant operation.
A number of engineering studies have been carried out on the surface concentrator in order to evaluate a proposed upgrade to these facilities. Based on this a capital expenditure programme has been identified to ensure ongoing statutory compliance and minimise the risk of production interruptions.
Gravity circuit gold recovery has been variable, an expected outcome given the variability in gold grade and the nature of free gold in the ore. AMC considers that this feature is likely to continue.
3.9 Infrastructure
Rosebery is an established operation and there are no known upgrades to infrastructure required based on the current mining and processing plan.
3.10 Environment
The Rosebery operation is subject to robust environmental management protocols (ISO 14001), reflecting the significant risks associated with acid mine drainage and protection of stream water quality. Environmental performance is regularly monitored through corporate audit, with only minor water-quality issues being identified, and through regular reporting to government as required by statutory permits; there is no current or imminent threat of coercive action by regulators.
An environmental bond (bank guarantee) of A$12.1M is lodged for the operation. The November 2009 closure estimate is A$15.25M, with a further A$17.8M required for the adjacent Hercules Mine, which is a “legacy” site held by the Rosebery operation. AMC considers the amounts appropriate for the present purpose. Progressive rehabilitation, including work on “legacy” sites, has reduced both long term closure financial liabilities and short term risks of environmental incidents associated with acid drainage.
Acid drainage risks are heightened by the high rainfall at the site. Acid drainage is managed with a sophisticated system which collects contaminated water which is then treated in a dedicated effluent treatment plant before discharge to the TSF and polishing pond and ultimately to the Pieman River.
There have been predictable minor exceedances of water-discharge thresholds set by the regulator, but these are generally the result of high rainfall/runoff events which inherently provide dilution of contaminants. Importantly, the frequency of exceedances has decreased in the last four years, reflecting progressive improvement of the water capture and treatment systems.
Closure liabilities are being annually reviewed by an external consultant, using a probabilistic approach. Unit rates applied to different closure activities reflect current costs, and the adoption of an 80% confidence limit for closure estimates is considered by AMC to be appropriate. A total closure liability of A$33.05M for Rosebery/Hercules is therefore considered realistic, but could require close scrutiny towards the end of mine life, when the duration and costs of post-decommissioning monitoring of water management and discharge systems would be more easily identified.
●
APPENDIX IV COMPETENT PERSON’S REPORT
— IV-55 —
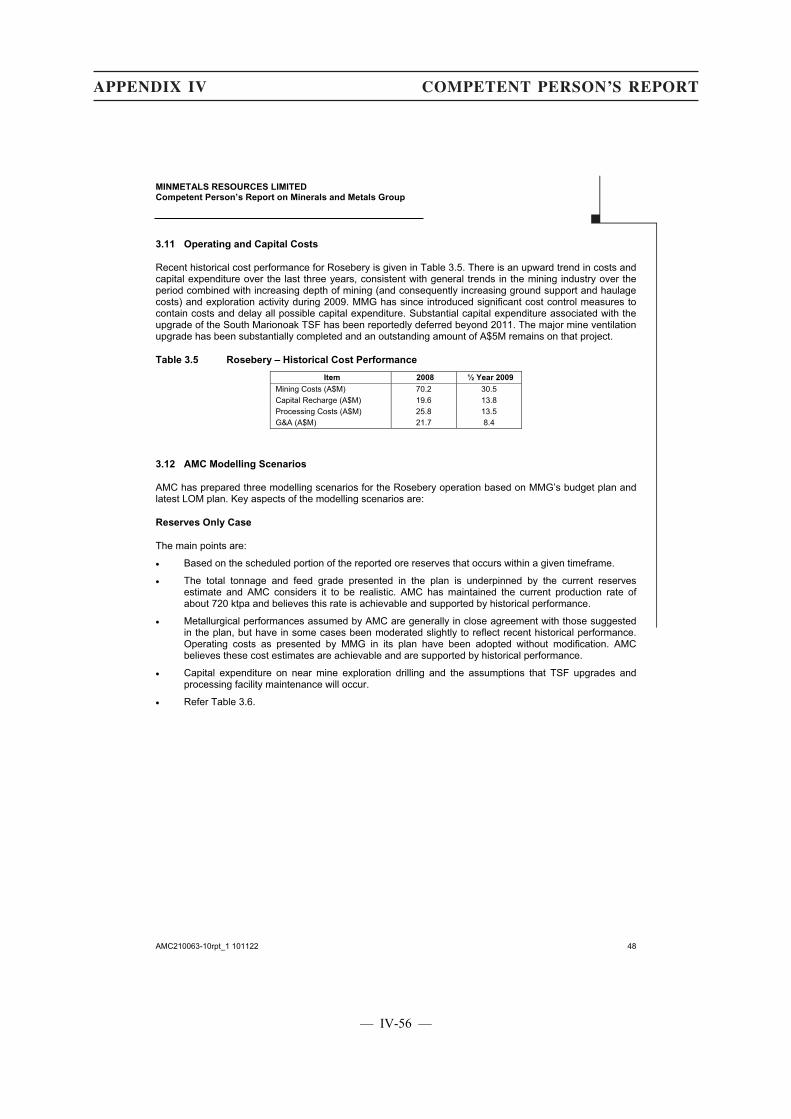
MINMETALS RESOURCES LIMITED Competent Person’s Report on Minerals and Metals Group
AMC210063-10rpt_1 101122 48
3.11 Operating and Capital Costs
Recent historical cost performance for Rosebery is given in Table 3.5. There is an upward trend in costs and capital expenditure over the last three years, consistent with general trends in the mining industry over the period combined with increasing depth of mining (and consequently increasing ground support and haulage costs) and exploration activity during 2009. MMG has since introduced significant cost control measures to contain costs and delay all possible capital expenditure. Substantial capital expenditure associated with the upgrade of the South Marionoak TSF has been reportedly deferred beyond 2011. The major mine ventilation upgrade has been substantially completed and an outstanding amount of A$5M remains on that project.
Table 3.5 Rosebery – Historical Cost Performance
Item 2008 ½ Year 2009
Mining Costs (A$M) 70.2 30.5 Capital Recharge (A$M) 19.6 13.8 Processing Costs (A$M) 25.8 13.5 G&A (A$M) 21.7 8.4
3.12 AMC Modelling Scenarios
AMC has prepared three modelling scenarios for the Rosebery operation based on MMG’s budget plan and latest LOM plan. Key aspects of the modelling scenarios are:
Reserves Only Case
The main points are:
� Based on the scheduled portion of the reported ore reserves that occurs within a given timeframe.
� The total tonnage and feed grade presented in the plan is underpinned by the current reserves estimate and AMC considers it to be realistic. AMC has maintained the current production rate of about 720 ktpa and believes this rate is achievable and supported by historical performance.
� Metallurgical performances assumed by AMC are generally in close agreement with those suggested in the plan, but have in some cases been moderated slightly to reflect recent historical performance. Operating costs as presented by MMG in its plan have been adopted without modification. AMC believes these cost estimates are achievable and are supported by historical performance.
� Capital expenditure on near mine exploration drilling and the assumptions that TSF upgrades and processing facility maintenance will occur.
� Refer Table 3.6.
●
APPENDIX IV COMPETENT PERSON’S REPORT
— IV-56 —
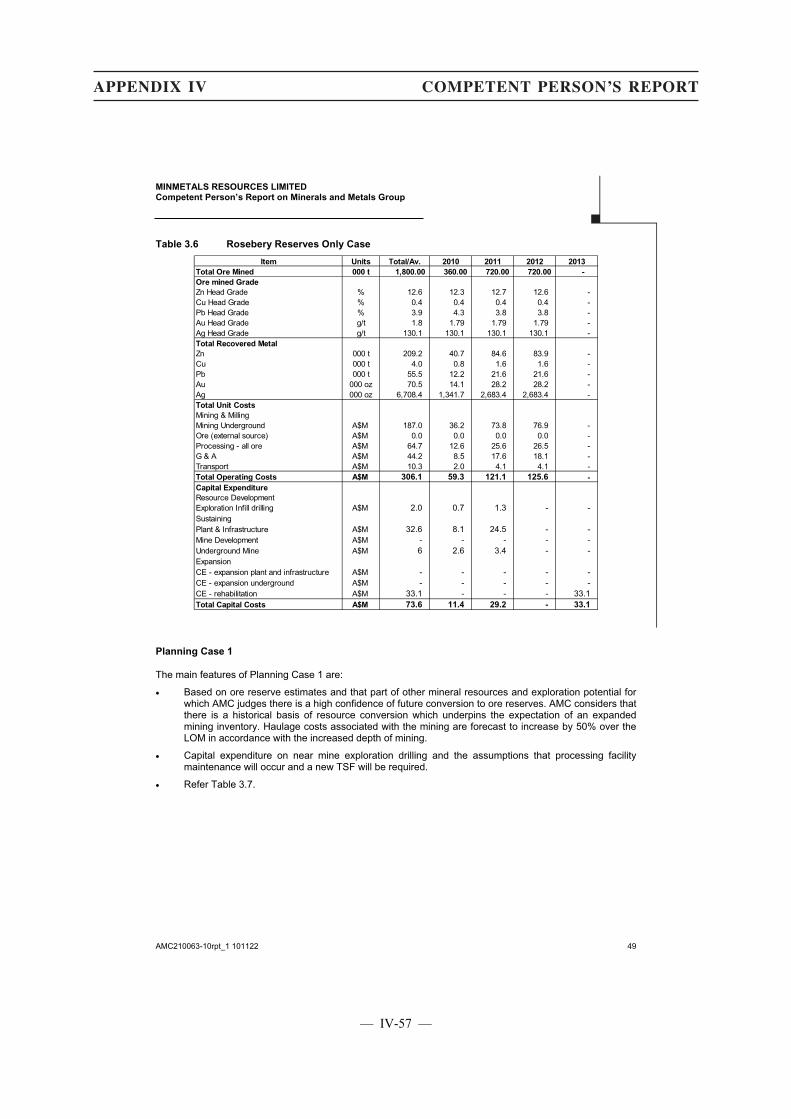
MINMETALS RESOURCES LIMITED Competent Person’s Report on Minerals and Metals Group
AMC210063-10rpt_1 101122 49
Table 3.6 Rosebery Reserves Only Case
Item Units Total/Av. 2010 2011 2012 2013
Total Ore Mined 000 t 1,800.00 360.00 720.00 720.00 -
Ore mined Grade
Zn Head Grade % 12.6 12.3 12.7 12.6 -Cu Head Grade % 0.4 0.4 0.4 0.4 -Pb Head Grade % 3.9 4.3 3.8 3.8 -Au Head Grade g/t 1.8 1.79 1.79 1.79 -Ag Head Grade g/t 130.1 130.1 130.1 130.1 -Total Recovered Metal
Zn 000 t 209.2 40.7 84.6 83.9 -Cu 000 t 4.0 0.8 1.6 1.6 -Pb 000 t 55.5 12.2 21.6 21.6 -Au 000 oz 70.5 14.1 28.2 28.2 -Ag 000 oz 6,708.4 1,341.7 2,683.4 2,683.4 -Total Unit Costs
Mining & MillingMining Underground A$M 187.0 36.2 73.8 76.9 -Ore (external source) A$M 0.0 0.0 0.0 0.0 -Processing - all ore A$M 64.7 12.6 25.6 26.5 -G & A A$M 44.2 8.5 17.6 18.1 -Transport A$M 10.3 2.0 4.1 4.1 -Total Operating Costs A$M 306.1 59.3 121.1 125.6 -
Capital Expenditure
Resource DevelopmentExploration Infill drilling A$M 2.0 0.7 1.3 - -SustainingPlant & Infrastructure A$M 32.6 8.1 24.5 - -Mine Development A$M - - - - -Underground Mine A$M 6 2.6 3.4 - -ExpansionCE - expansion plant and infrastructure A$M - - - - -CE - expansion underground A$M - - - - -CE - rehabilitation A$M 33.1 - - - 33.1Total Capital Costs A$M 73.6 11.4 29.2 - 33.1
Planning Case 1
The main features of Planning Case 1 are:
� Based on ore reserve estimates and that part of other mineral resources and exploration potential for which AMC judges there is a high confidence of future conversion to ore reserves. AMC considers that there is a historical basis of resource conversion which underpins the expectation of an expanded mining inventory. Haulage costs associated with the mining are forecast to increase by 50% over the LOM in accordance with the increased depth of mining.
� Capital expenditure on near mine exploration drilling and the assumptions that processing facility maintenance will occur and a new TSF will be required.
� Refer Table 3.7.
●
APPENDIX IV COMPETENT PERSON’S REPORT
— IV-57 —

MINMETALS RESOURCES LIMITED Competent Person’s Report on Minerals and Metals Group
AMC210063-10rpt_1 101122 50
Table 3.7 Rosebery Planning Case 1
Item Units Total/Av. 2010 2011 2012 2013 2014 2015 2016 2017 2018 2019 2020
Total Ore Mined 000 t 6,120.0 360.0 720.0 720.0 720.0 720.0 720.0 720.0 720.0 720.0 - -Ore mined Grade
Zn Head Grade % 11.2% 12.3% 12.7% 12.6% 11.4% 11.4% 10.2% 10.2% 10.2% 10.2% - -Cu Head Grade % 0.3% 0.4% 0.4% 0.4% 0.3% 0.3% 0.2% 0.2% 0.2% 0.2% - -Pb Head Grade % 3.8% 4.3% 3.8% 3.8% 3.7% 3.7% 3.7% 3.7% 3.7% 3.7% - -Au Head Grade g/t 1.5 1.79 1.79 1.79 1.55 1.55 1.37 1.37 1.37 1.37 - -Ag Head Grade g/t 130.5 130.10 130.10 130.10 130.48 130.48 130.76 130.76 130.76 130.76 - -Total Recovered Metal
Zn 000 t 632.8 40.7 84.6 83.9 75.9 75.9 68.0 68.0 68.0 68.0 - -Cu 000 t 10.4 0.8 1.6 1.6 1.3 1.3 1.0 1.0 1.0 1.0 - -Pb 000 t 181.4 12.2 21.6 21.6 21.0 21.0 21.0 21.0 21.0 21.0 - -Au 000 oz 205.3 14.1 28.2 28.2 24.4 24.4 21.5 21.5 21.5 21.5 - -Ag 000 oz 22,879.0 1,341.7 2,683.4 2,683.4 2,691.1 2,691.1 2,697.1 2,697.1 2,697.1 2,697.1 - -Total Unit Costs
Mining & MillingMining Underground A$M 663.6 36.2 73.8 76.9 77.6 78.4 79.1 79.8 80.5 81.2 - -Ore (external source) A$M - - - - - - - - - - - -Processing - all ore A$M 223.9 12.6 25.6 26.5 26.5 26.5 26.5 26.5 26.5 26.5 - -G & A A$M 152.5 8.5 17.6 18.1 18.1 18.1 18.1 18.1 18.1 18.1 - -Transport A$M 31.3 2.0 4.1 4.1 3.7 3.7 3.4 3.4 3.4 3.4 - -Total Operating Costs A$M 1,071.4 59.3 121.1 125.6 126.0 126.7 127.1 127.8 128.5 129.2 - -
Capital Expenditure
Resource DevelopmentExploration Infill drilling A$M 13.4 0.7 1.3 1.4 2.0 2.0 2.0 2.0 2.0 - - -SustainingPlant & Infrastructure A$M 152.6 8.1 24.5 18.5 17.0 26.9 26.8 26.8 4.0 - - -Mine Development A$M - - - - - - - - - - - -Underground Mine A$M 25.0 2.6 3.4 3.4 3.2 3.2 3.2 6.0 - - - -ExpansionCE - expansion plant and infrastructure A$M - - - - - - - - - - - -CE - expansion underground A$M 15.0 5.0 - - - - 10.0 - - - - -CE - rehabilitation A$M 33.1 - - - - - - - - - 33.1 -Total Capital Costs A$M 239.0 16.4 29.2 23.3 22.2 32.1 42.0 34.8 6.0 - 33.1 -
Planning Case 2
The main differences in Planning Case 2 relative to Planning Case 1 are:
� Typically adds to Planning Case 2 tonnages from existing mineral resources and readily demonstrable exploration potential for which AMC has reasonable, but lesser confidence of future conversion to ore reserves than in Planning Case 2.
� Additions are made to the mine production, sourced from areas which are currently exploration targets. AMC considers that there is a historical basis of exploration success which underpins the expectation of an expanded mining inventory.
� The capital expenditure schedule considers additional near mine exploration drilling, additional ventilation upgrade, and mine haulage upgrade. The inclusion of a paste backfill plant will enable the mine to be less constrained and thereby achieve higher rates of production, with the increased cost associated with increased usage of cement to be offset by an improvement in productivity.
� Refer Table 3.8.
●
APPENDIX IV COMPETENT PERSON’S REPORT
— IV-58 —
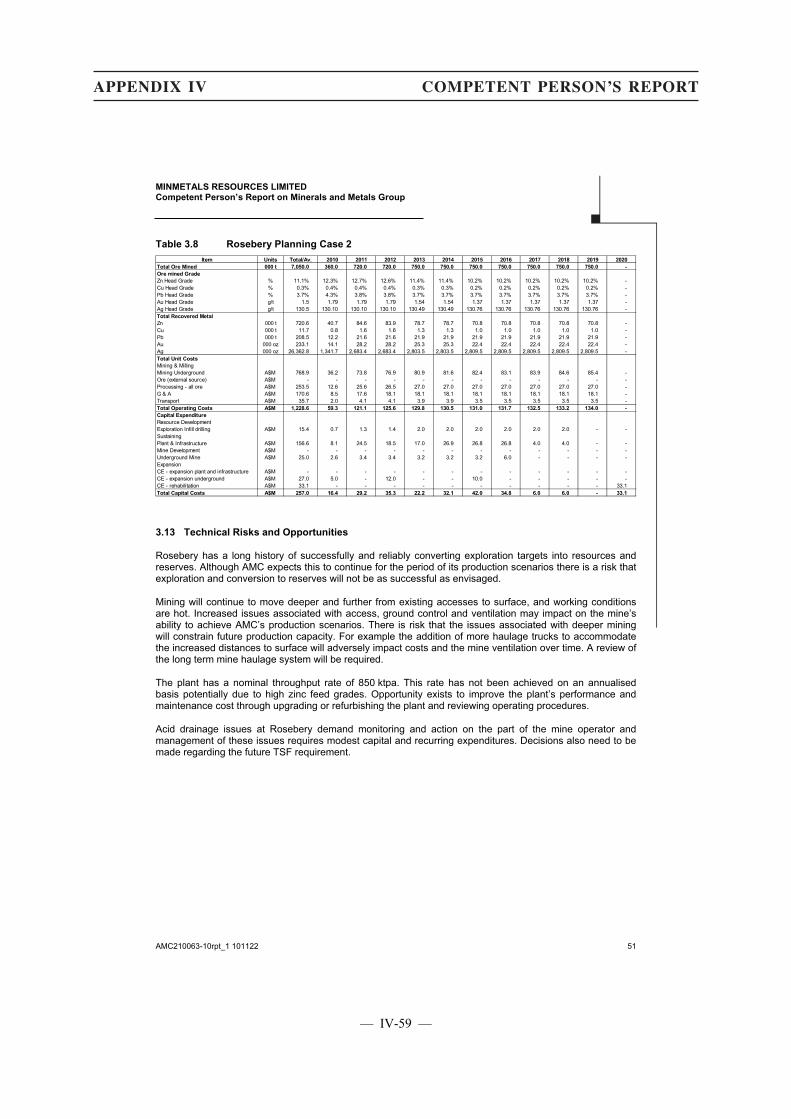
MINMETALS RESOURCES LIMITED Competent Person’s Report on Minerals and Metals Group
AMC210063-10rpt_1 101122 51
Table 3.8 Rosebery Planning Case 2
Item Units Total/Av. 2010 2011 2012 2013 2014 2015 2016 2017 2018 2019 2020
Total Ore Mined 000 t 7,050.0 360.0 720.0 720.0 750.0 750.0 750.0 750.0 750.0 750.0 750.0 -
Ore mined Grade
Zn Head Grade % 11.1% 12.3% 12.7% 12.6% 11.4% 11.4% 10.2% 10.2% 10.2% 10.2% 10.2% -Cu Head Grade % 0.3% 0.4% 0.4% 0.4% 0.3% 0.3% 0.2% 0.2% 0.2% 0.2% 0.2% -Pb Head Grade % 3.7% 4.3% 3.8% 3.8% 3.7% 3.7% 3.7% 3.7% 3.7% 3.7% 3.7% -Au Head Grade g/t 1.5 1.79 1.79 1.79 1.54 1.54 1.37 1.37 1.37 1.37 1.37 -Ag Head Grade g/t 130.5 130.10 130.10 130.10 130.49 130.49 130.76 130.76 130.76 130.76 130.76 -Total Recovered Metal
Zn 000 t 720.6 40.7 84.6 83.9 78.7 78.7 70.8 70.8 70.8 70.8 70.8 -Cu 000 t 11.7 0.8 1.6 1.6 1.3 1.3 1.0 1.0 1.0 1.0 1.0 -Pb 000 t 208.5 12.2 21.6 21.6 21.9 21.9 21.9 21.9 21.9 21.9 21.9 -Au 000 oz 233.1 14.1 28.2 28.2 25.3 25.3 22.4 22.4 22.4 22.4 22.4 -Ag 000 oz 26,362.8 1,341.7 2,683.4 2,683.4 2,803.5 2,803.5 2,809.5 2,809.5 2,809.5 2,809.5 2,809.5 -Total Unit Costs
Mining & MillingMining Underground A$M 768.9 36.2 73.8 76.9 80.9 81.6 82.4 83.1 83.9 84.6 85.4 -Ore (external source) A$M - - - - - - - - - - - -Processing - all ore A$M 253.5 12.6 25.6 26.5 27.0 27.0 27.0 27.0 27.0 27.0 27.0 -G & A A$M 170.6 8.5 17.6 18.1 18.1 18.1 18.1 18.1 18.1 18.1 18.1 -Transport A$M 35.7 2.0 4.1 4.1 3.9 3.9 3.5 3.5 3.5 3.5 3.5 -Total Operating Costs A$M 1,228.6 59.3 121.1 125.6 129.8 130.5 131.0 131.7 132.5 133.2 134.0 -
Capital Expenditure
Resource DevelopmentExploration Infill drilling A$M 15.4 0.7 1.3 1.4 2.0 2.0 2.0 2.0 2.0 2.0 - -SustainingPlant & Infrastructure A$M 156.6 8.1 24.5 18.5 17.0 26.9 26.8 26.8 4.0 4.0 - -Mine Development A$M - - - - - - - - - - - -Underground Mine A$M 25.0 2.6 3.4 3.4 3.2 3.2 3.2 6.0 - - - -ExpansionCE - expansion plant and infrastructure A$M - - - - - - - - - - - -CE - expansion underground A$M 27.0 5.0 - 12.0 - - 10.0 - - - - -CE - rehabilitation A$M 33.1 - - - - - - - - - - 33.1Total Capital Costs A$M 257.0 16.4 29.2 35.3 22.2 32.1 42.0 34.8 6.0 6.0 - 33.1
3.13 Technical Risks and Opportunities
Rosebery has a long history of successfully and reliably converting exploration targets into resources and reserves. Although AMC expects this to continue for the period of its production scenarios there is a risk that exploration and conversion to reserves will not be as successful as envisaged.
Mining will continue to move deeper and further from existing accesses to surface, and working conditions are hot. Increased issues associated with access, ground control and ventilation may impact on the mine’s ability to achieve AMC’s production scenarios. There is risk that the issues associated with deeper mining will constrain future production capacity. For example the addition of more haulage trucks to accommodate the increased distances to surface will adversely impact costs and the mine ventilation over time. A review of the long term mine haulage system will be required.
The plant has a nominal throughput rate of 850 ktpa. This rate has not been achieved on an annualised basis potentially due to high zinc feed grades. Opportunity exists to improve the plant’s performance and maintenance cost through upgrading or refurbishing the plant and reviewing operating procedures.
Acid drainage issues at Rosebery demand monitoring and action on the part of the mine operator and management of these issues requires modest capital and recurring expenditures. Decisions also need to be made regarding the future TSF requirement.
●
APPENDIX IV COMPETENT PERSON’S REPORT
— IV-59 —
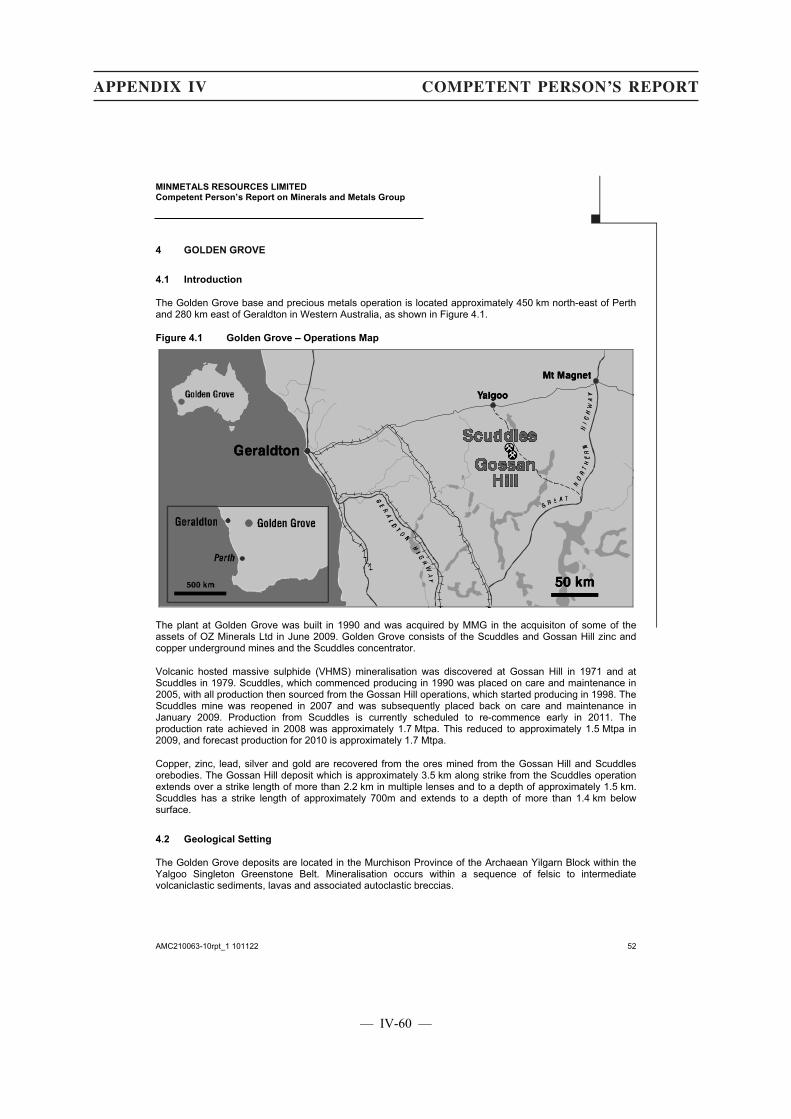
MINMETALS RESOURCES LIMITED Competent Person’s Report on Minerals and Metals Group
AMC210063-10rpt_1 101122 52
4 GOLDEN GROVE
4.1 Introduction
The Golden Grove base and precious metals operation is located approximately 450 km north-east of Perth and 280 km east of Geraldton in Western Australia, as shown in Figure 4.1.
Figure 4.1 Golden Grove – Operations Map
The plant at Golden Grove was built in 1990 and was acquired by MMG in the acquisiton of some of the assets of OZ Minerals Ltd in June 2009. Golden Grove consists of the Scuddles and Gossan Hill zinc and copper underground mines and the Scuddles concentrator.
Volcanic hosted massive sulphide (VHMS) mineralisation was discovered at Gossan Hill in 1971 and at Scuddles in 1979. Scuddles, which commenced producing in 1990 was placed on care and maintenance in 2005, with all production then sourced from the Gossan Hill operations, which started producing in 1998. The Scuddles mine was reopened in 2007 and was subsequently placed back on care and maintenance in January 2009. Production from Scuddles is currently scheduled to re-commence early in 2011. The production rate achieved in 2008 was approximately 1.7 Mtpa. This reduced to approximately 1.5 Mtpa in 2009, and forecast production for 2010 is approximately 1.7 Mtpa.
Copper, zinc, lead, silver and gold are recovered from the ores mined from the Gossan Hill and Scuddles orebodies. The Gossan Hill deposit which is approximately 3.5 km along strike from the Scuddles operation extends over a strike length of more than 2.2 km in multiple lenses and to a depth of approximately 1.5 km. Scuddles has a strike length of approximately 700m and extends to a depth of more than 1.4 km below surface.
4.2 Geological Setting
The Golden Grove deposits are located in the Murchison Province of the Archaean Yilgarn Block within the Yalgoo Singleton Greenstone Belt. Mineralisation occurs within a sequence of felsic to intermediate volcaniclastic sediments, lavas and associated autoclastic breccias.
●
APPENDIX IV COMPETENT PERSON’S REPORT
— IV-60 —
MINMETALS RESOURCES LIMITED Competent Person’s Report on Minerals and Metals Group
AMC210063-10rpt_1 101122 53
The Golden Grove Domain that hosts the Gossan Hill and Scuddles deposits lies on the eastern limb of the Warriedar Fold Belt where the stratigraphy dips steeply west and is west facing. The domain is bound to the west by the Mougooderra Faultand to the east, north and south by granitic rocks. The Golden Grove Domain has been metamorphosed to greenschist facies, post sulphide deposition.
The Golden Grove Domain is subdivided into three groups of which the Gossan Hill Group is of primary economic interest and consists of a sequence of felsic volcaniclastic and coherent volcanic rocks with an average thickness of 3 km and a north-south strike extent of 28 km. VHMS mineralisation is located in the central part of the Gossan Hill Group.
All currently exploited mineralisation occurs within two members of the Golden Grove Formation (part of the Gossan Hill Group) and known locally as GG4 and GG6. Exploration has identified mineralisation in other units such as GG2 and GG3 (in the footwall) and SC2 and SC3 (in the hangingwall).
Overlying the mineralised sequence at both deposits is a thick sequence of lavas and lava breccias. Post mineralisation intrusives including dacite, dolerite and rhyolite dykes commonly cross-cut the mineralisation.
4.3 Zinc and Copper Mineralisation
Mineralisation at Gossan Hill occurs as massive sulphides hosted within a volcanically derived sedimentary package. Figure 4.2 shows a longitudinal projection of the mineralisation at Scuddles. It is divided into six lenses, Main, Central/Intermediate, Deeps, Zeewijk, Batavia and the recently defined Cervantes. All lenses have similar mineralisation characteristics.
Figure 4.2 shows a longitudinal projection of the mineralisation at Gossan Hill, which generally dips sub-vertically and is divided into two zones.
The lower zone within the GG4 member contains the primary copper mineralisation, comprising pyrite-magnetite-pyrrhotite-chalcopyrite. The main copper lenses are A Copper and Q (GG4) Copper, but copper is also significant in Amity, Hougoumont (GG6), Ethel and C Zinc lenses.
The upper zone within the GG6 member hosts the primary zinc mineralisation as a pyrite-sphalerite assemblage, which is often underlain by a pyrite-pyrrhotite-chalcopyrite stringer zone. The main known zinc lenses are A, B and C Zinc, and the more recently discovered Amity, Hougoumont (GG6 & HW), Catalpa, Ethel, Cambewarra and Xantho.
Both the primary copper and primary zinc Mineral Resources extend to depth from the base of oxidation. Oxide copper mineralisation exists above the primary copper mineralisation and oxide gold (and silver) mineralisation exists above the primary zinc mineralisation.
At Scuddles, the mineralised sequence occurs within GG6, a sequence of fine-grained sandstone to siltstones with poorly sorted breccias. It is composed primarily of massive zinc and copper sulphides with an underlying stringer sulphide zone.
Figure 4.3 shows a longitudinal projection of the mineralisation at Scuddles. It is divided into six lenses, Main, Central/Intermediate, Deeps, Zeewijk, Batavia and the recently defined Cervantes. All lenses have similar mineralisation characteristics.
●
APPENDIX IV COMPETENT PERSON’S REPORT
— IV-61 —
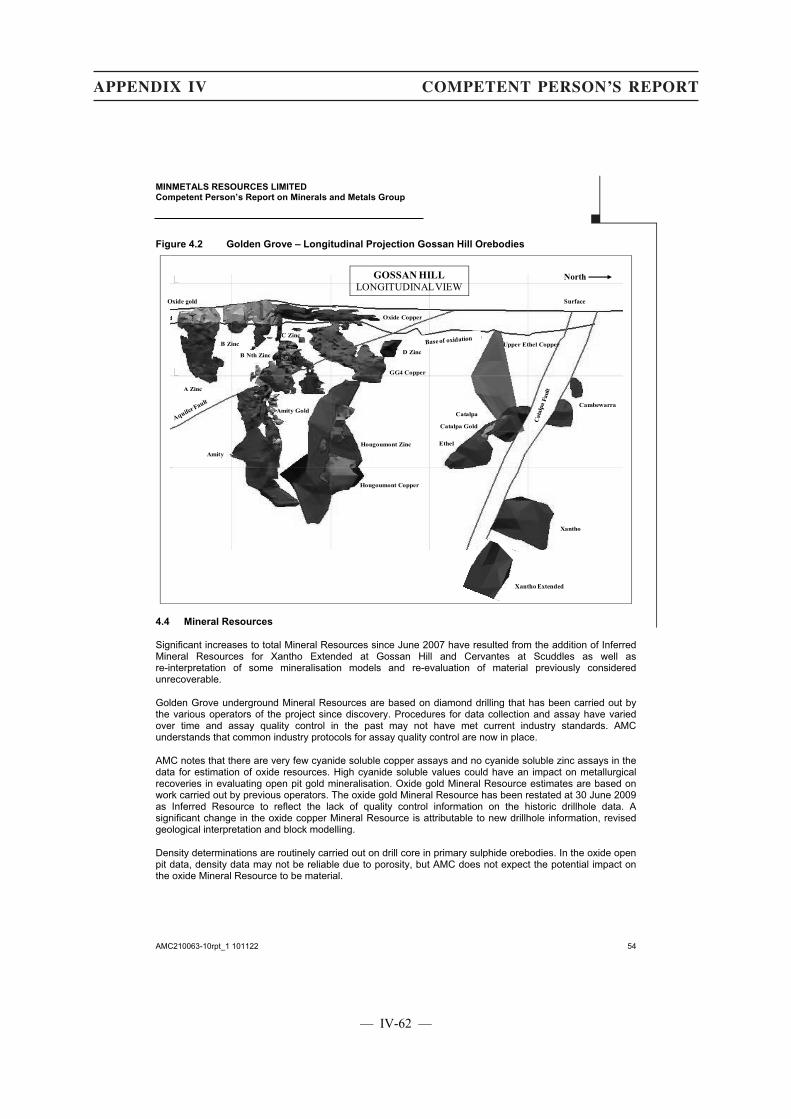
MINMETALS RESOURCES LIMITED Competent Person’s Report on Minerals and Metals Group
AMC210063-10rpt_1 101122 54
Figure 4.2 Golden Grove – Longitudinal Projection Gossan Hill Orebodies
A Zinc
B ZincC Zinc
GG4 Copper
d Oxide Copper
C Copper
Base of oxidation
Surface
Fault
B Nth Zinc
Amity
Xantho
Catalpa
Ethel
Amity Gold
Hougoumont Zinc
Cat
alpa
Faul
t
D Zinc
Hougoumont Copper
Catalpa Gold
Cambewarra
Upper Ethel Copper
Xantho Extended
Oxide gold Surface
GOSSAN HILLLONGITUDINAL VIEW
North
4.4 Mineral Resources
Significant increases to total Mineral Resources since June 2007 have resulted from the addition of Inferred Mineral Resources for Xantho Extended at Gossan Hill and Cervantes at Scuddles as well as re-interpretation of some mineralisation models and re-evaluation of material previously considered unrecoverable.
Golden Grove underground Mineral Resources are based on diamond drilling that has been carried out by the various operators of the project since discovery. Procedures for data collection and assay have varied over time and assay quality control in the past may not have met current industry standards. AMC understands that common industry protocols for assay quality control are now in place.
AMC notes that there are very few cyanide soluble copper assays and no cyanide soluble zinc assays in the data for estimation of oxide resources. High cyanide soluble values could have an impact on metallurgical recoveries in evaluating open pit gold mineralisation. Oxide gold Mineral Resource estimates are based on work carried out by previous operators. The oxide gold Mineral Resource has been restated at 30 June 2009 as Inferred Resource to reflect the lack of quality control information on the historic drillhole data. A significant change in the oxide copper Mineral Resource is attributable to new drillhole information, revised geological interpretation and block modelling.
Density determinations are routinely carried out on drill core in primary sulphide orebodies. In the oxide open pit data, density data may not be reliable due to porosity, but AMC does not expect the potential impact on the oxide Mineral Resource to be material.
●
APPENDIX IV COMPETENT PERSON’S REPORT
— IV-62 —
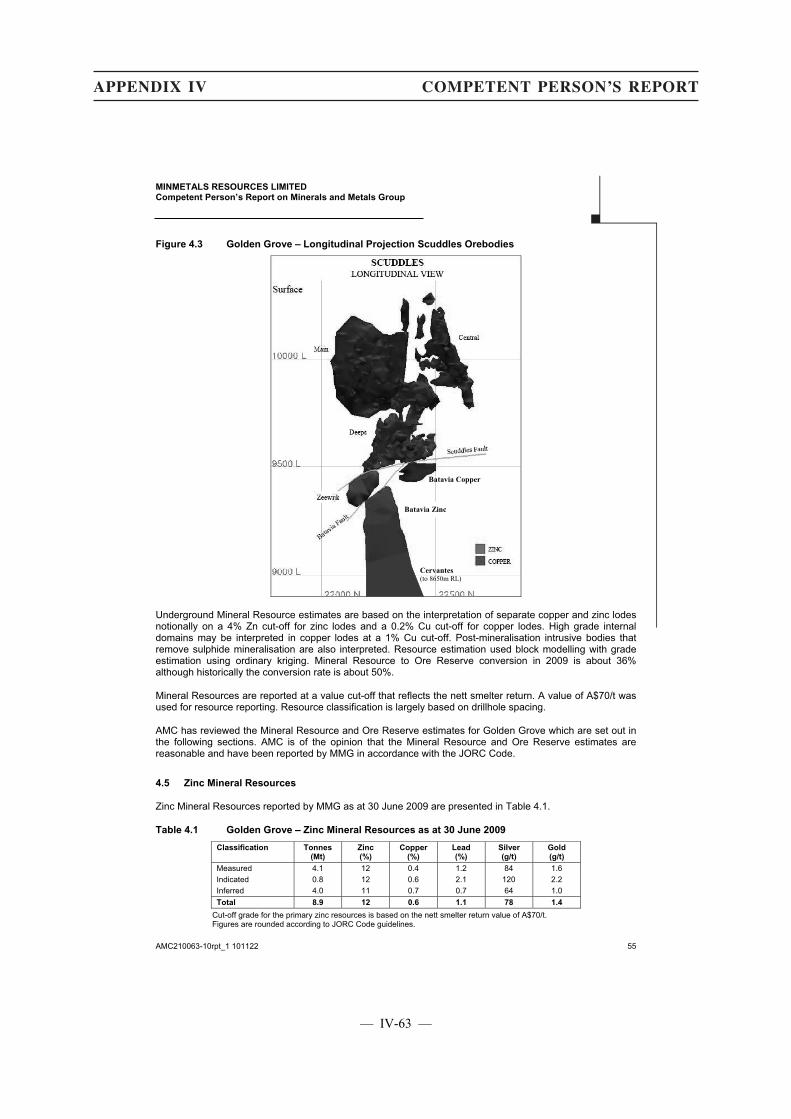
MINMETALS RESOURCES LIMITED Competent Person’s Report on Minerals and Metals Group
AMC210063-10rpt_1 101122 55
Figure 4.3 Golden Grove – Longitudinal Projection Scuddles Orebodies
Cervantes (to 8650m RL)
Batavia Copper
Batavia Zinc
Underground Mineral Resource estimates are based on the interpretation of separate copper and zinc lodes notionally on a 4% Zn cut-off for zinc lodes and a 0.2% Cu cut-off for copper lodes. High grade internal domains may be interpreted in copper lodes at a 1% Cu cut-off. Post-mineralisation intrusive bodies that remove sulphide mineralisation are also interpreted. Resource estimation used block modelling with grade estimation using ordinary kriging. Mineral Resource to Ore Reserve conversion in 2009 is about 36% although historically the conversion rate is about 50%.
Mineral Resources are reported at a value cut-off that reflects the nett smelter return. A value of A$70/t was used for resource reporting. Resource classification is largely based on drillhole spacing.
AMC has reviewed the Mineral Resource and Ore Reserve estimates for Golden Grove which are set out in the following sections. AMC is of the opinion that the Mineral Resource and Ore Reserve estimates are reasonable and have been reported by MMG in accordance with the JORC Code.
4.5 Zinc Mineral Resources
Zinc Mineral Resources reported by MMG as at 30 June 2009 are presented in Table 4.1.
Table 4.1 Golden Grove – Zinc Mineral Resources as at 30 June 2009
Classification Tonnes (Mt)
Zinc (%)
Copper (%)
Lead (%)
Silver (g/t)
Gold (g/t)
Measured 4.1 12 0.4 1.2 84 1.6 Indicated 0.8 12 0.6 2.1 120 2.2 Inferred 4.0 11 0.7 0.7 64 1.0 Total 8.9 12 0.6 1.1 78 1.4
Cut-off grade for the primary zinc resources is based on the nett smelter return value of A$70/t. Figures are rounded according to JORC Code guidelines.
●
APPENDIX IV COMPETENT PERSON’S REPORT
— IV-63 —
MINMETALS RESOURCES LIMITED Competent Person’s Report on Minerals and Metals Group
AMC210063-10rpt_1 101122 56
4.6 Zinc Ore Reserves
Zinc Ore Reserves reported by MMG as at 30 June 2009 are presented in Table 4.2.
Table 4.2 Golden Grove – Zinc Ore Reserves as at 30 June 2009
Classification Tonnes (Mt)t
Zinc (%)
Copper (%)
Lead (%)
Silver (g/t)
Gold (g/t)
Proved 1.2 13 0.4 1.5 73 1.6 Probable 0.9 11 0.4 1.7 95 2.0 Total 2.1 12 0.4 1.6 82 1.7
Cut-off grade based on nett smelter return values of A$110/t. Scuddles Ore Reserves previously applied a nett smelter return value of A$70. Copper price used is US$2.00/lb, zinc price of US$0.90/lb, lead price of US$0.70/lb, silver price of US$11/oz, gold price of US$750/oz and an exchange rate of 0.75 (A$/US$).
4.7 Copper Mineral Resources
Copper Mineral Resources reported by MMG as at 30 June 2009 are presented in Table 4.3.
Table 4.3 Golden Grove – Copper Mineral Resources as at 30 June 2009
Mineral Resource Classification Tonnes (Mt)
Zinc (%)
Copper (%)
Lead (%)
Silver (g/t)
Gold (g/t)
Primary Copper Measured 10 0.6 3.1 0.0 19 0.6 Indicated 3.2 0.4 2.8 - 14 0.5 Inferred 5.8 0.9 3.2 - 28 0.7
Total 19 0.7 3.1 0.0 21 0.6
Oxide Copper Measured - - - - - - Indicated - - - - - - Inferred 2.5 - 2.3 - - -
Total 2.5 - 2.3 - - -
Cut-off grade for the primary copper Resources is based on the nett smelter return value of A$70 per tonne. Oxide copper reported at a 0.5% Cu cut-off grade. Figures are rounded according to JORC Code guidelines.
4.8 Copper Ore Reserves
Copper Ore Reserves reported by MMG as at 30 June 2009 are presented in Table 4.4.
Table 4.4 Golden Grove – Copper Ore Reserves as at 30 June 2009
Classification Tonnes (Mt)
Zinc (%)
Copper (%)
Lead (%)
Silver (g/t)
Gold (g/t)
Proved 2.6 0.4 3.5 0.0 18 0.4 Probable 1.0 0.4 3.2 0.1 21 0.5 Total 3.6 0.4 3.4 0.0 19 0.5
Cut-off grade based on a Nett Smelter Return value of A$110/t. Scuddles Ore Reserves previously applied a nett smelter return value of A$70. Copper price used is US$2.00/lb, zinc price of US$0.90/lb, lead price of US$0.70/lb, silver price of US$11/oz, gold price of US$750/oz and an exchange rate of 0.75 (A$/US$).
4.9 Gold Mineral Resources
Gold Mineral Resources reported by MMG as at 30 June 2009 are presented in Table 4.5.
Table 4.5 Golden Grove - Gold Mineral Resources as at 30 June 2009
Classification Tonnes (Mt)
Zinc (%)
Copper (%)
Lead (%)
Silver (g/t)
Gold (g/t)
Measured - - - - - - Indicated - - - - - - Inferred 1.1 - - - 100 3.2 Total 1.1 - - - 100 3.2
Reported at a 1.0 g/t Au cut-off grade.
●
APPENDIX IV COMPETENT PERSON’S REPORT
— IV-64 —
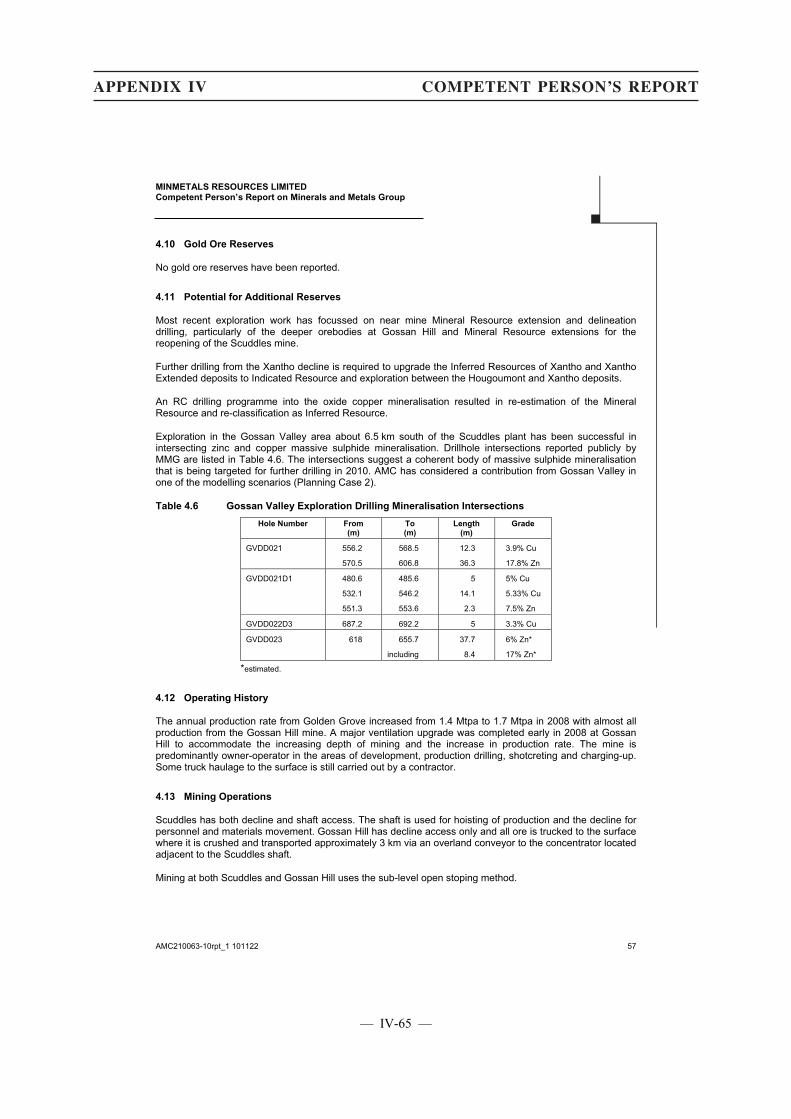
MINMETALS RESOURCES LIMITED Competent Person’s Report on Minerals and Metals Group
AMC210063-10rpt_1 101122 57
4.10 Gold Ore Reserves
No gold ore reserves have been reported.
4.11 Potential for Additional Reserves
Most recent exploration work has focussed on near mine Mineral Resource extension and delineation drilling, particularly of the deeper orebodies at Gossan Hill and Mineral Resource extensions for the reopening of the Scuddles mine.
Further drilling from the Xantho decline is required to upgrade the Inferred Resources of Xantho and Xantho Extended deposits to Indicated Resource and exploration between the Hougoumont and Xantho deposits.
An RC drilling programme into the oxide copper mineralisation resulted in re-estimation of the Mineral Resource and re-classification as Inferred Resource.
Exploration in the Gossan Valley area about 6.5 km south of the Scuddles plant has been successful in intersecting zinc and copper massive sulphide mineralisation. Drillhole intersections reported publicly by MMG are listed in Table 4.6. The intersections suggest a coherent body of massive sulphide mineralisation that is being targeted for further drilling in 2010. AMC has considered a contribution from Gossan Valley in one of the modelling scenarios (Planning Case 2).
Table 4.6 Gossan Valley Exploration Drilling Mineralisation Intersections
Hole Number From (m)
To (m)
Length (m)
Grade
GVDD021 556.2 568.5 12.3 3.9% Cu
570.5 606.8 36.3 17.8% Zn
GVDD021D1 480.6 485.6 5 5% Cu
532.1 546.2 14.1 5.33% Cu
551.3 553.6 2.3 7.5% Zn
GVDD022D3 687.2 692.2 5 3.3% Cu
GVDD023 618 655.7 37.7 6% Zn*
including 8.4 17% Zn*
*estimated.
4.12 Operating History
The annual production rate from Golden Grove increased from 1.4 Mtpa to 1.7 Mtpa in 2008 with almost all production from the Gossan Hill mine. A major ventilation upgrade was completed early in 2008 at Gossan Hill to accommodate the increasing depth of mining and the increase in production rate. The mine is predominantly owner-operator in the areas of development, production drilling, shotcreting and charging-up. Some truck haulage to the surface is still carried out by a contractor.
4.13 Mining Operations
Scuddles has both decline and shaft access. The shaft is used for hoisting of production and the decline for personnel and materials movement. Gossan Hill has decline access only and all ore is trucked to the surface where it is crushed and transported approximately 3 km via an overland conveyor to the concentrator located adjacent to the Scuddles shaft.
Mining at both Scuddles and Gossan Hill uses the sub-level open stoping method.
●
APPENDIX IV COMPETENT PERSON’S REPORT
— IV-65 —
MINMETALS RESOURCES LIMITED Competent Person’s Report on Minerals and Metals Group
AMC210063-10rpt_1 101122 58
Open pit mining operations at Gossan Hill are currently being evaluated to target shallow copper oxide material as well as deeper copper sulphides which overlay the upper stoping areas. There is also potential for a larger open pit operation which targets shallow gold oxide and deeper zinc sulphide material adjacent to the currently planned copper oxide pit.
Consideration has also been given to a separate mining operation at the Gossan Valley project, based on intersections of significant copper and zinc mineralisation and a considered potential total of approximately 5 Mt of zinc and copper ore. The Gossan Valley contribution to Planning Case 2 comprises approximately 2.7 Mt of zinc ore grading 14% Zn and 0.4 Mt of copper ore grading 4% Cu. It has been assumed that the operation will be similar to Gossan Hill, comprising decline access, with longhole stoping and truck haulage of ore to the surface for processing in the existing concentrator.
4.14 Processing and Concentrate Handling
Underground copper and zinc sulphide ores have been treated for many years, and the metallurgical response is well understood. There is little information on the copper and zinc sulphide ores from the proposed open pits but the metallurgical response should be similar to the underground ores provided the blend does not contain significant amounts of transition ore.
Copper oxide ore from the open pit will be campaigned through the existing flotation circuit. The ore will require sulphidisation as part of the flotation process. AMC considers the predicted performance from this ore of 80% recovery and 26% Cu concentrate grade to be reasonable.
Gold oxide ore from the open pits is proposed to be toll treated off-site. This ore contains significant silver values and some cyanide soluble copper. At this stage, a satisfactory treatment process for this ore has not been finalized.
Two basic ore types are produced at Golden Grove; low precious metal copper ore, and zinc ore containing significant lead, silver and gold. These ores are mined at both Gossan Hill and Scuddles and have been treated separately on a campaign basis through the same plant.
The Gossan Hill ore is crushed to approximately 90 mm then conveyed to the concentrator. Scuddles ore is crushed underground prior to being hoisted to the surface stockpile. To increase the grinding circuit throughput 40% of the ore is crushed in a secondary crusher to minus 75 mm. Ore is withdrawn from the surface stockpiles using vibrating feeders and conveyed to the grinding circuit.
The grinding circuit consists of a semi autogenous (SAG) mill, a ball mill and a pebble crusher. Crushed ore is fed to the 6.7m x 2.1m SAG mill fitted with a 1,500 kW drive, 125 mm grinding media is added to the mill.
Pulp is discharged through 75 mm pebble ports onto a 10 mm x 25 mm trommel screen. Trommel screen oversize is crushed to approximately 10 mm and returned to the SAG mill. SAG mill trommel undersize (-10 mm) is mixed with the ball mill discharge and pumped to the ball mill cyclones. The cyclone overflow is fed to the flotation circuit. Cyclone underflow is fed to the secondary ball mill which is a 6.7m x 3.8m unit fitted with a 1,500 kW drive, 65 mm and 40 mm balls are added to this mill.
The normal flotation feed sizing is approximately 80% passing 110 micron, the relatively is coarse grind has little or no effect on flotation performance.
The grinding circuit throughput needs to average 217 tph to achieve the budgeted throughput of 1.7 Mt. This throughput rate is being achieved by crushing approximately 40% of the feed to minus 75 mm in a secondary crusher. If the mill feed became significantly harder, there is capacity to crush a greater portion in the secondary crusher. A study is underway to investigate the replacement of the primary crusher with a unit capable of crushing to minus 75 mm. This could eliminate result in significant cost saving by eliminating the secondary crushing stage.
The copper ore flotation circuit consists of a talc pre-float stage, if required, followed by the copper flotation stage. The talc prefloat is discarded to tailing. Copper concentrate grade ranges from 22% to 25% Cu and recovery from 88% to 92%.
●
APPENDIX IV COMPETENT PERSON’S REPORT
— IV-66 —
MINMETALS RESOURCES LIMITED Competent Person’s Report on Minerals and Metals Group
AMC210063-10rpt_1 101122 59
Zinc ores contain significant amounts of silver, gold and lead that must be recovered prior to zinc flotation. This maximises the recovery of precious metals to the lead concentrate and improves zinc flotation by removing galena from the feed to the zinc section.
The high precious metal (HPM) circuit consisting of roughers, scavengers and two stages of cleaning. The performance of the HPM circuit is variable being dependent on head grade and mineralogy.
Regrinding of the HPM lead rougher concentrate is being investigated to liberate some galena sphalerite composites which will improve both the HPM lead concentrate grade and the zinc recovery in the zinc circuit.
The zinc flotation circuit consists of roughers, scavengers and two stages of cleaning. Zinc concentrate grade ranges from 50% to 54% Zn and recovery from 90% to 95%.
Concentrates are thickened then filtered. HPM concentrate is filtered using vacuum disc and copper and zinc concentrates are sent to a pressure filter. Concentrates are trucked to Geraldton for export.
Tailings from the flotation sections are classified in the backfill preparation plant, the coarse fraction being pumped underground as mine fill and the fines pumped to the TSF.
The five year metallurgical plan shows the processing plant treating approximately 1.7 Mtpa to 1.9 Mtpa in 2010 to 2012. Operating experience has demonstrated that this treatment rate and that the proposed metallurgical performance can be achieved.
The oxide copper ore performance has been established by extensive laboratory testwork and should be achievable.
4.15 Infrastructure
Golden Grove is a fly-in-fly-out operation with a sealed airstrip and is serviced by charter flights from both Perth and Geraldton. It has an established camp which provides accommodation for the workforce.
The site is connected to the state grid by a 132 kV transmission line.
Potable water is sourced from an onsite bore and raw water is sourced from water pumped from the underground operations.
4.16 Environment
Golden Grove is characterised by sophisticated and high-quality environmental management systems and performance, with experienced environmental personnel ensuring integration of environmental imperatives into planning and operations. Environmental challenges are generally managed in a pre-emptive manner, based on sound research and diligent monitoring and reporting. All relevant licences and permits are in place, with good compliance; 13 reports were made to the Department of Environment and Conservation in 2009, but they mostly related to the now-remedied elevated cadmium levels in water discharged from the site (see below).
Closure planning is well advanced, with detailed work programmes identified and costed at current rates. A 2010 closure estimate of A$43.5M (nett of demolition costs of A$8.9M) is considered by AMC to be appropriate for valuation purposes. In future, TSF3 could add as much as A$10M, although this increase could be offset by cost-saving opportunities currently being reviewed. This estimate does not include remediation of contaminated sites, which is considered unlikely to be required because of the future-land-use thrust of Western Australia’s contaminated sites legislation – people-intensive land uses of the sites in future are improbable. Closure will be facilitated by the availability of oxide waste from the proposed Gossan Hill open pit, especially for capping of TSF1.
●
APPENDIX IV COMPETENT PERSON’S REPORT
— IV-67 —
MINMETALS RESOURCES LIMITED Competent Person’s Report on Minerals and Metals Group
AMC210063-10rpt_1 101122 60
The significant environmental challenges requiring sustained management input in future are the management of acid drainage, surface-water management and heavy-metal contamination from mine-water discharge into the freshwater Lake Wownaminya; these are discussed further below. While no dust-management issues at the Port of Geraldton have been reported, the current socio-political focus in Western Australia on dust emissions from port-handling of mineral concentrates, especially at Esperance and Fremantle, demand vigilance, risk-awareness and pre-emptive planning.
Some historical sites of impact from acid drainage have been treated, but significant risk remains. The Gossan Hill ROM stockpile is the largest, with the need for capture and management of acid drainage identified by site personnel. Coffer dams have been constructed to collect ROM runoff, but further work is needed on hydraulic modelling and possibly lining of dams to manage contamination risks. Encapsulation of the ROM stockpile could become economically more feasible with development of an open pit, which will provide large volumes of inert, and possibly acid-consuming, mine waste within close proximity.
All areas which could possibly generate contaminated surface flows are equipped with drainage and containment systems, but low return-frequency designs (1 in 10-year, rather than 1 in 100-year) have resulted in some overtopping incidents. A LOM water management strategy, based on a predictive water balance model, is currently being developed to provide greater environmental protection.
In 2008, the environmental regulator expressed concern about high levels of cadmium (Cd) in water discharged to Lake Wownaminya. To remedy this issue, all mine water is now treated in the Mine Water Clarifier (MWC) after lime-dosing and treatment with flocculent, and then discharged to Pond B, which has been redesigned to give better mixing. Additional, manual lime-dosing in Pond B is carried out when required. Reduction of the pH set-point in the MWC from 12.0 to 11.5 has removed repetition of a one-off incident of high-pH (9.3) water reporting to Lake Wownaminya, and more rigorous removal of sediment in underground sumps in the Gossan Hill mine has further strengthened the wastewater management system. No elevated Cd levels have been recorded since the upgrade of the system. An apparent high selenium content in discharged water in 2009 was shown to be a laboratory assay error.
A detailed contaminated-site assessment of Lake Wownaminya is being undertaken to characterise the extent of heavy metal contamination of sediments and identify treatment options.
4.17 Operating and Capital Costs
Operating and capital costs for Golden Grove from 2007 to 2009 are summarised in Table 4.7. It should be noted that some costs such as electric power are expected to increase in the coming years.
In addition to normal sustaining capital, the current capital budget allows for expenditure of A$2M to upgrade the processing plant to treat copper oxide ore.
Table 4.7 Golden Grove – Operating and Capital Costs
Item Units 2007 2008 2009
Production Parameters Ore Mined kt 1,446 1,794 1,549 Ore Processed kt 1,453 1,661 1,410 Cash Operating Cost Mining A$M 113.0 138.8 93.2 Processing/Mntce A$M 40.6 46.3 39.8 Administration A$M 19.2 27.5 16.6 Conc. Transport/Port A$M 10.6 12.9 12.9 Total Operating Cost A$M 183.4 225.5 162.5
Capital Cost Sustaining Capital A$M 67.9 114.8 25.8 Total Capital A$M 67.9 114.8 25.8
●
APPENDIX IV COMPETENT PERSON’S REPORT
— IV-68 —

MINMETALS RESOURCES LIMITED Competent Person’s Report on Minerals and Metals Group
AMC210063-10rpt_1 101122 61
4.18 AMC Modelling Scenarios
MMG has provided AMC with a LOM plan detailing production for Golden Grove from 2010 based on mining reported reserves and additional non reserve material. AMC was also provided with a breakdown of the 30 June 2009 Ore Reserve which was then depleted based on reserve depletions reported in site monthly reports for July 2009 to June 2010.
As the Reserve Only Case is based on the 30 June 2009 Ore Reserve, depleted for production up to 30 June 2010, the life of the operation modelled in this case undercalls the likely mine life as it does not consider any possible additions to reserves since 2009, nor does it consider tonnage in extensions to orebodies currently being mined that are not currently at reserve status.
Information for the copper oxide open pit has been sourced from the mine design and cost estimate report for that project. The larger open pit included in Planning Case 2 is based on information provided and modelled by AMC in the 2009 review of the Golden Grove operations.
AMC has used the available information to prepare three scenarios for Golden Grove. Key aspects of the modelling scenarios are:
Reserve Only Case
This scenario is based on the June 30 2009 Ore Reserve which has been depleted for production from July 2009 to June 2010. Production in the latter years of a reserve only schedule tapers significantly beyond 2012. As a consequence not all reserves are included in the case modelled. As previously mentioned, not considering any possible additions to reserves since June 2009 undercalls the likely mine life. This case generates a mine life to 2012 with annual production maintained at approximately 1.7 Mt until 2011, with a reduction in the production rate to approximately 1 Mt in 2012.
Planning Case 1
A mining and processing inventory comprising the reported Ore Reserves for Scuddles and Gossan Hill depleted for mining to 30 June 2010 plus approximately 1.6 Mt of additional zinc and copper mineralisation that AMC considers likely to be mined. The case also includes a copper oxide open pit mining inventory of 1.8 Mt which has been evaluated at a Scoping Study level. The copper oxide open pit inventory comprises mostly copper oxide material and some copper sulphide material and is based on Mineral Resources reported as Inferred in June 2009 that AMC considers are likely to be mined. This case generates a mine life to 2014 with annual production maintained at approximately 1.7 Mt until 2013, with production reducing to 0.9 Mt in 2014.
Planning Case 2
The main differences in Planning Case 2 relative to Planning Case 1 are:
Additional underground production from Xantho Extended, upper areas of Amity copper and down dip extension of Hougoumont at Gossan Hill and potential production sourced from Gossan Valley, a potential resource containing both zinc and copper mineralisation that is currently being drilled out. Planning Case 2 also includes a significantly larger open pit, targeting gold oxide, zinc sulphide and copper sulphide mining inventories totalling 2.9 Mt. This is in addition to the open pit inventory included in Planning Case 1. The case generates a mine life to 2020 and maintains the same annual production rate of 1.7 Mt as scheduled in the other cases modelled until 2019, reducing to 1.4 Mt in 2020.
The modelling scenarios are summarised in Table 4.8, Table 4.9 and Table 4.10.
●
APPENDIX IV COMPETENT PERSON’S REPORT
— IV-69 —
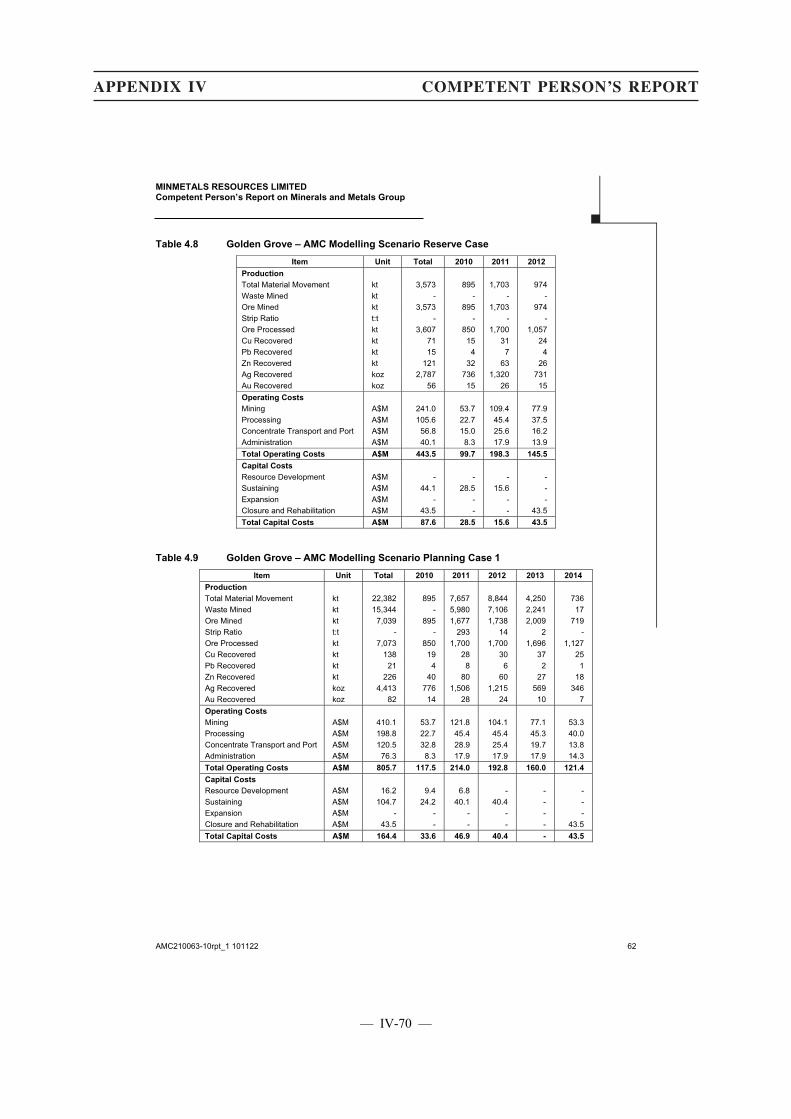
MINMETALS RESOURCES LIMITED Competent Person’s Report on Minerals and Metals Group
AMC210063-10rpt_1 101122 62
Table 4.8 Golden Grove – AMC Modelling Scenario Reserve Case
Item Unit Total 2010 2011 2012
Production
Total Material Movement kt 3,573 895 1,703 974 Waste Mined kt - - - - Ore Mined kt 3,573 895 1,703 974 Strip Ratio t:t - - - - Ore Processed kt 3,607 850 1,700 1,057 Cu Recovered kt 71 15 31 24 Pb Recovered kt 15 4 7 4 Zn Recovered kt 121 32 63 26 Ag Recovered koz 2,787 736 1,320 731 Au Recovered koz 56 15 26 15 Operating Costs
Mining A$M 241.0 53.7 109.4 77.9 Processing A$M 105.6 22.7 45.4 37.5 Concentrate Transport and Port A$M 56.8 15.0 25.6 16.2 Administration A$M 40.1 8.3 17.9 13.9 Total Operating Costs A$M 443.5 99.7 198.3 145.5
Capital Costs
Resource Development A$M - - - - Sustaining A$M 44.1 28.5 15.6 - Expansion A$M - - - - Closure and Rehabilitation A$M 43.5 - - 43.5 Total Capital Costs A$M 87.6 28.5 15.6 43.5
Table 4.9 Golden Grove – AMC Modelling Scenario Planning Case 1
Item Unit Total 2010 2011 2012 2013 2014
Production
Total Material Movement kt 22,382 895 7,657 8,844 4,250 736 Waste Mined kt 15,344 - 5,980 7,106 2,241 17 Ore Mined kt 7,039 895 1,677 1,738 2,009 719 Strip Ratio t:t - - 293 14 2 - Ore Processed kt 7,073 850 1,700 1,700 1,696 1,127 Cu Recovered kt 138 19 28 30 37 25 Pb Recovered kt 21 4 8 6 2 1 Zn Recovered kt 226 40 80 60 27 18 Ag Recovered koz 4,413 776 1,506 1,215 569 346 Au Recovered koz 82 14 28 24 10 7 Operating Costs
Mining A$M 410.1 53.7 121.8 104.1 77.1 53.3 Processing A$M 198.8 22.7 45.4 45.4 45.3 40.0 Concentrate Transport and Port A$M 120.5 32.8 28.9 25.4 19.7 13.8 Administration A$M 76.3 8.3 17.9 17.9 17.9 14.3 Total Operating Costs A$M 805.7 117.5 214.0 192.8 160.0 121.4
Capital Costs
Resource Development A$M 16.2 9.4 6.8 - - - Sustaining A$M 104.7 24.2 40.1 40.4 - - Expansion A$M - - - - - - Closure and Rehabilitation A$M 43.5 - - - - 43.5 Total Capital Costs A$M 164.4 33.6 46.9 40.4 - 43.5
●
APPENDIX IV COMPETENT PERSON’S REPORT
— IV-70 —
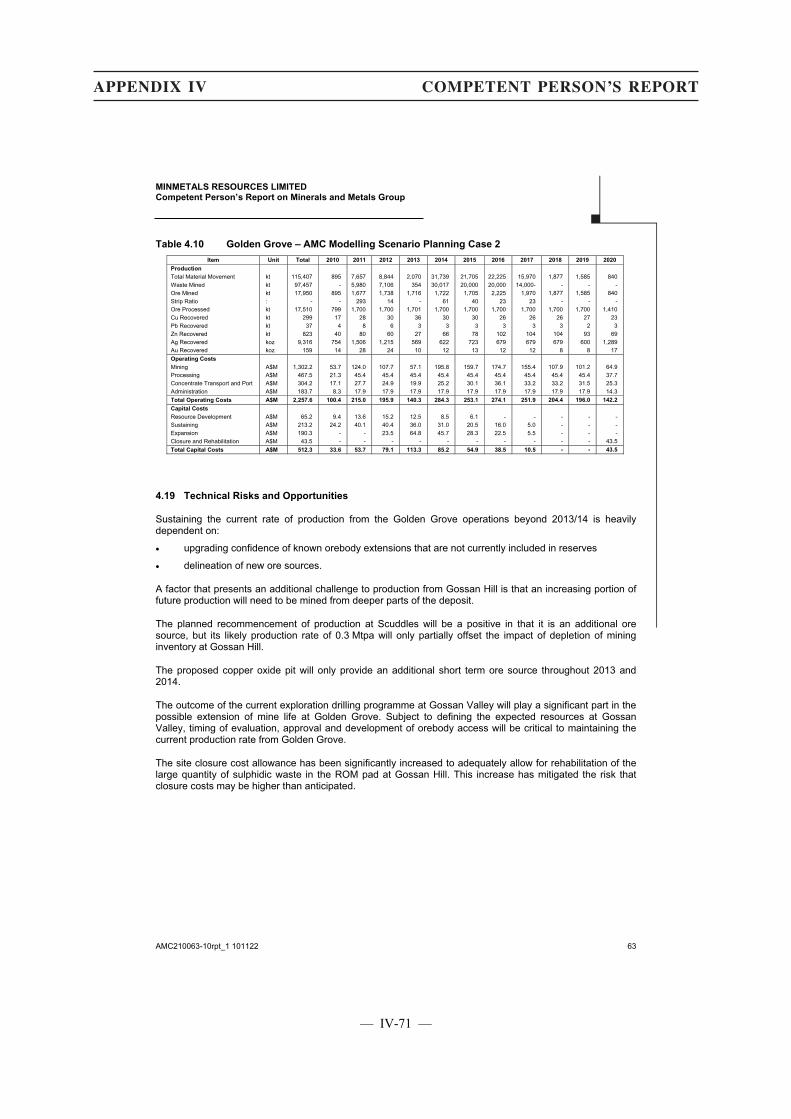
MINMETALS RESOURCES LIMITED Competent Person’s Report on Minerals and Metals Group
AMC210063-10rpt_1 101122 63
Table 4.10 Golden Grove – AMC Modelling Scenario Planning Case 2
Item Unit Total 2010 2011 2012 2013 2014 2015 2016 2017 2018 2019 2020
Production
Total Material Movement kt 115,407 895 7,657 8,844 2,070 31,739 21,705 22,225 15,970 1,877 1,585 840 Waste Mined kt 97,457 - 5,980 7,106 354 30,017 20,000 20,000 14,000- - - - Ore Mined kt 17,950 895 1,677 1,738 1,716 1,722 1,705 2,225 1,970 1,877 1,585 840 Strip Ratio : - - 293 14 - 61 40 23 23 - - - Ore Processed kt 17,510 799 1,700 1,700 1,701 1,700 1,700 1,700 1,700 1,700 1,700 1,410 Cu Recovered kt 299 17 28 30 36 30 30 26 26 26 27 23 Pb Recovered kt 37 4 8 6 3 3 3 3 3 3 2 3 Zn Recovered kt 823 40 80 60 27 66 78 102 104 104 93 69 Ag Recovered koz 9,316 754 1,506 1,215 569 622 723 679 679 679 600 1,289 Au Recovered koz 159 14 28 24 10 12 13 12 12 8 8 17 Operating Costs
Mining A$M 1,302.2 53.7 124.0 107.7 57.1 195.8 159.7 174.7 155.4 107.9 101.2 64.9 Processing A$M 467.5 21.3 45.4 45.4 45.4 45.4 45.4 45.4 45.4 45.4 45.4 37.7 Concentrate Transport and Port A$M 304.2 17.1 27.7 24.9 19.9 25.2 30.1 36.1 33.2 33.2 31.5 25.3 Administration A$M 183.7 8.3 17.9 17.9 17.9 17.9 17.9 17.9 17.9 17.9 17.9 14.3 Total Operating Costs A$M 2,257.6 100.4 215.0 195.9 140.3 284.3 253.1 274.1 251.9 204.4 196.0 142.2
Capital Costs
Resource Development A$M 65.2 9.4 13.6 15.2 12.5 8.5 6.1 - - - - - Sustaining A$M 213.2 24.2 40.1 40.4 36.0 31.0 20.5 16.0 5.0 - - - Expansion A$M 190.3 - - 23.5 64.8 45.7 28.3 22.5 5.5 - - - Closure and Rehabilitation A$M 43.5 - - - - - - - - - - 43.5 Total Capital Costs A$M 512.3 33.6 53.7 79.1 113.3 85.2 54.9 38.5 10.5 - - 43.5
4.19 Technical Risks and Opportunities
Sustaining the current rate of production from the Golden Grove operations beyond 2013/14 is heavily dependent on:
� upgrading confidence of known orebody extensions that are not currently included in reserves
� delineation of new ore sources.
A factor that presents an additional challenge to production from Gossan Hill is that an increasing portion of future production will need to be mined from deeper parts of the deposit.
The planned recommencement of production at Scuddles will be a positive in that it is an additional ore source, but its likely production rate of 0.3 Mtpa will only partially offset the impact of depletion of mining inventory at Gossan Hill.
The proposed copper oxide pit will only provide an additional short term ore source throughout 2013 and 2014.
The outcome of the current exploration drilling programme at Gossan Valley will play a significant part in the possible extension of mine life at Golden Grove. Subject to defining the expected resources at Gossan Valley, timing of evaluation, approval and development of orebody access will be critical to maintaining the current production rate from Golden Grove.
The site closure cost allowance has been significantly increased to adequately allow for rehabilitation of the large quantity of sulphidic waste in the ROM pad at Gossan Hill. This increase has mitigated the risk that closure costs may be higher than anticipated.
●
APPENDIX IV COMPETENT PERSON’S REPORT
— IV-71 —

MINMETALS RESOURCES LIMITED Competent Person’s Report on Minerals and Metals Group
AMC210063-10rpt_1 101122 64
5 AVEBURY
5.1 Introduction
The Avebury nickel mine is currently on care and maintenance.
The Avebury Mine is an underground mining operation within Mining Lease ML 3M/2003. The deposit is located on the north-west coast of Tasmania, 6 km west of Zeehan. The deposit was discovered during 1997 to 1998. An access decline was excavated in 2003 to 2004, ore development commenced in June 2007 and production stoping commenced in January 2008. In response to low metal prices, mining operations were suspended in December 2008 and milling in January 2009.
Mining operations had not reached full scale production at the time operations were suspended.
5.2 Geological Setting
Avebury is a nickel sulphide deposit located in the mid Cambrian, Mc Ivor Hill Ultramafic Complex, which has been intruded into Proterozoic and Cambrian aged sediments and volcanics. The nearby Heemskirk and Pine Hill granites are believed to have been the source of mineralisation.
The Avebury mineralisation is predominantly nickel sulphides such as pentlandite, with pyrrhotite and magnetite, occurring as steeply dipping gradational domains within and predominantly adjacent to the margins of the serpentinised Mid to Late Cambrian McIvor Hill Ultramafic Complex. The mineralisation and host sequence generally strike east-north-east with mineralisation domains of between 2m and 40m in thickness, with an average true width of 10m. There are 28 mineralised nickel domains with four main domains. Mineralogical characterisation being undertaken in 2009 and 2010 indicates that a proportion, approximately 0.15% nickel, is in the form of nickel silicates rather than nickel sulphides. With the exception of some recent drilling all geological data has been assayed for total nickel only. The block model contains total nickel which is inclusive of nickel silicates that cannot be recovered by the existing floatation process.
Further work is planned to establish the benefit of committing to assaying all samples for sulphide and silicate nickel.
The Avebury host rock and mineralisation contains low grade background arsenic in the form of nickel arsenides. There appears to be no correlation between the arsenic and nickel geological domains. There are some zones within the mineralisation with significant arsenic levels in excess of 1%. Arsenic has been interpreted and modelled separately in the mineral resource estimate. Before the suspension of operations, procedures were implemented to manage the arsenic content of the ore through grade control and blending. Insufficient time elapsed before suspension of operations to estimate the success of these procedures.
Near mine exploration and resource definition drilling commenced in May 2010. The aim of this drilling is to join East Avebury with the main Avebury deposit, increase the Mineral Resource and assist to gain a better understanding of the mineralisation controls.
Figure 5.1 shows a long projection of the Avebury mineralisation, with the different lenses shown as different colours. Figure 5.2 shows a geological cross section of the Avebury deposit.
●
APPENDIX IV COMPETENT PERSON’S REPORT
— IV-72 —
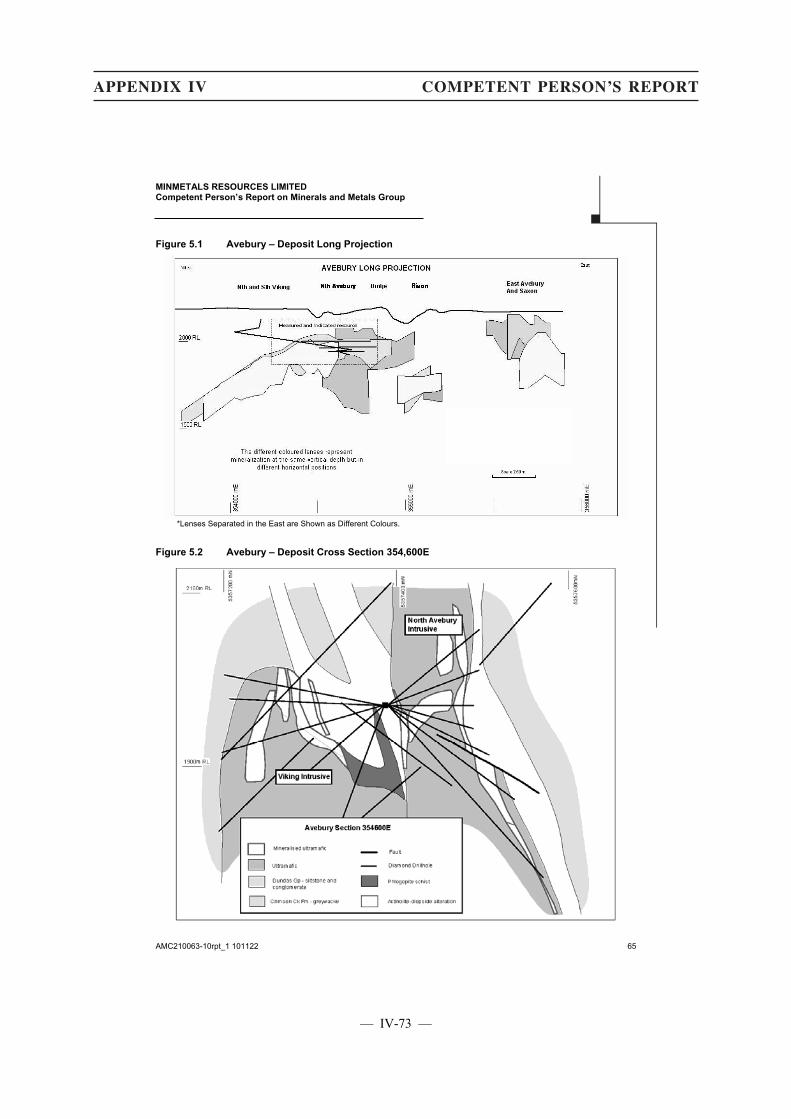
MINMETALS RESOURCES LIMITED Competent Person’s Report on Minerals and Metals Group
AMC210063-10rpt_1 101122 65
Figure 5.1 Avebury – Deposit Long Projection
*Lenses Separated in the East are Shown as Different Colours.
Figure 5.2 Avebury – Deposit Cross Section 354,600E
●
APPENDIX IV COMPETENT PERSON’S REPORT
— IV-73 —

MINMETALS RESOURCES LIMITED Competent Person’s Report on Minerals and Metals Group
AMC210063-10rpt_1 101122 66
5.3 Mineral Resource
The Avebury Mineral Resource reported by MMG as at 30 June 2009 is presented in Table 5.1.
Table 5.1 Avebury – Mineral Resource as at 30 June 2009
Classification Tonnes (Mt)
Nickel (%)
Measured 3.4 1.1 Indicated 4.7 1.0 Inferred 14.0 0.9 Total 22.0 1.0
Resources are stated at 0.4% Ni cut-off grade. Mineral Resources are total nickel, inclusive of sulphide and silicates mineralisation.
The mineral resource has increased since the previously reported figures in June 2008 with the inclusion of additional in mine and exploration drilling undertaken between June 2008 and December 2008. The Mineral Resource was updated prior to closure but not publicly reported until June 2009. The increase in the Inferred Mineral Resource is the inclusion of the East Avebury mineralisation and down dip North Avebury and Viking.
It should be noted that a 0.4% nickel cut-off was used for resource estimation and that down dip and along strike continuity becomes difficult to maintain at a cut-off grade greater than 1% nickel.
5.4 Ore Reserves
MMG did not report an Ore Reserves for Avebury in 2009.
The previously reported 2008 Ore Reserves included Proved and Probable Ore Reserves totalling 5.8 Mt at 1.0% nickel average grade and used a 0.7% nickel cut-off.
It should be noted that there is only a small margin between the 2008 reserve grade and the revised cut-off grade (0.9% nickel).
5.5 Exploration and Potential for Future Reserves
There is significant potential for exploration success in the Zeehan Mineral Field and the Mt Read Volcanics. The area contains numerous significant orebodies and many small scale historic workings. The area in which MMG has tenure to the south-west of the Avebury mine lease is highly prospective for ultramafic nickel sulphide and skarn style deposits.
Near-mine and district wide exploration has been on-going since the discovery of the main Avebury deposit, with successful near mine exploration adding to the planned mine life. Exploration programmes have used aeromagnetics, broad spaced surface mapping, geochemical soil sampling, diamond drilling to test for anomalous nickel, arsenic, zinc and chromium.
The Mining Lease 2M/2007 which existed over the Melba Flats area, 5 km north-east of Zeehan on the Murchison Highway, has been converted back into an exploration lease by MMG. Additional exploration will be undertaken for what is believed to be a more traditional higher grade nickel sulphide style mineralisation. The Melba Flats area contains numerous historic mine workings for silver, lead, zinc and nickel. No production has recently occurred from this field.
5.6 Mining Operations
The January 2007 feasibility study for Avebury was based on a production rate of 0.9 Mtpa. Before suspension of mining, the actual production rate had peaked in December 2008 at an annualised rate of 0.69 Mtpa. At the end of December 2008, the mine had produced a total of approximately 0.39 Mt of ore at 0.97% nickel.
●
APPENDIX IV COMPETENT PERSON’S REPORT
— IV-74 —
MINMETALS RESOURCES LIMITED Competent Person’s Report on Minerals and Metals Group
AMC210063-10rpt_1 101122 67
Mining methods were transverse and longitudinal long-hole open stoping. Transverse stopes were used in areas where the orebody width exceeded 8m. Longitudinal bench stoping occurred in areas less than 8m wide. Prior to the suspension of operations, rock and cemented rock backfill was used. A proposed paste backfill plant had not been constructed.
5.7 Processing and Concentrate Handling
The Avebury treatment flowsheet incorporates crushing and grinding of the ore followed by a flotation circuit that incorporates magnetic separation and regrinding on the flotation tailings. Although the magnetic separation and regrind equipment had been installed and commissioned, these units had only been utilised on an intermittent basis during the latter stages of the plant operation prior to the shut-down. Initial commissioning of the plant commenced in July 2008. Typical of flotation process plant commissioning, the production statistics indicate that the ore throughput rate progressively improved over time but improvements in concentrate grade and metallurgical recovery lagged behind. As at December 2008, the annualised ore milling rate had reached 93% of target (0.9 Mtpa). However contained metal production rate was only 62% of the design output. Materials handling difficulties had been encountered and the ore throughput rate had been achieved primarily by allowing the grind size to coarsen, a consideration that adversely impacted on the flotation performance. Apart from the low nickel recoveries, problems had been experienced in controlling the arsenic level in concentrate. The arsenic occurs in various nickel sulphide minerals which are recovered into the concentrate during the flotation process.
AMC anticipates that the design throughput rate would be achieved some nine months after resumption of operations provided that modifications to overcome the materials handling difficulties are implemented in the crushing circuit, including time to recruit and train operators together with some capital refurbishment of the plant. Target metallurgical performance might not be consistently attained for some considerable time thereafter however, particularly in relation to resolving the arsenic issue. It is likely that a hydrometallurgical leach process will be required to remove the arsenic from the flotation concentrate and although scout leach testwork has been carried out as a first step in identifying an appropriate process technique, it will take considerable time and effort to progress a testwork programme in sufficient detail to take any selected hydrometallurgical process route through to a design-construct phase.
It is estimated that a cost of circa A$5M could well be required to rectify the materials handling and processing constraints that presently exist in the treatment plant while a further A$10M could be needed for installation of the arsenic leach process. It is anticipated that a 17% nickel concentrate could be produced at 79% recovery of nickel and with arsenic levels below the penalty threshold if an effective arsenic leach process was installed.
AMC anticipates that some capital refurbishment would also be required to re-commission the existing processing operation. Although most of the plant is located in an enclosed building, crushing and conveying equipment as well as the concentrate thickener are exposed to the elements and some deterioration of the plant is expected over time even though the plant is being serviced on a care and maintenance programme. In addition, it is anticipated that most of the first fill commodities such as reagents and lubricants would have to be replaced prior to recommissioning. Operating personnel would have to be recruited and trained.
5.8 Environment
Acid mine drainage and associated water management are significant issues at Avebury, because treated drainage water reports ultimately to the nearby Comstock Creek. Contaminated water is mixed with relatively-alkaline mine water and directed to the TSF, settling pond, a wetland and a water storage dam before discharge. Some drains have been lined with limestone to assist removal of soluble metals, and flocculants added to remove suspended particles.
There is a history of exceedances of water-quality thresholds established by the environmental permit for the operation, but a significant number of these have properly been shown to result from poor quality upstream water, rather than from Avebury discharges per se. Negotiations with the environmental regulator have resulted in refinement of the monitoring and reporting systems to reflect upstream water quality, and there is no apparent current or imminent threat of coercive action by the regulator.
●
APPENDIX IV COMPETENT PERSON’S REPORT
— IV-75 —
MINMETALS RESOURCES LIMITED Competent Person’s Report on Minerals and Metals Group
AMC210063-10rpt_1 101122 68
Closure costs were estimated by an external and experienced consultant in late 2009 at approximately A$1.0M (net of demolition costs, and unchanged from 2008). Given that the strategic plan is to use acid-forming mine waste to backfill underground voids created during mining, this estimate is considered by AMC to be reasonable for current assessment purposes. However, it may require thorough review once long term plans for mining, waste management and water management are firmly established.
5.9 Operating and Capital Costs
In order to re-establish the operation at Avebury, AMC has estimated that a capital allocation of approximately A$5M would be required to refurbish the process equipment and re-commission the plant and a further A$10M could be needed for installation of the arsenic leach process. The costs of re-establishing the mining would depend upon decisions relating to equipment purchases and capitalised mine rehabilitation and development.
AMC’s has revised MMG’s estimates of the range of future operating costs as listed below:
� Mining: A$60.00/t to A$65.00/t.
� Milling: A$26.50/t to A$31.50/t.
� Site overheads, administration and sustaining capital: A$12.00/t to A$13.00/t.
MMG notes that the mining and milling costs are unlikely to be further reduced, and it is AMC’s opinion that the mining costs are overly optimistic, for example compared with the nearby Rosebery mining operations.
5.10 AMC Modelling Scenarios
AMC has prepared two modelling scenarios for the Avebury operation based on MMG’s feasibility study. As there are no reported reserves for Avebury, only the Planning Case 1 and Planning Case 2 have been prepared. Key aspects of the modelling scenarios are:
Planning Case 1
The main points are:
� Based on the scheduled portion of the reported mining inventory at full production.
� The total tonnage and feed grade presented in the plan is underpinned by a feasibility mining plan that has been adopted without modification to the production plan, based on a planned production rate of about 900 ktpa. Forecast mining costs have however been substantially increased by AMC to be more in line with industry experience.
� Metallurgical performances assumed by AMC have in some cases been moderated slightly to reflect recent historical performance. Operating costs as presented by MMG in its plan have been adopted without modification.
� Capital expenditure on upgrades about the processing facility is included.
Refer Table 5.2.
●
APPENDIX IV COMPETENT PERSON’S REPORT
— IV-76 —
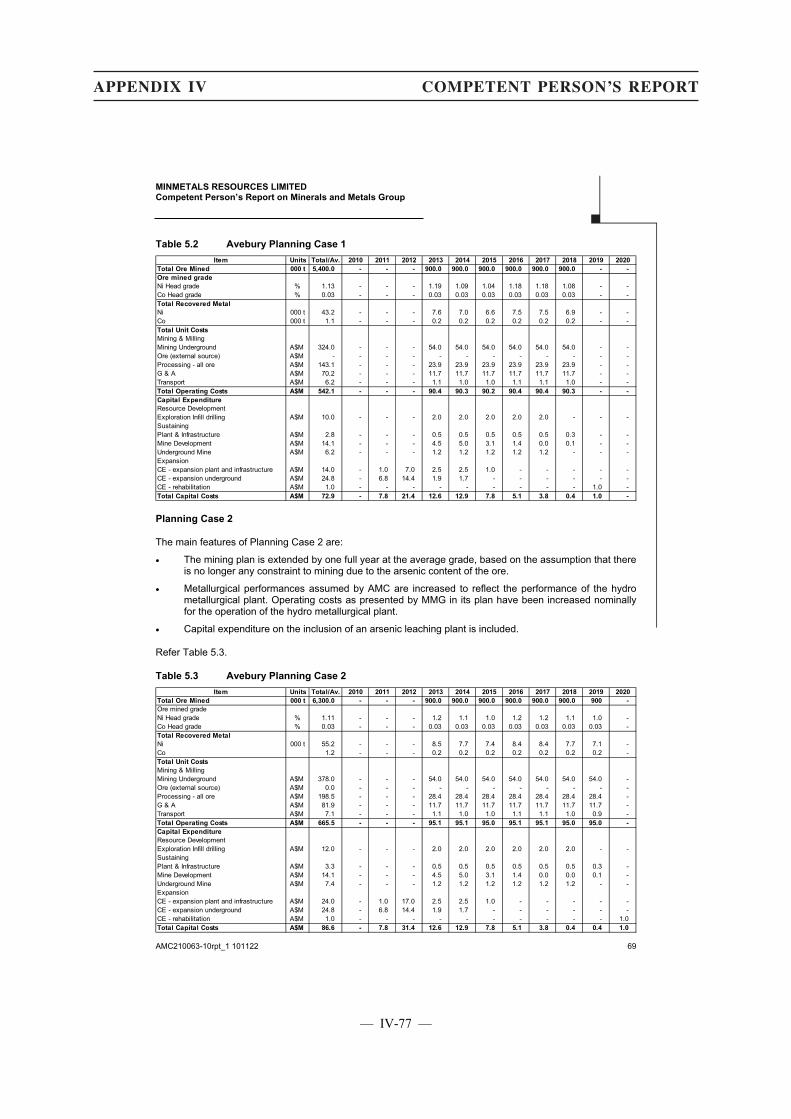
MINMETALS RESOURCES LIMITED Competent Person’s Report on Minerals and Metals Group
AMC210063-10rpt_1 101122 69
Table 5.2 Avebury Planning Case 1
Item Units Total/Av. 2010 2011 2012 2013 2014 2015 2016 2017 2018 2019 2020
Total Ore Mined 000 t 5,400.0 - - - 900.0 900.0 900.0 900.0 900.0 900.0 - -
Ore mined grade
Ni Head grade % 1.13 - - - 1.19 1.09 1.04 1.18 1.18 1.08 - -Co Head grade % 0.03 - - - 0.03 0.03 0.03 0.03 0.03 0.03 - -Total Recovered Metal
Ni 000 t 43.2 - - - 7.6 7.0 6.6 7.5 7.5 6.9 - -Co 000 t 1.1 - - - 0.2 0.2 0.2 0.2 0.2 0.2 - -Total Unit Costs
Mining & MillingMining Underground A$M 324.0 - - - 54.0 54.0 54.0 54.0 54.0 54.0 - -Ore (external source) A$M - - - - - - - - - - - -Processing - all ore A$M 143.1 - - - 23.9 23.9 23.9 23.9 23.9 23.9 - -G & A A$M 70.2 - - - 11.7 11.7 11.7 11.7 11.7 11.7 - -Transport A$M 6.2 - - - 1.1 1.0 1.0 1.1 1.1 1.0 - -Total Operating Costs A$M 542.1 - - - 90.4 90.3 90.2 90.4 90.4 90.3 - -
Capital Expenditure
Resource DevelopmentExploration Infill drilling A$M 10.0 - - - 2.0 2.0 2.0 2.0 2.0 - - -SustainingPlant & Infrastructure A$M 2.8 - - - 0.5 0.5 0.5 0.5 0.5 0.3 - -Mine Development A$M 14.1 - - - 4.5 5.0 3.1 1.4 0.0 0.1 - -Underground Mine A$M 6.2 - - - 1.2 1.2 1.2 1.2 1.2 - - -ExpansionCE - expansion plant and infrastructure A$M 14.0 - 1.0 7.0 2.5 2.5 1.0 - - - - -CE - expansion underground A$M 24.8 - 6.8 14.4 1.9 1.7 - - - - - -CE - rehabilitation A$M 1.0 - - - - - - - - - 1.0 -Total Capital Costs A$M 72.9 - 7.8 21.4 12.6 12.9 7.8 5.1 3.8 0.4 1.0 -
Planning Case 2
The main features of Planning Case 2 are:
� The mining plan is extended by one full year at the average grade, based on the assumption that there is no longer any constraint to mining due to the arsenic content of the ore.
� Metallurgical performances assumed by AMC are increased to reflect the performance of the hydro metallurgical plant. Operating costs as presented by MMG in its plan have been increased nominally for the operation of the hydro metallurgical plant.
� Capital expenditure on the inclusion of an arsenic leaching plant is included.
Refer Table 5.3.
Table 5.3 Avebury Planning Case 2
Item Units Total/Av. 2010 2011 2012 2013 2014 2015 2016 2017 2018 2019 2020
Total Ore Mined 000 t 6,300.0 - - - 900.0 900.0 900.0 900.0 900.0 900.0 900 -
Ore mined gradeNi Head grade % 1.11 - - - 1.2 1.1 1.0 1.2 1.2 1.1 1.0 -Co Head grade % 0.03 - - - 0.03 0.03 0.03 0.03 0.03 0.03 0.03 -Total Recovered Metal
Ni 000 t 55.2 - - - 8.5 7.7 7.4 8.4 8.4 7.7 7.1 -Co 1.2 - - - 0.2 0.2 0.2 0.2 0.2 0.2 0.2 -Total Unit Costs
Mining & MillingMining Underground A$M 378.0 - - - 54.0 54.0 54.0 54.0 54.0 54.0 54.0 -Ore (external source) A$M 0.0 - - - - - - - - - - -Processing - all ore A$M 198.5 - - - 28.4 28.4 28.4 28.4 28.4 28.4 28.4 -G & A A$M 81.9 - - - 11.7 11.7 11.7 11.7 11.7 11.7 11.7 -Transport A$M 7.1 - - - 1.1 1.0 1.0 1.1 1.1 1.0 0.9 -Total Operating Costs A$M 665.5 - - - 95.1 95.1 95.0 95.1 95.1 95.0 95.0 -
Capital Expenditure
Resource DevelopmentExploration Infill drilling A$M 12.0 - - - 2.0 2.0 2.0 2.0 2.0 2.0 - -SustainingPlant & Infrastructure A$M 3.3 - - - 0.5 0.5 0.5 0.5 0.5 0.5 0.3 -Mine Development A$M 14.1 - - - 4.5 5.0 3.1 1.4 0.0 0.0 0.1 -Underground Mine A$M 7.4 - - - 1.2 1.2 1.2 1.2 1.2 1.2 - -ExpansionCE - expansion plant and infrastructure A$M 24.0 - 1.0 17.0 2.5 2.5 1.0 - - - - -CE - expansion underground A$M 24.8 - 6.8 14.4 1.9 1.7 - - - - - -CE - rehabilitation A$M 1.0 - - - - - - - - - - 1.0Total Capital Costs A$M 86.6 - 7.8 31.4 12.6 12.9 7.8 5.1 3.8 0.4 0.4 1.0
●
APPENDIX IV COMPETENT PERSON’S REPORT
— IV-77 —
MINMETALS RESOURCES LIMITED Competent Person’s Report on Minerals and Metals Group
AMC210063-10rpt_1 101122 70
5.11 Technical Risks and Opportunities
Current risks related to the Avebury mine are related principally to the management of arsenic in the production stream. Lesser risks would be related to the ability to achieve the production schedule, and the constraints on production that would occur if the mining system reverts to a predominantly uncemented or waste rock type of backfill.
Assuming the care and maintenance regime is sufficient, it should be straightforward to reopen the mine once nickel prices improve. The tenements also have significant exploration potential.
As the process plant has not yet achieved design capacity metal output, it has not yet proven that the planned metallurgical recoveries can be achieved. The planned performance of the proposed leach plant is based on limited test work and requires further investigation.
●
APPENDIX IV COMPETENT PERSON’S REPORT
— IV-78 —
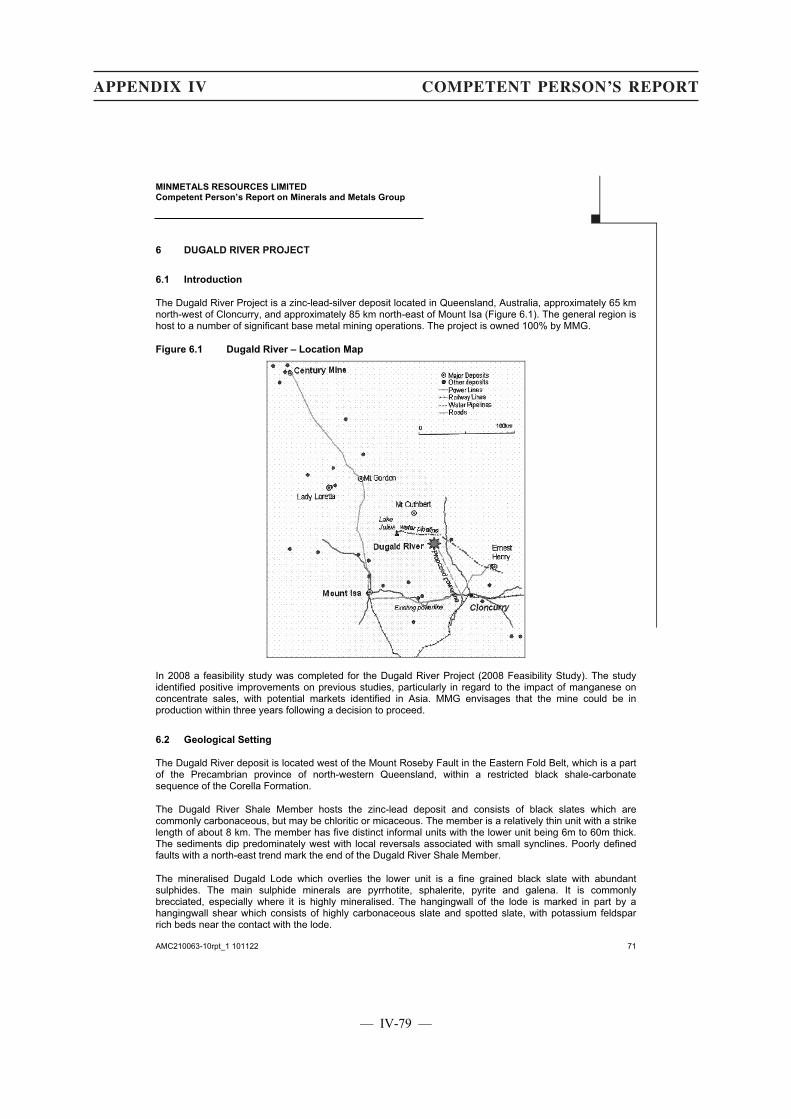
MINMETALS RESOURCES LIMITED Competent Person’s Report on Minerals and Metals Group
AMC210063-10rpt_1 101122 71
6 DUGALD RIVER PROJECT
6.1 Introduction
The Dugald River Project is a zinc-lead-silver deposit located in Queensland, Australia, approximately 65 km north-west of Cloncurry, and approximately 85 km north-east of Mount Isa (Figure 6.1). The general region is host to a number of significant base metal mining operations. The project is owned 100% by MMG.
Figure 6.1 Dugald River – Location Map
In 2008 a feasibility study was completed for the Dugald River Project (2008 Feasibility Study). The study identified positive improvements on previous studies, particularly in regard to the impact of manganese on concentrate sales, with potential markets identified in Asia. MMG envisages that the mine could be in production within three years following a decision to proceed.
6.2 Geological Setting
The Dugald River deposit is located west of the Mount Roseby Fault in the Eastern Fold Belt, which is a part of the Precambrian province of north-western Queensland, within a restricted black shale-carbonate sequence of the Corella Formation.
The Dugald River Shale Member hosts the zinc-lead deposit and consists of black slates which are commonly carbonaceous, but may be chloritic or micaceous. The member is a relatively thin unit with a strike length of about 8 km. The member has five distinct informal units with the lower unit being 6m to 60m thick. The sediments dip predominately west with local reversals associated with small synclines. Poorly defined faults with a north-east trend mark the end of the Dugald River Shale Member.
The mineralised Dugald Lode which overlies the lower unit is a fine grained black slate with abundant sulphides. The main sulphide minerals are pyrrhotite, sphalerite, pyrite and galena. It is commonly brecciated, especially where it is highly mineralised. The hangingwall of the lode is marked in part by a hangingwall shear which consists of highly carbonaceous slate and spotted slate, with potassium feldspar rich beds near the contact with the lode.
●
APPENDIX IV COMPETENT PERSON’S REPORT
— IV-79 —
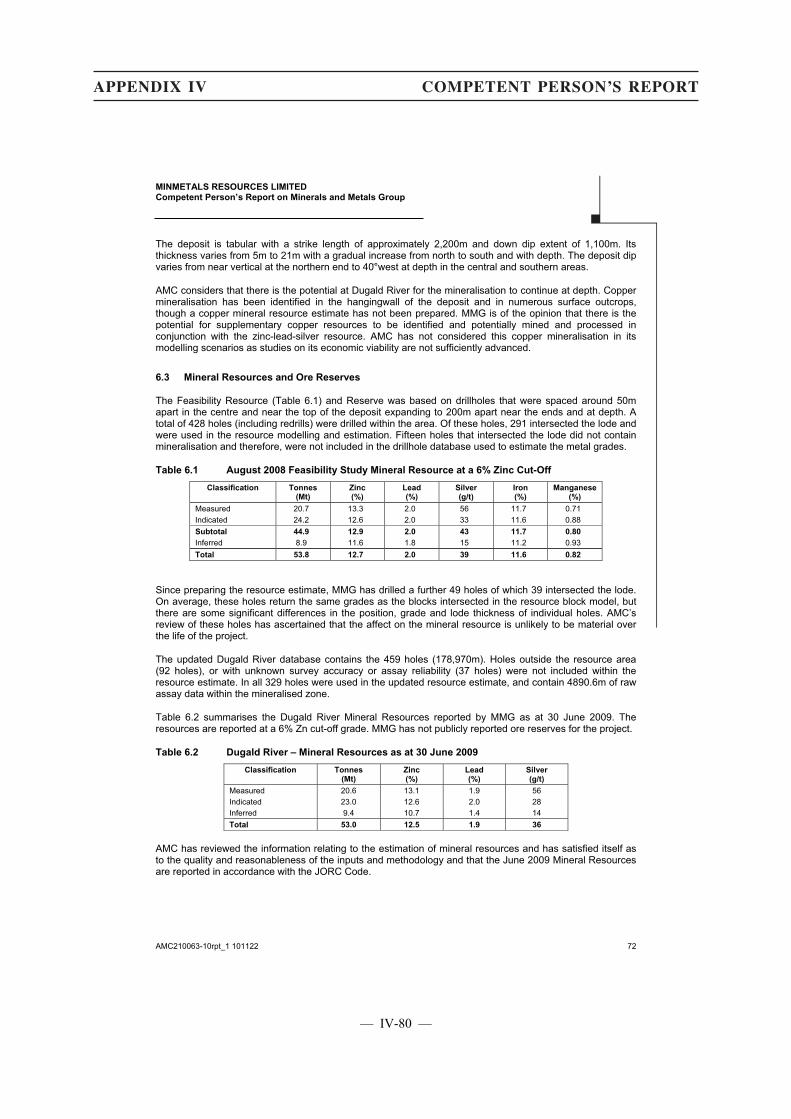
MINMETALS RESOURCES LIMITED Competent Person’s Report on Minerals and Metals Group
AMC210063-10rpt_1 101122 72
The deposit is tabular with a strike length of approximately 2,200m and down dip extent of 1,100m. Its thickness varies from 5m to 21m with a gradual increase from north to south and with depth. The deposit dip varies from near vertical at the northern end to 40�°west at depth in the central and southern areas.
AMC considers that there is the potential at Dugald River for the mineralisation to continue at depth. Copper mineralisation has been identified in the hangingwall of the deposit and in numerous surface outcrops, though a copper mineral resource estimate has not been prepared. MMG is of the opinion that there is the potential for supplementary copper resources to be identified and potentially mined and processed in conjunction with the zinc-lead-silver resource. AMC has not considered this copper mineralisation in its modelling scenarios as studies on its economic viability are not sufficiently advanced.
6.3 Mineral Resources and Ore Reserves
The Feasibility Resource (Table 6.1) and Reserve was based on drillholes that were spaced around 50m apart in the centre and near the top of the deposit expanding to 200m apart near the ends and at depth. A total of 428 holes (including redrills) were drilled within the area. Of these holes, 291 intersected the lode and were used in the resource modelling and estimation. Fifteen holes that intersected the lode did not contain mineralisation and therefore, were not included in the drillhole database used to estimate the metal grades.
Table 6.1 August 2008 Feasibility Study Mineral Resource at a 6% Zinc Cut-Off
Classification Tonnes (Mt)
Zinc (%)
Lead (%)
Silver (g/t)
Iron(%)
Manganese(%)
Measured 20.7 13.3 2.0 56 11.7 0.71 Indicated 24.2 12.6 2.0 33 11.6 0.88 Subtotal 44.9 12.9 2.0 43 11.7 0.80
Inferred 8.9 11.6 1.8 15 11.2 0.93 Total 53.8 12.7 2.0 39 11.6 0.82
Since preparing the resource estimate, MMG has drilled a further 49 holes of which 39 intersected the lode. On average, these holes return the same grades as the blocks intersected in the resource block model, but there are some significant differences in the position, grade and lode thickness of individual holes. AMC’s review of these holes has ascertained that the affect on the mineral resource is unlikely to be material over the life of the project.
The updated Dugald River database contains the 459 holes (178,970m). Holes outside the resource area (92 holes), or with unknown survey accuracy or assay reliability (37 holes) were not included within the resource estimate. In all 329 holes were used in the updated resource estimate, and contain 4890.6m of raw assay data within the mineralised zone.
Table 6.2 summarises the Dugald River Mineral Resources reported by MMG as at 30 June 2009. The resources are reported at a 6% Zn cut-off grade. MMG has not publicly reported ore reserves for the project.
Table 6.2 Dugald River – Mineral Resources as at 30 June 2009
Classification Tonnes (Mt)
Zinc (%)
Lead (%)
Silver (g/t)
Measured 20.6 13.1 1.9 56 Indicated 23.0 12.6 2.0 28 Inferred 9.4 10.7 1.4 14 Total 53.0 12.5 1.9 36
AMC has reviewed the information relating to the estimation of mineral resources and has satisfied itself as to the quality and reasonableness of the inputs and methodology and that the June 2009 Mineral Resources are reported in accordance with the JORC Code.
●
APPENDIX IV COMPETENT PERSON’S REPORT
— IV-80 —
MINMETALS RESOURCES LIMITED Competent Person’s Report on Minerals and Metals Group
AMC210063-10rpt_1 101122 73
6.4 Mining
Prior to the 2008 Feasibility Study, a range of mining studies were undertaken to establish the optimal mining method and project scale. Consideration of open pit operations transitioning to underground mining were evaluated, but not preferred. Of the underground mining options considered, a combination of down-hole benching and long-hole open stoping (LHOS) utilising rock and paste backfill at a combined rate of 2.0 Mtpa was selected.
The lode geometry lends itself to establishing two separate mining areas, the North Mine and the South Mine, accessed by two separate declines.It is envisaged that the bulk of the wider LHOS stopes will be mined from the South Mine (1.4 Mtpa) and 0.6 Mtpa from the North Mine. Levels will be mined on 25m vertical intervals to a depth of 1,100m below surface.
Based on the 2009 Mineral Resource estimate, the preferred mining method and expected mining recovery and dilution factors, MMG estimated a mining inventory which AMC has used as the basis for its valuation modelling scenarios. The mining inventory was estimated using a nett smelter return cut-off of A$125/t, which equates to 10.8% ZnEq4. AMC has examined the block model and concludes that the application of this relatively high cut-off to the resource (cut-off of 6% Zn) does not affect the continuity of the mineralisation included in the mining inventory; in fact it may be possible to increase the cut-off further without adversely affecting resource continuity.
6.5 Processing and Concentrate Handling
The predominant ore zone in the Dugald River deposit is a slate breccia with lesser proportions of banded breccia and massive breccia with galena and sphalerite constituting the value sulphide mineralisation. The dominant sulphide gangue mineral is pyrite, although pyrrhotite also occurs in varying proportions.
Mineralogical investigations have confirmed that manganese is present both in solid solution in the sphalerite as well as being associated with pyrrhotite. Although rejection of pyrrhotite could potentially minimise the manganese content of the final zinc concentrate, it will not be possible to alter the inherent manganese assay in the sphalerite mineral ensuing from the solid solution component.
Considerable metallurgical testwork has been undertaken on the Dugald River ore over the past 20 years with improvements in the process response being generated over time. Because of the fine grain size of the galena mineralisation in particular, it is only since the advent of commercial ultra-fine grinding mills that the major metallurgical advances have been made. Notable improvements in the lead metallurgy have ensued in recent years.
In relation to the zinc flotation response, a significant part of this work has been directed towards the high levels of manganese that can occur in the zinc concentrate. In the past, it was considered that the presence of manganese in the zinc concentrate would adversely impact downstream smelting processes.
MMG is of the opinion however that contemporary smelting and refining technologies and the development of facilities utilising these processing techniques have advanced in a way that will make it feasible to market high manganese zinc concentrates. MMG has received letters of intent from four smelters covering the total envisaged concentrate production, albeit with certain penalties for excess manganese content, supporting its opinion as to the saleability of the concentrate.
The Dugald River mineralisation requires fine grinding to achieve high metallurgical recoveries as is typical of the complex carbonaceous zinc/lead ores in the Mount Isa region. MMG has developed a process flowsheet (Figure 6.2) as part of the 2008 Feasibility Study which is based on the testwork results. The flowsheet however is typical for zinc/lead ores in the region. The process plant is envisaged to have a capacity of 2.0 Mtpa, consistent with the planned mine production rate.
4 ZnEq is defined on the basis of contribution to the nett smelter return as Zn% + Pb% ÷ 2 + Ag g/t ÷ 53
●
APPENDIX IV COMPETENT PERSON’S REPORT
— IV-81 —
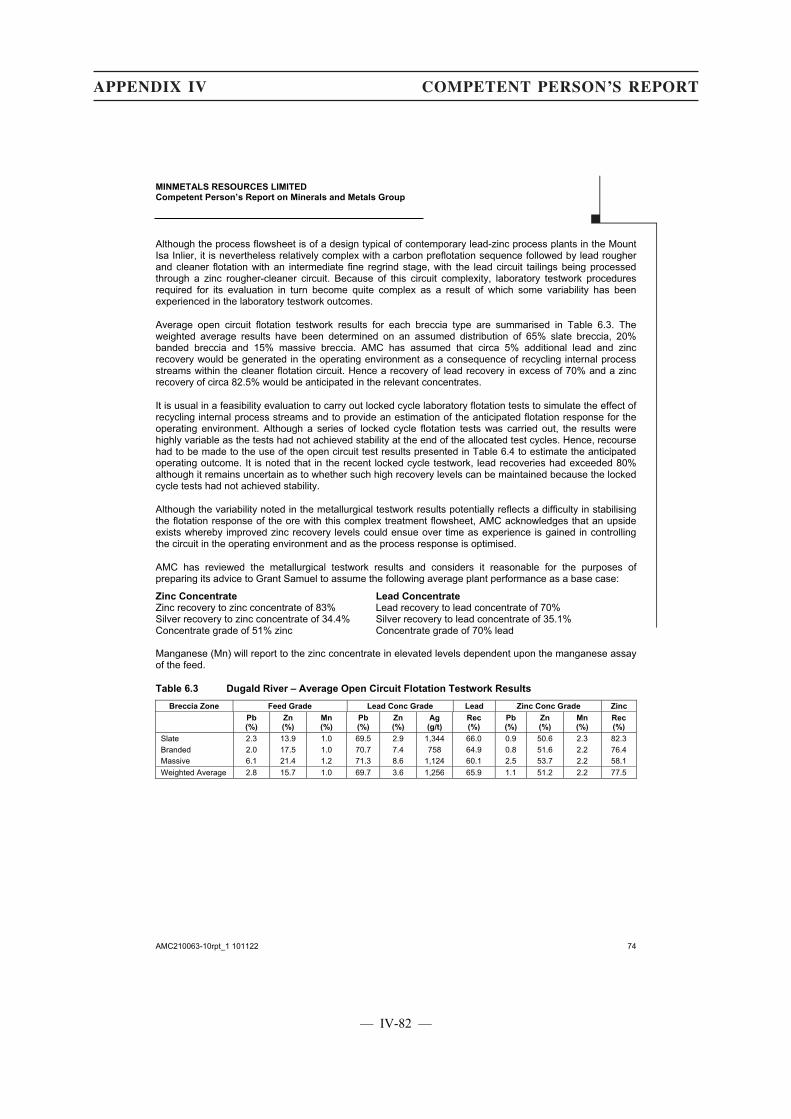
MINMETALS RESOURCES LIMITED Competent Person’s Report on Minerals and Metals Group
AMC210063-10rpt_1 101122 74
Although the process flowsheet is of a design typical of contemporary lead-zinc process plants in the Mount Isa Inlier, it is nevertheless relatively complex with a carbon preflotation sequence followed by lead rougher and cleaner flotation with an intermediate fine regrind stage, with the lead circuit tailings being processed through a zinc rougher-cleaner circuit. Because of this circuit complexity, laboratory testwork procedures required for its evaluation in turn become quite complex as a result of which some variability has been experienced in the laboratory testwork outcomes.
Average open circuit flotation testwork results for each breccia type are summarised in Table 6.3. The weighted average results have been determined on an assumed distribution of 65% slate breccia, 20% banded breccia and 15% massive breccia. AMC has assumed that circa 5% additional lead and zinc recovery would be generated in the operating environment as a consequence of recycling internal process streams within the cleaner flotation circuit. Hence a recovery of lead recovery in excess of 70% and a zinc recovery of circa 82.5% would be anticipated in the relevant concentrates.
It is usual in a feasibility evaluation to carry out locked cycle laboratory flotation tests to simulate the effect of recycling internal process streams and to provide an estimation of the anticipated flotation response for the operating environment. Although a series of locked cycle flotation tests was carried out, the results were highly variable as the tests had not achieved stability at the end of the allocated test cycles. Hence, recourse had to be made to the use of the open circuit test results presented in Table 6.4 to estimate the anticipated operating outcome. It is noted that in the recent locked cycle testwork, lead recoveries had exceeded 80% although it remains uncertain as to whether such high recovery levels can be maintained because the locked cycle tests had not achieved stability.
Although the variability noted in the metallurgical testwork results potentially reflects a difficulty in stabilising the flotation response of the ore with this complex treatment flowsheet, AMC acknowledges that an upside exists whereby improved zinc recovery levels could ensue over time as experience is gained in controlling the circuit in the operating environment and as the process response is optimised.
AMC has reviewed the metallurgical testwork results and considers it reasonable for the purposes of preparing its advice to Grant Samuel to assume the following average plant performance as a base case:
Zinc Concentrate Lead Concentrate Zinc recovery to zinc concentrate of 83% Lead recovery to lead concentrate of 70% Silver recovery to zinc concentrate of 34.4% Silver recovery to lead concentrate of 35.1% Concentrate grade of 51% zinc Concentrate grade of 70% lead Manganese (Mn) will report to the zinc concentrate in elevated levels dependent upon the manganese assay of the feed.
Table 6.3 Dugald River – Average Open Circuit Flotation Testwork Results
Breccia Zone Feed Grade Lead Conc Grade Lead Zinc Conc Grade Zinc
Pb(%)
Zn(%)
Mn(%)
Pb(%)
Zn(%)
Ag (g/t)
Rec(%)
Pb(%)
Zn(%)
Mn (%)
Rec (%)
Slate 2.3 13.9 1.0 69.5 2.9 1,344 66.0 0.9 50.6 2.3 82.3 Branded 2.0 17.5 1.0 70.7 7.4 758 64.9 0.8 51.6 2.2 76.4 Massive 6.1 21.4 1.2 71.3 8.6 1,124 60.1 2.5 53.7 2.2 58.1 Weighted Average 2.8 15.7 1.0 69.7 3.6 1,256 65.9 1.1 51.2 2.2 77.5
●
APPENDIX IV COMPETENT PERSON’S REPORT
— IV-82 —
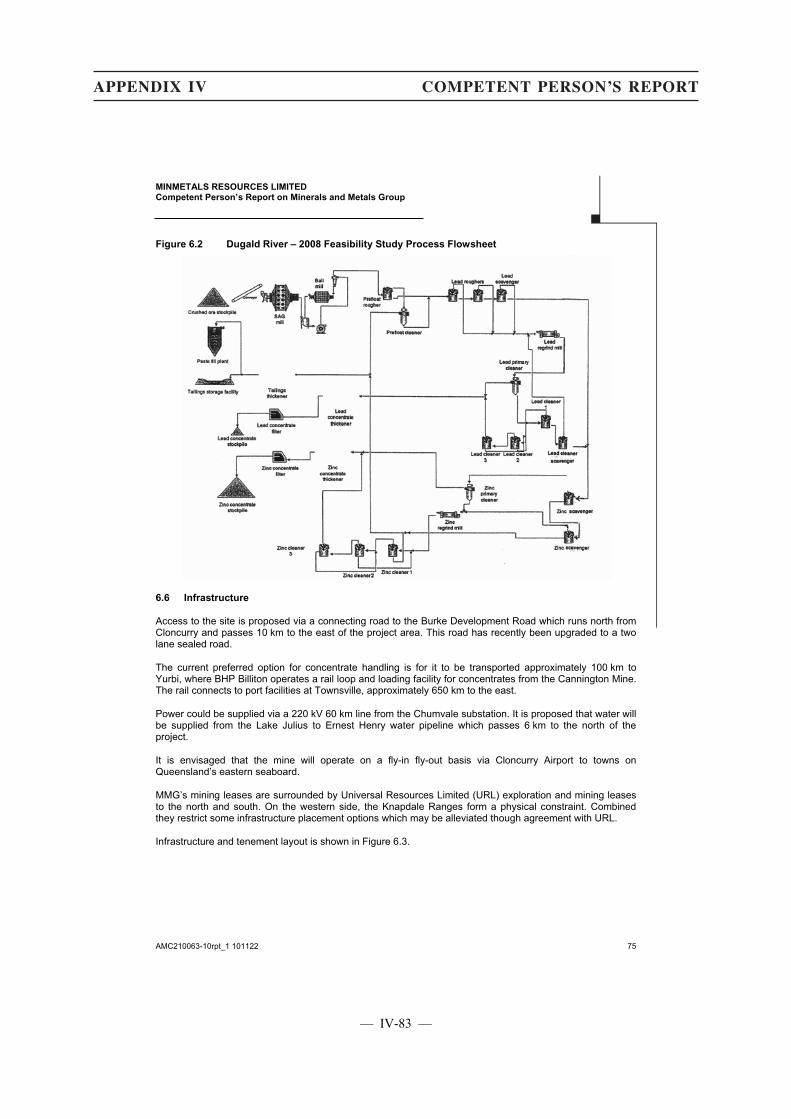
MINMETALS RESOURCES LIMITED Competent Person’s Report on Minerals and Metals Group
AMC210063-10rpt_1 101122 75
Figure 6.2 Dugald River – 2008 Feasibility Study Process Flowsheet
6.6 Infrastructure
Access to the site is proposed via a connecting road to the Burke Development Road which runs north from Cloncurry and passes 10 km to the east of the project area. This road has recently been upgraded to a two lane sealed road.
The current preferred option for concentrate handling is for it to be transported approximately 100 km to Yurbi, where BHP Billiton operates a rail loop and loading facility for concentrates from the Cannington Mine. The rail connects to port facilities at Townsville, approximately 650 km to the east.
Power could be supplied via a 220 kV 60 km line from the Chumvale substation. It is proposed that water will be supplied from the Lake Julius to Ernest Henry water pipeline which passes 6 km to the north of the project.
It is envisaged that the mine will operate on a fly-in fly-out basis via Cloncurry Airport to towns on Queensland’s eastern seaboard.
MMG’s mining leases are surrounded by Universal Resources Limited (URL) exploration and mining leases to the north and south. On the western side, the Knapdale Ranges form a physical constraint. Combined they restrict some infrastructure placement options which may be alleviated though agreement with URL.
Infrastructure and tenement layout is shown in Figure 6.3.
●
APPENDIX IV COMPETENT PERSON’S REPORT
— IV-83 —
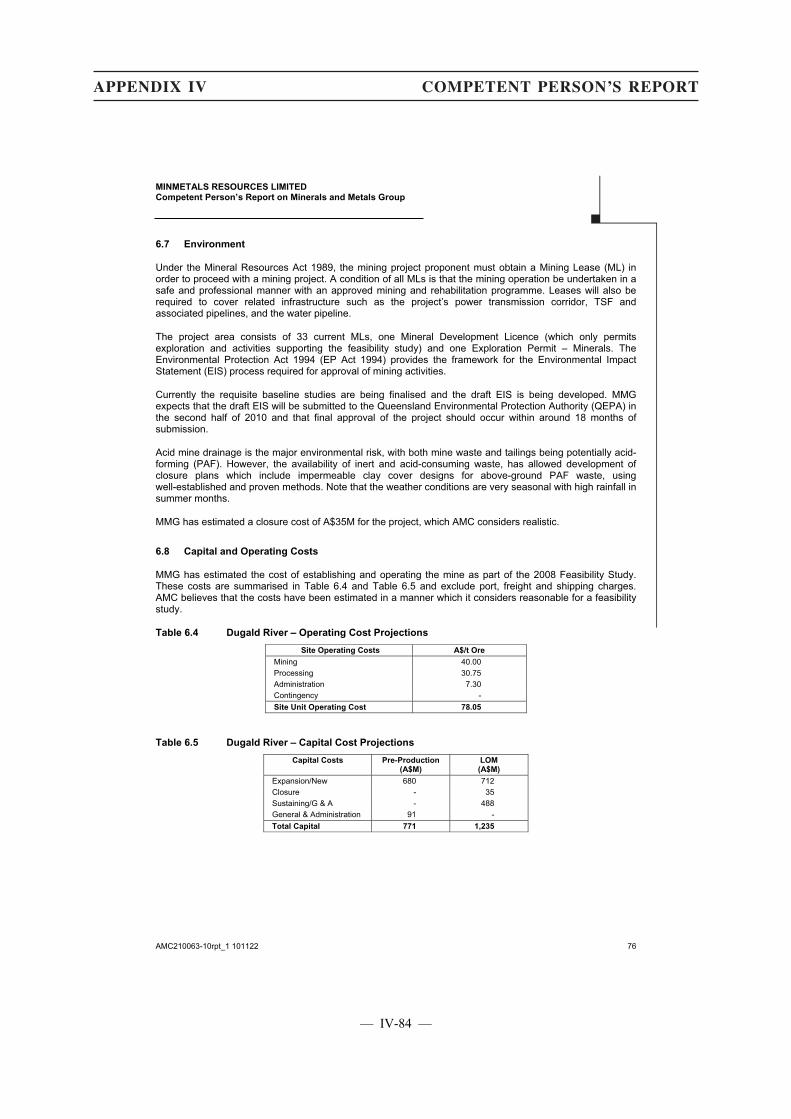
MINMETALS RESOURCES LIMITED Competent Person’s Report on Minerals and Metals Group
AMC210063-10rpt_1 101122 76
6.7 Environment
Under the Mineral Resources Act 1989, the mining project proponent must obtain a Mining Lease (ML) in order to proceed with a mining project. A condition of all MLs is that the mining operation be undertaken in a safe and professional manner with an approved mining and rehabilitation programme. Leases will also be required to cover related infrastructure such as the project’s power transmission corridor, TSF and associated pipelines, and the water pipeline.
The project area consists of 33 current MLs, one Mineral Development Licence (which only permits exploration and activities supporting the feasibility study) and one Exploration Permit – Minerals. The Environmental Protection Act 1994 (EP Act 1994) provides the framework for the Environmental Impact Statement (EIS) process required for approval of mining activities.
Currently the requisite baseline studies are being finalised and the draft EIS is being developed. MMG expects that the draft EIS will be submitted to the Queensland Environmental Protection Authority (QEPA) in the second half of 2010 and that final approval of the project should occur within around 18 months of submission.
Acid mine drainage is the major environmental risk, with both mine waste and tailings being potentially acid-forming (PAF). However, the availability of inert and acid-consuming waste, has allowed development of closure plans which include impermeable clay cover designs for above-ground PAF waste, using well-established and proven methods. Note that the weather conditions are very seasonal with high rainfall in summer months.
MMG has estimated a closure cost of A$35M for the project, which AMC considers realistic.
6.8 Capital and Operating Costs
MMG has estimated the cost of establishing and operating the mine as part of the 2008 Feasibility Study. These costs are summarised in Table 6.4 and Table 6.5 and exclude port, freight and shipping charges. AMC believes that the costs have been estimated in a manner which it considers reasonable for a feasibility study.
Table 6.4 Dugald River – Operating Cost Projections
Site Operating Costs A$/t Ore
Mining 40.00 Processing 30.75 Administration 7.30 Contingency - Site Unit Operating Cost 78.05
Table 6.5 Dugald River – Capital Cost Projections
Capital Costs Pre-Production (A$M)
LOM(A$M)
Expansion/New 680 712 Closure - 35 Sustaining/G & A - 488 General & Administration 91 - Total Capital 771 1,235
●
APPENDIX IV COMPETENT PERSON’S REPORT
— IV-84 —
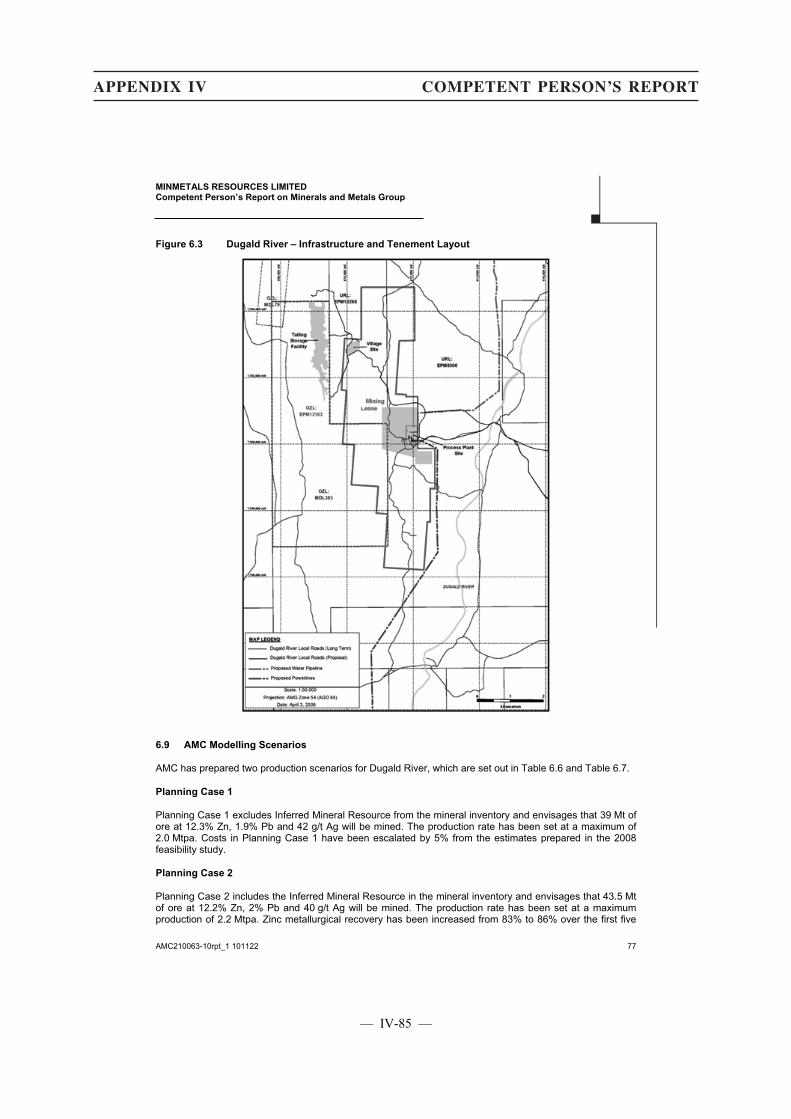
MINMETALS RESOURCES LIMITED Competent Person’s Report on Minerals and Metals Group
AMC210063-10rpt_1 101122 77
Figure 6.3 Dugald River – Infrastructure and Tenement Layout
6.9 AMC Modelling Scenarios
AMC has prepared two production scenarios for Dugald River, which are set out in Table 6.6 and Table 6.7.
Planning Case 1
Planning Case 1 excludes Inferred Mineral Resource from the mineral inventory and envisages that 39 Mt of ore at 12.3% Zn, 1.9% Pb and 42 g/t Ag will be mined. The production rate has been set at a maximum of 2.0 Mtpa. Costs in Planning Case 1 have been escalated by 5% from the estimates prepared in the 2008 feasibility study.
Planning Case 2
Planning Case 2 includes the Inferred Mineral Resource in the mineral inventory and envisages that 43.5 Mt of ore at 12.2% Zn, 2% Pb and 40 g/t Ag will be mined. The production rate has been set at a maximum production of 2.2 Mtpa. Zinc metallurgical recovery has been increased from 83% to 86% over the first five
●
APPENDIX IV COMPETENT PERSON’S REPORT
— IV-85 —
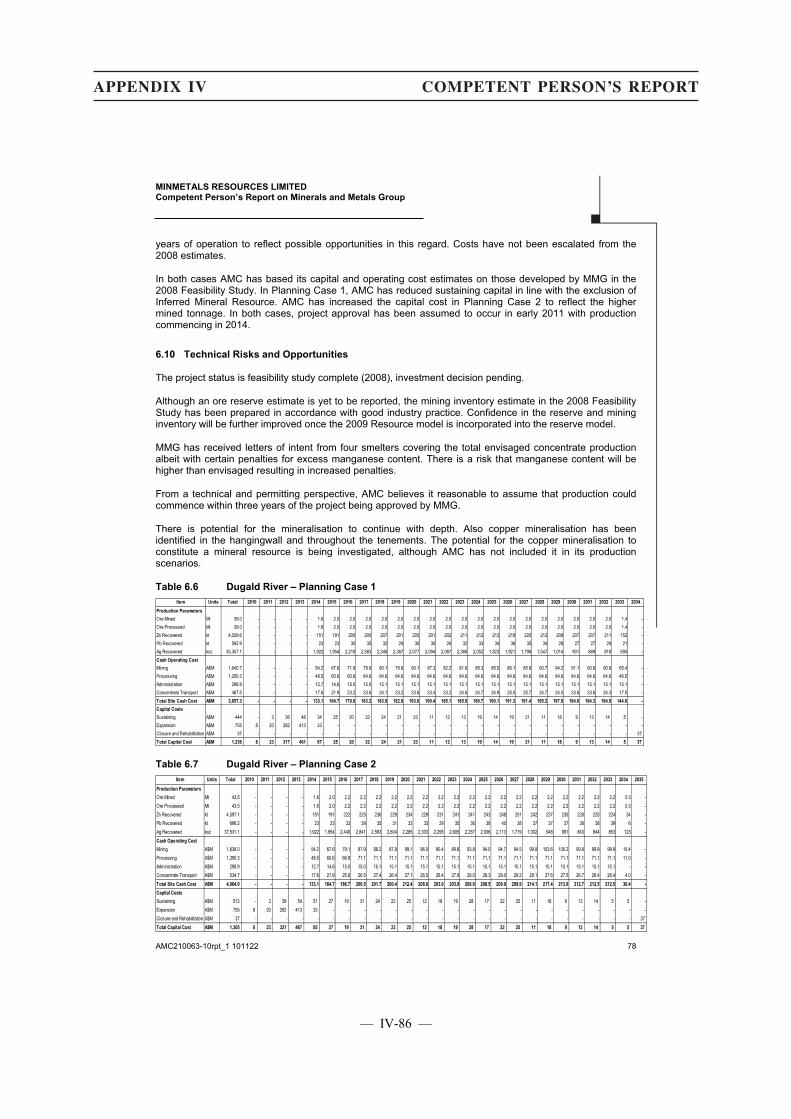
MINMETALS RESOURCES LIMITED Competent Person’s Report on Minerals and Metals Group
AMC210063-10rpt_1 101122 78
years of operation to reflect possible opportunities in this regard. Costs have not been escalated from the 2008 estimates.
In both cases AMC has based its capital and operating cost estimates on those developed by MMG in the 2008 Feasibility Study. In Planning Case 1, AMC has reduced sustaining capital in line with the exclusion of Inferred Mineral Resource. AMC has increased the capital cost in Planning Case 2 to reflect the higher mined tonnage. In both cases, project approval has been assumed to occur in early 2011 with production commencing in 2014.
6.10 Technical Risks and Opportunities
The project status is feasibility study complete (2008), investment decision pending.
Although an ore reserve estimate is yet to be reported, the mining inventory estimate in the 2008 Feasibility Study has been prepared in accordance with good industry practice. Confidence in the reserve and mining inventory will be further improved once the 2009 Resource model is incorporated into the reserve model.
MMG has received letters of intent from four smelters covering the total envisaged concentrate production albeit with certain penalties for excess manganese content. There is a risk that manganese content will be higher than envisaged resulting in increased penalties.
From a technical and permitting perspective, AMC believes it reasonable to assume that production could commence within three years of the project being approved by MMG.
There is potential for the mineralisation to continue with depth. Also copper mineralisation has been identified in the hangingwall and throughout the tenements. The potential for the copper mineralisation to constitute a mineral resource is being investigated, although AMC has not included it in its production scenarios.
Table 6.6 Dugald River – Planning Case 1
Item Units Total 2010 2011 2012 2013 2014 2015 2016 2017 2018 2019 2020 2021 2022 2023 2024 2025 2026 2027 2028 2029 2030 2031 2032 2033 2034
Production Parameters
Ore Mined Mt 39.0 - - - - 1.6 2.0 2.0 2.0 2.0 2.0 2.0 2.0 2.0 2.0 2.0 2.0 2.0 2.0 2.0 2.0 2.0 2.0 2.0 1.4 -Ore Processed Mt 39.0 - - - - 1.6 2.0 2.0 2.0 2.0 2.0 2.0 2.0 2.0 2.0 2.0 2.0 2.0 2.0 2.0 2.0 2.0 2.0 2.0 1.4 -Zn Recovered kt 4,029.6 - - - - 151 191 200 200 207 201 205 201 202 211 212 213 218 220 212 208 207 207 211 152 -Pb Recovered kt 592.9 - - - - 23 23 30 35 32 29 30 30 26 32 33 34 36 35 34 28 27 27 29 21 -Ag Recovered koz 35,357.1 - - - - 1,922 1,954 2,218 2,583 2,348 2,367 2,077 2,094 2,087 2,368 2,052 1,823 1,921 1,798 1,547 1,014 901 869 818 595 -Cash Operating Cost
Mining A$M 1,640.7 - - - - 54.2 67.6 71.9 79.9 80.1 79.8 90.1 87.3 82.2 81.6 85.3 85.5 86.1 85.9 90.7 94.2 91.1 90.8 90.8 65.4 -Processing A$M 1,250.3 - - - - 48.5 60.6 60.8 64.6 64.6 64.6 64.6 64.6 64.6 64.6 64.6 64.6 64.6 64.6 64.6 64.6 64.6 64.6 64.6 46.5 -Administration A$M 298.9 - - - - 12.7 14.6 15.0 15.0 15.1 15.1 15.1 15.1 15.1 15.1 15.1 15.1 15.1 15.1 15.1 15.1 15.1 15.1 15.1 15.1 -Concentrate Transport A$M 467.5 - - - - 17.6 21.9 23.2 23.6 24.1 23.2 23.8 23.4 23.2 24.6 24.7 24.9 25.5 25.7 24.7 24.0 23.8 23.8 24.3 17.5 -Total Site Cash Cost A$M 3,657.3 - - - - 133.1 164.7 170.8 183.2 183.9 182.8 193.6 190.4 185.1 185.9 189.7 190.1 191.3 191.4 195.2 197.9 194.6 194.3 194.9 144.6 -
Capital Costs
Sustaining A$M 444 - 3 36 48 34 25 20 32 24 21 23 11 12 13 19 14 19 21 11 18 9 13 14 5 -Expansion A$M 755 8 20 282 413 33 - - - - - - - - - - - - - - - - - - - -Closure and Rehabilitation A$M 37 - - - - - - - - - - - - - - - - - - - - - - - - 37Total Capital Cost A$M 1,236 8 23 317 461 67 25 20 32 24 21 23 11 12 13 19 14 19 21 11 18 9 13 14 5 37
Table 6.7 Dugald River – Planning Case 2
Item Units Total 2010 2011 2012 2013 2014 2015 2016 2017 2018 2019 2020 2021 2022 2023 2024 2025 2026 2027 2028 2029 2030 2031 2032 2033 2034 2035
Production Parameters
Ore Mined Mt 43.5 - - - - 1.6 2.0 2.2 2.2 2.2 2.2 2.2 2.2 2.2 2.2 2.2 2.2 2.2 2.2 2.2 2.2 2.2 2.2 2.2 2.2 0.3 -Ore Processed Mt 43.5 - - - - 1.6 2.0 2.2 2.2 2.2 2.2 2.2 2.2 2.2 2.2 2.2 2.2 2.2 2.2 2.2 2.2 2.2 2.2 2.2 2.2 0.3 -Zn Recovered kt 4,597.1 - - - - 151 191 222 225 236 229 234 229 231 241 241 243 248 251 242 237 235 228 225 224 34 -Pb Recovered kt 696.2 - - - - 23 23 33 39 35 31 33 33 29 35 36 38 40 38 37 37 37 38 38 39 6 -Ag Recovered koz 37,531.1 - - - - 1,922 1,954 2,440 2,841 2,583 2,604 2,285 2,303 2,295 2,605 2,257 2,006 2,113 1,719 1,002 948 991 843 844 853 123 -Cash Operating Cost
Mining A$M 1,836.0 - - - - 54.2 67.6 79.1 87.9 88.2 87.8 99.1 96.0 90.4 89.8 93.8 94.0 94.7 94.5 99.8 103.6 100.2 99.8 99.9 99.9 15.4 -Processing A$M 1,395.3 - - - - 48.5 60.6 66.9 71.1 71.1 71.1 71.1 71.1 71.1 71.1 71.1 71.1 71.1 71.1 71.1 71.1 71.1 71.1 71.1 71.1 11.0 -Administration A$M 298.9 - - - - 12.7 14.6 15.0 15.0 15.1 15.1 15.1 15.1 15.1 15.1 15.1 15.1 15.1 15.1 15.1 15.1 15.1 15.1 15.1 15.1 - -Concentrate Transport A$M 534.7 - - - - 17.6 21.9 25.8 26.5 27.4 26.4 27.1 26.5 26.4 27.9 28.0 28.3 29.0 29.2 28.1 27.6 27.5 26.7 26.4 26.4 4.0 -Total Site Cash Cost A$M 4,064.9 - - - - 133.1 164.7 186.7 200.5 201.7 200.4 212.4 208.8 203.0 203.9 208.0 208.5 209.9 209.9 214.1 217.4 213.9 212.7 212.5 212.5 30.4 -
Capital Costs
Sustaining A$M 513 - 3 39 54 51 27 19 31 24 23 25 12 18 19 28 17 22 25 11 18 9 13 14 5 5 -Expansion A$M 755 8 20 282 413 33 - - - - - - - - - - - - - - - - - - - - -Closure and Rehabilitation A$M 37 - - - - - - - - - - - - - - - - - - - - - - - - - 37Total Capital Cost A$M 1,305 8 23 321 467 85 27 19 31 24 23 25 12 18 19 28 17 22 25 11 18 9 13 14 5 5 37
●
APPENDIX IV COMPETENT PERSON’S REPORT
— IV-86 —
MINMETALS RESOURCES LIMITED Competent Person’s Report on Minerals and Metals Group
AMC210063-10rpt_1 101122 79
7 EXPLORATION
7.1 Introduction
MMG has interests in a number of regional exploration projects in Australia, Asia and Canada as well as exploration projects associated with, or close to its existing mining projects (near mine exploration). In addition MMG has established Commodity Task-Force Project Generation Teams, one each for copper, zinc and nickel, which are dedicated to defining the best mineral belts for specific target styles and target sizes in their respective commodities with the aim of discovering significant growth projects for MMG.
This section reviews the regional exploration projects and the near mine exploration, the potential results of which have not been taken into account in AMC’s modelling scenarios.
MMG’s current revised exploration budget is A$38M compared to a FY 2009 budget of A$24M and an actual expenditure in that year of approximately A$23M. The revised budget does not include planned expenditure of approximately US$4M to US$7M sourced from Business Development for the Izok Lake Canada update feasibility study, nor the availability of additional contingency funds for promising projects if the expenditure can be justified. MMG internal reports note a 15% reduction of the 2010 overall exploration budget across all regions to fund this contingency/strategic reserve. The budget is, in AMC’s opinion, a budget which allows progression of a number of projects from the conceptual stage through to advanced and is likely to significantly progress geological knowledge of the tenements.
7.2 Canadian Exploration Projects
In March 2007, through its acquisition of Wolfden Resources Inc. (Wolfden), Zinifex Limited acquired a portfolio of polymetallic exploration properties in northern Canada (Figure 7.1). These properties were transferred to OZ Minerals Limited (OZL) and are now held by MMG. Potential production from two of the properties, Izok Lake and High Lake, was previously included in OZL’s strategic plan from 2014 onwards to potentially contribute 50% of conceptual zinc concentrate production from 2016. However in 2009 OZL wrote down the carrying value of these projects from A$395M, the full acquisition and previously capitalised exploration expenditure, to zero.
AMC has undertaken a brief review of documents provided by MMG and held discussions with MMG management relating to these exploration properties but has not visited any of the sites.
Beyond the exploration and mineral resources definition requirements of these projects, their development will require advanced consideration of transport and services infrastructure, logistics, environmental constraints and permitting typical to Arctic and Sub-Arctic projects and studies are underway to upgrade understanding of the infrastructure requirements and synergies with other projects.
●
APPENDIX IV COMPETENT PERSON’S REPORT
— IV-87 —
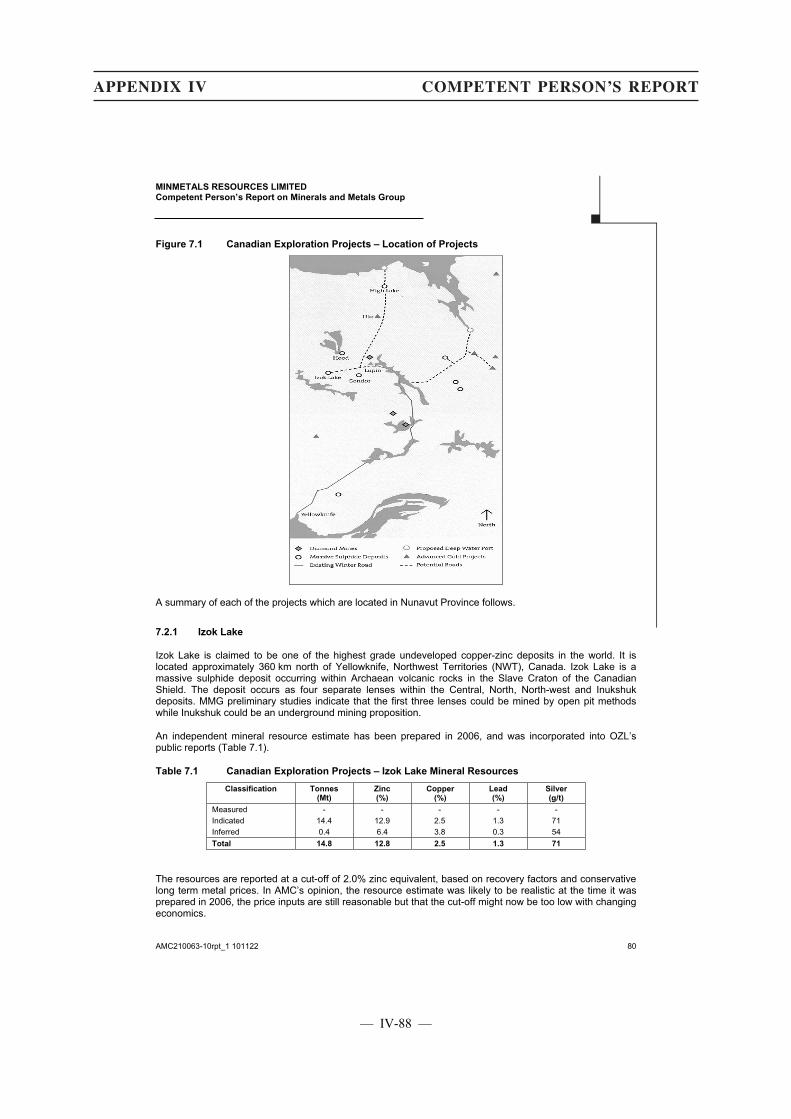
MINMETALS RESOURCES LIMITED Competent Person’s Report on Minerals and Metals Group
AMC210063-10rpt_1 101122 80
Figure 7.1 Canadian Exploration Projects – Location of Projects
A summary of each of the projects which are located in Nunavut Province follows.
7.2.1 Izok Lake
Izok Lake is claimed to be one of the highest grade undeveloped copper-zinc deposits in the world. It is located approximately 360 km north of Yellowknife, Northwest Territories (NWT), Canada. Izok Lake is a massive sulphide deposit occurring within Archaean volcanic rocks in the Slave Craton of the Canadian Shield. The deposit occurs as four separate lenses within the Central, North, North-west and Inukshuk deposits. MMG preliminary studies indicate that the first three lenses could be mined by open pit methods while Inukshuk could be an underground mining proposition.
An independent mineral resource estimate has been prepared in 2006, and was incorporated into OZL’s public reports (Table 7.1).
Table 7.1 Canadian Exploration Projects – Izok Lake Mineral Resources
Classification Tonnes (Mt)
Zinc (%)
Copper (%)
Lead (%)
Silver (g/t)
Measured - - - - - Indicated 14.4 12.9 2.5 1.3 71 Inferred 0.4 6.4 3.8 0.3 54 Total 14.8 12.8 2.5 1.3 71
The resources are reported at a cut-off of 2.0% zinc equivalent, based on recovery factors and conservative long term metal prices. In AMC’s opinion, the resource estimate was likely to be realistic at the time it was prepared in 2006, the price inputs are still reasonable but that the cut-off might now be too low with changing economics.
●
APPENDIX IV COMPETENT PERSON’S REPORT
— IV-88 —
MINMETALS RESOURCES LIMITED Competent Person’s Report on Minerals and Metals Group
AMC210063-10rpt_1 101122 81
AMC understands that environmental baseline studies and infrastructure studies have commenced as has an updated feasibility study. This study is reviewing the project and the project logistics including the most suitable means of access and the relationship with other MMG and third party projects. At the same time exploration is underway with the aim of significantly expanding the mineral resource base at Izok Lake particularly searching for deeper mineralisation beneath the main ore zone and extensions to the massive sulphide systems. An earlier preliminary economic assessment has been based on the production of 1.4 Mt of ore annually producing 140 kt of zinc concentrate and 30 kt of copper concentrate annually.
7.2.2 High Lake
The High Lake deposit is a volcanogenic massive sulphide deposit located 550 km north-north-east of Yellowknife, NWT. The property is about 45 km south of the Coronation Gulf, a potential deepwater Arctic Ocean port. The deposit consists of three zones of mineralisation, the West Zone and the AB and D Zones.
A Mineral Resource estimate prepared in 2006 (Table 7.2) and preliminary economic assessment has been conducted by an independent mineral resource estimator. The preliminary assessment envisages an open pit and underground operation with a mine life in excess of 12 years.
Table 7.2 Canadian Exploration Projects – High Lake Mineral Resources
Classification Tonnes (Mt)
Zinc (%)
Copper (%)
Lead (%)
Silver (g/t)
Gold (g/t)
Measured - - - - - - Indicated 17.2 3.4 2.3 0.3 70 1.0 Inferred 0.04 2.4 0.5 0.4 122 0.2 Total 17.2 3.4 2.3 0.3 70 1.0
The resources are reported at a cut-off of 2.0% copper equivalent, based on recovery factors and conservative long term metal prices. In AMC’s opinion the mineral resource estimate was likely to be realistic at the time it was prepared in 2006 and the metal prices used are still reasonable.
MMG has reported additional promising exploration results from the High Lake area, particularly High Lake East as a result of limited but active exploration over the last 12 months. The area remains prospective for the discovery of additional mineral resources.
7.2.3 Nunavut Gold Project
The Nunavut Gold Project consists of the Lupin Gold Mine and the Ulu Gold Project. The Lupin mine closed in early 2005 having produced 3,360 koz of gold at an average grade of 9.3 g/t gold. Infrastructure at the mine, including underground access remains in place. The previous owners have estimated the remaining mineral resources but these have not been publicly reported. However, there is an indication that there is still mineralisation which might add to mineral resources.
At the Ulu deposit, located 50 km to the south of High Lake and about 530 km north-north-east of Yellowknife, NWT, and 125 km north of Lupin, MMG report the potential for shear hosted high grade mineralisation that might feed the Lupin mill.
AMC is of the opinion that while these gold properties are prospective, there is still considerable evaluation work required to create value for MMG.
7.2.4 Nunavut Regional Exploration
MMG holds 2,600 km2 of exploration tenements and mining leases in the Slave Region of Nunavut, which contains the massive sulphide deposits Gondor and Hood, with the potential to provide additional feed to a mill at Izok Lake. The tenements are also prospective for nickel, base metals and gold as well as diamonds. MMG (and earlier OZL) expenditure to date is limited, although past expenditure by others is assumed by AMC to be significant.
●
APPENDIX IV COMPETENT PERSON’S REPORT
— IV-89 —
MINMETALS RESOURCES LIMITED Competent Person’s Report on Minerals and Metals Group
AMC210063-10rpt_1 101122 82
7.2.5 Ontario Nickel Copper PGE Exploration
In Ontario MMG is exploring for nickel-copper-platinum group elements (PGE) mineralisation in an alliance with Newgenco, a small private company with considerable global expertise in nickel sulphide exploration. Three areas (Sumach Lake, Valora Penassi and Savant Lake) totalling approximately 170 km2 have been staked to date in Ontario province, each with indications of prospective mafic-ultramafic intrusions with disseminated or trace nickel and copper sulphides. Expenditure is approximately A$0.4M to date.
7.2.6 Pelly Bay Nickel Project
MMG is currently negotiating the terms of the detailed joint venture agreement, based on a Letter of Intent on tenements at Pelly Bay in Nunavut, Canada on the Amaruk nickel project. This project is based on a highly prospective but unexplored district with occurrences of massive nickel sulphides. AMC notes limited expenditure by MMG to date and the early stage of the documentation.
7.3 Golden Grove Regional
The Golden Grove tenements cover an area of approximately 125 km2 and include 25 km strike length of favourable base metal greenstone stratigraphy. South of the “in mine area”, previous geological mapping and past and current drilling has identified mineralisation which is being actively tested. AMC has considered a contribution from this Gossan Valley area in one of the modelling scenarios so it is not considered further here, however the inclusion of this exploration area into one of AMC’s modelling scenarios emphasises the prospectivity of the Golden Grove tenements.
To the north of the “in mine” area, the favourable stratigraphy is known to extend approximately 2 km north of Scuddles mine with some minor sulphide intersections recorded. Further north, the stratigraphy appears to change but supports a 7 km long copper-zinc-lead anomaly found in the results of rotary air blast (RAB) holes which has not yet been adequately explained. Several massive pyrite-pyrrhotite intersections of uncertain stratigraphic affiliation have been made in this area.
Targets exist for a gold deposit, which may support a small open pit and a potential oxide copper open pit. There are also targets for remnant sulphide copper mineralisation, but these are considered low priority.
7.3.1 Wiluna Project
The Wiluna Project was acquired as part of Oxiana’s acquisition of Agincourt Resources (Agincourt) in 2007. The Wiluna Project region has been explored and mined primarily for gold. Tenements containing the long operating Wiluna gold mine were sold by Oxiana to Apex Minerals in 2006. Uranium rights for some selected tenements at the southern end of the project area have been transferred to Toro Energy Limited.
Within the remaining Wiluna Project area there are a number of generally low grade gold mineral resources. The ultramafic sequences are also prospective for nickel sulphide, and there have been historical narrow intersections of possible economic significance. Early work identified one small pod of high grade haematite and other indications of haematite rich lithology within two of the project ELs.
MMG has advised AMC that there is an environmental liability attached to the remaining tenements of A$5.3M. MMG has taken the decision to divest that part of the remaining 950 km2 of the Wiluna Project related to gold. Discussions with other stakeholders on tenures and calls for expressions of interest for the gold tenements and other commodities did not produce significant interest. MMG intends to exit the project.
7.4 Sepon
The Sepon Project covers an area of about 1,250 km2 over a sequence of Palaeozoic sediments and volcanic rocks in the Truong Son fold belt, a mobile belt between the cratons of Indo China and South China. The project geology is described in Section 2.1.2 of this report.
●
APPENDIX IV COMPETENT PERSON’S REPORT
— IV-90 —
MINMETALS RESOURCES LIMITED Competent Person’s Report on Minerals and Metals Group
AMC210063-10rpt_1 101122 83
In addition to the oxide gold and supergene copper resources considered in AMC’s modelling scenarios, Sepon also hosts significant primary copper and both partially oxidised and primary gold mineral resources that are not currently amenable to treatment through the existing processing plant facilities. These resources have not been considered in the modelling scenarios.
7.4.1 Regional Exploration
The priority for MMG is the discovery of additional resources of oxide gold and supergene copper mineralisation amenable to processing in the existing process plants. Primary gold mineralisation is a second tier target, followed by primary copper mineralisation. Molybdenum and base metals anomalies have also been detected and represent low priority exploration targets.
MMG has a coherent model of the near mine area and the mineralisation controls with numerous targets for gold (oxide and primary) and copper (supergene, exotic and primary) mineralisation.
To the west of the mine there are numerous gold pathfinder geochemical anomalies over 20 km of strike length. Some encouraging drill intersections have been recorded but overall results indicate a lack of continuity on the prospects tested to date. Several recently identified geochemical (soil and rock-chip) targets remain to be drill tested. To the east of the mine along some 10 km of strike, exploration has identified several fairly large areas in which gold occurs in association with jasperoid and quartz veining. Rock chip samples of up to 50 g/t gold have been recorded and trenching has identified zones 2m to 3m wide containing mainly 1 g/t gold to 5 g/t gold. Wide spaced shallow drilling over some 3 km strike length have recorded gold intersections mainly in the range 1m to 10m of 1 g/t gold to 10 g/t gold. Further drilling is required to evaluate the resource potential of these areas.
Copper potential is indicated by extensive areas of un-tested geochemical anomalism and early stage prospects extending west, east and south-east of the mining areas. Follow up exploration is being carried out.
The tenements are prospective for molybdenum within the core of the igneous complex, with a number of significant intersections having been identified but follow up work is required to establish the potential of the mineralisation.
Geochemically anomalous zinc (lead-silver) mineralisation has been located in the Din Daeng valley about 8 km north of the main Sepon mine area. Limited shallow drilling over some 500m across strike has recorded generally low grades of zinc with a little lead over intervals of 1m to 3m, but has failed to identify potentially economic mineralisation.
7.5 Other Asian Exploration
Outside of Sepon MMG has several programmes of generative and early stage exploration in Laos (initial generative projects) The future of these projects is dependent on a change of attitude of the Government of Laos towards MMG from its attitude to OZ Minerals Limited (one company one project). In Indonesia testing of targets generated on granted tenements has commenced.
7.5.1 Indonesia
MMG is actively engaged in exploration for porphyry copper and copper-gold systems throughout the prospective geological belts of the Indonesian archipelago. Several projects have been subject to intense exploration. While some of this exploration could be regarded as successful, the mineral resources identified, at Wia Wia, lateritic nickel, south eastern Sulawesi to be relinquished, or the target systems confirmed at Wonogiri, epithermal porphyry related gold, Java now seeking a joint venture with small gold-focussed junior companies, did not meet MMGs project requirements.
●
APPENDIX IV COMPETENT PERSON’S REPORT
— IV-91 —
MINMETALS RESOURCES LIMITED Competent Person’s Report on Minerals and Metals Group
AMC210063-10rpt_1 101122 84
There are four projects on current tenements in northern Sulawesi. Three granted tenements under the new Mining Act (IUPs) include Tapadaa, Toluludu and Biyonga while Tahele, also in Sulawesi, is still under the old KP title with transfer to an IUP pending. MMG holds 100% interest in all these tenements. Surface exploration and scout drilling completed to date has outlined strong copper and gold geochemical anomalism associated with porphyry alteration, but no further work is planned within the Tapadaa IUP until the areas of further interest within a National Park are available.
7.5.2 Australia Regional
Outside of its extensive land holdings around existing operations MMG is involved in active exploration projects in the Cobar basin on the Wagga Tank and other tenements and planned at Kadungle near Parkes in NSW. The Menninnie Dam and Nymagee projects are currently planned for divestment.
In the Cobar Basin in New South Wales, MMG has acquired an extensive package of tenements between Wagga Tank and Nymagee known as the Kidman Project with an area in excess of 1,000 km2 prospective for a range of target styles including CSA-style Cu-Zn-Pb type deposits. Review of previous data is in progress and drilling is planned.
The Kadungle project near Parkes is at an early stage in the process of ground acquisition in the region.
●
APPENDIX IV COMPETENT PERSON’S REPORT
— IV-92 —
MINMETALS RESOURCES LIMITED Competent Person’s Report on Minerals and Metals Group
AMC210063-10rpt_1 101122 85
8 SOURCES OF INFORMATION
The assessments reported herein are based on numerous documents, reports, correspondence, plans and sections and other information provided to AMC by MMG, mainly in the form of electronic copies. Printed material, not easily transmitted electronically, was reviewed by AMC in MMG’s offices in Melbourne and at the sites visited. Information was also obtained via site inspections and communications with MMG’s management personnel.
A list of material references used by AMC is presented in Appendix B. This list is not exhaustive.
Diagrams included in this report have been sourced from MMG, as have mineral resource and ore reserve estimates and past performance data.
●
APPENDIX IV COMPETENT PERSON’S REPORT
— IV-93 —
MINMETALS RESOURCES LIMITED Competent Person’s Report on Minerals and Metals Group
AMC210063-10rpt_1 101122 86
9 QUALIFICATIONS
AMC is a firm of mineral industry consultants whose activities include the preparation of due diligence reports and reviews on mining and exploration projects for equity and debt funding and for public reports.
AMC has completed assignments of a similar nature for Grant Samuel. AMC and its sub-consultants have also carried out technical consulting assignments for MMG and MMR and for many of its operations and projects. In all the assignments, AMC and its sub-consultants have acted as independent parties.
The contributors to this report are listed in Appendix C. Neither AMC nor its sub-consultants have any business relationship with Grant Samuel or MMG other than the carrying out of individual consulting assignments as engaged.
While some employees of AMC and its sub-consultants may have small direct or beneficial shareholdings in MMR, neither AMC nor the contributors to this report nor members of their immediate families have any interests in MMR that could be reasonably construed to affect their independence. AMC has no pecuniary interest, association or employment relationship with MMR or with Grant Samuel.
AMC is being paid a fee according to its normal per diem rates and out-of-pocket expenses in the preparation of this report. AMC’s fee is not contingent upon the outcome of the transaction subject to this report.
This report and the conclusions in it are effective at 1 July 2010. Those conclusions may change in the future with changes in relevant metal prices, exploration and other technical developments in regard to the projects and the market for mineral properties.
MMR has provided AMC with indemnities in regard to damages, losses and liabilities related to or arising out of AMC’s engagement other than those arising from illegal acts, bad faith or negligence on our part or our reliance on unauthorised statements from third parties.
This report has been provided to Grant Samuel for the purposes of performing its valuation in relation to the Transaction described in the covering letter to this report. AMC has given its consent for this report to be appended to a circular to share holders and has not withdrawn that consent before their lodgement with the HKEx. Neither the report nor any part of it may be used for any other purpose without AMC’s written consent.
The signatories to the report are corporate members of the AusIMM and bound by its Code of Ethics.
A M Chuk L J Gillett M AusIMM M AusIMM (CP), MMICA Principal Consultant Director
●
APPENDIX IV COMPETENT PERSON’S REPORT
— IV-94 —

MINMETALS RESOURCES LIMITED Competent Person’s Report on Minerals and Metals Group
AMC210063-10rpt_1 101122 Appendix A
APPENDIX A ABBREVIATIONS
A$ Australian dollar % percent Ag silver AMC AMC Consultants Pty Ltd Au gold BIF banded iron formations C centigrade CBX carbonate breccia CIL carbon in leach Cu copper CY Calendar Year ELs exploration licences EPA Environmental Protection Agency FY financial year g gram g/t grams per tonne Grant Samuel Grant Samuel & Associates Pty Ltd HPM high precious metal IGO Independence Group NL IT Integrated Tool Carrier km kilometres km2 square kilometres koz thousand ounces kt thousand tonnes ktpa thousand tonnes per annum Lao PDR Lao People's Democratic Republic Legend Legend Mining Limited LHD load, haul, dump LOM life-of-mine LOMP life-of-mine plan LXML Lane Xang Minerals Ltd M million m metres m2 square metre m3 cubic metres m3/s cubic metres per second MCF mine call factor MEPA mineral exploration and production
agreement mm millimetres MMG Minerals and Metals Group MMR Minmetals Resources Limited modelling scenarios
production and capital and operating cost projections as provided by AMC to Grant Samuel
mRL reduced level Mt million tonnes Mtpa million tonnes per annum MW megawatt Ni nickel NWT Northwest Territories OEM original equipment manufacturer Oxiana Oxiana Limited oz ounce PAF potentially acid-forming Pb lead PEM prospectivity enhancement
multiplier pH measure of acidity or alkalinity ppm parts per million
QA/QC quality assurance/quality control RAB rotary air blast RC reverse circulation RDP rhyodacite porphyry ROM run of mine SA South Australia SAG semi-autogenous grinding SLOS sub-level open stoping t tonnes TMU total metal unit tpa tonnes per annum tph tonnes per hour TSF tailings storage facility URL Universal Resources Limited US$ United States dollar VHMS volcanic hosted massive sulphide w/o Waste to Ore Ratio Wolfden Wolfden Resources Inc Zinifex Zinifex Limited Zn zinc
●
APPENDIX IV COMPETENT PERSON’S REPORT
— IV-95 —

MINMETALS RESOURCES LIMITED Competent Person’s Report on Minerals and Metals Group
AMC210063-10rpt_1 101122 Appendix B - 1
APPENDIX B SOURCES OF INFORMATION
1 CORPORATE
1.1 Accounting Financial
01.01.00004 MMG Annual Report 2009 FINAL 01.01.00005 MMG_Commodity Price Assumptions_2010-2014_20100326_FINAL 01.01.02346 MMG_Generic Valuation Model_Consolidation_20100531 1.2 Closure Provisions
01.02.00006 URS Provision Avebury and GG 9 Feb 09 01.02.00007 URS Provision GG, Sepon and PH 2 Feb 09 01.02.00008 URS Provision Rosebery and Hercules 22 Jan 09 01.02.02347 CEA Environmental Restoration Rehabilitation - 2010.ppt FINAL 01.02.02348 Closure Provisions_Final Report_12 Feb 2010 1.5 Corporate Overview
01.05.00011 20100616MMG_Business_Review_Final_WEB 01.05.00012 AMC Specialist Technical Report 30 April 2009 Final 01.05.00014 Microsoft PowerPoint - Project Opal - MMG Business Presentation 01.05.00015 Oxiana Zinifex Merger Scheme Book - Supplement 1 01.05.00016 Oxiana Zinifex Merger Scheme Book - Supplement 2 01.05.00017 Oxiana Zinifex Merger Scheme Book 01.05.00018 OZExplanatoryBooklet 01.05.02349 09June Final Mineral Resource Statements 01.05.02350 09June Final Ore Reserve Statements 01.05.02351 09June Mineral Resource & Ore Reserve Statement Executive Summary Rev A 01.05.02433 MMG_Business_Review_Final_WEB 1.11 Reports-Monthly
01.11.00324 April 2010 Monthly Report 01.11.00325 August 2009 Monthly Report - MMGFINAL 01.11.00326 December 2009 Monthly Report FINAL 01.11.00327 February 2010 Monthly Report 01.11.00328 January 2010 Monthly Report V2 01.11.00329 July 2009 Monthly Report - MMG FINAL 01.11.00330 March 2010 Monthly Report V2 01.11.00331 MMG Monthly Report - June 2009 FINAL 01.11.00332 November 2009 Monthly Report - V1 01.11.00333 October 2009 Monthly Report - FINAL 01.11.00334 September 2009 Monthly Report - FINAL 1.12 Reports-Quarterly
01.12.00335 091026_MMG_Sept_Quarterly_Report 01.12.00336 100128_MMG_Dec_Quarterly_Report_09(1) 01.12.00337 100503_MMG_March_Quarter_Production_Report
2 EXPLORATION
2.1 Canada
02.01.00379 HighLake_NTI_Agreement_1001 02.01.00380 HighLake_NTI_AmendingAgreement_0802 02.01.00381 OZ Canada Letter of Credit Details 02.01.00382 OZ_Nu_NWT_PropertySummary_042309 02.01.00383 OZ_ON_PropertySummary_0409 02.01.02436 LupinAssessment20100507 2.4 Exploration Management
02.04.00374 1Q 2010 QBR Exploration Report 02.04.00375 2010 Exploration Plan Text 02.04.00376 AMC Exploration update 02.04.00377 Feb 2010 Quarterly Business Review Report(Finance Update) 02.04.00378 FW Assets 02.04.02437 01 June 2009 02.04.02438 01 MMG Exploration - Monthly Report - January 2010 02.04.02439 02 July 2009 02.04.02440 02 MMG Exploration - Monthly Report - February 2010 02.04.02441 03 August 2009 02.04.02442 03 MMG Exploration - Monthly Report - March 2010 02.04.02443 04 MMG Exploration - Monthly Report - April 2010 02.04.02444 04 September 2009
02.04.02445 05 MMG Exploration - Monthly Report - May 2010 02.04.02446 05 October 2009 02.04.02447 06 MMG Exploration - Monthly Report - June 2010 02.04.02448 06 November 2009 02.04.02449 07 December 2009 02.04.02450 Exploration Report August 2009 02.04.02451 Exploration Report July 2009 02.04.02452 Exploration Report November 2009 02.04.02453 Exploration Report October 2009 02.04.02454 Exploration Report September 2009 02.04.02455 Exploration Summary Report 02.04.02456 Exploration Variance Analysis May 2010 02.04.02457 Q1 2010 Exploration Quarterly Business Review 02.04.02458 Q4 2009 Exploration Quarterly Business Review 02.04.02459 SR - Exploration Analysis
3 OPERATIONS-AVEBURY
3.1 Oveview
03.01.00486 Avebury map 3.2 Business Plan
03.02.00487 2008 costs various 03.02.00488 2009 PLAN AVEBURY FINAL 26 Nov 08v2 03.02.00489 Avebury Capex Budget 2009 - 2011 03.02.00490 Budgets 09-11 03.02.00491 december_quarter_op_costs 03.02.00492 inventory_avebury_dec2008 3.3 Geology
03.03.00493 2009 Avebury Geology and Exploration 03.03.00494 Avebury EL C and M 03.03.00495 Blockmodels 03.03.00496 Drilling database 03.03.00497 Mine openings 03.03.02470 Datamine 03.03.02471 Drill Plan2010 _with track 03.03.02472 Drill Sections 2010 03.03.02473 Drilling Priority List June 2010 03.03.02505 Avebury Drill Plan 3.3.1 Reports
03.03.01.00498 Annual Report SEL42_2007 2008 03.03.01.00499 AVEBURY DIAMOND DRILLHOLE A236 03.03.01.00500 MINEX annual reports 03.03.01.00501 Monthly Geology Reports 2008 3.3.2 Reserves and Resources
03.03.02.00502 BDA Review Avebury Resource Reserve Estimate November 2008 Rev3_TC Comments 03.03.02.00503 Resource and reserve documents 3.3.3 Reconciliation
03.03.03.00504 a1925 474 partial stope reconciliation 03.03.03.00505 Avebury Production Reconciliation Data 2008 03.03.03.00506 Avebury Production Reconciliation Data 2008 03.03.03.00507 feed vs grade control 03.03.03.00508 stope_reconciliation 03.03.03.00509 V1975 447 stope reconciliation 3.4 Mining
03.04.00510 Production Performance 03.04.00511 Stockpile Report 3.4.1 Monthly Reports
03.04.01.00512 EOM Mining Reports 2007 03.04.01.00513 EOM Mining Reports 2008 03.04.01.00514 OZ Minerals Management Report - Avebury - Nov 08 03.04.01.00515 OZ Minerals Management Report - Avebury - Oct 08 FINAL 03.04.01.00516 OZ Minerals Management Report - Avebury - Sep 08 3.4.2 Geotech
●
APPENDIX IV COMPETENT PERSON’S REPORT
— IV-96 —
MINMETALS RESOURCES LIMITED Competent Person’s Report on Minerals and Metals Group
AMC210063-10rpt_1 101122 Appendix B - 2
03.04.02.00517 Geotech memo Polberro UG visit 24.1.08 03.04.02.00518 Ground Control Management Plan 2008 3.5 Processing
03.05.00519 SAP_Equipment_List_2009_01_15 3.5.1 Monthly Reports
03.05.01.00520 Processing Department Monthly Reports Aug-Dec 2008 3.5.2 Process Overview
03.05.02.00521 Drawings 03.05.02.00522 Electrical Load List 03.05.02.00523 grinding circuit redesign 03.05.02.00524 Plant Process flow diagram 03.05.02.00525 SCADA Screens 3.5.3 Met Test Work
03.05.03.00526 Avebury_Mineralogy_ORC_final_I 03.05.03.00527 Avebury_Mineralogy_ORC_final_II 03.05.03.00528 Issues and options_R1 arthur dunstan Arsenic paper 03.05.03.00529 Metallurgical Info 03.05.03.00530 Outokumpu-Avebury flotation test mineralogy 300605 03.05.03.00531 Review of the Avebury Nickel Comminution Circuit 3.6 Projects and Studies
3.6.1 Care and Maintenance
03.06.01.00532 Care and Maintenance Meeting 20090113 03.06.01.00533 Care and Maintenance Plan (4 Feb) 03.06.01.00534 CB 20090113 03.06.01.00535 Overview File 03.06.01.00536 Risk Register1 3.6.2 Feasibility Study
03.06.02.00537 Feas Study April Model 03.06.02.00538 Feas Study Vol 1 - Summary 03.06.02.00539 Feas Study Vol 2 - Geological Resource 03.06.02.00540 Feas Study Vol 3 - Mining 03.06.02.00541 Feas Study Vol 4 - Processing 03.06.02.00542 Feas Study Vol 5 - Infrastructure 03.06.02.00543 Feas Study Vol 6 - Environmental 03.06.02.00544 Feas Study Vol 7 - Project Development and Financials 03.06.02.00545 Feasibility study 3.6.3 Reopening
03.06.03.00546 10April Avebury Review of Metallurgy& Initial Plant Operating Performance 03.06.03.00547 Avebury Reopening Study - 100225 Avebury Studies Memo 03.06.03.00548 AVEBURY REVIEW MEETING MAY 20TH 2010 notes of meeting 03.06.03.00549 Hydrometallurgy testing review - Richmond May 29, 2010 03.06.03.00550 IRC Progress Report - 10May MMG Avebury final 03.06.03.02475 09Oct Options Study - Re-Opening Rev B - MASTER 03.06.03.02476 2009 Budget Splits ver2 03.06.03.02477 2010 SOT Analysis 03.06.03.02478 Avebury Model_ver6_COG0.9Ni_900ktpa 03.06.03.02479 Minwid_Output Scheduling_V2_Rev11_900ktpa_0.9Ni 3.7 SHEC
03.07.00551 0709 Avebury Environmental - Jul 07 - Sep 07 03.07.00552 0712 Avebury Environmental - Oct 07 - Dec 07 03.07.00553 0803 Avebury Environmental - Jan 08 - Mar 08 03.07.00554 0806 Avebury Environmental - Apr 08 - Jun 08 03.07.00555 Allegiance Environmental Policy 03.07.00556 Avebury Annual EMP Progress Report 2007 03.07.00557 Avebury Annual EMP Progress Report 2008 03.07.00558 Avebury EHS Care and Maintenance Plan 03.07.00559 Avebury Land Use Permit 03.07.00560 Compliance 03.07.00561 Environmental Management Plan Progress Report 03.07.00562 Environmental Setting
4 OPERATIONS-CENTURY
4.1 Overview
04.01.00617 Century Overview 04.01.00618 Century Strategy
4.1.1 COO Reports - Monthly Reports 2007
04.01.01.00630 12 Dec 07 COO report 4.1.2 COO Reports - Monthly Reports 2008
04.01.02.00642 12 December 2008 COO report - Final 4.1.3 COO Reports - Monthly Reports 2009
04.01.03.00643 August 2009 COO Report - Final 04.01.03.00644 Century COO Report - Sept 2009 04.01.03.00645 December 2009 COO Report - Final 04.01.03.00646 February 2009 COO Report Version 1 04.01.03.00647 January 2009 COO Report v1[1].0 04.01.03.00648 July 2009 COO Report (USD Jun start) V4 04.01.03.00649 June 2009 COO Reportv2 04.01.03.00650 November 2009 COO Report 04.01.03.00651 October 2009 COO Report - FINAL 4.1.4 COO Reports - Monthly Reports 2010
04.01.04.00652 April 2010 COO Report V1.2 04.01.04.00653 February 2010 COO Report_V1.0 04.01.04.00654 January 2010 COO Report 04.01.04.00655 March 2010 COO Report V1 3 04.01.04.00656 May 2010 COO Report FINAL 4.2 Business Plan
04.02.00657 Cost Info 8.2.09 04.02.00658 LOM Physicals Schedule - Mine Physicals 04.02.00659 MMG Century Plan Presentation_ Final Pack_12.10.09 04.02.00660 MMG_Generic Valuation Model_Century_Apr2010_FINAL 4.3 Geology
04.03.00661 Century Geology - Silver 04.03.00662 Century Mine Geology Summary 4.3.1 Exploration Monthly Reports
04.03.01.00663 06 Century June 2008 04.03.01.00664 07 Century July 2008 04.03.01.00665 08 Century August 2008 04.03.01.00666 09 Century September 2008 04.03.01.00667 10 Century October 2008 04.03.01.00668 11 Century November 2008 04.03.01.00669 12 Century December 2008 4.3.2 Resource and Reserve - 2008
04.03.02.00670 Internal - 0308 Reserve Report March 08 04.03.02.00671 Internal - 0308 Resource Report March 08 04.03.02.00672 Internal - 0608 Reserve Report June 08_cog361 04.03.02.00673 Internal - 0608 Resource Report June 08 04.03.02.00674 Snowden Report 080205 Century_Resource_R 04.03.02.00675 Snowden Report 080506 OreReserve2008_R3 4.3.3 Resource and Reserve - 2009
04.03.03.00676 2009_reserve_vulcan_files 04.03.03.00677 Cut off grade option _ LH4 (3) 04.03.03.00678 MMG_Century_Reserve_December2009 04.03.03.00679 MMG_Century_Resource_December2009 04.03.03.02361 reserve changes 30062009_v2 4.3.4 Reconciliation
04.03.04.00680 aastage9v4 04.03.04.00681 cenapr2008_reconciliation_1month_31stDecember2009 04.03.04.00682 cenapr2009_reconciliation_1month_31stDecember2009 04.03.04.00683 End of Month Mine Physical Reconciliation Reports 04.03.04.00684 EOM April 09 Mine Physicals Reconciliation_Sign off Copy 04.03.04.00685 EOM April 10 Mine Physicals Reconciliation_sign off copy 04.03.04.00686 EOM August 09 Mine Physicals Reconciliation_sign off copy 04.03.04.00687 EOM December 09 Mine Physicals Reconciliation_sign off copy 04.03.04.00688 EOM February 09 Mine Physicals Reconciliation 04.03.04.00689 EOM February 10 Mine Physicals Reconciliation_sign off copy_Crushed Tonnes Amend 04.03.04.00690 EOM January 09 Reconciliation_Authorised for Release 04.03.04.00691 EOM January 10 Mine Physicals Reconciliation_sign off copy_v1
●
APPENDIX IV COMPETENT PERSON’S REPORT
— IV-97 —
MINMETALS RESOURCES LIMITED Competent Person’s Report on Minerals and Metals Group
AMC210063-10rpt_1 101122 Appendix B - 3
04.03.04.00692 EOM July 09 Mine Physicals Reconciliation_sign off copy 04.03.04.00693 EOM June 09 Mine Physicals Reconciliation_sign off copy 04.03.04.00694 EOM March 09 Mine Physicals Reconciliation_Sign off Copy 04.03.04.00695 EOM March 10 Mine Physicals Reconciliation_sign off copy 04.03.04.00696 EOM May 09 Mine Physicals Reconciliation_Sign off Copy_Amended 04.03.04.00697 EOM May 2010 Mine Physicals Reconciliation_sign_off_copy 04.03.04.00698 EOM November 09 Mine Physicals Reconciliation_sign off copy 04.03.04.00699 EOM October 09 Mine Physicals Reconciliation_sign off copy2 04.03.04.00700 EOM September 09 Mine Physicals Reconciliation_sign off copy 04.03.04.00701 Mining Cost Info for Minproc - provided to J.Botha 7.2.09 04.03.04.00702 Reserve Reconciliation post March 2008 04.03.04.00703 stage8 04.03.04.02362 Reserve_Reconciliation_Cenapr2009_June09_May10 4.3.6 Geotech
04.03.06.00704 996-795_Blast Risk Analysis Full Sign Off 20081221_Final 04.03.06.00705 After_Blast_Exclusion_Zones_for_2008_12_28 04.03.06.00706 After_Blast_Exclusion_Zones_for_2008_12_31 04.03.06.00707 Century_Mine_Geotechical_Review_May_2008_Mining_One 04.03.06.00708 Crackmeter Response Plan 04.03.06.00709 Geotechnical - risk assessment - September 2008 04.03.06.00710 Geotechnical F 054 04.03.06.00711 Geotechnical F 057 04.03.06.00712 Geotechnical Hazard Plan_2008_10_12 04.03.06.00713 Geotechnical Hazard Plan_2008_12_21 04.03.06.00714 Geotechnical Record GR337 04.03.06.00715 Geotechnical Record GR338 04.03.06.00716 JSA - drilling and loading of the 1008-755,1008-756,996-796ps,996-797ps Stage7 Nth Wall 04.03.06.00717 JSA - RESPONSE TO CRACK ALARMS_20081110 04.03.06.00718 MMG_Century_Geotech 04.03.06.00719 Wall Hazard Plan SW 20081204 04.03.06.00720 Wall Monitoring Review diagram - November 2008 04.03.06.00721 Wall Monitoring Review diagram - October 2008 4.4 Mining
04.04.00722 Century Pit Wall Cultural Clearance 4.4.1 Drilling and Blasting
04.04.01.00723 165mm_Stg_8_Cutback_May10 04.04.01.00724 20100527_Pattern Expansion 04.04.01.00725 251mm_Stg_8_Cutback_May10 04.04.01.00726 Case Study_165mm Shale Pattern Expansion, Century Mine 04.04.01.00727 Case Study_251mm Limestone Pattern Optimisation, Century Mine 04.04.01.00728 Century Presplit Optimisation Stage 7 8 interface 04.04.01.00729 Century165mm Waste Pattern Expansion and subdrill reduction 04.04.01.00730 EOM Drill Blast Report May 2010 04.04.01.00731 Example of _After_Blast_Exclusion_Zones_for_2008_12_31 04.04.01.00732 Explosives Budget Blast ParametersCY09Final 04.04.01.00734 Explosives Budget CY10-CY12_Blast Paramaters 04.04.01.00735 Explosives Budget CY10-CY12_Drilling Metres 04.04.01.00736 Explosives Budget CY10-CY12_Drilling Schedule 04.04.01.00737 Explosives Budget CY10-CY12_Unitronics 04.04.01.00744 Trial for reduced batter and buffer B&S in cutback area_V3 4.4.2 Equipment
04.04.02.00745 Equipment Component Age 04.04.02.00746 Equipment Schedule - CY09-CY15 04.04.02.00747 Mobile Maintenance Equipment Plan V12 20091209
04.04.02.02363 Top 10 AE Critical Equipment with Known Defects - Century 4.4.3 Pit Design
04.04.03.00748 MINENHIL00030AB_RE01_V01A_Stage6 Modelling 04.04.03.00749 MINENHIL00041AA_RE01_V01A_Stage 7 Buttress 04.04.03.00750 MINENHIL00041AA_RE02_V02A_WestWall_Drainage&Support 04.04.03.00751 Mining One Geotechnical Review_2248 04.04.03.00752 Mining One Report 1761 04.04.03.00753 Mining One Report 1894 04.04.03.00754 stage7 04.04.03.00755 stage7 04.04.03.00756 stage8 04.04.03.00757 stage8 04.04.03.00758 stage9_8cb 04.04.03.00759 stage9_8cb 4.4.4 Schedules
04.04.04.00760 Mill Feed Schedule_lom09_cutback_v12 04.04.04.00761 Mill Feed Schedule_PostPipeline_LOM_V3.9 04.04.04.00762 Mine Schedule_lom09_cutback_v12_bench draw down 04.04.04.00763 Mine Schedule_PostPipeline_LOMV_3.9_bench draw down 04.04.04.02364 First Principles - Equipment and Manning Plan v3.9 graphs 04.04.04.02365 PPLOM-V3.9 4.4.5 Waste Dumps
04.04.05.00764 DRAFT_Waste Rock Management 04.04.05.00765 Waste Dump Schedule 04.04.05.00766 Waste Dump Strategy 04.04.05.00767 West Dump Design and Construction Profile 4.5 Processing
04.05.02366 Reagents - Budget & Actual 2010 4.5.1 Process Overview
04.05.01.00768 PCS description 04.05.01.00769 Process Overview 04.05.01.00770 Visio-Karumba Simplified Network Drawing 04.05.01.00771 Visio-Lawnhill IA Network April 2008 4.5.2 Monthly Reports
04.05.02.00772 Metallurgy Weekly Report 100611 4.5.3 Met Projects
04.05.03.00773 07290 Century High Shear Stator Gas Dispersion Report 04.05.03.00774 Century Debottlenecking Study - Johnson and Munro 12-09-2008 04.05.03.00775 Century DEBOTTLENECKING STUDY SUMMARY 04.05.03.00776 Century Flotation Circuit Sized - 06 Model Development 06431 04.05.03.00777 Concentrate Pipeline - Current Operation 04.05.03.00778 Dextrin Trial - Final Report 04.05.03.00779 Jameson Cell Close Out Report 04.05.03.00780 ML003 Cyclones - Effect of changing vortex finders and spigots on ML003 cyclones 04.05.03.00781 ML003 Cyclones - Effect of ML003 on Zinc Rougher Circuit Performance 04.05.03.00782 ML003 Cyclones - Evaluation of ML003 Grinding Performance 04.05.03.00783 ML003 Cyclones - Primary Zn Simulations Report Dec 2008 DRAFT 04.05.03.00784 ML003 Cyclones Optimisation & Operating Strategy 04.05.03.00785 Progress Report - High Shear Stators _Phase 1_ v4 _2_ 04.05.03.00786 Project Definition - Jameson cell Tail Modification 04.05.03.00787 Project Definition - Maximum Power Demand 04.05.03.00788 Project Definition - Optimisation of Ultrafine Cleaning Circuit 04.05.03.00789 Recovery Taskforce Report 04.05.03.02367 Metallurgy Operations 3 Year Plan - CY 2010-14 - TA 090904 - Plant Avail YTD 4.6 Projects and Studies
04.06.02368 1 Ball Mill v 2 Ball Mills Revenue 04.06.02369 J-Cell Project Status Report 04.06.02370 Project Definition - Froth Viscosity Database
●
APPENDIX IV COMPETENT PERSON’S REPORT
— IV-98 —

MINMETALS RESOURCES LIMITED Competent Person’s Report on Minerals and Metals Group
AMC210063-10rpt_1 101122 Appendix B - 4
4.6.1 Century Phosphate
04.06.01.00790 20080926 Century Phosphate Project Concept 04.06.01.00791 20081001 Century Phosphate Concept paper 4.6.2 Silver King
04.06.02.00792 Appendices_JORC_Report 04.06.02.00793 Silver King Concept Study v1 ADG 04.06.02.00794 SILVER KING SUMMARY 04.06.02.00795 Zinifex JORC Report - Jan 2008 4.6.3 Improving Froth Performance in Zn Cleaners
04.06.03.02371 Improving Froth Performance in Zn Cleaners - Stage 1 04.06.03.02372 Proposal - Improving Froth Performance in Zn Cleaners 4.6.4 Improving Froth Pumping
04.06.04.02373 MMG AFE Form - Froth Pumping 04.06.04.02374 Project Definition - Improving Froth Pumping - Sump Agitator Trial 4.7 SHEC
04.07.00796 Century Group Env Audit Report 2008 04.07.00797 Century Rehabilitation Bank Undertaking 04.07.00798 EMP Century Mine Nov 2008 04.07.00799 Injury & Rehab Active Cases 04.07.00800 Lawn Hill Mine Plan of Operations 2007-2010 04.07.00801 MMG Century Plan of Operations 2010-2012 04.07.00802 Response to RFI re Karumba 04.07.00803 SDR07_Century 04.07.00804 Tailings Audit Report 2006 04.07.00805 Tailings Audit Report 2007 04.07.00806 Water Monitoring Program Review April 2008 4.7.1 Mine closure
04.07.01.00807 Century closure 27 Oct 08 04.07.01.00808 Century Mine Water Management Plan 04.07.01.00809 DRAFT Century Closure Plan 2008 04.07.01.00810 DRAFT Century Rehabilitation Plan 2008 04.07.01.00811 Mine Management Plan - Environment 04.07.01.00812 Mine Rehabilitation Schedule and Costs 04.07.01.00813 MMG Century Century closure plan June 2010 04.07.01.00814 Rehabilitation Plan 04.07.01.00815 Revegetation Costs - Waste Rock Dumps 04.07.01.00816 URS closure provision review_Century_051208 04.07.01.00817 _V1__Mine Rehabilitation Plan 4.7.2 Stream sediment Values Report
04.07.02.00818 Limnology Report Page Creek - ACTFR 2005 04.07.02.00819 Limnology Report Page Creek - ACTFR 2006 04.07.02.00820 Mg Trigger levels letter 04.07.02.00821 OZCM Magnesium Trigger Values Report 04.07.02.00822 Stream sediment values letter
5 OPERATIONS-GOLDEN GROVE
5.1 Overview
05.01.00959 Golden_Grove_Overview_060109 05.01.00960 OGGH Constitution 5.1.1 1.B.c.0001 Golden Grove Information Memorandum - Newmont
05.01.01.00961 a. Golden Grove Information Memorandum - Newmont 05.01.01.00962 b. Information Memorandum Appendices 5.1.2 COO Reports
05.01.02.00963 2009 05.01.02.00964 2010 5.2 Business Plan
05.02.00965 MMG_Generic Valuation Model_GoldenGrove_Apr2010_FINAL 05.02.02377 GG LOM Model 21Dec09 05.02.02378 GG_LOM_cashflow 05.02.02379 GG_LOM_cash_spend 05.02.02380 GG_LOM_Geology 05.02.02381 GG_LOM_GM_KPI's 05.02.02382 GG_LOM_GossanHill 05.02.02383 GG_LOM_KPI's 05.02.02384 GG_LOM_Mill 05.02.02385 GG_LOM_P&L
05.02.02386 GG_LOM_Scuddles 05.02.02387 GH Stats LOM 05.02.02388 Sc Stats LOM 05.02.02486 AIP Plan Budget 2010 to 2013 05.02.02487 Scuddles_10_LOM_submitted_170909 05.02.02488 Scuddles_EPS Dump Conversion Sheet 2009 BUdget LOM Nov (3) 5.3 Geology
05.03.00966 Golden Grove Due Diligence Study - Executive Summary 05.03.00967 Gossan Hill Amity Gold 05.03.00968 Gossan Hill Area Cross Section 05.03.00969 Hougo Zn and Cu Variography 05.03.00970 Introduction to GG 05.03.00971 OLGG_08_038-Exploration-Southern Leases 05.03.00972 QCopper_Copper Plots 05.03.00973 Resource Expansion Potential Report - Hellman and Schofield 05.03.00974 scudcvt_jul08 05.03.00975 TG Curve pictures 05.03.00976 Xantho_AFE_2008 05.03.00977 Xantho_drill_meters 5.3.1 Monthly Reports 05.03.01.02389 Monthly Report 0901 05.03.01.02390 Monthly Report 0902 05.03.01.02391 Monthly Report 0903 05.03.01.02392 Monthly_Report_0110 05.03.01.02393 Monthly_Report_0210 05.03.01.02394 Monthly_Report_0310 05.03.01.02395 Monthly_Report_0410 05.03.01.02396 Monthly_Report_0510 05.03.01.02397 Monthly_Report_0904 05.03.01.02398 Monthly_Report_0905 05.03.01.02399 Monthly_Report_0906 05.03.01.02400 Monthly_Report_0907 05.03.01.02401 Monthly_Report_0908 05.03.01.02402 Monthly_Report_0909 05.03.01.02403 Monthly_Report_1009_final 05.03.01.02404 Monthly_Report_1209 5.3.2 Resource and Reserve
05.03.02.01040 091119_Release_memo_cateth_nov09_z11_bmf 05.03.02.01041 091130_Release_memo_houg_nov09.bmf 05.03.02.01042 091221_Release_memo_am_dec09.bmf 05.03.02.01043 091228_Release_memo_houg_nov09.bmf 05.03.02.01044 09June Report - Mineral Resource and Ore Reserve Estimation Report_draft 05.03.02.01045 100105_Release_memo_gg4_jan10.bmf 05.03.02.01046 100112_Release_memo_am_dec09_dac41modified.bmf 05.03.02.01047 ghres_apr09_after_Stope_evaluation 05.03.02.01048 Golden Grove Resource-Reserve Review Final Oct 2008 05.03.02.01049 Golden Grove Resources_2009 05.03.02.01050 gossABCDzn_may09_nov09NSR 05.03.02.01051 gossACu_211c66 05.03.02.01052 gossam_dec09_dac41modified 05.03.02.01053 gosscateth_jul09_nov09NSR 05.03.02.01054 gosscateth_nov09_z11 05.03.02.01055 gossGG4_jan10 05.03.02.01056 gosshoug_nov09 05.03.02.01057 gossnorth_jun08_newNSR 05.03.02.01058 gossXT_jun09_nov09NSR 05.03.02.01059 MMG GG Preliminary Reserve Statement as at 30 June 2009 05.03.02.01060 MMG Primary Zinc and Copper Mineral Resource Statement_v2 05.03.02.01061 Net Smelter Return Block Model Script 05.03.02.01062 OZ Resource Statement 05.03.02.01063 scudcvt_jul09_nov09NSR 05.03.02.01064 scudtotal_jul09_nov09NSR 05.03.02.01065 Tonnes and Grades outside Reserve in Resource 05.03.02.02405 ghres_apr10_b4_Stope_evaluation
●
APPENDIX IV COMPETENT PERSON’S REPORT
— IV-99 —
MINMETALS RESOURCES LIMITED Competent Person’s Report on Minerals and Metals Group
AMC210063-10rpt_1 101122 Appendix B - 5
05.03.02.02406 Release_memo_Scudtotal_jun10_block model 05.03.02.02407 scudres_jun10_byArea 5.3.3 Reconciliation
05.03.03.01066 Monthly Reconciliations 5.3.5 Exploration
05.03.05.01067 ASX Announcement - Exploration Success at Golden Grove 05.03.05.01068 GG_SURFACE_EXPLORATION 05.03.05.01069 OZ_GG_Diamond Drilling Costs_2010&2011 5.4 Mining
05.04.01070 Due Diligence Reports 05.04.01071 Fixed_Asset_Register_Nov 05.04.01072 Gossan Hill 05.04.01073 Optiro 05.04.01074 OZ_GG_Scuddles_Longsection_charles1B 5.4.1 Monthly Reports
05.04.01.01075 01. January 2010 Monthly Report 05.04.01.01076 02. Feb 2010 Monthly Report 05.04.01.01077 03. March 2010 Montly Report 05.04.01.01078 04. April 2010 Monthly Report 05.04.01.01079 06 June 2009 Monthly Report 05.04.01.01080 07 July 2009 Monthly Report 05.04.01.01081 08 August 2009 Monthly Report 05.04.01.01082 10 October 2009 Monthly Report 05.04.01.01083 11 November Monthly Report 05.04.01.01084 12 December Monthly Report 05.04.01.01085 GM Monthly Report Dec 2008 05.04.01.01086 Gossan Hill Stats Monthly 2009 as at end Feb.xls 05.04.01.01087 Monthly Report July 2007 05.04.01.01088 Monthly Reports 05.04.01.01089 OZ_GG_01 January 2009 - Monthly Report V2 05.04.01.01090 OZ_GG_12 December 2008 - Monthly Report 05.04.01.02408 05. May 2010 Monthly Report 5.4.2 Geotech
05.04.02.01091 GeotechMonthly_2009_10 05.04.02.01092 GeotechMonthly_2009_11 05.04.02.01093 GeotechMonthly_2009_6 05.04.02.01094 GeotechMonthly_2009_7 05.04.02.01095 GeotechMonthly_2009_8 05.04.02.01096 GeotechMonthly_2009_9 05.04.02.01097 GeotechMonthly_2010_01 05.04.02.01098 GeotechMonthly_2010_02 05.04.02.01099 GeotechMonthly_2010_03 05.04.02.01100 GeotechMonthly_2010_04 05.04.02.01101 GeotechMonthly_2010_05 5.5 Processing
05.05.01146 108417.02R01revA_draft 05.05.01147 Appendix B 05.05.01148 Copper Flotation Circuit Spreadsheet 05.05.01149 Cu Ore G and T KM2324 Report 05.05.01150 OZ_GG Flotation Flowsheet Jan 2009 05.05.01151 OZ_GG_ Flotation Modelling UpdateV2_July_2008 05.05.01152 OZ_GG_08109 Golden Grove Draft Float Circuit Report DRAFT 05.05.01153 OZ_GG_Closing _Concentrate at 280109 05.05.01154 OZ_GG_Data management of stocks_mod 05.05.01155 OZ_GG_Float_Cell_Details 05.05.01156 OZ_GG_Float_Survey 2 - Baseline survey V3+water 05.05.01157 OZ_GG_Float_Survey 3 - Validation survey V2+water_Mar2008 05.05.01158 OZ_GG_Mill Physicals December 2008 05.05.01159 OZ_GG_Monthly Concentrate Comp Comparisons - for buyers 05.05.01160 OZ_GG_Physical Sept 08 05.05.01161 OZ_GG_Power_Usage & Electricity Trending 2008adj Dec 05.05.01162 OZ_GG_Process_Plant_ Fact Book 05.05.01163 OZ_GG_SMCC_Mill_Throughput_Report_June2007 05.05.01164 Processing Stats Monthly 2009 at end Feb.xls 05.05.01165 Zn Ore Quantitative Mineralogy MODA 05.05.01166 Zn&Cu Ore G andT KM2316 Report
5.5.1 Monthly Reports
05.05.01.01167 Golden Grove Production Stats 2006-08 5.6 Projects and Studies
05.06.01168 1005 TSF3 Project Summary Report 05.06.01169 2008 Strategic Plan Update Memo 05.06.01170 Flotation Concentration Material 05.06.01171 Flotation Testing of Golden Grove Oxide Blends 05.06.01172 Golden Grove April Presentation 05.06.01173 Golden Grove Haulage Study 05.06.01174 McSweeney Partners 05.06.01175 Metallurgical Test Works_G and T 05.06.01176 Metallurgical Test Works_Pre Oxiana 05.06.01177 MOA at Golden GroveRevC 05.06.01178 Orway Report 05.06.01179 Oxide Gold Processing Options Study Report 05.06.01180 Port. Bounty Winder Report (Part 1)b 05.06.01181 Port. Bounty Winder Report (Part 2)b 05.06.01182 Processing Options Study Report 05.06.01183 Scoping Review of Processing Options for Gossan Hill 05.06.01184 Scuddles Feasibility 2006 05.06.01185 Scuddles mining study combined 05.06.01186 Strategic Memo April 2007 05.06.01187 Summary - Port of Geraldton 05.06.01188 Underground Materials Handling Systems Concept Study 05.06.01189 Updated Project Overview Cuox Flotation and Sulphide Flotation 05.06.01190 Xantho Extended 5.6.1 GG Open Pit
05.06.01.01191 22a pit shells 05.06.01.01192 Directors presentation July 08 05.06.01.01193 gh22a 05.06.01.01194 gh25b 05.06.01.01195 OGGO Open Pit Preso 05.06.01.01196 Open Pit Studies 05.06.01.01197 OZ_GG_CuO_Openpit_DATABASE VALIDATION REPORT A 05.06.01.01198 OZ_GG_Open Pit Summary Jan2009 05.06.01.01199 QA GH22a 05.06.01.01200 QA GH25b 05.06.01.01201 Sep 10 OZ_GG_GH25_Economic Summary - Corp Prices Rec 82% Con 21 5% 5.6.2 Mining Proposals
05.06.02.01202 Mining Proposal - Borrow Pit for Development and Closure Projects - Oct 2008 05.06.02.01203 Mining Proposal - Existing Tailings Storage Facility – October 2007 05.06.02.01204 Mining Proposal - Expansion and Upgrade of Village - Apr 2008 05.06.02.01205 Mining Proposal - Tailings Storage Facility - October 2008 5.7 SHEC
05.07.01206 070102-OXGG-CM-2008 Incident Report Detail 05.07.01207 070519-OXXGG-JB-Form 1 CS Act cover letter (4) 05.07.01208 070524-OXGG-EKS-Part A Suspected Contamination Sites (2) 05.07.01209 070524-OXGG-EKS-Part B Known Contamination Site 05.07.01210 080402-OZGG-BD&JB-SS-Integrated Risk Register 05.07.01211 080517-OXGG-LT-DOIR Response to Site Inspection 05.07.01212 080624-OXGG-Golden Grove Ghse Inventory Revised Version 05.07.01213 081121-OZGG-CM-ECR Management System Mapped Out A0 size 05.07.01214 081220-OZGG-JB-Let Incident Cd exceedance of LDP 05.07.01215 100304-MMGGG-SY-NCSI Surveillance Audit Report 1-4 March 2010 05.07.01216 100330-MMGGG-Annual Audit Complaince Report 2009 05.07.01217 100331-MMGGG-CT-2009 Annual Environmental Report FINAL 05.07.01218 8931_GoldenGrove_SurvAuditReport0809 _6_ 05.07.01219 a. Due Diligence Report (Draft) - Environmental - Enesar 05.07.01220 Audit report - April 2008 GG minor edits
●
APPENDIX IV COMPETENT PERSON’S REPORT
— IV-100 —
MINMETALS RESOURCES LIMITED Competent Person’s Report on Minerals and Metals Group
AMC210063-10rpt_1 101122 Appendix B - 6
05.07.01221 b. Due Diligence - Enironmental - Plates 05.07.01222 DEC inspection -Tuesday 23rd September 05.07.01223 EPA referral GG Open Pit Project 05.07.01224 GGOzMinerals URS model 220109 cashflow only updated doconnor 05.07.01225 Golden Grove conditions of DoE Licence 05.07.01226 Inspection Report - Environmental Licence 5175-7 05.07.01227 Mining Proposal - Borrow Pit for Development and Closure Projects - Oct 2008 05.07.01228 Mining Proposal - Existing Tailings Storage Facility – October 2007 05.07.01229 Mining Proposal - Expansion and Upgrade of Village - Apr 2008 05.07.01230 MMG Ltd _Golden Grove_ Final SIA 16 October 05.07.01231 Oxiana GG Annual Environment Report 2007 05.07.01232 OZ_GGO TSF Closure Works Detailed Design - Stage 2 Report - Sept 07 DRAFT 05.07.01233 OZ_GG_42906354 609-W0038 1a Golden Grove Op Strat Sep08_Water 05.07.01234 OZ_GG_DEC Licence 5175-8 05.07.01235 Risk Register 05.07.01236 Social Impact Assessment and Management Plan 05.07.01237 Vegetation Clearance Permit 1678-1 05.07.01238 Vegetation Clearance Permit 812-1 5.7.1 Annual Environ Review 2005
05.07.01.01239 Annual Environ Review 2005 Section 1 05.07.01.01240 Annual Environ Review 2005 Section 2 05.07.01.01241 Annual Environ Review 2005 Section 3 05.07.01.01242 Annual Environ Review 2005 Section 4 5.7.2 Closure
05.07.02.01243 08-11-17 2008 C&R liability estimate - Golden Grove 05.07.02.01244 08-11-17 Golden Grove Closure and Reclamation Plan 05.07.02.01245 091107-MMGGG-SY 2009 C&R liability estimate - Golden Grove1 05.07.02.01246 091107-MMGGG-SY-Golden Grove Closure and Reclamation PlanV2 05.07.02.01247 9 Feb GG and Ave CandM 05.07.02.01248 Attachment - Summary of Change 05.07.02.01249 GoldenGve21dec09 05.07.02.01250 Life of Mine Working Closure Plan - 2005 05.07.02.01251 URS closure provision review_Golden Grove_051208 5.7.3 ISO11001 Audits
05.07.03.01252 080619-OXGG-CM-ISO14001 Recertification Audit Response 05.07.03.01253 080704-OXGG-CM-ISO14001 Corrective Action Summary 05.07.03.01254 8391_08 Apr_RES_EMS_Report_Oxiana Golden Grove
6 OPERATIONS-ROSEBERY
6.1 Overview
06.01.01468 2009 OZ Rosebery Plan 20.01.09 06.01.01469 2009 OZ Rosebery Plan NOTE Disregard Capex nos 06.01.01470 554 Oz Minerals BBS 20081125 06.01.01471 578 MMG BBP FY 10 V2 100503 06.01.01472 578 MMG BBS CY 14 V2 100503 06.01.01473 MMG Exploration Forum 2010 (PPTminimizer) 06.01.01474 Rosebery Strategy Board Summary_Oct08 06.01.01475 Rosebery Tenement Map 06.01.01476 Visitors Presentation_OZ Minerals_1 6.1.1 COO Reports
06.01.01.01477 90B03000 06.01.01.01478 Rosebery COO Apr 09 06.01.01.01479 Rosebery COO Apr10 06.01.01.01480 Rosebery COO Aug 09 06.01.01.01481 Rosebery COO Dec09 06.01.01.01482 Rosebery COO Feb 09 06.01.01.01483 Rosebery COO Feb10 06.01.01.01484 Rosebery COO Jan 09 06.01.01.01485 Rosebery COO Jan10 06.01.01.01486 Rosebery COO July 09 A$US 06.01.01.01487 Rosebery COO June 09
06.01.01.01488 Rosebery COO Mar 09v2 06.01.01.01489 Rosebery COO Mar10 06.01.01.01490 Rosebery COO May 09 06.01.01.01491 Rosebery COO May10 06.01.01.01492 Rosebery COO Nov09 06.01.01.01493 Rosebery COO Oct 09V1 06.01.01.01494 Rosebery COO Sep 09 6.2 Business Plan
06.02.01495 asset register 31 Jan 09 06.02.01496 Cost Booklet ROM CY2010 06.02.01497 Cost Booklet ROM CY2010V1 06.02.01498 CY2010 MMG Rosebery Departmental Summary Costs A$AUD 06.02.01499 Information for G Coster 06.02.01500 Mill Operation CY2010 budget updated 040909 06.02.01501 Mill Physicals 2010 06.02.01502 MMG Rosebery 2010 Plan Presentation V6 06.02.01503 MMG Rosebery Capital Projects CY2010 06.02.01504 MMG Rosebery COA CY2010 06.02.01505 MMG Rosebery Concentrate CY2010 06.02.01506 MMG Rosebery CY2010 Cashflow Budget A$AUD 06.02.01507 MMG Rosebery CY2010 P&L Budget A$AUD 06.02.01508 MMG Rosebery CY2010 06.02.01509 MMG Rosebery People CY2010 06.02.01510 MMG Rosebery Revenue CY2010 06.02.01511 MMG Rosebery SHE CY2010 06.02.01512 MMG_Generic Valuation Model_Rosebery_May2010_FINAL capex reduction 06.02.01513 OZ Rosebery 2009 Budget 06.02.01514 ROM YTD Costs 2007-08 June 06.02.01515 ROM YTD Costs December 2008 12.01.2009 06.02.01516 Rosebery Key consumable items and trends 06.02.01517 Sustaining Capital Forecast to 2030 (2) 6.3 Geology
06.03.01518 Exploration presentation Lorrigan Jan09 06.03.01519 Feb08_tenure_draped_on_MRV 06.03.01520 long section 0809 06.03.01521 Long Section Jan 09 06.03.01522 tenement summary 6.3.1 Exploration Monthly Reports
06.03.01.01523 0308_Rosebery_Exp 06.03.01.01524 0408_Rosebery_Exp 06.03.01.01525 0508_Rosebery_Exp 06.03.01.01526 0608_Rosebery_Exp 06.03.01.01527 0708_Rosebery_Exp_OZ 06.03.01.01528 0808_Rosebery_Exp_OZ 06.03.01.01529 0908_Rosebery_Exp_OZ 06.03.01.01530 1008_Rosebery_Exp_OZ 06.03.01.01531 1108_Rosebery_Exp_OZ 06.03.01.01532 1208_Rosebery_Exp_OZ 6.3.2 Resource and Reserve
06.03.02.01533 2008 Reserve Resource Statement 06.03.02.01534 2008_ressummary_fixed 06.03.02.01535 ASX Announcement - 2008 Resources Reserve Statement 06.03.02.01536 Estimated Economic Reserves December 2008 06.03.02.01537 Estimated Economic Reserves March 2008 06.03.02.01538 Memo_mining_inventory_Dec08 06.03.02.01539 Oz Rosebery RESOURCE STATEMENT_july2008 06.03.02.01540 resourcebalanceapr-jun2008 06.03.02.01541 Resource_june2008ORM 06.03.02.01542 Review of Ore Reserves 06.03.02.01543 Rosebery_09June MROR Report_Master 06.03.02.01544 Rosebery_09June MROR Report_Master 06.03.02.01545 SRK Leapfrog studies 06.03.02.01546 Survey Data Void Model Declines 06.03.02.01547 Upper levels resource above14L 06.03.02.02495 depleted models 06.03.02.02496 depletion wireframes 06.03.02.02497 holes3d
●
APPENDIX IV COMPETENT PERSON’S REPORT
— IV-101 —
MINMETALS RESOURCES LIMITED Competent Person’s Report on Minerals and Metals Group
AMC210063-10rpt_1 101122 Appendix B - 7
06.03.02.02498 wireframes 6.3.3 Reconciliations
06.03.03.01548 monthrec07_08 06.03.03.01549 reconciliation 06.03.03.01550 reconciliation_07_08 06.03.03.01551 Reconcilliation monthly 08_09 6.4 Mining
06.04.01691 307053 Rosebery Ventilation Review FINAL A 06.04.01692 December schedule rates 2008 06.04.01693 Historical Electricity Consumption & Unit Price 06.04.01694 planned ug development 06.04.01695 Prod by lens jul08-dec08 06.04.01696 Resource Rosebery pit (NSRPT gt 60) 06.04.01697 Revised Mine Budget DRAFT 06.04.01698 surface_topo 06.04.01699 UG PLANT EQUIPMENT REGISTER 6.4.1 Monthly Reports
06.04.01.01700 1.January Rosebery period report 2009 (Corrected 1) 06.04.01.01701 Mine Technical Service Monthly Reports 06.04.01.01702 Monthly reports 2006 -07 06.04.01.01703 Monthly reports 2007 - 08 06.04.01.01704 Monthly reports 2008 - 09 06.04.01.01705 Rosebery Monthly report April 2010 06.04.01.01706 Rosebery Monthly report Dec 2009 06.04.01.01707 Rosebery Monthly report Feb 2010 06.04.01.01708 Rosebery Monthly report Jan 2010 with plan figs 3 06.04.01.01709 Rosebery Monthly report Mar 2010 06.04.01.01710 Rosebery Monthly report Nov 2009 06.04.01.01711 Rosebery Monthly Reports 06.04.01.01712 Rosebery period report April 2009 new 06.04.01.01713 Rosebery period report Aug 2009 06.04.01.01714 Rosebery period report Feb 2009 Final 06.04.01.01715 Rosebery period report July 2009 (A 06.04.01.01716 Rosebery period report June 2009 06.04.01.01717 Rosebery period report March 2009 new 06.04.01.01718 Rosebery period report May 2009 new sat 11 06.04.01.01719 Rosebery period report Oct 2009 06.04.01.01720 Rosebery period report Sep 2009 6.4.2 Geotech
06.04.02.01721 4622 ESMP Audit Memo 240609 06.04.02.01722 Bobadil & 2-5 Dam Report 06.04.02.01723 Bobadil Wall lift 09 06.04.02.01724 Final Audit Report 06.04.02.01725 Geotech Bobadil 0809 06.04.02.01726 Geotech Reports 06.04.02.01727 ROSEBERYOCT20_47-53KLENS_OPTIONS_DRAFT_V1_2003 06.04.02.01728 Seismic event register Aug 1 08 to Feb 10 09(excl blasts) 06.04.02.01729 Seismic Monitoring System at Oz Minerals 6.5 Processing
06.05.01737 Historical Mill Performance 06.05.01738 Mill Physicals 06.05.01739 Mine Physicals 06.05.01740 MTS Metres CY2010 06.05.01741 Que River Physicals CY2010 06.05.01742 Report on Marcy SAG Mill Mechanical Inspection Rev A Issued 23-6-08 06.05.01743 Rosebery Comminution Asset Review Report GR Engineering 06.05.01744 Rosebery Concentrate Specifications 06.05.01745 Rosebery CY2010 metal production 06.05.01746 Rosebery Refurbishment Study - Rev B 06.05.01747 Rosebery refurbishment Works Summary Appendix A 6.5.1 EOM Metbalance
06.05.01.01748 April 10 Treatment Report - FINAL 06.05.01.01749 August 09 Treatment Report - FINAL 06.05.01.01750 December 09 Treatment Report - FINAL 06.05.01.01751 Feb 09 Treatment Report FINAL 06.05.01.01752 February 10 Treatment Report - FINAL
06.05.01.01753 January 09 Treatment Report - Final 06.05.01.01754 January 10 Treatment Report - FINAL 06.05.01.01755 July 09 Treatment Report - FINAL 06.05.01.01756 June 09 Treatment Report FINAL 06.05.01.01757 Mar 09 Treatment Report - FINAL 06.05.01.01758 March 10 Treatment Report - FINAL 06.05.01.01759 May 09 Treatment Report - FINAL revised 06.05.01.01760 May 10 Treatment Report - FINAL 06.05.01.01761 November 09 Treatment Report - FINAL 06.05.01.01762 October 09 Treatment Report - FINAL 06.05.01.01763 September 09 Treatment Report - FINAL 06.05.01.01764 Treatment Report Apr 09 V2 6.5.2 Monthly Reports
06.05.02.01765 Monthly Report April 09 06.05.02.01766 Monthly Report April 10 06.05.02.01767 Monthly Report August 09 06.05.02.01768 Monthly Report December 09 06.05.02.01769 Monthly Report February 10 06.05.02.01770 Monthly Report January 10 06.05.02.01771 Monthly Report July 09 06.05.02.01772 Monthly Report June 09 06.05.02.01773 Monthly Report March 09 06.05.02.01774 Monthly Report March 10 06.05.02.01775 Monthly Report May 09 06.05.02.01776 Monthly Report May 10 06.05.02.01777 Monthly Report November 09 06.05.02.01778 Monthly Report October 09 06.05.02.01779 Monthly Report September 09 6.5.3 Plant Upgrade Documents
06.05.03.01780 Plant Upgrade Draft Report Complete PDF_A Vol 1 06.05.03.01781 Plant Upgrade Draft Report Complete PDF_A Vol 2 06.05.03.01782 Plant Upgrade Draft Report Complete PDF_A Vol 3 06.05.03.01783 Plant Upgrade Draft Report Complete PDF_A Vol 4 06.05.03.01784 ZRM Prefeasibility Study FINAL 6.5.4 Tailings Waste Dump and Stock Pile
06.05.04.01785 ATC Report Dry Stacking of Tailings 06.05.04.01786 Rosebery Tailings Dam Studies 06.05.04.01787 Rosebery Tailings Geochem 28Nov2008 06.05.04.01788 TSF Resources 1986 Report 6.6 Projects and Studies
06.06.01789 200901 Rosebery Plant Upgrade Studies 06.06.01790 Rosebery Risk Review and Mitigation Report _Distilled 06.06.01791 Rosebery UG BM Study Debrief 06.06.01792 Rosebery Upgrade Strategy 06.06.01793 Worley Parsons Prefeasibility Study FINAL Dec 07 06.06.01794 ZRM Strategy PFS Outcomes Board Feb 2008 rev3 6.6.1 Geotech
06.06.01.01795 Acoustic Emisions -Rosebery-Nov06 06.06.01.01796 Acoustic Emissions Study Stage 2-Rosebery-Oct07 06.06.01.01797 Coffeys LOM AUDIT2006_7 06.06.01.01798 GS2006JUL30 ROSEBERY LOM SEQUENCE 06.06.01.01799 Report on Cemented Rock Fill Review STUDY08 Draft 06.06.01.01800 ZRM Early-age Test Report 6.6.2 Haulage Study
06.06.02.01801 Appendix 1 - Haulage Optimisation Checklist Draft.doc 06.06.02.01802 Appendix 2 - Haulage Optimisation Matrix Draft.doc 06.06.02.01803 Appendix 3 - Mining Method Optimisation Checklist Draft.doc 06.06.02.01804 Appendix 4 - Mining Method Optimisation Matrix Draft.doc 06.06.02.01805 Appendix 5 Haulage Optimisation Cost Summaries New Schedule update 080516.beh 06.06.02.01806 Zinifex Study Report - Draft.doc 6.6.3 LOM Mining Studies
06.06.03.01807 080328 Item 8.7 Rosebery Ventilation Upgrade 06.06.03.01808 ZRM ROMP Hill of Value Modelling 20080808 06.06.03.01809 ZRM Vent Presentation_COO_FINAL (2) 6.6.4 Open Pit Studies
06.06.04.01810 080808-4601-002 PB to GN Open Pit Assessment
●
APPENDIX IV COMPETENT PERSON’S REPORT
— IV-102 —
MINMETALS RESOURCES LIMITED Competent Person’s Report on Minerals and Metals Group
AMC210063-10rpt_1 101122 Appendix B - 8
06.06.04.01811 Other open pit Whittle results 06.06.04.01812 Resource Rosebery pit (NSRPT gt 60) 06.06.04.01813 Whittle Results Rose Pit Run1 v2 06.06.04.01814 Whittle Results Rose Pit Run1 v3 06.06.04.01815 Whittle Results Rose Pit Run4 v2 06.06.04.01816 Whittle Results Rose Pit Run4 6.6.5 Rsoebery Vent Shaft Project Report
06.06.05.01817 10Project Progress Summary NDC Report-October 09 06.06.05.01818 11Project Progress Summary NDC Report-November 09 06.06.05.01819 12Project Progress Summary NDC Report-December 09 06.06.05.01820 1Project Progress Summary NDC Report-January 10 06.06.05.01821 2Project Progress Summary NDC Report-February 10 06.06.05.01822 3Project Progress Summary NDC Report-March 10 06.06.05.01823 4 Project Progress Summary NDC Report-April 10 06.06.05.01824 5 Project Progress Summary NDC Report-may10 06.06.05.01825 6NDCProgress Report29-june2009 06.06.05.01826 7NDCProgress Report29-jul2009 06.06.05.01827 8Project Progress Summary NDC Report-August 09 06.06.05.01828 9Project Progress Summary NDC Report-September 09 6.6.6 South Hercules
06.06.06.01829 Appendix 2.Location and Previous Work 06.06.06.01830 Appendix 3.Geological and Resource Appendices 06.06.06.01831 Appendix 4.Geotechnical App 06.06.06.01832 Appendix 5.Environmental appendices 06.06.06.01833 Appendix 6.Metalurgical Appendices 06.06.06.01834 Appendix 7.Mine Design and Optimisation Appendix 06.06.06.01835 Appendix 8.Costing 06.06.06.01836 Appendix 9.Financial and legal appendices 06.06.06.01837 Development of South Hercules Mine 06.06.06.01838 DRAFT Final Review South Hercules Mining Study August 08 06.06.06.01839 South Hercules Mining Study Worksheets D Barrell Aug 2008 06.06.06.01840 Sth Herculese 6.7 SHEC
06.07.01841 2006 site photo 06.07.01842 20080820 OZ Minerals Asbestos audit report 06.07.01843 210047755_2_Rosebery OHS Compliance Obligations Register (two indexes) 06.07.01844 27. Annual Dam Surv Report 06.07.01845 August 2008 ISO14001-AS4801 Audit 06.07.01846 Copy of Data review 2008 & 2009 for EPA 06.07.01847 Copy of SR09_2_Environment_Workbook 06.07.01848 Data Request AMC 160610 06.07.01849 EMP Review FY 2009 06.07.01850 Environmental Management System Roadmap 06.07.01851 FY 2009 Review Addendum_Final to EPA 06.07.01852 GHD Lead Health Risk Assessment Report May 08 06.07.01853 MMG Rosebery WCLs 300610 (final) 06.07.01854 Rosebery Open Cut - 27-7-09 06.07.01855 Rosebery Open Cut Inspection - 3-6-09 06.07.01856 Water licence 6.7.3 Environment
06.07.03.01872 Environmental Managment Plan Review Sept 08 06.07.03.01873 Environmental Managmentt Roadmap 06.07.03.01874 Environmental Protection Notice 06.07.03.01875 Final EPN 7153.1 06.07.03.01876 Group Environmental Audit 06.07.03.01877 Rosebery Environmental Issues Memo 06.07.03.01878 URS Report 06.07.03.01879 URS Update Letter 6.7.4 Mine Closure
06.07.04.01880 2009 Summary of Change-Avebery 06.07.04.01881 2009 Summary of Change-Hercules 06.07.04.01882 2009 Summary of Change-RoseberyV2 06.07.04.01883 Addendum to Rosebery MCP 08 06.07.04.01884 Hercules Closure Priorities and Costs 06.07.04.01885 Hercules Decommissoining Plan
06.07.04.01886 Hercules update - signed 06.07.04.01887 Mine Closure Plan App A EPN 7153_1 06.07.04.01888 Mine Closure Plan App B Land Use Class Descriptions 06.07.04.01889 Mine Closure Plan App C Risk Management Procedure 06.07.04.01890 Mine Closure Plan App D Risk Register Final 06.07.04.01891 Mine Closure Plan App E Major Infrastructure Decommissioning Matrix 06.07.04.01892 Mine Closure Plan Main Report 06.07.04.01893 Mine Closure Plan v2 06.07.04.01894 MMG Rosebery Closure Liability Estimate 30 June 2009 06.07.04.01895 Rosebery update - signed 06.07.04.01896 Zinifex_Rosebery_Mine_Closure_Volume_2 (Update 2009) 6.7.5 Safety
06.07.05.01897 Events Incidents Summary 2004 2005 06.07.05.01898 Events Incidents Summary 2006 2007 06.07.05.01899 Events-Incidents Summary 2008 06.07.05.01900 Injury Frequency Rate Graphs 2004-5 06.07.05.01901 Injury Frequency Rate Graphs 2006-7 06.07.05.01902 Injury Frequency Rate Graphs 2008 06.07.05.01903 Significant Safety Incident Statistics 2004 2008 06.07.05.01904 Workers Comp Data 2004 2008
7 OPERATIONS-SEPON
7.1 Overview
07.01.02020 Ambassadors Visit November 2008 07.01.02021 LXML Performance Reporting Jan09 07.01.02022 Reconciliation data 2008_9 07.01.02023 Sepon Update 7.1.1 COO Reports
07.01.01.02024 COO Report May 10 07.01.01.02410 COO Report Apr09 07.01.01.02411 COO Report Apr10 07.01.01.02412 COO Report August09 07.01.01.02413 COO Report Dec09 07.01.01.02414 COO Report Feb10 07.01.01.02415 COO Report Jan10 07.01.01.02416 COO Report July09 07.01.01.02417 COO Report June09 07.01.01.02418 COO Report Mar10 07.01.01.02419 COO Report May 10 07.01.01.02420 COO Report May09 07.01.01.02421 COO Report Nov09 07.01.01.02422 COO Report Oct09-Final-181109 07.01.01.02423 COO Report Sept09-Final 7.2 Business Plan
07.02.02025 LXML Budget Report 2010 07.02.02026 MMG_Generic Valuation Model_LXML_Apr2010_FINAL 07.02.02499 LXML 2010 Budget V1 07.02.02500 LXML PReporting 2010 BudgetV1 7.3 Geology
07.03.02027 Sepon Copper Projects Dec 08m 07.03.02028 Sepon MEPA History Slides 20050900 07.03.02029 Sterilisation Program Reports 07.03.02030 THK Draft General Layout Mar08 A3 Land 12000 07.03.02031 TKH Copper Project Pit Names 15000 07.03.02032 TKN P1 Proposed drill sites_mapping points_grids 7.3.2 Resource and Reserve
07.03.02.02033 200907 MMG LXML SEP - Au Release Notes - Jun09 V3 07.03.02.02034 200907 MMG LXML SEP - Cu Release Notes - Jun09 V2 07.03.02.02035 2009_DKY 07.03.02.02036 2009_TKS_whole 07.03.02.02037 2009_VAT 07.03.02.02038 BDA Review Sepon Resource-Reserve Estimate November 2008 Rev6 07.03.02.02039 BDA Review Sepon Resource-Reserve Estimate November 2008 07.03.02.02040 Houay Yeng - 2008 Gold Resource Report - FINAL
●
APPENDIX IV COMPETENT PERSON’S REPORT
— IV-103 —

MINMETALS RESOURCES LIMITED Competent Person’s Report on Minerals and Metals Group
AMC210063-10rpt_1 101122 Appendix B - 9
07.03.02.02041 JORC Summary Sheets 07.03.02.02042 Khanong 2008 07.03.02.02043 Khanong_Resource_Report_2008 - Draft - with Appendices 07.03.02.02044 MMG LXML SEP - Au Compilation - Jun09 v2 07.03.02.02045 MMG LXML SEP - CuOx Compilation - Jun09 v1 07.03.02.02046 OZ LXML SEP - Au Release Notes - Jun08 07.03.02.02047 OZ LXML SEP - Cu Release Notes - Jun08 07.03.02.02048 Phavat North 2008 Resource complete report 07.03.02.02049 PHB - 2008 Copper Resource Statement - DRAFT 07.03.02.02050 Primary Gold Resource modeling Report 290308v1-DRAFT 07.03.02.02051 Proposed KHN Reserve Statement dated 10 Dec 2007 07.03.02.02052 Resource and Reserve data - 17062010 07.03.02.02053 Resource breakdown 07.03.02.02054 Resource Notes and Statements 07.03.02.02055 Sepon 2008 Resource Statement 07.03.02.02056 Sepon KHN and TKN Cu Reserve June 2007 07.03.02.02057 Sepon Reserve Statement as at June 2007 07.03.02.02058 Thengkham Area Pit Inventories 07.03.02.02059 Thengkham North 2007 07.03.02.02060 Thengkham North Reserves - Orebody Model 07.03.02.02501 Sepon Reserves and Inventory Status at End Dec 2009 7.3.3 Reconciliations
07.03.03.02061 End of Month Geology Reconciliation Procedure - 07.03.03.02062 Reconciliation data 2008_9 07.03.03.02502 Reconciliation data 7.3.4 Geotech
07.03.04.02063 Khanong Acid Rock Management and Geotech Group Studies Executive Summary v1 07.03.04.02064 Khanong OP Geotechnical Review Report Oct 2008 07.03.04.02065 Khanong Pit Operability Study Dec 08 07.03.04.02066 Khanong Pit Slope geotech Review Comments 07.03.04.02067 Pit Geotechnical Design Issues 07.03.04.02068 THK Nth Geotech Drill Collar Locations_KG 07.03.04.02069 THK Nth Pit A Pits 1st Geotech Drill Sites 07.03.04.02070 THK Nth Pit A Pits Tracks Mapping Proposed Geotech Drill Sites A3 Land 2500 7.3.5 Exploration
07.03.05.02071 Analysis of a Mo Bearing Sample May 2008 07.03.05.02072 Assessment of Primary Copper 07.03.05.02073 Drill Section Diagrams - Thengkham South 07.03.05.02074 Khanong Pacrim 99 paper by Stef Loader 07.03.05.02075 Nevada Paper Smith Olberg, Manini 07.03.05.02076 Pacrim Sepon Cu deposits 20081113 07.03.05.02077 RJH Sepon Structural framework Presentation 07.03.05.02078 Strat column revised by mark and mike - A3 07.03.05.02079 The Sepon Gold Deposits Paper 7.4 Mining
07.04.02080 Asset Register LXML 07.04.02081 Capital Budget 2009 TM2 07.04.02082 Cut Off Grades 07.04.02083 Hauling distance 07.04.02084 Hydrogeology 07.04.02085 Khanong Ore Type Explanation 07.04.02086 Lane Xang Minerals Limited Sepon Mine Khanong Copper Pit 07.04.02087 LXML Budget 2009 07.04.02088 LXML Quarterly report from BDA for the quarter ended 30 September 2008 07.04.02089 Memo Re Sterilisation 07.04.02090 MSC Notes on Khanong Pit Design Rev. 2 July 2006 07.04.02091 Review Site May 08 07.04.02092 ROM layout 07.04.02093 Schedule_Template_LOM_1108_TON_reformat 07.04.02094 Sepon_lay_out_A0_081209 07.04.02095 Stages Khanong diagram 07.04.02096 Stockpile Management 07.04.02097 Tailings Storage Facility No. 1 Stage 4 (Final) Construction Report
07.04.02098 Technical mining reports 07.04.02099 WTSF Stage 1 and 2 Construction Report 7.4.1 Reports
07.04.01.02100 2007 Annual Operations Report 07.04.01.02101 Business Analysis Report Dec 06 07.04.01.02102 Business Analysis Reports Additional 07.04.01.02103 Business Analysis Reports 07.04.01.02104 Capital Reports and Budgets 07.04.01.02105 Monthly Operations Reports 07.04.01.02106 Operations Monthly Report Apr 2010 07.04.01.02107 Operations Monthly Report April 2009 07.04.01.02108 Operations Monthly Report December 2009 07.04.01.02109 Operations Monthly Report Feb 2009 Edit 07.04.01.02110 Operations Monthly Report Feb 2010 07.04.01.02111 Operations Monthly Report Jan 2010 07.04.01.02112 Operations Monthly Report January 2009 07.04.01.02113 Operations Monthly Report July 2009 07.04.01.02114 Operations Monthly Report June 2009 07.04.01.02115 Operations Monthly Report Mar 2010 07.04.01.02116 Operations Monthly Report May 2009 07.04.01.02117 Operations Monthly Report May 2010 07.04.01.02118 Operations Monthly Report November 2007 07.04.01.02119 Operations Monthly Report November 2009 07.04.01.02120 Operations Monthly Report October 2009 07.04.01.02121 Operations Monthly Report Septemeber 2009 07.04.01.02122 Sepon Annual Report 2009 07.04.01.02123 Sepon Monthly Report August 2009 07.04.01.02124 Sepon Operations Monthly Report March 2009 07.04.01.02503 Operations Monthly Report June 2010 7.5 Processing
07.05.02125 Further Testwork on Copper Ores from Pha Bing 07.05.02126 Leaching of Copper from Exploratory Drill Core Samples 07.05.02127 Process Deign Criteria Sepon 07.05.02128 Schemtaic Flow Diagram - Sepon Copper Project Overall Process 07.05.02129 Schemtaic Flow Diagram - Sepon Gold Project Overall Process 07.05.02130 Sepon Process Flowsheet Overview GoL 07.05.02424 100507 GRichmond to RHooper Review of PhabingThengkham testwork 07.05.02425 Processing Presentation Jun10 7.6 Projects and Studies
07.06.02131 Aurifex Report - Review of Preliminary Primary Ore Testwork Results and Testwork Program 07.06.02132 Copper Expansion Prefeasibility Study 07.06.02133 Definitive Feasibility Report - Sepon Copper Project – Bateman Metals 07.06.02134 DFS (Oct 2001) - Drawings 07.06.02135 DFS (Oct 2001) - Section 1 - 3 07.06.02136 DFS (Oct 2001) - Section 4 - 13 07.06.02137 Diagram - Direct Cyanidation 07.06.02138 G. Hookey Nov 2007 Sediment Characterisation and Transport Study 07.06.02139 Golder Sept 2008 Factual Hydrogeological Report for Copper Expansion Project 07.06.02140 Independent Technical Advisor Completion Test Certificate 07.06.02141 Operational Summary - September 2007 - BDA 07.06.02142 Preliminary Assessment of Treatment Option - J MacIntrye 07.06.02143 Sepon Copper and Gold Expansion Projects Mid Project Review 07.06.02144 Sepon Copper Project Monthly Report - KDG - December 2004 07.06.02145 Sepon Gold Project Heap Leach Scoping Study 07.06.02146 Sepon Gold Project Monthly Report - KDG - December 2004 07.06.02147 Sepon Monthly reports 07.06.02148 Sepon Primary Gold Ore Testwork Report - J MacIntrye 07.06.02149 Sepon Project Development Group 3 Year Plan 07.06.02150 Sterilisation Program Reports 07.06.02151 Tengkham and Phabing Pit Optimisation and design report
●
APPENDIX IV COMPETENT PERSON’S REPORT
— IV-104 —
MINMETALS RESOURCES LIMITED Competent Person’s Report on Minerals and Metals Group
AMC210063-10rpt_1 101122 Appendix B - 10
07.06.02152 Thengkham Development Study v12 07.06.02153 Thengkham Draft Report 5June2008 07.06.02154 Thengkham South Leaching 7.7 SHEC
07.07.02155 2009 Model YTDV2 07.07.02156 Appendices 07.07.02157 Auditing and compliance 07.07.02158 Inderpendent review of Sepon closure provisions_Dec09 07.07.02159 ISO 14001 Certification Audit Report 07.07.02160 LXML Environmental Management Plan 2009 FINAL 07.07.02161 Mine closure 07.07.02162 Sepon 4jan10b 07.07.02163 Sepon Mine Closure Plan Gap Analysis v1 07.07.02164 Sepon Risk Register 10062010 07.07.02165 Sepon Update 07.07.02166 Tailings Geochemistry and Implications for Closure of the Western Tailings Storage Facility 07.07.02426 Inderpendent review of Sepon closure provisions_Dec09 07.07.02427 LXML 2006 RMCP Final Report 07.07.02428 Sepon Final Risk Register 07.07.02429 Sepon Mine Closure Plan Gap Analysis v1 07.07.02430 Sepon Operation Reclamation Plan 2009 -10 Final Report
8 PROJECTS-DUGALD RIVER
8.1 Overview
08.01.02274 100304 Dugald River Project Memo 08.01.02275 100304 Dugald River Project Memo 08.01.02276 Dugaldmasterv10 (Summary Physicals and Costs only) 08.01.02277 High Level Summary Table 8.1.1 Feasibility Study
08.01.01.02278 Vol 1 Executive Summary Rev 0 08.01.01.02279 Vol 2 Sect 1-4 08.01.01.02280 Vol 2 Sect 10-11 08.01.01.02281 Vol 2 Sect 12-15 08.01.01.02282 Vol 2 Sect 16-19 08.01.01.02283 Vol 2 Sect 5-6 08.01.01.02284 Vol 2 Sect 7-9 08.01.01.02285 Vol 3 Financial Analysis Rev B 8.2 Business Plan
08.02.02286 MMG_Generic_Dugald_150410 8.3 Geology
08.03.02287 00 Geology Index 08.03.02288 01 Drilling Database 20090108 08.03.02289 02 Current Resource Reports (rel Dec 2008) 08.03.02290 03 Previous Resource Reports 08.03.02291 04 Current Resource Data Files 08.03.02292 05 Current Resource Block Model - Modfin 08.03.02293 06 Current Resource Block Model - nsrzneq 08.03.02294 07 Lithology 20090108 08.03.02295 08 Current Gelogical Sections 08.03.02296 Dugald River Extract of AMC Report 8.4 Mining
08.04.02297 108019 Dugald River Backfill Options Study Final Report_PR_AGG 08.04.02298 Design Wireframe Animation Files 08.04.02299 Dewatering Study - CRE 08.04.02300 Dugald Backfill Options Study Draft Aug 08 08.04.02301 Dugald River Equipment Review Nov 2008 v 1 08.04.02302 Dugald_Backfill Report from Mehmet_11.9.08 08.04.02303 Dugald_Backfill Report from Mehmet_PT comments_15.9.08 08.04.02304 Geotechnical Study 08.04.02305 Geotech_081212 08.04.02306 Primary Ventilation 8.5 Processing
08.05.02307 Amdel_MinProcesSer_Dugald Phase 1A Testing Report_9May08 08.05.02308 DRFS Proc + G&A Budget 081216 08.05.02309 Other Reports by Ausenco
08.05.02310 Plant Engineering Main Feasibility Document BHPB Geotechnica 08.05.02311 Plant Engineering Main Feasibility Document BHPB Yurbi Drawi 08.05.02312 Plant Engineering Main Feasibility Document BHPB Yurbi Main 08.05.02313 Vol_2_Sect_7_Process_Plant 8.6 Infrastructure
08.06.02314 Powerline 08.06.02315 TSF
●
APPENDIX IV COMPETENT PERSON’S REPORT
— IV-105 —
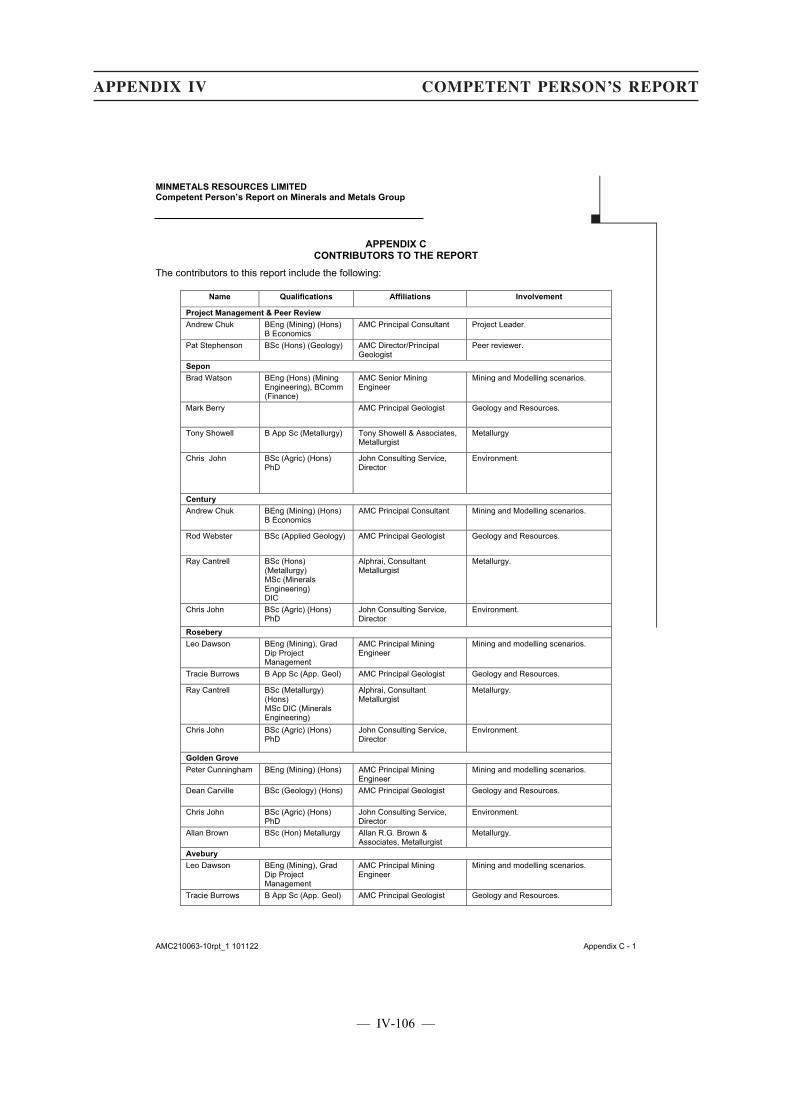
MINMETALS RESOURCES LIMITED Competent Person’s Report on Minerals and Metals Group
AMC210063-10rpt_1 101122 Appendix C - 1
APPENDIX C CONTRIBUTORS TO THE REPORT
The contributors to this report include the following:
Name Qualifications Affiliations Involvement
Project Management & Peer Review
Andrew Chuk BEng (Mining) (Hons) B Economics
AMC Principal Consultant Project Leader.
Pat Stephenson BSc (Hons) (Geology) AMC Director/Principal Geologist
Peer reviewer.
Sepon
Brad Watson BEng (Hons) (Mining Engineering), BComm (Finance)
AMC Senior Mining Engineer
Mining and Modelling scenarios.
Mark Berry AMC Principal Geologist Geology and Resources.
Tony Showell B App Sc (Metallurgy) Tony Showell & Associates, Metallurgist
Metallurgy
Chris John BSc (Agric) (Hons) PhD
John Consulting Service, Director
Environment.
Century
Andrew Chuk BEng (Mining) (Hons) B Economics
AMC Principal Consultant Mining and Modelling scenarios.
Rod Webster BSc (Applied Geology) AMC Principal Geologist Geology and Resources.
Ray Cantrell BSc (Hons) (Metallurgy) MSc (Minerals Engineering) DIC
Alphrai, Consultant Metallurgist
Metallurgy.
Chris John BSc (Agric) (Hons) PhD
John Consulting Service, Director
Environment.
Rosebery
Leo Dawson BEng (Mining), Grad Dip Project Management
AMC Principal Mining Engineer
Mining and modelling scenarios.
Tracie Burrows B App Sc (App. Geol) AMC Principal Geologist Geology and Resources.
Ray Cantrell BSc (Metallurgy) (Hons) MSc DIC (Minerals Engineering)
Alphrai, Consultant Metallurgist
Metallurgy.
Chris John BSc (Agric) (Hons) PhD
John Consulting Service, Director
Environment.
Golden Grove
Peter Cunningham BEng (Mining) (Hons) AMC Principal Mining Engineer
Mining and modelling scenarios.
Dean Carville BSc (Geology) (Hons) AMC Principal Geologist Geology and Resources.
Chris John BSc (Agric) (Hons) PhD
John Consulting Service, Director
Environment.
Allan Brown BSc (Hon) Metallurgy Allan R.G. Brown & Associates, Metallurgist
Metallurgy.
Avebury
Leo Dawson BEng (Mining), Grad Dip Project Management
AMC Principal Mining Engineer
Mining and modelling scenarios.
Tracie Burrows B App Sc (App. Geol) AMC Principal Geologist Geology and Resources.
●
APPENDIX IV COMPETENT PERSON’S REPORT
— IV-106 —
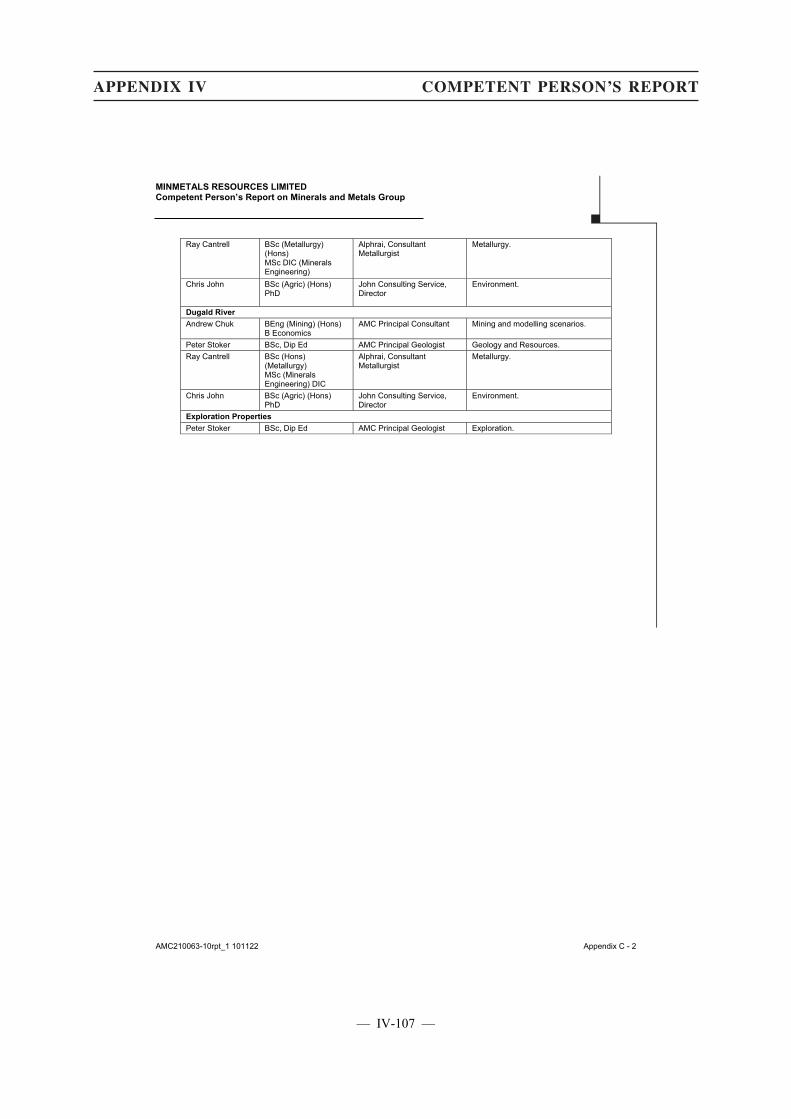
MINMETALS RESOURCES LIMITED Competent Person’s Report on Minerals and Metals Group
AMC210063-10rpt_1 101122 Appendix C - 2
Ray Cantrell BSc (Metallurgy) (Hons) MSc DIC (Minerals Engineering)
Alphrai, Consultant Metallurgist
Metallurgy.
Chris John BSc (Agric) (Hons) PhD
John Consulting Service, Director
Environment.
Dugald River
Andrew Chuk BEng (Mining) (Hons) B Economics
AMC Principal Consultant Mining and modelling scenarios.
Peter Stoker BSc, Dip Ed AMC Principal Geologist Geology and Resources. Ray Cantrell BSc (Hons)
(Metallurgy) MSc (Minerals Engineering) DIC
Alphrai, Consultant Metallurgist
Metallurgy.
Chris John BSc (Agric) (Hons) PhD
John Consulting Service, Director
Environment.
Exploration Properties
Peter Stoker BSc, Dip Ed AMC Principal Geologist Exploration.
●
APPENDIX IV COMPETENT PERSON’S REPORT
— IV-107 —
APPENDIX V VALUATION REPORT
G R A N T S A M U E L & A S S O C I A T E S
L E V E L 6
1 C O L L I N S S T R E E T M E L B O U R N E V I C 3 0 0 0
T : + 6 1 3 9 9 4 9 8 8 0 0 / F : + 6 1 3 9 9 9 4 9 8 8 3 8
w w w . g r a n t s a m u e l . c o m . a u
G R A N T S A M U E L & A S S O C I A T E S P T Y L I M I T E D
A B N 2 8 0 5 0 0 3 6 3 7 2 A F S L I C E N C E N O 2 4 0 9 8 5
[ ] October 2010
The Directors
Minmetals Resources Limited
Twelfth Floor, China Minmetals Tower
79 Chatham Road South
Tsimshatsui
KOWLOON
Hong Kong
Dear Directors
Valuation Report
1 Introduction
Minerals and Metals Group (“MMG”) consists of a portfolio of mining assets and exploration interests,
acquired from OZ Minerals Limited in June 2009. These assets and interests are owned, indirectly, by a
holding company named Album Resources Private Limited (“Album Resources”). China Minmetals
Corporation (“CMN”) is the ultimate sole shareholder of Album Resources.
The major assets of Album Resources (“Mineral Assets”) are:
� the Sepon copper/gold project in Laos;
� the Century zinc/lead mine in Queensland;
� the Golden Grove copper/zinc mine in Western Australia;
� the Rosebery lead/zinc mine in Tasmania;
� the Avebury nickel mine in Tasmania (currently on care and maintenance);
� the Dugald River zinc project in Queensland; and
� the Izok Lake and High Lake prospects in the Nunavut territories of northern Canada.
Minmetals Resources Limited (the “Company”) is a Hong Kong-incorporated company, listed on the
main board of The Stock Exchange of Hong Kong Limited (the “Stock Exchange”). The Company’s
principal activities are trading in non-ferrous metals, production of alumina and the manufacture and
distribution of aluminium and copper products. The Company is majority-controlled by CMN. CMN
and the Company are contemplating a transaction whereby the Company, through a wholly-owned special
purpose vehicle, All Glorious Limited, will acquire Album Resources from Album Enterprises Limited, a
wholly owned subsidiary of CMN (“Acquisition”).
The Directors of the Company have appointed Grant Samuel & Associates (“Grant Samuel”) as the
Competent Evaluator to prepare a report (“Valuation Report”) in connection with the Acquisition. The
Valuation Report is to set out a valuation of Album Resources, including a valuation of the Mineral
Assets, that complies Chapter 18 of the Rules Governing the Listing of Securities on the Stock Exchange
(the “Listing Rules”), including, but not limited to, Rules 18.24 and 18.34 of the Listing Rules (“Chapter
18 Valuation”). The Chapter 18 Valuation is as at 30 June 2010 but is based on assumptions, such as
forecast commodity prices and exchange rates, as at the date of the Valuation Report.
AMC Consultants Pty Ltd (“AMC”) was appointed by the Company as the Competent Person and to
provide specialist technical advice on the Mineral Assets to the Company and to prepare a Competent
The following is the text of a report from Grant Samuel & Associates, the Competent Evaluator, prepared in compliance with Chapter 18 of the Listing Rules and for the sole purpose of incorporation in this circular.
G R A N T S A M U E L & A S S O C I A T E S
L E V E L 6
1 C O L L I N S S T R E E T M E L B O U R N E V I C 3 0 0 0
T : + 6 1 3 9 9 4 9 8 8 0 0 / F : + 6 1 3 9 9 9 4 9 8 8 3 8
w w w . g r a n t s a m u e l . c o m . a u
G R A N T S A M U E L & A S S O C I A T E S P T Y L I M I T E D
A B N 2 8 0 5 0 0 3 6 3 7 2 A F S L I C E N C E N O 2 4 0 9 8 5
22 November 2010 The Directors Minmetals Resources Limited Twelfth Floor, China Minmetals Tower 79 Chatham Road South Tsimshatsui KOWLOON Hong Kong Dear Directors
Valuation Report 1 Introduction
Minerals and Metals Group (“MMG”) consists of a portfolio of mining assets and exploration interests, acquired from OZ Minerals Limited in June 2009. These assets and interests are owned, indirectly, by a holding company named Album Resources Private Limited (“Album Resources”). China Minmetals Corporation (“CMN”) is the ultimate sole shareholder of Album Resources. The major assets of Album Resources (“Mineral Assets”) are:
� the Sepon copper/gold project in Laos;
� the Century zinc/lead mine in Queensland;
� the Golden Grove copper/zinc mine in Western Australia;
� the Rosebery lead/zinc mine in Tasmania;
� the Avebury nickel mine in Tasmania (currently on care and maintenance);
� the Dugald River zinc project in Queensland; and
� the Izok Lake and High Lake prospects in the Nunavut territories of northern Canada. Minmetals Resources Limited (the “Company”) is a Hong Kong-incorporated company, listed on the main board of The Stock Exchange of Hong Kong Limited (the “Stock Exchange”). The Company’s principal activities are trading in non-ferrous metals, production of alumina and the manufacture and distribution of aluminium and copper products. The Company is majority-controlled by CMN. CMN and the Company are contemplating a transaction whereby the Company, through a wholly-owned special purpose vehicle, All Glorious Limited, will acquire Album Resources from Album Enterprises Limited, a wholly owned subsidiary of CMN (“Acquisition”). The Directors of the Company have appointed Grant Samuel & Associates (“Grant Samuel”) as the Competent Evaluator to prepare a report (“Valuation Report”) in connection with the Acquisition. The Valuation Report is to set out a valuation of Album Resources, including a valuation of the Mineral Assets, that complies Chapter 18 of the Rules Governing the Listing of Securities on the Stock Exchange (the “Listing Rules”), including, but not limited to, Rules 18.24 and 18.34 of the Listing Rules (“Chapter 18 Valuation”). The Chapter 18 Valuation is as at 30 June 2010 but is based on assumptions, such as forecast commodity prices and exchange rates, as at the date of the Valuation Report. AMC Consultants Pty Ltd (“AMC”) was appointed by the Company as the Competent Person and to provide specialist technical advice on the Mineral Assets to the Company and to prepare a Competent
— V-1 —
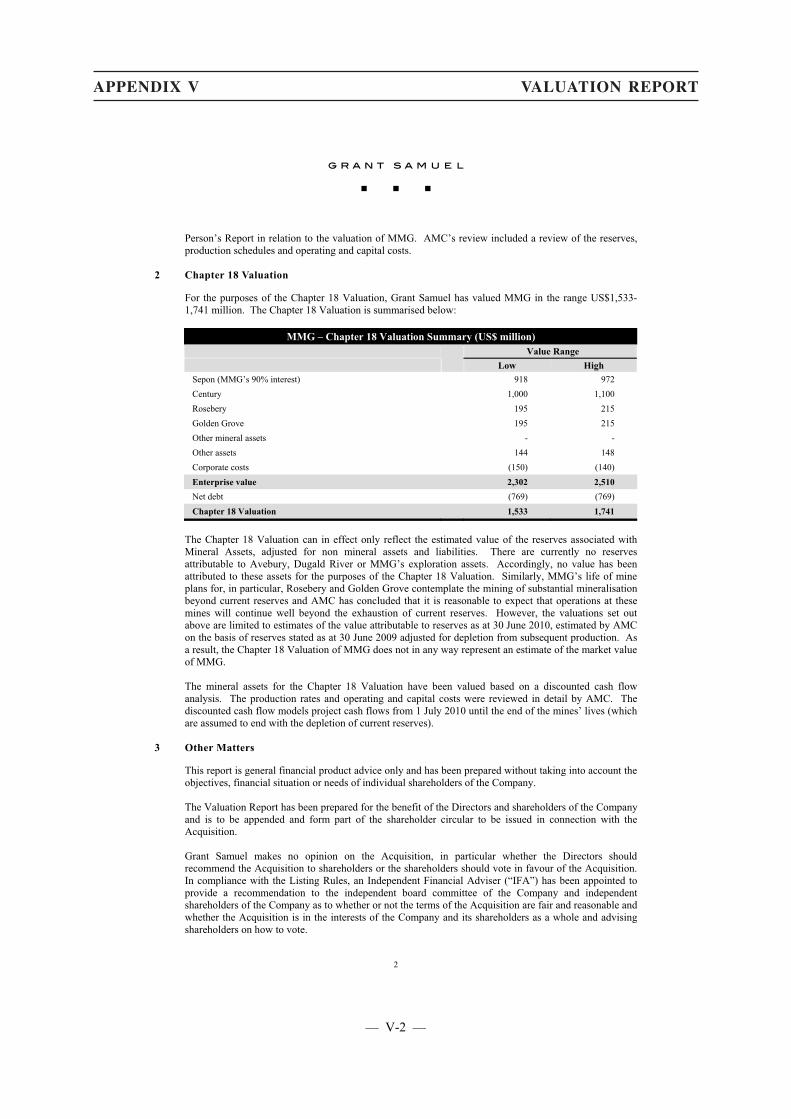
APPENDIX V VALUATION REPORT
2
Person’s Report in relation to the valuation of MMG. AMC’s review included a review of the reserves, production schedules and operating and capital costs.
2 Chapter 18 Valuation
For the purposes of the Chapter 18 Valuation, Grant Samuel has valued MMG in the range US$1,533-1,741 million. The Chapter 18 Valuation is summarised below:
MMG – Chapter 18 Valuation Summary (US$ million) Value Range Low High Sepon (MMG’s 90% interest) 918 972 Century 1,000 1,100 Rosebery 195 215 Golden Grove 195 215 Other mineral assets - - Other assets 144 148 Corporate costs (150) (140) Enterprise value 2,302 2,510 Net debt (769) (769) Chapter 18 Valuation 1,533 1,741
The Chapter 18 Valuation can in effect only reflect the estimated value of the reserves associated with Mineral Assets, adjusted for non mineral assets and liabilities. There are currently no reserves attributable to Avebury, Dugald River or MMG’s exploration assets. Accordingly, no value has been attributed to these assets for the purposes of the Chapter 18 Valuation. Similarly, MMG’s life of mine plans for, in particular, Rosebery and Golden Grove contemplate the mining of substantial mineralisation beyond current reserves and AMC has concluded that it is reasonable to expect that operations at these mines will continue well beyond the exhaustion of current reserves. However, the valuations set out above are limited to estimates of the value attributable to reserves as at 30 June 2010, estimated by AMC on the basis of reserves stated as at 30 June 2009 adjusted for depletion from subsequent production. As a result, the Chapter 18 Valuation of MMG does not in any way represent an estimate of the market value of MMG. The mineral assets for the Chapter 18 Valuation have been valued based on a discounted cash flow analysis. The production rates and operating and capital costs were reviewed in detail by AMC. The discounted cash flow models project cash flows from 1 July 2010 until the end of the mines’ lives (which are assumed to end with the depletion of current reserves).
3 Other Matters
This report is general financial product advice only and has been prepared without taking into account the objectives, financial situation or needs of individual shareholders of the Company. The Valuation Report has been prepared for the benefit of the Directors and shareholders of the Company and is to be appended and form part of the shareholder circular to be issued in connection with the Acquisition. Grant Samuel makes no opinion on the Acquisition, in particular whether the Directors should recommend the Acquisition to shareholders or the shareholders should vote in favour of the Acquisition. In compliance with the Listing Rules, an Independent Financial Adviser (“IFA”) has been appointed to provide a recommendation to the independent board committee of the Company and independent shareholders of the Company as to whether or not the terms of the Acquisition are fair and reasonable and whether the Acquisition is in the interests of the Company and its shareholders as a whole and advising shareholders on how to vote.
— V-2 —
APPENDIX V VALUATION REPORT
3
This letter is a summary of the Valuation Report. The full Valuation Report from which this summary has been extracted is attached and should be read in conjunction with this summary. The valuation is made as at the date of this letter and reflects circumstances and conditions as at that date.
Yours faithfully GRANT SAMUEL & ASSOCIATES PTY LIMITED
— V-3 —
APPENDIX V VALUATION REPORT
Valuation Report in relation to the Proposal to Acquire
Minerals and Metals Group
Grant Samuel & Associates Pty Limited (ABN 28 050 036 372)
November 2010
— V-4 —
APPENDIX V VALUATION REPORT
G R A N T S A M U E L & A S S O C I A T E S
L E V E L 6
1 C O L L I N S S T R E E T M E L B O U R N E V I C 3 0 0 0
T : + 6 1 3 9 9 4 9 8 8 0 0 / F : + 6 1 3 9 9 9 4 9 8 8 3 8
w w w . g r a n t s a m u e l . c o m . a u
G R A N T S A M U E L & A S S O C I A T E S P T Y L I M I T E D
A B N 2 8 0 5 0 0 3 6 3 7 2 A F S L I C E N C E N O 2 4 0 9 8 5
Financial Services Guide
This FSG is provided for the purposes of the Corporations Act 2001 (Cth)
governing the provision of financial product advice in Australia
Grant Samuel & Associates Pty Limited (“Grant Samuel”) holds Australian Financial Services Licence No. 240985 authorising it to provide financial product advice on securities and interests in managed investments schemes to wholesale and retail clients.
The Corporations Act, 2001 requires Grant Samuel to provide this Financial Services Guide (“FSG”) in connection with its provision of an independent expert report which is included in a document (“Disclosure Document”) provided to members by the company or other entity (“Entity”) for which Grant Samuel prepares the report. In the present circumstance, the report is a competent evaluator’s report (“Report”) which is to be released on the main board of The Stock Exchange of Hong Kong Limited.
Grant Samuel does not accept instructions from retail clients. Grant Samuel provides no financial services directly to retail clients and receives no remuneration from retail clients for financial services. Grant Samuel does not provide any personal retail financial product advice to retail investors nor does it provide market-related advice to retail investors.
When providing Reports, Grant Samuel’s client is the Entity to which it provides the Report. Grant Samuel receives its remuneration from the Entity. In respect of the Report for Minmetals Resources Limited (the “Company”) in relation to the proposal to acquire Album Resources Limited (“Album Resources”) (the “Valuation Report”), Grant Samuel will receive a fixed fee of US$900,000 plus reimbursement of out-of-pocket expenses for the preparation of the Report (as stated in Section 7.3 of the Valuation Report).
No related body corporate of Grant Samuel, or any of the directors or employees of Grant Samuel or of any of those related bodies or any associate receives any remuneration or other benefit attributable to the preparation and provision of a Report.
Grant Samuel is required to be independent of the Entity in order to provide a Report. The guidelines for independence in the preparation of Reports are set out in Regulatory Guide 112 issued by the Australian Securities & Investments Commission on 30 October 2007. The following information in relation to the independence of Grant Samuel is stated in Section 7.3 of the Valuation Report:
“Grant Samuel believes it is independent for the purposes of preparing the report. Grant Samuel, and each of Stephen Cooper, Sarah Morgan and Cameron Stewart, comply with the independence requirement under Rule 18.22 of the Listing Rules. Specifically, Grant Samuel and each of Stephen Cooper, Sarah Morgan and Cameron Stewart is independent of the Company, its directors, senior management and advisers and:
� do not have any economic or beneficial interest (present or contingent) in any of the assets being reported on;
� will not be remunerated with a fee dependent on the findings of this Valuation Report or the report dated 27 September 2010 setting out the market valuation of MMG;
� in the case of each of Stephen Cooper, Sarah Morgan and Cameron Stewart, is not an officer, employee or proposed officer of the Company or any group, holding or associated company of the Company; and
� in the case of Grant Samuel, is not a group, holding or associated company of the Company. None of Grant Samuel’s officers is an officer or proposed officer of any group, holding or associated company of the Company.
Grant Samuel had no part in the formulation of the Acquisition. Its only role has been the preparation of this report. Grant Samuel will receive a fixed fee of US$900,000 for the preparation of this report. This fee is not contingent on the outcome of the Acquisition. Grant Samuel’s out of pocket expenses in relation to the preparation of the report will be reimbursed. Grant Samuel will receive no other benefit for the preparation of this report.”
Grant Samuel has internal complaints-handling mechanisms and is a member of the Financial Ombudsman Service, No. 11929. If you have any concerns regarding the Valuation Report, please contact the Compliance Officer in writing at Level 19, Governor Macquarie Tower, 1 Farrer Place, Sydney NSW 2000. If you are not satisfied with how we respond, you may contact the Financial Ombudsman Service at GPO Box 3 Melbourne VIC 3001 or 1300 780 808. This service is provided free of charge.
Grant Samuel holds professional indemnity insurance which satisfies the compensation requirements of the Corporations Act, 2001.
Grant Samuel is only responsible for the Valuation Report and this FSG. Complaints or questions about the Disclosure Document should not be directed to Grant Samuel which is not responsible for that document. Grant Samuel will not respond in any way that might involve any provision of financial product advice to any retail investor.
— V-5 —

APPENDIX V VALUATION REPORT
Table of Contents
1 Background....................................................................................................................................................1
2 Scope of the Valuation Report......................................................................................................................2 2.1 Purpose of the Valuation Report.......................................................................................................2 2.2 Basis of Evaluation .............................................................................................................................2 2.3 Sources of the Information ................................................................................................................3 2.4 Limitations and Reliance on Information ........................................................................................3
3 Profile of MMG..............................................................................................................................................6 3.1 Overview .............................................................................................................................................6 3.2 Resources, Reserves and Production ................................................................................................7 3.3 Financial Performance.......................................................................................................................7 3.4 Financial Position ...............................................................................................................................8 3.5 Commodity Hedging ..........................................................................................................................9 3.6 Taxation Position................................................................................................................................9
4 Profile of MMG Assets ................................................................................................................................10 4.1 Sepon .................................................................................................................................................10 4.2 Century..............................................................................................................................................17 4.3 Rosebery............................................................................................................................................24 4.4 Golden Grove....................................................................................................................................29 4.5 Avebury.............................................................................................................................................34 4.6 Projects and Exploration .................................................................................................................37
5 Valuation Methodology...............................................................................................................................40 5.1 Overview ...........................................................................................................................................40 5.2 Valuation Assumptions ....................................................................................................................42 5.3 Resources Projects and Optionality................................................................................................44
6 Chapter 18 Valuation of MMG ..................................................................................................................46 6.1 Summary...........................................................................................................................................46 6.2 Sepon .................................................................................................................................................46 6.3 Century..............................................................................................................................................49 6.4 Rosebery............................................................................................................................................51 6.5 Golden Grove....................................................................................................................................52 6.6 Other Mineral Assets .......................................................................................................................53 6.7 Other Assets ......................................................................................................................................54 6.8 Corporate Costs................................................................................................................................54 6.9 Net Debt.............................................................................................................................................54
7 Qualifications, Declarations and Consents ................................................................................................55 7.1 Qualifications....................................................................................................................................55 7.2 Disclaimers........................................................................................................................................55 7.3 Independence ....................................................................................................................................55 7.4 Declarations ......................................................................................................................................56 7.5 Consents ............................................................................................................................................56 7.6 Other..................................................................................................................................................56
Appendix 1 - Discount Rates Appendix 2 - Overview of the Zinc and Copper Markets
— V-6 —
APPENDIX V VALUATION REPORT
1
1 Background
Minmetals Resources Limited (the “Company”) is a Hong Kong-incorporated company, listed on the main board of The Stock Exchange of Hong Kong Limited (the “Stock Exchange”). The Company’s principal activities are trading in non-ferrous metals, producing alumina and the manufacture and distribution of aluminium and copper products. The Company is majority-controlled by China Minmetals Non-Ferrous Metals Company Limited (“CMN”). CMN and the Company are contemplating a transaction whereby the Company, through a wholly-owned special purpose vehicle, All Glorious Limited, will acquire Album Resources Private Limited (“Album Resources”), an indirect wholly owned subsidiary of CMN, from Album Enterprises Limited, a wholly owned subsidiary of CMN (“Acquisition”). Album Resources owns a portfolio of mining assets and exploration interests, acquired from OZ Minerals Limited (“OZL”) in June 2009. This portfolio of assets is referred to as the Minerals and Metals Group (“MMG”). The major assets of Album Resources (“Mineral Assets”) are:
� the Sepon copper/gold project in Laos;
� the Century zinc/lead mine in Queensland;
� the Golden Grove copper/zinc mine in Western Australia;
� the Rosebery lead/zinc mine in Tasmania;
� the Avebury nickel mine in Tasmania (currently on care and maintenance);
� the Dugald River zinc project in Queensland; and
� the Izok Lake and High Lake prospects in the Nunavut territories of northern Canada.
— V-7 —
APPENDIX V VALUATION REPORT
2
2 Scope of the Valuation Report
2.1 Purpose of the Valuation Report
Under the Rules Governing the Listing of Securities on the Stock Exchange (the “Listing Rules”), specifically Listing Rule 18.09, a mineral company proposing to enter into a Relevant Notifiable Transaction in which the assets are solely or mainly mineral assets must include a valuation report which must be distributed to shareholders as part of the relevant circular. The valuation report is defined as a public valuation report prepared by a Competent Evaluator on mineral assets in compliance with Chapter 18 and the applicable Reporting Standards. A Relevant Notifiable Transaction is defined as:
� major transaction — a transaction or a series of transactions (aggregated under rules 14.22 and 14.23) by a listed issuer where any percentage ratio is 25% or more, but less than 100% for an acquisition or 75% for a disposal;
� very substantial disposal — a disposal or a series of disposals (aggregated under rules 14.22 and 14.23) of assets (including deemed disposals referred to in rule 14.29) by a listed issuer where any percentage ratio is 75% or more;
� very substantial acquisition — an acquisition or a series of acquisitions (aggregated under rules 14.22 and 14.23) of assets by a listed issuer where any percentage ratio is 100% or more; and
� reverse takeover — an acquisition or a series of acquisitions of assets by a listed issuer which, in the opinion of the Exchange, constitutes, or is part of a transaction or arrangement or series of transactions or arrangements which constitute, an attempt to achieve a listing of the assets to be acquired and a means to circumvent the requirements for new applicants set out in Chapter 8 of the Exchange Listing
The Company expects that the Acquisition will constitute a very substantial acquisition by the Company. Therefore, a valuation report prepared by a Competent Evaluator will be required. The Directors of the Company have appointed Grant Samuel & Associates (“Grant Samuel”) as the Competent Evaluator to prepare a report (“Valuation Report”) in connection with the Acquisition. The Valuation Report is to set out a valuation of Album Resources, including a valuation of the Mineral Assets, that complies with Chapter 18 of the Listing Rules, including, but not limited to, Rules 18.24 and 18.34 of the Listing Rules (“Chapter 18 Valuation”). The Valuation Report has been prepared for the benefit of the Directors and shareholders of the Company and is to be appended and form part of the shareholder circular to be issued to the shareholders of the Company in connection with the Acquisition. This report is general financial product advice only and has been prepared without taking into account the objectives, financial situation or needs of individual shareholders of the Company. Grant Samuel makes no opinion on the Acquisition, in particular whether the Directors should recommend the Acquisition to shareholders or the shareholders should vote in favour of the Acquisition. In compliance with the Listing Rules, an Independent Financial Adviser (“IFA”) has been appointed to provide a recommendation to the independent board committee of the Company and independent shareholders of the Company as to whether or not the terms of the Acquisition are fair and reasonable and whether the Acquisition is in the interests of the Company and its shareholders as a whole and advising shareholders on how to vote.
2.2 Basis of Evaluation
The Chapter 18 Valuation has been prepared in compliance with Chapter 18 of the Listing Rules. In particular, Listing Rule 18.34 states that:
— V-8 —
APPENDIX V VALUATION REPORT
3
� any valuation of mineral assets must be prepared under the VALMIN Code1, SAMVAL Code2, CIMVAL3 or such other code approved by the Exchange from time to time;
� the basis of the valuation, relevant assumptions and the reason why a particular method of valuation is considered most appropriate having regard to the nature of the valuation and the development status of the asset must be clearly stated; and
� if more than one valuation method is used and different valuations result, how the valuations compare and the reason for selecting the value adopted must be explained.
In addition, Listing Rule 18.30(3) states that measured and indicated resources are only included in economic analyses if the basis on which they are considered to be economically extractable is explained and that valuations for inferred resources are not permitted.
2.3 Sources of the Information
The following information was utilised and relied upon, without independent verification, in preparing this report: Publicly Available Information
� MMG Business Review for the year ended 31 December 2009;
� press releases, public announcements, media and analyst presentation material and other public filings by MMG including information available on its website;
� brokers’ reports and recent press articles on the copper, zinc and nickel industries; and
� sharemarket data and related information on Australian and international listed companies engaged in the copper, zinc and nickel industries.
Non Public Information provided by MMG
� copper, zinc and nickel industry reports;
� Album Resources financial report for the period from 8 April 2009 to 31 December 2009;
� management accounts for Album Resources for the six months ended 30 June 2010;
� detailed cash flow models for MMG including projections for MMG and the Mineral Assets; and
� other confidential documents, presentations and working papers. Grant Samuel’s representatives have previously visited Sepon, Century and Golden Grove. Grant Samuel has also held discussions with, and obtained information from, senior management of MMG.
2.4 Limitations and Reliance on Information
Grant Samuel believes that its opinion must be considered as a whole and that selecting portions of the analysis or factors considered by it, without considering all factors and analyses together, could
1 VALMIN Code represents the Code for the Technical Assessment and Valuation of Mineral and Petroleum Assets and Securities for
Independent Expert Reports (2005 edition), as prepared by the VALMIN Committee, a joint committee of The Australasian Institute of Mining and Metallurgy, the Australian Institute of Geoscientists and the Mineral Industry Consultants Association as amended from time to time.
2 SAMVAL Code represents the South African Code for the Reporting of Mineral Asset Valuation (2008 edition) as amended from time to time.
3 CIMVAL represents the Standards and Guidelines for Valuation of Mineral Properties endorsed by the Canadian Institute of Mining, Metallurgy and Petroleum, February 2003 (final version) as amended from time to time.
— V-9 —
APPENDIX V VALUATION REPORT
4
create a misleading view of the process underlying the opinion. The preparation of an opinion is a complex process and is not necessarily susceptible to partial analysis or summary. Grant Samuel’s opinion is based on economic, sharemarket, business trading, financial and other conditions and expectations prevailing at the date of this report. These conditions can change significantly over relatively short periods of time. If they did change materially, subsequent to the date of this report, the opinion could be different in these changed circumstances. This report is also based upon financial and other information provided by MMG and the Company. Grant Samuel has considered and relied upon this information. MMG and the Company represented in writing to Grant Samuel that to its knowledge the information provided by it was complete and not incorrect or misleading in any material aspect. Grant Samuel has no reason to believe that any material facts have been withheld. The information provided to Grant Samuel has been evaluated through analysis, inquiry and review to the extent that it considers necessary or appropriate for the purposes of forming an opinion as to the value of MMG. However, Grant Samuel does not warrant that its inquiries have identified or verified all of the matters that an audit, extensive examination or “due diligence” investigation might disclose. While Grant Samuel has made what it considers to be appropriate inquiries for the purposes of forming its opinion, “due diligence” of the type undertaken by companies and their advisers in relation to, for example, prospectuses or profit forecasts, is beyond the scope of a Competent Evaluator. In this context, Grant Samuel advises that it is not in a position nor is it practicable to undertake its own “due diligence” investigation of the type undertaken by accountants, lawyers or other advisers. Accordingly, this report and the opinions expressed in it should be considered more in the nature of an overall review of the anticipated commercial and financial implications rather than a comprehensive audit or investigation of detailed matters. An important part of the information used in forming an opinion of the kind expressed in this report is comprised of the opinions and judgement of management. This type of information was also evaluated through analysis, inquiry and review to the extent practical. However, such information is often not capable of external verification or validation. Preparation of this report does not imply that Grant Samuel has audited in any way the management accounts or other records of MMG. It is understood that the accounting information that was provided was prepared in accordance with generally accepted accounting principles and in a manner consistent with the method of accounting in previous years (except where noted). AMC Consultants Pty Ltd (“AMC”) was appointed by the Company as the Competent Person and to provide specialist technical advice on the Mineral Assets to the Company and to prepare a Competent Person’s Report in relation to the valuation of MMG. AMC’s review included a review of the reserves, production schedules and operating and capital costs. The report prepared by AMC is appended to and forms part of the circular to be sent to shareholders in connection with the Acquisition. The information provided to Grant Samuel and AMC included mine development plans, forecasts and feasibility studies for MMG’s key assets. MMG is responsible for the information contained in the mine development plans, forecasts and feasibility studies (“the forward looking information”). Grant Samuel and AMC have considered and, to the extent deemed appropriate, relied on this information for the purpose of their analysis. On the basis of the information provided to Grant Samuel and AMC, and the review conducted by Grant Samuel and AMC of such information, Grant Samuel and AMC have concluded that the forward looking information was prepared appropriately and accurately based on the information available to management at the time and within the practical constraints and limitations of such forward looking information. Grant Samuel and AMC have concluded that the forward looking information does not reflect any material bias, either positive or negative. Grant Samuel has no
— V-10 —

APPENDIX V VALUATION REPORT
5
reason to believe otherwise. However, the achievability of the forward looking information is not warranted or guaranteed by Grant Samuel. Future profits and cash flows are inherently uncertain. They are predictions by management of future events that cannot be assured and are not necessarily based on assumptions, many of which are beyond the control of the company or its management. Actual results may be significantly more or less favourable. Moreover, the forward looking information provided by MMG was not originally generated for, and may not be appropriate in the context of, a valuation of the Mineral Assets of MMG. Accordingly, AMC conducted a detailed review of the significant assumptions and technical factors underlying the forward looking information provided by MMG to AMC and Grant Samuel. This review included a review of the basis on which resources and reserves have been estimated, a review of likely future operating and capital costs, a review of likely future recovery rates, a review of environmental factors and such other reviews as AMC deemed appropriate. Having regard to these reviews, AMC made independent judgements regarding the technical assumptions that can reasonably be adopted for the purposes of the valuation of the assets of MMG (“technical valuation assumptions”). As part of its analysis, Grant Samuel has developed cash flow models on the basis of the technical valuation assumptions deemed appropriate by AMC. Grant Samuel has reviewed the sensitivity of net present values to changes in key variables. The sensitivity analysis isolates a limited number of assumptions and shows the impact of the expressed variations to those assumptions. No opinion is expressed as to the probability or otherwise of those expressed variations occurring. Actual variations may be greater or less than those modelled. In addition to not representing best and worst case outcomes, the sensitivity analysis does not, and does not purport to, show all the possible variations to the business model. The actual performance of the business may be negatively or positively impacted by a range of factors including, but not limited to:
� changes to the assumptions other than those considered in the sensitivity analysis;
� greater or lesser variations to the assumptions considered in the sensitivity analysis than those modelled; and
� combinations of different assumptions that may produce outcomes different to those modelled.
In forming its opinion, Grant Samuel has also assumed that:
� matters such as title, compliance with laws and regulations and contracts in place are in good standing and will remain so and that there are no material legal proceedings, other than as publicly disclosed; and
� the publicly available information relied on by Grant Samuel in its analysis was accurate and not misleading.
To the extent that there are legal issues relating to assets, properties, or business interests or issues relating to compliance with applicable laws, regulations, and policies, Grant Samuel assumes no responsibility and offers no legal opinion or interpretation on any issue.
— V-11 —
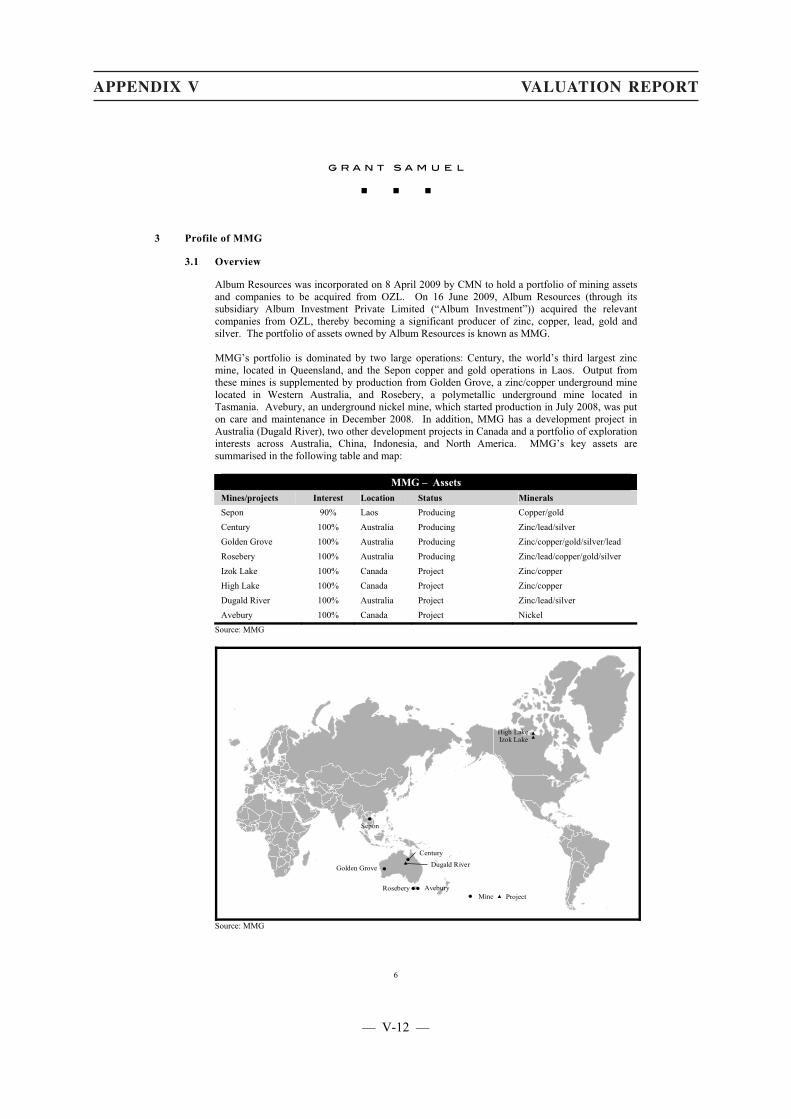
APPENDIX V VALUATION REPORT
6
3 Profile of MMG
3.1 Overview
Album Resources was incorporated on 8 April 2009 by CMN to hold a portfolio of mining assets and companies to be acquired from OZL. On 16 June 2009, Album Resources (through its subsidiary Album Investment Private Limited (“Album Investment”)) acquired the relevant companies from OZL, thereby becoming a significant producer of zinc, copper, lead, gold and silver. The portfolio of assets owned by Album Resources is known as MMG. MMG’s portfolio is dominated by two large operations: Century, the world’s third largest zinc mine, located in Queensland, and the Sepon copper and gold operations in Laos. Output from these mines is supplemented by production from Golden Grove, a zinc/copper underground mine located in Western Australia, and Rosebery, a polymetallic underground mine located in Tasmania. Avebury, an underground nickel mine, which started production in July 2008, was put on care and maintenance in December 2008. In addition, MMG has a development project in Australia (Dugald River), two other development projects in Canada and a portfolio of exploration interests across Australia, China, Indonesia, and North America. MMG’s key assets are summarised in the following table and map:
MMG – Assets Mines/projects Interest Location Status Minerals Sepon 90% Laos Producing Copper/gold Century 100% Australia Producing Zinc/lead/silver Golden Grove 100% Australia Producing Zinc/copper/gold/silver/lead Rosebery 100% Australia Producing Zinc/lead/copper/gold/silver Izok Lake 100% Canada Project Zinc/copper High Lake 100% Canada Project Zinc/copper Dugald River 100% Australia Project Zinc/lead/silver Avebury 100% Canada Project Nickel
Source: MMG
High LakeIzok Lake
Rosebery
Golden Grove Dugald River
Avebury
Century
Sepon
Mine Project
Source: MMG
— V-12 —
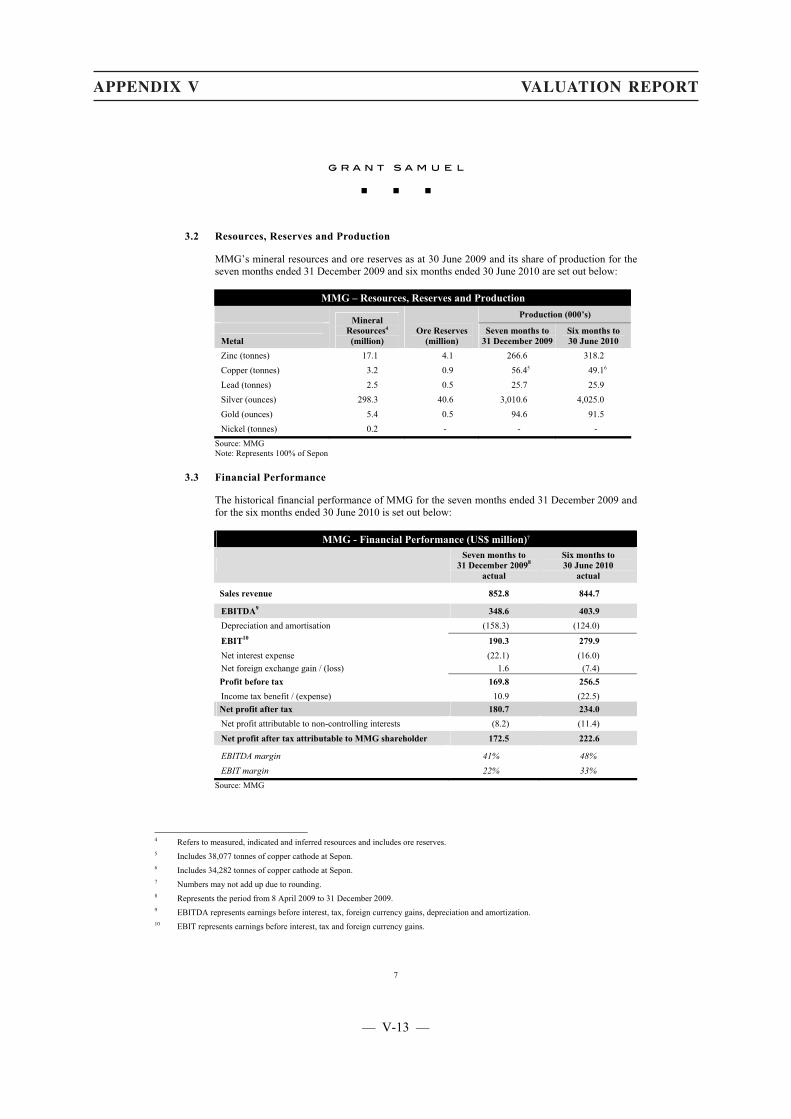
APPENDIX V VALUATION REPORT
7
3.2 Resources, Reserves and Production
MMG’s mineral resources and ore reserves as at 30 June 2009 and its share of production for the seven months ended 31 December 2009 and six months ended 30 June 2010 are set out below:
MMG – Resources, Reserves and Production Production (000’s)
Metal
Mineral Resources4 (million)
Ore Reserves (million)
Seven months to 31 December 2009
Six months to 30 June 2010
Zinc (tonnes) 17.1 4.1 266.6 318.2 Copper (tonnes) 3.2 0.9 56.45 49.16 Lead (tonnes) 2.5 0.5 25.7 25.9 Silver (ounces) 298.3 40.6 3,010.6 4,025.0 Gold (ounces) 5.4 0.5 94.6 91.5 Nickel (tonnes) 0.2 - - -
Source: MMG Note: Represents 100% of Sepon
3.3 Financial Performance
The historical financial performance of MMG for the seven months ended 31 December 2009 and for the six months ended 30 June 2010 is set out below:
MMG - Financial Performance (US$ million)7
Seven months to
31 December 20098 actual
Six months to 30 June 2010
actual
Sales revenue 852.8 844.7
EBITDA9 348.6 403.9 Depreciation and amortisation (158.3) (124.0)
EBIT10 190.3 279.9 Net interest expense (22.1) (16.0) Net foreign exchange gain / (loss) 1.6 (7.4) Profit before tax 169.8 256.5 Income tax benefit / (expense) 10.9 (22.5) Net profit after tax 180.7 234.0 Net profit attributable to non-controlling interests (8.2) (11.4) Net profit after tax attributable to MMG shareholder 172.5 222.6
EBITDA margin 41% 48% EBIT margin 22% 33%
Source: MMG
4 Refers to measured, indicated and inferred resources and includes ore reserves. 5 Includes 38,077 tonnes of copper cathode at Sepon. 6 Includes 34,282 tonnes of copper cathode at Sepon. 7 Numbers may not add up due to rounding. 8 Represents the period from 8 April 2009 to 31 December 2009. 9 EBITDA represents earnings before interest, tax, foreign currency gains, depreciation and amortization. 10 EBIT represents earnings before interest, tax and foreign currency gains.
— V-13 —
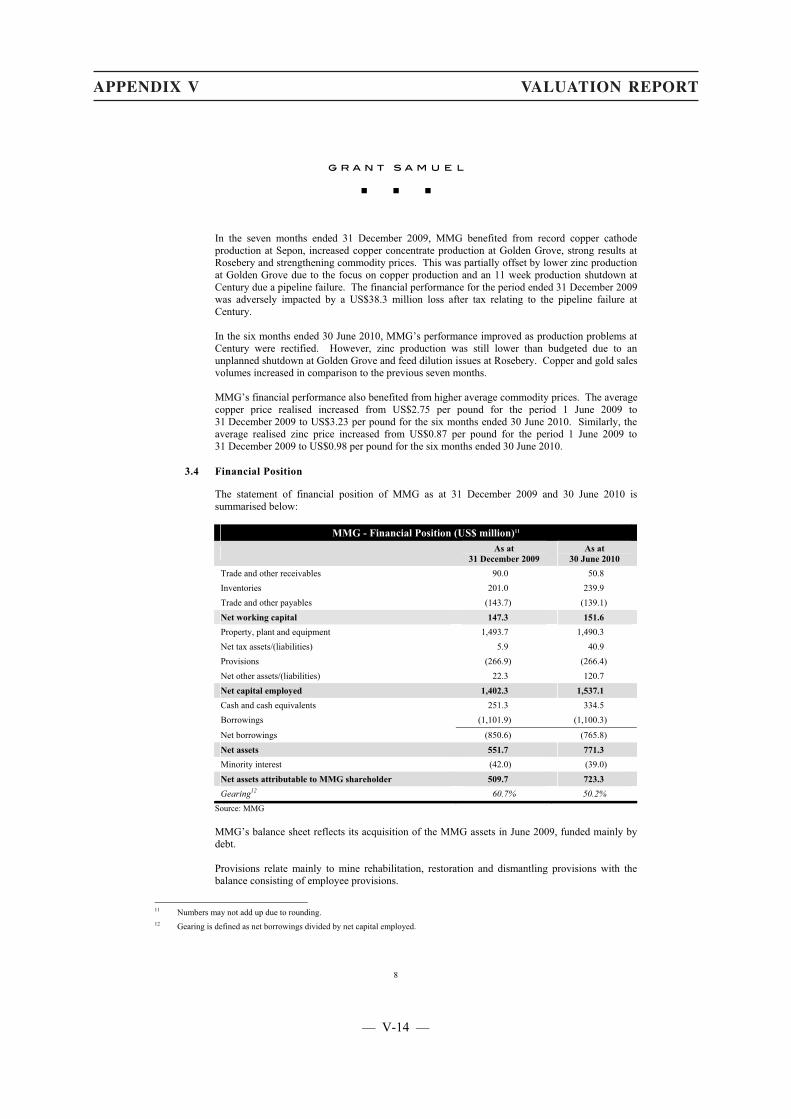
APPENDIX V VALUATION REPORT
8
In the seven months ended 31 December 2009, MMG benefited from record copper cathode production at Sepon, increased copper concentrate production at Golden Grove, strong results at Rosebery and strengthening commodity prices. This was partially offset by lower zinc production at Golden Grove due to the focus on copper production and an 11 week production shutdown at Century due a pipeline failure. The financial performance for the period ended 31 December 2009 was adversely impacted by a US$38.3 million loss after tax relating to the pipeline failure at Century. In the six months ended 30 June 2010, MMG’s performance improved as production problems at Century were rectified. However, zinc production was still lower than budgeted due to an unplanned shutdown at Golden Grove and feed dilution issues at Rosebery. Copper and gold sales volumes increased in comparison to the previous seven months. MMG’s financial performance also benefited from higher average commodity prices. The average copper price realised increased from US$2.75 per pound for the period 1 June 2009 to 31 December 2009 to US$3.23 per pound for the six months ended 30 June 2010. Similarly, the average realised zinc price increased from US$0.87 per pound for the period 1 June 2009 to 31 December 2009 to US$0.98 per pound for the six months ended 30 June 2010.
3.4 Financial Position
The statement of financial position of MMG as at 31 December 2009 and 30 June 2010 is summarised below:
MMG - Financial Position (US$ million)11
As at 31 December 2009
As at 30 June 2010
Trade and other receivables 90.0 50.8 Inventories 201.0 239.9 Trade and other payables (143.7) (139.1) Net working capital 147.3 151.6 Property, plant and equipment 1,493.7 1,490.3 Net tax assets/(liabilities) 5.9 40.9 Provisions (266.9) (266.4) Net other assets/(liabilities) 22.3 120.7 Net capital employed 1,402.3 1,537.1 Cash and cash equivalents 251.3 334.5 Borrowings (1,101.9) (1,100.3)
Net borrowings (850.6) (765.8) Net assets 551.7 771.3 Minority interest (42.0) (39.0) Net assets attributable to MMG shareholder 509.7 723.3 Gearing12 60.7% 50.2%
Source: MMG MMG’s balance sheet reflects its acquisition of the MMG assets in June 2009, funded mainly by debt. Provisions relate mainly to mine rehabilitation, restoration and dismantling provisions with the balance consisting of employee provisions.
11 Numbers may not add up due to rounding. 12 Gearing is defined as net borrowings divided by net capital employed.
— V-14 —
APPENDIX V VALUATION REPORT
9
Gearing as at 31 December 2009 was relatively high at approximately 61% but had reduced to approximately 50% at 30 June 2010. Borrowings at 30 June2010 represented fully drawn loan facilities of US$1,095 million which mature partly in June 2012 and partly in June 2016. MMG also has finance leases of approximately US$5 million. Most of MMG’s borrowings are secured by guarantees from CMN. MMG currently has no interest hedges in place. The minority interest reflects the Lao Government’s effective 10% economic interest in Sepon.
3.5 Commodity Hedging
As at 30 June 2010, MMG had no commodity price hedging in place.
3.6 Taxation Position
Under the Australian tax consolidation regime, MMG’s wholly owned Australian resident entities have elected to be taxed as a single entity. The MMG Australian tax consolidated group operates on a 31 December year-end. At 31 December 2009, MMG recognised US$65.5 million of Deferred Tax Assets (“DTA”), of which US$13.8 million related to carried forward income tax losses in Australia. In addition, MMG had US$104.2 million unrecognised DTA relating to deductible temporary differences. At 30 June 2010, MMG recognised US$95.1 million of DTA. MMG had US$55.2 million in unrecognised DTA. All DTA balances at 30 June 2010 relate to deductible temporary differences. At 30 June 2010, MMG had no Australian franking credits.
— V-15 —
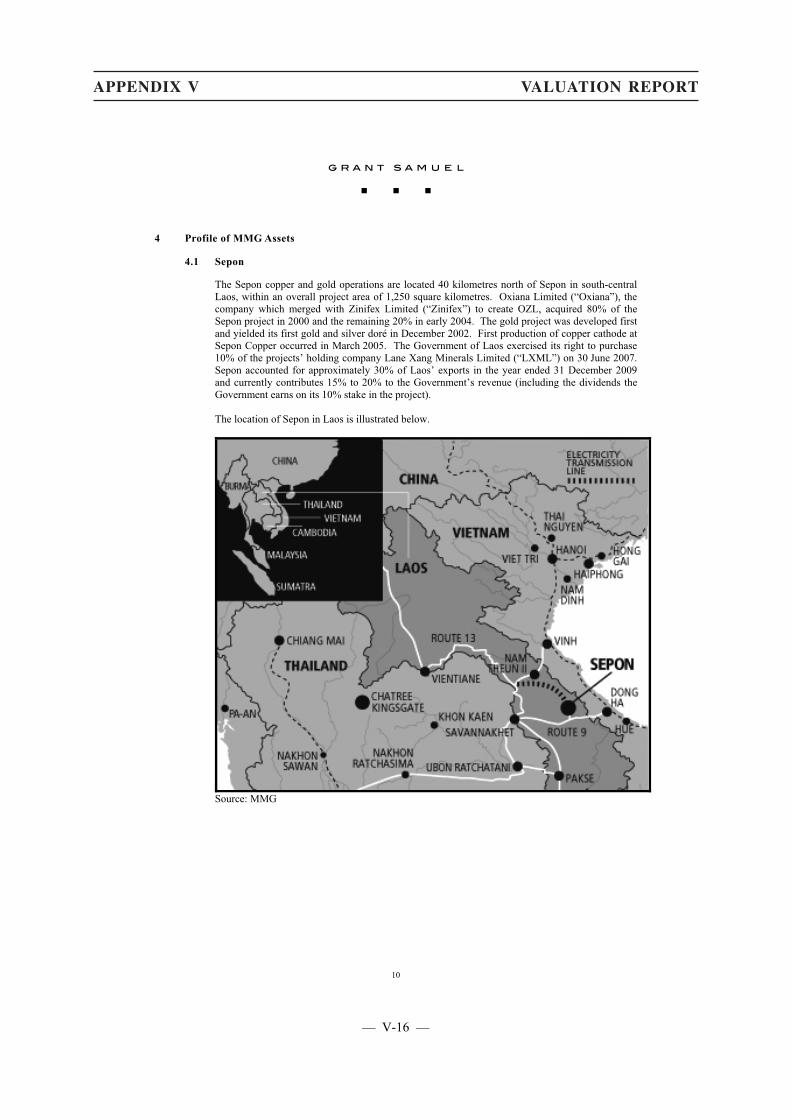
APPENDIX V VALUATION REPORT
10
4 Profile of MMG Assets
4.1 Sepon
The Sepon copper and gold operations are located 40 kilometres north of Sepon in south-central Laos, within an overall project area of 1,250 square kilometres. Oxiana Limited (“Oxiana”), the company which merged with Zinifex Limited (“Zinifex”) to create OZL, acquired 80% of the Sepon project in 2000 and the remaining 20% in early 2004. The gold project was developed first and yielded its first gold and silver doré in December 2002. First production of copper cathode at Sepon Copper occurred in March 2005. The Government of Laos exercised its right to purchase 10% of the projects’ holding company Lane Xang Minerals Limited (“LXML”) on 30 June 2007. Sepon accounted for approximately 30% of Laos’ exports in the year ended 31 December 2009 and currently contributes 15% to 20% to the Government’s revenue (including the dividends the Government earns on its 10% stake in the project). The location of Sepon in Laos is illustrated below.
Source: MMG
— V-16 —

APPENDIX V VALUATION REPORT
11
The location of the major mineral deposits that support Sepon’s current and future gold and copper operations is depicted on the map below:
Source: MMG 4.1.1 Sepon Copper
Overview
Feasibility studies into the development of the Sepon copper project began in 2002 and construction commenced in 2003. Processing started in February 2005 and the first copper cathodes were produced in mid-March 2005. Sepon Copper was originally developed on the basis of the Khanong deposit, which is still the main deposit being mined, while the Thengkham and Phabing deposits are expected to enter into production in 2011. Ore is treated through an atmospheric leaching/pressure oxidation and solvent extraction and electro-winning process to produce approximately 70,000 tonnes of high quality copper cathode per annum. The copper cathode is sold principally into Asian countries close to Laos. The combination of the quality of Sepon’s copper product, the project’s proximity to customers and the reliability of supply typically attracts a premium over the London Metals Exchange (“LME”) copper price. Lower grade supergene copper resources in the Thengkham North, Thengkham South and Phabing deposits, located approximately seven kilometres west of the current plant, and additional resource potential in the Sepon area form the basis of the Sepon Copper expansion project to 80,000 tonnes of copper per annum. MMG is also exploring for primary copper. While its processing would require a new treatment circuit and significant capital expenditure, existing infrastructure and parts of the existing treatment plant could be utilised. Geology and Mineralisation
The Khanong copper deposit is a near surface, high grade, supergene chalcocite and oxide copper body derived from the weathering of a replacement style sulphide deposit developed in shallow dipping, highly sheared carbonate rocks. Copper mineralisation covers a variety of primary and secondary styles. Along the contacts of the intrusive stocks, copper-gold skarns are developed. The Thengkham system, centered around the east-west trending Thengkham ridge, contains zones of primary copper, gold, silver and molybdenum mineralisation. Weathering has resulted in the formation of secondary supergene copper and gold deposits, mostly found in moderately dipping zones. Chalcocite supergene mineralisation is found next to primary pyrite and chalcopyrite mineralisation. Copper oxide and carbonate mineralisation is also present in the area.
— V-17 —
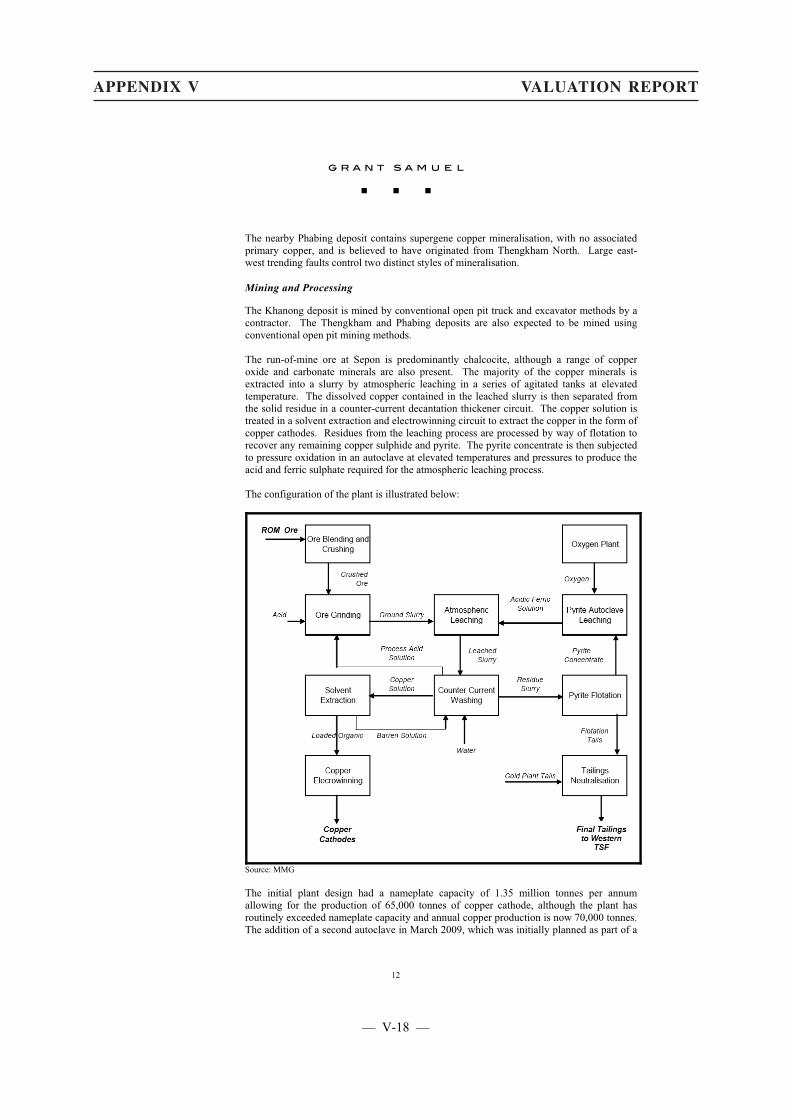
APPENDIX V VALUATION REPORT
12
The nearby Phabing deposit contains supergene copper mineralisation, with no associated primary copper, and is believed to have originated from Thengkham North. Large east-west trending faults control two distinct styles of mineralisation. Mining and Processing
The Khanong deposit is mined by conventional open pit truck and excavator methods by a contractor. The Thengkham and Phabing deposits are also expected to be mined using conventional open pit mining methods. The run-of-mine ore at Sepon is predominantly chalcocite, although a range of copper oxide and carbonate minerals are also present. The majority of the copper minerals is extracted into a slurry by atmospheric leaching in a series of agitated tanks at elevated temperature. The dissolved copper contained in the leached slurry is then separated from the solid residue in a counter-current decantation thickener circuit. The copper solution is treated in a solvent extraction and electrowinning circuit to extract the copper in the form of copper cathodes. Residues from the leaching process are processed by way of flotation to recover any remaining copper sulphide and pyrite. The pyrite concentrate is then subjected to pressure oxidation in an autoclave at elevated temperatures and pressures to produce the acid and ferric sulphate required for the atmospheric leaching process. The configuration of the plant is illustrated below:
Source: MMG The initial plant design had a nameplate capacity of 1.35 million tonnes per annum allowing for the production of 65,000 tonnes of copper cathode, although the plant has routinely exceeded nameplate capacity and annual copper production is now 70,000 tonnes. The addition of a second autoclave in March 2009, which was initially planned as part of a
— V-18 —
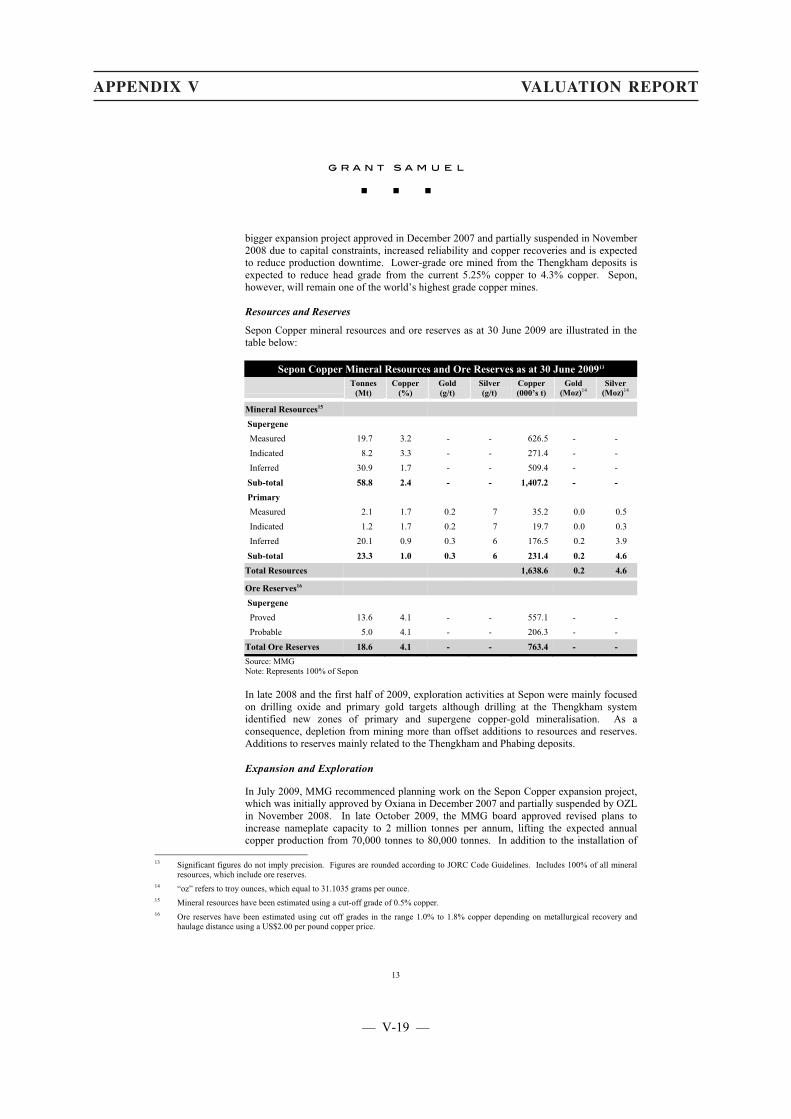
APPENDIX V VALUATION REPORT
13
bigger expansion project approved in December 2007 and partially suspended in November 2008 due to capital constraints, increased reliability and copper recoveries and is expected to reduce production downtime. Lower-grade ore mined from the Thengkham deposits is expected to reduce head grade from the current 5.25% copper to 4.3% copper. Sepon, however, will remain one of the world’s highest grade copper mines. Resources and Reserves
Sepon Copper mineral resources and ore reserves as at 30 June 2009 are illustrated in the table below:
Sepon Copper Mineral Resources and Ore Reserves as at 30 June 200913
Tonnes (Mt)
Copper(%)
Gold (g/t)
Silver (g/t)
Copper (000’s t)
Gold (Moz)14
Silver (Moz)14
Mineral Resources15 Supergene Measured 19.7 3.2 - - 626.5 - - Indicated 8.2 3.3 - - 271.4 - - Inferred 30.9 1.7 - - 509.4 - - Sub-total 58.8 2.4 - - 1,407.2 - - Primary Measured 2.1 1.7 0.2 7 35.2 0.0 0.5 Indicated 1.2 1.7 0.2 7 19.7 0.0 0.3 Inferred 20.1 0.9 0.3 6 176.5 0.2 3.9 Sub-total 23.3 1.0 0.3 6 231.4 0.2 4.6 Total Resources 1,638.6 0.2 4.6
Ore Reserves16 Supergene Proved 13.6 4.1 - - 557.1 - - Probable 5.0 4.1 - - 206.3 - - Total Ore Reserves 18.6 4.1 - - 763.4 - - Source: MMG Note: Represents 100% of Sepon In late 2008 and the first half of 2009, exploration activities at Sepon were mainly focused on drilling oxide and primary gold targets although drilling at the Thengkham system identified new zones of primary and supergene copper-gold mineralisation. As a consequence, depletion from mining more than offset additions to resources and reserves. Additions to reserves mainly related to the Thengkham and Phabing deposits. Expansion and Exploration
In July 2009, MMG recommenced planning work on the Sepon Copper expansion project, which was initially approved by Oxiana in December 2007 and partially suspended by OZL in November 2008. In late October 2009, the MMG board approved revised plans to increase nameplate capacity to 2 million tonnes per annum, lifting the expected annual copper production from 70,000 tonnes to 80,000 tonnes. In addition to the installation of
13 Significant figures do not imply precision. Figures are rounded according to JORC Code Guidelines. Includes 100% of all mineral
resources, which include ore reserves. 14 “oz” refers to troy ounces, which equal to 31.1035 grams per ounce. 15 Mineral resources have been estimated using a cut-off grade of 0.5% copper. 16 Ore reserves have been estimated using cut off grades in the range 1.0% to 1.8% copper depending on metallurgical recovery and
haulage distance using a US$2.00 per pound copper price.
— V-19 —
APPENDIX V VALUATION REPORT
14
the second autoclave commissioned in March 2009, the expansion includes an upgrade of the crushing circuit, the addition of leach tanks and flotation cells and a new counter-current decantation train. MMG estimates that the remaining capital expenditure will total approximately US$60 million and expects commissioning to be completed in November 2010. Including the addition of the autoclave mentioned above, the expansion is expected to reduce overall life-of-mine cash operating costs by approximately 10% and will allow Sepon to bring forward the treatment of lower grade ore that would otherwise only be treated towards the end of the project life. In late 2008, OZL started construction of a second power line and associated infrastructure to address the increased power demand from the proposed plant expansion, mitigate the risks associated with the dependency on a single transmission line and reduce line losses at higher power transmission rates. The capital cost of the project was initially estimated at US$30.6 million. Work on the project was suspended in November 2008 because of capital constraints but was restarted in August 2009. The project is expected to be commissioned in the third quarter of 2010 at a cost to MMG of approximately US$12 million. Recent exploration drilling has identified a number of primary copper targets and the Sepon project area remains prospective. Resource definition drilling is also ongoing at the known deposits. Operating Performance
Sepon Copper’s operating performance for the five years ended 31 December 2009 and the six months ended 30 June 2010 is summarised below:
Sepon Copper - Operating Statistics (100% basis)
Year ended 31 December
2005 2006 2007 2008 2009
Six months ended
30 June 2010Ore mined (000’s tonnes) 908 2,320 1,942 1,551 2,418 1,087
Ore milled (000’s tonnes) 644 1,231 1,225 1,328 1,405 724
Copper milled grade (%) 5.80 5.56 5.65 5.40 5.35 5.28
Copper cathode produced (000’s tonnes) 30.5 60.8 62.5 64.1 67.6 34.3
Total cash costs (US¢/lb copper)17 78 78 85 106 89 108
Source: MMG The first copper cathodes were produced by the Sepon copper plant on 14 March 2005. By the end of the year, the plant had reached full design capacity and total production marginally exceeded design capacity in 2006, 2007 and 2008. Cash costs were relatively stable until 2008. Despite an easing of cost pressures later in the year and the deferral of costs related to the Khanong cutback in the December quarter, cash costs were up almost 25% in 2008. Copper cathode production increased in 2009 following the commissioning of the second autoclave in March 2009. Production also benefited from higher head grades and steady recovery rates. In 2009, cash costs fell as a result of reductions in supply management, maintenance and administration costs, following cost saving initiatives implemented in 2008, and a decrease in fuel costs.
17 “lb” refers to pounds. There are 2,204 pounds per tonne.
— V-20 —
APPENDIX V VALUATION REPORT
15
Outlook
In 2010, MMG expects to produce 67,000 to 70,000 tonnes of copper cathode. Preparation for mining has started in the Thengkham and Phabing regions. Mining is currently expected to continue until 2020.
4.1.2 Sepon Gold
Overview
Exploration by CRA Limited (“CRA”), now Rio Tinto Limited (“Rio Tinto”), between 1993 and 1999 resulted in the delineation of approximately three million ounces of gold resources in various deposits at Sepon. Following further exploration and development, and Oxiana’s acquisition of the project, production commenced in December 2002. Since then, the Sepon Gold operation has produced over one million ounces through open pit mining and conventional treatment of oxide gold ore. Based on current oxide reserves, the mine life is not expected to extend much beyond 2012, although it could be extended if MMG delineates additional oxide resources. Studies are ongoing to assess the opportunity to process the larger primary gold resource. Geology and Mineralisation
Gold mineralisation is localised in structural and stratigraphic fluid traps. Mineralisation is finely disseminated and closely associated with decalcification and variable silica replacement of calcareous rocks along structures and at lithological contacts. The geometry of the gold ore is controlled by anticlinal structures and shallow dipping stratigraphy, structure and porphyry sills. Mining and Processing
The Sepon Gold operation is a conventional open pit oxide mining operation. Ore is mined by a contractor from a number of open pits and is treated in a conventional carbon-in-leach processing plant to produce a gold and silver doré. In 2005, the capacity of the plant was increased to 2.5 million tonnes per annum from the design capacity of 1.25 million tonnes per annum.
— V-21 —
APPENDIX V VALUATION REPORT
16
Resources and Reserves
Sepon Gold mineral resources and ore reserves as at 30 June 2009 are set out below:
Sepon Gold – Mineral Resources and Ore Reserves as at 30 June 200918
Tonnes (Mt)
Gold (g/t)
Silver (g/t)
Gold (Moz)
Silver (Moz)
Mineral Resources19 Oxide Gold Measured 4.2 1.0 3 0.1 0.4 Indicated 3.3 1.9 5 0.2 0.5 Inferred 2.9 1.0 5 0.1 0.5 Sub-total 10.4 1.3 4 0.4 1.4 Partial Oxide Gold Measured 2.4 1.6 9 0.1 0.7 Indicated 5.9 2.1 8 0.4 1.5 Inferred 1.8 0.7 6 0.0 0.4 Sub-total 10.1 0.7 8 0.6 2.6 Primary Gold Measured 5.4 3.0 7 0.5 1.2 Indicated 13.5 2.6 8 1.1 3.5 Inferred 5.6 1.8 7 0.3 1.3 Sub-total 24.4 2.5 8 2.0 5.9 Total Mineral Resources 3.0 9.9
Ore Reserves20 Oxide Gold Proved 2.4 1.0 1 0.1 0.1 Probable 1.2 2.1 5 0.1 0.2 Total Ore Reserves 3.5 1.4 2 0.2 0.3 Source: MMG Ore reserves at Sepon have recently been increased through successful exploration at the Houay Yeng and Dankoy deposits. Expansion and Exploration
The focus of exploration at Sepon in 2009 was on drilling oxide gold prospects located 5-15 kilometres west of the Sepon operations and primary gold targets close to the mine infrastructure. In particular, there is some prospect that additional oxide mineralisation will be delineated at the Hanong, Phavat and Thengkham Southwest targets. Primary gold resources have already been delineated and there is substantial upside potential in the area. As the ore is refractory, it would require a treatment process different from that used for the oxide ore. A number of options have been investigated, including pressure oxidation and bacterial oxidation. A scoping study contemplating roasting is due
18 Significant figures do not imply precision. Figures are rounded according to JORC Code Guidelines. Includes 100% of all mineral
resources, which include ore reserves. “oz” refers to troy ounces, which equal to 31.1035 grams per ounce. 19 Mineral resources have been estimated using a cut-off grade of 0.5g/t for oxide and partial oxide gold and 1.0g/t for primary gold. 20 Ore reserves have been estimated using cut off grades in the range 0.45g/t to 0.6g/t gold depending on metallurgical recovery and
haulage distance using a US$900/oz gold price.
— V-22 —
APPENDIX V VALUATION REPORT
17
to start. It appears that additional mineralisation would need to be delineated to make exploitation of the primary gold resource economic. Operating Performance
Sepon Gold’s operating performance for the five years ended 31 December 2009 and the six months ended 30 June 2010 is summarised below:
Sepon Gold Operating Statistics – 100% basis
Year to 31 December
2005 2006 2007 2008 2009
Six months ended
30 June 2010Ore mined (000’s tonnes) 3,078 2,880 1,510 1,613 2,830 1,310
Ore milled (000’s tonnes) 2,660 2,909 2,161 2,322 2,468 1,085
Gold milled grade (g/t gold) 2.77 2.25 1.79 1.60 1.66 2.01
Gold produced (000’s ounces) 200 176 102 93 105 55
Total cash costs (US$/oz gold) 260 330 445 538 494 503
Source: MMG In 2005, Oxiana completed an expansion of the Sepon gold operation that doubled the capacity of the gold processing plant to 2.5 million tonnes per annum. Head grades have been steadily decreasing leading to a declining gold production notwithstanding fluctuations in milled tonnage. Decreasing head grades and increasing unit costs resulted in a doubling of cash costs from 2005 to 2008. In 2009, the easing of external cost pressures and benefits from the company-wide cost reduction program implemented in 2008 contributed to lower cash costs. Outlook
In 2010, MMG expects to produce 95,000 to 100,000 ounces of gold. Based on gold oxide reserves, the project has a life of approximately one year.
4.2 Century
Overview
The Century mine is the largest zinc mine in Australia and the third largest open pit zinc mine in the world. It is located in north-west Queensland, approximately 250 kilometres north-west of Mount Isa. While the area around Century has been mined (although not continuously) for zinc and lead for close to 100 years, the Century deposit was only discovered by CRA in 1990. The Century project was later acquired by Pasminco Limited (“Pasminco”) in 1997. Development of the mine commenced soon afterwards and concentrate shipments began in late 1999. The mine was operated by administrators between 2001 and 2004, while Pasminco was in voluntary administration, and formed part of the asset base of Zinifex at the time of its listing. The Century mine was subsequently included in the portfolio of assets of OZL, which was formed following the merger of Zinifex with Oxiana in July 2008. In June 2009, MMG acquired Century mine and other assets from OZL. Century is operated on a fly-in/fly-out roster. Mining at Century is based on open pit extraction using conventional hydraulic excavators and haul trucks. A dedicated and well-equipped treatment plant employs a conventional grinding and froth flotation circuit. The resultant zinc and lead concentrates are pumped as slurry to the port facility at Karumba via a 304 kilometre pipeline. At Karumba, the slurry is dewatered, filtered, stockpiled and transported to bulk carriers moored off-shore. Since 2003, Century has consistently produced around 500,000 tonnes per annum of zinc in concentrate. While Century is primarily a zinc producer, lead and silver are also recovered. In
— V-23 —
APPENDIX V VALUATION REPORT
18
response to the steep decline in zinc prices in the second half of 2008, Century’s mining plan was revised to exclude approximately 5.5 million tonnes of sub-economic material, with the result that the end of mine life was brought forward to 2014, a year earlier than previously planned. However, at current zinc price levels, there is potential to include a portion of this material in the LOM mining inventory, which would extend the mine life to mid 2015. Geology and Mineralisation
The Century deposit is hosted by mid-Proterozoic rocks of the Mount Isa Inlier, which hosts a number of other major base metal deposits such as those at Mount Isa, Cannington, Dugald River and McArthur River. The Century mineralisation is stratiform, lying within a sequence of siltstones, shales and sandstones, which is overlain by a Cambrian limestone unconformity. The mineral deposit, which extends over an area of 1.2 kilometres by 1.4 kilometres, is generally flat lying (dipping at 5-25 degrees), although it rises more steeply towards the surface at an angle of around 70 degrees along the western flank of the deposit. The mineralised package is divided into Upper and Lower mineralised zones, divided by a horizon of siltstone waste. Sulphide mineralisation principally consists of sphalerite and galena, with lesser amounts of pyrite. The Lower zone, which contributes approximately 60% of resources, is characterised by higher zinc grades (around 15% zinc) but lower lead and silver grades (1% lead and 20 g/t silver). Lower zone mineralisation is also typically relatively high in organic carbon and silica by comparison with the Upper zone. While the Upper zone has lower zinc grades (around 10% zinc), it has higher lead and silver grades (4% lead and 150 g/t silver) and lower levels of organic carbon and silica. The deposit is split into southern and northern blocks by the east-west trending Pandora’s Fault. Mineralisation is constrained at the southern end of the deposit by the east-west trending Magazine Hill Fault, to the east by the Termite Range Fault and to the north by Nikki’s Fault. To the west, as the mineral deposit rises towards the surface, it is constrained by the limestone unconformity and surface erosion. The mineral deposit is well delineated on all four sides and there appears to be little prospect of identifying any significant mineralisation beyond the existing defined resource. Mining
Mining commenced in the relatively shallow southern block, where Stages 1 and 2 of the pit were mined. Subsequently, mining moved to Stages 3, 4 and 5 of the pit in the northern block, with the extraction of mineralisation along the eastern and northern flanks of the deposit. Mining of Stage 6 was completed in the December 2008 quarter and Stage 7 is currently being mined. The Stage 8 cutback commenced in late 2009 but progress during the initial few months was hampered by heavy rainfall. Stage 8 will mine to the ultimate pit limit with the northern block providing the majority of the ore for mining over the remaining life of the mine. The deposit deepens to the north and the pit will reach a depth of around 345 metres at its deepest point. Mining operations will conclude with the mining of Stage 9, which will extract the remaining economic ore in the southern block. The diagram below shows a plan view of the pit and the various mining stages.
— V-24 —

APPENDIX V VALUATION REPORT
19
Source: MMG A geotechnical review of the planned mining of Stage 7 indicated that the original mine plan involved the risk of failure of the western wall of the pit, as a result of the existence of steeply dipping shears towards the western margin of the pit. To address this risk, it was decided to accelerate the removal of overburden (including the steeply dipping shear zone) up to the ultimate western wall of the pit, where competent material will support the final pit design. The result was a substantial increase in the stripping ratio and waste ore movements for the 2006 to 2008 calendar years. A large portion of the overburden removal was completed in 2007-2008 with waste movements increasing from around 24 million bank cubic metres (“Mbcm”) per annum prior to the ramping up in 2006 to in excess of 42 Mbcm per annum during the period. Following the decline in the zinc price during 2008, the pit design was revised to minimise immediate capital spending and operating costs. The revised mining plan incorporated the deferral of approximately 8 Mbcm of waste removal to Stage 8 and consequently a significant reduction in material movements for the 2009 year followed by a more gradual reduction in subsequent years, as opposed to the previous mining schedule which required high levels of material movements in 2009 followed by a very sharp reduction in subsequent years. The material movement for the calendar year 2009 was therefore substantially lower than for 2008, at 27 Mbcm, with all waste placed in-pit. Waste movement is scheduled to be 19 Mbcm for 2010 and 22 Mbcm for 2011. The stripping ratio will fall from around 20 for the 2007-2008 period to around 13 in 2009 and 10 in 2010, with subsequent reductions through to the end of the mine life, which is scheduled for 2015. Run-of-mine ore is trucked to the ROM pad to the south-east of the pit. Ore from the Upper and Lower mineralised zones is stored on separate stockpiles to allow blending for optimal plant operation. Waste dumps to the east and north of the pit have largely been completed. In-pit waste dumping in the southern block has commenced and future waste will be dumped in pit and on a new waste dump developed to the west of the pit.
— V-25 —

APPENDIX V VALUATION REPORT
20
The smoothing of the material movement profile over the mine life and in-pit dumping of waste have allowed a significant reduction in the mining fleet and resulted in substantial cost savings. Processing
The concentrator was commissioned in 1999 and the first shipment of concentrate occurred in December 1999. The plant is operated to maximise zinc output. It has consistently treated in excess of 5.6 million tonnes per annum of ore, although milled tonnage was lower in 2009 because of the Karumba pipeline failure. The plant is in general terms a conventional crush/grind/flotation design, but the flow sheet is fairly complex because of the need to remove organic carbon and silica minerals associated with sphalerite. The ore is crushed in a primary crusher and ground in a SAG mill and two ball mills. The ground ore is then processed in a carbon prefloat circuit to remove a significant portion of the naturally floating carbon. The slurry then undergoes roughing and cleaning to produce a lead concentrate. The tailings from the lead flotation circuit gravitate to the primary zinc circuit, which includes a rougher-scavenger sequence. Concentrates from the rougher and first cleaner stages are fed to the ultra-fine zinc cleaning circuit. The combined product is reground to release silica before being processed through four ultra fine cleaning stages to produce the final zinc concentrate.
— V-26 —
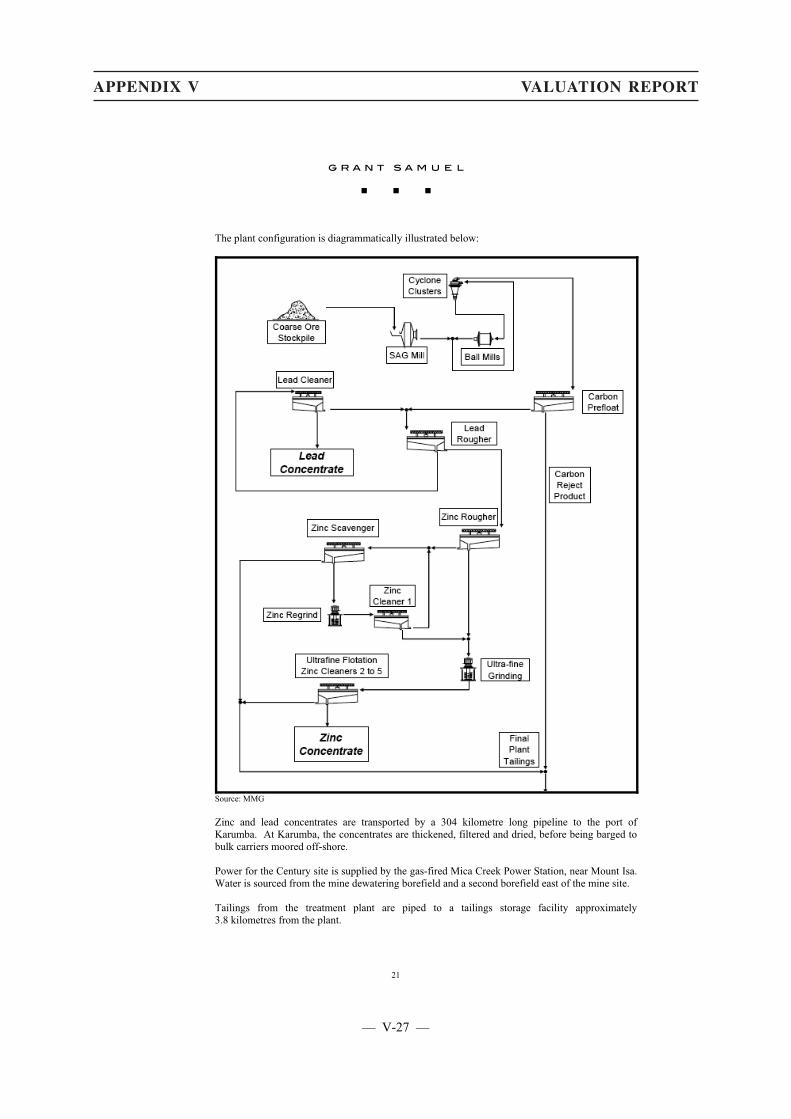
APPENDIX V VALUATION REPORT
21
The plant configuration is diagrammatically illustrated below:
Source: MMG Zinc and lead concentrates are transported by a 304 kilometre long pipeline to the port of Karumba. At Karumba, the concentrates are thickened, filtered and dried, before being barged to bulk carriers moored off-shore. Power for the Century site is supplied by the gas-fired Mica Creek Power Station, near Mount Isa. Water is sourced from the mine dewatering borefield and a second borefield east of the mine site. Tailings from the treatment plant are piped to a tailings storage facility approximately 3.8 kilometres from the plant.
— V-27 —
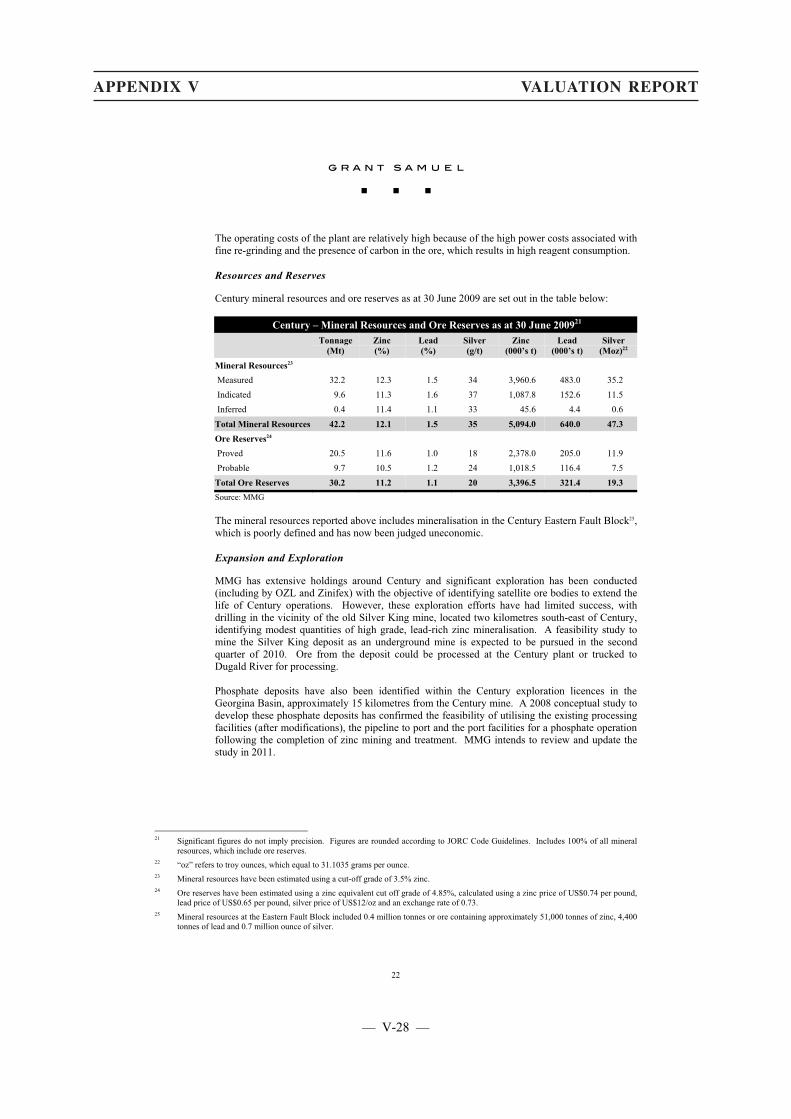
APPENDIX V VALUATION REPORT
22
The operating costs of the plant are relatively high because of the high power costs associated with fine re-grinding and the presence of carbon in the ore, which results in high reagent consumption. Resources and Reserves
Century mineral resources and ore reserves as at 30 June 2009 are set out in the table below:
Century – Mineral Resources and Ore Reserves as at 30 June 200921
Tonnage(Mt)
Zinc (%)
Lead (%)
Silver (g/t)
Zinc (000’s t)
Lead (000’s t)
Silver (Moz)22
Mineral Resources23 Measured 32.2 12.3 1.5 34 3,960.6 483.0 35.2 Indicated 9.6 11.3 1.6 37 1,087.8 152.6 11.5 Inferred 0.4 11.4 1.1 33 45.6 4.4 0.6 Total Mineral Resources 42.2 12.1 1.5 35 5,094.0 640.0 47.3 Ore Reserves24 Proved 20.5 11.6 1.0 18 2,378.0 205.0 11.9 Probable 9.7 10.5 1.2 24 1,018.5 116.4 7.5 Total Ore Reserves 30.2 11.2 1.1 20 3,396.5 321.4 19.3 Source: MMG The mineral resources reported above includes mineralisation in the Century Eastern Fault Block25, which is poorly defined and has now been judged uneconomic. Expansion and Exploration
MMG has extensive holdings around Century and significant exploration has been conducted (including by OZL and Zinifex) with the objective of identifying satellite ore bodies to extend the life of Century operations. However, these exploration efforts have had limited success, with drilling in the vicinity of the old Silver King mine, located two kilometres south-east of Century, identifying modest quantities of high grade, lead-rich zinc mineralisation. A feasibility study to mine the Silver King deposit as an underground mine is expected to be pursued in the second quarter of 2010. Ore from the deposit could be processed at the Century plant or trucked to Dugald River for processing. Phosphate deposits have also been identified within the Century exploration licences in the Georgina Basin, approximately 15 kilometres from the Century mine. A 2008 conceptual study to develop these phosphate deposits has confirmed the feasibility of utilising the existing processing facilities (after modifications), the pipeline to port and the port facilities for a phosphate operation following the completion of zinc mining and treatment. MMG intends to review and update the study in 2011.
21 Significant figures do not imply precision. Figures are rounded according to JORC Code Guidelines. Includes 100% of all mineral
resources, which include ore reserves. 22 “oz” refers to troy ounces, which equal to 31.1035 grams per ounce. 23 Mineral resources have been estimated using a cut-off grade of 3.5% zinc. 24 Ore reserves have been estimated using a zinc equivalent cut off grade of 4.85%, calculated using a zinc price of US$0.74 per pound,
lead price of US$0.65 per pound, silver price of US$12/oz and an exchange rate of 0.73. 25 Mineral resources at the Eastern Fault Block included 0.4 million tonnes or ore containing approximately 51,000 tonnes of zinc, 4,400
tonnes of lead and 0.7 million ounce of silver.
— V-28 —
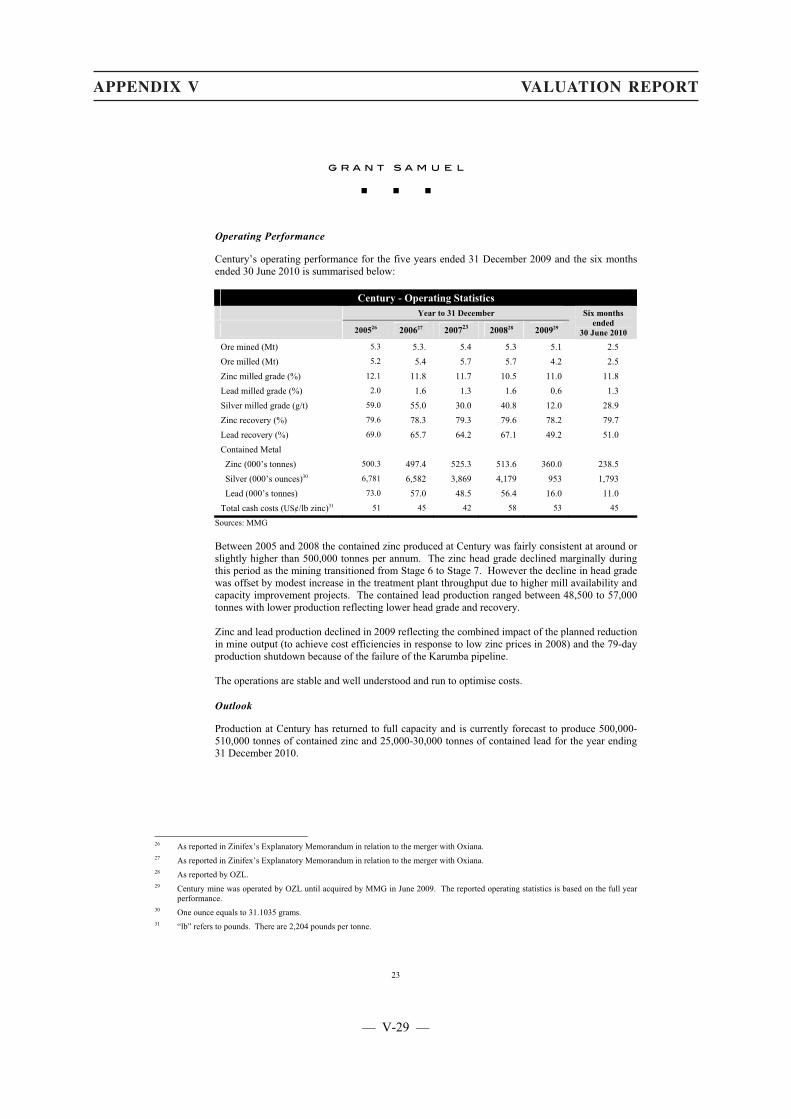
APPENDIX V VALUATION REPORT
23
Operating Performance
Century’s operating performance for the five years ended 31 December 2009 and the six months ended 30 June 2010 is summarised below:
Century - Operating Statistics Year to 31 December
200526 200627 200723 200828 200929
Six months ended
30 June 2010
Ore mined (Mt) 5.3 5.3. 5.4 5.3 5.1 2.5
Ore milled (Mt) 5.2 5.4 5.7 5.7 4.2 2.5
Zinc milled grade (%) 12.1 11.8 11.7 10.5 11.0 11.8
Lead milled grade (%) 2.0 1.6 1.3 1.6 0.6 1.3
Silver milled grade (g/t) 59.0 55.0 30.0 40.8 12.0 28.9
Zinc recovery (%) 79.6 78.3 79.3 79.6 78.2 79.7
Lead recovery (%) 69.0 65.7 64.2 67.1 49.2 51.0
Contained Metal
Zinc (000’s tonnes) 500.3 497.4 525.3 513.6 360.0 238.5
Silver (000’s ounces)30 6,781 6,582 3,869 4,179 953 1,793
Lead (000’s tonnes) 73.0 57.0 48.5 56.4 16.0 11.0
Total cash costs (US¢/lb zinc)31 51 45 42 58 53 45
Sources: MMG Between 2005 and 2008 the contained zinc produced at Century was fairly consistent at around or slightly higher than 500,000 tonnes per annum. The zinc head grade declined marginally during this period as the mining transitioned from Stage 6 to Stage 7. However the decline in head grade was offset by modest increase in the treatment plant throughput due to higher mill availability and capacity improvement projects. The contained lead production ranged between 48,500 to 57,000 tonnes with lower production reflecting lower head grade and recovery. Zinc and lead production declined in 2009 reflecting the combined impact of the planned reduction in mine output (to achieve cost efficiencies in response to low zinc prices in 2008) and the 79-day production shutdown because of the failure of the Karumba pipeline. The operations are stable and well understood and run to optimise costs. Outlook
Production at Century has returned to full capacity and is currently forecast to produce 500,000-510,000 tonnes of contained zinc and 25,000-30,000 tonnes of contained lead for the year ending 31 December 2010.
26 As reported in Zinifex’s Explanatory Memorandum in relation to the merger with Oxiana. 27 As reported in Zinifex’s Explanatory Memorandum in relation to the merger with Oxiana. 28 As reported by OZL. 29 Century mine was operated by OZL until acquired by MMG in June 2009. The reported operating statistics is based on the full year
performance. 30 One ounce equals to 31.1035 grams. 31 “lb” refers to pounds. There are 2,204 pounds per tonne.
— V-29 —
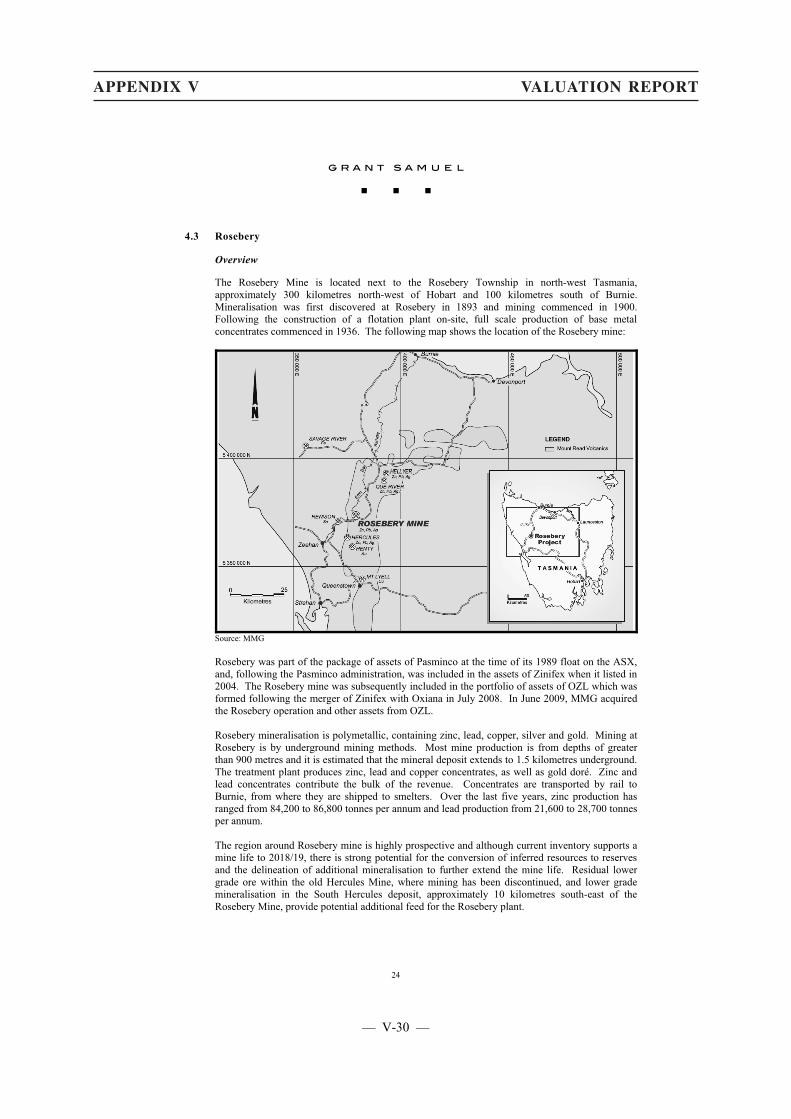
APPENDIX V VALUATION REPORT
24
4.3 Rosebery
Overview
The Rosebery Mine is located next to the Rosebery Township in north-west Tasmania, approximately 300 kilometres north-west of Hobart and 100 kilometres south of Burnie. Mineralisation was first discovered at Rosebery in 1893 and mining commenced in 1900. Following the construction of a flotation plant on-site, full scale production of base metal concentrates commenced in 1936. The following map shows the location of the Rosebery mine:
Source: MMG Rosebery was part of the package of assets of Pasminco at the time of its 1989 float on the ASX, and, following the Pasminco administration, was included in the assets of Zinifex when it listed in 2004. The Rosebery mine was subsequently included in the portfolio of assets of OZL which was formed following the merger of Zinifex with Oxiana in July 2008. In June 2009, MMG acquired the Rosebery operation and other assets from OZL. Rosebery mineralisation is polymetallic, containing zinc, lead, copper, silver and gold. Mining at Rosebery is by underground mining methods. Most mine production is from depths of greater than 900 metres and it is estimated that the mineral deposit extends to 1.5 kilometres underground. The treatment plant produces zinc, lead and copper concentrates, as well as gold doré. Zinc and lead concentrates contribute the bulk of the revenue. Concentrates are transported by rail to Burnie, from where they are shipped to smelters. Over the last five years, zinc production has ranged from 84,200 to 86,800 tonnes per annum and lead production from 21,600 to 28,700 tonnes per annum. The region around Rosebery mine is highly prospective and although current inventory supports a mine life to 2018/19, there is strong potential for the conversion of inferred resources to reserves and the delineation of additional mineralisation to further extend the mine life. Residual lower grade ore within the old Hercules Mine, where mining has been discontinued, and lower grade mineralisation in the South Hercules deposit, approximately 10 kilometres south-east of the Rosebery Mine, provide potential additional feed for the Rosebery plant.
— V-30 —
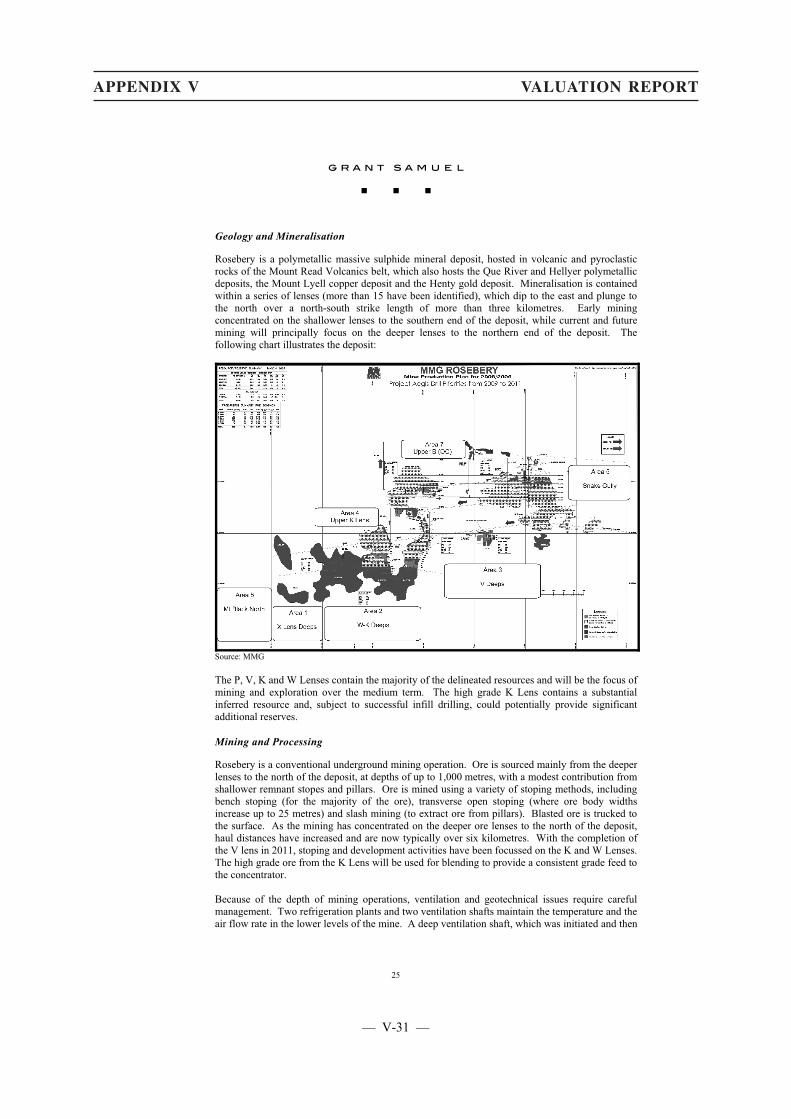
APPENDIX V VALUATION REPORT
25
Geology and Mineralisation
Rosebery is a polymetallic massive sulphide mineral deposit, hosted in volcanic and pyroclastic rocks of the Mount Read Volcanics belt, which also hosts the Que River and Hellyer polymetallic deposits, the Mount Lyell copper deposit and the Henty gold deposit. Mineralisation is contained within a series of lenses (more than 15 have been identified), which dip to the east and plunge to the north over a north-south strike length of more than three kilometres. Early mining concentrated on the shallower lenses to the southern end of the deposit, while current and future mining will principally focus on the deeper lenses to the northern end of the deposit. The following chart illustrates the deposit:
Source: MMG The P, V, K and W Lenses contain the majority of the delineated resources and will be the focus of mining and exploration over the medium term. The high grade K Lens contains a substantial inferred resource and, subject to successful infill drilling, could potentially provide significant additional reserves. Mining and Processing
Rosebery is a conventional underground mining operation. Ore is sourced mainly from the deeper lenses to the north of the deposit, at depths of up to 1,000 metres, with a modest contribution from shallower remnant stopes and pillars. Ore is mined using a variety of stoping methods, including bench stoping (for the majority of the ore), transverse open stoping (where ore body widths increase up to 25 metres) and slash mining (to extract ore from pillars). Blasted ore is trucked to the surface. As the mining has concentrated on the deeper ore lenses to the north of the deposit, haul distances have increased and are now typically over six kilometres. With the completion of the V lens in 2011, stoping and development activities have been focussed on the K and W Lenses. The high grade ore from the K Lens will be used for blending to provide a consistent grade feed to the concentrator. Because of the depth of mining operations, ventilation and geotechnical issues require careful management. Two refrigeration plants and two ventilation shafts maintain the temperature and the air flow rate in the lower levels of the mine. A deep ventilation shaft, which was initiated and then
— V-31 —
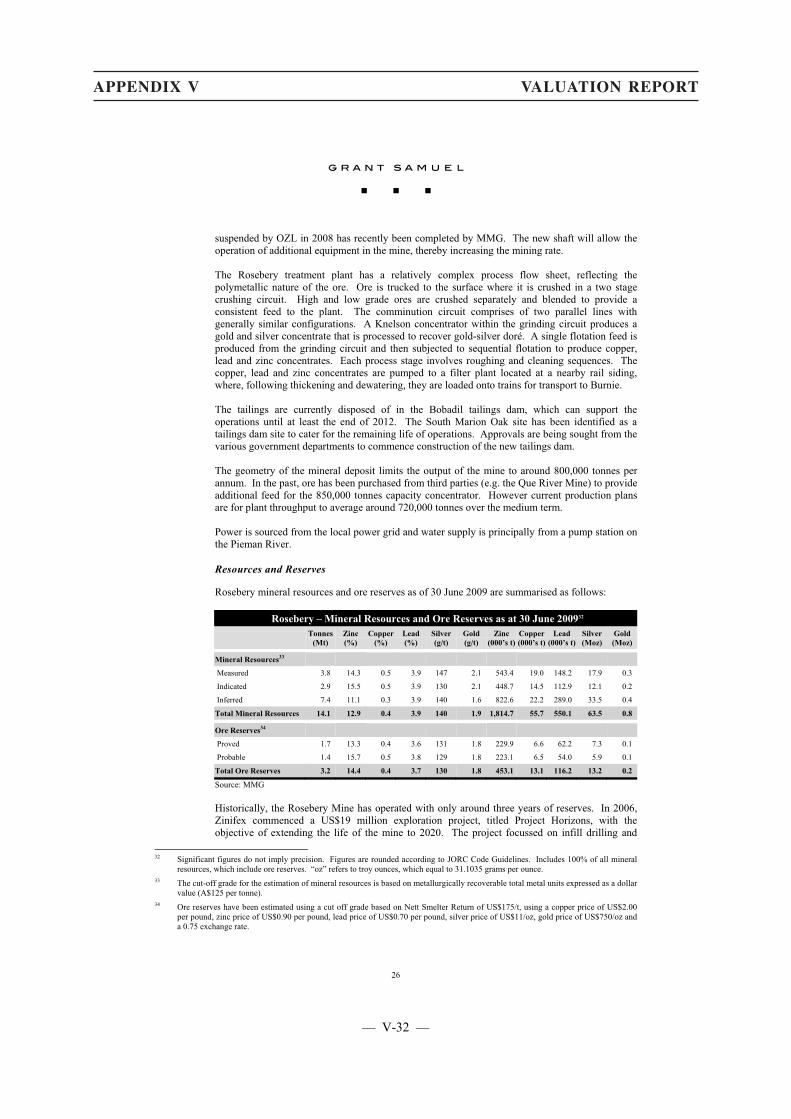
APPENDIX V VALUATION REPORT
26
suspended by OZL in 2008 has recently been completed by MMG. The new shaft will allow the operation of additional equipment in the mine, thereby increasing the mining rate. The Rosebery treatment plant has a relatively complex process flow sheet, reflecting the polymetallic nature of the ore. Ore is trucked to the surface where it is crushed in a two stage crushing circuit. High and low grade ores are crushed separately and blended to provide a consistent feed to the plant. The comminution circuit comprises of two parallel lines with generally similar configurations. A Knelson concentrator within the grinding circuit produces a gold and silver concentrate that is processed to recover gold-silver doré. A single flotation feed is produced from the grinding circuit and then subjected to sequential flotation to produce copper, lead and zinc concentrates. Each process stage involves roughing and cleaning sequences. The copper, lead and zinc concentrates are pumped to a filter plant located at a nearby rail siding, where, following thickening and dewatering, they are loaded onto trains for transport to Burnie. The tailings are currently disposed of in the Bobadil tailings dam, which can support the operations until at least the end of 2012. The South Marion Oak site has been identified as a tailings dam site to cater for the remaining life of operations. Approvals are being sought from the various government departments to commence construction of the new tailings dam. The geometry of the mineral deposit limits the output of the mine to around 800,000 tonnes per annum. In the past, ore has been purchased from third parties (e.g. the Que River Mine) to provide additional feed for the 850,000 tonnes capacity concentrator. However current production plans are for plant throughput to average around 720,000 tonnes over the medium term. Power is sourced from the local power grid and water supply is principally from a pump station on the Pieman River. Resources and Reserves
Rosebery mineral resources and ore reserves as of 30 June 2009 are summarised as follows:
Rosebery – Mineral Resources and Ore Reserves as at 30 June 200932
Tonnes (Mt)
Zinc (%)
Copper (%)
Lead (%)
Silver (g/t)
Gold (g/t)
Zinc (000’s t)
Copper (000’s t)
Lead (000’s t)
Silver (Moz)
Gold (Moz)
Mineral Resources33
Measured 3.8 14.3 0.5 3.9 147 2.1 543.4 19.0 148.2 17.9 0.3
Indicated 2.9 15.5 0.5 3.9 130 2.1 448.7 14.5 112.9 12.1 0.2
Inferred 7.4 11.1 0.3 3.9 140 1.6 822.6 22.2 289.0 33.5 0.4
Total Mineral Resources 14.1 12.9 0.4 3.9 140 1.9 1,814.7 55.7 550.1 63.5 0.8
Ore Reserves34
Proved 1.7 13.3 0.4 3.6 131 1.8 229.9 6.6 62.2 7.3 0.1
Probable 1.4 15.7 0.5 3.8 129 1.8 223.1 6.5 54.0 5.9 0.1
Total Ore Reserves 3.2 14.4 0.4 3.7 130 1.8 453.1 13.1 116.2 13.2 0.2
Source: MMG Historically, the Rosebery Mine has operated with only around three years of reserves. In 2006, Zinifex commenced a US$19 million exploration project, titled Project Horizons, with the objective of extending the life of the mine to 2020. The project focussed on infill drilling and
32 Significant figures do not imply precision. Figures are rounded according to JORC Code Guidelines. Includes 100% of all mineral
resources, which include ore reserves. “oz” refers to troy ounces, which equal to 31.1035 grams per ounce. 33 The cut-off grade for the estimation of mineral resources is based on metallurgically recoverable total metal units expressed as a dollar
value (A$125 per tonne). 34 Ore reserves have been estimated using a cut off grade based on Nett Smelter Return of US$175/t, using a copper price of US$2.00
per pound, zinc price of US$0.90 per pound, lead price of US$0.70 per pound, silver price of US$11/oz, gold price of US$750/oz and a 0.75 exchange rate.
— V-32 —
APPENDIX V VALUATION REPORT
27
exploration of the deeper K and PK Lenses. In May 2007, Zinifex announced that successful exploration drilling from the initial stages of Horizons had increased the Rosebery resource by 65% and substantially extended the life of the mine. Resources were further increased in 2008 but reserves have been decreasing. The following table shows movements in total mineral resources and ore reserves at Rosebery in recent years:
Rosebery – Mineral Resources and Ore Reserves As at 31 March 2007 As at 30 June
2005 2006 2007 2008 2009
Resources35 (Mt) 6.5 7.7 11.7 15.2 14.1 Reserves (Mt) 2.3 2.6 3.8 3.5 3.2 Source: MMG MMG believes there remains considerable potential for further increases at the Rosebery mine through exploration and delineation drilling. Drilling has also recommenced at the Jupiter prospect, which had previously returned encouraging results, seven kilometres south of Rosebery. Expansion
No major expansions are planned at Rosebery but there is an ongoing continuous improvement program to optimise the operations and reduce costs.
The processing plant at Rosebery was commissioned in the 1970s and no major upgrade has been carried out in more than 20 years. In the past, the reserves were insufficient to justify major capital spending on the concentrator. With Project Horizons extending the mine life, a prefeasibility study was undertaken in 2008 for the replacement of the concentrator with a more modern plant. The new plant was estimated to cost approximately US$140 million and was expected to have a throughput of one million tonnes per annum. However, MMG believes that greater value can be generated through the appropriate optimisation of the crushing and grinding circuits. A US$1 million study assessing the potential development of the Hercules mine is expected to be completed in 2011. Re-establishment of site access and bulk sampling is planned as part of a staged approach to the potential extraction of the resource, which is subject to confirmation that the South Hercules mineralisation is amenable to treatment through the Rosebery plant. The above reported resource estimates do not include the South Hercules resource, which have been estimated at 1.0 million tonnes at an average silver and gold grade of 133g/t and 2.4g/t respectively.
35 Refers to measured, indicated and inferred resources and includes ore reserves.
— V-33 —
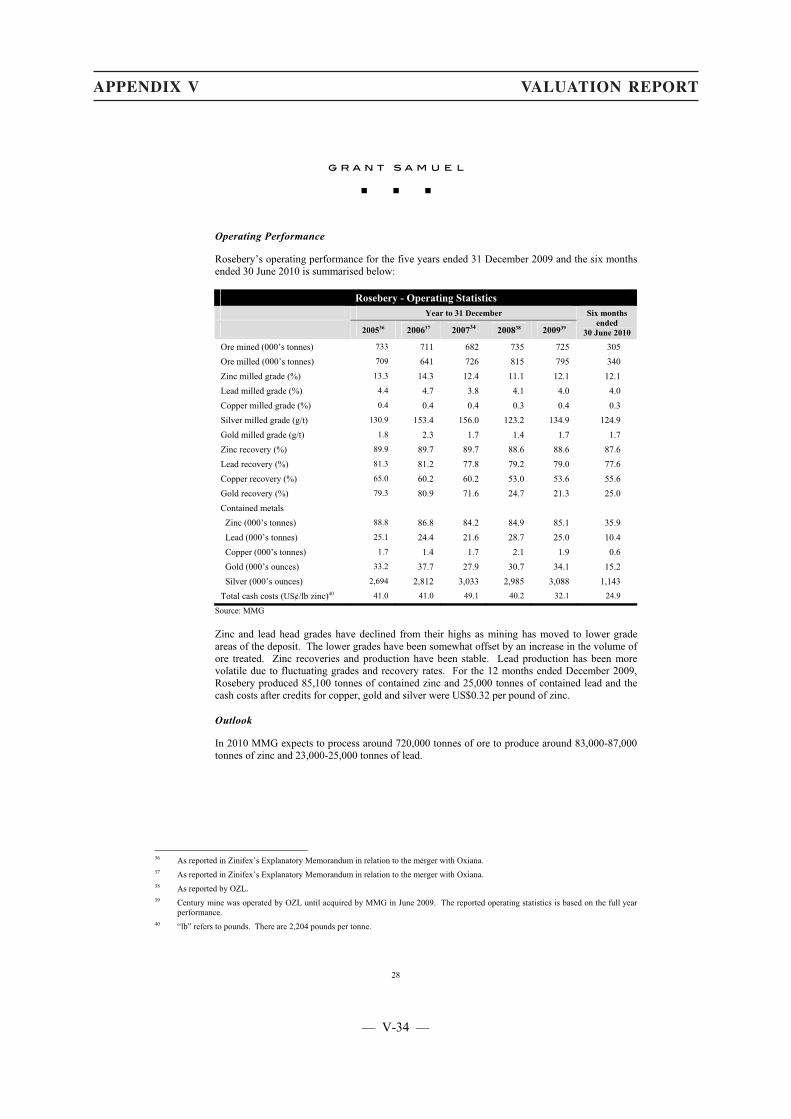
APPENDIX V VALUATION REPORT
28
Operating Performance
Rosebery’s operating performance for the five years ended 31 December 2009 and the six months ended 30 June 2010 is summarised below:
Rosebery - Operating Statistics Year to 31 December
200536 200637 200734 200838 200939
Six months ended
30 June 2010
Ore mined (000’s tonnes) 733 711 682 735 725 305
Ore milled (000’s tonnes) 709 641 726 815 795 340
Zinc milled grade (%) 13.3 14.3 12.4 11.1 12.1 12.1
Lead milled grade (%) 4.4 4.7 3.8 4.1 4.0 4.0
Copper milled grade (%) 0.4 0.4 0.4 0.3 0.4 0.3
Silver milled grade (g/t) 130.9 153.4 156.0 123.2 134.9 124.9
Gold milled grade (g/t) 1.8 2.3 1.7 1.4 1.7 1.7
Zinc recovery (%) 89.9 89.7 89.7 88.6 88.6 87.6
Lead recovery (%) 81.3 81.2 77.8 79.2 79.0 77.6
Copper recovery (%) 65.0 60.2 60.2 53.0 53.6 55.6
Gold recovery (%) 79.3 80.9 71.6 24.7 21.3 25.0
Contained metals Zinc (000’s tonnes) 88.8 86.8 84.2 84.9 85.1 35.9
Lead (000’s tonnes) 25.1 24.4 21.6 28.7 25.0 10.4
Copper (000’s tonnes) 1.7 1.4 1.7 2.1 1.9 0.6
Gold (000’s ounces) 33.2 37.7 27.9 30.7 34.1 15.2
Silver (000’s ounces) 2,694 2,812 3,033 2,985 3,088 1,143
Total cash costs (US¢/lb zinc)40 41.0 41.0 49.1 40.2 32.1 24.9
Source: MMG Zinc and lead head grades have declined from their highs as mining has moved to lower grade areas of the deposit. The lower grades have been somewhat offset by an increase in the volume of ore treated. Zinc recoveries and production have been stable. Lead production has been more volatile due to fluctuating grades and recovery rates. For the 12 months ended December 2009, Rosebery produced 85,100 tonnes of contained zinc and 25,000 tonnes of contained lead and the cash costs after credits for copper, gold and silver were US$0.32 per pound of zinc. Outlook
In 2010 MMG expects to process around 720,000 tonnes of ore to produce around 83,000-87,000 tonnes of zinc and 23,000-25,000 tonnes of lead.
36 As reported in Zinifex’s Explanatory Memorandum in relation to the merger with Oxiana. 37 As reported in Zinifex’s Explanatory Memorandum in relation to the merger with Oxiana. 38 As reported by OZL. 39 Century mine was operated by OZL until acquired by MMG in June 2009. The reported operating statistics is based on the full year
performance. 40 “lb” refers to pounds. There are 2,204 pounds per tonne.
— V-34 —
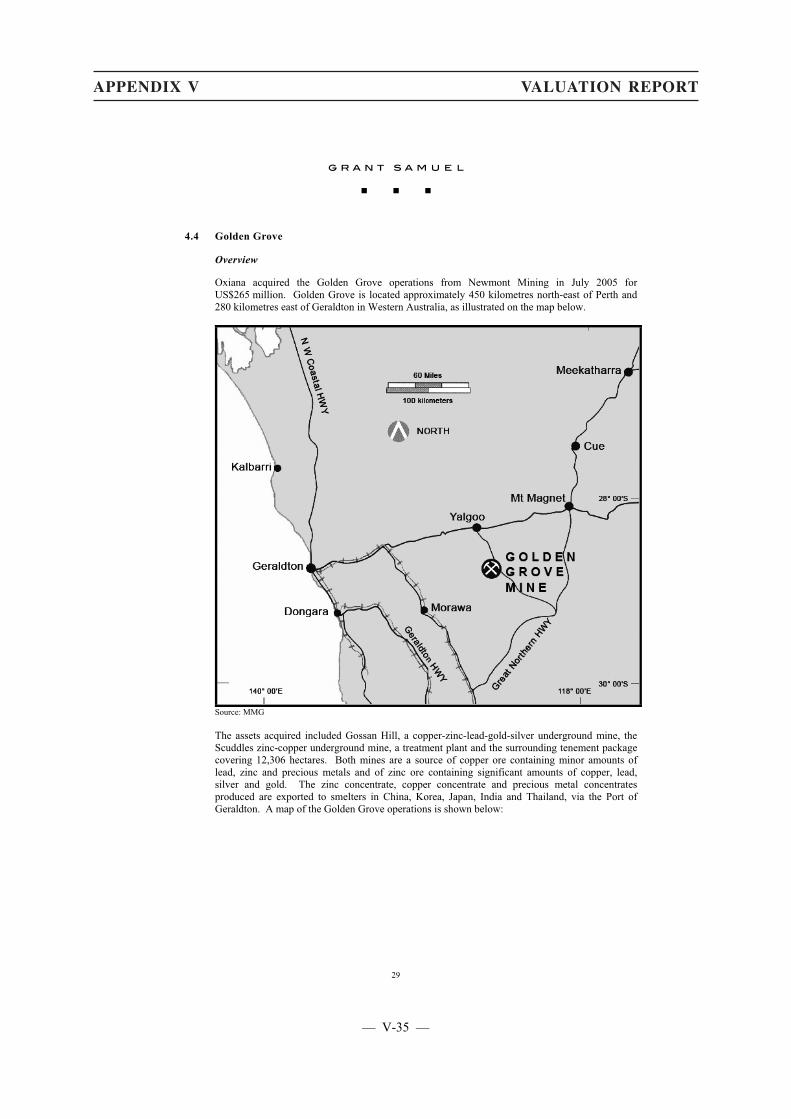
APPENDIX V VALUATION REPORT
29
4.4 Golden Grove
Overview
Oxiana acquired the Golden Grove operations from Newmont Mining in July 2005 for US$265 million. Golden Grove is located approximately 450 kilometres north-east of Perth and 280 kilometres east of Geraldton in Western Australia, as illustrated on the map below.
Source: MMG The assets acquired included Gossan Hill, a copper-zinc-lead-gold-silver underground mine, the Scuddles zinc-copper underground mine, a treatment plant and the surrounding tenement package covering 12,306 hectares. Both mines are a source of copper ore containing minor amounts of lead, zinc and precious metals and of zinc ore containing significant amounts of copper, lead, silver and gold. The zinc concentrate, copper concentrate and precious metal concentrates produced are exported to smelters in China, Korea, Japan, India and Thailand, via the Port of Geraldton. A map of the Golden Grove operations is shown below:
— V-35 —
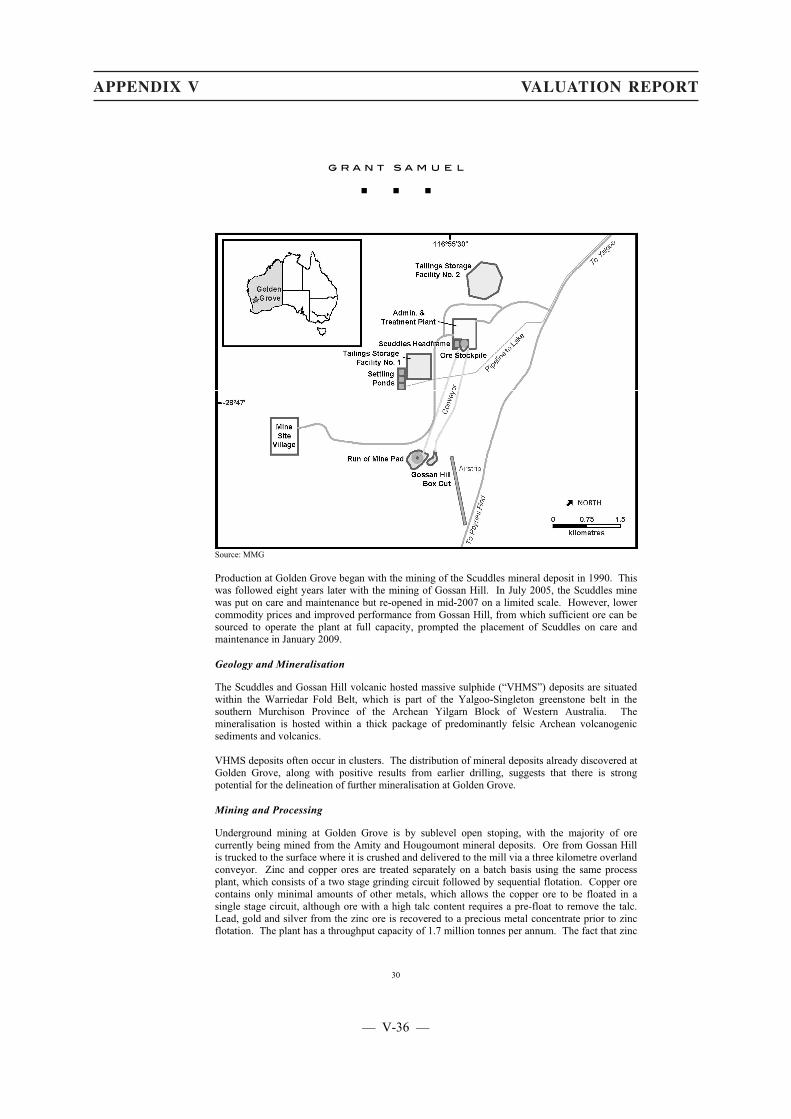
APPENDIX V VALUATION REPORT
30
Source: MMG Production at Golden Grove began with the mining of the Scuddles mineral deposit in 1990. This was followed eight years later with the mining of Gossan Hill. In July 2005, the Scuddles mine was put on care and maintenance but re-opened in mid-2007 on a limited scale. However, lower commodity prices and improved performance from Gossan Hill, from which sufficient ore can be sourced to operate the plant at full capacity, prompted the placement of Scuddles on care and maintenance in January 2009. Geology and Mineralisation
The Scuddles and Gossan Hill volcanic hosted massive sulphide (“VHMS”) deposits are situated within the Warriedar Fold Belt, which is part of the Yalgoo-Singleton greenstone belt in the southern Murchison Province of the Archean Yilgarn Block of Western Australia. The mineralisation is hosted within a thick package of predominantly felsic Archean volcanogenic sediments and volcanics. VHMS deposits often occur in clusters. The distribution of mineral deposits already discovered at Golden Grove, along with positive results from earlier drilling, suggests that there is strong potential for the delineation of further mineralisation at Golden Grove. Mining and Processing
Underground mining at Golden Grove is by sublevel open stoping, with the majority of ore currently being mined from the Amity and Hougoumont mineral deposits. Ore from Gossan Hill is trucked to the surface where it is crushed and delivered to the mill via a three kilometre overland conveyor. Zinc and copper ores are treated separately on a batch basis using the same process plant, which consists of a two stage grinding circuit followed by sequential flotation. Copper ore contains only minimal amounts of other metals, which allows the copper ore to be floated in a single stage circuit, although ore with a high talc content requires a pre-float to remove the talc. Lead, gold and silver from the zinc ore is recovered to a precious metal concentrate prior to zinc flotation. The plant has a throughput capacity of 1.7 million tonnes per annum. The fact that zinc
— V-36 —

APPENDIX V VALUATION REPORT
31
and copper ores are found in distinct deposits and are batch processed in the same plant affords MMG the flexibility to focus production on one metal or the other. Resources and Reserves
Golden Grove mineral resources and ore reserves as at 30 June 2009 are set out in the table below:
Golden Grove – Mineral Resources and Ore Reserves as at 30 June 200941
Tonnes (Mt)
Zinc (%)
Copper (%)
Lead (%)
Silver (g/t)
Gold (g/t)
Zinc (000’s t)
Copper (000’s t)
Lead (000’s t)
Silver (Moz)
Gold (Moz)
Mineral Resources42
Primary Copper
Measured 10.2 0.6 3.1 0.0 19 0.6 63.7 318.3 3.2 6.3 0.2
Indicated 3.2 0.4 2.8 - 14 0.5 12.7 89.0 - 1.4 0.1
Inferred 5.8 0.9 3.2 - 28 0.7 49.7 187.0 - 5.2 0.1
Sub-total 19.1 0.7 3.1 0.0 21 0.6 126.1 594.3 3.2 12.9 0.4
Oxide Copper
Measured - - - - - - - - - - -
Indicated - - - - - - - - - - -
Inferred 2.5 - 2.3 - - - - 58.0 - - -
Sub-total 2.5 - 2.3 - - - - 58.0 - - -
Zinc
Measured 4.1 12.1 0.4 1.2 84 1.6 495.4 18.3 49.2 11.1 0.2
Indicated 0.8 12.0 0.6 2.1 120 2.2 96.3 4.9 16.6 3.1 0.1
Inferred 4.0 11.1 0.7 0.7 64 1.0 439.5 26.4 27.8 8.1 0.1
Sub-total 8.9 11.6 0.6 1.1 78 1.4 1,031.2 49.7 93.6 22.3 0.4
Gold
Measured - - - - - - - - - - -
Indicated - - - - - - - - - - -
Inferred 1.1 - - - 100 3.2 - - - 3.6 0.1
Sub-total 1.1 - - - 100 3.2 - - - 3.6 0.1
Total Mineral Resources 1,157.3 702.0 96.9 38.7 0.9
Ore Reserves43
Primary Zinc
Proved 1.2 12.5 0.4 1.5 73 1.6 148.2 4.7 17.6 2.8 0.1
Probable 0.9 11.0 0.4 1.7 95 2.0 101.2 3.2 15.5 2.8 0.1
Sub-total 2.1 11.8 0.4 1.6 82 1.7 249.4 8.0 33.1 5.6 0.1
Primary Copper
Proved 2.6 0.4 3.5 0.0 18 0.4 11.5 90.0 0.5 1.5 0.0
Probable 1.0 0.4 3.2 0.1 21 0.5 4.2 33.4 0.6 0.7 0.0
Sub-total 3.6 0.4 3.4 0.0 19 0.5 15.7 123.4 1.1 2.2 0.1
Total Ore Reserves 265.1 131.3 34.1 7.8 0.2
Source: MMG
41 Significant figures do not imply precision. Figures are rounded according to JORC Code Guidelines. Includes 100% of all mineral
resources, which include ore reserves. “oz” refers to troy ounces, which equal to 31.1035 grams per ounce. 42 Mineral resources have been estimated using a cut-off grade based on the Nett Smelter Return value of US$70 per tonne. 43 Ore reserves have been estimated using a cut off grade based on Nett Smelter Return values ranging from US$100/t to US$110/t,
using a copper price of US$2.00 per pound, zinc price of US$0.90 per pound, lead price of US$0.70 per pound, silver price of US$11/oz, gold price of US$750/oz and a 0.75 exchange rate.
— V-37 —

APPENDIX V VALUATION REPORT
32
Expansion and Exploration
Golden Grove reserves support mining operations at current rates of production until approximately 2012. However, there is considerable potential to extend mining operations, both through mining underground resources and other mineralisation not currently in reserves, and through potential open pit mining of gold, copper and zinc mineralisation. In addition, the area around the Golden Grove operations remains prospective for further discoveries. Exploration at Golden Grove was suspended in late 2008 due to capital constraints but drilling recommenced at Gossan Hill and Scuddles in October 2009 and at Gossan Valley, located eight to 10 kilometres south of the Golden Grove operations, in the March 2010 quarter. At Gossan Hill, underground exploration has been promising, including at Xantho Deeps, at Amity and between Gossan Deeps and Hougoumont. At Scuddles, exploration is continuing and an update to resources is expected soon. Ore from Scuddles is expected to contribute to production when the Gossan Hill mine depletes. At Gossan Valley, MMG has had a number of promising results. The location of the various expansion opportunities are identified in the following long section of the Golden Grove mineral deposits:
A Zinc
B ZincC Zinc
GG4 Copper
d Oxide Copper
C Copper
Base of oxidation
Surface
Fault
B Nth Zinc
Amity
Xantho
Catalpa
Ethel
Amity Gold
Hougoumont Zinc
Cat
alpa
Faul
t
D Zinc
Hougoumont Copper
Catalpa Gold
Cambewarra
Upper Ethel Copper
Xantho Extended
Oxide gold Surface
GOSSAN HILLLONGITUDINAL VIEW
North
Source: MMG Construction of a new tailings storage facility started in late 2009 and is expected to be completed in September 2010. MMG estimates capital costs at US$24 million. In May 2010, MMG started a feasibility study contemplating the development of an open pit operation to exploit the oxide and the supergene copper resource found above the Gossan Hill underground operation. Treatment of the oxide copper would require some modifications to the current treatment process to allow flotation of the oxide ore. MMG expects total production of 240,000 tonnes of copper concentrate grading 25% copper from 2011 to 2014. The project is tabled for board approval in late 2010. Mining of the copper pit might also allow the subsequent recovery of zinc ore-bearing pillar remnants from the top of the underground mining operation.
— V-38 —
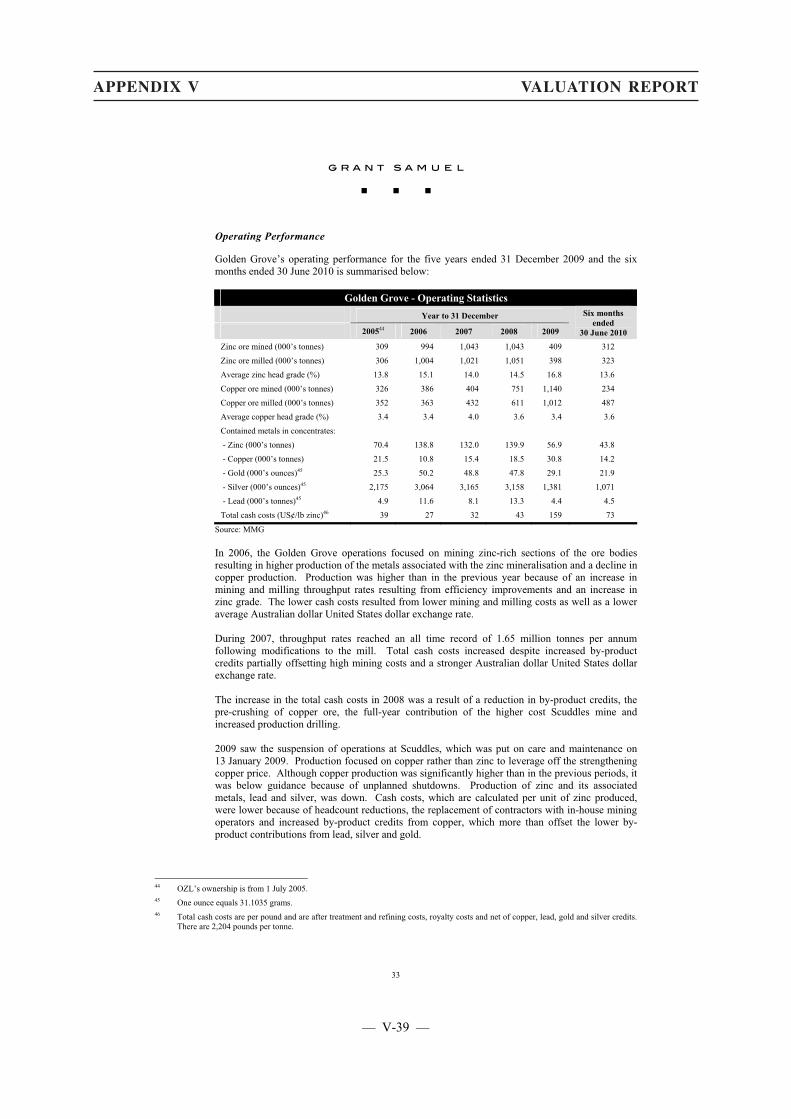
APPENDIX V VALUATION REPORT
33
Operating Performance
Golden Grove’s operating performance for the five years ended 31 December 2009 and the six months ended 30 June 2010 is summarised below:
Golden Grove - Operating Statistics
Year to 31 December
200544 2006 2007 2008 2009
Six months ended
30 June 2010 Zinc ore mined (000’s tonnes) 309 994 1,043 1,043 409 312
Zinc ore milled (000’s tonnes) 306 1,004 1,021 1,051 398 323
Average zinc head grade (%) 13.8 15.1 14.0 14.5 16.8 13.6
Copper ore mined (000’s tonnes) 326 386 404 751 1,140 234
Copper ore milled (000’s tonnes) 352 363 432 611 1,012 487
Average copper head grade (%) 3.4 3.4 4.0 3.6 3.4 3.6
Contained metals in concentrates:
- Zinc (000’s tonnes) 70.4 138.8 132.0 139.9 56.9 43.8
- Copper (000’s tonnes) 21.5 10.8 15.4 18.5 30.8 14.2
- Gold (000’s ounces)45 25.3 50.2 48.8 47.8 29.1 21.9
- Silver (000’s ounces)45 2,175 3,064 3,165 3,158 1,381 1,071
- Lead (000’s tonnes)45 4.9 11.6 8.1 13.3 4.4 4.5
Total cash costs (US¢/lb zinc)46 39 27 32 43 159 73
Source: MMG In 2006, the Golden Grove operations focused on mining zinc-rich sections of the ore bodies resulting in higher production of the metals associated with the zinc mineralisation and a decline in copper production. Production was higher than in the previous year because of an increase in mining and milling throughput rates resulting from efficiency improvements and an increase in zinc grade. The lower cash costs resulted from lower mining and milling costs as well as a lower average Australian dollar United States dollar exchange rate. During 2007, throughput rates reached an all time record of 1.65 million tonnes per annum following modifications to the mill. Total cash costs increased despite increased by-product credits partially offsetting high mining costs and a stronger Australian dollar United States dollar exchange rate. The increase in the total cash costs in 2008 was a result of a reduction in by-product credits, the pre-crushing of copper ore, the full-year contribution of the higher cost Scuddles mine and increased production drilling. 2009 saw the suspension of operations at Scuddles, which was put on care and maintenance on 13 January 2009. Production focused on copper rather than zinc to leverage off the strengthening copper price. Although copper production was significantly higher than in the previous periods, it was below guidance because of unplanned shutdowns. Production of zinc and its associated metals, lead and silver, was down. Cash costs, which are calculated per unit of zinc produced, were lower because of headcount reductions, the replacement of contractors with in-house mining operators and increased by-product credits from copper, which more than offset the lower by-product contributions from lead, silver and gold.
44 OZL’s ownership is from 1 July 2005. 45 One ounce equals 31.1035 grams. 46 Total cash costs are per pound and are after treatment and refining costs, royalty costs and net of copper, lead, gold and silver credits.
There are 2,204 pounds per tonne.
— V-39 —
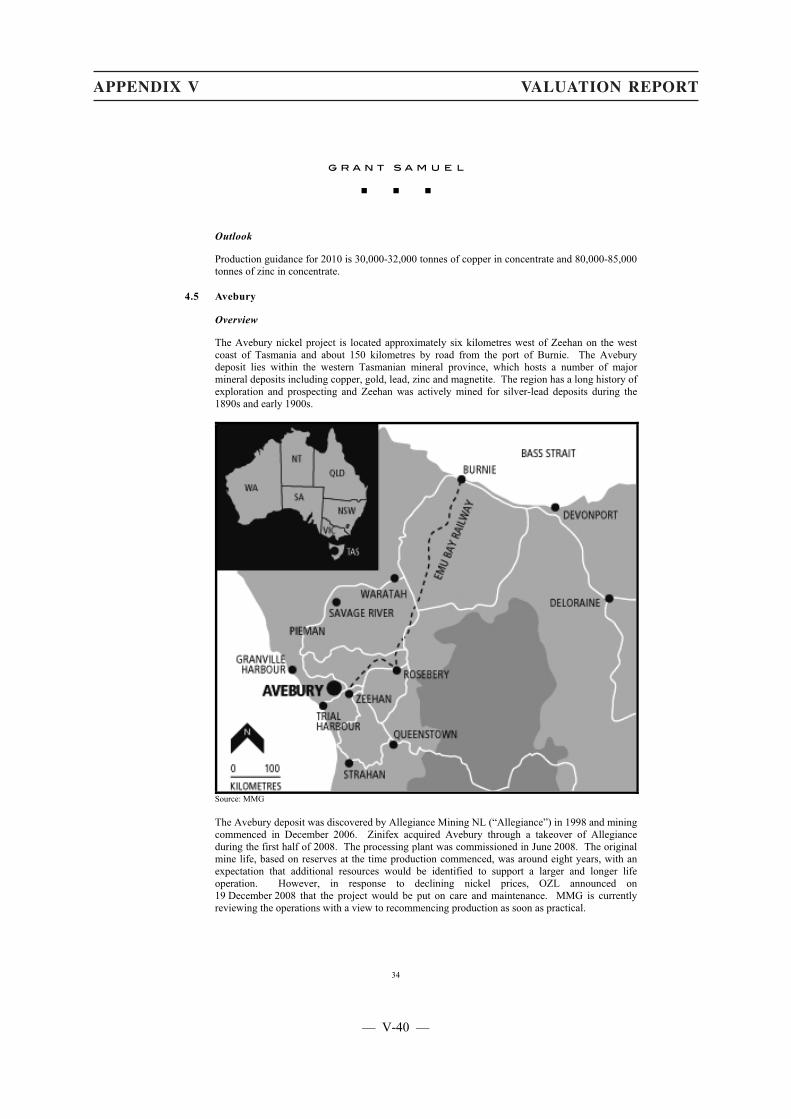
APPENDIX V VALUATION REPORT
34
Outlook
Production guidance for 2010 is 30,000-32,000 tonnes of copper in concentrate and 80,000-85,000 tonnes of zinc in concentrate.
4.5 Avebury
Overview
The Avebury nickel project is located approximately six kilometres west of Zeehan on the west coast of Tasmania and about 150 kilometres by road from the port of Burnie. The Avebury deposit lies within the western Tasmanian mineral province, which hosts a number of major mineral deposits including copper, gold, lead, zinc and magnetite. The region has a long history of exploration and prospecting and Zeehan was actively mined for silver-lead deposits during the 1890s and early 1900s.
Source: MMG The Avebury deposit was discovered by Allegiance Mining NL (“Allegiance”) in 1998 and mining commenced in December 2006. Zinifex acquired Avebury through a takeover of Allegiance during the first half of 2008. The processing plant was commissioned in June 2008. The original mine life, based on reserves at the time production commenced, was around eight years, with an expectation that additional resources would be identified to support a larger and longer life operation. However, in response to declining nickel prices, OZL announced on 19 December 2008 that the project would be put on care and maintenance. MMG is currently reviewing the operations with a view to recommencing production as soon as practical.
— V-40 —
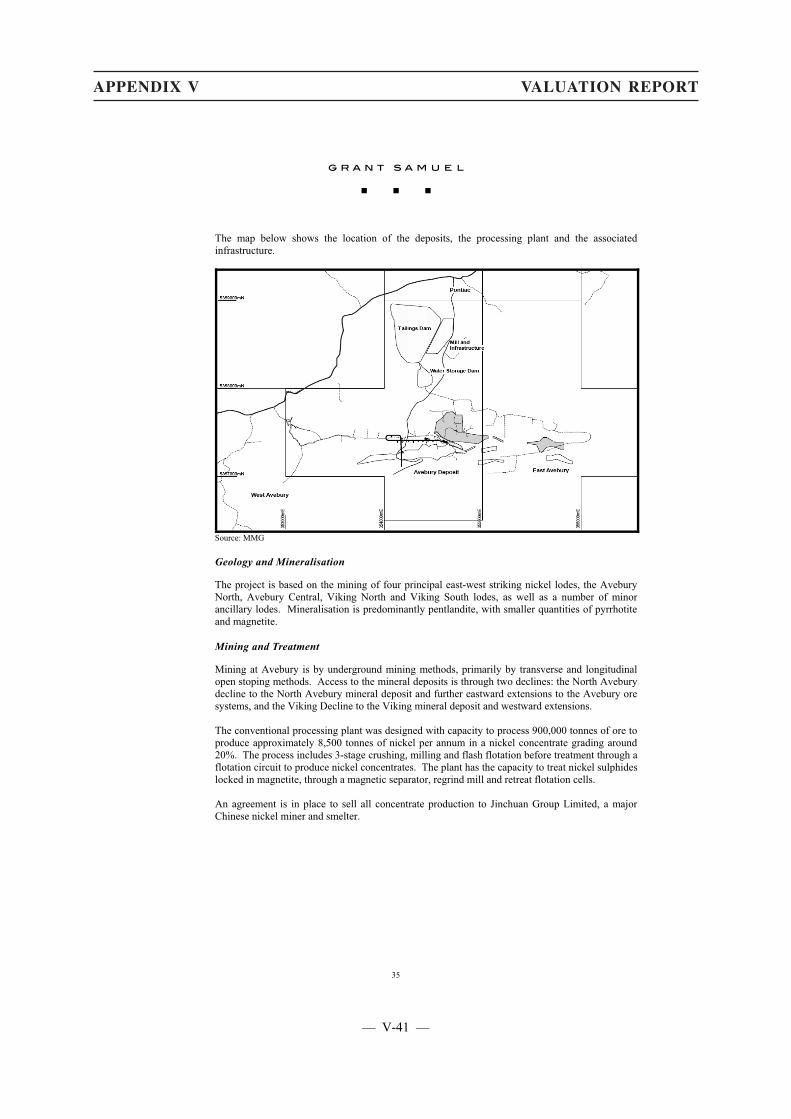
APPENDIX V VALUATION REPORT
35
The map below shows the location of the deposits, the processing plant and the associated infrastructure.
Source: MMG Geology and Mineralisation
The project is based on the mining of four principal east-west striking nickel lodes, the Avebury North, Avebury Central, Viking North and Viking South lodes, as well as a number of minor ancillary lodes. Mineralisation is predominantly pentlandite, with smaller quantities of pyrrhotite and magnetite. Mining and Treatment
Mining at Avebury is by underground mining methods, primarily by transverse and longitudinal open stoping methods. Access to the mineral deposits is through two declines: the North Avebury decline to the North Avebury mineral deposit and further eastward extensions to the Avebury ore systems, and the Viking Decline to the Viking mineral deposit and westward extensions. The conventional processing plant was designed with capacity to process 900,000 tonnes of ore to produce approximately 8,500 tonnes of nickel per annum in a nickel concentrate grading around 20%. The process includes 3-stage crushing, milling and flash flotation before treatment through a flotation circuit to produce nickel concentrates. The plant has the capacity to treat nickel sulphides locked in magnetite, through a magnetic separator, regrind mill and retreat flotation cells. An agreement is in place to sell all concentrate production to Jinchuan Group Limited, a major Chinese nickel miner and smelter.
— V-41 —

APPENDIX V VALUATION REPORT
36
Resources
Avebury mineral resources as at 30 June 2009 are summarised as follows:
Avebury – Mineral Resources as at 30 June 200947
Tonnage (Mt)
Nickel (%)
Nickel (000’s t)
Mineral Resources48 Measured 3.4 1.1 37.9 Indicated 4.7 1.0 44.4 Inferred 14.0 0.9 131.3 Total Mineral Resources 22.0 1.0 213.5
Source: MMG MMG is undertaking further drilling at Viking and Avebury East to delineate additional resources with a view to extending the life and increasing the value of the operation. Operating Performance
The Avebury processing plant was commissioned in June 2008 and the first nickel concentrate was produced in mid-July. Ramp up was ahead of schedule and the operations had reached a throughput rate of approximately 800,000 tonnes per annum by the time it was put on care and maintenance in December 2008 in response to declining nickel prices. Below is a summary of the operating performance of Avebury for the six months it was in operation:
Avebury – Operating Statistics
Quarter to
30 September 2008
Quarter to 31 December
2008
Year to 31 December
2008
Ore milled (000’s tonnes) 135.0 202.0 336.5 Nickel head grade (%) 1.0 0.9 0.9 Nickel recovery (%) 62.5 68.5 68.6 Nickel concentrate (000’s tonnes) 4.8 7.0 11.8 Concentrate grade (% nickel) 17.0 16.1 16.7 Contained nickel (000’s tonnes) 0.9 1.1 2.1 Total cash costs (US$/lb nickel)49 11.0 7.1 9.9
Source: MMG Outlook
The operation had not reached full capacity when it was put on care and maintenance and it is therefore not fully understood. In particular, the presence of higher than expected levels of arsenic in parts of the ore body can result in arsenic grades in the concentrate that exceed customer specifications. The configuration of the mine does not allow for selective mining or blending of high arsenic ores with low arsenic ores. A number of alternative options are currently under review. The operation will require the construction of a backfill plant and the development of a second tailings storage facility to add to the existing facility’s three year capacity. MMG believes that Avebury has the potential to operate at its nameplate capacity of 900,000 tonnes per annum
47 Significant figures do not imply precision. Figures are rounded according to JORC Code Guidelines. Includes 100% of all resources,
which include reserves. 48 Resources have been estimated using a cut-off grade of 0.7% nickel. 49 Total cash costs are per pound and are after treatment and refining costs, royalty costs and net of copper, lead, gold and silver credits.
There are 2,204 pounds per tonne.
— V-42 —
APPENDIX V VALUATION REPORT
37
and to become a profitable mine. MMG expects that once the arsenic issue has been resolved the operations could be re-started and reach production capacity within three months.
4.6 Projects and Exploration
4.6.1 Dugald River
Overview
The Dugald River project in based on one of the world’s largest known undeveloped lead-zinc-silver deposits. It is located in north-west Queensland, approximately 65 kilometres north-west of Cloncurry. The project is located close to power, water and transport infrastructure. Pasminco acquired the Dugald River project, together with the Century mine, from CRA in 1997. The project formed part of the assets acquired by Zinifex when it listed in 2004. The Dugald River deposit was discovered in the 1870s. Notwithstanding the size and attractive zinc grades of the deposit, it was not developed by previous owners because of marginal project economics and elevated manganese content that made the Dugald River zinc concentrates unattractive to zinc smelters at the time. Growth in the smelting industry, technological changes and the increase in zinc prices from late 2005 prompted OZL to conduct a pre-feasibility study, which was completed in December 2006. A feasibility study followed and was completed in December 2008. Since then, MMG has completed documentation and the environmental impact statement has been reactivated with the aim to submit permit approval in 2010. The mining lease portfolio is under review. MMG expects to seek board approval for the project in late 2010. Mining and Processing
The feasibility study concluded that a two million tonnes per annum underground mine with a mine life of over 20 years was optimal. Given the narrow, steeply dipping nature of the ore body, mining would be by conventional underground mining methods. High metal recovery rates could be achieved with standard crushing, grinding and flotation processing (although a relatively fine grind will be required). Annual average production of more than 200,000 tonnes of zinc, 25,000 tonnes of lead and one million ounces of silver in concentrate is contemplated. Dugald River has the potential to replace up to 40% of Century’s zinc production when Century operations cease. The presence of high grade ore will allow MMG to mine high grade zones selectively if required. The project has good access to infrastructure, with a sealed two-lane highway only 10 kilometres to the east of the site and power and water readily available. Zinc concentrates would be transported approximately 100 kilometres to BHP’s rail facility at Yurbi and then railed to Townsville. It is currently contemplated that Dugald River would be a fly-in/fly-out operation through Cloncurry airport. It is estimated that development and commissioning would take approximately three years from commencement of the project, allowing commercial production to commence in 2014. Initial capital costs are expected to be approximately US$790 million and average C1 cash costs are estimated at around US$0.65 per pound of zinc.
— V-43 —
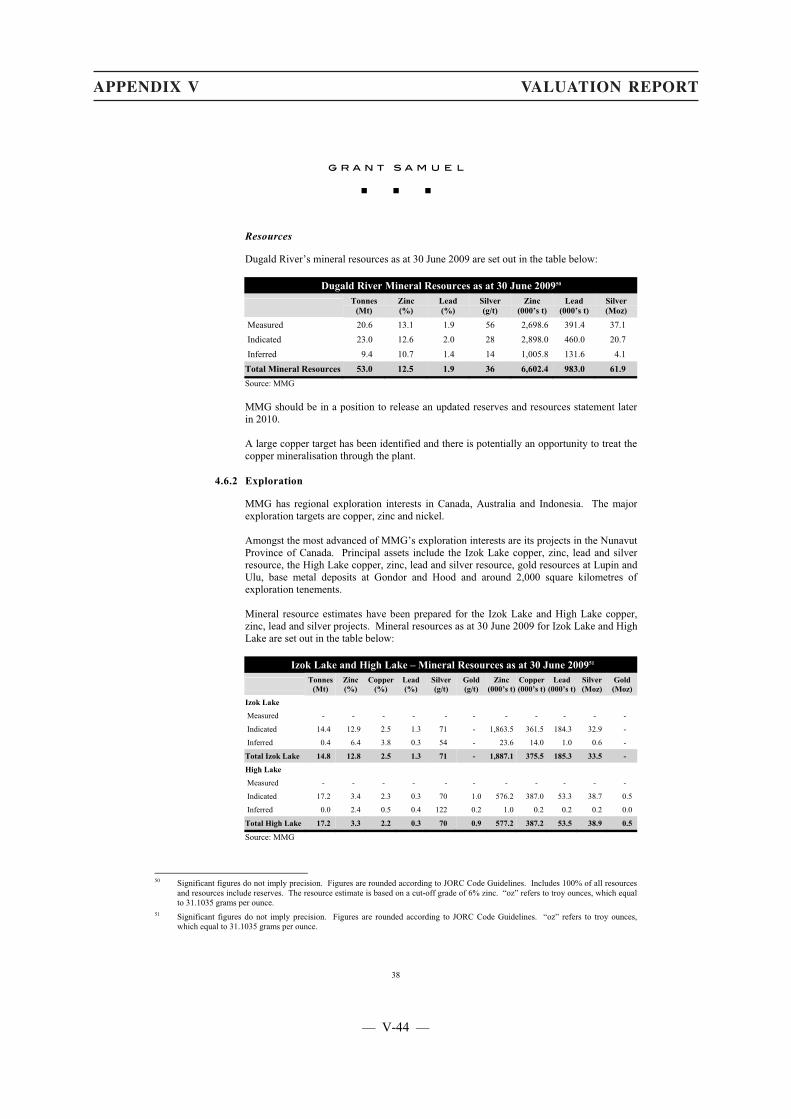
APPENDIX V VALUATION REPORT
38
Resources
Dugald River’s mineral resources as at 30 June 2009 are set out in the table below:
Dugald River Mineral Resources as at 30 June 200950
Tonnes(Mt)
Zinc (%)
Lead (%)
Silver (g/t)
Zinc (000’s t)
Lead (000’s t)
Silver (Moz)
Measured 20.6 13.1 1.9 56 2,698.6 391.4 37.1 Indicated 23.0 12.6 2.0 28 2,898.0 460.0 20.7 Inferred 9.4 10.7 1.4 14 1,005.8 131.6 4.1 Total Mineral Resources 53.0 12.5 1.9 36 6,602.4 983.0 61.9 Source: MMG MMG should be in a position to release an updated reserves and resources statement later in 2010. A large copper target has been identified and there is potentially an opportunity to treat the copper mineralisation through the plant.
4.6.2 Exploration
MMG has regional exploration interests in Canada, Australia and Indonesia. The major exploration targets are copper, zinc and nickel. Amongst the most advanced of MMG’s exploration interests are its projects in the Nunavut Province of Canada. Principal assets include the Izok Lake copper, zinc, lead and silver resource, the High Lake copper, zinc, lead and silver resource, gold resources at Lupin and Ulu, base metal deposits at Gondor and Hood and around 2,000 square kilometres of exploration tenements. Mineral resource estimates have been prepared for the Izok Lake and High Lake copper, zinc, lead and silver projects. Mineral resources as at 30 June 2009 for Izok Lake and High Lake are set out in the table below:
Izok Lake and High Lake – Mineral Resources as at 30 June 200951
Tonnes (Mt)
Zinc (%)
Copper (%)
Lead (%)
Silver (g/t)
Gold (g/t)
Zinc (000’s t)
Copper (000’s t)
Lead (000’s t)
Silver (Moz)
Gold (Moz)
Izok Lake
Measured - - - - - - - - - - -
Indicated 14.4 12.9 2.5 1.3 71 - 1,863.5 361.5 184.3 32.9 -
Inferred 0.4 6.4 3.8 0.3 54 - 23.6 14.0 1.0 0.6 -
Total Izok Lake 14.8 12.8 2.5 1.3 71 - 1,887.1 375.5 185.3 33.5 -
High Lake
Measured - - - - - - - - - - -
Indicated 17.2 3.4 2.3 0.3 70 1.0 576.2 387.0 53.3 38.7 0.5
Inferred 0.0 2.4 0.5 0.4 122 0.2 1.0 0.2 0.2 0.2 0.0
Total High Lake 17.2 3.3 2.2 0.3 70 0.9 577.2 387.2 53.5 38.9 0.5
Source: MMG
50 Significant figures do not imply precision. Figures are rounded according to JORC Code Guidelines. Includes 100% of all resources
and resources include reserves. The resource estimate is based on a cut-off grade of 6% zinc. “oz” refers to troy ounces, which equal to 31.1035 grams per ounce.
51 Significant figures do not imply precision. Figures are rounded according to JORC Code Guidelines. “oz” refers to troy ounces, which equal to 31.1035 grams per ounce.
— V-44 —

APPENDIX V VALUATION REPORT
39
Their remote location (Izok Lake is approximately 360 kilometres north of Yellowknife and High Lake is approximately 190 kilometres further north), the Arctic environment and the limited infrastructure in place mean that substantial capital expenditure would be required for their development. A concept study on Izok Lake was completed in 2009 and a pre-feasibility study is currently underway and is expected to be completed late 2010. The Lupin underground gold mine has been on care and maintenance since 2005. If further mineralisation is delineated there would be potential to reopen the mine. The Ulu gold project, for which underground development is in place, contains a modest resource with upside potential. Mineralisation from Ulu could potentially be treated at Lupin. More detail regarding MMG’s exploration interests are set out in the detailed report of AMC.
— V-45 —
APPENDIX V VALUATION REPORT
40
5 Valuation Methodology
5.1 Overview
Grant Samuel’s Chapter 18 Valuation of MMG has been assessed by aggregating calculated values for MMG’s Mineral Assets and adjusting for net debt and other assets and liabilities. Grant Samuel’s assessment of MMG’s Mineral Assets has been determined having regard to parameters outlined in Chapter 18 of the Listing Rules. In particular, Listing Rule 18.34 states that:
� any valuation of Mineral Assets must be prepared under the VALMIN Code52, SAMVAL Code53, CIMVAL54 or such other code approved by the Exchange from time to time;
� the basis of the valuation, relevant assumptions and the reason why a particular method of valuation is considered most appropriate having regard to the nature of the valuation and the development status of the asset must be clearly stated; and
� if more than one valuation method is used and different valuations result, how the valuations compare and the reason for selecting the value adopted must be explained.
Grant Samuel has concluded on the basis of Listing Rule 18.30(3) that its Chapter 18 Valuation of MMG can only take into account the estimated value of measured and indicated resources that are considered to be economically extractable, which will generally mean that the Chapter 18 Valuation will be limited to an estimate of the value of reserves (i.e. that portion of measured and indicated resources that has been demonstrated to be economic). Of particular significance, Listing Rule 18.30(3) states that valuations for inferred resources are not permitted. Market based valuations of resources assets (i.e. both valuations that attempt to estimate fair market value and market participants’ assessment of value as reflected in transaction prices) generally take into account, where appropriate, measured, indicated and inferred resources, the potential for exploitation of additional mineralisation not yet classified as resources, and broader exploration prospectivity. The exclusion of these sources of potential value from the Chapter 18 Valuation means that the Chapter 18 Valuation does not reflect a market value: it does not represent an estimate of the value that might be realised through an arm’s length transaction. Rather, the Chapter 18 Valuation is essentially an estimate of the value notionally attributable to reserves only. The quantum of the difference between fair market values and values estimated for the purposes of a Chapter 18 Valuation will depend on the nature of individual resources assets. For some assets, particularly those that are well understood and towards the end of their economic lives, it is likely that there will be limited opportunities to exploit mineralisation beyond current reserves. For such assets, the difference between market value and values estimated for the purposes of a Chapter 18 Valuation may be immaterial. However, for other assets (such as resources projects in the early stages of their development or mines where it is impractical or uneconomic to prove up significant reserves in advance of mining, but where the orebody being mined is such as to provide reasonable grounds to expect that mining will continue for years into the future) the difference between estimates of market value and estimates of value for the purpose of a Chapter 18 Valuation could be substantial.
52 VALMIN Code represents the Code for the Technical Assessment and Valuation of Mineral and Petroleum Assets and Securities for
Independent Expert Reports (2005 edition), as prepared by the VALMIN Committee, a joint committee of The Australasian Institute of Mining and Metallurgy, the Australian Institute of Geoscientists and the Mineral Industry Consultants Association as amended from time to time.
53 SAMVAL Code represents the South African Code for the Reporting of Mineral Asset Valuation (2008 edition) as amended from time to time.
54 CIMVAL represents the Standards and Guidelines for Valuation of Mineral Properties endorsed by the Canadian Institute of Mining, Metallurgy and Petroleum, February 2003 (final version) as amended from time to time.
— V-46 —
APPENDIX V VALUATION REPORT
41
There are four primary methodologies commonly used for valuing operating businesses:
� capitalisation of earnings or cash flow;
� discounting projected cash flows;
� industry rules of thumb; and
� estimation of the aggregate proceeds from an orderly realisation of assets. Each of these valuation methodologies has application in different circumstances. The primary factor in determining which methodology is appropriate is normally the actual practice adopted by purchasers of the type of businesses and assets involved. However, given that a Chapter 18 Valuation does not seek to replicate a market based valuation, this approach to determining which methodology to adopt is not necessarily helpful. Grant Samuel has adopted the discounted cash flow (“DCF”) methodology for the purpose of its Chapter 18 Valuation. The DCF methodology is widely used in the valuation of resources assets. More importantly, in the context of the requirements for a Chapter 18 Valuation, it allows for the preparation of an estimate of value that only takes into account specified mineralisation (i.e. reserves plus that portion of measured and indicated resources that are economically extractable). The discounted cash flow methodology involves the calculation of net present values by discounting expected future cash flows. Projected cash flows are discounted to a present value using discount rates that take into account the time value of money and risks associated with the cash flows. The discounted cash flow methodology is particularly appropriate for assets such as mineral assets where reserves are depleted over time and where significant capital expenditure is required. It is the primary method of valuation in the mining industry. Grant Samuel developed cash flow models for each of the key Mineral Assets of MMG. The financial models were developed by Grant Samuel on the basis of operating models developed by AMC based on life of mine plans provided by MMG. The operating models developed by AMC had regard only to that portion of measured and indicated resources that has been demonstrated to be economically extractable, which generally corresponded to reserves. AMC reviewed each of the technical assumptions in the operating models, including those regarding reserve estimates, production profiles, operating costs and capital costs. Grant Samuel determined the economic and financial assumptions used in the cash flow models. The net present value of each mineral asset has been calculated on an ungeared after tax basis as at 1 July 2010. Alternative valuation methodologies, such as reserve and resource multiples of comparable companies and comparable transactions, have not been considered as secondary evidence of value. Alternative valuation methodologies typically attribute value to measured and indicated resources that have not yet been proven economic, to inferred resources and to the opportunity for addition mineralisation such as exploration potential. There is no way of determining the value attributable solely to reserves through these valuation methodologies. The valuations of the Mineral Assets represent Grant Samuel’s overall judgements as to value given the parameters of Chapter 18 of the Listing Rules. They do not rely on any one particular set of economic assumptions. The valuations have been determined having regard to the sensitivity of DCF analysis to a range of economic assumptions. The valuations incorporate Grant Samuel’s judgemental assessment of the impact on value of factors such as location (and therefore exposure to sovereign risk). For the avoidance of any doubt, the Chapter 18 Valuation of MMG does not represent Grant Samuel’s assessment of the market value of the company. It effectively represents an estimate of the value that is notionally attributable to reserves only. Estimates of value determined on this basis are essentially theoretical. Such estimates of value could vary, potentially materially, from fair market value.
— V-47 —
APPENDIX V VALUATION REPORT
42
The valuations are based on a number of important assumptions, including assumptions regarding future metal prices and the A$:US$ exchange rate. The valuations reflect the technical judgements of AMC regarding the prospects for each of MMG’s operations. Metal prices, exchange rates and expectations regarding future operating parameters can change significantly over short periods of time. Such changes can have significant impacts on calculated value. Accordingly, while the values estimated are believed to be appropriate for the purpose of a Chapter 18 Valuation, they may not be appropriate for other purposes or in the context of changed economic circumstances or different operational prospects for the mining assets of MMG.
5.2 Valuation Assumptions
The valuations of the key Mineral Assets of MMG have been determined by reference to DCF valuation analysis. This analysis involves making a number of general assumptions regarding future commodity prices, economic factors and discount rates. The NPV valuations for each of the Mineral Assets are sensitive to the assumptions used in the analysis. Relatively small changes in certain variables can cause significant changes in value. For this reason, NPV valuations should be treated with caution. The key assumptions are:
� historical commodity prices and exchange rates from 1 July 2010 to 31 October 2010;
� long run real zinc prices in the range US$0.80-1.00 per pound;
� long run real copper prices in the range US$2.25-2.75 per pound;
� long run real lead prices in the range US$0.60-0.80 per pound;
� real gold prices of US$1,350 per ounce and real silver prices of US$24.00 per ounce, based on gold and silver prices prevailing around 31 October 2010;
� an exchange rate of A$1.00=US$0.98 declining in line with forward market estimates;
� long run inflation rates of 2.5% per annum for both Australia and the United States;
� nominal discount rates for the discounted cash flow valuations in the range 8.5-10.5%. The discount rates represent estimates of the costs of capital for investors in resources projects derived both in world markets and in the Australian market. The rates are estimates of weighted average costs of capital and have been applied to expected future ungeared after-tax cash flows. The basis for the selection of the rates is set out in Appendix 1; and
� tax depreciation schedules determined on the basis of tax written down values for various asset categories. Accumulated carry forward expenditures that are deductible for tax purposes have been allowed for in the financial models.
— V-48 —
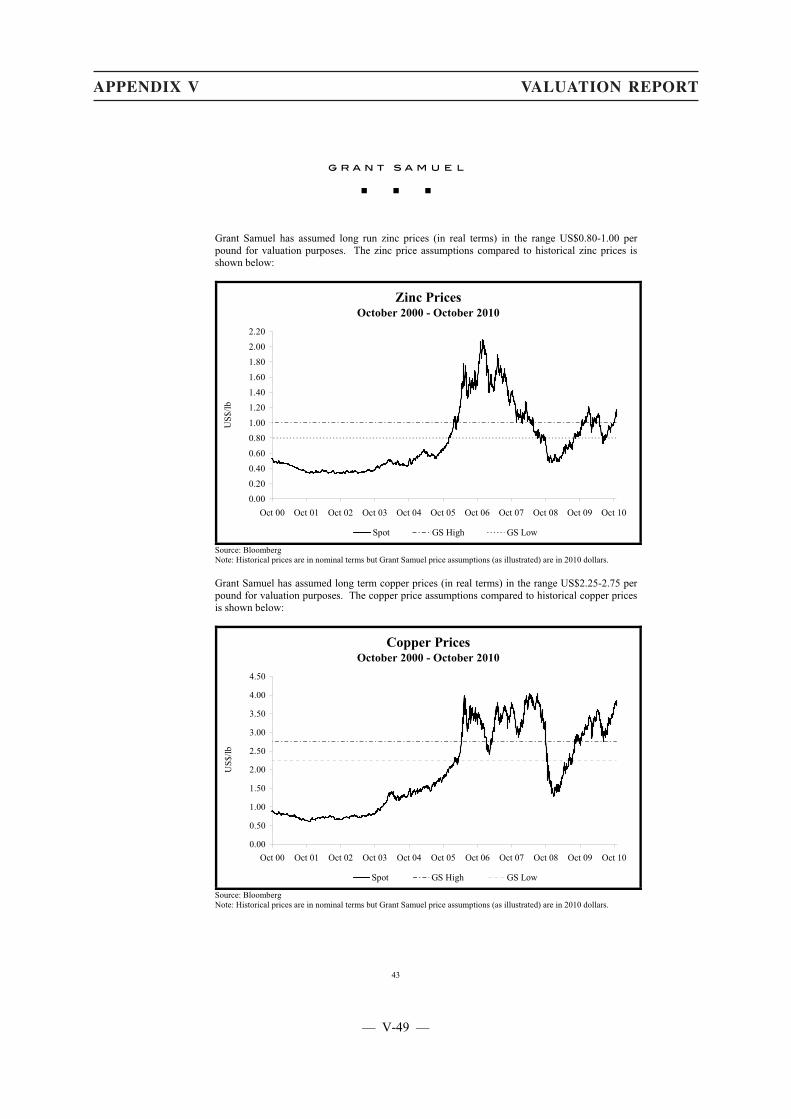
APPENDIX V VALUATION REPORT
43
Grant Samuel has assumed long run zinc prices (in real terms) in the range US$0.80-1.00 per pound for valuation purposes. The zinc price assumptions compared to historical zinc prices is shown below:
Zinc PricesOctober 2000 - October 2010
0.000.200.400.60
0.801.00
1.201.40
1.601.802.002.20
Oct 00 Oct 01 Oct 02 Oct 03 Oct 04 Oct 05 Oct 06 Oct 07 Oct 08 Oct 09 Oct 10
US$
/lb
Spot GS High GS Low
Source: Bloomberg Note: Historical prices are in nominal terms but Grant Samuel price assumptions (as illustrated) are in 2010 dollars. Grant Samuel has assumed long term copper prices (in real terms) in the range US$2.25-2.75 per pound for valuation purposes. The copper price assumptions compared to historical copper prices is shown below:
Copper PricesOctober 2000 - October 2010
0.00
0.50
1.00
1.50
2.00
2.50
3.00
3.50
4.00
4.50
Oct 00 Oct 01 Oct 02 Oct 03 Oct 04 Oct 05 Oct 06 Oct 07 Oct 08 Oct 09 Oct 10
US$
/lb
Spot GS High GS Low
Source: Bloomberg Note: Historical prices are in nominal terms but Grant Samuel price assumptions (as illustrated) are in 2010 dollars.
— V-49 —
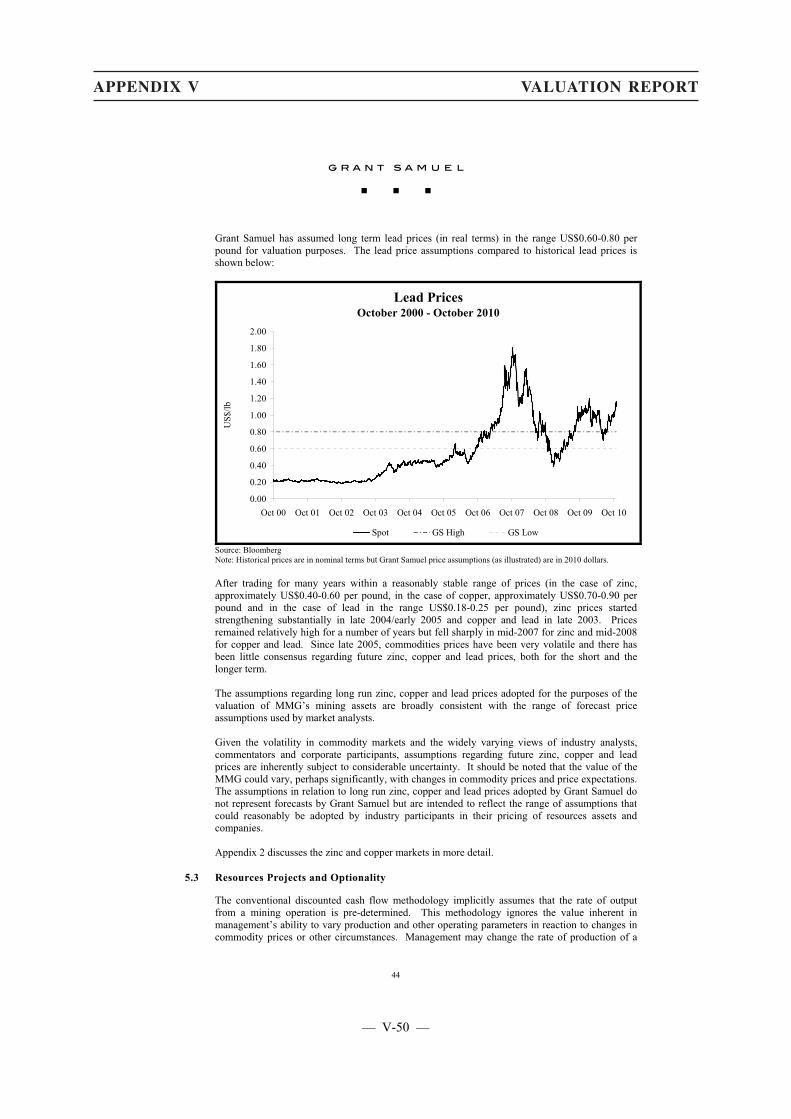
APPENDIX V VALUATION REPORT
44
Grant Samuel has assumed long term lead prices (in real terms) in the range US$0.60-0.80 per pound for valuation purposes. The lead price assumptions compared to historical lead prices is shown below:
Lead PricesOctober 2000 - October 2010
0.00
0.20
0.40
0.60
0.80
1.00
1.20
1.40
1.60
1.80
2.00
Oct 00 Oct 01 Oct 02 Oct 03 Oct 04 Oct 05 Oct 06 Oct 07 Oct 08 Oct 09 Oct 10
US$
/lb
Spot GS High GS Low
Source: Bloomberg Note: Historical prices are in nominal terms but Grant Samuel price assumptions (as illustrated) are in 2010 dollars. After trading for many years within a reasonably stable range of prices (in the case of zinc, approximately US$0.40-0.60 per pound, in the case of copper, approximately US$0.70-0.90 per pound and in the case of lead in the range US$0.18-0.25 per pound), zinc prices started strengthening substantially in late 2004/early 2005 and copper and lead in late 2003. Prices remained relatively high for a number of years but fell sharply in mid-2007 for zinc and mid-2008 for copper and lead. Since late 2005, commodities prices have been very volatile and there has been little consensus regarding future zinc, copper and lead prices, both for the short and the longer term. The assumptions regarding long run zinc, copper and lead prices adopted for the purposes of the valuation of MMG’s mining assets are broadly consistent with the range of forecast price assumptions used by market analysts. Given the volatility in commodity markets and the widely varying views of industry analysts, commentators and corporate participants, assumptions regarding future zinc, copper and lead prices are inherently subject to considerable uncertainty. It should be noted that the value of the MMG could vary, perhaps significantly, with changes in commodity prices and price expectations. The assumptions in relation to long run zinc, copper and lead prices adopted by Grant Samuel do not represent forecasts by Grant Samuel but are intended to reflect the range of assumptions that could reasonably be adopted by industry participants in their pricing of resources assets and companies. Appendix 2 discusses the zinc and copper markets in more detail.
5.3 Resources Projects and Optionality
The conventional discounted cash flow methodology implicitly assumes that the rate of output from a mining operation is pre-determined. This methodology ignores the value inherent in management’s ability to vary production and other operating parameters in reaction to changes in commodity prices or other circumstances. Management may change the rate of production of a
— V-50 —
APPENDIX V VALUATION REPORT
45
mine, close or re-open the mine or in certain circumstances even abandon it. Accordingly, a mine may be regarded as an option (or series of options) over the resources it contains. The value of management flexibility is illustrated by the example of a marginal mine, where the marginal cash production cost is equal to expected revenue. Application of the conventional discounted cash flow methodology would result in the estimate of a zero value for the mine. In reality, however, the mine will have some value, because management is able to reduce or cease production if marginal revenue falls below the marginal cash cost of production and to resume or increase production if commodity prices rise. Similarly, the designs and long term development alternatives for many mines allow management to change operating plans in the light of future commodity prices and operating costs. Life of mine plans frequently involve mining marginal ore, making additional cut backs or making other operational decisions at some point in the future. However, management is commonly not required to commit to such decisions at the commencement of the mining project. Firm commitments are only required much later in the project, at which time management will be able to make decisions on the basis of the commodity prices and other circumstances then prevailing. The mining operations as they relate to (for example) the mining of marginal ore or a final cut back may be thought of as a series of call options exercisable at the marginal mining costs to be incurred at the time. These options represent additional value not captured by the conventional discounted cash flow methodology. An alternative perspective is that management flexibility results in changes in commodity prices having an asymmetric impact on the value of a mining operation. If commodity prices rise unexpectedly, the mine will earn greater revenue (and may be able to mine additional mineralisation not originally scheduled for production). If commodity prices fall unexpectedly, production will be curtailed or, in the worst case, stopped. The mine will not continue, in the long term, to be operated at a cash operating loss. By contrast, deterministic valuation models implicitly assume that there is some possibility of the mine operating on a long term basis at a cash operating loss, in the same way that it implicitly assumes that the mine may earn “super profits” as a result of a persistent increase in commodity prices. Grant Samuel is aware of valuation methodologies that attempt to incorporate the option value associated with management flexibility, using a combination of conventional discounted cash flow analysis and option theory. However, the application of these methodologies is impractical in the context of the complex and unpredictable nature of mining operations. In making judgments on value, Grant Samuel has given general consideration as to the characteristics of the various mining operations and the value of management flexibility or underlying option value implicit in those characteristics. In particular, Grant Samuel has considered the extent to which:
� operations are marginal (i.e. the operations represent or incorporate options “close to the money”); and
� length of mine life or other characteristics give management flexibility over the conduct of mining operations.
The valuation of each project includes a subjective assessment of the real option value inherent in the project.
— V-51 —
APPENDIX V VALUATION REPORT
46
6 Chapter 18 Valuation of MMG
6.1 Summary
For the purposes of the Chapter 18 Valuation, Grant Samuel has valued MMG in the range US$1,533-1,741 million. The Chapter 18 Valuation is summarised below:
MMG – Chapter 18 Valuation Summary (US$ million)
Value Range
Valuation Report Section Reference Low High
Sepon (MMG’s 90% interest) 6.2 918 972 Century 6.3 1,000 1,100 Rosebery 6.4 195 215 Golden Grove 6.5 195 215 Other mineral assets 6.6 - - Other assets 6.7 144 148 Corporate costs 6.8 (150) (140) Enterprise value 2,302 2,510 Net debt 6.9 (769) (769) Chapter 18 Valuation 1,533 1,741
The Chapter 18 Valuation can in effect only reflect the estimated value of the reserves associated with Mineral Assets, adjusted for non mineral assets and liabilities. There are currently no reserves attributable to Avebury, Dugald River or MMG’s exploration assets. Accordingly, no value has been attributed to these assets for the purposes of the Chapter 18 Valuation. MMG’s life of mine plans for, in particular, Rosebery and Golden Grove contemplate the mining of substantial mineralisation beyond current reserves and AMC has concluded that it is reasonable to expect that operations at these mines will continue well beyond the exhaustion of current reserves. However, the valuations set out above are limited to estimates of the value attributable to reserves as at 30 June 2010, estimated by AMC on the basis of reserves stated as at 30 June 2009 adjusted for depletion from subsequent production. As a result, the Chapter 18 Valuation of MMG does not in any way represent an estimate of the market value of MMG. The Mineral Assets for the Chapter 18 Valuation have been valued based on DCF analysis. The production rates and operating and capital costs were reviewed in detail by AMC. The discounted cash flow models project cash flows from 1 July 2010 onwards until the end of the mines’ lives (which are assumed to end with the depletion of current reserves). AMC’s Competent Person’s report containing these assumptions is appended and forms part of the circular.
6.2 Sepon
For the purposes of the Chapter 18 Valuation, Grant Samuel has valued 100% of the Sepon copper and gold reserves in the range US$1,020-1,080 million. On this basis, MMG’s 90% interest in Sepon’s copper and gold reserves is valued in the range US$918-972 million. Grant Samuel has attributed a value to 100% of the Sepon Copper reserves of US$970-1,020 million and to 100% of the Sepon Gold reserves of US$50-60 million. The Chapter 18 Valuation of Sepon is an overall judgement on value. It takes into account the value of Sepon Copper reserves, which contribute most of the value of Sepon, and the value of the Sepon Gold reserves. The Chapter 18 Valuation also reflects Grant Samuel’s judgemental assessment of the impact on value of sovereign risk associated with Sepon’s location in Laos.
— V-52 —

APPENDIX V VALUATION REPORT
47
6.2.1 Sepon Copper
For the purposes of the Chapter 18 Valuation, Grant Samuel has valued the Sepon Copper reserves in the range US$970-1,020 million. The valuation is based on DCF analysis of the mining operation, on the assumption that only ore reserves are mined. A detailed financial model was developed based on the 30 June 2009 ore reserve depleted for production from July 2009 to June 2010. The analysis incorporates production, capital and operating cost projections developed by AMC using information provided by MMG. The model assumes the milling of 16.9 million tonnes of ore at an average copper grade of 4.0%. It is assumed that, following the completion in 2011 of the expansion of the copper operations, the plant is able to produce 81,000 tonnes of copper per annum. Mining is completed in 2018 but milling operations continue until 2019, with closure costs of US$120 million (in 2010 dollars) incurred in that year. The following table summarises projected production and costs for the Chapter 18 Valuation. The statistics include production for the half year commencing 1 July 2010:
Sepon Copper Chapter 18 Valuation – Model Parameters55
Year to 31 December
Six months ended 31 December
2010 2011 2012 2013 2014 Total life of
mine
Ore milled (000’s tonnes) 760 1,863 1,911 1,935 1,935 16,944 Copper milled grade (%) 5.0 4.6 4.6 4.6 4.6 4.0 Copper production (000’s tonnes) 34 78 80 81 81 617 Total cash costs (US¢/lb copper)56 129 124 135 133 127 133 Capital expenditure (US$ million) 60.6 46.2 25.7 11.0 11.0 304.557
The following table summarises the results of the DCF analysis for the Chapter 18 Valuation:
Sepon Copper Chapter 18 Valuation – DCF Analysis (US$ million)58 Long Term Copper Price Scenario
Discount Rate $2.25 $2.50 $2.75 8.5% 953 1,069 1,182 9.5% 930 1,041 1,148 10.5% 907 1,013 1,116
The table above illustrates the sensitivity of the calculated NPV values to a range of valuation assumptions. Because Sepon is located in Laos, there are arguably sovereign risk issues not associated with mines in first world jurisdictions. In Grant Samuel’s view, however, these sovereign risk issues have only a limited impact on the value of Sepon. In general, mining companies appear to be increasingly willing to develop or acquire projects in locations that would traditionally have been viewed as high risk (and which appear significantly riskier than Laos). In the case of Sepon, MMG has been producing from the Sepon Gold operation
55 Assumes 100% interest. Costs and capital expenditures are in 2010 dollars. 56 After royalties. The copper premium is taken as a credit. “lb” refers to pounds. There are 2,204 pounds per tonne. 57 Includes closure costs. 58 Assumes 100% interest.
— V-53 —
APPENDIX V VALUATION REPORT
48
since 2002 and from the Sepon Copper operation since March 2005. The permitting approvals process and the determination of arrangements between mine operator and government (which are parts of the project development process during which projects can be particularly vulnerable to the incidence of sovereign risk) are long since completed. MMG believes that it enjoys a well-established and productive relationship with the Laos government, under a 50 year agreement59 that sets out the rights and obligations of both parties. The experience of PanAust Limited (“PanAust”) in Laos, where PanAust has successfully developed the Phu Bia gold project and is producing from the significant Phu Kham copper-gold project, also suggests that Laos is a relatively benign environment from a sovereign risk perspective. Based on the DCF analysis for Sepon Copper’s ore reserves and having regard to the matters set out above, Grant Samuel has attributed an overall value of US$970-1,020 million to a 100% interest in Sepon Copper.
6.2.2 Sepon Gold
For the purposes of the Chapter 18 Valuation, Grant Samuel has valued the Sepon Gold reserves in the range US$50-60 million. The valuation is based on DCF analysis of the mining operation, on the assumption that only ore reserves are mined. A detailed financial model was developed based on the 30 June 2009 ore reserve depleted for production from July 2009 to June 2010. The analysis incorporates production, capital and operating cost projections developed by AMC using information provided by MMG. The model assumes the treatment of 1.4 million tonnes of ore grading 1.55g/t for total gold production of around 52,000 ounces at average cash costs of approximately US$266 per ounce. Site administration costs and closure costs relating to the gold operation have not been allocated to Sepon Gold but have been reflected in the cost estimates used for the Sepon Copper financial model. The following table summarises projected production and costs for the Chapter 18 Valuation. Production is assumed to be completed by the end of the 2010 calendar year:
Sepon Gold Chapter 18 Valuation – Model Parameters60
Six months ended 31 December 2010 Total life of mine
Ore milled (000’s tonnes) 1,399 1,399 Gold milled grade (g/t) 1.55 1.55 Gold production (000’s oz)61 52 52 Total cash costs (US$/oz gold)62 266 266 Capital expenditure (US$ million) - -
The following table summarises the results of the DCF analysis for the Chapter 18 Valuation:
59 The agreement is for an initial period of 30 years, which started in 2003, with two 10 year extensions possible. 60 Assumes 100% interest. Costs and capital expenditures are in 2010 dollars. 61 “oz” refers to troy ounces, which equal to 31.1035 grams per ounce. 62 After royalties.
— V-54 —
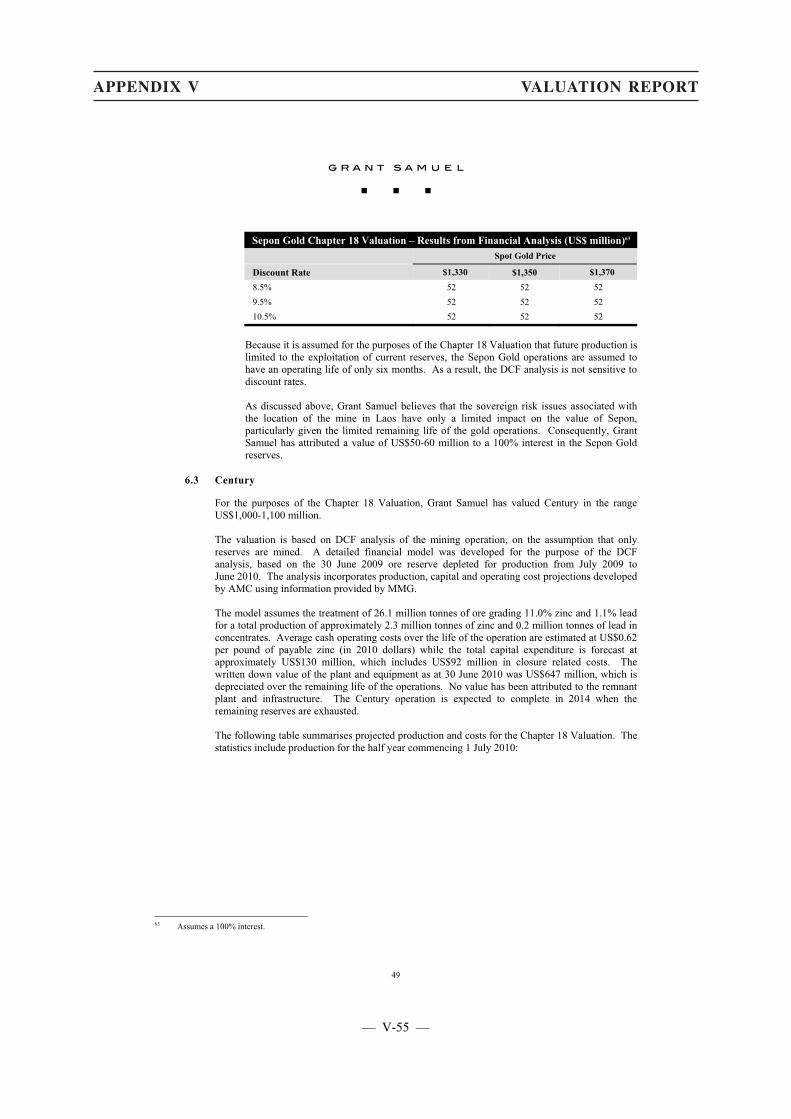
APPENDIX V VALUATION REPORT
49
Sepon Gold Chapter 18 Valuation – Results from Financial Analysis (US$ million)63 Spot Gold Price
Discount Rate $1,330 $1,350 $1,370
8.5% 52 52 52 9.5% 52 52 52 10.5% 52 52 52
Because it is assumed for the purposes of the Chapter 18 Valuation that future production is limited to the exploitation of current reserves, the Sepon Gold operations are assumed to have an operating life of only six months. As a result, the DCF analysis is not sensitive to discount rates. As discussed above, Grant Samuel believes that the sovereign risk issues associated with the location of the mine in Laos have only a limited impact on the value of Sepon, particularly given the limited remaining life of the gold operations. Consequently, Grant Samuel has attributed a value of US$50-60 million to a 100% interest in the Sepon Gold reserves.
6.3 Century
For the purposes of the Chapter 18 Valuation, Grant Samuel has valued Century in the range US$1,000-1,100 million. The valuation is based on DCF analysis of the mining operation, on the assumption that only reserves are mined. A detailed financial model was developed for the purpose of the DCF analysis, based on the 30 June 2009 ore reserve depleted for production from July 2009 to June 2010. The analysis incorporates production, capital and operating cost projections developed by AMC using information provided by MMG. The model assumes the treatment of 26.1 million tonnes of ore grading 11.0% zinc and 1.1% lead for a total production of approximately 2.3 million tonnes of zinc and 0.2 million tonnes of lead in concentrates. Average cash operating costs over the life of the operation are estimated at US$0.62 per pound of payable zinc (in 2010 dollars) while the total capital expenditure is forecast at approximately US$130 million, which includes US$92 million in closure related costs. The written down value of the plant and equipment as at 30 June 2010 was US$647 million, which is depreciated over the remaining life of the operations. No value has been attributed to the remnant plant and infrastructure. The Century operation is expected to complete in 2014 when the remaining reserves are exhausted. The following table summarises projected production and costs for the Chapter 18 Valuation. The statistics include production for the half year commencing 1 July 2010:
63 Assumes a 100% interest.
— V-55 —
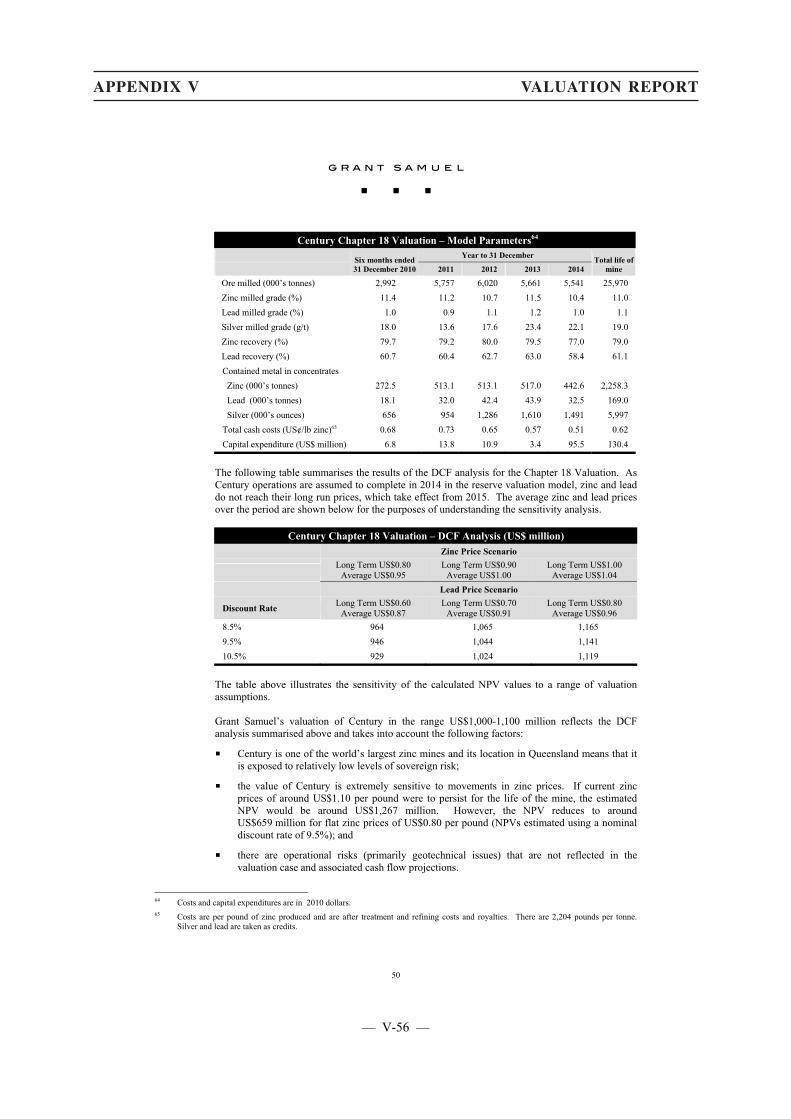
APPENDIX V VALUATION REPORT
50
Century Chapter 18 Valuation – Model Parameters64 Year to 31 December
Six months ended31 December 2010 2011 2012 2013 2014
Total life of mine
Ore milled (000’s tonnes) 2,992 5,757 6,020 5,661 5,541 25,970 Zinc milled grade (%) 11.4 11.2 10.7 11.5 10.4 11.0 Lead milled grade (%) 1.0 0.9 1.1 1.2 1.0 1.1 Silver milled grade (g/t) 18.0 13.6 17.6 23.4 22.1 19.0 Zinc recovery (%) 79.7 79.2 80.0 79.5 77.0 79.0 Lead recovery (%) 60.7 60.4 62.7 63.0 58.4 61.1 Contained metal in concentrates Zinc (000’s tonnes) 272.5 513.1 513.1 517.0 442.6 2,258.3 Lead (000’s tonnes) 18.1 32.0 42.4 43.9 32.5 169.0 Silver (000’s ounces) 656 954 1,286 1,610 1,491 5,997 Total cash costs (US¢/lb zinc)65 0.68 0.73 0.65 0.57 0.51 0.62 Capital expenditure (US$ million) 6.8 13.8 10.9 3.4 95.5 130.4
The following table summarises the results of the DCF analysis for the Chapter 18 Valuation. As Century operations are assumed to complete in 2014 in the reserve valuation model, zinc and lead do not reach their long run prices, which take effect from 2015. The average zinc and lead prices over the period are shown below for the purposes of understanding the sensitivity analysis.
Century Chapter 18 Valuation – DCF Analysis (US$ million) Zinc Price Scenario
Long Term US$0.80 Average US$0.95
Long Term US$0.90 Average US$1.00
Long Term US$1.00 Average US$1.04
Lead Price Scenario
Discount Rate Long Term US$0.60 Average US$0.87
Long Term US$0.70 Average US$0.91
Long Term US$0.80 Average US$0.96
8.5% 964 1,065 1,165 9.5% 946 1,044 1,141 10.5% 929 1,024 1,119
The table above illustrates the sensitivity of the calculated NPV values to a range of valuation assumptions. Grant Samuel’s valuation of Century in the range US$1,000-1,100 million reflects the DCF analysis summarised above and takes into account the following factors:
� Century is one of the world’s largest zinc mines and its location in Queensland means that it is exposed to relatively low levels of sovereign risk;
� the value of Century is extremely sensitive to movements in zinc prices. If current zinc prices of around US$1.10 per pound were to persist for the life of the mine, the estimated NPV would be around US$1,267 million. However, the NPV reduces to around US$659 million for flat zinc prices of US$0.80 per pound (NPVs estimated using a nominal discount rate of 9.5%); and
� there are operational risks (primarily geotechnical issues) that are not reflected in the valuation case and associated cash flow projections.
64 Costs and capital expenditures are in 2010 dollars. 65 Costs are per pound of zinc produced and are after treatment and refining costs and royalties. There are 2,204 pounds per tonne.
Silver and lead are taken as credits.
— V-56 —
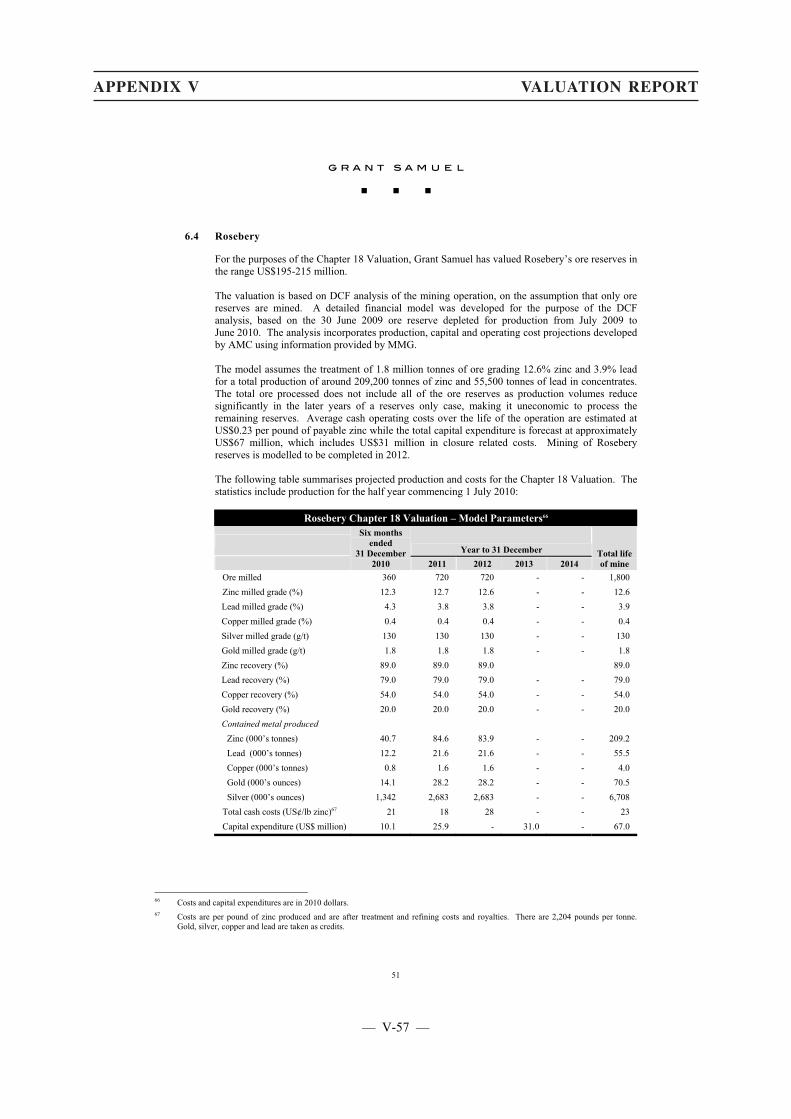
APPENDIX V VALUATION REPORT
51
6.4 Rosebery
For the purposes of the Chapter 18 Valuation, Grant Samuel has valued Rosebery’s ore reserves in the range US$195-215 million. The valuation is based on DCF analysis of the mining operation, on the assumption that only ore reserves are mined. A detailed financial model was developed for the purpose of the DCF analysis, based on the 30 June 2009 ore reserve depleted for production from July 2009 to June 2010. The analysis incorporates production, capital and operating cost projections developed by AMC using information provided by MMG. The model assumes the treatment of 1.8 million tonnes of ore grading 12.6% zinc and 3.9% lead for a total production of around 209,200 tonnes of zinc and 55,500 tonnes of lead in concentrates. The total ore processed does not include all of the ore reserves as production volumes reduce significantly in the later years of a reserves only case, making it uneconomic to process the remaining reserves. Average cash operating costs over the life of the operation are estimated at US$0.23 per pound of payable zinc while the total capital expenditure is forecast at approximately US$67 million, which includes US$31 million in closure related costs. Mining of Rosebery reserves is modelled to be completed in 2012. The following table summarises projected production and costs for the Chapter 18 Valuation. The statistics include production for the half year commencing 1 July 2010:
Rosebery Chapter 18 Valuation – Model Parameters66
Year to 31 December
Six months ended
31 December 2010 2011 2012 2013 2014
Total life of mine
Ore milled 360 720 720 - - 1,800 Zinc milled grade (%) 12.3 12.7 12.6 - - 12.6 Lead milled grade (%) 4.3 3.8 3.8 - - 3.9 Copper milled grade (%) 0.4 0.4 0.4 - - 0.4 Silver milled grade (g/t) 130 130 130 - - 130 Gold milled grade (g/t) 1.8 1.8 1.8 - - 1.8 Zinc recovery (%) 89.0 89.0 89.0 89.0 Lead recovery (%) 79.0 79.0 79.0 - - 79.0 Copper recovery (%) 54.0 54.0 54.0 - - 54.0 Gold recovery (%) 20.0 20.0 20.0 - - 20.0 Contained metal produced Zinc (000’s tonnes) 40.7 84.6 83.9 - - 209.2 Lead (000’s tonnes) 12.2 21.6 21.6 - - 55.5 Copper (000’s tonnes) 0.8 1.6 1.6 - - 4.0 Gold (000’s ounces) 14.1 28.2 28.2 - - 70.5 Silver (000’s ounces) 1,342 2,683 2,683 - - 6,708 Total cash costs (US¢/lb zinc)67 21 18 28 - - 23 Capital expenditure (US$ million) 10.1 25.9 - 31.0 - 67.0
66 Costs and capital expenditures are in 2010 dollars. 67 Costs are per pound of zinc produced and are after treatment and refining costs and royalties. There are 2,204 pounds per tonne.
Gold, silver, copper and lead are taken as credits.
— V-57 —

APPENDIX V VALUATION REPORT
52
The following table summarises the results of the DCF analysis for the Chapter 18 Valuation. As Rosebery operations are assumed to complete in 2012 in the reserve valuation model, zinc and lead do not reach their long run prices, which take effect from 2015. The average zinc and lead prices over the period are shown below for the purposes of understanding the sensitivity analysis.
Rosebery Chapter 18 Valuation – DCF Analysis (US$ million) Zinc Price Scenario
Long Term US$0.80 Average US$1.00
Long Term US$0.90 Average US$1.03
Long Term US$1.00 Average US$1.05
Lead Price Scenario
Discount Rate Long Term US$0.60 Average US$0.96
Long Term US$0.70 Average US$0.99
Long Term US$0.80 Average US$1.01
8.5% 197 205 214 9.5% 195 203 211 10.5% 193 201 209
The sensitivity analysis above is based on a range of zinc prices over the life of the operation and for different discount rates.
6.5 Golden Grove
For the purposes of the Chapter 18 Valuation, Grant Samuel has valued Golden Grove’s ore reserves in the range US$195-215 million. The valuation is based on DCF analysis of the mining operation, on the assumption that only reserves are mined. Detailed financial models were developed for the purpose of the DCF analysis, based on the 30 June 2009 Ore Reserve depleted for production from July 2009 to June 2010. The analysis incorporates production, capital and operating cost projections developed by AMC using information provided by MMG. The valuation assumes that 2.9 million tonnes is mined from Gossan Hill underground and 0.7 million tonnes from Scuddles underground. Total ore milled over the life of the project is approximately 3.6 million tonnes at grades of 10.9% zinc and 3.4% copper. On the assumption that production volumes would reduce significantly in the later years of a reserve only case (because a significant proportion of scheduled production for these years is derived from mineralisation not currently in reserves, which cannot be included in the reserves only case), production in these years is no longer economic and consequently not all reserves are included in the Chapter 18 Valuation case. For the purpose of the Chapter 18 Valuation scenario, operations only continue until 2012. Total capital expenditure is US$44 million. The following table summarises projected production and costs for the Chapter 18 Valuation. The statistics include production for the half year commencing 1 July 2010:
— V-58 —
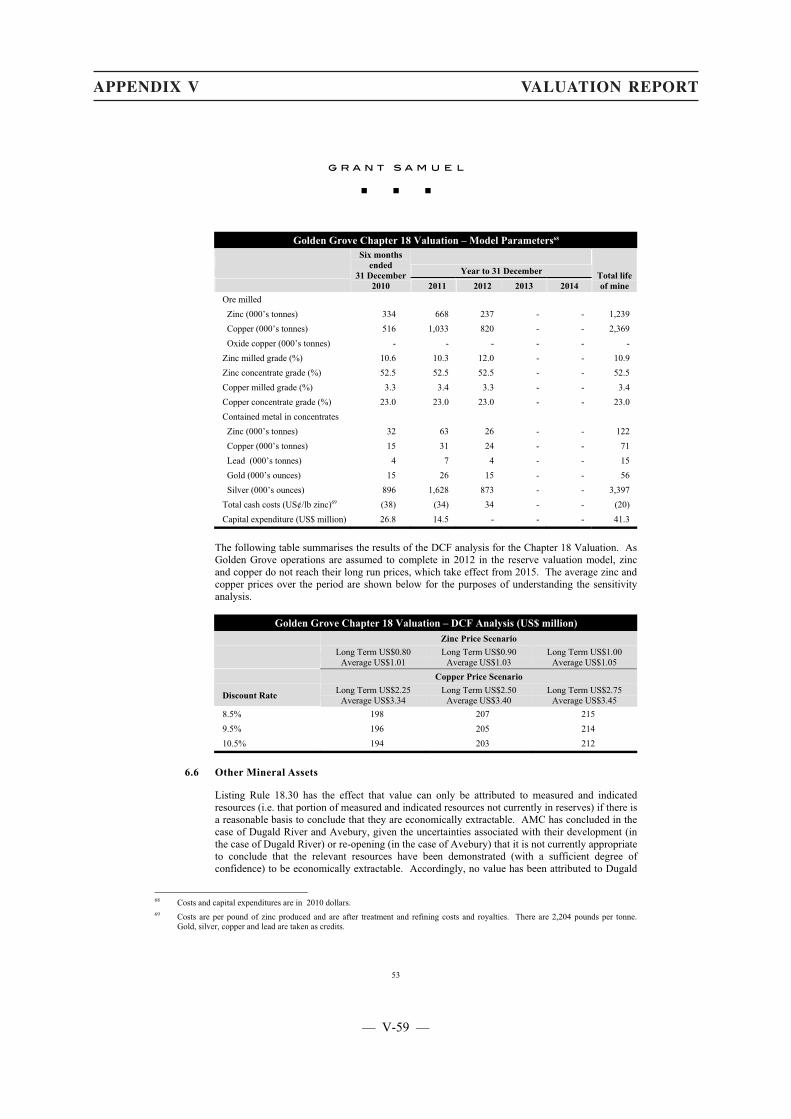
APPENDIX V VALUATION REPORT
53
Golden Grove Chapter 18 Valuation – Model Parameters68
Year to 31 December
Six months ended
31 December 2010 2011 2012 2013 2014
Total life of mine
Ore milled Zinc (000’s tonnes) 334 668 237 - - 1,239 Copper (000’s tonnes) 516 1,033 820 - - 2,369 Oxide copper (000’s tonnes) - - - - - - Zinc milled grade (%) 10.6 10.3 12.0 - - 10.9 Zinc concentrate grade (%) 52.5 52.5 52.5 - - 52.5 Copper milled grade (%) 3.3 3.4 3.3 - - 3.4 Copper concentrate grade (%) 23.0 23.0 23.0 - - 23.0 Contained metal in concentrates Zinc (000’s tonnes) 32 63 26 - - 122 Copper (000’s tonnes) 15 31 24 - - 71 Lead (000’s tonnes) 4 7 4 - - 15 Gold (000’s ounces) 15 26 15 - - 56 Silver (000’s ounces) 896 1,628 873 - - 3,397 Total cash costs (US¢/lb zinc)69 (38) (34) 34 - - (20) Capital expenditure (US$ million) 26.8 14.5 - - - 41.3
The following table summarises the results of the DCF analysis for the Chapter 18 Valuation. As Golden Grove operations are assumed to complete in 2012 in the reserve valuation model, zinc and copper do not reach their long run prices, which take effect from 2015. The average zinc and copper prices over the period are shown below for the purposes of understanding the sensitivity analysis.
Golden Grove Chapter 18 Valuation – DCF Analysis (US$ million) Zinc Price Scenario
Long Term US$0.80 Average US$1.01
Long Term US$0.90 Average US$1.03
Long Term US$1.00 Average US$1.05
Copper Price Scenario
Discount Rate Long Term US$2.25 Average US$3.34
Long Term US$2.50 Average US$3.40
Long Term US$2.75 Average US$3.45
8.5% 198 207 215 9.5% 196 205 214 10.5% 194 203 212
6.6 Other Mineral Assets
Listing Rule 18.30 has the effect that value can only be attributed to measured and indicated resources (i.e. that portion of measured and indicated resources not currently in reserves) if there is a reasonable basis to conclude that they are economically extractable. AMC has concluded in the case of Dugald River and Avebury, given the uncertainties associated with their development (in the case of Dugald River) or re-opening (in the case of Avebury) that it is not currently appropriate to conclude that the relevant resources have been demonstrated (with a sufficient degree of confidence) to be economically extractable. Accordingly, no value has been attributed to Dugald
68 Costs and capital expenditures are in 2010 dollars. 69 Costs are per pound of zinc produced and are after treatment and refining costs and royalties. There are 2,204 pounds per tonne.
Gold, silver, copper and lead are taken as credits.
— V-59 —
APPENDIX V VALUATION REPORT
54
River or Avebury for the purpose of the Chapter 18 valuation. Similarly, no value has been attributed to MMG’s exploration assets.
6.7 Other Assets
Other assets represent MMG’s investments in equities listed on major global exchanges. Given the liquidity of these investments and the fact that they represent portfolio interests, Grant Samuel believes that it is reasonable to value them at the prevailing share price and exchange rate. As at 30 June 2010, MMG’s investment represented by the market value of the shares converted to US$ at the spot rate totalled US$94 million. Since 30 June 2010, the US$ share price has appreciated. Accordingly, Grant Samuel has adopted a value of US$144-148 million based on MMG’s advice.
6.8 Corporate Costs
The valuation of MMG’s Mineral Assets does not reflect MMG’s corporate costs including centralised administration costs which are recharged to the individual operations. Therefore, a separate allowance has been made for the corporate costs. MMG’s corporate costs in terms of EBITDA are forecast to be approximately US$83.0 million in 2010. These costs include transaction related costs, which are unlikely to be incurred on an ongoing basis. As a result, Grant Samuel has assumed maintainable unallocated corporate costs of approximately US$70 million, which will decline over time in line with the closure of the individual operations. These costs represent costs associated with operating MMG’s head office in Melbourne and include costs of the MMG executive management team, finance, marketing, and corporate administration. These costs also include the cost of payroll, information technology, human resources, insurance and legal support services provided by the Melbourne head office to the MMG operations. Grant Samuel has assumed a value of US$(140) – (150) million in respect of the unallocated corporate costs. The range of negative values attributed to head office costs represents a multiple of 2.0-2.1 times maintainable EBITDA. The valuation range was supported by a DCF analysis.
6.9 Net Debt
MMG’s net debt for valuation purposes is summarised in the following table:
MMG – Net Debt for Valuation Purposes $ million
Cash and cash equivalents 334.4 Debt (1,100.3) Adjustment for Sepon net debt (2.7) Net Debt (768.6)
MMG’s net debt has been adjusted for the 10% of the net debt associated with Sepon that is not attributable to MMG.
— V-60 —

APPENDIX V VALUATION REPORT
55
7 Qualifications, Declarations and Consents
7.1 Qualifications
The Grant Samuel group of companies provide corporate advisory services (in relation to mergers and acquisitions, capital raisings, debt raisings, corporate restructurings and financial matters generally), property advisory services, manages specialist funds and provides marketing and distribution services to fund managers. The primary activity of Grant Samuel & Associates Pty Limited is the preparation of corporate and business valuations and the provision of independent advice and expert’s reports in connection with mergers and acquisitions, takeovers and capital reconstructions. Since inception in 1988, Grant Samuel and its related companies have prepared more than 435 public independent expert and appraisal reports. Grant Samuel is a corporate member of the Australasian Institute of Mining and Metallurgy (AusIMM). The persons responsible for preparing this report on behalf of Grant Samuel are Stephen Cooper BCom (Hons) ACA CA (SA) ACMA, Cameron Stewart LLB BCom and Sarah Morgan B.E. (Hons) PGDip Cont Art MBA MAusIMM. Each has a significant number of years of experience in relevant corporate advisory matters. Tina De Young BCom CFA, Matt Leroux M.Aero.E MBA and Shakeel Mohammed MS MBA assisted in the preparation of the report. Each of the above persons is an authorised representative of Grant Samuel pursuant to its Australian Financial Services Licence under Part 7.6 of the Corporations Act.
7.2 Disclaimers
It is not intended that this report should be used or relied upon for any purpose other than as a Valuation report in accordance with Chapter 18 of the Listing Rules. Grant Samuel expressly disclaims any liability to the Company or any shareholder of the Company who relies or purports to rely on the report for any other purpose and to any other party who relies or purports to rely on the report for any purpose whatsoever. This report has been prepared by Grant Samuel with care and diligence and the statements and opinions given by Grant Samuel in this report are given in good faith and in the belief on reasonable grounds that such statements and opinions are correct and not misleading. However, no responsibility is accepted by Grant Samuel or any of its officers or employees for errors or omissions however arising in the preparation of this report, provided that this shall not absolve Grant Samuel from liability arising from an opinion expressed recklessly or in bad faith.
7.3 Independence
Grant Samuel believes it is independent for the purposes of preparing the report. Grant Samuel, and each of Stephen Cooper, Sarah Morgan and Cameron Stewart, comply with the independence requirement under Rule 18.22 of the Listing Rules. Specifically, Grant Samuel and each of Stephen Cooper, Sarah Morgan and Cameron Stewart is independent of the Company, its directors, senior management and advisers and:
� do not have any economic or beneficial interest (present or contingent) in any of the assets being reported on;
� will not be remunerated with a fee dependent on the findings of this Valuation Report or the report dated 27 September 2010 setting out the market valuation of MMG;
� in the case of each of Stephen Cooper, Sarah Morgan and Cameron Stewart, is not an officer, employee or proposed officer of the Company or any group, holding or associated company of the Company; and
� in the case of Grant Samuel, is not a group, holding or associated company of the Company. None of Grant Samuel’s officers is an officer or proposed officer of any group, holding or associated company of the Company.
— V-61 —
APPENDIX V VALUATION REPORT
56
Grant Samuel had no part in the formulation of the Acquisition. Its only role has been the preparation of this report. Grant Samuel will receive a fixed fee of US$900,000 for the preparation of this report. This fee is not contingent on the outcome of the Acquisition. Grant Samuel’s out of pocket expenses in relation to the preparation of the report will be reimbursed. Grant Samuel will receive no other benefit for the preparation of this report.
7.4 Declarations
The Company has agreed that it will indemnify Grant Samuel and its employees and officers in respect of any liability suffered or incurred as a result of or in connection with the preparation of the report. This indemnity will not apply in respect of the proportion of any liability found by a court to be primarily caused by any conduct involving gross negligence or wilful misconduct by Grant Samuel. The Company has also agreed to indemnify Grant Samuel and its employees and officers for time spent and reasonable legal costs and expenses incurred in relation to any inquiry or proceeding initiated by any person. Any claims by the Company are limited to an amount equal to the fees paid to Grant Samuel. Where Grant Samuel or its employees and officers are found to have been grossly negligent or engaged in wilful misconduct Grant Samuel shall bear the proportion of such costs caused by its action. Advance drafts of this report were provided to the Company, MMG and its advisers. Certain changes were made to the drafting of the report as a result of the circulation of the draft report. There was no alteration to the methodology, evaluation or conclusions as a result of issuing the drafts.
7.5 Consents
This report has been prepared for the benefit of the Directors and shareholders of the Company and is to be appended and form part of the shareholder circular to be issued to the shareholders of the Company in connection with the Acquisition. Neither the whole nor any part of this report nor any reference thereto may be included in any other document without the prior written consent of Grant Samuel as to the form and context in which it appears.
7.6 Other
The accompanying letter dated 22 November 2010 and the Appendices form part of this report. GRANT SAMUEL & ASSOCIATES PTY LIMITED 22 November 2010
— V-62 —
APPENDIX V VALUATION REPORT
Page 1
Appendix 1
Selection of Discount Rate 1 Overview
Grant Samuel has selected discount rates of 8.5-10.5% (US dollar cash flows) to apply to the forecast nominal ungeared after tax cash flows for MMG’s Mineral Assets. The cash flows of MMG’s Mineral Assets have been denominated in US dollars and discounted on the basis of rates appropriate for international capital markets. Given that many of the potential acquirers of the Mineral Assets of MMG are international mining companies, the assets are likely to be priced on the basis of costs of capital established in international capital markets. Selection of the appropriate discount rate to apply to the forecast cash flows of any business enterprise is fundamentally a matter of judgement. The valuation of an asset or business involves judgements about the discount rates that may be utilised by potential acquirers of that asset. There is a body of theory which can be used to support that judgement. However, a mechanistic application of formulae derived from that theory can obscure the reality that there is no “correct” discount rate. Despite the growing acceptance and application of various theoretical models, it is Grant Samuel’s experience that many companies rely on less sophisticated approaches. Many businesses use relatively arbitrary “hurdle rates” which do not vary significantly from investment to investment or change significantly over time despite interest rate movements. Valuation is an estimate of what real world buyers and sellers of assets would pay and must therefore reflect criteria that will be applied in practice even if they are not theoretically correct. Grant Samuel considers the rates adopted to be reasonable discount rates that acquirers would use irrespective of the outcome or shortcomings of applying any particular theoretical model. The discount rates that Grant Samuel has adopted are reasonable relative to the rates derived from theoretical models. The discount rates represent an estimate of the weighted average cost of capital (“WACC”) appropriate for these assets. Grant Samuel has calculated a WACC based on a weighted average of the cost of equity and the cost of debt. This is the relevant rate to apply to ungeared cash flows. There are three main elements to the determination of an appropriate WACC. These are:
� cost of equity;
� cost of debt; and
� debt/equity mix. WACC is a commonly used basis but it should be recognised that it has shortcomings in that it:
� represents a simplification of what are usually much more complex financial structures; and
� assumes a constant degree of leverage which is seldom correct. The cost of equity has been derived from application of the Capital Asset Pricing Model (“CAPM”) methodology. The CAPM is probably the most widely accepted and used methodology for determining the cost of equity capital. There are more sophisticated multivariate models which utilise additional risk factors but these models have not achieved any significant degree of usage or acceptance in practice. However, while the theory underlying the CAPM is rigorous the practical application is subject to shortcomings and limitations and the results of applying the CAPM model should only be regarded as providing a general guide. There is a tendency to regard the rates calculated using CAPM as inviolate. To do so is to misunderstand the limitations of the model. For example:
� the CAPM theory is based on expectations but uses historical data as a proxy. The future is not necessarily the same as the past;
— V-63 —
APPENDIX V VALUATION REPORT
Page 2
� the measurement of historical data such as risk premia and beta factors is subject to very high levels of statistical error. Measurements vary widely depending on factors such as source, time period and sampling frequency;
� the measurement of beta is often based on comparisons with other companies. None of these companies is likely to be directly comparable to the entity for which the discount rate is being calculated and may operate in quite different markets;
� parameters such as the debt/equity ratio and risk premium are based on subjective judgements; and
� there is not unanimous agreement as to how the model should adjust for factors such as taxation. The CAPM was developed in the context of a “classical” tax system. Australia’s system of dividend imputation has a significant impact on the measurement of net returns to investors.
The cost of debt has been determined by reference to the pricing implied by the debt markets in the US. The cost of debt represents an estimate of the expected future returns required by debt providers. Selection of an appropriate debt/equity mix is a matter of judgement. The debt/equity mix represents an appropriate level of gearing, stated in market value terms, for the business over the forecast period. The relevant proportions of debt and equity have been determined having regard to the financial gearing of the industry in general and comparable companies, and judgements as to the appropriate level of gearing considering the nature and quality of the cash flow stream. The following sections set out the basis for Grant Samuel’s determination of the discount rates to be applied in valuing the assets of MMG and the factors which limit the accuracy and reliability of the estimates.
2 Definition and Limitations of the CAPM and WACC
The CAPM provides a theoretical basis for determining a discount rate that reflects the returns required by diversified investors in equities. The rate of return required by equity investors represents the cost of equity of a company and is therefore the relevant measure for estimating a company’s weighted average cost of capital. CAPM is based on the assumption that investors require a premium for investing in equities rather than in risk free investments (such as US medium to long term Treasury Bond). The premium is commonly known as the market risk premium and notionally represents the premium required to compensate for investment in the equity market in general. The risks relating to a company or business may be divided into specific risks and systematic risks. Specific risks are risks that are specific to a particular company or business and are unrelated to movements in equity markets generally. While specific risks will result in actual returns varying from expected returns, it is assumed that diversified investors require no additional returns to compensate for specific risk, because the net effect of specific risks across a diversified portfolio will, on average, be zero. Portfolio investors can diversify away all specific risk. However, investors cannot diversify away the systematic risk of a particular investment or business operation. Systematic risk is the risk that the return from an investment or business operation will vary with the market return in general. If the return on an investment was expected to be completely correlated with the return from the market in general, then the return required on the investment would be equal to the return required from the market in general (i.e. the risk free rate plus the market risk premium). Systematic risk is affected by the following factors:
� financial leverage: additional debt will increase the impact of changes in returns on underlying assets and therefore increase systematic risk;
� cyclicality of revenue: projects and companies with cyclical revenues will generally be subject to greater systematic risk than those with non-cyclical revenues; and
— V-64 —
APPENDIX V VALUATION REPORT
Page 3
� operating leverage: projects and companies with greater proportions of fixed costs in their cost structure will generally be subject to more systematic risk than those with lesser proportions of fixed costs.
CAPM postulates that the return required on an investment or asset can be estimated by applying to the market risk premium a measure of systematic risk described as the beta factor. The beta for an investment reflects the covariance of the return from that investment with the return from the market as a whole. Covariance is a measure of relative volatility and correlation. The beta of an investment represents its systematic risk only. It is not a measure of the total risk of a particular investment. An investment with a beta of more than one is riskier than the market and an investment with a beta of less than one is less risky. The discount rate appropriate for an investment which involves zero systematic risk would be equal to the risk free rate. The formula for deriving the cost of equity using CAPM is as follows: Re = Rf + Beta (Rm – Rf) Where: Re = the cost of equity capital; Rf = the risk free rate; Beta = the beta factor; Rm = the expected market return; and Rm - Rf = the market risk premium. The beta for a company or business operation is normally estimated by observing the historical relationship between returns from the company or comparable companies and returns from the market in general. The market risk premium is estimated by reference to the actual long run premium earned on equity investments by comparison with the return on risk free investments. The formula conventionally used to calculate a WACC under a classical tax system is as follows: WACC = (Re × E/V) + (Rd × (1-t) × D/V) Where: E/V = the proportion of equity to total value (where V = D + E); D/V = the proportion of debt to total value; Re = the cost of equity capital; Rd = the cost of debt capital; and t = the corporate tax rate The models, while simple, are based on a sophisticated and rigorous theoretical analysis. Nevertheless, application of the theory is not straightforward and the discount rate calculated should be treated as no more than a general guide. The reliability of any estimate derived from the model is limited. Some of the issues are discussed below:
� Risk Free Rate
Theoretically, the risk free rate used should be an estimate of the risk free rate in each future period (i.e. the one year spot rate in that year if annual cash flows are used). There is no official “risk free” rate but rates on government securities are typically used as an acceptable substitute. More importantly, forecast rates for each future period are not readily available. In practice, the long term Commonwealth Government Bond rate is used as a substitute in Australia and medium to long term Treasury Bond rates are used in the United States. It should be recognised that the yield to maturity of a long term bond is only an average rate and where the yield curve is strongly positive (i.e. longer term rates are significantly above short term rates) the adoption of a single long term bond rate has the effect of reducing the net present value where the major positive cash flows are in the initial years. The long term bond rate is therefore only an approximation. The ten year bond rate is a widely used and accepted benchmark for the risk free rate. Where the forecast period exceeds ten years, an issue arises as to the appropriate bond to use. While longer
— V-65 —
APPENDIX V VALUATION REPORT
Page 4
term bond rates are available, the ten year bond market is the deepest long term bond market in Australia and is a widely used and recognised benchmark. There is a very limited market for bonds of more than ten years. In the United States, there are deeper markets for longer term bonds. The 30 year bond rate is a widely used benchmark. However, long term rates accentuate the distortions of the yield curve on cash flows in early years. In any event, a single long term bond rate matching the term of the cash flows is no more theoretically correct than using a ten year rate. More importantly, the ten year rate is the standard benchmark used in practice. Where cash flows are less than ten years in duration the opposite issue arises. An argument could be made that shorter term, and therefore lower, bond rates should be used in determining the discount rate for there assets. While Grant Samuel believes this is a legitimate argument, an adjustment may give a misleading impression of precision for the whole methodology. In any event, the impact on valuation would usually be trivial. In practice, Grant Samuel believes acquirers would use a common rate. The ten year bond rate can be regarded as an acceptable standard risk free rate for medium to long term cash flows, particularly given its wide use.
� Market Risk Premium
The market risk premium (Rm - Rf) represents the “extra” return that investors require to invest in equity securities as a whole over risk free investments. This is an “ex-ante” concept. It is the expected premium and as such it is not an observable phenomenon. The historical premium is therefore used as a proxy measure. The premium earned historically by equity investments is calculated over a time period of many years, typically at least 30 years. This long time frame is used on the basis that short term numbers are highly volatile and that a long term average return would be a fair indication of what most investors would expect to earn in the future from an investment in equities with a 5-10 year time frame. In the United States it is generally believed that the premium is in the range of 5-6% but there are widely varying assessments (from 3% to 9%). Australian studies have been more limited but indicate that the long run average premium has been in the order of 6% using a geometric average (and is in the order of 8% using an arithmetic average) measured over more than 100 years of data1. Even an estimate based over a very long period such as 100 years is subject to significant statistical error. Given the volatility of equity market returns it is only possible to state that the “true” figure lies within a range of approximately 2-10% at a 95% confidence level (using the geometric average). In addition, the market risk premium is not constant and changes over time. At various stages of the market cycle investors perceive that equities are more risky than at other times and will increase or decrease their expected premium. Indeed, there are arguments being put forward at the present time that the risk premium is now lower than it has been historically. This view is reflected in the recent update of the Officer Study2 which indicates that (based on the addition of 17 years of data to 2004) the long term arithmetic average has declined to 7.17% from 7.94%. In practice, market risk premiums of 5-7% are typically adopted in Australia.
� Beta Factor
The beta factor is a measure of the expected covariance (i.e. volatility and correlation of returns) between the return on an investment and the return from the market as a whole. The expected beta factor cannot be observed. The conventional practice is to calculate an historical beta from past share price data and use it as a proxy for the future but it must be recognised that the expected beta is not necessarily the same as the historical beta. A company’s relative risk does change over time.
1 See, for example, R.R. Officer in Ball, R., Brown, P., Finn, F. J. & Officer, R. R., “Share Market and Portfolio Theory: Readings and
Australian Evidence” (second edition), University of Queensland Press, 1989 (“Officer Study”), which was based on data for the period 1883 to 1987 and therefore was undertaken prior to the introduction of dividend imputation in Australia.
2 Gray, S. and Officer, R.R., “A Review of the Market Risk Premium and Commentary on Two Recent Papers: A Report prepared for the Energy Networks Association”, August 2005.
— V-66 —
APPENDIX V VALUATION REPORT
Page 5
The appropriate beta is the beta of the company being acquired rather than the beta of the acquirer (which may be in a different business with different risks). Betas for the particular subject company may be utilised. However, it is also appropriate (and may be necessary if the investment is not listed) to utilise betas for comparable companies and sector averages (particularly as those may be more reliable). However, there are very significant measurement issues with betas which mean that only limited reliance can be placed on such statistics. Even measurement of historical betas is subject to considerable variation. There is no “correct” beta.
� Debt/Equity Mix
The tax deductibility of the cost of debt means that the higher the proportion of debt the lower the WACC, although this would be offset, at least in part, by an increase in the beta factor as leverage increases. The debt/equity mix assumed in calculating the discount rate should be consistent with the level implicit in the measurement of the beta factor. Typically, the debt/equity mix changes over time and there is significant diversity in the levels of leverage across companies in a sector. There is a tendency to calculate leverage at a point in time whereas the leverage should represent the average over the period the beta was measured. This can be difficult to assess with a meaningful degree of accuracy. The measured beta factors for listed companies are “equity” betas and reflect the financial leverage of the individual companies. It is possible to unleverage beta factors to derive asset betas and releverage betas to reflect a more appropriate or comparable financial structure. In Grant Samuel’s view this technique is subject to considerable estimation error. Deleveraging and releveraging betas exacerbates the estimation errors in the original beta calculation and gives a misleading impression as to the precision of the methodology. Deleveraging and releveraging is also incorrectly calculated based on debt levels at a single point in time. In addition, the actual debt and equity structures of most companies are typically relatively complex. It is necessary to simplify this for practical purposes in this kind of analysis. Finally, it should be noted that, for this purpose, the relevant measure of the debt/equity mix is based on market values not book values.
� Specific Risk
The WACC is designed to be applied to “expected cash flows”, which are effectively a weighted average of the likely scenarios. To the extent that a business is perceived as being particularly risky, this specific risk should be dealt with by adjusting the cash flow scenarios. This avoids the need to make arbitrary adjustments to the discount rate which can dramatically affect estimated values, particularly when the cash flows are of extended duration or much of the business value reflects future growth in cash flows. In addition, risk adjusting the cash flows requires a more disciplined analysis of the risks that the valuer is trying to reflect in the valuation. However, it is also common in practice to allow for certain classes of specific risk (particularly sovereign and other country specific risks) by adjusting the discount rate applied to forecast cash flows.
— V-67 —
APPENDIX V VALUATION REPORT
Page 6
3 Calculation of WACC for MMG’s Mineral Assets
3.1 Cost of Equity Capital
The cost of equity capital has been estimated by reference to the CAPM. Grant Samuel has adopted a cost of equity capital in the range 10.2-11.4%.
� Risk-Free Rate
Grant Samuel has adopted a risk free rate of 3.0%. The risk free rate is slightly higher than the current yield to maturity on ten year United States Treasury Notes and reflects the view that it seems unlikely that potential acquirers of MMG’s assets would have taken into account the recent decrease in risk free rates in the discount rate assumptions used for the purposes of valuing these assets.
� Market Risk Premium
Grant Samuel has consistently adopted a market risk premium of 6.0% and believes that, particularly in view of the general uncertainty, this continues to be a reasonable estimate. It is:
� not statistically significantly different to the premium suggested by the historical data;
� similar to that used by a wide variety of analysts and practitioners; and
� the same as that adopted by most regulatory authorities in Australia.
� Beta Factor
Grant Samuel has adopted a beta factor in the range 1.2-1.4 for the purposes of valuing MMG’s assets. Grant Samuel has considered the beta factors for a wide range of mining companies in determining an appropriate beta range for MMG’s assets. The betas have been calculated on two bases, relative to each company’s home exchange index and relative to the Morgan Stanley Capital International Developed World Index (“MSCI”), an international equities market index that is widely used as a proxy for the global stock market as a whole. Grant Samuel has also considered betas estimated on the basis of share market data over various periods of time. Betas are, conceptually, estimates of the expected systematic risk added to a diversified portfolio by an investment (although they are estimated by reference to historical share market data). Estimates based on historical data do not necessarily reflect investor expectations. A summary of betas for selected comparable listed companies is set out in the table below:
— V-68 —
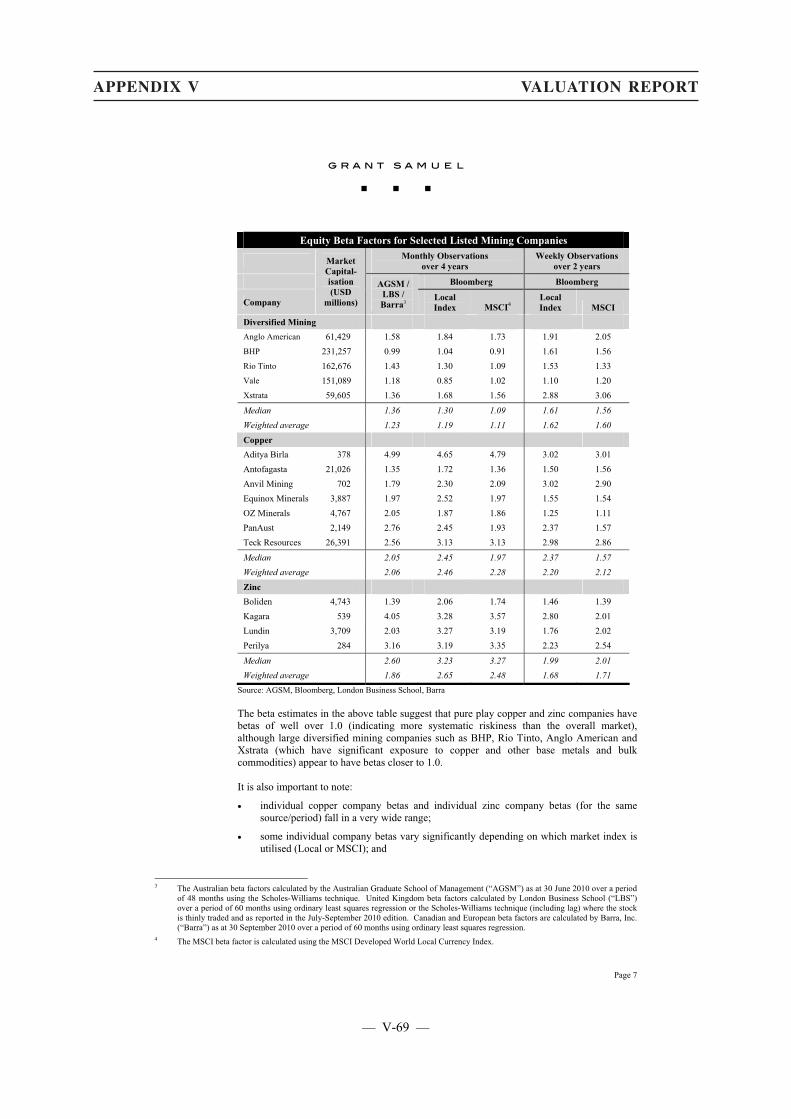
APPENDIX V VALUATION REPORT
Page 7
Equity Beta Factors for Selected Listed Mining Companies
Monthly Observations over 4 years
Weekly Observations over 2 years
Bloomberg Bloomberg
Company
Market Capital-isation (USD
millions)
AGSM / LBS / Barra3
Local Index MSCI4
Local Index MSCI
Diversified Mining Anglo American 61,429 1.58 1.84 1.73 1.91 2.05 BHP 231,257 0.99 1.04 0.91 1.61 1.56 Rio Tinto 162,676 1.43 1.30 1.09 1.53 1.33 Vale 151,089 1.18 0.85 1.02 1.10 1.20 Xstrata 59,605 1.36 1.68 1.56 2.88 3.06
Median 1.36 1.30 1.09 1.61 1.56 Weighted average 1.23 1.19 1.11 1.62 1.60 Copper Aditya Birla 378 4.99 4.65 4.79 3.02 3.01 Antofagasta 21,026 1.35 1.72 1.36 1.50 1.56 Anvil Mining 702 1.79 2.30 2.09 3.02 2.90 Equinox Minerals 3,887 1.97 2.52 1.97 1.55 1.54 OZ Minerals 4,767 2.05 1.87 1.86 1.25 1.11 PanAust 2,149 2.76 2.45 1.93 2.37 1.57 Teck Resources 26,391 2.56 3.13 3.13 2.98 2.86
Median 2.05 2.45 1.97 2.37 1.57 Weighted average 2.06 2.46 2.28 2.20 2.12 Zinc Boliden 4,743 1.39 2.06 1.74 1.46 1.39 Kagara 539 4.05 3.28 3.57 2.80 2.01 Lundin 3,709 2.03 3.27 3.19 1.76 2.02 Perilya 284 3.16 3.19 3.35 2.23 2.54
Median 2.60 3.23 3.27 1.99 2.01 Weighted average 1.86 2.65 2.48 1.68 1.71
Source: AGSM, Bloomberg, London Business School, Barra The beta estimates in the above table suggest that pure play copper and zinc companies have betas of well over 1.0 (indicating more systematic riskiness than the overall market), although large diversified mining companies such as BHP, Rio Tinto, Anglo American and Xstrata (which have significant exposure to copper and other base metals and bulk commodities) appear to have betas closer to 1.0. It is also important to note:
� individual copper company betas and individual zinc company betas (for the same source/period) fall in a very wide range;
� some individual company betas vary significantly depending on which market index is utilised (Local or MSCI); and
3 The Australian beta factors calculated by the Australian Graduate School of Management (“AGSM”) as at 30 June 2010 over a period
of 48 months using the Scholes-Williams technique. United Kingdom beta factors calculated by London Business School (“LBS”) over a period of 60 months using ordinary least squares regression or the Scholes-Williams technique (including lag) where the stock is thinly traded and as reported in the July-September 2010 edition. Canadian and European beta factors are calculated by Barra, Inc. (“Barra”) as at 30 September 2010 over a period of 60 months using ordinary least squares regression.
4 The MSCI beta factor is calculated using the MSCI Developed World Local Currency Index.
— V-69 —
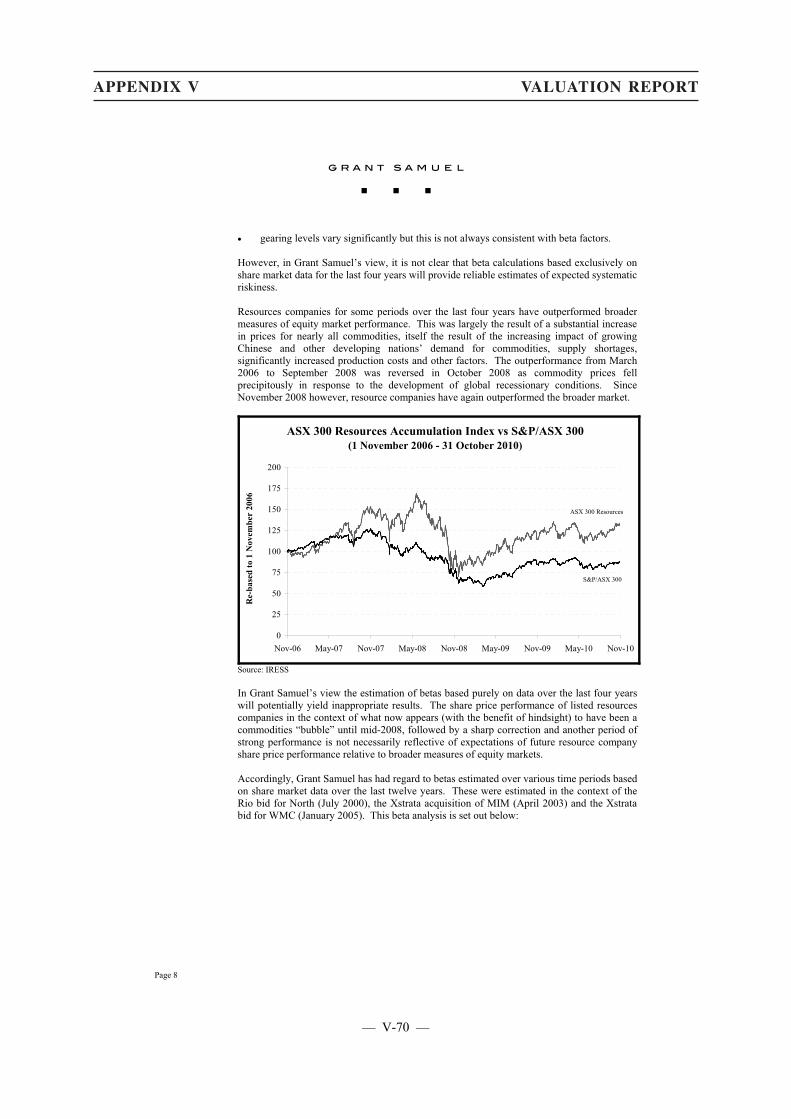
APPENDIX V VALUATION REPORT
Page 8
� gearing levels vary significantly but this is not always consistent with beta factors. However, in Grant Samuel’s view, it is not clear that beta calculations based exclusively on share market data for the last four years will provide reliable estimates of expected systematic riskiness. Resources companies for some periods over the last four years have outperformed broader measures of equity market performance. This was largely the result of a substantial increase in prices for nearly all commodities, itself the result of the increasing impact of growing Chinese and other developing nations’ demand for commodities, supply shortages, significantly increased production costs and other factors. The outperformance from March 2006 to September 2008 was reversed in October 2008 as commodity prices fell precipitously in response to the development of global recessionary conditions. Since November 2008 however, resource companies have again outperformed the broader market.
ASX 300 Resources Accumulation Index vs S&P/ASX 300 (1 November 2006 - 31 October 2010)
0
25
50
75
100
125
150
175
200
Nov-06 May-07 Nov-07 May-08 Nov-08 May-09 Nov-09 May-10 Nov-10
Re-
base
d to
1 N
ovem
ber
2006
S&P/ASX 300
ASX 300 Resources
Source: IRESS In Grant Samuel’s view the estimation of betas based purely on data over the last four years will potentially yield inappropriate results. The share price performance of listed resources companies in the context of what now appears (with the benefit of hindsight) to have been a commodities “bubble” until mid-2008, followed by a sharp correction and another period of strong performance is not necessarily reflective of expectations of future resource company share price performance relative to broader measures of equity markets. Accordingly, Grant Samuel has had regard to betas estimated over various time periods based on share market data over the last twelve years. These were estimated in the context of the Rio bid for North (July 2000), the Xstrata acquisition of MIM (April 2003) and the Xstrata bid for WMC (January 2005). This beta analysis is set out below:
— V-70 —

APPENDIX V VALUATION REPORT
Page 9
Beta Factors for Selected Listed Resources Companies July 2000 Beta Factor
Bloomberg5 AGSM6 Company
Equity Market Value
Millions US$M
Home Exchange MSCI7 OLS Scholes-
William Base Metals MIM Limited 1,024 1.40 0.99 1.91 1.49 Pasminco Limited 612 1.32 0.98 1.76 1.73 Cominco Limited 1,144 0.91 1.20 - - Phelps Dodge 3,075 1.03 1.13 - - Grupo Mexico 2,297 0.70 0.88 - - Western Metals 49 1.06 0.82 1.15 1.02 Asturiana de Zinc 407 1.08 1.41 - - Antafagasto 1,137 0.81 1.10 - - Union Miniere 960 0.81 1.10 - - Freeport McMoran 1,412 1.23 1.48 - - Teck Corporation 691 0.99 0.85 - -
Simple average 1.03 1.09 1.61 1.41 Weighted average 0.99 1.10 1.83 1.56 Median 1.03 1.10 1.76 1.49
Source: AGSM, Bloomberg
5 Betas sourced from Bloomberg are calculated over a five year period to 30 June 2000 using monthly observations. 6 Betas sourced from AGSM are calculated over a four year period to 31 March 2000 using monthly observations. They are calculated
relative to the All Ordinaries Index of the Australian Stock Exchange. 7 MSCI (Morgan Stanley Capital International All Countries World Index) calculated using the local currency of each company.
— V-71 —
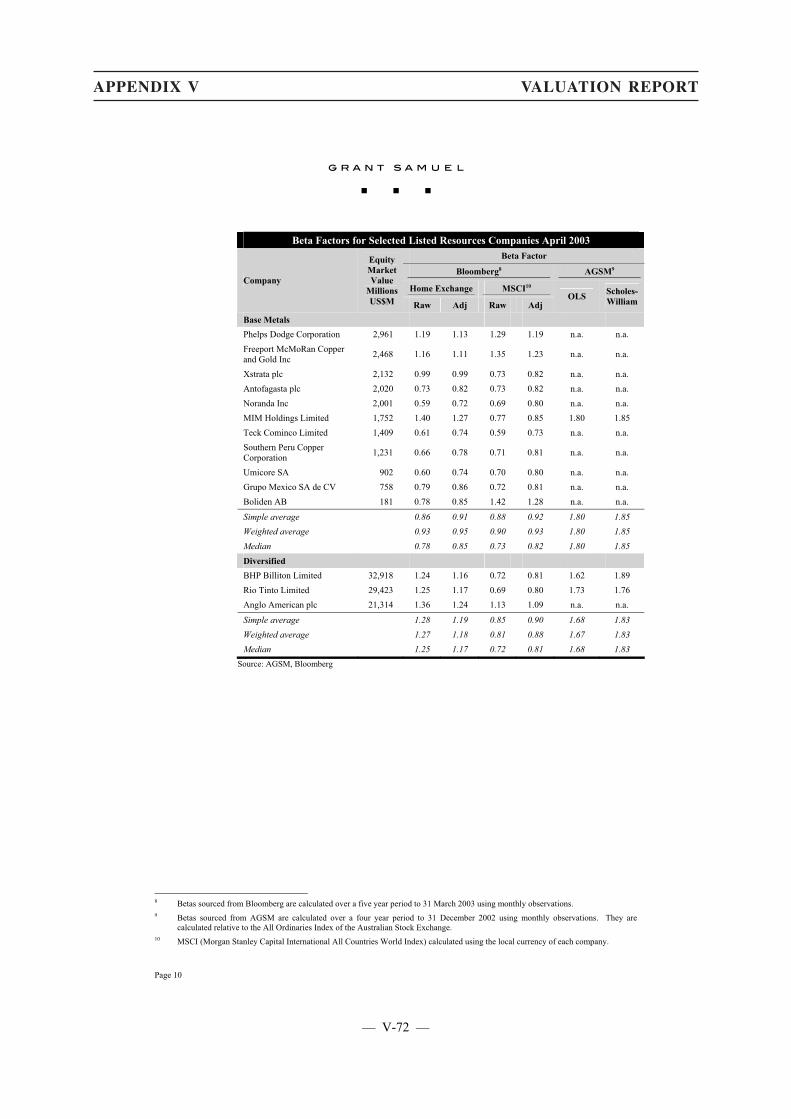
APPENDIX V VALUATION REPORT
Page 10
Beta Factors for Selected Listed Resources Companies April 2003 Beta Factor
Bloomberg8 AGSM9
Home Exchange MSCI10 Company
Equity Market Value
Millions US$M Raw Adj Raw Adj
OLS Scholes-William
Base Metals Phelps Dodge Corporation 2,961 1.19 1.13 1.29 1.19 n.a. n.a. Freeport McMoRan Copper and Gold Inc 2,468 1.16 1.11 1.35 1.23 n.a. n.a.
Xstrata plc 2,132 0.99 0.99 0.73 0.82 n.a. n.a. Antofagasta plc 2,020 0.73 0.82 0.73 0.82 n.a. n.a. Noranda Inc 2,001 0.59 0.72 0.69 0.80 n.a. n.a. MIM Holdings Limited 1,752 1.40 1.27 0.77 0.85 1.80 1.85 Teck Cominco Limited 1,409 0.61 0.74 0.59 0.73 n.a. n.a. Southern Peru Copper Corporation 1,231 0.66 0.78 0.71 0.81 n.a. n.a.
Umicore SA 902 0.60 0.74 0.70 0.80 n.a. n.a. Grupo Mexico SA de CV 758 0.79 0.86 0.72 0.81 n.a. n.a. Boliden AB 181 0.78 0.85 1.42 1.28 n.a. n.a.
Simple average 0.86 0.91 0.88 0.92 1.80 1.85 Weighted average 0.93 0.95 0.90 0.93 1.80 1.85 Median 0.78 0.85 0.73 0.82 1.80 1.85 Diversified BHP Billiton Limited 32,918 1.24 1.16 0.72 0.81 1.62 1.89 Rio Tinto Limited 29,423 1.25 1.17 0.69 0.80 1.73 1.76 Anglo American plc 21,314 1.36 1.24 1.13 1.09 n.a. n.a.
Simple average 1.28 1.19 0.85 0.90 1.68 1.83 Weighted average 1.27 1.18 0.81 0.88 1.67 1.83 Median 1.25 1.17 0.72 0.81 1.68 1.83
Source: AGSM, Bloomberg
8 Betas sourced from Bloomberg are calculated over a five year period to 31 March 2003 using monthly observations. 9 Betas sourced from AGSM are calculated over a four year period to 31 December 2002 using monthly observations. They are
calculated relative to the All Ordinaries Index of the Australian Stock Exchange. 10 MSCI (Morgan Stanley Capital International All Countries World Index) calculated using the local currency of each company.
— V-72 —

APPENDIX V VALUATION REPORT
Page 11
Beta Factors for Selected Listed Resources Companies January 2005 Beta Factor
Bloomberg11 AGSM12 Company
Equity Market Value
Millions US$M
Home Exchange MSCI13 OLS Scholes-
William Diversified Mining BHP 70,676 1.17 0.60 1.38 2.02 Rio Tinto 41,265 0.77 0.57 0.91 1.12 Anglo American 33,042 1.10 1.05 n.a. n.a. CVRD 27,657 0.28 0.11 n.a. n.a. Xstrata 11,039 1.43 1.46 n.a. n.a.
Median 1.10 0.60 1.15 1.57 Weighted Average 0.95 0.65 0.74 1.03 Copper Phelps Dodge 10,281 1.64 1.70 1.4114 n.a. Freeport McMoRan 6,750 1.06 1.07 n.a. n.a. Teck Cominco 5,683 1.43 1.22 n.a. 0.6315 Grupo Mexico 4,163 1.30 0.87 n.a. n.a. Antofagasta 4,047 0.64 0.64 n.a. n.a. Southern Peru Copper 3,720 0.79 0.81 0.59¹ n.a.
Median 1.18 0.97 1.00 0.63 Weighted Average 1.24 1.18 1.19 0.63
Source: AGSM, Bloomberg The evidence suggests a wide range of betas. However, for betas measured against the MSCI, the betas tend to be around 1 (and for some periods arguably appear somewhat lower than 1). Beta estimates are by their nature imprecise and judgmental, as highlighted by the shift in measured betas illustrated in the tables above. In Grant Samuel’s view, it is reasonable to adopt betas in the range 1.2-1.4. This range reflects beta estimates over a longer period of time than betas estimated over the last four years and appears broadly consistent with the views of market participants.
3.2 Cost of Debt
A cost of debt of 5.0% has been adopted (a margin of 2.0% over the risk free rate). This figure represents the expected future cost of borrowing over the duration of the cash flow model. Grant Samuel believes that this would be a reasonable estimate of an average interest rate, including a margin that would match the duration of the cash flows assuming that the operations were funded with a mixture of short term and long term debt.
3.3 Debt/Equity Mix
The selection of the appropriate debt/equity ratio involves perhaps the most subjectivity of all the elements of discount rate selection analysis. In determining an appropriate debt/equity mix, regard
11 Betas sourced from Bloomberg are calculated over a five year period to 30 November 2004 using monthly observations. 12 Betas sourced from AGSM are calculated over a four year period to 30 September 2004 using monthly observations. They are
calculated relative to the All Ordinaries Index of the Australian Stock Exchange. 13 MSCI (Morgan Stanley Capital International All Countries World Index) calculated using the local currency of each company. 14 Sourced from Ibbotson. 15 Sourced from the Financial Post Data Group, calculated based on 60 months of monthly data.
— V-73 —
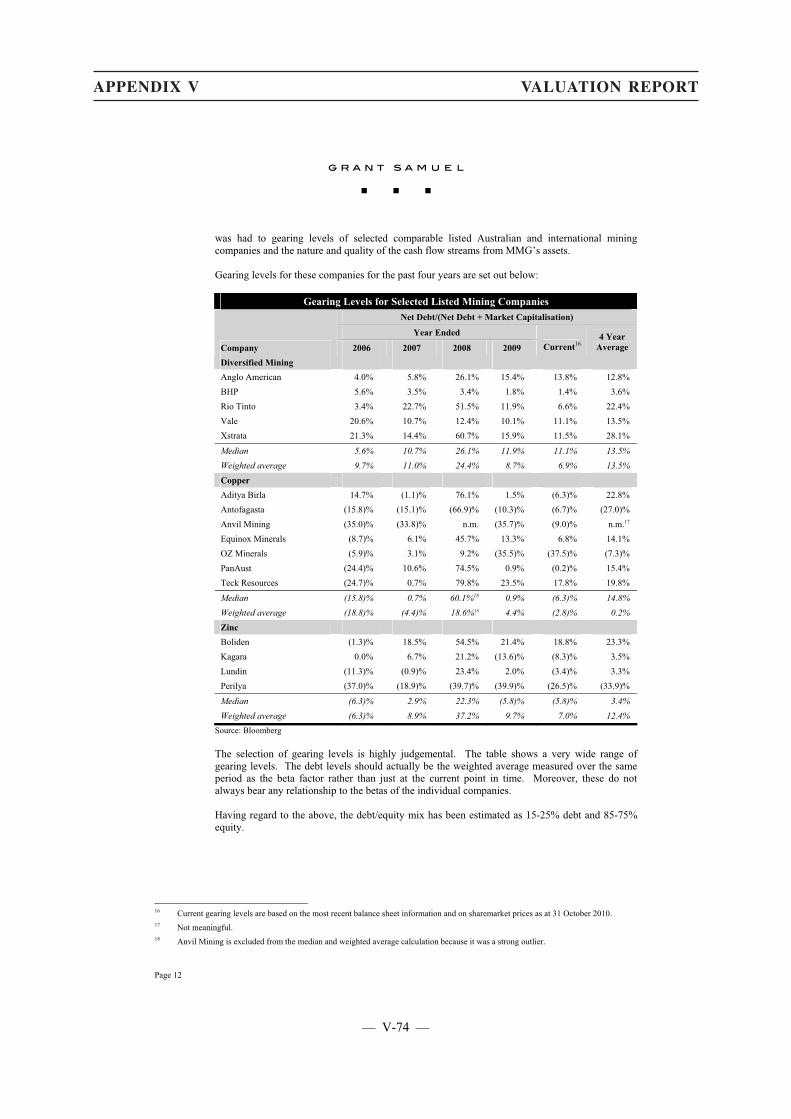
APPENDIX V VALUATION REPORT
Page 12
was had to gearing levels of selected comparable listed Australian and international mining companies and the nature and quality of the cash flow streams from MMG’s assets. Gearing levels for these companies for the past four years are set out below:
Gearing Levels for Selected Listed Mining Companies Net Debt/(Net Debt + Market Capitalisation)
Year Ended
Company 2006 2007 2008 2009 Current16 4 Year
Average
Diversified Mining Anglo American 4.0% 5.8% 26.1% 15.4% 13.8% 12.8% BHP 5.6% 3.5% 3.4% 1.8% 1.4% 3.6% Rio Tinto 3.4% 22.7% 51.5% 11.9% 6.6% 22.4% Vale 20.6% 10.7% 12.4% 10.1% 11.1% 13.5% Xstrata 21.3% 14.4% 60.7% 15.9% 11.5% 28.1%
Median 5.6% 10.7% 26.1% 11.9% 11.1% 13.5% Weighted average 9.7% 11.0% 24.4% 8.7% 6.9% 13.5% Copper Aditya Birla 14.7% (1.1)% 76.1% 1.5% (6.3)% 22.8% Antofagasta (15.8)% (15.1)% (66.9)% (10.3)% (6.7)% (27.0)% Anvil Mining (35.0)% (33.8)% n.m. (35.7)% (9.0)% n.m.17 Equinox Minerals (8.7)% 6.1% 45.7% 13.3% 6.8% 14.1% OZ Minerals (5.9)% 3.1% 9.2% (35.5)% (37.5)% (7.3)% PanAust (24.4)% 10.6% 74.5% 0.9% (0.2)% 15.4% Teck Resources (24.7)% 0.7% 79.8% 23.5% 17.8% 19.8%
Median (15.8)% 0.7% 60.1%18 0.9% (6.3)% 14.8% Weighted average (18.8)% (4.4)% 18.6%18 4.4% (2.8)% 0.2% Zinc Boliden (1.3)% 18.5% 54.5% 21.4% 18.8% 23.3% Kagara 0.0% 6.7% 21.2% (13.6)% (8.3)% 3.5% Lundin (11.3)% (0.9)% 23.4% 2.0% (3.4)% 3.3% Perilya (37.0)% (18.9)% (39.7)% (39.9)% (26.5)% (33.9)%
Median (6.3)% 2.9% 22.3% (5.8)% (5.8)% 3.4% Weighted average (6.3)% 8.9% 37.2% 9.7% 7.0% 12.4%
Source: Bloomberg The selection of gearing levels is highly judgemental. The table shows a very wide range of gearing levels. The debt levels should actually be the weighted average measured over the same period as the beta factor rather than just at the current point in time. Moreover, these do not always bear any relationship to the betas of the individual companies. Having regard to the above, the debt/equity mix has been estimated as 15-25% debt and 85-75% equity.
16 Current gearing levels are based on the most recent balance sheet information and on sharemarket prices as at 31 October 2010. 17 Not meaningful. 18 Anvil Mining is excluded from the median and weighted average calculation because it was a strong outlier.
— V-74 —

APPENDIX V VALUATION REPORT
Page 13
3.4 WACC
On the basis of the parameters outlined and assuming a corporate tax rate of 30%, the nominal WACC is calculated to be in the range 8.5-10.2%. This is an after tax discount rate to be applied to nominal ungeared after tax cash flows. However, it must be recognised that this is a very crude calculation based on statistics of limited reliability and involving a multitude of assumptions. Having regard to these matters, current volatility and market uncertainty, and the calculations and data set out above, Grant Samuel has adopted discount rates of 8.5-10.5% (US dollar cash flows) for the purpose of its DCF analysis. While the range is reasonably wide, Grant Samuel believes that the range of rates is reasonable having regard to current equity market conditions.
— V-75 —
APPENDIX V VALUATION REPORT
Page 1
Appendix 2
Overview of the Zinc and Copper Markets 1 Zinc
Overview
Zinc, a hard silver-grey metal, is the third most commonly used non-ferrous metal after aluminium and copper. Zinc is chemically reactive and rapidly oxidising when exposed to air. It alloys readily with metals such as copper and aluminium, and has a relatively low melting point. These characteristics are the basis of its major applications in corrosion protection, brass and die-casting. Zinc production is essentially a two stage process. Zinc miners mine zinc ore and treat the ore at mine site to yield zinc concentrates. Miners then sell the concentrates to smelters, which use hydrometallurgical or (less commonly) pyrometallurgical processes to produce refined zinc metal. A small amount of zinc slab (around 1% of production) is produced through recycling of scrap. Applications
Corrosion Protection Zinc’s most important application is in corrosion protection, which relies on zinc’s reactive nature. Galvanising is the main method of protection against the corrosion of steel. Galvanising involves the deposition of a thin coat of zinc over steel. Galvanising provides a physical barrier to protect steel, with the galvanising process resulting in a zinc-iron compound that creates an unbreakable bond between the steel and the zinc. The surface of the zinc coating on galvanised steel rapidly oxidises, creating a dense and relatively impermeable layer of zinc oxide that protects the zinc surface and steel below from further corrosion. Moreover, the zinc and iron form an electrolytic cell, such that even if the physical zinc barrier is damaged, corrosion preferentially attacks the more chemically reactive zinc rather than the less reactive iron. Galvanising accounts for around 50% of global zinc usage. Galvanised steel is principally used in the construction and automotive industries. In construction, galvanised steel is used for steel girders and structures and smaller items such as nuts, bolts and washers. In the automotive industry, galvanised steel sheets are used extensively in the manufacture of rust-resistant car bodies. In addition, galvanised steel sheet is used in the production of consumer appliances (e.g. washing machines) and industrial machinery for which corrosion resistance is important. Brass Brass is a copper-zinc alloy (commonly 65% copper and 35% zinc). Brasses have good corrosion-resistance properties, are machineable and malleable. Brasses have traditionally been used in marine applications, in engineering and for household fittings. Die-casting Zinc’s relatively low melting point (420 degrees C) makes it well suited for die-casting, in which molten metal is injected under high pressure into moulds or dies. Speciality zinc alloys, with small quantities of added aluminium, copper or magnesium, are used in die-casting applications. While die-casting has lost market share in some applications to plastics, die-casting is still used to manufacture precision components, for example in the automotive industry. Approximately 10% of zinc metal consumption relates to die-casting applications. Rolled Zinc Zinc alloys are more malleable than pure zinc and can be rolled into sheets or extruded into bars. Zinc sheets are used in the building industry, particularly in continental Europe, for roofing, gutters and other applications for which corrosion resistance is important. Rolled and extruded products account for around 10% of zinc consumption.
— V-76 —
APPENDIX V VALUATION REPORT
Page 2
Chemicals Zinc oxides and chemicals represent around 10% of zinc consumption. Zinc oxide is used in the vulcanization of rubber, mainly for the manufacture of car tyres. Zinc oxide is also used in applications such as paints, ceramics, animal feed and fertilizers, and in various consumer applications. The Zinc Market
The overall zinc market consists of two closely related but distinct sub-markets: the market for zinc concentrates, in which zinc miners are suppliers and smelters are consumers, and the market for zinc metal, in which smelters are suppliers and end users are consumers. Short term imbalances between the supply of and demand for concentrates (i.e. smelting capacity versus concentrate supply), as well as fluctuations in zinc prices, affect the treatment charges levied by smelters and the sharing of value between miners and smelters. The basis on which treatment charges are levied by smelters is discussed in more detail below. In the longer term, it appears reasonable to expect that smelter capacity will adjust to, on average, approximately match concentrate supply and that smelter charges will broadly reflect the rates of return required to justify the building of new smelters. Accordingly, in the longer term the major dynamics affecting the overall zinc market will be the factors affecting mine supply and end use demand for zinc, rather than factors relating to smelter arrangements. Statistics for the global refined zinc market are summarised as follows:
World Zinc Market 2005 2006 2007 2008 2009
Zinc consumption (000’s tonnes) Africa 201 199 211 197 172 Americas 1,946 1,999 1,902 1,812 1,497 Asia 5,423 5,866 6,169 6,383 6,381 of which China 2,900 3,300 3,600 3,875 4,125 Europe 2,682 2,709 2,714 2,514 2,023 Australasia 253 267 251 216 156 Total consumption 10,507 11,042 11,249 11,123 10,230
Zinc production (000’s tonnes) Africa 268 253 278 265 267 Americas 1,879 1,871 1,868 1,835 1,659 Asia 5,010 5,571 6,249 6,595 6,865 of which China 2,790 3,220 3,835 3,970 4,400 Europe 2,546 2,457 2,489 2,451 2,044 Australia 457 463 498 498 526 Total production 10,160 10,614 11,382 11,645 11,361
World zinc stockpile (000’s tonnes) 809 507 519 684 856
LME Cash Average (US¢/lb) 63 148 147 85 75 Source: MMG Zinc Consumption Demand for zinc is closely related to world GDP and industrial production growth. In addition, demand growth tends to slow as economies become wealthier and a greater proportion of GDP growth is contributed by services and high value-add activities. Global refined zinc consumption approximately doubled between 1960-1980, growing at an annualised rate of around 3.5%. The growth rate moderated over the next two decades with consumption increasing at an annualised rate of less than 2% over the period 1981-2000. The second half of this period witnessed the emergence of developing nations and in particular China as a significant consumer of refined zinc. The rate accelerated again between 2001 and 2007 when world refined zinc consumption increased by around 25%. The growth was driven primarily by the rapid Chinese industrialisation, which resulted in China’s zinc consumption almost tripling, consolidating its position as the dominant zinc consumer in the world. The
— V-77 —
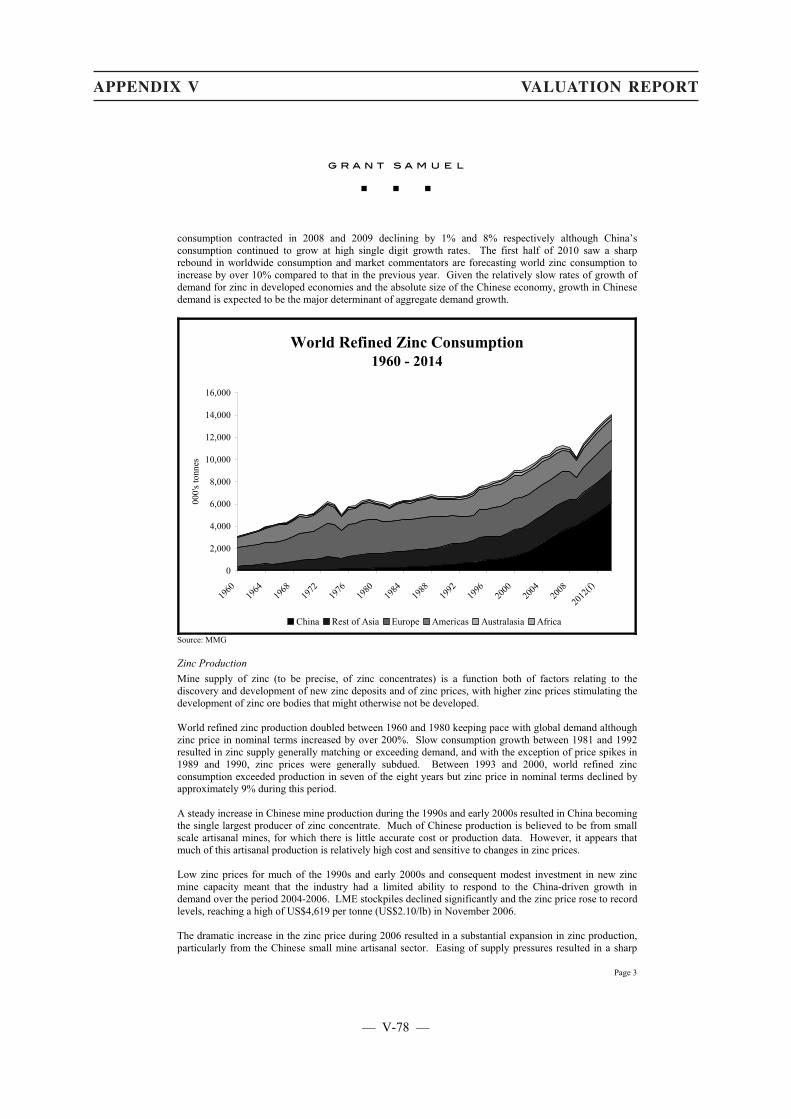
APPENDIX V VALUATION REPORT
Page 3
consumption contracted in 2008 and 2009 declining by 1% and 8% respectively although China’s consumption continued to grow at high single digit growth rates. The first half of 2010 saw a sharp rebound in worldwide consumption and market commentators are forecasting world zinc consumption to increase by over 10% compared to that in the previous year. Given the relatively slow rates of growth of demand for zinc in developed economies and the absolute size of the Chinese economy, growth in Chinese demand is expected to be the major determinant of aggregate demand growth.
World Refined Zinc Consumption1960 - 2014
0
2,000
4,000
6,000
8,000
10,000
12,000
14,000
16,000
1960
1964
1968
1972
1976
1980
1984
1988
1992
1996
2000
2004
2008
2012
(f)
000'
s ton
nes
China Rest of Asia Europe Americas Australasia Africa
Source: MMG Zinc Production Mine supply of zinc (to be precise, of zinc concentrates) is a function both of factors relating to the discovery and development of new zinc deposits and of zinc prices, with higher zinc prices stimulating the development of zinc ore bodies that might otherwise not be developed. World refined zinc production doubled between 1960 and 1980 keeping pace with global demand although zinc price in nominal terms increased by over 200%. Slow consumption growth between 1981 and 1992 resulted in zinc supply generally matching or exceeding demand, and with the exception of price spikes in 1989 and 1990, zinc prices were generally subdued. Between 1993 and 2000, world refined zinc consumption exceeded production in seven of the eight years but zinc price in nominal terms declined by approximately 9% during this period. A steady increase in Chinese mine production during the 1990s and early 2000s resulted in China becoming the single largest producer of zinc concentrate. Much of Chinese production is believed to be from small scale artisanal mines, for which there is little accurate cost or production data. However, it appears that much of this artisanal production is relatively high cost and sensitive to changes in zinc prices. Low zinc prices for much of the 1990s and early 2000s and consequent modest investment in new zinc mine capacity meant that the industry had a limited ability to respond to the China-driven growth in demand over the period 2004-2006. LME stockpiles declined significantly and the zinc price rose to record levels, reaching a high of US$4,619 per tonne (US$2.10/lb) in November 2006. The dramatic increase in the zinc price during 2006 resulted in a substantial expansion in zinc production, particularly from the Chinese small mine artisanal sector. Easing of supply pressures resulted in a sharp
— V-78 —
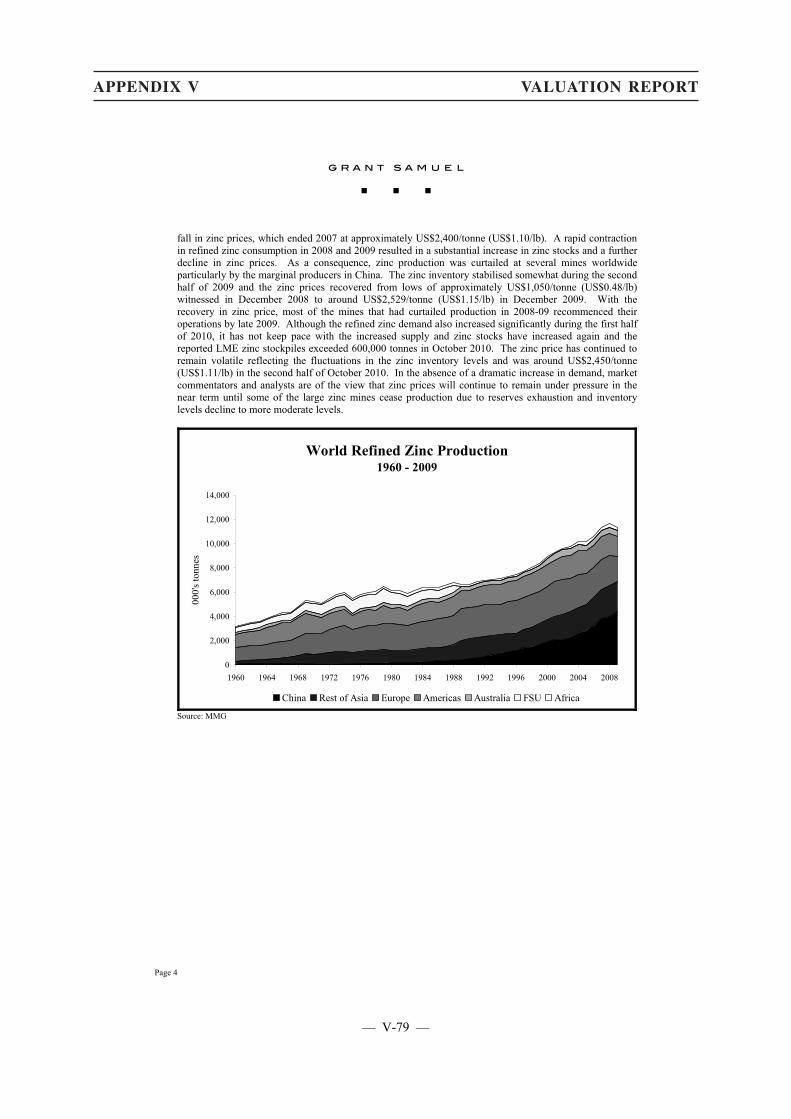
APPENDIX V VALUATION REPORT
Page 4
fall in zinc prices, which ended 2007 at approximately US$2,400/tonne (US$1.10/lb). A rapid contraction in refined zinc consumption in 2008 and 2009 resulted in a substantial increase in zinc stocks and a further decline in zinc prices. As a consequence, zinc production was curtailed at several mines worldwide particularly by the marginal producers in China. The zinc inventory stabilised somewhat during the second half of 2009 and the zinc prices recovered from lows of approximately US$1,050/tonne (US$0.48/lb) witnessed in December 2008 to around US$2,529/tonne (US$1.15/lb) in December 2009. With the recovery in zinc price, most of the mines that had curtailed production in 2008-09 recommenced their operations by late 2009. Although the refined zinc demand also increased significantly during the first half of 2010, it has not keep pace with the increased supply and zinc stocks have increased again and the reported LME zinc stockpiles exceeded 600,000 tonnes in October 2010. The zinc price has continued to remain volatile reflecting the fluctuations in the zinc inventory levels and was around US$2,450/tonne (US$1.11/lb) in the second half of October 2010. In the absence of a dramatic increase in demand, market commentators and analysts are of the view that zinc prices will continue to remain under pressure in the near term until some of the large zinc mines cease production due to reserves exhaustion and inventory levels decline to more moderate levels.
World Refined Zinc Production1960 - 2009
0
2,000
4,000
6,000
8,000
10,000
12,000
14,000
1960 1964 1968 1972 1976 1980 1984 1988 1992 1996 2000 2004 2008
000'
s ton
nes
China Rest of Asia Europe Americas Australia FSU Africa
Source: MMG
— V-79 —
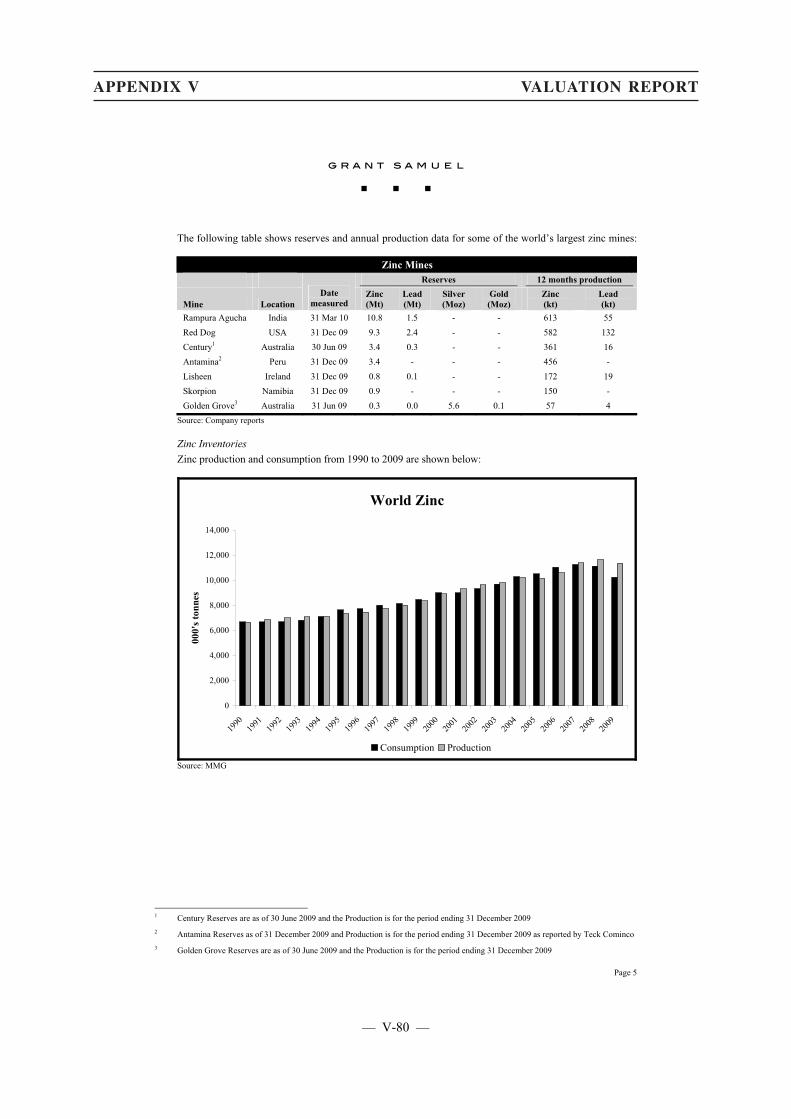
APPENDIX V VALUATION REPORT
Page 5
The following table shows reserves and annual production data for some of the world’s largest zinc mines:
Zinc Mines Reserves 12 months production
Mine Location Date
measured Zinc (Mt)
Lead (Mt)
Silver (Moz)
Gold (Moz)
Zinc (kt)
Lead (kt)
Rampura Agucha India 31 Mar 10 10.8 1.5 - - 613 55 Red Dog USA 31 Dec 09 9.3 2.4 - - 582 132
Century1 Australia 30 Jun 09 3.4 0.3 - - 361 16 Antamina2 Peru 31 Dec 09 3.4 - - - 456 - Lisheen Ireland 31 Dec 09 0.8 0.1 - - 172 19 Skorpion Namibia 31 Dec 09 0.9 - - - 150 - Golden Grove3 Australia 31 Jun 09 0.3 0.0 5.6 0.1 57 4
Source: Company reports Zinc Inventories Zinc production and consumption from 1990 to 2009 are shown below:
World Zinc
0
2,000
4,000
6,000
8,000
10,000
12,000
14,000
1990
1991
1992
1993
1994
1995
1996
1997
1998
1999
2000
2001
2002
2003
2004
2005
2006
2007
2008
2009
000'
s ton
nes
Consumption Production
Source: MMG
1 Century Reserves are as of 30 June 2009 and the Production is for the period ending 31 December 2009 2 Antamina Reserves as of 31 December 2009 and Production is for the period ending 31 December 2009 as reported by Teck Cominco 3 Golden Grove Reserves are as of 30 June 2009 and the Production is for the period ending 31 December 2009
— V-80 —
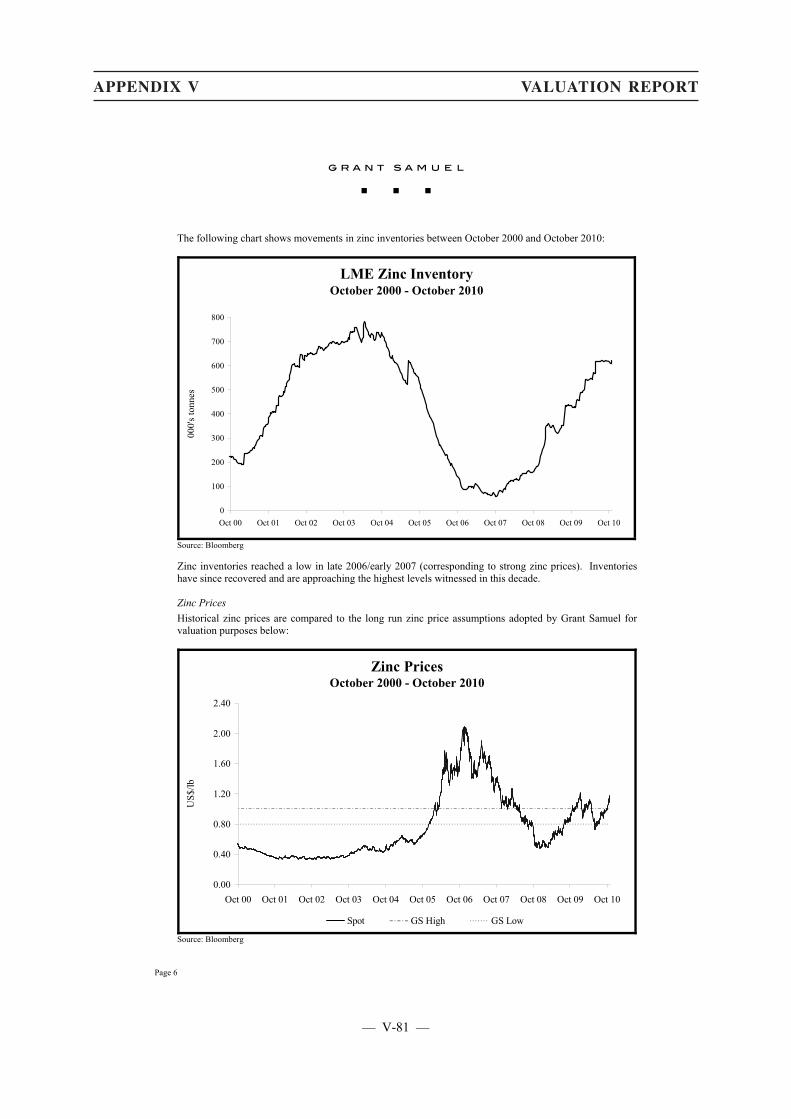
APPENDIX V VALUATION REPORT
Page 6
The following chart shows movements in zinc inventories between October 2000 and October 2010:
LME Zinc InventoryOctober 2000 - October 2010
0
100
200
300
400
500
600
700
800
Oct 00 Oct 01 Oct 02 Oct 03 Oct 04 Oct 05 Oct 06 Oct 07 Oct 08 Oct 09 Oct 10
000'
s ton
nes
Source: Bloomberg Zinc inventories reached a low in late 2006/early 2007 (corresponding to strong zinc prices). Inventories have since recovered and are approaching the highest levels witnessed in this decade. Zinc Prices Historical zinc prices are compared to the long run zinc price assumptions adopted by Grant Samuel for valuation purposes below:
Zinc PricesOctober 2000 - October 2010
0.00
0.40
0.80
1.20
1.60
2.00
2.40
Oct 00 Oct 01 Oct 02 Oct 03 Oct 04 Oct 05 Oct 06 Oct 07 Oct 08 Oct 09 Oct 10
US$
/lb
Spot GS High GS Low
Source: Bloomberg
— V-81 —
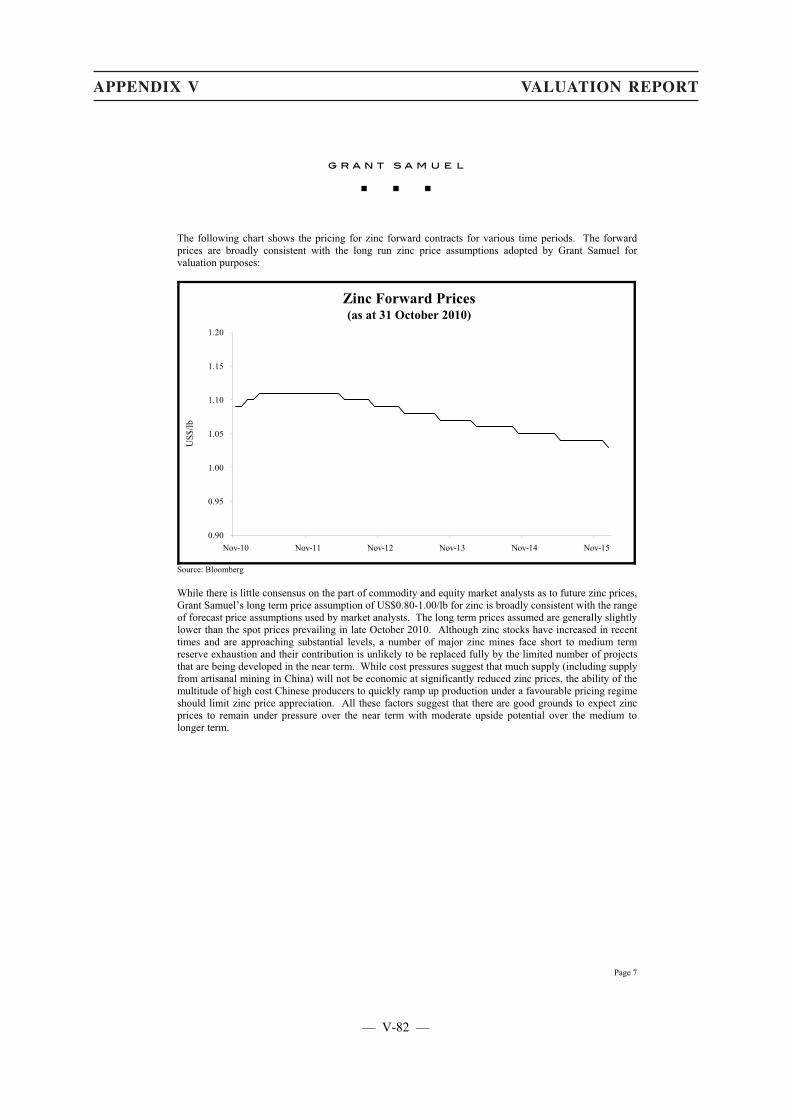
APPENDIX V VALUATION REPORT
Page 7
The following chart shows the pricing for zinc forward contracts for various time periods. The forward prices are broadly consistent with the long run zinc price assumptions adopted by Grant Samuel for valuation purposes:
Zinc Forward Prices(as at 31 October 2010)
0.90
0.95
1.00
1.05
1.10
1.15
1.20
Nov-10 Nov-11 Nov-12 Nov-13 Nov-14 Nov-15
US$
/lb
Source: Bloomberg While there is little consensus on the part of commodity and equity market analysts as to future zinc prices, Grant Samuel’s long term price assumption of US$0.80-1.00/lb for zinc is broadly consistent with the range of forecast price assumptions used by market analysts. The long term prices assumed are generally slightly lower than the spot prices prevailing in late October 2010. Although zinc stocks have increased in recent times and are approaching substantial levels, a number of major zinc mines face short to medium term reserve exhaustion and their contribution is unlikely to be replaced fully by the limited number of projects that are being developed in the near term. While cost pressures suggest that much supply (including supply from artisanal mining in China) will not be economic at significantly reduced zinc prices, the ability of the multitude of high cost Chinese producers to quickly ramp up production under a favourable pricing regime should limit zinc price appreciation. All these factors suggest that there are good grounds to expect zinc prices to remain under pressure over the near term with moderate upside potential over the medium to longer term.
— V-82 —
APPENDIX V VALUATION REPORT
Page 8
2 Copper
Overview
Copper is valued for its electrical and thermal conductive properties, its durability and its strength. Copper is the second most commonly used non-ferrous metal after aluminium. It readily alloys with other metals and is resistant to corrosion. These properties allow copper to be used in a wide range of applications in building and construction, electrical applications, electronics and communication, transportation, industrial machinery and equipment, consumer and general products. Copper is mined in open pit and underground mines. The orebodies contain a percentage of copper that is generally less than 5% of the ore. The miners either produce a copper concentrate (which is sold to smelters or traders) or copper metal (which is sold to end users or traders). Over the past decade, the commissioning of large copper mines that produce copper metal using solvent extraction/electrowinning (“SX/EW”) metallurgical processes has resulted in additional, low cost copper production. Recycled copper is a significant secondary source of copper. Copper and its alloys have been recycled for hundreds of years and account for a substantial proportion of the copper produced and sold each year. Applications
Copper is one of the first metals to be used by humans though its role has evolved over time. Since the discovery of electricity and magnetism in the 18th and 19th centuries, copper has found widespread use in electrical goods and wires and is used across a wide range of industries. Copper can be easily recovered and recycled. Building and Construction The building and construction industry is the largest consumer of copper. Non-corrosive copper pipes have been used for plumbing in buildings for centuries because they can be easily joined metallurgically by brazing or soldering. Copper and its alloys are now extensively used in building construction for wiring, water piping, gas tubing, roofing, architectural building design, heating and air conditioning systems, interior and exterior artwork, doorknobs, lightning rods, faucets and fire sprinkler systems. Copper does not burn or support combustion and is therefore relatively safe. Electrical, Electronics and Communication Copper is malleable, ductile and is a good conductor of electricity at room temperature. It is widely used in electric generators, household electrical wiring and wiring in appliances, lights, motors, radios and TV sets. Copper wires are used extensively in telecommunication networks for high speed transfer of voice and data. In the semiconductor industry, copper is used in microprocessor chips to transfer heat from the chip circuitry. Industrial Machinery and Equipment Copper readily forms alloys with other metals. Some alloys are commonly used in industrial machinery and equipment. Copper and its alloys are preferred for making products such as gear sets, bearings, and turbine blades because of their durability, machinability and ease of casting with high precision and tolerance. Transportation Copper is also used in the automobile, aerospace and railway industries. For many years, the radiator was the most important end use of copper in the automobile industry. However, the usage of copper in automotive electrical and electronic applications has grown rapidly while its use in the heat exchanger has declined. In the aerospace industry, the mechanical properties of copper alloys including their good strength-to-weight ratios, bearing strength and fatigue and corrosion resistance have favoured the use of these alloys in undercarriage components, aero engine bearings, bushings, display unit components, and helicopter motor spindles. A large amount of copper is used in railway systems for electrification and in the manufacture of switchgears and motor windings.
— V-83 —
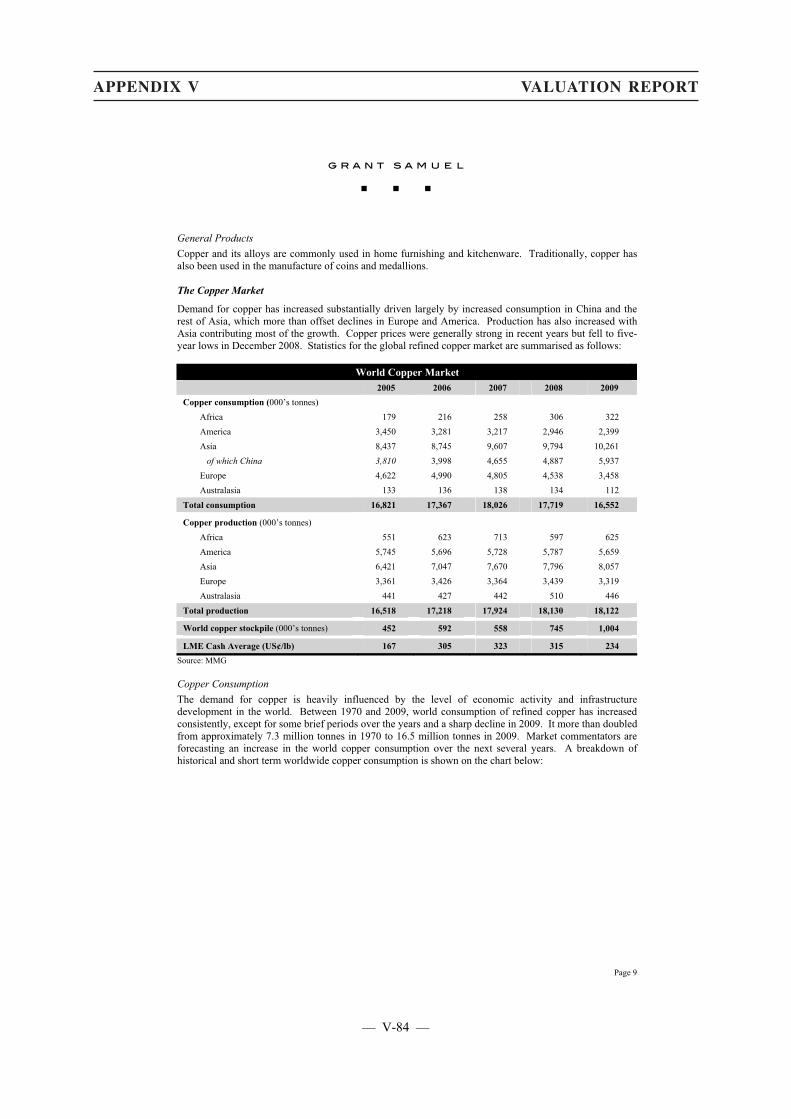
APPENDIX V VALUATION REPORT
Page 9
General Products Copper and its alloys are commonly used in home furnishing and kitchenware. Traditionally, copper has also been used in the manufacture of coins and medallions. The Copper Market
Demand for copper has increased substantially driven largely by increased consumption in China and the rest of Asia, which more than offset declines in Europe and America. Production has also increased with Asia contributing most of the growth. Copper prices were generally strong in recent years but fell to five-year lows in December 2008. Statistics for the global refined copper market are summarised as follows:
World Copper Market 2005 2006 2007 2008 2009
Copper consumption (000’s tonnes) Africa 179 216 258 306 322 America 3,450 3,281 3,217 2,946 2,399 Asia 8,437 8,745 9,607 9,794 10,261 of which China 3,810 3,998 4,655 4,887 5,937 Europe 4,622 4,990 4,805 4,538 3,458 Australasia 133 136 138 134 112 Total consumption 16,821 17,367 18,026 17,719 16,552
Copper production (000’s tonnes) Africa 551 623 713 597 625 America 5,745 5,696 5,728 5,787 5,659 Asia 6,421 7,047 7,670 7,796 8,057 Europe 3,361 3,426 3,364 3,439 3,319 Australasia 441 427 442 510 446 Total production 16,518 17,218 17,924 18,130 18,122
World copper stockpile (000’s tonnes) 452 592 558 745 1,004
LME Cash Average (US¢/lb) 167 305 323 315 234 Source: MMG Copper Consumption The demand for copper is heavily influenced by the level of economic activity and infrastructure development in the world. Between 1970 and 2009, world consumption of refined copper has increased consistently, except for some brief periods over the years and a sharp decline in 2009. It more than doubled from approximately 7.3 million tonnes in 1970 to 16.5 million tonnes in 2009. Market commentators are forecasting an increase in the world copper consumption over the next several years. A breakdown of historical and short term worldwide copper consumption is shown on the chart below:
— V-84 —
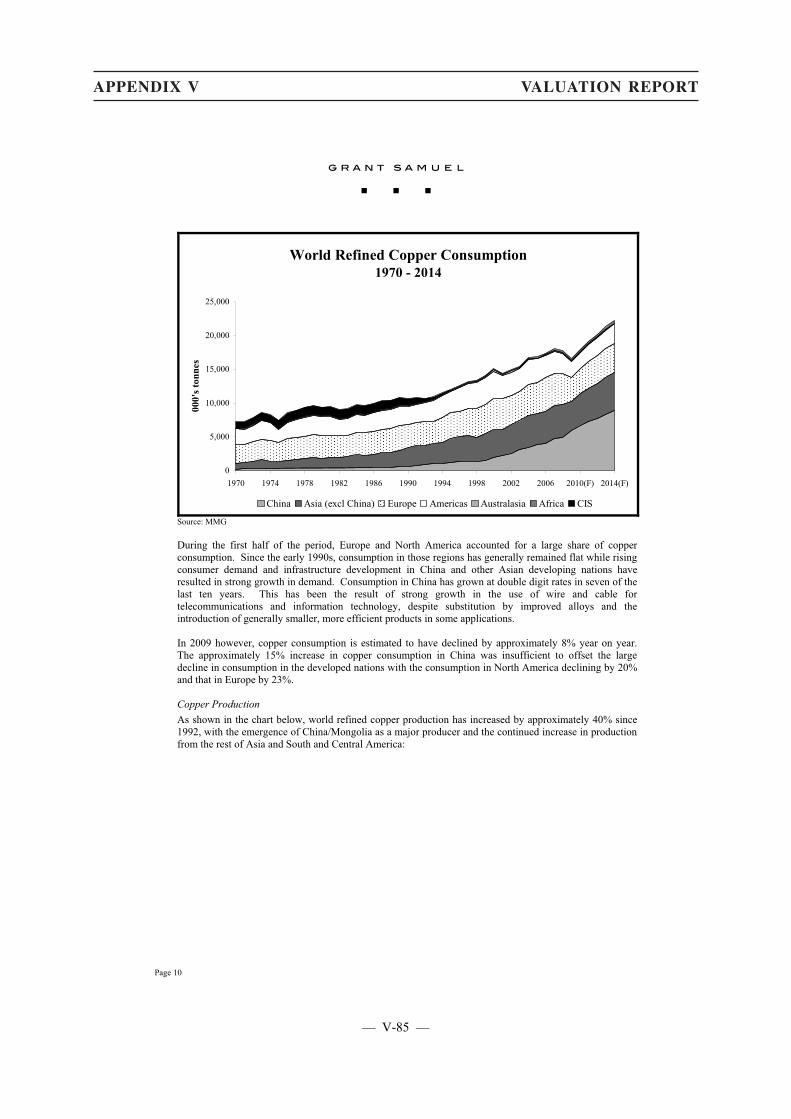
APPENDIX V VALUATION REPORT
Page 10
World Refined Copper Consumption1970 - 2014
0
5,000
10,000
15,000
20,000
25,000
1970 1974 1978 1982 1986 1990 1994 1998 2002 2006 2010(F) 2014(F)
000'
s ton
nes
China Asia (excl China) Europe Americas Australasia Africa CIS
Source: MMG During the first half of the period, Europe and North America accounted for a large share of copper consumption. Since the early 1990s, consumption in those regions has generally remained flat while rising consumer demand and infrastructure development in China and other Asian developing nations have resulted in strong growth in demand. Consumption in China has grown at double digit rates in seven of the last ten years. This has been the result of strong growth in the use of wire and cable for telecommunications and information technology, despite substitution by improved alloys and the introduction of generally smaller, more efficient products in some applications. In 2009 however, copper consumption is estimated to have declined by approximately 8% year on year. The approximately 15% increase in copper consumption in China was insufficient to offset the large decline in consumption in the developed nations with the consumption in North America declining by 20% and that in Europe by 23%. Copper Production As shown in the chart below, world refined copper production has increased by approximately 40% since 1992, with the emergence of China/Mongolia as a major producer and the continued increase in production from the rest of Asia and South and Central America:
— V-85 —
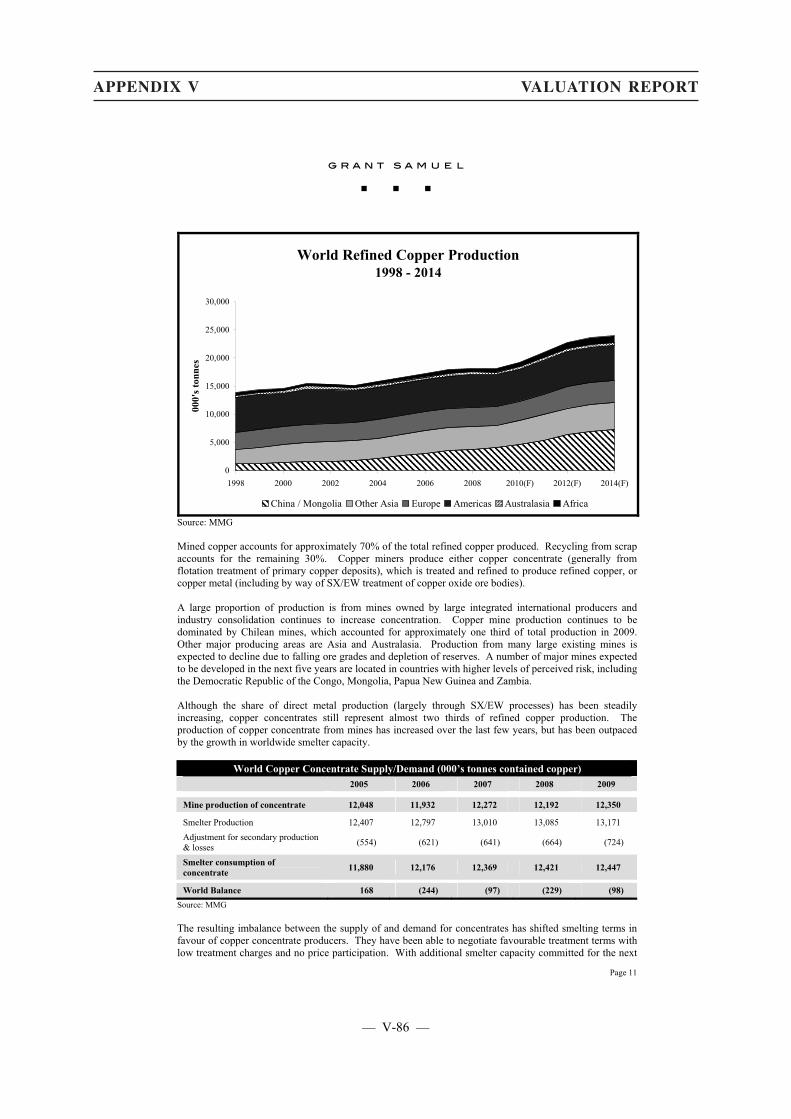
APPENDIX V VALUATION REPORT
Page 11
World Refined Copper Production1998 - 2014
0
5,000
10,000
15,000
20,000
25,000
30,000
1998 2000 2002 2004 2006 2008 2010(F) 2012(F) 2014(F)
000'
s ton
nes
China / Mongolia Other Asia Europe Americas Australasia Africa
Source: MMG Mined copper accounts for approximately 70% of the total refined copper produced. Recycling from scrap accounts for the remaining 30%. Copper miners produce either copper concentrate (generally from flotation treatment of primary copper deposits), which is treated and refined to produce refined copper, or copper metal (including by way of SX/EW treatment of copper oxide ore bodies). A large proportion of production is from mines owned by large integrated international producers and industry consolidation continues to increase concentration. Copper mine production continues to be dominated by Chilean mines, which accounted for approximately one third of total production in 2009. Other major producing areas are Asia and Australasia. Production from many large existing mines is expected to decline due to falling ore grades and depletion of reserves. A number of major mines expected to be developed in the next five years are located in countries with higher levels of perceived risk, including the Democratic Republic of the Congo, Mongolia, Papua New Guinea and Zambia. Although the share of direct metal production (largely through SX/EW processes) has been steadily increasing, copper concentrates still represent almost two thirds of refined copper production. The production of copper concentrate from mines has increased over the last few years, but has been outpaced by the growth in worldwide smelter capacity.
World Copper Concentrate Supply/Demand (000’s tonnes contained copper) 2005 2006 2007 2008 2009
Mine production of concentrate 12,048 11,932 12,272 12,192 12,350
Smelter Production 12,407 12,797 13,010 13,085 13,171 Adjustment for secondary production & losses (554) (621) (641) (664) (724)
Smelter consumption of concentrate 11,880 12,176 12,369 12,421 12,447
World Balance 168 (244) (97) (229) (98) Source: MMG The resulting imbalance between the supply of and demand for concentrates has shifted smelting terms in favour of copper concentrate producers. They have been able to negotiate favourable treatment terms with low treatment charges and no price participation. With additional smelter capacity committed for the next
— V-86 —
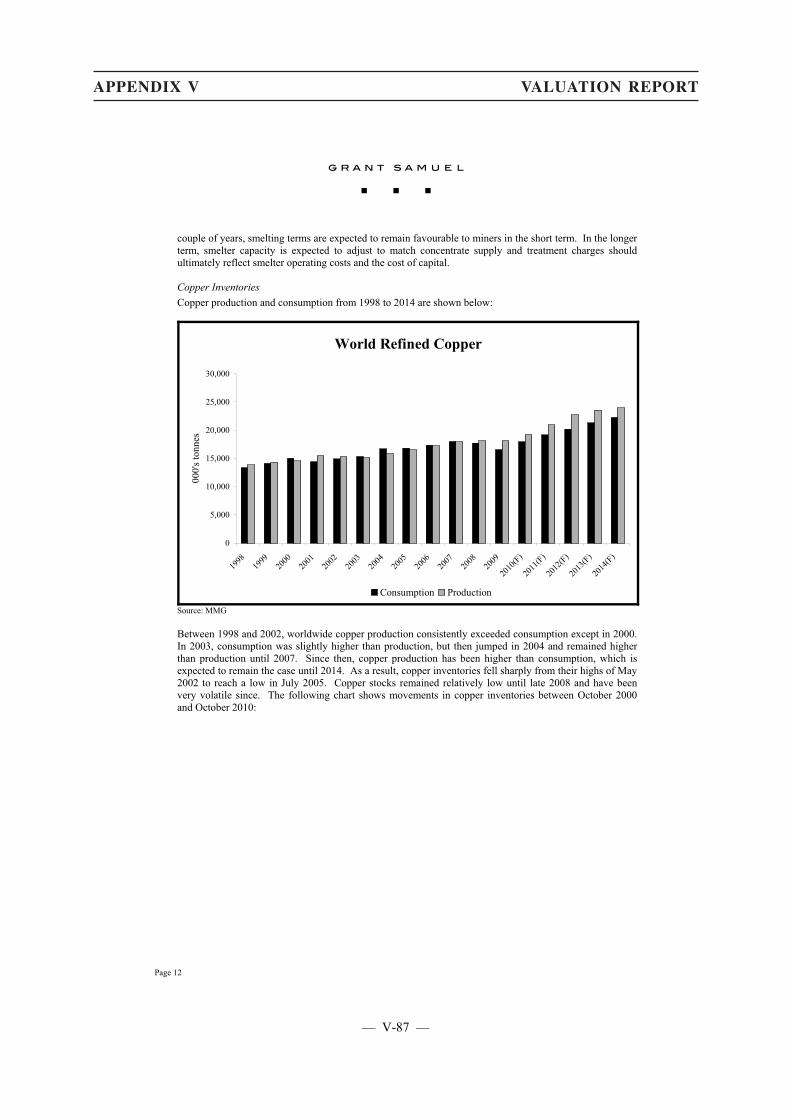
APPENDIX V VALUATION REPORT
Page 12
couple of years, smelting terms are expected to remain favourable to miners in the short term. In the longer term, smelter capacity is expected to adjust to match concentrate supply and treatment charges should ultimately reflect smelter operating costs and the cost of capital. Copper Inventories Copper production and consumption from 1998 to 2014 are shown below:
World Refined Copper
0
5,000
10,000
15,000
20,000
25,000
30,000
1998
1999
2000
2001
2002
2003
2004
2005
2006
2007
2008
2009
2010
(F)
2011
(F)
2012
(F)
2013
(F)
2014
(F)
000'
s ton
nes
Consumption Production
Source: MMG Between 1998 and 2002, worldwide copper production consistently exceeded consumption except in 2000. In 2003, consumption was slightly higher than production, but then jumped in 2004 and remained higher than production until 2007. Since then, copper production has been higher than consumption, which is expected to remain the case until 2014. As a result, copper inventories fell sharply from their highs of May 2002 to reach a low in July 2005. Copper stocks remained relatively low until late 2008 and have been very volatile since. The following chart shows movements in copper inventories between October 2000 and October 2010:
— V-87 —
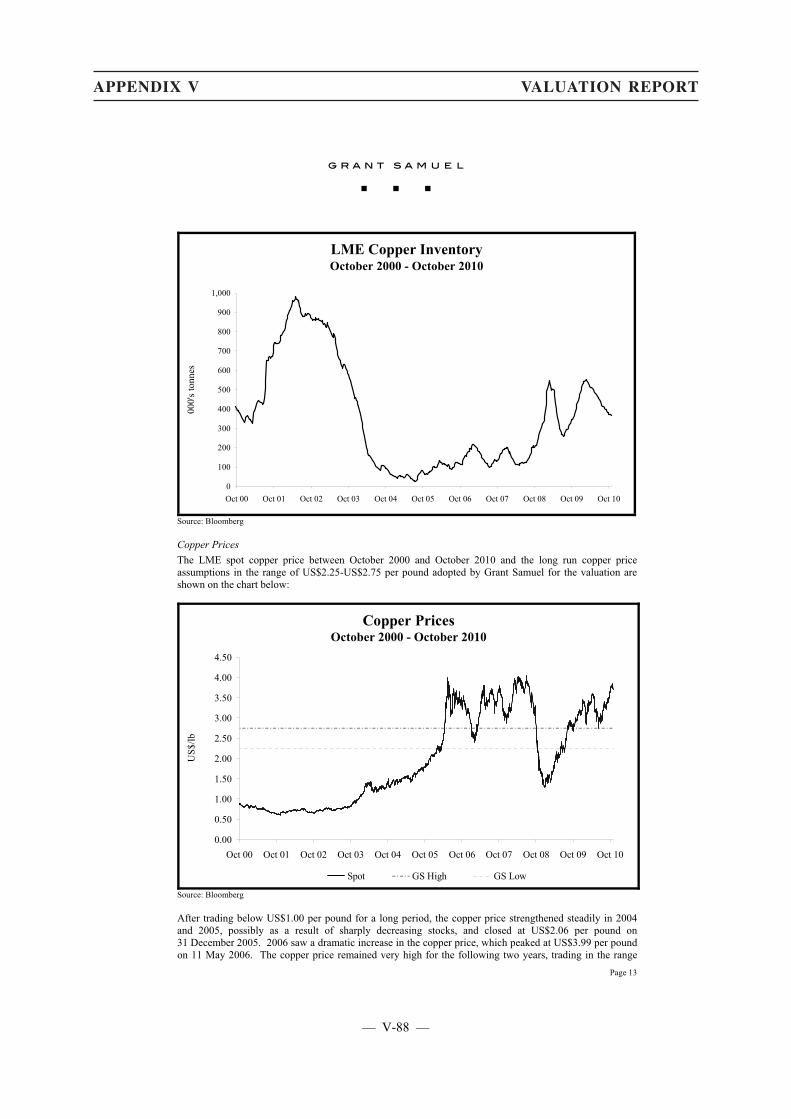
APPENDIX V VALUATION REPORT
Page 13
LME Copper InventoryOctober 2000 - October 2010
0
100
200
300
400
500
600
700
800
900
1,000
Oct 00 Oct 01 Oct 02 Oct 03 Oct 04 Oct 05 Oct 06 Oct 07 Oct 08 Oct 09 Oct 10
000'
s ton
nes
Source: Bloomberg Copper Prices The LME spot copper price between October 2000 and October 2010 and the long run copper price assumptions in the range of US$2.25-US$2.75 per pound adopted by Grant Samuel for the valuation are shown on the chart below:
Copper PricesOctober 2000 - October 2010
0.00
0.50
1.00
1.50
2.00
2.50
3.00
3.50
4.00
4.50
Oct 00 Oct 01 Oct 02 Oct 03 Oct 04 Oct 05 Oct 06 Oct 07 Oct 08 Oct 09 Oct 10
US$
/lb
Spot GS High GS Low
Source: Bloomberg After trading below US$1.00 per pound for a long period, the copper price strengthened steadily in 2004 and 2005, possibly as a result of sharply decreasing stocks, and closed at US$2.06 per pound on 31 December 2005. 2006 saw a dramatic increase in the copper price, which peaked at US$3.99 per pound on 11 May 2006. The copper price remained very high for the following two years, trading in the range
— V-88 —
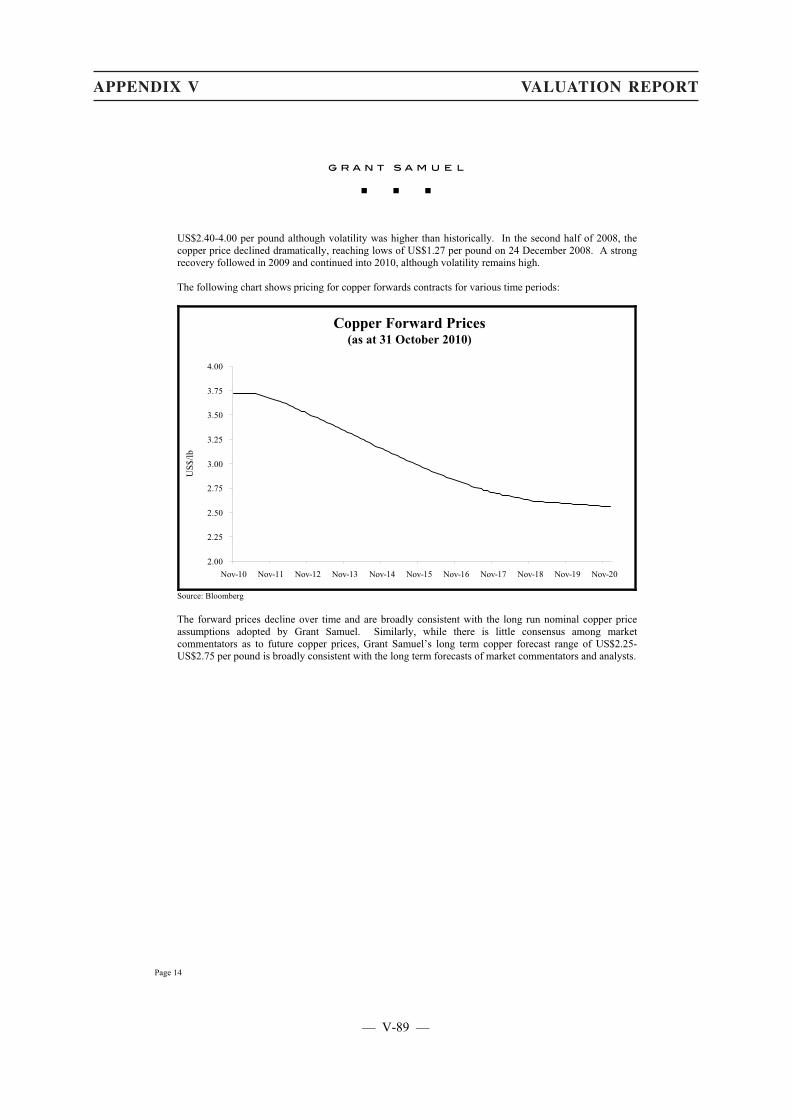
APPENDIX V VALUATION REPORT
Page 14
US$2.40-4.00 per pound although volatility was higher than historically. In the second half of 2008, the copper price declined dramatically, reaching lows of US$1.27 per pound on 24 December 2008. A strong recovery followed in 2009 and continued into 2010, although volatility remains high. The following chart shows pricing for copper forwards contracts for various time periods:
Copper Forward Prices(as at 31 October 2010)
2.00
2.25
2.50
2.75
3.00
3.25
3.50
3.75
4.00
Nov-10 Nov-11 Nov-12 Nov-13 Nov-14 Nov-15 Nov-16 Nov-17 Nov-18 Nov-19 Nov-20
US$
/lb
Source: Bloomberg The forward prices decline over time and are broadly consistent with the long run nominal copper price assumptions adopted by Grant Samuel. Similarly, while there is little consensus among market commentators as to future copper prices, Grant Samuel’s long term copper forecast range of US$2.25-US$2.75 per pound is broadly consistent with the long term forecasts of market commentators and analysts.
— V-89 —

1. RESPONSIBILITY STATEMENT
This circular, for which the Directors collectively and individually accept full responsibility,
includes particulars given in compliance with the Listing Rules for the purpose of giving information
with regard to the Enlarged Group. The Directors, having made all reasonable enquiries, confirm that
to the best of their knowledge and belief, the information contained in this circular is accurate and
complete in all material respects and not misleading or deceptive, and there are no other matters the
omission of which would make any statement in this circular misleading.
2. SHARE CAPITAL
Assuming no changes in the shareholding of the Company from the Latest Practicable Date other
than those contemplated under the Share Sale Deed, the authorised and issued share capital of the
Company (a) as at the Latest Practicable Date; (b) upon the increase in the authorised share capital
of the Company; (c) immediately after Completion (assuming no conversion of the PSCS); and (d)
immediately after Completion (assuming full conversion of the PSCS) and the issuance of all new
Shares under the Specific Mandate is set out below:
As at the Latest Practicable Date
Authorised: HK$
6,000,000,000 Shares as at the Latest Practicable Date 300,000,000.00
Issued and fully paid, or credited as fully paid:
2,026,216,799 Shares as at the Latest Practicable Date 101,310,839.95
Upon the increase in the authorised share capital of the Company
Authorised:
18,000,000,000 Shares 900,000,000.00
Issued and fully paid, or credited as fully paid:
2,026,216,799 Shares as at the Latest Practicable Date 101,310,839.95
APPENDIX VI GENERAL INFORMATION
— VI-1 —
App1,part B2
App1,part B10,22(1)14.67(1)14.67(2)
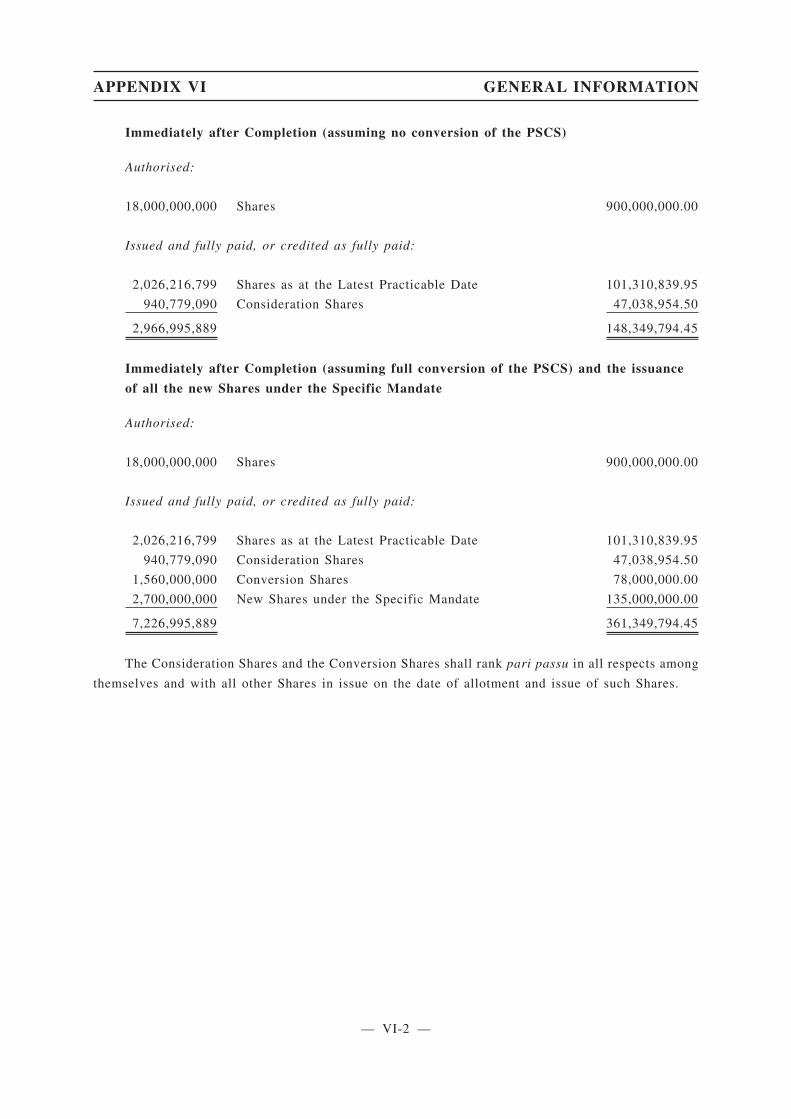
Immediately after Completion (assuming no conversion of the PSCS)
Authorised:
18,000,000,000 Shares 900,000,000.00
Issued and fully paid, or credited as fully paid:
2,026,216,799 Shares as at the Latest Practicable Date 101,310,839.95
940,779,090 Consideration Shares 47,038,954.50
2,966,995,889 148,349,794.45
Immediately after Completion (assuming full conversion of the PSCS) and the issuance
of all the new Shares under the Specific Mandate
Authorised:
18,000,000,000 Shares 900,000,000.00
Issued and fully paid, or credited as fully paid:
2,026,216,799 Shares as at the Latest Practicable Date 101,310,839.95
940,779,090 Consideration Shares 47,038,954.50
1,560,000,000 Conversion Shares 78,000,000.00
2,700,000,000 New Shares under the Specific Mandate 135,000,000.00
7,226,995,889 361,349,794.45
The Consideration Shares and the Conversion Shares shall rank pari passu in all respects among
themselves and with all other Shares in issue on the date of allotment and issue of such Shares.
APPENDIX VI GENERAL INFORMATION
— VI-2 —
3. DISCLOSURE OF INTERESTS
(a) Directors’ interests and short positions in the Shares, underlying Shares and debentures
of the Company or its associated corporations
As at the Latest Practicable Date, the interests and short positions of each of the Directors and
the chief executive of the Company in the Shares, underlying Shares and debentures of the Company
or any of its associated corporations (within the meaning of Part XV of the SFO) which were required
to be notified to the Company and the Stock Exchange pursuant to Divisions 7 and 8 of Part XV of
the SFO (including interests and short positions which they are taken or deemed to have under such
provisions of the SFO), or which were required to be entered in the register required to be kept
pursuant to Section 352 of the SFO or which were required to be notified to the Company and the
Stock Exchange pursuant to the Model Code for Securities Transactions by Directors of Listed Issuers
(the “Model Code”) as set out in Appendix 10 of the Listing Rules were as follows:
Long position in the underlying Shares
Name of DirectorNature of
interest
Number ofunderlying
Shares held
Approximatepercentage of
total number ofissued Shares
as at the LatestPracticable Date
(Note 1) (Note 2)
Li Fuli Personal 1,300,000 0.06%
Hao Chuanfu Personal 1,600,000 0.08%
Zhan Wei Personal 1,200,000 0.06%
Shen Ling Personal 1,000,000 0.05%
Zong Qingsheng Personal 1,000,000 0.05%
Xu Jiqing Personal 1,000,000 0.05%
Li Liangang Personal 1,100,000 0.05%
Notes:
1. The Directors’ interests in the underlying shares are through share options granted by the Company pursuant to
the share option scheme adopted by the Company on 28 May 2004.
2. The calculation is based on the number of underlying shares as a percentage of the total number of issued shares
of the Company (i.e. 2,026,216,799 shares) as at the Latest Practicable Date.
APPENDIX VI GENERAL INFORMATION
— VI-3 —
14.66(3)
App1,part B34,38(1) (1A)14A.59(4)
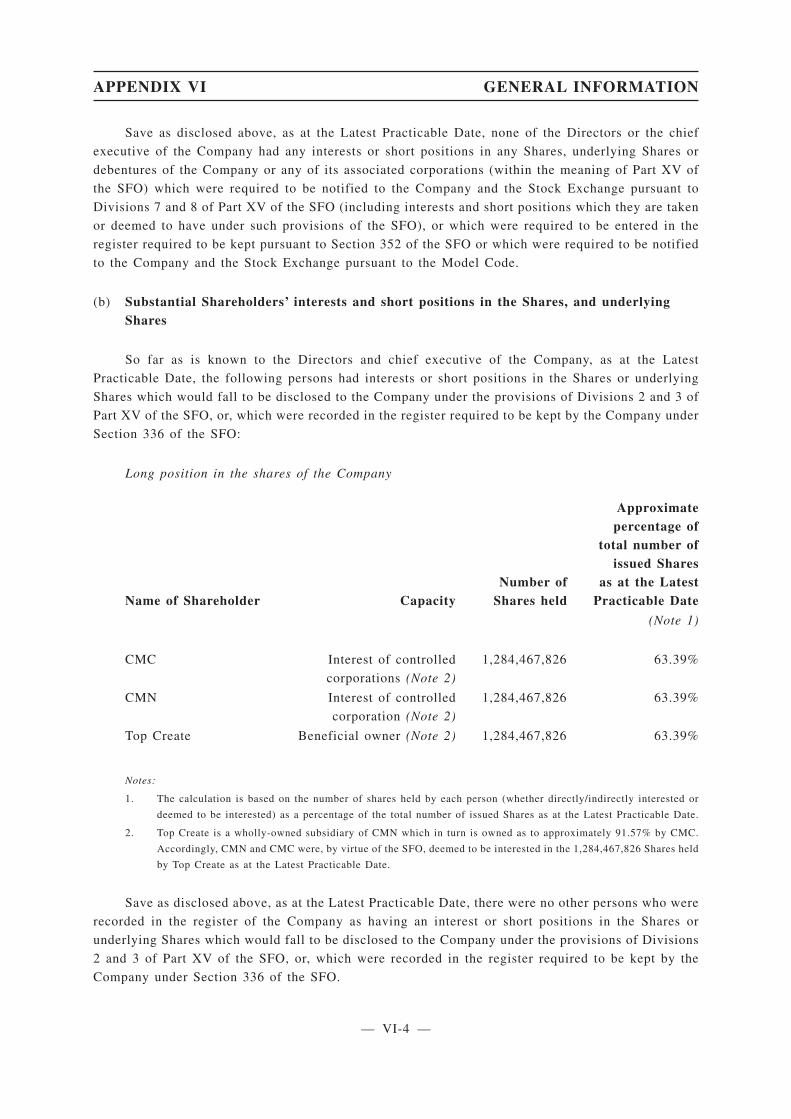
Save as disclosed above, as at the Latest Practicable Date, none of the Directors or the chief
executive of the Company had any interests or short positions in any Shares, underlying Shares or
debentures of the Company or any of its associated corporations (within the meaning of Part XV of
the SFO) which were required to be notified to the Company and the Stock Exchange pursuant to
Divisions 7 and 8 of Part XV of the SFO (including interests and short positions which they are taken
or deemed to have under such provisions of the SFO), or which were required to be entered in the
register required to be kept pursuant to Section 352 of the SFO or which were required to be notified
to the Company and the Stock Exchange pursuant to the Model Code.
(b) Substantial Shareholders’ interests and short positions in the Shares, and underlyingShares
So far as is known to the Directors and chief executive of the Company, as at the Latest
Practicable Date, the following persons had interests or short positions in the Shares or underlying
Shares which would fall to be disclosed to the Company under the provisions of Divisions 2 and 3 of
Part XV of the SFO, or, which were recorded in the register required to be kept by the Company under
Section 336 of the SFO:
Long position in the shares of the Company
Name of Shareholder CapacityNumber of
Shares held
Approximatepercentage of
total number ofissued Shares
as at the LatestPracticable Date
(Note 1)
CMC Interest of controlled
corporations (Note 2)
1,284,467,826 63.39%
CMN Interest of controlled
corporation (Note 2)
1,284,467,826 63.39%
Top Create Beneficial owner (Note 2) 1,284,467,826 63.39%
Notes:
1. The calculation is based on the number of shares held by each person (whether directly/indirectly interested or
deemed to be interested) as a percentage of the total number of issued Shares as at the Latest Practicable Date.
2. Top Create is a wholly-owned subsidiary of CMN which in turn is owned as to approximately 91.57% by CMC.
Accordingly, CMN and CMC were, by virtue of the SFO, deemed to be interested in the 1,284,467,826 Shares held
by Top Create as at the Latest Practicable Date.
Save as disclosed above, as at the Latest Practicable Date, there were no other persons who were
recorded in the register of the Company as having an interest or short positions in the Shares or
underlying Shares which would fall to be disclosed to the Company under the provisions of Divisions
2 and 3 of Part XV of the SFO, or, which were recorded in the register required to be kept by the
Company under Section 336 of the SFO.
APPENDIX VI GENERAL INFORMATION
— VI-4 —
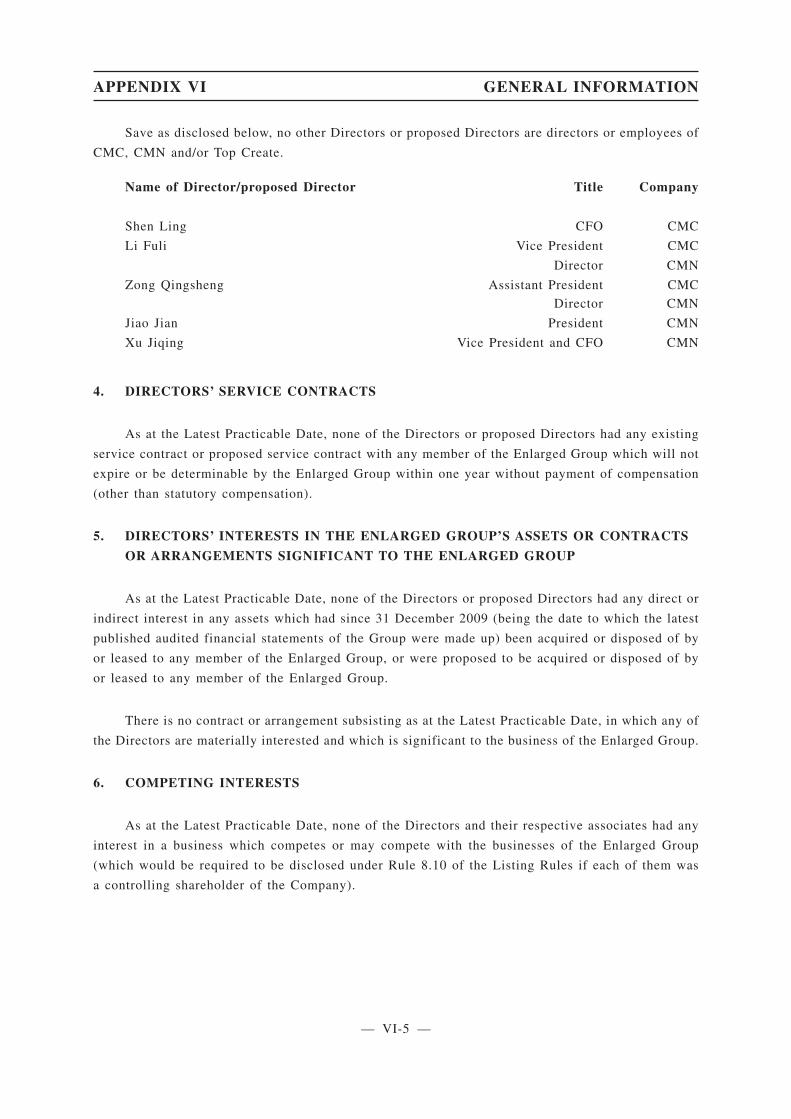
Save as disclosed below, no other Directors or proposed Directors are directors or employees of
CMC, CMN and/or Top Create.
Name of Director/proposed Director Title Company
Shen Ling CFO CMC
Li Fuli Vice President CMC
Director CMN
Zong Qingsheng Assistant President
Director
CMC
CMN
Jiao Jian President CMN
Xu Jiqing Vice President and CFO CMN
4. DIRECTORS’ SERVICE CONTRACTS
As at the Latest Practicable Date, none of the Directors or proposed Directors had any existing
service contract or proposed service contract with any member of the Enlarged Group which will not
expire or be determinable by the Enlarged Group within one year without payment of compensation
(other than statutory compensation).
5. DIRECTORS’ INTERESTS IN THE ENLARGED GROUP’S ASSETS OR CONTRACTS
OR ARRANGEMENTS SIGNIFICANT TO THE ENLARGED GROUP
As at the Latest Practicable Date, none of the Directors or proposed Directors had any direct or
indirect interest in any assets which had since 31 December 2009 (being the date to which the latest
published audited financial statements of the Group were made up) been acquired or disposed of by
or leased to any member of the Enlarged Group, or were proposed to be acquired or disposed of by
or leased to any member of the Enlarged Group.
There is no contract or arrangement subsisting as at the Latest Practicable Date, in which any of
the Directors are materially interested and which is significant to the business of the Enlarged Group.
6. COMPETING INTERESTS
As at the Latest Practicable Date, none of the Directors and their respective associates had any
interest in a business which competes or may compete with the businesses of the Enlarged Group
(which would be required to be disclosed under Rule 8.10 of the Listing Rules if each of them was
a controlling shareholder of the Company).
APPENDIX VI GENERAL INFORMATION
— VI-5 —
App1,part B3943(2)(a)14.66(7)
App1,part B40(1),(2)
14.66(8)14A.59(11)
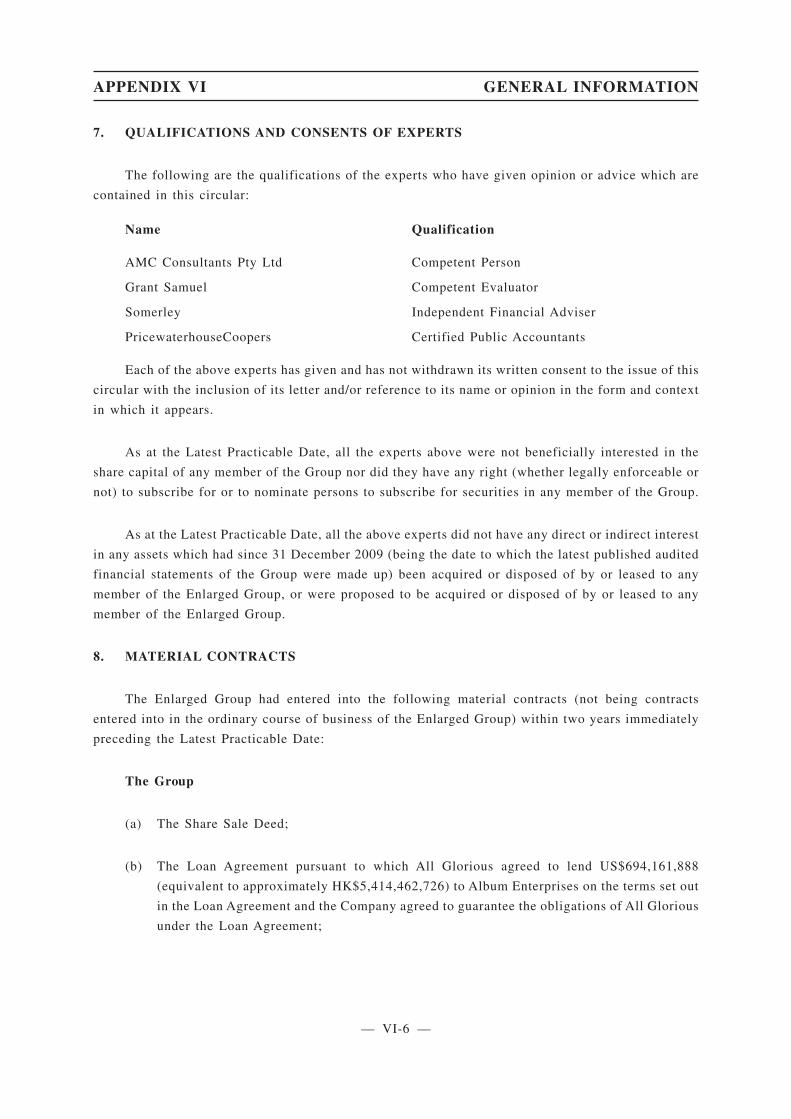
7. QUALIFICATIONS AND CONSENTS OF EXPERTS
The following are the qualifications of the experts who have given opinion or advice which are
contained in this circular:
Name Qualification
AMC Consultants Pty Ltd Competent Person
Grant Samuel Competent Evaluator
Somerley Independent Financial Adviser
PricewaterhouseCoopers Certified Public Accountants
Each of the above experts has given and has not withdrawn its written consent to the issue of this
circular with the inclusion of its letter and/or reference to its name or opinion in the form and context
in which it appears.
As at the Latest Practicable Date, all the experts above were not beneficially interested in the
share capital of any member of the Group nor did they have any right (whether legally enforceable or
not) to subscribe for or to nominate persons to subscribe for securities in any member of the Group.
As at the Latest Practicable Date, all the above experts did not have any direct or indirect interest
in any assets which had since 31 December 2009 (being the date to which the latest published audited
financial statements of the Group were made up) been acquired or disposed of by or leased to any
member of the Enlarged Group, or were proposed to be acquired or disposed of by or leased to any
member of the Enlarged Group.
8. MATERIAL CONTRACTS
The Enlarged Group had entered into the following material contracts (not being contracts
entered into in the ordinary course of business of the Enlarged Group) within two years immediately
preceding the Latest Practicable Date:
The Group
(a) The Share Sale Deed;
(b) The Loan Agreement pursuant to which All Glorious agreed to lend US$694,161,888
(equivalent to approximately HK$5,414,462,726) to Album Enterprises on the terms set out
in the Loan Agreement and the Company agreed to guarantee the obligations of All Glorious
under the Loan Agreement;
APPENDIX VI GENERAL INFORMATION
— VI-6 —
App1,part B5(1)
App1,part B5(2)
App1,part B5(1)
App1,part B40(1)
App1,part B4243(2)(c)
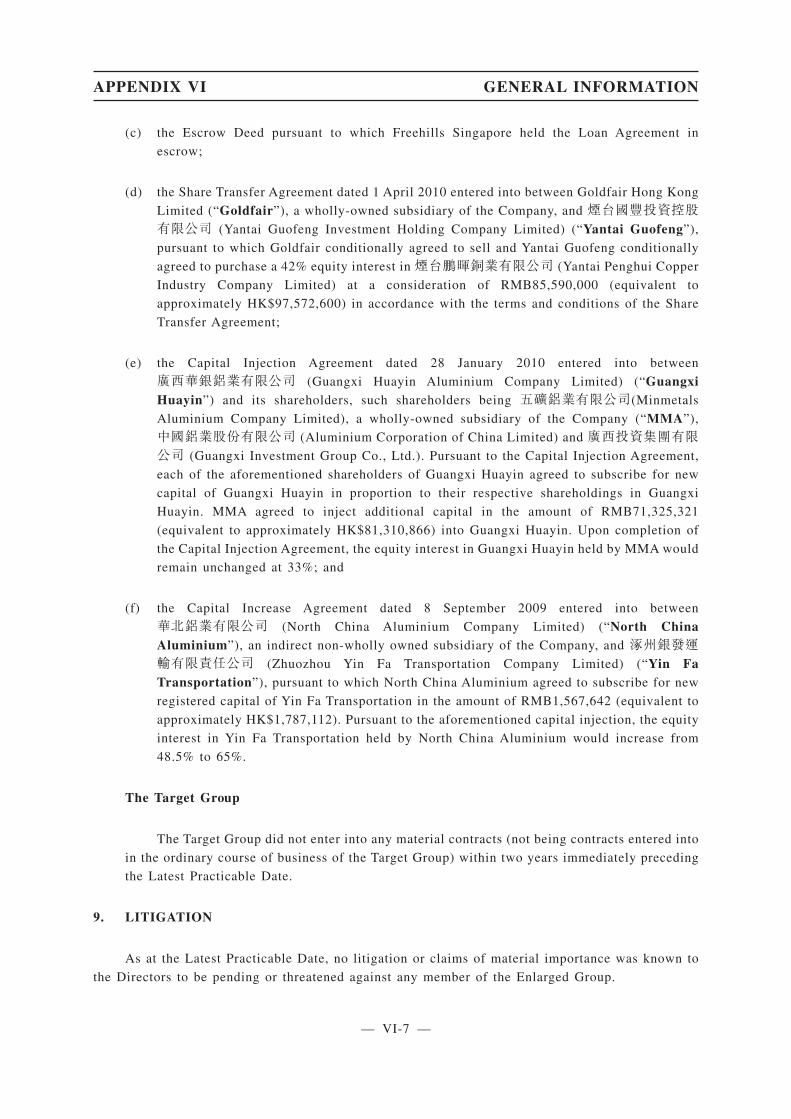
(c) the Escrow Deed pursuant to which Freehills Singapore held the Loan Agreement in
escrow;
(d) the Share Transfer Agreement dated 1 April 2010 entered into between Goldfair Hong Kong
Limited (“Goldfair”), a wholly-owned subsidiary of the Company, and 煙台國豐投資控股有限公司 (Yantai Guofeng Investment Holding Company Limited) (“Yantai Guofeng”),
pursuant to which Goldfair conditionally agreed to sell and Yantai Guofeng conditionally
agreed to purchase a 42% equity interest in 煙台鵬暉銅業有限公司 (Yantai Penghui Copper
Industry Company Limited) at a consideration of RMB85,590,000 (equivalent to
approximately HK$97,572,600) in accordance with the terms and conditions of the Share
Transfer Agreement;
(e) the Capital Injection Agreement dated 28 January 2010 entered into between
廣西華銀鋁業有限公司 (Guangxi Huayin Aluminium Company Limited) (“GuangxiHuayin”) and its shareholders, such shareholders being 五礦鋁業有限公司(Minmetals
Aluminium Company Limited), a wholly-owned subsidiary of the Company (“MMA”),
中國鋁業股份有限公司 (Aluminium Corporation of China Limited) and 廣西投資集團有限公司 (Guangxi Investment Group Co., Ltd.). Pursuant to the Capital Injection Agreement,
each of the aforementioned shareholders of Guangxi Huayin agreed to subscribe for new
capital of Guangxi Huayin in proportion to their respective shareholdings in Guangxi
Huayin. MMA agreed to inject additional capital in the amount of RMB71,325,321
(equivalent to approximately HK$81,310,866) into Guangxi Huayin. Upon completion of
the Capital Injection Agreement, the equity interest in Guangxi Huayin held by MMA would
remain unchanged at 33%; and
(f) the Capital Increase Agreement dated 8 September 2009 entered into between
華北鋁業有限公司 (North China Aluminium Company Limited) (“North ChinaAluminium”), an indirect non-wholly owned subsidiary of the Company, and 涿州銀發運輸有限責任公司 (Zhuozhou Yin Fa Transportation Company Limited) (“Yin FaTransportation”), pursuant to which North China Aluminium agreed to subscribe for new
registered capital of Yin Fa Transportation in the amount of RMB1,567,642 (equivalent to
approximately HK$1,787,112). Pursuant to the aforementioned capital injection, the equity
interest in Yin Fa Transportation held by North China Aluminium would increase from
48.5% to 65%.
The Target Group
The Target Group did not enter into any material contracts (not being contracts entered into
in the ordinary course of business of the Target Group) within two years immediately preceding
the Latest Practicable Date.
9. LITIGATION
As at the Latest Practicable Date, no litigation or claims of material importance was known to
the Directors to be pending or threatened against any member of the Enlarged Group.
APPENDIX VI GENERAL INFORMATION
— VI-7 —
App1,part B33
As at the Latest Practicable Date, no legal claims or proceedings that may have an influence on
the mining and exploration rights of the Operating Mines, Development Projects and various
exploration projects (which are currently held through the Target Company) are known to the
Directors to be pending or threatened by any third party against any member of the Enlarged Group
or vice versa.
10. GENERAL
(a) The address of the registered office of the Company is at 12th Floor, China Minmetals
Tower, 79 Chatham Road South, Tsimshatsui, Kowloon, Hong Kong.
(b) The company secretary of the Company is Ms. LEUNG Suet Kam, Lucia (“Ms. Leung”).
She joined the Group in September 1993. Ms. Leung holds a Bachelor’s degree in
Economics from the University of London, the United Kingdom and a Postgraduate
Diploma in Corporate Administration from the City University of Hong Kong. She is a
fellow member of The Institute of Chartered Secretaries and Administrators in the United
Kingdom and a fellow member of the Hong Kong Institute of Chartered Secretaries. Ms.
Leung has over seventeen years of experience in company secretarial affairs and over 20
years of experience in administration.
(c) In the event of any inconsistency, the English text of this circular shall prevail over the
Chinese text.
11. DOCUMENTS AVAILABLE FOR INSPECTION
Copies of the following documents will be available for inspection during business hours at the
registered office of the Company at 12th Floor, China Minmetals Tower, 79 Chatham Road South,
Tsimshatsui, Kowloon, Hong Kong from the date of this circular up to and including the date of the
EGM:
(a) the memorandum and articles of association of the Company;
(b) the written consents from the experts referred to under the paragraph headed “General
information — Qualifications and consents of experts” in this appendix;
(c) copies of each of the material contracts referred to under the paragraph headed “General
information — Material contracts” in this appendix;
(d) a letter from Somerley as set out on pages 44 to 98 of this circular;
(e) the published annual reports of the Company for each of the financial years ended 31
December 2008 and 31 December 2009;
(f) the published interim report of the Company for the six months ended 30 June 2010;
(g) the accountant’s report of the Target Company as set out in Appendix I to this circular;
APPENDIX VI GENERAL INFORMATION
— VI-8 —
18.05(4)
App1,part B36
App1,part B35,36
App1,part B36,43

(h) the report on unaudited pro forma financial information of the Enlarged Group as set out
in Appendix III to this circular;
(i) the Competent Person’s as set out in Appendix IV to this circular;
(j) the Valuation Report as set out in Appendix V to this circular; and
(k) this circular.
APPENDIX VI GENERAL INFORMATION
— VI-9 —
(Incorporated in Hong Kong with limited liability)
(Stock code: 1208)
NOTICE IS HEREBY GIVEN THAT the extraordinary general meeting (the “Meeting”) of
Minmetals Resources Limited (the “Company”) will be held at Fanling Room, Lower Level I,
Kowloon Shangri-La Hotel, 64 Mody Road, Tsimshatsui East, Kowloon, Hong Kong on Thursday,
9 December 2010 at 10:30 a.m. for the purpose of considering and, if thought fit, passing, with or
without modification, the following resolution as an ordinary resolution of the Company:
ORDINARY RESOLUTION
1. “THAT:
(a) the conditional sale and purchase deed (the “Share Sale Deed”) dated 19 October 2010 entered
into between Album Enterprises Limited (“Album Enterprises”) (as seller), All Glorious
Limited (“All Glorious”) (as buyer) and the Company (as guarantor and issuer of the
Consideration Shares (as defined below) and the PSCS (as defined below)) in relation to the
proposed acquisition of the entire issued share capital of Album Resources Private Limited (the
“Sale Shares”) at an aggregate consideration of US$1,846,000,000 (the “Purchase Price”), a
copy of which has been produced to the Meeting marked “A” and signed by the chairman of the
Meeting for the purpose of identification, and all the transactions contemplated thereunder,
including, but not limited to:
(i) the allotment and issuance by the Company of 940,779,090 new ordinary shares (the
“Consideration Shares”) of HK$0.05 each in the issued share capital of the Company
(each, a “Share”) at an issue price of HK$3.00 per Share to Album Enterprises or its
nominee on completion of the sale and purchase of the Sale Shares pursuant to the terms
and condition of the Share Sale Deed (“Completion”), to satisfy part of the Purchase Price;
(ii) the issuance by the Company of the perpetual subordinated convertible securities (the
“PSCS”) to Album Enterprises or its nominee pursuant to the terms and condition of the
Share Sale Deed, such PSCS being convertible into 1,560,000,000 new Shares at an initial
conversion price of HK$3.45 per Share, on Completion, to satisfy part of the Purchase
Price;
(iii) the increase in the authorised share capital of the Company from HK$300,000,000 divided
into 6,000,000,000 Shares to HK$900,000,000 divided into 18,000,000,000 Shares by the
creation of an additional 12,000,000,000 unissued Shares;
NOTICE OF EGM
— EGM-1 —
(iv) the grant of a specific mandate for the board of directors of the Company (“Directors”) toissue up to 2,700,000,000 new Shares at a discount of not more than 20% to the higher of:
(A) the closing price on the date of any relevant placing agreement or other agreementinvolving the proposed issue of securities under the specific mandate; and
(B) the average closing price in the five trading days immediately prior to the earlier of:
(1) the date of announcement of the placing or the proposed transaction orarrangement involving the proposed issue of securities under the specificmandate;
(2) the date of the placing agreement or other agreement involving the proposedissue of securities under the specific mandate; and
(3) the date on which the placing or subscription price is fixed,
and conditional upon Completion, for the period from the passing of this resolution at theMeeting up to the earlier of: (X) 31 July 2011 or (Y) the revocation or variation of theauthority given under this resolution at the Meeting by ordinary resolutions of the relevantshareholders of the Company as required under the Rules Governing the Listing ofSecurities of The Stock Exchange of Hong Kong Limited in a general meeting of theCompany; and
(v) the application to the Government of the Commonwealth of Australia under the ForeignAcquisitions and Takeovers Act 1965 (Cth) seeking approval for the transactionscontemplated under the Share Sale Deed and the negotiation and agreement by any one ofthe Directors, for and on behalf of the Company, to such undertakings as may be requiredto be given by the Company to the Government of the Commonwealth of Australia in orderfor the Company to obtain the aforementioned approval of the Government of theCommonwealth of Australia be and are hereby approved, confirmed and ratified; and
(b) any one of the Directors be and is hereby authorised to sign, execute, perfect, deliver, negotiate,agree and do all such documents, deeds, acts, matters and things, as the case may be including,without limitation, negotiating and agreeing to such undertakings as may be required to be givenby the Company to the Government of the Commonwealth of Australia in order for the Companyto obtain the approval of the Government of the Commonwealth of Australia as referred to inparagraph 1(a)(v) of this resolution, as he may in his opinion or discretion consider reasonable,necessary, desirable or expedient to implement and/or give effect to the Share Sale Deed and allthe transactions contemplated thereunder with any changes as such Director may considerreasonable, necessary desirable or expedient.
By Order of the BoardHao Chuanfu
Executive Director and President
Hong Kong, 22 November 2010
NOTICE OF EGM
— EGM-2 —
Notes:
1. A member entitled to attend and vote at the Meeting is entitled to appoint one or more (if the
member is a holder of two or more shares) proxies to attend and vote on his/her behalf. A proxy
need not be a member of the Company.
2. To be valid, the form of proxy and the power of attorney or other authority (if any) under which
it is signed or a notarially certified copy of such power of attorney or authority, must be
deposited with the share registrar of the Company, Computershare Hong Kong Investor Services
Limited, at 17M Floor, Hopewell Centre, 183 Queen’s Road East, Hong Kong as soon as possible
and in any event not less than 48 hours before the time appointed for holding the Meeting or any
adjournment thereof. Completion and return of a form of proxy will not preclude a member from
attending in person and voting at the meeting or any adjournment thereof, should he so wish, and
in such event, the form of proxy shall be deemed to be revoked.
3. The register of members of the Company will be closed from 7 December 2010 to 9 December
2010, both days inclusive, during which period no transfer of shares will be registered. In order
to qualify for attending and voting at the Meeting, all completed transfer forms accompanied by
the relevant share certificates must be lodged with the share registrar of the Company,
Computershare Hong Kong Investor Services Limited, at Rooms 1712-1716, 17th Floor,
Hopewell Centre, 183 Queen’s Road East, Hong Kong not later than 4:30 p.m. on 6 December
2010.
NOTICE OF EGM
— EGM-3 —