MISSION - HKEXnews
264
Annual Report 2015 (Stock Code: 00917)
-
Upload
khangminh22 -
Category
Documents
-
view
0 -
download
0
Transcript of MISSION - HKEXnews

Annual Report 2015
MISSION(Stock Code: 00917)
Annual Report 2015
Our residential communities are fully equipped
with high quality facilities and multi-purpose
spaces which rede�ne aesthetic standards
and a new way of living. We enable owners
and residents to experience the exquisite
and sensual lifestyle enjoyed by
home buyers around
the world.
We have developed large-scale multi-
purpose commercial complexes, all
well-recognised city landmarks that generate
new business opportunities and
breathe new life into throbbing
hearts of Chinese
metropolitans.
We have dedicated ourselves in rejuvenating old
city neighbourhood through comprehensive
redevelopment plans. As a living embodiment of
China’s cosmopolitan life, these mixed-use redevel-
opments have been undertaken to rejuvenate the
old city into vibrant communities character-
ised by eclectic urban housing, ample
public space, shopping, entertain-
ment and leisure facilities.
We pride ourselves on having created
large-scale self contained communities
that nurture family living and
promote a healthy cultural
and social life.
TRANSFORMINGCITY VISTAS
SPURRINGBUSINESS
OPPORTUNITIESREFINING LIVING
LIFESTYLE
CREATING MODERN COMMUNITIES

Annual Report 2015
MISSION(Stock Code: 00917)
Annual Report 2015
Our residential communities are fully equipped
with high quality facilities and multi-purpose
spaces which rede�ne aesthetic standards
and a new way of living. We enable owners
and residents to experience the exquisite
and sensual lifestyle enjoyed by
home buyers around
the world.
We have developed large-scale multi-
purpose commercial complexes, all
well-recognised city landmarks that generate
new business opportunities and
breathe new life into throbbing
hearts of Chinese
metropolitans.
We have dedicated ourselves in rejuvenating old
city neighbourhood through comprehensive
redevelopment plans. As a living embodiment of
China’s cosmopolitan life, these mixed-use redevel-
opments have been undertaken to rejuvenate the
old city into vibrant communities character-
ised by eclectic urban housing, ample
public space, shopping, entertain-
ment and leisure facilities.
We pride ourselves on having created
large-scale self contained communities
that nurture family living and
promote a healthy cultural
and social life.
TRANSFORMINGCITY VISTAS
SPURRINGBUSINESS
OPPORTUNITIESREFINING LIVING
LIFESTYLE
CREATING MODERN COMMUNITIES

CONTENTS
Corporate Profile
Chairman’s Statement
Financial Highlights
Business Review
Management Discussion and Analysis
Corporate Governance Report
Directors’ Profile
Senior Management Profile
Corporate Sustainability
Financial Section Contents
Major Projects Profile
Glossary of Terms
Corporate Information
2
6
10
14
88
99
110
116
120
129
248
256
258

New World China Land Limited (Stock Code: 00917) is the flagship Mainland China property arm of the Hong Kong-listed New World Development Company Limited (Stock Code: 00017) and is one of the leading large-scale national developers in Mainland China. NWCL has been listed in Hong Kong since July 1999, and it is a constituent stock of Morgan Stanley Capital International (MSCI) China Index. NWCL’s well-diversified projects are located in major cities or transportation hubs and include residential communities, serviced apartments, villas, offices, shopping centres, mixed-use comprehensive buildings, hotels and resorts.
Operating businesses in
in Mainland China24 Regions
Comprising major development projects30
A total asset value of
HK$134 billion
A GFA of property development and investment portfolio
million sq m25.74
New World China Land Limited 2
CORPORATE PROFILE

Annual Report 2015 3
CORE BRAND VALUES
With over 40 years of property development experience
and 30 years of investment experience in Mainland China
of New World Development Company Limited, we are
undoubtedly a mature and reliable developer with
outstanding reputation in complying with local market
rules and government regulations.
Unsurpassed Quality andLong Term Value
Fully Localised Hong Kong Brand
ComprehensiveProperty Development
Reliability and Reputation
Building City andCorporate Sustainability
As a Hong Kong-based and well recognised brand, we
fully apply our advanced and wide embracing experience
in Hong Kong to property development in Mainland
China, while at the same time develop projects that meet
the needs of the city. We value local concepts, we
understand market operation and culture through
extensive staff localisation, and as a result, we become
an integral part of the local community.
No matter what products or services we are offering,
“Quality” is always at our heart. Our continuous
adherence to excellent quality has won long term reliable
reputation in the market. We choose the best locations
in town to develop world-class properties with quality
property management services. Our determination in
providing the best contributes to preservation of asset
value in the long run.
We develop wide ranges and types of properties to cater
for varying demands on sizes and functions from different
market segments. Our dedicated professionalism and
wide embracing experiences in project planning and
execution have enabled us to handle the stringent
demand of multi-product lines with ease.
We value corporate sustainability and strike a balance
among the economy, environment and society. We
commit ourselves to long term urban revitalisation and
development, incorporate green design into our projects
and participate enthusiastically in diversified national
charity and community programmes. Our good corporate
behaviour has inspired the locals in joining us to create a
more harmonious society.

CORPORATE PROFILE
sq m
sq m
sq mBy location
By type
By usage
Beijing 1,357,817Tianjin 129,237Langfang 707,741Tangshan 156,914Jinan 105,049Shenyang 3,214,264Anshan 1,028,766Dalian 171,426Shanghai 263,084Nanjing 52,794Ningbo 633,736Wuhan 3,194,531Changsha and Yiyang 909,851Chengdu 3,663,827Guiyang 4,062,739Guangzhou 1,757,939Shenzhen 46,942Foshan 1,032,993Pearl River Delta 679,571Haikou 2,566,742
Total 25,735,963
Properties under development/held for development 22,986,275Completed investment properties 2,452,703Completed hotel properties 296,985
Total 25,735,963
Residential 13,226,647Commercial 3,019,992Office 1,941,030Hotel 1,059,241Carpark and others 6,489,053
Total 25,735,963

Chengdu Wuhan
YiyangGuiyang Changsha
FoshanGuangzhou
Pearl RiverDelta
Haikou
Shenzhen
Ningbo
Haikou
South China Sea
South China Sea Islands
Shanghai
Jinan
Nanjing
LangfangTianjin
Tangshan
Beijing Dalian
Shenyang
Anshan

In FY2015, NWCL recorded a profit attributable to equity holders of the Company of HK$3,313.13 million, representing a year-on-year decrease of 28.6%; GFA sold through its property sales operation reached 855,414 sq m with gross sales proceeds registered at approximately RMB13,068.3 million. Overall gross profit margin for property sales maintained at 41.6%.
New World China Land Limited 6
CHAIRMAN’S STATEMENT
To Our Shareholders:
During the year under review, the global economy was
filled with challenges and uncertainties. At home, the
recent Chinese stock market witnessed extreme volatility.
In the US, the interest rate hike cycle is expected to
commence soon. The European economy began to pick
up gradually as the European Central Bank is continuing
with its quantitative easing and low interest rate policies.
However, Europe remains troubled by the debt crisis of
Greece, which was added with Japan’s lack of structural
economic growth, heightening risk-averse sentiment in
the global market in the second quarter of 2015.
Externally, economic figures of the US in second quarter
showed improvements over the first one in 2015. With
declining fuel prices, stably improved unemployment
rate, continuous upward movement in real estate prices,
steady growth in wages and persistent improvement in
retail sales and corporate activities, the Federal Reserve
Board of the United States has already hinted that
interest rates may begin to rise before the end of 2015.
Although global funds will be drawn to the US when the
cycle of interest rate hike of the US begins, the pace of
rate increase is expected to be relatively moderate, and
as such, a big impact to international financial markets is
unlikely.
As for Mainland China, the first half of 2015 saw its
economy maintaining operation within a reasonable
range as key economic indicators gradually returned to
their steady paths amidst uncertain economic
environment at home and abroad, as well as the ever-
strengthening downward economic pressure. In the
second quarter of 2015, GDP grew 7% year-on-year,
while GDP for the first half of 2015 also increased 7%
compared to the same period last year. The figures are
in line with the economic growth target of 7% set out by
the Central Government. In the first half of 2015,
domestic consumption continued to be an increasingly
important contributor to economic growth, contributing
as much as 60% to the economy’s expansion, which is a
5.7% improvement compared to the same period of the

CHENG鄭
Annual Report 2015 7
previous year. Overall, the country’s economic structure
is gradually optimising. Domestic demand is making
stronger contribution to the economic stability, laying out
solid ground work to enhance the potential of consistent
economic growth.
On the other hand, the livelihood of mainland citizens
continued to improve as income of urban and rural
residents maintained accelerated growth. In the first half
of 2015, the national per capita disposable income
reached RMB10,931, or a year-on-year increase of 9%.
The median of the national per capita disposable income
was RMB9,700, marking a growth of 10.5% against the
last year’s figure. Residents’ consumption sustained
steady growth, while the gap between income of urban
residents and that of rural residents continued to narrow.

New World China Land Limited 8
CHAIRMAN’S STATEMENT
The continuous growth in residents’ income, together with the country’s urbanisation development strategy and
optimisation and transformation in the economic structure, are all favourable to the healthy development of the real
estate market in long run. As such, although the mainland economy is facing downward pull recently and the future
development of the real estate industry is filled with challenges, the Group is still cautiously optimistic with the
development of the real estate market in medium to long run, as the Central Government is expected to continue to
roll out favourable measures to boost economic growth.
Since early 2014, the downward pressure faced by the mainland economy has been constantly increasing. Sales in
the property market have been declining for 15 consecutive months. With the policy objective to stabilise the
economy and ensure employment, local governments have been taking steps to ease purchase restriction measures
for the property market since the second quarter of 2014. In late September 2014, People’s Bank of China (“PBOC”)
loosened approval conditions for second home mortgages. In November 2014, PBOC even kicked off the cycle of
lowering of interest rates and reserve requirement ratio for the first time in past two years. In the end of March 2015,
the Central Government lowered the minimum down-payment requirement for second home mortgages, while many
local governments adjusted the policy of the housing provident fund to lessen home buyers’ burden. These show that
the real estate market is one of the economic pillars of Mainland China, and the Central Government will not let it go
into continuous free fall to trigger systematic risks. After a series of interest rate cuts, reductions in reserve
requirement ratio and easing policies of real estate market have been implemented, the mainland’s
property market clearly returned to the upward path during the second quarter of 2015.
In the first half of 2015, commodity housing sold in the mainland amounted to
approximately RMB3,430 billion, recording a 10% year-on-year growth. The rate
of increase exceeded that of the first five months by 6.9%. Over the same
period, more than 500 million sq m of commodity housing was sold, which
grew 3.9% year-on-year and showed significant improvement when
compared to the 0.2% decline during the first five months. This was even the
first time that sales returned to the growth trend since January of last year.
However, the mainland’s property market is still noticeably polarised. Sales
were better for first-tier and some second-tier cities, but for most third- and
fourth-tier cities, stockpiles remain high and require a longer time to be consumed.
Xia HangJin Zhi Yu Ye, 2015Stainless Steel, 18K gold

Annual Report 2015 9
While NWCL is facing quite many macroeconomic uncertainties, its professional management team still manages to
successfully lead the Group to overcome various challenges in the market, fully demonstrating the Group’s ethos of
innovating constantly and pursuing excellence. In the light of the positive expectation on the development potential of
the Qianhai Free Trade Zone in Shenzhen, the Group has specially developed “New World Signature Hill”, a high-end
development project in Jiangangshan at the peripheries of Qianhai. The development’s water feature landscape was
crafted by world-class designers, who showed masterful attention to every single detail in the project. Their exquisite
designs show mainland customers of the unique brand essence — “The Artisanal Movement” — of the New World
Group for the first time. The Group has long been managing its business with the sustainable development approach,
and it has been actively engaged in adopting a number of green architectural design. The Group improved the energy
efficiency in the life cycle of new construction projects, the conservation of water resources and the use of eco-
materials. The Group’s commitment towards sustainability is also well recognised by the community. The Group was
honoured with the “China Real Estate Corporate Citizenship Award” and “Green Real Estate Award” under the 2015
Golden Brick Award for Real Estate of China in the 15th Annual Conference of Bo’ao 21st Century Real Estate
Forum. Looking into the future, the Group will keep up with improving its cost control, accelerating its assets turnover,
and actively exerting its unique advantages. The Group will continue to shoulder the role of a “city builder”, addressing
customer needs with finest attention and providing them with personalised experience that can lift the standard of
modern living.
Dr Cheng Kar-shun, Henry
Chairman and Managing Director
Hong Kong, 23 September 2015
Xia HangRu Ri Fang Sheng, 2015Stainless Steel, 18K gold

New World China Land Limited 10
FINANCIAL HIGHLIGHTS
Operating Result (HK$’000) FY 2015 FY 2014
Revenues
From continuing operations
Company and subsidiaries 17,459,237 21,850,106
Share of associated company and joint ventures (note 1) 1,913,127 2,924,368
19,372,364 24,774,474
From discontinued operation
Company and subsidiaries 673,180 529,749
20,045,544 25,304,223
Representing:
From continuing operations
Sale of properties 16,460,663 22,017,383
Rental income 1,297,818 1,262,835
Income from hotel operation 560,241 490,246
Property management services fee income 613,054 524,908
Contracting services income 440,588 479,102
19,372,364 24,774,474
From discontinued operation
Hotel management services fee income 673,180 529,749
20,045,544 25,304,223
Gross profit
From continuing operations
Company and subsidiaries 6,837,782 9,080,068
Share of associated company and joint ventures (note 2) 876,714 1,298,408
7,714,496 10,378,476
From discontinued operation
Company and subsidiaries 308,748 202,165
8,023,244 10,580,641
Profit attributable to equity holders of the Company
From continuing operations 3,347,164 4,779,389
From discontinued operation (34,033) (140,698)
3,313,131 4,638,691

Annual Report 2015 11
Operating Result (HK$’000) FY 2015 FY 2014
Earnings per share (HK cents)
Basic
From continuing operations 38.53 55.11
From discontinued operation (0.39) (1.62)
38.14 53.49
Diluted
From continuing operations 38.51 55.07
From discontinued operation (0.39) (1.62)
38.12 53.45
Dividend per share (HK cents)
Interim — 4.00
Final 3.00 3.00
Full year 3.00 7.00
As at As at
Financial Position (HK$’million) 30 June 2015 30 June 2014
Cash and bank balances 15,773.7 17,351.6
Total assets 134,427.5 120,926.1
Total liabilities 69,808.8 59,607.5
Capital and reserves attributable to the Company’s equity holders 60,781.9 57,752.5
Financial Ratios
Current ratio (times) 2.10 1.89
Net debt to equity ratio 45.5% 36.0%
Note 1: It represents attributable share of revenues of associated company and joint ventures to the Group.
Note 2: It represents attributable share of gross profit of associated company and joint ventures to the Group.

New World China Land Limited 12
FINANCIAL HIGHLIGHTS
20,045,544
25,304,223
8,023,244
10,580,641
3,313,131
4,638,691
Revenues (note 1) (HK$’000)
Gross pro�t (note 2) (HK$’000)
Pro�t attributable to equity holders of the Company (HK$’000)
FY2015
FY2014
FY2015
FY2014
FY2015
FY2014
Note 1: It represents revenues of the Company and subsidiaries plus share of revenues of associated company and joint ventures
attributable to the Group as tabulated on page 10.
Note 2: It represents gross profit of the Company and subsidiaries plus share of gross profit of associated company and joint ventures
attributable to the Group as tabulated on page 10.

Annual Report 2015 13
134,427,540
120,926,131
60,781,851
57,752,517
15,773,665
17,351,595
Total assets (HK$’000)
Capital and reserves attributable to the Company’s equity holders (HK$’000)
Cash and bank balances (HK$’000)
FY2015
FY2014
FY2015
FY2014
FY2015
FY2014

綵
綵
結
結
燈
燈

The Federal Reserve Board of the United States continued to taper off the scale of its monthly purchase of treasury bond by USD10 billion, down to the total monthly purchase scale of treasury bond of USD15 billion as at mid-September 2014, with the termination of the treasury bond purchase programme being expected in October 2014. The market remained concerned as to when the US would raise interest rates, and speculations revolved around whether the commencement of the interest rate hike cycle would have a profound impact on the outlook of the global economy.
綵
綵
結
結
燈
燈
Northern China — “張燈結綵Zhang Deng Jie Cai” — Festive Decorations of Lanterns and Ribbons
“張Zhang” is the third biggest family name in China. People with this surname mostly live in northern China. It is a Chinese tradition to hang up lanterns and coloured ribbons to create a vibrant and enthusiastic atmosphere when people celebrate festivals and joyous events. The traditional Chinese idiom “張燈結綵Zhang Deng Jie Cai”, or festive decorations of lanterns and ribbons, depicts jubilant occasions in which everyone is happy to be there.
Zhang

New World China Land Limited 16
BUSINESS REVIEW
BEIJINGHighlights
In the past year, Beijing’s GDP grew by 7.3% annually. The per capita income of urban and rural residents increased by 7.2% and 8.6% respectively on a year-on-year basis. Following the optimisation and upgrade of the industrial structure, the high-end service industry contributed approximately 60% to the GDP growth. The Third China (Beijing) International Fair for Trade in Services was successfully conducted in Beijing. The total imports and exports of the service and trading sectors rose by 15.4% while the foreign investment in actual use was up by 6.1%. With the implementation of the Beijing-Tianjin-Hebei integrated development strategy in 2015, Beijing signed agreements and memoranda with Tianjin and Hebei respectively on the working proposals in three key domains including transportation, eco-protection and industries. With an aim to creating clusters of cities through joint efforts and promoting regional economy, progress was achieved in major tasks such as the relocation of the Capital Steel Group to Caofeidian in Hebei and the cooperation between the Beijing Zhongguancun Demonstration Zone and the Tianjin Binhai New District.
Beijing Yuzhuang Project “Li Zun”

Annual Report 2015 17
N
2
1
Railway Station
Subway
Pedestrian Subway
Beijing New View Garden
Beijing Xin Yu Garden
Beijing New World Centre Phase I
Beijing New World Centre Phase II
Beijing Xin Yi Garden
Beijing Baoding Building Shopping Arcade
pentahotel Beijing
New World Beijing Hotel
32
37
58
59
31
Temple of Heaven
Hongqiao Market
Huashi Street
Guangqumennei StreetZhushikou Street East
Dongxinglong Street
Cho
ngw
enm
enw
ai S
tree
t
Bei
jingz
hann
an R
oad
Qin
ian
Str
eet
Dongcheng
Beijing Yanjing Building2
1
32
35 31
59
35
For details of the Group’s project portfolio, please refer to “Major
Projects Profile”.
The Beijing Municipality has prepared a list of additional
prohibited and restricted industries in strict accordance
with the “Regulation on the Prevention and Control of Air
Pollution in Beijing”. A total of 392 ordinary manufacturers
and polluting companies were forced to shut down.
Beijing has made continued effort to tackle traffic
congestion, including the completion of four new subway
lines and the completion of 100 km of transportation
microcirculation improvement project. Construction work
of the Beijing New International Airport spanning across
the Daxing District of Beijing and the Guangyang District
of Langfang in Hebei Province has officially commenced.
The project is planned to be completed by the end of
2019 and will serve as a major supporting infrastructure
in promoting Beijing-Tianjin-Hebei integrated development
as well as upgrading the economy of Mainland China.
BEIJING DEVELOPMENT PROPERTIESThree major properties with total GFA 859,050 sq m
19.9%
18.1% 20.9%
41.1%
OFFICE COMMERCIAL
RESIDENTIALCARPARK AND OTHERS
Qianmen Street East Chongwenmen Street East
BeijingRailway Station
37 58
Beijing Yuzhuang Project “Li Zun”

New World China Land Limited 18
Beijing New World Centre Phase I and II
Beijing — completion schedule of
properties for sale sq m
FY2017
Beijing Yuzhuang Project Phase II 101,616
Total 101,616
BEIJING
PROPERTY PORTFOLIO
Located at the core area of the Chongwen New World
commercial hub in Dongcheng District in Beijing, the
commercial parts of the Beijing New World Centre Phase
I and II maintain 100% occupancy rate and a stable
increase in rental income, continuously supporting the
commercial development of the whole area.
Situated in Yuzhuang Central Villa Zone, Shunyi District
in north eastern Beijing, Beijing Yuzhuang Project adjoins
the exit of the Beijing Future Science & Technology Park
of Jingcheng Expressway, boasting convenient
transportation. The GFA of the project is approximately
175,000 sq m, providing 308 villas. The eastern side of
the project “Li Zun” residences, which comprises 81
villas with size ranging from 600 to 1,000 sq m, were
launched for sale during the year under review with
satisfactory sales performance. The villas on the west
side ranging in size from 480 to 600 sq m are under
construction and are expected to be completed by June
2017.
BUSINESS REVIEW

Annual Report 2015 19
New World Beijing HotelBeijing New World Centre Phase I and II
pentahotel Beijing

New World China Land Limited 20
Beijing Yanjing Building
Beijing Yanjing Building is adjacent to the Temple of
Heaven, with a GFA of approximately 32,000 sq m. With
New World and Hongqiao commercial hubs on both
sides, the project is surrounded by a mature commercial
ambience. Plans to sell the project are under way.
The four-star pentahotel Beijing, located at Beijing New
World Centre Phase I, has seen steady rises in both
occupancy rate and revenue during the year under
review. The nearby New World Beijing Hotel, merely
800 m away from pentahotel Beijing and being the only
five-star hotel in southern Beijing, has recorded a 250%
year-on-year revenue increase since its opening in
November 2013.

Annual Report 2015 21
BUSINESS REVIEW
TIANJINHighlights
In 2014, Tianjin’s GDP reached RMB1,570 billion while fixed asset investment reached RMB1,170 billion, representing an annual increase of 10% and 15.1% respectively. Tianjin actively nurtured new sources of economic growth, and has been vigorously pursuing technological innovation. During the year, 14,000 small- and medium-sized new technology enterprises were set up, and total number of new technology firms reached 60,000. The establishment of Tianjin Independent Innovation Demonstration Zone was approved by the State Council. R&D spending of the city increased to 3% of the GDP.
Tianjin Xin An New World Plaza

New World China Land Limited 22
Under the Beijing-Tianjin-Hebei integrated development
strategy, various transfer platforms for the industries of
the Binhai New District and related districts and counties
have been confirmed, and resources in the capital have
been relied upon to accomplish further success. In 2014,
major events such as the Summer Davos Forum were
successfully held in Tianjin, further enhancing the city’s
international influence.
Tianjin speeded up the construction of the “Two Ports
and Four Roads”. Projects such as the 300,000-tonne
iron ore terminal at Tianjin Port and Phase II of Tianjin
International Cruise Terminal were completed. The cargo
handling volume of the port reached 540 million tonnes.
The construction of the Binhai International Airport
Terminal 2 was completed and in operation. There are
12 waiting rooms and passenger throughput exceeded
12 million. Construction of the Tianjin-Baoding Railway,
Nangang Railway and Beijing-Tianjin Intercity Express
Railway Extension Line speeded up. Expansion of the
Tangshan-Tianjin Expressway and the construction of
Subway Line 5 and Line 6 have also been under way
smoothly.
Tianjin Glorious Place

Annual Report 2015 23
TIANJIN
PROPERTY PORTFOLIO
With a planned GFA of approximately 300,000 sq m,
Tianjin Glorious Place is located at the core area of
Heping District. The large-scale community, mixed-use
development project comprises residences, apartments,
commercial and clubhouse facilities and was completed
in July 2014. The residences were sold out while the
apartment portion, Tower 11 and 12 comprising 38,000
sq m and offering fully furnished units ranging in size
from 57 to 128 sq m, is still for sale.
40
Subway
Bridge
38
39
Tianjin Xin An New World Plaza
Tianjin New World Garden
Tianjin Glorious Place
40
38
39
Dafeng R
oad
Xima R
oadN
ankaisanma R
oad
Chengxiangzhong R
oadN
anmenw
ai Street
Rongye S
treetC
hengxiangdong Road
Dongm
a Road
Hebei S
treet
Jinga
ng B
ridge
Zhangzizhong Road
Hai R
iver
Shizilin Bridge
Beima Road
Gulou West Street Gulou East Street
Nanma Road
Shenyida Street
Fuan Street
Duolun
Road
Jieyuan Road
Xiguan Street
Huanghe Road
Nankai
Heping
Hongqiao
Nankai Park
No.2 NankaiMiddle School
DahutongCommercial Area
NanshiFoodPavilion
WenTemple
HistoricalCulturalStreet
Nanyunhebei Road
Heping Road
N
For details of the Group’s project portfolio, please refer to “Major Projects
Profile”.
Xin Nan Shi “City Lounge”
BUSINESS REVIEW

New World China Land Limited 24
The commercial portion, Xin Nan Shi “City Lounge”, is
situated at Rongye Street, Heping CBD in Tianjin.
Covering a GFA of 25,000 sq m, Xin Nan Shi “City
Lounge” is strategically located at the golden juncture of
Heping Road, Dongma Road and the three major
commercial hub in Nanshi. Retail spaces mainly range in
size from 80 to 200 sq m. This is where lifestyle
amenities such as dining, shopping, recreational and
educational facilities converge.
Situated at the core commercial strip of Nankai District,
Tianjin Xin An New World Plaza is located at a key
development zone for culture and tourism. The project
boasts superb transport support including dual subway
network and more than 20 public bus routes. The project
offers integrated functions such as office, shopping,
catering, entertainment and recreational facilities and has
achieved an occupancy rate of 87%.
Xin Nan Shi “City Lounge”

Annual Report 2015 25
BUSINESS REVIEW
LANGFANGHighlights
In 2014, Langfang’s GDP grew by 8.2% when compared to last year, achieving the fastest growth rate in the entire Hebei Province. The service sector contributed over 50% of the economic growth for the first time, ranking first in the province.
Langfang New World Centre

New World China Land Limited 26
The position of Langfang has been further enhanced as
the functional extension area of the capital, the platform
for relocating and upgrading Beijing and Tianjin
industries, the demonstration zone for the incubation and
transformation of the national technological and
innovation achievement, as well as the eco-living city
along the Beijing-Tianjin Corridor. Langfang is proactively
speeding up the deve lopment of advanced
manufacturing industries, and is accelerating the
construction of various new projects such as the
industrial base for aerospace technological application
and the manufacture of lightweight magnesium alloy
parts for the Express Rail Link. The city has also newly
set up provincial level economic development zone and
cultural industry demonstration zone. A consensus has
been reached with respect to the integrated
transportation planning of Beijing and Langfang and the
establishment of the cargo distribution and transportation
system of the Beijing New International Airport. The
Beijing-Langfang Express Rail Link has been brought into
operation and the planning and design work for the
Tianjin-Shijiazhuang Expressway fully commenced.
Langfang New World Centre “Victoria Garden”

Annual Report 2015 27
LANGFANGPROPERTY PORTFOLIO
Langfang New World Centre is situated in the core area
of the Langfang CBD. The project has a GFA of 450,000
sq m and is divided into three different development
districts. District A has a five-star hotel, a large-scale
commercial centre and high-end apartments. District B
is being developed as a retail street and apartments,
while District C features grade-A offices, high-rise
apartments, townhouses and a kindergarten.
The “Causeway Bay Mansion” in District B was
completed in October 2014, offering apartments ranging
in size from 50 to 99 sq m. During the year under review,
sales rate reached 83%. “Victoria Garden” in District C
offers 545 residential units ranging in size from 99 to 180
sq m, and has achieved a sales rate of 71%.
Langfang New World Garden is located north of the main
city area, being a gateway along Langfang and Beijing.
Beijing Daxing International Airport is just a 20-minute
drive away. The project consists of two zones including
high-rise apartments and townhouses. With a GFA of
370,000 sq m, it offers residential units with size ranging
from 187 to 300 sq m.
LANGFANG DEVELOPMENT PROPERTIESTwo major properties with total GFA 700,243 sq m
20.4%
5.7%
10.3%
56.9%
6.7%HOTEL
OFFICE
COMMERCIAL
RESIDENTIAL
CARPARK AND OTHERS
Beijing–Tianjin Intercity High-speed Railway
Railway Station
Langfang New World Centre
Langfang New World Garden
4
5
4
5Beifeng Road
Aimin Road West
Aimin Road East
Guangyang RoadXi
nhua
Roa
d
Hep
ing
Roa
d
Guangming Road East
Renmin Park
LangfangRailway Station
Yin
he N
orth
Roa
d
LangfangGovernment
N
For details of the Group’s project portfolio, please refer to “Major
Projects Profile”.
Langfang New World Centre
BUSINESS REVIEW

New World China Land Limited 28
Langfang New World Garden
Langfang — completion schedule
of properties for sale sq m
FY2016
Langfang New World Centre
District A and C 238,800
Langfang New World Garden District 3 101,319
Total 340,119
FY2017
Langfang New World Garden District 1 95,337
Langfang New World Garden District 2 75,402
Total 170,739

Annual Report 2015 29
BUSINESS REVIEW
TANGSHANHighlights
In 2014, Tangshan’s GDP reached RMB622.5 billion while fixed asset investment reached RMB414.6 billion, representing an annual increase of 5.1% and 16% respectively. Tangshan has been actively promoting economic transformation and upgrade. The annual growth rates of the added value by the high-tech industries and equipment manufacturing industries were 20% and 11.3% respectively, which were higher than the growth rate of 4.6% of the general industries. Investment in the service sector amounting to RMB201.4 billion, which accounted for 48.6% of the fixed asset investment, was completed. Coastal development fully speeded up. Tangshan Port achieved a cargo handling capacity of 500 million tonnes, ranking fourth in China and fifth globally. Tangshan is actively capturing the opportunities brought by the Beijing-Tianjin-Hebei integrated development strategy, and has been aggressively constructing the Caofeidian Collaborative Development Demonstration Zone, with an aim to reaffirming its strategic position of undertaking the relocation of industries from the capital, and to enabling the newly migrated industries from Beijing and Tianjin to establish strong foothold in Tangshan.
Tangshan New World Centre

New World China Land Limited 30
Residential Portion of Tangshan New World Centre
Tangshan — completion schedule
of properties for sale sq m
FY2016
Tangshan New World Centre Phase II 71,971
Total 71,971

Annual Report 2015 31
TANGSHANPROPERTY PORTFOLIO
Tangshan New World Centre is situated in the core area
of the city. The GFA of the project is approximately
300,000 sq m, comprising a mix of commercial, office,
apartment and residential units.
At 136 m in height, the 31-storey office tower of
Tangshan New World Centre Phase II is the tallest
commercial building in Tangshan. In addition, it is also
the only commercial building in the region attaining the
LEED Certification issued by the US Green Building
Council. The project has already launched for sale and is
expected to be completed by October 2015. The
residential portion was completed in June 2015 and 214
units ranging in size from 134 to 308 sq m were launched
for sale.
TANGSHAN DEVELOPMENT PROPERTYOne property with total GFA 156,914 sq m
30.3%
31.1%
14.8%
23.8%OFFICE
COMMERCIAL
RESIDENTIALCARPARK AND OTHERS
High-speed Railway
Railway Station
Tangshan New World Centre6
6
Xuey
uan
Roa
d
Mag
uo R
oad
Beixin Road West Beixin Road East
Dachengshan Park
Longze Road South
TangshanGovernment
Tangshan Museum
Dazhao Park
Che
zhan
Roa
d
Nanxin Road East
Jian
she
Roa
d S
outh
TangshanSouth Station
Xinhua Road EastXinhua Road West
South Lake Park
N
For details of the Group’s project portfolio, please refer to “Major Projects
Profile”.
BUSINESS REVIEW

New World China Land Limited 32
BUSINESS REVIEW
JINANHighlights
In 2014, Jinan achieved stable economic growth, with an annual GDP growth of 8.8% and fixed asset investment growth of 16.1% when compared to the same period last year. The transformation and upgrade of the traditional industries of Jinan accelerated. The development of emerging industries such as new materials, new pharmaceutical sectors as well as building industrialisation speeded up. The added value and taxes of the above-scale industries rose by 10.1% and 17.1% respectively on annual basis, achieving in advance the target of eliminating the backward production capacity under the “12th Five-Year Plan”. Furthermore, construction of three national level science and technology parks and 10 bases for distinctive industries was completed in Jinan, while 35 municipal level corporate technology centres were also recognised.
Jinan New World Sunshine Garden

Annual Report 2015 33
Jinan New World Sunshine Garden
The urbanisation rate of the entire Jinan City reached
66.4%. The industrial layout has been completed, with
new urbanisation and layout of integrated transport
system speeding up and infrastructure facilities and
public services extending to the counties. Construction
of the expressway from Jinan to Lening, Airport Road
and southern extension project was completed and in
operation. Major projects of a number of link
expressways were in smooth progress.
PROPERTY PORTFOLIO
Jinan New World Sunshine Garden, situated in Huaiyin
District, has become a convenient area for home living.
The project has been developed in three phases with the
current Phase III at Eastern District II being the last
phase. The size of 1,376 residential units of Eastern
District II are primarily 60, 90, 140 sq m. During the year
under review, the accumulated sales rate was 94% and
the project was highly sought after by local home
purchasers. The commercial portion in the Western
District achieved an 87% occupancy rate while offices
recorded full occupancy, creating steadily growing rental
income.
The commercial portion of Jinan New World Sunshine
Garden Eastern District has a GFA of 78,000 sq m,
consisting of hotel, commercial and office. It is expected
to be completed by October 2016.
Jinan — completion schedule of
properties for sale sq m
FY2017
Jinan New World Sunshine Garden
Remaining Portion 34,299
Total 34,299
JINAN DEVELOPMENT PROPERTIESOne property with total GFA 78,144 sq m
32.1%
40.6%
3.3%
24.0%HOTEL
COMMERCIAL
OFFICE
CARPARK AND OTHERS
Railway
Railway Station
Jinan New World Sunshine Garden7
7
CityCentre
Jin Yi Road
Bayi OverpassBridge
Jin Qi Road
Zhongshan Park
Wei Liu R
oad
Huaiyin
Jin Si Road
Jin Liu Road
Jin Qi Road
Jin Shi Road
Yang Guang Xin R
oad
Jinan Station
Baotu Spring Park
N
For details of the Group’s project portfolio, please refer to “Major Projects
Profile”.
JINANBUSINESS REVIEW

碧輝煌
輝
煌碧

碧輝煌
輝
煌碧
North Eastern China — “金碧輝煌Jin Bi Hui Huang” — Splendour of Gold and Jade
“金Jin” is a surname common in north eastern China. The traditional Chinese idiom “金碧輝煌Jin Bi Hui Huang”, which translates into the splendour of gold and jade, is a phrase that describes the magnificent and glittering exterior or interior decorations of a building that catch the eye.
Jin

New World China Land Limited
BUSINESS REVIEW36
SHENYANGHighlights
Shenyang actively facilitated the upgrade of traditional industries and nurtured various emerging industries. Its goal was to become the country’s only city that demonstrates modernisation of construction industry. The pulling effects generated by the automotive industry was apparent, while strategic emerging industries such as intelligent robot, aviation and information technology have been developing at a swift pace. The direct connection point for the national Internet backbone came into use in Shenyang, and the super computer centre of the north eastern region was brought into operation. The value added by high-tech products of the city amounted to RMB174 billion, representing an annual growth of 9.6%. In addition, the development of service sector speeded up, with its value added reaching RMB337.1 billion, representing an annual increase of 6.2%. The proportion of the modern service industry to the service sector reached 54%. Shenyang initiated the four-year service industry development action plan, with logistics, exhibition, culture, tourism and other industries developing steadily. In 2014, a number of large-scale economic and trade events such as the “14th China International Equipment Manufacturing Exposition” and the aviation equipment trading focused “Shenyang Faku International Flight Convention” were successfully held. With a total of 300 exhibitions held in the year, the city has become one of the top ten cities in the China Exhibition Development Comprehensive Index and successfully established its position as the convention centre for the north eastern region.
Shenyang New World Centre (under construction)

Annual Report 2015 37
Construction of urban infrastructure has moved onto a
new stage. Construction of projects such as Subway
Line 9 and Line 10, Shenyang-Tieling Intercity Railway
(Shenyang section) and Shenyang South Station
speeded up.
Shenyang New World Garden “New World • The Riverpark”
Subway
Bridge
Railway Station
8
9
10
Shenyang New World Garden
Shenyang New World Centre
Shenyang New World Commercial Centre
8
8
8
8 9
10
ShenyangNew World GardenRemaining Phases
Wenhua Road
Qin
gnia
n S
tree
t
(Gol
den
Cor
ridor
)
San
hao
Str
eet
ShenyangNew World Garden
Phase I
Hun River
Zhongshan Park
Northeastern University Liaoning TV Tower
Sanhao
Bridge
Sanhao
Street
ShenshuiRoad
Heping
Nan
jing
Stre
et
Nanhu Park
ShenyangRailway Station
Zhonghua Road
Hunhe Bridge
Hep
ing
Stre
et
Shenshuiwan Park
For details of the Group’s project portfolio, please refer to “Major Projects
Profile”.
N

New World China Land Limited 38
Shenyang — completion schedule
of properties for sale sq m
FY2016
Shenyang New World Garden
Phase I West District A 53,434
Total 53,434
FY2017
Shenyang New World Centre — Expo 119,475
Shenyang New World Centre
Phase I and II 883,796
Total 1,003,271
PROPERTY PORTFOLIO
Shenyang New World Garden Phase II, “New World •
The Riverpark” is situated on the northern bank of Hun
River, adjoining the Shenshuiwan Park and benefitting
from the convenience and prosperity of Wulihe and
Sanhao Street. With a GFA of approximately 620,000 sq m,
the project offers residential units with river view and of
size ranging from 99 to 269 sq m. During the year under
review, 2,902 units were launched for sale with
satisfactory sales results.
“New World • The Masterpiece Crescent”, also under
Phase II of the project, is situated in the core area of the
northern bank of the Hun River. The project comprises
villas ranging in size from 480 to 1,700 sq m and
boasting spectacular views of the riverside. During the
year under review, 82 detached and duplex villas were
launched for sale. “New World • The Riverfront” in
District D of Phase II offers apartments ranging in size
from 74 to 430 sq m.
Shenyang New World Prosperous Commercial Building,
the office tower of the commercial portion of Shenyang
New World Garden Phase I, is located on the northern
bank of the Hun River and north of Sanhao Bridge. The
property enjoys scenic river views and offers units
ranging in size from 180 to 1,900 sq m for sale.
SHENYANGPerspective of Shenyang New World Garden “New World • The Riverfront”
SHENYANG DEVELOPMENT PROPERTIESThree major properties with total GFA 2,895,958 sq m
BUSINESS REVIEW

Annual Report 2015 39
“New World • The Elite” is the Group’s first high-end
apartment in Shenyang. Located in the core area of
Taiyuan Street CBD, the project offers unit ranging in size
from 67 to 178 sq m that are suitable for both
commercial and residential use. A total of 460 units were
launched for sale during the year under review.
Shenyang New World Centre is situated at the southern
tip of Golden Corridor. The project is being developed in
three phases. The project comprises Shenyang K11 Art
Mall, Shenyang New World Expo, Shenyang Expo New
World Hotel, office, apartment and entertainment
facilities. The project is expected to be completed by the
third quarter of 2016.
Shenyang New World Garden Phase II “New World • The Masterpiece Crescent”
Shenyang “New World • The Elite”
Perspective of Shenyang New World Prosperous Commercial Building

New World China Land Limited
BUSINESS REVIEW40
ANSHANHighlights
Anshan has taken strong initiative to adjust its industrial structure. Focus of the economic development shifted gradually from heavy industry to emerging and modern service industries. Anshan has made continuous effort to attract capital investment and businesses and set up commercial platform with 17 overseas chambers of commerce and trade associations, such as The Hong Kong General Chamber of Commerce. It established a partnership relationship with over 40 Fortune Global 500 companies and over 10 state-owned enterprises. Anshan newly set up 24 provincial level engineering technology R&D centres, key laboratories and innovation platforms for industrial professional technology. It also formulated and implemented a four-year action plan for the development of service industry. The main operating revenue of 14 service sector concentration zones reached RMB135 billion, representing a growth of 20%.
Anshan New World Garden Phase I “New World • Parkview Terrace”

Annual Report 2015 41
Anshan accelerated the construction of infrastructural
faci l i t ies. Besides the new construct ion and
transformation projects of 47 roads, seven bridges and
48 streets and lanes in the city areas, Anshan carried out
the repair and maintenance work of 150 km of rural
roads.
PROPERTY PORTFOLIO
Anshan New World Garden Phase I, “New World •
Parkview Terrace” is located at the core area of the
Anshan High-Tech Zone with excellent peripheral
amenities. The project comprises nine high-rise buildings
and offers residential units ranging in size from 82 to 230
sq m. During the year under review, 1,547 units were
launched with sales rate of 83%.
Anshan New World Garden Phase II, “New World • The
Grandiose” offers townhouses ranging in size from 350
to 530 sq m. During the year under review, 58
townhouses were launched for sale and sales
performance was satisfactory.
Anshan New World Garden Phase III, “New World •
Sunnyvale Heights” adjoins a number of large-scale
commercial centres and enjoys all-round lifestyle
amenities. The project offers residential units ranging in
size from 90 to 160 sq m and is expected to be launched
for sale in the third quarter of 2015.
ANSHAN DEVELOPMENT PROPERTIESOne property with total GFA 972,568 sq m
Anshan New World Garden11
11
1111
AnshanNo.1 Middle School
Xinying Road
Huailin Road
Yueling Road
Anqian Road
Keji R
oad
Qianshan Mid RoadYufoshan Tu
nnel
University of Science and Technology, Liaoning
To QianshanScenic Area
Lincheng street
YufoshanScenic Spot
11
High TechIndustrial Zone
For details of the Group’s project portfolio, please refer to “Major
Projects Profile”.
N
ANSHANBUSINESS REVIEW

New World China Land Limited 42
Anshan — completion schedule
of properties for sale sq m
FY2016
Anshan New World Garden Phase III A 145,748
Total 145,748
FY2017
Anshan New World Garden Phase III B 139,582
Total 139,582
Anshan New World Garden Phase II “New World • The Grandiose”
Anshan New World Garden Phase III “New World • Sunnyvale Heights”

Annual Report 2015
BUSINESS REVIEW43
DALIANHighlights
Dalian is an economic concentration zone with coastal industries offering remarkable advantages. In 2014, its GDP reached RMB800 billion, representing an annual increase of approximately 6%. The simultaneous development of advantageous industries such as petrochemical, equipment manufacturing, shipbuilding and information technology resulted in the continued expansion of the industrial chain. The Changxingdao petrochemical industrial base was incorporated into the national planning of the petrochemical industry, and the integrated oil refinery and petrochemical project has been making progress in a systematic manner. The output of the automotive industry increased by 40%, and the realised value of the automotive and auto parts and accessories industries amounted to RMB60 billion. The development of nine major industries such as the intelligent device, new energy and new materials were robust.
Dalian New World Tower

New World China Land Limited 44
The “Master Plan of Dalian Port Taiping Bay Port Area”
was reviewed and approved. The area will mainly support
the coastal industries in the coastal economic zone of
Taiping Bay and urban development. In addition, it will
undertake some of the functional adjustments of the old
port area of Dalian port, and will provide services for the
Liaoning Coastal Economic Belt. Construction of
infrastructural facilities accelerated and trial runs of the
South Binhai Avenue and Subway Line 1 and Line 2
were launched. Construction work on the projects
including the new airport, Dandong-Dalian Railway and
Bohai Avenue also speeded up.
Lobby of Dalian New World Tower Phase II “The Pinnacle”
Cafe of New World Dalian Hotel

Annual Report 2015 45
DALIAN
High-speed Railway
Railway
Railway Station
Dalian New World Plaza
Dalian New World Tower
New World Dalian Hotel
Dalian Railway Station
Victory Square
Zhongshan Square
Nanshan Road
Jiefang Street
Mingze S
treet
Luxun Road
Zhongshan Road
Yanan RoadYouhao S
treet
Cha
ngjia
ng R
oad
Shanghai RoadM
insheng Street
Shiji Street
Changjiang Road
Renmin Road
Minzhu Square
Zhongshan
41
42
60
60
42
41
PROPERTY PORTFOLIO
Dalian New World Tower is located in the core business
area at Renmin Road in the Zhongshan District,
commanding spectacular view of the Dalian Harbour. A
mixed-use development project in urban centre, Dalian
New World Tower comprises a five-star hotel, a high-end
shopping plaza and luxurious commercial apartments.
Phase II of the project, namely “The Pinnacle” is a
60-storey building that provides 935 fully furnished
residential or office units. The units range in size from 63
to 122 sq m, or can be expanded into whole floor of 1,713
sq m. During the year under review, the project launched
525 units with a sales rate of 77%.
For details of the Group’s project portfolio, please refer to “Major Projects
Profile”.
N
BUSINESS REVIEW

象 包萬
象
包
萬

象 包萬
象
包
萬Central China — “包羅萬象Bao Luo Wan Xiang” — Embracing Everything under the Sun
“羅Luo” is a surname mostly found in central China. The traditional Chinese idiom “包羅萬象Bao Luo Wan Xiang”, or embracing everything under the Sun, originates from the classic residential fengshui literature Huangdi Zhaijing (The Classic of Houses), a dialogue between man and nature. The idiom means everything on earth are being included, indicating an exciting and exhaustive collection of things and contents.
Luo

BUSINESS REVIEWNew World China Land Limited 48
SHANGHAIHighlights
In 2014, Shanghai’s GDP grew by 7% annually. The proportion of the value added from the tertiary sector to the city’s GDP increased to 64.8%. The growth rate of the Consumer Price Index maintained at 2.7%.
Shanghai K11 Art Mall

Annual Report 2015 49
Shanghai K11 Art Mall
The regulatory innovation of the Shanghai Pilot Free
Trade Zone has been pursued in a comprehensive
manner. A new round of 31 external liberalisation
measures was implemented, and an investment
management system centred on the management of
negative lists was basically set up. Innovative financial
measures such as free trade accounts and Renminbi
overseas loans were also launched. The financial reforms
aiming at the convertibility of capital accounts and the
liberalisation of the financial service sector were initiated
orderly. In addition, Shanghai kicked off the pilot
“Shanghai-Hong Kong Stock Connect” and supported
the launch of innovative products such as “Shanghai
Gold”. The city attracted BRICS Development Bank,
Shanghai International Aviation Court of Arbitration and
other institutions to set up local operation in Shanghai.
Shanghai initiated a new round of overall urban planning
and speeded up the construction of major infrastructure.
Construction of Subway Line 16 was completed and put
into service while certain sections of Line 13 were also in
operation. Construction of the fourth runway of Pudong
International Airport was completed smoothly. Shanghai
implemented a new round of a three-year action plan on
Intelligent City Construction, and successfully hosted the
first “World Cities Day”.
PROPERTY PORTFOLIO
Shanghai Hong Kong New World Tower is situated in the
core area of Shanghai. This landmark grade-A office
tower is the tallest building in the golden commercial
location of Huaihai Road and offers over 80,000 sq m of
rental space. The tower offers Shanghai’s first exclusive
clubhouse for senior executives and a creative
professional development centre. Together with
Shanghai K11 Art Mall in the commercial podium, the
mixed-use investment property offers office, recreational
and shopping facilities. The overall occupancy rate
maintained at 96%.
Subway
Bridge
Tunnel
43
44
45
61
62
Shanghai Hong Kong New World Tower
Shanghai Ramada Plaza & Shanghai Belvedere Service Apartment
Shanghai Jiu ZhouShopping Arcade
New World Shanghai Hotel
pentahotel Shanghai
4344
616245
Caoyang R
oad
ZhongshanPark
JinganWanhangdu Road
to Hongqiao Airport
Yananxi Road Overhead
Hongqiao Road
Xu Jia Hui Park
Lingling Road
ShanghaiStadium
Urum
qi Road
Huaihai Road
Xuhui
Dongan R
oad
Longwu R
oad
Zhongshannan Road
Zhaojiabang Road
Ruijin R
oad
Lupu Bridge
Beijing Road
Yanan Road
People’s Park
ShanghaiGovernment
Fuxing Park
Fuxing Road
Nanbei O
verhead Road
HuangpuXujiahui Road
Huangpu Rive
r
Nanpu Bridge
Lujiabang Road
Xizang Road
Changning
Zhonghua Road
Henan R
oad
Renmin R
oadZhongshandong R
oad
Nanjing Road
The Bund
Pudongnan Road
Oriental PearlTV Tower
Huashan R
oad
N
For details of the Group’s project portfolio, please refer to “Major Projects
Profile”.
Shanghai K11 Art Mall, located at the commercial
podium of Shanghai Hong Kong New World Tower,
transforms commercial retail into artistic experience. The
Art Mall regularly holds various types of art exhibitions in
dedicated art space and attracts many international
brands to move in. During the year under review,
occupancy rate was as high as 99%.
The Group’s another major mixed-use investment
property, Shanghai Ramada Plaza, is located opposite to
the Zhongshan Park in Changning District. It comprises
two hotels, serviced apartments and department store.
Shanghai Belvedere Service Apartment actively
promoted short-term leases and agreement cooperation
such as collaboration with local and overseas room
booking portals and multinational groups during the year
under review. These measures successfully attracted
short-term and business tenants. The apartment
maintained an overall occupancy rate of 80% while rental
revenue grew steadily.
SHANGHAIBUSINESS REVIEW
New World China Land Limited 50
Both New World Shanghai Hotel and pentahotel
Shanghai achieved an increase in their occupancy rates
and revenue respectively during the year under review.
Shanghai Hong Kong New World Tower
New World Shanghai Hotel
pentahotel Shanghai

BUSINESS REVIEWAnnual Report 2015 51
NINGBOHighlights
In 2014, Ningbo made new progress in the areas of economic expansion and quality enhancement. The container throughput of the port jumped to rank fifth in the world and first among the major ports of Mainland China in terms of growth. In terms of urban function enhancement, projects such as e-commerce “One City, Two Districts and One Centre”, return of Zhejiang merchants to the headquarter base, Metro Line 2 Phase I project, and the integrated transport hub at Ningbo Railway Station were pushed ahead steadily. Construction of Metro Line 3 Phase I and the North-South Ring freeway were basically completed. Construction of major functional zones speeded up, and the development and construction of Ningbo Hangzhou Bay New Zone, Meishan Industrial Concentration Zone were carried out swiftly. Regional images of Eastern New Town, Southern New Town, Zhenhai New Town and Dongqianhu Tourist Holiday Resort were further enhanced.
Perspective of Ningbo New World Plaza

New World China Land Limited 52
Ningbo City will continue to focus on the establishment
of the port economic zone, capturing the opportunities
brought by the national strategies of “One Belt, One
Road” and the Yangtze River Economic Belt.
PROPERTY PORTFOLIO
Ningbo New World Plaza is situated in the core area
of Jiangdong District, which is the key area of the river
promenade where the three rivers of the city meet and is
right next to subway and urban business centre. With a
GFA of approximately 800,000 sq m, the mixed-use
development project comprises high-end residences,
K11 Art Mall, grade-A office, five-star hotel and urban
park. It is earmarked to bring the locals a high-quality
lifestyle and commercial-cultural experiences.
Phase I of the project includes residential and commercial
portions and is expected to launch for sale in 2017.
Construction of Phase II of the project, including grade-A
office and hotel, is planned to commence in 2016.
Perspective of Ningbo New World Plaza
NINGBO DEVELOPMENT PROPERTIESOne property with total GFA 633,736 sq m
18.4%
5.0%
31.7%22.9%
22.0%
CARPARK AND OTHERS
HOTEL
OFFICECOMMERCIAL
RESIDENTIAL
‧‧‧‧‧‧‧‧‧‧‧‧‧‧‧‧‧‧‧‧‧‧‧‧‧‧‧‧‧‧‧‧‧‧‧
Ningbo New World Plaza
Subway (under construction)
30
•••
Yuyao River
Yong
jiang
Riv
er
Feng
hua
Rive
r
Ningbo Municipal Government
Yao’ai Road
Jiang
dong
Roa
d Nor
th
Zhongshan Road East
Ren
min
Roa
d
Baizhang Road
Jiangbei
Jiangdong
Haishu
Bank of China
Tianfeng Pagoda
Ningbo Sports Centre
30Jiangdong DistrictGovernment
Tianyi Square
N
For details of the Group’s project portfolio, please refer to “Major Projects
Profile”.
NINGBOBUSINESS REVIEW

BUSINESS REVIEWAnnual Report 2015 53
WUHANHighlights
In 2014, Wuhan achieved the goal of generating more than RMB1,000 billion of GDP, one year ahead of the “12th Five-year Plan”. Fixed social asset investments reached RMB700.3 billion, representing a growth of 16.7% when compared to last year. Wuhan has been actively attracting industrial investments, operating significant projects and construction industrial projects. Wuhan completed industrial investments amounting to RMB260.6 billion. Industrial projects with investment of over RMB5 billion, including Phase I of the Shanghai General Motors Wuhan Production Base, CNR Railway Transportation Equipment and Repair Base and Chow Tai Fook Jewellery Park, have been completed and are in operation. In addition, Wuhan kicked off the urban renewal project and the rejuvenation of old urban areas, with the demolition of 11 urban villages completed. Construction of the urban infrastructure in Wuhan made steady progress. Phase II of Subway Line 4, which connects the three towns of Hankou, Hanyang and Wuchang together with Metro Line 2, entered the soft opening phase. In response to the national strategy of “One Belt, One Road”, Wuhan opened up a near ocean aviation route that connects with four ASEAN countries. Operations of the Sino-Europe (Wuhan) International freight trains officially commenced.
Perspective of Wuhan New World • Times

New World China Land Limited 54
WUHAN DEVELOPMENT PROPERTIESFive major properties with total GFA 2,760,593 sq m
PROPERTY PORTFOLIO
Wuhan Guanggu New World is situated at Wuhan East
Lake High-tech Development Zone. The comprehensive
community development project comprises a commercial
portion, District A, and a residential portion, District B.
District A covers a site area of about 40,000 sq m and is
a multi-functional commercial development consisting of
a five-star hotel, grade-A offices and K11 Art Mall.
District B, spanning a site area of approximately 93,000
sq m, includes 15 high-rise buildings and approximately
33,000 sq m of waterscape garden. Shops in District B
were delivered to owners in March 2015. During the year
under review, 2,460 residential units were launched for
sale and the sales rate reached 99%.
Wuhan Menghu Garden, a large-scale low-density
residential project, comprises villas and mid-rise
residences and has a GFA of approximately 200,000 sq m.
Leveraging convenient transport and the scenic views of
Tazi Lake, the project launched a new phase of 18 villas
during the year under review and achieved a sales rate of
94%. Mid-rise residential units range in size from 43 to
180 sq m and are embraced by 20,000 sq m of
landscape garden. As of this financial year, an
accumulated 232 units were launched for sale. Sales
performance was satisfactory.
Wuhan Changqing Garden is a mega-sca le
comprehensive community development project in the
city. During the year under review, 306 residential units
of Site No. 6 south cluster were launched and completely
sold out. Construction of Phase II will begin in 2016. Site
No. 8, which is the high-end residential units of the
project, is located at the core area of the community
where stations of dual subway are located. In addition, a
300,000 sq m of commercial development will be
constructed in the vicinity. During the year under review,
78 residential units were launched and completely sold
out.
Railway
Railway Station
Subway
Bridge
Embankment
Tunnel
12
14
15
16
46
47
48
63
Wuhan Menghu Garden
Wuhan Changqing Garden
Wuhan New World Centre
Wuhan Guanggu New World
Wuhan New World • Times
Wuhan New World International Trade Tower
Wuhan K11 Gourmet Tower
Wuhan Xin Hua Garden
New World Wuhan Hotel
13
16
12
46
48
15
WuhanGovernment
ZhongshanPark
New Yangtze Bridge
Yang
tze
Rive
r
Jiefang RoadHan River
Yue Lake
Wuhan Yangtze River Bridge
Wuhan Yangtze River TunnelHanyang Ave
Jians
he A
veXinhuaxia Road
Linj
iang
Ave
Wuchang
Hankou
Hanyang
Qingnian R
oad
JiefangPark
Gusaoshu Road
Third Ring Road
Changqing Road
Changqing 1 Road
Changfeng Ave
Fazhan Ave
Hankou Railway Station
Huangpu Street
Zhongshan Ave
Wuh
an A
irpor
t Exp
ress
way
13
1447 63
East Lake
N
For details of the Group’s project portfolio, please refer to “Major Projects
Profile”.
WUHANBUSINESS REVIEW

Annual Report 2015 55
Changqing Garden Site No. 6 offers retail shops ranging
in size from 24 to 245 sq m. During the year under
review, 18 shops were launched for sale and sales rate
reached 78%. The renovated integrated service tower on
Site No. 4 was well received by the market, with 23 units
being launched for sale in the current financial year.
Sales rate reached 87%.
Retail shops of Wuhan Changqing Nanyuan are located
at an exceptional location right off the exit of the Subway
Line 2 at Changgang Road station. The delivery and
occupation of Phase III South District residences brought
an increasing flow of people and boosted the sales of
shops. During the year under review, over 60% of the
shops were sold.
Wuhan New World Centre is a large-scale mixed-use development project in the city comprising hotel, office, shopping mall, residences and retail street, and is the first property in central China to attain LEED Gold Certification. As Wuhan’s top-end office, office Tower A is now occupied by a long list of world-renowned enterprises and its rental rate reached 92%. Office Tower B was launched for sale in January 2015 with satisfactory sales performance.
Wuhan New World International Trade Tower is situated at a prime location of Jianshe Avenue in Hankou District. The US Embassy and the Consulate General of France in Wuhan are both tenants of this tower. Rental rate was as high as 96%.
Located at Wuhan City Qiaokou District, Wuhan New World • Times has a site area of approximately 145,000 sq m. The project has a GFA of 440,000 sq m and was divided into Site A and B. Site A has three office towers and Site B provides residences and other facilities including high-rise residential buildings, high-end apartments, kindergarten and primary school to accommodate various needs of customers.
Wuhan Menghu Garden
Wuhan Changqing Garden
Wuhan Guanggu New World

New World China Land Limited 56
Wuhan New World International Trade Tower
Wuhan — completion schedule
of properties for sale sq m
FY2016
Wuhan Menghu Garden Phase III C 30,008
Total 30,008
FY2017
Wuhan Menghu Garden Phase III A 17,669
Wuhan Guanggu New World 338,324
Total 355,993
Wuhan New World Centre

BUSINESS REVIEWAnnual Report 2015 57
CHANGSHAHighlights
Changsha actively facilitated the transformation and upgrade of its industries, industrial parks and enterprises while enhancing the development of traditional industries. Strategic emerging industries also grew strongly and swiftly. In 2014, Changsha’s annual GDP reached RMB781 billion, representing a year-on-year growth of 10%. Value added by large-scale industries rose by 12% to RMB305 billion.
Perspective of Changsha La Ville New World Phase III B

New World China Land Limited 58
Development of the modern service industry speeded
up. More than 500 new mobile and Internet companies
were founded, generating more than RMB10 billion of
output. The Alibaba Changsha Industrial Belt went online
comprehensively. Total output of cultural industries
reached RMB160 billion, and total income from the
tourism industry amounted to RMB119.2 billion.
Emerging industries gave significant support to the city’s
economic development. Value added by industries such
as automobiles and parts, new materials and information
technology accelerated at the rate of more than 25%.
Furthermore, the urban infrastructural construction of
Changsha continuously improved. Average daily passenger
volume of Subway Line 2 Phase I reached 180,000 people.
PROPERTY PORTFOLIO
Changsha La Ville New World Phase II A is located at the
southwest portion of the project, right next to the mixed-
use development project of Phase III B and the
interchange of intercity railway and the subway. The area
enjoys transport convenience. Phase II A commercial
portion has a GFA of approximately 8,000 sq m, offering
double-storey retail shops along the street and with size
ranging from 150 to 270 sq m. During the year under
review, 40 shops were launched for sale. Accumulated
sales rate reached nearly 90% and rental rate exceeded
80%.
Changsha and Yiyang — completion
schedule of properties for sale sq m
FY2016
Yiyang New World Scenic Heights
Phase I A 8,652
Yiyang New World Scenic Heights
Phase I C 12,573
Total 21,225
FY2017
Changsha La Ville New World Phase III B 122,806
Yiyang New World Scenic Heights
Phase I B 31,762
Yiyang New World Scenic Heights
Phase II 55,372
Total 209,940
CHANGSHA AND YIYANG DEVELOPMENT PROPERTIES
Two major properties with total GFA 902,536 sq m
High-speed Railway
Railway
17
18
Changsha La Ville New World
Yiyang New World Scenic Heights
17
City of Changsha
18
City of Yiyang
N
For details of the Group’s project portfolio, please refer to “Major Projects
Profile”.
CHANGSHA
Office development of Changsha La Ville New World
BUSINESS REVIEW

Annual Report 2015 59
Changsha La Ville New World Phase III C is located at
the eastern side of the project. With a GFA of 24,000 sq m,
the office is designed as a duplex office ranging in size
from 80 to 190 sq m. Since its sales launch in early
2015, the project was well received by the market with a
sales rate of over 60%. Phase III B mixed-use
development project is situated at the western side of
the project with a GFA of approximately 120,000 sq m. It
offers single storey and duplex apartments ranging in
size from 38 to 93 sq m, offices ranging in size from 42
to 164 sq m, as well as retail street. The project is
planned for sale in the first quarter of 2016.
Yiyang New World Scenic Heights Phase I is situated at
the High-tech Zone of Yiyang City, adjoining Zishan Lake
International Golf Club and the natural Zishan Lake
Reservoir that covers an area of approximately 1.06
million sq m. With a GFA of 367,000 sq m, the project
includes duplex villas, townhouses, high-rise residences
and commercial complexes. It is the only high-end
comprehensive development project with golf resources
and lake in the city, and will be launched for sale in
FY2016.
Perspective of commercial development of Yiyang New World Scenic Heights
Perspective of Yiyang New World Scenic Heights

BUSINESS REVIEWNew World China Land Limited 60
CHENGDUHighlights
In 2014, Chengdu’s GDP reached RMB1,000 billion, with an annual increase of 8.8%. Fixed asset investments rose to RMB660 billion. Value added by the service sector was expected to grow by 8% to a total of RMB508 billion. Core capabilities of the service sector, including trading and logistics, financial services and headquarters economy grew even stronger. Construction of national e-business demonstration city witnessed new accomplishments. The total amount of e-commerce transactions exceeded RMB500 billion. Chengdu was also strengthening its efforts to support the development of innovative technologies. Debt financing risk capital pools and angel investments were established to direct funds, and the innovative start-ups service platform was set up.
Perspective of Chengdu New World Riverside

Annual Report 2015 61
Perspective of Chengdu New World Riverside
Comprehensive planning of Chengdu Tianfu New District
was completed. Construction of the innovative
technology city, the central business district and Jinjiang
ecological belt accelerated. Backbone roads such as
Phase II of Tianfu Avenue were completed and in
operations, improving the urban highway network.
Integration of urban and rural public transport progressed
steadily. Construction of five subway lines and seven
related projects including Subway Line 3 fully
commenced. The operation of eastern extension of
Subway Line 2 commenced.
Chengdu New World Riverside
CHENGDU DEVELOPMENT PROPERTIESOne property with total GFA 3,624,763 sq m
Eco Wetland Park
Subway
Subway (under construction)
Bridge
Chengdu New World Riverside19
Airp
ort E
xpre
ssway
Hua Yang Road
Huayang Bus Terminal
International Convention & Exhibition CentreTianfu Software Park
Consulate General DistrictRing Expressway
Third Ring Road
Tianfu Ave
Lushan Road
Tianfu New City
South Tianfu Plaza
Chengdu Municipal Government
Chengdu ShuangliuInternational Airport
19
•••
Shuangliu
N
For details of the Group’s project portfolio, please refer to “Major Projects
Profile”.

New World China Land Limited 62
PROPERTY PORTFOLIO
Chengdu New World Riverside is located in the prime
location of Tianfu New District, between Chengdu
Shuangliu International Airport and Chengdu Tianfu
International Airport that will be built in the future. The
project boasts geographical advantage with Subway
Lines 1 and 18 located nearby. The project has a site
area of approximately 1.1 million sq m, and enjoys the
natural resources and serene environment of the 3,000
metre-long Jinjiang Ecological Zone. Construction of
Chengdu New World Plaza, a 340,000-sq-m, one-stop
lifestyle centre that converges shopping, retail street,
hotel as well as sports and cultural facilities in the core
centre of the project, began during the year under review
and will become the core living area of Tianfu New
District. Construction of the commercial portion of Phase
II was also completed and is currently put for lease. Both
the clubhouse and the kindergarten of approximately 7,000
sq m and 4,800 sq m respectively, commenced
operations.
Perspective of commercial development, Chengdu New World Plaza of Chengdu New World Riverside
During the year under review, six blocks of Phase II
Cluster I “Zhi Lan City” consisting of 1,046 residential
units ranging in size from 78 to 163 sq m were launched
for sale, and sales performance was satisfactory.
CHENGDU
Chengdu — completion schedule
of properties for sale sq m
FY2016
Chengdu New World Riverside
Phase II 1A 220,223
Total 220,223
FY2017
Chengdu New World Riverside
Phase II 1B 247,448
Chengdu New World Riverside
Phase II 2A 143,917
Total 391,365
BUSINESS REVIEW

BUSINESS REVIEWAnnual Report 2015 63
GUIYANGHighlights
In 2014, Guiyang’s GDP rose by 13.9% year-on-year to RMB249.7 billion. Zhongguancun Guiyang Science Park made its debut while the construction of the Guizhou Shuanglong Airport Economic Zone also began. The vertical and lateral integrated development mode of Guiyang Internet Financial Industry Park was formed, with 113 financial institutions setting up their local branch offices in Guiyang. Establishment of the Guiyang • Gui'an National Big Data Clustering Zone was approved.
Leveraging its construction of an innovative city in terms of technological finance and Internet finance in western China, Guiyang implemented the pilot work of national online finance, and facilitated the construction and business development of Guiyang’s Internet Financial Industry Park.
Guiyang Jinyang Sunny Town

New World China Land Limited 64
Phase II of the transportation un-cluttering project for the
central urban area of Guiyang was under way last year.
Preliminary work on the development of public transport
express system of the city was in progress. Construction
of Subway Line 1 was in full swing. Renovation of
Terminal 1 building of Longdongbao Airport was basically
completed with six new and more frequent international
routes. The annual passenger throughput volume
exceeded 12 million people. Furthermore, construction
of the high-speed rail system connecting Guiyang and
Guangzhou was completed and in operation, thrusting
Guiyang into the “High-Speed Rail” era.
PROPERTY PORTFOLIO
Guiyang Jinyang Sunny Town is located at the prime
location of Guanshan Lake District, the new municipal
and economic centre of Guiyang. The project is a
modern ecological showcase city with a GFA of four
million sq m, boasting comprehensive commercial and
educational facilities such as renowned secondary and
primary schools, Guiyang K11 Art Mall and New World
Guiyang Hotel. The project mainly offers high-rise
residential units ranging in size from 70 to 158 sq m,
mid-rise residential units ranging in size from 120 to 190
sq m, as well as villas ranging in size from 197 to 700 sq
m to cater to the various needs of home buyers.
Lightrail (under planning and construction)
Guiyang Jinyang Sunny Town
New World Guiyang Hotel
20
65
20 20
2065
20
20
20
Guanshanhu Park
Guiyang Government
GuiyangConvention Centre
Guiyang International Convention & Exhibition Centre
PublicTransportation Hub
Longtan Road
Jinx
ibei
Roa
d
Jinyang New
District
Jiny
angb
ei R
oad
Jinzhu Road
Gua
nsha
nbei
Roa
d
Linchengxi Road Linchengdong Road
Che
ngxi
nzho
ng R
oad
Che
ngxi
nbei
Roa
d
Guanshanxi Road Guanshandong Road
N
For details of the Group’s project portfolio, please refer to “Major Projects
Profile”.
GUIYANGBUSINESS REVIEW
Guiyang Jinyang Sunny Town

Annual Report 2015 65
Guiyang — completion schedule
of properties for sale sq m
FY2016
Guiyang Jinyang Sunny Town Phase II C 325,758
Guiyang Jinyang Sunny Town Phase III A 29,748
Total 355,506
FY2017
Guiyang Jinyang Sunny Town Phase IV A 64,937
Total 64,937
GUIYANG DEVELOPMENT PROPERTIESOne property with total GFA 3,867,935 sq m
New World Guiyang Hotel
Perspective of Guiyang Jinyang Sunny Town “Merry Land”
During the year under review, Guiyang Jinyang Sunny
Town launched 3,124 residential units of “Long Yue” for
sale, receiving good market response with more than 2,000
units sold.
Rental rate of the commercial portion of the project
exceeded 68%, with businesses such as catering, retail,
entertainment and recreation moving in. In the future, the
project will benefit from the transport convenience
brought by Light Rail Lines 1 and 2, which will further
bring about positive factors to the future development.
New World Guiyang Hotel has commenced operation
since September 2014.

出新
新
推出
推

出新
新
推出
推
Southern China — “推陳出新Tui Chen Chu Xin” — Evolving from Traditions to Innovations
“陳Chen” ranks number ten in the Hundred Family Names. It is the most common surname in southern China, in the provinces of Guangdong and Fujian, as well as in Hong Kong and Macau. “推陳出新Tui Chen Chu Xin”, in traditional Chinese idiom literally is evolving from traditions to innovations, means applying critical thinking on traditional subject matters to condense their quintessence such that new things or new ways of working can be created.
Chen

New World China Land Limited
BUSINESS REVIEW68
GUANGZHOUHighlights
In 2014, Guangzhou’s GDP grew by 8.6% year-on-year to RMB1,670 billion. Adjustments in industrial structure saw solid results, with the proportion of service industry increasing constantly. Hi-tech industries, strategic emerging industries and new businesses were growing strong and fast. Total volume of import and export expanded 9.8% to USD130.6 billion. Guangzhou topped Forbes China List of Best Cities for Business for the fourth time.
Guangzhou Central Park-view

Annual Report 2015 69
GUANGZHOU DEVELOPMENT PROPERTIESThree major properties with total GFA 1,416,243 sq m
16.1%
4.5%
10.9%
68.5%
CARPARK AND OTHERS
HOTEL
COMMERCIAL
RESIDENTIAL
Guangzhou drove forward with the upgrade and
transformation of key commercial districts by accelerating
the construction of international convention and
exhibition centre, logistics centre and procurement
centre. Guangzhou also refined its capabilities in trading
and commerce. A series of specialised trade exhibitions
and events were held to promote new consumption style
in areas such as information, culture, health and tourism.
Guangzhou clinched the top position in sub-provincial
cities of Mainland China in terms of its integrated tourism
competitiveness. Total retail sales of social consumer
products expanded by 12.5% to RMB769.8 billion when
compared to last year. The Guangzhou Free Trade Zone
was successfully declared, and Customs established
“21st Century Maritime Silk Road” special passageway
to encourage enterprises to build up overseas
manufacturing bases and sales networks, and to attend
international trade fairs. New businesses such as cross-
border e-commerce and market procurement were
developed. Total amount of imports and exports via
cross-border e-commerce reached RMB1.31 billion.
Guangzhou continued to drive the initiative to build its
transportation hub. Construction of major projects such
as the expansion of Baiyun Airport, Phase III of Nansha
port, national railways, intercity trains, subways, high
speed roads as well as municipal roads and bridges
accelerated. Construction of the high-speed rail links
connecting Guiyang to Guangzhou and Nanning to
Guangzhou was completed and in operation.
Railway Station
Subway
Bridge
22
21
23
50
51
52
Guangzhou Dong Yi Garden
Guangzhou Covent Garden
Guangzhou Park Paradise
Guangzhou New World Oriental Garden
Guangzhou Central Park-view
Guangzhou Park Paradise Area 6
21
5122
2222
52
23
Hua
nan
Brid
ge
Tianhe Park
Nanhu Park
Zhujiang Park Lingjiang Ave
Huangpu Ave
Guangzhou EastRailway Station
North Ring Road
Gua
ngzh
ou A
ve
Canton Tower
GuangzhouGovernment
Inner Ring Road
Zhongshan Ave
Pearl River
Jinz
hu E
xpre
ssw
ay
Baiyun MountainScenic Area
YuexiuTianhe
Liwan
Airp
ort E
xpre
ssw
ay
Huanan Expressway
Baiyu
n Av
enue
Liwan Government
Zhuji
ang
Bridge
Fangcun Ave
In
ner R
ing R
oad
50
Tianhe Road
Baiyun
N
For details of the Group’s project portfolio, please refer to “Major Projects
Profile”.
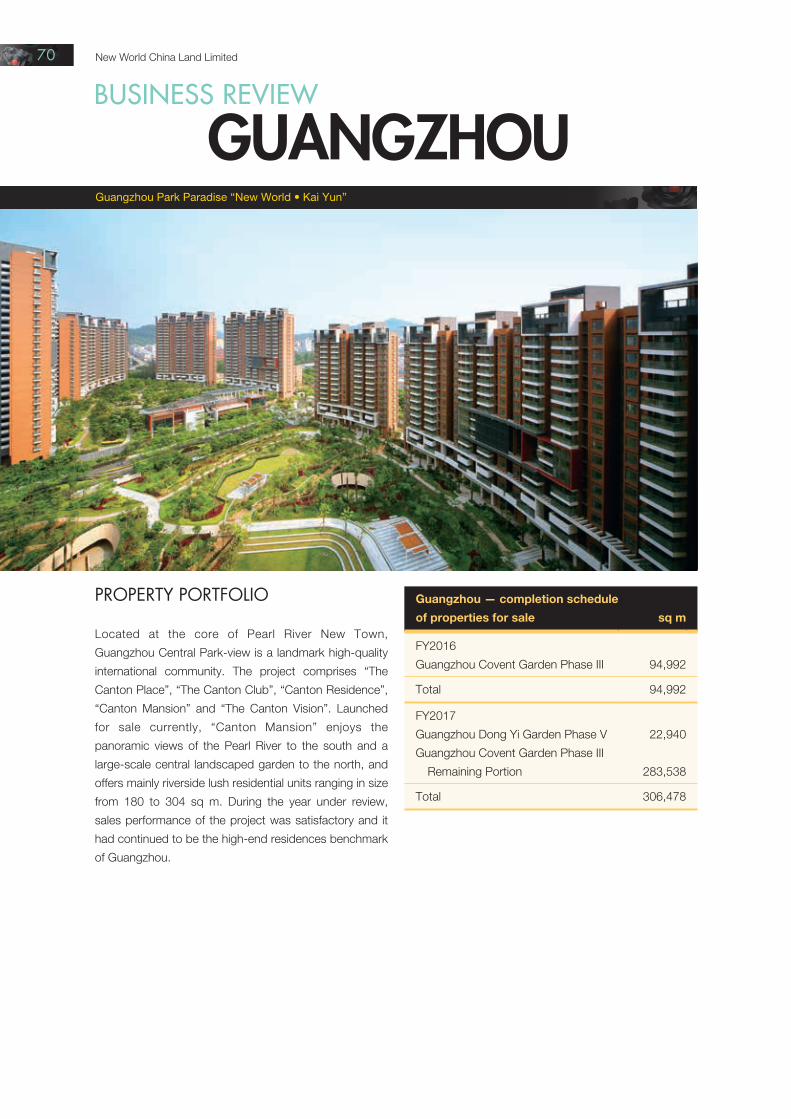
New World China Land Limited 70
Guangzhou — completion schedule
of properties for sale sq m
FY2016
Guangzhou Covent Garden Phase III 94,992
Total 94,992
FY2017
Guangzhou Dong Yi Garden Phase V 22,940
Guangzhou Covent Garden Phase III
Remaining Portion 283,538
Total 306,478
Guangzhou Park Paradise “New World • Kai Yun”
PROPERTY PORTFOLIO
Located at the core of Pearl River New Town,
Guangzhou Central Park-view is a landmark high-quality
international community. The project comprises “The
Canton Place”, “The Canton Club”, “Canton Residence”,
“Canton Mansion” and “The Canton Vision”. Launched
for sale currently, “Canton Mansion” enjoys the
panoramic views of the Pearl River to the south and a
large-scale central landscaped garden to the north, and
offers mainly riverside lush residential units ranging in size
from 180 to 304 sq m. During the year under review,
sales performance of the project was satisfactory and it
had continued to be the high-end residences benchmark
of Guangzhou.
GUANGZHOUBUSINESS REVIEW

Annual Report 2015 71
Guangzhou Park Paradise “New World • Caring Mansion”
Guangzhou Park Paradise “Jin Yun Feng”

New World China Land Limited 72
Guangzhou Park Paradise is located at the core of
Baiyun New Town and covers a site area of
approximately 1.2 million sq m. It has a GFA of 2.2
million sq m, 500,000 sq m of which will be developed
into a mixed-use development area which comprises a
five-star hotel, commercial retail, landscaping, cultural,
entertainment and recreational facilities, transport hub
and a catering centre. With the Subway Lines 2, 3 and
14 converging and the project’s comprehensive
amenities, Guangzhou Park Paradise attains the highest
quality community in Baiyun District. The single-unit-
whole-floor eco-mansion, “New World • Kai Yun” is
currently offering units with size ranging from 130 to 170
sq m for sale, and is well received by the market. The
sale of brand new “Star Villa” with units of 240 sq m
were overwhelmingly received and snatched up very
quickly at launch. “New World • Caring Mansion” offers
low-density duplex apartments ranging in size between
135 and 217 sq m and the sales performance was
satisfactory. High-rise apartment “Jin Yun Feng” was
highly sought after by the market and 1,820 units was
fully sold out.
“New World • Canton Bay”, the latest phase of
residential project of Guangzhou Covent Garden, is
located at the exceptional core position of Baietan in
Liwan District. With Subway Line 5 beginning here and
connecting with the existing Line 1 and 2, the project
enjoys the convenience brought by the multiple subway
lines. The project boasts 60,000 sq m of riverside
landscaped garden, 100,000 sq m of commercial
amenities, as well as secondary and primary schools to
satisfy the various daily needs of the residents. Launched
in July 2015, the new “Qin Rong Shi Guang” residential
cluster offers 465 three- to four-bedroom units ranging in
size from 99 to 141 sq m to meet the varied needs of
home buyers. In addition, top-end riverside villas “Yue
Fu” ranging in size from 208 to 240 sq m, 40 units was
launched for sale and the sales performance was
satisfactory.
“Wan Xiang Yuan” of Guangzhou Xintang New World
Garden is located at the core area of eastern
Guangzhou. In close proximity with the under
construction Subway Line 13, Shenzhen Expressway
and Guangzhou-Dongguan-Shenzhen Intercity Railway,
the project enjoys transport convenience. The final phase
of the project offers two- to four-bedroom apartments
ranging in size from 85 to 150 sq m. An accumulated
264 units was being sold.
Guangzhou Xintang New World Garden “Wan Xiang Yuan”

Annual Report 2015 73
Guangzhou Covent Garden “New World • Canton Bay”
Residential showflat of Guangzhou Covent Garden “New World • Canton Bay”

New World China Land Limited
BUSINESS REVIEW74
SHENZHENHighlights
In 2014, Shenzhen’s GDP exceeded RMB1,600 bill ion. Fixed asset investments totalled RMB271.7 billion, with five-year aggregate amount exceeding RMB1,000 billion.
Shenzhen New World Signature Hill

Annual Report 2015 75
Shenzhen’s position as a financial centre is continuously
enhanced. It ranked third in Mainland China in terms of
local and foreign currencies deposit and loan balances,
while total asset value of financial industry exceeded
RMB7,000 billion. The annual container throughput
exceeded 24 million standard containers, ranking in top
three globally. The annual passenger throughput volume
of the airport exceeded 36 million people. Development
and construction of 15 key regions, including the
Shenzhen Bay Mega-headquarters’ Base and
International Bio-valley, had accelerated. Shenzhen also
fully implemented its innovation-driven development
strategy. The number of international patent applications
reached 11,600 in 2014. This number tripled since 2010
and accounted for 48.5% of all international patent
applications in the nation.
Guangzhou Shenzhen High-speed Railway
Guangzhou Shenzhen Hong KongHigh-speed Railway (under construction)
Railway Station
54
55
Shenzhen New World Yi Shan Garden Phase III
Shenzhen New World Signature Hill
5455
Shenzhen NorthRailway Station
Guangzhou-Shenzhen H
ighway
Bao An Road
Yanpai Expressway
Yanba Expressway
Binhai BoulevardShenzhen
BayWestern
Corridor
Shennan BoulevardBeihuan Boulevard
Wutong Road
Guangsheng Road
Futian PortShenzhen Bay Port
Shekou Port
Huanggang PortLuohu Port
Shatoujiao Port
Shenzhen Baoan International Airport
Longgang
YantianLuohuFutianNanshan
Hong Kong
Qianhai
Baoan
N
For details of the Group’s project portfolio, please refer to “Major Projects
Profile”.
The Guangdong Free Trade Zone (“FTZ“) in Qianhai-
Shekou area was officially inaugurated in April 2015.
Running as an area with low tax and limited restrictions,
the FTZ has driven the development of logistics industry.
Meanwhile, cooperation between Shenzhen and Hong
Kong continued to deepen. Development of Qianhai
was propelled forward to focus on the development of
high-end emerging service industries and headquarters
economy so as to promote trade liberalisation in the
service sector. The GDP of Qianhai is expected to reach
the level of RMB150 billion by 2020. The city will
become an important strategic location in the Greater
Guangdong-Hong Kong-Macau Bay Area and along the
Maritime Silk Road.

New World China Land Limited 76
Shenzhen New World Signature Hill
PROPERTY PORTFOLIO
Shenzhen New World Signature Hill is situated at the top
of Jiangang Mountain in Baoan District, the vicinity has
the largest concentration of villas in Shenzhen. It is the
last luxurious villas project at the backyard of Qianhai
Free Trade Zone. Shenzhen New World Signature Hill
features a 10,000 sq m private lake. The four-level
waterfall landscaped gardens is designed to insinuate
the hillside contour. All these help to redefine the
standard of villa-style living in Shenzhen. A total of 54
duplex villas and townhouses of Phase I were launched
for sale in mid April 2015, offering accommodation
between 338 and 666 sq m. As at the end of June 2015,
about 80% of units have been sold.
Shenzhen New World Yi Shan Garden Phase III “The
Hillswood” is located at Shatoujiao in Yantian District.
The Wutong Mountain is at the northern doorstep of the
project while to the south is full sea view of Hong Kong.
Infused with joyous children sensibility and boundless
imagination, the 32,000 sq m large-scale sloped
landscape garden is a rarity in the area. “The Hillswood”
comprises three 33-storey residential towers and two
43-storey ultra-high-rise towers. The penthouse duplex
are the highest residences in the vicinity. The project
offers 978 residential units ranging in size between 30
and 376 sq m, and sales launch is expected to be in the
fourth quarter of 2015.
SHENZHENBUSINESS REVIEW

Annual Report 2015 77
Shenzhen New World Yi Shan Garden Phase III “The Hillswood”
Shenzhen New World Yi Shan Garden Phase III“The Hillswood” children’s facilities
Landscaping of Shenzhen New World Yi Shan Garden Phase III “The Hillswood”

New World China Land Limited
BUSINESS REVIEW78
FOSHANHighlights
In 2014, Foshan’s GDP rose by 8.6% year-on-year to RMB760.3 billion. Total fixed asset investments of society grew annually by 15% to RMB261.2 billion.
Currently, Foshan speeded up the adjustment of industrial structure. The enabling policy for the province’s technology transformation was actively implemented. Investments of RMB27.9 billion into industrial technology transformation were completed, representing a year-on-year increase of 23.7%. A total of 27 companies made their names onto the list of top 100 e-commerce businesses in Guangdong province. The Foshan (International) Furniture Expo Mall, Pingzhou Jade Street in Guicheng, and Lecong International Convention and Exhibition Center became National 4A scenic spots. The 10th China (Foshan) Machinery Exposition and the 7th China (Shunde) Industrial Design Expo were held successfully.
Canton International House (Left) and residential development (Right) of Canton First Estate

Annual Report 2015 79
Foshan took strong initiative to develop its infrastructure.
Construction of the Foshan West Railway Station,
Foshan-Zhaoqing Intercity Railway and Phase II of
Guangzhou-Foshan intercity subway accelerated.
Preliminary work of the projects for Phase I of Subway
Line 2 and Line 3 commenced.
PROPERTY PORTFOLIO
Canton First Estate is situated at the new centre of
Greater Guangzhou, with the high speed railway Foshan
West Railway Station located nearby and the
geographical advantages brought by the intersection of
Foshan Subway Lines 3, 4 and 8. This three million sq m
international golf-themed lake and mountain community
boasts a 730,000 sq m world-class golf course, 470,000
sq m forest, 330,000 sq m ecological lake and a 20-km
long landscaped greenway around the lake. The
project’s Foshan Golf Club is the only club in southern
China that has attained the international certificate
conferred by the Golf Environment Organisation which is
the most authoritative golf course certification
organisation in Europe. In addition, it is the main venue
for the European Tour in the next 10 years. Guangzhou
Foshan World is a 100,000 sq m prestigious mixed
development with Canton International House, Foshan
Canton Residence, Heart of Guangzhou-Foshan
Exhibition Centre, New World Foshan Hotel and offices.
Canton International House and Foshan Canton
Residence commenced operations in July 2015,
showcasing the international quality living.
FOSHAN DEVELOPMENT PROPERTIESOne property with total GFA 1,008,387 sq m
3.6%
8.5%
87.9%
CARPARK AND OTHERS
HOTEL
RESIDENTIAL
24
Guangzhou NorthRailway Station
Guangzhou SouthRailway Station
Shunde Port
Nanhai PortFoshan Airport
Guangzhou BaiyunInternational Airport
Foshan WestRailway Station
Guangzhou
Foshan
Shunde
West Ring 2nd Expressway
Foshan First Ring
Guangzhang Expressway
Jing
zhu
Expr
essw
ay
Railway Station
High-speed Railway 24
Intercity Railway
Canton First Estate
Erguang Expressway
Zhaoqing Expressway
Wuhan Guangzhou High Speed Railway
Guangzhou Foshan Highway
Guangzhou
Foshan
Circular Lightra
il
Guangzhou FoshanZhaoqing Intercity Lightrail
N
For details of the Group’s project portfolio, please refer to “Major Projects
Profile”.
FOSHANBUSINESS REVIEW

New World China Land Limited 80
During the year under review, 600 sq m single-detached
villas “Tian Luan”, townhouses “Jun Lin Tian Xia” ranging
in size from 380 to 460 sq m, and low-rise residences “The
Graceful Lakeshore” ranging in size from 130 to 160 sq m
were launched for sale concurrently. All of these properties
have drawn high attention from customers in Guangzhou,
Foshan and Hong Kong.
Perspective of New World Foshan Hotel
Golf Course of Canton First Estate

Annual Report 2015 81
Foshan — completion schedule
of properties for sale sq m
FY2017
Canton First Estate Phase II (CF19B) 49,074
Canton First Estate Phase II (CF20) 86,617
Total 135,691
Villa showflat of Canton First Estate
Villa of Canton First Estate

New World China Land Limited
BUSINESS REVIEW82
PEARL RIVER DELTAHighlights
In 2014, the Pearl River Delta’s GDP grew by 7.8% to RMB5,780 billion. Investments in newly signed projects in Nansha New District in Guangzhou exceeded RMB450 billion. A total of 30 company headquarters were set up in Nansha. A total of 7,363 enterprises also moved into Hengqin New District in Zhuhai. Investments in industrial and technological reform in the Pearl River Delta area exceeded RMB100 billion, representing a year-on-year increase of 34.2%.
Zhaoqing New World Garden “New World Canton Villa”

Annual Report 2015 83
As the comprehensive planning of the Pearl River Delta
began, the technological innovation and integration of
eco-safety in Pearl River Delta accelerated. The
development plan of the Pearl River-Xi River Economic
Belt was approved by the Central Government.
Construction of the Guangdong-Guangxi Interprovincial
Pilot Cooperation Special Zone accelerated.
In November 2014, the Guangdong provincial
government promulgated the “Pearl River Delta Area
Action Plan for Logistics Integration (2014—2020)”, and
proposed the construction of a three-hour logistics
economic circle to form well established network of an
integrated logistics system.
PROPERTY PORTFOLIO
Zhaoqing New World Garden is situated in Grade 4A
Star Lake National Park and boasts top-notch views of
the Star Lake. The project spans over an area of
approximately 540,000 sq m, offering single-detached
villas and residential units. The project includes a 5,000
sq m multifunctional and luxurious clubhouse. “New
World Canton Villa”, which is currently launched for sale,
offers single-detached lakeside villas ranging in size from
220 to 500 sq m. “Star Villa” provides residential units of
170 sq m. During the year under review, the first batch of
“Xing Xi”, which includes garden-view two-to four-
bedroom residential units ranging in size from 70 to 110
sq m, recorded an exceptional 80% sales rate on the
first day of sales.
PEARL RIVER DELTA DEVELOPMENT PROPERTIES
Four major properties with total GFA 547,570 sq m
5.2% 0.5%
94.3%
COMMERCIAL
RESIDENTIAL
CARPARK AND OTHERS
Railway
Expressway
Zhaoqing New World Garden
Huiyang Hu Xia Liao Project
Huiyang Palm Island Resort
Huizhou Changhuyuan
Shunde New World Centre
New World Shunde Hotel25
26
27
28
56
64
25 Huiyang
Huizhou
Dongguan
Zhaoqing
Shunde
ZhuhaiHong Kong
Shanwei
Macau
XinxingJiangmen
ZhongshanYunfu
Enping
Yangjiang
Guangzhou
Heyuan
Qingyuan
5664
28
2726
N
For details of the Group’s project portfolio, please refer to “Major Projects
Profile”.
PEARL RIVER DELTABUSINESS REVIEW

New World China Land Limited 84
Pearl River Delta — completion
schedule of properties for sale sq m
FY2016
Zhaoqing New World Garden Phase III
Remaining Portion 75,523
Total 75,523
Located at the prime area of the city centre, Shunde
New World Centre is a mature mixed-use property
development and investment project. During the year
under review, renovation of the project’s shopping mall
was completed and the tenant mix was optimised. The
occupancy rate reached as high as 97% while the overall
rental rate raised by 4%. The last residential tower on the
podium of the project will be launched for sale in the first
half of 2016, offering units ranging in size between 39
and 115 sq m.
Zhaoqing New World Garden
Shunde New World Centre

Annual Report 2015
BUSINESS REVIEW85
HAIKOUHighlights
As the strategic fulcrum city of the nation’s “21st Century Maritime Silk Road”, Haikou’s GDP reached RMB100.6 billion in 2014, achieving a year-on-year increase of 9.2%. Fixed asset investments reached RMB82.2 billion, representing an annual growth of 26.5%.
Consumer demand in Haikou continued to expand. With the establishment of the Qiongbei Tourism Transaction Platform, total direct income from tourism reached RMB14.2 billion, an increase of 18.2%. With the expansion of Offshore Duty-Free Shop at the Meilan Airport, total sales of duty-free goods reached RMB920 million, representing an increase of 52.5%.
Furthermore, Haikou is expediting its cooperation with Beibu Gulf and the Pan-Pearl River Delta area, putting the cooperation and coordination mechanism in the Pan-Beibu Gulfport into work. The city also facilitated the mega customs clearance cooperation among the “Three Locations and Seven Ports” of Hainan, Guangxi and Guangdong.
Haikou New World • Meilisha villa

New World China Land Limited 86
Haikou — completion schedule
of properties for sale sq m
FY2017
Haikou New World • Meilisha Phase II
(#0102) 89,928
Total 89,928
Haikou New World • Meilisha VillaPROPERTY PORTFOLIO
Haikou New World • Meilisha Project is located at the
core development area of the city and the coastal area in
north western Haidian Island, surrounded by the sea on
three sides. The project has a planned GFA of over two
million sq m. Residential mix includes villas, low and
high-rise residence and serviced apartments.
Commercial amenities include hotel, K11 Art Mall and
high-end wellness centre. There will also be six
educational institutions, including high quality secondary
and primary schools and kindergartens.
Haikou New World • Meilisha Project Phase I, “Joyful
Bay” and “Wealthy Bay” were launched for sale in
December 2013 and April 2015 respectively, these
includes single-detached villas with size ranging from
406 to 570 sq m, and stacked duplex villas ranging in
size from 266 to 270 sq m. Sales performance was
satisfactory. Phase I “Peaceful Bay” offers low-density
residential units ranging between 65 to 160 sq m.
Presale began in February 2015 and drew enthusiastic
market reaction.
Perspective of Haikou New World • Meilisha Project
HAIKOUBUSINESS REVIEW
Haikou New World • Meilisha villa

Annual Report 2015 87
Haikou New World • Meilisha Villa
HAIKOU DEVELOPMENT PROPERTIESOne property with total GFA 2,561,635 sq m
29.8%
6.8%
3.4%
60%
CARPARK AND OTHERS
HOTEL
COMMERCIAL
RESIDENTIAL
29
57
Bridge
Haikou New World • Meilisha
Haikou New World Garden
5729
Renm
in Bridge
Heping B
ridge
Haidian RiverHaikou XingangFerry Terminal
HaikouXingang
Shiji B
ridgeS
hiji Ave
Haidian Wu West RoadHainan University
Haidian Harbour
Renm
in Ave
Heping A
ve
Haijing Road
Haida R
oad
National Tax Building
Changdi Road Xinbuzhen
XinbudaoDevelopment
Zone
Henggou River
Haixin Bridge
Xinb
u Av
e
Haidian San West Road
Haidian Island
Wang Gate Gang
N
For details of the Group’s project portfolio, please refer to “Major Projects
Profile”.

New World China Land Limited 88
MANAGEMENT DISCUSSION AND ANALYSISBUSINESS REVIEW
During the year under review, the Mainland China property market saw a gradual improvement amid positive
developments on the regulatory policy which aimed at reinforcing healthy long-term development of the property
market and stimulating the slowing macro-economy at large. In the third quarter of 2014, progressive easing of
austerity measures was introduced by various local governments including terminating or relaxing the purchase
restriction policy, loosening mortgage restrictions by easing qualification for first-time homebuyers and relaxing loan
terms for existing homebuyers. On 30 March 2015, the PBOC, the Ministry of Housing and Urban-Rural Development
and the China Banking Regulatory Commission jointly issued the “Notice of Issues Concerning the Policies for
Individual Housing Loans” (關於個人住房貸款政策有關問題的通知) and Ministry of Finance and State Administration
of Taxation jointly issued the “Notice Concerning the Policy on Business Tax of Transfer of Residential Properties by
Individual” (關於調整個人住房轉讓營業稅政策的通知) to support reasonable housing demand for improvement-type
home purchases. Under these two directives, the minimum mortgage down payment requirement was lowered to
40% from the previous 60%–70% for the purchase of self-occupied ordinary residential units for the improvement of
living conditions and business tax was exempted upon transfer for properties owned for more than two years. In
addition, the PBOC had cut the benchmark lending interest rates four times and reduced reserve ratio requirement
for commercial banks three times during the year under review, further easing the country’s monetary policy amid the
pressure of descending macro-economy. On 26 August 2015, the PBOC announced a further cut of benchmark
lending rates and deposits rate by 25 basis points to a record low of 4.6% since 2011, and reduction of reserve ratio
requirement for financial institutions by 50 basis points.
According to the data announced by National Bureau of Statistics, the overall sales of commodity housing for the first
six months to June 2015 had increased by 3.9% in GFA and increased by 10.0% in sales revenue amount compared
to the corresponding period in 2014. Benefiting from the easing measures and loosening credit policies which helped
to reinforce the underlying strength of the PRC property market and stimulate overall housing demand, the Group
successfully accomplished its contracted sales target for FY2015 of RMB12.5 billion. During the year under review,
the Group achieved contracted sales of approximately RMB15,426 million with contracted GFA sold of 1,090,891 sq m,
representing a year-on-year increase of 4.3% and 7% in gross sales value and sales volume respectively. Included in
the remaining contracted sales secured and to be recorded, approximately 582,648 sq m GFA with gross sales
proceeds of approximately RMB5,334 million are for those projects scheduled to be completed within the next 12
months and their corresponding sales revenues shall be recorded in the consolidated income statement of FY2016.
For the year ended 30 June 2015, the Group’s core profit before revaluation, exchange difference, amortisation and
impairment of intangible assets reported at HK$2,624.60 million, representing a decrease of 41.3% from
HK$4,467.49 million recorded last year. The decrease in core profit was largely attributable to overall decrease in
attributable operating profit (“AOP”) from property sales resulted from cyclical effect of recording sales arising from
decrease in completion of GFA by 30% and decrease in gross profit margin of property sales by approximately 2.7
percentage points compared to last financial year. The Group’s profit attributable to shareholders posted at
HK$3,313.13 million, representing a decrease of 28.6% compared to FY2014. The decrease in profit attributable to
shareholders was mainly due to aforementioned decrease in core profit which effect was mitigated by an increase in
changes in fair value of investment properties compared to last year.

Annual Report 2015 89
Analysis of attributable operating profit
FY 2015 FY 2014HK$’000 HK$’000
Property sales 2,936,533 5,002,263Rental operation 559,083 543,106Hotel operation (262,998) (238,330)Property management services (125,302) (120,317)Hotel management services 106,689 36,280Other operations 3,085 (70,833)
AOP before finance costs and after taxation charge 3,217,090 5,152,169Bank and other interest income — corporate 123,910 129,400Deferred tax charge on undistributed profits (63,000) (175,622)Corporate administrative expenses (270,276) (266,263)Finance costs (383,121) (372,195)
AOP after corporate items 2,624,603 4,467,489
Changes in fair value of investment properties, net of deferred taxation 766,555 598,045Gain on remeasuring previously held equity interests of joint ventures
at fair value upon further acquisition as subsidiaries — 67,257Loss on disposal of associated companies — (2,486)Amortisation of intangible assets (54,692) (54,427)Impairment of intangible assets, net of deferred taxation (56,375) (91,892)Net foreign exchange gains/(losses) 33,040 (345,295)
688,528 171,202
Profit attributable to equity holders of the Company 3,313,131 4,638,691
Property salesDuring the year under review, the Group’s AOP from property sales operation recorded at HK$2,936.53 million, representing a 41.3% decrease as compared to AOP from property sales of HK$5,002.26 million achieved in FY2014. The overall recorded property sales volume of the Group for the year under review decreased by 39.5% comparing to the corresponding period last year to 855,414 sq m with recorded gross sale proceeds of approximately RMB13,068.30 million. The decrease in AOP from property sales was mainly resulted from decrease in volume of completed projects by 30% from last year’s completion of 1,553,567 sq m to 1,089,163 sq m completed during the year under review and planned deferral in launching the sale of high-end villas in Shenzhen New World Signature Hill and high-rise residential units in Shenzhen New World Yi Shan Garden until after completion instead of pre-selling at construction stage in order to maximise their returns and benefits from tapping the rising trend of property prices in the region and executing pricing strategy with more flexibility for sales of completed units.
The Group’s overall gross profit margin of 41.6% was 2.7% lower than gross profit margin recorded in FY2014. The decrease in overall gross profit margin was mainly due to difference in recorded sales mix of both years. The recorded property sales for the year under review was mainly from Tianjin Glorious Palace, Foshan Canton First Estate, Langfang New World Centre and Dalian New World Tower, which had relatively lower gross profit margin than property projects sold in last year which mainly included Guangzhou Park Paradise, Shenyang New World Garden, Beijing Xin Yi Garden office units, Guangzhou New World Oriental Garden and Guangzhou Covent Garden. Despite the decrease in overall gross profit margin, the Group’s average selling price during the year under review recorded an increase of RMB3,252 per sq m to RMB16,937 per sq m, representing a 23.8% increase as compared to the average selling price achieved in the last financial year. The increase in average selling price was attributable to different product mix in recorded sales mix of both years among which the recorded sales for the year under review comprised villas from Shenzhen New World Signature Hill and Beijing New World Yuzhuang and high-end residential units from Guangzhou Central Park-view and Guangzhou Park Paradise.

New World China Land Limited 90
MANAGEMENT DISCUSSION AND ANALYSISIn FY2015, the Group has completed 14 property development projects for sale in Beijing, Langfang, Tangshan,
Dalian, Tianjin, Chengdu, Changsha, Guangzhou, Foshan, Shenzhen, Zhaoqing and Haikou with a total GFA of
1,089,163 sq m, comprising 1,015,223 sq m of residential, 18,242 sq m of commercial properties, 25,609 sq m of
office space and 30,089 sq m of resident carpark space.
Development property projects for sale completed in FY2015
Total GFA NWCL’s
Usage (sq m) interest
Beijing New World Yuzhuang
(北京新世界麗樽) R, C, O 63,416 75%
Langfang New World Centre District B
(廊坊新世界中心B區) R, C 20,802 100%
Tangshan New World Centre Phase I
(唐山新世界中心一期) R, C 69,231 100%
Dalian New World Tower
(大連新世界大廈) R 76,230 100%
Tianjin Glorious Palace
(天津新匯華庭) R, P 105,201 100%
Chengdu New World Riverside Phase II
(成都河畔新世界二期) R 84,873 30%
Changsha La Ville New World Phase III C
(長沙新城新世界三期C) C, O, P 39,939 48%
Guangzhou Park Paradise Area 6
(廣州嶺南新世界六區) R, C 146,762 100%
Guangzhou Xintang New World Garden Phase V C
(廣州新塘新世界花園五期C) R 85,114 63%
Canton First Estate Phase I
(廣佛新世界莊園一期) R 178,717 85%
Shenzhen New World Signature Hill
(深圳新世界名鐫) R 58,692 100%
Shenzhen New World Yi Shan Garden Phase III
(深圳新世界倚山花園三期) R 95,594 100%
Zhaoqing New World Garden Phase III
(肇慶新世界花園三期) R, P 36,307 100%
Haikou New WorldMeilisha Phase I (#2)
(海口新世界美麗沙一期(#2)) R, P 28,285 100%
Total 1,089,163
R: Residential
C: Commercial
O: Office
P: Carpark

Annual Report 2015 91
Rental operationDuring the year under review, the Group’s AOP from rental operation recorded a moderate increase of 2.9% to
HK$559.08 million as compared to the last financial year. The increase in AOP from rental operation was mainly
attributable to increase in AOP contributions from Shanghai Hong Kong New World Tower K11 Art Mall resulting from
increase in occupancy rate and Wuhan New World International Trade Tower as a result of increase in average rental
rate upon renewal of tenancy contract.
During the year under review, a total GFA of 155,221 sq m was added to the Group’s investment properties portfolio
with the completion of 67,111 sq m of commercial properties, 11,039 sq m of service apartment and 77,071 sq m of
resident carpark space from investment projects located in Tianjin, Guiyang, Foshan, Langfang, Guangzhou,
Shenzhen and Zhaoqing.
Hotel operationDuring the year under review, the AOP from hotel operation recorded at a loss of HK$263.00 million as opposed to a
loss of HK$238.33 million recorded in the corresponding period last year. The decrease in overall AOP from hotel
operation was mainly due to the opening of New World Guiyang Hotel in September 2014 and which is still operating
at initial stage and incurred pre-operating expenses, and decrease in AOP from New World Dalian Hotel resulting
from decrease in occupancy rate and average room rate. The overall occupancy rate of the other six hotels of the
Group had improved during the year under review comparing to the same period last year. The Central Government’s
continuing anti-corruption initiatives remained a great challenge to the Group’s hotel operation.
The Group’s hotel portfolio currently comprises eight hotels with 2,855 rooms.
Hotel portfolio Number of rooms
pentahotel Beijing (北京貝爾特酒店) 307
New World Beijing Hotel (北京新世界酒店) 309
New World Shanghai Hotel (上海巴黎春天新世界酒店) 558
pentahotel Shanghai (上海貝爾特酒店) 258
New World Dalian Hotel (大連新世界酒店) 420
New World Wuhan Hotel (武漢新世界酒店) 327
New World Shunde Hotel (順德新世界酒店) 370
New World Guiyang Hotel (貴陽新世界酒店) 306
Total 2,855

New World China Land Limited 92
MANAGEMENT DISCUSSION AND ANALYSISOUTLOOK
As downward pressure continues to drag down the economy of Mainland China, local governments began to relax
curbing policies towards the real estate market since the third quarter of 2014. Currently, only first-tier cities such as
Beijing, Shanghai, Guangzhou and Shenzhen are still strictly imposing home purchase restrictions. In March 2015,
Premier Li Keqiang had no longer mentioned of the adjustment and control of the property market in his government
work report. The words changed from last year’s “curbing speculative investment demand” to “support people’s
demand for housing for personal use and of improvement nature, and promote the stable and sound development of
the real estate market”. In addition, the report raised that in the scope of housing support, physical housing and
housing subsidies will be implemented side by side, and a portion of stockpiles will be transformed to public rental
housing and resettlement housing.
Since the beginning of 2015, the PBOC continues to implement a prudent yet appropriately loose monetary policy,
exercising flexibility in a number of monetary policy tools to maintain sufficient liquidity and performing timely pre-
tuning and fine-tuning at appropriate levels. As policies to support growth in the property market were gradually
implemented, home buyers’ wait-and-see sentiments slowly turned to optimistic, with many speeding up their
purchase decisions. In addition, home improvement demands and investment demands that have both been
suppressed for a long time have now been released. Although from the second quarter of 2015 onwards, certain
economic indicators such as home sales and social financing scale have returned to the upward path, downside risk
still exists in the mainland’s economy. In particular, the growth in fixed asset investments may continue to slow down.
Amidst the downward pressure to the economy, the external landscape is still not optimistic. With the volatility in the
mainland’s stock market in the past few months, the Central Government may maintain a relatively loose monetary
policy in the near future. However, the room for further monetary easing in the mainland will be subject to inflation
trend, performance of the capital markets and changes in the monetary policies of the Federal Reserve Board of the
United States in the future. In the short run, relatively loose monetary policy will, to a certain extent, drive and support
the real estate market and fixed asset investments.
Looking ahead, the property markets of first-tier and some core second-tier cities are noticeably and certainly
warming up. However, the stockpile pressure in some third- and fourth-tier cities remains high. Supply and demand
will continue to be imbalanced. As such, it is believed that the Central Government will continue to uphold its
principles of “classification guidance, localisation implementation”. Based on the actual circumstances of various
cities, the Central Government will roll out targeted and differentiated adjustment and control policies for the property
market to actively promote its healthy development.

Annual Report 2015 93
At the Fifth Plenary Session of the Central Committee of the Communist Party of China to be convened in the second
half of 2015, the planning of the “13th Five-year Plan” will be discussed. This key roadmap, regarded as a symbol
that the mainland is emerging as a super power, will be the utmost important economic matter in the mainland for the
second half of the year. At present, there are large gaps in terms of the levels of economic development across
various regions of the country. Long-term issues such as overcapacity and environmental pollution are yet to be
resolved. Some analysts have pointed out that “rebalancing” the mode of economic development will be the keyword
for the planning of the “13th Five-year Plan”. Under the principles of “rebalancing”, “One Belt, One Road” and
“innovation-driven” will become two core strategies in the “13th Five-year Plan”. “One Belt, One Road” focuses on
the late comers of development in western China. It strives to drive the development in the middle and western parts
of the country by opening up to Eurasia, which in turn, can complete the objectives of industrial transfer and
transformation. “Innovation-driven”, on the other hand, is the exit for Mainland China’s economic development in the
future. The next five years will witness a large number of innovative and novel industries, and it will be an explosive
period for emerging economic models. Therefore, while the mainland’s economy is still encountering many challenges
in the short run, prospects in the medium and long term remain optimistic.
Currently, the Group has landbank of over 22.99 million sq m, covering over 20 first-, second- and third-tier cities in
Mainland China, of which approximately 79% of residential floor area is located in first- and second-tier cities.
Leveraging on the low-cost quality land bank and combining the Group’s sound financial position and brand
advantage, it is believed that the future gross profit margin will maintain at optimal levels. Over the past few years, the
Group has been actively focusing on a number of tasks. These include optimising its regional centralised procurement
systems, product standardisation process, cost control as well as improving its asset turnover. A certain level of
accomplishments has been made. In the future, the Group will continue to accelerate these kinds of work and actively
address the “new norm” of the stable but fast economic growth in the mainland. Our direction will also be aligned
with the constantly emerging new middle class of the mainland, offering them with excellent products, masterful
designs and meticulously personalised services and bringing them the best lifestyle experience.
In FY2016, the Group plans to complete 12 property projects for sale with a total GFA of 1,254,982 sq m, comprising
1,047,432 sq m of residential, 80,261 sq m of commercial and 127,289 sq m of office space for sale. With increasing
proportion of property projects to be completed in the next one or two years being located at second- and third-tier
cities, the Group expects that the achievable overall gross profit margin from property sales will be maintained at the
level of over 35%. It is anticipated that the contracted sales of FY2016 shall be about RMB16.5 billion accordingly.

New World China Land Limited 94
MANAGEMENT DISCUSSION AND ANALYSIS
Properties for sale to be completed in FY2016 Usage
Total GFA
(sq m)
NWCL’s
interest
Tangshan New World Centre Phase II
(唐山新世界中心二期) R, O 71,971 100%
Langfang New World Centre District A and C
(廊坊新世界中心A區及C區) R, C, O 238,800 100%
Langfang New World Garden District 3
(廊坊新世界花園三區) R 101,319 100%
Shenyang New World Garden Phase I West District A
(瀋陽新世界花園一期西區A) C, O 43,906 100%
Anshan New World Garden Phase III A
(鞍山新世界花園三期A) R 84,087 100%
Wuhan Menghu Garden Phase III C
(武漢夢湖香郡三期C) R, C 30,008 100%
Chengdu New World Riverside Phase II 1A
(成都河畔新世界二期1A) R 134,783 30%
Yiyang New World Scenic Heights Phase I A and C
(益陽新世界梓山湖畔一期A及C) R, C 21,225 100%
Guangzhou Covent Garden Phase III
(廣州逸彩庭園三期) R, C 94,992 100%
Guiyang Jinyang Sunny Town Phase II C
(貴陽金陽新世界二期 C) R 325,758 50%
Guiyang Jinyang Sunny Town Phase III A
(貴陽金陽新世界三期 A) R, C 29,748 50%
Zhaoqing New World Garden Phase III
(肇慶新世界花園三期) R, C 78,385 100%
Total 1,254,982

Annual Report 2015 95
LIQUIDITY AND CAPITAL RESOURCES
As at 30 June 2015, the Group’s cash and bank deposits amounted to HK$15,773.67 million (30 June 2014:
HK$17,351.60 million).
During the year under review, the Company issued US$900 million notes (equivalent to approximately HK$6,993
million) and HK$1,071 million notes at fixed rates ranging from 4.75% to 5.375% due in 2019 and 2022 respectively.
The Group’s consolidated net debt (aggregate of borrowings, net of cash and bank balances) amounted to
HK$29,391.25 million (30 June 2014: HK$22,071.61 million), translating into a gearing ratio of 45.5% (30 June 2014:
36.0%). The gearing ratio is calculated on the basis of net debts over total equity.
The Group’s borrowings from banks and fellow subsidiaries, liabilities of bonds and notes payable as at 30 June
2015 totalled HK$43,029.32 million (30 June 2014: HK$37,207.80 million) of which 19.9% were secured by way of
charges over assets and 80.1% were unsecured.
The maturity profile of the Group’s borrowings from banks and fellow subsidiaries, liabilities of bonds and notes
payable is set out as follows:
As at As at
30 June 2015 30 June 2014
HK$’million HK$’million
Repayable:
Within one year 10,776.50 14,197.17
Between one and two years 5,738.10 11,045.35
Between two and five years 24,177.16 10,388.42
After five years 2,337.56 1,576.86
Total 43,029.32 37,207.80
As at 30 June 2015, the Group’s committed unutilised bank loan facilities amounted to HK$8,161.75 million (30 June
2014: HK$3,002.13 million).

New World China Land Limited 96
MANAGEMENT DISCUSSION AND ANALYSIS

Annual Report 2015 97
Capital expenditure commitmentsThe capital expenditure commitments of the Group as at 30 June 2015 were HK$4,718,499,000 (30 June 2014:
HK$3,459,794,000) of which HK$4,611,133,000 (30 June 2014: HK$3,200,856,000) were contracted but not
provided for in the financial statements and HK$107,366,000 (30 June 2014: HK$258,938,000) were authorised but
not contracted for. The sources of funding for capital commitments are internally generated resources and bank loan
facilities.
Foreign currency exposureThe Group conducts its business mainly in Renminbi. Other than certain bank balances and borrowings denominated
in Hong Kong dollar and United States dollar, the Group does not have any material direct exposure to foreign
exchange fluctuations. During the year under review, the Group has not used any foreign currency derivative product
to hedge its exposure to currency risk.
CONTINGENT LIABILITIES
As at 30 June 2015, the Group has contingent liabilities of approximately HK$3,202,816,000 (30 June 2014:
HK$2,734,066,000) relating to corporate guarantees given in respect of bank loan facilities extended to certain joint
ventures.
As at 30 June 2015, the Group has provided guarantees in respect of mortgage facilities granted by certain banks
relating to the mortgage loans arranged for certain purchasers of properties developed by certain subsidiaries of the
Group and the Group’s attributable portion of outstanding mortgage loans under these guarantees amounted to
HK$2,239,958,000 (30 June 2014: HK$2,034,561,000).
DETAILS OF CHARGES ON GROUP’S ASSETS
As at 30 June 2015, the Group’s property, plant and equipment, investment properties, land use rights, properties
held for development and properties under development of HK$1,316,473,000 (30 June 2014: HK$1,382,166,000),
HK$5,425,703,000 (30 June 2014: HK$5,448,689,000), HK$248,728,000 (30 June 2014: HK$256,165,000),
HK$1,051,715,000 (30 June 2014: HK$923,335,000) and HK$6,234,373,000 (30 June 2014: HK$4,377,720,000)
respectively have been pledged as securities for long term bank borrowings and short term borrowings.

New World China Land Limited 98
MANAGEMENT DISCUSSION AND ANALYSISMAJOR ACQUISITION OR DISPOSAL
No major acquisition or disposal undertaken by the Group during the year under review.
EVENT AFTER THE REPORTING DATE
On 3 July 2015, the New World Development (China) Limited (“NWDC”), a wholly owned subsidiary of the Group,
entered into the Sales and Purchase Agreement with Chow Tai Fook Enterprises Limited to sell its entire equity
interest in New World Hotel Management (BVI) Limited (“NWHM”) together with related outstanding shareholder’s
loan and accrued interest due and owing by NWHM to NWDC for an aggregate cash consideration of
HK$1,963,000,000. Subject to fulfillment of several conditions precedent, the disposal is expected to be completed
on or before 31 December 2015 at a gain of approximately HK$844,000,000.
EMPLOYEES AND REMUNERATION POLICY
As at 30 June 2015, the Group has 10,742 full-time employees. Total staff related costs incurred during the year
under review were HK$710.69 million (2014: HK$638.57 million), of which retirement benefits were included.
Remuneration of employees is reviewed annually based on assessment of individual performance. Discretionary year-
end bonus was paid to employees based on individual performance.

Annual Report 2015 99
CORPORATE GOVERNANCE REPORTThe Board believes that good corporate governance is an essential component of factors that contribute to the
Company’s long term sustainability and competitiveness. To enhance the Company’s corporate governance
standard, the Board is committed to developing a strong corporate governance framework that helps foster positive
corporate culture that is conducive to sustainable business by adhering to the principles of effective management,
internal control, accountability and fair disclosure with due regard to the benefit of the Company’s stakeholders.
The Company has complied throughout the year with the provisions of the Corporate Governance Code (the “Code”)
set out in Appendix 14 to the Rules Governing the Listing of Securities on The Stock Exchange of Hong Kong Limited
(“Listing Rules”), except for the deviations from code provisions A.2.1 and E.1.2 with considered reasons as explained
below.
DIRECTORS AND BOARD PRACTICES
Composition and responsibilitiesThe Company is headed by the Board which currently comprises eleven directors, including seven executive directors
and four independent non-executive directors. The names, biographical details and relationship amongst them, if any,
are set out on pages 110 to 115 of this annual report.
The Board, led by the Chairman, is collectively responsible for the management and operations of the Company. It
formulates the overall strategy of the Group, sets the business directions and financial performance target of the
Group, and ensures that a good corporate governance framework and procedures are established and practised
throughout the Group. It is accountable to the shareholders of the Company for its performance and activities and is
the ultimate decision making body of the Group except for those matters that are reserved for approval by
shareholders in accordance with the articles of association of the Company, the Listing Rules and other applicable
laws and regulations.
The running of the day-to-day businesses of the Company is delegated by the Board to the management who is
working under the leadership and supervision of the Managing Director and the Executive Committee of the Board
except that authority is reserved for the Board to approve interim and annual financial statements, dividend policy,
annual budgets, business plans and significant operational matters.
The management is responsible for contributing to the success of the implementation of the policies laid down by the
Board in connection with the conduct of the businesses of the Group. It is accountable to the Board and is required
to obtain prior approval from the Executive Committee before making decision over matters prescribed by the
Executive Committee or entering into commitment on the Company’s behalf. The Executive Committee will monitor
the performance of the management with reference to the Group’s corporate goals and objectives and business plan
as determined and approved by the Board from time to time.
Chairman and managing directorDr Cheng Kar-shun, Henry is the Chairman and Managing Director of the Company. In his dual capacity as Chairman
and Managing Director, Dr Cheng Kar-shun, Henry is responsible for effective running of the Board and formulating
business strategies. He also provides leadership for effective running of the Company’s business and implementing
the policies devised by the Board.
New World China Land Limited 100
CORPORATE GOVERNANCE REPORTThe code provision A.2.1 provides that the roles of chairman and chief executive should be separate and should not
be performed by the same individual. However, the Board believes that Dr Cheng Kar-shun, Henry, in his dual
capacity as the Chairman and Managing Director, will provide strong and consistent leadership for the development
of the Group.
Independent non-executive directorsIndependent non-executive directors (“INED”) have a significant role in the Board by virtue of their independent
judgement and their views carry significant weight in the Board’s decisions. In particular, they bring an impartial view
to bear on issues of the Company’s strategy, performance and control, and take the lead where potential conflicts of
interest arise.
During the year, the Company has complied with Rules 3.10(1) and (2), and 3.10A of the Listing Rules with the
appointment of four INEDs, which represents at least one-third of the Board, and having an INED with relevant
professional qualifications or accounting or relating financial management expertise.
Three of the INEDs, namely Dr Cheng Wai-chee, Christopher, Hon Tien Pei-chun, James and Mr Lee Luen-wai, John,
have served the Company in this capacity for more than nine years. Notwithstanding their long term service, given
their wide spectrum of knowledge, extensive business experience and familiarity with the Company’s affairs, the
Board is of the opinion that they continue to bring independent and objective perspectives to the Company’s affairs.
A written annual confirmation of independence was received from each of the four INEDs pursuant to Rule 3.13 of the
Listing Rules and the Company considers each of the INEDs to be independent.
Appointment and re-electionA director may be appointed either by the shareholders in a general meeting or by the Board and the key terms of
appointment are set out in a service contract with the Company. Each director is appointed for a fixed term of three
years pursuant to the service contract subject to retirement by rotation and re-election at least once every three years
at the annual general meeting of the Company in accordance with the Company’s articles of association.
New director appointed by the Board will be subject to re-election by the shareholders at the first general meeting
after his/her appointment. The names of directors who are eligible for re-election at general meetings will be disclosed
in the notice of the relevant general meetings and their biographical details will be provided in the accompanying
circulars. The election of each director will be subject to vote of shareholders by separate resolutions.

Annual Report 2015 101
MeetingsThe Board meets regularly to discuss the overall strategy as well as the operation and financial performance of the
Group. Directors may participate either in person or through electronic means of communications. Four full board
meetings were convened in the fiscal year for reviewing and approving the financial and operating performance of the
Group.
The attendance of each individual director at the board meetings and general meetings is set out in the following
table:
Number of meetings attended/held
Board
Meetings
Annual
General
Meeting
Extraordinary
General
Meeting
Executive directors
Dr Cheng Kar-shun, Henry (Chairman) 4/4 1/1 1/1
Mr Cheng Kar-shing, Peter 3/4 1/1 0/1
Dr Cheng Chi-kong, Adrian 4/4 1/1 1/1
Ms Cheng Chi-man, Sonia 4/4 1/1 1/1
Mr Cheng Chi-him, Conrad 3/4 0/1 0/1
Mr Fong Shing-kwong, Michael 3/4 0/1 0/1
Ms Ngan Man-ying, Lynda 4/4 1/1 1/1
Independent non-executive directors
Dr Cheng Wai-chee, Christopher 4/4 1/1 0/1
Hon Tien Pei-chun, James 3/4 1/1 0/1
Mr Lee Luen-wai, John 4/4 1/1 1/1
Mr Ip Yuk-keung, Albert 4/4 1/1 1/1
All directors are given not less than fourteen days’ notice for regular board meetings and are invited to include matters
in the agenda. Relevant meeting materials are provided to the directors at least three days before the meetings to
ensure that they are given sufficient review time. Directors have separate access to the senior management and the
Company Secretary at all time and they may seek independent professional advices at the Company’s expense.
Matters which are material and may cause potential conflict of interest will be dealt with at board meetings instead of
by way of circulation or by a committee.
The proceedings of the board meetings are normally conducted by the Chairman who ensures that sufficient time is
allowed for discussion among the directors and equal opportunities are being given to the directors to express their
views and share their concerns. Directors are obliged to declare the nature and extent of his/her interest in a meeting
at which the question of entering into any proposed contract or arrangement is first considered and are required to
abstain from voting on the relevant board resolution which he/she or any of his/her associate has material interest
and shall not be counted in the quorum present at the meeting. All minutes, kept by the Company Secretary, record
in sufficient detail the matters considered by the Board and the decisions reached and are open for inspection at any
reasonable time by the directors.

New World China Land Limited 102
CORPORATE GOVERNANCE REPORTBoard committeesThe Board has set up four committees, namely, the Executive Committee, the Audit Committee, the Remuneration
Committee and the Nomination Committee to oversee various aspects of the Group’s affairs.
(i) Executive committeeThe Executive Committee serves as an executive arm of the Board in implementing the policies laid down by
the Board and handling the day-to-day businesses of the Company. They are responsible for overseeing the
management of the Company, considering issues regarding finance, investments, merger and acquisition.
Members of the Executive Committee currently include Dr Cheng Kar-shun, Henry as Chairman, Mr Cheng
Kar-shing, Peter, Dr Cheng Chi-kong, Adrian and Ms Ngan Man-ying, Lynda as members. Meetings of the
Executive Committee are held frequently as and when required.
(ii) Audit committeeThe Audit Committee is responsible for the review and supervision of the Group’s financial reporting process,
internal controls and review of the Company’s financial statements. The Audit Committee meets regularly with
the Company’s external auditors to discuss the audit process and accounting issues. Their written terms of
reference are in line with the provision of the Code and are available on the websites of the Company and the
Stock Exchange.
Members of the Audit Committee comprise four INEDs including Dr Cheng Wai-chee, Christopher as Chairman,
Hon Tien Pei-chun, James, Mr Lee Luen-wai, John and Mr Ip Yuk-keung, Albert, as members.
The Audit Committee met two times during the fiscal year. During the meetings, the Audit Committee has
reviewed the audit plans, internal control procedures and financial reporting system. They have also considered
the final results of the Group for FY2014, the interim results for FY2014/2015 and reviewed and discussed the
Report to the Audit Committee prepared by the external auditors relating to accounting issues and major
findings in course of audit. They have also reviewed with the management the internal audit report in respect of
certain property projects of the Group. Full minutes of the meetings are kept and sent to all members of the
Committee.
The attendance of individual member of the Audit Committee at the meetings is set out in the following table:
Members of Audit Committee
Number of
meetings
attended/held
Dr Cheng Wai-chee, Christopher 2/2
Hon Tien Pei-chun, James 1/2
Mr Lee Luen-wai, John 2/2
Mr Ip Yuk-keung, Albert 2/2
In September 2015, the Audit Committee reviewed and discussed with the management the final results and
the report on internal control system of the Group for FY2015.

Annual Report 2015 103
(iii) Remuneration committeeThe Remuneration Committee is responsible for making recommendations to the Board on the Company’s
policy and structure for all remuneration of the directors and senior management of the Company and on the
establishment of a formal and transparent procedure for developing remuneration policy. They have the
delegated responsibility to determine the specific remuneration packages of individual executive director and
senior management. Their written terms of reference are in line with the provision of the Code and are available
on the websites of the Company and the Stock Exchange.
Members of the Remuneration Committee comprise four INEDs and one executive director including Dr Cheng
Wai-chee, Christopher as Chairman, Hon Tien Pei-chun, James, Mr Lee Luen-wai, John, Mr Ip Yuk-keung,
Albert and Ms Ngan Man-ying, Lynda as members.
The Remuneration Committee convened one meeting during the fiscal year. The members have reviewed the
remuneration policy of the Company and made recommendation to the Board regarding the amount of
directors’ fees for the fiscal year. They have also considered and approved the salary packages to the executive
directors and senior management of the Company by reference to their duties and responsibilities with the
Company, prevailing market situation and the Company’s performance.
The attendance of individual member of the Remuneration Committee at the meeting is set out in the following
table:
Members of Remuneration Committee
Number of
meeting
attended/held
Dr Cheng Wai-chee, Christopher 1/1
Hon Tien Pei-chun, James 1/1
Mr Lee Luen-wai, John 1/1
Mr Ip Yuk-keung, Albert 1/1
Ms Ngan Man-ying, Lynda 1/1
(iv) Nomination committeeNomination Committee is responsible for formulating nomination policy for the Board’s consideration and
implementing the nomination policy approved by the Board, including but not limited to reviewing the
composition and diversity of the Board annually, identifying individuals suitably qualified to become board
member, monitoring the succession planning of directors and assessing the independence of independent non-
executive directors. Their written terms of reference are in line with the provision of the Code and are available
on the websites of both the Company and the Stock Exchange.
Any shareholder who wishes to nominate any person for election as a director at the general meeting of the
Company shall lodge with the Hong Kong principal place of business of the Company a written notice of his
intention within the period after the dispatch of the notice of the meeting and ending no later than seven days
prior to the date of such meeting. The Nomination Committee will consider the suitability of the candidate on
the basis of qualifications, experience and background, with due regard for the benefits of diversity on the
Board. Details of the nomination procedures are available on the Company’s website.

New World China Land Limited 104
CORPORATE GOVERNANCE REPORT
Members of the Nomination Committee comprise four INEDs and two executive directors including Dr Cheng
Kar-shun, Henry, as Chairman, Dr Cheng Wai-chee, Christopher, Hon Tien Pei-chun, James, Mr Lee Luen-wai,
John, Mr Ip Yuk-keung, Albert and Ms Ngan Man-ying, Lynda as members.
The Nomination Committee had reviewed for the fiscal year the structure, size, composition and diversity of the
Board with due consideration to the appropriate balance of skill and experience required by the Company and
had reviewed the independence of the independent non-executive directors of the Company having regard to
the criteria as set out in Rule 3.13 of the Listing Rules. The Nomination Committee did not make any
recommendation for any changes to the Board’s composition during the fiscal year.
Board diversity policyThe Company has in place a board diversity policy (the “Policy”) which set out the approach to achieve and maintain
diversity on the Board in order to improve board effectiveness and decision-making.
Pursuant to the Policy, the Company seeks to achieve board diversity through the consideration of a number of
factors, including but not limited to age, gender, educational background, professional experience, skill, knowledge,
experience, length of service, diversity required on the Board based on current and projected future activities of the
Company, and the extent to which the required skills, experience, expertise and diversity are represented on the
Board. All appointments of the members of the Board will also be based on meritocracy while taking into account of
the benefits of diversity.
An analysis of the Board’s current composition is set out in the following chart:
0
1
2
3
4
5
6
7
8
9
10
11
Number of director
Board tenureArea ofexpertise
GenderAgeDesignation
Independentnon-executive
Director
ExecutiveDirector
51–70
41–50
31–40
Male
Female
Banking and Finance
Finance and Accounting
Hotel Management
Real Estate Development
Sale and Marketing
GeneralManagement
11–15 years
6–10 years
0–5 years

Annual Report 2015 105
Induction, updates and trainingAn induction would be given to the newly appointed director to provide information regarding the businesses and
operation of the Company as well as his/her responsibilities under the statutes, rules and regulations. The Company
Secretary updates directors on the latest developments and changes to the Listing Rules and the applicable legal and
regulatory requirements regarding subjects necessary in the discharge of their duties. The Company provides all
members of the Board with monthly updates on the Company’s performance, position and prospects.
Directors are encouraged to participate in continuing professional development to develop and refresh their
knowledge and skills. The Company has devised a training record in order to assist the directors to record the training
they have undertaken and they are asked to submit a signed training record to the Company on annual basis.
During the year, the Company has arranged in-house training for the directors in the form of seminar and reading
materials on the introduction to Competition Ordinance as part of the continuing professional development for
directors. Individual director has also attended training courses or workshop relevant to his/her profession and/or
duties as directors. A summary of the training they have received for the year ended 30 June 2015 is as follows:
Seminar/reading materials
on the introduction to
Competition Ordinance
Other trainings relevant to
directors’ profession and/
or duties
Executive directors
Dr Cheng Kar-shun, Henry (Chairman)
Mr Cheng Kar-shing, Peter
Dr Cheng Chi-kong, Adrian —
Ms Cheng Chi-man, Sonia
Mr Cheng Chi-him, Conrad
Mr Fong Shing-kwong, Michael
Ms Ngan Man-ying, Lynda
Independent non-executive directors
Dr Cheng Wai-chee, Christopher
Hon Tien Pei-chun, James
Mr Lee Luen-wai, John
Mr Ip Yuk-keung, Albert
Remuneration of directorsIn recognition of their services with the Company, directors are paid directors’ fees annually with the approval of the
shareholders of the Company. Monthly salaries are also paid to directors commensurable with their duties in the
Group. To provide an opportunity for the directors to participate in the equity of the Company as well as to motivate
them to optimise their performance, most directors have been granted share options to subscribe for shares of the
Company under the share option schemes of the Company. In addition, all directors are covered by appropriate
insurance on directors’ liabilities from their risk exposure arising from the management of the Group.

New World China Land Limited 106
CORPORATE GOVERNANCE REPORTCorporate governance functionThe Board is collectively responsible for performing the corporate governance duties including:
(a) to develop, review and implement the Company’s policy and practices on corporate governance;
(b) to review and monitor the training and continuous professional development of directors and senior
management;
(c) to review and monitor the Company’s policies and practices on compliance with legal and regulatory
requirements;
(d) to develop, review and monitor the code of conduct and compliance manual (if any) applicable to employees
and directors;
(e) to review the Company’s compliance with the Code and disclosure in the Corporate Governance Report; and
(f) to develop, review and monitor the implementation of the shareholders’ communication policy to ensure its
effectiveness, and make recommendation to enhance shareholders’ relationship with the Company.
During the year, the Company has updated the compliance manuals on notifiable transactions in accordance with the
Listing Rules and maintained a disclosure manual for inside information as guideline for its employees to report
unpublished price sensitive information to the Company to ensure consistent and timely disclosure and fulfillment of
the Company’s continuous disclosure obligations. The Board has also maintained a shareholders’ communication
policy to set out the Company’s strategies for maintaining continuous and open communication with shareholders
and the investment community at large.
Model code for securities transactions by directors and by relevant employeesThe Company has adopted the Model Code for Securities Transactions by Directors of Listed Issuers (“Model Code”)
in Appendix 10 of the Listing Rules as the code of conduct regarding directors’ securities transactions. Having made
specific enquiries, all directors confirmed that they have complied with the standard set out in the Model Code during
the year under review.
The Company has established and adopted written guidelines, “Code for Securities Transactions by Relevant
Employees and Officers”, on no less exacting terms than the Model Code for securities transactions by relevant
employees and officers who are likely to be in possession of unpublished price sensitive information of the Company.

Annual Report 2015 107
FINANCIAL REPORTING AND INTERNAL CONTROL
Financial reportingThe Board, supported by the finance department, is responsible for the preparation of the financial statements of the
Company and the Group. In preparing the financial statements, the generally accepted accounting standards in Hong
Kong have been adopted together with the accounting standards issued by the Hong Kong Institute of Certified
Public Accountants and appropriate accounting policies have been used and applied consistently.
The Board aims to present a clear, balanced and understandable assessment of the Group’s performance in the
annual and interim report to the shareholders, announcements and other financial disclosures. The annual and interim
results are announced in timely manner within the limits of three months and two months respectively after the end of
the relevant periods.
The reporting responsibilities of PricewaterhouseCoopers, the Company’s external auditors, are stated in the
Independent Auditor’s Report on pages 152 to 153 of this annual report.
Internal control systemThe Board is responsible for internal control of the Group and for reviewing its effectiveness annually. Procedures
have been designed for safeguarding assets against unauthorised use or disposition, ensure the maintenance of
proper accounting records for the provision of reliable financial information for internal use or for publication, and
ensure compliance of applicable laws, rules and regulations. The procedures provide reasonable assurance against
material errors, losses or fraud. The key procedures involved are as follows:
(1) A defined organisational structure has been set up with clear line of responsibility and authority. Division heads
are assigned to the property projects in the PRC on regional basis to oversee and control the operational and
financial aspects of the projects. Systems are in place to review, approve, and administer contract works,
capital expenditures, sales and rental arrangement of the property projects.
(2) A comprehensive management accounting system has been adopted to provide financial and operational
performance indicators to the management in a timely manner. Proper controls are in place for the recording
and verification of accounting data to provide accurate and timely management information.
(3) The financial results of the property projects are measured against the annual operational and financial targets.
Variances against the budgets are analysed and explained to identify area of improvement and appropriate
corrective actions to be taken.
(4) Evaluation of the Group’s internal control is conducted by the internal audit department on an on-going basis.
The internal audit department performs risk-based audits to review the effectiveness of the Group’s material
internal controls so as to provide assurance that key business and operational risks are identified and managed.
The work carried out by the internal audit department will ensure the internal controls are in place and
functioning as intended. The internal audit department reports to the Board with its findings and makes
recommendations to improve the internal control of the Group. The department also sent their reports to the
Audit Committee for review and discussion.
During the course of audit performed by the external auditors, they will report on the weaknesses in the Group’s
internal control and accounting procedures which have come to their notice. Results of their finding and
recommendations will be reported back to the Board through the Audit Committee which will monitor the corrective
action to be taken.

New World China Land Limited 108
CORPORATE GOVERNANCE REPORTThe Board has also reviewed the adequacy of resources, qualifications and experiences of staff of the Company’s
accounting and financial reporting function and their training programmes and budget.
External auditor’s remunerationThe external auditor’s remuneration charged to consolidated income statement of the Group for the year ended 30
June 2015 amounted to HK$14,924,000 of which a sum of HK$9,837,000 was paid to PricewaterhouseCoopers for
its auditing services and of HK$909,000 for non-auditing services. The non-auditing services comprised primarily of
accounting, tax advisory and other related services.
COMMUNICATION WITH SHAREHOLDERS
The Company acknowledges the importance of communicating with shareholders, investors and the public. A
shareholders’ communication policy was adopted pursuant to the Code which aims at establishing a two-way
relationship and communication between the Company and its shareholders. To this end, various channels of
communication have been established and maintained to ensure that shareholders and the investment community
are kept abreast of the Company’s latest news and development. Information relating to the Company’s financial
results, corporate details, notifiable transactions, property projects and major events are disseminated through
publication of interim and annual report, announcements, circulars, press release and newsletters. These publications
can also be obtained from the Company’s website.
In addition, the Chairman, members of the Board and external auditors will attend the annual general meetings of the
Company where the directors will answer questions raised by the shareholders on the performance of the Group. To
ensure the general meetings are conducted in a fair and transparent manner, the Chairman has demanded voting by
poll on each resolution considered at the general meeting held in the past year and appointed the branch share
registrar in Hong Kong as the scrutineers to count the votes and explain to the shareholders at the meeting the
procedures for voting by poll. The poll results were subsequently posted on the websites of the Company and the
Stock Exchange.
The Company also holds press and analysts conferences at least twice a year following the release of interim and full
year results announcements at which the executive directors and senior management of the Group are available to
answer questions regarding the performance of the Group. The Group has participated in a number of roadshows
and meetings with investors and organised a number of site visits during the fiscal year 2015.
The Company is offering options to the shareholders and the non-registered shareholders to receive corporate
communication of the Company by electronic means or in printed form. The Board believes that electronic means of
communication will increase the efficiency in communication between the Company and the shareholders. The
Company will review and improve the policy and effectiveness of communication with shareholders and the public
from time to time.
The code provision E.1.2 provides (among other things) that the chairman of the independent board committee
should be available to answer question at any general meeting to approve any transaction that requires independent
shareholder’s approval. Dr Cheng Wai-chee, Christopher, the Chairman of the Independent Board Committee, was
not able to attend the extraordinary general meeting of the Company held on 30 June 2015 owing to other
commitment. The other members of the Board who attended the said meeting had answered the questions raised by
the attending shareholders at the meeting.

Annual Report 2015 109
COMPANY SECRETARY
The Company Secretary is one of the directors of the Company and has day-to-day knowledge of the Company’s
affairs. She reports to the Chairman and is responsible for advising the Board on governance matters. For the year
under review, the Company Secretary has taken 53 hours of relevant professional training.
SHAREHOLDERS’ RIGHTS
Convening of extraordinary general meeting and putting forward proposalsUnder the Articles of Association of the Company, any two or more shareholders or any one shareholder which is a
recognised clearing house (or its nominee) holding not less than one-tenth (1/10) of the paid up capital of the
Company which carries the right of voting at general meeting can convene and put forward proposals at an
extraordinary general meeting (“EGM”). The procedures for shareholders to convene and put forward proposals at an
EGM are stated as follows:
(1) The requisitionist(s) should sign a written request stating the objects of the meeting to be convened, and
deposit the same at the principal place of business of the Company in Hong Kong situated at 9/F., New World
Tower 1, 18 Queen’s Road Central, Hong Kong for the attention of the Company Secretary.
(2) The Company will then verify the request with the Company’s branch share registrar in Hong Kong and upon
confirmation that the request is proper and in order, the Company Secretary will ask the Board to convene an
EGM by serving sufficient notice to all the registered shareholders in accordance with the requirements set out
in the Listing Rules and the Articles of Association of the Company.
(3) In the event that the request has been verified as not in order, the shareholders concerned will be advised of
this outcome and accordingly, an EGM will not be convened as requested.
(4) Where, within 21 days from the date of deposit of the requisition, the directors of the Company do not proceed
duly to convene an EGM, the requisitionists themselves or any of them representing more than one-half of the
total voting rights of all of them, may convene the general meeting in the same manner, as nearly as possible,
as that in which meetings may be convened by the Board, provided that any meeting so convened shall not be
held after the expiration of three months from the date of deposit of the requisition.
Enquiries to the BoardShareholders who intend to put forward their enquiries about the Company to the Board could email their enquiries to
AMENDMENT OF THE COMPANY’S CONSTITUTIONAL DOCUMENTS
There have been no changes in the Company’s constitutional documents during the year.

New World China Land Limited 110
DIRECTORS’ PROFILE
Dr Cheng became the Chairman and Managing Director of New World China Land Limited in 1999. He is also the Chairman of each of the Executive Committee and the Nomination Committee of the Board of Directors of the Company and a director of certain subsidiaries of the Company. Dr Cheng is the Chairman and Executive Director of New World Development Company Limited, a substantial shareholder of the Company. He also acts as the Chairman and Executive Director of NWS Holdings Limited, Chow Tai Fook Jewellery Group Limited and International Entertainment Corporation. He is also the Chairman and Non-Executive Director of New World Department Store China Limited and Newton Resources Ltd, an Independent Non-Executive Director of HKR International Limited and Hang Seng Bank Limited, as well as a Non-Executive Director of SJM Holdings Limited, all being listed public companies in Hong Kong. He was a Non-Executive Director of Lifestyle International Holdings Limited, a listed public company in Hong Kong, up to his retirement on 4 May 2015. In addition, Dr Cheng is the Chairman of New World Hotels (Holdings) Limited and a Director of several substantial shareholders of the Company, namely Cheng Yu Tung Family (Holdings) Limited, Cheng Yu Tung Family (Holdings II) Limited, Chow Tai Fook Capital Limited, Chow Tai Fook (Holding) Limited and Chow Tai Fook Enterprises Limited. He is the Chairman of the Advisory Council for The Better Hong Kong Foundation and a Standing Committee Member of the Twelfth Chinese People’s Political Consultative Conference of the People’s Republic of China. In 2001, Dr Cheng was awarded the Gold Bauhinia Star by the Government of the Hong Kong Special Administrative Region. Dr Cheng is the brother of Mr Cheng Kar-shing, Peter, the father of Dr Cheng Chi-kong, Adrian and Ms Cheng Chi-man, Sonia, and the uncle of Mr Cheng Chi-him, Conrad.
Mr Cheng was appointed as an Executive Director of New World China Land Limited in June 1999. He is also a member of the Executive Committee of the Board of Directors of the Company and a director of certain subsidiaries of the Company. Mr Cheng is a Non-Executive Director of New World Development Company Limited, a substantial shareholder of the Company, and an Independent Non-Executive Director of King Fook Holdings Limited, both being listed public companies in Hong Kong. He was an Independent Non-Executive Director of Symphony Holdings Limited, up until his resignation on 15 December 2014. He is also a Director of several substantial shareholders of the Company, namely Cheng Yu Tung Family (Holdings) Limited, Cheng Yu Tung Family (Holdings II) Limited, Chow Tai Fook Capital Limited, Chow Tai Fook (Holding) Limited and Chow Tai Fook Enterprises Limited. In addition, he is a Director of NWS Service Management Limited, New World Hotels (Holdings) Limited, Hip Hing Construction Company Limited and Polytown Company Limited. Mr Cheng is committed to community services and is serving as the Chairman of Chow Tai Fook Charity Foundation, the Chairman of Hong Kong Renal Centre Limited, the Chairman of The Welfare Fund Limited, the Vice-Chairman of Hong Kong Economic Exchange and a Director of Green Council. He is the Commissar of the Chinese People’s Political Consultative Conference, Guangzhou City and the University Assembly member of University of Macau. Mr Cheng is a fellow member of the Hong Kong Institution of Engineers, Hong Kong Institute of Arbitrators and Hong Kong Construction Arbitration Centre. He is a CEDR Accredited Mediator and on the List of the Mediators of Hong Kong Mediation Accreditation Association Limited, Hong Kong International Arbitration Centre, Hong Kong Mediation Centre and Financial Dispute Resolution Centre. He is on the Panel of Arbitrators of South China International Economic and Trade Arbitration Commission/Shenzhen Court of International Arbitration and Huizhou Arbitration Commission, as well as a member of Society of Construction Law Hong Kong and The Chartered Institute of Arbitrators. He is the brother of Dr Cheng Kar-shun, Henry, the father of Mr Cheng Chi-him, Conrad as well as the uncle of Dr Cheng Chi-kong, Adrian and Ms Cheng Chi-man, Sonia.
Chairman and Managing DirectorDr Cheng Kar-shun, Henry
GBS (Aged 68)
Executive DirectorMr Cheng Kar-shing, Peter
(Aged 63)

Annual Report 2015 111
Ms Cheng was appointed as an Executive Director of New World China Land Limited in January 2010. She is currently the Chief Executive Officer of Rosewood Hotel Group, the hotel management arm of the Group, and is responsible for overseeing its operations. She joined the Group in February 2009 and is currently a director of certain subsidiaries of the Company. Ms Cheng is an Executive Director of New World Development Company Limited, a substantial shareholder of the Company. Before joining the Group, she had worked in a major international investment bank and a global US private equity firm specialising in real estate investments. Ms Cheng holds a Bachelor of Arts Degree with a concentration in Applied Mathematics from Harvard University in U.S.A. Ms Cheng is chairman of the advisory committees of the School of Hotel and Tourism Management at The Chinese University of Hong Kong and member of the advisory committees of the School of Hotel & Tourism Management Industry at The Hong Kong Polytechnic University. She is a member of the Y. Elites Association, the Young Presidents’ Organization, the Hong Kong United Youth Association and the Eleventh Guizhou Municipal Committee of The Chinese People’s Political Consultative Conference. She is the daughter of Dr Cheng Kar-shun, Henry and the niece of Mr Cheng Kar-shing, Peter. She is also the sister of Dr Cheng Chi-kong, Adrian and the cousin of Mr Cheng Chi-him, Conrad.
Executive DirectorMs Cheng Chi-man, Sonia(Aged 34)
Executive DirectorDr Cheng Chi-kong, Adrian(Aged 35)
Dr Cheng was appointed as an Executive Director of New World China Land Limited in March 2007. He is a member of the Executive Committee of the Board of Directors of the Company and a director of certain subsidiaries of the Company. Dr Cheng is the Executive Vice-Chairman and the Joint General Manager of New World Development Company Limited, a substantial shareholder of the Company, an Executive Director of New World Department Store China Limited, Chow Tai Fook Jewellery Group Limited and International Entertainment Corporation as well as a Non-Executive Director of Giordano International Limited and Modern Media Holdings Limited, all being listed public companies in Hong Kong. In addition, he is a Director of Chow Tai Fook (Holding) Limited and Chow Tai Fook Enterprises Limited, both being substantial shareholders of the Company. He is also the Chairman of New World Group Charity Foundation Limited. Dr Cheng worked in a major international bank prior to joining the New World Group in September 2006 and has substantial experience in corporate finance. Dr Cheng holds a Bachelor of Arts Degree (Cum Laude) from Harvard University and was conferred the Honorary Doctorate of Humanities by the Savannah College of Art and Design. He is the Vice-Chairman of All-China Youth Federation and the Youth Federation of the Central State-owned Enterprises, a Member of the Tianjin Municipal Committee of The Chinese People’s Political Consultative Conference, the Chairman of China Young Leaders Foundation, the Honorary Chairman of K11 Art Foundation and a Member of Board of the West Kowloon Cultural District Authority. Dr Cheng is the son of Dr Cheng Kar-shun, Henry and the nephew of Mr Cheng Kar-shing, Peter. He is also the brother of Ms Cheng Chi-man, Sonia and the cousin of Mr Cheng Chi-him, Conrad.

New World China Land Limited 112
DIRECTORS’ PROFILE
Executive DirectorMr Cheng Chi-him, Conrad
(Aged 36)
Executive DirectorMr Fong Shing-kwong, Michael
(Aged 67)
Mr Fong was appointed as an Executive Director of New World China Land
Limited in January 2003. He is also a director of certain subsidiaries of the
Company. Mr Fong is an Independent Non-Executive Director of Chuang’s
Consortium International Limited, a listed public company in Hong Kong, and a
Director of several unlisted companies, including NWS Service Management
Limited, New World Hotels (Holdings) Limited and Kiu Lok Property Services
(China) Ltd. Mr Fong joined the New World Group in 1978 and was appointed
as an Executive Director of New World Hotels International Limited from 1983
to 1997. He is responsible for hotel corporate management and project
development of the Company and the New World Group. Besides his over 30
years experience in the hospitality industry, Mr Fong has extensive experience
in property development, asset and facility management as well as investment
business in the PRC.
Mr Cheng was appointed as an Executive Director of New World China Land
Limited in January 2010 and is acting as a director of certain subsidiaries of the
Company. He graduated from University of Toronto in Canada with a
Bachelor’s Degree majoring in Statistics and has been specialising in project
management of property projects in China since 2005. He is currently an
Executive Director of International Entertainment Corporation and a Non-
Executive Director of Greenheart Group Limited, both being listed public
companies in Hong Kong. Mr Cheng is the son of Mr Cheng Kar-shing, Peter
and the nephew of Dr Cheng Kar-shun, Henry. He is also the cousin of
Dr Cheng Chi-kong, Adrian and Ms Cheng Chi-man, Sonia.

Annual Report 2015 113
Independent Non-Executive DirectorDr Cheng Wai-chee, ChristopherGBS OBE JP (Aged 67)
Executive DirectorMs Ngan Man-ying, Lynda(Aged 49)
Dr Cheng was appointed as an Independent Non-Executive Director of New World China Land Limited in June 1999. He also acts as the Chairman of each of the Audit Committee and the Remuneration Committee as well as a member of the Nomination Committee of the Board of Directors of the Company. Dr Cheng is the Chairman of Wing Tai Properties Limited, an Independent Non-Executive Director of NWS Holdings Limited and Kingboard Chemical Holdings Limited, all being listed public companies in Hong Kong. He is an Independent Non-Executive Director of Eagle Asset Management (CP) Limited (as manager of Champion Real Estate Investment Trust which is listed on the Hong Kong Stock Exchange). He is also an Independent Non-Executive Director of The Hongkong and Shanghai Banking Corporation Limited. Dr Cheng was an Independent Non-Executive Director of DBS Group Holdings Limited, a listed public company in Singapore, up until his resignation on 29 April 2013. Dr Cheng has a keen interest in the public services. He is currently a member of the Judicial Officers Recommendation Commission and a steward of the Hong Kong Jockey Club. He also serves as a member of the board of Overseers at Columbia Business School, the board of Temasek Foundation CLG Limited, and a member on the President’s Council on International Activities of the Yale University. Dr Cheng holds a Doctorate in Social Sciences honoris causa from The University of Hong Kong and a Doctorate in Business Administration honoris causa from The Hong Kong Polytechnic University. He graduated from the University of Notre Dame, Indiana with a BBA degree, and from Columbia University, New York with an MBA degree.
Ms Ngan was appointed as an Executive Director of New World China Land
Limited in January 2006. She is also a member of each of the Executive
Committee, the Remuneration Committee and the Nomination Committee of
the Board of Directors of the Company and a director of certain subsidiaries of
the Company. Ms Ngan is a Non-Executive Director of New World Department
Store China Limited, a listed public company in Hong Kong. Ms Ngan joined
the Group in 1999 and is the Financial Controller and a committee member of
the Group’s Operation Committee responsible for overseeing the Group’s
financial accounting, treasury management and corporate governance
monitoring. Prior to joining the Company, Ms Ngan worked for an international
accounting firm in Hong Kong and a tax consulting company in Australia.
Ms Ngan is a Practising Certified Public Accountant of the Hong Kong Institute
of Certified Public Accountants and a fellow member of the Association of
Chartered Certified Accountants of United Kingdom and has over 28 years of
experience in auditing, accounting, business advisory and tax consultancy.
Ms Ngan is the Company Secretary of New World China Land Limited.

New World China Land Limited 114
DIRECTORS’ PROFILE
Independent Non-Executive DirectorHon Tien Pei-chun, James
GBS JP (Aged 68)
Independent Non-Executive DirectorMr Lee Luen-wai, John
BBS JP (Aged 66)
Mr Tien was appointed as an Independent Non-Executive Director of New
World China Land Limited in June 1999. He is a member of each of the Audit
Committee, the Remuneration Committee and the Nomination Committee of
the Board of Directors of the Company. Mr Tien is Chairman of Manhattan
Holdings Ltd., Manhattan Garments (International) Ltd., Manhattan Realty Ltd.
and director of a number of private companies. He is also an Independent
Non-Executive Director of Yeebo (International Holdings) Limited, a listed public
company in Hong Kong. Mr Tien is very active in the community. Other than a
legislative councillor, Mr Tien also sits on the general committee of the Hong
Kong General Chamber of Commerce and is a court member of the Hong
Kong Polytechnic University.
Mr Lee was appointed as an Independent Non-Executive Director of New
World China Land Limited in December 2004. He is a member of each of the
Audit Committee, the Remuneration Committee and the Nomination Committee
of the Board of Directors of the Company. Mr Lee is the Managing Director and
the Chief Executive Officer of Lippo Limited, an Executive Director and the
Chief Executive Officer of both Lippo China Resources Limited and Hongkong
Chinese Limited, and an Independent Non-Executive Director of New World
Development Company Limited, a substantial shareholder of the Company, all
being listed public companies in Hong Kong. Mr Lee is a Fellow Member of
The Institute of Chartered Accountants in England and Wales, the Association
of Chartered Certified Accountants and the Hong Kong Institute of Certified
Public Accountants. He was a partner of Pricewaterhouse in Hong Kong and
has extensive experience in corporate finance and capital markets. Mr Lee is
an Honorary Fellow of the City University of Hong Kong and a Justice of Peace
in Hong Kong. He serves as a member on a number of Public Boards and
Committees including the Chairman of the Board of Trustees of the Hospital
Authority Provident Fund Scheme and the Chairman of the Queen Elizabeth
Hospital Governing Committee. In addition, Mr Lee serves as a member of the
Appeal Boards Panel (Education).

Annual Report 2015 115
Independent Non-Executive DirectorMr Ip Yuk-keung, Albert(Aged 63)
Mr Ip was appointed as an Independent Non-Executive Director of New World
China Land Limited in December 2012. He is a member of each of the Audit
Committee, the Remuneration Committee and the Nomination Committee of
the Board of Directors of the Company. Mr Ip is the Executive Director and
Chief Executive Officer of the Trustee — Manager of Hong Kong listed
Langham Hospitality Investments. Mr Ip is the Independent Non-Executive
Director of AEON Credit Service (Asia) Company Limited, Hopewell Highway
Infrastructure Limited, Hopewell Holdings Limited, Lifestyle International
Holdings Limited, Power Assets Holdings Limited and TOM Group Limited, all
being Hong Kong listed public companies. Mr Ip is also a Non-Executive
Director of Eagle Asset Management (CP) Limited (as manager of Hong Kong
listed Champion Real Estate Investment Trust).
Mr Ip is an international banking and real estate professional with 33 years of
banking experience in Hong Kong, Asia and United States. He was North Asia
Real Estate Head, Hong Kong Corporate Bank Head, Transaction Banking
Head — Hong Kong and Asia Investment Finance Head (Global Wealth
Management) of Citigroup. He was formerly a Managing Director of Citigroup
and Managing Director of Investments in Merrill Lynch (Asia Pacific).
With a passion to serve in education, Mr Ip is an Adjunct Professor of Lingnan
University and City University of Hong Kong. He is also a Council Member of
Lingnan University, a Member of the International Advisory Committee at
University of Macau, an Executive Fellow in Asia at Washington University in St.
Louis and a Research Fellow of the Institute for Financial Economics of
Singapore Management University. Mr Ip holds a Bachelor of Science degree
at Washington University in St. Louis (summa cum laude) and Master of
Science degrees at Cornell University and Carnegie-Mellon University. He was
an MBA lecturer at University of Pittsburgh, USA. Mr Ip is an Honorary Fellow
of Vocational Training Council. Mr Ip was appointed as a Member of Legal Aid
Services Council in September 2014 and was appointed to the Board of
Governors of the World Green Organisation effective from 2015.

New World China Land Limited 116
SENIOR MANAGEMENT PROFILE1 2 3 4 5
6 7 8 109
Yau Kwok-siu, Ronald
Geng Shu-sen, Kenneth
Wong Siu-man, Simon
Chan Chi-wing, Wingo
Li Sau-lung
Ngan Man-ying, Lynda
Chan Yiu-ho, Benny
Wong See-yuen
Wong Wai-kong, Ray
Lau Chung-chun, Desmond
1
6
2
7
3
8
4
9
5
10

Annual Report 2015 117
Yau Kwok-siu, Ronald
(Aged 52)
Mr Yau is a Deputy Regional Chief Executive of the
Group. He is primarily assisting Mr Wingo Chan in
overseeing the Group’s projects in Tangshan and Beijing.
Mr Yau graduated from the Robert Gordon University,
UK with Bachelor Degree in Quantity Surveying and the
Andrews University, USA with Master Degree in Business
Administration. He is a member of the Royal Institute of
Chartered Surveyors (RICS) and a fellow member of the
Australian Institute of Quantity Surveyors. Mr Yau has
more than 25 years’ working and management
experience in real estate development in Hong Kong and
PRC. Mr Yau joined the New World Group in 2011.
Wong Siu-man, Simon
(Aged 46)
Mr Wong is a Regional Chief Executive of the Group,
responsible for projects in Wuhan. Mr Wong graduated
from the University of Hong Kong majoring in business
administration. He possesses more than 19 years of
working experience in the property development sector
in PRC. Mr Wong is the Standing Vice President of Hong
Kong Chamber of Commerce in China — Wuhan,
Director of Hong Kong Hubei Fraternity, Vice Chairman
of Han Kong Association (H.K.), Vice Chairman of Wuhan
Overseas Friendship Association, Vice Chairman of
Wuhan Overseas Chamber of Commerce and Vice
Chairman of Wuhan Chamber of Industries. Mr Wong
joined the New World Group in 1996.
Li Sau-lung
(Aged 61)
Mr Li is a Regional Chief Executive of the Group, whose primary responsibility is to oversee the Group’s projects in Haikou. Mr Li graduated from the University of Hong Kong with Bachelor Degrees in Arts (Architectural Studies) and Architecture and the Hong Kong Polytechnic University with Master Degrees in International Real Estate and Management Research Studies. Mr Li is a Registered Architect in Hong Kong, Member of the Royal Institute of British Architects and the Hong Kong Institute of Architects. Mr Li has more than 31 years of experience in architecture, project management and property development and has held a number of senior positions in international consulting firms, property development companies and real estate investment funds. Mr Li joined the Group in 2011.
Chan Yiu-ho, Benny
(Aged 43)
Mr Chan is a Regional Chief Executive of the Group
whose primary responsibility is to oversee the Group’s
projects in Shenyang. Mr Chan holds a Bachelor Degree
in Business Administration from the Chinese University of
Hong Kong, and has over 15 years of experience in real
estate development in the PRC. Mr Chan is a Committee
Member of the 14th Chinese People’s Political
Consultative Conference of Heping District in Shenyang,
and Vice Chairman of Hong Kong Chamber of
Commerce in China — Shenyang. Prior to joining the
Group, Mr Chan worked for an international accounting
firm in Hong Kong. Mr Chan is a Certified Public
Accountant of the Hong Kong Institute of Certified Public
Accountants and a fellow member of the Association of
Chartered Certified Accountants of the United Kingdom.
Mr Chan joined the Group in 2000.

New World China Land Limited 118
SENIOR MANAGEMENT PROFILE
Wong Wai-kong, Ray
(Aged 47)
Mr Wong is a Regional Chief Executive of the Group,
responsible for overseeing the Group’s projects in
Changsha and Yiyang. He has ample experience in
project operation management, engineering and design
in the PRC. Mr Wong is the Vice Chairman of Hunan
Association of Enterprises with Foreign Investment, a
director of Architects Association of Hunan, the Honorary
Vice Principal of New World Primary School of Shazitang
Educational Group in Changsha, and has been acting as
the Adjunct Professor as well as the off-campus MBA
supervisor of Business School of Hunan University upon
invitation since 2013. Mr Wong joined the New World
Group in 1993.
Geng Shu-sen, Kenneth
(Aged 52)
Mr Geng is a Regional Director — Southern China of the
Group who primarily oversees the Group’s projects in
Guangdong (including Guangzhou, Foshan, Zhuhai,
Huizhou, Zhaoqing, Huiyang), Haikou, Guiyang and
Ningbo. Mr Geng holds Bachelor and Master Degrees in
Engineering and is also a professional engineer in both
the PRC and Australia. Mr Geng has over 29 years of
experience in real estate development in Hong Kong and
the PRC. Mr Geng is the Standing Committee Member
of the 12th Chinese People’s Political Consultative
Conference of Guangzhou, the Standing Committee
Member of the 7th Chinese People’s Political
Consultative Conference of Tianhe District in Guangzhou,
the Honorary Citizen of Guangzhou, the Honorary Citizen
of Zhaoqing, and also the Executive Director of
Guangzhou Overseas Friendship Association. Mr Geng
joined the Group in 1999 and was appointed as Regional
Director — Southern China in 2008.
Chan Chi-wing, Wingo
(Aged 53)
Mr Chan is a Regional Chief Executive of the Group who
primarily oversees the Group’s projects in Beijing, Tianjin,
Jinan, Tangshan and Langfang. Mr Chan has more than
24 years of experience in real estate development in
Hong Kong and the PRC. Mr Chan graduated from the
Faculty of Architecture, the University of Hong Kong.
Besides an honour degree in Architectural Studies from
the University of Hong Kong, Mr Chan has MBA, LLB (Hon)
and LLM degrees. He has also been called to the Bar in
England and Wales. Mr Chan had once joined the New
World Group in 1986. He has worked with the Group for
more than 17 years.
Wong See-yuen
(Aged 58)
Mr Wong is a Regional Chief Executive of the Group who
primarily oversees the Group’s project in Chengdu. Mr
Wong holds a Bachelor Degree in Construction
Management from Pacific Southern University and a
Master Degree in Business Administration from Seattle
International University. Mr Wong has over 35 years of
experience in real estate management, leasing and
project development and management of various
projects in Hong Kong and Mainland China. Mr Wong is
the Vice Chairman of Chengdu Association of Enterprises
with Foreign Investment, The House and Real Estate
Association of Chengdu, the Chengdu Executive
Committee Chairman of Hong Kong Chamber of
Commerce in China and the Executive Council Member
of Chengdu Overseas Friendship Association. Mr Wong
joined the New World Group in 2002.

Annual Report 2015 119
Lau Chung-chun, Desmond
(Aged 68)
Mr Lau is a Regional Director — North Eastern China of
the Group who primarily oversees the Group’s projects
in Shenyang and Anshan. Mr Lau has over 24 years of
experience in real estate development in Hong Kong and
the PRC. Mr Lau is a Model Worker of the City of
Shenyang, an Honorary Citizen of the City of Shenyang,
Vice Chairman of the Shenyang Real Estate Development
Association, Committee Member of the 10th, 11th and
12th Chinese People’s Political Consultative Conference
of Shenyang, Standing Committee Member of the 13th
and 14th Chinese People’s Political Consultative
Conference of Shenyang, Convenor (Shenyang Region)
of Hong Kong CPPCC (Provincial) Members Association,
Vice Chairman of the Overseas Chinese Congress in
Liaoning Province and Vice Chairman of the Liaoning
Real Estate Association. Mr Lau joined the Group in
1996.

New World China Land Limited
CORPORATE SUSTAINABILITYNWCL has always upheld its operation principles to maintain its competitiveness and profitability while committing to build a green community, as well as actively promote the concept of an environmentally friendly and quality living. The Group will continue to improve energy efficiency through optimising its architectural design and improving its operation measures, such that the environmental impact created from property development and business operation can be minimised.
During the year under review, the Group launched a variety of initiatives and organised a series of events to promote environmental education, staff development, sport, art and cultural exchange. At the same time, the Group has also made every effort to give back to the society. It has organised different voluntary services and donated charitably, envisioning to build a sustainable community with human touches from multiple directions.
120
SUSTAINABILITY COMMITTEE
Sustainability at NWCL is executed by the Sustainability Committee. The Committee is responsible for the formulation,
implementation, supervision, review and improvement of the Group’s sustainability affairs. It is the organisation
ultimately responsible for monitoring the Group’s sustainability strategy.
Green building designGreen building design involves increasing energy
efficiency within buildings, mitigating water use and
encouraging the usage of environmentally friendly
construction materials. As population growth places
additional demands on the environment, green building
design is one of the solutions that can effectively respond
to housing demands and lower environmental impact.
Launched in 2014 for the first time, The NWCL Green
Building Design Guidelines provide guidance and
recommendations on green design features, choice of
materials and best construction practices. The Guidelines
also emphasise social engagement and the needs of
residents. Designs such as barrier free access and urban
farming projects are also considered.
Canton First Estate advocates low-carbon life
ENVIRONMENT
NWCL places importance on environment protection, which is why the Group has been constantly identifying
solutions to address environmental challenges that it may face. Through green construction designs, strengthened
recognition on eco-friendly work and diversified activities, the Group brings the concept of environment protection to
the community, introducing a green lifestyle to people.

Annual Report 2015 121
Wuhan Guanggu New World is designed with technology and low-carbon living as its core concept
Haikou New World • Meilisha Project makes use of a seawater circulation system
EnergyThe Group established the Energy Advisory Committee
in June 2015 to monitor energy consumption, formulate
energy conservation measures, as well as to collect and
analyse energy consumption data of various businesses
and departments. The Committee also sets up energy
reduction targets and implementation plans for its
projects. Wuhan Guanggu New World, for example, was
designed with technology and low-carbon living as its
core concept. In addition to installing LED lighting system
in the carpark and common areas of the building, fresh
air from outdoors is also redirected into the indoor area
for better ventilation, which in turn reduces energy
demands during seasonal transition. It is estimated that
over 600,000 kWh of electricity has been saved per
annum resulted from these measures.
Water resourcesThe Group makes every effort to improve its
infrastructure facilities such that water can be conserved
in the operation of its properties. The landscape and
waterscape facilities at the Haikou New World • Meilisha
Project, for instance, make use of a seawater circulation
system, which is expected to conserve more than 1.13
million cbm of water each year, equivalent to more than
1,000 Olympic size swimming pools. Native plants are
planted to reduce water demand.
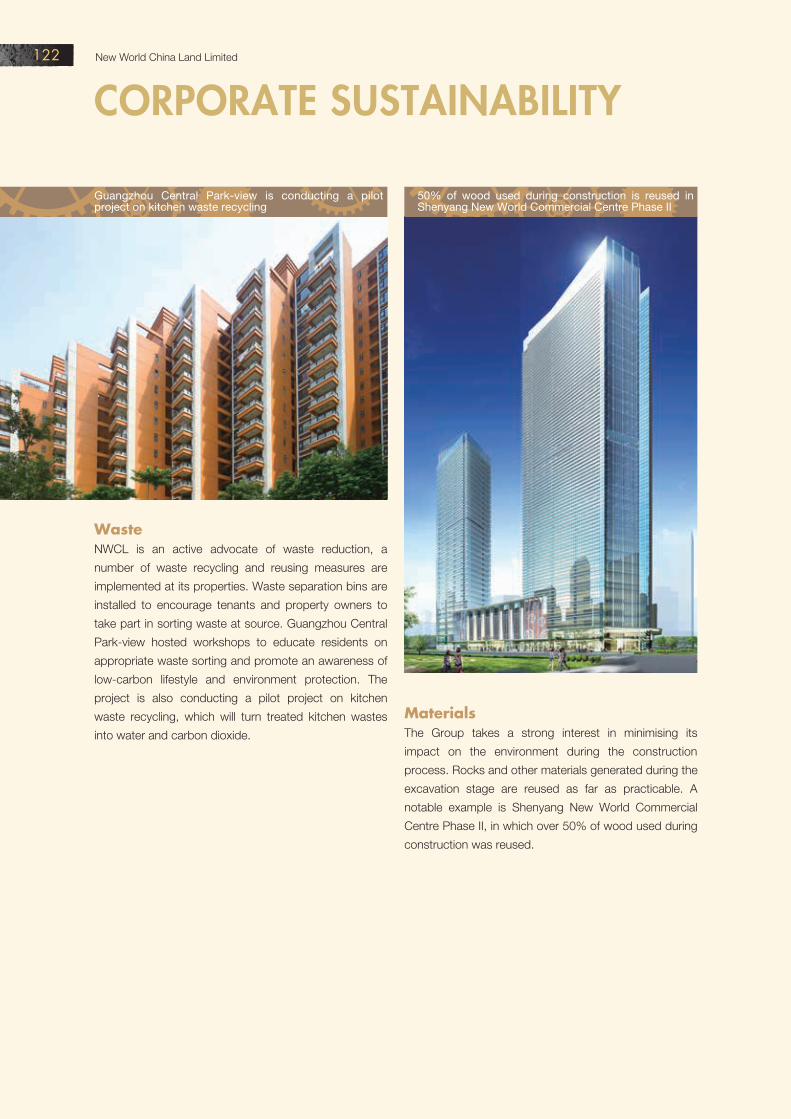
New World China Land Limited
CORPORATE SUSTAINABILITY122
WasteNWCL is an active advocate of waste reduction, a
number of waste recycling and reusing measures are
implemented at its properties. Waste separation bins are
installed to encourage tenants and property owners to
take part in sorting waste at source. Guangzhou Central
Park-view hosted workshops to educate residents on
appropriate waste sorting and promote an awareness of
low-carbon lifestyle and environment protection. The
project is also conducting a pilot project on kitchen
waste recycling, which will turn treated kitchen wastes
into water and carbon dioxide.
MaterialsThe Group takes a strong interest in minimising its
impact on the environment during the construction
process. Rocks and other materials generated during the
excavation stage are reused as far as practicable. A
notable example is Shenyang New World Commercial
Centre Phase II, in which over 50% of wood used during
construction was reused.
Guangzhou Central Park-view is conducting a pilot project on kitchen waste recycling
50% of wood used during construction is reused in Shenyang New World Commercial Centre Phase II

Annual Report 2015 123
COMMUNITY
NWCL strives to propel the holistic development of the communities in which it operates. The Group does not only
care for the needs of society, but also make it its goal to improve residents’ quality of life. The Group uses different
channels to reach the community and communicate with the public, bringing positive changes to the society.
Volunteers visit children in Foshan Red Cross Hospital School
NWCL volunteers participated in farmhouse rebuild voluntary service
Workshop of “City Trace Memories – The Intangible Cultural Heritage of Hong Kong”
NWCL has sponsored “Festival Croisements” for 10 consecutive years
Charitable donationsNWCL hopes to best utilise its charitable donations in
order to bring about broader social and environmental
benefit to the communities where it operates. The Group
provides education opportunities to disadvantaged
groups. A donation of RMB one million was made to
Foshan Red Cross Hospital School to ensure that
children recovering from illnesses can receive education
while being hospitalised. The Group also entered into a
cooperation agreement with Jinan Charity General
Association and donated RMB one million to support
university students of humble beginnings. The Group has
also pledged to an annual donation of RMB100,000 for
nurturing talents.
Community arts and cultureNWCL believes art and culture can make life better. As
such, a series of events that take art into everyday living
were rolled out. To promote public awareness on
intangible cultural heritage, the Group organised a
sculpture exhibition entitled “City Trace Memories — The
Intangible Cultural Heritage of Hong Kong” and set up
the installation art known as “Urban Cultural Typecase”
in Hong Kong. Mr Lam Siu Ngong, the title owner of “Hong
Kong King of Yuanyang Gold Medallist”, was also invited
to demonstrate his handful skills of making “Yuanyang”.
“Yuanyang”, a mixture of milk tea and coffee, is a symbol

New World China Land Limited
CORPORATE SUSTAINABILITY124
“Light Up Green Sense” event encourages the public in leading a low-carbon life in Shenyang
Disabled children sports game held in Shenyang
of East meets West uniqueness to Hong Kong.
Moreover, NWCL has sponsored “Festival Croisements”
of Wuhan for 10 consecutive years. The event is a
combination of art, poetry, industrial production and
other elements that aims at promoting the exchange of
Chinese and French cultures.
Environment protection and educationNWCL bel ieves that promoting the ideals of
environmental conservation is the key to drive a
sustainable lifestyle. Therefore, on top of exercising eco-
friendly practices in day-to-day operation, the Group also
envisions to spread green awareness to the public
through education, such that positive impact can be
brought to the local community and its environment. The
event known as “Light Up Green Sense” has been
organised for Shenyang and Tianjin, while Green Monday
has been actively promoted to encourage the public in
leading a low-carbon life. The NWCL Beijing Volunteer
Team, on the other hand, is bringing primary school
students on outdoors learning trips, such that they could
understand more about the value and use of mangroves
and other ecological systems. The concepts of
environmental conservation are transmitted effectively.
Caring for disadvantaged groupsThe Group works hard to give back to the society. It
makes the best use of its resources according to the
timing and circumstances. By joining up with charity
organisations, events and activities that address different
targets are organised. These include a charitable cookie
campaign in Guangzhou, where the baked cookies are
made by mentally disabled persons. Proceeds were
donated to charitable groups to help children suffering
from cancer. A disabled children sports game was also
held in Shenyang as an active way to support the
disadvantaged group.

Annual Report 2015 125
The first “Qianhai — Shenzhen — Hong Kong Athletics Carnival” is held to facilitate cultural exchanges between Shenzhen and Hong Kong
Mothers’ Day Event held in Chengdu
EMPLOYEE
NWCL regards staff development and engagement very highly. As the competence and professionalism of staff are
one of the keys to the Group’s success, it has launched a series of policies and initiatives to promote job skills
development and to create a fair work environment.
Regular professional trainings are organised in every region
Establishing a welcoming work environmentThe Group makes every effort to establish a welcoming
work environment, in which employees are protected
from any form of harassment or discrimination, where
each staff can perform and exert their potentials. The
Group has a fair set of recruitment and promotion rules
in place to ensure that staff members enjoy the same
recruitment and promotion opportunities regardless of
their gender, age, or ethnicity. The Group has also
formulated a fair compensation and benefit policy, while
the staff’s code of conduct sets forth the expected
professional standards in the workplace.
Employee talent and professional developmentNWCL takes a strong interest in the professional
development of its employees. During the year under
review, 136,655 hours of professional staff training were
made available, covering the topics of business ethics
and code of conduct, computer literacy, quality control,
occupational health and safety, as well as language
programmes. The Group also works hard to instil the
Support sports developmentThe Group attaches high importance to sports
development and believes that sports can nurture team
spirit. The “6th NWCL Community Sports Carnival” was
held in southern China and attracted participation of over
5,000 people. The first “Qianhai — Shenzhen — Hong
Kong Athletics Carnival” was held to facilitate cultural
exchanges between Shenzhen and Hong Kong. The
Group envisions to unite the public through sports, such
that we could work towards a common goal and the
importance of sports and health can be publicised at the
community level.

New World China Land Limited
CORPORATE SUSTAINABILITY126
Leader training programme in Dunhuang of Gansu is held to build team spirit
Occupational health and safetyThe Group takes the overall well-being of its staff to its
heart. It is an advocate of healthy lifestyle and it
encourages employees to achieve work-life balance. The
idea of occupational health is fused into the Group’s day-
to-day operation to safeguard the health and safety of its
people. Seminars themed around disease prevention
and healthy lifestyle are held on a regular basis and staff
is encouraged to take up sports. There are also stress
management courses and professional counselling to
help employees unwind from any tension felt at work.
Staff and family caringNWCL provides a range of benefits to its staff, including
staff canteen, staff discount on property purchase,
birthday leave and examination leave. To enhance
employees’ awareness on family life, the Group often
organises various seminars, covering topics like child
psychology and family health care. NWCL also extends
its care to the families of its employees. Scholarships and
internship programmes for staff’s children are specially
set up to facilitate the education and career development
of employees’ children.
Staff engagement and innovationThe Group also sees highly of staff input. The “LEAPING”
work improvement group scheme is set up to encourage
staff to explore new ideas, and to take part in the
company’s improvement and development. To
strengthen inter-departmental communication and to
help employees relax their body and mind, a staff
recreation area is set up at the Group’s Hong Kong
headquarters to enhance employees’ sense of belonging
to the company. The southern China subsidiary hosted a
leader training programme in Dunhuang of Gansu to
build colleagues’ confidence and to enhance team spirit.
NWCL places importance on construction site safety
Family activities are held to enhance employees’ awareness on family life
message that sustainability is crucial in daily operation
through training programmes and seminars, ensuring
that the whole workforce is aware of the concept of
sustainability and has undertaken occupational safety
training.

Annual Report 2015 127
VALUE CHAIN
NWCL’s endeavour to drive sustainability can create a positive impact on its suppliers. Its efforts are also able to
create long-term value in environment protection, the community and the economy, which in turn brings the Group a
wealth of opportunities.
were in place to ensure that suppliers conform to the
social, environment and ethical standards.
Quality managementTo maintain its superior quality, the Group conducts
reviews on its suppliers to ensure their legal and
regulatory compliance. Furthermore, the Group regularly
inspects the operation status of its various businesses. It
also conducts sample checks from time to time to
ensure that purchased materials comply with its
standards. When the standards of products and service
quality are comparable, the Group will give priority to
local suppliers as a way to contribute to the local
economy by increasing the demand for local offerings.
NWCL’s endeavour to maintain superior quality of its products and services
Supply chain managementThe Group has established comprehensive management
procedures for its suppliers in the areas such as pollution
control, waste and environmental management. There are
also guidelines in the use and procurement of resources
and materials in place to ensure that the relevant
requirements are adopted in tenders and agreements.
During the supplier selection process, the Group places
high importance on occupational health and safety, as well
as issues such as child labours and environmental
protection. The Group has also formulated a Supplier Code
of Conduct, emphasising that suppliers must comply with
all relevant local and national laws and regulations. These

New World China Land Limited
CORPORATE SUSTAINABILITY128
Ensuring customer health and safetyNWCL cares about customers’ health and safety. As
such, the Property Management Department oversees
the day-to-day inspection, maintenance and repair of
residential properties. The Southern China subsidiary, for
example, has formulated a series of guidelines to
safeguard residents’ health, safety and well-being, with
frontline employees trained to respond to contingencies.
In addition, regular fire drills are also conducted to
ensure that residents are aware of what to do in case of
emergencies.
Attaching high importance to customer feedbackThe Group actively listens to the voice of its customers
and takes timely and effective measures to handle
customer enquiries and complaints. The Property
Management Department meets with residents regularly
to collect their feedback for improving service quality.
NWCL Club organises “International Young Leader Training Programme” to introduce children to golf
The North Eastern subsidiary also conducts a monthly
owners’ survey to deepen their understanding about
owners’ needs.
NWCL ClubNWCL Club was founded in 2009, which is a
membership programme of NWCL developments. With
over 190,000 members across the country, NWCL Club
is a platform where a stylish and sophisticated lifestyle is
crafted. In addition to a diversified array of member-
exclusive events, NWCL Club also collaborates with
Chow Tai Fook Jewellery, New World Hotel, New World
Department Store and K11 Art Mall to offer personalised
services. During the year under review, NWCL Club
teamed up with a young children’s television channel and
the young adult English training organisation Education
First to organise the “International Young Leader Training
Programme”. The programme improved school
children’s language competence, and introduced them
to golf and expanded their international horizons.

FINANCIAL SECTION
CONTENTS
Report of the Directors
Independent Auditor’s Report
Consolidated Income Statement
Consolidated Statement of Comprehensive Income
Consolidated Statement of Financial Position
Statement of Financial Position
Consolidated Cash Flow Statement
Consolidated Statement of Changes in Equity
Notes to the Financial Statements
Financial Summary
130
152
154
155
156
158
159
160
162
247

New World China Land Limited 130
REPORT OF THE DIRECTORS
The directors have pleasure in presenting their annual report and financial statements for the year ended 30 June
2015.
GROUP ACTIVITIES
The principal activity of the Company is investment holding. The principal activities of the principal subsidiaries,
associated company and joint ventures are shown in note 44 to the financial statements.
FINANCIAL STATEMENTS
The results of the Group for the year ended 30 June 2015 and the state of affairs of the Company and the Group at
that date are set out in the financial statements on pages 154 to 246.
DIVIDENDS
The directors have resolved to recommend the payment of a final dividend of HK$0.03 per share (2014: HK$0.03 per
share) in respect of the year ended 30 June 2015. As no interim dividend has been declared, the proposed final
dividend will make a total distribution of HK$0.03 per share (2014: HK$0.07 per share) for the year. The proposed
final dividend, if approved at the forthcoming annual general meeting of the Company, will be paid on or about
Monday, 28 December 2015 to the shareholders whose names appear on the register of members of the Company
on Wednesday, 25 November 2015.
SHARE CAPITAL
Details of the movements in the share capital during the year are set out in note 31 to the financial statements.
RESERVES
Details of the movements in reserves are set out in note 32 to the financial statements. Distributable reserves of the
Company at 30 June 2015 amounted to HK$20,851 million (2014: HK$20,900 million).
PURCHASE, SALE OR REDEMPTION OF THE COMPANY’S LISTED SECURITIES
The RMB4,300 million 8.5% bonds due 2015, which were issued by the Company and listed on The Stock Exchange
of Hong Kong Limited, matured on 13 April 2015. Such bonds were fully redeemed by the Company at their principal
amount on the said maturity date and there was no outstanding balance of such bonds at 30 June 2015.
Save as disclosed above, neither the Company nor any of its subsidiaries has purchased, sold or redeemed any of
the Company’s listed securities during the year.

Annual Report 2015 131
PROPERTY, PLANT AND EQUIPMENT
Details of the movements in property, plant and equipment are set out in note 16 to the financial statements.
DONATION
Donation made by the Group during the year amounted to HK$8,904,000 (2014: HK$8,678,000).
DIRECTORS
The directors of the Company during the year and up to the date of this report were:
Executive directorsDr Cheng Kar-shun, Henry
Mr Cheng Kar-shing, Peter
Dr Cheng Chi-kong, Adrian
Ms Cheng Chi-man, Sonia
Mr Cheng Chi-him, Conrad
Mr Fong Shing-kwong, Michael
Ms Ngan Man-ying, Lynda
Independent non-executive directorsDr Cheng Wai-chee, Christopher
Hon Tien Pei-chun, James
Mr Lee Luen-wai, John
Mr Ip Yuk-keung, Albert
In accordance with Article 116 of the Company’s Articles of Association, Dr Cheng Chi-kong, Adrian, Mr Fong Shing-
kwong, Michael and Dr Cheng Wai-chee, Christopher will retire by rotation at the forthcoming annual general meeting,
and being eligible, will offer themselves for re-election. The remaining current directors continue in office.
No director has a service contract which is not determinable by the Company within one year without payment of
compensation other than statutory compensation.
PRE-EMPTIVE RIGHTS
No pre-emptive rights exist in the Cayman Islands in respect of the Company’s share capital.

New World China Land Limited 132
REPORT OF THE DIRECTORS
DIRECTORS’ INTEREST IN CONTRACTS
Save for contracts amongst group companies, no other contracts of significance in relation to the Company’s
business to which the Company, its subsidiaries, its holding company or fellow subsidiaries is a party, and in which
any director had a material interest, whether directly or indirectly, subsisted at the end of the year or at any time
during the year.
CONNECTED TRANSACTIONS
The Group has entered into the following connected transactions during the year and up to the date of this report:
A. Master services agreements(1) On 21 May 2012, a master services agreement (“NWD Master Agreement”) was entered into between the
Company and New World Development Company Limited (“NWD”) under which the Company agreed to
(i) engage members of NWD group to provide contracting services, property agency services and leasing
services to members of the Group; and (ii) provide leasing and property management services, as well as
hotel management services to members of NWD group, together with such other types of services the
Company and NWD may agree upon from time to time in writing, subject to the terms and conditions of
each definitive agreement which shall be on normal commercial terms or at prices and terms no less
favourable to the Company than terms available to or from (as the case may be) independent third parties,
with effect from 1 July 2012 for an initial term of three years.
For the purposes of the NWD Master Agreement, NWD group includes NWD, its subsidiaries or any other
company in the equity capital of which NWD and/or its subsidiaries taken together are directly or indirectly
interested so as to exercise or control the exercise of 30% or more of the voting power at general
meeting, or to control the composition of a majority of the board of directors, and the subsidiaries of such
company but excludes members of the Group.
NWD is a connected person of the Company by virtue of its substantial shareholding in the Company.
Details of the NWD Master Agreement were set out in the announcement of the Company dated 21 May
2012 and in a circular dated 8 June 2012. The aggregate transaction values in respect of (i) the services
rendered by the NWD group to the Group and (ii) the services rendered by the Group to the NWD group
under the NWD Master Agreement and the annual caps stipulated under the NWD Master Agreement for
the year ended 30 June 2015 were as follows:
Aggregate
transaction
values Annual caps
HK$’000 HK$’000
Services rendered by the NWD group to the Group 368,277 707,400
Services rendered by the Group to the NWD group 399,322 788,800

Annual Report 2015 133
The NWD Master Agreement was automatically renewed in accordance with its terms and conditions for
further three years from 1 July 2015 to 30 June 2018 with the passing of an ordinary resolution by the
independent shareholders of the Company by way of poll at an extraordinary general meeting of the
Company held on 30 June 2015. Details of the renewal of the NWD Master Agreement were set out in an
announcement of the Company dated 13 May 2015 and in a circular dated 12 June 2015.
(2) On 10 December 2012, a master contracting services agreement (“Master Contracting Services
Agreement”) was entered into between the Company and Mr Doo Wai-hoi, William (“Mr Doo”) under
which relevant members of the Group may enter into definitive agreements with companies controlled by
Mr Doo which were engaging in property development business (“Property Development Companies”) in
relation to the provision of contracting services by the Group to the Property Development Companies
during the period from 10 December 2012 to 30 June 2015 (both days inclusive).
No transaction was recorded under the Master Contracting Services Agreement for the year ended 30
June 2015 (2014: HK$198,188,000).
At the date of the Master Contracting Services Agreement, Mr Doo was a director of the Company and its
certain subsidiaries, as well as an associate of certain directors of the Company, and hence a connected
person of the Company under the Listing Rules. Details of the Master Contracting Services Agreement
were set out in the announcement of the Company dated 10 December 2012.
(3) On 27 June 2013, the Company entered into a master services agreement (“CTF Master Agreement”)
with Chow Tai Fook Enterprises Limited (“CTF”). Pursuant to the CTF Master Agreement, relevant
members of the Group may enter into definitive agreements with relevant members of the CTF group in
relation to the provision by the Group of hotel management and consultancy services as well as the
contracting services to the CTF group for an initial term of three years commencing from 1 July 2013.
For the purposes of the CTF Master Agreement, CTF group includes CTF and any other company which
is its subsidiaries, holding company, fellow subsidiaries of such holding company and any other
companies in the equity capital of which CTF and the abovementioned companies taken together can
exercise or control the exercise of 30% or more of the voting power at general meetings, or to control the
composition of a majority of the board of directors, and any other company which is its subsidiary but
excludes members of the NWD group which CTF has interest in solely through NWD.
The aggregate transaction values under the CTF Master Agreement for the year ended 30 June 2015
amounted to HK$274,712,000 (2014: HK$305,946,000), which were within the annual cap of
HK$459,000,000.
CTF is a substantial shareholder of NWD and is considered as a connected person of the Company.
Details of the CTF Master Agreement were set out in the announcements of the Company dated 27 June
2013 and 28 March 2014.

New World China Land Limited 134
REPORT OF THE DIRECTORS
CONNECTED TRANSACTIONS (Continued)
A. Master services agreements (Continued)
(4) On 30 June 2014, the Company and Mr Doo entered into a master operational services agreement (“Master
Operational Services Agreement”). Pursuant to the Master Operational Services Agreement, relevant
members of the Group may enter into operational agreements with Mr Doo or any of the corporations
controlled by Mr Doo or his family members in relation to the provision of construction, engineering and
related operational services to the Group for an initial term of three years commencing from 1 July 2014.
The aggregate transaction values under the Master Operational Services Agreement for the year ended
30 June 2015 amounted to HK$104,370,000 (2014: Nil), which were within the annual cap of
HK$412,000,000. The price and terms of the transactions conducted during the year had been
determined in accordance with the pricing policies and guidelines set out in the announcement of the
Company dated 30 June 2014 which contained details of the Master Operational Services Agreement.
Mr Doo was a director of the Company within the past twelve months preceding the date of the Master
Operational Services Agreement and is an associate of certain directors of the Company and hence a
connected person of the Company.
B. Master purchase agreementOn 19 March 2013, the Company entered into a master purchase agreement with Chow Tai Fook Jewellery
Group Limited (“CTFJ”) under which relevant members of the Group may from time to time enter into definitive
agreements with relevant members of the CTFJ group relating to the use of gift vouchers to purchase goods at
the stores of CTFJ and settlement of respective voucher value with rebates as well as the purchase of gold
products by relevant members of the Group from CTFJ group, subject to the terms and conditions of each
definitive agreement in compliance with those of the master purchase agreement with effect from 19 March
2013 for an initial term of three years. The gift vouchers and gold products will be provided to compliment the
purchasers of properties of the Group as part of the marketing activities of the Group. Details of the master
purchase agreement were set out in the announcement of the Company dated 19 March 2013.
The aggregate transaction values under the master purchase agreement for the year ended 30 June 2015
amounted to HK$61,067,000 (2014: HK$79,806,000), which were within the annual cap of HK$259,400,000.
CTFJ is an associate of CTF which is a substantial shareholder of NWD and is therefore regarded as a
connected person of the Company under the Listing Rules.
The master purchase agreement was automatically renewed in accordance with its terms and conditions for
further three years from 1 July 2015 to 30 June 2018. Details of the renewal of the master purchase agreement
were set out in the announcement of the Company dated 8 May 2015.

Annual Report 2015 135
C. Master sales agreementOn 27 June 2013, the Company entered into a master sales agreement (“Master Sales Agreement”) with New
World Department Store China Limited (“NWDS”). Pursuant to the Master Sales Agreement, relevant members
of the Group and relevant members of the NWDS group may enter into definitive agreements in respect of the
use of various cash equivalent gift coupons, gift cards and stored value shopping cards to be issued by the
Group, the prepaid shopping cards to be issued by NWDS group and purchased by the Group, or other
payment means acceptable to the NWDS group for purchase of goods at the department stores owned and
operated by NWDS group and the settlement of the relevant value represented by such payment (with discount,
if applicable), subject to the terms and conditions in compliance with those of the Master Sales Agreement for a
term of three years commencing from 1 July 2013. The Master Sales Agreement will facilitate smooth operation
of the marketing plan of the Group with a view to promoting sales of the properties of the Group.
The aggregate transaction values under the Master Sales Agreement for the year ended 30 June 2015
amounted to RMB18,123,000 (2014: RMB24,496,000), which were within the annual cap of RMB25,000,000.
NWDS is a connected person of the Company by virtue of its being a subsidiary of NWD. Details of the Master
Sales Agreement were set out in the announcement of the Company dated 27 June 2013.
D. Termination of lease agreementOn 28 November 2014, New World Development (Wuhan) Ltd. (“New World Wuhan”), an indirect wholly-owned
subsidiary, entered into a termination agreement with Hubei New World Department Store Co., Ltd. (“NWDS
Hubei”), a wholly-owned subsidiary of NWDS, to terminate the lease from New World Wuhan to NWDS Hubei in
respect of the property situated at 1st Floor to 5th Floor, Wuhan New World Centre, No. 632 Jiefang Avenue,
Qiaokou District, Wuhan, Hubei, the PRC and certain adjacent shops with an aggregate gross floor area of
42,000 square metres with effect from 1 December 2014 for a total consideration of RMB51,128,000 (subject
to adjustment) which was payable by New World Wuhan as to RMB21,128,000 within 14 days from the
effective date of the agreement and the balance would be payable within 14 days after handover of the
property. The termination agreement was entered into by New World Wuhan for purposes of carrying out
renovation of the property. Details of the termination agreement were set out in the announcement of the
Company dated 28 November 2014.
The consideration was subsequently adjusted to RMB40,331,000 based on the agreed net book value of the
subsisting refurbishment and enhancement work made by NWDS Hubei to the property as at 30 November
2014 in accordance with the terms of the termination agreement.
NWDS Hubei is a wholly-owned subsidiary of NWDS which in turn is a subsidiary of NWD. As such, NWDS
Hubei is an associate of the connected person of the Company under the Listing Rules.

New World China Land Limited 136
REPORT OF THE DIRECTORS
CONNECTED TRANSACTIONS (Continued)
E. DisposalOn 3 July 2015, New World Development (China) Limited (“NWDC”), a wholly-owned subsidiary, entered into a
sale and purchase agreement with CTF pursuant to which NWDC conditionally agreed to sell and CTF
conditionally agreed to acquire the entire issued share capital of, and the outstanding shareholder’s loans owing
from, New World Hotel Management (BVI) Limited (“NWHM”) for a consideration of HK$1,963,000,000, payable
by CTF as to 20% on the date of the agreement and as to 80% on completion. NWHM is the holding company
of certain companies which are principally engaged in the provision of hotel management services. Subject to
completion of the disposal which was expected to take place on or about 31 December 2015, NWHM will
cease to be an indirect wholly-owned subsidiary of the Company. The disposal will enable the Group to realise
its investment in non-core business and focus its resources on the operation of its existing core businesses.
CTF is a connected person of the Company as mentioned in paragraph A(3) above. The disposal therefore
constituted a connected transaction of the Company, details of which were set out in the announcement of the
Company dated 3 July 2015.
F. Master hotel leasing agreementOn 3 July 2015, the Company entered into a master hotel leasing agreement (“Master Hotel Leasing
Agreement”) with CTF. Pursuant to the Master Hotel Leasing Agreement, relevant members of the Group and
relevant members of the CTF group may enter into definitive agreements in respect of the leasing of hotels and
licensing of related licences to members of the CTF group, subject to the terms and conditions of each
definitive agreement in compliance with those of the Master Hotel Leasing Agreement with effect from 3 July
2015 and which shall continue up to and including 30 June 2025 and can be renewed for a further term of 10
years. The purposes of entering into the Master Hotel Leasing Agreement are to enable the Group to streamline
its hotel operation and strengthen further its foundation of rental operation which can generate a stable stream
of rental income for the Group.
CTF is a connected person of the Company as mentioned in paragraph A(3) above. Details of the Master Hotel
Leasing Agreement were set out in the announcement of the Company dated 3 July 2015.
G. Hotel agreementsPenta Hotels Germany GmbH (“PHGG”), which became an indirect wholly-owned subsidiary on 19 December
2013, entered into 24 hotel management agreements and 24 Licence and Royalty Agreements (collectively, the
“Hotel Agreements”) with certain subsidiaries of CTF (“Hotel Owners”) between February 2007 and March 2013
in relation to the management by PHGG of the hotels owned by the Hotel Owners and grant by PHGG to the
Hotel Owners of sublicences to use the “Penta” brand name in connection with the goods and services offered
in the hotels. The Hotel Agreements between PHGG and the Hotel Owners constitute continuing connected
transaction for the Company under the Listing Rules by virtue of the controlling interests of CTF in the Hotel
Owners. The aggregate transaction values under the Hotel Agreements for the year ended 30 June 2015
amounted to HK$18,349,000 (2014: HK$8,547,000). The price and terms of the transactions conducted during
the year had been determined in accordance with the pricing mechanism and terms set out in the
announcement of the Company dated 19 December 2013 which contained details of the Hotel Agreements.

Annual Report 2015 137
H. Other connected transactionIn July 1999, a deed of tax indemnity was entered into between NWD and the Group whereby NWD undertakes
to indemnify the Group in respect of, inter alia, certain PRC corporate income tax and land appreciation tax
payable in consequence of the disposal of certain properties held by the Group as at 31 March 1999. During
the year, tax indemnity amounting to HK$359,152,000 (2014: HK$1,075,306,000) was effected.
I. Annual review of the continuing connected transactionsThe independent non-executive directors of the Company had reviewed the continuing connected transactions
arising from the master services agreements (paragraphs A(1) to (4) above), the master purchase agreement
(paragraph B above), the master sales agreement (paragraph C above) and the Hotel Agreements (paragraph G
above) for the financial year ended 30 June 2015 and confirmed that the transactions have been entered into :
(a) in the ordinary and usual course of business of the Group;
(b) on normal commercial terms or better; and
(c) according to the agreements governing them on terms that are fair and reasonable and in the interests of
the Company’s shareholders as a whole.
The Company’s auditor was engaged to report on the Group’s continuing connected transactions in
accordance with Hong Kong Standard on Assurance Engagements 3000 “Assurance Engagements Other
Than Audits or Reviews of Historical Financial Information” and with reference to Practice Note 740 “Auditor’s
Letter on Continuing Connected Transactions under the Hong Kong Listing Rules” issued by the Hong Kong
Institute of Certified Public Accountants. The auditor has issued an unqualified letter containing the findings and
conclusions in respect of the abovementioned continuing connected transactions disclosed by the Group in
accordance with Main Board Listing Rule 14A.56. A copy of the auditor’s letter has been provided by the
Company to The Stock Exchange of Hong Kong Limited.
Save as disclosed above, a summary of significant related party transactions that do not constitute connected
transactions made during the year was disclosed in note 42 to the financial statements.

New World China Land Limited 138
REPORT OF THE DIRECTORS
DIRECTORS’ INTERESTS IN SECURITIES
As at 30 June 2015, the interests or short positions of the directors of the Company in the shares, underlying shares and debentures of the Company or any of its associated corporations (within the meaning of Part XV of the Securities and Futures Ordinance (“SFO”)) which were notified to the Company and The Stock Exchange of Hong Kong Limited (“Stock Exchange”) pursuant to Divisions 7 and 8 of Part XV of the SFO (including interests or short positions which they were taken or deemed to have under such provisions of the SFO), or which were recorded in the register required to be kept by the Company under Section 352 of the SFO, or which were required, pursuant to the Model Code for Securities Transactions by Directors adopted by the Company (the “Model Code”), to be notified to the Company and the Stock Exchange, were as follows:
(A) Long position in shares
Number of sharesPercentage
to the relevant issued share capital as at
30 June 2015Personal interests
Family interests
Corporate interests Total
New World China Land Limited(Ordinary shares of HK$0.10 each)Mr Cheng Kar-shing, Peter 755,961 — — 755,961 0.01Mr Fong Shing-kwong, Michael 1,856,895 — — 1,856,895 0.02Dr Cheng Wai-chee, Christopher 387,448 — — 387,448 0.00Hon Tien Pei-chun, James 387,448 — — 387,448 0.00Mr Lee Luen-wai, John 387,448 — — 387,448 0.00
New World Development Company Limited(Ordinary shares)Dr Cheng Kar-shun, Henry — 600,000 — 600,000 0.01Mr Cheng Kar-shing, Peter — 506,545 — 506,545 0.01Mr Fong Shing-kwong, Michael 213,182 — — 213,182 0.00
NWS Holdings Limited(Ordinary shares of HK$1.00 each)Dr Cheng Kar-shun, Henry 18,349,571 — 12,000,0001 30,349,571 0.80Mr Cheng Kar-shing, Peter 286,626 — 5,787,3692 6,073,995 0.16Mr Fong Shing-kwong, Michael 2,351,732 — — 2,351,732 0.06Dr Cheng Wai-chee, Christopher 2,644,155 — — 2,644,155 0.07
New World Department Store China Limited (Ordinary shares of HK$0.10 each) Ms Cheng Chi-man, Sonia 92,000 — — 92,000 0.01
Sun Legend Investments Limited (Ordinary shares) Mr Cheng Kar-shing, Peter — — 5003 500 50.00
Notes:
1. These shares are beneficially owned by a company which is wholly-owned by Dr Cheng Kar-shun, Henry.
2. These shares are beneficially owned by a company which is wholly-owned by Mr Cheng Kar-shing, Peter.
3. These shares are beneficially owned by a controlled corporation of Mr Cheng Kar-shing, Peter.

Annual Report 2015 139
(B) Long position in underlying shares — share options(1) The Company
Under the share option scheme of the Company adopted on 26 November 2002, share options were
granted to the undermentioned directors which entitle them to subscribe for shares of the Company and
accordingly they are regarded as interested in the underlying shares of the Company. Details of the share
options held by them during the year were as follows:
Number of share options
Name of director Date of grant
Exercisable
period
Balance
as at
1 July
2014
Exercised
during
the year
Balance
as at
30 June
2015
Exercise
price per
share
note
HK$
Dr Cheng Kar-shun, Henry 18 January 2011 1 2,077,922 — 2,077,922 3.036
Mr Cheng Kar-shing, Peter 18 January 2011 1 831,169 — 831,169 3.036
Dr Cheng Chi-kong, Adrian 18 January 2011 2 935,066 — 935,066 3.036
Mr Fong Shing-kwong, Michael 18 January 2011 1 449,481 (172,000)3 277,481 3.036
Ms Ngan Man-ying, Lynda 18 January 2011 1 1,038,961 — 1,038,961 3.036
Dr Cheng Wai-chee, Christopher 18 January 2011 1 311,688 — 311,688 3.036
Hon Tien Pei-chun, James 18 January 2011 1 311,688 — 311,688 3.036
Mr Lee Luen-wai, John 18 January 2011 1 311,688 — 311,688 3.036
Total 6,267,663 (172,000) 6,095,663
Notes:
1. Divided into 5 tranches, exercisable from 19 February 2011, 19 February 2012, 19 February 2013, 19 February 2014 and
19 February 2015, respectively to 18 February 2016.
2. Divided into 3 tranches, exercisable from 19 February 2013, 19 February 2014 and 19 February 2015, respectively to
18 February 2016.
3. The exercise dates were 8 April 2015, 9 April 2015 and 10 April 2015. On the trading date immediately before the exercise
dates, the closing prices per share were HK$5.02, HK$5.09 and HK$5.10, respectively.
4. The cash consideration paid by each of the directors for grant of the share options is HK$10.

New World China Land Limited 140
REPORT OF THE DIRECTORS
DIRECTORS’ INTERESTS IN SECURITIES (Continued)
(B) Long position in underlying shares — share options (Continued)
(2) New World Development Company LimitedUnder the share option scheme of the holding company, New World Development Company Limited
(“NWD”), the following directors have personal interests in share options to subscribe for shares in NWD
and are accordingly regarded as interested in the underlying shares of NWD. Details of the share options
of NWD held by them during the year were as follows:
Number of share options
Name of director Date of grant
Exercisable
period
Balance
as at
1 July
2014
Adjusted
during
the year
Exercised
during
the year
Balance
as at
30 June
2015
Exercise
price per
share
note note 3 note 3
HK$
Dr Cheng Kar-shun, Henry 19 March 2012 1 10,648,284 16,529 — 10,664,813 9.161
Mr Cheng Kar-shing, Peter 19 March 2012 1 532,413 825 — 533,238 9.161
Dr Cheng Chi-kong, Adrian 19 March 2012 1 3,726,898 5,785 — 3,732,683 9.161
Ms Cheng Chi-man, Sonia 19 March 2012 1 3,194,483 4,958 — 3,199,441 9.161
Mr Fong Shing-kwong,
Michael 19 March 2012 2 1,866,942 1,806 (950,000) 918,748 9.161
Mr Lee Luen-wai, John 19 March 2012 1 532,413 825 — 533,238 9.161
Total 20,501,433 30,728 (950,000) 19,582,161
Notes:
1. Divided into 4 tranches, exercisable from 19 March 2012, 19 March 2013, 19 March 2014 and 19 March 2015, respectively to
18 March 2016.
2. Divided into 3 tranches, exercisable from 19 March 2013, 19 March 2014 and 19 March 2015, respectively to 18 March 2016.
3. NWD declared final dividend for the year ended 30 June 2014 in cash (with scrip option) and interim dividend for the six months
ended 31 December 2014 in cash (with scrip option) during the year. Accordingly, adjustments were made to the number of
outstanding share options and the exercise price. The exercise price per share of the share options was adjusted from
HK$9.176 to HK$9.172 on 30 December 2014, and further to HK$9.161 on 22 May 2015.
4. The cash consideration paid by each of the directors for grant of the share options is HK$10.

Annual Report 2015 141
(3) NWS Holdings LimitedUnder the share option scheme of a fellow subsidiary, NWS Holdings Limited (“NWS”), the following
directors have personal interests in share options to subscribe for shares in NWS and are accordingly
regarded as interested in the underlying shares of NWS. Details of the share options of NWS held by
them during the year were as follows:
Number of share options
Name of director Date of grant
Exercisable
period
Balance
as at
1 July
2014
Granted
during
the year
Adjusted
during
the year
Exercised
during
the year
Balance
as at
30 June
2015
Exercise
price per
share
note note 2 note 2
HK$
Dr Cheng Kar-shun, Henry 9 March 2015 1 — 7,400,000 1,080 — 7,401,080 14.158
Dr Cheng Wai-chee,
Christopher 9 March 2015 1 — 1,400,000 204 — 1,400,204 14.158
Total — 8,800,000 1,284 — 8,801,284
Notes:
1. 60% of the share options are exercisable from 9 May 2015 to 8 March 2020 while the remaining 40% of the share options are
divided into two tranches, exercisable from 9 March 2016 and 9 March 2017, respectively to 8 March 2020.
2. NWS declared interim dividend for the six months ended 31 December 2014 in cash (with scrip option) during the year.
Accordingly, adjustments were made to the number of outstanding share options and the exercise price. The exercise price per
share of the share options was adjusted from HK$14.160 to HK$14.158 on 19 May 2015.
3. The cash consideration paid by each of the directors for grant of the share options is HK$10.

New World China Land Limited 142
REPORT OF THE DIRECTORS
DIRECTORS’ INTERESTS IN SECURITIES (Continued)
(C) Long position in debentures(1) The Company
The following directors have interests in the debentures issued by the Company. Details of the debentures
of the Company held by them as at 30 June 2015 were as follows:
Name of director
Amount of debentures issued by the Company
Percentage
to the total
debentures
in issue as
at 30 June
2015
Personal
interests
Family
interests
Corporate
interests Total
RMB RMB RMB RMB
Mr Cheng Kar-shing, Peter — 12,256,0001 16,000,0002 28,256,000 0.30
Mr Fong Shing-kwong, Michael 12,256,0001 — — 12,256,000 0.13
Mr Ip Yuk-keung, Albert — 3,064,0001 — 3,064,000 0.03
Total 12,256,000 15,320,000 16,000,000 43,576,000
Notes:
1. These debentures were issued in USD and had been translated into RMB using the rate of USD1 = RMB6.128.
2. These debentures are beneficially owned by a company which is wholly-owned by Mr Cheng Kar-shing, Peter.
(2) Fita International LimitedThe following director has interest in the debentures issued by Fita International Limited (“Fita”), a wholly-
owned subsidiary of NWD. Details of the debentures of Fita held by him as at 30 June 2015 were as
follows:
Name of director
Amount of debentures in USD issued by Fita
Percentage
to the total
debentures
in issue as
at 30 June
2015
Personal
interests
Family
interests
Corporate
interests Total
Mr Lee Luen-wai, John 1,000,000 1,000,000 — 2,000,000 0.27

Annual Report 2015 143
(3) NWD (MTN) LimitedThe following director has interest in the debentures issued by NWD (MTN) Limited (“MTN”), a wholly-
owned subsidiary of NWD. Details of the debentures of MTN held by him as at 30 June 2015 were as
follows:
Name of director
Amount of debentures in USD issued by MTN
Percentage
to the total
debentures
in issue as
at 30 June
2015
Personal
interests
Family
interests
Corporate
interests Total
Mr Fong Shing-kwong, Michael 1,000,000 — — 1,000,000 0.07
Save as disclosed above, as at 30 June 2015, none of the directors or chief executives of the Company had any
interests or short positions in the shares, underlying shares and debentures of the Company or any of its associated
corporations (within the meaning of Part XV of the SFO) which would have to be notified to the Company and the
Stock Exchange pursuant to Divisions 7 and 8 of Part XV of the SFO (including interests or short positions which they
were taken or deemed to have under such provisions of the SFO), or which were recorded in the register required to
be kept by the Company under Section 352 of the SFO, or which were required to be notified to the Company and
the Stock Exchange pursuant to the Model Code.
DIRECTORS’ RIGHTS TO ACQUIRE SHARES OR DEBENTURES
Save as disclosed under the section headed “Directors’ interest in securities” above, at no time during the year was
the Company, its subsidiaries, its fellow subsidiaries or its holding company, a party to any arrangement to enable the
directors of the Company or chief executives or any of their spouse or children under the age of 18 to acquire benefits
by means of the acquisition of shares in or debentures of the Company or any other body corporate.

New World China Land Limited 144
REPORT OF THE DIRECTORS
DIRECTORS’ INTERESTS IN COMPETING BUSINESS
During the year, the following directors are considered to have interests in the following businesses which compete or
are likely to compete, either directly or indirectly, with the business of the Group pursuant to the Listing Rules as set
out below:
Name of director
Name of entity with
competing business
Relevant business activities
of the entity
Nature of
interest of director
in the entity
Dr Cheng Kar-shun, Henry Chow Tai Fook (Holding) Limited
(“CTFH”) group of companies
Property investment and development
as well as hotel operation
Director
NWD group of companies Property development and investment
as well as hotel operation in China
Director
Supreme Harvest Development
Limited group of companies
Property investment and development
in Shanghai
Director
Mr Cheng Kar-shing, Peter CTFH group of companies Property investment and development
as well as hotel operation
Director
NWD group of companies Property development and investment
as well as hotel operation in China
Director
Dr Cheng Chi-kong, Adrian CTFH group of companies Property investment and development
as well as hotel operation
Director
Cheung Hung Development (Holdings)
Limited (“Cheung Hung”) group
of companies
Property investment and development Director
Ms Cheng Chi-man, Sonia NWD group of companies Property development and investment
as well as hotel operation in China
Director
Mr Cheng Chi-him, Conrad Cheung Hung group of companies Property investment and development Director
Mr Fong Shing-kwong, Michael NWD group of companies Property development and investment
as well as hotel operation in China
Director
Cheung Hung group of companies Property investment and development Director
Ceneric (Holdings) Limited Property development Shareholder
Ms Ngan Man-ying, Lynda NWD group of companies Property development and investment
as well as hotel operation in China
Director
As the board of directors of the Company is independent from the boards of the aforesaid companies and none of
the directors can control the board of the Company, the Group is capable of carrying its businesses independently of,
and at arm’s length from the businesses of such companies.

Annual Report 2015 145
SUBSTANTIAL SHAREHOLDERS’ INTERESTS IN SECURITIES
As at 30 June 2015, the interests or short position of substantial shareholders in the shares and underlying shares of
the Company as recorded in the register required to be kept under Section 336 of the SFO were as follows:
Long position of substantial shareholders in the shares of the Company
Name
Number of sharesPercentage to
the issued share capital
as at 30 June 2015
Beneficial interests
Corporate interests Total
Cheng Yu Tung Family (Holdings) Limited (“CYTF”) note 1 — 6,092,601,173 6,092,601,173 70.12
Cheng Yu Tung Family (Holdings II) Limited (“CYTF II”) note 1 — 6,092,601,173 6,092,601,173 70.12
Chow Tai Fook Capital Limited (“CTFC”) note 1 — 6,092,601,173 6,092,601,173 70.12
Chow Tai Fook (Holding) Limited (“CTFH”) note 1 — 6,092,601,173 6,092,601,173 70.12
Chow Tai Fook Enterprises Limited (“CTF”) note 2 — 6,092,601,173 6,092,601,173 70.12
New World Development Company Limited (“NWD”) note 3 5,721,977,644 370,623,529 6,092,601,173 70.12
Notes :
1. CYTF and CYTF II hold 48.98% and 46.65% interest in CTFC, respectively. CTFC in turn owns 78.58% interest in CTFH which holds the entire
interests in CTF. Therefore, CYTF, CYTF II, CTFC and CTFH are deemed to have interests in the shares in which CTF is deemed to be
interested by virtue of its interests in NWD as mentioned in note 2 below.
2. CTF and its subsidiaries have interests in more than one-third of the issued shares of NWD and accordingly CTF is deemed to have an interest
in the shares in which NWD is interested or deemed to be interested.
3. The number of shares held under the corporate interests of NWD includes 255,041,727 shares held by Easywin Enterprises Corporation
Limited, its wholly-owned subsidiary, 22,508,064 shares held by Great Worth Holdings Limited, its 60.90% owned subsidiary, and 93,073,738
shares held by High Earnings Holdings Limited, its 61.32% owned subsidiary.
Save as disclosed above, there is no other interest recorded in the register that is required to be kept under Section
336 of the SFO as at 30 June 2015.

New World China Land Limited 146
REPORT OF THE DIRECTORS
SHARE OPTION SCHEME
On 26 November 2002, the Company adopted a share option scheme (“2002 Share Option Scheme”) pursuant to
which employees, including directors of the Group, were given opportunity to obtain equity holdings in the Company.
In anticipation of its expiry on 26 November 2012, the Company adopted a new share option scheme (“2011 Share
Option Scheme”) at the annual general meeting of the Company held on 22 November 2011 and terminated the
operation of the 2002 Share Option Scheme. Any share options which were granted under the 2002 Share Option
Scheme prior to such termination shall continue to be valid and exercisable in accordance with the terms of the 2002
Share Option Scheme.
A summary of the 2002 Share Option Scheme and the 2011 Share Option Scheme was set out as follows :
2002 Share Option Scheme and 2011 Share Option Scheme
Purpose of the schemes To provide an opportunity for the full-time or part-time employees, including directors, of the Group to participate in the equity of the Company as well as to motivate them to optimise their performance
Participants of the schemes Full-time or part-time employees, including directors, of the Company or its subsidiaries
Total number of shares available for i ssue under the schemes and percentage of issued share capital as at the date of this annual report
The Company had granted share options representing the rights to subscribe for 96,226,400 shares under the 2002 Share Option Scheme up to the date of this report, together with share options representing 6,465,900 shares, 5,357,008 shares and 2,029,087 shares by way of adjustment on the number of share options as a result of the Company’s issue of rights shares which became unconditional on 8 April 2005, 16 November 2009 and 22 December 2011, respectively. No further share options will be granted under the 2002 Share Option Scheme.
The Company had granted share options representing the rights to subscribe for 41,682,100 shares under the 2011 Share Option Scheme up to the date of this report. The Company may further grant share options to subscribe for 537,812,151 shares of the Company, representing approximately 6.19% of the total issued share capital of the Company as at the date of this report.
Maximum entitlement of each participant under the schemes
The total number of shares issued and to be issued upon exercise of the options granted to each participant (including both exercised, cancelled and outstanding options) in any 12-month period must not exceed 1% of the shares in issue unless the same is approved by shareholders in general meeting.

Annual Report 2015 147
2002 Share Option Scheme and 2011 Share Option Scheme
The period within which the shares must be taken up under an option
At any time during a period to be notified by the directors, which period not to exceed five years commencing on the expiry of one month after the date on which the option is accepted and expiring on a date not later than the last day of the five-year period
The minimum period for which an option must be held before it can be exercised
one month
The amount payable on application or acceptance of the option and the period within which payments or calls must or may be made or loans for such purposes must be paid
HK$10 is to be paid as consideration for the grant of option within 28 days from the date of offer
The basis of determining the exercise price
The exercise price shall be determined by the directors, being at least the higher of:
(a) the closing price of shares as stated in the Hong Kong Stock Exchange’s daily quotations sheet on the date of offer, which must be a business day; and
(b) the average closing price of shares as stated in the Hong Kong Stock Exchange’s daily quotations sheets for the five business days immediately preceding the date of offer.
The remaining life of the schemes The schemes shall be valid and effective for a period of 10 years commencing on the respective dates of their adoption. The 2002 Share Option Scheme which was adopted on 26 November 2002 expired on 26 November 2012. The 2011 Share Option Scheme which was adopted on 22 November 2011 will expire on 22 November 2021.

New World China Land Limited 148
REPORT OF THE DIRECTORS
SHARE OPTION SCHEME (Continued)
During the year ended 30 June 2015, movements of share options granted to the directors and employees of the
Group under the 2002 Share Option Scheme and the 2011 Share Option Scheme were as follows:
(A) Movement of share options granted to directors was disclosed under the heading “Directors’ interests in
securities” above.
(B) Movement of share options granted to employees under the 2002 Share Option Scheme was as follows:
Number of share options note 1
Date of grant
Balance
as at
1 July
2014
Exercised
during
the year
Lapsed
during
the year
Balance
as at
30 June
2015
Exercise
price per
share
note 2
HK$
26 June to 23 July 2009 512,551 (504,529) (8,022) — 3.913
19 November to 16 December 2009 3,013 (1,533) (1,480) — 2.953
12 January to 2 February 2010 61,481 (58,338) (3,143) — 2.878
18 May to 14 June 2010 121,740 (121,740) — — 2.262
31 May to 25 June 2010 209,480 (170,000) — 39,480 2.349
10 November to 7 December 2010 693,137 (99,859) — 593,278 3.013
18 January to 14 February 2011 3,558,303 (1,398,803) (166,233) 1,993,267 3.036
26 July to 22 August 2011 733,242 (216,000) — 517,242 2.705
Total 5,892,947 (2,570,802) (178,878) 3,143,267

Annual Report 2015 149
(C) Movement of share options granted to employees under the 2011 Share Option Scheme was as follows:
Number of share options note 1
Date of grant
Balance
as at
1 July
2014
Granted
during
the year
Exercised
during
the year
Lapsed
during
the year
Balance
as at
30 June
2015
Exercise
price per
share
note 3 note 2
HK$
3 May to 30 May 2012 4,071,680 — (1,073,280) (200,000) 2,798,400 2.450
22 October to 16 November 2012 448,700 — (139,200) (110,400) 199,100 3.370
7 January to 1 February 2013 3,824,100 — (632,580) (452,960) 2,738,560 3.880
2 April to 29 April 2013 1,933,990 — (104,800) (37,200) 1,791,990 3.350
24 June to 25 June 2013 1,168,400 — (110,400) (165,600) 892,400 2.762
15 October to 17 October 2013 1,749,900 — (44,800) (230,000) 1,475,100 4.010
9 January to 13 January 2014 3,739,440 — (355,620) (12,800) 3,371,020 3.970
10 July to 11 July 2014 — 1,266,000 (105,600) (286,400) 874,000 4.720
23 October to 24 October 2014 — 1,132,000 (66,000) (264,000) 802,000 4.420
11 March to 12 March 2015 — 10,896,400 (44,000) — 10,852,400 4.968
8 May to 11 May 2015 — 914,000 — — 914,000 5.420
Total 16,936,210 14,208,400 (2,676,280) (1,759,360) 26,708,970
Notes:
1. The share options are exercisable within five years commencing from one month after the dates of grant, provided that the maximum
number of share options that can be exercised during each anniversary year is 20% of the total number of the share options granted
together with any unexercised share options carried forward from the previous anniversary years.
2. The weighted average closing prices of the shares immediately before the dates on which share options were exercised under the 2002
Share Option Scheme and the 2011 Share Option Scheme were HK$4.879 and HK$5.085, respectively.
3. The closing prices per share immediately before 10 July 2014, 23 October 2014, 11 March 2015 and 8 May 2015, the dates of offer to
grant, were HK$4.690, HK$4.280, HK$4.880 and HK$5.310, respectively.
The fair values of the share options granted during the year with exercise prices per share of HK$4.720, HK$4.420,
HK$4.968 and HK$5.420 are estimated at HK$1.501, HK$1.335, HK$1.540 and HK$1.704 each, respectively using
the Binomial pricing model. Values are estimated based on the risk-free rate ranging from 1.17% to 1.40% per annum
with reference to the rate prevailing on the Exchange Fund Notes, a five-year period historical volatility ranging from
37.94% to 40.52%, assuming dividend yield ranging from 0.57% to 1.68% and an expected option life of five years.
The Binomial pricing model required input of subjective assumptions such as the expected stock price volatility.
Change in the subjective input may materially affect the fair value estimates.

New World China Land Limited 150
REPORT OF THE DIRECTORS
CONTINUING OBLIGATIONS UNDER CHAPTER 13 OF THE LISTING RULES
Banking facilities with covenants relating to specific performance of the controlling shareholderIn accordance with the requirements under Rule 13.21 of the Listing Rules, the directors of the Company reported
below details of loan facilities of the Group, which exist at any time during the year and include conditions relating to
specific performance of the controlling shareholder of the Company.
On 28 May 2010, the Company obtained a five-year term loan facility of up to HK$1,000,000,000 and another term
loan facilities of up to an aggregate principal amount of HK$1,000,000,000 on 23 May 2011, which comprised a five-
year term loan facility of up to a principal amount of HK$500,000,000 and a three-year term loan facility of up to a
principal amount of HK$500,000,000 which are available in RMB, to finance general working capital of the Company.
On 30 May 2012, the Company was granted a three-year term loan facility of HK$500,000,000 which was extended
for further three years on 12 May 2015 to fund the general corporate funding requirement of the Company and its
subsidiaries, including re-financing the Company’s existing loans and was further granted loan facilities of
HK$920,000,000, HK$530,000,000, HK$1,000,000,000 and HK$4,500,000,000 on 17 December 2012,
12 November 2014, 27 May 2015 and 11 June 2015, respectively for a term of three to five years.
On 28 May 2010 and 5 July 2010, Superb Wealthy Group Limited (“Superb Wealthy”), a wholly-owned subsidiary,
was granted a five-year term loan facility of HK$500,000,000 and a four-year term loan facility of HK$700,000,000,
respectively. It also obtained loan facilities of HK$700,000,000 (revised to HK$400,000,000 in August 2012) and
HK$100,000,000 for a term of four to five years on 28 September 2011 and 21 October 2011, respectively. It was
further granted loan facilities of HK$450,000,000, HK$500,000,000 and HK$630,000,000 on 7 May 2012, 30 July
2012 and 19 December 2012, respectively and loan facilities of HK$600,000,000 and HK$500,000,000 on 19 April
2013 and 24 May 2013, respectively for a term of three to four years. Moreover, loan facilities of HK$1,000,000,000,
USD64,100,000, HK$300,000,000, RMB1,000,000,000, HK$1,000,000,000 and HK$500,000,000 for a term of
three to five years were obtained by Superb Wealthy on 7 May 2014, 18 June 2014, 30 June 2014, 22 September
2014, 13 October 2014 and 12 November 2014, respectively. On 28 January 2015 and 15 April 2015, Superb
Wealthy obtained three-year term loan facilities of HK$200,000,000 and HK$500,000,000 respectively. It further
obtained loan facilities of HK$1,000,000,000 and HK$500,000,000 for a term of three to five years on 19 June 2015.
On 25 July 2011, New World Hotel Management (BVI) Limited, a wholly-owned subsidiary, was granted a five-year
term loan facility of HK$1,000,000,000 to finance part of the consideration for acquiring a hotel management group.
On 19 June 2012, New World China Finance (BVI) Limited (“NWCF”), a wholly-owned subsidiary, was granted loan
facilities in an aggregate principal amount of up to HK$1,200,000,000 and USD38,560,500 with a tenor of three
years. It was further granted a three-year term loan facility of HK$300,000,000 on 11 April 2014. New World
Development (China) Limited (“NWDC”), a wholly-owned subsidiary, also obtained a loan facility of HK$500,000,000
on 9 July 2012 with a tenor of three years. On 24 September 2012, Spread Glory Investment Limited (“Spread
Glory”), a wholly-owned subsidiary, was granted a three-year term loan facility of HK$600,000,000. The facilities
obtained by Superb Wealthy, NWCF, NWDC and Spread Glory will be utilised to finance the investment in property
projects, repay borrowings and fund the Group’s general working capital requirement.

Annual Report 2015 151
Upon the granting of the above loan facilities, the Company undertook to the lenders that NWD would retain an
interest of at least 51% in the issued share capital of the Company, or would maintain 51% of the voting rights
attached to the issued share capital of the Company throughout the terms of the facilities. Failure to perform the
undertaking will constitute an event of default. If the event of default continues and has not been waived by the
lenders, the outstanding liability under the loan facilities will become immediately due and payable and the loan
facilities will be terminated.
STATEMENT OF PUBLIC FLOAT SUFFICIENCY
Based on the information publicly available to the Company and within the knowledge of the directors as at the date
of this annual report, the Company has maintained the prescribed public float under the Listing Rules.
MAJOR CUSTOMERS AND SUPPLIERS
During the year, less than 30% of the Group’s revenues and less than 30% of the Group’s purchases were
attributable to the Group’s five largest customers and five largest suppliers, respectively.
AUDITOR
The financial statements have been audited by Messrs PricewaterhouseCoopers, who retire and, being eligible, offer
themselves for re-appointment.
On behalf of the Board
Dr Cheng Kar-shun, Henry
Chairman and Managing Director
Hong Kong, 23 September 2015

New World China Land Limited 152
INDEPENDENT AUDITOR’S REPORT
To the shareholders of New World China Land Limited
(incorporated in the Cayman Islands with limited liability)
We have audited the consolidated financial statements of New World China Land Limited (the “Company”) and its
subsidiaries (together, the “Group”) set out on pages 154 to 246, which comprise the consolidated and company
statements of financial position as at 30 June 2015, and the consolidated income statement, the consolidated
statement of comprehensive income, the consolidated statement of changes in equity and the consolidated cash flow
statement for the year then ended, and a summary of significant accounting policies and other explanatory
information.
Directors’ responsibility for the consolidated financial statements
The directors of the Company are responsible for the preparation of consolidated financial statements that give a true
and fair view in accordance with Hong Kong Financial Reporting Standards issued by the Hong Kong Institute of
Certified Public Accountants and the disclosure requirements of the predecessor Hong Kong Companies Ordinance
(Cap. 32), and for such internal control as the directors determine is necessary to enable the preparation of
consolidated financial statements that are free from material misstatement, whether due to fraud or error.
Auditor’s responsibility
Our responsibility is to express an opinion on these consolidated financial statements based on our audit and to
report our opinion solely to you, as a body, and for no other purpose. We do not assume responsibility towards or
accept liability to any other person for the contents of this report.
We conducted our audit in accordance with Hong Kong Standards on Auditing issued by the Hong Kong Institute of
Certified Public Accountants. Those standards require that we comply with ethical requirements and plan and
perform the audit to obtain reasonable assurance about whether the consolidated financial statements are free from
material misstatement.
An audit involves performing procedures to obtain audit evidence about the amounts and disclosures in the
consolidated financial statements. The procedures selected depend on the auditor’s judgement, including the
assessment of the risks of material misstatement of the consolidated financial statements, whether due to fraud or
error. In making those risk assessments, the auditor considers internal control relevant to the entity’s preparation of
consolidated financial statements that give a true and fair view in order to design audit procedures that are
appropriate in the circumstances, but not for the purpose of expressing an opinion on the effectiveness of the entity’s
internal control. An audit also includes evaluating the appropriateness of accounting policies used and the
reasonableness of accounting estimates made by the directors, as well as evaluating the overall presentation of the
consolidated financial statements.
We believe that the audit evidence we have obtained is sufficient and appropriate to provide a basis for our audit
opinion.

Annual Report 2015 153
Opinion
In our opinion, the consolidated financial statements give a true and fair view of the state of affairs of the Company
and of the Group as at 30 June 2015, and of the Group’s profit and cash flows for the year then ended in accordance
with Hong Kong Financial Reporting Standards and have been properly prepared in accordance with the disclosure
requirements of the predecessor Hong Kong Companies Ordinance (Cap.32).
PricewaterhouseCoopers
Certified Public Accountants
Hong Kong, 23 September 2015

New World China Land Limited 154
CONSOLIDATED INCOME STATEMENTFor the year ended 30 June 2015
2015 2014
Note HK$’000 HK$’000
Continuing operations
Revenues 6 17,459,237 21,850,106
Cost of sales (10,621,455) (12,770,039)
Gross profit 6,837,782 9,080,067
Other income 7 733,019 1,359,585
Other gains/(losses), net 8 68,973 (111,898)
Changes in fair value of investment properties 17 899,117 616,122
Selling expenses (799,553) (737,786)
Administrative and other operating expenses (1,400,936) (1,249,934)
Operating profit before finance costs 9 6,338,402 8,956,156
Finance costs 10 (302,140) (311,314)
Share of results of associated company and joint ventures 386,153 462,277
Profit before taxation 6,422,415 9,107,119
Taxation charge 13 (2,918,335) (4,167,156)
Profit for the year from continuing operations 3,504,080 4,939,963
Discontinued operation
Loss for the year from discontinued operation 24 (34,033) (140,698)
Profit for the year 3,470,047 4,799,265
Profit attributable to:
Equity holders of the Company
From continuing operations 3,347,164 4,779,389
From discontinued operation (34,033) (140,698)
3,313,131 4,638,691
Non-controlling interests 156,916 160,574
3,470,047 4,799,265
Earnings per share 14
Basic
From continuing operations 38.53 cents 55.11 cents
From discontinued operation (0.39) cents (1.62) cents
38.14 cents 53.49 cents
Diluted
From continuing operations 38.51 cents 55.07 cents
From discontinued operation (0.39) cents (1.62) cents
38.12 cents 53.45 cents
Dividends 15 260,681 607,713

Annual Report 2015 155
CONSOLIDATED STATEMENT OF COMPREHENSIVE INCOMEFor the year ended 30 June 2015
2015 2014
HK$’000 HK$’000
Profit for the year 3,470,047 4,799,265
Other comprehensive income:
Items that may be reclassified to profit or loss:
Translation differences (61,676) (564,599)
Share of other comprehensive income of associated company
and joint ventures 1,978 (83,077)
Other comprehensive income for the year (59,698) (647,676)
Total comprehensive income for the year 3,410,349 4,151,589
Total comprehensive income attributable to:
Equity holders of the Company 3,258,178 3,999,840
Non-controlling interests 152,171 151,749
3,410,349 4,151,589
Total comprehensive income attributable to equity holders
of the Company arising from:
Continuing operations 3,293,173 4,140,207
Discontinued operation (34,995) (140,367)
3,258,178 3,999,840

New World China Land Limited 156
CONSOLIDATED STATEMENT OF FINANCIAL POSITIONAs at 30 June 2015
2015 2014
Note HK$’000 HK$’000
ASSETS
Non-current assets
Property, plant and equipment 16 5,831,924 4,763,887
Investment properties 17 24,684,353 21,971,592
Land use rights 18 720,144 703,901
Intangible assets 19 91,030 1,895,952
Properties held for development 21 19,741,250 18,182,575
Associated company and joint ventures 22 15,598,108 14,309,144
Available-for-sale financial assets 25 735,860 85,147
67,402,669 61,912,198
Current assets
Properties under development 27 17,671,570 21,091,110
Completed properties held for sale 28 19,885,358 8,977,146
Hotel inventories, at cost 4,102 4,002
Prepayments, debtors and other receivables 29 11,275,453 10,881,917
Amounts due from related companies 30 301,943 577,025
Cash and bank balances, unrestricted 26 15,773,665 17,351,595
64,912,091 58,882,795
Assets of disposal group classified as held for sale 24 2,112,780 —
Non-current assets reclassified as held for sale 23 — 131,138
67,024,871 59,013,933
Total assets 134,427,540 120,926,131
EQUITY
Capital and reserves attributable to the Company’s
equity holders
Share capital 31 868,877 868,335
Reserves 32 59,652,293 56,623,635
Proposed final dividend 32 260,681 260,547
60,781,851 57,752,517
Non-controlling interests 3,836,900 3,566,137
Total equity 64,618,751 61,318,654

Annual Report 2015 157
2015 2014
Note HK$’000 HK$’000
LIABILITIES
Non-current liabilities
Long term borrowings 33 34,388,409 25,226,035
Deferred tax liabilities 34 3,522,327 3,252,232
37,910,736 28,478,267
Current liabilities
Creditors and accruals 35 8,890,122 6,950,199
Deposits received on sale of properties 6,045,122 4,716,405
Amounts due to related companies 30 723,334 507,848
Short term loans 36 1,001,250 —
Current portion of long term borrowings 33 9,775,255 14,197,174
Amounts due to non-controlling interests 37 102,756 102,756
Taxes payable 38 4,432,361 4,654,828
30,970,200 31,129,210
Liabilities of disposal group classified as held for sale 24 927,853 —
31,898,053 31,129,210
Total liabilities 69,808,789 59,607,477
Total equity and liabilities 134,427,540 120,926,131
Net current assets 35,126,818 27,884,723
Total assets less current liabilities 102,529,487 89,796,921
Dr Cheng Kar-shun, Henry Mr Cheng Kar-shing, Peter
Director Director

New World China Land Limited 158
STATEMENT OF FINANCIAL POSITIONAs at 30 June 2015
2015 2014
Note HK$’000 HK$’000
ASSETS
Non-current asset
Subsidiaries 20 46,336,267 40,751,213
Current assets
Prepayments, debtors and other receivables 29 13,021 16,489
Amounts due from related companies 30 202,799 435,602
Cash and bank balances, unrestricted 26 4,148,864 5,241,629
4,364,684 5,693,720
Total assets 50,700,951 46,444,933
EQUITY
Capital and reserves attributable to the Company’s
equity holders
Share capital 31 868,877 868,335
Reserves 32 27,341,449 27,382,861
Proposed final dividend 32 260,681 260,547
Total equity 28,471,007 28,511,743
LIABILITIES
Non-current liability
Long term borrowings 33 20,261,349 10,860,351
Current liabilities
Creditors and accruals 35 177,881 188,222
Amounts due to related companies 30 — 27
Current portion of long term borrowings 33 1,727,678 6,823,029
Taxes payable 38 63,036 61,561
1,968,595 7,072,839
Total liabilities 22,229,944 17,933,190
Total equity and liabilities 50,700,951 46,444,933
Net current assets/(liabilities) 2,396,089 (1,379,119)
Total assets less current liabilities 48,732,356 39,372,094
Dr Cheng Kar-shun, Henry Mr Cheng Kar-shing, Peter
Director Director

Annual Report 2015 159
CONSOLIDATED CASH FLOW STATEMENTFor the year ended 30 June 2015
2015 2014Note HK$’000 HK$’000
Operating activitiesNet cash generated from operations 41(a) 762,133 3,733,208Tax paid (2,532,620) (2,487,383)
Net cash (used in)/from operating activities (1,770,487) 1,245,825
Investing activitiesInterest received 284,541 244,074Dividend income from an available-for-sale financial asset — 1,738Dividend income from joint ventures 65,368 30,526Additions to property, plant and equipment, land use rights
and investment properties (3,111,936) (2,569,492)Additions to available-for-sale financial assets (650,713) —Increase in investments in associated company and joint ventures (1,420,961) (2,465,781)Decrease in investments in associated company
and joint ventures 762,841 549,018Acquisition of subsidiaries 41(b) — (364,223)Acquisition of additional interests in subsidiaries — (90,280)Disposal of associated companies — 93,934Disposal of available-for-sale financial assets — 23,310Disposal of property, plant and equipment
and investment properties 455,024 500,892
Net cash used in investing activities (3,615,836) (4,046,284)
Financing activitiesInterest paid (2,432,825) (1,060,961)Increase in long term borrowings 8,697,886 9,006,059Issue of notes 7,907,299 —Repayment of long term borrowings (5,618,961) (5,543,262)Repayment of bonds (5,308,642) —Capital contribution from non-controlling interests — 132,758Issue of shares 17,284 59,320Increase/(decrease) in short term loans 1,001,250 (253,846)Repayment on advance from participating interest — (523,611)Dividends paid (260,554) (694,027)Dividends paid to non-controlling interests (232) (23,560)
Net cash from financing activities 4,002,505 1,098,870
Net decrease in cash and cash equivalents (1,383,818) (1,701,589)Cash and cash equivalents at beginning of the year 17,351,595 19,337,202Exchange differences on cash and cash equivalents (29,091) (284,018)
Cash and cash equivalents at end of the year 15,938,686 17,351,595
Analysis of cash and cash equivalentsUnrestricted cash and bank balances 26 15,773,665 17,351,595Unrestricted cash and bank balances attributable to
a discontinued operation 24 165,021 —
15,938,686 17,351,595

New World China Land Limited 160
CONSOLIDATED STATEMENT OF CHANGES IN EQUITYFor the year ended 30 June 2015
Attributable to equity holders
of the Company
Non-
controlling
interests
Total
equity
Share
capital Reserves
Shareholders’
funds
HK$’000 HK$’000 HK$’000 HK$’000 HK$’000
Balance at 1 July 2014 868,335 56,884,182 57,752,517 3,566,137 61,318,654
Translation differences — (56,931) (56,931) (4,745) (61,676)
Share of other comprehensive income of
associated company and joint ventures — 1,978 1,978 — 1,978
Other comprehensive income for the year — (54,953) (54,953) (4,745) (59,698)
Profit for the year — 3,313,131 3,313,131 156,916 3,470,047
Total comprehensive income for the year — 3,258,178 3,258,178 152,171 3,410,349
Transactions with owners
Contribution by and distribution to owners
Issue of shares 542 16,742 17,284 — 17,284
Capital contribution from
non-controlling interests — — — 118,824 118,824
Share-based payments — 14,426 14,426 — 14,426
Dividends paid — (260,554) (260,554) (232) (260,786)
Total transactions with owners 542 (229,386) (228,844) 118,592 (110,252)
Balance at 30 June 2015 868,877 59,912,974 60,781,851 3,836,900 64,618,751

Annual Report 2015 161
Attributable to equity holders
of the Company
Non-
controlling
interests
Total
equity
Share
capital Reserves
Shareholders’
funds
HK$’000 HK$’000 HK$’000 HK$’000 HK$’000
Balance at 1 July 2013 866,360 53,482,386 54,348,746 3,354,883 57,703,629
Translation differences — (555,774) (555,774) (8,825) (564,599)
Share of other comprehensive income of
associated company and joint ventures — (83,077) (83,077) — (83,077)
Other comprehensive income for the year — (638,851) (638,851) (8,825) (647,676)
Profit for the year — 4,638,691 4,638,691 160,574 4,799,265
Total comprehensive income for the year — 3,999,840 3,999,840 151,749 4,151,589
Transactions with owners
Contribution by and distribution to owners
Issues of shares 1,975 57,345 59,320 — 59,320
Capital contribution from
non-controlling interests — — — 199,146 199,146
Share-based payments — 12,920 12,920 — 12,920
Dividends paid — (694,027) (694,027) (23,560) (717,587)
1,975 (623,762) (621,787) 175,586 (446,201)
Change in ownership interests in a subsidiary
Acquisition of additional interests
in a subsidiary — 25,718 25,718 (116,377) (90,659)
Acquisition of subsidiaries — — — 296 296
Total transactions with owners 1,975 (598,044) (596,069) 59,505 (536,564)
Balance at 30 June 2014 868,335 56,884,182 57,752,517 3,566,137 61,318,654

New World China Land Limited 162
NOTES TO THE FINANCIAL STATEMENTS
1. GENERAL INFORMATION
New World China Land Limited (the “Company”) and its subsidiaries (together the “Group”) are principally
engaged in investment and development of property projects in the People’s Republic of China (the “PRC”).
The Company is a limited liability company incorporated in the Cayman Islands. The address of its registered
office is P.O. Box 309, Ugland House, Grand Cayman, KY1-1104, Cayman Islands. The address of its principal
place of business in Hong Kong is 9/F., New World Tower I, 18 Queen’s Road Central, Hong Kong.
The Company’s shares are listed on The Stock Exchange of Hong Kong Limited.
The immediate and ultimate holding company is New World Development Company Limited (“NWD”), a
company incorporated and listed in Hong Kong.
On 3 July 2015, the Company announced that the Group had entered into the sale and purchase agreement
with Chow Tai Fook Enterprises Limited, the substantial shareholder of NWD, to sell its entire interest in New
World Hotel Management (BVI) Limited, its subsidiaries and a joint venture (collectively referred to as the “Disposal
Group”) and the assignment and transfer of the shareholder’s loan for an aggregate consideration of
HK$1,963,000,000, receivable in cash (the “Disposal”).
Analysis of the results, cash flows, assets and liabilities of the Disposal Group is presented in note 24.
These financial statements have been approved for issue by the Board of Directors on 23 September 2015.
2. BASIS OF PREPARATION
The consolidated financial statements have been prepared in accordance with Hong Kong Financial Reporting
Standards (“HKFRS”) issued by the Hong Kong Institute of Certified Public Accountants (“HKICPA”) and the
applicable requirements of the predecessor Hong Kong Companies Ordinance (Cap. 32). The consolidated
financial statements have been prepared under the historical cost convention, as modified by the revaluation of
investment properties and available-for-sale financial assets which have been measured at fair value.
The preparation of consolidated financial statements in conformity with HKFRS requires the use of certain
critical accounting estimates. It also requires management to exercise its judgement in the process of applying
the Group’s accounting policies. The areas involving a higher degree of judgement or complexity, or areas
where assumptions and estimates are significant to the consolidated financial statements, are disclosed in note
5 below.

Annual Report 2015 163
(a) Adoption of revised standards, amendments to standards and interpretationThe Group has adopted the following revised standards, amendments to standards and interpretation
which are relevant to the Group’s operations and are mandatory for the financial year ended 30 June
2015:
Amendments to HKAS 19
(Revised 2011)
Employee Benefits: Defined Benefit Plans — Employee
Contributions
HKAS 32 (Amendment) Financial Instruments: Presentation — Offsetting Financial
Assets and Financial Liabilities
HKAS 36 (Amendment) Recoverable Amount Disclosures for Non-Financial Assets
HKAS 39 (Amendment) Novation of Derivatives and Continuation of Hedge Accounting
HK (IFRIC)-Int 21 Levies
Amendments to HKFRS 10, HKFRS 12
and HKAS 27 (Revised 2011)
Investment Entities
Annual Improvements Project Annual Improvements 2010–2012 Cycle
Annual Improvements Project Annual Improvements 2011–2013 Cycle
The adoption of the revised standards, amendments to standards and interpretation does not have a
significant impact on the results and financial position of the Group.
(b) Standards and amendments to standards which are not yet effectiveThe following new or revised standards and amendments to standards are mandatory for the accounting
periods beginning on or after 1 July 2015 or later periods but which the Group has not early adopted:
Effective for the year ending 30 June 2016:HKFRS 14 Regulatory Deferral Accounts
Amendments to HKFRS 11 Accounting for Acquisitions of Interests in Joint Operations
Amendments to HKFRS 10, HKFRS 12
and HKAS 28 (Revised 2011)
Investment Entities: Applying the Consolidation Exception
Amendments to HKFRS 10
and HKAS 28
Sales or Contribution of Assets between an Investor
and its Associate or Joint Venture
Amendments to HKAS 1 Disclosure initiative
Amendments to HKAS 16
and HKAS 38
Clarification of Acceptable Methods of Depreciation and
Amortisation
Amendments to HKAS 27 Equity Method in Separate Financial Statements
Annual Improvements Project Annual Improvements 2012–2014 Cycle
Effective for the year ending 30 June 2017 or after:HKFRS 9 (2014) Financial Instruments
HKFRS 15 Revenue from Contracts with Customers
The Group has already commenced an assessment of the impact of these new or revised standards and
amendments to standards, certain of which may be relevant to the Group’s operation and may give rise
to changes in accounting policies, changes in disclosures and remeasurement of certain items in the
financial statements.

New World China Land Limited 164
NOTES TO THE FINANCIAL STATEMENTS
3. PRINCIPAL ACCOUNTING POLICIES
The principal accounting policies adopted for the preparation of these financial statements, which have been
consistently applied to all the years presented, unless otherwise stated, are set out below:
(a) ConsolidationThe consolidated financial statements incorporate the financial statements of the Company and all of its
subsidiaries made up to 30 June.
(i) SubsidiariesA subsidiary is an entity (including a structured entity) over which the Group has control. The Group controls an entity when the Group has power over an entity, is exposed to, or has rights to, variable returns from its involvement with the entity and has the ability to affect these returns through its power over the entity. Subsidiaries are consolidated from the date on which control is transferred to the Group. They are deconsolidated from the date that control ceases.
The acquisition method of accounting is used to account for business combinations by the Group. The consideration transferred for the acquisition of a subsidiary is the fair values of the assets transferred, the liabilities incurred to the former owner of the acquiree and the equity interests issued by the Group. The consideration transferred includes the fair value of any asset or liability resulting from a contingent consideration arrangement. Acquisition-related costs are expensed as incurred. Identifiable assets acquired and liabilities and contingent liabilities assumed in a business combination are measured initially at their fair values at the acquisition date. On the acquisition by acquisition basis, the Group recognises a non-controlling interest in the acquiree either at fair value or at the non-controlling interest’s proportionate share of the acquiree’s net assets. If the business combination is achieved in stages, the acquirer’s previously held equity interest in the acquiree is remeasured to fair value at the acquisition date through profit or loss.
The excess of the consideration transferred, the amount of any non-controlling interest in the acquiree and the fair value of any previous equity interest in the acquiree at the date of acquisition over the fair value of the identifiable net assets acquired is recorded as goodwill. If this is less than the fair value of the net assets of the subsidiary acquired in the case of a bargain purchase, the difference is recognised directly in the income statement.
Inter-company transactions, balances and unrealised gains on transactions between group companies are eliminated. Unrealised losses are also eliminated. Accounting policies of subsidiaries have been changed where necessary to ensure consistency with the policies adopted by the Group.
When the Group ceases to have control, any retained interest in the entity is remeasured to its fair value at the date when control is lost, with the change in carrying amount recognised in profit or loss. The fair value is the carrying amount for the purposes of subsequently accounting for the retained interest as associated companies, joint ventures or financial assets. In addition, any amounts previously recognised in other comprehensive income in respect of that entity are accounted for as if the Group had directly disposed of the related assets or liabilities. This may mean that amounts previously recognised in other comprehensive income are reclassified to profit or loss.
The Company’s investments in subsidiaries are stated at cost less provision for impairment losses. The results of subsidiaries are accounted for by the Company on the basis of dividend received and receivable.

Annual Report 2015 165
(ii) Joint venturesInvestments in joint arrangements are classified either as joint operations or joint ventures,
depending on the contractual rights and obligations each investor has rather than the legal structure
of the joint arrangement. The Group has assessed the nature of its joint arrangements and
determined them to be joint ventures. Joint ventures are accounted for using the equity method.
Under the equity method of accounting, interests in joint ventures are initially recognised at cost and
adjusted thereafter to recognise the Group’s share of the post-acquisition profits or losses and
movements in other comprehensive income based on the relevant profit sharing ratios which vary
according to the nature of the joint ventures set out as follows:
Equity joint ventures/joint ventures in wholly foreign owned enterprisesEquity joint ventures/joint ventures in wholly foreign owned enterprises are joint ventures in respect
of which the capital contribution ratios of the venturers are defined in the joint venture contracts and
the profit sharing ratios and share of net assets of the venturers are in proportion to the capital
contribution ratios.
Co-operative joint venturesCo-operative joint ventures are joint ventures in respect of which the profit sharing ratios of the
venturers and share of net assets upon the expiration of the joint venture periods are not in
proportion to their capital contribution ratios but are as defined in the joint venture contracts.
Joint venture companies limited by sharesJoint venture companies limited by shares are limited liability companies in respect of which each
shareholder’s beneficial interests therein is in accordance with the amount of the voting share
capital held thereby.
The Group’s investments in joint ventures include goodwill identified on acquisition. Upon the
acquisition of the ownership interest in a joint venture, any difference between the cost of the joint
venture and the group’s share of the net fair value of the joint venture’s identifiable assets and
liabilities is accounted for as goodwill.
The Group’s investment in joint venture include the loans and advances to the joint venture which,
in substance, form part of the Group’s investment in the joint venture. The loans and advances to
the joint venture are a form of commercial arrangement between the parties to the joint venture to
finance the development of projects and viewed as a means by which the Group invests in the
relevant projects. These loans and advances have no fixed repayment terms and will be repaid
when the relevant joint venture has surplus cash flow.
When the Group’s share of losses in a joint venture equals or exceeds its interests in the joint
ventures (which includes any long-term interests that, in substance, form part of the Group’s
investment in the joint ventures), the Group does not recognise further losses, unless it has incurred
obligations or made payments on behalf of the joint ventures.
Unrealised gains on transactions between the Group and its joint ventures are eliminated to the
extent of the Group’s interest in the joint ventures. Unrealised losses are also eliminated unless the
transaction provides evidence of an impairment of the asset transferred. Accounting policies of the
joint ventures have been changed where necessary to ensure consistency with the policies adopted
by the Group.

New World China Land Limited 166
NOTES TO THE FINANCIAL STATEMENTS
3. PRINCIPAL ACCOUNTING POLICIES (Continued)
(a) Consolidation (Continued)
(iii) Associated companiesAn associated company is a company other than a subsidiary and a joint venture, in which the
Group has significant influence, but not control, through representatives on the board of directors.
Investments in associated companies are accounted for by the equity method of accounting and
are initially recognised at cost. The Group’s investments in associated companies include goodwill (net
of any accumulated impairment loss) identified on acquisition. The interests in associated
companies also include long term interest that, in substance, form part of the Group’s investment in
associated companies.
The share of post-acquisition profits or losses of associated companies is recognised in the
consolidated income statement, and the share of post-acquisition movements in other
comprehensive income is recognised in the consolidated statement of comprehensive income with
a corresponding adjustment to the carrying amount of the investment. When the share of losses in
an associated company equals or exceeds its interest in the associated company, including any
other unsecured receivables, the Group does not recognise further losses, unless it has incurred
legal and constructive obligations or made payments on behalf of the associated company.
Unrealised gains on transactions between the Group and its associated companies are eliminated
to the extent of the Group’s interest in the associated companies. Unrealised losses are also
eliminated unless the transaction provides evidence of an impairment of the asset transferred. For
equity accounting purpose, accounting policies of associated companies have been changed where
necessary to ensure consistency with the policies adopted by the Group.
(iv) Transactions with non-controlling interestsNon-controlling interests is the equity in a subsidiary which is not attributable, directly or indirectly,
to a parent. The Group treats transactions with non-controlling interests (namely, acquisitions of
additional interests and disposals of partial interests in subsidiaries that do not result in a loss of
control) as transactions with equity owners of the Group, instead of transactions with parties not
within the Group. For purchases of additional interests in subsidiaries from non-controlling
shareholders, the difference between any consideration paid and the relevant share acquired of the
carrying value of net assets of the subsidiary is recorded in equity. Gains or losses on disposals of
partial interests to non-controlling interests are also recorded in equity.

Annual Report 2015 167
(b) Intangible assets(i) Goodwill
Goodwill arising on acquisition of subsidiaries is included in intangible assets. Goodwill represents
the excess of the cost of an acquisition over the fair value of the attributable share of the net
identifiable assets of the acquired subsidiaries, associated companies or joint ventures and fair
value of the non-controlling interest in the acquiree. Goodwill on acquisitions of joint ventures and
associated companies is included in interests in joint ventures and associated companies. Goodwill
is tested annually for impairment and carried at cost less accumulated impairment losses.
Impairment losses on goodwill are not reversed. Gains and losses on the disposal of all or part of an
entity include the carrying amount of goodwill relating to the entity sold.
Goodwill is allocated to cash-generating units for the purpose of testing for impairment. The
allocation is made to those cash-generating units or groups of cash-generating units that are
expected to benefit from the business combination in which the goodwill arose.
(ii) TrademarksSeparately acquired trademarks are shown at historical cost. Trademarks acquired in a business
combination are recognised at fair value at the date of acquisition. Trademarks with indefinite life are
carried at cost less impairment and are not amortised.
(iii) Hotel management contractsSeparately acquired hotel management contracts are shown at historical cost. Hotel management
contracts acquired in a business combination are recognised at fair value at the date of acquisition.
Hotel management contracts have a finite useful life and are carried at cost less accumulated
amortisation. Amortisation is calculated using the straight-line method to allocate the cost of hotel
management contracts over their estimated useful lives of 20 years.
(iv) Customer relationshipsCustomer relationships acquired in a business combination are recognised at fair value at the date
of acquisition. Customer relationships have a finite useful life and are carried at cost less
accumulated amortisation. Amortisation is calculated using the straight-line method to allocate the
cost of customer relationships over their estimated useful lives of 20 years.
(v) Process, technology and know-howProcess, technology and know-how acquired in a business combination are recognised at fair value
at the date of acquisition. Process, technology and know-how have a finite useful life and are
carried at cost less accumulated amortisation. Amortisation is calculated using the straight-line
method to allocate the cost of process, technology and know-how over their estimated useful lives
of 10 years.

New World China Land Limited 168
NOTES TO THE FINANCIAL STATEMENTS
3. PRINCIPAL ACCOUNTING POLICIES (Continued)
(c) Non-current assets or disposal groups reclassified as held for sale and discontinued operationNon-current assets or disposal groups are reclassified as held for sale when their carrying amount is to be
recovered principally through a sale transaction and a sale is considered highly probable. They are stated
at the lower of carrying amount and fair value less costs to sell if their carrying amount is to be recovered
principally through a sale transaction rather than through continuing use. Investment properties classified
as non-current assets held for sale are stated at fair value at the end of the reporting period.
A discontinued operation is a component of the Group’s business, the operations and cash flows of
which can be clearly distinguished from the rest of the Group and which represents a separate major line
of business.
When an operation is classified as discontinued, a single amount is presented in the income statement,
which comprises the post-tax profit or loss of the discontinued operation and the post-tax gain or loss
recognised on the measurement to fair value less costs to sell, or on the disposal, of the assets or
disposal groups constituting the discontinued operation.
(d) Assets under leases(i) Finance leases
Leases that transfer to the Group substantially all the risks and rewards of ownership of assets are
accounted for as finance leases. Finance leases are capitalised at the lease’s commencement date
at the lower of the fair value of the leased assets and the present value of the minimum lease
payments. Each lease payment is allocated between the liability and finance charges so as to
achieve a constant rate on the finance balance outstanding. The corresponding rental obligations,
net of finance charges, are included in liabilities. The finance charges are charged to the income
statement over the lease periods so as to produce a constant periodic rate of interest on the
remaining balance of the liability for each period.
Assets held under finance leases are depreciated on the basis described in note 3(g)(ii) below.
(ii) Operating leasesLeases in which a significant portion of the risks and rewards of ownership are retained by the
lessor are classified as operating leases. Payments made under operating leases (net of any
incentives received from the lessor), are charged to the income statement on a straight-line basis
over the period of the lease.

Annual Report 2015 169
(e) Land use rightsThe upfront prepayments made for the land use rights held under operating lease are expensed in the
income statement on a straight-line basis over the period of the lease or when there is impairment, the
impairment is expensed in the income statement.
(f) Investment propertiesProperty that is held for long-term rental yields or for capital appreciation or both, and that is not occupied
by the companies in the Group, is classified as investment property.
Investment property also includes property that is being constructed or developed for future use as
investment property.
Investment property comprises land held under operating leases and buildings held under finance leases.
Land held under operating leases are classified and accounted for as investment property when the rest
of the definition of investment property is met. The operating lease is accounted for as if it was a finance
lease.
Investment property is measured initially at its cost, including related transaction costs. After initial
recognition, investment property is carried at fair value. Fair value is determined by professional qualified
valuers on an open market value basis at the end of each reporting period. Changes in fair value are
recognised in the income statement.
Subsequent expenditure is included in the carrying amount of the asset only when it is probable that
future economic benefits associated with the asset will flow to the Group and the cost of the asset can be
measured reliably. All other repairs and maintenance costs are expensed in the consolidated income
statement during the financial period in which they are incurred.
Where fair value of property that is being constructed or developed as investment property is not reliably
determinable, it is measured at cost until either its fair value becomes reliably determinable or construction
is completed (whichever is earlier).
If an investment property becomes owner-occupied, it is reclassified as property, plant and equipment,
and its fair value at the date of reclassification becomes its cost for accounting purposes.
If a property becomes an investment property because its use has changed, any difference resulting
between the carrying amount and the fair value of this property at the date of transfer is recognised in
equity as a revaluation of property, plant and equipment. However, if the fair value of the property at the
date of transfer which results in a reversal of the previous impairment loss, the write-back is recognised in
the consolidated income statement.

New World China Land Limited 170
NOTES TO THE FINANCIAL STATEMENTS
3. PRINCIPAL ACCOUNTING POLICIES (Continued)
(g) Property, plant and equipmentProperty, plant and equipment are stated at historical cost less accumulated depreciation and impairment
losses. Historical cost includes expenditure that is directly attributable to the acquisition of assets.
Subsequent costs are included in the carrying amount of the assets or recognised as a separate asset,
as appropriate, only when it is probable that future economic benefits associated with the asset will flow
to the Group and the cost of the asset can be measured reliably. The carrying amount of the replaced
part is derecognised. All other repair and maintenance costs are charged to the income statement during
the financial period in which they are incurred. The carrying amount of an asset is written down
immediately to its recoverable amount if the carrying value of an asset is greater than its estimated
recoverable amount.
(i) Assets under constructionAll direct costs relating to the construction of property, plant and equipment, including borrowing
costs during the construction period are capitalised as the costs of the assets.
(ii) DepreciationNo depreciation is provided on assets under construction until such time when the relevant assets
are completed and available for intended use.
Depreciation of other property, plant and equipment is calculated to allocate their cost to their
estimated residual values over their estimated useful lives using the straight-line method. Estimated
useful lives are summarised as follows:
Other properties 20–40 years
Leasehold improvements 5–10 years or over the relevant lease period
Furniture, fixtures and equipment 5–8 years
Motor vehicles 3 years
The residual values and useful lives of the assets are reviewed, and adjusted if appropriate, at the
end of each reporting period.
(iii) Gain or loss on disposalThe gain or loss on disposal of property, plant and equipment is determined by comparing the
difference between the net sales proceeds and the carrying amount of the relevant asset, and is
recognised in the income statement.

Annual Report 2015 171
(h) Impairment of investments in subsidiaries, joint ventures, associated companies and non-financial assetsNon-financial assets that have an indefinite useful life, for example goodwill, or have not yet been available
for use are not subject to amortisation and are tested annually for impairment. Assets are reviewed for
impairment whenever events or changes in circumstances indicate that the carrying amount may not be
recoverable. The carrying amount of an asset is written down immediately to its recoverable amount if the
carrying amount of the asset is greater than its estimated recoverable amount. An impairment loss is
recognised in the income statement for the amount by which the carrying amount of an asset exceeds its
recoverable amount. The recoverable amount is the higher of its fair value less costs of disposal and value
in use. For the purpose of assessing impairment, assets are grouped as cash-generating units for which
there are separately identifiable cash flows. Non-financial assets other than goodwill that suffered
impairment are reviewed for possible reversal of the impairment at the end of each reporting period.
Impairment testing of the investments in subsidiaries, joint ventures or associated companies is required
upon receiving dividends from these investments if the dividend exceeds the total comprehensive income
of the subsidiary, joint venture or associated company in the period the dividend is declared or if the
carrying amount of the investment in the separate financial statements exceeds the carrying amount in
the consolidated financial statements of the investee’s net assets including goodwill.
(i) InvestmentsThe Group classifies its investments in the categories of financial assets at fair value through profit or loss,
loans and receivables, held-to-maturity investments, and available-for-sale financial assets. Management
determines the classification of its investments at initial recognition depending on the purpose for which
the investments are acquired.
(i) Financial assets at fair value through profit or lossFinancial assets at fair value through profit or loss are financial assets held for trading and those
designated as at fair value through profit or loss at inception under certain circumstances. A
financial asset is classified in this category if acquired principally for the purpose of selling in the
short-term or if so designated by management. Assets in the category are classified as current
assets are expected to be settled within 12 months; otherwise, they are classified as non-current.
(ii) Loans and receivablesLoans and receivables are non-derivative financial assets with fixed or determinable payments that
are not quoted in an active market. They arise when the Group provides money, goods or services
directly to a debtor with no intention of trading the receivable and are included in current assets,
except for those with maturities of more than twelve months after the end of the reporting period,
which are classified as non-current assets.
(iii) Held-to-maturity investmentsHeld-to-maturity investments are non-derivative financial assets with fixed or determinable payments
and fixed maturities that management has the positive intention and ability to hold to maturity. Held-
to-maturity financial assets are included in non-current assets, except for those with maturities of
less than twelve months from the end of the reporting period, which are classified as current assets.

New World China Land Limited 172
NOTES TO THE FINANCIAL STATEMENTS
3. PRINCIPAL ACCOUNTING POLICIES (Continued)
(i) Investments (Continued)
(iv) Available-for-sale financial assetsAvailable-for-sale financial assets are non-derivatives that are either designated in this category or
not classified in any of the other categories. They are included in non-current assets unless
management intends to dispose of the investment within twelve months from the end of the
reporting period.
Regular way purchases and sales of financial assets are recognised on trade-date, which is the date on
which the Group commits to purchase or sell the asset. Investments are initially recognised at fair value
plus transaction costs for all financial assets not carried at fair value through profit or loss. Financial assets
carried at fair value through profit or loss are initially recognised at fair value and transaction costs are
expensed in the income statement. Financial assets are derecognised when the rights to receive cash
flows from the investments have expired or have been transferred and the Group has transferred
substantially all risks and rewards of ownership.
Available-for-sale financial assets and financial assets at fair value through profit or loss are subsequently
carried at fair value. Loans and receivables and held-to-maturity investments are carried at amortised cost
using the effective interest method.
Gains and losses arising from changes in the fair value of the financial assets at fair value through profit or
loss are included in the income statement in the financial period in which they arise. Changes in the fair
value of available-for-sale financial assets are recognised in other comprehensive income. When available-
for-sale financial assets are sold, the accumulated fair value adjustments are included in the income
statement as gains or losses from financial assets. Changes in the fair value of monetary financial assets
denominated in a foreign currency and classified as available-for-sale are analysed between translation
differences resulting from changes in amortised cost of the financial asset and other changes in the
carrying amount of the financial asset. The translation differences on monetary financial assets are
recognised in the income statement; translation differences on non-monetary financial assets are recognised
in other comprehensive income.
The fair values of quoted investment are based on current bid prices. If the market for a financial asset is
not active and for unlisted financial assets, the Group establishes fair value by using valuation techniques.
These include the use of recent arm’s length transactions, reference to other instruments that are
substantially the same, discounted cash flow analysis and option pricing models, making maximum use
of market inputs and relying as little as possible on entity-specific inputs.

Annual Report 2015 173
(j) Impairment of financial assetsThe Group assesses at the end of each reporting period whether there is objective evidence that a
financial asset or a group of financial assets is impaired. In the case of equity instruments classified as
available-for-sale financial assets, a significant or prolonged decline in the fair value of the asset below its
cost is considered in determining whether the assets are impaired. In case of debt instruments, objective
evidence of impairment includes significant financial difficulty of the issuer or counterparty; default or
delinquency in interest or principal payments; or it becoming probable that the borrower will enter
bankruptcy or financial re-organisation.
If any such evidence exists for available-for-sale financial assets, the cumulative loss, measured as the
difference between the acquisition cost and the current fair value, less any impairment loss on that
financial asset previously recognised in the income statement, is removed from equity and recognised in
the income statement. Impairment losses recognised in the income statement on equity instruments
classified as available-for-sale are not reversed through the income statement.
(k) Properties held for/under developmentProperties held for/under development comprise prepayments for land use rights, development
expenditure and borrowing costs capitalised, and are carried at the lower of cost and net realisable value.
Properties under development included in the current assets are expected to be realised in, or is intended
for sale in the Group’s normal operating cycle.
(l) Completed properties held for saleCompleted properties held for sale are initially measured at the carrying amount of the property at the
date of reclassification from properties under development. Completed properties held for sale are carried
at the lower of cost and net realisable value. Net realisable value is determined by reference to
management estimates based on prevailing market conditions.
(m) Hotel inventoriesHotel inventories primarily comprise food, beverages and operating supplies and are stated at the lower
of cost and net realisable value. Cost is calculated on the weighted average basis. Net realisable value is
determined on the basis of anticipated sales proceeds less estimated selling expenses.
(n) Contracts in progressContracts in progress comprise contract cost incurred, plus recognised profits (less recognised losses)
less progress billing. Cost comprises materials, direct labour and overheads attributable to bringing the
work in progress to its present condition.
Variations in contract work, claims and incentive payments are included in contract revenue to the extent
that may have been agreed with the customer and are capable of being reliably measured.
The Group uses the “percentage-of-completion method” to determine the appropriate amount to
recognise in a given period. The stage of completion is measured by reference to the contract costs
incurred up to the end of the reporting period as a percentage of total estimated costs for each contract.
Costs incurred in the year in connection with future activity on a contract are excluded from contract
costs in determining the stage of completion.

New World China Land Limited 174
NOTES TO THE FINANCIAL STATEMENTS
3. PRINCIPAL ACCOUNTING POLICIES (Continued)
(o) Trade and other receivablesTrade and other receivables are recognised initially at fair value and subsequently measured at amortised
cost using the effective interest method, less provision for impairment, which is established when there is
objective evidence that the Group will not be able to collect all amounts due according to the original
terms of receivable. Significant financial difficulties of the debtor, probability that the debtor will enter
bankruptcy and default or delinquency in payments are considered indicators that the trade receivable is
impaired. The amount of the provision is the difference between the carrying amount of the assets and
the present value of estimated future cash flows, discounted at the original effective interest rate. The
carrying amount of the assets is reduced through the use of an allowance account, and the amount of the
provision is recognised in the income statement. When a receivable is uncollectible, it is written off against
the allowance account for receivables. Subsequent recoveries of amounts previously written off are
credited in the income statement.
(p) Cash and cash equivalentsCash and cash equivalents include cash in hand, deposits held at call with banks, other short-term highly
liquid investments with original maturities of three months or less and bank overdrafts. Bank overdrafts
are shown within borrowings under current liabilities in the statement of financial position.
(q) Share capitalOrdinary shares are classified as equity.
Incremental costs directly attributable to the issue of new shares or options are shown in equity as a
deduction, net of tax, from the proceeds.
(r) Trade payablesTrade payables are obligations to pay for goods or services that have been acquired in the ordinary
course of business from suppliers. Trade payables are classified as current liabilities if payment is due
within one year or less (or in the normal operating cycle of the business if longer). If not, they are
presented as non-current liabilities.
Trade payables are recognised initially at fair value and subsequently measured at amortised cost using
the effective interest method.
(s) ProvisionsProvisions are recognised when the Group has a present legal or constructive obligation as a result of
past events; it is probable that an outflow of resources will be required to settle the obligation; and the
amount has been reliably estimated.
Where there are a number of similar obligations, the likelihood that an outflow will be required in
settlement is determined by considering the class of obligations as a whole. A provision is recognised
even if the likelihood of an outflow with respect to any one item included in the same class of obligations
may be small.
Provisions are measured at the present value of the expenditures expected to be required to settle the
obligation using a pre-tax rate that reflects current market assessments of the time value of money and
the risks specific to the obligation. The increase in the provision due to passage of time is recognised as
interest expense.

Annual Report 2015 175
(t) Contingent liabilities and contingent assetsA contingent liability is a possible obligation that arises from past events and whose existence will only be
confirmed by the occurrence or non-occurrence of one or more uncertain future events not wholly within
the control of the Group. It can also be a present obligation arising from past events that is not recognised
because it is not probable that outflow of economic resources will be required or the amount of obligation
cannot be measured reliably.
A contingent liability, other than that assumed in a business combination, is not recognised but is
disclosed in the notes to the financial statements. When a change in the probability of an outflow occurs
so that outflow is probable, it will then be recognised as a provision.
A contingent asset is a possible asset that arises from past events and whose existence will be confirmed
only by the occurrence or non-occurrence of one or more uncertain events not wholly within the control
of the Group.
A contingent asset is not recognised but is disclosed in the notes to the financial statements when an
inflow of economic benefits is probable. When inflow is virtually certain, an asset is recognised.
(u) Current and deferred taxationThe current taxation is calculated on the basis of the tax laws enacted or substantively enacted at the end
of the reporting period in the countries where the Group, joint ventures and associated companies
operate and generate taxable income. Management periodically evaluates positions taken in tax returns
with respect to situations in which applicable tax regulation is subject to interpretation and establishes
provisions where appropriate on the basis of amounts expected to be paid to the tax authorities.
Deferred taxation is provided in full, using the liability method, on temporary differences arising between
the tax bases of assets and liabilities and their carrying amounts in the consolidated financial statements.
However, deferred tax liabilities are not recognised if they arise from the initial recognition of goodwill, the
deferred taxation is not accounted for if it arises from initial recognition of an asset or liability in a
transaction other than a business combination that at the time of the transaction affects neither
accounting nor taxable profit or loss. Deferred taxation is determined using tax rates and laws that have
been enacted or substantively enacted by the end of the reporting period and are expected to apply
when the related deferred income tax asset is realised or the deferred income tax liability is settled.
Deferred taxation assets are recognised to the extent that it is probable that future taxable profit will be
available against which the temporary differences can be utilised.
Deferred taxation is provided on temporary differences arising on investments in subsidiaries, joint
ventures and associated companies, except where the timing of the reversal of the temporary difference
can be controlled and it is probable that the temporary difference will not reverse in the foreseeable future.
Deferred tax assets and liabilities are offset when there is a legally enforceable right to offset current tax
assets against current tax liabilities and when the deferred taxes assets and liabilities relate to income
taxes levied by the same taxation authority on either the taxable entity or different taxable entities where
there is an intention to settle the balances on a net basis.

New World China Land Limited 176
NOTES TO THE FINANCIAL STATEMENTS
3. PRINCIPAL ACCOUNTING POLICIES (Continued)
(v) BorrowingsBorrowings are recognised initially at fair value, net of transaction costs incurred. Borrowings are
subsequently stated at amortised cost; any difference between the proceeds (net of transaction costs)
and the redemption value is recognised in the consolidated income statement over the period of the
borrowings using the effective interest method or capitalised on the basis set out in note 3(w), where
appropriate.
Borrowings are classified as current liabilities unless the Group has an unconditional right to defer
settlement of the liability for at least twelve months after the end of the reporting period.
(w) Borrowing costsBorrowing costs incurred for the construction of any qualifying assets are capitalised during the period of
time that is required to complete and prepare the asset for its intended use. Investment income earned
on the temporary investment of specific borrowings pending their expenditure on qualifying assets is
deducted from the borrowing costs eligible for capitalisation. Other borrowing costs are expensed as
incurred.
(x) Employee benefits(i) Employee leave entitlements
Employee entitlements to annual leave are recognised when they accrue to employees. A provision
is made for the estimated liability for annual leave as a result of services rendered by employees up
to the end of the reporting period. Employee entitlements to sick leave and maternity leave are not
recognised until the time of leave.
(ii) Bonus plansProvision for bonus plans are recognised when the Group has a present legal or constructive
obligation as a result of services rendered by employees and a reliable estimate of the obligation
can be made.
(iii) Defined contribution plansThe Group’s contributions to defined contribution retirement plans, including the Mandatory
Provident Fund Scheme and employee pension schemes established by municipal government in
the PRC are expensed as incurred. Contributions are reduced by contributions forfeited by those
employees who leave the schemes prior to vesting fully in the contributions, where applicable.
(iv) Equity-settled share-based compensationThe fair value of the employee services received in exchange for the grant of the options is
recognised as an expense. The total amount to be expensed over the vesting period is determined
by reference to the fair value of the options granted at the date of grant, excluding the impact of any
non-market vesting conditions. At the end of each reporting period, the Group revises its estimates
of the number of options that are expected to vest. It recognises the impact of the revision of
original estimates, if any, in the income statement, with a corresponding adjustment to equity.
The proceeds received net of any directly attributable transaction costs are credited to share capital
(nominal value) and share premium when the options are exercised.

Annual Report 2015 177
On lapse of share option according to the plan, corresponding amount recognised in share option
reserve is transferred to retained profits.
The grant by the Company of options over its equity instruments to the employees of subsidiary
undertakings in the Group is treated as a capital contribution. The fair value of employee services
received, measured by reference to the grant date fair value, is recognised over the vesting period
as an increase to investment in subsidiary undertakings, with a corresponding credit to equity in the
parent entity accounts.
(y) Foreign currencies(i) Functional and presentation currency
Items included in the financial statements of each of the Group’s entities are measured using the
currency of the primary economic environment in which the entity operates (the “functional
currency”). The Company’s functional currency is Renminbi. The consolidated financial statements
are presented in Hong Kong dollars to facilitate analysis of financial information by the holding
company.
(ii) Transactions and balancesForeign currency transactions are translated into the functional currency using the exchange rates
prevailing at the dates of the transactions. Foreign exchange gains and losses resulting from the
settlement of such transactions and from the translation of monetary assets and liabilities
denominated in foreign currencies at the exchange rates ruling at the end of the reporting period are
recognised in the income statement.
Translation differences on financial assets held at fair value through profit or loss is reported as part
of the fair value gain or loss. Translation differences on non-monetary available-for-sale financial
assets are included in equity.
(iii) Group companiesThe results and financial position of all the Group’s entities that have a functional currency different
from the presentation currency are translated into the presentation currency as follows:
(1) assets and liabilities for each statement of financial position presented are translated at the
closing rate at the date of the end of that reporting period;
(2) income and expenses for each income statement are translated at average exchange rates; and
(3) all resulting exchange differences are recognised as a separate component of equity.
On the disposal of the Group’s entire interest in a foreign operation, or a disposal involving loss of
control over a subsidiary that includes a foreign operation, all of the exchange differences
accumulated in equity in respect of that operation attributable to the equity holders of the Company
are reclassified to profit or loss.

New World China Land Limited 178
NOTES TO THE FINANCIAL STATEMENTS
3. PRINCIPAL ACCOUNTING POLICIES (Continued)
(y) Foreign currencies (Continued)
(iii) Group companies (Continued)
In the case of a partial disposal that does not result in the Group losing control over a subsidiary
that includes a foreign operation, the proportionate share of accumulated exchange differences are
reattributed to non-controlling interests and are not recognised in profit or loss. For all other partial
disposals (that is, reductions in the Group’s ownership interest in associated companies or joint
ventures that do not result in the Group losing significant influence or joint control) the proportionate
share of the accumulated exchange difference is reclassified to profit or loss.
Goodwill and fair value adjustments arising on the acquisition of a foreign entity are treated as
assets and liabilities of the foreign entity and translated at the exchange rate ruling at the end of
reporting period.
(z) Segment reportingOperating segments are reported in a manner consistent with the internal reporting provided to the chief
operating decision-maker. The chief operating decision-maker, who is responsible for allocating resources
and assessing performance of the operating segments, has been identified as the executive committee
that makes strategic decisions.
(aa) Revenue recognitionRevenue comprises the fair value of the consideration received or receivable for the sale of goods and
services rendered in the ordinary course of the Group’s activities. Revenue is shown net of returns,
rebates and discounts, allowances for credit and other revenue reducing factors.
Revenue is recognised when the amount can be reliably measured, it is probable that future economic
benefits will flow to the Group and specific criteria for each of the activities have been met. Estimates are
based on historical results, taking into consideration the type of customers, the type of transactions and
the specifics of each arrangement.
(i) Property salesRevenue from sale of properties is recognised when the risks and rewards of the properties are
passed to the purchasers. Deposits and instalments received on properties sold prior to their
completion are included under current liabilities.
(ii) Rental incomeRental income from properties leased out under an operating lease is recognised in the income
statement on a straight-line basis over the lease term.
Contingent rents, such as turnover rents, rent reviews and indexation, are recorded as income in
the periods in which they are earned. Rent reviews are recognised when such reviews have been
agreed with tenants.
(iii) Hotel operation incomeHotel operation income is recognised when services are rendered.

Annual Report 2015 179
(iv) Property management services fee incomeProperty management services fee income is recognised when services are rendered.
(v) Project management fee incomeProject management fee income is recognised when services are rendered.
(vi) Hotel management services fee incomeHotel management services fee income is recognised when services are rendered.
(vii) Interest incomeInterest income is recognised on a time proportion basis using the effective interest method to the
extent that interest income can be reliably measured and it is probable that future economic benefit
will flow to the Group.
(viii) Construction incomeRevenue from construction service contracts is recognised using the percentage of completion
method when the contracts have progressed to a stage where an outcome can be estimated
reliably. Revenue from construction service contracts is measured by reference to the proportion of
costs incurred for work performed to the end of the reporting period as compared to the estimated
total costs to completion. Anticipated losses on contracts are fully provided when it is probable that
total contract costs will exceed total contract revenue. When the outcome of construction service
contract cannot be estimated reliably, contract revenue is recognised only to the extent of contract
costs incurred that are likely to be recoverable.
(ix) Trademark fee incomeTrademark fee income is recognised on an accrual basis in accordance with the relevant
agreements.
(x) Dividend incomeDividend income is recognised when the right to receive payment is established.
(ab) Dividend distributionDividend distribution to the Company’s shareholders is recognised as a liability in the financial statements
in the period in which the dividends are approved by the Company’s shareholders/directors.
(ac) Insurance contractsThe Group assesses at the end of each reporting period the liabilities under its insurance contracts using
current estimates of future cash flows. If the carrying amount of the relevant insurance liabilities is less
than the best estimate of the expenditure required to settle the relevant insurance liabilities at the end of
the reporting period, the Group recognises the entire difference in the income statement. These estimates
are recognised only when the outflow is probable and the estimates can be reliably measured.
The Group regards its financial guarantee contracts in respect of mortgage facilities provided to certain
property purchasers and guarantees provided to its related parties as insurance contracts.

New World China Land Limited 180
NOTES TO THE FINANCIAL STATEMENTS
4. FINANCIAL RISK MANAGEMENT AND FAIR VALUE ESTIMATION
The Group conducts its operation in the PRC and accordingly is subject to special consideration and risk
exposure under a unique political, economic and legal environment. The Group’s activities expose it to a variety
of financial risks and the Group’s overall risk management policy seeks to minimise potential adverse effects on
the Group’s financial performance. The Group continues to control financial risk in a conservative approach to
safeguard the interest of shareholders.
(a) Market risk(i) Foreign exchange risk
The Group’s operations are mainly conducted in the PRC. Entities within the Group are exposed to
foreign exchange risk from future commercial transactions and monetary assets and liabilities that
are denominated in a currency that is not the entity’s functional currency.
The Group currently does not have a foreign currency hedging policy. It manages its foreign
currency risk by closely monitoring the movement of the foreign currency rates and will consider to
enter into forward foreign exchange contracts to reduce the exposure should the need arises.
At 30 June 2015, the Group’s entities with functional currency of Renminbi had net monetary
liabilities denominated in Hong Kong dollar of HK$15,728,850,000 (2014: HK$13,412,391,000) and
net monetary liabilities denominated in United States dollar of HK$7,244,443,000 (2014: net
monetary assets HK$1,028,871,000) respectively. If Hong Kong dollar and United States dollar had
strengthened/weakened by 5% against Renminbi respectively with all other variables unchanged,
the Group’s profit before taxation would have been HK$1,148,665,000 (2014: HK$619,176,000)
lower/higher respectively.
This sensitivity analysis ignores any offsetting foreign exchange factors and has been determined
assuming that the change in foreign exchange rates had occurred at the end of the reporting
period. The stated change represents management’s assessment of reasonably possible changes
in foreign exchange rates at the end of the reporting period. Currency risks as defined by HKFRS 7
arise on account of monetary assets and liabilities being denominated in a currency that is not the
functional currency; differences resulting from the translation of financial statements into the Group’s
presentation currency are not taken into consideration.
(ii) Interest rate riskThe Group is exposed to interest rate risk through the impact of rate changes on interest bearing
liabilities and assets. Cash flow interest rate risk is the risk that changes in market interest rates will
impact cash flows arising from variable rate financial instruments. The Group’s interest bearing
assets mainly include bank deposits. The Group’s floating rate borrowings will be affected by
fluctuation of prevailing market interest rates and will expose the Group to cash flow interest rate
risk. Fair value interest rate risk is the risk that the value of a financial asset or liability will fluctuate
because of changes in market interest rates. The Group’s borrowings issued at fixed rates expose
the Group to fair value interest rate risk.
To mitigate the risk, the Group has maintained fixed and floating rate debts. The level of fixed rate
debt for the Group is decided after taking into consideration the potential impact of higher interest
rates on profit or loss, interest cover and the cash flow cycles of the Group’s businesses and
investments.

Annual Report 2015 181
If interest rates had been 100 basis points higher/lower with all other variables held constant, the
Group’s profit before taxation would have been HK$2,672,000 (2014: HK$8,262,000) higher/lower.
The sensitivity analysis has been determined assuming that the change in interest rates had
occurred throughout the year and had been applied to the exposure to interest rate risk for financial
instruments in existence at the end of the reporting period. The 100 basis point increase or
decrease represents management’s assessment of a reasonably possible change in those interest
rates which have the most impact on the Group at the end of the reporting period. Changes in
market interest rates affect the interest income or expense of non-derivative variable-interest
financial instruments. As a consequence, they are included in the calculation of profit before taxation
sensitivities.
(b) Credit riskThe credit risk of the Group and the Company mainly arises from deposits with bank, trade and other
receivables and balances receivable from related companies. The exposures to these credit risks are
closely monitored on an ongoing basis by established credit policies in each of its core businesses.
Deposits are mainly placed with high-credit-quality financial institutions. Trade receivables and amounts
due from related companies mainly include receivables from sale and lease of properties, property and
project management services and other services. The Group and the Company carry out regular review
and follow-up action on any overdue amounts to minimise exposures to credit risk. There is no
concentration of credit risk with respect to trade receivables from third party customers as there are a
large number of customers.
In addition, the Group and the Company monitor the exposure to credit risk in respect of the financial
assistance provided to subsidiaries, associated company and joint ventures through exercising control or
influence over their financial and operating policy decisions and reviewing their financial positions on a
regular basis.
The Group provides guarantees to banks in connection with certain property purchasers’ mortgage loans
for financing their purchase of the properties until the issuance of the official property title transfer
certificates by the relevant authority in the PRC. If a purchaser defaults on the payment of its mortgage
during the term of the guarantee, the bank holding the mortgage may demand the Group to repay the
outstanding amount of the loan and any accrued interest thereon. Under such circumstances, the Group
is able to retain the purchasers’ deposits and sell the properties to recover any amounts paid by the
Group to the bank. Therefore the Group’s credit risk is significantly reduced. Nevertheless, the net
realisable values of the relevant properties are subject to the fluctuation of the property market in general,
the Group assesses at the end of each reporting period the potential liabilities based on the current
estimates of future cash flows. As at 30 June 2015, no provision has been made in the financial
statements (2014: Nil).

New World China Land Limited 182
NOTES TO THE FINANCIAL STATEMENTS
4. FINANCIAL RISK MANAGEMENT AND FAIR VALUE ESTIMATION (Continued)
(c) Liquidity riskPrudent liquidity risk management includes managing the profile of debt maturities and funding sources,
maintaining sufficient cash, and ensuring the availability of funding from an adequate amount of
committed credit facilities. It is the policy of the Group and the Company to regularly monitor current and
expected liquidity requirements and to ensure that adequate funding is available for operating, investing
and financing activities. The Group and the Company also maintain undrawn committed credit facilities to
further reduce liquidity risk in meeting funding requirements. At 30 June 2015, the Group’s unutilised
committed bank loan facilities amounted to HK$8,162 million (2014: HK$3,002 million).
The table below analyses the Group’s and the Company’s financial liabilities into relevant maturity
groupings based on the remaining period at the end of the reporting period to the contractual maturity
dates. The amounts disclosed in the table are the contractual undiscounted cashflow.
Group
Carrying
amount
Total
contractual
undiscounted
cashflow
Within
1 year
Over 1 year
but within
5 years
After
5 years
HK$’000 HK$’000 HK$’000 HK$’000 HK$’000
At 30 June 2015
Creditors and accruals 8,708,785 8,708,785 7,907,162 780,694 20,929
Amounts due to associated
company and joint ventures 601,960 601,960 601,960 — —
Amounts due to group
companies 121,197 121,197 121,197 — —
Amounts due to companies
owned by a director 2,834 2,834 2,834 — —
Amounts due to non-
controlling interests 102,756 102,756 102,756 — —
Short term loans 1,001,250 1,064,347 1,064,347 — —
Long term borrowings 44,163,664 50,871,659 12,889,326 34,186,248 3,796,085
At 30 June 2014
Creditors and accruals 6,682,667 6,682,667 5,854,144 819,326 9,197
Amounts due to associated
company and joint ventures 371,919 371,919 371,919 — —
Amounts due to group
companies 135,962 135,962 135,962 — —
Amounts due to companies
owned by a director 2,669 2,669 2,669 — —
Amounts due to non-
controlling interests 102,756 102,756 102,756 — —
Long term borrowings 39,423,209 44,700,675 16,628,462 24,780,550 3,291,663

Annual Report 2015 183
Company
Carrying
amount
Total
contractual
undiscounted
cashflow
Within
1 year
Over 1
year but
within
5 years
After
5 years
HK$’000 HK$’000 HK$’000 HK$’000 HK$’000
At 30 June 2015
Creditors and accruals 177,881 177,881 177,881 — —
Long term borrowings 21,989,027 25,115,322 3,431,167 16,668,944 5,015,211
At 30 June 2014
Creditors and accruals 188,222 188,222 188,222 — —
Long term borrowings 17,683,380 19,063,179 7,615,633 7,361,800 4,085,746
(d) Capital managementThe Group’s objectives when managing capital are to safeguard the Group’s ability to continue as a going
concern in order to provide returns for shareholders and benefits for other stakeholders and to maintain
an optimal capital structure to reduce the cost of capital.
The Group generally obtains long term financing to on-lend or contribute as equity to its subsidiaries, joint
ventures and associated company to meet their funding needs in order to provide more cost-efficient
financing. In order to maintain or adjust the capital structure, the Group may adjust the amount of
dividends paid to shareholders, issue or repurchase shares, raise new debt financing or sell assets to
reduce debt.
The Group monitors capital on the basis of the Group’s gearing ratio. The gearing ratio is calculated as
net debt divided by total equity. Net debt is calculated as total borrowings less cash and bank balances.
The gearing ratios at 30 June 2015 and 2014 were as follows:
2015 2014
HK$’000 HK$’000
Consolidated total borrowings 45,164,914 39,423,209
Less: cash and bank balances (15,773,665) (17,351,595)
Consolidated net debt 29,391,249 22,071,614
Total equity 64,618,751 61,318,654
Gearing ratio 45.5% 36.0%
The increase in gearing ratio at 30 June 2015 was primarily due to increase in net debt for funding the
capital expenditure for investment properties under development, property, plant and equipment under
construction and properties under development.
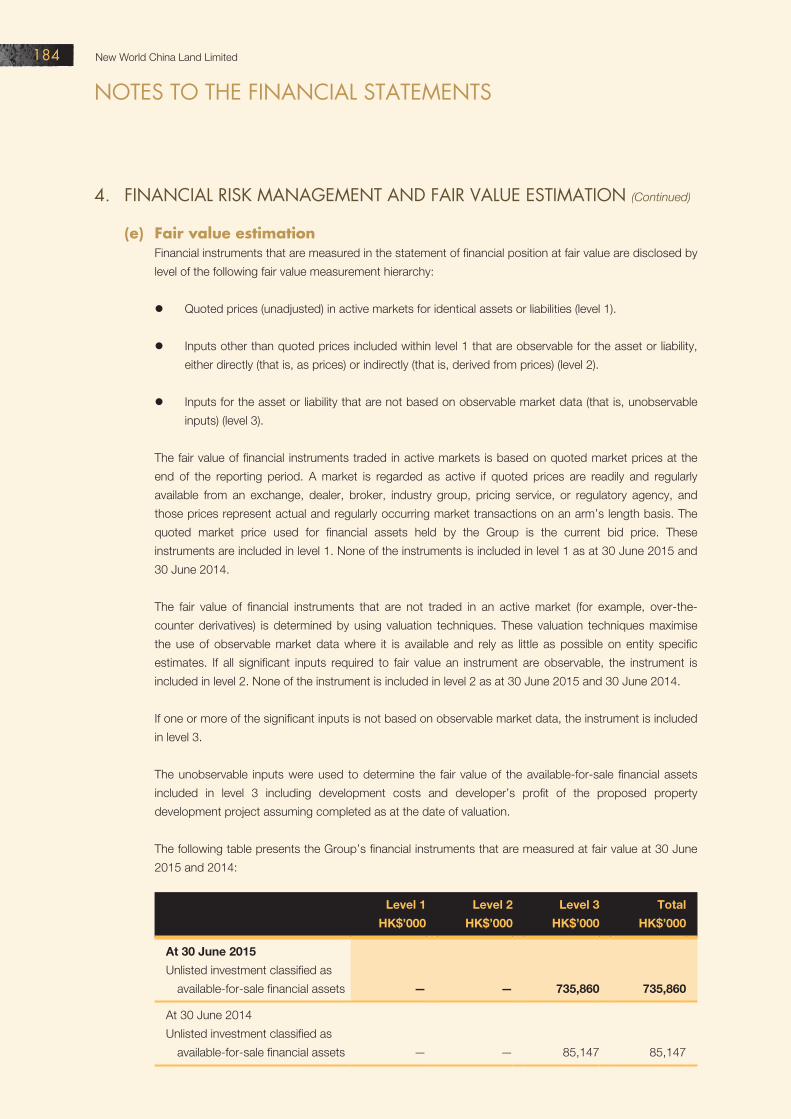
New World China Land Limited 184
NOTES TO THE FINANCIAL STATEMENTS
4. FINANCIAL RISK MANAGEMENT AND FAIR VALUE ESTIMATION (Continued)
(e) Fair value estimationFinancial instruments that are measured in the statement of financial position at fair value are disclosed by
level of the following fair value measurement hierarchy:
Quoted prices (unadjusted) in active markets for identical assets or liabilities (level 1).
Inputs other than quoted prices included within level 1 that are observable for the asset or liability,
either directly (that is, as prices) or indirectly (that is, derived from prices) (level 2).
Inputs for the asset or liability that are not based on observable market data (that is, unobservable
inputs) (level 3).
The fair value of financial instruments traded in active markets is based on quoted market prices at the
end of the reporting period. A market is regarded as active if quoted prices are readily and regularly
available from an exchange, dealer, broker, industry group, pricing service, or regulatory agency, and
those prices represent actual and regularly occurring market transactions on an arm’s length basis. The
quoted market price used for financial assets held by the Group is the current bid price. These
instruments are included in level 1. None of the instruments is included in level 1 as at 30 June 2015 and
30 June 2014.
The fair value of financial instruments that are not traded in an active market (for example, over-the-
counter derivatives) is determined by using valuation techniques. These valuation techniques maximise
the use of observable market data where it is available and rely as little as possible on entity specific
estimates. If all significant inputs required to fair value an instrument are observable, the instrument is
included in level 2. None of the instrument is included in level 2 as at 30 June 2015 and 30 June 2014.
If one or more of the significant inputs is not based on observable market data, the instrument is included
in level 3.
The unobservable inputs were used to determine the fair value of the available-for-sale financial assets
included in level 3 including development costs and developer’s profit of the proposed property
development project assuming completed as at the date of valuation.
The following table presents the Group’s financial instruments that are measured at fair value at 30 June
2015 and 2014:
Level 1 Level 2 Level 3 Total
HK$’000 HK$’000 HK$’000 HK$’000
At 30 June 2015
Unlisted investment classified as
available-for-sale financial assets — — 735,860 735,860
At 30 June 2014
Unlisted investment classified as
available-for-sale financial assets — — 85,147 85,147

Annual Report 2015 185
The following table presents the changes in level 3 instruments for the year ended 30 June 2015 and 2014:
Available-for-sale
financial assets
2015 2014
HK$’000 HK$’000
At beginning of the year 85,147 108,457
Additions 650,713 —
Disposals — (23,310)
At end of the year 735,860 85,147
5. CRITICAL ACCOUNTING ESTIMATES AND JUDGEMENTS
Estimates and judgements are continually evaluated and are based on historical experience and other factors,
including expectations of future events that are believed to be reasonable under the circumstances.
The Group makes estimates and assumptions concerning the future. The resulting accounting estimates will, by
definition, seldom equal the related actual results. The estimates and assumptions that have a significant effect
on carrying amounts of assets and liabilities are as follows:
(a) Valuation of completed investment properties and investment properties under developmentThe fair value of each investment property is individually determined at the end of each reporting period
by independent valuers based on a market value assessment. The valuers have relied on the discounted
cash flow analysis and the capitalisation of income approach as their primary methods, supported by the
direct comparison method. These methodologies are based upon estimates of future results and a set of
assumptions specific to each property to reflect its tenancy and cashflow profile. The fair value of each
investment property reflects, among other things, rental income from current leases and assumptions
about rental income from future leases in the light of current market conditions. The fair value also reflects,
on a similar basis, any cash outflows that could be expected in respect of the property.
In the case of investment properties under development, their face value reflects the expectations of
market participants of the value of the properties when they are completed, less deductions for the costs
required to complete the projects and appropriate adjustments for profit and risk. The valuation and all
key assumptions used in the valuation should reflect market conditions at the end of each reporting
period. The key assumptions include the value of completed properties, period of development,
outstanding construction costs, finance costs, other professional costs, risk associated with completing
the projects and generating income after completion and investors’ return as a percentage of value or
costs. The fair value is made by reference to independent valuation.

New World China Land Limited 186
NOTES TO THE FINANCIAL STATEMENTS
5. CRITICAL ACCOUNTING ESTIMATES AND JUDGEMENTS (Continued)
(b) Provision for properties held for/under development and for saleThe Group assesses the carrying amounts of properties held for/under development and for sale
according to their estimated net realisable value based on the realisability of these properties, taking into
account costs to completion based on past experience and net sales value based on prevailing market
conditions. Provision is made when events or changes in circumstances indicate that the carrying
amounts may not be realised. The assessment requires the use of judgement and estimates.
(c) Income taxesThe Group is subject to corporate income tax, land appreciation tax, withholding tax and other taxes in
the PRC. Significant judgement is required in determining the provision for taxes. There are transactions
and calculations for which the ultimate tax determination is uncertain during the ordinary course of
business. The Group recognises taxes based on estimates of the likely outcome with reference to current
tax laws and practices. Where the final tax outcome is different from the amounts that were initially
recorded, such differences will impact the provision for income and other taxes and deferred tax in the
period in which such determination is made.
Recognition of deferred tax assets, which principally relate to tax losses, depends on the management’s
expectation of future taxable profit that will be available against which tax losses can be utilised. The
outcome of their actual utilisation may be different.
(d) Estimated useful lives and impairment of property, plant and equipmentProperty, plant and equipment are long-lived but may be subject to technical obsolescence. The annual
depreciation charges are affected by the estimated useful lives that the Group allocates to each type of
property, plant and equipment. Management performs annual reviews to assess the appropriateness of
the estimated useful lives. Such reviews take into account the technological changes, prospective
economic utilisation and physical condition of the assets concerned.
Management also regularly reviews whether there are any indications of impairment and will recognise an
impairment loss if the carrying amount of an asset is higher than its recoverable amount which is the
greater of its net selling price or its value in use. In determining the value in use, management assesses
the present value of the estimated future cash flows expected to arise from the continuing use of the
asset and from its disposal at the end of its useful life. Estimates and judgements are applied in
determining these future cash flows and the discount rate. Management estimates the future cash flows
based on certain assumptions, such as market competition and development and the expected growth in
business.

Annual Report 2015 187
(e) Recoverability of prepayments, debtors and other receivablesThe Group assesses whether there is objective evidence as stated in notes 3(h) and 3(o) that
prepayments, debtors and other receivables are impaired. It recognises impairment based on estimates
of the extent and timing of future cash flows using applicable discount rates. The final outcome of the
recoverability and cash flows of these prepayments, debtors and other receivables will impact the amount
of impairment required.
(f) Financial guaranteesThe Group assesses at the end of each reporting period the liabilities under insurance contracts, using
current estimates of future cash flows.
In respect of the financial guarantee contracts provided to property purchasers, the Group considers the
net realisable value of the relevant properties against the outstanding mortgage principal and interest.
6. REVENUES AND SEGMENT INFORMATION
(a) The Group is principally engaged in investment in and development of property projects in the PRC.
Revenues comprise turnover which include gross proceeds from sale of properties, revenue from rental
and hotel operation, property management services fee income, project management fee income and
contracting services income.
2015 2014
HK$’000 HK$’000
Sale of properties 15,172,392 19,706,194
Rental income 828,864 792,868
Income from hotel operation 388,987 352,538
Property management services fee income 507,799 424,999
Project management fee income 120,607 94,405
Contracting services income 440,588 479,102
17,459,237 21,850,106

New World China Land Limited 188
NOTES TO THE FINANCIAL STATEMENTS
6. REVENUES AND SEGMENT INFORMATION (Continued)
(b) The chief operating decision-maker has been identified as the executive committee. This committee
reviews the Group’s internal reporting in order to assess performance and allocate resources.
Management has determined the operating segments based on these reports.
The committee considers the business from the perspective of the services and products. The
management assesses the performance of property sales, rental operation, hotel operation, property
management services operations and hotel management services operations. Other operations include
contracting services and ancillary services in property projects.
The executive committee assesses the performance of the operating segments based on a measure of
attributable operating profit (“AOP”) before finance costs and after taxation charge. This measurement
basis excludes the effects of changes in fair value of investment properties, gains and losses from
changes in group structure, net foreign exchange gains/(losses), amortisation and impairment of intangible
assets acquired from business combinations, income and expenses at corporate office and deferred tax
charge on undistributed profits. Interest income is included in the result of each operating segment that is
reviewed by the executive committee.
Sales between segments are carried out in accordance with terms agreed by the parties involved. The
revenue from external parties reported to the executive committee is measured in a manner consistent
with that in the consolidated income statement.
Segment assets consist primarily of property, plant and equipment, investment properties, land use rights,
properties held for/under development, intangible assets, prepayments, debtors and other receivables,
amounts due from related companies and completed properties held for sale. They exclude cash and
bank balances, available-for-sale financial assets and prepayment for proposed development projects
held and managed at corporate office. These are part of the reconciliation to total assets on the
consolidated statement of financial position.
Segment liabilities comprise mainly creditors and accruals, deposits received on sale of properties and
amounts due to related companies. They exclude bank and other borrowings, deferred tax liabilities,
taxes payable, other creditors and accruals at corporate office. These are part of the reconciliation to total
liabilities on the consolidated statement of financial position.
During the year ended 30 June 2015, the consolidated results of the hotel management services are
presented as discontinued operation in accordance with HKFRS 5 “Non-current Assets Held for Sales
and Discontinued Operations”. Prior year comparative segment information has been restated to conform
with the current year presentation accordingly.
The majority of the assets and operations of the Group are located in the PRC. Revenues are mainly
derived from the PRC. Non-current assets other than financial instruments are mainly located in the PRC.
(c) For the years ended 30 June 2014 and 30 June 2015, there was no revenue derived from a single
external customer exceeding 10% of total revenue.

Annual Report 2015 189
Continuing operationsDiscontinued
operation
Year ended 30 June 2015 Property
sales Rental
operation Hotel
operation
Property management
services Other
operations Sub-total
Hotel management
services TotalHK$’000 HK$’000 HK$’000 HK$’000 HK$’000 HK$’000 HK$’000 HK$’000
Segment revenuesCompany and subsidiaries
Total revenues 15,429,949 871,109 388,987 637,629 443,046 17,770,720 696,921 18,467,641Inter-segment revenues (136,950) (42,245) — (129,830) (2,458) (311,483) (23,741) (335,224)
External revenues 15,292,999 828,864 388,987 507,799 440,588 17,459,237 673,180 18,132,417Associated company and
joint ventures — attributable to the Group 1,167,664 468,954 171,254 105,255 — 1,913,127 — 1,913,127
16,460,663 1,297,818 560,241 613,054 440,588 19,372,364 673,180 20,045,544
Segment bank and other interest income 113,534 12,614 671 1,988 826 129,633 823 130,456
AOP before finance costs and after taxation charge
Company and subsidiaries 2,653,053 336,965 (130,481) (113,659) (8,066) 2,737,812 106,689 2,844,501Associated company and
joint ventures 283,480 222,118 (132,517) (11,643) 11,151 372,589 — 372,589
2,936,533 559,083 (262,998) (125,302) 3,085 3,110,401 106,689 3,217,090
Additions to non-current assets other than financial instruments 5,202,434 2,072,906 535,854 6,214 431,049 8,248,457 5,081 8,253,538
Depreciation and amortisation 90,092 5,860 207,193 4,293 1,307 308,745 60,625 369,370Impairment of intangible assets — — — — — — 56,375 56,375Share of results of associated
company and joint ventures 138,152 401,003 (145,359) (11,643) 4,000 386,153 — 386,153

New World China Land Limited 190
NOTES TO THE FINANCIAL STATEMENTS
6. REVENUES AND SEGMENT INFORMATION (Continued)
As at 30 June 2015
Property
sales
Rental
operation
Hotel
operation
Property
management
services
Other
operations Total
HK$’000 HK$’000 HK$’000 HK$’000 HK$’000 HK$’000
Segment assets 79,064,918 26,638,864 3,974,571 333,206 1,493,800 111,505,359
Associated company and
joint ventures 6,516,546 9,006,784 156,800 (84,424) 2,402 15,598,108
Available-for-sale financial assets 735,860
Property, plant and equipment
at corporate office 8,868
Prepayments, debtors and other
receivables at corporate office 13,708
Amounts due from related companies
at corporate office 202,793
Cash and bank balances
at corporate office 4,250,064
Assets of disposal group classified
as held for sale 2,112,780
Total assets 134,427,540
Segment liabilities 14,944,497 298,539 105,387 298,141 91,789 15,738,353
Creditors and accruals
at corporate office 212,814
Taxes payable 4,242,528
Borrowings 45,164,914
Deferred tax liabilities 3,522,327
Liabilities of disposal group classified
as held for sale 927,853
Total liabilities 69,808,789

Annual Report 2015 191
Continuing operationsDiscontinued
operation
Year ended 30 June 2014 Property
sales Rental
operation Hotel
operation
Property management
services Other
operations Sub–total
Hotel management
services TotalHK$’000 HK$’000 HK$’000 HK$’000 HK$’000 HK$’000 HK$’000 HK$’000
Segment revenuesCompany and subsidiaries
Total revenues 19,800,599 819,576 352,538 546,971 482,409 22,002,093 553,578 22,555,671Inter-segment revenues — (26,708) — (121,972) (3,307) (151,987) (23,829) (175,816)
External revenues 19,800,599 792,868 352,538 424,999 479,102 21,850,106 529,749 22,379,855Associated company and
joint ventures — attributable to the Group 2,216,784 469,967 137,708 99,909 — 2,924,368 — 2,924,368
22,017,383 1,262,835 490,246 524,908 479,102 24,774,474 529,749 25,304,223
Segment bank and other interest income 100,013 36,263 560 2,213 1,165 140,214 4,138 144,352
AOP before finance costs and after taxation charge
Company and subsidiaries 4,341,404 351,091 (87,039) (110,568) (79,290) 4,415,598 36,280 4,451,878Associated company and
joint ventures 660,859 192,015 (151,291) (9,749) 8,457 700,291 — 700,291
5,002,263 543,106 (238,330) (120,317) (70,833) 5,115,889 36,280 5,152,169
Additions to non-current assets other than financial instruments 5,079,625 1,236,445 1,008,981 4,612 242,037 7,571,700 144,779 7,716,479
Depreciation and amortisation 62,607 4,613 148,885 3,022 952 220,079 59,781 279,860Impairment of intangible assets — — — — — — 125,892 125,892Share of results of associated
company and joint ventures 232,397 401,612 (162,623) (9,627) 518 462,277 — 462,277
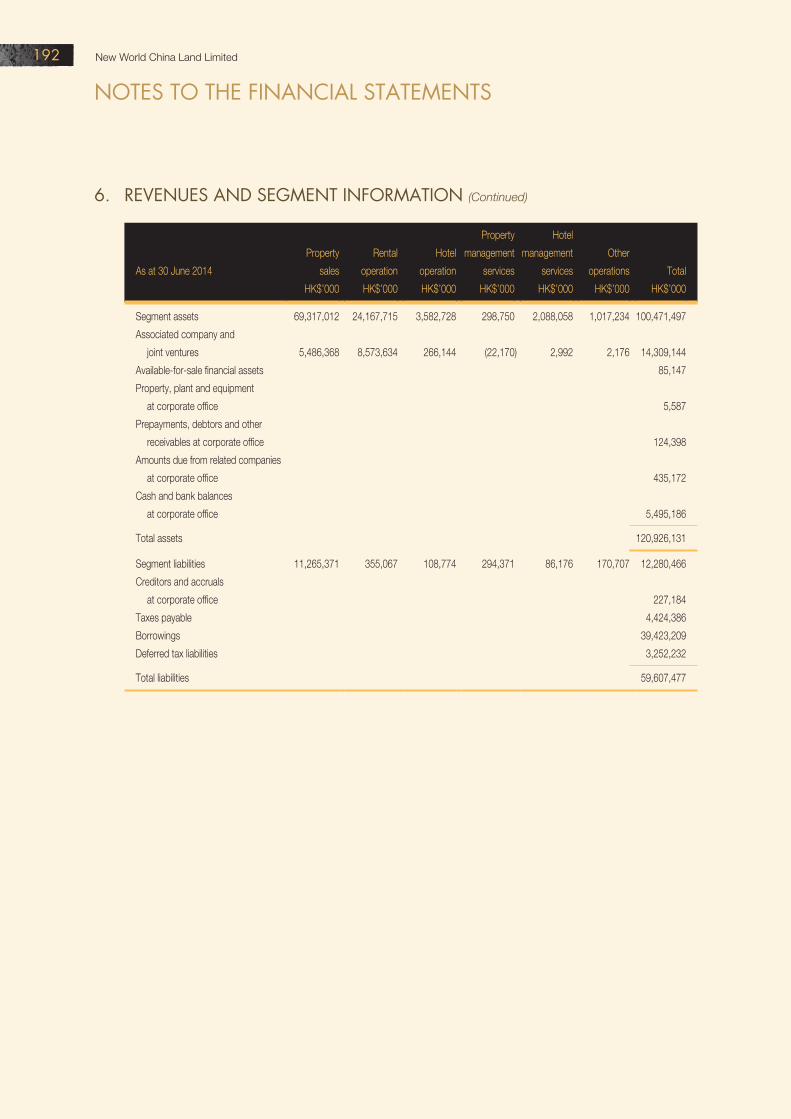
New World China Land Limited 192
NOTES TO THE FINANCIAL STATEMENTS
6. REVENUES AND SEGMENT INFORMATION (Continued)
As at 30 June 2014
Property
sales
Rental
operation
Hotel
operation
Property
management
services
Hotel
management
services
Other
operations Total
HK$’000 HK$’000 HK$’000 HK$’000 HK$’000 HK$’000 HK$’000
Segment assets 69,317,012 24,167,715 3,582,728 298,750 2,088,058 1,017,234 100,471,497
Associated company and
joint ventures 5,486,368 8,573,634 266,144 (22,170) 2,992 2,176 14,309,144
Available-for-sale financial assets 85,147
Property, plant and equipment
at corporate office 5,587
Prepayments, debtors and other
receivables at corporate office 124,398
Amounts due from related companies
at corporate office 435,172
Cash and bank balances
at corporate office 5,495,186
Total assets 120,926,131
Segment liabilities 11,265,371 355,067 108,774 294,371 86,176 170,707 12,280,466
Creditors and accruals
at corporate office 227,184
Taxes payable 4,424,386
Borrowings 39,423,209
Deferred tax liabilities 3,252,232
Total liabilities 59,607,477

Annual Report 2015 193
Reconciliations of reportable segment revenues to revenues of the Group and reportable AOP before finance
costs and after taxation charge to profit before taxation:
2015 2014
HK$’000 HK$’000
(i) Revenues
Total segment revenues 19,372,364 24,774,474
Less:
Revenues of associated company and joint ventures,
attributable to the Group (1,913,127) (2,924,368)
Revenues as presented in consolidated income statement 17,459,237 21,850,106
(ii) Profit before taxation
Total AOP before finance costs and after taxation charge 3,217,090 5,152,169
AOP from discontinued operation (106,689) (36,280)
AOP before finance costs and after taxation charge 3,110,401 5,115,889
Bank and other interest income — corporate 123,910 129,400
Deferred tax charge on undistributed profits (63,000) (175,622)
Corporate administrative expenses (270,276) (266,263)
Finance costs (355,017) (341,584)
AOP after corporate items 2,546,018 4,461,820
Changes in fair value of investment properties,
net of deferred taxation 766,555 598,045
Gain on remeasuring previously held equity interests of joint
ventures at fair value upon further acquisition as subsidiaries — 67,257
Loss on disposal of associated companies — (2,486)
Net foreign exchange gains/(losses) 34,591 (345,247)
801,146 317,569
Profit attributable to equity holders of the Company 3,347,164 4,779,389
Taxation charge 2,918,335 4,167,156
Profit attributable to non-controlling interests 156,916 160,574
Profit before taxation 6,422,415 9,107,119

New World China Land Limited 194
NOTES TO THE FINANCIAL STATEMENTS
7. OTHER INCOME
2015 2014
HK$’000 HK$’000
Tax indemnity from the ultimate holding company (note 13) 359,152 1,075,306
Bank and other interest income 295,162 242,432
Interest income from joint ventures, net of withholding tax (note) 78,705 41,847
733,019 1,359,585
Note: The property projects of the Group’s joint ventures have been partly financed by the Group in the form of equity capital and unsecured
shareholder’s advances. The interest income from joint ventures is recognised when the payment of interest has been approved by the
Group’s joint ventures. The Group’s attributable share of shareholders’ loan interest expenses of joint ventures is included in the share
of results of joint ventures as follows:
2015 2014
HK$’000 HK$’000
Share of shareholders’ loan interest expenses of joint ventures (59,200) (50,129)
8. OTHER GAINS/(LOSSES), NET
2015 2014
HK$’000 HK$’000
Net foreign exchange gains/(losses) 33,745 (281,743)
Loss on disposal of associated companies — (2,486)
Gain on remeasuring previously held equity interests of joint ventures
at fair value upon further acquisition as subsidiaries — 67,257
Gain on disposal of investment properties 35,228 105,074
68,973 (111,898)

Annual Report 2015 195
9. OPERATING PROFIT BEFORE FINANCE COSTS
2015 2014
HK$’000 HK$’000
Operating profit before finance costs is arrived at after crediting:
Gross rental income from investment properties 784,623 745,152
Gain on disposal of property, plant and equipment
and land use rights — 12,543
Gain on disposal of investment properties 35,228 105,074
and after charging:
Cost of properties sold 8,889,377 11,107,940
Staff costs (note 11) 585,772 514,880
Depreciation of property, plant and equipment 284,173 199,926
Outgoings in respect of investment properties 350,096 305,662
Rental for leased premises 49,046 40,084
Loss on disposal of property, plant and equipment 969 —
Amortisation of land use rights 24,572 20,153
Auditors’ remuneration 14,512 13,980
Contingent rent included in revenue amounted to HK$32,042,000 (2014: HK$30,393,000) for the year.
2015 2014
HK$’000 HK$’000
The future minimum rental receivable under non-cancellable operating
leases are as follows:
Within one year 482,014 535,590
Between two and five years 907,896 791,607
Beyond five years 753,074 687,440
2,142,984 2,014,637
Generally the Group’s operating leases are for terms of two to five years except for 61 (2014: 48) long term
leases which are beyond five years.

New World China Land Limited 196
NOTES TO THE FINANCIAL STATEMENTS
10. FINANCE COSTS
2015 2014HK$’000 HK$’000
Interest on bank borrowings and loans from other financial institutions — wholly repayable within five years 1,218,992 1,195,406 — not wholly repayable within five years 187,318 108,137Interest on loans from fellow subsidiaries wholly repayable
within five years 8,615 8,550Interest on loans from non-controlling interests not wholly repayable
within five years 19,830 1,898Interest on fixed rate bonds and notes payable
— wholly repayable within five years 808,409 651,598 — not wholly repayable within five years 21,586 —Interest on short term loans 15,164 20,300Interest on advances from participating interest 99,144 110,988
2,379,058 2,096,877Amounts capitalised in property, plant and equipment, investment
properties and properties held for/under development (2,076,918) (1,785,563)
302,140 311,314
Note: To the extent funds are borrowed generally and used for the purpose of financing certain property, plant and equipment, investment properties and properties held for/under development, the capitalisation rate used to determine the amounts of borrowing costs eligible for the capitalisation is 4.70% (2014: 4.28%) for the year.
11. STAFF COSTS
2015 2014HK$’000 HK$’000
Wages, salaries and other benefits 561,162 492,124Pension costs defined contribution plans (note) 10,184 9,836Share-based payments 14,426 12,920
585,772 514,880
Note: The Group has established a defined contribution retirement scheme under the Occupational Retirement Scheme Ordinance for all employees in Hong Kong since September 1999. The contributions to the scheme are based on a percentage of the employees’ salaries ranging from 5% to 10%, depending upon the length of service of the employees. The Group’s contributions to the scheme are expensed as incurred.
With the implementation of the Mandatory Provident Fund (“MPF”) Scheme Ordinance on 1 December 2000, the Group established a new MPF Scheme. Except for employees who commenced employment after 1 October 2000, all the existing employees were given an option to select between the existing defined contribution retirement scheme and the MPF Scheme. The employees who commenced employment after 1 October 2000 are required to join the MPF Scheme. The Group’s contributions to the MPF scheme are based on fixed percentages of members’ salaries, ranging from 5% of MPF relevant income to 10% of the basic salary. Members’ mandatory contributions are fixed at 5% of MPF relevant income.
The Group also contributes to retirement plans for its employees in the PRC at a percentage in compliance with the requirements of the respective municipal governments in the PRC.
The assets of all retirement schemes are held separately from those of the Group in independently administered funds. The total pension costs charged to the consolidated income statement for the year amounted to HK$ 10,184,000 (2014: HK$9,836,000).

Annual Report 2015 197
12. DIRECTORS’ AND SENIOR MANAGEMENT REMUNERATION
(i) Details of the directors’ emoluments are as follows:
Other Retirement Share option
Name of director Fees emoluments benefits benefits Total
HK$’000 HK$’000 HK$’000 HK$’000 HK$’000
For the year ended 30 June 2015
Dr Cheng Kar-shun, Henry 212 — — 82 294
Mr Cheng Kar-shing, Peter 212 1,350 90 33 1,685
Dr Cheng Chi-kong, Adrian 212 2,582 167 61 3,022
Ms Cheng Chi-man, Sonia 212 4,522 216 — 4,950
Mr Cheng Chi-him, Conrad 212 1,532 80 — 1,824
Mr Fong Shing-kwong, Michael 212 2,065 — 21 2,298
Ms Ngan Man-ying, Lynda 212 7,445 580 41 8,278
Dr Cheng Wai-chee, Christopher 339 — — 12 351
Hon Tien Pei-chun, James 297 — — 12 309
Mr Lee Luen-wai, John 297 — — 12 309
Mr Ip Yuk-keung, Albert 297 — — — 297
2,714 19,496 1,133 274 23,617
For the year ended 30 June 2014
Dr Cheng Kar-shun, Henry 200 — — 236 436
Mr Cheng Kar-shing, Peter 200 — — 94 294
Dr Cheng Chi-kong, Adrian 200 2,436 157 177 2,970
Ms Cheng Chi-man, Sonia 200 4,203 164 — 4,567
Mr Cheng Chi-him, Conrad 200 1,446 62 — 1,708
Mr Fong Shing-kwong, Michael 200 1,948 — 59 2,207
Ms Ngan Man-ying, Lynda 200 7,023 547 118 7,888
Dr Cheng Wai-chee, Christopher 320 — — 35 355
Hon Tien Pei-chun, James 280 — — 35 315
Mr Lee Luen-wai, John 280 — — 35 315
Mr Ip Yuk-keung, Albert 280 — — — 280
2,560 17,056 930 789 21,335

New World China Land Limited 198
NOTES TO THE FINANCIAL STATEMENTS
12. DIRECTORS’ AND SENIOR MANAGEMENT REMUNERATION (Continued)
(ii) The five individuals whose emoluments were the highest in the Group for the year include one (2014: one)
director whose emoluments are reflected in the analysis presented above. The emoluments payable to
the remaining four (2014: four) individuals during the year are as follows:
2015 2014
HK$’000 HK$’000
Salaries, discretionary bonus, other allowances and
other benefits in kind 33,669 26,343
Share option benefits 444 596
Contribution to retirement benefit scheme 1,270 1,429
35,383 28,368
The emoluments fall within the following bands:
Number of individuals
2015 2014
HK$5,000,001 — HK$5,500,000 1 1
HK$6,000,001 — HK$6,500,000 1 1
HK$7,000,001 — HK$7,500,000 — 1
HK$7,500,001 — HK$8,000,000 1 —
HK$9,000,001 — HK$9,500,000 — 1
HK$16,000,001 — HK$16,500,000 1 —
4 4
(iii) Other than the emoluments of directors and five highest paid individuals disclosed in note 12(i) and 12(ii),
the remuneration payable to the senior management during the year fall within the following bands:
Number of individuals
2015 2014
HK$1,500,001 — HK$2,000,000 — 1
HK$2,000,001 — HK$2,500,000 1 1
HK$2,500,001 — HK$3,000,000 2 4
HK$3,000,001 — HK$3,500,000 2 2
HK$3,500,001 — HK$4,000,000 1 —
HK$4,000,001 — HK$4,500,000 — 1
HK$4,500,001 — HK$5,000,000 1 —
7 9

Annual Report 2015 199
13. TAXATION CHARGE
2015 2014
HK$’000 HK$’000
Current taxation
PRC corporate income tax and withholding tax 1,010,518 1,383,531
PRC land appreciation tax 1,667,492 2,449,000
Deferred taxation 240,325 334,625
2,918,335 4,167,156
Share of taxation of associated company and joint ventures for the year ended 30 June 2015 of
HK$379,673,000 (2014: HK$584,779,000) is included in the consolidated income statement as share of results
of associated company and joint ventures.
The taxation on the Group’s profit before taxation differs from the theoretical amount that would arise using the
rate of taxation prevailing in the PRC in which the Group operates as follows:
2015 2014
HK$’000 HK$’000
Profit before taxation 6,422,415 9,107,119
Share of results of associated company and joint ventures (386,153) (462,277)
6,036,262 8,644,842
Calculated at a taxation rate of 25% (2014: 25%) 1,509,066 2,161,211
Income not subject to taxation (358,850) (532,539)
Expenses not deductible for taxation purposes 335,766 414,949
Tax losses not recognised 142,919 123,386
Deduction from PRC land appreciation tax (416,873) (612,250)
Utilisation of previously unrecognised tax losses (40,953) (28,690)
Temporary differences not recognised 8,551 3,342
Recognition of temporary differences 6,601 14,177
Deferred taxation on undistributed profits 64,616 174,570
1,250,843 1,718,156
PRC land appreciation tax 1,667,492 2,449,000
2,918,335 4,167,156
No provision for Hong Kong profit tax has been made as the Group has no estimated assessable profits in
Hong Kong for the year (2014: Nil). PRC corporate income tax (“CIT”) has been provided on the estimated
assessable profits of subsidiaries, associated company and joint ventures operating in the PRC at 25% (2014:
25%). PRC land appreciation tax (“LAT”) is provided at progressive rates ranging from 30% to 60% on the
appreciation of land value, being the proceeds of sale of properties less deductible expenditures including costs
of land use rights and property development expenditures.

New World China Land Limited 200
NOTES TO THE FINANCIAL STATEMENTS
13. TAXATION CHARGE (Continued)
In July 1999, a deed of tax indemnity was entered into between NWD, the ultimate holding company, and the
Company whereby the ultimate holding company undertakes to indemnify the Group in respect of, inter alia,
certain PRC CIT and LAT payable in consequence of the disposal of certain properties held by the Group as at
31 March 1999. During the year, tax indemnity amounting to HK$ 359,152,000 (2014: HK$1,075,306,000) was
effected (note 7).
14. EARNINGS PER SHARE
The calculation of basic and diluted earnings per share for the year is based on the following:
2015 2014
HK$’000 HK$’000
Profit attributable to equity holders of the Company arising from:
Continuing operations 3,347,164 4,779,389
Discontinued operation (34,033) (140,698)
3,313,131 4,638,691
Number of shares
2015 2014
Weighted average number of shares for calculating basic earnings
per share 8,685,806,399 8,672,612,430
Effect of dilutive potential shares:
Share options 6,544,197 6,721,368
Weighted average number of shares for calculating diluted
earnings per share 8,692,350,596 8,679,333,798
15. DIVIDENDS
2015 2014
HK$’000 HK$’000
Interim dividend paid of nil (2014: HK$0.04) per share — 347,166
Final dividend proposed of HK$0.03 (2014: HK$0.03) per share 260,681 260,547
260,681 607,713
At a meeting held on 23 September 2015, the directors recommended a final dividend of HK$0.03 per share.
This proposed dividend is not reflected as a dividend payable in these financial statements, but will be reflected
as an appropriation of contributed surplus for the year ending 30 June 2016.

Annual Report 2015 201
16. PROPERTY, PLANT AND EQUIPMENT
Group
Furniture, Assets
Other Leasehold fixtures and Motor under
properties improvements equipment vehicles construction Total
HK$’000 HK$’000 HK$’000 HK$’000 HK$’000 HK$’000
Cost
At 1 July 2014 2,804,783 848,389 925,034 94,252 1,807,526 6,479,984
Additions 20,872 37,163 59,426 4,427 897,137 1,019,025
Transfer from completed properties
held for sale 8,113 — — — — 8,113
Transfer from properties under
development — — — — 346,697 346,697
Transfer to disposal group classified as
held for sale — (12,784) (22,376) — — (35,160)
Disposals/write off (5,587) (240) (19,978) (8,755) — (34,560)
At 30 June 2015 2,828,181 872,528 942,106 89,924 3,051,360 7,784,099
Accumulated depreciation and impairment
At 1 July 2014 807,581 349,731 493,706 65,079 — 1,716,097
Charge for the year 129,425 82,695 68,466 9,520 — 290,106
Transfer to disposal group classified as
held for sale — (7,103) (14,328) — — (21,431)
Disposals/write off (4,774) (240) (19,647) (7,936) — (32,597)
At 30 June 2015 932,232 425,083 528,197 66,663 — 1,952,175
Net book value
At 30 June 2015 1,895,949 447,445 413,909 23,261 3,051,360 5,831,924
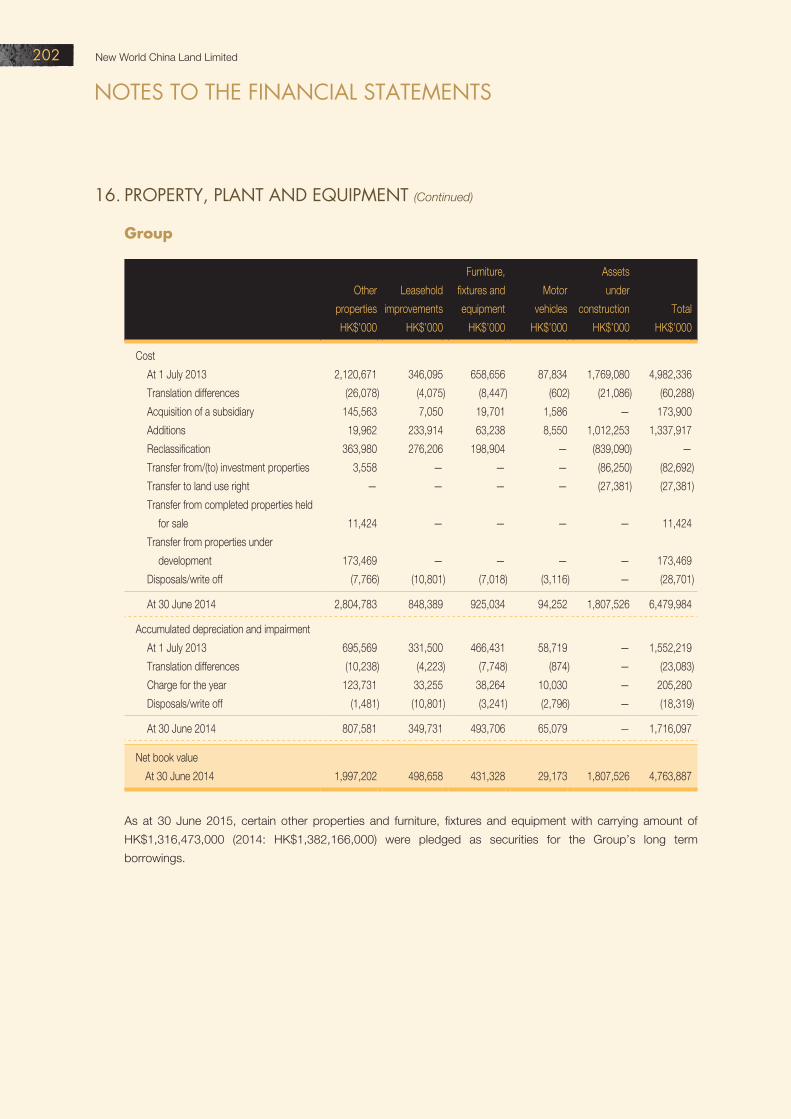
New World China Land Limited 202
NOTES TO THE FINANCIAL STATEMENTS
16. PROPERTY, PLANT AND EQUIPMENT (Continued)
Group
Furniture, Assets
Other Leasehold fixtures and Motor under
properties improvements equipment vehicles construction Total
HK$’000 HK$’000 HK$’000 HK$’000 HK$’000 HK$’000
Cost
At 1 July 2013 2,120,671 346,095 658,656 87,834 1,769,080 4,982,336
Translation differences (26,078) (4,075) (8,447) (602) (21,086) (60,288)
Acquisition of a subsidiary 145,563 7,050 19,701 1,586 — 173,900
Additions 19,962 233,914 63,238 8,550 1,012,253 1,337,917
Reclassification 363,980 276,206 198,904 — (839,090) —
Transfer from/(to) investment properties 3,558 — — — (86,250) (82,692)
Transfer to land use right — — — — (27,381) (27,381)
Transfer from completed properties held
for sale 11,424 — — — — 11,424
Transfer from properties under
development 173,469 — — — — 173,469
Disposals/write off (7,766) (10,801) (7,018) (3,116) — (28,701)
At 30 June 2014 2,804,783 848,389 925,034 94,252 1,807,526 6,479,984
Accumulated depreciation and impairment
At 1 July 2013 695,569 331,500 466,431 58,719 — 1,552,219
Translation differences (10,238) (4,223) (7,748) (874) — (23,083)
Charge for the year 123,731 33,255 38,264 10,030 — 205,280
Disposals/write off (1,481) (10,801) (3,241) (2,796) — (18,319)
At 30 June 2014 807,581 349,731 493,706 65,079 — 1,716,097
Net book value
At 30 June 2014 1,997,202 498,658 431,328 29,173 1,807,526 4,763,887
As at 30 June 2015, certain other properties and furniture, fixtures and equipment with carrying amount of
HK$1,316,473,000 (2014: HK$1,382,166,000) were pledged as securities for the Group’s long term
borrowings.

Annual Report 2015 203
17. INVESTMENT PROPERTIES
Group
2015 2014
HK$’000 HK$’000
Completed investment properties 19,076,103 18,452,717
Investment properties under development 5,608,250 3,518,875
24,684,353 21,971,592
Completed
investment
properties
Investment
properties
under
development Total
HK$’000 HK$’000 HK$’000
At 1 July 2014 18,452,717 3,518,875 21,971,592
Additions 243,658 1,809,494 2,053,152
Transfer from properties under development — 954,330 954,330
Transfer to completed properties held for sale (1,412,742) — (1,412,742)
Transfer from completed properties held for sale 506,569 — 506,569
Disposals (418,803) — (418,803)
Changes in fair value 478,244 420,873 899,117
Reclassified from assets held for sale 131,138 — 131,138
Reclassification 1,095,322 (1,095,322) —
At 30 June 2015 19,076,103 5,608,250 24,684,353
At 1 July 2013 16,771,879 3,156,362 19,928,241
Translation differences (217,850) (38,834) (256,684)
Additions 190,438 1,044,696 1,235,134
Transfer from property, plant and equipment 82,692 — 82,692
Transfer to land use rights (986) — (986)
Transfer from properties under development — 341,084 341,084
Transfer from completed properties held for sale 530,413 — 530,413
Disposals (373,286) — (373,286)
Changes in fair value 665,732 (49,610) 616,122
Reclassified as assets held for sale (131,138) — (131,138)
Reclassification 934,823 (934,823) —
At 30 June 2014 18,452,717 3,518,875 21,971,592

New World China Land Limited 204
NOTES TO THE FINANCIAL STATEMENTS
17. INVESTMENT PROPERTIES (Continued)
Valuation processes of the Group
The Group measures its investment properties at fair value. The investment properties were revalued by Knight
Frank Petty Limited, independent qualified valuer, who holds a recognised relevant professional qualification
and have recent experience in the locations and segments of the investment properties valued, at 30 June
2015 on an open market value basis. For all investment properties, their current use equates to the highest and
best use.
The Group’s finance department includes a team that reviews the valuation performed by the independent
valuer for financial reporting purposes. This team reports directly to the senior management and the Audit
Committee. Discussions of valuation processes and results are held between the management and valuer at
least once every six months, in line with the Group’s interim and annual reporting dates.
At each financial year end, the finance department verifies all major inputs to the independent valuation report;
assesses property valuation movements when compared to the prior year valuation report; and holds
discussions with the independent valuer.
Valuation techniques
Fair value of completed commercial and residential properties in the PRC is generally derived using the income
capitalisation method and wherever appropriate, by direct comparison method. Income capitalisation method is
based on the capitalisation of the net income and reversionary income potential by adopting appropriate
capitalisation rates, which are derived from analysis of sale transactions and valuers’ interpretation of prevailing
investor requirements or expectations. The prevailing market rents adopted in the valuation referenced to recent
lettings of the subject properties and other comparable properties.
Direct comparison method is based on comparing the property to be valued directly with other comparable
properties, which have recently transacted. However, given the heterogeneous nature of real estate properties,
appropriate adjustments are usually required to allow for any qualitative differences that may affect the price
likely to be achieved by the property under consideration.
Fair value of commercial and residential properties under development in the PRC is generally derived using the
residual method. This valuation method is essentially a means of valuing the completed properties by reference
to its development potential by deducting development costs together with developer’s profit and risk from the
estimated capital value of the proposed development assuming completed as at the date of valuation.
As at 30 June 2015, all investment properties are included in level 3 fair value hierarchy.
There were no changes to the valuation techniques during the year and there were no transfers between fair
value hierarchy during the year.

Annual Report 2015 205
The investment properties are held in the PRC under the following leases:
2015 2014
HK$’000 HK$’000
Leases of over 50 years 1,351,400 1,071,403
Leases of between 10 and 50 years 23,332,953 20,900,189
24,684,353 21,971,592
As at 30 June 2015, certain investment properties with carrying value of HK$5,425,703,000 (2014:
HK$5,448,689,000) were pledged as securities for the Group’s long term borrowings.
Information about fair value measurements using significant unobservable inputs:
Range of
significant unobservable inputs
2015
Fair value Valuation technique
Prevailing market
rents per month
Capitalisation
rate
HK$’000 HK$ %
Completed properties
Residential 2,914,065 Income capitalisation HK$11 — HK$208
per square metre
4% – 15%
Commercial 8,735,398 Income capitalisation HK$29 — HK$286
per square metre
3% – 8.5%
Office 2,259,750 Income capitalisation HK$55 — HK$128
per square metre
6% – 8%
Carparks 5,166,890 Direct comparison HK$81,000 —
HK$481,000
per carpark space
Total 19,076,103

New World China Land Limited 206
NOTES TO THE FINANCIAL STATEMENTS
17. INVESTMENT PROPERTIES (Continued)
Range of significant unobservable inputs
2015
Fair value
Valuation
technique
Prevailing market
rents
per month
Estimated costs
to completion
Estimated
developer’s profit
and risk margins
HK$’000 HK$ HK$ %
Properties under development
Residential 83,750 Residual HK$14,400
per square metre
HK$106,000,000 7%
Commercial 4,201,250 Residual HK$17,500 — HK$46,300
per square metre
HK$60,000,000 —
HK$2,397,000,000
5% – 25%
Carparks 1,323,250 Residual HK$125,000 —
HK$262,500
per carpark space
HK$18,000,000 —
HK$673,000,000
0.3% – 5%
Total 5,608,250
Range of
significant unobservable inputs
2014
Fair value Valuation technique
Prevailing market
rents per month
Capitalisation
rate
HK$’000 HK$ %
Completed properties
Residential 2,655,189 Income capitalisation HK$14 — HK$202
per square metre
4% – 15%
Commercial 7,896,463 Income capitalisation HK$23 — HK$267
per square metre
4% – 8.75%
Office 3,341,979 Income capitalisation HK$51 — HK$118
per square metre
6% – 8.25%
Carparks 4,559,086 Direct comparison HK$81,000 —
HK$437,000
per carpark space
Total 18,452,717

Annual Report 2015 207
Range of significant unobservable inputs
2014
Fair value
Valuation
technique
Prevailing market rents
per month
Estimated costs to
completion
Estimated
developer’s profit
and risk margins
HK$’000 HK$ HK$ %
Properties under development
Residential 79,625 Residual HK$16,300
per square metre
HK$130,600,000 11%
Commercial 2,465,000 Residual HK$10,400 — HK$27,000
per square metre
HK$20,100,000 —
HK$2,982,000,000
2% – 5%
Carparks 974,250 Residual HK$125,000 — HK$238,000
per carpark space
HK$400,000 —
HK$223,100,000
2% – 5%
Total 3,518,875
18. LAND USE RIGHTS
Group
2015 2014
HK$’000 HK$’000
At beginning of the year 703,901 621,096
Translation differences — (7,472)
Acquisition of subsidiaries — 64,437
Transfer from properties under development — 17,626
Transfer from property, plant and equipment — 27,381
Transfer from investment properties — 986
Additions 40,815 —
Amortisation (24,572) (20,153)
At end of the year 720,144 703,901
The Group’s interests in land use rights represent prepaid operating lease payments and are held in the PRC
under the following leases:
2015 2014
HK$’000 HK$’000
Leases of over 50 years 1,279 1,322
Leases of between 10 and 50 years 718,865 702,579
720,144 703,901
As at 30 June 2015, land use rights with carrying amount of HK$248,728,000 (2014: HK$256,165,000) were
pledged as securities for the Group’s long term borrowings and short term loans.

New World China Land Limited 208
NOTES TO THE FINANCIAL STATEMENTS
19. INTANGIBLE ASSETS
Group
Process,
Hotel technology
management and Customer
Goodwill Trademarks contracts know-how relationships Others Total
HK$’000 HK$’000 HK$’000 HK$’000 HK$’000 HK$’000 HK$’000
At 30 June 2013
Cost 559,227 614,865 428,063 38,916 544,817 67,636 2,253,524
Accumulated amortisation — — (41,023) (7,459) (52,212) — (100,694)
Accumulated impairment (212,589) — — — — — (212,589)
Net book value 346,638 614,865 387,040 31,457 492,605 67,636 1,940,241
Year ended 30 June 2014
Opening net book value 346,638 614,865 387,040 31,457 492,605 67,636 1,940,241
Acquisition of a subsidiary 11,903 63,603 60,524 — — — 136,030
Amortisation — — (23,294) (3,892) (27,241) — (54,427)
Impairment (90,000) — (35,892) — — — (125,892)
Closing net book value 268,541 678,468 388,378 27,565 465,364 67,636 1,895,952
At 30 June 2014
Cost 571,130 678,468 488,587 38,916 544,817 67,636 2,389,554
Accumulated amortisation — — (64,317) (11,351) (79,453) — (155,121)
Accumulated impairment (302,589) — (35,892) — — — (338,481)
Net book value 268,541 678,468 388,378 27,565 465,364 67,636 1,895,952
Year ended 30 June 2015
Opening net book value 268,541 678,468 388,378 27,565 465,364 67,636 1,895,952
Amortisation — — (23,559) (3,892) (27,241) — (54,692)
Impairment — — (56,375) — — — (56,375)
Transfer to disposal group
classified as held for sales (245,147) (678,468) (308,444) (23,673) (438,123) — (1,693,855)
Closing net book value 23,394 — — — — 67,636 91,030
At 30 June 2015
Cost 235,983 — — — — 67,636 303,619
Accumulated impairment (212,589) — — — — — (212,589)
Net book value 23,394 — — — — 67,636 91,030
Goodwill is allocated to the Group’s cash generating units identified according to business segment. As at 30
June 2015, goodwill of HK$14,227,000 (2014: HK$14,227,000), HK$9,167,000 (2014: HK$9,167,000) and
HK$245,147,000 (2014: HK$245,147,000) is allocated to the segments of property sales, hotel operation and
hotel management services respectively. Amortisation of intangible assets of HK$54,692,000 (2014:
HK$54,427,000) is included in the loss for the year from discontinued operation in the consolidated income
statement.

Annual Report 2015 209
For the purpose of impairment test, the recoverable amount of the business unit is determined based on value-
in-use calculations, which use cash flow projections based on financial budgets and a pre-tax discount rate.
For the segments of property sales and hotel operation, the key assumptions adopted on growth rates and
discount rates used in the value-in-use calculations are based on management best estimates. Growth rates
with 3.5% (2014: 3.5%) are determined by considering both internal and external factors relating to the relevant
segments. Discount rates used also reflect specific risks relating to the relevant segments, which range from 3.4%
to 7.5% (2014: 5.1% to 7.5%).
For the segment of hotel management services in 2014, the key assumptions adopted on growth rates and
discount rates used in the value-in-use calculations were based on management best estimates. A financial
budget of five-year with growth rate ranging from 23% to 83% were determined by considering both internal
and external factors relating to the relevant segment and the hotel management contracts in pipeline. Cash
flows beyond the five-year period were extrapolated using the estimated growth rates of 3%. Discount rate
used also reflected specific risks relating to the relevant segment, which was 18.2%.
20. SUBSIDIARIES
Company
2015 2014
HK$’000 HK$’000
Unlisted shares, at cost of HK$4 (2014: HK$4) — —
Amounts due by subsidiaries, net of provision 46,336,267 40,751,213
46,336,267 40,751,213
The amounts receivable are unsecured, interest free and have no fixed terms of repayment. The amounts
receivable form part of the Group’s investment in subsidiaries.
There is no non-controlling interest that is individually significant to the Group.
Details of principal subsidiaries are given in note 44.

New World China Land Limited 210
NOTES TO THE FINANCIAL STATEMENTS
21. PROPERTIES HELD FOR DEVELOPMENT
Group
2015 2014
HK$’000 HK$’000
Land use rights 8,880,578 9,022,435
Development and incidental costs 9,187,673 8,215,005
Interest capitalised 1,672,999 945,135
19,741,250 18,182,575
The analysis of the carrying value of land use rights held in the PRC included in the properties held for
development is as follows:
2015 2014
HK$’000 HK$’000
Leases of over 50 years 6,785,165 7,146,424
Leases of between 10 and 50 years 2,095,413 1,876,011
8,880,578 9,022,435
As at 30 June 2015, the aggregate carrying value of properties held for development pledged as securities for
long term borrowings amounted to HK$1,051,715,000 (2014: HK$923,335,000).

Annual Report 2015 211
22. ASSOCIATED COMPANY AND JOINT VENTURES
Group
2015 2014
HK$’000 HK$’000
Associated company
Group’s share of net assets (668) (645)
Amounts due to associated company
Non-interest bearing (2,657) (2,702)
Aggregate carrying amount of the Group’s interests in
associated company (3,325) (3,347)
Equity joint ventures/joint ventures in wholly foreign owned enterprises
Group’s share of net assets 2,568,920 2,291,200
Amounts due by joint ventures
Interest bearing (note ii) 30,310 30,310
Non-interest bearing (note i) 2,285,462 2,193,359
4,884,692 4,514,869
Co-operative joint ventures
Cost of investments 4,376,624 3,979,009
Goodwill 12,704 12,704
Share of undistributed post-acquisition results and reserves 1,833,106 2,001,193
6,222,434 5,992,906
Amounts due by joint ventures, net of provision
Interest bearing (note iii) 2,949,496 2,035,089
Non-interest bearing (note i) 1,083,393 701,450
10,255,323 8,729,445
Joint venture companies limited by shares
Group’s share of net assets (67,995) 121,603
Amounts due by joint ventures, net of provision
Interest bearing (note ii) 88,818 88,818
Non-interest bearing (note i) 440,595 237,131
461,418 447,552
Deposit for proposed joint venture — 620,625
Aggregate carrying amount of the Group’s interests in joint ventures 15,601,433 14,312,491
15,598,108 14,309,144

New World China Land Limited 212
NOTES TO THE FINANCIAL STATEMENTS
22. ASSOCIATED COMPANY AND JOINT VENTURES (Continued)
Notes:
(i) The amounts receivable are unsecured and interest free. The amounts receivable form part of the Group’s investment in joint ventures.
(ii) The amount receivable is unsecured and carries interest at 10% (2014: 10%) per annum. The amounts receivable form part of the
Group’s investment in joint ventures.
(iii) The amounts receivable are unsecured and carry interest ranging from Hong Kong prime rate to 8.5% (2014: Hong Kong prime rate to 8.5%)
per annum. The amounts receivable form part of the Group’s investment in joint ventures.
(iv) There is no associated company or joint venture that is individually significant to the Group. The Group’s share of results of the
associated company and joint ventures are as follows:
2015 2014
HK$’000 HK$’000
Profit for the year 386,153 462,277
Other comprehensive income for the year 1,978 (83,077)
Total comprehensive income for the year 388,131 379,200
(v) Details of principal joint ventures are given in note 44.
23. NON-CURRENT ASSETS RECLASSIFIED AS HELD FOR SALE
The Group entered into agreements in November 2013 to sell a portion of the investment properties in Tianjin
Xin An New World Plaza to a third party at a consideration of RMB112,492,000 (equivalent to HK$142,395,000)
and accordingly, the respective portion of the investment properties are classified as held for sale. The
transactions were subsequently cancelled and the Group had forfeited the deposit received from the third party
during the year ended 30 June 2015. The non-current assets classified as held for sale were reclassified to
investment properties.

Annual Report 2015 213
24. DISCONTINUED OPERATION
New World Hotel Management (BVI) Limited, its subsidiaries and a joint venture are engaged in the provision of
worldwide hotel management services, which is not the core business of the Group. The Board of Directors of
the Company believes that the Disposal will enable the Group to realise its investment in non-core business and
focus its resources on the operation of its existing core businesses of property development and investment in
the PRC. The negotiation for the Disposal was in final stage in June 2015 and the Company announced the
Disposal on 3 July 2015.
As at 30 June 2015, the assets and liabilities related to the Disposal Group have been presented as held for
sales and the consolidated results of the Disposal Group are presented as discontinued operation in
accordance with HKFRS 5 “Non-current Assets Held for Sale and Discontinued Operations”.
The consolidated statement of comprehensive income and consolidated cash flow statement distinguish the
discontinued operation from continuing operations. Comparative figures have been restated.
An analysis of the results, cash flows and assets and liabilities of the Disposal Group is as follows:
(a) Results of discontinued operation
2015 2014
HK$’000 HK$’000
Revenue 673,180 529,749
Cost of sales (364,431) (327,583)
Gross profit 308,749 202,166
Other income 822 4,137
Other losses, net (57,926) (125,940)
Administrative and other operating expenses (240,710) (212,367)
Operating profit/(loss) before finance costs 10,935 (132,004)
Finance costs (28,104) (30,611)
Loss before taxation (17,169) (162,615)
Taxation charge (16,864) 21,917
Loss for the year from discontinued operation (34,033) (140,698)

New World China Land Limited 214
NOTES TO THE FINANCIAL STATEMENTS
24. DISCONTINUED OPERATION (Continued)
(b) Assets of the disposal group classified as held for sales
2015
HK$’000
Property, plant and equipment 13,729
Intangible assets 1,693,855
Prepayments, debtors and other receivables 149,925
Cash and bank balances 165,021
Deferred tax assets 34,000
Other assets 56,250
2,112,780
(c) Liabilities of the disposal group classified as held for sales
2015
HK$’000
Long term borrowings 818,072
Creditors and accruals 92,846
Taxes payables 16,935
927,853
(d) Cash flows
2015 2014
HK$’000 HK$’000
Operating cash flows 108,212 5,173
Investing cash flows (4,253) (143,498)
Financing cash flows (84,237) (85,822)
Net cash from/(used in) discontinued operation 19,722 (224,147)

Annual Report 2015 215
25. AVAILABLE-FOR-SALE FINANCIAL ASSETS
Group
2015 2014
HK$’000 HK$’000
Unlisted investments, at fair value 735,860 85,147
The available-for-sale financial assets are denominated in Renminbi.
26. CASH AND BANK BALANCES
Group Company
2015 2014 2015 2014
HK$’000 HK$’000 HK$’000 HK$’000
Unrestricted balances 15,773,665 17,351,595 4,148,864 5,241,629
The effective interest rate on short term bank deposits was ranging from 0.001% to 3.59% (2014: 0.001% to
3.6%). These deposits have maturity date ranging from 2 to 93 days (2014: 2 to 92 days).
The carrying amounts of the cash and bank balances of the Group are denominated in the following currencies:
Group Company
2015 2014 2015 2014
HK$’000 HK$’000 HK$’000 HK$’000
Hong Kong dollar 2,176,300 2,450,850 1,549,118 2,172,631
Renminbi 13,194,019 13,730,931 2,596,353 3,067,340
United States dollar 403,346 1,166,750 3,393 1,658
Others — 3,064 — —
15,773,665 17,351,595 4,148,864 5,241,629
The conversion of Renminbi denominated balances into foreign currencies and the remittance of such foreign
currencies denominated bank balances and cash out of the PRC are subject to relevant rules and regulations of
foreign exchange control promulgated by the PRC government.

New World China Land Limited 216
NOTES TO THE FINANCIAL STATEMENTS
27. PROPERTIES UNDER DEVELOPMENT
Group
2015 2014
HK$’000 HK$’000
Land use rights 4,656,545 5,731,282
Development and incidental costs 11,379,053 13,751,847
Interest capitalised 1,635,972 1,607,981
17,671,570 21,091,110
The analysis of the carrying value of land use rights held in the PRC included in the properties under
development is as follows:
2015 2014
HK$’000 HK$’000
Leases of over 50 years 2,561,789 3,284,728
Leases of between 10 and 50 years 2,094,756 2,446,554
4,656,545 5,731,282
Properties under development with an aggregate carrying value of HK$6,234,373,000 (2014:
HK$4,377,720,000) were pledged as securities for the Group’s long term borrowings.
2015 2014
HK$’000 HK$’000
Properties under development for sale:
Expected to be completed and available for sale after
more than 12 months 9,601,038 9,195,582
Expected to be completed and available for sale within 12 months 8,070,532 11,895,528
17,671,570 21,091,110

Annual Report 2015 217
28. COMPLETED PROPERTIES HELD FOR SALE
Group
2015 2014
HK$’000 HK$’000
Land use rights 2,462,701 795,190
Development costs 16,282,933 7,762,144
Interest capitalised 1,139,724 419,812
19,885,358 8,977,146
The analysis of the carrying value of land use rights held in the PRC included in the completed properties held
for sale is as follows:
2015 2014
HK$’000 HK$’000
Leases of over 50 years 1,786,854 498,700
Leases of between 10 and 50 years 675,847 296,490
2,462,701 795,190
29. PREPAYMENTS, DEBTORS AND OTHER RECEIVABLES
Group Company
2015 2014 2015 2014
HK$’000 HK$’000 HK$’000 HK$’000
Trade debtors (note a) 2,634,329 2,923,518 — —
Prepaid land preparatory cost (note b) 2,227,043 2,019,803 — —
Deposits for purchase of land (note b) 3,111,177 2,999,245 — —
Prepayment for proposed development
projects (note b) 214,272 187,375 — —
Prepaid taxes (note b) 1,677,003 1,266,578 — —
Other prepayments, deposits and
receivables (note b) 1,411,629 1,485,398 13,021 16,489
11,275,453 10,881,917 13,021 16,489

New World China Land Limited 218
NOTES TO THE FINANCIAL STATEMENTS
29. PREPAYMENTS, DEBTORS AND OTHER RECEIVABLES (Continued)
Notes:
(a) Trade debtors mainly include sales proceed receivables, rental receivables and property management fee receivables. Sales proceed
receivables in respect of sale of properties are settled in accordance with the instalment schedules as stipulated in the sales and
purchase agreements. Monthly rental in respect of rental properties are payable in advance by tenants in accordance with the lease
agreements. Monthly property management fees are payable in advance in accordance with the agreements. The ageing analysis of
trade debtors based on invoice date is as follows:
Group
2015 2014
HK$’000 HK$’000
0 to 30 days 723,946 763,495
31 to 60 days 541,948 377,676
61 to 90 days 285,012 351,363
Over 90 days 1,083,423 1,430,984
2,634,329 2,923,518
The carrying amounts of the trade debtors of the Group are mainly denominated in Renminbi.
(b) The carrying amounts of the Group and the Company are mainly denominated in Renminbi and Hong Kong dollar respectively.
(c) At 30 June 2015, trade debtors of HK$1,540,687,000 (2014: HK2,236,695,000) were past due but not impaired. These relate to a
number of independent customers for whom there is no recent history of default. The ageing analysis of these trade receivables is as
follows:
Group
2015 2014
HK$’000 HK$’000
0 to 30 days 685,335 1,161,860
31 to 60 days 24,116 134,878
61 to 90 days 24,140 164,840
Over 90 days 807,096 775,117
1,540,687 2,236,695
(d) During the year, impairment loss on trade debtors of HK$4,276,000 (2014: HK$4,918,000) was recognised in the consolidated income
statement.
(e) The maximum exposure to credit risk at the reporting date is the carrying value of each class of receivable mentioned above. The Group
does not hold any collateral as security.

Annual Report 2015 219
30. AMOUNTS DUE FROM/(TO) RELATED COMPANIES
Related companies include group companies, joint ventures of the Group and companies owned by a director.
Group Company
2015 2014 2015 2014
HK$’000 HK$’000 HK$’000 HK$’000
Amounts due from group companies
(note a) 252,442 527,381 202,799 435,602
Amounts due from joint ventures (note b) 49,501 49,644 — —
301,943 577,025 202,799 435,602
Amounts due to group companies (note c) (121,197) (135,962) — —
Amounts due to joint ventures (note d) (599,303) (369,217) — (27)
Amounts due to companies owned by a
director (note e) (2,834) (2,669) — —
(723,334) (507,848) — (27)
(421,391) 69,177 202,799 435,575
Notes:
(a) The amounts due from group companies are unsecured, interest free and repayable on demand.
The carrying amounts of amounts due from group companies are denominated in the following currencies:
Group Company
2015 2014 2015 2014
HK$’000 HK$’000 HK$’000 HK$’000
Hong Kong dollar 203,745 484,628 202,799 435,602
Renminbi 48,697 42,753 — —
252,442 527,381 202,799 435,602

New World China Land Limited 220
NOTES TO THE FINANCIAL STATEMENTS
30. AMOUNTS DUE FROM/(TO) RELATED COMPANIES (Continued)
(b) For interest free amounts due from joint ventures of HK$19,191,000 (2014: HK$19,334,000), they are unsecured and repayable on
demand. For interest bearing amounts due from a joint venture of HK$30,310,000 (2014: HK$30,310,000), they are unsecured, carry
interest at 10% (2014: 10%) per annum and repayable on demand. The carrying amounts of amounts due from joint ventures are
denominated in United States dollar.
(c) The amounts due to group companies are unsecured, interest free and repayable on demand. The carrying amounts of amounts due to
group companies are denominated in Renminbi.
(d) The amounts payable are unsecured, interest free and repayable on demand. The amounts payable are mainly denominated in
Renminbi.
(e) The amounts due to companies owned by a director are unsecured, interest free and repayable on demand. The carrying amounts of
amounts due to companies owned by a director are denominated in Renminbi.

Annual Report 2015 221
31. SHARE CAPITAL
Company
2015 2014
HK$’000 HK$’000
Authorised:
30,000,000,000 shares of HK$0.1 each 3,000,000 3,000,000
Issued and fully paid:
8,688,769,557 (2014: 8,683,350,475) shares of HK$0.1 each 868,877 868,335
Details of the movement in the issued and fully paid share capital of the Company are summarised as follows:
Number of
shares of
HK$0.1 each HK$’000
At 1 July 2013 8,663,596,817 866,360
Exercise of share options (note) 19,753,658 1,975
At 30 June 2014 8,683,350,475 868,335
Exercise of share options (note) 5,419,082 542
At 30 June 2015 8,688,769,557 868,877
Note: Pursuant to the share option scheme adopted on 26 November 2002 (“2002 Share Option Scheme”) and the share option scheme
adopted on 22 November 2011 (“2011 Share Option Scheme”), the Company may grant options to directors and employees of the
Company or its subsidiaries to subscribe for shares in the Company. The movements in the number of share options granted during the
year and the balance outstanding at 30 June 2015 are as follows:
(a) Movement of share options under the 2002 Share Option Scheme
Number of share options
Number of
share options
exercisable
Date of offer to grant
Exercise price
per share
At
1 July
2014
Exercised
during
the year
Lapsed during
the year
At
30 June
2015
At
30 June
2015
HK$
26 June 2009 3.9131 512,551 (504,529) (8,022) — —
19 November 2009 2.9531 3,013 (1,533) (1,480) — —
12 January 2010 2.8781 61,481 (58,338) (3,143) — —
18 May 2010 2.2621 121,740 (121,740) — — —
31 May 2010 2.3491 209,480 (170,000) — 39,480 39,480
10 November 2010 3.0131 693,137 (99,859) — 593,278 593,278
18 January 2011 3.0361 9,825,966 (1,570,803) (166,233 ) 8,088,930 8,088,930
26 July 2011 2.7051 733,242 (216,000) — 517,242 190,512
12,160,610 (2,742,802) (178,878) 9,238,930 8,912,200
Weighted average exercise
price of each category (HK$) 3.031 3.090 3.072 3.013 3.024
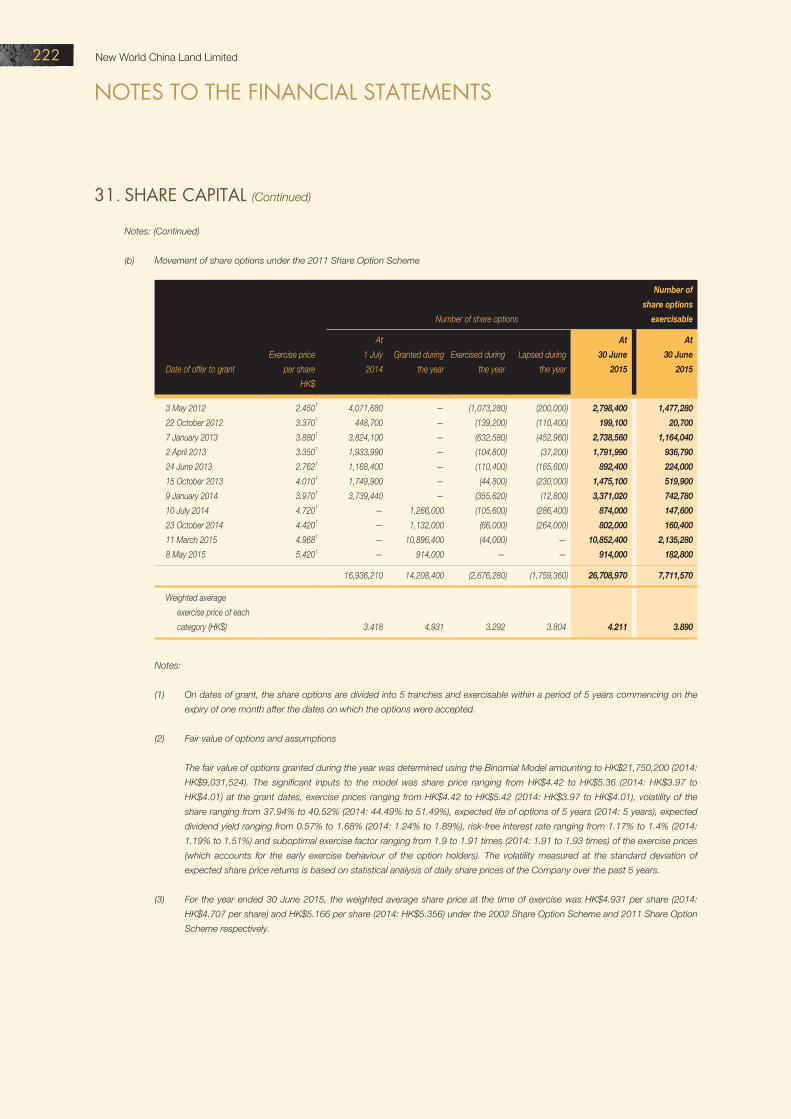
New World China Land Limited 222
NOTES TO THE FINANCIAL STATEMENTS
31. SHARE CAPITAL (Continued)
Notes: (Continued)
(b) Movement of share options under the 2011 Share Option Scheme
Number of share options
Number of
share options
exercisable
Date of offer to grant
Exercise price
per share
At
1 July
2014
Granted during
the year
Exercised during
the year
Lapsed during
the year
At
30 June
2015
At
30 June
2015
HK$
3 May 2012 2.4501 4,071,680 — (1,073,280) (200,000) 2,798,400 1,477,280
22 October 2012 3.3701 448,700 — (139,200) (110,400) 199,100 20,700
7 January 2013 3.8801 3,824,100 — (632,580) (452,960) 2,738,560 1,164,040
2 April 2013 3.3501 1,933,990 — (104,800) (37,200) 1,791,990 936,790
24 June 2013 2.7621 1,168,400 — (110,400) (165,600) 892,400 224,000
15 October 2013 4.0101 1,749,900 — (44,800) (230,000) 1,475,100 519,900
9 January 2014 3.9701 3,739,440 — (355,620) (12,800) 3,371,020 742,780
10 July 2014 4.7201 — 1,266,000 (105,600) (286,400) 874,000 147,600
23 October 2014 4.4201 — 1,132,000 (66,000) (264,000) 802,000 160,400
11 March 2015 4.9681 — 10,896,400 (44,000) — 10,852,400 2,135,280
8 May 2015 5.4201 — 914,000 — — 914,000 182,800
16,936,210 14,208,400 (2,676,280) (1,759,360) 26,708,970 7,711,570
Weighted average
exercise price of each
category (HK$) 3.418 4.931 3.292 3.804 4.211 3.890
Notes:
(1) On dates of grant, the share options are divided into 5 tranches and exercisable within a period of 5 years commencing on the
expiry of one month after the dates on which the options were accepted.
(2) Fair value of options and assumptions
The fair value of options granted during the year was determined using the Binomial Model amounting to HK$21,750,200 (2014:
HK$9,031,524). The significant inputs to the model was share price ranging from HK$4.42 to HK$5.36 (2014: HK$3.97 to
HK$4.01) at the grant dates, exercise prices ranging from HK$4.42 to HK$5.42 (2014: HK$3.97 to HK$4.01), volatility of the
share ranging from 37.94% to 40.52% (2014: 44.49% to 51.49%), expected life of options of 5 years (2014: 5 years), expected
dividend yield ranging from 0.57% to 1.68% (2014: 1.24% to 1.89%), risk-free interest rate ranging from 1.17% to 1.4% (2014:
1.19% to 1.51%) and suboptimal exercise factor ranging from 1.9 to 1.91 times (2014: 1.91 to 1.93 times) of the exercise prices
(which accounts for the early exercise behaviour of the option holders). The volatility measured at the standard deviation of
expected share price returns is based on statistical analysis of daily share prices of the Company over the past 5 years.
(3) For the year ended 30 June 2015, the weighted average share price at the time of exercise was HK$4.931 per share (2014:
HK$4.707 per share) and HK$5.166 per share (2014: HK$5.356) under the 2002 Share Option Scheme and 2011 Share Option
Scheme respectively.

Annual Report 2015 223
32. RESERVES
Group
Other Share
Contributed Share reserve option Exchange Retained
surplus premium (note) reserve reserve profits Total
HK$’000 HK$’000 HK$’000 HK$’000 HK$’000 HK$’000 HK$’000
As at 1 July 2014 11,207,539 16,304,097 227,955 37,925 5,145,410 23,961,256 56,884,182
Profit for the year — — — — — 3,313,131 3,313,131
Premium on issue of shares — 16,742 — — — — 16,742
Share-based payments — — — 14,426 — — 14,426
Transfer of reserve upon
exercise and lapse of share
options — 5,401 — (6,889) — 1,488 —
Dividends (260,554) — — — — — (260,554)
Translation differences
Subsidiaries — — — — (56,931) — (56,931)
Associated company and
joint ventures — — — — 1,978 — 1,978
As at 30 June 2015 before
proposed final dividend 10,946,985 16,326,240 227,955 45,462 5,090,457 27,275,875 59,912,974
Representing:
As at 30 June 2015 after
proposed final dividend 10,686,304 16,326,240 227,955 45,462 5,090,457 27,275,875 59,652,293
2015 proposed
final dividend 260,681 — — — — — 260,681
10,946,985 16,326,240 227,955 45,462 5,090,457 27,275,875 59,912,974

New World China Land Limited 224
NOTES TO THE FINANCIAL STATEMENTS
32. RESERVES (Continued)
Group (Continued)
Other Share
Contributed Share reserve option Exchange Retained
surplus premium (note) reserve reserve profits Total
HK$’000 HK$’000 HK$’000 HK$’000 HK$’000 HK$’000 HK$’000
As at 1 July 2013 11,901,566 16,224,647 202,237 49,630 5,784,261 19,320,045 53,482,386
Profit for the year — — — — — 4,638,691 4,638,691
Premium on issue of shares — 57,345 — — — — 57,345
Share-based payments — — — 12,920 — — 12,920
Transfer of reserve upon
exercise and lapse of
share options — 22,105 — (24,625) — 2,520 —
Acquisition of additional
interest in a subsidiary — — 25,718 — — — 25,718
Dividends (694,027) — — — — — (694,027)
Translation differences
Subsidiaries — — — — (555,774) — (555,774)
Associated company and
joint ventures — — — — (83,077) — (83,077)
As at 30 June 2014 before
proposed final dividend 11,207,539 16,304,097 227,955 37,925 5,145,410 23,961,256 56,884,182
Representing:
As at 30 June 2014 after
proposed final dividend 10,946,992 16,304,097 227,955 37,925 5,145,410 23,961,256 56,623,635
2014 proposed
final dividend 260,547 — — — — — 260,547
11,207,539 16,304,097 227,955 37,925 5,145,410 23,961,256 56,884,182
Note: Other reserve relates to fair value changes arising from business combination, the difference between the consideration paid and the
related share of net assets acquired from the acquisition of additional interests in subsidiaries.

Annual Report 2015 225
Company
ShareContributed Share Exchange option Accumulated
surplus premium reserve reserve losses TotalHK$’000 HK$’000 HK$’000 HK$’000 HK$’000 HK$’000
As at 1 July 2014 11,227,700 16,304,097 6,705,552 37,925 (6,631,866) 27,643,408Premium on issue of shares — 16,742 — — — 16,742Profit for the year — — — — 187,820 187,820Share-based payments — — — 14,426 — 14,426Transfer of reserve upon
exercise and lapse of share options — 5,401 — (6,889) 1,488 —
Translation difference — — 288 — — 288Dividends (260,554) — — — — (260,554)
As at 30 June 2015 before proposed final dividend 10,967,146 16,326,240 6,705,840 45,462 (6,442,558) 27,602,130
Representing:As at 30 June 2015 after
proposed final dividend 10,706,465 16,326,240 6,705,840 45,462 (6,442,558) 27,341,4492015 proposed final dividend 260,681 — — — — 260,681
10,967,146 16,326,240 6,705,840 45,462 (6,442,558) 27,602,130
As at 1 July 2013 11,921,727 16,224,647 7,077,674 49,630 (7,552,046) 27,721,632Premium on issue of shares — 57,345 — — — 57,345Profit for the year — — — — 917,660 917,660Share-based payments — — — 12,920 — 12,920Transfer of reserve upon
exercise and lapse of share options — 22,105 — (24,625) 2,520 —
Translation difference — — (372,122) — — (372,122)Dividends (694,027) — — — — (694,027)
As at 30 June 2014 before proposed final dividend 11,227,700 16,304,097 6,705,552 37,925 (6,631,866) 27,643,408
Representing:As at 30 June 2014 after
proposed final dividend 10,967,153 16,304,097 6,705,552 37,925 (6,631,866) 27,382,8612014 proposed final dividend 260,547 — — — — 260,547
11,227,700 16,304,097 6,705,552 37,925 (6,631,866) 27,643,408
The contributed surplus of the Company represents the excess of the consolidated net asset value of the
subsidiaries acquired over the nominal value of the share capital of the Company issued in exchange thereof as
a result of a reorganisation that took place in 1999, less distributions in subsequent years.
The loss attributable to equity holders of the Company is dealt with in the financial statements of the Company
to the extent of the profit of HK$187,820,000 (2014: HK$917,660,000).

New World China Land Limited 226
NOTES TO THE FINANCIAL STATEMENTS
33. LONG TERM BORROWINGS
Group Company
2015 2014 2015 2014
HK$’000 HK$’000 HK$’000 HK$’000
Bank loans (note i)
Secured 8,294,212 9,041,936 — —
Unsecured 18,356,558 16,324,119 4,760,382 3,157,694
Loans from fellow subsidiaries (note ii) 2,646,438 2,637,823 — —
Loans from non-controlling interests (note iii) 238,894 247,789 — —
Advances from participating interest (note iv) 1,896,704 1,967,617 5,560,287 5,516,761
Fixed rate bonds and notes payable (note v) 11,668,358 9,008,925 11,668,358 9,008,925
Loans from other financial institutions (note i)
Secured — 70,000 — —
Unsecured 1,062,500 125,000 — —
44,163,664 39,423,209 21,989,027 17,683,380
Current portion included in current liabilities (9,775,255) (14,197,174) (1,727,678) (6,823,029)
34,388,409 25,226,035 20,261,349 10,860,351
Notes:
(i) The loans from banks and other financial institutions are repayable as follows:
Group Company
Secured Unsecured Total Unsecured
2015 2014 2015 2014 2015 2014 2015 2014
HK$’000 HK$’000 HK$’000 HK$’000 HK$’000 HK$’000 HK$’000 HK$’000
Within one year 2,535,759 2,826,491 7,239,496 6,075,777 9,775,255 8,902,268 1,727,678 1,496,979
Between one and two years 2,291,554 2,536,297 3,446,545 5,871,229 5,738,099 8,407,526 90,000 1,660,715
Between two and five years 2,185,499 2,347,910 8,733,017 4,326,488 10,918,516 6,674,398 2,942,704 —
After five years 1,281,400 1,401,238 — 175,625 1,281,400 1,576,863 — —
8,294,212 9,111,936 19,419,058 16,449,119 27,713,270 25,561,055 4,760,382 3,157,694

Annual Report 2015 227
(ii) The loans from fellow subsidiaries are repayable between one and two years (2014: one and two years), unsecured and bear interest at
three months Hong Kong Interbank Offered Rate (“HIBOR”) (2014: three months HIBOR) per annum.
(iii) The loans from non-controlling interests are unsecured, have repayment terms as specified in the loan agreement and carry interest at 6.15%
(2014: ranging from 5% to 6.15%) per annum except for HK$52,449,000 (2014: Nil) which is interest free.
(iv) The advances from participating interest of certain property projects are unsecured, interest free and repayable in accordance with the
terms as specified in the agreements entered into between the Company and the participating interest.
(v) On 29 March 2012 and 12 April 2012, the Company issued 8.5% bonds in the aggregate amounts of RMB2,800 million and RMB1,500
million (equivalent to approximately HK$3,500 million and HK$1,875 million) respectively.
RMB2,800 million of the bonds were issued at a price of 100 per cent of the principal amount. RMB1,500 million of the bonds were
issued at a price of 100.972% of the principal amount, resulting in a premium on issue of RMB14.6 million (equivalent to approximately
HK$18.3 million).
These bonds bore interest with a coupon rate of 8.5% per annum, payable semi-annually in arrears on 11 April and 11 October each
year. These bonds were listed on The Stock Exchange of Hong Kong Limited. The bonds were redeemed on the maturity date on 11
April 2015 at the principal amount.
On 6 February 2013, the Company issued 5.5% bonds in the aggregate amounts of RMB3,000 million (equivalent to approximately
HK$3,750 million). The bonds were issued at a price of 100 per cent of the principal amount, bear interest at a coupon rate of 5.5% per
annum, payable semi-annually in areas on the 6 February and 6 August each year. The bonds are listed on The Stock Exchange of
Hong Kong Limited. The bonds will be redeemed on the maturity date on 6 February 2018 at the principal amount.
As at 30 June 2015, the fair value of the bonds amounted to RMB3,100.4 million (equivalent to approximately HK$3,875.5 million) (2014:
RMB7,528.3 million (equivalent to approximately HK$9,410.4 million)).
On 6 November 2014, the Company issued 5.375% notes in the aggregation amounts of USD900 million (equivalent to approximately
HK$6,993 million). The notes were issued at a price of 99.676 per cent of the principal amount, bear interest at a coupon rate of 5.375%
per annum, payable semi-annually in arrears on 6 November and 6 May each year. The notes are listed on The Stock Exchange of
Hong Kong Limited. The notes will be redeemed on the maturity date on 6 November 2019 at the principal amount.
As at 30 June 2015, the fair value of the notes amounted to USD941.7 million (equivalent to approximately HK$7,298.4 million).
On 28 January 2015, the Company issued 5% notes in the aggregation amounts of HK$800 million. The notes were issued at a price of
100 per cent of the principal amount, bear interest at a coupon rate of 5% per annum, payable semi-annually in arrears on 28 January
and 28 July each year. The notes will be redeemed on the maturity date on 28 January 2022 at the principal amount.
As at 30 June 2015, the fair value of the notes amounted to HK$837.1 million.
On 30 March 2015, the Company issued 4.75% notes in the aggregation amounts of HK$271 million. The notes were issued at a price
of 98.839 per cent of the principal amount, bear interest at a coupon rate of 4.75% per annum, payable annually in arrears on 30 March
each year. The notes will be redeemed on the maturity date on 30 March 2022 at the principal amount.
As at 30 June 2015, the fair value of the notes amounted to HK$283.6 million.

New World China Land Limited 228
NOTES TO THE FINANCIAL STATEMENTS
33. LONG TERM BORROWINGS (Continued)
Notes: (Continued)
(vi) The effective interest rates of borrowings are as follows:
2015 2014
Hong Kong United States Hong Kong United States
dollar Renminbi dollar dollar Renminbi dollar
Bank loans 2.60% 6.52% 1.89% 2.75% 6.47% 2.88%
Loans from fellow subsidiaries 0.39% — 0.39% 0.38% — 0.38%
Loans from non-controlling interests 2.50% 6.15% — 5.00% 6.15% —
Advances from participating interest 5.23% — — 5.64% — —
Fixed rate bonds and notes payable 4.94% 5.50% 5.38% — 7.19% —
Loans from other financial institutions — 7.63% — — 6.47% —
(vii) The fair value of bank loans, loans from fellow subsidiaries, loans from non-controlling interests, advances from participating interest and
loans from other financial institutions are based on cash flows discounted using cash flows discounted using the incremental borrowing
rates and are within level 2 of the fair value hierarchy.
(viii) The carrying amounts of the borrowings are denominated in the following currencies:
Group Company
2015 2014 2015 2014
HK$’000 HK$’000 HK$’000 HK$’000
Hong Kong dollar 18,254,207 16,319,506 11,376,826 8,674,455
Renminbi 18,321,032 22,652,238 3,729,375 9,008,925
United States dollar 7,588,425 451,465 6,882,826 —
44,163,664 39,423,209 21,989,027 17,683,380
(ix) For the interest-bearing borrowings, except for the loans from non-controlling interests of HK$52,449,000 (2014: HK$51,477,000)
which reprice in more than five years, the rest of the borrowings reprice or mature (whichever is earlier) in one year or less.
34. DEFERRED TAX LIABILITIES
Deferred taxation is provided in full, using the liability method, on temporary differences using the prevailing rate
of taxation in which the Group operates.
Deferred tax assets and liabilities are offset when there is a legally enforceable right to offset current tax assets
against current tax liabilities and when the deferred tax assets and liabilities relate to income taxed levied by the
same taxation authority on the taxable entity.

Annual Report 2015 229
The movement in deferred tax assets and liabilities (prior to offsetting of balances within the same taxation
jurisdiction) during the year is as follows:
Group
Deferred tax assets/(liabilities)
Accelerated
tax
depreciation
Revaluation
of
properties
Recognition
of
income
from sale
of
properties
Fair value
adjustment
of
properties
arising
from
acquisition
Tax
losses
Undistributed
profits of
subsidiaries,
associated
company and
joint venture Provisions Total
HK$’000 HK$’000 HK$’000 HK$’000 HK$’000 HK$’000 HK$’000 HK$’000
At 1 July 2013 (414,995) (1,063,211) (8,446) (1,082,222) 156,105 (452,855) 25,919 (2,839,705)
Exchange differences 5,293 15,033 106 13,417 (1,635) 7,954 (324) 39,844
Credited/(charged) to consolidated
income statement 8,557 (139,576) — 13,505 (5,728) (174,570) (2,813) (300,625)
Transfer — — — — — 27,250 — 27,250
Acquisition of subsidiaries — — — (178,996) — — — (178,996)
At 30 June 2014 (401,145) (1,187,754) (8,340) (1,234,296) 148,742 (592,221) 22,782 (3,252,232)
(Charged)/credited to consolidated
income statement (56,079) (176,581) — 39,427 21,275 (64,616) (3,751) (240,325)
Transfer — — — — — 4,230 — 4,230
Transfer to disposal group
classified as held for sale (24,081) — — — (9,919) — — (34,000)
At 30 June 2015 (481,305) (1,364,335) (8,340) (1,194,869) 160,098 (652,607) 19,031 (3,522,327)
Deferred tax assets are recognised for tax losses carried forward to the extent that realisation of the related tax
benefit through future taxable profits is probable. The Group did not recognise deferred tax assets of
HK$513,638,000 (2014: HK$498,393,000) in respect of losses amounting to HK$2,054,550,000 (2014:
HK$1,993,572,000) to carry forward against future taxable income. These tax losses will expire at various dates
up to and including 2020 (2014: 2019).
As at 30 June 2015, the aggregate amount of temporary differences associated with investments in subsidiaries
and joint ventures for which deferred tax liabilities have not been recognised amounting to approximately
HK$8,753,369,000 (2014: HK$7,040,966,000), as the directors consider that the timing of reversal of the
related temporary differences can be controlled and the temporary differences will not be reversed in the
foreseeable future.

New World China Land Limited 230
NOTES TO THE FINANCIAL STATEMENTS
35. CREDITORS AND ACCRUALS
Group Company
2015 2014 2015 2014
HK$’000 HK$’000 HK$’000 HK$’000
Trade creditors (note i) 7,519,797 5,495,755 — —
Other creditors and accruals (note ii) 1,370,325 1,454,444 177,881 188,222
8,890,122 6,950,199 177,881 188,222
Notes:
(i) The ageing analysis of trade creditors is as follows:
Group
2015 2014
HK$’000 HK$’000
0 to 30 days 6,582,749 5,033,097
31 to 60 days 14,445 17,787
61 to 90 days 70,172 78,323
Over 90 days 852,431 366,548
7,519,797 5,495,755
The carrying amounts of the trade creditors of the Group are mainly denominated in Renminbi as at 30 June 2015 and 2014.
(ii) Other creditors and accruals included retention payables of construction costs, other payables and various accruals. The carrying
amounts of other creditors and accruals of the Group and the Company are mainly denominated in Renminbi and Hong Kong dollar
respectively.

Annual Report 2015 231
36. SHORT TERM LOANS
Group
2015 2014
HK$’000 HK$’000
Loans from banks and other financial institutions
Secured 625,000 —
Unsecured 376,250 —
1,001,250 —
As at 30 June 2015, the effective interest rates of the short term loans range from 8.3% to 10.05%. Their
carrying amounts approximate their fair values.
The carrying amounts of short term loans are denominated in Renminbi.
37. AMOUNTS DUE TO NON-CONTROLLING INTERESTS
The amounts due to non-controlling interests are unsecured, interest free and repayable on demand. The
carrying amounts of the balances are mainly denominated in Hong Kong dollar as at 30 June 2015 and 2014
and approximate their fair values.
38. TAXES PAYABLE
Group Company
2015 2014 2015 2014
HK$’000 HK$’000 HK$’000 HK$’000
Corporate income tax payable 430,741 382,919 — —
Withholding tax payable 110,869 116,501 63,036 61,561
Land appreciation tax payable 3,748,751 3,979,906 — —
Other PRC taxes payable 142,000 175,502 — —
4,432,361 4,654,828 63,036 61,561

New World China Land Limited 232
NOTES TO THE FINANCIAL STATEMENTS
39. GUARANTEES
(i) Corporate guarantees for banking facilities
Group
The Group has corporate guarantees of approximately HK$3,202,816,000 (2014: HK$2,734,066,000)
given in respect of bank loan facilities extended to certain joint ventures. As at 30 June 2015, the Group’s
attributable portion of the outstanding amount under these bank loan facilities granted to the joint
ventures was approximately HK$2,683,191,000 (2014: HK$2,350,941,000).
Company
The Company has corporate guarantees given in respect of bank loan facilities extended to certain
subsidiaries and joint ventures of approximately HK$21,027,226,000 (2014: HK$16,878,727,000) and
HK$3,202,816,000 (2014: HK$2,734,066,000) respectively.
(ii) Guarantees in respect of mortgage facilities
As at 30 June 2015, the Group had provided guarantees in respect of mortgage facilities granted by
certain banks relating to the mortgage loans arranged for certain purchasers of properties developed by
certain subsidiaries of the Group and the Group’s attributable portion of outstanding mortgage loans
under these guarantees amounted to HK$2,239,958,000 (2014: HK$2,034,561,000). Pursuant to the
terms of the guarantees, upon default in mortgage payments by these purchasers, the Group is
responsible to repay the outstanding mortgage principals together with accrued interest owed by the
defaulted purchasers to the banks and the Group is entitled to take over the legal title and possession of
the related properties.

Annual Report 2015 233
40. COMMITMENTS
(i) Capital expenditure commitments
The capital expenditure commitments of the Group are as follows:
Group
2015 2014
HK$’000 HK$’000
Authorised but not contracted for
Purchase consideration for proposed development projects — 108,000
Property, plant and equipment 107,366 150,938
107,366 258,938
Contracted but not provided for
Property, plant and equipment 1,436,170 1,571,271
Investment properties 3,174,963 1,629,585
4,611,133 3,200,856
4,718,499 3,459,794
(ii) Lease commitments
Group Company
2015 2014 2015 2014
HK$’000 HK$’000 HK$’000 HK$’000
As at 30 June 2015, future
aggregate minimum lease
payments under non-
cancellable operating
leases in respect of land
and buildings are as
follows:
Within one year 46,818 39,050 18,526 16,703
Between two and
five years 86,572 63,260 31,303 9,320
Beyond five years 66,149 47,807 — —
199,539 150,117 49,829 26,023

New World China Land Limited 234
NOTES TO THE FINANCIAL STATEMENTS
41. NOTES TO CONSOLIDATED CASH FLOW STATEMENT
(a) Reconciliation of operating profit before finance costs to net cash generated from operations
2015 2014
HK$’000 HK$’000
Operating profit before finance costs including
discontinued operation 6,349,337 8,824,152
Interest income (374,689) (286,678)
Depreciation and amortisation 369,370 279,860
Share-based payments 14,426 12,920
Dividend income from an available-for-sale
financial asset — (1,738)
Gain on disposal/write off of property, plant and
equipment and investment properties (34,257) (117,617)
Tax indemnity from the ultimate holding company (359,152) (1,075,306)
Loss on disposal of associated companies — 2,486
Gain on remeasuring previously held equity interests
of joint ventures at fair value upon further
acquisition as subsidiaries — (67,257)
Impairment of intangible assets 56,375 125,892
Changes in fair value of investment properties (899,117) (616,122)
Net foreign exchange (gains)/losses (32,194) 281,791
Operating profit before working capital changes 5,090,099 7,362,383
Increase in properties held for/under development and
completed properties held for sale (5,338,383) (302,480)
(Increase)/decrease in prepayments, debtors and
other receivables (2,881,177) 463,371
Changes in balances with related companies 514,219 1,436,726
Increase/(decrease) in deposits received on sale of
properties 1,328,717 (4,442,495)
Increase/(decrease) in creditors and accruals 2,048,658 (784,297)
Net cash generated from operations 762,133 3,733,208

Annual Report 2015 235
(b) Analysis of net outflow of cash and cash equivalents in respect of acquisition of subsidiaries
The Group acquired subsidiaries for the year ended 30 June 2014 and the identified assets acquired and
liabilities assumed as at the date of acquisition are as follows:
2014
HK$’000
Property, plant and equipment 173,900
Land use rights 64,437
Properties held for development 562,500
Intangible assets 124,127
Completed properties held for sale 141,420
Prepayments, debtors and other receivables 154,150
Cash and bank balances 10,612
Deposits received on sale of properties (1,128)
Creditors and accruals (102,817)
Taxes payable (81,342)
Long terms borrowings (101,000)
Amount due to a joint venture (62,500)
Deferred tax liabilities (178,996)
Non-controlling interests (296)
Net assets acquired 703,067
Interest originally held by the Group as joint ventures (257,878)
445,189
Goodwill 11,903
Gain on remeasuring previously held equity interests of joint ventures at fair value
upon further acquisition as subsidiaries (67,257)
389,835
2014
HK$’000
Cash consideration paid 389,835
Consideration to be paid (15,000)
Cash and bank balances acquired (10,612)
364,223

New World China Land Limited 236
NOTES TO THE FINANCIAL STATEMENTS
42. RELATED PARTY TRANSACTIONS
(i) Transactions with related parties
The following is a summary of significant related party transactions carried out by the Group during the
year in the normal course of its business:
2015 2014
Note HK$’000 HK$’000
Interest expenses on loans from fellow subsidiaries (a) 8,615 8,550
Rental expense for leased premises to
fellow subsidiaries (b) 26,246 19,857
Property agency fee paid to fellow subsidiaries (c) 6,403 13,162
Purchase of goods from fellow subsidiaries and
a related company (d) 83,574 110,813
Interest income from joint ventures (e) 87,927 73,005
Property management services fee income from fellow
subsidiaries, joint ventures and related companies (f) 40,410 48,466
Rental income from fellow subsidiaries, a joint venture
and a related company (g) 98,196 124,431
Hotel management services fee income from fellow
subsidiaries, joint ventures and related companies (h) 126,649 97,964
Project management fee income from joint ventures
and related companies (i) 64,367 35,582
Contracting service income from related companies (j) 186,997 428,466
Sales of properties to a fellow subsidiary and
a related company (k) — 46,450

Annual Report 2015 237
Notes:
(a) Interest is charged at rates as specified in note 33(ii) on the outstanding balances due to certain fellow subsidiaries.
(b) The rental is charged at fixed monthly fees in accordance with the terms of the tenancy agreements.
(c) The property agency fee is charged by the fellow subsidiaries in accordance with the terms of the property agency agreements.
(d) This represents purchases of goods by means of presenting various cash equivalent gift coupons, gift cards and stored value
shopping cards to the stores operated by the fellow subsidiaries and a related company. Such fee is charged in accordance
with the terms of the agreements.
(e) This represents interest income in respect of loan financing provided to joint ventures. These loans are unsecured and carry
interest at rates as specified in note 22.
(f) The property management services fees are charged at fixed amounts to fellow subsidiaries, certain joint ventures and related
companies as specified in the management contracts.
(g) The rental income is charged at fixed monthly fees in accordance with the terms of the tenancy agreements.
(h) The hotel management services fee income is charged in accordance with the terms of the management service agreement.
(i) The project management fee income is charged in accordance with the terms of the agreement.
(j) The contracting services income is charged in accordance with the terms of the agreement.
(k) During the year ended 30 June 2014, a joint venture of the Group sold certain properties to Aerospace New World (China)
Technology Limited and Shenzhen Sunlong Communication Co., Ltd., a related company and a fellow subsidiary of the Group,
respectively, for a consideration of RMB17,088,000 (equivalent to HK$21,630,000) and RMB19,608,000 (equivalent to
HK$24,820,000) respectively.
(l) Total fees for the provision of project management, construction and engineering consultancy services in respect of certain of
the Group’s property projects paid and payable to certain fellow subsidiaries and related companies for the year amounted to
HK$439,999,000 (2014: HK$255,414,000). Such fees are charged at fixed amounts in accordance with the terms of the
respective contracts.
(m) A deed of tax indemnity was entered into between the ultimate holding company and the Company whereby the ultimate holding
company undertakes to indemnify the Group in respect of CIT and LAT payable in consequence of the disposal of certain
properties held by the Group as at 31 March 1999. During the year, tax indemnity amounting to HK$359,152,000 (2014:
HK$1,075,306,000) was effected (note 13).
(n) In November 2014, the Group entered into a termination agreement with Hubei New World Department Store Co., Ltd., a fellow
subsidiary of the Group, to early terminate the lease agreement at a consideration of RMB51,128,000 (equivalent to
HK$63,910,000) (subject to adjustment). The consideration was subsequently adjusted to RMB40,331,000 (equivalent to
HK$50,414,000) and an amount of RMB21,128,000 (equivalent to HK$26,410,000) has been paid to NWDS Hubei during the
year ended 30 June 2015.
(o) During the year ended 30 June 2014, the Group acquired a hotel management company from CTF Holdings Limited, a related
company of the Group at the consideration of €13,536,000 (equivalent to approximately HK$144,835,000).
(p) During the year ended 30 June 2014, the Group has acquired remaining interests in Dragon Fortune Limited from other
shareholders, of which Sun City Holdings Limited and Potassium Corp. are associates of Mr Peter Cheng and that Brinkley
Holdings Ltd is beneficially owned by Mr Stewart Cheng, for a consideration of HK$245,000,000. Upon completion, Dragon
Fortune Limited became an indirect wholly-owned subsidiary of the Group.

New World China Land Limited 238
NOTES TO THE FINANCIAL STATEMENTS
42. RELATED PARTY TRANSACTIONS (Continued)
(ii) Key management compensation
2015 2014
HK$’000 HK$’000
Salaries and other short-term employee benefits 135,216 120,375
Pension costs 5,188 5,100
Share option benefits 1,786 3,056
142,190 128,531
Key management includes executive directors, financial controller, company secretary, regional executives
and senior executives of hotel management team.
(iii) Balances with related parties
Balances with associated company, joint ventures, group companies and companies owned by a director
are disclosed in notes 22 and 30.
43. EVENT AFTER REPORTING PERIOD
On 3 July 2015, New World Development (China) Limited (“NWDC”), a wholly owned subsidiary of the Group,
entered into the sales and purchase agreement with Chow Tai Fook Enterprises Limited to sell its entire equity
interest in New World Hotel Management (BVI) Limited (“NWHM”) together with related outstanding
shareholder’s loan and accrued interest due and owing by NWHM to NWDC for an aggregate cash
consideration of HK$1,963,000,000. Subject to fulfillment of several conditions precedent, the disposal is
expected to be completed on or before 31 December 2015 at a gain of approximately HK$844,000,000.

Annual Report 2015 239
44. PARTICULARS OF PRINCIPAL SUBSIDIARIES, ASSOCIATED COMPANY AND JOINT VENTURES
Details of the principal subsidiaries, associated company and joint ventures which materially affect the results
for the year and/or assets of the Group as at 30 June 2015 are set out below:
Company name
Issued and fully paid up share capital/paid up
registered capital
Attributable interest held (note 1)
Principal activities
By the Company By the Group
2015 2014 2015 2014
Subsidiaries
Incorporated and operating in Hong Kong
Able Kingdom Limited HK$11 ordinary share
— — 100% 100% Investment holding
Best Goal International Limited HK$11 ordinary share
— — 100% — Investment holding
Billion Huge (International) Limited HK$950,001 950,001 ordinary
shares
— — 100% 100% Investment holding
Billion Park Investment Limited HK$1,000,000 1,000,000 ordinary
shares
— — 78.6% 78.6% Investment holding
China Joy International Limited HK$2 2 ordinary shares
— — 100% 100% Investment holding
Dragon Joy (China) Limited HK$1 1 ordinary share
— — 100% 100% Investment holding
Global Hero Holdings Limited HK$1 1 ordinary share
— — 100% 100% Investment holding
Lingal Limited HK$2,000 1,800 ordinary shares
200 non-voting deferred shares
— — 100% 100% Investment holding
Max Charm Investment Limited HK$2 2 ordinary shares
— — 100% 100% Investment holding
New World China Estate Agents Limited
HK$11 ordinary share
— — 100% — Estate agency
New World China Property Limited HK$2 2 ordinary shares
100% 100% 100% 100% Investment holding
New World Development (China) Limited
HK$4 2 ordinary shares
2 non-voting deferred shares
100% 100% 100% 100% Investment holding
New World Hotel Management Limited
HK$1 1 ordinary share
— — 100% 100% Hotel management

New World China Land Limited 240
NOTES TO THE FINANCIAL STATEMENTS
44. PARTICULARS OF PRINCIPAL SUBSIDIARIES, ASSOCIATED COMPANY AND JOINT VENTURES (Continued)
Company name
Issued and fully paid up share capital/paid up
registered capital
Attributable interest held (note 1)
Principal activities
By the Company By the Group
2015 2014 2015 2014
Subsidiaries (continued)
Incorporated and operating in Hong Kong (continued)
Pacific Great Investment Limited HK$50,000,00050,000,000 ordinary
shares
— — 100% 100% Investment holding
Penta Hotels (Asia Pacific) Limited HK$11 ordinary share
— — 100% 100% Hotel management
Rosewood Hotels and Resorts (Asia Pacific) Limited
HK$11 ordinary share
— — 100% 100% Hotel management
Silver World H.K. Development Limited
HK$1 1 ordinary share
— — 100% 100% Investment holding
Spread Glory Investments Limited HK$11 ordinary share
— — 100% 100% Investment holding
Sunny Trend Development Limited HK$2 2 ordinary shares
— — 100% 100% Investment holding
Super Gain Limited HK$11 ordinary share
— — 100% — Investment holding
Wing Shan International Country Club Co. Limited
HK$1,000,000 1,000,000 ordinary
shares
— — 89.2% 89.2% Investment holding
Incorporated in the British Virgin Islands
Art Bridge Development Limited US$1 1 share of US$1
— — 100% 100% Investment holding
Art Shadow Limited US$1 1 share of US$1
— — 100% 100% Investment holding
Banyan Developments Limited US$1 1 share of US$1
— — 100% 100% Investment holding
Brilliant Alpha Investment Limited US$1 1 share of US$1
— — 100% 100% Investment holding
Conful Enterprises Limited US$1 1 share of US$1
— — 100% 100% Investment holding
Dragon Fortune Limited US$57,89557,895 shares of
US$1 each
— — 100% 100% Investment holding
Esteemed Sino Limited US$1 1 share of US$1
— — 100% 100% Investment holding
Ever Brisk Limited US$1 1 share of US$1
— — 100% 100% Investment holding

Annual Report 2015 241
Company name
Issued and fully paid up share capital/paid up
registered capital
Attributable interest held (note 1)
Principal activities
By the Company By the Group
2015 2014 2015 2014
Fortune Star Worldwide Limited US$100100 shares of
US$1 each
— — 100% 100% Investment holding
Flighting Unicorn Limited US$1 1 share of US$1
— — 100% 100% Investment holding
Fu Hong Investments Limited US$1 1 share of US$1
— — 100% 100% Investment holding
Goodtrade Enterprises Limited US$1 1 share of US$1
— — 100% 100% Investment holding
Hinto Developments Limited US$1 1 share of US$1
— — 100% 100% Investment holding
K Fai Investments Limited US$11 share of US$1
— — 100% 100% Investment holding
Keep Bright Limited US$1 1 share of US$1
— — 100% 100% Investment holding
Lucky Win Development Limited US$1 1 share of US$1
— — 100% 100% Investment holding
Magic Chance Limited US$1 1 share of US$1
— — 100% 100% Investment holding
New World Anderson Development Company Limited
US$100 100 shares of US$1 each
— — 100% 100% Investment holding
New World China Finance (BVI) Limited
US$1 1 share of US$1
— — 100% 100% Financing
New World Hotel Management (BVI) Limited
US$1,000 1,000 shares of
US$1 each
— — 100% 100% Investment holding
Penta Hotel Holdings Limited US$1,000 1,000 shares of
US$1 each
— — 100% 100% Investment holding
Radiant Glow Limited US$1 1 share of US$1
— — 100% 100% Investment holding
Ramada Property Ltd. US$1,000 1,000 shares of US$1
each
— — 100% 100% Investment holding
Rise Eagle Worldwide Limited US$1 1 share of US$1
— — 100% 100% Investment holding
Rosewood Hotels and Resorts Holdings Limited
US$1 1 share of US$1
— — 100% 100% Investment holding
Sparkling Rainbow Limited US$1 1 share of US$1
— — 100% 100% Investment holding
Stand Fame Enterprises Limited US$1 1 share of US$1
— — 100% 100% Investment holding
Superb Wealthy Group Limited US$1 1 share of US$1
— — 100% 100% Financing
Sweet Prospects Enterprises Limited US$1 1 share of US$1
— — 100% 100% Investment holding

New World China Land Limited 242
NOTES TO THE FINANCIAL STATEMENTS
44. PARTICULARS OF PRINCIPAL SUBSIDIARIES, ASSOCIATED COMPANY AND JOINT VENTURES (Continued)
Company name
Issued and fully paid up share capital/paid up
registered capital
Attributable interest held (note 1)
Principal activities
By the Company By the Group
2015 2014 2015 2014
Subsidiaries (continued)
Incorporated in the British Virgin Islands (continued)
Triumph Hero International Limited US$10,000 10,000 shares of US$1
each
— — 100% 100% Investment holding
True Blue Developments Limited US$11 share of US$1
— — 100% 100% Investment holding
Twin Glory Investments Limited US$11 share of US$1
— — 100% 100% Investment holding
Incorporated and operating in the Philippines
NWH Management Philippines, Incorporated
Peso 9,492,00094,920 shares of
Peso 100 each
— — 100% 100% Hotel management
Incorporated and operating in the US
Rosewood Hotels and Resorts, L.L.C. US$260,623,748 — — 100% 100% Hotel management
Incorporated and operating in Germany
Penta Hotels Germany GmbH Euro25,000 — — 100% 100% Hotel management
Incorporated and operating in the PRC
Beijing Dongfang Huamei Real Estate Development Co., Ltd.
RMB200,000,000 — — 75%(note 2)
75% Land development
Beijing Lingal Real Estates Development Co., Ltd.
US$13,000,000 — — 100% 100% Property sales
Beijing New World Huamei Real Estate Development Co., Ltd.
RMB748,000,000 — — 75% 75% Property development
Chengdu Flighting Unicorn Management Services Co., Ltd.
RMB5,000,000 — — 100% 100% Management services
Chengdu Xinyi Real Estate Development Co., Ltd.
US$99,500,000 — — 60%(note 2)
60% Property development
Dalian New World Plaza International Co., Ltd.
RMB58,000,000 — — 88% 88% Property investment and development
Dalian New World Tower Co., Ltd. US$197,324,700 — — 100% 100% Property investment, development and hotel operation
Fengshi Trading (Shanghai) Co., Ltd. US$2,170,000 — — 100% — Property investment
Fortune Leader Overseas Chinese (Daiyawan) Investment Co. Ltd.
US$16,950,000 — — 100% 100% Golf club and resort operation

Annual Report 2015 243
Company name
Issued and fully paid up share capital/paid up
registered capital
Attributable interest held (note 1)
Principal activities
By the Company By the Group
2015 2014 2015 2014
Fortune Leader Overseas Chinese (Daiyawan) Real Estate Development Co. Ltd.
US$20,820,000 — — 100% 100% Property development
Foshan Country Club Co., Ltd. US$52,923,600 — — 84.8% 84.8% Golf club operation
Foshan Country Real Estate Development Co., Ltd.
RMB638,030,000 — — 84.8% 84.8% Property development
Foshan Da Hao Hu Real Estate Development Co., Ltd.
RMB1,278,558,000 — — 84.8% 84.8% Property development
Guangzhou Fong Chuen — New World Property Development Ltd.
RMB330,000,000 — — 100% 100% Property development
Guangzhou Jixian Zhuang New World City Garden Development Limited
US$24,000,000 — — 100% 100% Property development
Guangzhou Xin Hua Chen Real Estate Co., Ltd.
RMB200,000,000 — — 100% 100% Property development
Guangzhou Xin Hua Jian Real Estate Co., Ltd.
RMB244,000,000 — — 100% 100% Property development
Guangzhou Xin Sui Tourism Centre Ltd.
HK$180,000,000 — — 100% 100% Property development
Guangzhou Xin Yi Development Limited
HK$286,000,000 — — 90.5% 90.5% Property investment and development
Guangzhou Yibo Real Estate Development Co., Ltd.
RMB392,500,000 — — 100% 100% Property development
Guiyang New World Real Estate Co., Ltd.
US$301,350,000 — — 100%(note 2)
100% Property development and hotel operation
Haikou New World Housing Development Ltd.
US$8,000,000 — — 100% 100% Property development
Huamei Wealth (Beijing) Technology Co., Ltd.
RMB640,000,000 — — 100% 100% Property investment
Hunan Fortune Lake Property Development Co., Ltd.
RMB205,265,854 — — 100% 100% Property development
Hunan Success New Century Investment Company Limited
RMB680,000,000 — — 95%(note 2)
95% Property development
Jinan New World Sunshine Development Limited
US$69,980,000 — — 100% 100% Property development
Langfang New World Properties Development Co., Ltd.
US$145,300,000 — — 100% 100% Property development
Langfang Xin Zhong Properties Development Co., Ltd.
US$68,200,000 — — 100% 100% Property development
Nanjing New World Real Estate Co., Ltd.
US$45,339,518 — — 100% 100% Property investment
New World Anderson (Tianjin) Development Co., Ltd.
US$5,500,000 — — 100% 100% Property investment
New World (Anshan) Landscape Engineering Limited
RMB10,000,000 — — 100% 100% Landscape engineering

New World China Land Limited 244
NOTES TO THE FINANCIAL STATEMENTS
44. PARTICULARS OF PRINCIPAL SUBSIDIARIES, ASSOCIATED COMPANY AND JOINT VENTURES (Continued)
Company name
Issued and fully paid up share capital/paid up
registered capital
Attributable interest held (note 1)
Principal activities
By the Company By the Group
2015 2014 2015 2014
Subsidiaries (continued)
Incorporated and operating in the PRC (continued)
New World (Anshan) Property Development Co., Ltd.
RMB1,420,000,000 — — 100% 100% Property development
New World China Land (Haikou) Limited
US$600,000,000 — — 100% 100% Property investment and development
New World China Land Investments Company Limited
US$80,000,000 100% 100% 100% 100% Investment holding
New World Development (Wuhan) Co., Ltd.
US$112,000,000 — — 100% 100% Property investment and development
New World Development (Wuhan) Landscape Engineering Limited
US$1,800,000 — — 100% 100% Landscape engineering
New World Enterprises (Wuhan) Ltd. US$16,000,000 — — 100% 100% Property development
New World Goodtrade (Wuhan) Limited
US$188,000,000 — — 100% 100% Property investment and development
New World New Land Real Estate (Wuhan) Co., Ltd.
US$269,810,000 — — 100% — Property development
New World (Shenyang) Property Development Limited
RMB5,647,800,000 — — 100% 100% Property investment and development
Rosewood Hotels & Resorts (Shanghai) Limited
RMB500,000 — — 100% 100% Hotel management consultancy services
Shanghai Ramada Plaza Ltd. US$42,000,000 — — 100% 100% Property investment and hotel operation
Shanghai Trio Property Development Co., Ltd.
US$81,000,000 — — 100% 100% Property investment
Shenyang New World Xin Hui Properties Co., Ltd.
RMB501,520,000 — — 100% 100% Property development
Shenzhen Top One Real Estate Development Co., Ltd.
HK$150,000,000 — — 100% 100% Property development
Shenzhen Topping Real Estate Development Co., Ltd.
HK$294,000,000 — — 100% 100% Property development
Taiding Trading (Shanghai) Co., Ltd. US$7,800,000 — — 100% 100% Property investment
Tang Shan New World Property Development Co., Ltd.
US$117,000,000 — — 100% 100% Property development
Tianjin New World Housing Development Co., Ltd.
RMB80,000,000 — — 100% 100% Property development
Tianjin New World Properties Development Co., Ltd.
US$91,000,000 — — 100% 100% Property development
Tianjin Xin Guang Development Co., Ltd.
US$4,500,000 — — 100% 100% Property investment

Annual Report 2015 245
Company name
Issued and fully paid up share capital/paid up
registered capital
Attributable interest held (note 1)
Principal activities
By the Company By the Group
2015 2014 2015 2014
Wuhan New Eagle Enterprises Co., Limited
US$2,830,000 — — 100% 100% Property investment
Wuhan Xinhan Development Co., Ltd. US$16,000,000 — — 100%(note 3)
100% Property development
Zhaoqing New World Property Development Limited
US$16,500,000 — — 100% 100% Property development
Zhuhai New World Housing Development Limited
US$8,000,000 — — 100% 100% Property development
Associated company
Incorporated and operating in Hong Kong
Sun Legend Investments Limited HK$1,000 1,000 ordinary
shares
— — 50% 50% Investment holding
Joint ventures
Incorporated and operating in Hong Kong
Eminent Elite Limited HK$1 1 ordinary share
— — 49% 49% Investment holding
Fergurson Hotel Management Limited HK$2 2 ordinary shares
— — 50% 50% Hotel management
Global Perfect Development Limited HK$1,000,000 1,000,000 ordinary
shares
— — 50% 50% Investment holding
Incorporated in the British Virgin Islands
Concord Properties Holding (Guangzhou) Limited
US$10 10 ordinary shares of
US$1 each
— — 40% 40% Investment holding
Silvery Yield Development Limited US$100 100 ordinary shares of
US$1 each
— — 49% 49% Investment holding
Incorporated and operating in the PRC
(i) Co-operative joint ventures
Beijing Chong Wen — New World Properties Development Co., Ltd.
US$225,400,000 — — 70%(note 4)
70% Property investment and development and hotel operation
Beijing Chong Yu Real Estate Development Co., Ltd.
US$171,840,000 — — 70%(note 4)
70% Property investment and development
Beijing Xin Kang Real Estate Development Co., Ltd.
US$12,000,000 — — 70%(note 4)
70% Property investment and development
Beijing Xin Lian Hotel Co., Ltd. US$12,000,000 — — 55%(note 4)
55% Hotel operation
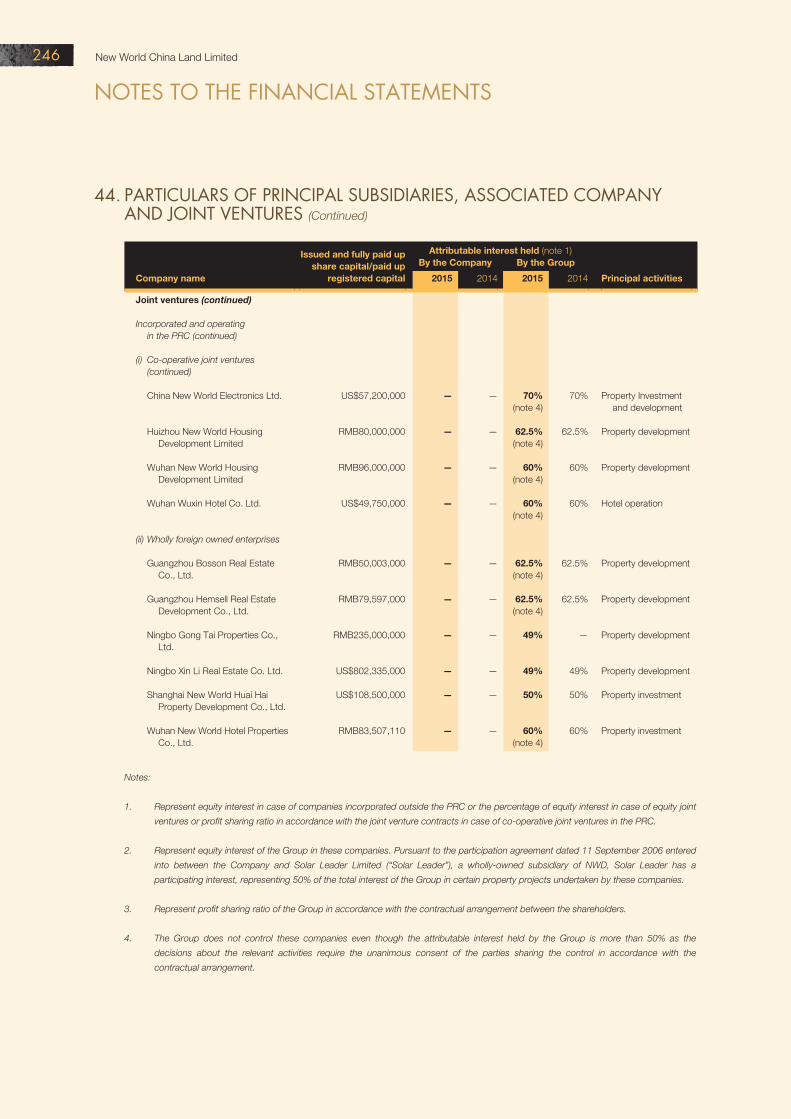
New World China Land Limited 246
NOTES TO THE FINANCIAL STATEMENTS
Company name
Issued and fully paid up share capital/paid up
registered capital
Attributable interest held (note 1)
Principal activities
By the Company By the Group
2015 2014 2015 2014
Joint ventures (continued)
Incorporated and operating in the PRC (continued)
(i) Co-operative joint ventures (continued)
China New World Electronics Ltd. US$57,200,000 — — 70%(note 4)
70% Property Investment and development
Huizhou New World Housing Development Limited
RMB80,000,000 — — 62.5%(note 4)
62.5% Property development
Wuhan New World Housing Development Limited
RMB96,000,000 — — 60%(note 4)
60% Property development
Wuhan Wuxin Hotel Co. Ltd. US$49,750,000 — — 60%(note 4)
60% Hotel operation
(ii) Wholly foreign owned enterprises
Guangzhou Bosson Real Estate Co., Ltd.
RMB50,003,000 — — 62.5%(note 4)
62.5% Property development
Guangzhou Hemsell Real Estate Development Co., Ltd.
RMB79,597,000 — — 62.5%(note 4)
62.5% Property development
Ningbo Gong Tai Properties Co., Ltd.
RMB235,000,000 — — 49% — Property development
Ningbo Xin Li Real Estate Co. Ltd. US$802,335,000 — — 49% 49% Property development
Shanghai New World Huai Hai Property Development Co., Ltd.
US$108,500,000 — — 50% 50% Property investment
Wuhan New World Hotel Properties Co., Ltd.
RMB83,507,110 — — 60%(note 4)
60% Property investment
Notes:
1. Represent equity interest in case of companies incorporated outside the PRC or the percentage of equity interest in case of equity joint
ventures or profit sharing ratio in accordance with the joint venture contracts in case of co-operative joint ventures in the PRC.
2. Represent equity interest of the Group in these companies. Pursuant to the participation agreement dated 11 September 2006 entered
into between the Company and Solar Leader Limited (“Solar Leader”), a wholly-owned subsidiary of NWD, Solar Leader has a
participating interest, representing 50% of the total interest of the Group in certain property projects undertaken by these companies.
3. Represent profit sharing ratio of the Group in accordance with the contractual arrangement between the shareholders.
4. The Group does not control these companies even though the attributable interest held by the Group is more than 50% as the
decisions about the relevant activities require the unanimous consent of the parties sharing the control in accordance with the
contractual arrangement.
44. PARTICULARS OF PRINCIPAL SUBSIDIARIES, ASSOCIATED COMPANY AND JOINT VENTURES (Continued)

Annual Report 2015 247
FINANCIAL SUMMARY
RESULTS
2015 2014 2013 2012 2011HK$’000 HK$’000 HK$’000 HK$’000 HK$’000
Revenues 17,459,237 21,850,106 16,153,872 12,528,755 13,557,227
Operating profit after finance costs 6,036,262 8,644,842 6,942,261 5,719,033 4,685,543Share of results of associated companies and joint ventures 386,153 462,277 964,636 373,171 378,176
Profit before taxation 6,422,415 9,107,119 7,906,897 6,092,204 5,063,719Taxation charge (2,918,335) (4,167,156) (3,051,541) (2,812,704) (1,917,443)
Profit for the year from continuing operations (note) 3,504,080 4,939,963Loss for the year from discontinued operation (note) (34,033) (140,698)
Profit for the year 3,470,047 4,799,265 4,855,356 3,279,500 3,146,276
Attributable to: Equity holders of the Company 3,313,131 4,638,691 4,616,314 3,080,929 3,025,826 Non-controlling interests 156,916 160,574 239,042 198,571 120,450
3,470,047 4,799,265 4,855,356 3,279,500 3,146,276
ASSETS AND LIABILITIES
2015 2014 2013 2012 2011HK$’000 HK$’000 HK$’000 HK$’000 HK$’000
Property, plant and equipment, investment properties and land use rights 31,236,421 27,439,380 23,979,454 20,504,444 16,723,223Properties held for development 19,741,250 18,182,575 17,350,847 15,864,552 12,478,678Associated companies and joint ventures 15,598,108 14,309,144 12,914,943 11,502,724 10,047,204Intangible assets 91,030 1,895,952 1,940,241 1,925,141 23,394Available-for-sale financial assets 735,860 85,147 108,457 108,457 58,362Net current assets 35,126,818 27,884,723 35,206,973 27,199,442 21,054,114
Total assets less current liabilities 102,529,487 89,796,921 91,500,915 77,104,760 60,384,975Long term borrowings (34,388,409) (25,226,035) (30,957,581) (22,919,267) (14,151,021)Deferred tax liabilities (3,522,327) (3,252,232) (2,839,705) (2,460,377) (2,185,100)
64,618,751 61,318,654 57,703,629 51,725,116 44,048,854
Note: The financial results for New World Hotel Management (BVI) Limited and its subsidiaries were presented as discontinued operation and
comparative for the year ended 30 June 2014 have been restated accordingly. The financial results prior to 2014 have not been restated.

New World China Land Limited 248
MAJOR PROJECTS PROFILE
NWCL's
Accounting
NWCL's
Attributable Total GFA Residential Commercial Office Hotel
Carpark
and others Expected
completion dateNO Region Project name Classification Interest (sq m) (sq m) (sq m) (sq m) (sq m) (sq m) Development status
Projects under development/held for development
1 Beijing Beijing New View Garden Remaining Phases Joint venture 70% 22,561 2,223 12,629 7,709 Under planning TBD
Beijing New View Garden Commercial Centre 39,653 16,531 8,052 15,070 Under planning Mar/2018
2 Beijing Beijing Xin Yu Garden Remaining Phases Joint venture 70% 605,600 251,000 99,800 135,100 119,700 Under planning TBD
Beijing Xin Yu Garden Commercial Centre 89,620 60,925 28,695 Under planning Dec/2018
3 Beijing Beijing Yuzhuang Project Phase II Subsidiary 75% 101,616 101,616 Under development Jun/2017
4 Langfang Langfang New World Centre District C1 Subsidiary 100% 126,768 55,546 6,251 40,086 24,885 Under development Sep/2015
Langfang New World Centre District A and C2 234,313 83,975 52,942 46,951 50,445 Under development Jun/2016
5 Langfang Langfang New World Garden District 3 Subsidiary 100% 119,317 101,319 17,998 Under development Dec/2015
Langfang New World Garden District 1 120,785 89,615 5,722 25,448 Under development Jul/2016
Langfang New World Garden District 2 99,060 68,138 7,264 23,658 Under development May/2017
6 Tangshan Tangshan New World Centre Phase II Subsidiary 100% 156,914 23,203 37,447 48,768 47,496 Under development Oct/2015
7 Jinan Jinan New World Sunshine Garden Remaining Portion Subsidiary 100% 78,144 2,604 31,695 18,729 25,116 Under development Oct/2016
8 Shenyang Shenyang New World Garden Phase I West District A Subsidiary 100% 53,434 5,471 38,435 9,528 Under development Jun/2016
Shenyang New World Garden Phase II D 655,855 455,974 20,439 179,442 Under development Jun/2018
Shenyang New World Garden Remaining Phases 849,280 533,784 50,211 265,285 Under planning TBD
9 Shenyang Shenyang New World Centre — Expo Subsidiary 100% 119,475 119,475 Under development Sep/2016
Shenyang New World Centre Phase I and II 883,796 308,691 327,201 133,637 114,267 Under development Sep/2016
Shenyang New World Centre Remaining Phases 238,092 238,092 Under planning TBD
10 Shenyang Shenyang New World Commercial Centre Phase II Subsidiary 100% 96,026 25,266 51,406 19,354 Under planning TBD
11 Anshan Anshan New World Garden Phase III A Subsidiary 100% 145,748 84,087 15,936 45,725 Under development Jun/2016
Anshan New World Garden Phase III B 139,582 86,564 13,287 39,731 Under development Jun/2017
Anshan New World Garden Remaining Phases 687,238 498,734 13,312 175,192 Under planning TBD
12 Wuhan Wuhan Menghu Garden Phase III C Subsidiary 100% 30,008 28,387 1,621 Planning completed Dec/2015
Wuhan Menghu Garden Phase III A 17,669 17,669 Planning completed Sep/2016
13 Wuhan Wuhan Changqing Garden Phase IX Area 6 South District Phase II Joint venture 60% 208,654 158,684 49,970 Planning completed Sep/2017
Wuhan Changqing Garden Phase IX Area 6 North District 446,647 346,520 10,927 89,200 Planning completed Mar/2018
Wuhan Changqing Garden Phase IX Area 7 363,550 174,220 47,830 14,100 127,400 Under planning Dec/2019
Wuhan Changqing Garden Phase IX Area 8 310,800 234,000 76,800 Under planning Dec/2019
Wuhan Changqing Garden Remaining Phases 250,040 85,506 68,634 74,000 21,900 Under planning TBD
14 Wuhan Wuhan New World Centre Phase III Subsidiary 100% 136,650 31,805 59,432 45,413 Planning completed Feb/2018
15 Wuhan Wuhan Guanggu New World Subsidiary 100% 338,324 49,372 132,269 62,269 94,414 Planning completed Jan/2017
16 Wuhan Wuhan New World • Times Subsidiary 100% 658,251 238,805 26,000 250,000 143,446 Under planning TBD
17 Changsha Changsha La Ville New World Phase III B Subsidiary 48% 122,806 68,261 24,058 30,487 Under development Dec/2016
Changsha La Ville New World Phase IV 422,389 377,767 7,239 37,383 Under planning TBD
18 Yiyang Yiyang New World Scenic Heights Phase I A Subsidiary 100% 8,652 5,889 2,763 Under development Dec/2015
Yiyang New World Scenic Heights Phase I B 31,762 13,863 17,899 Under planning Dec/2016
Yiyang New World Scenic Heights Phase I C 12,573 12,573 Under development Jun/2016
Yiyang New World Scenic Heights Phase II 55,372 42,589 1,800 10,983 Under planning Jun/2017
Yiyang New World Scenic Heights Phase III 232,540 126,885 56,212 49,443 Under planning Dec/2017
Yiyang New World Scenic Heights Remaining Phases 16,442 12,067 2,109 2,266 Under planning TBD

Annual Report 2015 249
NWCL's
Accounting
NWCL's
Attributable Total GFA Residential Commercial Office Hotel
Carpark
and others Expected
completion dateNO Region Project name Classification Interest (sq m) (sq m) (sq m) (sq m) (sq m) (sq m) Development status
Projects under development/held for development
1 Beijing Beijing New View Garden Remaining Phases Joint venture 70% 22,561 2,223 12,629 7,709 Under planning TBD
Beijing New View Garden Commercial Centre 39,653 16,531 8,052 15,070 Under planning Mar/2018
2 Beijing Beijing Xin Yu Garden Remaining Phases Joint venture 70% 605,600 251,000 99,800 135,100 119,700 Under planning TBD
Beijing Xin Yu Garden Commercial Centre 89,620 60,925 28,695 Under planning Dec/2018
3 Beijing Beijing Yuzhuang Project Phase II Subsidiary 75% 101,616 101,616 Under development Jun/2017
4 Langfang Langfang New World Centre District C1 Subsidiary 100% 126,768 55,546 6,251 40,086 24,885 Under development Sep/2015
Langfang New World Centre District A and C2 234,313 83,975 52,942 46,951 50,445 Under development Jun/2016
5 Langfang Langfang New World Garden District 3 Subsidiary 100% 119,317 101,319 17,998 Under development Dec/2015
Langfang New World Garden District 1 120,785 89,615 5,722 25,448 Under development Jul/2016
Langfang New World Garden District 2 99,060 68,138 7,264 23,658 Under development May/2017
6 Tangshan Tangshan New World Centre Phase II Subsidiary 100% 156,914 23,203 37,447 48,768 47,496 Under development Oct/2015
7 Jinan Jinan New World Sunshine Garden Remaining Portion Subsidiary 100% 78,144 2,604 31,695 18,729 25,116 Under development Oct/2016
8 Shenyang Shenyang New World Garden Phase I West District A Subsidiary 100% 53,434 5,471 38,435 9,528 Under development Jun/2016
Shenyang New World Garden Phase II D 655,855 455,974 20,439 179,442 Under development Jun/2018
Shenyang New World Garden Remaining Phases 849,280 533,784 50,211 265,285 Under planning TBD
9 Shenyang Shenyang New World Centre — Expo Subsidiary 100% 119,475 119,475 Under development Sep/2016
Shenyang New World Centre Phase I and II 883,796 308,691 327,201 133,637 114,267 Under development Sep/2016
Shenyang New World Centre Remaining Phases 238,092 238,092 Under planning TBD
10 Shenyang Shenyang New World Commercial Centre Phase II Subsidiary 100% 96,026 25,266 51,406 19,354 Under planning TBD
11 Anshan Anshan New World Garden Phase III A Subsidiary 100% 145,748 84,087 15,936 45,725 Under development Jun/2016
Anshan New World Garden Phase III B 139,582 86,564 13,287 39,731 Under development Jun/2017
Anshan New World Garden Remaining Phases 687,238 498,734 13,312 175,192 Under planning TBD
12 Wuhan Wuhan Menghu Garden Phase III C Subsidiary 100% 30,008 28,387 1,621 Planning completed Dec/2015
Wuhan Menghu Garden Phase III A 17,669 17,669 Planning completed Sep/2016
13 Wuhan Wuhan Changqing Garden Phase IX Area 6 South District Phase II Joint venture 60% 208,654 158,684 49,970 Planning completed Sep/2017
Wuhan Changqing Garden Phase IX Area 6 North District 446,647 346,520 10,927 89,200 Planning completed Mar/2018
Wuhan Changqing Garden Phase IX Area 7 363,550 174,220 47,830 14,100 127,400 Under planning Dec/2019
Wuhan Changqing Garden Phase IX Area 8 310,800 234,000 76,800 Under planning Dec/2019
Wuhan Changqing Garden Remaining Phases 250,040 85,506 68,634 74,000 21,900 Under planning TBD
14 Wuhan Wuhan New World Centre Phase III Subsidiary 100% 136,650 31,805 59,432 45,413 Planning completed Feb/2018
15 Wuhan Wuhan Guanggu New World Subsidiary 100% 338,324 49,372 132,269 62,269 94,414 Planning completed Jan/2017
16 Wuhan Wuhan New World • Times Subsidiary 100% 658,251 238,805 26,000 250,000 143,446 Under planning TBD
17 Changsha Changsha La Ville New World Phase III B Subsidiary 48% 122,806 68,261 24,058 30,487 Under development Dec/2016
Changsha La Ville New World Phase IV 422,389 377,767 7,239 37,383 Under planning TBD
18 Yiyang Yiyang New World Scenic Heights Phase I A Subsidiary 100% 8,652 5,889 2,763 Under development Dec/2015
Yiyang New World Scenic Heights Phase I B 31,762 13,863 17,899 Under planning Dec/2016
Yiyang New World Scenic Heights Phase I C 12,573 12,573 Under development Jun/2016
Yiyang New World Scenic Heights Phase II 55,372 42,589 1,800 10,983 Under planning Jun/2017
Yiyang New World Scenic Heights Phase III 232,540 126,885 56,212 49,443 Under planning Dec/2017
Yiyang New World Scenic Heights Remaining Phases 16,442 12,067 2,109 2,266 Under planning TBD

New World China Land Limited 250
MAJOR PROJECTS PROFILE
NWCL's
Accounting
NWCL's
Attributable Total GFA Residential Commercial Office Hotel
Carpark
and others Expected
completion dateNO Region Project name Classification Interest (sq m) (sq m) (sq m) (sq m) (sq m) (sq m) Development status
Projects under development/held for development
19 Chengdu Chengdu New World Riverside Phase II 1A Subsidiary 30% 220,223 134,783 85,440 Under development Jun/2016
Chengdu New World Riverside Phase II 1B 360,262 234,423 1,122 124,717 Under development Apr/2018
Chengdu New World Riverside Phase II 2A and 2B 266,665 161,958 104,707 Under development Apr/2018
Chengdu New World Plaza 387,926 26,603 150,610 60,987 149,726 Planning completed Sep/2018
Chengdu New World Riverside Remaining Phases 2,389,687 1,774,585 615,102 Under planning TBD
20 Guiyang Guiyang Jinyang Sunny Town Phase II B Remaining Portion Subsidiary 50% 10,203 10,203 Under development TBD
Guiyang Jinyang Sunny Town Phase II C 434,726 325,758 11,454 97,514 Under development Jun/2016
Guiyang Jinyang Sunny Town Phase II E 232,889 232,889 Under development Jul/2018
Guiyang Jinyang Sunny Town Phase III A 66,943 45,395 563 20,985 Under development Apr/2016
Guiyang Jinyang Sunny Town Phase IV A 84,047 64,937 19,110 Under development Dec/2016
Guiyang Jinyang Sunny Town Remaining Phases 3,039,127 1,624,647 261,753 466,090 686,637 Under planning TBD
21 Guangzhou Guangzhou Dong Yi Garden Phase V Subsidiary 100% 26,128 22,940 3,188 Under development Jun/2017
22 Guangzhou Guangzhou Covent Garden Phase III Subsidiary 100% 113,457 87,204 26,253 Under development Aug/2015
Guangzhou Covent Garden Phase III 7,788 7,788 Under development Dec/2015
Guangzhou Covent Garden Phase III Remaining Portion 345,847 283,538 62,309 Under development Oct/2016
Guangzhou Covent Garden Remaining Phases 385,715 318,813 38,587 28,315 Planning completed TBD
23 Guangzhou Guangzhou Park Paradise Phase III B Subsidiary 100% 84,957 5,047 63,494 16,416 Under development Apr/2018
Guangzhou Park Paradise Phase V A 282,330 128,298 77,853 76,179 Under development Jul/2018
Guangzhou Park Paradise Phase V B 48,591 42,369 6,222 Planning completed Nov/2019
Guangzhou Park Paradise Remaining Phases 121,430 87,339 25,033 9,058 Under planning TBD
24 Foshan Canton First Estate Phase II (CF19B) Subsidiary 85% 85,826 49,074 36,752 Under development Dec/2016
Canton First Estate Phase II (CF20) 86,617 86,617 Under development Jun/2017
Canton First Estate Remaining Phases 835,944 750,507 85,437 Under planning TBD
25 Zhaoqing Zhaoqing New World Garden Phase III Remaining Portion Subsidiary 100% 81,960 75,523 2,862 3,575 Under development Jun/2016
26 Huiyang Huiyang Hu Xia Liao Project Subsidiary 100% 162,717 162,717 Under planning TBD
27 Huiyang Huiyang Palm Island Resort Remaining Phases Subsidiary 100% 211,063 211,063 Under planning TBD
28 Huizhou Huizhou Changhuyuan Phase IV Joint venture 63% 91,830 67,070 24,760 Under planning TBD
29 Haikou Haikou New World • Meilisha Phase II (#0102) Subsidiary 100% 119,153 87,781 2,147 29,225 Under development Nov/2016
Haikou New World • Meilisha Phase II (#03) 41,524 30,643 10,881 Planning completed Sep/2017
Haikou New World • Meilisha Phase II (#1801) 197,182 129,034 68,148 Under development Mar/2018
Haikou New World • Meilisha K11 (#1902) 129,002 66,792 62,210 Under development Sep/2017
Haikou New World • Meilisha Remaining Phases 2,074,774 1,287,659 19,629 174,686 592,800 Under planning TBD
30 Ningbo Ningbo New World Plaza Phase I Joint venture 49% 260,212 139,595 42,556 53,549 24,512 Under development May/2019
Ningbo New World Plaza Remaining Phases 373,524 102,144 147,232 31,863 92,285 Under planning TBD
Total (Projects under development/ held for development) 22,986,275 13,125,693 2,143,142 1,726,935 762,256 5,228,249

Annual Report 2015 251
NWCL's
Accounting
NWCL's
Attributable Total GFA Residential Commercial Office Hotel
Carpark
and others Expected
completion dateNO Region Project name Classification Interest (sq m) (sq m) (sq m) (sq m) (sq m) (sq m) Development status
Projects under development/held for development
19 Chengdu Chengdu New World Riverside Phase II 1A Subsidiary 30% 220,223 134,783 85,440 Under development Jun/2016
Chengdu New World Riverside Phase II 1B 360,262 234,423 1,122 124,717 Under development Apr/2018
Chengdu New World Riverside Phase II 2A and 2B 266,665 161,958 104,707 Under development Apr/2018
Chengdu New World Plaza 387,926 26,603 150,610 60,987 149,726 Planning completed Sep/2018
Chengdu New World Riverside Remaining Phases 2,389,687 1,774,585 615,102 Under planning TBD
20 Guiyang Guiyang Jinyang Sunny Town Phase II B Remaining Portion Subsidiary 50% 10,203 10,203 Under development TBD
Guiyang Jinyang Sunny Town Phase II C 434,726 325,758 11,454 97,514 Under development Jun/2016
Guiyang Jinyang Sunny Town Phase II E 232,889 232,889 Under development Jul/2018
Guiyang Jinyang Sunny Town Phase III A 66,943 45,395 563 20,985 Under development Apr/2016
Guiyang Jinyang Sunny Town Phase IV A 84,047 64,937 19,110 Under development Dec/2016
Guiyang Jinyang Sunny Town Remaining Phases 3,039,127 1,624,647 261,753 466,090 686,637 Under planning TBD
21 Guangzhou Guangzhou Dong Yi Garden Phase V Subsidiary 100% 26,128 22,940 3,188 Under development Jun/2017
22 Guangzhou Guangzhou Covent Garden Phase III Subsidiary 100% 113,457 87,204 26,253 Under development Aug/2015
Guangzhou Covent Garden Phase III 7,788 7,788 Under development Dec/2015
Guangzhou Covent Garden Phase III Remaining Portion 345,847 283,538 62,309 Under development Oct/2016
Guangzhou Covent Garden Remaining Phases 385,715 318,813 38,587 28,315 Planning completed TBD
23 Guangzhou Guangzhou Park Paradise Phase III B Subsidiary 100% 84,957 5,047 63,494 16,416 Under development Apr/2018
Guangzhou Park Paradise Phase V A 282,330 128,298 77,853 76,179 Under development Jul/2018
Guangzhou Park Paradise Phase V B 48,591 42,369 6,222 Planning completed Nov/2019
Guangzhou Park Paradise Remaining Phases 121,430 87,339 25,033 9,058 Under planning TBD
24 Foshan Canton First Estate Phase II (CF19B) Subsidiary 85% 85,826 49,074 36,752 Under development Dec/2016
Canton First Estate Phase II (CF20) 86,617 86,617 Under development Jun/2017
Canton First Estate Remaining Phases 835,944 750,507 85,437 Under planning TBD
25 Zhaoqing Zhaoqing New World Garden Phase III Remaining Portion Subsidiary 100% 81,960 75,523 2,862 3,575 Under development Jun/2016
26 Huiyang Huiyang Hu Xia Liao Project Subsidiary 100% 162,717 162,717 Under planning TBD
27 Huiyang Huiyang Palm Island Resort Remaining Phases Subsidiary 100% 211,063 211,063 Under planning TBD
28 Huizhou Huizhou Changhuyuan Phase IV Joint venture 63% 91,830 67,070 24,760 Under planning TBD
29 Haikou Haikou New World • Meilisha Phase II (#0102) Subsidiary 100% 119,153 87,781 2,147 29,225 Under development Nov/2016
Haikou New World • Meilisha Phase II (#03) 41,524 30,643 10,881 Planning completed Sep/2017
Haikou New World • Meilisha Phase II (#1801) 197,182 129,034 68,148 Under development Mar/2018
Haikou New World • Meilisha K11 (#1902) 129,002 66,792 62,210 Under development Sep/2017
Haikou New World • Meilisha Remaining Phases 2,074,774 1,287,659 19,629 174,686 592,800 Under planning TBD
30 Ningbo Ningbo New World Plaza Phase I Joint venture 49% 260,212 139,595 42,556 53,549 24,512 Under development May/2019
Ningbo New World Plaza Remaining Phases 373,524 102,144 147,232 31,863 92,285 Under planning TBD
Total (Projects under development/ held for development) 22,986,275 13,125,693 2,143,142 1,726,935 762,256 5,228,249

New World China Land Limited 252
MAJOR PROJECTS PROFILE
NWCL's
Accounting
NWCL's
Attributable Total GFA Residential Commercial Office Hotel Carpark and others
NO Region Project name Classification Interest (sq m) (sq m) (sq m) (sq m) (sq m) (sq m)
Completed Investment Properties
31 Beijing Beijing New World Centre Phase I Joint venture 70% 94,188 74,232 19,956
32 Beijing Beijing New World Centre Phase II Joint venture 70% 73,392 46,378 27,014
33 Beijing Beijing Zhengren Building Joint venture 70% 16,415 16,415
34 Beijing Beijing New World Garden Joint venture 70% 34,544 34,544
Beijing Xin Yang Commercial Building 3,439 3,439
Beijing Xin Cheng Commercial Building 8,051 8,051
35 Beijing Beijing Xin Yi Garden Joint venture 70% 52,358 52,358
1a Beijing Beijing New View Garden Joint venture 70% 11,398 11,398
2a Beijing Beijing Xin Yu Garden Joint venture 70% 24,800 3,603 21,197
36 Beijing Beijing Xin Kang Garden Joint venture 70% 39,910 11,725 28,185
37 Beijing Beijing Baoding Building Shopping Arcade Subsidiary 100% 62,286 40,286 22,000
38 Tianjin Tianjin Xin An New World Plaza Subsidiary 100% 96,181 78,283 6,614 11,284
39 Tianjin Tianjin New World Garden Subsidiary 100% 7,395 7,395
40 Tianjin Tianjin Glorious Place Subsidiary 100% 25,661 25,661
7a Jinan Jinan New World Sunshine Garden Subsidiary 100% 26,905 7,830 19,075
8a Shenyang Shenyang New World Garden Subsidiary 100% 308,833 10,584 298,249
10a Shenyang Shenyang New World Commercial Centre Subsidiary 100% 9,473 9,473
11a Anshan Anshan New World Garden Subsidiary 100% 56,198 4,509 51,689
41 Dalian Dalian New World Plaza Subsidiary 88% 69,196 49,413 19,783
42 Dalian Dalian New World Tower Subsidiary 100% 48,982 27,067 21,915
43 Shanghai Shanghai Hong Kong New World Tower Joint venture 50% 130,385 35,474 80,549 14,362
44 Shanghai Shanghai Ramada Plaza Subsidiary 100% 34,340 20,743 13,597
Shanghai Belvedere Service Apartment 37,935 37,935
45 Shanghai Shanghai Jiu Zhou Shopping Arcade Subsidiary 100% 129 129
46 Wuhan Wuhan New World International Trade Tower I Subsidiary 100% 121,828 104,556 17,272
Wuhan New World International Trade Tower II 10,005 10,005
14a Wuhan Wuhan New World Centre Subsidiary 100% 82,317 45,766 8,657 27,894
Wuhan New World Centre Joint venture 60% 6,202 563 5,639
47 Wuhan Wuhan K11 Gourmet Tower Subsidiary 100% 20,947 10,367 10,580
15 Wuhan Wuhan Guanggu New World Subsidiary 100% 362 362
13a Wuhan Wuhan Changqing Garden Joint venture 60% 91,097 62,710 3,151 25,236
48 Wuhan Wuhan Xin Hua Garden Joint venture 60% 71,769 36,069 35,700
17a Changsha Changsha La Ville New World Phase I Subsidiary 48% 7,315 386 6,929
19a Chengdu Chengdu New World Riverside Phase I Subsidiary 30% 39,064 39,064
49 Nanjing Nanjing New World Centre Subsidiary 100% 52,794 41,712 11,082
20a Guiyang Guiyang Jinyang Sunny Town Subsidiary 50% 155,283 80,142 75,141
21a Guangzhou Guangzhou Dong Yi Garden Subsidiary 100% 13,616 8,221 5,395
50 Guangzhou Guangzhou New World Oriental Garden Subsidiary 100% 34,159 21,787 12,372
51 Guangzhou Guangzhou Central Park-view Subsidiary 91% 67,187 29,868 17,408 19,911
22a Guangzhou Guangzhou Covent Garden Subsidiary 100% 30,432 22,669 7,763
23 Guangzhou Guangzhou Park Paradise Subsidiary 100% 92,315 22,112 15,708 54,495

Annual Report 2015 253
NWCL's
Accounting
NWCL's
Attributable Total GFA Residential Commercial Office Hotel Carpark and others
NO Region Project name Classification Interest (sq m) (sq m) (sq m) (sq m) (sq m) (sq m)
Completed Investment Properties
31 Beijing Beijing New World Centre Phase I Joint venture 70% 94,188 74,232 19,956
32 Beijing Beijing New World Centre Phase II Joint venture 70% 73,392 46,378 27,014
33 Beijing Beijing Zhengren Building Joint venture 70% 16,415 16,415
34 Beijing Beijing New World Garden Joint venture 70% 34,544 34,544
Beijing Xin Yang Commercial Building 3,439 3,439
Beijing Xin Cheng Commercial Building 8,051 8,051
35 Beijing Beijing Xin Yi Garden Joint venture 70% 52,358 52,358
1a Beijing Beijing New View Garden Joint venture 70% 11,398 11,398
2a Beijing Beijing Xin Yu Garden Joint venture 70% 24,800 3,603 21,197
36 Beijing Beijing Xin Kang Garden Joint venture 70% 39,910 11,725 28,185
37 Beijing Beijing Baoding Building Shopping Arcade Subsidiary 100% 62,286 40,286 22,000
38 Tianjin Tianjin Xin An New World Plaza Subsidiary 100% 96,181 78,283 6,614 11,284
39 Tianjin Tianjin New World Garden Subsidiary 100% 7,395 7,395
40 Tianjin Tianjin Glorious Place Subsidiary 100% 25,661 25,661
7a Jinan Jinan New World Sunshine Garden Subsidiary 100% 26,905 7,830 19,075
8a Shenyang Shenyang New World Garden Subsidiary 100% 308,833 10,584 298,249
10a Shenyang Shenyang New World Commercial Centre Subsidiary 100% 9,473 9,473
11a Anshan Anshan New World Garden Subsidiary 100% 56,198 4,509 51,689
41 Dalian Dalian New World Plaza Subsidiary 88% 69,196 49,413 19,783
42 Dalian Dalian New World Tower Subsidiary 100% 48,982 27,067 21,915
43 Shanghai Shanghai Hong Kong New World Tower Joint venture 50% 130,385 35,474 80,549 14,362
44 Shanghai Shanghai Ramada Plaza Subsidiary 100% 34,340 20,743 13,597
Shanghai Belvedere Service Apartment 37,935 37,935
45 Shanghai Shanghai Jiu Zhou Shopping Arcade Subsidiary 100% 129 129
46 Wuhan Wuhan New World International Trade Tower I Subsidiary 100% 121,828 104,556 17,272
Wuhan New World International Trade Tower II 10,005 10,005
14a Wuhan Wuhan New World Centre Subsidiary 100% 82,317 45,766 8,657 27,894
Wuhan New World Centre Joint venture 60% 6,202 563 5,639
47 Wuhan Wuhan K11 Gourmet Tower Subsidiary 100% 20,947 10,367 10,580
15 Wuhan Wuhan Guanggu New World Subsidiary 100% 362 362
13a Wuhan Wuhan Changqing Garden Joint venture 60% 91,097 62,710 3,151 25,236
48 Wuhan Wuhan Xin Hua Garden Joint venture 60% 71,769 36,069 35,700
17a Changsha Changsha La Ville New World Phase I Subsidiary 48% 7,315 386 6,929
19a Chengdu Chengdu New World Riverside Phase I Subsidiary 30% 39,064 39,064
49 Nanjing Nanjing New World Centre Subsidiary 100% 52,794 41,712 11,082
20a Guiyang Guiyang Jinyang Sunny Town Subsidiary 50% 155,283 80,142 75,141
21a Guangzhou Guangzhou Dong Yi Garden Subsidiary 100% 13,616 8,221 5,395
50 Guangzhou Guangzhou New World Oriental Garden Subsidiary 100% 34,159 21,787 12,372
51 Guangzhou Guangzhou Central Park-view Subsidiary 91% 67,187 29,868 17,408 19,911
22a Guangzhou Guangzhou Covent Garden Subsidiary 100% 30,432 22,669 7,763
23 Guangzhou Guangzhou Park Paradise Subsidiary 100% 92,315 22,112 15,708 54,495

New World China Land Limited 254
MAJOR PROJECTS PROFILE
NWCL's
Accounting
NWCL's
Attributable Total GFA Residential Commercial Office Hotel Carpark and others
NO Region Project name Classification Interest (sq m) (sq m) (sq m) (sq m) (sq m) (sq m)
Completed Investment Properties
52 Guangzhou Guangzhou Park Paradise Area 6 Subsidiary 100% 22,438 22,438
53 Guangzhou Guangzhou Xintang New World Garden Joint venture 63% 81,549 22,886 58,663
54 Shenzhen Shenzhen New World Yi Shan Garden Subsidiary 100% 38,925 38,925
55 Shenzhen Shenzhen New World Signature Hill Subsidiary 100% 8,017 8,017
56 Shunde Shunde New World Centre Joint venture 42% 48,517 33,577 14,940
25a Zhaoqing Zhaoqing New World Garden Subsidiary 100% 16,662 15,062 1,600
28a Huizhou Huizhou Changhuyuan Joint venture 63% 30,298 354 29,944
57 Haikou Haikou New World Garden Phase III Subsidiary 100% 5,107 5,107
4a Langfang Langfang New World Centre District B Subsidiary 100% 7,498 5,747 1,751
24a Foshan Canton First Estate Phase I (CF19A) Subsidiary 85% 24,606 11,039 13,567
Subtotal 2,452,703 100,954 876,850 214,095 — 1,260,804
NWCL's
Accounting
NWCL's
Attributable Total GFA Residential Commercial Office Hotel Carpark and others
NO Region Project name Classification Interest (sq m) (sq m) (sq m) (sq m) (sq m) (sq m)
Completed hotel properties
58 Beijing pentahotel Beijing Joint venture 55% 23,988 23,988
59 Beijing New World Beijing Hotel Joint venture 70% 53,998 53,998
60 Dalian New World Dalian Hotel Subsidiary 100% 53,248 53,248
61 Shanghai New World Shanghai Hotel Subsidiary 100% 46,942 46,942
62 Shanghai pentahotel Shanghai Subsidiary 100% 13,353 13,353
63 Wuhan New World Wuhan Hotel Joint venture 60% 29,411 29,411
64 Shunde New World Shunde Hotel Joint venture 33% 36,524 36,524
65 Guiyang New World Guiyang Hotel Subsidiary 50% 39,521 39,521
Subtotal 296,985 — — — 296,985 —
Total (Completed investment and hotel properties) 2,749,688 100,954 876,850 214,095 296,985 1,260,804

Annual Report 2015 255
NWCL's
Accounting
NWCL's
Attributable Total GFA Residential Commercial Office Hotel Carpark and others
NO Region Project name Classification Interest (sq m) (sq m) (sq m) (sq m) (sq m) (sq m)
Completed Investment Properties
52 Guangzhou Guangzhou Park Paradise Area 6 Subsidiary 100% 22,438 22,438
53 Guangzhou Guangzhou Xintang New World Garden Joint venture 63% 81,549 22,886 58,663
54 Shenzhen Shenzhen New World Yi Shan Garden Subsidiary 100% 38,925 38,925
55 Shenzhen Shenzhen New World Signature Hill Subsidiary 100% 8,017 8,017
56 Shunde Shunde New World Centre Joint venture 42% 48,517 33,577 14,940
25a Zhaoqing Zhaoqing New World Garden Subsidiary 100% 16,662 15,062 1,600
28a Huizhou Huizhou Changhuyuan Joint venture 63% 30,298 354 29,944
57 Haikou Haikou New World Garden Phase III Subsidiary 100% 5,107 5,107
4a Langfang Langfang New World Centre District B Subsidiary 100% 7,498 5,747 1,751
24a Foshan Canton First Estate Phase I (CF19A) Subsidiary 85% 24,606 11,039 13,567
Subtotal 2,452,703 100,954 876,850 214,095 — 1,260,804
NWCL's
Accounting
NWCL's
Attributable Total GFA Residential Commercial Office Hotel Carpark and others
NO Region Project name Classification Interest (sq m) (sq m) (sq m) (sq m) (sq m) (sq m)
Completed hotel properties
58 Beijing pentahotel Beijing Joint venture 55% 23,988 23,988
59 Beijing New World Beijing Hotel Joint venture 70% 53,998 53,998
60 Dalian New World Dalian Hotel Subsidiary 100% 53,248 53,248
61 Shanghai New World Shanghai Hotel Subsidiary 100% 46,942 46,942
62 Shanghai pentahotel Shanghai Subsidiary 100% 13,353 13,353
63 Wuhan New World Wuhan Hotel Joint venture 60% 29,411 29,411
64 Shunde New World Shunde Hotel Joint venture 33% 36,524 36,524
65 Guiyang New World Guiyang Hotel Subsidiary 50% 39,521 39,521
Subtotal 296,985 — — — 296,985 —
Total (Completed investment and hotel properties) 2,749,688 100,954 876,850 214,095 296,985 1,260,804

New World China Land Limited 256
GLOSSARY OF TERMS
GENERAL TERMS
Company or NWCL: New World China Land Limited
FY: Financial year, 1 July to 30 June
GDP: Gross Domestic Product
GFA: Gross floor area
Group: New World China Land Limited and its subsidiaries
New World Group: New World Development Company Limited and its subsidiaries
HK: Hong Kong
HK$ or HKD: Hong Kong dollar(s), the lawful currency of Hong Kong
LEED: Leadership in Energy and Environmental Design
China, PRC or Mainland China: The People’s Republic of China
R&D: Research and development
RMB or CNY: Renminbi, the lawful currency of The People’s Republic of China
SAR or HKSAR: Special Administrative Region — A status granted to Hong Kong to own an
independent government and legislative system and to enjoy a degree of
autonomy from the PRC Government under the principle of “one country,
two systems”
Stock Exchange: The Stock Exchange of Hong Kong Limited
TBD: To be determined
US or USA: The United States of America
US$ or USD: United States dollar(s), the lawful currency of the United States of America

Annual Report 2015 257
FINANCIAL TERMS
Basic Earnings Per Share or EPS: Profit attributable to equity holders of the Company
Weighted average number of shares in issue during the year
Current Ratio: Current assets
Current liabilities
HIBOR: Hong Kong Interbank Offered Rate
Net Debt: The aggregate of borrowings, net of cash and bank balances
Gearing Ratio: Net debt
Total equity
MEASUREMENT
Cbm: Cubic metre
Km: Kilometre
Sq km: Square kilometre
Sq m: Square metre

New World China Land Limited 258
CORPORATE INFORMATION
BOARD OF DIRECTORS
Executive directorsDr Cheng Kar-shun, Henry
(Chairman and Managing Director)
Mr Cheng Kar-shing, Peter
Dr Cheng Chi-kong, Adrian
Ms Cheng Chi-man, Sonia
Mr Cheng Chi-him, Conrad
Mr Fong Shing-kwong, Michael
Ms Ngan Man-ying, Lynda
Independent non-executive directorsDr Cheng Wai-chee, Christopher
Hon Tien Pei-chun, James
Mr Lee Luen-wai, John
Mr Ip Yuk-keung, Albert
COMPANY SECRETARY
Ms Ngan Man-ying, Lynda
AUDITOR
PricewaterhouseCoopers
REGISTERED OFFICE
P.O. Box 309
Ugland House
Grand Cayman KY1-1104
Cayman Islands
HEAD OFFICE AND PRINCIPAL PLACE OF BUSINESS IN HONG KONG
9/F., New World Tower 1
18 Queen’s Road Central
Hong Kong
PRINCIPAL BANKERS
Agricultural Bank of China Ltd
Bank of China (Hong Kong) Limited
Bank of Communications Co., Ltd.
The Bank of East Asia, Limited
China Merchants Bank Co., Limited
Hang Seng Bank Limited
The Hongkong and Shanghai Banking
Corporation Limited
Sumitomo Mitsui Banking Corporation

Annual Report 2015 259
PRINCIPAL SHARE REGISTRAR AND TRANSFER OFFICE
Royal Bank of Canada Trust Company (Cayman) Limited
4/F., Royal Bank House
24 Shedden Road
George Town
Grand Cayman KY1-1110
Cayman Islands
HONG KONG BRANCH SHARE REGISTRAR AND TRANSFER OFFICE
Tricor Standard Limited
Level 22, Hopewell Centre
183 Queen’s Road East
Hong Kong
STOCK CODE
Hong Kong Stock Exchange 00917
INVESTOR INFORMATION
For more information about the Group
please contact
the Corporate Communications Department at:
New World China Land Limited
9/F., New World Tower 1
18 Queen’s Road Central
Hong Kong
Tel: (852) 2131 0201
Fax: (852) 2131 0216
Email: [email protected]
WEBSITE
www.nwcl.com.hk

Chinese Version
The Chinese version of this Annual Report is available on request from New World China Land Limited.
Where the English and the Chinese texts conflict, the English text prevails.
© New World China Land Limited 2015

The design concept of this annual report has stemmed from the culture of Chinese surnames.
Historical Chinese literatures and the emergence of the oracle have revealed that China is one of the earliest country that uses surnames. Records of Chinese ethnic
surnames trace back to “The Hundred Family Names” from the Song Dynasty, which chronicles the development
and history of the Chinese culture.
DESIGNCONCEPT
Surnames are symbolic of continuing bloodlines and transmission of heritage within Chinese clans. Surnames,
families, and clans are the carriers of millennia of Chinese civilisation. Traditionally, Chinese society places high
importance on families. The culture of surnames upholds the common origins of an extended family and highlights
the concept of clans. The art pieces themed around the surnames “Ye” and “Fang” featured in the cover page and
inserts of the annual report are commissioned works created by the young Beijing artist Xia Hang. Amongst his works
“Ru Ri Fang Sheng” (Rising like the Sun) originates from the surname “Fang” (which also mean “square”), has nearly
4,700 years of history; it is an artistic musical box made of 50 wheel gears. The second work, named “Jin Zhi Yu Ye”
(Golden Branches and Jade Leaves) is inspired by the family name “Ye”; it takes on the solemnity inherited by royal
descendants and is presented in the shape of maple leaves. Both pieces have been set with 18K gold wheels gears
and are handcrafted by the skillful artisan of Chow Tai Fook Jewellery. They are now on display at the clubhouse of
New World Signature Hill in Shenzhen.
As the Group is developing in many cities in Mainland China, the theme of the design has based on the most
common surnames of northern (Zhang), north eastern (Jin), central (Luo) and southern China (Chen). Using Chinese
idioms that consist of these four surnames, the Group invited young designers from Mainland China and Hong Kong
to produce artworks based on the unique meanings of these four surnames with their creative designs. The designs
demonstrate the imagination of NWCL and echoes with the corporate branding of the New World Group — “At New
World, We Are All Artisans!”, where contemporary meets heritage.

Annual Report 2015
MISSION(Stock Code: 00917)
Annual Report 2015
Our residential communities are fully equipped
with high quality facilities and multi-purpose
spaces which rede�ne aesthetic standards
and a new way of living. We enable owners
and residents to experience the exquisite
and sensual lifestyle enjoyed by
home buyers around
the world.
We have developed large-scale multi-
purpose commercial complexes, all
well-recognised city landmarks that generate
new business opportunities and
breathe new life into throbbing
hearts of Chinese
metropolitans.
We have dedicated ourselves in rejuvenating old
city neighbourhood through comprehensive
redevelopment plans. As a living embodiment of
China’s cosmopolitan life, these mixed-use redevel-
opments have been undertaken to rejuvenate the
old city into vibrant communities character-
ised by eclectic urban housing, ample
public space, shopping, entertain-
ment and leisure facilities.
We pride ourselves on having created
large-scale self contained communities
that nurture family living and
promote a healthy cultural
and social life.
TRANSFORMINGCITY VISTAS
SPURRINGBUSINESS
OPPORTUNITIESREFINING LIVING
LIFESTYLE
CREATING MODERN COMMUNITIES