contents - HKEXnews
30
-
Upload
khangminh22 -
Category
Documents
-
view
3 -
download
0
Transcript of contents - HKEXnews
Playmates Toys Limited(Incorporated in Bermuda with limited liability)
(Stock code 869)www.playmatestoys.com
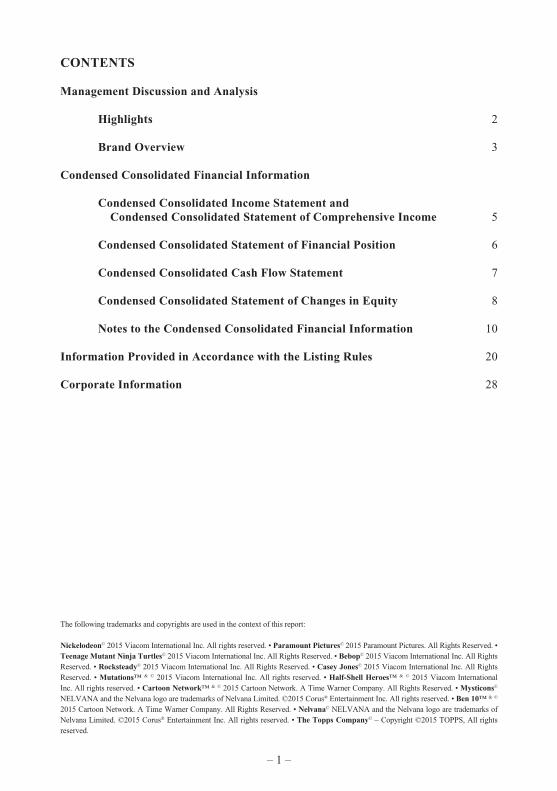
CONTENTS
Management Discussion and Analysis
Highlights 2
Brand Overview 3
Condensed Consolidated Financial Information
Condensed Consolidated Income Statement and Condensed Consolidated Statement of Comprehensive Income 5
Condensed Consolidated Statement of Financial Position 6
Condensed Consolidated Cash Flow Statement 7
Condensed Consolidated Statement of Changes in Equity 8
Notes to the Condensed Consolidated Financial Information 10
Information Provided in Accordance with the Listing Rules 20
Corporate Information 28
The following trademarks and copyrights are used in the context of this report:
Nickelodeon© 2015 Viacom International Inc. All rights reserved. • Paramount Pictures© 2015 Paramount Pictures. All Rights Reserved. • Teenage Mutant Ninja Turtles© 2015 Viacom International Inc. All Rights Reserved. • Bebop© 2015 Viacom International Inc. All Rights Reserved. • Rocksteady© 2015 Viacom International Inc. All Rights Reserved. • Casey Jones© 2015 Viacom International Inc. All Rights Reserved. • Mutations™ & © 2015 Viacom International Inc. All rights reserved. • Half-Shell Heroes™ & © 2015 Viacom International Inc. All rights reserved. • Cartoon Network™ & © 2015 Cartoon Network. A Time Warner Company. All Rights Reserved. • Mysticons© NELVANA and the Nelvana logo are trademarks of Nelvana Limited. ©2015 Corus® Entertainment Inc. All rights reserved. • Ben 10™ & © 2015 Cartoon Network. A Time Warner Company. All Rights Reserved. • Nelvana© NELVANA and the Nelvana logo are trademarks of Nelvana Limited. ©2015 Corus® Entertainment Inc. All rights reserved. • The Topps Company© – Copyright ©2015 TOPPS, All rights reserved.
– 1 –
MANAGEMENT DISCUSSION AND ANALYSIS
Highlights
For the six months ended 30 June2015
HK$’0002014
HK$’000
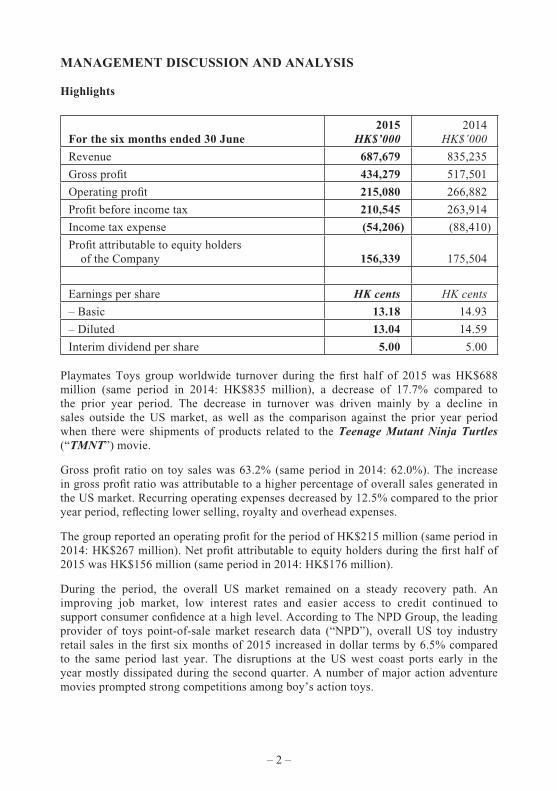
Revenue 687,679 835,235
Gross profi t 434,279 517,501
Operating profi t 215,080 266,882
Profi t before income tax 210,545 263,914
Income tax expense (54,206) (88,410)
Profi t attributable to equity holders of the Company 156,339 175,504
Earnings per share HK cents HK cents
– Basic 13.18 14.93
– Diluted 13.04 14.59
Interim dividend per share 5.00 5.00
Playmates Toys group worldwide turnover during the fi rst half of 2015 was HK$688 million (same period in 2014: HK$835 million), a decrease of 17.7% compared to the prior year period. The decrease in turnover was driven mainly by a decline in sales outside the US market, as well as the comparison against the prior year period when there were shipments of products related to the Teenage Mutant Ninja Turtles (“TMNT”) movie.
Gross profi t ratio on toy sales was 63.2% (same period in 2014: 62.0%). The increase in gross profi t ratio was attributable to a higher percentage of overall sales generated in the US market. Recurring operating expenses decreased by 12.5% compared to the prior year period, refl ecting lower selling, royalty and overhead expenses.
The group reported an operating profi t for the period of HK$215 million (same period in 2014: HK$267 million). Net profi t attributable to equity holders during the fi rst half of 2015 was HK$156 million (same period in 2014: HK$176 million).
During the period, the overall US market remained on a steady recovery path. An improving job market, low interest rates and easier access to credit continued to support consumer confi dence at a high level. According to The NPD Group, the leading provider of toys point-of-sale market research data (“NPD”), overall US toy industry retail sales in the fi rst six months of 2015 increased in dollar terms by 6.5% compared to the same period last year. The disruptions at the US west coast ports early in the year mostly dissipated during the second quarter. A number of major action adventure movies prompted strong competitions among boy’s action toys.
– 2 –
In most international markets, the continued weakness of local currencies against the US dollar had a signifi cant negative impact on US dollar-based businesses, including ours.
In the second half of 2015, we expect competitive pressure will further intensify and ongoing currency headwinds will continue to impact international markets. In addition, comparison against prior year will be more challenging in the second half of 2015 due to the signifi cant boost provided by the blockbuster TMNT movie last summer. Nevertheless, we remain positive in our longer term outlook, driven by the resilience of the TMNT franchise, the release of the second TMNT movie in 2016, as well as the launch of major new brands beginning in 2017.
The Board declared a HK Cents 5 per share interim dividend distribution.
Brand Overview
Teenage Mutant Ninja Turtles
Nickelodeon’s TMNT TV show continues to be popular among the core boys’ audience. Rollout of Season 3 will continue through the end of September in the US, with Season 4 premiering in October 2015 with an exciting new theme. Nickelodeon will also launch an hour-long Half-Shell Heroes TV special this November, developed specifi cally for younger TMNT fans.
Following up on the box offi ce hit last summer, Paramount Pictures will release the next TMNT movie in summer 2016. Lead actors Megan Fox and Will Arnett will return as April O’Neil and Vern Fenwick, respectively, joined by a number of exciting legacy characters in the TMNT universe, including Bebop, Rocksteady and Casey Jones!
Driven by the sustained popularity of the TV show, as well as the introduction of signifi cant new product segments such as Half-Shell Heroes and Mutations, Playmates’ TMNT toys continued to perform well at retail in the US, despite competition from several major action adventure movies released during spring and summer. According to NPD and trade reports, TMNT continued to rank among the top selling boy’s action toy brands in the US and key international markets during the fi rst half of 2015.
– 3 –
New Brands
Ben 10. Playmates Toys will serve as the global master toy partner for Cartoon Network’s re-launch of Ben 10, a powerful franchise with proven ratings and merchandise success around the world. The new Ben 10 animated TV series will premiere in selected markets in fall 2016 and across North America in 2017, followed by the launch of our Ben 10 toy line in fall 2017.
Mysticons. Playmates Toys will be the global master toy partner for Mysticons, a brand new animated Girls Action TV series developed by Nelvana Studio, in partnership with Nickelodeon and The Topps Company. Mysticons will debut globally in 2017.
We remain committed to the proven strategy of focusing our resources and efforts to manage our established brands for long term profi tability, while actively but selectively identifying and acquiring new investment opportunities.
– 4 –
CONDENSED CONSOLIDATED FINANCIAL INFORMATION
Condensed Consolidated Income Statement and Condensed Consolidated Statement of Comprehensive IncomeFor the six months ended 30 June 2015
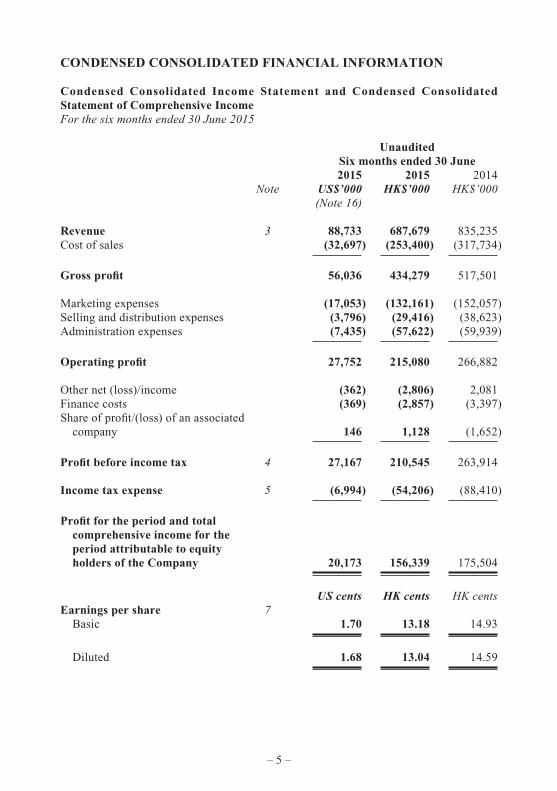
Unaudited Six months ended 30 June 2015 2015 2014 Note US$’000 HK$’000 HK$’000 (Note 16)
Revenue 3 88,733 687,679 835,235Cost of sales (32,697) (253,400) (317,734)
Gross profi t 56,036 434,279 517,501
Marketing expenses (17,053) (132,161) (152,057)Selling and distribution expenses (3,796) (29,416) (38,623)Administration expenses (7,435) (57,622) (59,939)
Operating profi t 27,752 215,080 266,882
Other net (loss)/income (362) (2,806) 2,081Finance costs (369) (2,857) (3,397)Share of profi t/(loss) of an associated company 146 1,128 (1,652)
Profi t before income tax 4 27,167 210,545 263,914
Income tax expense 5 (6,994) (54,206) (88,410)
Profi t for the period and total comprehensive income for the period attributable to equity holders of the Company 20,173 156,339 175,504
US cents HK cents HK centsEarnings per share 7 Basic 1.70 13.18 14.93
Diluted 1.68 13.04 14.59
– 5 –
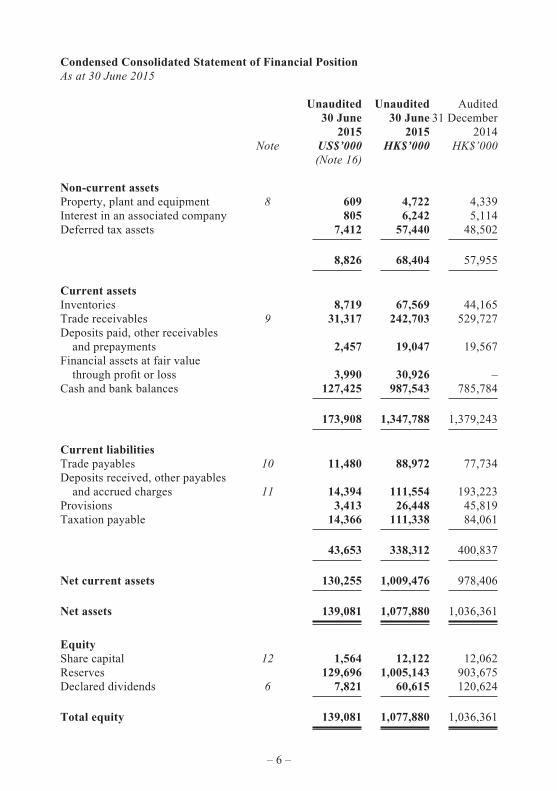
Condensed Consolidated Statement of Financial PositionAs at 30 June 2015
Unaudited Unaudited Audited 30 June 30 June 31 December 2015 2015 2014 Note US$’000 HK$’000 HK$’000 (Note 16)
Non-current assetsProperty, plant and equipment 8 609 4,722 4,339Interest in an associated company 805 6,242 5,114Deferred tax assets 7,412 57,440 48,502
8,826 68,404 57,955
Current assetsInventories 8,719 67,569 44,165Trade receivables 9 31,317 242,703 529,727Deposits paid, other receivables and prepayments 2,457 19,047 19,567Financial assets at fair value through profi t or loss 3,990 30,926 –Cash and bank balances 127,425 987,543 785,784
173,908 1,347,788 1,379,243
Current liabilitiesTrade payables 10 11,480 88,972 77,734Deposits received, other payables and accrued charges 11 14,394 111,554 193,223Provisions 3,413 26,448 45,819Taxation payable 14,366 111,338 84,061
43,653 338,312 400,837
Net current assets 130,255 1,009,476 978,406
Net assets 139,081 1,077,880 1,036,361
EquityShare capital 12 1,564 12,122 12,062Reserves 129,696 1,005,143 903,675Declared dividends 6 7,821 60,615 120,624
Total equity 139,081 1,077,880 1,036,361
– 6 –
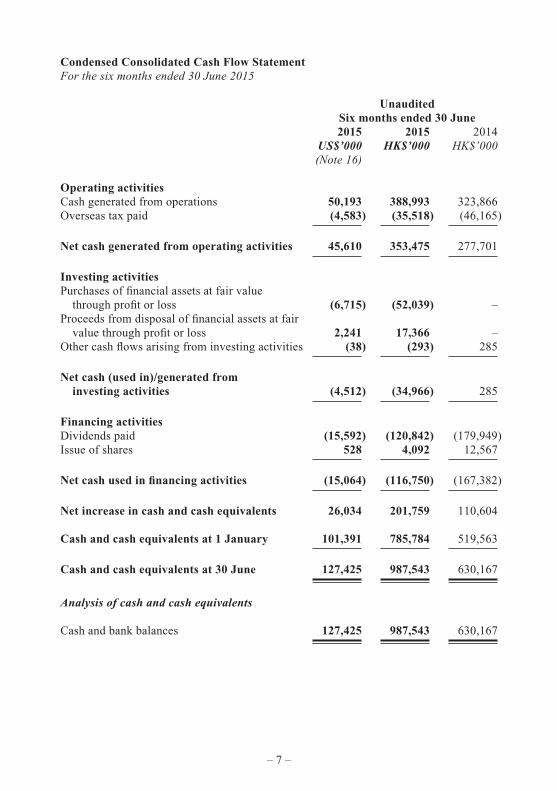
Condensed Consolidated Cash Flow StatementFor the six months ended 30 June 2015
Unaudited Six months ended 30 June 2015 2015 2014 US$’000 HK$’000 HK$’000 (Note 16)
Operating activitiesCash generated from operations 50,193 388,993 323,866Overseas tax paid (4,583) (35,518) (46,165)
Net cash generated from operating activities 45,610 353,475 277,701
Investing activitiesPurchases of fi nancial assets at fair value through profi t or loss (6,715) (52,039) –Proceeds from disposal of fi nancial assets at fair value through profi t or loss 2,241 17,366 –Other cash fl ows arising from investing activities (38) (293) 285
Net cash (used in)/generated from investing activities (4,512) (34,966) 285
Financing activitiesDividends paid (15,592) (120,842) (179,949)Issue of shares 528 4,092 12,567
Net cash used in fi nancing activities (15,064) (116,750) (167,382)
Net increase in cash and cash equivalents 26,034 201,759 110,604
Cash and cash equivalents at 1 January 101,391 785,784 519,563
Cash and cash equivalents at 30 June 127,425 987,543 630,167
Analysis of cash and cash equivalents
Cash and bank balances 127,425 987,543 630,167
– 7 –
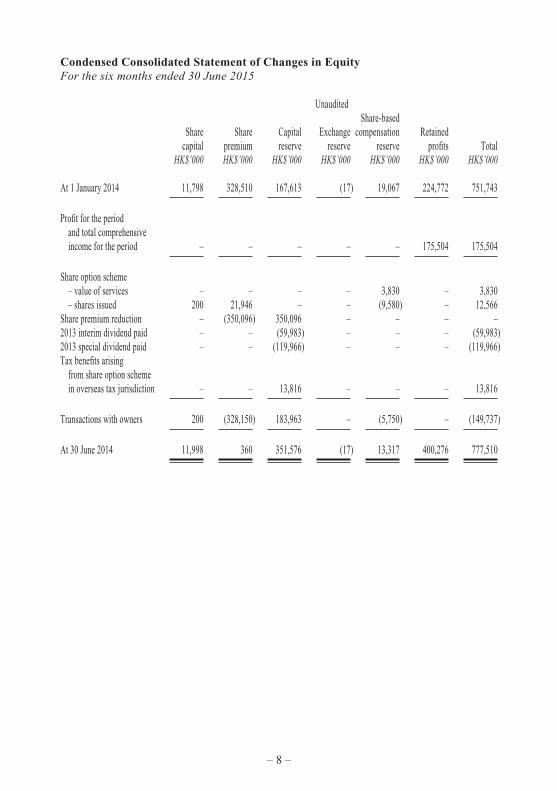
Condensed Consolidated Statement of Changes in EquityFor the six months ended 30 June 2015
Unaudited Share-based Share Share Capital Exchange compensation Retained capital premium reserve reserve reserve profi ts Total HK$’000 HK$’000 HK$’000 HK$’000 HK$’000 HK$’000 HK$’000
At 1 January 2014 11,798 328,510 167,613 (17) 19,067 224,772 751,743
Profi t for the period and total comprehensive income for the period – – – – – 175,504 175,504
Share option scheme – value of services – – – – 3,830 – 3,830 – shares issued 200 21,946 – – (9,580) – 12,566Share premium reduction – (350,096) 350,096 – – – –2013 interim dividend paid – – (59,983) – – – (59,983)2013 special dividend paid – – (119,966) – – – (119,966)Tax benefi ts arising from share option scheme in overseas tax jurisdiction – – 13,816 – – – 13,816
Transactions with owners 200 (328,150) 183,963 – (5,750) – (149,737)
At 30 June 2014 11,998 360 351,576 (17) 13,317 400,276 777,510
– 8 –
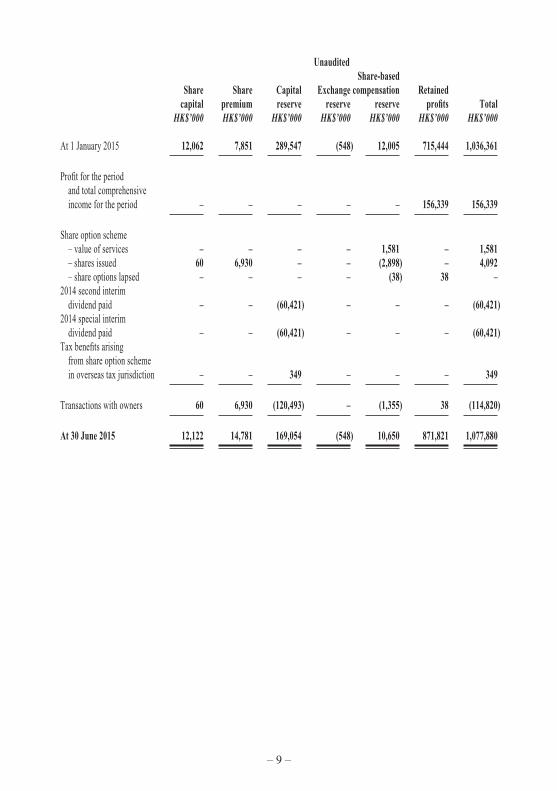
Unaudited Share-based Share Share Capital Exchange compensation Retained capital premium reserve reserve reserve profi ts Total HK$’000 HK$’000 HK$’000 HK$’000 HK$’000 HK$’000 HK$’000
At 1 January 2015 12,062 7,851 289,547 (548) 12,005 715,444 1,036,361
Profi t for the period and total comprehensive income for the period – – – – – 156,339 156,339
Share option scheme – value of services – – – – 1,581 – 1,581 – shares issued 60 6,930 – – (2,898) – 4,092 – share options lapsed – – – – (38) 38 –2014 second interim dividend paid – – (60,421) – – – (60,421)2014 special interim dividend paid – – (60,421) – – – (60,421)Tax benefi ts arising from share option scheme in overseas tax jurisdiction – – 349 – – – 349
Transactions with owners 60 6,930 (120,493) – (1,355) 38 (114,820)
At 30 June 2015 12,122 14,781 169,054 (548) 10,650 871,821 1,077,880
– 9 –
Notes to the Condensed Consolidated Financial Information
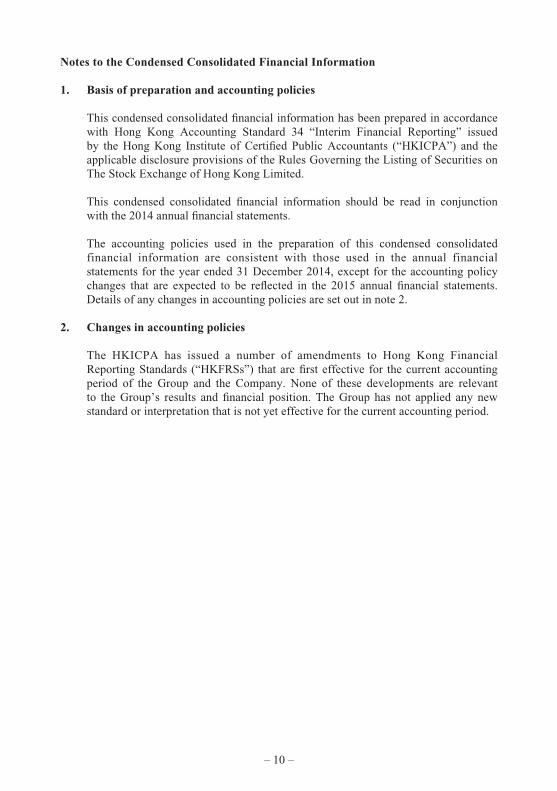
1. Basis of preparation and accounting policies
This condensed consolidated fi nancial information has been prepared in accordance with Hong Kong Accounting Standard 34 “Interim Financial Reporting” issued by the Hong Kong Institute of Certifi ed Public Accountants (“HKICPA”) and the applicable disclosure provisions of the Rules Governing the Listing of Securities on The Stock Exchange of Hong Kong Limited.
This condensed consolidated fi nancial information should be read in conjunction with the 2014 annual fi nancial statements.
The accounting policies used in the preparation of this condensed consolidated financial information are consistent with those used in the annual financial statements for the year ended 31 December 2014, except for the accounting policy changes that are expected to be refl ected in the 2015 annual fi nancial statements. Details of any changes in accounting policies are set out in note 2.
2. Changes in accounting policies
The HKICPA has issued a number of amendments to Hong Kong Financial Reporting Standards (“HKFRSs”) that are fi rst effective for the current accounting period of the Group and the Company. None of these developments are relevant to the Group’s results and fi nancial position. The Group has not applied any new standard or interpretation that is not yet effective for the current accounting period.
– 10 –
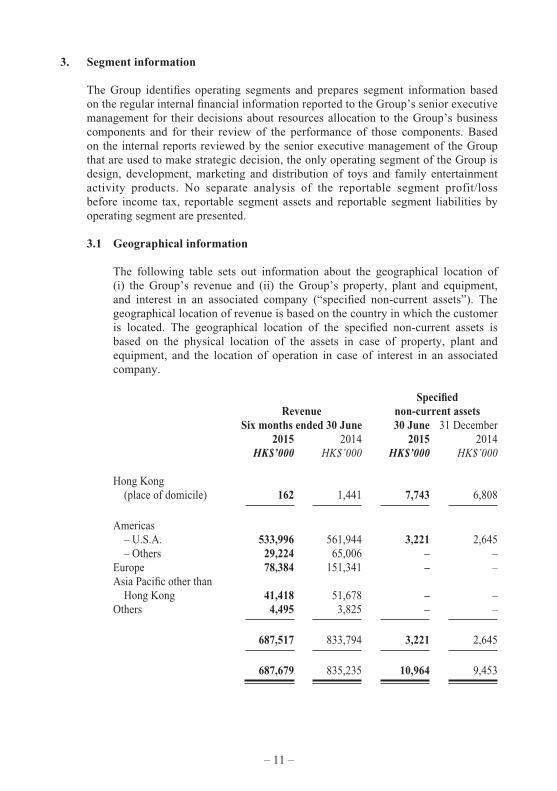
3. Segment information
The Group identifi es operating segments and prepares segment information based on the regular internal fi nancial information reported to the Group’s senior executive management for their decisions about resources allocation to the Group’s business components and for their review of the performance of those components. Based on the internal reports reviewed by the senior executive management of the Group that are used to make strategic decision, the only operating segment of the Group is design, development, marketing and distribution of toys and family entertainment activity products. No separate analysis of the reportable segment profit/loss before income tax, reportable segment assets and reportable segment liabilities by operating segment are presented.
3.1 Geographical information
The following table sets out information about the geographical location of (i) the Group’s revenue and (ii) the Group’s property, plant and equipment, and interest in an associated company (“specifi ed non-current assets”). The geographical location of revenue is based on the country in which the customer is located. The geographical location of the specifi ed non-current assets is based on the physical location of the assets in case of property, plant and equipment, and the location of operation in case of interest in an associated company.
Specifi ed Revenue non-current assets Six months ended 30 June 30 June 31 December 2015 2014 2015 2014 HK$’000 HK$’000 HK$’000 HK$’000
Hong Kong (place of domicile) 162 1,441 7,743 6,808
Americas – U.S.A. 533,996 561,944 3,221 2,645 – Others 29,224 65,006 – –Europe 78,384 151,341 – –Asia Pacifi c other than Hong Kong 41,418 51,678 – –Others 4,495 3,825 – –
687,517 833,794 3,221 2,645
687,679 835,235 10,964 9,453
– 11 –
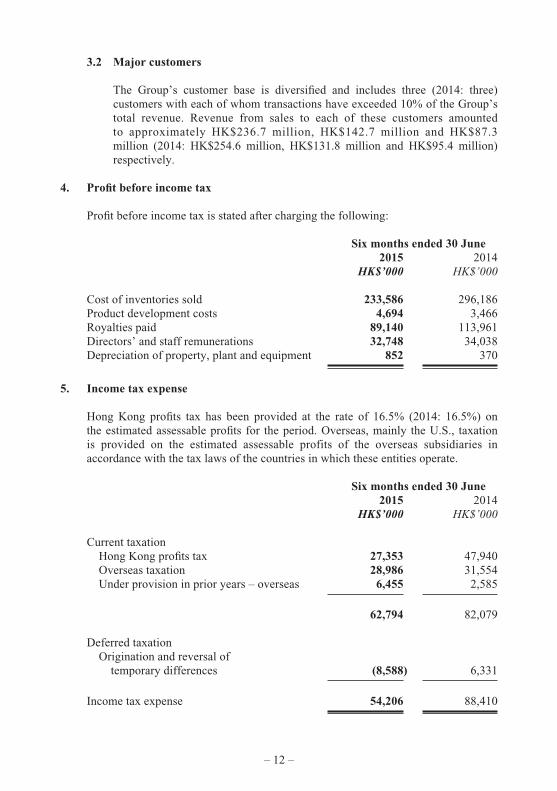
3.2 Major customers
The Group’s customer base is diversifi ed and includes three (2014: three) customers with each of whom transactions have exceeded 10% of the Group’s total revenue. Revenue from sales to each of these customers amounted to approximately HK$236.7 million, HK$142.7 million and HK$87.3 million (2014: HK$254.6 million, HK$131.8 million and HK$95.4 million) respectively.
4. Profi t before income tax
Profi t before income tax is stated after charging the following:
Six months ended 30 June 2015 2014 HK$’000 HK$’000
Cost of inventories sold 233,586 296,186Product development costs 4,694 3,466Royalties paid 89,140 113,961Directors’ and staff remunerations 32,748 34,038Depreciation of property, plant and equipment 852 370
5. Income tax expense
Hong Kong profi ts tax has been provided at the rate of 16.5% (2014: 16.5%) on the estimated assessable profi ts for the period. Overseas, mainly the U.S., taxation is provided on the estimated assessable profits of the overseas subsidiaries in accordance with the tax laws of the countries in which these entities operate.
Six months ended 30 June 2015 2014 HK$’000 HK$’000
Current taxation Hong Kong profi ts tax 27,353 47,940 Overseas taxation 28,986 31,554 Under provision in prior years – overseas 6,455 2,585
62,794 82,079
Deferred taxation Origination and reversal of temporary differences (8,588) 6,331
Income tax expense 54,206 88,410
– 12 –
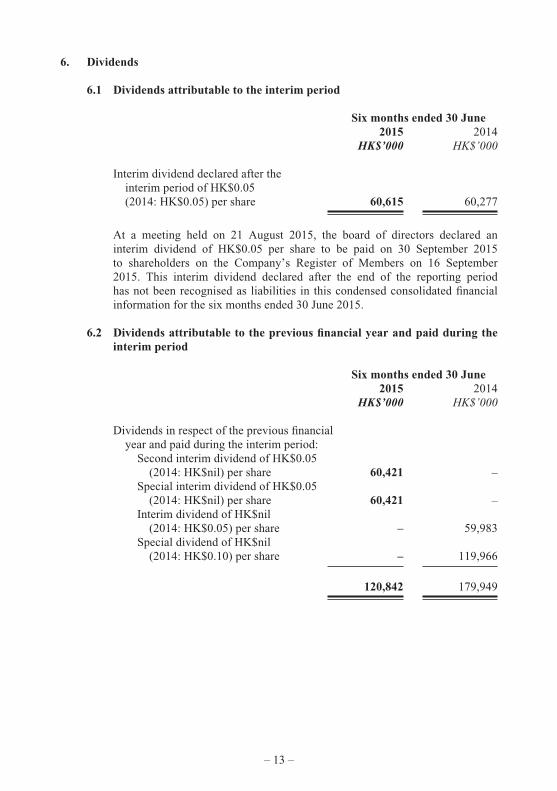
6. Dividends
6.1 Dividends attributable to the interim period
Six months ended 30 June 2015 2014 HK$’000 HK$’000
Interim dividend declared after the interim period of HK$0.05 (2014: HK$0.05) per share 60,615 60,277
At a meeting held on 21 August 2015, the board of directors declared an interim dividend of HK$0.05 per share to be paid on 30 September 2015 to shareholders on the Company’s Register of Members on 16 September 2015. This interim dividend declared after the end of the reporting period has not been recognised as liabilities in this condensed consolidated fi nancial information for the six months ended 30 June 2015.
6.2 Dividends attributable to the previous fi nancial year and paid during the interim period
Six months ended 30 June 2015 2014 HK$’000 HK$’000
Dividends in respect of the previous fi nancial year and paid during the interim period: Second interim dividend of HK$0.05 (2014: HK$nil) per share 60,421 – Special interim dividend of HK$0.05 (2014: HK$nil) per share 60,421 – Interim dividend of HK$nil (2014: HK$0.05) per share – 59,983 Special dividend of HK$nil (2014: HK$0.10) per share – 119,966
120,842 179,949
– 13 –
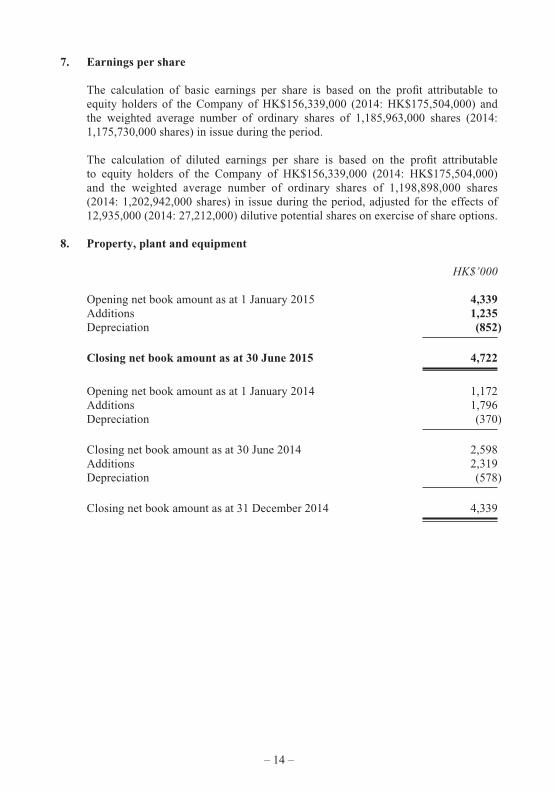
7. Earnings per share
The calculation of basic earnings per share is based on the profi t attributable to equity holders of the Company of HK$156,339,000 (2014: HK$175,504,000) and the weighted average number of ordinary shares of 1,185,963,000 shares (2014: 1,175,730,000 shares) in issue during the period.
The calculation of diluted earnings per share is based on the profi t attributable to equity holders of the Company of HK$156,339,000 (2014: HK$175,504,000) and the weighted average number of ordinary shares of 1,198,898,000 shares (2014: 1,202,942,000 shares) in issue during the period, adjusted for the effects of 12,935,000 (2014: 27,212,000) dilutive potential shares on exercise of share options.
8. Property, plant and equipment
HK$’000
Opening net book amount as at 1 January 2015 4,339Additions 1,235Depreciation (852)
Closing net book amount as at 30 June 2015 4,722
Opening net book amount as at 1 January 2014 1,172Additions 1,796Depreciation (370)
Closing net book amount as at 30 June 2014 2,598Additions 2,319Depreciation (578)
Closing net book amount as at 31 December 2014 4,339
– 14 –
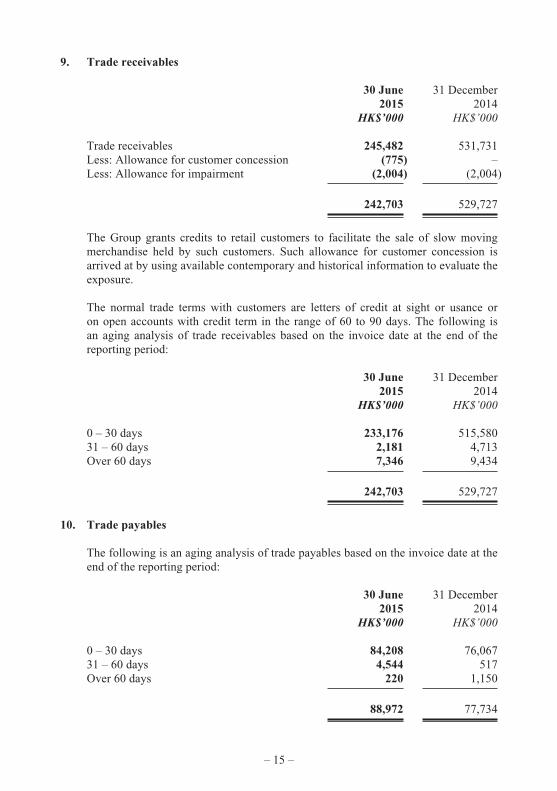
9. Trade receivables
30 June 31 December 2015 2014 HK$’000 HK$’000
Trade receivables 245,482 531,731Less: Allowance for customer concession (775) –Less: Allowance for impairment (2,004) (2,004)
242,703 529,727
The Group grants credits to retail customers to facilitate the sale of slow moving merchandise held by such customers. Such allowance for customer concession is arrived at by using available contemporary and historical information to evaluate the exposure.
The normal trade terms with customers are letters of credit at sight or usance or on open accounts with credit term in the range of 60 to 90 days. The following is an aging analysis of trade receivables based on the invoice date at the end of the reporting period:
30 June 31 December 2015 2014 HK$’000 HK$’000
0 – 30 days 233,176 515,58031 – 60 days 2,181 4,713Over 60 days 7,346 9,434
242,703 529,727
10. Trade payables
The following is an aging analysis of trade payables based on the invoice date at the end of the reporting period:
30 June 31 December 2015 2014 HK$’000 HK$’000
0 – 30 days 84,208 76,06731 – 60 days 4,544 517Over 60 days 220 1,150
88,972 77,734
– 15 –
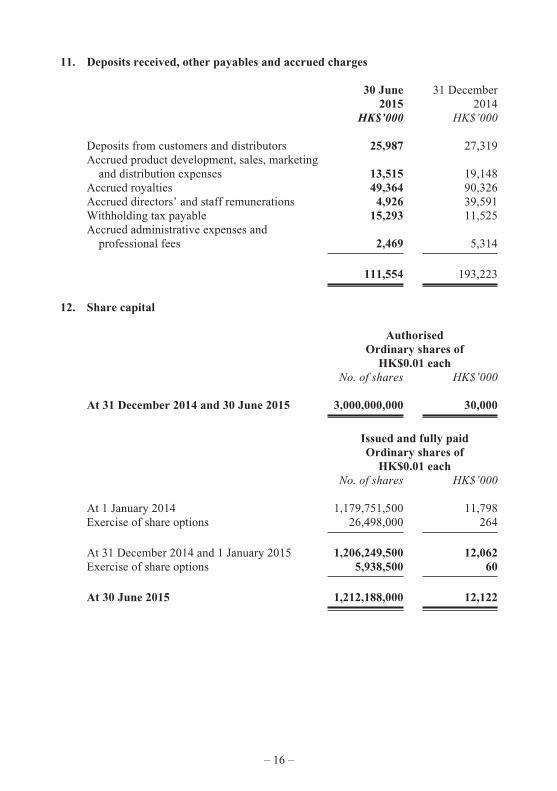
11. Deposits received, other payables and accrued charges
30 June 31 December 2015 2014 HK$’000 HK$’000
Deposits from customers and distributors 25,987 27,319Accrued product development, sales, marketing and distribution expenses 13,515 19,148Accrued royalties 49,364 90,326Accrued directors’ and staff remunerations 4,926 39,591Withholding tax payable 15,293 11,525Accrued administrative expenses and professional fees 2,469 5,314
111,554 193,223
12. Share capital
Authorised Ordinary shares of HK$0.01 each No. of shares HK$’000
At 31 December 2014 and 30 June 2015 3,000,000,000 30,000
Issued and fully paid Ordinary shares of HK$0.01 each No. of shares HK$’000
At 1 January 2014 1,179,751,500 11,798Exercise of share options 26,498,000 264
At 31 December 2014 and 1 January 2015 1,206,249,500 12,062Exercise of share options 5,938,500 60
At 30 June 2015 1,212,188,000 12,122
– 16 –
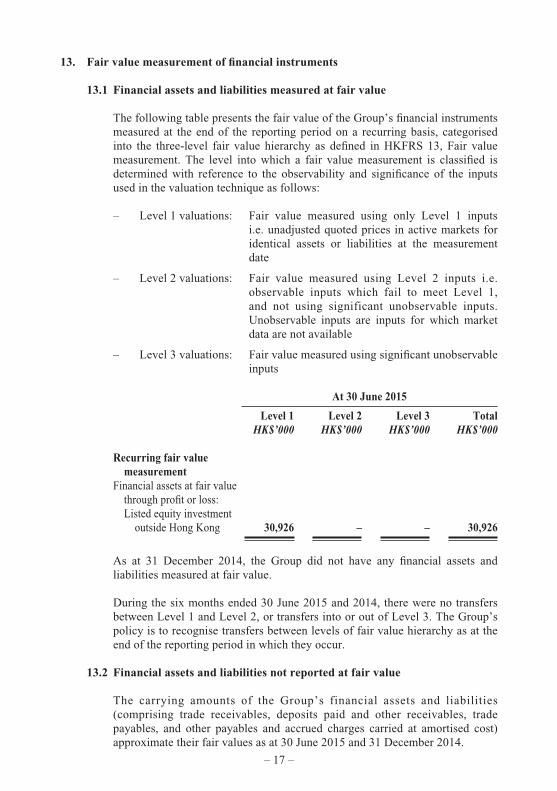
13. Fair value measurement of fi nancial instruments
13.1 Financial assets and liabilities measured at fair value
The following table presents the fair value of the Group’s fi nancial instruments measured at the end of the reporting period on a recurring basis, categorised into the three-level fair value hierarchy as defi ned in HKFRS 13, Fair value measurement. The level into which a fair value measurement is classifi ed is determined with reference to the observability and signifi cance of the inputs used in the valuation technique as follows:
– Level 1 valuations: Fair value measured using only Level 1 inputs i.e. unadjusted quoted prices in active markets for identical assets or liabilities at the measurement date
– Level 2 valuations: Fair value measured using Level 2 inputs i.e. observable inputs which fail to meet Level 1, and not using significant unobservable inputs. Unobservable inputs are inputs for which market data are not available
– Level 3 valuations: Fair value measured using signifi cant unobservable inputs
At 30 June 2015
Level 1 Level 2 Level 3 Total HK$’000 HK$’000 HK$’000 HK$’000
Recurring fair value measurement Financial assets at fair value through profi t or loss: Listed equity investment outside Hong Kong 30,926 – – 30,926
As at 31 December 2014, the Group did not have any fi nancial assets and liabilities measured at fair value.
During the six months ended 30 June 2015 and 2014, there were no transfers between Level 1 and Level 2, or transfers into or out of Level 3. The Group’s policy is to recognise transfers between levels of fair value hierarchy as at the end of the reporting period in which they occur.
13.2 Financial assets and liabilities not reported at fair value
The carrying amounts of the Group’s financial assets and liabilities (comprising trade receivables, deposits paid and other receivables, trade payables, and other payables and accrued charges carried at amortised cost) approximate their fair values as at 30 June 2015 and 31 December 2014.
– 17 –
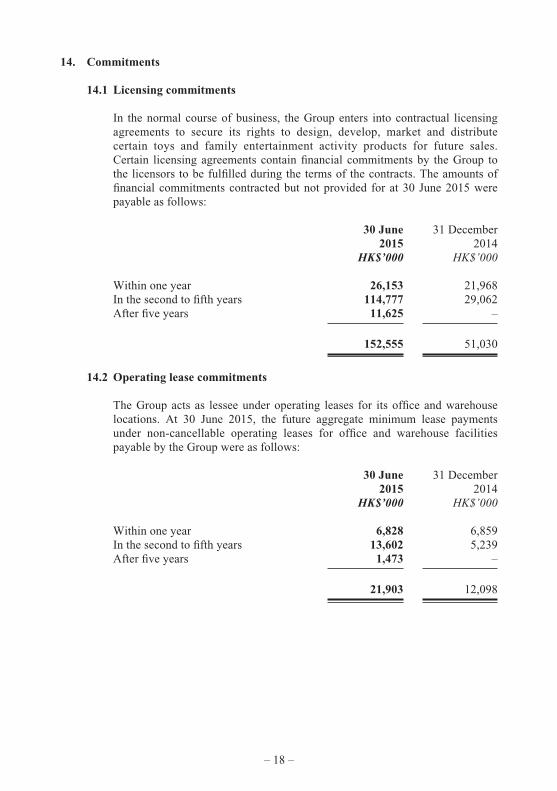
14. Commitments
14.1 Licensing commitments
In the normal course of business, the Group enters into contractual licensing agreements to secure its rights to design, develop, market and distribute certain toys and family entertainment activity products for future sales. Certain licensing agreements contain fi nancial commitments by the Group to the licensors to be fulfi lled during the terms of the contracts. The amounts of fi nancial commitments contracted but not provided for at 30 June 2015 were payable as follows:
30 June 31 December 2015 2014 HK$’000 HK$’000
Within one year 26,153 21,968In the second to fi fth years 114,777 29,062After fi ve years 11,625 –
152,555 51,030
14.2 Operating lease commitments
The Group acts as lessee under operating leases for its offi ce and warehouse locations. At 30 June 2015, the future aggregate minimum lease payments under non-cancellable operating leases for offi ce and warehouse facilities payable by the Group were as follows:
30 June 31 December 2015 2014 HK$’000 HK$’000
Within one year 6,828 6,859In the second to fi fth years 13,602 5,239After fi ve years 1,473 –
21,903 12,098
– 18 –
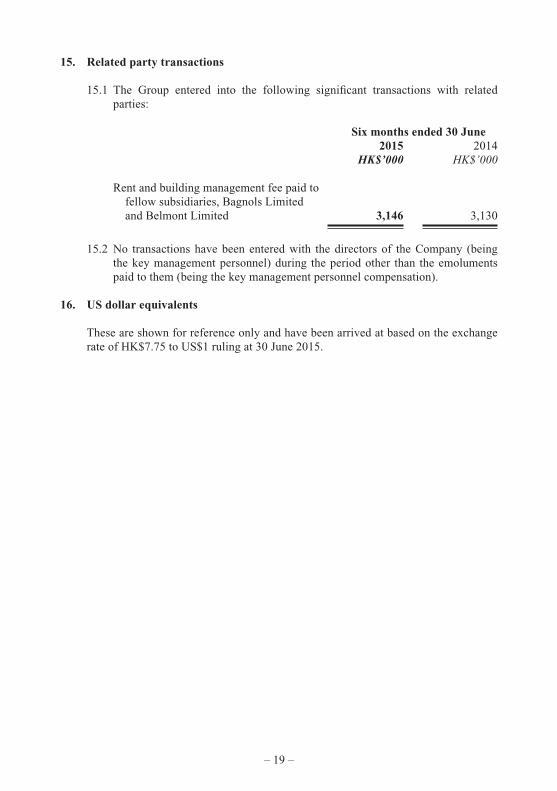
15. Related party transactions
15.1 The Group entered into the following signifi cant transactions with related parties:
Six months ended 30 June 2015 2014 HK$’000 HK$’000
Rent and building management fee paid to fellow subsidiaries, Bagnols Limited and Belmont Limited 3,146 3,130
15.2 No transactions have been entered with the directors of the Company (being the key management personnel) during the period other than the emoluments paid to them (being the key management personnel compensation).
16. US dollar equivalents
These are shown for reference only and have been arrived at based on the exchange rate of HK$7.75 to US$1 ruling at 30 June 2015.
– 19 –
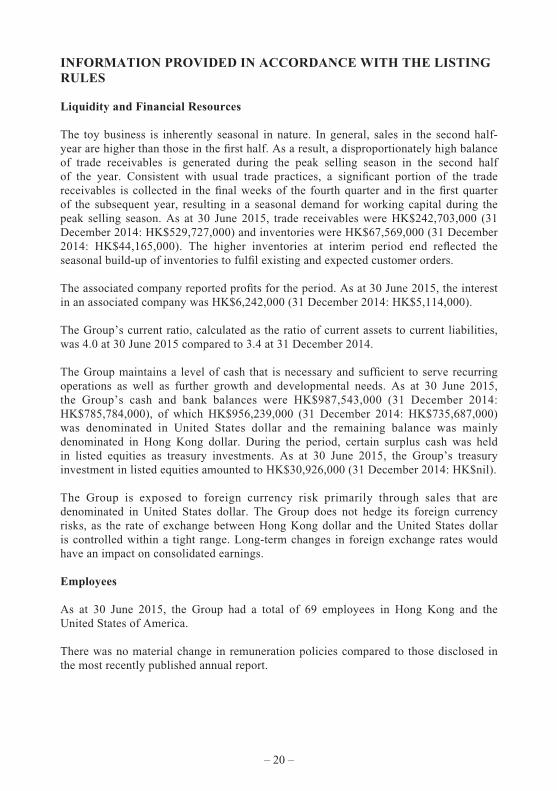
INFORMATION PROVIDED IN ACCORDANCE WITH THE LISTING RULES
Liquidity and Financial Resources
The toy business is inherently seasonal in nature. In general, sales in the second half-year are higher than those in the fi rst half. As a result, a disproportionately high balance of trade receivables is generated during the peak selling season in the second half of the year. Consistent with usual trade practices, a signifi cant portion of the trade receivables is collected in the fi nal weeks of the fourth quarter and in the fi rst quarter of the subsequent year, resulting in a seasonal demand for working capital during the peak selling season. As at 30 June 2015, trade receivables were HK$242,703,000 (31 December 2014: HK$529,727,000) and inventories were HK$67,569,000 (31 December 2014: HK$44,165,000). The higher inventories at interim period end refl ected the seasonal build-up of inventories to fulfi l existing and expected customer orders.
The associated company reported profi ts for the period. As at 30 June 2015, the interest in an associated company was HK$6,242,000 (31 December 2014: HK$5,114,000).
The Group’s current ratio, calculated as the ratio of current assets to current liabilities, was 4.0 at 30 June 2015 compared to 3.4 at 31 December 2014.
The Group maintains a level of cash that is necessary and suffi cient to serve recurring operations as well as further growth and developmental needs. As at 30 June 2015, the Group’s cash and bank balances were HK$987,543,000 (31 December 2014: HK$785,784,000), of which HK$956,239,000 (31 December 2014: HK$735,687,000) was denominated in United States dollar and the remaining balance was mainly denominated in Hong Kong dollar. During the period, certain surplus cash was held in listed equities as treasury investments. As at 30 June 2015, the Group’s treasury investment in listed equities amounted to HK$30,926,000 (31 December 2014: HK$nil).
The Group is exposed to foreign currency risk primarily through sales that are denominated in United States dollar. The Group does not hedge its foreign currency risks, as the rate of exchange between Hong Kong dollar and the United States dollar is controlled within a tight range. Long-term changes in foreign exchange rates would have an impact on consolidated earnings.
Employees
As at 30 June 2015, the Group had a total of 69 employees in Hong Kong and the United States of America.
There was no material change in remuneration policies compared to those disclosed in the most recently published annual report.
– 20 –
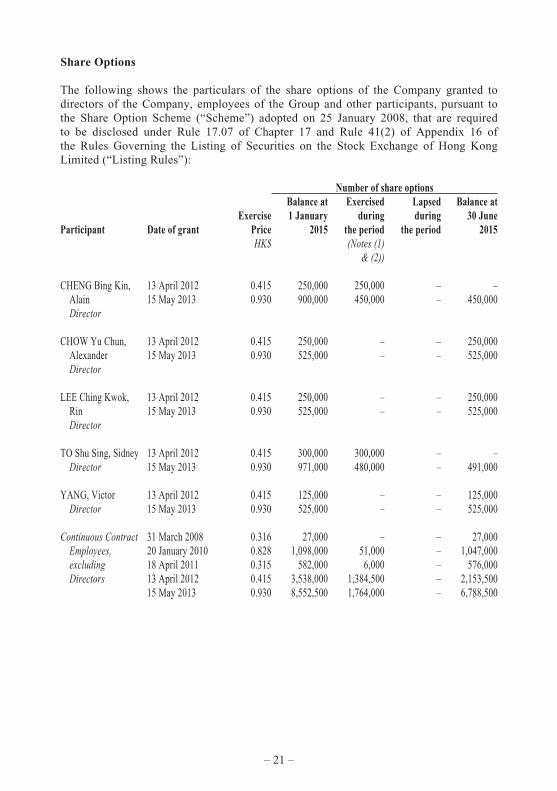
Share Options
The following shows the particulars of the share options of the Company granted to directors of the Company, employees of the Group and other participants, pursuant to the Share Option Scheme (“Scheme”) adopted on 25 January 2008, that are required to be disclosed under Rule 17.07 of Chapter 17 and Rule 41(2) of Appendix 16 of the Rules Governing the Listing of Securities on the Stock Exchange of Hong Kong Limited (“Listing Rules”):
Number of share options Balance at Exercised Lapsed Balance at Exercise 1 January during during 30 JuneParticipant Date of grant Price 2015 the period the period 2015 HK$ (Notes (1) & (2))
CHENG Bing Kin, 13 April 2012 0.415 250,000 250,000 – – Alain 15 May 2013 0.930 900,000 450,000 – 450,000 Director
CHOW Yu Chun, 13 April 2012 0.415 250,000 – – 250,000 Alexander 15 May 2013 0.930 525,000 – – 525,000 Director
LEE Ching Kwok, 13 April 2012 0.415 250,000 – – 250,000 Rin 15 May 2013 0.930 525,000 – – 525,000 Director
TO Shu Sing, Sidney 13 April 2012 0.415 300,000 300,000 – – Director 15 May 2013 0.930 971,000 480,000 – 491,000
YANG, Victor 13 April 2012 0.415 125,000 – – 125,000 Director 15 May 2013 0.930 525,000 – – 525,000
Continuous Contract 31 March 2008 0.316 27,000 – – 27,000 Employees, 20 January 2010 0.828 1,098,000 51,000 – 1,047,000 excluding 18 April 2011 0.315 582,000 6,000 – 576,000 Directors 13 April 2012 0.415 3,538,000 1,384,500 – 2,153,500 15 May 2013 0.930 8,552,500 1,764,000 – 6,788,500
– 21 –
Number of share options Balance at Exercised Lapsed Balance at Exercise 1 January during during 30 JuneParticipant Date of grant Price 2015 the period the period 2015 HK$ (Notes (1) & (2))
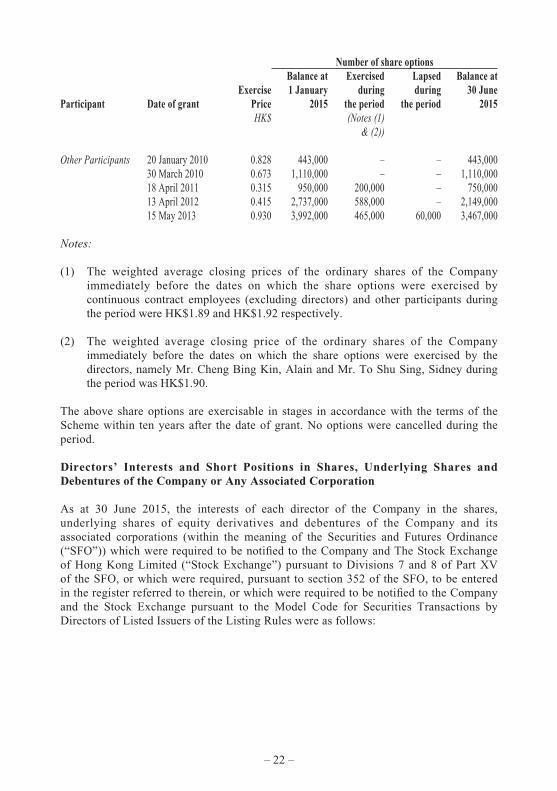
Other Participants 20 January 2010 0.828 443,000 – – 443,000 30 March 2010 0.673 1,110,000 – – 1,110,000 18 April 2011 0.315 950,000 200,000 – 750,000 13 April 2012 0.415 2,737,000 588,000 – 2,149,000 15 May 2013 0.930 3,992,000 465,000 60,000 3,467,000
Notes:
(1) The weighted average closing prices of the ordinary shares of the Company immediately before the dates on which the share options were exercised by continuous contract employees (excluding directors) and other participants during the period were HK$1.89 and HK$1.92 respectively.
(2) The weighted average closing price of the ordinary shares of the Company immediately before the dates on which the share options were exercised by the directors, namely Mr. Cheng Bing Kin, Alain and Mr. To Shu Sing, Sidney during the period was HK$1.90.
The above share options are exercisable in stages in accordance with the terms of the Scheme within ten years after the date of grant. No options were cancelled during the period.
Directors’ Interests and Short Positions in Shares, Underlying Shares and Debentures of the Company or Any Associated Corporation
As at 30 June 2015, the interests of each director of the Company in the shares, underlying shares of equity derivatives and debentures of the Company and its associated corporations (within the meaning of the Securities and Futures Ordinance (“SFO”)) which were required to be notifi ed to the Company and The Stock Exchange of Hong Kong Limited (“Stock Exchange”) pursuant to Divisions 7 and 8 of Part XV of the SFO, or which were required, pursuant to section 352 of the SFO, to be entered in the register referred to therein, or which were required to be notifi ed to the Company and the Stock Exchange pursuant to the Model Code for Securities Transactions by Directors of Listed Issuers of the Listing Rules were as follows:
– 22 –
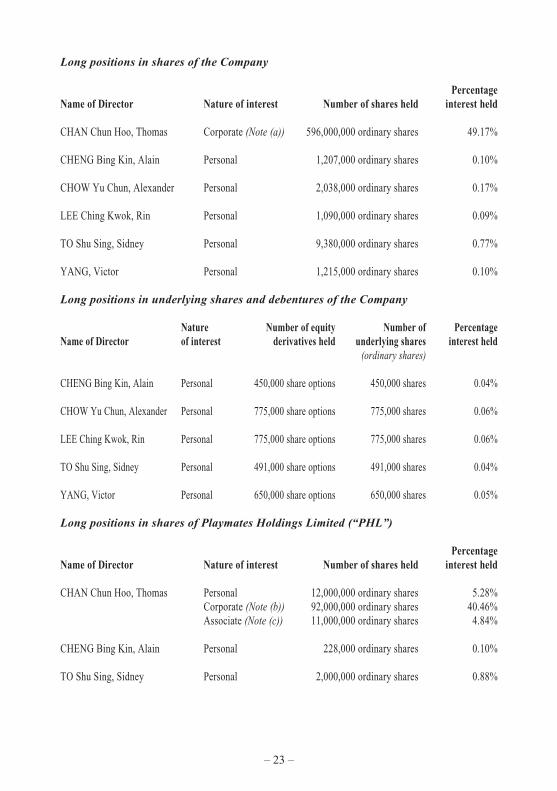
Long positions in shares of the Company
PercentageName of Director Nature of interest Number of shares held interest held
CHAN Chun Hoo, Thomas Corporate (Note (a)) 596,000,000 ordinary shares 49.17%
CHENG Bing Kin, Alain Personal 1,207,000 ordinary shares 0.10%
CHOW Yu Chun, Alexander Personal 2,038,000 ordinary shares 0.17%
LEE Ching Kwok, Rin Personal 1,090,000 ordinary shares 0.09%
TO Shu Sing, Sidney Personal 9,380,000 ordinary shares 0.77%
YANG, Victor Personal 1,215,000 ordinary shares 0.10%
Long positions in underlying shares and debentures of the Company
Nature Number of equity Number of PercentageName of Director of interest derivatives held underlying shares interest held (ordinary shares)
CHENG Bing Kin, Alain Personal 450,000 share options 450,000 shares 0.04%
CHOW Yu Chun, Alexander Personal 775,000 share options 775,000 shares 0.06%
LEE Ching Kwok, Rin Personal 775,000 share options 775,000 shares 0.06%
TO Shu Sing, Sidney Personal 491,000 share options 491,000 shares 0.04%
YANG, Victor Personal 650,000 share options 650,000 shares 0.05%
Long positions in shares of Playmates Holdings Limited (“PHL”)
PercentageName of Director Nature of interest Number of shares held interest held
CHAN Chun Hoo, Thomas Personal 12,000,000 ordinary shares 5.28% Corporate (Note (b)) 92,000,000 ordinary shares 40.46% Associate (Note (c)) 11,000,000 ordinary shares 4.84%
CHENG Bing Kin, Alain Personal 228,000 ordinary shares 0.10%
TO Shu Sing, Sidney Personal 2,000,000 ordinary shares 0.88%
– 23 –
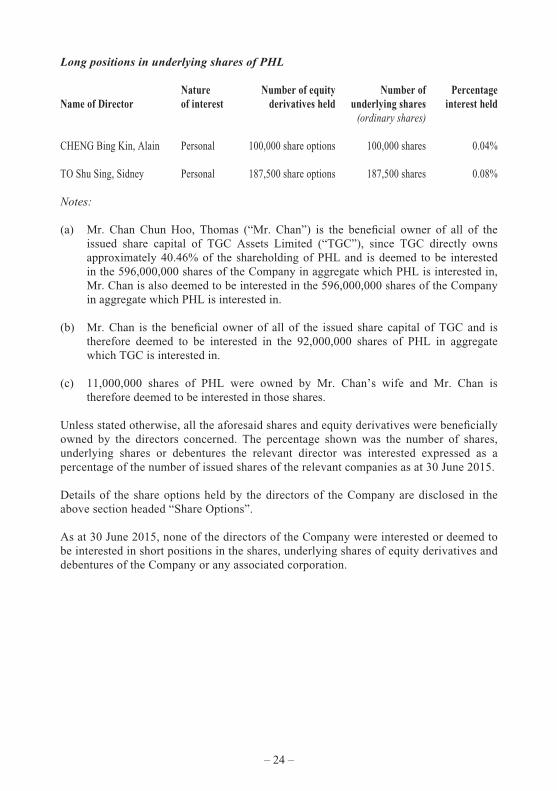
Long positions in underlying shares of PHL
Nature Number of equity Number of PercentageName of Director of interest derivatives held underlying shares interest held (ordinary shares)
CHENG Bing Kin, Alain Personal 100,000 share options 100,000 shares 0.04%
TO Shu Sing, Sidney Personal 187,500 share options 187,500 shares 0.08%
Notes:
(a) Mr. Chan Chun Hoo, Thomas (“Mr. Chan”) is the benefi cial owner of all of the issued share capital of TGC Assets Limited (“TGC”), since TGC directly owns approximately 40.46% of the shareholding of PHL and is deemed to be interested in the 596,000,000 shares of the Company in aggregate which PHL is interested in, Mr. Chan is also deemed to be interested in the 596,000,000 shares of the Company in aggregate which PHL is interested in.
(b) Mr. Chan is the benefi cial owner of all of the issued share capital of TGC and is therefore deemed to be interested in the 92,000,000 shares of PHL in aggregate which TGC is interested in.
(c) 11,000,000 shares of PHL were owned by Mr. Chan’s wife and Mr. Chan is therefore deemed to be interested in those shares.
Unless stated otherwise, all the aforesaid shares and equity derivatives were benefi cially owned by the directors concerned. The percentage shown was the number of shares, underlying shares or debentures the relevant director was interested expressed as a percentage of the number of issued shares of the relevant companies as at 30 June 2015.
Details of the share options held by the directors of the Company are disclosed in the above section headed “Share Options”.
As at 30 June 2015, none of the directors of the Company were interested or deemed to be interested in short positions in the shares, underlying shares of equity derivatives and debentures of the Company or any associated corporation.
– 24 –
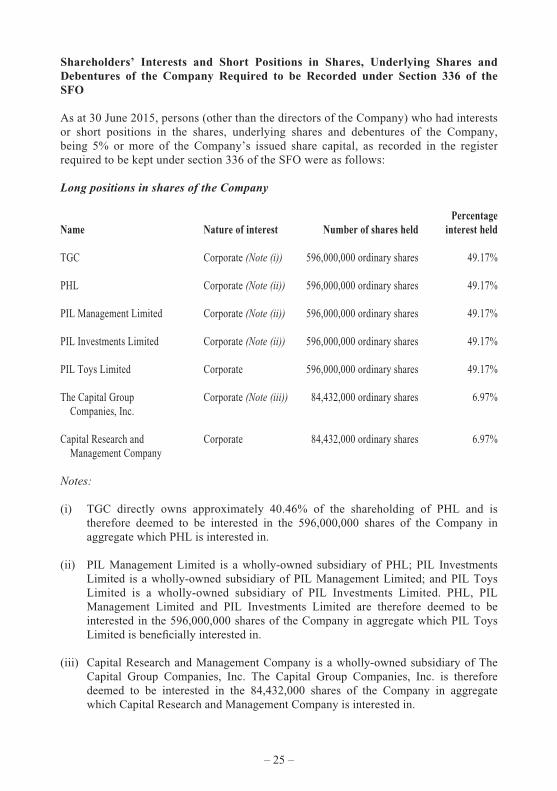
Shareholders’ Interests and Short Positions in Shares, Underlying Shares and Debentures of the Company Required to be Recorded under Section 336 of the SFO
As at 30 June 2015, persons (other than the directors of the Company) who had interests or short positions in the shares, underlying shares and debentures of the Company, being 5% or more of the Company’s issued share capital, as recorded in the register required to be kept under section 336 of the SFO were as follows:
Long positions in shares of the Company
PercentageName Nature of interest Number of shares held interest held
TGC Corporate (Note (i)) 596,000,000 ordinary shares 49.17%
PHL Corporate (Note (ii)) 596,000,000 ordinary shares 49.17%
PIL Management Limited Corporate (Note (ii)) 596,000,000 ordinary shares 49.17%
PIL Investments Limited Corporate (Note (ii)) 596,000,000 ordinary shares 49.17%
PIL Toys Limited Corporate 596,000,000 ordinary shares 49.17%
The Capital Group Corporate (Note (iii)) 84,432,000 ordinary shares 6.97% Companies, Inc.
Capital Research and Corporate 84,432,000 ordinary shares 6.97% Management Company
Notes:
(i) TGC directly owns approximately 40.46% of the shareholding of PHL and is therefore deemed to be interested in the 596,000,000 shares of the Company in aggregate which PHL is interested in.
(ii) PIL Management Limited is a wholly-owned subsidiary of PHL; PIL Investments Limited is a wholly-owned subsidiary of PIL Management Limited; and PIL Toys Limited is a wholly-owned subsidiary of PIL Investments Limited. PHL, PIL Management Limited and PIL Investments Limited are therefore deemed to be interested in the 596,000,000 shares of the Company in aggregate which PIL Toys Limited is benefi cially interested in.
(iii) Capital Research and Management Company is a wholly-owned subsidiary of The Capital Group Companies, Inc. The Capital Group Companies, Inc. is therefore deemed to be interested in the 84,432,000 shares of the Company in aggregate which Capital Research and Management Company is interested in.
– 25 –
Purchase, Sale or Redemption of Shares
The Company has not redeemed any of its shares during the period. Neither the Company nor any of its subsidiaries has purchased or sold any of the Company’s shares during the period.
Compliance with the Corporate Governance Code
The Company has applied the principles and complied with all the applicable code provisions (“Code Provisions”) of the Corporate Governance Code as set out in Appendix 14 of the Listing Rules throughout the six months ended 30 June 2015, except in respect of one Code Provision providing for the roles of the chairman and the chief executive offi cer to be performed by different individuals.
In respect of the segregation of the roles of the chairman and chief executive offi cer, the Group’s practice is that the Chairman also acts as chief executive offi cer. This allows him to focus on Group strategy and at the same time ensure that all key issues are considered by the board in a timely manner. The executive directors supported by the senior executives are delegated with the responsibilities of running the business operations and making operational and business decisions of the Group. The board considers that this structure is suitable and effective in facilitating the operations and business development of the Company and maintaining the checks and balances between the board and the management of the business of the Group. The structure outlined above will be reviewed regularly to ensure that sound corporate governance is in place.
The Audit Committee has reviewed with the management the accounting principles and practices adopted by the Group and discussed internal controls and financial reporting matters including a review of the unaudited condensed consolidated fi nancial information for the six months ended 30 June 2015.
– 26 –
Compliance with the Model Code
The Company has adopted the Model Code as set out in Appendix 10 of the Listing Rules for securities transactions by directors of the Company. All the members of the Board have confi rmed, following specifi c enquiry by the Company, that they have complied with the required standard as set out in the Model Code throughout the period ended 30 June 2015.
Closure of Register of Members
The Register of Members of the Company will be closed from 15 September 2015 to 16 September 2015, both days inclusive, during which period no transfer of shares of the Company will be registered. In order to be qualifi ed for the declared dividend, all transfers accompanied by the relevant share certifi cates must be lodged with the Company’s branch share registrars, Tricor Abacus Limited at Level 22, Hopewell Centre, 183 Queen’s Road East, Hong Kong no later than 4:30 p.m. on 14 September 2015. The interim dividend will be paid on 30 September 2015 to the shareholders on the Register of Members of the Company on 16 September 2015.
On behalf of the BoardCHAN Chun Hoo, Thomas
Chairman
Hong Kong, 21 August 2015
– 27 –
CORPORATE INFORMATION
DirectorsCHAN Chun Hoo, Thomas (Chairman)CHENG Bing Kin, Alain (Executive Director)CHOW Yu Chun, Alexander (Independent Non-executive Director)LEE Ching Kwok, Rin (Independent Non-executive Director)TO Shu Sing, Sidney (Executive Director)YANG, Victor (Independent Non-executive Director)
Company SecretaryNG Ka Yan
Registered Offi ceClarendon House2 Church StreetHamilton HM 11Bermuda
Principal Offi ce23/F., The Toy House100 Canton RoadTsimshatsuiKowloon, Hong Kong
AuditorsGrant Thornton Hong Kong Limited Certifi ed Public Accountants
Legal AdvisorsConyers Dill & PearmanDeacons
Principal BankersThe Bank of East Asia, LimitedChong Hing Bank LimitedHang Seng Bank LimitedUBS AG
Principal Share RegistrarsCodan Services LimitedClarendon House2 Church StreetHamilton HM 11Bermuda
Branch Share RegistrarsTricor Abacus LimitedLevel 22Hopewell Centre183 Queen’s Road EastHong Kong
Stock CodeThe shares of Playmates Toys Limited are listed for trading on The Stock Exchange of Hong Kong Limited(Stock Code: 869)
Websitewww.playmatestoys.com
– 28 –

Playmates Toys Limited(Incorporated in Bermuda with limited liability)
(Stock code 869)www.playmatestoys.com